/


Текст
D
o
w
n
l
o
a
d
e
d
b
y
[
U
n
i
v
e
r
s
i
t
y
o
f
C
a
l
i
f
o
r
n
i
a
,
S
a
n
D
i
e
g
o
]
a
t
0
0
:
0
8
1
9
M
a
y
2
0
1
7
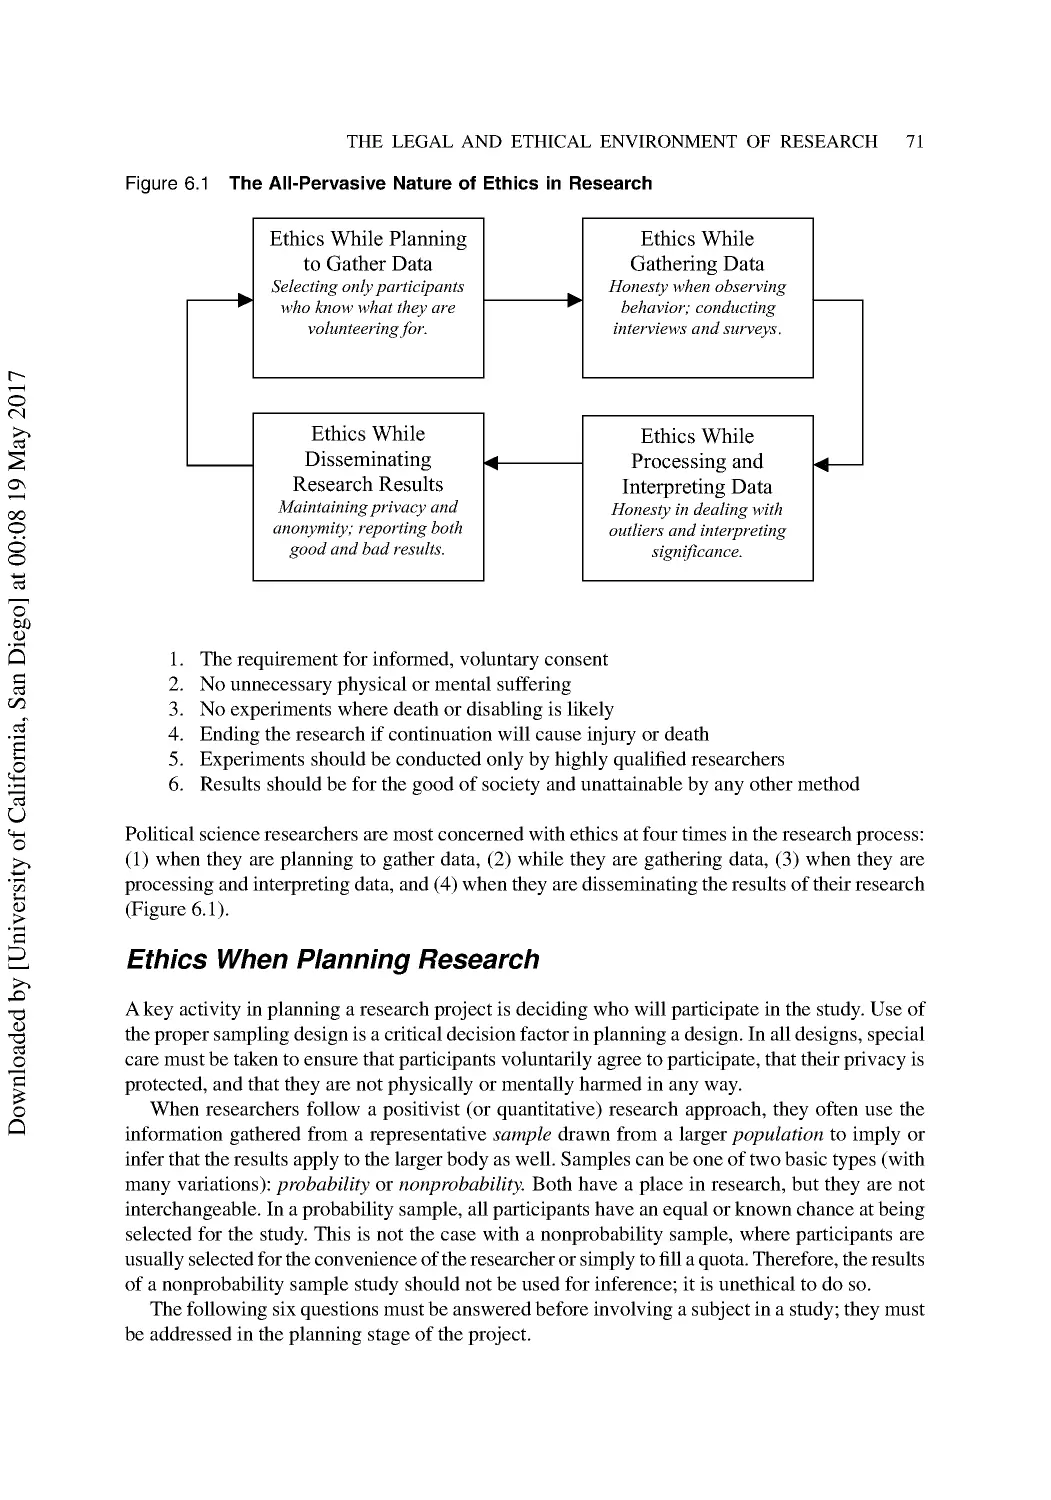
Research Methods
for Political Science
S ECOND EDITION
D
o
w
n
l
o
a
d
e
d
b
y
[
U
n
i
v
e
r
s
i
t
y
o
f
C
a
l
i
f
o
r
n
i
a
,
S
a
n
D
i
e
g
o
]
a
t
0
0
:
0
8
1
9
M
a
y
2
0
1
7
This page intentionally left blank
D
o
w
n
l
o
a
d
e
d
b
y
[
U
n
i
v
e
r
s
i
t
y
o
f
C
a
l
i
f
o
r
n
i
a
,
S
a
n
D
i
e
g
o
]
a
t
0
0
:
0
8
1
9
M
a
y
2
0
1
7
Research Methods
for Political Science
S ECOND EDITION
Quantitative and Qualitative Approaches
David E. McNabb
D
o
w
n
l
o
a
d
e
d
b
y
[
U
n
i
v
e
r
s
i
t
y
o
f
C
a
l
i
f
o
r
n
i
a
,
S
a
n
D
i
e
g
o
]
a
t
0
0
:
0
8
1
9
M
a
y
2
0
1
7
Library of Congress Cataloging-in-Publication Data
McNabb, David E.
Research methods for political science : quantitative and qualitative approaches /
by David E. McNabb. — 2nd ed.
p. cm.
Includes bibliographical references and index.
ISBN 978-0-7656-2313 -3 (pbk. : alk. paper)
1. Political science—Methodology. 2. Political science—Research. I . Title.
JA71.5.M34 2009
320.072—dc22
2008049000
First published 2010 by M.E. Sharpe
Published 2015
2 Park Square, Milton Park, Abingdon, Oxon OX14 4RN
711 Third Avenue, New York, NY 10017, USA
Routledge is an imprint of the Taylor & Francis Group, an informa business
by Routledge
Copyright © 2010 Taylor & Francis. All rights reserved.
No part of this book may be reprinted or reproduced or utilised in any form or by
any electronic, mechanical, or other means, now known or hereafter invented,
including photocopying and recording, or in any information storage or retrieval
system, without permission in writing from the publishers.
Notices
No responsibility is assumed by the publisher for any injury and/or damage to
persons or property as a matter of products liability, negligence or otherwise,
or from any use of operation of any methods, products, instructions or ideas
contained in the material herein.
Practitioners and researchers must always rely on their own experience and
knowledge in evaluating and using any information, methods, compound s, or
experiments described herein. In using such information or methods they should
be mindful of their own safety and the safety of others, including parties for
whom they have a professional responsibility.
Product or corporate names may be trademarks or registered trademarks, and
are used only for identification and explanation without intent to infringe.
ISBN 13: 9780765623133 (pbk)
D
o
w
n
l
o
a
d
e
d
b
y
[
U
n
i
v
e
r
s
i
t
y
o
f
C
a
l
i
f
o
r
n
i
a
,
S
a
n
D
i
e
g
o
]
a
t
0
0
:
0
8
1
9
M
a
y
2
0
1
7
Dedicated to
J.C ., with everlasting affection, and
to the memory of my father, J.B. McNabb.
D
o
w
n
l
o
a
d
e
d
b
y
[
U
n
i
v
e
r
s
i
t
y
o
f
C
a
l
i
f
o
r
n
i
a
,
S
a
n
D
i
e
g
o
]
a
t
0
0
:
0
8
1
9
M
a
y
2
0
1
7
This page intentionally left blank
D
o
w
n
l
o
a
d
e
d
b
y
[
U
n
i
v
e
r
s
i
t
y
o
f
C
a
l
i
f
o
r
n
i
a
,
S
a
n
D
i
e
g
o
]
a
t
0
0
:
0
8
1
9
M
a
y
2
0
1
7
vii
Brief Table of Contents
Preface and Acknowledgments
xvii
Introduction
xix
Part 1 Foundations of Political Science Research
1
1 Research Fundamentals
3
2 Research Approaches and Methods
15
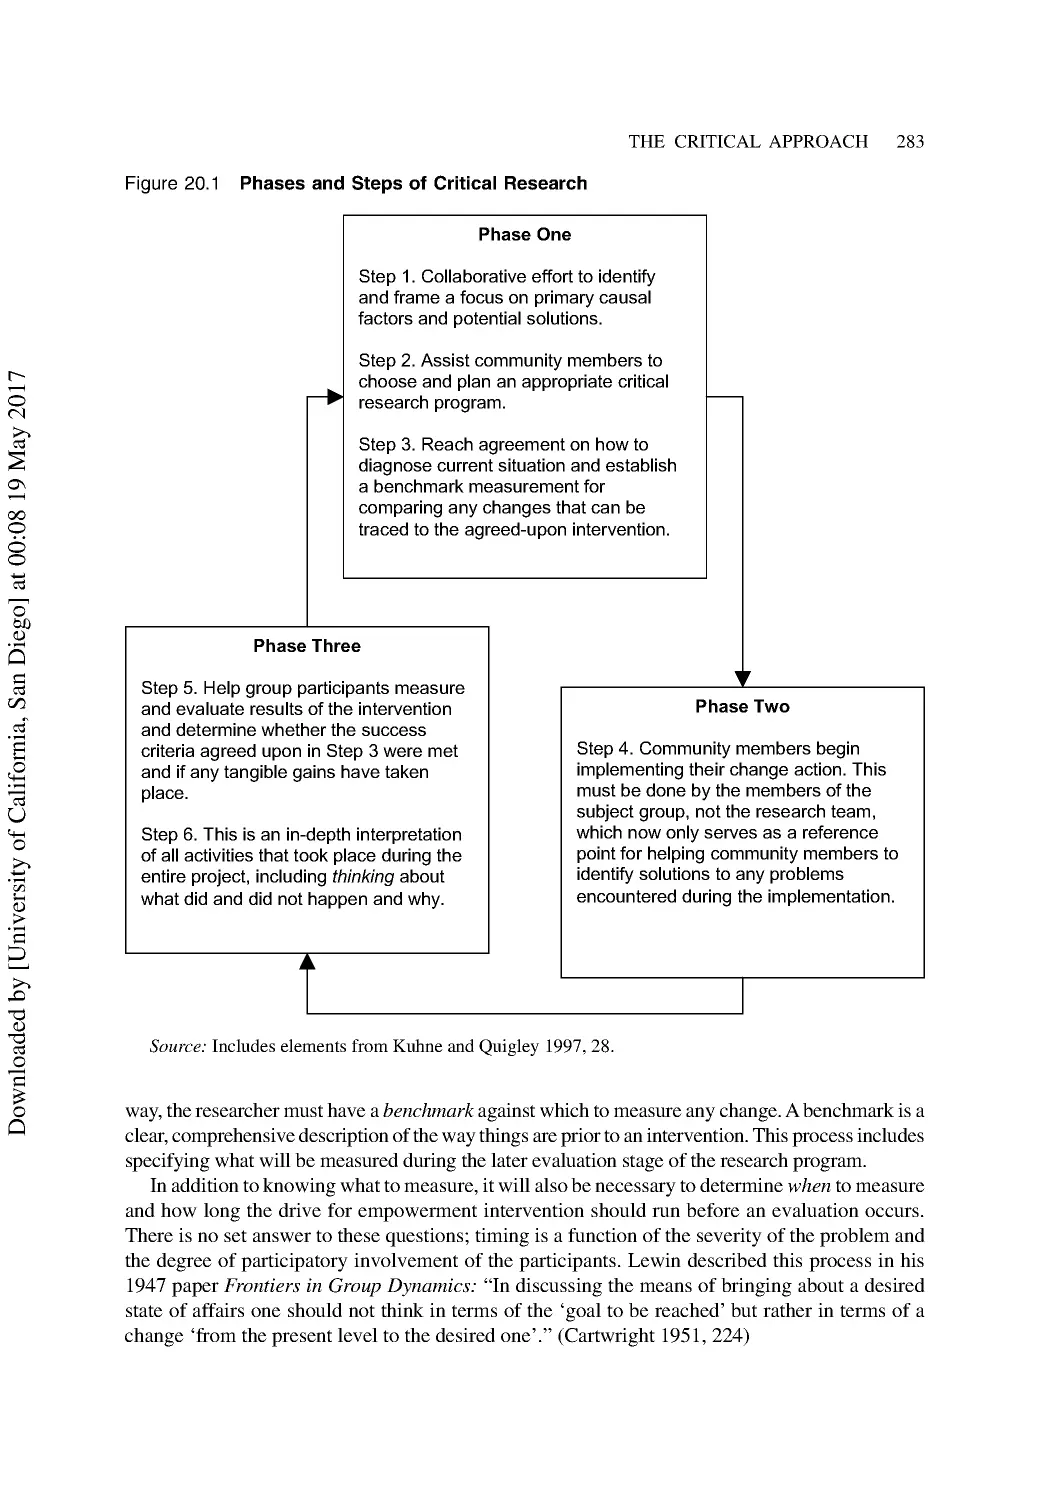
3 Understanding the Research Process
29
4 Selecting a Research Design and Choosing a Research Topic
40
5 Preparing a Research Proposal
57
6 The Legal and Ethical Environment of Research
66
Part 2 Quantitative Research Approaches and Methods
77
7 Introduction to Quantitative Methods
79
8 Exploratory Research: The Probing Approach
96
9 Descriptive Research: The Survey Approach
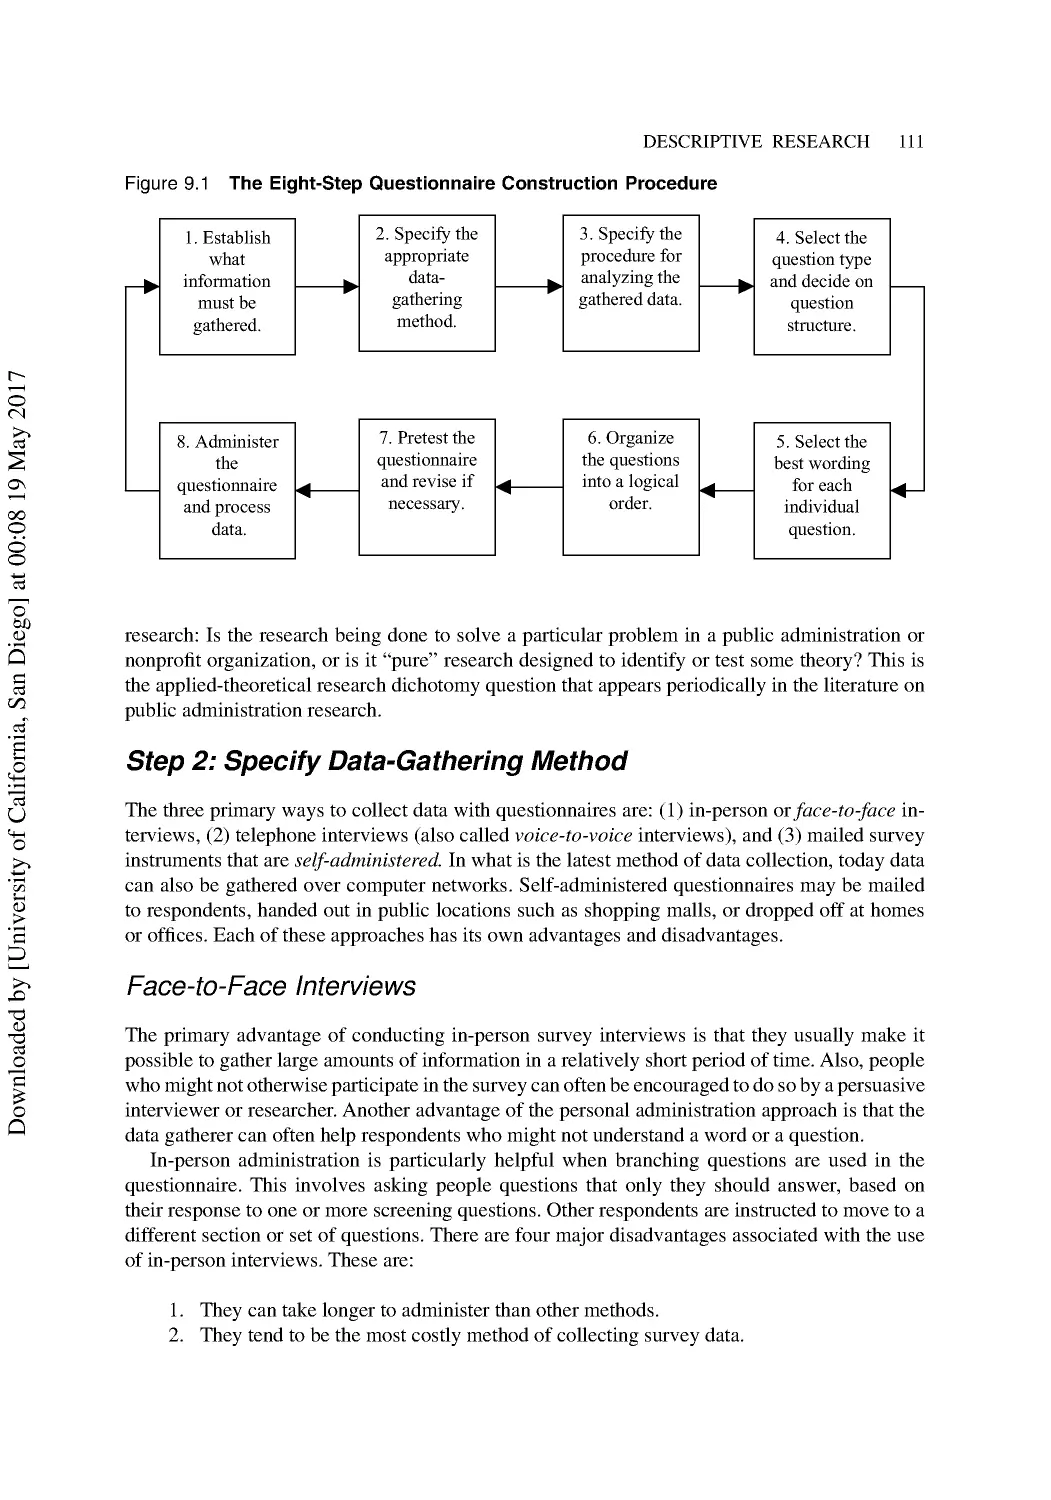
109
10 Causal Research: The Experimental Approach
125
11 Interpreting Exploratory and Descriptive Statistics
141
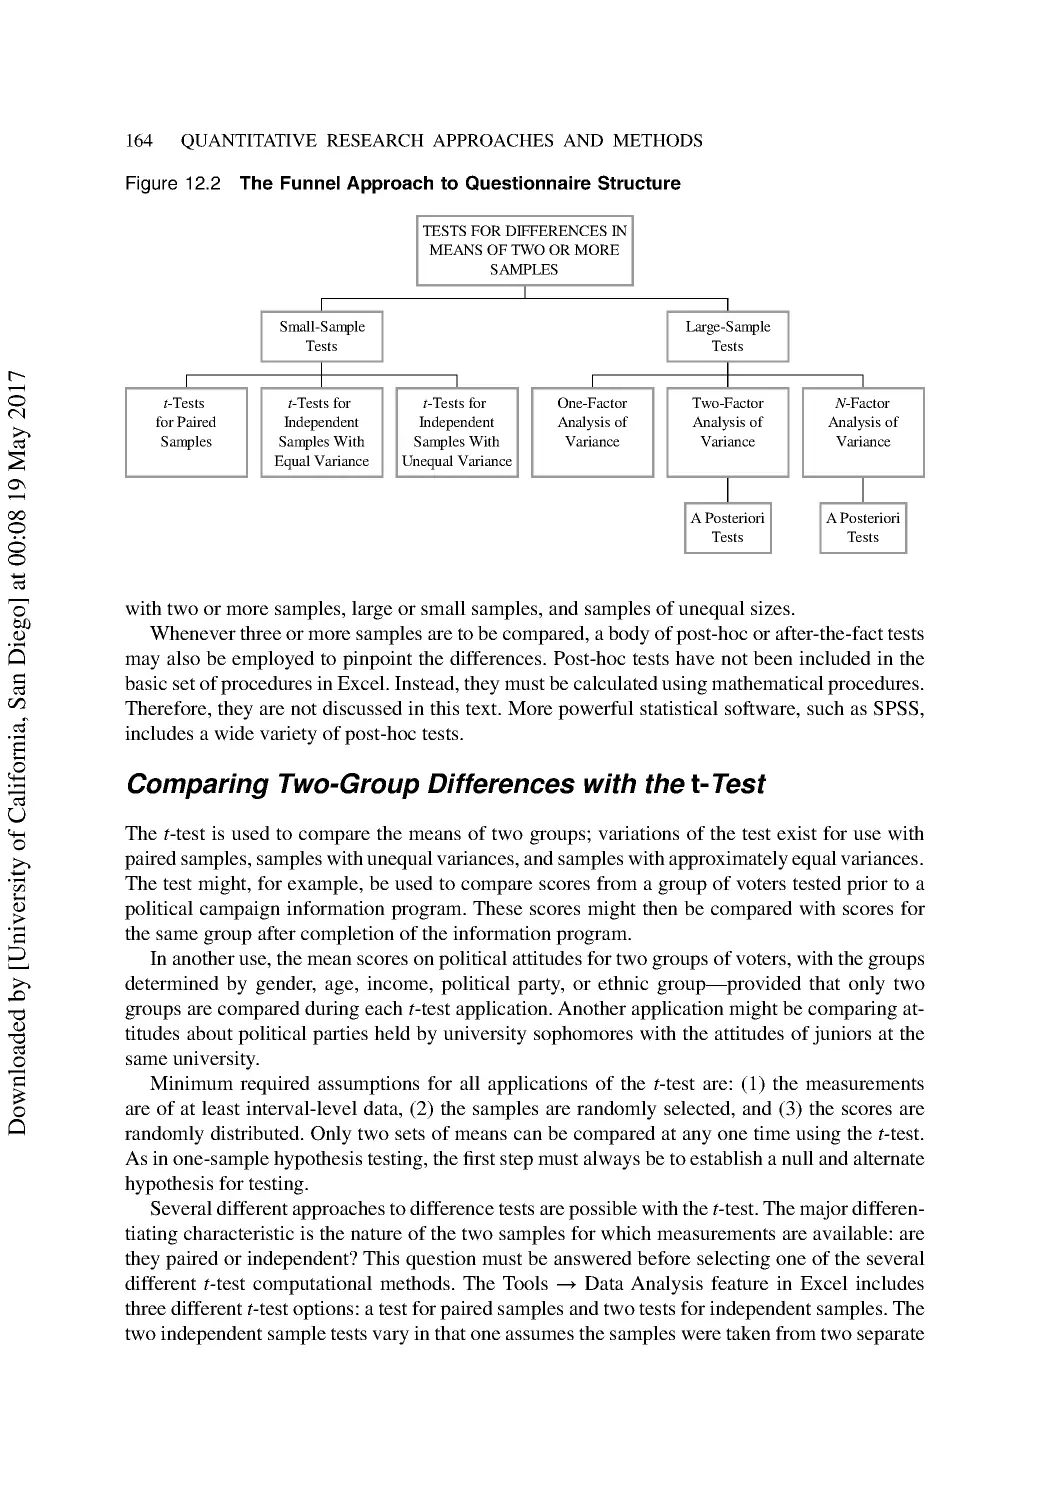
12 Testing Research Hypotheses
157
13 Introduction to Nonparametric Statistics
176
D
o
w
n
l
o
a
d
e
d
b
y
[
U
n
i
v
e
r
s
i
t
y
o
f
C
a
l
i
f
o
r
n
i
a
,
S
a
n
D
i
e
g
o
]
a
t
0
0
:
0
8
1
9
M
a
y
2
0
1
7
viii BRIEF TABLE OF CONTENTS
14 Correlation and Regression Analysis in Political Science
192
15 Exploring Multivariate Statistics
207
Part 3 Qualitative Research Approaches and Methods
223
16 Introduction to Qualitative Research Methods
225
17 Explanatory Research: Case and Historical Methods
236
18 The Interpretive Approach I: Grounded Theory Methods
251
19 The Interpretive Approach II: Ethnographic Research Methods
264
20 The Critical Approach: Feminist and Empowerment Research
276
21 Analysis Methods for Qualitative Data
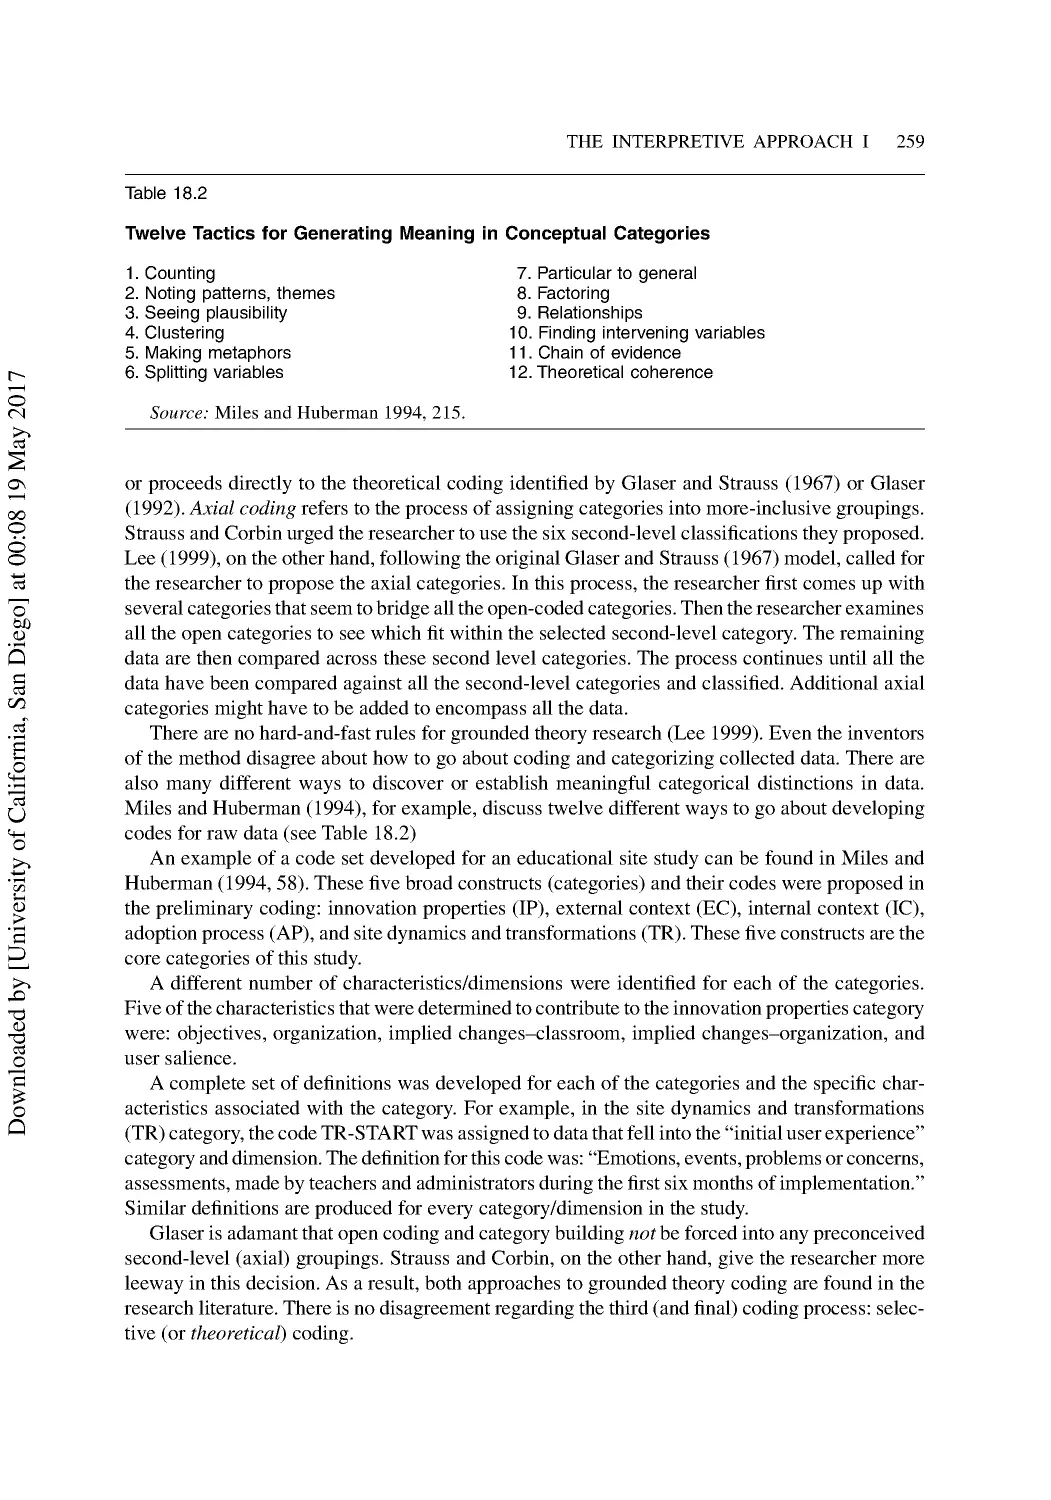
287
22 Analyzing Texts, Documents, and Artifacts
303
Part 4 Preparing and Presenting Research Findings
327
23 Organizing Information in Tables, Charts, and Graphs
329
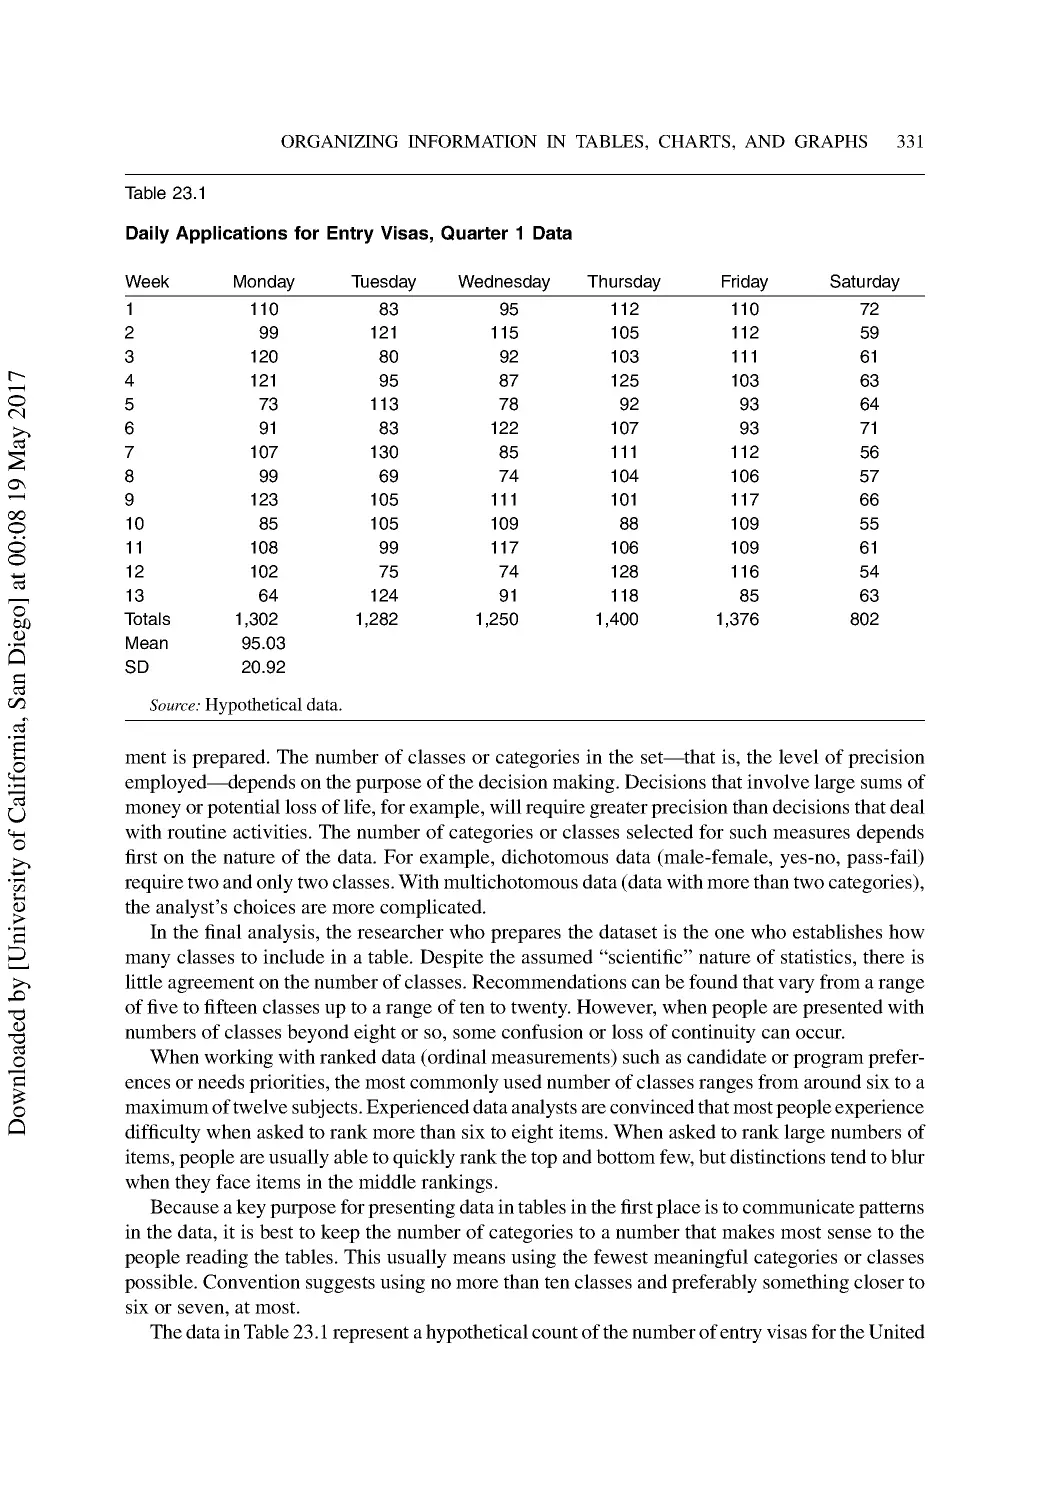
24 Organizing and Writing a Research Report
344
25 Introduction to Statistical Software
364
Bibliography
383
Author Index
403
Subject Index
409
About the Author
425
D
o
w
n
l
o
a
d
e
d
b
y
[
U
n
i
v
e
r
s
i
t
y
o
f
C
a
l
i
f
o
r
n
i
a
,
S
a
n
D
i
e
g
o
]
a
t
0
0
:
0
8
1
9
M
a
y
2
0
1
7
ix
Detailed Table of Contents
Preface and Acknowledgments ................................................................................................. xvii
Introduction ................................................................................................................................ xix
Structure of the Book .......................................................................................................... xix
Summary ............................................................................................................................ xxii
Part 1 Foundations of Political Science Research ................................................................. 1
1 Research Fundamentals.......................................................................................................3
Purposes of Political Science Research.................................................................................. 3
The “Big Issues” in Political Science..................................................................................... 4
Categories of Political Science Research ............................................................................... 6
From Thematic Focus to Research Topics ............................................................................. 7
Different Answers for Similar Problems .............................................................................. 10
Defining Research ................................................................................................................ 11
Summary .............................................................................................................................. 13
Discussion Questions ........................................................................................................... 13
Additional Reading .............................................................................................................. 14
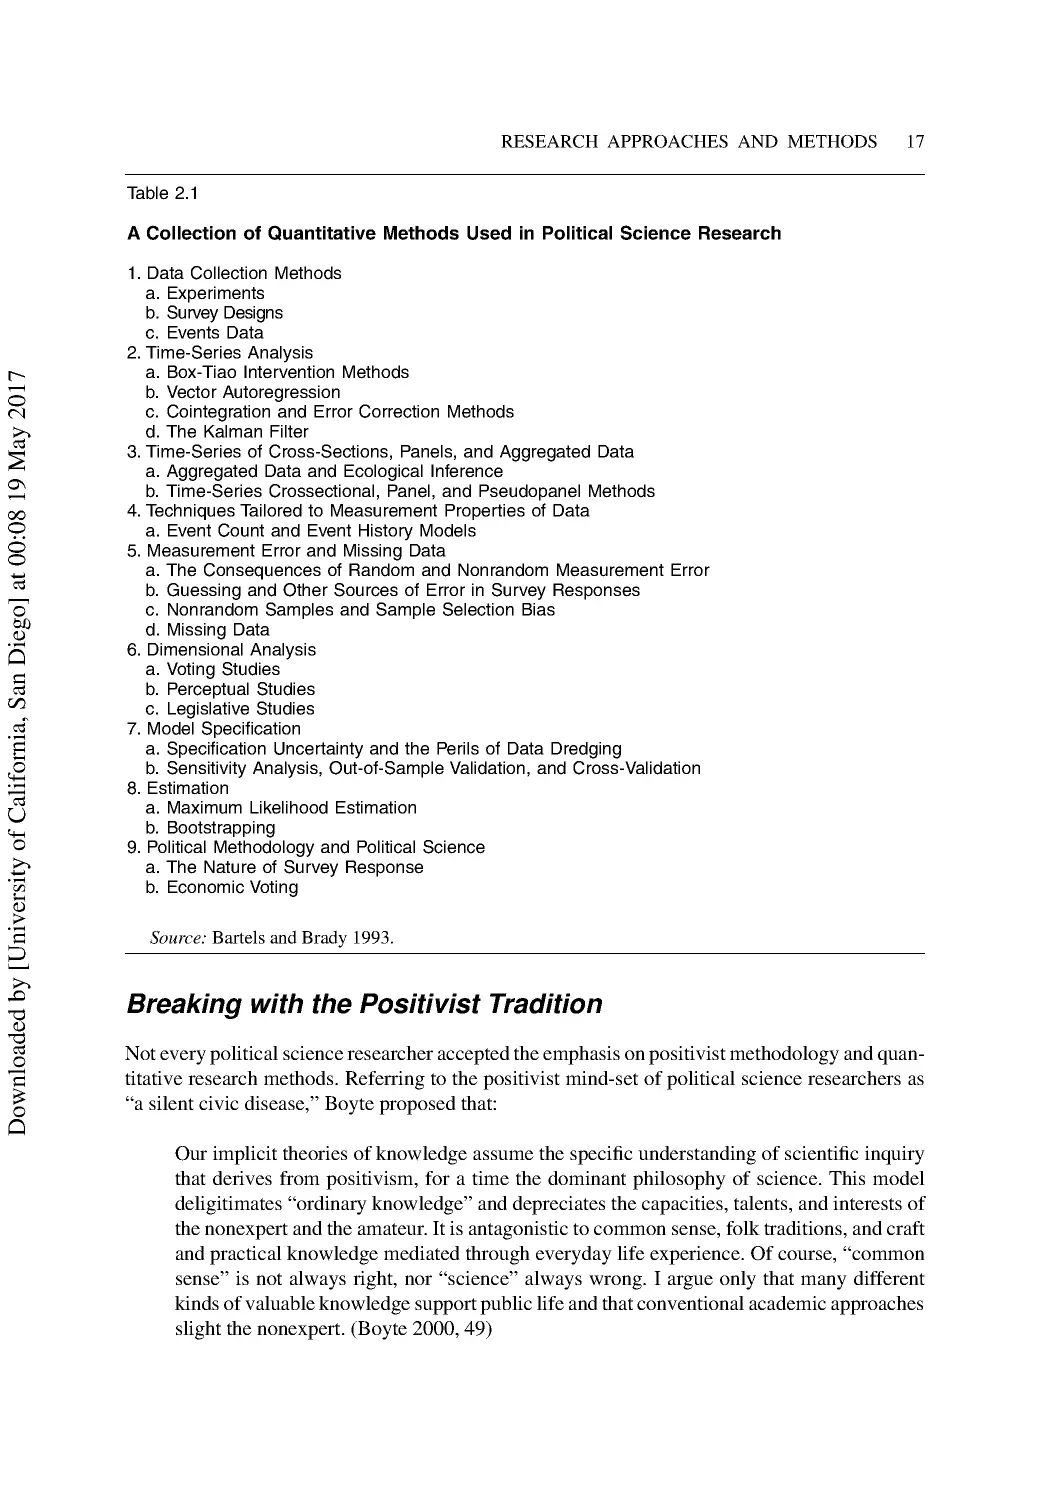
2 Research Approaches and Methods.................................................................................. 15
The Positivist Research Approach ....................................................................................... 15
The Postpositivist Revolution .............................................................................................. 19
A New Beginning for Research............................................................................................ 19
Research Methods in Political Science ................................................................................ 20
Three Common Positivist Research Approaches ................................................................. 20
Postpositivist Research Approaches..................................................................................... 24
Summary .............................................................................................................................. 27
Discussion Questions ........................................................................................................... 28
Additional Reading .............................................................................................................. 28
3 Understanding the Research Process ............................................................................... 29
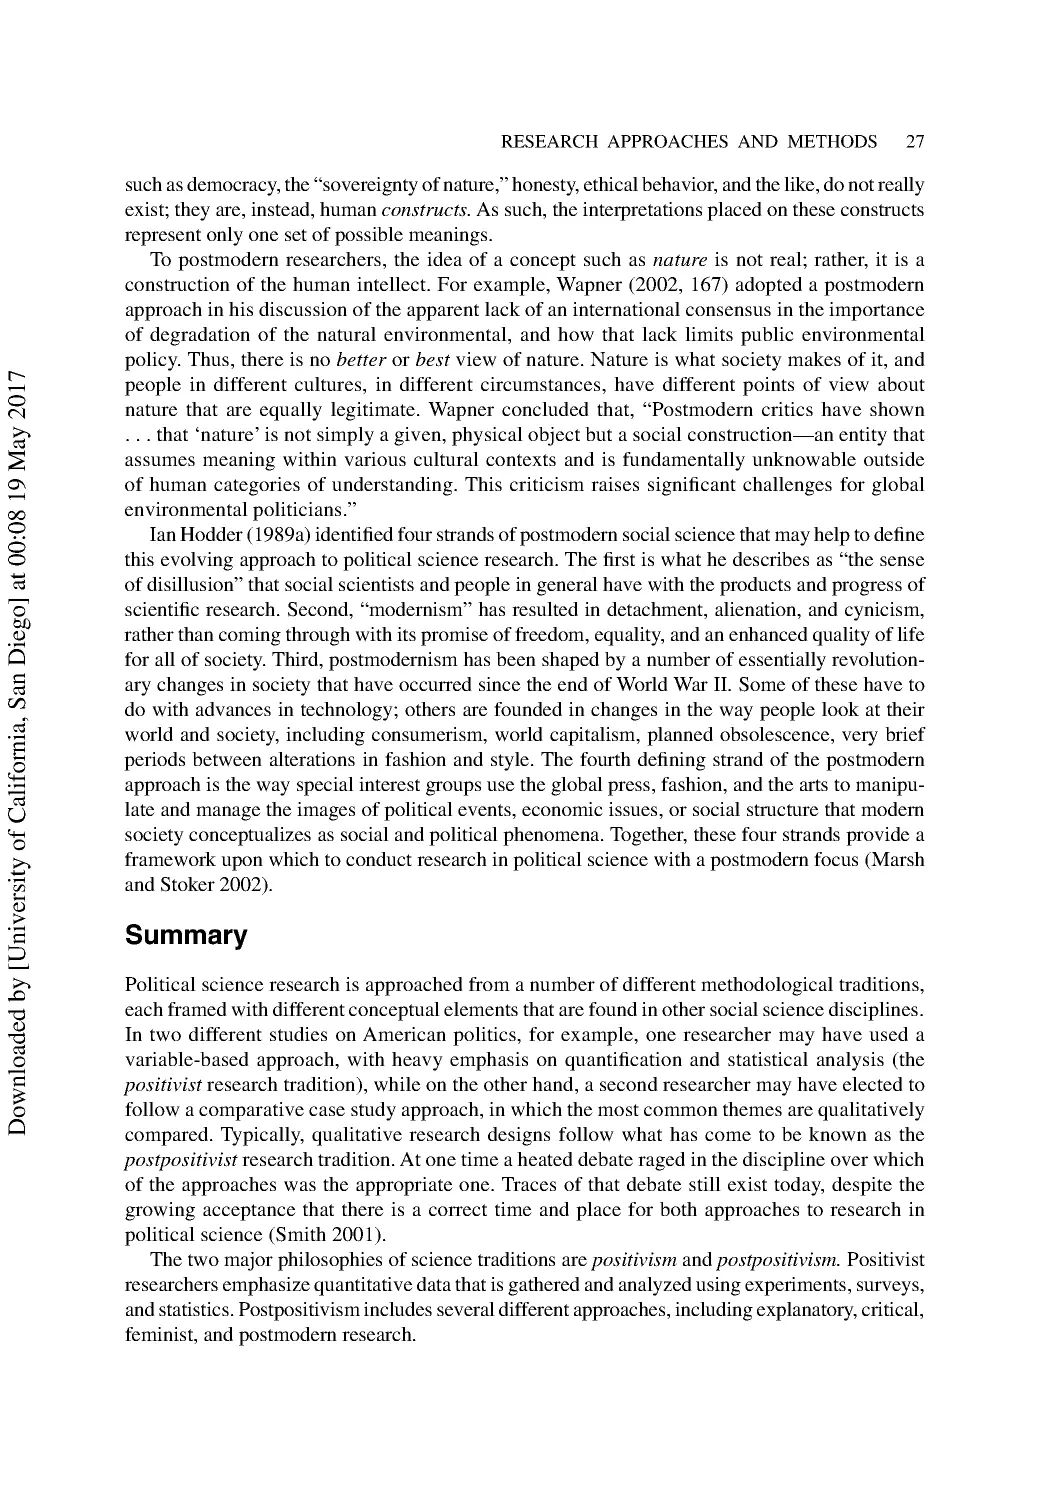
Steps in the Research Process .............................................................................................. 29
Step 1: Identify the Research Problem ................................................................................. 31
Step 2: Establish Research Objectives ................................................................................. 33
Step 3: Decide on a Research Strategy ................................................................................ 34
Step 4: Prepare a Research Plan ........................................................................................... 34
D
o
w
n
l
o
a
d
e
d
b
y
[
U
n
i
v
e
r
s
i
t
y
o
f
C
a
l
i
f
o
r
n
i
a
,
S
a
n
D
i
e
g
o
]
a
t
0
0
:
0
8
1
9
M
a
y
2
0
1
7
x
DETAILED TABLE OF CONTENTS
Step 5: Gather the Data ........................................................................................................ 34
Step 6: Analyze and Interpret the Data ................................................................................ 36
Step 7: Prepare and Present the Findings ............................................................................. 37
Summary .............................................................................................................................. 38
Discussion Questions ........................................................................................................... 39
Additional Reading .............................................................................................................. 39
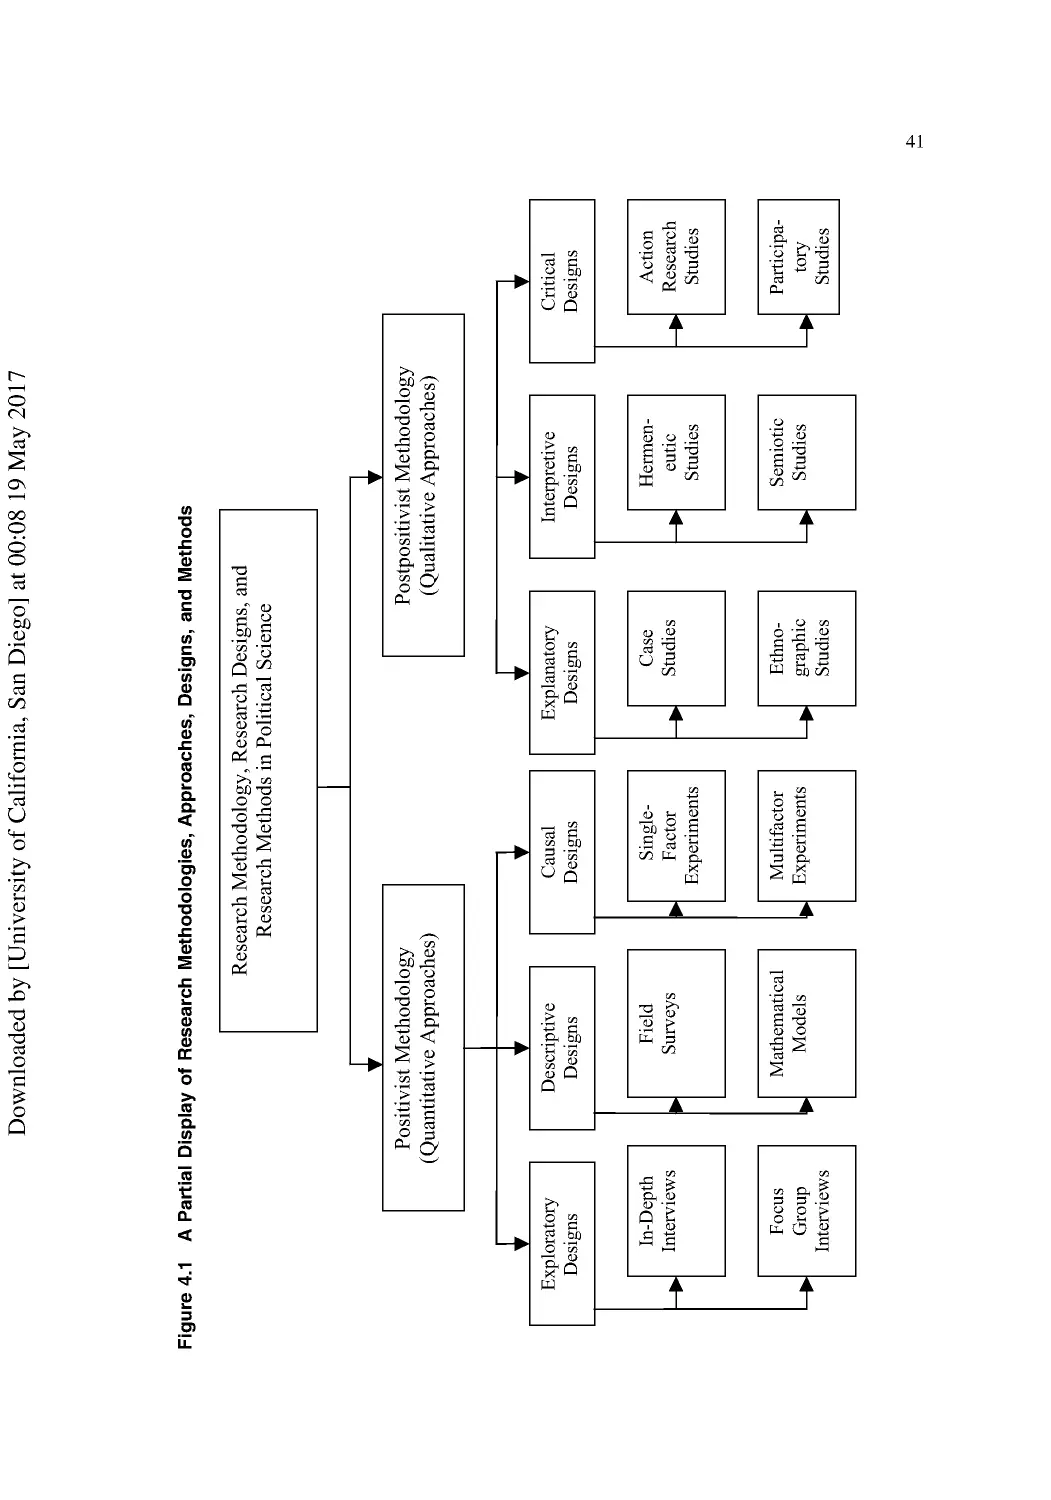
4 Selecting a Research Design and Choosing a Research Topic........................................ 40
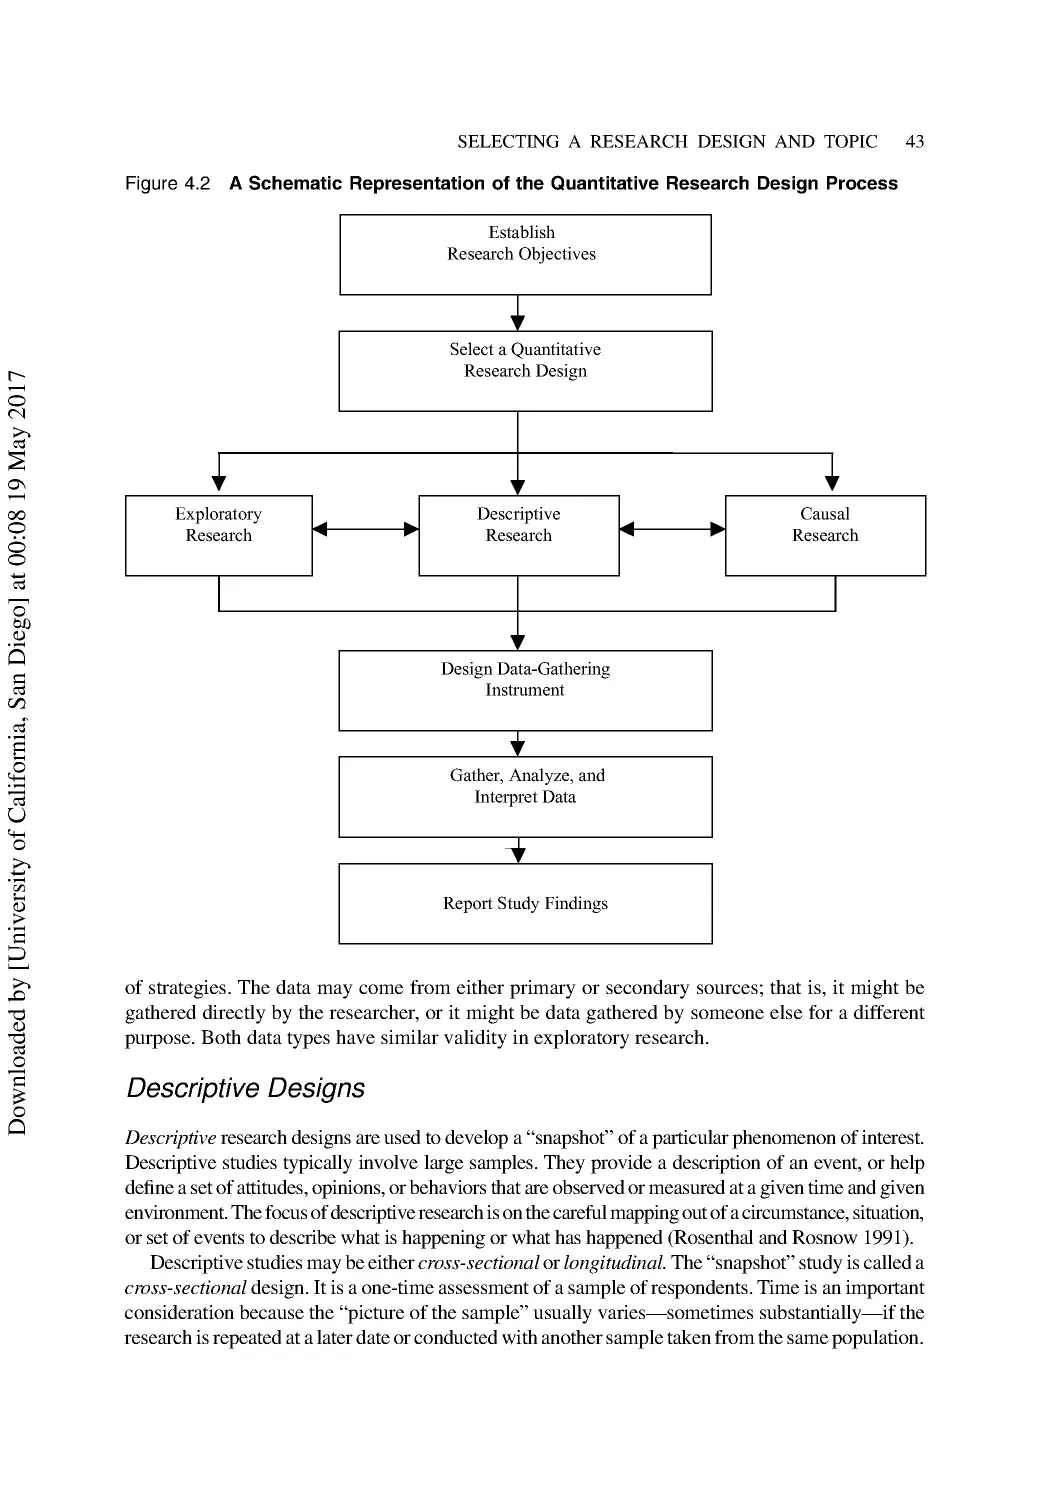
Quantitative Designs ............................................................................................................ 42
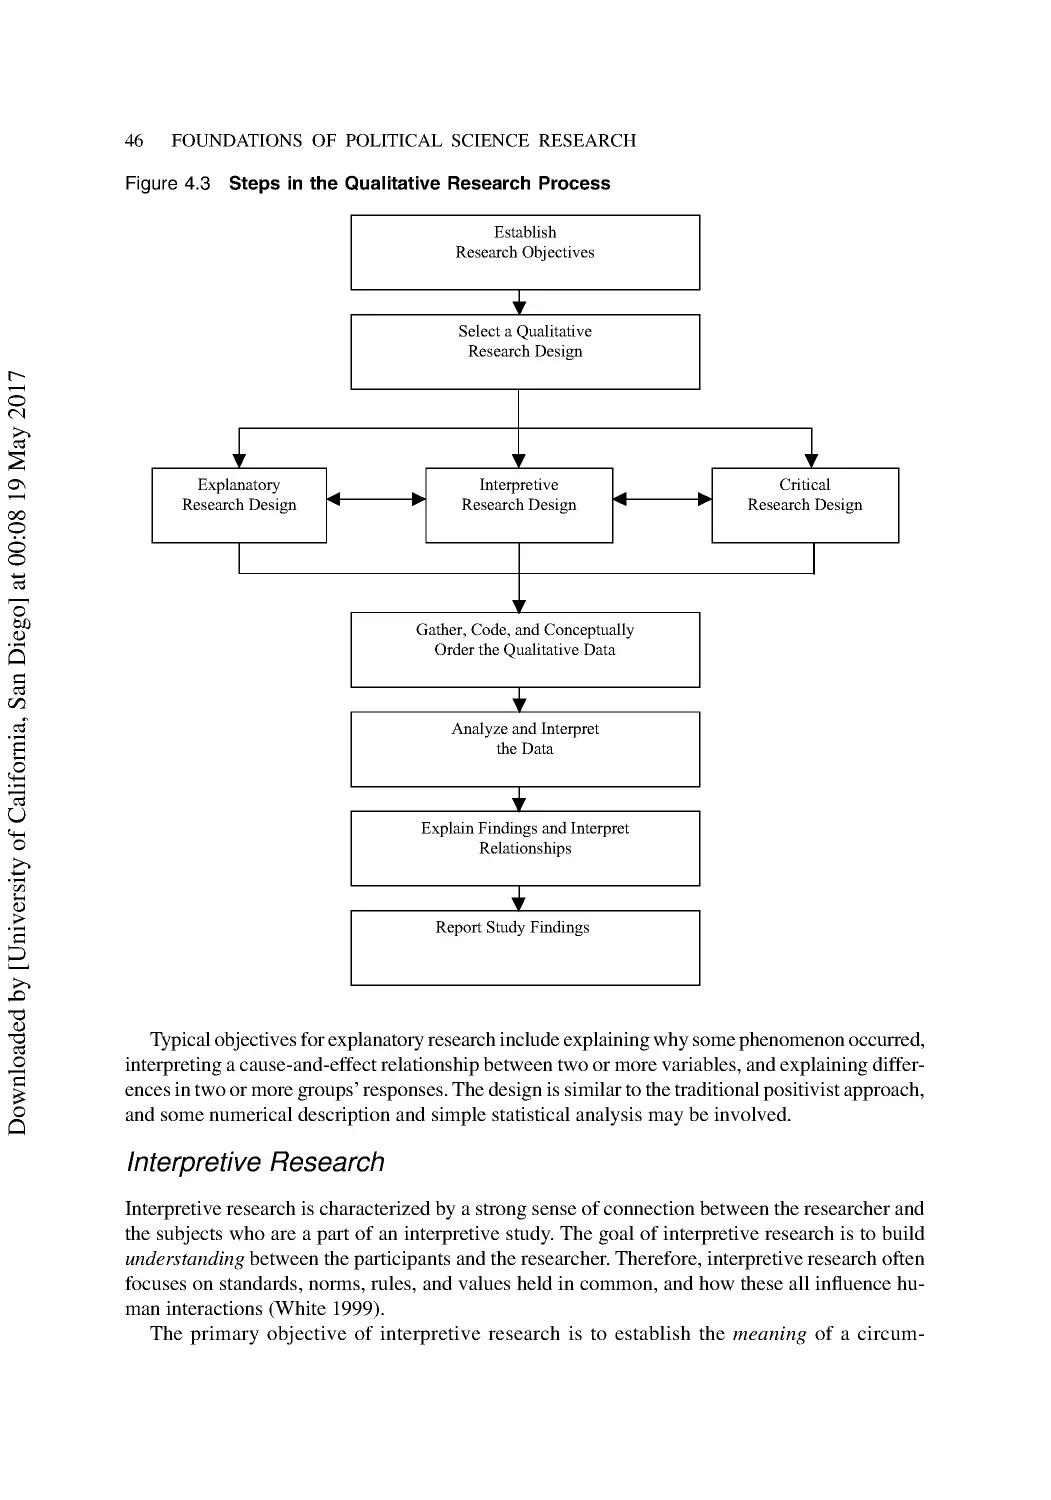
Qualitative Designs .............................................................................................................. 45
Combined Research Designs................................................................................................ 47
Choosing a Research Topic .................................................................................................. 48
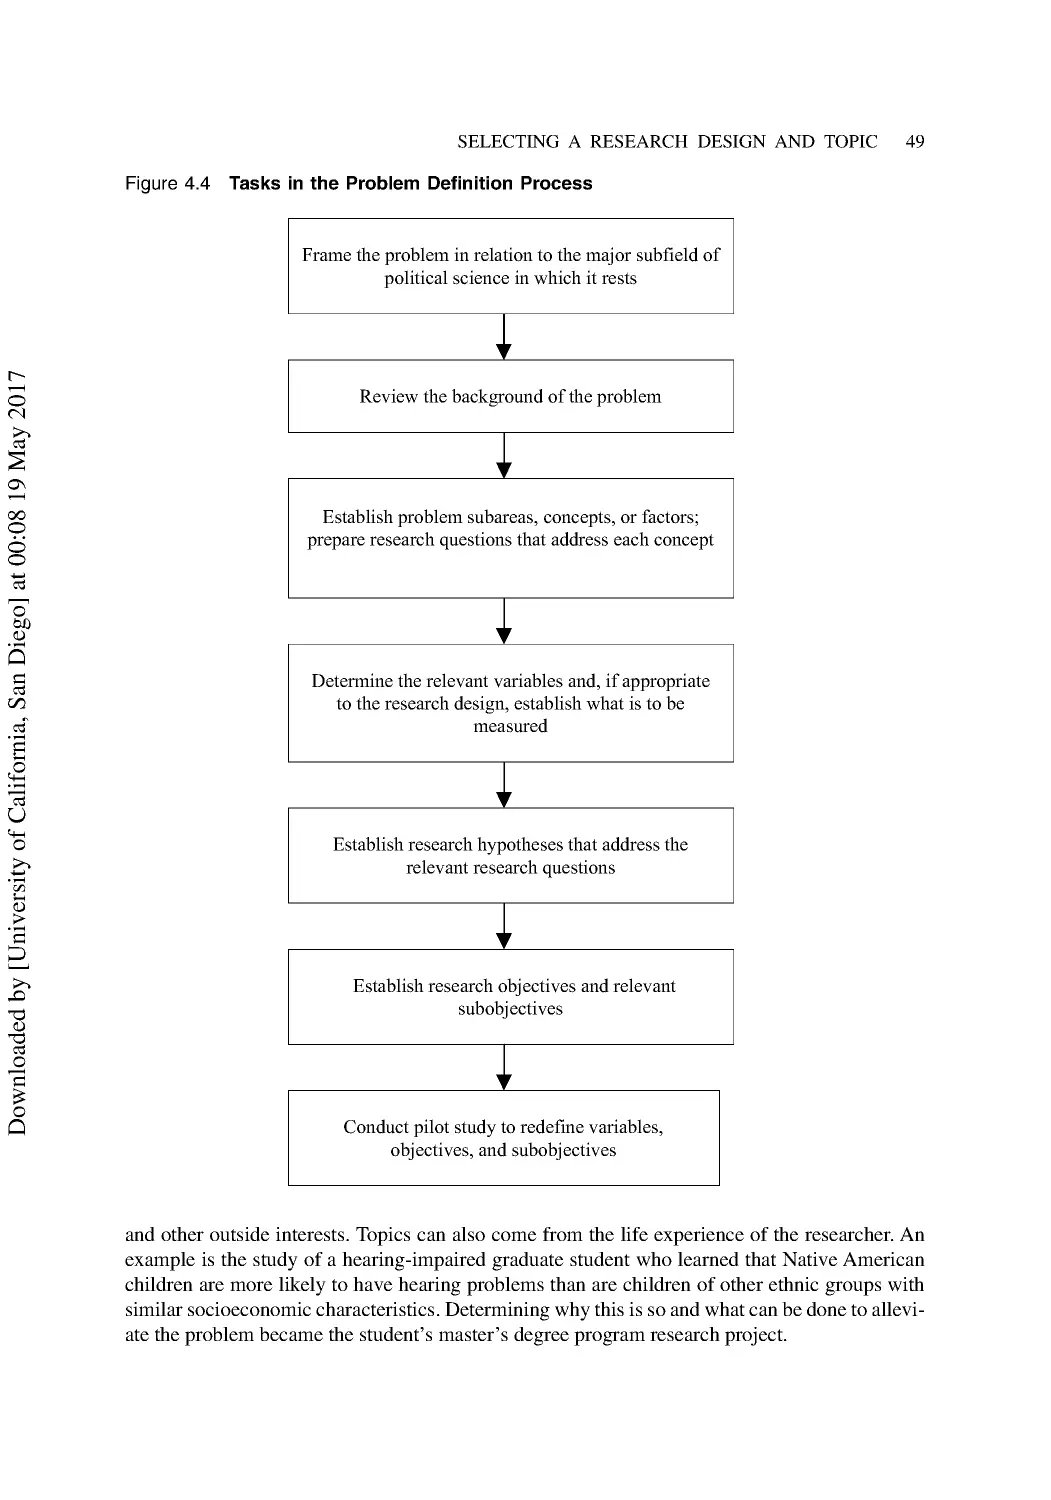
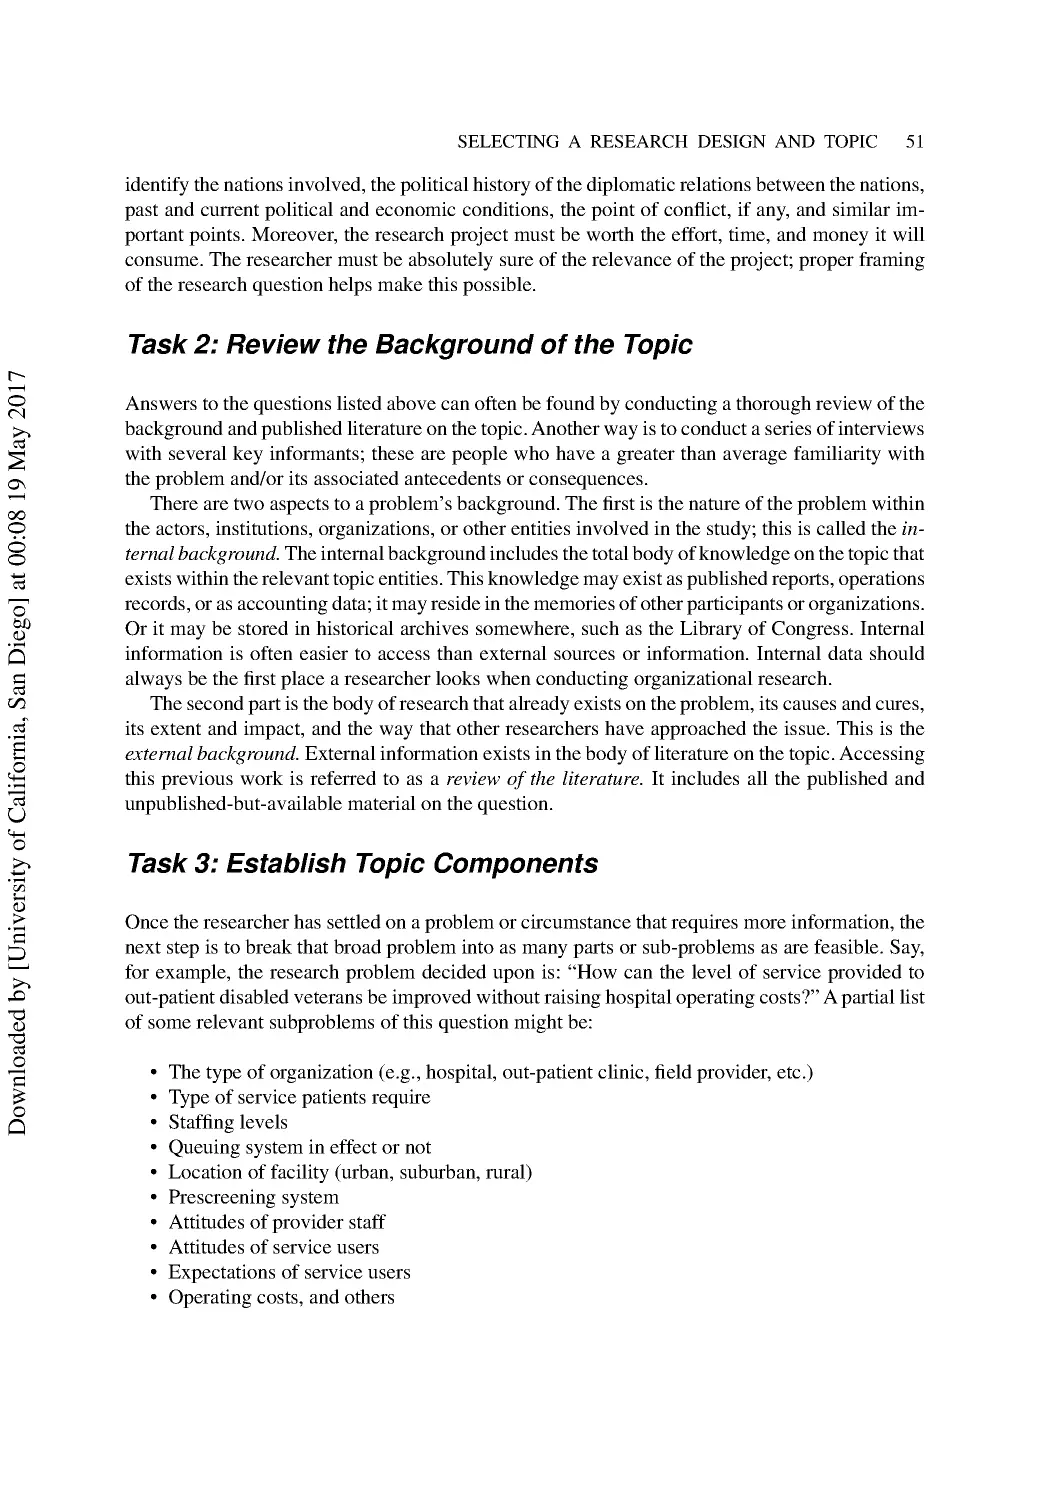
Tasks in Problem Definition ................................................................................................. 50
Choosing a Research Theme or Position ............................................................................. 54
Summary .............................................................................................................................. 55
Discussion Questions ........................................................................................................... 56
Additional Reading .............................................................................................................. 56
5 Preparing a Research Proposal......................................................................................... 57
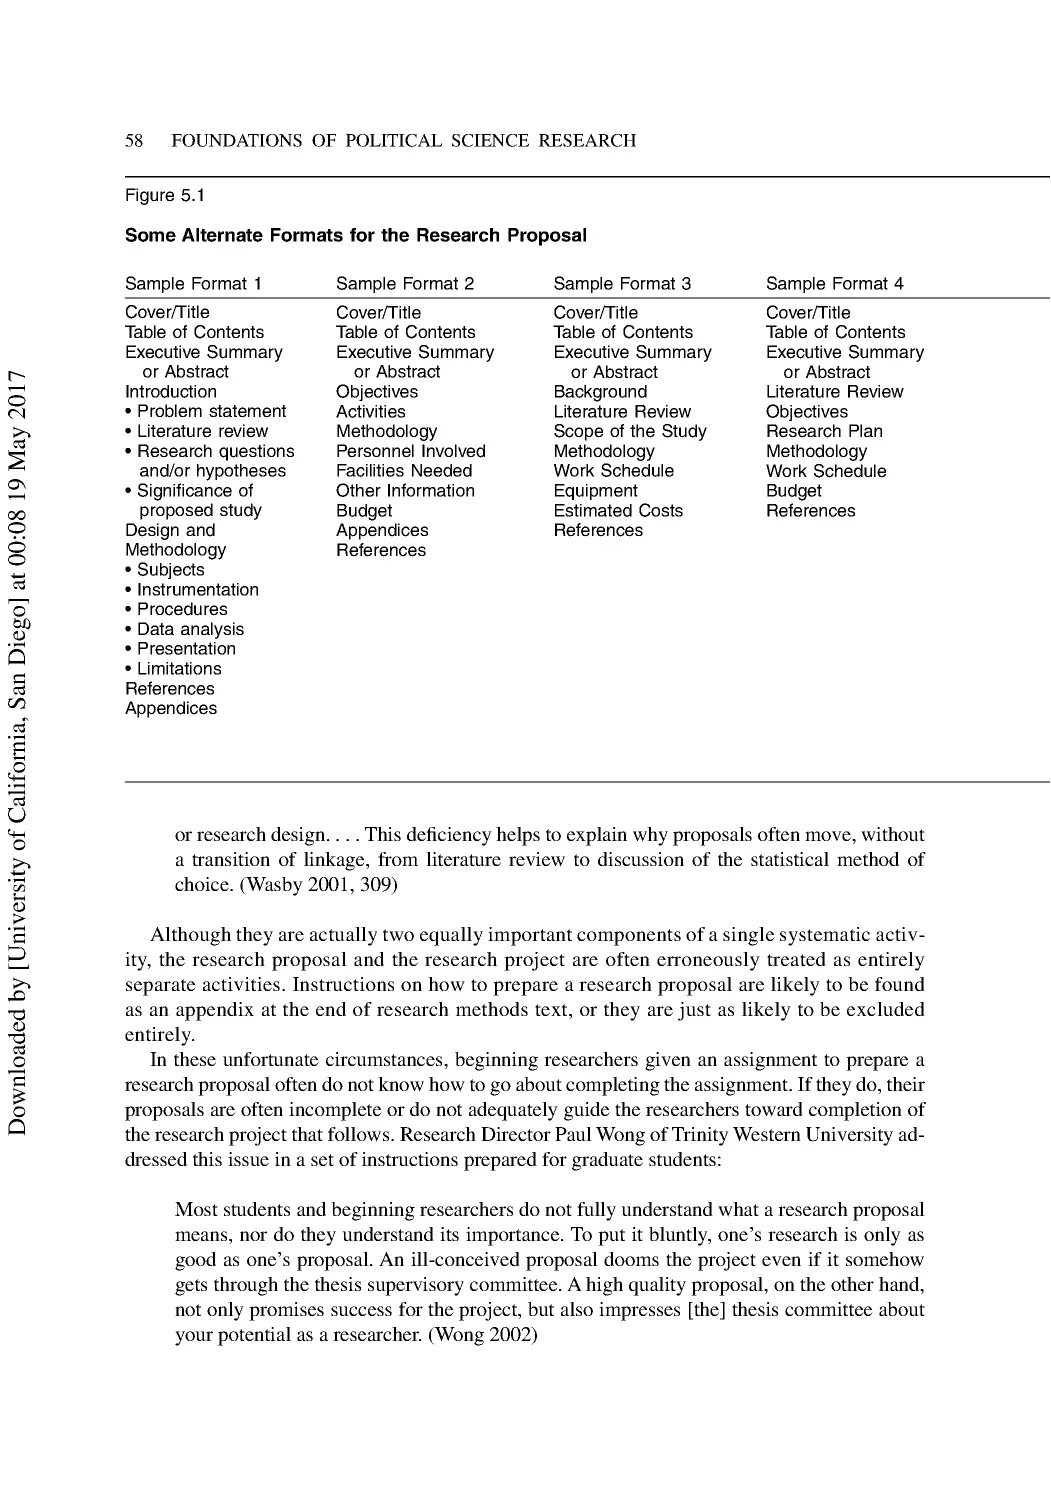
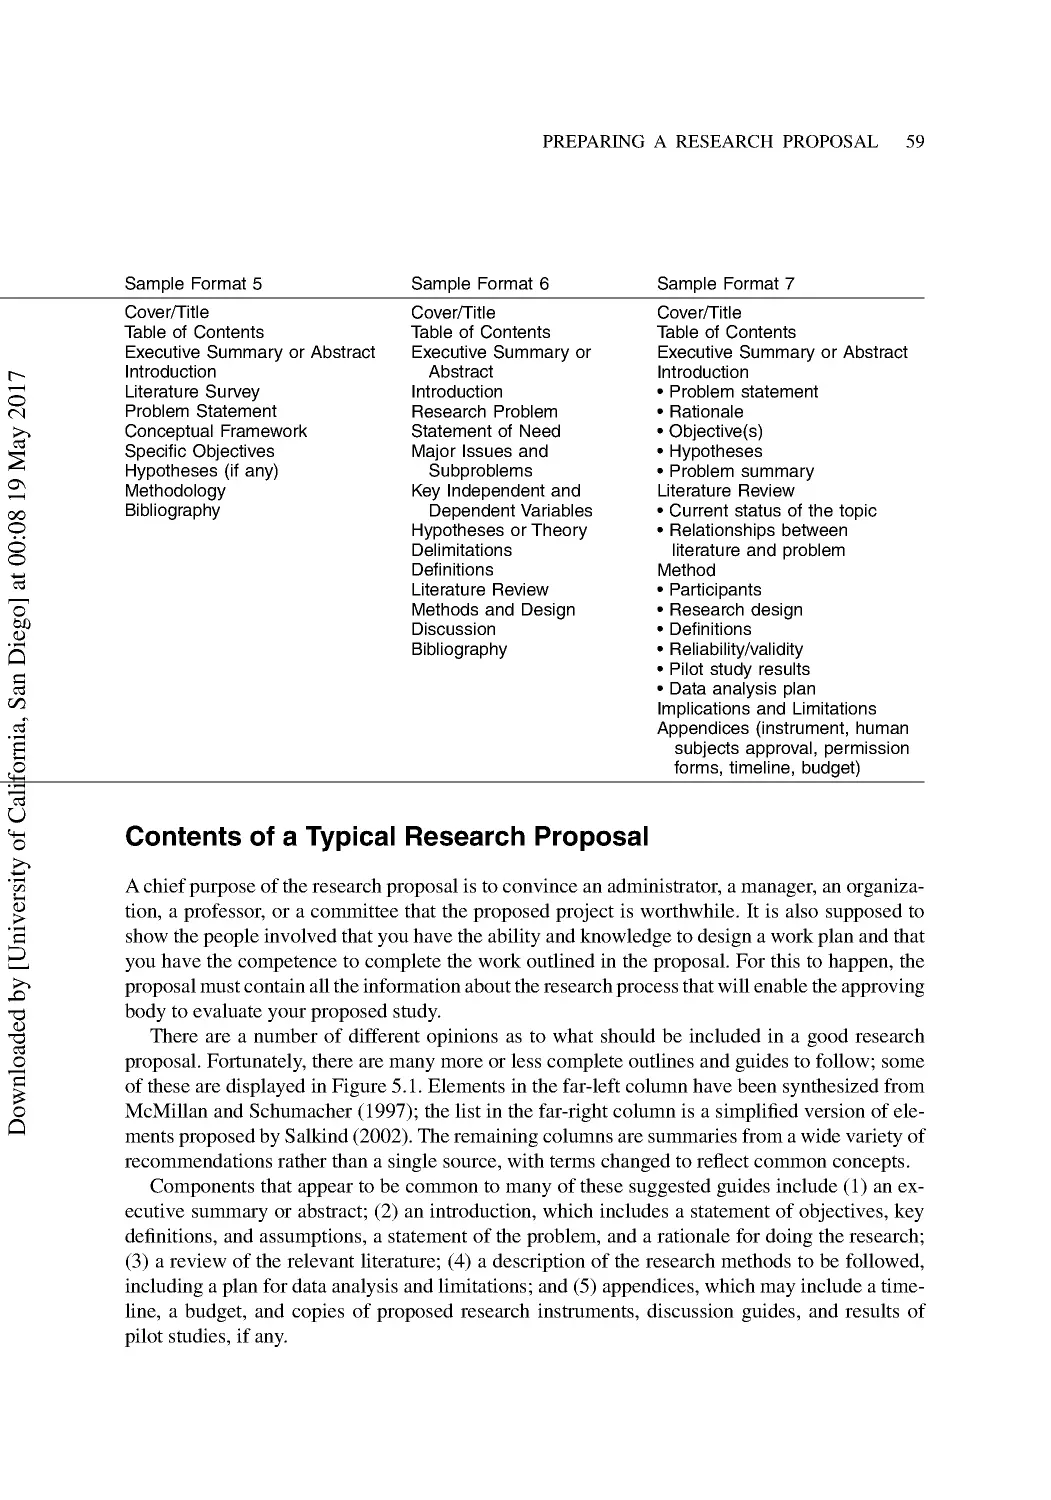
Contents of a Typical Research Proposal ............................................................................. 59
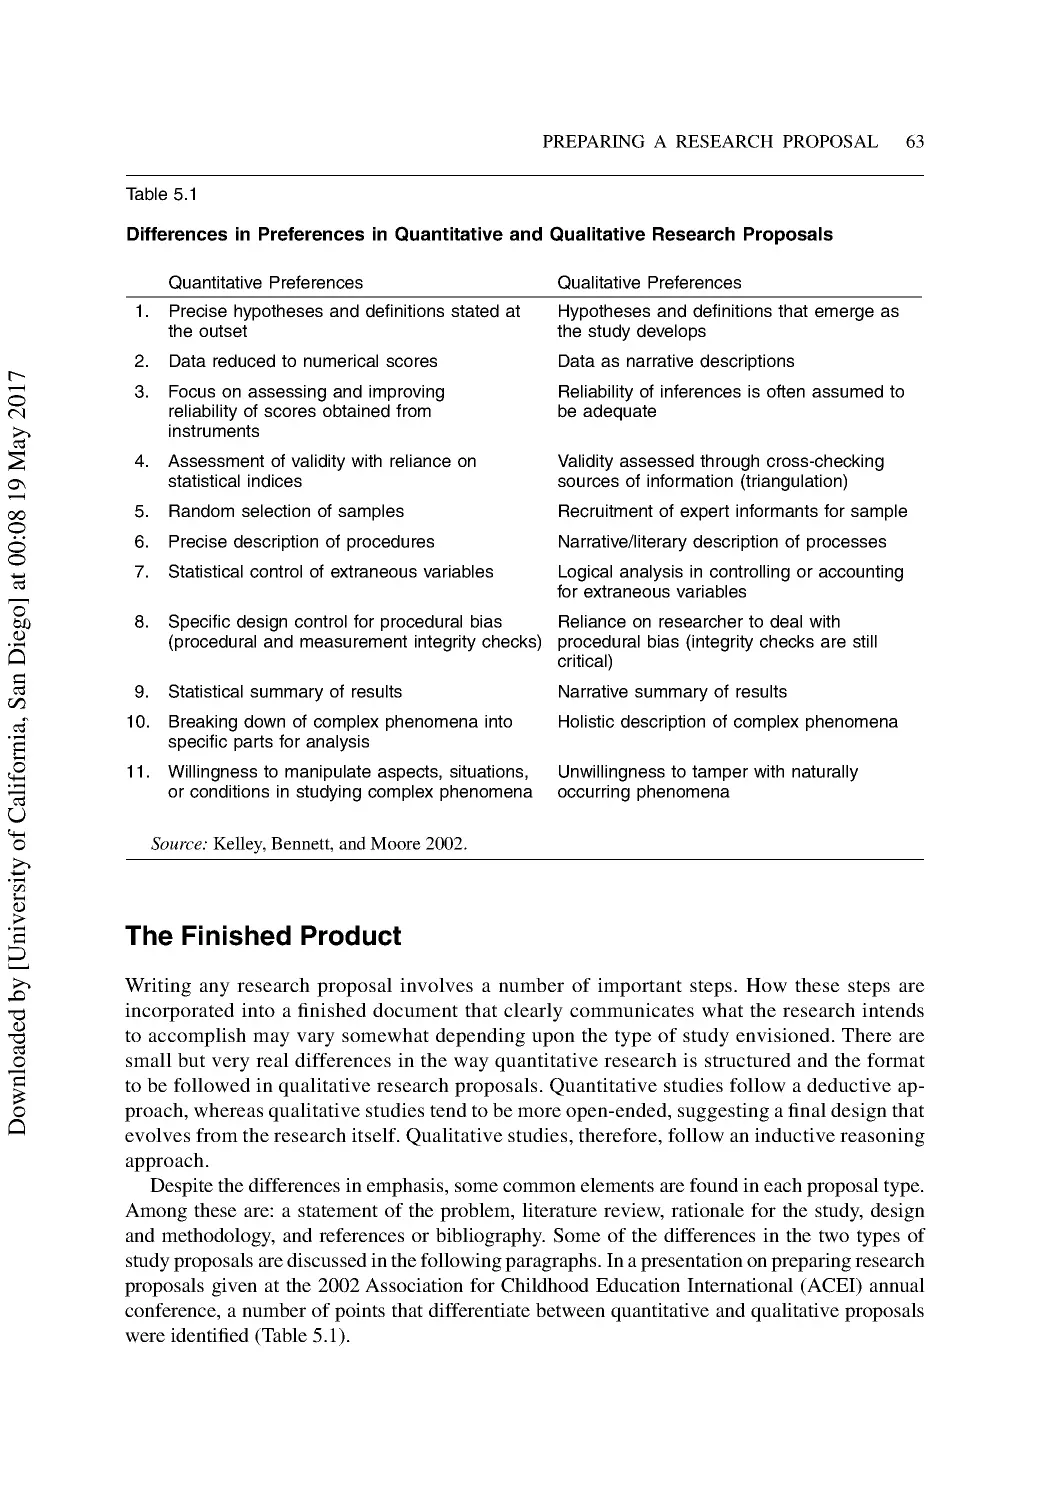
The Finished Product ........................................................................................................... 63
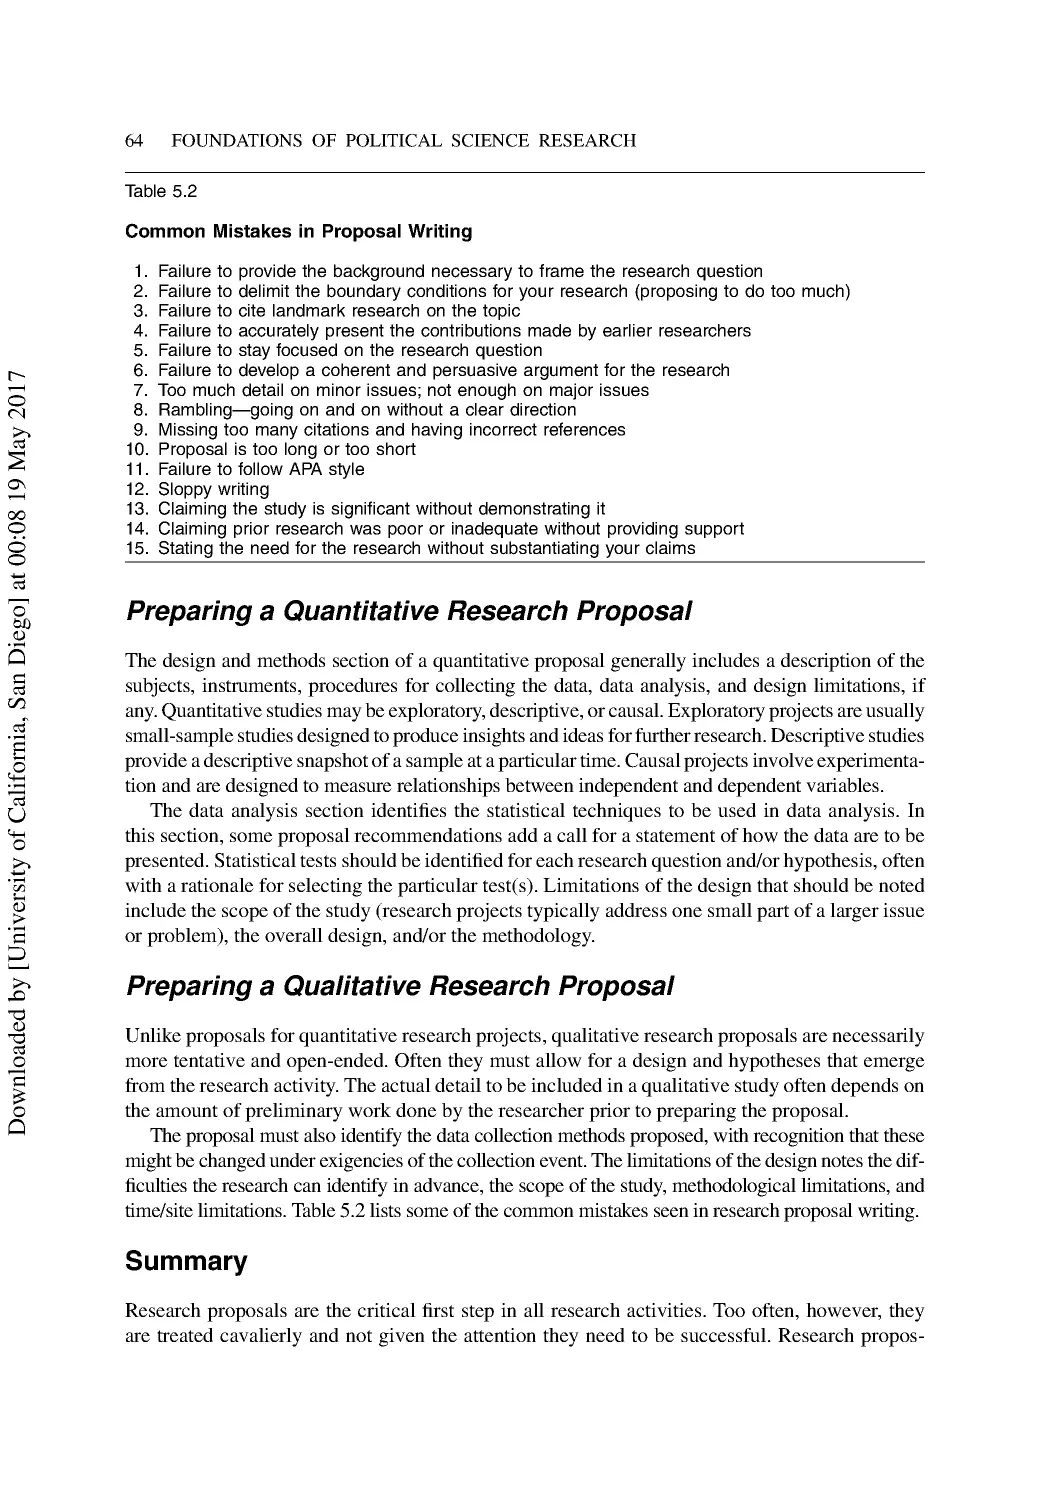
Summary .............................................................................................................................. 64
Discussion Questions ........................................................................................................... 65
Additional Reading .............................................................................................................. 65
6 The Legal and Ethical Environment of Research ........................................................... 66
The Meaning of Ethics ......................................................................................................... 67
How Can You Know Which Is the Right Decision? ............................................................ 68
Five Important Research Problem Areas.............................................................................. 68
Research Ethics .................................................................................................................... 69
Summary .............................................................................................................................. 74
Discussion Questions ........................................................................................................... 75
Additional Reading .............................................................................................................. 75
Part 2 Quantitative Research Approaches and Methods ................................................... 77
7 Introduction to Quantitative Methods ............................................................................. 79
Fundamentals of Measurement ............................................................................................ 79
Issues of Reliability and Validity ......................................................................................... 82
Defining Statistics ................................................................................................................ 82
Categories of Statistics ......................................................................................................... 84
Parameters vs. Statistics ....................................................................................................... 84
Descriptive Statistics ........................................................................................................... 85
Inferential Statistics.............................................................................................................. 86
Statistics in Political Science Research ................................................................................ 87
Introduction to Sampling......................................................................................................87
D
o
w
n
l
o
a
d
e
d
b
y
[
U
n
i
v
e
r
s
i
t
y
o
f
C
a
l
i
f
o
r
n
i
a
,
S
a
n
D
i
e
g
o
]
a
t
0
0
:
0
8
1
9
M
a
y
2
0
1
7
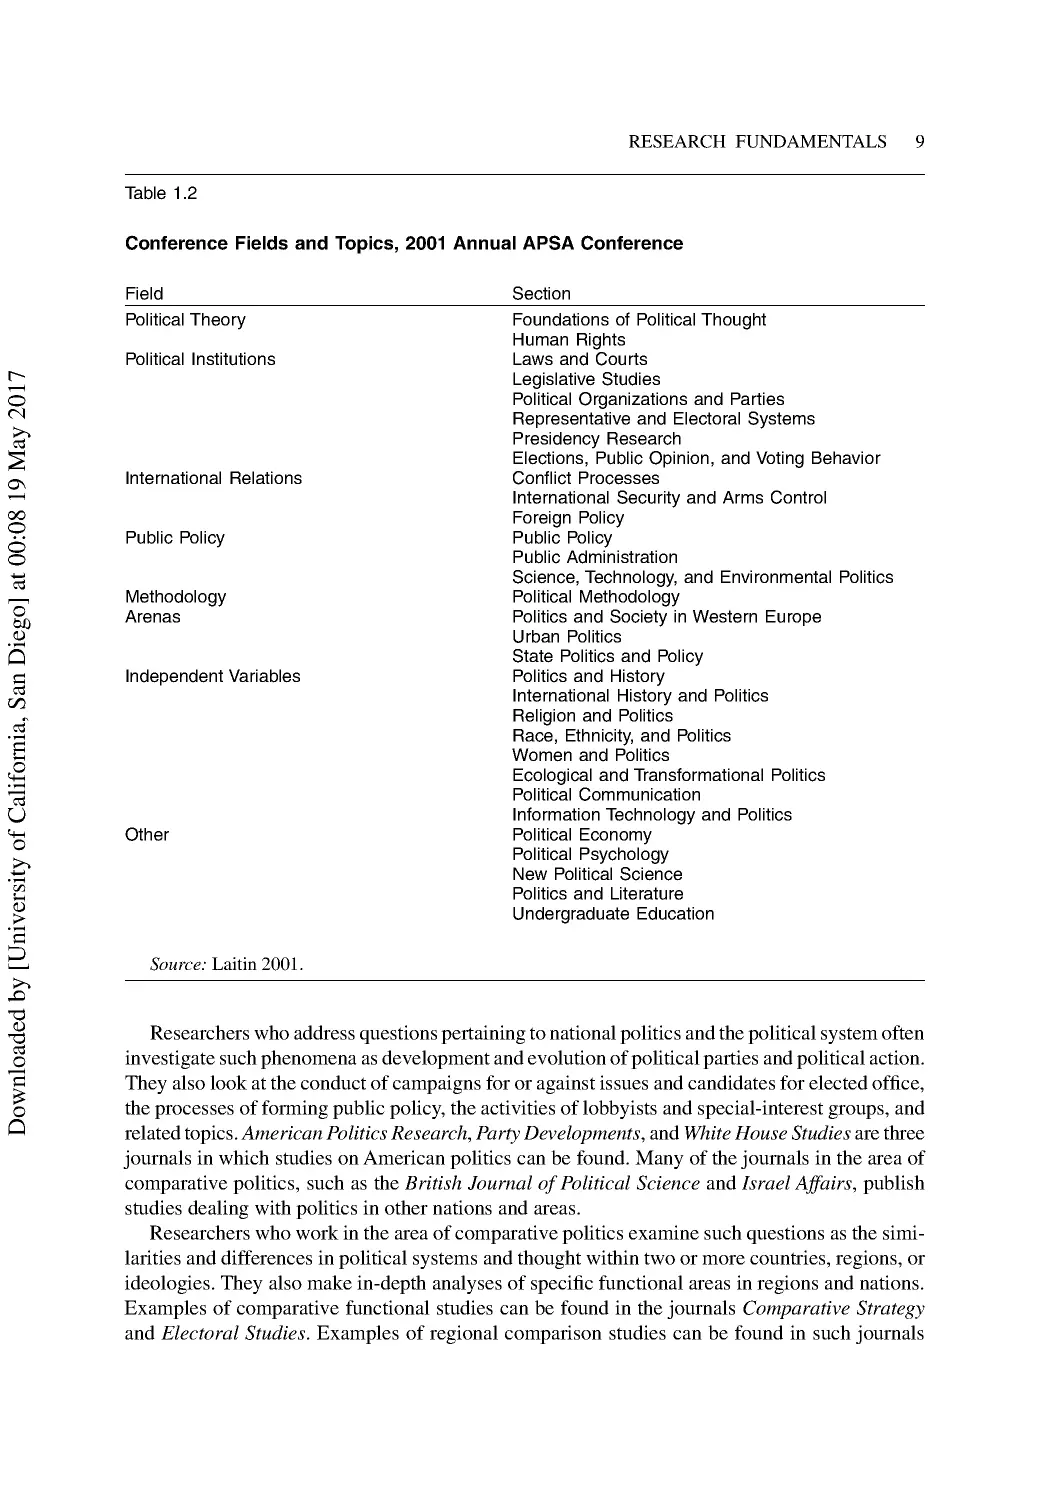
DETAILED TABLE OF CONTENTS xi
Some Sampling Methods ..................................................................................................... 88
Dealing with Error and Bias in Sampling ............................................................................ 90
The Meaning of Sample Distributions ................................................................................. 92
Summary .............................................................................................................................. 93
Discussion Questions ........................................................................................................... 94
Additional Reading .............................................................................................................. 95
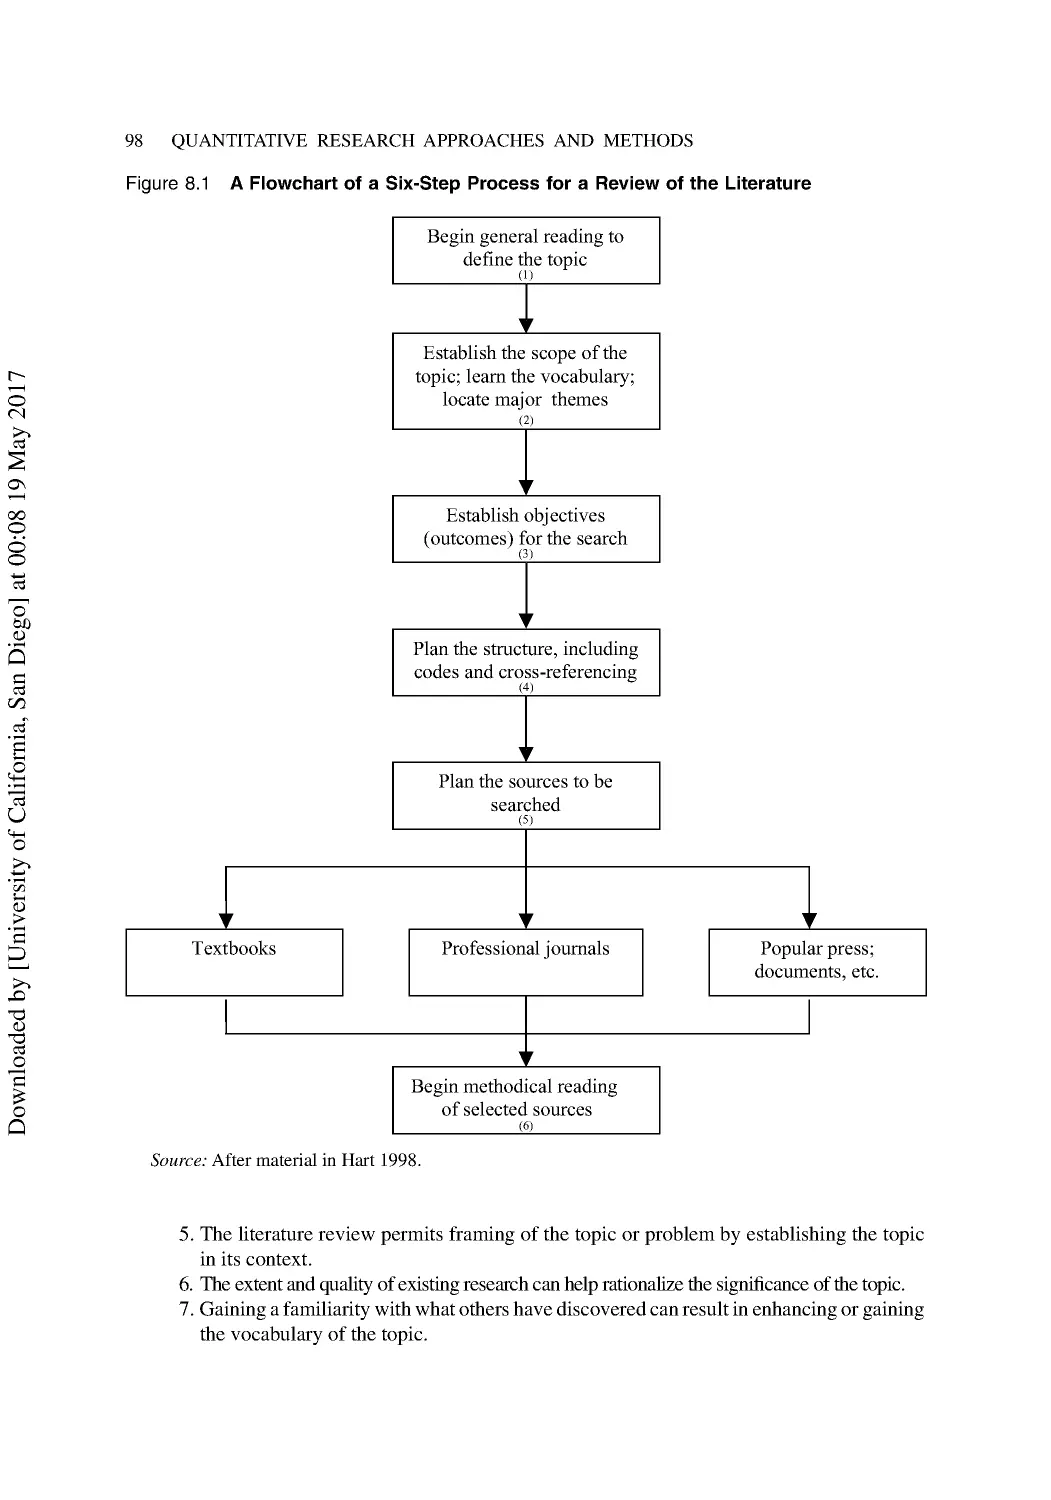
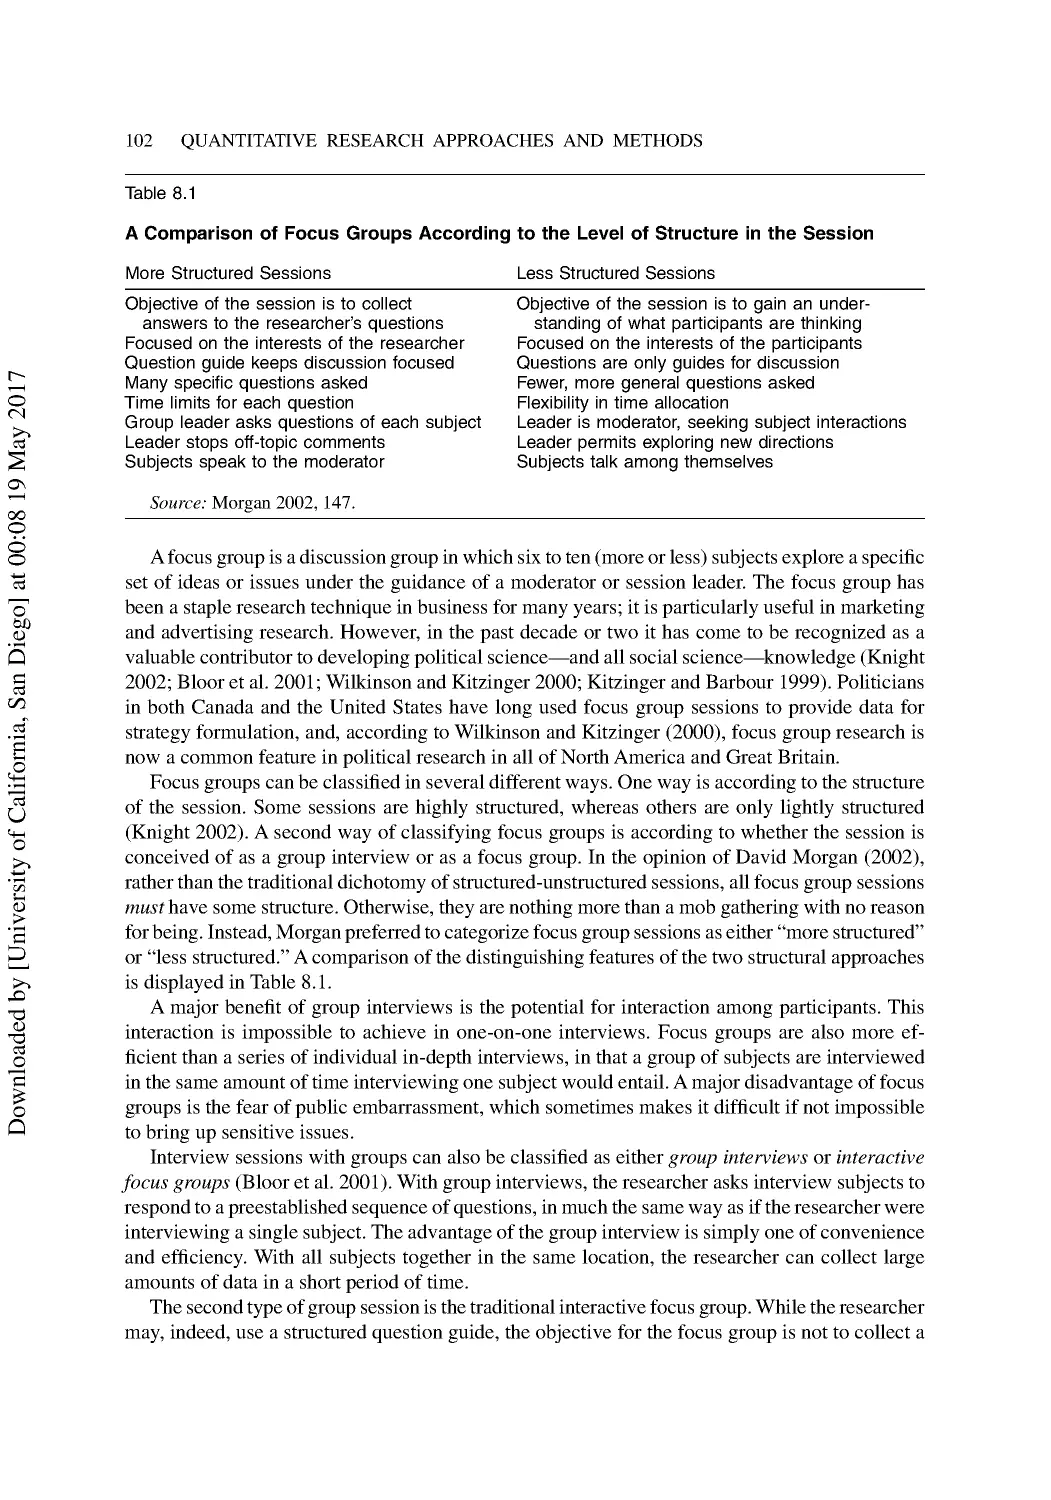
8 Exploratory Research: The Probing Approach ............................................................... 96
Purposes for Exploratory Research ...................................................................................... 96
Methods in Exploratory Data Collection ............................................................................. 97
Analyzing Exploratory Data .............................................................................................. 106
Summary ............................................................................................................................ 107
Discussion Questions ......................................................................................................... 108
Additional Reading ............................................................................................................ 108
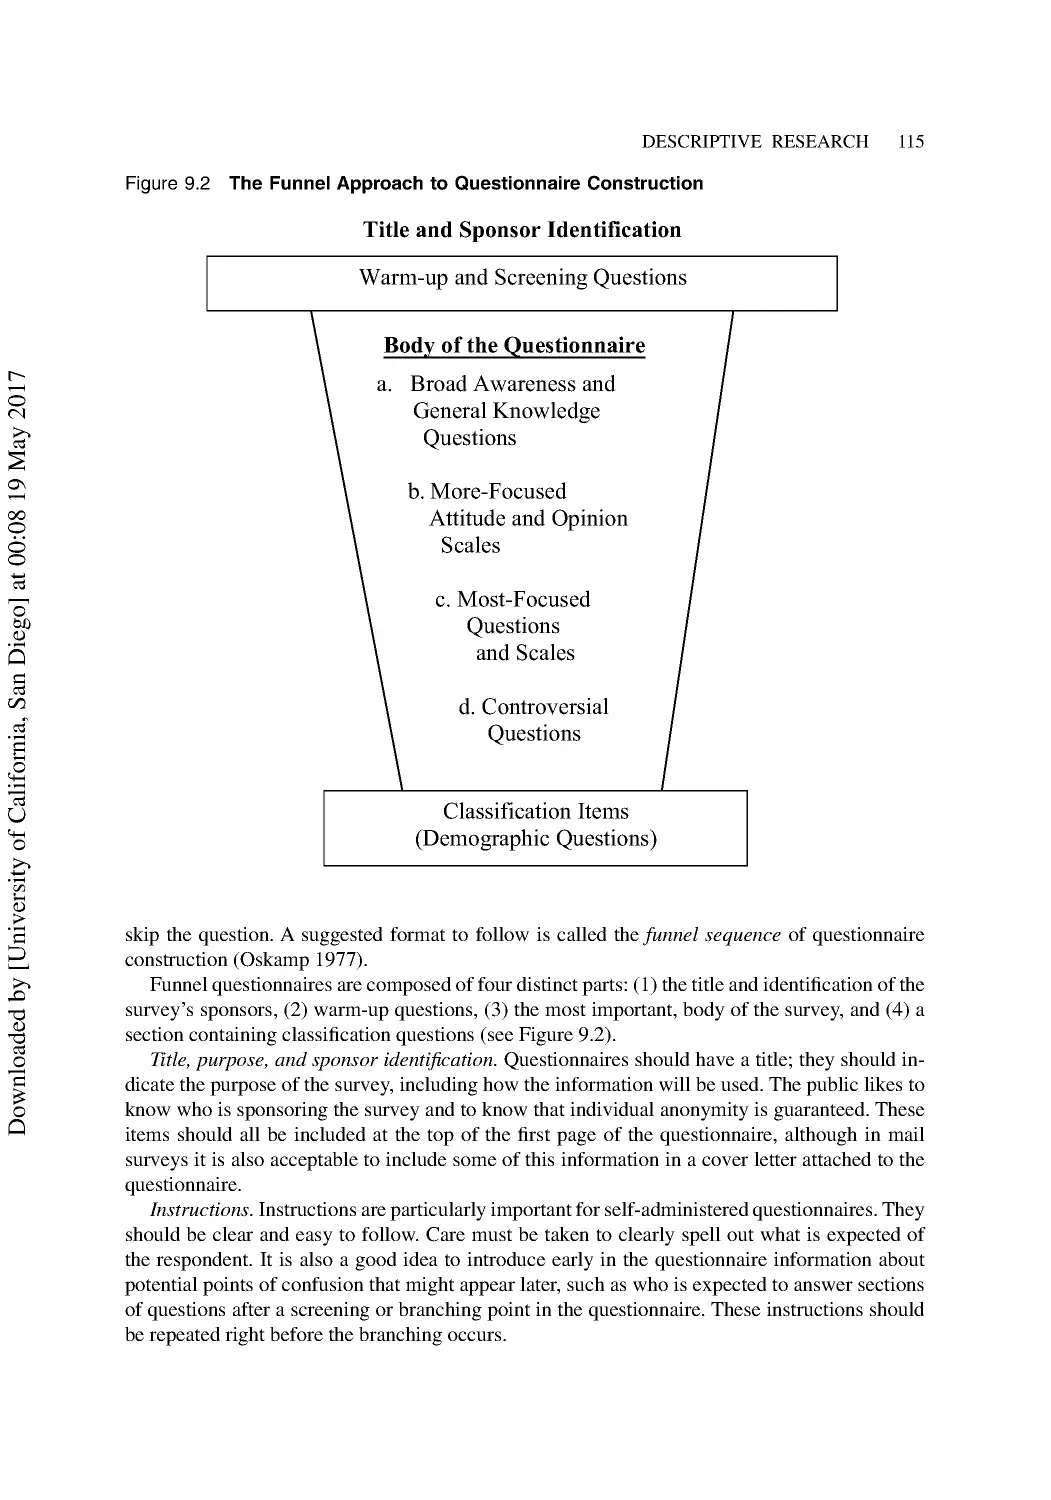
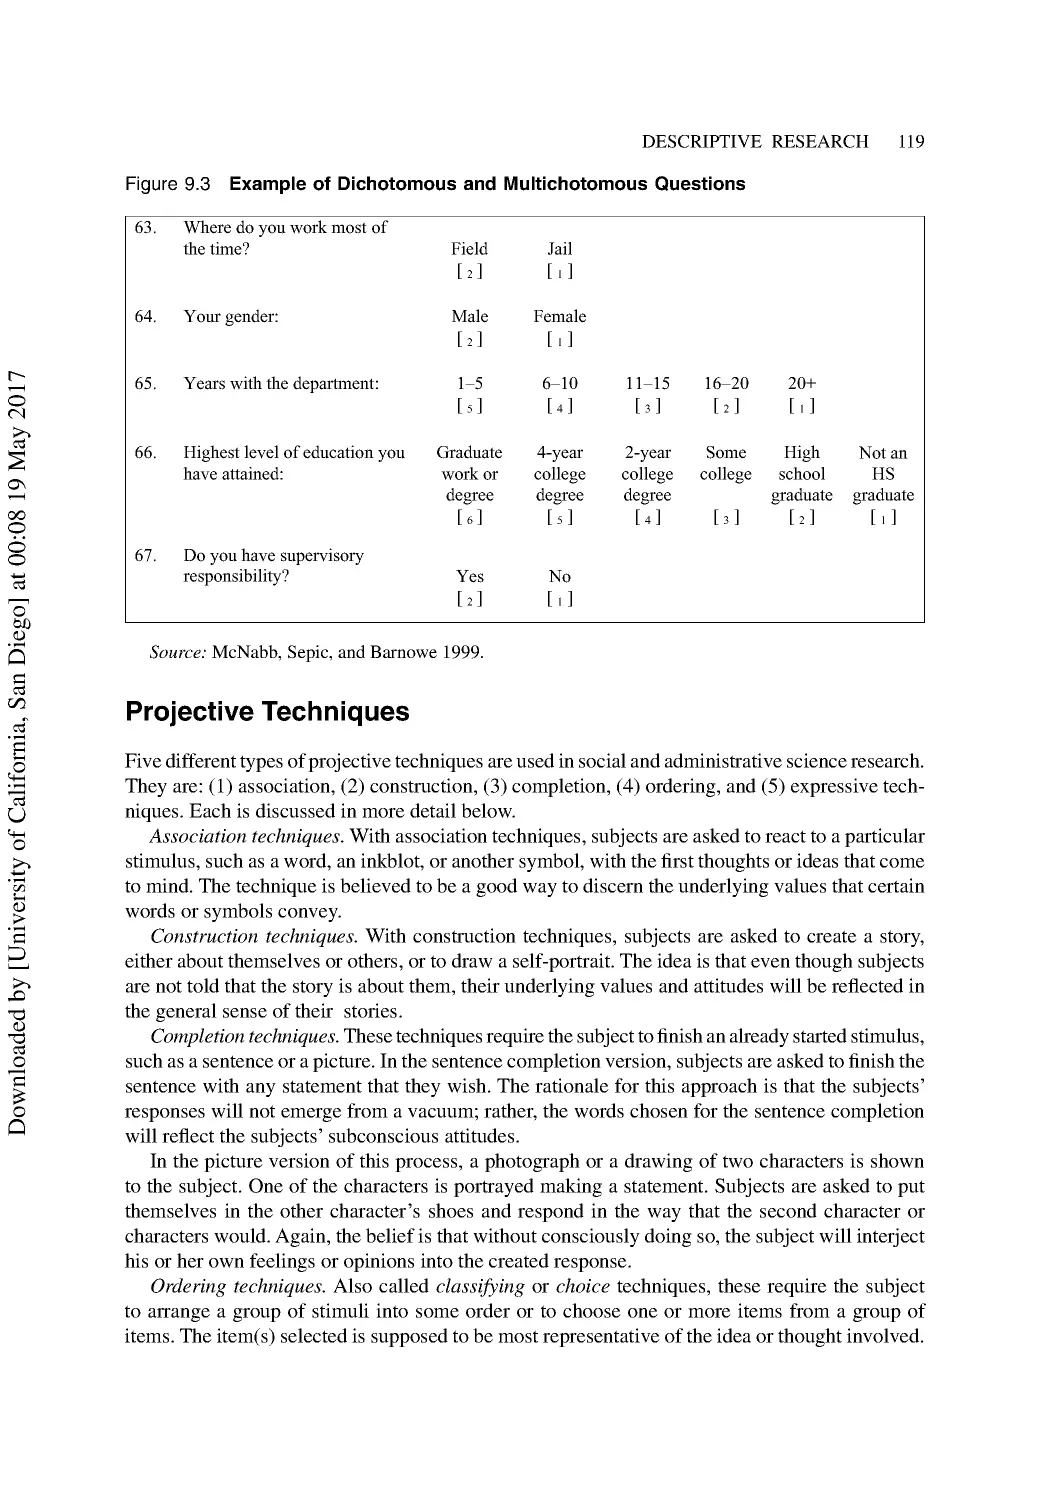
9 Descriptive Research: The Survey Approach ................................................................ 109
Advantages of Using Questionnaires ................................................................................. 109
Some Characteristics of Questionnaires............................................................................. 110
How to Prepare Your Own Questionnaire .......................................................................... 110
Developing and Wording Questions .................................................................................. 117
Projective Techniques ........................................................................................................119
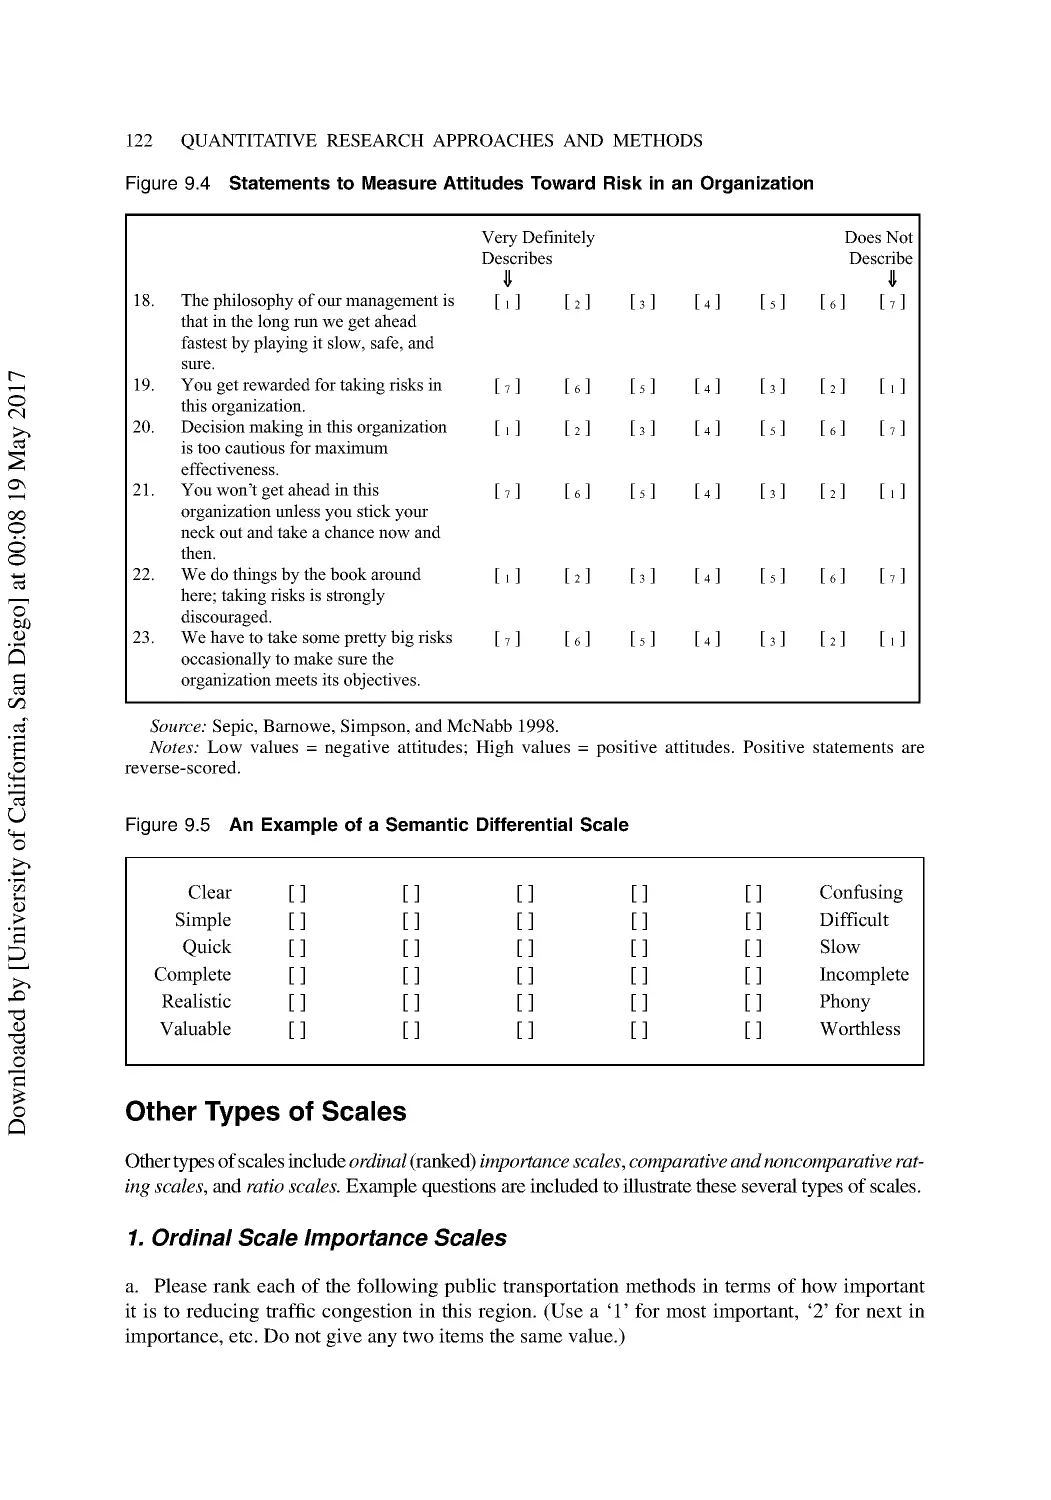
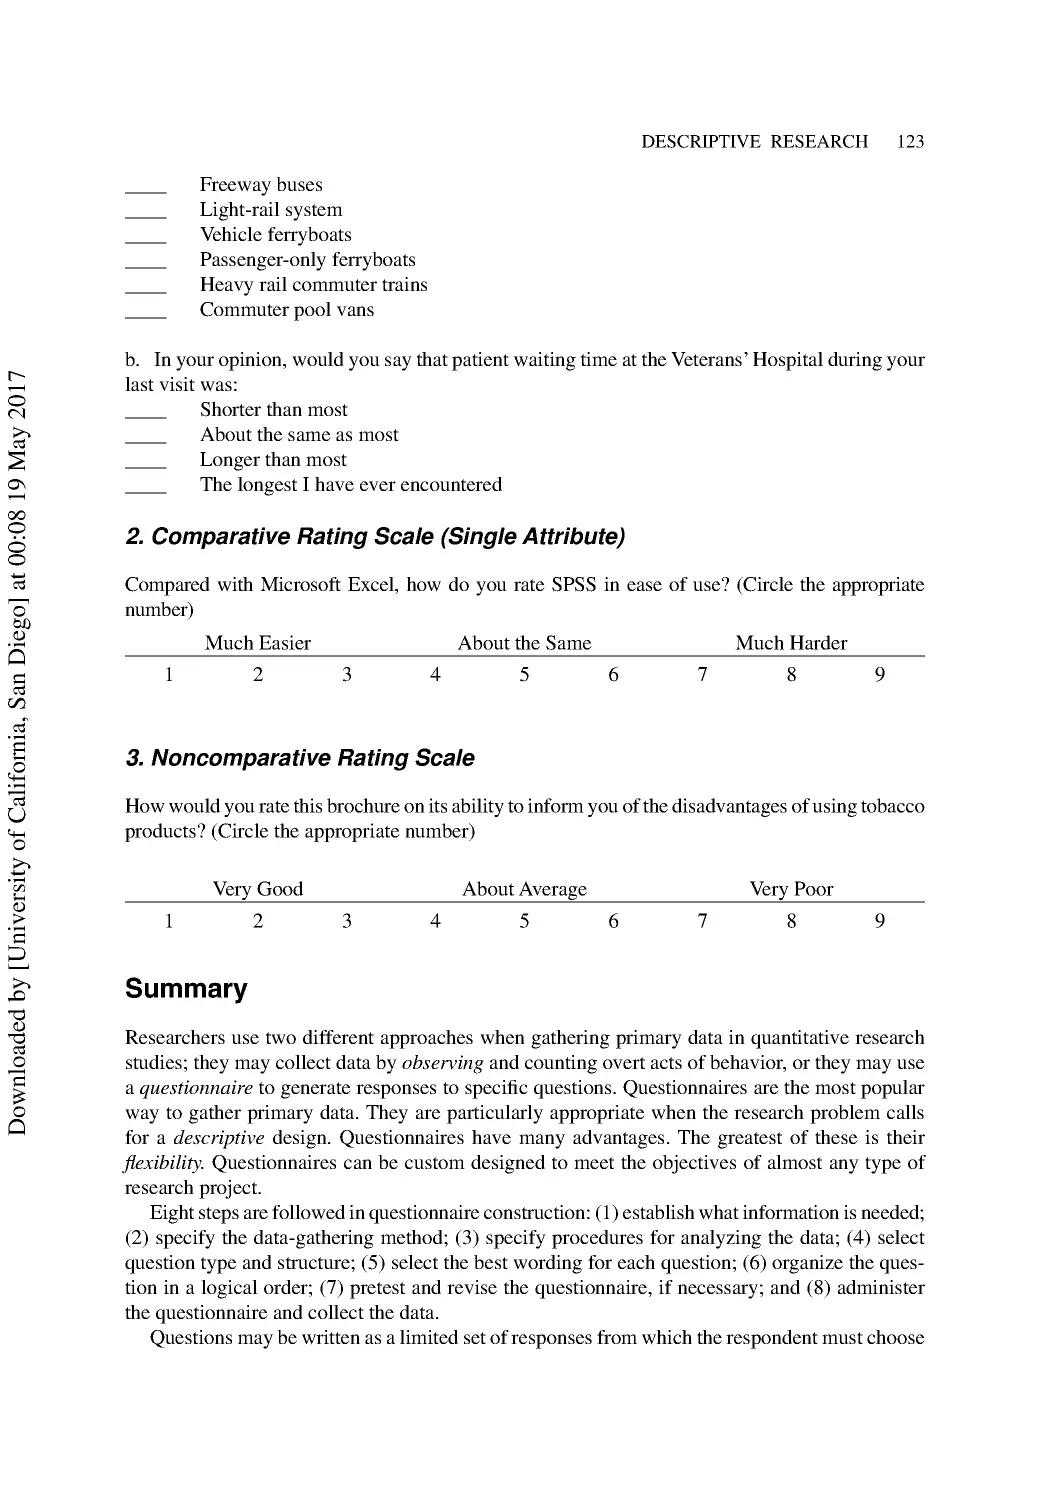
Developing and Using Scales............................................................................................. 120
Other Types of Scales......................................................................................................... 122
Summary ............................................................................................................................ 123
Discussion Questions ......................................................................................................... 124
Additional Reading ............................................................................................................ 124
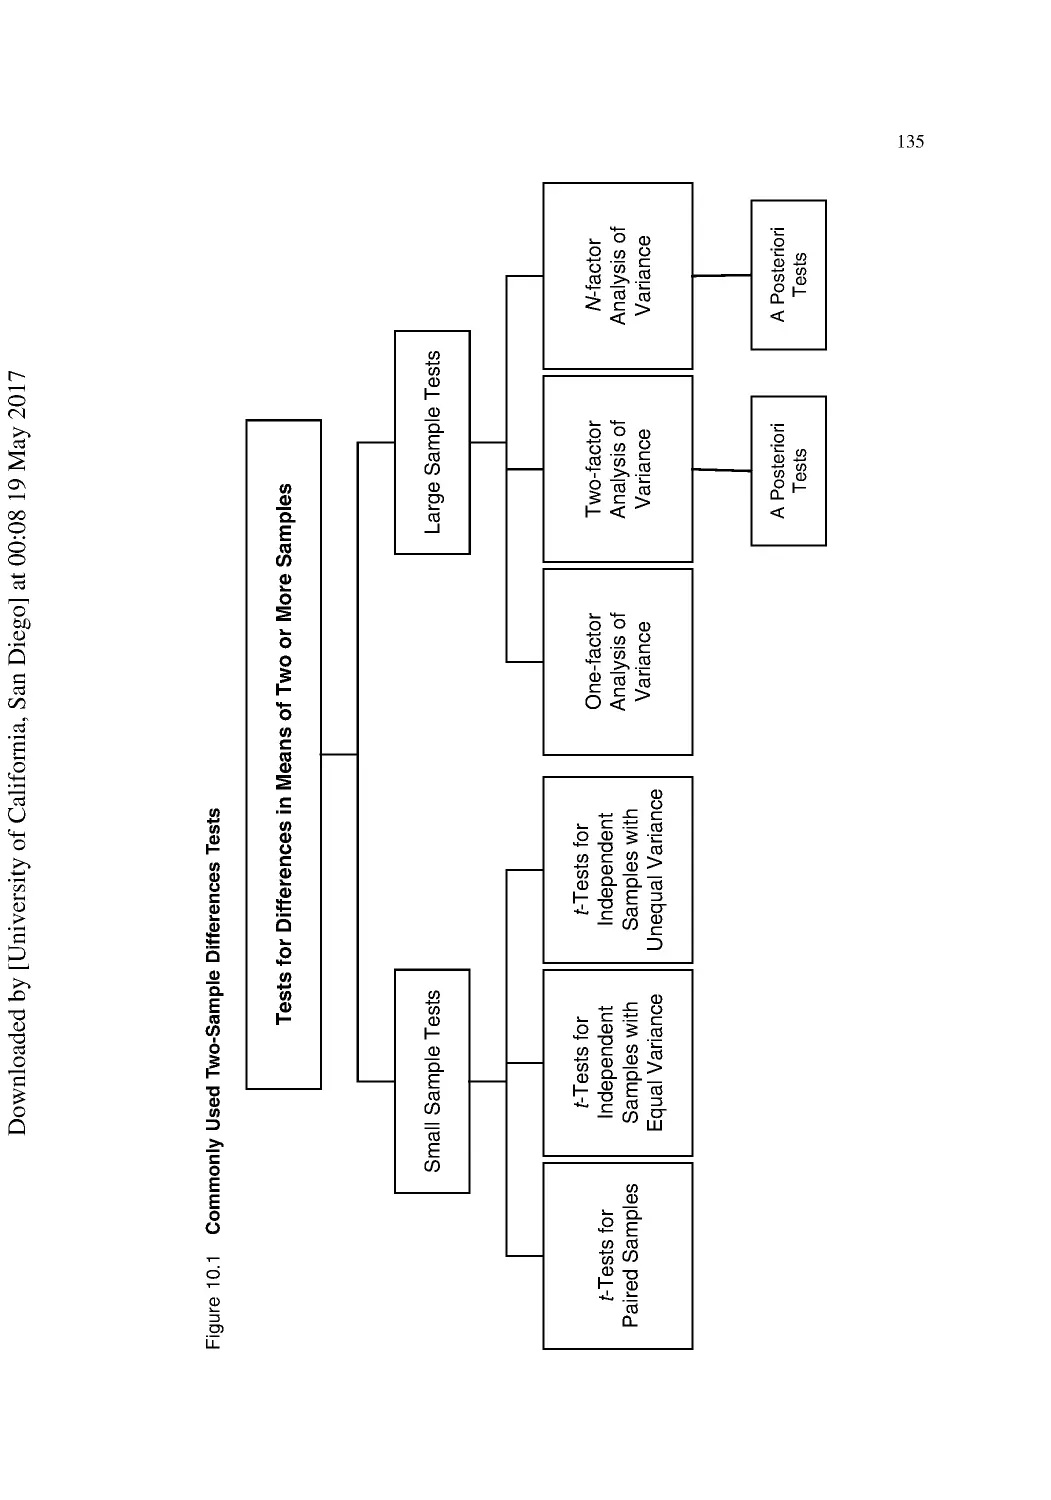
10 Causal Research: The Experimental Approach ............................................................ 125
Key Concepts in Experimental Design .............................................................................. 125
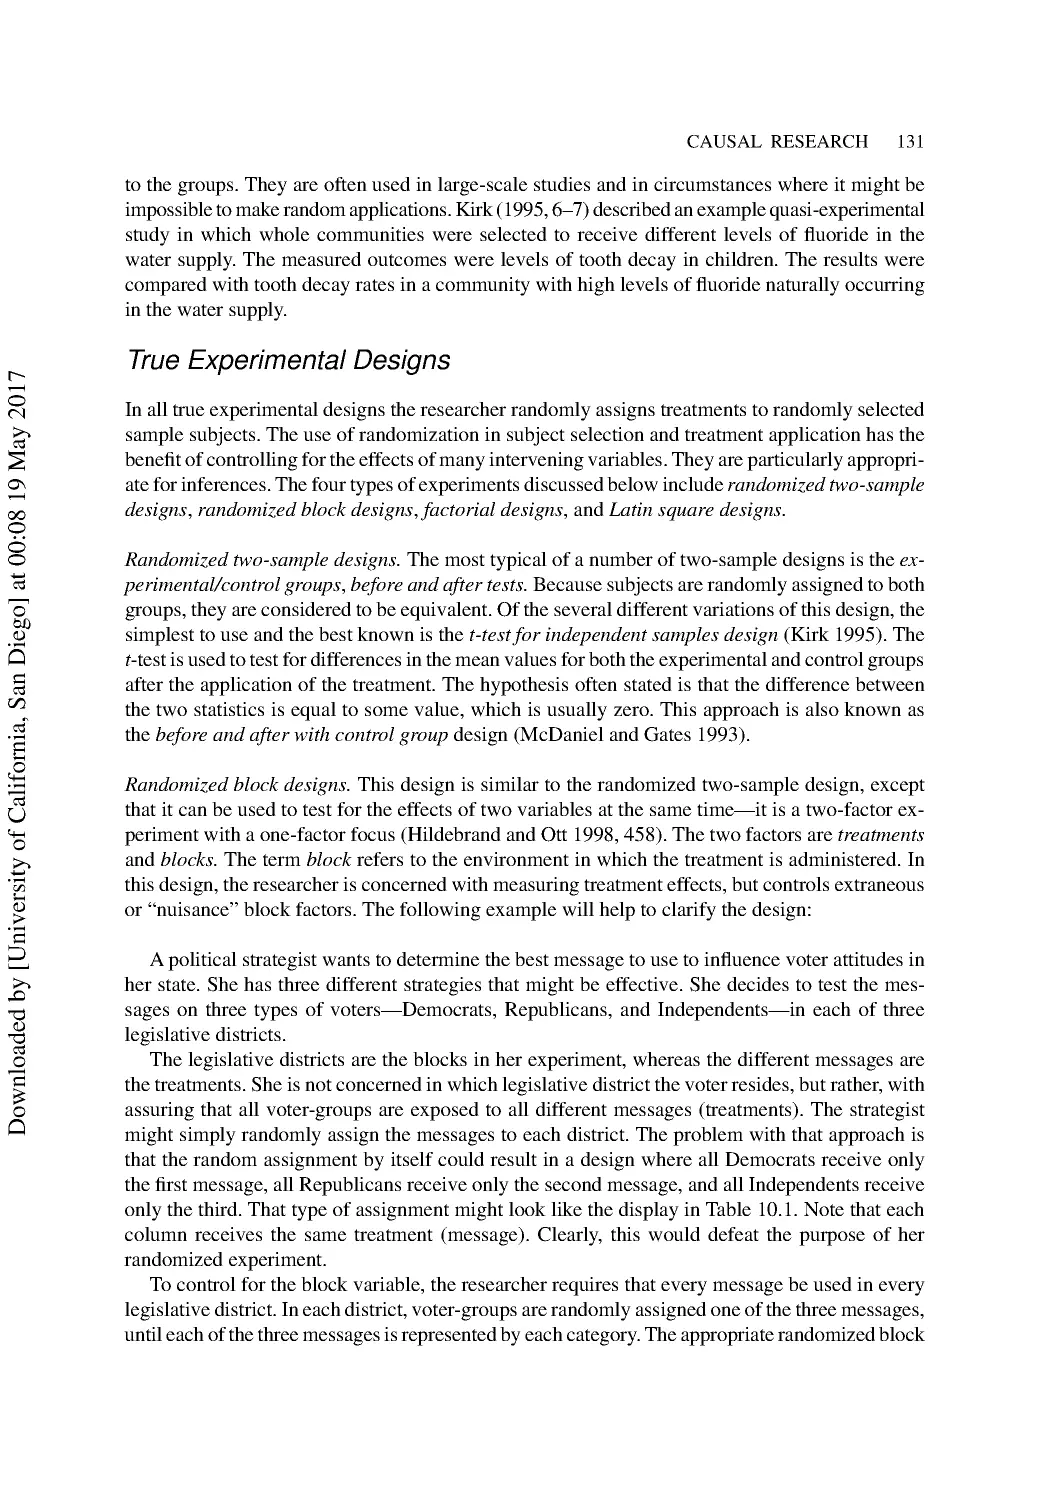
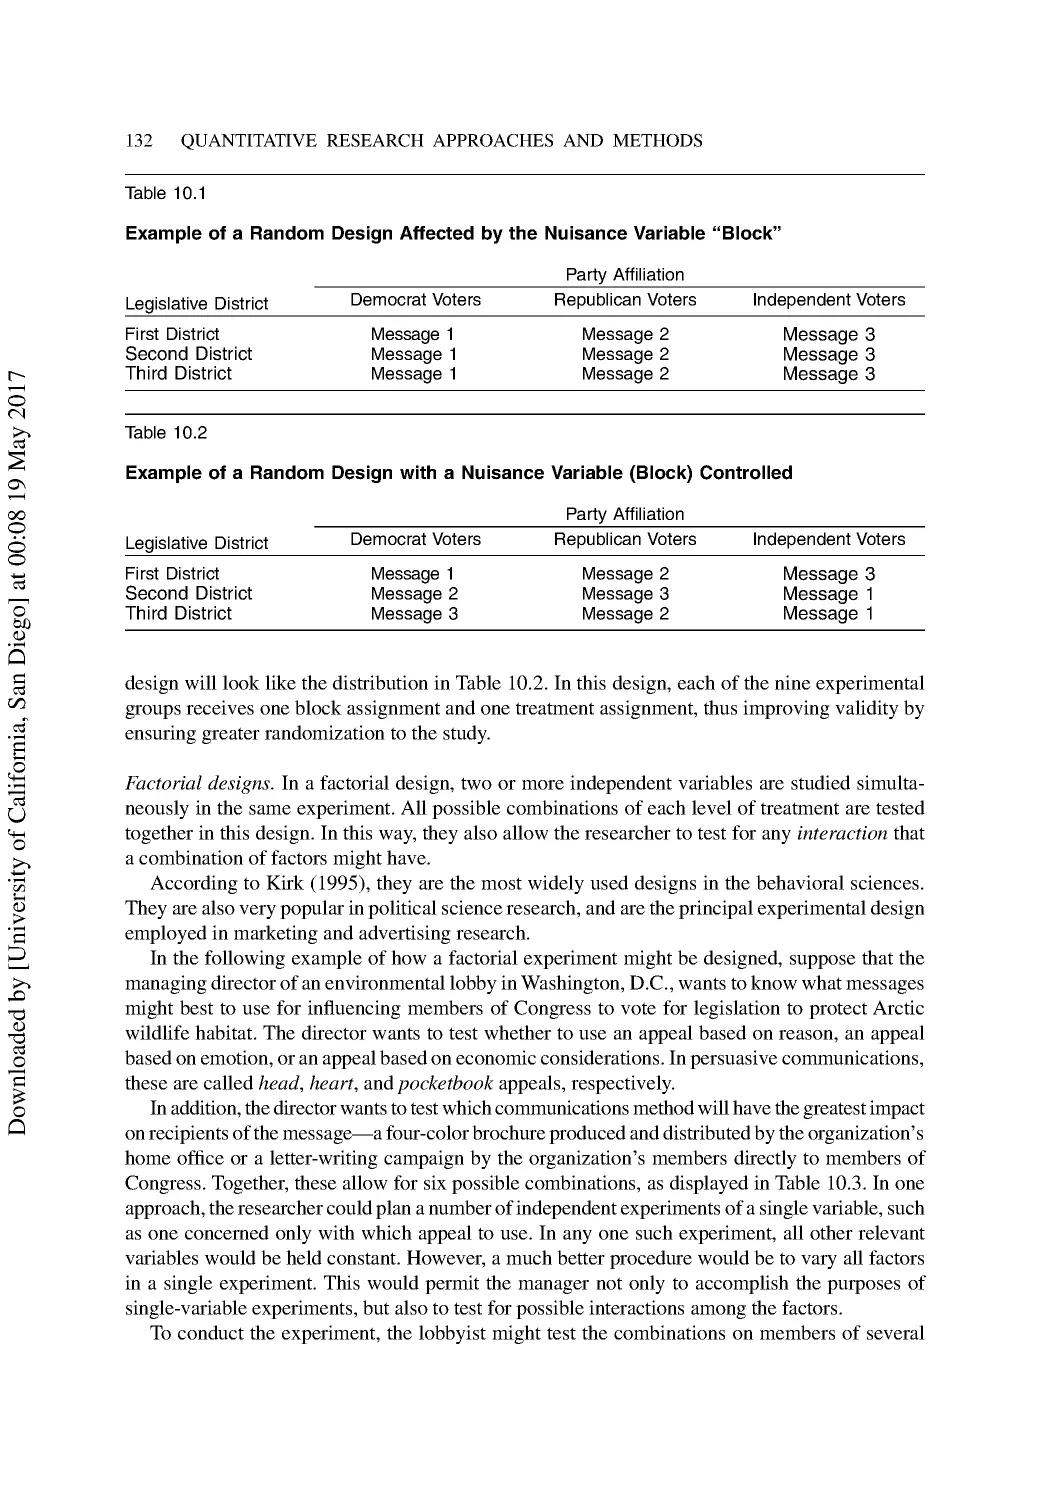
Approaches to Experimental Design.................................................................................. 127
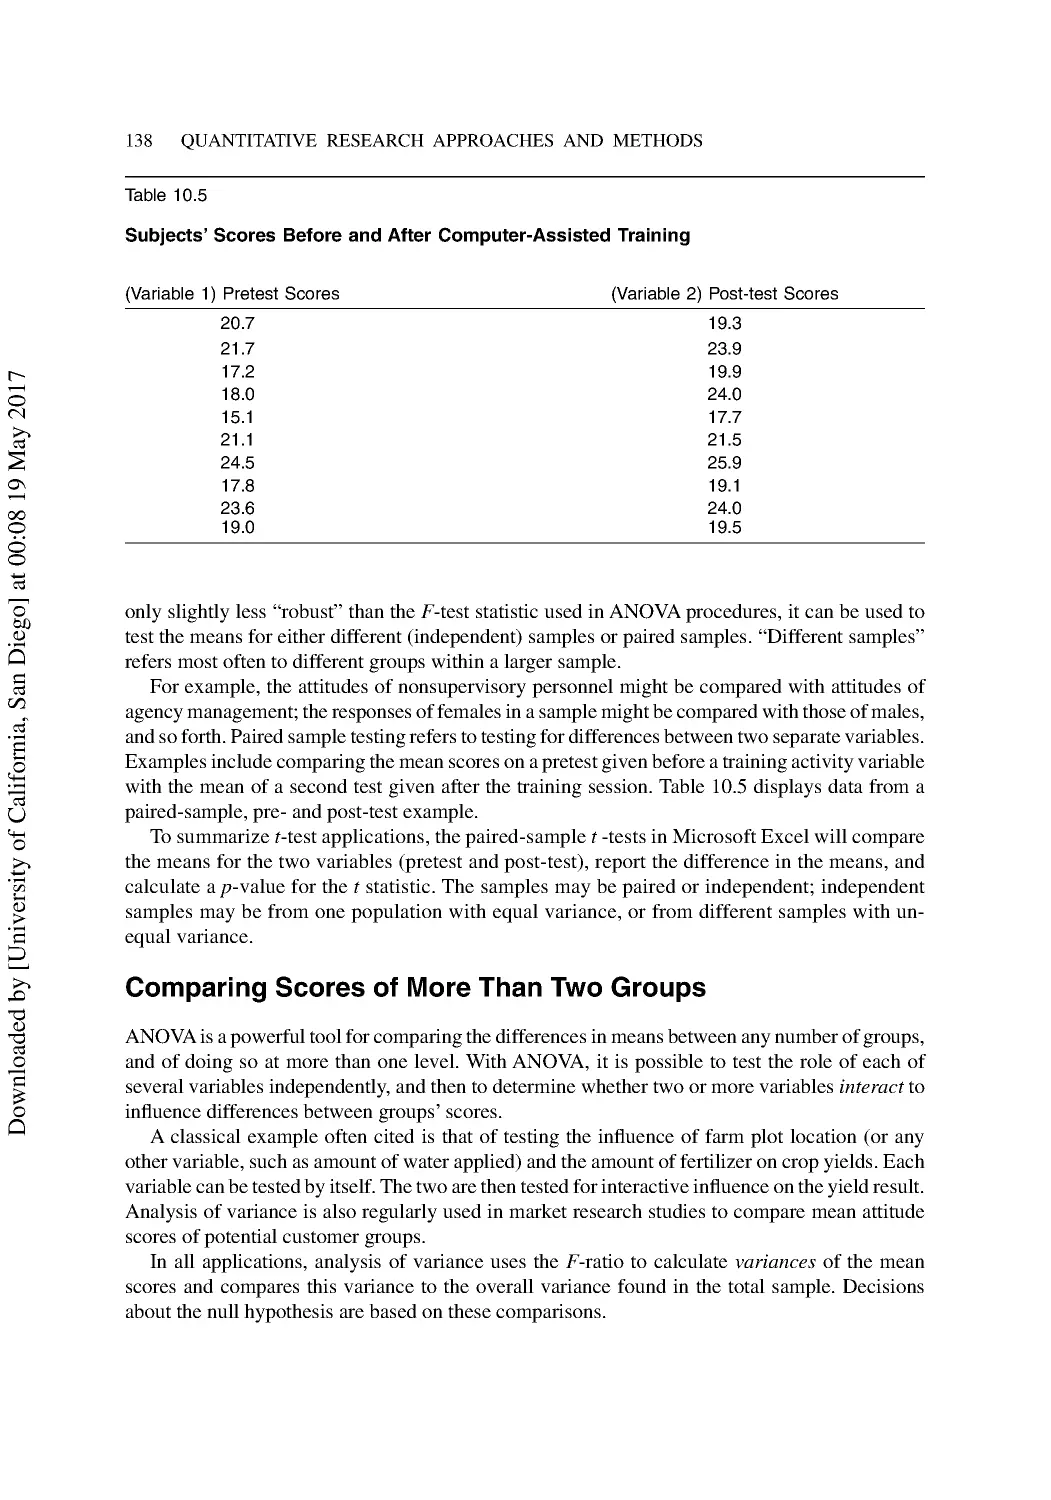
Testing Differences with Student’s t-Test .......................................................................... 136
Different Approaches for the t-Test.................................................................................... 137
Comparing Scores of More Than Two Groups .................................................................. 138
Summary ............................................................................................................................ 139
Discussion Questions ......................................................................................................... 139
Additional Reading ............................................................................................................ 140
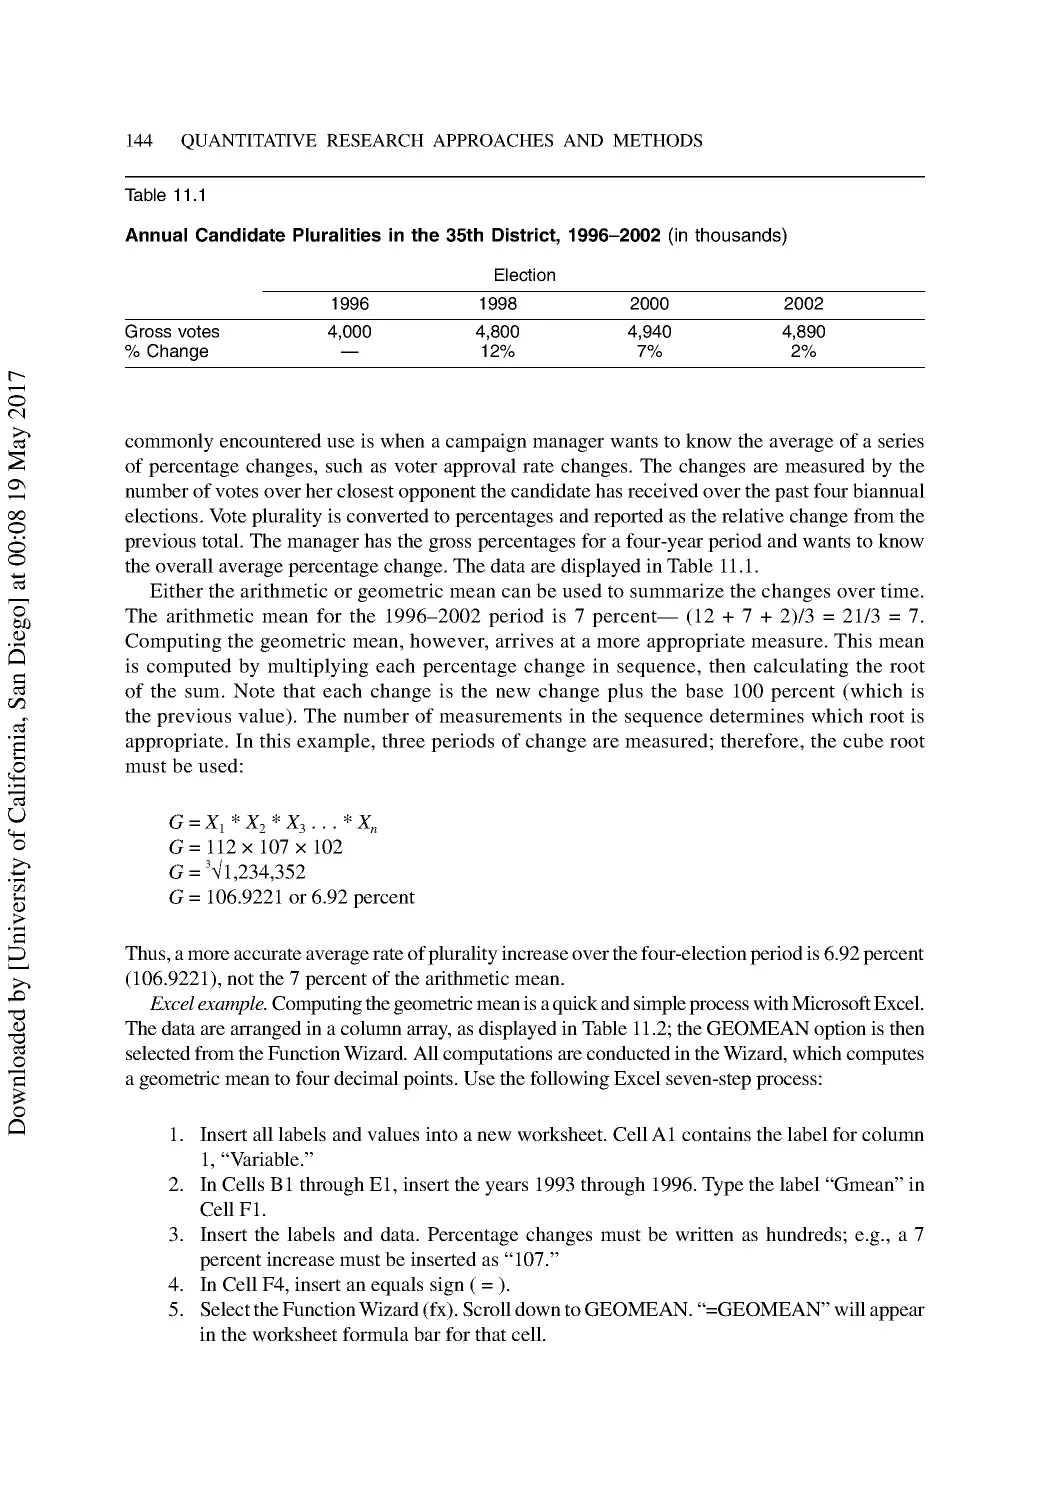
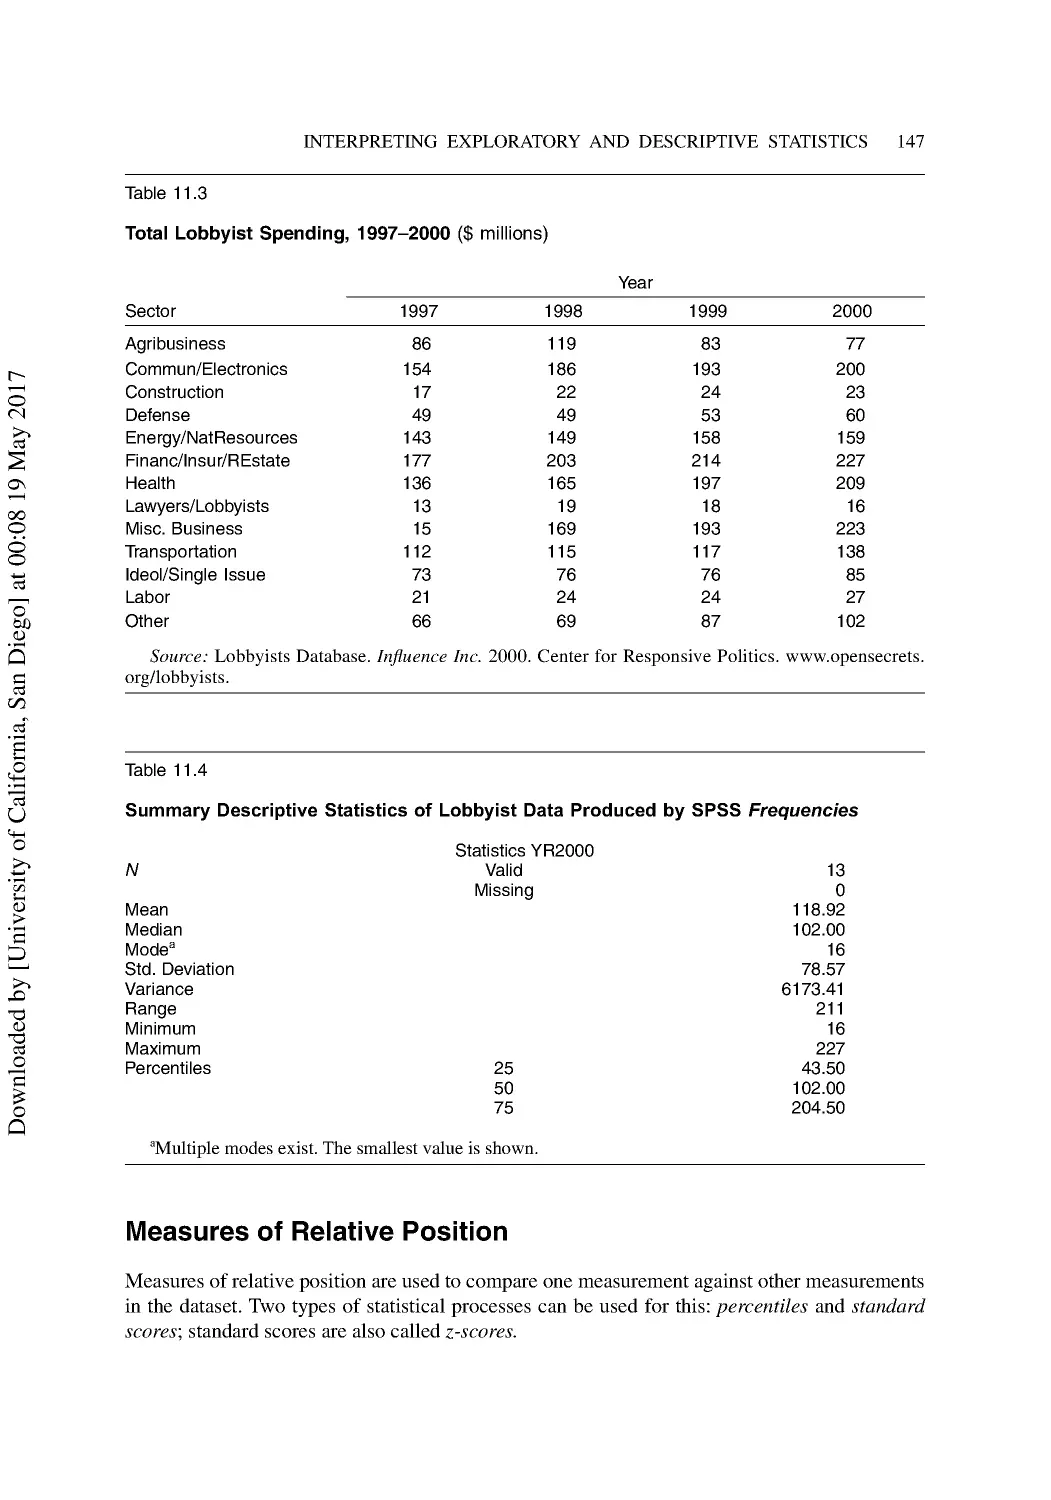
11 Interpreting Exploratory and Descriptive Statistics ..................................................... 141
Measures of Central Tendency ........................................................................................... 141
Measures of Variability ...................................................................................................... 145
Measures of Relative Position............................................................................................ 147
Measures of Correlation ..................................................................................................... 150
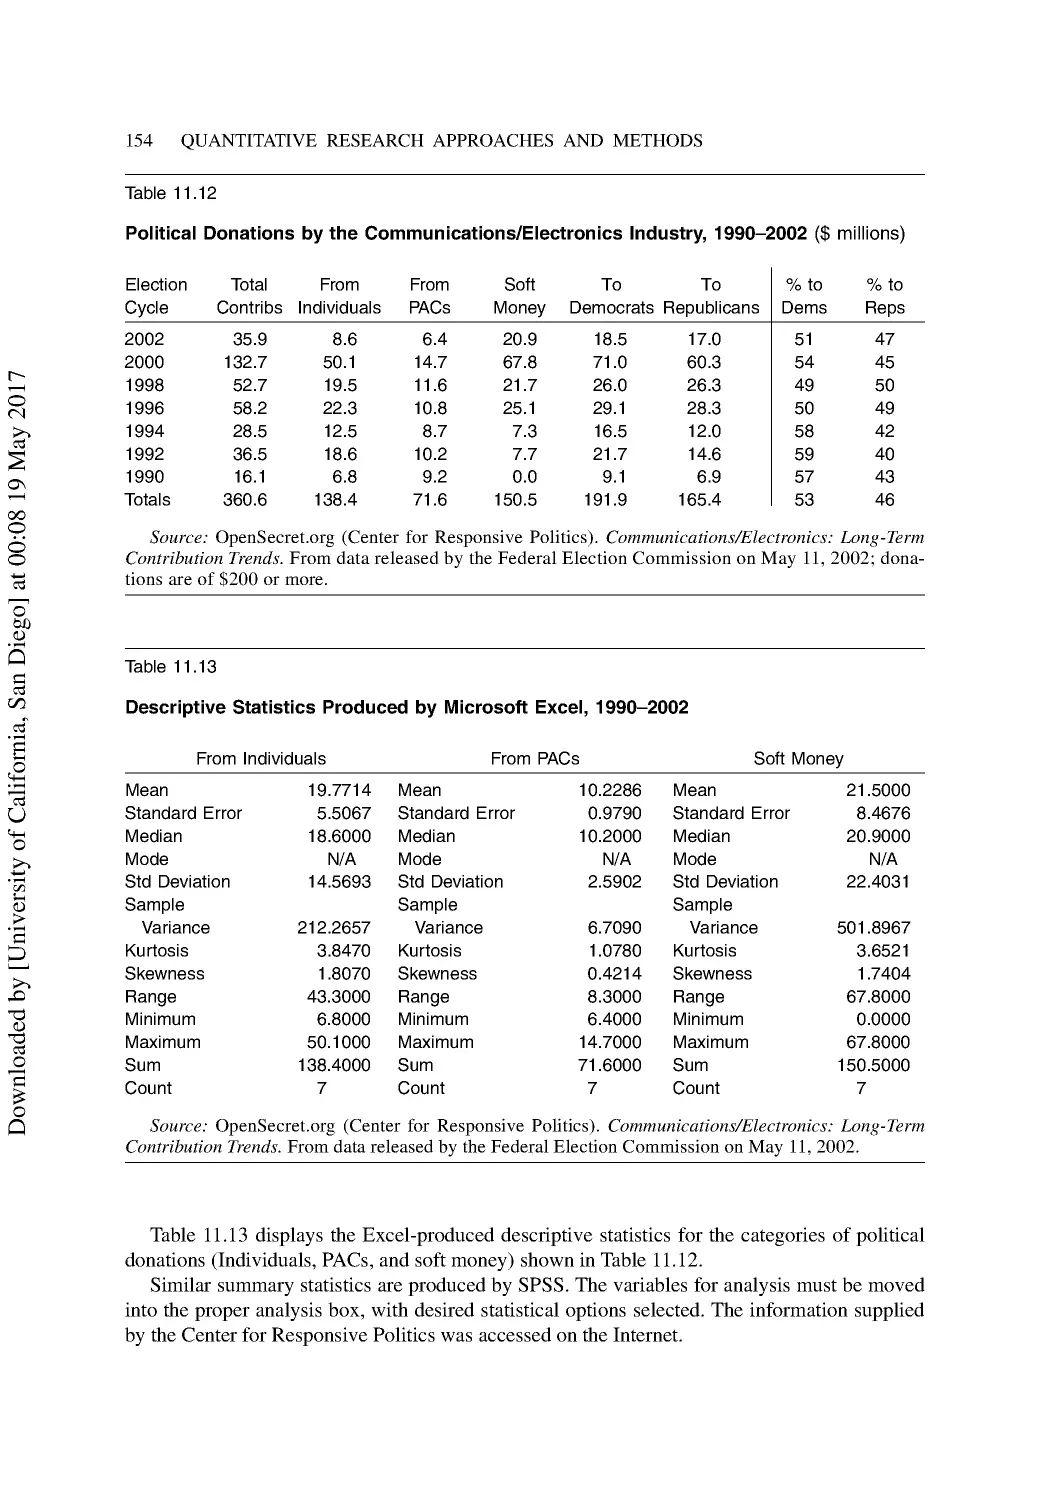
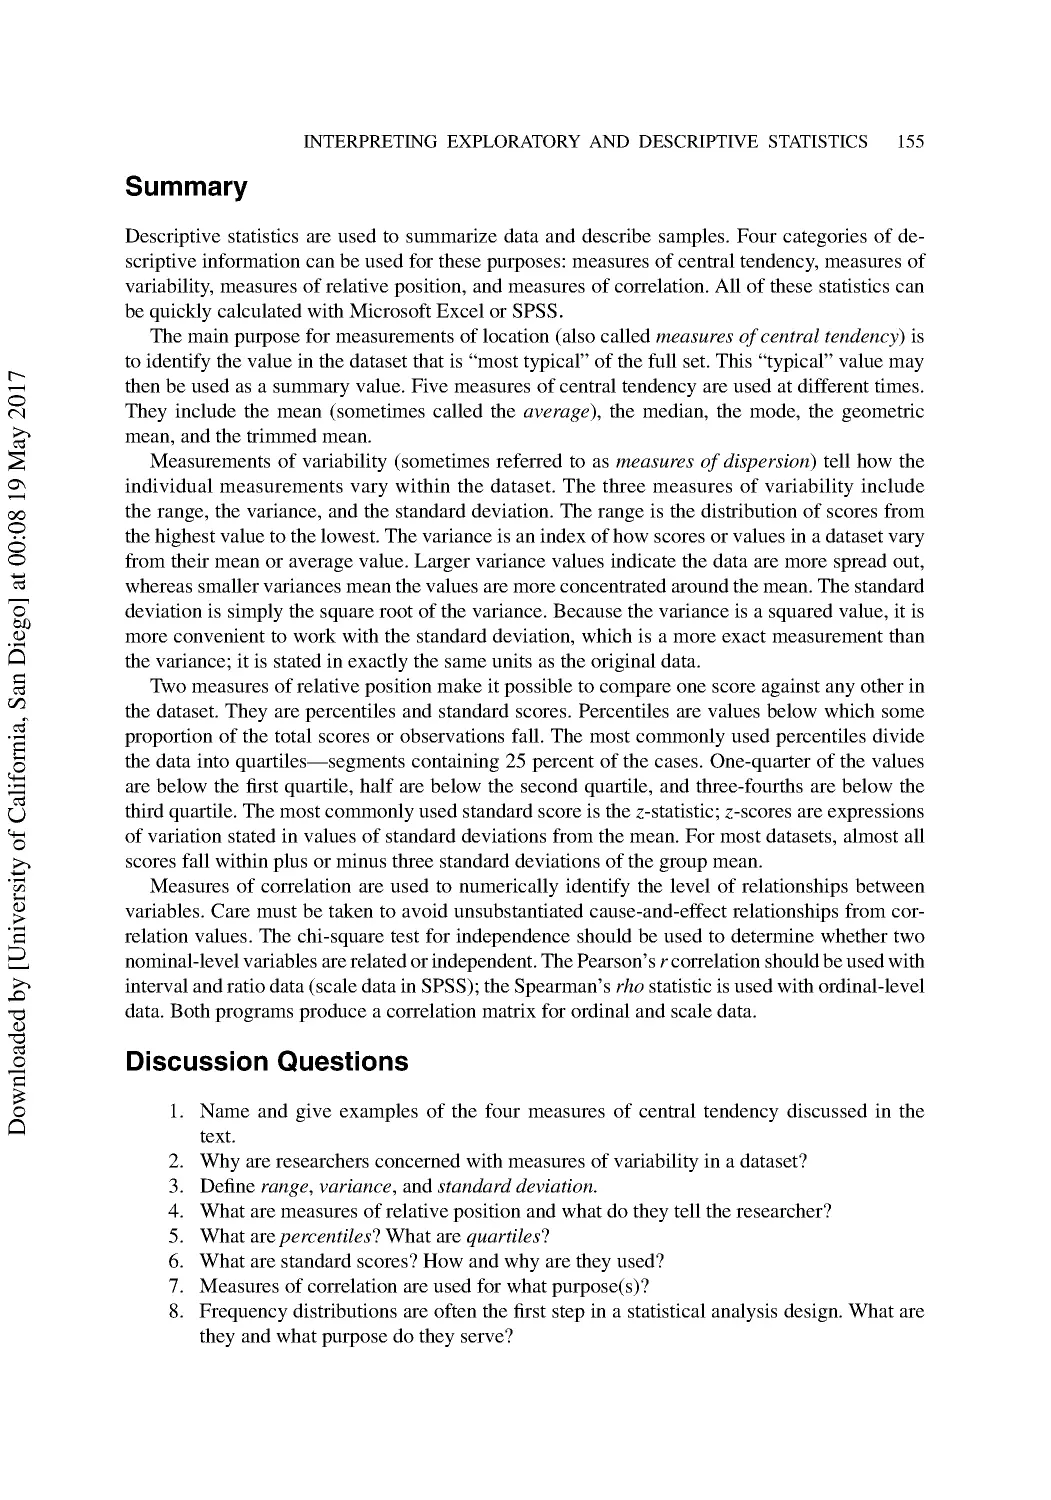
Calculating Descriptive Statistics with Excel .................................................................... 153
Summary ............................................................................................................................ 155
Discussion Questions ......................................................................................................... 155
Additional Reading ............................................................................................................ 156
D
o
w
n
l
o
a
d
e
d
b
y
[
U
n
i
v
e
r
s
i
t
y
o
f
C
a
l
i
f
o
r
n
i
a
,
S
a
n
D
i
e
g
o
]
a
t
0
0
:
0
8
1
9
M
a
y
2
0
1
7
xii DETAILED TABLE OF CONTENTS
12 Testing Research Hypotheses .......................................................................................... 157
Fundamentals of Hypothesis Testing ................................................................................. 157
Classes of Hypothesis Tests ............................................................................................... 158
Probability and Hypothesis Testing.................................................................................... 159
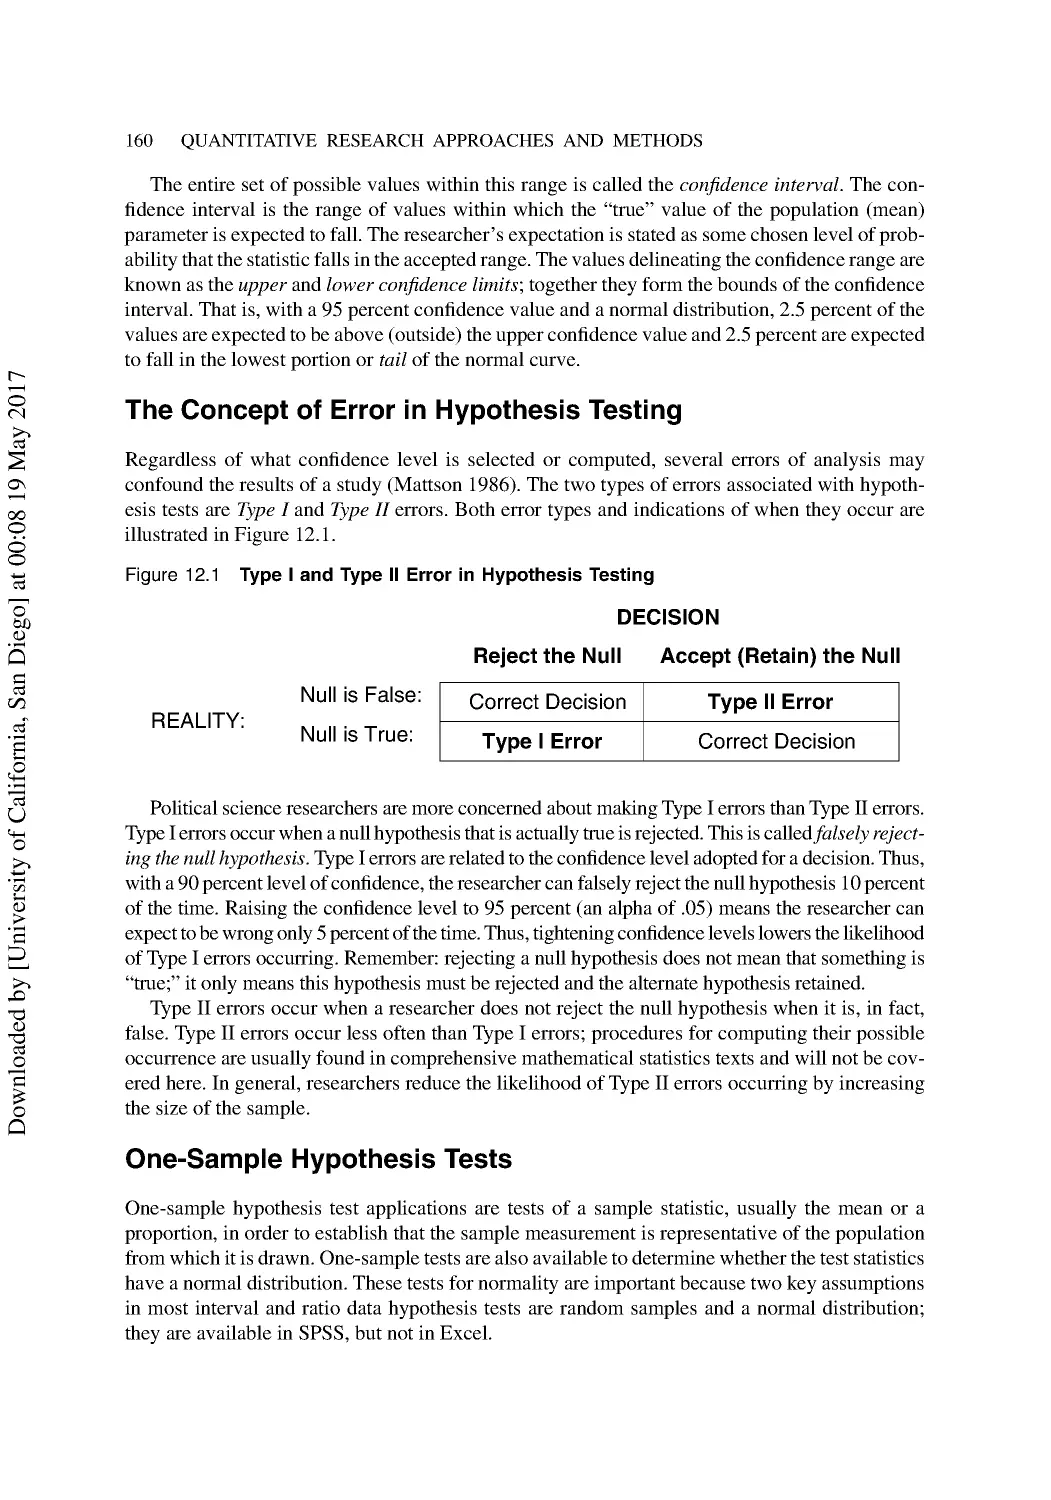
The Concept of Error in Hypothesis Testing...................................................................... 160
One-Sample Hypothesis Tests............................................................................................ 160
The Excel Confidence Test................................................................................................. 161
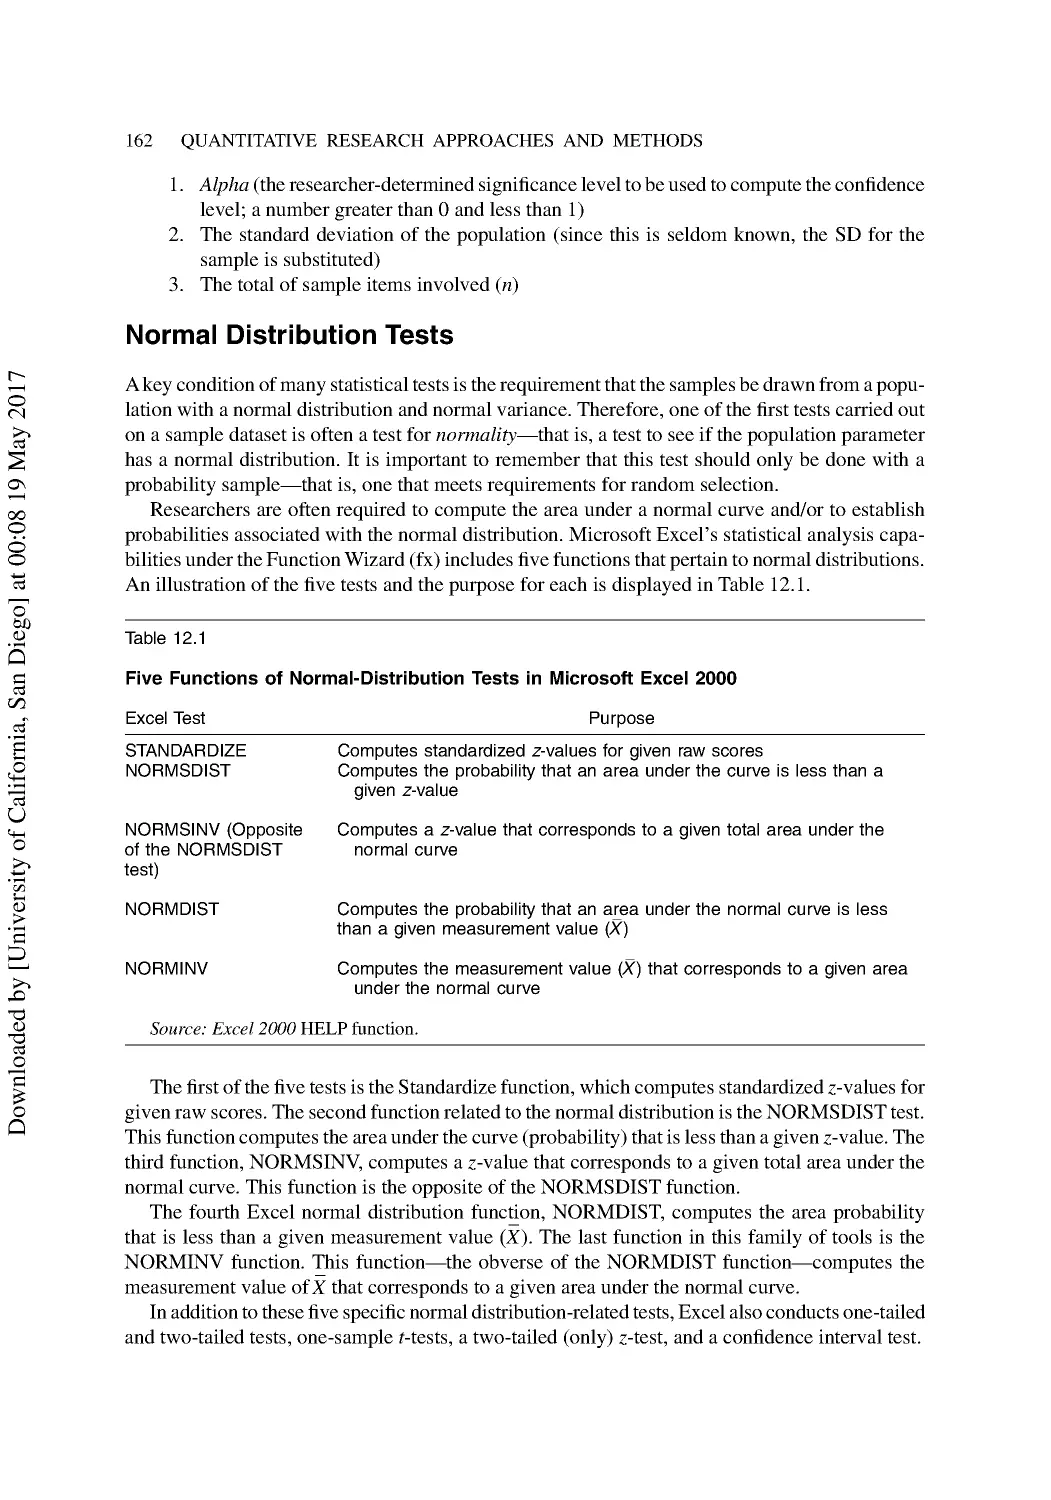
Normal Distribution Tests .................................................................................................. 162
Summary ............................................................................................................................ 174
Discussion Questions ......................................................................................................... 174
Additional Reading ............................................................................................................ 175
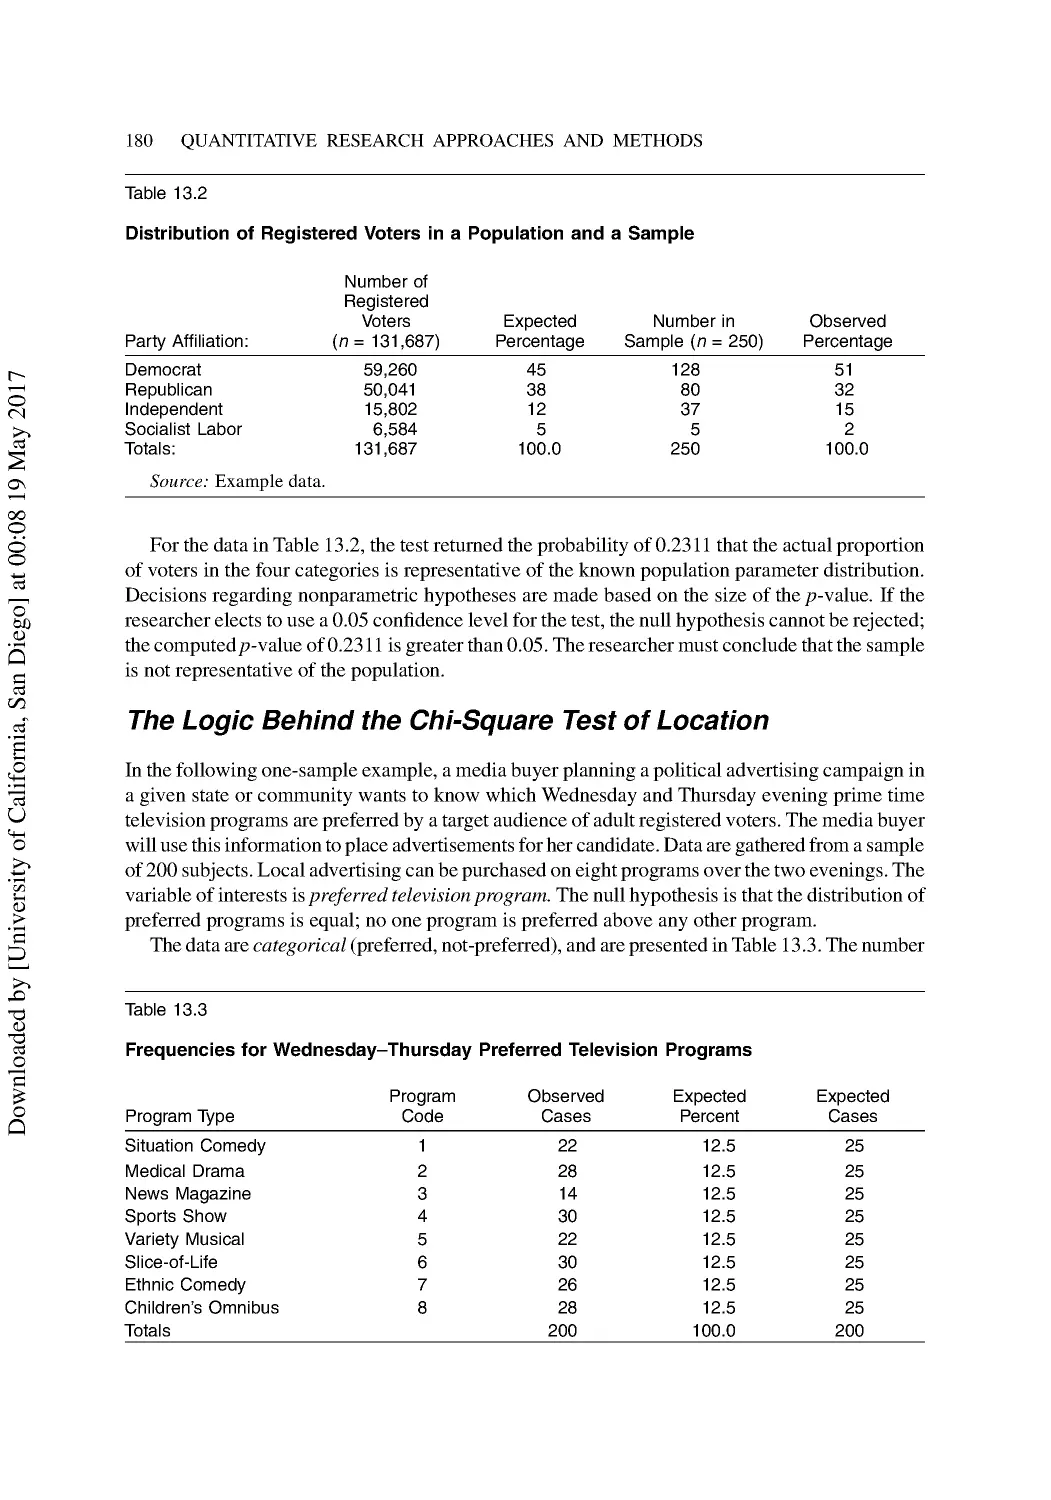
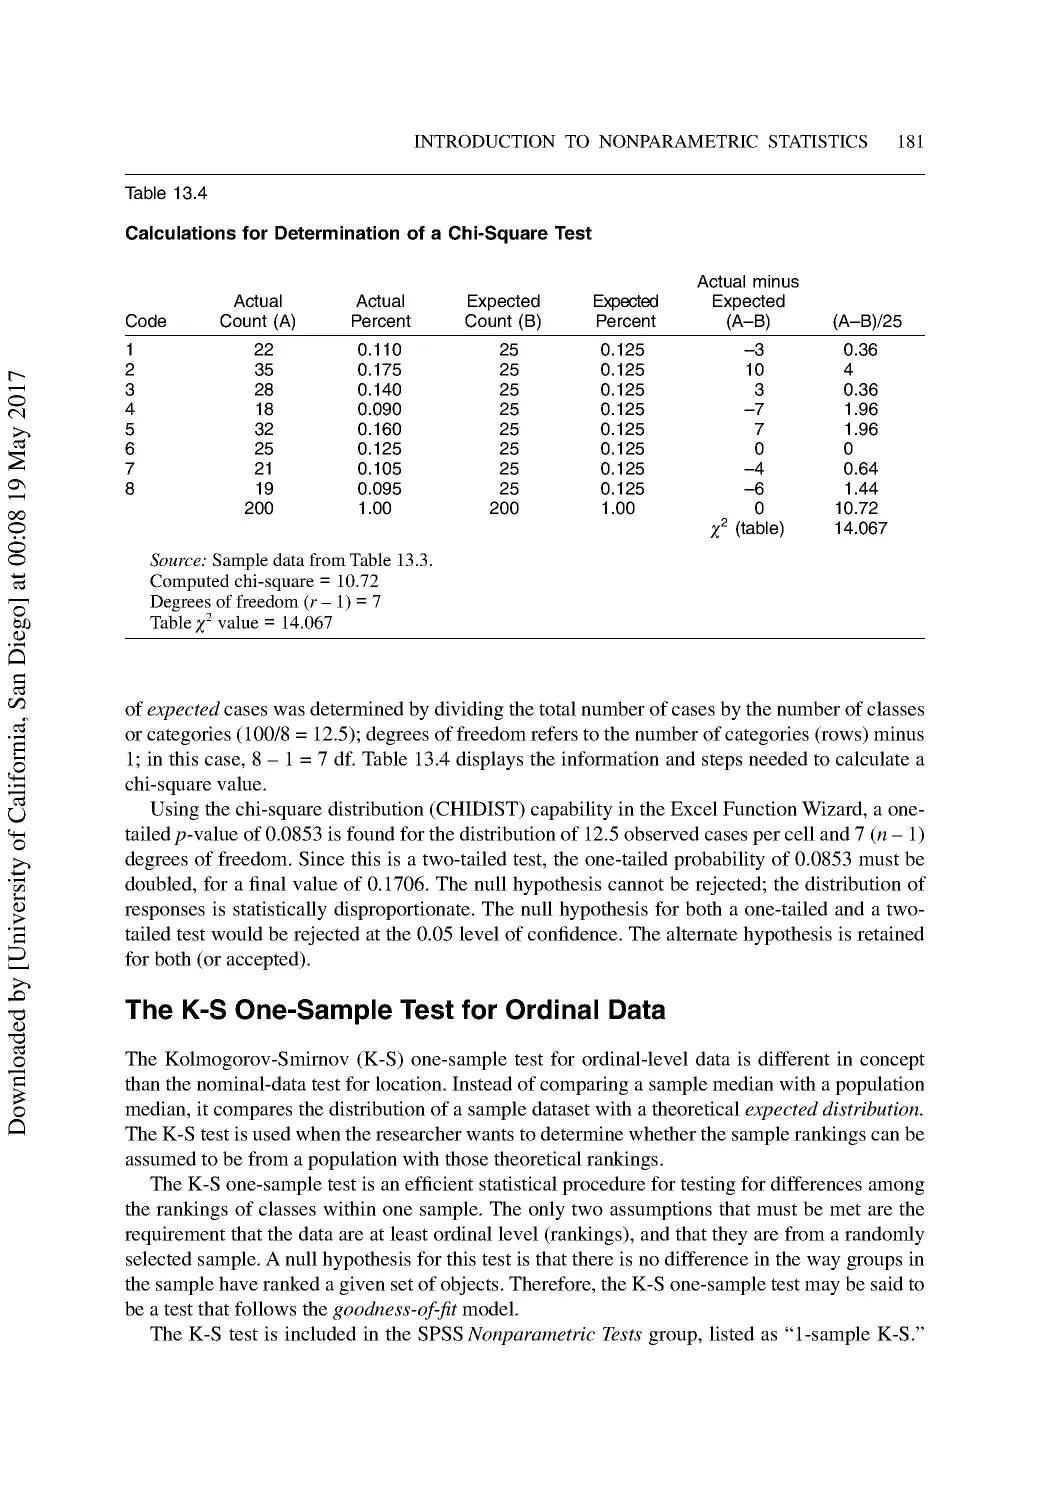
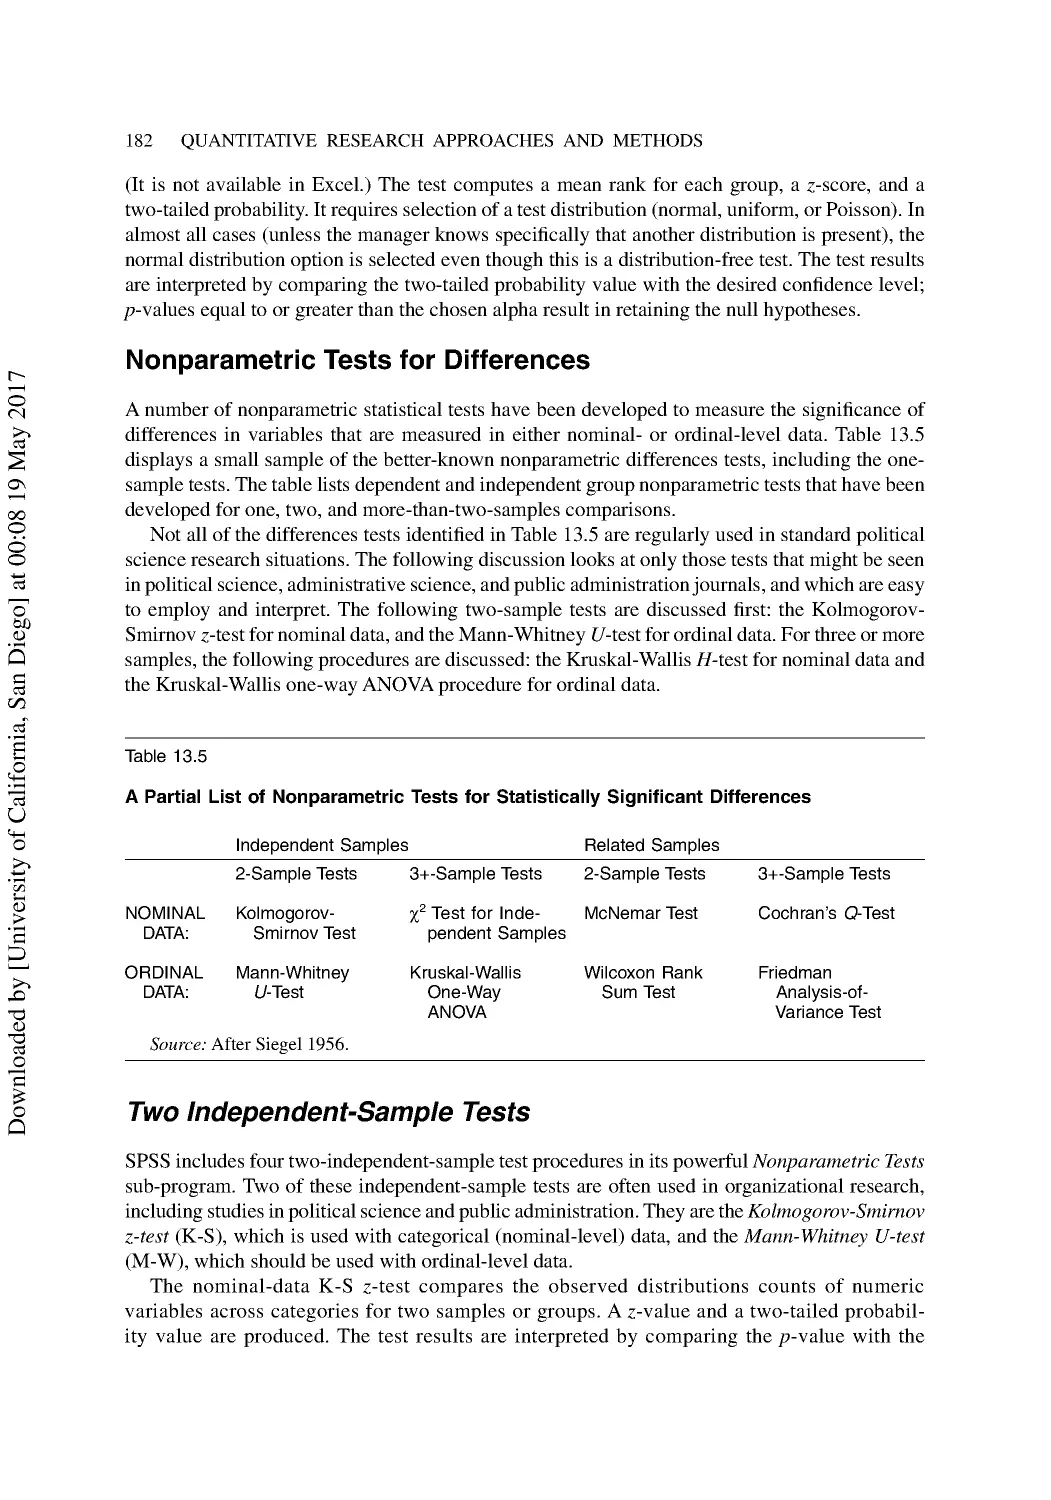
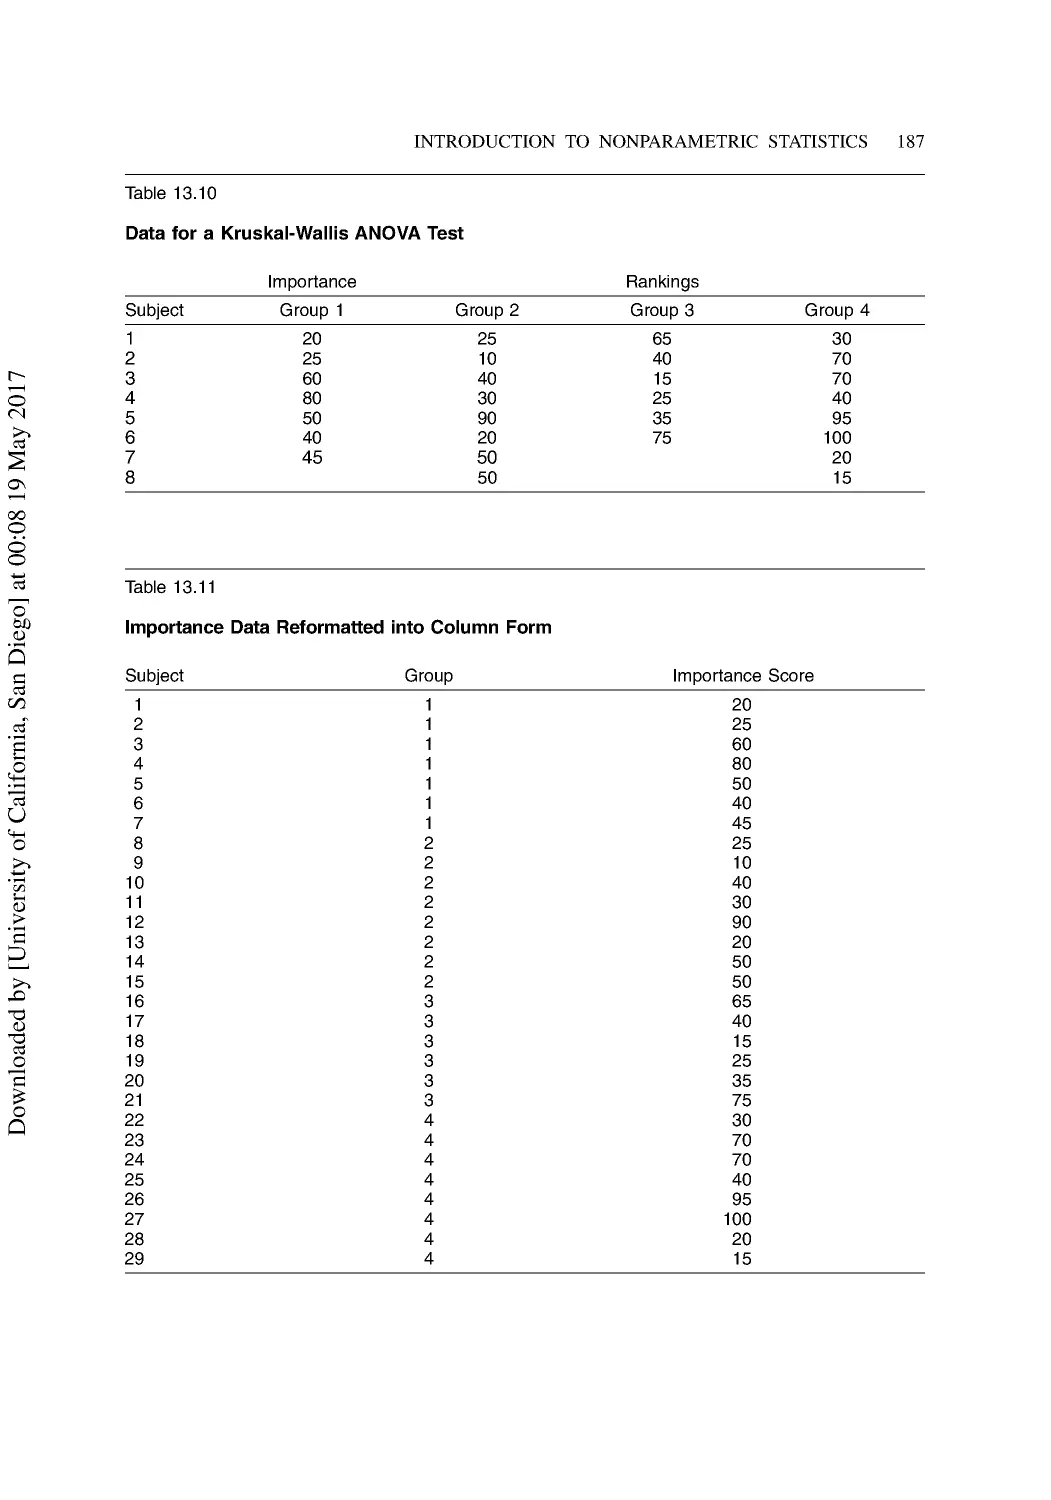
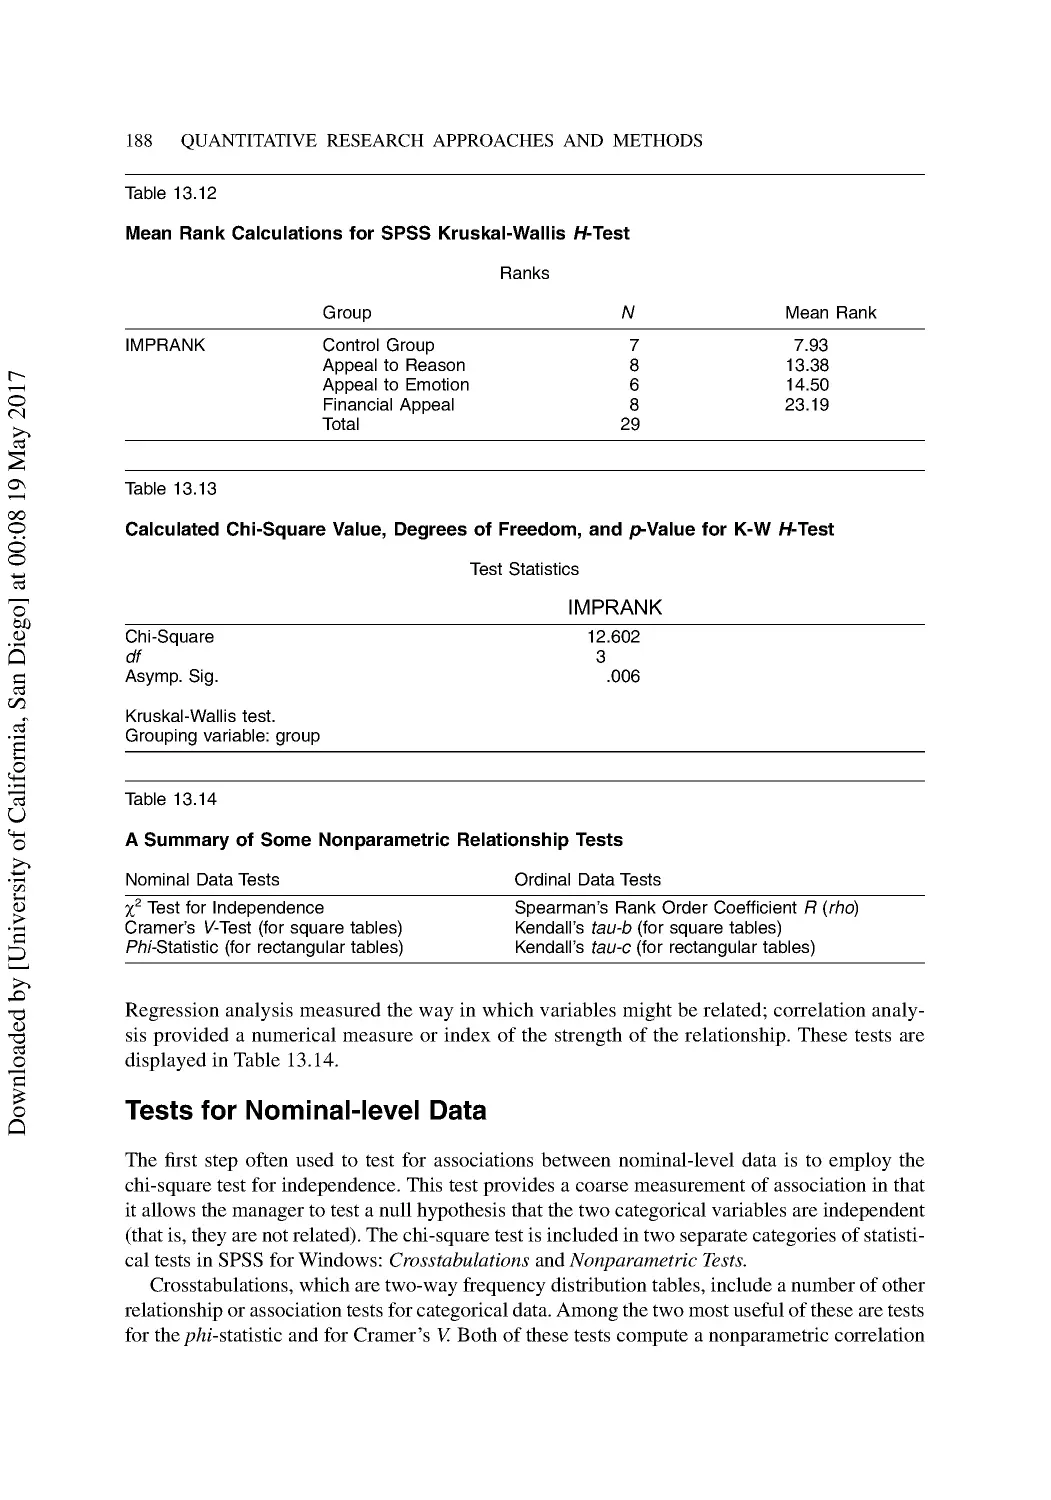
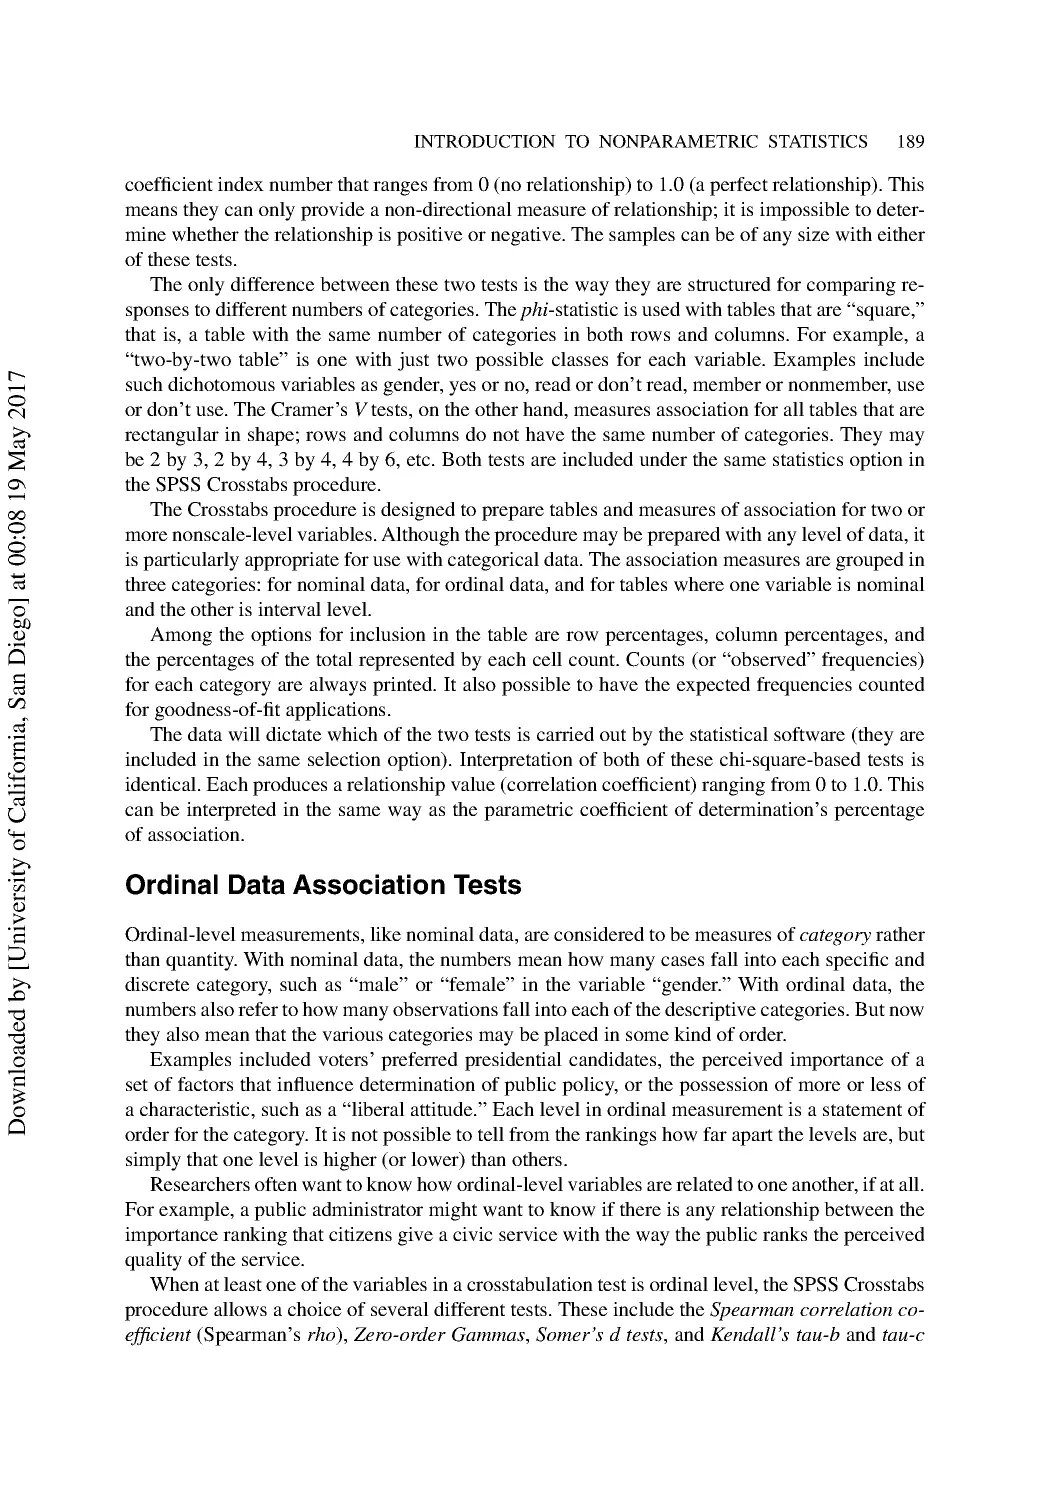
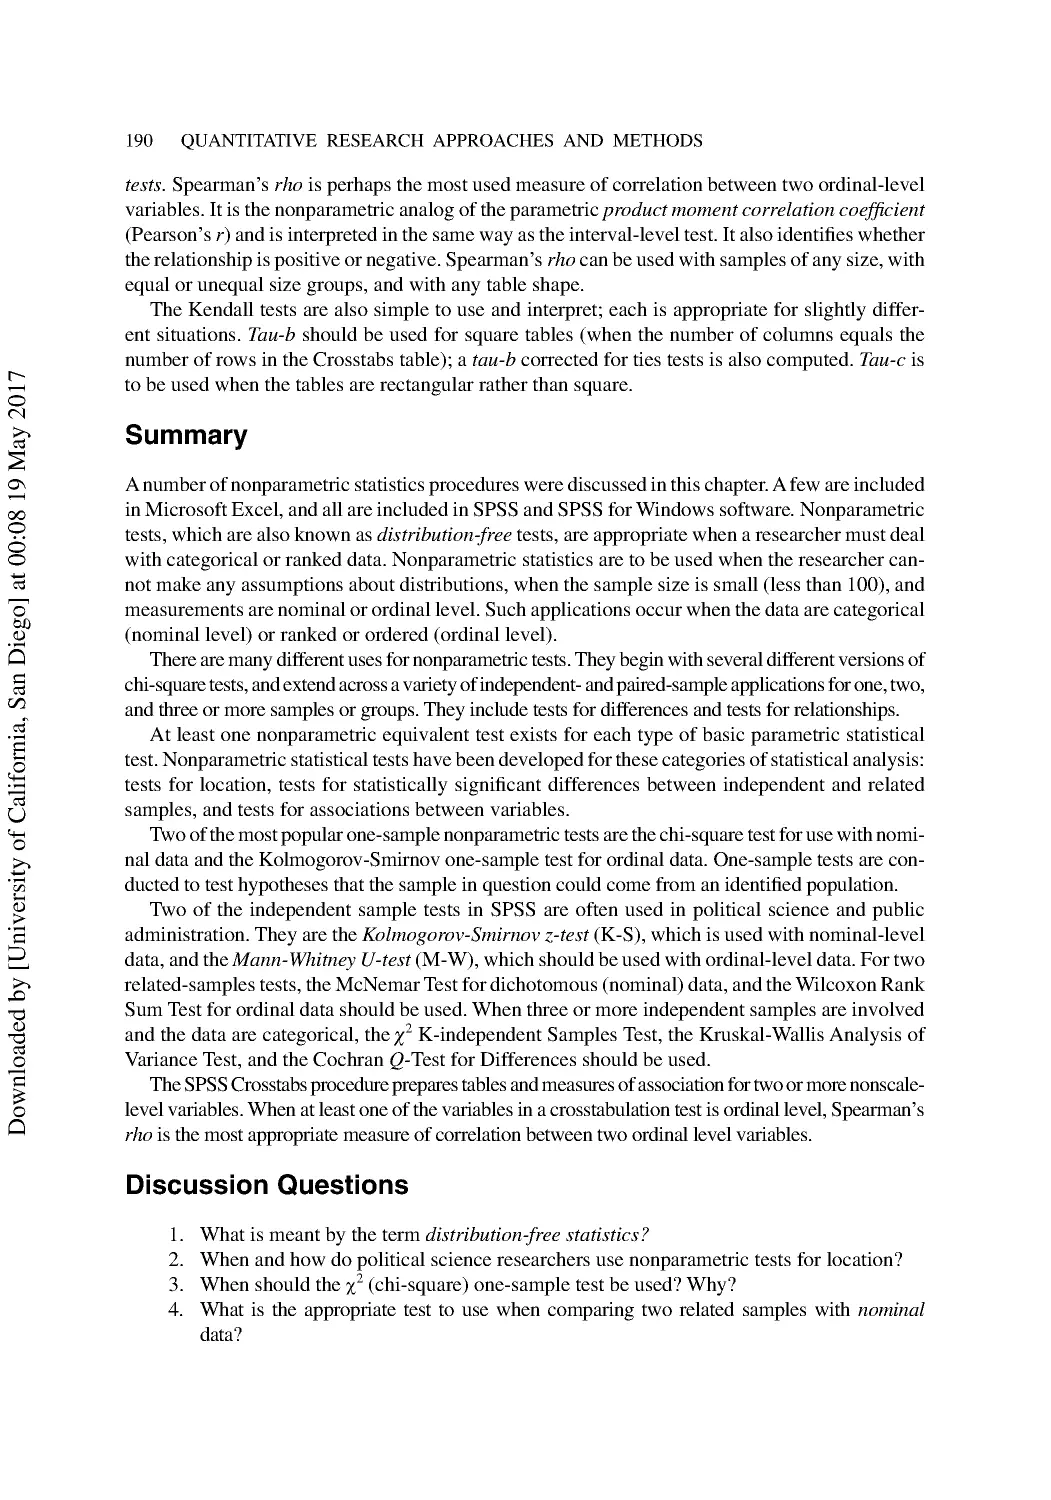
13 Introduction to Nonparametric Statistics ...................................................................... 176
Nonparametric Analogs of Parametric Tests ...................................................................... 177
Nonparametric Tests for Location ...................................................................................... 178
One-Sample Nonparametric Tests...................................................................................... 179
The K-S One-Sample Test for Ordinal Data ...................................................................... 181
Nonparametric Tests for Differences ................................................................................. 182
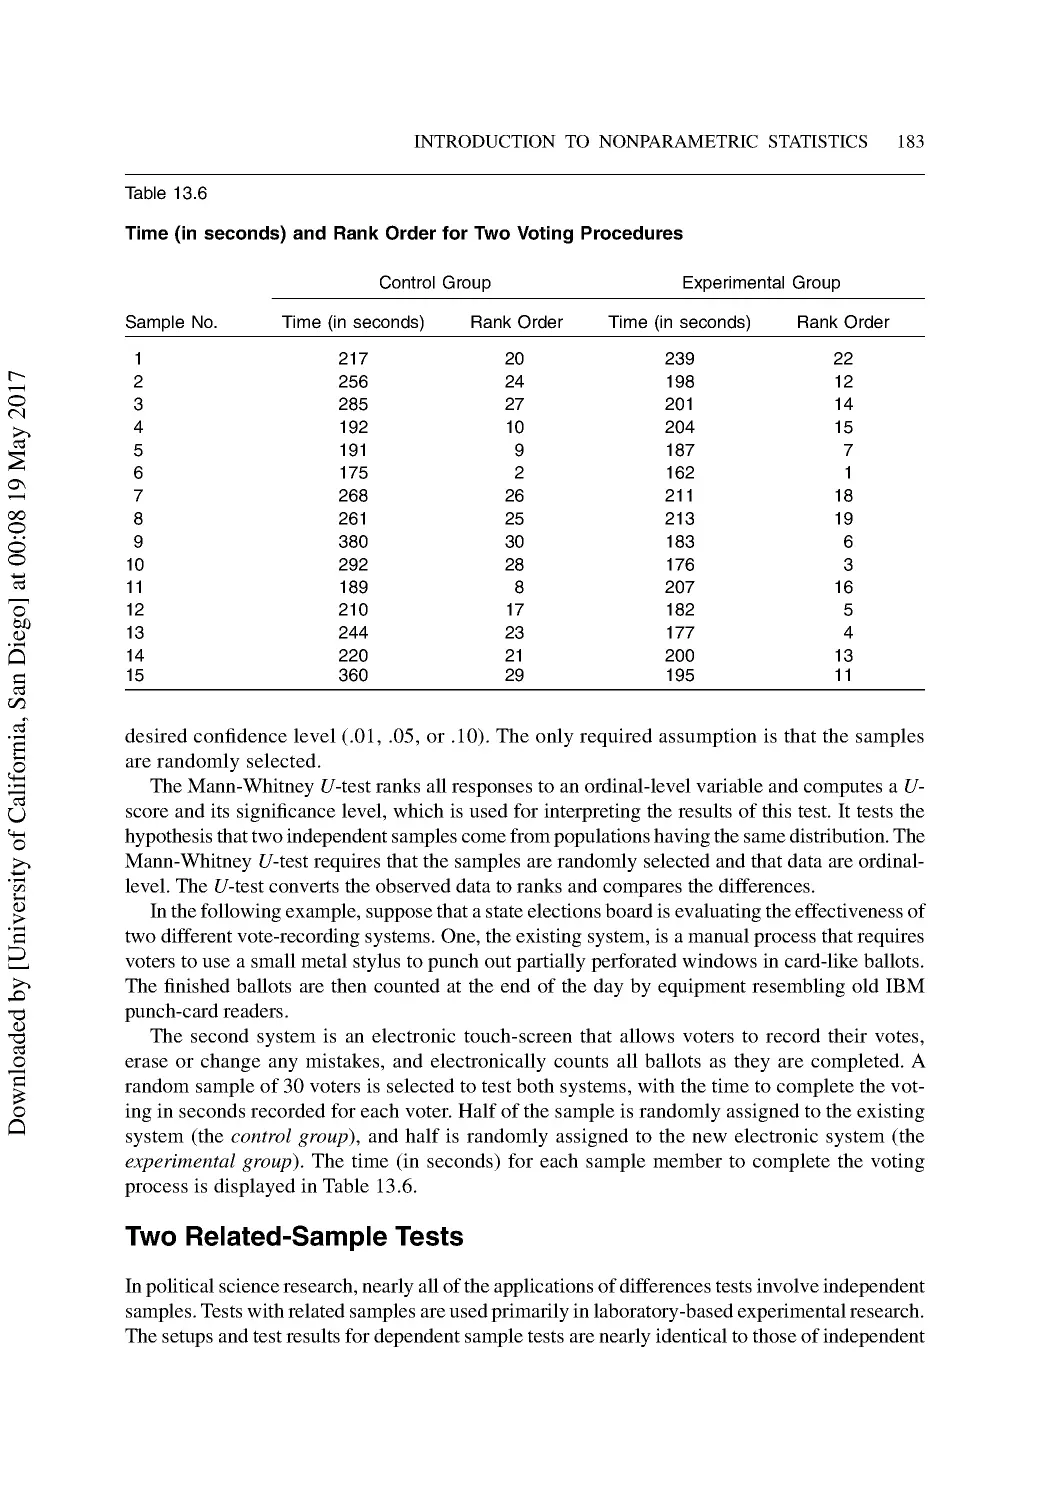
Two Related-Sample Tests ................................................................................................. 183
Three or More Independent Sample Tests.......................................................................... 184
Nonparametric Relationship Tests ..................................................................................... 186
Tests for Nominal-level Data ............................................................................................. 188
Ordinal Data Association Tests .......................................................................................... 189
Summary ............................................................................................................................ 190
Discussion Questions ......................................................................................................... 190
Additional Reading ............................................................................................................ 191
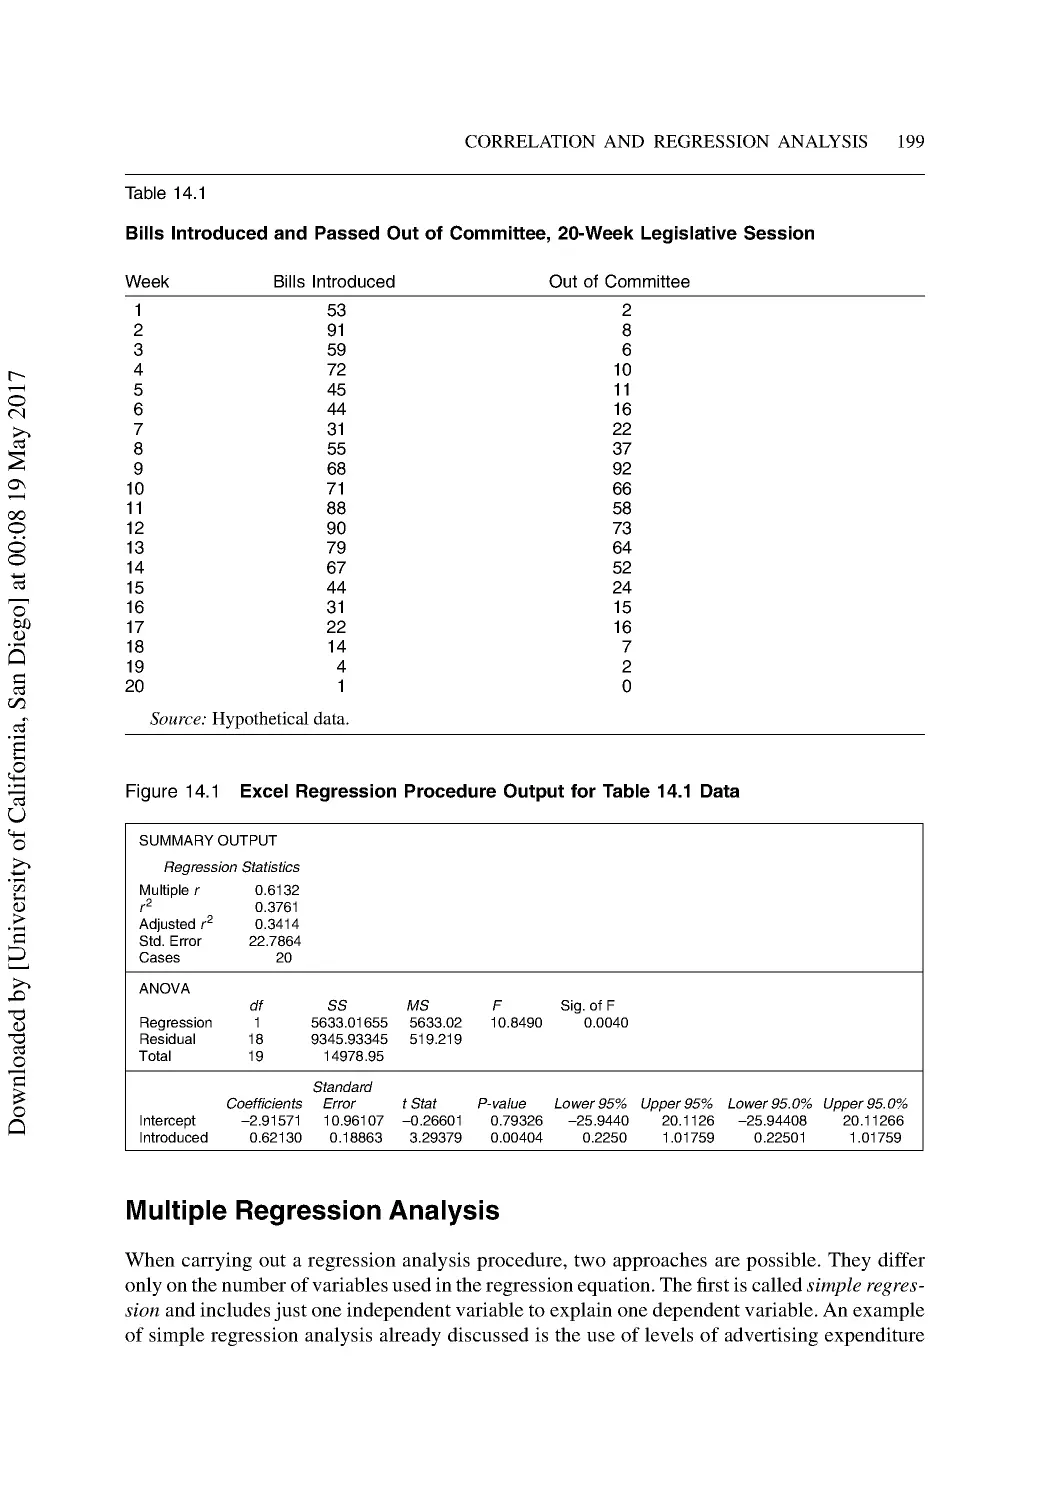
14 Correlation and Regression Analysis in Political Science............................................. 192
Relationship Test Applications ........................................................................................... 193
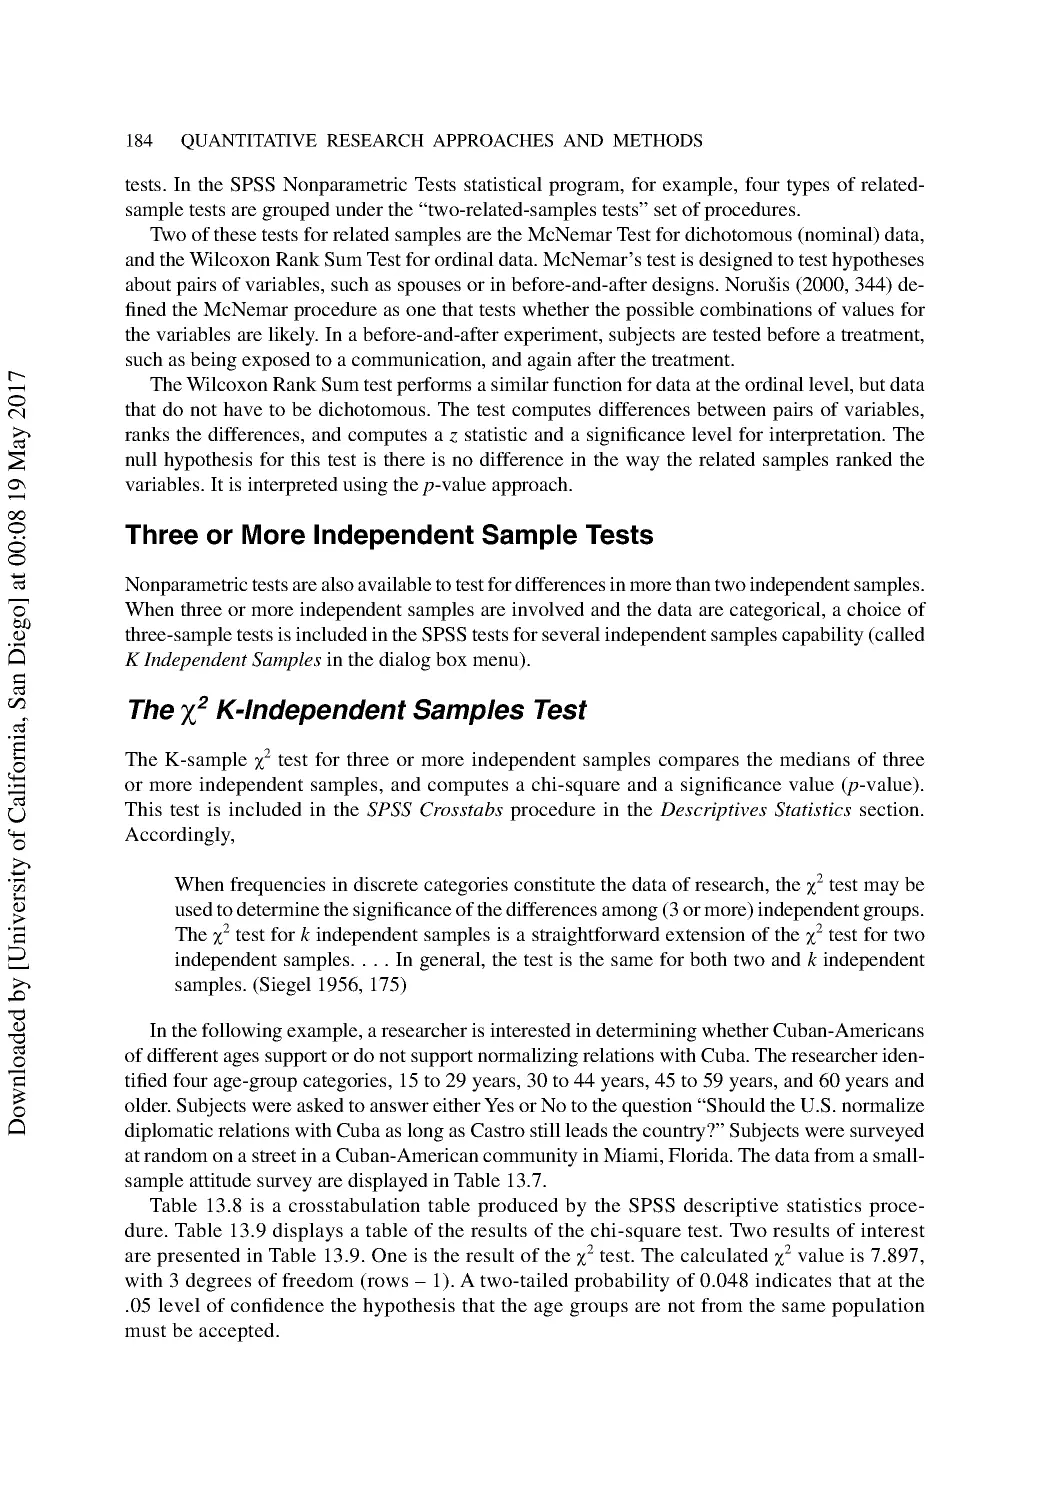
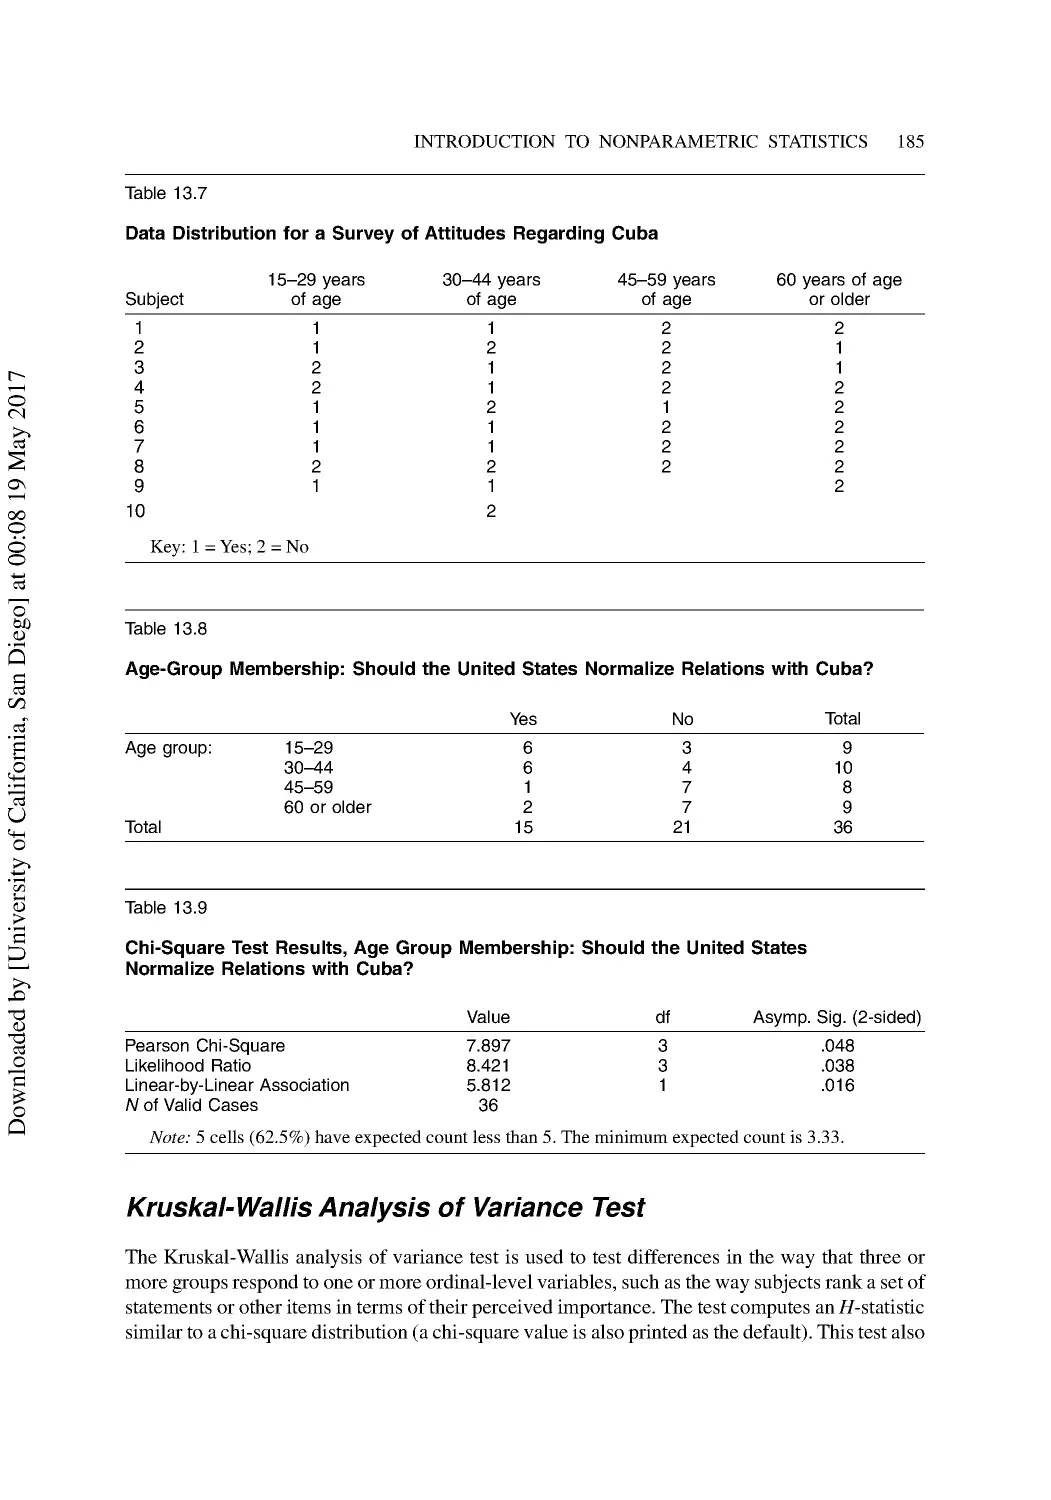
Correlation Analysis........................................................................................................... 194
Correlation Statistics .......................................................................................................... 194
Simple Regression Analysis ............................................................................................... 196
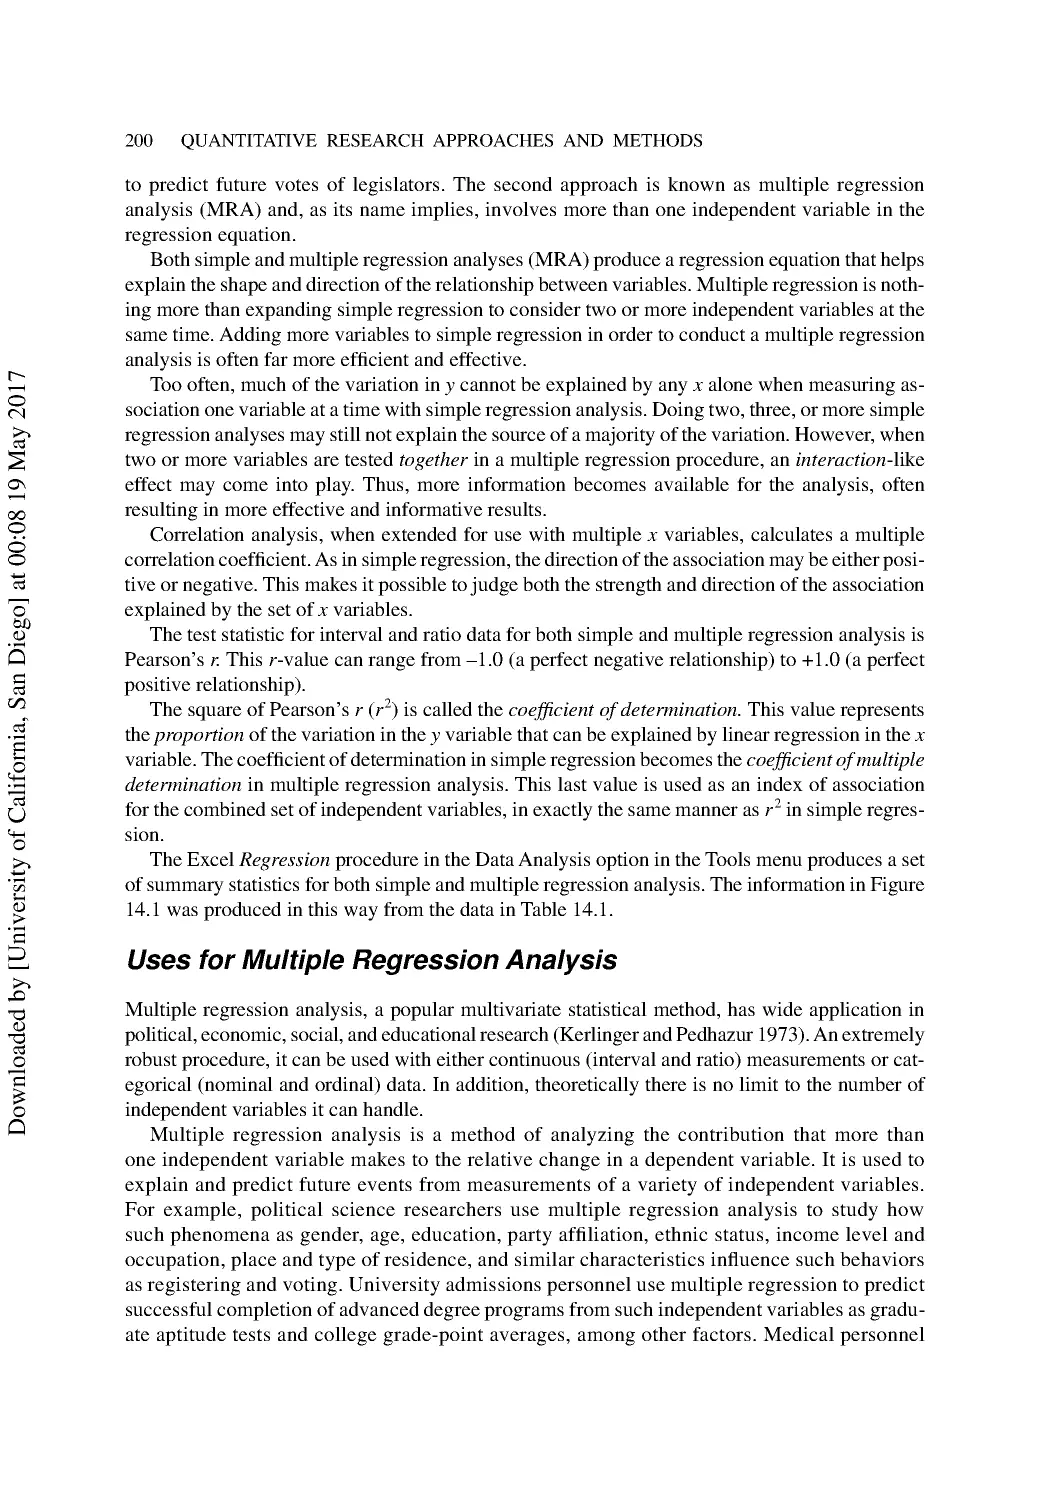
A Simple Regression Example ........................................................................................... 198
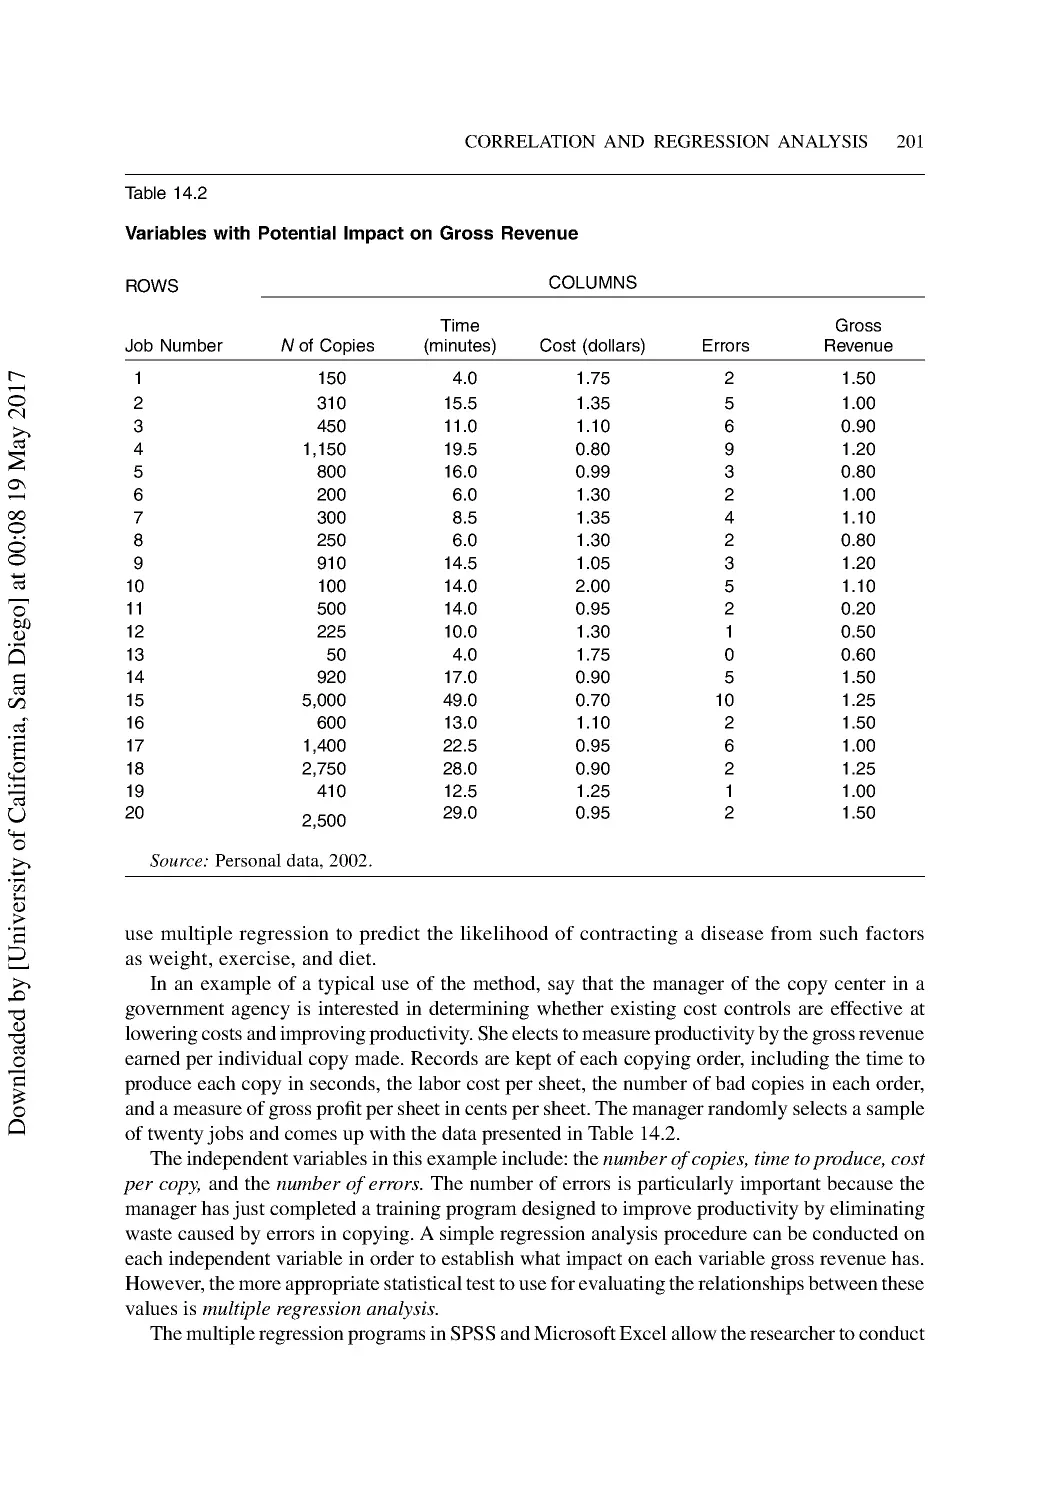
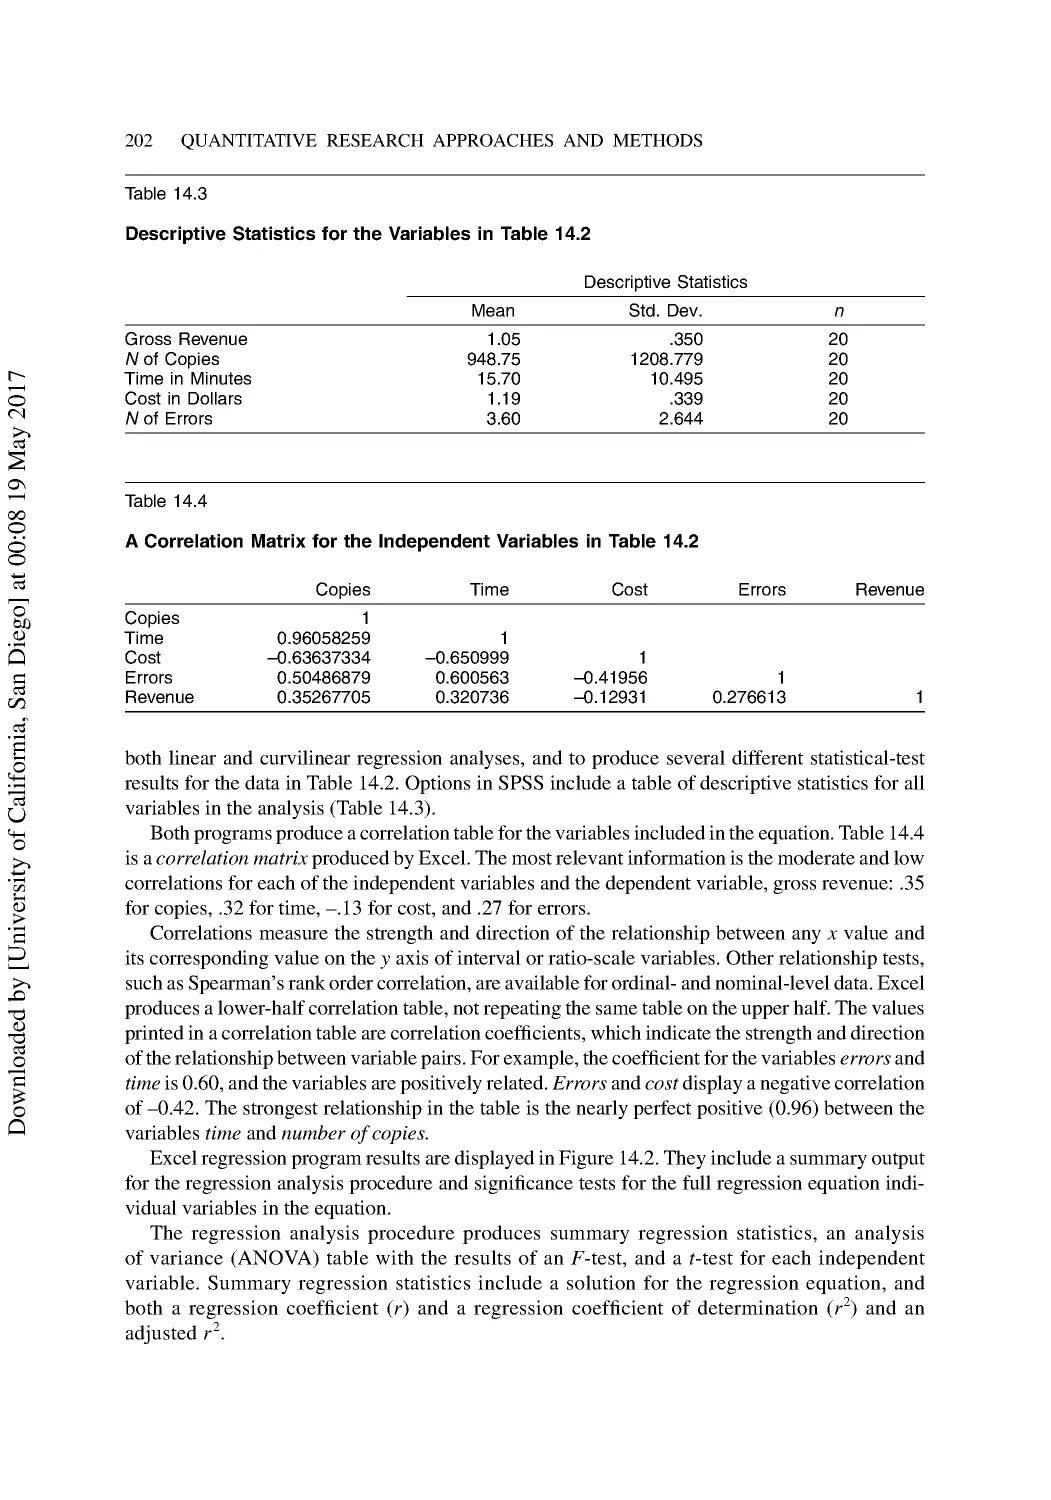
Multiple Regression Analysis ............................................................................................ 199
Multiple Regression with Dummy Variables ..................................................................... 205
Summary ............................................................................................................................ 205
Discussion Questions ......................................................................................................... 206
Additional Reading ............................................................................................................ 206
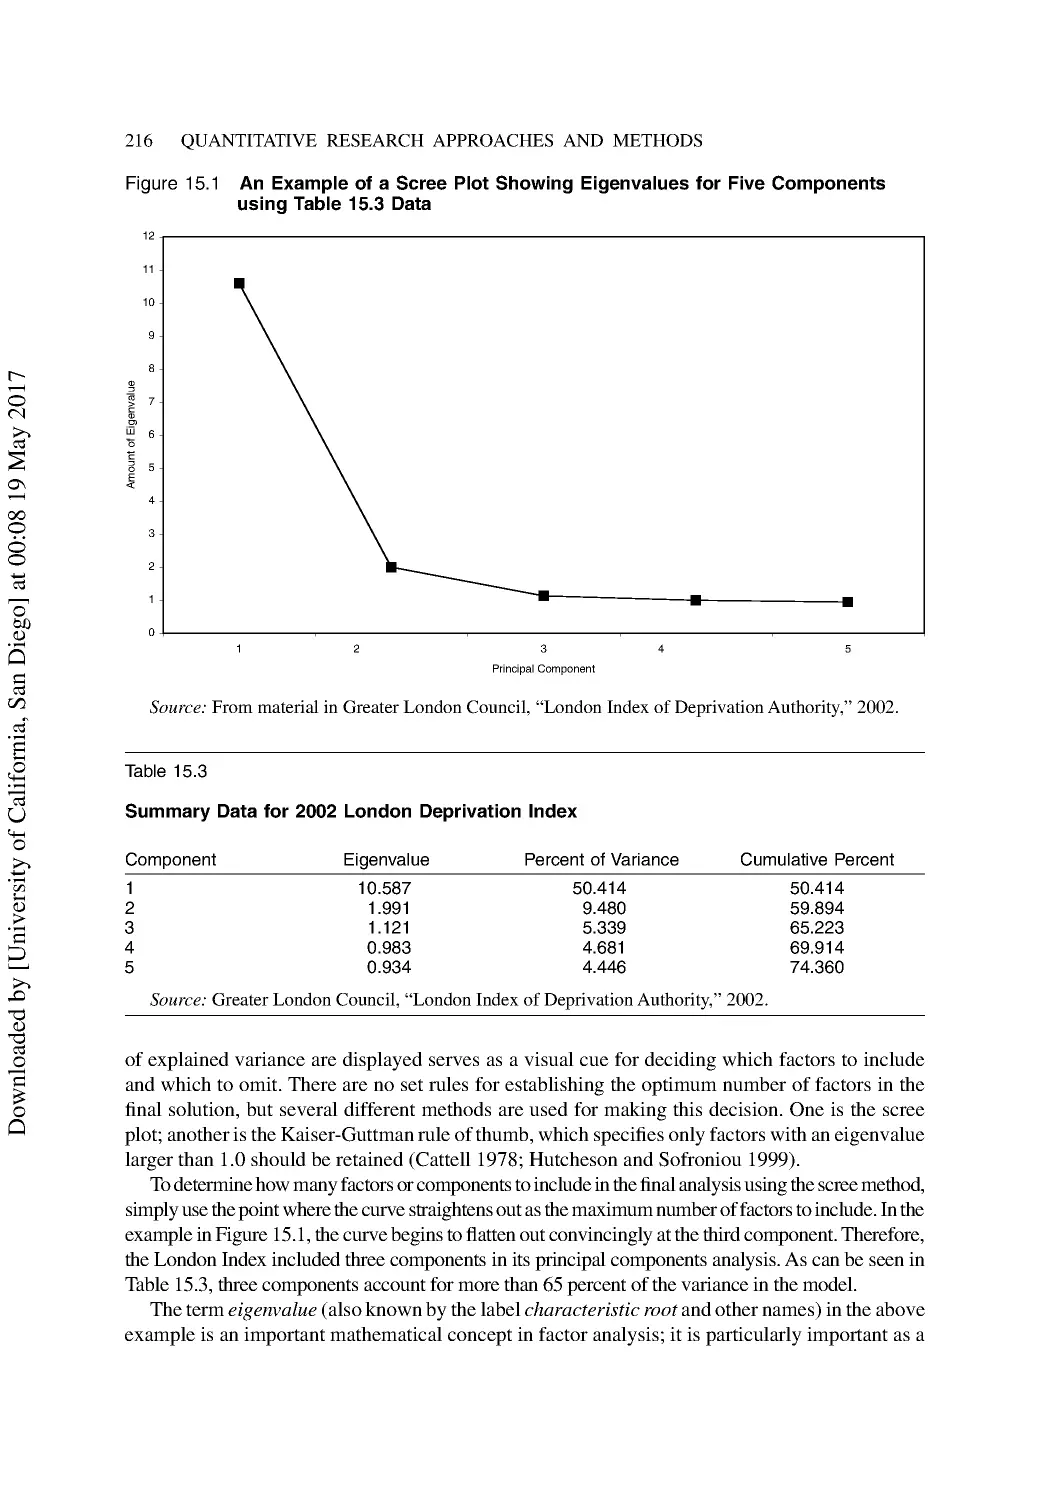
15 Exploring Multivariate Statistics .................................................................................... 207
Predicting with Discriminant Analysis............................................................................... 207
Group-Classification Applications ..................................................................................... 210
Factor and Cluster Analysis Methods ................................................................................ 211
Factor Analysis................................................................................................................... 212
Conducting a Factor Analysis with SPSS .......................................................................... 214
Cluster Analysis ................................................................................................................. 217
D
o
w
n
l
o
a
d
e
d
b
y
[
U
n
i
v
e
r
s
i
t
y
o
f
C
a
l
i
f
o
r
n
i
a
,
S
a
n
D
i
e
g
o
]
a
t
0
0
:
0
8
1
9
M
a
y
2
0
1
7
DETAILED TABLE OF CONTENTS xiii
Multiple Analysis of Variance (MANOVA)....................................................................... 219
Summary ............................................................................................................................ 219
Discussion Questions ......................................................................................................... 220
Additional Reading ............................................................................................................ 221
Part 3 Qualitative Research Approaches and Methods .................................................... 223
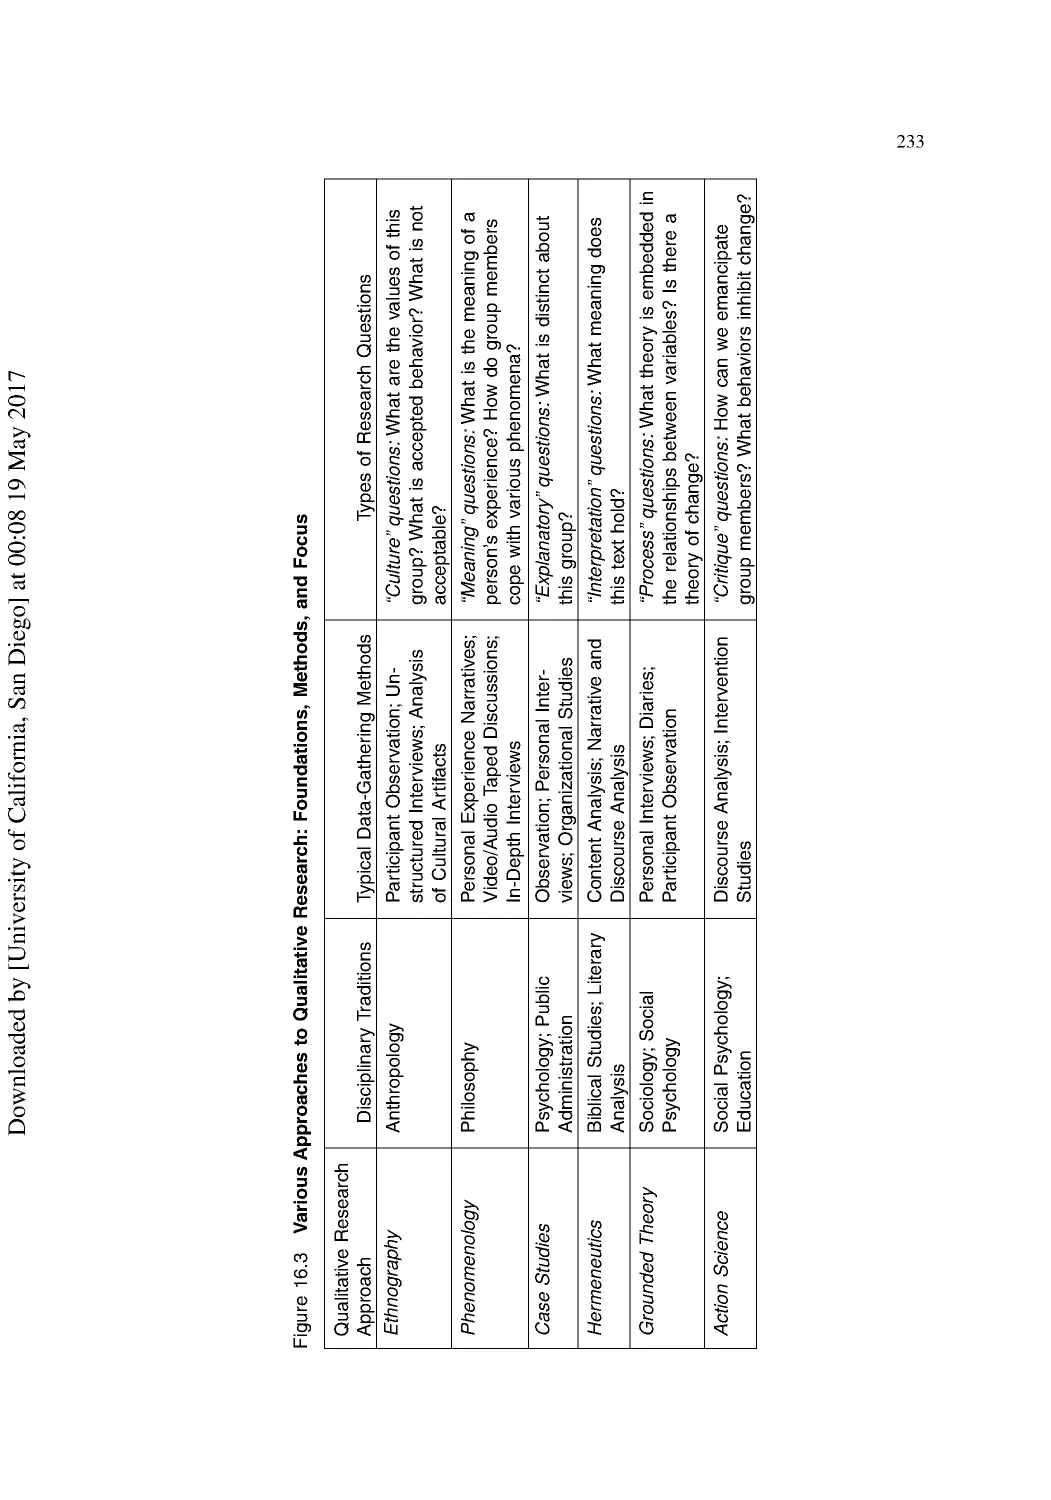
16 Introduction to Qualitative Research Methods ............................................................. 225
Qualitative Research Strategies.......................................................................................... 227
Which Strategy Is Best? ..................................................................................................... 231
Analyzing and Interpreting Qualitative Data ..................................................................... 232
Summary ............................................................................................................................ 234
Discussion Questions ......................................................................................................... 235
Additional Reading ............................................................................................................ 235
17 Explanatory Research: Case and Historical Methods .................................................. 236
Case Method Research ....................................................................................................... 236
What Is a Case Study?........................................................................................................ 236
Three Types of Case Studies .............................................................................................. 237
When to Use the Case Study Approach ............................................................................. 238
The Single-Case Study ....................................................................................................... 239
The Multi-Case Method ..................................................................................................... 239
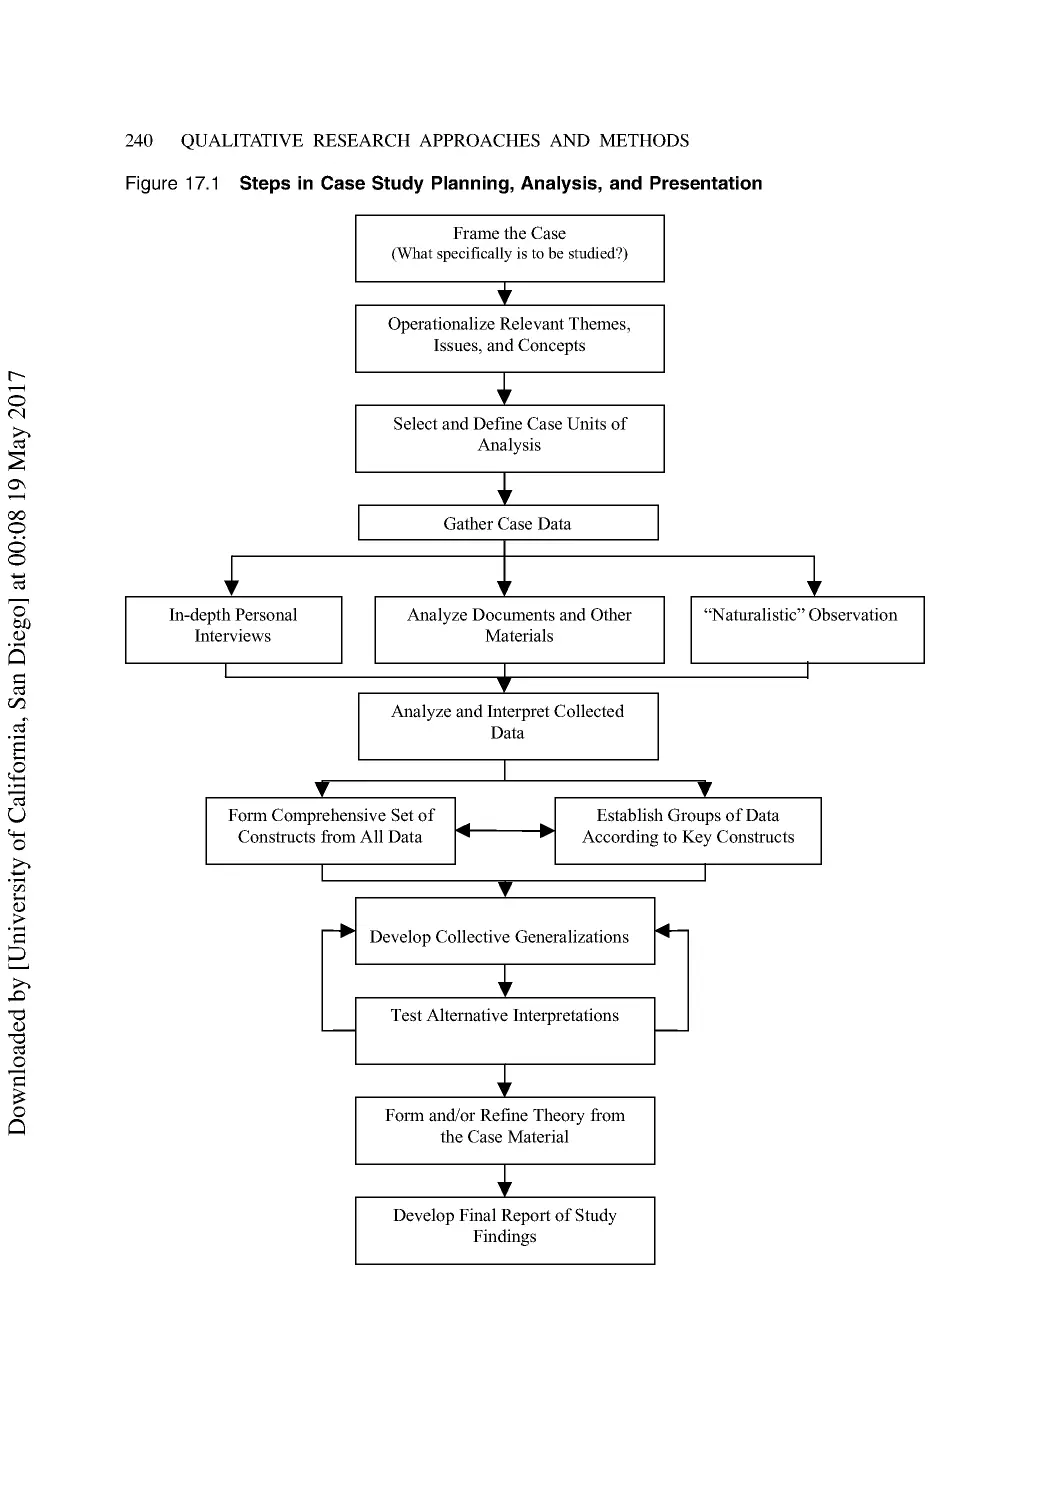
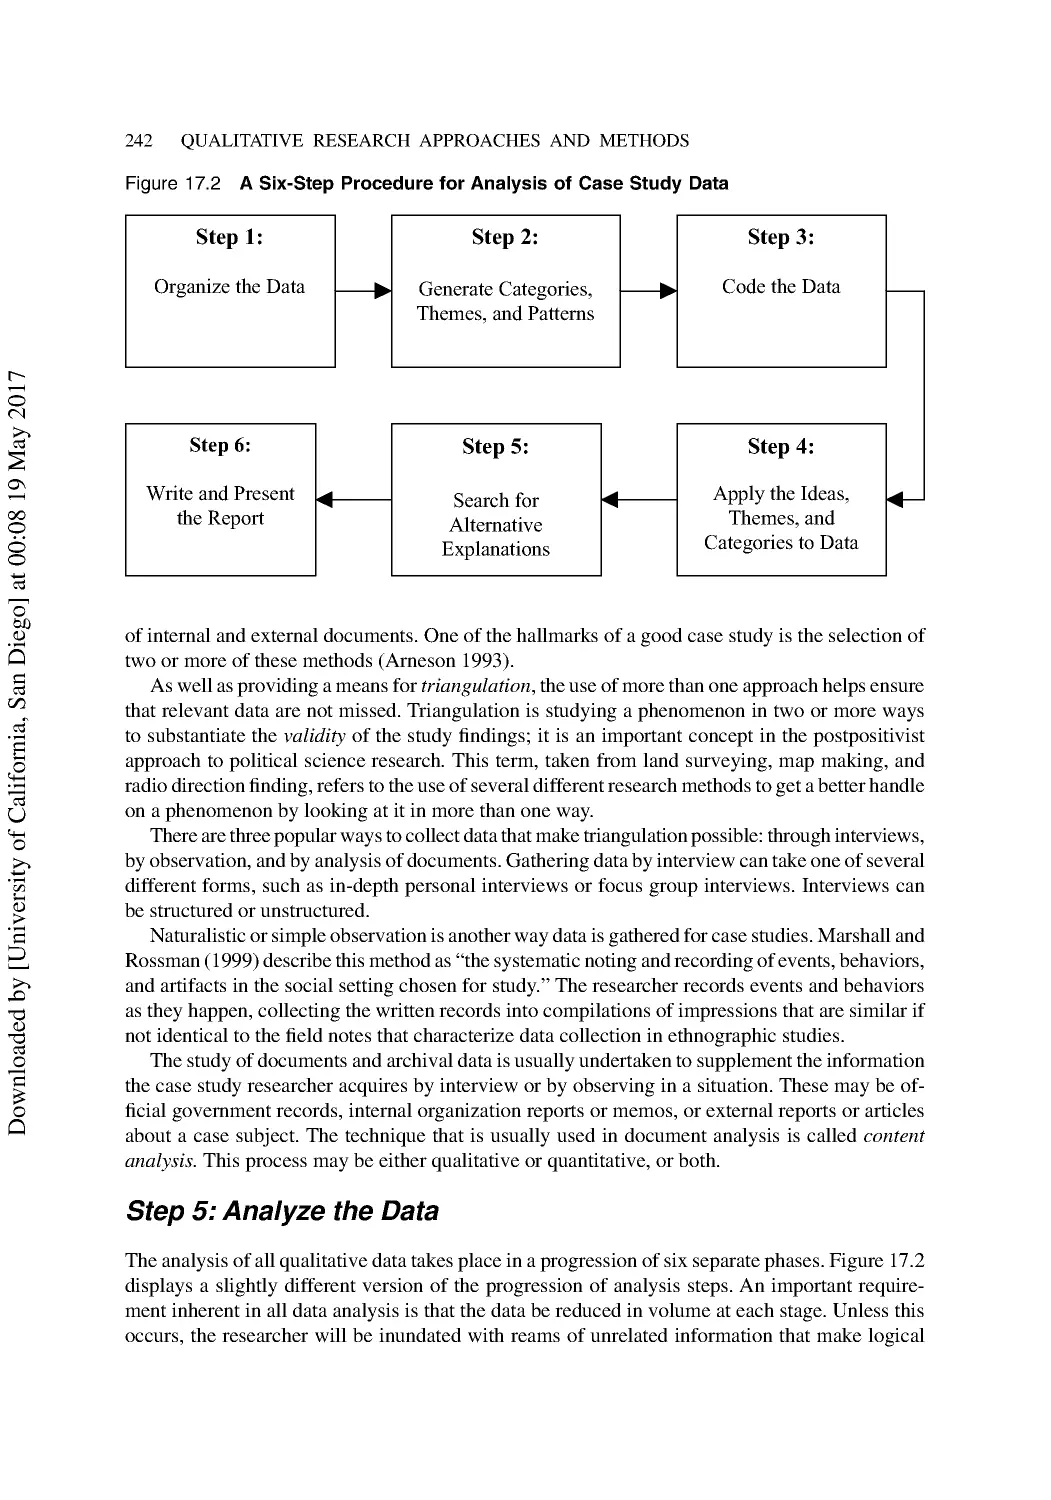
Steps in the Case Study Method......................................................................................... 239
Important Guidelines for Case Study Reports ................................................................... 243
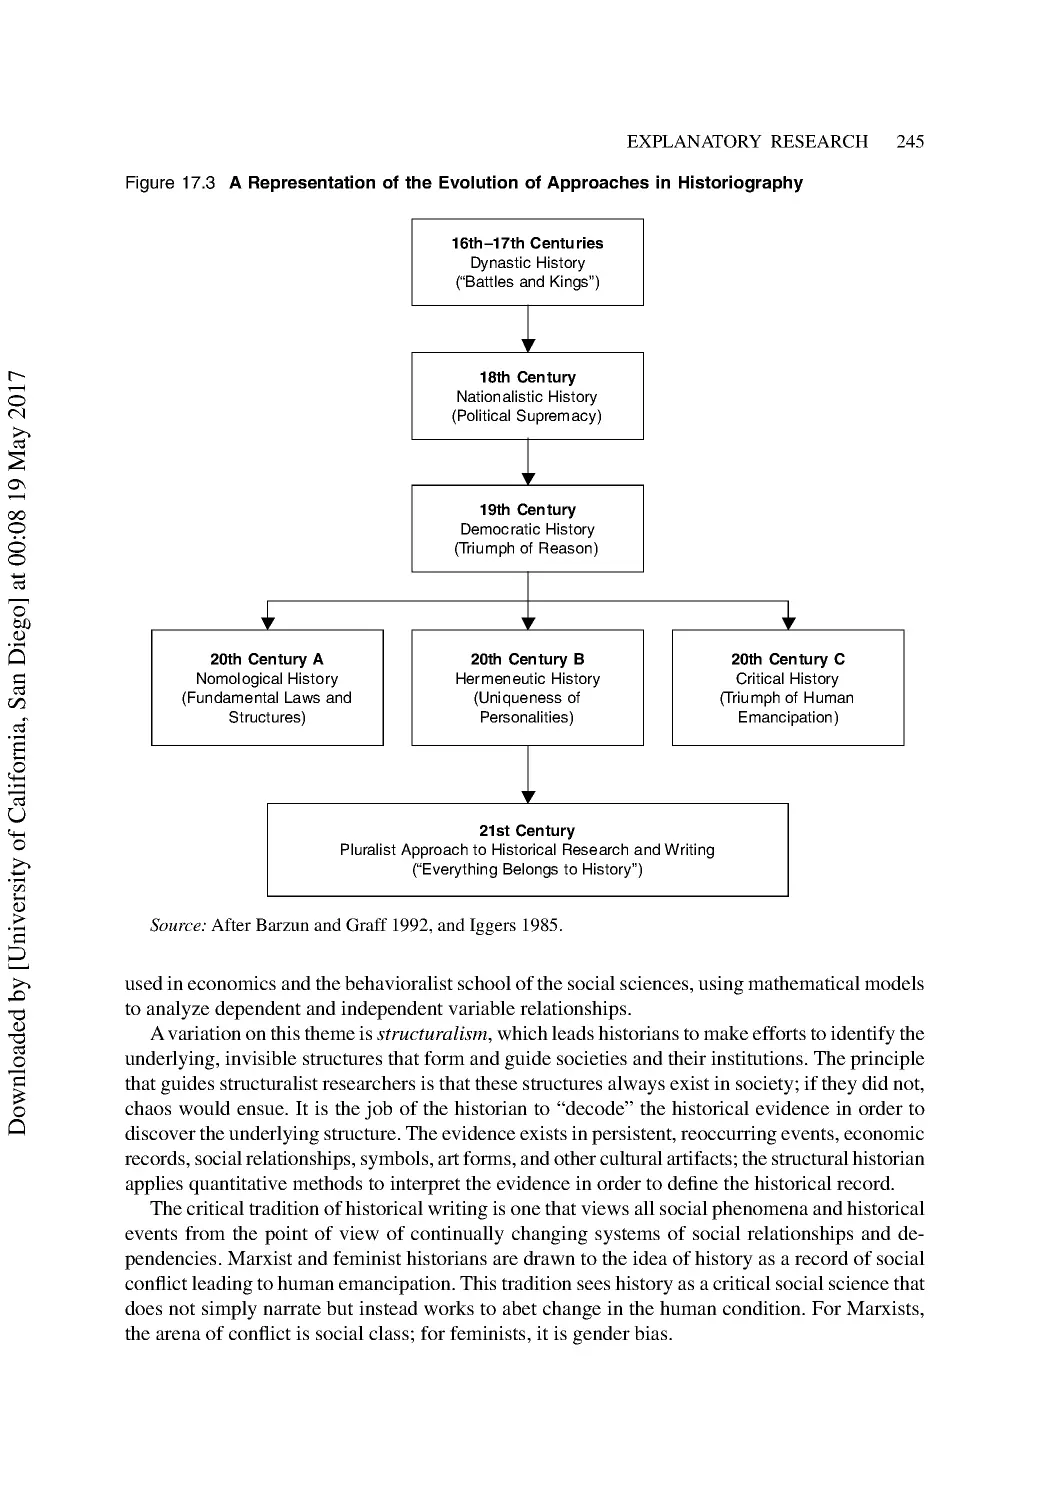
Historical Research in Political Science ............................................................................ 244
Capturing the Nature of Political History .......................................................................... 246
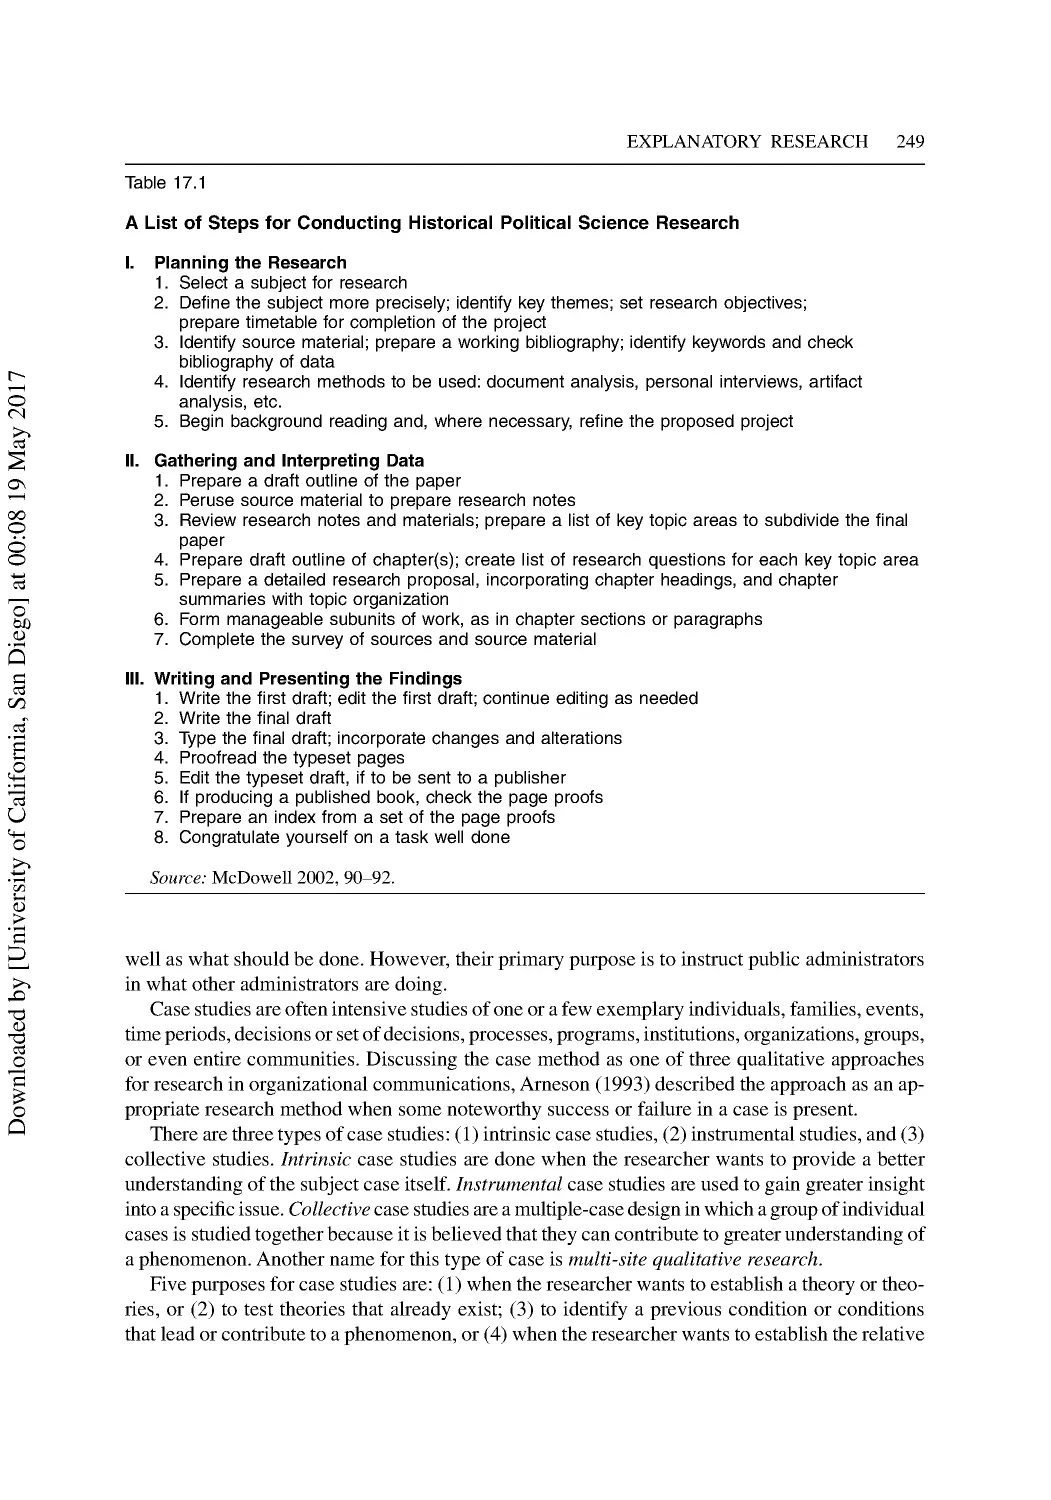
Conducting Historical Research......................................................................................... 248
Summary ............................................................................................................................ 248
Discussion Questions ......................................................................................................... 250
Additional Reading ............................................................................................................ 250
18 The Interpretive Approach I: Grounded Theory Methods .......................................... 251
Early Goals for Grounded Theory...................................................................................... 252
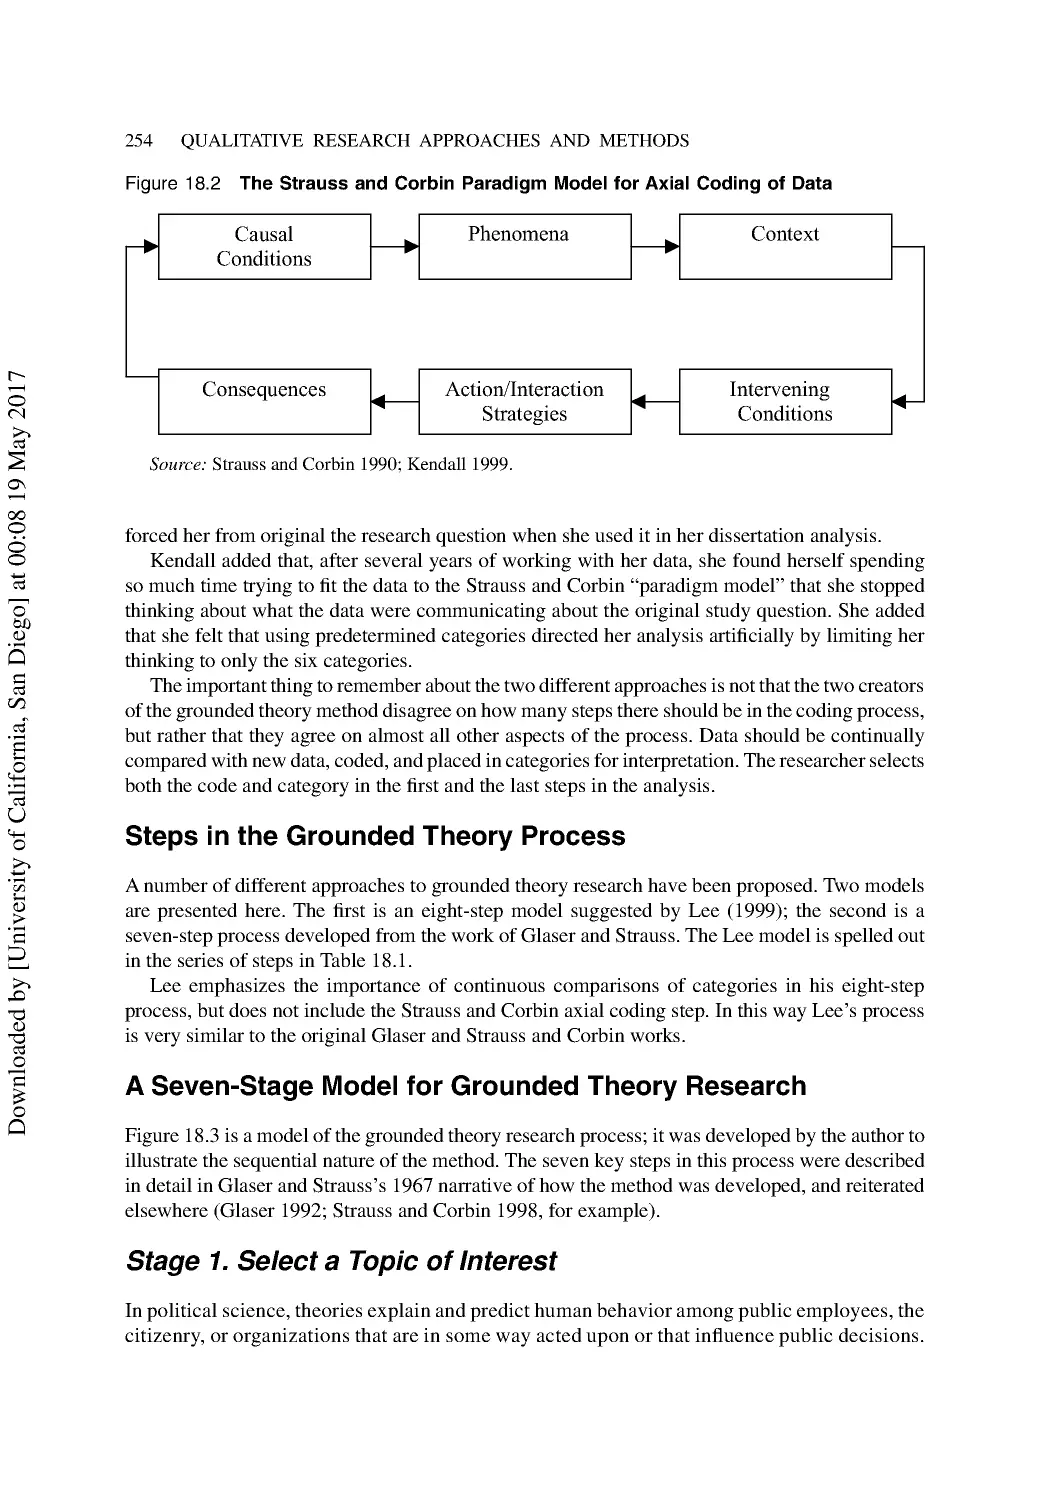
Importance of Grouping and Coding ................................................................................. 253
Two Approaches to Grounded Theory ............................................................................... 253
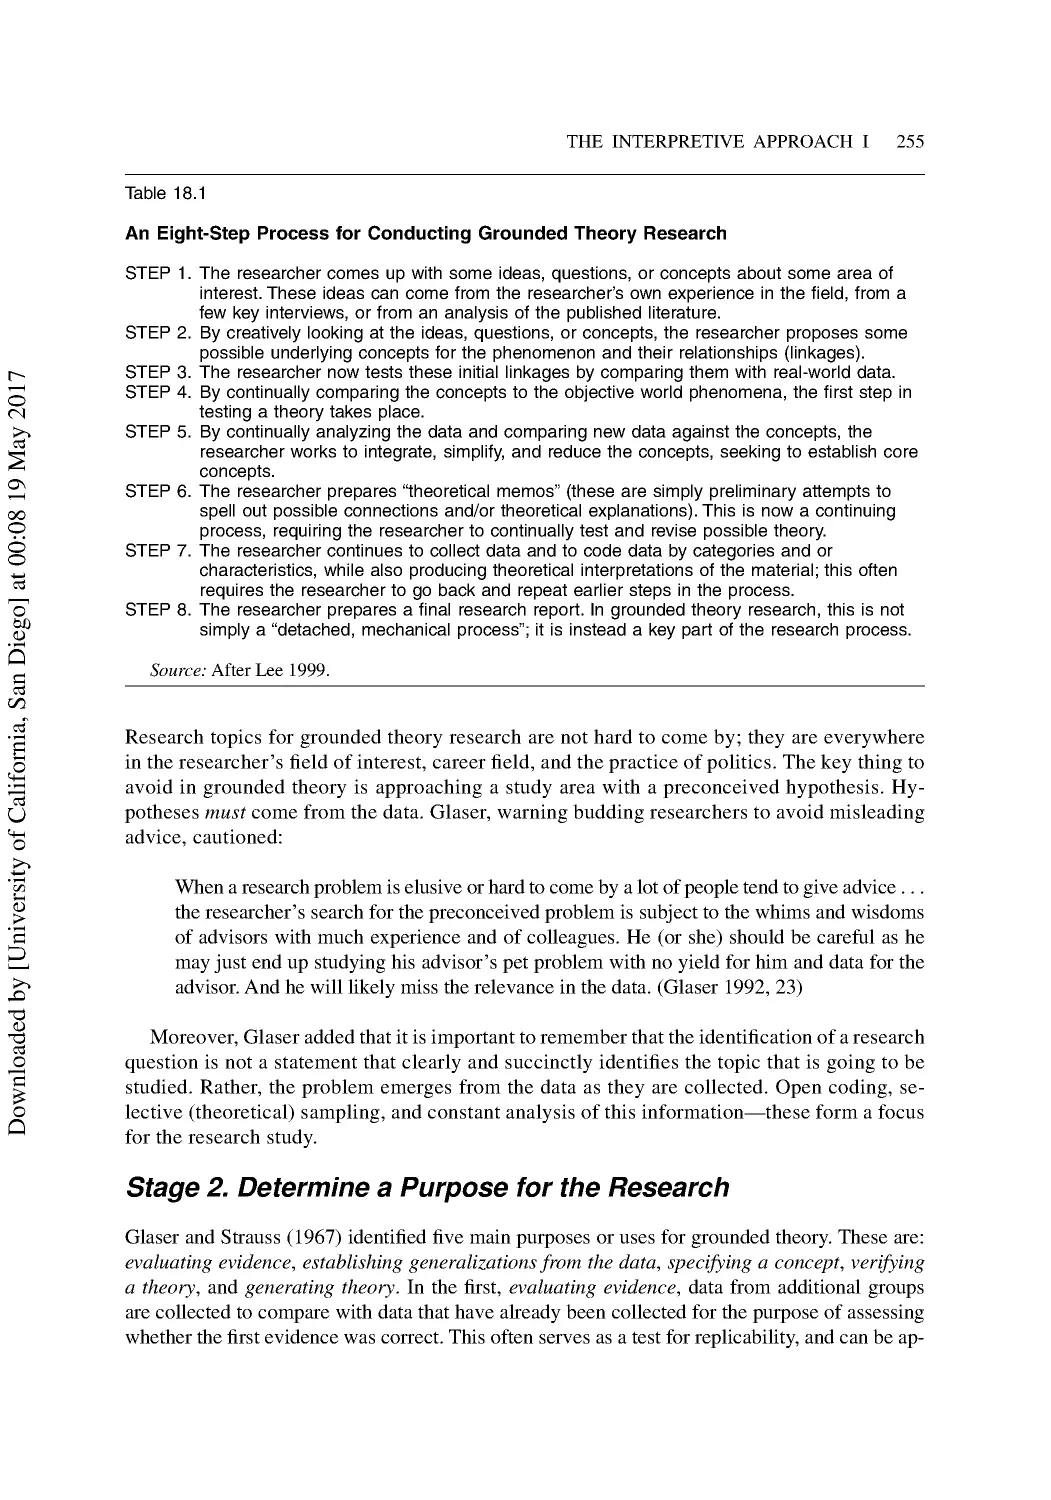
Steps in the Grounded Theory Process .............................................................................. 254
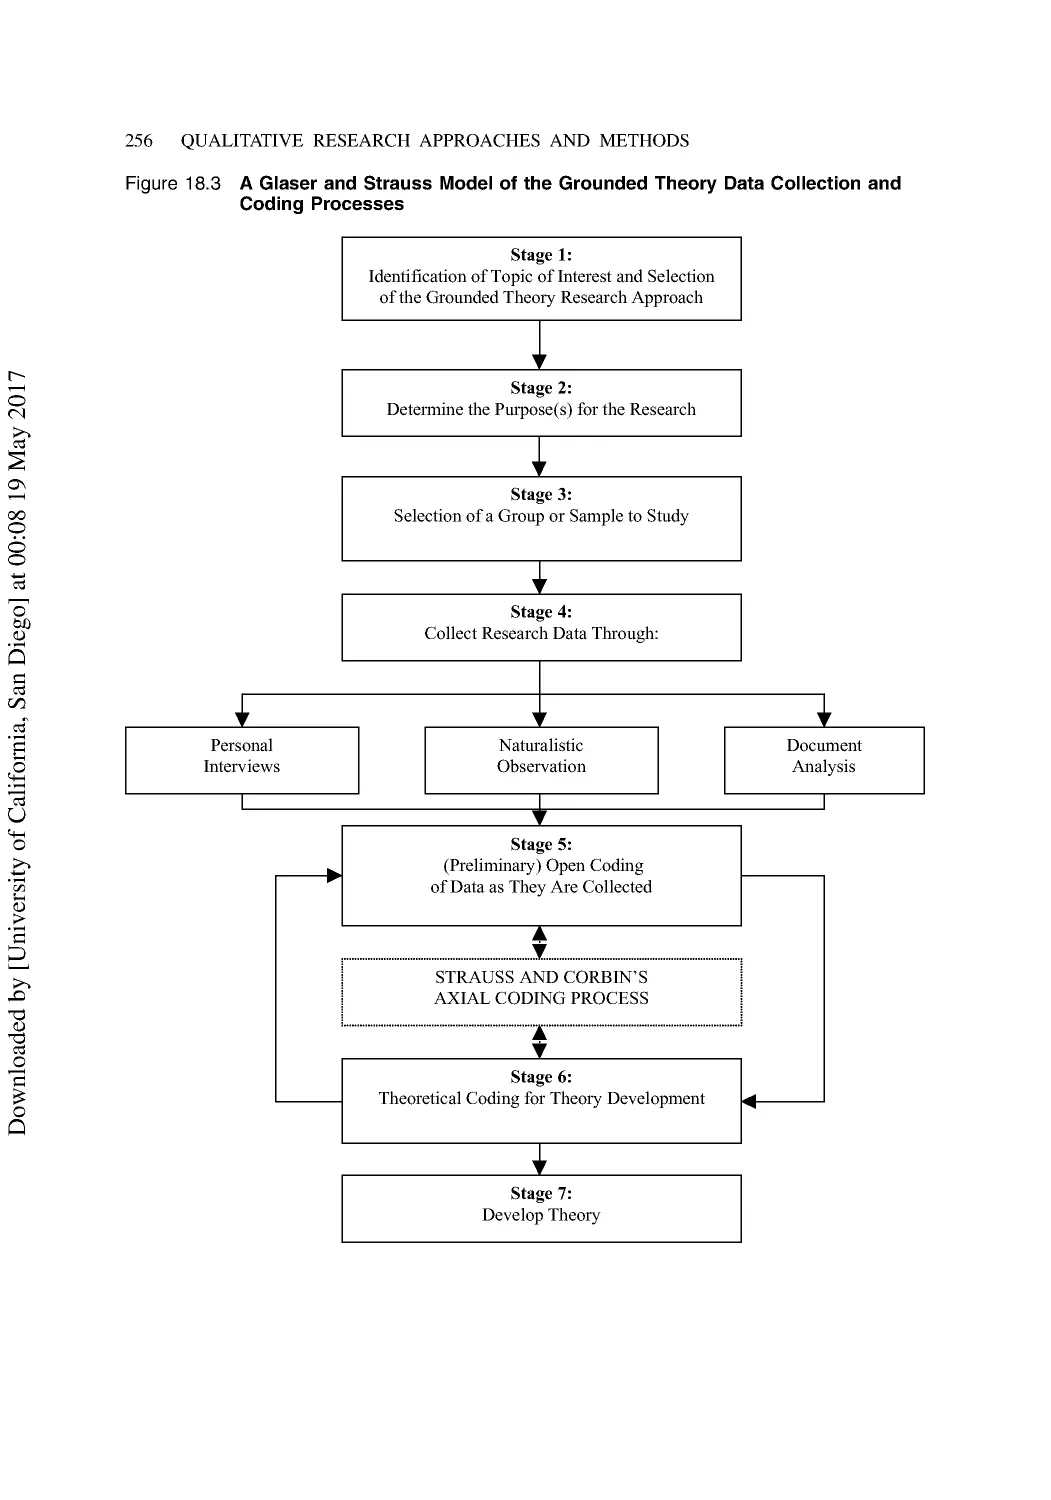
A Seven-Stage Model for Grounded Theory Research ...................................................... 254
A Brief Caveat About the Method...................................................................................... 260
Grounded Theory Research in Practice.............................................................................. 261
Grounded Theory and Public Policy .................................................................................. 262
Summary ............................................................................................................................ 262
Discussion Questions ......................................................................................................... 263
Additional Reading ............................................................................................................ 263
19 The Interpretive Approach II: Ethnographic Research Methods ............................... 264
Industrialization and the Social Sciences ........................................................................... 264
Ethnography, Ethology, or Ethnology? .............................................................................. 265
D
o
w
n
l
o
a
d
e
d
b
y
[
U
n
i
v
e
r
s
i
t
y
o
f
C
a
l
i
f
o
r
n
i
a
,
S
a
n
D
i
e
g
o
]
a
t
0
0
:
0
8
1
9
M
a
y
2
0
1
7
xiv DETAILED TABLE OF CONTENTS
Ethnography in Political Science Research........................................................................ 272
Urbanism Research ............................................................................................................ 273
Ethnography and Organizational Culture........................................................................... 273
Summary ............................................................................................................................ 274
Discussion Questions ......................................................................................................... 274
Additional Reading ............................................................................................................ 275
20 The Critical Approach: Feminist and Empowerment Research.................................. 276
The Feminist Research Model ........................................................................................... 276
Empowerment Research..................................................................................................... 280
Summary ............................................................................................................................ 285
Discussion Questions ......................................................................................................... 285
Additional Reading ............................................................................................................ 286
21 Analysis Methods for Qualitative Data .......................................................................... 287
What Are Qualitative Data? ............................................................................................... 287
Components of Qualitative Data Analysis ......................................................................... 288
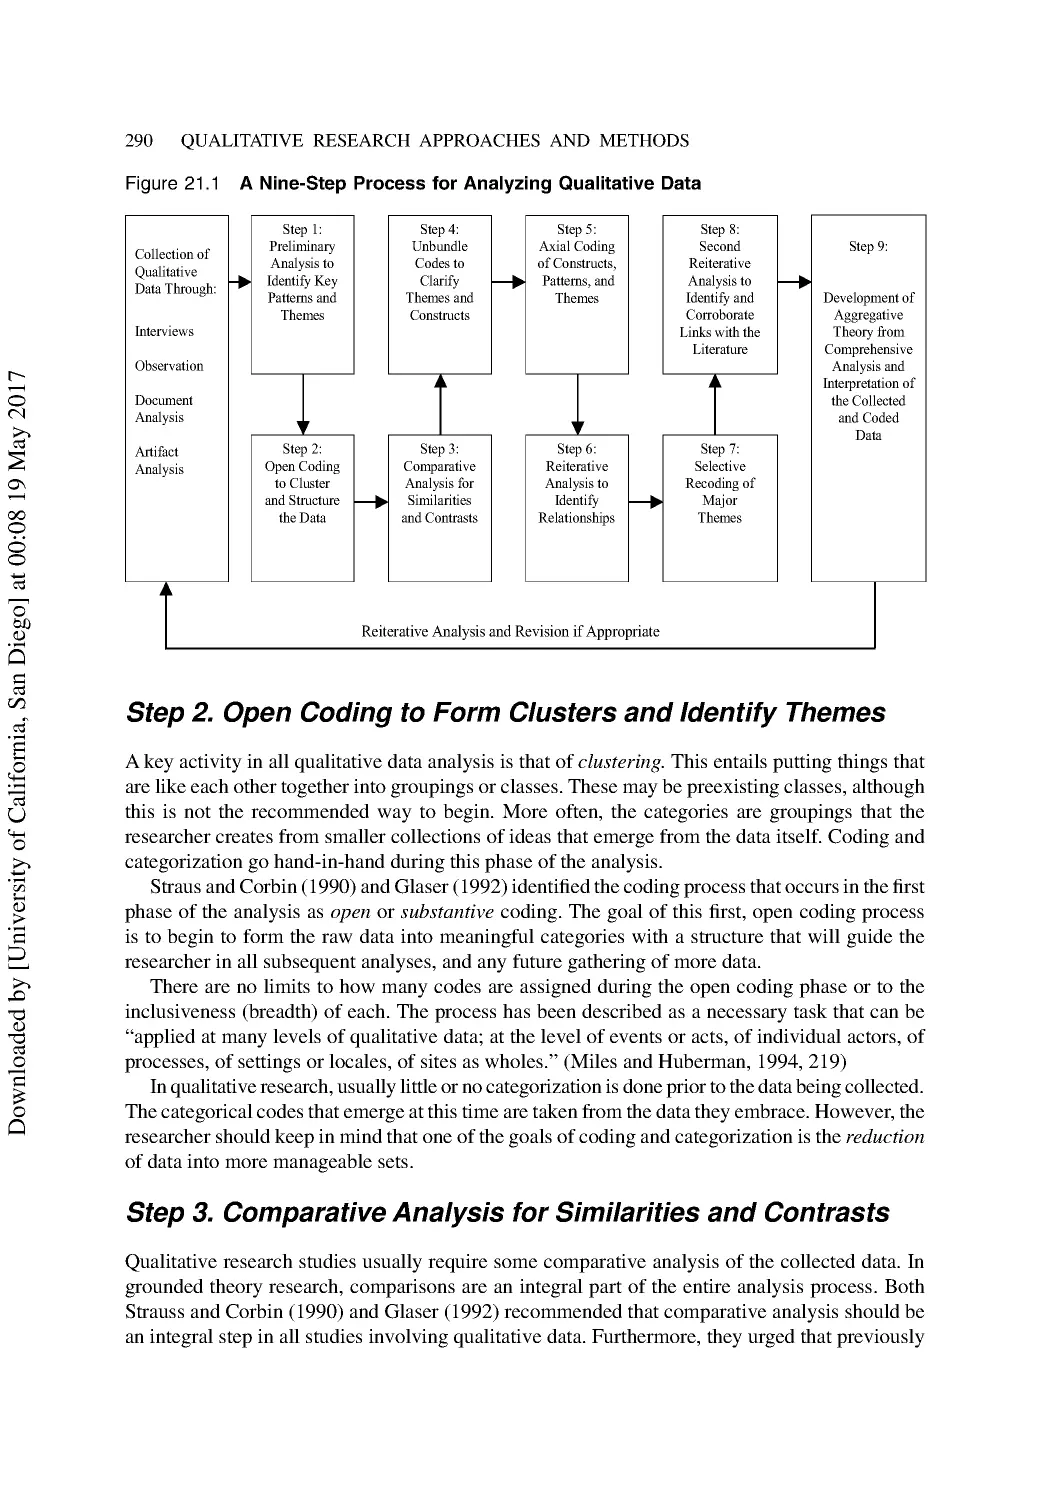
Bringing Order to Raw Qualitative Data ........................................................................... 289
A Nine-Step Analysis Process ............................................................................................ 289
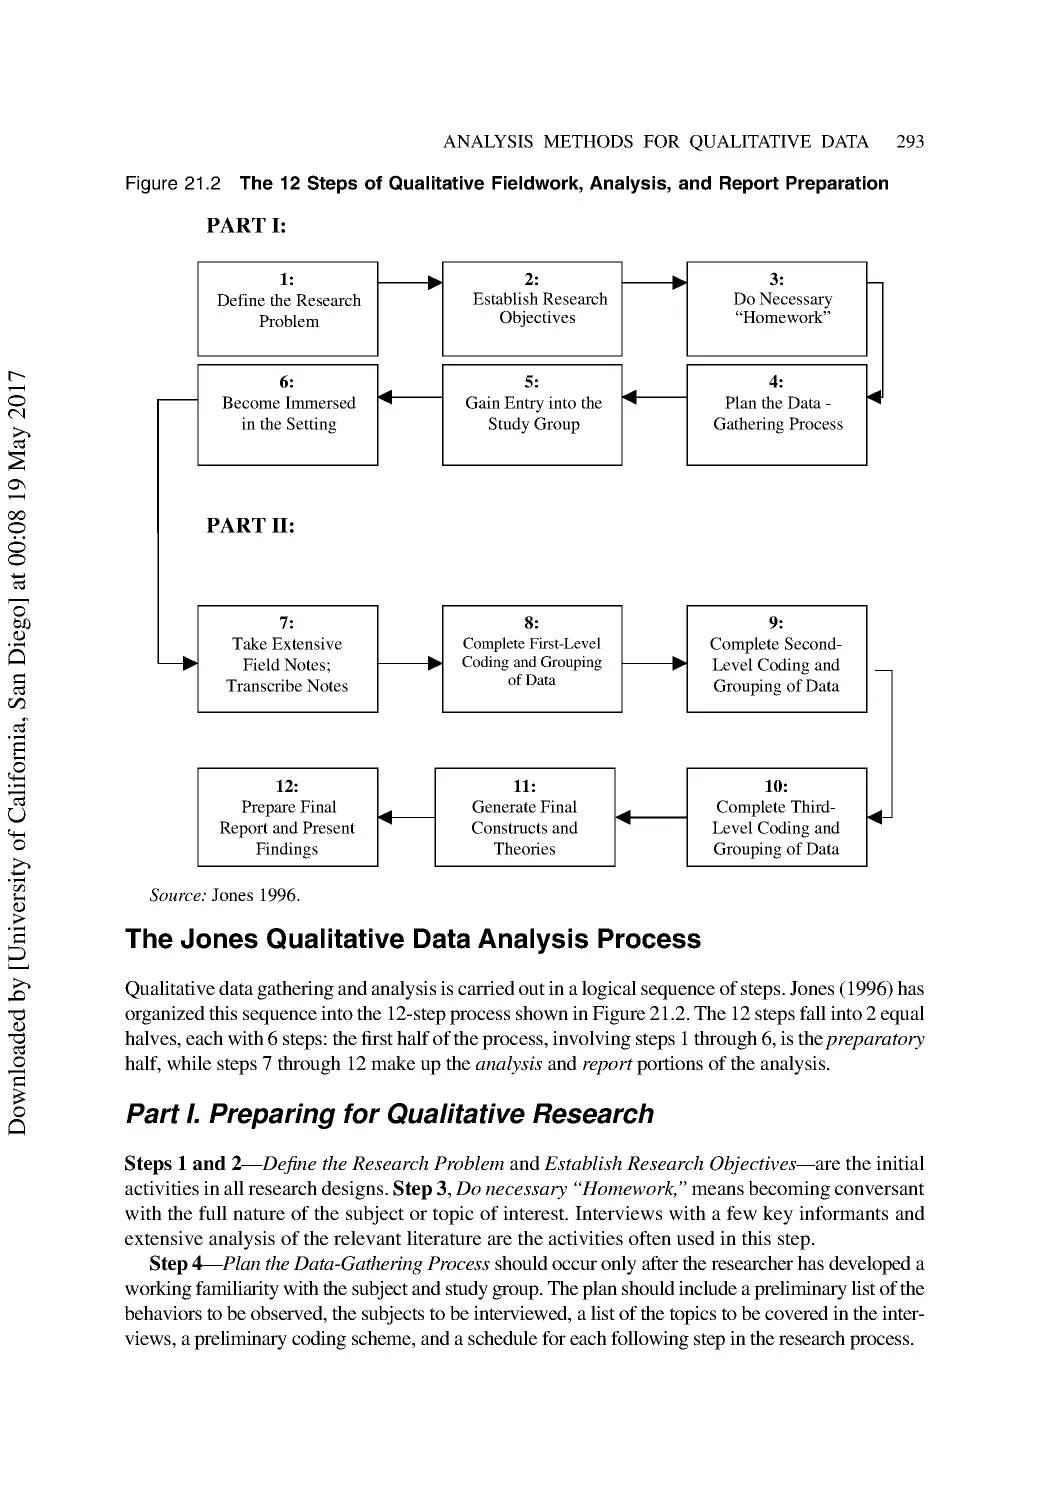
The Jones Qualitative Data Analysis Process .................................................................... 292
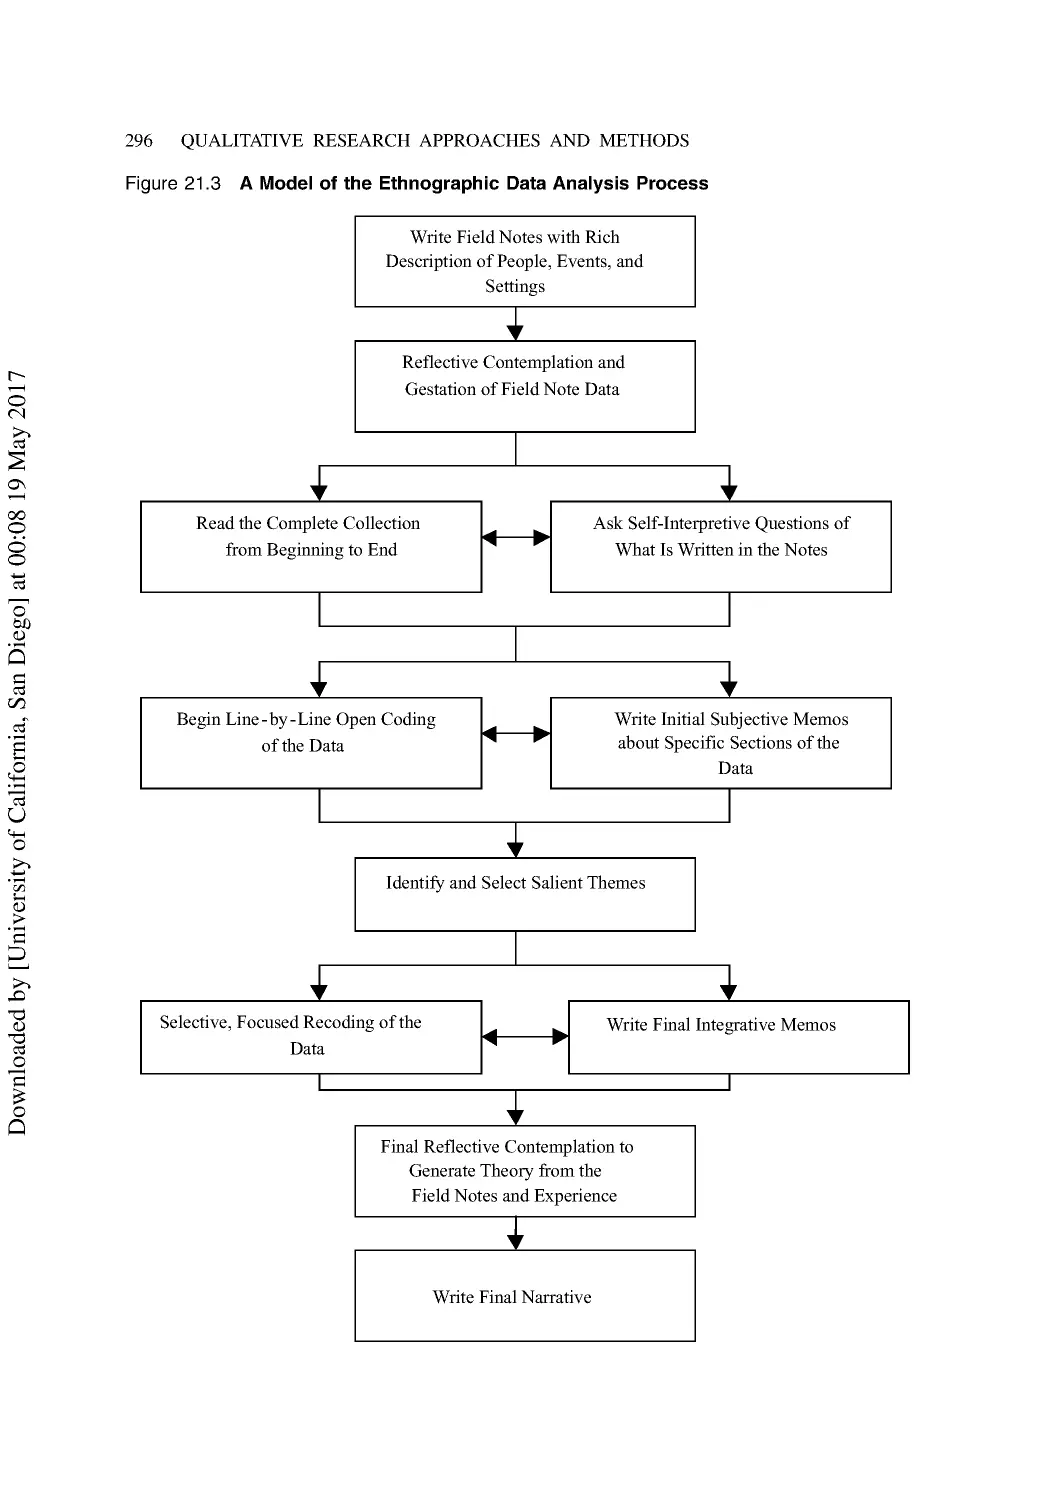
Analysis of Ethnographic Study Data ................................................................................ 295
Computer Analysis of Qualitative Data ............................................................................. 299
Summary ............................................................................................................................ 301
Discussion Questions ......................................................................................................... 302
Additional Reading ............................................................................................................ 302
22 Analyzing Texts, Documents, and Artifacts ................................................................... 303
Analysis of Texts as Data ................................................................................................... 304
Reviewing the Relevant Literature..................................................................................... 305
Document Research Using Archival Data.......................................................................... 306
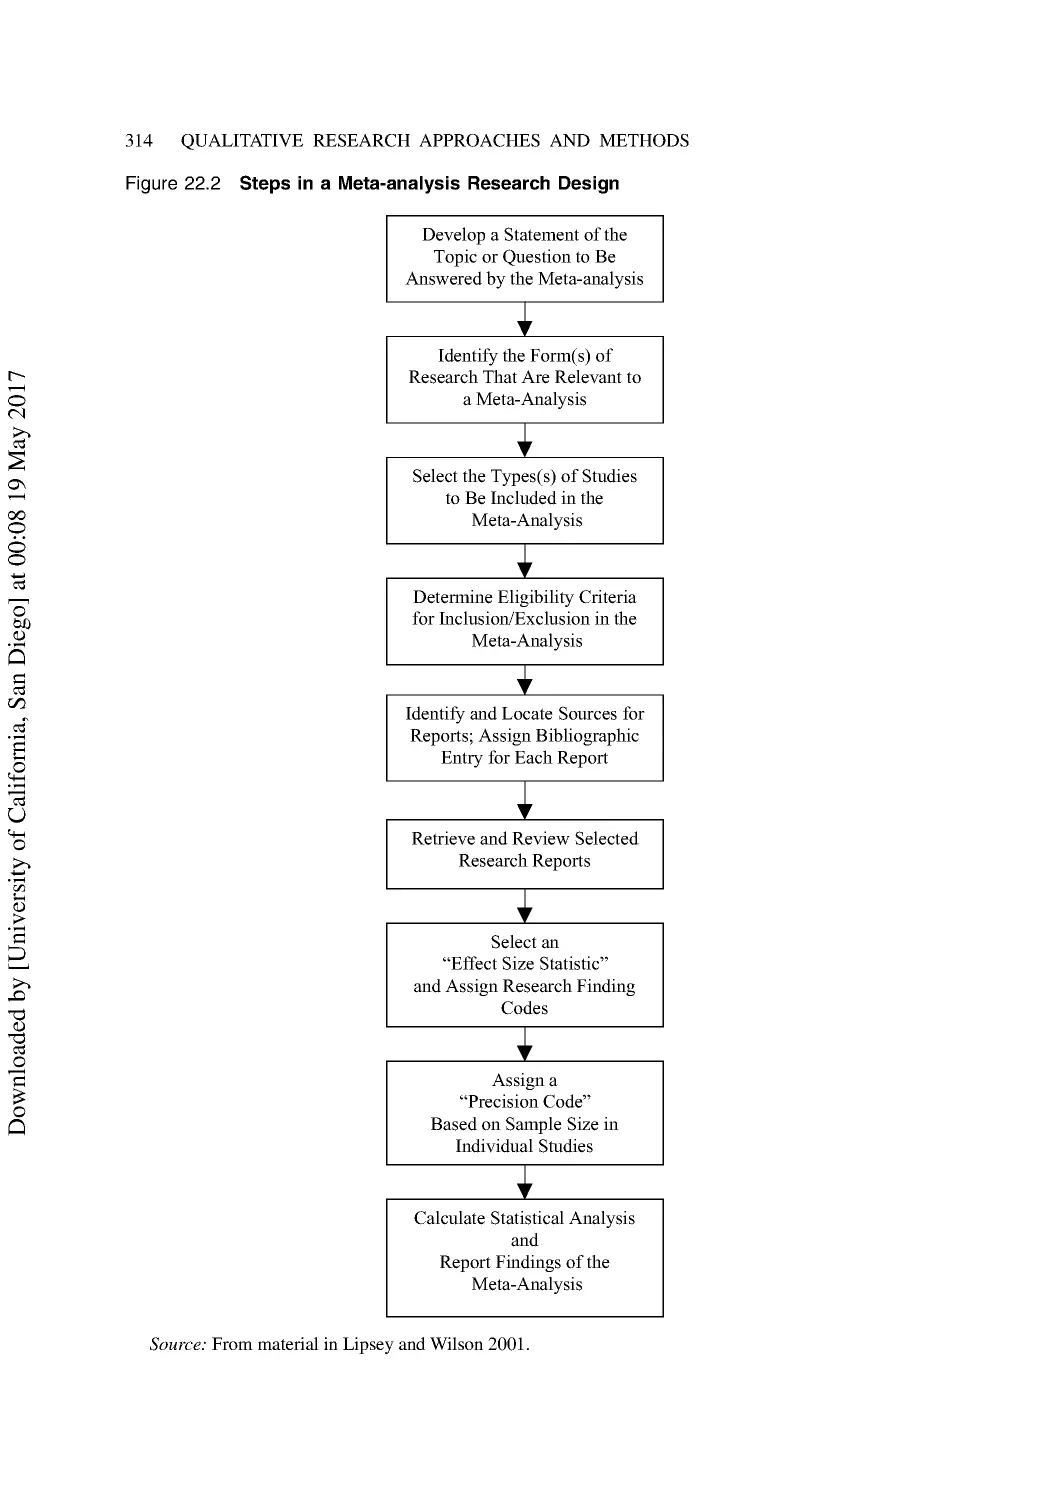
Performing a Meta-Analysis of Existing Research ............................................................ 311
Hermeneutic Analysis of Text and Nontext Material ......................................................... 315
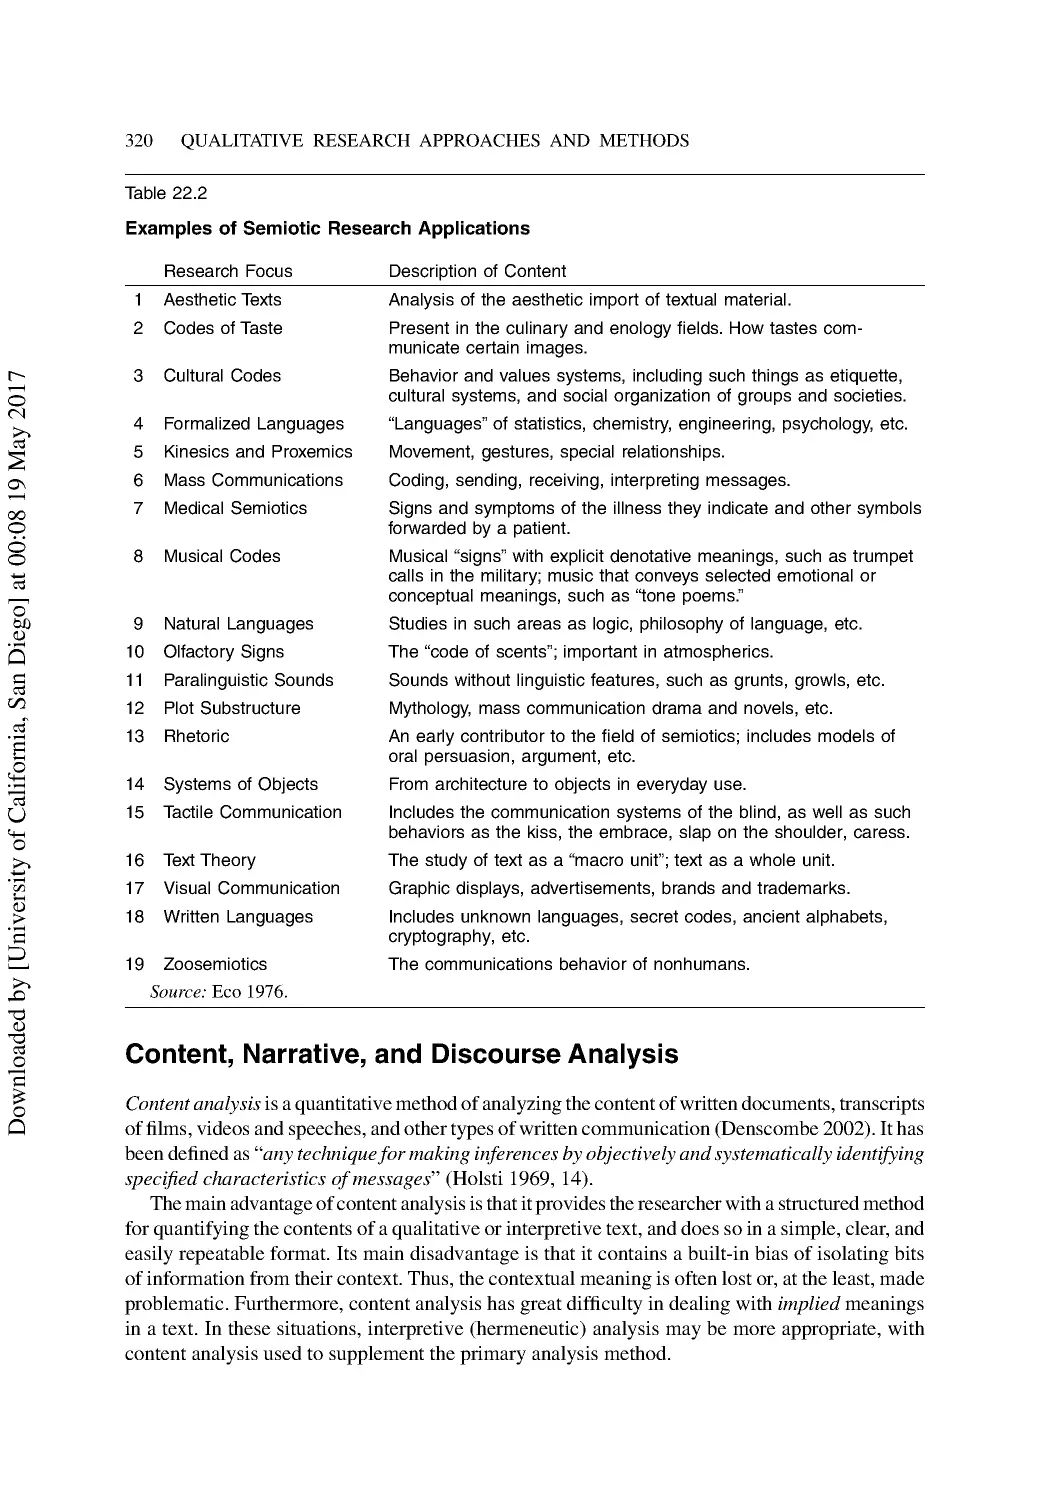
Semiotics: The Analysis of Signs and Symbols ................................................................. 318
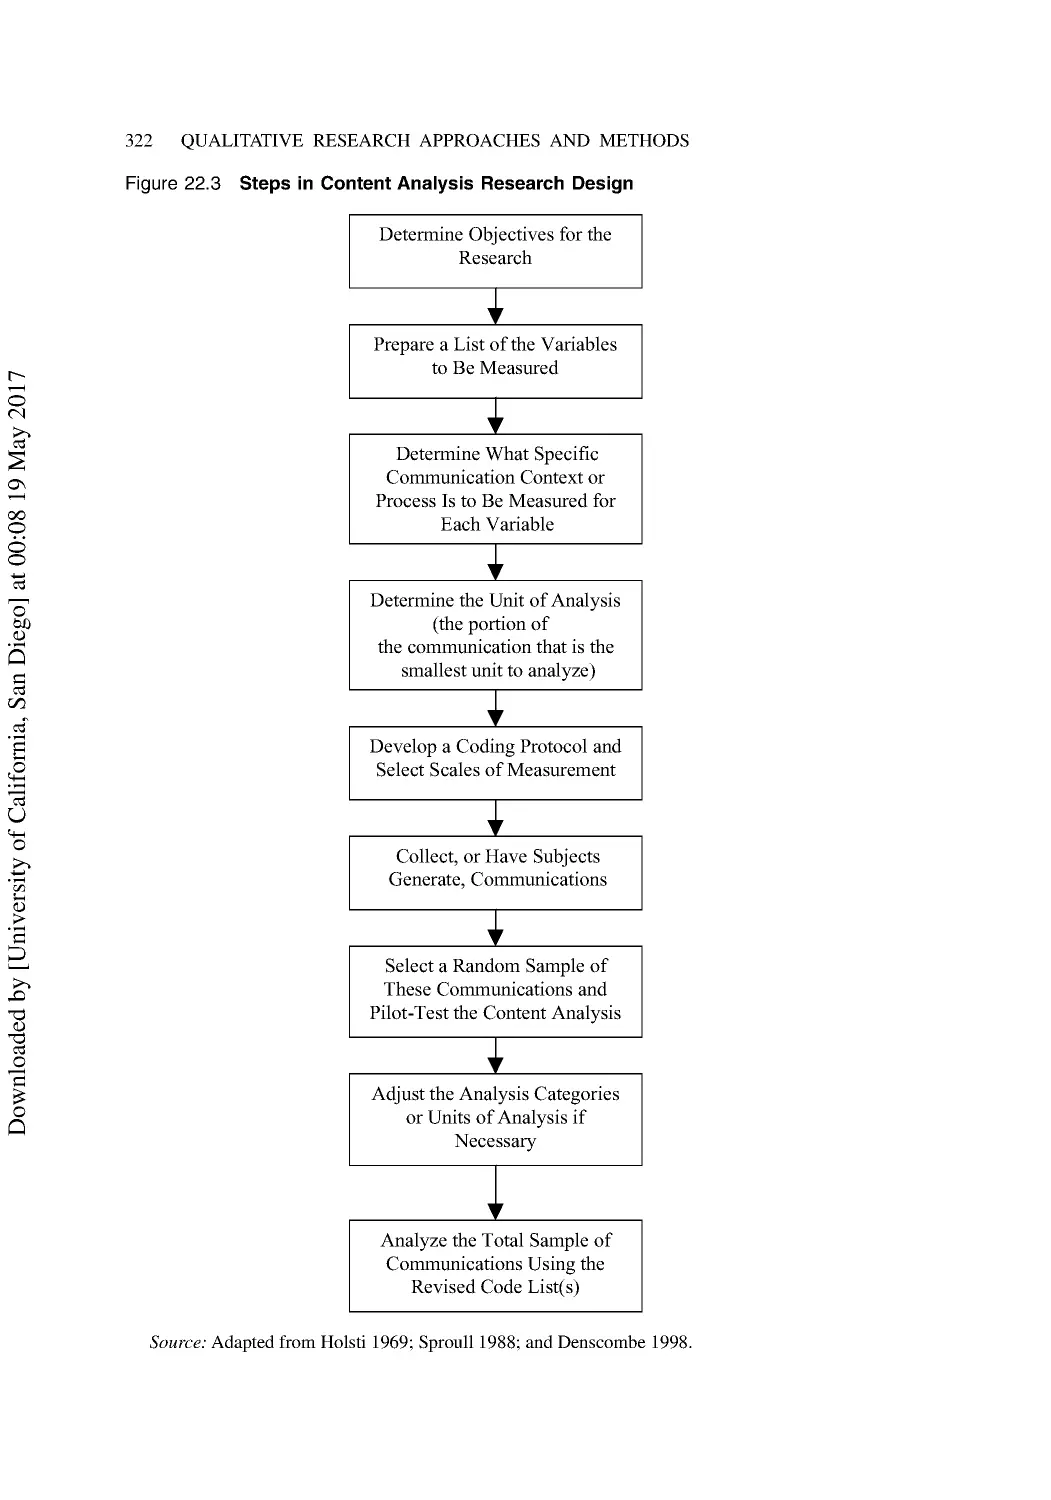
Content, Narrative, and Discourse Analysis ...................................................................... 320
Examining Material Culture (Artifact Analysis) ................................................................ 324
Summary ............................................................................................................................ 325
Discussion Questions ......................................................................................................... 326
Additional Reading ............................................................................................................ 326
Part 4 Preparing and Presenting Research Findings........................................................ 327
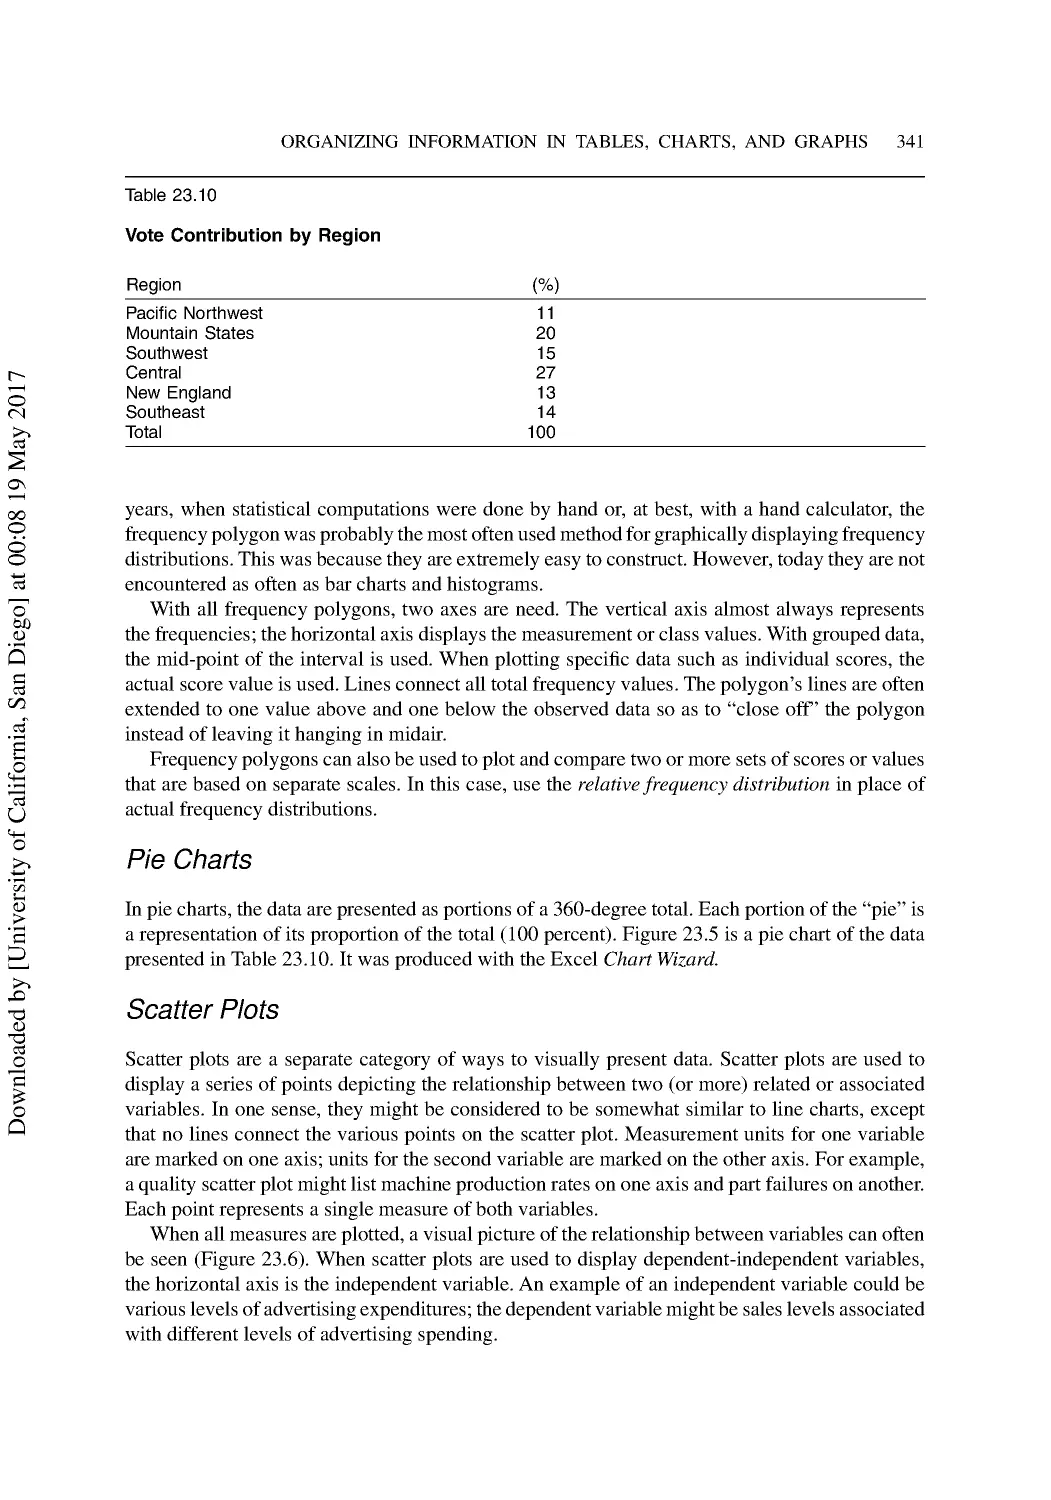
23 Organizing Information in Tables, Charts, and Graphs .............................................. 329
Making Sense out of Raw Data.......................................................................................... 329
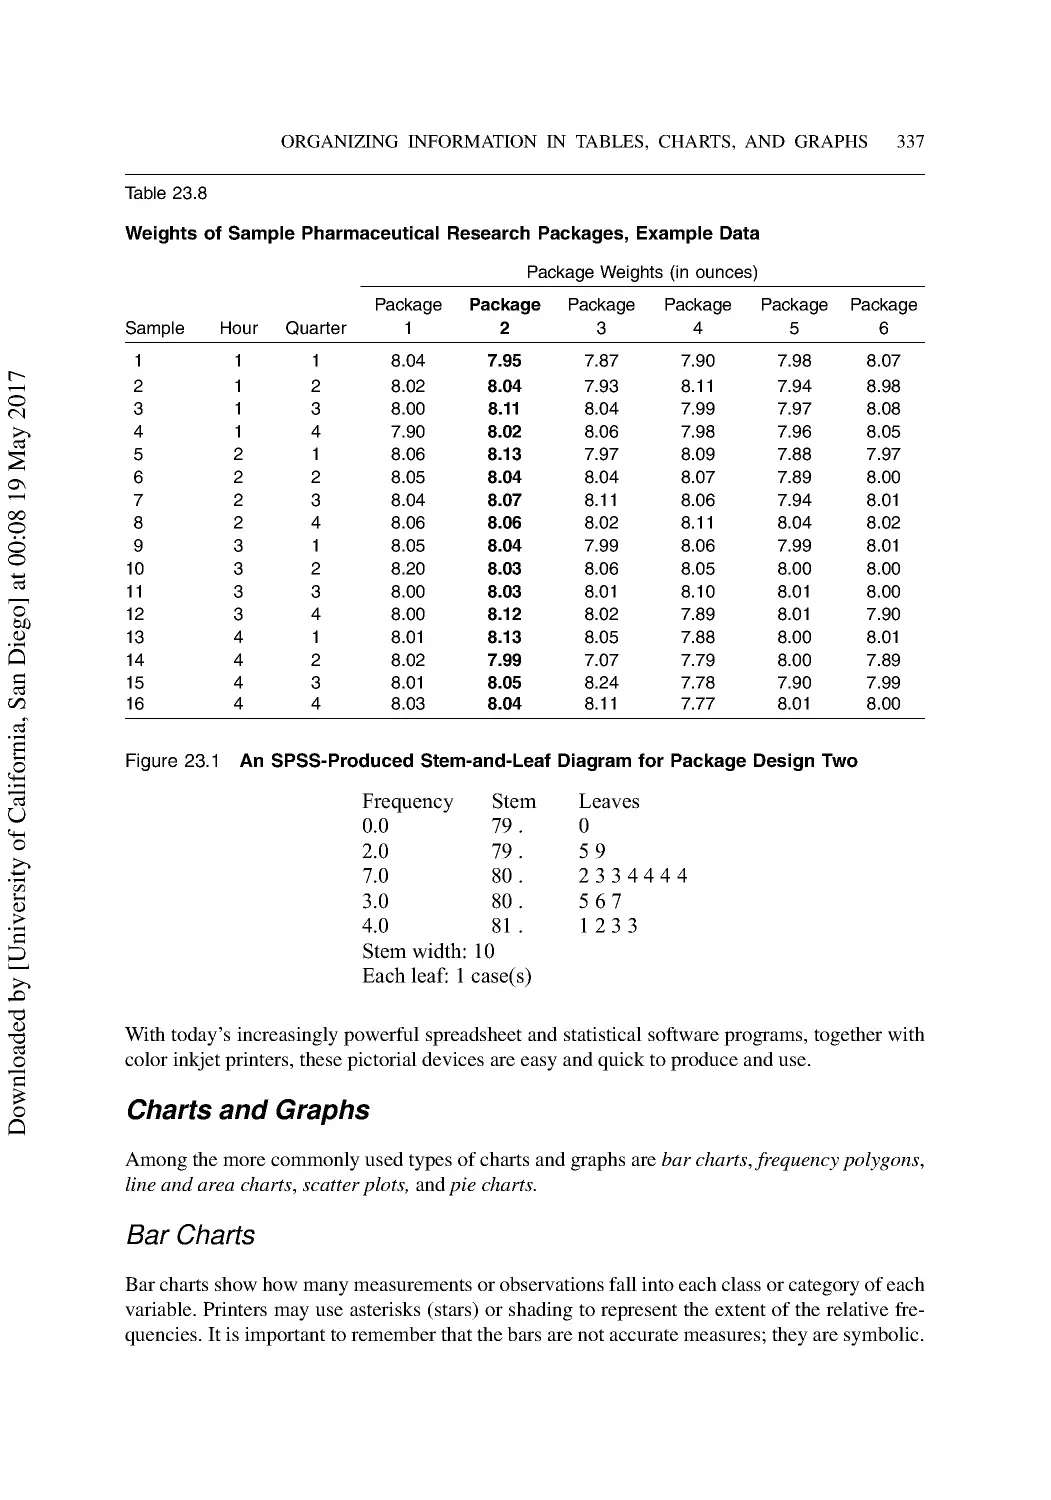
Preparing a Stem-and-Leaf Diagram ................................................................................. 336
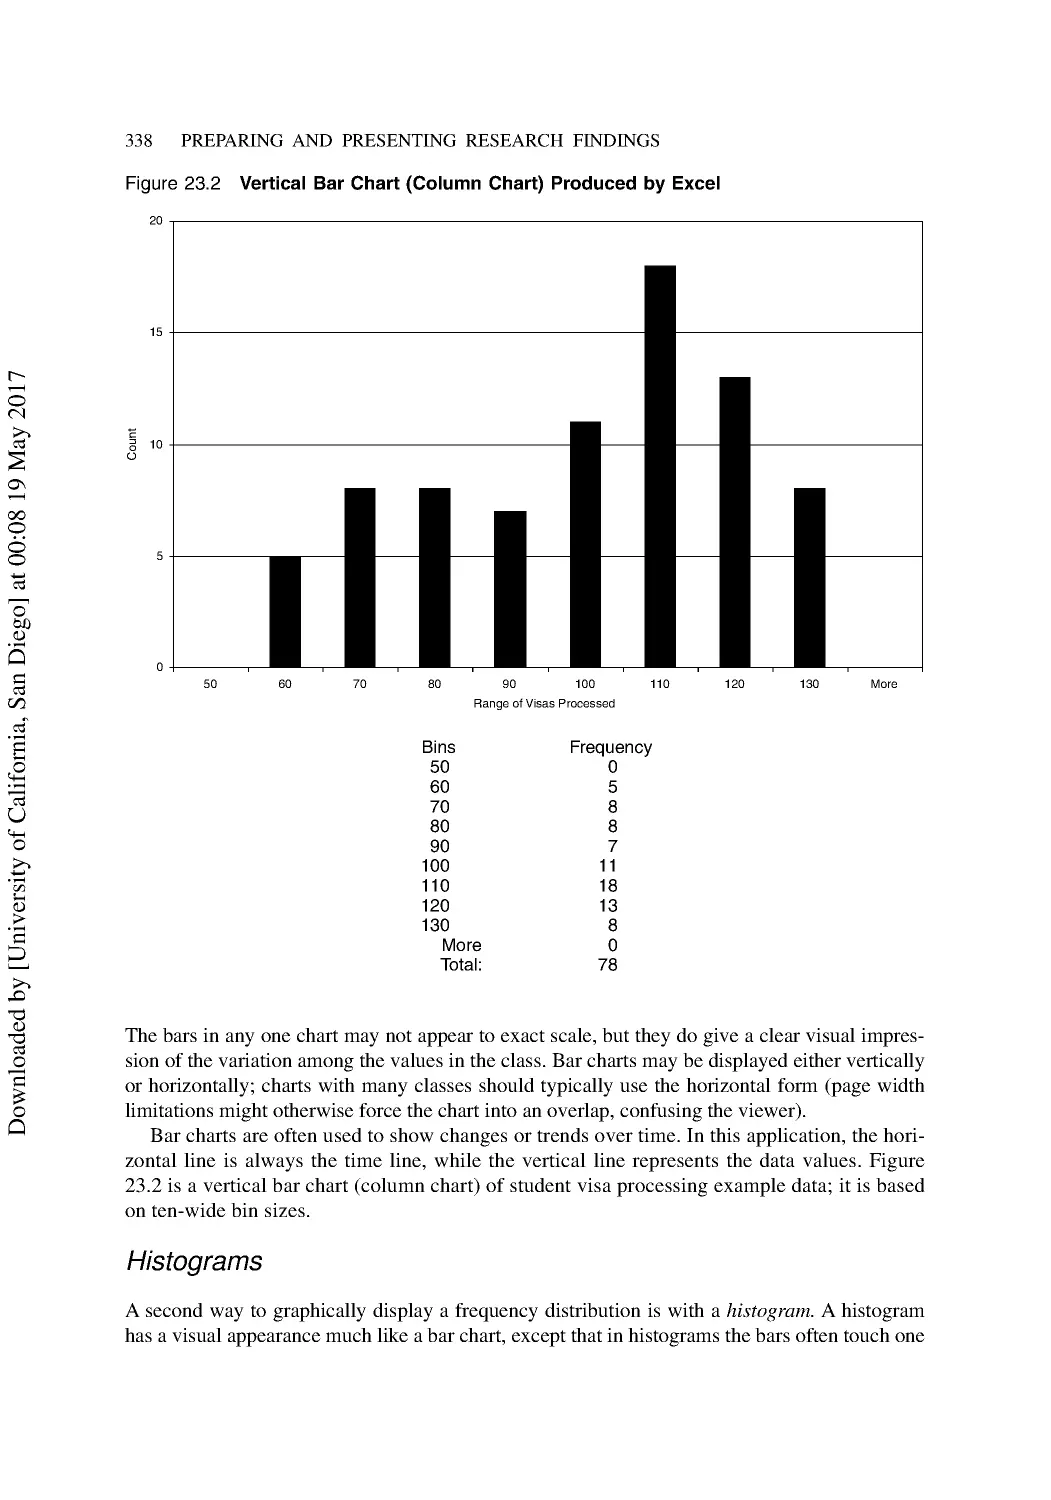
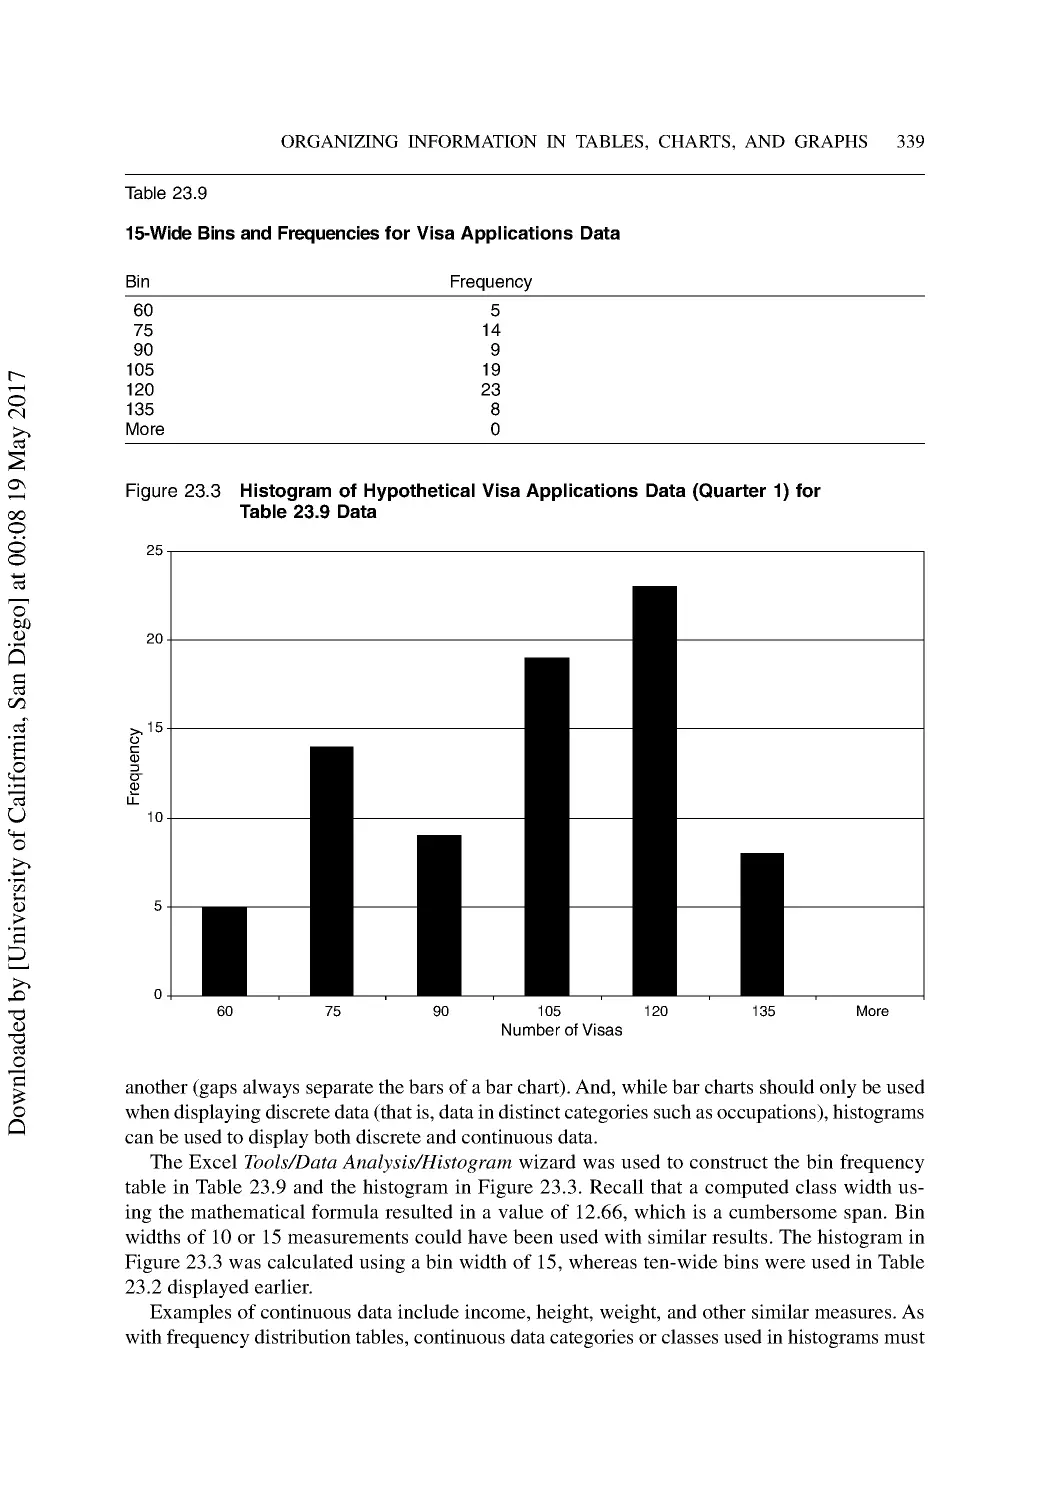
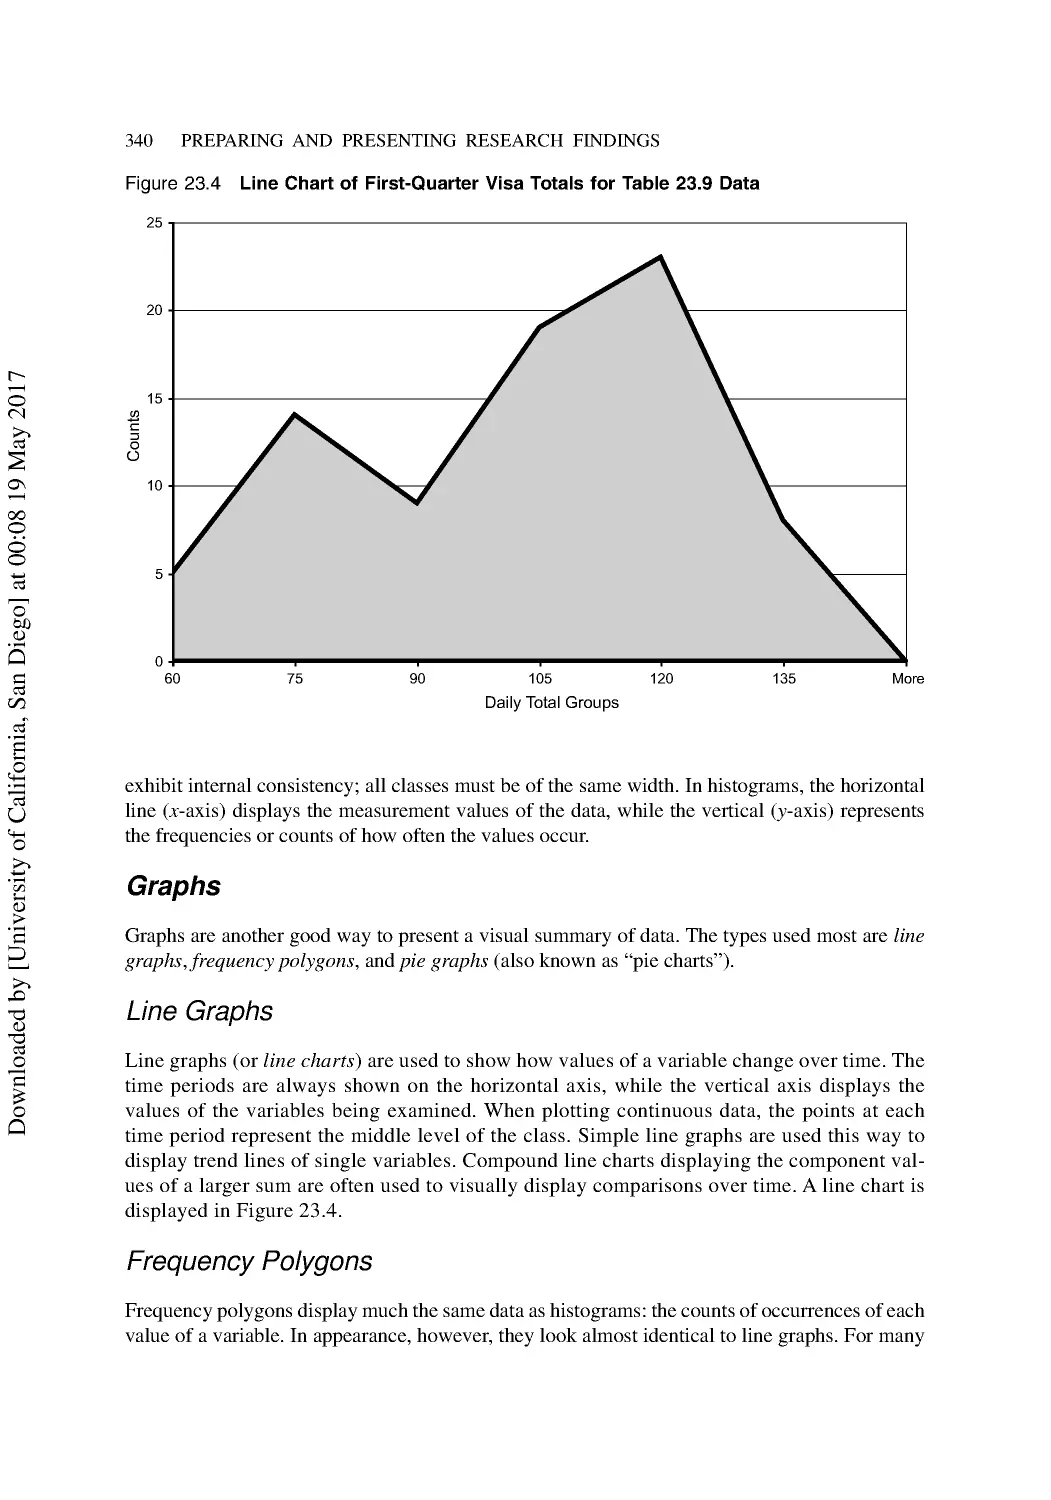
Communicating with Charts and Graphs ........................................................................... 336
Summary ............................................................................................................................ 343
Discussion Questions ......................................................................................................... 343
Additional Reading ............................................................................................................ 343
D
o
w
n
l
o
a
d
e
d
b
y
[
U
n
i
v
e
r
s
i
t
y
o
f
C
a
l
i
f
o
r
n
i
a
,
S
a
n
D
i
e
g
o
]
a
t
0
0
:
0
8
1
9
M
a
y
2
0
1
7
DETAILED TABLE OF CONTENTS xv
24 Organizing and Writing a Research Report .................................................................. 344
How to Structure a Research Report .................................................................................. 344
Sections in a Research Report............................................................................................ 345
Style: First Person or Third Person? .................................................................................. 351
Conclusions and/or Recommendations Section ................................................................. 352
Style in Research Report Writing....................................................................................... 355
Some Standard Style Requirements ................................................................................... 357
Other Style Manuals........................................................................................................... 360
Special Requirements for Political Science Research Papers ............................................ 361
Summary ............................................................................................................................ 363
Discussion Questions ......................................................................................................... 363
Additional Reading ............................................................................................................ 363
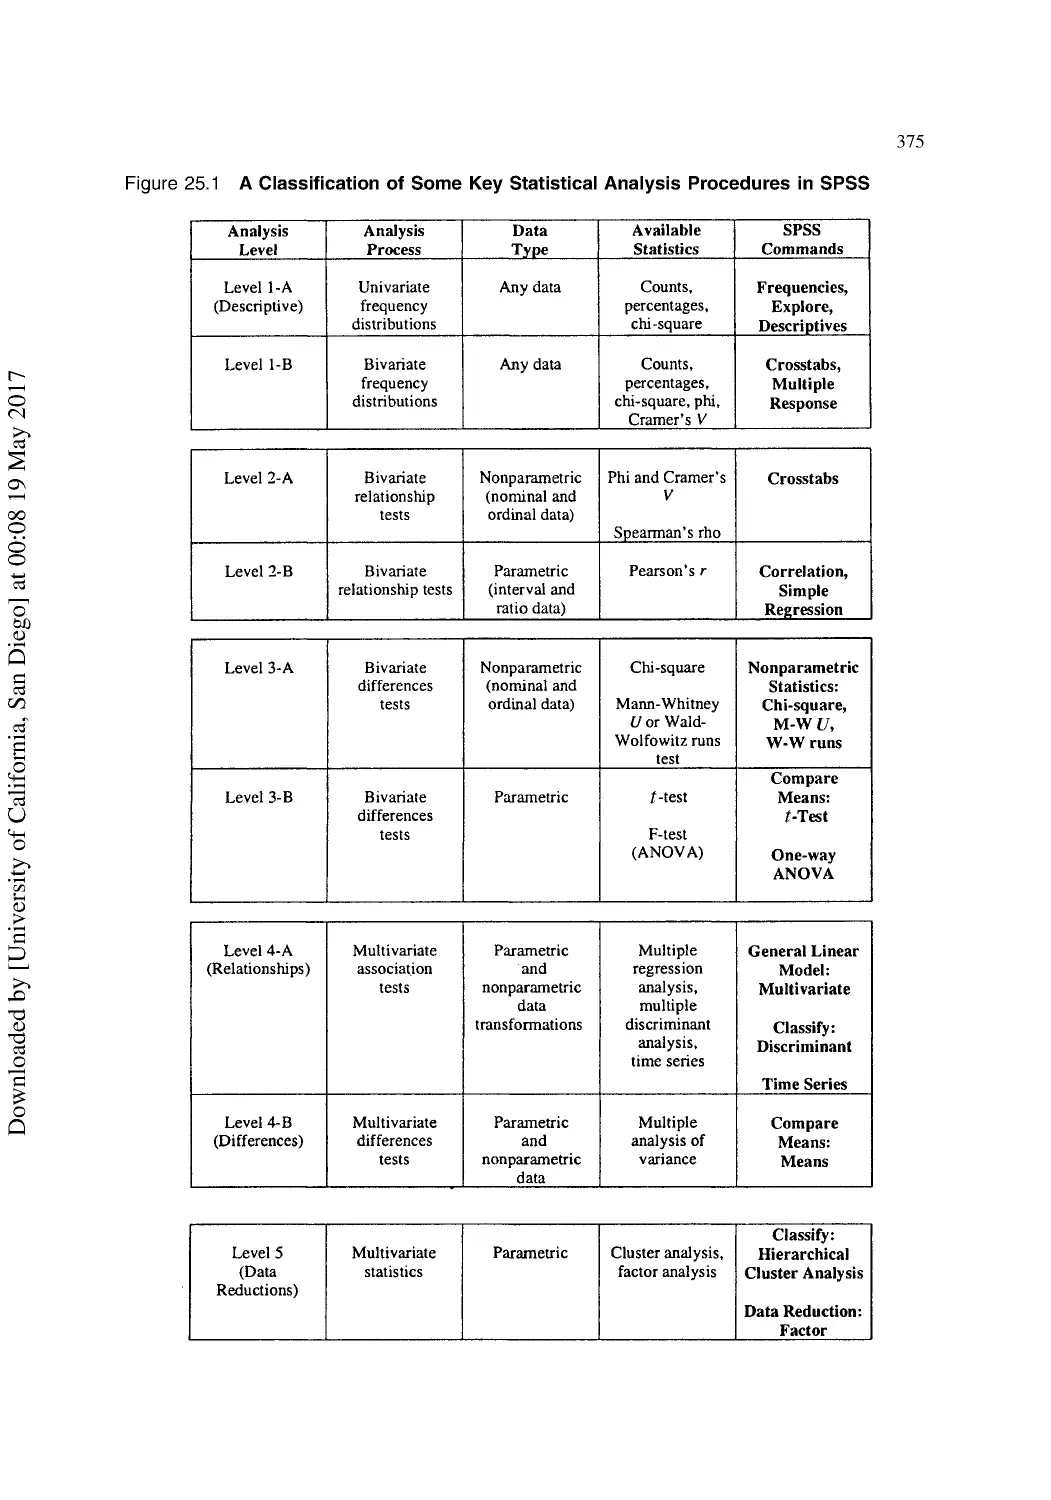
25 Introduction to Statistical Software................................................................................ 364
SPSS®: The Opening Screen ............................................................................................. 364
The Main Menu Bar ........................................................................................................... 365
The Variable View .............................................................................................................. 366
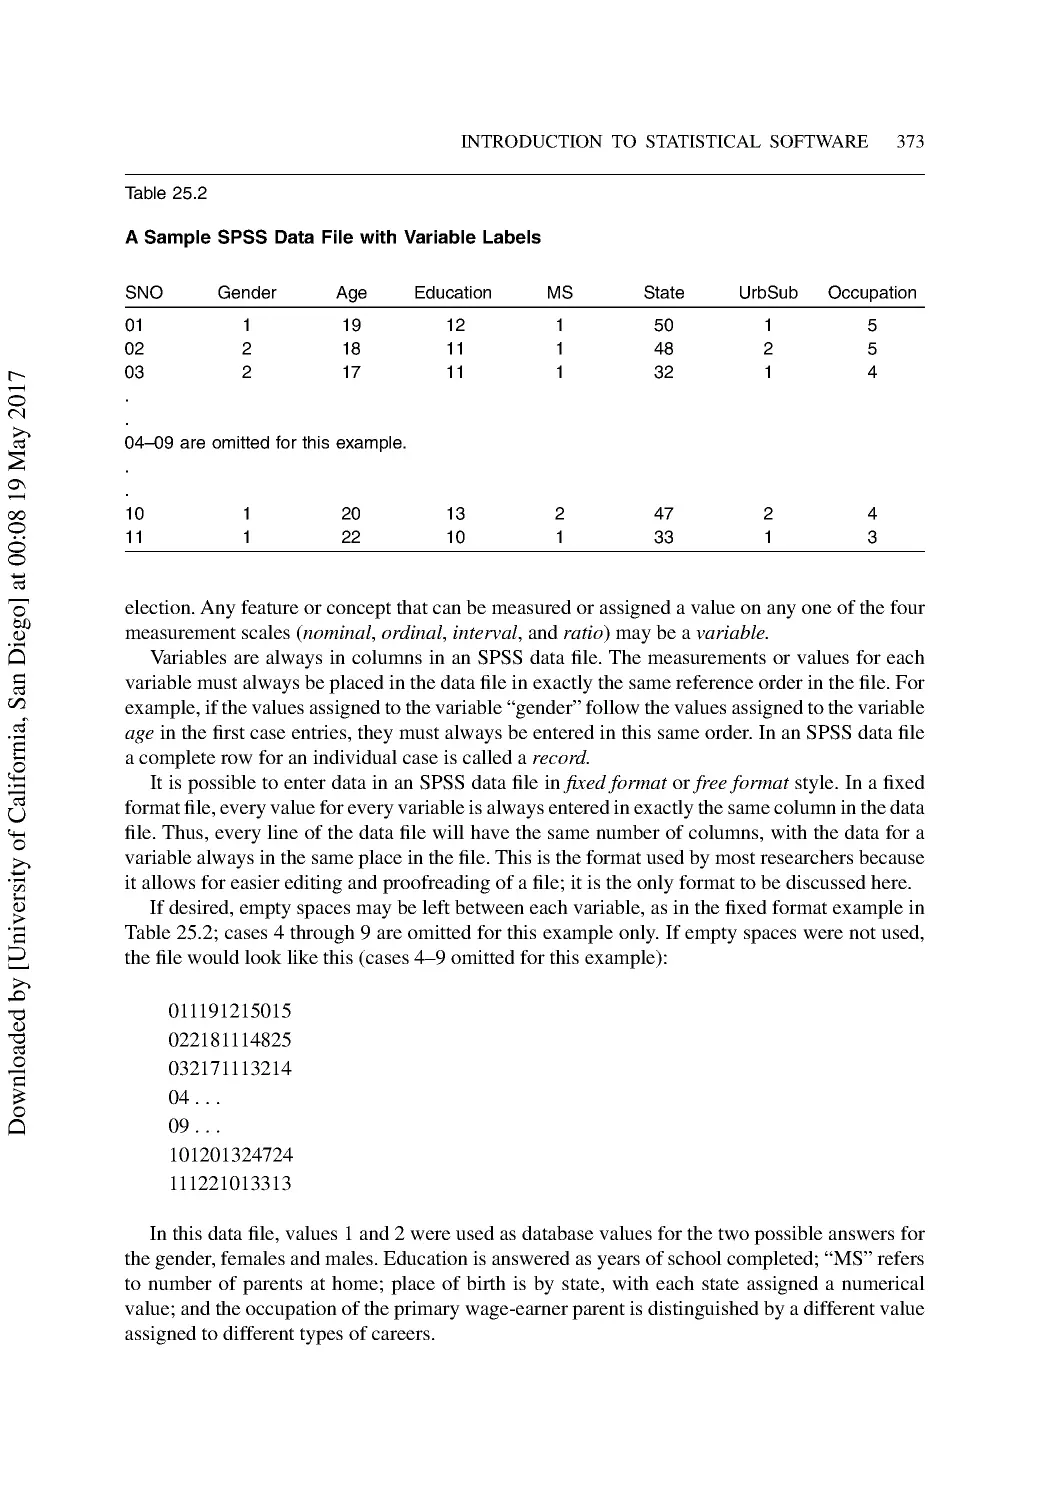
The Data View.................................................................................................................... 372
Putting SPSS to Work ........................................................................................................ 374
Summary ............................................................................................................................ 380
Discussion Questions ......................................................................................................... 381
Additional Reading ............................................................................................................ 381
Bibliography ............................................................................................................................. 383
Author Index ............................................................................................................................. 403
Subject Index ............................................................................................................................ 409
About the Author....................................................................................................................... 425
D
o
w
n
l
o
a
d
e
d
b
y
[
U
n
i
v
e
r
s
i
t
y
o
f
C
a
l
i
f
o
r
n
i
a
,
S
a
n
D
i
e
g
o
]
a
t
0
0
:
0
8
1
9
M
a
y
2
0
1
7
This page intentionally left blank
D
o
w
n
l
o
a
d
e
d
b
y
[
U
n
i
v
e
r
s
i
t
y
o
f
C
a
l
i
f
o
r
n
i
a
,
S
a
n
D
i
e
g
o
]
a
t
0
0
:
0
8
1
9
M
a
y
2
0
1
7
xvii
Preface and Acknowledgments
The primary goal of all science is to expand human knowledge. For this to happen, scientists
must engage in research. The discipline of political science is the branch of social science that
contributes to the growth of knowledge about politics, government, and the polity. Its objective is
to help us learn about our political systems and the political behavior of our fellow human beings.
This book is designed to help political scientists perform research in order to expand the body of
knowledge about these and related topics.
The purpose of this book is to provide in one location information about how to design, conduct,
interpret, and report on research that is carried out by political scientists. It has been written to serve
as a guide for designing research activities that investigate political or administrative science topics.
While its focus is on how to do research for students of political science, it is hoped that it will also be
a valuable tool for those persons already embarked on their careers. The text can also aid students of
other social science and education disciplines who have little or no experience in writing a scholarly
paper for a class. Political science graduate students will find the book especially useful for design-
ing and completing assignments in their research methods course and for preparing their master’s
degree thesis or doctoral dissertation. Managers now employed in administrative and managerial
positions in government, academia, and nonprofit organizations may also find the book useful as a
step-by-step guide for designing and conducting a research project with their internal staff.
This second edition of the book has been extensively revised. It has been shortened and honed
to provide less theoretical background information and more topical instructions on the task of
conducting research. The text covers such important topics as research design, specifying research
problems, designing quantitative research studies and a variety of qualitative research studies.
It also includes instructions on how to mine meaning from both quantitative and qualitative re-
search data. The book begins with a brief discussion on the types of studies and topics of interest
to political science researchers. It includes a brief review of some of the underlying disciplinary
questions studied by political scientists. Changes in the philosophy of science from the positivist
approach to postpositivist theory and critical research are discussed.
Acknowledgments
I wish to thank the staff at M.E. Sharpe for their assistance and support throughout the preparation of
this revised edition. These talented people were exceptionally helpful by providing knowledgeable,
insightful editorial criticism that certainly improved the final product. I particularly wish to thank
Mr. Harry Briggs, M.E. Sharpe executive editor, for his continued support and encouragement, and
to thank the anonymous reviewers and adopters of the text for their guidance in preparation of the
book. I am especially indebted to the faculty and administrators of Pacific Lutheran University for
their moral and financial support. As always, I thank my family for their continued sustenance.
D
o
w
n
l
o
a
d
e
d
b
y
[
U
n
i
v
e
r
s
i
t
y
o
f
C
a
l
i
f
o
r
n
i
a
,
S
a
n
D
i
e
g
o
]
a
t
0
0
:
0
8
1
9
M
a
y
2
0
1
7
This page intentionally left blank
D
o
w
n
l
o
a
d
e
d
b
y
[
U
n
i
v
e
r
s
i
t
y
o
f
C
a
l
i
f
o
r
n
i
a
,
S
a
n
D
i
e
g
o
]
a
t
0
0
:
0
8
1
9
M
a
y
2
0
1
7
xix
Introduction
Research Methods for Political Science was researched and written to fill a need for a methods book
that incorporates the latest thinking in the major subfields of political science, including compara-
tive politics, international relations, and public administration, among others. It includes discussions
and examples of research topics and research methods found in the current professional literature.
A key advantage of the text is that it integrates both positivist and postpositivist approaches under
one cover. It also provides specific instructions in the use of available statistical software programs.
The text also illustrates some of the developments in social science research and management and
organizational research, in addition to research in the political and administrative sciences.
The book is neither just another text on quantitative research methods, nor is it a statistics text.
It includes elements of both in addition to a solid introduction to qualitative research approaches.
However, because of the continued heavy interest in positivist research methods found in most
major political science journals and papers presented at the numerous political science conferences
I have attended over the past several years, the book places a slight emphasis on the statistical tools
employed by today’s political scientists. Both descriptive and inferential statistical methods are
discussed, with step-by-step instructions for their use also included. Qualitative methods discussed
include explanatory, interpretive, and critical research designs.
It is also important to know that this is not a text about political science or one of its subfields. It
does not compare political systems, discuss declining citizen participation, or provide instructions
on how to run a political campaign. Certainly, it must and does cite examples of such topics and
of the research approaches taken and data-gathering methods used by political scientists.
What this book is about is how anyone considering a career as either a practicing politician,
a director of political campaigns, a future academic researcher, or a political scientist in general,
can design and conduct research that meets the basic requirement of being “good science.”
The book draws extensively upon the findings, recommendations, conclusions, and intellec-
tual creativity of many present and past political scientists. This guide to research methods owes
an unlimited debt to their scholarship. However, these examples should not be considered to be
comprehensive or fully representative of the scope of the discipline. The examples were chosen
by the author, and reflect his own experience, education, and bias. Whatever errors exist, whether
they are errors of omission or commission, are entirely the responsibility of this author.
Structure of the Book
The book is organized into five major sections. The first section, “Foundations of Political Science
Research,” contains six chapters. Chapter 1, “Research Fundamentals,” is an overview of the philo-
D
o
w
n
l
o
a
d
e
d
b
y
[
U
n
i
v
e
r
s
i
t
y
o
f
C
a
l
i
f
o
r
n
i
a
,
S
a
n
D
i
e
g
o
]
a
t
0
0
:
0
8
1
9
M
a
y
2
0
1
7
xx
INTRODUCTION
sophical approaches to research and science: the objectivist and the humanist approaches—more
commonly known as the positivist and postpositivist approaches. This discussion is followed by
an overview of the purpose and rationale of political science research in general, including a brief
look at the big issues in political science. Chapter 2 expands on the topics introduced in Chapter
1, with particular emphasis on the many different quantitative and qualitative approaches and
methods that can be used in political science research.
Chapter 3, “Understanding the Research Process,” introduces a systematic process that all
research activities typically follow, regardless of their objectives, approaches, or methods.
This chapter begins with a discussion of the importance of thoroughly defining the problem
before beginning the research and includes a review of different ways to organize reports of
research findings. The chapter concludes with a brief review of some of the current research
in the discipline.
Chapter 4, “Selecting a Research Design and Choosing a Research Topic,” takes readers through
the process of selecting an appropriate strategy. It also provides suggestions on how and where
to begin the background research for a study, including carrying out examinations of textbooks,
journals, electronically stored and retrieved articles, and other materials in sources inside and
outside of the researchers’ organization. The early research proposals produced by most begin-
ning political science researchers tend to be far too broad for the resources at hand (particularly
time and money). Chapter 5 leads readers through the process of preparing a research proposal, a
necessary activity in all graduate studies and for applying for research grants.
Chapter 6, “The Legal and Ethical Environment of Research,” includes an overview of the
moral foundations upon which research decisions are based and concludes with a discussion of
the moral concerns and ethical dilemmas encountered by researchers in this and related fields.
Special emphasis is placed on research with human subjects.
Part 2, “Quantitative Research Approaches and Methods,” begins with an overview of the
fundamentals of designing and conducting research in the positivist tradition. Chapter 7, “Intro-
duction to Quantitative Methods,” explains the characteristics of measurements and includes an
explanation of the types or categories of statistics used in research. This chapter continues with a
review of the sampling process and chief sampling methods, including probability and nonprob-
ability sampling. Sampling is an important concept in the use of inferential statistics, as is the
nature of sample distributions; both are reviewed in this chapter.
The next three chapters in this section introduce researchers to the three chief quantitative
research designs: exploratory, descriptive, and causal. Chapter 8, “Exploratory Research: The
Probing Approach,” is an introduction to the ways researchers use one-on -one and small group
interviews to collect information for insights and ideas that can be used to design more detailed
and rewarding research projects. This approach is often referred to as small-sample research. It
often employs qualitative methods to bring out information that can then be used to design large-
sample survey studies.
Chapter 9, “Descriptive Research: The Survey Approach,” provides guidance on how to design
and conduct large-sample field surveys. It includes instructions for writing questions and con-
structing questionnaires. This section is a practical guide to writing the many types of questions
and scales that are used to measure attitudes and opinions. The chapter also includes instruction
on how to put these questions into a logical sequence in the formal data-gathering instrument
(the questionnaire).
Chapter 10, “Causal Research: The Experimental Approach,” describes the experimental method
and illustrates how political scientists conduct causal research. Experiments and experimental
design are concepts used to design and conduct cause-and-effect research studies. The discussion
D
o
w
n
l
o
a
d
e
d
b
y
[
U
n
i
v
e
r
s
i
t
y
o
f
C
a
l
i
f
o
r
n
i
a
,
S
a
n
D
i
e
g
o
]
a
t
0
0
:
0
8
1
9
M
a
y
2
0
1
7
INTRODUCTION xxi
includes an introduction to single-factor and multiple-factor design methods. Chapter 11, “Inter-
preting Exploratory and Descriptive Statistics,” introduces the basic descriptive statistics used in
research. The chapter provides simple-to-understand definitions of measures of central tendency,
of variability, of relative position, and of correlation.
In Chapter 12, “Testing Research Hypotheses,” readers are shown how and why statistical tests
are used to communicate information that relates to the validity of the results of the research. This
is the first of several chapters dealing with inferential statistics. Inferential statistics are statistical
tests used with samples rather than entire populations and in which probabilities play an important
role. The chapter examines one and two or more sample hypothesis tests, including the t-test and
analysis of variance procedures.
Chapter 13, “Introduction to Nonparametric Statistics,” explains the use of statistical tests on
measurements that do not meet the more stringent requirements of inferential statistics. Chapter
14, “Correlation and Regression Analysis in Political Science,” goes into greater detail on two
related statistical tools that are a part of nearly every quantitative research report. These tools help
researchers determine the strength and direction of relationships between variables, and to predict
how changes in one variable may influence changes in a related variable.
Chapter 15, “Exploring Multivariate Statistics,” provides a discussion and instruction on how
to apply important multivariate statistical processes for association analysis, relationships, and
causality. These tests can now be quickly processed with modern statistical software for personal
computers. Instructions and examples of software applications are included.
Part 3, “Qualitative Research Approaches and Methods,” introduces qualitative (interpretive)
research strategies and methods. Chapter 16, “Introduction to Qualitative Research Methods,”
reviews the development and purpose of qualitative research strategies. It illustrates how qualitative
designs can, for example, contribute to understanding public organizational culture and its impact
upon the voting public and public agency employees. Chapter 17, “Explanatory Research: Case
and Historical Methods,” describes both the single- and the multi-case approach and includes an
introduction to historical research methods. The case method is considered by many to be the most
used qualitative design in political science. It has also been shown to be particularly valuable in
public administration and nonprofit organization research. For many political scientists, history
plays a critical role in developing knowledge in the discipline. However, little if any instruction
on the process of historiography is included in current political science curricula. This chapter
attempts to rectify that error of omission.
Chapter 18, “The Interpretive Approach I: Grounded Theory Methods,” discusses research used
in interpretive approaches in political science. In grounded theory studies, researchers approach
a situation, event, or relationship with little or no preconceived theoretical bias; they construct a
theory only after the in-depth analysis of the study data. Chapter 19, “The Interpretive Approach II:
Ethnographic Research Methods,” examines the research approach that involves participant ob-
servation and other culture-base investigative methods. Ethnography was originally developed
by anthropologists to describe and explain phenomena in distant and what were considered to
be primitive societies. It has been successfully adapted to research on modern political cultures
and subcultures.
Chapter 20 is an introduction to the critical approach. The chapter focuses on feminist and em-
powerment research as they are used in political science research. Chapter 21, “Analysis Methods
for Qualitative Data,” explains some of the ways researchers go about analyzing and interpreting
the data they collect in these interpretive studies. Chapter 22, “Analyzing Texts, Documents, and
Artifacts,” continues the discussion of the analysis of qualitative data by reviewing the chief tools
used to collect, organize, and contain such data.
D
o
w
n
l
o
a
d
e
d
b
y
[
U
n
i
v
e
r
s
i
t
y
o
f
C
a
l
i
f
o
r
n
i
a
,
S
a
n
D
i
e
g
o
]
a
t
0
0
:
0
8
1
9
M
a
y
2
0
1
7
xxii INTRODUCTION
Part 4, “Preparing and Presenting Research Findings,” begins with Chapter 23, “Organizing
Information in Tables, Charts, and Graphs,” in which these graphic tools are used to present
descriptive statistical data to improve the quality and readability of research reports. Chapter 24,
“Organizing and Writing a Research Report,” includes a discussion on the importance of following
various organizational procedures, adhering to accepted political science research writing style,
and dealing with citations and credits. The final chapter in the book, Chapter 25, is entitled “Intro-
duction to Statistical Software.” The key element is a discussion of how computer programs are
used to analyze quantitative data. The chapter includes specific steps on how to use the statistical
software program SPSS.
Summary
Research and interpreting research findings are important skills required of all political scientists.
Researching means gathering, processing, and interpreting data of some kind. Research results
must be communicated in intelligently and cogently written reports. Political scientists also must
interpret and evaluate research reports that have been produced by academics, administrators, or
contract-research organizations.
There are at least five very good reasons for developing or expanding the skills needed to use
research methods and prepare written research reports. The first reason is that it will help develop
and hone analysis and communication skills. Second, the research process helps the political scien-
tist remain aware of what others in the career field are doing and saying about common problems.
The third reason has to do with believability. Anyone reading a research report must be able to
achieve the same or similar results by following the same research design.
Fourth, following long-established guidelines for research and report writing makes verification
through publishing easier and more likely to take place. Finally, political scientists, social workers,
and public and nonprofit agency administrators are often required to make quick, intelligent deci-
sions. The best decisions are almost always made after all the available information pertaining to
outcomes of the decisions is gathered, digested, and evaluated. This usually involves some type
of formal or informal research activity.
The research activity can be defined as the process of systematically acquiring data to answer
a question or solve a problem. Research methodology refers to the steps involved in a given
approach. Two philosophical approaches underlie political science research: positivism and post-
positivism. The positivist approach is the traditional scientific method that involves the following
steps: selection of a hypothesis, observation, data collection, hypothesis testing, and acceptance
or rejection of the hypothesis. The postpositivist approach is associated with qualitative research
methods; it emphasizes understanding as well as description of phenomena.
D
o
w
n
l
o
a
d
e
d
b
y
[
U
n
i
v
e
r
s
i
t
y
o
f
C
a
l
i
f
o
r
n
i
a
,
S
a
n
D
i
e
g
o
]
a
t
0
0
:
0
8
1
9
M
a
y
2
0
1
7
Part 1
Foundations of Political Science Research
D
o
w
n
l
o
a
d
e
d
b
y
[
U
n
i
v
e
r
s
i
t
y
o
f
C
a
l
i
f
o
r
n
i
a
,
S
a
n
D
i
e
g
o
]
a
t
0
0
:
0
8
1
9
M
a
y
2
0
1
7
This page intentionally left blank
D
o
w
n
l
o
a
d
e
d
b
y
[
U
n
i
v
e
r
s
i
t
y
o
f
C
a
l
i
f
o
r
n
i
a
,
S
a
n
D
i
e
g
o
]
a
t
0
0
:
0
8
1
9
M
a
y
2
0
1
7
1 Research Fundamentals
The constantly changing and expanding environment of the social science disciplines is also reflected
in the study of politics. Political science includes the study of local, state, and national politics and
governance, international relations, political theory and political history, to name only a few of the wide
variety of human endeavors included in the study of politics and political behavior. Thus, political sci-
ence can be defined as a diverse and constantly changing field of inquiry into the political behavior of
individuals and groups of human beings, the institutions with which mankind identifies and governs itself,
and the values that underlie political thought and systems. The research conducted by political scientists
necessarily addresses the many questions that arise in this wide-ranging field of social science.
Purposes of Political Science Research
Research is conducted for many different purposes. At its most fundamental level, the purpose of
research may be either basic or applied. Basic research, which is also called pure or theoretical
research, is conducted to increase the general storehouse of knowledge. Basic research concerns
coming up with theories about what political phenomena are and why events happen the way they
do. An example of basic research is the study of the fossils of life forms that existed on earth millions
of years ago. This science of paleontology is characterized by an emphasis on theory building rather
than on the application of solutions to a real-life problem. A typical theory in paleontology might
be concerned with why the dinosaurs disappeared. The findings of paleontologists are interesting
indeed, but to many people in the world of politics they have little immediate, practical value.
Applied research, on the other hand, is conducted to help solve practical problems or to help
researchers and political scientists understand past behavior in order to guide them in their attempts
at predicting future behavior. Applied researchers are concerned with developing theories about
why something happened; they look for causal relationships. They conduct research in order to
describe in detail what happened, how it happened, and why; in this way, they hope to be able to
predict its happening again in the future.
Political science research is more likely to be applied than to be basic, although pure research does
play a large role in the discipline’s academic community. Political scientists working in both basic
and applied approaches use the same methodologies, follow similar research designs, and concern
themselves with performing research tasks with scientific rigor, ethics, validity, and reliability.
Describing the Purposes for Research
A number of authors have tried to develop a set of purposes that are specific to the topics and
questions found in political science research. Babbie (2001), for example, identified the following
3
D
o
w
n
l
o
a
d
e
d
b
y
[
U
n
i
v
e
r
s
i
t
y
o
f
C
a
l
i
f
o
r
n
i
a
,
S
a
n
D
i
e
g
o
]
a
t
0
0
:
0
8
1
9
M
a
y
2
0
1
7
4 FOUNDATIONS OF POLITICAL SCIENCE RESEARCH
three purposes of research in the social sciences, including political science: (1) the exploration of
a topic; (2) the description of a topic, situation, or event; or (3) to explain some phenomenon. In
their discussion of the comparative method in political science research, Pennings, Keman, and
Kleinnijenhuis (1999), identified three purposes of research as being able to identify: (1) regularities
regarding the relationship between societal and political actors, (2) the processes of institutional-
ization of political life, and (3) the changes in society that emerge from the first two forces.
Stallings and Ferris (1988) identified a three-category system to categorize the purposes of doing
research, terming the different purposes conceptual, relationship, and evaluative. The purpose of
a conceptual study is to establish the fundamental concepts that underlie a problem. Conceptual
studies are designed to identify critical variables for further research or to frame a problem for
which another study can be developed. The purpose of a relationship study is to either describe
relationships between variables or to investigate the potential for causation resulting from a
relationship. Finally, evaluative studies are designed to explain or evaluate an event, a program,
a policy, or some other phenomenon. A different approach was taken by Lathrop (1969), who
described the following four purposes in his research methods text: (1) theory testing, (2) extend-
ing the range of applicability of existing research, (3) resolving conflicting research findings, and
(4) replicating previous studies.
Another way to characterize these reasons for research is to look upon them as research objectives.
In science, research objectives and research purposes are nearly interchangeable terms. For example,
three often-stated objectives for research are: (1) to explore a topic for the purpose of gaining insights
and ideas, (2) to describe a topic, which typically has the purpose of counting the occurrence of one
or more phenomena, or (3) to establish and/or measure causation; in a causal study, the purpose is
to determine the power of one or more independent variables to influence change in a dependent
variable. These objectives could have just as easily been termed purposes.
Researchers study the issues that they think should be examined, and conduct research the
way that they believe knowledge is gained. Whether they are aware of it or not, researchers in
all disciplines are guided in the way they conduct their studies by the underlying philosophi-
cal positions they bring to the research table (Marsh, Stoker, and Furlong 2002). The bases for
these positions are cast from what in philosophy are known as ontology and epistemology, both
of which are concerned with knowledge and the way scientists develop knowledge. Ontology
is the field of philosophy that deals with what we can learn—what is “out there” that can be
known. It has to do with what is the nature of the world we can experience. Epistemology, on
the other hand, is concerned with questions about the way that we learn—the methods used by
humans to gain knowledge. It is also concerned with the validity of knowledge; it deals with
questions about how we can know anything and how we can be certain what we do know is
true (Plotkin 1994).
The “Big Issues” in Political Science
In the early 1980s, the editorial board of the American Political Science Association (APSA)
began a series of publications for which a variety of political scientists were invited to submit
papers describing the then-current state of intellectual activity in the political science discipline.
Follow-on volumes appeared in 1993 and 2002 (Finifter 1983 and 1993; Katznelson and Milner
2002). A comparative summary of the major section headings in each of the volumes is displayed
in Table 1.1 .
In the first edition of the State of the Discipline series, a major question that concerned re-
searchers was whether research in the discipline should be theoretical or applied (Gunnell 1983,
D
o
w
n
l
o
a
d
e
d
b
y
[
U
n
i
v
e
r
s
i
t
y
o
f
C
a
l
i
f
o
r
n
i
a
,
S
a
n
D
i
e
g
o
]
a
t
0
0
:
0
8
1
9
M
a
y
2
0
1
7
RESEARCH FUNDAMENTALS 5
12). This was taking place during the peak influence of the behavioral focus in political science
research, when politics was considered first and foremost a behavioral system. The behavioral
emphasis had become the dominant research approach during the decades of the 1950s and the
1960s. The research of the period was described as:
There was a distinct emphasis on pure or theoretical science and a turning away from the
idea of liberal reform and social control as the rationale of social science. . . . The 1960s
were a decade of optimism about the advance of scientific theory and the achievement of the
behavioral goal of science of politics modeled after the [methodological rigor of the natural
sciences], . . . Paramount to all of these efforts was some notion of politics as a “system.”
(Gunnell 1983, 12)
Gunnell described the period as one when many political science researchers were becoming
dissatisfied with the behavioral/systems model. This was also a time when the idea of political
science as a policy science emerged, with much research focusing on policy questions. However,
it was also becoming more and more difficult to clearly identify any limited set of core issues in
the discipline. Different interests and concerns forced different levels of emphasis. Political sci-
ence became too diverse for there to be any core set of issues that people agreed should be applied
across the board. “Although one could say that the field was vital, it could just as easily be said
that it was without definite direction or focus” (Gunnell 1983, 33–34).
Agreement on what constitutes “appropriate” political science research is continually evolv-
ing. The big issues in political science change regularly, as evidenced in the three State of the
Discipline volumes. By the time that an issue trickles its way down through the many academic
and practicing political scientists who might have an interest in the topic, it may be outdated and
something new has come along to pique the interests of researchers in the field. Heywood (2000)
may have been guided by this fact when he avoided discussing specific questions in his book on
Table 1.1
State-of-the-Discipline Section Headings in Three Editions of a Survey Volume
Section 1983
1993
2002
1
Political Science: The Discipline
and Its Scope and Theory
Theory and Method
The State in the Era of
Globalization
2
American Political Processes
and Policymaking
Political Processes and
Individual Political
Behavior
Democracy, Justice, and
Their Institutions
3
Comparative Political
Processes and Policymaking
Political Institutions of the
State
Citizenship, Identity, and
Political Participation
4
Micropolitical Behavior:
American and Comparative
Nations and Their
Relationships
Studying Politics
5
International Politics
6
Addresses from the Lasswell
Symposium: The Uses of Social
Science
Sources: Finifter, ed., 1983, 1993; Katznelson and Milner, eds., 2002.
D
o
w
n
l
o
a
d
e
d
b
y
[
U
n
i
v
e
r
s
i
t
y
o
f
C
a
l
i
f
o
r
n
i
a
,
S
a
n
D
i
e
g
o
]
a
t
0
0
:
0
8
1
9
M
a
y
2
0
1
7
6 FOUNDATIONS OF POLITICAL SCIENCE RESEARCH
Key Concepts in Politics, and instead enumerated 15 key concepts, 20 ideologies, 19 research
approaches, 25 different values, 17 different governmental systems, 28 different structures, 15 dif-
ferent levels of government institutions and issue focus, and 7 different ways to look at questions
and concerns in political science—all of which are topics of political science research. There are
enough questions named in his small volume to supply political scientists with as many ideas for
research questions as they will ever need.
Fragmentation in Political Science Research
Most disciplines, including political science, have undergone substantial growth since the middle
of the last century. One of the unplanned consequences of this growth has been a trend toward
greater interdisciplinary research; many researchers have wandered far from a limited core of
questions to look at a variety of different, unrelated questions, with the goal of “finding some-
thing new to study.” This trend has brought about a fragmentation of disciplines into smaller and
smaller areas of interest.
Like its sister social sciences, political science has also become segmented into many sepa-
rate and increasingly focused subfields (Abramson 1997). Each of these subfields has at least
one—and usually many more than one—journal dedicated to disseminating advances in its field.
A review of 2001 and 2002 issues of four important journals in the discipline—the American
Journal of Political Science, American Political Science Review, Journal of Politics, and the
Political Research Quarterly—found papers describing research on the discipline’s traditional
themes of political theory, American politics, elections/voting, judiciary, comparative politics,
international relations, research methodology, public administration, and program evaluation.
However, papers on a wide variety of individual topics that did not fit into any of the key sub-
fields were also published.
Currently, the American Political Science Review publishes research papers in five categories
of inquiry: political theory, American politics, comparative politics, international relations, and
public administration. The journal includes a sixth category, research methods and analysis, with
an established focus on methodological issues, not on politics or political topics.
Categories of Political Science Research
In an attempt to provide some structure to the burgeoning field of political science, Fagan (2002)
grouped a collection of working papers in political science into just over a dozen categories. The
major topics he identified are American politics, comparative politics, political communication,
political theory, public administration, international relations, political economy, public policy,
and methods and data. Superimposed upon these major focus areas are a number of subfields. For
example, Cochran et al. (1995) identified nine topic areas that fall under the umbrella of studies in
the public policy subfield: intergovernmental relations, the economy in general, economic issues
such as taxation and spending, energy and the environment, crime and criminal justice, health
care, education, legal and social equality, and diversity and tolerance.
Ruget (2002) defined four “structuring dimensions” of political science research. These include
the status of the discipline in academia, the research fields addressed by political scientists, socio-
logical characteristics of political scientists themselves, and their political allegiance. Together,
these dimensions make up the symbolic capital of the discipline. An important conclusion of her
research is that apparently not all fields in the discipline have the same “symbolic force,” which
she described as follows:
D
o
w
n
l
o
a
d
e
d
b
y
[
U
n
i
v
e
r
s
i
t
y
o
f
C
a
l
i
f
o
r
n
i
a
,
S
a
n
D
i
e
g
o
]
a
t
0
0
:
0
8
1
9
M
a
y
2
0
1
7
RESEARCH FUNDAMENTALS 7
For historical and intellectual reasons, the study of American political phenomena has be-
come dominant in the discipline, while other domains, like political theory . . . [which used
to be considered the core of the field] are implicitly considered to be less professionally
promising. In 1991, for example, the course “American Government” was required by 80%
of the political science departments in four-year colleges and universities, whereas a general
introduction to the discipline was required in only 48% of them. (Ruget 2002, 472)
This emphasis on American government has not been accidental and probably should not be
considered a weakening of the discipline. American political science, like British political science,
Indian political science, Russian political science, and others, has maintained its particular focus on
developing specific kinds of knowledge about its own system of governance. Thus, “The modifier
American has to be taken seriously,” according to Katznelson and Milner (2002, 3).
The attempts of early political scientists to arrive at explanations for the emergence of the liberal
democratic United States has naturally resulted in an emphasis on democracy and the features that
have enabled democracy to endure. However, if the papers commissioned for the third volume
in the State of the Discipline series are any indication, dramatic changes in the focus of political
science are taking place—including a globalization of the discipline.
Research topics in political science in the early years of the twenty-first century range across the
entire spectrum of the social sciences. Despite the widely diverse nature of the discipline, several
common themes have been found to characterize the research (Katznelson and Milner 2002, 2).
These include: (1) a pragmatic orientation to the concept of the state that incorporates the study
of power and choice as integral features; (2) study of the nature of liberal political regimes and
their stability, with an increasing focus on democracy; and (3) a commitment to the study of the
state in ways that are open and systematic.
From Thematic Focus to Research Topics
How does the thematic focus of the political science discipline translate into topics for research?
One way to discern what might be a legitimate topic for research in political science is to look at
what other researchers are examining, and to see what is being funded and what is being published.
Indicative of the variety of research topics is the following partial list of recent political science
research studies that are being supported by the National Science Foundation (NSF).
In 2007, the NSF announced that it would support research that advanced “knowledge and
understanding of citizenship, government, and politics. . . . Substantive areas include, but are not
limited to, American government and politics, comparative government and politics, international
relations, political behavior, political economy, and political institutions.” Examples of program
awards included research studies on bargaining processes; campaigns and elections, electoral
choice, and electoral systems; citizen support in emerging and established democracies; democra-
tization, political change, and regime transitions; domestic and international conflict; international
political economy; party activism; political psychology and political tolerance; political and
research methodology; and research experiences for students (NSF 2007).
Branches of Political Science
Another way to put a frame around the scope of work in political science is to look at how the disci-
pline structures itself. Several attempts have been made to reduce the large and growing number of
research topics to a smaller number of fundamental themes. The Social, Behavioral, and Economic
D
o
w
n
l
o
a
d
e
d
b
y
[
U
n
i
v
e
r
s
i
t
y
o
f
C
a
l
i
f
o
r
n
i
a
,
S
a
n
D
i
e
g
o
]
a
t
0
0
:
0
8
1
9
M
a
y
2
0
1
7
8 FOUNDATIONS OF POLITICAL SCIENCE RESEARCH
Sciences division (SBE) of the NSF funds research in, but not limited to, the following six political
science topic areas listed above. Along these same lines, Laitin identified four branches and two
support areas of the discipline:
There are four substantive fields in political science: Political Theory, Comparative Politics,
Political Institutions, and International Relations. [In addition] there is one field (Methodol-
ogy) that develops tools to address the methodological problems in each of the substantive
fields. There is also an applied field (Public Policy) whose practitioners address policy
problems relying on the substantive knowledge and methodological skills developed in the
non-applied part of the discipline. (Laitin 2001, 7)
The American Political Science Association recognizes five key thematic fields in political
science: political theory, political institutions, international relations, public policy, and methods—
and three nonsubstantive areas: political arenas, independent variables, and an “other” category.
These fields and section subfields are listed in Table 1.2. Public administration was not identified
as one of the major subfields of political science. Instead, it was included it as part of an applied
public policy field.
Political Science Research in Journals
A sampling of some of the most important political science journals helps to bring closure to this
problem of definition and structure. Researchers in the discipline today appear to be focusing on
questions in five broad fields of inquiry. These are (1) the history, theory, and philosophy of politics;
(2) American politics; (3) comparative politics; (4) public administration (including the judiciary,
public law, and criminal justice); and (5) international relations and related geopolitical issues.
Rather than limit the focus to American politics exclusively, the second topic in the list (American
politics) might be changed to national politics in recognition that significant research in political
science is taking place throughout the world. Some of this national research is comparative, while
other studies focus on interpreting a single national system. However, this research all addresses
issues that are national in scope. Researchers in other nations substitute their own nation or region
for American politics, of course, but generally follow a similar set of topic areas.
Still another way to get a handle on the huge scope of research on political science top-
ics and themes comes from a review of the 102 journals in the discipline recognized by the
American Political Science Association. Two of these are official APSA journals: American
Political Science Review and PS: Political Science and Politics. Others are grouped into ten
categories, two of which are affiliated in some way with the association; one affiliated category
includes three APSA section journals. Sections are the topic categories of the association, such
as international relations, public policy, and others. The second category includes the fifteen
journals of regional, state, and national political science associations. Other journal categories
recognized by APSA include American politics, international politics, comparative politics,
public administration and public policy, policy studies, political theory, women and politics,
and a catchall other category.
Researchers in the area of the history, theory, and philosophy of politics study such questions
as theories of political thought, the historical foundations of governance, and related philosophical
and historical issues. APSA lists nearly twenty journals in this topic area. Among them are the
Critical Review of International Social and Political Philosophy, History of Political Thought,
and the Journal of Political Thought.
D
o
w
n
l
o
a
d
e
d
b
y
[
U
n
i
v
e
r
s
i
t
y
o
f
C
a
l
i
f
o
r
n
i
a
,
S
a
n
D
i
e
g
o
]
a
t
0
0
:
0
8
1
9
M
a
y
2
0
1
7
RESEARCH FUNDAMENTALS 9
Researchers who address questions pertaining to national politics and the political system often
investigate such phenomena as development and evolution of political parties and political action.
They also look at the conduct of campaigns for or against issues and candidates for elected office,
the processes of forming public policy, the activities of lobbyists and special-interest groups, and
related topics. American Politics Research, Party Developments, and White House Studies are three
journals in which studies on American politics can be found. Many of the journals in the area of
comparative politics, such as the British Journal of Political Science and Israel Affairs, publish
studies dealing with politics in other nations and areas.
Researchers who work in the area of comparative politics examine such questions as the simi-
larities and differences in political systems and thought within two or more countries, regions, or
ideologies. They also make in-depth analyses of specific functional areas in regions and nations.
Examples of comparative functional studies can be found in the journals Comparative Strategy
and Electoral Studies. Examples of regional comparison studies can be found in such journals
Table 1.2
Conference Fields and Topics, 2001 Annual APSA Conference
Field
Section
Political Theory
Foundations of Political Thought
Human Rights
Political Institutions
Laws and Courts
Legislative Studies
Political Organizations and Parties
Representative and Electoral Systems
Presidency Research
Elections, Public Opinion, and Voting Behavior
International Relations
Conflict Processes
International Security and Arms Control
Foreign Policy
Public Policy
Public Policy
Public Administration
Science, Technology, and Environmental Politics
Methodology
Political Methodology
Arenas
Politics and Society in Western Europe
Urban Politics
State Politics and Policy
Independent Variables
Politics and History
International History and Politics
Religion and Politics
Race, Ethnicity, and Politics
Women and Politics
Ecological and Transformational Politics
Political Communication
Information Technology and Politics
Other
Political Economy
Political Psychology
New Political Science
Politics and Literature
Undergraduate Education
Source: Laitin 2001.
D
o
w
n
l
o
a
d
e
d
b
y
[
U
n
i
v
e
r
s
i
t
y
o
f
C
a
l
i
f
o
r
n
i
a
,
S
a
n
D
i
e
g
o
]
a
t
0
0
:
0
8
1
9
M
a
y
2
0
1
7
10 FOUNDATIONS OF POLITICAL SCIENCE RESEARCH
as the International Journal of Middle East Studies, West European Politics, and the Journal of
Commonwealth and Comparative Studies.
Political scientists who study events and trends in international relations often adopt the case study
method in their analyses. They describe in detail the politics, political systems, and public policies of
other nations. They make comparisons of national governments and international institutions and poli-
cies such as global trade, monetary policy, defense, or environmental protection, for example. Other
researchers in this field study the functions and policies of larger international bodies like the European
Union, the United Nations, the North American Free Trade Agreement (NAFTA), and other issues of
a bilateral, multilateral, or geopolitical nature. Examples of research in this area can be found in such
journals as Foreign Affairs, Foreign Policy, International Politics, and the Review of International
Studies—only a few of the nineteen journals specifically devoted to international politics.
Different Answers for Similar Problems
Researchers in each subfield begin from a common starting point—the purpose statement upon which a
research hypothesis or hypotheses are formed. From this beginning, they move in different ways to ac-
complish what on the surface may appear to be a common goal but, in reality, is something else entirely.
Say, for example, that researchers in three different subfields find themselves interested in questions
dealing with how issues influence voter behavior. A researcher in political activity might want to know
whether voters in California react differently than voters in Nebraska to the agriculture platform in the
message of a presidential candidate. A researcher in the area of public policy might design a study to
determine whether families from different ethnic groups respond differently to a candidate’s stand on
welfare reform training programs. Still another researcher working in the area of international relations
might want to compare the way adults in the European Union vote after the introduction of a common
currency. Similar differences occur in other subfields of political science.
These different researchers necessarily begin their studies with widely different assumptions.
The first researcher might assume that different levels of industrialization influence the attitudes
of voters in both states. The public policy researcher may assume that all ethnic groups feel the
same about training and welfare reform. The researcher in international relations may assume that
the citizens of all European Union nations have similar opinions about replacing their national cur-
rency with the euro, the common currency of the European Union. Each one of these assumptions
is a hypothesis that can be tested (Mattson 1986). In turn, each hypothesis becomes the starting
point for identification of a research question.
Good political science research always follows a predetermined design and method. Any topic
may be investigated in a variety of different ways. The two chief approaches to research were
discussed earlier—the positivist and the postpositivist approaches. However, the researcher must
remember that both the design of the study and the method followed are dictated by the nature of
the research problem and the objectives for the research. Following a design means always begin-
ning with a definition of a research problem, adopting a systematic plan for collecting, analyzing,
and interpreting the data and for reporting the study findings. Getting from the beginning to the
end of a research project can take many different paths.
Katznelson and Milner provided a concise summary of the focus of political science research
and the discipline itself at the close of their introductory chapter for the third edition of State of
the Discipline. They wrote:
Contested and methodologically diverse, political science nonetheless remains focused, as it
has for a century, on a particular understanding of how to study the modern state and liberal
D
o
w
n
l
o
a
d
e
d
b
y
[
U
n
i
v
e
r
s
i
t
y
o
f
C
a
l
i
f
o
r
n
i
a
,
S
a
n
D
i
e
g
o
]
a
t
0
0
:
0
8
1
9
M
a
y
2
0
1
7
RESEARCH FUNDAMENTALS 11
democracy. Though there have been shifts, of course, in emphasis and method, attempts
to periodize the discipline’s history mislead if not grounded in these powerful continuities
delineating the discipline. Moreover, though political science has not produced fixed find-
ings in the strong sense of the term . . . its intellectual debates have been cumulative and its
disputations have grown more textured, more variegated, and in many respects, though not
all, more capable over time. (Katznelson and Milner 2002, 25)
Defining Research
Political science is a big field, and almost any aspect of political behavior is interesting. Deciding
how to look at the problem will be suggested by the nature of the problem itself and the objectives
spelled out by the researcher. Selecting which methodological tradition to adopt follows from,
rather than precedes, the selection of a research topic. In this section, research and the activity of
research, will be defined.
What Is Research?
Research is an important skill required of all managers in public and nonprofit organizations. Research
means gathering, processing, and interpreting data, then intelligently and cogently communicating the
results in a report that describes what was discovered from the research. Knowing how to interpret and
evaluate research that has been done by academics, administrators, or contract research organizations
is another important skill. To learn the skills needed to both conduct and evaluate research, students
of public administration are often required to complete one or more courses in research methodology.
Designing and conducting a research project is usually a requirement in those courses.
When beginning political scientists embark on what too often seems to be an extremely daunting
and thoroughly confusing task, they find themselves faced with such questions as these:
s 7HATISTHEPURPOSEFORDOINGTHISRESEARCH
s 7HATISAh@RESEARCHPROBLEMv
s 7HOHASTHENEEDEDINFORMATION
s 7HATISTHEBESTWAYTOASKQUESTIONS
s 7HICHRESEARCHDESIGNSHOULDBEFOLLOWEDINTHISSITUATION
s (OWSHOULDTHEDATABEGATHERED
s (OWSHOULDDATABEPROCESSED
s 7HATDOESALLTHISPROCESSEDDATAMEAN
s 7HATISTHEBESTWAYTOCOMMUNICATETHESElNDINGS
s !NDMANY
MANYMORE
Equally important, they must decide what questions not to ask, what questions cannot be read-
ily answered, and how much research can be conducted in the time allotted and with the people
and money available.
The Research Activity
Research is the activity scientists perform to gain a better understanding of how their world works.
More formally, research can be defined as the process of systematically acquiring data to answer a
question or solve a problem (Strauss and Corbin 1998). Research methodology refers to the approach
D
o
w
n
l
o
a
d
e
d
b
y
[
U
n
i
v
e
r
s
i
t
y
o
f
C
a
l
i
f
o
r
n
i
a
,
S
a
n
D
i
e
g
o
]
a
t
0
0
:
0
8
1
9
M
a
y
2
0
1
7
12 FOUNDATIONS OF POLITICAL SCIENCE RESEARCH
the researcher takes to acquire the information. In philosophy, this is the purview of epistemology.
Finally, research techniques or processes refer to the steps involved in a given approach.
Achinstein (1970) defined the research activity as a set of easily understood procedures for
acquiring information, and as a philosophical mind-set that people bring to any research activity.
Rosenthal and Rosnow (1991) added that scientific research should not be considered simply a fixed
procedure. Rather, it should be looked upon as a philosophical way of approaching all research,
regardless of the problem addressed and approaches and methods employed. This scientific ap-
proach to research referred to by Achinstein and others means that researchers should approach a
research problem without any preconceived answers; it requires avoiding any hint of subjective
bias. It includes preparing comprehensive operational definitions, forming hypotheses and theories,
and applying the appropriate quantitative or qualitative method of data analysis.
The goals that guide all research have been suggested as being: (1) describe some event, thing,
or phenomenon; (2) predict future behavior or events based on observed changes in existing
conditions; or (3) provide for greater understanding of phenomena and how variables are related
(Shaughnessy and Zechmeister 1994). Today there is a growing awareness of the need to use
research to better understand as well as to describe human events and phenomena.
The first step in scientific research is to recognize a problem. As noted earlier, research is
problem solving. A researcher must recognize that something is not known or understood about a
problem or situation. He or she must believe that the unknown information is important enough
for an effort to be taken to search for the answer to the problem.
The researcher might then formulate a hypothesis or hypotheses. These are tentative explana-
tions of a solution or interpretation of the variables or a relationship, or cause-and-effect perception
of a situation. The researcher might employ inductive reasoning, which means moving from the
specific to the general. This reasoning process is involved in the act of making an inference; that
is, using data from a sample for describing the characteristics or behaviors of larger populations.
Or the researcher might conclude that the facts in the case or situation speak for themselves.
The researcher could then test the hypothesis or hypotheses. In quantitative designs, objective
statistical tests are used for this purpose. In qualitative designs, the researcher makes a subjective
determination of the validity of the hypothesis. Next, the researcher examines or makes some
type of observations and/or measurements of the “things” (variables) associated with the problem;
this is data collection. The researcher then arranges the collected data in some meaningful order,
looking for similarities and dissimilarities while doing so.
The process of gathering or accumulating data might require asking people to complete a survey
questionnaire, personally interviewing a number of people, observing events or reading about them,
reading and cataloging published documents, or preparing an in-depth study of one or more cases.
However gathered, these data must be coded, tabulated, arranged and classified, and analyzed and
interpreted if they are to become information. If after conducting an analysis of the data, the researcher
determines the hypothesis is valid, he or she might then see if there are other applications to which
the hypothesis can be applied. The researcher could propose, for example, that, “In this study, such
and such was true; therefore, in further applications, the same must occur and also be true.”
The final activity in this scientific approach to research is the verification of conclusions made
from the research. This might entail replication of the design with a different sample. For example,
THERESEARCHERASKS
h)F@!OCCURREDONCE
WILLITOCCUR INSIMILARCIRCUMSTANCES v)F ITDOES
THEN
the researcher might propose a theory. And if others accept the theory, the researcher might at-
tempt to have it accepted as a law.
While there are other ways to go about conducting research, the scientific approach underlies
them all. This approach emerged during the Enlightenment, the explosion in scientific investigation
D
o
w
n
l
o
a
d
e
d
b
y
[
U
n
i
v
e
r
s
i
t
y
o
f
C
a
l
i
f
o
r
n
i
a
,
S
a
n
D
i
e
g
o
]
a
t
0
0
:
0
8
1
9
M
a
y
2
0
1
7
RESEARCH FUNDAMENTALS 13
and artistic creativity that began in Europe in the seventeenth century. Early scientific investigators
proposed the scientific approach to research as a way of maintaining rigor in scientific investigation.
The method, simply put, meant not coming to a conclusion on a basis of preformed beliefs alone,
but instead on only what can be observed or tested by the senses. Authority, custom, or tradition—
the stuff of metaphysics—should not be the source of knowledge and understanding. Instead, these
should come from the reality of objects themselves (Richardson and Fowers 1983).
Summary
The study of politics and political activity is the science that contributes to the growth of knowledge
about the institutions and individuals that constitute the world of politics. As one of the social
sciences, the research that takes place in the discipline helps us learn about political systems and
the political behavior of our fellow human beings. Political science research can involve almost
any method of learning available: political science researchers face an almost unlimited number
of research questions toward which to direct their investigative activity. This chapter examined
some of the question topics addressed by political science research and looked at some suggestions
that have been made to distill the list down to a more focused set of major fields.
Research is the process of acquiring data to answer a question or solve a problem. Research
methodology is the approach the researcher takes to acquire the information. In philosophy, this is
the purview of epistemology. Finally, the terms research techniques or processes refer to the steps
involved in a given approach. Research activity has been defined as a set of easily understood
procedures for acquiring information, and as a philosophical mind-set that people bring to any
research activity. Scientific research should not be considered simply a fixed procedure. Rather,
it should be looked upon as a philosophical way of approaching all research, regardless of the
problem being addressed and the approaches and methods employed. Research is conducted to
(1) describe something; (2) predict future behavior or events; or (3) provide greater understanding
of phenomena and whatever relationships are revealed.
Most political science research focuses on questions in five broad fields of inquiry: (1) the his-
tory, theory, and philosophy of politics; (2) American (or other national) politics; (3) comparative
politics; (4) public administration (including the judiciary, public law, and criminal justice); and
(5) international relations and related geopolitical issues. Each of the subfields of political sci-
ence has its own set of common concerns and its own research traditions. However, in general,
mainstream research continues to be focused on the positivist approach and the use of quantitative
methods. A problem with identifying the big issues in political science is the constant change in
the discipline.
Discussion Questions
1. In your own words, come up with a definition for political science research that you can
use to explain the activity to people who have never done research.
2. Why is it important for political scientists to develop research skills?
3. What is meant by “scientific research”?
4. Come up with an explanation that connects knowledge, logic, and reasoning.
5. Compare inductive and deductive reasoning. Use examples.
6. What reasons do positivist/scientific/quantitative researchers give for following their
approaches to political science research? How does this differ from the naturalist/inter-
pretist/narrative/qualitative approach to political science research?
D
o
w
n
l
o
a
d
e
d
b
y
[
U
n
i
v
e
r
s
i
t
y
o
f
C
a
l
i
f
o
r
n
i
a
,
S
a
n
D
i
e
g
o
]
a
t
0
0
:
0
8
1
9
M
a
y
2
0
1
7
14 FOUNDATIONS OF POLITICAL SCIENCE RESEARCH
Additional Reading
Beyerstein, Barry L. 1996. Distinguishing Science from Pseudoscience. Monograph prepared for The Center
for Curriculum and Professional Development. Victoria, BC: Simon Fraser University.
Burnham, Peter, Karin Gilland, Wyn Grant, and Zig Layton-Henry. 2004. Research Methods in Politics.
Houndmills, UK: Palgrave Macmillan.
Collins, Harry, and Trevor Pinch. 1998. The Golem: What Everyone Should Know About Science. Cambridge,
UK: Cambridge University Press.
Couvalis, George. 1997. The Philosophy of Science: Science and Objectivity. London: Sage.
Ethridge, Marcus E., ed. 2003. The Political Research Experience: Readings and Analysis. 3rd ed. Armonk,
NY: M.E . Sharpe.
Golden, M. Patricia. 1983. The Research Experience. 2nd ed. Itasca: Iowa State University Press.
Hughes, John, and Wes Sharrock. 1997. The Philosophy of Social Research. 3rd ed. London: Addison Wesley
Longman.
Lastrucci, Carlo L. 1967. The Scientific Approach: Basic Principles of the Scientific Method. Cambridge,
MA: Shenkman Publishing.
D
o
w
n
l
o
a
d
e
d
b
y
[
U
n
i
v
e
r
s
i
t
y
o
f
C
a
l
i
f
o
r
n
i
a
,
S
a
n
D
i
e
g
o
]
a
t
0
0
:
0
8
1
9
M
a
y
2
0
1
7
15
2 Research Approaches and Methods
Two major methodological positions guide political science researchers: the positivist or be-
havioralist approach, and the postpositivist or interpretist approach. The positivist approach is
usually referred to as quantitative research; the postpositivist approach is referred to as qualita-
tive research. The postpositivist approach is also sometimes referred to as realist, hermeneutic,
or narrative research. The positivist and postpositivist approaches are the chief methodological
approaches that political scientists follow to gain knowledge about the political world (Oakley
2000; Marsh, Stoker, and Furlong 2002). Each will be described in somewhat greater detail in
the following pages.
The Positivist Research Approach
The positivist approach to scientific inquiry emerged as a reaction to the metaphysically based
philosophy of science that characterized science up to the Age of Enlightenment, which lasted from
roughly 1600 to 1800. Before then, knowledge that was developed under ecclesiastical sponsor-
ship was ascribed to supernatural or deific forces (Trochim 2002). This science was fashioned
on a belief that everything in the world was created by God, and everything in the world was as
God wanted it to be. People could not hope to know why things existed or how they came to be
(other than as a creation of God). Rather, they could only observe and describe the world and its
many phenomena as it existed.
The positivist reaction to metaphysical science was empiricism. Empiricism means that all
knowledge must be sensed (seen, felt, heard, measured) to be real; faith alone—the idea of know-
ing something is true because you believe it to be true—was an insufficient basis for explaining a
phenomenon or as a foundation for knowledge. The idea that if phenomena cannot be measured
they should not be studied was a logical extension of this reaction to metaphysics. These early
positivists also believed that the goal of all science—natural and social—is to describe everything
that can be experienced.
Positivists proposed cause-and-effect theories about phenomena, and then framed those theories
in a way that they could be stated as hypotheses, which could then be tested. The preferred method
of testing a hypothesis was to conduct an experiment in which variables were manipulated—that is,
their values changed—and the results then observed and recorded. This pattern of inquiry eventually
came to be called the scientific method. The scientific method relies on logical reasoning, an emphasis
on experience (observation), and a commitment to measurement. While it was developed as a way of
researching in the natural sciences, by the end of the nineteenth century the scientific method—with
hypotheses, experimentation, observation, and quantification—was also being applied in the social
sciences; it is the model of scientific inquiry that positivist researchers still follow today.
D
o
w
n
l
o
a
d
e
d
b
y
[
U
n
i
v
e
r
s
i
t
y
o
f
C
a
l
i
f
o
r
n
i
a
,
S
a
n
D
i
e
g
o
]
a
t
0
0
:
0
8
1
9
M
a
y
2
0
1
7
16 FOUNDATIONS OF POLITICAL SCIENCE RESEARCH
Another fundamental tenet of positivism is that science must be objective, or value free; scientific
knowledge should be based upon what is observed, not on the opinion or beliefs of the researcher.
Positivist researchers emphasize “precise quantitative data” that are gathered and analyzed using
experiments, surveys, and statistics; they employ “rigorous, exact measures by carefully analyzing
numbers from the measures” (Neuman 2000, 66). Neuman summarized positivism in the following
way: “Positivism sees social science as an organized method for combining deductive logic with
precise empirical observations of individual behavior in order to discover and confirm a set of
probabilistic causal laws that can be used to predict general patterns of human activity [Neuman’s
emphasis].” The chief activity in positivist research is counting. The tools used in counting are
obtrusive and controlled measurements, with data gathered by surveys, experiments, case-control
studies, statistical records, structured observations, content analysis, and other quantitative tech-
niques (Oakley 2002, 26–27).
Quantitative Methods
In political science in general, traditional research has long focused on the employment of positivist
research methods with their emphasis on quantitative applications. Much social science research
still follows a positivist approach (Boyte 2000). Positivist research is characterized by researchers
who remain detached from their subjects in order to remain “value free” in their investigations.
They produce predictive theories based on experimentation, and emphasize mathematical and
statistical methods in their analysis. Smith et al. described the quantitative tradition in political
science research in the preface of their text on research methods:
Political science has changed substantially in the last thirty years. Many textbooks and most
professional journals cannot be understood fully without some minimal acquaintance with
the philosophy of science or social science and a wide range of empirical and statistical
methods including computer science, various forms of statistical analysis, content analysis,
survey research, and many others. (Smith et al. 1976, xi)
Bartels and Brady (1993) examined more than 2,000 articles in six of the most important
political science journals and several different collections of papers. They concluded that quan-
titative methods was still predominate in political science research. Their topic organization
scheme is repeated in Table 2.1. Bartels and Brady had difficulty in achieving what they hoped
would be a “logical way” of organizing the large collection of studies. Rather than continuing
to try, they elected instead to follow what they called “a rough logical progression from data
collection through modeling to estimation.” One striking conclusion that may be taken away
from the Bartels and Brady discussion is not about the wide range of types of studies found
in the literature but, rather, that as late as 1993, a matching qualitative research methodology
category was not considered important enough to be included in their collection of papers on
theory and method.
Yan and Anders (2000) reviewed 634 research papers published over a three-year period
in eight public administration/political science professional journals. They found that most
published research dealt with managerial issues relating to federal, state, or local government,
with the emphasis on state and local levels. A smaller number dealt with public sector issues
in general, while only a small portion addressed international issues. The primary emphasis
of the examined research was on government in general or issues that concern the executive
branches at all levels.
D
o
w
n
l
o
a
d
e
d
b
y
[
U
n
i
v
e
r
s
i
t
y
o
f
C
a
l
i
f
o
r
n
i
a
,
S
a
n
D
i
e
g
o
]
a
t
0
0
:
0
8
1
9
M
a
y
2
0
1
7
RESEARCH APPROACHES AND METHODS 17
Breaking with the Positivist Tradition
Not every political science researcher accepted the emphasis on positivist methodology and quan-
titative research methods. Referring to the positivist mind-set of political science researchers as
“a silent civic disease,” Boyte proposed that:
Our implicit theories of knowledge assume the specific understanding of scientific inquiry
that derives from positivism, for a time the dominant philosophy of science. This model
deligitimates “ordinary knowledge” and depreciates the capacities, talents, and interests of
the nonexpert and the amateur. It is antagonistic to common sense, folk traditions, and craft
and practical knowledge mediated through everyday life experience. Of course, “common
sense” is not always right, nor “science” always wrong. I argue only that many different
kinds of valuable knowledge support public life and that conventional academic approaches
slight the nonexpert. (Boyte 2000, 49)
Table 2.1
A Collection of Quantitative Methods Used in Political Science Research
1. Data Collection Methods
a. Experiments
b. Survey Designs
c. Events Data
2. Time-Series Analysis
a. Box-Tiao Intervention Methods
b. Vector Autoregression
c. Cointegration and Error Correction Methods
d. The Kalman Filter
3. Time-Series of Cross-Sections, Panels, and Aggregated Data
a. Aggregated Data and Ecological Inference
b. Time-Series Crossectional, Panel, and Pseudopanel Methods
4. Techniques Tailored to Measurement Properties of Data
a. Event Count and Event History Models
5. Measurement Error and Missing Data
a. The Consequences of Random and Nonrandom Measurement Error
b. Guessing and Other Sources of Error in Survey Responses
c. Nonrandom Samples and Sample Selection Bias
d. Missing Data
6. Dimensional Analysis
a. Voting Studies
b. Perceptual Studies
c. Legislative Studies
7. Model Specification
a. Specification Uncertainty and the Perils of Data Dredging
b. Sensitivity Analysis, Out-of-Sample Validation, and Cross-Validation
8. Estimation
a. Maximum Likelihood Estimation
b. Bootstrapping
9. Political Methodology and Political Science
a. The Nature of Survey Response
b. Economic Voting
Source: Bartels and Brady 1993.
D
o
w
n
l
o
a
d
e
d
b
y
[
U
n
i
v
e
r
s
i
t
y
o
f
C
a
l
i
f
o
r
n
i
a
,
S
a
n
D
i
e
g
o
]
a
t
0
0
:
0
8
1
9
M
a
y
2
0
1
7
18 FOUNDATIONS OF POLITICAL SCIENCE RESEARCH
Smith (2001) joined a group of members of the American Political Science Association in
protesting the positivist tradition of political science research. The goal of what he described
as a group of several hundred scholars was to “restructure the profession.” According to Smith,
worrisome political scientists worry that the discipline is becoming identified too closely with
heavily mathematical research—either formal models or statistical analyses. It is also more about
methods than substance. Yet, it still falls “woefully short, methodologically, in the eyes of math-
ematicians.” Too often, he added, a project’s “chief claim to fame” is its introduction of a new
modeling or statistical technique into political science, rather than use of the model or technique
to say something new or significant about politics.
More Criticisms of Positivist Research
Additional critics have attacked the traditional positivist research approach followed by many po-
litical science researchers. Their view is that political scientists still place far too great an emphasis
upon applied research. As a result, political scientists make few if any contributions to advancing
the state of knowledge in the field. Naím summed up the perception of political science research
during an interview with Dr. Larry Summers, former president of Harvard University and a for-
mer Secretary of the Treasury. Naím compared what he called “the extraordinary progress in the
revolution in technologies, biology and electronics, computer processing, and even astronomy”
with what he then identified as “the dearth of comparable results in the social sciences, particularly
in economics and political science” (Naím 2002, 38–39).
Smith offered a similar negative view in this criticism of political science research:
[P]olitical scientists have, in recent years, put too much effort into trying to make the
discipline more of a science, hence putatively superior to other sources of political
knowledge, and not enough effort into making it a source of distinctive insights into
substantive political questions. . . . I would have political scientists, political-science
departments, university administrators, and providers of financial support for our re-
search devote fewer resources to work that achieves greater methodological (usually
mathematical) rigor in addressing minor questions, justified in the often vain hope that
such efforts will serve as stepping stones toward more scientific work on larger ques-
tions. (Smith 2001, B10)
Richardson and Fowers (1983, 471) echoed the critical view of social science research with
their statement that, “in spite of tremendous effort, enormous methodological sophistication, and
many decades of efforts,” social science has not achieved anything close to the type of “explana-
tory theory that counts as truth and is needed for precise prediction and instrumental control.
Just describing interesting patterns of variables—which always have many exceptions—does
not yield the sort of technical control over events we associate with modern physics, biology,
or engineering.”
It is important to know that today most political science researchers agree that no single
method is the only appropriate way to conduct research. This includes positivism and post-
positivism, the methodology that emerged in reaction to the strict empiricism of the positiv-
ists. Rather, there is a place and a purpose for all approaches and methods. The appropriate
choice from among the growing variety of research traditions in political science must be,
as Dryzek (1986, 315) has noted, “Contingent upon time and place and a given set of socio-
political circumstances.”
D
o
w
n
l
o
a
d
e
d
b
y
[
U
n
i
v
e
r
s
i
t
y
o
f
C
a
l
i
f
o
r
n
i
a
,
S
a
n
D
i
e
g
o
]
a
t
0
0
:
0
8
1
9
M
a
y
2
0
1
7
RESEARCH APPROACHES AND METHODS 19
The Postpositivist Revolution
Postpositivism emerged as a reaction to the strict empiricism of the positivists, which holds that
humans can only know what their senses tell them (Jones 1971). Adoption of the postpositivist
approach was a “radical shift” away from objective, value-free, universal knowledge that charac-
terized the rationalist, positivist, and behavioralist approach to research (Locher and Prügl 2001).
The idea of research ethics based on human rights and justice that emerged after World War II also
influenced a reaction against “value-free” positivist research; it also helped to generate interest in
a research methodology that no long simply described what was, but that went beyond the obvi-
ous to interpret and explain why things are the way they are. Heppell (2002, 15), an early critic
of the positivist focus, identified what he saw as a problem in the political science research of the
period: “There is wide agreement today among philosophers of science that scientific hypotheses
and theories are not derived from observed facts, but invented to account for them.”
While empiricism is the way of learning things that says we can only know what our senses
tell us, another way of learning is through a process of mental reflection. This is the investi-
gative position that E. Terrence Jones (1971) called “rationalism.” To make the jump to this
rationalist way of learning, political scientists have increasingly been forced to adopt qualitative
approaches for conducting their research; this approach is called “postpositivism”; it reflects
a rejection of the positivist tradition. Today, postpositivist political scientists apply rational-
ist or qualitative methods to study what governments choose to do and what they choose not
to do. They are particularly interested in studying the distribution and exercise of power and
domination, and the actions of individuals and groups who seek to gain power and hold onto it
once they have it. Accordingly, the aim of the behavioralists has been “to apply the scientific
method vigorously and rigorously to every nook and cranny” of political science, while on the
other hand, the goals of the postpositivists have been to emphasize ideas more than constructs
that must be observed and measured:
Empirical scientists have often made a fetish of measuring. Worse still, they have confused
efforts to avoid bias caused by unconscious or uncritical values with the avoidance of all
evaluation. They too have developed a crude positivism that most philosophers, if they ever
held it, have long since abandoned. (Pennock 1966, 46)
A New Beginning for Research
From this small beginning in the early 1970s, research methodology has evolved into more than
the one positivist way of approaching scientific inquiry in political science. In addition to the
traditional explanatory approach taken by the positivists, two additional positions in research
today are the interpretive and the critical approaches (Neuman 2000; White and Adams 1994).
Interpretive research has been defined as “the systematic analysis of socially meaningful action
through the direct detailed observation of people in natural settings and interpretations of how
people create and maintain their social worlds” (Neuman 2000, 71).
Interpretive political scientists often employ the tools of anthropological research, partici -
pant observation, and field research. The major research activity followed in all postpositivist/
interpretist research approaches is observation. Interpretist observation is unobtrusive, however.
Specific data-gathering techniques employed include participant observation, in-depth interview-
ing, action research case studies, life-history methods, focus groups, and similar qualitative tools
(Oakley 2000).
D
o
w
n
l
o
a
d
e
d
b
y
[
U
n
i
v
e
r
s
i
t
y
o
f
C
a
l
i
f
o
r
n
i
a
,
S
a
n
D
i
e
g
o
]
a
t
0
0
:
0
8
1
9
M
a
y
2
0
1
7
20 FOUNDATIONS OF POLITICAL SCIENCE RESEARCH
The critical approach to research is sometimes referred to as emancipative or empowering
research. This approach has as its key objective helping research participants to identify and un-
derstand the causes of their circumstances, and then empowering them to bring about the change
that they feel is required. The approach is “a critical process of inquiry that goes beyond surface
illusions to uncover the real structures in the material world in order to help people change condi-
tions and build a better world for themselves” (Neuman 2000, 76). Feminist and Marxist political
science research are two of the major directions taken in critical research.
Research Methods in Political Science
Political science is an exceptionally dynamic discipline. Researchers have taken many different
approaches to the study of political questions. At times, supporters of one approach or another have
made strident claims that theirs is the only way to study politics. However, such chauvinistic attitudes
are no longer as common as they once were. Today, political scientists are in general agreement that
many different research methods and research topics are valid and appropriate. They are more likely
than not to agree with the following conclusions: “there is no one method of acquiring knowledge
about politics” (Stoker and Marsh 2002, 15); and “there now exist not only multiple approaches to
empirical research, but also multiple agendas for the discipline as a whole” (Farr, Dryzek, and Leon-
ard 1995, 2). According to Denscombe (2002), there is a growing tendency to combine the use of
different methods and different research strategies within the same studies. Researchers eclectically
select one or the other, drawing on their individual strengths and compensating for their weaknesses.
It is an exciting time to be conducting research in political science!
Three Common Positivist Research Approaches
Positivist approaches examined include institutional analysis, behavioralism, and rational choice
theory. A slightly disproportionate emphasis has been given to the discussion on behavioralism
because it is, as a review of the literature reveals, still the methodology of preference for a large
number of political scientists.
Institutionalism
For most of its history as a discipline among the social sciences, the dominant methodological
approach in political science was institutionalism. The institutional focus remained the direction
of choice up until the 1950s, when it was replaced by the behavioralist approach. Prior to this
change in focus, most political science research dealt with questions relating to the institutions
that make up the polity and the rules and conventions that emerged to allow political institutions
to function. The chief research topics of political science were concerned with describing—often
by the comparative method—such formal institutions as constitutions, legal systems, and govern-
ment structures, and their changes over time. For more than a hundred years, “Institutionalism was
political science” (Lowndes 2002, 90; Shepsle 1995, 277). The topic of political science research
for that period was the concept of the state and the institutions that made the state possible. The
concept of the state was of particular interest to nineteenth-century American political scientists,
and to discuss government meant to discuss institutions. Shepsle concluded that, for the most
part, government was the “institutional manifestation of the state” and that this political science
research agenda carried on into the early decades of the twentieth century.
The institutions that were the focus of institutionalist political science are not the organizations
D
o
w
n
l
o
a
d
e
d
b
y
[
U
n
i
v
e
r
s
i
t
y
o
f
C
a
l
i
f
o
r
n
i
a
,
S
a
n
D
i
e
g
o
]
a
t
0
0
:
0
8
1
9
M
a
y
2
0
1
7
RESEARCH APPROACHES AND METHODS 21
that make up the political world, but rather, such concepts as the formal and informal rules, politi-
cal standards, norms, and guides for accepted political behavior. The term political does not refer
exclusively to party politics, but instead to the broader view of governance in general. Political
phenomena are social phenomena; the rules that enable society to work are also necessary for
government to work. How governments work—not how they should work—was the question that
institutionalists sought to answer. One of the earliest examples of an institutional study is Woodrow
Wilson’s 1885 investigation of the American Congress. His study (Congressional Government)
sought to explain the way Congress actually operates, not the way the Constitution says it should
work (Shepsle 1995).
Institutionalism appears to be enjoying a renewed popularity among political scientists, although
in a format dramatically different from the institutionalism of the past; it no longer focuses only
on the task of explaining political organizations by comparison. Instead, new institutionalists are
interested in such concepts as the ways that power is gained, held, and exercised in political cir-
cumstances, in how values are shared and disseminated among members of political groups, and
on the broader issues of organizational design. Institutionalism is still commonly used in some
subfields of political science, including public administration and constitutional studies.
According to Lowndes (2002, 91), new institutionalists are no long concerned solely with
how political institutions affect individuals, but also with the “interaction between institutions
and individuals.” Lowndes (97) identified six changes that are helping to make the institutional
approach more palatable. Institutionalists have gone from
s An old focus on organizations toward a new focus on rules
s A concentration on formal concepts to informal definitions of institutions
s !VIEWOFPOLITICALINSTITUTIONSASSTATICTOAVIEWOFTHEMAS DYNAMIC
s Submerged (or ignored) values to a position that sees values as critical to understanding
institutional relationships
s A holistic view of institutions to one that focuses on their individual parts and components
s !VIEWOFINSTITUTIONSASINDEPENDENTENTITIESTOONETHATSEESTHEMASEMBEDDEDINSOCIETIES
and specific contexts
Behavioralism
Beginning in the middle to late 1950s, some political scientists began looking for ways to improve
society by enhancing political institutions, increasing public participation, and otherwise addressing
politically based social problems. The institutional focus was unable to meet the needs of the new
researchers, who felt that the purely descriptive approach of institutional methods was not able to
successfully address the important issues of the discipline. A new political science was needed;
the rigorous application of scientific principles of other behavioral sciences was seen to meet this
need. This new way of studying political phenomena was, in the words of Shepsle (1995, 279),
“tremendously important to the study of politics because it emphasized, in its many variations,
precise observation, counting and measuring where possible, the clear statement of hypotheses, and
unambiguous standards for accepting or rejecting them.” Furthermore, it was a radical shift away
from the rambling narratives that characterized much of the political science of the period.
Behavioralism took hold in social science research in the 1920s. By the 1940s, it was deeply
entrenched in all social science. Social researchers began to move their data-gathering activities
out of the laboratory or classroom and into the real world, which made it even easier to apply
behavioralist research principles to political science research. For example, experimental social
D
o
w
n
l
o
a
d
e
d
b
y
[
U
n
i
v
e
r
s
i
t
y
o
f
C
a
l
i
f
o
r
n
i
a
,
S
a
n
D
i
e
g
o
]
a
t
0
0
:
0
8
1
9
M
a
y
2
0
1
7
22 FOUNDATIONS OF POLITICAL SCIENCE RESEARCH
scientist William S. Verplanck (1994, 4) described the lessons he learned while conducting research
at the Naval Medical Research Lab during the Second World War:
If you’re really going to learn about behavior, unless you settle for a kind of myopia, you
have to do research in the “real” world, that is, the world in which we all live every day,
and not solely in the restrictive environment of a laboratory. Neither what is theoretically
best nor what works best in the lab is necessarily the best elsewhere.
The behavioralist approach continued to gain acceptance over the next several years until by
the 1950s it had become the dominant way of conducting social science research. In the 1960s, the
primary focus of political science had shifted from the study of political institutions to the study of
the political behavior of people in the “real world” described by Verplanck. However, acceptance
of the behavioralist approach was not without a great deal of controversy. Somit and Tanenhaus
described the acrimonious introduction of behavioralism to political science research this way:
Political scientists have quarreled over many matters in the contemporary period but the
most divisive issue by far has been behavioralism. If the controversy it has elicited is any
measure, this latest quest for a more scientific politics is easily the paramount development
in the discipline’s entire history. (Somit and Tanenhaus 1967, 173)
According to Gunnell (1983, 15), the objectives of behavioral research are to be reached by
“the formulation of systematic concepts and hypotheses; the development of explanatory gener-
alizations that would raise inquiry beyond mere factual empiricisms; interdisciplinary borrowing;
empirical methods of research; (and) direct observation.”
The following eight assumptions and objectives are characteristics of behavioralist concepts
and methods in political science research that differentiate the approach from the traditional in-
stitutionalist approach (Easton 1962, 7–8; Somit and Tanenhaus 1967, 177–179):
1. Regularities: These are discoverable commonalities in political behavior. They are ex-
pressed as generalizations or theories. Political science is capable of prediction and should
avoid the purely descriptive studies that characterized most of institutionalist research.
2. Verification: The validity of the generalizations must be testable and shown to be tied
to relevant political behavior. Political science researchers should focus on observable
phenomena—what is done, what is said by individuals. These data can then be studied
together as “political aggregates.” Institutional behavior is the behavior of individuals.
3. Techniques: The means for collecting and interpreting data about the generalizations and
behavior must exist; they must be examined using rigorous means for observing, recording,
measuring, and analyzing behavior. Research must be theory oriented and theory driven.
4. Quantification: Precise measuring requires quantification and application of mathematical
(statistical) analysis. Data must be quantified; only quantification will make the discovery
of precise relationships and regularities possible.
5. Values: Ethical evaluations are not empirical explanations, and their use should be kept
apart. They require different methods of evaluation and interpretation. Extreme care
must be taken not to mistake one for the other. The “truth” of such values as democracy,
equality, freedom, and so forth, cannot be proven scientifically, and therefore should not
be a part of political science research. Only observable, measurable behavior, not the
“great issues” of society, is grist for the political science mill.
D
o
w
n
l
o
a
d
e
d
b
y
[
U
n
i
v
e
r
s
i
t
y
o
f
C
a
l
i
f
o
r
n
i
a
,
S
a
n
D
i
e
g
o
]
a
t
0
0
:
0
8
1
9
M
a
y
2
0
1
7
RESEARCH APPROACHES AND METHODS 23
6. Systemization: Research ought to be systematic. Theory and research are closely associ-
ated parts of the orderly development of knowledge. “Research untutored by theory may
prove trivial, and theory unsupported by data, futile” (Easton 1962, 7).
7. Pure Science: Although recognizing the importance of applied solving of real-life prob-
lems of society, political science research should focus on “pure research” that advances
our knowledge of the political world. Behavioralists contended that applied research is
an “unproductive diversion of energy, resources, and attention” (Somit and Tanenhaus
1967, 178).
8. Integration: Political science research must not ignore the other social science disciplines;
only by integrating all knowledge about human behavior will political science be brought
back to its earlier high status and returned to where it belongs: among the social sciences.
Sanders summarized the position of behavioralism in the new century by pointing out that, for
behavioralists and post-behavioralists alike, the main objective for social research is to explain
the behavior of individuals and groups of individuals. Their basic research question is, “Why do
individuals, institutional actors, and nation states behave the way they do?” He added,
Embedded in the behavioralist notion of explanation is the idea of causality. Although be-
havioralists are aware that causality may be as much a reflection of the way we think about
the world as it is of “reality,” they nonetheless insist that, unless a theory makes some sort
of causal statement, it cannot be deemed to explain anything. (Sanders 2002, 63)
Rational Choice Theory
Rational choice theory is a way of explaining human behavior. It is based on the idea that
people make decisions for the purpose of providing themselves the greatest possible benefits. In
economics—where most of the principles of the theory were developed—this is referred to as the
process of “maximizing utility.”
Political scientists began to employ rational choice theory during the 1960s and 1970s, partly in
reaction to the behavioralist position that human behavior is not a matter of personal choice, but is
instead shaped by psychological and social accidents to which humans are exposed, often against
their will. In political science, the essential focus of choice theory research that has emerged is
the analysis of the ways that groups of individuals respond to challenges in political institutions,
public policy, and other political phenomena.
In the form in which it is used today, rational choice theory is probably closer to the institu-
tionalist position than it is to behavioralism. Shepsle described how rational choice theory differs
from behavioralism this way:
In place of responsive, passive, sociological man, the rational choice paradigm substitutes
a purpose, a proactive agent, a maximizer of privately held values. A rational agent is one
who comes to a social situation with preferences over possible social states, beliefs about the
world around oneself, and a capability of employing these data intelligently. Agent behavior
takes the form of choices based on either intelligent calculation or internalized rules that
reflect optimal adaptation to experience. (Shepsle 1995, 280)
A key concept in rational choice theory is that all human behavior occurs for a purpose. Given
a set of options and information about the costs and benefits of their choices, people will act in the
D
o
w
n
l
o
a
d
e
d
b
y
[
U
n
i
v
e
r
s
i
t
y
o
f
C
a
l
i
f
o
r
n
i
a
,
S
a
n
D
i
e
g
o
]
a
t
0
0
:
0
8
1
9
M
a
y
2
0
1
7
24 FOUNDATIONS OF POLITICAL SCIENCE RESEARCH
way that provides them the greatest payoffs—they make the rational decision. Thus, all behavior
is centered on the self. One of the underlying assumptions in rational choice theory is that people
calculate their actions as though they were playing a game to win. Individuals make political deci-
sions; groups do not. Compromise occurs when it results in greater utility for the collected group
than maintaining an individual position. This helps explain why political parties form.
Another key concept in rational choice theory is that all the players know—and generally adhere
to—the rules of the game. “Rules” in this sense are similar to the standards and norms that are a
focus in the institutionalist approach to political science.
Postpositivist Research Approaches
The many qualitative research approaches now finding their way into use in political science
and the other social sciences have been grouped together under the label of interpretive theory
(Bevir and Rhodes 2002). Interpretive approaches to research involve the use of what is essen-
tially subjective narrative. Narrative methods are believed to produce knowledge that is different
from knowledge gained by traditional (positivist) science. To interpretive researchers such as the
postmodernists, for example, the things that citizens take for granted, such as the sovereignty of
nature, are not “Truth,” but rather, simply a concept that has been constructed by humans. Some
societies accept the premise that the natural environment is something that should be protected
and preserved, while others do not. Neither view is inherently better than the other. This has been
pointed out explicitly in research in international cooperation on environmental issues. Before
progress can be made, negotiators must take care to ensure that everyone is working from the
same basic assumptions (Wapner 2002).
According to Denscombe (2002, 18), some writers use the term constructionism to categorize
the same approaches that fall under the interpretist label. Constructionism means that the research-
ers do not hold the idea that the world of reality is “out there,” waiting only to be discovered.
Rather, they believe that humans construct all social phenomena and that no single construction
is better than any other.
Denscombe found that most of the different postpositivist research approaches share a number
of common points. First, all reality is considered to be subjective; it is constructed and interpreted
by people. Second, humans react to the knowledge that they are being studied. When people
become aware of this fact, their behavior changes—often in a subtle but real manner. Hence, the
researcher can never identify the “true” behavior.
Third, this approach holds that it simply is not possible to gain objective knowledge about social
phenomena. Despite all their efforts, researchers cannot be objective. Fourth, there is little or no prospect
of producing grand theories explaining the social world using these research approaches. All reality is
subjective, created by individuals, and subject to change; thus, a common theory is impossible.
Several interpretive approaches guiding qualitative research in political science include critical
research, such as the feminist and emancipatory (Marxist) approaches, and the anti-foundationalist
or postmodern approaches. A key characteristic of each of these three approaches is their emphasis
on narrative. They are typically small-sample studies, often analyzing a single case or a few cases,
and placing greater emphasis upon qualitative methods than on mathematical tools.
The Feminist Research Approach
Feminist issues appeared in political theory studies during the 1970s. An initial goal of feminist
research was to “document the dreadful history of misogynist statements by one male author or
D
o
w
n
l
o
a
d
e
d
b
y
[
U
n
i
v
e
r
s
i
t
y
o
f
C
a
l
i
f
o
r
n
i
a
,
S
a
n
D
i
e
g
o
]
a
t
0
0
:
0
8
1
9
M
a
y
2
0
1
7
RESEARCH APPROACHES AND METHODS 25
another, statements that have served to justify the exclusion of women from the political realm and
confine them to the private world of the family. (Saxonhouse 1993, 15)” The feminist approach
took on greater importance in political theory research during the decade of 1980s, a phenomenon
chronicled thus:
[No] story of political theory in the 1980s would be complete without stressing the extraor-
dinary development and vitality of feminist thought. Its explorations ramified into all aspects
of politics, society, personality, and inquiry; the constitution and construction of gender
differences; the retrieval of neglected writers, agents, and questions, and the corresponding
expansion or reconstitution of [what] political theory theorizes about; the exploration of
covert gender assumptions in theoretical categories such as the public/private distinction,
rights, and justice; the examination of bias and discrimination in practical spheres structured
by such categories; and the questioning of entire modes of philosophy and social inquiry . . .
as gender-based and partial. (Galston 1993, 31)
The feminist approach to research and to science in general is based on the contention that
women see things differently, have different ways of learning, and different ways of describing
meaning than men. Because of centuries of women being forced to accept a lesser status in the
political sphere, feminist-oriented political science research was developed as a tool to aid women
in their emancipatory efforts. Feminist researchers take issue with the gender-based political theory
and political writing that is both overtly and covertly gender biased.
Feminist researchers tend to see traditional positivist research as resulting in a science with
a gender bias that is potentially misleading at best, and insulting and derogatory at worst. When
feminist political science researchers examine such political phenomena as international relations
and politics, state formation, war and peace, revolutions, international political economies, and
global governance, they include in their analyses discussions about the role of gender in these
events. Thus, gender is considered to be inherent in all international politics and other political
writing (Locher and Prügl 2001).
Feminist research has been identified as one of four types of action-oriented research (Small 1995).
The first of the three other models of action research is the traditional action research as proposed
by Kurt Lewin in the 1940s. The second model is participatory research, which, by breaking down
barriers between researchers and the researched, enables people to identify the cause of their problems
and to develop their own ways to deal with them. The third approach is empowerment research,
which has its foundations in community psychology; empowerment research is seen as a tool to help
people gain “mastery over their own affairs.” Feminist research, according to Small (1995, 5), has
as its primary goal “the promotion of the feminist agenda by challenging the male dominance and
advocating the social, political, and economic equality of men and women.” It has been described
as “research for women rather than about women” (Allen and Baber 1992).
The Marxist Approach
What may be the first of the critical approaches to research in the social sciences, classical Marx-
ism, was based on the idea that conflict between the haves and have-nots, workers versus owners,
the worker class versus the capitalist ruling class, is at the root of all political behavior. Therefore,
Marxist research focuses on ways to highlight disparities, to identify the economic structures that
form and restrict development of society, and on studies that foster egalitarian and emancipatory
principles (Marsh, Stoker, and Furlong 2002).
D
o
w
n
l
o
a
d
e
d
b
y
[
U
n
i
v
e
r
s
i
t
y
o
f
C
a
l
i
f
o
r
n
i
a
,
S
a
n
D
i
e
g
o
]
a
t
0
0
:
0
8
1
9
M
a
y
2
0
1
7
26 FOUNDATIONS OF POLITICAL SCIENCE RESEARCH
Four main principles are associated with classical Marxism: economism, determinism, materi-
alism, and structuralism. Economism refers to the concept that economic forces determine social
conditions. The determinism principle says that capitalist production methods determine the role
people hold in life; people are not free to choose their lot. Materialism refers to the materialism
of the ruling class, the owners and operators of factories and the ruling classes they support. Fi -
nally, structuralism refers to Marx’s contention that economic and political structures established
the actions of men. Modern Marxism is radically different from the classical version, however.
Accordingly,
[W]hile modern Marxism is characterized by diversity, most of it: rejects economism; rejects
determinacy, emphasizing contingency; rejects materialism, acknowledging an independent
role for ideas; rejects structuralism, accepting a key role for agents; no longer privileges
class, acknowledging the crucial role of other causes of structured inequality; and, to an
extent, privileges politics. (Marsh, Stoker, and Furlong, 2002)
The Postmodern Approach
Among the postpositivist approaches that have gained some acceptance since they appeared
in the last decades of the twentieth century is the postmodern position, also known as the anti-
foundationalist approach. This approach to political science research has its roots in the critical
theory found in art, music, and literature, which emerged during the 1960s. Several key principles
of postmodernism are that no single fundamental political truth exist; there is no one absolutely
certain way to gain knowledge; no rules exist to guarantee the rationality of science.
According to Oakley (2002), postmodernism refers to the extensive cultural changes that have
taken place in Western societies since the end of World War II. Some of the salient phenomena
include the emergence of a global economy, the weakening of radical politics and collapse of
the Soviet Union, a lost faith in the power of rationality to bring about freedom, the rapid and
pervasive spread of technology, the spread of popular culture, and other events and conditions.
Postmodernist critics hold that, since social science is itself a part of the modernist condition, then
the changes in the philosophical foundations of political science research that are still evolving
make it necessary to adopt a postmodernist approach to research in these disciplines.
The postmodern approach has been adopted by a variety of political scientists and philosophers
who, according to Dwight Allman (1995, 69), “dispute the viability of modern civilization.”
This means, in essence, that the positivist approach of searching for an all-encompassing “true”
picture of a social event is a waste of time. Each event must be described individually, taking
into consideration the intentions of the actors, the experience of the investigator, and the external
environment of the time of the event.
To determine the meaning of a political phenomenon, the postmodernist believes that the
time, situation, and intent of the social actor must be considered in addition to the event or
behavior itself. Furthermore, there is no one best way to describe or define a social or political
event. Equally, for the researcher, there is no one best way to investigate a social or political
behavior or event. One of the most important tasks of the researcher is to interpret the phe-
nomenon itself before it can be researched. First, the researcher frames the act within a larger
context that includes the objectives of the social actors and the specific circumstances existing
at the time of the action (Fay 1975).
The postmodern researcher cannot simply progress from a known and accepted foundation of
basic assumptions. To the postmodernist, the meaning of the concepts we usually take for granted,
D
o
w
n
l
o
a
d
e
d
b
y
[
U
n
i
v
e
r
s
i
t
y
o
f
C
a
l
i
f
o
r
n
i
a
,
S
a
n
D
i
e
g
o
]
a
t
0
0
:
0
8
1
9
M
a
y
2
0
1
7
RESEARCH APPROACHES AND METHODS 27
such as democracy, the “sovereignty of nature,” honesty, ethical behavior, and the like, do not really
exist; they are, instead, human constructs. As such, the interpretations placed on these constructs
represent only one set of possible meanings.
To postmodern researchers, the idea of a concept such as nature is not real; rather, it is a
construction of the human intellect. For example, Wapner (2002, 167) adopted a postmodern
approach in his discussion of the apparent lack of an international consensus in the importance
of degradation of the natural environmental, and how that lack limits public environmental
policy. Thus, there is no better or best view of nature. Nature is what society makes of it, and
people in different cultures, in different circumstances, have different points of view about
nature that are equally legitimate. Wapner concluded that, “Postmodern critics have shown
THAT@NATUREISNOTSIMPLYA GIVEN
PHYSICALOBJECTBUTASOCIALCONSTRUCTIONANENTITYTHAT
assumes meaning within various cultural contexts and is fundamentally unknowable outside
of human categories of understanding. This criticism raises significant challenges for global
environmental politicians.”
Ian Hodder (1989a) identified four strands of postmodern social science that may help to define
this evolving approach to political science research. The first is what he describes as “the sense
of disillusion” that social scientists and people in general have with the products and progress of
scientific research. Second, “modernism” has resulted in detachment, alienation, and cynicism,
rather than coming through with its promise of freedom, equality, and an enhanced quality of life
for all of society. Third, postmodernism has been shaped by a number of essentially revolution-
ary changes in society that have occurred since the end of World War II. Some of these have to
do with advances in technology; others are founded in changes in the way people look at their
world and society, including consumerism, world capitalism, planned obsolescence, very brief
periods between alterations in fashion and style. The fourth defining strand of the postmodern
approach is the way special interest groups use the global press, fashion, and the arts to manipu-
late and manage the images of political events, economic issues, or social structure that modern
society conceptualizes as social and political phenomena. Together, these four strands provide a
framework upon which to conduct research in political science with a postmodern focus (Marsh
and Stoker 2002).
Summary
Political science research is approached from a number of different methodological traditions,
each framed with different conceptual elements that are found in other social science disciplines.
In two different studies on American politics, for example, one researcher may have used a
variable-based approach, with heavy emphasis on quantification and statistical analysis (the
positivist research tradition), while on the other hand, a second researcher may have elected to
follow a comparative case study approach, in which the most common themes are qualitatively
compared. Typically, qualitative research designs follow what has come to be known as the
postpositivist research tradition. At one time a heated debate raged in the discipline over which
of the approaches was the appropriate one. Traces of that debate still exist today, despite the
growing acceptance that there is a correct time and place for both approaches to research in
political science (Smith 2001).
The two major philosophies of science traditions are positivism and postpositivism. Positivist
researchers emphasize quantitative data that is gathered and analyzed using experiments, surveys,
and statistics. Postpositivism includes several different approaches, including explanatory, critical,
feminist, and postmodern research.
D
o
w
n
l
o
a
d
e
d
b
y
[
U
n
i
v
e
r
s
i
t
y
o
f
C
a
l
i
f
o
r
n
i
a
,
S
a
n
D
i
e
g
o
]
a
t
0
0
:
0
8
1
9
M
a
y
2
0
1
7
28 FOUNDATIONS OF POLITICAL SCIENCE RESEARCH
Discussion Questions
1. Discuss the differences between the positivist and postpositivist philosophies of science.
2. How does the phrase “value free” relate to research in political science?
3. Why did the postpositivists break away from the positivist tradition in research?
4. What is meant by the term empiricism in research?
5. Define the institutional analysis research approach and give an example of a political
science research project using this approach.
6. Define the behavioralist research approach and give an example of a political science
research project using this approach.
7. Define the constructionist research approach and give an example of a political science
research project using this approach.
8. Define the rational choice theory research approach and give an example of a political
science research project using this approach.
9. Define the feminist research approach and give an example of a political science research
project using this approach.
10. Describe the postmodernist research approach and give an example of a political science
research project using this approach.
Additional Reading
Couvalis, George. 1997. The Philosophy of Science: Science and Objectivity. London: Sage.
Gerring, John. 2001. Social Science Methodology: A Critical Framework. Cambridge, UK: Cambridge
University Press.
Hinkle, D., William Wiersma, and Stephen G. Jurs. 2002. Applied Statistics for the Behavioral Sciences. 5th
ed. Stamford, CT: Cengage Learning.
Hughes, John, and Wes Sharrock. 1997. The Philosophy of Social Research. 3rd ed. London: Addison Wesley
Longman.
Marsh, David, and Gerry Stoker. 2002. Theory and Methods in Political Science. 2nd ed. Houndmills, UK:
Palgrave Macmillan.
Schwab, Donald P. 2008. Research Methods for Organizational Studies. Mahwah, NJ: Lawrence Erlbaum
Associates.
D
o
w
n
l
o
a
d
e
d
b
y
[
U
n
i
v
e
r
s
i
t
y
o
f
C
a
l
i
f
o
r
n
i
a
,
S
a
n
D
i
e
g
o
]
a
t
0
0
:
0
8
1
9
M
a
y
2
0
1
7
29
3 Understanding the Research Process
All research activity takes place in a logical sequence of steps or stages. McDowell (2002), per-
haps taking this concept to the extreme, identified a process for research that involves as many as
twenty distinct steps. Regardless of how many steps are identified, most researchers would probably
agree that research involves at a minimum the following distinct activities. First, the researcher
identifies a problem circumstance, question, event, or situation (this is the study problem). Second,
the researcher designs a method of collecting information that promises effective resolution of
the problem or question (planning a research strategy). Third, information about the problem is
collected (a data gathering activity); sometimes this means collecting quantitative data, at other
times, qualitative data. Fourth, once the information is collected, its meaning must be found (data
processing, analysis, and interpretation). Finally, all the pieces must be put together in a report
of the research findings—either written or oral or both—that either helps establish resolution of
the problem or identifies a need for additional research.
How these activities are put together is the subject matter of this and the remaining chapters.
Together, the parts make up the whole that constitutes the systematic process of research strategy
and methods. This chapter examines that process by explaining each of the steps in detail. The
process has been compressed in order to be relevant for all types of research approaches. Research
in political science takes many forms and approaches, and other authors may suggest a different
process. However, if all the steps in the process presented here are followed, most researchers
will successfully complete their projects.
There are few limits to the variety of choices of study questions, research strategies, data col-
lection methods, data processing, and evaluation approaches. There are also many different ways
of interpreting the results. It is possible to put these together in many different combinations, none
of which is inherently more correct than another. Today, these different combinations are all seen
as valid research strategies. Their selection and application is based upon the nature of the study
question, the objectives for the study, the level of skill of the researcher, and his or her comfort
with the research methods that are most appropriate for the objectives of the research.
Steps in the Research Process
Today, both quantitative and qualitative research strategies are considered to be legitimate designs
for research in public administration and the other social and administrative sciences; the different
designs simply serve different purposes. Whichever approach is taken, all research takes place
in a series of activities similar to the seven-step process discussed below (see Figure 3.1). This
seven-step process has been used to guide research activities in the social, administrative, and
D
o
w
n
l
o
a
d
e
d
b
y
[
U
n
i
v
e
r
s
i
t
y
o
f
C
a
l
i
f
o
r
n
i
a
,
S
a
n
D
i
e
g
o
]
a
t
0
0
:
0
8
1
9
M
a
y
2
0
1
7
30 FOUNDATIONS OF POLITICAL SCIENCE RESEARCH
natural sciences. The steps begin with identifying the research problem; they proceed through
establishing objectives and strategy, planning and collecting data, and analyzing and reporting the
findings. The process is a composite of quantitative and qualitative methodologies.
Frankfort-Nachmias and Nachmias (1996, 20) suggested a model for social science research
that more closely follows the traditional plan for quantitative studies. Their model begins with
identifying the problem, then goes on to include the writing of hypotheses, research design, mea-
Step 1: Identify the Research Problem
(Why should effort be spent on this research topic; what study
questions need to be addressed; what is the research
hypothesis?)
Step 2: Establish Research Objectives
(What information must be collected to answer the study
questions and improve the quality of the final research report?)
Step 3: Select the Research Strategy
(What is the best and most cost-effective way to gather this
information; how should the sources be studied?)
Step 4: Prepare a Research Plan
(What specific steps must be taken to gather this information
from these sources following the selected strategy?)
Step 5: Gather the Data
(What activities are needed to monitor and manage the process
to be sure the right data are collected?)
Step 6: Analyze and Interpret the Data
(What do the data mean, specifically in terms of the problem?)
Step 7: Prepare and Present the Research Findings
(Does the interpreted information address the research problem
and answer study questions; what are the implications of the
research findings?)
Figure 3.1 A Seven-Step Process for All Research Approaches, with
Checklist Questions
D
o
w
n
l
o
a
d
e
d
b
y
[
U
n
i
v
e
r
s
i
t
y
o
f
C
a
l
i
f
o
r
n
i
a
,
S
a
n
D
i
e
g
o
]
a
t
0
0
:
0
8
1
9
M
a
y
2
0
1
7
UNDERSTANDING THE RESEARCH PROCESS 31
surement, data collection, data analysis, and generalization. Qualitative research process models
vary with the methods employed. Among the methods used most often in the social sciences are
simple and participant observation, in-depth personal interviews, key informant and focus group
interview, and similar designs (Devine 2002). Each of these methods begins with identifying a
research problem, and each includes stating a goal for the study and planning the remaining ele-
ments, including data collection.
Step 1: Identify the Research Problem
The first step in research is to clearly and succinctly identify the research problem. Frankfort-
Nachmias and Nachmias (1996, 52) defined the research problem as “an intellectual stimulus
calling for a response in the form of scientific inquiry”; they added that the problem is typically
described with a set of concepts that have been identified or selected by the researcher. The problem
concepts are, in turn, the variables evaluated in the study.
The label “study problem” is not always used to describe this initial activity in the research
process. In the social sciences, it is often replaced with the phrase defining the study question. Other
authors refer to it as a process of establishing a rationale for the study. The “question” has also
been called the research topic, the research situation, the information need, and other things. The
labels all mean the same thing: they justify the reason for expending the time and effort required to
complete a research project before starting the process. Researchers agree that clearly identifying
the study problem is among the most important steps in the entire research process (Berg 1998).
If defining the study problem is not done correctly, it is likely that the remaining activities will be
a waste of the time and labor of the researcher. Data will have been gathered, but the reason and
meaning of that data will be lost. There are usually no simple answers to study questions; instead,
each involves many subcomponents and antecedent factors.
The research problem often consists of two key components. It is important to not confuse one
with the other. The first is a statement of the problem as it is seen by the researcher; the second
is the set of research questions that will be addressed in the study. The following is an example
of a problem statement:
This research examines some reasons why the governments and voter publics of the three
Baltic States—Estonia, Latvia, and Lithuania—have different expectations of benefits and
costs resulting from possible membership in the European Union (Berg 1998, 23).
The research questions associated with this study problem might include the following:
s 7HATARE THECOSTANDBENElTEXPECTATIONSTOEACHGOVERNMENT
s (OWHAVECITIZENSINEACHCOUNTRYVOTEDON %5MEMBERSHIPINTHEPAST
s 7HATCHANGESHAVEOCCURREDINPUBLICOPINIONABOUT%5MEMBERSHIP
s 7HICHGROUPSINEACHCOUNTRYSUPPORTMEMBERSHIPANDWHICHOPPOSEIT
s 7HATCONDITIONSHASTHE%UROPEAN5NIONMADEA PRICEOF%5MEMBERSHIP
Some of the key activities involved in the process of identifying the study problem include (1)
determining the unit of analysis for the study, (2) finding out what other researchers have discovered
and reported about the issue, (3) identifying relevant concepts that are functions of the problem,
and (4) translating the concepts into variables that can be stated in hypotheses and tested. The unit
of analysis refers to the most basic, complete component part of the study concepts that can be
D
o
w
n
l
o
a
d
e
d
b
y
[
U
n
i
v
e
r
s
i
t
y
o
f
C
a
l
i
f
o
r
n
i
a
,
S
a
n
D
i
e
g
o
]
a
t
0
0
:
0
8
1
9
M
a
y
2
0
1
7
32 FOUNDATIONS OF POLITICAL SCIENCE RESEARCH
investigated. The unit of analysis selected will affect the final research design, the data collection
process selected, and the way the data are analyzed.
Key concepts that collectively constitute the study question may be determined by interpretive
analysis of exploratory interview data or by conducting a small-sample pilot study—both of which
should be augmented by a study of the problem as it has been experienced and examined by other
investigators. Exploratory activities include conducting intensive interviews with persons with
some knowledge of the problem; these persons are sometimes referred to as key informants and
the activity is known as conducting key informant interviews.
A second way to identify potential concepts that influence the problem is by testing a preliminary
data-gathering instrument on a small subsample of participants. Analysis of these findings will
often reveal the underlying structure of the problem, including the concepts that frame the issues.
Finally, research designs should always include a thorough reading of what other investigators
have discovered. In the language of scientific research, this process is called a literature review.
It is absolutely critical that the literature search be more than a simple spin through items found
on the Internet. Certainly, electronic data sources are important, but they must be augmented with
other sources. Examples of other sources include archival data, artifacts, symbols, historical nar-
ratives, and many other published and unpublished documents.
Conducting a Literature Review
An important part of the early development of a research project is carrying out a comprehen-
sive review of the published literature on the topic. This examination of prior research on the
topic is important for several fundamental reasons. First, it helps to define and delimit the study
problem. Second, a review of the literature may reveal previous research that clearly answers the
problem, thereby making further effort superfluous. It typically involves reading and analyzing
material in published books, professional and academic journals, and government documents,
among other sources.
The focus of the literature review should always be on the key ideas that could function as
leads for further investigation. The literature typically builds on the work already done by other
investigators, often including the authors of that work in the list of references. These references,
in turn, become important contributors to the design of an appropriate research project.
Previous investigators often have already stated and tested some meaningful and enlightening
hypotheses about the topic—very little in social science is really “new.” The task of the research is
to gather these previously published ideas, to evaluate their usefulness as they related specifically
to your research, and to determine whether they suggest new ways of looking at the problem that
might have been missed (Selltiz, Wrightsman, and Cook 1976).
Identifying Variables and Writing Hypotheses
The term variable is used to identify the characteristics or properties of the concepts that are to be
studied. In a quantitative research design, variables must have two or more values—also known
as levels. The characteristic must be able to take on any one of the values, and typically varies
from subject to subject. The variation can be in quantity or in quality. For example, political party
affiliations may have as many values as there are recognized parties. In U.S. presidential elections,
the two traditional values of the variable party are Democrat and Republican. Periodically, third
parties attempt to gain voter recognition, but as yet have not unseated the traditional two parties,
despite millions of dollars in contributions.
D
o
w
n
l
o
a
d
e
d
b
y
[
U
n
i
v
e
r
s
i
t
y
o
f
C
a
l
i
f
o
r
n
i
a
,
S
a
n
D
i
e
g
o
]
a
t
0
0
:
0
8
1
9
M
a
y
2
0
1
7
UNDERSTANDING THE RESEARCH PROCESS 33
Social class is another variable often seen in social science research; traditionally, it has five
levels: lower, lower-middle, middle, upper-middle, and upper (Frankfort-Nachmias and Nachmias
1996). The variable gender is what is known as a dichotomous variable, because it has just two
possible classes: male or female. Other kinds of variables include the following:
s Multichotomous: A multichotomous variable provides a selection of more than two pos-
sible answers from which to choose. Examples include multiple choice quiz questions and
questions with more than two possible answers from which to choose such as ethnic group,
social class, or residence type. A question type that has a similar appearance, but one that is
not multichotomous, is a list of items from which respondents may select more than one—
these are called “check all that apply” questions. Checking all the publications from a list of
magazines to which you subscribe, or all the radio stations you regularly listen to or television
stations you watch, are examples. They are dichotomous rather than multichotomous in that
the only possible coding for such responses is checked–not checked. In this sense, then, each
item on the list is an individual variable (or question) with two values.
s Continuous: Continuous variables—also called measurement variables—are not restricted
to specific categories and can take almost any value within an upper and lower limit. Age in
years, income in dollars, height in inches and fractions of inches, air pressure in pounds per
square inch: these are all examples of continuous variables.
s Discrete: Also known as categorical variables, discrete variables are restricted to only a set
number of possible values; discrete variables also have a minimum-sized unit. An example
is the number of family members living in the same household.
s Control: Control variables are used in experiments in order to test the possibility that a rela-
tionship between two variables might be explained only in the presence of another variable.
For example, to test whether gender influences party affiliation, control variables might
include social class, education, occupation, or income.
s Dependent: Dependent variables are the variables that the researcher is attempting to explain.
An example might be voting behavior.
s Independent: Independent variables are the variables that “cause” a change in the dependent
variable. Causality is very difficult to prove in social and political research, however, so
rather than “cause,” researchers usually use the word “explain” instead.
Step 2: Establish Research Objectives
Step 2 in the research process is spelling out in advance and in detail what is to be accomplished
by the research. These are the objectives for the study. This step is closely allied to the first step,
identifying the research problem. Both address the reasons for doing the research. At this stage,
however, the objectives may still be tentative; a final set of objectives may not emerge until after
a review of the literature pertaining to the study question has been completed.
The research problem is a statement of the reason for doing the research; research objectives
are statements of what the researcher wants the study to accomplish. Say, for example, that an
appointed advisor to the governor manages a statewide program to collect ideas on ways to
improve high school students’ awareness about the prevention of sexually transmitted diseases.
The political advisor believes it is important to begin the study with a research project to identify
students’ current attitudes and awareness. A study question might be how to determine the best
way to accomplish this task. Specific research objectives might include first determining students’
current level of awareness of the diseases, their cause and spread, and methods of prevention.
D
o
w
n
l
o
a
d
e
d
b
y
[
U
n
i
v
e
r
s
i
t
y
o
f
C
a
l
i
f
o
r
n
i
a
,
S
a
n
D
i
e
g
o
]
a
t
0
0
:
0
8
1
9
M
a
y
2
0
1
7
34 FOUNDATIONS OF POLITICAL SCIENCE RESEARCH
A second objective might be to determine where the students received their information. An-
other might be to establish their preferred medium of communication and its ability to effectively
convey persuasive messages. And another might be to measure local public opinion about the plan
in general. Finally, the researcher will also want to know who makes up the population at greatest
risk so that in selecting the sample to study, the appropriate subjects are included.
Step 3: Decide on a Research Strategy
Step 3 of the research process is deciding on the research strategy that provides the most cost-effective
way of gathering the needed information, and the strategy that produces the best possible answer for
the research or study question. A partial list of the positivist and postpositivist strategies followed by
political scientists today was discussed in Chapter 2. They included institutionalism, behavioralism,
and rational choice theory among the positivist approaches, and the feminist and Marxist and other
interpretive designs as postpositivist approaches. Each of these strategies provides the researcher with
a wide variety of data-gathering approaches and specific methods and data-processing and analysis
techniques from which to choose. Each strategy has its own advocates and critics as well, although
the acrimony between the camps has become far less strident than it was in the past.
Peter John (2002, 216) described the irrationality of the disagreement between opposing schools of
political science research methodology in the following way: “The current debate between quantitative
and qualitative research is shallow and rests on stereotypes of the research process.” He went on to
add that researchers were correct in choosing a method that satisfies the objectives of their research.
All researchers should design research projects capable of testing hypotheses, and that also allow
them to apply their skills and knowledge to conduct “exciting and imaginative pieces of work.” The
selection of approach and method should be based on the first two steps in the research process.
Positivist strategies typically involve sample research, quantified data such as mathematical models
and correlation and regression analysis, time-series, and other methods calling for statistical analysis.
Postpositivist strategies may employ ethnographic methods common in anthropology, participant
observation methods used in sociology, hermeneutic and symbiotic methods used in historical and
literary approaches, or in-depth personal and focus group interviews found in psychological inves-
tigations. The key, of course, is to match the correct methods with the specified strategy.
Step 4: Prepare a Research Plan
In Step 4 the researcher prepares a plan for the subsequent research activity. This means identify-
ing in advance the research subjects or sample, the methods planned for gathering and processing
data, and a timeline for completing the project. Thus, designing an effective research plan requires
five decisions or choices: (1) the data source; (2) the research approach; (3) the data-gathering
instrument; (4) a sampling plan; and (5) the method of contacting study subjects. Each of these
steps will be discussed in detail in subsequent chapters. Data sources are diverse and range as
far apart as polling individual respondents in election night, voting booth exit interviews, and
archival data describing events leading up to the eighteenth-century French and Indian War on
the American frontier.
Step 5: Gather the Data
Step 5 is an action step; it involves gathering the data needed for meeting the study objectives
and answering the study question. Depending upon the research strategy selected, data may be
D
o
w
n
l
o
a
d
e
d
b
y
[
U
n
i
v
e
r
s
i
t
y
o
f
C
a
l
i
f
o
r
n
i
a
,
S
a
n
D
i
e
g
o
]
a
t
0
0
:
0
8
1
9
M
a
y
2
0
1
7
UNDERSTANDING THE RESEARCH PROCESS 35
gathered by such activities as: (1) participating in a social situation and recording the findings; (2)
overtly or covertly observing the behavior of subjects; (3) interviewing subjects one at a time or
in groups; (4) administering a questionnaire to survey the attitudes of a sample of voters; or (5)
reviewing documents or other information materials.
The researcher may gather primary data, secondary data, or both. These data can come from
internal sources, external sources, or both. A classification of data sources is displayed in Table 3.1 .
Primary data are original data that the researcher gathers from original sources. Examples of primary
data include responses to a questionnaire, an interview, or some other type of measurement.
Secondary data are data that have been collected by someone else for another purpose. Examples
Table 3.1
A Classification of Data Sources
I. Positivist Research Data Sources
A. Primary Data Sources
1. Field Surveys
a. Questionnaires
b. Attitude surveys
c. Lifestyle surveys
2. Field Studies
a. Observation studies
b. Personal interviews
c. Focus group interviews
d. Videotaping and audio recording
3. Experiments
a. Laboratory experiments
b. Field experiments
B. Secondary Data Sources
a. Organization internal reports
b. Organization invoice and/or accounts payable records
c. Registered voter lists
d. Vote records
e. Production and service records
f. Human resource records
II. Postpositivist Research Data Sources
A. Existing Documents
a. Books, periodicals, published reports, films, unpublished literature
b. Local, state, and federal government documents
c. Professional association papers and reports
d. College and university documents
e. Consultants’ research reports
f. Meeting minutes
g. Commercial databases
h. Other
B. Internal Records
a. E -mail
b. Memoranda
c. Policy papers
d. Reports and other documents
C. External Sources
a. Interviews
b. Life histories
c. Case studies
d. Observation and participant observation
D
o
w
n
l
o
a
d
e
d
b
y
[
U
n
i
v
e
r
s
i
t
y
o
f
C
a
l
i
f
o
r
n
i
a
,
S
a
n
D
i
e
g
o
]
a
t
0
0
:
0
8
1
9
M
a
y
2
0
1
7
36 FOUNDATIONS OF POLITICAL SCIENCE RESEARCH
of secondary data include government statistical reports, articles in professional journals, and city or
agency records. Neither data type is inherently better than the other, but care must always be taken
in the interpretation of secondary data to ensure that it meets the specific research objectives.
Researchers employ various tools in the data collection process. Examples include survey ques-
tionnaires, interview discussion guides, tape recorders, video cameras, and other recording devices.
When observing the behavior of individuals, simple paper-and-pencil recording is common. In
such instances, the data collection process includes applying order and structure to the dataset.
Step 6: Analyze and Interpret the Data
Step 6 is a payoff step; it is also the activity that may be the most difficult for beginning research-
ers to master. Once the data are in hand, the researcher must establish some order in the data and
determine their meaning and/or implications. This interpretation must be carried out so that the
findings can be related to the original study question and research objectives.
Researchers are typically interested in knowing the following things about a mass of data:
First, they want to know what is “typical” in the sample. This means getting some idea of the
central tendency of the responses. In everyday language, they want to know what are the averages.
Second, they want to know how widely individuals in the sample vary in their responses. In a
community economic development study, for example, the director might want to know whether
local citizens have similar or widely diverse attitudes about proposed development of a ten-acre
parcel on the city limits.
Third, researchers want to see how subjects are distributed across the study variables. For ex-
ample, is the number of people who prefer a new park for the ten-acre site the same or greater than
the number who prefer a new shopping center? A good way to display this type of information is
to use charts or graphs showing the frequency of responses. Fourth, the analyst will want to show
how the different variables relate to one another. It may be important to know, for example, that
the preferences for different types of uses for the parcel seen related to certain characteristics of
the population, such as age, gender, occupation, or annual income.
Finally, the researcher will want to describe any differences among the two or more groups or
objects. It might be important to know, for example, whether males in the sample respond differ-
ently about their preferences for the site than do females in the sample. This type of understanding
is important because much public administration research focuses on the comparisons of groups
of citizens (Selltiz, Wrightsman, and Cook 1976).
Tabulating Responses
The first activity in data analysis is to tabulate the responses to all items (questions or categories
of phenomena) in the study. In a quantitative study, this could mean counting all the answers
to each question or schedule item. This counting of responses is often referred to by the phrase
frequency distributions, after the statistical software process that counts responses and prepares
summary data for the researcher. Frequency distributions and summaries are prepared for one
variable at a time, producing univariate statistics for each variable. Counts of how many subjects
answered yes to a question and how many answered no, and the distribution of males and females
in a sample are both examples of univariate frequencies. Univariate statistics include measures of
central tendency, variation, and location.
Once univariate statistical tabulations are done, the researcher then begins bivariate tabulations.
In this process, responses to one variable are tabulated with a second variable. The information
D
o
w
n
l
o
a
d
e
d
b
y
[
U
n
i
v
e
r
s
i
t
y
o
f
C
a
l
i
f
o
r
n
i
a
,
S
a
n
D
i
e
g
o
]
a
t
0
0
:
0
8
1
9
M
a
y
2
0
1
7
UNDERSTANDING THE RESEARCH PROCESS 37
is usually presented in a table (called crosstabulations or “crosstabs” for short). For example,
responses to a yes-no question are displayed broken down for males and females in the cross-
tabulation table displayed in Table 3.2 .
In addition to simple counts of responses, crosstabulations can also display some summary
information for each of the responses. The individual boxes with counts displayed are called cells;
rows run across the page, and columns run down the page. Summary statistics include the percent-
age of the total represented by the number of responses in each cell, the cell’s percentage of the
row total, and the cell’s percentage of the column. Row, column, and total percentage values are
provided along the sides of the crosstabulation table. Finally, a wide variety of statistical tests for
nominal, ordinal, and interval/rations data can also be produced with crosstabulation software.
After analyzing relevant bivariate data, the analyst turns first to either variable correlation or hy-
pothesis tests, then proceeds to any of the many multivariate statistical processes needed to meet
the objectives of the study.
For a qualitative study, the researcher often begins the analysis by reviewing the data to establish
a structural skeleton that will provide for meaningful interpretation and discussion. In qualita-
tive research, the typical data analysis has been the narrative text (Miles and Huberman 1994).
This is often a comprehensive rewrite of the researcher’s field notes, with the researcher ’s verbal
interpretation and conclusions from the data. There are few agreed-upon styles and formats for
the broad scope of qualitative analysis methods. Selection is left up to the researcher. According
to Miles and Huberman,
Valid analysis requires, and is driven by, displays (i.e., narrative text and graphic presenta-
tions of qualitative research findings) that are as simultaneous as possible, are focused, and
are as systematically arranged as the questions at hand demand. While such displays may
sometimes be overloading, they will never be monotonous. Most important, the chances of
drawing and verifying valid conclusions are very much greater. . . . The qualitative analyst
has to handcraft all such data displays . . . each analyst has to invent his or her own. (Miles
and Huberman 1994, 79)
Step 7: Prepare and Present the Findings
Step 7 includes preparing the research report and presenting the findings either orally or visually,
or both. It is the final step in the process, but is second in importance only to clearly defining and
focusing on a research problem/study question. An outline for the research report follows the
same outline developed during the fourth step, preparation of a research plan. Some portions of
the report, such as a description of the research problem, delineation of research objectives, the
Table 3.2
A Simple Crosstabulation of Bivariate Data
Response
Gender
Did Vote
Did Not Vote
Totals
Males
47
81
128
Females
76
53
129
Totals
123
134
257
D
o
w
n
l
o
a
d
e
d
b
y
[
U
n
i
v
e
r
s
i
t
y
o
f
C
a
l
i
f
o
r
n
i
a
,
S
a
n
D
i
e
g
o
]
a
t
0
0
:
0
8
1
9
M
a
y
2
0
1
7
38 FOUNDATIONS OF POLITICAL SCIENCE RESEARCH
review of the literature, and rationale for selecting the strategy employed, may have been written
as the researcher completed the earlier steps in the process.
There are many different ways to gather data, or conduct a research project, and many different
ways of communicating the research findings. Ultimately, however, someone must sit down and
write out the results of the study. These results must then be passed on to a supervisor, a fellow
employee, members of a funding organization, or, if possible, even published in a brochure, report,
or professional journal.
Doing good research means more than using good scientific methods to select the sample,
gather data, and tabulate the results. It also means interpreting what the data mean in terms of
the study objectives and writing a research report that clearly and effectively communicates the
findings of the research effort. Using an appropriate style is critical in all research writing. Style
refers to the words, syntax, and punctuation that are used or not used. It includes the way these
components are placed into sentences and paragraphs. It involves the structure and organization
of the report, and whether it conforms to the traditions of the discipline. It also refers to the way
that the author ’s sources are cited, identified, and credited.
As a researcher in political science, public administration, or any of the administrative or social
sciences—present or future—it is important to remember that there is no one “best” writing style.
Your style is your own. One or more styles might be more appropriate for a given discipline, but
the choice of style often seems arbitrary. The best style to use in all research reports and organi-
zational papers is one that is clear, concise, and readable.
The processes necessary for producing a research report for the social and administrative sci-
ences are similar to those that are used for research in chemistry, physics, biology, or any other
natural science. Slightly different research, analysis, interpretation, and presentation processes
are involved, however.
Following an accepted style enhances the readability of the research report, regardless of
its discipline. Academicians and managers and administrators are typically pressed for time.
If a paper is written in a familiar format (style) it will be easier to read—and take less of the
reader’s time. This often results in greater acceptance of the research findings—an extremely
important point for research that comes up with negative findings. This benefit alone should
be a desired outcome.
One issue that makes professional writing difficult for researchers and students is the lack of con-
formity in formats required by different disciplines and their journals. Using the format demanded
by the editors of political science association–sponsored journals, for example, will probably result
in rejection of the paper by the editors of a business administration, sociology, education, or an
economics journal. Researchers must determine which style is required in their field, and which
styles are unacceptable. The only thing consistent about writing style is inconsistency!
Summary
The research process can be defined as the process of systematically acquiring data to answer a
question or solve a problem. Research is done to help managers, administrators, and academics
achieve a better understanding of how the world works. Research methodology refers to the ap-
proach researchers take as they examine their study questions or problems. The research process
involves seven steps: (1) identify the research problem; (2) establish research objectives; (3) decide
on a research strategy; (4) prepare a research plan; (5) gather the data; (6) analyze and interpret
the data; and (7) prepare and present the findings.
Using an appropriate style is critical in all research writing. Style refers to the words, syntax,
D
o
w
n
l
o
a
d
e
d
b
y
[
U
n
i
v
e
r
s
i
t
y
o
f
C
a
l
i
f
o
r
n
i
a
,
S
a
n
D
i
e
g
o
]
a
t
0
0
:
0
8
1
9
M
a
y
2
0
1
7
UNDERSTANDING THE RESEARCH PROCESS 39
and punctuation that are used or not used. The best style to use in all research reports and organi-
zational papers is one that is clear, concise, and readable.
Discussion Questions
1. Why is it so important to clearly define your research question before designing a research
study?
2. Give several examples of what you consider to be good research objectives. How do they
relate to the research question?
3. What is a key informant interview?
4. Why is it important to conduct a thorough review of the literature before collecting
data?
5. Name some sources for published information about political science research topics.
6. What is a research plan?
7. What is a research strategy?
8. What is the meaning of the phrase “writing style”?
Additional Reading
Babbie, Earl. 2006. The Practice of Social Research. 10th ed. Belmont, CA: Wadsworth Thompson Learning.
Bouma, Gary D., and Rod Ling. 2004. The Research Process. 5th ed. Oxford: Oxford University Press.
Graziano, Anthony M., and Michael L. Raulin. 2006. Research Methods: A Process of Inquiry. 6th ed.
Boston: Allyn & Bacon.
Johnson, Janet B., Richard A. Joslyn, and H.T. Reynolds. 2001. Political Science Research Methods. Wash-
ington, DC: CQ Press.
Martin, Maner. 2001. The Research Process. 2nd ed. New York: McGraw-Hill.
Morton, Rebecca B. 2001. Methods and Models. Cambridge, UK: Cambridge University Press.
D
o
w
n
l
o
a
d
e
d
b
y
[
U
n
i
v
e
r
s
i
t
y
o
f
C
a
l
i
f
o
r
n
i
a
,
S
a
n
D
i
e
g
o
]
a
t
0
0
:
0
8
1
9
M
a
y
2
0
1
7
40
4 Selecting a Research Design and Choosing
a Research Topic
Researchers must make several decisions when beginning a research study in political science.
These include selecting a research approach, choosing a research design, deciding on a research
method, and designing a specific study to meet the objectives for the research project. Some of
the alternatives available to political science researchers are displayed in Figure 4.1.
The two families of research approaches seen most often in political science research are
quantitative and qualitative designs. Examples of quantitative designs include experiments, lon-
gitudinal and cross-sectional studies and surveys, content analysis, and cases analyses. Examples
of qualitative designs include case and historical research, ethnography, and grounded theory,
among others.
The term research design refers to the way an investigator applies a logical structure to his
or her research project. The function of this step in the research process is to make sure that the
data gathered are sufficient and appropriate for answering the research questions completely and
unambiguously (de Vaus 2001). Two terms are often used interchangeably to designate this portion
of the research process: research design and research methods. They are not the same, however.
Researchers can choose from three quantitative research designs: exploratory, descriptive, and
causal. Three qualitative designs are also available: explanatory, interpretive, and critical. Several
different research methods are available for each research design; examples are shown in Figure
4.1 . Research methods refers to the ways in which data are collected. Some examples of methods
used in quantitative studies include questionnaires, structured or semi-structured interviews, ob-
servation, document and artifact analysis, and unobtrusive methods. Examples of methods used
in qualitative studies include participant observation, unstructured interviews, and hermeneutic
analysis of texts.
Other authors have followed different taxonomies in describing the optional available ways to
conduct research. For example, Hakim (2000, 9) identified eight types of study designs: (1) litera-
ture reviews, secondary data analysis, and meta-analysis of existing data; (2) qualitative research,
including in-depth interviews and focus groups; (3) research based on administrative records and
documentary evidence; (4) ad hoc interview surveys; (5) regular or continuous interview surveys;
(6) case studies; (7) longitudinal studies; and (8) experimental social research.
An important idea to remember about research design selection is that the researcher is never
locked into using any one “best” design. There are many acceptable ways to conduct research;
the only selection criterion that ought to make sense is that the method chosen must provide the
best possible conclusions. Phillips (1976) described the process of selecting a research design as
a Magna Charta for the researcher; he added that,
D
o
w
n
l
o
a
d
e
d
b
y
[
U
n
i
v
e
r
s
i
t
y
o
f
C
a
l
i
f
o
r
n
i
a
,
S
a
n
D
i
e
g
o
]
a
t
0
0
:
0
8
1
9
M
a
y
2
0
1
7
41
R
e
s
e
a
r
c
h
M
e
t
h
o
d
o
l
o
g
y
,
R
e
s
e
a
r
c
h
D
e
s
i
g
n
s
,
a
n
d
R
e
s
e
a
r
c
h
M
e
t
h
o
d
s
i
n
P
o
l
i
t
i
c
a
l
S
c
i
e
n
c
e
P
o
s
i
t
i
v
i
s
t
M
e
t
h
o
d
o
l
o
g
y
(
Q
u
a
n
t
i
t
a
t
i
v
e
A
p
p
r
o
a
c
h
e
s
)
P
o
s
t
p
o
s
i
t
i
v
i
s
t
M
e
t
h
o
d
o
l
o
g
y
(
Q
u
a
l
i
t
a
t
i
v
e
A
p
p
r
o
a
c
h
e
s
)
E
x
p
l
o
r
a
t
o
r
y
D
e
s
i
g
n
s
D
e
s
c
r
i
p
t
i
v
e
D
e
s
i
g
n
s
I
n
-
D
e
p
t
h
I
n
t
e
r
v
i
e
w
s
C
a
u
s
a
l
D
e
s
i
g
n
s
E
x
p
l
a
n
a
t
o
r
y
D
e
s
i
g
n
s
I
n
t
e
r
p
r
e
t
i
v
e
D
e
s
i
g
n
s
C
r
i
t
i
c
a
l
D
e
s
i
g
n
s
F
o
c
u
s
G
r
o
u
p
I
n
t
e
r
v
i
e
w
s
F
i
e
l
d
S
u
r
v
e
y
s
M
a
t
h
e
m
a
t
i
c
a
l
M
o
d
e
l
s
E
t
h
n
o
-
g
r
a
p
h
i
c
S
t
u
d
i
e
s
S
e
m
i
o
t
i
c
S
t
u
d
i
e
s
P
a
r
t
i
c
i
p
a
-
t
o
r
y
S
t
u
d
i
e
s
A
c
t
i
o
n
R
e
s
e
a
r
c
h
S
t
u
d
i
e
s
H
e
r
m
e
n
-
e
u
t
i
c
S
t
u
d
i
e
s
C
a
s
e
S
t
u
d
i
e
s
S
i
n
g
l
e
-
F
a
c
t
o
r
E
x
p
e
r
i
m
e
n
t
s
M
u
l
t
i
f
a
c
t
o
r
E
x
p
e
r
i
m
e
n
t
s
F
i
g
u
r
e
4
.
1
A
P
a
r
t
i
a
l
D
i
s
p
l
a
y
o
f
R
e
s
e
a
r
c
h
M
e
t
h
o
d
o
l
o
g
i
e
s
,
A
p
p
r
o
a
c
h
e
s
,
D
e
s
i
g
n
s
,
a
n
d
M
e
t
h
o
d
s
D
o
w
n
l
o
a
d
e
d
b
y
[
U
n
i
v
e
r
s
i
t
y
o
f
C
a
l
i
f
o
r
n
i
a
,
S
a
n
D
i
e
g
o
]
a
t
0
0
:
0
8
1
9
M
a
y
2
0
1
7
42 FOUNDATIONS OF POLITICAL SCIENCE RESEARCH
[The researcher] is not chained to a set of techniques simply because they have worked
adequately in the past, nor must [he or she] defer to the supposedly superior methodological
knowledge of other investigators because of their research reputation. It is not necessary
for [researchers] to continually look back over [their] shoulder, wondering if others would
consider (the) procedure to be “correct” or incorrect. . . . What counts is not what others
think of those procedures but how well they work. (Phillips 1976, 5)
What Phillips and others like him mean is that the key to good research results is “doing good
science.” This simply means selecting a research design that best meets the objectives for the study.
It is the research question that drives the selection of a research design (Denscombe 2002).
Quantitative Designs
Quantitative research designs are employed in the sequence of steps shown in Figure 4.2 . In de-
ciding what strategy to follow in a quantitative design, political science researchers usually seek
answers to these six basic questions (Miller 1991):
1. What characteristics of the people in my sample (such as demographic differences) dis-
tinguish them from other groups or subgroups of people whom I might have included in
my study?
2. Are there any differences in the subgroups contained in this sample that might influence
either the way the questions are answered or the opinions that are offered?
3. Is there a statistically significant difference in the answers of any groups or subgroups
in this sample, or did they all answer the questions in roughly the same way?
4. What confidence can I have that any difference that I do find did not occur by chance?
5. Is there any association between any two or more variables in my study? Is it relevant?
Is it significant?
6. If there is any relationship between two or more variables, is it possible to measure how
strong it is and whether it is a positive or negative relationship?
Types of Quantitative Designs
Depending on their research objectives, researchers select from three types of quantitative research
designs: exploratory, descriptive, or causal. In each of these approaches, one or more of a variety
of statistical tools are used to test ideas or concepts and to communicate research findings.
Exploratory Designs
Exploratory studies are small-sample designs used primarily for gaining insights and ideas about
research problems and the variables and issues associated with those problems. These types of
studies are sometimes referred to as “pilot studies.” Exploratory studies are often employed as the
first step in a multi-part research project. Because of their limited scope, however, they seldom
exist as stand-alone approaches. Exploratory studies help the researcher gain greater understand-
ing of a problem for which more information is needed. They also help the researcher identify
variables that may be only tangentially or only marginally related, and thus should not be included
in a more extensive research effort.
Data gathering in exploratory research may involve quantitative, qualitative, or a combination
D
o
w
n
l
o
a
d
e
d
b
y
[
U
n
i
v
e
r
s
i
t
y
o
f
C
a
l
i
f
o
r
n
i
a
,
S
a
n
D
i
e
g
o
]
a
t
0
0
:
0
8
1
9
M
a
y
2
0
1
7
SELECTING A RESEARCH DESIGN AND TOPIC 43
of strategies. The data may come from either primary or secondary sources; that is, it might be
gathered directly by the researcher, or it might be data gathered by someone else for a different
purpose. Both data types have similar validity in exploratory research.
Descriptive Designs
Descriptive research designs are used to develop a “snapshot” of a particular phenomenon of interest.
Descriptive studies typically involve large samples. They provide a description of an event, or help
define a set of attitudes, opinions, or behaviors that are observed or measured at a given time and given
environment. The focus of descriptive research is on the careful mapping out of a circumstance, situation,
or set of events to describe what is happening or what has happened (Rosenthal and Rosnow 1991).
Descriptive studies may be either cross-sectional or longitudinal. The “snapshot” study is called a
cross-sectional design. It is a one-time assessment of a sample of respondents. Time is an important
consideration because the “picture of the sample” usually varies—sometimes substantially—if the
research is repeated at a later date or conducted with another sample taken from the same population.
ESTABLISH
ESTABLISH
ESTABLISH
ESTABLISH
Establish
Research Objectives
Select a Quantitative
Research Design
Design Data-Gathering
Instrument
Gather, Analyze, and
Interpret Data
Report Study Findings
Exploratory
Research
Descriptive
Research
Causal
Research
Figure 4.2 A Schematic Representation of the Quantitative Research Design Process
D
o
w
n
l
o
a
d
e
d
b
y
[
U
n
i
v
e
r
s
i
t
y
o
f
C
a
l
i
f
o
r
n
i
a
,
S
a
n
D
i
e
g
o
]
a
t
0
0
:
0
8
1
9
M
a
y
2
0
1
7
44 FOUNDATIONS OF POLITICAL SCIENCE RESEARCH
The purpose of a cross-sectional design is to determine to what extent different categories or classes
in the single sample differ on some outcome (independent) variable. Categories could be gender,
different age groups, income groups, social class groups, ethnic groups, and the like.
Descriptive research that is repeated with the same sample over two or more time intervals is
longitudinal research. Studies using panels of the same participants are longitudinal studies. The
purpose of a longitudinal study is to identify and measure change in subjects’ responses. The same
elements in a cross-sectional design apply to a longitudinal study, except a follow-on measurement
or measurements are taken after passage of a period of time. Cohort studies—research projects that
follow a sample over time to evaluate attitudes and behaviors—are longitudinal studies. They are
popular for measuring changes in voter attitudes as a campaign progresses or as an administration
serves its elected period in office.
Researchers use two related-but-different types of descriptive research strategies—field stud-
ies or field surveys. Field studies tend to go into greater depth on a smaller number of issues or
items; field surveys evaluate a larger number of issues in lesser depth. Field surveys are the most
commonly encountered approach in political science; they make up more than 80 percent of all
quantitative research. Surveys are popular because they are relatively easy to design and adminis-
ter. The wide availability today of powerful desktop computers and statistical software has made
them much easier to tabulate and interpret. It is currently possible to use interactive surveying
techniques, with the responses immediately entered into a database and tabulated.
Both field studies and field surveys produce data that are presented as numeric descriptions.
These descriptions may be of a sample of subjects or of an entire population. Many different
types of variables can be used, including but not limited to demographic characteristics, attitudes,
opinion, intentions, characteristics of organizations, groups, families, subgroups, and so forth. In
essence, almost anything that can be measured can be a descriptive variable.
Causal Designs
Causal research studies are often the last step in a three-part approach to research in the adminis-
trative and social sciences. These designs typically involve planning and conducting experiments.
Causal studies may be either relational or experimental. The purpose of relational studies is to
identify how one or more variables are related to one another. They are sometimes called correla-
tion studies. The purpose of an experimental study is to identify the cause or causes of change in
a variable or event—that is, determining “what leads to what” (Rosenthal and Rosnow 1991).
The classic version of experimental design includes these five key components (de Vaus 2001,
47–50):
1. One pre-test measurement of the dependent (outcome) variable for all subjects
2. Two groups, one that is to be exposed to the treatment (intervention) and the other, the
control group, which is not exposed
3. Random assignment of subjects to the groups; this occurs prior to the pre-test
4. One treatment (intervention)
5. One post-test of both groups on the dependent (outcome) variable
Designing an experiment is the key activity in a causal research project. Experiments in-
volve subjecting two or more samples or subsamples to different treatments or interventions.
Researchers may manipulate one, two, or more independent variables in the same treatment
experiment. Researchers must be careful in the design of experiments and interpretation of
D
o
w
n
l
o
a
d
e
d
b
y
[
U
n
i
v
e
r
s
i
t
y
o
f
C
a
l
i
f
o
r
n
i
a
,
S
a
n
D
i
e
g
o
]
a
t
0
0
:
0
8
1
9
M
a
y
2
0
1
7
SELECTING A RESEARCH DESIGN AND TOPIC 45
the findings so that potential intervening or confounding variables do not muddy the results
of the study.
The classic example of the need for careful attention to experimental design, and how experi-
ments are used to provide information about behaviors, is the set of experiments conducted at the
Western Electric Hawthorne manufacturing facility near Cicero, Illinois. The studies were begun
in 1924 and consisted of four phases (Hodgetts 2002). A random sample of assembly workers was
selected, moved to a special location, and subjected to variations in working conditions, including
varying the speed of the production line, different levels of lighting, rest periods, group mem-
berships and norms, and so forth. Researchers measured performance under normal conditions,
changed a working condition characteristic (a variable), and measured performance again. To their
surprise, production increased with negative environmental changes just as they did with positive
changes. The design did not consider the effect on workers of being singled out for attention. This
unplanned change is what is known as an intervening or confounding variable.
Qualitative Designs
Qualitative research is not based on a single, unified theoretical concept, nor does it follow a single
methodological approach. Rather, a variety of theoretical approaches and methods are involved
(Flick 1999a). All of these approaches and methods have one common underlying objective: to
understand the event, circumstance, or phenomenon under study.
Types of Qualitative Designs
Broadly speaking, qualitative strategies fall into three categories of study techniques. These are
explanatory, interpretive, and critical designs (White 1999). Some include ethnography, kinetics
(the study of movement), atmospherics, phenomenology, and proxemics (the study of space in
social settings). Additional examples include using such data-gathering methods as focus groups,
elite-group interviewing, and the use of unobtrusive measures.
Qualitative data are typically gathered in one of four ways: (1) by observation (usually but
not exclusively participant observation), (2) during in-depth personal interviews, (2) unobtrusive
measures, and (4) a combination of these and other methods in what is known as a triangulation
approach (Esterberg 2002).
Figure 4.3 displays the interconnected nature of the qualitative process. In all three approaches,
several different techniques may be employed for gathering data, including observation, participation,
interviewing, and document analysis. In each, data are coded, placed in some intelligent order, interpreted,
and used for explaining and/or predicting future interrelationships in similar circumstances.
Explanatory Research
Explanatory research is the approach taken in most mainstream qualitative research. Its goal is
to go beyond the traditional descriptive designs of the positivist approach to provide meaning as
well as description. The purpose of explanatory research is also broader than that of descriptive
research; it is conducted to build theories and predict events:
Explanatory research strives to build theories that explain and predict natural and social
events. Theory building requires the development of a collection of related and testable law-
like statements that express causal relationships among relevant variables. The ultimate goal
of explanatory research is the control of natural and social events. (White 1999, 44)
D
o
w
n
l
o
a
d
e
d
b
y
[
U
n
i
v
e
r
s
i
t
y
o
f
C
a
l
i
f
o
r
n
i
a
,
S
a
n
D
i
e
g
o
]
a
t
0
0
:
0
8
1
9
M
a
y
2
0
1
7
46 FOUNDATIONS OF POLITICAL SCIENCE RESEARCH
Typical objectives for explanatory research include explaining why some phenomenon occurred,
interpreting a cause-and-effect relationship between two or more variables, and explaining differ-
ences in two or more groups’ responses. The design is similar to the traditional positivist approach,
and some numerical description and simple statistical analysis may be involved.
Interpretive Research
Interpretive research is characterized by a strong sense of connection between the researcher and
the subjects who are a part of an interpretive study. The goal of interpretive research is to build
understanding between the participants and the researcher. Therefore, interpretive research often
focuses on standards, norms, rules, and values held in common, and how these all influence hu-
man interactions (White 1999).
The primary objective of interpretive research is to establish the meaning of a circum-
ESTABLISH
Establish
Research Objectives
Select a Qualitative
Research Design
Gather, Code, and Conceptually
Order the Qualitative Data
Analyze and Interpret
the Data
Explain Findings and Interpret
Relationships
Report Study Findings
Explanatory
Research Design
Interpretive
Research Design
Critical
Research Design
Figure 4.3 Steps in the Qualitative Research Process
D
o
w
n
l
o
a
d
e
d
b
y
[
U
n
i
v
e
r
s
i
t
y
o
f
C
a
l
i
f
o
r
n
i
a
,
S
a
n
D
i
e
g
o
]
a
t
0
0
:
0
8
1
9
M
a
y
2
0
1
7
SELECTING A RESEARCH DESIGN AND TOPIC 47
stance, event, or social situation. It goes beyond simple description or explanation in aiming
to enhance people’s understanding of the symbols, artifacts, beliefs, meanings, feelings, or
attitudes of the people in the study situation (White 1999). Interpretive research has much in
common with the study of phenomenology in philosophy and the phenomenological approach
to sociological research. Public administration theorist Camilla Stivers provided this view
of interpretive research:
To me, interpretation entails sense-making: taking a more or less inchoate bundle of events
and processes—what might be thought of as a situation or group of situations—and putting
a frame around them based on more or less conscious assumptions about what is likely to
be important, significant or meaningful. (Stivers 2000, 132)
Critical Research
Critical research is the least-used approach in political science research in general, although
it is an increasingly important tool in public administration and sociological research. In ad-
dition, a growing number of applications are now seen in education research. The subjective
nature of critical analysis makes it difficult for students to adopt in meaningful ways. While
it has potential for application in political science, it has not yet been widely adopted. Ac-
cording to White:
Criticism is the most radical of the three modes of [qualitative] research because it calls
into question our most basic assumptions and asks us to evaluate them as a basis for action.
Critical research does not always satisfy the critic, nor does it always change beliefs and
values, but it has the potential to do so. (White 1999, 57)
The overriding objective of critical research is to change people’s beliefs and actions in ways
that the investigator believes will better satisfy their needs and wants. The criticism points out
inconsistencies that exist between what is true and false and what is good and bad. It aims to
bring people to actions that are commensurate with accepted truth and goodness. According to
White (1999), the “truth” of critical research is only realized when people (through a process of
self-reflection) finally take action to change their situation.
Combined Research Designs
Combined designs entail using both qualitative and quantitative methods. The three broad classes
of combined studies are archival, media, and artifact studies. Techniques used in these types of
studies include content analysis, document analysis, and in situ analysis (also known as within-site
analysis). Several types of multivariate statistical tools are also used in these designs, including
canonical correlation, and cluster and factor analysis. These statistical tools all require some
subjective (qualitative) interpretation of the data.
Flick is one of many writers on research and research methods who now report that good re-
search often requires the use of a combination of quantitative and qualitative approaches:
It is well known that the juxtaposition “qualitative–quantitative” has sometimes led to
not very fruitful controversies and is sometimes used as a schematic demarcation. But the
combination of approaches is often truthful as well. (Flick 1999a, 634)
D
o
w
n
l
o
a
d
e
d
b
y
[
U
n
i
v
e
r
s
i
t
y
o
f
C
a
l
i
f
o
r
n
i
a
,
S
a
n
D
i
e
g
o
]
a
t
0
0
:
0
8
1
9
M
a
y
2
0
1
7
48 FOUNDATIONS OF POLITICAL SCIENCE RESEARCH
Choosing a Research Topic
Beginning researchers often find themselves at the start of the research process struggling for
answers to such questions as: What shall I research? How shall I do it? And, once I’ve gathered
my data, how can I make any sense of it? How can I know what it really means? For some, simply
choosing a subject to research and write about can be the most difficult part of the entire project.
How political science students determine a topic to research, identify research problems, formulate
study questions, and other related concerns are the subjects addressed in this section.
Research in political science is conducted for two very broad purposes: The first type is con-
ducted to solve real problems in everyday political life; this is known as applied, practical, or
policy research. Policy research is conducted in all subfields of political science except political
theory. These studies are conducted to improve the way that politics works, with the unstated
understanding that if we make it work better, we also make it work longer. Applied research
is particularly important in the public administration subfield of political science. Much of the
research in that subfield is conducted to provide information needed to make better administra-
tive and managerial decisions. According to Hakim (2000, 4), policy research is concerned with
“knowledge for action.” As a result, it focuses on “actionable factors” or variables. The objective
of this type of research can be expressed in the phrase “It is more important to change the world
than to understand it.”
The second type of research is conducted for the purpose of advancing the body of knowledge
about politics and the political world. This research is called basic or pure research. Hakim (2000)
called studies of this type theoretical research. The long-term goal of social theoretical research
is to build greater social science knowledge; in political science, the purpose is to produce greater
knowledge and understanding of politics and the political process.
The methods employed in political science theoretical research are often aimed at identifying
causal processes and coming up with explanations for them. Furthermore, policy research has
an underlying goal of prediction. For this reason, political science researchers conducting policy
research employ simulations, mathematical modeling, forecasting, time series studies, and other
more advance quantitative tools. The primary audience for theoretical research is other political
scientists in the academic community. These fellow researchers have similar disciplinary back-
grounds; they speak the same scientific language and are familiar with the same sets of assump-
tions and operational definitions.
Defining the Research Topic
A key requirement for all research is beginning with a clear, concise, and thorough definition
of the topic upon which the research is to be carried out (research topics are also called “study
problems”). Defining the topic does not mean that answers are known before the questions are
asked. Rather, it means that the researcher has a specific goal in mind for the research—before
getting started. Having said this, it must also be said that choosing a valid research topic is hardly
ever an easy process. The process of topic definition provided in Figure 4.4 may help researchers
who face this often difficult task.
Sources of Research Topics
Research topics can come from questions discovered in texts, in the professional literature, from
classroom discussions, from reading the newspaper or watching a television news or talk show,
D
o
w
n
l
o
a
d
e
d
b
y
[
U
n
i
v
e
r
s
i
t
y
o
f
C
a
l
i
f
o
r
n
i
a
,
S
a
n
D
i
e
g
o
]
a
t
0
0
:
0
8
1
9
M
a
y
2
0
1
7
SELECTING A RESEARCH DESIGN AND TOPIC 49
and other outside interests. Topics can also come from the life experience of the researcher. An
example is the study of a hearing-impaired graduate student who learned that Native American
children are more likely to have hearing problems than are children of other ethnic groups with
similar socioeconomic characteristics. Determining why this is so and what can be done to allevi-
ate the problem became the student’s master’s degree program research project.
)UDPHWKHSUREOHPLQUHODWLRQWRWKHPDMRUVXEILHOGRI
SROLWLFDOVFLHQFHLQZKLFKLWUHVWV
5HYLHZWKHEDFNJURXQGRIWKHSUREOHP
(VWDEOLVKSUREOHPVXEDUHDVFRQFHSWVRUIDFWRUV
SUHSDUHUHVHDUFKTXHVWLRQVWKDWDGGUHVVHDFKFRQFHSW
'HWHUPLQHWKHUHOHYDQWYDULDEOHVDQGLI DSSURSULDWH
WRWKHUHVHDUFKGHVLJQHVWDEOLVKZKDWLVWREH
PHDVXUHG
(VWDEOLVKUHVHDUFKK\SRWKHVHVWKDWDGGUHVVWKH
UHOHYDQWUHVHDUFKTXHVWLRQV
(VWDEOLVKUHVHDUFKREMHFWLYHVDQGUHOHYDQW
VXEREMHFWLYHV
&RQGXFWSLORWVWXG\WRUHGHILQHYDULDEOHV
REMHFWLYHVDQGVXEREMHFWLYHV
Figure 4.4 Tasks in the Problem Definition Process
D
o
w
n
l
o
a
d
e
d
b
y
[
U
n
i
v
e
r
s
i
t
y
o
f
C
a
l
i
f
o
r
n
i
a
,
S
a
n
D
i
e
g
o
]
a
t
0
0
:
0
8
1
9
M
a
y
2
0
1
7
50 FOUNDATIONS OF POLITICAL SCIENCE RESEARCH
Bernard (2000, 82–83) identified five broad classes of research topics, based upon their rela-
tionships with various types of variables:
1. Internal conditions, which include attitudes, beliefs, values, lifestyles, and perceptions
of participants in the political arena
2. External conditions: these are primarily past, present, and predicted demographic char-
acteristics of the political actors
3. Behavioral characteristics: these include a wide variety of relevant behaviors, from how
people vote or why they do not vote, where they get their information, with whom they
communicate, how much they work and play, etc.
4. Artifacts: what Bernard described as the “physical residue” of human behavior
5. Environmental conditions: these include the physical and social environmental character-
istics—often referred to as cultural factors—that have some impact on the political and
social world. They range from such items as the amount of rainfall and other geophysi-
cal features of a region to whether the society exists under democratic or authoritarian
regimes. Working conditions and gender and race factors are also sources of research
topics that fall under this class.
Sylvan Barnet made these statements about choosing a research topic: “No subject is unde-
sirable,” and “No subject is too trivial for study” (1993, 177–78). Barnet might have added: No
subject is inherently uninteresting. It is the way subjects are researched and reported that makes
them desirable or undesirable, interesting or uninteresting. Here are a few guidelines to think about
when choosing a research project topic:
s 2ESEARCHANDWRITEABOUTSOMETHINGTHATINTERESTSYOU
s "ESUREENOUGHMATERIALABOUTTHETOPICISAVAILABLETODOAGOODJOB
s -AKESURE THATTHETOPICISNOTSO LARGETHATITISOVERWHELMING
s "ESURETHETOPIClTSYOURABILITIESANDUNDERSTANDING
s -AKESURE YOUTAKEGOODNOTESONCE YOUSTARTREADINGABOUTTHETOPIC
s !SKYOURREFERENCELIBRARIANFORGUIDANCEON YOURRESEARCHTOPIC
s 2UNTHETOPICBY YOURINSTRUCTORFORHISOR HERASSISTANCE
s &OCUS
FOCUS
ANDFOCUS
Tasks in Problem Definition
The process displayed in Figure 4.4 has been designed to help researchers identify and define
research topics and study problems. There are seven components in the definition process; each
is discussed is some detail below.
Task 1: Frame the Study Topic in Its Environment
The first step in the problem definition process is determining whether the proposed research
project will produce information that is commensurate with the purpose, goals, and objectives of
the organization, program, or agency. To do this, the researcher must frame the research problem
within the broader field or subfield of political science in which it rests.
For example, if the research is to be in the area of international relations, the researcher must
D
o
w
n
l
o
a
d
e
d
b
y
[
U
n
i
v
e
r
s
i
t
y
o
f
C
a
l
i
f
o
r
n
i
a
,
S
a
n
D
i
e
g
o
]
a
t
0
0
:
0
8
1
9
M
a
y
2
0
1
7
SELECTING A RESEARCH DESIGN AND TOPIC 51
identify the nations involved, the political history of the diplomatic relations between the nations,
past and current political and economic conditions, the point of conflict, if any, and similar im-
portant points. Moreover, the research project must be worth the effort, time, and money it will
consume. The researcher must be absolutely sure of the relevance of the project; proper framing
of the research question helps make this possible.
Task 2: Review the Background of the Topic
Answers to the questions listed above can often be found by conducting a thorough review of the
background and published literature on the topic. Another way is to conduct a series of interviews
with several key informants; these are people who have a greater than average familiarity with
the problem and/or its associated antecedents or consequences.
There are two aspects to a problem’s background. The first is the nature of the problem within
the actors, institutions, organizations, or other entities involved in the study; this is called the in-
ternal background. The internal background includes the total body of knowledge on the topic that
exists within the relevant topic entities. This knowledge may exist as published reports, operations
records, or as accounting data; it may reside in the memories of other participants or organizations.
Or it may be stored in historical archives somewhere, such as the Library of Congress. Internal
information is often easier to access than external sources or information. Internal data should
always be the first place a researcher looks when conducting organizational research.
The second part is the body of research that already exists on the problem, its causes and cures,
its extent and impact, and the way that other researchers have approached the issue. This is the
external background. External information exists in the body of literature on the topic. Accessing
this previous work is referred to as a review of the literature. It includes all the published and
unpublished-but-available material on the question.
Task 3: Establish Topic Components
Once the researcher has settled on a problem or circumstance that requires more information, the
next step is to break that broad problem into as many parts or sub-problems as are feasible. Say,
for example, the research problem decided upon is: “How can the level of service provided to
out-patient disabled veterans be improved without raising hospital operating costs?” A partial list
of some relevant subproblems of this question might be:
s 4HETYPEOFORGANIZATIONEG
HOSPITAL
OUT
PATIENTCLINIC
lELDPROVIDER
ETC
s 4YPEOFSERVICEPATIENTSREQUIRE
s 3TAFlNGLEVELS
s 1UEUINGSYSTEMINEFFECTOR NOT
s ,OCATIONOFFACILITYURBAN
SUBURBAN
RURAL
s 0RESCREENINGSYSTEM
s !TTITUDESOFPROVIDERSTAFF
s !TTITUDESOFSERVICEUSERS
s %XPECTATIONSOFSERVICEUSERS
s /PERATINGCOSTS
ANDOTHERS
D
o
w
n
l
o
a
d
e
d
b
y
[
U
n
i
v
e
r
s
i
t
y
o
f
C
a
l
i
f
o
r
n
i
a
,
S
a
n
D
i
e
g
o
]
a
t
0
0
:
0
8
1
9
M
a
y
2
0
1
7
52 FOUNDATIONS OF POLITICAL SCIENCE RESEARCH
Task 4: Determine Relevant Variables and What Is to
Be Measured or Evaluated
Once the topic is identified, the researcher must determine which specific and relevant components
should be studied. For example, say a researcher is confronted with citizen distrust of government.
Should the researcher collect data on local economic conditions, neighborhoods, schools, ethnic
groups, families, peer groups, students who drop out, students who do not drop out, students
below a certain age, students above that age, etc.? Each option will come up with very different
information.
Related to this question is one of accessibility. If the element or subject to be measured is a
person, that subject must have the needed information, be willing to share the information with
the researcher, speak the researcher’s language, and be able to put into words why they behaved
in a certain way. The same problems exist for all possible measurement elements.
A variable is anything that changes in value or varies in some way. Thus, variables are
phenomena that can be “measured” in some way. Said another way, variables are study ques-
tions that have been rephrased into testable statements. For example, the high school dropout
phenomenon is a study question, whereas the annual rate of dropouts is a variable that can
be measured. Other variables include the gender of the dropout, the dropout’s age, ethnic
group, the level of education of the dropout’s parents, the location of the dropout’s residence,
and many more. A listing of some of the types of variables researchers use is displayed in
Figure 4.5 .
There are several ways to identify variables. One way is to divide them into two catego-
ries based on the type of numerical measurements they provide. These are categorical and
continuous variables. Categorical variables identify a limited number of possible categories.
Gender is an example, with just two categories possible: female or male. Continuous variables,
on the other hand, can have an unlimited number of values. Values for continuous variables
can be measured on a continuous scale (such as weights, height in inches, etc.) . They are not
restricted to specific, discrete categories or values, as are categorical variables. Attitude scales
that provide continuous data are used often in public administration research. Researchers
are concerned with mean (average) scores on a scale, not the response category (score) of
any single subject.
A second way of looking at variables is whether they are dependent or independent. This
dichotomy is important in causal research designs. Dependent variables are variables that are
influenced in some way by another variable or variables. Independent variables are the variables
that act upon the dependent variables. For example, the dependent variable voting behavior can
be influenced by many different factors, such as the type of political contest involved, the income,
education, occupation, or the age of the voter/nonvoter, etc.
Task 5: Establish Research Hypotheses
The hypothesis is the fundamental building block of all scientific research. It defines the research
topic and the researcher ’s ideas about it. Hypotheses can be defined in many different ways. One
way is to look at the hypothesis as the researcher’s ideas about a relationship between two phe-
nomena (variables). Shaughnessy and Zechmeister (1994) defined hypotheses as nothing more
than a “tentative explanation for something.”
D
o
w
n
l
o
a
d
e
d
b
y
[
U
n
i
v
e
r
s
i
t
y
o
f
C
a
l
i
f
o
r
n
i
a
,
S
a
n
D
i
e
g
o
]
a
t
0
0
:
0
8
1
9
M
a
y
2
0
1
7
SELECTING A RESEARCH DESIGN AND TOPIC 53
Figure 4.5 A Partial Classification of Variables
Variable:
A characteristic, quantity, or anything of interest that can have different values. Examples
include such things as savings account amounts, stock prices, package designs, weight,
monthly sales, gender, salaries, etc. The values of variables may be said to be either
continuous or categorical.
Independent Variable:
A variable that functions as the causal element in a hypothesis. A change in the value of
an independent variable is said to “cause” a positive or negative change in a dependent
variable. An example is the independent variable “poverty” in the hypothesis “Poverty
causes crime.”
Dependent Variable:
The second part of a causal hypothesis, a change in the value of a dependent variable is
hypothesized to have been “caused” by a change in the level of the independent variable.
In the hypothesis “Poverty causes crime,” the level of crime is the dependent variable.
Intervening Variable:
Sometimes referred to as a control variable, an intervening variable lies between an
independent and a dependent variable. A change in the intervening variable must be “caused”
by the independent variable; this change then “causes” the change in the dependent variable.
For example, in the hypothesis “Workplace stress causes physical illness, which causes
absenteeism,” physical illness is the intervening variable.
Conditional Variable:
This variable establishes the antecedent conditions necessary for change in the dependent
variable. The values of a conditional variable influence the level of impact that the independent
and intervening variables have on a dependent variable. In the example “Poverty causes
substance abuse, causing HIV-positive rates to increase, wherever needle exchange programs
are proscribed,” existence of needle exchange programs is the conditional variable.
Study Variable:
A variable whose cause or effect status the researcher is trying to discover through research.
The study variable can be an independent variable, a dependent variable, an intervening
variable, or a conditional variable.
Continuous Variables:
Quantities that can take any value within a range of measurements, such as weight or
percentage of increase in the price of a stock, are said to be continuous.
Categorical Variables:
Categorical variables have values that can vary only in specific steps or categories (they
are sometimes called discrete variables).
D
o
w
n
l
o
a
d
e
d
b
y
[
U
n
i
v
e
r
s
i
t
y
o
f
C
a
l
i
f
o
r
n
i
a
,
S
a
n
D
i
e
g
o
]
a
t
0
0
:
0
8
1
9
M
a
y
2
0
1
7
54 FOUNDATIONS OF POLITICAL SCIENCE RESEARCH
Tasks 6 & 7: Establish Objectives, Subobjectives and
Do a Pilot Study
Research objectives are statements of what the researcher wants to accomplish by completing the
research activity. They are related directly to the study question. For example, the director of a
program designed to help single parents receiving public assistance make the move to full-time
employment might be concerned that the program participation rate is declining while the numbers
of parents receiving assistance is not declining. Why enrollment is declining is a key study ques-
tion. Identifying ways to reverse the decline might serve as the program director’s main research
objective. Subobjectives might include the following items, although this is only a partial list of
the possible factors the director may wish to include in the study:
s )DENTIFYCHARACTERISTICSOFCLIENTSWHOPARTICIPATEINTHEPROGRAM
s $ETERMINEREASONSWHYTHEYELECTEDTOPARTICIPATE
s )DENTIFYCHARACTERISTICSOFCLIENTSWHODONOTPARTICIPATEINTHEPROGRAM
s $ETERMINEREASONSWHYTHEYELECTEDTONOTPARTICIPATE
s )DENTIFYBARRIERSTOPARTICIPATION
s )DENTIFYWHATINCENTIVESMIGHTENTICEMOREQUALIlEDPEOPLETOPARTICIPATE
s $ETERMINEWHATSUCCESSESOTHERPROGRAMSHAVEHADANDWHETHERTHEYCAN BETRANSPLANTEDTO
the local program.
Choosing a Research Theme or Position
Once the researcher has decided on a topic, there are many options on how to approach the study
of the topic. According to Seech (1993), research studies and their reports can follow one of five
different approaches or themes:
s 4HESISOR hPOSITIONv
s #OMPARE
AND
CONTRAST
s !NALYSIS
s 3UMMARY
s "ASICRESEARCH
A thesis or position study is one in which the researcher begins by stating a position, either his
or her own or some other person’s or group’s. This is then followed by arguments for or against
the point of view. Various types of evidence are presented to support one viewpoint and/or refute
the others. Political candidates regularly produce position papers in which they spell out their
support or lack of support for such things as tax increases, school budgets, welfare expenditures,
and so forth. The evidence presented in such papers is usually the product of a research project.
Compare-and-contrast studies are used to compare two or more ideas, methods, proposals, or
positions. First, each of the approaches to be compared is defined. Research is usually necessary to
fully develop each position. Several paragraphs follow, in which key points of the differences are
listed. This portion of the study is then followed by a more detailed discussion of the differences.
The arguments that can be used to explain the differences are then spelled out. The researcher then
selects one argument and, using evidence found in the research to support the argument, explains
to readers why that argument is “best.”
Analysis studies are closely related to generic research reports and often follow a similar
D
o
w
n
l
o
a
d
e
d
b
y
[
U
n
i
v
e
r
s
i
t
y
o
f
C
a
l
i
f
o
r
n
i
a
,
S
a
n
D
i
e
g
o
]
a
t
0
0
:
0
8
1
9
M
a
y
2
0
1
7
SELECTING A RESEARCH DESIGN AND TOPIC 55
structure. These studies require the researcher to carry out an in-depth analysis of an idea.
Examples include such political science issues as characteristics of political parties, voting be-
havior, rules or standards that permit political institutions to continue to function, presidential
policies, privatizing services, spending limitations, fiscal policies, foreign policy, and others. The
researchers’ opinions about the topic and its meanings or ramifications are typically included
in analysis reports.
The investigator reviews and summarizes existing literature on a topic, then writes an analyti-
cal summary in which he or she interprets the information for the reading audience. For example,
a researcher might be assigned to research and write a report about how passage of a people’s
initiative putting a cap on state automobile excise taxes affects a state highway department’s plans
to reinforce bridges to comply with federal earthquake damage requirements. The researcher will
first go to the published literature to review trends and developments on all the topics. This could
be followed by a series of interviews with department and budget administrators to establish their
opinions about such things as delaying work on some bridges, finding cheaper ways to do the
required work, or identifying other revenue sources.
Summary studies are detailed summaries of a topic or issue. They are much like an expanded
version of the review of the literature section of other types of studies. These summary report
studies include a brief introduction defining and describing the topic, then move immediately into
a summary of what other researchers or practitioners have said about the topic. Unlike analysis
studies, summary reports often do not require the author to subjectively interpret the previous
research, but only to summarize what others have reported.
Seech’s last style or approach to research studies is basic research. The form followed in
research studies is rooted in the earliest traditions of scientific research. The scientific method
approach to research evolved out of this tradition. Because of this, social science and administra-
tive research usually follows a structure similar to research for such disciplines as chemistry or
biology, for example.
When conducting a basic research study, the researcher designs and conducts a data-gathering
project. To do this, the researcher may elect to follow a qualitative or a quantitative approach. In
either approach, the data can be either primary or secondary. Collecting primary data means the
researcher gathers “new” information. This might mean conducting a survey with a questionnaire,
carrying out a series of personal interviews, employing content analysis to published documents,
or conducting an experiment. Afterward, the gathered primary data are processed (often with
computers) and interpreted. Researchers can then draw relevant conclusions and make recom-
mendations.
Research to collect secondary data means getting most of one’s information from already
published sources. These data can be found in libraries, on the Internet, or in internal publications,
among other sources. Because this material has already been published, the researcher must use
extreme care to report all the sources of material used in the report.
Summary
A variety of research designs are employed by researchers in political science and other social
science disciplines. Quantitative research designs are often employed in a sequence: they may
begin with a small-sample, exploratory study to provide information for developing a question-
naire, followed by a large-sample descriptive study. The results of a descriptive study may then
be used to design an experiment (a causal design).
Qualitative research strategies fall into three categories: explanatory, interpretive, and critical.
D
o
w
n
l
o
a
d
e
d
b
y
[
U
n
i
v
e
r
s
i
t
y
o
f
C
a
l
i
f
o
r
n
i
a
,
S
a
n
D
i
e
g
o
]
a
t
0
0
:
0
8
1
9
M
a
y
2
0
1
7
56 FOUNDATIONS OF POLITICAL SCIENCE RESEARCH
These approaches can be applied to many different research methods, including ethnography,
kinetics, atmospherics, phenomenology, and proxemics, among others.
The principal data collection methods used for gathering qualitative data in political science
research are unobtrusive observation, participant observation, personal interviewing, archival
analysis, and artifact analysis. Combined designs entail using both qualitative and quantitative
methods. The three broad classes of combined studies are archival, media, and artifact studies.
Techniques used in these types of studies include content analysis, document analysis, and in situ
analysis.
A seven-step process can aid the researcher in identifying and defining a research problem or
topic: (1) relate the problem to the program mission and objectives; (2) review the background
of the problem, usually by conducting a literature review; (3) break the problem down into its
subareas, components, or factors. Additional steps include: (4) select the most relevant variables
and determine what should be measured; (5) establish testable research hypotheses; (6) establish
objectives for the research and establish relevant subobjectives; and (7) conduct a pilot study to
check on the validity of the variables, measurements, and hypotheses.
Discussion Questions
1. Describe how the three phases of quantitative research might be used for a study of your
choosing.
2. Define the three approaches used in qualitative research.
3. Using a research question of your own choosing, describe how you would apply each of
the seven steps in the research problem–defining process.
4. Where might you find topics for a political science research project?
5. Do you agree with the statement that no subject is too trivial for study? Why or why
not?
6. What is the purpose of breaking a problem into smaller components or factors?
7. How do you know what to measure in a research project?
8. Must all variables you identify be measured? Why or why not?
9. How do you know what to focus on in a research study?
10. Name and define four different focus approaches to research.
Additional Reading
Anastas, Jeane W., and Marian L. MacDonald. 1994. Research Design for Social Work and the Human
Services. New York: Lexington Books.
Carlson, James M., and Mark S. Hyde. 2002. Doing Empirical Political Research. Boston: Houghton Mif-
flin.
Corbett, Michael. 1996. Research Methods in Political Science. Bellevue, WA: MicroCase.
Schram, Sanford, and Brian Caterino. 2006. Making Political Science Matter: Debating Knowledge, Research
and Method. New York: New York University Press.
Schwab, Donald P. 2008. Research Methods for Organizational Studies. Mahwah, NJ: Lawrence Erlbaum
Associates.
Wildavsky, Aaron. 1993. Craftways: On the Organization of Scholarly Work. 2nd ed. New Brunswick, NJ:
Transaction Publishers.
D
o
w
n
l
o
a
d
e
d
b
y
[
U
n
i
v
e
r
s
i
t
y
o
f
C
a
l
i
f
o
r
n
i
a
,
S
a
n
D
i
e
g
o
]
a
t
0
0
:
0
8
1
9
M
a
y
2
0
1
7
57
5 Preparing a Research Proposal
The research proposal is an important first step in the research process. The proposal is a descrip-
tion of what the researcher plans to undertake and why, as well as how the researcher plans to
carry out the research project. As such, it serves as a guide that keeps the researcher focused on
the tasks that need to be done. It also provides the research sponsor with a rationale for investing
in the effort. The purpose of the final report, on the other hand, is to explain what the researcher
concluded from his or her analysis. Because it serves as a guide or checklist, preparing a good
research proposal in advance makes writing the final report much easier.
Although the proposal is a critical component of the total research process, it has too often
been ignored or simply left to the researcher to discover how it should be done. Or it is treated
as something that everyone intuitively knows how to write. Nothing could be further from the
truth, however. Poorly written proposals have been identified as one of the major causes of failure
to receive committee approval or, more importantly, failure to receive funding for the proposed
study (Wasby 2002).
After a stint reviewing research proposals at the National Science Foundation (NSF), political
science professor Stephen Wasby concluded that many graduate students were apparently receiv-
ing little or no instruction in the skills needed to produce effective research proposals. Although
many proposals he read contained exciting research ideas, they were too often poorly written
or incompletely presented. The good ideas were often “embedded in horrendously constructed
proposals.” In many proposals, a clear statement of the research problem and a well-executed
literature review would be followed by a thin or nonexistent description of the research design.
Or there would not be a transition statement between the literature review and the statistics to be
used. Hypotheses, where present, were often not developed from the discussed literature, or from
any literature for that matter.
Wasby blamed graduate school curricula for the poor showing of so many research pro-
posals. In his view, graduate work in the social sciences—including political science, public
administration, and social services—has not always provided students with enough experience
in proposal writing. And what instruction students do receive in this important skill during their
research methods courses is too often inadequate or even inappropriate for the proposed task.
For example:
A related aspect of inadequate training is that our methods training seldom focuses on
particular methods. For example, elite interviewing and content analysis, and when to use
them, are critical components of a well-rounded methods curriculum. That curriculum,
however, instead becomes additional training in statistics, with the course in “Methods”
becoming “Statistics II or Statistics III,” with little if any attention to problem specification
D
o
w
n
l
o
a
d
e
d
b
y
[
U
n
i
v
e
r
s
i
t
y
o
f
C
a
l
i
f
o
r
n
i
a
,
S
a
n
D
i
e
g
o
]
a
t
0
0
:
0
8
1
9
M
a
y
2
0
1
7
58 FOUNDATIONS OF POLITICAL SCIENCE RESEARCH
Figure 5.1
Some Alternate Formats for the Research Proposal
Sample Format 1
Sample Format 2
Sample Format 3
Sample Format 4
Cover/Title
Table of Contents
Executive Summary
or Abstract
Introduction
s 0ROBLEM STATEMENT
s ,ITERATURE REVIEW
s 2ESEARCH QUESTIONS
and/or hypotheses
s 3IGNIlCANCE OF
proposed study
Design and
Methodology
s 3UBJECTS
s )NSTRUMENTATION
s 0ROCEDURES
s $ATA ANALYSIS
s 0RESENTATION
s ,IMITATIONS
References
Appendices
Cover/Title
Table of Contents
Executive Summary
or Abstract
/BJECTIVES
Activities
Methodology
Personnel Involved
Facilities Needed
Other Information
Budget
Appendices
References
Cover/Title
Table of Contents
Executive Summary
or Abstract
Background
Literature Review
Scope of the Study
Methodology
Work Schedule
Equipment
Estimated Costs
References
Cover/Title
Table of Contents
Executive Summary
or Abstract
Literature Review
/BJECTIVES
Research Plan
Methodology
Work Schedule
Budget
References
or research design. . . . This deficiency helps to explain why proposals often move, without
a transition of linkage, from literature review to discussion of the statistical method of
choice. (Wasby 2001, 309)
Although they are actually two equally important components of a single systematic activ-
ity, the research proposal and the research project are often erroneously treated as entirely
separate activities. Instructions on how to prepare a research proposal are likely to be found
as an appendix at the end of research methods text, or they are just as likely to be excluded
entirely.
In these unfortunate circumstances, beginning researchers given an assignment to prepare a
research proposal often do not know how to go about completing the assignment. If they do, their
proposals are often incomplete or do not adequately guide the researchers toward completion of
the research project that follows. Research Director Paul Wong of Trinity Western University ad-
dressed this issue in a set of instructions prepared for graduate students:
Most students and beginning researchers do not fully understand what a research proposal
means, nor do they understand its importance. To put it bluntly, one’s research is only as
good as one’s proposal. An ill-conceived proposal dooms the project even if it somehow
gets through the thesis supervisory committee. A high quality proposal, on the other hand,
not only promises success for the project, but also impresses [the] thesis committee about
your potential as a researcher. (Wong 2002)
D
o
w
n
l
o
a
d
e
d
b
y
[
U
n
i
v
e
r
s
i
t
y
o
f
C
a
l
i
f
o
r
n
i
a
,
S
a
n
D
i
e
g
o
]
a
t
0
0
:
0
8
1
9
M
a
y
2
0
1
7
PREPARING A RESEARCH PROPOSAL 59
Contents of a Typical Research Proposal
A chief purpose of the research proposal is to convince an administrator, a manager, an organiza-
tion, a professor, or a committee that the proposed project is worthwhile. It is also supposed to
show the people involved that you have the ability and knowledge to design a work plan and that
you have the competence to complete the work outlined in the proposal. For this to happen, the
proposal must contain all the information about the research process that will enable the approving
body to evaluate your proposed study.
There are a number of different opinions as to what should be included in a good research
proposal. Fortunately, there are many more or less complete outlines and guides to follow; some
of these are displayed in Figure 5.1. Elements in the far-left column have been synthesized from
McMillan and Schumacher (1997); the list in the far-right column is a simplified version of ele-
ments proposed by Salkind (2002). The remaining columns are summaries from a wide variety of
recommendations rather than a single source, with terms changed to reflect common concepts.
Components that appear to be common to many of these suggested guides include (1) an ex-
ecutive summary or abstract; (2) an introduction, which includes a statement of objectives, key
definitions, and assumptions, a statement of the problem, and a rationale for doing the research;
(3) a review of the relevant literature; (4) a description of the research methods to be followed,
including a plan for data analysis and limitations; and (5) appendices, which may include a time-
line, a budget, and copies of proposed research instruments, discussion guides, and results of
pilot studies, if any.
Sample Format 5
Sample Format 6
Sample Format 7
Cover/Title
Table of Contents
Executive Summary or Abstract
Introduction
Literature Survey
Problem Statement
Conceptual Framework
3PECIlC /BJECTIVES
Hypotheses (if any)
Methodology
Bibliography
Cover/Title
Table of Contents
Executive Summary or
Abstract
Introduction
Research Problem
Statement of Need
-AJOR )SSUES AND
Subproblems
Key Independent and
Dependent Variables
Hypotheses or Theory
Delimitations
Definitions
Literature Review
Methods and Design
Discussion
Bibliography
Cover/Title
Table of Contents
Executive Summary or Abstract
Introduction
s 0ROBLEM STATEMENT
s 2ATIONALE
s /BJECTIVES
s (YPOTHESES
s 0ROBLEM SUMMARY
Literature Review
s #URRENT STATUS OF THE TOPIC
s 2ELATIONSHIPS BETWEEN
literature and problem
Method
s 0ARTICIPANTS
s 2ESEARCH DESIGN
s $ElNITIONS
s 2ELIABILITYVALIDITY
s 0ILOT STUDY RESULTS
s $ATA ANALYSIS PLAN
Implications and Limitations
Appendices (instrument, human
SUBJECTS APPROVAL
PERMISSION
forms, timeline, budget)
D
o
w
n
l
o
a
d
e
d
b
y
[
U
n
i
v
e
r
s
i
t
y
o
f
C
a
l
i
f
o
r
n
i
a
,
S
a
n
D
i
e
g
o
]
a
t
0
0
:
0
8
1
9
M
a
y
2
0
1
7
60 FOUNDATIONS OF POLITICAL SCIENCE RESEARCH
The Abstract or Executive Summary
Although quite different in form, these two early elements serve very similar purposes. Both
elements are designed to be brief summaries of the material included in the full proposal. Both
should be written with the reader foremost in mind. That is, they are written in such a way that
the reader will be able to get a moderately complete overview of what the proposal is about. In
length, abstracts range from a low of about 100 words to a high of 300, with most closer to 200
words. Some abstracts have exceeded 500 words, but when this happens, they lose their intended
purpose as a brief summary. An executive summary, which may be written as either a narrative or
in bulleted or numbered form, should not exceed one full page. Both the abstract and the execu-
tive summary should outline the proposed research project and present a brief statement of the
research objectives and the methods proposed for accomplishing them.
The Introduction
This is where you “sell” your proposed project. It must be written in such a way that readers
come to believe in the project and your ability to accomplish it as described. If you are seeking
financial support for the research, the reader must be able to come away from the proposal feel-
ing that the money will be well invested and provide a payoff that justifies the investment of time
and money.
The purpose of the introduction is to provide the reader with enough background and content
to clearly understand what the research project is about. The introduction may include several or
all of the following elements:
1. A statement of the research problem;
2. A rationale for the proposed study that clearly indicates why it is worth doing;
3. A brief description of the major issues and (known) problems to be addressed by the
research;
4. If a quantitative study, a statement of the hypotheses; if a qualitative study, a statement
of theory, if any. Note: these are not the statistical null and alternative hypotheses;
5. Limitations you expect and definitions of key concepts;
6. Sometimes, a review of the literature on the topic, although this is more often a separate
section of the proposal.
Statement of the Problem
The statement of the research problem is usually the chief component of this section. In much
academic research, the problem is derived from the literature; that is, researchers determine what
to study from what they read that others have proposed. Often, beginning academic researchers are
advised to follow this same path: study the journals of a discipline, pick a recognized investigator
or investigators, and then focus on research that closes identified gaps in the published research.
However, in fields of inquiry such as political science, research tends to be more applied than
theoretical. Thus, research problems often emerge from problems encountered in the day-to-day
operations of existing organizations, or they arise with proposed modifications to existing orga-
nizational processes.
In either case, the problem or problems to be investigated should be framed in the theoretical
concepts of the discipline. For example, say that the issue has to do with a health care admin-
D
o
w
n
l
o
a
d
e
d
b
y
[
U
n
i
v
e
r
s
i
t
y
o
f
C
a
l
i
f
o
r
n
i
a
,
S
a
n
D
i
e
g
o
]
a
t
0
0
:
0
8
1
9
M
a
y
2
0
1
7
PREPARING A RESEARCH PROPOSAL 61
istration problem. To address this issue effectively, the researcher(s) should have grounding
in health care administration. Some of this grounding comes from practical experience in the
field. In this way, the research is able to locate the problem within the current thinking found
in the literature.
Researchers should keep the following cautionary points in mind as they approach this critical
component of the proposal (Paxton and Cox 2000):
s "ESURE TOTAKEENOUGHTIMETOEXPLORETHECURRENTRESEARCHINTHElELD 4 HISHASTWOPAYOFFS
it can help you avoid choosing a topic that has already been thoroughly investigated, and it
can help you narrow your study to something that can be done in the allotted time frame,
and done well.
s $ONOTTRYTOBEdifferent in your choice of topic and/or your methodology just to be dif-
ferent; be able to justify what you plan to do. Choose a research problem that can make a
difference. It is acceptable to use new methods on problems that have been studied earlier
in different ways.
s $ONOTCHOOSEATOPICTHATISTOOCOMPLICATED
BUTEQUALLYIMPORTANTDONOTFOCUSON A
problem that can be seen as too trivial. Attempting to study a highly complex problem is
one of the main reasons why many graduate students fail to finish their academic programs.
Three important rules to remember are: focus, focus, and focus.
s !VOIDCHOOSINGARESEARCHPROBLEMTHATYOUARE NOTTRULYINTERESTEDIN4AKINGTHEEASYWAY
out is often taking no way out.
The Literature Review
A literature review is simply the researcher’s detailed summary and interpretation of the published
articles, books, and related materials that pertain to the issues that frame the research problem. A
thorough analysis and interpretation of the published literature tells the researcher what has or has
not been studied and said about the issues, as well as the methods used to study them, and thereby
provides clear signals about how to plan and conduct the proposed research project. Demonstrat-
ing a direct link to previous research in your proposal is always a good idea. A literature review
serves a number of additional functions (Wong 2002):
1. It demonstrates your knowledge of the problem and its larger theoretical foundation.
2. It demonstrates your ability to critically evaluate relevant literature.
3. It shows your knowledge of the issues surrounding the research problem.
4. It indicates your ability to integrate and synthesize information.
5. It provides new insights and new models for the framework of your research.
6. It helps you to avoid “reinventing the wheel.”
7. It gives credit to those who have previously studied the problem.
8. It helps convince readers that your research will make a significant contribution to the
problem area and discipline.
There is no one best way to organize the literature review. However you choose to structure
the narrative of your analysis, remember to follow a logical path of presentation. You must make
it easy for the reader to follow. To do so, group related topics together, separated by subheadings
such as those used in this guide. Remember to synthesize and integrate your findings during the
section and summarize the issues and your conclusions at the end.
D
o
w
n
l
o
a
d
e
d
b
y
[
U
n
i
v
e
r
s
i
t
y
o
f
C
a
l
i
f
o
r
n
i
a
,
S
a
n
D
i
e
g
o
]
a
t
0
0
:
0
8
1
9
M
a
y
2
0
1
7
62 FOUNDATIONS OF POLITICAL SCIENCE RESEARCH
Study Objectives
Another important element in the Introduction section is a definitive statement of the study’s objec-
tives. Study objectives usually begin with a statement of the problem, a discussion of the need for
the project and the questions that the study is designed to answer, and the activities that will take
place. The objective (or goal) is a statement of what you expect to determine from the findings.
For example, in a research project to determine why a selected minority group exhibits dispro-
portionately low citizen participation in municipal planning sessions, a study objective might be
to identify what causal factors influence the group’s involvement. The rationale for the researcher
might be a need to create activities and programs designed to elicit greater group participation.
Research Design and Methodology
The research design and methods section describes the design or procedures you plan to follow in
conducting your research. Methods might be surveys, interviews, library research, lab work, fieldwork,
analysis of historical documents, analysis of physical artifacts, and many others. The underlying
purpose of the methods section is to inform others how you plan to approach your research project.
It must contain enough information to convince the reader that your methodology is sound and ap-
propriate. This section, like the others, will vary with the type of study proposed. Some elements are
more important for a quantitative study than they are for a qualitative project. For example, research
in the sciences most often follows a quantitative design. Therefore, the proposal requires a detailed
description of the proposed experiments, laboratory work, research subjects, data collection methods,
and similar details. Such studies also require identification of the population from which the sample
or samples will be drawn, sample size, sample elements, and related sample data.
Although much social science research continues to be quantitative, an increasing number of stud-
ies are following a qualitative approach. Proposals for qualitative studies also require a description
of the sources and types of data to be collected, strategies and processes for data collection, and the
techniques, if any, proposed for analysis of the collected data. Data collection tools, interview discus-
sion guides, and other related information should also be described in the proposal. Some discussion
of how quantitative and qualitative proposals differ is included in the following section.
References and/or Bibliography
The research proposal must include detailed bibliographic data for every source addressed in
preparing for and writing the proposal. In addition, the bibliography may also include a list of all
the resources the researcher plans to investigate during the conduct of the subsequent research.
Sources are grouped according to whether they are primary or secondary, and in what form they
exist. Primary sources are those from which the researcher collects the data firsthand. An example
is persons to be interviewed. Secondary sources are those collected originally by others, such as
journals, databases, and similar sources.
Public administration and nonprofit organization management disciplines tend to follow the
American Psychology Association (APA) style more often than not, although it is a good idea to
check with the sponsors of your research to determine which style they prefer. For example, the
publisher of this text prefers to follow the current edition of the Chicago Manual of Style. Other
commonly encountered styles include Harvard University’s A Uniform System of Citations, a
similar volume published by Columbia University, and the style recommended by the Modern
Language Association (MLA).
D
o
w
n
l
o
a
d
e
d
b
y
[
U
n
i
v
e
r
s
i
t
y
o
f
C
a
l
i
f
o
r
n
i
a
,
S
a
n
D
i
e
g
o
]
a
t
0
0
:
0
8
1
9
M
a
y
2
0
1
7
PREPARING A RESEARCH PROPOSAL 63
The Finished Product
Writing any research proposal involves a number of important steps. How these steps are
incorporated into a finished document that clearly communicates what the research intends
to accomplish may vary somewhat depending upon the type of study envisioned. There are
small but very real differences in the way quantitative research is structured and the format
to be followed in qualitative research proposals. Quantitative studies follow a deductive ap-
proach, whereas qualitative studies tend to be more open-ended, suggesting a final design that
evolves from the research itself. Qualitative studies, therefore, follow an inductive reasoning
approach.
Despite the differences in emphasis, some common elements are found in each proposal type.
Among these are: a statement of the problem, literature review, rationale for the study, design
and methodology, and references or bibliography. Some of the differences in the two types of
study proposals are discussed in the following paragraphs. In a presentation on preparing research
proposals given at the 2002 Association for Childhood Education International (ACEI) annual
conference, a number of points that differentiate between quantitative and qualitative proposals
were identified (Table 5.1).
Table 5.1
Differences in Preferences in Quantitative and Qualitative Research Proposals
Quantitative Preferences
Qualitative Preferences
1. Precise hypotheses and definitions stated at
the outset
Hypotheses and definitions that emerge as
the study develops
2. Data reduced to numerical scores
Data as narrative descriptions
3. Focus on assessing and improving
reliability of scores obtained from
instruments
Reliability of inferences is often assumed to
be adequate
4. Assessment of validity with reliance on
statistical indices
Validity assessed through cross-checking
sources of information (triangulation)
5. Random selection of samples
Recruitment of expert informants for sample
6. Precise description of procedures
Narrative/literary description of processes
7. Statistical control of extraneous variables
Logical analysis in controlling or accounting
for extraneous variables
8. Specific design control for procedural bias
(procedural and measurement integrity checks)
Reliance on researcher to deal with
procedural bias (integrity checks are still
critical)
9. Statistical summary of results
Narrative summary of results
10. Breaking down of complex phenomena into
specific parts for analysis
Holistic description of complex phenomena
11. Willingness to manipulate aspects, situations,
or conditions in studying complex phenomena
Unwillingness to tamper with naturally
occurring phenomena
Source: Kelley, Bennett, and Moore 2002.
D
o
w
n
l
o
a
d
e
d
b
y
[
U
n
i
v
e
r
s
i
t
y
o
f
C
a
l
i
f
o
r
n
i
a
,
S
a
n
D
i
e
g
o
]
a
t
0
0
:
0
8
1
9
M
a
y
2
0
1
7
64 FOUNDATIONS OF POLITICAL SCIENCE RESEARCH
Preparing a Quantitative Research Proposal
The design and methods section of a quantitative proposal generally includes a description of the
subjects, instruments, procedures for collecting the data, data analysis, and design limitations, if
any. Quantitative studies may be exploratory, descriptive, or causal. Exploratory projects are usually
small-sample studies designed to produce insights and ideas for further research. Descriptive studies
provide a descriptive snapshot of a sample at a particular time. Causal projects involve experimenta-
tion and are designed to measure relationships between independent and dependent variables.
The data analysis section identifies the statistical techniques to be used in data analysis. In
this section, some proposal recommendations add a call for a statement of how the data are to be
presented. Statistical tests should be identified for each research question and/or hypothesis, often
with a rationale for selecting the particular test(s). Limitations of the design that should be noted
include the scope of the study (research projects typically address one small part of a larger issue
or problem), the overall design, and/or the methodology.
Preparing a Qualitative Research Proposal
Unlike proposals for quantitative research projects, qualitative research proposals are necessarily
more tentative and open-ended. Often they must allow for a design and hypotheses that emerge
from the research activity. The actual detail to be included in a qualitative study often depends on
the amount of preliminary work done by the researcher prior to preparing the proposal.
The proposal must also identify the data collection methods proposed, with recognition that these
might be changed under exigencies of the collection event. The limitations of the design notes the dif-
ficulties the research can identify in advance, the scope of the study, methodological limitations, and
time/site limitations. Table 5.2 lists some of the common mistakes seen in research proposal writing.
Summary
Research proposals are the critical first step in all research activities. Too often, however, they
are treated cavalierly and not given the attention they need to be successful. Research propos-
Table 5.2
Common Mistakes in Proposal Writing
1. Failure to provide the background necessary to frame the research question
2. Failure to delimit the boundary conditions for your research (proposing to do too much)
3. Failure to cite landmark research on the topic
4. Failure to accurately present the contributions made by earlier researchers
5. Failure to stay focused on the research question
6. Failure to develop a coherent and persuasive argument for the research
4OO MUCH DETAIL ON MINOR ISSUES NOT ENOUGH ON MAJOR ISSUES
8. Rambling—going on and on without a clear direction
9. Missing too many citations and having incorrect references
10. Proposal is too long or too short
11. Failure to follow APA style
12. Sloppy writing
13. Claiming the study is significant without demonstrating it
14. Claiming prior research was poor or inadequate without providing suppor t
15. Stating the need for the research without substantiating your claims
D
o
w
n
l
o
a
d
e
d
b
y
[
U
n
i
v
e
r
s
i
t
y
o
f
C
a
l
i
f
o
r
n
i
a
,
S
a
n
D
i
e
g
o
]
a
t
0
0
:
0
8
1
9
M
a
y
2
0
1
7
PREPARING A RESEARCH PROPOSAL 65
als are often rejected because the problem is too trivial or too broad to be meaningful. Another
cause of rejection is the researcher ’s failure to clearly and cogently describe the methodology to
be followed.
Proposals serve several different purposes. First, they show that the researcher is competent to
carry out the project, that the research is important and should be done, and that it is connected
to prior research in its issues and methods. Research proposals should include a statement of the
problem, the significance of the study, a review of the relevant literature, and a statement of the
research questions and hypotheses. Quantitative proposals usually identify the population, sample
selection, subjects, instruments, data gathering and analysis procedures, and references. Qualitative
proposals are more tentative, with the design often emerging from the research activity. However,
they should also state the selection of the case or cases and how and why they were selected.
Discussion Questions
1. In your own words, explain why a researcher should prepare a research proposal before
embarking on a research project.
2. Why did the National Science Foundation conclude that graduate students have received
little in the way of instruction in how to write a research proposal?
3. What recommendations would you make to your professors to improve the amount and/
or quality of instruction in research method?
4. What are the major topics that should be in all research proposals?
5. What are some of the benefits of doing a comprehensive literature review?
6. Discuss the list of mistakes commonly found in research proposals with a fellow student
to be sure you both understand how to make sure they don’t happen to you.
7. What is APA style and why should you know how to use it?
8. Why is it important to use a recognized style for citations and references?
Additional Reading
California State University–Sacramento. 2005. Research and Sponsored Projects: Proposal Development
Handbook. www.csus.edu.rsp/Chapter6.htm.
Kelley, Michael F., Linda Bennett, and Lin Moore. 2002. “Preparing High Quality Research Proposals for
ACEI.” Paper presented at the 2002 annual conference in San Diego, CA: Association for Childhood
Education International.
Ogden, Thomas E., and Israel A. Goldberg. 2002. Research Proposals: A Guide to Success. San Diego, CA:
Academic Press.
Paxton, Patsy, and Stephen J. Cox. 2000. “Preparing Research Proposals.” New Zealand. www.wintec.ac .nz/
files/research%20connections/PreparingResearchProposals.doc.
Wasby, Stephen L. 2001. “Proposal Writing. A Remedy for a Missing Part of Graduate Training.” PS: Politi-
cal Science and Politics 34 (2) (June), 309–312.
D
o
w
n
l
o
a
d
e
d
b
y
[
U
n
i
v
e
r
s
i
t
y
o
f
C
a
l
i
f
o
r
n
i
a
,
S
a
n
D
i
e
g
o
]
a
t
0
0
:
0
8
1
9
M
a
y
2
0
1
7
66
6 The Legal and Ethical
Environment of Research
All science, including political science, is increasingly subject to the influence of uncontrollable
forces emanating from the political and ethical environments. Government legislators and admin-
istrators, the popular press, the general public, and a growing number of crusading social scientists
are alike in their increasingly justified calls for moral reform in research, passage of ethics laws
and codes, and greater education and training in ethical behavior for scientists working in all dis-
ciplines. Calls for ethics reform have been directed at every level of government, from the Office
of the President of the United States to the smallest local special service district.
Ethical problems in government run the gamut from sexual harassment to embezzlement of
millions of dollars. And when they happen, they are loudly pointed out by the press as examples
of the poor quality of public servants in general. Citing a Gallup Poll, USA Today reporter Karen
Peterson (2001) wrote that, for only the second time in half a century, ethics and morality are near
the top of a list of the major problems that people believe are facing the nation. Gallup reported
that 78 percent of the public feels that the nation’s moral values are somewhat or very weak.
Those are not isolated, seldom-seen instances; nor is the problem a new one. The behavior of
researchers in political science has long been affected by ethics as well as politics (Rohr 1998).
The problem of unethical behavior by researchers became a particularly important political issue
for Congress in the last decades of the 1900s. According to LaFollette (1994, 264), scientists had
“forged data, falsified experiments, and plagiarized before that time, but scientists and politicians
alike had treated such behavior as isolated, deviant, irrelevant, or unrepresentative of normal sci-
ence, and the news media only paid temporary attention when new cases were developed.”
According to one widely cited author on the topic, Terry Cooper (1998), interest in political
ethics appears to have mushroomed. This has resulted in a growing demand for in-service training,
publication of many ethics articles, and professional conferences devoted solely to ethics problems
in government. In addition, political science undergraduate and graduate education programs are
requiring students to successfully complete a course in ethical behavior. This heightened interest
in ethics has also included the practice of research. Every aspect of political research and analysis
involves ethics (J. Mitchell 1998). Jerry Mitchell included most types of research in his analysis,
including “pure” social science, as well as more “applied” studies such as policy analyses, and
program evaluations. He considerd ethics to be an issue whether research is conducted to describe
problems, predict outcomes, evaluate solutions, or measure agency performance.
The American Political Science Association (APSA) actively works to strengthen regulations
dealing with research. For example, in 2001 the Consortium of Social Science Associations, to
which APSA belongs, joined with other organizations to form a new research-accrediting group, the
D
o
w
n
l
o
a
d
e
d
b
y
[
U
n
i
v
e
r
s
i
t
y
o
f
C
a
l
i
f
o
r
n
i
a
,
S
a
n
D
i
e
g
o
]
a
t
0
0
:
0
8
1
9
M
a
y
2
0
1
7
THE LEGAL AND ETHICAL ENVIRONMENT OF RESEARCH 67
Association for the Accreditation of Human Research Protection Programs (AAHRPP). This group
is expected to play a major role in improving the system of protection for human subjects.
But ethics is more than protecting human subjects; there are many ways to define this value-
laden term. The next section discusses several of the approaches to defining ethics.
The Meaning of Ethics
Ethics, a branch of philosophy, is the study of the moral behavior of humans in society. It has
been further defined as the set of principles that govern the conduct of an individual or a group of
persons, and briefly as the study of morality or moral behavior (Velasquez 1998). Morality refers
to the standards that people have about what is right, what is wrong, what is good, and what is
evil; these standards are the behavior norms of a society. Moral behavior is acting in ways that
follow the moral standards that exist in society. Moral standards are the rules by which a society
functions. Examples of moral standards include the moral commandments: Do not kill, Do not
steal, Do not lie, etc. Standards are about what behavior is acceptable, what is “right” and what
is “good” in society, and their opposites, of course. While moral standards often differ from time
to time, they remain relatively constant for at least a generation or more. When they do change,
they tend to do so very slowly.
What is meant by behavior that is unethical? In the specific sense of scientific research it
refers to the concept of scientific misconduct. Misconduct “encompasses acts of deception—
alteration of data or materials, false representation of authorship or originality, and misrepresen-
tation to advance oneself or to hurt the career or position of another” (Fox and Braxton 1994,
374). Behavior that is ethical, on the other hand, is behavior that reflects the moral standards
of a society.
Scientific research of all types is beset with ethical dilemmas, paradoxes, and ambiguities (de
Laine 2000). This is particularly true when research involves potential physical or mental harm
to human subjects, and when the research is conducted in social settings, as the following state-
ment suggests:
Ethical and moral dilemmas are an occupational work hazard of fieldwork that the researcher
cannot plan for, but nonetheless must be addressed on the spot, by drawing on the values,
ideals, ethical codes, moral and professional standards, intuition and emotions. (de Laine
2000, 6).
Ethicists have identified a number of different theoretical foundations for the values, ideals,
ethical codes, and moral standards that researchers draw upon when faced with these dilemmas.
Examples of the types of events that trigger ethical conflicts include the following behaviors cited
by LaFollette (1994) who considered them to be the cause of the increased oversight activity of
Congress over the last two decades:
The behavior in question ranged from fabrication of data, falsified experiments, or faked
specimens and artifacts, to the deliberate misrepresentation or altering of data and theft
of ideas from research proposals and published articles. Congressional attention concen-
trated on unethical or illegal activities that took place during the process of proposing,
conducting, or communicating federally funded research in the biological, physical, and
behavioral sciences [including political science], mathematics, and engineering. (LaFol-
lette 1994, 270)
D
o
w
n
l
o
a
d
e
d
b
y
[
U
n
i
v
e
r
s
i
t
y
o
f
C
a
l
i
f
o
r
n
i
a
,
S
a
n
D
i
e
g
o
]
a
t
0
0
:
0
8
1
9
M
a
y
2
0
1
7
68 FOUNDATIONS OF POLITICAL SCIENCE RESEARCH
The Office of Research Integrity (ORI) is one of the agencies established by Congress to
monitor research fraud. The agency came up with a list of fourteen ethical topics with applicabil-
ity to research. The topics were grouped under three headings: (1) the research community, (2)
professional development, and (3) the research process. The five subgroups in the research pro-
cess category concerned data management, publication of findings, authorship, peer review, and
research misconduct specifically. A partial list of the topics under research misconduct includes
the following (ORI 2005, 5):
s 7HATFACTORSAFFECTTHEDETECTIONOFRESEARCHMISCONDUCT
s 7HATFACTORSDISCOURAGETHEREPORTINGOFRESEARCHMISCONDUCT
s 7HATFACTORSMOTIVATEINDIVIDUALSTOCOMMITRESEARCHMISCONDUCT
s 7HATHAPPENSTOWHISTLE
BLOWERS
How Can You Know Which Is the Right Decision?
These principles of ethics may help guide the researcher when preparing, conducting, and re-
porting the results of research studies. Some of the principles have resulted in laws that define
specifically what a researcher can and cannot do. However, it is not enough to simply do what is
legal; researchers have a moral responsibility that goes far beyond adhering to the letter of the
law. Because there is no one comprehensive moral theory that is capable of stating exactly when
a utilitarian consideration should take precedent over a right, a standard of justice, or the need
for caring, the political science researcher is forced to “follow his or her conscience” when faced
with an ethical dilemma.
Ethical dilemmas that cause the most difficulty for researchers in political science are not those
associated which what Orlans (1967) described as outright “knavery—lying, bad faith, conscious
misrepresentation to get money, or the deliberate breach of the terms on which it was obtained (i.e,
research grants).” Those are practical problems of a legal nature rather than problems of ethics.
Instead, he considered the following issues to be the most problematic:
The persistent ethical dilemmas in . . . research are those in which the right course of action
is not clear, in which honorable [researchers] may differ and no consistent rule obtains; they
involve issues in [which] what is reasonable to one [person] is ignoble to another; in which
honesty must be reconciled with tact and effectiveness; in which the disinterested pursuit of
innocent truth can abet the interested selection of useful knowledge; in which the judgment of
the pragmatic [person] of affairs confronts that of the academic moralist. (Orlans 1967, 4)
Five Important Research Problem Areas
Reynolds (1979, 43) identified five problem areas where ethical dilemmas occur most often in
research:
1. Research program effects—the positive and negative effects of an overall research program
2. Research project effects—the positive and negative effects that result from a specific
research project
3. Participation effects—how participation in the research project will affect each participant
4. Overall distribution effects—how the key positive and negative effects of research are
distributed evenly among different social groups (stakeholders)
D
o
w
n
l
o
a
d
e
d
b
y
[
U
n
i
v
e
r
s
i
t
y
o
f
C
a
l
i
f
o
r
n
i
a
,
S
a
n
D
i
e
g
o
]
a
t
0
0
:
0
8
1
9
M
a
y
2
0
1
7
THE LEGAL AND ETHICAL ENVIRONMENT OF RESEARCH 69
5. Consideration of participants’ rights and welfare—the features of the research program
and project that ensure that the rights and welfare of participants are, or will be respected
Because research projects are carried out for all levels and functions of government, the ethical
conduct of research is extremely important. Researchers have dual responsibilities. First, their
research must be done in an ethically correct manner, particularly so when working with human
subjects. In addition, the sponsoring agency has a moral obligation to be honest and complete,
and to support ethical methodological choices. Morality, political science functions, and research
ethics are closely interconnected.
Research Ethics
Research ethics refers to the application of moral standards to decisions made in planning, conduct-
ing, and reporting the results of research studies. The fundamental moral standards involved are
those that focus on what is right and what is wrong. Beyond this, however, Jerry Mitchell (1998)
identified the following four practical ethical principles that shape morality in political research:
truthfulness, thoroughness, objectivity, and relevance.
The truthfulness principle means that it is unethical for researchers to purposefully lie, deceive,
or in any way employ fraud. Deliberately misrepresenting the purpose of a study, not informing
subjects of the dangers of participation, hiding the identity of the sponsor of the study, or inflat-
ing or understating the findings of a research project are all examples of research that fails the
truthfulness principle.
Despite the belief that truthfulness is a fundamental standard for all human endeavors, it
sometimes gets sacrificed to expediency in certain research applications. When it does, a rationale
for not telling the truth is usually provided. For example, some researchers believe that certain
research could not be conducted without deception of some sort. They believe that disclosing the
true sponsor of a study will unnecessarily bias the findings. Researchers who use deception use
two arguments to justify their actions: (1) they assume that participants will not suffer any physical
or mental harm as a result of the deception, and (2) they take the responsibility of informing the
participants about the deception after the research study is completed (Zikmund 1994).
The thoroughness principle demands that researchers not cut corners in their designs. This
means being methodologically thorough (Jerry Mitchell 1998, 312). It means “doing good sci-
ence” by following all steps in a study. Researchers are morally obligated to include the following
in their study reports:
1. Definitions for all key concepts used in the study
2. Selection of appropriate samples or group participants, including full descriptions
3. Identification of all limitations of the research design
4. A description of the analysis design
Furthermore, remaining methodologically thorough means that all results and findings are
reported—good news and bad. It means guaranteeing that participants will be neither physically
harmed nor emotionally distressed. Thoroughness is not a simple concept, however, and can cause
a great deal of difficulty for a researcher. Jerry Mitchell (1998, 313) summarized this difficulty
in the following way: “In short, thoroughness is evidently at the core of methodology; the ethical
problem is defining exactly what thoroughness means in the actual conduct of research.”
The objectivity principle refers to the need for the researcher to remain objective and impartial
D
o
w
n
l
o
a
d
e
d
b
y
[
U
n
i
v
e
r
s
i
t
y
o
f
C
a
l
i
f
o
r
n
i
a
,
S
a
n
D
i
e
g
o
]
a
t
0
0
:
0
8
1
9
M
a
y
2
0
1
7
70 FOUNDATIONS OF POLITICAL SCIENCE RESEARCH
throughout all aspects of the study. The researcher should never interject his or her own personal
feelings or biases into the design of a study, selection of participants, writing and/or asking of
questions, or interpreting results. “Doing good science” means that the researcher does not bias the
study in any way. This means using probability methods to select a sample, wording questions is
such a way as to avoid any hint of leading the subject to give a desired answer, and not allowing
one’s own values to color the results.
Not all researchers believe that remaining neutral is the proper role for a researcher to take
in conducting research for public organizations. Some say that it is impossible to do so. These
researchers object to the positivist philosophy of science and instead purposefully place them-
selves as one with the study participants. These researchers follow a postpositivist approach and
employ such qualitative methods as ethnography, case analysis, grounded theory, and action or
participatory research methods.
The final ethical research principle discussed by Mitchell is relevance. Research should
never be frivolous, or done because the researcher “has an axe to grind” and wants the study
done to punish the persons or groups involved in the subject organization. According to
Mitchell, in a democracy, research has a moral responsibility to be understandable to people
and useful. Research that fails this test can be open to ridicule and worse. One example was
a $27,000 study to determine why inmates want to escape from prison (TFCS 2001). The
phrase, “it if sounds ridiculous, people will think it is” applies to all research. Kumar (1996,
192) has summarized the need for relevance in the following way: “If you cannot justify the
relevance of the research you are conducting, you are wasting your respondents’ time, which
is unethical.”
Hardwig (1991) has made the valid point that, today, teams of scientists conduct most research.
The body of knowledge in most disciplines has grown so great and is evolving so rapidly that it
has become increasingly difficult for any one investigator to have a complete grasp of everything
going on in his or her discipline. This fact has contributed to the potential for scientific fraud.
Although Hardwig was talking about research in the natural sciences, his warning applies equally
to researchers in the social sciences as well:
[R]esearch is increasingly done by teams because no one knows enough to be able to do
the experiment by herself. Increasingly, no one could know enough—sheer limitations of
intellect prohibit it. The cooperation of researchers from different specializations and the
resulting division of cognitive labor are, consequently, often unavoidable if an experiment
is to be done at all. . . . Specialization and teamwork are thus inescapable features of much
modern knowledge acquisition. (Hardwig 1991, 695–96)
The Nuremberg Code
The acceptance of ethical standards as a guiding principle for all research with human subjects
is based upon decisions made during the Nuremberg Military Tribunal on Nazi war crimes held
after the end of World War II. The standards that emerged from those trials resulted in adoption
of what is known as the Nuremberg Code (Neuman 2000; Neef, Iwata, and Page 1986). Although
originally applied to medical experiments only, the principles in the code are today used in all
research involving human subjects, including the social and administrative research employed in
political science. Included in the code are the following principles:
D
o
w
n
l
o
a
d
e
d
b
y
[
U
n
i
v
e
r
s
i
t
y
o
f
C
a
l
i
f
o
r
n
i
a
,
S
a
n
D
i
e
g
o
]
a
t
0
0
:
0
8
1
9
M
a
y
2
0
1
7
THE LEGAL AND ETHICAL ENVIRONMENT OF RESEARCH 71
1. The requirement for informed, voluntary consent
2. No unnecessary physical or mental suffering
3. No experiments where death or disabling is likely
4. Ending the research if continuation will cause injury or death
5. Experiments should be conducted only by highly qualified researchers
6. Results should be for the good of society and unattainable by any other method
Political science researchers are most concerned with ethics at four times in the research process:
(1) when they are planning to gather data, (2) while they are gathering data, (3) when they are
processing and interpreting data, and (4) when they are disseminating the results of their research
(Figure 6.1).
Ethics When Planning Research
A key activity in planning a research project is deciding who will participate in the study. Use of
the proper sampling design is a critical decision factor in planning a design. In all designs, special
care must be taken to ensure that participants voluntarily agree to participate, that their privacy is
protected, and that they are not physically or mentally harmed in any way.
When researchers follow a positivist (or quantitative) research approach, they often use the
information gathered from a representative sample drawn from a larger population to imply or
infer that the results apply to the larger body as well. Samples can be one of two basic types (with
many variations): probability or nonprobability. Both have a place in research, but they are not
interchangeable. In a probability sample, all participants have an equal or known chance at being
selected for the study. This is not the case with a nonprobability sample, where participants are
usually selected for the convenience of the researcher or simply to fill a quota. Therefore, the results
of a nonprobability sample study should not be used for inference; it is unethical to do so.
The following six questions must be answered before involving a subject in a study; they must
be addressed in the planning stage of the project.
Ethics While Planning
to Gather Data
Selecting only participants
who know what they are
volunteering for.
Ethics While
Gathering Data
Honesty when observing
behavior; conducting
interviews and surveys.
Ethics While
Processing and
Interpreting Data
Honesty in dealing with
outliers and interpreting
significance.
Ethics While
Disseminating
Research Results
Maintaining privacy and
anonymity; reporting both
good and bad results.
Figure 6.1 The All-Pervasive Nature of Ethics in Research
D
o
w
n
l
o
a
d
e
d
b
y
[
U
n
i
v
e
r
s
i
t
y
o
f
C
a
l
i
f
o
r
n
i
a
,
S
a
n
D
i
e
g
o
]
a
t
0
0
:
0
8
1
9
M
a
y
2
0
1
7
72 FOUNDATIONS OF POLITICAL SCIENCE RESEARCH
1. Has the participant given his or her informed consent to be included in the study?
2. Has the subject voluntarily agreed to participate, or has some form of coercion been used
to force the subject’s participation?
3. Have subjects been fully informed of their right not to participate, and of any risks and/
or benefits that might accrue from the study?
4. Will the subject be harmed, either physically or mentally, in any way as a result of par-
ticipation in the study?
5. Is it necessary to use deception, to disguise the research, or use covert research methods
in order to collect the data?
6. Will a jury of external professional peers validate the study?
Informed Consent. The idea of “informed consent” is based upon Western society’s ideas
of individual freedom and self-determination, as spelled out in the body of common law
(Neef, Iwata, and Page 1986). A person’s right to be free from intrusion by others is supported
by a number of court decisions, among them the 1973 Roe v. Wade decision. From this and
other court actions, the following components of informed consent have been of particular
interest:
s 4HECAPACITYOFTHEPERSONTOCONSENTTOPARTICIPATION
s 4HEFREEANDVOLUNTARYGIVINGOFCONSENT
AND
s #ONSENTTHATISBASEDUPONSUBJECTSKNOWLEDGEOFTHERESEARCHANDPOSSIBLEOUTCOMES
Courts have held that the capacity to consent requires that the person giving consent know-
ingly and rationally understand the nature of the experiment or study, any associated risk,
and other relevant information. At the same time, researchers are not permitted to decide
whether the subject is competent enough to make the decision; all people retain the right to
manage their own affairs.
In research involving children, parents have traditionally been allow to give consent on their
behalf, but Neef, Iwata, and Page (1986) note that the courts have not always accepted that as a
right. Therefore, researchers are advised to acquire the consent of parents and the child, as well
as that of relevant organizations (such as schools).
Voluntary Consent. There are two aspects to the concept of voluntary consent. First, the agree-
ment must be entirely free of any coercion. Second, the subject must understand that the consent
can be withdrawn at any time without harmful consequence (Neef, Iwata, and Page 1986). Often,
academic researchers use the students in their classes as participants in research studies. Students
are not required to participate and must know that their standing in the class will not suffer as a
result of their not participating.
Knowledgeable Consent. All potential research participants must be made aware of all aspects
of the study. This means that they must be told of their rights to (1) not participate, (2) withdraw
at any time, as well as (3) what risks might be involved, and (4) the potential benefits of the study,
if any. If the study is a medical experiment, they must also know the risks and benefits of any
alternative treatments.
Freedom from Harm. A fundamental ethical principle that must be followed in all research studies
is that no harm shall befall the participants as a result of their participation in the research. Harm
is broadly defined; for example, it can mean physical, cultural, social, or psychological distress
as well as physical pain (Neuman 2000; Oppenheim 1992).
D
o
w
n
l
o
a
d
e
d
b
y
[
U
n
i
v
e
r
s
i
t
y
o
f
C
a
l
i
f
o
r
n
i
a
,
S
a
n
D
i
e
g
o
]
a
t
0
0
:
0
8
1
9
M
a
y
2
0
1
7
THE LEGAL AND ETHICAL ENVIRONMENT OF RESEARCH 73
Ethics When Gathering Data
Kumar (1996) identified five key points in the research when an ethical concern for respondents is
particularly important: (1) when seeking consent from the subject, (2) when providing incentives
to participate, if any, (3) when seeking sensitive information or information that might embarrass
or otherwise cause discomfort to the subject, (4) when there is a possibility of causing harm, and
(5) while maintaining confidentiality for the respondent.
A number of ethical issues come into play when conducting interviews or writing question-
naires. The ethics of data gathering in all forms continue to raise controversial questions among
researchers (Oppenheim 1992). The two problems that cause most difficulty are the potential for
bias on the part of the interviewer or in the wording of the question, and the response distortion that
such biases can cause. Most researchers concede that it is impossible to eliminate all interviewer
bias; conscientious training of interviewers is the only way to reduce it.
Ethics in Processing and Interpreting Data
Researchers are sometimes asked to conduct a research study and analyze the collected data in
order provide “scientific credence” to pre-established conclusions—in other words, to perform
research to justify decisions or opinions after they are made. Researchers have also been asked to
compromise their ethical standards as a condition for receiving a contract to conduct research. Both
of these situations present ethical dilemmas. The researcher has three options in these situations
(Neuman 2000): One, the researcher may feel that loyalty to an employer or group overrides any
ethical considerations and quietly go along with the request. Two, the researcher may publicly
oppose the request, making the opposition a part of the public record. This places the researcher
in the role of a whistle-blower, and could result in loss of credibility in the agency, elimination
of future research opportunities, or even loss of a job. Three, he or she can simply refuse to make
compromises and walk away from the request, aware that another researcher might be found to
do the work.
Making the “right” moral decision in such situations is not an easy choice. Opting for the first
path may not only cause the researcher undue personal stress, it could also open the door to crimi-
nal prosecution. On the other hand, refusing to go along with the request opens the researcher to
accusations of disloyalty to the organization and disregard for the well-being of fellow workers.
Ethicists often encourage selecting the path of the whistle-blower; it is clearly the “most moral”
of the three options. However, whistle-blowers are seldom rewarded for their willingness to pub-
licize unethical activity. The whistle-blower must be in a position to prove his or her allegations
in a court of law, where deliberations could take years to complete. In the intervening time, the
whistle-blower is often ostracized by fellow workers, removed from any meaningful work in the
organization, eliminated from potential promotion, and ultimately forced to suffer loss of a job.
The popular press has aired many reports of whistle-blowers who have not only lost their job, but
their home and other possessions as well. It takes a brave person to adopt this role; thankfully,
many still do.
Refusing to do the study may be the easiest way out of the dilemma. If morality can exist on a
continuum, this path is less immoral than going along with the request and less moral than publicly
disclosing the request. This does not mean to imply that it is an easy solution. Choosing not to
do the research may mean loss of income or professional standing. On the other hand, comply-
ing with the request because someone else will do it anyway is never an acceptable justification.
In discussing the conflict that often arises in such situations, Neuman (2000, 103) concluded:
D
o
w
n
l
o
a
d
e
d
b
y
[
U
n
i
v
e
r
s
i
t
y
o
f
C
a
l
i
f
o
r
n
i
a
,
S
a
n
D
i
e
g
o
]
a
t
0
0
:
0
8
1
9
M
a
y
2
0
1
7
74 FOUNDATIONS OF POLITICAL SCIENCE RESEARCH
h7HATEVERTHESITUATION
UNETHICALBEHAVIORISNEVERJUSTIlEDBY THEARGUMENT@)F) DIDNTDOIT
someone else would have.’”
Ethics in Disseminating Research Results
Researchers are faced with two broad classes of ethical considerations when communicating their
findings. The first includes issues that come into play with the distribution and/or publication of
findings. The second centers on obligations to protect the privacy of research participants.
Researchers must consider the following when communicating the results of their research: (1)
whether to tell the entire story rather than just a few significant portions; (2) presenting insignifi-
cant, adverse, or negative findings; and (3) contributing to the general storehouse of disciplinary
knowledge. Telling the entire story relates to the idea of methodological completeness discussed
earlier. The obligation to include findings that reflect negatively on the sponsoring agency, the
research method, or the researchers themselves is based on the ethical standard of honesty. Telling
only part of the truth is little different than not telling the truth at all. Contributing to knowledge
in the field refers to researchers’ obligation to the ethos of the profession, both as administrators
and as researchers.
In addition to the ethical obligation to be truthful when preparing a research report, the re-
searcher must also protect the rights of participants. Three participant ethics issues are of particu-
lar importance when disseminating the results of a research study: (1) protecting the privacy of
participants, (2) ensuring the anonymity of participants, and (3) respecting the confidentiality of
individuals involved in the study.
An integral part of every study is, or should be, a description of the sample participants. This
description should always be done in the aggregate, focusing on characteristics of the group,
such as measures of central tendency, variation, and the like. The results of any single participant
should never be made known, except in interpretive studies, which can focus on a single case.
The confidentiality standard means that no one other than the primary researcher should know
the names and addresses of sample members. This means making a single list, kept only by the
principal researcher.
Researchers also have a moral obligation to avoid reporting incomplete research results, issuing
misleading reports, and issuing biased reports (Malhotra 1999). Incomplete reports are more likely
to be disseminated when the researcher uncovers adverse or negative information. Misleading
results are released to intentionally sway an audience, even if they are not an actual lie.
Summary
The potential for unethical behavior is a universal problem; it affects academic political scientists
and those working as administrators at all levels of government and non-governmental organiza-
tions. Political scientists, elected officials, public administrators, and the popular press have called
for moral reform, passage of ethics laws and codes, and greater education and training in ethical
behavior for everyone involved in science and in politics. These have been directed at every level
of government, from the Office of the President of the United States to the smallest local special
service district.
Ethics, a branch of philosophy, is the study of the moral behavior of humans in society. Morality
refers to the standards that people have about what is right, what is wrong, what is good, or what
is evil. Moral behavior means acting in ways that follow the moral standards that exist in society.
Moral standards are the rules by which a society functions.
D
o
w
n
l
o
a
d
e
d
b
y
[
U
n
i
v
e
r
s
i
t
y
o
f
C
a
l
i
f
o
r
n
i
a
,
S
a
n
D
i
e
g
o
]
a
t
0
0
:
0
8
1
9
M
a
y
2
0
1
7
THE LEGAL AND ETHICAL ENVIRONMENT OF RESEARCH 75
Research ethics refers to the application of moral standards to decisions made in planning,
conducting, and reporting the results of research studies. The fundamental moral standards in-
volved are those that focus on what is right and what is wrong. Four additional practical ethical
principles shape morality in political science research: truthfulness, thoroughness, objectivity,
and relevance.
Principles found in the Nuremberg Code are today used in all research that involves hu-
man subjects, including the social and administrative research employed in political science.
The key clauses of the code deal with rules for ensuring that participants have the right to not
participate, that they are informed of all risks, and that they will not be intentionally physically
or mentally harmed.
Political science researchers are particularly concerned with ethics at four times in the research
process: (1) when they are planning to gather data, (2) while they are gathering data, (3) when
they are processing and interpreting data, and (4) when they are disseminating the results of their
research.
Discussion Questions
1. What are ethics? What are research ethics?
2. What are the sources of our moral standards?
3. What are some the reasons for malfeasance in government?
4. Why has a large segment of the population lost faith in the morality of many elected and
appointed public officials?
5. What is the cause of the precipitous drop in the public’s trust in government?
6. How can you explain the growth in the incidence of lapsed morals among leaders in
business, nonprofit organizations, and in government?
7. How would you incorporate protection for human subjects in a research project in which
you plan to interview children between the ages of 10 and 13?
8. Does asking people how they voted in the last election constitute a breach of research
ethics? Would it be important to include provision for the protection of human subjects
in such a study?
Additional Reading
Cooper, Terry L. 1998. The Responsible Administrator: An Approach to Ethics for the Administrative Role.
4th ed. San Francisco: Jossey-Bass.
de Laine, Marlene. 2000. Fieldwork, Participation and Practice: Ethics and Dilemmas in Qualitative Re-
search. London: Sage.
Elliott, Deni, and Judy E. Stern, eds. 1997. Research Ethics. Hanover, NH: University Press of New England.
Garofalo, Charles, and Dean Geuras. 1999. Ethics in the Public Sector: The Moral Mind at Work. Washington,
DC: Georgetown University Press.
Neuman, W. Lawrence. 2000. “The Ethics and Politics of Social Research.” In Social Research Methods:
Qualitative and Quantitative Approaches, 89–120. 4th ed. Boston: Allyn and Bacon.
Rohr, John A. 1998. Public Service, Ethics, and Constitutional Practice. Lawrence: University Press of
Kansas.
D
o
w
n
l
o
a
d
e
d
b
y
[
U
n
i
v
e
r
s
i
t
y
o
f
C
a
l
i
f
o
r
n
i
a
,
S
a
n
D
i
e
g
o
]
a
t
0
0
:
0
8
1
9
M
a
y
2
0
1
7
This page intentionally left blank
D
o
w
n
l
o
a
d
e
d
b
y
[
U
n
i
v
e
r
s
i
t
y
o
f
C
a
l
i
f
o
r
n
i
a
,
S
a
n
D
i
e
g
o
]
a
t
0
0
:
0
8
1
9
M
a
y
2
0
1
7
Part 2
Quantitative Research Approaches and Methods
D
o
w
n
l
o
a
d
e
d
b
y
[
U
n
i
v
e
r
s
i
t
y
o
f
C
a
l
i
f
o
r
n
i
a
,
S
a
n
D
i
e
g
o
]
a
t
0
0
:
0
8
1
9
M
a
y
2
0
1
7
This page intentionally left blank
D
o
w
n
l
o
a
d
e
d
b
y
[
U
n
i
v
e
r
s
i
t
y
o
f
C
a
l
i
f
o
r
n
i
a
,
S
a
n
D
i
e
g
o
]
a
t
0
0
:
0
8
1
9
M
a
y
2
0
1
7
79
7 Introduction to Quantitative Methods
An underlying objective of much research in political science is to uncover information needed to
expand and improve the level of awareness and understanding of one or more political phenomena.
Although they generally narrow their focus to more specific areas of interest, such as political
theory, American government, international relations, or public policy, political scientists employ
methods and techniques that are common to all the social sciences.
In designing a research study, political scientists must establish priorities, identify alternatives
and choose options, set and manage budgets, and often hire, motivate, and, when necessary, fire
research assistants. They receive, give, or pass on instructions, develop and write research plans
with objectives and strategies, monitor their staff ’s performance, and keep higher-level administra-
tors and funding bodies informed about their progress toward achieving their research objectives.
In turn, higher-level administrators are often called upon to communicate to internal and external
stakeholders the progress of the researcher in their units.
In every one of these tasks, political scientists and administrators make decisions. In doing so,
they compare two or more alternatives, weigh the costs and benefits of each, and then select and
implement the better alternative. To improve the quality of their decisions, administrators must
thoroughly understand the processes involved in conducting research.
To make effective decisions, political scientists and public administrators use quantitative
research methods to produce information that has the potential for improving the quality of those
decisions. Often, using numbers with words makes communicating easier, faster, and far more
effective than the use of words alone.
To understand the use and meaning of statistics and statistical methods, it is necessary to first
understand the nature of measurements. Therefore, this chapter begins with a discussion of the
four types of measurements. The next several chapters illustrate how these different types of
measurements are applied in quantitative research designs. The material focuses on how to use
statistical methods and interpret statistical information, rather than on the theoretical side of statis-
tical analysis. The purpose of this chapter is to help researchers and those involved in approving,
funding, monitoring, or evaluating research in political science.
Fundamentals of Measurement
The key to ensuring that everyone who reads a research report understands the measure-
ments lies in the consistent use of the measurement scale appropriate for the task at hand. In
the following discussion the term data refers to the numbers (i.e., values) that signify some
variable measurements. Variables are things that can be counted or measured, and different
values of a variable can convey different meanings. Helping to establish and maintain this
D
o
w
n
l
o
a
d
e
d
b
y
[
U
n
i
v
e
r
s
i
t
y
o
f
C
a
l
i
f
o
r
n
i
a
,
S
a
n
D
i
e
g
o
]
a
t
0
0
:
0
8
1
9
M
a
y
2
0
1
7
80 QUANTITATIVE RESEARCH APPROACHES AND METHODS
meaning is the nature of the measurement used to collect the data. Measurements can be one
of four types or levels.
The four different types or levels of measurement in political science research are: (1) nominal,
(2) ordinal, (3) interval, and (4) ratio. The label scales is sometimes used to mean both the mea-
surement tools used to collect data and the data themselves. Statisticians have developed different
statistical tests to analyze data of each different data or scale type. In differentiating between the
data types, each level or type must meet one or more rules. Moving beyond the lowest or the
“least powerful” of the four scales in terms of meaning that can be conveyed toward higher level
or more powerful scales, the preceding rules must also apply to each higher-level measurement.
Thus, one rule applies to the lowest level, two rules to the next highest, three rules for the next,
and four rules for the highest-level data.
Nominal Data
Nominal data, the least powerful of the four types of data, must comply with just one rule. This
rule states that different numbers must mean different things. Thus, a nominal scale, as the term
implies, is simply a naming or classification scale. For example, for a question in which voters
are asked to name the party they prefer, the number 1 might be used to refer to Democrats; the
number 2 used to refer to Republicans; and the number 3 to refer to Independents. With nominal
data, the differences in categories to which a number is assigned are qualitative differences; this
means the number is subjectively assigned to one category in a class that contains more than one
category. Tabulating responses to the party preference question will entail counting how many 1s,
how many 2s, and how many 3s occur in the sample.
With nominal-level data, numbers or labels are used only to differentiate between things.
The numbers or labels serve no other purpose or function and supply no additional information.
Furthermore, once a number has been assigned to a given category in a variable, all other items
with the same characteristics in that variable must belong to the same category or group; that
number will always mean that attribute and only that attribute. The same numbers can, of course,
be used to mean something entirely different when used in a new variable. Examples of nominal
or categorical scales include the following:
4HEVALUESOF@AND@ARBITRARILYASSIGNEDTOTHECATEGORIESOFFEMALEANDMALE
4HEVALUES@AND@ASSIGNEDTOSERVICEUSER ANDNONUSERGROUPS
3. Numbers used to denote different types of occupations, political party membership, class
in college (freshman, sophomore, etc.), newspapers, or magazines read.
4. The counts of the number of times a head comes up when a coin is tossed.
Ordinal Data
An ordinal scale of measurement supplies more information than a nominal scale; two rules apply
as opposed to just one with nominal data. The nominal scale rule, different numbers mean differ-
ent things, must first be passed. But the second rule—the things being measured can be ranked
or ordered along some dimension—must also apply. With ordinal data (often simply referred to
as ranked data), the differences between measures are quantitative rather than just qualitative.
When things are ordered, they are arranged in some logical sequence—they may have more or
less of a particular characteristic than others in the set. The primary limitation that exists with
ordinal measurements is that the numbers never state precisely how much difference exists in
D
o
w
n
l
o
a
d
e
d
b
y
[
U
n
i
v
e
r
s
i
t
y
o
f
C
a
l
i
f
o
r
n
i
a
,
S
a
n
D
i
e
g
o
]
a
t
0
0
:
0
8
1
9
M
a
y
2
0
1
7
INTRODUCTION TO QUANTITATIVE METHODS 81
the sets of two or more collections of data; we know only that “more” or “ less” of something is
communicated by these numbers. We do not how much more or less, however.
A typical use for ordinal scales is to measure people’s preferences or rankings for services or
things. Much of the opinion data collected by political scientists are based upon ordinal scales.
Examples include surveys of issue awareness, policy preferences, and preference rankings for
political candidates. For example, a survey question in which subjects are asked to state their
preference for a policy issue might have five possible answers: Strongly approve, approve, neither
approve nor disapprove, do not approve, and strongly do not approve. A value is assigned to each
possible answer. The responses of all members of the sample are then counted. The counts are
considered ordinal because there is an implied rank order to the possible responses, even though
it is impossible to know the extent of the differences between each value.
Interval Data
The third class of measurement data is equidistant interval—more commonly referred to simply
as interval. To qualify as an interval scale, the measurements must now pass three tests. First,
the different numbers must mean different things. Second, the things measured can be ranked or
ordered on some appropriate dimension. The third—the most important rule—is that the differ-
ences between adjacent levels on the scale are (or are assumed to be) equal.
With interval data, in addition to determining that one scale item falls above or below another,
it is now possible to determine “exactly” how much one item differs from another. The differences
between levels on the scale can be any size. The zero point on the scale can be set anywhere on
the scale that the researcher wants it to be. The key requirement is that a single-unit change always
measures the same amount of change in whatever is being measured. The unit gradations within
the scale may be as broad or as fine as need be.
Measuring temperature using the Fahrenheit scale is a good example of interval scale data.
Fahrenheit scales have a zero point, but it is no more important that any other number on the scale.
Others examples are grade-point averages, dimensions, and IQ scores. Attitude scales using dif-
ferent levels of agreement are assumed to provide interval level data. This makes attitude scales
a highly desired measurement tool for all social and administrative science researchers. Interval
scales provide more information than either nominal or ordinal scales because of the equal distance
between measurement points.
There are, however, still limitations to the information provided by interval data. For example,
because the zero point is set arbitrarily, it is not possible to say that one measure is exactly twice
as great as or smaller than another. We cannot say that 100 degrees Fahrenheit is exactly twice
as warm as 50 degrees; nor that 35 degrees is half as warm as 70 degrees. Nor can we say that
“Strongly Agree” is twice as strong a response as its neighbor, “Agree.” We can only say that the
differences between single points on the scale are equal. We must turn to the fourth level, ratio
scales, to make such qualifying statements.
Ratio Data
As with the other three scales or data types, lower-level rules also apply to ratio scales. Different
numbers must still mean different things; the data can still be ranked or ordered on some dimen-
sion; and the intervals between adjacent points are of equal value. The ratio-required fourth rule
is that the measurement scale has an absolute or fixed zero point—even if it is not used in the
specific range of items being measured.
D
o
w
n
l
o
a
d
e
d
b
y
[
U
n
i
v
e
r
s
i
t
y
o
f
C
a
l
i
f
o
r
n
i
a
,
S
a
n
D
i
e
g
o
]
a
t
0
0
:
0
8
1
9
M
a
y
2
0
1
7
82 QUANTITATIVE RESEARCH APPROACHES AND METHODS
Examples of ratio scales are time, distance, mass, and various combinations of these; units
sold; number of purchasers; and temperature according to the Celsius scale. In applications of
statistics in political science research, the distinction between interval and ratio is of little practical
value. The same statistical tests can be used for either data type; they are also interpreted in the
same manner. As a result, statistical software packages like the Statistical Package for the Social
Sciences (SPSS) have combined the two into a single category called scale data, which includes
statistical tests for both interval and ratio data.
Issues of Reliability and Validity
Whenever designing a research study that involves measuring any element or concept, researchers
must pay particular attention to ensure that (1) they are measuring what they intended to measure;
and (2) that every time they measure the concept, the scale they use produces consistent results. The
first of these issues is a matter of reliability; the second is one of validity. Reliability refers to the
concept that a measurement (such as a question in a survey) consistently measures the same thing;
this is particularly important when dealing with measures of attitudes, opinions, and values. This
stability of the measurement procedure is a major concern in longitudinal research designs.
Validity refers to the degree to which the measurement measures what it is intended to measure.
Researchers are concerned with two types of validity: internal and external. Internal validity refers
to the degree to which the measurement instrument (such as a question in a questionnaire) yields
the same results for all cases in the study. This does not mean all answers must be the same. Rather,
it means that every response relates to a question with the same meaning. External validity relates
to the inferential quality of the measurement or the study—do the results apply to all similar cases
that satisfy the same conditions outlined in the study question and design? Probability measures
help answer this question with quantitative studies; careful scale construction, sample selection,
and interpretation help provide some assurance of validity in qualitative studies.
Defining Statistics
The term statistics is used in a number of different ways. First, it is used to refer to the numerical data
in a report. Examples include such things as the number of elections a person votes in over a five-year
period, the number of hours worked on political campaigns, or the number of environmental bills sup-
ported by a legislator or a group of legislators. It can refer to earnings, costs per unit of municipal refuse
trucks, turnover rates among congressional aides, performance ratios, age and gender of citizens in the
community, and so forth. The term statistics is also used to define the many mathematical techniques
and procedures used for collecting, describing, analyzing, and interpreting data.
Statistical processes can include simple counts of events or the determination of the central
values of a group of counts. It can include conducting hypothesis tests or determining relation-
ships between two variables. In summary, statistics may be considered as both numerical data
and the variety of tools or techniques that administrators and researchers use to process raw data
to make it more meaningful.
Important Terms and Concepts
Like every discipline or management function, a variety of concepts and terms not part of our
common language experience are to be found in the study of management statistics. Definitions
for some of these concepts are:
D
o
w
n
l
o
a
d
e
d
b
y
[
U
n
i
v
e
r
s
i
t
y
o
f
C
a
l
i
f
o
r
n
i
a
,
S
a
n
D
i
e
g
o
]
a
t
0
0
:
0
8
1
9
M
a
y
2
0
1
7
INTRODUCTION TO QUANTITATIVE METHODS 83
s Descriptive statistics: Measurements or numbers used to summarize or describe data sets.
s Inferential statistics: Statistical techniques used to make estimates or inferences about the
characteristics of interest for a population using the data from a sample data set.
s Sample: A portion of a population. The sample is chosen as representative of the entire
population.
s Population: The set of all elements for which measurements are possible. A population can
consist of products, workers, customers, firms, prices, etc., about which the decision maker
or manager is interested. Another word used to identify a population is universe.
s Statistic: A number used as a summary measure for a sample. For example, “The mean age
for the 20 students in the sample is 20.3 years.”
s Parameter: A numerical value used as a summary measure for a population or universe. For
example, in the statement “The mean age for all entering college or university freshmen is
19.1 years,” the age of all entering freshmen is a parameter.
s Variable: A characteristic or quantity that can have different values. Examples include such
things as saving account amounts, stock prices, package designs, weight, monthly sales, gen-
der, salaries, etc. The values of variables may be said to be either continuous or discrete.
s Continuous variables: Quantities that are measured, such as weight or percentage of increase
in the price of a stock, are said to be continuous. Values for continuous variables can be
measured on a continuous scale, such as weight, and are not restricted to specific, discrete
categories or values.
s Discrete variables: Discrete variables have values that can vary only in specific steps or cat-
egories (they are sometimes called categorical). Assuming that we assign in advance the value
OF@FORFEMALEAND@FORMALE
THEVARIABLEgender is an example of a discrete variable.
s Univariate statistics: Univariate statistics are the statistics describing a single variable. They
include such measures as the valid number of responses (frequencies); the mean, median,
and mode; and standard deviation.
s Bivariate statistics: These are measurements with which two variables are described or
compared at the same time. A cross tabulation table is an example of bivariate statistics in
use. Counts, percentages, correlations, difference tests, and many other statistical tests can
be carried out with bivariate statistics.
s Multivariate statistics: Multivariate statistics, such as multiple regression analysis, are sta-
tistics used when more than one independent variable influences one dependent variable.
For example, votes for a candidate are probably influenced by aesthetics, age, experience,
and advertising.
Statistics vs. Measurements
Statistics is the collective term used to denote the numbers used to communicate the measure-
ments of something. The measurements of a particular sample are typically drawn from a larger
body. The larger group is called the population or universe. As we have seen, only the numerical
values that apply to the sample are known as “statistics,” whereas the values of the population are
known as “parameters.” In learning about applying statistics to political science situations, this
difference is seldom a problem; managers rarely deal with entire populations.
Measurement is the term used to refer to numbers read from some type of scale. The scale can
be numerical or qualitative. The numerical values encountered in statistics are typically based
upon some verbal scale or other measuring device, such as measuring the likelihood of a citizen’s
voting in the next election on a scale with various levels of likelihood. This type of scale can
D
o
w
n
l
o
a
d
e
d
b
y
[
U
n
i
v
e
r
s
i
t
y
o
f
C
a
l
i
f
o
r
n
i
a
,
S
a
n
D
i
e
g
o
]
a
t
0
0
:
0
8
1
9
M
a
y
2
0
1
7
84 QUANTITATIVE RESEARCH APPROACHES AND METHODS
have a set number of possible answers, as with a five-point scale—or it can be a nonfixed point
between poles on a continuum. With such measurement or recording devices, the numbers are
arranged according to some meaningful scale that has been determined to be appropriate by the
person or persons reading the scale.
Categories of Statistics
Statistics can be categorized in several different ways. One way is according to how they are ap-
plied. Statistics can be used to describe something or they can be used to infer similar measure-
ments in another, larger group. The first of these applications is called descriptive statistics; the
second application type is called inferential statistics. Descriptive statistics are used to numerically
describe such things as events, concepts, people, or work.
Another use of descriptive statistics is for summarizing a set of data. A data set is simply a
collection of a distinct set of measurements. A data set can be as large as the combined total of all
measurements of all United States residents taken every ten years for the Census of Population.
Or, it can be as small as a dozen or so test scores from a mid-term examination.
Inferential statistics describe a class of statistics that are used for one or more of the following
three purposes:
1. To make generalizations about a larger group—called a population—from which a sample
is taken,
2. To estimate or draw conclusions about a population, or
3. To make predictions about some future event or state of affairs.
Note that all of these uses of statistics employ measurements of a smaller group (a sample) for
making inferences about a larger group (a population). This is why they are known as “inferential
statistics.” The term sample is used to mean some portion of a population. Samples are usually
chosen to be representative of some larger population. A population, on the other hand, is the set of
all elements for which measurements are possible. A population can consist of products, workers,
customers, firms, prices, or anything else about which the decision maker is interested.
A survey of every unit in a population is called a census. Individually, each person, item, or
thing in the sample, population, or universe is called a population unit. Another label sometimes
used to identify a population is a universe. The labels population and universe are often used in-
terchangeably to mean a complete set or group of people, items, events, and so forth from which
a sample is or can be drawn.
Parameters vs. Statistics
Another way that statisticians categorize measurement data is based on whether they apply it to a
sample or to its parent population. Differences in these applications result in two types of statisti-
cal: parametric statistics and nonparametric statistics.
A parameter is a numerical value used as a summary measure for a population or a universe.
For example, consider the statement, “The mean age for all entering college or university fresh-
men in California is 18.8 years.” Because 18.8 years is the average of all entering freshmen—the
population—it is a parameter.
A statistic, on the other hand, is a number used as a summary measure for a sample. For ex-
ample, consider the statement, “The mean age for a sample of 30 Benson College freshmen is
D
o
w
n
l
o
a
d
e
d
b
y
[
U
n
i
v
e
r
s
i
t
y
o
f
C
a
l
i
f
o
r
n
i
a
,
S
a
n
D
i
e
g
o
]
a
t
0
0
:
0
8
1
9
M
a
y
2
0
1
7
INTRODUCTION TO QUANTITATIVE METHODS 85
20.3 years.” The mean for this sample is a statistic. In this case, the mean for the sample is larger
than it was for the population of all college and university freshmen in the country, and statisti-
cal techniques have been developed to determine whether the two mean values are “statistically
different” or not.
Parametric Statistics
Parametric statistics require that measurements come from a population in which the distribution
of variances is normal. This doesn’t mean that all the measurements are the same. Rather, it means
that the differences vary in what we call a “normal” way. For example, take the measurements of
the incomes of a randomly drawn sample of a thousand households. If each of the measurements
were plotted, it would be expected that the distribution of incomes for members of the sample
would come close to the same distribution that occurred in the population—and, this distribution
would be expected to be “normal.”
Plotting this distribution would result in a typical bell-shaped curve. There would be a few
values at either end of the curve, but the bulk would fall around the middle value—near what
would be the mean for the sample. When discussing measures of central tendency, it would be
appropriate to refer to the average or mean income of the group with this measurement. Inferential
statistical tests could be used as well.
Nonparametric Statistics
Nonparametric statistical procedures must be used when working with nominal and ordinal-
level data. No assumptions can be made about the distribution of these measurements; nor can
any assumptions be made about the larger population. Rather, with nonparametric statistics, the
distribution must be assumed to not be normal.
Surveying a sample of new voters in Florida can be used as an example. The voters are ex-
amined to see if they declared a party affiliation—often called a “pass or fail” test. Only one of
two possible outcomes is possible. There is no way to establish if the distribution of “passes” and
“fails” is normal or not. A mean or average score is no longer possible; instead, the researcher can
only say something like “3 out of 100 failed,” or that “97 out of 100 passed.” Both the “3” and
the “97” are nonparametric statistics.
Descriptive Statistics
One of the great advantages of using numbers instead of words to describe something is that it
often makes it easier for both the sender and receiver to agree on what is being said. For example,
one person might be described as being 6 feet tall, and a second person as being 5 feet, 9 inches
tall. Clearly, when both people are standing on the same level surface, one is taller than the other.
But how great is the difference? It is hard to tell by just looking at the two people.
By measuring the differences in height, it becomes possible to know for sure. Because num-
bers were used instead of just saying, “one is taller,” it is now possible to know that one person
is precisely three inches taller than the other person. Furthermore, in the English language the
word “three” and the symbol “3” refer to the same amount. Three inches or three bananas are the
same number as three oranges.
The same communication concept is true for fractions and percentages. Most people will
comprehend the idea behind the phrase “one-third” and will know that 33.3 percent is very nearly
D
o
w
n
l
o
a
d
e
d
b
y
[
U
n
i
v
e
r
s
i
t
y
o
f
C
a
l
i
f
o
r
n
i
a
,
S
a
n
D
i
e
g
o
]
a
t
0
0
:
0
8
1
9
M
a
y
2
0
1
7
86 QUANTITATIVE RESEARCH APPROACHES AND METHODS
the same thing as one-third. One-third of a gallon is the same share of the whole as is one-third
of a liter, or one-third of a pound, even though the absolute quantities are different. One-third of
anything is always one-third of whatever is the unit of measurement. Numbers make it possible
to communicate these ideas.
The same goes for other percentages. One hundred percent of anything can only mean all of
it, a totality. One hundred and ten percent, on the other hand, is all of something plus ten percent
more. And every time you use it or say it, it is the same. That’s the beauty of using statistics when
communicating; little or nothing is lost in translation. Because things can be measured, they can
be described.
According to Lang and Heiss (1994), the four basic types of descriptive statistics used in po-
litical science research are:
1. Measures of central tendency. This includes the mean, the mode, and the median values
of a data set.
2. Measures of variability in the data set. The three variability values to be discussed are
the standard deviation (SD), the range, and the interquartile range.
3. Measures of relative position in the set. Included are percentiles and standard scores.
The most commonly used standardized score is the z score.
4. Measures of correlation between two or more variables. Correlation tests are used to
show how strongly and in what direction two variables are related, if at all.
Inferential Statistics
The second major class of statistics is inferential statistics. With inferential statistical tests, research-
ers assume or infer that measurements of some characteristics of a smaller group (the sample) are
held in common by some larger group (the population). One example of inferential statistics is
in the periodic testing of small portions of a production run (a sample or samples) to estimate the
failure or error rate of the entire day’s production (a population).
Another example of how inferential statistics is used is the now famous experience of ad-
ministrators who determined statistically that taking one aspirin a day could greatly decrease the
likelihood of having a heart attack. In the aspirin experiment, some 10,000 medical doctors were
recruited to participate in a ten-year experiment. Half were to take one aspirin a day; the other
half, an inert placebo (colored chalk).
Participants were assigned to their group randomly so that no one knew to which group he or
she belonged. After just a few years, the incidence of heart attacks among the aspirin takers was
found to be so much lower than the placebo group that the experiment was called to a halt and the
results announced. Taking one aspirin a day was deemed to be highly likely to reduce one’s chance
of (that is, lower the probability of) having a heart attack. Thus, the assumption (or inference) was
made that the results (measurements) of the sample applied to the overall population as well.
The basic types of inferential statistics (i.e., procedures) used in political science research
include, but are not limited to, the following:
1. The t-test for significant differences between means of dependent (uncorrelated)
groups
2. The t-test for significant differences between the means of paired or correlated groups
3. Simple regression analysis for measuring the strength and the direction of relationships
between variables
D
o
w
n
l
o
a
d
e
d
b
y
[
U
n
i
v
e
r
s
i
t
y
o
f
C
a
l
i
f
o
r
n
i
a
,
S
a
n
D
i
e
g
o
]
a
t
0
0
:
0
8
1
9
M
a
y
2
0
1
7
INTRODUCTION TO QUANTITATIVE METHODS 87
4. Analysis of variance (ANOVA) tests for differences on one variable for two or more
groups
5. Analysis of variance (ANOVA) tests for differences on two or more variables between
two or more groups, and for any interaction that might result from the two variables
6. Analysis of covariance, as used in pre- and post-test experimental applications
Statistics in Political Science Research
Political scientists use both descriptive and inferential statistics in their research. In both applica-
tions, the numerical information may be presented in tables, charts, and as graphical illustrations.
The most important of these statistics and some of the more commonly encountered uses of de-
scriptive and inferential statistical tests are discussed in the following sections.
A wide variety of inferential statistical tools have been developed for use in these four applica-
tions. Naturally, not all of these have application to the majority of decisions that face managers or
administrators. The tests included have been selected for their extensive use in organization and
organizational management literature, their relative ease of application and clear interpretation
characteristics, and their availability in most general statistical software packages.
It is no longer necessary for anyone to memorize confusing statistical formulas or to work com-
plex statistical calculations by hand. Most political science researchers have access to a personal
computer. Powerful statistical software has been available almost from the desktop computer ’s
introduction. However, much of the early statistical software was limited in scope because of
hardware restrictions that resulted in slow processing speed and limited the number of variables
and/or cases that could be contained in a working dataset. Efficient statistical processing of large
datasets required far more memory than available on early desktop computers. This is no longer a
problem. Throughout the remainder of this book, a variety of statistical software will be referenced,
primarily Microsoft’s Excel and the Statistical Package for the Social Sciences (SPSS).
Introduction to Sampling
Seldom if ever will researchers find themselves measuring entire populations. Rather, they draw
samples from populations and measure the elements in that sample. Sample measurements are
called statistics. These results are then assumed as applying to the entire sample as well; they
conclude that similar results would be found if every element in the sample were measured.
Population measurements are called parameters.
Researchers acquire sample statistics to estimate a larger population’s unknown parameters.
The process is known as inference, and the statistical tests that are used for this purpose are called
inferential statistics. If all possible information needed to solve a problem could be collected, there
would be no need to sample. Decision makers seldom have this luxury; they are typically limited
in time and money. Therefore, people making decisions based on research use data gathered from
samples, and make their decisions based on probabilities that the sample data mirrors what could
be expected if it were possible to survey an entire population (Fitz-Gibbon and Morris 1987).
Why We Sample
The main reasons why samples are used in place of a census of a population involve considerations of
cost, time, accuracy, and the “destructive” nature of the measurement process. Costs and time are closely
related. In planning a statistical study budget, the researcher must address these key concerns:
D
o
w
n
l
o
a
d
e
d
b
y
[
U
n
i
v
e
r
s
i
t
y
o
f
C
a
l
i
f
o
r
n
i
a
,
S
a
n
D
i
e
g
o
]
a
t
0
0
:
0
8
1
9
M
a
y
2
0
1
7
88 QUANTITATIVE RESEARCH APPROACHES AND METHODS
s (OWACCURATEMUSTTHElNALRESULTSBEINORDERTOMAKETHETYPEOFDECISIONREQUIREDINTHE
particular business situation?
s 7HATISTHECOSTTOTHEORGANIZATIONIF THEWRONGDECISIONISMADE
s (OWMUCHMOREINFORMATIONMUSTBEADDEDTOREACHTHATLEVELOFACCURACY
s 7HATKINDSOFDATAARENEEDED (OWMUCHDOESITCOSTTOACQUIREIT
s #ANWEAFFORDTHEEXTRACOST
Sampling Precision
Researchers use measurements of the characteristics of a sample for inferring or forecasting similar
characteristics about larger samples or populations. In a sense, they use the sample data to predict
how a population will act or react under the same conditions in some future situation or event.
However, researchers can control few if any of the intervening variables that might affect that
future event; they are asked to measure the unknowable. The idea of sampling precision refers to
how confident the researcher feels about using the sample for inferences.
Using sample data this way is based upon the fundamental concepts of probability. The
researcher’s level of confidence is typically stated in terms of probability, and typically
stated as either a “0.10, 0.05, or a 0.01 level of confidence.” In the language of probability,
a value of 1.0 indicates 100 percent confidence in a statistical result; 0.10 indicates that the
researcher is 90 percent sure about the results; 0.05 means 95 percent sure, and 0.01 means
99 percent sure.
Achieving a high degree of precision is often difficult—if not impossible—without greatly
increasing the size of a sample. This is not the problem that it might seem to be, however. In most
research in the social and administrative sciences, it is seldom necessary to achieve very high
degrees of precision or reliability. Instead, decision makers can most often deal very well with
information that is only relative. The cost of acquiring additional information in order to improve
the precision of a measurement is often prohibitive. Precision, and hence, reliability, increase at
a far slower rate than the corresponding increase in sample size. Reliability grows at the square
root of the increase in sample size. Thus, to double reliability requires making the sample four
times as large!
Using very large samples can have other drawbacks as well. One is the destructive nature of
the survey process. Destructive refers to the idea that being asked a question about an issue may
influence a subject’s attitude toward that issue, thus resulting in what is considered by researchers
to be a “tainting” of a previously “clean” response. Subsequent responses to the same question
may, therefore, be influenced by the first experience. Simply by being asked questions, subjects
begin to think about the subjects of the questions. This can result in changes in their attitudes.
Exposure to a survey questionnaire may help the subject verbalize deep-seated attitudes that had
lain dormant but were brought to the fore during the study. There are a number of techniques that
researchers can use to achieve greater reliability of a sample study. Among the most important of
these is the type of sampling method employed.
Some Sampling Methods
Sampling method refers to the way the sample units are selected from a parent population. When
deciding which combination of sampling characteristics to use, researchers must make decisions
in five basic areas. Each of these concerns is discussed in some detail below. When combined,
they allow for thirty-two different possible combinations. The five basic decisions are:
D
o
w
n
l
o
a
d
e
d
b
y
[
U
n
i
v
e
r
s
i
t
y
o
f
C
a
l
i
f
o
r
n
i
a
,
S
a
n
D
i
e
g
o
]
a
t
0
0
:
0
8
1
9
M
a
y
2
0
1
7
INTRODUCTION TO QUANTITATIVE METHODS 89
s 0ROBABILITYVERSUSNONPROBABILITYSAMPLE
s 3INGLEUNITVERSUSCLUSTEROFUNITS
s 5NSTRATIlEDVERSUSSTRATIlEDSAMPLE
s %QUALUNITPROBABILITYVERSUSUNEQUALPROBABILITY
s 3INGLESTAGEVERSUSMULTISTAGE
Probability Versus Nonprobability Sample?
This may be the single most important decision in sampling. Probability sampling is one of the
fundamental bases upon which all inferential statistics is built. A probability sample is one in
which the sample units (people, parts, groups, homes, cities, tribes, companies, etc.) are selected at
random and all have an equal chance at being selected. Examples include simple random samples
(SRS) and systematic samples.
A nonprobability sample is one in which chance selection techniques are not used. Examples
include convenience samples (selected at the convenience of the manager) and quota samples, where
only subjects with specific characteristics are added until some predetermined mix is achieved. A
third example of a nonprobability sample often used in the public administration field of political
science research is a judgment sample. Judgment sampling entails substituting experience or the
judgment of an administrator or researcher for a more scientific approach at randomization. It
often means deliberately picking a sample that is nonrepresentative of a population.
The choice between a probability and nonprobability sample is often based on the cost- versus-value
principle. The researcher will pick the method that provides the greatest margin of value over cost. A
worthwhile rule of thumb to follow in sample selection is that the more diversified the population, the
greater the need to guarantee representativeness by following a probability sampling method.
Single Unit or Cluster Sampling?
A sampling unit is the basic element of the population—such as a person or a thing—being sampled.
When choosing whether to use single unit or cluster sampling methods, the deciding factor is the
nature of the sampling unit. In single unit sampling, each sampling unit is selected independently.
In cluster sampling, the units are selected as groups. If sampling units are households, single unit
sampling requires that all households in the population of interest be selected without reference to
any other characteristic. A cluster sample might change the sampling unit to the random selection
of city blocks, with some or all households on each selected block then surveyed.
Cluster sampling usually costs less per sampling unit than single unit sampling. As a rule of
thumb, whenever a study involves a low tolerance for error with a high expected cost of errors,
and a highly heterogeneous population, single unit sampling is favored over cluster sampling.
Stratified or Unstratified Sampling?
The third consideration is the stratified or unstratified sample question. A sample stratum is a por-
tion of a population that has one or more characteristics of interest to the analyst. Examples include
political party membership, income level, age, and many others. The final sample is selected so
that it reflects the same percentages of the characteristic that are found in the larger population. A
stratified sample may help to ensure representativeness and, thus, reduce potential for sampling
error. Finally, to obtain the same level of sampling error, a smaller sample size is needed with a
stratified sample than would be needed if a nonstratified sample were used.
D
o
w
n
l
o
a
d
e
d
b
y
[
U
n
i
v
e
r
s
i
t
y
o
f
C
a
l
i
f
o
r
n
i
a
,
S
a
n
D
i
e
g
o
]
a
t
0
0
:
0
8
1
9
M
a
y
2
0
1
7
90 QUANTITATIVE RESEARCH APPROACHES AND METHODS
Equal or Unequal Unit Probability?
The question of equal unit or unequal unit probability sampling (that is, a greater or lesser likeli-
hood of a sampling element’s being included) is closely associated with strata in the population.
The final sample drawn will included a disproportionately larger (or smaller) percentage of the
characteristic of interest.
Although a key tenet of probability sampling is the concept of equal probability of being se-
lected, researchers often find themselves in situations where following the equal probability rule
will result in biased results. For example, a political campaign manager conducting a survey of
local voting patterns will probably include more persons older than 50 years of age and fewer in
the 18 to 24 age group in the sample because the older group tends to vote disproportionately more
often than younger voters. The researcher’s sample is more than likely to be heavily weighted in
favor of relevant demographic and ethnic, socioeconomic, and gender groups because they are
more likely to have a disproportionate influence on the outcome of the election.
Single-Stage or Multistage Sampling?
The final consideration has to do with single or multistage sampling. The number of stages in-
cluded in a sampling process is usually dictated by the nature of the population and the sample
frame (source of units). For example, sampling state legislators in a budgeting process is typically
a single-stage process; subjects are randomly selected from the list of members. The following
type of multistage sampling would involve this three-stage process:
1. The first stage is random selection of census tracts in the various socioeconomic sections
of the region.
2. This is followed by the random selection of residential blocks in the selected census tracts.
3. The third stage is the random selection of individual households in each selected block.
In a comprehensive survey of consumer attitudes across a large area, a multistage process
will often be used. Multistage sampling is the method of choice for needs analysis studies when
sampling large populations and with population elements disbursed over a wide area.
Dealing with Error and Bias in Sampling
The ultimate objective of all sampling is to select a set of elements from a population in such a
way that the measurements of that set of elements accurately reflect the same measurements of the
population from which they were selected. A number of potential pitfalls exist to make achieving
this objective difficult. Among these are bias and several different types of potential error. These
are characterized as sampling error and nonsampling error. Several types of nonsampling error
can occur, including sampling frame error, nonresponse error, and data error.
Sampling Error
Sampling error occurs when a sample with characteristics that do not reflect the population is
studied. It is almost impossible to specify a sample that exactly matches the parameters of a given
population. Nor will the results of a second sample exactly match the first. More samples taken
will not increase the likelihood of a perfect match occurring.
D
o
w
n
l
o
a
d
e
d
b
y
[
U
n
i
v
e
r
s
i
t
y
o
f
C
a
l
i
f
o
r
n
i
a
,
S
a
n
D
i
e
g
o
]
a
t
0
0
:
0
8
1
9
M
a
y
2
0
1
7
INTRODUCTION TO QUANTITATIVE METHODS 91
Two laws of numbers influence sampling error. First, the law of large numbers suggests that
increasing sample size will reduce the size of the sampling error encountered. However, the law
of diminishing returns also applies to this error reduction method. Recall that to reduce error by
half requires making the sample four times as large. Using a statistically efficient sampling plan
is clearly the best way to control sampling error.
Nonsampling Error
Nonsampling error can result from many different sources. Several of these sources include prob-
lems with the sampling frame, with subjects’ nonresponse, and errors in the data themselves. Each
of these sources of error is discussed in greater detail below.
Sampling Frame Error
The sampling frame is the source (such as a list or a telephone directory) from which the sample is
drawn. If the study is a test of components provided by an outside supplier, the sampling frame is
the collected total of all parts provided by the supplier. If the sample is to be drawn from customers
who enter a particular facility, the sample frame consists of the actual premises; the population in
this example is all persons who enter the facility during the survey period.
For example, a sociologist conducted a study of the attitudes and concerns about terrorism
among a group of regional airline passengers. The sampling frame for the study consisted of
the list of passengers with reservations to fly on a specific route on a specific day. Individual
passengers were randomly selected from those waiting in the boarding lounge before boarding
their aircraft. The key to reducing sampling frame error is to start with as complete a sampling
frame as possible. If the sampling frame is a list of clients, it should be up-to-date and include
everyone. If the sampling frame is a list of voters in a given precinct or legislative district, it
should include all citizens who are registered to vote, not just the voters who voted in the last
one or two elections.
A way to adjust for potential sampling frame error has been developed by researchers who gather
data by telephone. Increasingly, private telephone numbers are not included in printed telephone
directories. To deal with this problem, the survey operators modified their telephone book sampling
frames to include unknown, nonlisted numbers. In a process that is called plus-one dialing, they
do this by adding one number to the numbers taken at random from the directory.
Nonresponse Error
Nonresponse error is another problem encountered in survey decision making. When only small
proportions of subjects respond, there is a strong probability that the results are not characteristic
of the population. This type of error can be reduced through the use of incentives for completing
and returning the survey instrument, and through follow-up telephoning, although there is no
guarantee that error reduction will occur.
Data Error
Finally, data error can occur because of distortions in the data collected or from mistakes in data
coding, analysis, or interpretation of statistical analysis. Several different ways to reduce data
error in research projects are:
D
o
w
n
l
o
a
d
e
d
b
y
[
U
n
i
v
e
r
s
i
t
y
o
f
C
a
l
i
f
o
r
n
i
a
,
S
a
n
D
i
e
g
o
]
a
t
0
0
:
0
8
1
9
M
a
y
2
0
1
7
92 QUANTITATIVE RESEARCH APPROACHES AND METHODS
s %NSURETHATSURVEYINSTRUMENTSQUESTIONNAIRES ARE WELLPREPARED
SIMPLETOREAD
ANDEASY
to understand.
s !VOIDINTERNALBIASSUCHASTHEUSEOFLEADINGOR VALUE
LADENWORDS
s 0ROPERLYSELECTANDTRAININTERVIEWERSTOCONTROLDATA
GATHERINGBIASORERROR
s 5SESOUNDEDITING
CODING
ANDTABULATINGPROCEDURESTOREDUCETHEPOSSIBILITYOFDATAPRO-
cessing error.
Sample Bias
Bias in sampling refers to the sampling process itself; it is sometimes referred to systematic bias.
Bias can be intentional or unintentional. Intentional bias is used when a researcher has a particular
point to prove and uses statistics to support the pre-established conclusion. For example, an agri-
culture decision maker might intentionally select a better piece of ground to show more dramatic
yield improvements from a new plant seed.
Unintentional bias can occur as a result of a researcher’s best efforts to include relevant elements
in the final sample. For example, in the decision to determine whether voters might approve a
special bond issue for library construction, the researcher might telephone only registered voters.
This results in a double bias. First, it includes only people with telephones, and second, it ignores
the library users who have not voted in the past, but would in order to improve the library system.
The best way to avoid or reduce any and all bias is to maintain random selection procedures.
The Meaning of Sample Distributions
When researchers talk about sample distributions, they are referring to the way a statistic would
be distributed if computed for a series of samples taken from the same population. This concept
has several uses: first, it gives the researcher a quick estimate of the validity of the results of the
study. Second, it enables the researcher to estimate the values of some variable in a population of
interest. Third, it produces a value that is associated with determining sample size.
Sampling distributions represents a fundamental concept in statistics (Zikmund 1994). It is sometimes
a difficult concept to grasp, however. This is because it refers to a hypothetical distribution of something
that will never take place: randomly selecting a very large number of samples (such as 5,000 or more)
from a specified population, computing a mean for every sample, then examining the distribution of
those means. The mean of all the 5,000 sample means is called the expected value of that statistic, and
the standard deviation of the sampling distribution is the standard error of the mean.
When political science researchers draw two or more random samples of subjects or items from
a given population, the statistics computed for each sample will almost always vary. Such varia-
tion is natural and expected. Drawing samples from the same population will produce summary
measures that are also different from the first sample or samples drawn. Drawing more and more
samples will also produce varying measurements. From this point on, assume that the statistic is
the mean value on any relevant question, characteristic, or scale item.
If the value of the mean for each of the group of samples were displayed as a frequency distribu-
tion, the individual sample measurements is typically distributed in such a way that the distribution
of values would present a picture of a normal, symmetrical (bell-shaped) distribution. Most of the
values would cluster around the center of the range, with smaller and smaller amounts drifting
off toward the edges. This pictorial representation of the frequency distribution would be what is
called a bell-shaped curve. A key requirement of most inferential statistical tests is that the data
be normally distributed.
D
o
w
n
l
o
a
d
e
d
b
y
[
U
n
i
v
e
r
s
i
t
y
o
f
C
a
l
i
f
o
r
n
i
a
,
S
a
n
D
i
e
g
o
]
a
t
0
0
:
0
8
1
9
M
a
y
2
0
1
7
INTRODUCTION TO QUANTITATIVE METHODS 93
The Standard Error of the Mean
The standard error of the mean provides an indication of how close the sample mean probably
is to the mean of the population. This statistic is an estimate of the sampling variability in the
sample mean. It is important to remember that the standard error of the mean is only an estimated
standard deviation of a hypothetical series of samples.
For example, in a study of public agency organizational climate, scale items consisted of such
statements about the organization as: “Red-tape is kept to a minimum in this organization.” The
mean score on this seven-point agreement scale was 3.50; the standard deviation for the sample
was 1.512. A standard error of .535 indicated that the sample mean was within a little more than
half a point of what could be expected as the mean for the population from which the sample
was drawn.
Central Limit Theorem
A rule of statistics called the central limit theorem states that as the number of samples drawn from
a population gets larger, the distribution of the sample statistic will take on a normal distribution.
At least thirty samples are necessary for the likelihood of the normal distribution to occur. In a
normal distribution, the two sides of the curve are the same, with the mean and median both fall-
ing at the peak of the curve. Distributions that are not symmetrical are said to be skewed. Skewed
distributions that have fewer values at the high end (right side) of a distribution are said to be
positively skewed, or skewed to the right. When the values taper off toward the left side of the
distribution, it is said to be negatively skewed, or skewed to the left. Distributions can also have
more than one peak (in what is called a bipolar distribution).
Summary
Political scientists use words and numbers to communicate the results of their research and creative
thinking about ideas and topics in the political world. Academic department heads, deans, college
presidents, legislators, public administrators, and other organizational managers also use words
and numbers to communicate with their staffs and supervisors, as well as with people and groups
outside their organization. Statistics are numbers, and the results of tests conducted on sets of
numbers. The results can be presented either in tables, graphs, or other illustrations, which help
to ensure mutual understanding of the data at hand.
When the term statistics is used, it can mean one or more specific measures or values describing
some thing, a sample of some type. Or, the word can be used to refer to a body of mathematical
tools and techniques invented for analyzing and giving meaning to sets of numbers.
The numerical values in statistics are typically measurements taken with some type of scale or
measuring device. These scales provide different levels of information, based upon the type of data
they are intended to acquire. The four types or levels of data (the terms apply to the data-gathering
scales as well) from the “lowest” in power to the “highest,” are nominal, ordinal, interval, and
ratio. Each data type has a body of statistical tests that are appropriate for that level; lower-level
tests should not be used on higher-level data.
Researchers are concerned with reliability and validity (internal and external) in all their mea-
surements. Reliability refers to the ability to measure what the researcher intends to measure.
Validity refers to consistency in measuring across all cases.
Statistics are used in two main ways: (1) as descriptive statistics, they are used to summarize
D
o
w
n
l
o
a
d
e
d
b
y
[
U
n
i
v
e
r
s
i
t
y
o
f
C
a
l
i
f
o
r
n
i
a
,
S
a
n
D
i
e
g
o
]
a
t
0
0
:
0
8
1
9
M
a
y
2
0
1
7
94 QUANTITATIVE RESEARCH APPROACHES AND METHODS
a larger set of numbers, called a “data set”; (2) as inferential statistics, the measurements of a
smaller group—a sample—are used for making assumptions about a larger group—the popula-
tion or universe of interest.
Statistics may also be parametric or nonparametric. Parametric statistics require that certain
assumptions be made of the host population, such as a normal distribution. With nonparametric
statistics, no such assumptions need be made.
Sampling in public administration research is used because it is more efficient than studying a
full population. Sampling can lower the cost and improve the efficiency of measurement activities.
Studying a sample rather than an entire population saves time and money. It is also thought to be
less “destructive” of underlying attitudes (the process of measuring may influence future measure-
ments). Decision makers must take care to avoid introducing bias and sampling or nonsampling
errors into the sample design and selection process.
The five fundamental considerations of the sampling process result in many different possible
combinations in sample design. Sample design choices are based on the questions of: (1) prob-
ability vs. nonprobability, (2) single unit vs. unit clusters, (3) stratified vs. unstratified, (4) equal
unit probability vs. weighted probability, and (5) single-stage vs. multistage sampling.
Sampling distributions—the way each individual measurement clusters around some sta-
tistic—tend to reflect distinct patterns, with most following what is referred to as the normal
distribution. In a normal distribution, the bulk of the measurements cluster around the mean
value, with a few trailing off above and below the mean. When plotted, they look like the fa-
miliar “bell-shaped curve.” Most inferential statistics require that the data be from a normal
distribution.
According to the central limit theorem, as the size of the sample increases, the distribu-
tion of the sample measurements tends to take on the shape of normal distribution, whereas
small-sample studies may result in data that are not reflective of the parameters of the larger
population.
Discussion Questions
1. Define the four levels of measurement and name the rules that apply for each type.
2. In questionnaire construction and statistics, what is the meaning of the term scales?
3. Discuss the differences between reliability and validity in constructing a survey instru-
ment.
4. Define the following terms:
a. Population
b. Sample
c. Parameter
d. Statistic
e. Parametric statistics
f. Descriptive statistics
g. Inferential statistics
h. Variable
5. Why do researchers sample?
6. What is a probability sample?
7. What is a simple random sample (SRS)?
8. What is a nonprobability sample?
9. When would it be appropriate to survey a population instead of a sample?
D
o
w
n
l
o
a
d
e
d
b
y
[
U
n
i
v
e
r
s
i
t
y
o
f
C
a
l
i
f
o
r
n
i
a
,
S
a
n
D
i
e
g
o
]
a
t
0
0
:
0
8
1
9
M
a
y
2
0
1
7
INTRODUCTION TO QUANTITATIVE METHODS 95
Additional Reading
Einspruch, Eruch. 1998. An Introductory Guide to SPSS® for Windows
®
. Thousand Oaks, CA: Sage.
Fink, Arlene. 2002. How to Sample in Surveys. 2nd ed. Thousand Oaks, CA: Sage.
Hinkle, D., William Wiersma, and Stephen G. Jurs. 2002. Applied Statistics for the Behavioral Sciences. 5th
ed. Stamford, CT: Cengage Learning.
Johnson, Janet B., Richard A. Joslyn, and H.T. Reynolds. 2001. Political Science Research Methods. Wash-
ington DC: CQ Press.
Mattson, Dale. 1986. Statistics: Difficult Concepts, Understandable Explanations. Oak Park, IL: Bolchazy-
Carducci.
Neufeld, John L. 1997. Learning Business Statistics with Microsoft® Excel. Upper Saddle River, NJ: Prentice
Hall.
Phillips, John L. 2008. How to Think About Statistics. 5th ed. New York: W.H. Freeman.
Schwab, Donald P. 2008. Research Methods for Organizational Studies. Mahwah, NJ: Lawrence Erlbaum
Associates.
D
o
w
n
l
o
a
d
e
d
b
y
[
U
n
i
v
e
r
s
i
t
y
o
f
C
a
l
i
f
o
r
n
i
a
,
S
a
n
D
i
e
g
o
]
a
t
0
0
:
0
8
1
9
M
a
y
2
0
1
7
96
8 Exploratory Research:
The Probing Approach
Depending on their research objectives, researchers may select from three types of quantitative
research designs: exploratory, descriptive, or causal. A research project could involve the use
of just one or two designs, or all three. When all the types are used, a researcher begins with an
exploratory study for preliminary identification of possible factors or variables, then moves to a
descriptive study to define the salient or key variables, and concludes with a causal study such as
an experiment to test the variables for strength of association or cause-and-effect relationships.
For some reason, exploratory research is not discussed in any great detail in political science
research textbooks; however, this important first-step design is important enough to merit greater
attention. Therefore, this chapter looks at some of the ways that exploratory designs can be used
in all the subfields of political science.
Purposes for Exploratory Research
Most exploratory research is conducted for one of two purposes: (1) a preparatory examination of
an issue in order to gain insights and ideas, or (2) information-gathering for immediate applica-
tion to an administrative problem. In neither case is exploratory research intended to serve as an
in-depth look into all the factors related to a political phenomenon.
Because of their limited scope, exploratory studies are seldom used as stand-alone designs.
When they are they can provide information for administrative decision making. The typical
objective of these exploratory studies may be either to find an answer to a specific organizational
question or to provide information upon which to base a decision, such as gathering cost-benefit
information for a proposed administrative action. Such studies are often used in the applied public
administration subfield of political science.
The great majority of exploratory research is conducted to investigate an issue or topic in order
to develop insight and ideas about its underlying nature. Topics are often a problem or issue that
requires additional research study for problem resolution. Designing and conducting a small-
sample exploratory study, therefore, is often the first step in a more comprehensive or complex
research project. Usually, the researcher has only a little or no prior knowledge about the issue
or its components. As a result, the research itself is often very flexible and unstructured. Because
the research has few preconceptions even about how to study the problem, the first research steps
usually involve qualitative methods (Aaker, Kumar, and Day 1998).
The objective of a typical exploratory research design is to gain as much information in as short
a time as possible, with little expenditure of money and effort. Naturally, the actual wording of the
D
o
w
n
l
o
a
d
e
d
b
y
[
U
n
i
v
e
r
s
i
t
y
o
f
C
a
l
i
f
o
r
n
i
a
,
S
a
n
D
i
e
g
o
]
a
t
0
0
:
0
8
1
9
M
a
y
2
0
1
7
EXPLORATORY RESEARCH 97
objective will depend on the reason for which the exploratory research is needed. For example,
when the information is needed for developing a questionnaire—the survey instrument—for a
large-sample descriptive study, the objective is to identify the variables and their constructs. In
these situations, exploratory studies are sometimes referred to as “pilot studies.”
When the exploratory study precedes a social experiment of some type, a typical objective
might be to determine which independent variables, treatments, or levels should be used in the
experiment. In these applications, the exploratory study is also used to identify the key dependent
and independent variables that will be tested in an experiment (a causal design). Exploratory stud-
ies also help the researcher identify which variables may be only tangentially or only marginally
related, thereby telling the researcher what variables should not be included in the more extensive
experimental research project.
Methods in Exploratory Data Collection
Data gathering in exploratory research takes place in only a few different ways. Hakim (2000)
identified three approaches: (1) prior research reviews, (2) single-subject in-depth or focus group
interviews, (3) examination of administrative records and documentary evidence. Aaker, Kumar, and
Day (1998) suggested a similar list of approaches: (1) literature reviews, (2) personal interviews, (3)
focus group unstructured interviews, and (4) case studies. The four techniques suggested by Aaker,
Kumar, and Day, plus a fifth method, the pilot survey, are discussed in greater detail below.
The Literature Review
An exploratory research design, like all research, involves examining the reported findings of other
researchers. The process is called a literature review, and is one of the first steps in any research
project. While it is recommended that all research include a review of the literature, the technique
is especially applicable as an exploratory research technique. A six-step process for conducting a
literature review is presented in Figure 8.1 .
Among other reasons, researchers use the literature review to gain knowledge about what they
should be looking for in their own data gathering, as well as for weighing the applicability of
their proposed research methods. In doing so, they look for major themes in the research, which
they may later incorporate into their research questions. According to Knight (2002), some major
themes in a review of the literature include: What is the point of concern with this topic? Why is
it important, and to whom is it important? On what points do other researchers agree and on what
and why do they disagree? Out of all this literature, what research question has been missed or
treated too lightly? What research question or questions, then, should I focus on? What research
methodology and methods have been used to study this problem?
The next step in the process is to establish objectives for the review. Hart (1998, 27) identified
nearly a dozen purposes or objectives for a literature review, including but not limited to the fol-
lowing (these are not in any prioritized order, nor will all apply for any one review):
1. The literature review can inform the researcher what has been done and what needs to
be done on the research topic.
2. It provides a means for discovering important variables that are relevant to the topic.
3. It can make it possible to identify relationships between ideas and practices.
4. It provides a means for synthesizing various takes on the topic, often allowing the re-
searcher to gain a new perspective.
D
o
w
n
l
o
a
d
e
d
b
y
[
U
n
i
v
e
r
s
i
t
y
o
f
C
a
l
i
f
o
r
n
i
a
,
S
a
n
D
i
e
g
o
]
a
t
0
0
:
0
8
1
9
M
a
y
2
0
1
7
98 QUANTITATIVE RESEARCH APPROACHES AND METHODS
Begin general reading to
define the topic
Establish the scope of the
topic; learn the vocabulary;
locate major themes
Establish objectives
(outcomes) for the search
Plan the structure, including
codes and cross-referencing
Plan the sources to be
searched
Popular press;
documents, etc.
Professional journals
Textbooks
Begin methodical reading
of selected sources
(1)
(2)
(3)
(4)
(5)
(6)
Source: After material in Hart 1998.
Figure 8.1 A Flowchart of a Six-Step Process for a Review of the Literature
5. The literature review permits framing of the topic or problem by establishing the topic
in its context.
6. The extent and quality of existing research can help rationalize the significance of the topic.
7. Gaining a familiarity with what others have discovered can result in enhancing or gaining
the vocabulary of the topic.
D
o
w
n
l
o
a
d
e
d
b
y
[
U
n
i
v
e
r
s
i
t
y
o
f
C
a
l
i
f
o
r
n
i
a
,
S
a
n
D
i
e
g
o
]
a
t
0
0
:
0
8
1
9
M
a
y
2
0
1
7
EXPLORATORY RESEARCH 99
8. It helps to gain understanding of the structure of the topic.
9. It provides a means for relating the researcher’s ideas and theory to actual application of
the theory’s concepts.
10. The literature review informs the researcher of the main methodologies and research
techniques that others have used to study the topic.
11. It describes the historical development of the topic and changes in its significance.
Research activities such as establishing codes, phenomena constructs, cross-referencing and
other structural activities, as well as evaluating textual material, follow a standard process for
evaluating and interpreting qualitative data. Knight (2002, 182) reduced this process to just two
steps: (1) indexing or coding the data, and (2) reflecting upon and interpreting the data.
The exploratory literature review can become an integral part of the research report, or it can
simply provide the researcher with background information, only some of which may find its way
into the body of the study. Although they are not specifically exploratory studies, the following two
examples of how the exploratory literature review can be woven into the final research paper help
to illustrate the value of the technique. The first example is an illustration of the way the review is
used as a distinct section in the paper; the example can be seen in the summer 2002 issue of Politi-
cal Science Quarterly (PSQ) in a paper on Senate scrutiny of federal court nominees (Hartley and
Holmes 2002, 259–278). The analysis of the literature was incorporated into the “Background and
Review of the Literature” section of the paper. The review was organized into four main themes or
constructs: (1) lower court nominees and institutional change, (2) institutional changes in the Senate,
(3) a historical review of the current controversy, and (4) Senate scrutiny on nominations.
It is likely that the decision to use these constructs came after a review of the literature. As with
the majority of exploratory studies, Hartley and Holmes used the most basic of descriptive statistics
in their paper—two bivariate line charts and five simple frequency distribution tables. No measures
of central tendency (averages) or of variation or correlation were included with the tables.
A different approach can be seen in the paper “Human Rights and Domestic Violence” (Hawkins
and Humes 2002, 231–257), in the same issue of PSQ. This paper followed a combined approach,
using parts of two of the three qualitative approaches described by Hakim (2000): a research re-
view combined with analysis of administrative records and documentary evidence. Hawkins and
Humes examined two competing theories pertaining to differences in the willingness of nations
to intervene in domestic violence issues. One theory focused on social movements; the second
on international socialization. Their review of the literature was interwoven throughout the paper.
The nature of the research design of Hawkins and Humes did not provide for any tables or graphs,
or any statistics in their paper.
Personal Interviews
Exploratory research designs often involve conducting personal interviews with knowledgeable
individuals. In policy studies, these subjects may come from within and/or outside the organiza-
tion. In theoretical studies, the subjects are often other professionals in the discipline, including
professors and political practitioners. Whatever their source or affiliation, these individuals are
collectively referred to as “key informants,” and the process is known as key informant interviews.
Key informant subjects are selected because they are likely to be better informed about the study
problem and the issues associated with that problem.
Gaskell (2000, 51) defined the personal interview process in these terms: The depth interview
is a conversation between two (or more) friends. It may last as long as two hours or more, but
D
o
w
n
l
o
a
d
e
d
b
y
[
U
n
i
v
e
r
s
i
t
y
o
f
C
a
l
i
f
o
r
n
i
a
,
S
a
n
D
i
e
g
o
]
a
t
0
0
:
0
8
1
9
M
a
y
2
0
1
7
100 QUANTITATIVE RESEARCH APPROACHES AND METHODS
normally lasts for an hour to an hour-and-a-half. The interviewer begins the session with some
introductory comments about the research, thanks the subject for agreeing to participate, and asks
permission to tape the session. The information-gathering session should start with some straight-
forward, interesting, and nonthreatening questions. The interviewer must remain attentive and show
interest in what the respondent is saying; eye contact is encouraged; proper body language should
be used—respond with nods when appropriate, smile when you should, and remain serious and
sympathetic when you are expected to be so. Always try to end the session on a positive note.
According to Gaskell, in an exploratory research project, the personal interview is used to
collect the basic data for gaining an understanding of the relationships between the people in the
study and the larger social group on which the study is focused. An objective for interviews in
these situations is to amass the “thick description” that characterizes much qualitative research.
The researcher uses the focus group to develop an understanding of the beliefs, opinions, attitudes,
values, and motivations for behavior of people in the social group. If it is not used specifically
for developing instruments for additional research, the interview is a valuable way of framing the
study in its context and developing hypotheses for descriptive or experimental research designs.
In an illustration of how interviews were used in an exploratory study, the author was a member
of a team of faculty and students engaged to design and conduct an extensive community needs
analysis for a regional general hospital. The team’s first step in the study was to conduct a series
of in-depth interviews with key local employers, community leaders, hospital administrators, and
senior medical staff. These data were then developed into a comprehensive needs-analysis ques-
tionnaire administered throughout a three-community region. In its presentation to the hospital
district board of directors, the hospital administrative staff used the findings of the exploratory
study to justify further research. The exploratory research report provided concrete evidence that
a larger, in-depth survey was needed to provide information necessary to complete the district’s
ten-year development plan.
To be effective, an interviewer must begin an interview session by establishing rapport with
the subject (Johnson 2002). This is done by developing and building on a sense of intimate as-
sociation such as is found between two close friends in a conversation. The goal of the interview
is to ferret out “deep” information, knowledge, and feelings. Johnson suggested that interviewers
use the following four-step process in a semi- or fully structured interview:
1. Begin with two or three introductory “ice-breakers” to get the ball rolling.
2. Once the subject appears comfortable with the process, employ several transition ques-
tions. These may help to explain the purposes of the research. It is also a good time to
secure the subject’s permission to use a tape recorder, if appropriate.
3. Now start asking the key questions that address the heart of the research question. This
may involve as few as four or five questions, but in a typical in-depth interview, there
is no set limit to the number of questions that should be used. The goal is to continue
asking questions until the desired information objectives are met.
4. The interview session typically ends with the interviewer summarizing some of the main
points that were brought up. The interviewer may also take this time to share with the
informant some of the points raised by other subjects.
The techniques involved in conducting personal interviews have been honed over many years
in such disciplines as anthropology, sociology, and psychology, among others. In their Handbook
on Interview Research, Gubrium and Holstein (2002) have collected a large body of literature
on the various ways to conduct interviews. The three topics in their collection that most apply
D
o
w
n
l
o
a
d
e
d
b
y
[
U
n
i
v
e
r
s
i
t
y
o
f
C
a
l
i
f
o
r
n
i
a
,
S
a
n
D
i
e
g
o
]
a
t
0
0
:
0
8
1
9
M
a
y
2
0
1
7
EXPLORATORY RESEARCH 101
here are in-depth interviewing, focus group interviewing, and interviewing for survey research.
As Knight (2002) noted, “Good [interview] research depends upon researchers and participants
developing trust and sympathy, which are necessary if participants are to speak freely and, per-
haps, to work with the researcher to tease out fresh understanding and bring some embodied or
embedded things into words.” Once this rapport is established, the interviewer can proceed with
the rest of the process. The researcher can follow this six-step process for conducting personal
interviews (Gaskell 2000):
1. Prepare the conversation guide. The guide is a list of topics that the researcher wants
covered in the interview. It should be followed as a guide, not addressed in any mandated
order. Interviews, if conducted correctly, can be freewheeling, open-ended conversations,
with important topics that the researcher had not even considered coming to the fore.
Certainly, there is a core of items that must be covered, but the key idea in interviews is
to maintain your flexibility.
2. Select the way the interviews are to be conducted. Three options are possible: individual
interviews, group interviews, or a combination of the two.
3. Determine how you plan to select the respondents. Will you randomly select subjects,
accept anyone willing to participate, or target a specific group of key informants whose
opinions you feel are necessary to meet research objectives?
4. Conduct the interviews. A large body of literature exists on how to successfully con-
duct personal interviews. Three of the key points in this literature are (1) be friendly,
unthreatening, and empathetic; (2) be a good, attentive listener; and (3) remain flexible
and uncritical.
5. Transcribe the interviews just as they took place.
6. Analyze the body of information collected. Some researchers feel that it is a good idea to
wait a week or two after collecting the data before beginning the analysis; others begin
right after all data are collected. No method has been proven to be best.
An important point to remember in scheduling and conducting personal interviews is that infor-
mants do not always move on the same schedule that drives the researcher. Informants often have
topics they want aired and will remain focused on them until they are satisfied. In addition, the in-
terview will often take what Johnson described as “unexpected turns or digressions” toward topics
that the informant is interested in or knows about. He also noted that these unexpected shifts in the
interview process can be very productive. Therefore, the interviewer should be willing to depart from
the planned discussion guide, going along with the informant to see where the discussion leads.
Focus Group Methods
Focus group interview sessions are another often-used exploratory research technique (Kitzinger
and Barbour 1999). The focus group is a good way of developing an understanding of key issues
before writing questions and can also enable the researcher to gain a sharper focus on the way
that questions are worded. Focus groups can also be used to develop story scenarios (“vignettes”)
to be used in in-depth interviewing designs. Respondents are asked to react to the scenarios,
usually responding to a structured question list in a quantitative study, and an unstructured list
in qualitative designs. Kitzinger and Barbour also point out that focus groups may be used after
completion of a survey in order to help explain response outliers. Outliers can only be identified,
not explained, in survey research.
D
o
w
n
l
o
a
d
e
d
b
y
[
U
n
i
v
e
r
s
i
t
y
o
f
C
a
l
i
f
o
r
n
i
a
,
S
a
n
D
i
e
g
o
]
a
t
0
0
:
0
8
1
9
M
a
y
2
0
1
7
102 QUANTITATIVE RESEARCH APPROACHES AND METHODS
A focus group is a discussion group in which six to ten (more or less) subjects explore a specific
set of ideas or issues under the guidance of a moderator or session leader. The focus group has
been a staple research technique in business for many years; it is particularly useful in marketing
and advertising research. However, in the past decade or two it has come to be recognized as a
valuable contributor to developing political science—and all social science—knowledge (Knight
2002; Bloor et al. 2001; Wilkinson and Kitzinger 2000; Kitzinger and Barbour 1999). Politicians
in both Canada and the United States have long used focus group sessions to provide data for
strategy formulation, and, according to Wilkinson and Kitzinger (2000), focus group research is
now a common feature in political research in all of North America and Great Britain.
Focus groups can be classified in several different ways. One way is according to the structure
of the session. Some sessions are highly structured, whereas others are only lightly structured
(Knight 2002). A second way of classifying focus groups is according to whether the session is
conceived of as a group interview or as a focus group. In the opinion of David Morgan (2002),
rather than the traditional dichotomy of structured-unstructured sessions, all focus group sessions
must have some structure. Otherwise, they are nothing more than a mob gathering with no reason
for being. Instead, Morgan preferred to categorize focus group sessions as either “more structured”
or “less structured.” A comparison of the distinguishing features of the two structural approaches
is displayed in Table 8.1.
A major benefit of group interviews is the potential for interaction among participants. This
interaction is impossible to achieve in one-on -one interviews. Focus groups are also more ef-
ficient than a series of individual in-depth interviews, in that a group of subjects are interviewed
in the same amount of time interviewing one subject would entail. A major disadvantage of focus
groups is the fear of public embarrassment, which sometimes makes it difficult if not impossible
to bring up sensitive issues.
Interview sessions with groups can also be classified as either group interviews or interactive
focus groups (Bloor et al. 2001). With group interviews, the researcher asks interview subjects to
respond to a preestablished sequence of questions, in much the same way as if the researcher were
interviewing a single subject. The advantage of the group interview is simply one of convenience
and efficiency. With all subjects together in the same location, the researcher can collect large
amounts of data in a short period of time.
The second type of group session is the traditional interactive focus group. While the researcher
may, indeed, use a structured question guide, the objective for the focus group is not to collect a
Table 8.1
A Comparison of Focus Groups According to the Level of Structure in the Session
More Structured Sessions
Less Structured Sessions
/BJECTIVE OF THE SESSION IS TO COLLECT
/BJECTIVE OF THE SESSION IS TO GAIN AN UNDER
answers to the researcher’s questions
standing of what participants are thinking
Focused on the interests of the researcher
Focused on the interests of the participants
Question guide keeps discussion focused
Questions are only guides for discussion
Many specific questions asked
Fewer, more general questions asked
Time limits for each question
Flexibility in time allocation
'ROUP LEADER ASKS QUESTIONS OF EACH SUBJECT ,EADER IS MODERATOR
SEEKING SUBJECT INTERACTIONS
Leader stops off-topic comments
Leader permits exploring new directions
3UBJECTS SPEAK TO THE MODERATOR
3UBJECTS TALK AMONG THEMSELVES
Source: Morgan 2002, 147.
D
o
w
n
l
o
a
d
e
d
b
y
[
U
n
i
v
e
r
s
i
t
y
o
f
C
a
l
i
f
o
r
n
i
a
,
S
a
n
D
i
e
g
o
]
a
t
0
0
:
0
8
1
9
M
a
y
2
0
1
7
EXPLORATORY RESEARCH 103
series of individual answers but rather to generate interactive discussion among the group members.
When subjects respond and react to the comments of other group members, the resultant discussion
can often bring to light the meanings, opinions, and norms that underlie attitudes and behaviors.
Table 8.2 illustrates how these different classification schemes affect the role of the researcher.
In the highly structured group interview the researcher is simply an interrogator, asking each
subject the same questions. There is little room for creative thinking in this type of session; the
researcher does not probe for deeper responses. Typically, the interviewer has little or no knowl-
edge about the reasons and objectives for the study and did not have any role in the development
of the question guide.
In the less structured group interview, the researcher takes on a slightly more active role, serving
much as a teacher employing the Socratic method. The session leader continues to ask a prescribed
set of questions, but allows more flexibility in the responses, often probing for more information
when the respondent stumbles or is unable to put a response into words. The leader may rephrase
the question or go so far as to state it as a projective sentence-completion statement. The point of
the session is, however, to gain answers to every question on the list from every subject. Applica-
tion of the structure takes place in the editing of the transcript.
Most focus groups are lightly structured sessions. In fact, the structure may be so slight that it
is all but invisible. The researcher uses the question list only as a tool to generate discussion and
only partially as a list of items that must be answered. In a focus group session with more struc-
ture, the leader serves as a moderator, allowing discussion to proceed as it may and encouraging
interaction, but eventually bringing the group back to the point in question. The moderator-leader
is less concerned with how the group gets to its conversation destination and more concerned that
it continues to move in the desired direction.
In a lightly structured focus group, the goal of the session is not to secure answers to questions,
but to generate interactive discussion. In this situation, the session leader takes on the role of a
conversation catalyst. This is the most difficult of the four roles that a session leader may take.
The leader must take great pains to keep the conversation moving, while not allowing any one or
two members to dominate the discussion.
Often, researchers experience great difficulty in gaining the participation of the one or two
reticent session members who sit quietly taking it all in but refraining from offering their own
comments. Sometimes, however, the objective of the session is to investigate the way that the
group members interact, who leads and who follows, who forces an issue and who is willing to
compromise. In these sessions, the discussion is of less interest than the interaction process.
While focus groups are an ideal way to explore people’s opinions, concerns, desires, and expe-
riences, they may be most valuable for examining how these opinions are expressed, influenced,
formed, and counter-formed in a social situation (Kitzinger and Barbour 1999). In an effective
Table 8.2
The Role of the Group Leader in Group Interviews and Focus Group Sessions
Session Type
Question Guide
Group Interview
Interactive Focus Group
Highly Structured
Leader as Interrogator
Leader as Moderator
Semistructured
Socratic Leader
Leader as Catalyst
Source: After Morgan 2002.
D
o
w
n
l
o
a
d
e
d
b
y
[
U
n
i
v
e
r
s
i
t
y
o
f
C
a
l
i
f
o
r
n
i
a
,
S
a
n
D
i
e
g
o
]
a
t
0
0
:
0
8
1
9
M
a
y
2
0
1
7
104 QUANTITATIVE RESEARCH APPROACHES AND METHODS
focus group session, subjects develop their own questions, frames of reference, and ideas. They
follow their own priorities and do so on their own terms, using their own vocabulary.
Bloor et al. (2001) discussed how focus groups are used for opinion-gathering purposes. In such
applications, the focus group is used to (1) bring out background or contextual information, (2)
identify salient issues that appear to be held in common among sample members, (3) discern the
everyday language—including slang—that subjects use when talking about the topic, (4) gather
respondent opinions about previous research that has been done on the topic.
An example of how focus groups are used along with traditional survey research can be seen
in Rosenthal’s 2000 study of gender styles among committee chairpersons in state legislatures.
Rosenthal conducted a series of three group sessions over the 1994 and 1996 National Conference
of State Legislators conferences. Her design also included ethnographic observation of legislative
committees in action and concluded with a mailed survey to committee chairpersons. More than
300 usable instruments were returned, for response rates of 39 percent for women legislators and
30.5 percent for males.
Convenience sample methods were used to form the focus groups. One group was made up
exclusively of female committee chairs; a second group consisted of only male committee chairs;
and the third group contained a mix of males and females. Respondents were from twenty-four
different U.S. state legislatures. During the sessions, participants were asked to define “consensus”
and to describe the functioning of committee business during their tenure as committee chair.
Rosenthal coded and combined the responses into two broad sets of characteristics. Comments
were coded as either destructive or integrative. Variables in the destructive classification included
comments pertaining to winning and losing, interest group competition, bargaining, and majority
votes. Variables coded as integrative included comments pertaining to deliberation, discussion,
and overall participant satisfaction in the outcome.
The Case Study
The case study is the least-used exploratory research technique; instead, case study designs tend
to be complete as they stand. However, the case study is not the most appropriate tool for explor-
atory studies. Rather, good case studies typically to go into too much depth for the objectives of
an exploratory design.
Before beginning a discussion of the case study as an exploratory research tool, one point must
be made: the case study in these applications ought not be looked upon as a research methods
choice; rather, it is simply a choice of how to get information to help determine what should be
studied in a more comprehensive study. By whatever method of data collection is used, the re-
searcher elects to study the case or cases in an exploratory way because of what can be learned
for additional research (Stake 2000). However, because the case study is increasingly accepted as
an appropriate qualitative research design, it will be discussed in detail in Chapter 17.
According to Knight (2002), a case study is the study of one of something. (Although case
studies might involve more than one item, they are investigated individually.) In political science,
the case can be a party, a candidate, a state legislature, a political office, a domestic or foreign
policy decision—the list includes, essentially, any single event, person, organizational unit, site,
or whatever else is applicable to the world of politics. The case study can be simple or complex.
This great applicability of the case is also one of its greatest detractions.
A problem that researchers often face with case studies is the difficulty of defining the bound-
aries of the case. Despite this difficulty, case studies do have a number of advantages. First, they
tend to bring out information that might be ignored, forgotten, or not even brought to mind in a
D
o
w
n
l
o
a
d
e
d
b
y
[
U
n
i
v
e
r
s
i
t
y
o
f
C
a
l
i
f
o
r
n
i
a
,
S
a
n
D
i
e
g
o
]
a
t
0
0
:
0
8
1
9
M
a
y
2
0
1
7
EXPLORATORY RESEARCH 105
different study method. Second, because they are usually descriptions of what the research sees in
the case, they are not artificial constructs such as what a survey or an experiment might produce.
No variables are controlled in a case; what you see is what you get.
Third, by their very nature, case studies push the researcher to work in depth, to go beyond the
surface indications to get at reasons why things happen as they do. The fourth advantage is closely
related to the third—case studies force researchers to look for meanings, not simply descriptions.
The goal with a case study is to establish understanding. Its purpose is to define and describe the
case, not to use the case as a representation of the world (Stake 2000).
The fifth advantage associated with the case study approach is that it helps the researcher
remember that the political world is as complex and variable as any social institution. Political
phenomena are not usually simple, single-faceted events; they are as complex as the people who
exist and function in this world. A survey, no matter how complex or sophisticated, provides only
a snapshot of the phenomena; a case study can be like a master ’s oil painting, deep, with many
nuances and a variety of meanings. The sixth advantage naturally follows the fifth. Because of its
complexity, case research can be what Knight termed “a powerful antidote to determinism and
over generalization.” Finally, case studies tend to be person-centered, a fact that further adds to
their informative underpinning.
The case study, like all research designs, is constructed around a distinct structure (Stake 2000,
440). While the case may be built upon only a few research questions, the issues in the case tend
to focus on complex relationships. Stake identified six major conceptual issues that are typically
addressed in a case study:
1. Framing the case: setting its boundaries and identifying the object of the case study.
2. Selecting the issues to address: the phenomena, themes, constructs, or issues that result
in formation of research questions.
3. Close analysis of the case material in order to identify the relevant data patterns that
frame the issues.
4. If appropriate, triangulating key observations and interpretations through the use of other
research methods.
5. Examining the data and relevant literature in order to identify interpretations that differ
from the one adopted by the researcher.
6. Developing the conclusions that can be drawn from the case, including what generaliza-
tions may be applied in similar situations.
For example, Bryant (2002) studied the indigenous population of a group of islands in the
Philippines. He followed an ethnographic data-gathering approach, using the case study to il-
lustrate the conflicting influences of nongovernmental organizations (NGOs) on development
and conservation. The objective of the case was to reveal that, despite their different agendas,
the NGOs shared a common objective: to help local residents internalize state control over their
environment through self-regulation.
The Pilot Survey
Another approach used in exploratory research is the survey of a small random sample drawn
from the same population of interest as the larger study planned. This is what is called a pilot
survey or pilot study. A common purpose of a pilot study is to pretest an early draft of a survey
questionnaire. Results of the exploratory study are used only to test the validity and reliability
D
o
w
n
l
o
a
d
e
d
b
y
[
U
n
i
v
e
r
s
i
t
y
o
f
C
a
l
i
f
o
r
n
i
a
,
S
a
n
D
i
e
g
o
]
a
t
0
0
:
0
8
1
9
M
a
y
2
0
1
7
106 QUANTITATIVE RESEARCH APPROACHES AND METHODS
of the study design and the instrument questions. Problem words, phrases, and entire questions
may be edited, deleted, or replaced. Results of such pilot studies should never be included with
the findings of the final study.
Pilot studies are nothing more than small-sample applications of a standard questionnaire
survey. The questions included in the pilot study instrument are usually generated through
the use of one or more of the other exploratory methods: literature reviews, interviews, focus
groups, or case studies. Pilot studies are extremely important in survey research. They are used
to pretest the proposed questionnaire, check the wording, and ensure that the researcher and
respondents have the same definitions of key words, phrases, and, if used, acronyms. Beginning
researchers often ask two questions in one, believing they are being more efficient in the use
of time and space. But double-barreled questions are not only difficult for subjects to answer,
they are next to impossible to code and tabulate. The researcher is never sure which half of the
question was answered.
Consider this example of a poorly written demographic question: “How many children do you
have and what are their ages?” This is really a series of questions. First, it asks, “Do you have
any children?” (This says nothing about the gender of the children). Second, it asks, “How many
children do you have?” (It says nothing about whether they live with you or elsewhere). If you
have children, “What is the age of the first child?” “What is the age of the second child?” and so
on. The pilot survey is also a good opportunity to test whether the respondents have the knowledge
necessary to answer the question. People will often answer questions simply because they think
that they must, whether they really know the answer or not.
Pilot studies can be conducted with a small sample drawn from the same population from which
the final sample will be drawn, or if this is not possible for some reason, pilot studies can also be
carried out on a sample of persons with some knowledge of the subject, the study objectives, and
methods, and a willingness to contribute their time and effort. In academic situations, professors
often use a sample of their students to pretest the instrument designed for use in the outside social
environment—a nonprobability convenience sample. Care must be taken in using students in the
pilot study, however, particularly undergraduates. Not only are younger students likely to have
little knowledge of the situation under study, they may not grasp the relevance of certain items
in the instrument. They often use very different terms for phenomena from those that researchers
and eventual study subjects employ. About the only justification for using students to pretest a
survey instrument designed for nonstudents is that conducting some type of pretest is better than
not pretesting at all.
Analyzing Exploratory Data
Data in exploratory research may be quantitative, qualitative, or a combination of forms. The data
might come from either primary or secondary sources—that is, either gathered directly by the
researcher or previously gathered by someone else for a different purpose. Both data types have
similar validity in exploratory research. Their analysis occurs in different ways, however.
Analysis of Quantitative Data
In general, only descriptive statistics and graphic presentations of data are employed in the
analysis of exploratory research data. This statement is qualified because some researchers
may employ inferential statistical tests on the data in something like a “dry run,” in which the
methods are tested for applicability, not the data itself. The most commonly used descriptive
D
o
w
n
l
o
a
d
e
d
b
y
[
U
n
i
v
e
r
s
i
t
y
o
f
C
a
l
i
f
o
r
n
i
a
,
S
a
n
D
i
e
g
o
]
a
t
0
0
:
0
8
1
9
M
a
y
2
0
1
7
EXPLORATORY RESEARCH 107
statistics include measures of central tendency and measures of variability, although measures
of correlation are also used.
Little credence should be given to associations found in small-sample data, however. Small-
sample correlations should only be used as indicators of variables that might be included in follow-
on descriptive or experimental research designs. Nonparametric tests, such as the Chi-square test of
independence, are often used to analyze exploratory research data, but they, too, have sample-size
minimum limits. The general rule is that in a crosstabulation of two (or more) variables, each cell in
the crosstabulation table must have at least five responses. Often, this rule cannot be met in exploratory
studies, where samples are small and random selection of subjects cannot always be guaranteed.
Tables, charts, and graphs are also considered to fall under the category of descriptive statis-
tics. A first analytical step the researcher takes when establishing order and meaning from raw,
unprocessed data is to construct either a frequency distribution table, a stem-and-leaf diagram,
a histogram, or any combination of these graphic devices. Stem-and-leaf diagrams can often be
more informative than simple frequency tables in that none of the underlying data are lost in the
analysis; all values are displayed in the diagram. Histograms also present summary data, but they
do not display individual values for a class in the same way that a stem-and-leaf diagram does.
Analysis of Qualitative Data
Probably the single greatest advantage of employing qualitative research methods in exploratory
studies—and possibly the greatest disadvantage as well—is the richness of the information gained.
Richness refers to the large number of topics that may surface in an interview, for example. As
Gaskell (2000, 53) has pointed out, “The broad aim of [all qualitative data] analysis is to look for
meanings and understanding of what is said in the data, but the researcher must interpret this.”
Summary
The purpose of exploratory research studies is to provide the researcher with greater insight into
the study problem and ideas about the variables that should be included in a larger or more compre-
hensive study to follow. In addition, the findings of an exploratory study can often be used to train
data-gatherers and help the researcher design and test a data-processing plan. Equally important,
the findings of an exploratory study can often provide guidance to the researcher in rephrasing the
study question. It can also require the imposition of totally new variables into the study.
Among other reasons, researchers use the literature review to gain knowledge about what they
should be looking for in their own data gathering, as well as for weighing the applicability of their
proposed research methods. They look for major themes in the database, which they may later
incorporate into their research questions.
A major advantage of employing qualitative research methods in exploratory studies—and
possibly the greatest disadvantage as well—is the richness of the information gained. It is an
advantage because it often goes beyond simple description or numeration to also include some
level of deeper understanding of the underlying motivations, attitudes, justifications for interac-
tions and behaviors, for example.
Data gathering in exploratory research generally takes place in one of three different ways: (1)
prior research reviews, (2) in-depth interviews and focus group, and (3) administrative records and
documentary evidence. Sources of exploratory data include: (1) literature reviews, (2) individual
in-depth interviews, (3) focus group unstructured interviews, and (4) case studies. These four
techniques plus a fifth method, the pilot survey, were discussed in this chapter.
D
o
w
n
l
o
a
d
e
d
b
y
[
U
n
i
v
e
r
s
i
t
y
o
f
C
a
l
i
f
o
r
n
i
a
,
S
a
n
D
i
e
g
o
]
a
t
0
0
:
0
8
1
9
M
a
y
2
0
1
7
108 QUANTITATIVE RESEARCH APPROACHES AND METHODS
Discussion Questions
1. What is the main reason for conducting an exploratory study?
2. What role does a literature review take in an exploratory research design?
3. How and when would you use personal interviews in an exploratory research project?
4. How do structured and unstructured interviews differ?
5. What is a focus group? Name the different classifications of focus groups.
6. What role does the researcher take during a focus group session?
7. Name the different types of case studies.
8. What is a pilot study, and what is its major purpose?
9. Describe how you would analyze quantitative data collected in an exploratory study.
Additional Reading
Bryman, Alan. 2001. Social Research Methods. Oxford: Oxford University Press.
Hart, Chris. 1998. Doing a Literature Review: Releasing the Social Science Research Imagination. London:
Sage.
Pennings, Paul, Hans Keman, and Jan Kleinnijenhuis. 1999, 2006. Doing Research in Political Science.
London: Sage.
Stebbins, Robert A. 2001. Exploratory Research in the Social Sciences. Thousand Oaks, CA: Sage.
Wengraf, Tom. 2001. Qualitative Research Interviewing: Biographic Narrative and Semi-Structured Methods.
Thousand Oaks, CA: Sage.
D
o
w
n
l
o
a
d
e
d
b
y
[
U
n
i
v
e
r
s
i
t
y
o
f
C
a
l
i
f
o
r
n
i
a
,
S
a
n
D
i
e
g
o
]
a
t
0
0
:
0
8
1
9
M
a
y
2
0
1
7
109
9 Descriptive Research:
The Survey Approach
Researchers use two different approaches when gathering data in descriptive quantitative
research studies; they may collect data by observing and counting overt acts of behavior, or
they may use a questionnaire to generate responses to specific questions, including questions
about attitudes, opinions, motivations, knowledge, demographics, and many more categories
of data.
Questionnaires are the most popular way to gather primary data. It has been estimated
that questionnaires are used in 85 percent or more of all quantitative research projects. They
are particularly appropriate when the research problem calls for a descriptive design. This
chapter discusses the process of descriptive research design and the steps involved in ques-
tionnaire preparation, including the nature, limitations, and wide variety of ways to write
survey questions.
Questionnaires can be used to gather information about large numbers of respondents (popula-
tions) or small groups (samples). Most of the time, political science research is conducted with
samples. The sample method used most often is the probability or random sample. Samples that
are representative of the population are surveyed; the researcher then makes inferences about the
population from the sample data. Within some known margin of error, the sample statistics are
assumed to be a reflection of the population’s parameters. Careful planning and construction of
the questionnaire is, therefore, a critical step in research.
Advantages of Using Questionnaires
Questionnaires have many advantages. The greatest of these is the considerable flexibility of the
questionnaire. Questionnaires can be custom designed to meet the objectives of almost any type
of research project. Researchers can also purchase the rights to employ many different types of
pre-prepared questionnaires that have been developed by other researchers. They have been thor-
oughly tested with a variety of different samples. The purpose of testing the survey in this way
is to establish confidence (reliability) in the ability of the questions to effectively measure some
phenomenon of interest.
These purchased pre-prepared questionnaires—called standardized instruments—are considered
highly reliable and can be ordered from a wide variety of test catalogs. Their biggest drawback is
that their use involves a compromise; they were developed for some different purpose, time, and
sample than the researcher’s study. At one time, they were used extensively in human resources
applications, but their popularity has waned in recent years.
D
o
w
n
l
o
a
d
e
d
b
y
[
U
n
i
v
e
r
s
i
t
y
o
f
C
a
l
i
f
o
r
n
i
a
,
S
a
n
D
i
e
g
o
]
a
t
0
0
:
0
8
1
9
M
a
y
2
0
1
7
110 QUANTITATIVE RESEARCH APPROACHES AND METHODS
Some Characteristics of Questionnaires
Questionnaires can be designed to gather information from any group of respondents. Ques-
tionnaires can be short or long, simple or complex, straightforward or branched. They can be
rigidly structured or be a loosely organized list of topics to discuss. They can be administered
face-to-face, over the telephone, by mail, and over computer networks. Usually, respondents’
answers are relatively easy to code and tabulate. This can reduce turnaround time and lower
project costs.
Questionnaires can be designed to determine what people know, what they think, or how they
act or plan to act. They can measure subjects’ factual knowledge about a thing or an idea, or they
can be used to measure people’s opinions, attitudes, or motives for behaving in certain ways. They
can be used to measure the frequency of past behaviors or to predict future actions. When subjects
are children or persons from different cultures, response alternatives in the form of pictures or
symbols may be substituted for words.
Because of the flexibility of the questionnaire, there are very few rules to follow in development
of the instrument. However, constructing an effective questionnaire does demand a high degree
of skill. Questions must be arranged in a logical order; they must be worded in such a way that
their meaning is clear to people of all backgrounds, ages, and educational levels. Particular care
must be taken when asking questions of a potentially controversial or personal nature so as not
to embarrass or offend respondents. Folz (1996, 79–80) has summarized the concerns associated
with questionnaire construction in this way:
Know what you want to ask and why you want to ask it; compose clear, unambiguous ques-
tions; keep the survey (questionnaire) as brief as possible; and have a plan for analyzing the
result before the instrument is administered.
How to Prepare Your Own Questionnaire
When preparing a questionnaire, follow a systematic procedure to ensure that it will fulfill the
three key questionnaire objectives (Malhotra 1999). A questionnaire must: (1) successfully gather
information that answers each study question; (2) motivate respondents to answer all questions
to the best of their ability; and (3) keep all potential error to a minimum. Following these steps
helps to make sure the questionnaire does what it should.
Steps in Developing a Questionnaire
The eight-step procedure displayed in Figure 9.1 has been shown to help in the preparation of
effective questionnaires and questions. Because questionnaire construction is as much an art as it
is a science, the list should be considered as a guide, rather than a checklist of steps that must be
followed in the order presented.
Step 1: Determine What Information Is Needed
Before any questions are written, the researcher must be absolutely certain that the objectives for
the research are clearly spelled out. It is never enough for a researcher to just “think” that he or she
has an idea of what it would be nice to know. Rather, only questions that contribute to the overall
research objective should be asked. This begins with an understanding of the scope of the proposed
D
o
w
n
l
o
a
d
e
d
b
y
[
U
n
i
v
e
r
s
i
t
y
o
f
C
a
l
i
f
o
r
n
i
a
,
S
a
n
D
i
e
g
o
]
a
t
0
0
:
0
8
1
9
M
a
y
2
0
1
7
DESCRIPTIVE RESEARCH 111
research: Is the research being done to solve a particular problem in a public administration or
nonprofit organization, or is it “pure” research designed to identify or test some theory? This is
the applied-theoretical research dichotomy question that appears periodically in the literature on
public administration research.
Step 2: Specify Data-Gathering Method
The three primary ways to collect data with questionnaires are: (1) in-person or face-to-face in-
terviews, (2) telephone interviews (also called voice-to-voice interviews), and (3) mailed survey
instruments that are self-administered. In what is the latest method of data collection, today data
can also be gathered over computer networks. Self-administered questionnaires may be mailed
to respondents, handed out in public locations such as shopping malls, or dropped off at homes
or offices. Each of these approaches has its own advantages and disadvantages.
Face-to-Face Interviews
The primary advantage of conducting in-person survey interviews is that they usually make it
possible to gather large amounts of information in a relatively short period of time. Also, people
who might not otherwise participate in the survey can often be encouraged to do so by a persuasive
interviewer or researcher. Another advantage of the personal administration approach is that the
data gatherer can often help respondents who might not understand a word or a question.
In-person administration is particularly helpful when branching questions are used in the
questionnaire. This involves asking people questions that only they should answer, based on
their response to one or more screening questions. Other respondents are instructed to move to a
different section or set of questions. There are four major disadvantages associated with the use
of in-person interviews. These are:
1. They can take longer to administer than other methods.
2. They tend to be the most costly method of collecting survey data.
1. Establish
what
information
must be
gathered.
2. Specify the
appropriate
data-
gathering
method.
3. Specify the
procedure for
analyzing the
gathered data.
4. Select the
question type
and decide on
question
structure.
8. Administer
the
questionnaire
and process
data.
6. Organize
the questions
into a logical
order.
7. Pretest the
questionnaire
and revise if
necessary.
5. Select the
best wording
for each
individual
question.
Figure 9.1 The Eight-Step Questionnaire Construction Procedure
D
o
w
n
l
o
a
d
e
d
b
y
[
U
n
i
v
e
r
s
i
t
y
o
f
C
a
l
i
f
o
r
n
i
a
,
S
a
n
D
i
e
g
o
]
a
t
0
0
:
0
8
1
9
M
a
y
2
0
1
7
112 QUANTITATIVE RESEARCH APPROACHES AND METHODS
3. The changing demographic makeup of the country means that fewer adults of working
age will be at home during the day.
4. Interviewers are subjected to potential personal harm when interviewing takes place in
some urban areas.
One way that researchers get around these problems is by conducting interviews in public
places, such as shopping malls or recreational facilities. While this tends to eliminate the poor
and older citizens from the sample, it does allow a large number of completed questionnaires to
be gathered in a very short time.
Telephone Interviews
The major advantages of telephone surveys are (1) the relative speed with which the data can
be gathered, (2) their lower cost, and (3) the opportunity for the researcher to ask questions that
might not be answered in a face-to-face situation. To reach people at home, most interviews are
conducted on weekday evenings or on Saturdays; this allows public administration researchers
to use public agency or office telephones after the working day, further cutting the costs of data
gathering. Telephone interviews are usually conducted from a central location, thus reducing
researcher travel time and its related cost.
The major disadvantages of telephone interviewing are the inability to make eye contact with
respondents and to know that people with the desired demographic profiles are answering the
questions. Another disadvantage is the limited length of time that the respondent is willing to give
to the interview. Also, many respondents are leery of providing personal information to strangers
over the telephone. They may assume that the caller is a telemarketer rather than someone who is
conducting legitimate research. Or they fear that the caller has sinister motives.
Finally, no one is as yet aware of the effect the wide use of cellular telephones will have on
response rates for telephone interviewing. Researchers do know that it is becoming increasingly
difficult to acquire the desired number of completed instruments in the time allowed for data
gathering.
Mailed Questionnaires
Mailing questionnaires is often the least expensive of all data-gathering processes. On the other
hand, this method often results in the lowest return rates of all data-gathering methods. Return
rates are referred to as response rates when applied to face-to-face and voice-to-voice interviewing.
They all mean the number of completed questionnaires received by the researcher. It is important
to plan for return rates when planning the sample size. For example, it is not uncommon to achieve
return rates of 10 percent or less in a mailed questionnaire, although the typical rate is closer to
25 to 40 percent. This means that for a sample of 100, the researcher might have to mail out from
400 to 1,000 survey instruments!
Step 3: Determine Analysis Procedure
The way that the gathered data will be coded, tabulated, analyzed, and interpreted plays a big
role in the way the questionnaire and individual questions are developed. Today, computers us-
ing readily available, easy-to-use statistical software tabulate almost all survey results. For this
reason, most questionnaires are pre-coded (classification numbers appear beside each question
D
o
w
n
l
o
a
d
e
d
b
y
[
U
n
i
v
e
r
s
i
t
y
o
f
C
a
l
i
f
o
r
n
i
a
,
S
a
n
D
i
e
g
o
]
a
t
0
0
:
0
8
1
9
M
a
y
2
0
1
7
DESCRIPTIVE RESEARCH 113
and each possible response), making data entry simple and less error prone. The increasing use
of machine-readable answer forms further improves the data entry process. Responses to open-
ended questions are grouped into categories, and classes are then translated into numerical form
for counting and additional statistical analysis.
Step 4: Select Question Type and Structure
There are many different ways to classify questions. The most common way is by the type of
measurements they produce: nominal, ordinal, interval, or ratio data. Another is by the character
of the measurement values; that is, are the values discreteASIN@YESOR @NOANSWERS OR ARETHEY
continuous (such as incomes, weights, attitude scale data, etc.) . A third classification system is
based on the form of the responses; that is, are the answers open-ended or close-ended.
A fourth way to classify question types is based on the objective of the generated response; that
is, on the cognitive level of the information produced. Folz (1996) has identified these six broad
categories of objective-based questions: factual, opinion, attitude, motive, knowledge, and action
or behavior questions. Each question type delivers a different type of information and must be
worded in such a way that this objective is achieved.
Table 9.1 displays the question types alongside respondents’ level of cognitive activity ad-
dressed by each type. These three stages are (1) the cognitive (knowledge) stage, (2) the affective
(attitudinal) stage, and (3) the action (or behavioral) stage. Examples of the information each type
of question produces are also shown.
Step 5: Select Best Wording for Each Question
Very great differences in responses can occur with small variations in the wording of a question.
As a result, extreme care must be taken in developing questions. The key things to look for when
writing questions are clarity, brevity, simplicity, precision, bias, and appropriateness.
Clarity. Questions must be worded so that everyone completing the questionnaire understands
what is being asked. Each question should address a single topic. Trying to include too much in
a question often results in what is called a double-barreled question. Double-barreled questions
result when two or more answers are required in the same question. They are not only confusing
Table 9.1
A Classification of Question Types by Content
Cognitive Awareness
Stage
Type of Question
Information Acquired
Cognitive Stage:
Factual
Knowledge
The facts about people or things.
What people know about things.
Affective Stage:
Opinions
Attitudes
Motives
What people say about things.
What people believe about things.
Why people act the way they do.
Action Stage:
Behavior
How people act, what they do; how they
will respond to certain stimuli.
Source: Folz 1996.
D
o
w
n
l
o
a
d
e
d
b
y
[
U
n
i
v
e
r
s
i
t
y
o
f
C
a
l
i
f
o
r
n
i
a
,
S
a
n
D
i
e
g
o
]
a
t
0
0
:
0
8
1
9
M
a
y
2
0
1
7
114 QUANTITATIVE RESEARCH APPROACHES AND METHODS
to the respondent, but also to the researcher; it can be difficult if not impossible for the researcher
to know what part of the question generated the response.
Brevity. Questions should always be as short and as to-the-point as possible. Never ask two
questions in one—avoid the use of “and” in a question. Somewhat longer questions can be included
with in-person interviews and mail surveys, but shorter questions—less than 20 words—should
be used in telephone interviews (Folz 1996).
Also, be sure that the questionnaire itself is not too long. A rule of thumb to follow is that
interviews should take no longer than an hour or so to complete. Phone surveys should be kept to
less than twenty minutes. Mailed, self-administered instruments should be kept to four standard
pages or less.
Simplicity. Never ask complex or difficult-to-answer questions. Make sure the question is one
that subjects can answer knowledgeably. Use short words and simple sentences. This is not to say
that respondents should be given the impression that they are being looked down upon. Rather,
focus on words that are in common everyday use.
Precision. The wording of every question must be as precise as possible (focus, focus, focus!).
Never use ambiguous words in the body of the question. Examples of words with ambiguous
meanings include “sometimes,” “possibly,” “maybe,” and so on. And always make sure that each
question asks just one thing.
Freedom from bias. Avoid asking questions that arouse strong emotions, generate resistance, or
result in a refusal to answer. If you must ask these questions, place them at or near the end of the
questionnaire, so that they do not result in only partially completed instruments. Such questions
will often cause respondents to simply stop answering all questions, resulting in an incomplete
instrument.
Do not ask “leading” questions—that is, questions that direct or influence the response toward
one point of view. These, too, will often cause subjects to not respond to the survey. Large numbers
of refusals to answer can greatly influence the results of a survey by introducing what is known as
nonresponse error or bias. Often, subjects who do not complete the questionnaire would respond
far differently than those who do respond.
Appropriateness. As has been said, be sure that each question is one that needs to be asked.
Avoid “fishing expeditions.” Relate each and every question to the study objectives. This point
is related to the bias issue, as well.
Today, many people have very strong opinions about what should be asked and what should
not. Federal privacy laws also confound this issue. This is particularly true with classification
or demographic questions. Gender, marital status, ethnicity, income, and the like are potential
stumbling blocks in any questionnaire. It is important to ask such questions only if they are criti-
cal to the study. It they are not absolutely needed, they are inappropriate and should be left out
of the questionnaire.
Step 6: Organize Questions into a Logical Order
The sequence of items in a questionnaire can also unintentionally influence or bias answers to
questions that occur later in the instrument (an item is just another word for a question). There-
fore, the researcher needs to carefully organize the questionnaire in such a way that subjects are
encouraged to follow through with answers to all questions.
Questions are usually arranged in an order that begins with the broad and easy-to-answer
questions placed before the more focused in-depth questions. The latter often require a signifi-
cant effort on the part of the subject to answer. If the task is too difficult, respondents will often
D
o
w
n
l
o
a
d
e
d
b
y
[
U
n
i
v
e
r
s
i
t
y
o
f
C
a
l
i
f
o
r
n
i
a
,
S
a
n
D
i
e
g
o
]
a
t
0
0
:
0
8
1
9
M
a
y
2
0
1
7
DESCRIPTIVE RESEARCH 115
skip the question. A suggested format to follow is called the funnel sequence of questionnaire
construction (Oskamp 1977).
Funnel questionnaires are composed of four distinct parts: (1) the title and identification of the
survey’s sponsors, (2) warm-up questions, (3) the most important, body of the survey, and (4) a
section containing classification questions (see Figure 9.2).
Title, purpose, and sponsor identification. Questionnaires should have a title; they should in-
dicate the purpose of the survey, including how the information will be used. The public likes to
know who is sponsoring the survey and to know that individual anonymity is guaranteed. These
items should all be included at the top of the first page of the questionnaire, although in mail
surveys it is also acceptable to include some of this information in a cover letter attached to the
questionnaire.
Instructions. Instructions are particularly important for self-administered questionnaires. They
should be clear and easy to follow. Care must be taken to clearly spell out what is expected of
the respondent. It is also a good idea to introduce early in the questionnaire information about
potential points of confusion that might appear later, such as who is expected to answer sections
of questions after a screening or branching point in the questionnaire. These instructions should
be repeated right before the branching occurs.
Figure 9.2 The Funnel Approach to Questionnaire Construction
7LWOHDQG6SRQVRU,GHQWLILFDWLRQ
%RG\RIWKH4XHVWLRQQDLUH
D %URDG$ZDUHQHVVDQG
*HQHUDO.QRZOHGJH
4XHVWLRQV
E 0RUH)RFXVHG
$WWLWXGHDQG2SLQLRQ
6FDOHV
F 0RVW)RFXVHG
4XHVWLRQV
DQG6FDOHV
G &RQWURYHUVLDO
4XHVWLRQV
:DUPXSDQG6FUHHQLQJ4XHVWLRQV
&ODVVLILFDWLRQ,WHPV
'HPRJUDSKLF4XHVWLRQV
D
o
w
n
l
o
a
d
e
d
b
y
[
U
n
i
v
e
r
s
i
t
y
o
f
C
a
l
i
f
o
r
n
i
a
,
S
a
n
D
i
e
g
o
]
a
t
0
0
:
0
8
1
9
M
a
y
2
0
1
7
116 QUANTITATIVE RESEARCH APPROACHES AND METHODS
Warm-up questions. These are simple, easy-to-answer questions that subjects can answer quickly
and with a minimum of effort. They are often dichotomous or, at most, simple multiple-choice
questions. These are usually questions designed to discern factual or knowledge information; they
seldom dive right into gathering attitudinal data. Items in this section of the questionnaire are often
screening questions—that is, questions to determine whether the respondent qualifies as a primary
target subject. Examples of screening questions include the following three items.
1. Do you consider yourself to be a Democrat or a Republican voter?
Democrat
Republican
2. Do you drive your personal car to work more than three times a week?
Yes
No
3. Do you own a bicycle?
Yes
No
The objective of this section is to ease respondents into the questionnaire and to bring
them to a level of comfort with the questions and the question-answering process. Therefore,
questions that are potentially contentious, controversial, or personal in nature should never
be included early in the instrument. The best place for potentially controversial questions
is right after the most important body of the questionnaire and just before the classification
questions.
In the past, some researchers have tried to use warm-up questions that have no connection
whatsoever to the study, but that were asked only in an attempt to capture subjects’ interest
in the survey process. There have not been any convincing reports in the literature on the
effectiveness of this ploy, however. Because of the already existing difficulty of gaining
subjects’ willingness to participate in yet another survey, it is probably a good idea not to
waste a question this way. Researchers are encouraged to stick to the point and focus all their
attention on gaining only meaningful data.
Body of the questionnaire. This is where the most important questions should be placed.
Again, the easiest of these questions should appear before the more difficult or complex ques-
tions. The questions should be placed in a logical order that does not require the respondent
to leap from one idea to another. When changes in direction are necessary, a line or two
of additional instructions or words calling the shift to the respondent’s attention should be
considered.
The first part of this section is sometimes used as a transition section between the introduction
and ultimate core section of the questionnaire. Researchers use this section of the questionnaire
to ask questions to determine subjects’ awareness of the survey issue. Other questions can serve
to test their knowledge of component factors, indicators, and possible causal factors. These are
usually broad questions that help build an overall view of the study for the researcher.
In the second part of the instrument, researchers often employ more focused attitude,
opinion, or other types of scales—if scales are included in the design. Because they often
require the subject to think about the question before answering, this is often where nonre-
sponse error creeps into the survey. Another type of question that is sometimes included in
either the second or last third of the body of the instrument is for gathering what is called
lifestyle information. These data are often grouped together into a category of information
called psychographics. Lifestyle information is used to develop a more in-depth profile of
the respondents, adding attitude, opinion, value, and activity information to the traditional
demographic profile.
D
o
w
n
l
o
a
d
e
d
b
y
[
U
n
i
v
e
r
s
i
t
y
o
f
C
a
l
i
f
o
r
n
i
a
,
S
a
n
D
i
e
g
o
]
a
t
0
0
:
0
8
1
9
M
a
y
2
0
1
7
DESCRIPTIVE RESEARCH 117
The third part of the body of the questionnaire is where the most focused questions should
be placed, as should all potentially controversial or personally embarrassing questions. The
reason for this is that while subjects might skip a threatening question because it appears
near the end of the questionnaire, they will have already provided answers for the bulk of
the instrument. Questionnaires that are mostly completed are almost as valuable as those that
are completely answered.
Classification items. Classification items are questions that enable the researcher to de-
scribe the sample in some detail and to compare the responses of one or more subgroups of
subjects with responses of other subgroups. Classification information is sometimes referred
to as demographic data because it usually consists of demographic statistics about the sub-
jects themselves.
These data are, indeed, important to the research results, but not as critical as the informa-
tion contained in the body of the questionnaire. This occurs because researchers are seldom
interested in any one subject’s responses, but instead they want to know the mean (average)
scores for the entire group. Thus, missing some classification data does not render the instru-
ment completely useless.
Step 7: Pretest and Revise the Questionnaire
Every questionnaire should be pretested on a group of subjects that as closely as possible reflects
the same characteristics as the study sample. This is the critical “de-bugging” phase of questionnaire
construction. No matter how many times the researcher or members of the research team go over
the instrument, some problems are almost sure to surface. Typographical errors and misspellings
are the least of these potential problems.
People in a career path will often share a particular sense of meanings for words and phrases
that are not likely to be shared by everyone else. Thus, subjects who share the experience and
characteristics of the study sample, not the research team, must look at question wording. The
best way to do this is to administer the questionnaire to a random sample of subjects from the
population of interest. The results from questionnaire pretests should not be included with the
findings of the final study sample.
Step 8: Rewrite the Questions and Administer the Survey
The final step in the questionnaire construction process is producing the questionnaire in its final
form. This may involve making a number of adjustments to the questionnaire that were brought
to light during the pretest. Adjustments may mean changes in wording, reordering the flow of
questions, and even deleting some questions. Particular care must be given to questions for which
potentially embarrassing answers will ensue.
The final instrument is usually printed if it is to be distributed by mail or if subjects are asked
to complete the instrument alone and on their own time. In such circumstances any branching
instructions in the instrument must be clear and easy to follow. If the survey is to be administered
in a personal interview procedure, the final form may be a discussion guide that the subjects do
not see. In that case, the instrument may be less formal and include remarks and comments for
the administrator’s reminders while asking or recording answer. Finally, great care must be taken
in administering the questionnaire so that subjects remain comfortable during the process and
remain willing to cooperate with the research team.
D
o
w
n
l
o
a
d
e
d
b
y
[
U
n
i
v
e
r
s
i
t
y
o
f
C
a
l
i
f
o
r
n
i
a
,
S
a
n
D
i
e
g
o
]
a
t
0
0
:
0
8
1
9
M
a
y
2
0
1
7
118 QUANTITATIVE RESEARCH APPROACHES AND METHODS
Developing and Wording Questions
Responses to questions produce what is called raw data. Only when coded, tabulated, and inter-
preted, does raw data become information. The way in which questions are formed influences the
way they are coded, tabulated, and interpreted. Questions may be written in many different ways;
they can include a limited set of responses from which the respondent must choose (closed-ended)
or they can allow respondents to provide answers freely and in their own words (open-ended).
Most survey questions used in descriptive research designs are close-ended. These questions
force respondents to choose from only those alternatives provided by the researcher. While this
results in survey instruments that tend to be more objective than open-ended questions, it can
also work as a disadvantage. Closed-ended questions force subjects into using the same ideas,
terms, and alternatives that the researcher uses—thus following the potential bias of the researcher
(Oskamp 1977).
Open-ended questions are far more difficult to code and tabulate than are closed-ended ques-
tions. Therefore, open-ended questions are used most often in a small-sample, exploratory research
design or as a component in an otherwise completely qualitative design.
Closed-Ended Questions
Closed-ended questions can be organized into two broad classes: structured answer (dichotomous
and multiple-choice) and scales. Structured answer questions are used for warm-up, introductory,
and classification portions of the questionnaire, while scales are more commonly found in the
body of the instrument. The types of scales used most often in public administration and social
science research are: (1) attitude scales, (2) importance scales, (3) rating scales, and (4) readiness-
to-act scales.
Structured answer questions. Structured answer questions are the easiest type to write and the easi-
est for respondents to answer. There are two types of structured answer questions: dichotomous and
multichotomous. For both types, the data provided are discrete (also known as categorical data).
The examples of dichotomous and multichotomous questions displayed in Figure 9.3 were
used in a public safety agency survey of organizational climate and culture. Dichotomous ques-
tions require respondents to select from just two alternative answers. Examples include gender
(female/male), behavior (do/don’t), intentions (will/will not), status (employed/unemployed), and
any number of such two-alternative answer forms. Multichotomous questions allow for more than
two possible answers (they are also called multiple-choice questions).
Open-Ended Questions
Open-ended questions can also be divided into two broad types: completely unstructured response
and projective techniques. Unstructured response questions elicit responses that are entirely the
subject’s own. The researcher provides no clues or direction for the response, although subsequent
questions might probe for more information.
The subject may answer the question in any way desired, with a short or a long answer, and
with or without qualifying statements. Projective techniques also allow subjects to respond to
some stimuli in their words. The stimulus can be words, pictures, or symbols. The questions are
structured in such a way that the respondent unconsciously projects hidden feelings or attitudes
into the response. It is believed that in this way projective questions can produce answers that
might not otherwise surface.
D
o
w
n
l
o
a
d
e
d
b
y
[
U
n
i
v
e
r
s
i
t
y
o
f
C
a
l
i
f
o
r
n
i
a
,
S
a
n
D
i
e
g
o
]
a
t
0
0
:
0
8
1
9
M
a
y
2
0
1
7
DESCRIPTIVE RESEARCH 119
Projective Techniques
Five different types of projective techniques are used in social and administrative science research.
They are: (1) association, (2) construction, (3) completion, (4) ordering, and (5) expressive tech-
niques. Each is discussed in more detail below.
Association techniques. With association techniques, subjects are asked to react to a particular
stimulus, such as a word, an inkblot, or another symbol, with the first thoughts or ideas that come
to mind. The technique is believed to be a good way to discern the underlying values that certain
words or symbols convey.
Construction techniques. With construction techniques, subjects are asked to create a story,
either about themselves or others, or to draw a self-portrait. The idea is that even though subjects
are not told that the story is about them, their underlying values and attitudes will be reflected in
the general sense of their stories.
Completion techniques. These techniques require the subject to finish an already started stimulus,
such as a sentence or a picture. In the sentence completion version, subjects are asked to finish the
sentence with any statement that they wish. The rationale for this approach is that the subjects’
responses will not emerge from a vacuum; rather, the words chosen for the sentence completion
will reflect the subjects’ subconscious attitudes.
In the picture version of this process, a photograph or a drawing of two characters is shown
to the subject. One of the characters is portrayed making a statement. Subjects are asked to put
themselves in the other character ’s shoes and respond in the way that the second character or
characters would. Again, the belief is that without consciously doing so, the subject will interject
his or her own feelings or opinions into the created response.
Ordering techniques. Also called classifying or choice techniques, these require the subject
to arrange a group of stimuli into some order or to choose one or more items from a group of
items. The item(s) selected is supposed to be most representative of the idea or thought involved.
63. Where do you work most of
the time?
Field
Jail
[2][
1]
64. Your gender:
Male
Female
[2][
1]
65. Years with the department:
1–5
6–10
11–15 16–20
20+
[5][
4][
3][
2][
1]
66. Highest level of education you
have attained:
Graduate
work or
degree
4-year
college
degree
2-year
college
degree
Some
college
High
school
graduate
Not an
HS
graduate
[6][
5][
4][
3][
2][
1]
67. Do you have supervisory
responsibility?
Yes
No
[2][
1]
Figure 9.3 Example of Dichotomous and Multichotomous Questions
Source: McNabb, Sepic, and Barnowe 1999.
D
o
w
n
l
o
a
d
e
d
b
y
[
U
n
i
v
e
r
s
i
t
y
o
f
C
a
l
i
f
o
r
n
i
a
,
S
a
n
D
i
e
g
o
]
a
t
0
0
:
0
8
1
9
M
a
y
2
0
1
7
120 QUANTITATIVE RESEARCH APPROACHES AND METHODS
This method can also measure what is known as salience, which is another way of indicating the
importance that a respondent places on each of the items.
Expressive techniques. In these techniques, subjects are asked to creatively express themselves
in some way, such as by drawing a picture, a cartoon, finger painting, and so on. The method is
often used in conjunction with the construction technique. The two are considered to reinforce
each other. The picture will reveal an underlying attitude, with the subject’s description of the
events or components of the picture often indicating salience.
It is important to recognize that projective techniques require skilled and empathetic interpre-
tation that goes far beyond the abilities of most students of political science. On the other hand,
in the use of a trained professional, they can and do provide valuable information that might not
otherwise surface in a traditional, scale-driven attitudinal research study.
Developing and Using Scales
As noted earlier, the types of scales that are used most often in public administration research are:
(1) attitude scales, (2) importance scales, and (3) rating scales. Each is discussed in more detail
in the following pages.
Attitude Scales
Attitude scales are the scales used most often in political science research. An attitude can be defined
as a relatively enduring, learned disposition that provides motivation to respond in a consistent
way toward a given object (Oskamp 1977). Researchers are interested in people’s attitudes for
any number of reasons. Just a few of these reasons are:
s 6OTERSATTITUDESTOWARDCANDIDATESANDISSUESDIRECTLYINmUENCETHEOUTCOMEOFELECTIONS
s #ITIZENSATTITUDESINmUENCETHEFORMATIONANDADOPTIONOFPUBLICPOLICIES
s 0EOPLESATTITUDESINmUENCETHEIRBEHAVIORANDTHECONSISTENCYOFTHATBEHAVIOR
s !TTITUDESDETERMINEGROUPSUPPORTFORISSUESANDPROGRAMS
Many different types of scales for measuring attitudes have been developed. The types of attitude
scale that are used most often today include: (1) Likert scales, (2) semantic differential rating scales,
and (3) a related semantic differential approach, the Stapel scale. Each is discussed below.
Likert Scales
By far the most favored attitude-measuring tool in use today is the Likert scale, developed in the
early 1930s. Likert scales do not require a panel of judges to rate the scale items. The researcher
prepares a pool of items that express an opinion about a subject or one of its contributing aspects.
Items are individual statements. While the resulting data are most appropriately considered to
be ordinal level data, some researchers treat them as interval level and process Likert data with
interval-scale statistics. The argument has been summarized this way:
The level of measurement of a Likert-type index is ordinal. The items do not really measure
the quantity of a characteristic, but we can use the items to rank the cases. However, by adding
together the numbers assigned to the response categories for each item, we are treating the
measurement as if it were interval. This practice allows us to use more statistical techniques for
D
o
w
n
l
o
a
d
e
d
b
y
[
U
n
i
v
e
r
s
i
t
y
o
f
C
a
l
i
f
o
r
n
i
a
,
S
a
n
D
i
e
g
o
]
a
t
0
0
:
0
8
1
9
M
a
y
2
0
1
7
DESCRIPTIVE RESEARCH 121
analysis. Many analysts feel that treating Likert-type scales as if they were interval measures
provides more advantages than disadvantages. (O’Sullivan and Rassel 1995, 274)
Objective of Likert Scales
The objective of the Likert scale is to measure the extent of subjects’ agreement with each item.
The extent is measured on a five-point scale: strongly agree, agree, undecided, disagree, and
strongly disagree. 4HEITEMSAREASSIGNEDVALUESRUNNINGFROM @ THROUGH @ RESPECTIVELY $E-
pending on how the statements are worded (positively or negatively, approving or disapproving,
etc.), the researcher can use low mean scores to equate with either positive or negative attitudes,
while using high mean scores to reflect the opposite attitude.
Researchers are typically not concerned with subjects’ responses to any one item on the
scale. Rather, an attitude score is established by summing all ratings of items in that scale.
Reverse scoring must be used when items stated in positive and negative terms are used together
in the same Likert scale. An example of a Likert-type scale designed to measure subjects’
attitudes or opinions about one aspect of an organization’s climate is displayed in Figure 9.4 .
Responses are coded in reverse order for the first two questions in that scale. Because low
scores are assigned to negative attitudes, agreeing with the statement in question 18 is coded
with low values. Question 19 is assumed to register a positive attitude toward the company.
Positive attitudes are assigned with high values. Hence, agreeing with the statement is coded
with high values.
Individual attitude statements to be used as statements or items in the Likert scale are often
generated by an exploratory study that uses series of in-depth interviews with key informants in
the organization or sample.
Semantic Differential and Stapel Scales
Two additional scales are often used to measure attitudes and opinions. These are the semantic
differential and its close relative, the Stapel scale. The Stapel scale is almost identical to the se-
mantic differential, except that only one of the polar adjectives is used instead of both; they are
unipolar rather than bipolar.
Semantic differential scales are pairs of opposing adjectives, with spaces between each
for subjects to mark their opinion. A seven-point scale typically separates the adjectives.
Subjects are asked to make a personal judgment about a characteristic or a complete concept.
For example, they can be used to help researchers build a picture of how subjects rate the
service they receive at a particular agency. Or the adjective pairs could pertain to the agency
as a whole.
In the following example, subjects are asked to rate the overall effectiveness of a brochure
describing any program or agency. Subjects are first asked to read the brochure, then asked to
rate it on the following five-point scale. Subjects are to check the box that most closely matches
their perceptions of the document. Figure 9.5 includes adjectives that could be used to describe a
public service announcement proposed for an AIDS prevention campaign.
In practice, many researchers consider the points on both the semantic differential and Stapel
scales to be equidistant, thus providing interval-level data. However, because the assigned dif-
ferences are arbitrarily assigned, other researchers feel that the scale only provides ordinal data.
This conflicting interpretation has resulted in a reduction in the use of the scales in social and
administrative science research.
D
o
w
n
l
o
a
d
e
d
b
y
[
U
n
i
v
e
r
s
i
t
y
o
f
C
a
l
i
f
o
r
n
i
a
,
S
a
n
D
i
e
g
o
]
a
t
0
0
:
0
8
1
9
M
a
y
2
0
1
7
122 QUANTITATIVE RESEARCH APPROACHES AND METHODS
Clear
[]
[]
[]
[]
[]
Confusing
Simple
[]
[]
[]
[]
[]
Difficult
Quick
[]
[]
[]
[]
[]
Slow
Complete
[]
[]
[]
[]
[]
Incomplete
Realistic
[]
[]
[]
[]
[]
Phony
Valuable
[]
[]
[]
[]
[]
Worthless
Figure 9.5 An Example of a Semantic Differential Scale
Very Definitely
Describes
Does Not
Describe
18. The philosophy of our management is
that in the long run we get ahead
fastest by playing it slow, safe, and
sure.
[1][
2][
3][
4][
5][
6][
7]
19. You get rewarded for taking risks in
this organization.
[7][
6][
5][
4][
3][
2][
1]
20. Decision making in this organization
is too cautious for maximum
effectiveness.
[1][
2][
3][
4][
5][
6][
7]
21. You won’t get ahead in this
organization unless you stick your
neck out and take a chance now and
then.
[7][
6][
5][
4][
3][
2][
1]
22. We do things by the book around
here; taking risks is strongly
discouraged.
[1][
2][
3][
4][
5][
6][
7]
23. We have to take some pretty big risks
occasionally to make sure the
organization meets its objectives.
[7][
6][
5][
4][
3][
2][
1]
Source: Sepic, Barnowe, Simpson, and McNabb 1998.
Notes: Low values = negative attitudes; High values = positive attitudes. Positive statements are
reverse-scored.
Figure 9.4 Statements to Measure Attitudes Toward Risk in an Organization
Other Types of Scales
Other types of scales include ordinal (ranked) importance scales, comparative and noncomparative rat-
ing scales, and ratio scales. Example questions are included to illustrate these several types of scales.
1. Ordinal Scale Importance Scales
a. Please rank each of the following public transportation methods in terms of how important
IT IS TO REDUCING TRAFlC CONGESTION IN THIS REGION 5SE A @ FOR MOST IMPORTANT
@ FOR NEXT IN
importance, etc. Do not give any two items the same value.)
D
o
w
n
l
o
a
d
e
d
b
y
[
U
n
i
v
e
r
s
i
t
y
o
f
C
a
l
i
f
o
r
n
i
a
,
S
a
n
D
i
e
g
o
]
a
t
0
0
:
0
8
1
9
M
a
y
2
0
1
7
DESCRIPTIVE RESEARCH 123
____
Freeway buses
____
Light-rail system
____
Vehicle ferryboats
____
Passenger-only ferryboats
____
Heavy rail commuter trains
____
Commuter pool vans
b. In your opinion, would you say that patient waiting time at the Veterans’ Hospital during your
last visit was:
____
Shorter than most
____
About the same as most
____
Longer than most
____
The longest I have ever encountered
2. Comparative Rating Scale (Single Attribute)
Compared with Microsoft Excel, how do you rate SPSS in ease of use? (Circle the appropriate
number)
Much Easier
About the Same
Much Harder
123456789
3. Noncomparative Rating Scale
How would you rate this brochure on its ability to inform you of the disadvantages of using tobacco
products? (Circle the appropriate number)
Very Good
About Average
Very Poor
123456789
Summary
Researchers use two different approaches when gathering primary data in quantitative research
studies; they may collect data by observing and counting overt acts of behavior, or they may use
a questionnaire to generate responses to specific questions. Questionnaires are the most popular
way to gather primary data. They are particularly appropriate when the research problem calls
for a descriptive design. Questionnaires have many advantages. The greatest of these is their
flexibility. Questionnaires can be custom designed to meet the objectives of almost any type of
research project.
Eight steps are followed in questionnaire construction: (1) establish what information is needed;
(2) specify the data-gathering method; (3) specify procedures for analyzing the data; (4) select
question type and structure; (5) select the best wording for each question; (6) organize the ques-
tion in a logical order; (7) pretest and revise the questionnaire, if necessary; and (8) administer
the questionnaire and collect the data.
Questions may be written as a limited set of responses from which the respondent must choose
D
o
w
n
l
o
a
d
e
d
b
y
[
U
n
i
v
e
r
s
i
t
y
o
f
C
a
l
i
f
o
r
n
i
a
,
S
a
n
D
i
e
g
o
]
a
t
0
0
:
0
8
1
9
M
a
y
2
0
1
7
124 QUANTITATIVE RESEARCH APPROACHES AND METHODS
(closed-ended), or they may allow respondents to provide answers in their own words (open-ended).
There are two types of closed-end questions: structured answer (dichotomous and multiple choice)
and scales. Structured answer questions are used for warm-up, introductory, and classification
portions of the questionnaire; scales are usually found in the body of the questionnaire. The types
of scales used most often in public administration research are: (1) attitude scales, (2) importance
scales, and (3) rating scales.
Open-ended questions can also be divided into two broad types: completely unstructured
response and projective techniques. Unstructured response questions are entirely the subject’s
own responses to a question. Projective techniques also allow subjects to respond to some
stimuli in his or her words. The stimulus can be words, pictures, or symbols. The questions
are structured in such a way that the respondent unconsciously projects hidden feelings or
attitudes into the response. Five different types of projective techniques are used in public
administration research: (1) association, (2) construction, (3) completion, (4) ordering, and
(5) expressive techniques.
Many different types of scales have been developed for measuring attitudes. The attitude scale
methods that are used most often today are: (1) Likert scales, (2) the semantic differential rating
scale, and its related approach, (3) the Stapel scale. Several other scales were illustrated in the
chapter as well.
Discussion Questions
1. Why are questionnaires such a popular way of collecting research data?
2. Name the three objectives for questionnaires described by Malhotra.
3. List the six steps to follow in preparing a questionnaire.
4. What is the relevance of brevity and clarity in questionnaires?
5. What are classification items? Why are they important? Give some examples.
6. What are some of the problems associated with classification items?
7. Discuss the pros and cons of using Likert scales for measuring attitudes.
8. What are bipolar adjectives, and how would you use them in a research project?
9. What are projective techniques, and how might they be used in political science
research?
Additional Reading
Alreck, Pamela L., and Robert B. Settle. 1995. The Survey Research Handbook. 2nd ed. Chicago: Irwin.
DeVelin, Robert F. 1991. Scale Development: Theory and Applications. Newbury Park, CA: Sage.
Lussier, Robert N. 2002. Statistically Speaking: Decision Making via Descriptive Statistics and Statistical
Tests. Louisville, KY: BrownHerron.
Oskamp, Stuart. 1977. Attitudes and Opinions. Englewood Cliffs, NJ: Prentice Hall.
Saris, Willem E., and Irmtraud N. Gallhofer. 2007. Design, Evaluation and Analysis of Questionnaires for
Survey Research. New York: Wiley-Interscience.
D
o
w
n
l
o
a
d
e
d
b
y
[
U
n
i
v
e
r
s
i
t
y
o
f
C
a
l
i
f
o
r
n
i
a
,
S
a
n
D
i
e
g
o
]
a
t
0
0
:
0
8
1
9
M
a
y
2
0
1
7
125
10 Causal Research:
The Experimental Approach
Experimental design (ED) is the term used in the social, behavioral, and natural sciences to
identify the processes involved in designing, conducting, and evaluating the results of all types
of experiments. Researchers conduct experiments when they want to determine whether a causal
relationship exists between two or more variables. ED also enables researchers to measure the
strength—and sometimes the direction—of the possible relationship.
Experiments are characterized by three distinguishing components (Greeno 2001). First, at least
two groups of similar subjects are selected; one group is administered a “treatment” of some kind.
The second group—usually referred to as the control group—either gets no treatment or an alter-
native treatment. This treatment is referred to as the independent variable. Second, the researcher
determines what activity, behavior, or result to measure after application of the treatment(s). The
variable that is altered as a result of the experiment is the dependent variable. The measured change
in the dependent variable is the outcome of the experiment. The researcher observes the dependent
variable to discern the amount of shift, if any, that might have occurred after application of the
treatment. In one of the earliest examples of experimental design, independent variable treatment
was application or no application of fertilizer; the dependent variable measured outcome was
variation in crop yields on plots with and without the treatment (Cochran 1977).
The third distinguishing characteristic of experiments is the requirement that subjects be ran-
domly assigned to all test groups. Randomization ensures that the researcher does not influence
who receives the treatment and who does not. It is a method for controlling for the possible effects
of extraneous, or confounding, factors that might influence the outcome.
Key Concepts in Experimental Design
Quantitative research can have as its fundamental focus either (1) the illumination of concepts
and themes, (2) the description of events or phenomena, or (3) the determination of causal effects
that the manipulation of one or more factors may have on some variable of interest. These three
different approaches are called exploratory, descriptive, and causal. Causal research is called
experimental research because it follows an experimental design. In exploratory and descriptive
designs, the researcher is a collector of data that already exist. In an experiment, however, the
researcher becomes an active participant in the data-generating process by manipulating different
treatments to examine their effects on a variable of interest.
A number of important concepts play a role in experimental design. Some of the key concerns
involved in the design, conduct, and interpretation of experiments and the statistical tests employed
D
o
w
n
l
o
a
d
e
d
b
y
[
U
n
i
v
e
r
s
i
t
y
o
f
C
a
l
i
f
o
r
n
i
a
,
S
a
n
D
i
e
g
o
]
a
t
0
0
:
0
8
1
9
M
a
y
2
0
1
7
126 QUANTITATIVE RESEARCH APPROACHES AND METHODS
in experimental design are probability and confidence levels, sample factors, and inference; these
and other factors are discussed below.
Probability. Probability is the level of confidence a researcher holds in implying that a causal
relationship exists; it is also a numerical indication of the researcher’s belief in the reliability of a
prediction that X is a cause of Y, or that the occurrence of X makes Y more likely.
Confidence levels. Confidence levels are related to the concept of probability. Before widespread
acceptance of the p-value approach to hypothesis testing, managers were required to compute
acceptance and rejection levels and to look up decision values in tables. Today, most statistical
packages, such as SPSS and Excel, compute critical p-values along with t-test, z-test, and F-test
values. The decision whether to retain or reject the null hypothesis can now be made by compar-
ing the computed p-value with the confidence level or alpha. Confidence levels used most often
in all social science include the .01, the .05, and the .10 probability values.
Statistical significance. This is the term used to describe the point or value beyond which
analysts accept or reject a null hypothesis; decisions are made in accordance with preselected
levels of confidence. Hypothesis tests are themselves sometimes called significance tests. In the
past, the critical values of a statistic had to be read from a table of values found at the end of most
statistics texts. These were then compared with a value that was found by following steps in a
formula for calculating the statistical test. Today, the value at which the decision can to be made
appears as a probability value in the results of most, if not all, inferential statistical tests. This is
called the p-value approach.
Alpha levels. Alpha is the Greek symbol used for the probability value. Most researchers make
hypothesis acceptance decisions at the .05 level of confidence. However, the nature of the study and
required level of confidence in the results often require that an alpha of .10 or of .01 be employed.
In statistical notation, the lowercase Greek letter alpha (α) is used to represent the confidence
value. P-values the same or greater than the selected alpha result in retaining (or accepting) the null
hypothesis; p-values less than the significance value require that the null hypothesis be rejected.
The confidence coefficient. When analysts use the .05 level of confidence, they are in fact saying they
are 95 percent sure about a hypothesis decision. This “95 percent” is what is known as the confidence
coefficient and is the probability that a null hypothesis is retained when it should be retained.
Experimental validity. Experimental validity means that the experiment and statistical analysis
measure what the researcher wants to measure. There are two types of validity: internal and ex-
ternal. Internal validity refers to the effectiveness of the design at limiting possible explanations
for the outcome to the treatment applied. This means controlling external or confounding factors.
External validity refers to the degree to which the researcher can make inferences to larger popu-
lations from the results of the sample experiment. Over time, field experiments have been shown
to provide a greater level of external validity and a lower level of internal validity than laboratory
experiments (McDaniel and Gates 1993).
Independent variable. Also called the explanatory or experimental variable, this is the changed
or manipulated factor in an experiment. It can be anything that the researcher believes might influ-
ence a change in something else.
Dependent variable. The phenomenon that the researcher observes in order to check for a change as
a result of the application of treatment. The observed and measured change is called the outcome.
Treatment. Treatment refers to the changes the researcher makes in the independent variable
or variables. Different instructional methods, communications methods, prices, models, designs,
and issues are examples of variables that are manipulated in the experiment.
Randomness. The random assignment of subjects to treatment and control groups is a funda-
mental assumption of experimental design.
D
o
w
n
l
o
a
d
e
d
b
y
[
U
n
i
v
e
r
s
i
t
y
o
f
C
a
l
i
f
o
r
n
i
a
,
S
a
n
D
i
e
g
o
]
a
t
0
0
:
0
8
1
9
M
a
y
2
0
1
7
CAUSAL RESEARCH 127
Degrees of freedom. Degrees of freedom (abbreviated as df) refers to the number of observations
in an experiment that are free to vary. The degrees of freedom must be known when using a statistical
table, such as the t-table or F-table, to determine a critical value in hypothesis testing. Modern sta-
tistical software eliminates the need for using statistical tables, but df are still reported when making
hypothesis decisions using the p-value approach. Degrees of freedom are reported either for columns
(variables) or rows (cases) or both, depending on the test in question. When a statistics calculation
is concerned only with description, the degree of freedom is n, the full sample size (Phillips 1977).
However, when the statistical calculation is concerned with inference, the df is always smaller than
n (e.g ., n – 1, n – 2, etc.). Degrees of freedom are discussed in greater detail on page 137.
Inference. Researchers can never prove beyond all doubt that for a given population, X is a cause
of Y. Rather, they can only infer from the observation of sample results that a causal relationship
exists for the population from which the sample was drawn. In all science, causality is always
inferred; it is never proven conclusively.
Approaches to Experimental Design
Experiments can take any one of three different approaches. The first is a group of approaches
known as pre-experimental designs. A second type is one that is used often in political science
research, the quasi-experimental design. The third group consists of two types of true experiments,
laboratory experiments and field experiments.
Pre-experimental designs are the least scientifically rigorous of all experimental designs. They
provide little or no control over confounding variables. As a result, they are considered to be
only slightly better than simple descriptive studies when the results are used to make inferences.
The advantages that make them so desirable in political research is that they are far less costly to
administer than classical experiments, and they typically take far less time to administer. A pre-
experimental design may produce results in a week or less—a fact that makes them popular with
campaign managers in the midst of a heated political race. Three of the most commonly used pre-
experimental designs are the one-time, single case study, the one-group pretest, post-test design,
and the base-group comparison design (McDaniel and Gates 1993).
In a quasi-experimental design, researchers follow most of the requirements of true experiments.
They employ treatments, outcomes, and sample units, but do not use random sampling methods
to assign subjects to sample groups (Cook and Campbell 1979). The groups usually already exist,
and are chosen because of this existing structure or cohesiveness. Examples might be the regis-
tered voters of two different communities, groups of lobbyists supporting a controversial issue
and groups of lobbyists who support an opposite point of view, or elected government officials
in two different nations.
Laboratory experiments are one of the two main types of classical experimental designs. They
take place in controlled environments, such as classrooms, university laboratories, research centers,
and similar locations. In this type of experiment, the researcher creates a situation that mirrors ex-
ternal conditions as much as possible; the researcher then manipulates the independent variable(s)
and measures changes in the dependent variable. In political science research, most studies tend to
be empirical. Therefore, laboratory experiments are seldom seen outside of academic settings.
In field experiments, the research is conducted in a realistic situation—often in one or more
communities. Although the researcher attempts to control conditions as much as possible, the
potential for bias from intervening or confounding variables is always present in these situations.
Both laboratory and field experiments involve two principal components: (1) the actual process
of designing the experiment, and (2) determination of the statistical tests to use in evaluating the
D
o
w
n
l
o
a
d
e
d
b
y
[
U
n
i
v
e
r
s
i
t
y
o
f
C
a
l
i
f
o
r
n
i
a
,
S
a
n
D
i
e
g
o
]
a
t
0
0
:
0
8
1
9
M
a
y
2
0
1
7
128 QUANTITATIVE RESEARCH APPROACHES AND METHODS
results of the experiment. These two principal components of ED incorporate a number of con-
nected activities (Kirk 1995, 1). As in all research, these begin with establishing a valid research
question and end with interpreting the results of the research. Activities involved in experimental
design include the following:
1. Selecting a valid research question and forming a hypothesis or hypotheses that can be
scientifically tested using proven ED methods.
2. Identifying the treatments (i.e ., the independent variable or variables), establishing what
changes in the dependent variable will be measured as a result of the changes in treatment,
and identifying the variables and conditions that might confound or bias the results.
3. Identifying the population from which a sample will be drawn, the characteristics or
constraints that limit the sample alternatives, and determining the sample size needed
for validity in the experiment.
4. Determining the approach for assigning units to test and control groups. This involves
selecting from several experimental designs. Although more than fourteen designs have
been developed, the four basic designs used most often are the one-sample, two-sample,
factorial, and Latin square designs.
5. Planning the appropriate statistical analysis processes to be used for analyzing and in-
terpreting results of the experiment.
Step 1: Determine the Research Question
Research questions are the concepts the researcher wants to study. The question selected dictates
which research design, data collection method, and analysis approach satisfies the objectives
spelled out for the selected study question. Political scientists typically examine questions that fall
under the categories of either political theory, the philosophy and/or history of politics and politi-
cal institutions, American politics, comparative politics, elections and voting behavior, all levels
of the judiciary, public policy, public administration, program evaluation, international relations,
research methodology, and other related topics. Researchers in other nations substitute their own
nation or region for American politics, but generally follow a similar set of topic areas.
Step 2: Select Research Treatments
The concept of treatments originated with the founder of experimental design and methods,
agricultural researcher Sir Ronald A. Fisher. Fisher developed ED techniques in order to test the
influences of such factors as water, fertilizer, soil type, and other variables on improving yields of
farm crops (Antony 1998). Classical experimental design follows the procedures set forth by Sir
Ronald Fisher and William D. Gosset, who published his statistics research under the pen name
of “Student” (Cochran 1977). The design involves the random assignment of subjects or units to
experimental and control groups, pretesting to establish benchmarks, variations in treatments, and
post-testing after treatment application.
Selection of a treatment variable also involves identifying as many potentially confounding
variables as well. Confounding or extraneous variables threaten internal validity. They range from
the effects of being tested, history, changes that subjects may undergo over the time from pretest
to post-test (called maturation), and any variations that might creep into the measuring instrument
(such as leading questions and unintentional bias).
In political science research, treatments have included such examples as different types of mes-
D
o
w
n
l
o
a
d
e
d
b
y
[
U
n
i
v
e
r
s
i
t
y
o
f
C
a
l
i
f
o
r
n
i
a
,
S
a
n
D
i
e
g
o
]
a
t
0
0
:
0
8
1
9
M
a
y
2
0
1
7
CAUSAL RESEARCH 129
sages and different types of communication media (such as television versus newspaper), testing
of different issues or appeals to voters, comparisons of different policy scenarios with various
groups, and similar variables that may be manipulated in experimental situations.
Examples of how treatments employed in political science research include two papers published
in the July 2000 edition of the American Journal of Political Science. In the first paper, Bottom
and co-authors (2000) described a laboratory experiment on the institutional effect on majority
rule instability. Subjects were assigned to forty six-person groups. Groups were assigned to one of
four different treatments, which involved different meeting arrangements to represent bicameral
or unicameral formats for policy decisions.
In the second paper, Gilliam and Iyengar (2000) used as their treatment different versions of
a hypothetical television news script. In one version, a crime was described as violent and the
perpetrators as nonwhite males; in other versions, these descriptions were changed. The hypothesis
tested was that inflammatory news stories influence citizens’ attitudes toward minorities.
Step 3: Identify the Population and Select a Sample
Researchers must be certain that the population they are studying is one that is appropriate for
the research question and study hypotheses. Samples are smaller groups or research subjects
that are drawn from larger populations. The sample selection process begins with identifying the
appropriate subjects for the study. This decision is based upon the research question selected by
the investigator. The researcher must take care to ensure that the sample is representative of the
population of interest and is large enough to enable the researcher to apply the level of precision
necessary in measuring the effects of the independent variable(s).
Sample size has an influence on the level of Type I and Type II errors acceptable to the re-
searcher (Wyner 1997). “Error” refers to making right or wrong decisions based on the evidence
established in the analysis of the data. A Type I error means deciding that the null hypothesis is
false when, in reality, it is true. A Type II error is the opposite: concluding that a null hypothesis
is true when it is actually false. While neither can be eliminated entirely, Type I error can be
controlled by establishing more rigid confidence levels and random selection of subjects. Type II
error can be controlled by increasing the sample size. A rule of thumb often followed in establish-
ing sample size for empirical research is that the sample must consist of at least thirty subjects or
10 percent of the total population size; they typically do not exceed 100. When researching with
larger populations, such as the entire population of a state or of the nation, most sample sizes
seldom exceed 1,000 subjects. Nearly any statistical textbook will have a formula for rigorous-
sample size determination.
Randomness in Sample Selection
Randomness refers to the way subjects are assigned to experimental and control groups. The
principle of random selection and assignment of cases was introduced in 1925 by Sir Ronald
Fisher. The principal gains from random assignment are that it allows the researcher to control
for any bias that might originate from treatment effects or from confounding variables because
applications are averaged across all possible groupings (Yates 1977).
The most common approach to selecting a random sample is called a simple random sample (SRS).
The key characteristic of this type of sample is that every potential sample member has an equal
chance at being selected. Often, subjects are numbered sequentially, then either a table of random
numbers or a computer-generated random table is used to select individual subject numbers from the
D
o
w
n
l
o
a
d
e
d
b
y
[
U
n
i
v
e
r
s
i
t
y
o
f
C
a
l
i
f
o
r
n
i
a
,
S
a
n
D
i
e
g
o
]
a
t
0
0
:
0
8
1
9
M
a
y
2
0
1
7
130 QUANTITATIVE RESEARCH APPROACHES AND METHODS
list. The total list is called the sample frame. Randomly generated telephone numbers (called random
digit dialing) are another method used in random sample selection. When the sample frame is large,
as with a telephone directory, the researcher often simply opens the directory at random, arbitrarily
decides on a starting point on the page and a number of pages to turn each time, then continues through
the directory from either front to back or the reverse, following the same selection system.
Step 4: Select Experimental Design and Assign Units to Test
and Control Groups
The three major categories of experimental design used most often by political science researchers
today include pre-experimental designs, quasi-experimental designs, and true experimental designs.
Of a wide number of applications of these three basic approaches, the most commonly used designs
include one-sample pre-experimental designs, quasi-experimental designs, randomized two-sample
designs, randomized block designs, factorial designs, and Latin square designs. Each of these is
discussed in greater detail below, beginning with the three types of pre-experimental designs.
Pre-Experimental Designs
Pre-experimental designs are used primarily because of their ease of application and speedy
turnaround. Pre-experimental designs are little better than standard descriptive studies in their use
for inferences to larger populations. They typically take any one of three different approaches,
ranging from the least scientifically rigorous to the nearly so.
One-time single case study. In this design, the researcher selects a convenience sample that he or she
expects is similar to the population of interest. This could be a group of students, a neighborhood, a
group of House or Senate employees, or any other convenient group. The researcher administers a
treatment of some kind and then measures the previously identified dependent variable. No pretests
are taken, so the researcher never knows if the treatment induced any change. The design does not
control for confounding variables, nor is a control group included in the research.
The single group, pretest and post-test design. This design adds the validity safeguard of estab-
lishing a benchmark to measure against after the treatment. This is a very common design, used
extensively in tests of public acceptance of political strategies and other types of attitude and
opinion research, for example. However, the research does not include a control group. Elimina-
tion of a control group makes the results of the experiment potentially suspect. There is no way
of controlling for maturation or other confounding variables.
Base-group comparison design. In this type of pre-experimental design, the researcher uses two
groups—an experimental and a control group—but does not use random assignment of subjects
to either group. Treatments are applied to the entire sample, so it is not possible to randomly
assign treatment to sample subjects. No pretests are used, thus making it possible only to infer
causality from the results of the treatment.
Quasi-Experimental Designs
Quasi-experimental designs are similar to true experiments. The major difference is that the re-
searcher randomly assigns subjects to groups, but does not use random application of treatments
D
o
w
n
l
o
a
d
e
d
b
y
[
U
n
i
v
e
r
s
i
t
y
o
f
C
a
l
i
f
o
r
n
i
a
,
S
a
n
D
i
e
g
o
]
a
t
0
0
:
0
8
1
9
M
a
y
2
0
1
7
CAUSAL RESEARCH 131
to the groups. They are often used in large-scale studies and in circumstances where it might be
impossible to make random applications. Kirk (1995, 6–7) described an example quasi-experimental
study in which whole communities were selected to receive different levels of fluoride in the
water supply. The measured outcomes were levels of tooth decay in children. The results were
compared with tooth decay rates in a community with high levels of fluoride naturally occurring
in the water supply.
True Experimental Designs
In all true experimental designs the researcher randomly assigns treatments to randomly selected
sample subjects. The use of randomization in subject selection and treatment application has the
benefit of controlling for the effects of many intervening variables. They are particularly appropri-
ate for inferences. The four types of experiments discussed below include randomized two-sample
designs, randomized block designs, factorial designs, and Latin square designs.
Randomized two-sample designs. The most typical of a number of two-sample designs is the ex-
perimental/control groups, before and after tests. Because subjects are randomly assigned to both
groups, they are considered to be equivalent. Of the several different variations of this design, the
simplest to use and the best known is the t-test for independent samples design (Kirk 1995). The
t-test is used to test for differences in the mean values for both the experimental and control groups
after the application of the treatment. The hypothesis often stated is that the difference between
the two statistics is equal to some value, which is usually zero. This approach is also known as
the before and after with control group design (McDaniel and Gates 1993).
Randomized block designs. This design is similar to the randomized two-sample design, except
that it can be used to test for the effects of two variables at the same time—it is a two-factor ex-
periment with a one-factor focus (Hildebrand and Ott 1998, 458). The two factors are treatments
and blocks. The term block refers to the environment in which the treatment is administered. In
this design, the researcher is concerned with measuring treatment effects, but controls extraneous
or “nuisance” block factors. The following example will help to clarify the design:
A political strategist wants to determine the best message to use to influence voter attitudes in
her state. She has three different strategies that might be effective. She decides to test the mes-
sages on three types of voters—Democrats, Republicans, and Independents—in each of three
legislative districts.
The legislative districts are the blocks in her experiment, whereas the different messages are
the treatments. She is not concerned in which legislative district the voter resides, but rather, with
assuring that all voter-groups are exposed to all different messages (treatments). The strategist
might simply randomly assign the messages to each district. The problem with that approach is
that the random assignment by itself could result in a design where all Democrats receive only
the first message, all Republicans receive only the second message, and all Independents receive
only the third. That type of assignment might look like the display in Table 10.1. Note that each
column receives the same treatment (message). Clearly, this would defeat the purpose of her
randomized experiment.
To control for the block variable, the researcher requires that every message be used in every
legislative district. In each district, voter-groups are randomly assigned one of the three messages,
until each of the three messages is represented by each category. The appropriate randomized block
D
o
w
n
l
o
a
d
e
d
b
y
[
U
n
i
v
e
r
s
i
t
y
o
f
C
a
l
i
f
o
r
n
i
a
,
S
a
n
D
i
e
g
o
]
a
t
0
0
:
0
8
1
9
M
a
y
2
0
1
7
132 QUANTITATIVE RESEARCH APPROACHES AND METHODS
design will look like the distribution in Table 10.2 . In this design, each of the nine experimental
groups receives one block assignment and one treatment assignment, thus improving validity by
ensuring greater randomization to the study.
Factorial designs. In a factorial design, two or more independent variables are studied simulta-
neously in the same experiment. All possible combinations of each level of treatment are tested
together in this design. In this way, they also allow the researcher to test for any interaction that
a combination of factors might have.
According to Kirk (1995), they are the most widely used designs in the behavioral sciences.
They are also very popular in political science research, and are the principal experimental design
employed in marketing and advertising research.
In the following example of how a factorial experiment might be designed, suppose that the
managing director of an environmental lobby in Washington, D.C ., wants to know what messages
might best to use for influencing members of Congress to vote for legislation to protect Arctic
wildlife habitat. The director wants to test whether to use an appeal based on reason, an appeal
based on emotion, or an appeal based on economic considerations. In persuasive communications,
these are called head, heart, and pocketbook appeals, respectively.
In addition, the director wants to test which communications method will have the greatest impact
on recipients of the message—a four-color brochure produced and distributed by the organization’s
home office or a letter-writing campaign by the organization’s members directly to members of
Congress. Together, these allow for six possible combinations, as displayed in Table 10.3 . In one
approach, the researcher could plan a number of independent experiments of a single variable, such
as one concerned only with which appeal to use. In any one such experiment, all other relevant
variables would be held constant. However, a much better procedure would be to vary all factors
in a single experiment. This would permit the manager not only to accomplish the purposes of
single-variable experiments, but also to test for possible interactions among the factors.
To conduct the experiment, the lobbyist might test the combinations on members of several
Table 10.1
Example of a Random Design Affected by the Nuisance Variable “Block”
Legislative District
Party Affiliation
Democrat Voters
Republican Voters
Independent Voters
First District
Second District
Third District
Message 1
Message 1
Message 1
Message 2
Message 2
Message 2
Message 3
Message 3
Message 3
Table 10.2
Example of a Random Design with a Nuisance Variable (Block) Controlled
Legislative District
Party Affiliation
Democrat Voters
Republican Voters
Independent Voters
First District
Second District
Third District
Message 1
Message 2
Message 3
Message 2
Message 3
Message 2
Message 3
Message 1
Message 1
D
o
w
n
l
o
a
d
e
d
b
y
[
U
n
i
v
e
r
s
i
t
y
o
f
C
a
l
i
f
o
r
n
i
a
,
S
a
n
D
i
e
g
o
]
a
t
0
0
:
0
8
1
9
M
a
y
2
0
1
7
CAUSAL RESEARCH 133
state legislatures, randomly assigning legislators to each of the six groups. Referring to the dia-
gramed experiment in Table 10.3, the design allows the researcher to test for the following in one
statistical operation:
1. The main effects of the communications appeal altogether,
2. The simple effects of each appeal separately,
3. The main effects of communications method together,
4. The simple effects of each communications method separately, and
5. The interaction effects of appeal times method.
In this example, a simple analysis of variance (ANOVA) procedure would test the significance
of each of the four main and simple effects, while also providing a bonus test for interaction.
Analysis of variance procedures are discussed in the next section.
Latin square design. The Latin square design is similar to the randomized block design in that it
allows the researcher to control for the effects of nuisance factors. However, this design lets the
researcher control for two or more nuisance variables at the same time. The key characteristic
of the Latin square design is the assignment of each level of treatment to every combination of
nuisance variables. If rows and columns are levels of the nuisance factors, each level of treatment
appears once in each row of the design and once in each column.
For example, in the following Latin square design scenario, the Tribal Council of a Native
American tribe is interested in expanding income enhancement opportunities for tribal members.
The funding for the program would come from development of a gambling center and/or resort
on tribal lands.
Three types of opportunities have been identified as levels for the treatment variable (treatment):
promises of service jobs now (T1), technical job training with low monthly stipends (T2), and trans-
portation to nearby colleges for academic education with stipends replaced by tuition grants (T3). A
layout of the experiment is displayed in Table 10.4 . The Tribal Council is running the experiment
to see if enough support for gambling exists to proceed with planning the development.
Three groups of tribal members have been identified: modernists, traditionalists, and externally
focused (status). Modernists (S1) want to bring gambling to the reservation; traditionalists (S2)
will accept a resort but do not want gambling; and externally focused members (S3) live off the
reservation and consider themselves integrated into the larger, nontribal community.
Three levels of development (develop) are identified: no change (D1), gambling center only
(D2), or gambling center and resort (D3). The three test hypotheses for this Latin square are (1)
there is no difference in the means of the treatment groups, (2) there is no difference in the means
Table 10.3
Example of a Two-Factor Factorial Experimental Design
Type of Appeal and Treatments
Heart Appeal
Pocketbook
Communication Method
Head Appeal (A1)
(A2)
Appeal (A3)
Home Office Brochure (C1)
A1 C1
A2 C1
A3 C1
Membership Letter-Writing Campaign (C2)
A1 C2
A2 C2
A3 C2
D
o
w
n
l
o
a
d
e
d
b
y
[
U
n
i
v
e
r
s
i
t
y
o
f
C
a
l
i
f
o
r
n
i
a
,
S
a
n
D
i
e
g
o
]
a
t
0
0
:
0
8
1
9
M
a
y
2
0
1
7
134 QUANTITATIVE RESEARCH APPROACHES AND METHODS
of the social orientation groups (rows), and (3) there is no difference in the means of the develop-
ment preference groups (columns).
Step 5: Plan the Appropriate Statistical Analysis
The underlying concepts of one-sample hypothesis testing also apply to a body of statistical
techniques designed to test hypotheses with two or more samples. These tools permit managers
to test whether the different values found in two or more samples are statistically significant or
whether they could have occurred by chance.
Another way to look at a hypothesis test is to consider it a significance test, the results of which
help the researcher evaluate certain characteristics in measurements. Differences are one class of
characteristics; relationships are another. In experiments, the researcher is almost always testing
for differences in the outcomes of a set of treatments.
Researchers want to know if the differences seen in test measurements are “real” or if they are
simply chance-related variations that are seen every time a new measurement is made and which
would fall within the range of a normal distribution of the statistic. They are looking for differ-
ences that are statistically significant. A difference that is statistically significant is one with a high
probability that the differences did not occur through chance alone. It is important to remember
that the analyst never knows if the differences are, indeed, “real.” Rather, within a predetermined
acceptable level of confidence, such as 90, 95, or 99 percent, the procedure only entails rejecting
or accepting a hypothesis or hypotheses about a difference.
Many statistical techniques exist to test for differences with all levels of measurements. Managers
will most likely find themselves using several tests for comparing differences in means, a statistic
that requires interval or ratio data. However, other data types can also be tested for differences.
The choice of a particular statistical test for differences between measures depends upon the na-
ture of the measurements themselves. A statistic based on two groups’ categorical measurement
(nominal data) should not be measured with the same statistic used for a continuous (nominal or
ratio level data) variable, for example.
As can be seen in Figure 10.1, an extensive body of statistical tools has been developed for
testing hypotheses about statistics for two or more groups. Various tests exist for use with para-
metric and nonparametric statistics. Parametric statistical tests can be used only with data at the
equidistant-interval or ratio level. When the data are ordinal (ranked) or nominal (categorical), a
body of tests known as nonparametric statistics must be used.
In addition, parametric statistics require that the data be from random samples, with a
normal distribution. When these assumptions cannot be met, nonparametric tests must be used
Table 10.4
Example of a Two-Factor, Three-Treatments, Latin Square Experimental Design
Development Type Supported and Treatments
No Development
Gambling Only
Gambling and
Status
(D1)(
D
2)
Resort (D3)
Modernists (S1)T
1
T2
T3
Traditionalists (S2)T
2
T3
T1
Externally Orienteds (S3)T
3
T1
T2
D
o
w
n
l
o
a
d
e
d
b
y
[
U
n
i
v
e
r
s
i
t
y
o
f
C
a
l
i
f
o
r
n
i
a
,
S
a
n
D
i
e
g
o
]
a
t
0
0
:
0
8
1
9
M
a
y
2
0
1
7
135
T
e
s
t
s
f
o
r
D
i
f
f
e
r
e
n
c
e
s
i
n
M
e
a
n
s
o
f
T
w
o
o
r
M
o
r
e
S
a
m
p
l
e
s
S
m
a
l
l
S
a
m
p
l
e
T
e
s
t
s
L
a
r
g
e
S
a
m
p
l
e
T
e
s
t
s
t
-
T
e
s
t
s
f
o
r
P
a
i
r
e
d
S
a
m
p
l
e
s
t
-
T
e
s
t
s
f
o
r
I
n
d
e
p
e
n
d
e
n
t
S
a
m
p
l
e
s
w
i
t
h
E
q
u
a
l
V
a
r
i
a
n
c
e
t
-
T
e
s
t
s
f
o
r
I
n
d
e
p
e
n
d
e
n
t
S
a
m
p
l
e
s
w
i
t
h
U
n
e
q
u
a
l
V
a
r
i
a
n
c
e
O
n
e
-
f
a
c
t
o
r
A
n
a
l
y
s
i
s
o
f
V
a
r
i
a
n
c
e
T
w
o
-
f
a
c
t
o
r
A
n
a
l
y
s
i
s
o
f
V
a
r
i
a
n
c
e
N
-
f
a
c
t
o
r
A
n
a
l
y
s
i
s
o
f
V
a
r
i
a
n
c
e
A
P
o
s
t
e
r
i
o
r
i
T
e
s
t
s
A
P
o
s
t
e
r
i
o
r
i
T
e
s
t
s
F
i
g
u
r
e
1
0
.
1
C
o
m
m
o
n
l
y
U
s
e
d
T
w
o
-
S
a
m
p
l
e
D
i
f
f
e
r
e
n
c
e
s
T
e
s
t
s
D
o
w
n
l
o
a
d
e
d
b
y
[
U
n
i
v
e
r
s
i
t
y
o
f
C
a
l
i
f
o
r
n
i
a
,
S
a
n
D
i
e
g
o
]
a
t
0
0
:
0
8
1
9
M
a
y
2
0
1
7
136 QUANTITATIVE RESEARCH APPROACHES AND METHODS
in place of parametric tests. Some parametric tests require that the samples be independent
from one another, while other tests have been developed for use with dependent or paired
samples. Separate-but-related statistical tests have been developed to meet either indepen-
dence requirement.
Two of the statistical tests often used when comparing the mean values for independent samples
are the student’s t-test for independent samples, and the one-way, two-way, and n-way analysis
of variance tests (ANOVA). When the decision maker has any doubt about the independence of
the samples, testing a null hypothesis for dependence with the Levene test for independence can
be done before selecting either of the difference tests.
Once the researcher is assured the samples are independent, the next step is to decide whether
the t-test or analysis of variance is appropriate. The t-test has more limitations than ANOVA, and
is usually used for comparisons between the means of two (and only two) relatively small samples,
with each sample having about the same number of observations or cases.
Testing Differences with Student’s t-Test
The t-test is used to compare the means of two groups with approximately equal variances. This
could be the test scores of two groups of employment applicants. Scores from a group of trainees
gathered prior to a training program might be compared with scores for the same group after
completion of the training. Another might be comparing different sample means in production
line situations, such as filling boxes or bottles. Many similar such uses are possible. Minimum
required assumptions for using the t-test include the following: (1) the measurements are of at
least interval-level data, (2) the samples are randomly selected, and (3) the scores are randomly
distributed.
Only two sets of means can be compared at any one time using the t-test. The data analysis
tool in Microsoft Excel contains four different types of t-tests: The t-tests in Excel programs
are to be used only when the manager has all the raw data (individual measurements) avail-
able. When this is not the case, when the manager has only the means at hand, it is possible
to make a similar comparison using just summary data and the Excel mathematical formula
capability. ANOVA, which compares variances between samples, also requires that the raw
data be available.
As in one-sample hypothesis testing, the first step must be to prepare the null and alternate
hypotheses. It is possible to perform both a one-tailed test and a two-tailed test with the pooled
variance t-test in Excel. A typical two-tailed test hypothesis pair, to determine where the means
are different in any way, would be:
H0: μ1 |aμ2
HA:μ1=μ2
If a one-tailed test is desired, either a greater or lesser hypothesis pair must be written as
follows:
μ1 Greater than μ2 μ1 Lesser than μ2
H0:μ1≥μ2
H0:μ1≤μ2
HA:μ1<μ2
HA:μ1>μ2
D
o
w
n
l
o
a
d
e
d
b
y
[
U
n
i
v
e
r
s
i
t
y
o
f
C
a
l
i
f
o
r
n
i
a
,
S
a
n
D
i
e
g
o
]
a
t
0
0
:
0
8
1
9
M
a
y
2
0
1
7
CAUSAL RESEARCH 137
The difference between one-tailed and two-tailed tests is that in one-tailed tests the re-
searcher specifies the direction of the difference: it is either greater or lesser. The probabilities
calculated with the t-test on a one-tailed test are half of the probabilities for a two-tailed test.
It should be noted that deciding whether to select either the one- or two-tailed tests cannot
be done arbitrarily. If the manager has no specific reason to expect a difference in one direc-
tion, it follows that no prediction can be made in advance. The manager is obligated to use
the two-tailed test.
Different Approaches for the t-Test
Several different approaches to difference tests are possible with the t-test. The major differenti-
ating characteristic between these tests is the nature of the samples for which measurements are
available: are they paired or independent? This question must be answered before selecting one
of the several different t-test computational methods. At the heart of this issue is what is known
as degrees of freedom. As was introduced on page 127, degrees of freedom refers to the limits to
which a set of measurements may vary. The concept is rooted in physics, where an object that
can move on a flat plane is said to have two degrees of freedom. If it can move in only a straight
line, it has just one degree of freedom.
In statistics, this idea is used to mean the number of independent comparisons that can be
taken between sets of data. For example, if we have two observations, we are limited to just one
independent comparison. Two observations means two independent measurements, such as would
be taken from a sample of just two individuals. If there are three observations, then we have two
independent comparisons, and so on. In statistical notation, we write this as “n – 1” degrees of
freedom, with n meaning the total number of observations.
Degrees of freedom are computed differently depending upon whether the data are collected
from the same individuals, as in a pre-test and a post-test situation, or whether they are collected
from different sets of individuals (two independent samples). Data collected from the same in-
dividuals at different times are called correlated data. Data collected from separate samples are
called uncorrelated data.
To determine the degrees of freedom for correlated data, one is subtracted from the total num-
ber of cases. To compute the degrees of freedom for uncorrelated data, one is subtracted from
each sample. In statistical notations, this is shown as: df = n1 + n2. The various t-tests contained
in Excel include these different values in their computations; all the manager needs to do is to
select the correct option.
Both the Excel Function Wizard and Data Analysis Tool include three different t-test op-
tions: a test for paired samples and two tests for independent samples. The two independent
sample tests vary in that one assumes the samples were taken from populations with equal
variance, while the second test assumes two populations in which the variance is unequal.
In practice, this means the manager should select the equal variance option when compar-
ing the means of two samples, both of which were randomly selected from the same larger
population. The unequal variance option is to be used when the populations are different.
An example would be comparing the means of samples taken from two separate production
lines or processing machines.
All two-sample t-tests compare sample (or group) means by computing a student’s t-value and
comparing the significance of whatever difference is found between the means. Considered to be
D
o
w
n
l
o
a
d
e
d
b
y
[
U
n
i
v
e
r
s
i
t
y
o
f
C
a
l
i
f
o
r
n
i
a
,
S
a
n
D
i
e
g
o
]
a
t
0
0
:
0
8
1
9
M
a
y
2
0
1
7
138 QUANTITATIVE RESEARCH APPROACHES AND METHODS
only slightly less “robust” than the F-test statistic used in ANOVA procedures, it can be used to
test the means for either different (independent) samples or paired samples. “Different samples”
refers most often to different groups within a larger sample.
For example, the attitudes of nonsupervisory personnel might be compared with attitudes of
agency management; the responses of females in a sample might be compared with those of males,
and so forth. Paired sample testing refers to testing for differences between two separate variables.
Examples include comparing the mean scores on a pretest given before a training activity variable
with the mean of a second test given after the training session. Table 10.5 displays data from a
paired-sample, pre- and post-test example.
To summarize t-test applications, the paired-sample t -tests in Microsoft Excel will compare
the means for the two variables (pretest and post-test), report the difference in the means, and
calculate a p-value for the t statistic. The samples may be paired or independent; independent
samples may be from one population with equal variance, or from different samples with un-
equal variance.
Comparing Scores of More Than Two Groups
ANOVA is a powerful tool for comparing the differences in means between any number of groups,
and of doing so at more than one level. With ANOVA, it is possible to test the role of each of
several variables independently, and then to determine whether two or more variables interact to
influence differences between groups’ scores.
A classical example often cited is that of testing the influence of farm plot location (or any
other variable, such as amount of water applied) and the amount of fertilizer on crop yields. Each
variable can be tested by itself. The two are then tested for interactive influence on the yield result.
Analysis of variance is also regularly used in market research studies to compare mean attitude
scores of potential customer groups.
In all applications, analysis of variance uses the F-ratio to calculate variances of the mean
scores and compares this variance to the overall variance found in the total sample. Decisions
about the null hypothesis are based on these comparisons.
Table 10.5
Subjects’ Scores Before and After Computer-Assisted Training
(Variable 1) Pretest Scores
(Variable 2) Post-test Scores
20.7
19.3
21.7
23.9
17.2
19.9
18.0
24.0
15.1
17.7
21.1
21.5
24.5
25.9
17.8
19.1
23.6
24.0
19.0
19.5
D
o
w
n
l
o
a
d
e
d
b
y
[
U
n
i
v
e
r
s
i
t
y
o
f
C
a
l
i
f
o
r
n
i
a
,
S
a
n
D
i
e
g
o
]
a
t
0
0
:
0
8
1
9
M
a
y
2
0
1
7
CAUSAL RESEARCH 139
To make its comparisons, analysis of variance compares the means of two samples or two groups
within a sample. Furthermore, ANOVA statistical program results include summary statistics for
each sample or group, an F-ratio, and a probability value. This makes interpretation simple. The
means are “statistically different” if the p-value is less (smaller) than the analyst-selected confi-
dence level. The p-value of the F-ratio will indicate whether the null hypothesis is to be rejected,
but it will not indicate where the differences lie. Another test, called an a posteriori or post-hoc
test, is required. When one of these is selected, actual differences will be highlighted, while those
that are statistically “the same” will be so marked. The three versions of ANOVA are discussed
in detail in Chapter 12.
Summary
This chapter has looked at a number of ways researchers design experiments and test for differ-
ences in the results of different levels of a treatment. Two broad classes of tests were discussed.
The first class included the various types of two-sample t-tests. Minor variations in portions of
the computation formulas are necessary for paired or independent samples—correlated or uncor-
related data. Microsoft Excel’s analysis programs (Function Wizard and Data Analysis Tools)
both take these differences into consideration, enabling the analysts to specify which computation
procedure to follow. Typically, t-tests should be used for smaller sample sizes (around a total of 30
cases), and preferably with groups that are equal in size. The t-test can only be used to compare
the means of two groups at a time.
The second major category of differences tests discussed in this chapter was analysis of variance
(ANOVA) procedures. These all use the F-ratio to compare variances across two or more samples
or groups. Analysis of variance procedures do not limit the number of groups being compared.
Thus, three, four, and more levels or groups’ scores can be compared at the same time. Equally,
analysis of variance can test for differences with more than one factor at a time. These tests are
discussed in more detail in Chapter 12.
Discussion Questions
1. Name and discuss the key concepts in experimental design.
2. How do quasi-experimental designs differ from true experimental designs?
3. Name the five steps to follow when designing and conducting political science
experiments.
4. Distinguish between association and causality.
5. When should Student’s t-test be used to test for statistically significant differences?
6. Name the several different t-test models researchers used to compare group means.
7. What is analysis of variance (ANOVA), and what is it used for?
8. Describe a situation in which a political science researcher might want to use a causal
(experimental) research design.
D
o
w
n
l
o
a
d
e
d
b
y
[
U
n
i
v
e
r
s
i
t
y
o
f
C
a
l
i
f
o
r
n
i
a
,
S
a
n
D
i
e
g
o
]
a
t
0
0
:
0
8
1
9
M
a
y
2
0
1
7
140 QUANTITATIVE RESEARCH APPROACHES AND METHODS
Additional Reading
Collier, Raymond O., Jr., and Thomas J. Hummel, eds. 1977. Experimental Design and Interpretation.
Berkeley, CA: McCutchan.
Cook, Thomas D., and Donald T. Campbell. 1979. Quasi-Experimentation: Design and Analysis Issues for
Field Settings. Chicago: Rand McNally.
Kirk, Roger E. 1995. Experimental Design: Procedures for the Behavioral Sciences. Pacific Grove, CA:
Brooks/Cole.
Ryan, Thomas P. 2007. Modern Experimental Design. New York: Wiley.
Tabachnick, Barbara G., and Linda S. Fidell. 2006. Experimental Designs Using ANOVA. Pacific Grove,
CA: Duxbury Press.
D
o
w
n
l
o
a
d
e
d
b
y
[
U
n
i
v
e
r
s
i
t
y
o
f
C
a
l
i
f
o
r
n
i
a
,
S
a
n
D
i
e
g
o
]
a
t
0
0
:
0
8
1
9
M
a
y
2
0
1
7
141
11 Interpreting Exploratory and
Descriptive Statistics
Researchers use exploratory and descriptive statistics for such tasks as describing a sample, pro-
viding a quantitative summary of a variable, summarizing a dataset, and similar purposes. Of all
the various statistics available for these purposes, four classes of descriptive statistics are used in
almost every political science research study:
1. Measures of central tendency (or measures of location)
2. Measures of variability
3. Measures of relative position
4. Measures of correlation
These four types of measurements make it possible to reduce a large dataset to a smaller amount
of meaningful numbers that everyone can understand. They provide essential information about
the internal structure of the raw data (Lang and Heiss 1994).
The main purpose for measurements of location (also called measures of central tendency) is
to identify the value in the dataset that is “most typical” of the full set. This “typical” value may
then be used as a summary value. Several different numbers can be used as measures of location.
These include the mean (arithmetic, geometric, and trimmed mean), the median, and the mode.
Measurements of variability (sometimes referred to as measures of dispersion) tell how the
individual measurements vary within the dataset. Variability measures include the range, the vari-
ance, and the standard deviation in a set of measurements. Scatterplots are also used to visually
illustrate how each measurement falls in comparison to all others.
Percentiles and distributions in general are used to indicate position and variation within a
range of data, while measures of correlation help to describe relationships between two or more
variables. Each of these descriptive measures is discussed in some detail below.
Measures of Central Tendency
The easiest way to quickly summarize a set of measurements is to identify the most typical value in the
set. This value is sometimes called “the most representative score.” Most people refer to this most typical
value as the average value. Five types of averages can be used to show central tendency. They are:
s The Arithmetic Mean. Also known as the “average of all scores,” the mean is the number
arrived at by adding up all the values of a variable and then dividing by the number of
D
o
w
n
l
o
a
d
e
d
b
y
[
U
n
i
v
e
r
s
i
t
y
o
f
C
a
l
i
f
o
r
n
i
a
,
S
a
n
D
i
e
g
o
]
a
t
0
0
:
0
8
1
9
M
a
y
2
0
1
7
142 QUANTITATIVE RESEARCH APPROACHES AND METHODS
items or cases in the set. It is used when the distribution of scores is fairly symmetrical
about the center value. When plotted, a symmetrical distribution produces the typical
bell-shaped curve.
s The Median. This quantitative measure is the halfway point in a dataset. Exactly one-half of
the values lie above the median value and one-half fall below that point. The median should
be used when the scores are not symmetrical, such as when they are closely grouped but with
a few very high or very low scores. These very high values might have a disproportionate
influence on the arithmetic mean.
s The Mode. The mode is simply the value for a variable that appears most often. It is the value
with the greatest frequency of occurrence. The mode can be used for a quick estimate of the
typical or representative score.
s The Geometric Mean. This is the root of the product of all items in the dataset. It is particu-
larly appropriate when computing an average of changes in percentages.
s The Trimmed Mean. This average value is used when the dataset includes one or more outli-
ers. It is trims the top and bottom values of the sample by some percentage. A new arithmetic
mean is then calculated from the truncated dataset.
The Arithmetic Mean
The term “central tendency” refers to a point in a dataset that corresponds to a typical, repre-
sentative, or central value. The measurement used most often for this is the arithmetic mean.
Means are only valid for use with ratio or equidistant interval (i.e., continuous) data; a mean
cannot be computed for categorical data. Average scores for attitude and opinion scales are
typical examples of the appropriate use of means. In attitude and opinion scales, a mean (or
“average”) score for the total sample conveys far more information than the exact response
for any one subject in the sample. For example, assume that 100 voters are asked their opin-
ions about a proposed national health insurance plan. An individual subject might respond
with any value from 1 to 5 on a five-point attitude scale. The researcher used low scores for
negative attitudes and high scores for positive attitudes. While any one subject’s score might
be interesting to know, by itself it doesn’t tell the research much. However, a sample mean
of 1.2 on the scale clearly suggests a negative attitude interpretation of the attitude held by
members of this sample.
Arithmetic means are calculated for both populations and samples. Their computation is similar,
but separate notation or symbols differentiate them. Below are symbols used to signify sample
sizes and means for samples and populations:
N = the total number of cases in a population
n = the total number of cases in a sample
μ = the mean of a population (pronounced “mew”)
X = the mean for a sample (pronounced “X-bar”)
Mean scores or values are generally not valid for use with qualitative measurements such as rank-
ings or numbers assigned to categories (ordinal and nominal data). For example, political polling firms
might ask citizens to rank a number of different gubernatorial candidates in their order of preference.
The research firm wants to know which candidate is the one most preferred, which is second, etc. A
mean rank value has no meaning in this case. In the following example, say that voters are asked to
D
o
w
n
l
o
a
d
e
d
b
y
[
U
n
i
v
e
r
s
i
t
y
o
f
C
a
l
i
f
o
r
n
i
a
,
S
a
n
D
i
e
g
o
]
a
t
0
0
:
0
8
1
9
M
a
y
2
0
1
7
INTERPRETING EXPLORATORY AND DESCRIPTIVE STATISTICS 143
note their occupation from a list of eight or nine categories. In this case, the total number for each
category is informative; determining the mean or average occupational category is nonsense. Despite
this limitation, it must be noted that computing mean ranks is often done with certain nonparametric
statistical tests and may be encountered on some statistical program printouts.
The Median
The median is the halfway point in a set of numbers. Half of the values are above the median value,
half are below. The median is appropriate for all data types, but is particularly useful with ranking
(ordinal) data, or when the dataset contains outliers, which would disproportionately influence the
mean. Because the median deals with structure or order in the dataset, it can be used with ordinal
and interval/ratio data, but it is meaningless with nominal (categorical) data.
For a small-sample example of how the median is computed, say that during the first half-hour of
a fund-raising event, a public broadcast radio station received donations in the following amounts:
$25, $18, $20, $22, and $100
The mean donation value is $185 divided by 5 ($185/5), and equals $37. However, a mean of
$37 is misleading, since the $100 outlier unduly disproportionately influences the result. A more
meaningful measure of location in this case would be the median. This is achieved by rearranging
the data in ascending order ($18, $20, $22, $25, and $100) and then selecting the value that falls
in the center. The median for the five values is $22. For larger datasets, the median can be located
in the list of values by subtracting one from the total number of cases and then dividing by 2. A
formula for finding the median is:
Median = (n – 1)/2
The Mode
The mode is the only measurement that makes sense when dealing with nominal-level variables.
It is defined as the value that appears most often in a collection of all counts for a variable. The
example below was obtained in a focus-group study conducted for a marketer of sports shoes.
Subjects were asked which of four shoe styles they preferred. Individual styles were assigned
identifying code numbers ranging from 1 to 4. The final tally of subjects’ preferences was:
3,2,1,1,3,4,2,3,1,2,1,1,1
The category value “1” appears most often in the dataset: six times. This gives the researcher
the maximum amount of information. Since the numbers represent specific styles and are not
quantitative, both the mean and the median clearly are inappropriate measures of location in this
example. Political campaign finance managers are often interested in the modal distribution, the
distribution of donation amounts within a total range of amounts.
The Geometric Mean
Not all statistics texts include a discussion of the geometric mean. This is a mistake, for there
are many instances where a geometric mean is far more appropriate than an arithmetic mean. A
D
o
w
n
l
o
a
d
e
d
b
y
[
U
n
i
v
e
r
s
i
t
y
o
f
C
a
l
i
f
o
r
n
i
a
,
S
a
n
D
i
e
g
o
]
a
t
0
0
:
0
8
1
9
M
a
y
2
0
1
7
144 QUANTITATIVE RESEARCH APPROACHES AND METHODS
commonly encountered use is when a campaign manager wants to know the average of a series
of percentage changes, such as voter approval rate changes. The changes are measured by the
number of votes over her closest opponent the candidate has received over the past four biannual
elections. Vote plurality is converted to percentages and reported as the relative change from the
previous total. The manager has the gross percentages for a four-year period and wants to know
the overall average percentage change. The data are displayed in Table 11.1 .
Either the arithmetic or geometric mean can be used to summarize the changes over time.
The arithmetic mean for the 1996–2002 period is 7 percent— (12 + 7 + 2)/3 = 21/3 = 7.
Computing the geometric mean, however, arrives at a more appropriate measure. This mean
is computed by multiplying each percentage change in sequence, then calculating the root
of the sum. Note that each change is the new change plus the base 100 percent (which is
the previous value). The number of measurements in the sequence determines which root is
appropriate. In this example, three periods of change are measured; therefore, the cube root
must be used:
G=X1*X2*X3...*Xn
G=112×107×102
G=
3
√1,234,352
G = 106.9221 or 6.92 percent
Thus, a more accurate average rate of plurality increase over the four-election period is 6.92 percent
(106.9221), not the 7 percent of the arithmetic mean.
Excel example. Computing the geometric mean is a quick and simple process with Microsoft Excel.
The data are arranged in a column array, as displayed in Table 11.2; the GEOMEAN option is then
selected from the Function Wizard. All computations are conducted in the Wizard, which computes
a geometric mean to four decimal points. Use the following Excel seven-step process:
1. Insert all labels and values into a new worksheet. Cell A1 contains the label for column
1, “Variable.”
2. In Cells B1 through E1, insert the years 1993 through 1996. Type the label “Gmean” in
Cell F1.
3. Insert the labels and data. Percentage changes must be written as hundreds; e.g ., a 7
percent increase must be inserted as “107.”
4. In Cell F4, insert an equals sign ( = ).
5. Select the Function Wizard (fx). Scroll down to GEOMEAN. “=GEOMEAN” will appear
in the worksheet formula bar for that cell.
Table 11.1
Annual Candidate Pluralities in the 35th District, 1996–2002 (in thousands)
Election
1996
1998
2000
2002
Gross votes
4,000
4,800
4,940
4,890
% Change
—
12%
7%
2%
D
o
w
n
l
o
a
d
e
d
b
y
[
U
n
i
v
e
r
s
i
t
y
o
f
C
a
l
i
f
o
r
n
i
a
,
S
a
n
D
i
e
g
o
]
a
t
0
0
:
0
8
1
9
M
a
y
2
0
1
7
INTERPRETING EXPLORATORY AND DESCRIPTIVE STATISTICS 145
6. Hit Return to begin the calculation.
7. The value for the geometric mean will appear in Cell F4, alongside the last inserted
percentage change value.
Note: Roots of different power may also be used, thus allowing extension to the time series
data. Excel GEOMEAN automatically computes the root that is appropriate for the dataset.
Trimmed Mean
The trimmed mean is a mean computed from a truncated set of values rather than the entire set
of measurements. It is particularly useful when one or more extreme measurements have the po-
tential to produce misleading summary statistics. It is calculated by deleting some percentage of
responses at both ends of the distribution before calculating the mean for the remaining values.
For example, to establish a 30 percent trimmed mean, remove the bottom 15 percent and top 15
percent and calculate the mean for the remaining 70 percent. The TRIMMEAN function in the
Excel Function Wizard makes it simple to make this calculation.
Measures of Variability
Once the researcher has determined the appropriate measure of location, the next concern is to de-
termine how the distribution of numbers in the data varies around the central value. The researcher
asks how and to what extent the scores or values differ from one another, and how this variability
can be summarized. The three most common ways to express variability—the range, variance, and
standard deviation—all provide information about the distribution of responses within the range.
The Range
The range is the easiest statistic to compute. It is determined by subtracting the lowest value from
the highest value in a distribution. It can be misleading, however, and is not used very often by
itself. By itself, the range does not take into consideration the variability within a distribution; it is
only a crude approximation of variability. For example, consider the following two sets of data:
Dataset A: 65, 80, 81, 82, 83, 84, 98
Dataset B: 65, 69, 74, 78, 87, 89, 98
Both sets have the same range: 98 – 65 = 33. However, a closer look at the two sets reveals that Set
B clearly has more internal variability than Set A. Also limiting the uses for the range is that it uses
Table 11.2
Excel Worksheet Setup for the Geometric Mean
Election Year
Variable
1996
1998
2000
2002
Gmean
Sales
4,000
4,800
4,940
4,890
%Change
112
107
102
106.9221
D
o
w
n
l
o
a
d
e
d
b
y
[
U
n
i
v
e
r
s
i
t
y
o
f
C
a
l
i
f
o
r
n
i
a
,
S
a
n
D
i
e
g
o
]
a
t
0
0
:
0
8
1
9
M
a
y
2
0
1
7
146 QUANTITATIVE RESEARCH APPROACHES AND METHODS
only two values in the set of measurements: the highest and lowest. As a result, percentiles (or fractiles)
are often used with the range to give more meaning to this measurement. Percentiles are values below
which some proportion of the total scores or observations fall. The most commonly used percentiles
divide the data into quartiles. These divide the data into roughly 25-percent segments. A quarter of the
values fall below the first (or 25 percent) quartile; half are below the second (or 50 percent) quartile; and,
three-fourths are below the third quartile. The second quartile value is the same value as the median.
One important application of quartiles used in political science is the interquartile range. This
includes all values above the first quartile and below the third quartile, which is the same as the
range for the central 50 percent of all cases.
The Variance
The variance is an index of how scores or values in a dataset vary from their mean or average value.
Because it is only an index of variation, interpreting the variance is more art than science. Statistically,
the variance is defined as the average of the squared deviation of all values in the range, divided by
the number of cases in the dataset (minus 1). Larger variance values indicate the data are more spread
out, whereas smaller variances mean the values are more concentrated around the mean.
Many comprehensive statistics texts distinguish between the variance of a set of scores for a
sample (S2) and the variance of a set of values for a population. The formulas for computing each
are slightly different: for a population, the divisor is N – 1; for a sample, the divisor is n – 1. Similar
differences occur with the standard deviation of populations and samples. Because researchers
are most often dealing with samples rather than total populations, researchers almost always work
with the variance for a sample.
The Standard Deviation
Because the variance is only an index or rough indicator of variation and, thus, somewhat abstract,
it is far more common to find variability stated in terms of the standard deviation rather than as
the variance. The standard deviation is nothing more than the square root of the variance. Rather
than a squared value, which suggests or implies variation, the standard deviation is a more exact
measurement, stated in exactly the same units as the original data.
Because the standard deviation focuses on variation from the true mean, it is probably the most reliable
of all the measures of variability. It is certainly the one used most often. As with the variance, standard
deviations for samples and for populations vary slightly in their computation formulas. The divisor for
the standard deviation of a population is the total number of cases (N); for a sample, it is n – 1.
Excel example. Excel’s procedure for obtaining the variance or standard deviation for samples
and populations is included under the statistics function found in the Function Wizard (fx on the
main toolbar). The subcommand for the sample variance is VAR; for the variance of a population,
it is VARP. To obtain the standard deviation for a sample, the function command is STDEV; for
the standard deviation of a population, it is STDEVP.
SPSS example. Instructions for determining the variance and standard deviation in a variable
or dataset are found in two Analysis processes under the Descriptive Statistics subprogram. These
subprograms are Frequencies and Descriptives.
Table 11.3 displays the amounts that lobbyists for companies, labor unions, and other orga-
nizations spent on lobbying activities in Washington, D.C., from 1997 to 2000. The expenditure
information was reported on their Web pages by the Center for Responsive Politics, May 5, 2002.
Table 11.4 contains summary descriptive statistics produced by the SPSS Frequencies program.
D
o
w
n
l
o
a
d
e
d
b
y
[
U
n
i
v
e
r
s
i
t
y
o
f
C
a
l
i
f
o
r
n
i
a
,
S
a
n
D
i
e
g
o
]
a
t
0
0
:
0
8
1
9
M
a
y
2
0
1
7
INTERPRETING EXPLORATORY AND DESCRIPTIVE STATISTICS 147
Table 11.3
Total Lobbyist Spending, 1997–2000 ($ millions)
Year
Sector
1997
1998
1999
2000
Agribusiness
86
119
83
77
Commun/Electronics
154
186
193
200
Construction
17
22
24
23
Defense
49
49
53
60
Energy/NatResources
143
149
158
159
Financ/Insur/REstate
177
203
214
227
Health
136
165
197
209
Lawyers/Lobbyists
13
19
18
16
Misc. Business
15
169
193
223
Transportation
112
115
117
138
Ideol/Single Issue
73
76
76
85
Labor
21
24
24
27
Other
66
69
87
102
Source: Lobbyists Database. Influence Inc. 2000. Center for Responsive Politics. www.opensecrets.
org/lobbyists.
Table 11.4
Summary Descriptive Statistics of Lobbyist Data Produced by SPSS Frequencies
Statistics YR2000
N
Valid
13
Missing
0
Mean
118.92
Median
102.00
Modea
16
Std. Deviation
78.57
Variance
6173.41
Range
211
Minimum
16
Maximum
227
Percentiles
25
43.50
50
102.00
75
204.50
a
Multiple modes exist. The smallest value is shown.
Measures of Relative Position
Measures of relative position are used to compare one measurement against other measurements
in the dataset. Two types of statistical processes can be used for this: percentiles and standard
scores; standard scores are also called z-scores.
D
o
w
n
l
o
a
d
e
d
b
y
[
U
n
i
v
e
r
s
i
t
y
o
f
C
a
l
i
f
o
r
n
i
a
,
S
a
n
D
i
e
g
o
]
a
t
0
0
:
0
8
1
9
M
a
y
2
0
1
7
148 QUANTITATIVE RESEARCH APPROACHES AND METHODS
Percentiles
Percentiles are points or values used to indicate the percentage of subjects or measurements with
scores below that point. Percentiles are not often found in political science statistics, but can be
very useful in selected situations. A well-known example of the use of percentiles is students’
scores on the Scholastic Aptitude Test (SAT). SAT results include an indication of how the set of
scores for one student compares with all other scores for that test set. Similar applications exist for
the Graduate Record Examination (GRE), the Law School Aptitude Test (LAST), and the General
Management Aptitude Test (GMAT).
Say, for example, a graduate business school applicant scores 580 on the GMAT. This might
be reported as falling in the 85th percentile (P85) of all scores for persons taking the test at that
time. This means that 85 percent of all applicants had scores lower than the applicant’s 580. If the
applicant had scored, say, 450, this might have fallen in the 65th percentile (P65), and so on. The
50th percentile (P50) is always the median value for that set of scores.
Excel example. Microsoft Excel includes procedures for obtaining any-level percentiles as well
as standard quartiles. These functions are incorporated into the Statistics toolbox of the Function
Wizard (fx). When the Function Wizard is selected, two lists appear in the window. The left-hand
list shows categories of functions, one of which is Statistics. Within the Statistics master-category
function are a variety of specific functions. These appear in the right-hand window. Scroll bars
must be used to display all the choices included.
The commands for Excel’s percentile function are slightly different from most applications.
In Excel, a value between 0 and 1 must be entered. For example, to arrive at the 90 percent
PERCENTILEVALUE
THEUSERMUSTENTER@WITHOUTTHEQUOTATIONMARKS
OFCOURSE )NMOSTOTHER
applications, the values to be entered are a number between 0 and 99. Thus, to have a statistics
PROGRAMCOMPUTETHETHPERCENTILEVALUE
THEUSER ENTERS @ AGAIN
WITHOUTTHEQUOTATION
marks).
With the Excel quartile function, the user may set the “Quart” value from 0 to 4. Setting it to
1, 2, or 3 will return the corresponding quartile values. Setting it to 0 or 4 will return either the
minimum or maximum values in the dataset range. Excel uses the median value for the second
quartile.
Standard Scores
Standard scores are the scores of the dataset that have been transformed in some way. When the
scores are all transformed in the same way, it becomes possible to compare any two or more scores
against one another on an equal basis. They are often used to compare the scores on one study
against the scores on another study, as in a pre- and post-text research design. The standard-score
transformation process used most often is the z-score. Z-scores are raw scores that have been
converted into standard deviation units. The z-score indicates how many standard deviation units
any one score is from the mean score for the total group.
Z-scores also make it possible to compare a single subject’s scores on two different scales.
For example, the SAT includes a communications skills and a mathematics skills component.
The mean score for each of these components serves as the common reference point for the test
population; standard deviations are the common unit used to measure variability, thus providing
a clear picture of how each score compares with the total group’s scores.
Excel example. Standardized scores (z-values) are easy and quick to compute with Microsoft
Excel. All that is required is to highlight the dataset. Data from a hypothetical set of scores on a
D
o
w
n
l
o
a
d
e
d
b
y
[
U
n
i
v
e
r
s
i
t
y
o
f
C
a
l
i
f
o
r
n
i
a
,
S
a
n
D
i
e
g
o
]
a
t
0
0
:
0
8
1
9
M
a
y
2
0
1
7
INTERPRETING EXPLORATORY AND DESCRIPTIVE STATISTICS 149
political awareness survey taken in six separate samples drawn from the population in four dif-
ferent wards of the city appear in Table 11.5. To calculate z-scores with Microsoft Excel, follow
these simple steps:
1. Arrange the raw data into a one-column data array.
2. Calculate the mean and standard deviation for the total sample using the Excel Func-
tion Wizard. Note: To calculate the mean, use the Average option in the set of statistical
applications. To find the standard deviation for the sample, use the Function Wizard’s
STDDEV option in the same set of applications. The formula for standardization requires
three numbers:
a. The value to be standardized
b. The mean for the sample
c. The standard deviation (SD) for the sample
3. Using the Standardize option in the Function Wizard applications, insert the three ap-
propriate values.
4. For a shortcut, type the mean in the cell below the cell where it was calculated using an
Excel Wizard formula. Do the same thing for the standard deviation value.
5. Now, click and hold on the small fill capability box in the lower right-hand corner of
only the cell in which you copied the mean. Drag down to the bottom of the data array.
The repeated formula calculates the appropriate value in each cell. Do the same for the
standard deviation column. Note: If you include the cell that contains the formula for the
mean and/or the SD in this click and fill, Excel will calculate a new mean and a new SD
formula for each raw score, but using one less raw value each time. All the subsequent
means and SDs will be wrong.
6. Now, click on the second, empty z-score cell, click and hold the drag button, and
drag to the bottom of the array. Correct z-scores will be calculated for each raw
data value.
7. Now go back and use the Format → Cells → Numbers selections and format for the
number of places after the decimal point desired.
8. Add lines, boldface, or other options as desired.
The results of a standardization of the measurements in Table 11.5 can be seen in Table 11.6 .
The left-hand column contains the recorded raw measurements. The right-hand column displays
the standardized z-score conversions for each raw score.
Table 11.5
Weights of Sample Units, AM Dataset
Awareness Scores
Ward
Sample 1 Sample 2 Sample 3 Sample 4
Sample 5 Sample 6
1
18.4
17.9
18.6
19.0
17.8
18.7
2
18.2
18.0
18.5
19.1
17.4
19.0
3
18.0
18.1
18.4
19.2
16.9
18.8
4
17.9
18.2
18.6
19.1
17.6
18.5
Source: Example data.
D
o
w
n
l
o
a
d
e
d
b
y
[
U
n
i
v
e
r
s
i
t
y
o
f
C
a
l
i
f
o
r
n
i
a
,
S
a
n
D
i
e
g
o
]
a
t
0
0
:
0
8
1
9
M
a
y
2
0
1
7
150 QUANTITATIVE RESEARCH APPROACHES AND METHODS
Measures of Correlation
Measures of correlation are used to reveal the relationships or associations between two or more
variables or subjects. In many statistics texts, correlation is discussed under the umbrella of infer-
ential statistics. However, since measures of correlation are commonly included in the preliminary
section of reports, together with other descriptive statistics, it is not inappropriate to include them
as descriptive statistics as well. Different correlation measures are used with different types of
data, as indicated in Table 11.7 .
The data in Table 11.7 can also be grouped into just two categories, depending upon the type
of measurements they represent—discrete (sometimes referred to as categorical) and continuous
data. Nominal and ordinal data are discrete or categorical measurements. Interval and ratio data
can vary within a set of ranges; thus, they are considered to be continuous. However, it is more
appropriate to apply the correct statistical test as indicated.
The chi-square test for independence should be used to determine whether two nominal level variables
are related or independent. The null hypothesis for the test is that the two variables are independent.
Table 11.8 displays the results of a crosstabulation (crosstabs) table for two variables in a hypothetical
survey of political behaviors and attitudes of a sample of 60 registered voters. In this hypothetical sample,
20 subjects reported they considered themselves to be affiliated with the Republican Party, 29 said they
were affiliated with the Democrat Party, and 11 indicated they were Independents. The researcher wants
to know whether there is any association between party affiliation and voting behavior.
Table 11.6
Standardized Values for Political Awareness Scores in Four City Wards
(sample mean = 18.3; sample standard deviation = 0.583)
Raw Score
Z-score
18.4
0.1216
18.2
–0 .2164
18.0
–0 .5694
17.9
–0 .7682
17.9
–0 .7365
18.0
–0 .5148
18.1
–0 .3432
18.2
–0 .1716
18.6
0.5148
18.5
0.3432
18.4
0.1716
18.6
0.5148
19.0
1.2013
19.1
1.3729
19.2
1.5445
19.1
1.3729
17.8
–0 .8581
17.4
–1 .5445
16.9
–2 .4026
17.6
–1 .2013
18.7
0.6865
19.0
1.2013
18.8
0.8581
18.5
0.3432
D
o
w
n
l
o
a
d
e
d
b
y
[
U
n
i
v
e
r
s
i
t
y
o
f
C
a
l
i
f
o
r
n
i
a
,
S
a
n
D
i
e
g
o
]
a
t
0
0
:
0
8
1
9
M
a
y
2
0
1
7
INTERPRETING EXPLORATORY AND DESCRIPTIVE STATISTICS 151
Because both variables are nominal-level measurements, the chi-square test in the Descriptive
Statistics Crosstabs option is the appropriate test. The results of that test are displayed in Table
11.9 . The chi-square test for independence produces a Pearson chi-square value, the degrees of
freedom for the dataset, and a “two-sided” (more often referred to as “two-tailed”) significance
value. Two-sided tests mean that the researcher looks at the correlations for both variables, from
either direction—that is, regardless of which variable is dependent and which is independent. The
easiest way to interpret the results of the test is to compare the significance value with the level
of confidence established by the researcher; the .05 level of confidence is used most often in all
social science research.
In Table 11.9, the calculated significance level of .037 (the Pearson chi-square value) is less
than the researcher-set .05 level of confidence. The null hypothesis is that these two variables are
not related; or said another way, the two variables are independent. The alternate hypothesis is that
Table 11.7
Data Types and Their Appropriate Correlation Statistics
Data Type
Measurement Statistic
Nominal
Chi-square (F2 )
Ordinal
Spearman’s rank order coefficient (rho)
Interval/Ratio
Pearson’s correlation coefficient (r )
Table 11.8
SPSS-Produced Crosstabulations Table for Sample Data, n = 60
Political Party Affiliationa
Voted in Presidential Election
Did Vote
Did Not Vote
Totals
Republican
14
6
20
Democrat
10
19
29
Independent
4
7
11
Totals
28
32
60
Note:
a
Political party affiliation, voted in presidential election crosstabulation count.
Table 11.9
Chi-Square Test for Independence on Party Affiliation and Voting Behavior, n = 60
Chi-Square Tests
Value
df
Asymp. Sig.
(2-sided)
Pearson Chi-Square
6.574
2
. 037
Likelihood Ratio
6.693
2
. 035
Linear-by-Linear Association
4.483
1
. 034
N of Valid Cases
60
0 cells (0.0%) have expected count less than 5. The minimum expected count is 5.13.
D
o
w
n
l
o
a
d
e
d
b
y
[
U
n
i
v
e
r
s
i
t
y
o
f
C
a
l
i
f
o
r
n
i
a
,
S
a
n
D
i
e
g
o
]
a
t
0
0
:
0
8
1
9
M
a
y
2
0
1
7
152 QUANTITATIVE RESEARCH APPROACHES AND METHODS
the two variables—party affiliation and voting behavior—for this sample are related. Therefore,
the null hypothesis must be rejected and the alternate hypothesis accepted. The two variables are
not independent.
Note that only the lower half of the correlation matrix is displayed in Table 11.10. The upper half
simply duplicates the same information. SPSS Correlations/Bivariate with the ordinal test (Spear-
man’s) option selected, produces both the upper and lower part of the matrix as a default; the duplicated
information was deleted by the author. Excel produces a lower-half matrix as its default output.
Only two of the correlation coefficients in this example were significant at the .05 level of
confidence: the relationship between attitudes toward rail travel and travel abroad (r = .345, sig.
= .007), and the attitude of the sample toward tour-group travel and travel abroad (r = .363, sig. =
.0 04). Thus, the research can assume that there is a low to moderate relationship between the two
variables. The Pearson’s scale-level data correlation matrix in both SPSS and Excel are identical
to the ordinal-level Spearman’s tests. It is only necessary to request the appropriate test option.
Understanding Frequency Distributions
Understanding the information contained in a given set of scores or values requires looking at the
ways frequency distributions of scores can be distributed around their mean value. We are most
familiar with what are called “normal distributions.” These are the typical bell-shaped curves that
enclose what we call a “normal distribution.” Normal distributions tend to be symmetric, with
the mean and median falling near one another at the mid or high point on the curve. This is often
the modal value as well.
Table 11.10
Spearman’s Correlation Coefficients for Variables in Hypothetical Travel Survey
Spearman’s rho (r ) Correlations
Toward
travel in
U.S .
Toward
travel
abroad
Toward
travel
this year
Toward
cruise
travel
Toward
rail
travel
Toward
tour group
travel
Toward travel
in U.S.
Correlation
Coefficient
1.000
Toward travel
abroad
Correlation
Coefficient
–. 168
1.000
Sig. (2-tail)
. 198
.
Toward travel
this year
Correlation
Coefficient
–.096
.060
1.000
Sig. (2-tail)
. 466
. 650
.
Toward cruise
travel
Correlation
Coefficient
.150
–.164
.212
1.000
Sig. (2-tail)
.252
. 210
. 104
.
Toward rail
travel
Correlation
Coefficient
.154
.345
.039
.0 61
1.000
Sig. (2-tail)
. 239
.0 07
. 769
. 646
.
Toward tour
group travel
Correlation
Coefficient
. 011
.363
. 010
–.089
–.131
1.000
Sig. (2-tail)
.931
.004
. 940
. 500
. 317
.
Source: Example data.
D
o
w
n
l
o
a
d
e
d
b
y
[
U
n
i
v
e
r
s
i
t
y
o
f
C
a
l
i
f
o
r
n
i
a
,
S
a
n
D
i
e
g
o
]
a
t
0
0
:
0
8
1
9
M
a
y
2
0
1
7
INTERPRETING EXPLORATORY AND DESCRIPTIVE STATISTICS 153
Most distributions encountered in decision making are more or less normal. That is, the bulk
of the responses or scores cluster around the mean, with the rest trailing off toward the ends. The
above information about normal distributions has been found to be true so often that it is now
accepted as a “rule” (Table 11.11). Sometimes, the distribution of scores does not cluster around
the mean. Instead, it may be grouped at either end of the scale or even have more than one mode.
These distributions are known as “skewed” or asymmetrical, and somewhat different distribution
rules prevail.
In normal distributions, one standard deviation above the mean will include some 34 percent
of all the cases in the dataset. Similarly, one standard deviation below the mean will include
another 34 percent of the sample, for a total of 68 percent falling within a range of plus or minus
one standard deviation. Another 27 percent of the cases will be included if one more standard
deviation above and below the mean is included. Together, some 95 percent of all cases will fall
within two standard deviations above or below the mean. Finally, when three standard deviations
are included, 99.7 percent of all cases will be included under the curve (this makes the normal
distribution six standard deviations wide).
Not all distributions are normal. Some have a majority of the values gathered at either the low
or high end of the scale. Other distributions have the great majority gathered at the center, whereas
others may bunch up in two or more points or modes. The three most commonly encountered
non-normal distributions are positively skewed, negatively skewed, and bimodal distributions.
Positively skewed distributions have their peak nearer the left-hand end of the graph, with the
line stretched out toward the lower right-hand corner. Negatively skewed distributions have greater
concentrations at the right-hand side, with the left line stretched toward the lower left-hand corner.
Bimodal distributions have two concentrations of scores and have curves resembling a two-humped
camel’s back. Multimodal distributions have three or more concentrations or peaks.
Calculating Descriptive Statistics with Excel
The Microsoft Excel Data Analysis package contained in the Tools subprogram will produce a
complete set of summary statistics with very little effort. To begin, the first step is to establish a
“data array”—a spreadsheet table in which all data are arranged in columns and rows. The data
array shown in Table 11.12 is public information published in 2002 by the Center for Responsive
Politics. Table 11.13 displays Excel-produced descriptive statistics for donations by individuals,
PACs, and soft money.
Steps for Excel. Follow these steps with Microsoft Excel to produce Descriptive Statistics:
1. Arrange the data in a spreadsheet data array.
2. Highlight the data only.
3. Select the Tools option, followed by the Data Analysis option.
4. In the Data Analysis option, select Descriptive Statistics.
Table 11.11
Empirical Rules for Normal Distributions
Approximately 68% of all the items will be within one standard deviation of the mean.
Approximately 95% of the items will be within two standard deviations of the mean.
Almost all items will be within three standard deviations of the mean.
D
o
w
n
l
o
a
d
e
d
b
y
[
U
n
i
v
e
r
s
i
t
y
o
f
C
a
l
i
f
o
r
n
i
a
,
S
a
n
D
i
e
g
o
]
a
t
0
0
:
0
8
1
9
M
a
y
2
0
1
7
154 QUANTITATIVE RESEARCH APPROACHES AND METHODS
Table 11.13 displays the Excel-produced descriptive statistics for the categories of political
donations (Individuals, PACs, and soft money) shown in Table 11.12 .
Similar summary statistics are produced by SPSS. The variables for analysis must be moved
into the proper analysis box, with desired statistical options selected. The information supplied
by the Center for Responsive Politics was accessed on the Internet.
Table 11.12
Political Donations by the Communications/Electronics Industry, 1990–2002 ($ millions)
Election
Total
From
From
Soft
To
To
%to
%to
Cycle
Contribs Individuals PACs
Money Democrats Republicans Dems
Reps
2002
35.9
8.6
6.4
20.9
18.5
17.0
51
47
2000
132.7
50.1
14.7
67.8
71.0
60.3
54
45
1998
52.7
19.5
11.6
21.7
26.0
26.3
49
50
1996
58.2
22.3
10.8
25.1
29.1
28.3
50
49
1994
28.5
12.5
8.7
7.3
16.5
12.0
58
42
1992
36.5
18.6
10.2
7.7
21.7
14.6
59
40
1990
16.1
6.8
9.2
0.0
9.1
6.9
57
43
Totals
360.6
138.4
71.6
150.5
191.9
165.4
53
46
Source: OpenSecret.org (Center for Responsive Politics). Communications/Electronics: Long-Term
Contribution Trends. From data released by the Federal Election Commission on May 11, 2002; dona-
tions are of $200 or more.
Table 11.13
Descriptive Statistics Produced by Microsoft Excel, 1990–2002
From Individuals
From PACs
Soft Money
Mean
19.7714 Mean
10.2286 Mean
21.5000
Standard Error
5.5067 Standard Error
0.9790 Standard Error
8.4676
Median
18.6000 Median
10.2000 Median
20.9000
Mode
N/A
Mode
N/A
Mode
N/A
Std Deviation
14.5693 Std Deviation
2.5902 Std Deviation
22.4031
Sample
Variance
212.2657
Sample
Variance
6.7090
Sample
Variance
501.8967
Kurtosis
3.8470 Kur tosis
1.0780 Kur tosis
3.6521
Skewness
1.8070 Skewness
0.4214 Skewness
1.7404
Range
43.3000 Range
8.3000 Range
67.8000
Minimum
6.8000 Minimum
6.4000 Minimum
0.0000
Maximum
50.1000 Maximum
14.7000 Maximum
67.8000
Sum
138.4000 Sum
71.6000 Sum
150.5000
Count
7
Count
7
Count
7
Source: OpenSecret.org (Center for Responsive Politics). Communications/Electronics: Long-Term
Contribution Trends. From data released by the Federal Election Commission on May 11, 2002.
D
o
w
n
l
o
a
d
e
d
b
y
[
U
n
i
v
e
r
s
i
t
y
o
f
C
a
l
i
f
o
r
n
i
a
,
S
a
n
D
i
e
g
o
]
a
t
0
0
:
0
8
1
9
M
a
y
2
0
1
7
INTERPRETING EXPLORATORY AND DESCRIPTIVE STATISTICS 155
Summary
Descriptive statistics are used to summarize data and describe samples. Four categories of de-
scriptive information can be used for these purposes: measures of central tendency, measures of
variability, measures of relative position, and measures of correlation. All of these statistics can
be quickly calculated with Microsoft Excel or SPSS.
The main purpose for measurements of location (also called measures of central tendency) is
to identify the value in the dataset that is “most typical” of the full set. This “typical” value may
then be used as a summary value. Five measures of central tendency are used at different times.
They include the mean (sometimes called the average), the median, the mode, the geometric
mean, and the trimmed mean.
Measurements of variability (sometimes referred to as measures of dispersion) tell how the
individual measurements vary within the dataset. The three measures of variability include
the range, the variance, and the standard deviation. The range is the distribution of scores from
the highest value to the lowest. The variance is an index of how scores or values in a dataset vary
from their mean or average value. Larger variance values indicate the data are more spread out,
whereas smaller variances mean the values are more concentrated around the mean. The standard
deviation is simply the square root of the variance. Because the variance is a squared value, it is
more convenient to work with the standard deviation, which is a more exact measurement than
the variance; it is stated in exactly the same units as the original data.
Two measures of relative position make it possible to compare one score against any other in
the dataset. They are percentiles and standard scores. Percentiles are values below which some
proportion of the total scores or observations fall. The most commonly used percentiles divide
the data into quartiles—segments containing 25 percent of the cases. One-quarter of the values
are below the first quartile, half are below the second quartile, and three-fourths are below the
third quartile. The most commonly used standard score is the z-statistic; z-scores are expressions
of variation stated in values of standard deviations from the mean. For most datasets, almost all
scores fall within plus or minus three standard deviations of the group mean.
Measures of correlation are used to numerically identify the level of relationships between
variables. Care must be taken to avoid unsubstantiated cause-and-effect relationships from cor-
relation values. The chi-square test for independence should be used to determine whether two
nominal-level variables are related or independent. The Pearson’s r correlation should be used with
interval and ratio data (scale data in SPSS); the Spearman’s rho statistic is used with ordinal-level
data. Both programs produce a correlation matrix for ordinal and scale data.
Discussion Questions
1. Name and give examples of the four measures of central tendency discussed in the
text.
2. Why are researchers concerned with measures of variability in a dataset?
3. Define range, variance, and standard deviation.
4. What are measures of relative position and what do they tell the researcher?
5. What are percentiles? What are quartiles?
6. What are standard scores? How and why are they used?
7. Measures of correlation are used for what purpose(s)?
8. Frequency distributions are often the first step in a statistical analysis design. What are
they and what purpose do they serve?
D
o
w
n
l
o
a
d
e
d
b
y
[
U
n
i
v
e
r
s
i
t
y
o
f
C
a
l
i
f
o
r
n
i
a
,
S
a
n
D
i
e
g
o
]
a
t
0
0
:
0
8
1
9
M
a
y
2
0
1
7
156 QUANTITATIVE RESEARCH APPROACHES AND METHODS
Additional Reading
Dekking, Frederik M., Cornelis Kraaikamp, Hendrik P. Lopuhaä, and Ludolf E. Meester. 2007. A Modern
Introduction to Probability and Statistics: Understanding Why and How. London: Springer.
Good, Phillip I., and James W. Hardin. 2006. Common Errors in Statistics (and How to Avoid Them). 2nd
ed. New York: Wiley-Interscience.
Kirkpatrick, Lee A., and Brooke C. Feeney. 2009. A Simple Guide to SPSS for Version 16.0 . Belmont, CA:
Wadsworth Publishing.
Mallery, Paul, and Darren George. 2008. SPSS for Windows Step by Step. Boston: Allyn & Bacon.
Phillips, John L. 2008. How to Think About Statistics. Rev. ed. New York: W.H. Freeman.
Salkind, Neil J. 2006. Statistics for People Who (Think They) Hate Statistics: The Excel Edition. Thousand
Oaks, CA: Sage.
D
o
w
n
l
o
a
d
e
d
b
y
[
U
n
i
v
e
r
s
i
t
y
o
f
C
a
l
i
f
o
r
n
i
a
,
S
a
n
D
i
e
g
o
]
a
t
0
0
:
0
8
1
9
M
a
y
2
0
1
7
157
12 Testing Research Hypotheses
Before data are gathered, processed, and interpreted, someone must have established a purpose, or
reason for the study. All subsequent analysis follows from this purpose. In scientific research, the reason
is typically expressed as a hypothesis or a set of hypotheses. A hypothesis is a statement that describes
some assumption of the researcher. Hypotheses also explain or suggest a researcher ’s conclusions about
some phenomenon of interest. For example, the statement, “People over 50 years of age vote more
often than do people 30 years of age and younger,” is a testable hypothesis about the behavior of two
defined groups of people. The testable research assumption is that age influences voting behavior.
In addition to setting the stage for a research project, hypotheses guide further research action,
and they dictate the appropriate research design to follow. For example, hypotheses written about
the mean score for a group on an attitude scale dictate the type of data-gathering methods to be
followed: subjects must answer questions that reveal their attitudes. This usually means develop-
ment of a questionnaire that the researcher administers in a survey research design.
The voting age hypothesis above calls for collecting data that can be analyzed with correlation
statistics. Equally, a hypothesis that calls for comparing the responses of one subgroup with that
of another group drawn from the same population dictates analysis that allows the researcher to
compare group responses.
Finally, the type of research hypothesis largely influences selection of the appropriate statistical
method or methods for a research project and the way that the alternative explanation is formed.
This chapter addresses the fundamentals of hypothesis testing and techniques for one-sample
hypothesis tests; it concludes with an introduction to the ideas behind using p-values to make
decisions about hypotheses.
Fundamentals of Hypothesis Testing
Hypotheses can be written in many different ways and for many different purposes. For example,
they can be formed to address relationships between variables or differences between values. They
can be stated as facts or as the way responses are distributed. They can be written as predictions
and as comparisons. They can refer to a sample statistic, a population parameter, or a proportion. In
all approaches, they are usually written as pairs, a null hypothesis and its obverse, the alternate. In
political science, researchers typically form one or more of these three main types of hypotheses:
1. Predictive hypotheses. These are predictions about the future value of a measurement.
Examples include predictions about legislator’s votes over the next several quarters,
predictions about the movements of stock prices, and the government’s predictions of
annual growth in the deficit, productivity, or unemployment.
D
o
w
n
l
o
a
d
e
d
b
y
[
U
n
i
v
e
r
s
i
t
y
o
f
C
a
l
i
f
o
r
n
i
a
,
S
a
n
D
i
e
g
o
]
a
t
0
0
:
0
8
1
9
M
a
y
2
0
1
7
158 QUANTITATIVE RESEARCH APPROACHES AND METHODS
2. Comparative hypotheses. These make comparisons between groups of people, companies,
countries, products, and the like. These are often used in hypotheses about differences
between scores of one group compared with another. Examples include differences in
mean product preference scores between two samples of beer drinkers, and production-rate
differences encountered after a change in environmental conditions (sometimes called a
treatment).
3. Association hypotheses. These deal with the levels of relationship or association between
two or more variables. Examples include measuring whether new advertising, a shift in
policy announced at a series of press briefings, or modifications in issue focus influence
attitudes among voters.
It is important to remember that hypotheses are statements about events or things that re-
searchers believe are true or not true. They are assumptions, not facts. Statistical tests are carried
out to verify the statement or assumption. Hypotheses are usually employed in pairs. The first
of the pair is typically stated in status quo terms; that is, a predicted change in attitudes will not
take place; variables are not related; groups’ scores on political awareness surveys after a public
opinion campaign will not differ from scores gathered before the campaign. This is called the
null hypothesis, and is represented by the symbol H0. Null hypotheses are also said to exist as
“negative statements.” Examples include: “There is no association between the age of a machine
and its production-error rate.” “There is no difference in a sample of voters’ preferences for can-
didates seeking office in the 35th legislative district.” “There is no disproportionate distribution
in the frequencies of responses among different age groups to a question on political issues.” An
alternate hypothesis is always paired with the null hypothesis. Alternate hypotheses are stated in
terms exactly opposite from null hypotheses. They are represented by the symbol HA.
Statistical processes exist to test hypotheses about all types of measurements: categorical
(nominal), ordered (ordinal), and continuous (interval and ratio) data. Hypothesis tests exist for a
single case, a single sample, for two or more groups, differences in a statistic or parameter, about a
single proportion, and for differences between two or more proportions. A commonly encountered
use of hypothesis tests is for testing for differences between sample statistics that are known by
the researcher and of parameters that are unknown (inferred).
In statistical notation, hypotheses stated as recognizing no difference or change are signified
by the notation: H0 = HA. The alternate hypothesis to this null hypothesis is that the two are not
equal, and is signified by the notation H0 HA. Change in one direction only is indicated by the
notations: H0 HA, or H0 HA. This type of hypothesis is also stated as one is “equal to or less
than” the other, or that one is “greater than or equal to” the other; these statements are signified
by the notations H0 HA and H0 HA, respectively.
One-direction changes (either greater or less than) are called a one-tailed test. When the test
involves difference in any direction, it is called a two-tailed test. Statistical processing programs
often print out test statistics for both one- and two-tailed tests for the same data. The choice of
which result to use, either a one-tailed, two-tailed, or both tests, is dictated by the pre-established
null hypothesis.
Classes of Hypothesis Tests
Researchers must deal with three different classes of hypothesis tests: (1) tests concerning a single
subject, (2) tests for a single group or sample, and (3) tests of hypotheses about two or more groups.
A variety of different hypothesis tests have been developed for use with each of these three classes
D
o
w
n
l
o
a
d
e
d
b
y
[
U
n
i
v
e
r
s
i
t
y
o
f
C
a
l
i
f
o
r
n
i
a
,
S
a
n
D
i
e
g
o
]
a
t
0
0
:
0
8
1
9
M
a
y
2
0
1
7
TESTING RESEARCH HYPOTHESES 159
of hypotheses. Among the most commonly used in political science research are Z-tests, t-tests,
and analysis of variance (ANOVA) tests.
Probability and Hypothesis Testing
Research decisions based on inferential statistics are made on the basis of what is probably true, not
on what is actually true. Probabilities are, in fact, the basis of all statistical inference. Researchers
seldom if ever have perfect information before them when they are required to make a decision.
To gain information and reduce uncertainty, researchers typically use the results of a sample as
an approximation of what is or what might be true of a population. They make inferences about
the population from the sample data
However, a major limitation of sample research is that a study based on another sample taken
from the same population will almost always produce results that are entirely different from the
results of the first sample data. One way that researchers lower the risk of this happening is by
increasing the size of their sample; larger samples lower the influence of extreme values—what we
call outliers—in a data set. However, collecting data costs money and takes time, both of which are
limited resources; increasing the sample size is often simply not possible. What researchers do instead
is to change the acceptable level of confidence they have in the results of the hypothesis test.
Hypotheses are simply statements or predictions by someone that explain or suggest some
conclusion, event, or thing. Hypotheses are suggestions or beliefs about something; they are not
“true” statements. Researchers can have varying amounts of confidence in the veracity of their
predictions. They can be 100 percent sure, 95 percent sure, 90 percent sure—or any other amount.
This degree of faith in the truth of the hypothesis statement is the level of confidence; confidence
levels are typically stated as probabilities, and abbreviated as p-values. Probabilities and p-values
are typically stated as decimals; they range from 0.0 to 1.0 . For example, when a researcher is 99
percent sure that a statement is true, the probability of truth is .01. A probability of 1.0 refers to a
perfect level of confidence; it means that the researcher is 100 percent sure about the statement.
Confidence Intervals and p-Values
A confidence interval is the researcher’s estimate of the probability of all possible random samples
drawn from the same population falling within a range of values that contains the mean of the popula-
tion. The Greek lowercase letter for m (μ) is the symbol used to signify this parameter. The decision
to accept or reject a null hypothesis is based upon a level of probability that is acceptable.
The researcher-established probability is called the confidence level; it is the degree of confi-
dence the researcher has that the decision to accept or reject the null hypothesis will not be in error.
Confidence levels are also considered to be the probabilities that the results of the test could not
have occurred by chance. For example, a confidence level of .05 means that the statistic values
for 95 out of 100 samples will fall within the range that contains the population parameter. This
range is also referred to as the sample space.
No two samples drawn from the same population can be expected to have the same mean or
variation. With normal distributions, roughly half of the possible values of a sample statistic will fall
above the mean, and half below. Thus, sample space refers to a range of statistics that fall to either
side of the population mean and are considered to be statistically the same. Acceptable ranges refer to
the proportion of possible values of the statistic that fall between the mean and a cut-off point some
distance from the mean. The range includes values greater and less than the central mean. Values
falling outside of this acceptable range are those that call for rejection of the null hypothesis.
D
o
w
n
l
o
a
d
e
d
b
y
[
U
n
i
v
e
r
s
i
t
y
o
f
C
a
l
i
f
o
r
n
i
a
,
S
a
n
D
i
e
g
o
]
a
t
0
0
:
0
8
1
9
M
a
y
2
0
1
7
160 QUANTITATIVE RESEARCH APPROACHES AND METHODS
The entire set of possible values within this range is called the confidence interval. The con-
fidence interval is the range of values within which the “true” value of the population (mean)
parameter is expected to fall. The researcher’s expectation is stated as some chosen level of prob-
ability that the statistic falls in the accepted range. The values delineating the confidence range are
known as the upper and lower confidence limits; together they form the bounds of the confidence
interval. That is, with a 95 percent confidence value and a normal distribution, 2.5 percent of the
values are expected to be above (outside) the upper confidence value and 2.5 percent are expected
to fall in the lowest portion or tail of the normal curve.
The Concept of Error in Hypothesis Testing
Regardless of what confidence level is selected or computed, several errors of analysis may
confound the results of a study (Mattson 1986). The two types of errors associated with hypoth-
esis tests are Type I and Type II errors. Both error types and indications of when they occur are
illustrated in Figure 12.1 .
DECISION
Reject the Null Accept (Retain) the Null
Null is False:
Correct Decision
Type II Error
REALITY:
Null is True:
Type I Error
Correct Decision
Figure 12.1 Type I and Type II Error in Hypothesis Testing
Political science researchers are more concerned about making Type I errors than Type II errors.
Type I errors occur when a null hypothesis that is actually true is rejected. This is called falsely reject-
ing the null hypothesis. Type I errors are related to the confidence level adopted for a decision. Thus,
with a 90 percent level of confidence, the researcher can falsely reject the null hypothesis 10 percent
of the time. Raising the confidence level to 95 percent (an alpha of .05) means the researcher can
expect to be wrong only 5 percent of the time. Thus, tightening confidence levels lowers the likelihood
of Type I errors occurring. Remember: rejecting a null hypothesis does not mean that something is
“true;” it only means this hypothesis must be rejected and the alternate hypothesis retained.
Type II errors occur when a researcher does not reject the null hypothesis when it is, in fact,
false. Type II errors occur less often than Type I errors; procedures for computing their possible
occurrence are usually found in comprehensive mathematical statistics texts and will not be cov-
ered here. In general, researchers reduce the likelihood of Type II errors occurring by increasing
the size of the sample.
One-Sample Hypothesis Tests
One-sample hypothesis test applications are tests of a sample statistic, usually the mean or a
proportion, in order to establish that the sample measurement is representative of the population
from which it is drawn. One-sample tests are also available to determine whether the test statistics
have a normal distribution. These tests for normality are important because two key assumptions
in most interval and ratio data hypothesis tests are random samples and a normal distribution;
they are available in SPSS, but not in Excel.
D
o
w
n
l
o
a
d
e
d
b
y
[
U
n
i
v
e
r
s
i
t
y
o
f
C
a
l
i
f
o
r
n
i
a
,
S
a
n
D
i
e
g
o
]
a
t
0
0
:
0
8
1
9
M
a
y
2
0
1
7
TESTING RESEARCH HYPOTHESES 161
Inferential statistics involves using measurements of a sample to draw conclusions about
the characteristics of a population. Researchers never know with complete certainty that the
sample statistics match the population parameters. On the other hand, researchers do know that
drawing another random sample or samples from the same population will usually produce
similar but different values for their statistics. It will not happen every time, however. The
researcher wants to know how likely it is that (with what degree of probability) the sample
statistic will fall within an acceptable range of possible values. This acceptable range is
called the confidence interval.
A Single-Case Hypothesis Test
In a single-case hypothesis test, a researcher is typically interested in knowing if the case statistic,
such as a mean score on a test of issue awareness, falls within a defined range of values for a
population. The range of possible values is known as the confidence interval. The null hypothesis
for this example is that the case statistic is the same as that of the sample from which it is taken.
The alternate hypothesis is that the statistic for the case is not in the acceptable sample space. The
one-sample z-test is used to test this hypothesis. The following steps explain how to use Microsoft
Excel for the procedure.
1. Using the Standardize procedure from the Excel Function Wizard, convert the single-
subject statistic to a z-score . Note: the terms z-score and z-value are often used inter-
changeably.
2. Select a confidence level for deciding whether the score falls within the acceptable
range. The .05 level of confidence has long been the level used in most social science
research, including political science. The normal distribution table found in most
statistics texts refers to the proportion of area under the bell-shaped curve of a normal
distribution that corresponds to the z-value. A check of the table reveals that the .05
level of confidence coincides with a z-score of 1.96. This value represents the number
of standard deviations from the population parameter. The larger the z, the farther it
falls from the center of the curve; the smaller the z, the closer it is to the center of the
sample space.
3. Determine whether the standardized (z-score) single-case test statistic value is greater
or less than the 1.95 confidence value. If it is the same or smaller than 1.96, retain the
null—the case does belong to the group. If it is greater—that is, if the z-value is larger
than 1.96—reject the null and accept the alternate hypothesis; the case does not belong
to the group.
The Excel Confidence Test
Researchers often want to know what percentage of all possible samples would include the pa-
rameter for the population somewhere within the interval (range) of their statistic values. Since
the actual parameter value is seldom known, an estimate for this number must be made. The
sample statistic is substituted for the unknown parameter. The sample statistic usually used for
this purpose is the sample mean.
Microsoft Excel’s Confidence test function can quickly establish an estimate for the range of
values above and below the hypothesized population mean. Three values are needed to complete
the Confidence test:
D
o
w
n
l
o
a
d
e
d
b
y
[
U
n
i
v
e
r
s
i
t
y
o
f
C
a
l
i
f
o
r
n
i
a
,
S
a
n
D
i
e
g
o
]
a
t
0
0
:
0
8
1
9
M
a
y
2
0
1
7
162 QUANTITATIVE RESEARCH APPROACHES AND METHODS
1. Alpha (the researcher-determined significance level to be used to compute the confidence
level; a number greater than 0 and less than 1)
2. The standard deviation of the population (since this is seldom known, the SD for the
sample is substituted)
3. The total of sample items involved (n)
Normal Distribution Tests
A key condition of many statistical tests is the requirement that the samples be drawn from a popu-
lation with a normal distribution and normal variance. Therefore, one of the first tests carried out
on a sample dataset is often a test for normality—that is, a test to see if the population parameter
has a normal distribution. It is important to remember that this test should only be done with a
probability sample—that is, one that meets requirements for random selection.
Researchers are often required to compute the area under a normal curve and/or to establish
probabilities associated with the normal distribution. Microsoft Excel’s statistical analysis capa-
bilities under the Function Wizard (fx) includes five functions that pertain to normal distributions.
An illustration of the five tests and the purpose for each is displayed in Table 12.1.
Table 12.1
Five Functions of Normal-Distribution Tests in Microsoft Excel 2000
Excel Test
Purpose
STANDARDIZE
Computes standardized z-values for given raw scores
NORMSDIST
Computes the probability that an area under the curve is less than a
given z-value
NORMSINV (Opposite Computes a z-value that corresponds to a given total area under the
of the NORMSDIST
normal curve
test)
NORMDIST
Computes the probability that an area under the normal curve is less
than a given measurement value (X )
NORMINV
Computes the measurement value (X ) that corresponds to a given area
under the normal curve
Source: Excel 2000 HELP function.
The first of the five tests is the Standardize function, which computes standardized z-values for
given raw scores. The second function related to the normal distribution is the NORMSDIST test.
This function computes the area under the curve (probability) that is less than a given z-value. The
third function, NORMSINV, computes a z-value that corresponds to a given total area under the
normal curve. This function is the opposite of the NORMSDIST function.
The fourth Excel normal distribution function, NORMDIST, computes the area probability
that is less than a given measurement value X ). The last function in this family of tools is the
NORMINV function. This function—the obverse of the NORMDIST function—computes the
measurement value ofX that corresponds to a given area under the normal curve.
In addition to these five specific normal distribution-related tests, Excel also conducts one-tailed
and two-tailed tests, one-sample t-tests, a two-tailed (only) z-test, and a confidence interval test.
D
o
w
n
l
o
a
d
e
d
b
y
[
U
n
i
v
e
r
s
i
t
y
o
f
C
a
l
i
f
o
r
n
i
a
,
S
a
n
D
i
e
g
o
]
a
t
0
0
:
0
8
1
9
M
a
y
2
0
1
7
TESTING RESEARCH HYPOTHESES 163
Two or More Sample Hypothesis Tests
In addition to the one-sample tests, social scientists and statisticians have developed a body
of statistical techniques designed to test hypotheses about two or more samples. Techniques
for testing for differences permit political science researchers to apply experimental design
methods in which they test whether the differences in mean scores for two or more samples
are statistically significant or whether they could have occurred by chance.
Statistical procedures for two types of research situations are discussed here: small-sample
tests for two groups, and large-sample tests for two or more than two groups. The two-group tests
include several versions of t-tests; tests for large samples or for more than two groups are the
analysis of variance (ANOVA) procedures. Two-group tests are based upon the t-distribution, a
special distribution that is shaped by the degrees of freedom with the dataset.
These procedures are most appropriate with small samples—that is, when the total number
of cases is 30 or less (Anderson, Sweeney, and Williams 2002, 295, 394). However, because the
difference between the t-distribution and a normal distribution is made nearly insignificant as the
number of degrees of freedom increase, this size limitation is typically ignored, and t-tests are
used for comparing the means of any size samples.
The three situations in which the t-test is applied include (1) when the samples are paired, (2)
when the samples come from a population or populations with equal variances, and (3) when the
samples come from populations with unequal variances.
Political science researchers are highly likely to find themselves using one or more two-sample
procedures very early in their research careers. The several tests for comparing differences are
among the most commonly reported statistical results found in research literature. Techniques
exist to test for differences with all levels of data.
Two-Group Hypothesis Tests
As can be seen in Figure 12.2, an extensive body of statistical tools has been developed for testing
hypotheses about statistics for two or more groups. These procedures are to be used with paramet-
ric statistics. Parametric statistical tests require the measurements to be at the equidistant-interval
or ratio level. Parametric statistics also require that the data be from random samples and have a
normal distribution.
When these assumptions cannot be met, nonparametric tests must be used in place of parametric
tests. In addition, some parametric tests require that the samples be independent from one another,
while other tests have been developed for use with dependent or paired samples. Separate-but-
related statistical tests have been developed to meet each independence requirement. Whether the
samples are independent (as most are) or are dependent (as with samples that are paired), some
minor differences will be found in the computational formulas, although their interpretation is
identical. Finally, the t-tests and ANOVA procedures discussed here should be used only when
the researcher has all the raw data (individual measurements) available; the tests should never be
used with data that are already summarized.
Two of the statistical tests often used when comparing the mean values for independent samples
are the Student’s t-test for two samples, and the one-way, two-way, and n-way analysis of vari-
ance tests (ANOVA). Although the t-test has more limitations than the F-test, it is well suited for
comparisons between the means of two, but only two, relatively small samples (typically around
thirty cases), and with each sample having the same or nearly the same number of observations
or cases. Analysis of variance, on the other hand, is considered to be very robust. It can be used
D
o
w
n
l
o
a
d
e
d
b
y
[
U
n
i
v
e
r
s
i
t
y
o
f
C
a
l
i
f
o
r
n
i
a
,
S
a
n
D
i
e
g
o
]
a
t
0
0
:
0
8
1
9
M
a
y
2
0
1
7
164 QUANTITATIVE RESEARCH APPROACHES AND METHODS
Figure 12.2 The Funnel Approach to Questionnaire Structure
with two or more samples, large or small samples, and samples of unequal sizes.
Whenever three or more samples are to be compared, a body of post-hoc or after-the-fact tests
may also be employed to pinpoint the differences. Post-hoc tests have not been included in the
basic set of procedures in Excel. Instead, they must be calculated using mathematical procedures.
Therefore, they are not discussed in this text. More powerful statistical software, such as SPSS,
includes a wide variety of post-hoc tests.
Comparing Two-Group Differences with the t-Test
The t-test is used to compare the means of two groups; variations of the test exist for use with
paired samples, samples with unequal variances, and samples with approximately equal variances.
The test might, for example, be used to compare scores from a group of voters tested prior to a
political campaign information program. These scores might then be compared with scores for
the same group after completion of the information program.
In another use, the mean scores on political attitudes for two groups of voters, with the groups
determined by gender, age, income, political party, or ethnic group—provided that only two
groups are compared during each t-test application. Another application might be comparing at-
titudes about political parties held by university sophomores with the attitudes of juniors at the
same university.
Minimum required assumptions for all applications of the t-test are: (1) the measurements
are of at least interval-level data, (2) the samples are randomly selected, and (3) the scores are
randomly distributed. Only two sets of means can be compared at any one time using the t-test.
As in one-sample hypothesis testing, the first step must always be to establish a null and alternate
hypothesis for testing.
Several different approaches to difference tests are possible with the t-test. The major differen-
tiating characteristic is the nature of the two samples for which measurements are available: are
they paired or independent? This question must be answered before selecting one of the several
different t-test computational methods. The Tools → Data Analysis feature in Excel includes
three different t-test options: a test for paired samples and two tests for independent samples. The
two independent sample tests vary in that one assumes the samples were taken from two separate
t-Tests
for P aired
Samples
t-Tests for
Independent
Samples With
Equal Variance
t-Tests for
Independent
Samples With
Unequal Variance
Small-Sample
Tests
One-F actor
Analysis of
Variance
A Posteriori
Tests
Two-Factor
Analysis of
Variance
A Posteriori
Tests
N-Factor
Analysis of
Variance
Large -S ample
Tests
TESTS FOR DIFFERENCES IN
MEANS OF TWO OR MORE
SAMPLES
D
o
w
n
l
o
a
d
e
d
b
y
[
U
n
i
v
e
r
s
i
t
y
o
f
C
a
l
i
f
o
r
n
i
a
,
S
a
n
D
i
e
g
o
]
a
t
0
0
:
0
8
1
9
M
a
y
2
0
1
7
TESTING RESEARCH HYPOTHESES 165
populations, while the second test assumes two populations in which the variance is known to be
either equal or unequal. Because researchers seldom if ever know the variance of a population,
this usually means the researcher selects the unequal variance option.
Regardless of which option is used, both samples should always be randomly selected from
the population or populations. The unequal variance option should be used when the samples are
drawn from different populations. An example would be comparing the means of samples taken
from two separate cities or different states.
All two-sample t-tests compare sample means by computing a Student’s t-value, and compar-
ing the significance of whatever difference is found between the calculate t-statistic and a critical
t-statistic for the number of degrees of freedom in the dataset. Considered to be only slightly less
“robust” than the F-test, the t-test is very easy to use and interpret and is, therefore, a popular tool
for comparing the mean scores of two samples or groups.
A Paired-Sample Example
A typical example of a paired two-sample hypothesis test application is the standard pre- and post-
test research design used in education, training, and public opinion measurements. Researchers use
this design when they want to know if the differences between the first and second measurements
are “real,” or if they are simply chance-related variations encountered every time a new measure-
ment is made. This type of design is often used during an experimental test of a “treatment,” such
as different instructional methods or different communications media.
In all these applications, the researchers are looking for differences that are statistically sig-
nificant. A difference that is statistically significant is one with an acceptable level of probability
that the differences did not occur through chance alone. It is important to remember that the
analyst never knows if the differences are, indeed, “real.” The procedure calls for accepting or
rejecting a hypothesis with the possibility of making the wrong decision held to a level within
some acceptable level of confidence. This means that the research accepts the possibility that
a correct decision was made—that is, avoiding making a Type I error—90, 95, or 99 percent
of the time.
Table 12.2 displays data from a paired-sample, pre- and post-test example. In this ex -
ample, a political science researcher wanted to know if a white paper prepared by the staff
of a state senator changed a sample of voters’ attitudes toward a proposed change in funding
for the state’s portion of elementary school teachers’ salaries. A group of community leaders
completed a 25-item opinion questionnaire and then were asked to read the white paper. The
group was administered the same opinion survey one week later. Scores for the pre- and post-
test survey are displayed in Table 12.2. Table 12.3 displays the results of a Microsoft Excel
paired-sample t-test.
The researcher ’s null hypothesis for this study was that the mean of the group before reading
the white paper was the same as the mean for the group after reading the white paper. An alpha
of .05 was selected as the test confidence level. In statistical notation, the null and alternate hy-
potheses for this example are:
H0: μpre = μpost
HA: μpre | μpost
D
o
w
n
l
o
a
d
e
d
b
y
[
U
n
i
v
e
r
s
i
t
y
o
f
C
a
l
i
f
o
r
n
i
a
,
S
a
n
D
i
e
g
o
]
a
t
0
0
:
0
8
1
9
M
a
y
2
0
1
7
166 QUANTITATIVE RESEARCH APPROACHES AND METHODS
Because no direction—neither greater nor lesser—in the change was specified, this was
a two-tailed test. The important information in the Excel procedure results includes the in-
formation in Table 12.4 . Interpretations of the information in the above output include the
following:
s 4HEMEAN FORTHEPRE
SAMPLEWASAFTERREADINGTHEWHITEPAPER
THESCORE INCREASED
to 21.56 for the post-sample.
s 4HECALCULATEDt-statistic was –2 .77, with 9 degrees of freedom.
s 4HECRITICALt -statistic for 9 degrees of freedom was 2.26, which is less than the critical t of
–2.77.
s 5SINGTHISINFORMATIONALONE
THENULLWOULDBEREJECTEDANDTHEALTERNATEHYPOTHESISACCEPTED
s 4HECALCULATEDp-value for the data was .022, which is less than the alpha of .05.
s 5SING THE p-value approach, the null would also be rejected and the alternate hypothesis
accepted.
Table 12.3
Excel Output of a Paired Two-Sample t-Test
t-Test: Paired Two-Sample for Means
Variable 1
Variable 2
Mean
19.87
21.56
Variance
8.8134
7.7671
Observations
10
10
Pearson Correlation
0.776726572
Hypothesized Mean Difference
0
df
9
t Stat
– 2 .768013281
p (T<=t ) one-tail
0.010912144
t Critical one-tail
1.833113856
p (T<=t ) two-tail
0.021824288
t Critical two-tail
2.262158887
Table 12.2
Subject Attitude Scores Before and After Reading an Issue White Paper
Pretest Scores
(Variable 1)
Post-test Scores
(Variable 2)
20.7
19.3
21.7
23.9
17.2
19.9
18.0
24.0
15.1
17.7
21.1
21.5
24.5
25.9
17.8
19.1
23.6
24.4
19.0
19.9
D
o
w
n
l
o
a
d
e
d
b
y
[
U
n
i
v
e
r
s
i
t
y
o
f
C
a
l
i
f
o
r
n
i
a
,
S
a
n
D
i
e
g
o
]
a
t
0
0
:
0
8
1
9
M
a
y
2
0
1
7
TESTING RESEARCH HYPOTHESES 167
One-tailed and Two-tailed Tests
The difference between one-tailed and two-tailed tests is that in one-tailed tests the researcher
specifies the direction of the difference: the mean is either larger or smaller than the mean of the
second group. The probabilities calculated with the t-test on a one-tailed test are half of the prob-
abilities for a two-tailed test. It should be noted that deciding whether to select either the one- or
two-tailed tests can not be done arbitrarily. If the researcher has no specific reason to expect a
difference in one direction, it follows that no prediction can be made in advance. The analyst is
then obligated to use the two-tailed test. A typical two-tailed test hypothesis pair, to determine
where the means are different in any way, would be:
H0:μ1=μ2
HA:μ1μ2
If a one-tailed test is desired, either a greater or lesser hypothesis pair must be written; these
would appear as follows:
μ1 greater than μ2
μ1 lesser than μ2
H0:
μ1μ2
H0:
μ1μ2
HA:
μ1<μ2
HA:
μ1>μ2
A Two-Sample, Unequal Variance Example
In the following example, a political scientist was interested in the percentages of voters who
said they supported a bill to limit increases in property taxes to no more than 5 percent per year.
Data were collected in 28 counties; 15 counties were considered to be predominately urban,
while 13 counties were predominately rural. The results of the telephone survey are displayed
in Table 12.5.
A one-tailed t-test was conducted using Microsoft Excel on the data to test the hypothesis that
voters in rural counties were more likely to support a bill to limit increases in property taxes than
were voters in urban counties. The results of that test procedure are displayed in Table 12.6 . The
null and alternate hypotheses for this study problem can be written as follows:
H0:μ1μ2
HA:μ1<μ2
Table 12.4
Selected Information in Excel t-Test Output
Pretest
Post test
Mean
19.87
21.56
df
9
t Stat
– 2 .768013281
p (T<=t ) two-tail
0.021824288
t Critical two-tail
2.262158887
D
o
w
n
l
o
a
d
e
d
b
y
[
U
n
i
v
e
r
s
i
t
y
o
f
C
a
l
i
f
o
r
n
i
a
,
S
a
n
D
i
e
g
o
]
a
t
0
0
:
0
8
1
9
M
a
y
2
0
1
7
168 QUANTITATIVE RESEARCH APPROACHES AND METHODS
The null hypothesis for this study was that rural voters are no more likely to support the tax-
limit bill than are urban voters. The alternate or test statistic was the opposite of the null: rural
voters are more likely to support limits on property taxes than are urban voters. Because this was
a one-tailed test, the p-value for the one-tailed test is used for decisions on the hypotheses. The
decision rule is: reject the null and accept the alternate hypothesis if the p-value for the one-tailed
test is equal to or less than .05. The critical one-tailed p-value calculated by the procedure is .05,
with a .05 level of confidence. Therefore, there is enough information to conclude with a 95 percent
level of confidence that a statistically significant difference in the preferences will be reported in
the survey. Therefore, the null hypothesis must be rejected and the alternate accepted.
Comparing Two Group Scores with ANOVA
The second set of tests for differences is based on differences in the variances in group means—
analysis of variance tests, or ANOVA for short. The two most commonly encountered versions
Table 12.5
Percentages of Voters Supporting a Tax-Limit Bill
Urban Counties
Rural Counties
22.20
33.30
19.90
29.89
42.09
59.76
26.12
35.22
41.11
51.98
46.44
54.66
63.67
69.09
44.12
45.24
44.22
47.93
44.23
53.22
60.56
61.12
33.12
42.90
51.07
58.43
43.07
43.55
Table 12.6
Excel Results of a t-Test on Urban/Rural Support of a Proposed Tax-Limit Bill
t-Test: Two-Sample Assuming Unequal Variances
Urban Voters
Rural Voters
Mean
41.698
49.44153846
Variance
153.2067886
138.7881641
Observations
15
13
Hypothesized Mean Difference
0
df
26
t-Stat
– 1.694229869
p (T<=t) one-tail
0.051084648
t Critical one-tail
1.705616341
p (T<=t) two-tail
0.102169296
t Critical two-tail
2.055530786
D
o
w
n
l
o
a
d
e
d
b
y
[
U
n
i
v
e
r
s
i
t
y
o
f
C
a
l
i
f
o
r
n
i
a
,
S
a
n
D
i
e
g
o
]
a
t
0
0
:
0
8
1
9
M
a
y
2
0
1
7
TESTING RESEARCH HYPOTHESES 169
of the test are one-way analysis of variance, and n-way analysis of variance. The first version
involves testing differences in a single factor; these differences can be tested with any number of
groups during the same procedure. The second version tests differences in two or more factors
across any number of groups. Factors are what are known in experimental design as treatments.
Both versions of ANOVA involve analysis based on what is referred to as the F-test. The F-test
is a ratio developed from calculating the value computed for the variances in means for each
group and the value calculated as an estimate of the variation caused by the measurements for
individuals in the group.
ANOVA is a powerful tool for comparing the differences in the variation between means of any
number of groups, and of doing so at more than one factor level. With ANOVA, it is also possible
to test the role of each of several variables independently, and then to determine whether two or
more variables interact to influence any differences in groups’ mean scores. In all applications,
analysis of variance uses the F-statistic to compare the variances in each group’s mean scores.
The process compares the variance of each mean to the overall variance found in the sample. In
statistical notation, the overall variance is referred to as “error,” and relates to the distance from
the mean for each individual case. A large “error” score infers that the scores are widely disbursed;
a small “error” score means little variation in the set of scores.
Analysis of variance compares variances in the means of two samples or groups. The procedure
produces summary statistics for each sample or group, an F-ratio (also called an F-statistic), and a
probability value (called a significance value in some software’s printed output). Interpretation of
the results is a one-step process: the means are “statistically different” if the p-value is the same
or less than the analyst-selected confidence level.
Interpretation becomes a little more complicated when more than two groups or levels are
compared. The p-value of the F-ratio will indicate whether the null hypothesis is to be rejected,
but it will not indicate where the differences lie; an a posteriori test is required. When one of these
is selected, actual differences will be identified, while those that are statistically “the same” will
be so indicated. None of these after-the-fact tests is available in Microsoft Excel, but they are
available in more powerful statistical packages such as SPSS.
Three Versions of ANOVA
There are three different models of ANOVA: a one-way or one-factor model, a two-factor model,
and an “n-way” or three or more factor version. One-way analysis of variance is the basic procedure;
it is used when two or more group means are being compared across a single factor. For example,
a political campaign manager might want to know if married female voters and unmarried female
voters respond differently to an advertisement for a presidential candidate. The response variable
must be at least interval level; the grouping variable can be any level data.
One-Way Analysis of Variance
One-way ANOVA compares the mean scores on a scale variable across two or more categories of a
single categorical variable. The category variable is called a grouping variable. Grouping variables
are often demographic characteristics, such as gender, marital status, ethnic group, education level,
occupation, or some similar social characteristic.
Three different ways of estimating variance are possible: (1) a total estimate of the vari-
ance of all cases; (2) a between-group estimate based on the variation of the subgroups’
means around a “grand mean,” which is nothing more than a mean of the means; and (3) a
D
o
w
n
l
o
a
d
e
d
b
y
[
U
n
i
v
e
r
s
i
t
y
o
f
C
a
l
i
f
o
r
n
i
a
,
S
a
n
D
i
e
g
o
]
a
t
0
0
:
0
8
1
9
M
a
y
2
0
1
7
170 QUANTITATIVE RESEARCH APPROACHES AND METHODS
within-group estimate that is based on the variation of subgroup cases around their subgroup
mean. ANOVA simply divides the between-group variance by the within-group variance to
come up with a value that is called the F-ratio, or F-statistic. The total group variance model
is not used in ANOVA.
The following example represents the method used for testing differences in the scores of two
groups. A new office administrator was hired to manage the office of a U.S. Congresswoman.
Under the leadership of the former manager, staff morale had declined dramatically, the overall
quality and quantity of the staff ’s work had dropped, customer service was ranked very poor by
the visitors to the congresswoman’s office, and staff absenteeism was becoming a major problem.
Before making sweeping changes in the office, the new manager wanted to determine if supervi-
sors, staff workers, and visitors to the congresswoman’s office perceived the office climate in the
same way. A seven-point composite organizational climate scale was administered to a random
selection of twelve supervisors, twenty-five members of the staff, and twenty regular visitors to
the office. Individual scores on the scale are shown in Table 12.7 .
The manager ’s null hypothesis was: “There is no difference in the way staff employees, office
supervisors, and outside visitors rate the organization’s climate.” The alternate hypothesis was:
“Supervisors, staff, and visitors have different interpretations about the climate at this organization.”
To test this hypothesis, a one-way analysis of variance procedure and a 95 percent confidence level
were used to analyze the survey data. The results of that procedure are presented in Figure 12.3 .
To interpret these results, refer to the p-value of 0.00094 printed along with the F-ratio of 7.9530.
The large F-value alone would indicate that the difference in the three groups’ means is statisti-
cally significant. This is supported by the very small p-value. In this case, the null hypothesis is
rejected and the alternate hypothesis accepted; the groups do view the office climate differently.
The F-test is always multidirectional, testing for differences in either direction; therefore, it is
always a two-tailed test.
Two-Way ANOVA
Two-way analysis of variance designs are the simplest example of a class of statistical tests
developed for what are called “factorial experiments” or “factorial designs.” In all such cases,
the goal of ANOVA is to test the means of two or more groups on two or more variables or
factors at the same time. In addition, the procedure tests to see if two or more of the variables
working together may have had an impact on the differences, in what is known at the interac-
tion effect.
In this example of a two-factor analysis of variance procedure, the advertising manager
for the State Lottery wants to establish which is the best day to advertise in a newspaper and
in which section of the paper the ad should appear. The two factors are day of the week and
position. Four days are selected: Wednesday, Thursday, Friday, and Saturday. Three posi-
tions are tested: general news (the first two sections of the paper), the sports section, and
the family section (which includes the entertainment pages). Outcomes to be compared are
daily sales totals.
In setting up the experiment, position is to be the manager’s grouping variable. The two factors
being tested are position and day of the week. Four levels of the position variable are included in
order to match the four days of the levels, making it necessary to record 48 total observations.
Analysis of variance will compare the mean of the four levels of each of the three positions with
each of the four days in each position.
This analysis of variance procedure will compute an F-ratio with p-values and critical F-values
D
o
w
n
l
o
a
d
e
d
b
y
[
U
n
i
v
e
r
s
i
t
y
o
f
C
a
l
i
f
o
r
n
i
a
,
S
a
n
D
i
e
g
o
]
a
t
0
0
:
0
8
1
9
M
a
y
2
0
1
7
TESTING RESEARCH HYPOTHESES 171
Table 12.7
Organizational Climate Scales Scores for Supervisors, Staff, and Visitors
Supervisors
Staff
Visitors
2.9
3.2
3.8
4.8
5.6
4.1
4.0
3.0
3.0
2.8
5.7
2.5
3.3
3.1
2.1
2.6
5.0
5.6
3.7
6.0
1.8
4.2
3.3
1.6
4.8
4.4
2.3
4.4
5.4
3.1
2.9
3.4
2.0
1.9
4.9
9.0
4.1
1.9
5.3
3.3
6.0
2.3
4.1
1.3
5.0
4.1
6.4
2.1
6.7
3.2
4.7
2.0
5.0
3.5
3.9
2.9
5.1
ANOVA: Single Factor
SUMMARY
Groups
Count
Sum
Mean
Variance
Supervisors
12
42.3
3.525
. 8711
Staff
25
115.7
4.628
1.2813
Visitors
20
61.1
3.055
3.0658
ANOVA
Source of Variation
SS
df
MS
F
F crit
Between Groups
29.03795088
2 14.51897544
7.9530
.0 0094
3.1682
Within Groups
98.5824
54
1.8256
Total
127.6203509
56
p-value
Figure 12.3 Results of an Excel One-Factor ANOVA Test (p-value emphasis added)
for each of the three positions, the four days (labeled as “columns” in the ANOVA summary table),
and a measurement of the effect of any interaction between position and day. Table 12.8 on page
173 displays the two factors and sales totals; Figure 12.4 on page 172 displays the results of an
Excel two-factor analysis of variance procedure.
There are three results to interpret in the ANOVA results produced in this Excel application
D
o
w
n
l
o
a
d
e
d
b
y
[
U
n
i
v
e
r
s
i
t
y
o
f
C
a
l
i
f
o
r
n
i
a
,
S
a
n
D
i
e
g
o
]
a
t
0
0
:
0
8
1
9
M
a
y
2
0
1
7
172 QUANTITATIVE RESEARCH APPROACHES AND METHODS
SUMMARY
WED’DAY
THURSDAY
FRIDAY SAT’DAY
Total
GENERAL NEWS (1)
Count
4
4
4
4
16
Sum
3849
4074
5114
5533
18570
Average
962.25
1018.51
2
7
8
.51
3
8
3
.25
1160.625
Varianc e
1244.916667 4008.333333 3548.333333 198328.9167 74228.38333
SPORTS (2)
Count
4
4
4
4
16
Sum
4796
4238
5281
7591
21906
Average
1199
1059.51
3
2
0
.25
1897.75
1369.125
Varianc e
836.6666667 5713.666667 11287.58333 3912.916667 112788.3833
FAMILY (3)
Count
4
4
4
4
16
Sum
4072
6923
7628
6686
25309
Average
1018
1730.75
1907
1671.51
5
8
1
. 8125
Varianc e
358.6666667
10224.25 1124 .666667 20045.66667 127379.3625
Total
Count
12
12
12
12
Sum
12717
15235
18023
19810
Average
1059.75 1269.583333 1501.916667 1650.833333
Variance
11807.29545 121749.9015 94174.81061 108985.9697
ANOVA
Sourc e of Variation
SS
df
MS
F
p- value
F crit
Sample
1419238.042
2 709619.0208 32.67190463 0.000000008 3.25944427
Columns
2431282.229
3 810427.4097 37.31327129 0.000000000 2.866265447
Interaction
1502755.958
6 250459.3264 11.53151619 0.000000360 2.363748308
Within7
8
1
9
0
3
.75
36 21719.54861
Total
6135179.979
47
ANOVA: Two-Factor With Replication
Figure 12.4 Two-Factor ANOVA Results for Sales/Advertising and Media/Day
D
o
w
n
l
o
a
d
e
d
b
y
[
U
n
i
v
e
r
s
i
t
y
o
f
C
a
l
i
f
o
r
n
i
a
,
S
a
n
D
i
e
g
o
]
a
t
0
0
:
0
8
1
9
M
a
y
2
0
1
7
TESTING RESEARCH HYPOTHESES 173
of this test: The first null hypothesis was that there is no difference in the position factor. These
are the groups in the table; each includes four iterations of sales results. The second null hy-
pothesis is that there is no difference in the days of the week the advertisement is placed. The
final null hypothesis is that there is no interaction between the two factors as they relate to the
differences, if any. These results can be interpreted in two ways. First is the traditional p-value
approach. Since these are less than the .05 level of confidence, all three of the null hypotheses
are rejected.
Another way is to compare the F-ratio with the critical value of F. In the past, analysts had to
look this up in a table of values for various degrees of freedom and values for the .05 and .01 levels
of confidence. This is no longer necessary. The critical value for the data and degrees of freedom
is presented alongside the p-value. If the F statistic is smaller than the critical value from the F
table, the null hypothesis is retained. In this example, the F statistic is larger than the critical F for
all three hypotheses. Hence, all three null hypotheses must be rejected. The samples (newspaper
locations) are statistically different from one another.
Three-Way ANOVA and More
This design is very much like two-way ANOVA. The principal effects of each factor are examined
to see if it makes a difference between groups. This is followed by tests for interactions among
the variables. However, now these interactions are expanded; two-way interactions, three-way
interactions, and more are evaluated. The results are interpreted in the same way as one- and
two-way analyses.
Designs have been developed to test the impact on differences for more than two sets of groups
at the same time. These tests compare all factors against each grouping variable at time, then test
for interaction, and then test for combinations of groups. These are known as multivariate analysis
of variance (MANOVA). Finally, a technique has been designed that combines regression analy-
sis with ANOVA. Known as ANCOVA, it makes analyzing a data set a rich experience. Neither
MANOVA nor ANCOVA is discussed here.
Table 12.8
Daily Sales by Position and Day of Week
Position
Sales by Day of the Week
Wednesday
Thursday
Friday
Saturday
1
$ 933
$ 979
$1,240
$1,610
1
1,004
1,112
1,299
1,020
1
933
1,003
1,353
1,003
1
979
980
1,222
1,900
2
1,217
1,172
1,175
1,945
2
1,171
1,034
1,371
1,837
2
1,178
1,011
1,421
1,958
2
1,230
1,021
1,314
1,851
3
1,021
1,871
1,889
1,835
3
1,015
1,735
1,948
1,631
3
1,041
1,642
1,872
1,500
3
995
1,675
1,919
1,720
D
o
w
n
l
o
a
d
e
d
b
y
[
U
n
i
v
e
r
s
i
t
y
o
f
C
a
l
i
f
o
r
n
i
a
,
S
a
n
D
i
e
g
o
]
a
t
0
0
:
0
8
1
9
M
a
y
2
0
1
7
174 QUANTITATIVE RESEARCH APPROACHES AND METHODS
Summary
Researchers deal with three main types of hypotheses: predictive hypotheses, comparative hypotheses,
and association hypotheses. Hypotheses are usually stated as pairs: a hypothesis that is to be tested, and
an alternative hypothesis, which is the obverse of the test hypothesis. In practice, most test hypotheses
are stated in “null” form. That is, they refer to a status quo situation. The alternative hypothesis is stated
in terms opposite from null hypotheses. When interpreting hypothesis tests, they are said to be either
retained or accepted if they are true, and rejected or not accepted if they are found to be false.
Two types of errors are associated with hypothesis tests—Type I Error and Type II Error. Type
I errors occur when a null hypothesis that is actually true is rejected. Type II errors occur when a
null hypothesis that is false is not rejected. In practice, hypothesis tests are often associated with
confidence intervals for sample statistics. Normal distribution tests in Excel compute the area
under a normal curve that falls below a test statistic. SPSS for Windows includes several tests for
normality; Excel does not.
Researchers often want to know what percentage of all possible samples would include the
parameter for the population somewhere within the interval (range) of their statistic values.
Since the actual parameter value is seldom known, an estimate for this number must be made. The
sample statistic is substituted for the unknown parameter. The sample statistic usually used for this
purpose is the sample mean. Microsoft Excel’s Confidence test function can quickly establish an
estimate for the range of values above and below the hypothesized population mean.
Researchers are often required to compute the area under a normal curve and/or to establish prob-
abilities associated with the normal distribution. Excel includes five functions that pertain to normal
distributions. The social science statistical package SPSS provides additional possibilities for dealing
with questions about distributions. For example, the Explore procedure in the descriptive statistics
set of processes also includes normal distribution-associated tests among its capabilities.
Differences tests are among the statistical tools used most often by political science research-
ers, along with correlation and regression analysis procedures. Two sets of procedures for testing
differences between the means of groups were discussed in this chapter: First, t-test applications
for two-sample tests were explained. Then, analysis of variance procedures for testing differences
with two or more groups were examined.
The paired-sample t-tests in Microsoft Excel compares the means for two related groups, as in
a pretest and post-test research design. The procedure then reports both the calculated and critical
t-statistic for the means, and calculates a p-value for the t-statistic. Results for both a one-tailed
and a two-tailed test are produced. In addition to the procedure for comparing paired samples,
Excel includes a similar procedure for testing independent samples; independent samples may
be from one population with equal variance or from different samples with unequal variance.
Analysis of variance (ANOVA) is used for samples of any size and with any number of
groups or subgroups. Three different levels of analysis of variance tests were also discussed:
one-factor, two-factor, and three or more factor designs. All ANOVA procedures produce a
calculated and a critical F-statistic and a p-value that can be used for quick interpretation of
the test results.
Discussion Questions
1. Name and define the three major types of research hypotheses.
2. What is the difference between a null hypothesis and an alternate hypothesis? Which one
do you test, and why?
D
o
w
n
l
o
a
d
e
d
b
y
[
U
n
i
v
e
r
s
i
t
y
o
f
C
a
l
i
f
o
r
n
i
a
,
S
a
n
D
i
e
g
o
]
a
t
0
0
:
0
8
1
9
M
a
y
2
0
1
7
TESTING RESEARCH HYPOTHESES 175
3. What role does probability play in hypothesis testing?
4. What is a confidence interval and what is it used for?
5. Discuss the concepts of Type I and Type II error in hypothesis testing.
6. What are some of the ways researchers use one-sample hypothesis tests?
7. What are some of the ways researchers use two or more sample hypothesis tests?
8. What is an F-ratio and in what hypothesis test is it used?
9. What is a degree of freedom?
Additional Reading
Berman, Evan. 2007. Essential Statistics for Public Managers and Policy Analysts. 2nd ed. Washington,
DC: CQ Press.
Brightman, Harvey J. 1999. Analysis in Plain English with Microsoft Excel. Pacific Grove, CA: Duxbury
Press.
Lehmann, E.L ., and Joseph P. Romano. 2008. Testing Statistical Hypotheses. London: Springer.
Levine, David M., Mark L. Berenson, and David Stephan. 1997. Statistics for Managers Using Microsoft
Excel. Upper Saddle River, NJ: Prentice Hall.
Miller, Gerald J., and Marcia L. Whicker, eds. 1999. Handbook of Research Methods in Public Administra-
tion. New York: W.H. Marcel Dekker.
Williams, David. 2001. Weighing the Odds: A Course in Probability and Statistics. Cambridge: Cambridge
University Press.
D
o
w
n
l
o
a
d
e
d
b
y
[
U
n
i
v
e
r
s
i
t
y
o
f
C
a
l
i
f
o
r
n
i
a
,
S
a
n
D
i
e
g
o
]
a
t
0
0
:
0
8
1
9
M
a
y
2
0
1
7
176
13 Introduction to Nonparametric Statistics
Quantitative research results are often grouped into two broad classes of measurements: parametric
and nonparametric statistics. Parametric statistics are measurements about samples and popula-
tions. Sample measurements are called statistics; population measurements are called parameters.
Most quantitative political researchers work with parametric statistics. Parametric statistics are
also called inferential statistics because the statistical results are inferred to apply to a population
from which the sample or samples were drawn.
Measurement data can be either continuous or discrete. The measurements in inferential statistics
are almost always from variables that produce continuous measurements. Continuous variables
can have many different possible values; they are not restricted to a specific number of categories
as are categorical variables. An example of a continuous variable is a test score. An example of a
categorical variable is the answer to a Yes or No question. Because only two answers are possible,
this type of categorical variable is also called a dichotomous variable. Another common form of a
categorical variable is the multiple-choice question. Multiple-choice questions usually have from
three to five possible answers, but are not limited to any number of categories. Multiple-choice
questions are also known as multichotomous variables. Because categorical statistics cannot be
used for inferential purposes, they are known collectively as nonparametric statistics. Categorical
data may be either nominal- or ordinal-level measurements (Lehmkuhl 1996).
A large collection of nonparametric statistical tests has been developed for use with categorical
variables. In fact, Lapin (1993, 605) considered the many choices to be one of the major disad-
vantages of the body of nonparametric test: there are almost too many from which to choose. It is
hard to be sure that exactly the best tests has been chosen for the dataset being investigated.
Parametric statistics must meet several basic assumptions. These are: (1) the samples must
be randomly selected, (2) the data are assumed to come from samples with equal variances, (3)
the distribution of responses must be normally distributed, and (4) the samples are assumed to
be independent from one another. Another assumption often cited is that researchers must be able
to replicate the results with other studies. Except for a few examples, in parametric statistics
the measurements must be interval- or ratio-level data; they use mean scores in their computa-
tions. Nonparametric statistics, on the other hand, use rank and frequency distribution information
(Lehmkuhl 1996). Means are not appropriate for these data. Instead, measures of central tendency
are likely to be either the median or the mode.
These required assumptions cannot always be met. Distributions are often not normal; they may
be all gathered around one value or the other, becoming what is known as “positively or negatively
skewed.” They may be bipolar, or evenly distributed across all possible scores. When only two
answers are possible, it is meaningless to talk about a “normal distribution” or a “bell-shaped
curve.” In addition, researchers often draw samples from two or more very different populations.
D
o
w
n
l
o
a
d
e
d
b
y
[
U
n
i
v
e
r
s
i
t
y
o
f
C
a
l
i
f
o
r
n
i
a
,
S
a
n
D
i
e
g
o
]
a
t
0
0
:
0
8
1
9
M
a
y
2
0
1
7
INTRODUCTION TO NONPARAMETRIC STATISTICS 177
Therefore, no assumptions can be made about the population parameters. When this happens, there
is no way of assuring that the samples have equal variances. In all these cases, nonparametric
statistics may be more appropriate for analyzing research results.
Parametric statistics are typically used for making inferences about some population parameter
or parameters. With nonparametric statistics, however, the assumption of a normal distribution
does not apply; that is, nonparametric statistics are those that are considered to be “distribution
free.” In a dichotomous variable, for example, the distribution can only be binomial (only two
answers); this is the same type of data developed by flipping a coin.
Because nonparametric statistics do not require the assumptions necessary for parametric
statistics, one might wonder why they are not always used. In fact, nonparametric statistical tests
can be used with all levels of data. This is not done because they typically provide less informa-
tion than parametric statistics. They are sometimes described as being “less powerful,” or “not
as robust” as parametric tests. However, these accusations are not really relevant; there are times
when nonparametric statistics are the only appropriate choice. Lehmkuhl summarized the position
of when parametric statistics should and should not be used in the following way:
Nonparametric tests should not be substituted for parametric tests when parametric tests are
more appropriate. Nonparametric tests should be used when the assumptions of parametric
tests cannot be met, when very small numbers of data are used, and when no basis exists
for assuming certain types of shapes of distributions. (Lehmkuhl 1996, 106)
Thus, nonparametric statistics are entirely appropriate for use when the researcher cannot make
any assumptions about distributions, when the sample size is small (less than 100), and measure-
ments are nominal or ordinal level. Such applications occur when the data are categorical (nominal
level) or ranked or ordered (ordinal level).
An illustration of a manifestly appropriate application of a nonparametric statistical test is
the chi-square-based Cramer’s V test for relationships between nominal-level variables. This
statistic, with its table-shape variant the phi-statistic, provides an index of the strength of a rela-
tionship, although it does not tell the direction of that relationship. Although nonparametric tests
for differences will provide information about differences in measurements between two or more
groups, they are unable to include information about possible interaction between two or more
influencing variables.
Nonparametric Analogs of Parametric Tests
At least one nonparametric equivalent test exists for each type of basic parametric statistical test
(StatSoft 2002). This chapter discusses some of the most commonly used nonparametric statistical
tests in each of four general categories of statistical analysis:
s 4ESTSFORLOCATIONIE
CENTRALTENDENCY
s 4ESTSFORSTATISTICALLYSIGNIlCANTDIFFERENCESBETWEENGROUPSINDEPENDENTSAMPLES
s 4ESTSFORDIFFERENCESBETWEENVARIABLESDEPENDENTSAMPLES
s 4ESTSFORASSOCIATIONSBETWEENALLTYPESOFVARIABLES
The statistical tests used most often when dealing with parametric statistics and interval and/or
ratio-scale data include (1) the single-sample t- or z-tests; (2) the two-sample t-test for independent
samples and the analysis of variance (ANOVA) test for two or more samples; (3) the two-sample
D
o
w
n
l
o
a
d
e
d
b
y
[
U
n
i
v
e
r
s
i
t
y
o
f
C
a
l
i
f
o
r
n
i
a
,
S
a
n
D
i
e
g
o
]
a
t
0
0
:
0
8
1
9
M
a
y
2
0
1
7
178 QUANTITATIVE RESEARCH APPROACHES AND METHODS
t-test for differences in the means of dependent samples, such as with pre-and post-same-group
testing and paired-sample testing; and (4) the Pearson’s correlation coefficient statistic for associa-
tions. Table 13.1 displays a variety of the available nonparametric tests.
Not all of these nonparametric tests are included in the Excel statistical package. However,
provision for the majority of the nonparametric relationship and differences tests are included in the
more comprehensive and powerful statistical software package, SPSS. For additional information,
a standard statistical methods textbook should be consulted. One or more nonparametric procedures
for tests of location, for differences, and for association are discussed in the following pages.
Nonparametric Tests for Location
Tests of location are designed to determine whether a sample or samples could have come from a
known population (Siegel 1956). The procedure is to compare a sample’s measurement of central
tendency with a known or hypothesized parameter. When the researcher is dealing with parametric
data, the one-sample t-test or z-test are the preferred procedures.
The t-test is used compare a sample mean with a hypothesized population mean; the z-test is
used with large samples, and the unknown population standard is replaced by the sample standard
deviation. In both these applications the scores are assumed to have come from a population where
the distribution is normal. Because both tests compare means, the data must be either interval or
ratio. When these assumptions cannot be met, the nonparametric chi-square test of location may
be substituted for the t-test or the z-test.
In general, nonparametric tests of location are very similar to the chi-square goodness-of-fit procedure.
Both one-sample and two-sample models compare actual distributions with expected distributions. In
the one-sample test, the researcher draws a sample, then attempts to determine if there is any significant
difference in the location (central tendency) between the sample and the population. Because the data
are nominal or ordinal, the central tendency measurement in these tests is usually the median. In a
two- (or more) sample test, the researcher wants to know if there is a statistically significant difference
Table 13.1
Selected Nonparametric Analogs to Parametric Statistical Tests
Test Type
Nonparametric Analog
Parametric Tests
Tests for location
Chi-square one-sample tests
t-test for small samples
Kolmogorov-Smirnov
z-test for samples of 30
one-sample test
or more
Differences tests with
Mann-Whitney U-test
t-test for independent samples
independent samples
Kolmogorov-Smirnov
F-test of variance (ANOVA)
two-sample test
Kruskal-Wallis H-test
Kruskal-Wallis ANOVA
Differences tests with
Friedman’s two-way analysis
t-test for dependent [paired]
dependent samples
of variance test
samples
McNemar’s chi-square test
ANOVA
Tests for association between Spearman’s rho, χ
2
, phi, and
Pearson’s correlation
two or more variables
Cramer’s V
coefficient
D
o
w
n
l
o
a
d
e
d
b
y
[
U
n
i
v
e
r
s
i
t
y
o
f
C
a
l
i
f
o
r
n
i
a
,
S
a
n
D
i
e
g
o
]
a
t
0
0
:
0
8
1
9
M
a
y
2
0
1
7
INTRODUCTION TO NONPARAMETRIC STATISTICS 179
between the actual (observed) distribution of responses and an expected distribution. Modified versions
of the chi-square test are appropriate for one, two, and three or more sample situations.
Tests based on the chi-square statistic (χ2) are extremely versatile statistical tools. (Greek letters
are used throughout statistics and mathematics; in English, the Greek letter χ is written as “chi,”
and pronounced “ki.” Because the final statistic is squared, the test and distribution are called
chi-square, and written as χ
2
.) Chi-square has important applications with both parametric and
nonparametric statistical tests. The statistic is based on the χ
2
distribution, which was originally
developed for use with small samples where the assumptions of normality could not be upheld.
Small-sample results, simply because of the limited number of responses available, seldom
resemble a normal distribution, for example. The one-sample location test is just one of many
tests based on the χ
2
distribution. Several other χ
2
- based nonparametric tests are discussed below.
This simple-to-use and easy to understand test has become a popular one-sample test for making
decisions about the distribution of responses in one-sample situations.
The inclusion of this test in the majority of statistical software packages has increased its
popularity such that it has replaced many other tests, such as the one-sample sign test, in many
empirical research applications. Although it is used with all types of measurements, the test is
particularly at home with all types of categorical measurements.
One-Sample Nonparametric Tests
Of the many statistical tests that are available for testing hypotheses about a single sample, two of the
most popular are the chi-square test for use with nominal data and the Kolmogorov-Smirnov one-sample
test for ordinal data. One-sample tests are conducted to test hypotheses that the sample in question could
come from an identified population. One-sample tests use a goodness-of-fit model, in which they test
for a disproportionate or unexpected distribution of scores across the various categories of a variable.
The One-Sample Chi-Square Test
The X
2
one-sample test should be used when a researcher has questions about the distribution of
responses in data taken from a sample. Specifically, the researcher has questions about the distri-
bution of responses that fall into the spread of possible responses.
For example, say that the County Clerk of a rural county in a western state has reported that
for the past decade, the number of registered voters in the county has remained stable. County
records reveal that 45 percent are registered Democrats, 38 percent are Republicans, 12 percent
are Independents, and 5 percent are members of the Socialist Labor Party (Table 13.2).
In these types of applications, the one-sample test is similar to the goodness-of-fit test because
it compares the set of observed cases against an expected distribution. The null hypothesis for this
test is that the proportion of cases that make up a sample of county voters will not differ from the
known distribution. The alternate hypothesis is that the distribution does not mirror the expected
distribution of responses.
The chi-square test (CHITEST) in the Excel Function Wizard looks at differences within the
sample, computes a chi-square distribution, and compares the actual distribution of responses with
the expected distribution. The only required assumptions for the χ
2
test are (1) that the sample is
randomly selected, and (2) each observation must fit into one and only one class. CHITEST only
returns the two-tailed probability for a χ
2
statistic with the appropriate degrees of freedom (number
of rows minus 1); it does not return a calculated chi-square value. The syntax for this simple test
is: CHITEST = (actual range, expected range).
D
o
w
n
l
o
a
d
e
d
b
y
[
U
n
i
v
e
r
s
i
t
y
o
f
C
a
l
i
f
o
r
n
i
a
,
S
a
n
D
i
e
g
o
]
a
t
0
0
:
0
8
1
9
M
a
y
2
0
1
7
180 QUANTITATIVE RESEARCH APPROACHES AND METHODS
For the data in Table 13.2, the test returned the probability of 0.2311 that the actual proportion
of voters in the four categories is representative of the known population parameter distribution.
Decisions regarding nonparametric hypotheses are made based on the size of the p-value. If the
researcher elects to use a 0.05 confidence level for the test, the null hypothesis cannot be rejected;
the computed p-value of 0.2311 is greater than 0.05. The researcher must conclude that the sample
is not representative of the population.
The Logic Behind the Chi-Square Test of Location
In the following one-sample example, a media buyer planning a political advertising campaign in
a given state or community wants to know which Wednesday and Thursday evening prime time
television programs are preferred by a target audience of adult registered voters. The media buyer
will use this information to place advertisements for her candidate. Data are gathered from a sample
of 200 subjects. Local advertising can be purchased on eight programs over the two evenings. The
variable of interests is preferred television program. The null hypothesis is that the distribution of
preferred programs is equal; no one program is preferred above any other program.
The data are categorical (preferred, not-preferred), and are presented in Table 13.3 . The number
Table 13.2
Distribution of Registered Voters in a Population and a Sample
Number of
Registered
Voters
Expected
Number in
Observed
Par ty Affiliation:
(n = 131,687)
Percentage Sample (n = 250) Percentage
Democrat
59,260
45
128
51
Republican
50,041
38
80
32
Independent
15,802
12
37
15
Socialist Labor
6,584
5
5
2
Totals:
131,687
100.0
250
100.0
Source: Example data.
Table 13.3
Frequencies for Wednesday–Thursday Preferred Television Programs
Program Type
Program
Code
Observed
Cases
Expected
Percent
Expected
Cases
Situation Comedy
1
22
12.5
25
Medical Drama
2
28
12.5
25
News Magazine
3
14
12.5
25
Spor ts Show
4
30
12.5
25
Variety Musical
5
22
12.5
25
Slice-of-Life
6
30
12.5
25
Ethnic Comedy
7
26
12.5
25
Children’s Omnibus
8
28
12.5
25
Totals
200
100.0
200
D
o
w
n
l
o
a
d
e
d
b
y
[
U
n
i
v
e
r
s
i
t
y
o
f
C
a
l
i
f
o
r
n
i
a
,
S
a
n
D
i
e
g
o
]
a
t
0
0
:
0
8
1
9
M
a
y
2
0
1
7
INTRODUCTION TO NONPARAMETRIC STATISTICS 181
of expected cases was determined by dividing the total number of cases by the number of classes
or categories (100/8 = 12.5); degrees of freedom refers to the number of categories (rows) minus
1; in this case, 8 – 1 = 7 df. Table 13.4 displays the information and steps needed to calculate a
chi-square value.
Using the chi-square distribution (CHIDIST) capability in the Excel Function Wizard, a one-
tailed p-value of 0.0853 is found for the distribution of 12.5 observed cases per cell and 7 (n – 1)
degrees of freedom. Since this is a two-tailed test, the one-tailed probability of 0.0853 must be
doubled, for a final value of 0.1706. The null hypothesis cannot be rejected; the distribution of
responses is statistically disproportionate. The null hypothesis for both a one-tailed and a two-
tailed test would be rejected at the 0.05 level of confidence. The alternate hypothesis is retained
for both (or accepted).
The K-S One-Sample Test for Ordinal Data
The Kolmogorov-Smirnov (K-S) one-sample test for ordinal-level data is different in concept
than the nominal-data test for location. Instead of comparing a sample median with a population
median, it compares the distribution of a sample dataset with a theoretical expected distribution.
The K-S test is used when the researcher wants to determine whether the sample rankings can be
assumed to be from a population with those theoretical rankings.
The K-S one-sample test is an efficient statistical procedure for testing for differences among
the rankings of classes within one sample. The only two assumptions that must be met are the
requirement that the data are at least ordinal level (rankings), and that they are from a randomly
selected sample. A null hypothesis for this test is that there is no difference in the way groups in
the sample have ranked a given set of objects. Therefore, the K-S one-sample test may be said to
be a test that follows the goodness-of-fit model.
The K-S test is included in the SPSS Nonparametric Tests group, listed as “1-sample K-S .”
Table 13.4
Calculations for Determination of a Chi-Square Test
Code
Actual
Count (A)
Actual
Percent
Expected
Count (B)
Expected
Percent
Actual minus
Expected
(A–B)
(A–B)/25
1
22
0.110
25
0.125
–3
0.36
2
35
0.175
25
0.125
10
4
3
28
0.140
25
0.125
3
0.36
4
18
0.090
25
0.125
–7
1.96
5
32
0.160
25
0.125
7
1.96
6
25
0.125
25
0.125
0
0
7
21
0.105
25
0.125
–4
0.64
8
19
0.095
25
0.125
–6
1.44
200
1.00
200
1.00
0
10.72
F2 (table)
14.067
Source: Sample data from Table 13.3 .
Computed chi-square = 10.72
Degrees of freedom (r – 1) = 7
Table F
2
value = 14.067
D
o
w
n
l
o
a
d
e
d
b
y
[
U
n
i
v
e
r
s
i
t
y
o
f
C
a
l
i
f
o
r
n
i
a
,
S
a
n
D
i
e
g
o
]
a
t
0
0
:
0
8
1
9
M
a
y
2
0
1
7
182 QUANTITATIVE RESEARCH APPROACHES AND METHODS
(It is not available in Excel.) The test computes a mean rank for each group, a z-score, and a
two-tailed probability. It requires selection of a test distribution (normal, uniform, or Poisson). In
almost all cases (unless the manager knows specifically that another distribution is present), the
normal distribution option is selected even though this is a distribution-free test. The test results
are interpreted by comparing the two-tailed probability value with the desired confidence level;
p-values equal to or greater than the chosen alpha result in retaining the null hypotheses.
Nonparametric Tests for Differences
A number of nonparametric statistical tests have been developed to measure the significance of
differences in variables that are measured in either nominal- or ordinal-level data. Table 13.5
displays a small sample of the better-known nonparametric differences tests, including the one-
sample tests. The table lists dependent and independent group nonparametric tests that have been
developed for one, two, and more-than-two-samples comparisons.
Not all of the differences tests identified in Table 13.5 are regularly used in standard political
science research situations. The following discussion looks at only those tests that might be seen
in political science, administrative science, and public administration journals, and which are easy
to employ and interpret. The following two-sample tests are discussed first: the Kolmogorov-
Smirnov z-test for nominal data, and the Mann-Whitney U-test for ordinal data. For three or more
samples, the following procedures are discussed: the Kruskal-Wallis H-test for nominal data and
the Kruskal-Wallis one-way ANOVA procedure for ordinal data.
Table 13.5
A Partial List of Nonparametric Tests for Statistically Significant Differences
Independent Samples
Related Samples
2-Sample Tests
3+-Sample Tests
2-Sample Tests
3+-Sample Tests
NOMINAL Kolmogorov-
χ2 Test for Inde-
McNemar Test
Cochran’s Q-Test
DATA:
Smirnov Test
pendent Samples
ORDINAL Mann-Whitney
Kruskal-Wallis
Wilcoxon Rank
Friedman
DATA:
U-Test
One-Way
ANOVA
Sum Test
Analysis-of-
Variance Test
Source: After Siegel 1956.
Two Independent-Sample Tests
SPSS includes four two-independent-sample test procedures in its powerful Nonparametric Tests
sub-program. Two of these independent-sample tests are often used in organizational research,
including studies in political science and public administration. They are the Kolmogorov-Smirnov
z-test (K-S), which is used with categorical (nominal-level) data, and the Mann-Whitney U-test
(M-W), which should be used with ordinal-level data.
The nominal-data K-S z-test compares the observed distributions counts of numeric
variables across categories for two samples or groups. A z-value and a two-tailed probabil-
ity value are produced. The test results are interpreted by comparing the p-value with the
D
o
w
n
l
o
a
d
e
d
b
y
[
U
n
i
v
e
r
s
i
t
y
o
f
C
a
l
i
f
o
r
n
i
a
,
S
a
n
D
i
e
g
o
]
a
t
0
0
:
0
8
1
9
M
a
y
2
0
1
7
INTRODUCTION TO NONPARAMETRIC STATISTICS 183
desired confidence level (.01, .05, or .10). The only required assumption is that the samples
are randomly selected.
The Mann-Whitney U-test ranks all responses to an ordinal-level variable and computes a U-
score and its significance level, which is used for interpreting the results of this test. It tests the
hypothesis that two independent samples come from populations having the same distribution. The
Mann-Whitney U-test requires that the samples are randomly selected and that data are ordinal-
level. The U-test converts the observed data to ranks and compares the differences.
In the following example, suppose that a state elections board is evaluating the effectiveness of
two different vote-recording systems. One, the existing system, is a manual process that requires
voters to use a small metal stylus to punch out partially perforated windows in card-like ballots.
The finished ballots are then counted at the end of the day by equipment resembling old IBM
punch-card readers.
The second system is an electronic touch-screen that allows voters to record their votes,
erase or change any mistakes, and electronically counts all ballots as they are completed. A
random sample of 30 voters is selected to test both systems, with the time to complete the vot-
ing in seconds recorded for each voter. Half of the sample is randomly assigned to the existing
system (the control group), and half is randomly assigned to the new electronic system (the
experimental group). The time (in seconds) for each sample member to complete the voting
process is displayed in Table 13.6.
Two Related-Sample Tests
In political science research, nearly all of the applications of differences tests involve independent
samples. Tests with related samples are used primarily in laboratory-based experimental research.
The setups and test results for dependent sample tests are nearly identical to those of independent
Table 13.6
Time (in seconds) and Rank Order for Two Voting Procedures
Sample No.
Control Group
Experimental Group
Time (in seconds)
Rank Order
Time (in seconds)
Rank Order
1
217
20
239
22
2
256
24
198
12
3
285
27
201
14
4
192
10
204
15
5
191
9
187
7
6
175
2
162
1
7
268
26
211
18
8
261
25
213
19
9
380
30
183
6
10
292
28
176
3
11
189
8
207
16
12
210
17
182
5
13
244
23
177
4
14
220
21
200
13
15
360
29
195
11
D
o
w
n
l
o
a
d
e
d
b
y
[
U
n
i
v
e
r
s
i
t
y
o
f
C
a
l
i
f
o
r
n
i
a
,
S
a
n
D
i
e
g
o
]
a
t
0
0
:
0
8
1
9
M
a
y
2
0
1
7
184 QUANTITATIVE RESEARCH APPROACHES AND METHODS
tests. In the SPSS Nonparametric Tests statistical program, for example, four types of related-
sample tests are grouped under the “two-related-samples tests” set of procedures.
Two of these tests for related samples are the McNemar Test for dichotomous (nominal) data,
and the Wilcoxon Rank Sum Test for ordinal data. McNemar’s test is designed to test hypotheses
about pairs of variables, such as spouses or in before-and-after designs. Norušis (2000, 344) de-
fined the McNemar procedure as one that tests whether the possible combinations of values for
the variables are likely. In a before-and-after experiment, subjects are tested before a treatment,
such as being exposed to a communication, and again after the treatment.
The Wilcoxon Rank Sum test performs a similar function for data at the ordinal level, but data
that do not have to be dichotomous. The test computes differences between pairs of variables,
ranks the differences, and computes a z statistic and a significance level for interpretation. The
null hypothesis for this test is there is no difference in the way the related samples ranked the
variables. It is interpreted using the p-value approach.
Three or More Independent Sample Tests
Nonparametric tests are also available to test for differences in more than two independent samples.
When three or more independent samples are involved and the data are categorical, a choice of
three-sample tests is included in the SPSS tests for several independent samples capability (called
K Independent Samples in the dialog box menu).
The χ2 K-Independent Samples Test
The K-sample χ
2
test for three or more independent samples compares the medians of three
or more independent samples, and computes a chi-square and a significance value (p-value).
This test is included in the SPSS Crosstabs procedure in the Descriptives Statistics section.
Accordingly,
When frequencies in discrete categories constitute the data of research, the χ
2
test may be
used to determine the significance of the differences among (3 or more) independent groups.
The χ
2
test for k independent samples is a straightforward extension of the χ
2
test for two
independent samples. . . . In general, the test is the same for both two and k independent
samples. (Siegel 1956, 175)
In the following example, a researcher is interested in determining whether Cuban-Americans
of different ages support or do not support normalizing relations with Cuba. The researcher iden-
tified four age-group categories, 15 to 29 years, 30 to 44 years, 45 to 59 years, and 60 years and
older. Subjects were asked to answer either Yes or No to the question “Should the U.S. normalize
diplomatic relations with Cuba as long as Castro still leads the country?” Subjects were surveyed
at random on a street in a Cuban-American community in Miami, Florida. The data from a small-
sample attitude survey are displayed in Table 13.7 .
Table 13.8 is a crosstabulation table produced by the SPSS descriptive statistics proce-
dure. Table 13.9 displays a table of the results of the chi-square test. Two results of interest
are presented in Table 13.9 . One is the result of the χ
2
test. The calculated χ2
value is 7.897,
with 3 degrees of freedom (rows – 1). A two-tailed probability of 0.048 indicates that at the
. 05 level of confidence the hypothesis that the age groups are not from the same population
must be accepted.
D
o
w
n
l
o
a
d
e
d
b
y
[
U
n
i
v
e
r
s
i
t
y
o
f
C
a
l
i
f
o
r
n
i
a
,
S
a
n
D
i
e
g
o
]
a
t
0
0
:
0
8
1
9
M
a
y
2
0
1
7
INTRODUCTION TO NONPARAMETRIC STATISTICS 185
Table 13.7
Data Distribution for a Survey of Attitudes Regarding Cuba
3UBJECT
15–29 years
of age
30–44 years
of age
45–59 years
of age
60 years of age
or older
1
1122
2
1221
3
2121
4
2122
5
1212
6
1122
7
1122
8
2222
911
2
10
2
Key:1=Yes;2=No
Table 13.8
Age-Group Membership: Should the United States Normalize Relations with Cuba?
Yes
No
Total
Age group:
15–29
6
3
9
30–44
6
4
10
45–59
1
7
8
60 or older
2
7
9
Total
15
21
36
Table 13.9
Chi-Square Test Results, Age Group Membership: Should the United States
Normalize Relations with Cuba?
Value
df
Asymp. Sig. (2-sided)
Pearson Chi-Square
7.897
3
.048
Likelihood Ratio
8.421
3
.038
Linear-by-Linear Association
5.812
1
.016
N of Valid Cases
36
Note: 5 cells (62.5%) have expected count less than 5. The minimum expected count is 3.33 .
Kruskal-Wallis Analysis of Variance Test
The Kruskal-Wallis analysis of variance test is used to test differences in the way that three or
more groups respond to one or more ordinal-level variables, such as the way subjects rank a set of
statements or other items in terms of their perceived importance. The test computes an H-statistic
similar to a chi-square distribution (a chi-square value is also printed as the default). This test also
D
o
w
n
l
o
a
d
e
d
b
y
[
U
n
i
v
e
r
s
i
t
y
o
f
C
a
l
i
f
o
r
n
i
a
,
S
a
n
D
i
e
g
o
]
a
t
0
0
:
0
8
1
9
M
a
y
2
0
1
7
186 QUANTITATIVE RESEARCH APPROACHES AND METHODS
provides a significance value that can be used in the same way as a p-value for interpreting the
results. If there are a large number of ties in raw data, a second chi-square and significance value
corrected for ties is also computed.
The Kruskal-Wallis procedure tests for differences in the way that three or more independent
groups or samples rank a variable in order to establish whether three or more independent samples
are from the same population (Siegel 1956). In much the same way as the Kruskal-Wallis H-test,
it computes a chi-square and a significance value, and repeats these results corrected for ties in
the data. This test is also included in SPSS Nonparametric Tests.
In the following example, a researcher is interested in determining the best appeal to use
in order to influence citizens’ attitudes about constructing a new wastewater treatment facility
in the community. The city and county must float a bond issue in order to pay for the facility;
property taxes are expected to increase if the bond issue passes. Table 13.10 displays the data for
the hypothetical test of three independent groups exposed to different advertising appeals and a
control group that does not get the treatment. All subjects were asked to rank the importance of
a proposed community bond issue by awarding up to 100 points; the more points awarded, the
greater the importance.
To prepare the data for an SPSS K-W analysis of variance test procedure, the data in Table
13.10 must be rearranged into three columns, as displayed in Table 13.11 . Column 1 is the subject
number variable, with subjects numbered sequentially from 1 to 29. Column 2 is the grouping
variable. Groups are numbered from 1 to 4, with 1 assigned to the control group, 2 to the reason
group, 3 to the emotion group, and 4 to the financial appeal group. The third column is the rank
value given by each subject. The SPSS procedure requires entry of the rank variable as the test
variable and the group assignment variable as the grouping variable. The default selection for
the test is the K-W H-test, so this box should already be checked. Table 13.12 shows mean rank
calculations for this test.
The SPSS procedure produces a summary table in which the calculated mean rankings for
each group are displayed, and a test statistics result for the test (Table 13.13). In this example, the
computed chi-square is 12.602, with 3 degrees of freedom, and a significance of .006. There are
only six chances in 1,000 that a Type I error will occur. The null—the distribution of rankings
is not the same in all groups—must be rejected and the alternate hypothesis, the distribution is
similar in all groups, accepted.
The Cochran Q-Test for Differences
The nonparametric test for differences in three or more related samples is the Cochran Q-test for
nominal data. For differences between three or more related samples where the data are ordinal,
the Friedman analysis of variance test for ordinal-level data may be used. Neither of these tests is
included in the standard edition of SPSS for Windows, version 10.0 and below. Readers are en-
couraged to consult a standard nonparametric statistics text for instruction on the manual methods
for conducting these two tests. The tests are included in more powerful editions of earlier desktop
and mainframe versions of the software.
Nonparametric Relationship Tests
In the previous chapter on parametric statistical tests for relationships, it was brought out that
two different statistical techniques are needed to determine whether a significant relationship
existed, and to provide information about both the strength and the direction of a relationship.
D
o
w
n
l
o
a
d
e
d
b
y
[
U
n
i
v
e
r
s
i
t
y
o
f
C
a
l
i
f
o
r
n
i
a
,
S
a
n
D
i
e
g
o
]
a
t
0
0
:
0
8
1
9
M
a
y
2
0
1
7
INTRODUCTION TO NONPARAMETRIC STATISTICS 187
Table 13.10
Data for a Kruskal-Wallis ANOVA Test
Importance
Rankings
3UBJECT
Group 1
Group 2
Group 3
Group 4
1
20
25
65
30
2
25
10
40
70
3
60
40
15
70
4
80
30
25
40
5
50
90
35
95
6
40
20
75
100
74
55
0
20
8
50
15
Table 13.11
Importance Data Reformatted into Column Form
3UBJECT
Group
Importance Score
112
0
212
5
316
0
418
0
515
0
614
0
714
5
822
5
921
0
10
2
40
11
2
30
12
2
90
13
2
20
14
2
50
15
2
50
16
3
65
17
3
40
18
3
15
19
3
25
20
3
35
21
3
75
22
4
30
23
4
70
24
4
70
25
4
40
26
4
95
27
4
100
28
4
20
29
4
15
D
o
w
n
l
o
a
d
e
d
b
y
[
U
n
i
v
e
r
s
i
t
y
o
f
C
a
l
i
f
o
r
n
i
a
,
S
a
n
D
i
e
g
o
]
a
t
0
0
:
0
8
1
9
M
a
y
2
0
1
7
188 QUANTITATIVE RESEARCH APPROACHES AND METHODS
Regression analysis measured the way in which variables might be related; correlation analy-
sis provided a numerical measure or index of the strength of the relationship. These tests are
displayed in Table 13.14.
Tests for Nominal-level Data
The first step often used to test for associations between nominal-level data is to employ the
chi-square test for independence. This test provides a coarse measurement of association in that
it allows the manager to test a null hypothesis that the two categorical variables are independent
(that is, they are not related). The chi-square test is included in two separate categories of statisti-
cal tests in SPSS for Windows: Crosstabulations and Nonparametric Tests.
Crosstabulations, which are two-way frequency distribution tables, include a number of other
relationship or association tests for categorical data. Among the two most useful of these are tests
for the phi-statistic and for Cramer ’s V. Both of these tests compute a nonparametric correlation
Table 13.12
Mean Rank Calculations for SPSS Kruskal-Wallis H-Test
Ranks
Group
N
Mean Rank
IMPRANK
Control Group
7
7.93
Appeal to Reason
8
13.38
Appeal to Emotion
6
14.50
Financial Appeal
8
23.19
Total
29
Table 13.13
Calculated Chi-Square Value, Degrees of Freedom, and p-Value for K-W H-Test
Test Statistics
IMPRANK
Chi-Square
12.602
df
3
Asymp. Sig.
.006
Kruskal-Wallis test.
Grouping variable: group
Table 13.14
A Summary of Some Nonparametric Relationship Tests
Nominal Data Tests
Ordinal Data Tests
χ2 Test for Independence
Spearman’s Rank Order Coefficient R (rho)
Cramer’s V-Test (for square tables)
Kendall’s tau-b (for square tables)
Phi-Statistic (for rectangular tables)
Kendall’s tau-c (for rectangular tables)
D
o
w
n
l
o
a
d
e
d
b
y
[
U
n
i
v
e
r
s
i
t
y
o
f
C
a
l
i
f
o
r
n
i
a
,
S
a
n
D
i
e
g
o
]
a
t
0
0
:
0
8
1
9
M
a
y
2
0
1
7
INTRODUCTION TO NONPARAMETRIC STATISTICS 189
coefficient index number that ranges from 0 (no relationship) to 1.0 (a perfect relationship). This
means they can only provide a non-directional measure of relationship; it is impossible to deter-
mine whether the relationship is positive or negative. The samples can be of any size with either
of these tests.
The only difference between these two tests is the way they are structured for comparing re-
sponses to different numbers of categories. The phi-statistic is used with tables that are “square,”
that is, a table with the same number of categories in both rows and columns. For example, a
“two-by -two table” is one with just two possible classes for each variable. Examples include
such dichotomous variables as gender, yes or no, read or don’t read, member or nonmember, use
or don’t use. The Cramer ’s V tests, on the other hand, measures association for all tables that are
rectangular in shape; rows and columns do not have the same number of categories. They may
be 2 by 3, 2 by 4, 3 by 4, 4 by 6, etc. Both tests are included under the same statistics option in
the SPSS Crosstabs procedure.
The Crosstabs procedure is designed to prepare tables and measures of association for two or
more nonscale-level variables. Although the procedure may be prepared with any level of data, it
is particularly appropriate for use with categorical data. The association measures are grouped in
three categories: for nominal data, for ordinal data, and for tables where one variable is nominal
and the other is interval level.
Among the options for inclusion in the table are row percentages, column percentages, and
the percentages of the total represented by each cell count. Counts (or “observed” frequencies)
for each category are always printed. It also possible to have the expected frequencies counted
for goodness-of-fit applications.
The data will dictate which of the two tests is carried out by the statistical software (they are
included in the same selection option). Interpretation of both of these chi-square-based tests is
identical. Each produces a relationship value (correlation coefficient) ranging from 0 to 1.0 . This
can be interpreted in the same way as the parametric coefficient of determination’s percentage
of association.
Ordinal Data Association Tests
Ordinal-level measurements, like nominal data, are considered to be measures of category rather
than quantity. With nominal data, the numbers mean how many cases fall into each specific and
discrete category, such as “male” or “female” in the variable “gender.” With ordinal data, the
numbers also refer to how many observations fall into each of the descriptive categories. But now
they also mean that the various categories may be placed in some kind of order.
Examples included voters’ preferred presidential candidates, the perceived importance of a
set of factors that influence determination of public policy, or the possession of more or less of
a characteristic, such as a “liberal attitude.” Each level in ordinal measurement is a statement of
order for the category. It is not possible to tell from the rankings how far apart the levels are, but
simply that one level is higher (or lower) than others.
Researchers often want to know how ordinal-level variables are related to one another, if at all.
For example, a public administrator might want to know if there is any relationship between the
importance ranking that citizens give a civic service with the way the public ranks the perceived
quality of the service.
When at least one of the variables in a crosstabulation test is ordinal level, the SPSS Crosstabs
procedure allows a choice of several different tests. These include the Spearman correlation co-
efficient (Spearman’s rho), Zero-order Gammas, Somer’s d tests, and Kendall’s tau-b and tau-c
D
o
w
n
l
o
a
d
e
d
b
y
[
U
n
i
v
e
r
s
i
t
y
o
f
C
a
l
i
f
o
r
n
i
a
,
S
a
n
D
i
e
g
o
]
a
t
0
0
:
0
8
1
9
M
a
y
2
0
1
7
190 QUANTITATIVE RESEARCH APPROACHES AND METHODS
tests. Spearman’s rho is perhaps the most used measure of correlation between two ordinal-level
variables. It is the nonparametric analog of the parametric product moment correlation coefficient
(Pearson’s r) and is interpreted in the same way as the interval-level test. It also identifies whether
the relationship is positive or negative. Spearman’s rho can be used with samples of any size, with
equal or unequal size groups, and with any table shape.
The Kendall tests are also simple to use and interpret; each is appropriate for slightly differ-
ent situations. Tau-b should be used for square tables (when the number of columns equals the
number of rows in the Crosstabs table); a tau-b corrected for ties tests is also computed. Tau-c is
to be used when the tables are rectangular rather than square.
Summary
A number of nonparametric statistics procedures were discussed in this chapter. A few are included
in Microsoft Excel, and all are included in SPSS and SPSS for Windows software. Nonparametric
tests, which are also known as distribution-free tests, are appropriate when a researcher must deal
with categorical or ranked data. Nonparametric statistics are to be used when the researcher can-
not make any assumptions about distributions, when the sample size is small (less than 100), and
measurements are nominal or ordinal level. Such applications occur when the data are categorical
(nominal level) or ranked or ordered (ordinal level).
There are many different uses for nonparametric tests. They begin with several different versions of
chi-square tests, and extend across a variety of independent- and paired-sample applications for one, two,
and three or more samples or groups. They include tests for differences and tests for relationships.
At least one nonparametric equivalent test exists for each type of basic parametric statistical
test. Nonparametric statistical tests have been developed for these categories of statistical analysis:
tests for location, tests for statistically significant differences between independent and related
samples, and tests for associations between variables.
Two of the most popular one-sample nonparametric tests are the chi-square test for use with nomi-
nal data and the Kolmogorov-Smirnov one-sample test for ordinal data. One-sample tests are con-
ducted to test hypotheses that the sample in question could come from an identified population.
Two of the independent sample tests in SPSS are often used in political science and public
administration. They are the Kolmogorov-Smirnov z-test (K-S), which is used with nominal-level
data, and the Mann-Whitney U-test (M-W), which should be used with ordinal-level data. For two
related-samples tests, the McNemar Test for dichotomous (nominal) data, and the Wilcoxon Rank
Sum Test for ordinal data should be used. When three or more independent samples are involved
and the data are categorical, the F
2
K-independent Samples Test, the Kruskal-Wallis Analysis of
Variance Test, and the Cochran Q-Test for Differences should be used.
The SPSS Crosstabs procedure prepares tables and measures of association for two or more nonscale-
level variables. When at least one of the variables in a crosstabulation test is ordinal level, Spearman’s
rho is the most appropriate measure of correlation between two ordinal level variables.
Discussion Questions
1. What is meant by the term distribution-free statistics?
2. When and how do political science researchers use nonparametric tests for location?
3. When should the χ
2
(chi-square) one-sample test be used? Why?
4. What is the appropriate test to use when comparing two related samples with nominal
data?
D
o
w
n
l
o
a
d
e
d
b
y
[
U
n
i
v
e
r
s
i
t
y
o
f
C
a
l
i
f
o
r
n
i
a
,
S
a
n
D
i
e
g
o
]
a
t
0
0
:
0
8
1
9
M
a
y
2
0
1
7
INTRODUCTION TO NONPARAMETRIC STATISTICS 191
5. What is the appropriate test to use when comparing two related samples with ordinal
data?
6. Name at least one nonparametric relationship test for nominal data and describe how to
interpret the test results.
7. Name at least one nonparametric relationship test for ordinal data and describe how to
interpret the test results.
8. Is it ever appropriate to use a parametric test on nonparametric data? Why or why not?
Additional Reading
Higgins, James J. 2003. Introduction to Nonparametric Statistics. Pacific Grove, CA: Duxbury Press.
Norušis, Marija. 2005. SPSS 15.0 Statistical Procedures Companion. Upper Saddle River, NJ: Prentice
Hall.
— —— . 2008. SPSS 16.0 Guide to Data Analysis. Upper Saddle River, NJ: Prentice Hall.
Sprent, Peter, and Nigel C. Smeeton. 2007. Applied Nonparametric Statistical Methods. 4th ed. New York:
Chapman & Hall/CRC.
Wasserman, Larry. 2007. All Nonparametric Statistics. London: Springer.
D
o
w
n
l
o
a
d
e
d
b
y
[
U
n
i
v
e
r
s
i
t
y
o
f
C
a
l
i
f
o
r
n
i
a
,
S
a
n
D
i
e
g
o
]
a
t
0
0
:
0
8
1
9
M
a
y
2
0
1
7
192
14 Correlation and Regression Analysis in
Political Science
There are many instances when researchers are interested in determining either (1) how two or
more variables are associated or related to one another, or (2) how a change in one variable or
variables influences or moves with a change in another variable or variables. The statistical test
used most often in these circumstances is regression analysis. Identifying and measuring the
strength of relationships is, in fact, one of the most fundamental tasks of data analysis in political
science research.
Measuring relationships also influences the type of research design selected by the researcher.
For example, a researcher might have a “feeling” that the public’s use of a state park is directly
related to the price charged for access to the facilities. Or a highway maintenance researcher might
believe that maintaining consistent quality on patchwork paving is to be related to gaining citizens’
approval on city bond issue proposals. Another researcher might want to know whether the level
of service provided to citizens by her agency is related to staff workload or if the productivity of
staff members is related to the amount or type of training they receive.
Other elected officials and public managers might look at these same problems and have other
questions. For example, another researcher might want to know whether park use is related to
amount and type of advertising about park availability. Another highway department researcher
might want to know if paving quality is affected by the age of the equipment used or training of
employees in the use of the equipment. The public agency researcher might have an idea that the
level of service provided by public workers is affected by the announcement of a deferred pay
increase. And another researcher might want to determine whether employee productivity varies
with changes in the weather. In every one of these examples, regression analysis can be an ap-
propriate statistical design in a research project.
It is important to note that the relationships described in these examples have alternative conclu-
sions. The point is that a variable relationship is not always what it appears to be. Variables may
only seem to be associated, or they may be only a “confounding” factor in the issue. Researchers
test many different variables before selecting what seems to be the most probable answer.
Obviously, it would be irresponsible on the part of a researcher to make major economic deci-
sions based on how the researcher’s estimates about a relationship between two or more variables.
Before making the decision, the researcher would propose a hypothesis about a relationship, write
an alternate hypothesis, and then test the hypotheses statistically.
The correct procedure is to assume that associations do not exist until they are “proven” sta-
tistically. Fortunately, an extensive body of easy-to-use statistical tools exists to help managers
identify and weigh evidence about relationships. This process is often described as proving that
D
o
w
n
l
o
a
d
e
d
b
y
[
U
n
i
v
e
r
s
i
t
y
o
f
C
a
l
i
f
o
r
n
i
a
,
S
a
n
D
i
e
g
o
]
a
t
0
0
:
0
8
1
9
M
a
y
2
0
1
7
CORRELATION AND REGRESSION ANALYSIS 193
the relationship is statistically significant. The phrase statistically significant means that the iden-
tified relationship did not occur because of chance alone and that there is some measured degree
of probability that it does, indeed, exist.
The logic behind a relationship test is found in all research; it is based on establishing and test-
ing a hypothesis. For example, researchers want to know, first, are the variables related, second,
in what way are they related, and, third, how strong is the relationship. The null hypothesis for
this procedure is that the variables are independent; they are not related. The alternate hypothesis
is that they are not independent; they are related.
It is possible to carry out statistical tests for associations with all levels of data. Because each
test employs different assumptions, measures, and calculations, it is particularly important that
the appropriate test statistic be selected for the type of data collected. Tests for nominal and
ordinal-level data were covered in the chapter on nonparametric statistics. Tests for interval and
ratio data are covered here.
Measures of relationship between two interval- or ratio-level variables involve two closely
related measurement concepts: regression analysis and correlation analysis. Regression analysis
measures the way in which two or more variables are related to one another, whereas correlation
analysis provides a measure of the strength of the relationship. Together, these constitute what
may be the most heavily used statistical tests in political science, public administration, and
economics.
Relationship Test Applications
Relationship tests have two broad applications. They can be used to examine the way in which
variables vary together (a covariational relationship), or they may be used to test whether a causal
relationship exists. An example of a covariational relationship is expressed in the statement, “Wis-
dom increases with age.” The hypothesis is that as people get older, they get smarter. An example
of a causal relationship is a prediction that if advertising expenditures are increased, the number
of votes received by a political candidate will also increase. The hypothesis is that advertising
“causes” votes. Of course, this assertion ignores all other potentially intervening variables, such
as the quality of the advertising, the amount and quality of an opponent’s advertising, and even
the weather on Election Day.
In political science and other social science organization research, covariational relationships
are seldom studied. Rather, researchers tend to focus on identifying cause-and-effect relationships.
Thus, only causal relationships are discussed here.
All causal relationships have three key characteristics in common. First, the variables always
vary together (either positively or negatively). Second, a time factor is always involved. One vari-
able must change in order to “cause” a commensurate change in the other. The independent variable
always changes first, followed by the dependent variable. In the advertising and votes example above,
advertising expenditures was the independent variable; votes was the dependent variable.
And finally, the relationship is statistically significant; it did not appear through chance alone.
In other words, it is not a “fake” relationship. An example of a fake or “spurious” relationship
existed some sixty or more years ago when it was reported that more families were using pots and
pans made of aluminum. It was also reported that more people were being diagnosed with cancer.
Reporters assumed a cause-and-effect relationship between these two independent social factors,
and reported their conclusions—causing aluminum cookware sales to plummet. Knowledgeable
scientists quickly debunked this spurious relationship, however, and sales of aluminum cookware
continued their climb.
D
o
w
n
l
o
a
d
e
d
b
y
[
U
n
i
v
e
r
s
i
t
y
o
f
C
a
l
i
f
o
r
n
i
a
,
S
a
n
D
i
e
g
o
]
a
t
0
0
:
0
8
1
9
M
a
y
2
0
1
7
194 QUANTITATIVE RESEARCH APPROACHES AND METHODS
The analytical techniques used to test relationships fall into two closely related families of tests:
correlation analysis and regression analysis. Correlation analysis and regression are concerned
with providing a mathematical measurement of the strength of any relationship between variables;
both will also indicate strength of the relationship and the direction in which the variables are
related to one another.
Correlation analysis and regression analysis are most appropriate for use with interval- and
ratio-level measurements. When dealing with categorical or ranked data, other, somewhat less
powerful, tests must be used. However, it is possible to create what are called dummy variables
from nominal and ranked data in order to test relationships with similar regression analysis
reliability.
Correlation Analysis
Correlation analysis is the interval and ratio-data test for association. As the last chapter indicated,
similar tests exist for nonparametric data. Correlation analysis enables the researcher to measure
the degree to which the two variables are related, measure the strength of the relationship, and,
with data above the nominal level, identify the direction of that association (i.e., whether it is
positive or negative).
The concept of correlation analysis is closely linked to regression analysis in several ways.
Regression analysis provides a way of estimating the value of one variable from the value of
another, and of determining the way in which two or more variables are associated. As a result, it
is often used for predictive purposes.
Correlation analysis can also indicate how well the regression line explains any relationship
between variables. And the easier correlation analysis test can be used instead of regression when
the only question the manager asks is, “How strongly are the two variables related?”
This numerical value for correlation analysis serves as a mathematical summary measure of
the degree of correlation between two variables, x and y. The summary number is called the cor-
relation coefficient; it is expressed in statistical notation as the lower-case Greek letter r (rho).
The value of any “r” falls between –1 .0 and +1.0 . This enables the researcher to indicate both
positive and negative relationships.
In both correlation and regression analysis, measurements for the two (or more) variables can
be plotted on a graph with an x- and y-axis. If all the paired points of x and y lie on a straight 45
degree line, then the correlation between the variables would be “perfect”; the value of the cor-
relation coefficient would be 1.0. Therefore, the value 1.0 always represents a perfect positive
correlation, while the value –1.0 always represents a perfect negative correlation and the 45 degree
line is reversed. A negative correlation means that as the x-axis values increase, y-values would
decrease, and in reverse, as x-axis values decrease, y-values would increase. The value 0.0 refers
to no association whatsoever between the two variables.
Correlation Statistics
The Coefficient of Determination
The coefficient of determination is the square of the correlation coefficient value; it is probably the
most useful measurement in correlation analysis. It provides a clear, easy-to-understand measure-
D
o
w
n
l
o
a
d
e
d
b
y
[
U
n
i
v
e
r
s
i
t
y
o
f
C
a
l
i
f
o
r
n
i
a
,
S
a
n
D
i
e
g
o
]
a
t
0
0
:
0
8
1
9
M
a
y
2
0
1
7
CORRELATION AND REGRESSION ANALYSIS 195
ment of the explanatory power of a correlation coefficient. In addition, r
2
(r-squared) can help
show how closely the computed r describes a relationship between two variables.
For example, say that a correlation coefficient (r) of 0.667 is found to exist between the variables
Votes Received (VR) and Advertising Expenditures (AE). The square of this value is an r
2
coeffi-
cient of determination of 0.44 . The coefficient of determination now provides an interpretation that
everyone can understand: 44 percent of the variation in votes received is explained by variation in
spending on advertising, while 56 percent is unexplained, or due to other, unidentified, factors.
An important caveat to keep in mind when making such interpretations of the results of cor-
relation analysis is that it is never possible to say for certain that a dependent variable or variables
actually cause a change in the independent variable (that x causes y). Instead, it is only possible
to report the direction and strength of a statistical relationship.
The Standard Error of the Estimate
One of the key concepts of statistics is measurement of the variability in a dataset; a number of
tools have been developed to measure this variability. Three of the most commonly encountered
variability measurements include the range, the variance, and the standard deviation. The point of
these measurements is that data seldom fit neatly into values or categories that researchers would
like to see. Instead, most often the data vary, either positively or negatively, from some middle
point of a range of data. The central point used most often in analysis is the average score.
A similar variability concept applies in regression analysis, although in regression, the central
point is not an average, but is instead the computed best line of regression. Because the observed
data points do not all fall on the regression line, the regression equation is not a perfect indicator of
association; rather, it is an estimate. How close it comes to estimating can be judged by computing
one additional value, the standard error of the estimate. In statistical notation, the standard error
of the estimate is indicated by the symbol Syx. When calculated, the standard error of the estimate
provides a measure of the variation around the fitted line of regression. It is measured in the same
units as the dependent variable (y) in much the same way that the standard deviation measures
variability around the mean.
In application, the standard error of the estimate is used to make inferences about the predicted
value of y. For example, a small standard error suggests that the data points cluster relatively
closely to the plotted regression line; in a word, the data are homogeneous. A large standard error
means suggests that data points are widely disbursed on either side of the regression line and that
a high degree of variability exists.
A second inference statistic is produced with the standard error of the estimate, the p-value.
The p-value is a confidence measure, in that it suggests with what degree of probability the re-
gression equation can be relied upon. In this way, it is used to make decisions about the statistical
significance of the relationship between the two variables.
Three quick steps can provide most of the information a manager needs to have about the
potential relationship between a set of values. In Excel, these are the XY Scatterplot in the Chart
Wizard, and the CORREL and RSQ calculations in the Function Wizard.
Interpreting Correlation Values
Researchers have developed many different ways of interpreting correlation values in order to
describe relationships in terms that have meaning for everyone. The following defining model
is a purely subjective suggestion. Many other models can be found in the research literature. In
D
o
w
n
l
o
a
d
e
d
b
y
[
U
n
i
v
e
r
s
i
t
y
o
f
C
a
l
i
f
o
r
n
i
a
,
S
a
n
D
i
e
g
o
]
a
t
0
0
:
0
8
1
9
M
a
y
2
0
1
7
196 QUANTITATIVE RESEARCH APPROACHES AND METHODS
this model, values range from 0 to 1 in units of ten percentage points for each level. Since the
coefficients of determination are the squares of the r-values, it is not necessary to use positive or
negative values. The labels and their respective values are:
0.0
= No relationship
0.01 to 0.19 = Weak relationship
0.20 to 0.39 = Low but definite relationship
0.40 to 0.59 = Moderate relationship
0.60 to 0.79 = Strong relationship
0.80 to 0.99 = Very strong relationship
± 1.0
= Perfect relationship (positive or negative)
Interpretations of the correlation coefficient (r) and the coefficient of determination (r
2
) are
slightly different. For example in the two test-score data, the r-value could be interpreted as: “The
more than .99 correlation coefficient suggests that the relationship between the two test scores is
nearly perfectly linear.” To interpret the r
2
, use the above table of interpretation labels. For example:
“The r
2
of 0.95 suggests that there is a very strong relationship between the two tests.”
Simple Regression Analysis
Regression analysis is a statistical procedure developed to determine whether two or more interval-
or ratio-level variables are related. To put it another way, regression analysis allows the manager
to determine how different values of one variable (called the dependent variable) might or might
not help to explain variation in another variable, which is called an independent variable. This
is the methodology underlying experiments, which are often specifically designed to determine
whether changes in one variable will influence changes in another variable.
Testing versions of a homeland security bill is an example of an experiment. In such an experi-
ment, legislators might take the versions to three or more similar regions. In each, one or several
variables will be changed, with all other variables kept as constant as possible. Different costs
for the bill might be published in each test market, while restrictions and jurisdictions remain
unchanged. At the end of the test period, survey results in each test market might be compared to
see if overall cost of the legislation had any impact on citizen acceptance. In this way, legislators
are able to get a handle on citizen willingness to support potential legislation.
In addition to measuring the way in which variables are related, regression analysis also enables
managers to predict responses or reactions to changes in independent variables. Such predictions are
often needed before making expenditure decisions. From the above example, a marketer will be able
to predict with some level of certainty consumers’ purchases of the product at different price levels.
This, in turn, will enable production to predict how many machines and how much raw material
will be needed, the finance staff to predict how much money to borrow to build the factories needed to
make the product, sales managers to predict how large a sales staff will be needed, and the distribution
manager to predict how many trucks and drivers will be needed to get the product to market. Prediction
is one of the most important uses of regression analysis results, if not the most important.
The Regression Procedure
The regression analysis procedure begins with collecting a dataset that includes pairs of observed
values or measurements. One set of measurements is needed for each variable to be included in
D
o
w
n
l
o
a
d
e
d
b
y
[
U
n
i
v
e
r
s
i
t
y
o
f
C
a
l
i
f
o
r
n
i
a
,
S
a
n
D
i
e
g
o
]
a
t
0
0
:
0
8
1
9
M
a
y
2
0
1
7
CORRELATION AND REGRESSION ANALYSIS 197
the analysis. The idea of pairs of measurements may be somewhat misleading. It does not mean
regression analysis is restricted to analyzing just two variables at a time. With multiple regres-
sion analysis, many variables can be included. The term pair refers instead to measurements for
a dependent variable and one or more independent variables.
The next step in the procedure is to produce a scatter plot of all measurements. Value pairs
should be plotted as points on a scatter diagram (also called a scatter plot). A scatter diagram has
two axes: a vertical line (the y-axis) and a horizontal line (the x-axis). The vertical line represents
values on the dependent (or changed) variable. The horizontal line identifies increments of the
independent variable or variables.
Regression analysis evaluates all recorded data points and computes a regression equation. A
regression function or numerical value is produced. When multiplied with independent variable
values, this function enables the researcher to predict the value of a corresponding measurement of
the dependent variable(y), given any value of x. The final step in the regression analysis procedure
is interpretation of the findings.
The Regression Equation
Interpretation of the findings of a regression analysis procedure begins with fitting the sample data
into a best-fit line. The regression analysis statistical procedure in statistics software packages does
this through a process called the method of least squares. This process measures the amount each
point varies from a proposed line, squares each deviation, and then sums the squares.
After computing these values, the minimum squared value of all differences establishes the slope of
the regression line. At the same time, the regression process determines the point at which the y-axis (the
vertical line in the scatter diagram) and the computed regression line would meet. This point is called
the intercept. Once this point is known, the regression equation is used to predict additional points along
the line, given a value for the x-axis. In statistical notation, the regression equation is expressed thus:
y=a+bx
where
y = the value of y calculated from the estimated regression equation
a = the point on y where the regression line intercepts on y
b = the amount of change in x required for a corresponding change in y which, when plotted,
represents the slope of the line
x = a measured value for independent variable (x)
In some statistics texts, the statistical symbol for the y intercept point is given as bo, and the
symbol for the regression slope value as b1. The regression equation for straight-line regression
(linear), then is depicted as:
yi=bo+b1xi
where
yi = the predicted value of y for measurement i
xi = the value of x for measurement i
D
o
w
n
l
o
a
d
e
d
b
y
[
U
n
i
v
e
r
s
i
t
y
o
f
C
a
l
i
f
o
r
n
i
a
,
S
a
n
D
i
e
g
o
]
a
t
0
0
:
0
8
1
9
M
a
y
2
0
1
7
198 QUANTITATIVE RESEARCH APPROACHES AND METHODS
In general terms, we would interpret the y = a + bx equation in this way: “As x changes, y also
changes by b times the change in x.” Once the regression equation has been obtained, predictions
or estimates of the dependent variable can be made. For example, say that we have computed the
following regression equation:
y=4.0199+.00896*x
This is interpreted to mean that the regression line begins at that point on the vertical axis that
coincides with the value of 4.0199. Then, any subsequent increase in a value on the x-axis, mul-
tiplied by 0.00896, will equal a corresponding change in y. Moving along the x-axis and periodi-
cally plotting the increases to both x and y, connecting each point, produces a graphic impression
of the regression line.
The shape of the regression line is an indication of how much of the change in the independent
variable is explained by the dependent variable. The regression equation indicates how steep the
line must be, whether it slopes to the right or left, or is curvilinear. When very little or no relation-
ship exists, the scatter plot will show the data points distributed haphazardly around the space,
with no connection visible.
Researchers usually look for a linear relationship, one that shows a definite relationship between
the variables. However, not all relationships will be linear. Some will be curvilinear, some will
be more or less flat, showing no relationship whatsoever, some may be U-shaped, and others may
take on S-like patterns. Techniques are available for dealing with nonlinear relationships, but are
not part of most introductory management statistics texts and are not discussed here.
A Simple Regression Example
The caucus secretary of the legislature wanted to know the relationship between the number
of bills introduced per week and the number that made it out of committee. Data were col-
lected for the 20 weeks that the legislature was in session. She decided to use Microsoft Excel
to (1) see if a relationship existed, (2) find out the strength and direction of the relationship,
and (3) determine whether it would be possible to predict committee productivity at future
legislative sessions. A regression analysis was conducted on the data. The data are shown in
Table 14.1 .
In this simple example, three Excel Wizard applications were applied to the data. First, the Chart
Wizard’s XY Scatterplot program is used to graphically display the type of relationship between
the two variables. Next, using the Add a Trend Line option from the Tools menu, a linear trend was
fitted to the scatter plot. Because the scatter diagram revealed a linear relationship, the next step is
to call up the CORREL (Correlations) program in the Function Wizard. The value produced is the
correlation coefficient (also referred to as the Pearson Product Moment Correlation Coefficient
after the statistician who first reported its application).
The third step is to interpret the relationship findings using the RSQ (r-square) capabil-
ity in the Function Wizard, which makes it much easier to make an interpretation. The r
2
value produced is the coefficient of determination, and used to express the relationship as a
percentage.
The results of the Excel correlation procedure are displayed in Figure 14.1. The Excel result for
the CORREL test was 0.61. The result for the RSQ test was 0.3761, which, rounded to 0.38, can
be interpreted as “38 percent of the change in the dependent variable, Bills Passed by Committee,
is explained by the independent variable, the Number of Bills Introduced each week.”
D
o
w
n
l
o
a
d
e
d
b
y
[
U
n
i
v
e
r
s
i
t
y
o
f
C
a
l
i
f
o
r
n
i
a
,
S
a
n
D
i
e
g
o
]
a
t
0
0
:
0
8
1
9
M
a
y
2
0
1
7
CORRELATION AND REGRESSION ANALYSIS 199
Multiple Regression Analysis
When carrying out a regression analysis procedure, two approaches are possible. They differ
only on the number of variables used in the regression equation. The first is called simple regres-
sion and includes just one independent variable to explain one dependent variable. An example
of simple regression analysis already discussed is the use of levels of advertising expenditure
Table 14.1
Bills Introduced and Passed Out of Committee, 20-Week Legislative Session
Week
Bills Introduced
Out of Committee
15
3
2
29
1
8
35
9
6
47
2
1
0
54
5
1
1
64
4
1
6
73
1
2
2
85
5
3
7
96
8
9
2
10
71
66
11
88
58
12
90
73
13
79
64
14
67
52
15
44
24
16
31
15
17
22
16
18
14
7
19
4
2
20
1
0
Source: Hypothetical data.
SUMMARY OUTPUT
Regression Statistics
Multiple r
0.6132
0.3761
!DJUSTEDr 2
0.3414
Std. Error
22.7864
Cases
20
ANOVA
df
SS
MS
F
Sig. of F
Regression
1
5633.01655 5633.02 10.8490
0.0040
Residual
18
9345.93345 519.219
Total
19
14978.95
Coefficients
Standard
Error
t Stat
P-value
Lower 95% Upper 95% Lower 95.0% Upper 95.0%
Intercept
–2.91571 10.96107 –0 .26601 0.79326 –25 .9440
20.1126 –25.94408
20.11266
Introduced
0.62130 0.18863 3.29379 0.00404
0.2250
1.01759
0.22501
1.01759
r2
Figure 14.1 Excel Regression Procedure Output for Table 14.1 Data
D
o
w
n
l
o
a
d
e
d
b
y
[
U
n
i
v
e
r
s
i
t
y
o
f
C
a
l
i
f
o
r
n
i
a
,
S
a
n
D
i
e
g
o
]
a
t
0
0
:
0
8
1
9
M
a
y
2
0
1
7
200 QUANTITATIVE RESEARCH APPROACHES AND METHODS
to predict future votes of legislators. The second approach is known as multiple regression
analysis (MRA) and, as its name implies, involves more than one independent variable in the
regression equation.
Both simple and multiple regression analyses (MRA) produce a regression equation that helps
explain the shape and direction of the relationship between variables. Multiple regression is noth-
ing more than expanding simple regression to consider two or more independent variables at the
same time. Adding more variables to simple regression in order to conduct a multiple regression
analysis is often far more efficient and effective.
Too often, much of the variation in y cannot be explained by any x alone when measuring as-
sociation one variable at a time with simple regression analysis. Doing two, three, or more simple
regression analyses may still not explain the source of a majority of the variation. However, when
two or more variables are tested together in a multiple regression procedure, an interaction-like
effect may come into play. Thus, more information becomes available for the analysis, often
resulting in more effective and informative results.
Correlation analysis, when extended for use with multiple x variables, calculates a multiple
correlation coefficient. As in simple regression, the direction of the association may be either posi-
tive or negative. This makes it possible to judge both the strength and direction of the association
explained by the set of x variables.
The test statistic for interval and ratio data for both simple and multiple regression analysis is
Pearson’s r. This r-value can range from –1 .0 (a perfect negative relationship) to +1.0 (a perfect
positive relationship).
The square of Pearson’s r (r
2
) is called the coefficient of determination. This value represents
the proportion of the variation in the y variable that can be explained by linear regression in the x
variable. The coefficient of determination in simple regression becomes the coefficient of multiple
determination in multiple regression analysis. This last value is used as an index of association
for the combined set of independent variables, in exactly the same manner as r
2
in simple regres-
sion.
The Excel Regression procedure in the Data Analysis option in the Tools menu produces a set
of summary statistics for both simple and multiple regression analysis. The information in Figure
14.1 was produced in this way from the data in Table 14.1 .
Uses for Multiple Regression Analysis
Multiple regression analysis, a popular multivariate statistical method, has wide application in
political, economic, social, and educational research (Kerlinger and Pedhazur 1973). An extremely
robust procedure, it can be used with either continuous (interval and ratio) measurements or cat-
egorical (nominal and ordinal) data. In addition, theoretically there is no limit to the number of
independent variables it can handle.
Multiple regression analysis is a method of analyzing the contribution that more than
one independent variable makes to the relative change in a dependent variable. It is used to
explain and predict future events from measurements of a variety of independent variables.
For example, political science researchers use multiple regression analysis to study how
such phenomena as gender, age, education, party affiliation, ethnic status, income level and
occupation, place and type of residence, and similar characteristics influence such behaviors
as registering and voting. University admissions personnel use multiple regression to predict
successful completion of advanced degree programs from such independent variables as gradu-
ate aptitude tests and college grade-point averages, among other factors. Medical personnel
D
o
w
n
l
o
a
d
e
d
b
y
[
U
n
i
v
e
r
s
i
t
y
o
f
C
a
l
i
f
o
r
n
i
a
,
S
a
n
D
i
e
g
o
]
a
t
0
0
:
0
8
1
9
M
a
y
2
0
1
7
CORRELATION AND REGRESSION ANALYSIS 201
use multiple regression to predict the likelihood of contracting a disease from such factors
as weight, exercise, and diet.
In an example of a typical use of the method, say that the manager of the copy center in a
government agency is interested in determining whether existing cost controls are effective at
lowering costs and improving productivity. She elects to measure productivity by the gross revenue
earned per individual copy made. Records are kept of each copying order, including the time to
produce each copy in seconds, the labor cost per sheet, the number of bad copies in each order,
and a measure of gross profit per sheet in cents per sheet. The manager randomly selects a sample
of twenty jobs and comes up with the data presented in Table 14.2 .
The independent variables in this example include: the number of copies, time to produce, cost
per copy, and the number of errors. The number of errors is particularly important because the
manager has just completed a training program designed to improve productivity by eliminating
waste caused by errors in copying. A simple regression analysis procedure can be conducted on
each independent variable in order to establish what impact on each variable gross revenue has.
However, the more appropriate statistical test to use for evaluating the relationships between these
values is multiple regression analysis.
The multiple regression programs in SPSS and Microsoft Excel allow the researcher to conduct
Table 14.2
Variables with Potential Impact on Gross Revenue
ROWS
Job Number
COLUMNS
N of Copies
Time
(minutes)
Cost (dollars)
Errors
Gross
Revenue
1
150
4.0
1.75
2
1.50
2
310
15.5
1.35
5
1.00
3
450
11.0
1.10
6
0.90
4
1,150
19.5
0.80
9
1.20
5
800
16.0
0.99
3
0.80
6
200
6.0
1.30
2
1.00
7
300
8.5
1.35
4
1.10
8
250
6.0
1.30
2
0.80
9
910
14.5
1.05
3
1.20
10
100
14.0
2.00
5
1.10
11
500
14.0
0.95
2
0.20
12
225
10.0
1.30
1
0.50
13
50
4.0
1.75
0
0.60
14
920
17.0
0.90
5
1.50
15
5,000
49.0
0.70
10
1.25
16
600
13.0
1.10
2
1.50
17
1,400
22.5
0.95
6
1.00
18
2,750
28.0
0.90
2
1.25
19
410
12.5
1.25
1
1.00
20
2,500
29.0
0.95
2
1.50
Source: Personal data, 2002.
D
o
w
n
l
o
a
d
e
d
b
y
[
U
n
i
v
e
r
s
i
t
y
o
f
C
a
l
i
f
o
r
n
i
a
,
S
a
n
D
i
e
g
o
]
a
t
0
0
:
0
8
1
9
M
a
y
2
0
1
7
202 QUANTITATIVE RESEARCH APPROACHES AND METHODS
both linear and curvilinear regression analyses, and to produce several different statistical-test
results for the data in Table 14.2 . Options in SPSS include a table of descriptive statistics for all
variables in the analysis (Table 14.3).
Both programs produce a correlation table for the variables included in the equation. Table 14.4
is a correlation matrix produced by Excel. The most relevant information is the moderate and low
correlations for each of the independent variables and the dependent variable, gross revenue: .35
for copies, .32 for time, – .13 for cost, and .27 for errors.
Correlations measure the strength and direction of the relationship between any x value and
its corresponding value on the y axis of interval or ratio-scale variables. Other relationship tests,
such as Spearman’s rank order correlation, are available for ordinal- and nominal-level data. Excel
produces a lower-half correlation table, not repeating the same table on the upper half. The values
printed in a correlation table are correlation coefficients, which indicate the strength and direction
of the relationship between variable pairs. For example, the coefficient for the variables errors and
time is 0.60, and the variables are positively related. Errors and cost display a negative correlation
of –0 .42 . The strongest relationship in the table is the nearly perfect positive (0.96) between the
variables time and number of copies.
Excel regression program results are displayed in Figure 14.2 . They include a summary output
for the regression analysis procedure and significance tests for the full regression equation indi-
vidual variables in the equation.
The regression analysis procedure produces summary regression statistics, an analysis
of variance (ANOVA) table with the results of an F-test, and a t-test for each independent
variable. Summary regression statistics include a solution for the regression equation, and
both a regression coefficient (r) and a regression coefficient of determination (r
2
)andan
adjusted r
2
.
Table 14.3
Descriptive Statistics for the Variables in Table 14.2
Descriptive Statistics
Mean
Std. Dev.
n
Gross Revenue
1.05
. 350
20
N of Copies
948.75
1208.779
20
Time in Minutes
15.70
10.495
20
Cost in Dollars
1.19
.339
20
N of Errors
3.60
2.644
20
Table 14.4
A Correlation Matrix for the Independent Variables in Table 14.2
Copies
Time
Cost
Errors
Revenue
Copies
Time
Cost
Errors
Revenue
1
0.96058259
–0 .63637334
0.50486879
0.35267705
1
– 0.650999
0.600563
0.320736
1
–0 .41956
–0 .12931
1
0.276613
1
D
o
w
n
l
o
a
d
e
d
b
y
[
U
n
i
v
e
r
s
i
t
y
o
f
C
a
l
i
f
o
r
n
i
a
,
S
a
n
D
i
e
g
o
]
a
t
0
0
:
0
8
1
9
M
a
y
2
0
1
7
CORRELATION AND REGRESSION ANALYSIS 203
Displayed Statistics for Interpretation
The three sets of statistics displayed in Figure 14.2 are (1) the set of regression statistics, (2) an ANOVA
table, and (3) the coefficients for the standard error, t-statistic and its p-value, and the confidence
intervals for the coefficients. The coefficients are the calculated values that, with the computed y-
axis intercept value, are included in the computed regression correlation. These values are the data
needed to calculate a future value for y given new values for the independent variables.
The Model Summary produced by SPSS is displayed in Table 14.5. It includes (1) the regres-
sion coefficient (r), (2) a regression coefficient of determination (r
2
), (3) an adjusted r
2
, and (4)
the standard error value. The strength of the computed r
2
tells the researcher how effective the
set of independent variables are at “explaining” the variation in the dependent variable Y. In the
copy center example data, the r
2
of 0.17 suggests that the model is only marginally successful at
explaining the variation in gross revenue.
The adjusted r
2
is an estimate of how well the model would fit a different dataset from the
same population; the adjusted r
2
is always less than the r
2
. The standard error of the estimate is
a measure of the variability of the distribution of values of the dependent variable. The smaller
this value is in real terms, the less variability in the Y values. Normally, close to 95 percent of all
Y values will fall within two standard errors of the estimate.
The ANOVA table is a hypothesis test on the regression equation. The purpose of the test is to
determine whether a linear relationship exists between the set of independent variables and the
dependent variable. The null hypothesis for this test is that a set of independent variables cannot
predict Y. Table 14.6 shows results of an ANOVA test on the data in Table 14.2 . The large sig-
nificance (0.557) and the small F (0.777) indicate that this regression model is clearly not a good
predictor. There is a probability of more than 55 percent that the variables cannot predict changes
in Y any better than could random prediction.
SUMMARY OUTPUT
Regression Statistics
Multiple r
0.41
r2
0.17
!DJUSTEDr
– 0.05
Standard Error 0.36
Observations
20
ANOVA
df
SS
MS
F
Significance F
Regression
4
0.399141 0.09978 0.777402 0.55692
Residual
15
1.925359 0.12835
Total
19
2.3245
Coefficients
Standard
Error
t Stat
Lower 95% Upper 95% Lower 95% Upper 95%
Intercept
0.7675
0.5336 1.4381 0.1709 –0 .36998
1.90492 –0 .36998
1.90492
Copies
0.0002
0.0003 0 .9102 0.3771 –0 .00032
0.00079 –0 .00032
0.00079
Time
– 0 .0164
0.0324 –0 .5072 0.6194 –0 .08557
0.05267 –0 .08557
0.05267
Cost
0.1703
0.3206 0.5311 0.6031 –0 .51308
0.85362 –0 .51308
0.85362
Errors
0.0305
0.0412 0.7406
0.4703 –0 .05729
0.11831 –0 .05729
0.11831
p-value
2
Figure 14.2 Regression Analysis Output Produced by Microsoft Excel
Source: Excel output from data in Table 14.2 .
D
o
w
n
l
o
a
d
e
d
b
y
[
U
n
i
v
e
r
s
i
t
y
o
f
C
a
l
i
f
o
r
n
i
a
,
S
a
n
D
i
e
g
o
]
a
t
0
0
:
0
8
1
9
M
a
y
2
0
1
7
204 QUANTITATIVE RESEARCH APPROACHES AND METHODS
Table 14.7 displays the individual coefficients for each of the independent variables in the
regression equations. In the equation, the value for the slope (α) plus the measurements for each
of the x variables multiplied by their corresponding coefficients is necessary in order to compute
future values of y. Results of the corresponding t-tests are significant tests for each of the inde-
pendent variables.
Table 14.5
Model Summary Produced by the SPSS Regression Procedure, Table 14.2 Data
Model Summary
Std. Error of
Model
R
R2
!DJUSTED R
2
the Estimate
1
.414
172
– .049
.358
Predictors: (constant), n of errors, cost in dollars, n of copies, time in minutes.
Table 14.6
ANOVA Table for SPSS Regression Analysis
Sum of
Mean
Model
Squares
df
Square
F
Sig.
1
Regression
.399
4
. 100
.777
.557
Residual
1.925
15
. 128
Total
2.325
19
Predictors: (constant), n of errors, cost in dollars, n of copies, time in minutes.
Dependent variable: gross revenue.
Table 14.7
Regression Coefficients Produced by the SPSS Regression Procedure
Coefficients
t
Sig.
Model
Unstandardized
Coefficients B Std. Error
Standardized
Coefficients Beta
1
(Constant)
.767
. 534
1.438
. 171
n of copies
2.359E-04
.000
. 815
. 910
. 377
time in minutes
– 1 .645E-02
.0 32
–.494
– .507
. 619
cost in dollars
. 170
.321
. 165
.531
.603
n of errors
3.051E-02
. 041
. 231
. 741
. 470
Dependent variable: gross revenue.
ANOVA
D
o
w
n
l
o
a
d
e
d
b
y
[
U
n
i
v
e
r
s
i
t
y
o
f
C
a
l
i
f
o
r
n
i
a
,
S
a
n
D
i
e
g
o
]
a
t
0
0
:
0
8
1
9
M
a
y
2
0
1
7
CORRELATION AND REGRESSION ANALYSIS 205
Since all significance values are greater than the normal cut off of .05, none of the variables
is significant. The overall conclusion that must be drawn from this regression equation is that the
four independent variables of number of copies, cost, time, and number of errors are not good
predictors of gross revenue.
Multiple Regression with Dummy Variables
Multiple regression is generally employed with continuous dependent and independent variables.
However, it is also possible to use categorical data for either the dependent or independent vari-
able, or both. This requires creating what is called an indicator, or dummy, variable out of the
categorical variable (Siegel 2002). For example, say that the variable gender—with two categories,
female and male—is an important factor in a regression equation. To create a dummy variable,
the researcher simply assigns a value of zero to the first category of gender and a value of one to the
other category. The multiple regression equation uses one category as the baseline against which
to compare the presence of the second category. Dummy variables can be used by themselves in a
regression equation or in conjunction with continuous variables.
Values for dummy variables are assigned according to the number of alternative categories that
are named for a variable. The general rule is to assign one category fewer than the total number
of values. Thus, for a two-category variable such as gender, dummy variables of 0 and 1 are as-
signed. For a three-category variable, dummy variables are 0, 1, and 2.
Multiple regression models have also been developed for those times when the researcher wants
to use a categorical variable for the dependent or y-axis variable. If the categorical dependent
variable has only two categories, either a multiple logit regression or a probit regression model
can be used. If the dependent variable has more than two values—as in yes, no, and maybe—then
the multinomial logit or multinomial probit model should be used. None of these four models
is available in the standard Excel or SPSS software packages, but can be found in extensions of
these two commonly used software programs.
The probit model is used extensively in political science research. According to Norušis (2000),
probit analysis is used when the researcher wants to estimate the strength of a stimulus variable
or set of variables that are needed to produce a certain proportion of dichotomous responses.
Examples of a set of stimulus variables are television advertising, newspaper advertising, voters’
perceptions of a candidate’s performance during a televised debate, and political party affiliation;
an example of a response that these stimuli might influence is the proportion of voters who are
likely to vote for a particular candidate.
In a logit analysis procedure, the dependent variables are always categorical, while the inde-
pendent variables can be factor scores. Factors are composite variables that are composed of one
or more individual items or variables. The program allows the researcher to use from one to ten
dependent and factor variables combined.
Summary
When researchers are interested in determining either (1) how two or more variables are associated
or related to one another, or (2) how a change in one variable or variables affects another variable,
they carry out what are called association tests. These tests include correlation and regression
analyses. Identifying and measuring the strength of relationships is one of the most fundamental
tasks of data analysis.
Variable relationships have alternative conclusions; they are not always what they appear to be.
D
o
w
n
l
o
a
d
e
d
b
y
[
U
n
i
v
e
r
s
i
t
y
o
f
C
a
l
i
f
o
r
n
i
a
,
S
a
n
D
i
e
g
o
]
a
t
0
0
:
0
8
1
9
M
a
y
2
0
1
7
206 QUANTITATIVE RESEARCH APPROACHES AND METHODS
Statistical tests may indicate that variables are associated, whereas in truth, they may be only a
“confounding” factor in the behavior of a variable of interest. Researchers test many different
variables before selecting what seems to be the most probable answer, and even then they may
not have a true measurement.
It is possible to carry out statistical tests for associations with all levels of data. Because each
test employs different assumptions, measures, and calculations, it is particularly important that
the appropriate test statistic be selected for the type of data collected.
Relationship tests have two broad applications. They can be used to examine the way in which
variables vary together (a covariational relationship) or they may be used to test whether a causal
relationship exists. The analytical techniques used to test relationships fall into two families of tests:
regression analysis and correlation analysis. Regression analysis identifies the way in which two or
more variables are related to one another. Correlation analysis, on the other hand, is concerned with
providing a mathematical measurement of the strength of any relationship between variables.
Regression analysis and correlation analysis are most appropriate for use with interval- and
ratio-level measurements. When dealing with categorical or ranked data, other, somewhat less
powerful, nonparametric tests must be used. However, it is possible to create what are called
dummy variables from nominal and ranked data in order to test relationships using the more
powerful parametric techniques.
Discussion Questions
1. What are the two broad applications for relationship tests?
2. What does correlation analysis tell the researcher about two variables?
3. What is the coefficient of determination?
4. Describe how correlation values are subjectively interpreted.
5. What is simple regression analysis and what does it tell the researcher?
6. What is the difference between dependent and independent variables?
7. What is a multiple regression analysis?
8. Describe the multiple regression procedure.
9. What is the meaning of slope?
10. What is the meaning of intercept?
11. What is a dummy variable?
Additional Reading
Babbie, Earl. 2006. The Practice of Social Research. 10th ed. Belmont, CA: Wadsworth/Thompson Learning.
Chen, Peter Y., and Paula M. Popovich. 2002. Correlation: Parametric and Nonparametric Measures.
Thousand Oaks, CA: Sage.
Field, Andy. 2005. Discovering Statistics Using SPSS®
. Thousand Oaks, CA: Sage.
Kerlinger, Fred N., and Elazar J. Pedhazur. 1973. Multiple Regression in Behavioral Research. New York:
Holt, Rinehart, and Winston.
Miles, Jeremy, and Mark Shevlin. 2000. Applying Regression and Correlation: A Guide for Students and
Researchers. Thousand Oaks, CA: Sage.
Norušis, Marija J. 2008. SPSS® 16.0 Guide to Data Analysis. Upper Saddle River, NJ: Prentice Hall.
D
o
w
n
l
o
a
d
e
d
b
y
[
U
n
i
v
e
r
s
i
t
y
o
f
C
a
l
i
f
o
r
n
i
a
,
S
a
n
D
i
e
g
o
]
a
t
0
0
:
0
8
1
9
M
a
y
2
0
1
7
207
15 Exploring Multivariate Statistics
This chapter explores several additional multivariate statistical analysis techniques. A common goal
of multivariate statistical analysis is to determine and explain how groups of variables are related
and ultimately to develop theories of causation that can be traced to those relationships (Bernard
2000). Among the many multivariate procedures developed for data analysis are multiple regres-
sion analysis, partial regression, path analysis, multiple dimensional scaling, multiple analyses of
variance and covariance, multiple discriminant analysis, principal component and factor analysis,
cluster analysis, and more. This chapter will explore three major families of multivariate statistics:
(1) multiple discriminant analysis (MDA), a group-membership prediction and classification tool;
(2) factor analysis; and (3) cluster analysis. Both factor analysis and cluster analysis can be use for
reduction of large data sets and statistically summarizing data sets. Multiple analysis of variance
(MANOVA) and multiple analysis of covariance (MANCOVA) are mentioned, but not discussed
in any detail. Multiple regression analysis (MRA), an extension of the simple regression procedure,
was discussed in Chapter 14.
Predicting with Discriminant Analysis
Discriminant analysis and multiple discriminant analysis are among a series of statistical tech-
niques designed to analyze relationships among two or more variables (Bennett and Bowers
1976; Maxwell 1977; Klecka 1980). Discriminant analysis has been defined as a mathematical
technique that weighs and combines a set of measurements in such a way that their ability to
discriminate between two or more groups is maximized (Cooper 1987). When more than two
grouping variables are used in the design, the discriminant process is considered to be multiple
discriminant analysis (MDA).
Classifying groups with cluster analysis is based upon a set of classification correlations that
are mathematically generated between each scale item and the composite functions. Contribution is
measured by the size of correlation value; higher correlation coefficients mean greater contribution
(Dalgleish and Chant 1995). The functions are then interpreted by the strength of the individual
items that contribute most to the function.
While several authors have examined mathematical rules for determining cutoff points for
including an item in the interpretation (see, for example, Glorfeld 1995), most analysts resort to
rules of thumb to set their cutoff values. Coefficients of less than 0.40 or 0.50 are often left out
of the analysis, but this is only a subjective decision. Too many retained items greatly increase
the difficulty of the required subjective interpretation of functions; too few and the function
often lacks intuitive sense.
The underlying research problem in discriminant analysis is how to establish a decision rule
D
o
w
n
l
o
a
d
e
d
b
y
[
U
n
i
v
e
r
s
i
t
y
o
f
C
a
l
i
f
o
r
n
i
a
,
S
a
n
D
i
e
g
o
]
a
t
0
0
:
0
8
1
9
M
a
y
2
0
1
7
208 QUANTITATIVE RESEARCH APPROACHES AND METHODS
that enables assigning (or predicting) a subject whose group membership is not known to only
one of the categories that make up a complete group. Although assigning is done on the basis of
measurements on sets of descriptor variables, selection of these loading items is the province of
the researcher. Thus, it is difficult if not impossible to know if the selected items constitute the
best combination of items.
A set of measurements can be any number of different types of descriptive variables, in-
cluding such descriptors as demographics, attitude scales, lifestyle characteristics, behavioral
measurements, preferences, and others. Group assignment or prediction is made upon the basis
of subjects’ scores on these characteristics. A group can be any two or more distinct sets in a
sample. Examples of two-group sets include Republican/Democrat, committed/noncommitted
voters; legislators who, regardless of their party affiliation, traditionally vote for legislation on
social issues and those who vote against such legislation; nonprofit organizations that either
support or ignore environmental issues; patients with one or more symptoms who are likely to
develop or not develop a disease.
Regardless of the application, discriminant analysis requires that several important assumptions
be met. First, the distribution of measurements for the descriptive (independent) variables must
be approximately normal. Second, the sample must be relatively large; samples in the range of
250 to 300 are considered to be of minimum size, although the process works with even smaller
samples. Third, independent variable measurements must be at least nominal level (or transformed
into dummy variables). Fourth, it must be possible to distinguish between two or more known
categories among the sample. And fifth, there should be no missing values on either the dependent
or independent variables for any subject included in the analysis; most statistical packages provide
for elimination of cases with missing data with a simple instruction.
Purposes for Discriminant Analysis
In practice, discriminant analysis can be used in at least five different types of applications. First,
the technique may be used a way of classifying and describing subjects in two or more respective
relevant groups at the same time. Second, political researchers use discriminant analysis as a tool
for improving the quality of their predictions about which subject is most likely to belong with
which citizen group and why. Third, researchers often use the technique to determine which de-
scriptive variables have the greatest power to discriminate between two or more groups of people.
Fourth, the method may be used as a post hoc test, in which it serves as a check for diagnoses or
predictions made on the bases of other types of evaluations. And fifth, discriminant analysis may
be used to gauge how far apart groups are located on a set of descriptive characteristics. In this
application, which is somewhat similar to the discrimination test, the distance between groups is
based upon the location of the central tendency values (called centroids) for each group in two-
dimensional space established by computer-generated functions.
The Descriptive Discriminant Analysis Model
In their review of the capacity of discriminant analysis procedures contained in three different
statistical software packages, Huberty and Lowman (1997) distinguished between two funda-
mental types of discriminant analysis: descriptive discriminant analysis (DDA) and predictive
discriminant analysis (PDA). In the DDA model, the grouping variable serves as the predictor
variable, with the responses on the descriptive characteristics variables taking on the role of
the outcome variables.
D
o
w
n
l
o
a
d
e
d
b
y
[
U
n
i
v
e
r
s
i
t
y
o
f
C
a
l
i
f
o
r
n
i
a
,
S
a
n
D
i
e
g
o
]
a
t
0
0
:
0
8
1
9
M
a
y
2
0
1
7
EXPLORING MULTIVARIATE STATISTICS 209
The research question in descriptive designs is centered, not on the differences themselves, but
instead on how the groups differ on some set of descriptors. For example, discriminant analysis
may be used to test whether voters and nonvoters are the same or different on a set of lifestyle
characteristics. The same model could be used to develop descriptive profiles of several candi-
dates for political office, or between adults who are politically active or politically inactive, for
example. The DDA method tests the power of the grouping variable to differentiate among the
characteristics of group members.
DDA was used in a study conducted to test methodology for segmenting students’ preferences
for various types of post-secondary education (McNabb 1980). This study compared different
scales of measurement on the basis of their power to discriminate between pre-identified seg-
ments. The study first grouped a sample of 195 secondary school students into different groups
according their stated intent to attend one of five different types of post-secondary institutions.
A sixth group that did not plan to continue their education immediately after high school was
also tested. This enabled the researcher to determine which of the demographic, social, eco-
nomic, and attitudinal scales had the greatest power to classify subjects into their pre-identified
choice-groups.
The Predictive Discriminant Analysis Model
Most applications of discriminant analysis in political science research use the predictive ap-
proach. In predictive applications the grouping variable is simply the categorical variable that
signifies group membership; in these circumstances, the set of characteristics variables serves as
the predictor variables. The predictive model is discussed in greater detail below.
In an example of the predictive (PDA) application, Cooper (1987) first used cluster analysis
to group nations according to the type and size of their debt to foreign banks. After developing a
profile of nations that had failed in the past, he then used discriminant analysis to predict which
debtor nations were most likely to fail in their repayments of the debt.
Roberts (1992) used the PDA model in a voter prediction study. She employed panel information
gathered in three waves leading up to the 1990 Texas gubernatorial elections. The data consisted of
measurements of subjects’ attitude changes over time. Her sample of 283 subjects was 52.5 percent
male, 47.5 percent female; 49.6 percent registered Republicans, and 50.4 percent Democrats.
The dependent variable in the study was exit interviews in which subjects reported which
candidate they had voted for. Independent variables—the descriptive scales—consisted of multi-
item variables measuring partisanship, gender, degree of media reliance, and closeness of their
attention in following the race. After editing for missing data, Roberts had a database of 160 valid
cases. Using the set of independent variable demographic measurements, predictive discriminant
analysis revealed that they correctly grouped 84 percent of the male voters and 91 percent of the
female voters.
In another example of a predictive application, Kim (1995) conducted a comparative study
in which he tested the power of selected scales to predict the voting behavior of uncommitted
voters in 1992 presidential elections. He tested his model on samples in North Carolina and in
the Republic of South Korea (Table 15.1). Kim then used the same scales to predict how voter
behavior would change if a third or minority party dropped from the race late in the campaign
period. Kim found that in political polls, analysts are often uncertain as to how to treat uncommit-
ted voters in the findings. That uncertainty has resulted in at least four different ways of looking
at uncommitted voter data:
D
o
w
n
l
o
a
d
e
d
b
y
[
U
n
i
v
e
r
s
i
t
y
o
f
C
a
l
i
f
o
r
n
i
a
,
S
a
n
D
i
e
g
o
]
a
t
0
0
:
0
8
1
9
M
a
y
2
0
1
7
210 QUANTITATIVE RESEARCH APPROACHES AND METHODS
1. Eliminate the group from the analysis entirely.
2. Assign the uncommitted group on the basis of another discrete descriptive variable, such
as the party affiliation of the respondent.
3. Predict the group assignments on the basis of an attitudinal variable, such as the respon-
dent’s attitude toward candidates, parties, and/or their position of key political issues in
the campaign.
4. Use qualitative information gathered from intensive personal interviews with a small
sample of respondents, then classify the uncommitted group according to how similar
they are to the interviewed sample.
Kim was convinced that none of the four approaches used took full advantage of the collected
information. Also, they often resulted in grossly inadequate prediction results—a fact that could
have serious effects on a political campaign strategy. Instead, Kim proposed using a discriminant
analysis design upon which to base the uncommitted voter classifications.
At the conclusion of his analysis, Kim concluded that discriminant analysis is particularly useful
for the following purposes: (1) to identify the election issues and the demographic variables with
the greatest power to discriminate between groups, (2) to predict how many of the uncommit-
ted voters would vote for each of the candidates, and (3) to judge the effect that one candidate’s
withdrawing from a race with more than two candidates will have on the distribution of votes for
the remaining candidates.
Kim’s comparison of possible Korean voter reaction with third-party candidates in a race, and
their reaction when the third-party candidate withdraws, was particularly insightful. The results
of his analysis with 17 predictor variables are displayed in Table 15.1; the data were collected
from nationwide polls.
Group-Classification Applications
The group-classification process can be worked in much the same way that Kim used the PDA model
to test the power of scales to predict the voting behavior of uncommitted voters in Korean presidential
elections. Consider the following example: Suppose that a researcher is working with two equal-size
groups of politically aware people, of which 160 consider themselves to be liberals at heart and 160
conservatives. Each of the 320 subjects is measured on several describing characteristics.
The researcher wants to know whether the variables can be used as a tool for distinguishing
between the two political groups. Discrimination analysis, by comparing known with predicted
group membership, will give the analyst a numeric measure of the prediction effectiveness of the
scale. Using MDA can give the researcher indispensable evidence for supporting a conclusion.
Table 15.1
An Example of Discriminant Results for a Prediction Application
Prediction Power with 3rd-Party
Prediction Power, 3rd-Party Candidate
Country Sample
Candidate in the Race
out of the Race
United States
73.0% of grouped cases correctly
87.0% of grouped cases correctly
classified
classified
Korea
82.9% of grouped cases correctly
87.2% of grouped cases correctly
classified
classified
D
o
w
n
l
o
a
d
e
d
b
y
[
U
n
i
v
e
r
s
i
t
y
o
f
C
a
l
i
f
o
r
n
i
a
,
S
a
n
D
i
e
g
o
]
a
t
0
0
:
0
8
1
9
M
a
y
2
0
1
7
EXPLORING MULTIVARIATE STATISTICS 211
Post Hoc Validation of Other Diagnosis Methods
Runyon, Faust, and Orvaschel (2002) used discriminant analysis to determine whether two scales
developed to diagnose children with post-traumatic stress disorder (PTSD) were effective in
distinguishing between children who were or were not suffering current depression. The research-
ers tested the Children’s Schedule of Affective Disorders and Schizophrenia (K-SDAS) and the
Children’s Depression Inventory (CDI) on a sample of 96 children, ranging in age from 5 to 17
years. Their discriminant analysis found that, overall, the items they selected after analysis of
variance for statistically significant differences were able to successfully classify children with
both disorders 81.8 percent of the time.
Discriminant Analysis Software
The Statistical Package for the Social Sciences (SPSS) contains a discriminant analysis capability.
Discriminant analysis is possibly best known in political science as a tool for predicting which
individuals will fall into two or more separate groups based upon the measurements taken from a
similar sample of subjects. This method is used for situations where the researcher wants to build
a predictive model of group membership based on observed characteristics of each case. The
procedure generates a discriminant function—or for more than two groups, a set of discriminant
functions—based on the combinations of the predictor variables that result in the best distinction
between the groups.
Factor and Cluster Analysis Methods
Many multivariate analysis techniques or methods have been developed to assist in the management
and analysis of large databases. Large databases are those datasets that consist of measurements in
the neighborhood of 300 or more subjects and/or 100 or more variables. Among these techniques
are principal component analysis, standard factor analysis, and cluster analysis.
Principal component analysis (PCA) is similar to standard factor analysis (SFA) in concept
and application. In fact, it is just one of the seven different ways that the SPSS statistical soft-
ware package provides for extracting the factors that underlie a set of measurements. However,
the principal components model does not result in a direct reduction in the number of variables.
Instead, the model lists components in the order of the amount of variation they explain in all the
variables (Cattell 1978; Goddard and Kirby 1976; Dunteman 1994). Principal component analysis
transforms an original dataset of variables into a set of uncorrelated variables.
Factor analysis serves many different purposes, the most important of which are the reduction
in the number of variables and testing of hypotheses. The standard factor analysis (SFA) model,
which is also known as common factor analysis, is used more often than principal component
analysis. With SFA, the observed variables are considered to be causal influences on the underly-
ing factors as well as influences on factors that are unique to each observed variable (Lance and
Vandenberg 2002).
Cluster analysis also results in a reduction in the amount of data with which the researcher
must work, but involves more subjective decision making than factor analysis. However, cluster
analysis is a popular tool for grouping people into similar categories or classifications; it has
become an important statistical tool for identifying and describing voter segments in political
campaigning, and even more important as a tool in business for segmenting markets for prod-
ucts and services.
D
o
w
n
l
o
a
d
e
d
b
y
[
U
n
i
v
e
r
s
i
t
y
o
f
C
a
l
i
f
o
r
n
i
a
,
S
a
n
D
i
e
g
o
]
a
t
0
0
:
0
8
1
9
M
a
y
2
0
1
7
212 QUANTITATIVE RESEARCH APPROACHES AND METHODS
Factor Analysis
Factor analysis is one of a family of statistical techniques for summarizing interrelationships among a
set of variable measurements, identifying underlying structure in a dataset, and reducing the number
of variables with which the researcher must work. The techniques all produce a smaller number of
artificial variables, called factors or components. Factors are artificial constructs generated by the
statistical program that are based on measures of inter-correlations; they represent what is common
among the original variables (Babbie 2001; Cattell 1978; Lance and Vandenberg 2002).
Bernard (2000) called these underlying constructs “super variables” because they are made
up of more than one initial variable. The initial variables make up the factors on the basis of the
strength of their similarity correlation with the factor. The variables included in the factor, in turn,
help the researcher find meaning in and subjectively explain the composition of each factor.
A factor is a new variable that is a composite of other variables. By examining the commonality
of the initial variables and the strength of their factor correlations (called factor loadings), factor
analysis helps make it possible to explain portions of the variance in a dependent variable. An
arbitrary number of important variables (importance is determined by the size of the factor load-
ings) are determined to make up the composite factor. Interpretation of the factor is a subjective
determination of the researcher.
The cutoff point in the number of variables loading on a factor is at the discretion of the
researcher. Traditionally, only variables with correlation values of 0.60 or greater are always in-
cluded, and loadings of 0.30 to 0.59 are considered as possible contributors. According to Bernard,
however, some researchers use 0.50 as the cutoff point in factor loadings, with values from 0.30
to 0.49 considered as possibly worth including.
Many researchers feel that the subjective interpretation of factors is one of the greatest advan-
tages of factor analysis. Subjective interpretation makes it possible to interject an aspect of reality
to the process; it is an attempt to decipher meaning from simple numerical description. However,
Babbie (2001) saw this subjectivity as the root cause of several disadvantages of the technique,
including the following:
s 4HEFACTORSTHEMSELVESAREGENERATEDMATHEMATICALLY
WITHNO MEANINGFULASSISTANCEOFTHE
researcher; interpretation occurs after establishment of the factors and factor loadings of the
individual variables.
s &ACTORANALYSISDOESNOTPROVIDEA MEANSFORDISPROVINGAHYPOTHESISTHEREFORE
ITISMORE
a qualitative analysis technique than a scientific, positivist research approach.
s .OMATTERWHATDATATHERESEARCHERINCLUDESINTHEANALYSISMATRIX
FACTORANALYSISWILLGEN-
erate a factor solution. The algorithm ignores the form and content of the initial variables.
Therefore, the factor result may be nonsense.
Factor analysis requires that the data meet a few simple assumptions: a normal distribution,
a large sample size (an n of at least 300, although some researchers reduce this to a minimum
of 150 cases), at least nominal-level (or standardized) data, a linear relationship, and outliers
screened and omitted.
Applications of Standard Factor Analysis
Factor analysis is used in two major applications. One, exploratory factor analysis (EFA),
identifies relationships among variables. The relationships are not always obvious in the data,
D
o
w
n
l
o
a
d
e
d
b
y
[
U
n
i
v
e
r
s
i
t
y
o
f
C
a
l
i
f
o
r
n
i
a
,
S
a
n
D
i
e
g
o
]
a
t
0
0
:
0
8
1
9
M
a
y
2
0
1
7
EXPLORING MULTIVARIATE STATISTICS 213
but show up as a pattern of correlations with artificial factors. The purpose of EFA is to sum-
marize, group, and explain the data. The research interprets the meaning of the factor according
to its correlated items. The second chief application for factor analysis is called confirmatory
factor analysis (CFA). CFA is the newer of the two uses and is rapidly gaining acceptance by
researchers.
Exploratory Factor Analysis
In exploratory factor analysis, the researcher uses the method to determine the minimum number
of hypothetical factors or components that account for the variance between the variables; it is
also used to explore the data for ways to reduce the number of active variables. Well into the
1990s, exploratory models remained the chief factor analysis application in the social sciences
(Kim and Mueller 1994). The following steps are presented to guide the researcher through the
EFA process:
1. Collect the data from a representative sample.
2. Determine which of the observed variables should be included in the analysis.
3. Determine which method of extraction to use in the analysis.
4. Specify how many factors should be included in the solution.
5. Interpret the patterns of factor loadings, variances, and covariances.
6. Rotate the matrix to test for alternative factor structures.
7. Interpret the final EFA solution.
In an example of an exploratory factor analysis, data acquired by Lee, Barnowe, and McNabb
(1999) were subjected to an EFA to identify the underlying structure of an international envi-
ronmental awareness database. The study assessed awareness and perceived importance of risk
associated with a number of environmental and social concerns among a sample of 295 university
students in the United States and Taiwan.
The researchers combined portions of several instruments available in the research literature
to produce a topical and comprehensive instrument. The final instrument was pretested in several
undergraduate and graduate classes in private and public universities. The major change to the
instrument resulting from pretesting was a revision to the response scales: a sixth response, “Not
familiar with this issue,” was added for all items.
The instrument contained a list of forty-five issues that the researchers believed were natu-
rally classified into three broad groups: items pertaining to the natural, social, and technological
environments.
The natural environment scale consisted of twenty-four items often cited as pressing environ-
mental problems. These ranged from ozone depletion and acid rain to Ebola and dioxins. The scale
was developed from items loading on what was subjectively interpreted as five broad categories
of environmental issues: air pollution (5 items); water pollution (3 items); solid and toxic waste
(3 items); climate and nature, including species loss (6 items); and disease and illnesses concerns
(7 items).
The social environment issues scale contained thirteen items associated with the quality of
life and health and welfare in modern society. Example items range from tobacco and drug use to
AIDS and crime and violence. The scale was constructed from six items loading on each of two
subscale categories: social issues (6 items), and health-related issues (7 items).
The third scale, the technological environment, consisted of eight items that ranged from nuclear
D
o
w
n
l
o
a
d
e
d
b
y
[
U
n
i
v
e
r
s
i
t
y
o
f
C
a
l
i
f
o
r
n
i
a
,
S
a
n
D
i
e
g
o
]
a
t
0
0
:
0
8
1
9
M
a
y
2
0
1
7
214 QUANTITATIVE RESEARCH APPROACHES AND METHODS
waste to cloning and irradiation of food. These items were loaded most highly on the technology
scale. The scale was constructed from four items each in of two subscale categories: technological
dangers (4 items), and science and energy (4 items).
The instrument was administered to a sample of 192 undergraduate and graduate-school students
at three U.S . universities, with a translated version administered to 103 students at the National
University of Taiwan. Responses were made using five-point scales ranging from Not-at-All -
Important to Absolutely Critical. A set of demographic classification items was also included.
Confirmatory Factor Analysis
The purpose of the confirmatory factor analysis model is to test hypotheses, either about the num-
ber of underlying factors or the variables or items that load on any single factor or component.
Having made the assertion in advance which items belong to which factor, the researcher can test
his assertion (hypothesis) by examining factor loadings. While describing the difference between
the two approaches is relatively simple, Kim and Mueller (1994) point out that, in practice, the
distinction is not always this clear; some of both models is found in many studies.
Factor analysis methods have been traced back to the initial development of the principal com-
ponents model developed by Charles Spearman in 1904. Nearly all of the factor analysis literature
from that date, and especially through the 1970s, was concerned with exploratory applications.
However, from the 1980s onward, there has been significantly more interest in the CFA model.
The objective of confirmatory factor analysis is related to hypothesis testing. The researcher hy-
pothesizes that a number of items or variables are collectively related. He or she can run a factor
analysis on the data to test whether the relationships exist as they were hypothesized.
In his monograph on confirmatory factor analysis, Long (1983) identified a number hypotheses
that may be established for a CFA analysis. These include specifying the number of factors to be
included in the solution, deciding what variables to include, what variances and covariances to
expect among both common and unique factors, and what relationships between variables and
underlying factors and/or between unique factors and initial variables to expect.
Lance and Vandenberg (2002, 223) developed the data in Table 15.2 to illustrate the major dif-
ferences between the EFA and CFA approaches. They added that that CFA should be considered
a tool for testing the validity of an underlying structure using prior-identified variables, whereas
EFA should be used as a technique for identifying which variables are related with which other
variables. The following seven steps were proposed by Lance and Vandenberg to lead the researcher
through the process of conducting a confirmatory factor analysis.
1. Collect the data from a representative sample.
2. Determine which of the observed variables should be included in the analysis.
3. Determine which method of extraction to use in the analysis.
4. Specify how many factors to include in the solution.
5. Interpret the patterns of factor loadings, variances, and covariances.
6. Rotate the matrix to test for alternative factor structures.
7. Interpret the final EFA solution.
Conducting a Factor Analysis with SPSS
The SPSS factor analysis program procedure is highly flexible: it provides seven methods of factor
extraction and five methods of rotation. Three methods of computing factor scores are included,
D
o
w
n
l
o
a
d
e
d
b
y
[
U
n
i
v
e
r
s
i
t
y
o
f
C
a
l
i
f
o
r
n
i
a
,
S
a
n
D
i
e
g
o
]
a
t
0
0
:
0
8
1
9
M
a
y
2
0
1
7
EXPLORING MULTIVARIATE STATISTICS 215
and factor scores can be saved as variables for additional analysis. The following example is
contained in the Help file of SPSS for Windows Factor Analysis.
What underlying attitudes lead people to respond to the questions on a political survey as
they do? Examining the correlations among the survey items reveals that there is significant
overlap among various subgroups of items—questions about taxes tend to correlate with
each other, questions about military issues correlate with each other, and so on. With fac-
tor analysis, you can investigate the number of underlying factors and, in many cases, you
can identify what the factors represent conceptually. Additionally, you can compute factor
scores for each respondent, which can then be used in subsequent analyses. (SSPS Version
11.0, p. 2002)
SPSS produces the following statistics for each variable: the number of valid cases, the mean,
and standard deviation. Among many other test results, the SPSS factor analysis program also pro-
duces a correlation matrix of variables, including their significance levels; an initial solution, with
communalities, eigenvalues, and percentage of variance explained; an unrotated solution, including
factor loadings, communalities, and eigenvalues; a rotated solution, including rotated pattern matrix
and transformation matrix; a factor score coefficient matrix and factor covariance matrix.
In addition, the SPSS factor analysis program produces two plots: a “scree plot” of eigenvalues
and a loading plot of the first two or three factors. The scree plot shown in Figure 15.1 was produced
from a principal component analysis results in a report on the London Deprivation Index published
in 2002 by the Greater London Council. The summary data are displayed in Table 15.3 .
Scree plots are simply the value of the eigenvalue plotted on a y-axis (vertical), with the num-
ber of the factor (the composite variable) plotted on the x-axis (horizontal). The term “scree” is
a word from geology that is used as the name for the rubble and other debris that collects at the
bottom of a rocky slope (Child 1990). The SPSS-produced table in which eigenvalues and amount
Table 15.2
A Comparison of EFA and CFA Factor Analysis Approaches
Issue
EFA
CFA
Mathematical Model
Either standard factor or
Standard-factor model
principal components
Selection of Measures
Wide variation
Determined by hypothesized factor format
Number of Factors
Determine from the data
Specified before the analysis
Interpretation of Factors Interpreted from items
Specified before the analysis
loading on each factor
Factor Pattern Matrix
Fully free; no constraints
Constrained; a fixed set of elements
Factor Correlations
Established after rotation
Estimated before the analysis
Goodness of Fit
Not an issue
A key, controversial issue
Source: After material in Lance and Vandenberg 2002.
D
o
w
n
l
o
a
d
e
d
b
y
[
U
n
i
v
e
r
s
i
t
y
o
f
C
a
l
i
f
o
r
n
i
a
,
S
a
n
D
i
e
g
o
]
a
t
0
0
:
0
8
1
9
M
a
y
2
0
1
7
216 QUANTITATIVE RESEARCH APPROACHES AND METHODS
0
1
2
3
4
5
6
7
8
9
10
11
12
12
34
5
Principal Component
A
m
o
u
n
t
o
f
E
i
g
e
n
v
a
l
u
e
Figure 15.1 An Example of a Scree Plot Showing Eigenvalues for Five Components
using Table 15.3 Data
Source: From material in Greater London Council, “London Index of Deprivation Authority,” 2002.
Table 15.3
Summary Data for 2002 London Deprivation Index
Component
Eigenvalue
Percent of Variance
Cumulative Percent
1
10.587
50.414
50.414
2
1.991
9.480
59.894
3
1.121
5.339
65.223
4
0.983
4.681
69.914
5
0.934
4.446
74.360
Source: Greater London Council, “London Index of Deprivation Authority,” 2002.
of explained variance are displayed serves as a visual cue for deciding which factors to include
and which to omit. There are no set rules for establishing the optimum number of factors in the
final solution, but several different methods are used for making this decision. One is the scree
plot; another is the Kaiser-Guttman rule of thumb, which specifies only factors with an eigenvalue
larger than 1.0 should be retained (Cattell 1978; Hutcheson and Sofroniou 1999).
To determine how many factors or components to include in the final analysis using the scree method,
simply use the point where the curve straightens out as the maximum number of factors to include. In the
example in Figure 15.1, the curve begins to flatten out convincingly at the third component. Therefore,
the London Index included three components in its principal components analysis. As can be seen in
Table 15.3, three components account for more than 65 percent of the variance in the model.
The term eigenvalue (also known by the label characteristic root and other names) in the above
example is an important mathematical concept in factor analysis; it is particularly important as a
D
o
w
n
l
o
a
d
e
d
b
y
[
U
n
i
v
e
r
s
i
t
y
o
f
C
a
l
i
f
o
r
n
i
a
,
S
a
n
D
i
e
g
o
]
a
t
0
0
:
0
8
1
9
M
a
y
2
0
1
7
EXPLORING MULTIVARIATE STATISTICS 217
component in deciding how many factors or components to retain in the final analysis (Kim and
Mueller 1994), and for determining how much variance is explained by each factor.
Eigenvalues are simply the sum of the squares of the factor loadings on each independent factor.
This is the total amount of variance for that factor. A glance at the computed factor-loading matrix
will reveal that variables load on more than one variable at the same time. This is not a problem,
for it is the sum of all (squared) loadings—the “similarity coefficients”—that is of interest. The
larger the eigenvalue, the more variance is explained by the factor.
Cluster Analysis
Cluster analysis is a generic label for a number of statistical processes used to group objects, people,
variables, or concepts into more or less homogeneous groups on the basis of their similarities
(Lorr 1983). Bernard (2000, p. 646) defined the cluster statistical technique as “a descriptive tool
for exploring relations among items—for finding what goes with what.” The result of a cluster
analysis is a set of classes, types, categories, or some other type of group.
One of the difficulties researchers have with using cluster analysis is the lack of consensus on
the terms used for cluster parts and processes. For example, some of the names used in the past
for cluster techniques include typological analysis numerical taxonomy, pattern recognition, and
classification analysis. Other terms that are used interchangeably in applications of cluster analy-
sis include the following terms used to mean the “things” being classified: subject, case, entity,
object, pattern, and operational taxonomic units (OTUs). Entity seems to be used most often, but
certainly not by any meaningful majority. Terms used to mean the “things” that are used to as-
sess the similarities between entities include: variable, attribute, character or characteristic, and
feature, among others. Finally, the following terms are used interchangeably to mean similarity:
resemblance, proximity, and association (Aldenderfer and Blashfield 1984).
Cluster analysis can be used for many different tasks, including but not limited to data reduction,
identification of natural groupings or types, development of classification systems, and for the testing
of hypotheses. There at least six objectives for a cluster analysis process (Lorr 1983, 3–4):
1. To identify natural clusters of independent variables.
2. To identify some number of distinguishable groups or clusters of cases.
3. To construct a rationale for classifying subjects or items into groups.
4. To generate hypotheses within the data by uncovering unexpected clusters.
5. To test hypothesized groupings that the researcher believes are present in a larger group
of cases.
6. To identify homogeneous subgroups that are characterized by the patterns of variables
upon which the classification reveals.
Problems with Cluster Analysis
Cluster analysis is not without its disadvantages, a number of which were pointed out by Aldenderfer
and Blashfield (1984). Foremost of these may the fact that cluster analysis, unlike much of our statisti-
cal knowledge, is constructed upon rather simple mathematical procedures; the techniques are not yet
supported by a large body of statistical reasoning. As a result, a great deal of subjective interpretation is
required in the identifying underlying structure and the selection of distinct clusters from the output.
A second problem is that cluster analysis methods have been developed in many different dis-
ciplines, including anthropology, sociology, psychology, political science, and others. Thus, the
D
o
w
n
l
o
a
d
e
d
b
y
[
U
n
i
v
e
r
s
i
t
y
o
f
C
a
l
i
f
o
r
n
i
a
,
S
a
n
D
i
e
g
o
]
a
t
0
0
:
0
8
1
9
M
a
y
2
0
1
7
218 QUANTITATIVE RESEARCH APPROACHES AND METHODS
conventions that have been built up over the years reflect the biases extant in those disciplines.
Furthermore, as more applications occur, new users seem intent upon adding their own contribu-
tions to the process, as is evidenced by the lack of even a standard terminology.
A third disadvantage of cluster analysis is the problematic nature of replication—a key require-
ment for scientific analysis. Different cluster methods regularly result in different cluster solutions
from the same dataset. A fourth disadvantage has to do with the strategic rationale for grouping in
the first place: the reason for doing a cluster analysis is to identify the structure within a dataset,
whereas the technique itself imposes a structure upon the data.
Like all statistical processes, the cluster analysis procedure progresses through a logical series
of steps, which are presented in Figure 15.2 . Not included in the chart, but a vital preliminary
Select a representative and
adequately large sample
Select a set of attributes to be
included in the grouping
analysis
Administer instrument; collect
data
Administer a principal
component analysis if
database is too large
z -score standardization
Other standardization
approaches
Standardize data if too
many different types of
measurements used
Compare profiles of each cluster and
interpret the findings
Apply a second cluster analytic
procedure to test accuracy of first
solution
Replicate study with a second sample
if possible
Run cluster analysis and conduct
initial group analysis
Figure 15.2 A Flowchart of the Steps Involved in a Cluster Analysis Procedure
D
o
w
n
l
o
a
d
e
d
b
y
[
U
n
i
v
e
r
s
i
t
y
o
f
C
a
l
i
f
o
r
n
i
a
,
S
a
n
D
i
e
g
o
]
a
t
0
0
:
0
8
1
9
M
a
y
2
0
1
7
EXPLORING MULTIVARIATE STATISTICS 219
step just the same, is the establishment of objectives for the research. The researcher must always
determine in advance what outcome of the statistical procedure is desired. Once this is established,
the researcher then develops or selects an appropriate data-gathering instrument, for which there
are an adequately large sample of subjects and a representative set of attributes or characteristics
for collecting measurements.
Cluster analysis works with all types and levels of data, but it is usually best to standardize the
scores so that a common measurement is used in the final analysis. If the database is too large, if
there are too many variables and too many branches in the cluster tree for logical interpretation,
the researcher may wish to reduce the number of active variables.
One way to do this is by conducting either a standard factor analysis or a principal compo-
nent analysis first, and then refer to the results of this secondary analysis as input for the cluster
analysis procedure. Selecting the right algorithm refers to choosing among the many different
types of clustering methods that are available. Aldenderfer and Blashfield (1984) identified
seven different clustering methods; hierarchical-agglomerative, iterative, and factor analytic
are the three most popular methods used in social science. Of these, hierarchical-agglomerative
cluster analysis is most common. Other types of cluster algorithms include hierarchical divisive,
density search, clumping, and graph theoretic. Researchers interested in knowing more about
these models should consult one of the many books written specifically on the cluster analysis
method.
Within the hierarchical-agglomerative model, researchers can chose from several different
linkage models—linkage refers to the way that dendograms (cluster analysis trees) are used to
identify groupings—single linkage, complete linkage, average linkage. Because of its simplicity
and ease of interpretation, single linkage may be the more popular model.
Cluster analysis may have any or more of the following goals: (1) to develop a typology or
classification system, (2) to investigate methods for grouping subjects, (3) to generate hypotheses
through data exploration, and (4) to test hypotheses by comparing cluster analysis groupings with
groups identified another way. Of these uses, the creation of classifications is by far the most com-
mon use for cluster analysis. However, in applied cluster analysis, two or more of these uses are
likely to be combined in the study.
Multiple Analysis of Variance (MANOVA)
Statistical procedures have been developed to test the impact on differences for more than two
sets of groups at the same time. These tests compare all factors against each grouping variable
individually, then test for interaction, and then test again for combinations of groups. These pro-
cedures are known as multiple analysis of variance (MANOVA). In addition, a procedure called
MANCOVA has been developed that combines a regression analysis with ANOVA.
Neither MANOVA nor MANCOVA is employed sufficiently to warrant a more detailed discus-
sion here. However, since they are based on the same concepts underlying analysis of variance
procedures used in experimental research designs, they are not difficult to learn and use. Addi -
tional information about these two procedures is available in most advanced statistical methods
textbooks.
Summary
This chapter looked at several popular multivariate statistical procedures: multiple discriminant
analysis, factor analysis, and cluster analysis. Discriminant analysis is one of a series of statistical
D
o
w
n
l
o
a
d
e
d
b
y
[
U
n
i
v
e
r
s
i
t
y
o
f
C
a
l
i
f
o
r
n
i
a
,
S
a
n
D
i
e
g
o
]
a
t
0
0
:
0
8
1
9
M
a
y
2
0
1
7
220 QUANTITATIVE RESEARCH APPROACHES AND METHODS
techniques designed to analyze relationships among two or more variables. It has been defined
as a mathematical technique that weighs and combines a set of measurements in a way that their
ability to discriminate between two or more groups is maximized. When more than two grouping
variables are used in the design, the discriminant process is considered to be multiple discriminant
analysis (MDA).
The underlying research problem in discriminant analysis is how to establish a decision rule
that enables assigning (or predicting) a subject whose group membership is not known to be
one of the categories that make up a complete group. Although assigning is done on the basis of
measurements on sets of descriptor variables, selection of these loading items is the province of
the researcher.
Discriminant analysis can be used for at least five different purposes: (1) as a way of classifying
and describing subjects in two or more groups at the same time; (2) as a tool for improving the
quality of predictions about which subject belongs with which group and why; (3) to determine
which descriptive variables have the greatest power to discriminate between two or more groups
of people; (4) as a post hoc test, in which it serves as a check for diagnoses or predictions made
on the bases of other types of evaluations; and (5) to gauge how far apart the groups are located
on a set of descriptive characteristics.
A number of multivariate analysis procedures have been developed to help researchers man-
age large databases—that is, datasets that consist of measurements in the neighborhood of 300
or more subjects and/or more than 100 variables. Among these tools are principal component
analysis, standard factor analysis, and cluster analysis. Principal component analysis (PCA) is
similar to standard factor analysis (SFA) in concept and application; it is one of seven different
ways that the SPSS statistical software package provides for extracting the factors that underlie
a set of measurements.
Factor analysis serves many different purposes, the most important of which are reduction
in the number of variables and testing of hypotheses. Factor analysis requires the researcher
to subjectively interpret each factor based on the variables that load on the factor—which
some believe to be one of the greatest advantages of factor analysis. Subjective interpretation
makes it possible to attempt to decipher meaning from what is otherwise simple numerical
description.
Cluster analysis also results in a reduction in the amount of data with which the researcher
must work, but involves more subjective decision making than factor analysis. However, cluster
analysis is a popular tool for grouping people into similar categories. It has become an important
statistical tool for identifying and describing voter segments in political campaigning, and even
more important as a tool for segmenting groups of citizens with needs for various public services.
MANOVA and MANCOVA are multivariate statistical methods for testing hypotheses with more
than two levels.
Discussion Questions
1. What is multiple discriminant analysis (MDA) and what is it used for?
2. Describe the MDA procedure.
3. How does discriminant analysis improve the quality of predictions?
4. What is principle component analysis (PCA), and what is it used for?
5. What is standard factor analysis (SFA) and what is it used for?
6. What is cluster analysis and what is it used for?
7. What are MANOVA and MANCOVA?
D
o
w
n
l
o
a
d
e
d
b
y
[
U
n
i
v
e
r
s
i
t
y
o
f
C
a
l
i
f
o
r
n
i
a
,
S
a
n
D
i
e
g
o
]
a
t
0
0
:
0
8
1
9
M
a
y
2
0
1
7
EXPLORING MULTIVARIATE STATISTICS 221
Additional Reading
Aldenderfer, Mark S., and Roger K. Blashfield. 1984. Cluster Analysis. Beverly Hills, CA: Sage.
Bennett, Spencer, and David Bowers. 1976. An Introduction to Multivariate Techniques for Social and Be-
havioral Sciences. London: Macmillan.
Brown, Timothy A. 2006. Confirmatory Factor Analysis for Applied Research. New York: The Guilford
Press.
Cureton, Edward E., and Ralph B. D’Agostino. 1993. Factor Analysis: An Applied Approach. Mahwah, NJ:
Lawrence Erlbaum Associates.
Huberty, Carl J. 1994. Applied Discriminant Analysis. New York: John Wiley.
Hutcheson, Graeme, and Nick Sofroniou. 1999. The Multivariate Social Scientist. London: Sage.
Klecka, William R. 1980. Discriminant Analysis. Beverly Hills, CA: Sage.
Loor, Maurice. 1983. Cluster Analysis for Social Scientists. San Francisco: Jossey-Bass.
Meyers, Lawrence S., Glenn C. Gamst, and Anthony J. Guarino. 2005. Applied Multivariate Research:
Design and Interpretation. Thousand Oaks, CA: Sage.
D
o
w
n
l
o
a
d
e
d
b
y
[
U
n
i
v
e
r
s
i
t
y
o
f
C
a
l
i
f
o
r
n
i
a
,
S
a
n
D
i
e
g
o
]
a
t
0
0
:
0
8
1
9
M
a
y
2
0
1
7
This page intentionally left blank
D
o
w
n
l
o
a
d
e
d
b
y
[
U
n
i
v
e
r
s
i
t
y
o
f
C
a
l
i
f
o
r
n
i
a
,
S
a
n
D
i
e
g
o
]
a
t
0
0
:
0
8
1
9
M
a
y
2
0
1
7
Part 3
Qualitative Research Approaches and Methods
D
o
w
n
l
o
a
d
e
d
b
y
[
U
n
i
v
e
r
s
i
t
y
o
f
C
a
l
i
f
o
r
n
i
a
,
S
a
n
D
i
e
g
o
]
a
t
0
0
:
0
8
1
9
M
a
y
2
0
1
7
This page intentionally left blank
D
o
w
n
l
o
a
d
e
d
b
y
[
U
n
i
v
e
r
s
i
t
y
o
f
C
a
l
i
f
o
r
n
i
a
,
S
a
n
D
i
e
g
o
]
a
t
0
0
:
0
8
1
9
M
a
y
2
0
1
7
225
16 Introduction to Qualitative
Research Methods
One important consequence of the push to extend the scope of research has been a widespread
increase in the use of subjective qualitative methods to replace or augment the once-prevalent
emphasis on objective, positivist research principles. Lan and Anders (2000) have described this
change in emphasis as a major paradigm shift in the philosophy of science.
Building their argument on the seminal work of Thomas S. Kuhn (The Structure of Scientific
Revolutions, 1970), Lan and Anders concluded that more than one approach to research is not
only possible, it is desirable. If science does progress by shifts in paradigms, as their interpretation
of Kuhn’s work suggests, and if it is indeed true that more than one paradigm can exist within a
single discipline, then the question of which research approach to take is moot. Researchers are
not required to follow the same set of rules. White and Adams (1994, 19–20) have summarized
this point thus:
We are persuaded by the weight of historical and epistemological evidence that no single
approach—even if accorded the highly positive label science—is adequate for the conduct
of research in public administration. If research is to be guided by reason, a diversity of
approaches, honoring both practical and theoretical reasons, seems necessary.
The term qualitative research is used to describe a set of nonstatistical inquiry techniques and
processes used to gather data about social phenomena. Qualitative data refers to some collection of
words, symbols, pictures, or other nonnumeric records, materials, or artifacts that are collected by
a researcher and have relevance to the social group under study. The uses for these data go beyond
simple description of events and phenomena; rather, they are used for creating understanding, for
subjective interpretation, and for critical analysis as well.
Qualitative research differs from quantitative research in several fundamental ways. For
example, qualitative research studies typically involve what has been described as “inductive,
theory-generating, subjective, and nonpositivist processes.” In contrast, quantitative research
involves “deductive, theory-testing, objective, and positivist processes” (Lee 1999, 10). Creswell
(1994) identified five ways that these two approaches differ, based upon these five philosophical
foundations: ontology (researchers’ perceptions of reality); epistemology (the role or roles taken
by researchers); axiological assumptions (researchers’ values); rhetorical traditions (the style of
language used by researchers); and methodological approaches (approaches taken by researchers).
The differences identified by Creswell are displayed in Figure 16.1 .
A key difference lies in the epistemology of the two approaches. In qualitative research designs,
D
o
w
n
l
o
a
d
e
d
b
y
[
U
n
i
v
e
r
s
i
t
y
o
f
C
a
l
i
f
o
r
n
i
a
,
S
a
n
D
i
e
g
o
]
a
t
0
0
:
0
8
1
9
M
a
y
2
0
1
7
226 QUALITATIVE RESEARCH APPROACHES AND METHODS
researchers must often interact with individuals in the groups they are studying. Researchers record
not only what they see, but also their interpretations of the meaning inherent in the interactions
that take place in the groups. Quantitative researchers, on the other hand, maintain a deliberate
distance and objectivity from the study group. They are careful to avoid making judgments about
attitudes, perceptions, values, interactions, or predispositions.
Another way to describe the differences between qualitative and quantitative research methods has
been proposed by Cassell and Symon (1997). The most fundamental of these differences is a bias against
using numbers for qualitative research, whereas quantitative research is biased heavily toward numeric
measurements and statistical analysis—the positivist approach to scientific analysis (White 1999). The
objective of this positive approach to research is to control events through a process of prediction that
is based on explanation; it employs inferential statistical methods (White and Adams 1994).
The second difference is what is referred to as the subjective-objective dichotomy. Qualitative
researchers “explicitly and overtly apply” (Lee 1999, 7) their own subjective interpretations of
what they see and hear—often, they are active participants in the phenomenon under study. On
the other hand, a foundation stone of the quantitative, positivist research approach is researcher
objectivity. The researcher is expected to function as an unbiased, unobtrusive observer, reporting
only what happens or what can be measured.
These two approaches also differ in a third way: qualitative researchers tend to approach the
research process with a willingness to be flexible, to follow where the data lead them. Qualitative
researchers often approach a topic with few or no preconceived assumptions; these are expected to
appear out of the data as they are collected and studied. Quantitative research, on the other hand,
tends to be guided by a strict set of rules and formal processes. Typically, specific hypotheses
are established prior to the data gathering and tested during the analysis. Variables are identified
and explicitly defined beforehand. Searching for cause-and-effect relationships between defined
variables that can be measured is a hallmark of quantitative research studies.
RESEARCH STRATEGIES
Philosophical
Foundations
Qualitative Research Designs
Quantitative Research Designs
ONTOLOGY
(Perceptions of
Reality)
Researchers assume that multiple,
SUBJECTIVELY DERIVED REALITIES CAN
coexist.
Researchers assume that a
SINGLE
OBJECTIVE WORLD EXISTS
EPISTEMOLOGY
(Roles for the
Researcher)
Researchers commonly assume
that they must interact with their
studied phenomena.
Researchers assume that they are
independent from the variables
under study.
AXIOLOGY
(Researchers’ Values)
Researchers overtly act in a value-
laden and biased fashion.
Researchers overtly act in a value-
free and unbiased manner.
RHETORIC
(Language Styles)
Researchers often use
personalized, informal, and context-
laden language.
Researchers most often use
impersonal, formal, and rule-based
text.
METHODOLOGY
(Approaches to
Research)
Researchers tend to apply
induction, multivariate, and
multiprocess interactions, following
context-laden methods.
Researchers tend to apply
deduction, limited cause-and-effect
relationships, with context-free
methods.
Figure 16.1 Five Ways Qualitative Research Differs from Quantitative Research
Source: Creswell 1994.
D
o
w
n
l
o
a
d
e
d
b
y
[
U
n
i
v
e
r
s
i
t
y
o
f
C
a
l
i
f
o
r
n
i
a
,
S
a
n
D
i
e
g
o
]
a
t
0
0
:
0
8
1
9
M
a
y
2
0
1
7
INTRODUCTION TO QUALITATIVE RESEARCH METHODS 227
A fourth way that the two approaches differ has to do with the aim of the study. Qualitative
researchers seek understanding of social interactions and processes in organizations, whereas
quantitative studies are more often concerned with predicting future events and behaviors. To
make these predictions, they often apply inferential statistical analyses to measurements taken
from representative samples drawn from a population of interest.
A fifth difference is associated with the context of the study. Qualitative research is usually
concerned with a situation or event that takes place within a single organizational context. A major
goal of much quantitative research is to apply the study results to other situations; thus, quantita-
tive research is what Lee terms “more generalizable.”
A sixth way that these two approaches to research differ is the emphasis that qualitative re-
searchers assign to the research process. The way that subjects interact with, and react to, the
researcher during the qualitative study is of as much an interest as the original phenomenon of
interest. Quantitative researchers tend to take great pains to avoid introducing extraneous influences
into the study and seek to isolate subjects from the process as much as possible by controlling
for process effects.
Qualitative Research Strategies
Qualitative research strategies can be grouped into three broad strategic classes. These are (1)
explanatory research studies, (2) interpretive research studies, and (3) critical research studies.
These strategies and the four key approaches that are followed in most social science research
are displayed in Figure 16.2 . These roughly correspond to the exploratory-descriptive-causal
categories of quantitative research designs.
Explanatory Research
Explanatory research was described by Schwandt (1997) in his dictionary of terms and concepts
encountered in qualitative research as studies that are conducted to develop a causal explanation
of some social phenomenon. The researcher identifies a specific social event or circumstance (a
consequence)—such as crime in the inner city—that he or she wants to investigate. The researcher
then seeks to identify the social, economic, climate, practice, or other such characteristic (variable)
in the social environment that can be explained as a cause of the consequence of interest.
One of the major objectives of explanatory research is to build theories that researchers can then
use to explain a phenomenon, and which can then be used to predict future behavior or events in
similar circumstances. The ability to predict responses allows investigators a measure of control
over events. Therefore, the ultimate goal of all explanatory research is the control of natural and
social events (White 1999). Explanatory research is the easiest approach to understand and apply,
and is often used simply for this reason.
In addition to this controlling aspect of explanatory research, the strategy is seen by many as
the fastest way to produce a cumulative stream of knowledge in a field or discipline. Possibly
because of this, and because of their relationship to control, studies that are designed to explain a
phenomenon are still the strategy seen most often in public administration research.
Explanatory strategies fulfill much the same role in qualitative research that exploratory research
does in quantitative research; they are used as a means of gathering fundamental information about the
topic, its contributing factors, and the influences a phenomenon might have on various outcomes. This
process can be described as gaining insights and ideas about a study problem. These studies are seldom
complete in themselves; they are conducted as preliminaries to additional, follow-on research.
D
o
w
n
l
o
a
d
e
d
b
y
[
U
n
i
v
e
r
s
i
t
y
o
f
C
a
l
i
f
o
r
n
i
a
,
S
a
n
D
i
e
g
o
]
a
t
0
0
:
0
8
1
9
M
a
y
2
0
1
7
228
Q
u
a
l
i
t
a
t
i
v
e
R
e
s
e
a
r
c
h
S
t
r
a
t
e
g
i
e
s
C
r
i
t
i
c
a
l
R
e
s
e
a
r
c
h
S
t
u
d
i
e
s
I
n
t
e
r
p
r
e
t
i
v
e
R
e
s
e
a
r
c
h
S
t
u
d
i
e
s
E
x
p
l
a
n
a
t
o
r
y
R
e
s
e
a
r
c
h
S
t
u
d
i
e
s
C
a
s
e
M
e
t
h
o
d
R
e
s
e
a
r
c
h
H
i
s
t
o
r
i
c
a
l
R
e
s
e
a
r
c
h
E
m
p
o
w
e
r
m
e
n
t
/
F
e
m
i
n
i
s
t
R
e
s
e
a
r
c
h
E
t
h
n
o
g
r
a
p
h
i
c
R
e
s
e
a
r
c
h
A
c
t
i
o
n
S
c
i
e
n
c
e
R
e
s
e
a
r
c
h
G
r
o
u
n
d
e
d
T
h
e
o
r
y
R
e
s
e
a
r
c
h
F
i
g
u
r
e
1
6
.
2
S
o
m
e
Q
u
a
l
i
t
a
t
i
v
e
R
e
s
e
a
r
c
h
S
t
r
a
t
e
g
i
e
s
i
n
P
o
l
i
t
i
c
a
l
S
c
i
e
n
c
e
R
e
s
e
a
r
c
h
D
o
w
n
l
o
a
d
e
d
b
y
[
U
n
i
v
e
r
s
i
t
y
o
f
C
a
l
i
f
o
r
n
i
a
,
S
a
n
D
i
e
g
o
]
a
t
0
0
:
0
8
1
9
M
a
y
2
0
1
7
INTRODUCTION TO QUALITATIVE RESEARCH METHODS 229
Interpretive Research
Not all research theorists agree that human events or actions can be defined by the causal explanations
that are part and parcel of explanatory research. Instead, these critics argue that human action can
never be explained this way. It can only be understood by studies that follow the second approach in
the triad of qualitative approaches, which is interpretation. The researcher arrives at an interpretation
of a phenomenon by developing (subjective) meanings of social events or actions.
Interpretive research helps us achieve understanding of actions of people in social circumstances
and situations. White cites as an example the way an interpretive researcher goes beyond describing
why a job-enrichment program is not working, using established hypotheses of motivation and job
design. Instead, the interpretive researcher might circulate among employees in their job setting,
ask them what they think about the program, the meaning it has for them, and how it conflicts or
reinforces their existing attitudes, opinions, and behaviors. In this way, the researcher seeks to
“discover the meaning of the program; how it fits with (the workers’) prior norms, rules, values,
and social practice” (White 1994, 45).
Schwandt (1997, 73) has offered this description of interpretation in research: “A classifica-
tion, explication, or explanation of the meaning of some phenomenon.” Thus, interpretive studies
require the researcher to go beyond simply describing or explaining what a phenomenon is to
also “interpret” the phenomenon for the reader. This entails providing an interpretation of what
it means, as well as what it is. Schwandt concluded that the term interpretation is used as a syn-
onym for hermeneutics or Verstehen (Verstehen defines an approach to the social sciences that is
committed to providing understanding of human actions).
Research can be classified as interpretive when it builds on the assumption that humans learn
about reality from the meanings they assign to social phenomena such as language, consciousness,
shared experiences, publications, tools, and other artifacts. The task is made difficult because a
fundamental tenet of interpretive theory is that social phenomena are constantly changing. Thus,
the meanings that people assign are in constant flux. At the same time, interpretive research is
always context-laden. Thus, interpretation is like shooting at a constantly moving target.
A primary goal of the interpretive research approach is to provide many-layered descriptions
and interpretations of human experiences (Meacham 1998). To achieve this goal, interpretive
research looks at the way humans make sense out of events in their lives—as they happen, not as
they are planned. Therefore, to thoroughly understand an event or an organization, the researcher
must also understand its historical context.
Interpretive research is important for the study of government organizations and agencies.
The fundamental objective for interpretive research makes this approach particularly relevant in
applications such as these:
The basic aim of the interpretive model is to develop a more complete understanding of
social relationships and to discover human possibilities. Recent studies of organizational
culture demonstrate the importance of interpretive methods for properly understanding
norms, values, and belief systems in organizations. (White 1994, 45)
Principles of Interpretive Research
Klein and Myers (1999) developed a set of seven fundamental principles to help researchers con-
duct and evaluate interpretive research studies. The first and most fundamental of these principles
is the hermeneutic circle, derived from document and literary analysis. The hermeneutic circle
D
o
w
n
l
o
a
d
e
d
b
y
[
U
n
i
v
e
r
s
i
t
y
o
f
C
a
l
i
f
o
r
n
i
a
,
S
a
n
D
i
e
g
o
]
a
t
0
0
:
0
8
1
9
M
a
y
2
0
1
7
230 QUALITATIVE RESEARCH APPROACHES AND METHODS
was devised to illustrate a phenomenon of the learning/understanding process. People develop
understanding about complex concepts from the meanings they bring to the parts that make up the
concept; these can be words and the way that they relate to one another. Interpretation of the larger
whole moves from a preliminary understanding of the parts to understanding the whole. It then
moves back again to a better understanding of the parts, and on and on. The process of understand-
ing thus moves continuously in an expanding circle of greater and greater understanding.
The second principle of interpretive research is the importance of the contextual nature of the
studied phenomenon or organization that was mentioned earlier. The researcher’s “meaning” is
derived out of the particular social and historical context in which the phenomenon is embedded;
at the same time, all patterns that can be discovered within this embedded context are constantly
changing. The organization that is interpreted is thus time and situation specific.
The interactions between researchers and the subjects they study constitute the third of the seven
principles of interpretive research; the information is not something inherent in the phenomenon.
Rather, it is developed as a result of the social interrelations of both subjects and researcher. Gum-
messon (1991) likens this to the interaction that often results in the researcher metamorphosing
into an “internal consultant” role during case study research. By interacting with participants, the
researcher becomes one with the members of the group under study.
Abstraction and generalization together make up the fourth principle of interpretive research.
This principle deals with abstractions as it attempts to bring order to disunited parts by categoriz-
ing them into generalizations and concepts with wider application. The inferences drawn by the
researcher that are based on his or her subjective interpretation of the single case must be seen as
theoretical generalizations.
The fifth principle of interpretive research is dialogical reasoning. In this intellectual process,
the researcher explicitly weighs all preconceptions and/or biases brought to the planned research
activity against the information that actually emerges from the actual research process. This
principle forces the researcher to begin by defining the underlying assumptions that guide the
research and the research paradigm upon which the study is based. Through a process of dialog
with participant actors, the researcher defines and redefines the assumptions and research ques-
tions in light of the data that emerge.
The principle of multiple interpretations demands that the researcher aggressively compare
his or her historical and contextual interpretation of the phenomenon against all other available
interpretations and the reasons offered for them. Thus, the researcher subjects his or her own pre-
conceptions and biases to comparison against competing interpretations, including those of the
participants in the organization under study. Even if no conflicting interpretations are found during
the study, the researcher is expected to probe for them and to document the fruitless process. In this
way, the researcher strengthens the conclusions and interpretations derived from the analysis.
The final principle of interpretive research is that of suspicion. This requires the researcher to
not accept an interpretation at face value. To avoid making false interpretations, the researcher
must examine every personal preconception, conclusion, definition, and derived meaning with a
healthy dose of skepticism.
Critical Research
Critical qualitative research is a third approach to investigations of social phenomena adopted by
public administration researchers. Critical research in public administration has evolved from ap-
proaches exemplified in Marxian critical sociology and Freudian psychotherapy traditions (Argyris,
Putnam, and Smith 1985. According to Klein and Myers (1999), a study can be considered to be
D
o
w
n
l
o
a
d
e
d
b
y
[
U
n
i
v
e
r
s
i
t
y
o
f
C
a
l
i
f
o
r
n
i
a
,
S
a
n
D
i
e
g
o
]
a
t
0
0
:
0
8
1
9
M
a
y
2
0
1
7
INTRODUCTION TO QUALITATIVE RESEARCH METHODS 231
critical in nature if it is a social critique that that exposes harmful or alienating social conditions.
Furthermore, the purpose of the critique should be to emancipate members of the society from
the harmful conditions, thus eliminating the causes of the alienation. Members of the society are
not told how to change their conditions, but are instead helped to identify on their own alternative
ways of defining their society and achieving human potential.
The primary objective of critical research is to help people change their beliefs and actions
as part of a process of helping them become aware of the often-unconscious bases for the way
they act or their beliefs. By becoming aware of why they live and think the way they do, “critique
points out inconsistencies between what is true and false, good and bad; it compels [people] to
act in accordance with truth and goodness” (White 1994, 46).
Critical public administration research begins with the assumption that a crisis exists in some aspect
of society. The researcher approaches the study of this crisis from a deeply personal and involved
commitment to help the people involved. Recognition of a “crisis,” then, is one of the key concepts
of the approach. The role of critical research in these circumstances is explained in the following:
From [the crisis] perspective, society is seen as [torn] by social and political divisions that
make the process of social reproduction . . . prone to actual or incipient breakdown. Society
[is not] a harmonious, self-regulating system. Rather, it must be seen as a field of complex
and contradictory possibilities for social actors who would . . . assume command of these
possibilities and produce new social realities which would express their ability to act as
empowered, autonomous agents. The task of critical research involves identifying these
possibilities and suggesting what social actors might do to bring their lives under their
conscious direction. (Hansen and Muszyaki 1990, 2)
A number of structural themes characterize critical research. The two that seem to appear most
regularly in the literature of critical research methodology are distortion in the perceptions held by
members of a group and rejection of the idea of the disinterested scientist. With the first theme, the
goal of critical research is to integrate social theory and application or practice in such a way that
the members of social groups become cognizant of distortions and other problems in their society
or their value systems. Then the group members are encouraged to propose ways to change their
social and value systems so as to improve their quality of life (Schwandt 1997).
The second key theme in critical research is the refusal to accept the traditional idea that called
for the social scientist to remain objective or “disinterested,” and its replacement with the concept
of the active, change-oriented researcher whose emphasis is on motivating change processes in
social groups and individuals. The technique of adopting a critical perspective in professional
communication has been described thus:
The critical perspective aims at empowerment and emancipation. It reinterprets the relation-
ship between researcher and participants as one of collaboration, where participants define
research questions that matter to them and where social action is the desired goal. (Blyler
1998, 33)
Which Strategy Is Best?
The choice of which strategy to adopt when designing a qualitative study will depend upon the
objectives the researcher has identified for the study. Often considered the easiest of the three
strategies to carry out, and possibly because of this, by far most qualitative research studies follow an
D
o
w
n
l
o
a
d
e
d
b
y
[
U
n
i
v
e
r
s
i
t
y
o
f
C
a
l
i
f
o
r
n
i
a
,
S
a
n
D
i
e
g
o
]
a
t
0
0
:
0
8
1
9
M
a
y
2
0
1
7
232 QUALITATIVE RESEARCH APPROACHES AND METHODS
explanatory design. However, according to White (1999) and others, there is a strong movement
among researchers in all the social and administrative sciences to go beyond a simple descriptive
explanation of a phenomenon to also explore whatever meaning underlies the behavior, event, or
circumstance. Professionals, administrators, sponsoring agencies, and the public at large are asking
researchers to explain what things mean, rather than simply describing them as they appear.
An even smaller number of researchers is extending the range of research even further by
designing studies that begin with a critique of a social phenomenon and end with the design
and introduction of subject-sponsored new ways of addressing old problems (Robinson 1994).
The critical approach in public administration is still in its infancy, however (White 1999).
This approach has been employed often enough, however, to result in a reputation for making
it difficult to transform research results into meaningful program applications. The method re-
quires subjects to formulate alternative concepts or courses of action; the role of the researcher
is to assist the group in, first, identifying and then resolving their social problems themselves.
Despite this difficulty, the critical approach is seen as an important way of addressing single-
case studies.
Additional Qualitative Research Strategies
Many different types of research approaches are employed for conducting qualitative research.
The four research approaches most often followed are case studies, grounded theory, ethnogra-
phy, and action science. These are not the only approaches seen in research in the administrative
and social sciences, however. Others include phenomenology, hermeneutics, ethnomethodolgy,
atmospherics, systems theory, chaos theory, nonlinear dynamics, grounded theory, symbolic
interactionism, ecological psychology, cognitive anthropology, human ethnology, and holistic
ethnography, to name only a few (Patton 1990; Denzin and Lincoln 1994b; Morse 1994; Marshall
and Rossman 1999).
Figure 16.3 displays six popular research approaches, their disciplinary traditions, some common
ways data are gathered, and a suggestion of some of the types of research questions addressed. The
disciplinary approaches compared include (1) ethnography, (2) phenomenology, (3) case studies
approach, (4) hermeneutics, (5) grounded theory, and (6) action science.
Analyzing and Interpreting Qualitative Data
All qualitative research strategies and approaches involve three basic components: (1) collection
of data, (2) analysis and interpretation of that data, and (3) communicating research findings in one
or more communications media, such as producing a written report (Strauss and Corbin 1998).
The major methods used to collect qualitative data include: (1) participation in the group setting
or activity, (2) personal and group interviewing, (3) observation, and (4) document and cultural
artifact analysis. There are also many secondary methods of collecting information (Marshall and
Rossman 1999). These include historical analysis, recording and analysis of live histories and
narratives, films, videos and photographs, kinesics, proxemics, unobtrusive measures, surveys,
and projective techniques.
Some researchers collect qualitative data by actually participating in a social situation and
writing down what they see, while others do so by unobtrusively observing social interrelation-
ships and behaviors. Researchers also gather qualitative data for analysis by video or audio tape
recordings of narrative accounts of life histories, events, perceptions, or personal values; they
question subjects using structured or unstructured, personal or group, interviews. Still others collect
D
o
w
n
l
o
a
d
e
d
b
y
[
U
n
i
v
e
r
s
i
t
y
o
f
C
a
l
i
f
o
r
n
i
a
,
S
a
n
D
i
e
g
o
]
a
t
0
0
:
0
8
1
9
M
a
y
2
0
1
7
233
Q
u
a
l
i
t
a
t
i
v
e
R
e
s
e
a
r
c
h
A
p
p
r
o
a
c
h
D
i
s
c
i
p
l
i
n
a
r
y
T
r
a
d
i
t
i
o
n
s
T
y
p
i
c
a
l
D
a
t
a
-
G
a
t
h
e
r
i
n
g
M
e
t
h
o
d
s
T
y
p
e
s
o
f
R
e
s
e
a
r
c
h
Q
u
e
s
t
i
o
n
s
E
t
h
n
o
g
r
a
p
h
y
A
n
t
h
r
o
p
o
l
o
g
y
P
a
r
t
i
c
i
p
a
n
t
O
b
s
e
r
v
a
t
i
o
n
;
U
n
-
s
t
r
u
c
t
u
r
e
d
I
n
t
e
r
v
i
e
w
s
;
A
n
a
l
y
s
i
s
o
f
C
u
l
t
u
r
a
l
A
r
t
i
f
a
c
t
s
“
C
u
l
t
u
r
e
”
q
u
e
s
t
i
o
n
s
:
W
h
a
t
a
r
e
t
h
e
v
a
l
u
e
s
o
f
t
h
i
s
g
r
o
u
p
?
W
h
a
t
i
s
a
c
c
e
p
t
e
d
b
e
h
a
v
i
o
r
?
W
h
a
t
i
s
n
o
t
a
c
c
e
p
t
a
b
l
e
?
P
h
e
n
o
m
e
n
o
l
o
g
y
P
h
i
l
o
s
o
p
h
y
P
e
r
s
o
n
a
l
E
x
p
e
r
i
e
n
c
e
N
a
r
r
a
t
i
v
e
s
;
V
i
d
e
o
/
A
u
d
i
o
T
a
p
e
d
D
i
s
c
u
s
s
i
o
n
s
;
I
n
-
D
e
p
t
h
I
n
t
e
r
v
i
e
w
s
“
M
e
a
n
i
n
g
”
q
u
e
s
t
i
o
n
s
:
W
h
a
t
i
s
t
h
e
m
e
a
n
i
n
g
o
f
a
p
e
r
s
o
n
’
s
e
x
p
e
r
i
e
n
c
e
?
H
o
w
d
o
g
r
o
u
p
m
e
m
b
e
r
s
c
o
p
e
w
i
t
h
v
a
r
i
o
u
s
p
h
e
n
o
m
e
n
a
?
C
a
s
e
S
t
u
d
i
e
s
P
s
y
c
h
o
l
o
g
y
;
P
u
b
l
i
c
A
d
m
i
n
i
s
t
r
a
t
i
o
n
O
b
s
e
r
v
a
t
i
o
n
;
P
e
r
s
o
n
a
l
I
n
t
e
r
-
v
i
e
w
s
;
O
r
g
a
n
i
z
a
t
i
o
n
a
l
S
t
u
d
i
e
s
“
E
x
p
l
a
n
a
t
o
r
y
”
q
u
e
s
t
i
o
n
s
:
W
h
a
t
i
s
d
i
s
t
i
n
c
t
a
b
o
u
t
t
h
i
s
g
r
o
u
p
?
H
e
r
m
e
n
e
u
t
i
c
s
B
i
b
l
i
c
a
l
S
t
u
d
i
e
s
;
L
i
t
e
r
a
r
y
A
n
a
l
y
s
i
s
C
o
n
t
e
n
t
A
n
a
l
y
s
i
s
;
N
a
r
r
a
t
i
v
e
a
n
d
D
i
s
c
o
u
r
s
e
A
n
a
l
y
s
i
s
“
I
n
t
e
r
p
r
e
t
a
t
i
o
n
”
q
u
e
s
t
i
o
n
s
:
W
h
a
t
m
e
a
n
i
n
g
d
o
e
s
t
h
i
s
t
e
x
t
h
o
l
d
?
G
r
o
u
n
d
e
d
T
h
e
o
r
y
S
o
c
i
o
l
o
g
y
;
S
o
c
i
a
l
P
s
y
c
h
o
l
o
g
y
P
e
r
s
o
n
a
l
I
n
t
e
r
v
i
e
w
s
;
D
i
a
r
i
e
s
;
P
a
r
t
i
c
i
p
a
n
t
O
b
s
e
r
v
a
t
i
o
n
“
P
r
o
c
e
s
s
”
q
u
e
s
t
i
o
n
s
:
W
h
a
t
t
h
e
o
r
y
i
s
e
m
b
e
d
d
e
d
i
n
t
h
e
r
e
l
a
t
i
o
n
s
h
i
p
s
b
e
t
w
e
e
n
v
a
r
i
a
b
l
e
s
?
I
s
t
h
e
r
e
a
t
h
e
o
r
y
o
f
c
h
a
n
g
e
?
A
c
t
i
o
n
S
c
i
e
n
c
e
S
o
c
i
a
l
P
s
y
c
h
o
l
o
g
y
;
E
d
u
c
a
t
i
o
n
D
i
s
c
o
u
r
s
e
A
n
a
l
y
s
i
s
;
I
n
t
e
r
v
e
n
t
i
o
n
S
t
u
d
i
e
s
“
C
r
i
t
i
q
u
e
”
q
u
e
s
t
i
o
n
s
:
H
o
w
c
a
n
w
e
e
m
a
n
c
i
p
a
t
e
g
r
o
u
p
m
e
m
b
e
r
s
?
W
h
a
t
b
e
h
a
v
i
o
r
s
i
n
h
i
b
i
t
c
h
a
n
g
e
?
F
i
g
u
r
e
1
6
.
3
V
a
r
i
o
u
s
A
p
p
r
o
a
c
h
e
s
t
o
Q
u
a
l
i
t
a
t
i
v
e
R
e
s
e
a
r
c
h
:
F
o
u
n
d
a
t
i
o
n
s
,
M
e
t
h
o
d
s
,
a
n
d
F
o
c
u
s
D
o
w
n
l
o
a
d
e
d
b
y
[
U
n
i
v
e
r
s
i
t
y
o
f
C
a
l
i
f
o
r
n
i
a
,
S
a
n
D
i
e
g
o
]
a
t
0
0
:
0
8
1
9
M
a
y
2
0
1
7
234 QUALITATIVE RESEARCH APPROACHES AND METHODS
qualitative data by examining collections of printed documents, past and present artifacts, or by
an examination of cultural or artistic creations, including the media. And some use a combination
of these and other methods.
Analysis
The analysis and interpretation of qualitative data begins with bringing the raw data into some
level of order. First, the researcher identifies and selects a set of relevant categories or classes into
which to sort the data. Comparing the data across categories—a step that is typically used in the
testing of hypotheses—often follows the initial comparing phase of the analysis. Strauss and Corbin
(1998) call this a process of conceptualizing. This means reducing the often bulky amounts of raw
data into workable, ordered bits of information that the researcher can manage with confidence.
Kvale (1996) described this act of data categorization as a key qualitative research activity and
one that most distinguishes qualitative strategies from quantitative research.
Another procedure sometimes used for this purpose is what is known as power or influence
analysis. In this process, the researcher first collects data by observing the way people interact or
by questioning them on their perceptions of such factors as power or influence in the organiza-
tion. The researcher can then draw a diagram or chart to illustrate the interactions and responses
to others within a group or other social setting. Examples of graphic displays of this type include
context charts, linkage patterns and knowledge flow charts, and role and power charts (Miles and
Huberman 1994).
Interpretation
The next step in analysis of qualitative data is interpreting the patterns and connections that are
revealed or hidden by bringing the data into order. Interpretation occurs when the researcher
draws conclusions from whatever structure becomes revealed in the data. If graphic diagrams are
used, the interpretation requires the researcher to explain the connections and interfaces that have
been recorded by examining and describing the personal connections, misconnections, interfaces,
relationships, and/or interplay of behaviors. These explanations become the gist of a cogent and
meaningful report, which is the third step in the process.
These three steps must be followed in all studies, regardless of which underlying discipline
the study falls into, which approach the researcher follows, or which technique is used to gather
and analyze the data.
Summary
Qualitative research describes a set of nonstatistical inquiry techniques for gathering data about
social phenomena. Qualitative data are words, symbols, pictures, or other nonnumeric records,
materials, or artifacts collected by a researcher. The uses for these data go beyond simple description
of events and phenomena; they are used for creating understanding, for subjective interpretation,
and for critical analysis as well.
Qualitative research differs from quantitative research in several fundamental ways. Qualitative
research studies employ inductive, theory-generating, subjective, and nonpositivist processes, while
quantitative research uses deductive, theory testing, objective, and positivist processes. Creswell
(1994) identified five ways these two approaches differ, based upon these five philosophical founda-
tions: ontology, epistemology, axiological assumptions, rhetorical traditions, and methodological.
D
o
w
n
l
o
a
d
e
d
b
y
[
U
n
i
v
e
r
s
i
t
y
o
f
C
a
l
i
f
o
r
n
i
a
,
S
a
n
D
i
e
g
o
]
a
t
0
0
:
0
8
1
9
M
a
y
2
0
1
7
INTRODUCTION TO QUALITATIVE RESEARCH METHODS 235
Qualitative research strategies can be grouped into three broad classes: (1) explanatory, (2)
interpretive, and (3) critical. These roughly correspond to the exploratory-descriptive-causal cat-
egories of quantitative research designs. The choice of which strategy to adopt when designing
a qualitative study depends upon what objectives the researcher has for the study; these must be
clearly stated prior to going into the field to embark on the collection of data.
Many different types of research approaches are employed for conducting qualitative research
in public administration. Among the disciplinary approaches often followed are ethnography,
phenomenology, case studies, hermeneutics, grounded theory, and action science. All qualitative
research strategies and approaches involve three basic components: (1) collection of data, (2)
analysis and interpretation of that data, and (3) communicating research findings in one or more
communications media, such as producing a written report.
The major methods used to collect qualitative data include: (1) participation in the group setting
or activity, (2) personal and/or group interviewing, (3) observation, and (4) document and cultural
artifact analysis. There are also many secondary methods of collecting information, including his-
torical analysis, live histories and narratives, films, videos and photographs, kinesics, proxemics,
unobtrusive measures, surveys, and projective techniques.
Discussion Questions
1. In your own words, define what is meant by qualitative research.
2. What are qualitative data? How do they differ from quantitative data?
3. Distinguish between ontology and epistemology.
4. Discuss the following statement: Qualitative researchers seek understanding of social
interactions and processes in organizations, whereas quantitative studies are more often
concerned with predicting future events and behaviors.
5. Name and define the three major types of qualitative research strategies.
6. Name and discuss a primary goal of the interpretive research approach.
7. Name the seven fundamental principles of interpretive research identified by Klein and
Myers.
8. Discuss some of the objectives that would lead a political science researcher to design a
critical research project.
9. Select two of the additional qualitative research designs listed in the text and describe
how they might be used in a political science research project.
Additional Reading
Cassell, Catherine, and Gillian Symon, eds. 2004. Essential Guide to Qualitative Methods in Organizational
Research. Thousand Oaks, CA: Sage.
Creswell, John W. 2008. Research Design: Qualitative, Quantitative, and Mixed Methods Approaches. 3rd
ed. Thousand Oaks, CA: Sage.
Denzin, Norman K., and Yvonna S. Lincoln, eds. 2007. Collecting and Interpreting Qualitative Materials.
3rd ed. Thousand Oaks, CA: Sage.
Lee, Thomas W. 1999. Using Qualitative Methods in Organizational Research. Thousand Oaks, CA:
Sage.
Marshall, Catherine, and Gretchen B. Rossman. 2006. Designing Qualitative Research. 4th ed. Thousand
Oaks, CA: Sage.
D
o
w
n
l
o
a
d
e
d
b
y
[
U
n
i
v
e
r
s
i
t
y
o
f
C
a
l
i
f
o
r
n
i
a
,
S
a
n
D
i
e
g
o
]
a
t
0
0
:
0
8
1
9
M
a
y
2
0
1
7
236
17 Explanatory Research: Case and
Historical Methods
This chapter looks at two increasingly popular explanatory research strategies: case research and
historical research. The case method has been a popular research approach for more than fifty
years; Whelan (1989) traced the case approach as far back as 1948, when a planning committee
was formed at Harvard University to develop guidelines for applying the method to research
in public administration. Under the leadership of Harold Stein, the original committee became
the Inter-University Case Program (IUCP) in 1951. The IUCP published a text with twenty-six
cases just a year later (Stein 1952). In the introduction to that casebook, Stein defined the public
administration case as “a narrative of the events that constitute or lead to a decision or group of
related decisions by . . . public administrators” (xxvii). The historical approach has been around
even longer. Both are discussed in this chapter.
Case Method Research
A number of now-classic case studies were published beginning about the same time that the
method was evolving at Harvard. Philip Selznick’s TVA and the Grass Roots appeared in 1949;
Herbert Kaufman’s study of the forest service, The Forest Ranger, was published in 1960. A
third classic case study, Michael Lipsky’s (1980) study of city bureaucracies, Street-Level
Bureaucracy, has helped the case approach to achieve recognition as a valid and important
research methodology.
The popularity of the case study approach lies in the great flexibility of the method. Case
studies can take a single-case approach, a multiple case approach, or an analysis of a group
of case studies on a concept of interest in the meta-case approach (Yin 1994; Stake 2006).
Case studies can be written to serve as examples of what a public administrator ought not to
do, as well as what should be done. However, the primary purpose of the case is to identify
what in the case is common to the group or groups and what is specific to the case or cases
under study.
What Is a Case Study?
Many different definitions for case studies have been proposed. Yeager traced most of them to
Harold Stein, who, in an article published in 1952, was one of the first to promote the method as a
way to do political science and public administration research. He defined the method as “a narra-
D
o
w
n
l
o
a
d
e
d
b
y
[
U
n
i
v
e
r
s
i
t
y
o
f
C
a
l
i
f
o
r
n
i
a
,
S
a
n
D
i
e
g
o
]
a
t
0
0
:
0
8
1
9
M
a
y
2
0
1
7
EXPLANATORY RESEARCH 237
tive of the events that lead to a decision or group of related decisions by a public administrator or
group of public administrators.” T.V. Bonoma defined the case method in a Journal of Marketing
Research article, approaching it from a management point of view:
A case is a description of a [public] management situation based on interview, archival,
naturalistic observation, and other data, constructed to be sensitive to the context in which
management behavior takes place and to its temporal restraints. These are characteristics
shared by all cases. (Quoted by Yeager 1989, 685)
In the first edition of his important book on the case method, Yin (1984, 13) wrote: “As a
research strategy, the distinguishing characteristic of the case is that it attempts to examine
(a) a contemporary phenomenon in its real-life context, especially when (b) the boundaries
between phenomenon and context are not clearly evident. ” Yin described the case study as
“an empirical inquiry” that investigates a contemporary phenomenon within its real-life
context, and particularly when “the boundaries between phenomenon and context are not
clearly evident.”
Case studies are often intensive studies of one or a few exemplary individuals, families, events,
time periods, decisions or sets of decisions, processes, programs, institutions, organizations, groups,
or even entire communities (Lang and Heiss 1990; Arneson 1993). Discussing the case method
as one of three qualitative approaches for research in organizational communications, Arneson
(1993, 164) saw it as an appropriate research method when some noteworthy success or failure
in a case is present, adding that “Qualitative case studies most appropriately address programs
directed toward individualized outcomes.”
Three Types of Case Studies
Three different types of case studies have been identified: instrumental, intrinsic, and collective
(Stake 2000). The instrumental case study is the type used in exploratory research designs. It is
conducted mainly because it promises to provide insight into an issue, not for any specific inter-
est in the case itself. Stake saw the case as playing a secondary or supporting role. It is studied
because it improves understanding of something else.
An intrinsic case study design is chosen when the researcher just wants more and better infor-
mation about the case. The objective is not to study the case because it illustrates some specific
characteristic or problem. Rather, it is undertaken just because the researcher thinks that it is in-
teresting or will provide better understanding of the phenomenon. An example of an intrinsic case
study would be a study of how a state legislature implemented a new electronic voting system in
their chambers. In these situations, the subject case is expected to contribute to a greater under-
standing of a topic of interest, such as performance measurement, but not to serve as a design for
applying performance measurement in the agency serving as the case. The case could highlight
the improvements in time and correct recording of floor votes.
The collective case study is one of the major research approaches taken in comparative politi-
cal studies. In this approach, a group of similar cases, say conservative parties in several different
countries, are studied in order to examine a particular phenomenon. This method is known by
several different names, including a multiple-case and cross-case study. Yeager (1989) called this
type of case multi-site qualitative research.
The collective design is also used to suggest whether a characteristic might be common to
a larger population of similar cases. An example of a collective case study might be a study of
D
o
w
n
l
o
a
d
e
d
b
y
[
U
n
i
v
e
r
s
i
t
y
o
f
C
a
l
i
f
o
r
n
i
a
,
S
a
n
D
i
e
g
o
]
a
t
0
0
:
0
8
1
9
M
a
y
2
0
1
7
238 QUALITATIVE RESEARCH APPROACHES AND METHODS
how five coal-rich states are handling environmental protection pressures from citizens’ groups,
with the objective of highlighting best practices for other state governments to follow. The cases
selected might be chosen because they are similar or because they are different. They are selected
because the researcher believes that understanding what is going on in those cases will result in
better understanding about a larger group of cases.
When to Use the Case Study Approach
Van Evera (1997) proposed five different situations for which the case study method is a particu-
larly appropriate design:
1. When the researcher wants to establish a theory or theories,
2. When testing theories that already exist,
3. When identifying a previous condition or conditions that lead or contribute to a phenom-
enon (what Van Evera called antecedents),
4. When the researcher wants to establish the relative importance of those contributing
conditions, and,
5. When trying to establish the fundamental importance of the case with regard to other
potential examples.
Establishing a theory upon which to base predictions of future events is an important reason for
much of the published research in the administrative sciences. In his review of works that used the
case study method to examine city planning and planners, Fischler (2000) noted that case studies
are uniquely suited for exploring the interaction of personal behavior and collective institutions,
and the interplay of agency and structure. In this way, case studies were seen as contributing to
the development of a theory of government planning practices.
Fischler also called cases “the most essential tools” in theory development. Developing theory
from case studies occurs through a four-phase process: (1) formulation of research questions and
hypotheses, (2) selection of the case and definition of units of analysis, (3) data gathering and
presentation, and (4) analysis and theory building.
Bailey (1994) also identified a variety of purposes for the case study. In addition to descriptive,
interpretive, and critical purposes, case studies are used for solving administrative problems and
for forming theory. They can have a purely practitioner-oriented focus, or they can be “esoteric
scholarly studies.” For maximum value, however, Bailey recommended that the ideal case study
is one that has value for both practitioners and academics.
Because political science researchers have used the case study for so long and in so many
different ways, it is not surprising that so many different purposes for the method have surfaced.
However, most authors agree with Lang and Heiss, who contended that this one fundamental
principle underlies all case studies:
The basic rationale for a case study is that there are processes and interactions . . . which
cannot be studied effectively except as they interact and function within the [case] itself.
Thus, if we learn how these processes interact in one person or organization, we will know
more about the processes as factors in themselves and perhaps apply [what we have learned]
to other similar type persons or organizations. (Lang and Heiss 1990, 86)
D
o
w
n
l
o
a
d
e
d
b
y
[
U
n
i
v
e
r
s
i
t
y
o
f
C
a
l
i
f
o
r
n
i
a
,
S
a
n
D
i
e
g
o
]
a
t
0
0
:
0
8
1
9
M
a
y
2
0
1
7
EXPLANATORY RESEARCH 239
For both the single- and multi-case approaches, the purpose of the study is not to be a repre-
sentative picture of “the world,” but rather to represent the specific case or cases. Yet while this is
certainly true, good case studies do include features of the case or set of cases that are uniform and
generalizable, as well as those that have the appearance of being relatively unique to the case(s)
under study (Bailey 1994).
The Single-Case Study
Most case studies that are conducted in subfields of political science, with the exception of comparative
politics, are single-case studies; they are used in all the social and administrative sciences, making
them what Miles and Huberman (1998, 193) called the traditional mode of qualitative analysis.
In an example of a single case, Poister and Harris (2000) examined a mature total quality man-
agement program in the Pennsylvania Department of Transportation. The program began in 1982
with the introduction of quality circles and evolved into a major strategic force in the department,
with quality concepts incorporated into all levels of the culture of the organization.
Poister and Harris (175) point to the experience of this department as an example for other
agencies to emulate—one of the key purposes of the case study. They concluded their study stating
that the department “Has indeed transformed itself over the past 15 years around core values of
quality and customer service. Hopefully, its experience along these lines will be helpful to other
public agencies that have embarked on this journey more recently.”
The Multi-Case Method
Ammons, Coe, and Lombardo (2001) used a multi-case approach to compare the performance of
three public sector benchmarking projects. Two of the projects were national in scope, while the
third was a single-state program. The first project was a 1991 program sponsored by the Innovation
Groups to collect performance measurement information from cities and counties across the country.
This information was eventually incorporated into a national performance-benchmarking informa-
tion network, the PBCenter. Although the effort started aggressively by measuring 43 programs,
ultimately both participation and enthusiasm among potential users of the information lagged.
The second case in this multi-case study, the Center for Performance Measurement, was a
national program sponsored by the International City/County Management Association (ICMA).
The third case examined a North Carolina project to provide performance statistics to the state’s
city managers. By 1995, it had evolved into the North Carolina Local Government Performance
Management Project, and was run by the School of Government at the University of North
Carolina–Chapel Hill.
The Ammons, Coe, and Lombardo case study concluded that all three programs had failed to
deliver results that even closely approached the expectations of their participants, and many felt
that program costs exceeded any benefits. On the basis of their comparative analysis of the three
cases, the authors recommended that administrators of similar projects in the future make sure that
participants have realistic expectations for benchmarking before they buy into their programs.
Steps in the Case Study Method
The model presented in Figure 17.1 illustrates various steps in the selection and preparation of a
case study. The model can be considered a flowchart; case study activities should begin at the top
and proceed downward. The concepts included in the model owe much to Robert Stake’s 1995
D
o
w
n
l
o
a
d
e
d
b
y
[
U
n
i
v
e
r
s
i
t
y
o
f
C
a
l
i
f
o
r
n
i
a
,
S
a
n
D
i
e
g
o
]
a
t
0
0
:
0
8
1
9
M
a
y
2
0
1
7
240 QUALITATIVE RESEARCH APPROACHES AND METHODS
Frame the Case
(What specifically is to be studied?)
Operationalize Relevant Themes,
Issues, and Concepts
Analyze Documents and Other
Materials
Analyze and Interpret Collected
Data
Form and/or Refine Theory from
the Case Material
Develop Collective Generalizations
In-depth Personal
Interviews
Gather Case Data
Test Alternative Interpretations
Establish Groups of Data
According to Key Constructs
“Naturalistic” Observation
Select and Define Case Units of
Analysis
Form Comprehensive Set of
Constructs from All Data
Develop Final Report of Study
Findings
Figure 17.1 Steps in Case Study Planning, Analysis, and Presentation
D
o
w
n
l
o
a
d
e
d
b
y
[
U
n
i
v
e
r
s
i
t
y
o
f
C
a
l
i
f
o
r
n
i
a
,
S
a
n
D
i
e
g
o
]
a
t
0
0
:
0
8
1
9
M
a
y
2
0
1
7
EXPLANATORY RESEARCH 241
synopsis of the case method. Additional contribution to the model came from the five components
of a case study design identified by Yin (1994, 20). The components were (1) the study question;
(2) its propositions (others call these hypotheses), if any; (3) the unit or units of analysis; (4) the
logic that links the collected information to the propositions; and (5) the criteria selected by the
researcher for interpreting the case. The necessary steps in case study research can be condensed
as follows.
Step 1: Frame the Case
The first step in researching a case study is to establish a frame for the research. Framing goes
beyond identifying the basic research problem. Instead, when framing the case, the researcher
must answer three questions: First, why should the case study method be used in preference to any
other research method in this situation? Second, why should this particular case be studied? Are
there more representative cases available for study? And, third, why choose the specific behaviors
or phenomena to study?
Step 2: Operationalize Key Constructs
Operationalizing relevant themes, issues, research questions, and variables is the second step in
the process. “Operationalizing” describes the process of defining or conceptualizing the key con-
structs or themes that form and shape the research. Operationalizing also requires the researcher to
identify any limitations and assumptions for the research. Depending upon the research approach
followed, operationalizing activities can take place before or after the data are collected. When
it is done after the data are collected, the study is more appropriately a grounded theory study. In
the grounded theory approach, the structure and order emerge from the collected data; in these
studies all data are “right.”
Regardless of when this step takes place, its purpose is the same: to impose order and struc-
ture to the data, and to identify any limitations or assumptions. Order and structure imposed by
the researcher before the data are collected helps to ensure that the needed data will be collected
during case interviews and observations.
Step 3: Define Units of Analysis
The third step in case study analysis is defining the units of analysis. This critical step hinges upon
how the researcher has defined the problem to be studied. As noted earlier, case studies can focus
on many different types or amounts of phenomena; they can be either single-case or multi-case
studies. While most case studies typically focus on individuals, on pairs (dyads), small or large
groups, processes, or organizations (Marshall and Rossman 1999), they can also be about a deci-
sion or set of decisions made by administrators, supervisors, or work teams in programs, agencies,
small subunits of agencies, or groups of agencies that address a similar problem or service. These
are all what is meant by the term unit of analysis. Deciding on the unit of analysis it is what Yin
(1994) called a narrowing of the relevant data.
Step 4: Collect the Data
The fourth step, data collection, can take place in a variety of ways. The techniques used most
often include (1) interviews, (2) simple (also called naturalistic) observation, and (3) analysis
D
o
w
n
l
o
a
d
e
d
b
y
[
U
n
i
v
e
r
s
i
t
y
o
f
C
a
l
i
f
o
r
n
i
a
,
S
a
n
D
i
e
g
o
]
a
t
0
0
:
0
8
1
9
M
a
y
2
0
1
7
242 QUALITATIVE RESEARCH APPROACHES AND METHODS
of internal and external documents. One of the hallmarks of a good case study is the selection of
two or more of these methods (Arneson 1993).
As well as providing a means for triangulation, the use of more than one approach helps ensure
that relevant data are not missed. Triangulation is studying a phenomenon in two or more ways
to substantiate the validity of the study findings; it is an important concept in the postpositivist
approach to political science research. This term, taken from land surveying, map making, and
radio direction finding, refers to the use of several different research methods to get a better handle
on a phenomenon by looking at it in more than one way.
There are three popular ways to collect data that make triangulation possible: through interviews,
by observation, and by analysis of documents. Gathering data by interview can take one of several
different forms, such as in-depth personal interviews or focus group interviews. Interviews can
be structured or unstructured.
Naturalistic or simple observation is another way data is gathered for case studies. Marshall and
Rossman (1999) describe this method as “the systematic noting and recording of events, behaviors,
and artifacts in the social setting chosen for study.” The researcher records events and behaviors
as they happen, collecting the written records into compilations of impressions that are similar if
not identical to the field notes that characterize data collection in ethnographic studies.
The study of documents and archival data is usually undertaken to supplement the information
the case study researcher acquires by interview or by observing in a situation. These may be of-
ficial government records, internal organization reports or memos, or external reports or articles
about a case subject. The technique that is usually used in document analysis is called content
analysis. This process may be either qualitative or quantitative, or both.
Step 5: Analyze the Data
The analysis of all qualitative data takes place in a progression of six separate phases. Figure 17.2
displays a slightly different version of the progression of analysis steps. An important require-
ment inherent in all data analysis is that the data be reduced in volume at each stage. Unless this
occurs, the researcher will be inundated with reams of unrelated information that make logical
Step 1:
Organize the Data
Step 6:
Write and Present
the Report
Step 5:
Search for
Alternative
Explanations
Step 4:
Apply the Ideas,
Themes, and
Categories to Data
Step 2:
Generate Categories,
Themes, and Patterns
Step 3:
Code the Data
Figure 17.2 A Six-Step Procedure for Analysis of Case Study Data
D
o
w
n
l
o
a
d
e
d
b
y
[
U
n
i
v
e
r
s
i
t
y
o
f
C
a
l
i
f
o
r
n
i
a
,
S
a
n
D
i
e
g
o
]
a
t
0
0
:
0
8
1
9
M
a
y
2
0
1
7
EXPLANATORY RESEARCH 243
interpretation impossible. Organizing the data into sets of mutually exclusive categories is one
way that data reduction occurs.
Step 6: Prepare and Present a Report of the Findings
The final step in the process is producing a comprehensive narrative of the case. The narrative
is a descriptive account of the program, person, organization, office, or agency under study. It
requires that all the information necessary to understand the case be included in the narrative. It
typically revolves around the researcher’s interpretation of the behaviors and events observed in
the case during the study period. Patton (1990, 304) referred to the final case narrative as “the
descriptive, analytic, interpretive, and evaluative treatment of the more comprehensive descriptive
data” (collected by the researcher).
The case study report must clearly show that the researcher has accurately explained what he
or she perceived to be the “facts.” In addition, it must contain a discussion of what the researcher
believes are relevant alternative interpretations, as well as an explanation of why the researcher
chose not to accept those alternatives. Finally, all case studies should end with a conclusion that
is soundly based in the interpretation adopted by the researcher (Yeager 1989).
Important Guidelines for Case Study Reports
A number of guidelines have been offered for preparing case study reports. Yin (1994) identified
five key characteristics possessed by the best, most informative case studies. These are:
The case study must be significant. Cases that are “significant” are those that stand out as su-
perior examples—they are the “best in their class.” They illustrate a particular point in a better or
more succinct way than others that could have been chosen. In this way, the researcher indicates
that selection of the case or cases was not only appropriate, but that the study adds to the body of
knowledge about the topic or issue; the study makes a significant contribution. Research problems
that are trivial do not make good case studies.
The case study must be complete. Cases that are complete leave the reader with the feeling that
all relevant evidence has been collected, evaluated, interpreted, and either accepted or rejected.
The operative word here, of course, is relevant.
The case study must consider alternative perspectives. It is important that the researcher not
limit the analysis of case data to a single point of view. Alternative explanations for a social phe-
nomenon always exist (Marshall and Rossman 1999). Throughout the analysis of the case data,
the researcher is obligated to identify alternative explanations or interpretations of the raw data.
The case study must display sufficient evidence. Data reduction solely for the sake of
brevity in a case analysis is not desirable. All the relevant evidence must appear in the final
narrative. Condensing, distilling, and combining data takes place at each step of the analy-
sis; otherwise, the final report would end up as little more than a hodgepodge of unrelated,
disjointed raw data.
The case study must be written in an engaging way. While this does not apply directly to the
concept of completeness in a case report, it is relevant because it has a great influence on whether
the case will ultimately be read, understood, and, where appropriate, used in policy development.
It is a question of style. Complaints often heard about case studies include (1) that they are too
long, (2) they are cumbersome to read and interpret, and (3) they are simply boring. Writers of
cases should strive to engage readers’ intelligence, entice their interest by early hinting at exciting
information to come, and seduce readers into accepting the underlying premise (Yin 1984).
D
o
w
n
l
o
a
d
e
d
b
y
[
U
n
i
v
e
r
s
i
t
y
o
f
C
a
l
i
f
o
r
n
i
a
,
S
a
n
D
i
e
g
o
]
a
t
0
0
:
0
8
1
9
M
a
y
2
0
1
7
244 QUALITATIVE RESEARCH APPROACHES AND METHODS
Historical Research in Political Science
Halfway through America’s Civil War, during what may have been the greatest crisis of the nation’s
short history, defeat at the ballot box almost succeeded in destroying the Union where the force of
arms had thus far failed. With the North and South still locked in armed conflict, President Abraham
Lincoln and his supporters in Congress were dealt what Carson, Jenkins, Rhode, and Souva (2001)
described as a “stunning defeat.” After the votes in the 1862 mid-term congressional elections
were counted, the Republican Party had lost its majority in the House of Representatives. This
potentially crippling political loss forced the president to forge a coalition with the Unconditional
War Party, a splinter party based in the Border States, in order to continue the war.
Why did Lincoln’s political defeat occur? What ramifications did it hold for the future waging
of the war? And possibly more important, what effect did it have on the peace that followed? What
lessons might be learned from the dramatic shift in the fortunes of the majority party? The political
scientists who authored the paper on this topic asked themselves these and similar questions, and
embarked on a historical research project to find the answers. They also used the election results to
test their hypothesis that modern political theories can be applied in an historical context to shed light
on what otherwise might have remained hidden. They concluded that electoral district–specific events
had at least as much if not more effect on the outcome of the elections than national events such as
the horrendous loss of life resulting from the poor showing of the North’s armies to that time.
This story of the congressional elections of 1862 is just one of literally hundreds of examples
of historical research methods used in the analysis of political science phenomena. One or more
historical studies may be found in nearly every issue of most of the journals in this discipline.
However, not much can be found describing how to use the historical method in political science
research. The purpose of this part of the chapter is to rectify that situation.
Capturing the Concept of History with Historical Research
Political scientists using historical research methods approach the study of history from a number
of different points of view. One way of describing the different directions historians have taken
was proposed by Georg Iggers (1985). Iggers identified three approaches that historical research-
ers have followed since history was recognized as a separate discipline in the nineteenth century.
The first is the hermeneutic approach; the second is a nomological approach; and the third is a
critical emphasis, as exemplified by Marxist and feminist approaches.
The model in Figure 17.3 illustrates the evolution of emphases in historical research as sug-
gested by such authors as Barzun and Graff (1992) and Iggers (1985), among others.
The hermeneutic tradition of historical analysis has the longest record of use among the three
approaches. Hermeneutics is a way of interpreting historical documents and other phenomena in
light of the events that took place at the time of the writing of those texts, as well as approaching
the interpretation from the intent and experiences of the text’s author.
The hermeneutic tradition has its roots in the study of religious texts from the points of view of
the writers and subsequent interpretists. The objective of historians who follow the hermeneutic
approach is the search for what Iggers (1985, 37) termed “the uniqueness of historical personali-
ties.” This is similar to the Great Man approach of the early historians.
Nomology is the science of laws, and the nomological approach to a discipline attempts to
discern fundamental laws that can be used to explain and eventually predict future events. This
approach seeks to make history more “scientific.” In doing so, it tries to apply the tools of the
natural science to historical investigation. Nomological political scientists apply quantitative tools
D
o
w
n
l
o
a
d
e
d
b
y
[
U
n
i
v
e
r
s
i
t
y
o
f
C
a
l
i
f
o
r
n
i
a
,
S
a
n
D
i
e
g
o
]
a
t
0
0
:
0
8
1
9
M
a
y
2
0
1
7
EXPLANATORY RESEARCH 245
16th –17 th Centu ries
Dynastic History
(“Battles and Kings”)
18th Cen tury
Nation alistic History
(Political Suprem acy)
19th Cen tury
Democ ratic History
(Triumph of Reason)
20th Cen tury A
Nomol ogical History
(Fun dam e ntal La ws and
Struct ures)
20th Cen tury B
Her men eut ic History
(Uni que ness of
Pers onalities)
20th Century C
Critical History
(Triu mph of H uman
Emancipation )
21st Cen tury
Plurali st Approach to Hi storical Rese arch and Writing
(“E v ery t hing Belongs to History”)
used in economics and the behavioralist school of the social sciences, using mathematical models
to analyze dependent and independent variable relationships.
A variation on this theme is structuralism, which leads historians to make efforts to identify the
underlying, invisible structures that form and guide societies and their institutions. The principle
that guides structuralist researchers is that these structures always exist in society; if they did not,
chaos would ensue. It is the job of the historian to “decode” the historical evidence in order to
discover the underlying structure. The evidence exists in persistent, reoccurring events, economic
records, social relationships, symbols, art forms, and other cultural artifacts; the structural historian
applies quantitative methods to interpret the evidence in order to define the historical record.
The critical tradition of historical writing is one that views all social phenomena and historical
events from the point of view of continually changing systems of social relationships and de-
pendencies. Marxist and feminist historians are drawn to the idea of history as a record of social
conflict leading to human emancipation. This tradition sees history as a critical social science that
does not simply narrate but instead works to abet change in the human condition. For Marxists,
the arena of conflict is social class; for feminists, it is gender bias.
Figure 17.3 A Representation of the Evolution of Approaches in Historiography
Source: After Barzun and Graff 1992, and Iggers 1985.
D
o
w
n
l
o
a
d
e
d
b
y
[
U
n
i
v
e
r
s
i
t
y
o
f
C
a
l
i
f
o
r
n
i
a
,
S
a
n
D
i
e
g
o
]
a
t
0
0
:
0
8
1
9
M
a
y
2
0
1
7
246 QUALITATIVE RESEARCH APPROACHES AND METHODS
Shifting Directions in Historical Political Science
The writing of political history has changed in a number of different ways during its several-
hundred-year history. One way it has changed is in the same way that political science itself has
changed. Orren and Skowronek (1995) traced the three positions of political science beginning with
the formal academic discipline’s first fifty years, beginning in 1880 and ending about 1930.
The focus of this period was on the institutions of politics. By institutions, Orren and Skowronek
meant the fundamental formal and informal rules and agreements that made it possible for govern-
ment to function and the political and economic world to survive even in the face of revolutionary
change. The key institution that made this possible was the Constitution, with its formal structure.
Therefore, the natural topics for research were constitutional arrangements. Addressing a series
of contact points in society where political conflict occurs, Avery Leiserson explained this need
for a formal constitutional institution:
The distinction [that occurs] between social and political structures in a free democracy . . . a
free people, voluntarily associated in a society . . . requires a political system, a formal structure
of legally coercive public offices and [a] decision-making process based upon units of electoral
organization different from those of the social and economic structures. (Leiserson 1968, 17)
During the 1950s and 1960s, adoption of the behavioralist approach by political scientists re-
sulted in what has been described by Orren and Skowronek as a radical reorientation of the study
of politics. During these two decades the focus of political science research shifted from institutions
to analysis of the behavior of individuals in political groups and organizations.
Political history research, except for the continuing interest of researchers on political thought,
also shifted; studies appeared that investigated changes in social structures and groups that were
influenced by behavioral forces. Political scientists looked upon government as a process that could
be defined and measured in behavioral terms. It was believed that inferential approaches could
allow for the predicting of behavior in the future. The institutions of government were considered
part of the larger political system that itself was a product of human creation.
The final phase of political science described by Orren and Skowronek began as a reaction to the
strict empiricism advocated by behavioralists. Political scientists developed mathematical models to
describe behavior in their application of rational choice theory. Adopted from economics, rational
choice theory assumes that people make decisions, including political decisions, based upon their
perceptions of achieving the greatest benefits, or utility, from the chosen alternative.
The principles of game theory have been widely adopted by rational theory researchers, to-
gether with a renewed interest in institutionalism. Some “new institutionalist” researchers now
study institutions to “make sense of institutional politics as a more or less stable game in play.”
Institutions—the formal and informal rules, norms, and standards of the political world—exist to
bring equilibrium to the process of government.
Capturing the Nature of Political History
If history is the written record of past or current events, then political history must be the written
record of past or current political phenomena (Hockett 1955; Elton 1984). This makes political
history the recorded story of politics, political institutions, and the actors in the political world.
Political history began with the first written records of society in the Middle East and continues
up to and including the political activities taking place today.
D
o
w
n
l
o
a
d
e
d
b
y
[
U
n
i
v
e
r
s
i
t
y
o
f
C
a
l
i
f
o
r
n
i
a
,
S
a
n
D
i
e
g
o
]
a
t
0
0
:
0
8
1
9
M
a
y
2
0
1
7
EXPLANATORY RESEARCH 247
Politics are social phenomena; they occur in the context of society. As a result, some might
describe political history as social history. Without people interacting with people, there can be
no politics. As Elton has noted (1984, 6), there is no politics without contact. As a result, political
history entails the description of the events, institutions, societies, and individuals that come into
contact with one another, in whatever form at whatever time.
It has also been said that political history is the record of power—the striving for, getting,
preserving, or reacting against—power over one’s fellow human beings (Elton 1984; Stoker and
Marsh 2002). Thus, by its very nature, the history of politics is the story of humans in conflict
over power. Certainly, some of this conflict involved rational, intelligent, peace-loving diplomats
sitting across from one another, negotiating in a civilized manner. But most of it has been a long
and bloody record of war, famine, pillage, fratricide, regicide, genocide, and the whole litany of
examples of man’s ability to do harm to his fellow man. It can make for a great read!
Changing Focus of Political History
According to Elton (1984), the broad, or global, focus of political history has also undergone a
relatively slow process of evolutionary change in the past 200 years. The earliest focus of political
historians—and the one with the longest record of inquiry—is the history of political thought. This
type of history reached its full stride with historical analyses of the historical treatises of Greece and
Rome, and may have peaked with the political discourse of Machiavelli. It includes analyses of the
writings of influential observers and commentators on politics and government such as Plato, Hob-
bes, Locke, and Marx, to mention just a few examples (Tuck 2001). Because political science was
for many years a branch of philosophy, the philosophical approach to politics was to be expected.
The second emphasis for political history was diplomatic and military history. This approach to
history became popular during the nineteenth century when writing history became the province
of “professional historians.” As history departments appeared in colleges and universities, history
professors took on the task of writing history in addition to teaching it. This history was generally
written in a straightforward—some would say dry—manner. It focused on detailed reporting of the
recorded activities of governmental institutions, important diplomats, and famous military leaders.
The primary source for this history was the archival records of various branches of government,
including agencies and departments. This is referred to as the Great Man or Battles and Kings
approach to political history. In the words of Elton, this type of history is “under a cloud,” but it
is still being written today.
The third approach, and essentially a product of only the nineteenth century, is constitutional and
administrative history. The historical record of these topics was considered important because they
helped to explain the rules of the society from which they were drawn. In this sense, this shift in focus
helped facilitate the focus of research from attention on the stories of great men and great events to
the institutions that make government possible. Elton considered the writing of administrative history
to be more “basic” and constitutional history able to prove more information. He concluded:
The political historian needs first to be thoroughly acquainted with what happened and could
happen in the ordinary running of affairs within the society that is his concern, and thus to
understand the machinery which made possible the translation of power into action; only
then is he able to tell the political story both accurately and in depth. (Elton 1984, 28)
Political history has not seen a new guiding force emerge to replace the emphases of the past.
Instead, in the words of Burke (2001), today history is concerned with nearly every activity of
D
o
w
n
l
o
a
d
e
d
b
y
[
U
n
i
v
e
r
s
i
t
y
o
f
C
a
l
i
f
o
r
n
i
a
,
S
a
n
D
i
e
g
o
]
a
t
0
0
:
0
8
1
9
M
a
y
2
0
1
7
248 QUALITATIVE RESEARCH APPROACHES AND METHODS
humanity. One new unifying thread is concerned with culture, and the idea that reality is socially
or culturally constructed; this is the concept of cultural relativism. It is often “history from the
bottom,” a narrative of everyday humans and their efforts to survive—the story of ordinary people
and the way they cope with change in their society.
The sources of this history are no longer the archives of governments or the diaries of important
people, but oral histories, private letters, cultural artifacts and paraphernalia, photographs—
anything that helps tell a story. These and other, related changes have not made history easier
to write: “The discipline is now more fragmented than ever before,” according to Burke (17).
Despite the lack of a solid foundation upon which to evaluate historical research, for political
science researchers, one good thing has come from the shifting philosophical ground. Accord-
ing to Burke,
The long-standing opposition between political and non-political historians is finally dissolv-
ing. G.M. Trevelyan’s notorious definition of social history as “history with the politics left
out” is now rejected by almost everyone. Instead we find concern with the social element
in politics and the political element in society. On the one hand, political historians no long
confine themselves to “high” politics, to leaders, to elites. They discuss the geography and
sociology of elections and the “republic in the village.” They examine “political cultures,”
the assumptions about politics which form part of everyday life but differ widely from one
period or region to another. (Burke 2001, 18)
Conducting Historical Research
Historical research should be as systematic and intellectually rigorous as every other research
design. The historical approach takes place at the same pace, identifying a study problem and
research questions. It then follows a logical a series of distinct steps or stages. However, recom-
mendations on how to define these steps vary from author to author.
For example, Hockett (1955) claimed that historical research occurs in three steps: the gathering
of data; the critical evaluation of the data; and the presentation of the facts, interpretations, and
conclusions the historical researcher draws from the data. W.H. McDowell (2002), on the other
hand, went so far as to spell out a series of twenty distinct steps for historical research. McDowell’s
list of twenty steps is paraphrased in Table 17.1 .
Of all the tasks in the McDowell’s detailed list, the most important of all may be the third step
in the list of activities under gathering and interpreting data: Research notes can be entered on
individual sheets of notepaper, kept in bound notebooks, written on note cards, or even entered
directly into a computer. They should be organized according to topic areas and filed together.
Individual notes should include the following information: a descriptive heading, the chapter and/
or section in which the information is to be used, a clear distinction between paraphrased and
quoted material, and complete source identification. Detailed bibliographic information is usually
kept in a separate file, but enough information to clearly identify the name of the author, date of
publication, and page number of the material should be included on every note.
Summary
The case method has long been one of the most popular approaches followed in public administra-
tion research. The popularity of the case study approach lies in the great flexibility of the method.
Case studies can be written to serve as examples of what a public administrator ought not to do, as
D
o
w
n
l
o
a
d
e
d
b
y
[
U
n
i
v
e
r
s
i
t
y
o
f
C
a
l
i
f
o
r
n
i
a
,
S
a
n
D
i
e
g
o
]
a
t
0
0
:
0
8
1
9
M
a
y
2
0
1
7
EXPLANATORY RESEARCH 249
well as what should be done. However, their primary purpose is to instruct public administrators
in what other administrators are doing.
Case studies are often intensive studies of one or a few exemplary individuals, families, events,
time periods, decisions or set of decisions, processes, programs, institutions, organizations, groups,
or even entire communities. Discussing the case method as one of three qualitative approaches
for research in organizational communications, Arneson (1993) described the approach as an ap-
propriate research method when some noteworthy success or failure in a case is present.
There are three types of case studies: (1) intrinsic case studies, (2) instrumental studies, and (3)
collective studies. Intrinsic case studies are done when the researcher wants to provide a better
understanding of the subject case itself. Instrumental case studies are used to gain greater insight
into a specific issue. Collective case studies are a multiple-case design in which a group of individual
cases is studied together because it is believed that they can contribute to greater understanding of
a phenomenon. Another name for this type of case is multi-site qualitative research.
Five purposes for case studies are: (1) when the researcher wants to establish a theory or theo-
ries, or (2) to test theories that already exist; (3) to identify a previous condition or conditions
that lead or contribute to a phenomenon, or (4) when the researcher wants to establish the relative
Table 17.1
A List of Steps for Conducting Historical Political Science Research
I. Planning the Research
3ELECT A SUBJECT FOR RESEARCH
$ElNE THE SUBJECT MORE PRECISELY IDENTIFY KEY THEMES SET RESEARCH OBJECTIVES
PREPARE TIMETABLE FOR COMPLETION OF THE PROJECT
3. Identify source material; prepare a working bibliography; identify keywords and check
bibliography of data
4. Identify research methods to be used: document analysis, personal interviews, artifact
analysis, etc.
"EGIN BACKGROUND READING AND
WHERE NECESSARY
RElNE THE PROPOSED PROJECT
II. Gathering and Interpreting Data
1. Prepare a draft outline of the paper
2. Peruse source material to prepare research notes
3. Review research notes and materials; prepare a list of key topic areas to subdivide the final
paper
4. Prepare draft outline of chapter(s); create list of research questions for each key topic area
5. Prepare a detailed research proposal, incorporating chapter headings, and chapter
summaries with topic organization
6. Form manageable subunits of work, as in chapter sections or paragraphs
7. Complete the survey of sources and source material
III. Writing and Presenting the Findings
1. Write the first draft; edit the first draft; continue editing as needed
2. Write the final draft
3. Type the final draft; incorporate changes and alterations
4. Proofread the typeset pages
5. Edit the typeset draft, if to be sent to a publisher
6. If producing a published book, check the page proofs
7. Prepare an index from a set of the page proofs
8. Congratulate yourself on a task well done
Source: McDowell 2002, 90–92.
D
o
w
n
l
o
a
d
e
d
b
y
[
U
n
i
v
e
r
s
i
t
y
o
f
C
a
l
i
f
o
r
n
i
a
,
S
a
n
D
i
e
g
o
]
a
t
0
0
:
0
8
1
9
M
a
y
2
0
1
7
250 QUALITATIVE RESEARCH APPROACHES AND METHODS
importance of those contributing conditions, and (5) to establish the fundamental importance of
the case with other potential examples.
Case studies can be single-case or multi-case designs. Designing and preparing a case study
takes place through a series of interlocking steps. The case must be framed; key constructs, vari-
ables, and terms must be operationalized; unit(s) of analysis selected and defined; data analyzed;
and a final case report prepared.
Historical research has a long history as a separate discipline in the nineteenth century. Over
the centuries, various approaches in this research method have evolved. One is the hermeneutic
approach; the second is a nomological approach; and, the third is a critical emphasis, as exempli-
fied by Marxist and feminist approaches.
The objective of the hermeneutic approach is the search for “the uniqueness of historical per-
sonalities.” This is similar to the Great Man approach of the early historians. The nomological
approach looks for fundamental laws that can be used to explain and eventually predict future
events. Nomological historians apply quantitative tools used in economics and the behavioralist
school of the social sciences. A variation of the nomological approach is structuralism, which
leads historians to identify the underlying, invisible structures that form and guide societies and
their institutions.
Political phenomena and historical events are viewed by the critical tradition of history as sys-
tems of social relationships and dependencies that are continually changing. Marxist and feminist
historians—two examples of schools in the critical tradition—see history as a process leading to
human emancipation. The historical approach follows a series of distinct steps or stages.
Discussion Questions
1. Describe the case study research method.
2. What role does the case method play in political science research?
3. Describe how a political science researcher would use the instrumental case study ap-
proach.
4. Describe how a political science researcher would use the intrinsic case study ap-
proach.
5. Describe how a political science researcher would use the collective case study ap-
proach.
6. Discuss the meaning of the following statement: The study is not to be a representative
picture of “the world.”
7. Name and define the steps in the case research method procedure.
8. What role does the historical research method play in political science research?
Additional Reading
Burke, Peter, ed. 2001. New Perspectives on Historical Writing. 2nd ed. Cambridge, UK: Polity Press.
Denzin, Norman K., and Yvonna S. Lincoln, eds. 2008. Strategies of Qualitative Inquiry. Thousand Oaks,
CA: Sage.
Marshall, Catherine, and Gretchen B. Rossman. 2006. Designing Qualitative Research. 4th ed. Thousand
Oaks, CA: Sage.
Miles, Mathew B., and A. Michael Huberman, eds. 2002. The Qualitative Researcher’s Companion. Beverly
Hills, CA: Sage
Yin, Robert K. 2002. Case Study Research: Design and Methods. 3rd ed. Thousand Oaks, CA: Sage.
D
o
w
n
l
o
a
d
e
d
b
y
[
U
n
i
v
e
r
s
i
t
y
o
f
C
a
l
i
f
o
r
n
i
a
,
S
a
n
D
i
e
g
o
]
a
t
0
0
:
0
8
1
9
M
a
y
2
0
1
7
251
18 The Interpretive Approach I:
Grounded Theory Methods
The grounded theory approach to qualitative research has, since the late 1960s, captured the meth-
odological interests and imagination of researchers in all the social and administrative sciences.
One of its principal inventors, Barney G. Glaser (1999), described this approach as a methodol-
ogy for getting from the systematic collection of data to production of a multivariate conceptual
theory. The grounded theory method has been used successfully in many different circumstances,
disciplines, and cultures. The fact that it is easily generalizable to many different disciplines and a
variety of research topics has contributed to its increasing acceptance worldwide. Accordingly,
Grounded theory is a general method. It can be used on any data or combination of data. It
was developed partially by me with quantitative data [which] is expensive and somewhat
hard to obtain. . . . Qualitative data are inexpensive to collect, very rich in meaning and
observation, and rewarding to collect and analyze. So, by default to ease and growing use,
grounded theory is being linked to qualitative data and is seen as a qualitative method, using
symbolic interaction, by many. Qualitative grounded theory accounts for the global spread
of its use. (Glaser 1999, 842)
The grounded theory method evolved from roots in the symbolic interactionism theoretical
research of social psychologist George H. Mead at the University of Chicago, his one-time stu-
dent Herbert Blumer, and others (Robrecht 1995). Mead believed that people defined themselves
through the social roles, expectations, and perspectives they acquired from society and through
the processes of socialization and social interactions.
Blumer added three additional concepts to Mead’s thesis: (1) the meanings that people assign
to things will determine the way they behave toward them, (2) these meanings come from people’s
social interactions, and (3) to deal with these meanings, people undergo a process of constant
interpretation (Annells 1996). Grounded theory was “invented” by Glaser and Strauss (1967)
as a way to develop explanatory and predictive theory about the social life, roles, and expected
behaviors of people.
From its early roots in sociology and social psychology, the method has evolved and grown in
importance to become what Brian Haig (1996) has described as “currently the most comprehensive
qualitative research methodology available.” Also noting this increased acceptance, Denzin and
Lincoln (1994b, 204) called it “the most widely used interpretive strategy in the social sciences
today.” Recently, this method has also become an increasingly important research approach in
political science. Miller and Fredericks commented on this growth:
D
o
w
n
l
o
a
d
e
d
b
y
[
U
n
i
v
e
r
s
i
t
y
o
f
C
a
l
i
f
o
r
n
i
a
,
S
a
n
D
i
e
g
o
]
a
t
0
0
:
0
8
1
9
M
a
y
2
0
1
7
252 QUALITATIVE RESEARCH APPROACHES AND METHODS
It is increasingly apparent that the grounded theory approach has become a paradigm of
choice in much of the qualitatively oriented research in nursing, education, and other disci-
plines. Grounded theory has become a type of central organizing concept that serves to both
direct the research process as well as provide a heuristic for data analysis and interpretation.
(Miller and Fredericks 1996, 538)
Early Goals for Grounded Theory
Grounded theory was first proposed as a reaction against the restrictions that its inventors saw in
positivist research methodology. Chief among these perceived restrictions was the requirement to
conduct research for the purpose of testing preconceived theoretical hypotheses. Today, the primary
objective of all grounded theory research is to develop theory out of the information gathered,
rather than the testing of predetermined theories through a process of experimentation.
The process begins with the researcher focusing on some area of study. This could be any phenomenon,
circumstance, trend, or behavior in any of the social or administrative science areas. Using such tools as
observation and interviewing, among others, the researcher gathers relevant data from as many different
sources as are available. Analysis of the data begins with grouping it into categories and assigning codes.
Through a process of continually comparing data with other categories, theory can be generated.
Grounded theory requires the researcher to organize and apply structure to the data accord-
ing to an eclectic set of researcher-determined groupings or categories. As the researcher forms
categories, new data are compared across the formed categories. Linkages between categories
and characteristics are also identified. The data and their linkages are assigned discrete codes that
enable the researcher to identify them with their specific groupings. Similar codes are in turn as-
signed to other data that fit a broader category or categories. As the process continues, categories
are constantly reevaluated and changed when necessary. Only when no additional revisions are
intuitively possible does the analyst form a theory from the collected and analyzed data. Figure
18.1 illustrates the constant comparative method of data analysis.
(1)
Inductive [Open] Category
Coding; Compare New
Data Across Earlier
Categories
(4)
Integrate New Data into
Expanded/Revised
Categories to Build
Understanding
(3)
Identify and Explore
Possible Relationships and
Patterns Across
Categories
(2)
Refine, Revise, and Expand
Initial Conceptual
Categories
Source: Maykut and Morehouse 1994, 135.
Figure 18.1 Processes in the Constant Comparative Method of Data Analysis
D
o
w
n
l
o
a
d
e
d
b
y
[
U
n
i
v
e
r
s
i
t
y
o
f
C
a
l
i
f
o
r
n
i
a
,
S
a
n
D
i
e
g
o
]
a
t
0
0
:
0
8
1
9
M
a
y
2
0
1
7
THE INTERPRETIVE APPROACH I 253
Importance of Grouping and Coding
Rather than being only a matter of convenience for later reference, the actual assigning of data to
their relevant groupings is a critical early step in the analysis process. Strauss and Corbin (1998,
3) defined the coding process as, “The analytical process through which data are fractured, con-
ceptualized, and integrated to form theory.” It is the key activity in the microanalysis stage of the
data; it includes both the first and the second stages of coding.
The researcher applies a rigorous analytical process in order to develop theory out of the in-
vestigated social situation(s) after several runs through the raw data and coded categories. Thus,
a key concept in grounded theory is the continual analysis of the data during and after they are
collected.
Insights and ideas are also generated after in-depth analysis of the data. The analyst searches for
commonalties and differences in the data. New data are fitted into the constructs or categories that
are seen as pivotal in the data. Commonalities are compared and contrasted as the analyst weighs
possible theories against other possible interpretations. Ultimately, a theory that is “grounded” in
the data will emerge from the analysis.
Two Approaches to Grounded Theory
The analysis process identified by Glaser and Strauss in 1967 has been modified over time, so
that today there are (at least) two approaches to grounded theory. Locke (1996) identified the two
approaches as the Straussian—after Anselm Strauss—and the Glaserian—after Barney Glaser.
Strauss and Corbin (1990), reporting that they observed their graduate students having great dif-
ficulty in organizing, coding, and analyzing their data, proposed that an additional step be added
to the process. Glaser responded in 1992, taking issue with Strauss and Corbin for straying from
the original emphasis on developing theory and adopting instead a process that he believed em-
phasized conceptual description over theory generation.
Both approaches are fundamentally similar, however, with whatever controversy that surfaces
focusing on the addition of a third level of coding proposed by Strauss and Corbin. Both approaches
emphasize the importance of coding as a key concept in the analysis. Glaser (1992) advocates
sticking to the two steps in the coding process introduced in the original work. Glaser ’s two coding
processes are open and theoretical. During the first phase, coding can be relatively freewheeling,
and open to continuous revision, compression, and merging. During the final, theoretical, phase
of the analysis, the researcher is advised to rework the groupings as required to bring substance
to any emerging theoretical conclusions.
Strauss and Corbin (1990) reported that the grounded theory process as originally proposed in
1967 made it difficult for beginning researchers to produce clear and cogent theory from the data.
Retaining the open and substantive coding levels, they proposed that a third, intermediate step in
the coding/analysis process be added. They called this intermediate step axial coding (Glaser 1992;
Kendall 1999). This step—proposed as a way to “demystify” the grounded theory process—requires
the researcher to place all the initially “open-coded” data into six categories specified by Strauss
and Corbin. The six predetermined categories are: (1) conditions, (2) phenomena, (3) context, (4)
intervening conditions, (5) actions/strategies, and (6) consequences (Figure 18.2).
A number of authors have objected to what they see as an artificial restriction that “axial coding”
forces upon the researcher. Hall and Callery (2001), for example, concluded that the intermediary
six steps resulted in a “mechanical approach” to data analysis that limited theory building. Kendall
(1999) saw that axial coding could be advantageous for beginning researchers, but added that it
D
o
w
n
l
o
a
d
e
d
b
y
[
U
n
i
v
e
r
s
i
t
y
o
f
C
a
l
i
f
o
r
n
i
a
,
S
a
n
D
i
e
g
o
]
a
t
0
0
:
0
8
1
9
M
a
y
2
0
1
7
254 QUALITATIVE RESEARCH APPROACHES AND METHODS
forced her from original the research question when she used it in her dissertation analysis.
Kendall added that, after several years of working with her data, she found herself spending
so much time trying to fit the data to the Strauss and Corbin “paradigm model” that she stopped
thinking about what the data were communicating about the original study question. She added
that she felt that using predetermined categories directed her analysis artificially by limiting her
thinking to only the six categories.
The important thing to remember about the two different approaches is not that the two creators
of the grounded theory method disagree on how many steps there should be in the coding process,
but rather that they agree on almost all other aspects of the process. Data should be continually
compared with new data, coded, and placed in categories for interpretation. The researcher selects
both the code and category in the first and the last steps in the analysis.
Steps in the Grounded Theory Process
A number of different approaches to grounded theory research have been proposed. Two models
are presented here. The first is an eight-step model suggested by Lee (1999); the second is a
seven-step process developed from the work of Glaser and Strauss. The Lee model is spelled out
in the series of steps in Table 18.1 .
Lee emphasizes the importance of continuous comparisons of categories in his eight-step
process, but does not include the Strauss and Corbin axial coding step. In this way Lee’s process
is very similar to the original Glaser and Strauss and Corbin works.
A Seven-Stage Model for Grounded Theory Research
Figure 18.3 is a model of the grounded theory research process; it was developed by the author to
illustrate the sequential nature of the method. The seven key steps in this process were described
in detail in Glaser and Strauss’s 1967 narrative of how the method was developed, and reiterated
elsewhere (Glaser 1992; Strauss and Corbin 1998, for example).
Stage 1. Select a Topic of Interest
In political science, theories explain and predict human behavior among public employees, the
citizenry, or organizations that are in some way acted upon or that influence public decisions.
Causal
Conditions
Phenomena
Context
Intervening
Conditions
Action/Interaction
Strategies
Consequences
Figure 18.2 The Strauss and Corbin Paradigm Model for Axial Coding of Data
Source: Strauss and Corbin 1990; Kendall 1999.
D
o
w
n
l
o
a
d
e
d
b
y
[
U
n
i
v
e
r
s
i
t
y
o
f
C
a
l
i
f
o
r
n
i
a
,
S
a
n
D
i
e
g
o
]
a
t
0
0
:
0
8
1
9
M
a
y
2
0
1
7
THE INTERPRETIVE APPROACH I 255
Research topics for grounded theory research are not hard to come by; they are everywhere
in the researcher’s field of interest, career field, and the practice of politics. The key thing to
avoid in grounded theory is approaching a study area with a preconceived hypothesis. Hy -
potheses must come from the data. Glaser, warning budding researchers to avoid misleading
advice, cautioned:
When a research problem is elusive or hard to come by a lot of people tend to give advice . . .
the researcher’s search for the preconceived problem is subject to the whims and wisdoms
of advisors with much experience and of colleagues. He (or she) should be careful as he
may just end up studying his advisor ’s pet problem with no yield for him and data for the
advisor. And he will likely miss the relevance in the data. (Glaser 1992, 23)
Moreover, Glaser added that it is important to remember that the identification of a research
question is not a statement that clearly and succinctly identifies the topic that is going to be
studied. Rather, the problem emerges from the data as they are collected. Open coding, se-
lective (theoretical) sampling, and constant analysis of this information—these form a focus
for the research study.
Stage 2. Determine a Purpose for the Research
Glaser and Strauss (1967) identified five main purposes or uses for grounded theory. These are:
evaluating evidence, establishing generalizations from the data, specifying a concept, verifying
a theory, and generating theory. In the first, evaluating evidence, data from additional groups
are collected to compare with data that have already been collected for the purpose of assessing
whether the first evidence was correct. This often serves as a test for replicability, and can be ap-
Table 18.1
An Eight-Step Process for Conducting Grounded Theory Research
STEP 1. The researcher comes up with some ideas, questions, or concepts about some area of
interest. These ideas can come from the researcher’s own experience in the field, from a
few key interviews, or from an analysis of the published literature.
STEP 2. By creatively looking at the ideas, questions, or concepts, the researcher proposes some
possible underlying concepts for the phenomenon and their relationships (linkages).
STEP 3. The researcher now tests these initial linkages by comparing them with real-world data.
34%0 "Y CONTINUALLY COMPARING THE CONCEPTS TO THE OBJECTIVE WORLD PHENOMENA
THE lRST STEP IN
testing a theory takes place.
STEP 5. By continually analyzing the data and comparing new data against the concepts, the
researcher works to integrate, simplify, and reduce the concepts, seeking to establish core
concepts.
STEP 6. The researcher prepares “theoretical memos” (these are simply preliminary attempts to
spell out possible connections and/or theoretical explanations). This is now a continuing
process, requiring the researcher to continually test and revise possible theory.
STEP 7. The researcher continues to collect data and to code data by categories and or
characteristics, while also producing theoretical interpretations of the material; this often
requires the researcher to go back and repeat earlier steps in the process.
STEP 8. The researcher prepares a final research report. In grounded theory research, this is not
simply a “detached, mechanical process”; it is instead a key part of the research process.
Source: After Lee 1999.
D
o
w
n
l
o
a
d
e
d
b
y
[
U
n
i
v
e
r
s
i
t
y
o
f
C
a
l
i
f
o
r
n
i
a
,
S
a
n
D
i
e
g
o
]
a
t
0
0
:
0
8
1
9
M
a
y
2
0
1
7
256 QUALITATIVE RESEARCH APPROACHES AND METHODS
Stage 1:
Identification of Topic of Interest and Selection
of the Grounded Theory Research Approach
Stage 7:
Develop Theory
Stage 2:
Determine the Purpose(s) for the Research
Stage 3:
Selection of a Group or Sample to Study
Stage 4:
Collect Research Data Through:
STRAUSS AND CORBIN’S
AXIAL CODING PROCESS
Personal
Interviews
Naturalistic
Observation
Document
Analysis
Stage 5:
(Preliminary) Open Coding
of Data as They Are Collected
Stage 6:
Theoretical Coding for Theory Development
Figure 18.3 A Glaser and Strauss Model of the Grounded Theory Data Collection and
Coding Processes
D
o
w
n
l
o
a
d
e
d
b
y
[
U
n
i
v
e
r
s
i
t
y
o
f
C
a
l
i
f
o
r
n
i
a
,
S
a
n
D
i
e
g
o
]
a
t
0
0
:
0
8
1
9
M
a
y
2
0
1
7
THE INTERPRETIVE APPROACH I 257
plied for validating both internal evidence (from within the study group) and external evidence
(data from sources other than the study group).
It can also be a powerful and important use for grounded theory because a study’s categories
and properties are generated from collected evidence. Collected and compared evidence is used
for a defining illustration of the conceptual category. Glaser and Strauss (1967, 23) considered
these categories to be the fundamental building block of theory: “In generating theory, it is not the
fact upon which we stand but the conceptual category that was generated from it.”
The second purpose of grounded theory is establishing generalizations from the data. If a theory
is to emerge from the collected “facts,” they must be generalizable to other situations or they re-
main isolated bits of data—interesting but irrelevant. If they are applicable only to a single case,
group, circumstance, or situation, they remain descriptors of only that specific phenomenon. In
searching for generalizations, or universals, the researcher establishes boundaries of applicability,
while at the same time attempting to broaden the theory.
The third purpose is specifying a concept. This design requires specific identification of a study
sample or population for a one-case study. Grounded theory’s comparative evaluations are used
to clearly identify the key dimensions (i.e., key concept or concepts) that make the study group
distinctive. It tells your readers why you chose to study one group and not another. It involves
comparing the unit of analysis (individuals or groups) selected for the study with other units that are
not selected. This comparison often brings to light the distinctive properties of the selected unit.
For example, a study of homeless women—such as Alisse Waterston’s (1999) Love, Sorrow,
and Rage: Destitute Women in a Manhattan Residence—has many different categories of subjects
from which to select for a subject sample. Waterston chose to study a group of HIV-positive or
possible HIV-positive homeless women residing at a shelter in a metropolitan area. Waterston
could have begun her data analysis with a comparison of the characteristics of this study group
with other similar groups of at-risk women. By revealing the specific characteristics of the study
group that are of interest to the research, the reader will be unlikely to confuse members of the
study group with others who are not included.
Verifying a theory is the fourth purpose for using grounded theory. When conducting this type
of research study for the purpose of verifying an existing theory, the researcher focuses on find-
ing information that corroborates the existing concept. In the process, the researcher generates
new theories only for the purpose of adjusting or modifying the original theory. No new theories
are sought. Neither Glaser nor Strauss said much about this potential use for the grounded theory
method, emphasizing instead its role in generating new theory.
The fifth purpose, and the one for which the method is named, is generating theory that is
related to the research topic. This is the primary purpose of grounded theory research; the re-
searcher ’s main goal is the systematic generation of new theories from the data collected. There
are two broad types of theory that can be generated through this process: substantive and formal.
Substantive theory addresses specific, empirical, or applied tasks in public administration, such as
police and fire department community relations, management development programs and employee
training, solid waste disposal, water purity, road construction, city planning, and similar items.
Formal theory, on the other hand, deals with broader, often philosophical issues. Example topic
areas include public participation in the democratic process, authority and power in management
situations, reward systems, and so forth.
Both of these applications are what Glaser and Strauss (1967, 32) identified as “middle-range,”
meaning they fall somewhere between practical working hypothesis in the everyday conduct of an
administrator’s job, and all-inclusive grand theories, such as global warming. It is important to note
that both of these types of theories must be grounded in data if they are to be accepted as relevant.
D
o
w
n
l
o
a
d
e
d
b
y
[
U
n
i
v
e
r
s
i
t
y
o
f
C
a
l
i
f
o
r
n
i
a
,
S
a
n
D
i
e
g
o
]
a
t
0
0
:
0
8
1
9
M
a
y
2
0
1
7
258 QUALITATIVE RESEARCH APPROACHES AND METHODS
Stage 3. Select a Group to Study
According to Strauss and Corbin, determining where to go to get the data needed for a research
study remains one of the major issues confronting grounded theory researchers. Researchers need
to know who can provide the information that illustrates the central or core concept in the study.
They call this the theoretical sampling problem and define it as the process of picking the sources
that can provide the most information about the research topic. The aim of theoretical sampling
is “to maximize opportunities to compare events, incidents, or happenings to determine how a
category varies in terms of its properties and dimensions.”
This suggests that the researcher must be more concerned with ensuring the representative-
ness of the sample than in the concept of randomness. Researchers are encouraged to carefully
select the subjects from whom information will be acquired. This becomes even more important
as the study progresses. Sampling must become more specific with time because the theory that
is emerging must eventually control the sample selection. Once some categories are established,
all further sampling must be focused on developing, solidifying, and enriching the formed cat-
egories. Accordingly,
The basic question in theoretical sampling is: what groups or subgroups does one turn to next
in data collections. And for what theoretical purpose? In short, how does the [researcher]
select multiple comparison groups? The possibilities of multiple comparisons are infinite, and
so groups must be chosen according to theoretical criteria. (Glaser and Strauss 1967, 47)
Stage 4. Collect Research Data
There are no restrictions to how data are collected in a grounded theory design. However, most
researchers use personal interviews, simple or naturalistic observation, and narratives, and often
include some document or artifact analysis. One of the distinctive characteristics of the grounded
theory method is that the data collection, coding, and interpretation stages of the research are car-
ried out in concert, not as individual activities. One leads to the other, then on to the next, and back
again. These steps “should blur and intertwine continually, from the beginning of an investigation
to its end.” Grounded theory methodology can be used for arriving at theories from data that are
collected in any type of social research—quantitative and qualitative. All theories are developed
for one or both of two fundamental purposes: to explain or to predict.
Stage 5. Open Coding of Data
Coding is the process of applying some conceptually meaningful set of identifiers to the concepts,
categories, and characteristics. The key things to remember about open coding are that it is always
the initial step in data analysis, and that its purpose is to establish (or discover) categories and
their properties.
Open coding is the free assignment of data to what the researcher sees as the naturally appearing
groupings of ideas in the data (Lee 1999). As many categories as needed can be created. These can
be looked upon as the fundamental, explanatory factors that identify the central research concept.
Each category contains as many bits of data (datum) as found to fit in that category. Data bits are
more or less indivisible, and intuitively fit into just one category.
The open coding process continues until one or more “core categories” are established. Then,
the coding process turns either to Strauss and Corbin’s axial coding, using preconceived categories,
D
o
w
n
l
o
a
d
e
d
b
y
[
U
n
i
v
e
r
s
i
t
y
o
f
C
a
l
i
f
o
r
n
i
a
,
S
a
n
D
i
e
g
o
]
a
t
0
0
:
0
8
1
9
M
a
y
2
0
1
7
THE INTERPRETIVE APPROACH I 259
or proceeds directly to the theoretical coding identified by Glaser and Strauss (1967) or Glaser
(1992). Axial coding refers to the process of assigning categories into more-inclusive groupings.
Strauss and Corbin urged the researcher to use the six second-level classifications they proposed.
Lee (1999), on the other hand, following the original Glaser and Strauss (1967) model, called for
the researcher to propose the axial categories. In this process, the researcher first comes up with
several categories that seem to bridge all the open-coded categories. Then the researcher examines
all the open categories to see which fit within the selected second-level category. The remaining
data are then compared across these second level categories. The process continues until all the
data have been compared against all the second-level categories and classified. Additional axial
categories might have to be added to encompass all the data.
There are no hard-and-fast rules for grounded theory research (Lee 1999). Even the inventors
of the method disagree about how to go about coding and categorizing collected data. There are
also many different ways to discover or establish meaningful categorical distinctions in data.
Miles and Huberman (1994), for example, discuss twelve different ways to go about developing
codes for raw data (see Table 18.2)
An example of a code set developed for an educational site study can be found in Miles and
Huberman (1994, 58). These five broad constructs (categories) and their codes were proposed in
the preliminary coding: innovation properties (IP), external context (EC), internal context (IC),
adoption process (AP), and site dynamics and transformations (TR). These five constructs are the
core categories of this study.
A different number of characteristics/dimensions were identified for each of the categories.
Five of the characteristics that were determined to contribute to the innovation properties category
were: objectives, organization, implied changes–classroom, implied changes–organization, and
user salience.
A complete set of definitions was developed for each of the categories and the specific char-
acteristics associated with the category. For example, in the site dynamics and transformations
(TR) category, the code TR-START was assigned to data that fell into the “initial user experience”
category and dimension. The definition for this code was: “Emotions, events, problems or concerns,
assessments, made by teachers and administrators during the first six months of implementation.”
Similar definitions are produced for every category/dimension in the study.
Glaser is adamant that open coding and category building not be forced into any preconceived
second-level (axial) groupings. Strauss and Corbin, on the other hand, give the researcher more
leeway in this decision. As a result, both approaches to grounded theory coding are found in the
research literature. There is no disagreement regarding the third (and final) coding process: selec-
tive (or theoretical) coding.
Table 18.2
Twelve Tactics for Generating Meaning in Conceptual Categories
1. Counting
7. Par ticular to general
2. Noting patterns, themes
8. Factoring
3. Seeing plausibility
9. Relationships
4. Clustering
10. Finding intervening variables
5. Making metaphors
11. Chain of evidence
6. Splitting variables
12. Theoretical coherence
Source: Miles and Huberman 1994, 215.
D
o
w
n
l
o
a
d
e
d
b
y
[
U
n
i
v
e
r
s
i
t
y
o
f
C
a
l
i
f
o
r
n
i
a
,
S
a
n
D
i
e
g
o
]
a
t
0
0
:
0
8
1
9
M
a
y
2
0
1
7
260 QUALITATIVE RESEARCH APPROACHES AND METHODS
Stage 6. Selective (or Theoretical) Coding of Data
Selective or theoretical coding is the name given to the process of imposing a final structure to the
data and establishing rank-order importance of the conceptual categories (Lee 1999). Just as in
the second-level coding process, the research proposes a small number of overarching categories.
Next, these categories are ordered according to how the researcher sees their potential to contain
or explain the collected data. In the third step, the researcher picks what he or she estimates is the
most powerful or important category; all of the data are then judged for their fit in that theoretical
category. The researcher then repeats the process, using the second most important category and
all remaining data for fit in this category. The process continues until all data are categorized. The
researcher is then ready to develop theory about the phenomenon.
The underlying purpose of all theory is to explain and/or predict. The purpose of the theoretical
coding stage is to identify the relationships between categories and their properties as they are
found in the data. Theories are built in a process that moves from the specific (individual examples,
incidences, or cases, for example) to the general. In this way, the researcher develops a theory that
is applicable (explains and/or predicts) to more than the individual example, incidence, or case.
The process occurs in the following six stages (Miller and Fredericks 1996):
1. Preliminary (open) categories are formed from the first data collected.
2. More general or broad categories that include preliminary groupings are formed from
this and new data as they are added to the analysis.
3. Categories are further refined and defined.
4. A set of core categories is finally accepted.
5. As data are analyzed, they are assigned as characteristics or dimensions of these core
categories.
6. Continual comparison may produce a revised coding scheme, which, in turn, may require
revisions to the characteristics/dimensions of the codes.
Step 7: The Final Stage—Development of a Theory
This is the culmination of all preceding activities in the process: forming a theory that is grounded in the
data. Although it is last in this process model, theory development is not “saved for last.” Rather, at each
stage in the process of grounded theory, the researcher prepares theoretical memos in which he or she
records ideas, conclusions, propositions, and theoretical explanations of the phenomena under study.
These memos serve as summaries of the researcher’s conclusions—recorded as they are being
formed—and, as such, are the grist from which a theory or set of hypotheses are developed. To
qualify as a grounded theory, a theory must exhibit these key characteristics (Locke 1996):
1. The theory must closely fit the topic and disciplinary area studied.
2. The theory must be understandable to and useful to the actors in the studied situation.
3. Finally, the theory must be complex enough to account for a large portion, if not most,
of the variation in the area studied.
A Brief Caveat About the Method
Often, grounded theory research results neglect to address the issue of theory in the presentation of
their findings. This does not take anything away from the process, however, because in describing
D
o
w
n
l
o
a
d
e
d
b
y
[
U
n
i
v
e
r
s
i
t
y
o
f
C
a
l
i
f
o
r
n
i
a
,
S
a
n
D
i
e
g
o
]
a
t
0
0
:
0
8
1
9
M
a
y
2
0
1
7
THE INTERPRETIVE APPROACH I 261
what was discovered from the research and proposing specific recommendations, some derived
theory must underlie the conclusions. It is just a matter of putting it into words. The researcher
would not have the confidence necessary to make recommendations regarding the findings unless
he or she were sufficiently confident in the theoretical conclusions derived from the data.
One of the reasons why Strauss and Corbin proposed their six pre-established categories for the
second-level or axial coding step was because they saw that their graduate students were having
great difficulty in conceptualizing the necessary categories for collected data. Lee also commented
on the difficulty of the method:
Grounded theory is a long-term, labor intensive and time-consuming process. It requires
multiple waves of data collection, with each wave of data based on theoretical sampling.
In addition, the iterative process should continue until a theoretical saturation is achieved.
Given all this, researchers should avoid grounded theory approaches unless they can commit
substantial resources to a study. (Lee 1999, 50)
Grounded Theory Research in Practice
King, Feltey, and Susel (1998) used grounded theory methodology in their study of the underly-
ing causes of public antipathy in the political process and ways to improve participation in public
administration policymaking decisions. Using personal interviews and focus group discussions,
they gathered data from private citizens and public administrators from several communities in
Ohio. Focus group participants were asked to respond freely to four broad questions:
1. How can more effective public participation be achieved?
2. What does public participation mean to the participant?
3. What are the barriers to participation?
4. What advice do you have for people trying to bring about
more and more diverse participation?
Their analysis occurred in two stages. First, in the open stage of their coding, the transcribed
interviews were coded by each researcher working independently and using a qualitative form of
content analysis. Second, the researchers synthesized the individually coded responses to come
up with a set of categories and themes. These were discussed in detail in their report. Specific
quotations from respondents were woven throughout their final narrative, thus providing insightful
reinforcement of the thematic concepts they drew from the data.
King, Feltey, and Susel (1998) identified three categories of barriers to effective public
participation: (1) contemporary lifestyles, (2) existing administrative practices, and (3) current
techniques for participation. The pressures and complexity of daily life, together with certain
demographic factors such as class, income, education, family size, and a breakdown in tradi-
tional neighborhood ties, were identified as probable causes for the lack of public participation
in the communities studied.
The theory generated from this research included a three-part proposal for dealing with the
three sets of barriers to participation. First, citizens within the community must be “empowered,”
while at the same time, citizens need to be educated in ways to organize and research issues and
policies. Second, public administrators must be reeducated; their traditional role of “expert man-
ager” must be replaced with one of “cooperative participant,” or “partner.” Administrators must
also develop their interpersonal skills, including listening, team building, and the like. Finally,
D
o
w
n
l
o
a
d
e
d
b
y
[
U
n
i
v
e
r
s
i
t
y
o
f
C
a
l
i
f
o
r
n
i
a
,
S
a
n
D
i
e
g
o
]
a
t
0
0
:
0
8
1
9
M
a
y
2
0
1
7
262 QUALITATIVE RESEARCH APPROACHES AND METHODS
the structures and processes of administration must be changed to make it easier for the public to
become involved in and contribute to the policy formation process.
Grounded Theory and Public Policy
Cook and Barry (1995) used the grounded theory method to research the public policy interactions
between the public and private sectors. They chose the grounded theory method because of what
they saw as the “paucity of work” in the area, and because of a desire to build a rich description
of the business owners’ ideas and beliefs about public policy and their ability to help shape it.
Over a two-year study, they conducted 31 in-depth interviews with owners in 27 firms, together
with three government administrators. All of the executives were owners of their firms. In addi-
tion to these in-depth interviews, Cook and Barry also attended 9 trade association meetings with
a government-relations focus; more than 50 additional executives participated in the meetings.
Concluding their data-gathering process, they examined more than 150 public documents, papers,
memos, and newspaper stories.
In an example of what is clearly one of the major disadvantages of the method—an overabun-
dance of raw data—Cook and Barry reported that their initial transcripts produced more than 700
individual pages of data. Before they could code and analyze the data, they were forced to produce
detailed abstracts of each transcript, thus eliminating some 60 percent of the original data.
Two levels of coding were then used on the remaining data: “received” coding and “emer-
gent” coding. The first level was derived from their review of the literature in the field, their prior
learning and biases, and categories that the interviewees themselves used. These were primarily
descriptive and definitional in nature. These codes were than merged into broader codes—what
the authors called overarching dimensions—that related to issues, issue characteristics, and the
influence process.
In the sense of theory, Cook and Barry found it to be “evident” that interactions between owners
of small firms and policymakers helped to create a system for interpreting and making sense of
the process. These determined (1) whether a small business executive would commit to working
on a policy issue, and (2) how he or she would carry out that work. Executives tended to agree
to work on issues that they believed they had some possibility of influencing, and to not concern
themselves with policy questions that they felt were beyond their reach.
Summary
Grounded theory is a general qualitative research method that can be used on any data or combina-
tion of data. It was developed initially for use with quantitative and/or qualitative data. However,
quantitative data often are expensive and difficult to obtain. On the other hand, qualitative data are
inexpensive to collect; they can be very rich in meaning and observation, and are often rewarding
to collect and analyze. So, by default to ease and growing use, grounded theory research today
is linked to qualitative data; it is classified as a qualitative method that uses symbolic interaction
(Glaser 1992).
The grounded theory research process begins with focusing on some area of study—a phenom-
enon, circumstance, trend, or behavior in any of the social or administrative science areas. Using
observation and interviewing, among other methods, researchers gather relevant data from as many
different sources as are available. Analysis of the data begins with grouping it into categories and
assigning codes. Through a process of continually comparing data with other categories, theory
can be generated.
D
o
w
n
l
o
a
d
e
d
b
y
[
U
n
i
v
e
r
s
i
t
y
o
f
C
a
l
i
f
o
r
n
i
a
,
S
a
n
D
i
e
g
o
]
a
t
0
0
:
0
8
1
9
M
a
y
2
0
1
7
THE INTERPRETIVE APPROACH I 263
Completion of a grounded theory research project results in the researcher identifying (1)
one or more core concepts that relate to the issue of interest, (2) examples in the data that are
representative of each core concept, and (3) an indication of a set of relationships between the
core concepts and their example indicators. It is important to remember that grounded theory re-
search involves a long-term, laborious, and time-consuming process. The researcher should have
a substantial grounding in the area of interest and the ability to formulate a broad, meaningful
conceptual interest area.
Discussion Questions
1. Define and describe the grounded theory approach to qualitative research.
2. Describe the symbolic interactionism concept developed by Mead and the additions that
others have made to his theory.
3. Why was grounded theory first developed, and what made it so popular so quickly?
4. Discuss the importance of grouping and coding to grounded theory research.
5. Compare the Straussian and the Glaserian approaches to grounded theory.
6. Name and discuss the seven steps in the grounded theory research process.
7. What is open coding?
8. Discuss the example of grounded theory research in public policy included in the chapter.
Additional Reading
Charon, Joel M. 2006. Symbolic Interactionism: An Introduction, An Interpretation. 9th ed. Upper Saddle
River, NJ: Prentice Hall.
Denzin, Norman K. 2007. Symbolic Interactionism and Culture Studies: The Politics of Interpretation. New
York: Wiley-Blackwell.
Glaser, Barney G. 1992. Basics of Grounded Theory Analysis. Mill Valley, CA: Sociology Press.
Lee, Thomas W. 1999. Using Qualitative Methods in Organizational Research. Thousand Oaks, CA:
Sage.
Miles, Mathew B., and A. Michael Huberman, eds. 1994. Qualitative Data Analysis: A Sourcebook of New
Methods. 2nd ed. Beverly Hills, CA: Sage.
Strauss, Anselm, and Juliet Corbin. 1998. Basics of Qualitative Research: Techniques and Procedures for
Developing Grounded Theory. 2nd ed. Thousand Oaks, CA: Sage.
D
o
w
n
l
o
a
d
e
d
b
y
[
U
n
i
v
e
r
s
i
t
y
o
f
C
a
l
i
f
o
r
n
i
a
,
S
a
n
D
i
e
g
o
]
a
t
0
0
:
0
8
1
9
M
a
y
2
0
1
7
264
19 The Interpretive Approach I I:
Ethnographic Research Methods
Ethnographic methods are not often employed in political science research, but when they are, they
can provide great quantities of important information. The main reason for their infrequent use is
that these study designs typically require more time to conduct than researchers are able to devote
to their research projects. In their parent disciplines of anthropology and sociology, ethnographic
studies may take as long as six months to a year or more to complete. When they can be used in
political science research, however, they have the potential to produce powerful narratives that
provide deep insight into the needs of society.
The practice “thick description” is a hallmark of all ethnographic research. Thick description
refers to research notes that exhibit the great depth and detailed complexity found in ethnographic
reports. An example is the description of a social event that might last three minutes or less,
but takes up many pages of descriptive narrative. This use of detailed description means that
ethnographic methods can be an excellent design choice when the study objective is to provide
deep background information for long-term, strategic public policy forming. On the other hand,
ethnographic methods are generally not appropriate when a management decision must be made
immediately on the basis of the findings of the research.
Despite their drawbacks, ethnographic methods have a long and important history in research
in the social and human sciences. They can be traced at least as far back as the Industrial Revolu-
tion, if not longer (Neuman 2000, 346).
Industrialization and the Social Sciences
A by-product of the industrialization of Western society was a belief by some observers that fac-
tory labor was dehumanizing society; unskilled workers were often seen as just another easily
replaceable component in the production process. Beginning in the nineteenth century, however,
concern over the deteriorating human condition in tenements and factories resulted in calls for
changes in the way society treated its citizens. An increasingly educated public, the clergy, and
a few in the governing elite came to recognize that the deterioration in social conditions needed
to be stopped and, if possible, reversed. These early critics looked to science for solutions to the
problems of the new industrialized society.
This faith in the power of science to produce answers to the problems of society encouraged
adoption of a “scientific approach” to the study of the social problems and needed changes. If
advances in the natural sciences and technology could be profitably applied to problems in in-
dustrial invention and innovation, it was reasoned, why couldn’t they also be applied to solving
D
o
w
n
l
o
a
d
e
d
b
y
[
U
n
i
v
e
r
s
i
t
y
o
f
C
a
l
i
f
o
r
n
i
a
,
S
a
n
D
i
e
g
o
]
a
t
0
0
:
0
8
1
9
M
a
y
2
0
1
7
THE INTERPRETIVE APPROACH II 265
social problems? If science could be used to improve production, why couldn’t it also be used to
improve everyone’s quality of life?
The Contribution of Anthropology
Anthropology, one of the source disciplines for ethnographic research, has three main focuses:
cultural anthropology, physical anthropology, and archeology.
Cultural anthropology, originally devoted almost exclusively to the study of distant and
unfamiliar cultures, was soon found to be an appropriate way of studying less complex but still-
modern world societies that had remained in relative isolation from the emerging industrialized
world (Alasuutari 1995). From that expanded application it was not long before anthropology
and its research tool, ethnography, were seen to have a place in the study of modern cultures and
subcultures.
Physical anthropologists followed the lead of Darwinian ideas and began to seek answers to
questions that dealt with the evolution of humankind. Physical anthropologists are sometimes
called in to assist forensic scientists in the identification of crime and accident victims, and to aid
in the design of living and work spaces, including furniture and tools.
Archaeologists were at one time included under the cultural anthropology umbrella, but found
their own niche by focusing on studies of ancient and unknown material cultures. Today, however,
archaeologists can be found conducting analyses of relatively recently deposited cultural artifacts.
An example is the archaeological study of garbage dumps to depict trends in fashion, invention,
and other descriptions of cultural artifacts.
The Contribution of Sociology
The traditional focus of sociology—another discipline that uses ethnographic methods in research—
has also changed. Initially, the purpose of sociological research was to identify cause-and-effect
relationships between the perceived ills and abuses of the new industrial society and the lives of adults
and children forced to live and work in crowded, dangerous, and often unsanitary conditions.
Because of the continually evolving nature of the focus of study for the social sciences, a new direc-
tion for ethnographic research has emerged. Ethnographic studies are carried out in the inner cities of
modern societies, in suburban and rural settings, in cross-cultural situations, in large and small organi-
zations, and in investigations into any way in which the social forces of culture and subculture impact
people. More important, however, may be the emphasis on interpreting social behavior—including
political behavior—that has replaced the earlier model of simply describing it. The ethnographer has
thus taken on the important task of contributing to the formation of public policy.
Through an eclectic process of trial and error, anthropologists and sociologists developed a
way of conducting research that allowed them to meet their study objectives in all kinds of social
and cultural settings. Researchers in political science have also adopted the ethnographic research
method. Among other applications, ethnography has become one of several important approaches
for the study of the groups in the polity, the act of governance, the grass roots formation of public
policy, and the administration of diverse agencies and functions of government.
Ethnography, Ethology, or Ethnology?
Ethnographic research has several different forms. Among these are ethnography, ethology, and
ethnology (see Figure 19.1). Ethnography is the descriptive study of living cultures, while ethnol-
D
o
w
n
l
o
a
d
e
d
b
y
[
U
n
i
v
e
r
s
i
t
y
o
f
C
a
l
i
f
o
r
n
i
a
,
S
a
n
D
i
e
g
o
]
a
t
0
0
:
0
8
1
9
M
a
y
2
0
1
7
266 QUALITATIVE RESEARCH APPROACHES AND METHODS
ogy refers to the activity of using the information gathered by ethnography (Encyclopedia.com
2008). Thus, a public administrator might use an ethnological report in the process of framing
public policy. Ethology, on the other hand, is simply a different approach to the research process;
it refers to the somewhat less-intense practice of simple observation (Jones 1996).
Ethology is most commonly encountered in the context of animal behavior studies, although
a branch seeks to apply ethological principles to human behavior as well. Ethnography involves
actively observing, recording, and explaining why a culture is described in the way it is by the
ANTHROPOLOGY
(Culture-Based
Behaviors)
Key Informant
Interviews
SOCIOLOGY
(Group-Based
Behaviors)
PSYCHOLOGY
(Individual Behavior
Motivations)
Ethnographic
Research Methods
Participant
Observation
Simple
Observation
Political Science Research
(Political Theory, American Politics, International Politics,
Comparative Politics, Political Institutions, etc.)
Public-Policy Formulation
Data Analysis and
Interpretation
Research Report Preparation and
Distribution
Document
Analysis
Legislation
Bureaucratic
Interpretations
Administrative
Rules and Directives
HISTORY
(Record of Social
Achievement)
Figure 19.1 A Model of How Ethnographic Research Is Used to Shape Public Policy
D
o
w
n
l
o
a
d
e
d
b
y
[
U
n
i
v
e
r
s
i
t
y
o
f
C
a
l
i
f
o
r
n
i
a
,
S
a
n
D
i
e
g
o
]
a
t
0
0
:
0
8
1
9
M
a
y
2
0
1
7
THE INTERPRETIVE APPROACH II 267
ethnographer. While ethnography is sometimes used as a synonym for “participant observation,”
ethology is used as a synonym for “simple” or unobtrusive observation.
Ethnographers immerse themselves into the day-to-day activities of the group they are study-
ing. The goal is to learn as much as they can about the behaviors and social processes taking place
in the culture. They do this in order to (1) describe the setting in as much detail as possible (a
process called thick description), and (2) to come up with some theoretical ideas that allows them
to interpret and explain what they have seen and heard.
Terry Williams (1996, 31), writing about his ethnographic study of the cocaine subculture in
New York after-hours clubs during the 1970s and 1980s, defined ethnography as a “science of
cultural description; more than that, it is a methodology. It is a way of looking at people, a way
of looking at a culture. It is recording how people perceive, construct and interact in their own
private world.”
Ethnographers live, work, and play with their study populations for long periods of time. Their
aim is to be absorbed into the group. Their underlying objective is to be “accepted” as a non-
threatening or nonintrusive member of the group. Then events and interrelationships will unfold
as they would naturally, as if the observer were not in attendance. This process is called “gaining
entry” and is the key to a successful research project. Without acceptance, without entry into the
inner workings of the group, the researcher remains an outsider; he or she is then perceived as a
threat and subsequently either shunned or lied to, at best.
The process of living with a social group (doing fieldwork) involves observing and recording
individuals’ behaviors. The ethnographer summarizes these field notes into a larger descriptive
generalization that is purported to describe the behavior of the larger society. The researcher must
then develop subjective descriptions that are based on a large number of generalizations. In making
these generalizations, the ethnographer moves from the specific to the general. That is, the behaviors
of one or a small group are used to infer that those behaviors are also those of the larger groups
in similar circumstances. The ethnographer should also develop interpretations of the observed
behaviors; the question “why” should be answered to the best of the ethnographer’s ability.
According to Jones (1996), one of the major attractions of ethnography for field researchers
is that it permits them to develop meaningful, coherent pictures of the social group and setting.
Researchers get to see the phenomenon as a whole, in all of its complexity, and not just bits and
pieces. Jones also suggested a way to differentiate between ethnological and ethological research
involving human behavior.
The key differentiating characteristic is whether the research is conducted to develop a theory or
to provide background information needed to make a management decision. Figure 19.2 illustrates
that, despite the different steps involved in the two approaches, they are very similar. For most
of the early history of ethnography, study results were often little more than simple descriptions;
interpretation of the event, setting, or behavior was left to the reader.
This often resulted in questioning confidence in the validity of ethnographic generalizations.
The following statement illustrates the older paradigm: “Ethnographic generalizations are by
themselves only best fit statements about the incidence or frequency of occurrences in the society.
By themselves they say little or nothing about what goes with what” (Cohen 1973, 37). Cohen’s
solution to this problem was to call for more correlational or causal research into ethnography.
This, he believed, would improve validity by improving interpretation.
According to Whiting and Whiting (1973), ethnographers collect samples of types of behavior
in order to understand the cognitive and social-structure regularities in a society. Ethnographers
study the roles people adopt, economic systems, political systems, religious systems, personality,
and many other aspects of any or all types of social organizations and systems.
D
o
w
n
l
o
a
d
e
d
b
y
[
U
n
i
v
e
r
s
i
t
y
o
f
C
a
l
i
f
o
r
n
i
a
,
S
a
n
D
i
e
g
o
]
a
t
0
0
:
0
8
1
9
M
a
y
2
0
1
7
268 QUALITATIVE RESEARCH APPROACHES AND METHODS
ETHNOGRAPHY
Decision
ETHOLOGY
Needed?
NO
YES
Participant
Simple
Observation
Observation
Define the
Study Problem
Establish Research
Objectives
Do “Homework”
Select the Type of Behavior to
Study in the Field
Gain Entry into the Group
Take Detailed Field Notes
Establish Significant
Abstractions from the Field
Data
Generate Theoretical Ideas
from the Data
Interpret Findings and Prepare
and Present a Final Research
Report
Determine Methods of
Recording Behaviors
Label and Define in Detail
Behaviors of Interest
Record Behaviors as They
Occur
Interpret Measurements and
Prepare Findings
Apply Findings to Decision-
Making Processes
Source: After Jones 1996, Chapter 3.
Figure 19.2 Fieldwork Processes for Ethnography and Ethology
D
o
w
n
l
o
a
d
e
d
b
y
[
U
n
i
v
e
r
s
i
t
y
o
f
C
a
l
i
f
o
r
n
i
a
,
S
a
n
D
i
e
g
o
]
a
t
0
0
:
0
8
1
9
M
a
y
2
0
1
7
THE INTERPRETIVE APPROACH II 269
Duveen (2000) has described the work that ethnographers do as the production of thick descrip-
tion, and sees it as a two-part process. First, the researcher writes down everything that he or she
sees. Duveen refers to the thick description of events, settings, and behaviors as capturing the
sense of the social actors, groups, and institutions being described. Second, he called attention to
the fact that the researchers’ own interpretations of what are recorded influence the final descrip-
tion. Together, the two-part process of observation-interpretation moves from one activity to the
other, then backward to repeat itself again and again.
Figure 19.3 is a chart illustrating the key processes involved in conducting and presenting
the results of an ethnographic study. It illustrates the several different layers of observation-
interpretation that characterize good ethnographic fieldwork, field notes, and final report
preparation.
Ethnographic methods are employed in a number of different forms. Examples of these varia-
tions are ethnomethodology, community-based ethnography, and ethology. Each of these research
approaches has its own advocates and detractors, but all are considered to fall under the larger
category of field research.
Ethnomethodology has been defined by Neuman (2000, 348) as “the study of commonsense
knowledge.” It combines themes from sociology and philosophy, and is usually seen as an ap-
plication of phenomenology (Adler and Adler 1998). Researchers who follow this approach focus
their concern on how people go about living their everyday lives.
Ethnomethodologists study mundane, everyday behaviors in exceptionally close detail. They
often use mechanical and electronic methods of recording the behavior of people. They then
analyze in minute detail these audio- and videotapes, films, and other records, using what Adler
and Adler (1998, 99) have described as “an intricate notational system that allows [them] to view
the conversational overlaps, pauses, and intonations to within one-tenth of a second . . . they have
directed a particular emphasis toward conversation analysis.”
Become Immersed into
the Setting
Define the
Research Problem
Establish Research
Objectives
Gain Entry to the
Group
“Do Your
Homework”
Plan Data-
Gathering Process
Take Comprehensive
Field Notes
Field Analysis of Field
Notes
Informal Analysis
and Interpretation of
Major Themes
Prepare Report in
Which You Present
Theory
Generate Theoretical
Concepts
Develop Significant
Constructs
Figure 19.3 Ethnographic Fieldwork, Analysis and Presentation Processes
Source: After Jones 1996.
D
o
w
n
l
o
a
d
e
d
b
y
[
U
n
i
v
e
r
s
i
t
y
o
f
C
a
l
i
f
o
r
n
i
a
,
S
a
n
D
i
e
g
o
]
a
t
0
0
:
0
8
1
9
M
a
y
2
0
1
7
270 QUALITATIVE RESEARCH APPROACHES AND METHODS
Community-based ethnography (CBR) is closely associated with the critical approach known
as action research (Stringer 1997) and has been used primarily in research in education. Stringer
described the purpose of community-based research as a way of providing workers in professional
and community groups with knowledge that is normally only used by academic researchers. As
with all action research, CBR is designed to help people expand their knowledge and understand-
ing of a situation, and on their own to come up with effective solutions to the problems they
face. Everyone—researcher and researched—is involved in the process. Stringer (1997, 17–18),
describes CBR as:
intrinsically participatory; its products are not outsider accounts, portrayals, or reports, but
collaborative accounts written from the emic—or insider—perspective of the group. Such
accounts, grounded in hermeneutic, meaning-making processes of dialogue, negotiation,
and consensus, provide the basis for group, community, or organization action. People can
review their activities, develop plans, and resolve problems, initiate projects, or restructure
an organization.”
Applying Ethological Methodology
Ethology research addresses many of the same issues addressed by traditional ethnography. Initially,
the method focused primarily on animal behavior—Charles Darwin, for example, is considered
to have been one of the pioneers in this field of research. Today, however, this approach is often
used in organizational research, where it is employed for identifying and describing behavior in
social settings.
The approach taken in an ethology study involves simple observation, which can be either
visible or hidden (unobtrusive). Organ and Bateman (1991), discussing ethologic observation in
the context of organizational behavior research, referred to the method as naturalistic observa-
tion. They identified a number of appealing characteristics, as well as some of the shortcomings,
for this approach.
Possibly the most important advantage is what Organ and Bateman call the contextual richness
that is possible with observation (36). Because the observation approach makes it possible for
the researcher to provide extensive detail in researcher findings, this approach has gained wide
acceptance over the years; its use can be seen in many published articles, books, autobiographies,
newspaper stories, conversations, and speeches.
In addition to this extensive body of available literature, the natural experience that research-
ers gained from working in and dealing with organizations of all types, sizes, and purposes is
also an advantage. This is what is referred to as the richness in personal insight of naturalistic
observation in organizational research. Summarizing their critique of the method, Organ and
Bateman concluded:
[Simple] observation is an attractive method of research because it confronts its subject
head-on . It deals with raw, real-world behavior. Because the data are rich with the drama
of human existence, it is easy to relate to accounts of these studies. (Organ and Bateman
1991, 37)
Among the disadvantages of observation is that it often results in a report bias that is traceable
to the natural tendency of people to exercise selective perception and selective retention. Selective
perception means that from all the myriad stimuli that we encounter, everyone sees what they
D
o
w
n
l
o
a
d
e
d
b
y
[
U
n
i
v
e
r
s
i
t
y
o
f
C
a
l
i
f
o
r
n
i
a
,
S
a
n
D
i
e
g
o
]
a
t
0
0
:
0
8
1
9
M
a
y
2
0
1
7
THE INTERPRETIVE APPROACH II 271
want to see, what they are interested in, and what they think is important. Whether they do so
consciously or unconsciously, people ignore much of what else goes on.
This idea has been suggested by a number of different investigators. John Dewey, for example,
noted that human perception is never neutral. Rather, human knowledge and intelligence, what
we think of as past experience, always influences perception. Furthermore, judgment is involved
in all perception. Otherwise, the perception is nothing more than a form of what is called sensory
excitation (Phillips 1987, 9).
According to Hanson (1958), the theories, hypotheses, frameworks, or background knowledge
held by researchers have the power to influence everything that is observed. Therefore, observa-
tion cannot have a neutral foundation. The process of observation is unconsciously influenced
by the ideas, theories, hypotheses, or general knowledge that the researcher holds going into the
observation.
Selective retention means that people usually remember what they think was said, what they
wanted to hear, what they believe occurred, or what fits within their personal framing of the issue.
Hence, what is remembered is inherently subjective; it can never be considered the “Truth.”
Because observation is recorded as the field notes of one or more researchers, it will always
contain what the researcher feels is important, or the researcher’s belief about what action or
actions caused or influenced a reaction. Field notes will often omit what the researcher believes
to be trivial or unimportant. We are all drawn to dramatic or exciting situations—they make for
interesting reading, even when they have little or no bearing on the central issue or issues.
Field notes and the material that is eventually included in a report pass through a filter formed
from the perceptions and memory of events held by the researcher. Therefore, researchers must
always struggle with the answerable question: Would another observer have drawn the same conclu-
sion from these events? Researchers use thick description in an attempt to provide an answer.
Conducting Ethnographic Fieldwork
All variations of ethnography involve fieldwork. Ethnographic fieldwork includes such activities as
(1) engaging in participant observation, (2) collecting genealogies, (3) recording conversations, (4)
writing field notes, (5) interpreting the findings, and (6) writing up the field notes and interpreta-
tions as reports. Field notes describe events, incidents that catch the researcher ’s eye, in addition
to any and everything that is deemed to be relevant to the study at hand at the moment it occurs.
According to Fetterman (1989, 12), fieldwork is the key activity in all ethnographic research de-
signs. Applying the basic concepts of anthropology, methods and techniques of collecting data, and
data analysis are the fundamental elements of “doing ethnography.” Major decisions in fieldwork
involve the choice of what equipment to use—including tape recorders and video cameras.
Anthropologists and sociologists who study cultures firsthand have determined that the best
way to do their fieldwork is with the process of participant observation. The early ethnographic
researchers chose participant observation as their preferred way to function in the field for many
reasons. One was the often great distances they had to travel simply to reach the study society.
That meant that they were forced to spend longer periods with the groups under study simply to
justify the cost and physical hardship they were often forced to endure. Living for long periods
of time in the “primitive” community, sometimes in the same huts or shelters of the members of
the society under study, researchers were forced into being participants in order to survive—not
to mention understand what they were observing.
According to Bernard (1995), participant observation requires researchers to get close to people,
making them comfortable enough to permit the researcher to observe and record observations
D
o
w
n
l
o
a
d
e
d
b
y
[
U
n
i
v
e
r
s
i
t
y
o
f
C
a
l
i
f
o
r
n
i
a
,
S
a
n
D
i
e
g
o
]
a
t
0
0
:
0
8
1
9
M
a
y
2
0
1
7
272 QUALITATIVE RESEARCH APPROACHES AND METHODS
about their lives. Establishing rapport with people in the new community means learning how to
act in such a way that the people go about their day-to-day business when the researcher appears.
Possibly most important, it means being able to retreat from the group-member role to think about
what has been learned, and writing about it convincingly.
Ethnography in Political Science Research
When political science evolved into an academic discipline in its own light during the early
decades of the twentieth century, its own journals, professional associations, conferences, and
academic departments soon followed. Bits and pieces from all the social and behavioral sci-
ences were incorporated into its structure—and its research methodology. It is important to
remember that all the tools and methods used in political science research were invented for
other purposes.
Ethnography has become one of the most widely applied qualitative research methods in all
social science research, including political science. It has been shown to be a valuable tool for
gathering information about behaviors embedded in, and specific to, cultures and subcultures.
In its application during the early decades of the twentieth century, it was often used to identify
administrative options for making decisions on matters of public policy.
Fetterman (1989, 11) has defined the method and its focus this way: “Ethnography is the art
and science of describing a group or culture. The description may be of a small tribal group in
some exotic land or a classroom in middle-class suburbia. [The] ethnographer writes about the
routine, daily lives of people. The more predictable patterns of human thought and behavior are
the focus of inquiry.”
Ethnographic methods are used in administrative sciences to analyze and diagnose the culture
and operating climate of organizations (Wilson 1989; Schein 1992). In this application, the purpose
of the research is to improve the practice of administration in the public sector, while ethnographic
research is a way of acquiring the information that makes such improvement possible.
Yeager (1989, 726) has described participant observation as an “old and widely used research
method both in public administration and in other fields of study.” In public administration use
today, it incorporates many different techniques, including simple, group, and unobtrusive observa-
tions, depth-interviewing of key informants, ethnography, and controlled observation techniques.
Yeager adds,
Participant observation includes material that the observer gains directly from personally
seeing or hearing an event occur. Often the participant observer establishes personal relation-
ships with subjects and maintains those relationships over a period of time. . . . Rapport and
trust are established with subjects to a far greater extent than in other methods. Typically,
more exhaustive data are gathered on fewer subjects using participant observation than with
other methods. (726)
Ethnographic field research requires the most intense connection between the researcher and
the subjects of the study (Kornblum 1996); it is not unusual for ethnographers who have lived
and worked within a group for many years to begin to take on a self-identity that places greater
loyalty and connection to the study group than to the researcher’s prior connections.
While similar in method and analysis, ethnography as it is applied today is far different from
the ethnography that evolved with the social sciences more than a century ago. “Ethnography is
no longer a method used only to study foreign cultures; it has also become a method to study what
D
o
w
n
l
o
a
d
e
d
b
y
[
U
n
i
v
e
r
s
i
t
y
o
f
C
a
l
i
f
o
r
n
i
a
,
S
a
n
D
i
e
g
o
]
a
t
0
0
:
0
8
1
9
M
a
y
2
0
1
7
THE INTERPRETIVE APPROACH II 273
is foreign or strange in our society and how social subcultures or subworlds are constructed—the
adventure that begins just around the corner” (Flick 1999a, 641).
As ethnography has moved beyond its original focus on describing small, distant, and primi-
tive societies, or of examining the social disruption that was rooted in communities undergoing
industrialization, it was used to study groups in locations that its founders would never have
considered. One of these is the modern city.
Urbanism Research
According to Fox (1977, 9), there are several different directions being taken by urban political
scientists and sociologists: the anthropology of urbanism, the anthropology of poverty in urban
settings, and the anthropology of urbanization. Despite their differences, they all appear to have
the following principles in common: First, there is near unanimous agreement among urban an-
thropologists that cities are important locations for research. Second, urban anthropologists are
convinced that anthropology can make “important methodological and theoretical contributions
to the study of urban place.”
Ethnography and Organizational Culture
Every organization, whether in the public or private sector, has its own distinctive culture, as well
as its distinct operating climate. The study of organizational culture owes much of its method and
underlying principles to ideas produced through ethnographic research. Change-agent consultants
working on organizational development projects with organizational culture are very likely to use
either ethnographic or ethologic methodology for their data gathering. Organizational culture has
been defined in many different ways, but most are similar to the following classic definition:
Organizational culture is the shared and implicit assumptions held by a group and that
determines how members of the group perceive, think about, and react to its various envi-
ronments. (Schein 1992, 229)
Other definitions include those of Margulies and Wallace (1973), who defined culture as the
learned beliefs, values, and patterns of behavior that characterize an organization; Peters and
Waterman (1982) saw culture as the shared system of values that manifests itself through differ-
ent cultural artifacts.
In addition to a culture, organizations can also be said to have a distinct operating climate that re-
sults from the interaction of employees, administrators, and managers functioning within that culture.
Operating climate has been defined as a concept that reflects the content and strength of the salient
values, attitudes, behaviors, and feelings of the people working in an organization (Payne 1971).
The study of culture in organizations is approached from two broad perspectives: (1) the tra-
ditional positivist approach, and (2) the postpositivist approach. Researchers who study organi-
zational cultures from a positivist viewpoint hold the opinion that there are clear, easily identified
dimensions of culture that can be measured (usually with a questionnaire).
McNabb and Sepic (1995), for example, developed a scale for diagnosing the organizational
culture of an agency of the federal government. They used employees’ attitudes and opinions on
nine dimensions of culture and climate. These included (1) organizational structure, (2) responsi-
bility, (3) risk and challenge, (4) rewards, (5) warmth and support, (6) conflict, (7) organizational
identity, (8) ethics, and (9) approved practices.
D
o
w
n
l
o
a
d
e
d
b
y
[
U
n
i
v
e
r
s
i
t
y
o
f
C
a
l
i
f
o
r
n
i
a
,
S
a
n
D
i
e
g
o
]
a
t
0
0
:
0
8
1
9
M
a
y
2
0
1
7
274 QUALITATIVE RESEARCH APPROACHES AND METHODS
The descriptive profiles developed with such studies of an organization can then be compared
with the cultures of other groups. Organizational culture is something that can be reinforced or
changed—the fundamental goal of an organizational development initiative.
The second school of thought follows an interpretist view. To these investigators, it is impos-
sible to measure culture. This is because the culture of an organization changes form with each
attempt to pin it down; each observer comes away with a different interpretation, based upon
his or her personal values and experiences. Culture is, therefore, extremely difficult to manage;
efforts to initiate a desired change may be fruitless—a mindless task with no hope of a concrete,
lasting result.
Summary
In the new social science disciplines that emerged in the eighteenth and nineteenth centuries,
curiosity was raised about primitive societies, as well as how industrialization was affecting
children, families, and the working poor. This resulted in research efforts to understand (1) why
social problems occurred, and (2) what could (or ought to) be done to change society in order to
improve the lot of the poor and disenfranchised. Adding to this curiosity was news about many
strange societies and cultures.
Sociology evolved as a way to conduct systematic investigations into the newly emerging
industrial society and the litany of social ills that was seen as an unwanted by-product of the
industrialization process. Early attempts at establishing a systematic way of explaining human
behavior and mental aberrations resulted in the creation of the science of psychology. Building
on a tradition born from early travel stories and forging a scientific way of looking at indigenous
cultures, another group of scholars created the new social science of anthropology.
Through an eclectic process of trial and error, anthropologists and sociologists developed a
way of conducting research that allowed them to meet their study objectives in all kinds of social
and cultural settings. The name given to this method was ethnography.
Ethnographers often live, work, and play with the members of the group they are studying for
long periods of time. Their aim is to be absorbed into the group, with the underlying objective of
becoming “accepted” as a nonthreatening or nonintrusive member of the group so that events and
interrelationships unfold as they would naturally, as if an observer were not in attendance. This
process of gaining entry is the key to a successful research project.
The process of living with a social group during fieldwork involves observing and recording
individuals’ behaviors. The ethnographer summarizes these field notes into a larger descriptive
generalization that purports to describe the behavior of the wider society. The researcher must then
develop subjective descriptions that are based on a large number of generalizations. In making these
generalizations, the ethnographer moves from the specific to the general. That is, the behaviors
of one or a small group are used to infer that those behaviors are also those of the larger groups
in similar circumstances. The ethnographer should also develop interpretations of the observed
behaviors; the question “why” should be answered to the best of the ethnographer’s ability.
Discussion Questions
1. Describe how you would design an ethnographic study to investigate voting behavior
among minority women.
2. Explain what the term thick description means in ethnographic research.
3. How has field research evolved from its early stages?
D
o
w
n
l
o
a
d
e
d
b
y
[
U
n
i
v
e
r
s
i
t
y
o
f
C
a
l
i
f
o
r
n
i
a
,
S
a
n
D
i
e
g
o
]
a
t
0
0
:
0
8
1
9
M
a
y
2
0
1
7
THE INTERPRETIVE APPROACH II 275
4. What do ethnographers do when they study groups?
5. How does ethnography differ from ethnology?
6. Explain the role of ethnographic research in adding to greater understanding of questions
in political science.
7. Define the term ethnomethodology.
8. Describe how you would use participant observation in a political science research project.
9. What are urbanism studies?
10. Discuss the role of ethnography in the study of organizational culture.
Additional Reading
Alasuutari, Pertti. 1995. Researching Culture: Qualitative Method and Cultural Studies. London: Sage.
Bernard, H. Russell. 2001. Research Methods in Anthropology. 3rd ed. Thousand Oaks, CA: Sage.
Emerson, Robert M., Rachel I. Fretz, and Linda L. Shaw. 1995. Writing Ethnographic Fieldnotes. Chicago:
University of Chicago Press.
Fetterman, David M. 1989. Ethnography, Step by Step. Newbury Park, CA: Sage.
Fox, Richard G. 1977. Urban Anthropology: Cities in Their Cultural Settings. Englewood Cliffs, NJ: Pren-
tice Hall.
Gray, Ann. 2003. Research Practice for Cultural Studies: Ethnographic Methods and Lived Cultures. Lon-
don: Sage.
D
o
w
n
l
o
a
d
e
d
b
y
[
U
n
i
v
e
r
s
i
t
y
o
f
C
a
l
i
f
o
r
n
i
a
,
S
a
n
D
i
e
g
o
]
a
t
0
0
:
0
8
1
9
M
a
y
2
0
1
7
276
20 The Critical Approach:
Feminist and Empowerment Research
This chapter addresses two increasingly important approaches in the broader category of critical
research: feminist research and empowerment research. These approaches evolved out of the ac-
tion research model developed in the 1940s by Kurt Lewin, who is considered to be one of the
founders of social psychology. Subsequent researchers working in this approach recognized the
need for a research design devoid of any gender bias and included feminist research as a varia-
tion of the action-oriented research approach. Lewin, a refugee who fled to the United States in
the 1930s from Nazi Germany, also developed a research model that focused on empowering
members of minority groups who were dominated by a more powerful majority. This empower-
ment research was conceived as a way for exploited groups to break the chain of exploitation by
taking action against their exploiters. The role of the researcher in this model was to function as
a guidance resource for the people.
The action research model is founded on research into the psychology of communities that
was carried out by Lewin and other social psychologists during and after World War II. Both
the feminist and empowerment approaches are generally considered to be qualitative research
methods, although some quantitative methods are also used in the research activity (Small 1995;
Westmarland 2001; Sarantakos 2004).
Although much research in political science still follows a positivist model, nontraditional
approaches such as feminist and empowerment research have made substantial strides toward
becoming “mainstream.” Schulz and Mullings commented on this state of affairs in their 2006
text Gender, Race, Class, and Health:
At this time in the United States [2005], traditional methodologies remain highly valued,
while many other countries rely more on qualitative and consensus studies in setting their
public policy agendas and enacting corresponding legislation. The current U.S. Congress
is calling for, and in some cases requiring, very narrow “scientific” research designs and
protocols that focus on “proving” cause and effect—a troubling and obviously political
move. (Schulz and Mullings 2005, 22)
The Feminist Research Model
The feminist approach has made significant contributions to our understanding in political science.
Feminist issues took center stage in many political theory studies during the turbulent 1970s. An
initial goal of feminist research was to “document the dreadful history of misogynist statements
D
o
w
n
l
o
a
d
e
d
b
y
[
U
n
i
v
e
r
s
i
t
y
o
f
C
a
l
i
f
o
r
n
i
a
,
S
a
n
D
i
e
g
o
]
a
t
0
0
:
0
8
1
9
M
a
y
2
0
1
7
THE CRITICAL APPROACH 277
by male authors—statements that were considered to have justified the exclusion of women
from the political realm and confine them to the private world of the family” (Saxonhouse 1993,
15). The feminist approach took on greater importance during the decade of 1980s when it grew
in acceptance as a perspective of choice in many research studies on political theory. Galston
chronicled this phenomenon:
[No] story of political theory in the 1980s would be complete without stressing the extraor-
dinary development and vitality of feminist thought. Its explorations ramified into all aspects
of politics, society, personality, and inquiry; the constitution and construction of gender
differences; the retrieval of neglected writers, agents, and questions, and the corresponding
expansion or reconstitution of what political theory theorizes about; the exploration of covert
gender assumptions in theoretical categories such as the public/private distinction, rights,
and justice; the examination of bias and discrimination in practical spheres structured by
such categories; and the questioning of entire modes of philosophy and social inquiry . . .
as gender-based and partial. (Galston 1993, 31)
The feminist approach to research and to science in general is based on the value-free fact that
women see things differently than men. Moreover, education research has shown that the genders
have different ways of learning and different ways of describing meaning. Thus, how women and
men view research phenomena often differs in many, often highly meaningful ways.
For centuries, men have dominated academic, administrative, and managerial career fields;
most research in these areas was designed and conducted by males for male readers. Hence, the
extensive and important role of women in society was often ignored or, at best, glossed over.
However, many believed that the centuries during which females were forced to accept a lesser
status in the academic and political spheres demanded that a new, more equal approach to science
be implemented.
The drive toward equal career opportunity revealed that a new approach to research was needed to
ensure that an equal voice was given to both genders in description of social and political phenomena.
The changes occurring in society during the last quarter of the twentieth century essentially demanded
establishment of a feminist-oriented approach to research in political science and the other social
sciences. The feminist research model—which today is used by researchers of both genders—was
seen as the methodological emphasis that would aid in this critical emancipatory effort by eliminating
the gender bias seen in most of the social science research then being published.
Researchers who employ the feminist approach contend that gender-based political theory and
political writing have long been both overtly and covertly gender biased. Thus, many feminist
researchers saw traditional positivist research as resulting in a science with a gender bias that was
potentially misleading at best, and insulting and derogatory at worst.
When feminist researchers in political science examine such political phenomena as international
relations and politics, state formation, war and peace, revolutions, international political economies,
and global governance, they now include in their analyses discussions about the role of gender in
these events. Thus, gender is finally considered to be a relevant factor in all international politics,
public policy, and other writing on governance phenomena (Locher and Prügl 2001).
Research for Women by Women
Feminist research, according to Small (1995), has as its primary goal “the promotion of the feminist
agenda by challenging the male dominance and advocating the social, political, and economic
D
o
w
n
l
o
a
d
e
d
b
y
[
U
n
i
v
e
r
s
i
t
y
o
f
C
a
l
i
f
o
r
n
i
a
,
S
a
n
D
i
e
g
o
]
a
t
0
0
:
0
8
1
9
M
a
y
2
0
1
7
278 QUALITATIVE RESEARCH APPROACHES AND METHODS
equality of men and women.” It has also been described as research for women rather than about
women (Allen and Baber 1992). Feminist researchers share with their fellow social scientists what
has been described as a concern for ethical issues, a belief in social justice, an ethic of compassion,
and an awareness of the power of language to distort the experiences of research subjects.
Typical of the themes approached from a feminist research perspective are the papers published
in the April 2002 issue of the International Feminist Journal of Politics: “Toward a Feminist Po-
litical Economy” (Prügl), “Rewriting (Global) Political Economy as Reproductive, Productive,
and Virtual (Foucauldian) Economics” (Peterson), and “The UN Approach to Harmful Traditional
Practices” (Winter, Thompson, and Jeffreys).
Feminist research methodology has a long history of use in political science research. For
example, two papers with feminist research foundations were published in the July/August 2002
issue of Public Administration Review. These were “Gender Differences in Agency Head Salaries:
The Case of Public Education” (Meier and Wilkins) and “Sex-based Occupational Segregation in
U.S. State Bureaucracies, 1987–97” (Kerr, Miller, and Reid).
Another example of the growing influence of feminist theories and the feminist research
approach can be found in the Winter/Spring 2004 issue of the Brown Journal of World Affairs
(Peterson 2004; Prügl 2004; Sylvester 2004; Tickner 2004; Wibben 2004). The five papers
included in this special symposium section on feminist theories in international relations have
interest for both political science researchers because of their emphasis on eliminating gender
bias in government.
Focus of Feminist Research
Feminist research, which is sometimes referred to as emancipative or empowering research, is
considered to be one of the four chief variations of action research. Action research is research
or analysis done in order to improve the performance quality of an organization or group. It has
been widely applied in efforts to improve public education operations and in programs of orga-
nizational development. This approach has as its key objective helping research participants to
identify and understand the causes of their circumstances or malfunction, and then to empower
them to bring about the change that they feel is required. Neuman (2000) described the approach
as a process of inquiry that helps people change their working or living conditions and build a
better world for themselves.
Small described the focus of feminist research as promoting the feminist agenda by challenging
male dominance and advocating female and male social, political, and economic equality. As with
all other models of action research, feminist research seeks to (1) bring about social change, (2)
emancipate participants (i.e ., women), and (3) enhance the lives of the participants.
Writing about gender inequality in science, Sandra Harding described how this multipart focus
translates into actual research topics in more specific terms:
Indeed many feminist research projects are “mission directed,” that is, they are designed
to produce solutions to pressing economic, legal, medical and health, political, or other
problems that women encounter in some particular social context. Thus, these projects do
not aim to discover value-neutral, transcendental truths. Yet, they do produce theoretical
knowledge through such research. Indeed, for feminism, theoretical knowledge is also ac-
tion in the world; how we conceptualize the world around us changes how we will interact
with it and how others will interact with us. (Harding 2006, 68)
D
o
w
n
l
o
a
d
e
d
b
y
[
U
n
i
v
e
r
s
i
t
y
o
f
C
a
l
i
f
o
r
n
i
a
,
S
a
n
D
i
e
g
o
]
a
t
0
0
:
0
8
1
9
M
a
y
2
0
1
7
THE CRITICAL APPROACH 279
Feminist researchers are more likely to adopt a postpositivist approach to their work, although
there are no hard-and-fast rules that make it the required epistemology. Furthermore, while some
have advocated that a distinctive set of feminist methods should exist, others are less convinced
that a purely feminist methodology is possible. And a third group argues that while, indeed, no
special feminist methodology currently exists, as more feminist research appears, one is slowly
being formed. Accordingly, “Feminist researchers share the values of overcoming oppression,
empowering women, and transforming society so that equality between men and women can be
achieved. The purpose of knowledge is to change or transform what is considered the patriarchal
nature of society” (Small 1995, 947).
Arriving at the current focus of the feminist research perspective has been an evolutionary
process, including contributions from liberal, Marxist, and radical political philosophies on the one
hand, and the ideas of women of color and lesbians on the other. Talking about how this dynamic
early history of the women’s movement in the 1970s influenced the adoption of a new feminist
perspective on research, Harding (2006, 66) described the almost mainstream status that feminist
research has been awarded in the middle of the first decade of the twenty-first century: “In this
heady context, feminist science studies projects headed off in different and sometimes conflicting
directions. . . . Today, [however] the field can seem to have settled into the kind of more sedate
mopping-up projects characteristic of mature intellectual and social movements.”
A Consensus on Feminist Research
The debate on whether there is such a thing as a distinctive feminist research methodology has
diminished, but not extinguished. A number of authors note that this is still a divisive issue among
some advocates of the feminist research model (Harding 1987; Small 1995; Westmarland 2001;
Waller 2005; Ironstone-Catterall 2006). Other chroniclers of the evolutionary development of
feminist research have pointed out the disagreement among the several branches of this approach
regarding the question of whether research methodologies that are uniquely feminist do exist.
The consensus appears to be that, while no unique methods have been identified, feminist
researchers do apply the existing quantitative and qualitative methods in a distinctly feminist
way. As a consequence, it is common to find feminist survey research, feminist experimen-
tal research, and feminist field research being used when they are consistent with feminist
principles.
However, it is more common to find feminist researchers using such qualitative methods as
in-depth interviews, participant observation, document analysis, ethnographic studies, and similar
methods. Despite this tendency to use methods that were originally developed by others, feminist
researchers typically adjust them to meet their specific perspectives, as one author has noted:
It must be kept in mind that when feminist researchers employ methods that were developed
for and by other groups of researchers, they adjust them so that they fit within the critical
and emancipatory stance of feminism, and they are directed towards breaking down taken-
for-granted concepts and rebuilding them into new entities. In doing so, they lay bare the
essential concepts of research and use this as the basis for revealing what is really going
on. (Sarantakos 2004, 63)
If no feminist research methods exist, what, then, makes this approach different from other
research methods? According to analyses of the various branches of feminist research, the fol-
lowing points are common to this approach.
D
o
w
n
l
o
a
d
e
d
b
y
[
U
n
i
v
e
r
s
i
t
y
o
f
C
a
l
i
f
o
r
n
i
a
,
S
a
n
D
i
e
g
o
]
a
t
0
0
:
0
8
1
9
M
a
y
2
0
1
7
280 QUALITATIVE RESEARCH APPROACHES AND METHODS
s &EMINISTRESEARCHERSARELIKELYTOFOCUSTHEIRATTENTIONUPONMARGINALIZEDPEOPLEINA SOCIAL
context. Their objective is to ensure that everyone is heard or represented. This often means
that, since most research has focused on men, only women’s voices have not been heard.
s )N THE BELIEF THAT ACTION IN SOCIAL SETTINGS IS SUBJECTIVE AND POLITICAL
FEMINIST RESEARCHERS
often substitute subjectivity for the strict objectivity of the positivist traditions. This is often
manifested in a strongly anti-positivistic orientation.
s &EMINISTRESEARCHERSOFTENSTUDYTHESOCIALCONDITIONSOFWOMENINA SEXISTANDPATRIARCHAL
society in order to enlighten citizens about sexist practices that have produced unequal and
discriminating social environments.
s "ECAUSESOCIETYISORGANIZEDINWAYSTHATOVERTLYANDCOVERTLYSUPPORTSEXISM
FEMINISTRESEARCH
typically exhibits an explicit focus on change in these social settings, structures, and cultures.
s &EMINISTRESEARCHISNOTEXCLUSIVELYABOUTWOMEN
BUTITISOFTENDONEWITHANEMANCIPA-
tory emphasis—for women. This research tends to emphasize women’s experiences.
s 0UBLISHEDFEMINISTRESEARCHISOFTENCRITICALOFNONFEMINISTSCHOLARSHIP
ISBASEDON FEMINIST
theory, may be multidisciplinary, focuses on social change, and seeks to ensure equal concern
for all humanity.
s "ECAUSEFEMINISTRESEARCHERSOFTENDEVELOPA SPECIALRELATIONSHIPWITHTHESUBJECTSINTHEIR
studies, published feminist research often includes the researcher ’s story.
Empowerment Research
Empowerment research has been seen as a tool to aid people in gaining mastery over their own
affairs. Small (1995) defined empowerment in this context as being concerned with individuals
and groups who are excluded by the majority on the basis of their demographic characteristics or
because of some other physical or emotional difficulties. Empowerment research may be a par-
ticularly relevant model for some research in the nonprofit sector. For example, because the focus
of many nonprofits is on aiding minorities and less-advantaged citizens in a society, managers
of these organizations may see significant advances in the conditions of some client groups as a
result of successfully carrying out an empowerment research activity.
The selective focus of much of the empowerment research that has taken place thus far sup-
ports this conclusion. Typical questions addressed in published empowerment research include
issues of mental health, citizen involvement, sexuality, and community health problems. Certainly
these topics are also of interest to political scientists, but with declining resources coupled with
greater and greater demands on their efforts, public agencies have turned more and more to the
private and nonprofit sectors to handle much of the service load in these areas. As a result, politi-
cal science researchers have had to adopt many of the research methods first developed in other
social sciences.
How Empowerment Research Works
The empowerment research approach begins with researchers identifying situations where a group
has felt isolated, or been forced to remain silent over some social injustice, or been banned from
seeking equal or fair treatment by a more powerful majority. These groups are often considered
the “outsiders” of a society, an organization, or a community. The role of the researcher or research
team is to help the outsider group take action to rectify the injustice.
The second step in the empowerment process is helping these outsider groups gain for themselves
an understanding of the underlying issues at the root of their isolation. This must be done with
D
o
w
n
l
o
a
d
e
d
b
y
[
U
n
i
v
e
r
s
i
t
y
o
f
C
a
l
i
f
o
r
n
i
a
,
S
a
n
D
i
e
g
o
]
a
t
0
0
:
0
8
1
9
M
a
y
2
0
1
7
THE CRITICAL APPROACH 281
only supportive rather than directive help from the researchers. The process concludes with the
outsider group gaining a voice in and power over the decisions that affect them—and an ability to
force needed change. In a word, it is a process designed to help people to become empowered.
Page and Czuba (1999, 3) addressed this issue from the perspective of using extension education
to empower citizens. They defined the process of empowerment as a “multi-dimensional social
process that helps people gain control over their own lives. It is a process that fosters power (that
is, the capacity to implement) in people, for use in their own lives, their communities, and in their
society, by acting on issues that they define as important.”
Page and Czuba identified the three components of this definition as: multidimensionality, socially
embedded, and a continuing process. By multidimensionality they meant that it involves elements of
sociology, psychology, economic, and other components that shape a society. They also noted that
the empowerment process occurs at the individual, group, and community levels, often concurrently.
Empowerment is a socially embedded process because it takes place with individuals acting and react-
ing with one another; it cannot occur in isolation. The process component refers to the characteristic
of beginning from a starting point and working through a series of phases toward accomplishing an
identified goal. Finally, they emphasized that the fundamental tenet of empowerment is the connec-
tion in collaborative activity between individuals and a community or group.
The Collaborative Nature of Empowerment Research
Empowerment research is necessarily collaborative in nature. Researchers provide a mechanism
for members of the group to identify group strengths and resources that may not have been rec-
ognized prior to the appearance of the research team. As the group becomes empowered, group
members are able to achieve control over the internal and external forces that affect them and are
thus motivated to bring about relevant and needed change.
Finally, the process focuses on bringing out the natural abilities and skills of the members
of the group under study. Rather than focusing on group members’ weaknesses, empowerment
research aims at bringing their strengths to the fore and providing guidance in the task of putting
those strengths to work for the members’ benefit.
For the research team working on an empowerment activity, the process is often a long, time-
consuming, but eminently personally rewarding process, with seemingly as many steps backward
as forward. Disenfranchised people, or citizens in other ways subjected to demeaning pressures,
are often loath to take up the fight again after having failed in many previous efforts; beating your
head against a wall only feels good when you stop. This is where the outside research team can
contribute to turning those attitudes around.
When the outsiders see that there is someone with a genuine and lasting interest in helping them
to help themselves, the world for them can, indeed, be turned upside down. The individuals are able
to make the transition on their own from subjugation to empowerment. Page and Czuba warned
that the researchers cannot give people power and cannot make them “empowered.” Rather, the
researchers can only supply the resources, opportunities, encouragement, and support the people
need to make the change on their own.
Empowerment research is not without its problems and potential pitfalls. Myron Glazer discussed
one of the most damaging of these pitfalls in his small volume on field research:
Field workers often immerse themselves in societies characterized by deeply rooted social
inequality. Indeed, this problem and its solution have long captured the imagination and
dedication of social [and administrative] scientists, yet the analysis of human suffering
D
o
w
n
l
o
a
d
e
d
b
y
[
U
n
i
v
e
r
s
i
t
y
o
f
C
a
l
i
f
o
r
n
i
a
,
S
a
n
D
i
e
g
o
]
a
t
0
0
:
0
8
1
9
M
a
y
2
0
1
7
282 QUALITATIVE RESEARCH APPROACHES AND METHODS
places a special burden on researchers. They are constantly plagued by their own feelings
of bitterness and anger. Their very scholarly detachment and struggles for objectivity often
lead to a profound sense of guilt and impotence. Some field workers hope to strike back
through their writing. Others, less patient, more action oriented, join the downtrodden and
suffer their fate. (Glazer 1972, 59)
The Empowerment Research Process
Critical research, including empowerment research, takes place in a series of six steps (Kuhne and
Quigley 1997). These steps are grouped into three distinct phases. The first phase, planning, includes
steps 1, 2, and 3. Phase two, action, involving implementation of an intervention or program (step
4), is the single most critical step in this phase. Finally, the third phase—reflection—covers steps
5 and 6. In step 5, the researchers and community or group engage in evaluation of their progress
or lack of progress. The last step in this process involves implementation of any changes that
emerge after evaluation of the activities conducted to that point. The relationship between these
six steps and three phases is displayed in Figure 20.1.
First Phase Actions
The first phase in the empowerment approach to critical research involves three key founda-
tional steps. The first step is observing and working with the community of actors to develop
an understanding of the problem that includes as much as possible, including causal factors
and potential solutions.
Developing an understanding of the problem involves conducting extensive interviews with
members of the group in order to bring out the subjects’ perceptions on the problem and its pos-
sible cause or causes. The research team then arranges for community participants to discuss these
perceptions in order to arrive at a group consensus.
In collaborative transformation actions such as empowerment research, the researcher’s
perception of the problem is not nearly as important as how the participants view it. If the study
group does not agree on a problem and the action they will take for solution, the researcher may
become a part of the problem rather than a contributor to a solution. Gathering the benchmark
information may involve brainstorming with participants and other researchers, exploring the
published professional literature, and, often, simple observation of the group. Finally, the re-
searcher and group participants must decide together whether the problem is significant enough
to warrant the study.
Defining and planning the project is the second step in the first phase of the empowerment
research process. The most important part of this planning activity is deciding how to deal
with the problem at hand. In a collaborative research activity, this means getting the partici-
pants to agree on the intervention program they want to implement and then organizing the
group for action.
The end result of this step should be generating among the members of the group a readiness
to not only put in the effort that will be required, but also to accept change of any kind. Finally, it
also entails (1) agreeing on how individual participants are to be involved in the action phase of
the process, and (2) what action will be taken in the event of a failure of the program to achieve
the desired results.
Determining the measurements is the third step in this first phase. This step is the diagnostic
stage of critical research. In order to know if something has been improved, if it is “better” in some
D
o
w
n
l
o
a
d
e
d
b
y
[
U
n
i
v
e
r
s
i
t
y
o
f
C
a
l
i
f
o
r
n
i
a
,
S
a
n
D
i
e
g
o
]
a
t
0
0
:
0
8
1
9
M
a
y
2
0
1
7
THE CRITICAL APPROACH 283
Figure 20.1 Phases and Steps of Critical Research
Source: Includes elements from Kuhne and Quigley 1997, 28.
way, the researcher must have a benchmark against which to measure any change. A benchmark is a
clear, comprehensive description of the way things are prior to an intervention. This process includes
specifying what will be measured during the later evaluation stage of the research program.
In addition to knowing what to measure, it will also be necessary to determine when to measure
and how long the drive for empowerment intervention should run before an evaluation occurs.
There is no set answer to these questions; timing is a function of the severity of the problem and
the degree of participatory involvement of the participants. Lewin described this process in his
1947 paper Frontiers in Group Dynamics: “In discussing the means of bringing about a desired
STATEOFAFFAIRSONE SHOULDNOTTHINKINTERMSOFTHE @GOALTOBEREACHED BUTRATHERINTERMSOFA
CHANGE@FROMTHEPRESENTLEVELTOTHEDESIREDONEv#ARTWRIGHT
Phase One
Step 1. Collaborative effort to identify
and frame a focus on primary causal
factors and potential solutions.
Step 2. Assist community members to
choose and plan an appropriate critical
research program.
Step 3. Reach agreement on how to
diagnose current situation and establish
a benchmark measurement for
comparing any changes that can be
traced to the agreed-upon intervention.
Phase Two
Step 4. Community members begin
implementing their change action. This
must be done by the members of the
subject group, not the research team,
which now only serves as a reference
point for helping community members to
identify solutions to any problems
encountered during the implementation.
Phase Three
Step 5. Help group participants measure
and evaluate results of the intervention
and determine whether the success
criteria agreed upon in Step 3 were met
and if any tangible gains have taken
place.
Step 6. This is an in-depth interpretation
of all activities that took place during the
entire project, including thinking about
what did and did not happen and why.
D
o
w
n
l
o
a
d
e
d
b
y
[
U
n
i
v
e
r
s
i
t
y
o
f
C
a
l
i
f
o
r
n
i
a
,
S
a
n
D
i
e
g
o
]
a
t
0
0
:
0
8
1
9
M
a
y
2
0
1
7
284 QUALITATIVE RESEARCH APPROACHES AND METHODS
Second Phase Activity: Action
A single step is involved in the second phase of the research program, the action phase. The
implementation of the emancipation task is the responsibility of the members of the group, not
the research team. The role of the researchers at this time is to function as a reference point,
providing methodological advice if asked, but not acting as leaders or instigators of the action.
Empowerment research, like other action research, involves collaboration and direct participation
of the research subjects.
Another important aspect of the role of the research team in this phase is keeping the group
moving according to its initial plan. If, in the opinion of the researchers, the plan will not gener-
ate an appropriate intervention or produce the desired change, the team can help the community
group plan and initiate a second version of the activity—something in the way of a contingency
plan. Finally, to keep the research program focused on meeting the group’s objectives, the research
team must maintain good records of the intervention implementation, its effects, and how and in
what form changes are generated.
Third Phase Activities
Phase three is the reflection part of the emancipatory research project. It includes the last two steps:
(5) evaluating results and (6) transitioning the change into the group or organization. Evaluating
the results of the change effort may take as long as or longer than the actual implementation of
whatever action the team takes on. All aspects of the data collected before and during the action
phase must be collected and studied.
The research team must work closely with group participants to evaluate what the data reveal
about the problem and results of the intervention. This includes determining whether the success
criteria agreed upon in step 3 were met, and spelling out whatever tangible gains may have oc-
curred, regardless of how small or great. If the problem is resolved, end the project; if not, repeat
a second cycle—or more. Action research cycles should continue until the desired change is ac-
cepted and functioning.
Suchman (1967, 177) described what is involved in the evaluation process this way: “What
we evaluate is the action hypothesis that defined program activities will achieve specified, desired
objectives through their ability to influence those intervening processes that affect the occurrence
of these objectives. . . . An understanding of all three factors—program, objective, and intervening
process—is essential to the conduct of [evaluation].”
The Implementation Process
The last step in the third phase of the process is the actual implementation, or transitioning the
change into the behavior and attitudes of the oppressor and oppressed groups or organizations.
During this stage of the research, the team and subject population also begin planning for carrying
the change initiative to the next level.
At this point the research team assists the community in thinking about what happened, and
what did not and why, while preparing the group to continue on the path to emancipation after the
research team has departed. This includes answering such questions as: Did the project produce
promising results? Do the promised changes reflect what is actually happening? Should another
cycle of action research be initiated? Kuhne and Quigley (1997, 34) described this step as a process
of “analyzing outcomes and revising plans for another cycle of acting.”
D
o
w
n
l
o
a
d
e
d
b
y
[
U
n
i
v
e
r
s
i
t
y
o
f
C
a
l
i
f
o
r
n
i
a
,
S
a
n
D
i
e
g
o
]
a
t
0
0
:
0
8
1
9
M
a
y
2
0
1
7
THE CRITICAL APPROACH 285
This sixth step also involves putting together a final report of the entire process for group
participants and any other researcher/participant team planning for a similar intervention of their
own. Thus, the report must be complete, produced in a form that everyone can understand, and
it helps to add to theoretical knowledge of change in groups and organizations and the action
research process in general.
Summary
This chapter has addressed two related critical research approaches: feminist research and em-
powerment research. The feminist approach to research and to science in general is based on
emphasizing the point that women see things differently than men, and the genders have different
ways of learning and different ways of describing meaning. Feminist research is conducted to
promote the feminist agenda by challenging male dominance and advocating female and male
social, political, and economic equality. This research seeks to (1) bring about social change, (2)
emancipate participants (i.e ., women), and (3) enhance the lives of the participants.
While no uniquely feminist methods appear to exist, feminist researchers use existing quan-
titative and qualitative methods in a distinctly feminist way. It is common to find that feminist
survey research, feminist experimental research, and feminist field research are used—but only
in ways consistent with feminist principles. Feminist researchers typically use such qualitative
methods as in-depth interviews, participant observation, document analysis, ethnographic studies,
and similar methods.
Empowerment research focuses on helping people find ways to gain mastery over their own
affairs. Empowerment has been defined as being concerned with individuals and groups who are
excluded from mainstream society by the majority because of demographic characteristics or some
other physical or emotional characteristic. Empowerment research may be particularly relevant
for some nonprofit sector research.
Empowerment research takes place in a series of six steps, which are grouped into three dis-
tinct phases. The planning phase includes the first three steps. Phase two, action, involves step
4—implementation of an intervention or program. The third phase—reflection—covers the last
two steps of evaluation and implementation of any changes that emerge from the research.
Discussion Questions
1. What is feminist research and how is it applied in political science?
2. Why has the feminist research model been so enthusiastically adopted by many political
science researchers?
3. What is the meaning of the term gender bias? How can it influence research findings?
4. What is the primary objective of feminist research?
5. Do you believe that a purely feminist research methodology exist? Why or why not?
6. Name and define the seven points that were said to be common to the different variations
in feminist research.
7. What is empowerment research and why was it developed?
8. What is meant by the phrase the collaborative nature of empowerment research?
9. What is the role of field workers in empowerment research?
10. Describe in detail the three phases of empowerment research.
D
o
w
n
l
o
a
d
e
d
b
y
[
U
n
i
v
e
r
s
i
t
y
o
f
C
a
l
i
f
o
r
n
i
a
,
S
a
n
D
i
e
g
o
]
a
t
0
0
:
0
8
1
9
M
a
y
2
0
1
7
286 QUALITATIVE RESEARCH APPROACHES AND METHODS
Additional Reading
Argyris, Chris, Robert Putnam, and Diana McLain Smith. 1985. Action Science. San Francisco: Jossey-
Bass.
Geuss, Raymond. 1981. The Idea of a Critical Theory: Habermas and the Frankfurt School. Cambridge:
Cambridge University Press.
Harding, Sandra, ed. 2004. The Feminist Standpoint Theory Reader: Intellectual and Political Controversies.
New York: Routledge.
Marrow, Alfred J. 1977. The Practical Theorist: The Life and Work of Kurt Lewin. New York: Teachers Col-
lege Press, Columbia University.
McIntyre, Alice. 2007. Participatory Action Research. Thousand Oaks, CA: Sage.
Ramazanoğlu, Caroline, with Janet Holland. 2002. Feminist Methodology: Challenges and Choices. Thou-
sand Oaks, CA: Sage.
D
o
w
n
l
o
a
d
e
d
b
y
[
U
n
i
v
e
r
s
i
t
y
o
f
C
a
l
i
f
o
r
n
i
a
,
S
a
n
D
i
e
g
o
]
a
t
0
0
:
0
8
1
9
M
a
y
2
0
1
7
287
21 Analysis Methods for Qualitative Data
The fundamental building block of all research consists of data. Data can take many different
forms and can be gathered in many different ways. In their most irreducible form, data can be
quantitative or qualitative. Increasingly, and in more and more disciplines, data employed in
political science research projects exist in both quantitative and qualitative form. In addition to
different forms, data can be gathered in many different ways—by interview, questionnaire, overt
or covert observation, by analysis of documents or artifacts, or by the subjective experiences of
the researcher, to name only the most commonly encountered data collection methods (Martin
2000). Regardless of their form or how they are gathered, in their raw state data have little or no
intrinsic meaning. Data must be processed, analyzed, and interpreted by a researcher before they
take on any rational sense.
The analysis processes for quantitative and qualitative research data are similar in some ways,
but different in others. Similarities include (1) data are not just there, they must be collected in
some way by a researcher; (2) when processed, both quantitative and qualitative data can be used
for inference; (3) comparative analyses are used with both data types; and (4) researchers are
concerned with both the reliability and the validity of all data.
Quantitative data differ from qualitative data primarily in the way they are tabulated, collated,
and processed. Quantitative data are typically computer processed and analyzed with a variety of
standard statistical tests. These tests are applied for one or more of the following purposes: (1) to
describe a data set, (2) to generate hypotheses through a process of association testing, and (3) to
test hypotheses (Fitz-Gibbon and Morris 1987).
Qualitative data, on the other hand, exhibit variety in both form and context. They can also be
evaluated and interpreted in a variety of ways. Qualitative data can be words, pictures, artifacts,
music scores, and so on. Furthermore, each of the several different analysis approaches has its
own underlying purpose, and each often produces a different outcome. This chapter discusses
a few of the more prevalent ways of analyzing qualitative data and includes three separate but
similar processing models.
What Are Qualitative Data?
Qualitative data are data that have been gathered during the conduct of interpretive or postpositiv-
ist research studies. This kind of data exists most often as some sort of narrative. Thus, it can be
a written text, transcripts of conversations or interviews, transcripts of therapeutic or consultive
interviews, records of legal trials, or transcripts of focus group discussions. It can exist as histori-
cal or literary documents, ethnographic field notes, diaries, newspaper clippings, or magazine and
journal articles. It can also be in the form of photographs, maps, illustrations or paintings, musical
D
o
w
n
l
o
a
d
e
d
b
y
[
U
n
i
v
e
r
s
i
t
y
o
f
C
a
l
i
f
o
r
n
i
a
,
S
a
n
D
i
e
g
o
]
a
t
0
0
:
0
8
1
9
M
a
y
2
0
1
7
288 QUALITATIVE RESEARCH APPROACHES AND METHODS
scores, tape recordings, films, or any other nonquantitative or quantitative source. Most of the time,
however, qualitative research data are haphazardly stored in collections of rough field notes.
Miles and Huberman (1998, 182) suggested that qualitative data exist as “the essences of
people, objects, and situations.” In their discussion, essences refers to the reactions and interpre-
tations that researchers take away from the raw experiences of a research encounter or situation.
A researcher must process, analyze, and interpret these “essences” in order transform them into
a meaningful conclusion.
The following brief statement bears emphasizing: All data must be analyzed and interpreted
before they have meaning. All unprocessed and uninterpreted data are called raw data. Raw quan-
titative data refers to the compilation of a set of numbers arranged according to values assigned by
a researcher to optional responses to questions or as counts of event occurrences. Raw qualitative
data exist most often as a body of unorganized unstructured field notes or narratives; that is, in
the form of words or other symbols, but not numbers.
Components of Qualitative Data Analysis
There are two parts to the interpretation and analysis of qualitative data. The first is data man-
agement; the second is data analysis. Data management includes three important steps. First,
managing data begins with organizing the collection process. This includes preplanning, careful
selection of the sample or situation to be included in the study, and making sure that entry into
and acceptance by the study group is achieved. The researcher must maintain a concise record of
the steps and processes taken throughout the study. A précis of this record must be included in the
final research report under the heading of methodology.
The second step in this process is designing a system for storage of the collected data. In the past,
this meant devising a system of index cards, preparing analytical memorandums, and careful categori-
cal coding—in what some analysts referred to as the clerical portion of qualitative research. It was
laborious and time consuming. Today, however, computer software programs are increasingly taking
the place of this unappealing activity. A key activity in this half of the management/analysis process
is devising a system for retrieving data for comparative analyses and other interpretive activities. It
is important to remember the process because some researchers still work this way:
Only a few short decades ago, QDA (qualitative data analysis) was purely a manual process.
Bits of data were copied onto cards, using the traditional technique of cutting and pasting.
These cards were filed under appropriate categories generated by the researcher . . . [who]
then strove to link the data and connect categories through these physical materials and ma-
nipulations, to produce meaningful reflections of the phenomena being studied. The process
was a daunting one for researchers. Researchers had to manage overwhelming compilations
of material, make analytical decisions that were rarely clear or simple, and work through the
tedious and frustrating processes of coding, deriving themes, and building theories. (Este,
Sieppert, and Barsky 1998, 138)
The second half of the interpretation process is the actual analysis of data. This phase of the
interpretation process also includes three activities: (1) data reduction, (2) data display, and (3)
drawing conclusions from the data. First, data reduction is almost always a crucial stage in the
interpretation process. It involves selecting the most salient themes and constructs that emerge from
the data. Not every bit of data can be its own category; if this were true, the research report would
never be written. Qualitative investigations have been known to generate thousands of pages of
D
o
w
n
l
o
a
d
e
d
b
y
[
U
n
i
v
e
r
s
i
t
y
o
f
C
a
l
i
f
o
r
n
i
a
,
S
a
n
D
i
e
g
o
]
a
t
0
0
:
0
8
1
9
M
a
y
2
0
1
7
ANALYSIS METHODS FOR QUALITATIVE DATA 289
records. From out of that mass of unconnected narrative, the researcher must choose or devise a
conceptual framework. This framework will be constructed of themes, clusters, and summaries.
The next part of the analysis phase is data display. In the chapters on quantitative research
methods, this was discussed as the use of descriptive and summary statistics, and presenting
information in charts, graphs, and tables. These same graphic displays are often used to present
qualitative data. Whatever research approach is followed, the objective is to be able to present
findings as an organized, focused collection of pertinent information, out of which a researcher—
and a reader—can draw relevant conclusions.
Finally, drawing conclusions forces the researcher to interpret the results of the study. It is not
enough simply to present the data as they appear, even if they have been effectively organized,
categorized, and structured. The research must explain what the data mean in relation to the study
design and objectives and in terms of study’s contribution to theory.
Bringing Order to Raw Qualitative Data
The analysis and interpretation of qualitative data begins with bringing the raw data into some
level of order. First, the researcher identifies and selects a set of relevant categories or classes
in which to sort the data. Comparing the data across categories—a step that is typically used in
the testing of hypotheses—often follows the initial comparing phase of the analysis. Strauss and
Corbin (1998) call this a process of conceptualizing.
Conceptualizing refers to the act of reducing the often bulky amounts of raw data into workable,
ordered bits of information that the researcher can manage with confidence. Kvale (1996) described
this act of data categorization as a key qualitative research activity, one that most distinguishes
qualitative strategies from quantitative research.
Researchers can best analyze and interpret raw data if they employ some orderly process.
Both a nine-step and twelve-step data analysis process are discussed below. Figure 21.1 displays
a model of the first of the two processes, a nine-step process.
A Nine-Step Analysis Process
This nine-step process for analyzing and interpreting qualitative data has its roots in the three fold grounded
theory interpretation models of Strauss and Corbin (1990), Neuman (2000), and information provided in
Miles and Huberman (1994 and 1998). Each of the nine steps is discussed in more detail below.
Step 1. Preliminary Analysis for Patterns and Structure
Order and structure must be brought to all data if they are ultimately to become information. Miles
and Huberman (1994) refer to order—the patterns or themes in textual qualitative data—as Gestalts.
This is because they pull together a variety of smaller portions of data into larger wholes.
A key task of the qualitative researcher is sorting and re-sorting data to identify patterns, from
which meaning and definition can be established. Finding patterns in the data is a subjective
process, and one that often comes naturally to the researcher. Miles and Huberman see this as a
potential problem, however, and offer the following caveat:
The human mind finds patterns so quickly and easily that it needs no how-to advice. Patterns
just “happen,” almost too quickly. The important thing, rather, is to be able to (a) see real
added evidence in the same pattern [and] (b) remain open to disconfirming evidence when
it appears. (Miles and Huberman 1994, 216)
D
o
w
n
l
o
a
d
e
d
b
y
[
U
n
i
v
e
r
s
i
t
y
o
f
C
a
l
i
f
o
r
n
i
a
,
S
a
n
D
i
e
g
o
]
a
t
0
0
:
0
8
1
9
M
a
y
2
0
1
7
290 QUALITATIVE RESEARCH APPROACHES AND METHODS
Step 2. Open Coding to Form Clusters and Identify Themes
A key activity in all qualitative data analysis is that of clustering. This entails putting things that
are like each other together into groupings or classes. These may be preexisting classes, although
this is not the recommended way to begin. More often, the categories are groupings that the
researcher creates from smaller collections of ideas that emerge from the data itself. Coding and
categorization go hand-in-hand during this phase of the analysis.
Straus and Corbin (1990) and Glaser (1992) identified the coding process that occurs in the first
phase of the analysis as open or substantive coding. The goal of this first, open coding process
is to begin to form the raw data into meaningful categories with a structure that will guide the
researcher in all subsequent analyses, and any future gathering of more data.
There are no limits to how many codes are assigned during the open coding phase or to the
inclusiveness (breadth) of each. The process has been described as a necessary task that can be
“applied at many levels of qualitative data; at the level of events or acts, of individual actors, of
processes, of settings or locales, of sites as wholes.” (Miles and Huberman, 1994, 219)
In qualitative research, usually little or no categorization is done prior to the data being collected.
The categorical codes that emerge at this time are taken from the data they embrace. However, the
researcher should keep in mind that one of the goals of coding and categorization is the reduction
of data into more manageable sets.
Step 3. Comparative Analysis for Similarities and Contrasts
Qualitative research studies usually require some comparative analysis of the collected data. In
grounded theory research, comparisons are an integral part of the entire analysis process. Both
Strauss and Corbin (1990) and Glaser (1992) recommended that comparative analysis should be
an integral step in all studies involving qualitative data. Furthermore, they urged that previously
&ROOHFWLRQRI
4XDOLWDWLYH
'DWD7KURXJK
,QWHUYLHZV
2EVHUYDWLRQ
'RFXPHQW
$QDO\VLV
$UWLIDFW
$QDO\VLV
6WHS
3UHOLPLQDU\
$QDO\VLVWR
,GHQWLI\.H\
3DWWHUQVDQG
7KHPHV
6WHS
&RPSDUDWLYH
$QDO\VLVIRU
6LPLODULWLHV
DQG&RQWUDVWV
6WHS
8QEXQGOH
&RGHVWR
&ODULI\
7KHPHVDQG
&RQVWUXFWV
6WHS
$[LDO&RGLQJ
RI&RQVWUXFWV
3DWWHUQV DQG
7KHPHV
6WHS
2SHQ&RGLQJ
WR&OXVWHU
DQG6WUXFWXUH
WKH'DWD
6WHS
6HFRQG
5HLWHUDWLYH
$QDO\VLVWR
,GHQWLI\DQG
&RUURERUDWH
/LQNVZLWKWKH
/LWHUDWXUH
6WHS
5HLWHUDWLYH
$QDO\VLVWR
,GHQWLI\
5HODWLRQVKLSV
6WHS
'HYHORSPHQWRI
$JJUHJDWLYH
7KHRU\IURP
&RPSUHKHQVLYH
$QDO\VLVDQG
,QWHUSUHWDWLRQRI
WKH&ROOHFWHG
DQG&RGHG
'DWD
6WHS
6HOHFWLYH
5HFRGLQJRI
0DMRU
7KHPHV
5HLWHUDWLYH$QDO\VLVDQG5HYLVLRQLI $SSURSULDWH
Figure 21.1 A Nine-Step Process for Analyzing Qualitative Data
D
o
w
n
l
o
a
d
e
d
b
y
[
U
n
i
v
e
r
s
i
t
y
o
f
C
a
l
i
f
o
r
n
i
a
,
S
a
n
D
i
e
g
o
]
a
t
0
0
:
0
8
1
9
M
a
y
2
0
1
7
ANALYSIS METHODS FOR QUALITATIVE DATA 291
gathered data be continuously compared with every bit of new data. Ragin and Zaret (1983) also
considered comparative research to be one of the research tactics that distinguish research on
social groups.
Neuman (2000) identified comparison as a “central process” to the analysis of all data. In
this central role, comparative analysis has two broad objectives: the first is to find cases or
evidence that belong together, based on one or more relevant characteristics. The second is to
isolate anomalies in the data—events or cases that do not fit a pattern. Similarities enable the
researcher to place the data within its proper category, as well as to develop new categorical
codes that embrace the unclassified phenomenon. Anomalies are the distinct characteristics that
are central to the research problem; finding distinctive differences in data is like a prospector
finding the “mother lode.”
Miles and Huberman (1994, 254) considered the process of comparative analysis to be a part
of their drawing and verifying conclusions step in the analysis of qualitative data. Refuting crit-
ics whom they accused of considering the act of making comparisons “odious,” they responded,
“Comparison is a time-honored, classic way to test a conclusion. We draw a contrast or make
a comparison between two sets of things—persons, roles, activities, cases as a whole—that are
KNOWNTODIFFERINSOMEOTHERIMPORTANTRESPECT 4 H ISISTHE@METHODOFDIFFERENCES
WHICHGOES
back to Aristotle if not further.”
Comparative analysis is not without its problems, however. Researchers planning a comparative
study should first consider these warnings about the use of comparisons in research:
1. Mindless comparisons are useless. Researchers must be sure that their comparisons are
the “right” ones, and that it makes sense to use them in the analysis.
2. Comparisons should extend beyond the data alone. They should also be compared with
what the researcher knows about the things being studied.
3. Researchers should pause before including a comparison in a research report, to ask
themselves, “How big must a difference be before it makes a difference?” and “How do
I know that?”
4. With qualitative comparisons, researchers are concerned with the practical significance
of the data; they cannot apply the statistical significance tests that are available in quan-
titative studies.
Strauss and Corbin (1998, 73) placed great importance on the activity of comparative analysis.
In their opinion, making comparisons is an integral activity that should be used at any and all steps
in the data analysis process. They define the comparative analysis process as “an analytical tool
used to stimulate thinking about properties and dimensions of categories.” They considered the
act of making comparisons to be one of the two tasks that are essential for development of theory
in qualitative research; the other essential task is asking questions.
Step 4. Unbundle Codes to Clarify Themes and Constructs
In this stage, the researcher reviews the coded to data to determine whether any categorical con-
structs make better intuitive sense as two or more factors rather than the one originally assigned.
Unbundling means the dismantling of a major category into two or more categorical constructs;
careful reexamination of data should always precede this. If an unbundling is warranted, care
must also be taken to apply the characteristics originally assigned to the category to each of the
newly established categories.
D
o
w
n
l
o
a
d
e
d
b
y
[
U
n
i
v
e
r
s
i
t
y
o
f
C
a
l
i
f
o
r
n
i
a
,
S
a
n
D
i
e
g
o
]
a
t
0
0
:
0
8
1
9
M
a
y
2
0
1
7
292 QUALITATIVE RESEARCH APPROACHES AND METHODS
Step 5. Axial Coding of Constructs, Patterns and Themes
Axial coding affords the researcher a second opportunity to introduce order and structure into the
initially coded data. Axial coding can use preestablished codes such as the six categories sug-
gested by Strauss and Corbin (1998), or it can be freely employed without any imposed structure,
as Glaser (1992) proposed. Strauss and Corbin added their six categories when they found that
the lack of structure at this point made it difficult for beginning researchers to produce clear and
cogent theory from the data. Retaining the substantive coding levels, they proposed adding a
third, intermediate step in the coding/analysis process. They called this intermediate step “axial
coding” (Glaser 1992; Kendall 1999). This step was proposed as a way to demystify the grounded
theory process. It requires the researcher to place all the initially open-coded data into these six
categories: (1) conditions, (2) phenomena, (3) context, (4) intervening conditions, (5) actions/
strategies, and (6) consequences.
These categories require the researcher to look for antecedents that lead to the particular event or
circumstance, in addition to any resulting consequences. They also force the researcher to reexamine
the strategies and processes involved in both the target organization and the research design.
Step 6. Reiterative Analysis to Identify Relationships
Researchers must establish categories and codes for the major and minor constructs within the
data, develop meaningful ideas about the data in context, edit and make critical interpretations,
and—perhaps most importantly—generate ideas and theories from them. A key activity in this
process is identifying relationships between constructs and groupings.
Step 7. Selective Recoding of Major Themes
Patterns will usually emerge from the early analysis, permitting the researcher to identify salient
themes. As the analysis and reanalysis of the mass of collected data continues, it is often possible
to merge several themes into a smaller number of categories. In addition to themes, these broader
groupings are referred to as constructs or factors. The process of merging is much like the data
reduction statistical techniques of factor analysis or cluster analysis, in which the researcher col-
lects data into a few salient themes. This data reduction or aggregation process makes it much
easier to summarize the findings from the research.
Step 8. Second Reiterative Analysis to Identify and
Corroborate Links with the Literature
By the time the research has reached this point in the analysis, clear links with themes in the rel-
evant literature in the field should begin to come apparent. The researcher must use this time to
clearly show the reader how the collected data and the research activity connect to and/or build
upon prior research in this field.
Step 9. Development of Theory from the Analysis
A major goal of research is to contribute to the body of knowledge in the intellectual or academic
field in which the researcher is working. This means that one or more theories should emerge
from the analysis.
D
o
w
n
l
o
a
d
e
d
b
y
[
U
n
i
v
e
r
s
i
t
y
o
f
C
a
l
i
f
o
r
n
i
a
,
S
a
n
D
i
e
g
o
]
a
t
0
0
:
0
8
1
9
M
a
y
2
0
1
7
ANALYSIS METHODS FOR QUALITATIVE DATA 293
The Jones Qualitative Data Analysis Process
Qualitative data gathering and analysis is carried out in a logical sequence of steps. Jones (1996) has
organized this sequence into the 12-step process shown in Figure 21.2 . The 12 steps fall into 2 equal
halves, each with 6 steps: the first half of the process, involving steps 1 through 6, is the preparatory
half, while steps 7 through 12 make up the analysis and report portions of the analysis.
Part I. Preparing for Qualitative Research
Steps 1 and 2—Define the Research Problem and Establish Research Objectives—are the initial
activities in all research designs. Step 3, Do necessary “Homework,” means becoming conversant
with the full nature of the subject or topic of interest. Interviews with a few key informants and
extensive analysis of the relevant literature are the activities often used in this step.
Step 4—Plan the Data-Gathering Process should occur only after the researcher has developed a
working familiarity with the subject and study group. The plan should include a preliminary list of the
behaviors to be observed, the subjects to be interviewed, a list of the topics to be covered in the inter-
views, a preliminary coding scheme, and a schedule for each following step in the research process.
PART I:
PART II:
1:
Define the Research
Problem
2:
Establish Research
Objectives
3:
Do Necessary
“Homework”
6:
Become Immersed
in the Setting
7:
Take Extensive
Field Notes;
Transcribe Notes
12:
Prepare Final
Report and Present
Findings
5:
Gain Entry into the
Study Group
8:
Complete First-Level
Coding and Grouping
of Data
11:
Generate Final
Constructs and
Theories
10:
Complete Third-
Level Coding and
Grouping of Data
9:
Complete Second-
Level Coding and
Grouping of Data
4:
Plan the Data -
Gathering Process
Figure 21.2 The 12 Steps of Qualitative Fieldwork, Analysis, and Report Preparation
Source: Jones 1996.
D
o
w
n
l
o
a
d
e
d
b
y
[
U
n
i
v
e
r
s
i
t
y
o
f
C
a
l
i
f
o
r
n
i
a
,
S
a
n
D
i
e
g
o
]
a
t
0
0
:
0
8
1
9
M
a
y
2
0
1
7
294 QUALITATIVE RESEARCH APPROACHES AND METHODS
Steps 5 and 6—Gaining Entry into the Study Group and Become Immersed in the Setting—are
closely related activities; in fact, they often occur simultaneously. While these are more appropri-
ately tasks to use in ethnographic research, they are also important in other qualitative research
designs. For example, researchers conducting a study of the operating climate within a government
agency must first gain permission of the agency director and the support and compliance of both
the managers and agency staff.
Part II. Analyzing and Reporting
Step 7—the first activity in the second half of the research process is Take Extensive Field Notes.
Field notes are the notes, recordings, reminders, and other subjective reports that the researcher
records while observing behaviors or interviewing respondents. They are the records produced
during the process of conducting field research. Field research is what is done when researchers
want to know something about people, understand behaviors, or describe a group of people who
interact in some way (Neuman 2000). Field notes are the detailed written reports and/or diagrams
or pictures of what the researcher sees and hears. The term used to describe the required detail
needed in field notes is thick description. Finally, field notes should be written down or transcribed
on a regular basis, as soon as possible after the observed phenomenon occurs.
Taking good field notes is not an easy process; the researcher must make a conscious effort
to devote the time and work necessary to produce good notes because, without them, the final
report of the research can only be second rate. Preparing field notes can be a tedious, laborious
task, and it requires self-discipline to be done correctly. The notes contain extensive descriptive
detail drawn from memory. Researchers must make it a habit—better yet, a compulsion—to write
their notes every day and to begin to transcribe them immediately after leaving the field. Field
notes must be neat and organized because “the researcher will return to them over and over again.
Once written, the notes are private and valuable. A researcher treats them with care and protects
confidentiality” (Neuman 2000, 363).
Once field notes are transcribed into organized records of the researcher’s observations or
interviews, they must then be put to a preliminary, interpretive analysis. This occurs during steps
8 through 11. Analysis is an ongoing process that begins during the first venture into the field
experience and continues until a final set of codes, categories, and constructs is established.
The process concludes with production of the final report of the research. Miles and Huberman
(1994) recommend employing a series of reporting guides or worksheets to ensure that this portion
of the process is complete. These include the following: (1) a contact summary; (2) a summary of
each document analyzed in the study; (3) first-, second-, and third-level coding and grouping
of constructs, patterns, or factors discovered in the data; and (4) a final detailed summary of the
site in which the activities, behaviors, and events were studied.
Step 8—First-level Coding and Grouping of Data begins with preparation of contact summaries
and a summary of each document, if any, analyzed for the study. The contact summary is usually
nothing more than a single sheet that contains answers to a set of focusing or summary questions
about each subject contacted in the study. It often includes demographic information, indications
of relative position in the group under study, and is used to ensure continuity in the treatment of
responses from all contacts. The document summary is applicable only when documents of any
type are acquired for analysis at the research site. The purpose of this guide is to establish a record
of the document’s significance and how it relates to observations, interviews, or final analysis.
First-level coding is done to develop the initial descriptive codes around which all subse-
quent data will be organized or grouped. These codes are abbreviations that establish descriptive
D
o
w
n
l
o
a
d
e
d
b
y
[
U
n
i
v
e
r
s
i
t
y
o
f
C
a
l
i
f
o
r
n
i
a
,
S
a
n
D
i
e
g
o
]
a
t
0
0
:
0
8
1
9
M
a
y
2
0
1
7
ANALYSIS METHODS FOR QUALITATIVE DATA 295
categories or groupings in the data. Miles and Huberman (1994, 56) have defined a code as “an
abbreviation or symbol applied to a segment of words—most often a sentence or paragraph of
transcribed field notes—in order to classify the words.”
Codes should be considered as categories. As such, they are retrieval and organizing devices
that allow the analyst to spot quickly, pull out, then cluster all the segments relating to the particular
question, hypothesis, concept, or theme. Clustering sets the stage for analysis.
Step 9—second-level, or pattern coding takes place during the analysis process. Second-level
coding involves establishing interpretive codes. Here the researcher goes beyond simple descrip-
tion and begins to form interpretive labels for categories of behaviors. The goal at this point is to
be able to read repeating patterns in the data.
Step 10—involves third-level, or thematic development coding (also called memoing). Memoing
refers to producing preliminary or partial summary reports for the personal use of the researcher
or research team. These might, for example, be used to summarize a pattern or a theme in the
data, and even be incorporated wholesale into the final analysis. At the third analysis level, the
researcher begins to establish explanatory codes that link larger groups of patterns into what are
called themes. These are the major constructs that will make up the central structure under which
the final analysis will occur and be recorded.
Step 11—the final activity in the coding and analysis process is a brief summary of the constructs,
events, members, circumstances, and other relevant information that can serve both as a summary
of the data-gathering experience and memory-jogger during the preparation of the final report.
Step 12—the last step in this, as in any other type of research project, is to combine the
notes, constructs, patterns, and themes, along with the researcher’s analysis and synthesis, into
some form of research report. This important step in the qualitative research process is not
simply putting the researcher’s field notes together in one cover. Rather, it involves a number
of important activities:
Assembling evidence, arguments, and conclusions into a report is always a crucial
step; but more than in quantitative approaches, the careful crafting of evidence and
explanation makes or breaks [qualitative] research. A researcher distills mountains of
evidence into exposition and prepares extensive footnotes. She or he weaves together
evidence and arguments to communicate a coherent, convincing picture to readers.
(Neuman 2000, 395)
Analysis of Ethnographic Study Data
Ethnographic data are the content of researchers’ field notes, while ethnographic narratives are
researchers’ descriptions of the interplay of individuals in groups, and how that interaction is
influenced by the culture of the group or organization.
The information contained in field notes consists of “rich descriptions” of the people, settings,
and events observed by the participant researcher. They can be tape recordings of subjects’ life
histories, opinions, dreams, and so forth. They might also be photographs, drawings, films, vid-
eotapes, artifacts, or written documents. Ethnographers use descriptions of these physical objects
in their reports of social interactions. The model displayed in Figure 21.3 reveals the detailed
nature of the steps followed in the analysis of ethnographic data. The processes identified in the
model are shown as individual activities. However, in actual practice, some are best carried out in
conjunction with others. Collectively, they take place in these six analytical phases that culminate
in writing of the research report.
D
o
w
n
l
o
a
d
e
d
b
y
[
U
n
i
v
e
r
s
i
t
y
o
f
C
a
l
i
f
o
r
n
i
a
,
S
a
n
D
i
e
g
o
]
a
t
0
0
:
0
8
1
9
M
a
y
2
0
1
7
296 QUALITATIVE RESEARCH APPROACHES AND METHODS
Write Field Notes with Rich
Description of People, Events, and
Settings
Reflective Contemplation and
Gestation of Field Note Data
Read the Complete Collection
from Beginning to End
Ask Self-Interpretive Questions of
What Is Written in the Notes
Begin Line - by - Line Open Coding
of the Data
Write Initial Subjective Memos
about Specific Sections of the
Data
Identify and Select Salient Themes
Selective, Focused Recoding of the
Data
Write Final Integrative Memos
Final Reflective Contemplation to
Generate Theory from the
Field Notes and Experience
Write Final Narrative
Figure 21.3 A Model of the Ethnographic Data Analysis Process
D
o
w
n
l
o
a
d
e
d
b
y
[
U
n
i
v
e
r
s
i
t
y
o
f
C
a
l
i
f
o
r
n
i
a
,
S
a
n
D
i
e
g
o
]
a
t
0
0
:
0
8
1
9
M
a
y
2
0
1
7
ANALYSIS METHODS FOR QUALITATIVE DATA 297
Phase I. Reflective Contemplation
Once the data collecting activity is complete, many researchers like to step away from their material to
pause for a while and simply think about what they saw, heard, and took away from the experience. This
is the act of reflective contemplation. During this quiet time away from the study site and data collection,
ideas, insights, and preliminary interpretations are free to gestate in the mind of the researcher.
After a brief period away from the data—too long and data will be lost from memory—the
researcher returns to the data collection and begins a full reading of the material from beginning
to end. It is likely that this experience will give the researcher his or her first “big picture” of
everything that has occurred during the research study.
Phase II. Interpretive Questioning
Interpretive questioning is the process of making marginal notes or comments on separate pages for
guidance in the continuation of reading and interpreting. It begins during the first complete reading
of field notes that follows reflective contemplation. It involves writing questioning notes that help
guide the development of structure and organization. These questions can also serve as suggestions
for subsequent open coding of the data. They can include any self-directed questions, suggestions
for groupings, and even ideas for subsequent coding. The following sorts of questions are typical
examples of questions that might be asked at this time (Emerson, Fretz, and Shaw 1995, 146):
s 7HATARE PEOPLEDOINGINTHISSETTING
s 7HATARE THEYTRYINGTOACCOMPLISH 7HATARETHEYAVOIDING
s (OW
EXACTLY
DOTHEYGOABOUTTHESEBEHAVIORS
s 7HATSORTSOFTHINGSDOPEOPLESAYTOEACHOTHER
s (OWDOPEOPLEUNDERSTANDWHATISGOINGON INTHEIRGROUPOR SOCIETY
s 7HATASSUMPTIONSGUIDETHEIRBEHAVIOR
s 7HATWASGOINGON HERE 7HATDID ) LEARNABOUTTHEPARTICIPANTSWHEN) MADETHESENOTES
s 7HYDID ) INCLUDETHISINFORMATION
Phase III. Open Coding and Interpretive Memoing
This process also begins during the initial full reading of the data collection. The researcher writes
identifying words or phrases to describe the portions of data that comprise relevant categories or
classes of phenomena. The codes themselves should be detailed enough to inform the researcher
to what they apply, without having to resort to looking up the meaning of a code in a reference
file every time it appears. Also, it is important to remember that codes should emerge from the
data themselves; they are not artificial constructs created by the researcher.
Both quantitative and qualitative data-gathering processes are used in this phase. Qualitative
methodology consists of construction techniques (stories from supplied cartoon situations) and
sentence completion techniques. These projective techniques can be employed to draw out the
personal perceptions and attitudes of owners and managers of small businesses, for example. As
Kassarjian (1974) has indicated, these techniques—more so than quantitative methods—force the
respondent to respond in a manner that reflects his or her own need/value system.
The second part of this analysis phase is interpretive memoing. Memoing can be found in most
research data analyses. In the open-coding step, memos are written to record the insights and ideas
that come to the researcher during the initial, top-to-bottom reading of the data collection. They
D
o
w
n
l
o
a
d
e
d
b
y
[
U
n
i
v
e
r
s
i
t
y
o
f
C
a
l
i
f
o
r
n
i
a
,
S
a
n
D
i
e
g
o
]
a
t
0
0
:
0
8
1
9
M
a
y
2
0
1
7
298 QUALITATIVE RESEARCH APPROACHES AND METHODS
may serve as suggestions for further analysis, references to relevant literature, personal reminders,
subjective opinions, preliminary evaluations, or for similar purposes. They should not be considered
the final word on the data; the researcher still has much analytical work to do.
Together, initial open coding and memoing set the stage for the remainder of the analysis.
At this stage in the process, however, it is important to remember that this is just the first pass
through the data; changes are to be expected to occur at every subsequent phase. The need for
flexibility at this stage was characterized by Emerson, Fretz, and Shaw (1995, 157): “Initial cod-
ing and memoing require the [researcher] to step back from the field setting to identify, develop,
and modify the broader analytic themes and arguments. Early on [however], these efforts should
remain flexible and open.”
Phase IV. Identification of Salient Themes in the Data
In this phase of the analysis, the researcher should return to a broader view of the data collection
in order to discern the core, reoccurring themes that he or she has found in the research data. At
the same time, any linkages discovered between themes and constructs should be pointed out.
Figure 21.4 illustrates how themes are shown to be linked to antecedent conditions and resulting
consequences and transformations.
At the conclusion of this step, the researcher may elect to sort his or her field notes and/or
memos into new groups that reflect the selected themes. This step can also be done during the
final coding and memoing phase.
Phase V. Focused Coding and Interpretive Memoing
Focused coding—also called selective coding—is what Emerson, Fretz, and Shaw (1995) describe
as the product of a “fine-grained, line-by-line analysis of the notes.” It often results in prepara-
tion of an outline for a first draft of an ethnographic narrative. As one of the last steps in the data
analysis process, focused coding should begin to integrate the final categories into a coherent whole
that addresses the central issue or issues of the study. It may include unbundling of previously
formed categories, the formation of entirely new categories, or making no change whatsoever. Its
purpose is to bring the researcher to a point where no new categories, characteristics, or relation-
ships emerge from the data (Strauss and Corbin 1998).
Antecedent
Conditions
Themes:
Behaviors
Attitudes
Taboos
Values/Beliefs
Etc.
External
Influences
Internal
Filtering
Behavior
Reinforcement or
Modification
Figure 21.4 An Illustration of Linkages Between Themes and Other Factors
Source: Emerson, Fretz, and Shaw 1995.
D
o
w
n
l
o
a
d
e
d
b
y
[
U
n
i
v
e
r
s
i
t
y
o
f
C
a
l
i
f
o
r
n
i
a
,
S
a
n
D
i
e
g
o
]
a
t
0
0
:
0
8
1
9
M
a
y
2
0
1
7
ANALYSIS METHODS FOR QUALITATIVE DATA 299
Integrative memoing also takes place during the open-coding phase. Integrative memos are the
concrete manifestations of the researcher ’s thinking process at this stage. They are used to justify
the decisions made during the selection of salient themes. Furthermore, memoing is done to provide
a record of any conclusions, revisions, or insights that emerge from the second run-through of the
data. Integrative memos may follow a single concept through the mass of data, connecting these
data with other categories as required. Or it may serve to integrate two or more concepts into a
larger whole. Integrative memos that chronicle the background information of the study should
also be written. These help to set the stage for analytical narrative writing, as well as providing a
record of the researcher ’s role in the investigation.
Three analytical tools can facilitate the final integration process: (1) writing a storyline, (2)
applying diagrams and other graphic display techniques, and (3) reviewing and re-sorting the
open memos. A storyline is nothing more than a subjective summary of the project in the words
of the researcher, without referring back to the data or memos. It should flow as a freely written
narrative, much as if it were a life history of the project. At this point, details of the research are
not critical; they can be inserted later. The overall purpose is to enable the researcher to take an
“omniscient narrator” view of the experience, writing what he or she believes occurred, its mean-
ing and its relevance. The storyline is not the final interpretive ethnographic narrative, however.
It should be considered just another interpretation guide for the researcher.
Diagrams and other graphic displays have long been important analysis tools. Miles and
Huberman offer important guidance in the use of diagrams, including descriptions and graphic
examples of several different approaches. They warn, however, that diagrams and other graphic
displays should never be used in an analysis without a description of the content of the display.
They describe the integrative capability of diagrams in the following terms:
The display helps the writer see patterns; the first text [i.e., the first draft] makes sense of
the display and suggests new analytic moves in the displayed data; a revised or extended
display points to new relationships and explanations, leading to more differentiated and
integrated text, and so on. Displays beget analyses, which then beget more powerful, sug-
gestive displays. (Miles and Huberman 1998, 189)
Reviewing and re-sorting memos is a third way of arriving at a final integration of the data.
Recall that memos are subjective notes prepared by the researcher during the review of the data.
They contain the conclusions, questions, possible integrations, and perceived connections of themes
and constructs as seen by the researcher. In one sense, then, they can be considered a reduced
data set. Some researchers use this opportunity to re-sort their memos into new categories that
emerged from selective coding of the open-coded data. This provides a possible final structure
and organization to guide the researcher in final writing of the report.
Phase VI. Final Analytical Contemplation to Generate Theory
The final step in the analysis of ethnographic research data is to reach closure by generating theory
that is grounded in the study and its setting. While the concepts are similar, the theory generated
by ethnographic research is not the same as the grounded theory method first described by Glaser
and Strauss (1967) and modified by Strauss and Corbin (1998).
Ethnographers do not “discover” theory in their data. Rather, they create theory during each and
every step of their fieldwork and analysis (Emerson, Fretz, and Shaw 2001). For ethnographers,
theory generation occurs during the “reflexive” interplay between theory and data. Ethnographers
D
o
w
n
l
o
a
d
e
d
b
y
[
U
n
i
v
e
r
s
i
t
y
o
f
C
a
l
i
f
o
r
n
i
a
,
S
a
n
D
i
e
g
o
]
a
t
0
0
:
0
8
1
9
M
a
y
2
0
1
7
300 QUALITATIVE RESEARCH APPROACHES AND METHODS
introduce theory at every point in their studies. Emerson, Fretz, and Shaw identify the key objective
of this interactive process in the following way: “The goal of fieldwork . . . is to generate theory
that grows out of or is directly relevant to activities occurring in the setting under study” (167).
Computer Analysis of Qualitative Data
There has been a dramatic growth in the use of computers in research and the availability of
analysis software in the past several decades (Tak, Nield, and Becker 1999; Este, Sieppert, and
Barsky 1998; Richards and Richards 1998; Miles and Huberman 1994; Weitzman and Miles 1995).
In some research settings, technology has simplified the many necessary but time-consuming
and often boring tasks of the data analysis process. However, qualitative researchers have not
universally accepted them.
Although today’s computer programs are capable of processing large volumes of text material
and records, sorting and indexing the data, and retrieving information from a variety of different
directions, few researchers have used the qualitative-data-analysis programs that are presently
available (Richards and Richards 1998). Instead, most data coding, sorting, categorizing, and
analysis is still done the way it has been done for more than a hundred years—by hand.
This section provides a brief introduction to the concept of computer analysis, using a single
program package as an illustration. If readers seek more information about these programs they are
encouraged to refer to one of several published reviews, such as Computer Programs for Qualita-
tive Data Analysis by Weitzman and Miles (1995). Miles and Huberman (1994) include a valuable
point-by -point comparison of a dozen or more commercially available analysis programs in their
text on qualitative data analysis. Richards and Richards (1998) provide a useful introduction to
the theoretical underpinnings of computer software programs for analyzing qualitative data, but
without evaluating many specific programs.
In the taxonomy of analysis software suggested by Richards and Richards, software is divided
into two broad classifications: general-purpose software packages and special-purpose software de-
veloped specifically for data analysis. General-purpose packages include standard word-processing
programs, database management systems, and text-search software. Richards and Richards (1998)
identify five categories of special-purpose software:
s #ODE
ANDRETRIEVESOFTWARE
s 2ULE
BASED
THEORY
BUILDINGSYSTEMS
s ,OGIC
BASEDSYSTEMS
s )NDEX
BASEDSYSTEMS
s #ONCEPTUAL
OR SEMANTIC
NETWORKSYSTEMS
The two approaches that seem to offer the most promise at this time are logic-based systems
and conceptual network systems. Richards and Richards (1998) provide an extensive review of
a logic-based system they authored, NUD*IST (Non-numerical Unstructured Data Indexing,
Searching, and Theorizing).
NUD*IST allows the user to code themes and categories by simply attaching labels to segments
of the text (Tak, Nield, and Becker 1999). Like a majority of the systems discussed by Richards and
Richards, NUD*IST is built around a code-and-retrieve facility. It has been expanded to include
a number of different optional processes—a feature that may have turned out to be one of the
program’s greatest faults. Richards and Richards (1998) offer this caveat about their program:
D
o
w
n
l
o
a
d
e
d
b
y
[
U
n
i
v
e
r
s
i
t
y
o
f
C
a
l
i
f
o
r
n
i
a
,
S
a
n
D
i
e
g
o
]
a
t
0
0
:
0
8
1
9
M
a
y
2
0
1
7
ANALYSIS METHODS FOR QUALITATIVE DATA 301
NUD*IST appears, compared with the other systems described here, as a rather awkward
hybrid, containing features of code-and-retrieve, ways of handling production-rule and other
types of conceptual-level reasoning, conceptual representations alternative to conceptual
network systems, and database storage facilities, all interacting through interlocking
tools. . . . And, perhaps most important, the software offers many ways for a researcher
never to finish a study. (237)
Despite the potentially confusing complexity of NUD*IST, it has become one of, if not the
most, popular computer software program for analysis of qualitative data. It is particularly popular
in education, nursing and other medical studies, and some sociological applications. It seems to
be used less often in ethnographic studies, and is hardly ever seen in political science research.
Despite its slow adoption, a few innovators in political science and nongovernment organization
research have started to test its capabilities.
The second software program to receive special mention by Richards and Richards was the
conceptual network system ATLAS/ti. Thomas Mühr developed ATLAS in Germany during the
1980s, when most of the work on analysis software was under way. It was discussed in his 1991
article in Qualitative Sociology. ATLAS is built on a code-and-retrieve foundation, to which has
been added an excellent memoing capability; codes can be assigned to memos as well as the
original text. Its distinguishing feature, however, is its ability to create conceptual graphic displays
that show relationships and linkages. Accordingly,
Allied with ATLAS’s sophisticated text-retrieval system, the graphs support subtle explora-
tion of text via a visually immediate interface that relates the text to the systems or theories
in the [setting] being studied. (Richard and Richards 1998, 240)
In conclusion, the application of special-purpose software packages for qualitative data analysis
is probably here to stay. As more and more professional researchers discover the capabilities of
the packages and more students are exposed to them in their research methods classes, this growth
in use should accelerate. As of today, however, owing to their complexity—due in large part to
their extensive capabilities—most researchers still analyze their data using traditional, minimal
techniques and processes.
Summary
Conducting any qualitative research is a time-consuming, complicated, and often confusing task.
One of the most problematic components of the process has been the task of analyzing qualitative
data. The analysis processes for quantitative and qualitative research data are similar in some ways,
but different in others. Similarities include (1) data are not just there—they must be collected in
some way by a researcher; (2) when processed, both quantitative and qualitative data can be used
for inference; (3) comparative analyses are used with both data types; and (4) researchers are
concerned with both the reliability and validity of all data.
Quantitative data differ from qualitative data primarily in the way they are tabulated, collated,
and processed. Quantitative data are typically computer processed and analyzed with a variety of
standard statistical tests. These tests are applied for one or more of the following purposes: (1) to
describe a data set, (2) to generate hypotheses, and (3) to test hypotheses.
Qualitative data, on the other hand, exhibit variety both in form and context. They can also be
evaluated and interpreted in a variety of ways. Qualitative data can be words, pictures, artifacts,
D
o
w
n
l
o
a
d
e
d
b
y
[
U
n
i
v
e
r
s
i
t
y
o
f
C
a
l
i
f
o
r
n
i
a
,
S
a
n
D
i
e
g
o
]
a
t
0
0
:
0
8
1
9
M
a
y
2
0
1
7
302 QUALITATIVE RESEARCH APPROACHES AND METHODS
music scores, and so forth. Furthermore, each of the several different analysis approaches has its
own underlying purpose, and each often produces a different outcome.
Qualitative data are data that have been gathered during the conduct of interpretive or post-
positivist research studies. This kind of data can be written text, transcripts of conversations or
interviews, transcripts of therapeutic or consultive interviews, records of legal trials, transcripts
of focus group discussions. It can exist as historical or literary documents, ethnographic field
notes, diaries, newspaper clippings, or magazine and journal articles. It can also be in the form
of photographs, maps, illustrations, or paintings, musical scores, tape recordings, films, or any
other nonquantitative or quantitative source. All data must be analyzed and interpreted before
they are meaningful.
There are two parts to the interpretation and analysis of qualitative data. The first is data man-
agement, and the second is data analysis. Many different techniques and strategies have been
developed for analyzing qualitative data; three are discussed in this chapter. The first is a nine-step
process; the second follows twelve steps divided into two halves. The third was developed by
anthropologists for analyzing ethnographic data.
Advances in computer software have resulted in a number of different special-purpose software
packages for analyzing qualitative data. Researchers studying political science and nonprofit
management topics are adopting these new approaches for analysis in greater numbers.
Discussion Questions
1. How do qualitative data contribute to the understanding of complex political ques-
tions?
2. Name the components of qualitative data.
3. The interpretation and analysis of qualitative data has two parts: name and describe
them.
4. Name the nine steps in the qualitative data analysis process.
5. What is axial coding? Why is it used?
6. What is the purpose for data and concept comparisons during analysis?
7. Describe the process of reiterative analysis.
8. Discuss the twelve-point scheme for analyzing qualitative data. Are all the steps
important?
9. What is meant by first-, second-, and third-level coding?
10. What role does reflective contemplation play in the interpretation of qualitative data?
Additional Reading
Auerbach, Carl, and Louise B. Silverstein. 2003. Qualitative Data: An Introduction to Coding and Analysis.
New York: New York University Press.
Bryman, Alan. 1994. Analyzing Qualitative Data. New York: Routledge.
Fielding, Nigel G., and Raymond M. Lee. 1998. Computer Analysis and Qualitative Data. London: Sage.
Gibbs, Graham. 2008. Analyzing Qualitative Data (A Qualitative Research Kit). London: Sage.
Munton, Anthony G., Joanne Silvester, Peter Stratton, and Helga Hanks. 1999. Attributions in Action: A
Practical Approach to Coding Qualitative Data. New York: John Wiley & Sons.
Silverman, David. 2006. Interpreting Qualitative Data: Methods for Analyzing Talk, Texts and Interaction.
3rd ed. London: Sage.
D
o
w
n
l
o
a
d
e
d
b
y
[
U
n
i
v
e
r
s
i
t
y
o
f
C
a
l
i
f
o
r
n
i
a
,
S
a
n
D
i
e
g
o
]
a
t
0
0
:
0
8
1
9
M
a
y
2
0
1
7
303
22 Analyzing Texts, Documents, and Artifacts
Sources of research data include people, their words and actions, publications, material culture,
and any item or symbol that communicates a message of any kind. Data-gathering methods in-
clude watching the way that people act; asking them questions about their opinions, attitudes, or
perceptions; reading what they have written; watching their movements; listening to their songs
and other sounds; rummaging through their garbage; examining their tools and toys; decipher-
ing their signs, symbols, or facial expressions—the list can go on and on. This chapter discusses
some of the ways that researchers go about examining textual material, cultural artifacts, body
language, and similar types of written and unwritten communications, records, documents, signs,
and symbols.
For convenience, these different sources of research data can be grouped into four broad cat-
egories. The first is written texts. These include such sources as books, periodicals, narratives,
reports, pamphlets, and other published materials. Collectively, this group of sources includes
most if not all of the mass media. Research using these sources is often called library research,
or desk research.
The second category is formal and informal documents; it includes personal messages and as-
sorted types of archival information, such as personal notes and memos, government records and
vital statistics, and other informal written materials, including e-mail. The third category of sources
is made up of the wide variety of nonwritten communications. This group includes such things as
graphic displays (graphs, tables, charts), photographs and illustrations, tools and other artifacts,
films and videotapes. The final category includes all nonverbal signs and symbols. Among these
are the silent messages in body language, facial expressions, gestures, music and dance, animal
sounds and behavior, and even noise.
Researchers employ a variety of analysis tools and methods in their study of texts, symbols,
and artifacts. Among these are hermeneutics, content analysis, meta-analysis, semiotic analysis,
discourse analysis, site surveys, and more. Table 22.1 displays the relationship between various
sources of data and methods used in their analysis. The analysis approaches used most often in
public and nonprofit organization research are the formal literature review; hermeneutic analysis
of textual material; content, discourse, and narrative analysis; meta-analysis; archival analysis;
and semiotic analysis. Each of these will be discussed in greater detail in the following pages.
Preparing diagrams and other graphic representations of ideas and their interrelationships is a
valuable process for several reasons. First, it forces the researcher to step back from the complexity
of the data to take a broader view of the study in its entirety. Second, it forces the researcher to
establish collective constructs that embrace a variety of ideas and categories. And third, it forces
the researcher to examine relationships between themes, constructs, and events.
Another way to categorize these research approaches might be to look at the formal lit-
D
o
w
n
l
o
a
d
e
d
b
y
[
U
n
i
v
e
r
s
i
t
y
o
f
C
a
l
i
f
o
r
n
i
a
,
S
a
n
D
i
e
g
o
]
a
t
0
0
:
0
8
1
9
M
a
y
2
0
1
7
304 QUALITATIVE RESEARCH APPROACHES AND METHODS
erature review, meta-analysis, hermeneutics, content analysis, and semiotics as methods, and
archives, texts, artifacts, and signs and symbols as sources of research data. This chapter is
structured along these lines, with the discussion of textual sources first discussed in a section
on the literature search process. Narrative and discourse analyses are discussed in the content
analysis section.
Analysis of Texts as Data
In political science, if not research in all of the social and administrative sciences, library-based
research draws on documents of all types as the source of data. It is, in this respect, the opposite
of the field research methods that have been discussed up to this point. These types of library or
desk-research projects are common in such fields of inquiry as philosophy, social theory, law, and
history, much of which rely almost exclusively upon documents as their key source (Denscombe
2002). They are also important in public administration research, with many studies drawing upon
legislative archives for data.
From the researcher ’s point of view, literature or “documentary” research can be grouped
into three key classes. The first is the traditional literature review that is or should be a part of
all scientific research. A key purpose of the literature review is to provide background informa-
tion that can then be used to design a complete research project. The second strategy is called
the archival study. In substance similar to a standard literature review, it draws upon public and
private formal documents, records, and other material of a historical nature for data. These may
Table 22.1
The Relationship Between Sources, Examples, and Study Methods
Source
Examples
Analysis Methods
7RITTEN4EXTS
s 0ROFESSIONAL ,ITERATURE
(ERMENEUTICS
s -ASS -EDIA
#ONTENT !NALYSIS
s .ARRATIVES
.ARRATIVE !NALYSIS
s "OOKS AND 3TORIES
-ETA
ANALYSIS
Literature Review
)NFORMAL $OCUMENTS
s !RCHIVAL )NFORMATION
(ERMENEUTICS
AND /THER7RITTEN
s 'OVERNMENT 2EPORTS
#ONTENT !NALYSIS
2ECORDS
s 6ITAL 3TATISTICS
!RCHIVAL !NALYSIS
s 2ECORDS
$OCUMENTS
3EMIOTICS
s .OTES AND -EMOS
.ONWRITTEN #OMMUNI
s 0HOTOS AND $RAWINGS
3EMIOTICS
CATIONS AND
s &ILMS AND6IDEOS
$ISCOURSE !NALYSIS
-ATERIAL #ULTURE
s 4OOLS AND !RTIFACTS
(ERMENEUTICS
s 'RAPHS AND4ABLES
3ITE 3URVEYS
.ONVERBAL 3IGNS
s "ODY ,ANGUAGE
3EMIOTICS
3YMBOLS
AND /THER
s 'ESTURES
0ROXEMICS
#OMMUNICATIONS
s -USIC AND $ANCE
+INESICS
s .ONVERBAL 3OUNDS
s 3IGNS
s .OISE
D
o
w
n
l
o
a
d
e
d
b
y
[
U
n
i
v
e
r
s
i
t
y
o
f
C
a
l
i
f
o
r
n
i
a
,
S
a
n
D
i
e
g
o
]
a
t
0
0
:
0
8
1
9
M
a
y
2
0
1
7
ANALYZING TEXTS, DOCUMENTS, AND ARTIFACTS 305
or may not be stored in a library. When they are, they are generally not open for general access
or circulation. The third approach is what is known as a meta-analysis design. In this approach,
researchers use other studies as subjects for analysis. Meta-analysis is a quantitative technique
for summarizing other investigators’ research on a topic; as such, it uses the literature as a source
of data in its own right.
Reviewing the Relevant Literature
A crucial early step in the design and conduct of all research is a thorough investigation of the
relevant literature on the study topic, the research question, and the methodology followed by
others who have studied the same or similar problems. Called a review of the relevant literature
or, simply, a literature review, the process has been defined as “a systematic, explicit, and repro-
ducible method for identifying, evaluating, and interpreting the existing body of recorded work
produced by researchers, scholars, and practitioners” (Fink 1998, 3).
The literature review serves three fundamental purposes: First, it shows those who read the
research findings that the researcher is aware of the existing work already done on the topic.
Second, it clearly identifies what the researcher believes are the key issues, crucial questions,
and the obvious gaps in the field. Third, it establishes a set of guiding signs that help readers to
see which theories and principles the researcher used to shape the research design and analysis
(Denscombe 1998).
Purposes for the Literature Review
Despite the critical importance of the literature review, some researchers either skip this step
entirely, in the mistaken belief that theirs is a “unique” study problem, or, if they do look into the
literature of the study topic, field, or discipline, they often take a wrong approach. The literature
review is not intended to be just a summary of each of the articles and books that were read. Nor
should a literature review be a list of the authors with whom the researcher agrees or disagrees.
The good literature review has a greater purpose than this: it is a source of data in its own right
(Denscombe 1998).
Among the most meaningful strategic purposes to which the literature review can be put are
the following (Piantanida and Garman 1999):
1. The review can trace the historical evolution of the study problem or key issues, themes,
or constructs pertaining to the problem.
2. The review can provide a schematic of the different schools of thought that have developed
or are developing with regard to the study problem.
3. The review can examine the study problem from several different disciplines (examples
include looking at welfare reform from the point of view of both social work and eco-
nomics).
4. The review can examine the positions of different stakeholder groups, such as public
administrators, citizen groups, nonprofit organizations, and others.
5. The review can trace different conceptual schools of thought that have emerged over time
and that may be currently taking opposing or conflicting views in the literature.
These are only a few of the many approaches for a literature review; the important thing to
remember about this list is that none of the approaches or strategies is mutually exclusive. A good
D
o
w
n
l
o
a
d
e
d
b
y
[
U
n
i
v
e
r
s
i
t
y
o
f
C
a
l
i
f
o
r
n
i
a
,
S
a
n
D
i
e
g
o
]
a
t
0
0
:
0
8
1
9
M
a
y
2
0
1
7
306 QUALITATIVE RESEARCH APPROACHES AND METHODS
literature review can achieve many goals at the same time. Lang and Heiss (1990) identified two
key purposes for reviewing the related literature. First, it should help the researcher hone his or
her attack on a specific study problem, and second, it provides a point of reference when discuss-
ing and interpreting the findings of the research. Specifically, a well-conducted literature review
can do all of the following:
s (ELPTOSETSPECIlCLIMITSFORSUBSEQUENTRESEARCH
s )NTRODUCETHERESEARCHERTONEWANDDIFFERENTWAYSOFLOOKINGATTHEPROBLEM
s (ELPAVOIDERRORS ANDOMISSIONSINPLANNINGTHESTUDY
s 3UGGESTNEWIDEAS
s !CQUAINTTHERESEARCHERWITHNEWSOURCESOFDATAAND
OFTEN
TOTALLYDIFFERENTWAYSOFLOOKING
at an issue
A formal literature review should follow an organized series of steps. The action model por-
trayed in Figure 22.1 has been developed from several sources, but owes a special debt to the
contributions of Arlene Fink (1998). The model begins with an encouragement to researchers to
study all their options before embarking on their journey through the literature. This means that
all potential sources should be considered. Limiting a literature search to a quick perusal of the
Internet or a run through a single CD-ROM database is not the way to conduct a thorough scien-
tific study of the literature.
The second step in the literature review process is made up of three equally important activi-
ties: establish some basis for selecting articles (content criteria); establish some methodological
criteria, such as should the readings all be quantitative or qualitative studies, should there be a
certain minimum size, were sample members randomly selected and assigned to groups, and so
on. The decision will be based on the study question and may change somewhat when the search
itself—the third activity in this step—is under way.
The collected research literature must then be read in detail. As this occurs, relevant catego-
ries of information should begin to stand out. These categories must be coded, with the pertinent
information copied onto cards or worksheets.
Repeated salient themes in the literature should be recorded; these often serve as discus-
sion points during the writing of the final research report. At this point, the researcher often
continues by writing interpretive memos that summarize the material and allow the researcher
to comment on the content. These memos are sometimes carried into the final report with little
or no revision.
During the next-to-last stage in the process, the researcher is encouraged to record all the
important bibliographic information on the source documents. This usually includes information
about the author(s), the discipline in which they did their research, all information about the source,
and any connections to other sources that have been or might be investigated.
Document Research Using Archival Data
Archives, long thought to be of interest only to librarians, have come to be recognized as rich
sources of research material in the social sciences, including political science. They are particu-
larly valuable as a source for cross-checking interview and narrative study data. In this way they
contribute to improved validity through triangulation—using several different approaches in a
research study. While it is certainly possible for bias and dishonesty to exist in archival data, they
are less susceptible to some types of error, including researcher error.
D
o
w
n
l
o
a
d
e
d
b
y
[
U
n
i
v
e
r
s
i
t
y
o
f
C
a
l
i
f
o
r
n
i
a
,
S
a
n
D
i
e
g
o
]
a
t
0
0
:
0
8
1
9
M
a
y
2
0
1
7
ANALYZING TEXTS, DOCUMENTS, AND ARTIFACTS 307
Identify and Locate All
Literature Sources
Identify High-Quality
Studies
Describe the Source
Documents for the Report
Acquire and Read the
Literature
Code and Categorize the
Data Found in the Literature
Analyze the Data
in Detail
Write Interpretive Notes and
Memos
Note Salient Themes and
Trends in the Data
Report All Relevant
Findings
Establish Feasible
Content Criteria
Select Methodological
Quality Criteria
Figure 22.1 A Model of the Literature Review Process
Source: Fink 1998; and others.
D
o
w
n
l
o
a
d
e
d
b
y
[
U
n
i
v
e
r
s
i
t
y
o
f
C
a
l
i
f
o
r
n
i
a
,
S
a
n
D
i
e
g
o
]
a
t
0
0
:
0
8
1
9
M
a
y
2
0
1
7
308 QUALITATIVE RESEARCH APPROACHES AND METHODS
The Archival Record
The research element in an archival study is the record (Dearstyne 1993). Records are concrete
extensions of human memory. They are created and stored for record information, to document
transactions, to justify actions, and to provide official and unofficial evidence of events. A record
can be any type of saved information. A record can be created, received, or maintained by a person,
an institution, or an organization. Records can be official government reports, recorded e-mail
communications, letters, diaries, journals, ledgers, meeting minutes, deeds, case files, election
results, drawings and other illustrations, blueprints, agreements, memoranda, and any other type
of material that has some greater or lesser historical value.
Records can exist in many different forms and different characteristics. For example, they can
be stored in the form of computer tapes or disks; in electronic data storage; words, figures and il-
lustrations on paper or parchment; on microfilm and microfiche; cassette tape; film and videotape;
among others. Records that are established and maintained by organizations or institutions are
called official records. The National Historical Publications and Records Commission recently
estimated that there are more than 4,500 historical record repositories in the United States alone.
In addition, almost every state has its own historical society and can often direct the researcher
to sources not kept in official government archives. A few examples of specific archival records
included the following:
1. Private letters and collections
2. Political and judicial documents
3. Voter registration lists
4. The Congressional Record
5. Actuarial records (i.e., vital statistics)
6. Records of quasi-governmental agencies (weather reports, etc.)
7. The mass media
8. Professional and academic journals
9. Company and organization records
10. Personal histories
11. Published and unpublished documents
Activities of Archivists
Archivists collect, organize, and store documentary evidence of events, operations, corre-
spondence, and organizational functioning. In this way, they perform a valuable service for
historians and social science researchers. However, gaining access to archives can sometimes
be problematic. If the attitude of one of America’s leading archivists, T.R. Schellenberg, is any
indication, a guiding principle of archival science might be a place for everything and everything
in its place. One implication that can be taken away from Schellenberg is: And that is where
there they should stay.
Researchers, by the very act of researching archival data, must often synthesize, reorga-
nize, restructure, and condense archival data in order to interpret its meaning. Schellenberg
grudgingly admitted this fact, but did so believing that researchers could not really be trusted
to leave things the way they found them. He blamed this on their lack of knowledge of the
archival profession, but forgave them for their ignorance, as can be seen in the following
comments:
D
o
w
n
l
o
a
d
e
d
b
y
[
U
n
i
v
e
r
s
i
t
y
o
f
C
a
l
i
f
o
r
n
i
a
,
S
a
n
D
i
e
g
o
]
a
t
0
0
:
0
8
1
9
M
a
y
2
0
1
7
ANALYZING TEXTS, DOCUMENTS, AND ARTIFACTS 309
If historians [and other social scientists] fail to preserve the evidential values of records by
insisting on a violation of the principle of provenance, their action may be attributed to their
ignorance of the archival profession, about which they are expected to know very little, and
may for this reason be excused. (Schellenberg 1984)
Regardless of whether you feel that Schellenberg’s statement displayed a condescending and
biased attitude about the purpose of collections, he was indeed making a valid point—one that
everyone should remember: As researchers, we all owe future investigators the same right of ac-
cess to the original archival data that we expect. Therefore, researchers must always treat archives
with care; they must be left in the state we would like them to be when we find them.
Types of Archives
Webb and coauthors (2000) group the many sources into just two broad classes or types of archives:
the running record (essentially all types of public documents, artifacts, and mass media), and the
episodic and private record (these are discontinuous and usually not a part of the public record).
Running record archives are the continuous, ongoing records of society. The first thing that
comes to mind when we think about this source is the extensive body of vital statistics and other
records kept by all levels of governments and the mass media. However, it also includes actuarial
records of insurance companies, recorded votes of political officeholders, government budgets,
and the like. As with the second type of archival records, these data can exist as words, numbers,
pictures, graphic displays, and the residue of human activity, society’s refuse, and so forth.
Webb et al. (2000) alerted the researcher to two classes of potential bias that can creep into
public records—selective deposit and selective survival. Artifacts survive in nature because they
are not consumed, not eroded away, or not combined into other artifacts and thus lost to view or
memory. For example, ceremonial stones, decorative stone facings, and similar components of
Greek and Roman structures have been removed over the centuries to be incorporated into the
baser constructions of later generations. Temples have become stables.
Changes in political administrations usually result in the filing away and delivery to archival storage
of volume after volume of written records. Potentially damaging or embarrassing records somehow
get misplaced, “accidentally” removed from the archival record. In other instances, well-meaning
historians or social science researchers may be charged with bringing order to a body of unorganized
archival records. In the process, they often “edit” the raw data, unwilling to leave it as they found it.
What survives may be what that researcher believed was important. Also, records of events tend to
be grouped together, thereby blurring the real contextual time structure of events.
The phenomenon is visible today in the decay evident in many inner cities. Buildings are aban-
doned, their materials removed and used for other purposes. What remains for later generations to
read is far different than the record as it was originally laid down. Researchers are encouraged in
such instances to fall back on the tried and true practice of triangulation, the use of other sources
to validate the remaining archival record. Other studies might include written records prepared by
visitors from other cultures, biographies and histories, others’ interpretations of the time, and for
phenomena in the not too distant past, the remembrances of participants in the event or events.
A Triangulation Example Using Archival Data
An example of triangulation design in which archival data played a role is the Monopoli and
Alworth (2000) study involving Navaho World War II veterans. Four surviving tribal members
D
o
w
n
l
o
a
d
e
d
b
y
[
U
n
i
v
e
r
s
i
t
y
o
f
C
a
l
i
f
o
r
n
i
a
,
S
a
n
D
i
e
g
o
]
a
t
0
0
:
0
8
1
9
M
a
y
2
0
1
7
310 QUALITATIVE RESEARCH APPROACHES AND METHODS
were part of a panel who participated in a 1950s Thematic Apperception Test (TAT) study of at-
titudes and opinions of Native Americans. The surviving subjects were interviewed and the data
compared with archival records of the original study.
In addition to the benefits of a longitudinal design, the researchers were also able to identify
some biasing errors in the earlier study results that might not have come to light with the use of the
archival data in the modern study. Webb and colleagues (2000) also identified the mass media as an
important source of archival data. Citing a number of different studies, they concluded that care-
fully selected media could clearly serve as a record of the values of society at a given period.
An example of triangulation in an archival design involving a comparison of official written
histories with daily reports of speeches, paid announcements, and published articles appearing in
the regional mass media of the period was conducted by McNabb (1968). The study subject was
the conflict between advocates of public ownership of electrical power generation and distribution,
and those represented by the large holding-company forces of investor-owned utilities led by the
Samuel Insull group of utilities. The battle began in earnest shortly before World War I, eventually
becoming one of the last great causes of the Progressive Movement in the United States.
Public administration researchers are often particularly concerned with political and judicial
records, another source of the public record. These include speeches by candidates and office-
holders, their supporters or their opponents, voting records, judicial decisions (including minority
opinions), and other similar records.
Researchers may also be interested in legislators’ seniority, party majorities, committee as-
signments, political philosophy, events participated in, or legislative emphasis during times of
economic or political stress, and many other such phenomena. For example, a study conducted in
the state of Washington evaluated legislative effectiveness under stress as measured by the number
and scope of bills passed during two periods when a tie existed in the lower house.
Episodic and Private Archives
It is important to remember that episodic and private record archives are, first, private data.
Furthermore, they are usually not as accessible as are public records; they tend to be stored for
shorter periods and are often destroyed after a set period of time. This accounts for one of the
major differences between the two broad classes of archives: it is often not possible to perform
longitudinal analyses on private archival data.
Episodic archives can be grouped into three broad classes: company records, institutional records,
and personal documents. Company information such as sales records has long been used to measure
the popularity, preference, and loyalty toward a product, event, idea, or service. This information is
also used to measure the effectiveness of advertising and government informational communications
programs. Institutional records are the files of companies, organizations, agencies, and institutions.
They can be used to measure job stress by records of absenteeism, tardiness, turnover, and labor
union grievances, for example. They can also be used to evaluate agency effectiveness by measur-
ing customer complaints and the content of suggestion programs, for example. Personal records
such as letters, memos, collections, artwork, and other possessions are usually the concern of
historians, and as such have little application for research in public administration.
A Word of Caution Concerning Archives
Caution is advised in the use of archival materials because of the potential distortion that can
exist in personal archives (Webb et al. 2000). Low-paid clerical workers often indifferently keep
D
o
w
n
l
o
a
d
e
d
b
y
[
U
n
i
v
e
r
s
i
t
y
o
f
C
a
l
i
f
o
r
n
i
a
,
S
a
n
D
i
e
g
o
]
a
t
0
0
:
0
8
1
9
M
a
y
2
0
1
7
ANALYZING TEXTS, DOCUMENTS, AND ARTIFACTS 311
archives with no stake in the accuracy of their product. Because record keepers may feel that the
saved material has little value, it might be stored haphazardly. It could be years if not decades
before the material is again examined; therefore, their diligence or lack thereof seldom comes to
light. When a researcher appears on the scene, however, there is a tendency for their interest to be
revitalized, with the unfortunate result of some altering or even destruction of recorded data.
Archive research involves a way of looking at published and previously prepared material, and
also defines the type of materials that are examined. While this approach to the investigation of
archival records of all types can serve as an excellent source of pertinent data for many studies
in public administration and nonprofit organization management, archives are not without their
disadvantages. This final warning was provided by Webb and coauthors:
For all their gains [i.e., advantages], however, the gnawing reality remains that archives have
been produced for someone else by someone else. There must be a careful evaluation of the
way in which the records were produced, for the risk is high that one is getting a cut-rate
version of another’s errors. (Webb et al. 2000, 84)
Nontextual Archives: Physical Traces
Physical evidence is another information source that might be considered to be “archival evidence,”
in that it was recorded for future researchers to interpret. According to Webb et al. (2000), physi-
cal evidence is probably the least used source of data in the social and administrative sciences.
However, it does hold what they called “flexible and broad-gauge potential.” There are two broad
classes of physical evidence:
s Erosion measures—the degree of selective wear or erosion that occurs over time; an
example would be the rate of wear in museum floor tiles, which serves as a measure of
exhibit popularity.
s Accretion measures—the degree to which materials collect over time. There are two subclasses
of accretion measures: (1) Remnants, where only one or a few traces are available for study,
and (2) series, where an accumulated body of evidence remains.
The major advantage of physical evidence data is its inconspicuousness. It is, indeed, a silent
measure of change. What is measured is generated without the subjects’ knowledge of its use by
investigators. It circumvents the problems of awareness of being measured and removes the bias
that comes from the measurement process itself becoming a part of the phenomenon. With all
types of physical traces, and particularly when the phenomenon still occurs, index numbers are
generated for comparisons, rather than the specific measurements themselves.
Performing a Meta-Analysis of Existing Research
Examining the literature of a study topic has been shown to have many purposes. First, it allows
the researcher to frame his or her study in light of what others have investigated previously. Sec-
ond, it can provide insights and new ideas regarding the study problem. Third, it can suggest new
ways of examining the problem or conducting analysis of the gathered data. A meta-analysis is a
fourth purpose for analysis of existing literature on a topic, method, or conclusions.
Lipsey and Wilson (2001) defined meta-analysis as a type of survey research in which, instead of
surveying people as subjects, previously prepared research reports are the subjects of analysis. Meta-
D
o
w
n
l
o
a
d
e
d
b
y
[
U
n
i
v
e
r
s
i
t
y
o
f
C
a
l
i
f
o
r
n
i
a
,
S
a
n
D
i
e
g
o
]
a
t
0
0
:
0
8
1
9
M
a
y
2
0
1
7
312 QUALITATIVE RESEARCH APPROACHES AND METHODS
analyses are used in order to summarize and compare the results of many different studies; other
researchers have produced most if not all of these other studies. Meta-analysis is an excellent way of
establishing the state of research findings on a subject—it provides the researcher with the “big picture,”
rather than simply another discussion of one or a few parts of the question, problem, or issue.
Furthermore, meta-analyses can only be applied to empirical research reports—that is, stud-
ies using primary research and data gathering. The technique is not appropriate for the types of
qualitative studies that summarize a set of other research studies. Although it is not necessary that
the studies that are examined in the meta-analysis be the results of experiments, many research
analysts have focused on these types of studies in their meta-analyses.
Advantages and Disadvantages of Meta-Analysis
Lipsey and Wilson (2001) identified four important advantages of the meta-analysis research
design. First, the complete process of establishing a coding scheme and criteria for selecting stud-
ies (a survey protocol), reading the study reports, coding the material, and subjecting it to a rigid
statistical analysis imposes a discipline on the researcher that is sometimes missing in qualitative
summarizations and comparative analyses.
Second, the process results in greater sophistication in summarizing research, particularly when
compared with qualitative summary attempts. The application of common statistical tests across
all the studies can correct for wide differences in sample size, for example.
Third, meta-analysis may enable the researcher to find effects or associations that other com-
parative processes miss. Finally, it provides a way to organize and structure diverse information
from a wide variety of study findings. Meta-analysis is not without its disadvantages, however.
Lipsey and Wilson admit to the validity of these criticisms, but are convinced that the strengths
of the method far outweigh any such disadvantages. A few of the criticisms that have been cited
for the method include the following:
1. The large amount of effort and expertise it requires is an often-cited disadvantage of the
method. Properly done, a meta-analysis takes considerably more time than a conventional
qualitative research review; many aspects of the method require specialized knowledge,
particularly in the selection and computation of appropriate effect sizes (i.e ., the statistic
chosen for comparison across all the studies).
2. It may not be sensitive to some important issues, including but not limited to the social
context of the study, theoretical influences and implications, methodological quality,
design issues, procedures, and the like.
3. The mix of studies (an apples and oranges issue) combined into larger groups may hide
subtle differences seen in individual studies.
4. Finally, inclusion of studies that are methodologically weak can detract from the findings
in strong studies.
How to Do a Meta-Analysis
Fink (1998, 216) has recommended the following series of seven steps for conducting a meta-
analysis:
s 3TEP #LARIFYTHEOBJECTIVESOFTHEANALYSIS
s 3TEP 3ETEXPLICITCRITERIAFORINCLUDINGANDEXCLUDINGSTUDIES
D
o
w
n
l
o
a
d
e
d
b
y
[
U
n
i
v
e
r
s
i
t
y
o
f
C
a
l
i
f
o
r
n
i
a
,
S
a
n
D
i
e
g
o
]
a
t
0
0
:
0
8
1
9
M
a
y
2
0
1
7
ANALYZING TEXTS, DOCUMENTS, AND ARTIFACTS 313
s 3TEP *USTIFYMETHODSFORSEARCHINGTHELITERATURE
s 3TEP 3EARCHTHELITERATUREUSINGA STANDARDIZEDPROTOCOLFORINCLUDINGANDEXCLUDINGSTUDIES
s 3TEP $EVISEASTANDARDIZEDPROTOCOLTOCOLLECTDATAFROMEACHSTUDY
INCLUDINGSTUDYPUR-
poses, methods, and outcomes (i.e., effects measured).
s 3TEP $ESCRIBEINDETAILTHESTATISTICALMETHODFORPOOLINGRESULTS
s 3TEP 2EPORTTHERESULTSOFTHECOMPARATIVEANALYSIS
INCLUDEDCONCLUSIONSANDPERCEIVED
limitations.
A slightly longer, but possibly more informative, list of steps can be discerned by combining
ideas from Lipsey and Wilson’s (2001) manual on the method with Fink’s later review (2004). This
summary procedure model is displayed in Figure 22.2, and the steps are discussed below.
Statement of the topic or question. This step provides the framework upon which all subsequent
steps in the process follow. An example question statement for a meta-analysis might be: How
have mandatory sentencing guidelines affected the number of repeat arrests for crimes in which
a weapon was involved?
Identify the form(s) of research relevant to a meta-analysis on the topic. The “form” aspect
refers to the type of analysis conducted in the individual research studies. For example, this could
be studies that report treatment/control group experiments. Or it could be studies that focus on
correlations between two or more variables.
Another example is a standard two-sample comparison study. In the example proposed in the
first step in this discussion, a typical form might have been studies that compare mean rates of
arrest or length of sentences before mandatory sentencing, and then a repeat study after imposi-
tion of sentencing minimums. This is a typical pre- and post-treatment comparison or hypothesis
testing research design. The test statistic for the next step could be t-test scores or p-values of
comparisons.
Select types of studies to be included in the analysis. This decision step is similar to the
step above, but refers more to the statistical tests used. Four types of tests are regularly used in
meta-analyses: (1) central tendency descriptions (such as mean scores), (2) pre-group/post-group
hypothesis test studies, (3) other group contrasts, either pure experiments or nonexperimental
grouping comparisons (for example, comparing gender or age groups, etc.), and (4) studies em-
ploying regression analysis.
Determine eligibility criteria. In this step the researcher chooses the criteria upon which to
base a decision to include the study in the meta-analysis. Examples of types of criteria often used
include (1) the distinguishing feature of a study (what made writing about it worthwhile), (2) re-
search subjects (i.e., types or characteristics of respondents used in the study), (3) key variable(s),
(4) research designs, (5) cultural and/or linguistic range, (6) time frame involved, and (7) type
of publication.
Identify and locate sources of research reports. At this stage the research must apply the deci-
sion criteria established in the previous step. Lipsey and Wilson urged that the researcher develop
a meticulous accounting system so that each study is assigned its own detailed bibliographic entry
and its own identification number in order to facilitate future cross-referencing and to ensure that
reports are assigned to their appropriate comparison group. A brief description of the subject report
should also be prepared at this time.
Some sources and listings for research reports include review articles, references in other stud-
ies, computer databases, bibliographies, professional and academic journals, conference programs
and proceedings, correspondence with researchers active in the field, government agencies, the
Internet, colleges and universities, professional associations, and others.
D
o
w
n
l
o
a
d
e
d
b
y
[
U
n
i
v
e
r
s
i
t
y
o
f
C
a
l
i
f
o
r
n
i
a
,
S
a
n
D
i
e
g
o
]
a
t
0
0
:
0
8
1
9
M
a
y
2
0
1
7
314 QUALITATIVE RESEARCH APPROACHES AND METHODS
Develop a Statement of the
Topic or Question to Be
Answered by the Meta-analysis
Identify the Form(s) of
Research That Are Relevant to
a Meta-Analysis
Assign a
“Precision Code”
Based on Sample Size in
Individual Studies
Select the Types(s) of Studies
to Be Included in the
Meta-Analysis
Determine Eligibility Criteria
for Inclusion/Exclusion in the
Meta-Analysis
Identify and Locate Sources for
Reports; Assign Bibliographic
Entry for Each Report
Select an
“Effect Size Statistic”
and Assign Research Finding
Codes
Retrieve and Review Selected
Research Reports
Calculate Statistical Analysis
and
Report Findings of the
Meta-Analysis
Figure 22.2 Steps in a Meta-analysis Research Design
Source: From material in Lipsey and Wilson 2001.
D
o
w
n
l
o
a
d
e
d
b
y
[
U
n
i
v
e
r
s
i
t
y
o
f
C
a
l
i
f
o
r
n
i
a
,
S
a
n
D
i
e
g
o
]
a
t
0
0
:
0
8
1
9
M
a
y
2
0
1
7
ANALYZING TEXTS, DOCUMENTS, AND ARTIFACTS 315
Retrieve and review eligible research studies. This step involves several activities: first, re-
searchers must find bibliographic references to potentially eligible studies. Second, a copy of
the study must be obtained for screening. If it is considered to be eligible, it must be coded for
inclusion in the meta-analysis.
Select an effect size statistic for use with the entire sample of reports. In a meta-analysis, a
single quantitative research finding may serve as a statistical representation of the relationships
among the variables of interest. This statistical representation is the effect size statistic that will
be used in comparative analysis during the meta-analysis. Research findings in the subject reports
are test statistics; each must be coded as a value on the same effect size statistic. This must be the
same statistic across the entire sample of reports.
For example, if the effect size statistic is the correlation between two or more variables, the
variables in all the reports must have been measured at the same level (nominal, ordinal, or interval),
with the same correlation statistic employed (Pearson’s r, Spearman’s rho, the chi-square-based phi,
or Cramer’s V ). Similar restrictions apply for other statistical measures that might be selected.
Assign a precision code for each research report. A precision code is similar to a weighting
system. It is based upon the sample size employed in each subject report. For example, a study
in which a sample size of 500 was tested can be expected to be considerably more precise than
one in which the sample size was, say, only 5—or even 50. The statistical calculations used in
meta-analysis take these precision weights into effect, thus correcting for possible error associ-
ated with small samples. The greater the perceived reliability, the greater should be the precision
code value assigned to the study.
Statistical analysis and report findings. Finally, researchers must keep in mind that there are
two parts to a meta-analysis coding process. The first part is the information that describes charac-
teristics of the subject report; this is the “study descriptor” portion of coding. Study characteristics
include such information as the methods, the measures, sample characteristics and size, constructs
developed, treatments given, and the like. The second part of the coding protocol is the part that
covers information about the empirical findings contained in the report; this is the “effect sizes”
portion of the coding, together with the precision code for each study. Effect sizes, for example,
are the statistical values that indicate the association between variables.
The first three sections of this chapter discussed documentary data as a source of data that
researchers turn into information. The following section begins a discussion on some of the ways
that researchers actually conduct analyses of texts. Texts will be shown to include such things
as signs and symbols, as well as artifacts and other facets of material culture. Methods such as
hermeneutics, semiotics, and content analysis will be discussed.
Hermeneutic Analysis of Text and Nontext Material
Hermeneutics is a method of analyzing all types of data (but, particularly written texts) accord-
ing to a set of principles that requires the analyst to decipher the meaning of the text (1) through
the eyes and intent of the writer or creator of the text or artifact, (2) according to the time frame
existing at the time of the writing, and (3) considering the political and cultural environmental
influences existing at the time of the creation of the text or artifact.
Hermeneutics owes its long history of interpretive applications to the analysis of first, re-
ligious texts, and, second, legal documents and written administrative rulings (see, Gadamer
1975a and 1986; Bauman 1992; Alejandro 1993). The term originates from the Greek word
hermeneutikós, which refers to the act of explaining. “Explaining” refers to making clear or
clarifying the obscure (Bauman 1992).
D
o
w
n
l
o
a
d
e
d
b
y
[
U
n
i
v
e
r
s
i
t
y
o
f
C
a
l
i
f
o
r
n
i
a
,
S
a
n
D
i
e
g
o
]
a
t
0
0
:
0
8
1
9
M
a
y
2
0
1
7
316 QUALITATIVE RESEARCH APPROACHES AND METHODS
Hermeneutic analysis requires that the researcher take a holistic, or “contextualist” ap-
proach to analysis of a problem. The meaning of a text or social phenomenon that is analyzed
hermeneutically depends on the whole—that is, the text, the author(s), and the context. Mean-
ing cannot be deciphered without understanding the context as well as the text or phenomenon
(Wachterhauser 1986).
Hermeneutics is a way of clarifying the meaning of a text by interpreting it historically (Moore
1990, 94). It looks upon a text as the “medium which links human subjects [i.e., writers of tex-
tual material] to their world and to their past . . . it involves identification with the intentions and
situation of the [writer].” Maas (1999), writing about the hermeneutic analysis of religious texts,
explained this two-part focus by describing both a material and a formal object for the process.
The material object is the text or other document that is being explained; the formal object is
deciphering the sense of the author at the time the text was written.
Hermeneutic analysis is particularly relevant when studying historical documents, such
as past legislation, the records of discourse that occurred over legislative or administrative
hearings, and similar applications. In this way, public administration hermeneutics deals with
government texts or documents as its material object, with the deciphering of the intent of
the framers at the time of its creation (i.e., passage or implementation) as its formal object.
Thus, legislation that might seem silly today has the potential to be interpreted as logical
and meaningful when considered in the light of events and circumstances at the time of its
enactment, or lack thereof.
Principles of Hermeneutics
Several key principles underlie the hermeneutical analysis process. First, all thought is derived
from language and follows the same laws that regulate language. A writer uses the traditions and
conventions of his or her time and particular circumstances, including the rhetorical logic, the
same sequence of ideas, and the same rules of grammar in use at the time of the text’s creation.
Therefore, if the analyst wishes to fully understand the writer and “correctly” interpret the writer’s
words, he or she must first understand the author ’s meaning at the time and place of the writing.
The interpreter must know the writer’s language, his or her train of thought or context of the text,
and the writer ’s psychological and historical condition at the time of the writing. Hence, the first
principle of hermeneutics is (Maas 1999, 3): “Find the sense of a book by way of its language
(grammatically and philologically) by way of the rules of logic . . . and by way of the writer ’s
mental and external condition [at the time of writing].”
Several other principles follow from this first principle of hermeneutics. Among them are that
hermeneutic analysis presupposes (1) that the analyst has knowledge of both the grammar and
historical evolution of the language in which the work is written, (2) is familiar with the laws of
logic and rhetoric, and (3) has knowledge of psychological principles and the facts of history (of
the time when the work was written).
Hermeneutic Analysis of Nontext Material
While it is used most often as a method for analyzing texts, hermeneutics is applicable to more
than this; it is a broadly based theory of interpreting all creations of humankind. Henrietta Moore,
describing philosophy’s contributions to hermeneutic theory and application, wrote about the
expanded application in these terms:
D
o
w
n
l
o
a
d
e
d
b
y
[
U
n
i
v
e
r
s
i
t
y
o
f
C
a
l
i
f
o
r
n
i
a
,
S
a
n
D
i
e
g
o
]
a
t
0
0
:
0
8
1
9
M
a
y
2
0
1
7
ANALYZING TEXTS, DOCUMENTS, AND ARTIFACTS 317
[The] theory of [hermeneutic] interpretation may be extended beyond the written text to
encompass other human phenomena which can be said to have textual characteristics. One
such phenomenon is meaningful action . . . and action is understood when it can be explained
why the individual acted as (he or she) did, and thus can only be explained when a reason
or motive for the action can be adduced. (Moore 1990, 99)
Richardson also commented on the application of hermeneutic analysis to phenomena other
than textual materials, although admitting a sense of puzzlement over the fact:
Hermeneutics has come forward as that comprehensive standpoint from which to view all the
projects of human learning. For those of us who have been puzzled by the new intellectual
dominance of hermeneutics, the key is that the term no long refers to the interpretation of
texts only but encompasses all the ways in which subjects and objects are involved in human
communication . . . hermeneutics or interpretation has come to be regarded as shorthand for
all the practices of human learning. (Richardson 1995)
Moore saw that the problem of analyzing meaningful action is at the very heart of much of
the research and philosophical speculation in the social sciences, including public administration.
She proposed that it be approached with the understanding that the social world is made up of
individuals who speak and act in meaningful ways, and added that “these individuals create the
social world which gives them their identity and being, and their creations can only be understood
through a process of interpretation” (1990, 111).
Meaning and Emphasis in Hermeneutics
Hermeneutics holds that there is always a plurality of meanings available for every hu-
man phenomenon. Meaning is not something that just exists; every reader must interpret it.
Interpretations will vary from reader to reader, and can be understood only in the light of
historical, social, and linguistic traditions. According to Alejandro (1993), data interpretation
is a “construction of meaning” that distinguishes the researcher ’s labor from the purpose of
hermeneutics. The researcher seeks certainty; hermeneutics seeks clarity that is anchored in
the principle that the meaning that interpretation makes possible is not arbitrary, nor is it the
outcome of the researcher. The construction of meaning is framed by the boundaries inherent
in the text (or phenomenon) itself as well as in the background established by the traditions
in which it was created.
Bauman (1992, 12) also commented on this difference in emphasis. Social phenomena—the
subject matter of political science research—because they are ultimately acts of human beings,
must be understood in a different way than by simply explaining. Men and women do what they
do on purpose. True understanding can occur only when we know the purpose, the intent of the
actor, his or her distinctive thoughts and feelings that lead up to an action. “To understand a human
act . . . [is] to grasp the meaning with which the actor ’s intention invested it . . . [this is] essentially
different from [the goal] of natural science.”
In terms of its importance for research on questions in political organizations, hermeneutics
provides a new way of looking at public issues. The hermeneutic approach assumes that the “con-
stant of history” exists in the mind of every individual, and that citizens’ actions are inescapably
influenced by their beliefs, traditions, and historical events. In the words of Vincent Descombes
(1991, 254), there can be no understanding without interpretation.
D
o
w
n
l
o
a
d
e
d
b
y
[
U
n
i
v
e
r
s
i
t
y
o
f
C
a
l
i
f
o
r
n
i
a
,
S
a
n
D
i
e
g
o
]
a
t
0
0
:
0
8
1
9
M
a
y
2
0
1
7
318 QUALITATIVE RESEARCH APPROACHES AND METHODS
The Hermeneutic Circle
The process of hermeneutic analysis is less a method than it is a philosophical approach to scien-
tific inquiry. By this is meant that, counter to traditional scientific epistemology that focuses first
on explaining and then predicting, the hermeneutic approach is concerned with interpretation in
order to understand. Achieving understanding, according to Bauman (1992, 17), means following
a circular approach “toward better and less vulnerable knowledge.”
This path to understanding is called the hermeneutic circle. It means beginning by interpreting
a single part of the whole, then reevaluating and restating the interpretation in light of information
about the time and intent of the event or text. Only then does one move to the next part—again
searching the context for greater enlightenment.
Merrell (1982, 113) added to understanding of this process by describing the way the analysis
moves from the whole to its parts and back to the whole: “When written texts are broken down
into isolated segments, those segments can then be relatively easily juxtaposed, compared, and
contrasted. That is, they can be subjected to analysis by means of which consciousness of con-
densed and embedded wholes can be increased.”
Understanding of parts thus builds on greater understanding. With each of the parts assessed
and reassessed in this way—in a circular analytic process that Bauman described as being “ever
more voluminous, but always selective”—full understanding emerges at last.
In a final word on the hermeneutic method, Wachterhauser (1986, 12) left researchers the
following warning, referring to the principle of hermeneutic analysis that establishes and vali-
dates many different possible interpretations of a text: “There are no fundamental, underlying
@4RUTHS2ATHER
THERATIONALISTICIDEALOFDISCOVERINGA SETOFSELF
EVIDENT
FOUNDATIONALTRUTHS
from which all legitimate knowledge-claims would follow by strict logical inference is impos-
sible to achieve.”
Semiotics: The Analysis of Signs and Symbols
Semiotics is a relatively modern interpretive science; it emerged during the middle and last half
of the twentieth century as a way of describing how meaning is derived from text, language, and
social actions as symbols. The primary social action of interest was initially limited to language—in
both its written and spoken word forms. However, it was soon applied to analysis of things other
than texts, but which could be “read” as text. Social structure, ritual and myth, material culture,
including art and tools: these all became the subject of research into the meaning of their signs
and symbols. Today, semiotics is used as a way of interpreting all types of verbal and nonverbal
signs and symbols, regardless of the discipline.
The Meaning of Semiotics
Winfred Nöth (1990), writing on the history of the science of semiotics, identified four underly-
ing disciplines that have contributed to the development of the Western semiotic tradition. These
included semantics (including the philosophy of language), logic, rhetoric, and hermeneutics. Other
disciplines that helped forge modern semiotics include linguistics, aesthetics, poetics, nonverbal
communication, epistemology, and the human sciences in general.
Many definitions of semiotics have been proposed; most relate it in some way to the interpre-
tation of signs and symbols (Pierce 1962; Barthes 1968; Eco 1976; Sebeok 1976; Hodder 1982;
Silverman 1983; Nöth 1990; Manning and Cullum-Swan 1998). For example, Nöth (1990) drew
D
o
w
n
l
o
a
d
e
d
b
y
[
U
n
i
v
e
r
s
i
t
y
o
f
C
a
l
i
f
o
r
n
i
a
,
S
a
n
D
i
e
g
o
]
a
t
0
0
:
0
8
1
9
M
a
y
2
0
1
7
ANALYZING TEXTS, DOCUMENTS, AND ARTIFACTS 319
upon previous definitive work to give semiotics the broadest possible definition. In her Handbook
of Semiotics, she referred to semiotics as simply the science of meaning, adding:
[The science of signs] has for its goal a general theory of signs in all their forms and mani-
festations, whether in animals or men, whether normal or pathological, whether linguistic
or nonlinguistic, whether personal or social. Semiotics is thus an interdisciplinary approach.
(Nöth 1990, 49)
Manning and Cullum-Swan (1998, 251) were just as brief in their proposed definition, but took
a slightly different approach, electing to refer to semiotics simply as “the science of signs.” They
defined a sign as “anything that represents or stands for something else in the mind of someone.”
This definition has two parts: first, what they term an expression (such as a word, a sound, a sym-
bol, or the like), and second, a content, which is what completes the sign by giving it meaning.
A sign has been defined as:
[S]omething which stands to somebody for something in some respect or capacity. It addresses
somebody, that is, it creates in the mind of that person an equivalent sign, or perhaps a more devel-
oped sign . . . the sign stands for something, its object. It stands for that object, not in all respects,
but in reference to a sort of idea, which I sometimes call the ground. (Silverman 1983, 14)
Perhaps the most complete definition of what constitutes a sign was provided by Umberto Eco
(1976, 16), who defined a sign as “everything that, on the grounds of a previously established social
convention, can be taken as something standing for something else” [emphasis in original].
Components and Forms of Signs
Signs come in many different forms. Sebeok (1976) grouped the many different types of signs into
six broad classifications: signal, symptom, icon, index, symbol, and name. Semiotics pioneer John
Pierce, however, developed the most widely used classification system, in 1962. He grouped signs
into just three classes: icons, indices, and symbols. An icon is a sign that signifies its meaning by
qualities of its own. An index communicates its meaning by being an example of its intended sign,
such as a weathercock or a yardstick. Pierce considered the symbol to be a synonym for sign.
Political science researchers may use semiotics in any research involving verbal or nonverbal
communication. Table 22.2 contains an extensive list of fields and study types that Eco (1976,
9–14) believed belong to the field of semiotics. By extension, they may be of interest to political
scientists, public administrators, and managers of nonprofit organizations as well.
A Final Word of Caution About Signs
Anthropologist Christopher Tilley (1989), who identified himself first as an anthropologist and only
second as a student of symbols, offered this final caveat regarding the interpretation of signs:
Meaning . . . resides in a system of relationships between signs and not in the signs them-
selves. A sign considered in isolation would be meaningless. Furthermore, the meaning of a
sign is not predetermined, but is rather of cultural and historical convention. Consequently,
it does not matter how a signifier appears, so long as it preserves its difference from other
signifiers [emphasis in original]. (Tilley 1989, 186)
D
o
w
n
l
o
a
d
e
d
b
y
[
U
n
i
v
e
r
s
i
t
y
o
f
C
a
l
i
f
o
r
n
i
a
,
S
a
n
D
i
e
g
o
]
a
t
0
0
:
0
8
1
9
M
a
y
2
0
1
7
320 QUALITATIVE RESEARCH APPROACHES AND METHODS
Content, Narrative, and Discourse Analysis
Content analysis is a quantitative method of analyzing the content of written documents, transcripts
of films, videos and speeches, and other types of written communication (Denscombe 2002). It has
been defined as “any technique for making inferences by objectively and systematically identifying
specified characteristics of messages” (Holsti 1969, 14).
The main advantage of content analysis is that it provides the researcher with a structured method
for quantifying the contents of a qualitative or interpretive text, and does so in a simple, clear, and
easily repeatable format. Its main disadvantage is that it contains a built-in bias of isolating bits
of information from their context. Thus, the contextual meaning is often lost or, at the least, made
problematic. Furthermore, content analysis has great difficulty in dealing with implied meanings
in a text. In these situations, interpretive (hermeneutic) analysis may be more appropriate, with
content analysis used to supplement the primary analysis method.
Table 22.2
Examples of Semiotic Research Applications
Research Focus
Description of Content
1 Aesthetic Texts
Analysis of the aesthetic import of textual material.
2 Codes of Taste
Present in the culinary and enology fields. How tastes com-
municate certain images.
3 Cultural Codes
Behavior and values systems, including such things as etiquette,
cultural systems, and social organization of groups and societies.
4 Formalized Languages
“Languages” of statistics, chemistry, engineering, psychology, etc.
5 Kinesics and Proxemics Movement, gestures, special relationships.
6 Mass Communications
Coding, sending, receiving, interpreting messages.
7 Medical Semiotics
Signs and symptoms of the illness they indicate and other symbols
forwarded by a patient.
8 Musical Codes
Musical “signs” with explicit denotative meanings, such as trumpet
calls in the military; music that conveys selected emotional or
conceptual meanings, such as “tone poems.”
9 Natural Languages
Studies in such areas as logic, philosophy of language, etc.
10 Olfactory Signs
The “code of scents”; important in atmospherics.
11 Paralinguistic Sounds
Sounds without linguistic features, such as grunts, growls, etc.
12 Plot Substructure
Mythology, mass communication drama and novels, etc.
13 Rhetoric
An early contributor to the field of semiotics; includes models of
oral persuasion, argument, etc.
14 3YSTEMS OF /BJECTS
&ROM ARCHITECTURE TO OBJECTS IN EVERYDAY USE
15 Tactile Communication
Includes the communication systems of the blind, as well as such
behaviors as the kiss, the embrace, slap on the shoulder, caress.
16 Text Theory
The study of text as a “macro unit”; text as a whole unit.
17 Visual Communication
Graphic displays, advertisements, brands and trademarks.
18 Written Languages
Includes unknown languages, secret codes, ancient alphabets,
cryptography, etc.
19 Zoosemiotics
The communications behavior of nonhumans.
Source: Eco 1976.
D
o
w
n
l
o
a
d
e
d
b
y
[
U
n
i
v
e
r
s
i
t
y
o
f
C
a
l
i
f
o
r
n
i
a
,
S
a
n
D
i
e
g
o
]
a
t
0
0
:
0
8
1
9
M
a
y
2
0
1
7
ANALYZING TEXTS, DOCUMENTS, AND ARTIFACTS 321
Content analysis is best used when dealing with communications in which the messages tend
to be clear, straightforward, obvious, and simple. The more that a text relies on subtle and/or
intricate meanings, the less likely is the ability of content analysis to reveal the full meaning of
the communication. Thus, content analysis is used most often to describe attributes of messages,
without reference to the intentions of the message sender or the effect of the message on the re-
ceiver (Denscombe 1998, 169; Holsti 1969, 27). Counting how many times in a speech a candidate
denigrates the character of a political opponent is an example application of content analysis.
The major purpose of all content analysis is to be able to make inferences about one or more
variables uncovered in a text. It accomplishes this by systematically and objectively analyzing
either the content of the text, the process of communication itself, or both (Sproull 1988). Content
analysis takes place in the nine-step process displayed in Figure 22.3 .
The content analysis process begins with establishing objectives for the content analysis research.
The first step in the process should be a familiar one by now: Establish objectives for the research pro-
cess. This means determining in advance of the research what you want to accomplish by its conduct.
Next, assuming that the researcher has some familiarity with the larger issues and/or themes at stake
in the phenomenon, a list should be made of what variables are to be counted in the text. Variables are
not the same as words; rather, they tend to be constructs that can be said to describe or refer to broader
complex issues of behavior or attitude. This list is clearly embedded in the study objectives.
Once the researcher has decided what to look for and where to look for it, he or she must then
establish a system for first coding the content items, while also determining how they are going to
be counted and recorded. The texts themselves are then collected. Holsti (1969) recommended that
at this time researchers should draw a random sample of the materials for a pilot test of the study.
The pilot test will provided important clues as to the relative effectiveness of the research design.
For example, since the variables of interest are established before measurement takes place, there
is a possibility that the variables are not treated significantly in the sample of sources chosen. In
that case, the researcher would have to go back and identify new variables for the study.
The final steps in the study involve conducting statistical analysis on the measurements. When
possible, these should include correlation analysis and simple hypothesis testing.
Complementary Tools: Narrative and Discourse Analysis
Content analysis is related to several similar research designs, among which are narrative analysis
and discourse analysis. A narrative is an oral or written exposition that typically describes the events
in the life of a person or people. It is usually the exposition of a single person. A discourse is either
an oral or written communication designed to inform, rather than entertain. The term discourse is
often used to identify an exchange of communication between two or more speakers or writers.
Narratives have been formally defined as “a means of representing or recapitulating past experience by
a sequence of ordered sentences that match the temporal (time) sequence of the events which, it is inferred,
actually occurred” (Labov, cited by Cortazzi 1993, 43). A narrative analysis is a qualitative approach
to the interpretation of texts and, as such, is often used to augment a quantitative analysis of content.
Noting the mutually supportive roles of the various methods, Holsti reminded researchers that
the content analyst should use qualitative and quantitative methods to supplement each other. It is by
moving back and forth between these approaches that the investigator is most likely to gain insight
into the meaning of [his] data. . . . It should not be assumed that qualitative methods are insightful,
and quantitative ones merely mechanical methods for checking hypotheses. The relationship is a
circular one; each provides new insights on which the other can feed. (Holsti 1969, 11)
D
o
w
n
l
o
a
d
e
d
b
y
[
U
n
i
v
e
r
s
i
t
y
o
f
C
a
l
i
f
o
r
n
i
a
,
S
a
n
D
i
e
g
o
]
a
t
0
0
:
0
8
1
9
M
a
y
2
0
1
7
322 QUALITATIVE RESEARCH APPROACHES AND METHODS
Determine Objectives for the
Research
Prepare a List of the Variables
to Be Measured
Adjust the Analysis Categories
or Units of Analysis if
Necessary
Determine What Specific
Communication Context or
Process Is to Be Measured for
Each Variable
Determine the Unit of Analysis
(the portion of
the communication that is the
smallest unit to analyze)
Develop a Coding Protocol and
Select Scales of Measurement
Select a Random Sample of
These Communications and
Pilot-Test the Content Analysis
Collect, or Have Subjects
Generate, Communications
Analyze the Total Sample of
Communications Using the
Revised Code List(s)
Figure 22.3 Steps in Content Analysis Research Design
Source: Adapted from Holsti 1969; Sproull 1988; and Denscombe 1998.
D
o
w
n
l
o
a
d
e
d
b
y
[
U
n
i
v
e
r
s
i
t
y
o
f
C
a
l
i
f
o
r
n
i
a
,
S
a
n
D
i
e
g
o
]
a
t
0
0
:
0
8
1
9
M
a
y
2
0
1
7
ANALYZING TEXTS, DOCUMENTS, AND ARTIFACTS 323
Narratives are a record of events that have significance for both the narrator and his or her
audience (a researcher, for example). Narratives are formally structured; they have a beginning,
middle, and end. Furthermore, they are organized according to a set of distinct structures with
formal and identifiable characteristics (Cortazzi 1993; Coffey and Atkinson 1996).
Cortazzi adapted the narrative evaluation or analysis model developed by W. Labov and J.
Waletsky. Table 22.3 summarizes the model. Labov’s purpose for developing the model was to
illustrate how informal styles of narrative (speech) correlate with a number of extant social char-
acteristics. The specific document selected for analysis might be newspaper stories, speeches at
local service clubs, or official records such the Congressional Record.
Manning and Cullum-Swan (1998) have described several different approaches to the analysis of
narratives, among which are Russian formalism and structural methods such as top-down or bottom-up
approaches. Russian formalism emphasizes the role that form plays in conveying meaning in a narrative.
It has been used to analyze the form that Russian fairy tales follow, for example. Each tale follows a
similar, simple structure. Others have used the same approach to examine myths, poetry, and fiction.
Top-down approaches analyze the narrative text according to a set of culturally established
rules of grammar and exposition. These methods are used extensively in education. Bottom-up
methods, on the other hand, use elements in the text to build a structure for analyzing the whole.
This is the approach followed most often in ethnographic research.
Karl Bühler (1934, cited in Merrell 1982) provided an early framework of narrative and
discourse analysis that is still relevant today. Bühler saw three main functions for a language.
First, it must be expressive: the message must serve to convey the emotions or thoughts of
the user of the language. Second, it must serve a signaling or stimulative function: that is,
the message must stimulate an expected response by the receiver. And third, it must have a
descriptive function. The user of the language must be able to use it to describe a particular
state of affairs in ways that convey the full picture. Others have added additional functions;
the most important of these is an argumentative or explanatory function, by which language
users present alternative thoughts, views, or propositions to the descriptive messages (Mer-
rell 1982, 116).
Discourse Analysis of Communications
Discourse analysis is a method of analyzing oral or written communications in order to identify the
formal structure of the message, while at the same time keeping a use-of-the-language purpose in
mind. It can be applied to the same types of messages, texts, documents, and so on that are appropriate
Table 22.3
A Variation of the Labov/Cortazzi Six-Part Narrative Evaluation Model
Structural Element
Comment
Questions
Abstract
A 100-word summary
What was this about?
Orientation
Establishes the situation
Who? What? When? Where?
#OMPILATION
-AJOR ACCOUNT OF THE EVENTS THAT ARE
Then what happened?
central to the story
Evaluation
High point of the analysis
So what?
Result
Outcome of the events or resolution of
What finally happened?
the problem
Conclusion
Return to the present
Finish of the narrative
D
o
w
n
l
o
a
d
e
d
b
y
[
U
n
i
v
e
r
s
i
t
y
o
f
C
a
l
i
f
o
r
n
i
a
,
S
a
n
D
i
e
g
o
]
a
t
0
0
:
0
8
1
9
M
a
y
2
0
1
7
324 QUALITATIVE RESEARCH APPROACHES AND METHODS
for content analysis, albeit for a different purpose. Discourse analysis is strongly associated with the
analysis of linguistic structures in the message or text. Potter and Wetherell (1994, 48) refer to this
point in their discussion of three particularly pertinent features of discourse analysis.
First, discourse analysis is concerned with talk and texts as “social practices.” It examines the
linguistic content—that is, the meaning and the topics discussed—in a message, as well as being
concerned with the features of language form such as grammar and cohesion. Second, discourse
analysis has a triple concern with the themes of action, construction, and variability in the mes-
sage. Third, discourse analysis is concerned with the rhetorical or augmentative organization of
texts and talks. And fourth, the objective of discourse analysis is to take the focus of analysis away
from questions of how a text version relates to reality to ask instead how the version is designed
to compete successfully with one or more alternative versions. These points are incorporated in
the following five points that direct discourse analysis:
s 6ARIATIONINTHEMEANDMESSAGEISTOBEUSEDASA LEVERINANALYSIS
s 4HEDISCOURSEMUSTBEREADANDANALYZEDINMINUTEDETAIL
s !KEYPOINTINTHEANALYSISISTHESEARCHFORRHETORICALORGANIZATION
s !CCOUNTABILITY!REPOINTSMADEWITHORWITHOUTBEINGSUPPORTED
s &INALLY
DISCOURSEANALYSISREQUIRESCROSS
REFERENCINGWITHOTHERSTUDIES
Examining Material Culture (Artifact Analysis)
The study of artifacts in material culture—the tools and other objects that are created, used, or left
behind by society—is closely related to the science of semiotics. While it owes a great debt to the
science of archeology, it is not restricted to the search for meaning among the shards and bones
of ancient civilizations. Artifact analysis is a modern science as well; modern archeologists also
study the garbage dumps of modern society.
Archeologist Ian Hodder (1982) considered artifact analysis to involve a process that began
with the interpretation of signs and symbols, making it a legitimate target for both hermeneutic
and semiotic analysis approaches. He defined the term symbol as the word used to refer to an
object or social situation in which a “direct, primary or literal meaning also designates another
indirect, secondary and figurative meaning.” Hodder (1989) identified the key problem affecting
the interpretation of artifacts as the need to locate them within the contexts of their creation, while
at the same time interpreting them within the context of the modern researcher. By the very act
of being interpreted, the artifact is removed to a new and different context, thus bringing decisive
interpretation into question. Potentially, many meanings are possible; the researcher must decide
not which is best, but which is most probable.
Also related to this problem is the fact that material culture, because it often lasts a long time,
either takes on or is given new meanings the longer it is separated from its primary producer.
While the artifacts typically retain their original form, their meaning changes: “Material items are
continually being reinterpreted in new contexts” (Hodder 1989, 120).
Tilley (1989, 188) also commented on the need to look beyond the individual piece of material
culture itself when deciphering its meaning: “To understand material culture we have to think in terms
that go beneath the surface appearances to an underlying reality. This means that we are thinking in
terms of relationships between things, rather than simply in terms of the things themselves.” For the
political science researcher who plans a study of material culture, Tilley urged researchers to remem-
ber that “The interpretation of the meaning and significance of material culture is a contemporary
activity. The meaning of the past does not reside in the past, but belongs in the present.”
D
o
w
n
l
o
a
d
e
d
b
y
[
U
n
i
v
e
r
s
i
t
y
o
f
C
a
l
i
f
o
r
n
i
a
,
S
a
n
D
i
e
g
o
]
a
t
0
0
:
0
8
1
9
M
a
y
2
0
1
7
ANALYZING TEXTS, DOCUMENTS, AND ARTIFACTS 325
The Interpretation of Material Culture
The interpretation of artifacts requires that the researcher function in a scientific environment that
is halfway between past and present. Interpretation also involves comparing different examples of
material culture. This makes the interpretation process problematic, at best. The physical evidence
under study is often not what was expected; it has “The potential to be patterned in unexpected
ways” (Hodder 1998, 121). Furthermore, because physical evidence cannot “talk” directly to the
researcher, it forces the analyst to evaluate and enlarge his or her own experience and worldview.
At all stages of the evaluation of material culture—from identifying categories, attributes, and
what Hodder called the “understanding of high-level social processes”—the researcher must work
at three levels of interpretation simultaneously:
1. The researcher must examine the context within which artifacts are deemed to have
similar meanings.
2. Inseparable from understanding the context is the identification of similarities and differ-
ences in the artifacts. By showing that people responded the same way to similar stimuli,
patterns are identified.
3. While working with the first two levels of interpretation, the researcher must also establish
their relevance in terms of historical theories regarding the data.
Hodder also cautioned interpreters of material culture to not become locked into a theory sim-
ply because it is fashionable at the time of the research: “Observation [of material culture] and
interpretation are theory laden, although theories can be changed in confrontation with material
evidence in a dialectical fashion.”(1998) In a final word of warning, he discussed controversies
over what is seen as a major weakness of artifact analysis: the lack of a method for confirming
interpretive conclusions. For all researchers working with material culture, Hodder proposed two
processes to satisfy the critics of interpretation:
Perhaps the major difficulty is that material culture, by its very nature, straddles the divide
between a universal and natural science approach to materials and a historical, interpretive
approach to culture. There is thus a particularly marked lack of agreement in the scientific
community about the appropriate bases for confirmation procedures . . . the twin struts of
conformation are coherence and correspondence. (Hodder 1998, 122)
As has been shown, material culture interpretation methods involve the simultaneous pro-
cesses of these three activities: (1) definition of the context of the artifact at its time of creation,
(2) identification of patterns of similarities and difference, and (3) the use of relevant theories of
social and material culture.
The researcher ’s conclusions must present a coherent picture of the interpretation of the ar-
tifacts, while also establishing a corresponding relationship between the artifacts, their context,
and the interpretive conclusion.
Summary
This chapter discussed some of the ways that researchers go about examining texts, cultural artifacts,
body language, and similar types of written and unwritten communications, records, documents,
signs, and symbols. The different sources of research data were grouped into four broad categories.
D
o
w
n
l
o
a
d
e
d
b
y
[
U
n
i
v
e
r
s
i
t
y
o
f
C
a
l
i
f
o
r
n
i
a
,
S
a
n
D
i
e
g
o
]
a
t
0
0
:
0
8
1
9
M
a
y
2
0
1
7
326 QUALITATIVE RESEARCH APPROACHES AND METHODS
Written texts, formal and informal documents, nonwritten communications, and nonverbal signs
and symbols.
Written texts include books, periodicals, narratives, reports, pamphlets, the mass media, and
other published materials. Research using these sources is often called library research, or desk
research. Formal and informal documents include personal messages and assorted types of archi-
val information, such as personal notes and memos, government records and vital statistics, and
other informal written materials, including e-mail. The wide variety of nonwritten communica-
tions, include graphic displays (graphs, tables, and charts), photographs and illustrations, tools
and other artifacts, films, and videotapes. The nonverbal signs and symbols category includes all
body language, facial expressions, gestures, music and dance, animal sounds and behavior, and
even noise.
Researchers employ a variety of analytical tools and methods in their study of texts, symbols,
and artifacts. Among these are hermeneutics, content analysis, meta-analysis, semiotic analysis,
discourse analysis, site surveys, and more. The analysis approaches used most often in public
and nonprofit organization research are the formal literature review; hermeneutic analysis of
textual material; content, discourse, and narrative analysis; meta-analysis; archival analysis; and
semiotic analysis.
Discussion Questions
1. In your own words, define “archives” and “archival material.”
2. Name some types of archival data and explain how they can be important for political
science research.
3. What is a meta-analysis? What are the steps in a meta-analysis procedure?
4. What is the hermeneutic approach to the analysis of textual data? How is the hermeneutic
process carried out?
5. What is the hermeneutic circle?
6. What is semiotics? How can political scientists use this method?
7. What is content analysis? Give an example or two of how and when you would use the
method.
8. What is narrative and discourse analysis?
9. What are some of the ways that culture affects political behavior?
10. How would you design a research project to study the role of neighborhood culture on
campaign participation among young voters?
Additional Reading
Banks, Marcus. 2001. Visual Methods in Social Research. London: Sage.
Cook, Michael. 1986. The Management of Information from Archives. Aldershot, UK: Gower.
Fink, Arlene. 2004. Conducting Research Literature Reviews. 2nd ed. Thousand Oaks, CA: Sage.
Fontana, David. 2003. The Secret Language of Symbols: A Visual Key to Symbols and Their Meanings. San
Francisco: Chronicle Books.
Gadamer, Hans-Georg. 2008. Philosophical Hermeneutics. Berkeley: University of California Press.
Gee, James Paul. 2005. An Introduction to Discourse Analysis: Theory and Method. New York: Rout-
ledge.
Jasper, David. 2004. A Short Introduction to Hermeneutics. Louisville, KY: Westminster John Knox Press.
Lipsey, Mark W., and David B. Wilson. 2001. Practical Meta-Analysis. Thousand Oaks, CA: Sage.
Webb, Eugene J., Donald T. Campbell, Richard D. Schwartz, and Lee Sechrest. 2000. Unobtrusive Measures.
2nd ed. Thousand Oaks, CA: Sage.
D
o
w
n
l
o
a
d
e
d
b
y
[
U
n
i
v
e
r
s
i
t
y
o
f
C
a
l
i
f
o
r
n
i
a
,
S
a
n
D
i
e
g
o
]
a
t
0
0
:
0
8
1
9
M
a
y
2
0
1
7
Part 4
Preparing and Presenting Research Findings
D
o
w
n
l
o
a
d
e
d
b
y
[
U
n
i
v
e
r
s
i
t
y
o
f
C
a
l
i
f
o
r
n
i
a
,
S
a
n
D
i
e
g
o
]
a
t
0
0
:
0
8
1
9
M
a
y
2
0
1
7
This page intentionally left blank
D
o
w
n
l
o
a
d
e
d
b
y
[
U
n
i
v
e
r
s
i
t
y
o
f
C
a
l
i
f
o
r
n
i
a
,
S
a
n
D
i
e
g
o
]
a
t
0
0
:
0
8
1
9
M
a
y
2
0
1
7
329
23 Organizing Information in Tables,
Charts, and Graphs
When first collected, “raw” data by themselves make little or no sense. Raw data are simply a
loose collection of numbers; they have no inherent meaning of their own. Data must be put into
some kind of order or structure; they must be grouped together into logical sets. Numbers do
not speak for themselves; they acquire meaning only when they are organized in terms of some
mutually understood framework (Wasson 1965). Researchers often use tables, charts, and graphs
to do this.
Nearly all research reports contain statistical data presented in tables, graphs, or charts. De-
scriptive statistics particularly are almost always presented in some sort of tabular or graphic form
(such as bar charts and pie charts). The type of table, chart, or graph used often depends upon
the preference of the manager presenting the information. There are many different styles from
which to choose. While the nature of the data has some influence on the structure selected for
presentation, this is mostly a matter of user preference. For example, summary data are usually
presented in the form of a table. However, graphic displays of numeric data can often have more
impact for a reader.
Most good research reports make maximum use of graphic communications tools. Remember
the old saying “A picture is worth ten thousand words”? This is true for research reports as well.
Graphics and other illustrations make reports more readable and, in the process, more effective
in meeting their communications objectives.
Tables, summaries, graphs, and other illustrations serve two fundamental purposes. First, they
make it easier for the researcher to capture the meaning of data and to more clearly apply the data
to the decisions or actions that are going to be made based on the results of the study. Second, they
make it easier for the readers of the report to see how the researcher arrived at the conclusions
and interpretations that are presented in the report.
This chapter describes three ways that researchers use structure and graphic representations
to better discover meaning in their studies, while also improving the communications quality of
their decision-making reports. It begins with a discussion on how to make sense of ungrouped
or “raw” data. This is followed by a discussion on how to make and use tables. The chapter then
examines several ways of developing charts and graphs.
Making Sense out of Raw Data
A principal objective of descriptive statistics is to summarize the information contained in a dataset.
A collection of raw data by itself typically contains very little information; further analysis and
D
o
w
n
l
o
a
d
e
d
b
y
[
U
n
i
v
e
r
s
i
t
y
o
f
C
a
l
i
f
o
r
n
i
a
,
S
a
n
D
i
e
g
o
]
a
t
0
0
:
0
8
1
9
M
a
y
2
0
1
7
330 PREPARING AND PRESENTING RESEARCH FINDINGS
bringing of order to the set is required. Researchers use tables and graphs to present data about
a single variable, about two variables at the same time, and about more than two variables. Is
statistical parlance, these are call univariate, bivariate, and multivariate statistics.
Univariate Statistical Presentations
One of the first analysis steps the researcher takes to establish some meaning from raw data is to
construct a graphic presentation of the underlying structure. This can be in the form of a frequency
distribution table, a stem-and-leaf diagram, a histogram, or any combination of these tools. Nearly
all statistical-analysis reports include frequency distributions. However, for some reason, analysts
often bypass stem-and-leaf diagrams.
Stem-and-leaf diagrams can often be more informative than simple frequency tables in that none
of the underlying data are lost in the analysis; all values are displayed in the diagram. Histograms
also present summary data, but they do not display individual values for a class in the same way
that a stem-and-leaf diagram does.
Before any analysis occurs, raw data are typically entered into a spreadsheet-based data file.
Examples include Microsoft Excel and the Statistical Package for the Social Sciences (SPSS). In
all spreadsheets, individual variables are entered as separate columns, while “cases” are entered
in rows. A different value is assigned to each category of a variable; each value is then assigned a
definition. For example, for the variable gender the value 1 might be used for all females and the
value 2 used for all males. Statistical software programs count the frequency of occurrence for each
value, compute summary statistics and percentages, calculate measures of central tendency and
variation, and conduct a host of other tests appropriate for the type of data. Collections of data are
maintained in datasets. Statistically processed data are maintained in data files or output files.
Frequency Distribution Tables
Preparing frequency distribution tables is typically the first step in applying structure to a collection
of raw data. Frequency tables present the frequency of occurrence for each class or category included
in the data structure. The data in a frequency table are presented as counts and as percentages.
Percentages are easily understood and typically convey more meaning than simple frequencies.
Statistical software programs that produce tables, charts, and graphs usually include a proce-
dure for producing summary statistics as well. Summary statistics include relative frequencies,
which are usually presented as percentages, measures of central tendency, and variation, among
others. Usually, the researcher will want more information than just the counts of occurrences in a
frequency distribution table. Therefore, statistical software programs such as SPSS also allow the
researcher to print the row, column, and total percentage of the total that each class represents.
Four guidelines to think about when arranging data in a table are: (1) the total number of classes
or categories to include, (2) the upper and lower limits of each category, (3) the titles, captions,
headings, and legends you want in the table, and (4) any additional explanatory information to
include, such as the relative percentage each number of occurrences represents.
Establishing Categories or Classes
Preparing a frequency table begins with determining how to group the table data into meaning-
ful categories. The total number of categories or classifications that cover all possibilities for the
dataset is called a category set. The category set should be selected as the data-gathering instru-
D
o
w
n
l
o
a
d
e
d
b
y
[
U
n
i
v
e
r
s
i
t
y
o
f
C
a
l
i
f
o
r
n
i
a
,
S
a
n
D
i
e
g
o
]
a
t
0
0
:
0
8
1
9
M
a
y
2
0
1
7
ORGANIZING INFORMATION IN TABLES, CHARTS, AND GRAPHS 331
ment is prepared. The number of classes or categories in the set—that is, the level of precision
employed—depends on the purpose of the decision making. Decisions that involve large sums of
money or potential loss of life, for example, will require greater precision than decisions that deal
with routine activities. The number of categories or classes selected for such measures depends
first on the nature of the data. For example, dichotomous data (male-female, yes-no, pass-fail)
require two and only two classes. With multichotomous data (data with more than two categories),
the analyst’s choices are more complicated.
In the final analysis, the researcher who prepares the dataset is the one who establishes how
many classes to include in a table. Despite the assumed “scientific” nature of statistics, there is
little agreement on the number of classes. Recommendations can be found that vary from a range
of five to fifteen classes up to a range of ten to twenty. However, when people are presented with
numbers of classes beyond eight or so, some confusion or loss of continuity can occur.
When working with ranked data (ordinal measurements) such as candidate or program prefer-
ences or needs priorities, the most commonly used number of classes ranges from around six to a
maximum of twelve subjects. Experienced data analysts are convinced that most people experience
difficulty when asked to rank more than six to eight items. When asked to rank large numbers of
items, people are usually able to quickly rank the top and bottom few, but distinctions tend to blur
when they face items in the middle rankings.
Because a key purpose for presenting data in tables in the first place is to communicate patterns
in the data, it is best to keep the number of categories to a number that makes most sense to the
people reading the tables. This usually means using the fewest meaningful categories or classes
possible. Convention suggests using no more than ten classes and preferably something closer to
six or seven, at most.
The data in Table 23.1 represent a hypothetical count of the number of entry visas for the United
Table 23.1
Daily Applications for Entry Visas, Quarter 1 Data
Week
Monday
Tuesday
Wednesday Thursday
Friday
Saturday
1
110
83
95
112
110
72
2
99
121
115
105
112
59
3
120
80
92
103
111
61
4
121
95
87
125
103
63
5
73
113
78
92
93
64
6
91
83
122
107
93
71
7
107
130
85
111
112
56
8
99
69
74
104
106
57
9
123
105
111
101
117
66
10
85
105
109
88
109
55
11
108
99
117
106
109
61
12
102
75
74
128
116
54
13
64
124
91
118
85
63
Totals
1,302
1,282
1,250
1,400
1,376
802
Mean
95.03
SD
20.92
Source: Hypothetical data.
D
o
w
n
l
o
a
d
e
d
b
y
[
U
n
i
v
e
r
s
i
t
y
o
f
C
a
l
i
f
o
r
n
i
a
,
S
a
n
D
i
e
g
o
]
a
t
0
0
:
0
8
1
9
M
a
y
2
0
1
7
332 PREPARING AND PRESENTING RESEARCH FINDINGS
States processed at a U.S. embassy each week over a quarter. Numbers are smaller on Saturdays
because of a shorter workday. The visa officer recorded processing an average of a little more than
95 visas per day during the quarter, with a standard deviation of almost 21. The embassy officer
wants to display the data in a table that best explains the underlying structure of the data.
The hypothetical data in Table 23.1 are shown organized into rows and columns. The rows
are weeks; each week is considered a case. Each column is a different day’s total number of visa
applications processed (these values are known as the “frequency of responses”). The width or
inclusiveness of each class in a table is influenced by the nature of the data, the frequencies of
occurrence, and the guidelines for the maximum number of classes to include. A formula to help
establish class width follows:
Class Width =
Range of the Data
Preferred Number of Categories
The range is determined by subtracting the lowest value from the highest measurement. The
analyst has complete freedom to choose, again guided by the previously mentioned rules of
thumb, the number of classes or categories to use. By scanning through the data, the analyst can
see that the highest number of sales applications processed (130) occurred on Tuesday of Week
7. The lowest number (54) occurred on Saturday of Week 12. Therefore, the range is 130 minus
54, or 76. The embassy officer thinks that he would like to present the data after it is grouped in
six or so classes. To establish class width, the officer substitutes the range and desired number
of classes numbers in the formula, and comes up with a class width of 12.66 .
W= 76 =12.66
6
A class width of 12.66 would, of course, be very difficult to work with. However, since
the nature of the data seems to lend itself to groupings of 10, and because 12.66 is about as
close to 10 as it is to 15, it is much more likely that the officer would use a class width of 10
rather than the cumbersome 12.66. If a class width of 10 is selected, the number of classes
must be increased from the desired 6 to 9. This is still below the convention-imposed upper
limit of 10. The important thing to remember is that all the classes must be the same size
(equal in width), and that all measures can fall into one and only one class. Thus, the 10-
wide ranges for each class should be 50–59, 60–69, and so on. Table 23.2 was produced by
the Data Analysis: Histograms capability in Microsoft Excel. Note that only one value of
the class width range needs to be identified for the table bin-width requirement. Excel uses
the term “bin” to refer to the categories within which response values will be collected, and
bin-width to refer to how many values are to be included in each bin. For example, the age
categories 15–24 and 25–34 are bins. Each bin has a width of ten values. Both bins and bin-
widths may be chosen by the researcher.
Additional guidelines for presenting data in tables begin with numbering each table and
including a caption. Most often, it is easier to read the table when the data are arranged down-
ward, as opposed to having them spread across a page. Columns and rows must be identified,
with qualifiers placed under the table in the form of footnotes. The caption and figure number
of a table is always printed above the table; captions for graphs, charts, and other illustrations
are presented below the figure.
Almost any type of data can be presented in a table. In addition, tables may display
D
o
w
n
l
o
a
d
e
d
b
y
[
U
n
i
v
e
r
s
i
t
y
o
f
C
a
l
i
f
o
r
n
i
a
,
S
a
n
D
i
e
g
o
]
a
t
0
0
:
0
8
1
9
M
a
y
2
0
1
7
ORGANIZING INFORMATION IN TABLES, CHARTS, AND GRAPHS 333
information about one, two, or more than two variables. That is, they may be univariate,
bivariate, or multivariate. Table 23.3 is a univariate table; it displays data for only the
variable gender.
Table 23.4 is a bivariate table, in which responses for two variables are included. The
variables are gender of respondent and political party membership. Table 23.5 is a multivari-
ate table, in which the distribution of frequency responses for three variables, gender, height,
and weight, are displayed.
Relative Frequency Distribution Tables
A type of table often seen in research reports is the relative frequency distribution table. In a
frequency distribution table, instead of reporting every measurement or response separately as is
required for a stem-and-leaf diagram, all scores are grouped into classes, their occurrence counted,
and converted to proportions and percentages. Relative frequency refers to the proportion of the
total that each group or value represents.
Knowing the relative frequency of responses can be important for several different types of
comparisons of the distribution of responses. The researchers compare counts and percentages. The
Table 23.2
Excel Frequency Table Showing 10-Wide Bins, Table 23.1 Data
Bins
Frequency
50
0
60
5
70
8
80
8
90
7
100
11
110
18
120
13
130
8
More
0
Total:
78
Source: Example data from Table 23.1 .
Table 23.3
Gender Distribution of Responses, Satisfaction Study Sample
Gender
Sample n
Count
Percent of
Responses
Percent of
Total Sample
Females
500
456
58.6
45.6
Males
500
322
41.4
32.2
Missing
—
222
—
22.2
Total
1,000
778
100.0
100.0
Source: Experimental data.
D
o
w
n
l
o
a
d
e
d
b
y
[
U
n
i
v
e
r
s
i
t
y
o
f
C
a
l
i
f
o
r
n
i
a
,
S
a
n
D
i
e
g
o
]
a
t
0
0
:
0
8
1
9
M
a
y
2
0
1
7
334 PREPARING AND PRESENTING RESEARCH FINDINGS
relative frequency of responses for each class can also be read as a probability of occurrence for
that class. Table 23.6 is an example of a simple frequency distribution table that shows responses
to a scale of exercise participation.
Rules for Frequency Distribution Tables
Researchers must be aware of the important rules to follow when preparing frequency dis-
tribution tables. First, the table must exhibit internal consistency. That is, groups or classes
must be equal in size. In Table 23.6, except for the upper level, all classes consisted of three-
hour levels. Although the highest category appears to be open-ended, it is not. It includes
the highest count while making it possible for the researcher to deal with outliers. Outliers
are “abnormal” counts that fall outside of the normal distribution confidence interval. That
is, they are either excessively high or low. Because they fall outside of the assumed normal
distribution, ignoring them results in loss of the information about the case. Therefore, if the
outlier is abnormally high, it is grouped with the highest class; if it is abnormally low, it is
grouped with the lowest class.
An example for the data in Table 23.6 would be if one member of the employer-sponsored fit-
Table 23.4
A Bivariate Table Produced with SPSS Crosstabs Program
Gender:
Political Party
Totals
Democrat
Republican
Independent
Female
Count:
28
6
16
50
% within Sex of
56.0
12.0
32.0
100.0
Respondent
Male
Count:
12
26
12
50
% within Sex of
24.0
52.0
24.0
100.0
Respondent
Totals:
Count:
40
32
28
100
% within Sex of
40.0
32.0
28.0
100.0
Respondent
Source: Experimental data.
Table 23.5
Physical Characteristics of Fitness Group A-1, Week 1
Mean Weight
Gender
Sample n
Mean Height (inches)
(pounds)
Females
456
66.6
129.50
Males
322
71.3
177.00
Total
778
Source: Example data.
D
o
w
n
l
o
a
d
e
d
b
y
[
U
n
i
v
e
r
s
i
t
y
o
f
C
a
l
i
f
o
r
n
i
a
,
S
a
n
D
i
e
g
o
]
a
t
0
0
:
0
8
1
9
M
a
y
2
0
1
7
ORGANIZING INFORMATION IN TABLES, CHARTS, AND GRAPHS 335
ness program was an “exercise freak,” working out more than 3 hours a day, 6 or 7 days a week,
or a total of 21 hours. The gap between 13 and 21 hours would require two blank classes. By
including the outlier in the highest “normal” class, its ability to excessively influence the group
average has been alleviated.
Second, frequency distribution tables should include the relative frequency and often, but not
necessarily always, the cumulative frequency of occurrences. Relative frequency is the proportion
of the total each class represents. It can be stated as a decimal or as a percentage. In decimal form
the total must always equal 1; in percentages, the total must equal 100 percent. In Table 23.6, the
relative frequency of the lowest category is .156, or 15.6 percent.
Table 23.7 is an expanded version of a relative frequency table. The final column on the right
displays the cumulative relative frequency. This is simply the sum of a class and all preceding
classes. For example, the cumulative relative frequency for the second level, 4 to 6 hours, is its
value (21.9 percent) plus the value of the 3-hours or less class (15.6 percent), for a total of 37.5
percent. The data in Table 23.7 are from a fitness program study. In this example, the sample
includes 35 workers instead of 32; three of the subjects did not respond to the question of how
many hours they exercised each week.
Finally, some statistical software packages include provisions for computing relative fre-
quencies when the data contain missing values. A missing value might occur when a subject
refuses to answer a particular question on a survey. When this occurs, the relative frequency
distribution column will include the proportion of the total represented by the missing val-
ues. A separate column labeled valid percent will appear in the table alongside the relative
frequency column.
Table 23.6
Weekly Exercise Rates, Total Sample
Weekly Hours of Exercise
Frequency
Relative
Frequency
Cumulative
Percent
3 hours or less
5
.1 56
15.6
4to6hours
7
.2 19
37.5
7to9hours
10
.312
68.7
10 to 12 hours
8
. 250
93.7
13 hours or more
2
.063
100.0
Weekly Hours of
Exercise
Count
Percent
Valid Percent
Cumulative
Percent
3 hours or less
5
14.3
15.6
15.6
4to6hours
7
20.0
21.9
37.5
7to9hours
10
28.6
31.2
68.7
10 to 12 hours
8
22.8
25.0
93.7
13 hours or more
2
5.7
6.3
100.0
Missing
3
8.6
—
Totals
35
100.0
100.0
Table 23.7
Weekly Exercise Rates, Total Sample
D
o
w
n
l
o
a
d
e
d
b
y
[
U
n
i
v
e
r
s
i
t
y
o
f
C
a
l
i
f
o
r
n
i
a
,
S
a
n
D
i
e
g
o
]
a
t
0
0
:
0
8
1
9
M
a
y
2
0
1
7
336 PREPARING AND PRESENTING RESEARCH FINDINGS
Preparing a Stem-and-Leaf Diagram
A stem-and-leaf diagram is a convenient way to display at one glance each of the measurements
for each major value. As a result, it is appropriate for use with relatively small samples. In the
Package 2 dataset displayed in boldface type in Table 23.8, the first value to show up in the stem
diagram will be the whole number of ounces in a pharmaceutical research package: 7, 8, or 9. The
second value in the stem is the first digit after the decimal point; in this dataset the lowest value
is 7.5; the next is 7.9, and so on. The stem contains all whole numbers; leaves are the hundredths-
of-an-ounce measurement after the whole number.
The following example of a pharmaceutical researcher at a research hospital is provided
to illustrate how data might be presented in a stem-and-leaf diagram. The researcher is
responsible for ensuring that the package-filling equipment loads eight ounces of a new
pain-killing product into each package. The product is being distributed as part of a medical
experiment to determine whether a new drug is more effective than aspirin at treating arthritis
pain. It would not be cost effective to weigh every single package; instead, with the approval
of supervising medical staff, the researcher randomly selects six sample packages from the
package-filling line.
Over a four-hour morning shift, sets of sample packages are pulled and weighed every quarter-
hour, until a total sample of 96 packages (4*4*6) in 16 samples of six packages each is collected.
The researcher must present a summary of the measurements to the experiment supervisor. The
summary can be presented as a stem-and-leaf diagram, a frequency distribution table, or a histo-
gram. The stem-and-leaf diagram option is described here.
Before any of these communications tools can be processed by statistical software, however,
the data must first be entered as a dataset in a spreadsheet format. Stems and leaves are the values
of a variable. In this dataset, each package in a sample is assumed to be a separate variable. For
the sake of brevity, the stem-and-leaf diagram in Figure 23.1 was produced for only one column,
the Package 2 variable (a full stem-and-leaf diagram for all 96 packages in the sample, and the
variable would be “Package Weights”).
Preparing a Stem-and-Leaf Diagram with SPSS
Excel does not include a special function or “Wizard” for creating stem-and-leaf diagrams. How-
ever, with several simple intermediate steps, it is possible to come up with a satisfactory diagram.
SPSS does have this capability to quickly produce a stem-and-leaf diagram for each variable in the
dataset. For this example, each of the six packages selected was considered to be a variable; the
Package 2 set was chosen for the example SPSS stem-and-leaf diagram. The results are presented
in a different form than they appear in the table: the first value in the stem—in this column, 7 and
8 only—was the first digit in the stem. The second digit was the tenths value, resulting in stem
values of 79, 80 and 81. The leaves in the diagram are the hundredths of an ounce measurement
(i.e ., the second number after the decimal point). The first column in the output lists the number
of leaf measurements in that category. For example, there were two observations in the 7.9 to 7.9
category (7.95 and 7.99), seven observations in the 8.0 to 8.49 category, and four observations in
the 8.00 to 8.19 category (8.11, 8.12, 8.13, and a second 8.13).
Communicating with Charts and Graphs
Charts and graphs are used to pictorially present numerical data. They are most often used to dis-
play summary information about a dataset, although they are not limited to this application alone.
D
o
w
n
l
o
a
d
e
d
b
y
[
U
n
i
v
e
r
s
i
t
y
o
f
C
a
l
i
f
o
r
n
i
a
,
S
a
n
D
i
e
g
o
]
a
t
0
0
:
0
8
1
9
M
a
y
2
0
1
7
ORGANIZING INFORMATION IN TABLES, CHARTS, AND GRAPHS 337
With today’s increasingly powerful spreadsheet and statistical software programs, together with
color inkjet printers, these pictorial devices are easy and quick to produce and use.
Charts and Graphs
Among the more commonly used types of charts and graphs are bar charts, frequency polygons,
line and area charts, scatter plots, and pie charts.
Bar Charts
Bar charts show how many measurements or observations fall into each class or category of each
variable. Printers may use asterisks (stars) or shading to represent the extent of the relative fre-
quencies. It is important to remember that the bars are not accurate measures; they are symbolic.
Table 23.8
Weights of Sample Pharmaceutical Research Packages, Example Data
Package Weights (in ounces)
Package Package Package Package Package Package
Sample Hour Quarter
1
2
3456
1
1
1
8.04
7.95
7.87
7.90
7.98
8.07
2
1
2
8.02
8.04
7.93
8.11
7.94
8.98
3
1
3
8.00
8.11
8.04
7.99
7.97
8.08
4
1
4
7.90
8.02
8.06
7.98
7.96
8.05
5
2
1
8.06
8.13
7.97
8.09
7.88
7.97
6
2
2
8.05
8.04
8.04
8.07
7.89
8.00
7
2
3
8.04
8.07
8.11
8.06
7.94
8.01
8
2
4
8.06
8.06
8.02
8.11
8.04
8.02
9
3
1
8.05
8.04
7.99
8.06
7.99
8.01
10
3
2
8.20
8.03
8.06
8.05
8.00
8.00
11
3
3
8.00
8.03
8.01
8.10
8.01
8.00
12
3
4
8.00
8.12
8.02
7.89
8.01
7.90
13
4
1
8.01
8.13
8.05
7.88
8.00
8.01
14
4
2
8.02
7.99
7.07
7.79
8.00
7.89
15
4
3
8.01
8.05
8.24
7.78
7.90
7.99
16
4
4
8.03
8.04
8.11
7.77
8.01
8.00
Frequency Stem
Leaves
0.0
79.
0
2.0
79.
59
7.0
80.
2334444
3.0
80.
567
4.0
81.
1233
Stem width: 10
Each leaf: 1 case(s)
Figure 23.1 An SPSS-Produced Stem-and-Leaf Diagram for Package Design Two
D
o
w
n
l
o
a
d
e
d
b
y
[
U
n
i
v
e
r
s
i
t
y
o
f
C
a
l
i
f
o
r
n
i
a
,
S
a
n
D
i
e
g
o
]
a
t
0
0
:
0
8
1
9
M
a
y
2
0
1
7
338 PREPARING AND PRESENTING RESEARCH FINDINGS
The bars in any one chart may not appear to exact scale, but they do give a clear visual impres-
sion of the variation among the values in the class. Bar charts may be displayed either vertically
or horizontally; charts with many classes should typically use the horizontal form (page width
limitations might otherwise force the chart into an overlap, confusing the viewer).
Bar charts are often used to show changes or trends over time. In this application, the hori-
zontal line is always the time line, while the vertical line represents the data values. Figure
23.2 is a vertical bar chart (column chart) of student visa processing example data; it is based
on ten-wide bin sizes.
Histograms
A second way to graphically display a frequency distribution is with a histogram. A histogram
has a visual appearance much like a bar chart, except that in histograms the bars often touch one
0
5
10
15
20
50
60
70
80
90
100
110
120
130
More
Range of Visas Processed
C
o
u
n
t
Figure 23.2 Vertical Bar Chart (Column Chart) Produced by Excel
Bins
Frequency
50
0
60
5
70
8
80
8
90
7
100
11
110
18
120
13
130
8
More
0
Total:
78
D
o
w
n
l
o
a
d
e
d
b
y
[
U
n
i
v
e
r
s
i
t
y
o
f
C
a
l
i
f
o
r
n
i
a
,
S
a
n
D
i
e
g
o
]
a
t
0
0
:
0
8
1
9
M
a
y
2
0
1
7
ORGANIZING INFORMATION IN TABLES, CHARTS, AND GRAPHS 339
another (gaps always separate the bars of a bar chart). And, while bar charts should only be used
when displaying discrete data (that is, data in distinct categories such as occupations), histograms
can be used to display both discrete and continuous data.
The Excel Tools/Data Analysis/Histogram wizard was used to construct the bin frequency
table in Table 23.9 and the histogram in Figure 23.3. Recall that a computed class width us-
ing the mathematical formula resulted in a value of 12.66, which is a cumbersome span. Bin
widths of 10 or 15 measurements could have been used with similar results. The histogram in
Figure 23.3 was calculated using a bin width of 15, whereas ten-wide bins were used in Table
23.2 displayed earlier.
Examples of continuous data include income, height, weight, and other similar measures. As
with frequency distribution tables, continuous data categories or classes used in histograms must
Table 23.9
15-Wide Bins and Frequencies for Visa Applications Data
Bin
Frequency
60
5
75
14
90
9
105
19
120
23
135
8
More
0
0
5
10
15
20
25
60
75
90
105
120
135
More
Number of Visas
F
r
e
q
u
e
n
c
y
Figure 23.3 Histogram of Hypothetical Visa Applications Data (Quarter 1) for
Table 23.9 Data
D
o
w
n
l
o
a
d
e
d
b
y
[
U
n
i
v
e
r
s
i
t
y
o
f
C
a
l
i
f
o
r
n
i
a
,
S
a
n
D
i
e
g
o
]
a
t
0
0
:
0
8
1
9
M
a
y
2
0
1
7
340 PREPARING AND PRESENTING RESEARCH FINDINGS
exhibit internal consistency; all classes must be of the same width. In histograms, the horizontal
line (x-axis) displays the measurement values of the data, while the vertical (y-axis) represents
the frequencies or counts of how often the values occur.
Graphs
Graphs are another good way to present a visual summary of data. The types used most are line
graphs, frequency polygons, and pie graphs (also known as “pie charts”).
Line Graphs
Line graphs (or line charts) are used to show how values of a variable change over time. The
time periods are always shown on the horizontal axis, while the vertical axis displays the
values of the variables being examined. When plotting continuous data, the points at each
time period represent the middle level of the class. Simple line graphs are used this way to
display trend lines of single variables. Compound line charts displaying the component val-
ues of a larger sum are often used to visually display comparisons over time. A line chart is
displayed in Figure 23.4 .
Frequency Polygons
Frequency polygons display much the same data as histograms: the counts of occurrences of each
value of a variable. In appearance, however, they look almost identical to line graphs. For many
0
5
10
15
20
25
60
75
90
105
120
135
More
Daily Total Groups
C
o
u
n
t
s
Figure 23.4 Line Chart of First-Quarter Visa Totals for Table 23.9 Data
D
o
w
n
l
o
a
d
e
d
b
y
[
U
n
i
v
e
r
s
i
t
y
o
f
C
a
l
i
f
o
r
n
i
a
,
S
a
n
D
i
e
g
o
]
a
t
0
0
:
0
8
1
9
M
a
y
2
0
1
7
ORGANIZING INFORMATION IN TABLES, CHARTS, AND GRAPHS 341
years, when statistical computations were done by hand or, at best, with a hand calculator, the
frequency polygon was probably the most often used method for graphically displaying frequency
distributions. This was because they are extremely easy to construct. However, today they are not
encountered as often as bar charts and histograms.
With all frequency polygons, two axes are need. The vertical axis almost always represents
the frequencies; the horizontal axis displays the measurement or class values. With grouped data,
the mid-point of the interval is used. When plotting specific data such as individual scores, the
actual score value is used. Lines connect all total frequency values. The polygon’s lines are often
extended to one value above and one below the observed data so as to “close off” the polygon
instead of leaving it hanging in midair.
Frequency polygons can also be used to plot and compare two or more sets of scores or values
that are based on separate scales. In this case, use the relative frequency distribution in place of
actual frequency distributions.
Pie Charts
In pie charts, the data are presented as portions of a 360-degree total. Each portion of the “pie” is
a representation of its proportion of the total (100 percent). Figure 23.5 is a pie chart of the data
presented in Table 23.10. It was produced with the Excel Chart Wizard.
Scatter Plots
Scatter plots are a separate category of ways to visually present data. Scatter plots are used to
display a series of points depicting the relationship between two (or more) related or associated
variables. In one sense, they might be considered to be somewhat similar to line charts, except
that no lines connect the various points on the scatter plot. Measurement units for one variable
are marked on one axis; units for the second variable are marked on the other axis. For example,
a quality scatter plot might list machine production rates on one axis and part failures on another.
Each point represents a single measure of both variables.
When all measures are plotted, a visual picture of the relationship between variables can often
be seen (Figure 23.6). When scatter plots are used to display dependent-independent variables,
the horizontal axis is the independent variable. An example of an independent variable could be
various levels of advertising expenditures; the dependent variable might be sales levels associated
with different levels of advertising spending.
Table 23.10
Vote Contribution by Region
Region
(%)
Pacific Northwest
11
Mountain States
20
Southwest
15
Central
27
New England
13
Southeast
14
Total
100
D
o
w
n
l
o
a
d
e
d
b
y
[
U
n
i
v
e
r
s
i
t
y
o
f
C
a
l
i
f
o
r
n
i
a
,
S
a
n
D
i
e
g
o
]
a
t
0
0
:
0
8
1
9
M
a
y
2
0
1
7
342 PREPARING AND PRESENTING RESEARCH FINDINGS
Pacific Northwest
11%
Mountain States
20%
Southwest
15%
Central
27%
New England
13%
Southeast
14%
Figure 23.5 Vote Contribution by Region for Table 23.10 Data
0
20
40
60
80
100
120
140
02
04
06
08
01
0
0
Quantity
D
a
i
l
y
T
o
t
a
l
s
Figure 23.6 A Scatter Plot Example
D
o
w
n
l
o
a
d
e
d
b
y
[
U
n
i
v
e
r
s
i
t
y
o
f
C
a
l
i
f
o
r
n
i
a
,
S
a
n
D
i
e
g
o
]
a
t
0
0
:
0
8
1
9
M
a
y
2
0
1
7
ORGANIZING INFORMATION IN TABLES, CHARTS, AND GRAPHS 343
Summary
When first collected, raw data seldom make sense. Raw data are simply a loose collection of
numbers with no intuitive meaning of their own. Data must be put into some kind of order or
structure; they must be grouped together into sets that have logic and structure. Numbers do not
speak for themselves; they acquire meaning only when they are organized in terms of some mu-
tually understood framework. To begin with, data must be ordered and classified into a structure
that has meaning and pertains to the decision problem. Often, the first step in this process is the
preparation of simple univariate, bivariate, and/or multivariate tables that present the data in
summary form.
Tables are nothing more than sets of numbers and their identifying labels, presented in some
organized, logical way. When quantitative information is arranged in tables, it is easier for per-
sons reading the report to spot trends, relationships, and differences in the data. Examples of data
almost always presented in the form of a table include demographic data, such as family incomes,
subjects’ occupational categories, the geographical dispersion of voters, and size or performance
measures that fall within researcher-determined tolerances.
An early step in the analysis and interpretation of statistical data is arranging the collected
numbers in some logical sequence; this is often done by reorganizing the data into ascending or
descending order, or transforming it into standardized values, which can then be organized into
logical tabular form.
Graphic displays of data also improve the researcher’s ability to communicate meaning to read-
ers. Bar charts, histograms, line and area charts, scatter plots, and pie charts are used to graphically
display the information mined from datasets.
Discussion Questions
1. Why do good research reports make maximum possible use of graphic display tools?
2. What are some reasons to display data in tables?
3. What is a frequency distribution table? How does it differ from a relative frequency dis-
tribution table? What are the rules for making a relative frequency distribution table?
4. What is a stem-and-leaf diagram? What are its advantages?
5. Seven different types of charts and graphs were mentioned in the chapter. Name and
describe at least five of them.
6. What is a pie chart? What is a frequency polygon?
7. How can you use Microsoft Excel to make charts and graphs?
8. How can you make tables with SPSS for Windows?
Additional Reading
Albert, Jim. 2003. Teaching Statistics Using Baseball. Washington, DC: The Mathematical Association of
America.
Green, Samuel B., Neil J. Salkind, and Theresa M. Akey. 1999. Using SPSS for Windows: Analyzing and
Understanding Data. 2nd ed. Upper Saddle River, NJ: Prentice Hall.
Myers, Judith G. 2003. Banishing Bureaucratese: Using Plain Language in Government Writing. Vienna,
VA: Management Concepts.
Tufte, Edward R. 1983. The Visual Display of Quantitative Information. Cheshire, CT: Graphic Press.
D
o
w
n
l
o
a
d
e
d
b
y
[
U
n
i
v
e
r
s
i
t
y
o
f
C
a
l
i
f
o
r
n
i
a
,
S
a
n
D
i
e
g
o
]
a
t
0
0
:
0
8
1
9
M
a
y
2
0
1
7
344
24 Organizing and Writing a Research Report
Once research data has been collected, tabulated, and analyzed, the researcher must then organize
the information and choose a structure for presenting the findings of the study and his or her con-
clusions. There are many different ways to do this. One way is to use a chronological organization
style. A second approach is to use an organization style that goes from the general to the specific
or from the specific to the general. The researcher could use the points in the definition of the
study question or the research hypotheses as a discussion structure. This could mean starting a
paragraph with a point or a hypothesis, then using material from the literature to show how the
point is applied in practice. Many other approaches are also possible.
This book presents no ironclad rules to follow when deciding how to organize research findings
and present ideas. However, it is recommended that the report writer avoid jumping around from
one point to another with no underlying plan. Remember: a fundamental goal of your writing is
that it be read. For that to happen, it must be interesting and readable. This requires adopting a
structure and sticking to it.
How to Structure a Research Report
The key step in organizing and presenting ideas in a political science research is to select a point
of view. This involves deciding how you will structure the paper so that the ideas flow smoothly
from section to section. The chances of the paper being read can often be improved by following
a simple, standard structure and by using a writing style consistent with the writing in that field of
study. Later, if the researcher tries to publish the research report, the format must meet the specific
structure and style requirements of the selected journal. For now, researchers should concentrate
on meeting as many of the requirements as possible.
Points of View for Research Report
Different disciplines in the social and administrative sciences and the humanities often recommend
a variety of ways to structure or organize their written report. A valuable overview of some of the
different directions or points of view that researchers can take when planning and writing reports
of their findings has been suggested by Sorrels (1984, Chapter 6), who lists seven different points
of view (or “patterns”) that are often chosen:
1. The indirect pattern, which moves from factual parts to a general conclusion.
2. The direct form, which reverses this order. With this form you move from a general
conclusion to the facts that support it.
D
o
w
n
l
o
a
d
e
d
b
y
[
U
n
i
v
e
r
s
i
t
y
o
f
C
a
l
i
f
o
r
n
i
a
,
S
a
n
D
i
e
g
o
]
a
t
0
0
:
0
8
1
9
M
a
y
2
0
1
7
ORGANIZING AND WRITING A RESEARCH REPORT 345
3. A chronological pattern. In this organization form you take the reader through an order
of events, such as a sequence of dates.
4. A spatial pattern. An example of this method is a paper that moves the reader from one
department or location to others in a logical sequence.
5. An analytical organization, in which the whole is separated into parts, with each part
addressed completely before moving onto the next part.
6. A comparative pattern. As the name implies, parts of a whole are compared point by point.
7. A ranked method, where portions of the paper are presented in the order of their impor-
tance or impact; the importance may be in ascending or descending order.
Sections in a Research Report
Written research reports contain, at most, nine or ten parts or sections. These are usually organized in
an order similar to that displayed below. However, it is also important to remember that not all papers
and reports follow this format and not all include every one of these major components. The key is
to find the structure that meets the requirements of the medium in which it will be presented.
I. Title Page
II. Abstract
III. Introduction or Rationale for the Study
IV. Review of the Literature examined for the study
V. Discussion of the Methodology used for the study
VI. Complete discussion of the Results or Findings
VII. Conclusions and/or Recommendations
VIII. Detailed list of the References and/or Sources Cited
IX. Appendices
The following sections contain a brief discussion of the major report components. Keep in mind
that this represents a summary or compendium of many different report style recommendations.
As they scan published papers and books, researchers are likely to encounter a host of variations
from this list of components. This should not create problems; instead, it allows for greater flex-
ibility in preparing the presentation. Keep in mind that most researchers and business writers in
general do not regularly follow any one style or format for their reports. Thus, the format and
style presented here have been designed to meet most writing requirements and can be safely
followed in most instances.
Notice that this list does not include any mention of charts, tables, graphs, illustrations, draw-
ings, models, or other graphic communication tools. That is because these tools are not limited to
any one section of a report. Naturally, graphic items are seldom if ever found on the title page or
in the abstract or references. However, there is nothing to say that they cannot be used in any or
all of the other sections. When used correctly, graphic tools greatly improve the communicative
ability of a report. They allow the researcher to present detailed information clearly, succinctly,
and at a glance, regardless of where they are used in the report.
The Title and Title Page
The title is often one of the most important components of a paper. It should leap off the page
at the reader, grabbing his or her attention. This does not mean that it should be “cute.” In fact,
D
o
w
n
l
o
a
d
e
d
b
y
[
U
n
i
v
e
r
s
i
t
y
o
f
C
a
l
i
f
o
r
n
i
a
,
S
a
n
D
i
e
g
o
]
a
t
0
0
:
0
8
1
9
M
a
y
2
0
1
7
346 PREPARING AND PRESENTING RESEARCH FINDINGS
always avoid using anything that smacks of being cute. Never use slang in your writing. If for
some reason slang must be used for special effect, for example, it should always be set off in
quotation marks or italics.
Most students and beginning researchers tend to use titles that are too general or that do not say
anything about what the research or assignment involves. For example, “A Report in Compliance
with the Research Assignment of February 2,” is not an appropriate title, even if it is accurate.
Do not make the title too long; eight or ten words ought to be the maximum. Fewer are best.
On the other hand, do not be too terse (abruptly brief). Research papers are not newspaper stories;
short, tricky headlines as titles are not appropriate—even if they are explained in the first section
of the paper.
Components of a Good Title
Good titles contain four key components. First, they identify the topic. Second, they spell out
the specific dimension of the study. Third, they name whom the study is about; and fourth, they
explain what methodology was followed. Thus, when coming up with a title, researchers must
consider the following:
1. The topic of the study
2. The specific application or dimension of the topic you studied (examples might be in-
novations, revisions, results, effects, use of, new ways of, etc.)
3. The agency, location, people, industry, or other such relevant focus
4. Key methodology used (qualitative, quantitative, etc.)
The purpose of the title is to tell the reader what the paper is about—and to capture the reader ’s
interest so that the full, finished product is read. For example, say that a researcher has examined
the actions of a state agency accused of practices that are destructive to the environment. The
research report might be titled: “Environmental Actions of a State Agency.” But that’s not good
enough. Readers need to know what kinds of actions were studied, why they are important enough
to study, and why a report has been written. Who really cares? A better approach to take with the
above title, then, might be: “A Review of Reports of the Environmentally Destructive Logging
Practices of the State Bureau of Water Resources.”
The topic of the paper, the first component, is the “environment.” The specific dimension
studied is “environmentally destructive logging practices.” The organization is the “State
"UREAUOF7ATER2ESOURCESv4HEMETHODOLOGYISAhREVIEWvOFPUBLISHEDREPORTS!h@REVIEWv
usually refers to a secondary literature research strategy. The researcher studies the issue by
reading all available information about the bureau and the topic. Then, a synthesis of that
information is presented in the research report. This qualitative research method is known
as a “literature review.”
It is good to include the research method followed in the title of the final report as often as
possible. Some examples of titles for reports in these types of studies include the following.
Example Qualitative Study Titles
s h!N %THNOGRAPHIC!NALYSIS OF5SING#OMMUNITY-EETINGS TO/VERCOME.EGATIVE0UBLIC
Attitudes”
s h5SING0ERSONAL)NTERVIEWSASAWay of Measuring Public Confidence in Mutual Funds”
D
o
w
n
l
o
a
d
e
d
b
y
[
U
n
i
v
e
r
s
i
t
y
o
f
C
a
l
i
f
o
r
n
i
a
,
S
a
n
D
i
e
g
o
]
a
t
0
0
:
0
8
1
9
M
a
y
2
0
1
7
ORGANIZING AND WRITING A RESEARCH REPORT 347
Example Quantitative Study Titles
s h!&ACTOR!NALYSISOF#ONSUMER!TTITUDESAbout Banning Smoking in Tacoma, Washington”
s h!4IME3ERIES!NALYSISOF-INORITY(IRING$ATAIN4WO#ALIFORNIA3TATE!GENCIESv
Finally, the title page should include the title of the paper, the name of the author or authors
(usually in alphabetical order based on the first letter of the last name), and any other relevant
information. Examples of title pages for a typical class term paper and for a large paper (a master ’s
thesis) are shown in Figures 24.1 and 24.2 .
The Abstract
The abstract is a concise summary of the research study and report. It is placed at the top of the
first page of the paper, immediately below the title and before the introduction section. While
most reports are typed double-spaced, the abstract is usually typed single-spaced and indented
five spaces on both margins of the paper.
Typically, the abstract ranges from 100 to 200 words. In some journals, such as the Journal
of Marketing Channels, instructions for authors call for the abstract to be fewer than 100 pages.
Whatever the length, in this short space the abstract must inform readers what was done, how it
was done, the most significant results or findings, and what readers will find when they read the
entire paper.
Abstracts are found in all professional journal articles and in the long-form listing of papers
included in such CD-ROM databases as ABI-Inform and others. Abstracts contain enough infor-
mation to accurately inform the researcher of the key ideas in a paper, while also encouraging the
researcher to read the full paper.
In a report prepared for internal distribution, such as a study done for management or a consul-
tant’s recommendation report, the abstract is replaced by the slightly longer executive summary.
While abstracts follow normal sentence construction, the executive summary may be presented
Figure 24.1 Title Page for a Research Report
THE TITLE OF YOUR REPORT
by
Your E. Name
[Put the name of the group, team, or organization here]
[Put the name of the parent agency here]
[Put the submission date of the report here]
D
o
w
n
l
o
a
d
e
d
b
y
[
U
n
i
v
e
r
s
i
t
y
o
f
C
a
l
i
f
o
r
n
i
a
,
S
a
n
D
i
e
g
o
]
a
t
0
0
:
0
8
1
9
M
a
y
2
0
1
7
348 PREPARING AND PRESENTING RESEARCH FINDINGS
in outline or bulleted form. The executive summary is often made into an overhead transparency
and used to guide an audience through an oral presentation of the paper. The executive summary
is seldom used for classroom reports.
A Sample Abstract
In the abstract in Figure 24.3, the authors tell the audience that the paper is about a survey of the
perceptions and attitudes regarding environmental and social issues held by students in Canada,
Taiwan, and the United States. It explains who were members of the sample and provides a ratio-
nale for conducting the research. A brief suggestion of the results is also included.
The Introduction
In some professional journal formats, this section might be called the Background section. In others
it is referred to as the Rationale for the Study. In some journals, the section might have no label or
headline; the writer just begins with the writing. Many political science journals continue to use
the Introduction label. Whether the label is used or not, the purpose of the introduction section is
to explain for the reader in some detail what the study and paper are all about. Beyond this, there
are few specific rules about what goes in the introduction, only suggestions. The following are
some ideas you might wish to think about as you write the introduction for the report or paper.
The introduction section is where readers are introduced to the full scope of the study topic.
It includes background information on the topic or situation, the researcher, funding agencies,
if any, and any other relevant preliminary information. It is the place to state why the topic was
selected. It is also where the steps taken in developing the study are listed. The introduction sec-
tion explains how or why the study was first considered, and what the researcher hoped to learn
by studying this particular topic.
THE PRIVATE vs. PUBLIC-POWER FIGHT IN SEATTLE:
1930–1934:
A study of efforts to influence public opinion
by
Your E. Name
A thesis submitted in partial fulfillment of the requirements for the degree of
Master of Arts in Communications
University of Washington
Seattle, Washington
Figure 24.2 Title Page for a Master’s Degree Thesis
D
o
w
n
l
o
a
d
e
d
b
y
[
U
n
i
v
e
r
s
i
t
y
o
f
C
a
l
i
f
o
r
n
i
a
,
S
a
n
D
i
e
g
o
]
a
t
0
0
:
0
8
1
9
M
a
y
2
0
1
7
ORGANIZING AND WRITING A RESEARCH REPORT 349
The introduction section sometimes includes a brief discussion of some key items of the lit-
erature so that readers can see how the research relates to other work done on this topic. Special
care must be taken to avoid simply repeating what others have written, however. It is important
that the researcher interpret others’ reports and indicate how they relate to the new study.
The introduction is the first place where the writing should begin to sparkle. It must be carefully
written and rewritten. It is the first chance to “hook” the people who are in a position to judge your
research and writing. To summarize, the introduction should include the following:
s !BRIEFNOMORE THANONE OR TWOPARAGRAPHS REVIEWOFTHEBACKGROUNDOFTHESTUDY
s !STATEMENTEXPLAININGWHYTHETOPICWASSELECTED
s )F APPROPRIATE
ABRIEFINTRODUCTIONTOOTHERRESEARCHON THESUBJECT
s !NINDICATIONOFWHATWILLBEPRESENTEDINTHEPAGESTOFOLLOWAND
s !NYADDITIONALINFORMATIONTHATLOGICALLYCOULDBECONSIDEREDAS ANINTRODUCTIONTOTHERE -
search project, study, topic, or paper.
Review of the Literature
The section that follows the introduction is the Review of the Literature. It should contain the
majority of your analysis of what other researchers and authors have said about the topic. This is
where results of the library and/or Internet investigation are presented. Since everything included
in this section comes from the work of others, the researcher must be careful to always cite sources;
if someone else did the work first, they must be given credit for their work.
For research papers that follow a document analysis strategy, this section might more appro-
priately be called the discussion section. For example, for a paper about how managers in public
organizations exercise one or more aspects of good leadership, all data might come from already
published sources, such as one or more broadly focused management journals or similar sources
on CD-ROM or the Internet. Once this is complete, the researcher might then carry out a more
extensive search of the public administration literature for specific articles on the managers in
the public sector specifically. This is not as difficult as it sounds because good examples tend to
get lots of attention in the media.
The researcher might include introductory paragraphs defining the topic and variables in
Figure 24.3 Sample Abstract for a Research Report
ABSTRACT
This paper presents findings of a cross-cultural survey of university students’ perceptions of the
importance of environmental and social issues, and of policies and programs to deal with the
issues. Graduate and undergraduate students in Canada, Taiwan, and the United States were
surveyed. The study grew out of discrepancies seen in various cultures’ priorities for resolving
environmental problems. The researchers developed a list of 45 environmental and/or social
problems and 20 statements about how organizations deal with environmental problems. The
findings supported the propositions that different countries have different ideas about global
environmental problems, that more international cooperation is needed, and that management
education must include more comprehensive discussions of environmental problems to prepare
researchers to function in the sustainable-growth economies of the future.
D
o
w
n
l
o
a
d
e
d
b
y
[
U
n
i
v
e
r
s
i
t
y
o
f
C
a
l
i
f
o
r
n
i
a
,
S
a
n
D
i
e
g
o
]
a
t
0
0
:
0
8
1
9
M
a
y
2
0
1
7
350 PREPARING AND PRESENTING RESEARCH FINDINGS
question; in this example it means describing specific leadership traits. Then, the literature that
addressed each of the traits might be examined. In this way, the researcher might do all his or her
research examining already published sources.
Or, the researcher might be asked to prepare a more structured study that involves observing
leadership traits as exhibited by managers in the researcher’s own organization. The method of
gathering this data might be either qualitative, quantitative, or a combination of the two. In this situ-
ation, the literature search can provide suggestions about what traits might be more important than
others, how leadership traits are or might be measured, and other relevant foundation material.
Research and Theory
Developing new ideas and concepts requires that a researcher first have a thorough grounding in
existing theory. This comes from a comprehensive review of the literature on the topic. Sources may
be personal interviews you conduct with “experts.” They may be the extensive body of domestic
and international professional and/or occupational literature, or current and past textbooks. Or
they may be other published materials such as newspapers, encyclopedias, yearbooks, unpublished
papers, opinion pieces by other scholars, or material prepared expressly for and carried only on
the Internet. To summarize, the review of the literature (or discussion section in a shorter paper)
should do the following:
s 2EVIEWEARLIERWORKDONEINTHElELD
s %XPLAINHOWEARLIERWORKRELATESTOTHISINVESTIGATION
s 'IVEEXAMPLESOFDIRECTIONSBEINGTAKENBYOTHERINVESTIGATORS
s 'IVEA SENSE OFCONTINUITYOR CLOSURETOYOURWORK
s &ORA SHORTERPAPER
PROVIDETHEBODYOFYOURIDEASANDRESULTSOFTHESTUDY
Methodology
Sometimes called research methods, or methods and materials, or simply the methods section,
this is the part of the report where how the work was done is finally and fully explained. In
research studies, this section describes in some detail how data were collected and processed.
Was the study completely a library study? Was the research limited to a study of Internet
sources? If so, why? Was a custom-designed questionnaire developed, or was a pre-prepared
questionnaire used for the survey? Why? Were the data gathered by observation? If so, was the
researcher functioning as a full participant or as an unobtrusive bystander? Did the research
involve conducting a series of personal interviews? Was an experiment designed and carried
out? These are only a few of the many different ways to gather information. The method chosen
will depend upon the nature of the study problem, the relevant study variables, and the resources
available to the researcher.
Methods and Data Differences
It is worthwhile here to briefly review one of the key differences in data as it relates to study meth-
odology. This is the primary-secondary data dichotomy. Primary data are data that the researcher
generates; they can be considered to be specific to the research project at hand. An example is the
collective responses to the questions in a questionnaire (also called a survey instrument) that are
acquired from a sample of subjects.
D
o
w
n
l
o
a
d
e
d
b
y
[
U
n
i
v
e
r
s
i
t
y
o
f
C
a
l
i
f
o
r
n
i
a
,
S
a
n
D
i
e
g
o
]
a
t
0
0
:
0
8
1
9
M
a
y
2
0
1
7
ORGANIZING AND WRITING A RESEARCH REPORT 351
Secondary data, on the other hand, are data that were collected by someone else for a different
purpose. Examples include published economic or demographic statistics. Typically, secondary
data are cheaper and quicker to gather. Primary data tend to be the more reliable of the two data
types, although there is a place and purpose for both. If the study is library or Internet research
for a short paper, it will involve gathering secondary data exclusively. If the research study means
conducting an experiment to evaluate citizens’ responses to various public service announcements,
it means gathering primary data.
When gathering secondary data, remember that every source of information used must be
identified in the paper. This means including a complete bibliographic citation, including page
numbers for actual quotes you include in your paper (page numbers should not be used with source
citations when they are paraphrased).
Conducting a research study can mean studying published books and articles in the library or
checking sources over the Internet. It can require examining artifacts or observing behavior in the
field. It can involve developing a set of questions and asking people to respond to a questionnaire.
Or it can require carefully designing and conducting an experiment with human subjects. In every
case, the researcher must describe exactly what was done and how. That information goes in the
methods section of the research paper.
The Results (Findings) Section
Once readers have been told what was researched and how it was done, it is time to tell them what
the research revealed—what it accomplished. Sometimes this section is called the Discussion
section; sometimes it is labeled simply Results or Findings. Whichever, this is where readers are
shown the results of the effort; in the process, it explains the reasons for conducting the research
in the first place.
This information must be present clearly, factually, simply, and without editorial comment. It
is not the place for the researcher to introduce opinions or reactions. This means that conclusions,
judgments, or evaluations of the information should not be interjected into this section of the report.
The job of the author is simply to explain what the data reveal, nothing more.
Do not “editorialize” about the data in this section. Remain cool and objective; simply “tell
it like it is.” Avoid negative opinions. For example, don’t say that a legislator was “unqualified
to serve on the committee.” However, it is possible to describe the behavior that makes you or
others think that he or she lacked the necessary qualifications. Let your readers make their own
evaluations and conclusions; never tell them what to think.
Style: First Person or Third Person?
Typically, quantitative reports are always written in the third person, while qualitative study re-
ports may be written in either the first or third person. It is good to get into the habit of using the
form that is used most often in your field of interest or study. For example, authors are strongly
encouraged to avoid using the first person approach (“I”) in reports on business or economics
research, whereas many public administration journals include papers written in both forms. The
topic and research methodology followed should dictate the form to use.
As a rule of thumb, however, it is difficult to get into trouble when always using clear, objec-
tive writing, and writing in the third person format. Having said this, it is also important to know
that many instructors require that personal opinions be included in class writing. It is believed
that doing so encourages students to develop critical thinking skills. Whenever the issue comes
D
o
w
n
l
o
a
d
e
d
b
y
[
U
n
i
v
e
r
s
i
t
y
o
f
C
a
l
i
f
o
r
n
i
a
,
S
a
n
D
i
e
g
o
]
a
t
0
0
:
0
8
1
9
M
a
y
2
0
1
7
352 PREPARING AND PRESENTING RESEARCH FINDINGS
up, it is best to comply with one of the first requirements of all writing in organizations: Write for
your audience. To summarize, here are some key points for the “Results” or “Findings” section
of your paper:
s 0OLITICALSCIENCEANDPUBLICADMINISTRATIONPAPERSAREWRITTENINEITHERlRSTORTHIRDPERSON
format.
s 5NLESSSPECIlCALLYASKEDFORYOUR OPINION
DONOTEDITORIALIZEINTHE2ESULTSSECTIONYOUR
opinion goes in the conclusions section.
s 4RYNOTTOEDITORIALIZEABOUTTHESTUDYRESULTSINTHE&INDINGSSECTION2EMAINCOOLANDOBJEC-
tive here.
s !VOID NEGATIVE OPINIONS IN THE BODY OF THE REPORT LET THE READERS COME TO THEIR OWN
conclusions.
s 5SECLEAR
OBJECTIVEWRITINGATALLTIMES
Is It Style or Is It Format?
The words style and format are often used interchangeably to refer to the way a paper is put
together. They shouldn’t be, because they mean different things. Format refers to the way the
research paper is structured or organized. It includes headlines, subheads, and the order of the
components of your paper. Style, on the other hand, refers to the choice of words and sentences
used in the report. It includes punctuation and grammar.
Format often varies from discipline to discipline, journal to journal, and according to the
purpose of the paper. Sometimes, when people talk about style, they are referring to the writing
rules endorsed by an organization like the American Management Association or the University of
Chicago. At other times, they mean the subjective, creative, artistic part of writing: selecting words
that sparkle, using the active rather than the passive voice, using a variety of sentence lengths.
What to Avoid
What kinds of textbooks and articles do you hate to read? A volume with sentences that ramble
on forever? One with huge seas of black or gray that put you to sleep because the author refused
to end paragraphs, did not use headlines or subheads, or did not include illustrations or graphics
to perk up the text? Those that offend you because they either talk down to you or assume you
have twenty years of experience in the field and that you understand the complicated or esoteric
jargon the author insists on using? Most people prefer books and articles that can be read and
understood. These are the examples to use as models for your own writing. Good writing can be
learned, just as poor writing can be avoided!
Conclusions and/or Recommendations Section
Writing a research report can be much like writing a speech. In both cases, the writer selects a
topic, finds out something about the topic, and then writes about it. The writer closes with a sum-
mary and shares conclusions about the process with an audience. People who teach speech making
have reduced this to a three-part structure: (1) tell your audience what you are going to tell them,
(2) tell it to them, and then (3) tell them what you told them.
In a sense, we have been following these directions as we moved from section to section in this
chapter. In the Introduction, readers are told how to explain what the research and report are going
D
o
w
n
l
o
a
d
e
d
b
y
[
U
n
i
v
e
r
s
i
t
y
o
f
C
a
l
i
f
o
r
n
i
a
,
S
a
n
D
i
e
g
o
]
a
t
0
0
:
0
8
1
9
M
a
y
2
0
1
7
ORGANIZING AND WRITING A RESEARCH REPORT 353
to be about. The Methodology section describes the way the data will be gathered and processed.
The Results section presents the main body of your research findings. Now is the time to wrap
things up by telling the audience what was learned from the research.
A good Conclusions section can be one of the most valuable components of a paper (Markman,
Markman, and Waddell 1989). The well-written conclusion is part summary, part conclusion, and
part recommendations. This section can be used for several different purposes. First, it provides
an opportunity to summarize the main ideas gleaned from the literature. It also permits repeating
any critical findings from any experimental research that might have been conducted. Second, it
allows the researcher to interpret the findings and to present a subjective interpretation in his or
her own words. In a good public administration paper, this may be the only place where the re-
searcher can be original. To this point, the writing must have remained completely objective. Only
the facts were reported. Finally, the conclusions section gives the researcher a chance to prove to
the readers that the research idea, design, and project were valid and worth the doing.
Now, however, the researcher must explain what it all means. To do this well requires the
researcher to finally be creative, analytical, and persuasive. At the same time, this is where
the author tries to influence the audience or to convince them that the presented interpretation is
the “right” one.
Preparing the Conclusions Section
Begin this section with a brief summary of the research, add your interpretation, and close the
report with what you see as either implications of the findings, or your recommendations. The
“Conclusions” section should:
s 3UMMARIZETHEMAINIDEAS
s 3AYWHATTHESEIDEASMEAN
s )NCLUDEA PERSONALINTERPRETATIONOFTHElNDINGSYOURopinions);
s #ONVINCEREADERSTHATTHERESEARCHWASWORTHTHEEFFORT
s -AKERECOMMENDATIONS
IF ANY
TOTHEREADER
Source Citations, References, and Bibliography
This is where the writer identifies all sources of information used in the conduct of the research
project and preparation of the research report. Typically, there are two parts to citations: (1) the
place in your report where you cite the sources used in your study; and (2) an alphabetical list—a
bibliography—of all sources cited, studied, or examined during the study.
The first part is the Notes or Sources Cited, and can be presented in the report as endnotes,
footnotes, or in-text citations. Notes are gathered in end- or footnotes in the same numerical order
as they appear in the paper. In-text citations appear in the body of the paper as the pertinent source
information is used.
The second part is the References or Bibliography section; it contains complete bibliographic
information about all sources used in the study. Many different bibliographic styles are used in
research writing. It is usually best to follow the style used by the most influential writers in the
field or to follow the style employed by the “best” journal in the discipline.
Writers may use footnotes, endnotes, or in-text citations to cite sources. Location information
is needed for others to either replicate the study or test for flaws. For papers of approximately 10
to 12 pages, authors are no longer required to include endnotes or footnotes. This does not mean
D
o
w
n
l
o
a
d
e
d
b
y
[
U
n
i
v
e
r
s
i
t
y
o
f
C
a
l
i
f
o
r
n
i
a
,
S
a
n
D
i
e
g
o
]
a
t
0
0
:
0
8
1
9
M
a
y
2
0
1
7
354 PREPARING AND PRESENTING RESEARCH FINDINGS
that authors can use the work of others as their own. Doing so is plagiarism, and plagiarism is
theft. The practice is unethical, immoral, and in most cases, illegal. At some universities and col-
leges, students can be expelled for plagiarism.
What it does mean is that the citations issue can be dealt with by placing the author ’s name and
date of publication in parenthesis at the beginning or end of the section dealing with that work.
This is called the “in-text” or “author-date” citation. It is used in conjunction with a reference list.
The in-text citation method is growing in popularity; most publications and organizations prefer
that it be used exclusively. It is the method used throughout this book.
The “References” section of the research paper must include a complete bibliographic citation
for every source used in the research. If a source has been examined for the study but not used, it
is not necessary to include it in the references.
References Section Summary
The information used as background for a research project can come from published books; peri-
odicals (magazines, newspapers, journals); interviews or surveys; films; electronic sources such
as the Internet; government or company brochures, reports or pamphlets; television programs; or
any other source you find. There are a variety of rules for how to list these sources, both as notes
and references.
In the past, some stylebooks called for both notes and references to be included. Today, however,
in-text citations are usually substituted for endnotes or footnotes. Most periodicals require in-text
citations be used instead of endnotes or footnotes, together with a formal references (or sources
cited) list at the end of the paper.
Appendix or Appendices
The appendix is the last component of a research paper. This word has two plural forms: ap-
pendixes or appendices; you may use the one you prefer. The appendix is where to place any
attachments that might relate to the paper but that cannot or should not be placed in the body
of the paper itself. A brochure or advertisement is an example. Other examples include a copy
of the questionnaire used in a research study, a complicated mathematical table, or a copy of an
article from a magazine, journal, or a newspaper. There are no limits to what can or what should
be included in the appendices.
The wide variety of materials that could qualify as appendices suggests that there is no one
rule or special format to follow for appendices. Style manuals with recommendations pertaining
to the appendix tend to agree on the following conclusions, however:
s 2ESEARCHPAPERSFORPUBLICADMINISTRATION
BUSINESS
ORECONOMICSSELDOMREQUIREANAPPENDIX
or appendices.
s 7HENUSED
APPENDICESSHOULDBEATTACHEDAFTERTHEBIBLIOGRAPHY
s 7HILEITISNOTCOMPLETELYNECESSARY
ASINGLETITLEPAGEWITHTHELABEL!PPENDIX SHOULDBE
placed before all the attached material.
s /NLYTHENUMBEROFTHEAPPENDIXTITLEPAGEISNOTEDINTHETABLEOFCONTENTS
s 7HENMORE THANONEAPPENDIXISUSED
THEWORD!PPENDICESISPLACEDINTHETABLEOFCONTENTS
and on the section title page.
s -ULTIPLE APPENDICES CAN BE LABELED ALPHABETICALLY
AS FOLLOWS Appendix A, Appendix B,
Appendix C, and so forth.
D
o
w
n
l
o
a
d
e
d
b
y
[
U
n
i
v
e
r
s
i
t
y
o
f
C
a
l
i
f
o
r
n
i
a
,
S
a
n
D
i
e
g
o
]
a
t
0
0
:
0
8
1
9
M
a
y
2
0
1
7
ORGANIZING AND WRITING A RESEARCH REPORT 355
Style in Research Report Writing
When editors talk about style, they mean one or more of these writing features: (1) an author’s choice
of words and sentences, (2) how the author employs basic rules of grammar and punctuation, or (3)
the mechanics of footnotes, endnotes, in-text citations, and various ways of recording bibliographic
(reference) notation. This section is about the third component of style: notes, citations, and refer-
ence notation. It is also a brief introduction to several of the most commonly used notation styles:
the American Psychology Association (APA), the University of Chicago (Chicago Style), and the
Modern Language Association (MLA). Several discipline style references are also explained.
Formats for Endnotes, Footnotes, and In-Text Citations
Endnotes, footnotes, and in-text citations are tools used to show your reader(s) where you found
your information. Endnotes are placed at the end of your paper, just before or after your bibliog-
raphy. Footnotes are placed on the bottom of the page where they are introduced. An identifying
number or symbol is placed at the end of the material for which the endnote or footnote applies,
and that number is used to designate the reference information. Superscript is the preferred font
for the notations;
1
is an example of superscript.
Both endnotes and footnotes allow you to include additional or parenthetical information that
is not otherwise considered part of the regular flow of your paper. Notes can be personal observa-
tions, or comments or questions raised about the sources. They can also be asides—information
that adds to the understanding or fuller appreciation of a point in the paper itself. However, their
primary purpose is to tell the reader the source of the ideas. Unless the ideas are exclusively yours,
their source must always be cited.
Endnote and footnote entries are made in numerical order, from the first to the last. The first
time a source is mentioned, a complete bibliographic entry is included. Use the same format re-
quired for a complete bibliography. If the end- or footnote is not a citation but rather additional or
parenthetical information, it should be written using complete sentences with proper punctuation.
With end- or footnotes, the complete citation is included in only the first note. After the first entry,
all subsequent entries use only the author’s last name. The Latin ibid. and op. cit. are no longer
used in research reports or scientific writing.
Format for In-Text Citations
Today, the preferred way of noting sources in the body of a paper is the in-text citation method.
In-text citations should appear following the source material to which they pertain. An in-text
citation consists of the author’s last name and the year of publication, without commas or periods.
Page numbers are added if a direct quote is used, in which case a comma goes between the date
and page number ( e.g ., Jones 2009; Jones 2009, 38).
Say, for example, that you are writing a paper about religion and business. One of your sources
discusses parables found in modern business literature. If you use an idea found in the book or
article but express it in your own words (i.e ., you paraphrase), you need not place it in quotation
marks. At the end of your reference to that work, you must add the following notation: (Manners
2000). Beyond this, no end- or footnote notation is required. However, if you quote from the work,
you must add the page number after the date, thus: (Mannners 2000, 223). The work itself would
be listed in your reference list this way (or in some other accepted form):
Manners, Donald E. 2000. Biblical Parables in Modern Business Writing. Sioux City: Reality
Publishing.
D
o
w
n
l
o
a
d
e
d
b
y
[
U
n
i
v
e
r
s
i
t
y
o
f
C
a
l
i
f
o
r
n
i
a
,
S
a
n
D
i
e
g
o
]
a
t
0
0
:
0
8
1
9
M
a
y
2
0
1
7
356 PREPARING AND PRESENTING RESEARCH FINDINGS
Use of Notes in Large Reports
For larger papers and research reports (40 pages or longer), some editors suggest that it is bet-
ter to continue to use footnotes or endnotes instead of in-text citations. However, if the paper
is to be published in a professional journal, the system required by the journal must be used.
If it is a paper for a class, follow the instructor’s requirements. Here is a good rule of thumb
to follow: If the paper is shorter than 20 or so pages, do not use endnotes or footnotes; if the
paper is longer than 20 pages, you may use endnotes or footnotes. Other than this, use them
if doing so makes the paper easier to read or understand. For class, always do what your
instructor requires.
The Bibliography (References) Section
Most style manuals have grouped source materials into three broad categories: (1) books; (2)
periodicals (magazines, journals), and newspapers; and (3) miscellaneous, including pamphlets,
brochures, annual reports, letters, interviews, films, and so on. Today, a fourth category has been
added: electronic sources. These include the World Wide Web, CD-ROMs, and miscellaneous
electronically accessed databases.
A word of caution: There is a lack of agreement on which is the best or most appropriate way
to list citations. Almost every discipline has its own format. It is up to you to determine which
format is accepted or preferred in the organization for which the paper is written. Follow that style.
Considerable disagreement also exists on citation formats for electronic sources. Several different
citation guides are listed here; one is the Columbia Guide to Online Style (1998) published by
Columbia University Press.
Political science, public administration, and economics publications usually follow format
requirements established or promoted by their respective professional associations. These
formats may differ somewhat from the three main style formats—APA, Chicago, and MLA.
Communications courses also have format requirements of their own; they often follow a
newspaper style established by either the Associated Press (AP) or United Press International
(UPI). Citation formats for papers written for natural sciences also vary somewhat from the
three major styles.
The following pages contain examples of citation styles for the MLA, APA, and the Uni-
versity of Chicago (as set forth in the Chicago Manual of Style). These are the three standard
styles recommended for writers. However, some academic disciplines and professions use
styles that may differ somewhat from any of the three standard styles. This section also
includes mention of some style requirements for government, business, and economic dis-
ciplines. Included are styles approved for management, marketing, accounting and finance,
human resources, public administration, and economics. Professional societies for each of
these disciplines have adopted required styles for all writing in their professional journals.
And, not all societies in the profession have identical style requirements. The following is a
summary of style information:
s -OSTSTYLEMANUALSGROUPSOURCES INTOTHREECATEGORIESBOOKS
PERIODICALS
ANDMISCELLANEOUS
s 4ODAY
AFOURTHCATEGORYISALSOUSEDELECTRONICSOURCES
s 4HEREAREMANYDIFFERENTWAYSTOCITESOURCES 5SEone and stick to it.
s 4HREEMAJORSTYLESARE THESTANDARDFORMSUSEDINACADEMICWRITINGOFTENWITHSOMEVARIA-
tion): APA, Chicago, and MLA.
D
o
w
n
l
o
a
d
e
d
b
y
[
U
n
i
v
e
r
s
i
t
y
o
f
C
a
l
i
f
o
r
n
i
a
,
S
a
n
D
i
e
g
o
]
a
t
0
0
:
0
8
1
9
M
a
y
2
0
1
7
ORGANIZING AND WRITING A RESEARCH REPORT 357
s 3OME DISCIPLINES RECOMMEND USING EITHER !SSOCIATED 0RESS !0 STYLE OR 5NITED 0RESS
International (UPI) style.
s .EVERCREATEYOUROWNSTYLENEVERMIXSTYLESWITHINTHESAME PAPER
s 3TYLEMANUALSHAVEBEENWRITTENFORMANYOCCUPATIONS &INDTHEONEUSEDINYOURINDUSTRY
or discipline and use it for all your writing.
Some Standard Style Requirements
APA Style Highlights
The American Psychological Association (APA) prefers that authors use in-text citations with
references to an end-of-paper “Works Cited” section. This applies for all papers, regardless of
length. All source listings in “Works Cited” should include author name(s), title of the work, and
publication information. In the in-text citations, page numbers are required for all direct quotes. If
a cited author is mentioned in a sentence, the publication date is placed in parentheses immediately
afterward—for example, Manners (2000). If the source material does not mention the author ’s
name, then the name and publication date appear in parentheses following all source material—
for example, (Manners 2000).
APA style requires you to underline a book or title of a periodical (but not the title of an article
in the periodical) if you do not have access to an italic typeface. Do not indent the first line of a
listing; instead, indent the second and each subsequent line three spaces (MLA requires a five-
space indentation). All author names must be listed—never use et al. All names must be inverted
(listed last name first). If you do not have an author ’s name, alphabetize the listing by the first
word of the title (except for articles such as the, a, or an).
Capitalize both words in short titles like Atlantic Monthly. Do not put quotation marks
around the titles of journal articles. Capitalize only the first word of book titles; however, if
the title is only two or three words, all can be capitalized. Capitalize only the first word in a
subtitle of a book.
Use double space or space-and-a-half for listings. APA also allows but does not require you to
drop short labels as Press, Co., Corp., or Inc., after the name of the publisher. Names of university
presses are usually typed out in full, thus Oxford University Press.
Periodical citations include the name(s) of the author(s), date of publication, title or headlines
of the articles, and name of the periodical; use initial capital letters for periodical title names (e.g .,
Journal of Macroeconomics, Journal of State and Local Government). Volume and issue numbers,
when available, are also included, appearing just before page numbers. Do not include “vol.” or
“no.); instead, list the volume number, insert a space, insert the issue number in parentheses). The
listing should read as follows:
Author(s) name, date. Journal article title. Journal Title, 24 (2): 123–32.
Other sources includes such things as pamphlets, government or company brochures, disserta-
tions, conference proceedings, personal letters and interviews, annual reports, and the like. These
are all legitimate published sources and should be listed in your bibliography in the same way as
books and periodicals.
Chicago Style Highlights
The editorial staff of the University of Chicago Press, a major publisher of works by academic authors,
printed its first Manual of Style for writers in 1906. Since that time, the manual has gone through at
D
o
w
n
l
o
a
d
e
d
b
y
[
U
n
i
v
e
r
s
i
t
y
o
f
C
a
l
i
f
o
r
n
i
a
,
S
a
n
D
i
e
g
o
]
a
t
0
0
:
0
8
1
9
M
a
y
2
0
1
7
358 PREPARING AND PRESENTING RESEARCH FINDINGS
least fifteen revisions, with more on the way. Possibly because it deals with the publication of books
more than articles or papers, the Chicago manual recommends use of footnotes rather than in-text
citations. A full biographic listing is required in the end-of-work References section.
When available, all listings should include the author name(s), title of the work, and publication
information. Page numbers are required for all direct quotes. Publication dates are placed at or
near the end of the listing, immediately before the citation’s page numbers. Chicago style requires
book and periodical titles to be in italics. Bibliographic listings are presented in alphabetical order,
single-spaced, with two spaces between each listing.
Only first-author names should be inverted (listed last name first); others are listed first name,
middle initial, last name. If you do not have an author’s name, alphabetize the listing by the first
word of the title. All authors’ names must be listed—never use et al. Capitalize the first letter of
all words in book, journal, and newspaper titles, with the exception of articles and short preposi-
tions. Put quotation marks around the titles of journal, magazine, and newspaper articles. Chicago
style requires these items to be listed in the following order:
s .AMEOFTHEAUTHORSOR AUTHORS
EDITORS
OR INSTITUTIONRESPONSIBLEFORTHEWRITINGOFTHEBOOK
(such as the University of Chicago)
s &ULLTITLEOFTHEBOOK
INCLUDINGSUBTITLEIF ONEEXISTS
s 3ERIES
IF ANY
s %DITION
IF NOTTHElRST
s 0UBLICATIONCITY
s .AMEOFTHEPUBLISHER
s $ATEOFPUBLICATION
Periodical citations should include as many of the following as possible:
s .AMES OFTHEAUTHORS
s 4ITLEOFTHEARTICLE
s .AMEOFTHEPUBLICATION
s 6OLUMEANDNUMBER OFTHEPERIODICAL
s $ATEOFTHEVOLUMEOR OFTHEISSUE
s 0AGENUMBERSOFTHEARTICLE
Some style examples include the following:
1. A government pamphlet brochure, no author listed:
U.S. Dept. of Agriculture. Regulations for Applying Pesticides. Washington, DC: U.S Govern-
ment Printing Office, 1990.
2. Company pamphlet, brochure, or annual report:
The Boeing Co. 1997 Annual Report. Seattle: The Boeing Co., 1998.
Electronic sources must include as much of the following information that is available. For a
known author, include the following:
D
o
w
n
l
o
a
d
e
d
b
y
[
U
n
i
v
e
r
s
i
t
y
o
f
C
a
l
i
f
o
r
n
i
a
,
S
a
n
D
i
e
g
o
]
a
t
0
0
:
0
8
1
9
M
a
y
2
0
1
7
ORGANIZING AND WRITING A RESEARCH REPORT 359
s !UTHORNAMES
s $ATEITEMWASPLACEDON THE7EB
s 4ITLEOFTHEPIECEINCLUDINGEDITIONNUMBER
IF NOTTHEORIGINAL
s 4YPEOFMEDIUM
s 0RODUCEROPTIONAL
s )F AVAILABLESUPPLIEROR DATABASEIDENTIlEROR NUMBER
s $ATEYOUACCESSEDTHEARTICLE
When the author is unknown, include the following information:
s 4ITLEEDITION
s 4YPEOFMEDIUM
s 9EAR
s 0RODUCER
s )F AVAILABLE3UPPLERDATABASEIDENTIlEROR NUMBER
s !CCESSDATE
MLA Style Highlights
This style is seldom used in political science writing, so it is only introduced here. According
to the Modern Language Association of America (MLA), all sources included in a bibliography
include three main components: author name(s), title, and publication information. All other style
formats are in agreement with these requirements; they differ, however, in the way and the order
in which they are presented. MLA requires that this section be a separate page or pages and be
titled “ Works Cited.”
In citing books using MLA style, an entry can include most (but seldom all) of the following
information:
1. Author name(s)
2. Title of the section, if a part of a book
3. Title of the book
4. Name of the editor, translator or compiler, if appropriate
5. Edition of the work
6. Name(s) or number(s) of the volume(s) used, if a multivolume work
7. Name of the series, if part of a series of books
8. Place of publication (city)
9. Name of the publisher
10. Date of publication
11. Page numbers, if quoted or if the work is part of a compendium
12. Any other relevant bibliographic information and/or annotation
In addition to the above parts, as many as twelve or more types of book listings are described
in the MLA style manual. These range from a single author to multiple or unknown authors. Also
included are compilations by editors, various editions or volumes in a series, parts of books, the
forward or preface, encyclopedias, and dictionaries.
D
o
w
n
l
o
a
d
e
d
b
y
[
U
n
i
v
e
r
s
i
t
y
o
f
C
a
l
i
f
o
r
n
i
a
,
S
a
n
D
i
e
g
o
]
a
t
0
0
:
0
8
1
9
M
a
y
2
0
1
7
360 PREPARING AND PRESENTING RESEARCH FINDINGS
Other Style Manuals
Many different style manuals have been written to help you with your writing. While they all
seem to vary a bit in their recommendations, they serve a common purpose: that is to serve as a
guide to the “proper” way to present your written report. Some of the manuals are slim pamphlets;
others are full-size books. Some manuals give suggestions and rules for all aspects of researching;
others are only guides to citing sources. The following is a partial list of available style manuals;
most can be found in any college or university library.
General
1. The Complete Guide to Citing Government Information Sources:
A Manual for Writers and Librarians
2. Electronic Styles: A Handbook for Citing Electronic Information
3. The Little, Brown Guide to Writing Research Papers
4. The McGraw-Hill Style Manual
5. Manual for Writers of Term Papers, Theses and Dissertations (Kate Turabian)
6. A Manual of Style: U.S . Government Printing Office
7. Prentice-Hall Handbook for Writers
Environmental and Earth Sciences
1. Suggestions to Authors of the Reports of the United States Geological Survey
Originally an internal USGS document, this manual has been made available to the public and
serves as a guidebook for all writing in the earth sciences.
Education
1. Journal Instructions to Authors: A Compilation of Manuscript Guidelines from Education
Computer Topics
1. Electronic Styles: A Handbook for Citing Electronic Information
Journalism
1. Broadcast News Manual of Style
2. UPI Stylebook (United Press International)
3. AP Stylebook (Associated Press)
Law
1. The Bluebook: A Uniform System of Citation
Psychology
1. Publication Manual of the American Psychological Association (APA Style Manual)
Social Science
1. Writing for Social Scientists: How to Start and Finish Your Thesis, Book or Article.
D
o
w
n
l
o
a
d
e
d
b
y
[
U
n
i
v
e
r
s
i
t
y
o
f
C
a
l
i
f
o
r
n
i
a
,
S
a
n
D
i
e
g
o
]
a
t
0
0
:
0
8
1
9
M
a
y
2
0
1
7
ORGANIZING AND WRITING A RESEARCH REPORT 361
Special Requirements for Political Science
Research Papers
Style recommendations of the American Political Science Association can be found in such journals
as the American Political Science Review and other journals of the American Political Science
Association. In addition to in-text citations, the following style items are used.
1. Cover page: The title of the paper, author ’s name, position, and organizational affiliation
(for class papers use the course number and name). At the top of the first page, only the
title is repeated.
2. Abstract: An abstract of no more than 100 words should be placed on the first page
between the title and start of the paper ’s text. No Abstract headline is required.
3. Headings: The introduction section does not have a heading. Do not number any headings
or subheadings. Headings are typically used for the Findings and Conclusions sections.
Other headings may be used at the discretion of the author.
4. Summary: Papers should not end with a summary section. If relevant, a summary may
be included in the author’s conclusion section.
5. Tables, graphs, figures: When the paper is distributed within an organization, the tables,
graphs, and figures should be inserted into the paper itself. When sending the paper
to a journal for publication, tables, graphs, and figures should be attached as separate
sheets.
Authors must explain all tables, graphs, and figures in the body of the paper itself.
All tables, graphs, and figures must be numbered and titled. When submitting the paper
to a journal, tables must be numbered with Roman numerals (Example: Table IX). For
papers distributed within an organization, either Roman numerals or Arabic numbers
may be used.
A reference to the table must be included in the body of the text. Tables must have a
title and a descriptive legend. Titles, column headings, captions, and so forth must be
clear and to the point.
Figures must be numbered with Arabic numerals (example: Figure 9). Each figure
must have a title followed by a descriptive legend. The figure’s title should be part of
the caption.
6. Endnotes and footnotes: Authors should avoid the use of notes as much as possible. If
notes must be used, they should be numbered sequentially. A listing of endnotes typed
on a separate page must be placed before the References section. Footnotes appear at the
bottom of the page in which they are listed. Papers of twenty pages or less usually do
not include footnotes or endnotes; longer papers may include either end- or footnotes,
but are not required to do so.
7. Citations: The first line of the citation should be flush left; all other lines are to be indented
three spaces. Do not number the citations. In the body of the paper, use Chicago Manual
style with in-text citations format for documentation:
Jones and Smith (1997) found that . . .
If the in-text citation deals with a quotation, the page number must be added after the date
of publication, separated by a comma.
Jones and Smith (1997, 25) reported, “The moon . . .”
D
o
w
n
l
o
a
d
e
d
b
y
[
U
n
i
v
e
r
s
i
t
y
o
f
C
a
l
i
f
o
r
n
i
a
,
S
a
n
D
i
e
g
o
]
a
t
0
0
:
0
8
1
9
M
a
y
2
0
1
7
362 PREPARING AND PRESENTING RESEARCH FINDINGS
8. References: The references section should include only works cited in the text. They must
be typed on a separate page(s) under the heading: “References.” References are listed
alphabetically according to the last name and first name and middle initial of the first
author, followed by each additional author in first name first sequence. The following
examples should be followed for reference listings:
A. Book citations, more than one author:
Rouge, Anna M., Madeline M. Smith, and Marvin O. Johnson. 1994. Governing the
Ungovernable City. San Bruno, CA: Mathematics Press.
For more than one work by the same author or authors, list the works in order of pub-
lication (earliest first). Use an eight-spaced underline in place of the author ’s name in
subsequent citations for same author. If subsequent works have different second or more
authors, continue to list them chronologically (earliest first) after the first notation of the
principal author. Examples include:
Lee, Brian, and Elizabeth Chung. 1994. American Government. Chicago: Federated.
—— — . 1997. Development in the Central City. Roseburg, OR: City Press.
—— — , and Susan H. Arden. 1996. Training for Quick Advancement. Tacoma, WA:
Pacific Lutheran University Press.
B. Books with an editor (collective works):
Rom, Charlene D., and William D. Brown. 1997. “Health Programs in the Inner City.’
In Richard E. Keating and John P. MacDonough, eds. Medical Delivery Systems Today,
33–52. Seattle: University of Washington Press.
C. Periodicals:
Pearl, Andrew O. 1995. “Measuring Organizational Climate in Public Safety Organiza-
tions. American Journal of Political Science 17 (Winter): 101–110.
Finance and Economics Research Reports
The Journal of Macroeconomics and the Journal of Economic Perspectives are examples of
finance periodicals. They follow style requirements established by the American Finance As-
sociation. Style requirements for publications in these disciplines can be found in the Journal of
Macroeconomics.
Public Management Reports
Papers written for management topics usually follow style requirements established by the Ameri-
can Academy of Management. Examples and guidelines for authors can be found in the Academy
of Management Review and other periodicals published by the academy.
Like all other discipline publication requirements, the Academy of Management asks that all
papers be double-spaced and typed in a plain 12-point typeface (font). If it is impossible to itali-
cize in the paper, underlining is allowed. Boldface type should be used for the title and headings.
Tables should be typed in the same font used for the body of the paper. A title page is required.
An abstract of 75 or fewer words should be included under the title near the top of the second
page. The abstract should state the purposes for the research; include any theoretical basis for the
hypotheses, analyses, major results, and implications of the findings.
D
o
w
n
l
o
a
d
e
d
b
y
[
U
n
i
v
e
r
s
i
t
y
o
f
C
a
l
i
f
o
r
n
i
a
,
S
a
n
D
i
e
g
o
]
a
t
0
0
:
0
8
1
9
M
a
y
2
0
1
7
ORGANIZING AND WRITING A RESEARCH REPORT 363
Summary
This chapter described a variety of methods and tools used for organizing and presenting political
science research findings. It began with a description of the variety of points of views that research
authors use to ensure that their ideas flow smoothly from section to section. Examples described
include the indirect, direct, chronological, spatial, analytical, comparative, and ranked methods.
The chapter then described in detail the organizational structure of most research reports. This
format is used for reports, but may not be appropriate for research reports prepared for professional
journals. Journals have their own distinctive style requirements. Most political science journals
follow some version of the American Psychology Association (APA) or University of Chicago
styles. The chapter included a brief discussion of some of the most-often-used rules for in-text
citations in a research report and ended with References (or Bibliography) section.
Discussion Questions
1. Several different points of view for research writing were discussed in the chapter. Com-
pare and contrast the ones that you are most interested in using in your research.
2. What should you remember about the title of a research report?
3. In your own words, describe what makes a good abstract.
4. What should be included in the introduction section of a research report?
5. What are some of the important questions to answer in the methods section of the research
report?
6. What goes in the results section of the research report?
7. Where should you discuss your research methodology in the report?
8. How does the conclusions section differ from the results section?
9. What is an in-text citation? Why should you use them instead of footnotes or end-
notes?
10. When and why should you write in the first person? In the third person? What is the
difference?
Additional Reading
APA. 2001. Publication Manual. 5th ed. Washington, DC: American Psychological Association.
Baugh, L. Sue. 1995. How to Write Term Papers and Reports. Lincolnwood, IL: VGM Career Horizons.
Becker, Howard S. 2007. Writing for Social Scientists: How to Start and Finish Your Thesis, Book, or Article.
2nd ed. Chicago: University of Chicago.
Lewin, Beverly. 2008. Writing Readable Research: A Guide for Social Scientists. London: Equinox Publishing.
Williams, Joseph M. 1990. Style: Toward Clarity and Grace. Chicago: University of Chicago.
D
o
w
n
l
o
a
d
e
d
b
y
[
U
n
i
v
e
r
s
i
t
y
o
f
C
a
l
i
f
o
r
n
i
a
,
S
a
n
D
i
e
g
o
]
a
t
0
0
:
0
8
1
9
M
a
y
2
0
1
7
364
25 Introduction to Statistical Software
The Statistical Package for the Social Sciences (SPSS) is a powerful software package developed to
perform simple and complex statistical analyses of quantitative data. The program enables users to
create, modify, and analyze very large sets of data. It can also produce such graphic displays as tables,
charts, and graphs. Data entry is facilitated by the use of a standard spreadsheet format; cases are in
rows, and variables are entered in columns. A case is the responses or measurements of a single subject
or study element. A variable is something that the researcher is able to measure or count in some way.
Depending on the version of SPSS purchased, users of the program may find some small differences
in the display of their analysis processes. However, the data analysis instructions are the same or very
similar.
This chapter is organized into five distinct sections. The first deals with how to access the SPSS
program. Once you are in the program, several menus and toolbars will become visible. The second
section describes the options available in the SPSS Main Menu bar at the top of the screen. At the
lower left-hand corner of the screen are two file tabs, which are discussed in the third and fourth
sections of the chapter. They are the Variable View and the Data View files; each is accessed by
clicking on the appropriate file tab. The Variable View file is described first because it is where
you insert all descriptive information about the data file, including variable and value descriptions
and names. The fourth section briefly describes characteristics of entering numeric data into the
Data View file. The fifth section deals with several introductory file processing activities. The
instructions presented here are for Version 16 of SPSS for Windows.
SPSS®: The Opening Screen
The process of launching SPSS software is the same as that for any other frequently used software.
At the initial window, double-click on the SPSS icon. The Data Editor window will appear on the
screen. (If the SPSS shortcut icon does not appear on the main Windows screen, click on Start,
then Programs, then select SPSS.) Superimposed on this opening screen may be a dialog box that
asks: “What would you like to do?” Available options include:
s 2UNTHETUTORIAL
s 4YPEINDATA
s 2UNAN EXISTINGQUERY
s #REATEA NEWlLEUSINGTHEDatabase Wizard
s /PENAN EXISTINGDATASOURCE
s /PENANOTHERTYPEOFlLE
D
o
w
n
l
o
a
d
e
d
b
y
[
U
n
i
v
e
r
s
i
t
y
o
f
C
a
l
i
f
o
r
n
i
a
,
S
a
n
D
i
e
g
o
]
a
t
0
0
:
0
8
1
9
M
a
y
2
0
1
7
INTRODUCTION TO STATISTICAL SOFTWARE 365
If you have a database loaded on the hard drive or on an external drive or disc, you may call up
that file for immediate activity. Or, you may select Cancel, which opens the Data Editor for data
entry. You must have entered data in the Data Editor before SPSS can perform any operations.
Data can be entered directly or imported from an existing file, such as an Excel spreadsheet or a
word-processing program.
The Main Menu Bar
The SPSS opening screen will show two toolbars at the top of the screen and a full-screen
spreadsheet (with gridlines). Along the left side of the screen are row numbers. At the top of the
spreadsheet is a row for you to indicate the names and qualities of the variables in your study.
Above the spreadsheet is the Main Menu bar (For all versions lower than Version 10, this is the
SPSS Data Editor Toolbar). Menus are named; tools are displayed as icons.
Look at the top line on the SPSS screen. Visible at the top of the screen are the names for eleven
file menus. These menus allow you to access every process, tool, and feature contained in SPSS.
Beginning at the left and running across the screen, these file menus are:
s File menu: This allows you to open, close, save, and otherwise work with all types
of SPSS files.
s Edit menu: This allows you to cut and paste, move files, and find elements in a file or record
(a record is all the data for a single case).
s Vi e w menu: This allows you to turn on or off visible features, change fonts, and show
gridlines.
s Data menu: A key option, this allows you to define variables, indicate the type of measure-
ments used, and assign labels to variables and values.
s Transform menu: This feature allows you to convert, transform or change variable
values, count responses, recode values, etc. Transformation to standardized scores is a
popular option.
s Analyze menu: Along with the Data menu, this is the option you will use most often; it can
be considered to be the heart of SPSS. It allows you to name any type of analysis you want
to carry out.
s Graphs menu: This feature allows you to select from many different ways to graphically
display data, including tables, graphs, and charts.
s Utilities menu: This allows you to call up information about your variables and your
data file.
s Add-ons menu: Allows you to access and/or apply a variety of lesser-used statistical tests,
graphics and statistical guides.
s Window menu: Allows you to switch from one window to another, and back.
s Help menu: The standard online help feature that explains all features, tools, etc., as needed
by the analyst.
Working with the Data Editor Toolbar
The Data Editor toolbar allows quick access to commands dealing with data and data files. A
string of eighteen different icons is displayed on the toolbar, running across the screen just under
the Main Menu bar. These icons are shortcuts to a variety of SPSS commands, most of which are
D
o
w
n
l
o
a
d
e
d
b
y
[
U
n
i
v
e
r
s
i
t
y
o
f
C
a
l
i
f
o
r
n
i
a
,
S
a
n
D
i
e
g
o
]
a
t
0
0
:
0
8
1
9
M
a
y
2
0
1
7
366 PREPARING AND PRESENTING RESEARCH FINDINGS
also embedded within the main menus. Using the icons just makes it easier and quicker to do your
analyses. Beginning at the left of the toolbar, the icons enable the following actions:
s Open a file
s Save the file you are working on
s Print a file or output from a statistical process
s Dialog box recall (recalls the last dialog box you used)
s Undo reverses the last process
s Redo redoes the last process
s Goto (chart) takes you to a named chart in the file
s Goto (case) takes you to a named case in the file
s Variables provides information about variables
s Find a record in a file
s Insert a case (record) into a file (cases are rows)
s Insert a variable into a file (variables are columns)
s Split a file on some dimension of a variable; allows for comparisons
s Weights allow you to assign weights to variables
s Select cases according to a user-selected dimension or measurement
s Turn value labels on or off in the visual display
s Create a set of variables to use as an index, etc.
s Show displays all variables in your file
The Variable View
Defining Variables and Their Characteristics
Look at the bottom left-hand corner of the SPSS Data Editor dialog box. You should see two file
tabs: One says Data View and the other says Variable View; click on the Variable View tab. You are
now ready to define your variables and their values. In this file, all information about each variable
is entered in row format, going across the page (this is an important distinction because data for
each variable will later be entered in column format). The first row will hold all the information
for your first variable; row 2 will hold all information about your second variable, and so forth.
SPSS will automatically move this information into the appropriate column for the variable.
You will have ten decisions to make about each variable in your dataset, although several will
be made for you in the default mode. These variable characteristic decisions are in columns read-
ing from left to right as follow:
s Column 1: This is where you enter the name of the variable. Variable names can be any length in
these later versions of SPSS (older versions restricted names to eight characters) and should start
with a letter of the alphabet. On the screen, variable names will appear in lowercase type.
s Column 2: This permits you to change the form of the variable data. The default is “numeric,” which
is the form you will use almost always; an SPSS manual may be consulted to learn about other
data categories. Make sure that numeric is what appears in the cell. Move on to the next column.
s Column 3: This establishes the width of the cell. The default is eight spaces. You can widen it,
reduce it in width, or leave it at the default width. The defining characteristic is the number of
characters you use for the variable name or the number of characters in a value for that variable.
D
o
w
n
l
o
a
d
e
d
b
y
[
U
n
i
v
e
r
s
i
t
y
o
f
C
a
l
i
f
o
r
n
i
a
,
S
a
n
D
i
e
g
o
]
a
t
0
0
:
0
8
1
9
M
a
y
2
0
1
7
INTRODUCTION TO STATISTICAL SOFTWARE 367
For example, a variable name that is 6 characters wide (such as “gender”) will have values
that are 1 character wide (such as the number 1 for female and 2 for male), and will require
a column width of at least 6 characters—the length of the variable name. If, however, the
variable length is, say, only 3 characters wide (such as “inc” for income) it might require
from 3 to 5 characters. The column width for this variable will be based on the number of
characters required for the variable name. A good rule of thumb to follow is to stick with
variable names of 8 characters or less.
s Column 4: This changes the number of decimals you want to use for each variable. The
default is two decimal points. It can be raised or lowered or left as it is. For categorical data,
it is usually best to change this number to zero (0).
s Column 5: This is where you may enter a longer label for the short variable name you
entered in column 1. Variable labels will then appear along with the shorter variable name
in all printouts, making it easier for you to later remember what the statistical results
apply to; this is very important with databases with many variables. In current versions
of SPSS, variable labels can be any number of characters in length, including spaces
and symbols (in earlier versions, the length was restricted to forty characters). It is still
a good idea to keep variable names as short as possible while providing the necessary
meaning.
s Column 6: This opens the box for providing definitions to the values of a variable. Earlier
versions restricted value labels to twenty characters in length, including spaces and symbols.
While no longer a limitation, it is still a good rule to follow. Follow this five-step procedure
to input these value labels into your data dictionary:
Step 1: Click on the blank cell in this column. Then, click on the small three-dot box
that will appear at the right-hand side of the cell. This will bring up the Values
dialog box.
Step 2: Enter a number you have assigned for the value in the Values window.
Step 3. Enter a label for the value in the Label window.
Step 4: Click on the Add button. This is a critical step; you must do this after entering each
value and value label!
Step 5: Repeat the process for each value of the variables. Click on OK.
s Column 7: This is where you can assign a value for any data missing for this variable.
Follow this procedure:
Step 1: Click on the three-dot button.
Step 2: Click on the Discrete Missing Values button.
Step 3: Enter the number you want to use to signify missing data for this variable.
Step 4. Click OK. You can use any number or numbers that are not actual values for the
variable. For most variables, the value 9 is used. Note: If you leave a cell blank,
it will still be counted as a zero and used in the divisor when calculating statistics
for the dataset.
TIP: Never leave a cell blank and never leave a row blank! You will know if it is
blank (that is, without a missing value assigned) because a faint period (dot) will
show up in the cell when you are in the Data View file.
D
o
w
n
l
o
a
d
e
d
b
y
[
U
n
i
v
e
r
s
i
t
y
o
f
C
a
l
i
f
o
r
n
i
a
,
S
a
n
D
i
e
g
o
]
a
t
0
0
:
0
8
1
9
M
a
y
2
0
1
7
368 PREPARING AND PRESENTING RESEARCH FINDINGS
s Column 8: This column allows you to specify how wide the variable name will be. The default is
the exact width of the name as it appears. If not, change the width to match the number of characters
taken by the name, but no more than eight. Usually, you will not need to change this value.
s Column 9: This column allows you to specify the alignment you want for the data in each
cell. You can choose from flush right, flush left, or centered.
s Column 10: In this column you tell the computer the type of measurement for the variable.
The three types to choose from are scale, ordinal, or nominal.
Assigning Variable Names
Assigning a name to a variable is the first of the ten decisions you must make in the Variable View
file. Here are some tips to help you with the naming process:
s 6ARIABLENAMESCAN BEASLONGASNEEDED(OWEVER
ITISBESTTOKEEPTHEMSHORT
SOTHEYSTILL
have meaning.
s 6ARIABLENAMESTYPICALLYSTARTWITHA LETTEROFTHEALPHABET
BUTCAN INCLUDESOME NUMBERS
and symbols among the eight characters. For example, you can name variables var1, var2,
etc., but not 1var, 2var, 3var, etc.
s %ACHVARIABLEMUSTHAVEITSOWNDISTINCTNAMEnever repeat a variable name.
s 5SENAMESFORVARIABLESTHATHAVESOMEMEANINGTOYOUANDTHATAREEASYTOREMEMBER &OR
example, instead of “plofbrth” for the variable “place of birth,” you might want to instead
use the full word “state,” or “birth,” or “place,” or simply POB. It is always your choice!
s 3OMEWORDScannot be used as variable names. These are words used in computational syntax,
such as AND, OR, BUT, LESS, MORE, and so forth. You will discover these as you try to
use the reserved words.
s !LL VARIABLENAMESWILLBE ENTEREDINLOWERCASETYPE
SO FORGETABOUTUSINGCAPITALLETTERS
For example, you might type in gender, Gender, or GENDER for a variable name, but it will
be displayed as “gender” on the screen and in all statistical output.
s !LWAYSREMEMBERTOALSOENTERLONGERVARIABLELABELSWHENTHEREISAPOSSIBILITYOFCONFUSION
or misunderstanding. These labels can be as long as forty characters (including spaces). They
will always be printed along with the shorter variable names in statistical output.
The Measurement Type Column
The second column in the Variable View file is naming the measurement type for each variable.
The most common types are numeric and alphanumeric. Of these, numeric data is the most-used
data type. Numeric data is simply numbers, as an assigned number or a concept, such as female
or male for the variable “gender”. In alphanumeric data, the names of the value would be inserted.
By informing the program that, say, female and male (or, a and b, or x and y, etc.) is being entered
instead of a number, the program will count these names or letters just as if they were a number.
Width and Decimals
The next two columns in the Variable View are for column width and for the number of
decimals of a value. Changing these two columns is optional. Column width applies to the
width of the values used for variables. You may change the size for variables with values of
D
o
w
n
l
o
a
d
e
d
b
y
[
U
n
i
v
e
r
s
i
t
y
o
f
C
a
l
i
f
o
r
n
i
a
,
S
a
n
D
i
e
g
o
]
a
t
0
0
:
0
8
1
9
M
a
y
2
0
1
7
INTRODUCTION TO STATISTICAL SOFTWARE 369
more or fewer digits. The default space for the column width is eight spaces. You may leave it at
eight or change it.
The default value for decimals is two. However, since most values you assign to a variable value
are only one or two discrete numbers, you may want to change the number of decimals to zero.
Remember: the decimals only refer to the value of the categories for the variable; if your values
are discrete data, change the number of decimals to zero. If you do not make this change, every
value for this variable will have as many decimals as the number indicated in the data editor—a
real problem when processing and presenting data.
Variable Labels
It is typical to have a longer, more meaningful statement or label for the variable name spelled
out in all SPSS statistical output. This is particularly important if the name assigned to a vari-
able is an abbreviation of parts of two or more words or an acronym. SPSS makes this possible
by allowing you to add a longer name once during the define variables phase of the data entry.
You can then continue to use the shorter variable name in your processing commands, but the
output will automatically print out the full name as well. For example, you might select this
three-character name for a variable referring to subjects’ date of birth: PDOB. You could add
the longer variable label Subjects’ date of birth to avoid confusion later. To add labels, follow
this simple procedure:
1. To enter new, longer labels into your program file, move the curser to the first empty cell
in the fifth column of the first line; this is the Label column. Click in this empty cell.
2. This will bring up a new dialog box, one that permits you to enter the longer name
for each variable. Enter the longer name you wish; the cell will increase in size as
you type. Then move down to the next line and repeat the process for the second
variable.
3. Repeat this process for each variable in your dataset. Remember: while variable names
ought to be short, usually eight characters or less in length, variable labels can be as long
as you want them to be. Labels of less than forty characters long (including spaces and/
or symbols) used to be a requirement and are still traditional.
Value Labels
The value labels (Values) task is the sixth column in the defining variables process. You will
usually want a full value label printed out for each value of your variables. For example, if the
variable is “gender,” you will have two possible values, one value for female and a different value
for male. If you enter only the numeric values, say 1 for female and 2 for male, when the data are
processed, you will get results for each numeric value, but your reader will not know that you
meant 1 to signify females and 2 for males. The added labels for each value ensure that they will
always appear with the results of any statistical analysis carried out with that variable. This is
especially important when you have many possible values for a variable.
As noted, the variable “gender” will have two values: 1 for females and 2 for males (and pos-
sibly a third value for a No Response category, where subjects did not respond to this question).
Because you could enter only numerical data into the data file, you must now take this opportunity
to tell SPSS what each of these numerical values means.
Entering value labels is as easy as entering labels for variables. It is also possible to go back
D
o
w
n
l
o
a
d
e
d
b
y
[
U
n
i
v
e
r
s
i
t
y
o
f
C
a
l
i
f
o
r
n
i
a
,
S
a
n
D
i
e
g
o
]
a
t
0
0
:
0
8
1
9
M
a
y
2
0
1
7
370 PREPARING AND PRESENTING RESEARCH FINDINGS
later and add, change, or remove values and their labels. To add labels in a new dataset, follow
this simple procedure:
1. Click on the empty cell under the Values box in the dialog line. A small box with three
dots will appear at the right side of this cell. Click on this small box. The Value Labels
dialog box will appear. This will allow you to enter a value and a label for the value for
each variable. There are three windows in this box.
2. The first window is the Values section; enter the number for the first value for this vari-
able here. To return to the gender variable example, for that variable the first number to
be entered would be a 1.
3. Now click on the Label window. This will bring up a new dialog box, one that permits
you to enter the longer name for the variable.
4. Once you have entered the desired label, click on Add. The value and label assigned
should now appear in the larger white area alongside the Add button. NOTE: If you do
not click on Add, the value and label will not be saved.
5. Click on the Values box again and then the Label to add the next value and its label. Be
sure to click on the Add button after entering every value and its label.
6. You may also wish to add a value such as a zero for missing values in the data; missing
values occur when a question is not answered, for example. That procedure is discussed
in the next section.
7. To change or remove values and/or their labels, such as would be necessary if you were
to combine two or more values into one, click on the Change or Remove buttons and
follow instructions.
Missing Values
Every cell in a dataset will be considered to have some numeric value entered—even if it is left
blank. In SPSS, a blank cell is automatically read as a zero (0) unless the program is given other
instructions. Therefore, when entering data it is a good idea to not leave any cells blank. However,
you do not always have data for every cell; often subjects will either intentionally or accidentally
omit a response to a variable. When this happens, researchers using SPSS usually enter a value
to indicate that those data are missing.
These values are counted separately and not included in analysis requiring a mean (average)
of the data. An example of a missing value is the number 9 entered when subjects fail to indicate
their gender on a self-administered questionnaire. The number used to indicate missing data is
only valid for a single variable, although the same valid number can be used for as many variables
as desired. Any number other than those values specifically assigned in the dataset can be used;
however, the values 9 and 0 are what are usually used.
Whatever value is assigned to represent missing data, that same number must not be used for
another response in the same question. For example, if subjects are asked to indicate their rank
order preference for a set of nine or ten items, the numbers 9 or 10 cannot be used to signify miss-
ing data in the data file; the value must be one that is not used for this one variable. To add labels
in a new dataset, follow this simple procedure:
1. Click on the Variable View tab for the Data Editor to appear.
2. Select the Missing function.
3. This will bring up the Missing Values dialog box. Two buttons appear at the top of
D
o
w
n
l
o
a
d
e
d
b
y
[
U
n
i
v
e
r
s
i
t
y
o
f
C
a
l
i
f
o
r
n
i
a
,
S
a
n
D
i
e
g
o
]
a
t
0
0
:
0
8
1
9
M
a
y
2
0
1
7
INTRODUCTION TO STATISTICAL SOFTWARE 371
the box: one is titled No Missing Values; if you have not already assigned a value, this
button will show a black dot inside. The second option is for Discrete Missing Values.
Click on this second button.
4. Enter the number you wish to use to signify missing data in the first of three small boxes
below the Discrete Missing Values button.
5. When you have entered the missing value for a variable, click on the Continue button;
this brings you back to the dialog box.
6. You may now select the Value Labels option to add a label for the number you want to use to
signify a missing value. This is done in the same way as adding all value labels. First enter
the value, and then enter the label “Missing Values,” or “No Response,” or any label you want
to use. Remember to click on the Add button when you have entered the value and its label.
7. When you are finished, click on the OK button. Repeat this process for each missing
value of each variable in your dataset. The number you selected for the missing value
for that one variable will now appear in the Missing cell for the variable.
Columns and Align
The Columns file characteristic is simply another option that allows you to specify the width of
the area on the spreadsheet file that your data will occupy. The default is again eight characters;
it can be raised or lowered as much as you desire. Most analysts only bother changing the default
if it is too limiting.
Align is another housekeeping option, affecting only the way the data will appear in its final
datafile form. Options are flush left, flush right, and centered.
The Measure Column
The final defining decision in the Variables Vi e w file is Measure; it lets you specify the type of
data each variable will provide. You have three options: Scale, Ordinal, and Nominal. These tell
the statistical analysis processor what type of data it has for each variable. Different types of
measurement data require different types of statistical analyses. When you indicate to the Data
Editor the type of data represented by each variable, it will automatically select the correct analysis
technique for each test you ask it to do.
Scale data consist of measurements that are considered to be either equidistant interval (usu-
ally simply identified as interval) or ratio data. Statistical analyses conducted on these data types
usually provide the researcher with the greatest amount of information possible. Examples are
comparative rating scales, attitude scales, awareness scales, and similar question types. The key
to understanding this type of measurement is that the intervals between the various points on the
scale are (or are considered to be) exactly the same size; they are equidistant from one another.
They are the closest things to a ruler that we have available in the social sciences. In the second
variety of scale data encountered in statistical texts is called ratio data. In these measurements, an
equal difference remains between points on the scale, but the ratio scale has a “fixed” or absolute
zero point. The same statistical analyses are used for both variations of scale data.
Another way of defining scale measurements is that the data produced are considered to be
continuous rather than discrete. Continuous data (or data from continuous variables) are data that
can be any value on the scale. For example, an average or mean score on a 5-point attitude scale
can be 2.0, 3.4, 1.7, 4.3, etc., etc.; these are continuous data.
The second option in this question about the type of measurement data gathered for a question
D
o
w
n
l
o
a
d
e
d
b
y
[
U
n
i
v
e
r
s
i
t
y
o
f
C
a
l
i
f
o
r
n
i
a
,
S
a
n
D
i
e
g
o
]
a
t
0
0
:
0
8
1
9
M
a
y
2
0
1
7
372 PREPARING AND PRESENTING RESEARCH FINDINGS
is what is called ordinal scale data. The easiest way to differentiate ordinal data from scale or
nominal measurements is that these measurements are ranked or ordered on some set of charac-
teristics, but the differences between rankings are not known or considered to be equidistant. All
rank order preference scales are ordinal measurements.
Discrete data are data taken from nominal scale measurements. An example of discrete data
is the values assigned to a dichotomous question such as “What is your gender?” The answer
could only be female or male (i.e ., 1 or 2). No mean can be calculated. Another example is a list
of eight different types of occupations from which subjects might select one that applies to them.
Frequency distributions of all responses for a sample would result in a distribution of responses
across the eight options; no mean can be calculated.
The above set of rules (Table 25.1) should help you differentiate between the different types of
measurements; prior rules also apply to higher-level data (i.e ., the nominal rule also applies to ordinal,
interval, and ratio; the ordinal rule also applies to interval and ratio, but not to nominal, etc.):
The Data View
Entering Data into an SPSS Data File
If you have not done so already, you are now ready to enter data. Remember: in fixed format, which
most of you will use, all data for any one case must be entered in rows and inserted in the correct
columns for that variable. Remember to regularly save the data on a disk or a memory device.
SPSS is somewhat limited in what it accepts as data. The easiest way to deal with these limits
is to treat all information that is going to be processed in an SPSS analysis as numeric data. Other
than names developed for variables and measured or assigned values of those variables, only
numbers should be entered for processing. Numeric SPSS data are numbers used to signify a set
of measurements or labels for a specific set of cases.
The term case refers to a single entity in a data set; the case usually has more than one variable.
Examples of cases include the data for one person among a group of people studied (i.e ., in a
sample); one city in an investigation of a group of cities, or one household in a group of political
precincts examined for voting results. Whatever the element included in the study, the collective
group of cases is called either a population (all possible cases) or a sample (a selected group of
cases taken from an identified population).
Cases are always entered in rows in an SPSS data file. Each case in the sample is assigned its
own identifying number (1, 2, 3, etc.) . Each case contains a set of features that are identified and
recorded as numbers. These features are the values assigned to each of the variables. Examples
of variables include the gender of a subject (subject is another word for a case), the number of
school-aged children in a community, or the number of citizens in a precinct who voted in the last
Table 25.1
SPSS Data Types and Their Applicable Rules
Data Type
Applicable Rules for Differentiation
Nominal
Different numbers always refer to different things.
Ordinal
The numbers can be ranked or ordered on some dimension.
Scale
The different points on the scale are equidistant (i.e ., equal), and the scale
may have a fixed or absolute zero.
D
o
w
n
l
o
a
d
e
d
b
y
[
U
n
i
v
e
r
s
i
t
y
o
f
C
a
l
i
f
o
r
n
i
a
,
S
a
n
D
i
e
g
o
]
a
t
0
0
:
0
8
1
9
M
a
y
2
0
1
7
INTRODUCTION TO STATISTICAL SOFTWARE 373
election. Any feature or concept that can be measured or assigned a value on any one of the four
measurement scales (nominal, ordinal, interval, and ratio) may be a variable.
Variables are always in columns in an SPSS data file. The measurements or values for each
variable must always be placed in the data file in exactly the same reference order in the file. For
example, if the values assigned to the variable “gender” follow the values assigned to the variable
age in the first case entries, they must always be entered in this same order. In an SPSS data file
a complete row for an individual case is called a record.
It is possible to enter data in an SPSS data file in fixed format or free format style. In a fixed
format file, every value for every variable is always entered in exactly the same column in the data
file. Thus, every line of the data file will have the same number of columns, with the data for a
variable always in the same place in the file. This is the format used by most researchers because
it allows for easier editing and proofreading of a file; it is the only format to be discussed here.
If desired, empty spaces may be left between each variable, as in the fixed format example in
Table 25.2; cases 4 through 9 are omitted for this example only. If empty spaces were not used,
the file would look like this (cases 4–9 omitted for this example):
011191215015
022181114825
032171113214
04...
09...
101201324724
111221013313
In this data file, values 1 and 2 were used as database values for the two possible answers for
the gender, females and males. Education is answered as years of school completed; “MS” refers
to number of parents at home; place of birth is by state, with each state assigned a numerical
value; and the occupation of the primary wage-earner parent is distinguished by a different value
assigned to different types of careers.
Table 25.2
A Sample SPSS Data File with Variable Labels
SNO
Gender
Age
Education
MS
State
UrbSub Occupation
0
111
91
215
015
0
221
81
114
825
0
321
71
113
214
.
.
04–09 are omitted for this example.
.
.
1
012
01
324
724
1
112
21
013
313
D
o
w
n
l
o
a
d
e
d
b
y
[
U
n
i
v
e
r
s
i
t
y
o
f
C
a
l
i
f
o
r
n
i
a
,
S
a
n
D
i
e
g
o
]
a
t
0
0
:
0
8
1
9
M
a
y
2
0
1
7
374 PREPARING AND PRESENTING RESEARCH FINDINGS
Putting SPSS to Work
This is the fifth and final section of this chapter. Assuming that you have successfully entered data
to a data file, defined all the variables in that file, and established labels for variables and values of
those variables, you have competed the set-up phase of SPSS. You can begin to use this powerful
software to manipulate and analyze the dataset. The remainder of the guide will focus on four
analytic processes: Developing summary statistics for the dataset, preparing graphic displays,
transforming data, and some inferential statistical analysis on the data.
Processing Numerical Data with SPSS
Data (the numerical values you collect or assign to phenomena) are entered into a file using the
SPSS Data Editor capability. This can be done in several different ways. The most common way
is to manually type the data directly into the appropriate columns in the Data Editor window. You
can do this before or after you define your variables and assign labels to all possible values of
each variable.
Figure 25.1 is a classification of some of the key layers of statistical analysis seen in public
administration research reports, together with the statistical analysis tools in SPSS and the com-
mands for conducting those analyses. When all the variables and values are defined and all the
data have been entered into your data file, it is time to save this information into an SPSS Save
file (SPSS.sav).
Developing Summary Statistics
SPSS calculates summary statistics for three types of measurements: scale, ordinal, and
nominal. Scale data is the label SPSS uses to identify both interval and ratio data. Summary
statistics are produced in three SPSS analysis programs: Frequencies, Explore, and Descrip-
tives. Crosstabulations provides similar statistics and are used more for multivariate analyses
and presentations of data.
The Frequencies Procedure
Nominal level measurements are numbers that are applied to categorical variables. The values
assigned to categorical variables refer to mutually exclusive groups, categories, or classes within a
variable, and have no quantitative reference. Examples include the categories used to differentiate
subjects by gender, by race, by political party affiliation, by voting behavior (did vote vs. did not
vote), and so forth. Researchers want to know how many cases fit into each category. The statistics
used for these measurements are called nonparametric.
The SPSS procedure used to develop descriptive statistics for categorical variables is called
Frequencies. This procedure counts the number of cases in each designated category and
identifies the mode for the variable (the mode is the category with the most cases). The mode
is one type of average (or measure of central tendency); it is the only average to use with this
kind of data.
D
o
w
n
l
o
a
d
e
d
b
y
[
U
n
i
v
e
r
s
i
t
y
o
f
C
a
l
i
f
o
r
n
i
a
,
S
a
n
D
i
e
g
o
]
a
t
0
0
:
0
8
1
9
M
a
y
2
0
1
7
375
Figure 25.1 A Classification of Some Key Statistical Analysis Procedures in SPSS
D
o
w
n
l
o
a
d
e
d
b
y
[
U
n
i
v
e
r
s
i
t
y
o
f
C
a
l
i
f
o
r
n
i
a
,
S
a
n
D
i
e
g
o
]
a
t
0
0
:
0
8
1
9
M
a
y
2
0
1
7
376 PREPARING AND PRESENTING RESEARCH FINDINGS
SPSS Frequencies produces its results in the form of a table—sometimes referred to as a
frequency distribution table. Within each Frequencies table are five columns of information; mov-
ing from left to right, these are:
1. User-assigned Value Labels (such as female, male, yes, no, etc.) .
2. The Frequency (i.e ., the count) with which this category occurs.
3. Percent of the total that each row represents. If any data are missing, a row will indicate
what percentage of the total is missing cases represent.
4. A Valid Percent column, in which are displayed the percentages of the total minus any
missing cases that are accounted for by the counts for each category. If there are no miss-
ing cases, this column will be a repetition of the third (Percent) column.
5. Finally, a Cumulative Percent column, in which are shown the percentages of each row
plus all rows preceding this row. For example, if the percentage of responses for the first
category on a five-point rating scale is 13, and the percentage of the second category is 12,
the cumulative percentage for the first category is 13. For the second category, the cumula-
tive percentage is 25. If the percentage for the third category is 10, the cumulative percent-
age for this third row is 35. The Cumulative Percent column has no statistical relevance to
qualitative variables, however, and should be ignored when processing this kind of data.
Using the Frequencies Dialog Box
To carry out the SPSS Frequencies procedure on data entered into a data file, first click on the
Analyze option on the Main Menu bar. Then click on the second option from the list that appears:
Descriptives. You will have four options from which to choose: (1) Frequencies, (2) Descriptives,
(3) Explore, or (4) Crosstabs. Click on the Frequencies button.
The Frequencies dialog box contains two large windows and several different command options.
All variables in the data file will appear in the large window at the left-hand side of the box. Highlight
the variable you wish to analyze by clicking on it in the list. Then click on the small arrow between
the two large windows. The selected variable will now appear in the right window. To remove it,
simply reverse the process. It is possible to highlight as many variables as you want to at the same
time. One click on the center arrow will move all variables you select to the Analyze window.
Now click on the small window that reads Display Frequency Tables—it appears just beneath
the main variable list. A check mark showing in the small window means that a table will be
produced. Now go to the Statistics button located near the bottom of the gray dialog box. This
will bring up the Frequencies: Statistics dialog box. You may request percentile information,
measures of dispersion (such as the standard deviation, etc.), measures of central tendency, or
measures of distribution. Go to the Central Tendency section and click on the small window
alongside the Mode. All you need to do to have SPSS process your request is to click on Con-
tinue in this dialog box, and click on OK in the Frequencies dialog box that reappears after you
clicked on Continue.
Summary Statistics for Continuous Measurements
Statistical analysis of quantitative (numerical) measurements can be said to take place on two
fundamental levels—descriptive and inferential statistics. There are, of course, statistical tools
that do not fall into either of these categories; learning about them is best left to a course in quan-
titative methods.
D
o
w
n
l
o
a
d
e
d
b
y
[
U
n
i
v
e
r
s
i
t
y
o
f
C
a
l
i
f
o
r
n
i
a
,
S
a
n
D
i
e
g
o
]
a
t
0
0
:
0
8
1
9
M
a
y
2
0
1
7
INTRODUCTION TO STATISTICAL SOFTWARE 377
Descriptive statistics are used to summarize the numerical information in a dataset, to numeri-
cally describe the cases, and to provide some sort of structure to the data. Univariate descriptive
statistics does this one variable at a time. It is also possible to develop descriptive statistics for
two variables at the same time; this is called bivariate statistical analysis (i.e ., two variables). It
is also possible to analyze more than two variables at once in what is called multivariate statisti-
cal analysis.
The use of Frequencies with quantitative—nominal—data is the same as it is for qualitative data,
except for the selection of the appropriate measure of central tendency. For quantitative variables,
the mean and median are also calculated. The mean is the arithmetic average; the median is the mid-
point in the range of possible values. Also important for quantitative measurements are measures of
variation and of dispersion. To employ the Frequencies procedure, follow this set of steps:
s 3ELECT!NALYZE → Descriptive Statistics → Frequencies.
s 3ELECTTHEVARIABLEOR VARIABLESDESIREDMOVETHEMINTOTHEVariables window.
s #LICKONTHE$ISPLAYFrequency Tables button.
s 3ELECT3TATISTICS→ Central Tendency → Mean, Median, and Mode.
s .EXT
INTHE$ISPERSIONBOXOFTHE3TATISTICS$IALOGBOX
SELECT3TD $EVIATION
2ANGE
-INIMUM
and Maximum.
s 3ELECT#ONTINUE
s 3ELECT/+
How to Use the Explore Procedure
To calculate descriptive statistics for a variable using the SPSS Explore process, begin by clicking
on the Analyze command on the Main Menu bar. From the list of available statistical processes,
select Descriptive Statistics. Then select Explore. This will bring up the Explore dialog box.
This box has four windows. The largest box displays the names of all the variables in your
dataset. Highlight the variable you want to analyze. Then click on the small arrow alongside
this box; the variables will be moved to the window labeled Dependent List. When you want
complete analysis for one variable at a time, ignore the other two windows (i.e ., Factor List,
and Label Cases By). Click on OK and complete descriptive statistics will be produced for each
variable named.
Explore can also be used to develop descriptive statistics for different levels of a variable. The
phrase “different levels” means the different categories represented in the variable. For example,
the variable “gender” has two levels (also referred to as categories or groups): female and male.
The variable “political party” might have three levels: Democrat, Republican, and Independent. The
variable “class standing” might have five levels: freshman, sophomore, junior, senior, and graduate.
Explore will quickly and easily produce descriptive statistics for each subgroup in the variable.
s 3ELECT!NALYZE → Descriptive Statistics → Explore.
s 3ELECTTHEVARIABLEOR VARIABLESDESIREDMOVETHEMINTOTHE$EPENDENTVariables window.
s 3ELECTTHEhGROUPINGVARIABLEvFORWHICHYOUWANTTHESTATISTICALBREAKDOWNANDMOVEITINTO
the Factor List window.
s #LICKON THE$ISPLAYFrequency Tables button.
s #LICKON THE Statistics button.
s 3ELECT#ONTINUE
s 3ELECTOK.
D
o
w
n
l
o
a
d
e
d
b
y
[
U
n
i
v
e
r
s
i
t
y
o
f
C
a
l
i
f
o
r
n
i
a
,
S
a
n
D
i
e
g
o
]
a
t
0
0
:
0
8
1
9
M
a
y
2
0
1
7
378 PREPARING AND PRESENTING RESEARCH FINDINGS
How to Use the Descriptives Procedure
Descriptives is the third way to produce descriptive statistics for numeric data with SPSS; it pro-
vides a quick list of each variable, the number of valid responses for each variable, and selected
descriptive statistics. To access the program, follow these steps:
s 3ELECT!NALYZE → Descriptive Statistics → Descriptives.
s 3ELECTTHEVARIABLEOR VARIABLESDESIREDMOVETHEMINTOTHE6ARIABLES window.
s 3ELECT/PTIONS For quantitative data, click on Mean, Std. Deviation, and if desired, Minimum
and Maximum.
s 9OUCAN CHOOSETOHAVETHEDATAPRESENTEDINANYONEOFFOURDIFFERENTWAYS BY THEWAY
the variables appear in your variable list; (2) in alphabetical order; (3) by ascending value
of their means; and (4) by descending order of their means.
The Crosstabulations Procedure
Known as “two-way frequency distribution tables,” the results of a Crosstabs table present the
distribution of responses, with percentages, of two or more variables at the same time. In addition,
a wide variety of statistical analyses are included in the Crosstabs procedure. All types of data can
be analyzed in a Crosstabs table. The SPSS Crosstabs procedure is a tool for displaying the data
from one variable against those of another variable or variables. The rows of a crosstabulation
table (called a Crosstab by SPSS) represent the different values or levels of one variable, while
the columns of the table represent the values of a second variable. A simple 2 × 2 crosstabulation
will look something like this (Table 25.3).
Convention requires that each box in a table (except for those with labels) be called a cell.
Table 25.3
A Typical 2 x 2 Crosstabulation with Cells Numbered
Response
Gender
Yes
No
Female
(Cell 1)
(Cell 2)
Male
(Cell 3)
(Cell 4)
Thus, in the above example, the data for females who answered “yes” will fall in Cell 1, data for
females/no in Cell 2, males/yes in Cell 3, and males/no in Cell 4.
Crosstabs tables can have as many rows and/or as many columns as required. However, be
advised that when they exceed something like five or six rows or columns, tables can become
cumbersome to read and difficult to interpret. Crosstabs produces statistical tests for use with
interval, ordinal, and nominal (i.e., categorical) data.
SPSS permits up to four bits of information to be displayed in each cell. These include (1)
the count of occurrences, (2) the percentage of the row total represented by the count in a cell,
(3) the percentage of the column total in the cell, and (4) the percentage of the total number
of counts for the variable. Row and column total counts and percentages are displayed in the
table margins.
D
o
w
n
l
o
a
d
e
d
b
y
[
U
n
i
v
e
r
s
i
t
y
o
f
C
a
l
i
f
o
r
n
i
a
,
S
a
n
D
i
e
g
o
]
a
t
0
0
:
0
8
1
9
M
a
y
2
0
1
7
INTRODUCTION TO STATISTICAL SOFTWARE 379
Crosstabs tables are most appropriately used when both variables are categorical (i.e., nominal
data). However, there are times when the researcher wishes to display the distribution of ordinal-
or interval-level responses across the entire range of cells. In such cases, the categorical variable
is often referred to as a grouping variable and its values are placed as rows. The scale data are
displayed in columns. The example in Table 25.4 uses party affiliation data as its row variable and
the responses of a sample of subjects to a five-point rating scale. Rating scale values in columns
are Strongly Agree, Agree, Neither Agree nor Disagree, Disagree, and Strongly Disagree.
From the information in Table 25.4, it is clear that this is a relatively cumbersome way to
present data; the table is complex and “busy.” Possibly a more meaningful way to present and
analyze the information in the table would be a simple 3 × 1 table, with the means scores on the
scale shown for each of the three categories of party affiliation. A one-way analysis of variance
test could then be conducted to test for statistically significant different attitudes among the three
party affiliation groups.
Using the Crosstabs Procedure
The Crosstabs procedure is bundled into the same Summary statistics package as Frequencies,
Explore, and Descriptives. In addition to this summary table, another key feature of Crosstabs
is its ability to produce both association and differences test statistics for nominal, ordinal, and
scale data.
Tests for Independence
The chi-square test of independence can be used with all data types. Its purpose is to test whether
the row subgroups are independent from each other. The chi-square test is interpreted by examin-
ing the probability value produced with the chi-square value. When using a 95 percent confidence
level, if this p-value is 0.05 or less, the null can be rejected and the alternative hypothesis is
retained (that is, if the p-value is 0.05 or less, the responses of the groups can be assumed to be
statistically different or independent).
Measures of Association
The Crosstabs procedure makes it possible to carry out a variety of association tests for nonpara-
metric data. Several are described here.
Table 25.4
An Example 3 x 5 Crosstabulation Table with Counts and Totals
Response Category
Political
Neither
Par ty
Strongly
Agree nor
Strongly
Affiliation
Agree
Agree
Disagree
Disagree
Disagree
Totals
Democrat
38
27
15
9
7
96
Republican
7
10
12
22
30
81
Independent
10
11
7
8
10
46
Totals
55
48
34
39
47
223
D
o
w
n
l
o
a
d
e
d
b
y
[
U
n
i
v
e
r
s
i
t
y
o
f
C
a
l
i
f
o
r
n
i
a
,
S
a
n
D
i
e
g
o
]
a
t
0
0
:
0
8
1
9
M
a
y
2
0
1
7
380 PREPARING AND PRESENTING RESEARCH FINDINGS
Statistics for Nominal Data: There are four categories of statistical tests from which to select
for nominal data: the contingency coefficient, phi and Cramer’s V, lambda, and the uncertainty
coefficient. Of these, the two easiest statistical tests to use for testing for association are the phi
statistic and Cramer’s V. Both the phi and Cramer’s V statistic measure association in one direc-
tion; the values produced can range from 0.0 to 1.0 . Therefore, while they indicate the strength
of an association, they do not indicate the direction of that association (i.e ., positive or negative).
The phi statistic should be consulted for 2 × 2 tables only; Cramer’s V is applicable for all rect-
angular tables. These are accessed through the same selection in the Nominal Data section of the
Crosstabs → statistics → select the desired tests.
Statistics for Ordinal Data: SPSS Crosstabs statistics provides a variety of optional association
tests for use with ordinal data. The first of these, and the one that is often considered to be most
appropriate, is the Spearman correlation coefficient, called Spearman’s rho. This test is accessed
through the Correlations button on the Crosstabs → Statistics dialog box. The program produces
both a Pearson’s r correlation coefficient for use when the column variable is interval or ratio
level, and the Spearman’s rho when the column data are ordinal. Care must be taken in selecting
the correct statistic, since the values appear in the same output box.
Both r and rho are interpreted in the same way—as indicators of the relative strength of an
association. They should not be interpreted as measures of causation. Their values can range from
–0.1 to +0.1.
Other ordinal-level statistical tests available in Crosstabs include Gamma, Somers’s d, Kendall’s
tau-b, and Kendall’s tau-c. To see examples and more detailed explanations of what these tests do
and when to use them, consult SPSS for Window Base System User’s Guide (2008) or SPSS Guide
to Data Analysis (2005), both by Marija J. Norušis.
Statistics Involving Interval and Ratio Data: A test for association is also possible when one of
the variables in a Crosstabs procedure is interval (or ratio) level and the other variable is nominal
level. This is the eta coefficient. Eta is interpreted in the same way as Pearson’s correlation coef-
ficient. Eta does not assume a linear relationship exists between the two variables. When squared,
the value of eta can also be interpreted as a measure of the proportion of the total variability in the
interval-level variable that can be known when the values of the nominal-level variable (gender,
for example) are known.
Summary
This chapter was an introduction to file management procedures and basic statistical applications
used in statistical software such as SPSS. The chief lessons presented included how to set up a
spreadsheet-based data file and how to add the descriptive information that improves the interpre-
tation of the many statistical tests that are possible with commonly available software packages,
most if not all of which use the spreadsheet format. The chapter concluded with example instruc-
tions for using SPSS to process a variety of summary statistical tests.
Discussion Questions
1. Describe the Data Editor in SPSS.
2. Name the eleven file menus on the SPSS Main Menu.
3. What goes in the SPSS rows? What goes in columns? Is this a spreadsheet format?
4. Describe how to enter variable information (variable names, values, value names, etc.)
into SPSS Data Editor.
D
o
w
n
l
o
a
d
e
d
b
y
[
U
n
i
v
e
r
s
i
t
y
o
f
C
a
l
i
f
o
r
n
i
a
,
S
a
n
D
i
e
g
o
]
a
t
0
0
:
0
8
1
9
M
a
y
2
0
1
7
INTRODUCTION TO STATISTICAL SOFTWARE 381
5. Why is it important to enter a value for missing values in every subject’s file?
6. The Data Editor toolbar holds icons for eighteen processes. How many of these can
you identify?
7. How do you identify variables in the SPSS editor?
8. Name some of the descriptive statistical processes available in the SPSS software.
9. What results can the SPSS Explore subprogram produce?
10. What is a crosstabulation? How can you produce a Crosstab with SPSS?
Additional Reading
Einspruch, Eric L. 2005. An Introductory Guide to SPSS for Windows. 2nd ed. Thousand Oaks, CA: Sage.
Green, Samuel B., and Neil J. Salkind. 2007. Using SPSS for Windows and Macintosh: Analyzing and Un-
derstanding Data. 5th ed. Upper Saddle River, NJ: Prentice Hall.
Green, Samuel B., Neil J. Salkind, and Theresa M. Akey. 2000. Using SPSS for Windows: Analyzing and
Understanding Data. 2nd ed. Upper Saddle River, NJ: Prentice Hall.
Kirkpatrick, Lee A. and Brooke C. Feeney. 2009. A Simple Guide to SPSS® for Version 16.0 . Belmont, CA:
Wadsworth.
Norušis, Marija J. 2005. SPSS 15.0 Guide to Data Analysis. Upper Saddle River, NJ: Prentice Hall.
—— —. 2008. SPSS for Windows Base System User’s Guide (Version 16.0). Chicago: SPSS Inc. Upper
Saddle River, NJ: Prentice Hall.
Wagner, William E. III . 2006. Using SPSS for Social Statistics and Research Methods. Thousand Oaks, CA:
Pine Forge Press.
D
o
w
n
l
o
a
d
e
d
b
y
[
U
n
i
v
e
r
s
i
t
y
o
f
C
a
l
i
f
o
r
n
i
a
,
S
a
n
D
i
e
g
o
]
a
t
0
0
:
0
8
1
9
M
a
y
2
0
1
7
This page intentionally left blank
D
o
w
n
l
o
a
d
e
d
b
y
[
U
n
i
v
e
r
s
i
t
y
o
f
C
a
l
i
f
o
r
n
i
a
,
S
a
n
D
i
e
g
o
]
a
t
0
0
:
0
8
1
9
M
a
y
2
0
1
7
383
Bibliography
Aaker, David A., V. Kumar, and George S. Day. 1998. Marketing Research. 6th ed. New York: John Wiley
& Sons.
Abdellah, Faye G., Eugene Levine, and Barbara Levine. 1994. Preparing Nursing Research for the 21st
Century. New York: Springer Publishing.
Abramson, Paul R. 1997. “Probing Well Beyond the Bounds of Conventional Wisdom.” American Journal
of Political Science 41 (April): 675–82.
Achinstein, Peter. 1970. “Concepts of Science: A Philosophical Analysis.” In Frank E. Egler, ed., The Way
of Science, 40–47 . New York: Hafner Publishing.
Adler, Patricia A., and Peter Adler. 1998. “Observational Techniques.” In Norman K. Denzin and Yvonna
S. Lincoln, eds., Collecting and Interpreting Qualitative Materials, 79–109. Thousand Oaks, CA:
Sage.
Alasuutari, Pertti. 1995. Researching Culture: Qualitative Method and Cultural Studies. London: Sage.
Aldenderfer, Mark S., and Roger K. Blashfield. 1984. Cluster Analysis. Beverly Hills, CA: Sage.
Alejandro, Roberto. 1993. Hermeneutics, Citizenship, and the Public Sphere. Albany: State University of
New York.
Allen, K.R., and K.M. Baber. 1992. “Ethical and Epistemological Tensions in Applying a Postmodern Per-
spective to Feminist Research.” Psychology of Women Quarterly 16 (1): 1–15.
Allman, Dwight D. 1995. “Nietzscheanism Contra Nietzsche.” Perspectives on Political Science 24 (Spring):
69–76.
Ammons, David N., Charles Coe, and Michael Lombardo. 2001. “Performance-Comparison Projects in Local
Government: Participants’ Perspectives.” Public Administration Review 61 (1): 100–110.
Anderson, David R., Dennis J. Sweeney, and Thomas A. Williams. 2002. Statistics for Business and Econom-
ics. 8th ed. Mason, OH: South-Western.
Annells, Merilyn. 1996. “Grounded Theory Method: Philosophical Perspectives, Paradigm of Inquiry, and
Postmodernism.” Qualitative Health Research 6 (3): 379–94.
Antony, Jiju. 1998. “Some Key Things Industrial Engineers Should Know About Experimental Design.”
Logistics Information Management 11 (6): 386–92.
Apter, David E. 1977. Introduction to Political Analysis. Cambridge, MA: Winthrop.
Argyris, Chris, Robert Putnam, and Diana M. Smith. 1985. Action Science. San Francisco: Jossey-Bass.
Arneson, Pat. 1993. “Situating Three Contemporary Qualitative Methods in Applied Organizational Com-
munication Research: Historical Documentation Techniques, the Case Study Method, and the Critical Ap-
proach to Organizational Analysis.” In Sandra L. Herndon and Gary L. Kreps, eds., Qualitative Research:
Applications in Organizational Communications, 159–73. Cresskill, NJ: Hampton Press.
Babbie, Earl. 2001. The Practice of Social Research. 9th ed. Belmont, CA: Wadsworth/Thompson Learn-
ing.
Bailey, Mary T. 1994. “Do Physicists Use Case Studies? Thoughts on Public Administration Research.” In
Jay D. White and Guy B. Adams, eds., Research in Public Administration: Reflections on Theory and
Practice, 183–96. Thousand Oaks, CA: Sage.
Banks, Marcus. 2001. Visual Methods in Social Research. London: Sage.
Barnet, Sylvan. 1993. Critical Thinking, Reading, and Writing. Boston: St. Martin’s.
Barnett, Marva T. 1987. Writing for Technicians. 3rd ed. New York: Delmar Publishers.
D
o
w
n
l
o
a
d
e
d
b
y
[
U
n
i
v
e
r
s
i
t
y
o
f
C
a
l
i
f
o
r
n
i
a
,
S
a
n
D
i
e
g
o
]
a
t
0
0
:
0
8
1
9
M
a
y
2
0
1
7
384 BIBLIOGRAPHY
Bartels, Larry M., and Henry E. Brady. 1993. “The State of Quantitative Political Methodology.” In Ada W.
Finifter, ed., Political Science: The State of the Discipline, 121–59. Washington, DC: American Political
Science Association.
Barthes, Roland. 1968. Elements of Semiology, trans. Annette Lavers and Colin Smith. New York: Hill and Wang.
Barzun, Jacque, and Henry F. Graff. 1992. The Modern Researcher. 5th ed. New York: Harcourt, Brace and
World.
Bauer, Martin W., and George Gaskell, eds. 2000. Qualitative Researching with Text, Image and Sound.
London: Sage.
Bauman, Zygmunt. 1992. Hermeneutics and the Social Sciences. Aldershot, UK: Gregg Revivals.
Becker, Howard S. 1986. Writing for Social Scientists. Chicago: University of Chicago Press.
Bennett, Spencer, and David Bowers. 1976. An Introduction to Multivariate Techniques for Social and Be-
havioral Sciences. London: Macmillan.
Berg, Bruce L. 1998. Qualitative Research Methods for the Social Sciences. 2nd ed. Needham, MA: Allyn
and Bacon.
Bernard, H. Russell. 1988. Research Methods in Cultural Anthropology. Beverly Hills, CA: Sage.
—— —. 1994. “Methods Belong to All of Us.” In Robert Borofsky, ed., Assessing Cultural Anthropology,
168–79. New York: McGraw-Hill.
—— —. 1995. Research Methods in Anthropology. 2nd ed. Walnut Creek, CA: Alta Mira Press.
—— —. 2000. Social Research Methods. Thousand Oaks, CA: Sage.
Berndtson, Erkki. 1997. “Behavioralism and the History of American Political Science.” Paper presented at the
17th World Congress of the International Political Science Association, August 17–21. Seoul, Korea. Avail-
able at www.valt.helsinki.fi/vol/tutkimus/julkaisut/verkko/behavior.htm (accessed February 12, 2008).
Bevir, Mark, and R.A .W. Rhodes. 2002. “Interpretive Theory.” In David Marsh and Gerry Stoker, eds. Theory
and Methods in Political Science, 132–52. 2nd ed. Houndmills, UK: Palgrave Macmillan.
Binmore, Ken, Aland Kirman, and Piero Tani, eds. 1993. Frontiers of Game Theory. Cambridge, MA: MIT
Press.
Bloor, Michael, Jane Frankland, Michelle Thomas, and Kate Robson. 2001. Focus Groups in Social Research.
London: Sage.
Blyler, Nancy. 1998. “Taking a Political Turn: The Critical Perspective and Research in Professional Com-
munications.” Technical Communication Quarterly 7 (1): 33–53.
Borofsky, Robert, ed. 1994. Assessing Cultural Anthropology. New York: McGraw-Hill.
Boskoff, Alvin. 1972. The Mosaic of Sociological Theory. New York: Thomas Y. Crowell.
Bottom, William P., Cheryl L. Eavey, Gary J. Miller, and Jennifer N. Victor. 2000. “The Institutional Effect
on Majority Rule Instability: Bicameralism in Spatial Policy Decisions.” American Journal of Political
Science 44 (July): 523–40.
Bowen, Elinor R., and George I. Balch. 1981. “Epistemology, Methodology, and Method in the Study of
Political Behavior.” In Samuel L. Long, ed., The Handbook of Political Behavior, 1–37. New York:
Plenum Press.
Box, Richard C. 1992. “An Examination of the Debate over Research in Public Administration.” Public
Administration Review 52 (1): 62–69.
Boyte, Harry C. 2000. “The Struggle Against Positivism.” Academe 86 (4): 46–51.
Brase, Charles S., and Corrine P. Brase. 1999. Understandable Statistics: Concepts and Methods. 6th ed.
Boston: Houghton Mifflin.
Bredemeier, Harry C., and Richard M. Stephenson. 1967. “The Analysis of Culture.” In P.I. Rose, ed., The
Study of Society, 119–33 . New York: Random House.
Breisach, Ernst. 1994. Histography: Ancient, Medieval and Modern. 2nd ed. Chicago: University of Chicago
Press.
Brewer, Gene A., James W. Douglas, Rex L. Facer II, and Laurence J. O’Toole Jr. 2000. “Determinants of
Graduate Research Productivity in Doctoral Programs of Public Administration.” Public Administration
Review 59 (5): 373–82.
Brookfield, Stephen D. 1988. Developing Critical Thinkers. Milton Keynes, UK: Open University Press.
Bryant, Christopher G.A. 1985. Positivism in Social Theory and Research. New York: St. Martin’s Press.
"RYANT
2AYMOND, h.ON
GOVERNMENTAL/RGANIZATIONSAND'OVERNMENTALITY@#ONSUMING"IODIVERSITY
and Indigenous People in the Philippines.” Political Studies 50 (June): 268–92.
Buckler, Steve. 2002. “Normative Theory.” In David March and Gerry Stoker, eds., Theory and Methods in
Political Science, 172–94. 2nd ed. Houndmills, UK: Palgrave Macmillan.
D
o
w
n
l
o
a
d
e
d
b
y
[
U
n
i
v
e
r
s
i
t
y
o
f
C
a
l
i
f
o
r
n
i
a
,
S
a
n
D
i
e
g
o
]
a
t
0
0
:
0
8
1
9
M
a
y
2
0
1
7
BIBLIOGRAPHY 385
Burke, Peter, ed. 2001. New Perspectives on Historical Writing. 2nd ed. Cambridge, UK: Polity Press.
Button, Graham, ed. 1991. Ethnomethodology and the Human Sciences. New York: Cambridge Univer-
sity.
California State University–Sacramento. 2005. Research and Sponsored Projects: Proposal Development
Handbook. Available at www.csus .edu.rsp/Chapter6.htm (accessed February 7, 2008).
Carson, Jamie L., Jeffery A. Jenkins, David W. Rhode, and Mark A. Souva. 2001. “The Impact of National
Tides and District-Level Effects on Electoral Outcomes: The U.S . Congressional Elections of 1862–63.”
American Journal of Political Science 45 (10): 887–98.
Cartwright, Dorwin, ed. 1951. Field Theory in Social Science: Selected Theoretical Papers by Kurt Lewin.
New York: Harper & Row.
Cassell, Catherine, and Gillian Symon, eds. 1997. Qualitative Methods in Organizational Research. Thou-
sand Oaks, CA: Sage.
—— —. 2004. Essential Guide to Qualitative Methods in Organizational Research. Thousand Oaks, CA:
Sage.
Cattell, Raymond B. 1978. The Scientific Use of Factor Analysis in the Behavioral and Life Sciences. New
York: Plenum Press.
Ceram, C.W. 1984. Gods, Graves and Scholars, trans. E .B. Garside and Sophie Wilkins. Harmondsworth,
UK: Penguin.
Charlesworth, James C. 1962. The Limits of Behavioralism in Political Science. Philadelphia: American
Academy of Political and Social Sciences.
Child, Dennis. 1990. The Essentials of Factor Analysis. 2nd ed. London: Cassell.
Cleary, Robert E. 1992. “Revisiting the Doctoral Dissertation in Public Administration: An Examination of
the Dissertations of 1990.” Public Administration Review 52 (1): 55–61.
Cochran, Clarke E., Lawrence C. Mayer, T.R. Carr, and N. Joseph Cayer. 1995. American Public Policy: An
Introduction, 5th ed. New York: St. Martin’s Press.
Cochran, William G. 1977. “Early Developments of Techniques in Comparative Experimentation.” In
Raymond O. Collier, Jr. and Thomas J. Hummel, eds., Experimental Design and Interpretation, 5–21 .
Berkeley, CA: McCutchan Publishing.
Coffey, Amanda, and Paul Atkinson. 1996. Making Sense of Qualitative Data. Thousand Oaks, CA: Sage.
Cohen, Ronald. 1973. “Generalizations in Ethnography.” In Raoul Narol and Ronald Cohen, eds., A Handbook
of Method in Cultural Anthropology, 31–50. New York: Columbia University Press.
Collier, Raymond O. Jr., and Thomas J. Hummel, eds. 1977. Experimental Design and Interpretation.
Berkeley, CA: McCutchan.
Columbia University. 1998. Columbia Guide to Online Style. New York: Columbia University Press.
Comstock, Donald E., and Russell Fox. 1993. “Participatory Research as Critical Theory: The North Bonn-
eville, USA, Experience.” In Peter Park, Mary Brydon-Miller, Budd Hall, and Ted Jackson, eds., Voices
of Change: Participatory Research in the United States and Canada, 103–24 . Wesport, CT: Bergin and
Garvey.
Cook, Deborah. 1991. “Rereading Gadamer: A Response to James Risser.” In Hugh J. Silverman, ed., Ga-
damer and Hermeneutics, 106–16. London: Routledge.
Cook, Michael. 1986. The Management of Information from Archives. Aldershot, UK: Gower.
Cook, Ronald G., and David Barry. 1995. “Shaping the External Environment: A Study of Small Firms’ At-
tempts to Influence Public Policy.” Business and Society (December): 1–18. Available at http://Proquest.
umi.com (accessed May 7, 2001).
Cook, Thomas D., and Donald T. Campbell. 1979. Quasi-Experimentation: Design and Analysis Issues for
Field Settings. Chicago: Rand McNally.
Cooper, Charles W., and Edmund J. Robins. 1962. The Term Paper: A Manual and Model. 3rd ed. Stanford,
CA: Stanford University Press.
Cooper, John C.B. 1987. Country Creditworthiness: The Use of Cluster Analysis and Discriminant Analysis.
Glasgow: Glasgow College of Technology.
Cooper, Terry L. 1998. The Responsible Administrator: An Approach to Ethics for the Administrative Role.
4th ed. San Francisco: Jossey-Bass.
Corbett, Michael. 1996. Research Methods in Political Science. 2nd ed. Bellevue, WA: MicroCase Corp.
Cortazzi, Martin. 1993. Narrative Analysis. London: Falmer Press.
Cozzetto, Don A. 1998. “Quantitative Research in Public Administration: A Need to Address Some Serious
Methodological Problems.” Administration & Society 26 (11): 337–43.
D
o
w
n
l
o
a
d
e
d
b
y
[
U
n
i
v
e
r
s
i
t
y
o
f
C
a
l
i
f
o
r
n
i
a
,
S
a
n
D
i
e
g
o
]
a
t
0
0
:
0
8
1
9
M
a
y
2
0
1
7
386 BIBLIOGRAPHY
Creswell, John W. 1994. Research Design: Qualitative and Quantitative Approaches. Thousand Oaks, CA:
Sage.
Cunningham, J. Barton. 1995. “Strategic Considerations in Using Action Research for Improving Personnel
Practices.” Public Personnel Management 24 (4): 515–40.
Dalgleish, Lenard I., and David Chant. 1995. “A SAS Macro for Bootstrapping the Results of Discriminant
Analysis.” Educational and Psychological Measurement 55 (August): 613–24 .
Dastmalchian, A., P. Blyton, and R. Adamson. 1991. The Climate of Workplace Relations. London: Routledge.
Davidson, Larry, David A. Stayner, Stacy Lambert, Peter Smith, and William H. Sledge. 2001. “Phenomeno-
logical and Participative Research on Schizophrenia.” In Deborah L. Tolman and Mary Brydon-Miller,
eds., From Subjects to Subjectivities: A Handbook of Interpretive and Participatory Methods, 163–79.
New York: New York University Press.
Davis, Whitney. 1989. “Towards an Archeology of Thought.” In Ian Hodder, ed., The Meaning of Things,
202–9. London: HarperCollins.
Dearstyne, Bruce W. 1993. The Archival Enterprise. Chicago: American Library Association.
de Laine, Marlene. 2000. Fieldwork, Participation and Practice: Ethics and Dilemmas in Qualitative Re-
search. London: Sage.
Denhardt, Katherine G. 1989. “The Management of Ideals: A Political Perspective on Ethics.” Public Ad-
ministration Review 49 (1): 187–93 .
Denison, Dwight V., and Robert Eger III. 2000. “Tax Evasion from a Policy Perspective.” Public Adminis-
tration Review 60 (2): 163–72 .
Denscombe, Martyn. 2002. The Good Research Guide. Buckingham, UK: Open University.
Denzin, Norman K. 1978. The Research Act. New York: McGraw-Hill.
Denzin, Norman K., and Yvonna S. Lincoln, eds. 1994a. “Introduction: Entering the Field of Qualitative
Research.” In Norman. K. Denzin and Yvonne. S . Lincoln, eds., Handbook of Qualitative Research, 1–34.
Thousand Oaks, CA: Sage.
—— —. 1994b. Handbook of Qualitative Research. Thousand Oaks, CA: Sage.
—— —. 2000. Handbook of Qualitative Research, 2nd ed. Thousand Oaks, CA: Sage.
—— —. 2007. Collecting and Interpreting Qualitative Materials. 3rd ed. Thousand Oaks, CA: Sage.
—— —. 2008. Strategies of Qualitative Inquiry. Thousand Oaks, CA: Sage.
DePoy, Elizabeth, and Ann Hartman. 1999. “Critical Action Research: A Model for Social Work Knowing.”
Social Work 44 (6): 560–70.
Descombes, Vincent. 1991. “The Interpretation of Texts.” In Hugh J. Silverman, ed., Gadamer and Herme-
neutics, 247–68. London: Routledge.
de Vaus, David A. 2001. Research Design in Social Research. Thousand Oaks, CA: Sage.
Devine, Fiona. 2002. “Quantitative Methods.” In David Marsh and Gerry Stoker, eds. Theory and Methods
in Political Science, 197–215. 2nd ed. Houndmills, UK: Palgrave Macmillan.
Dood, Janet S., ed. 1986. The ACS Style Guide: A Manual for Authors and Editors. Washington, DC: Ameri-
can Chemical Society.
Dryzek, John S. 1986. “The Progress of Political Science.” Journal of Politics 48 (May): 301–20.
Dunteman, George T. 1994. “Principal Components Analysis.” In Michael S. Lewis-Beck, ed., Factor Analysis
and Related Techniques, 157–245. London: Sage.
Dusche, Richard A. 1994. “Research on the History and Philosophy of Science.” In Dorothy L. Gabel, ed.,
Handbook on Research in Science Teaching and Learning, 443–65 . New York: Macmillan.
Duveen, Gerard. 2000. “Piaget, Ethnographer.” Social Science Information 39(1): 79–97.
%ASTON
$AVID h4HE #URRENT-EANING OF @"EHAVIORALISM IN 0OLITICAL3CIENCEv )N *AMES # #HATS-
worth, ed. The Limits of Behavioralism in Political Science, 1–25. Philadelphia: American Academy of
Political and Social Science.
Eber, Herbert W. 1975. “Multivariate Methodologies for Evaluation Research.” In Elmer L. Struening and
Marcia Guttentag, eds., Handbook of Evaluation Research. Beverly Hills: Sage.
Eco, Umberto. 1976. A Theory of Semiotics. Bloomington: Indiana University.
Einspruch, Eric. 1998. An Introductory Guide to SPSS for Windows. Thousand Oaks, CA: Sage.
Eisner, Elliot W. 1997. “The New Frontier in Qualitative Research Methodology.” Qualitative Inquiry 3
(2): 259–74 .
Elliott, Deni, and Judy E. Stern. 1997. Research Ethics. Hanover, NH: University Press of New England.
Elliott, Jacques. 1951. The Changing Culture of a Factory: A Study of Authority and Participation in an
Industrial Setting. London: Tavistock Institute.
D
o
w
n
l
o
a
d
e
d
b
y
[
U
n
i
v
e
r
s
i
t
y
o
f
C
a
l
i
f
o
r
n
i
a
,
S
a
n
D
i
e
g
o
]
a
t
0
0
:
0
8
1
9
M
a
y
2
0
1
7
BIBLIOGRAPHY 387
Elton, Geoffrey R. 1984. Political History: Principles and Practice. New York: Garland.
Emerson, Robert M., Rachel I. Fretz, and Linda L. Shaw. 1995. Writing Ethnographic Fieldnotes. Chicago:
University of Chicago Press.
— —— . 2001. “Observational Field Work.” Annual Review of Sociology 7: 351–78.
Encyclopedia.com . 2008. “Ethnology.” The Columbia Encyclopedia, 6th ed. 2008. Columbia University Press.
Retrieved March 10, 2009 from Encyclopedia.com: http://www.encyclopedia.com/doc/1E1-ethnolog.
html
Engeman, Thomas S. 1995. “Behavioralism, Postbehavioralism and the Reemergence of Political Philosophy.”
Perspectives on Political Science 24 (Fall): 214–17 .
Este, David, Jackie Sieppert, and Allan Barsky. 1998. “Teaching and Learning Qualitative Research with
and without Qualitative Data Analysis Software.” Journal of Research on Computing in Education 31
(2): 138–55 .
Esterberg, Kristin G. 2002. Qualitative Methods in Social Research. Boston: McGraw-Hill.
Eulau, Heinz. 2002. “Tradition and Innovation: On the Tension Between Ancient and Modern Ways in the
Study of Politics.” In Heinz Eulau, ed., Behavioralism in Political Science. New York: Atherton Press.
Fagan, Patrick. 2002. Working Paper Sites of Political Science. Available at http://workingpapers.org (ac-
cessed June 1, 2002).
Fairweather, George W., and Louis G. Tornatsky. 1977. Experimental Methods for Social Policy Research.
New York: Pergamon Press.
Farr, James, John S. Dryzek, and Stephen T. Leonard, eds. 1995. Political Science in History. Cambridge,
UK: Cambridge University Press.
Fay, Brian. 1975. Social Theory and Political Practice. London: George Allen & Unwin.
Fernandez, Sergio, and Ross Fabricant. 2000. “Methodological Pitfalls in Privatization Research: Two Cases
from Florida’s Child Support Enforcement Program.” Public Productivity and Management Review 24
(2): 133–44 .
Fetterman, David M. 1989. Ethnography: Step by Step. Newbury Park, CA: Sage.
Finifter, Ada W., ed. 1983. Political Science: The State of the Discipline. Washington, DC: American Politi-
cal Science Association.
— —— . 1993. Political Science: The State of the Discipline II. Washington, DC: American Political Science
Association.
Fink, Arlene. 1998. Conducting Research Literature Reviews. Thousand Oaks, CA: Sage.
— —— . 2004. Conducting Research Literature Reviews. 2nd ed. Thousand Oaks, CA: Sage.
Fischer, Frank. 1998. “Policy Inquiry in Postpostive Perspective.” Policy Studies Journal 26 (Spring):
129–46.
Fischler, Raphaël. 2000. “Case Studies of Planners at Work.” Journal of Planning Literature 15 (2):
184–95.
Fitz-Gibbon, Carol Taylor, and Lynn Lyons Morris. 1987. How to Analyze Data. Newbury Park, CA:
Sage.
Fletcher, Roland. 1989. “The Messages of Material Behavior: A Preliminary Discussion of Nonverbal Mean-
ing.” In Ian Hodder, ed., The Meaning of Things: Material Culture and Symbolic Expression, 33–40.
London: HarperCollins Academic.
Flick, Uwe. 1999a. “Qualitative Methods in the Study of Culture and Development: An Introduction.” Social
Science Information 38 (4): 631–58.
—— —. 1999b. “Social Constructions of Change: Qualitative Methods for Analyzing Developmental Pro-
cesses.” Social Science Information 38 (4): 625–29.
Folz, David H. 1996. Survey Research for Public Administration. Thousand Oaks, CA: Sage.
Fong, Margaret L. 1992. “When a Survey Isn’t Research.” Counselor Education & Supervision 31 (4):
194–96.
Fowler, H. Ramsey, and Jane E. Aaron. 1995. The Little, Brown Handbook. 6th ed. New York: HarperCol-
lins.
Fox, Mary F., and John M. Braxton. 1994. “Misconduct and Social Control in Science: Issues, Problems,
Solutions.” Journal of Higher Education 65 (3): 373–83.
Fox, Richard G. 1977. Urban Anthropology: Cities in Their Cultural Settings. Englewood Cliffs, NJ: Pren-
tice Hall.
Frankfort-Nachmias, Chava, and David Nachmias. 1996. Research Methods in the Social Science. 5th ed.
New York: St. Martin’s Press.
D
o
w
n
l
o
a
d
e
d
b
y
[
U
n
i
v
e
r
s
i
t
y
o
f
C
a
l
i
f
o
r
n
i
a
,
S
a
n
D
i
e
g
o
]
a
t
0
0
:
0
8
1
9
M
a
y
2
0
1
7
388 BIBLIOGRAPHY
Fredericksen, Patricia, and Rosanne London. 2000. “Disconnect in the Hollow State: The Pivotal Role of
Organizational Capacity in Community-Based Development Organizations.” Public Administration
Review 60 (3): 230–30 .
Freedman, Paul. 1960. The Principles of Scientific Research. 2nd ed. London: Pergamon Press.
Gabel, Dorothy. 1995. “An Introduction to Action Research.” Presidential address at National Association
for Research in Science Teaching Annual Meeting. San Francisco, CA (April 24). Available at www.phy.
nau.edu (accessed November 14, 2000).
Gabel, Mathew J., and John D. Huber. 2000. “Putting Parties in Their Place: Inferring Party Left-Right Ideo-
logical Positions from Party Manifestos Data.” American Journal of Political Science 44 (1): 94–103.
Gadamer, Hans-Georg. 1975a. “Hermeneutics and Social Science.” Cultural Hermeneutics 2: 307–16.
—— —. 1975b. Truth and Method, trans. Joel Weinsheimer and Donald G. Marshall. London: Sheed and
Ward.
—— —. 1986. “Text and Interpretation.” In Bruce R. Wachterhauser, ed., Hermeneutics and Modern Phi-
losophy, 377–96. Albany: State University of New York.
—— —. 1990. Truth and Method. 2nd ed. New York: Crossroads Publishing.
Galston, Wiliam A. 1993. “Political Theory in the 1980s: Perplexity Amidst Diversity.” In Ada W. Finister,
ed., Political Science: The State of the Discipline II, 27–54. Washington, DC: American Political Science
Association.
Garceau. Oliver, ed. 1968. Political Research and Political Theory. Cambridge, MA: Harvard University
Press.
Garofalo, Charles, and Dean Geuras. 1999. Ethics in the Public Sector: The Moral Mind at Work. Washington,
DC: Georgetown University Press.
Garrick, John. 1999. “Doubting the Philosophical Assumptions of Interpretive Research.” International
Journal of Qualitative Studies in Education 12 (2): 147–57.
Garson, G. David, and Samuel Overman. 1983. Public Management Research in the United States. New
York: Praeger.
Gaskell, George. 2000. “Individual and Group Interviewing.” In Martin W. Bauer and George Gaskell, eds.,
Qualitative Researching with Text, Image, and Sound, 38–56. London: Sage.
Geertz, Clifford. 1973. The Interpretation of Cultures: Selected Essays. New York: Basic Books.
Geuss, Raymond. 1981. The Idea of a Critical Theory: Habermas and the Frankfurt School. Cambridge:
Cambridge University Press.
Gibaldi, Joseph, and Walter S. Achtert. 1988. MLA Handbook for Writers of Research Papers. New York:
Modern Language Association of America.
Gill, Jeff, and Kenneth J. Meier. 2000. “Public Administration Research and Practice: A Methodological
Manifesto.” Journal of Public Administration Research and Theory 10 (1): 157–99 .
Gill, John, and Phil Johnson. 1991. Research Methods for Managers. London: Chapman.
Gilliam, Franklin D. Jr., and Shanto Iyengar. 2000. “Prime Suspects: The Influence of Local Television News
on the Viewing Public.” American Journal of Political Science 44 (7): 560–73.
Glanz, Jeffrey. 1999. “A Primer on Action Research for the School Administrator.” Clearing House 72 (5):
301–5.
Glaser, Barney G. 1992. Emergence vs. Forcing: Basics of Grounded Theory Analysis. Mill Valley, CA:
Sociology Press.
—— —. 1999. “The Future of Grounded Theory.” Keynote Address at the Fourth Annual Qualitative Health
Research Conference. Vancouver, BC, February 1998. Qualitative Health Research 9 (6): 836–45.
Glaser, Barney G., and Anselm L. Strauss. 1967. The Discovery of Grounded Theory: Strategies for Qualita-
tive Research. Chicago: Aldine.
Glazer, Myron. 1972. The Research Adventure: Promise and Problems of Field Work. New York: Random
House.
Glorfeld, Louis W. 1995. “An Improvement on Horn’s Parallel Analysis Methodology for Selecting the Cor-
rect Number of Factors to Retain.” Educational and Psychological Measurement 55 (June): 377–93 .
Goddard, John, and Andrew Kirby. 1976. An Introduction to Factor Analysis. Norwich, UK: University of
East Anglia.
Goel, M. Lal. 1988. Political Science Research: A Methods Workbook. Ames: Iowa State University.
Golden, M. Patricia, ed. 1976. The Research Experience. Itasca, IL: F.E . Peacock Publishers.
Goss, Robert P. 1996. “A Distinct Public Administration Ethics?” Journal of Public Administration Research
and Theory 6 (4): 573–98.
D
o
w
n
l
o
a
d
e
d
b
y
[
U
n
i
v
e
r
s
i
t
y
o
f
C
a
l
i
f
o
r
n
i
a
,
S
a
n
D
i
e
g
o
]
a
t
0
0
:
0
8
1
9
M
a
y
2
0
1
7
BIBLIOGRAPHY 389
Gottfredson, Gary D. 1996. “The Hawthorne Misunderstanding (and How to Get the Hawthorne Effect in
Action Research).” Journal of Crime and Delinquency 33 (1): 28–49.
Greater London Council. 2002. “The London Index of Deprivation: An Alternative to the IMD2000.” Con-
sultation document, researched and written by Brian Robson, with Iain Deas, Michael Bradford, Cecilia
Wong, and Margrethe Andersen. July.
Greeno, Catherine G. 2001. “The Classical Experimental Design.” Family Process 40 (4): 495–99 .
Gubanich, Alan A. 1991. Writing a Scientific Paper. Dubuque, IA: Kendall/Hunt Publishing.
Gubrium, Jaber F., and James A. Holstein, eds. 2002. Handbook of Interview Research: Contexts and Method.
Thousand Oaks, CA: Sage.
Gummesson, Evert. 1991. Qualitative Methods in Management Research. Newbury Park, CA: Sage.
Gunnell, John G. 1983. “Political Theory: The Evolution of a Sub-field.” In Political Science: the State of
the Discipline, 3–45. Washington, DC: American Political Science Association.
Gurman, Pamela J., ed. 1997. Written Communications Resources Digest. Needham Heights, MA: Simon
& Schuster.
Gustafsson, Bengt, Lars Ryden, Gunnar Tibell, and Peter Wallensteen. 1984. “The Uppsala Code of Ethics
for Scientists.” Journal of Peace Research 21(November): 311–16.
'USTAVSEN
"JORN h!CTION2ESEARCH
$EMOCRATIC$IALOGUE
ANDTHE)SSUEOF@#RITICAL-ASSIN#HANGEv
Qualitative Inquiry 2 (1): 90–104.
Haig, Brian. 1996. “Grounded Theory as Scientific Method.” Philosophy of Education Society Yearbook.
Available at www.ed.uiuc.edu/EPS (accessed November 2, 2000).
Hair, Joseph F. Jr., Rolph E. Anderson, Ronald L. Tatham, and William C. Black. 1992. Multivariate Data
Analysis with Readings. New York: Macmillan.
Hakim, Catherine. 2000. Research Design. 2nd ed. London: Routledge.
Hall, Wendy A., and Peter Callery. 2001. “Enhancing the Rigor of Grounded Theory: Incorporating Reflexiv-
ity and Relationality.” Qualitative Health Research 11 (2): 257–72 .
Hammer, Dean, Jessica Bleiman, and Kenneth Park. 1999. “Between Positivism and Postmodernism: Hannah
Arendt on the Formation of Policy Judgments.” Policy Studies Journal 16 (2): 148–82.
Hansen, Philip, and Alicja Muszyaki. 1990. “Crisis in Rural Life and Crisis in Thinking: Directions for
Critical Research.” Canadian Review of Sociology and Anthropology 27 (2): 1–23.
Hanson, N.R. 1958. Patterns of Discovery: An Inquiry into the Conceptual Foundations of Science. Cam-
bridge, UK: Cambridge University Press.
Harding, Sandra. 1987. “Is There a Feminist Method?” In Sandra Harding, ed., Feminism and Methodology:
Social Science Issues, 1–14 . Bloomington: University of Indiana Press.
—— —. 2006. Science and Social Inequality: Feminist and Postcolonial Issues. Urbana: University of Il-
linois Press.
Hardwig, John. 1991. “The Role of Trust in Knowledge.” Journal of Philosophy 88 (December): 693–708.
Harnack, Andrew, and Eugene Kleppinger. 1997. ONLINE! A Reference Guide to Using Internet Sources.
New York: St. Martin’s Press.
Harper, Douglas. 1975. “Hermeneutics and Social Science.” Cultural Hermeneutics 2 (2): 307–16.
—— —. 1986. “Text and Interpretation.” In Brice Wachterhauser, ed., Hermeneutics and Modern Society,
377–96. Albany: State University of New York.
—— —. 1998. “On the Authority of the Image: Visual Methods at the Crossroads.” In Norman K. Denzin
and Yvonna S. Lincoln, eds., Collecting and Interpreting Qualitative Materials, 130–49. Thousand Oaks:
Sage.
Harrison, Lisa. 2001. Political Research: An Introduction. London: Routledge.
Hart, Chris. 1998. Doing a Literature Review. London: Sage.
Hartley, Roger E., and Linda M. Holmes. 2002, “The Increasing Senate Scrutiny of Lower Court Nominees.”
Political Science Quarterly 117 (Summer): 259–78.
Harvey, Don, and Donald R. Brown. 1996. An Experiential Approach to Organizational Development. 5th
ed. Upper Saddle River, NJ: Prentice Hall.
Hauck, Robert J. 2001. “Reforming Human Subjects Protection: The Beat Goes On.” PS: Political Science
& Politics 34 (June): 332–33 .
Hawkins, Darren, and Melissa Humes. 2002. “Human Rights and Domestic Violence.” Political Science
Quarterly 117 (Summer): 231–57.
Hedges, Alan, and Sue Duncan. 2000. “Qualitative Research in the Social Policy Field.” In Laura Marks, ed.,
Qualitative Research in Context, 191–215. Henley-on-Thames, UK: ADMAP Publications.
D
o
w
n
l
o
a
d
e
d
b
y
[
U
n
i
v
e
r
s
i
t
y
o
f
C
a
l
i
f
o
r
n
i
a
,
S
a
n
D
i
e
g
o
]
a
t
0
0
:
0
8
1
9
M
a
y
2
0
1
7
390 BIBLIOGRAPHY
Heppell, Timothy D. 2002. “The Ideological Composition of the Parliamentary Conservative Party, 1992–97.”
British Journal of Politics and International Relations 2 (June): 299–324.
Heywood, Andrew. 2000. Key Concepts in Politics. Houndmills, UK: Palgrave.
Hildebrand, David H., and Lyman Ott. 1998. Statistical Thinking for Managers. 4th ed. Pacific Grove, CA:
Duxbury Press.
Hockett, Charles F. 1955. A Course in Modern Linguistics. New York: Macmillan.
Hodder, Ian. 1982. Symbols in Action. Cambridge, UK: Cambridge University Press.
—— —. 1989. The Meaning of Things: Material Culture and Symbolic Expression. London: HarperCollins
Academic.
——— . 1998. “The Interpretation of Documents and Material Culture.” In Norman K. Denzin and Yvonna S.
Lincoln, eds., Collecting and Interpreting Qualitative Materials, 110–29. Thousand Oaks, CA: Sage.
Hodgetts, Richard M. 2002. Modern Human Relations at Work, 8th ed. Ft. Worth: Harcourt.
Holsti, Ole R. 1969. Content Analysis for the Social Sciences and Humanities. Reading, MA: Addison-
Wesley.
Hoonaard, Will C. van den. 2001. “Is Research Ethics Review a Moral Panic?” Canadian Review of Sociol-
ogy and Anthropology 38 (2): 19–36.
Houston, David J., and Sybil M. Delevan. 1990. “Public Administration Research: An Assessment of Journal
Publications.” Public Administration Review 50 (6): 674–81.
Huberty, Carl, and Laureen L. Lowman. 1997. “Discriminant Analysis via Statistical Packages.” Educational
and Psychological Measurement 57 (October): 759–84.
Hughes, John, and Wes Sharrock, eds. The Philosophy of Social Research. 3rd ed. London: Longman.
1997.
Hutcheson, Graeme, and Nick Sofroniou. 1999. The Multivariate Scientist. London: Sage.
Iggers, Georg C. 1985. New Directions in European Historiography. London: Methuen.
Imms, Mike. 2000. “The Theory of Qualitative Research.” In Laura Marks, ed., Qualitative Research in
Context, 1–15. Henley-on -Thames, UK: ADMAP Publications.
Ironstone-Catterall, Penelope. 2006. “Feminist Research Methodology and Woman’s Health: A Review
of the Literature.” National Network on Environments and Women’s Health (Canada) and York Uni-
versity White Paper. Available at www.yorku.ca/nnewh/english/pubs/workpap2.pdf (accessed July
28, 2006).
James-Catalano, Cynthia N. 1996. Researching on the World Wide Web. Rocklin, CA: Prima Publishing.
Janesick, Valerie J. 1994. “The Dance of Qualitative Research Design.” In Norman K. Denzin and Yvonne.
S. Lincoln, eds., Handbook of Qualitative Research, 209–19. Thousand Oaks, CA: Sage.
John, Peter. 2002. “Quantitative Methods.” In David Marsh and Gerry Stoker, eds., Theory and Methods in
Political Science, 216–30 . 2nd ed. Houndmills, UK: Palgrave.
Johnson, Janet, Richard A. Joslyn, and H.T. Reynolds. 2001. Political Science Research Methods. 4th ed.
Washington, DC: Congressional Quarterly.
Johnson, John M. 2002. “In-Depth Interviewing.” In Jaber F. Gubrium and James A. Holstein, eds., Handbook
of Interview Research. Thousand Oaks, CA: Sage.
Johnson, Richard A., and Dean W. Wickern. 1988. Applied Multivariate Statistical Analysis. 2nd ed. Engle-
wood Cliffs, NJ: Prentice-Hall.
Jones, E. Terrence. 1971. Conducting Political Research. New York: Harper & Row.
Jones, Russell A. 1996. Research Methods in the Social and Behavioral Sciences. 2nd ed. Sunderland, MA:
Sinauer.
Joseph, Sara, Jenny Schultz, and Melissa Castan. 2000. The International Covenant on Civil and Political
Rights. Oxford, UK: Oxford University Press.
Jurich, Katarin. 2001. “Getting the Story Straight: Grounded Theory, Hermeneutics and the Practice of
Fieldwork on the Plains of South Dakota.” Sociological Perspectives 43 (4): S149–62. Available at
EBSCO-Host (accessed August 3, 2001).
Kalinosky, Kathy. 1997. “Action Research and Learner Participation in a Homeless Shelter.” New Directions
for Adult and Continuing Education 73 (Spring): 52–55.
Kaplan, Robert S. 1998. “Innovation Action Research: Creating New Management Theory and Practice.”
Journal of Management Accounting Research 10: 89–119.
Kaplan, Robert S., and David P. Norton. 1996. The Balanced Scorecard. Boston: Harvard Business School
Press.
Kassarjian, Harold H. 1974. Handbook of Consumer Behavior. Upper Saddle River, NJ: Prentice Hall.
D
o
w
n
l
o
a
d
e
d
b
y
[
U
n
i
v
e
r
s
i
t
y
o
f
C
a
l
i
f
o
r
n
i
a
,
S
a
n
D
i
e
g
o
]
a
t
0
0
:
0
8
1
9
M
a
y
2
0
1
7
BIBLIOGRAPHY 391
Katznelson, Ira, and Helen Milner, eds. 2002. Political Science III: The State of the Discipline. Washington,
DC: American Political Science Association.
Kaufman, Herbert. 1960. The Forest Ranger: A Study in Administrative Behavior. Baltimore, MD: John
Hopkins University Press.
Kaufman, Leonard, and Peter J. Rousseeuw. 1990. Finding Groups in Data: An Introduction to Cluster
Analysis. New York: John Wiley.
Keller, Julia. 1998. “Cyber-Goofs Point Out Need for Fact Checking.” Seattle Times (December 27): C2.
Kelley, Kevin T. 1996. The Logic of Reliable Inquiry. Oxford, UK: Oxford University.
Kelley, Michael F., Linda Bennett, and Lin Moore. 2002. “Preparing High Quality Research Proposals for ACEI.”
Power Point Presentation for 2002 annual conference, San Diego, CA, Association for Childhood Education In-
ternational. Available at www.acei.org/PrepHighQualityResearchProposals.ppd (accessed February 7, 2008).
Kendall, Judy. 1999. “Axial Coding and the Grounded Theory Controversy.” Western Journal of Nursing
Research 21 (6): 743–58.
Kennedy, X.J ., and Dorothy M. Kennedy. 1987. The Bedford Guide for College Papers. New York: St.
Martin Press.
Kerlinger, Fred N., and Elazar J. Pedhazur. 1973. Multiple Regression in Behavioral Research. New York:
Holt, Rinehart, and Winston.
Kerr, Brink, William Miller, and Margaret Reid. 2002. “Sex-based Occupational Segregation in U.S . State
Bureaucracies, 1987–97.” Public Administration Review 62 (4): 412–23.
Kidder, Louise H. 1986. Research Methods in Social Relations. New York: Holt, Rinehart, and Winston.
Kim, Jae-on, and Charles W. Mueller. 1994. “Introduction to Factor Analysis.” In Michael S. Lewis-Beck,
ed., Factor Analysis and Related Techniques, 1–74 . London: Sage.
Kim, Taeyong. 1995. “Discriminant Analysis as a Prediction Tool for Uncommitted Voters in Pre-election
Polls.” International Journal of Public and Opinion Research 7 (3): 110–27 .
King, Cheryl S., Kathryn M. Feltey, and Bridget O. Susel. 1998. “The Question of Participation: Toward Au-
thentic Public Participation in Public Administration.” Public Administration Review 58 (4): 317–26.
King, James R. 1999. “Am Not! Are Too! Using Queer Standpoint in Postmodern Critical Ethnography.”
International Journal of Qualitative Studies in Education 12 (5): 473–91.
Kiniry, Malcolm, and Mike Rose, eds. 1990. Critical Strategies for Academic Writing. Boston: Bedford Books.
Kirk, Roger E. 1995. Experimental Design: Procedures for the Behavioral Sciences. Pacific Grove, CA:
Brooks/Cole.
Kitzinger, Jenny, and Rosaline S. Barbour. 1999. “Introduction: The Challenge and Promise of Focus
Groups.” In Jenny Kitzinger and Rosaline S. Barbour, eds. Developing Focus Group Research, 1–20.
London: Sage.
Klecka, William R. 1980. Discriminant Analysis. Beverly Hills, CA: Sage.
Klein, Heinz K., and Michael D. Myers. 1999. “A Set of Principles for Conducting and Evaluating Interpre-
tive Field Studies in Information Systems.” MIS Quarterly 23 (1): 67–98.
Kline, Paul. 1994. An Easy Guide to Factor Analysis. London: Routledge.
Kluckholm, Clyde. 1967. “The Study of Culture.” In P.I . Rose, ed., The Study of Society, 74–93 . New York:
Random House.
Knight, Peter K. 2002. Small Scale Research. London: Sage.
Konecki, Krysztof. 1997. “Time in the Recruiting Search Process by Headhunting Companies.” In Anselm
Strauss and Juliet Corbin, eds., Grounded Theory in Practice, 131–45. Thousand Oaks: CA: Sage.
Kornblum, William. 1996. “Introduction.” In Carolyn D. Smith and William Kornblum, eds., In the Field:
Readings on the Field Research Experience, 1–7 . 2nd ed. Wesport, CT: Praeger.
Krazanowski, W.J . 1988. Principles of Multivariate Analysis: A User’s Perspective. Oxford, UK: Oxford
University Press.
Kuechler, Manfred. 1998. “The Survey Method.” American Behavioral Scientist 42 (2): 178–200.
Kuehne, Valerie S. 1998/99. “Building Intergenerational Communities Through Research and Evaluation.”
Generations 22 (4): 82–88 .
Kuhn, Thomas S. 1970. The Structure of Scientific Revolutions. 2nd ed. Chicago: University of Chicago Press.
Kuhne, Gary W., and Allen Quigley. 1997. “Understanding and Using Action Research in Practice Settings.”
New Directions for Adult and Continuing Education 73 (2): 23–40.
Kuhns, Eileen, and S.V. Martorana, eds. 1982. Qualitative Methods for Institutional Research. San Francisco:
Jossey-Bass.
Kumar, Ranjit. 1996. Research Methodology. London: Sage.
D
o
w
n
l
o
a
d
e
d
b
y
[
U
n
i
v
e
r
s
i
t
y
o
f
C
a
l
i
f
o
r
n
i
a
,
S
a
n
D
i
e
g
o
]
a
t
0
0
:
0
8
1
9
M
a
y
2
0
1
7
392 BIBLIOGRAPHY
Kvale, Steiner. 1996. Interviewing: An Introduction to Qualitative Research. Thousand Oaks, CA: Sage.
LaFollette, Marcel C. 1994. “The Politics of Research Misconduct: Congressional Oversight, Universities,
and Science.” Journal of Higher Education 65 (3): 261–65 .
Laitin, David D. 2001. “The Political Science Discipline.” Paper presented at the annual meeting of the
American Political Science Association, August 30–September 2. San Francisco, CA. Available at http://
pro.harvard.edu/abstracts (accessed June 1, 2002).
Lan, Zhiyong, and Kathleen K. Anders. 2000. “A Paradigmatic View of Contemporary Public Administration
Research.” Administration and Society 32 (2): 138–66.
Lance, Robert E., and Robert J. Vandenberg. 2002. “Confirmatory Factor Analysis.” In Fritz Drasgow
and Neal Schmitt, eds., Measuring and Analyzing Behavior in Organizations, 221–54. San Francisco:
Jossey-Bass.
Lane, Ruth. 1992. “Political Culture: Residual Category or General Theory?” Contemporary Political Stud-
ies 25 (3): 362–88 .
Lang, Gerhard, and George D. Heiss. 1990. A Practical Guide to Research Methods. 2nd ed. Lanham, MD:
University Press of America.
Lapin, Lawrence L. 1993. Statistics for Modern Business Decisions. 3rd ed. Fort Worth, TX: Dryden.
Lasswell, Harold D. 1953. “Why Be Quantitative?” In Bernard Berelson and Morris Janowitz, eds., Reader
in Public Opinion and Communication, 265–72 . Glencoe, IL: The Free Press.
Lastrucci, Carlo L. 1967. The Scientific Approach: Basic Principles of the Scientific Method. Cambridge:
Schenkman Publishing.
Lathrop, Richard G. 1969. Introduction to Psychological Research. New York: Harper & Row.
Laurence, Helen, and William Miller, eds. 2000. Academic Research on the Internet: Options for Scholars
and Libraries. New York: Hawthorne Information Press.
LeCompte, Margaret D. 2002. “The Transformation of Ethnographic Practice: Past and Current Challenges.”
Qualitative Research 2 (December): 283–99.
LeCompte, Margaret D., and Jean J. Schensul. 1999. Designing and Conducting Ethnographic Research.
Walnut Creek, CA: AltaMira Press.
Lee, Chung-Shing, J. Thad Barnowe, and David E. McNabb. 1999. “Environmental Issues in Taiwan and
the USA: Public Perceptions, Attitudes and Priorities.” Paper presented at the 2002 Pan-Pacific Confer-
ence, Santiago, Chile.
Lee, Raymond M. 2000. Unobtrusive Methods in Social Research. Buckingham, UK: Open University
Press.
Lee, Thomas W. 1999. Using Qualitative Methods in Organizational Research. Thousand Oaks, CA: Sage.
Leedy, Paul D. 1974. Practical Research: Planning and Design. New York: Macmillan.
Lehmann, Donald R. 1985. Market Research and Analysis. 2nd ed. Homewood, IL: Irwin.
Lehmkuhl, L. Don. 1996. “Nonparametric Statistics: Methods for Analyzing Data Not Meeting Assumptions
Required for the Application of Parametric Tests.” Journal of Prosthetics and Orthodontics (Online) 8
(3): 105–13. Available at www.oandp.org/jpo/library (accessed May 19, 2002).
Leiserson, Avery. 1968. “Empirical Approaches to Democratic Theory.” In Oliver Garceay, ed. Political
Research and Political Theory, 13–36. Cambridge, MA: Harvard University Press.
Leiter, Kenneth. 1980. A Primer on Ethnomethodology. New York: Oxford University Press.
Lenkowsky, Leslie, and James L. Perry. 2000. “Reinventing Government: The Case of National Service.”
Public Administration Review 60 (4): 298–307.
Lessor, Roberta. 2000. “Using the Team Approach of Anselm Strauss in Action Research: Consulting on a
Project in Global Education.” Sociological Perspectives 43 (4): S133–48.
Lester, James D. Sr., and James D. Lester Jr. 1992. The Research Paper Handbook. Glenview, IL: Scott
Foreman.
Lewicki, R.J ., R.D . Bowen, D.R. Hall, and F.S . Hall. 1988. Experiences in Management and Organizational
Behavior. 3rd ed. New York: John Wiley.
Lewis-Beck, Michael S., ed. 1994. Factor Analysis and Related Techniques. London: Sage.
Li, Xia, and Nancy B. Crane. 1996. Electronic Styles: A Handbook for Citing Electronic Information. Med-
ford, NJ: Information Technology Today.
Lincoln, Yvonna S. 1997. “From Understanding to Action: New Imperatives, New Criteria, and New Methods
for Interpretive Researchers.” Theory and Research in Social Education 26 (1): 12–29.
Lindzey, Gardner. 1961. Projective Techniques and Cross-Cultural Research. New York: Appleton-Century-
Crofts.
D
o
w
n
l
o
a
d
e
d
b
y
[
U
n
i
v
e
r
s
i
t
y
o
f
C
a
l
i
f
o
r
n
i
a
,
S
a
n
D
i
e
g
o
]
a
t
0
0
:
0
8
1
9
M
a
y
2
0
1
7
BIBLIOGRAPHY 393
Linz, Juan J. “Ecological Analysis and Survey Research.” 1980. In Mattei Dogan and Stein Rokkan, eds.,
Quantitative Ecological Analysis in the Social Sciences, 91–131. Cambridge, MA: Massachusetts Institute
of Technology.
Lippitt, Ronald, Jeanne Watson, and Bruce Westley. 1958. The Dynamics of Planned Change. New York:
Harcourt, Brace.
Lipsey, Mark W., and David B. Wilson. 2001. Practical Meta-Analysis. Thousand Oaks, CA: Sage.
Lipsky, Michael. 1980. Street-Level Bureaucracy. New York: Russell Sage.
Locher, Birgit, and Elisabeth Prügl. 2001. “Feminism and Constructivism: Worlds Apart or Sharing the
Middle Ground?” International Studies Quarterly 45 (March): 111–29.
Locke, Karen. 1996. “Rewriting the Discovery of Grounded Theory After 25 Years?” Journal of Manage-
ment Inquiry 5 (3): 239–46.
Long, Scott. 1983. Confirmatory Factor Analysis. Beverly Hills, CA: Sage.
Lorr, Maurice. 1983. Cluster Analysis for Social Scientists. San Francisco: Jossey-Bass.
Lowndes, Vivien. 2002. “Institutionalism.” In David Marsh and Gerry Stoker, eds., Theory and Methods in
Political Science, 90–108. 2nd ed. Houndmills, UK: Palgrave.
Lyotard, Jean-François. 1984. The Postmodern Condition: A Report on Knowledge, trans. Geoff Bennington
and Brian Jameson. Minneapolis: University of Minnesota Press.
Maas, A.J. 1999. “Hermeneutics.” Trans. Janet Grayson. The Catholic Encyclopaedia, vol. VII . Available at
www.newadvent.org/cathen/0/2/1anum (accessed August 8, 2000).
Malhotra, Naresh K. 1999. Marketing Research: An Applied Orientation. 3rd ed. Upper Saddle River, NJ:
Prentice Hall.
Maner, Martin. 2001. The Research Process. 2nd ed. New York: McGraw-Hill.
Manheim, Jarol B., Richard C. Rich, and Lars Willnat. 2002. Empirical Political Analysis: Research Methods
in Political Science. 5th ed. New York: Longman.
Manly, Bryan F. 1986. Multivariate Statistical Methods: A Primer. London: Chapman & Hall.
Manning, Peter K., and Betsy Cullum-Swan. 1998. “Narrative, Content, and Semiotic Analysis.” In Nor-
man K. Denzin and Yvonna S. Lincoln, eds., Collecting and Interpreting Qualitative Materials, 246–73.
Thousand Oaks, CA: Sage.
March, James. 1977. “Administrative Practice, Organizational Theory, and Political Philosophy: Ruminations
on the Reflections of John M. Gaus.” Political Science and Politics 30 (4): 689–98 .
Margulies, N., and J. Wallace. 1973. Organizational Change: Techniques and Applications. Glenview, IL:
Scott Foreman.
Markman, Roberta H., Peter T. Markman, and Marie L. Waddell. 1989. 10 Steps in Writing the Research
Paper. 4th ed. New York: Barron’s Educational Series.
Marks, Laura. 2000. Qualitative Research in Context. Henley-on -Thames, UK: ADMAP Publications.
Marrow, Alfred J. 1977. The Practical Theorist: The Life and Work of Kurt Lewin. New York: Teachers
College Press.
Marsh, David, and Gerry Stoker. 2002. “Marxism.” In David Marsh and Gerry Stoker, eds., Theory and
Methods in Political Science, 153–71 . 2nd ed. Houndmills, UK: Palgrave.
Marsh, David, Gerry Stoker, and Paul Furlong. 2002. “A Skin, Not a Sweater: Ontology and Epistemology
in Political Science.” In David Marsh and Gerry Stoker, eds., Theory and Methods in Political Science,
17–41. 2nd ed. Houndmills, UK: Palgrave.
Marshall, Catherine, and Gretchen B. Rossman. 1999. Designing Qualitative Research. 3rd ed. Thousand
Oaks, CA: Sage.
Martin, Lana A. 2000. “Effective Data Collection.” Total Quality Management 11 (3): 341–45.
Mattson, Dale. 1986. Statistics: Difficult Concepts, Understandable Explanations. Oak Park, IL: Bolchazy-
Carducci.
Maxwell, Albert E. 1977. Multivariate Analysis in Behavioral Research. London: Chapman & Hall.
Maxwell, Joseph A. 1996. Qualitative Research Designs: An Interactive Approach. Thousand Oaks, CA:
Sage.
Maykut, Pamela, and Richard Morehouse. 1994. Beginning Qualitative Research: A Philosophic and Practi-
cal Guide. London: The Falmer Press.
McCoy, Charles A., and John Playford, eds. 1967. Apolitical Politics: A Critique of Behavioralism. New
York: Thomas Y. Crowell.
McCurdy, Howard E., and Robert E. Cleary. 1984. “Why Can’t We Resolve the Research Issue in Public
Administration?” Public Administration Review 44 (1): 49–55 .
D
o
w
n
l
o
a
d
e
d
b
y
[
U
n
i
v
e
r
s
i
t
y
o
f
C
a
l
i
f
o
r
n
i
a
,
S
a
n
D
i
e
g
o
]
a
t
0
0
:
0
8
1
9
M
a
y
2
0
1
7
394 BIBLIOGRAPHY
McDaniel, Carl Jr., and Roger H. Gates. 1993. Contemporary Marketing Research. Fort Worth, TX: West
Publishing.
McDonald, Gael. 2000. “Business Ethics: Practical Proposals for Organizations.” Journal of Business Ethics
25 (2): 169–84.
McDowell, W.H. 2002. Historical Research: A Guide. London: Longman.
McMillan, James H. and Sally S. Schumacher. 1997. Research in Education: A Conceptual Introduction.
4th ed. New York: Addison Wesley Longman.
McNabb, David E. 1968. “The Private vs. Public Power Fight in Seattle, 1930–1934.” Unpublished master ’s
degree thesis. Seattle: University of Washington.
———. 1991. “Shaping the 18th-Century Consumer Society: The London Post and General Advertiser, 1734–
1809.” Proceedings of the 16th Annual European Studies Conference (October), Omaha, Nebraska.
———. 1980. Experimental Methodology for Segmenting the Postsecondary Education Market. Unpublished
Ph.D. dissertation. Corvallis, OR: Oregon State University.
McNabb, David E., J. Thad Barnowe, and Richard Nordi. 1989. “Small Business Managers’ Perceptions of
Pacific Rim Market Opportunities.” Proceedings, Pan Pacific Conference VI (May), Sydney, Australia.
McNabb, David E., and F. Thomas Sepic. 1995. “Culture, Climate, and Total Quality Management: Measur-
ing Readiness for Change.” Public Productivity and Management Review 18 (4): 369–85.
McNabb David E., F. Thomas Sepic, and J. Thad Barowe. 1999. Organizational Climate Survey Question-
naire, Tacoma, WA: Pacific Lutheran University.
McWilliam, Carol L. 1996. “Creating Understanding That Cultivates Change.” Qualitative Inquiry 2 (2):
151–76.
-EACHAM
3HUAIB * h4HREADS OF A .EW ,ANGUAGE ! 2ESPONSE TO %ISENHARTS @/N THE 3UBJECT OF
Interpretive Review.’” Review of Educational Research 68 (4): 401–7 .
Meier, Kenneth J., and Vicky M. Wilkins. 2002. “Gender Differences in Agency Head Salaries: The Case of
Public Education.” Public Administration Review 62 (4): 405–11 .
Melia, Kathy M. 1996. “Rediscovering Glaser.” Qualitative Health Research 6 (3): 368–79.
Mercier, Jean. 1994. “Looking at Organizational Culture Hermeneutically.” Administration and Society 261
(5): 28–47 .
Merrell, Floyd. 1982. Semiotic Foundations. Bloomington: Indiana University Press.
Merriam, Saran B., and Edwin L. Simpson. 1984. Guide to Research for Educators and Trainers of Adults.
Melbourne, FL: Krieger Publishing.
Merton, Robert K. 1967. “Research and Sociological Theory.” In P.I. Rose, ed., The Study of Society, 35–48.
New York: Random House.
Miles, Matthew B., and A. Michael Huberman. 1994. Qualitative Data Analysis: A Sourcebook of New
Methods. 2nd ed. Beverly Hills, CA: Sage.
— —— . 1998. “Data Management and Analysis Methods.” In Norman K. Denzin and Yvonna S. Lincoln,
eds., Collecting and Interpreting Qualitative Materials, 179–210. Thousand Oaks, CA: Sage.
Miller, Delbert C. 1991. Handbook of Research Design and Social Measurement. 5th ed. Newbury Park,
CA: Sage.
Miller, Gerald J., and Marcia L. Whicker, eds. 1999. Handbook of Research Methods in Public Administra-
tion. New York: Marcel Dekker.
Miller, Steven I., and Marcel Fredericks. 1996. Qualitative Research Methods: Social Epistemology and
Practical Inquiry. New York: Peter Lang.
Mitchell, Jerry. 1998. “Ethical Principles for Public Administration Research.” In James Bowman and
Donald Menzel, eds., Teaching Ethics and Values in Public Administration Programs, 305–20. Albany:
State University of New York Press.
Mitchell, Marilyn L. 1998. Employing Qualitative Methods in the Private Sector. Thousand Oaks, CA:
Sage.
Monopoli, John, and Lori L. Alworth. 2000. “The Use of the Thematic Apperception Test in the Study of
Native American Psychological Characteristics: A Review and Archival Study of Navaho Men.” Genetic,
Social and General Psychology Monographs 126 (1): 43–79.
Montgomery, D.C. 1991. Design and Analysis of Experiments. 3rd ed. New York: John Wiley.
Moore, Henrietta. 1990. “Paul Ricoeur: Action, Meaning, Text.” In Christopher Tilley, ed., Reading Material
Culture: Structuralism, Hermeneutics, and Post-Structuralism, 85–120. Oxford, UK: Blackwell.
Morgan, David L. 2002. “Focus Group Interviewing.” In Jaber F. Gurium and James A. Holstein, eds. Hand-
book of Interview Research, 141–59. Thousand Oaks, CA: Sage.
D
o
w
n
l
o
a
d
e
d
b
y
[
U
n
i
v
e
r
s
i
t
y
o
f
C
a
l
i
f
o
r
n
i
a
,
S
a
n
D
i
e
g
o
]
a
t
0
0
:
0
8
1
9
M
a
y
2
0
1
7
BIBLIOGRAPHY 395
Morse, Janice M. 1994. “Designing Funded Qualitative Research.” In Norman K. Denzin and Yvonna S.
Lincoln, eds., Handbook of Qualitative Research, 220–35. Thousand Oaks, CA: Sage.
Morton, Rebeccca B. 1999. Methods and Models: A Guide to the Empirical Analysis of Formal Models in
Political Science. Cambridge, UK: Cambridge University Press.
Mulaik, Stanley A. 1972. The Foundations of Factor Analysis. New York: McGraw-Hill.
Munhall, Patricia L., and Carolyn J. Oiler. 1994. Nursing Research: A Qualitative Perspective. Norwalk,
CT: Appleton-Century-Crofts.
Mühr, Thomas. 1991. “Atlas/ti-A Protype for the Support of Text Interpretation.” Qualitative Sociology,
14(4): 349–71 .
Myers, M.D. 1997. “Qualitative Research in Information Systems.” MIS Quarterly 21 (2): 241–42 . Available
at www.misq.org/misqd961/world/ (accessed April 28, 1999).
Naím, Moisés. 2002. “The World According to Larry.” Foreign Policy 130 (4): 31–39 .
Nakano, Lynne Y. 2000. “Volunteering as a Lifestyle Choice: Negotiating Self-Identity in Japan.” Ethnology
39 (2): 93–107.
Naroll, Raoul, and Ronald Cohen, eds. 1973. A Handbook of Method in Cultural Anthropology. New York:
Columbia University Press.
Narotzky, Susana. 2000. “The Cultural Basis of a Regional Economy: The Vega Baja Del Segura in Spain.”
Ethnology 39 (1): 1–14 .
National Science Foundation (NSF). 2007. National Science Foundation Directorate for Social, Behav-
ioral and Economic Sciences (SBE). (November 23). Available at www.nsf.gov/funding/pgm_summ.
jsp”pims_id=5418&org=ses (accessed April 15, 2008).
Neef, Nancy A., Brian A. Iwata, and Terry J. Page. 1986. “Ethical Standards in Behavioral Research.” In
Alan Poling and R. Wayne Fuqua, eds., Research Methods in Applied Behavior Analysis: Issues and
Advances, 233–63. New York: Plenum Press.
Neuman, W. Lawrence. 2000. Social Research Methods: Qualitative and Quantitative Approaches. Boston:
Allyn and Bacon.
Northrop, Alana, and Kenneth L. Kraemer. 1982. “Contributions of Political Science and Public Administra-
tion to Qualitative Research Methods.” In Eileen Kuhns and S.V. Martorana, eds., Qualitative Methods
for Institutional Research, 43–54. San Francisco: Jossey-Bass.
Norušis, Marija J. 2000. SPSS for Window Base System User’s Guide. Chicago: SPSS Inc.
—— —. 2006. SPSS 15.0 Guide to Data Analysis. Upper Saddle River, NJ: Prentice Hall.
Nöth, Winfried. 1990. Handbook of Semiotics. Bloomington: Indiana University Press.
Novak, Joseph D., and D. Bob Gowin. 1984. Learning How to Learn. Cambridge, UK: Cambridge Univer-
sity Press.
Oakley, Ann. 2002. Experiments in Knowing. Cambridge, UK: Polity Press.
Oliver, Paul. 1997. Teach Yourself Research: For Business, Marketing and Education. Chicago: NTC Pub-
lishing Group.
Oppenheim, A.N. 1992. Questionnaire Design, Interviewing, and Attitude Measurement. 2nd ed. New York:
St. Martin’s Press.
Organ, Dennis W., and Thomas S. Bateman. 1991. Organizational Behavior. 4th ed. Homewood, IL: Richard
D. Irwin.
ORI. 2005. Federal Research Misconduct Policy. Office of Research Integrity. Washington DC: U.S . Depart-
ment of Health and Human Services. Available at http://ori.dhhs.gov/policies/fed_research_misconduct.
shtml (accessed June 14, 2008).
Orlans, Harold. 1967. “Ethical Problems in the Relations of Research Sponsors and Investigators.” In Gideon
Sjoberg, ed., Ethics, Politics, and Social Research. Cambridge, MA: Schenkman Publishing.
Orren, Karen, and Stephen Skowronek. 1995. “Order and Time in Institutional Study: A Brief for the Histori-
cal Approach.” In James Farr, John S. Dryzek, and Stephen T. Leonard, eds., Political Science in History,
296–317. Cambridge, UK: Cambridge University Press.
Oskamp, Stuart. 1977. Attitudes and Opinions. Englewood Cliffs, NJ: Prentice Hall.
O’Sullivan, Elizabethann, and Gary R. Rassel. 1995. Research Methods for Public Administrators. 2nd ed.
White Plains, NY: Longman.
Page, Nanette, and Cheryl E. Czuba. 1999. “Empowerment: What Is It?” Journal of Extension 37 (5): Np.
Available at www.joe.org/joe/19990ctober/comm1.html (accessed April 12, 2008).
Patton, Michael Q. 1990. Qualitative Evaluation and Research Methods. 2nd ed. Newbury Park, CA:
Sage.
D
o
w
n
l
o
a
d
e
d
b
y
[
U
n
i
v
e
r
s
i
t
y
o
f
C
a
l
i
f
o
r
n
i
a
,
S
a
n
D
i
e
g
o
]
a
t
0
0
:
0
8
1
9
M
a
y
2
0
1
7
396 BIBLIOGRAPHY
—— —. 2002. “Two Decades of Developments in Qualitative Research.” Qualitative Social Work 1 (Sep-
tember): 261–83.
Paxton, Patsy, and Stephen J. Cox. 2000. “Preparing Research Proposals.” New Zealand. Available at www.win-
tec.ac .nz/files/research%20connections/PreparingResearchProposals.doc (accessed February 12, 2008).
Payne, R.L . 1971. “Organizational Climate: The Concept and Some Research Findings.” Prakseologia 39
(1): 40–50.
Pechenik, Jan A. 1987. A Short Guide to Writing About Biology. New York: HarperCollins.
Pelto, Pertti J. 1970. Anthropological Research: The Structure of Inquiry. Cambridge, UK: Cambridge
University Press.
Pencek, Bruce. 2000. “Internet Sources for Politics, Political Science and Political Scientists.” In Helen Lau-
rence and William Miller, eds., Academic Research on the Internet: Options for Scholars and Libraries,
293–334. New York: Hawthorne Information Press.
Pennings, Paul, Hans Keman, and Jan Kleinnijenhuis. 1999. Doing Research in Political Science. Thousand
Oaks, CA: Sage.
Pennock, J. Roland. 1966. “Political Philosophy and Political Science.” In Oliver Garceau, ed., Political
Research and Political Theory, 35–57. Cambridge: Harvard University.
Pernanen, Kai. 1993. “Research Approaches in the Study of Alcohol-Related Violence.” Alcohol Health and
Research World 17 (2): 101–8 .
Perry, James L., and Kenneth L. Kraemer. 1986. “Research Methodology in the Public Administration Review,
1975–1984.” Public Administration Review 46 (3): 215–26.
Peters, Thomas J., and Robert W. Waterman. 1982. In Search of Excellence: Lessons from America’s Best
Run Companies. New York: Harper & Row.
Peterson, Karen S. 2001. “Would I Lie to You?” USA Today, July 5, 8D.
Peterson, V. Spike. 2004. “Feminist Theories Within, Invisible To, and Beyond IR.” Brown Journal of World
Affairs, 10 (2): 35–46.
——— .2002. “Rewriting (Global) Political Economy as Reproducible, Productive and Virtual (Foucauldian)
Economics.” International Feminist Journal of Politics 4 (1): 1–30 .
Petrick, Joseph A., and John F. Quinn. 1997. Management Ethics: Integrity at Work. Newbury Park, CA: Sage.
Pfiffner, John M. 1940. Research Methods in Public Administration. New York: The Ronald Press.
Phillips, Bernard S. 1977. Social Research: Strategy and Tactics. 3rd ed. New York: Macmillan.
Phillips, Denis C. 1987. Philosophy, Science, and Social Inquiry. Oxford: Pergamon.
Piantanida, Maria, and Noreen B. Garman. 1999. The Qualitative Dissertation. Thousand Oaks, CA: Sage.
Pierce, John R. 1962. Symbols, Signals, and Noise. London: Hutchinson.
Plotkin, Henry. 1994. The Nature of Knowledge. London: Allen Lane/Penguin Press.
Poister, Theodore H. 1978. Public Program Analysis: Applied Research Methods. Baltimore, MD: University
Park Press.
Poister, Theodore H., and Richard H. Harris Jr. 2000. “Building Quality Improvement over the Long Run:
Approaches, Results, and Lessons Learned from the PennDOT Experience.” Public Productivity and
Management Review 24 (2): 161–76.
Potter, Jonathan, and Margaret Wetherell. 1994. “Analyzing Discourse.” In Alan Bryman and Robert B.
Burgess, eds., Analyzing Qualitative Data, 47–66 . London: Routledge.
Prügl, Elisabeth. 2004. “International Institutions and Feminist Politics.” Brown Journal of World Affairs,
10 (2): 69–84.
———. 2000. “Towards a Feminist Political Economy.” International Feminist Journal of Politics 4 (1):
31–36.
Punnett, Betty J., and Oded Shenkat. 1996. Handbook for International Management Research. Cambridge,
UK: Blackwell.
Quigley, B. Allan, and Gary W. Kuhne, eds. 1997a. “Creating Practical Knowledge Through Action Re-
search: Posing Problems, Solving Problems, and Improving Daily Practice.” New Directions for Adult
and Continuing Education 73 (Spring): 3–32.
—— —. 1997b. “The Role of Research in the Practice of Adult Education.” New Directions for Adult and
Continuing Education 73 (2) (Spring): 3–22 .
Rabin, Jack, W. Barkley Hildreth, and Gerald J. Miller, eds. 1989. Handbook of Public Administration Re-
search. New York: Marcel Dekker.
Racker, Efraim. 1997. “A View of Misconduct in Science.” In Deni Elliott and Judy E. Stern, eds., Research
Ethics, 34–51. Hanover, NH: University Press of New England.
D
o
w
n
l
o
a
d
e
d
b
y
[
U
n
i
v
e
r
s
i
t
y
o
f
C
a
l
i
f
o
r
n
i
a
,
S
a
n
D
i
e
g
o
]
a
t
0
0
:
0
8
1
9
M
a
y
2
0
1
7
BIBLIOGRAPHY 397
Raelin, Joseph A. 1997. “Action Learning and Action Science: Are They Different?” Organizational Dynam-
ics 26 (1): 21–35.
Ragin, Charles, and David Zaret. 1983. “Theory and Method in Comparative Research: Two Strategies.”
Social Forces 61 (3): 731–54.
Randall, Vicky. 2002. “Feminism.” In David Marsh and Gerry Stoker, eds., Theory and Methods in Political
Science, 109–30. Houndmills, UK: Palgrave Macmillan.
Reason, Peter. 1998. “Three Approaches to Participative Inquiry.” In Norman K. Denzin and Yvonna S.
Lincoln, eds., Strategies of Qualitative Inquiry, 261–91. Thousand Oaks, CA: Sage.
Reisman, David. 1979. “Ethical and Practical Dilemmas of Fieldwork in Academic Settings: A Personal
Memoir.” In R.K. Merton, J.S . Coleman, and P.H. Rossi, eds., Qualitative and Quantitative Social Re-
search, 210–31. New York: The Free Press.
Reynolds, Paul D. 1979. Ethical Dilemmas and Social Science Research. San Francisco: Jossey-Bass.
Richards, Thomas J., and Lyn Richards. 1998. “Using Computers in Qualitative Research.” In Norman K.
Denzin and Yvonna S. Lincoln, eds., Collecting and Interpreting Qualitative Materials, 211–45. Thou-
sand Oaks: Sage.
Richardson, Frank C., and Blaine J. Fowers. 1983. “Interpretive Social Science.” American Behavioral
Scientist 41 (4): 465–95.
Richardson, Kurt A. 1995. “Postmetaphysical Hermeneutics: When Practice Triumphs over Theory.” Jian
Dao 4 (1995): 29–44 .
Roberts, Marylyn. 1992. “Predicting Voting Behavior via the Agenda-Setting Tradition.” Journalism Quar-
terly 69 (Winter): 878–92.
Robinson, Viviane M.J. 1994. “The Practical Promise of Critical Research in Education.” Educational Ad-
ministration Quarterly 30 (1): 56–77 .
Robrecht, Linda C. 1995. “Grounded Theory: Evolving Methods.” Qualitative Health Research 5(2): 169–78.
Rodgers, Robert, and Nanette Rodgers. 1999. “The Sacred Spark of Academic Research.” Journal of Public
Administration Research and Theory 9 (3): 473–92.
Rohr, John A. 1998. Public Service, Ethics, and Constitutional Practice. Lawrence: University of Kansas Press.
Rosenthal, Cindy Simon. 2000. “Gender Styles in State Legislature Committees: Raising Their Voices in
Resolving Conflict.” Women and Politics 21 (2): 21–45.
Rosenthal, Robert, and Ralph L. Rosnow. 1991. Essentials of Behavioral Research. 2nd ed. New York:
McGraw-Hill.
Rothman, Jack. 1974. Planning and Organizing for Social Change: Action Principles from Social Science
Research. New York: Columbia University.
Rubin, Jack W., Barkley Hildreth, and Gerald J. Miller, eds. 1989. Handbook of Public Administration. New
York: Marcel Dekker.
Ruget, Vanessa. 2002. “Scientific Capital in American Political Science: Who Possesses What, When and
How?” New Political Science 24 (September): 467–78.
Rummel, R.J . 1970. Applied Factor Analysis. Evanston, IL: Northwestern University Press.
Runyon, Melissa K., Jan Faust, and Hellen Orvaschel. 2002. “Differential Symptom Patterns of Posttraumatic
Stress Disorder (PTSD) in Maltreated Children with and without Concurrent Depression.” Child Abuse
and Neglect 26 (January): 39–53.
Rutgers, Mark R. 1997. “Beyond Woodrow Wilson: The Identity of the Study of Public Administration in
Historical Perspective.” Administration and Society 29 (3): 276–300 .
Salkind, Neil J. 2002. Exploring Research. 6th ed. Upper Saddle River, NJ: Prentice Hall.
Sanders, David. 2002. “Behavioralism.” In David Marsh and Gerry Stoker, eds., Theory and Methods in
Political Science, 45–64. 2nd ed. Houndmills, UK: Palgrave Macmillan.
Sarantakos, Satirios. 2004. Social Research. Houndmills, UK: Palgrave.
3AXONHOUSE
!RLENE h4EXTS AND #ANONS 4HE 3TATUS OF THE @'REAT "OOKS IN 0OLITICAL 3CIENCEv )N
Ada W. Finifter, ed. Political Science: The State of the Discipline II, 3–27 . Washington, DC: American
Political Science Association.
Scarbrough, Elinor. 2000. “The British Election Study and Electoral Research.” Political Studies 48 (3):
391–414 .
Schein, Edgar H. 1992. Organizational Culture and Leadership. 2nd ed. San Francisco: Jossey-Bass.
—— —. 1996. “Culture: The Missing Concept in Organization Studies.” Administrative Science Quarterly
41 (2): 229–40.
Schellenberg, James A. 1978. Masters of Social Psychology. Oxford, UK: Oxford University Press.
D
o
w
n
l
o
a
d
e
d
b
y
[
U
n
i
v
e
r
s
i
t
y
o
f
C
a
l
i
f
o
r
n
i
a
,
S
a
n
D
i
e
g
o
]
a
t
0
0
:
0
8
1
9
M
a
y
2
0
1
7
398 BIBLIOGRAPHY
Schellenberg, T.R. 1984. “Archival Principles of Arrangement.” In Maygene F. Daniels and Timothy
Walch, eds., Modern Archives Reader, 63–86. Washington, DC: National Archives and Records
Service.
Schmuck, Richard A. 1997. Practical Action Research for Change. Arlington Heights, IL: SkyLight.
Schulz, Amy J., and Leith Mullings, eds. 2006. Gender, Race, Class, and Health. San Francisco: Jossey-
Bass.
Schwab, Donald P. 1999. Research Methods for Organizational Studies. Mahwah, NJ: Lawrence Erlbaum
Associates.
Schwandt, Thomas A. 1997. Qualitative Inquiry: A Dictionary of Terms. Thousand Oaks, CA: Sage.
Scott, Judy E. 2000. “Facilitating Interorganizational Learning with Information Technology.” Journal of
Management Information Systems 17 (2): 81–114 .
Seaman, Catherine C., and Phyllis J. Verbonick. 1982. Research Methods. 2nd ed. New York: Appleton-
Century-Crofts.
Sebeok, Thomas A. 1976. Contributions to the Doctrine of Signs. Lanham, MD: University Press of
America.
Seech, Zachary. 1993. Writing Philosophy Papers. Belmont, CA: Wadsworth Publishing.
Selltiz, Claire, Lawrence S. Wrightsman, and Stuart W. Cook. 1976. Research Methods in Social Relations.
New York: Holt, Rinehart, and Winston.
Selznick, Philip. 1949. TVA and the Grass Roots: A Study in the Sociology of Formal Organization. Berkeley:
University of California Press.
Sepic, F. Thomas, J. Thad Barnowe, Merlin C. Simpson, and David E. McNabb. 1998. “Assessment of Orga-
nizational Climate and Commitment: First Steps Toward Organizational Revitalization.” Paper presented
at the annual meeting of the Western Decision Sciences Institute (April), Reno, Nevada.
Shaughnessy, John J., and Eugene B. Zechmeister. 1994. Research Methods in Psychology. 3rd ed. New
York: McGraw-Hill.
Shelly, Gary B. Thomas J. Cashman, and Misty E. Vermatt. 1995. Microsoft Office: Introductory Concepts
and Techniques. Danvers, MA: Boyd and Fraser.
Shepsle, Kenneth A. 1995. “Studying Institutions: Some Lessons from the Rational Choice Approach.” In
James Farr, John S. Dryzek, and Stephen T. Leonard, eds., Political Science in History, 276–95. Cam-
bridge, UK: Cambridge University Press.
Shively, W. Phillips. 1974. The Craft of Political Research. Englewood Cliffs, NJ: Prentice-Hall.
Siblay, Mulford Q. 1962. “The Limitations of Behavioralism.” In James S. Charlesworth, ed., The Limits
of Behavioralism in Political Science, 68–93 . Philadelphia: American Academy of Political and Social
Science.
Siegel, Andrew F. 2002. Practical Business Statistics, 5th ed. New York: McGraw-Hill.
Siegel, Sidney. 1956. Nonparametric Statistics for the Behavioral Sciences. New York: McGraw-Hill.
Silverman, David. 1993. Interpreting Qualitative Data: Methods for Analyzing Talk, Text and Interaction.
London: Sage.
3ILVERMAN
%RIC +
AND #LIFFORD 'EERTZ h4OWARD A -ORE @4HICK 5NDERSTANDINGv )N #HRISTOPHER
Tilley, ed., Reading Material Culture: Structuralism, Hermeneutics, and Post-Structuralism, 121–59.
Oxford, UK: Blackwell.
Silverman, Hugh J. 1991. Gadamer and Hermeneutics. London: Routledge.
Silverman, Kaja. 1983. The Subject of Semiotics. Oxford, UK: Oxford University Press.
Small, Stephen A. 1995. “Action-Oriented Research: Models and Methods.” Journal of Marriage and the
Family 57 (4): 941–56.
Smirnov, W., ed. 1988. Political Science: Integration of Research. Papers presented at the 14th World Con-
gress of Political Sciences. Washington, DC: USSR Academy of Science.
Smith, Carolyn D., and William Kornblum, eds. 1996. In the Field: Readings on the Field Research Experi-
ence. 2nd ed. Wesport, CT: Praeger.
Smith, Charles B. 1981. A Guide to Business Research. Chicago: Nelson-Hall.
Smith, Barbara L., Karl F. Johnson, David W. Paulsen, and Frances Shocket. 1976. Political Research Meth-
ods: Foundations and Techniques. Boston: Houghton Mifflin.
Smith, Rogers M. 2001. “Putting the Substance Back in Political Science.” Chronicle of Higher Education
48 (April 5): B10.
Somit, Albert, and Joseph Tanenhaus. 1967. The Development of American Political Science: From Burges
to Behavioralism. Boston: Allyn and Bacon.
D
o
w
n
l
o
a
d
e
d
b
y
[
U
n
i
v
e
r
s
i
t
y
o
f
C
a
l
i
f
o
r
n
i
a
,
S
a
n
D
i
e
g
o
]
a
t
0
0
:
0
8
1
9
M
a
y
2
0
1
7
BIBLIOGRAPHY 399
Soni, Vidu. 2000. “A Twenty-First Century Reception for Diversity in the Public Sector: A Case Study.”
Public Administration Review 60 (5): 395–408.
Sorrels, Bobbye D. 1984. Business Communications Fundamentals. New York: Macmillan.
Sproull, Natalie L. 1988. Handbook of Research Methods. Metuchen, NJ: Scarecrow Press.
Stack, Carol. 1996. “Doing Research in the Flats.” In Carolyn D. Smith and William Kornblum, eds., In the
Field: Readings on the Field Research Experience, 21–25. 2nd ed. Wesport, CT: Praeger.
Stake, Robert E. 2006. Multiple Case Study Analysis, New York: Guilford Press.
——— . 2000. “Case Studies.” In Norman. K. Denzin and Yvonne. S . Lincoln, eds., Handbook of Qualitative
Research, 2nd ed., 435–54. Thousand Oaks, CA: Sage.
—— —. 1995. The Art of Case Study Research. Thousand Oaks, CA: Sage.
Stallings, Robert A., and James M. Ferris. 1988. “Public Administration Research: Work in PAR, 1940–1984.”
Public Administration Review 48 (1): 580–87.
StatSoft, Inc. 2002. Nonparametric Statistics. Available at www.statsoft.com/textbook/stnonpar.html (ac-
cessed May 19, 2002).
Stein, Harold, ed. 1952. Public Administration and Policy Development: A Case Book. New York: Harcourt,
Brace, and World.
Stivers, Camilla. 2000. “Public Administration Theory as a Discourse.” Administrative Theory & Praxis
221 (2): 132–39.
Stoker, Gerry, and David Marsh. 2002. “Introduction.” In Gerry Stoker and David Marsh, eds., New Perspec-
tives on Historical Writing, 1–17 . 2nd ed. Cambridge, UK: Polity Press.
Stone, Eugene F. 1978. Research Methods in Organizational Behavior. Santa Monica, CA: Goodyear Pub-
lishing.
Strauss, Anselm, and Juliet Corbin. 1990. Basics of Qualitative Research. Thousand Oaks, CA: Sage.
—— —. 1998. Basics of Qualitative Research. 2nd ed. Thousand Oaks, CA: Sage.
—— —, eds. 1997. Grounded Theory in Practice. Thousand Oaks, CA: Sage.
Stringer, Ernie, ed. 1997. Community-based Ethnography: Breaking Traditional Boundaries of Research,
Teaching, and Learning. Mahwah, NJ: Lawrence Erlbaum Associates.
Strunk, William, Jr., and E.B. White. 1979. The Elements of Style. 3rd ed. Boston: Allyn and Bacon.
Suchman, Edward A. 1967. Evaluative Research: Principles and Practice in Public Service and Social Ac-
tion Programs. New York: Russell Sage Foundation.
Suppe, Frederick. 1988. “The Structure of a Scientific Paper.” Philosophy of Science. 65 (September):
381–405.
Sylvester, Christine. 2004. “Woe or Whoa! International Relations Where It’s Not Supposed to Be.” Brown
Journal of World Affairs, 10 (2): 57–68.
Sytsma, Sid. 2002. The Basics of Experimental Design. Available at www.liutaiomottola.com/myth/expdesig.
htme (accessed May 7, 2002).
Tabachnick, Barbara G., and Linda S. Fidell. 1989. Using Multivariate Statistics. 2nd ed. New York: Harper
& Row.
Tak, Sunghee H., Margaret Nield, and Heather Becker. 1999. “Use of a Computer Software Program for
Qualitative Analyses—Part 1: Introduction to NUD*IST (N1).” Western Journal of Nursing Research
31 (1): 111–18.
Taxpayers for Common Sense (TFCS). 2001. “Senator William Proxmire and the History of the Golden
Fleece Award.” Available at www.taxpayer.net/proxmire.html (accessed July 7, 2001).
Thompson, Bruce. 1995. “Stepwise Regression and Stepwise Discriminant Analysis Need Not Apply Here:
A Guideline Editorial.” Educational and Psychological Measurement 55 (August): 525–34.
Thompson, James R. 2000. “Reinvention as Reform: Assessing the National Performance Review.” Public
Administration Review 60 (6): 508–21 .
Tibbetts, Arn. 1987. Practical Business Writing. Boston: Little, Brown.
Tickner, J. Ann. 2004. “The Growth and Future of Feminist Theories in International Relations.” Brown
Journal of World Affairs, 10 (2): 47–56 .
Tilley, Christopher. 1989. “Interpreting Material Culture.” In Ian Hodder, ed., The Meaning of Things: Mate-
rial Culture and Symbolic Expression, 185–94. London: HarperCollins Academic.
—— —, ed. 1990. Reading Material Culture: Structuralism, Hermeneutics, and Post-structuralism. Oxford,
UK: Blackwell.
Tolman, Deborah L., and Mary Brydon-Miller, eds. 2001. From Subjects to Subjectivities. New York: New
York University Press.
D
o
w
n
l
o
a
d
e
d
b
y
[
U
n
i
v
e
r
s
i
t
y
o
f
C
a
l
i
f
o
r
n
i
a
,
S
a
n
D
i
e
g
o
]
a
t
0
0
:
0
8
1
9
M
a
y
2
0
1
7
400 BIBLIOGRAPHY
Travers, Max. 2001. Qualitative Research through Case Studies. London, Sage.
Trochim, William K. 2002. Positivism and Post-Positivism. Available at http://trochim.human.cornell.edu/
kb/positivism.htm (accessed June 10, 2002).
Tuck, Richard. 2001. “History of Historical Thought.” In Peter Burke, ed., New Perspectives on Historical
Writing, 218–32. 2nd ed. Cambridge, UK: Polity Press.
Turner, Roy, ed. 1974. Ethnomethodology: Selected Readings. Harmondsworth, UK: Penguin.
Van Evera, Stephen. 1997. Guide to Methods for Students of Political Science. Ithaca, NY: Cornell University
Press.
Velasquez, Manuel. 1998. Business Ethics: Concepts and Cases. 4th ed. Upper Saddle River, NJ: Prentice
Hall.
Verplanck, William S. 1994. Fifty-Seven Years of Searching Among Behavioralisms: A Memoir. Available at
http://web.utk.edu/~wverplan/bibn049 (accessed May 7, 2001).
Wachterhauser, Brice. 1986. “History and Language in Understanding.” In Brice Wachterhauser, ed., Herme-
neutics and Modern Philosophy, 5–61. Albany: State University of New York.
Waddington, David. 1997. “Participant Observation.” In Catherine Cassell and Gillian Symon, eds., Qualita-
tive Methods in Organizational Research, 107–22 . Thousand Oaks, CA: Sage.
Walizer, Michael H., and Paul L. Wienir. 1978. Research Methods and Analysis: Searching for Relationships.
New York: Harper & Row.
Walker, Robert, ed. 1985. Applied Qualitative Research. Aldershot, UK: Gower Publishing.
Waller, Alisha A. 2005. “Work in Progress—Feminist Research Methodologies: Why, What and How.” Paper
presented at the 35th ASEE/IEE Frontiers in Education Conference (October 19–22), Indianapolis, Indiana.
Available at http://fie.engrng.pitt.edu/fie2005/papers/1588.pdf (accessed July 27, 2006).
Wapner, Paul. 2002. “The Sovereignty of Nature? Environmental Protection in a Postmodern Age.” Inter-
national Studies Quarterly 40 (June): 167–87.
Ward, Hugh. 2002. “Rational Choice.” In David Marsh and Gerry Stoker, eds., Theory and Methods in
Political Science, 65–69. 2nd ed. Houndmills, UK: Palgrave Macmillan.
Wasby, Stephen L. 2002. “Proposal Writing—A Remedy for a Missing Part of Graduate Training.” PS:
Political Science and Politics online
Wasson, Chester R. 1965. Research Analysis for Marketing Decision [sic]. New York: Appleton-Century-
Crofts.
Waterston, Alisse. 1999. Love, Sorrow, and Rage: Destitute Women in a Manhattan Residence. Philadelphia:
Temple University Press.
Webb, Eugene J., Donald T. Campbell, Richard D. Schwartz, and Lee Sechrest. 2000. Unobtrusive Measures.
2nd ed. Thousand Oaks, CA: Sage.
Weitzman, Eben A., and Matthew B. Miles. 1995. Computer Programs for Qualitative Data Analysis: A
Software Sourcebook. Thousand Oaks, CA: Sage.
Wengraf, Tom. 2001. Qualitative Research Interviewing. London: Sage.
Westmarland, Nicole. 2001. “The Quantitative/Qualitative Debate and Feminist Research: A Subjective
View of Objectivity.” Forum: Qualitative Social Research 2 (1). Available at www.qualitative-research.
net/fqs-texte/1–01/1–01westmarland-e .pdf (accessed July 27, 2006).
Whelan, Robert K. 1989. “Data Administration and Research Methods in Public Administration.” In Jack
Rabin, W.B. Hildreth, and G.J. Miller, eds., Handbook of Public Administration Research, 657–82. New
York: Marcel Dekker.
White, Jay D. 1986. “Dissertations and Publications in Public Administration.” Public Administration Review
46 (3): 227–39 .
—— —. 1999. The Narrative Foundations of Public Administration Research. Washington, DC: Georgetown
University Press.
White, Jay D., and Guy B. Adams, eds. 1994. Research in Public Administration. Thousand Oaks, CA:
Sage.
Whiting, Beatrice, and John Whiting. 1973. “Methods for Observing and Recording Behavior.” In Raoul
Naroll and Ronald Cohen, eds., A Handbook of Method in Cultural Anthropology, 282–315. New York:
Columbia University Press.
Wibben, Annick. 2004. “Feminist International Relations: Old Debates and new Directions.” Brown Journal
of World Affairs 10 (2): 97–114 .
Wildavsky, Aaron. 1993. Craftways: On the Organization of Scholarly Work. 2nd ed. New Brunswick, NJ:
Transaction Publishers.
D
o
w
n
l
o
a
d
e
d
b
y
[
U
n
i
v
e
r
s
i
t
y
o
f
C
a
l
i
f
o
r
n
i
a
,
S
a
n
D
i
e
g
o
]
a
t
0
0
:
0
8
1
9
M
a
y
2
0
1
7
BIBLIOGRAPHY 401
7ILKINSON
3UE
AND#ELIA +ITZINGER h @#LINTON &ACES .ATION!#ASE 3TUDYIN THE #ONSTRUCTION OF
Focus Group Data as Public Opinion.” Sociological Review 48 (August): 408–24 .
Williams, Terry. 1996. “Exploring the Cocaine Culture.” In Carolyn D. Smith and William Kornblum, eds.,
In the Field: Readings on the Field Research Experience, 27–32. 2nd ed. Wesport, CT: Praeger.
Wilson, James Q. 1989. Bureaucracy: What Government Agencies Do and How They Do It. New York:
Basic Books.
Winter, Bronwyn, Denise Thompson, and Sheila Jeffreys. 2002. “The UN Approach to Harmful Traditional
Practices: Some Conceptual Problems.” International Feminist Journal of Politics (April): 72–94.
Wishart, David. 1999. ClustanGraphics Primer: A Guide to Cluster Analysis. Edinburgh: Clustan Ltd.
Wong, Paul T.P. 2002. How to Write a Research Proposal. Langley, BC: Trinity Western University, Graduate
Program in Counseling Psychology. Available at www.meaning.ca/articles/print/writing_research_pro-
posal_mau02.htm (accessed February 12, 2008).
Worlcott, Harry F. 1995. The Art of Fieldwork. Walnut Creek, CA: AltaMira Press.
Wyner, Gordon A. 1997. “Experimental Design.” Marketing Research 9 (3): 39–41.
Yan, Zhiyong, and Kathleen K. Anders. 2000. “A Paradigmatic View of Contemporary Public Administration
Research: An Empirical Test.” Administration & Society 32 (May): 138–65 .
Yates, Frank. 1977. “Sir Ronald Fisher and the Design of Experiments.” In Raymond O. Collier Jr. and
Thomas J. Hummel, eds. Experimental Design and Interpretation, 24–42. Berkeley, CA: McCutchan
Publishing.
Yeager, Samuel J. 1989. “Classic Methods in Public Administration Research.” In Jack Rabin, W.B. Hildreth,
and G.J. Miller, eds., Handbook of Public Administration, 683–793. New York: Dekker.
Yin, Robert K. 1984. Case Study Research: Design and Methods. Thousand Oaks, CA: Sage.
—— —. 1994. Case Study Research: Design and Methods. 2nd ed. Thousand Oaks, CA: Sage.
Zeisel, Hans. 1968. Say It with Figures. 5th ed. New York: Harper & Row.
Zikmund, William G. 1994. Research Methods. Fort Worth, TX: Dryden.
Zuchert, Catherine. 1995. “The Postmodern Problem.” Perspectives on Political Science 24 (Spring):
78–84.
D
o
w
n
l
o
a
d
e
d
b
y
[
U
n
i
v
e
r
s
i
t
y
o
f
C
a
l
i
f
o
r
n
i
a
,
S
a
n
D
i
e
g
o
]
a
t
0
0
:
0
8
1
9
M
a
y
2
0
1
7
This page intentionally left blank
D
o
w
n
l
o
a
d
e
d
b
y
[
U
n
i
v
e
r
s
i
t
y
o
f
C
a
l
i
f
o
r
n
i
a
,
S
a
n
D
i
e
g
o
]
a
t
0
0
:
0
8
1
9
M
a
y
2
0
1
7
403
Author Index
Aaker, David A., 96, 97
Abramson, Paul R., 6
Achinstein, Peter, 12
Adams, Guy B., 19, 225, 226
Adler, Patricia A., 2 69
Adler, Peter, 269
Akey, Theresa M., 3 43 , 381
Alasuutari, Pertti, 265 , 275
Albert, Jim, 343
Aldenderfer, Mark S., 2 17, 219, 221
Alejandro, Roberto, 315, 317
Allen, K. R., 25, 278
Allman, Dwight D., 26
Alreck, Pamela L., 124
Alworth, Lori L., 309
Ammons, David N., 239
Anastas, Jeane W., 56
Anders, Kathleen K., 16, 225
Anderson, David, 163
Antony, Jiju, 128
Arden, Susan H., 362
Argyris, Chris, 230, 286
Arneson, Pat, 237, 242 , 249
Atkinson, Paul, 323
Auerbach, Carl, 302
Babbie, Earl, 39, 206 , 2123
Baber, K. M ., 25, 278
Bailey, Mary T., 238, 239
Banks, Marcus, 326
Barbour, Rosaline S., 101, 102, 103
Barnet, Sylvan, 50
Barnowe, J. Thad, 119, 213
Barry, David, 262
Barsky, Allan, 288, 300
Bartels, Larry M., 16, 17
Barthes, Roland, 318
Barzun, Jacque, 244, 245
Bateman, Thomas S., 270
Baugh, L. Sue, 363
Bauman, Zygmunt, 315, 317, 318
Becker, Heather, 300
Becker, Howard S., 363
Bennett, Linda, 63, 65
Bennett, Spencer, 207, 221
Berenson, Mark L., 175
Berg, Bruce L., 31
Berman, Evan, 175
Bernard, H. Russell, 50, 207, 212 , 217, 271, 275
Bevir, Mark, 24
Beyerstein, Barry L., 14
Blashfield, Roger K., 217, 219, 221
Bloor, Michael, 102 , 104
Blyler, Nancy, 231
Bottom, William, 129
Bouma, Gary D., 39
Bowers, David, 207, 221
Boyte, Harry C., 16, 17
Brady, Henry E., 16, 17
Braxton, John M., 67
Brightman, Harvey J. , 175
Brown, Timothy A., 22 1
Brown, William D., 36 2
Bryant, Raymond L., 105
Bryman, Alan, 108, 302
Burke, Peter, 247, 248, 250
Burnham, Peter, 14
Callery, Peter, 253
Campbell, Donald T., 127, 140, 309, 310 , 311 , 326
Carlson, James M., 56
Carr, T. R., 6
Carson, Jamie L., 244
Cartwright, Dorwin, 283
Cassell, Catherine, 226 , 235
Caterino, Brian, 56
Cattell, Raymond B., 211, 212, 216
Cayer, N. Joseph, 6
Chant, David, 207
Charon, Joel M., 263
Chen, Peter Y., 206
Cheryl, P., 129
Child, Dennis, 215
Chung, Elizabeth, 362
D
o
w
n
l
o
a
d
e
d
b
y
[
U
n
i
v
e
r
s
i
t
y
o
f
C
a
l
i
f
o
r
n
i
a
,
S
a
n
D
i
e
g
o
]
a
t
0
0
:
0
8
1
9
M
a
y
2
0
1
7
404 AUTHOR INDEX
Cochran, Clarke, 6
Cochran, William, 125 , 128
Coe, Charles, 239
Coffey, Amanda, 323
Cohen, Ronald, 267
Collier, Raymond O., Jr., 140
Collins, Harry, 14
Cook, Michael, 326
Cook, Ronald G., 262
Cook, Stuart W., 32, 36
Cook, Thomas D., 127, 140
Cooper, John C. B., 207, 209
Cooper, Terry L., 66, 75
Corbett, Michael, 56
Corbin, Juliet, 11, 232, 234, 253, 254, 263, 289,
290, 291, 292, 298, 299
Cortazzi, Martin, 321, 323
Couvalis, George, 14, 28
Cox, Stephen J., 61, 65
Creswell, John W., 225, 226, 234, 235
Cullum-Swan, Betsy, 318, 319, 323
Cureton, Edward E., 2 21
Czuba, Cheryl E., 281
D’Agostino, Ralph B., 22 1
Dalgleish, Lenard L., 207
Day, George S., 96, 97
Dearstyne, Bruce W., 308
Dekking, Frederik M., 1 56
De Laine, Marlene, 67, 75
Denscombe, Martyn, 20, 24, 42, 304, 305, 320,
321, 322
Denzin, Norman K., 232, 235, 250, 251, 263
Descombes, Vincent, 317
De Vaus, David A., 40, 44
DeVelin Robert F., 1 24
Devine, Fiona, 31
Dryzek, John S., 18, 20
Dunteman, George T., 211
Duveen, Gerard, 269
Easton, David, 22, 23
Eavey, L ., 129
Eco, Umberto, 318, 319, 320
Einspruch, Erich, 95, 381
Elliott, Deni, 75
Elton, Geoffrey R., 246, 247
Emerson, Robert M. , 275, 297, 298, 299, 300
Este, David, 288, 300
Esterberg, Kristin G., 45
Ethridge, Marcus E., 14
Fagan, Patrick, 6
Farr, James, 20
Fay, Brian, 26
Feeney, Brooke C., 156, 381
Feltey, Kathryn M., 26 1
Ferris, James M., 4
Fetterman, David M., 271, 272, 275
Fidell, Linda S., 140
Field, Andy, 206
Fielding, Nigel G., 30 2
Finifter, Ada W., 4, 5
Fink, Arlene, 95, 305, 306, 307, 312, 313, 326
Fischler, Raphaël, 238
Fitz-Gibbon, Carol Taylor, 87, 287
Flick, Uwe, 45, 47, 273
Folz, David H., 110, 113, 114
Fontana, David, 326
Fowers, Blaine J., 13, 18
Fox, Mary F., 67
Fox, Richard G., 273, 275
Frankfort-Nachmias, Chave, 30, 31, 33
Frankland, Jane, 102, 104
Fredericks, Marcel, 252 , 260
Fretz, Rachel I., 275, 297, 298, 299, 300
Furlong, Paul, 4, 15, 25, 26
Gadamer, Hans-Georg, 315, 326
Gallhofer, Irmtraud N., 12 4
Galston, Wiliam A., 25, 277
Gamst, Glenn C., 221
Garman, Noreen B., 305
Garofalo, Charles, 75
Gaskell, George, 99, 101, 107
Gates, Roger H., 126, 127, 131
Gee, James Paul, 326
George, Darren, 156
Gerring, John, 28
Geuras, Dean, 75
Geuss, Raymond, 286
Gibbs, Graham, 302
Gilland, Karin, 14
Gilliam, Franklin D. , Jr., 129
Glaser, Barney G., 251, 253, 254, 255, 256, 257, 258,
259, 262, 263 , 290, 292, 299
Glazer, Myron, 282
Glorfeld, Louis W. , 2 07
Goddard, John, 211
Godlberg, Israel A., 65
Golden, M. Patricia, 14
Good, Phillip I., 15 6
Graff, Henry F., 244, 245
Grant, Wyn, 14
Gray, Ann, 275
Graziano, Anthony M., 39
Green, Samuel B., 343, 381
Greeno, Catherine G., 125
Guarino, Anthony J., 221
Gubrium, Jaber F., 100
Gummesson, Evert, 230
Gunnell, John G., 4, 5, 22
D
o
w
n
l
o
a
d
e
d
b
y
[
U
n
i
v
e
r
s
i
t
y
o
f
C
a
l
i
f
o
r
n
i
a
,
S
a
n
D
i
e
g
o
]
a
t
0
0
:
0
8
1
9
M
a
y
2
0
1
7
AUTHOR INDEX 405
Haig, Brian, 251
Hakim, Catherine, 40, 48, 97, 99
Hall, Wendy A., 2 53
Hanks, Helga, 302
Hansen, Philip, 231
Hanson, N. R., 271
Hardin, James W., 156
Harding, Sandra, 278, 279, 286
Hardwig, John, 70
Harris, Richard H., Jr., 239
Hart, Chris, 97, 98, 108
Hartley, Roger E., 9 9
Hawkins, Darren, 99
Heiss, George D., 86, 141, 237, 238, 306
Heppell, Timothy D. , 19
Heywood, Andrew, 5
Higgins, James J., 191
Hildebrand, David H., 1 31
Hinkle, D., 28, 95
Hockett, Charles F., 246, 248
Hodder, Ian, 27, 318, 324, 325
Hodgetts, Richard M., 4 5
Holland, Janet, 286
Holmes, Linda M., 99
Holstein, James A., 100
Holsti, Ole R., 320, 321, 322
Huberman, A. Michael, 37, 234, 239, 250, 259, 263, 288,
289, 290, 291, 294, 295, 299,300
Huberty, Carl, 208, 221
Hughes, John, 14, 28
Humes, Melissa, 99
Hummel, Thomas J., 1 40
Hutcheson, Graeme, 216, 221
Hyde, Mark S., 56
Iggers, Georg C., 244, 245
Ironstone-Catterall, Penelope, 279
Iwata, Brian A., 70, 72
Iyengar, Shanto, 129
Jasper, David, 326
Jenkins, Jeffrey A., 244
John, Peter, 34
Johnson, Janet B., 39, 95
Johnson, John M., 100
Johnson, Karl F., 16
Johnson, Marvin O., 262
Jones, E. Terrence, 19
Jones, Russell A., 266, 267, 268, 269, 293
Joslyn, Richard A. , 39, 95
Jurs, Stephen G., 28 , 95
Kassarjian, Harold H., 297
Katznelson, Ira, 4, 5, 7, 10, 11
Kaufman, Herbert, 236
Kelley, Michael F., 63, 65
Keman, Hans, 4, 108
Kendall, Judy, 253, 254 , 292
Kerlinger, Fred N., 2 00 , 206
Kim, Jae-on, 213, 214, 217
Kim, Taeyong, 209
King, Cheryl S., 261
Kirby, Andrew, 211
Kirk, Roger E., 128, 131, 132, 140
Kirkpatrick, Lee A., 156, 381
Kitzinger, Celia, 102
Kitzinger, Jenny, 101, 102, 103
Klecka, William R., 207, 221
Klein, Heinz K., 229, 230
Kleinnijenhuis, Jan, 4, 108
Knight, Peter K., 97, 99 , 101 , 102, 104
Kornblum, William, 272
Kraaikamp, Cornelis, 156
Kuhn, Thomas S., 225
Kuhne, Gary W., 282, 283, 284
Kumar, Ranjit, 70, 73
Kumar, V., 96, 97
Kvale, Steiner, 234, 289
LaFollette, Marcel C., 66, 67
Laitin, David D., 8
Lance, Robert E., 211, 212, 214, 215
Lang, Gerhard, 86, 141, 237, 238, 306
Lapin, Lawrence L., 176
Lastrucci, Carlo L., 14
Lathrop, Richard G., 4
Lawrence, E., 6
Layton-Henry, Zig, 14
Lee, Brian, 362
Lee, Chung-Shing, 213
Lee, Raymond M., 302
Lee, Thomas W., 225, 226, 235, 254, 255, 258, 259, 260,
261, 263
Lehmann, E. L., 175
Lehmkuhl, L. Don, 176
Leiserson, Avery, 246
Leonard, Stephen T. , 2 0
Levine, David M., 175
Lewin, Beverly, 363
Lincoln, Yvonna S., 232, 235, 250, 251
Ling, Rod, 39
Lipsey, Mark W., 311, 312, 313, 314, 326
Lipsky, Michael, 236
Locher, Birgit, 19, 25, 277
Locke, Karen, 253, 260
Lombardo, Michael, 239
Long, Scott, 214
Lopuhaä, Hendrik P., 156
Lorr, Maurice, 217, 221
Lowman, Laureen L., 208
Lowndes, Vivien, 20, 21
Lussier, Robert N., 124
D
o
w
n
l
o
a
d
e
d
b
y
[
U
n
i
v
e
r
s
i
t
y
o
f
C
a
l
i
f
o
r
n
i
a
,
S
a
n
D
i
e
g
o
]
a
t
0
0
:
0
8
1
9
M
a
y
2
0
1
7
406 AUTHOR INDEX
Maas, A. J ., 316
MacDonald, Marian L., 56
Malhotra, Naresh K., 74, 110
Mallery, Paul, 156
Manners, Donald E., 355, 357
Manning, Peter K., 318, 319, 323
Margulies, N., 273
Markman, Peter T., 353
Markman, Roberta H., 353
Marrow, Alfred J., 2 86
Marsh, David, 4, 15, 20, 25, 26, 27, 28, 247
Marshall, Catherine, 232, 235, 241, 242, 243, 250
Martin, Lana A., 287
Martin, Maner, 39
Mattson, Dale, 10, 95, 160
Maxwell, Albert E., 207
Mayer, C., 6
Maykut, Pamela, 252
McDaniel, Carl, Jr., 126, 127, 131
McDowell, W. H. , 29, 248, 249
McIntyre, Alice, 286
McMillan, James H., 59
McNabb, David E., 119, 122, 209, 213 , 273, 310
Meacham, Shuaib J., 229
Meester, Ludolf E., 156
Merrell, Floyd, 318 , 323
Meyers, Lawrence S., 221
Miles, Jeremy, 206
Miles, Matthew B., 37, 234, 239, 250, 259, 263,
288, 289, 290, 291, 294, 295, 299,
300
Miller, Delbert C., 42
Miller, Gary J., 129
Miller, Gerald J. , 175
Miller, Steven L., 25 2 , 260
Milner, Helen, 4, 5, 7, 10, 11
Mitchell, Jerry, 66, 69
Monopoli, John, 309
Moore, Henrietta, 316, 317
Moore, Lin, 63, 65
Morehouse, Richard, 252
Morgan, David L., 102, 103
Morris, Lynn Lyons, 87, 287
Morse, Janice M., 232
Morton, Rebecca B., 39
Mueller, Charles W., 213, 214, 217
Mullings, Leith, 276
Munton, Anthony G., 3 02
Muszyaki, Alicja, 231
Myers, Judith G., 343
Myers, Michael D., 229, 230
Nachmias, David, 30, 31, 33
Naím, Moisés, 18
Neef, Nancy A., 70, 72
Neufeld, John L., 95
Neuman, W. Lawrence, 16, 19, 20, 70, 72, 73, 75, 264,
269, 278, 289, 291, 294, 295
Nield, Margaret, 300
Norusis, Marija J., 184, 191, 205, 206, 381
Nöth, Winfried, 318 , 319
Oakley, Ann, 15, 16, 19, 26
Ogden, Thomas E., 65
Oppenheim, A. N., 72, 73
Organ, Dennis W., 270
Orlans, Harold, 68
Orren, Karen, 246
Orvaschel, Hellen, 211
Oskamp, Stuart, 115, 118 , 120, 124
O’Sullivan, Elizabethann, 121
Ott, Lyman, 131
Page, Nannette, 281
Page, Terry J., 70, 72
Patton, Michael Q., 232, 243
Paulsen, David W., 16
Paxton, Patsy, 61 , 65
Payne, R. L., 273
Pearl, Andrew O., 36 2
Pedhazur, Elazar J., 200, 206
Pennings, Paul, 4, 108
Pennock, J . Roland, 19
Peters, Thomas J., 273
Peterson, Karen S., 66
Peterson, V. Spike, 278
Phillips, Bernard S., 40, 42
Phillips, Denis C. , 271
Phillips, John L., 95, 156
Piantanida, Maria, 305
Pierce, John R., 318, 319
Pinch, Trevor, 14
Plotkin, Henry, 4
Poister, Theodore H., 2 39
Popovich, Paula M., 2 06
Potter, Jonathan, 324
Prügl, Elisabeth, 19, 25, 277, 278
Putnam, Robert, 230, 286
Quigley, Allen, 282, 283 , 284
Ramazanoglu, Caroline, 286
Rassel, Gary R., 121
Raulin, Michael L., 39
Reynolds, H. T., 39, 95
Reynolds, Paul D., 68
Rhode, David W., 244
Rhodes, R. A. W., 24
Richards, Lyn, 300, 301
Richards, Thomas J., 300, 301
Richardson, Frank C., 13, 18
Richardson, Kurt A., 317
D
o
w
n
l
o
a
d
e
d
b
y
[
U
n
i
v
e
r
s
i
t
y
o
f
C
a
l
i
f
o
r
n
i
a
,
S
a
n
D
i
e
g
o
]
a
t
0
0
:
0
8
1
9
M
a
y
2
0
1
7
AUTHOR INDEX 407
Roberts, Marylyn, 209
Robinson, Viviane M. J ., 232
Robrecht, Linda C., 251
Robson, Kate, 102, 104
Rohr, John A., 66, 75
Rom, Charlene D., 362
Romano, Joseph P., 175
Rosenthal, Cindy Simon, 104
Rosenthal, Robert, 43, 44
Rosnow, Ralph L., 43 , 44
Rossman, Gretchen B., 232, 235, 241, 242, 243, 250
Rouge, Anna M., 362
Ruget, Vanessa, 6, 7
Runyon, Melissa K., 211
Ryan, Thomas P., 140
Salkind, Neil J., 59, 156 , 343, 381
Sanders, David, 23
Sarantakos, Satirios, 276, 279
Saris, Willem E., 124
Saxonhouse, Arlene, 25, 277
Schein, Edgar H., 272, 273
Schellenberg, James A., 309
Schram, Sanford, 56
Schulz, Amy J., 276
Schumacher, Sally S., 59
Schwab, Donald P., 28, 56, 95
Schwandt, Thomas A., 2 27, 229, 231
Schwartz, Richard D., 309, 310, 311, 326
Sebeok, Thomas A., 318, 319
Sechrest, Lee, 309, 310, 311 , 326
Seech, Zachary, 54
Selltiz, Claire, 32, 36
Selznick, Philip, 236
Sepic, F. Thomas, 119, 122 , 273
Settle, Robert B., 124
Sharrock, Wes, 14, 28
Shaughnessy, John J., 12, 52
Shaw, Linda L., 275, 297, 298, 299, 300
Shepsle, Kenneth A., 20, 21, 23
Shevlin, Mark, 206
Shocket, Frances, 16
Siegel, Andrew F., 205
Siegel, Sidney, 178, 182, 184 , 186
Sieppert, Jackie, 288, 300
Silverman, David, 302, 318 , 319
Silverstein, Louise B., 302
Silvester, Joanne, 302
Simpson, Merlin C., 122
Skowronek, Stephen, 246
Small, Stephen A., 2 5, 276, 277, 279, 280
Smeeton, Nigel C. , 191
Smith, Barbara L., 16
Smith, Diana M., 230, 286
Smith, Madeline M., 362
Smith, Rogers M., 18, 27
Sofroniou, Nick, 216 , 221
Somit, Albert, 22 , 23
Sorrels, Bobbye D., 34 4
Souva, Mark A., 244
Sprent, Peter, 191
Sproull, Natalie L. , 3 2 1, 322
Stake, Robert E., 104, 105, 236, 237, 239
Stallings, Robert A. , 4
Stebbins, Robert A., 108
Stein, Harold, 236
Stephan, David, 175
Stern, Judy E., 75
Stivers, Camilla, 47
Stoker, Gerry, 4, 15, 20, 25, 26, 27, 28, 247
Stratton, Peter, 302
Strauss, Anselm L., 11, 232, 234, 251, 253, 254, 255, 256,
257, 258, 259, 263 , 289, 290, 291, 292, 298, 299
Stringer, Ernie, 270
Suchman, Edward A., 284
Susel, Bridget O., 26 1
Sweeney, J., 163
Sylvester, Christine, 278
Symon, Gillian, 226, 235
Tabachnick, Barbara G., 140
Tak, Sunghee H., 300
Tanenhaus, Joseph, 22, 23
Thomas, Michelle, 102, 104
Tickner, J. Ann, 278
Tilley, Christopher, 319, 324
Trochim, William K., 15
Tuck, Richard, 247
Tufte, Edward R., 343
Vandenberg, Robert J., 211, 212, 214, 215
Van Evera, Stephen, 238
Velasquez, Manuel, 67
Verplanck, William S., 22
Victor, Jennifer N., 129
Wachterhauser, Brice, 316, 318
Waddell, Marie L., 353
Wagner, William, E., III, 381
Wallace, J., 273
Waller, Alisha, 279
Wapner, Paul, 24, 27
Wasby, Stephen L., 57, 58, 65
Wasserman, Larry, 191
Wasson, Chester R., 329
Waterman, Robert W., 273
Waterston, Alisse, 257
Webb, Eugene J., 309, 310, 311, 326
Weitzman, Eben A., 30 0
Wengraf, Tom, 108
Westmarland, Nicole, 276, 279
Wetherell, Margaret, 324
D
o
w
n
l
o
a
d
e
d
b
y
[
U
n
i
v
e
r
s
i
t
y
o
f
C
a
l
i
f
o
r
n
i
a
,
S
a
n
D
i
e
g
o
]
a
t
0
0
:
0
8
1
9
M
a
y
2
0
1
7
408 AUTHOR INDEX
Whelan, Robert K., 236
Whicker, Marcia L., 175
White, Jay D., 19, 45 , 46, 47, 225, 226, 227, 229, 231, 232
Whiting, Beatrice, 267
Whiting, John, 267
Wibben, Annick, 278
Wiersma, William, 28, 95
Wildavsky, Aaron, 56
Wilkinson, Sue, 102
Williams, David, 175
Williams, Joseph M., 363
Williams, Terry, 267
Williams, Thomas A., 163
Wilson, David B., 311, 312, 313, 314, 326
Wilson, James Q., 272
Wong, Paul T. P., 58, 61
Wrightsman, Lawrence S., 32, 36
Wyner, Gordon A., 129
Yan, Zhiyong, 16, 225
Yates, Frank, 129
Yeager, Samuel J., 237, 243, 272
Yin, Robert K., 236, 237, 241, 243, 250
Zechmeister, Eugene B., 12, 52
Zikmund, William G., 69, 92
D
o
w
n
l
o
a
d
e
d
b
y
[
U
n
i
v
e
r
s
i
t
y
o
f
C
a
l
i
f
o
r
n
i
a
,
S
a
n
D
i
e
g
o
]
a
t
0
0
:
0
8
1
9
M
a
y
2
0
1
7
409
Subject Index
ABI-Inform, 347
Abstract
research proposal, 60
research report, 347–48, 349f, 361
Abstraction, 230
Academy of Management Review, 362
Accretion measures, 311
Action research, 25 , 270, 276
Action Science, 233f
Alpha level, 126, 162
American Academy of Management, 362
American Finance Association, 362
American Journal of Political Science, 6, 129
American Political Science Association (APSA), 4, 8, 9t,
18, 66 –67, 361
American Political Science Review, 6, 8, 361
American Politics Research, 9
American Psychology Association (APA), 62, 355, 357
Analysis of variance (ANOVA)
experimental design (ED), 135f, 136, 137–39
hypothesis testing, 158–59, 163–64, 168–73
inferential statistics, 87
multiple regression analysis (MRA), 202–5
n-way analysis of variance, 168–69, 173
one-way analysis of variance, 168–70, 171
two-way analysis of variance, 168, 170–71, 172f, 173
Analysis research, 54–55
Analytical organization, 345
Anthropology, 265 , 266f
Anti-foundationalist approach, 24, 26–27
Appendix, research report, 354
Applied research, 4–5, 8, 18, 48
Archeology, 265
Archival study
activities, 308–9
archival record, 308
episodic record, 309, 310
nontextual archives, 311
private record, 309, 310
Archival study (continued)
running record, 309
triangulation, 309–10
value of, 306
Arithmetic mean, 141–43
Artifact analysis, 324 –25
Associated Press (AP), 356, 357
Association for the Accreditation of Human Research
Protection Programs (AAHRPP), 66 –67
Association hypothesis, 158
Association measures, 379–80
Association technique, 119
Association tests, 177, 178t, 186 , 188–90
Asymmetrical distribution, 153
Attitude scale, 120–21, 122f
Axial coding
grounded theory, 253–54, 256f, 258–59, 261
qualitative data analysis, 292
Axiology, 225, 226f
Bar chart, 337–38
Base-group comparison design, 127, 130
Basic research, 3, 48, 55
Before and after with control group design, 131
Behavioralism, 15, 21–23
Behavioral system, 5
Bell-shaped curve, 92, 152–53
Benchmarks, 282–83
Best line of regression, 195
Bias sampling, 90, 92
Bibliography
research proposal, 62
research report, 353–54, 356–57
Bimodal distribution, 153
Bipolar distribution, 93
Bivariate statistics, 36 –37, 83
Bivariate table, 333 , 334t
Blocks, 131–32
British Journal of Political Science, 9
Brown Journal of World Affairs, 278
D
o
w
n
l
o
a
d
e
d
b
y
[
U
n
i
v
e
r
s
i
t
y
o
f
C
a
l
i
f
o
r
n
i
a
,
S
a
n
D
i
e
g
o
]
a
t
0
0
:
0
8
1
9
M
a
y
2
0
1
7
410 SUBJECT INDEX
Case study
collective case study, 237–38
data analysis, 242–43
data collection, 241–42
defined, 236–37
discussion questions, 250
explanatory research, 236–43
exploratory research, 104–5
instrumental case study, 237
intrinsic case study, 237
multi-case study, 237, 239
overview, 233f
pre-experimental design, 127, 130
procedural flowchart, 239, 240f, 241
rationale for, 238–39
reading suggestions, 250
research presentation, 243
research report, 243
research steps, 239, 240f, 241–43
single case study, 127, 130, 239
Categorical variable
defined, 33, 53f
nonparametric statistics, 176, 180–81
Category, 6–7, 84, 234, 252, 258–59
Category set, 330 –33 , 334t
Causal relationship, 3, 193–94
Causal research
correlation, 44
relational research, 3, 44, 125
research design, 40, 41f, 44–45, 125
See also Experimental design (ED); Explanatory
research
Central limit theorem
bipolar distribution, 93
mean, 93
median, 93
sampling, 93
skewed distribution, 93
Central tendency measures
arithmetic mean, 141–43
descriptive statistics, 86, 141–45
geometric mean, 141, 142, 143–45
median, 141, 142, 143
mode, 141, 142, 143
sample mean, 142
trimmed mean, 141, 142, 145
Characteristic root, 216–17
Charts, 336–42
Chi-square location test, 178–81
Chi-square test of independence, 150–52, 379
Chronological pattern, 345
Citations, research report, 353–54, 355,
361–62
Classes, 234
Classification correlations, 207
Close-ended question, 113 , 118, 119f
Cluster analysis
applications, 217
disadvantages, 217–19
multivariate statistics, 211, 217–19
procedural flowchart, 218f
qualitative data analysis, 290, 292
Clustering, 290
Cluster sampling, 89
Cochran Q-test, 186
Coding
axial coding, 253–54, 256f, 258–59, 261, 292
development coding, 295
first-level, 294–95
focused, 298–99
grounded theory, 253–54, 256f, 258–60, 261
open coding, 253, 258–59, 290, 297–98
pattern coding, 295
pre-coding, 112–13
qualitative data analysis, 290, 291–92, 294–95, 297–99
questionnaires, 112–13
second-level, 295
selective coding, 253, 260, 298–99
thematic coding, 295
theoretical coding, 253, 260
unbundling, 291
Coefficient of determination, 194–95, 200
Coefficient of multiple determination, 200
Cohort research, 44
Collective case study, 237–38
Columbia Guide to Online Style (Columbia University
Press), 62 , 356
Common factor analysis, 211
Community-based ethnography, 269, 270
Comparative analysis, 290–91
Comparative hypothesis, 158
Comparative pattern, 345
Comparative Politics, 8, 9 –10
Comparative rating scale, 123
Comparative Strategy, 9
Compare-and-contrast research, 54
Completely unstructured response question, 118
Completion technique, 119
Components, 212
Conceptualizing, 234 , 241, 289
Conceptual study, 4
Conditional variable, 53f
Confidence coefficient, 126
Confidence interval, 159–60, 161 –62
Confidence level
experimental design (ED), 126, 134
hypothesis testing, 159, 160, 165
Confirmatory factor analysis (CFA), 213, 214, 215t
Confounding variable, 45, 125, 192
Consent, 72
Consequence, 227
Constructionism, 24
D
o
w
n
l
o
a
d
e
d
b
y
[
U
n
i
v
e
r
s
i
t
y
o
f
C
a
l
i
f
o
r
n
i
a
,
S
a
n
D
i
e
g
o
]
a
t
0
0
:
0
8
1
9
M
a
y
2
0
1
7
SUBJECT INDEX 411
Construction technique, 119
Constructs, 292
Content analysis, 242, 303, 304t, 320–21, 322f
Contextual richness, 270
Continual analysis, 253
Continuous variable
defined, 33, 53f, 83
descriptive research, 113
inferential statistics, 176
Control group, 44, 125
Control variable
defined, 33, 53f
questionnaires, 113
Correlated data, 137
Correlation analysis, 194, 200
Correlation coefficient, 194
Correlation matrix, 202
Correlation measures
chi-square test for independence, 150–52
descriptive statistics, 86, 141, 150–53
experimental design (ED), 44, 137–38
frequency distribution, 152–53
statistical software, 152
Correlation statistics
coefficient of determination, 194–95, 200
coefficient of multiple determination, 200
correlation values, 195–96
standard error of the estimate, 195
Counting, 109
Covariational relationship, 193
Cramer ’s V test, 177, 188 –89
Critical research
historical research, 244, 245
postpositivism, 19, 20, 24–27
research design, 40, 41f, 47
See also Empowerment research; Feminist research
Critical Review of International Social and Political
Philosophy, 8
Critical sociology, 230 –31
Critical theory, 26
Cross-case study, 237
Cross-sectional research, 43–44
Crosstabulations, 36 –37, 188–90
statistical software, 378–80
Cultural anthropology, 265
Culture, 272
Cumulative frequency, 335
Cumulative relative frequency, 335
Data, 79–82, 287
Data analysis
case study, 242–43
ethnographic research, 296, 296f, 297–300
exploratory research, 106–7
frequency distribution, 36–37, 152–53
grounded theory, 252f
quantitative research, 287
Data analysis (continued)
questionnaires, 112–13
research ethics, 71f, 73–74
research process, 30f, 36–37
tabulations, 36–37
See also Qualitative data analysis
Data collection
case study, 241–42
exploratory research, 97–106
grounded theory, 258
interviews, 45, 99–104
observation, 45
participant observation, 45
qualitative research, 45, 225, 232, 233f, 234
questionnaires, 111–12
research ethics, 71f, 73
research process, 30f, 34–36
triangulation, 45, 242, 309–10
See also Research method
Data error, 91–92
Data file, 330
Data interpretation
qualitative research, 234
research process, 30f, 36–37
Data management, 288
Data set, 84, 330
Data sources
classification of, 35t
positivist research, 35t
postpositivist research, 35t
primary data, 35t, 55, 62, 350
secondary data, 35t, 55, 62, 351
Datum, 258
Deductive reasoning, 63
Defining the study question, 31
Degrees of freedom, 127, 137
Dendogram, 219
Dependent variable
causal relationship, 193
defined, 33, 53f
experimental design (ED), 125, 126
multivariate statistics, 83
simple regression analysis, 196
Descriptive discriminant analysis (DDA), 208–9
Descriptive research
cross-sectional research, 43–44
discussion questions, 124
field study, 44
field survey, 44
longitudinal research, 44
observation, 109
projective techniques, 118, 119–20
questionnaires, 109–19
reading suggestions, 124
research design, 40, 41f, 43–44
scales, 118, 120–23
D
o
w
n
l
o
a
d
e
d
b
y
[
U
n
i
v
e
r
s
i
t
y
o
f
C
a
l
i
f
o
r
n
i
a
,
S
a
n
D
i
e
g
o
]
a
t
0
0
:
0
8
1
9
M
a
y
2
0
1
7
412 SUBJECT INDEX
Descriptive statistics
central tendency measures, 86, 141–45
correlation measures, 86, 141, 150–53
defined, 83, 84
discussion questions, 155
Microsoft Excel, 144–45, 146, 148–49, 150t, 153–54
numerical description, 85–86
political science research, 87
reading suggestions, 156
relative position measures, 86, 141, 147–50
variability measures, 86, 141, 145–47
Desk research, 303, 304
Determinism, 26
Development coding, 295
Diagrams, 299, 336
Dialogical reasoning, 230
Dichotomous question, 118, 119f
Dichotomous variable, 33, 176
Direct form, 344
Discourse analysis, 303, 304t, 321 , 323–24
Discrete variable
defined, 33, 53f, 83
descriptive research, 113
inferential statistics, 176
Discriminant analysis
applications, 208, 210–11
classification correlations, 207
descriptive discriminant analysis (DDA), 208–9
group-classifications, 210–11
multiple discriminant analysis (MDA), 207
multivariate statistics, 207–11
post hoc test, 208, 211
prediction, 207–8, 209–10
predictive discriminant analysis (PDA), 208, 209–10
set of measurements, 208
statistical software, 211
Dispersion measures, 141
Document analysis, 303 –18 , 320–23
archival study, 304–5, 306, 308–11
content analysis, 303, 304t, 320–21, 322f
discourse analysis, 303, 304t, 321, 323–24
discussion questions, 326
formal/informal documents, 303, 304t
hermeneutics, 303, 304t, 315–18
literature review, 304, 305–6, 307f
meta-analysis, 303, 304t, 305, 311–13, 314f, 315
narrative analysis, 303, 304t, 321, 323
reading suggestions, 326
written text, 303, 304f
Doing good research, 38
Double-barreled question, 13–14
Double bias, 92
Dummy variable, 205
Economics report, 362
Economism, 26
Eigenvalue, 216 –17
Electoral Studies, 9
Emancipatory research, 20, 24, 25–26, 278
Empiricism, 15 , 19
Empowerment research, 20, 25, 278
characteristics, 280–81
collaboration, 281–82
discussion questions, 285
reading suggestions, 286
research process, 282–85
Endnotes, 353–54, 355, 356, 361
Entity, 217
Episodic record, 309, 310
Epistemology, 4, 225–26
Equal unit sampling, 90
Equidistant interval data. See Interval data
Erosion measures, 311
Error
correlation statistics, 195
data error, 91–92
experimental design (ED), 129
hypothesis testing, 160
nonresponse error, 91, 114
nonsampling error, 91–92
sampling, 90–92, 129
sampling error, 90–91
standard error of the estimate, 195
standard error of the mean, 92, 93
Type I error, 129, 160
Type II error, 129, 160
Eta, 380
Ethics. See Research ethics
Ethnographic research
anthropology, 265, 266f
data analysis, 296, 296f, 297–300
discussion questions, 274–75
fieldwork, 269f, 271–72
history, 266f
industrialization impact, 264–65
interpretive research, 264–74
overview, 233f
participant observation, 271–72
psychology, 266f
public policy, 266f
reading suggestions, 275
sociology, 265, 266f
urbanism, 273
validity, 267
Ethnography, 265–67, 269–70
fieldwork, 268f
organizational culture, 272, 273–74
political science, 272–73
Ethnology, 265–66
Ethnomethodology, 269
Ethology
defined, 265, 266–67
fieldwork, 268f
D
o
w
n
l
o
a
d
e
d
b
y
[
U
n
i
v
e
r
s
i
t
y
o
f
C
a
l
i
f
o
r
n
i
a
,
S
a
n
D
i
e
g
o
]
a
t
0
0
:
0
8
1
9
M
a
y
2
0
1
7
SUBJECT INDEX 413
Ethology (continued)
research methodology, 270–71
Evaluative study, 4
Executive summary
research proposal, 60
research report, 347–48
Experiential research, 15
Experimental/control groups, before and after test, 131
Experimental design (ED)
analysis of variance (ANOVA), 135f, 136, 137–39
causal research, 44–45, 125
characteristics, 44–45, 125
discussion questions, 139
field experiment, 127–28
key concepts, 125–27
laboratory experiment, 127
Microsoft Excel, 136–38
population identification, 129
positivism, 15
pre-experimental design, 127, 130
procedure for, 128–36
quasi-experimental design, 127, 130–31
reading suggestions, 140
research question, 128
sample selection, 129–30
selection of, 130–34
statistical analysis, 134, 135f, 136–39
testing differences, 134, 135f, 136–39
treatments, 44–45, 125, 126, 128–29, 131–32, 133–34,
169
true experimental design, 127–28, 131–34
types, 127–28
Experimental validity, 126
Explanatory research, 18, 19, 228f
objectives, 227
research design, 40, 41f, 45–46
See also Case study; Historical research
Exploratory factor analysis (EFA), 212–14, 215t
Exploratory research
applications, 96–97
case study, 104–5
data analysis, 106–7
data collection, 97–106
discussion questions, 108
focus group interview, 101–4
literature review, 97–99
personal interview, 99–101
pilot survey, 42, 105–6
qualitative data analysis, 107
quantitative data analysis, 106–7
reading suggestions, 108
research design, 40, 41f, 42–43
Exploratory statistics, 141
Expressive technique, 120
External validity, 82, 126
Face-to-face interview, 111–12
Factor analysis
applications, 212–14
confirmatory factor analysis (CFA), 213, 214, 215t
exploratory factor analysis (EFA), 212–14, 215t
multivariate statistics, 211, 212–17
qualitative data analysis, 292
statistical software, 214–17
Factorial design, 132–33, 170
Factor loading, 212, 217
Factors, 169, 212, 292
Falsely rejecting the null hypothesis, 160
Feminist research
characteristics, 276–77
discussion questions, 285
feminist agenda, 277–79
focus of, 278–79
historical research, 244, 245
methodology distinction, 279–80
postpositivism, 24–25, 279
reading suggestions, 286
Field experiment, 127–28
Field notes, 294
Field research, 294
Field study, 44
Field survey, 44
Fieldwork
ethnographic research, 269f, 271–72
ethnography, 268f
ethology, 268f
Finance report, 362
Findings, research. See Graphic presentations; Research
presentation
First-level coding, 294–95
Flexibility
questionnaires, 109, 110
research approach, 226
Focused coding, 298–99
Focus group interview, 101–4
group interview, 102, 103t
interactive focus group, 102–3
structure level, 102–3
Footnotes, 353–54, 355, 356, 361
Foreign Affairs, 10
Forest Ranger, The (Kaufman), 236
Formal theory, 257
Format, research report, 352, 355
Fractile, 146
Framing, 241
Freedom from harm, 72
Frequency distribution
bell-shaped curve, 92, 152–53
correlation measures, 152–53
data analysis, 36–37
modal value, 152
normal distribution, 152–53
six standard deviations wide, 153
D
o
w
n
l
o
a
d
e
d
b
y
[
U
n
i
v
e
r
s
i
t
y
o
f
C
a
l
i
f
o
r
n
i
a
,
S
a
n
D
i
e
g
o
]
a
t
0
0
:
0
8
1
9
M
a
y
2
0
1
7
414 SUBJECT INDEX
Frequency distribution table, 330, 333t, 334–35, 336,
374, 376
Frequency polygon, 340–41
F-test, 169, 173
Funnel questionnaire, 115–17, 164f
Gender, Race, Class, and Health (Schulz and Mullings),
276
Generalizations, 230, 257, 267
General Management Aptitude Test (GMAT), 148
Geometric mean, 141, 142, 143–45
Goodness-of-fit test, 179, 181
Graduate Record Examination (GRE), 148
Grand theories, 257
Graphic presentations
bar chart, 337–38
bivariate table, 333, 334t
category set, 330–33, 334t
charts, 336–42
diagrams, 336
discussion questions, 343
frequency distribution table, 330, 333t, 334–35,
336
frequency polygon, 340–41
graphs, 336–42
histogram, 330, 336, 338–40
line chart, 340
multivariate table, 333, 334t
pie chart, 341, 342f
raw data, 329–35
reading suggestions, 343
relative frequency distribution table, 333–34, 335t
scatter plot, 341, 342f
statistical software, 330, 336
stem-and-leaf diagram, 330, 336, 337f
tables, 330–35
univariate statistical presentations, 330–36
univariate table, 333
Graphs, 336–42
Grounded theory
application, 261–62
axial coding, 253–54, 256f, 258–59, 261
characteristics, 251–52
coding, 253–54, 256f, 258–60, 261
data analysis, 252f
data collection, 258
disadvantages, 260–61
discussion questions, 263
eight-step model, 254, 255t
Glaserian approach, 253–54
grouping, 252, 253
interpretive research, 251–62
objectives, 252
open coding, 253, 258–59
operationalizing, 241
overview, 233f
public policy, 262
Grounded theory (continued)
reading suggestions, 263
research process, 254–60
selective coding, 253, 260
seven-stage model, 254–55, 256f, 257–60
Straussian approach, 253–54
theoretical coding, 253, 260
Grouping, 252, 253
Grouping variable, 208
Group interview, 102, 103t
Handbook of Semiotics (Nöth), 318 –19
Handbook on Interview Research (Gubrium and
Holstein), 100–101
Hermeneutic circle, 229–30 , 318
Hermeneutics, 15 , 229, 233f, 244
document analysis, 303, 304t, 315–18
meaning construction, 317
nontext material, 316–17
principles, 316
Histogram, 330, 336, 338–40
Historical research
critical research, 244, 245
discussion questions, 250
explanatory research, 244–48
feminist research, 244, 245
hermeneutics, 244
Marxist research, 244, 245
nomology, 244–45
political science, 246–48
reading suggestions, 250
research evolution, 245f
research process, 248, 249f
structuralism, 245
History of Political Thought, 8
Hypothesis
case study, 241
defined, 52
formation of, 12
positivism, 15
research process, 32–33
research topic, 52
topic investigation, 10
Hypothesis testing
analysis of variance (ANOVA), 158–59, 163–64168 –73
association hypothesis, 158
classification, 158–59
comparative hypothesis, 158
confidence interval, 159–60, 161–62
discussion questions, 174–75
error, 160
fundamentals, 157–58
inferential statistics, 159–60, 161
Microsoft Excel, 161–62, 167–68
multi-sample test, 163
normal distribution, 162–73
null hypothesis, 158, 160, 161
D
o
w
n
l
o
a
d
e
d
b
y
[
U
n
i
v
e
r
s
i
t
y
o
f
C
a
l
i
f
o
r
n
i
a
,
S
a
n
D
i
e
g
o
]
a
t
0
0
:
0
8
1
9
M
a
y
2
0
1
7
SUBJECT INDEX 415
Hypothesis testing (continued)
one-sample test, 160–61
one-tailed test, 158, 167
paired-sample test, 165–67
predictive hypothesis, 157, 159
probability, 159–60
reading suggestions, 175
single-case test, 161
t-test, 158–59, 163–68
two-group test, 163–65
two-sample, unequal variance test, 167–68
two-tailed test, 158, 167
Z-test, 158–59, 161
Independent variable
causal relationship, 193
defined, 33, 53f
experimental design (ED), 125, 126
multivariate statistics, 83
simple regression analysis, 196
In-depth interview, 100–101
Indicator variable, 205
Indirect pattern, 344
Inductive reasoning, 12, 63
Industrialization, 264 –65
Inference, 12, 127
Inferential statistics, 86 –87
analysis of covariance, 87
analysis of variance (ANOVA), 87
defined, 83, 84
hypothesis testing, 159–60, 161
parametric statistics, 176
political science research, 87
probability, 159
simple regression analysis, 86
t-test, 86
Influence analysis, 234
Information, 12, 31, 110–11
Informed consent, 72
Institutionalism
historical research, 246
positivist research, 20–21
Instrumental case study, 237
Integrative memo, 299
Interaction effect, 170
Interactive focus group, 102–3
Intercept, 197
Internal consistency, 334
Internal validity, 82, 126
International Feminist Journal of Politics, 278
International Journal of Middle East Studies, 9–10
International Relations, 8, 9t, 10
Interpretive memo, 297–98
Interpretive questioning, 297
Interpretive research, 228f
hermeneutic circle, 229–30, 318
objectives, 229
Interpretive research (continued)
postpositivism, 15, 19, 24
principles, 229–30
research design, 40, 41f, 46–47
See also Ethnographic research; Grounded theory
Inter-University Case Program (IUCP), 236
Interval data, 81, 113
Interval scale, 81, 120–21, 122f
Intervening variable, 45, 53f
Intervention, 44–45
Interviews
exploratory research, 99–104
face-to-face, 111–12
focus group, 101–4
in-depth, 100–101
key informants, 32, 99
personal interview, 99–101
qualitative research, 45
quantitative research, 99–104
self-administered, 111, 112
survey, 100–101
telephone, 111, 112
Intrinsic case study, 237
Israel Affairs, 9
Journal of Commonwealth and Comparative Studies, 10
Journal of Economic Perspectives, 362
Journal of Macroeconomics, 362
Journal of Marketing Channels, 347
Journal of Marketing Research, 237
Journal of Political Thought, 8
Journal of Politics, 6
Journals, professional, 8–10
See also specific publication
Kendall’s tau-b/tau-c -tests, 189–90
Key Concepts in Politics (Heywood), 5 –6
Key informants, 32, 99
Knowledgeable consent, 72
Kolmogorov-Smirnov (K-S) one-sample test, 181–82
Kolmogorov-Smirnov z-test, 182–83
Kruskal-Wallis ANOVA test, 182 , 185–86, 187t, 188t
Kruskal-Wallis H-test, 182 , 188t
K-sample F
2
test, 184, 185t
Laboratory experiment, 127
Latin square design, 133–34
Law, 12
Law School Aptitude Test (LAST), 148
Leading question, 114
Levene test for independence, 136
Library research, 303, 304
Likert scale, 120–21, 122f
Linear relationship, 198
Line chart, 340
Literature review
document analysis, 304, 305–6
exploratory research, 97–99
flowchart, 98f
D
o
w
n
l
o
a
d
e
d
b
y
[
U
n
i
v
e
r
s
i
t
y
o
f
C
a
l
i
f
o
r
n
i
a
,
S
a
n
D
i
e
g
o
]
a
t
0
0
:
0
8
1
9
M
a
y
2
0
1
7
416 SUBJECT INDEX
Literature review (continued)
objectives, 305–6
research process, 32, 307f
research proposal, 61
research report, 346, 349–50
Location measures, 141
Location tests, 177, 178–82
Logical reasoning, 15
Logit analysis, 205
Longitudinal research, 44
Love, Sorrow, and Rage (Waterston), 257
Lower confidence limit, 160
Mailed questionnaire, 111 , 112
Mann-Whitney U-test, 182 , 183
Manual of Style (University of Chicago Press), 62, 355,
356, 357–59
Marxist research, 25–26, 244, 245
Materialism, 26
Maturation, 128
Maximizing utility, 23
McNemar Test, 184
Mean
arithmetic mean, 141–43
central limit theorem, 93
geometric mean, 141, 142, 143–45
sample mean, 142
trimmed mean, 141, 142, 145
Measurement
data, 79–82
defined, 83–84
interval data, 81, 113
nominal data, 80, 113
ordinal data, 80–81, 113
positivism, 15
quantitative research, 79–82
ratio data, 81–82, 113
scales, 80–82
variables, 79–80
Median
central limit theorem, 93
central tendency measures, 141, 142, 143
Memo
integrative, 299
interpretive, 297–98
theoretical, 260
Mental reflection, 19
Meta-analysis
advantages, 312
defined, 311–12
disadvantages, 312
document analysis, 303, 304t, 305, 311–13, 314f, 315
procedural steps, 312–13, 314f, 315
Method of least squares, 197
Microanalysis, 253
Microsoft Excel
correlation measures, 152
Microsoft Excel (continued)
correlation statistics, 195
descriptive statistics, 144–45, 146, 148–49, 150t, 153–54
experimental design (ED), 136–38
geometric mean, 144–45
graphic presentations, 330, 331–32, 333t, 341, 342f
hypothesis testing, 161–62, 167–68
multiple regression analysis (MRA), 200, 201–2, 203f
nonparametric statistics, 179, 181
percentile, 148
simple regression analysis, 198–99
standard deviation, 146
standard score, 148–49, 150t
trimmed mean, 145
Mind-set, 12, 17
Modal value, 152
Mode, 141, 142, 143
Modern Language Association (MLA), 62, 355, 356, 359
Moral behavior, 67
Morality, 67
Moral responsibility, 68
Moral standards, 67
Multi-case study, 237, 239
Multichotomous question, 118, 119f
Multichotomous variable, 33, 176
Multidimensionality, 281
Multinomial logit model, 205
Multinomial probit model, 205
Multiple analysis of covariance (MANCOVA), 207, 219
Multiple analysis of variance (MANOVA), 173, 207, 219
Multiple-choice question, 118, 119f
Multiple discriminant analysis (MDA), 207
Multiple logit regression, 205
Multiple regression analysis (MRA)
applications, 200–203
correlation analysis, 200
dummy variable, 205
interpretative statistics, 203–5
Microsoft Excel, 200, 201–2, 203f
multivariate statistics, 83
regression procedure, 199–200
statistical software, 201–2, 203–5
Multi-sample hypothesis test, 163
Multi-site qualitative research, 237
Multistage sampling, 90
Multivariate statistics
cluster analysis, 211, 217–19
defined, 83
discriminant analysis, 207–11
discussion questions, 220
factor analysis, 211, 212–17
reading suggestions, 221
Multivariate table, 333, 334t
Narrative analysis, 303 , 304t, 321, 323
Narrative research, 15 , 24
Narrative text, 37
D
o
w
n
l
o
a
d
e
d
b
y
[
U
n
i
v
e
r
s
i
t
y
o
f
C
a
l
i
f
o
r
n
i
a
,
S
a
n
D
i
e
g
o
]
a
t
0
0
:
0
8
1
9
M
a
y
2
0
1
7
SUBJECT INDEX 417
National politics, 8 , 9
National Science Foundation (NSF), 7–8, 57
Naturalistic observation, 270
Negatively skewed (skewed to the left), 93, 153
Nominal data, 80, 113, 182–83, 184, 186, 188–89
Nominal scale, 80
Nomology, 244 –45
Noncomparative rating scale, 123
Nonparametric statistics
association tests, 177, 178t, 186, 188–90
chi-square location test, 178–81
Cochran Q-test, 186
Cramer ’s V test, 177, 188–89
defined, 84, 85
differences tests-dependent samples, 177, 178t, 182t,
183–84, 186
differences tests-independent samples, 177, 178t, 182–83,
184–86, 187t, 188t
discussion questions, 190–91
hypothesis testing, 163
Kolmogorov-Smirnov (K-S) one-sample test, 181–82
Kolmogorov-Smirnov z-test, 182–83
Kruskal-Wallis ANOVA test, 182, 185–86, 187t, 188t
Kruskal-Wallis H-test, 182, 188t
K-sample F
2
test, 184, 185t
location tests, 177, 178–82
Mann-Whitney U-test, 182, 183
McNemar test, 184
Microsoft Excel, 179, 181
nominal data, 182–83, 184, 186, 188–89
one-sample Chi-Square test, 179–80
one-sample tests, 179–81
ordinal data, 181–83, 184, 188t, 189–90
reading suggestions, 191
statistical software, 181–82, 184, 185t, 186, 188–90
statistical tests, 134, 136, 177–90
Wilcoxon Rank Sum Test, 184
Nonprobability sample, 71, 89
Nonresponse error, 91, 114
Nonsampling error
data error, 91–92
nonresponse error, 91
sampling frame error, 91
Normal distribution
frequency distribution, 152–53
hypothesis testing, 162–73
NUD*IST (Non-numerical Unstructured Data Indexing,
Searching, and Theorizing), 300–301
Null hypothesis, 158, 160, 161
Nuremberg Code, 70–71
Objectivity
quantitative research, 12, 16, 226
research ethics, 69–70
Observation
descriptive research, 109
ethology, 270–71
Observation (continued)
naturalistic observation, 270
participant, 45, 271–72
positivism, 15
qualitative research, 45
simple observation, 270–71
Office of Research Integrity (ORI), 68
Official records, 308
One-group pretest, post-test design, 127,
130
One-sample Chi-Square test, 179–80
One-sample hypothesis test, 160 –61
One-sample nonparametric tests, 179–81
One-tailed test, 136–37, 158 , 167
One-time, single case study, 127, 130 , 239
Ontology, 4 , 225, 226f
Open coding
grounded theory, 253, 258–59, 290
qualitative data analysis, 297–98
Open-ended question, 113, 118, 119–20
Operating climate, 272, 273
Ordering technique, 119–20
Ordinal data, 80–81, 113
Ordinal scale, 80–81, 120
Ordinal scale importance scale, 122–23
Organizational culture, 272, 273–74
Outlier, 143, 159, 334
Output file, 330
Paired-sample hypothesis test, 165–67
Pairs of measurement, 197
Paradigm shift, 225
Parameter, 83, 84, 109, 176
Parametric statistics
defined, 84, 85, 176
hypothesis testing, 163
statistical tests, 134, 136, 178t
Participant observation, 45, 271–72
Participatory research, 25
Party Developments, 9
Past experience, 271
Pattern coding, 295
Percentile, 146, 147, 148
Performance measurement, 237
Personal interview, 99–101
Phenomenology, 47, 233f, 269
Physical anthropology, 265
Physical evidence, 311
Pie chart, 341, 342f
Pilot study, 42 , 105 –6
Plagiarism, 354
Point of view, 344–45
Policy research, 48
Policy science, 5
Political Institutions, 8, 9t
Political Research Quarterly, 6
Political Science Quarterly, 99
D
o
w
n
l
o
a
d
e
d
b
y
[
U
n
i
v
e
r
s
i
t
y
o
f
C
a
l
i
f
o
r
n
i
a
,
S
a
n
D
i
e
g
o
]
a
t
0
0
:
0
8
1
9
M
a
y
2
0
1
7
418 SUBJECT INDEX
Political science research
applications, 3–4
categories, 6–7
defined, 3, 11–13
disciplinary branches, 7–8
disciplinary fragmentation, 6
discussion questions, 13
ethnography, 272–73
historical research, 246–48
inferential statistics, 87
issues, 4–6
professional journals, 8–10
reading suggestions, 14
research activity, 11–13
research method, 20
research report, 361–62
research topic, 7, 10–11
statistics, 87
Political Theory, 8, 9t
Population, 83 , 84
Population unit, 84
Position research, 54
Positively skewed (skewed to the right), 93, 153
Positivist research
behavioralism, 15, 21–23
criticism of, 17–18
data sources, 35t
discussion questions, 28
institutionalism, 20–21
quantitative methods, 16, 17t
rational choice theory, 23–24
reading suggestions, 28
strategies, 34
tenets of, 15–16
topic investigation, 10
See also Quantitative research
Posteriori test, 139
Post hoc test, 139, 208, 211
Postmodern approach, 24, 26–27
Postpositivist research
critical research, 19, 20, 24–27
data sources, 35t
discussion questions, 28
feminist research, 24–25, 279
interpretive research, 15, 19, 24
Marxist research, 25–26
postmodern approach, 24, 26–27
reading suggestions, 28
strategies, 34
tenets of, 19, 24
topic investigation, 10
See also Qualitative research
Power analysis, 234, 247
Practical research, 48
Prediction, 48 , 207–8 , 209–10
Predictive discriminant analysis (PDA), 208, 209–10
Predictive hypothesis, 157, 159
Pre-experimental design
base-group comparison design, 127, 130
one-group pretest, post-test design, 127, 130
one-time, single case study, 127, 130
Presentation of research findings. See Graphic
presentations; Research presentation
Primary data
bibliography, 62
defined, 55
positivist research, 35t
research report, 350
Primary-secondary data dichotomy, 350–51
Principal component analysis (PCA), 211
Private record, 309, 310
Probability
experimental design (ED), 126
hypothesis testing, 159–60
inferential statistics, 159
Probability of occurrence, 333–34
Probability sample, 71, 89, 90
Probability value (p-value), 126, 127, 159–60
Probing approach. See Exploratory research
Probit regression model, 205
Projective techniques, 118 , 119–20
Proportion, 200
PS: Political Science and Politics, 8
Psychology, 266f
Psychotherapy, 230–31
Public Administration Review, 278
Public management report, 362
Public policy
disciplinary field, 8, 9t
ethnographic research, 266f
grounded theory, 262
Pure research, 3, 23, 48
Qualitative data analysis
coding, 290, 291–92, 294–95, 297–99
components, 288–89
computer analysis, 300–301
data analysis, 234, 288–89
data display, 289
data interpretation, 289
data management, 288
discussion questions, 302
ethnographic data, 296, 296f, 297–300
nine-step process, 289–92
qualitative data, 287–88
raw data, 234, 289
reading suggestions, 302
twelve-step process, 293–95
See also Artifact analysis; Document analysis;
Semiotics
Qualitative research
axiology, 226f
characteristics, 225–27
D
o
w
n
l
o
a
d
e
d
b
y
[
U
n
i
v
e
r
s
i
t
y
o
f
C
a
l
i
f
o
r
n
i
a
,
S
a
n
D
i
e
g
o
]
a
t
0
0
:
0
8
1
9
M
a
y
2
0
1
7
SUBJECT INDEX 419
Qualitative research (continued)
data analysis, 234
data collection, 45, 225, 232, 233f, 234
data interpretation, 234
disciplinary traditions, 233f
discussion questions, 235
epistemology, 225–26
inductive reasoning, 63
interviews, 45
observation, 45
ontology, 226f
participant observation, 45
postpositivism, 15, 19, 41f
reading suggestions, 235
research design, 40, 41f, 45–47
research method, 40
research methodology, 226f
research process, 29–38
research questions, 233f
research strategies, 45, 227, 228f, 229–32, 233f
rhetoric, 226f
subjectivity, 12, 226
triangulation, 45, 242, 309–10
See also Critical research; Explanatory research;
Interpretive research
Quantitative research
axiology, 226f
causal research design, 40, 41f, 44–45, 125
characteristics, 225–27
data analysis, 287
deductive reasoning, 63
discussion questions, 94
epistemology, 226
measurement, 79–82
objectivity, 12, 16, 226
ontology, 226f
positivism, 16, 17t, 41f
reading suggestions, 95
reliability, 82
research design, 40, 41f, 42–45, 47
research method, 40
research methodology, 226f
research process, 29–38
rhetoric, 226f
sampling, 87–93
statistics, 82–87
types, 17t
validity, 82
See also Descriptive research; Experimental design
(ED); Exploratory research
Quasi-experimental design, 127, 130–31
Questionnaires
administration, 117
advantages of, 109
characteristics, 110
close-ended question, 113, 118, 119f
Questionnaires (continued)
coding, 112–13
data analysis, 112–13
data collection, 111–12
descriptive research, 109–19
development procedure, 110–17
funnel approach, 115–17, 164f
information determination, 110–11
nonresponse error, 114
open-ended question, 113, 118, 119–20
pretest, 117
question classification, 113
question selection, 113–14
question sequence, 114–17
question structure, 113
raw data, 118
response rate, 112
return rate, 112
revision, 117
Random digit dialing, 130
Randomized block design, 131–32
Randomized two-sample design, 131
Randomness, experimental design (ED), 125, 126, 129–30
Range, 145–46, 195
Ranked method, 345
Ratio data, 81–82, 113
Rational choice theory, 23 –24 , 246
Rationale for the study, 31
Rationalism, 19
Ratio scale, 81 –82
Raw data
graphic presentations, 329–35
qualitative data analysis, 234, 289
questionnaires, 118
Realist research, 15
References
research proposal, 62
research report, 353–54, 356–57, 362
Reflective contemplation, 297
Regression analysis
correlation analysis, 194, 200
correlation statistics, 194–96, 200
discussion questions, 206
multiple regression analysis (MRA), 83, 199–205
reading suggestions, 206
relationship test applications, 193–94
simple regression analysis, 86, 196–99
statistical significance, 192–93
Regression function, 197
Relational research, 3, 44, 125
Relationship study, 4
Relative frequency, 335
Relative frequency distribution, 341
Relative frequency distribution table, 333 –34 , 335t
Relative position measures
descriptive statistics, 86, 141, 147–50
D
o
w
n
l
o
a
d
e
d
b
y
[
U
n
i
v
e
r
s
i
t
y
o
f
C
a
l
i
f
o
r
n
i
a
,
S
a
n
D
i
e
g
o
]
a
t
0
0
:
0
8
1
9
M
a
y
2
0
1
7
420 SUBJECT INDEX
Relative position measures (continued)
percentile, 147, 148
standard score (z-score), 147, 148–49, 150t
Reliability, 82
Reports. See Research report
Research
activity of, 11–13
applications, 3–4
defined, 11–13
issues in, 4–6
Research design
causal research, 40, 41f, 44–45, 125
combined designs, 47
critical research, 40, 41f, 47
descriptive research, 40, 41f, 43–44
discussion questions, 56
explanatory research, 40, 41f, 45–46
exploratory research, 40, 41f, 42–43
interpretive research, 40, 41f, 46–47
qualitative research, 40, 41f, 45–47
quantitative research, 40, 41f, 42–45, 47
reading suggestions, 56
research proposal, 62
Research ethics
data analysis, 71f, 73–74
data collection, 71f, 73
defined, 69
discussion questions, 75
ethical dilemmas, 68–69
ethics defined, 67–68
Nuremberg Code, 70–71
objectivity principle, 69–70
political science, 66
reading suggestions, 75
regulations, 66–67
relevance principle, 70
research presentation, 71f, 74
research process, 71–74
sampling, 71–72
thoroughness principle, 69
truthfulness principle, 69
Research method
defined, 40
graphic overview, 41f
qualitative research, 40, 41f
quantitative research, 40, 41f
Research methodology
defined, 11–12, 225
graphic overview, 41f
research proposal, 62
research report, 350, 353
Research objectives, 4, 30f, 33–34, 62
Research position, 54–55
Research presentation
case study, 243
ethics, 71f, 74
Research presentation (continued)
research process, 30f, 37–38
See also Graphic presentations
Research problem
identification of, 30f, 31–33
research proposal, 60–61
research topic, 31, 49f, 50–51
Research process
checklist questions, 30f
data analysis, 30f, 36–37
data collection, 30f, 34–36
data interpretation, 30f, 36–37
discussion questions, 39
graphic overview, 30f
hypothesis, 32–33
literature review, 32
objectives, 30f, 33–34, 62
plan preparation, 30f, 34
problem identification, 30f, 31–33
qualitative research, 29–38
quantitative research, 29–38
reading suggestions, 39
report preparation, 30f, 37–38
research presentation, 30f, 37–38
strategy, 30f, 34
study problem, 30f, 31
variables, 31, 32–33
Research proposal
abstract, 60
bibliography, 62
common mistakes, 64t
contents, 59–62
defined, 57
discussion questions, 65
executive summary, 60
importance of, 57–59
introduction, 60
literature review, 61
qualitative research, 63t, 64
quantitative research, 63t, 64
reading suggestions, 65
references, 62
research design, 62
research methodology, 62
research problem statement, 60–61
sample formats, 58–59f
study objectives, 62
Research report
abstract, 347–48, 349f, 361
appendix, 354
bibliography, 353–54, 356–57
case study, 243
citations, 353–54, 355, 361–62
conclusion, 352–54
data differences, 350–51
discussion questions, 363
D
o
w
n
l
o
a
d
e
d
b
y
[
U
n
i
v
e
r
s
i
t
y
o
f
C
a
l
i
f
o
r
n
i
a
,
S
a
n
D
i
e
g
o
]
a
t
0
0
:
0
8
1
9
M
a
y
2
0
1
7
SUBJECT INDEX 421
Research report (continued)
economics, 362
endnotes, 353–54, 355, 356, 361
finance, 362
footnotes, 353–54, 355, 356, 361
format, 352, 355
introduction, 348–49, 352–53
literature review, 346, 349–50
methodology, 350, 353
plagiarism, 354
point of view, 344–45
political science, 361–62
public management, 362
reading suggestions, 363
references, 353–54, 356–57, 362
research process, 30f, 37–38
results, 351, 352, 353
sections, 345–54
structure, 344–45
style, 351–52, 355–57
style manuals, 357–60
theoretical research, 350
title, 345–47
title page, 347, 348f, 361
writing rules, 352
Research situation, 31
Research theme, 54–55
Research topic
definition of, 48
focus of, 7
investigation of, 10–11
problem definition process, 49f, 50–51
problem identification, 31
sources, 48–49
Response rate, 112
Results, research. See Graphic presentations; Research
presentation
Results, research report, 351, 352, 353
Return rate, 112
Review of the relevant literature. See Literature review
Richness in personal insight, 270
Running record, 309
Russian formulism, 323
Sample
defined, 84
stratum, 89
Sample distribution, 92
Sample frame, 130
Sample mean, 142
Sample space, 159
Sampling
bias, 90, 92
central limit theorem, 93
cluster, 89
consent, 72
defined, 83
Sampling (continued)
equal unit, 90
error, 90–92, 129
experimental design (ED), 129–30
freedom from harm, 72
grounded theory, 258
informed consent, 72
knowledgeable consent, 72
multistage, 90
nonprobability, 71, 89
nonsampling error, 91–92
precision in, 88
probability, 71, 89, 90
quantitative research, 87–93
questionnaires, 109
randomness, 125, 126, 129–30
rationale for, 87–88
sample distribution, 92
sampling error, 90–91
sampling methods, 88–90
sampling variability, 93
simple random sample (SRS), 129–30
single-stage, 90
single unit, 89
standard error of the mean, 92, 93
stratified, 89
theoretical sampling problem, 258
unequal unit, 90
unstratified, 89
voluntary consent, 72
Sampling error, 90–91
Sampling frame error, 91
Sampling unit, 89
Scale data, 82
Scales
attitude scale, 120–21, 122f
comparative rating scale, 123
descriptive research, 118, 120–23
interval scale, 81, 120–21, 122f
Likert scale, 120–21, 122f
nominal scale, 80
noncomparative rating scale, 123
ordinal scale, 80–81, 120
ordinal scale importance scale, 122–23
ratio scale, 81–82
semantic differential scale, 121, 122f
Stapel scale, 121
Scatter diagram, 197
Scatter plot, 197, 341 , 342f
Scholastic Aptitude Test (SAT), 148
Scientific method, 15
Scientific misconduct, 67
Scientific research, 12 –13
Scree plot, 215–16
Secondary data
bibliography, 62
D
o
w
n
l
o
a
d
e
d
b
y
[
U
n
i
v
e
r
s
i
t
y
o
f
C
a
l
i
f
o
r
n
i
a
,
S
a
n
D
i
e
g
o
]
a
t
0
0
:
0
8
1
9
M
a
y
2
0
1
7
422 SUBJECT INDEX
Secondary data (continued)
defined, 55
positivist research, 35t
research report, 351
Second-level coding, 295
Selective coding, 253, 260 , 298–99
Selective perception, 270–71
Selective retention, 270, 271
Self-administered interview, 111 , 112
Semantic differential scale, 121 , 122f
Semiotics
applications, 304t, 320t
defined, 318–19
disadvantages, 319
Sensory excitation, 271
Set of measurements, 208
Significance test, 126, 134
Signs and symbols. See Semiotics
Similarity correlation, 212
Simple observation, 270–71
Simple random sample (SRS), 129–30
Simple regression analysis
example, 198–200
inferential statistics, 86
Microsoft Excel, 198–99
regression equation, 197–98
regression procedure, 196–97
Single-case hypothesis test, 161
Single case study, 127, 130 , 239
Single-stage sampling, 90
Single unit sampling, 89
Six standard deviations wide, 153
Skewed distribution
asymmetrical, 153
bimodal, 153
central limit theorem, 93
frequency distribution, 153
negatively skewed (skewed to the left), 93, 153
positively skewed (skewed to the right), 53, 93
Slope, 197
Snapshot study, 43 –44
Socially embedded process, 281
Sociology, 265, 266f
Somer ’s d-test, 189–90
Spatial pattern, 345
Spearman correlation coefficient (Spearman’s rho),
189–90
Spreadsheet-based data file, 330
See also Microsoft Excel
SPSS for Window Base System User’s Guide (Norusis),
380
SPSS Guide to Data Analysis (Norusis), 380
Standard deviation, 146, 147t, 195
Standard error of the estimate, 195
Standard error of the mean, 92, 93
Standard factor analysis (SFA), 211
Standardized instruments, 109
Standard score (z-score), 147, 148–49, 150t
Stapel scale, 121
State of the Discipline (Katznelson and Milner), 4–5,
7, 10
Statistical Package for the Social Sciences (SPSS)
correlation measures, 152
Crosstabs, 378–80
Data Editor Toolbar, 364–66
data entry, 372–73
Data View, 364, 366
Descriptives, 374, 378
discriminant analysis, 211
discussion questions, 380–81
Explore, 374, 377
factor analysis, 214–17
Frequencies, 374, 376–77
graphic presentations, 330, 336
Main Menu, 364, 365
Missing Values, 370–72
multiple regression analysis (MRA), 201–2, 203–5
nonparametric statistics, 181–82, 184, 185t, 186,
188–90
numerical data processing, 374, 375f
reading suggestions, 381
scale data, 82
standard deviation, 146, 147t
stem-and-leaf diagram, 336, 337f
summary statistics development, 374, 376–78
Variable View, 364, 366–70
Statistical significance
experimental design (ED), 126, 134
hypothesis testing, 165
regression analysis, 192–93
Statistics
bivariate, 36–37, 83
categories, 84
concept definitions, 83
defined, 82, 83, 84–85
exploratory, 141
parameter, 84, 109, 176
political science research, 87
quantitative research, 82–87
univariate, 36, 83, 330–36
See also Correlation statistics; Descriptive statistics;
Inferential statistics; Multivariate statistics;
Nonparametric statistics
Stem-and-leaf diagram, 330, 336, 337f
Storyline, 299
Stratified sampling, 89
Stratum sample, 89
Street-Level Bureaucracy (Lipsky), 236
Structuralism, 26 , 245
Structured answer question, 118, 119f
Structure of Scientific Revolutions, The (Kuhn), 225
Student’s t-test. See t-test
D
o
w
n
l
o
a
d
e
d
b
y
[
U
n
i
v
e
r
s
i
t
y
o
f
C
a
l
i
f
o
r
n
i
a
,
S
a
n
D
i
e
g
o
]
a
t
0
0
:
0
8
1
9
M
a
y
2
0
1
7
SUBJECT INDEX 423
Study problem, 30f, 31
Study question, 31 , 52
Study variable, 53f
Style
research report, 351–52, 355–60
writing manuals, 357–60
Subculture, 272
Subjective description, 267
Subjective-objective dichotomy, 226
Subjectivity, 12, 226
Substantive theory, 257
Summary research, 55
Summary statistics, 37
Survey instrument, 350
Survey research
field survey, 44
focus group interview, 104
personal interview, 100–101
pilot survey, 42, 105–6
See also Descriptive research; Questionnaires
Suspicion, 230
Symbolic capital, 6
Symbolic interactionism, 251
Systematic bias, 92
Tables, 330–35
Tabulations, 36 –37, 188–90
t-distribution, 163
Telephone interview, 111 , 112
Text analysis. See Document analysis
Thematic coding, 295
Theoretical memo, 260
Theoretical sampling problem, 258
Theory
building, 3, 227
coding, 253, 260
proposal of, 12
research, 3, 4–5
Thesis research, 54
Thick description, 100, 267, 269, 294
Title, research report, 345–47
Title page, research report, 347, 348f, 361
Traditional mode of qualitative analysis, 239
Treatments, 44–45, 125, 126, 128–29, 131–32, 133–34, 169
Triangulation, 45 , 242, 309–10
Trimmed mean, 141, 142, 145
True experimental design, 127–28, 131–34
factorial design, 132–33
Latin square design, 133–34
randomized block design, 131–32
randomized two-sample design, 131
t-test
experimental design (ED), 135f, 136–38
hypothesis testing, 158–59, 163–68
inferential statistics, 86
t-test for independent samples design, 131
TVA and the Grass Roots (Selznick), 236
Two-group hypothesis test, 163–65
Two-sample, unequal variance test, 167–68
Two-tailed test, 136 –37, 158, 167
Type I error
experimental design (ED), 129
hypothesis testing, 160
Type II error
experimental design (ED), 129
hypothesis testing, 160
Unbundling codes, 291
Uncorrelated data, 137
Unequal unit sampling, 90
Uniform System of Citations, A (Harvard University), 62
United Press International (UPI), 356 , 357
Units of analysis, 241
Univariate statistics, 36, 83, 330 –36
Univariate table, 333
Universe, 83, 84
Unstratified sampling, 89
Upper confidence limit, 160
Urbanism research, 273
Validity
ethnographic research, 267
experimental design (ED), 126
external validity, 82, 126
internal validity, 82, 126
quantitative research, 82
Valid percent, 335
Value
correlation statistics, 195–96
eigenvalue, 216–17
modal value, 152
probability value (p-value), 126, 127, 159–60
variables, 32
Value-free research, 16, 19
Variability measures
descriptive statistics, 86, 141, 145–47
range, 145–46, 195
standard deviation, 146, 147t, 195
variance, 138–39, 146, 195
Variables
categorical, 33, 53f, 176, 180–81
conditional, 53f
confounding, 45, 125, 192
continuous, 33, 53f, 83, 113, 176
control, 33, 53f
defined, 53f, 83
dependent, 33, 53f, 83, 125, 126, 193, 196
dichotomous, 33, 176
discrete, 33, 53f, 83, 113, 176
dummy, 205
grouping, 208
independent, 33, 53f, 83, 125, 126, 193, 196
indicator, 205
intervening, 45, 53f
level, 32
D
o
w
n
l
o
a
d
e
d
b
y
[
U
n
i
v
e
r
s
i
t
y
o
f
C
a
l
i
f
o
r
n
i
a
,
S
a
n
D
i
e
g
o
]
a
t
0
0
:
0
8
1
9
M
a
y
2
0
1
7
424 SUBJECT INDEX
Variables (continued)
measurement, 79–80
multichotomous, 33, 176
research problem identification,
31
research process, 31, 32–33
study, 53f
value, 32
Variance
correlation statistics, 195
descriptive statistics, 146
experimental design (ED), 138–39
Verstehen, 229
Voluntary consent, 72
Western Electric Hawthorne, 45
West European Politics, 9–10
Whistle-blowers, 73
White House Studies, 9
Wilcoxon Rank Sum Test, 184
Writing rules, 352
Written text. See Document analysis
Zero-order Gammas, 189–90
z-score , 147, 148–49, 150t
z-test, 158 –59, 161
D
o
w
n
l
o
a
d
e
d
b
y
[
U
n
i
v
e
r
s
i
t
y
o
f
C
a
l
i
f
o
r
n
i
a
,
S
a
n
D
i
e
g
o
]
a
t
0
0
:
0
8
1
9
M
a
y
2
0
1
7
425
About the Author
David E. McNabb is professor emeritus at Pacific Lutheran University. After a career in business
and government that has included positions as director of economic development for the city of
Fullerton, California, and communications director for the majority caucus of the Washington
State House of Representatives, Professor McNabb embarked on a second career in academia. He
advanced to the rank of professor on the faculty at Pacific Lutheran University. He has a BA from
California State College at Fullerton, an MA from the University of Washington, and a PhD from
Oregon State University. He has taught a variety of courses both in the United States and abroad,
including college and university programs in Latvia, Bulgaria, Germany, the United Kingdom,
Italy, France, and Belgium. He is the author of seven books and nearly ninety peer-reviewed
conference papers and articles.
He has served at different times as a member of the Seattle, Washington, Citizens’ Advisory
Committee on Solid Waste Management; the Kirkland, Washington, Central Business District
Advisory Committee; and the Port of Tacoma, Washington, International Trade Association,
among others. He has been a member of the Propeller Club and Rotary. He was a thesis advisor
for the Evergreen State College MPA program, and a visiting faculty member. He is also a visiting
professor at the Stockholm School of Economics–Riga. He continues to write and to teach gradu-
ate and undergraduate courses. Dr. McNabb is a member of the Academy of Political Science, the
American Political Science Assocviation, and the American Society for Public Administration.
D
o
w
n
l
o
a
d
e
d
b
y
[
U
n
i
v
e
r
s
i
t
y
o
f
C
a
l
i
f
o
r
n
i
a
,
S
a
n
D
i
e
g
o
]
a
t
0
0
:
0
8
1
9
M
a
y
2
0
1
7
This page intentionally left blank
D
o
w
n
l
o
a
d
e
d
b
y
[
U
n
i
v
e
r
s
i
t
y
o
f
C
a
l
i
f
o
r
n
i
a
,
S
a
n
D
i
e
g
o
]
a
t
0
0
:
0
8
1
9
M
a
y
2
0
1
7