/


Автор: Khalil H.A.E. Khalil E.E.
Теги: energy construction energy efficiency urban development
ISBN: 978-1-4822-5065-7
Год: 2015


Текст
EnErgy
EfficiEncy
in the Urban
EnvironmEnt
MECHANICAL and AEROSPACE ENGINEERING
Frank Kreith & Darrell W. Pepper
Series Editors
RECENTLY PUBLISHED TITLES
Air Distribution in Buildings, Essam E. Khalil
Alternative Fuels for Transportation, Edited by Arumugam S. Ramadhas
Computer Techniques in Vibration, Edited by Clarence W. de Silva
Distributed Generation: The Power Paradigm for the New Millennium,
Edited by Anne-Marie Borbely and Jan F. Kreider
Elastic Waves in Composite Media and Structures: With Applications to Ultrasonic
Nondestructive Evaluation, Subhendu K. Datta and Arvind H. Shah
Elastoplasticity Theory, Vlado A. Lubarda
Energy Audit of Building Systems: An Engineering Approach, Moncef Krarti
Energy Conversion, Second Edition, Edited by D. Yogi Goswami and Frank Kreith
Energy Efficiency in the Urban Environment, Heba Allah Essam E. Khalil and
Essam E. Khalil
Energy Management and Conservation Handbook, Second Edition,
Edited by Frank Kreith and D. Yogi Goswami
Essentials of Mechanical Stress Analysis, Amir Javidinejad
The Finite Element Method Using MATLAB®, Second Edition, Young W. Kwon and
Hyochoong Bang
Fluid Power Circuits and Controls: Fundamentals and Applications, John S. Cundiff
Fuel Cells: Principles, Design, and Analysis, Shripad Revankar and Pradip Majumdar
Fundamentals of Environmental Discharge Modeling, Lorin R. Davis
Handbook of Energy Efficiency and Renewable Energy, Edited by Frank Kreith and
D. Yogi Goswami
Handbook of Hydrogen Energy, Edited by S.A. Sherif, D. Yogi Goswami,
Elias K. Stefanakos, and Aldo Steinfeld
Heat Transfer in Single and Multiphase Systems, Greg F. Naterer
Heating and Cooling of Buildings: Design for Efficiency, Revised Second Edition,
Jan F. Kreider, Peter S. Curtiss, and Ari Rabl
Intelligent Transportation Systems: Smart and Green Infrastructure Design, Second
Edition, Sumit Ghosh and Tony S. Lee
Introduction to Biofuels, David M. Mousdale
Introduction to Precision Machine Design and Error Assessment, Edited by Samir Mekid
Introductory Finite Element Method, Chandrakant S. Desai and Tribikram Kundu
Large Energy Storage Systems Handbook, Edited by Frank S. Barnes and Jonah G. Levine
Machine Elements: Life and Design, Boris M. Klebanov, David M. Barlam, and
Frederic E. Nystrom
Mathematical and Physical Modeling of Materials Processing Operations,
Olusegun Johnson Ilegbusi, Manabu Iguchi, and Walter E. Wahnsiedler
Mechanics of Composite Materials, Autar K. Kaw
Mechanics of Fatigue, Vladimir V. Bolotin
Mechanism Design: Enumeration of Kinematic Structures According to Function,
Lung-Wen Tsai
Mechatronic Systems: Devices, Design, Control, Operation and Monitoring,
Edited by Clarence W. de Silva
The MEMS Handbook, Second Edition (3 volumes), Edited by Mohamed Gad-el-Hak
MEMS: Introduction and Fundamentals
MEMS: Applications
MEMS: Design and Fabrication
Multiphase Flow Handbook, Edited by Clayton T. Crowe
Nanotechnology: Understanding Small Systems, Third Edition, Ben Rogers, Jesse Adams,
Sumita Pennathur
Nuclear Engineering Handbook, Edited by Kenneth D. Kok
Optomechatronics: Fusion of Optical and Mechatronic Engineering, Hyungsuck Cho
Practical Inverse Analysis in Engineering, David M. Trujillo and Henry R. Busby
Pressure Vessels: Design and Practice, Somnath Chattopadhyay
Principles of Solid Mechanics, Rowland Richards, Jr.
Principles of Sustainable Energy Systems, Second Edition, Edited by Frank Kreith with
Susan Krumdieck, Co-Editor
Thermodynamics for Engineers, Kau-Fui Vincent Wong
Vibration and Shock Handbook, Edited by Clarence W. de Silva
Vibration Damping, Control, and Design, Edited by Clarence W. de Silva
Viscoelastic Solids, Roderic S. Lakes
Weatherization and Energy Efficiency Improvement for Existing Homes: An Engineering
Approach, Moncef Krarti
EnErgy
EfficiEncy
in the UrbAn
EnvironmEnt
Heba Allah Essam E. Khalil
Essam E. Khalil
Boca Raton London New York
CRC Press is an imprint of the
Taylor & Francis Group, an informa business
CRC Press
Taylor & Francis Group
6000 Broken Sound Parkway NW, Suite 300
Boca Raton, FL 33487-2742
© 2015 by Taylor & Francis Group, LLC
CRC Press is an imprint of Taylor & Francis Group, an Informa business
No claim to original U.S. Government works
Version Date: 20141216
International Standard Book Number-13: 978-1-4822-5065-7 (eBook - PDF)
This book contains information obtained from authentic and highly regarded sources. Reasonable
efforts have been made to publish reliable data and information, but the author and publisher cannot
assume responsibility for the validity of all materials or the consequences of their use. The authors and
publishers have attempted to trace the copyright holders of all material reproduced in this publication
and apologize to copyright holders if permission to publish in this form has not been obtained. If any
copyright material has not been acknowledged please write and let us know so we may rectify in any
future reprint.
Except as permitted under U.S. Copyright Law, no part of this book may be reprinted, reproduced,
transmitted, or utilized in any form by any electronic, mechanical, or other means, now known or
hereafter invented, including photocopying, microfilming, and recording, or in any information storage or retrieval system, without written permission from the publishers.
For permission to photocopy or use material electronically from this work, please access www.copyright.com (http://www.copyright.com/) or contact the Copyright Clearance Center, Inc. (CCC), 222
Rosewood Drive, Danvers, MA 01923, 978-750-8400. CCC is a not-for-profit organization that provides licenses and registration for a variety of users. For organizations that have been granted a photocopy license by the CCC, a separate system of payment has been arranged.
Trademark Notice: Product or corporate names may be trademarks or registered trademarks, and are
used only for identification and explanation without intent to infringe.
Visit the Taylor & Francis Web site at
http://www.taylorandfrancis.com
and the CRC Press Web site at
http://www.crcpress.com
To our students who deserve to know.
To our family who supported us to know.
To my mother who always urged me to know.
To my sons, may you enjoy a better environment.
Contents
List of Figures...................................................................................................... xvii
List of Tables......................................................................................................... xxi
Preface.................................................................................................................. xxiii
Acknowledgements............................................................................................ xxv
About the Authors............................................................................................ xxvii
1. Energy-Efficient Quality of Life................................................................... 1
1.1 General....................................................................................................1
1.2 Energy Efficiency Concepts, Definitions and Measures.................. 1
1.3 Quality of Life as an Indicator for Human Progress........................ 3
1.3.1 Quality of Life versus Standard of Living Concepts........... 4
1.3.2 Quality of Life Indices.............................................................. 4
1.4 Ecological Footprint and Human Development Index.................... 6
1.5 Quality of Life and Sustainability....................................................... 8
1.5.1 Quality of Life, Energy Efficiency and Renewable
Energies in the Built Environment....................................... 11
1.6 Energy Performance............................................................................ 14
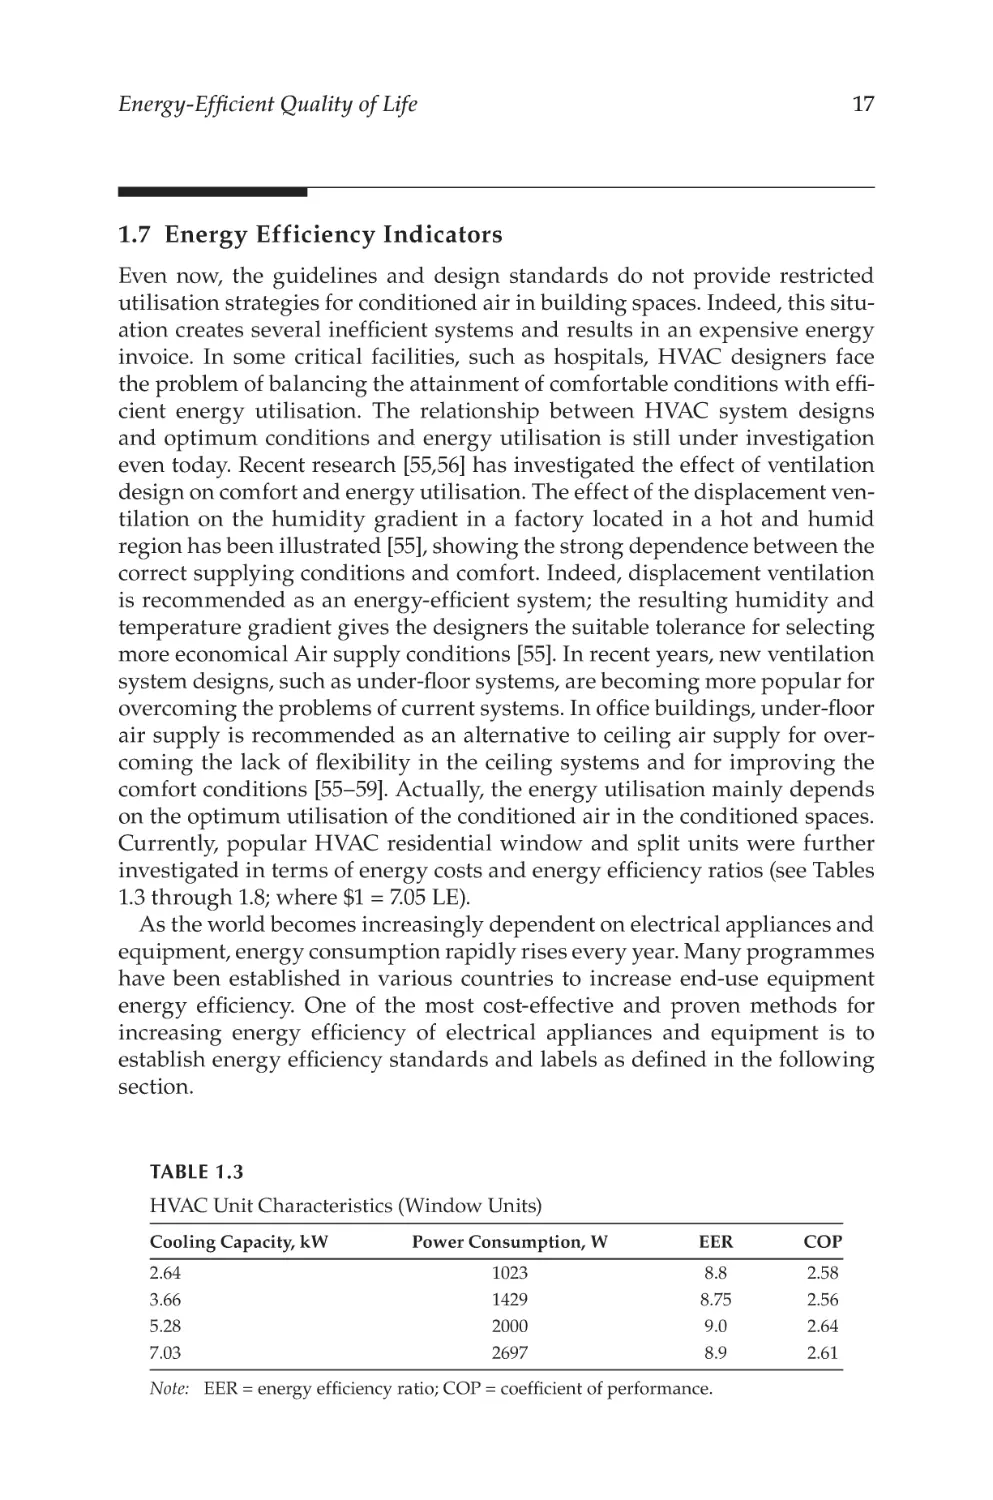
1.7 Energy Efficiency Indicators............................................................... 17
1.8 Energy Efficiency Standards.............................................................. 19
1.9 Energy Labels....................................................................................... 19
1.10 Concluding Remarks...........................................................................22
References........................................................................................................ 23
2. Energy Efficiency Strategies in Urban Planning of Cities.................... 27
2.1 Introduction.......................................................................................... 27
2.2 Cities and Energy Consumption: The Macrolevel.......................... 27
2.2.1 Size............................................................................................ 27
2.2.1.1 Mega Growth, Mega Complexity.......................... 28
2.2.2 Role and Competitiveness..................................................... 29
2.3 Cities and Energy Consumption: The Microlevel........................... 33
2.3.1 Urban Pattern.......................................................................... 33
2.3.1.1 Compact versus Dispersed Development...........34
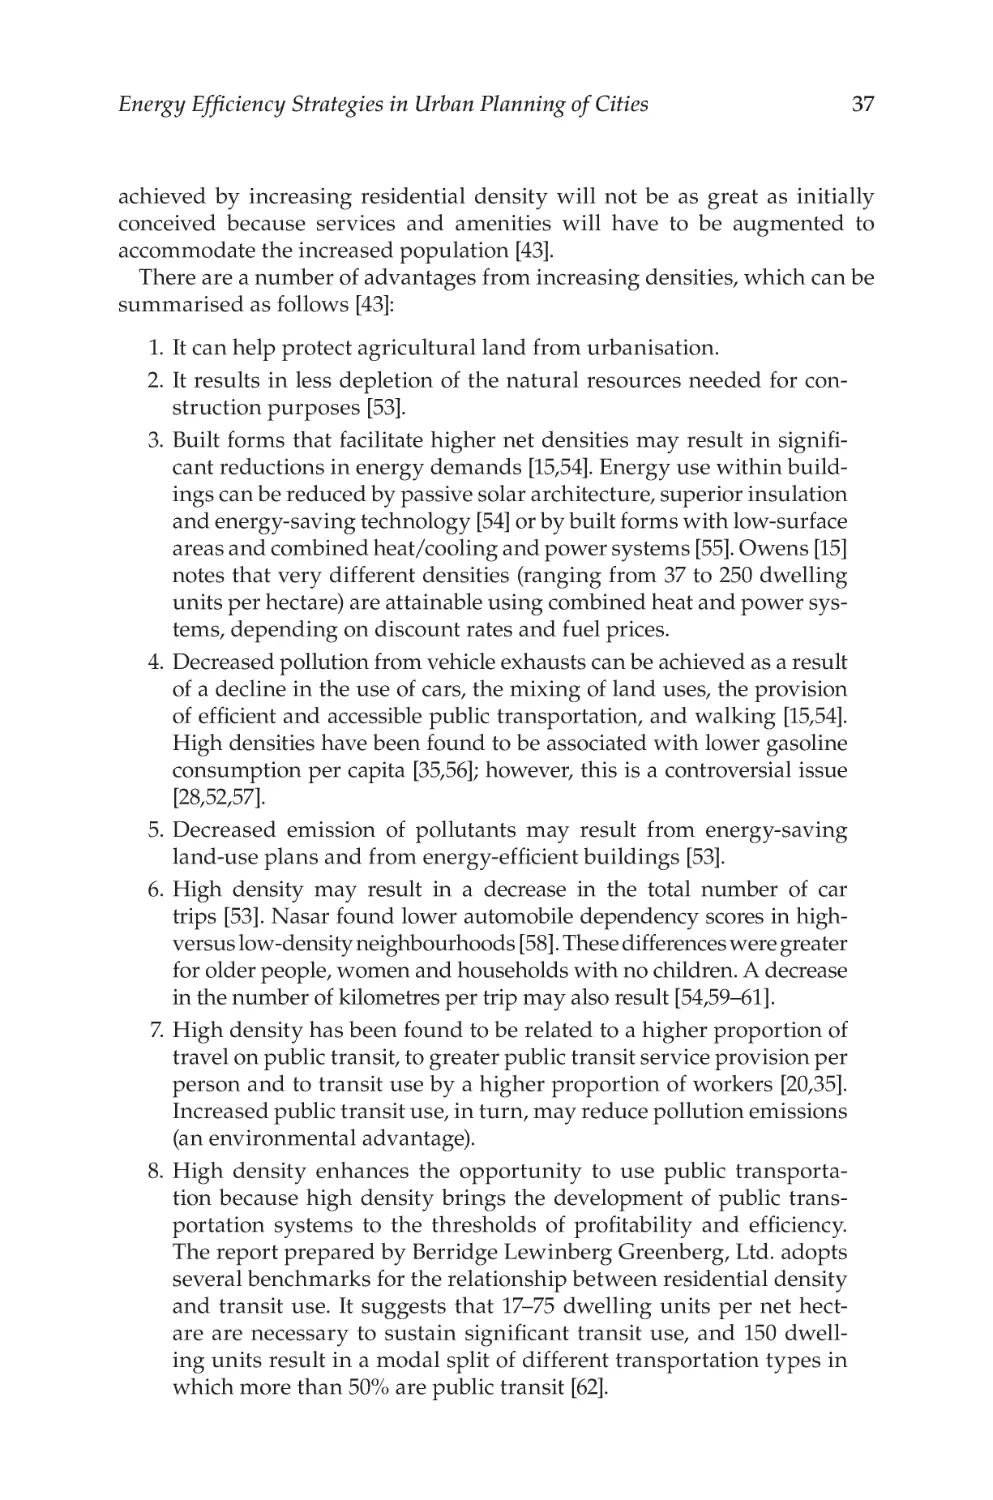
2.3.1.2 Density...................................................................... 35
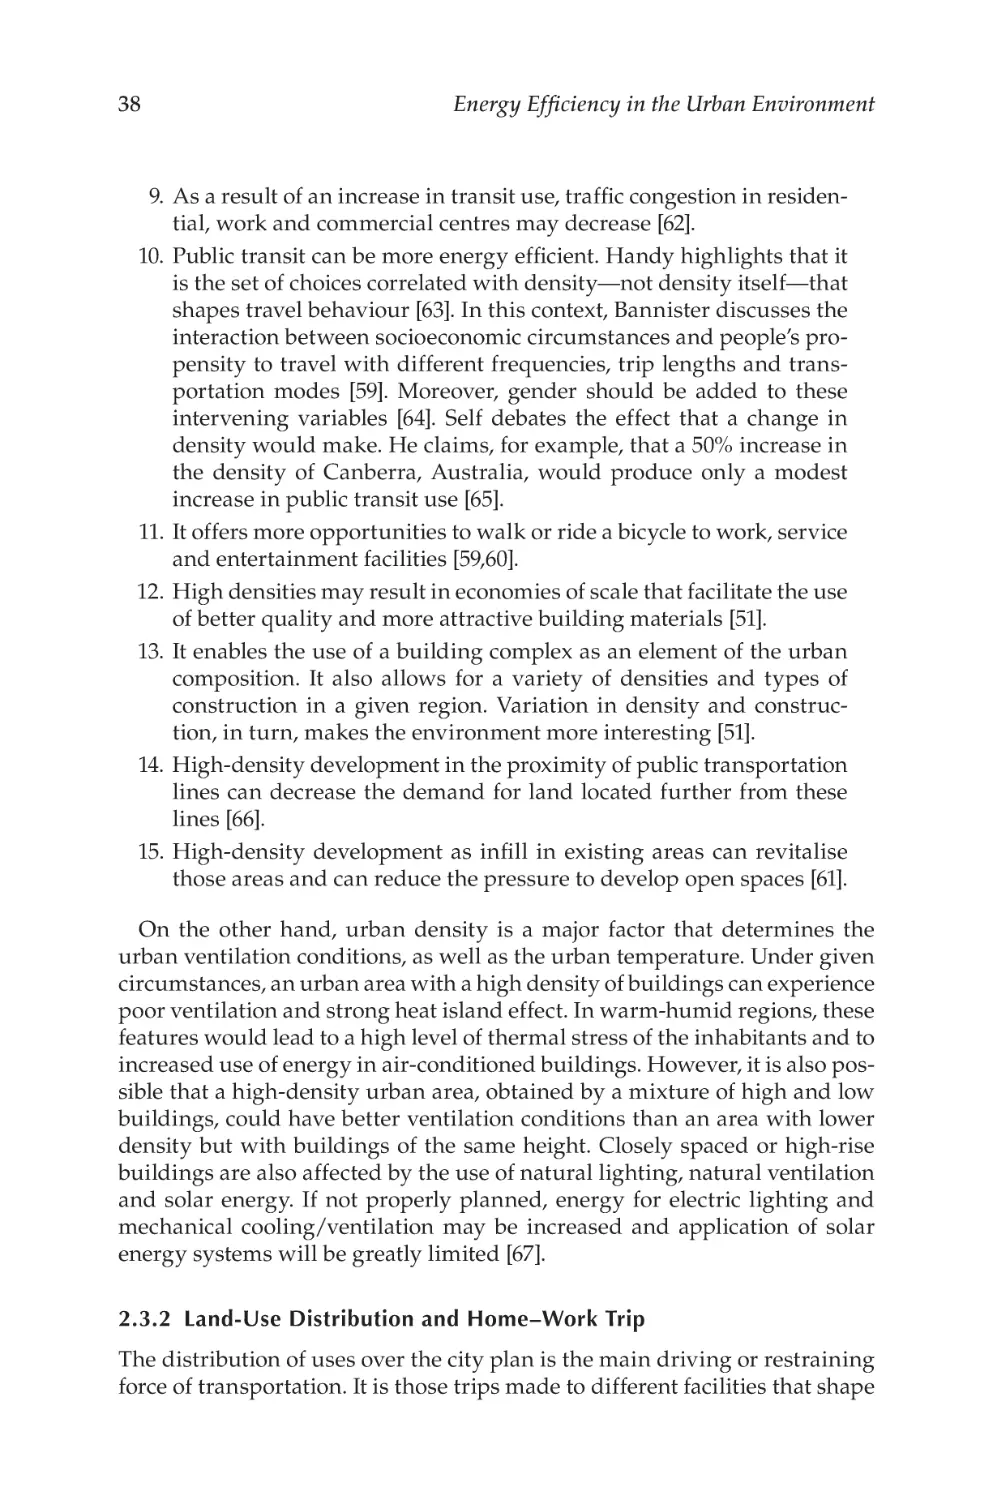
2.3.2 Land-Use Distribution and Home–Work Trip.................... 38
2.3.2.1 New Urbanism and Transit-Oriented
Development............................................................ 39
ix
x
Contents
2.3.2.2
Long-Distance Leisure Time Travel:
Compensatory Travel?............................................ 40
2.3.3 Road Network and Transportation Network..................... 40
2.3.3.1 Road Network.......................................................... 41
2.3.3.2 Transportation......................................................... 41
2.3.3.3 Parking...................................................................... 41
2.3.4 Buildings: Form, Height and Facade Treatment.................42
2.3.5 Renewable Energy..................................................................44
2.4 City Consumption and City Impact.................................................. 47
2.4.1 Ecological Footprint............................................................... 47
2.4.2 Sustainability Assessment..................................................... 49
2.5 Roles of Stakeholders in Planning for EE......................................... 50
2.5.1 Legislations and Laws Addressing Environmental
Issues........................................................................................ 50
2.5.2 Governance.............................................................................. 50
2.6 The Middle East Context..................................................................... 52
2.6.1 The Gulf Area.......................................................................... 52
2.6.1.1 A Return to Compact Cities................................... 52
2.6.1.2 Masdar City: Innovative Technologies................ 52
2.6.2 Egypt.........................................................................................54
2.6.2.1 Strategic Planning for Cities Programme............ 55
2.6.2.2 Cairo.......................................................................... 57
2.7 Conclusions........................................................................................... 59
References........................................................................................................ 60
3. Energy-Efficient Urban Areas: Theories and Green
Rating Systems.........................................................................................67
3.1 Introduction.......................................................................................... 67
3.2 Quality of Life Is a Right..................................................................... 68
3.3 Measuring Sustainable Development............................................... 69
3.3.1 Indices to Rate Urban Agglomerations................................ 70
3.3.1.1 Comprehensive Assessment System
for Building Environmental Efficiency
(CASBEE).................................................................. 70
3.3.1.2 LEED for Neighbourhood Development............. 71
3.3.1.3 Green City Index..................................................... 72
3.4 Sustainable Urbanism Theories......................................................... 72
3.4.1 NU and Smart Growth........................................................... 73
3.4.2 Transit-Oriented Development............................................. 75
3.4.3 Sustainable Urbanism............................................................ 76
3.5 Best Practices in Energy Efficiency and Sustainable
Urbanism Principles............................................................................ 76
3.6 Guidelines for Egyptian Sustainable Cities.....................................77
3.7 Conclusions...........................................................................................84
References........................................................................................................84
Contents
xi
4. Energy-Efficient Informalisation............................................................... 87
4.1 Introduction: Scarce Resources, Efficient Practices,
Urbanisation and Sustainability........................................................ 87
4.2 Western Urbanisation and the Call for Sustainable Urban
Development......................................................................................... 88
4.3 The Developing World Urbanisation: Informalisation................... 89
4.3.1 Informal Areas Built on Agricultural Land........................ 89
4.3.2 Informal Areas Built on Desert Land.................................. 90
4.3.3 Informal Area Upgrading Programmes.............................. 90
4.4 Do Informal Areas Possess Sustainable Potentials?
Is Informalisation ‘Smart’?.................................................................90
4.4.1 Defined Neighbourhood (with Quality Architecture
and Urban Design).................................................................. 91
4.4.2 Compactness............................................................................ 91
4.4.2.1 Walkability............................................................... 91
4.4.2.2 Connectivity............................................................. 91
4.4.2.3 Increased Density.................................................... 92
4.4.3 Completeness with Daily and Lifelong Utilities................ 93
4.4.3.1 Mixed Use and Diversity....................................... 94
4.4.3.2 Mixed Housing........................................................ 95
4.4.4 Connectedness with Integrating Transportation
and Land Use........................................................................... 95
4.4.5 Enhancing the Quality of Life.............................................. 96
4.4.6 Stakeholder Participation....................................................... 96
4.5 Conclusions......................................................................................... 100
References...................................................................................................... 100
5. Energy Generation Plants and Leakages of Energy in
Urban Egypt.................................................................................................. 103
5.1 Conventional Power Plants............................................................... 103
5.1.1 General................................................................................... 103
5.1.2 Need for Power...................................................................... 104
5.1.3 Characteristics of a Steam Power Plant............................. 104
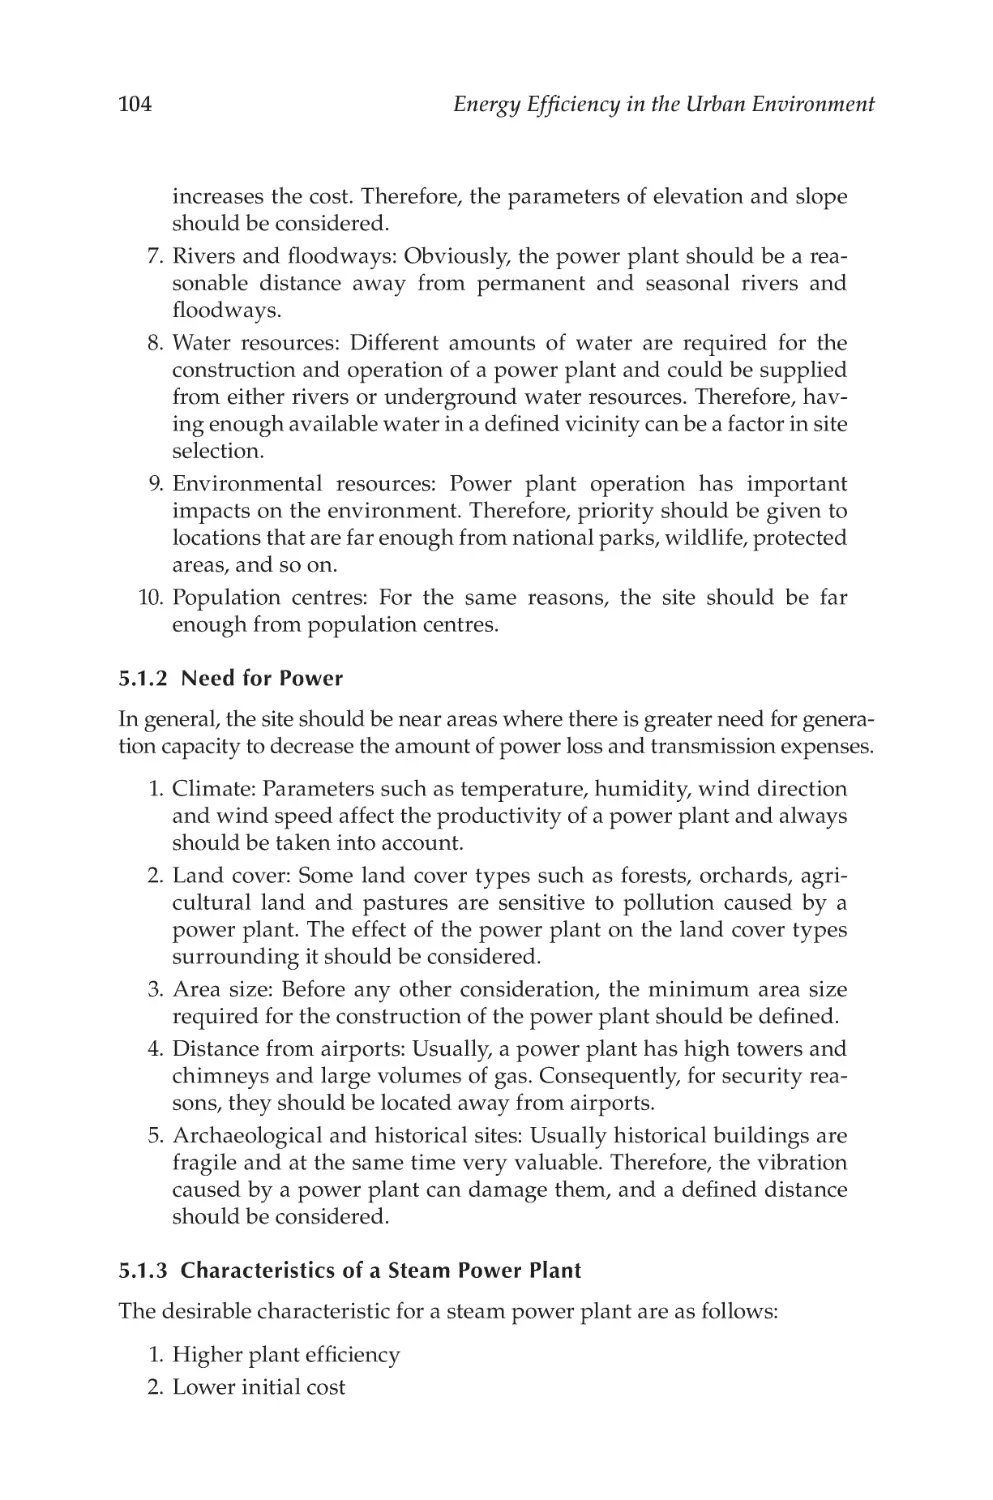
5.1.4 Classification of Power Plant Cycle.................................... 105
5.1.4.1 Rankine Steam Cycle............................................ 105
5.1.4.2 Gas Cycles.............................................................. 107
5.2 Strategic Urban Planning Programme: Lacking Energy
Component.......................................................................................... 107
5.2.1 Description of SUP Processes............................................. 108
5.2.1.1 Basic Stages of an SUP Process............................ 109
5.2.1.2 Critical Comments on SUP Processes................ 109
5.2.1.3 Theoretical Development..................................... 109
5.3 Building New Communities in Desert Areas................................ 111
5.3.1 Strategic Plan Highlights..................................................... 112
5.3.2 Partnerships........................................................................... 113
xii
Contents
5.3.3 Leveraging............................................................................. 113
5.3.4 Community Involvement..................................................... 113
References...................................................................................................... 113
6. Energy in Buildings.................................................................................... 115
6.1 Energy-Efficient Buildings: A Challenging Era............................. 115
6.1.1 Energy Declaration of Buildings........................................ 115
6.1.2 Energy Performance............................................................. 118
6.1.3 Need for Further Development.......................................... 119
6.1.4 Mathematical Simulation Tools.......................................... 120
6.1.5 Arab Energy in Buildings Code......................................... 121
6.1.6 Conclusions............................................................................ 122
6.2 Indoor Environmental Quality........................................................ 122
6.2.1 General................................................................................... 122
6.2.2 Definitions............................................................................. 123
6.2.3 Requirements........................................................................ 125
6.2.4 Minimum Ventilation Rates................................................ 125
6.2.5 Outdoor Air Delivery Monitoring...................................... 125
6.2.5.1 Spaces Ventilated by Mechanical Systems........ 125
6.2.5.2 Naturally Ventilated Spaces................................. 126
6.2.5.3 CO2 Sensors............................................................ 126
6.2.6 Filtration and Air Cleaner Requirements.......................... 127
6.2.6.1 Particulate Matter.................................................. 127
6.2.6.2 Ozone...................................................................... 127
6.2.6.3 Bypass Pathways................................................... 127
6.2.7 Building Requirements........................................................ 127
6.2.7.1 Building Entrances................................................ 127
6.2.8 Thermal Environmental Conditions
for Human Occupancy Comfort......................................... 128
6.2.9 Acoustical Control................................................................ 129
6.2.9.1 Exterior Sound....................................................... 129
6.2.9.2 Interior Sound........................................................ 129
6.2.9.3 OITC and STC........................................................ 129
6.2.10 Day Lighting by Top Lighting............................................ 130
6.2.10.1 Minimum Daylight Zone by Top Lighting........ 130
6.2.10.2 Skylight Characteristics........................................ 130
6.2.11 Isolation of the Building from Pollutants in Soil.............. 131
6.2.12 Prescriptive Option.............................................................. 131
6.2.12.1 Day Lighting by Side Lighting............................ 131
6.2.13 Materials................................................................................. 131
6.2.13.1 Adhesives and Sealants........................................ 132
6.2.13.2 Emissions................................................................ 133
6.2.13.3 Floor Covering Materials..................................... 133
6.2.13.4 Composite Wood, Wood Structural
Panel and Agrifibre Products.............................. 133
Contents
xiii
6.2.13.5 Office Furniture Systems and Seating................ 134
6.2.13.6 Ceiling and Wall Systems.................................... 134
6.2.14 Performance Option............................................................. 134
6.2.14.1 Day Lighting Simulation...................................... 134
6.2.14.2 Direct Sun Limitation on Work Plane
Surface in Offices................................................... 135
6.2.14.3 Materials................................................................. 135
6.3 Rating Systems of Energy-Efficient Buildings............................... 136
6.3.1 Introduction........................................................................... 136
6.3.2 Major Appliances.................................................................. 137
6.3.2.1 European Union Energy Label............................ 137
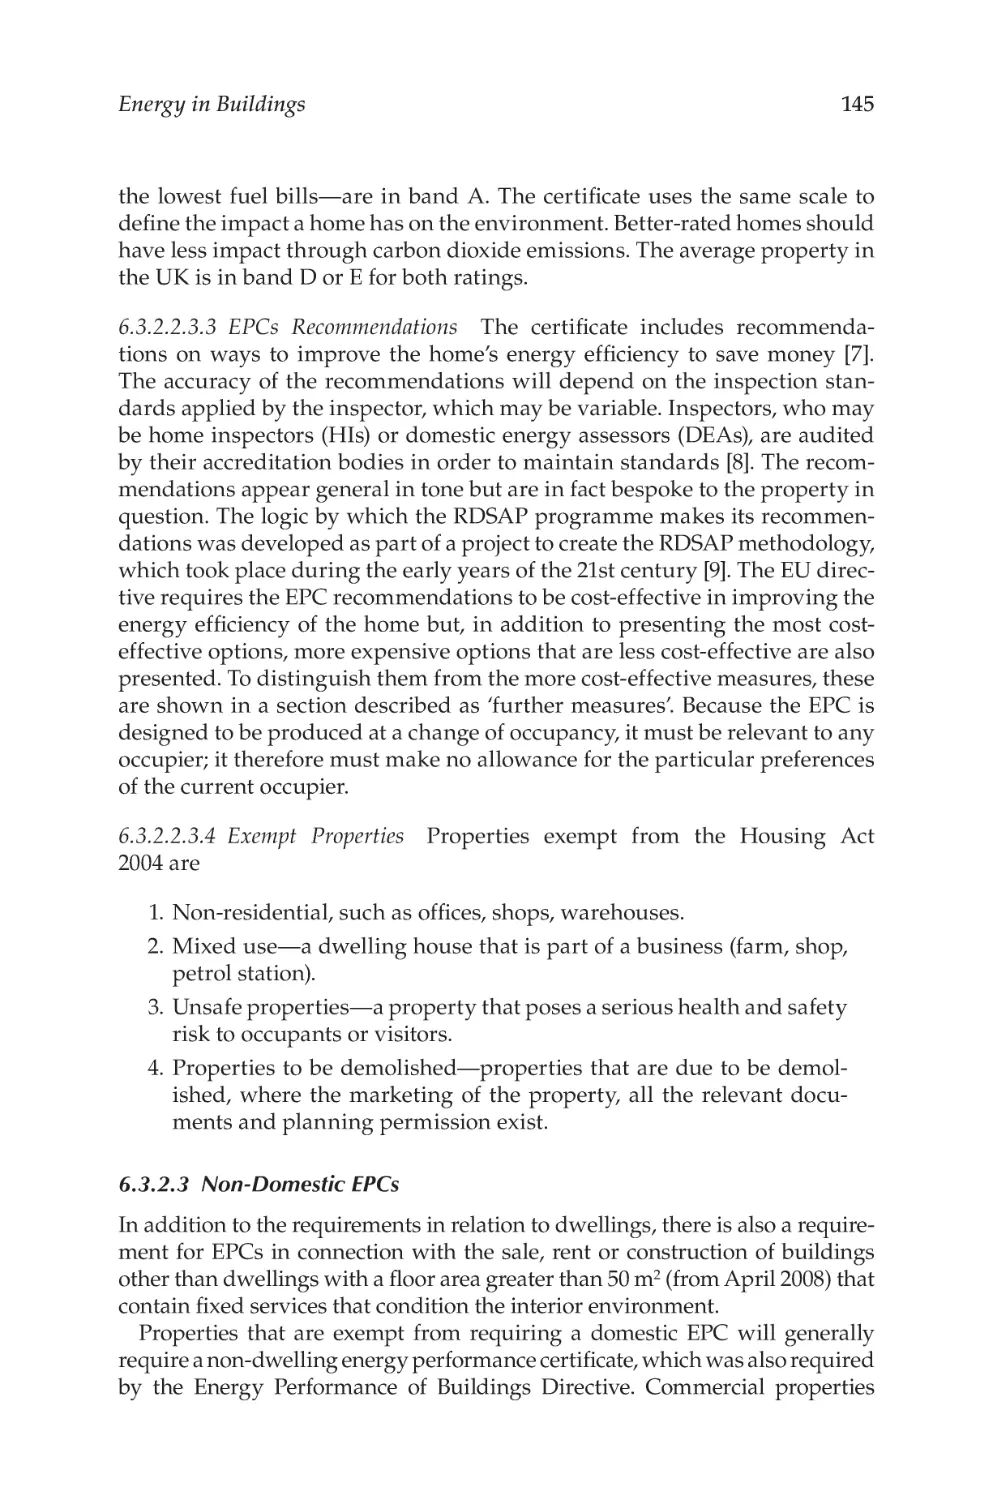
6.3.2.2 U.K. Energy Performance Certificate................. 142
6.3.2.3 Non-Domestic EPCs.............................................. 145
6.3.2.4 Display Energy Certificates................................. 146
6.3.2.5 Criticism................................................................. 147
6.3.2.6 The Energy Label Australia................................. 147
6.3.2.7 Base Energy Consumption and Star Rating...... 149
6.3.2.8 U.S. Energy Star..................................................... 160
6.3.2.9 Energy Performance Ratings............................... 163
6.3.3 Summary of Energy Standards and Labelling................. 164
Reference Standards..................................................................................... 165
Related Acts................................................................................................... 166
References...................................................................................................... 167
7. Low Carbon Buildings............................................................................... 169
7.1 Energy-Efficient Designs of Low Carbon Buildings..................... 169
7.1.1 Summary................................................................................ 169
7.1.2 Rationale and Benefits.......................................................... 170
7.1.3 The Holistic Approach: Think ‘Pyramids’........................ 171
7.2 Energy-Efficient Buildings................................................................ 174
7.2.1 Energy Declaration of Buildings........................................ 174
7.2.2 Energy Declaration of Existing Buildings......................... 175
7.2.3 Energy Declaration of New Buildings............................... 176
7.2.4 Issues for International Collaboration............................... 176
7.2.5 Concluding Remarks............................................................ 178
7.3 New Design Practices........................................................................ 179
7.3.1 General................................................................................... 179
7.3.2 Comfort Levels...................................................................... 180
7.3.2.1 Introduction........................................................... 180
7.3.2.2 Problem Identification.......................................... 180
7.3.2.3 Status Quo.............................................................. 181
7.3.2.4 Closure.................................................................... 181
7.3.3 Air Quality............................................................................. 181
7.3.3.1 Introduction........................................................... 181
7.3.3.2 Problem Identification.......................................... 183
xiv
Contents
7.3.3.3 Status Quo.............................................................. 183
7.3.3.4 Closure.................................................................... 184
7.3.4 Energy-Efficient Building Design....................................... 184
7.3.4.1 Introduction........................................................... 184
7.3.4.2 Problem Identification: Pyramid Concept......... 184
7.3.4.3 Status Quo.............................................................. 185
7.3.4.4 Closure.................................................................... 186
7.3.5 Air-Conditioning System Design of
Commercial Buildings......................................................... 186
7.3.5.1 Load Characteristics............................................. 186
7.3.5.2 Design Concepts.................................................... 187
7.3.5.3 Special Considerations......................................... 187
7.3.5.4 Design Criteria....................................................... 188
7.3.5.5 Building Contents................................................. 188
7.3.5.6 Effect of Ambient Atmosphere............................ 188
7.3.5.7 Sound and Vibration............................................. 189
7.3.6 Evaluation Indices................................................................. 189
7.3.6.1 Introduction........................................................... 189
7.3.6.2 Problem Identification.......................................... 189
7.3.6.3 Status Quo.............................................................. 189
7.3.6.4 Closure.................................................................... 191
References...................................................................................................... 192
Further Readings.......................................................................................... 194
8. Green Buildings........................................................................................... 195
8.1 General................................................................................................ 195
8.2 Concepts.............................................................................................. 197
8.2.1 Life Cycle Assessment.......................................................... 198
8.3 Measures and Assessments.............................................................. 199
8.3.1 Guiding Principles for Sustainable Existing
Buildings...........................................................................199
8.3.2 Design Considerations and Enforcement.......................... 204
8.4 New Design Practices and Renewable Energy Blends................. 205
8.4.1 Ocean and Alternative Energies......................................... 206
8.5 Closure................................................................................................. 207
References...................................................................................................... 209
9. Current Energy Leakages in Egyptian Buildings................................. 211
9.1 Examples of Public and Residential Buildings.............................. 211
9.1.1 Building Blocks of a National Standards and
Labelling Programme.......................................................... 211
9.1.2 Technical/Policy................................................................... 211
9.1.3 Proposed Process.................................................................. 212
Contents
xv
9.2
Measures and Assessments.............................................................. 212
9.2.1 Proposed Labels for Egypt: Major Appliances................. 212
9.2.1.1 Refrigerators, Freezers and Combined
Appliances.............................................................. 212
9.2.1.2 Washing Machines and Tumble Dryers............. 213
9.2.1.3 Dishwashers........................................................... 215
9.2.1.4 Air Conditioners.................................................... 215
9.2.1.5 Light Bulbs............................................................. 216
9.2.2 Concluding Remarks............................................................ 216
9.3 Laws, Codes and Standards............................................................. 217
9.3.1 Building Mechanical Systems............................................. 217
9.3.2 Ventilation Controls for High-Occupancy Areas............. 219
9.3.3 Building Service Water-Heating Systems.......................... 232
9.3.4 Energy-Saving Equipment...................................................234
9.4 Energy Auditing................................................................................. 235
9.4.1 General................................................................................... 235
9.4.2 Benchmarking....................................................................... 237
9.4.2.1 Walk-Through or Preliminary Audit................. 238
9.4.2.2 General Audit........................................................ 238
9.4.2.3 Investment-Grade Audit....................................... 239
9.4.2.4 Pollution Audits..................................................... 241
References...................................................................................................... 241
10. Future Prospects.......................................................................................... 243
10.1 Continuous Urbanisation and Climate Change............................ 243
10.2 Energy Efficiency and Urban Expansion........................................ 243
10.3 Integrating Renewable Energies into Urban Planning................. 244
10.4 Energy-Efficient Building Envelopes.............................................. 245
10.5 Providing Integrated Solutions for Low-Income
Areas Constituting Most Urbanisation Activities ........................ 246
10.6 Awareness Regarding Climate Change, Energy Crisis and
Resource-Efficient Urbanism............................................................ 247
10.7 Bottom-Up Approaches versus Top-Down Interventions........... 248
10.8 New Business Models of Green Economy that Support
Energy-Efficient Urban Development............................................. 249
References...................................................................................................... 250
Bibliography......................................................................................................... 251
List of Figures
Figure 1.1
Key indicators for energy demand and CO2 emissions..............2
Figure 1.2
Human Development Index and ecological footprint, 2005......... 7
Figure 1.3
Green City Index for European cities............................................ 9
Figure 1.4
The Wheel of Urban Prosperity.................................................... 10
Figure 1.5
Current power generation technologies in Egypt...................... 15
Figure 1.6
Energy consumption by sector 2006–2007 in Egypt.................. 16
Figure 1.7
Building energy consumption by utility in Egypt..................... 16
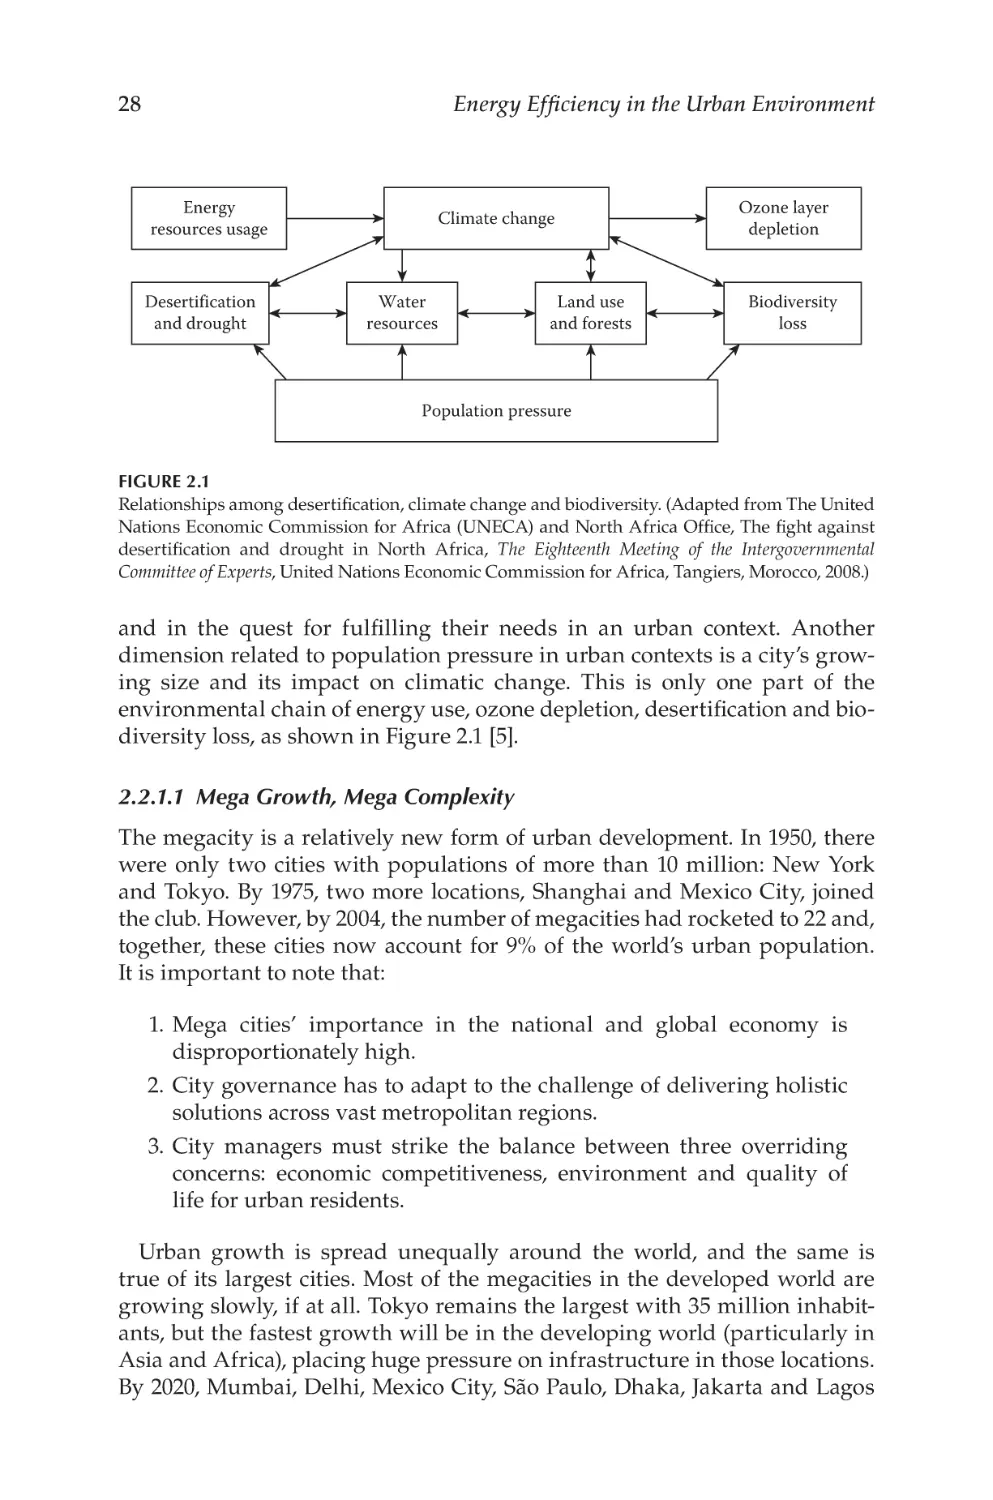
Figure 2.1
elationships among desertification, climate change
R
and biodiversity.............................................................................. 28
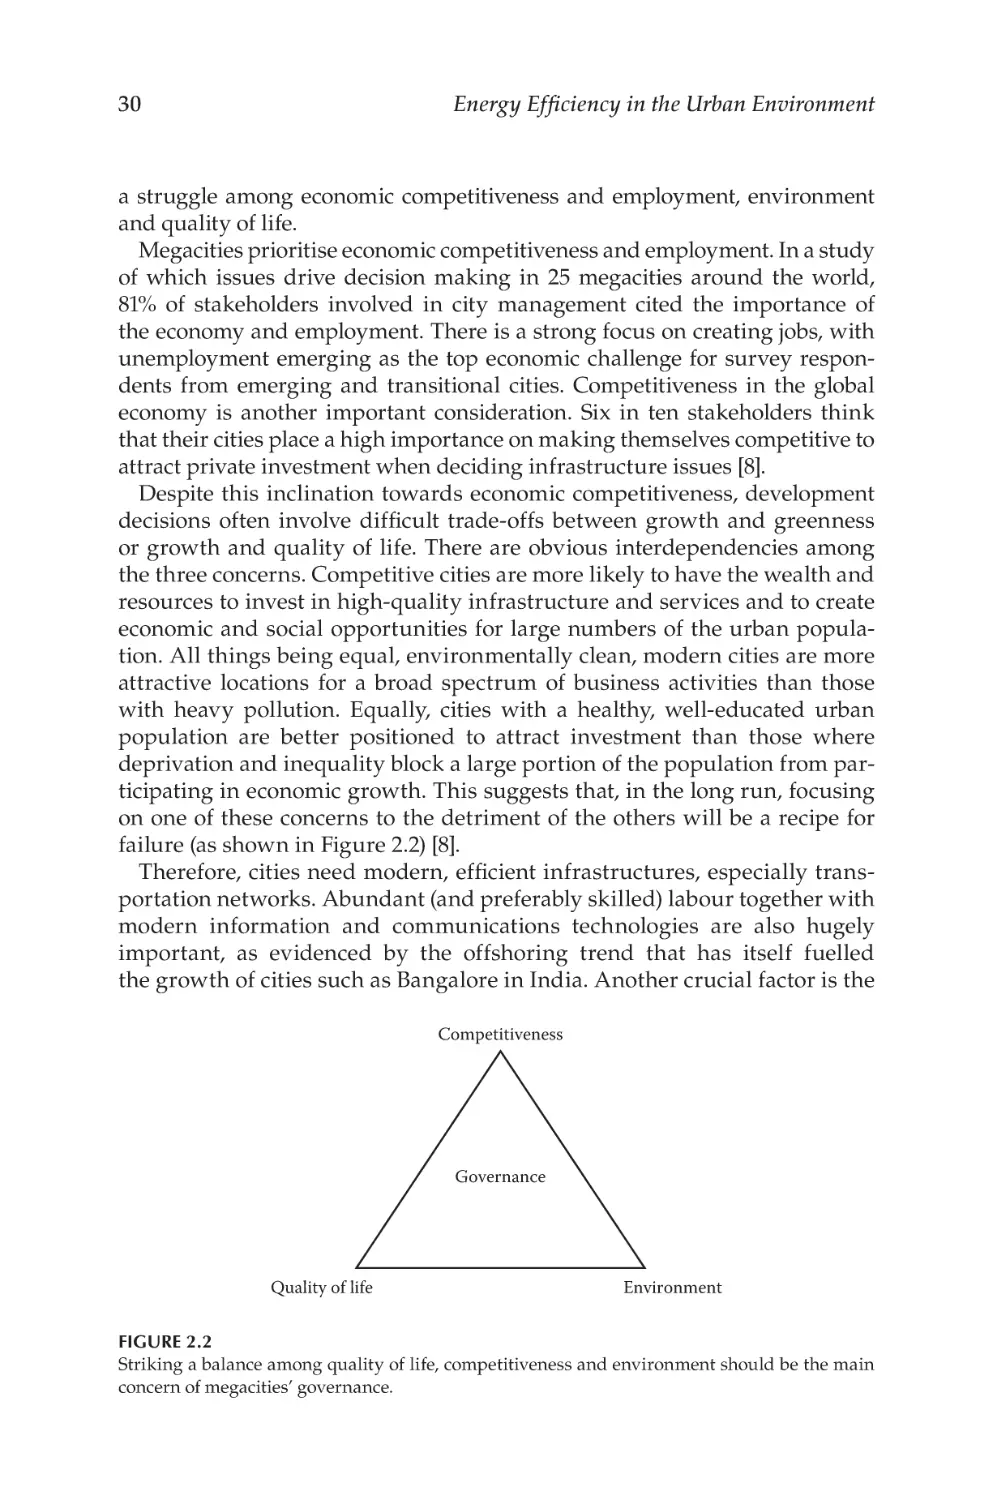
Figure 2.2
triking a balance among quality of life, competitiveness
S
and environment should be the main concern of
megacities’ governance..................................................................30
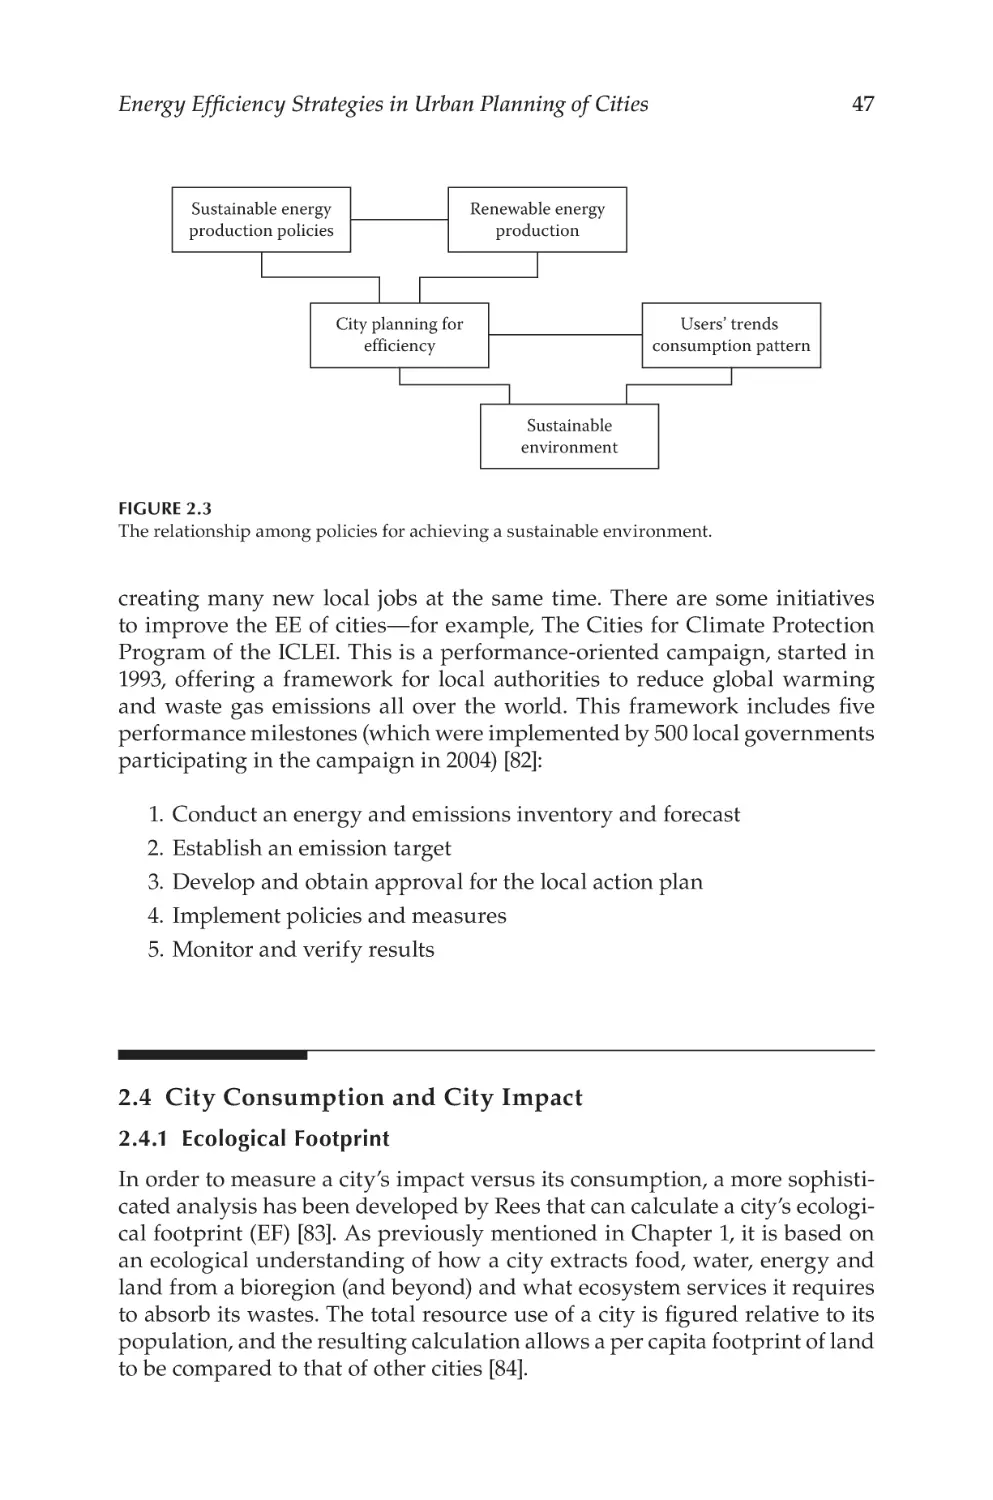
Figure 2.3
he relationship among policies for achieving
T
a sustainable environment............................................................ 47
Figure 2.4
eeping Ashmun city boundaries to the minimum and
K
preserving surrounding agricultural land................................. 56
Figure 2.5
World’s most polluted cities.......................................................... 58
Figure 2.6
Greater Cairo with the surrounding new cities......................... 58
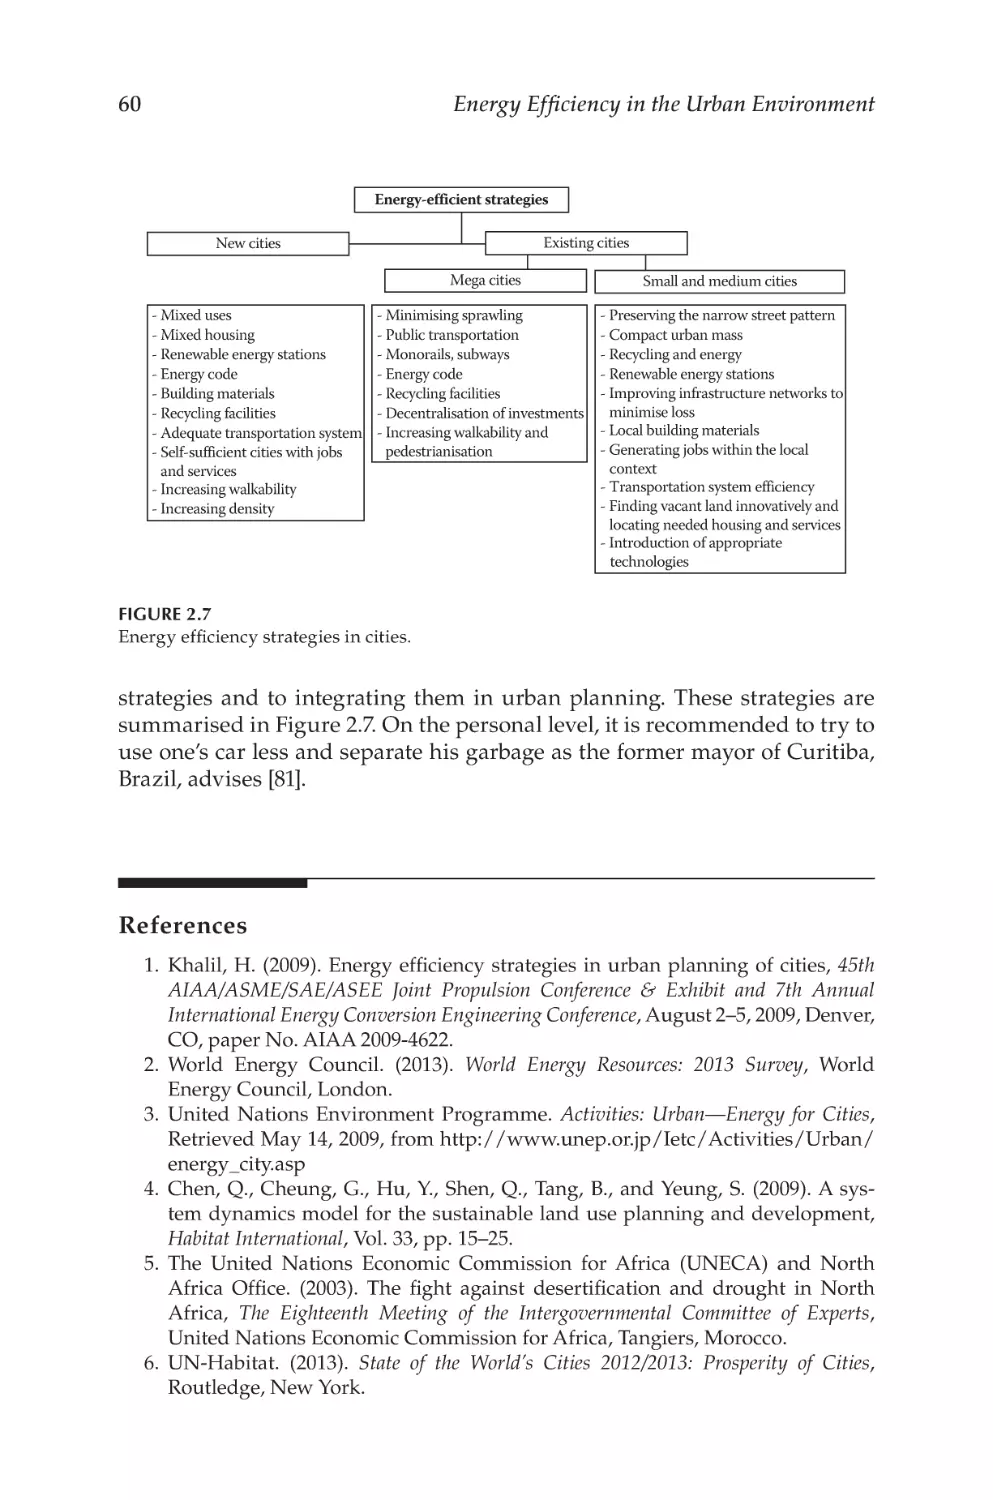
Figure 2.7
Energy efficiency strategies in cities............................................ 60
Figure 4.1
Giza northern sector land uses..................................................... 92
Figure 4.2
omogeneous buildings in Boulaq Al-Dakrour district,
H
Cairo................................................................................................. 93
Figure 4.3
ommunity hospital, nursery and vocational centre
C
located within 300–500 m for daily accessibility....................... 93
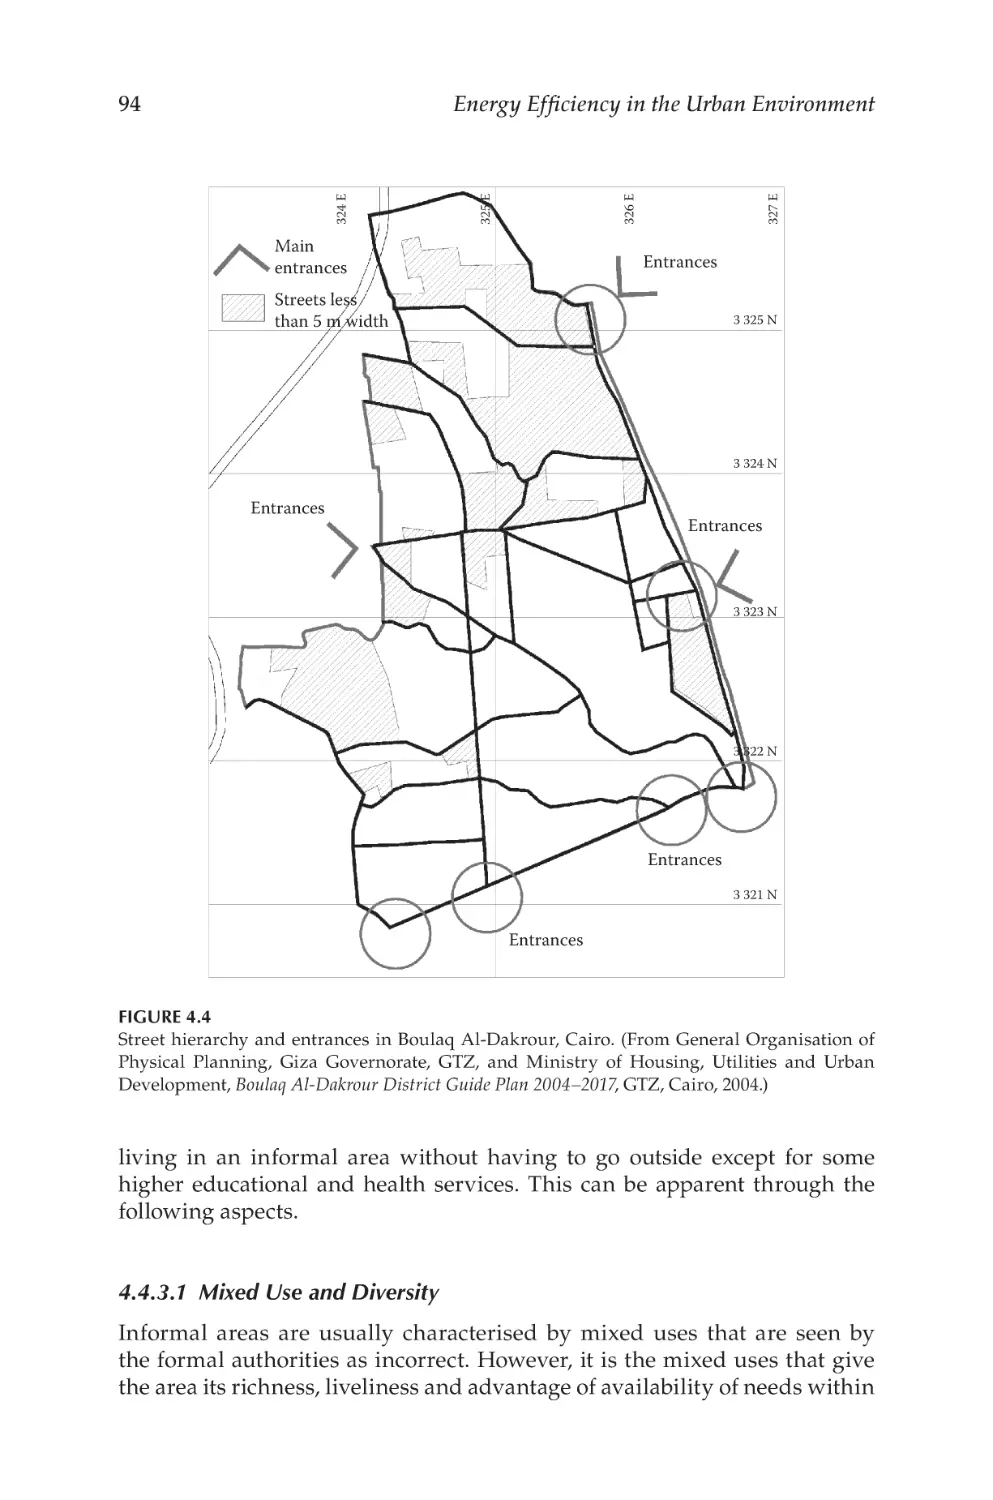
Figure 4.4
treet hierarchy and entrances in Boulaq Al-Dakrour,
S
Cairo........................................................................................................ 94
Figure 4.5
Mixed uses prevail in streets of Boulak Al-Dakrour, Cairo........ 95
Figure 4.6
Imbaba Airport housing area, Cairo............................................ 97
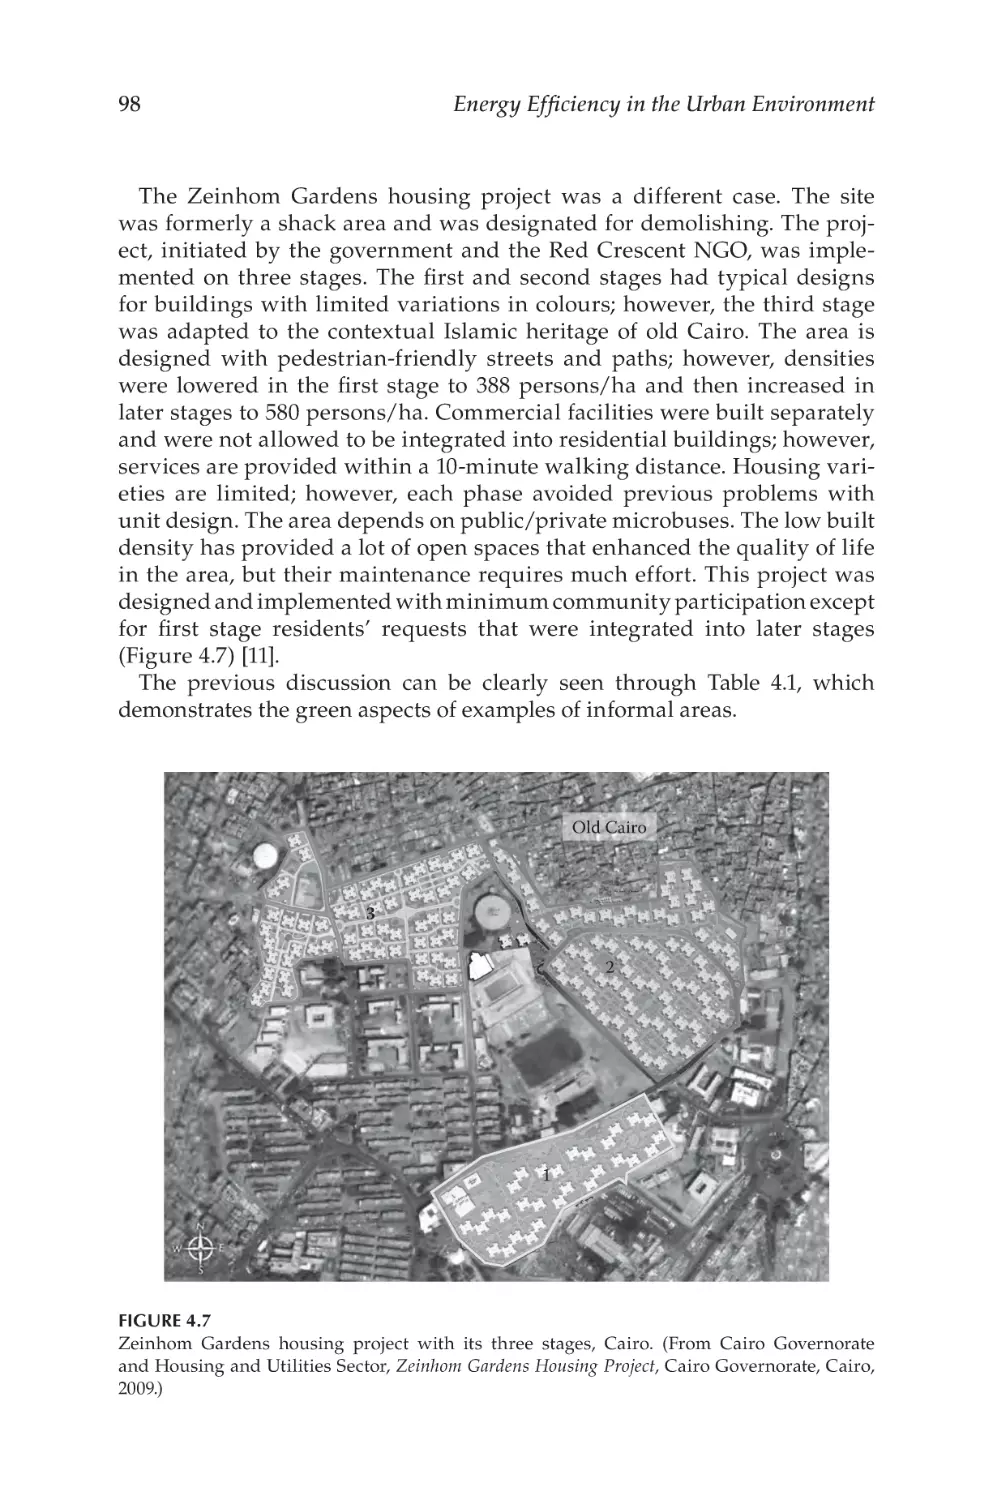
Figure 4.7
einhom Gardens housing project with its three stages,
Z
Cairo................................................................................................. 98
xvii
xviii
List of Figures
Figure 5.1
Simple Rankine power cycle....................................................... 105
Figure 5.2
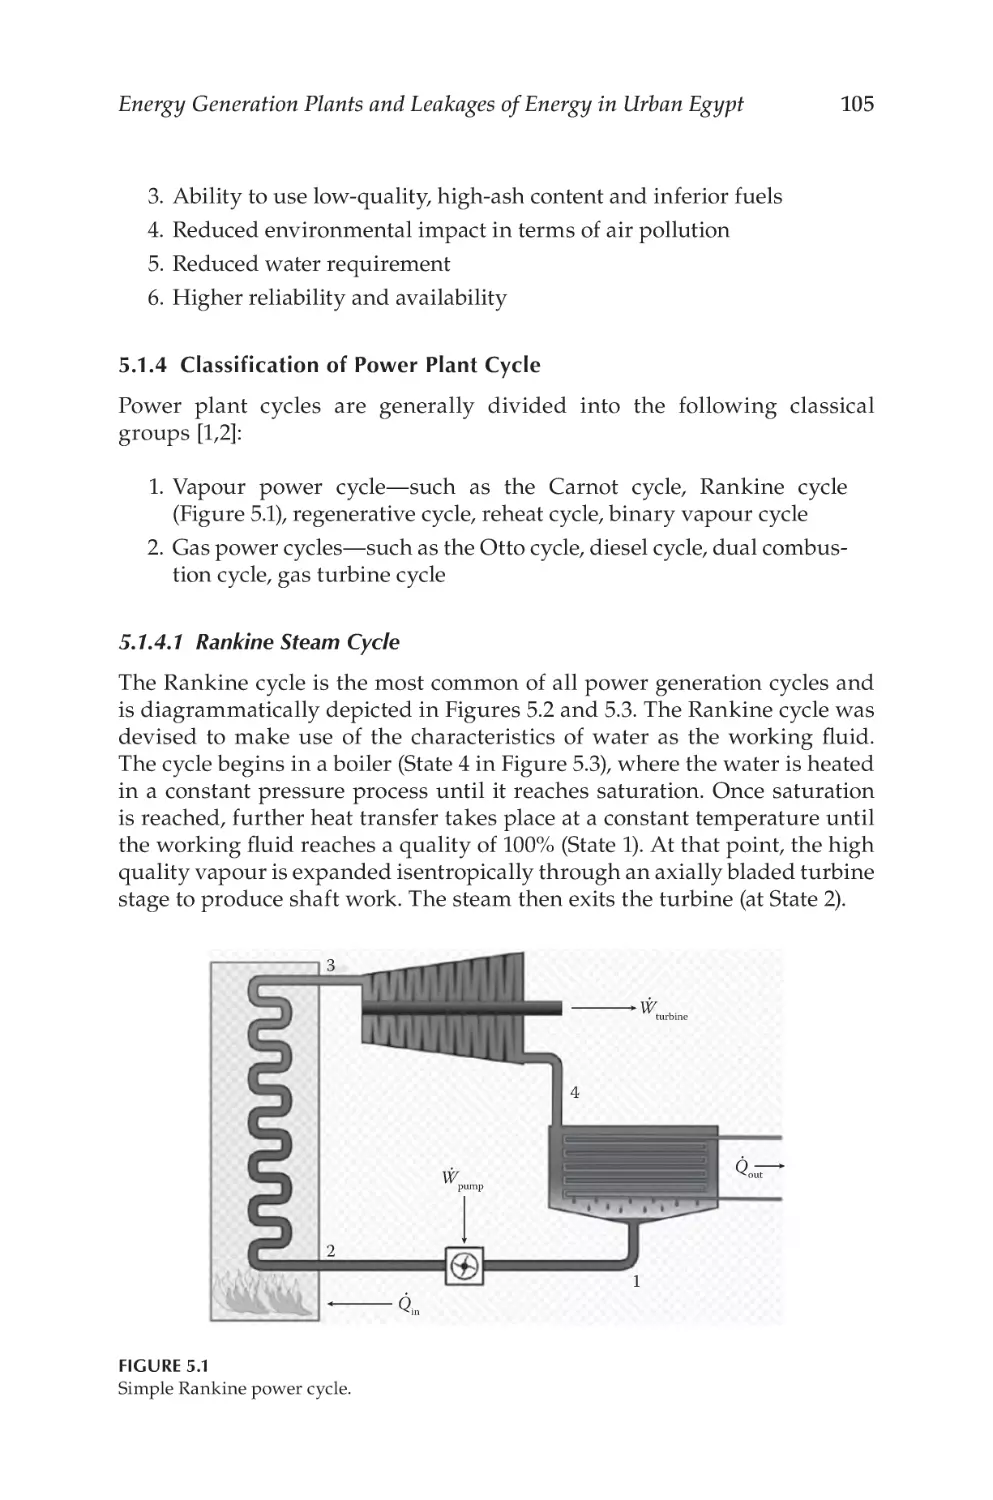
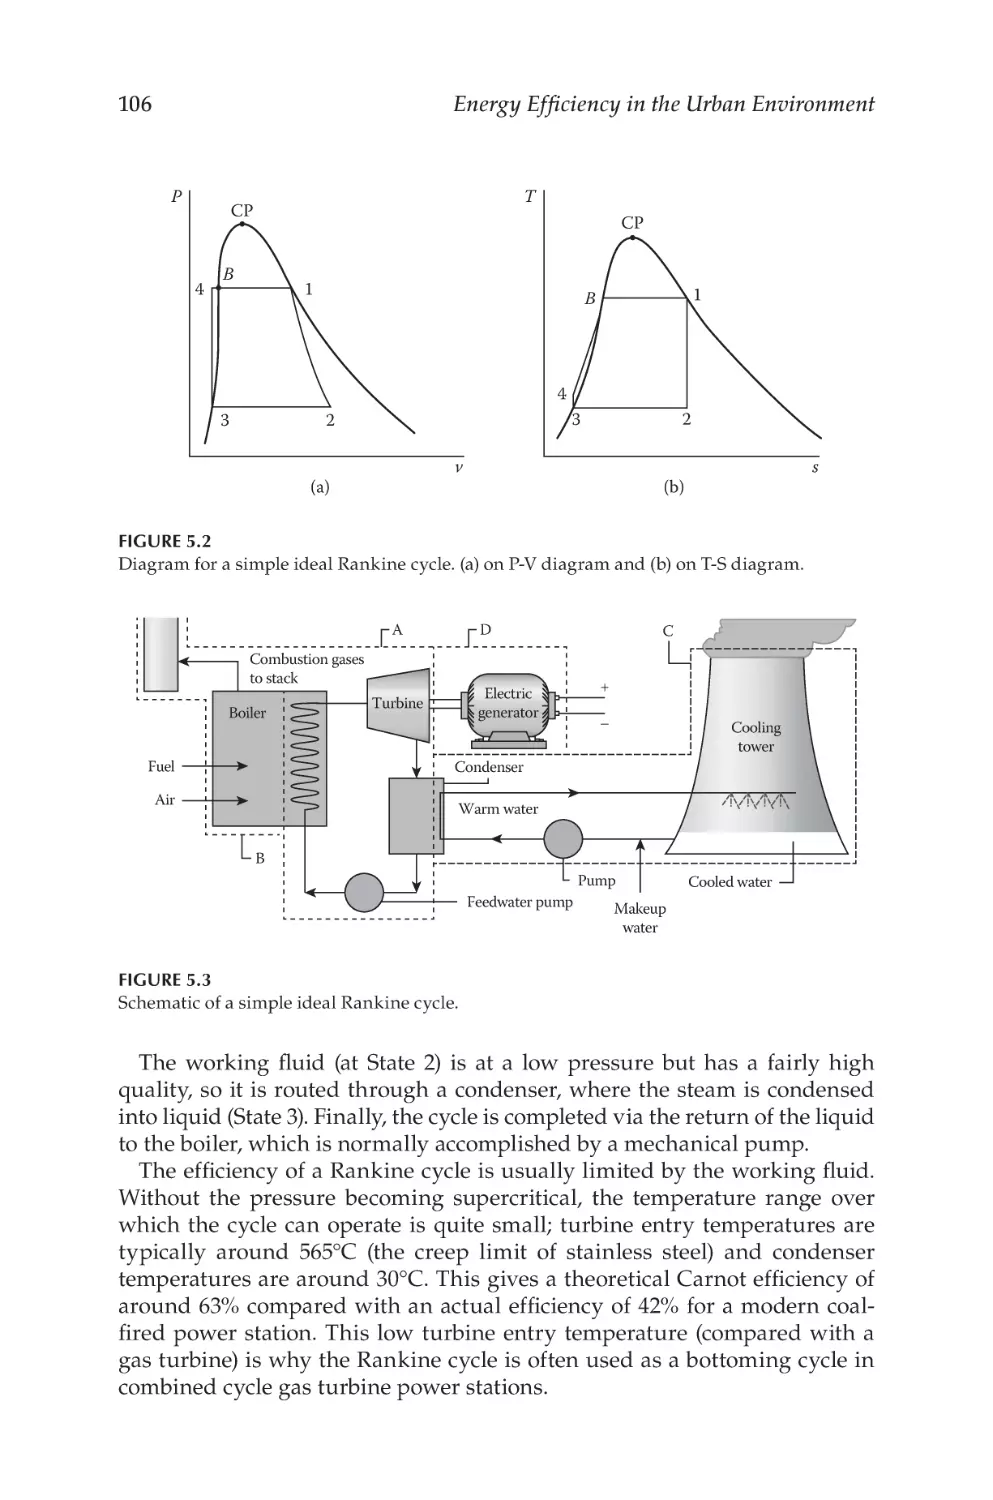
Diagram for a simple ideal Rankine cycle................................ 106
Figure 5.3
Schematic of a simple ideal Rankine cycle................................ 106
Figure 6.1
Energy flow chart in buildings................................................... 117
Figure 6.2
Horizontal daylight area.............................................................. 124
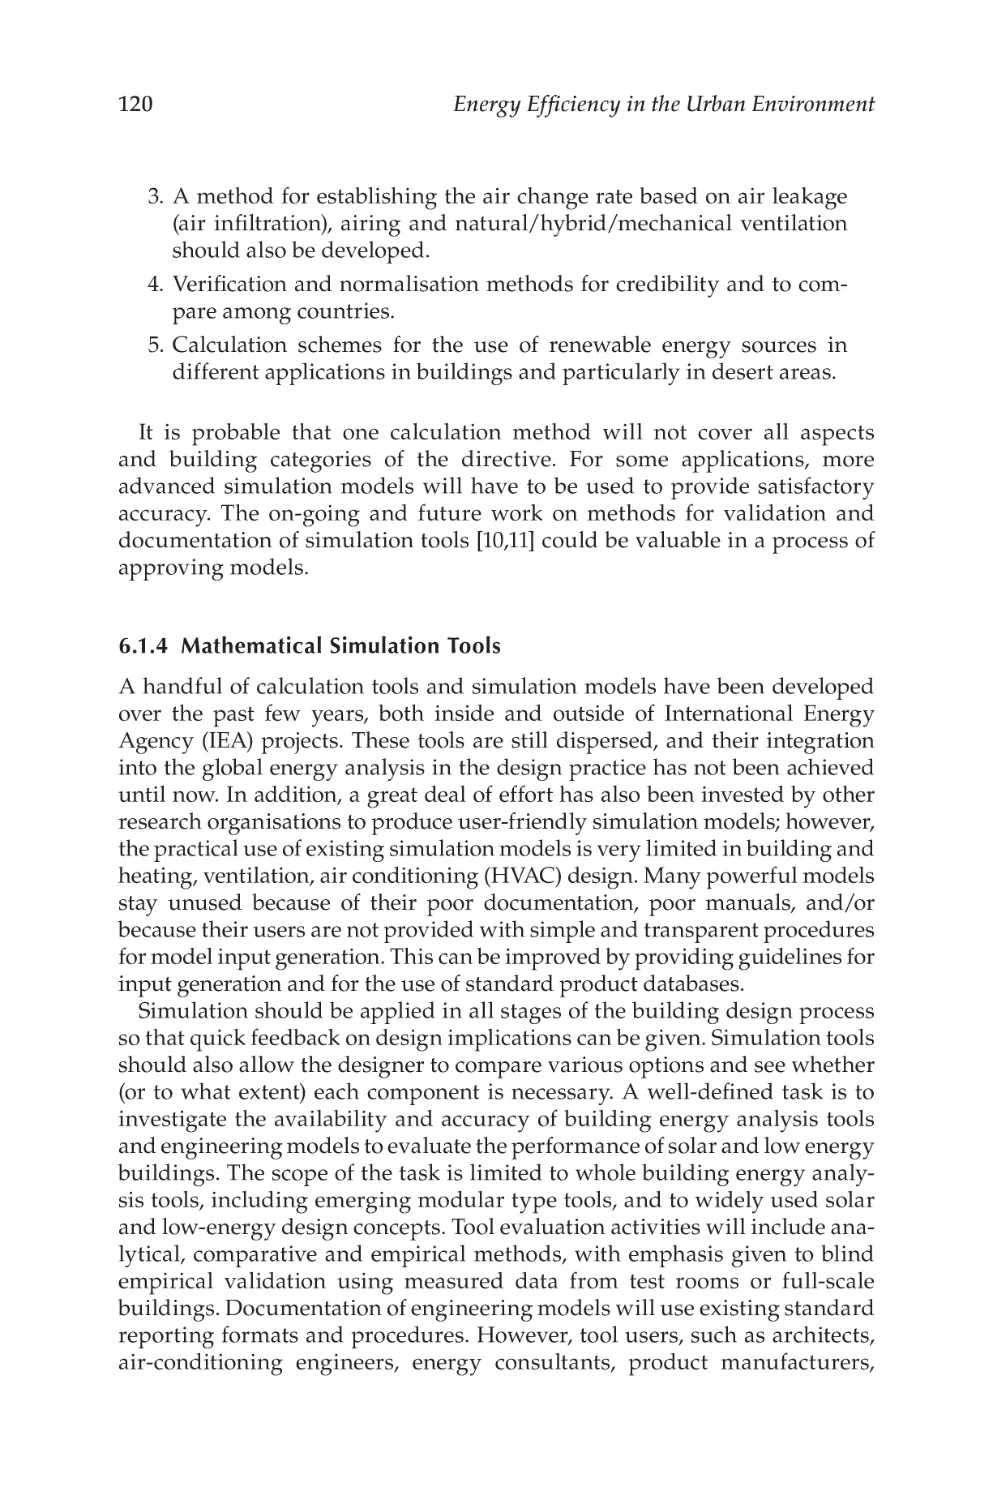
Figure 6.3
Vertical daylight area................................................................... 125
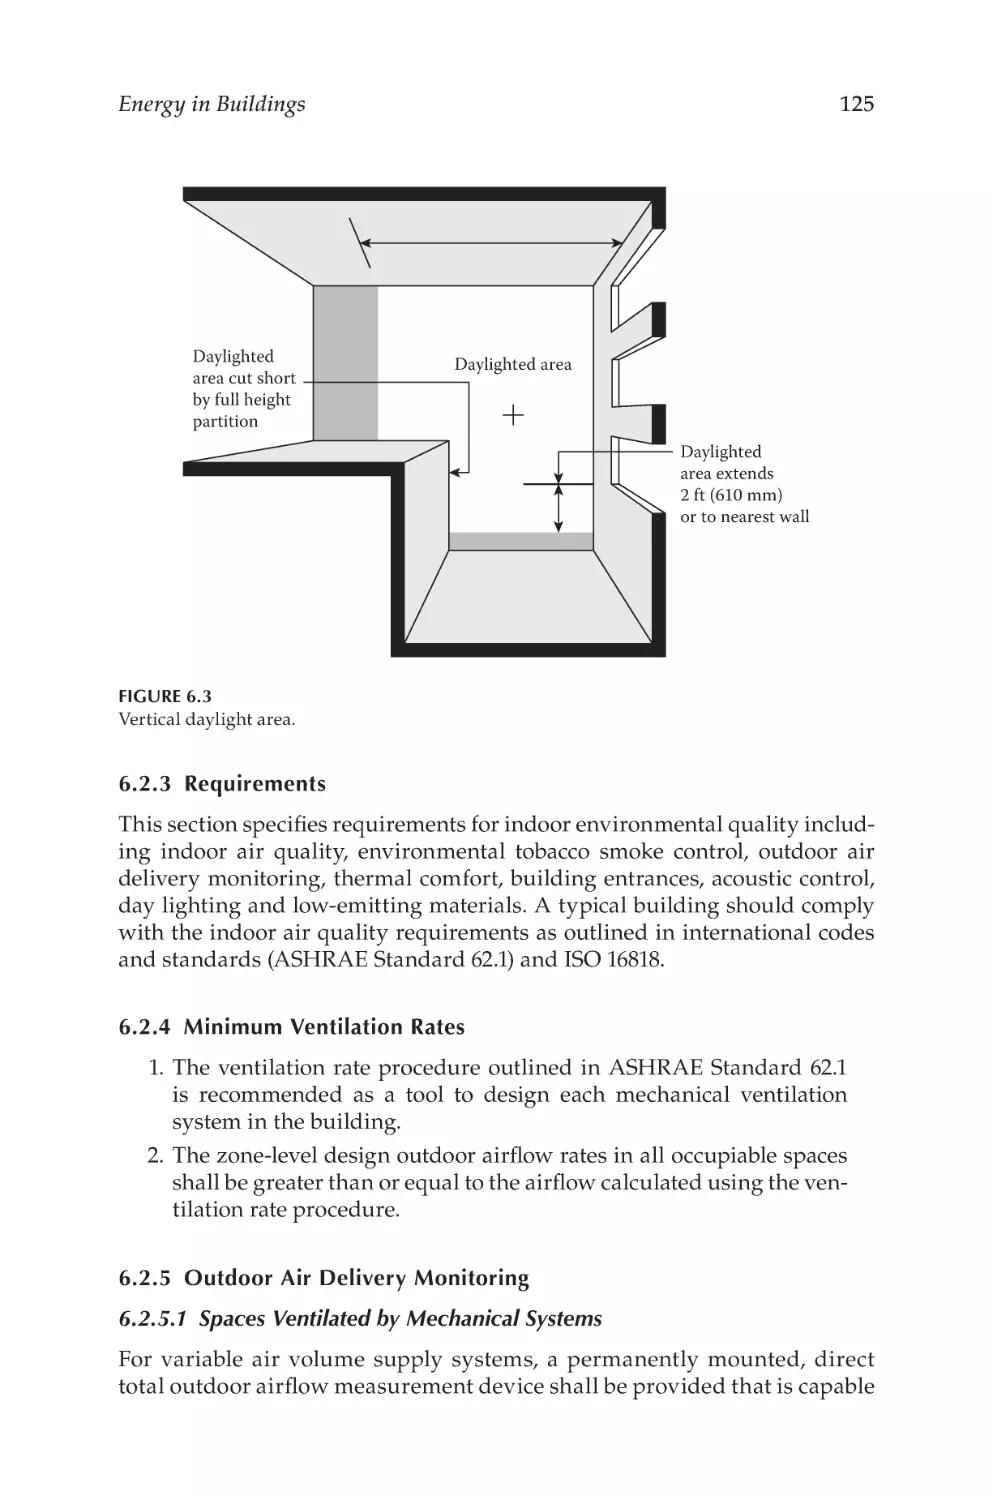
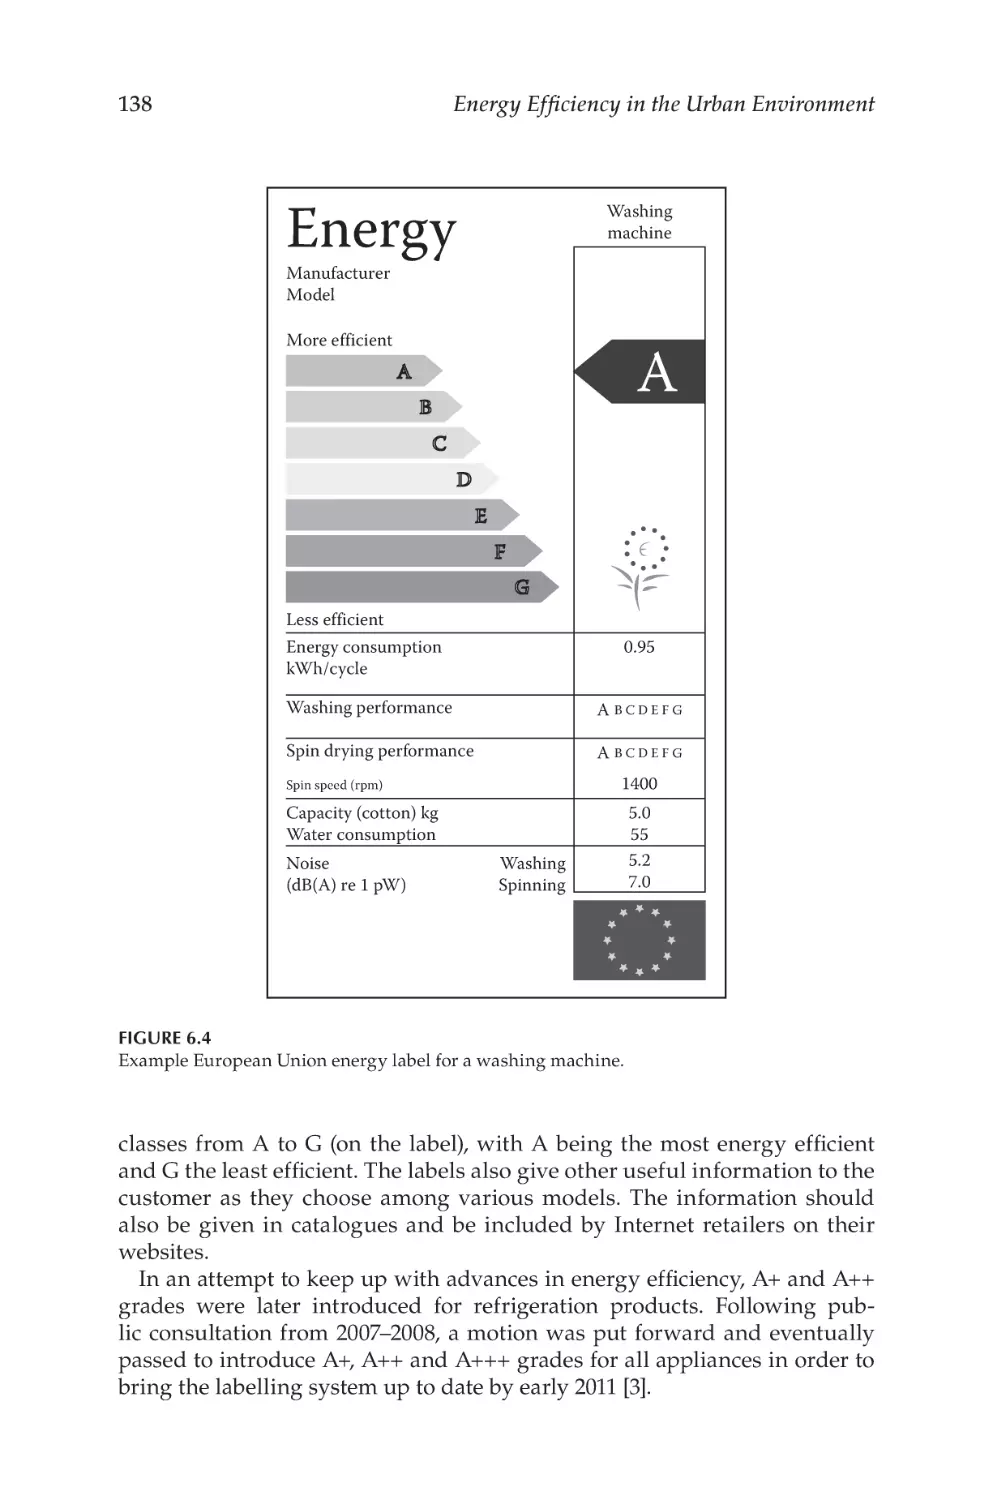
Figure 6.4
xample European Union energy label for
E
a washing machine....................................................................... 138
Figure 6.5
Label for refrigerators and freezers............................................ 139
Figure 6.6
Label for washing machines and tumble dryers..................... 139
Figure 6.7
Label for condenser dryers.......................................................... 140
Figure 6.8
Label for vented dryers................................................................ 140
Figure 6.9
Label for combined washer/dryers............................................ 141
Figure 6.10 Label for dishwashers.................................................................. 141
Figure 6.11 Label for air conditioners............................................................. 142
Figure 6.12 Example of energy label for United Kingdom.......................... 143
Figure 6.13 Example of the energy rating label............................................ 148
Figure 6.14 S
ample of the Australian energy labels for refrigerators
and freezers AS/NZS 4474.2:2009............................................... 155
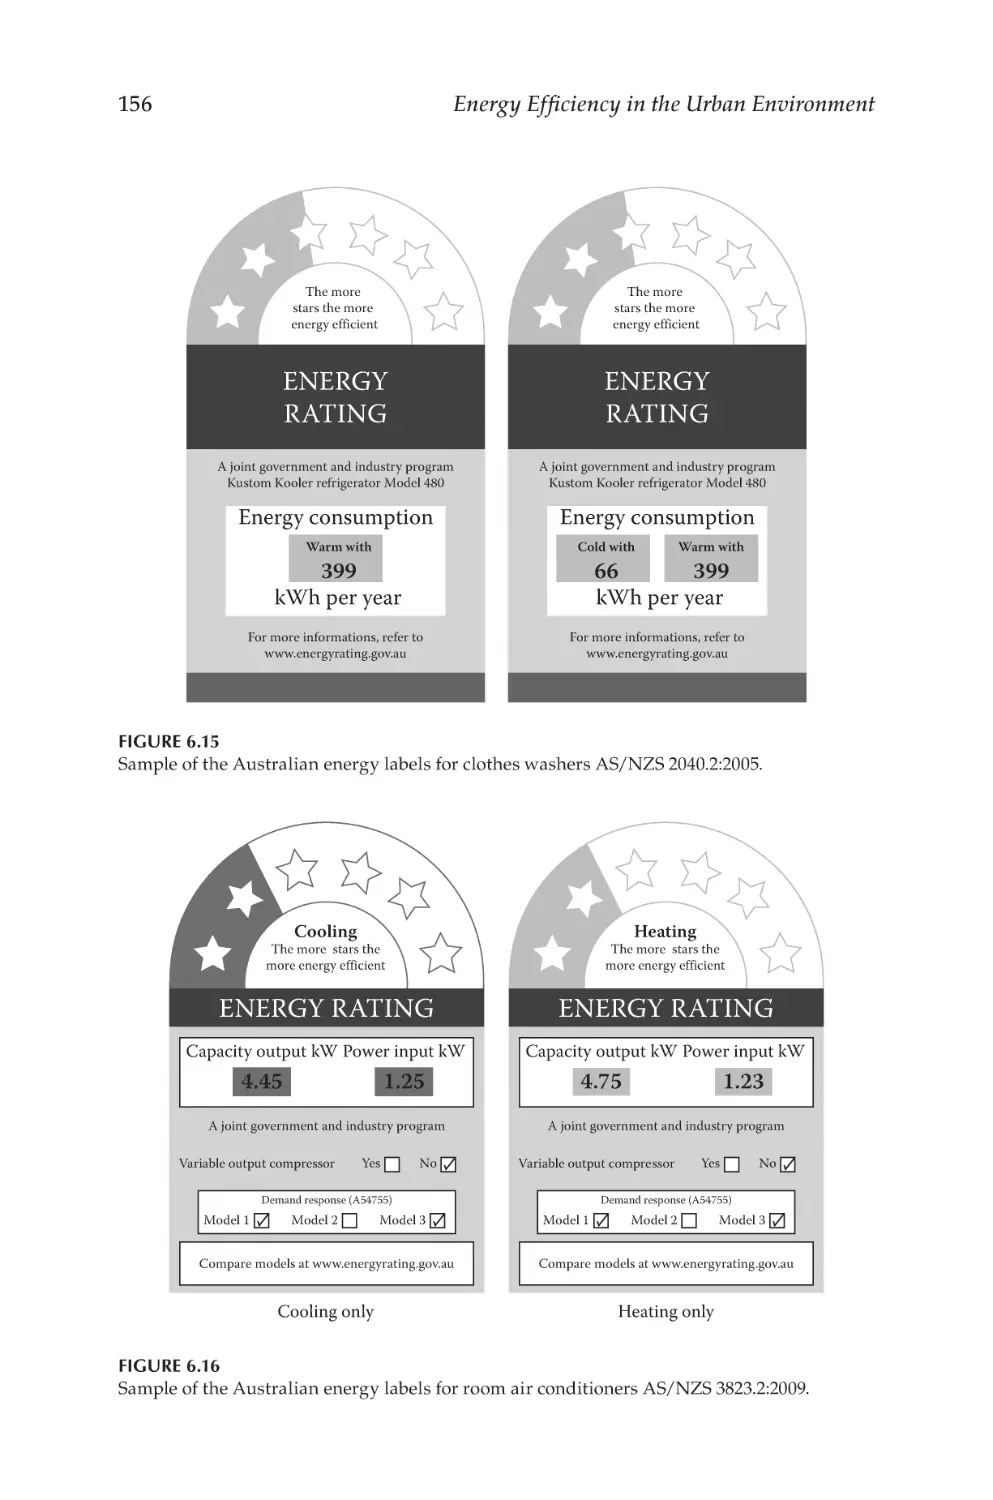
Figure 6.15 S
ample of the Australian energy labels for clothes
washers AS/NZS 2040.2:2005...................................................... 156
Figure 6.16 S
ample of the Australian energy labels for room
air conditioners AS/NZS 3823.2:2009......................................... 156
Figure 6.17 Cooling only, heating only and reverse cycle labels................ 157
Figure 6.18 Energy labels for super efficiency units.................................... 157
Figure 6.19 Reverse cycle (super efficiency rating)....................................... 158
Figure 6.20 Gas appliance label....................................................................... 159
Figure 7.1
Overall building energy performance....................................... 172
Figure 7.2
Harmonisation of terms is essential.......................................... 173
Figure 7.3
Example of energy performance certificate.............................. 173
Figure 7.4
oundaries and main building energy performance
B
elements.......................................................................................... 174
List of Figures
xix
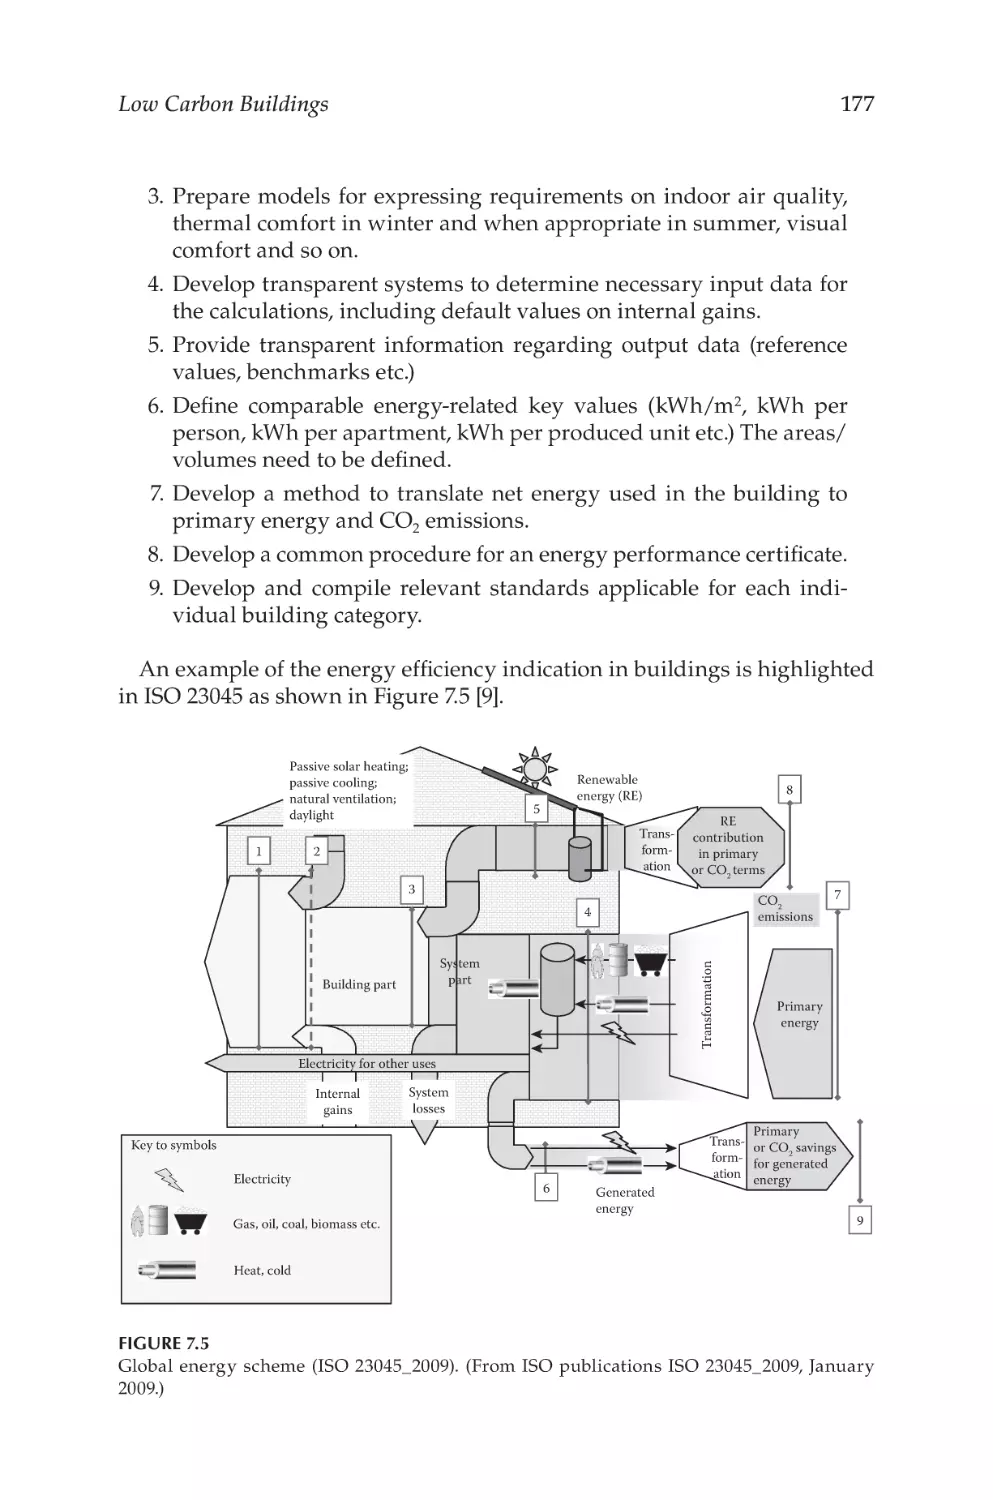
Figure 7.5
Global energy scheme (ISO 23045_2009)................................... 177
Figure 7.6
Egyptian energy air conditioner label....................................... 179
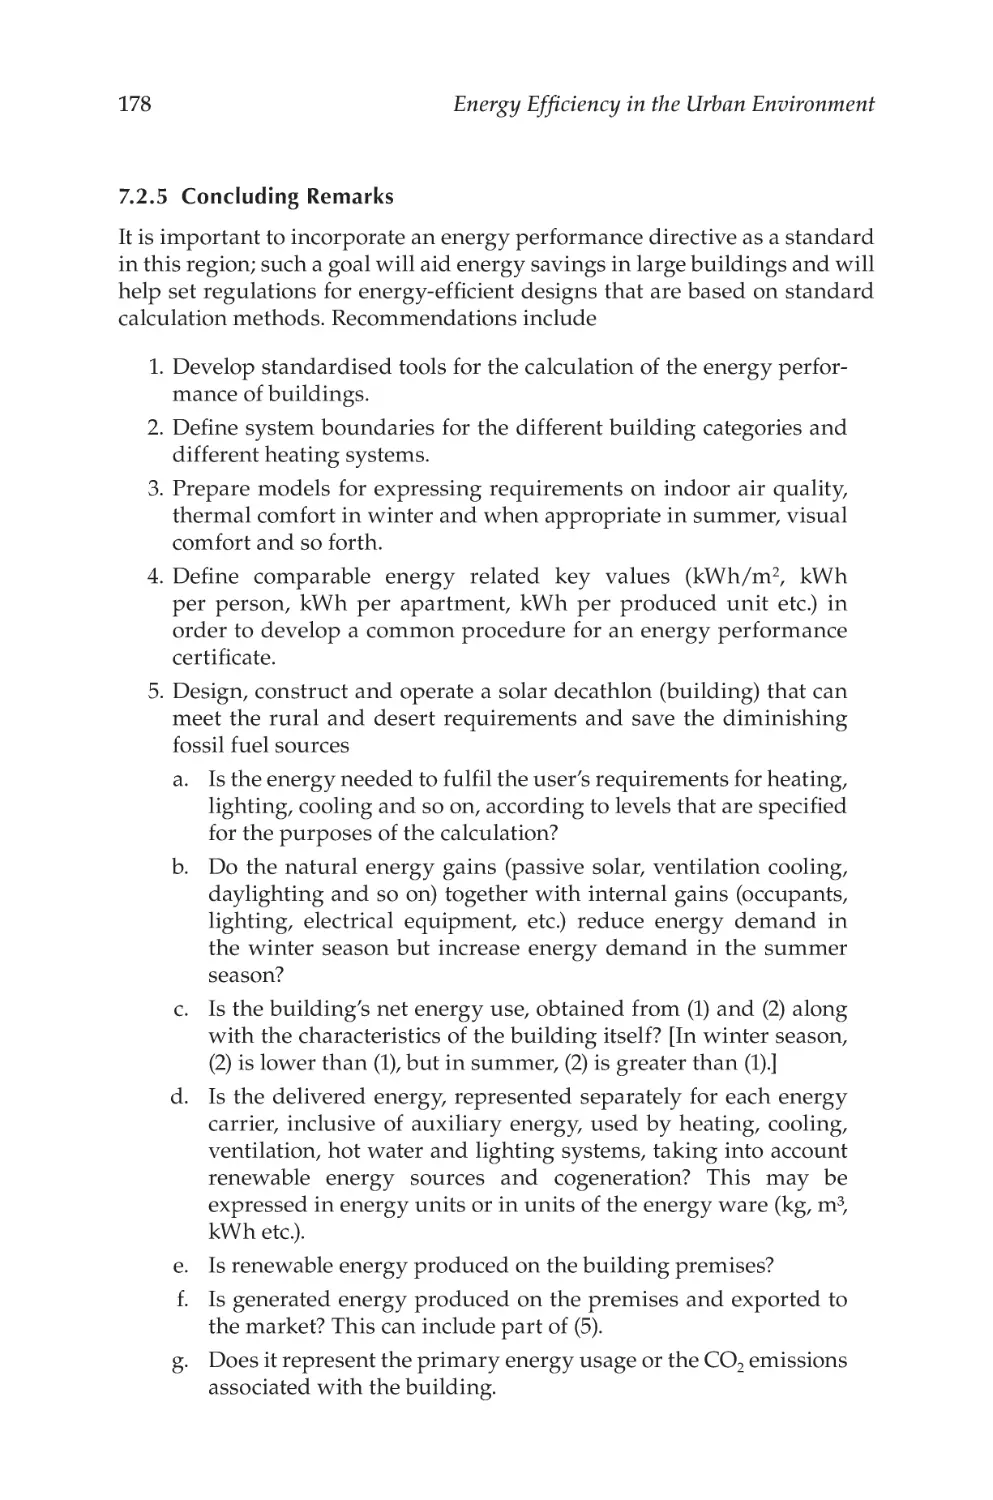
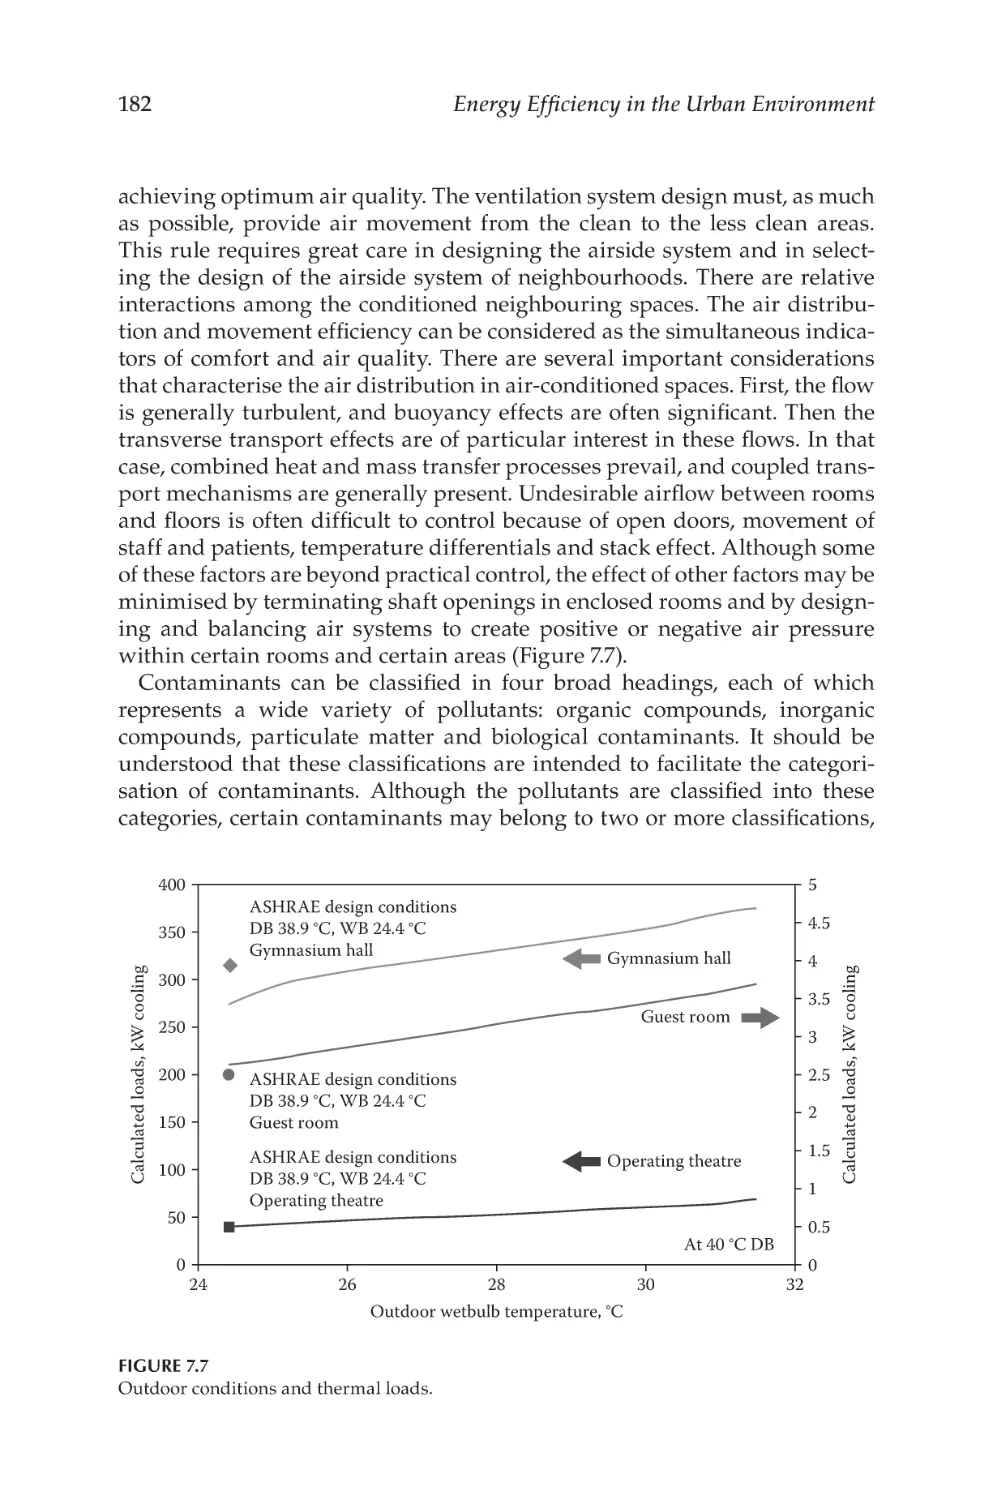
Figure 7.7
Outdoor conditions and thermal loads..................................... 182
Figure 7.8
Overall building energy performance indicators.................... 185
Figure 7.9
Effect of moisture content on the colour of artefacts............... 188
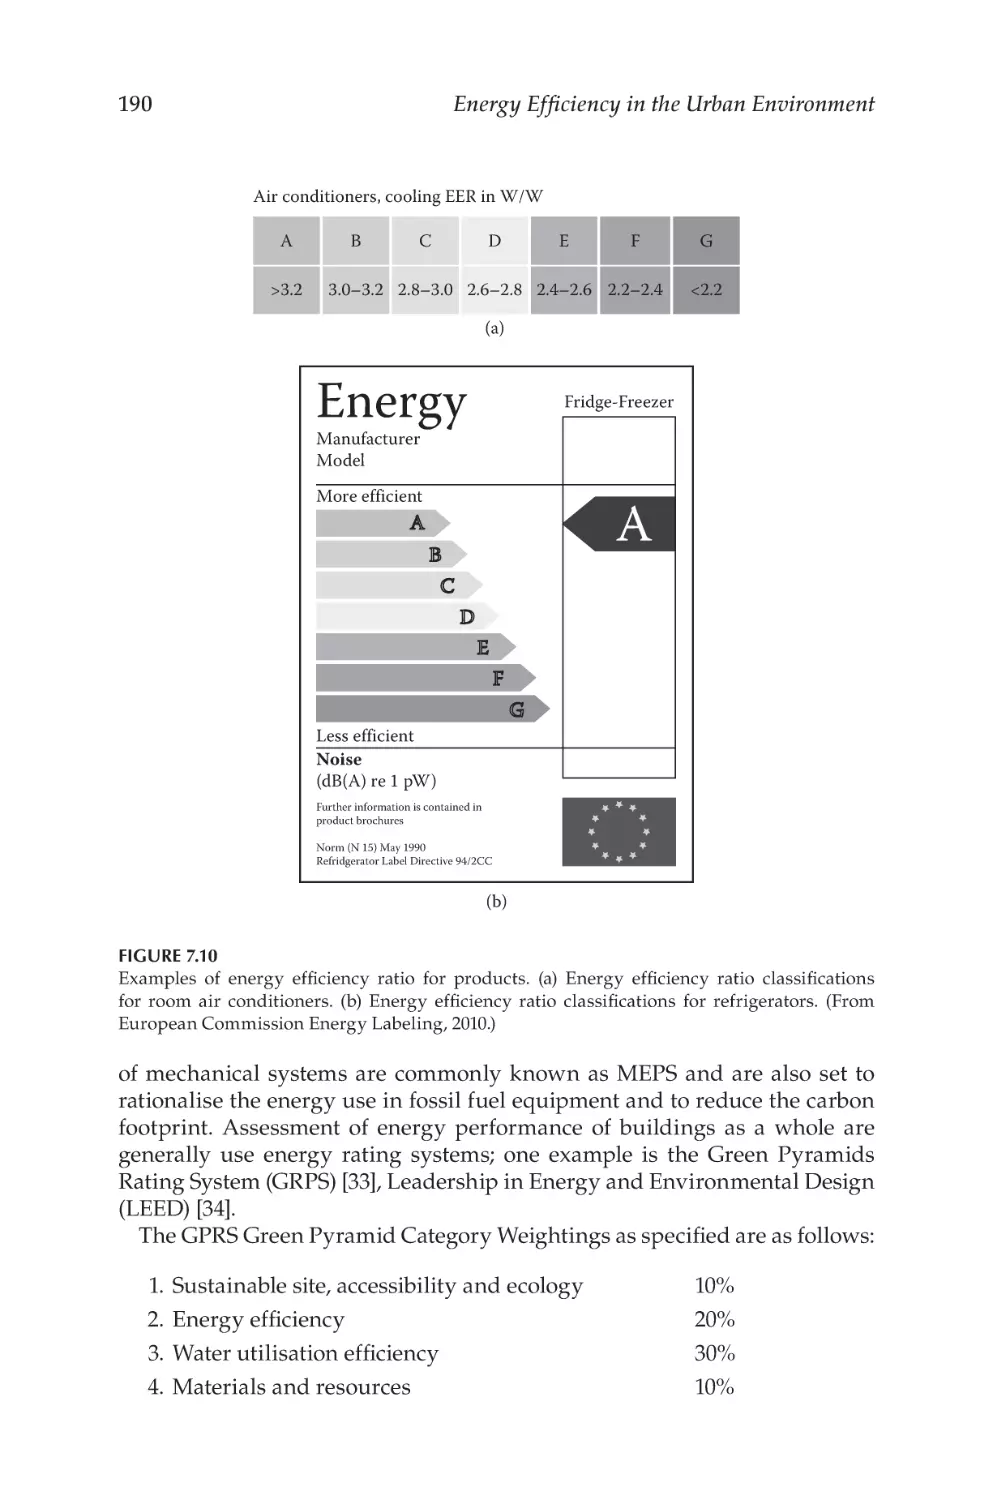
Figure 7.10 Examples of energy efficiency ratio for products..................... 190
Figure 7.11 Green building rating system..................................................... 192
Figure 8.1
Solar shingles are installed on a rooftop................................... 206
Figure 9.1
Energy labels for refrigerators.................................................... 213
Figure 9.2
Energy labels for washing machines......................................... 213
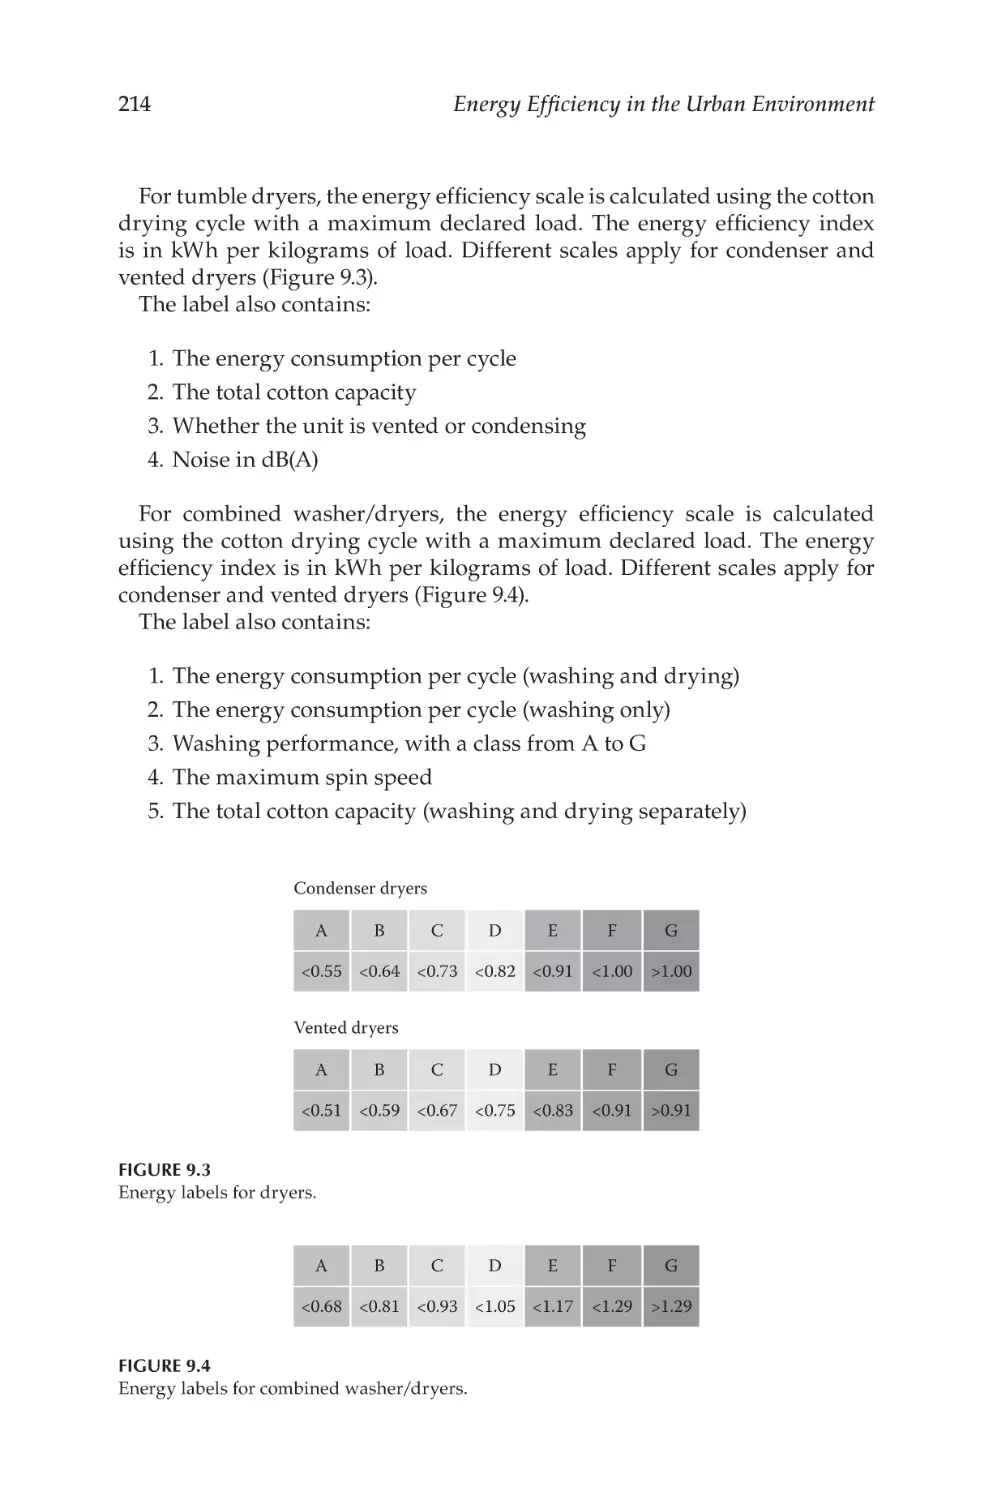
Figure 9.3
Energy labels for dryers............................................................... 214
Figure 9.4
Energy labels for combined washer/dryers.............................. 214
Figure 9.5
Energy labels for dishwashers.................................................... 215
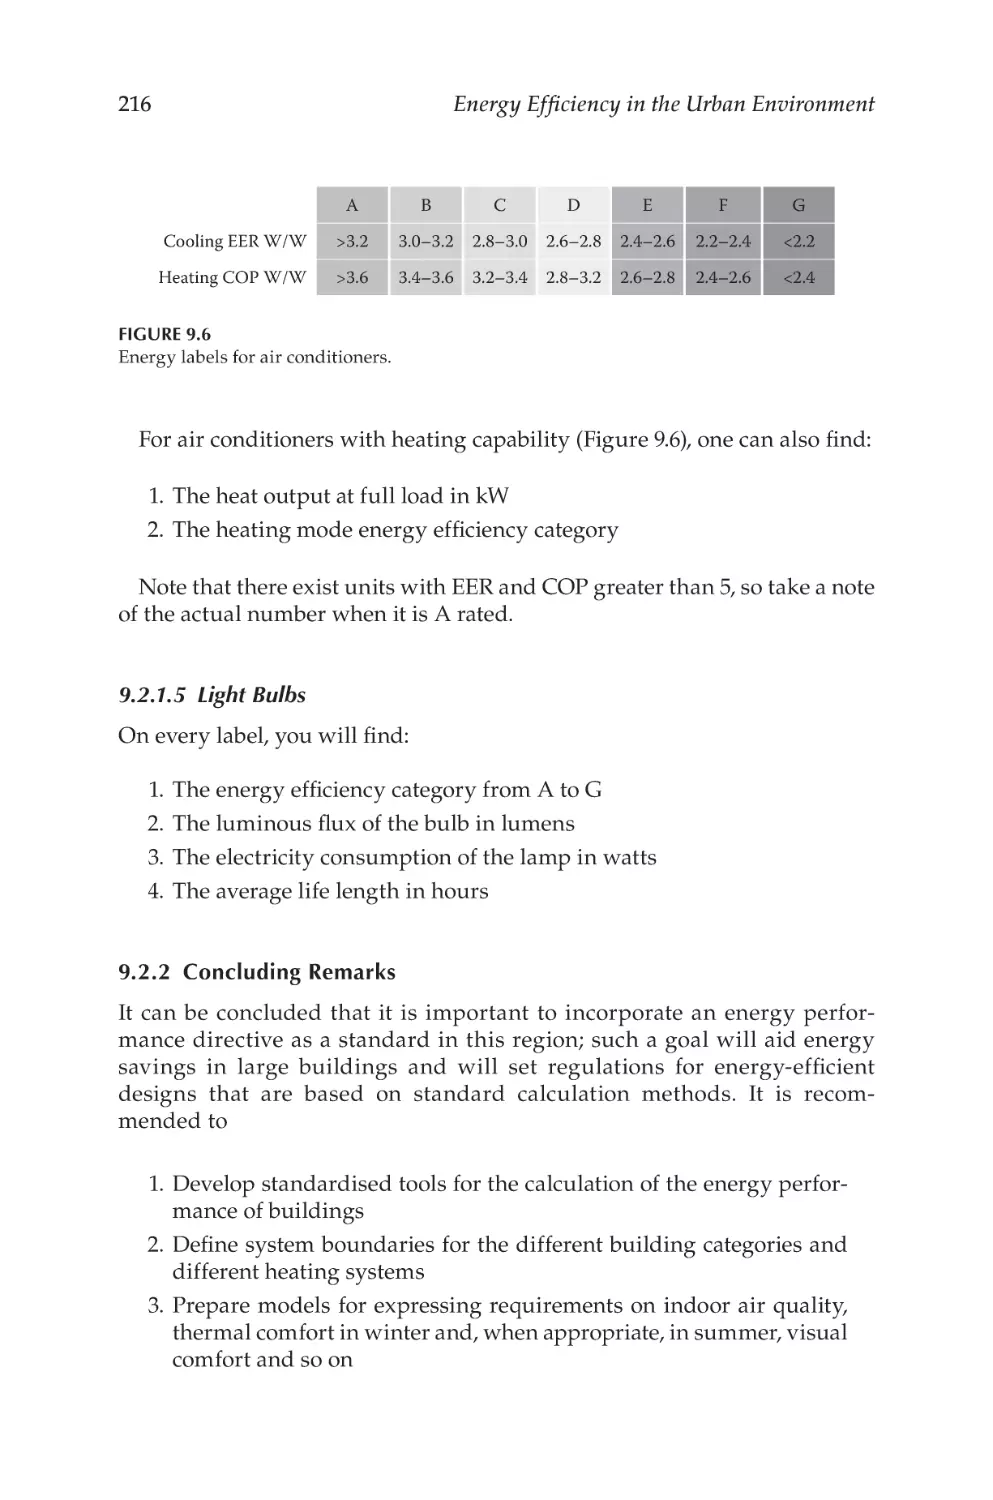
Figure 9.6
Energy labels for air conditioners.............................................. 216
List of Tables
Table 1.1
I ndicators Concerning Energy Efficiency Derived from
the Green City Index for Different Areas..................................... 12
Table 1.2
nergy Efficiency Indicators as Achieving Good Quality
E
of Life and Sustaining It................................................................. 14
Table 1.3
HVAC Unit Characteristics (Window Units)............................... 17
Table 1.4
HVAC Unit Costs (Window Units)................................................ 18
Table 1.5
HVAC Unit Estimated Energy Costs (Window Units)............... 18
Table 1.6
HVAC Unit Characteristics (Split Units)....................................... 18
Table 1.7
HVAC Unit Costs (Split Units)....................................................... 18
Table 1.8
HVAC Unit Estimated Energy Costs (Split Units)....................... 19
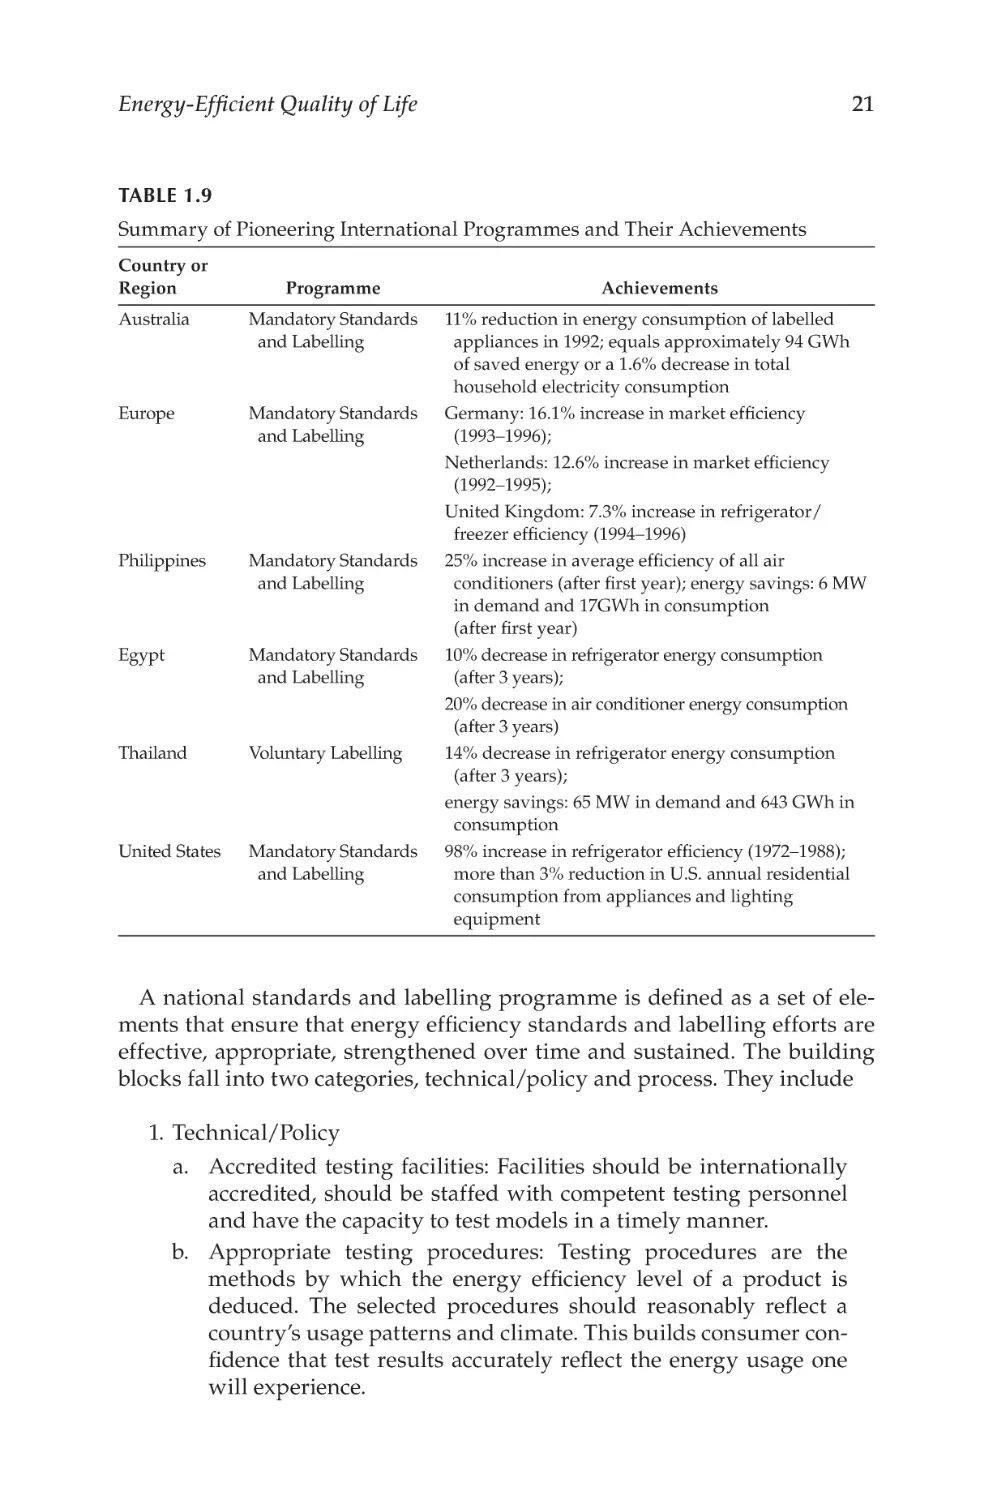
Table 1.9
ummary of Pioneering International Programmes
S
and Their Achievements................................................................. 21
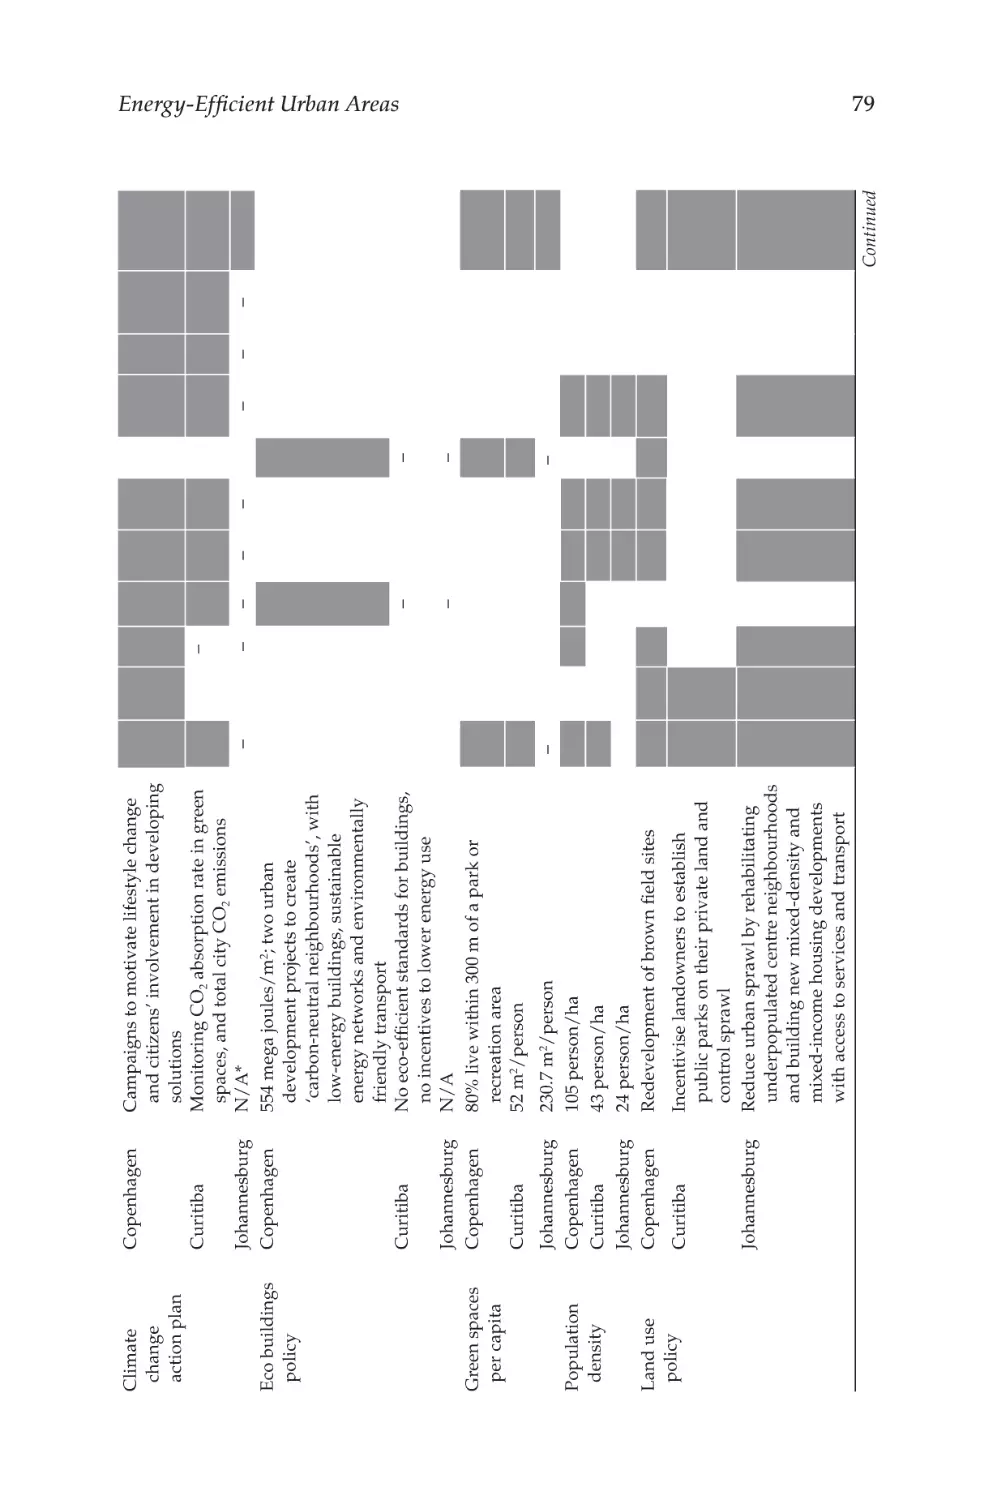
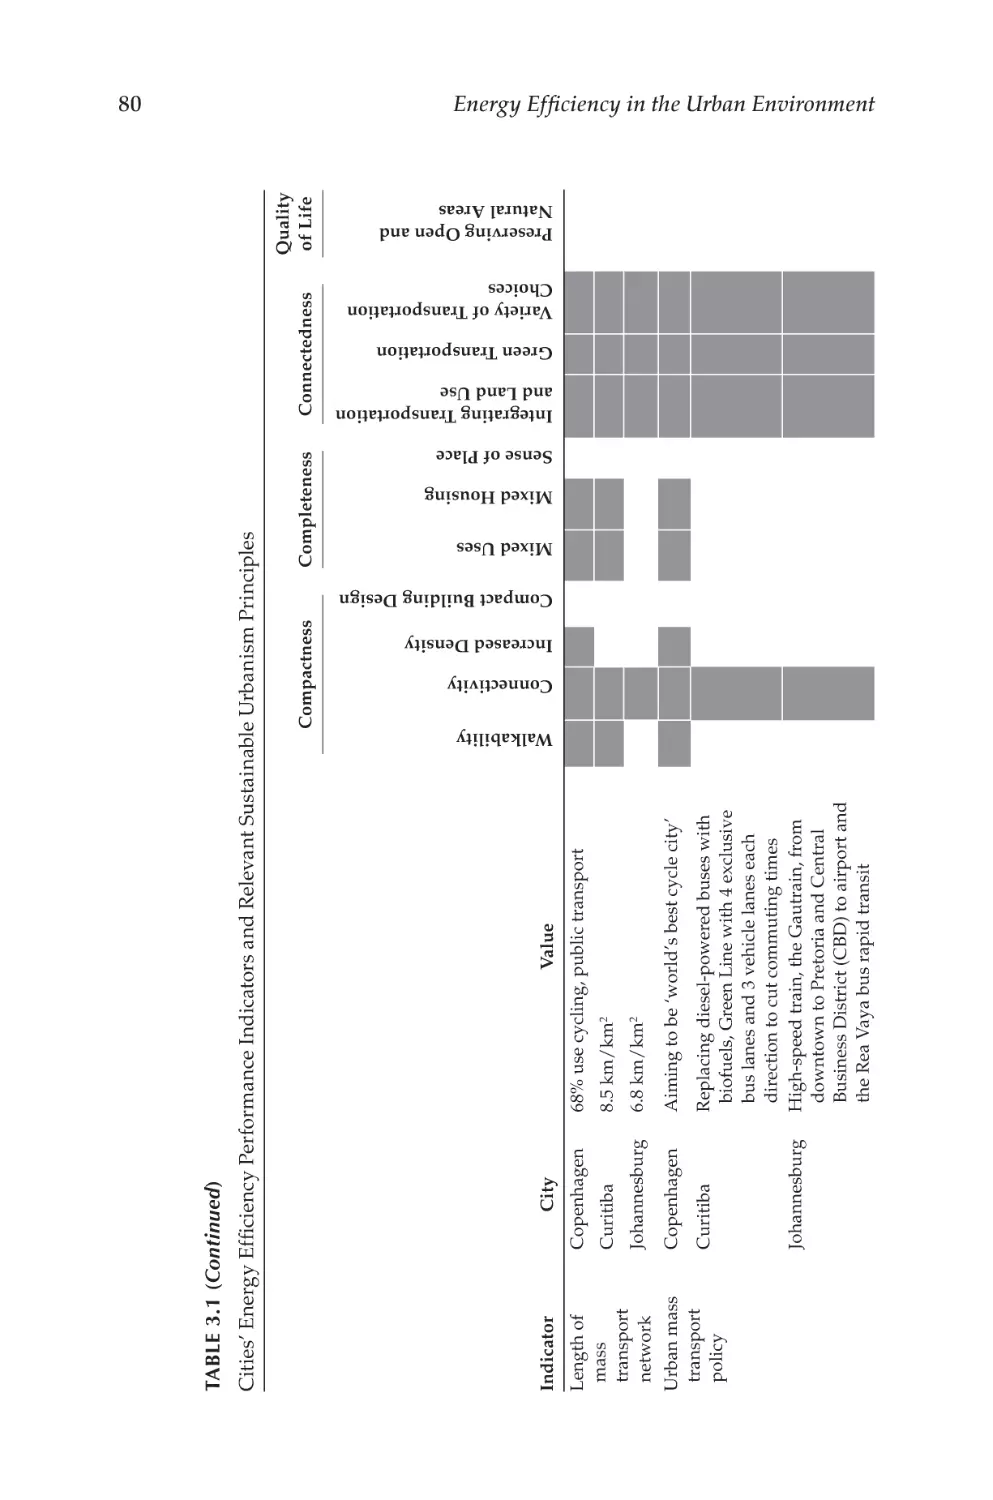
Table 3.1
ities’ Energy Efficiency Performance Indicators
C
and Relevant Sustainable Urbanism Principles.......................... 78
Table 3.2
1 0th of Ramadan City Energy Efficiency Performance
and Adoption of Sustainable Urbanism Principles.................... 82
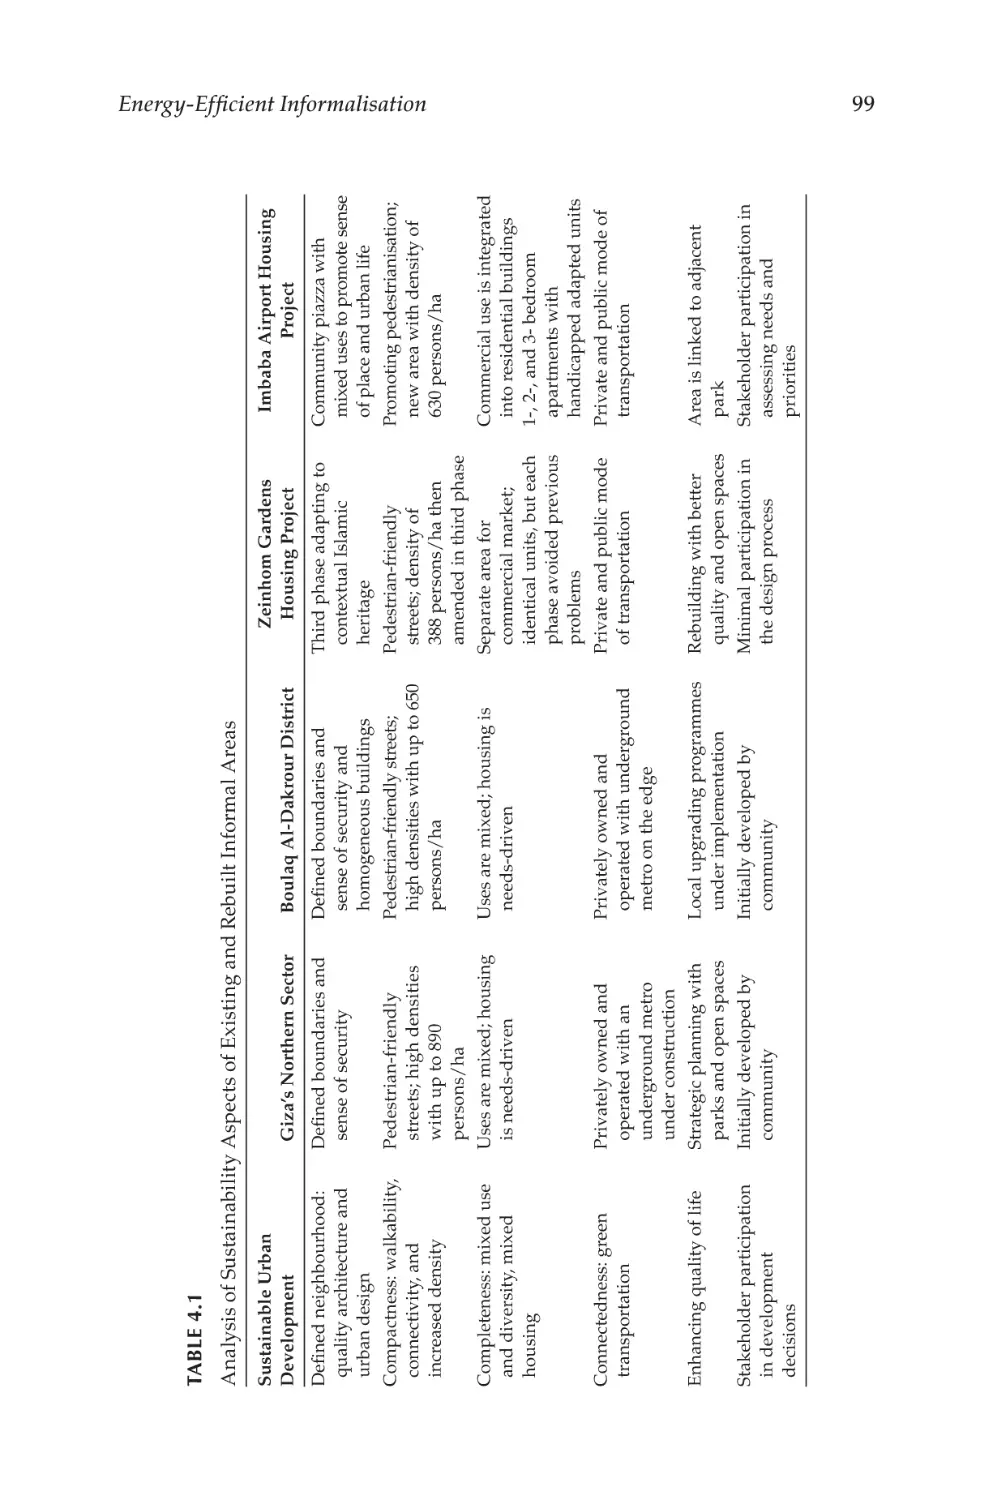
Table 4.1
nalysis of Sustainability Aspects of Existing and Rebuilt
A
Informal Areas................................................................................. 99
Table 6.1
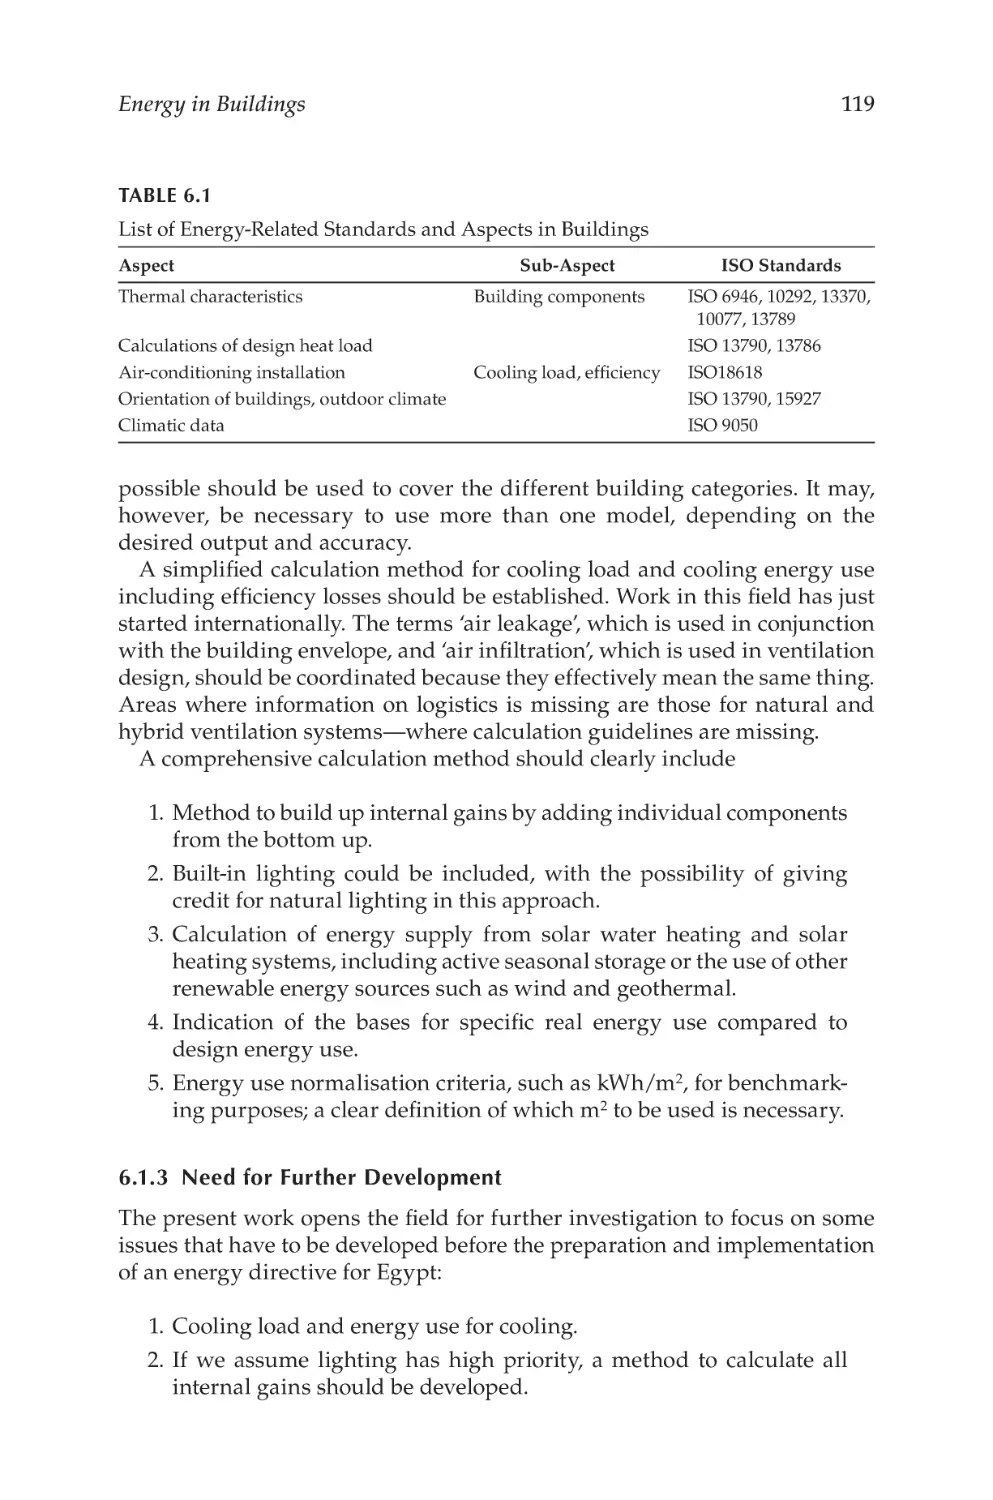
List of Energy-Related Standards and Aspects in Buildings.... 119
Table 6.2
Minimum Top Lighting Area...................................................... 130
Table 6.3
ummary of Pioneering International Programmes
S
and Their Achievements............................................................... 165
Table 9.1
lectrical Operated Unitary Air Conditioners
E
and Condensing Units.................................................................. 218
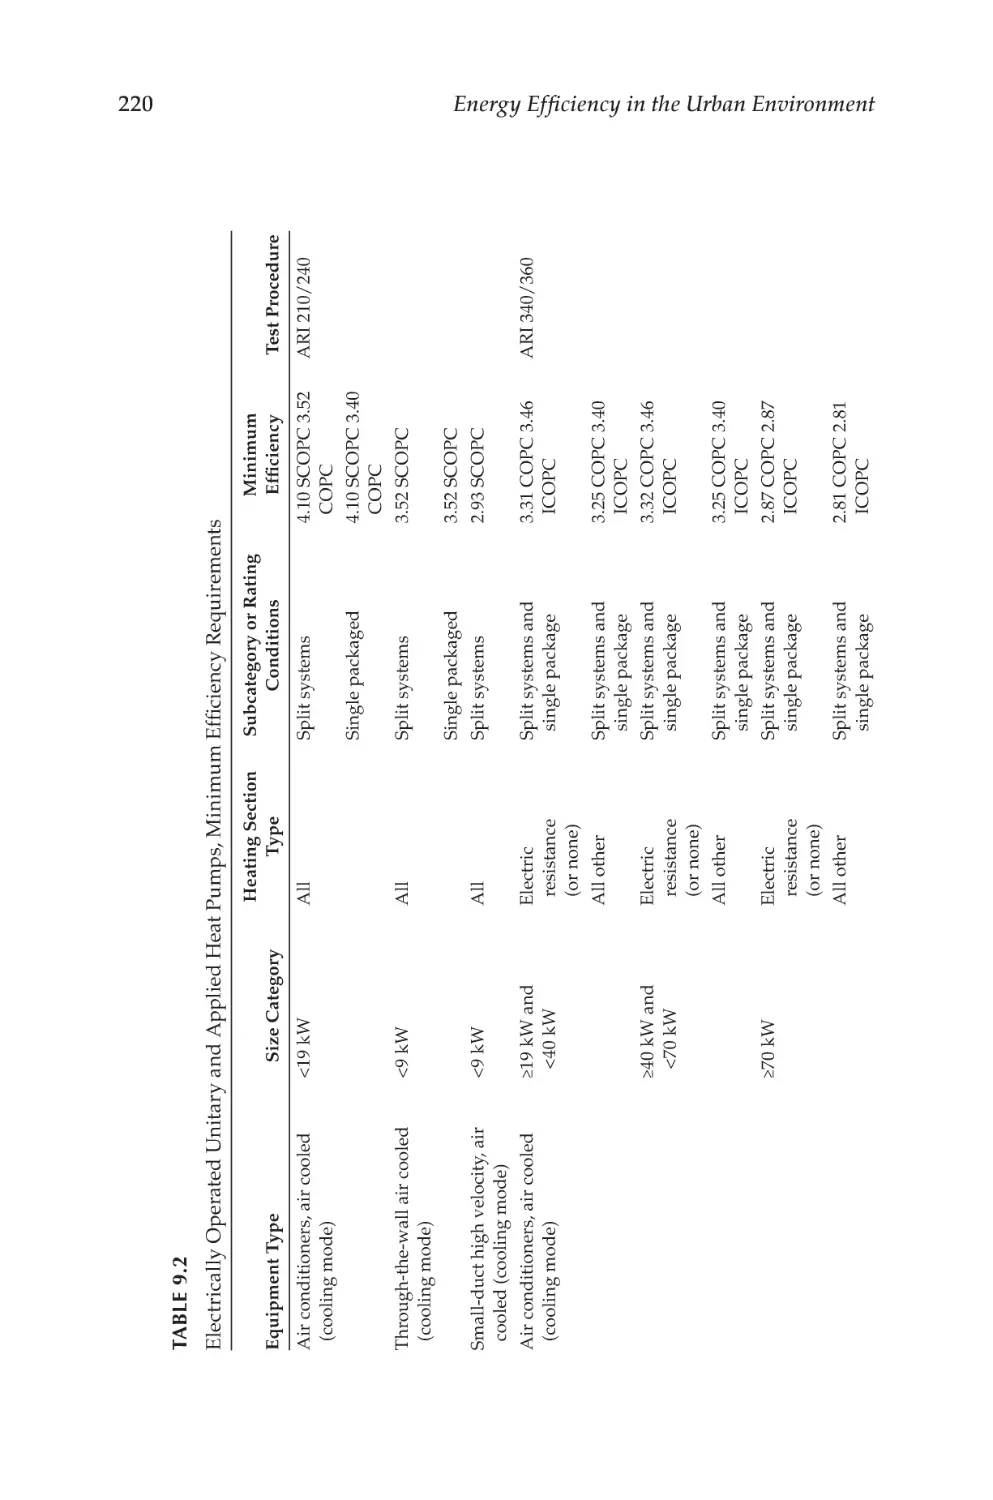
Table 9.2
lectrically Operated Unitary and Applied Heat Pumps,
E
Minimum Efficiency Requirements............................................ 220
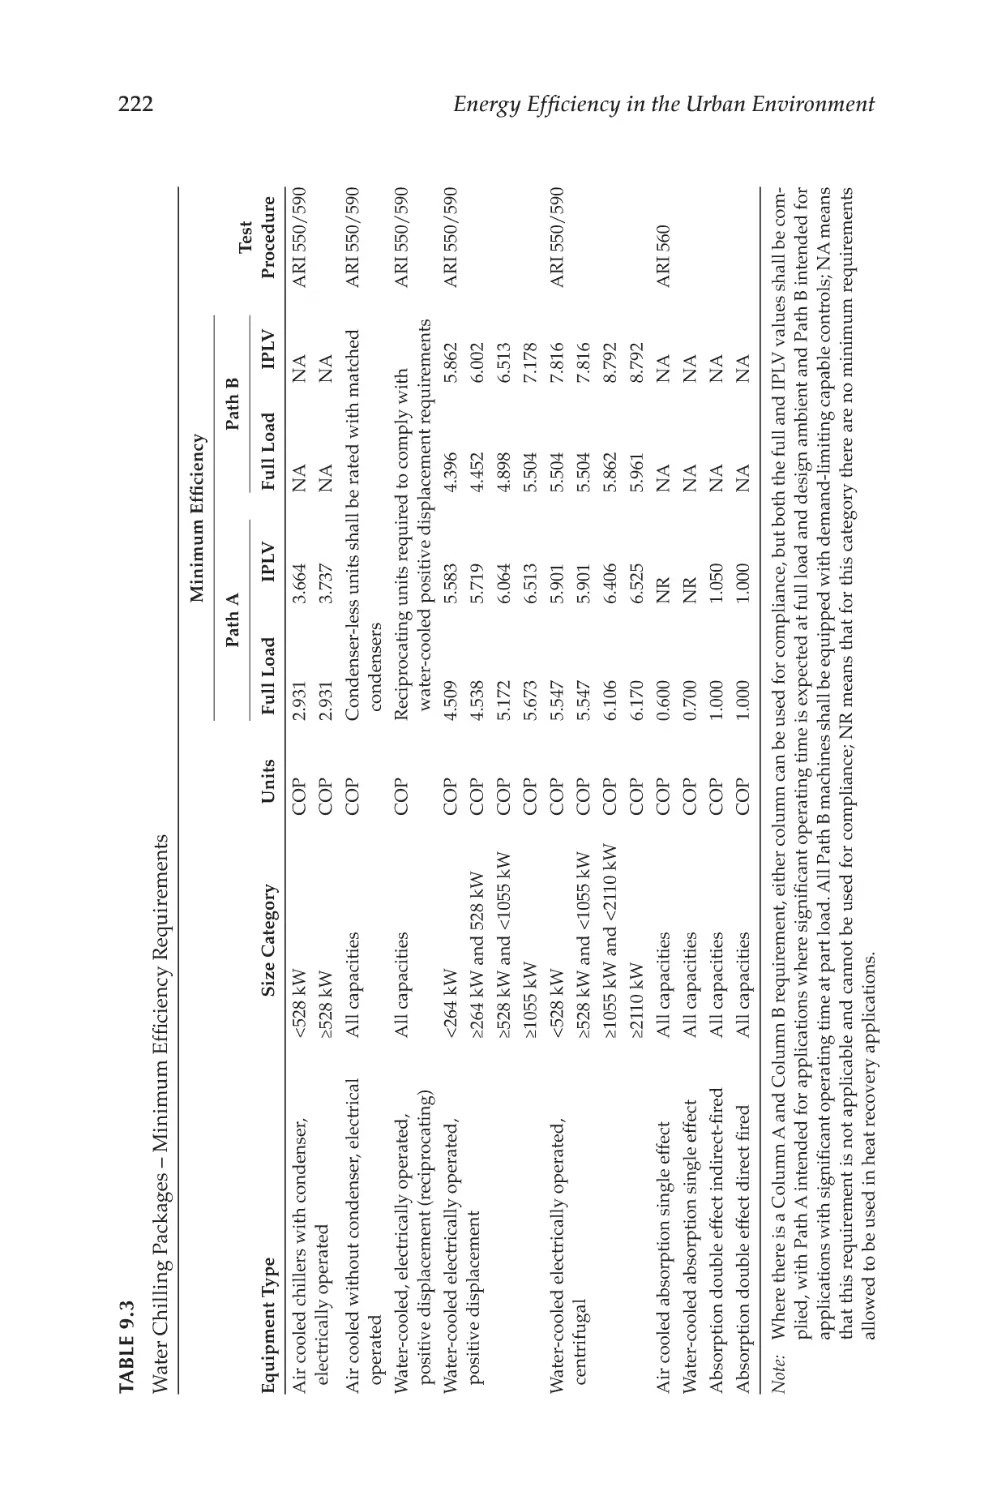
Table 9.3
ater Chilling Packages – Minimum Efficiency
W
Requirements.................................................................................222
xxi
xxii
List of Tables
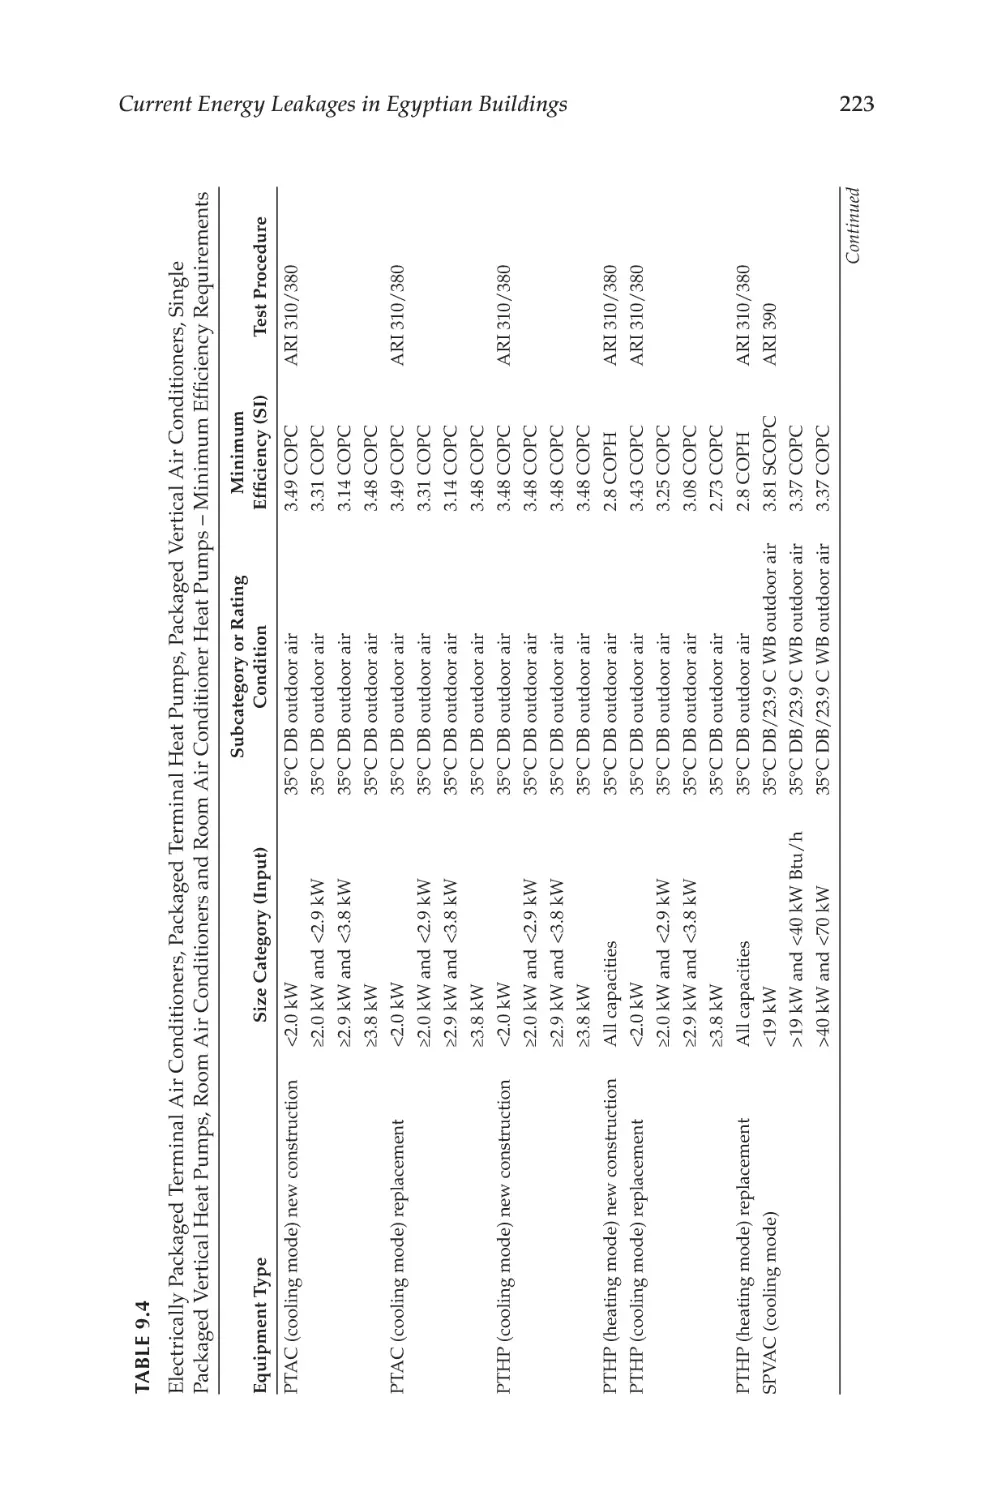
Table 9.4
lectrically Packaged Terminal Air Conditioners,
E
Packaged Terminal Heat Pumps, Packaged Vertical
Air Conditioners, Single Packaged Vertical Heat Pumps,
Room Air Conditioners and Room Air Conditioner Heat
Pumps – Minimum Efficiency Requirements...........................223
Table 9.5
arm Air Furnaces and Combustion Warm Air
W
Furnaces/Air-Conditioning Units, Warm Air Duct
Furnaces and Unit Heaters...........................................................225
Table 9.6
as and Oil Fired Boilers – Minimum Efficiency
G
Requirements................................................................................. 226
Table 9.7
Performance Requirements for Heat Rejection Equipment.... 227
Table 9.8
inimum System Size for Which an Economiser
M
Is Required................................................................................228
Table 9.9
High-Limit Shutoff Control Options for Air Economiser....... 228
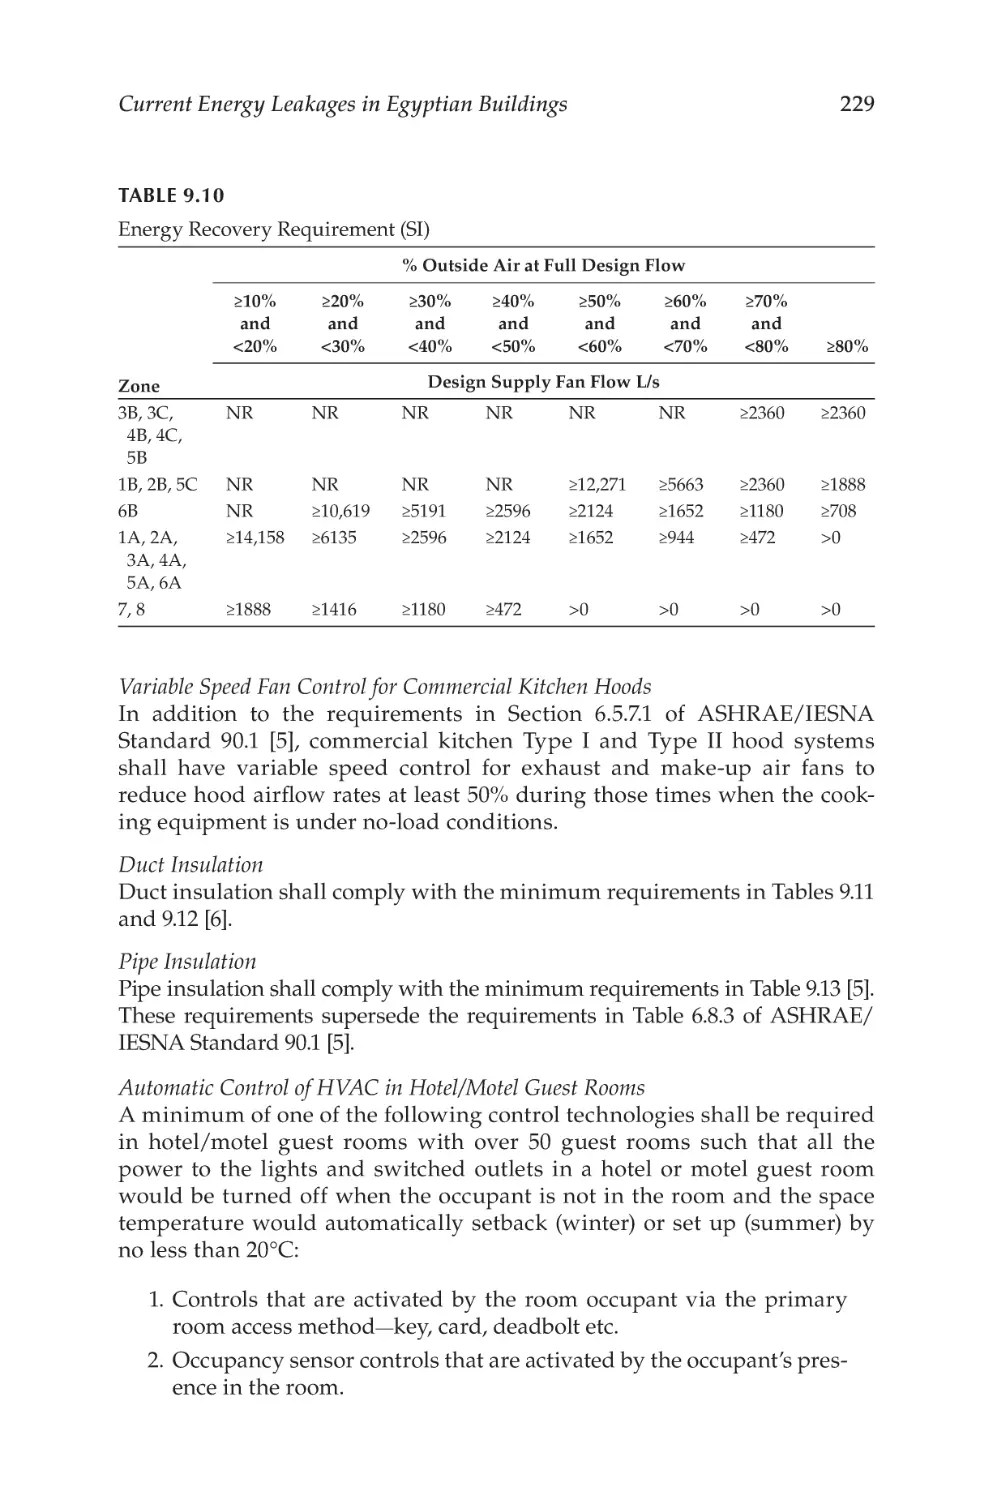
Table 9.10
Energy Recovery Requirement (SI)............................................. 229
Table 9.11
inimum Duct Insulation R-Value, Cooling and Heating
M
Only Supply Ducts and Return Ducts........................................ 230
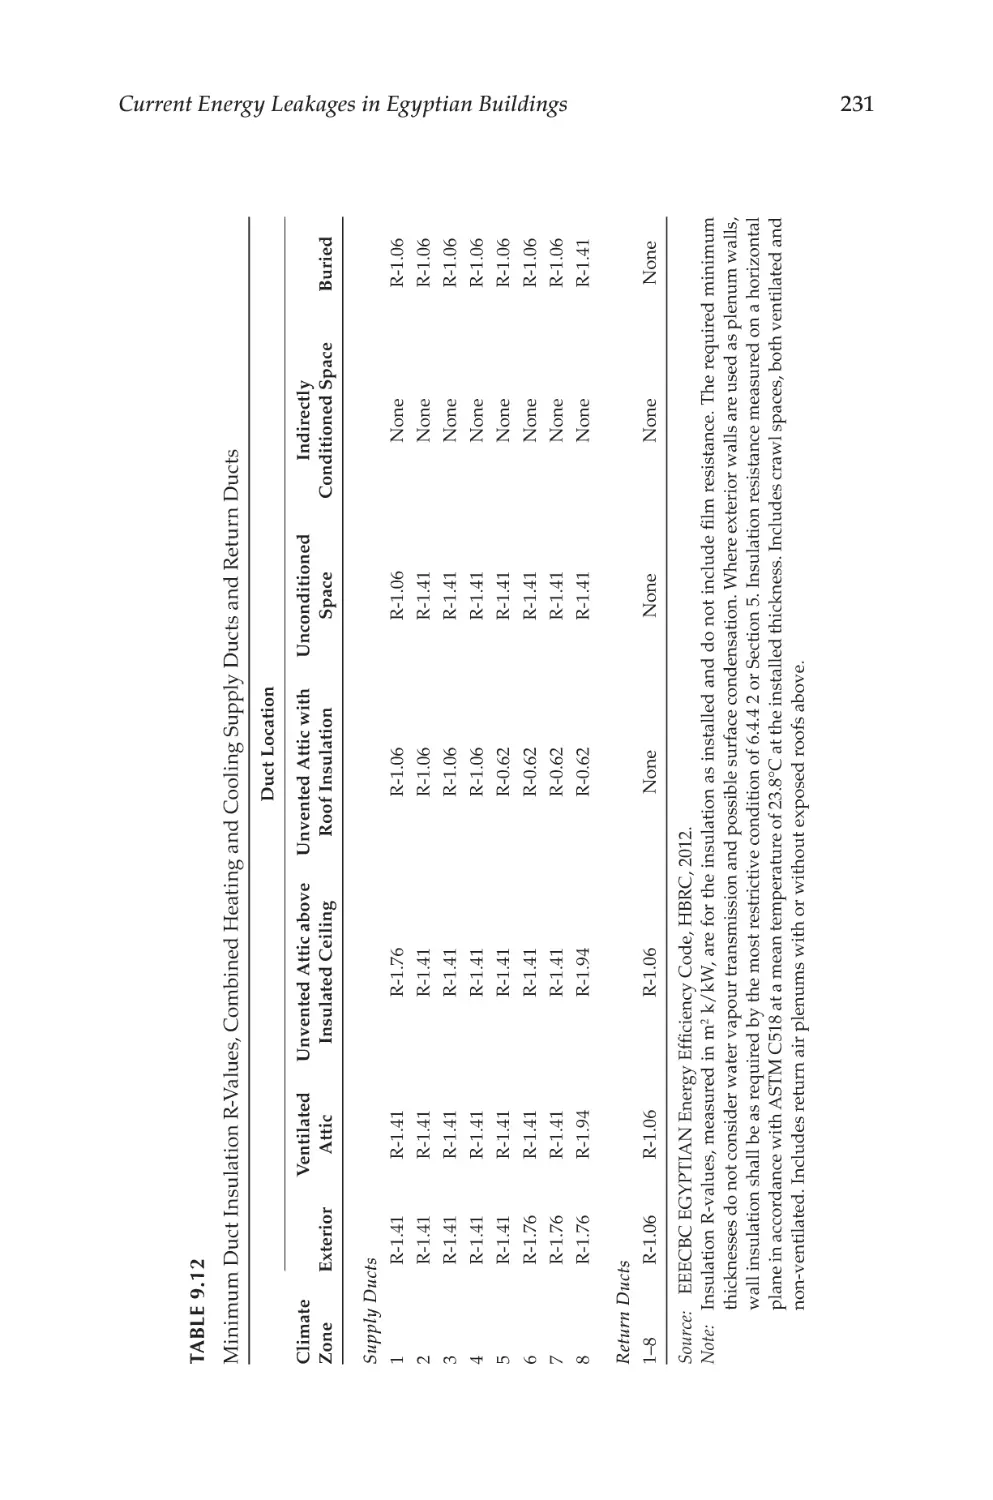
Table 9.12
inimum Duct Insulation R-Values, Combined Heating
M
and Cooling Supply Ducts and Return Ducts........................... 231
Table 9.13
Minimum Pipe Thermal Insulation Thickness......................... 232
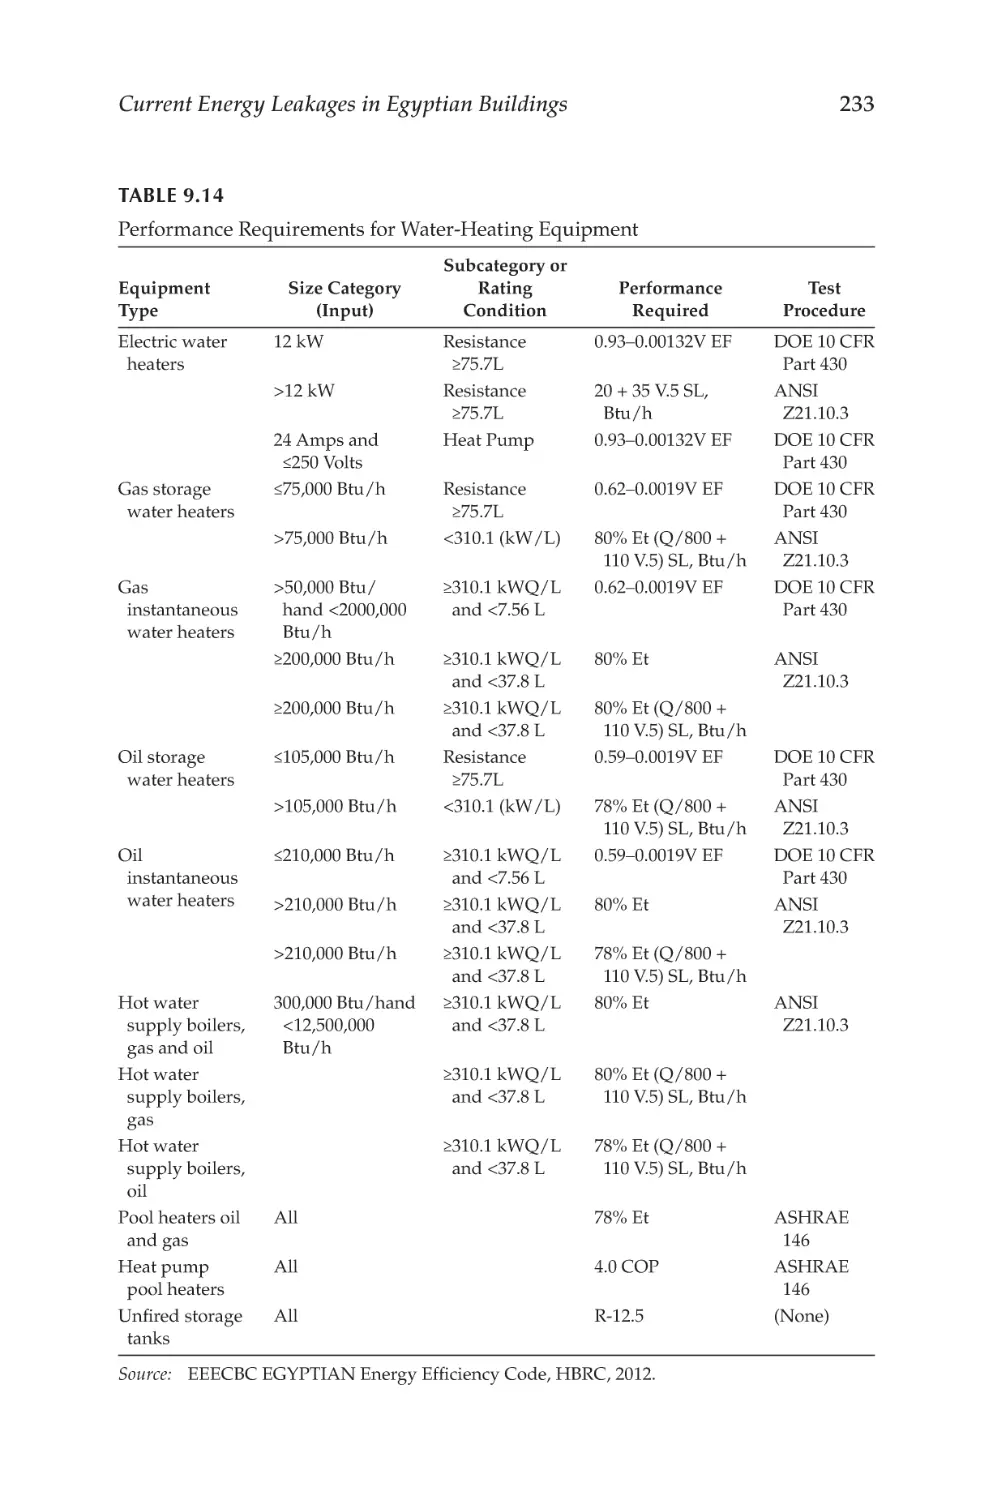
Table 9.14
Performance Requirements for Water-Heating Equipment......233
Preface
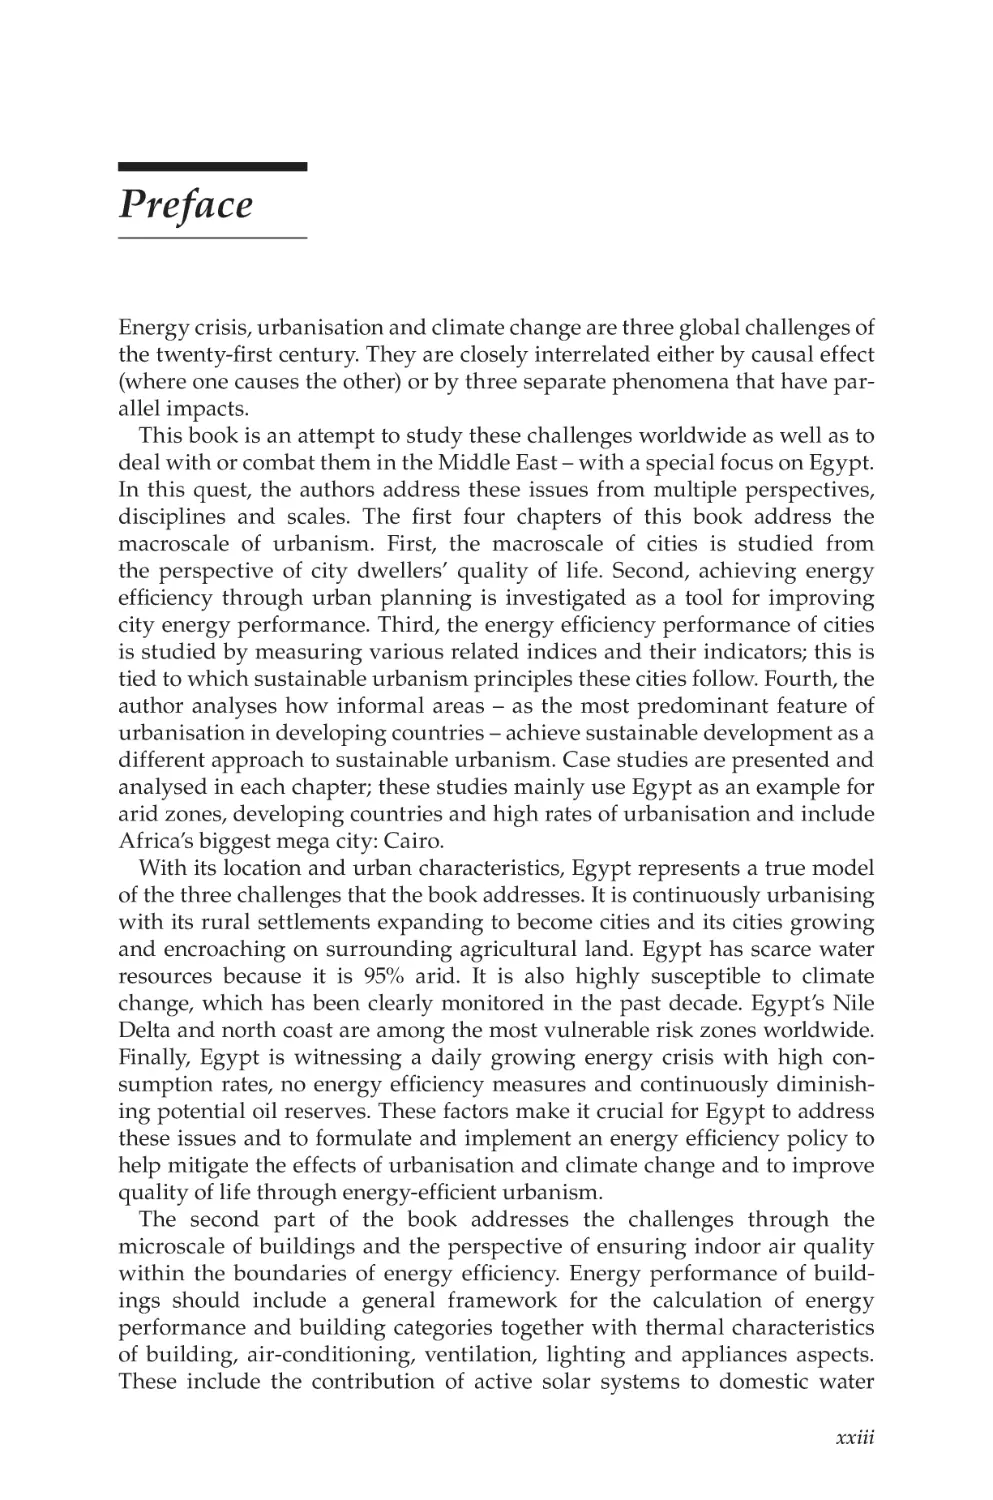
Energy crisis, urbanisation and climate change are three global challenges of
the twenty-first century. They are closely interrelated either by causal effect
(where one causes the other) or by three separate phenomena that have parallel impacts.
This book is an attempt to study these challenges worldwide as well as to
deal with or combat them in the Middle East – with a special focus on Egypt.
In this quest, the authors address these issues from multiple perspectives,
disciplines and scales. The first four chapters of this book address the
macroscale of urbanism. First, the macroscale of cities is studied from
the perspective of city dwellers’ quality of life. Second, achieving energy
efficiency through urban planning is investigated as a tool for improving
city energy performance. Third, the energy efficiency performance of cities
is studied by measuring various related indices and their indicators; this is
tied to which sustainable urbanism principles these cities follow. Fourth, the
author analyses how informal areas – as the most predominant feature of
urbanisation in developing countries – achieve sustainable development as a
different approach to sustainable urbanism. Case studies are presented and
analysed in each chapter; these studies mainly use Egypt as an example for
arid zones, developing countries and high rates of urbanisation and include
Africa’s biggest mega city: Cairo.
With its location and urban characteristics, Egypt represents a true model
of the three challenges that the book addresses. It is continuously urbanising
with its rural settlements expanding to become cities and its cities growing
and encroaching on surrounding agricultural land. Egypt has scarce water
resources because it is 95% arid. It is also highly susceptible to climate
change, which has been clearly monitored in the past decade. Egypt’s Nile
Delta and north coast are among the most vulnerable risk zones worldwide.
Finally, Egypt is witnessing a daily growing energy crisis with high consumption rates, no energy efficiency measures and continuously diminishing potential oil reserves. These factors make it crucial for Egypt to address
these issues and to formulate and implement an energy efficiency policy to
help mitigate the effects of urbanisation and climate change and to improve
quality of life through energy-efficient urbanism.
The second part of the book addresses the challenges through the
microscale of buildings and the perspective of ensuring indoor air quality
within the boundaries of energy efficiency. Energy performance of buildings should include a general framework for the calculation of energy
performance and building categories together with thermal characteristics
of building, air-conditioning, ventilation, lighting and appliances aspects.
These include the contribution of active solar systems to domestic water
xxiii
xxiv
Preface
heating based on renewable energy sources, Combined Power and Heat
(CPH) production and district cooling systems. The book demonstrates the
importance of i ncorporating an energy performance directive as a standard
in our region; such a goal will aid energy savings in large buildings and set
regulations for energy-efficient designs that are based on standard calculation methods. Energy standards would be largely based on international
standards and appropriately modified to suit local practices. The target is
to develop standardised tools for the calculation of the energy performance
of buildings, with defined system boundaries for the different building categories and for d
ifferent cooling/heating systems, and to develop a common procedure for obtaining an ‘energy performance certificate’. This book
attempts to provide transparent information regarding output data (reference values, benchmarks, etc.) and to define comparable energy-related key
values (kWh/m2, kWh per person, kWh per apartment, kWh per produced
unit etc.). Proposals to develop a common procedure for an energy performance certificate and CO2 emissions are also given.
Acknowledgements
The authors thank their colleagues and collaborators for the useful discussions
that led to the elaboration of this book. The authors express their special thanks
and gratitude to their family legends, the late Dr. Khalil Hassan Khalil and
late Dr. Galal Shawki of Cairo University, for their teaching and mentoring.
The authors extend their gratitude to Dr. Ahmad Khalil for his extensive discussions and technical support. Thanks are also due to Eng. Hala Assaf for her
everlasting support to Dr. Heba Allah Essam Khalil.
Heba Khalil extends her gratitude to her mentor, Dr. Sahar Attia, for her
continuous encouragement in the publication of this book. Thanks are also
due to her husband, Eng. Abdel Monem Abul Fadl; without his support, this
book would not have been possible.
The authors also thank the publishers for their advice and support
throughout the publishing process.
Finally, the authors thank one and all who inspired this work by posing
questions or probing existing problems that required new research to realise
new concepts and solutions.
xxv
About the Authors
Heba Allah Essam El-Din Khalil holds a BSc (2000) in architectural engineering, MSc (2003) in urban planning and a PhD (2007) in architectural
engineering from Cairo University. Currently, she is an associate professor in
the Department of Architectural Engineering, Faculty of Engineering, Cairo
University, with 15 years of academic experience. She has pursued scientific
research in various fields, including community development, p
articipatory
evaluation, informal areas development, energy-efficient strategies in urban
planning, sustainable urbanism, green rating systems, affordable housing,
quality of life and strategic planning. She has supervised more than 25 MSc
and PhD theses in related research domains. She has participated in several
national and international conferences, workshops and training courses. She
is currently participating in a number of joint research projects with Cairo
University and other international research institutes. She is a member of the
informal hub of the Habitat Universities initiative UN-Habitat.
Dr. Khalil has additional professional experience as an architect and as
an urban planner on various projects. She worked with international agencies as Deutsche Gesellschaft für Internationale Zusammenarbeit (GIZ)
GmbH in participatory development, including facilitation and evaluation.
She has worked for UN-Habitat in sustainable urban development strategy
in Arab countries and in strategic planning for cities and city regions in
Egypt. She has designed a number of private and public buildings. She was a
member of the winning team of Khedive’s Cairo rehabilitation competition.
This multidisciplinary experience has supported her academic competence
and sense of the real surrounding world.
Essam E. Khalil holds a BS (1971) and MS (1973) in mechanical engineering from Cairo University, and DIC (1976) and PhD (1977) from Imperial
College of Science and Technology, London University, UK. Currently,
he is a professor of mechanical engineering at Cairo University (since
June 1988). He has more than 44 years of experience in design and simulation of combustion chambers for terrestrial and aerospace applications.
He has published more than 600 papers in journals and conference proceedings as well as 12 books on combustion, energy and indoor air quality
control. Dr. Khalil is a fellow of ASME, fellow of ASHRAE, convenor of ISO
TC205WG2 on energy efficiency and ISO TC163 WG4, and also a member
of ISO TC163. He is an ASHRAE distinguished lecturer. He is a recipient
of the Outstanding Achievement in Science Award, Cairo University, 2005,
2006 and 2008; best Paper Award from AIAA Terrestrial Energy TC, 2005;
xxvii
xxviii
About the Authors
ASME George Westinghouse Award, 2009; ASME James Harry Potter Gold
Medal 2012; and Distinguished Service Award ASHRAE and Sustained
Services Award AIAA.
He is the editor of Energy & Buildings, CFD Letters, and International Journal
of Reacting Systems and also an associate editor of Energy Technology and Policy.
1
Energy-Efficient Quality of Life
1.1 General
Energy-efficient quality of life will be viewed in this chapter within the
following framework:
Energy efficiency concepts, definitions and measures
Quality of life as an indicator for human progress
Ecological Footprint and Human Development Index
Quality of life and sustainability
Energy performance
Energy efficiency indicators
Energy efficiency standards
Energy labels
The chapter ends with concluding remarks.
1.2 Energy Efficiency Concepts, Definitions and Measures
The year 2007 marked a watershed in human history; for the first time, more
people lived in cities than in the countryside [1]. It is estimated that by the
middle of the century, 70% of the world’s population will reside in cities [2].
This rapid urbanisation is especially evident in the cities of the developing
world where more than 70% of the world’s urban population currently live.
Over the past 50 years, cities have expanded into the land around them
at a rapid rate. Highways and transport systems have been built in tandem
to support this physical growth. Valuable farmland has been eaten up, and
car dependency has increased. Between 2010 and 2015, urban populations
are expected to grow by around 200,000 people on average each day, with
91% of this daily increase expected to take place in developing countries.
This increase is led by Asian and African cities [2].
1
2
Energy Efficiency in the Urban Environment
UN-HABITAT’s State of the World’s Cities report for 2006–2007 points out
that, in many cases, urban growth will become synonymous with slum
formation. Already, Asia is home to more than half of the world’s slum
population (581 million) followed by sub-Saharan Africa (199 million) and
Latin America and the Caribbean (134 million) [3]. Cities and urban settlements must be prepared to meet this challenge. To avoid being v
ictims
of their own success, cities must search for ways in which to develop
sustainably.
A successful city must balance social, economic and environmental needs;
it has to respond to pressure from all sides. It should offer investors security, infrastructure (including water and energy) and efficiency. It should
also put the needs of its citizens at the forefront of all its planning activities.
It must recognise its natural assets, its citizens and its environment and must
build on these to ensure the best possible returns.
Modern cities are products of fossil fuel technology—most of the world’s
energy is used by cities themselves and by the farming, industrial production and transport systems that supply them. Modern urban living crucially
depends on uninterrupted energy supplies. The world’s major transport
systems start and end in cities. They are the nodes from which mobility
emanates, with low transport costs having rendered distances irrelevant,
plugging cities into an increasingly global hinterland [4].
As world populations grow (many faster than the average 2%), the need for
more and more energy is exacerbated as illustrated in Figure 1.1. The world’s
electricity consumption in 2011 was 22 TWh/yr and estimated to reach
23 TWh by 2020 [5]. Such ever-increasing demand could place significant
strain on the current energy infrastructure and could potentially damage
45,000
40,000
35,000
30,000
25,000
20,000
15,000
10,000
5,000
0
Population,
million
Total produced
energy, Mtoe
1993
Electricity
production/year
total, TWh
2011
CO2 emissions/year
total, Gt
2020
FIGURE 1.1
Key indicators for energy demand and CO2 emissions. (From World Energy Council, Energy for
Tomorrow’s World, the Realities, the Real Options and the Agenda for Achievement, WEC Commission
Report, WEC, New York, 1993; World Energy Council, World Energy Resources: 2013 Survey, WEC,
London, 2013.)
Energy-Efficient Quality of Life
3
world environmental health by CO, CO2, SO2, NOx effluent gas emissions,
and global warming. Achieving solutions to environmental problems that
we face today requires long-term potential actions for sustainable development. Enhanced lifestyle and energy demand rise together where the
wealthy industrialised economies, which contain 25% of the world’s population, consume 75% of the world’s energy supply [6]. The world’s energy
consumption in 2011 was 14,092 Mtoe; about 30 Giga metric tons of CO2
emissions were released into the atmosphere to meet this energy demand [5].
Greenhouse gas (GHG) emissions and energy demand have risen high on
the global environmental agenda—particularly with the Kyoto Protocol
and other related global agreements. Consequently, an urgent need for the
incorporation of energy efficiency issues to be included in urban planning
and construction has risen [7]. Currently, it is the pursuit of more economic
growth that guides development, especially in cities. However, there is a
rising demand for an alternate view of development—one that provides a
better quality of life and, at the same time, one that works within the constraints of limited available resources, especially energy. This chapter will
review the current understanding of what comprises the notion of quality
of life and its relation to sustainable development. Furthermore, this chapter
investigates a number of the available indices used to measure quality of life
and sustainable development. It reviews the different indicators for energy
efficiency at the macrolevel and at the microlevel.
1.3 Quality of Life as an Indicator for Human Progress
Quality of life has been the domain of development discourse for the past
decade. It has been widely recognised that measuring progress in terms of
gross domestic product (GDP) is not sufficient [8–10]. This chapter attempts
to examine the concept of quality of life with respect to other related concepts
such as standard of living, cost of living and life satisfaction. In the quest to
rate cities and countries according to their quality of life, numerous attempts
by various organisations can be found. However, Cummins [11] states,
‘The quality of life construct has a complex composition, so it is perhaps
not surprising that there is neither agreed definition nor a standard form of
measurement’.
Consequently, numerous debates exist regarding quantifying quality of
life, such as those concerning what aspects should be measured, the relative
weight of different aspects [12], the average versus real citizen’s quality of life
and objective versus subjective indicators. Khalil reviewed the efforts of different organisations to address the issue. She analysed the different aspects
and relative weights used by these organisations, thus revealing multiple
facets of the concept of quality of life [13].
4
Energy Efficiency in the Urban Environment
1.3.1 Quality of Life versus Standard of Living Concepts
GDP (as a measure of the average standard of living) used to be c onsidered
the one and only indicator for evaluating the well-being of a nation.
However, many concerns were raised with respect to inequality of wealth
distribution; hence, the Gini coefficient was introduced to measure income
distribution. Further, GDP was normalised using purchasing power parities
(PPPs) to be able to compare results from various countries on an actual base
with respect to the local circumstances of cost of living.
However, according to the Economist Intelligence Unit, it has long been
accepted that material well-being, as measured by GDP per person, cannot
alone explain the broader quality of life in a country [14]. Income or standard
of living is of course crucial; without resources, any progress is difficult.
Yet, other aspects must also be gauged. One strand of the literature has tried
to adjust GDP by quantifying omitted facets—for example, various non-
market activities and social ills such as environmental pollution. However,
it has faced insurmountable difficulties in assigning monetary values to the
various factors and intangibles of socioeconomic well-being.
Currently, Human Development Index (HDI) is another widely used indicator for quantifying progress. It combines measures of life expectancy,
education and standard of living in an attempt to quantify the options available to individuals within a given society. It is used by the United Nations
Development Programme in their Human Development Report.
In the 2010 Human Development Report, three new measures were introduced. The inequality-adjusted HDI, the Gender Inequality Index and the
Multidimensional Poverty Index were applied to most countries in the world,
and they provide important new insights [15].
Despite the high appreciation and dependence on HDI, there are still more
aspects that can describe and be attributed to quality of life. The debate is
still unresolved. According to Veenhoven [12], HDI is of little weight as a
measure of overall well-being. He claims that HDI adds apples and oranges,
where chances for a good life (wealth and education) are added to outcomes
(life expectancy) and outer qualities (wealth and equality) are added to an
inner one (education).
Alternatively, there have been numerous attempts to construct alternative, non-monetary indices of social and economic well-being. The following
section attempts to study the concept of quality of life and the relevant efforts
to measure it worldwide.
1.3.2 Quality of Life Indices
According to Rapley [16], quality of life has developed from being a social
scientific index of the relative well-being of whole populations (a measure
of the state of states) to being a measurable aspect of individual subjective
experiences (an index of the state of persons). The ecological economist
Energy-Efficient Quality of Life
5
Robert Costanza adds that although quality of life has long been an explicit
or implicit policy goal, adequate definition and measurement have been
elusive [17].
Regarding measuring quality of life, Gabriel and Rosenthal criticise current media and academic measures. They claim that media rankings of city
quality are largely ad hoc. Despite considerable progress having been made
academically in measuring urban quality of life [18–22], the most compre
hensive measures of quality of life have been static in nature [19,20]. Thus, little
data is available concerning changes in those measures over time [23].
Following the longstanding controversy in social indicators research,
two approaches for measuring quality of life are identified as ‘objective’ or
social indicators and subjective well-being (SWB) [25].* Although the objective approach focuses on measuring ‘hard’ facts, such as income or living
accommodations in meter square, the subjective approach is concerned with
‘soft’ matters such as satisfaction with income and perceived adequacy of
dwelling [12]. These two contrary conceptualisations are tracked by Noll;
his Scandinavian View† centred on the notions of ‘good society’ and the objective indicators of quality of life (or living) of society as a whole. On the other
hand, subjective indicators at the level of individuals are more evident in the
American model that commands more consensuses in the Western world [16].
Concerning the term subjective well-being, Veenhoven prefers the term life
satisfaction because life satisfaction refers to an overall evaluation of life
rather than to current feelings or to specific psychosomatic symptoms [29].
Some of the indices that focused on subjective surveys and questionnaires
to measure quality of life include the Global Person Generated Index (GPGI)
that uses a mix of open-ended questions, scoring and point allocation to
establish a particular person’s satisfaction with the most important areas of
his life [30–32]. Another example is the Wellbeing in Developing Countries
Quality of Life (WeDQoL) [33], which obtains scores that not only reflect
the general perspective of people in each country investigated but also the
priorities of each person completing the measure, taking into account their
geographical and social positions [34]. World Health Organization Quality
of Life (WHOQOL) is another example that is used in health-related quality
of life research. It has a questionnaire about self-perceived well-being during the last two weeks and addresses physical health, psychological health,
social relationships and environmental conditions, in addition to perceived
overall quality of life [35].
Practically, there are indicators that cannot be graded as either subjective
or objective because there are different gradings in between. This is e vident
in the four indices proposed and used by different organisations (and
reviewed in the following sections) to score and rate cities and countries
* A history of the social indicators and SWB movements in the social sciences can be found
in Land [24].
† Demonstrated in the works of Drewnowski [26]; Erikson and Uusitalo [27]; and Erikson [28].
6
Energy Efficiency in the Urban Environment
according to their quality of life/living. These organisations vary in nature
and interests and thus in focus and methodology. Mercer, a private company,
is the global leader for trusted human resources and related financial advice,
products and services. Their aim is to enhance the financial and retirement
security, health, and productivity and employment relationships of the
global workforce. The EIU is the business information arm of The Economist
Group, publisher of The Economist. For more than six decades, the unit has
been delivering impartial business intelligence to clients, equipping decision makers with insight they can trust. Another attempt independently
rates nations according to quality of life. The Organisation for Economic
Cooperation and Development (OECD) has a different focus. Currently,
34 countries are building on its successor, the Organisation for European
Economic Cooperation (OEEC).* Today, its members regularly work together
to identify, discuss and analyse problems and to promote policies.
The objective approach can be detected in the measurement of quality of
living performed by Mercer consultants, while the subjective approach can
be detected in OECD’s measurements of quality of life [13]. Another possibility for combining objective and subjective approaches to measuring overall well-being is Happy Life Years (HLY) suggested by Veenhoven, where
the subjective indicator called ‘life satisfaction’ is combined with objective length of life and is expressed in the number of ‘happy life years’ [12],
which depends on the fit between environmental conditions and p
ersonal
capabilities.
1.4 Ecological Footprint and Human Development Index
In the development realm, there are a number of indices used to measure or
to quantify progress. The ecological footprint (EF) developed by Wackernagel
and Rees is considered one of the most important indices used to quantify the
impact of development [36]. It translates various types of consumption into the
common metric: total area of productive land and water ecosystems required
to produce the resources that the population consumes and to assimilate the
wastes that the population produces, wherever on Earth that land and water
may be located [37].
The shortcoming of EF is its limited ability to provide positive policies that
enable cities to solve their local and global problems. In this stream, Newman
emphasises the importance of a sustainability assessment approach for c ities
that take environmental impact seriously, while simultaneously asserting the
value of social and economic progress [38]. On the other hand as mentioned
before, one of the more widely used indices is HDI.
* OEEC was established in 1947 to run the US-financed Marshall Plan for reconstruction of
a continent ravaged by war.
7
Energy-Efficient Quality of Life
Despite the high appreciation of and dependence on HDI, the debate
concerning its relevance for measuring quality of life is still unresolved.
Moreover, there is no straightforward pattern relating HDI to other dimensions of human development such as sustainability and empowerment.
The lack of correlation can be seen in the large number of countries that have
high HDI values but perform poorly on sustainability; about a quarter of the
world’s countries have a high HDI [15].
As an approach to remedy the limitations of each index, the Global
Footprint Network presents their Human Development Initiative as the
combination of two indices: the EF, with data about given current
population and available land area, and the United Nations’ HDI, which
measures a country’s average achievements in areas of health, knowledge
and standard of living [39]. This combination enables measurement of the
minimal conditions for sustainable human development, defined as a situation in which all humans can have fulfilling lives without degrading the
planet. This is illustrated in Figure 1.2, where all countries lie outside the
sustainable quadrant. All countries either provide high living conditions
but exceed the available earth’s biocapacity, or do not overburden available
resources but do not provide adequate living conditions for their population. Careful investments in energy systems, transportation, health, education or urban infrastructure can move countries into a stronger position
in the HDI-EF graph, providing higher human development and less of an
ecological deficit. These investments need to be tested for how they will
affect the three sub-indices of the HDI, as well as the country’s resource
dependence. If they generate gains in both arenas, they will advance
human well-being that can last [40].
North America
Ecological footprint
(global hectares per person)
10
European Union
Europe, non-EU
Latin America and Caribbean
8
Middle East and Asia
6
4
2
Threshold for high
human development
Asia-Pacific
1961
2005
Africa
Global average available
biocapacity per person
Sustainable
development
quadrant
(This must also include the
needs of wild species.)
0
0.0
0.2
0.4
0.6
0.8
1.0
Human Development Index
FIGURE 1.2
Human Development Index and ecological footprint, 2005. (From Our Human Development
Initiative, 2011, Global Footprint Network, from http://www.footprintnetwork.org/en/index.
php/GFN/page/fighting_poverty_our_human_development_initiative)
8
Energy Efficiency in the Urban Environment
1.5 Quality of Life and Sustainability
Quality of life has been the domain of development discourse for the past
decade. It has been widely recognised that measuring progress in terms of
GDP is not sufficient. However, an adequate definition of quality of life is
still missing. Diverse ‘objective’ and ‘subjective’ indicators across a range of
disciplines and scales and recent work on SWB surveys and the psychology
of happiness have spurred renewed interest [17].
Currently, there are a number of indices proposed and used by different
organisations to score and rate cities and countries according to their quality
of life. These organisations vary in nature and interests and thus in focus
and methodology [13]. The most important indices are Quality of Living by
Mercer [41], Quality of Life Index by the EIU [14],* nations’ rankings according to quality of life compiled independently [42], and OECD’s Your Better
Life Index [43]. It is apparent that these different indices focus on a number of
common aspects as the main core of quality of life, namely: housing, income,
jobs, community, education, environment, governance, health, life satisfaction, safety and work–life balance.
Despite these various efforts, an important aspect is still missing in most
indices. It is sustainability—whether or not this level of quality of life can be
sustained and whether or not it is affecting the ability of future generations
to attain such levels. This notion is still underscored because it is complex to
assess [13].
There are other indices that measure and rate the sustainability of a
city. One of the most recent sustainability indices is the Green City Index.
This index measures the current environmental performance of major
cities on different continents as well as their commitment to reducing
their future environmental impact by way of on-going initiatives and
objectives. The EIU, in cooperation with Siemens, developed the methodology. An independent panel of urban sustainability experts provided
important insights and feedback on the methodology. The index scores
cities across eight categories (as shown in Figure 1.3): CO2 emissions,
energy, buildings, transport, water, waste and land use, air quality and
environmental governance, and 30 individual indicators. Sixteen of the
index’s 30 indicators are derived from quantitative data and aim to measure how a city is currently performing. The remaining 14 indicators are
qualitative assessments of cities’ aspirations or ambitions—for example,
their commitment to consuming more renewable energy, to improving the
energy efficiency of buildings, to reducing c ongestion or to recycling and
reusing waste [44].
* The business information arm of The Economist Group, publisher of The Economist.
9
Energy-Efficient Quality of Life
CO2
10
8
Environmental governance
Energy
6
4
2
Air quality
0
Buildings
Transport
Waste and land use
Water
Amsterdam
Best
Average
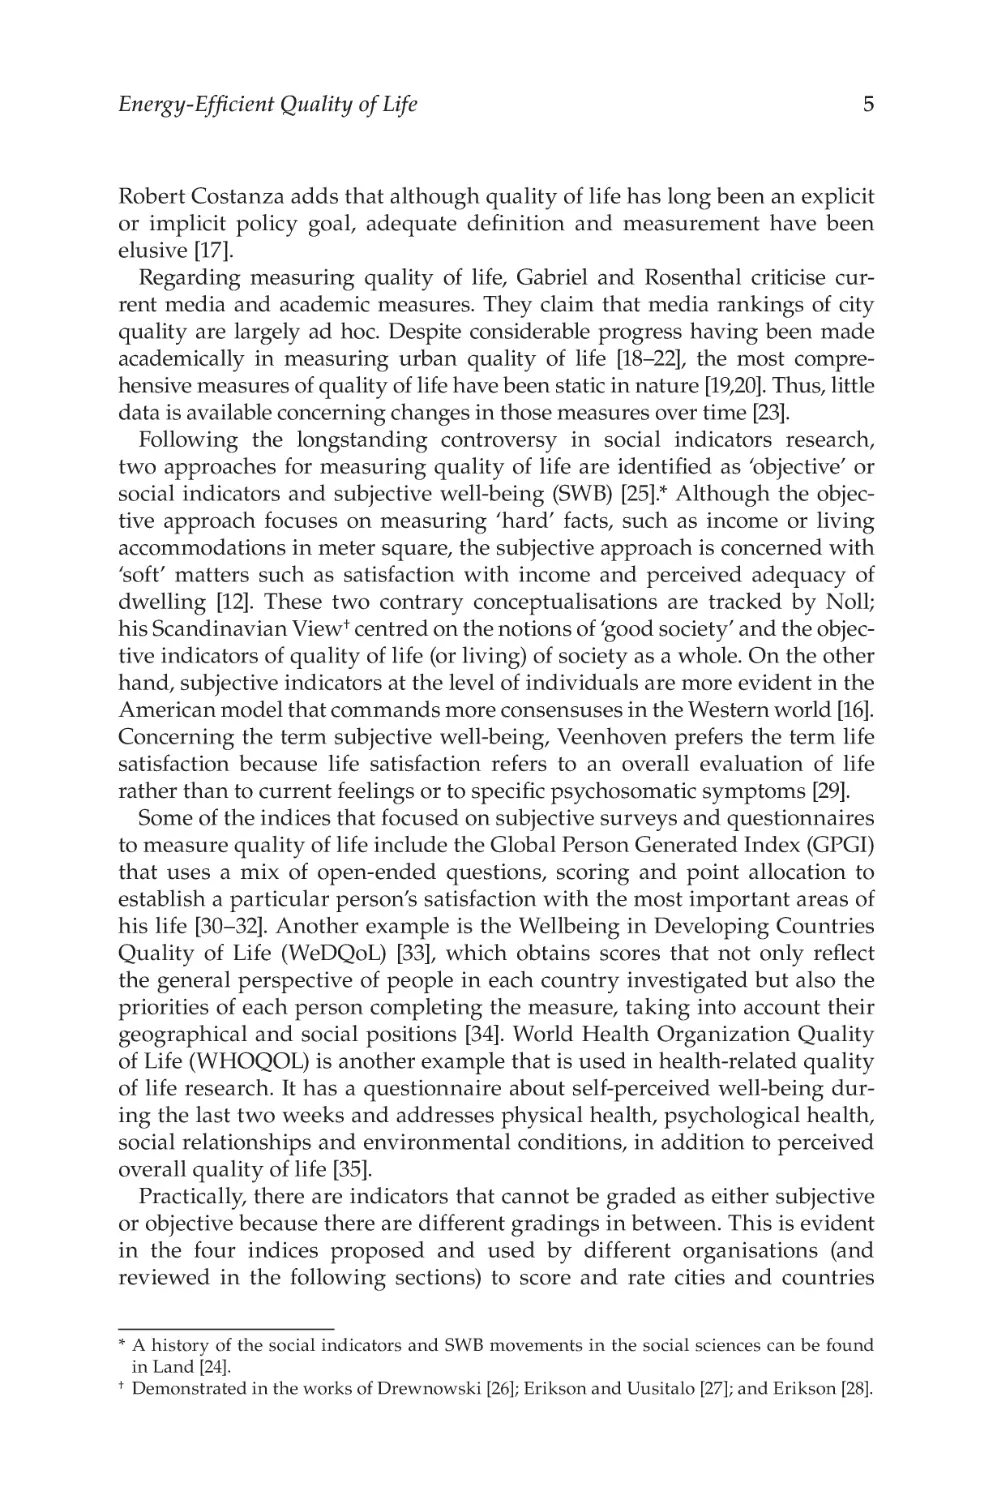
FIGURE 1.3
Green City Index for European cities. (From Green City Index, Siemens, Retrieved May 7, 2012,
from http://www.siemens.com/entry/cc/en/greencityindex.htm.)
The index is composed of aggregate scores of all of the underlying
indicators. It is first aggregated by category, creating a score for each area
of infrastructure and policy (i.e. energy). Finally, overall, it is based on the
composite of the underlying category scores. To create the category scores,
each underlying indicator is aggregated according to an assigned weighting. In general, most indicators receive the same weighting, or importance,
in the index. The category scores are then rebased onto a scale of 0–10.
To build the overall index scores, the EIU assigned even weightings on
each category score; the index is essentially the sum of all category scores,
rebased out of 100. This equal weighting reflects feedback from the expert
panel as well as wider research on measuring environmental sustainability,
10
Energy Efficiency in the Urban Environment
which indicated that all categories in this index merit equal weighting [44].
Currently, this index covers Europe, Latin America, Asia, the United States
and Canada, Germany and Africa [45].
Thus, the index offers a tool to enhance the understanding and decisionmaking abilities of all those interested in environmental performance,
from individual citizens through to leading urban policymakers. However,
this index is not directly concerned with quality of life or with how people
are satisfied with their lives.
The recent City Prosperity Index (CPI) has attempted to fill this gap in
assessment indices. It was developed and published by UN-HABITAT in its
report on the state of the world’s cities in 2012–2013. It comprises of five different dimensions, as illustrated in Figure 1.4 [2]: productivity, infrastructure
development, quality of life, equity and social inclusion, and environmental
sustainability. The CPI addresses issues of quality of life and of s ustainability.
However, the indicators that constitute quality of life in the CPI are just
Urban prosperity
so
t i o ns
inte
ra c
n
o ke
sio
clu
Ur
Eq
e
Spoke
interactions
rity
pe
os
pr
t
nd
lif
Policy
interactions
of
ya
ty
cia
ali
s
l in
Qu
t i on
Sp
ac
c
tera
Spoke in
uit
e
ctur
stru
Policy
interactions
Laws and
urban planning
Policy
interactions
o
Sp
er
int
Urban
pros
per
ity
Infra
Government
institutions
ility
n
ba
ke
inab
ke
Sp o
ns
usta
tio
men
tal s
perity
pros
iron
in
ter
ac
ns
Env
ban
Ur
Productivity
io
Policy
interactions
Policy
interactions
Urb
an
p
r
os
pe
rit
y
FIGURE 1.4
The Wheel of Urban Prosperity. (From United Nations Human Settlements Programme
(UN-HABITAT), State of the World’s Cities Report 2012/2013: Prosperity of Cities, UN-HABITAT,
Nairobi, Kenya, 2012.)
Energy-Efficient Quality of Life
11
a part of the overall indicators comprising the notion of quality of life as
viewed by other indices.
This index is still under development by the secretariat of the CPI, an
expert group formed by UN-HABITAT to discuss and develop the used
i ndicators.* The main debates about indicators are which ones to measure, their relative weights, whether they represent the average versus real
citizen’s quality of life, and the use of objective versus subjective indicators.
This is still not clearly resolved in the CPI, thus leaving much space for
debating its representation of reality.
Another recent addition to the list is the International Ecocity Framework
and Standards (IEFS) developed by the Ecocity Builders and the British
Columbia Institute of Technology, Canada [46]. It is still under development but has similar categories and indicators as the Green City Index.
However, it depends on more qualitative assessment rather than quantitative assessment, which can serve better when using participatory evaluation
of e nvironmental performance of districts and cities.
1.5.1 Quality of Life, Energy Efficiency and Renewable
Energies in the Built Environment
Despite the involvement of the Green City Index in measuring energy efficiency as part of achieving environmental sustainability, it does not explicitly
correlate to measuring how much energy is used to attain a c ertain quality
of life for city dwellers. Thus, the indicators concerning energy efficiency
in the Green City Index are first extracted from different categories and
highlighted. As mentioned earlier, the Green City Index was originally subdivided into eight categories: CO2 emissions, energy, buildings, transport,
water, waste and land use, air quality and environmental governance, and
30 individual indicators. In each report, the EIU aggregated categories differently combining energy and CO2, creating a separate category for land use
or combining it with buildings, and creating a separate category for sanitation. A review of the indicators of each category in different reports and
their r elevance to energy efficiency resulted in the list of indicators shown in
Table 1.1 (common indicators in different reports are highlighted) [44,47–50].
It is clear that similar indicators are used in all reports. However, other indicators are tailored to certain areas according to the state of things and to
available information [51]. Second, these energy efficiency indicators can be
classified into two groups: the first group relates directly to the energy used
to achieve a good quality of life, while the other group relates indirectly to
the matter and is more concerned with sustaining this quality of life from
the point of using energy e fficiently. Table 1.2 shows this classification of
indicators.
* A series of Expert Group meetings started in May 2013 in Tehran to discuss the validity of
the index, which continued in Nairobi in June 2013 for further development.
Land use
Buildings
Energy and
CO2
Category
Population density
Green spaces per capita
Total final energy consumption, in megajoules per unit of real GDP (in Euros,
base year 2000)
The percentage of total energy derived from renewable sources as a share of
the city’s total energy consumption, in terajoules
An assessment of the extensiveness of policies promoting the use of clean
and efficient energy
Measure of a city’s strategy to combat its contribution to climate change
Percentage of households with access to electricity
Total final energy consumption in the residential sector, per square meter of
residential floor space
An assessment the extensiveness of cities’ energy efficiency standards for
buildings
An assessment of the extensiveness of efforts to promote energy efficiency of
buildings
Measure of a city’s efforts to minimise the environmental impact of buildings
Number of LEED-certified buildings (silver, gold or platinum) per 100,000
persons
An assessment of the comprehensiveness of policies to contain the urban
sprawl and promote the availability of green spaces
Assessment of a city’s efforts to sustain and improve the quantity and quality
(e.g. proximity and usability) of green spaces and its tree planting policy
Sum of all public parks, recreation areas, greenways, waterways and other
protected areas accessible to the public, in m2 per inhabitant
Population density, in persons per km2
Electricity consumption per
unit of GDP
Renewable energy
consumption
Clean and efficient energy
policies
Climate change action plan
Access to electricity
Energy consumption of
residential buildings
Energy-efficient building
standards
Energy-efficient building
initiatives
Eco buildings policy
Number of LEED-certified
buildings
Green land-use policies
Description
Total final energy consumption, in gigajoules per head
Energy consumption
Indicators
Indicators Concerning Energy Efficiency Derived from the Green City Index for Different Areas
TABLE 1.1
Index
All but Europe
All but Europe
Europe; U.S. &
Canada
Europe; U.S. &
Canada
Europe; U.S. &
Canada
Latin America; Asia
U.S. & Canada
Latin America; Asia
Africa
Europe
All
Europe
Europe; U.S. &
Canada
All
12
Energy Efficiency in the Urban Environment
Average commute time from
residence to work
Congestion reduction policy
Stock of cars and
motorcycles
Urban mass transport policy
Length of mass transport
network
Green transport promotion
Size of non-car transport
network
Latin America; Asia;
Africa
U.S. & Canada
All
Measure of a city’s efforts to reduce congestion
Latin America
Europe; U.S. &
Canada
Latin America; Asia;
Africa
Europe; U.S. &
Canada
Europe; U.S. &
Canada
Africa
Latin America; Asia;
Africa
U.S. & Canada
The total percentage of the working population travelling to work on public
transport, by bicycle and on foot
Length of cycling lanes and the public transport network, in km per m2 of
city area
Evaluation of availability of public transport, including length of public
transport network
An assessment of the extensiveness of efforts to increase the use of cleaner
transport
Composed of two sub-indicators: (1) total length of all train, tram, subway,
bus and other mass transport routes within the city’s boundaries, measured
in terms of the area of the city (in km/km2); and (2) total length of all
superior modes of public transport, for example, Bus Rapid Transport BRT
System, trolleybus, tram, light rail and subway, measured in terms of the
area of the city (in km/km2)
Total stock of cars and motorcycles, with half-weighting allocated to
motorcycles, measured in terms of vehicles per person
Measure of a city’s efforts to create a viable mass transport system as an
alternative to private vehicles
Average commute time from residence to work, in minutes
Measure of a city’s efforts to minimise the environmental and ecological
impact of urban development
Assessment of how rigorously a city promotes containment of urban sprawl
and reuse of brown field areas
Percentage of the population living in informal settlements
Source: Khalil, H. (2012). Sustainable Urbanism: Theories and Green Rating Systems, 10th Annual International Energy Conversion Engineering Conference,
48th AIAA/ASME/SAE/ASEE Joint Propulsion Conference & Exhibit, Atlanta, GA.
Transport
Population living in informal
settlements
Use of non-car transport
Urban sprawl
Land-use policy
Energy-Efficient Quality of Life
13
14
Energy Efficiency in the Urban Environment
TABLE 1.2
Energy Efficiency Indicators as Achieving Good Quality of Life and Sustaining It
Energy Efficiency Indicators
Category
Achieving Good Quality of Life
Energy
and CO2
Energy consumption
Electricity consumption per unit of GDP
Access to electricity
Buildings
Energy consumption of residential buildings
Land use
Green land-use policies
Green spaces per capita
Population density
Population living in informal settlements
Size of non-car transport network
Length of mass transport network
Stock of cars and motorcycles
Average commute time from residence
to work
Congestion reduction policy
Waste
transport
Sustaining Good Quality of Life
Same
Same
Renewable energy consumption
Clean and efficient energy policies
Climate change action plan
Energy-efficient building standards
Energy-efficient building initiatives
Eco building policy
Number of LEED-certified buildings
Same
Land-use policy
Urban sprawl
Waste recycling and reuse policy
Use of non-car transport
Green transport promotion
Urban mass transport policy
Note: LEED, Leadership in Energy and Environmental Design.
1.6 Energy Performance
Energy performance of buildings should include a general framework for
the calculation of energy performance and building categories together
with the thermal characteristics of the building, air conditioning, ventilation, lighting and appliances considered. These include active solar systems’ contribution to domestic water heating based on renewable energy
sources, Combined Power and Heat (CPH) production and district cooling systems. The following sub-section demonstrates the importance of
incorporating an energy performance directive as a standard in the Middle
East region; such a goal will aid in energy savings in large buildings and
will set regulations for energy-efficient designs that are based on standard
calculation methods. The proposed standard would be largely based on
international standards and would be appropriately modified to suit local
practices. The target is to develop standardised tools for the calculation of
the energy performance of buildings, with defined system boundaries for
the different building categories and for different cooling/heating systems.
15
Energy-Efficient Quality of Life
The goal is to develop common procedures for obtaining an ‘energy
performance c ertificate’. The present work provides transparent information regarding o
utput data (reference values, benchmarks etc.) and defines
comparable energy-related key values (kWh/m2, kWh per person, kWh per
apartment, kWh per produced unit etc.). Proposals to develop a common
procedure for an ‘energy performance certificate’ and CO2 emissions are
given here.
Analyses of energy performance would be initiated from a country’s
power generation pattern [52] (Figure 1.5), with energy consumption by
sector and energy consumption by utility (as shown in Figures 1.6 and 1.7
for Egypt), as an example. In commercial buildings, air-conditioning systems
can consume as much as 56% of the total energy used in the building.
Therefore, it is a challenge to design an optimum HVAC airside system that
provides comfort and air quality in air-conditioned spaces with e fficient
energy consumption. The air condition to be maintained is dictated by how
the conditioned space is used and by the comfort of users. Therefore, the air
conditioning embraces more than cooling or heating. Comfortable air conditioning is defined as ‘the process of treating air to control simultaneously
its temperature, h
umidity, cleanliness, and distribution to meet the comfort
requirements of the o
ccupants of the conditioned space’ [53]. Air conditioning,
therefore, includes the entire heat exchange operation in addition to the regulation of velocity, thermal radiation and quality of air, as well as the removal
of f oreign particles and vapours [53].
It is probable that one calculation method will not cover all aspects and
building categories for the proposed directive. For some applications, more
Power generation by plant type
Total generated 108 MWh–
14%
1%
56%
19%
10%
Steam turbines
Wind turbines
Gas turbines
Hydroelectric
Combined cycles
FIGURE 1.5
Current power generation technologies in Egypt. (From Khalil, E. E. (2012). Energy performance
of commercial buildings: A new direction, Proceedings, ASME IMECE, November.)
16
Energy Efficiency in the Urban Environment
5%
6%
4%
7%
3%
33%
37%
5%
Agricultural
Industrial
Commercial
Others
Residential
Governmental
Lighting
Utilities
FIGURE 1.6
Energy consumption by sector 2006–2007 in Egypt. (From Khalil, E. E. (2012). Energy performance of commercial buildings: A new direction, Proceedings, ASME IMECE, November.)
6%
17%
56%
21%
Air-conditioning systems
Lighting systems
Electrical appliances
Fan systems
FIGURE 1.7
Building energy consumption by utility in Egypt. (From Khalil, E. E. (2012). Energy performance of commercial buildings: A new direction, Proceedings, ASME IMECE, November.)
advanced simulation models will have to be used to provide satisfactory
accuracy. The on-going and future work on methods for validation and on
documentation of simulation tools at Housing and Building Research Center
(HBRC) and Cairo University [52–54] could be valuable within the process of
approving models.
17
Energy-Efficient Quality of Life
1.7 Energy Efficiency Indicators
Even now, the guidelines and design standards do not provide restricted
utilisation strategies for conditioned air in building spaces. Indeed, this situation creates several inefficient systems and results in an expensive energy
invoice. In some critical facilities, such as hospitals, HVAC designers face
the problem of balancing the attainment of comfortable conditions with efficient energy utilisation. The relationship between HVAC system designs
and optimum conditions and energy utilisation is still under investigation
even today. Recent research [55,56] has investigated the effect of ventilation
design on comfort and energy utilisation. The effect of the displacement ventilation on the humidity gradient in a factory located in a hot and humid
region has been illustrated [55], showing the strong dependence between the
correct supplying conditions and comfort. Indeed, displacement ventilation
is recommended as an energy-efficient system; the resulting humidity and
temperature gradient gives the designers the suitable tolerance for selecting
more economical Air supply conditions [55]. In recent years, new ventilation
system designs, such as under-floor systems, are becoming more popular for
overcoming the problems of current systems. In office buildings, under-floor
air supply is recommended as an alternative to ceiling air supply for overcoming the lack of flexibility in the ceiling systems and for improving the
comfort conditions [55–59]. Actually, the energy utilisation mainly depends
on the optimum utilisation of the conditioned air in the conditioned spaces.
Currently, popular HVAC residential window and split units were further
investigated in terms of energy costs and energy efficiency ratios (see Tables
1.3 through 1.8; where $1 = 7.05 LE).
As the world becomes increasingly dependent on electrical appliances and
equipment, energy consumption rapidly rises every year. Many programmes
have been established in various countries to increase end-use equipment
energy efficiency. One of the most cost-effective and proven methods for
increasing energy efficiency of electrical appliances and equipment is to
establish energy efficiency standards and labels as defined in the following
section.
TABLE 1.3
HVAC Unit Characteristics (Window Units)
Cooling Capacity, kW
2.64
3.66
5.28
7.03
Power Consumption, W
EER
COP
1023
1429
2000
2697
8.8
8.75
9.0
8.9
2.58
2.56
2.64
2.61
Note: EER = energy efficiency ratio; COP = coefficient of performance.
18
Energy Efficiency in the Urban Environment
TABLE 1.4
HVAC Unit Costs (Window Units)
Cooling Capacity, kW
Power Consumption, W
Air Flowa
Unit Cost, LE
1023
1429
2000
2697
540
630
1020
1275
1400
1700
2000
2400
2.64
3.66
5.28
7.03
a
Airflow is in m3/h.
TABLE 1.5
HVAC Unit Estimated Energy Costs (Window Units)
Cooling Capacity, kW
Power Consumption,
kWh/day at 40°C Outdoor
Air Flow
10.23
14.29
20.00
26.97
540
630
1020
1275
2.64
3.66
5.28
7.03
HVAC Cost,
LE/day
2.046
2.858
4.0
4.394
Note: Calculated at 10 h/day and 0.2 LE/kWh.
TABLE 1.6
HVAC Unit Characteristics (Split Units)
Cooling Capacity, kW
Power Consumption, W
EER
COP
1056
1389
2111
2775
3409
3784
9.0
9.0
9.0
8.65
8.8
9.25
2.64
2.64
2.64
2.64
2.58
2.71
2.78
3.66
5.57
7.03
8.8
10.26
Note: EER = energy efficiency ratio; COP = coefficient of performance.
TABLE 1.7
HVAC Unit Costs (Split Units)
Cooling Capacity, kW
2.64
3.66
5.28
7.03
8.8
10.26
a
Airflow is in m3/h.
Power Consumption, W
1056
1389
2111
2775
3409
3784
Air Flowa
509
509
798
956
1528
1528
Unit Cost, LE
3400
3700
4000
4400
5500
6000
19
Energy-Efficient Quality of Life
TABLE 1.8
HVAC Unit Estimated Energy Costs (Split Units)
Cooling Capacity, kW
2.64
3.66
5.28
7.03
8.8
10.26
Power Consumption,
kWh/day at 40°C Outdoor
10.56
13.89
21.11
27.75
34.09
37.84
Air Flow m3/h
509
509
798
956
1528
1528
HVAC Cost,
LE/day
2.112
27.78
4.222
5.550
6.818
7.568
Note: Calculated at 10 h/day and 0.2 LE/kWh.
1.8 Energy Efficiency Standards
Energy efficiency standards are a set of procedures and regulations that
prescribe the energy performance of manufactured products, sometimes
prohibiting the sale of products less energy efficient than the minimum standard. The term ‘standard’ commonly encompasses two possible meanings:
1. A well-defined protocol (or laboratory test procedure) for obtaining
a sufficiently accurate estimate of the energy performance of a product in the way it is typically used or at least a relative ranking of the
energy performance compared to other models
2. A target limit on energy performance (usually a maximum use or
minimum efficiency) formally established by a government-based
agency upon a specified test standard
1.9 Energy Labels
Energy efficiency labels are affixed to manufactured products indicating a
product’s energy performance (usually in the form of energy use, efficiency
and/or cost) in order to provide consumers with the data necessary for making informed purchases. Energy labels serve as a complement to energy
standards. These labels provide consumers with information that allows
them to select more efficient models. Labels also allow utility companies and
government energy conservation agencies to offer incentives to consumers
to buy the most energy-efficient products. The effectiveness of energy labels
is highly dependent on how the information is presented to the consumer.
In developing countries, energy efficiency plays an important role in achieving global sustainable development. Energy efficiency improvements can
20
Energy Efficiency in the Urban Environment
slow the growth of energy consumption, can save consumers money and
can reduce capital expenses for energy infrastructure. Energy consumption
is increasing rapidly in these countries, yet energy efficiency remains far
below the levels in developed countries. For most developing countries, the
foreign exchange needed to finance energy sector expansion is a significant
drain on reserves. Additionally, energy efficiency reduces local environmental impacts, such as water and air pollution from power plants, and mitigates
greenhouse gas emissions. Standards and labelling programmes provide
enormous energy-saving potential that can direct developing countries
towards sustainable energy use. Improved end-use efficiency from standards and labelling programmes can c ontribute s ignificantly to developing
economies. The main benefits are
1. Less of a need for new power plants: The cost of saving 1 kWh of
energy through energy efficiency programmes has proven much
less expensive than producing 1 kWh of energy by building a new
power plant.
2. Reduced greenhouse gas emissions: Less energy production means
less carbon dioxide emissions from power plants. This contributes to
environmental benefits such as slowing down environmental pollution and global warming and preserving natural resources and the
ecosystem.
3. Improved competitiveness for local manufacturers: Local companies
that upgrade the efficiency of their products can compete better with
multinational companies, especially with lower production costs.
4. Higher consumer disposable income: Less spending on electric bills
increases consumer purchasing power for other products, which
helps local businesses.
5. Increased cash flow in the local economy: With higher disposable
income, consumers are more willing to spend, thus injecting more
money into the local economy.
6. Improved trade balance: Decrease in energy demand will reduce
the consumption of indigenous resources (i.e., natural gas and oil),
allowing more to be exported (for Lebanon, less to be imported).
Increased export earnings (or less import spending) help alleviate
trade deficits in Arab countries.
7. Avoiding a future energy deficit as power demand rises: Energy
exporting countries have become net importers due to dramatic
increases in electricity demand. Energy efficiency programmes
can help slow down the demand and prevent energy deficits in the
future.
Table 1.9 summarises recent international energy labelling activities that
have impacted national economies.
21
Energy-Efficient Quality of Life
TABLE 1.9
Summary of Pioneering International Programmes and Their Achievements
Country or
Region
Programme
Achievements
Australia
Mandatory Standards
and Labelling
Europe
Mandatory Standards
and Labelling
Philippines
Mandatory Standards
and Labelling
Egypt
Mandatory Standards
and Labelling
Thailand
Voluntary Labelling
United States
Mandatory Standards
and Labelling
11% reduction in energy consumption of labelled
appliances in 1992; equals approximately 94 GWh
of saved energy or a 1.6% decrease in total
household electricity consumption
Germany: 16.1% increase in market efficiency
(1993–1996);
Netherlands: 12.6% increase in market efficiency
(1992–1995);
United Kingdom: 7.3% increase in refrigerator/
freezer efficiency (1994–1996)
25% increase in average efficiency of all air
conditioners (after first year); energy savings: 6 MW
in demand and 17GWh in consumption
(after first year)
10% decrease in refrigerator energy consumption
(after 3 years);
20% decrease in air conditioner energy consumption
(after 3 years)
14% decrease in refrigerator energy consumption
(after 3 years);
energy savings: 65 MW in demand and 643 GWh in
consumption
98% increase in refrigerator efficiency (1972–1988);
more than 3% reduction in U.S. annual residential
consumption from appliances and lighting
equipment
A national standards and labelling programme is defined as a set of elements that ensure that energy efficiency standards and labelling efforts are
effective, appropriate, strengthened over time and sustained. The building
blocks fall into two categories, technical/policy and process. They include
1. Technical/Policy
a. Accredited testing facilities: Facilities should be internationally
accredited, should be staffed with competent testing personnel
and have the capacity to test models in a timely manner.
b. Appropriate testing procedures: Testing procedures are the
methods by which the energy efficiency level of a product is
deduced. The selected procedures should reasonably reflect a
country’s usage patterns and climate. This builds consumer confidence that test results accurately reflect the energy usage one
will experience.
22
Energy Efficiency in the Urban Environment
c. Energy labels: Standards and labels can be established s eparately
or as complementary programmes. Many types of labelling programmes exist.
d. Energy efficiency standards can be mandatory or voluntary and
can be based either on maximum energy consumption or on
minimum energy efficiency.
e. An energy policy framework that is conducive to energy
efficiency is critical to the longevity of a national standards
programme. Supportive policies include government procurement requirements, voluntary programmes, incentives to manufacturers, consumer awareness campaigns and demand-side
management and i ntegrated resource planning.
2. Proposed Process
a. Compliance with voluntary and mandatory standards and
labelling requirements must be ensured through a credible
enforcement scheme to guarantee programme effectiveness.
Programme
evaluation will inform necessary programme
modifications, justify further activities and provide the documentation necessary to sustain the standards and labelling
programmes over the long term.
b. The legislative process should ensure that standards and labels
are periodically reviewed and raised (‘ratcheted’ upward) as the
overall product efficiency of the market improves. The changes
will mostly depend on the results of programme evaluation.
c. In the programme design and improvement process, input from
all stakeholders (government, private companies, consumer associations etc.) should be considered. Cooperation among the stakeholders is the key to programmes’ success. However, local and
national governments must also hold its decision final, after carefully considering all suggestions.
1.10 Concluding Remarks
It is important to incorporate an energy performance directive as a s tandard
in this region. Meeting such a goal will aid energy savings in large buildings
and will set regulations for energy-efficient designs that are based on standard calculation methods. The following recommendations apply:
1. Develop standardised tools for the calculation of the energy performance of buildings within urban and rural environments and their
relation to providing adequate quality of life
Energy-Efficient Quality of Life
23
2. Define system boundaries for the different building categories and
different heating/cooling systems
3. Prepare requirement models for indoor air quality, thermal comfort
in winter and summer, visual comfort and so forth
4. Define comparable energy-related key values (kWh/m2, kWh per
person, kWh per apartment, kWh per produced unit, etc.) and develop
a common procedure for an ‘energy performance certificate’
5. Design, construct and operate a solar decathlon (building) that
can meet the rural and desert requirements and that can save
diminishing fossil fuel resources
References
1. GlobeScan and MRC McLean Hazel. (2007). Megacity Challenges: A Stakeholder
Perspective, Siemens AG, Munich.
2. United Nations Human Settlements Programme (UN-HABITAT). (2012).
The State of the World’s Cities Report 2012/2013: Prosperity of Cities, UN-HABITAT,
Nairobi, Kenya.
3. United Nations Human Settlements Programme (UN-HABITAT). (2006). The State
of The World’s Cities Report 2006/2007: 30 Years of Shaping The Habitat Agenda,
Earthscan, London, UK.
4. Girardet, H. (2004). Urban Planning and Sustainable Energy: Theory and Practice,
Forum Barcelona, Retrieved May 12, 2009, from http://www.barcelona2004.
org/www.barcelona2004.org/eng/banco_del_conocimiento/dialogos/
fichac390.html
5. World Energy Council. (2013). World Energy Resources: 2013 Survey, World
Energy Council, London.
6. Omer, A. M. (2008). Energy, environment and sustainable development,
Renewable and Sustainable Energy Reviews, Vol. 12, No. 9, pp. 2265–2300.
7. United Nations Environment Programme. Activities: Urban—Energy for Cities,
Retrieved May 14, 2009, from http://www.unep.or.jp/Ietc/Activities/Urban/
energy_city.asp
8. Eckersley, R. (1998). Perspectives on progress: Economic growth, quality of
life and ecological sustainability, In R. Eckersley, ed., Measuring Progress: Is Life
Getting Better? CSIRO Publishing, Melbourne, pp. 3–34.
9. Shea, W. (1976). Introduction: The quest for a high quality of life, In J. KingFarlow and W. Shea, eds., Values and The Quality of Life, Science History
Publications, New York, pp. 1–5.
10. Cummins, R. A., Eckersley, R., Pallant, J., Vugt, J. V., and Misajon, R. (2003).
Developing a national index of subjective wellbeing: The Australian unity
wellbeing index, Social Indicators Research, Vol. 64, pp. 159–190.
11. Cummins, R. (1997). Comprehensive Quality of Life Scale—Adult, School of
Psychology, Deakin University, Melbourne.
24
Energy Efficiency in the Urban Environment
12. Veenhoven, R. (2007). Subjective measures of well-being, In M. McGillivray, ed.,
Human Well-Being, Concept and Measurement, Palgrave/McMillan, Houndmills,
NH, pp. 214–239.
13. Khalil, H. (2012). Enhancing quality of life through strategic urban planning,
Sustainable Cities and Society, Vol. 5, pp. 77–86.
14. The Economist Intelligence Unit (EIU). (2007). The Economist Intelligence
Unit’s quality-of-life index, the world in 2005, The Economist, Retrieved
January 20, 2012, from http://www.economist.com/media/pdf/QUALITY_
OF_LIFE.pdf
15. United Nations Development Programme (UNDP). (2010). Human Development
Report 2010, 20th Anniversary Edition, The Real Wealth of Nations: Pathways to
Human Development, UNDP, New York.
16. Rapley, M. (2003). Quality of Life Research: A Critical Introduction, Sage, London.
17. Costanza, R., Fisher, B., Ali, S., Beer, C., Bond, L., Boumans, R., Danigelis, N. L.,
et al. (2008). An integrative approach to quality of life measurement, research
and policy, Surveys and Perspectives Integrating Environment & Society, Vol. 1,
pp. 11–15.
18. Roback, J. (1982). Wages, rents, and the quality of life, Journal of Political Economy,
Vol. 90, pp. 1257–1278.
19. Blomquist, G., Berger, M., and Hoehn, J. (1988). New estimates of the quality of
life in urban areas, American Economic Review, Vol. 78, No. 1, pp. 89–107.
20. Gyourko, J. and Tracy, J. (1991). The structure of local public finance and the
quality of life, Journal of Political Economy, Vol. 99, No. 4, pp. 774–806.
21. Kahn, M. (1995). A revealed preference approach to ranking city quality of life,
Journal of Urban Economics, Vol. 38, pp. 221–235.
22. Gabriel, S. A., Mattey, J., and Wascher, W. L. (2003). Compensating differentials
and evolution in the quality-of-life among U.S. states, Regional Science and Urban
Economics, Vol. 33, No. 5, pp. 619–649.
23. Gabriel, S. A. and Rosenthal, S. S. (2004). Quality of the business environment
versus quality of life: Do firms and households like the same cities? The Review
of Economics and Statistics, Vol. 86, No. 1, pp. 438–444.
24. Land, K. C. (1996). Social indicators and the quality of life: Where do we stand
in the mid-1990s? Social Indicators Network News, Vol. 45, pp. 5–8.
25. Diener, E. and Suh, E. (1997). Measuring quality of life: Economic, social, and
subjective indicators, Social Indicators Research, Vol. 40, pp. 189–216.
26. Drewnowski, J. (1974). On Measuring and Planning the Quality of Live, Mouton,
published for the Institute of Social Studies, The Hague.
27. Erikson, R. and Uusitalo, H. (1987). The Scandinavian approach to welfare
research, In R. Erikson, E. Hansen, S. Ringen, and H. Uusitalo, eds., The
Scandinavian Model: Welfare States and Welfare Research, M. E. Sharpe, New York,
pp. 177–193.
28. Erikson, R. (1993). Descriptions of inequality: The Swedish approach to welfare
research, In M. Nussbaum and A. Sen, eds., The Quality of Life, Clarendon Press,
Oxford, pp. 67–87.
29. Veenhoven, R. (1996). The study of life satisfaction, In W. Saris, R. Veenhoven,
and A. Scherpenzeel, eds., A Comparative Study of Satisfaction with Life in Europe,
Eötvös University Press, Budapest, pp. 11–48.
30. Ruta, D. (1998). Patient generated assessment: The next generation, MAPI
Quality of Life Newsletter, Vol. 20, pp. 461–489.
Energy-Efficient Quality of Life
25
31. Ruta, D. A., Garratt, A. M., Leng, M., Russell, I. T., and MacDonald, L. M. (1994).
A new approach to the measurement of quality of life: The patient generated
index (PGI), Medical Care, Vol. 32, No. 11, pp. 1109–1126.
32. Ruta, D., Camfield, L., and Martin, F. (2004). Assessing individual quality of
life in developing countries: Piloting a global PGI in Ethiopia and Bangladesh,
Quality of Life Research, Vol. 13, No. 9, p. 1545.
33. Woodcock, A., Camfield, L., McGregor, J. A., and Martin, F. (2009). Validation of
the WeDQoL-goals-Thailand measure: Culture-specific individualized quality
of life, Social Indicators Research, Vol. 94, No. 1, pp. 135–171.
34. McGregor, J. A., Camfield, L., and Woodcock, A. (2009). Needs, wants and goals:
Wellbeing, quality of life and public policy, Applied Research Quality Life, Vol. 4,
pp. 135–154.
35. WHOQOL Group. (1998). Development of the World Health Organization
WHOQOL-BREF quality of life assessment, Psychological Medicine, Vol. 28,
pp. 551–558.
36. Wackernagel, M. and Rees, W. (1996). Our Ecological Footprint: Reducing Human
Impact on the Earth, New Society Publishers, Gabriola Island, BC.
37. Rees, W. (2000). Eco-footprint analysis: Merits and brickbats, Ecological
Economics, Vol. 32, No. 3, pp. 371–374.
38. Newman, P. (2006). The environmental impact of cities, Environment and
Urbanization, Vol. 18, No. 2, pp. 275–295.
39. Our Human Development Initiative. (2011). Global Footprint Network, Retrieved
April 30, 2012, from http://www.footprintnetwork.org/en/index.php/GFN/
page/fighting_poverty_our_human_development_initiative/
40. Wackernagel, M. (2009). Securing human development in a resourceconstrained world, DAC News, Retrieved April 30, 2012, from http://www.
oecd.org/dataoecd/52/1/43844294.htm#H56
41. Mercer. (2011). Mercer 2011 Quality of Living Survey Highlights—Defining ‘Quality
of Living’, Mercer, Retrieved January 25, 2012, from http://www.mercer.com/
articles/quality-of-living-definition-1436405
42. Nation Ranking. (2011). Quality of Life Index 2011 Ranking: Quantifying the World
of Sovereign States, Retrieved January 21, 2012, from https://nationranking.
wordpress.com/category/quality-of-life-index/
43. Organization for Economic Cooperation and Development (OECD). (2011).
Better Life Initiative Executive Summary, OECD Better Life Initiative, Retrieved
January 20, 2012, from http://oecdbetterlifeindex.org/
44. The Economist Intelligence Unit. (2009). European Green City Index: Assessing The
Environmental Impact of Europe’s Major Cities, Siemens AG, Munich.
45. Green City Index. (2012). Siemens, Retrieved May 7, 2012, from http://www.
siemens.com/entry/cc/en/greencityindex.htm
46. Ecocity Standards. (2011). International Ecocity Framework and Standards,
Retrieved January 15, 2014, from http://www.ecocitystandards.org/
47. The Economist Intelligence Unit. (2010). Latin American Green City Index:
Assessing The Environmental Performance of Latin America’s Major Cities, Siemens
AG, Munich.
48. The Economist Intelligence Unit. (2011). African Green City Index: Assessing The
Environmental Performance of Africa’s Major Cities, Siemens AG, Munich.
49. The Economist Intelligence Unit. (2011). Asian Green City Index: Assessing The
Environmental Performance of Asia’s Major Cities, Siemens AG, Munich.
26
Energy Efficiency in the Urban Environment
50. The Economist Intelligence Unit. (2011). US and Canada Green City Index:
Assessing The Environmental Performance of 27 Major US and Canadian Cities,
Siemens AG, Munich.
51. Khalil, H. (2012). Sustainable urbanism: Theories and green rating systems,
10th Annual International Energy Conversion Engineering Conference, 48th AIAA/
ASME/SAE/ASEE Joint Propulsion Conference & Exhibit, Atlanta, GA.
52. Khalil, E. E. (2005). Energy performance of buildings directive in Egypt: A new
direction, HBRC Journal, Vol. 1, pp. 197–213.
53. Medhat, A. A. and Khalil, E. E. (2006). Thermal comfort meets human
acclimatization in Egypt, Proceeding of Healthy Building, Vol. 2, pp. 25.
54. Khalil, E. E. (2012). Energy performance of commercial buildings: A new direction,
Proceedings, ASME IMECE, November 2012.
55. Kosonen, R. (2002). Displacement ventilation for room air moisture control in
hot and humid climate, ROOMVENT 2002, pp. 241–244.
56. Leite, B. C. C. and Tribess, A. (2002). Analysis of under floor air distribution system: Thermal comfort and energy consumption, ROOMVENT 2002,
pp. 245–248.
57. Kameel, R. and Khalil, E. E. (2002). Prediction of turbulence behavior using k-ε
model in operating theatres, ROOMVENT 2002, pp. 73–76.
58. Khalil, E. E. (2008). Arab-air conditioning and refrigeration code for energyefficient buildings, Arab Construction World, Vol. 28, No. 8, pp. 24–26.
59. Khalil, E. E. (2008). Air conditioning and refrigeration code for energy-efficient
buildings in the Arab world, Journal of Kuwait Society of Engineers, Vol. 100,
pp. 94–95.
2
Energy Efficiency Strategies in
Urban Planning of Cities*
2.1 Introduction
As discussed in Chapter 1, the world’s energy consumption in 2011 was
14,092 Mtoe; about 30 Giga metric tons of CO2 emissions were released in
the atmosphere to meet this energy demand [2]. Greenhouse gas (GHG)
emissions and energy demand have risen high on the global environmental agenda—particularly with the Kyoto Protocol and other related global
agreements. Consequently, an urgent need has arisen for the incorporation
of energy efficiency issues into urban planning and construction [3]. To meet
the urban challenges of today, and the challenges to come, appropriate
planning strategies and management frameworks must be a vailable, through
which cities can apply innovative approaches suitable for their local circumstances. This chapter will review the challenges that cities face and factors
that affect new strategies for urban planning where energy efficiency is the
core issue shaping the city’s future.
2.2 Cities and Energy Consumption: The Macrolevel
The city can be seen as an ecosystem comprising five main sub-systems that
interact together. These are population sector, employment sector, housing
sector, transport sector and urban land sector [4].
2.2.1 Size
Cities vary in size, starting from only 25,000 inhabitants—the number of city
dwellers specified by Egypt’s General Organization of Physical Planning
(GOPP). In Egypt, population size is the main driving force of urbanisation
* Most of this chapter is derived from Khalil [1].
27
28
Energy Efficiency in the Urban Environment
Energy
resources usage
Desertification
and drought
Climate change
Water
resources
Land use
and forests
Ozone layer
depletion
Biodiversity
loss
Population pressure
FIGURE 2.1
Relationships among desertification, climate change and biodiversity. (Adapted from The United
Nations Economic Commission for Africa (UNECA) and North Africa Office, The fight against
desertification and drought in North Africa, The Eighteenth Meeting of the Intergovernmental
Committee of Experts, United Nations Economic Commission for Africa, Tangiers, Morocco, 2008.)
and in the quest for fulfilling their needs in an urban context. Another
dimension related to population pressure in urban contexts is a city’s growing size and its impact on climatic change. This is only one part of the
environmental chain of energy use, ozone depletion, desertification and biodiversity loss, as shown in Figure 2.1 [5].
2.2.1.1 Mega Growth, Mega Complexity
The megacity is a relatively new form of urban development. In 1950, there
were only two cities with populations of more than 10 million: New York
and Tokyo. By 1975, two more locations, Shanghai and Mexico City, joined
the club. However, by 2004, the number of megacities had rocketed to 22 and,
together, these cities now account for 9% of the world’s urban population.
It is important to note that:
1. Mega cities’ importance in the national and global economy is
disproportionately high.
2. City governance has to adapt to the challenge of delivering holistic
solutions across vast metropolitan regions.
3. City managers must strike the balance between three overriding
concerns: economic competitiveness, environment and quality of
life for urban residents.
Urban growth is spread unequally around the world, and the same is
true of its largest cities. Most of the megacities in the developed world are
growing slowly, if at all. Tokyo remains the largest with 35 million inhabitants, but the fastest growth will be in the developing world (particularly in
Asia and Africa), placing huge pressure on infrastructure in those locations.
By 2020, Mumbai, Delhi, Mexico City, São Paulo, Dhaka, Jakarta and Lagos
Energy Efficiency Strategies in Urban Planning of Cities
29
will each have populations of more than 20 million. Moreover, it is estimated
that between 2010 and 2015 some 200,000 people on average will be added to
the world’s urban population every day with 91% of this increase expected
to take place in developing countries [6]. For many emerging cities, soaring
populations are extremely difficult to manage; at current rates of growth,
the number of inhabitants in Nigeria’s Lagos will double by 2020, mainly
through expansion of informal settlements. By contrast, most mature cities
(as well as many transitional ones) will need to address a different kind of
demographic challenge in the form of population ageing.
There is a continuous debate about megacities. On one level, these supersized cities are seen as the engines of the global economy, efficiently connecting the flow of goods, people, culture and knowledge. They offer, at least
potentially, unprecedented concentrations of skills and technical resources
that can bring increased wealth and improved quality of life to vast numbers
of people. However, megacities also conjure up an altogether darker vision.
Most cities in the developing world face huge challenges ranging from congestion and pollution to security threats and inadequate services groaning
under the weight of excessive demand. Those in the developing world also
struggle to cope with the rapid growth of informal settlements. In 2006,
almost one in three members of the world’s urban population lives in slums,
without access to good housing or basic services [7].
Today’s megacities are not only bigger than the cities of the mid-20th c entury
but also more complex. For one, they are increasingly competing with, and
dependent on, relationships with other cities in the global economy. At the
same time, we are witnessing the emergence of new city regions—sprawling
conurbations that extend far beyond the boundaries of a single city. Examples
include the ‘BosWash stretch’ (extending from Boston, MA, to Washington, DC)
in the United States, and Chongqing in China. These huge megacity regions
create a new urban dynamic. Commuters travel large distances from densely
populated suburbs. Economic activity frequently becomes de-concentrated,
dissipating from the centre to the periphery. Often fragmented systems of metropolitan governance have not caught up with this trend, with the result that it
is difficult to deliver an efficient, holistic approach to infrastructure challenges
at a metro regional level [8]. In addition, other new spatial configurations are
increasingly taking place, such as urban corridors and city regions. These large
urban configurations, as grouped in networks of cities, amplify the benefits of
economies of agglomeration, increasing efficiencies and enhancing connectivity. They also generate economies of scale that are beneficial in terms of labour
markets, as well as transport and communication infrastructure, which in turn
increase local consumer demand [6].
2.2.2 Role and Competitiveness
In the context of continuous globalisation, there is a focus on competitiveness to attract investments to increase cities’ prosperity. In this quest, there is
30
Energy Efficiency in the Urban Environment
a struggle among economic competitiveness and employment, environment
and quality of life.
Megacities prioritise economic competitiveness and employment. In a study
of which issues drive decision making in 25 megacities around the world,
81% of stakeholders involved in city management cited the importance of
the economy and employment. There is a strong focus on creating jobs, with
unemployment emerging as the top economic challenge for survey respondents from emerging and transitional cities. Competitiveness in the global
economy is another important consideration. Six in ten stakeholders think
that their cities place a high importance on making themselves competitive to
attract private investment when deciding infrastructure issues [8].
Despite this inclination towards economic competitiveness, development
decisions often involve difficult trade-offs between growth and greenness
or growth and quality of life. There are obvious interdependencies among
the three concerns. Competitive cities are more likely to have the wealth and
resources to invest in high-quality infrastructure and services and to create
economic and social opportunities for large numbers of the urban population. All things being equal, environmentally clean, modern cities are more
attractive locations for a broad spectrum of business activities than those
with heavy pollution. Equally, cities with a healthy, well-educated urban
population are better positioned to attract investment than those where
deprivation and inequality block a large portion of the population from participating in economic growth. This suggests that, in the long run, focusing
on one of these concerns to the detriment of the others will be a recipe for
failure (as shown in Figure 2.2) [8].
Therefore, cities need modern, efficient infrastructures, especially transportation networks. Abundant (and preferably skilled) labour together with
modern information and communications technologies are also hugely
important, as evidenced by the offshoring trend that has itself fuelled
the growth of cities such as Bangalore in India. Another crucial factor is the
Competitiveness
Governance
Quality of life
Environment
FIGURE 2.2
Striking a balance among quality of life, competitiveness and environment should be the main
concern of megacities’ governance.
Energy Efficiency Strategies in Urban Planning of Cities
31
quality of basic services; people with access to quality housing, education
and good basic services such as water and electricity are much more likely
to fulfil their potential and to contribute to economic growth. The wider
business environment is also a key factor; research from the Economist intelligence unit indicates that clear, business-friendly policies and regulations
are more important factors in attracting international investment than
i ncentives such as subsidies and tax breaks [8].
Whatever their potential, however, many of today’s megacities feature
a catalogue of environmental problems. Congestion, air and water pollution, waste management and degradation of green areas are familiar issues
in most large cities around the world, and they are particularly extreme in
the megacities of the developing world. There are also huge inequalities in
the distribution of wealth and in economic opportunity among cities. In its
recent report on urbanisation trends, UN-Habitat describes cities as ‘the new
locus of poverty’. World Bank estimates predict that although rural areas are
currently home to a majority of the world’s poor, by 2035 cities will become
the predominant locations of poverty [8].
The consequences of a failure to improve quality of life for the urban poor
are huge. The UN-Habitat research indicates that people living in slums,
where a large proportion of the urban poor reside, are more likely to be
affected by child mortality and acute respiratory illnesses and by waterborne diseases than are their non-slum counterparts. They are also more
likely to live near hazardous locations, making them more vulnerable to
natural disasters such as floods. Inadequate access to basic services saddles
them ‘with heavy health and social burdens, which ultimately affect their
productivity’ [7]. Poverty may be less extreme in the more developed cities,
but social problems still abound.
Historically, cities tend to get rich first and then clean up later. Unfortu
nately, that approach could be disastrous in the context of climate change;
this is one reason for the growing focus on sustainable urban development.
Sustainable solutions promote greater use of alternative energy sources and
more energy-efficient buildings and transport, measures to combat congestion and CO2 emissions, water and waste recycling, and the use of vegetation
to filter pollution and capture carbon dioxide. Although several cities have
started implementing at least some of these measures to good effect, there
will be a need for more concerted efforts if the environmental cost of urbanisation is to be reduced.
Consequently, it is not growth and economic prosperity that cities should
seek; it is rather a more sustainable development that combines efficiency,
accountability and environmental responsiveness. This is a goal that comprises the main core of the Sustainable Cities Programme (SCP), a worldwide
technical cooperation activity of the United Nations. The SCP works at the
city level in c ollaboration with local partners to strengthen their capabilities
for environmental planning and management. Each city-level SCP project
is adapted to the particular needs, priorities and circumstances of that city;
32
Energy Efficiency in the Urban Environment
onetheless, all SCP city projects follow the same general approach, and all
n
are implemented through the same series of activities known as the SCP
process [9].
The SCP recognises that environmental deterioration is not inevitable.
Although many, perhaps even most, cities are still suffering severe environmental and economic damage, there are encouraging signs. Some cities
are learning how to better plan and more effectively manage the process of
urban development, avoiding or alleviating environmental problems while
realising the positive potentials of city growth and change. The SCP aims to
support cities in finding—and managing—development paths that are more
effectively fitted to their environmental opportunities and constraints.
There is a common approach that is shared by all SCP cities and that holds
true across the full range of partner cities [9].
1.
2.
3.
4.
5.
6.
Central focus on development–environment interactions
Broad-based participation by public, private and community groups
Concern for inter-sectoral and inter-organisational aspects
Reliance on bottom-up and demand-led responses
Focus on process – problem-solving and getting things done
Emphasis on local capacity building
More recent initiatives in this field are promoted by various organisations. The Urban Low Emission Development Strategies (LEDS) project,
funded by the European Commission and implemented by UN-Habitat and
the International Council for Local Environmental Initiatives (ICLEI),* has
the objective of enhancing the transition to low emission urban development in emerging economy countries. It offers selected local governments in
Brazil, India, Indonesia and South Africa a comprehensive m
ethodological
framework (the GreenClimateCities methodology)† to integrate low-carbon
strategies into all sectors of urban planning and development. Another
initiative is the Cities and Climate Change Initiative (CCCI) that builds
on UN-Habitat’s long experience in sustainable urban development. The
i nitiative helps c ounterparts to develop and implement pro-poor and innovative climate change policies and strategies. CCCI also is developing a suite
* ICLEI Local Governments for Sustainability is the world’s leading association of more than
1000 metropolises, cities, urban regions and towns representing over 660 million people in
86 countries. ICLEI promotes local action for global sustainability and supports cities to
become sustainable, resilient, resource efficient, biodiverse, low carbon; to build a smart
infrastructure; and to develop an inclusive, green urban economy with the ultimate aim of
achieving healthy and happy communities. Website: http://www.iclei.org
† ICLEI’s GreenClimateCities programme offers a process to local governments integrating
low emission alternatives into their planning processes and policies. It has a clear methodology, with guidance and/or tools provided for each step. For further information, refer to
http://www.iclei.org/our-activities/our-agendas/low-carbon-city/gcc.html
Energy Efficiency Strategies in Urban Planning of Cities
33
of tools to support city leaders and practitioners in addressing the impact of
climate change (adaptation) and to help to reduce greenhouse gas emissions
(mitigation) [10].
2.3 Cities and Energy Consumption: The Microlevel
Within planning research, it is commonly assumed that the design and
location of residential areas have important consequences for households’
energy consumption for housing and transport. It is believed that p
hysical
planning and design make it possible to achieve a more sustainable consumption pattern. Mainly there are four distinct consumption categories:
energy use for cooling/heating and operating the house; energy use for
everyday travel; energy use for long leisure-time travel by plane; and energy
use for long leisure-time travel by car.
2.3.1 Urban Pattern
In their study of the relationship between urban planning and energy
consumption, Holden and Norland pose the question: Does the change of
urban forms tend to reduce the frequency and length of journeys and, hence,
energy consumption? To this day, the disagreement persists and the critiques
against planning have many different forms, including [11]:
1. Claims that engine technology, taxes on gasoline and driving,
and road pricing are more effective measures for reducing energy
consumption than urban planning [12,13].
2. The assertion that socioeconomic and attitudinal characteristics of
people are far more important determinants of travel behaviour than
urban form. Critics in this matter emphasise that the importance of
form is highly overestimated in empirical studies [14].
3. Casting doubt on the assumption that proximity to everyday services and workplace will contribute to reduced travel in a highly
mobile society [15,16].
4. That the relationship between non-work travel, especially long
leisure-time travel, and urban form has been neglected [17].
5. The assertion that travel preferences rather than urban form influence travel behaviour: People live in city centres because they prefer
to travel less, and not that they travel less because they live in city
centres (the ‘self-selection bias’) [13].
Even though these aspects should not be taken lightly, there seems to
be overwhelming support in the literature for the idea that planning does
34
Energy Efficiency in the Urban Environment
atter in determining the level of energy consumption in urban areas. This
m
view is based on theory and empirical studies advocating that planning is
an important instrument for promoting sustainable development.
2.3.1.1 Compact versus Dispersed Development
When it comes to land-use characteristics that influence energy use for everyday transport, Næss concludes that the following characteristics are favourable for reducing energy use per capita: high population density for the city
as a whole; high density within each residential area; centralised settlement
within cities and towns (i.e. higher density in the inner part than on the
fringe); centralised workplace location; low parking capacity at workplaces;
decentralised concentration at the regional level; and a high population for
each city [11,18].
The main principle in the compact city theory is high-density development
close to or within the city core with a mixture of housing, workplaces and
shops. This implies densely and concentrated housing development, which
favours semidetached and multifamily housing. Under this theory, development of residential housing areas on (or beyond) the urban fringe, and
single-family housing in particular, are banned. Furthermore, central, highdensity development supports a number of other attributes that are favourable to sustainable energy use: low energy use for housing and everyday
travel, efficient remote heating/cooling systems, proximity to a variety of
workplaces and public and private services, as well as a highly developed
public transport system.
The supporters of the compact city theory [19–24] believe that the compact
city has environmental and energy advantages, as well as social benefits.
The list of advantages is remarkably long, including a better environment,
affordable public transport, the potential for improving the social mix and a
higher quality of life [25]. However, the main justification for the compact city
is that it results in the least energy-intensive activity pattern, thereby helping
us cope with the issues of global warming. The supporters of the dispersed
city suggest that the green city—that is, a more open type of urban structure,
where buildings, fields and other green areas form a mosaic-like pattern [11,18].
The list of arguments against the compact city theory is even longer than
the list in support of it and includes: that it rejects suburban and semirural living, neglects rural communities, affords less green and open space,
increases congestion and segregation, reduces environmental quality and
lessens the power for making local decisions [11,25].
However, until fairly recently, an international consensus favouring the
compact city as a sustainable development approach has dominated the
debate [26]. Although there has always been considerable scepticism, the concept of the compact city has been so dominant that it seems inconceivable
that a nyone would oppose the current tide of opinion towards promoting
greater sustainable development and the compact city in particular [27].
Energy Efficiency Strategies in Urban Planning of Cities
35
Consequently, it is not surprising that the ‘move towards the compact city is
in the mainstream throughout Europe’ [28, p. 275].
The disagreements between the compact city and dispersed city discourses
can be summarised to a large extent as a debate about two issues—which
form affords the greater energy efficiency, and which aspects of sustainable
development are more important?
The relationship between urban form and energy efficiency—especially
energy use for travel—is at the core of the sustainable urban form debate.
During recent decades, there has been a multitude of empirical studies supporting the relative energy efficiency of the two urban forms. Boarnet and
Crane worked through this literature and came to a rather surprising conclusion: ‘Very little is known regarding how the built environment influences
travel’ [13, p. 4]. Although these authors were referring to the United States,
we find the same scepticism in Europe. Williams et al. conclude that ‘A great
deal still needs to be learnt about the complexity of different forms and their
impacts’ [29, p. 335]. This includes the relationship between urban compactness and travel patterns. A possible relationship between the built form and
long leisure-time travel by car and plane is a part of this new knowledge that
has to be learned [11].
The possible impacts of urban forms are not limited to travel behaviour.
The built form also influences social conditions, economic issues, environmental quality and ecology within the city [29]. All these aspects are also
important parts of the sustainable development concept and therefore can be
used as criteria for a discussion about sustainable urban form. It should come
as no surprise that a study that has minimising energy consumption as an
overall goal could easily reach different conclusions from those of a study that
aims at using urban form to ‘reduce the number of people exposed to fine particles’ or to ‘promote social equity’. In the end, it will be necessary to balance
these impacts because sustainable urban form is ultimately about values [30].
The dispute between the two camps has led to the development of a number of middle positions, which try to combine the best aspects of the compact
and the dispersed city discourses, while at the same time trying to avoid the
disadvantages of each. Among such alternative middle positions are the
urban village [31,32], ‘New Urbanism’, the sustainable urban matrix [33],
transit-oriented development [13], smart growth [34] and decentralised concentration [35–37], and sustainable urbanism [38]. These alternatives all try
to combine the energy efficiency gained from a compact urban form with the
broader quality-of-life aspects gained from the dispersed city. Still, whether a
specific urban form will be more energy efficient is an empirical question [11].
2.3.1.2 Density
Much of the concern with density in planning and other related fields has
been over high urban density and its assumed negative effect on the quality
of life of urban residents. The city has historically been perceived to be a place
36
Energy Efficiency in the Urban Environment
of overcrowding, noise, dirt, crime, poverty, disease and so forth [39–41].
The high density existing in cities during the early period of the Industrial
Revolution was seen as one of the major culprits of poverty and disease.
As a result, planning controls (in Canada and Great Britain, for example)
usually specified maximum densities. The planning reaction was a strong
movement towards lower density housing outside of the city. In the United
States and Canada, this took the form of a move to the suburbs, but in Great
Britain and Sweden, it resulted in garden cities [41,42]. Radberg describes
the garden city movement as representing decentralised urban growth [39].
The assumption was that these relatively low-density residential areas would
not suffer from the ills found in high-density cities and would offer a higher
quality of life to residents [43].
More recently, there have been many second thoughts on, and strong criticisms of, these trends. Environmentalists express concern about the environmental implications of low density [44], and urbanists are concerned about
the decline of the city [19,40] or of the community [45,46]. Questions about low
densities also have been posed by those who are concerned about the efficient
use of land and public services [40]; by feminists and researchers who argue
that low-density suburbs are hostile to women’s lives—especially employed
women with children and single parents [47] and by sociologists who criticise
the social homogeneity and the social segregation in these low-density areas
[46,48]. There are some, of course, who mention all of these problems [43,49].
In 1994, a detailed set of principles were set out in Sustainable Development:
The UK Strategy (Department of the Environment 1994a), which was subject to
further revision in 1999 (UK Government’s Strategy for Sustainable Development
1999). In this strategy, the land-use planning system was targeted for specific
treatment and the foundations laid for more recent policy statements on car
usage and urban layouts [50]:
(24.20) Urban growth should be encouraged in the most sustainable
settlement form. The density of towns is important. More compact urban
development uses less land …
The scope for reducing travel, especially by car, is dependent on the
size, density of development, and range of services on offer …
(24.26) Town and city centres must incorporate the best principles of
urban design …
Indeed, the commission recommended that planning guidance should
increasingly reflect the growing sustainable agenda and should become much
more integrated with other public policy areas, notably economic policy [49].
Hitchcock [51] and Orchard [52] direct attention to the fact that, on the
whole, the discussion about increasing density and reducing urban land consumption concentrates almost totally on residential densities. It neglects all
of the other land uses that make up a city, even though these land uses represent a significant proportion of a city’s total land area. If these non-residential
land uses are not taken into account, the reduction in land consumption
Energy Efficiency Strategies in Urban Planning of Cities
37
achieved by increasing residential density will not be as great as initially
conceived because services and amenities will have to be augmented to
accommodate the increased population [43].
There are a number of advantages from increasing densities, which can be
summarised as follows [43]:
1. It can help protect agricultural land from urbanisation.
2. It results in less depletion of the natural resources needed for construction purposes [53].
3. Built forms that facilitate higher net densities may result in significant reductions in energy demands [15,54]. Energy use within buildings can be reduced by passive solar architecture, superior insulation
and energy-saving technology [54] or by built forms with low-surface
areas and combined heat/cooling and power systems [55]. Owens [15]
notes that very different densities (ranging from 37 to 250 dwelling
units per hectare) are attainable using combined heat and power systems, depending on discount rates and fuel prices.
4. Decreased pollution from vehicle exhausts can be achieved as a result
of a decline in the use of cars, the mixing of land uses, the provision
of efficient and accessible public transportation, and walking [15,54].
High densities have been found to be associated with lower gasoline
consumption per capita [35,56]; however, this is a controversial issue
[28,52,57].
5. Decreased emission of pollutants may result from energy-saving
land-use plans and from energy-efficient buildings [53].
6. High density may result in a decrease in the total number of car
trips [53]. Nasar found lower automobile dependency scores in highversus low-density neighbourhoods [58]. These differences were greater
for older people, women and households with no children. A decrease
in the number of kilometres per trip may also result [54,59–61].
7. High density has been found to be related to a higher proportion of
travel on public transit, to greater public transit service provision per
person and to transit use by a higher proportion of workers [20,35].
Increased public transit use, in turn, may reduce pollution emissions
(an environmental advantage).
8. High density enhances the opportunity to use public transportation because high density brings the development of public transportation systems to the thresholds of profitability and efficiency.
The report prepared by Berridge Lewinberg Greenberg, Ltd. adopts
several benchmarks for the relationship between residential density
and transit use. It suggests that 17–75 dwelling units per net hectare are necessary to sustain significant transit use, and 150 dwelling units result in a modal split of different transportation types in
which more than 50% are public transit [62].
38
Energy Efficiency in the Urban Environment
9. As a result of an increase in transit use, traffic congestion in residential, work and commercial centres may decrease [62].
10. Public transit can be more energy efficient. Handy highlights that it
is the set of choices correlated with density—not density itself—that
shapes travel behaviour [63]. In this context, Bannister discusses the
interaction between socioeconomic circumstances and people’s propensity to travel with different frequencies, trip lengths and transportation modes [59]. Moreover, gender should be added to these
intervening variables [64]. Self debates the effect that a change in
density would make. He claims, for example, that a 50% increase in
the density of Canberra, Australia, would produce only a modest
increase in public transit use [65].
11. It offers more opportunities to walk or ride a bicycle to work, service
and entertainment facilities [59,60].
12. High densities may result in economies of scale that facilitate the use
of better quality and more attractive building materials [51].
13. It enables the use of a building complex as an element of the urban
composition. It also allows for a variety of densities and types of
construction in a given region. Variation in density and construction, in turn, makes the environment more interesting [51].
14. High-density development in the proximity of public transportation
lines can decrease the demand for land located further from these
lines [66].
15. High-density development as infill in existing areas can revitalise
those areas and can reduce the pressure to develop open spaces [61].
On the other hand, urban density is a major factor that determines the
urban ventilation conditions, as well as the urban temperature. Under given
circumstances, an urban area with a high density of buildings can experience
poor ventilation and strong heat island effect. In warm-humid regions, these
features would lead to a high level of thermal stress of the inhabitants and to
increased use of energy in air-conditioned buildings. However, it is also possible that a high-density urban area, obtained by a mixture of high and low
buildings, could have better ventilation conditions than an area with lower
density but with buildings of the same height. Closely spaced or high-rise
buildings are also affected by the use of natural lighting, natural ventilation
and solar energy. If not properly planned, energy for electric lighting and
mechanical cooling/ventilation may be increased and a pplication of solar
energy systems will be greatly limited [67].
2.3.2 Land-Use Distribution and Home–Work Trip
The distribution of uses over the city plan is the main driving or restraining
force of transportation. It is those trips made to different facilities that shape
Energy Efficiency Strategies in Urban Planning of Cities
39
our daily activities, whether going to work, or using educational, health
or other public services, or just for leisure. Housing location influences the
distances to different types of facilities, and the spatial location of most of
these facilities suggests that average travel distances will be shortest for
inner-city residents. However, there are claims that high accessibility to different services might create an increased demand for transport. Moreover,
opting for a wider range of jobs, shops and leisure activities might establish
the need for more everyday travel.
2.3.2.1 New Urbanism and Transit-Oriented Development
In urban design literature, the development of what is loosely referred to as
‘New Urbanism’ applies a raft of sustainable objectives to new urban layouts.
The evolution of this movement may be traced to the development of urban
villages (in the UK) and sustainable growth management projects, also known
as New Urbanism (in the United States), that have been ‘directed toward
creating an alternative to the typical car-dominated suburban sprawl that predominates on the fringe of virtually all western cities and towns’ [68, p. 207].
The main design concept in New Urbanism is the creation of a ‘module’ or
‘ped-shed’ (walkable urban design and sustainable place making). It is made
up of a walkable neighbourhood with a 400-m radius to shops, services and
transport nodes in which the fabric creates a series of interconnected pedestrian friendly streets. It does not necessarily ban the private car; however, it
serves to ‘maximize interaction while minimizing the travel needed to do it’
[68, p. 209]. The logic is that there will be a dramatic reduction in car parking provision. It decreases from the predominant post-war patterns of two
or three spaces per dwelling to one space or less. Consequently, a link is
established between reduced car parking standards and the design of mixed
uses, small street blocks and interconnected streets [69]. At a more fundamental level, conventional Western post-war car parking layouts are challenged by the need to raise residential densities to make for greater land-use
efficiencies [70] and to foster non-car-based trip generation where a provision of less than one space per dwelling is a desirable objective [71]. Morris
and Kaufman acknowledged that this focus on New Urbanism will make a
significant contribution to achieving more sustainable cities, yet they voiced
concern that ‘While the intentions and potential to re-shape cities and towns
towards less car dependence is a strong thrust of many practitioners of new
urbanism, the evidence of major gains on the ground is limited’ [68, p. 208].
The two approaches, New Urbanism and transit-oriented development,
do not target increasing densities—any increase in density that is achieved
is basically a by-product of a minimal nature. The emphasis of the New
Urbanism movement is on small towns. New urbanists envision towns or
neighbourhoods that are compact, mixed use and pedestrian friendly [42].
The emphasis of transit-oriented development, whose principal proponent is
Calthorpe [49,72], is to plan balanced, mixed-use areas with a simple cluster
40
Energy Efficiency in the Urban Environment
of housing, retail space and offices within a one-quarter mile walking radius
of a light rail system. The motivation for transit-oriented d
evelopment is to
improve the ills brought about by dependence on the automobile and the
mismatch that exists between old suburban patterns and the post-industrial
culture. The goal is to preserve open space and reduce automobile traffic
without necessarily increasing density. Calthorpe [73] defines average net
residential densities of urban transit-oriented developments as 44 dwelling units per hectare, with densities of 62–123 units per hectare for up to
three-story apartment buildings [43,72].
2.3.2.2 Long-Distance Leisure Time Travel: Compensatory Travel?
An important question that arises from looking at the wider issue of energy
use and greenhouse gas emissions is whether, for certain income levels,
reduced local everyday travel will be compensated for by increased longdistance leisure travel at other times. Is it the case that—for certain income
levels—the sum of ‘environmental vices’ is constant and that households
managing on a small everyday amount of transport create even heavier environmental strain through, for instance, weekend trips to a cottage or longdistance holiday trips by plane? In the professional debate, some [73] have
claimed that people living in high-density, inner-city areas will, to a larger
extent than their counterparts living in low-density areas, travel out of town
on weekends—for instance, to a cottage—in order to compensate for the lack
of access to a private garden. In addition to this ‘hypothesis of compensation’, others, including the Swedish mobility researcher Vilhelmson [74],
have launched a ‘hypothesis of opportunity’, which asserts that the time and
money people save due to shorter distance daily travel will probably be used
for long-distance leisure-time travel [11].
A study conducted in Norway suggested that the total energy use
decreases as density reaches a certain point, although the data indicate
that the total energy use increases at higher density levels. This pattern is
similar to a p
attern in the relationship between energy use and city size
found by a number of empirical studies of cities in Norway, Sweden and
England [18]. According to these studies, up to a certain point, energy use
per capita decreases as density increases, but thereafter energy use starts
to increase. Thus, the advantages of ‘megacities’ or ‘extreme density areas’
seem to be outweighed by the advantages offered by more modest forms of
urban compactness [11].
2.3.3 Road Network and Transportation Network
Transportation is the leading consumer of energy and fuel in the city.
The spread of roads among extended urban areas has helped people easily commute within these vast areas, thus making distances irrelevant and
promoting more and more dispersion.
Energy Efficiency Strategies in Urban Planning of Cities
41
2.3.3.1 Road Network
The road network connects the various parts of the city and connects the city
with its surrounding context. Thus, it contributes to the efficiency of the city,
the flow of people and goods, and consequently to the economic cycle.
However, the emphasis on road network design has created not so lively
neighbourhoods. This was expressed by The Prince’s Foundation when
examining ‘Sustainable Urban Extensions’ in the UK, in which the problem
is summarised thus:
House builders place a high priority on complying with rules and guidance on highway engineering. They are anxious that their estates’ street
system should be adopted by the local authority with the minimum
of negotiation and delay. Estates are consequently designed around
road layouts based on loops, dead-end spines and cul-de-sacs, whose
principal aim is to handle road traffic as efficiently and safely as possible.
But as well as discouraging travel on foot or by bicycle, these ‘roads first–
houses second’ designs can damage the harmonious grouping of houses
and visual quality…. [75, p. 1]
2.3.3.2 Transportation
Because a compact city strategy is recommended to be adopted, an emphasis
on the development of rail transport of great accessibility, safety, sustainability and environmental friendliness is the main target. In a study conducted
in 25 megacities, the following was found [8]:
1. Transportation is seen as the single biggest infrastructure challenge
by a large margin and is a key factor in city competitiveness.
2. With air pollution and congestion emerging as the two top environmental challenges, stakeholders predict a strong emphasis on mass
transit solutions.
3. Cities are more likely to focus on incremental improvements to existing infrastructure, rather than on new systems.
4. Demand management is rarely mentioned as a major strategy for
addressing the cities’ transport problems.
2.3.3.3 Parking
Parking policy is commonly viewed as a complementary measure to reduce
car use when combined with other initiatives. Sustainability seeks to establish less reliance than previously existed on private car usage—for example,
by promoting compact urban development in areas well served by good public transport. Urban design policy promotes a departure from the ‘roads first,
houses later’ philosophy (as dictated by many highway standards) to give
42
Energy Efficiency in the Urban Environment
precedence to the relationship among buildings rather than strict adherence
to predetermined road design in new residential environments. A new design
approach to car parking has emerged where there is a shift from the previously adopted orthodoxy of minimum standards to maximum ceilings (i.e. no
more than one space per dwelling). Such a trend towards reduction of parking
standards (and thus provision) is at variance with the projected growth in car
ownership worldwide [50].
Research studies clearly demonstrate that a trade-off exists between relaxing current car parking standards and raising residential density [70,76].
Urban design commentators and practitioners increasingly lobby in favour
of a ‘car-free urbanism’ in which the sustainable residential neighbourhood
is based on radical rethinking of density and parking policy. The avoidance
of inflexible standards will yield improved layouts, so that urban design can
reclaim the city back from the car [77].
2.3.4 Buildings: Form, Height and Facade Treatment
Globally, buildings are responsible for approximately 40% of the total world
annual energy consumption. Most of this energy is for the provision of lighting, heating, cooling and air conditioning [67].
One way of reducing building energy consumption is to design buildings
that are more economical in their use of energy for heating, lighting, cooling, ventilation and hot water supply. Passive measures, particularly natural
or hybrid ventilation rather than air conditioning, can dramatically reduce
primary energy consumption. However, exploitation of renewable energy
in buildings and agricultural greenhouses can also significantly contribute
towards reducing dependency on fossil fuels. Therefore, promoting innovative renewable applications and reinforcing the renewable energy m
arket
will contribute to preservation of the ecosystem by reducing emissions
at local and global levels. This will also contribute to the amelioration of
environmental conditions by replacing conventional fuels with renewable
energies that produce no air pollution or greenhouse gases. The provision
of good indoor environmental quality while achieving energy and costefficient operation of the heating, ventilating and air-conditioning (HVAC)
plants in buildings represents a multivariant problem. The comfort of building occupants is dependent on many environmental parameters including
air speed, temperature, relative humidity and quality in addition to lighting
and noise. The overall objective is to provide a high level of building performance (BP), which can be defined as indoor environmental quality (IEQ),
energy efficiency (EE) and cost efficiency (CE).
IEQ is the perceived condition of comfort that building occupants experience due to the physical and psychological conditions to which they are
exposed by their surroundings. The main physical parameters affecting
IEQ are air speed, temperature, relative humidity and quality. EE is related
to the provision of the desired environmental conditions while consuming
Energy Efficiency Strategies in Urban Planning of Cities
43
the minimal quantity of energy. CE is the financial expenditure on energy
relative to the level of environmental comfort and productivity that the
building occupants attained. The overall CE can be increased by improving
the IEQ and the EE of a building [67].
Urban planning has a considerable impact on the future EE of buildings,
and planners lack useful tools to support their decisions. A study was made
presenting a new method based on a genetic algorithm that is able to search
for optimum urban forms in mid-latitude climates (35–50°). Here, more
energy-efficient urban forms are defined as those that have high building
absorptance in winter and low summer building absorptance. These forms
can be designed by choosing among regular tridimensional building geometries with fixed floor space indices, which can be parameterised by adjusting
the following variables: number of floors, building length ratio, grid azimuth
and aspect ratio on both directions. The results obtained show that adequate
urban planning, based on the consideration of the local radiation conditions
as a function of latitude, may result in significantly better building thermal
performance. In particular, it is concluded that the highest latitudes are more
restrictive in terms of optimal solutions: pavilions (cross-sectional square
blocks) are the best solutions for latitudes of 50° and terraces (blocks infinite
in length) are preferred for 45°. For lower latitudes, all urban forms are possible. In terms of grid angle with the cardinal direction, it is concluded that
the angle should stay between −15° and +15°, except for the latitude of 50°
where it can ranges from −45° to +45°. For slab and terrace urban forms, the
spacing between blocks in the north–south direction should be maximised,
quantified by a building-height-to-street-width (aspect) ratio that decreases
with the increase of latitude, ranging from 0.6 for a latitude of 35°, to 0.4 for
a latitude of 45°. For pavilions, the north–south aspect ratio is independent
of latitude and should stay close to 0.7. The pavilion is the urban form that
allows for a larger number of floors [78].
Arguably, the most successful designs were in fact the simplest. Paying
attention to orientation, plan and form can have far greater impact on energy
performance than opting for elaborate solutions. However, a design strategy
can fail when those responsible for specifying materials, for example, do not
implement the passive solar strategy correctly. Similarly, cost-cutting exercises can seriously upset the effectiveness of a design strategy. Therefore, it is
imperative that a designer fully informs key personnel, such as the quantity
surveyor and client, about their design and be prepared to defend it. Therefore,
the designer should have an adequate understanding of how the occupants or
processes, such as ventilation, would function within the building. Thinking
through such processes in isolation without reference to others can lead to
conflicting strategies, which can have a detrimental impact upon performance. Likewise, if the design intent of the building is not communicated to
its occupants, there is a risk that they will use it inappropriately, thus compromising its performance. Hence, the designer should communicate in simple
terms the actions expected of the occupant to control the building [67].
44
Energy Efficiency in the Urban Environment
2.3.5 Renewable Energy
Research into future alternatives has been and is still being conducted to
solve today’s complex problems such as the rising energy requirements
of a rapidly and constantly growing world population and global environmental pollution. Therefore, options for a long-term and environmentally friendly energy supply have to be developed that lead to the use of
renewable sources (water, sun, wind, biomass, geothermal, hydrogen) and
fuel cells. Renewables could shield a nation from negative effects in the
energy supply, pricing and related environmental concerns. For many
years, hydrogen (for fuel cells) and the sun [for photovoltaics (PVs)] have
been considered as likely and eventual substitutes for oil, gas, coal and uranium. They are the most abundant elements in the universe. The use of
solar energy or PVs for everyday electricity needs has distinct advantages:
avoiding consuming resources and degrading the environment through
polluting emissions, oil spills and toxic by-products. A 1-kW PV system
producing 150 kWh each month prevents 75 kg of fossil fuel from being
mined. It avoids 150 kg of CO2 from entering the atmosphere and keeps
473 L of water from being consumed. Electricity from fuel cells can be used
in the same way as grid power—to run a ppliances and light bulbs and even
to power cars because each gallon of gasoline p
roduced and used in an
internal combustion engine releases roughly 12 kg of CO2, a greenhouse
gas (GHG) that contributes to global warming [67].
Sunlight is not only inexhaustible but also only energy source that is
completely non-polluting. The World Summit on Sustainable Development
held in Johannesburg in 2002 committed itself to ‘encourage and promote
the development of renewable energy sources to accelerate the shift towards
sustainable consumption and production’. Accordingly, it aimed at breaking
the link between resource use and productivity. This can be achieved by the
following:
1. Trying to ensure economic growth does not cause environmental
pollution
2. Improving resource efficiency
3. Examining the whole life cycle of a product
4. Enabling consumers to receive more information on products and
services
5. Examining how taxes, voluntary agreements, subsidies and regulation and information campaigns can best stimulate innovation and
investment to provide cleaner technology
Until 2002, renewable energy contributed as much as 20% of the global
energy supply worldwide [79]. More than two-thirds of this came from biomass use, mostly in developing countries, some of it unsustainable. Yet, the
Energy Efficiency Strategies in Urban Planning of Cities
45
potential for energy from sustainable technologies is huge. On the technological side, renewables have an obvious role to play. In general, there is no
problem in terms of the technical potential of renewables to deliver energy.
Moreover, there are very good opportunities for Renewable Energy Targets
(RETs) to play an important role in reducing emissions of GHGs into the
atmosphere, certainly far more than have been exploited so far. However,
there are still some technical issues to address in order to cope with the intermittency of some renewables, particularly wind and solar. Yet, the biggest
problem with relying on renewables to deliver the necessary cuts in GHG
emissions is more to do with politics and policy issues than with technical
ones [79]. For example, the single most important step governments could
take to promote and increase the use of renewables is to improve access for
renewables to the energy market. This access to the market needs to be under
favourable conditions and, possibly, under favourable economic rates as well.
One move that could help, or at least justify, better market access would be
to acknowledge that there are environmental costs associated with other
energy supply options and that these costs are not currently internalised
within the market price of electricity or fuels [67].
Renewables are generally weather dependent and as such their likely
output can be predicted but not controlled. The only control possible is
to reduce the output below that available from the resource at any given
time. Therefore, to safeguard system stability and security, renewables
must be used in conjunction with other, controllable, generation and with
large-scale energy storage. There is a substantial cost associated with this
provision.
The recent REN21* report (2014) states that renewables have entered the
mainstream as we begin the Decade of Sustainable Energy for All (SE4ALL),†
mobilising towards universal access to modern energy services, improved
rates of EE and expanded use of renewable energy sources by 2030. In 2012,
renewable energy provided an estimated 19% of global final energy consumption, and it continued to grow in 2013. Of this total share in 2012,
modern renewables accounted for approximately 10%, with the remainder
(estimated at just over 9%) coming from traditional biomass. Heat energy
from modern renewable sources accounted for an estimated 4.2% of total
final energy use; hydropower made up about 3.8%, and an estimated 2% was
provided by power from wind, solar, geothermal and biomass, as well as
by biofuels. The combined modern and traditional renewable energy share
* REN21 is the global renewable energy policy multi-stakeholder network that connects a wide
range of key actors. REN21’s goal is to facilitate knowledge exchange, policy development
and joint action towards a rapid global transition to renewable energy.
† The UN Secretary-General’s initiative Sustainable Energy for All mobilises global action to
achieve universal access to modern energy services, double the global rate of EE and double
the share of renewable energy in the global energy mix by 2030. As the newly launched
Decade for Sustainable Energy for All (2014–2024) unfolds, REN21 will work closely with the
SE4ALL Initiative towards achieving its three objectives.
46
Energy Efficiency in the Urban Environment
remained about level with 2011, even as the share of modern renewables
increased. This is because the rapid growth in modern renewable energy is
tempered by a slow migration away from traditional biomass and a continued rise in total global energy demand [80].
It is useful to codify all aspects of sustainability, thus ensuring that all
factors are taken into account for each and every development proposal.
Therefore, with the intention of promoting debate, the following considerations are proposed [67]:
1.
2.
3.
4.
5.
6.
7.
8.
Long-term availability of the energy source or fuel
Price stability of energy source or fuel
Acceptability or otherwise of by-products of the generation process
Grid services, particularly controllability of real and reactive power
output
Technological stability, likelihood of rapid technical obsolescence
Knowledge base of applying the technology
Life of the installation—a dam may last more than 100 years, but a
gas turbine probably will not
Maintenance requirement of the plant
However, the improved energy performance of cities from these kinds of
initiatives is usually being outweighed by the increases in the use of fossil
fuels by private transports that have occurred in recent years. This is the
case all over the developed world, and particularly in the United States
and Australia, where low-density urban sprawl has made it very difficult
to introduce energy-efficient public transport systems. In cities with lowdensity sprawl where most people rely on private cars, it will be particularly
important to introduce new transport propulsion such as fuel cell technology to make private transport and public transport less polluting and more
energy efficient [81].
Really significant breakthroughs in urban EE and introduction of sustainable energy systems in cities will emerge only as a result of major changes
in national energy policy. We have seen some significant breakthroughs in
some countries, but far more needs to be done to t ransform our cities from
fossil fuel junkies to sustainable, future-proof s ystems [81].
Thus, in order to reach a sustainable environment, a combination of policies and actions is essential (as proposed in Figure 2.3). These policies
include sustainable energy production and renewable energy production
as c onsiderations for city planning regarding EE. When these policies are
combined with trends in users’ consumption patterns, a sustainable environment can be reached.
It is important to note that the know-how exists to decrease urban energy
use by 50% or more without significantly affecting living standards, while
47
Energy Efficiency Strategies in Urban Planning of Cities
Sustainable energy
production policies
Renewable energy
production
City planning for
efficiency
Users’ trends
consumption pattern
Sustainable
environment
FIGURE 2.3
The relationship among policies for achieving a sustainable environment.
creating many new local jobs at the same time. There are some initiatives
to improve the EE of cities—for example, The Cities for Climate Protection
Program of the ICLEI. This is a performance-oriented campaign, started in
1993, offering a framework for local authorities to reduce global warming
and waste gas emissions all over the world. This framework includes five
performance milestones (which were implemented by 500 local governments
participating in the campaign in 2004) [82]:
1.
2.
3.
4.
5.
Conduct an energy and emissions inventory and forecast
Establish an emission target
Develop and obtain approval for the local action plan
Implement policies and measures
Monitor and verify results
2.4 City Consumption and City Impact
2.4.1 Ecological Footprint
In order to measure a city’s impact versus its consumption, a more sophisticated analysis has been developed by Rees that can calculate a city’s ecological footprint (EF) [83]. As previously mentioned in Chapter 1, it is based on
an ecological understanding of how a city extracts food, water, energy and
land from a bioregion (and beyond) and what ecosystem services it requires
to absorb its wastes. The total resource use of a city is figured relative to its
population, and the resulting calculation allows a per capita footprint of land
to be compared to that of other cities [84].
48
Energy Efficiency in the Urban Environment
The EF, as previously explained, translates consumption of various types
into a common metric—the total area of productive land and water ecosystems required to produce the resources that the population consumes and to
assimilate the wastes that the population produces, wherever on Earth that
land and water may be located [85]. In calculating the footprint of nations or
regions, the different bioproductivities of various land types are taken into
account; this is achieved by incorporating equivalency factors, such that the
calculated EF is expressed as standardised acres of world-average productivity. EFs quantify humans’ overall impact on nature in relation to carrying
capacity [86]. In 2000, the average global footprint was 6.25 acres per capita,
but there were only 4.8 acres available per person based on the biologically
productive area divided by the world population. Hence, we were in a deficit
of 1.45 acres per person [86], depleting Earth’s natural capital rather than
living off nature’s interest [87]. According to the Global Footprint Network
for 2007, these numbers are 6.7 acres per person as EF per capita worldwide,
while the biocapacity for Earth is only 4.4 acres per capita. Thus, the deficit
has increased to 2.3 acres [88].
The concept of an EF is now firmly ensconced in the environmental
literature and, despite its limitations [89–95], there is considerable support among researchers and environmentalists for the footprint as a clear,
unambiguous indicator of human impact on nature that is easily applied
[85,93,94,96].
One of the important linkages, that is not often drawn, is between EF,
urban density and transport energy. Some commentators have criticised the
use of per capita car use and per capita land use as confounding the statistics
because population is in both denominators [97,98]. However, if the population factor is removed, then it is possible to look at whether land area (the
direct footprint of a city) relates to transport [84].
One inherent weakness of using the EF is that it, like other inventory
tools, is intended to measure impact. The EF is not designed look at cause
and effect. However, where qualitative data provide insight into decision-
making processes and choices, the EF becomes a useful tool for understanding the pathways to different outcomes. Also, the raw data assembled for its
calculation could be used for specific questions of importance in planning
practice.
In addition, the EF could be used by policy makers as part of the approval
process for proposed developments. Rather than restricting development
according to standard urban design codes, developments could be classified by a maximum EF. It would be up to developers and designers to
plan communities that fall within the assigned EF. Rather than crippling
innovation and creativity in urban design through legislation, a maximum
assigned EF would foster new ideas and designs to tackle the sustainability
challenge [87].
A study on the EF in EcoVillage at Ithaca, New York (United States), found
that consumption, not built form, contributes most to the overall footprint;
Energy Efficiency Strategies in Urban Planning of Cities
49
therefore, the link between design and behaviour is of critical importance.
The experiences at EcoVillage at Ithaca suggest that physical design may be
a catalyst or facilitator of some changes in consumption, especially as they
relate to utilities and possibly also to transportation, but no overall conclusion on the interaction between design and behaviour can be drawn from
this study [87].
2.4.2 Sustainability Assessment
The EF helps when assessing development on the global scale, but on the
local scale there is a need for a much more comprehensive tool. A key aspect
to sustainability assessment is the assistance it provides to complex, controversial urban policy issues. One example is the density of cities and planned
developments—a very controversial policy area in some urban settings.
There is a strong global economic rationale for redeveloping car-dependent
cities into focused centres and corridors to make better use of infrastructure at the scale required to provide such local services as public transport,
shops and community services within walking distance. The lesser need for
transport, the reduced urban sprawl and EF, the far greater opportunities for
housing diversity, and other equity issues all provide additional justification
at local and global levels. However, those local residents in the area where
redevelopment is planned often perceive it as a threat to their local environment and social amenity. Sustainability assessment of such development
can ensure there are real global economic, environmental and social benefits
(often regional benefits but they may as well be global for many local people),
but it can also ensure that developers include real local economic, social and
environmental benefits. It can be used to ensure that there is a clear rationale
for any development in terms of local environmental benefit (enhancing the
local sense of place) and of local socioeconomic benefit (clear provision of
better services). With these in place, the local and global issues can be seen to
be resolved and a net benefit provided [84].
‘Good’ planning begins with an assessment of users’ needs [99]. For example, transit stops are located in a way that is sensitive to demand. However,
planning may also help to shape demand. Indeed, the very
existence
of planning reveals some general level of acceptance that land markets
require guidance to ensure the provision of needs but in a sustainable
manner. There are a number of arguments against sprawl; in some cases,
suburban development has devoured many wetlands, with consequences
for future water quality and supply [100,101], while in other parts of the
world it has engulfed arable land. Auto-dependence and associated air pollution have severe implications for those with respiratory problems, and
carbon dioxide emissions may contribute to climate change with unforeseeable consequences [87].
Cities will always be centres of consumerism. However, we can change
the way they utilise resources. This can be done by conceptualising cities as
50
Energy Efficiency in the Urban Environment
sustainable ecotechnical systems, which requires converting their largely
linear resource throughput into circular resource flows. EE, resource produc
tivity, and urban and industrial ecology are key terms in this context [78].
2.5 Roles of Stakeholders in Planning for EE
2.5.1 Legislations and Laws Addressing Environmental Issues
In order to achieve more energy-efficient cities, where development is sustainable and environmentally responsive, laws and legislations should play
a vital role. In 2000, the city of Barcelona introduced its mandatory ‘solar
ordinance’. All new housing, offices, restaurants, and public buildings have
to install solar hot water systems if they use substantial amounts of hot water.
Old buildings also have to be fitted with solar hot water systems when they
are refurbished. Around the Mediterranean, use of solar hot water systems
has become commonplace. In Japan, about 10% of all dwellings have their
own solar hot water systems [81].
In German cities, solar PV panels are becoming commonplace, despite
the country’s relatively cloudy skies. This is primarily due to the German
government’s ‘feed-in’ legislation, which has fixed subsidies and favourable
tariffs for owners of PV roofs. They used to be paid about 50 cents/kWh
for selling their electricity back to the electricity grid, which is about four
times the price paid to conventional electricity generators. The policy has
led to a massive growth in demand for solar PV technology across the
country. Similar policies have been introduced in Austria, France and
Spain [81].
2.5.2 Governance
Better governance is a vital step towards better cities. With so many areas
crying out for investment in better infrastructure, it is not surprising that
funding emerges as a big issue for many stakeholders in a study survey
done on megacities.* However, for those involved in city management, it is
improvements to governance—rather than just money—that are the top
* A unique global research project undertaken by two independent research organisations,
GlobeScan and MRC McLean Hazel, with the support of Siemens, the infrastructure provider.
The goal of the project was to carry out research at the individual megacity level to gather
objective data as well as perspectives from mayors, city administrators and other experts
on local infrastructure challenges. The findings are based on an in-depth survey of over
500 megacity stakeholders, including elected officials, public- and private-sector employees,
and influencers such as academics, NGOs and media. This survey was supplemented with
extensive secondary research, to enable the team to shed light on the key challenges faced by
global cities at various stages of development.
Energy Efficiency Strategies in Urban Planning of Cities
51
riority going forward. More than half of respondents with knowledge of
p
urban management see improved planning as the priority for solving city
problems, compared with only 12% that prioritise increased funding. In
addition to more strategic planning, there is also a strong focus on managing infrastructure and services more efficiently. Both these goals will require
cities to make the step from passive administration of existing services to a
more active style of managing systems that focuses on improved efficiency
and more m
easurable outcomes [8].
There is also a relationship between the scale of the environmental burdens and the appropriate roles of different levels of government. Some
governance failures can be traced to a mismatch between the scale of the
problem and the scale at which the response has been articulated. Local
governance should not be expected to reduce carbon emissions voluntarily,
although it can be a very appropriate level for driving local water and sanitation improvements. Global governance, on the other hand, is clearly needed
to help develop institutional mechanisms to reduce contributions to global
climate change, but it is inappropriate for developing institutional mechanisms for managing local water and sanitation systems. On the other hand,
reducing local environmental burdens often requires support (or at least
the absence of opposition) from global processes and institutions, while
responses to global burdens often need to be rooted in local agency [102,103].
Moreover, cities and their needs are complex, and the traditional, departmentally organised approach to city governance needs to be rethought to
enable more holistic solutions on the one hand and more responsiveness and
accountability to citizens at a local level on the other [8].
The search for improved efficiency may require megacities to contract out
the management of more services to the private sector. One of the more surprising findings in the survey is the fact that the main perceived advantage
of private sector operation is improved efficiency (more than access to funding). Where cities do increase private sector involvement, they will need to
create the right framework for success. There is a variety of models available,
where ownership and operation of services can be shared. But when entering into partnerships with the private sector, the consequences must be well
thought through, and success will require a ‘context-sensitive’ approach to
privatisation, with overall control (and responsibility) resting with the public sector. If comprehensive governance models and efficient management
structures are put in place, economic attractiveness, environmental protection, and quality of life for all citizens need not be contradictory goals [8].
Today, there is almost universal recognition in governments at all levels
that it is essential to incorporate environmental considerations into urban
planning and management. This provides significant benefits in every area
of urban life, cutting across issues such as health, poverty, security, and economic development. Moreover, there is an essential call for better communication within the government and with other stakeholders involved in city
planning and operation.
52
Energy Efficiency in the Urban Environment
2.6 The Middle East Context
2.6.1 The Gulf Area
The Gulf area as an arid zone provides a challenge for architects and urban
planners to build urban settlements that respond to the needs of inhabitants
for climatic comfort and in the same time be sensitive to energy use and
its consequences of climate change. This section reviews two approaches to
tackle this issue and provide a climatic responsive built environment that is
energy efficient.
2.6.1.1 A Return to Compact Cities
Over centuries, the climate in Arabia has become a major factor that shaped
the daily life of local societies and, thus, the form of their cities. Old cities
were characterised by their compactness, which stemmed from the need for
protection from the harsh environment. Urban fabric has been dominated
by the building masses, the limited number of enclosed public and outdoor
spaces, and the inward-looking architecture. Besides its environmental
utility, compactness also provided a physical support to the local community, reflecting its strong social structure and complex network of kinships.
Nowadays, Gulf cities that are mostly shaped by the modern movement
and American lifestyle are in complete negation with their past. An unprecedented sprawl effect is taking place all over the Gulf countries due to the
heavy reliance on private transportation, high building technology, powerful air-conditioning systems and private housing [104].
A study by Ben-Hamouche on cities in Arabia recognised two historical
shifts in the form of the city. The first one occurred during the industrialisation era from the old compact city to the modern dispersed city, and the
second shift is expected to occur in the information age from the modern
dispersed city back to the post-modern compact city through the combination of the concepts of sustainability and IT. He refers to the New Urbanism
movement and its principles in his call for referral to compact cities as a remedy to the cancerous sprawl and suburbia [104].
Although this study claims that the information age will make the city more
compact, due to the diminishing need for mechanical mobility, this increased
accessibility might not lead to compactness. The sprawling may continue;
only car usage might decrease but not necessarily increasing density.
2.6.1.2 Masdar City: Innovative Technologies [105]
As the geographical core of the Masdar sustainable energy initiative, Masdar
City has been one of the elements to move forward the most quickly. The
concept is simple but radical: zero-carbon and zero-waste. This involves a
radical rethink of everything about the way that the city will function.
Energy Efficiency Strategies in Urban Planning of Cities
53
The 7 km2 site selected is near the airport and about 17 km from the city of
Abu Dhabi, and were it not in the desert, it would be classified as a ‘greenfield’ site. The fundamentals of the plan have been agreed, ground has been
broken and phase one is underway. Initially, more than $300 million of procurement is in place, and an additional $1 billion was expected to be committed by the end of 2009. The city was due to be built in 7 years, at a total cost of
$22 billion. The first $4 billion of this was coming from the Masdar Initiative,
with the remaining $18 billion being raised through direct investments and
other financial instruments. In 2013, the Abu Dhabi government has committed $15 b
illion to Masdar city. Moreover, more than $1 billion of equity
has been invested across renewable energy projects with a total value of over
$6.9 billion [106].
Sir Norman Foster, the British architect, is behind the design of the city,
and detailed planning and preparation has been done by a range of international consultants and experts, including Pooran Desai from BioRegional,
the UK consultancy WSP, Canada and United States-based CH2M Hill.
2.6.1.2.1 Building Design
Much of the design will adopt local, vernacular architectural principles,
but this will also be mixed with a lot of cutting edge technology, some of it
still in the experimental phase. The city will incorporate traditional medinas, souks and wind towers and will make use of open, public squares and
narrow shaded walkways to connect homes, schools, restaurants and shops.
The buildings themselves will then adopt a wide range of passive measures,
and they should consume well under a quarter of the energy used by comparable buildings elsewhere in the region.
2.6.1.2.2 Transportation
There will be no cars in Masdar City—indeed, no internal combustion
engines of any type. Instead, there will be a network of electric trams (a light
rail transit or LRT system, which will also link to the planned Abu Dhabi
LRT system) and smaller, ‘personal rapid transit’ vehicles, effectively an
automatic, driverless system of electric taxis controlled by a central computer. These will be programmed so that, once occupied, the passenger has
privacy and no other passenger can board along the route.
2.6.1.2.3 Renewable Energy
All the energy used in Masdar will be renewably generated, not only the
electrical power but also that for heating, cooling and transport. The bulk
of this is likely to come from one solar form or another. There will be power
generation for a smart grid from solar thermal power and concentrating
PV and also distributed PV throughout the city. The wind resource in Abu
Dhabi is generally poor and will contribute little to the overall mix, but
some geothermal and waste-to-energy, particularly from bio waste, are also
likely to be significant contributors.
54
Energy Efficiency in the Urban Environment
As well as providing a regional location, there are also numerous partnership opportunities for companies with technologies that may be used at
Masdar. Among the energy technologies expected to be sourced are PV and
solar thermal power generation (concentrating PV, parabolic trough and parabolic dish generation); advanced thermal waste treatment plants; geothermal
systems that can be used for district cooling; and smart grid management
systems. A range of other district cooling systems are also being considered,
together with water desalination and grey-water treatment plants, and waste
handling systems, including plasma and pyrolysis. More widely, procurement is also underway for IT systems, the transport infrastructure and facilities management and services.
The Arabic word ‘Masdar’ was chosen as the name of the project because
one definition of the word is ‘source’—in the sense of the root or spring
from which things originate. For years, many good renewable energy projects have suffered through lack of access to sources of funding. The Masdar
Initiative demonstrates that the combination of good projects and a plentiful source of funding can result in very rapid development of even the
most ambitious plans. As such, it may also be a beacon for other places that
are contemplating whether large-scale investment in renewables really can
pay off.
2.6.2 Egypt
There is a growing awareness in Egypt about the change in climate since
1982 when that country established the Egyptian Environmental Affairs
Agency (EEAA). Egypt was also one of the first Arab countries to sign the
United Nations Framework Convention on Climate Change (UNFCCC) in
1992. Egypt has participated in and undertaken several actions that deal
with climate change and environmental issues [107].
1. Ratification of the UNFCCC, the issuance of Law 4/1994 for the
Protection of the Environment, and participation in various international workshops and conferences related to climate change to
avoid having any international obligations on developing countries,
including Egypt.
2. The Ministry of Electricity and Energy has established several projects in the field of new and renewable energy (wind, solar, hydro
and bio) and has encouraged EE projects.
3. The Ministry of State for Environmental Affairs has established
guidelines for the private sector to encourage investments in the
field of clean energy projects, waste recycling and afforestation.
4. With the restructuring of the National Committee of Climate
Change in 2007, as the coordinator on the national level related to climate change issues, by putting a visionary for needed policies and
Energy Efficiency Strategies in Urban Planning of Cities
55
strategies to deal with these issues, and by suggesting mechanisms
required for implementation.
5. Maximising the benefit from Kyoto Protocol Mechanisms through
implementing Clean Development Mechanism Projects.
An energy code for BP was established by the Housing and Building
Research Center (HBRC) in 2006. It specifies the energy consumption of
buildings according to their use and typology. This was an initiative to
make buildings more energy efficient; however, this code has not been yet
implemented.
2.6.2.1 Strategic Planning for Cities Programme
On the urban planning level, since 2008, there have been a lot of efforts made
to upgrade more than 200 Egyptian cities. The programme, conducted by the
GOPP, started strategic planning of cities under the auspices of the Ministry
of Housing. A parallel programme is run and funded by the UN-Habitat
concerning small cities (i.e. 25,000–50,000 inhabitants).
It is important to note that continuous urbanisation of rural areas in Egypt
has created a unique case. One can find cities that are just villages in their
structure, plan, network and physical and social infrastructure. These cities comprise most of the Egyptian urban context. This is primarily due to
the way a city is defined by the government (according to population size).
Typically, a city is defined as a settlement with more than 25,000 inhabitants.
In other words, a village could become a city when its population exceeds
this limit; however, it will still hold its rural characteristics, way of life, function and physical features.
In the context of the strategic planning of cities, three main sectors are
studied: shelter and informal areas, infrastructure and local economic
development. Three other sub-crosscutting sectors are investigated: local
governance; environment; and poverty, women & vulnerability. Its main
activities include preparing a city profile for the sectors investigated, a list of
projects that are required by the city that represent its priorities, and a strategic plan with these projects situated in the appropriate locations that shows
the road network, land uses and city limits. All processes are conducted with
a participatory approach where all the city stakeholders are involved in the
process of planning, prioritising and decision making. The final product is
the strategic plan for the city.
The environment sector is mainly concerned with environmental hazards,
pollution, noise and solid waste management and recycling. There is no mentioning of energy responsiveness or planning for maximising efficiency of
energy use. However, these issues might be tackled depending on the environment consultant concept and the local context of the city under study.
Despite the programme’s negligence related to energy responsive strategies, it provides a unique opportunity to really make our cities green and
56
Energy Efficiency in the Urban Environment
energy responsive. There are a number of ideas and actions that, if gathered
and formulated into a strategy, could present a pioneer example within local
contexts of the developing world.
In the progress of strategically planning the city of Ashmun in the governorate of Menoufia, Egypt, a number of ideas and requests were submitted by
the local community that are energy responsive in essence (Figure 2.4) [108].
1. Preserving city boundaries with minimal increase just to accommodate future needed services and the preservation of agricultural
land.
2. The need to build a ring road to increase transportation efficiency
and decrease energy consumption and pollution.
3. Increasing the heights to double the street width (law specifies max
building height = 1.5 street width) in structurally fit buildings to
become four floors instead of only three floors. Thus dandifying
existing urban areas instead of horizontal spread of the city.
4. Non-inclusion of sprawling houses in city limits in order to prevent
or minimise future expansion on agricultural land.
5. Wise location of needed services, appropriate rates per capita of services and facilities, and their concentration in single location central
to community.
6. Advocating mixed uses as commercial/residential uses.
FIGURE 2.4
Keeping Ashmun city boundaries to the minimum and preserving surrounding agricultural
land. (From Associated Consultants. (2008). Strategic Planning for Ashmun City, Menoufia, Egypt,
Ministry of Housing, Utilities & Urban Communities and The General Organization of Physical
Planning (GOPP), Cairo, Egypt.)
Energy Efficiency Strategies in Urban Planning of Cities
57
7. Locating workshops in a special area outside the residential mass,
increasing efficiency of operation, management and transportation
to other cities for further manufacturing.
8. The need to replace old deteriorated water supply asbestos pipes to
prevent leakages and minimise health problems.
9. Better road network linkage with surrounding settlements for better
and efficient transportation. Proposing a bridge to decrease travelling distance to neighbouring industrial zone (Sadat city). Thus providing jobs, preventing agricultural land loss and advocating more
efficient industrial centres.
These ideas were required and enforced by the local community and the
elected leaders, which shows awareness of the pressing issues of energy
responsiveness and conventional resources depletion, despite the fact that
a direct correlation to EE was not explicit. But this subtle concern can provide
a solid base for more action to provide strategies for planning for EE in
Egyptian cities.
2.6.2.2 Cairo
The megacity of Cairo is rated second worldwide for its pollution rate
(Figure 2.5) [8]. There are approximately 18 million people living in the
Greater Cairo region, which consists of five governorates. Expansion has
caused many problems related to the environment, quality of life and infrastructure. Cairo is denser than many other cities because the law specifies
an allowed maximum density of 150 person/feddan (357 persons/ha); it does
not need to become any denser. However, there is a need to revise the current development strategies concerning the sprawling communities around
the city. These gated communities are a replica of the American image of
the perfect housing environment, where a villa exists on a private piece of
land with a front lawn and a back garden. The building density is as low as
25% (downtown can reach 60%–70%) to accommodate for the extended open
spaces. These communities were originally part of the green belt designated
to surround Greater Cairo. However, there was a shift towards transforming
it into dwelling areas, but with low densities, as an attempt to preserve the
concept of the green belt.
Although there is a growing demand for these communities, they are
far from environmentally friendly. The extension towards the new cities
of Sheikh Zaied and 6th of October on one side of Cairo and the cities of
Obour, Elshorouk and New Cairo on the other defies the original concept
of establishing these as separate cities and transforms them into parts or
districts of ever-growing Greater Cairo (see Figure 2.6).
This has really affected energy consumption trends, especially in increasing car dependency. The lack of an adequate transportation system that
58
Energy Efficiency in the Urban Environment
Particle matter in 2002 (µg/m3)
100
50
0
150
200
1st
Delhi
(India)
Cairo
(Egypt)
2nd
3rd
Calcutta
(India)
Mexico City
(Mexico)
41st
Tokyo
(Japan)
57th
London
(UK)
91st
New York
(US)
96th
0
Pollution levels
Population levels
5
10
15
20
25
30
Population in 2005 (millions)
35
40
FIGURE 2.5
World’s most polluted cities. (From The World Bank as cited in GlobeScan and MRC McLean
Hazel, Megacity Challenges: A Stakeholder Perspective, Siemens AG, Munich, 2007.)
To Alexandria
To Alexandria
Ring road
Sheikh Zaied City
40,000 p
Obour City
1,00,000 p
Greater Cairo
urban mass
14 million p
6 October
City
5,00,000 p
To ismailia
Shorouk City
62,000 p
Badr City
60,000 p
New Cairo
City 3,02,000 p
To Ein sokhna
15 May City
1,80,000 p
To Oasis
To Fayoum
To upper Egypt
FIGURE 2.6
Greater Cairo with the surrounding new cities.
Energy Efficiency Strategies in Urban Planning of Cities
59
links all spread-out areas increases car dependency and fuel consumption.
The home–work trip is becoming a daily nightmare resulting in congested
traffic with a continuous peak hour.
Moreover, these gated communities and nearby new cities lack sub-centres
that provide adequate services or businesses. Thus a trip to downtown Cairo
is essential for obtaining services.
2.7 Conclusions
In November 2007, UN-Habitat held an Expert Group Meeting on ‘Cities in
Climate Change’ in Nairobi, Kenya, bringing together participants from
UN agencies, research institutions, local authorities and the private sector.
The experts discussed the role of UN-Habitat regarding climate change
and worked out basic elements for the agency’s strategy on cities in climate
change. The main outcomes of the Expert Group Meeting are that UN-Habitat
has a clear role to play in dealing with climate change at the local level with
a special focus on urban areas in developing countries. Furthermore, climate change should be regarded as a cross-cutting issue and integrated into
UN-Habitat’s existing initiatives and programmes [109].
The experts underlined the importance of immediate action—for example:
1. Launching of the Sustainable Urban Development Network (SUDNet)
in 2008 for strengthening the performance of local governments to
enhance climate change mitigation and adaptation measures in developing countries through existing and new partnerships
2. Promoting city-to-city cooperation
3. Conducting vulnerability assessments and risk mapping at the local
level and providing guidelines for adaptive local planning
4. Collecting and sharing case studies on good practice
5. Developing mechanisms to assist cities in preventing land-use conflicts arising from relocation of human settlements
6. Assisting governments in translating National Adaptation Plans of
Action to Local Adaptation Plans of Action together with adequate
transfer of resources
This is in line with the experience gained from the Strategic Planning for
Cities Program in Egypt because the actions required by the experts are
what the programme in Egypt lacks on the broad level.
Much can be done in the developing countries. In the Egyptian context,
there is a need for more awareness and action with regard to energy-efficient
60
Energy Efficiency in the Urban Environment
Energy-efficient strategies
Existing cities
New cities
Mega cities
- Mixed uses
- Mixed housing
- Renewable energy stations
- Energy code
- Building materials
- Recycling facilities
- Adequate transportation system
- Self-sufficient cities with jobs
and services
- Increasing walkability
- Increasing density
- Minimising sprawling
- Public transportation
- Monorails, subways
- Energy code
- Recycling facilities
- Decentralisation of investments
- Increasing walkability and
pedestrianisation
Small and medium cities
- Preserving the narrow street pattern
- Compact urban mass
- Recycling and energy
- Renewable energy stations
- Improving infrastructure networks to
minimise loss
- Local building materials
- Generating jobs within the local
context
- Transportation system efficiency
- Finding vacant land innovatively and
locating needed housing and services
- Introduction of appropriate
technologies
FIGURE 2.7
Energy efficiency strategies in cities.
strategies and to integrating them in urban planning. These strategies are
summarised in Figure 2.7. On the personal level, it is recommended to try to
use one’s car less and separate his garbage as the former mayor of Curitiba,
Brazil, advises [81].
References
1. Khalil, H. (2009). Energy efficiency strategies in urban planning of cities, 45th
AIAA/ASME/SAE/ASEE Joint Propulsion Conference & Exhibit and 7th Annual
International Energy Conversion Engineering Conference, August 2–5, 2009, Denver,
CO, paper No. AIAA 2009-4622.
2. World Energy Council. (2013). World Energy Resources: 2013 Survey, World
Energy Council, London.
3. United Nations Environment Programme. Activities: Urban—Energy for Cities,
Retrieved May 14, 2009, from http://www.unep.or.jp/Ietc/Activities/Urban/
energy_city.asp
4. Chen, Q., Cheung, G., Hu, Y., Shen, Q., Tang, B., and Yeung, S. (2009). A system dynamics model for the sustainable land use planning and development,
Habitat International, Vol. 33, pp. 15–25.
5. The United Nations Economic Commission for Africa (UNECA) and North
Africa Office. (2003). The fight against desertification and drought in North
Africa, The Eighteenth Meeting of the Intergovernmental Committee of Experts,
United Nations Economic Commission for Africa, Tangiers, Morocco.
6. UN-Habitat. (2013). State of the World’s Cities 2012/2013: Prosperity of Cities,
Routledge, New York.
Energy Efficiency Strategies in Urban Planning of Cities
61
7. United Nations Human Settlements Programme. (2006). The State of The World’s
Cities Report 2006/2007: 30 Years of Shaping The Habitat Agenda, Earthscan,
London, UK.
8. GlobeScan and MRC McLean Hazel. (2007). Megacity Challenges: A Stakeholder
Perspective, Siemens AG, Munich.
9. The United Nations Centre for Human Settlements (UNCHS) and the United
Nations Environment Programme (UNEP). (1999). The SCP Source Book Series,
Volume 5 Institutionalising the Environmental Planning and Management (EPM)
Process, UNCHS, Nairobi, Kenya.
10. UN-Habitat. (2012). Evaluation Report 2/2012 Mid-Term Evaluation of the Cities
and Climate Change Initiative, UN-Habitat, Nairobi.
11. Holden, E. and Norland, I. T. (2005). Three challenges for the compact city as a
sustainable urban form: Household consumption of energy and transport in
eight residential areas in the greater Oslo Region, Urban Studies, Vol. 42, No. 12,
pp. 2145–2166.
12. Gordon, P. and Richardson, H. W. (1989). Gasoline consumption and
cities—A reply, Journal of the American Planning Association, Vol. 55, No. 3,
pp. 342–345.
13. Boarnet, M. G. and Crane, R. (2001). Travel by Design. The Influence of Urban Form
on Travel, Oxford University Press, New York.
14. Stead, D., Williams, J. and Titheridge, H. (2000). Land use, transport
and people: Identifying the connections, In K. Williams, E. Burton, and
M. Jenks, eds., Achieving Sustainable Urban Form, E & FN Spon, London,
pp. 174–186.
15. Owens, S. (1992). Energy, environmental sustainability and land use planning,
In M. J. Breheny, ed., Sustainable Development and Urban Form, Pion Ltd, London,
pp. 79–105.
16. Simmonds, D. and Coombe, D. (2000). The transport implications of alternative
urban forms, In K. Williams, E. Burton, and M. Jenks, eds., Achieving Sustainable
Urban Form, E & FN Spon, London, pp. 115–123.
17. Titheridge, H., Hall, S., and Banister, D. (2000). Assessing the sustainability
of urban development policies, In K. Williams, E. Burton, and M. Jenks, eds.,
Achieving Sustainable Urban Form, E & FN Spon, London, pp. 149–159.
18. NÆSS, P. (1997). Fysisk Planlegging Og Energibruk [Physical Planning and Energy
use], Tano Aschehoug, Oslo.
19. Jacobs, J. (1961). The Death and Life of Great American Cities: The Failure of Town
Planning, Random House, New York.
20. Newman, P. and Kenworthy, J. (1989). Gasoline consumption and cities:
A comparison of US cities with a global survey, Journal of the American Planning
Association, Vol. 55, No. 1, pp. 24–37.
21. Commission of the European Communities (CEC). (1990). Green Paper on the
Urban Environment, European Commission, Brussels.
22. Elkin, T., Mclaren, D., and Hillman, M. (1991). Reviving the City: Towards
Sustainable Urban Development, Friends of the Earth, London.
23. Sherlock, H. (1991). Cities are Good for Us, Paladin, London.
24. McLaren, D. (1992). Compact or dispersed? Dilution is no solution, Built
Environment, Vol. 18, No. 4, pp. 268–284.
25. Frey, H. (1999). Designing the City: Towards a More Sustainable Urban Form, Spon
Press, London.
62
Energy Efficiency in the Urban Environment
26. Williams, K., Burton, E., and Jenks, M. (2000a). Achieving sustainable urban
form: An introduction, In K. Williams, E. Burton, and M. Jenks, eds., Achieving
Sustainable Urban Form, E & FN Spon, London, pp. 1–6.
27. Smyth, H. (1996). Running the gauntlet: A compact city within a doughnut
of decay, In M. Jenks, E. Burton, and K. Williams, eds., The Compact City.
A Sustainable Urban Form? E & FN Spon, London, pp. 101–113.
28. Jenks, M., Burton, E., and Williams, K., eds. (1996). The Compact City: A Sustainable
Urban Form? E & FN Spon, London.
29. Williams, K., Burton, E. and Jenks, M. (2000b). Achieving sustainable urban
form: Conclusions, In K. Williams, E. Burton, and M. Jenks, eds., Achieving
Sustainable Urban Form, E & FN Spon, London, pp. 347–355.
30. Buxton, M. (2000). Energy, transport and urban form in Australia, In K. Williams,
E. Burton, and M. Jenks, eds., Achieving Sustainable Urban Form, E & FN Spon,
London, pp. 54–63.
31. Newman, P. and Kenworthy, J. R. (1999). Sustainability and Cities: Overcoming
Automobile Dependence, Island Press, Washington, DC.
32. Thompson-Fawcett, M. (2000). The contribution of urban villages to sustainable
development, In K. Williams, E. Burton, and M. Jenks, eds., Achieving Sustainable
Urban Form, E & FN Spon, London, pp. 275–285.
33. Hasic, T. (2000). A sustainable urban matrix: Achieving sustainable urban form
in residential buildings, In K. Williams, E. Burton, and M. Jenks, eds., Achieving
Sustainable Urban Form, E & FN Spon, London, pp. 329–336.
34. Stoel, T. B., Jr. (1999). Reining in urban sprawl. Environment, Vol. 41, No. 4,
pp. 6–11.
35. Breheny, M. (1996). Centrists, decentrists and compromisers: Views on the
future of urban form, In K. Williams, E. Burton, and M. Jenks, eds., The Compact
City: A Sustainable Urban Form? E & FN Spon, London, pp. 13–35.
36. Høyer, K. G. and Holden, E. (2003). Household consumption and ecological
footprints in Norway: Does urban form matter? Journal of Consumer Policy,
Vol. 26, pp. 327–349.
37. Holden, E. (2004). Ecological footprints and sustainable urban form, Journal of
Housing and the Built Environment, Vol. 19, No. 1, pp. 91–109.
38. Farr, D. (2008). Sustainable Urbanism: Urban Design with Nature, John Wiley,
Hoboken, NJ.
39. Radberg, J. (1998). Ebenezer Howard’s dream: 100 years after. Paper presented
at the 44th International Federation of Housing and Planning World Congress,
September 13–17, Lisbon, Portugal.
40. Lehman and Associates. (1995). Urban Density Study: General Report, Office for
the Greater Toronto Area, Toronto, Canada.
41. Gowling, D. and Penny, L. (1988). Urbanisation, planning and administration in the London region: Processes of a metropolitan culture. In H. van der
Cammen, ed., Four Metropolises in Western Europe, Van Gorcum, Maastricht, The
Netherlands, pp. 5–59.
42. Madanipour, A. (1996). Design of Urban Space, John Wiley, New York.
43. Churchman, A. (1999). Disentangling the concept of density, Journal of Planning
Literature, Vol. 13, No. 4, pp. 389–411.
44. Van der Ryn, S. (1986). The suburban context. In S. Van der Ryn and P. Calthorpe,
eds., Sustainable Communities: A New Design Synthesis for Cities, Suburbs and
Towns, Sierra Club Books, San Francisco, CA.
Energy Efficiency Strategies in Urban Planning of Cities
63
45. Scully, V. (1994). The architecture of community, In P. Katz, ed., The New Urbanism:
Toward an Architecture of Community, McGraw-Hill, New York, pp. 221–230.
46. Smyth, J. (1992). The economic power of sustainable development: Building the
new American dream, In B. Walter, A. Lois, and R. Crenshaw, eds., Sustainable
Cities: Concepts and Strategies for Eco-City Development, Eco-Home Media, Los
Angeles, CA.
47. Churchman, A. (1993). A differentiated perspective on urban quality of
life: Women, children and the elderly, In M. Bonnes, ed., Perception and
Evaluation of Environmental Quality, UNESCO Programme on Man and
Biosphere, Rome, pp. 165–178.
48. Shannon, G. and Cromley, E. (1985). Settlement and density patterns: Toward
the 21st century, In J. Wohlwill and W. Van Vliet, eds., Habitats for Children:
The Impacts of Density, Lawrence Erlbaum, Hillsdale, NJ, pp. 1–16.
49. Calthorpe, P. (1992). The pedestrian pocket: New strategies for suburban
growth, In B. Walter, A. Lois, and R. Crenshaw, eds., Sustainable Cities: Concepts
and Strategies for Eco-City Development, Eco-Home Media, Los Angeles, CA,
pp. 27–35.
50. Stubbs, M. (2002). Car parking and residential development: Sustainability,
design and planning policy, and public perceptions of parking provision, Journal
of Urban Design, Vol. 7, No. 2, 2002, pp. 213–237.
51. Hitchcock, J. (1994). A Primer on the Use of Density in Land Use Planning, Papers on
Planning and Design no. 41, Program in Planning, University of Toronto, Toronto,
Canada.
52. Orchard, L. (1995). National urban policy in the 1990’s, In Troy, P., ed., Australian
Cities: Issues, Strategies and Policies for Urban Australia in the 1990’s, University of
Cambridge Press, Cambridge, pp. 65–86.
53. Breheny, M. (1992). The contradictions of compact city: A review, In M. Breheny,
ed., Sustainable Development and Urban Form, Pion Ltd, London, pp. 138–159.
54. Stenhouse, D. (1992). Energy conservation benefits of high density mixeduse land development. In B. Walter et al., eds., Sustainable Cities: Concepts and
Strategies for Eco-City Development, Eco-Home Media, Los Angeles, CA.
55. Rydin, Y. (1992). Environmental dimensions of residential development and the
implications for local planning practice, Journal of Environmental Planning and
Management, Vol. 35, No. 1, pp. 43–61.
56. Newman, P. and Kenworthy, J. (1989). Cities and Automobile Dependence: An
International Sourcebook, Gower Technical Press, Brookfield, VT.
57. Gordon, P. and Richardson, H. (1997). Are compact cities a desirable planning
goal? Journal of the American Planning Association, Vol. 63, No. 1, pp. 95–106.
58. Nasar, J. (1997). Neo-traditional development, auto-dependency and sense of
community, In M. Amiel and J. Vischer, eds., Space Design and Management for
Place Making, EDRA 28, EDRA, Edmond, OK.
59. Bannister, D. (1992). Energy use, transport and settlement patterns. In
M. Breheny, ed., Sustainable Development and Urban Form, Pion Ltd, London.
60. Woodhull, J. (1992). How alternative forms of development can reduce traffic
congestion. In B. Walter et al., eds., Sustainable Cities: Concepts and Strategies for
Eco-City Development, Eco-Home Media, Los Angeles, CA.
61. Berridge Lewinberg Greenberg, Ltd. (1991). Guidelines for the Reurbanisation of
Metropolitan Toronto, Municipality of Metropolitan Toronto Corporate Printing
Services, Toronto, Canada.
64
Energy Efficiency in the Urban Environment
62. Berridge Lewinberg Greenberg, Ltd. (1991). Study of the Reurbanisation of
Metropolitan Toronto, Municipality of Metropolitan Toronto Corporate Printing
Services, Toronto, Canada.
63. Handy, S. (1996). Understanding the link between urban form and nonwork
travel behavior, Journal of Planning Education and Research, Vol. 15, No. 3,
pp. 183–198.
64. Pickup, L. (1984). Women’s gender-role and its influence on travel behavior,
Built Environment, Vol. 10, No. 1, pp. 61–68.
65. Self, P. (1997). Environmentalism and Cities. Newsletter Urban Research Program
no. 32, Research School of Social Sciences, Australian National University,
Canberra.
66. Shireman, W. (1992). How to use the market to reduce sprawl, congestion
and waste in our cities. In B. Walter et al., eds., Sustainable Cities: Concepts and
Strategies for Eco-City Development, Eco-Home Media, Los Angeles, CA.
67. Omer, A. M. (2008). Energy, environment and sustainable development,
Renewable and Sustainable Energy Reviews, Vol. 12, No. 9, pp. 2265–2300.
68. Morris, W. and Kaufman, J. (1998). The new urbanism: An introduction to
the movement and its potential impact on travel demand with an outline of
its application in Western Australia, Urban Design International, Vol. 3, No. 4,
pp. 207–221.
69. Walsh, B. (1997). The right mix for urban living, Urban Environment Today,
Vol. 14, February 20, pp. 8–9.
70. Llewelyn-Davies, South Bank University, Environment Trust Associates, and
London Planning Advisory Committee. (1994). The Quality of London’s Residential
Environment, London Planning Advisory Committee, London.
71. McMullen, D. (2000). High densities—Key to meeting housing needs, Urban
Environment Today, February 10, p. 9.
72. Calthorpe, P. (1993). The Next American Metropolis, Princeton Architectural Press,
New York.
73. Kennedy, M. (1995). Ekologisk stadsplanering I Europa [Ecological urban planning in Europe], In Den miljövänliga staden—en Utopi? Rapport från en seminarserie, MiljÖprosjekt Sankt JÖrgen, Gøteborg.
74. Vilhelmson, B. (1990). Va r dagliga rørlighet: om resandes utveckling, førdelning och
gränser [Our Daily Mobility: On the Development, Distribution and Limits of
Travelling], TFB report 1990:16, The Swedish Transport Board, Stockholm.
75. The Prince’s Foundation. (2000). Sustainable Urban Extensions: Planned Through
Design. A Collaborative Approach to Developing Sustainable Town Extensions through
Enquiry by Design, The Prince’s Foundation, London, p. 1.
76. Oldfield King Planning Ltd. (1998). Car Parking and Social Housing: National
Planning and Housing Policy, National Housing Federation, London.
77. Crilly, M. (1999). Novocastrian urbanism, Urban Design Quarterly, Vol. 72, p. 10.
78. Panão, M. O., Gonçalves, H. J., and Ferrão, P. M. (2008). Optimization of the
urban building efficiency potential for mid-latitude climates using a genetic
algorithm approach, Renewable Energy, Vol. 33, No. 5, pp. 887–896.
79. DEFRA. (2002). Energy Resources. Sustainable Development and Environment.
Department of Environment, Food and Rural Affairs, DEFRA, Doncaster, UK.
80. REN21 Renewable Energy Policy Network for the 21st Century. (2014).
Renewables 2014, Global Status Report, REN21 Secretariat, UNEP, Paris, France.
Energy Efficiency Strategies in Urban Planning of Cities
65
81. Girardet, H. (2004). Urban Planning and Sustainable Energy: Theory and Practice,
Forum Barcelona, Retrieved May 12, 2009, from http://www.barcelona2004.
org/www.barcelona2004.org/eng/banco_del_conocimiento/dialogos/
fichac390.html
82. Gerardet, H. (2008). Cities People Planet: Urban Development and Climate Change,
2nd ed., John Wiley, West Sussex, England.
83. Rees, W. (1992). Ecological footprints and appropriated carrying capacity,
Environment & Urbanization, Vol. 4, No. 2, pp. 121–130.
84. Newman, P. (2006). The environmental impact of cities, Environment and
Urbanization, Vol. 18, No. 2, pp. 275–295.
85. Rees, W. (2000). Eco-footprint analysis: Merits and brickbats, Ecological
Economics, Vol. 32, No. 3, pp. 371–374.
86. Chambers, N., Simmons, C., and Wackernagel, M. (2000). Sharing Nature’s
Interest: Ecological Footprints as an Indicator of Sustainability, Earthscan, London.
87. Andrey, J., Johnson, L. C., Moos, M., and Whitfield, J. (2006). Does design matter? The ecological footprint as a planning tool at the local level, Journal of Urban
Design, Vol. 11, No. 2, pp. 195–224.
88. Ewing, B., Moore, D., Goldfinger, S., Oursler, A., Reed, A. and Wackernagel, M.
(2010). The Ecological Footprint Atlas 2010, Global Footprint Network, Oakland, CA.
89. Gordon, P. and Richardson, H. (1998). Farmland preservation and ecological
footprints: A critique, Planning and Markets, Vol. 1, No. 1, pp. 1–7.
90. Holmberg, J., Lundqvist, U., Robert, K. H., and Wackernagel, M. (1999). The
ecological footprint from a systems perspective of sustainability, International
Journal of Sustainable Development and World Ecology, Vol. 6, No. 1, pp. 17–33.
91. Van den Bergh, J. and Verbruggen, H. (1999). Spatial sustainability, trade and
indicators: An evaluation of the ecological footprint, Ecological Economics,
Vol. 29, pp. 61–72.
92. Deutsch, L., Jansson, A., Troell, M., Ronnback, P., Folke, C., and Kautsky, N.
(2000). The ecological footprint: Communicating human dependence on nature’s
work, Ecological Economics, Vol. 32, No. 3, pp. 351–356.
93. Herendeen, R. (2000). Ecological footprint is a vivid indicator of indirect effects,
Ecological Economics, Vol. 32, No. 3, pp. 357–358.
94. Moffatt, I. (2000). Ecological footprints and sustainable development, Ecological
Economics, Vol. 32, No. 3, pp. 359–362.
95. Rapport, D. J. (2000). Ecological footprints and ecosystem health: Comple
mentary approaches to a sustainable future, Ecological Economics, Vol. 32, No. 3,
pp. 367–370.
96. Templet, P. (2000). Externalities, subsidies, and the ecological footprint: An
empirical analysis, Ecological Economics, Vol. 32, No. 3, pp. 381–384.
97. Brindle, R. E. (1994). Lies, damned lies and ‘automobile dependence’—
Some hyperbolic reflections, Australian Transport Research Forum, Vol. 94,
pp. 117–131.
98. Evill, B. (1995). Population, urban density, and fuel use: Eliminating spurious
correlation, Urban Policy and Research, Vol. 13, No. 1, pp. 29–36.
99. Leung, H. L. (2003). Land Use Planning Made Plain, 2nd ed., University of Toronto
Press, Toronto.
100. Draper, D. (1998). Our Environment, A Canadian Perspective, Thomson Nelson,
Toronto.
66
Energy Efficiency in the Urban Environment
101. Pollard, T. (2001). Greening the American dream? Planning, Vol. 67, No. 10,
pp. 10–16.
102. Wilbanks, T. J. and Kates, R. W. (1999). Global change in local places: How scale
matters. Climatic Change, Vol. 43, No. 3, pp. 601–628.
103. McGranahan, G. (2005). An overview of urban environmental burdens at three
scales: Intra-urban, urban-regional, and global, special feature on the environmentally sustainable city, International Review for Environmental Strategies, Vol. 5,
No. 2, pp. 335–356.
104. Ben-Hamouche, M. (2008). Climate, cities and sustainability in the Arabian
region: Compactness as a new paradigm in urban design and planning, ArchnetIJAR, International Journal of Architectural Research, Vol. 2, No. 2, pp. 196–208.
105. Milford, E. (2009). Masdar city: A source of inspiration, Renewable Energy World
Magazine, Vol. 12, No. 2, Retrieved from http://www.renewableenergyworld.
com/rea/news/article/2009/04/masdar-city-a-source-of-inspiration, March 15,
2009.
106. Masdar’s Fact sheet. (2014). Retrieved November 7, 2014, from Masdar: http://
www.masdar.ae/en/media/detail/masdar-fact-sheet-ver-1-jan-2013
107. Ministry of State for Environmental Affairs and Egyptian Environmental Affairs
Agency. (2009). Climate Change 2001–2009, Retrieved May 3, 2009, from http://
www.eeaa.gov.eg
108. Associated Consultants. (2008). Strategic Planning for Ashmun City, Menoufia,
Egypt, Ministry of Housing, Utilities and Urban Communities and General
Organization of Physical Planning (GOPP), Cairo, Egypt.
109. Expert group meeting on cities in climate change, Urban Environment Newsletter,
February 2008, Urban Environment Section, UN-Habitat, Nairobi, Kenya, in collaboration with UNEP, DTIE, Urban Environment Unit, Retrieved from http://
www.unhabitat.org/scp, February 15, 2009.
3
Energy-Efficient Urban Areas:
Theories and Green Rating Systems*
3.1 Introduction
Sustainability is the governing paradigm of the 21st century. It has been the
core of development debates for decades. However, expanding cities, especially in developing countries, are still lacking good guidance for coping
with this paradigm. In these countries, the brown agenda dominates urban
development; the green agenda is seen as a luxury and something to be
considered in future generations. However, the current debate of quality of
life (QOL) versus standard of living provides a strong base to support more
environmentally responsive urban development. There is a growing awareness that providing a good QOL is a right of even the very vulnerable. This
shift in paradigm advocates a more holistic approach to urban development.
But question remains: What kind of urban planning theory or trend should
be advocated to ensure a more sustainable development?
Currently, sustainable development is measured using a number of indicators and scales, of which ecological footprint and human development index
are of vital importance. Moreover, there is a growing body of indices to rate
urban agglomerations, whether on the macroscale of cities, such as the Green
City Index, Low Carbon City Index and Comprehensive Assessment System
for Building Environmental Efficiency (CASBEE) for cities, or the microscale
of neighbourhoods and urban areas, such as Leadership in Energy and
Environmental Design (LEED) for neighbourhoods. These indices tend
to measure performance in a number of fields—namely energy and CO2,
land use, transport, waste, water, sanitation, air quality and environmental
governance.
Cities are planned, managed and then are rated. Most of the recommendations and conclusion ratings fall within the field of urban management
and urban governance. If the city has good urban governance, it will most
likely be well managed. However, what about urban planning? Which trend
* Most of this chapter is derived from Khalil [1].
67
68
Energy Efficiency in the Urban Environment
of planning facilitates good urban management and provides a stable
groundwork for good governance to stand on?
In contrast to the aforementioned efforts to rate the sustainability of
urban agglomerations, there are a number of theories that claim to create or
promote sustainable urbanism; these are new urbanism (NU), smart growth,
transit-oriented development (TOD) and sustainable urbanism. However,
little evidence exists to support the link between following a certain t heory
and achieving precise progress on the sustainability charts. Developing
countries, especially in Africa, are urbanising at a very fast rate. What about
the cities to be built? What are the concepts that should govern urban planning of these new settlements? What lessons could be learned from rating
existing cities to plan more successfully sustainable cities?
This chapter attempts to study this link and to analyse the relationship
between adopting sustainable urbanism theories and scoring high on the
green indices with a focus on energy efficiency. The chapter will analyse
the urban pattern of highly ranked cities and correlate it to sustainable
urbanism theories. It includes a matrix of relations highlighting the most
important aspects or concepts that should be adopted to improve the energy
efficiency score of a city. It further applies this matrix to one of Egypt’s new
cities to provide a forward vision for improving QOL within the Egyptian
context.
3.2 Quality of Life Is a Right
QOL has been the domain of development discourse for the past decade.
It has been widely recognised that measuring progress in terms of gross
domestic product (GDP) is not sufficient. According to the ecological economist Costanza [2], although QOL has long been an explicit or implicit policy goal, adequate definition and measurement have been elusive. Diverse
‘objective’ and ‘subjective’ indicators across a range of disciplines and scales,
and recent work on subjective well-being surveys and the psychology of
happiness, have spurred renewed interest.
It is widely accepted now that seeking better QOL should be the ultimate
goal of development plans and not just concentrating on economic progress. Currently, there is a shift away from depending on the GDP as a measure of material well-being. Consequently, there are a number of indices
proposed and used by different organisations to score and rate cities and
countries according to their QOL. These various indices were discussed
in Chapter 1: Quality of Living by Mercer [3], Quality of Life Index by the
Economist Intelligence Unit (EIU) [4], nations’ ranking according to QOL [5],
Your Better Life Index by the Organisation for Economic Cooperation
and Development (OECD) [6], and City Prosperity Index by UN-Habitat.
Energy-Efficient Urban Areas
69
All these indices attempt to measure how much QOL a person enjoys with
a continuous emphasis that it is multifaceted. After years of relying on the
human development index (HDI) as the main measure of progress, the shift
of UN agencies, especially UN-Habitat, to adopting QOL as a measure of
progress recognises that it should be a right and not a luxury.
3.3 Measuring Sustainable Development
It is essential to measure how cities are performing with respect to sustainable development. Thus, the need for combining indices or for an integrative
tool is crucial to bring together environmental and human issues. According
to Newman, this approach has a much more positive agenda because it
encourages a much more pro-urban process and has the potential to drive an
integrated policy agenda [7]. Sustainability assessment emerged mainly from
the need to resolve the tension between ecologists, who saw most development as essentially negative, and those working for social justice (especially
in low- and middle-income countries), who saw development as crucial to
meeting human needs. Thus these assessments can help in shaping a development approach that would allow present and future generations to benefit
economically, socially and environmentally.
According to Moos et al., there are four general approaches to assess the
sustainability of different types of development [8,9]. The first focuses on the
extent to which resources and ecological functions are protected from development, thus comparing how well two designs conserve the most e cologically
valuable land. The theoretical foundation was led by environmental planning
theorists and practitioners such as McHarg [10] and Hough [11], and many of
these principles are also evident in what is c ommonly known as ecosystem
planning [12,13]. However, this approach is limited in its ability to deal with
the issue of sprawl and the implications of sprawl for transportation patterns
and resource consumption more generally.
A second approach depends on ecosystem indicators, relying species
diversity or forest health to measure how human activities impact the environment. This approach focuses on assessing changes over time, although
resultant data also provide an opportunity to compare different developments or regions. Its shortcoming is the difficulty of translating the i ndicators
into prescriptive information for planners and developers.
The third type of assessment measures the performance of a certain project against a set of established criteria. The U.S. Green Building Council’s
LEED, the British Building Research Establishment Environmental Assess
ment Method for buildings (BREEAM), and the Japanese CASBEE certification process have all created sustainability criteria for buildings and
other larger scales.
70
Energy Efficiency in the Urban Environment
The fourth type of assessment combines various environmental impacts
into a common metric to facilitate comparisons over time and space. Both
development attributes and consumptive patterns of residents or businesses
occupying the space [14] are considered to provide some p
rescriptive information on how to improve the built form (e.g. ecological footprint). However,
in order to be comprehensive, data assembly and the translation of various
activities into a common metric become challenging [9].
Chapter 1 has highlighted the Human Development Initiative—where the
ecological footprint and HDI have been combined. The initiative targeted
how countries in the quest to achieve higher HDI consume (or not) their
environmental resources and whether current development actions are sensitive to the country’s ecological capacity or not.
3.3.1 Indices to Rate Urban Agglomerations
Globally, tools for evaluating cities are not as widely available as they are for
buildings. There is a growing demand for tools to evaluate measures and
activities on the scale of a city or a society as a whole. Currently, there are
a number of indices to rate urban agglomerations varying in scale and thus
the criteria or indicators they monitor or rate. Among these indices related
to the urban scale are CASBEE for urban development and CASBEE for cities
in Japan, LEED for neighbourhoods in the United States, and the Green City
Index developed by the EIU and Siemens. Other indices related to a ssessing
the sustainability of settlements that are tailored to local circumstances
include megacity sustainability indicators in Brazil [15], the Sustainability
Cities Index rating the biggest 20 cities in the United Kingdom [16] and the
Freiburg Charter for Sustainable Urbanism [17].
3.3.1.1 Comprehensive Assessment System for
Building Environmental Efficiency (CASBEE)
CASBEE is a tool developed in Japan under the leadership of the Ministry of
Land, Infrastructure and Transport. It has several scales, such as for housing
and offices, and in recent years, the ministry has been working on developing a low-carbon version of CASBEE for cities. Included in the process are
the CASBEE tool for housing and other buildings as well as a tool for urban
development and a tool for evaluating a city as a whole. The building and
urban development tools were completed in 2007, and a third comprehensive
tool was released in 2011 [18]. One fundamental principle guiding this effort
is the need to reduce environmental loads and to create a low-carbon society
while also improving the QOL. Clear, simple and comprehensive evaluation
results should also be presented in a visual format, which is very important
in obtaining consensus from the general public [19].
One example of the application of the CASBEE tool for urban development
is Harumi Triton Square, a large-scale urban redevelopment area located
Energy-Efficient Urban Areas
71
about 1 km from Tokyo Station. It was evaluated as ‘A with four stars’ on a
ratings scale or one to five stars [20].
Completed city environmental performance assessments would provide
strong support for environmental measures within each municipality, and
they would also function as a tool for comparing the environmental efficiencies of various measures with other cities. This would attract more attention
from citizens and enhance their sense of belonging to their local communities. It is also expected to help motivate the community itself by introducing
a competitive consciousness among cities [19].
3.3.1.2 LEED for Neighbourhood Development
In 2000, the U.S. Green Building Council (USGBC) launched its rating system, LEED, a set of standards for green buildings. The LEED standard
combines prerequisites with optional credits that count towards an overall
score. The levels of performance start at certified on the low end and platinum on the high end.
However, LEED has faced some criticism. Farr criticised its shortcomings
because it is building-centred and places low value on a project’s location and
context, particularly concerning auto-dependency. In 2002, the USGBC Board of
Directors inaugurated the LEED for Neighbourhood Development (LEED-ND)
rating system in partnership with the Congress of New Urbanism (CNU) and
the National Resource Defense Council. It increased the weighting given to
land use and transportation concerns. In 2005, the USGBC board modified its
mission to address both buildings and community [21]. The resulting rating
system integrates the principles of smart growth, NU and green building into
the first national standard for green neighbourhood development.
As stated by the LEED-ND guidebook, each of these three principles is an
integral part of the LEED-ND rating system. Although each has a unique
perspective, they reinforce each other by providing a set of criteria designed
to help developers and designers envision sustainable communities in terms
of where they are located, how they are designed and how they perform.
It places emphasis on the site selection, design and construction elements
that bring buildings and infrastructure together into a neighbourhood and
relate it to its landscape as well as to its local and regional context [22].
Scale of eligible projects may range from whole neighbourhoods, portions
of neighbourhoods, or multiple neighbourhoods, with no absolute minimum
or maximum size limit. However, the recommended size range is at least two
buildings up to 320 acres. Moreover, it is recommended that the majority
(more than 50%) of planned project square footage consists of new construction or substantial renovation to ensure that the project has enough flexibility to meet a substantial number of requirements in the LEED-ND rating
system.
Although projects may contain only a single use, typically a mix of uses
will provide the most amenities to residents and workers and will enable
72
Energy Efficiency in the Urban Environment
people to drive less and safely walk or bike more. Small infill projects that are
single use but that complement existing neighbouring uses, such as a new
affordable housing infill development in a neighbourhood that is already
well served by retail and commercial uses, are also good candidates for
certification.
It is vital to note that LEED-ND is not intended to certify an entire town,
county or city. Nor was it designed to rate existing neighbourhoods with
no new development. Its main goal is to be applied during the design of
new developments or during redevelopment and major retrofits. In addition,
it can be used to analyse whether existing development regulations—such
as zoning codes, development standards, landscape requirements, building codes, or comprehensive plans—are ‘friendly’ or are forming barriers
to sustainable developments. LEED-ND can also be used as a tool to meet
greenhouse gas reduction targets and as a ‘best practice’ manual for new
development.
3.3.1.3 Green City Index
The Green City Index, as mentioned in Chapter 1, measures the current
environmental performance of major cities on different continents as well
as their commitment to reducing their future environmental impact by way
of on-going initiatives and objectives. The EIU, in cooperation with Siemens,
developed the methodology of the index.
The index scores cities across eight categories: CO2 emissions, energy,
buildings, transport, water, waste and land use, air quality, and environmental governance; and it has 30 individual indicators. Sixteen of the index’s
30 indicators are derived from quantitative data and aim to measure how
a city is currently performing. The remaining 14 indicators are qualitative
assessments of cities’ aspirations or ambitions [23]. Currently, this index
covers areas of Europe, Latin America, Asia, the United States and Canada,
Germany and Africa [24].
Despite fuelling some debates regarding the choice of certain indicators
and the neglect of others, this index offers a tool to enhance understanding
and to highlight needed interventions for improving the environmental performance of a particular city.
3.4 Sustainable Urbanism Theories
In the quest for forming a theory for sustainable urban planning, the debate
between going compact or dispersed has dominated the philosophical and
empirical research. The main principle in the compact city theory is highdensity development close to or within the city core with a mixture of
Energy-Efficient Urban Areas
73
housing, workplaces and shops [25]. This debate, where the supporters of
each growth pattern claim to attain sustainability in a more comprehensive
way, was discussed in Chapter 2. The supporters of the compact city theory
believe that the compact city has environmental and energy advantages as
well as social benefits. On the other hand, as stated by Næss, the supporters
of the dispersed city support the idea of the green city—that is, a more open
type of urban structure, where buildings, fields and other green areas form a
mosaic-like pattern [25,26]. However, dispersed development that embraces
nature into the urban context has other impacts that are not at all sustainable.
Sprawling land development has been consuming most of the American
countryside at an alarming rate. Sprawl is defined as development that is
dispersed, auto-dependent, single use, and where it is impossible to walk
to your daily needs. There is a growing general awareness that low-density
residential development threatens farmland and open space, raises public
service costs, encourages people and wealth to leave central cities, creates
serious traffic congestion, and degrades the environment and our QOL [27].
The disagreements between the compact city and dispersed city discourses can, to a large extent, be summarised as a debate about two issues:
Which form affords the greater energy efficiency, and which aspects of
sustainable development are more important? [28].
As discussed in Chapter 2, a number of in-between ideas have emerged
that try to achieve energy efficiency and provide broader QOL. Examples
of such theories are the urban village, NU, the sustainable urban matrix,
TOD, smart growth, decentralised concentration and sustainable urbanism.
3.4.1 NU and Smart Growth
One of the strongest theories advocating for compactness and objecting to sprawling is that of NU. The CNU was founded by six architects:
Peter Calthorpe, Andres Duany, Elizabeth Moule, Elizabeth Plater-Zyberk,
Stephanos Polyzoides and Daniel Solomon in 1993 and were assisted in the
coordination of their effort by Peter Katz, who became the first Executive
Director of CNU. The main goal of the movement and subsequent theory
and charters is to promote traditional urbanism as an antidote to conventional sprawl and to write a charter that would rebut Congrès Internationaux
d’Architecture Moderne (CIAM) and its Athens Charter and would serve as
a governing document for this reform movement.
Farr states that the greatest strength of the CNU has been its design
excellence and rhetorical mastery in communicating the vocabulary of
urbanism as it related to clients’ projects. It has excelled in creating mixeduse neighbourhood developments and transit villages, featuring town
centres, fine-grained walkable street grids, and a highly diverse ensemble of traditional buildings and architectural styles. He adds that the two
new urbanist innovations, the urban-rural transect and the smart code,
both developed by Andres Duany, have the potential to reshape the urban
74
Energy Efficiency in the Urban Environment
development process. The urban–rural transect applies the ecological
framework of the natural transect to describe human settlements across
a spectrum of intensity ranging from wilderness to dense urban centres.
The smart code is a transect-based, form-based code that seeks to replace
existing zoning codes with new codes that are simple and clear and that
can be calibrated locally [21].
The principles of urbanism can be applied increasingly to projects at the
full range of scales from a single building to an entire community. These
principles are as follows [29,30]:
1. Walkability: Implying that (a) most things are within a 1 0-minute
walk of home and work; (b) pedestrian-friendly street design
(buildings close to street; porches, windows, and doors; tree-lined
streets; on street parking; hidden parking lots; garages in rear lane;
narrow, slow speed streets); and (c) pedestrian streets free of cars in
special cases.
2. Connectivity: Having (a) an interconnected street grid network that
disperses traffic and eases walking; (b) a hierarchy of narrow streets,
boulevards, and alleys; and (c) a high-quality pedestrian network
and public realm that makes walking pleasurable.
3. Mixed-use and diversity: Having (a) a mix of shops, offices, apartments and homes on site; mixed-use within neighbourhoods, within
blocks and within buildings; and (b) diversity of people—of ages,
income levels, cultures and races.
4. Mixed housing: With a range of types, sizes and prices in closer
proximity.
5. Quality architecture and urban design that emphasise beauty, aesthetics and human comfort; create a sense of place; and advocate
special placement of civic uses and sites within the community.
Moreover, the human scale architecture and beautiful surroundings
nourish the human spirit.
6. Traditional neighbourhood structure, where there is (a) a discernible centre and edge with public space at the centre; (b) importance of quality public realm; public open space designed as civic
art; (c) a range of uses and densities within a 10-minute walk; and
(d) transect planning—highest densities at town centre and progressively less dense towards the edge. This urban-to-rural transect
hierarchy has appropriate building and street types for each area
along the continuum.
7. Increased density where more buildings, residences, shops and
services are closer together for ease of walking, enabling a more
efficient use of services and resources, and creating a more convenient, enjoyable place to live.
Energy-Efficient Urban Areas
75
8. Green transportation including (a) a network of high-quality
trains connecting cities, towns and neighbourhoods and (b) a
pedestrian-friendly design that encourages a greater use of bicycles, rollerblades, scooters and walking as daily transportation.
9. Sustainability, insuring (a) minimal environmental impact of development and its operations; (b) ecofriendly technologies, respect for
ecology, and value of natural systems; (c) energy efficiency, less use
of finite fuels; (d) more walking, less driving; and (e) more local
production.
10. QOL that results from the previous aspects, where places are created
that enrich, uplift and inspire the human spirit.
Smart growth initiatives identify the relationship between development
patterns and QOL by implementing new policies and practices promoting better housing, transportation, economic development, and preservation of environmental quality. It traces its roots back to the 1970s;
however, it was consolidated when Harriet Tregoning, then Director of
Development, Community, and Environment at the U.S. Environment
Protection Agency, developed the ten principles of smart growth in 1996.
At that time, many environmentalists were simply antigrowth, viewing all
development—without distinction—as hostile to the environment. These
principles succeeded in uniting a decentralised grassroots movement of
local and regional citizen activists and municipal leaders under the Smart
Growth banner [21].
The ten principles of smart growth are: (1) mix land uses; (2) take advantage
of compact building design; (3) create housing opportunities and choices for
a range of household types, family sizes and incomes; (4) create walkable
neighbourhoods; (5) foster distinctive, attractive communities with a strong
sense of place; (6) preserve open space, farmland, natural beauty and critical environmental areas; (7) reinvest in and strengthen existing communities and achieve more balanced regional development; (8) provide a variety
of transportation choices; (9) make development decisions predictable, fair
and cost-effective; and (10) encourage citizen and stakeholder participation
in development decisions [27].
3.4.2 Transit-Oriented Development
Also known as transit-oriented design, or TOD, this is the creation of compact, walkable communities centred around high-quality train systems,
making it possible to enjoy a higher QOL without complete dependence on a
car for mobility and survival. It is a major solution to the serious and growing problems of peak oil and global warming by creating dense, walkable
communities connected to a train line that greatly reduces the need for driving and the burning of fossil fuels.
76
Energy Efficiency in the Urban Environment
Components of TOD include (a) a walkable design with pedestrian as the
highest priority; (b) a train station as the prominent feature of the town centre
with a regional node containing a mixture of uses in close proximity including office, residential, retail and civic uses; (c) high-density, high-quality
development within a 10-minute walk circle surrounding the train station;
(d) collector support transit systems including trolleys, streetcars, light rail,
buses and so forth; (e) easy use of bicycles, scooters and rollerblades as daily
support transportation systems; and (f) reduced and managed parking inside
a 10-minute walk circle around the town centre/train station [31].
3.4.3 Sustainable Urbanism
In a more comprehensive movement, Farr established the concept of ‘sustainable urbanism’. He states its basic tenets as walkable and transit-served
urbanism integrated with high-performance buildings and high-performance
infrastructure. Sustainable urbanism emphasises that the personal appeal and
societal benefits of neighbourhood living—meeting daily needs on foot—are
greatest in neighbourhoods that integrate five attributes: definition (defined
centre and edge), compactness (increasing sustainable effectiveness), completeness (daily and lifelong utility), connectedness (integrating transportation and land use), and biophilia (human access to nature) [21].
According to Khalil, guidelines for sustainable urban development can
be formulated using a number of criteria: (a) Defined neighbourhood with a
defined centre and edge comprising a traditional neighbourhood structure
and advocating high-quality architecture and urban design; (b) compactness
for an increased sustainable effectiveness through advocating walkability,
connectivity, increased density and compact building design; (c) completeness
with daily and lifelong utilities including diversity of mixed uses, mixed housing and fostering distinctive, attractive communities with a strong sense of
place; (d) connectedness with integrating transportation and land use, green
transportation and a variety of transportation choices; (e) enhancing the QOL
by preserving open space, farmland, natural beauty and critical environmental
areas and a more balanced regional development, promoting human access to
nature; and (f) such sustainable urban development should encourage citizen
and stakeholder participation in the development decisions [30].
3.5 Best Practices in Energy Efficiency
and Sustainable Urbanism Principles
This section analyses the relationship between scoring high in energy
efficiency on the Green City Index and adopting the relevant principles
of sustainable urbanism. As shown in Table 1.1 in Chapter 1, indicators
Energy-Efficient Urban Areas
77
concerning energy efficiency have been extracted from the Green City
Index. These indicators will be used to study the relevance to sustainable
urbanism principles for the highest-ranking city. In the European Green
Index, Copenhagen scores as Europe’s greenest city. Successive governments at the national and municipal levels have strongly supported the
promotion of sustainable development and have been taking environmental issues and s ustainable energy seriously since the oil shock of the
1970s [23]. In Latin America, Curitiba scores highest as Latin America’s
greenest metropolis, c ontinuing to live up to its reputation for sustainable
urban planning [32]. It has been pursuing a long-term strategy since the
1960s to control urban sprawl and to plan and manage its transportation
systems. In the African index, Johannesburg was chosen because it ranks
above average overall, along with five other cities. It is particularly strong
in energy and CO2, land use, transport, air quality and environmental governance, ranking above average in each category [33].
The previous analysis of best practices in Europe, Latin America, and
Africa (as specified in Table 3.1 [23,32,33]) has shown the relationship
between scoring high on energy efficiency indicators and applying or
fulfilling principles of sustainable urbanism. For decades, Copenhagen
and Curitiba have been famous for their adoption of sustainable urbanism principles. Therefore, it is clear that urban planning is the major
tool to achieve eco-efficiency and not limit actions to urban management and p
roposing policies. Johannesburg, as with most African cities,
is still expanding and thus needs to develop a comprehensive approach
to
tackling its urban development and to ensuring energy efficiency.
In August 2011, the city launched its Growth Development Strategy to try
to o
vercome problems of sprawling and population increase. This should
be advocated in fast g rowing cities and emerging new ones in a continuously u rbanising world.
3.6 Guidelines for Egyptian Sustainable Cities
The city of 10th of Ramadan is an example of new development in Egypt.
It was one of the first new cities to be developed outside existing cities
in the 1970s and is situated to the northeast of Cairo, some 50 km away.
The city was planned according to the principles of the Athens Charter,
advocating separation of uses and car dependency. This has contributed
to its limited ability to attract population and to sustain growth. Although
the city has a strong industrial economy based in its big industrial zone,
currently the city’s population is only 260,000 (far behind its original target population of 500,000 by 2005) with only 66% occupation and a density
of 42.8 inhabitants/ha. Table 3.2 [1,34] illustrates the poor performance
Clean and
efficient
energy
policies
Electricity
consumption
Sustainable
urbanism
principles
743 megajoules of electricity per
US$1,000 GDP
5.6 gigajoule/inhabitant
18.76% renewables
84% of electricity from hydropower
Promotes solar power, convert landfill
gas into electricity
Copenhagen
Curitiba
Johannesburg
Johannesburg
80.63 gigajoules/inhabitant
Curitiba
Value
Copenhagen
Johannesburg
Curitiba
City
Copenhagen
Indicator
Compact Building Design
–
–
Sense of Place
Mixed Housing
Mixed Uses
Increased Density
Connectivity
Walkability
Completeness
Connectedness
Integrating Transportation
and Land Use
Compactness
Green Transportation
Cities’ Energy Efficiency Performance Indicators and Relevant Sustainable Urbanism Principles
Variety of Transportation
Choices
TABLE 3.1
Quality
of Life
Preserving Open and
Natural Areas
78
Energy Efficiency in the Urban Environment
Land use
policy
Population
density
Green spaces
per capita
Eco buildings
policy
Climate
change
action plan
Incentivise landowners to establish
public parks on their private land and
control sprawl
Reduce urban sprawl by rehabilitating
underpopulated centre neighbourhoods
and building new mixed-density and
mixed-income housing developments
with access to services and transport
Curitiba
Johannesburg
230.7 m2/person
105 person/ha
43 person/ha
24 person/ha
Redevelopment of brown field sites
Campaigns to motivate lifestyle change
and citizens’ involvement in developing
solutions
Monitoring CO2 absorption rate in green
spaces, and total city CO2 emissions
N/A*
554 mega joules/m2; two urban
development projects to create
‘carbon-neutral neighbourhoods’, with
low-energy buildings, sustainable
energy networks and environmentally
friendly transport
No eco-efficient standards for buildings,
no incentives to lower energy use
N/A
80% live within 300 m of a park or
recreation area
52 m2/person
Johannesburg
Copenhagen
Curitiba
Johannesburg
Copenhagen
Curitiba
Johannesburg
Copenhagen
Curitiba
Johannesburg
Copenhagen
Curitiba
Copenhagen
–
–
–
–
–
–
–
–
–
–
–
–
–
–
–
Continued
Energy-Efficient Urban Areas
79
Length of
mass
transport
network
Urban mass
transport
policy
Indicator
6.8 km/km2
Aiming to be ‘world’s best cycle city’
Replacing diesel-powered buses with
biofuels, Green Line with 4 exclusive
bus lanes and 3 vehicle lanes each
direction to cut commuting times
High-speed train, the Gautrain, from
downtown to Pretoria and Central
Business District (CBD) to airport and
the Rea Vaya bus rapid transit
Johannesburg
Copenhagen
Curitiba
Johannesburg
8.5 km/km2
Curitiba
Value
68% use cycling, public transport
City
Copenhagen
Sense of Place
Mixed Housing
Mixed Uses
Increased Density
Connectivity
Walkability
Completeness
Connectedness
Integrating Transportation
and Land Use
Compactness
Green Transportation
Compact Building Design
Cities’ Energy Efficiency Performance Indicators and Relevant Sustainable Urbanism Principles
Variety of Transportation
Choices
TABLE 3.1 (Continued)
Quality
of Life
Preserving Open and
Natural Areas
80
Energy Efficiency in the Urban Environment
Johannesburg
Curitiba
Copenhagen
Increase % of regularly using a bicycle to
get to work or education from 36% to
50% by 2015 to reduce congestion
Traffic light sequencing, traffic
information systems, dedicated delivery
times and access points
Solar power signals at key intersections
not susceptible to power failures causing
congestion and higher fuel consumption
from queuing drivers
Source: The energy efficiency performance indicators are derived from: The Economist Intelligence Unit, European Green City Index: Assessing the
Environmental Impact of Europe’s Major Cities, Siemens AG, Munich, 2009; The Economist Intelligence Unit, Latin American Green City Index:
Assessing the Environmental Performance of Latin America’s Major Cities, Siemens AG, Munich, 2010; The Economist Intelligence Unit, African Green
City Index: Assessing the Environmental Performance of Africa’s Major Cities, Siemens AG, Munich, 2011. The related sustainable urbanism principles are according to: Khalil, H., Sustainable urbanism: Theories and green rating systems, 48th AIAA/ASME/SAE/ASEE Joint Propulsion
Conference & Exhibit and 10th Annual International Energy Conversion Engineering Conference, 30 July–1 August, 2012, Atlanta, GA.
Note: Adopted principles are highlighted.
* Not applicable.
Congestion
reduction
policy
Energy-Efficient Urban Areas
81
Note:
Source:
Mixed Uses
Separation of
uses
Compact
Building
Design
Buildings are
mainly compact
Increase
Density
Density is low
and occupancy
too
Connectivity
Good road
network
No pedestrian
network, services Walkability
are too far
New metro line is planned to link the city to Cairo
150,000 workers commuting daily to surrounding towns and villages, a new electric train is planned to reduce congestion from
commuting factory buses
414.3 megajoules/inhabitant while the world average rate is 684 megajoule/inhabitant; however it is less than the average rate of
Egypt is 450 megajoules/inhabitant
No renewable energy or liquefied gas
No concern for climate change or responsiveness to city location in an arid zone
No concern with ecobuildings or improving environmental performance
12.28 m2/person; however, most open spaces are not planted and existing green spaces lack maintenance—in addition to 94 m2/
person of forests and agricultural land surrounding the city
42.8 person/ha but planned to increase mixed-use centres to increase density
Originally planned with low net densities then increased in following districts
No available data
Mixed Housing
A variety of
types and sizes
The energy efficiency performance indicators are derived from: Associated Consultants and Little, A.D., 10th of Ramadan Strategic Plan, General Organisation of
Physical Planning and Ministry of Housing, Utilities and Urban Development, Cairo, Egypt. 2010. The related adopted sustainable urbanism principles are according
to Khalil, H., Sustainable urbanism: Theories and green rating systems, 48th AIAA/ASME/SAE/ASEE Joint Propulsion Conference & Exhibit and 10th Annual
International Energy Conversion Engineering Conference, 30 July–1 August, 2012, Atlanta, GA, paper No. AIAA 2012-4248.
Adopted principles are highlighted.
Urban mass transport policy
Congestion reduction policy
Population density
Land use policy
Length of mass transport network
Clean and efficient energy policies
Climate change action plan
Ecobuildings policy
Green spaces per capita
Sustainable urbanism principles
Electricity consumption
Indicator
Sense of Place
A sense of
incompleteness
Quality of Life
Green
Transportation
Not present
Connectedness
Variety of
Transportation
Choices
Buses,
microbuses and
auto rickshaw
(three wheeler)
Completeness
Preserving
Open and
Natural Areas
No maintenance
Compactness
Transportation is Integrating
Transportation
not well
and Land Use
integrated
10th of Ramadan City Energy Efficiency Performance and Adoption of Sustainable Urbanism Principles
TABLE 3.2
82
Energy Efficiency in the Urban Environment
Energy-Efficient Urban Areas
83
of the city with respect to energy efficiency in indicators and adoption of
sustainable urbanism principles.
In order for the city of 10th of Ramadan to improve its performance,
it should adopt the principles of sustainable urbanism in its urban development plans. The latest strategic urban development plan was c oncluded
in 2010; however, it is not operational yet. This plan focused on economic development and on increasing the city’s efficiency; however, little
concern was directed towards more green policies. Thus, the following
recommendations can be concluded based on analysis of best practices
worldwide:
1. It is vital to increase occupancy by advocating mixed uses to develop
currently vacant neighbourhood service centre and to ensure availability of daily needs within walking distances.
2. Increasing densities in existing parts and new districts to enhance
walkability and decrease energy consumption.
3. Enhancing cyclability through dedicating separate lanes, especially
since the city now is underpopulated (a factor that facilitates implementing such ideas).
4. Raising awareness about climate change plans for municipalities
and city residents.
5. Encouraging factory owners to invest in public housing for their
workers instead of expanding their bus fleet for daily transporting
workers to surrounding towns and villages.
6. Enforcing the current Egyptian energy code for buildings to ensure
better performance, especially in commercial and administrative
buildings.
7. Developing a comprehensive transportation network advocating fast transit systems to decrease energy consumption and
congestion.
8. Speeding up the implementation of the designated electric train to
link the city to Cairo.
9. Encouraging the use of solar energy in many applications (such as
water heaters or street lighting), especially because the city is in the
middle of the desert.
10. Promoting planting designated green areas but using ecological
landscapes and choosing suitable plants that are responsive to the
arid climate and limited availability of water for irrigation and that
require less maintenance.
11. Encouraging recycling to preserve resources and to maximise the
benefit from latent energy used during initial manufacturing.
84
Energy Efficiency in the Urban Environment
3.7 Conclusions
Energy efficiency is currently the main concern for environmental performance. It is a common denominator in many sectors related to the city: land
use management, building construction, transportation, infrastructure and
more. This entails a holistic approach to urban management in order to promote green cities. This chapter has shown the strong interrelation between
adopting sustainable urbanism principles and achieving high environmental performance. It takes years to change cities that were planned to be car
dependent, where uses were separated. However, such continuous effort is
crucial because the world is rapidly urbanising; the number of city dwellers
has exceeded that of rural inhabitants. There are great opportunities to learn
from best practices in various areas worldwide to enhance energy efficiency.
However, user commitment remains essential to reverse current consuming behaviour. Moreover, municipalities’ adherence to a comprehensive,
yet flexible, plan advocating energy efficiency over time, even with a change
of personnel, can create more sustainable cites.
References
1. Khalil, H. (2012). Sustainable urbanism: Theories and green rating systems, 48th
AIAA/ASME/SAE/ASEE Joint Propulsion Conference & Exhibit and 10th Annual
International Energy Conversion Engineering Conference, 30 July–1 August, 2012,
Atlanta, GA, paper No. AIAA 2012–4248.
2. Costanza, R., Fisher, B., Ali, S., Beer, C., Bond, L., Boumans, R., Danigelis, N. L.,
et al. (2008). An integrative approach to quality of life measurement, research
and policy, Surveys and Perspectives Integrating Environment and Society, Vol. 1,
pp. 11–15.
3. Mercer. (2011). Mercer 2011 Quality of Living Survey Highlights—Defining ‘Quality
of Living’, Mercer, Retrieved January 25, 2012, from http://www.mercer.com/
articles/quality-of-living-definition-1436405
4. The Economist Intelligence Unit (EIU). (2007). The Economist Intelligence
Unit’s quality-of-life index, the world in 2005, The Economist, Retrieved
January 20, 2012, from http://www.economist.com/media/pdf/QUALITY_
OF_LIFE.pdf
5. Nation Ranking. (2011). Quality of Life Index 2011 Rankings, Nation Ranking:
Quantifying the World of Sovereign States, Retrieved January 21, 2012, from
https://nationranking.wordpress.com/category/quality-of-life-index/
6. Organization for Economic Cooperation and Development (OECD). (2011).
Better Life Initiative Executive Summary, OECD Better Life Initiative, Retrieved
January 20, 2012, from http://oecdbetterlifeindex.org/
7. Newman, P. (2006). The environmental impact of cities, Environment and
Urbanization, Vol. 18, No. 2, pp. 275–295.
Energy-Efficient Urban Areas
85
8. Devuyst, D., Hens, L., and De Lannoy, W. (2003). How Green Is the City?
Sustainability Assessment and the Management of Urban Environments, Columbia
University Press, New York.
9. Moos, M., Whitfield, J., Johnson, L. C., and Andrey, J. (2006). Does design
matter? The ecological footprint as a planning tool at the local level, Journal of
Urban Design, Vol. 11, No. 2, pp. 195–224.
10. McHarg, I. (1969). Design with Nature, The Natural History Press, Garden City, NY.
11. Hough, M. (1995). Cities and Natural Process, Routledge, London.
12. Dramstad, W. E., Olson, J., and Forman, R. (1996). Landscape Ecology
Principles in Landscape Architecture and Land Use Planning, Island Press,
Washington, DC.
13. Gordon, D. and Tamminga, K. (2002). Large-scale traditional neighbourhood development and pre-emptive ecosystem planning: The Markham
experience, 1989–2001, Journal of Urban Design, Vol. 7, No. 3, pp. 321–340.
14. Spangenberg, J. H. and Lorek, S. (2002). Environmentally sustainable household consumption: From aggregate environmental pressures to priority fields
of action, Ecological Economics, Vol. 43, pp. 127–140.
15. Leite, C. and Tello, R. (2011). Megacity Sustainability Indicators, Retrieved April 15,
2012, from http://www.stuchileite.com
16. Forum for The Future and General Electric GE. (2010). The Sustainability Cities
Index 2010, Forum for The Future and GE, London.
17. The Academy of Urbanism. (2010). The Freiburg Charter of Sustainable Urbanism:
Learning from Place, The Academy of Urbanism, London.
18. Committee for The Development of Environmental Performance Assessment
Tool for Cities and Institute for Building Environment and Energy Conser
vation. (2011). Overview of CASBEE for Cities, Japan Sustainable Building
Consortium (JSBC), Tokyo.
19. Edahiro, J. (2009). Conceptual Basis of the Movement to Create and Propagate
‘Eco-Model Cities’ Initiatives of the Japanese Government, JFS Newsletter No. 78,
Retrieved June 8, 2011, from http://www.japanfs.org/en/mailmagazine/
newsletter/pages/028824.html
20. Murakami, S. (2008). Promoting eco-model cities to create a low-carbon society,
International Seminar on Promoting the Eco-Model Cities for the Low Carbon Society,
Tokyo, Japan.
21. Farr, D. (2008). Sustainable Urbanism: Urban Design with Nature, John Wiley,
Featherstone, NJ.
22. Congress for the New Urbanism, Natural Resources Defense Council, and U.S.
Green Building Council. (2012). LEED 2009 for Neighborhood Development Rating
System, U.S. Green Building Council, Washington, DC.
23. The Economist Intelligence Unit. (2009). European Green City Index: Assessing
The Environmental Impact of Europe’s Major Cities, Siemens AG, Munich.
24. Green City Index. (2012). Siemens, Retrieved May 7, 2012, from http://www.
siemens.com/entry/cc/en/greencityindex.htm
25. Holden, E. and Norland, I. T. (2005). Three challenges for the compact city as
a sustainable urban form: Household consumption of energy and transport in
eight residential areas in the greater Oslo region, Urban Studies, Vol. 42, No. 12,
pp. 2145–2166.
26. NÆSS, P. (1997). Fysisk Planlegging Og Energibruk [Physical Planning and Energy
Use], Tano Aschehoug, Oslo.
86
Energy Efficiency in the Urban Environment
27. Tirado, J. (n.d.). Smart Growth Advances Nationally, New Urbanism, Retrieved
December 24, 2009, from www.newurbanism.org
28. Khalil, H. (2009). Energy efficiency strategies in urban planning of cites, Seventh
International Energy Conversion Engineering Conference IECEC 2009, AIAA,
Orlando.
29. Principles of New Urbanism. (n.d.). New Urbanism, Retrieved December 24,
2009, from http://www.newurbanism.org/newurbanism
30. Khalil, H. (2010). New urbanism, smart growth and informal areas: A quest for
sustainability, In Steffen Lehmann, Husam AlWaer and Jamal Al-Qawasmi (eds.),
Sustainable Architecture & Urban Development, CSAAR, Amman, pp. 137–156.
31. Transit Oriented Development. (n.d.). Design for a Livable Sustainable Future,
Transit Oriented Development, Retrieved January 29, 2010, from http://
www.transitorienteddevelopment.org
32. The Economist Intelligence Unit. (2010). Latin American Green City Index:
Assessing the Environmental Performance of Latin America’s Major Cities, Siemens
AG, Munich.
33. The Economist Intelligence Unit. (2011). African Green City Index: Assessing the
Environmental Performance of Africa’s Major Cities, Siemens AG, Munich.
34. Associated Consultants and Little, A. D. (2010). 10th of Ramadan Strategic Plan,
General Organisation of Physical Planning and Ministry of Housing, Utilities
and Urban Development, Cairo.
4
Energy-Efficient Informalisation*
4.1 Introduction: Scarce Resources, Efficient
Practices, Urbanisation and Sustainability
Urbanisation is the leading sector on which humans are working; the
ever-growing population is spreading globally and constantly moving
into cities. Major urbanisation activities are taking place in the developing
world. Over the past 50 years, cities have expanded into the land around
them at a rapid rate. Highways and transport systems have been built,
and valuable farmland has been lost. Globally, urbanisation levels will rise
dramatically in the next 40 years—by 70%, with a population of almost
6.4 billion (UN Population Division 2007). According to the UN-Habitat
2008 report ‘The State of the World’s Cities 2008/2009: Harmonious
Cities’, every day 193,107 new city dwellers are added to the world’s urban
population, which translates to slightly more than two people every
second. For the years 2000–2005, in developed nations, the total increase
in urban population per month was 500,000, with an annual growth rate
of 0.54%, compared to 5 million in the developing world, with an annual
growth rate of 2.67% [2].
Cities and urban settlements must be prepared to meet this challenge.
In order to avoid being victims of their own success, cities must search
for ways in which to develop sustainably. A successful city must balance
social, economic and environmental needs; it has to respond to pressure
from all sides.
There are a number of theories that define sustainable urban development. In the Western world, there are urban movements that combat
suburbanisation, such as ‘new urbanism’, smart growth, Transit Oriented
Development (TOD) and sustainable urbanism. They attempt to achieve
more environmentally sustainable urbanism. This urbanism, as specified
by the UN-Habitat (2009), requires that (a) greenhouse gas emissions are
reduced and serious climate change mitigation, and adaptation actions are
* Most of this chapter is derived from Khalil [1].
87
88
Energy Efficiency in the Urban Environment
implemented; (b) urban sprawl is minimised, and more compact towns and
cities served by public transport are developed; (c) non-renewable resources
are sensibly used and conserved; (d) renewable resources are not depleted;
(e) the energy used and the waste produced per unit of output or consumption is reduced; (f) the waste produced is recycled or disposed of in ways
that do not damage the wider environment; and (g) the ecological footprint
of towns and cities is reduced [3].
Although cities in the developed world grow in a planned pattern, following one code or the other, compact or dispersed, those in the developing
world mostly grow informally. This informal growth poses an additional
challenge to the urbanisation process itself. The UN-Habitat agenda stresses
that cities, in their quest for development, should consider social aspects.
These aspects are (a) equal access to and fair and equitable provision of
services; (b) social integration by prohibiting discrimination and offering opportunities and physical space to encourage positive interaction;
(c) gender and disability sensitive planning and management; and (d) the
prevention, reduction and elimination of violence and crime [3].
This chapter addresses the issue of informal urbanisation in the developing world and compares it to sustainability criteria as specified by the new
trends of sustainable urbanism. The chapter highlights the green aspects of
this form of urbanisation in the developing world, with a special reference
to Egypt, as opposed to the dominant idea of unsafe, informal and illegal
areas. These sustainability potentials can be the groundwork for upgrading programmes in addition to the provision of shelter, water, sanitation and
services.
4.2 Western Urbanisation and the Call for
Sustainable Urban Development
Urban settlements in the developed world are expanding mainly by suburbanisation and the creation of new settlements. There is much debate about
how to urbanise sustainably—how to combat the disadvantages of current
planning theories ruling urban expansion. There are mainly two trends or
poles driving urban planning and growth—compact and dispersed development. Currently there are several theories and practices that are leading
urban design and planning in the Western hemisphere; these are new urbanism, smart growth, transit-oriented development and sustainable urbanism.
They all share common aspects and principles (as discussed in Chapter 3).
They all aspire to achieve better energy efficiency and to provide improved
quality of life for city dwellers. This chapter will discuss the relationship
between these aspects of sustainable urban design and planning and informal areas in the developing countries.
Energy-Efficient Informalisation
89
4.3 The Developing World Urbanisation: Informalisation
Informal growth is the dominating pattern in the urbanisation process all
over the developing world. It is how people meet their needs when their
governments fail to do so. Informalisation can be defined as ‘a process which
is unregulated by the institutions of society in a legal and social environment in which similar activities are regulated’ [4].
Roy states that there are two different perspectives dominating debates
about informality. The first one is derived from the ‘Urban 21 Report’ published in Urban Future 21: A Global Agenda for 21st Century by Sir Peter Hall
and Ulrich Pfeiffer. They see informally growing cities as deteriorating,
decaying and uncontrolled. The second perspective is
pioneered by
Hernando De Soto in The Mystery of Capital (2000), where he considers
informality as a heroic adventure. He views an informal economy as
people’s natural and creative reaction to government inefficiency in supplying basic needs for the poor. However, these two perspectives represent
two antidotes, where neither is solely true in itself. Instead, informality can be seen as a pattern for urbanisation instead of being an adversary of the formal sector, providing a promising resource instead of a
catastrophe [5].
A recent definition of informal areas in Egypt is ‘all what is self-built,
whether single or multi storey buildings or shacks, in the absence of law and
urban regulations enforcement. They are areas built on land not allocated
for construction as specified in the city urban plan. Despite the fact that the
buildings’ conditions may be good, they might be unsafe environmentally
and socially, and or lacking basic infrastructure and services’ [6].
There are mainly two types of informal areas: squatter areas and informal
subdivisions. Squatter areas are mainly chaotic, unplanned and marginal;
informal subdivisions are subdivided land with legal ownership, but that
lack infrastructure and areas for public services and uses [7].
In Egypt, the general classification of informal areas includes the informal areas built on agricultural land and areas built on desert land (the two
main patterns of informal areas) in addition to shacks and environmentally
unsafe areas.
4.3.1 Informal Areas Built on Agricultural Land
These areas are illegal because they are built on agricultural land not
allocated for construction, and they defy the banning of mixed uses as specified by law. Their general characteristics are: (a) narrow long streets with a
width of no more than 4–5 meters, some even with dead ends; (b) regular
block shapes according to agricultural basins subdivisions; and (c) housing
units having constant depth but with different street frontage. Heights are
according to owner’s affordability.
90
Energy Efficiency in the Urban Environment
4.3.2 Informal Areas Built on Desert Land
These appear on vacant land on city fringes where the land is publicly
owned, making the buildings there illegal. Their general characteristics are:
(a) curved, uneven streets; (b) temporary houses made of primitive materials
such as tin, carton or straw; and (c) insecure tenure.
4.3.3 Informal Area Upgrading Programmes
Informal areas and slums pose a significant threat to the green agenda
because many are built on physically unsafe land that is vulnerable to
natural hazards. They often deprive the city of surrounding agricultural land
and foreshore land for flood control and natural biofiltration from fringing
wetland vegetation. Severe erosion can result from steep slopes when they
are settled upon.
Informal area and slum upgrading programmes are mainly c oncerned
with a totally different agenda. These programmes are oriented towards
the brown agenda, with five main dimensions: access to safe water, sanitation, providing secure tenure, durable housing, and sufficient living
area. These are the indicators set by UN-Habitat to identify the improvement of slum dwellers as stated by Target 11 of the Millennium Develop
ment Goals (MDGs). However, this focus neglects other aspects of
environmental sustainability such as reducing greenhouse gas emissions,
minimising sprawling, sensibly using non-renewable resources, waste
recycling, reducing energy consumption and reducing cities’ ecological
footprints.
4.4 Do Informal Areas Possess Sustainable
Potentials? Is Informalisation ‘Smart’?
Usually, when informal areas or slums are addressed, the brown agenda and
its relative indicators are the main concern. However, these areas are rarely
seen as having green aspects or sustainable characteristics. Citing four examples, the following section discusses the presence of many of the sustainability aspects as stated in new urban planning trends for informal areas in the
Egyptian context. Boulaq Al-Dakrour and Giza’s northern sector (Imbaba)
are two informal districts of Cairo, each with around 700,000–900,000 inhabitants. The other examples are two upgrading projects, one located in vacant
land at the relocated Imbaba airport and the other in Zeinhom district,
a formerly shack area that was demolished.
Energy-Efficient Informalisation
91
4.4.1 Defined Neighbourhood (with Quality Architecture
and Urban Design)
Informal areas usually have defined edges that separate them from their
surrounding areas—such as a railroad, canal, or ring road. They have a distinct urban pattern, especially those following agricultural basin subdivisions. However, they do not have centres; instead, the main streets act as the
centres with a concentration of uses and markets. Secondary streets act as
recreational spaces where children play due to the prevailing sense of security (see Figure 4.1) [8].
What these areas lack is an overall urban vision because they are built incrementally. Moreover, where the land is privately owned, open spaces are usually
overlooked because they have little or no economic value. Also, when there is
an open space, it is not taken care of unless there is a strong sense of community among residents. As for the quality of architecture, in some areas, it can be
poor but can be upgraded to promote local character and sense of place.
However, the prevailing visual image is homogeneous due to building
with the same materials, bricks and concrete, and following the same urban
pattern (see Figure 4.2).
4.4.2 Compactness
Informal areas are compact in density (e.g.: 890 person/ha in Boulaq
Al-Dakrour district), exceeding other formal areas due to the private development mechanism, thereby providing a perfect setting for walkability and
energy efficiency. The buildings are stacked together with usually only one
free facade that minimises thermal loads, maximises space use and enhances
energy efficiency. Compactness can be explained through the following
aspects.
4.4.2.1 Walkability
Informal areas are characterised by narrow streets that are mainly pedestrian. Services, which are mainly community built, are usually within less
than a 10-minute walk (see Figure 4.3). However, government provided services may not exist in close proximity.
4.4.2.2 Connectivity
Streets are interconnected; however, they are more favourable for pedestrians than vehicles because they are narrow. Although there is a network
of wider streets, due to increased traffic load, they are usually congested—
especially at marketplaces and area entrance points. Moreover, streets
can be too long and without crossings, which decreases connectivity (see
Figure 4.4) [9].
92
Energy Efficiency in the Urban Environment
Residential
Commercial
Government
Health
Educational
The Nile
Dispersed buildings
Vacant land
Roads
Other uses
Ring road
Linear urban pattern
Former airport
Railroad
FIGURE 4.1
Giza northern sector land uses. (From Ministry of Housing, Utilities and Urban Development,
Project for Giza Northern Sector Development and Reuse of Imbaba Airport Site, Ministry of Housing,
Utilities and Urban Development, Cairo, 2008.)
4.4.2.3 Increased Density
Informal areas are characterised by very high densities (e.g.: in Boulaq
Al-Dakrour, this ranges from 490 to 2,500 persons/ha); usually upgrading
programmes tend to relocate some families to decrease this density, if possible. However, the high density should be maintained, unless it poses a threat
93
Energy-Efficient Informalisation
(a)
(b)
FIGURE 4.2
Homogeneous buildings in Boulaq Al-Dakrour district, Cairo. (a) Buildings on AlAmer street
as one of the typical mid sized streets in the area, and (b) Buildings on Zenin Street as one of
the main streets in the area.
320 m
300 m
CBO
420 m
230 m
El Zeinin
FIGURE 4.3
Community hospital, nursery and vocational centre located within 300–500 m for daily
accessibility.
to human living conditions. The UN-Habitat suggests a m
aximum crowding
indicator of two persons/room.
4.4.3 Completeness with Daily and Lifelong Utilities
These areas have a variety of uses that make them complete and i ndependent
for daily needs. They can be considered as a separate identity and provide
lifelong utilities for many residents. Residents can spend their life working,
94
Main
entrances
327 E
326 E
325 E
324 E
Energy Efficiency in the Urban Environment
Entrances
Streets less
than 5 m width
3 325 N
3 324 N
Entrances
Entrances
3 323 N
3 322 N
Entrances
3 321 N
Entrances
FIGURE 4.4
Street hierarchy and entrances in Boulaq Al-Dakrour, Cairo. (From General Organisation of
Physical Planning, Giza Governorate, GTZ, and Ministry of Housing, Utilities and Urban
Development, Boulaq Al-Dakrour District Guide Plan 2004–2017, GTZ, Cairo, 2004.)
living in an informal area without having to go outside except for some
higher educational and health services. This can be apparent through the
following aspects.
4.4.3.1 Mixed Use and Diversity
Informal areas are usually characterised by mixed uses that are seen by
the formal authorities as incorrect. However, it is the mixed uses that give
the area its richness, liveliness and advantage of availability of needs within
95
Energy-Efficient Informalisation
Residential/commercial
Residential
Residential/health care
Youth centre
Residential/commercial/religious
FIGURE 4.5
Mixed uses prevail in streets of Boulak Al-Dakrour, Cairo. (From GTZ, Participatory Development
in Urban Areas Program, Boulaq Al-Dakrour District, GTZ, Cairo, 2007.)
the area—an advantage sought by the new urban trend plans (Figure 4.5).
These areas also offer uses and utilities for a diverse spectrum of groups,
ages and incomes [10].
4.4.3.2 Mixed Housing
There is a variety of housing opportunities in informal areas because
they are community built and are driven by community needs. Different
sizes are available, and in some areas there is a variety of standards,
especially in informal areas built on private lands. In Boulak Al-Dakrour,
Giza, Egypt, there are buildings with high standard apartments and
other buildings accommodating more than one household per unit. This
diversity and community-driven development pattern adds to the area’s
sense of place, as opposed to the identical blocks in publicly developed
projects.
4.4.4 Connectedness with Integrating Transportation and Land Use
Informal areas have their own transportation network and modes that
might be exclusive to them, which is why entrances to these areas are
always considered as transportation nodes. They rely on private transportation modes, ranging from microbuses, pickup trucks and recently auto
rickshaws (toktok). These are usually in bad condition and driven by unlicensed drivers, thus posing a threat to passengers’ lives and to the environment. Sometimes these areas are built beside railways, underground metro
or transportation stations and can benefit from such facilities. Despite this
drawback in transportation in informal areas, people use bicycles a lot or
they walk, thus adding to the area’s green advantages. Land uses are distributed according to needs; commercial uses and other services are distributed along the main streets, leaving the narrower streets for residential and
recreational uses.
96
Energy Efficiency in the Urban Environment
4.4.5 Enhancing the Quality of Life
Because informal areas usually grow on undeveloped land; whether it is
agricultural or a high risk zone, these areas do not provide access to nature.
On the contrary, they are a threat to nature. This can be overcome by preserving whatever vacant land still exists inside the informal areas and by
belting the whole area to prevent its further encroachment on green fields.
However, because these areas are usually on the fringes of cities, they have
the advantage of proximity to nearby nature. The quality of life of informal area residents can be enhanced through addressing the attributes of the
brown agenda and by emphasising green advantages, providing an outlet
for overcrowded residents to enjoy nature.
4.4.6 Stakeholder Participation
Informal areas are self-built by the community and its informal sector.
Almost all development decisions are community directed. The community
has succeeded in providing housing and basic services through collaborative efforts. Other services, such as child care facilities, medical centres,
training centres and so forth, are usually provided through communitybased organisations. Thus, these efforts provide a solid ground for further
participation.
Most upgrading programmes focus on the five main dimensions in
accordance with the UN-Habitat indicators, namely: access to safe water,
sanitation, providing secure tenure, durable housing and sufficient living
area. In this quest, these programmes might overlook the green potentials
of the informal area to the extent that they might decrease them. Rebuilding
projects provide a perfect opportunity to build on the green potential of
informal areas and to avoid their pitfalls.
In the government-managed Imbaba housing project, a community
piazza is designed to be the heart of the neighbourhood (13,896 inhabitants on 22 hectares). The area is designed with two main mixed use axes
that link the areas to the adjacent park and lead to the main piazza with
its community facilities (e.g.: nursery and mosque). The design promotes
pedestrianisation with proximity of services within 600 m. The density
is 630 persons/ha, resembling the surrounding district, and commercial uses are integrated with residential buildings. The area provides a
diversity of housing alternatives with one-, two-, and three-bedroom flats
and handicapped adapted units, thus adding completeness to the area.
However, no green transportation was integrated into the project, only
linking the area to the public bus route and to the public/private microbus
service. The project aspires to enhance the quality of life of families relocated due to the demolishing of their former houses during main street
widening in the comprehensive plan to upgrade Giza’s northern sector.
97
Energy-Efficient Informalisation
Moreover, the nearby new park is one of the ambitious projects to improve
the quality of life for the whole sector. This project has special significance
because there have been a lot of debates about it in the media in the years
since the r elocation of Imbaba airport and the availability of its former site
for development. Various stakeholders participated in different stages—
from the preliminary concept to the various surveys to assessing needs
and priorities (Figure 4.6) [8].
Informal
settlement
Park
FIGURE 4.6
Imbaba Airport housing area, Cairo. (From Ministry of Housing, Utilities and Urban
Development, Project for Giza Northern Sector Development and Reuse of Imbaba Airport Site,
Ministry of Housing, Utilities and Urban Development, Cairo, 2008.)
98
Energy Efficiency in the Urban Environment
The Zeinhom Gardens housing project was a different case. The site
was formerly a shack area and was designated for demolishing. The project, initiated by the government and the Red Crescent NGO, was implemented on three stages. The first and second stages had typical designs
for buildings with limited variations in colours; however, the third stage
was adapted to the contextual Islamic heritage of old Cairo. The area is
designed with pedestrian-friendly streets and paths; however, densities
were lowered in the first stage to 388 persons/ha and then increased in
later stages to 580 persons/ha. Commercial facilities were built separately
and were not allowed to be integrated into r esidential buildings; however,
services are provided within a 10-minute walking distance. Housing varieties are limited; however, each phase avoided previous problems with
unit design. The area depends on public/private microbuses. The low built
density has provided a lot of open spaces that enhanced the quality of life
in the area, but their maintenance requires much effort. This project was
designed and implemented with minimum community participation except
for first stage residents’ requests that were integrated into later stages
(Figure 4.7) [11].
The previous discussion can be clearly seen through Table 4.1, which
demonstrates the green aspects of examples of informal areas.
Old Cairo
3
2
1
FIGURE 4.7
Zeinhom Gardens housing project with its three stages, Cairo. (From Cairo Governorate
and Housing and Utilities Sector, Zeinhom Gardens Housing Project, Cairo Governorate, Cairo,
2009.)
Stakeholder participation
in development
decisions
Enhancing quality of life
Connectedness: green
transportation
Completeness: mixed use
and diversity, mixed
housing
Defined neighbourhood:
quality architecture and
urban design
Compactness: walkability,
connectivity, and
increased density
Sustainable Urban
Development
Privately owned and
operated with an
underground metro
under construction
Strategic planning with
parks and open spaces
Initially developed by
community
Pedestrian-friendly
streets; high densities
with up to 890
persons/ha
Uses are mixed; housing
is needs-driven
Defined boundaries and
sense of security
Giza’s Northern Sector
Local upgrading programmes
under implementation
Initially developed by
community
Privately owned and
operated with underground
metro on the edge
Uses are mixed; housing is
needs-driven
Defined boundaries and
sense of security and
homogeneous buildings
Pedestrian-friendly streets;
high densities with up to 650
persons/ha
Boulaq Al-Dakrour District
Analysis of Sustainability Aspects of Existing and Rebuilt Informal Areas
TABLE 4.1
Rebuilding with better
quality and open spaces
Minimal participation in
the design process
Third phase adapting to
contextual Islamic
heritage
Pedestrian-friendly
streets; density of
388 persons/ha then
amended in third phase
Separate area for
commercial market;
identical units, but each
phase avoided previous
problems
Private and public mode
of transportation
Zeinhom Gardens
Housing Project
Area is linked to adjacent
park
Stakeholder participation in
assessing needs and
priorities
Commercial use is integrated
into residential buildings
1-, 2-, and 3- bedroom
apartments with
handicapped adapted units
Private and public mode of
transportation
Community piazza with
mixed uses to promote sense
of place and urban life
Promoting pedestrianisation;
new area with density of
630 persons/ha
Imbaba Airport Housing
Project
Energy-Efficient Informalisation
99
100
Energy Efficiency in the Urban Environment
4.5 Conclusions
Unmanaged or chaotic urban growth is considered a significant obstacle to
sustainable urban development. In a report about Egypt’s achievement of
the MDGs, it was recommended to plan and develop environmentally sustainable urban communities with affordable low-cost housing and improved
operation and maintenance of water and sanitation services [12].
Because more than 60% of Egypt’s urban development is informal, it is
vital to study informal areas and to analyse their sustainability. Through
case study analysis, some of their green characteristics are highlighted. They
are compact, walkable and dense. They provide for lifelong needs with a variety of housing and mixed uses. Initially, they are needs driven and depend
mainly on their communities’ participation in development. However, other
absent sustainability aspects should be introduced such as green transportation and promoting access to nature. This can be done by controlling
the encroachment of informal areas on agricultural land (belting informal
areas) and by providing more sustainable housing opportunities and transit-
oriented development. However, the case might be different in slums and
in squatter areas because they tend to be more environmentally hazardous.
The people’s way of developing is ‘smart’; however, their settlements need
a more comprehensive approach to ensure the provision of needs, housing
and services in a more environmentally responsive pattern. This must be the
basis for projects—whether upgrading or redevelopment. The redevelopment projects show that it is important to maintain high densities, walkability, mixed uses and mixed housing and to integrate with nearby open spaces.
Providing access to safe water, sanitation, secure tenure, durable housing
and sufficient living area should not divert projects from attending to other
sustainability aspects.
On the other hand, new formal developments—especially for medium and
upper strata—should not overlook the lessons learned from informal development. Low-density dispersed suburbanisation is not the way for environmentally sustainable development. Henceforth, there is a need to develop theories
and guidelines for formal planning to address sustainability issues in both
informal areas and their upgrading programmes and new formal development
deduced from the liveliness of informal areas and global guidelines for sustainable urban development and more locally tailored theories and practices.
References
1. Khalil, H. (2010). New urbanism, smart growth and informal areas: A quest for
sustainability, In Steffen Lehmann, Husam AlWaer and Jamal Al-Qawasmi (eds.),
Sustainable Architecture & Urban Development, CSAAR, Amman, pp. 137–156.
Energy-Efficient Informalisation
101
2. United Nations Human Settlements Programme (UN-Habitat). (2008). State of
the World’s Cities 2008/2009: Harmonious Cities, Earthscan, London, UK.
3. United Nations Human Settlements Programme (UN-Habitat). (2009). Planning
Sustainable Cities: Policy Directions, Global Report On Human Settlements, Abridged
Edition, Earthscan, London, UK.
4. Oldham, L., Shorter, F., and Tekçe, B. (1994). A Place to Live, Families and Child
Health in a Cairo Neighbourhood, The American University in Cairo Press, Cairo,
p. 10.
5. Roy, A. (2005). Urban informality: Toward an epistemology of planning, Journal
of The American Planning Association, Vol. 71, No. 2, pp. 147–158.
6. General Organization of Physical Planning (GOPP) and United Nations
Development Program (UNDP). (2007). Improving Living Condition within
Informal Settlements through Adopting Participatory Planning: General Framework
for Upgrading and Controling Informal Areas, GOPP, Cairo.
7. Imperato, I. and Ruster, J. (2003). Slum Upgrading and Participation: Lessons from
Latin America, The World Bank, Washington, DC.
8. Ministry of Housing, Utilities and Urban Development. (2008). Project for Giza
Northern Sector Development and Reuse of Imbaba Airport Site, Ministry of Housing,
Utilities and Urban Development, Cairo.
9. General Organisation of Physical Planning, Giza Governorate, GTZ, and
Ministry of Housing, Utilities and Urban Development. (2004). Boulaq
Al-Dakrour District Guide Plan 2004–2017, GTZ, Cairo.
10. GTZ. (2007). Participatory Development in Urban Areas Program, Boulaq Al-Dakrour
District, GTZ, Cairo.
11. Cairo Governorate and Housing and Utilities Sector. (2009). Zeinhom Gardens
Housing Project, Cairo Governorate, Cairo.
12. Ministry of Economic Development. (2008). Egypt Achieving The Millennium
Development Goals: A Midpoint Assessment, Ministry of Economic Development,
Cairo, Egypt.
5
Energy Generation Plants and
Leakages of Energy in Urban Egypt
5.1 Conventional Power Plants
5.1.1 General
In general, the construction and operation of a power plant requires the
existence of some conditions such as water resources and stable soil type.
There are other criteria that, although not required for the power plant,
should be considered—such as population centres and protected areas—
because they will be affected by either the construction or operation of the
plant. The following list covers most of the factors that should be studied
and considered in the selection of proper sites for power plant construction:
1. Transportation network: Easy access and enough access to a transportation network are required during power plant construction
and during operation periods.
2. Gas pipe network: Vicinity to the gas pipes reduces the required
expenses.
3. Power transmission network: To transfer the generated electricity to
the consumers, the plant should be connected to an electrical transmission system. Therefore, the nearness to the electrical network can
play a roll.
4. Geology and soil type: The power plant should be built in an area
with soil and rock layers that can stand the weight and vibrations of
the power plant.
5. Earthquake and geological faults: Even weak and small earthquakes
can damage many parts of a power plant intensively. Therefore, the
site should be far enough away from faults and previous earthquake
areas.
6. Topography: It has been proven that high elevation has a negative
effect on production efficiency of gas turbines. In addition, changing
a sloping area into a flat site for the construction of the power plant
103
104
7.
8.
9.
10.
Energy Efficiency in the Urban Environment
increases the cost. Therefore, the parameters of elevation and slope
should be considered.
Rivers and floodways: Obviously, the power plant should be a reasonable distance away from permanent and seasonal rivers and
floodways.
Water resources: Different amounts of water are required for the
construction and operation of a power plant and could be supplied
from either rivers or underground water resources. Therefore, having enough available water in a defined vicinity can be a factor in site
selection.
Environmental resources: Power plant operation has important
impacts on the environment. Therefore, priority should be given to
locations that are far enough from national parks, wildlife, protected
areas, and so on.
Population centres: For the same reasons, the site should be far
enough from population centres.
5.1.2 Need for Power
In general, the site should be near areas where there is greater need for generation capacity to decrease the amount of power loss and transmission expenses.
1. Climate: Parameters such as temperature, humidity, wind direction
and wind speed affect the productivity of a power plant and always
should be taken into account.
2. Land cover: Some land cover types such as forests, orchards, agricultural land and pastures are sensitive to pollution caused by a
power plant. The effect of the power plant on the land cover types
surrounding it should be considered.
3. Area size: Before any other consideration, the minimum area size
required for the construction of the power plant should be defined.
4. Distance from airports: Usually, a power plant has high towers and
chimneys and large volumes of gas. Consequently, for security reasons, they should be located away from airports.
5. Archaeological and historical sites: Usually historical buildings are
fragile and at the same time very valuable. Therefore, the vibration
caused by a power plant can damage them, and a defined distance
should be considered.
5.1.3 Characteristics of a Steam Power Plant
The desirable characteristic for a steam power plant are as follows:
1. Higher plant efficiency
2. Lower initial cost
Energy Generation Plants and Leakages of Energy in Urban Egypt
3.
4.
5.
6.
105
Ability to use low-quality, high-ash content and inferior fuels
Reduced environmental impact in terms of air pollution
Reduced water requirement
Higher reliability and availability
5.1.4 Classification of Power Plant Cycle
Power plant cycles are generally divided into the following classical
groups [1,2]:
1. Vapour power cycle—such as the Carnot cycle, Rankine cycle
(Figure 5.1), regenerative cycle, reheat cycle, binary vapour cycle
2. Gas power cycles—such as the Otto cycle, diesel cycle, dual combustion cycle, gas turbine cycle
5.1.4.1 Rankine Steam Cycle
The Rankine cycle is the most common of all power generation cycles and
is diagrammatically depicted in Figures 5.2 and 5.3. The Rankine cycle was
devised to make use of the characteristics of water as the working fluid.
The cycle begins in a boiler (State 4 in Figure 5.3), where the water is heated
in a constant pressure process until it reaches saturation. Once saturation
is reached, further heat transfer takes place at a constant temperature until
the working fluid reaches a quality of 100% (State 1). At that point, the high
quality vapour is expanded isentropically through an axially bladed turbine
stage to produce shaft work. The steam then exits the turbine (at State 2).
3
Wturbine
4
Qout
Wpump
2
Qin
FIGURE 5.1
Simple Rankine power cycle.
1
106
Energy Efficiency in the Urban Environment
P
T
CP
4
B
CP
1
4
3
1
B
2
2
3
v
(a)
s
(b)
FIGURE 5.2
Diagram for a simple ideal Rankine cycle. (a) on P-V diagram and (b) on T-S diagram.
A
D
Combustion gases
to stack
Boiler
Fuel
Electric
generator
Turbine
C
+
–
Cooling
tower
Condenser
Air
Warm water
B
Feedwater pump
Pump
Cooled water
Makeup
water
FIGURE 5.3
Schematic of a simple ideal Rankine cycle.
The working fluid (at State 2) is at a low pressure but has a fairly high
uality, so it is routed through a condenser, where the steam is condensed
q
into liquid (State 3). Finally, the cycle is completed via the return of the liquid
to the boiler, which is normally accomplished by a mechanical pump.
The efficiency of a Rankine cycle is usually limited by the working fluid.
Without the pressure becoming supercritical, the temperature range over
which the cycle can operate is quite small; turbine entry temperatures are
typically around 565°C (the creep limit of stainless steel) and condenser
temperatures are around 30°C. This gives a theoretical Carnot efficiency of
around 63% compared with an actual efficiency of 42% for a modern coalfired power station. This low turbine entry temperature (compared with a
gas turbine) is why the Rankine cycle is often used as a bottoming cycle in
combined cycle gas turbine power stations.
Energy Generation Plants and Leakages of Energy in Urban Egypt
107
The working fluid in a Rankine cycle follows a closed loop and is reused
constantly. The water vapour and entrained droplets often seen billowing
from power stations are generated by the cooling systems (not from the
closed loop Rankine power cycle) and represent the waste heat that could
not be converted to useful work. Note that cooling towers operate using the
latent heat of vapourisation of the cooling fluid. The white billowing clouds
that form in cooling tower operation are the result of water droplets that are
entrained in the cooling tower airflow; they are not, as commonly thought,
steam. Although many substances could be used in the Rankine cycle, water
is usually the fluid of choice due to its favourable properties, such as nontoxicity and non-reactive chemistry, abundance and low cost, as well as its
thermodynamic properties.
5.1.4.2 Gas Cycles
One of the principal advantages the Gas cycles have over other cycles is that
during the compression stage relatively little work is required to drive the
pump due to the working fluid being in its liquid phase at this point. By
condensing the fluid to liquid, the work required by the pump will only
consume approximately 1%–3% of the turbine power and so give a much
higher efficiency for a real cycle. The benefit of this is lost somewhat due to
the lower heat addition temperature. Gas turbines, for instance, have turbine
entry temperatures approaching 1500°C. Nonetheless, the efficiencies of
steam cycles and gas turbines are fairly well matched.
5.2 Strategic Urban Planning Programme:
Lacking Energy Component
Strategic planning is a technique that has been applied to many facets of
human activity; the application of strategic planning in urban contexts—in
cities, regions and other metropolitan areas—is a relatively recent development. Its beginnings were eminently practical and artistical: a mixture of
thought, techniques and art or expertise.
Fifteen years of practice proved to be enough time for the technique to
spread and for the first ‘Meeting of American and European Cities for the
Exchange of Experiences in Strategic Planning’ to be organised. Institutions
sponsoring the meeting, held in Barcelona in 1993, included the InterAmerican Development Bank, the European Community Commission and
the Iberoamerican Cooperation Institute. The cities of Amsterdam, Lisbon,
Lille, Barcelona, Toronto and Santiago de Chile participated, among others.
At that meeting, it was demonstrated—along with other relevant aspects—
that if cooperative processes are used in large cities in order to carry out
108
Energy Efficiency in the Urban Environment
strategic planning processes, and if a reasonable degree of comprehension
is reached between the administration, businesses and an ample representation of social agents, organisational synergies will develop that will eventually improve resource management and citizens’ quality of life.
Strategic urban planning (SUP), hence, has dominated the urban planning field for the past two decades or more. It aims to improve the city’s
performance and to ensure that future development is planned and responsive. Its reliance on a participatory approach enriches the process, promotes
local ownership and ensures—to an extent—its actual implementation. The
overall aim of the process is to improve the performance of the city through
adopting the strategic urban development plan. Its general objectives include
clarifying which city model is desired and working toward that goal, coordinating public and private efforts, channelling energy, adapting to new
circumstances and improving the living conditions of the citizens affected.
Thus, it can be viewed as a tool to enhance the quality of life of city residents.
In the United States, SUP processes, also known as urban renewal projects,
began to appear at the end of the 20th century. The city of San Francisco carried
out its process between 1982 and 1984. The main motivation behind starting
the SUP process was the attempt to adequately react to problematic situations
(mainly economic crisis or standstill). At the beginning of the 21st century, this
kind of organisation is not reactive but proactive. In the case of Spain, crisis
situations are not the main causes of these processes, rather they are motivated
by the search for an improved level of public–private cooperation—the wish
to coordinate activity, continued improvements, the wish to launch revitalisation processes and even to follow others. The initial determination needed to
launch this type of process varies by region; in Spain, most processes (approximately 50%) are fronted by public entities, although a significant percentage
has mixed public–private leadership.
5.2.1 Description of SUP Processes
An SUP process is defined as a city project that unifies diagnoses, specifies
public and private actions, and establishes a coherent mobilisation framework for the cooperation of urban social actors. A participative process is a
priority when defining contents because this process will be the basis for the
viability of the objectives and actions proposed. The result of the strategic
plan should not necessarily be the creation of regulations or of a government
programme (although its adoption by the state and local government should
mean the instigation of regulations, investment, administrative measures,
policy initiatives etc.) but rather a policy contract between public institutions
and civil society. For this reason, the process following the approval of the
plan and the monitoring and implementation of measures or actions is just as
or more important than the process of elaboration and consensual approval.
That is why SUP is now considered a type of governance.
Energy Generation Plants and Leakages of Energy in Urban Egypt
109
5.2.1.1 Basic Stages of an SUP Process
1. Using the work of the technical secretary as a starting point, work
groups debate and approve a diagnosis of the city that includes its
localisation. The document must be approved by the executive committee, by the general council, or by a full meeting of the corporation
as the case may be.
2. Based on the diagnosis, and keeping in mind its antecedents and
conclusions, strengths and weaknesses, the next step is the creation
of scenarios and, based on the use of imagination and rigour, the
development of prospective tasks related to the creation of future
alternatives so that the executive committee can select a model or
vision for the city. Their choice will be the basis for the generation of related key topics and/or directions for general actions to
be taken.
3. Once the work teams have been reorganised, mainly made up of
key decision makers and implementers, each key topic and line
of action will be dealt with separately, designing a detailed list of
necessary and/or advisable projects. Once the results have been
consolidated, a prioritised list of projects will be made available
from which a selection will be made. The next step is the elaboration of an action plan that includes the agents involved, timing and
resources.
4. Once all of the previously mentioned documents have been
approved, the next step is implementation—carrying out the project itself. This stage is decisive; at this point, plans are usually
given a structure in which the organisation is even more explicitly
clarified.
5.2.1.2 Critical Comments on SUP Processes
Sectors in the area of civic participation, as well as planning professionals and political activists, have all expressed criticism of SUP processes.
However, SUP processes include aspects that favour selective participation,
territorial organisation and coordination/cooperation between public and
private sectors. On the other hand, SUP processes seem to be independent of
political ideologies.
5.2.1.3 Theoretical Development
Knowledge relating to SUP processes is evolving in two complementary
directions that can be denominated, borrowing concepts from programming, as bottom-up and top-down.
110
Energy Efficiency in the Urban Environment
5.2.1.3.1 Bottom-Up
There are clear differences between what could be called the traditional
approach to strategic planning and the emerging approach.
1.
2.
3.
4.
5.
6.
Before: product predominance; now: process predominance
Before: sector specific; now: integrated
Before: normative; now: strategic
Before: goal oriented; now: cost-benefit oriented
Before: urban-offer oriented; now: urban-demand oriented
Before: subject to administrative limitations; now: supersedes administrative limitations and enters in metropolitan areas
7. Before: open participation; now: focused participation
Of course, in 2006, there was a clear evolution that attempted to adapt to
changes, political sensitivities and even trends. In any case, this is a line of
thought and action that takes full advantage of the experience of projects
that have already been implemented.
5.2.1.3.2 Top-Down
Given that:
1. The influence of each agent in the global process under consideration for implementation is yet to be determined.
2. There are no generally accepted criteria when creating instruments
for measuring progress or regression on the path toward achieving
main goals.
3. Cooperation processes among different agents within the city to
carry out strategic planning are usually undertaken using a ‘framework’ organisational structure that highlights differences.
4. Both politics and outside events affect a large city.
This line of research seeks to further the design of a model that will determine the factors related to the success of strategic planning processes in
large cities and metropolitan areas. It should be pointed out that a theory
explaining SUP in metropolitan areas and/or regions would involve furthering the consolidation of social design.
Since 2008, a national project to prepare strategic urban plans for cities
has been launched in Egypt following the issuing of a new building law
that mandated a strategic urban plan for each urban agglomeration. This
project is administered by the General Organization of Physical Planning
(GOPP). In this context, the project for SUP for small cities, funded by the
UN-Habitat, aims to improve performance and accountability in planning,
Energy Generation Plants and Leakages of Energy in Urban Egypt
111
implementing, and coordinating action and contributes to achieving the
MDGs. The
project adopts a decentralised and integrated approach to
address three main substantive areas: shelter, basic urban services and local
economic development—along with environment, governance and vulnerability as additional crosscutting areas. Because the project design is built
mainly on sustainable development, through a participatory process, local
stakeholders prepare a strategic urban plan for the following two decades
with priority actions to improve housing conditions, urban services and
local economy. All gathered data are compiled in urban observatories to
contribute to the effective management of urban policy [3].
The process of SUP in all cities in Egypt depends mainly on identifying
development projects as the main drivers for achieving future vision and
objectives. An initial list of projects is proposed based on feedback from local
stakeholders and on current needs identified in the city profile. Stakeholders
are divided into four groups representing local administration, local popular
council, community-based organisations and the private sector. These four
groups are asked to identify priority projects according to their perspectives,
and then responses are compiled to consolidate priorities. First priority projects are those that the four groups have identified as priority; second priority
projects are those that three groups have identified as priority and so forth
for third and fourth priority. The strategic development plan focuses on first
and second priority projects as the main drivers for achieving development
objectives [4].
It is important to utilise the strategic planning process with its participatory methodology to improve quality of life in cities based on the stakeholders’ subjective rating of categories defining their quality of life. However, it is
obvious that until now there has been no concern with energy efficiency as
an aspect of sustainability. However, this can be correlated with the current
low quality of services in Egyptian cities; hence, they are more concerned
with their more vital needs.
5.3 Building New Communities in Desert Areas
During the 1970s, Egyptian state envisioned developing new cities to accommodate the ever growing urban population (mainly Cairo) in more appropriate environments in the desert areas surrounding cities or on major
development corridors [5]. The first generation included 10th of Ramadan,
15th of May, 6th of October, and Sadat City in the Greater Cairo metropolitan
area. Although all new urban communities (NUCs) have been planned as
self-sustaining since the late 1970s, they have not yet reached their planned
capacities. Moreover, they currently serve either as dorm cities or only workplaces for different groups, increasing daily commuting. This is evident in
112
Energy Efficiency in the Urban Environment
the city of 10th of Ramadan, a deserted city at night that buzzes during day
with its factory workers on their daily trip in from surrounding villages.
Because the main driving force for moving from rural to urban or urban to
urban areas is the search for a better job opportunity, it is clear how vital it is
to properly plan these new communities. Thus, it is clear that housing should
follow jobs and not vice versa. If it is vital to transfer people to improve their
quality of living, jobs must be provided first. Otherwise, high-income inhabitants will continue to commute to their original jobs, creating other problems of traffic, transportation and pollution; lower income dwellers would
refuse to move because the job–housing package is more essential for them.
On the other hand, lack of appropriate housing in the new job location might
result in more commuting, raising expenditures or unemployment where
people would refuse to move in the search for a better job. In both cases, the
situation creates more poverty instead of solving the problem and of course
accentuates the issue of mobility and energy for transportation [6]. Until now,
NUCs in Egypt have been planned according to the principles of the Athens
Charter, advocating separation of uses and car dependency. This has contributed to their limited ability to attract population and to sustain growth.
5.3.1 Strategic Plan Highlights
In order to reserve the current urban trend in new communities, especially
in Egypt, and to improve their performance, the principles of sustainable urbanism should be adopted in urban development plans. SUP can
be immensely useful. The strategic urban plan should focus on economic
development and on increasing the city’s efficiency. There should be a focus
on promoting green policies. A number of relevant recommended actions,
based on analysis of best practices worldwide, would be analysed as follows:
1. Housing: An increasing number of residents in the zone will have
a decent, safe place to live, in terms of affordable housing construction programmes, self-help housing projects, migrant farm worker
housing construction, new mobile home parks and increased code
enforcement for new and existing housing.
2. Economic development: Community and economic development
activities and efforts to create employment opportunities and to promote business expansion and entrepreneurship, with micro business loans and technical assistance.
3. Education: Including construction of new school buildings, utilisation of bookmobiles to reach unserved areas, and establishment of
special task forces to provide adult and job training, GED achievement and youth employment programmes.
4. Health care services: Would provide mobile medical clinics to travel
from school to school and to build permanent medical clinics.
Energy Generation Plants and Leakages of Energy in Urban Egypt
113
5. Infrastructure: Planned projects would provide clean drinking
water, safe sewage disposal systems, established bus services to provide access to jobs and training, and increased fire fighting, paramedic and public safety services.
6. Community facilities: Including construction of three multipurpose
community centres and creation of programmes to facilitate volunteer community building activities.
5.3.2 Partnerships
Partnerships include participation by federal, state and local governments, non-profits, area businesses, public schools and the community
college.
5.3.3 Leveraging
The Desert Communities Empowerment has identified a range of organisations at the regional, governorate and local level where it intends to seek
potential funding and technical assistance. The plan also identifies other
sources of funding and support from local communities and organisations
in terms of in-kind contributions.
5.3.4 Community Involvement
Outreach to the residents in the designated areas consisted of press releases,
articles in local newspapers, surveys, a series of public meetings and creation of special topical subcommittees. The overall plan includes all the local
and small communities in the area. There was a concerted effort to include
all residents in the area in terms of both low-income and minority status.
Efforts were made to present information at meetings and in local newspapers in English and in Spanish, so that residents of the area were fully
informed about the planning process, and they were aware that their views
were considered to be important in developing the community assessment
and the plan. Numerous local organisations; local, county and state agencies;
as well as self-help groups provided letters of support for the designation as
an empowerment zone.
References
1. Khalil, E. E. (1990). Power Plant Design, Gordon and Breech, NY, USA.
2. Khalil, E. E. (2013). Boiler Furnace Design, LAP Publishers, Saarbrücken,
Germany.
114
Energy Efficiency in the Urban Environment
3. General Organization for Physical Planning (GOPP) and United Nations
Human Settlements Project (UN-Habitat). (2008). Terms of Reference for Preparing
Strategic Urban Planning for Small Cities in Egypt, UN-Habitat, Earthscan,
London, UK.
4. Khalil, H. (2012). Enhancing quality of life through strategic urban planning,
Sustainable Cities and Society, Vol. 5, pp. 77–86.
5. Arandel, C. and El Batran, M. (1997). The Informal Housing Development Process
in Egypt, Centre Nacional de la Recherche Scientifique, Bordeaux.
6. Khalil, H. (2012). Affordable housing: Quantifying the concept in the Egyptian
context, Journal of Engineering and Applied Science, Vol. 59, No. 2, pp. 129–148.
6
Energy in Buildings
This chapter generally is devoted to defining energy-efficient buildings and
the relevant indoor environmental quality; it gives a brief account of rating
systems of energy-efficient buildings.
6.1 Energy-Efficient Buildings: A Challenging Era
The developing community in its path for rapid development is endeavouring to make all necessary and appropriate measures to enhance the efficiency
of energy utilisation and to increase the beneficiation of the energy resources.
Throughout Egypt, energy resources are widely used and consumption rates
are in general exceeding the internationally accepted values. The use and
application of new and renewable energy sources can be harnessed to design,
construct, and to operate a solar building of moderate size for desert applications. This chapter demonstrates the importance of incorporating an energy
performance directive as a standard in our region; such a goal will aid energy
savings in large buildings and will set regulations for energy-efficient designs
that are based on standard calculation methods. The target is to develop standardised tools for the calculation of the energy performance of buildings, with
defined system boundaries for the different building categories and for different cooling/heating systems. We endeavour to prepare models for expressing requirements of indoor air quality, thermal comfort in winter (and, when
appropriate, in summer), visual comfort and so on with a common procedure
for an ‘energy performance certificate’.
6.1.1 Energy Declaration of Buildings
All countries around the globe have developed or are now undertaking the
development of the following specific codes with their compliance procedures and measures:
1. Residential Energy: Building Codes
2. Commercial Energy: Building Codes
The implementation of such a project is hoped to be realised through
close cooperation and association with the Housing and Building National
115
116
Energy Efficiency in the Urban Environment
Centre, universities, and the building and construction industry. The main
targets of the Energy Performance Directive are
‘Legislative authorities shall ensure that, when buildings are constructed,
sold, or rented out, an energy performance certificate is made available to
the owner or by the owner to the prospective buyer or tenant, as the case
might be.…’
‘The energy performance certificate for buildings shall include reference values such as current legal standards and benchmarks in order
to make it possible for consumers to compare and assess the energy
performance of the building. The certificate shall be accompanied by
recommendations for cost-effective improvement of the energy performance….’ [Available at www.epbd.eu]
The following steps are required for the energy certification:
1. Develop methodologies for energy declaration of the buildings
2. Develop reference values (key numbers) and/or systems for benchmarking
3. Provide a labelling system for selected buildings
The primary use of energy declarations is, among others, to
1. Create consciousness of energy efficiency in buildings and also
improve the knowledge of energy use in buildings
2. Use the information to determine if the building works as well as
possible with regard to its technical design
3. Use the information for benchmarking
4. Use the information for suggesting measures and recommendations
for reducing energy use
5. Provide the information necessary to make calculations of the
environmental impact due to the energy use (e.g. carbon dioxide
emissions)
6. Describe selected energy properties of the building
7. Give the basis for a common energy performance certification of a
building
It is believed that depending on the purpose of the energy declaration,
different procedures can be of interest. Different actors need different information. In order to give relevant advice to the property owner about which
measures are cost-effective, a very careful examination and calculation of
the building’s energy balance is necessary. A careful analysis is also necessary to give relevant information to the users about how they can decrease
their energy use without decreasing, to an unacceptable level, the indoor
117
Energy in Buildings
air quality and thermal comfort. The main purpose is to reduce the energy
consumption in the commercial and public building sector and hence also
to reduce carbon dioxide emissions. One way to proceed is to carry out the
energy calculations in different steps for existing buildings.
1. The first step is to collect measured energy use information (e.g. from
energy bills) and make a benchmarking to decide if the actual building is better or worse compared to similar buildings—for example,
if the energy use seems to be higher than the average for a comparable
grouping of buildings.
2. A second step is to make a careful energy calculation that can be
compared to the measured energy use. This has to be carried out to
identify the types of measures that can be recommended.
3. Some important aspects that are necessary to take into consideration
when developing a common tool for energy declaration of buildings
will be addressed. Figure 6.1 demonstrates the energy flow chart
proposed in the European Energy Performance Directive [1,2].
Energy certification and ways of
expressing energy requirements
Conversion factors
Primary energy and
CO2 emissions
Delivered energy
Hot water
Lighting
Heating system Cooling system Ventilation
characteristics characteristics
system
Net energy
Automation
and controls
Building
Internal gains
Heat
transmission
Air change
Indoor and
outdoor climate
Solar gains
FIGURE 6.1
Energy flow chart in buildings. (From Khalil, E. E. (2005). Energy performance of buildings
directive in Egypt: A new direction, HBRC Journal, Vol. 1.)
118
Energy Efficiency in the Urban Environment
6.1.2 Energy Performance
The energy performance of buildings should include a general framework
for the calculation of energy performance and the building categories to be
included. Let us consider here the basic recommended method for calculating the energy performance of buildings [3–10]; it should include at least, but
not limited to, the following aspects:
1. Thermal characteristics of the building (envelope and interior
partitions and so on)
2. Air-conditioning system
3. Ventilation system
4. Hot water supply and winter seasonal heating
5. Built-in lighting installation for commercial sector
6. The building’s orientation: its position and outdoor climatic
conditions
7. Passive solar systems and solar protection
8. Natural ventilation (if available)
9. Indoor climatic design conditions
The positive influence of renewable energy sources on the environment
should be included, such as
1. Active solar systems’ contribution to domestic water heating based
on renewable energy sources
2. Combined power and heat production
3. District cooling/heating systems
4. Natural lighting with goals to save electricity and cooling energy
Building categories to be covered can include
1.
2.
3.
4.
5.
6.
7.
Office buildings
Educational facilities
Healthcare facilities and hospitals
Hotels and restaurants
Sporting facilities
Department stores and commercial buildings
Warehouses, museums, cold stores and so forth
Starting from the contents of the calculation framework and looking at
the currently available European and international standards, Table 6.1
is the simple outcome summary. Preferably, as few calculation models as
119
Energy in Buildings
TABLE 6.1
List of Energy-Related Standards and Aspects in Buildings
Aspect
Thermal characteristics
Calculations of design heat load
Air-conditioning installation
Orientation of buildings, outdoor climate
Climatic data
Sub-Aspect
Building components
Cooling load, efficiency
ISO Standards
ISO 6946, 10292, 13370,
10077, 13789
ISO 13790, 13786
ISO18618
ISO 13790, 15927
ISO 9050
possible should be used to cover the different building categories. It may,
however, be necessary to use more than one model, depending on the
desired output and accuracy.
A simplified calculation method for cooling load and cooling energy use
including efficiency losses should be established. Work in this field has just
started internationally. The terms ‘air leakage’, which is used in conjunction
with the building envelope, and ‘air infiltration’, which is used in ventilation
design, should be coordinated because they effectively mean the same thing.
Areas where information on logistics is missing are those for natural and
hybrid ventilation systems—where calculation guidelines are missing.
A comprehensive calculation method should clearly include
1. Method to build up internal gains by adding individual components
from the bottom up.
2. Built-in lighting could be included, with the possibility of giving
credit for natural lighting in this approach.
3. Calculation of energy supply from solar water heating and solar
heating systems, including active seasonal storage or the use of other
renewable energy sources such as wind and geothermal.
4. Indication of the bases for specific real energy use compared to
design energy use.
5. Energy use normalisation criteria, such as kWh/m2, for benchmarking purposes; a clear definition of which m2 to be used is necessary.
6.1.3 Need for Further Development
The present work opens the field for further investigation to focus on some
issues that have to be developed before the preparation and implementation
of an energy directive for Egypt:
1. Cooling load and energy use for cooling.
2. If we assume lighting has high priority, a method to calculate all
internal gains should be developed.
120
Energy Efficiency in the Urban Environment
3. A method for establishing the air change rate based on air leakage
(air infiltration), airing and natural/hybrid/mechanical ventilation
should also be developed.
4. Verification and normalisation methods for credibility and to compare among countries.
5. Calculation schemes for the use of renewable energy sources in
different applications in buildings and particularly in desert areas.
It is probable that one calculation method will not cover all aspects
and building categories of the directive. For some applications, more
advanced simulation models will have to be used to provide satisfactory
accuracy. The on-going and future work on methods for validation and
documentation of simulation tools [10,11] could be valuable in a process of
approving models.
6.1.4 Mathematical Simulation Tools
A handful of calculation tools and simulation models have been developed
over the past few years, both inside and outside of International Energy
Agency (IEA) projects. These tools are still dispersed, and their integration
into the global energy a nalysis in the design practice has not been achieved
until now. In addition, a great deal of effort has also been invested by other
research organisations to produce user-friendly simulation models; however,
the practical use of existing simulation models is very limited in building and
heating, ventilation, air conditioning (HVAC) design. Many powerful m
odels
stay unused because of their poor documentation, poor manuals, and/or
because their users are not provided with simple and transparent procedures
for model input generation. This can be improved by providing guidelines for
input generation and for the use of standard product databases.
Simulation should be applied in all stages of the building design process
so that quick feedback on design implications can be given. Simulation tools
should also allow the designer to compare various options and see whether
(or to what extent) each component is necessary. A well-defined task is to
investigate the availability and accuracy of building energy analysis tools
and engineering models to evaluate the performance of solar and low energy
buildings. The scope of the task is limited to whole building energy analysis tools, including emerging modular type tools, and to widely used solar
and low-energy design concepts. Tool evaluation activities will include analytical, comparative and empirical methods, with emphasis given to blind
empirical validation using measured data from test rooms or full-scale
buildings. Documentation of engineering models will use existing standard
reporting formats and procedures. However, tool users, such as architects,
air-conditioning engineers, energy consultants, product manufacturers,
Energy in Buildings
121
and building owners and managers, are the ultimate beneficiaries of such
research and should be informed through targeted reports and articles.
A tool validation should proceed as follows:
1. Qualification of simulation models: The aim of this subtask is to
make the simulations safer thanks to better selection and a better
use of the models available. This activity will include a review of
HVAC models available, a review of datasets, a definition of simulation requirements and a definition of qualification tests.
2. Design process analysis: Description of the building and energy data
required for the use of simulation in the different phases of design,
a description of simulation results to support the decisions in the
different phases and a description of the information flow from preliminary design until audit and retrofit.
3. Information management: Assess the capabilities of the existing
simulation tools [Department of Energy, EnergyPlus, American
Society of heating, Refrigeration and Air Conditioning Engineers
(ASHRAE)], establish a checklist of data required, propose default
values and define possible support for data collection and communication language among users.
4. Data exchange: This includes a review of data exchange formats
available and a selection of one data exchange format, which has a
connection to a life cycle energy simulation programme.
6.1.5 Arab Energy in Buildings Code
A challenging task is to design, build, and set the guidelines for a reliable
energy code that satisfies the general needs of the Arab nations and to tailor
energy utilisation in buildings as follows:
1. Set minimum energy efficiency levels of general energy-consuming
equipment in typical residential and/or commercial buildings.
2. Set the climatic data for the Arab world and build up the relevant
building envelope data that are used for energy calculations based
on local building materials and practices.
3. Set the prescriptive energy in kW/m2 of floor area for d
ifferent
applications.
4. Devise a methodology of trade-off of energy-consuming elements to
achieve an energy-efficient building.
5. Use internationally verified calculation tools of energy patterns and
buildings’ energy signatures such as those of the U.S. Department of
Energy (DOE) [12].
122
Energy Efficiency in the Urban Environment
6.1.6 Conclusions
From the aforementioned analyses, one may conclude the importance of
incorporating an energy performance directive as a standard in our region;
such a goal will aid energy savings in large buildings and will set regulations for energy-efficient designs that are based on standard calculation
methods. The proposed standard would be largely based on international
standards and appropriately modified to suit local practices. Basically, the
proposal is to
1. Develop standardised tools for the calculation of the energy performance of buildings.
2. Define system boundaries for the different building categories.
3. Prepare models for expressing requirements on indoor air q
uality,
thermal comfort in winter (and, when appropriate, in summer),
visual comfort and so forth.
4. Develop transparent systems to determine necessary input data for
the calculations, including default values on internal gains.
5. Define comparable energy-related key values (kWh/m2, kWh per
person, kWh per apartment, kWh per produced unit etc.). The areas/
volumes need to be defined.
6. Develop a method to translate net energy used in the building to
primary energy and carbon dioxide emissions.
7. Develop a common procedure for an ‘energy performance certificate’.
8. Develop and compile relevant standards applicable for each individual building category.
6.2 Indoor Environmental Quality
6.2.1 General
Indoor environmental quality, as the name implies, simply refers to the quality
of the air in an office or in other building environments. Workers are often
concerned that they have symptoms or health conditions from exposure to
contaminants in the buildings where they work. One reason for this concern
is that their symptoms often get better when they are not in the building.
Although research has shown that some respiratory symptoms and i llnesses
can be associated with damp buildings, it is still unclear what measurements
of indoor contaminants show that workers are at risk for disease. In most
instances, where a worker and his or her physician suspect that the building
environment is causing a specific health condition, the information available
Energy in Buildings
123
from medical tests and tests of the environment is not sufficient to establish
which contaminants are responsible. Indoor environments are highly complex, and building occupants may be exposed to a variety of contaminants
(in the form of gases and particles) from office machines, cleaning products,
construction activities, carpets and furnishings, perfumes, cigarette smoke,
water-damaged building materials, m
icrobial growth (fungal/mould and
bacterial), insects and outdoor pollutants. Other factors such as indoor
temperatures, relative humidity and ventilation levels can also affect how
individuals respond to the indoor environment. Understanding the sources
of indoor environmental contaminants and controlling them can often
help prevent or resolve building-related worker symptoms. Practical guidance for improving and maintaining the indoor environment is available.
Workers who have persistent or worsening symptoms should seek medical
evaluation to establish a diagnosis and to obtain recommendations for treatment of their condition.
This section specifies requirements for indoor environmental quality
including indoor air quality, environmental tobacco smoke control, outdoor
air delivery monitoring, thermal comfort, building entrances, acoustic control, day lighting and low-emitting materials.
6.2.2 Definitions
The following words and terms shall, for the purposes of this chapter and as
used elsewhere in this code, have the meanings shown herein:
1. Agrifibre products: Agrifibre products include wheat board, strawboard, panel substrates and door cores, but do not include furniture, fixtures and equipment (FF&E) not considered base building
elements.
2. Composite wood products: Composite wood products include hardwood plywood, particleboard and medium-density fibreboard. Com
posite wood products do not include hardboard, structural plywood,
structural panels, structural composite lumber, oriented strand board,
glued laminated timber as specified in ‘Structural Glued Laminated
Timber’ (ANSI A190.1-2002) or prefabricated wood I-joists.
3. Daylit area: Area under horizontal fenestration (skylight) or adjacent
to vertical fenestration (window) and described in Figures 6.2 and 6.3.
4. Daylit space: Space bounded by vertical planes rising from the
boundaries of the daylit area on the floor to above the floor or roof.
5. HVAC units, small: Those containing less than 0.22 kg of refrigerant.
6. Interior, building: The inside of the weatherproofing system.
7. MERV: Filter minimum efficiency reporting value, based on
ASHRAE 52.2-2009.
124
Energy Efficiency in the Urban Environment
Skylight
width
45 degrees
H = Floor to
ceiling height
Daylight area
beneath
conventional
skylight
Full
height
H
partition
H
Daylighted
area
H
H
Daylighted
area
H
H
H
Outline of
skyline above
Daylighted area
Daylighted
area includes
45
degrees floor of
atrium and
the top floor
next to the
atrium
45 degrees
Daylighted
area
Nondaylighted
area
Daylighted
FIGURE 6.2
Horizontal daylight area.
8. Moisture content: The weight of the water in wood expressed as a
percentage of the weight of the oven-dry wood.
9. Multi-occupant spaces: Indoor spaces used for presentations and
training, including classrooms and conference rooms.
10. Single occupant spaces: Private offices, workstations in open offices,
reception work stations and ticket booths.
11. VOC: A volatile organic compound broadly defined as a chemical
compound based on carbon chains or rings with vapour pressures greater than 0.1 mm of mercury at room temperature. These
compounds typically contain hydrogen and may contain oxygen,
nitrogen and other elements.
H
125
Energy in Buildings
Daylighted
area cut short
by full height
partition
Daylighted area
Daylighted
area extends
2 ft (610 mm)
or to nearest wall
FIGURE 6.3
Vertical daylight area.
6.2.3 Requirements
This section specifies requirements for indoor environmental quality including indoor air quality, environmental tobacco smoke control, outdoor air
delivery monitoring, thermal comfort, building entrances, acoustic control,
day lighting and low-emitting materials. A typical building should comply
with the indoor air quality requirements as outlined in international codes
and standards (ASHRAE Standard 62.1) and ISO 16818.
6.2.4 Minimum Ventilation Rates
1. The ventilation rate procedure outlined in ASHRAE Standard 62.1
is recommended as a tool to design each mechanical ventilation
system in the building.
2. The zone-level design outdoor airflow rates in all occupiable spaces
shall be greater than or equal to the airflow calculated using the ventilation rate procedure.
6.2.5 Outdoor Air Delivery Monitoring
6.2.5.1 Spaces Ventilated by Mechanical Systems
For variable air volume supply systems, a permanently mounted, direct
total outdoor airflow measurement device shall be provided that is capable
126
Energy Efficiency in the Urban Environment
of measuring the system’s minimum outdoor airflow rate. The device shall
be capable of measuring flow within an accuracy of ±15% of the m inimum
outdoor airflow rate. The device shall also be capable of being used to
warn the building operator or for sending a signal to a building c entral
monitoring system when flow rates are not in
compliance. Naturally,
there are some exceptions to this requirement. For each air h
andling
system that serves only densely occupied spaces, a direct total outdoor
airflow m
easurement device is not required if a permanently installed
CO2 monitoring s ystem is provided for all densely occupied spaces. For air
handling systems that serve only a single densely occupied space, CO2
monitoring is required only for that space. The CO2 monitoring system
shall record v
entilation
system
performance in terms of d
ifferential
indoor-to-outdoor CO2 levels. The CO2 monitoring
system shall be
capable of indicating the CO2 level in a direct read-out display in the
occupied space, conveying such level to a building central monitoring
system, or both. Constant v
olume air supply systems that use a damper
position feedback system are not required to have a direct total outdoor
airflow measurement device.
6.2.5.2 Naturally Ventilated Spaces
A permanently installed CO2 monitoring system shall be provided in densely
occupied spaces designed to operate without a mechanical ventilation system
for any period of time that the space is occupied. Indoor CO2 sensors or air
sampling probes shall be located within the room between 1 and 2 m above
the floor and on a wall location at least 6 m from operable openings. The CO2
monitoring system shall be capable of indicating the CO2 level in a direct
read-out display in the occupied space, conveying such level to a building
central monitoring system, or both. Where floor plans are less than 12 m
wide, sensors shall be located as close to the centre of the space as p
ractical.
One CO2 sensor is allowed to be used to represent multiple spaces if the
natural ventilation design uses passive stack(s) or other means to induce airflow through those spaces equally and simultaneously without intervention
by building occupants.
6.2.5.3 CO2 Sensors
Spaces with CO2 sensors or air sampling probes leading to a central CO2
monitoring station shall have one sensor or probe for each 1000 m² of floor
space and shall be located in the room between 1 and 2 m above the floor.
CO2 sensors must be accurate to ±50 ppm at 1000 ppm. For all spaces with
CO2 sensors, target concentrations shall be calculated for full and part load
conditions (to include no less than 25%, 50%, 75%, and 100%). Metabolic rate,
occupancy, ceiling height, and outdoor air CO2 concentration assumptions
Energy in Buildings
127
and target concentrations shall be shown in the design documents. Outdoor air
CO2 concentrations shall be determined by one of the following:
1. CO2 concentration shall be assumed to be 400 ppm without any
direct measurement
2. CO2 concentration shall be dynamically measured using a CO2
sensor located near the position of the outdoor air intake
6.2.6 Filtration and Air Cleaner Requirements
6.2.6.1 Particulate Matter
1. The particulate matter filters or air cleaners shall have an Minimum
Energy Values (MERV) of not less than 8 and shall comply with and
be provided where required in Section 5.9 of ASHRAE Standard 62.1.
2. In addition to ASHRAE Standard 62.1 Section 6.2.1.1, when the building is located in an area that is designated ‘non-attainment’ with the
National Ambient Air Quality Standards for PM2.5 as determined
by the American Heating Institute (AHI) (in the United States by
the Environmental Protection Agency [EPA]), particle filters or aircleaning devices having a MERV of not less than 13 when rated in
accordance with ASHRAE Standard 52.2 shall be provided to clean
outdoor air prior to its introduction to occupied spaces.
6.2.6.2 Ozone
In addition to ASHRAE Standard 62.1 Section 6.2.1.2 requirements, when the
building is located in an area that is designated ‘non-attainment’ with the
National Primary and Secondary Ambient Air Quality Standards for ozone
as determined by the AHJ (in the United States, by the EPA), air cleaner
cleaning devices having a removal efficiency of no less than the one efficiency specified in ASHRAE Standard 62.1 Section 6.2.1.2 shall be provided
to clean outdoor air prior to its introduction to occupied spaces.
6.2.6.3 Bypass Pathways
All filter frames, air cleaner racks, access doors and air cleaner cartridges
shall be sealed to eliminate air bypass pathways.
6.2.7 Building Requirements
6.2.7.1 Building Entrances
All building entrances shall employ an entry mat system that shall have a
scraper surface, an absorption surface and a finishing surface. Each surface
shall be a minimum of the width of the entry opening, and the minimum
128
Energy Efficiency in the Urban Environment
length is measured in the primary direction of travel. Exceptions can be
made for
1. Entrances to individual dwelling units.
2. Length of entry mat surfaces is allowed to be reduced due to a b
arrier,
such as a counter, partition or wall, or due to local regulations prohibiting the use of scraper surfaces outside the entry. In this case, entry
mat surfaces shall have a minimum length of 1 m of indoor surface,
with a minimum combined length of 2 m.
6.2.7.1.1 Scraper Surface
The scraper surface shall comply with the following:
1.
2.
3.
4.
Shall be the first surface stepped on when entering the building
Shall be either immediately outside or inside the entry
Shall be a minimum of 1 m long
Shall be either permanently mounted grates or removable mats with
knobby or squeegee-like projections
6.2.7.1.2 Absorption Surface
The absorption surface shall comply with the following:
1. Shall be the second surface stepped on when entering the building
2. Shall be a minimum of 1 m long and made from materials that can
perform both a scraping action and a moisture wicking action
6.2.7.1.3 Finishing Surface
The finishing surface shall comply with the following:
1. Shall be the third surface stepped on when entering the building
2. Shall be a minimum of 1.2 m long and made from material that will
both capture and hold any remaining particles or moisture
6.2.8 Thermal Environmental Conditions
for Human Occupancy Comfort
The building shall be designed in compliance with ASHRAE Standard 55.
Exceptions are spaces with special requirements for processes, activities or
contents that require a thermal environment outside that which humans
find thermally acceptable, such as food storage, natatoriums, shower rooms,
saunas and drying rooms.
Energy in Buildings
129
6.2.9 Acoustical Control
6.2.9.1 Exterior Sound
Wall and roof-ceiling assemblies that are part of the building envelope shall
have a composite outdoor–indoor transmission class (OITC) r ating of 40 or
greater or a composite sound transmission class (STC) rating of 50 or greater,
and fenestration that is part of the building envelope shall have an OITC or STC
rating of 30 or greater for any of the following conditions:
1. Buildings within 300 m of expressways
2. Buildings within 8 km of airports serving more than 10,000 commercial jets per year
3. Where yearly average day-night average sound levels at the property line
exceed 65 decibels
Exceptions to that are buildings that may have to adhere to functional and
operational requirements such as factories, stadiums, storage, enclosed parking structures and utility buildings.
6.2.9.2 Interior Sound
Interior wall and floor/ceiling assemblies separating interior rooms and
spaces shall be designed in accordance with all of the following:
1. Wall and floor-ceiling assemblies separating adjacent dwelling units,
dwelling units and public spaces, adjacent tenant spaces, tenant spaces
and public places, and adjacent classrooms shall have a composite
STC rating of 50 or greater.
2. Wall and floor-ceiling assemblies separating hotel rooms, motel
rooms and patient rooms in nursing homes and hospitals shall have
a composite STC rating of 45 or greater.
3. Wall and floor-ceiling assemblies separating classrooms from rest
rooms and showers shall have a composite STC rating of 53 or
greater.
4. Wall and floor-ceiling assemblies separating classrooms from music
rooms, mechanical rooms, cafeteria, gymnasiums and indoor swimming pools shall have a composite STC rating of 60 or greater.
6.2.9.3 OITC and STC
OITC values for assemblies and components shall be determined in accordance with ASTM E1332. STC values for assemblies and components shall
be determined in accordance with ASTM E90 and ASTM E413.
130
Energy Efficiency in the Urban Environment
6.2.10 Day Lighting by Top Lighting
There shall be a minimum fenestration area providing day lighting by top
lighting for large enclosed spaces. In buildings three stories and less above
grade, conditioned or unconditioned enclosed spaces that are greater than
2000 m2 directly under a roof with a finished ceiling height greater than 4 m
and that have a lighting power allowance for general lighting equal to or greater
than 5.5 W/m2, shall comply with the following.
6.2.10.1 Minimum Daylight Zone by Top Lighting
A minimum of 50% of the floor area directly under a roof in spaces with a
lighting power density or lighting power allowance greater than 5 W/m2 shall
be in the daylight zone. Areas that are daylit shall have a minimum top lighting
area to daylight zone area ratio as shown in Table 6.2. For purposes of compliance with Table 6.2, the greater of the space lighting power density and the
space lighting power allowance shall be used.
6.2.10.2 Skylight Characteristics
Skylights used to comply with Section 6.2.10.1 shall have a glazing material
or diffuser that has a measured haze value greater than 90%, tested according to ASTM D1003 (notwithstanding its scope) or another test method
approved by the authority having jurisdiction. Exceptions are for skylights with
a measured haze value less than or equal to 90% whose combined area does
not exceed 5% of the total skylight area.
Skylights are capable of preventing direct sunlight from entering the occupied space below the well during occupied hours. This shall be accomplished
using one or more of the following:
1.
2.
3.
4.
Orientation
Automated shading or diffusing devices
Diffusers
Fixed internal or external baffles
TABLE 6.2
Minimum Top Lighting Area
General Lighting Power Density or Lighting Power
Allowances in Daylight Zone
W/m2
14 W/m2 < LPD
10 W/m2 < LPD < 14 W/m2
5 W/m2 < LPD < 10 W/m2
Minimum Top Lighting Area
to Daylight Zone Area Ratio
3.6%
3.3%
3.0%
Energy in Buildings
131
6.2.11 Isolation of the Building from Pollutants in Soil
For building projects that include construction or expansion of a groundlevel foundation and that are located on ‘brownfield’ sites or in ‘Zone 1’ and
are located in counties identified to have a significant probability of radon
concentrations higher than 4 picocuries/L on the U.S. EPA Map of Radon
Zones, shall have a soil gas retarder system installed between the newly constructed space and the soil.
6.2.12 Prescriptive Option
6.2.12.1 Day Lighting by Side Lighting
6.2.12.1.1 Minimum Effective Aperture
Office spaces and classrooms shall comply with the following criteria: All
north-, south- and east-facing facades for those spaces shall have a minimum
effective aperture for vertical fenestration. Opaque interior surfaces in daylight
zones shall have visible light reflectance greater than or equal to 80% for ceilings and 70% for partitions higher than 1.5 m in daylight zones.
6.2.12.1.2 Office Space Shading
Each west-, south- and east-facing facade shall be designed with a shading
projection factor. Shading is allowed to be external or internal using the
projection factor, interior. The building is allowed to be rotated up to 45 degrees
for purposes of calculations and for showing compliance. The following
shading devices are allowed to be used: louvers, sun shades, light shelves,
and any other permanent device. Any vertical fenestration that employs a
combination of interior and external shading is allowed to be separated into
multiple segments for compliance purposes. Each segment shall comply
with the requirements for either external or interior projection factor.
1. Building self-shading through roof overhangs or recessed windows.
2. External buildings and other permanent infrastructure or geological formations that are not part of the building. Trees, shrubs or any
other organic shading device shall not be used to comply with the
shading projection factor requirements. Exceptions to that include
building projects that comply with the prescriptive compliance option:
Vertical fenestration that receives direct solar radiation for less than
250 hours per year because of shading by permanent e xternal buildings, existing permanent infrastructure, or topography.
6.2.13 Materials
Reported emissions or VOC contents specified here shall be from a representative product sample and conducted with each product reformulation
132
Energy Efficiency in the Urban Environment
or at a minimum of every three years. Products c ertified under third-party
certification programmes as meeting the specific emission or VOC content
requirements listed here are exempted from this three-year testing requirement but shall meet all the other requirements as listed here.
6.2.13.1 Adhesives and Sealants
Products in this category include carpet, resilient, and wood flooring adhesives; base cove adhesives; ceramic tile adhesives; drywall and panel adhesives; aerosol adhesives; adhesive primers; acoustical sealants; fire stop
sealants; HVAC air duct sealants; sealant primers; and caulks. All adhesives
and sealants used on the interior of the building (defined as inside of the
weatherproofing system and applied on-site) shall comply with the requirements of either 6.2.13.1.1 or 6.2.13.1.2.
6.2.13.1.1 Emissions Requirements
Emissions shall be determined according to CA/DHS/EHLB/R-174 (commonly referred to as California Section 01350) and shall comply with the
limit requirements for either office or classroom spaces regardless of the
space type.
6.2.13.1.2 VOC Content Requirements
VOC content shall be complying with and shall be determined according to
and complying with the following limit requirements:
1. Adhesives, sealants, and sealant primers: SCAQMD Rule 1168. HVAC
duct sealants shall be classified as in the ‘Other’ category within the
SCAQMD Rule 1168 sealants table.
2. Aerosol adhesives: Green Seal Standard GS-36.
Exceptions to 6.2.13.1: The following solvent welding and sealant products are not required to meet the emissions or the aforementioned VOC
content requirements: Cleaners, solvent cements, and primers used with
plastic ‘piping and conduit in plumbing, fire suppression, and electrical systems. HVAC air duct sealants when the air temperature of the space in which
they are applied is less than 4.5°C.
6.2.13.1.3 Paints and Coatings
Products in this category include sealers, stains, clear wood finishes,
floor sealers and coatings, waterproofing sealers, primers, flat paints and
coatings, non-flat paints and coatings, and rust preventative coatings.
Energy in Buildings
133
Paints and coatings used on the interior of the building (defined as inside
of the weatherproofing system and applied on-site) shall comply with either
6.2.13.2.1 or 6.2.13.2.2.
6.2.13.2 Emissions
6.2.13.2.1 Emissions Requirements
Emissions shall be determined according to CA/DHS/EHLB/R-174 (commonly referred to as California Section 01350) and shall comply with the
limit requirements for either office or classroom spaces regardless of the
space type.
6.2.13.2.2 VOC Content Requirements
VOC content shall comply with and be determined according to and comply
with the following limit requirements:
1. Architectural paints, coatings and primers applied to interior surfaces walls and ceilings: Green Seal Standard GS-11
2. Clear wood finishes, floor coatings, stains, sealers and shellacs:
SCAQMD rules
6.2.13.3 Floor Covering Materials
Floor covering materials installed in the building interior shall comply with
the following:
1. Carpet: Carpet shall be tested in accordance with and shown to be
compliant with the requirements of CA/DHS/EHLB/R-174 (commonly referred to as California Section 01350). Products that have
been verified and labelled to be in compliance with Section 9 of the
CA/DHS/EHLB/R-174 comply with this requirement.
2. Hard surface flooring in office spaces and classrooms: Materials
shall be tested in accordance with and shown to be compliant with
the requirements of CA/DHS/EHLB/R-174 (commonly referred to
as California Section 01350). Products that have been verified and
labelled to be in compliance with SCS-EC10.2 comply with this
requirement.
6.2.13.4 Composite Wood, Wood Structural Panel and Agrifibre Products
Composite wood, wood structural panels and agrifibre products used on
the interior of the building (defined as inside of the weatherproofing system)
shall contain no added urea–formaldehyde resins. Laminating adhesives
134
Energy Efficiency in the Urban Environment
used to fabricate on-site and shop-applied composite wood and agrifibre
assemblies shall contain no added urea–formaldehyde resins. Composite
wood and agrifibre products are defined as: particleboard, medium-density
fibreboard, wheat board, strawboard, panel substrates and door cores.
Materials considered as FF&E are not considered base building elements
and are not included in this requirement. Emissions for products covered
by this section shall be determined according to and shall comply with one
of the following:
1. Third-party certification shall be submitted indicating compliance
with the California Air Resource Board’s (CARB) regulation entitled:
Airborne Toxic Control Measure to Reduce Formaldehyde Emissions from
Composite Wood Products; third-party certifiers shall be approved by
CARB.
2. CA/DHS/EHLB/R-174 (commonly referred to as California Section
01350) and shall comply with the limit requirements for either office
or classroom spaces regardless of the space type.
Exceptions are for structural panel components such as plywood, particle
board, wafer board and oriented strand board identified as ‘EXPOSURE 1’,
‘EXTERIOR’ or ‘HUD-APPROVED’ are considered acceptable for interior use.
6.2.13.5 Office Furniture Systems and Seating
All office furniture systems and seating installed prior to occupancy shall be
tested according to ANSI/BIFMA Standard M7.1 testing protocol and shall
not exceed the limit requirements of this standard.
6.2.13.6 Ceiling and Wall Systems
These systems include ceiling and wall insulation, acoustical ceiling panels,
tackable wall panels, gypsum wall board and panels, and wall coverings.
Emissions for these products shall be determined according to CA/DHS/
EHLB/R-174 (commonly referred to as California Section 01350) and shall
comply with the limit requirements for either office or classroom spaces
regardless of the space type.
6.2.14 Performance Option
6.2.14.1 Day Lighting Simulation
6.2.14.1.1 Usable Illuminance in Office Spaces and Classrooms
The design for the building project shall demonstrate an illuminance of at least
30 fc (300 lux) on a plane 1 m above the floor, within 75% of the area of the
Energy in Buildings
135
daylight zones. The simulation shall be made at noon on the equinox using an
accurate physical or computer day lighting model.
1. Computer models shall be built using daylight simulation software
based on the ray tracing or radiosity methodology.
2. Simulation is to be done using either the CIE Overcast Sky Model or
the CIE Clear Sky Model.
Exception to 6.2.14.1.1 is where the simulation demonstrates that existing
adjacent structures preclude meeting the illuminance requirements.
6.2.14.2 Direct Sun Limitation on Work Plane Surface in Offices
It shall be demonstrated that direct sun does not strike anywhere on a
work surface in the work plane in any daylit space for more than 20% of the
occupied hours during an equinox day in regularly occupied office spaces.
If the work surface height is not defined, a height of 0.75 m above the floor
shall be used.
6.2.14.3 Materials
The emissions of all the materials listed here and used within the b
uilding
(defined as inside of the weatherproofing system and applied on-site) shall be
modelled for individual VOC concentrations. The sum of each individual
VOC concentration from the materials listed here shall be shown to be
in compliance with the limits as listed in Section 4.3 of the CA/DHS/
EHLB/R-174 (commonly referred to as California Section 01350) and shall
be compared to 100% of its corresponding listed limit. In addition, the
modelling for the building shall include at a minimum criteria. Emissions
of materials used for modelling VOC concentrations shall be obtained in
accordance with the testing procedures of CA/DHS/EHLB/R-174 unless
otherwise noted below.
1. Tile, strip, panel and plank products including vinyl composition
tile, resilient floor tile, linoleum tile, wood floor strips, parquet
flooring, laminated flooring and modular carpet tile.
2. Sheet and roll goods including broadloom carpet, sheet vinyl, sheet
linoleum, carpet cushion, wall covering and other fabrics.
3. Rigid panel products including gypsum board, other wall panelling,
insulation board, oriented strand board, medium density fibre board,
wood structural panel, acoustical ceiling tiles and particleboard.
4. Insulation products.
5. Containerised products including adhesives, sealants, paints, other
coatings, primers and other ‘wet’ products.
136
Energy Efficiency in the Urban Environment
6. Cabinets, shelves and work surfaces that are permanently attached
to the building before occupancy. Emissions of these items shall be
obtained in accordance with the ANSI/BIFMA Standard M7.1.
7. Office furniture systems and seating installed prior to initial occupancy. Emissions from these items shall be obtained in accordance
with the ANSI/BIFMA Standard M7.1.
Exception to 6.2.14.2 are salvaged materials that have not been refurbished
or refinished within one year prior to installation.
6.3 Rating Systems of Energy-Efficient Buildings
6.3.1 Introduction
Attempts to adequately design an optimum HVAC airside system that
furnishes comfort and air quality in air-conditioned spaces with efficient
energy consumption comprise is a great challenge. Air conditioning identifies the conditioning of air for maintaining specific conditions of temperature, humidity and dust levels inside an enclosed space. The conditions to
be maintained are d
ictated by the need for which the conditioned space is
intended and for the comfort of users. So, the air conditioning embraces
more than cooling or heating. The comfort air conditioning is defined as ‘the
process of treating air to control simultaneously its temperature, humidity,
cleanliness and distribution to meet the comfort requirements of the occupants of the conditioned space’ [13]. Air conditioning, therefore, includes the
entire heat exchange operation as well as the regulation of velocity, thermal
radiation and quality of air, as well as the removal of foreign particles and
vapours. Achieving occupant comfort and health is the result of a collaborative effort of environmental conditions, such as indoor air temperature,
relative h
umidity, airflow velocity, pressure relationship, air movement efficiency, contaminant concentration, illumination and visual comfort, sound
and noise, and other factors. In the holistic approach, the totality of the effects
of the heat sink and sources in the building and the technical building systems that are recoverable for space conditioning are typically considered in
the calculation of the thermal energy needs.
Because the technical building thermal system losses depend on the
energy input, which itself depends on the recovered system thermal sources,
iteration might be required.
The calculation procedure can be devised as follows:
1. Subsystem calculations are first performed as per prevailing standards and that will be followed by determination of the recoverable
thermal system losses.
Energy in Buildings
137
2. The recoverable thermal system losses are then added to the other
recoverable heat sources already included (e.g. solar and internal
heat gains, recoverable thermal losses from lighting and/or other
technical building systems such as domestic hot water) in the calculation of the needs for heating and cooling.
3. Thermal energy needs for heating and cooling are then recalculated.
4. Iterations are performed from Step 1 until the calculated changes of
the energy needs between two successive iterations are less than a
defined limit (e.g. 1%) or calculations will be stopped after a specified number of iterations.
5. Continue to calculate the difference between the energy at the start
of the iterations and the end; these are the recovered system thermal
losses.
Examples of the internationally recognised energy labels are listed here.
These are summarised in terms of applications in buildings, both residential
and commercial. These include
1.
2.
3.
4.
Residential washing machines
Household refrigerators
Residential air conditioners
Water heaters
6.3.2 Major Appliances
For major appliances, energy labels are separated into at least four categories:
1. The appliance’s details: according to each appliance, specific details
of the model and its materials.
2. Energy class: a colour code associated with a letter (from A to G) that
gives an idea of the appliance’s electrical consumption.
3. Consumption, efficiency, capacity and so on: this section gives information according to appliance type.
4. Noise: the noise emitted by the appliance is described in decibels.
6.3.2.1 European Union Energy Label
According to several different European Union (EU) directives (92/75/CEE,
94/2/CE, 95/12/CE, 96/89/CE, 2003/66/CE, Italia), most white goods, light
bulb packaging and cars must have an EU energy label (see Figure 6.4)
clearly displayed when these items are offered for sale or rent. The energy
efficiency of the appliance is rated in terms of a set of energy efficiency
138
Energy Efficiency in the Urban Environment
Energy
Washing
machine
Manufacturer
Model
More efficient
A
A
B
C
D
E
F
G
Less efficient
Energy consumption
kWh/cycle
0.95
Washing performance
A BCDEFG
Spin drying performance
A BCDEFG
1400
Spin speed (rpm)
Capacity (cotton) kg
Water consumption
Noise
(dB(A) re 1 pW)
Washing
Spinning
5.0
55
5.2
7.0
FIGURE 6.4
Example European Union energy label for a washing machine.
classes from A to G (on the label), with A being the most energy efficient
and G the least efficient. The labels also give other useful information to the
customer as they choose among various models. The information should
also be given in catalogues and be included by Internet retailers on their
websites.
In an attempt to keep up with advances in energy efficiency, A+ and A++
grades were later introduced for refrigeration products. Following public consultation from 2007–2008, a motion was put forward and eventually
passed to introduce A+, A++ and A+++ grades for all appliances in order to
bring the labelling system up to date by early 2011 [3].
139
Energy in Buildings
6.3.2.1.1 Refrigerators, Freezers and Combined Appliances
The energy efficiency labels for freezers and refrigerators are shown in
Figure 6.5; the index is calculated for each appliance according to its consumption and its compartments’ volume, taking into account the appliance
type. The index is thus not calculated in KWh.
The label also contains:
1. The annual energy consumption in KWh per year
2. The capacity of fresh foods in litres for refrigerators and combined
appliances
3. The capacity of frozen foods in litres for freezers and combined
appliances
4. The noise in dB(A)
For cold appliances (and this product alone), for models that are more economical than those of category A, categories A+ and A++ have been assigned.
6.3.2.1.2 Washing Machines, Tumble Dryers and Combined Appliances
For washing machines, the energy efficiency scale is calculated using a cotton cycle at 60°C with a maximum declared load (as shown in Figure 6.6).
This load is typically 6 kg. The energy efficiency index is in KWh per kilograms of washing.
The energy label also contains information on
1.
2.
3.
4.
5.
Total consumption per cycle
Washing performance, with a class from A to G
Spin drying performance, with a class from A to G
Maximum spin speed
The total cotton capacity in kg
A++
A+
A
B
C
D
E
F
G
<30
<42
<55
<75
<90
<100
<110
<125
>125
C
D
E
F
G
<0.39
>0.39
FIGURE 6.5
Label for refrigerators and freezers.
A
B
<0.19 <0.23 <0.27 <0.31 <0.35
FIGURE 6.6
Label for washing machines and tumble dryers.
140
Energy Efficiency in the Urban Environment
6. Water consumption per cycle in litres
7. Noise in the washing and spinning cycles in dB(A)
For tumble dryers, the energy efficiency scale is calculated using the cotton
drying cycle with a maximum declared load. The energy efficiency index is
in KWh per kilograms of load. Different scales apply for condenser and vented
dryers (as shown here in Figures 6.7 and 6.8).
The label also contains:
1.
2.
3.
4.
The energy consumption per cycle
The total cotton capacity
Whether the unit is vented or condensing
Noise in dB(A)
For combined washer dryers, the energy efficiency scale is calculated using
the cotton drying cycle with a maximum declared load. The energy efficiency
index is in KWh per kilograms of load. Different scales apply for condenser
and vented dryers (shown in Figure 6.9).
The label also contains:
1.
2.
3.
4.
5.
6.
The energy consumption per cycle (washing and drying)
The energy consumption per cycle (washing only)
Washing performance, with a class from A to G
The maximum spin speed
The total cotton capacity (washing and drying separately)
Water consumption for a full load washed and dried; note that condenser dryers may use significant amounts of water on the d
rying
cycle
7. Noise in dB (A) (separately for washing, spinning and drying)
A
B
C
D
E
<0.55 <0.64 <0.73 <0.82 <0.91
F
G
<1.00
>1.00
F
G
<0.91
>0.91
FIGURE 6.7
Label for condenser dryers.
A
B
C
D
E
<0.51 <0.59 <0.67 <0.75 <0.83
FIGURE 6.8
Label for vented dryers.
141
Energy in Buildings
A
B
C
D
E
<0.68 <0.81 <0.93 <1.05 <1.17
F
G
<1.29
>1.29
F
G
<2.05
>2.05
FIGURE 6.9
Label for combined washer/dryers.
A
B
C
D
E
<1.06 <1.25 <1.45 <1.65 <1.85
FIGURE 6.10
Label for dishwashers.
6.3.2.1.3 Dishwashers
For dishwashers, the energy efficiency is calculated according to the number
of place settings. For the most common size of appliance, the 12 place setting
machine, the following classes apply as shown in Figure 6.10. The unit is
expressed in KWh per 12 place settings.
The label also contains:
1.
2.
3.
4.
5.
6.
The energy consumption in kWh per cycle
The efficiency of the washing cycle, with a class from A to G
The efficiency of the drying cycle, with a class from A to G
The capacity as a number of place settings
The water consumption in litres per cycle
Noise in dB(A)
6.3.2.1.4 Ovens
The label also contains:
1.
2.
3.
4.
The efficiency, with a class from A to G
The energy consumption in kWh
The volume in litres
The type (small/medium/large)
6.3.2.1.5 Air Conditioners
The directive applies only to units under 12 kW. On every label, one shall find:
1. The model
2. The energy efficiency category from A to G
3. The annual energy consumption (full load at 500 hours per year)
142
Energy Efficiency in the Urban Environment
A
B
C
D
E
F
G
Cooling EER W/W
>3.2
3.0–3.2
2.8–3.0
2.6–2.8
2.4–2.6
2.2–2.4
<2.2
Heating COP W/W
>3.6
3.4–3.6
3.2–3.4
2.8–3.2
2.6–2.8
2.4–2.6
<2.4
FIGURE 6.11
Label for air conditioners.
4.
5.
6.
7.
8.
The cooling output at full load in kW
The energy efficiency ratio (EER) in cooling mode at full load
The appliance type (cooling only, cooling/heating)
The cooling mode (air or water cooled)
The noise rating in dB (where applicable)
For air conditioners with heating capability, one shall also find (Figure 6.11):
1. The heat output at full load in kW
2. The heating mode energy efficiency category
Note that there exist units with EER and coefficient of performance (COP)
> 5, so take a note of the actual number when it is A rated.
6.3.2.1.6 Light Bulbs
On every label, you will find:
1.
2.
3.
4.
The energy efficiency category from A to G
The luminous flux of the bulb in lumens
The electricity consumption of the lamp in watts
The average life length in hours
6.3.2.1.7 Televisions
New standards that televisions need to meet for the Energy Star efficiency
rating came into effect early in September 2009 [4].
6.3.2.2 U.K. Energy Performance Certificate
A sample is shown here in Figure 6.12.
6.3.2.2.1 Home Energy Performance Rating Charts
Energy performance certificates (EPCs) are part of home information packs [1],
which have been in effect since August 2007 in England and Wales for domestic
properties with four or more bedrooms. The scheme was extended to encompass three-bedroom homes from September 2007. Rental properties have a
certificate valid for 10 years that is required on a new tenancy commencing on
143
Energy in Buildings
Energy efficiency rating
Current
Potential
Very energy efficient - lower running costs
(92–100)
A
B
(81–91)
70
C
(69–80)
D
(55–68)
52
E
(39–54)
F
(21–38)
G
(1–20)
Not energy efficient - higher running costs
UK 2005
Directive 2002/91/EC
Environmental (CO2) impact rating
Current
Very environmentally friendly lower CO2 emissions
(92–100)
(81–91)
(69–80)
(55–68)
Potential
A
B
C
63
D
(39–54)
E
(21–38)
(1–20)
37
F
G
Not environmentally friendly higher CO2 emissions
UK 2005
FIGURE 6.12
Example of energy label for United Kingdom.
Directive 2002/91/EC
144
Energy Efficiency in the Urban Environment
or after October 2008 [2]. They are a result of EU Directive 2002/91/EC relating
to the energy performance of buildings [3], as transposed into British law by the
Housing Act 2004 and The Energy Performance of Buildings (Certificates and
Inspections) (England and Wales) Regulations 2007 [4].
6.3.2.2.2 Procedure
The energy survey needed to produce an EPC is performed by an inspector who visits the property and examines key items such as loft insulation,
domestic boiler, hot water tank, radiators, windows for double glazing and
so on. He or she then inputs the observations into a software programme that
actually p
erforms the calculation of energy efficiency. The programme gives
a single number for the rating of energy efficiency and a recommended value
of the potential for improvement. There are similar figures for environmental impact. A table of estimated energy bills per annum (and the potential
for improvement) is also presented but without any reference to householder
bills. The householder will have to pay for the survey, which costs around
£60 for a four-bedroom house.
6.3.2.2.3 Domestic EPCs
The calculation of the energy ratings on the EPC is based on the RDSAPv3
procedure, which is a simplified version of the SAP2005. SAP is short for
standard assessment procedure and RDSAP for reduced data SAP; both are
derived from the UK Building Research Establishment’s Domestic Energy
Model (BREDEM), which was originally developed in the 1980s and also
underlies the National Home Energy Rating (NHER) rating. EPCs have to be
produced as part of a home information pack by home inspectors or domestic
energy assessors who are registered under an approved certification scheme.
6.3.2.2.3.1 Property Details
details [5]:
1.
2.
3.
4.
5.
The certificate contains the following property
Property address
Property type (for example, detached house)
Date of inspection
Certificate date and serial number
Total floor area
The total floor area is the area contained within the external walls of the
property. The figure includes internal walls, stairwells, and the like, but it
excludes garages, porches, areas less than 1.5 m high, balconies and any
similar area that is not an internal part of the dwelling [6].
6.3.2.2.3.2 The A to G Scale EPCs present the energy efficiency of dwellings
on a scale of A to G. The most efficient homes—those which should have
Energy in Buildings
145
the lowest fuel bills—are in band A. The certificate uses the same scale to
define the impact a home has on the environment. Better-rated homes should
have less impact through carbon dioxide emissions. The average property in
the UK is in band D or E for both ratings.
6.3.2.2.3.3 EPCs Recommendations The certificate includes recommendations on ways to improve the home’s energy efficiency to save money [7].
The accuracy of the recommendations will depend on the inspection standards applied by the inspector, which may be variable. Inspectors, who may
be home inspectors (HIs) or domestic energy assessors (DEAs), are audited
by their accreditation bodies in order to maintain standards [8]. The recommendations appear general in tone but are in fact bespoke to the property in
question. The logic by which the RDSAP programme makes its recommendations was developed as part of a project to create the RDSAP methodology,
which took place during the early years of the 21st century [9]. The EU directive requires the EPC recommendations to be cost-effective in improving the
energy efficiency of the home but, in addition to presenting the most costeffective options, more expensive options that are less cost-effective are also
presented. To distinguish them from the more cost-effective measures, these
are shown in a section described as ‘further measures’. Because the EPC is
designed to be produced at a change of occupancy, it must be relevant to any
occupier; it therefore must make no allowance for the particular preferences
of the current occupier.
6.3.2.2.3.4 Exempt Properties Properties exempt from the Housing Act
2004 are
1. Non-residential, such as offices, shops, warehouses.
2. Mixed use—a dwelling house that is part of a business (farm, shop,
petrol station).
3. Unsafe properties—a property that poses a serious health and safety
risk to occupants or visitors.
4. Properties to be demolished—properties that are due to be demolished, where the marketing of the property, all the relevant documents and planning permission exist.
6.3.2.3 Non-Domestic EPCs
In addition to the requirements in relation to dwellings, there is also a requirement for EPCs in connection with the sale, rent or construction of buildings
other than dwellings with a floor area greater than 50 m2 (from April 2008) that
contain fixed services that condition the interior environment.
Properties that are exempt from requiring a domestic EPC will generally
require a non-dwelling energy performance certificate, which was also required
by the Energy Performance of Buildings Directive. Commercial properties
146
Energy Efficiency in the Urban Environment
and public buildings currently account for nearly 25% of the UK’s carbon
emissions, contributing to global climate change [10]. All non-dwelling EPCs
must be carried out by, or under the direct supervision of, a trained nondomestic energy assessor, registered with an approved accreditation body.
Department for Communities and Local Government (DCLG) has arranged
for a publicly accessible central register of such assessors maintained by the
Landmark Information Group.
There are three levels of buildings: Level 3, Level 4, and Level 5. The complexity and the services used by that building will determine which level it
falls under. They are as follows:
1. Level 3 = small buildings, with heating systems less than 100 kW
and cooling systems less than 12 kW
2. Level 4 = purpose built buildings, with heating systems greater than
100 kW and cooling systems greater than 12 kW
3. Level 5 = larger buildings that are complex in shape
A commercial energy assessor must be qualified to the level of the building to carry out the inception.
Beginning in October 2008, all buildings including factories, offices, retail
premises and public sector buildings must have an EPC whenever the building is sold, built or rented. Public buildings in England and Wales (but not
Scotland) also require a display energy certificate showing actual energy use
and not just the theoretical energy rating. Beginning in January 2009, inspections for air-conditioning systems were introduced.
6.3.2.4 Display Energy Certificates
Display energy certificates (DECs) show the actual energy usage of a building and the operational rating, and help the public see the energy efficiency
of a building. This is based on the energy consumption of the building as
recorded by gas, electricity and other meters. The DEC should be clearly
displayed at all times and be clearly visible to the public. A DEC is always
accompanied by an advisory report that lists cost-effective measures to
improve the energy rating of the building. DECs are only required for buildings with a total useful floor area of more than 1000 m2 that are occupied by
a public authority and institution providing a public service to a large number of persons and therefore visited by those persons. They are valid for
one year. The accompanying advisory report is valid for seven years.
However, to make it easier for public authorities with multiple buildings
on one site to comply with the legislation, a site-based approach for the first
year (to October 2009) is allowed where it is not possible to produce individual DECs. This means that only one DEC will need to be produced based
on the total energy consumption of the buildings on the site. Public bodies
most affected by this relaxation are NHS Trusts, universities and schools.
Energy in Buildings
147
The requirement for DECs came into effect in October 2008. They were
trialed in the UK under an EU-funded project also called ‘Display’ and coordinated by Energie-Cités; participants included Durham County Council
and the Borough of Milton Keynes.
6.3.2.5 Criticism
EPCs have gained some political controversy, partly reflecting the housing
market crisis in the United Kingdom (2008). Many in the housing industry,
such as the Royal Institution of Chartered Surveyors, have criticised the
introduction of both Home Information Pack (HIPs) and EPCs because they
are not automatically qualified to carry out inspections. The EPC suffers
deficiencies in attempting to evaluate the energy efficiencies of houses. For
example, it takes no account of wall thickness at all, so that some very thick
and thus insulating walls in older houses count the same as though they
were only two bricks thick. A further objection is often made concerning
the quality of inspection made to produce the certificate. It cannot be invasive, so the inspector cannot drill walls or ceilings to determine the state or
even existence of any insulation. He can either assume the worst (no insulation present) or rely on the householder (who may know about the matter).
This can produce uncertainty about the validity of the output from his or
her analysis. In addition, the procedure lacks detail—for example, draught
proofing is not considered nor is the balance between ventilation and heat
retention for the dwelling. Finally, EPCs pose particular problems for the
owners of listed buildings because improvements such as double glazing
are often barred by the controls on changes to such structures, making it
difficult to rectify low ratings.
6.3.2.6 The Energy Label Australia
The energy rating label enables consumers to compare the energy efficiency
of domestic appliances on a fair and equitable basis. It also p
rovides an incentive for manufacturers to improve the energy performance of appliances.
The energy rating label was first introduced in 1986 in New South Wales and
Victoria. It is now mandatory in all states and territories for refrigerators,
freezers, clothes washers, clothes dryers, dishwashers and air conditioners
(single phase only) to carry the label when they are offered for sale. Threephase air conditioners may carry an energy label if the suppliers choose to
apply for one.
The energy rating label has two main features:
1. The star rating gives a quick comparative assessment of the model’s
energy efficiency.
2. The comparative energy consumption (usually kWh/year) provides
an estimate of the annual energy consumption of the appliance
148
Energy Efficiency in the Urban Environment
based on the tested energy consumption and information about
the typical use of the appliance in the home. Air conditioners show
the power consumption of the appliance (kW or kWh/h).
The star rating of an appliance is determined from the energy consumption and size of the product. These values are measured under Australian
standards that define test procedures for measuring energy consumption
and minimum energy performance criteria. Appliances must meet these
criteria before they can be granted an energy rating label (Figure 6.13).
Following several years of negotiation between government and
industry, the familiar red and yellow energy rating label was revised
in 2000. Energy efficiency is now measured against a tougher standard. This change encourages improved technology and more efficient
products, which will save consumers money and will help reduce harmful greenhouse gas emissions. An old energy label was in use in Australia
from 1986 until 2000 and was being reviewed during 2003 to coordinate
and plan future changes across all product groups. The elements under
consideration are deciding whether the green band at the base of the label
should be retained and making the appliance capacity more prominent on
the energy label.
The more
stars the more
energy efficient
ENERGY
RATING
Energy consumption
384
kWh per year
FIGURE 6.13
Example of the energy rating label.
Energy in Buildings
149
6.3.2.6.1 Programmes for Other Appliances
1. Background to the energy labelling programme
2. History of the energy labelling programme
3. Energy labelling: facts and fiction
4. How are star ratings calculated?
5. Tips for purchasing energy-efficient appliances
6. Energy costs: the second price tag
7. Tips on how to save energy when using an appliance
8. Why is energy efficiency important?
9. How are appliances tested for energy consumption?
10. Refrigerators and freezers
6.3.2.6.2 Refrigerators
How are Refrigerator Star Ratings Calculated?
6.3.2.6.2.1 Comparative Energy Consumption The energy consumption of a
refrigerator is measured under conditions specified in an Australian standard. Over a year, this value is known as the comparative energy consumption or CEC.
6.3.2.6.2.2 Concept of Adjusted Volume The measure of energy service for a
refrigerator is the volume that has to be cooled. However, freezers operate
at a much colder temperature than fresh food compartments, so the volume
of these compartments is ‘adjusted’ to take into account the extra energy
required to achieve this task. The energy service provided by a refrigerator
or freezer is called the total adjusted volume.
6.3.2.6.2.3 Performance To be eligible for an energy label, a refrigerator
has to meet a temperature operation test and a pull down test as defined
in the Australian standard. Refrigerators also have to meet the minimum
energy performance standards (MEPS) requirements for minimum energy
efficiency.
6.3.2.7 Base Energy Consumption and Star Rating
The base energy consumption (BEC) defines the ‘one star’ line for particular products. An additional star is awarded when the CEC of the model is
reduced by a defined percentage from the BEC. Energy reductions per star
from 2010 were set at 23% per star. For example, a CEC that was 0.77 of the
BEC or less would achieve two stars. Similarly, a CEC of 0.5929 (0.77 × 0.77)
of the BEC or less would achieve three stars and so on.
150
Energy Efficiency in the Urban Environment
For refrigerators and freezers, there are a total of 10 groups that have been
defined under the standard. However, to determine star ratings, a number
of these groups are compared on the same basis, especially where they are
performing a similar task. From 2010, there are only three BEC rating scales
which cover all 10 refrigerator and freezer groups.
Refrigerators and freezers are a special category of product under the
energy labelling programme because they are also subjected to MEPS.
The effect of the MEPS requirements for refrigerators and freezers was
considered when the BEC lines were developed. The new BEC lines from
2010 are based on curves that have been developed on the basis of estimated surface (adjusted volume to the power of two-thirds) area rather than
adjusted v
olume, which has been used previously; this helps reduce the
effect of size bias.
What about Adaptive Defrost?
Adaptive defrost is smart technology for frost-free refrigerators and freezers
where the appliance adjusts the frequency of automatic defrosts to match
frost load on the evaporator. Adaptive defrost systems are recognised by the
Australian standard for refrigerators and freezers, but at this stage, a realistic test to assess the performance of these controls is not included in the test
method. The standard assumes that at least one defrost per day will occur
during normal operation, although some smart systems may have a longer
time between defrosts under normal conditions of use. An adaptive defrost
allowance of 1.05 is included in the MEPS levels, but this allowance is not
included in star rating equations.
6.3.2.7.1 Clothes Washers
1. CEC: The energy consumption of a clothes washer is measured
under conditions specified in an Australian standard. Over a year,
it is assumed that the clothes washer is used seven times per week
at rated capacity on a warm wash (warm CEC in red). A value for
cold wash energy of seven times per week is also shown on the label
(cold CEC in blue). The clothes washer is labelled on the ‘normal’
or ‘regular’ p
rogramme (programme s pecified for a normally soiled
cotton load). The energy consumption of a clothes washer includes
electrical energy for motors and pumps and the energy embodied in
any imported hot water or electrical energy used to heat the water
internally. The majority of energy for a clothes washer is used to heat
water on a warm wash.
2. Capacity: The measure of energy service for a clothes washer is rated
load capacity. This is the value declared by the manufacturer and
defines the test load used in the Australian standard.
3. Performance: To be eligible for an energy label, a clothes washer
must be able to meet a minimum level of wash performance and
Energy in Buildings
151
a minimum level of spinning performance and must not exceed the
‘wear and tear’ limits that are defined in the Australian standard.
4. BEC and star rating: The BEC defines the ‘one star’ line for p
articular
products. An additional star is awarded when the CEC of the model
is reduced by a defined percentage from the BEC. The energy reduction per star is 27% for clothes washers. For example, a model that
had a CEC that was 0.73 of the BEC or less would achieve two stars.
Similarly, a CEC of 0.533 (0.73 × 0.73) of the BEC or less would achieve
three stars and so on.
For clothes washers, front and top loading models are rated on the same
basis. The warm wash energy consumption and a component of residual
moisture (spin performance) are used to define the star rating in c omparison
with the BEC. Therefore, a model that has a good spin performance may get
a marginally higher star rating than a model of the same capacity and CEC
with a poor spin performance. The detailed star rating equations are contained in the document ‘Equations for Appliance Star Ratings’.
6.3.2.7.2 Clothes Dryers
1. CEC: The energy consumption of clothes dryer is measured under
conditions specified in an Australian standard. Over a year, it is
assumed that the clothes dryer is used at rated capacity once per
week (52 times per year). The initial moisture content of the clothes
load is also defined in the standard.
2. Capacity: The measure of energy service for a clothes dryer is rated
load capacity. This is the value declared by the manufacturer and
defines the test load used in the Australian standard for the determination of energy consumption.
3. Performance: To be eligible for an energy label, a clothes dryer must
be able to dry a standard load in a single operation. Other requirements are a maximum clothes temperature limit of less than 130°C
(to prevent scorching) and minimum efficiency requirements that
are defined in the Australian standard.
4. BEC and star rating: The BEC defines the ‘one star’ line for particular products. An additional star is awarded when the CEC of the
model is reduced by a defined percentage from the BEC. The energy
reduction per star is 15% for clothes dryers. For example, a model
that had a CEC that was 0.85 of the BEC or less would achieve two
stars. Similarly, a CEC of 0.723 (0.85 × 0.85) of the BEC or less would
achieve 3 stars and so on.
For clothes dryers, timer and autosensing models are treated slightly differently: timer models are given a 10% penalty on energy (and for the subsequent
152
Energy Efficiency in the Urban Environment
calculation of the star rating) on the basis that the way timer controls are used
in normal practice results in some overdrying of the clothes load. Under the
standard test, timer dryers are operated until the load reaches a final moisture
content of 6%, although autosensing dryers are operated until they terminate
their drying automatically (but at a moisture content of less than or equal to
6%), so the tested difference is usually less than 10%. There is an overview of
how star ratings are calculated for other products on this site.
6.3.2.7.3 Dishwashers
1. CEC: The energy consumption of a dishwasher is measured under
conditions specified in an Australian standard. Over a year, it is
assumed that the dishwasher is used seven times per week (365 times
per year). The programme used for the energy labelling programme
is currently the one specified by the manufacturer, although by April
2004, all dishwashers were re-labelled on their ‘normal’ programme
using the revised AS/NZS 2007 Part 1 test method released in 2003.
2. Capacity: The measure of energy service for a dishwasher is the
number of place settings. This is the value declared by the manufacturer and defines the test load used in the Australian standard.
3. Performance: To be eligible for an energy label, a dishwasher must
be able to meet the specified wash and dry performance criteria
defined in the Australian standard.
4. BEC and star rating: The BEC defines the ‘one star’ line for particular products. An additional star is awarded when the CEC of the
model is reduced by a defined percentage from the BEC. The energy
reduction per star is 30% for dishwashers. For example, a model that
had a CEC that was 0.70 of the BEC or less would achieve two stars.
Similarly, a CEC of 0.49 (0.70 × 0.70) of the BEC or less would achieve
three stars and so on.
The detailed star rating equations are contained in the document
‘Equations for Appliance Star Ratings’. There is an overview of how star ratings are calculated for other products on this site.
6.3.2.7.4 Air Conditioners
1. Power input (also called comparative energy consumption): The
energy consumption or power input of an air conditioner is measured under conditions specified in an Australian standard. Because
air-conditioner use is affected by climate and this varies substantially
across Australia, the cooling and/or heating power input shown on
the energy label is the energy the air conditioner uses per hour at
rated capacity (the units on the label are in kW, which is the same as
kWh/h). To work out the annual energy use will require information on the climate and other factors such as occupancy (hours that
Energy in Buildings
153
cooling is required) and building shell performance (insulation,
glazing, orientation etc.). It is important to note that, under normal
usage, the air conditioner will spend a significant amount of time at
less than its rated capacity; in terms of efficiency, this is really only
important for variable speed drive models.
2. Capacity output: The measure of energy service for an air conditioner is the rated cooling and/or heating capacity of the air conditioner, usually specified in kW. (Some product brochures use
BTUs, although this is now unusual. Some retailers use compressor
‘horsepower’, but this has no meaning in terms of the units’ capability.) These rated values are as declared by the manufacturer and the
test conditions are defined in the Australian standard. The heating
capacity of a reverse cycle air conditioner is the heat that can be put
into a room. Similarly, the cooling capacity is the heat that can be
removed from a room. The cooling capacity is made up of the sensible component (usually the majority of the capacity), which relates to
the actual temperature reduction (cooling) of the air, plus the latent
component, which is a measure of the dehumidification effect of the
indoor air. Latent cooling capacity is sometimes expressed as moisture removal capacity in litres or kilograms of water per hour (1 kg
per hour of moisture removal is equal to 683 W latent capacity).
3. How can the capacity output be greater than the power input?
Refrigerative air conditioners (the only type covered by energy labelling in Australia; evaporative units are not included) use a technique
called the vapour compression cycle to ‘move’ energy in the form of
heat from one space to another. This is generally a very efficient process, and the amount of heat moved is typically two to three times
(or more) the energy required to run the compressor system. This
ratio is called the energy efficiency ratio (cooling) or coefficient of
performance and is used as the basis for determining the star rating of an air conditioner (see following). The efficiency of the system depends on the components used (their design and how well
these are matched) and the temperature difference between inside
and outside (as the temperature difference increases, the system
becomes less efficient). The system uses a refrigerant (which exists
as a gas at low pressure and as a liquid under compression) that is
compressed and liquefied, allowed to cool in a condenser, and then
allowed to expand to become a gas in an evaporator (the expansion
is accompanied by a strong cooling effect). In this operation, the condenser becomes warm and the evaporator becomes cold as the heat
is moved from the evaporator to the condenser.
The principle is the same as used in a normal refrigerator, which ‘moves’
heat from the inside of refrigerator to the outside. In the case of an air
154
Energy Efficiency in the Urban Environment
conditioner, when in cooling mode, the heat is removed from the room being
cooled and pushed outside through the refrigeration system. Similarly, if the
unit can operate in ‘reverse’ (the so-called heating mode or reverse cycle),
the process runs backward and the energy is collected from outside and
moved inside to the room being heated.
1. Performance: To be eligible for an energy label (and to comply with
MEPS), an air conditioner must meet the maximum cooling test as
defined in the Australian standard; this ensures that the air conditioner is capable of operating under extreme conditions. The air conditioner also has to have a tested capacity of not less than 95% of the
rated value and a tested energy consumption of not more than 105%
of the rated value.
2. Star rating: The star rating for air conditioners is determined differently than for other appliances. For air conditioners, the measure
of energy efficiency is the EER for cooling and the COP for heating.
The EER and COP are defined as the capacity output divided by the
power input. The star rating index is calculated on the tested values
for energy and capacity, rather than the nameplate or rated values.
Typically, the EER and COP are in the range 2.0–3.5 (meaning that the
cooling or heating output is 2–3.5 times as great as the power input, or
an efficiency of 200%–350%). This is achieved by the use of a refrigeration heat pump that collects internal heat and moves it outside when in
cooling mode or collects ambient heat from outside and moves it inside
when in heating mode. The apparent efficiency of heat pumps is high
because they can move much lower grade energy in the form of heat
than they require as electrical power input. The star rating for air conditioners is determined from the tested EER and COP. For cooling, one
star is equal to an EER of 2.0 with an extra star for an increase in EER
of 0.3. For heating, one star is equal to a COP of 2.3 with an extra star
for an increase in COP of 0.3. From 2010, one star was equal to an EER
and COP of 2.75 with a step of 0.5 for each additional star. Importantly,
from 2010, the star rating will be based on an annual efficiency calculation that includes any non-operational energy consumption.
What Do the Labels Look Like for Each of the Labelled Products?
1. Requirements for gas space heaters, gas water heaters and gas
cookers: Energy labels can be found on gas space heaters (AS4553
and AS4556) and gas water heaters (storage and instantaneous)
(AS4552). Gas energy labels are similar in format to those found
on electrical appliances, except they are blue in colour and annual
energy is shown in megajoule. The gas labelling programme is
currently an industry voluntary scheme that was once managed by
the Australian Gas Association (AGA).
155
Energy in Buildings
Energy tests, label requirements and relevant performance requirements are specified in following standards:
a. AS 4551 (AG 101) Domestic Gas Cooking Appliances
b. AS 4552 (AG 102) Gas Water Heaters
c. AS 4553 (AG 103) Gas Space Heating Appliances
d. AS 4554 (AG 104) Gas Laundry Dryers
e. AS 4555 (AG 105) Domestic Gas Refrigerators
f. AS 4556 (AG 106) Indirect Gas-Fired Ducted Air Heaters
g. AS 4557 (AG 107) Domestic Outdoor Gas Barbecues
h. AS 4558 (AG 108) Decorative Gas Log Fires and Other Fuel Effect
Appliances (Figures 6.14 through 6.19).
2. Strategy and work programme for gas appliances: The main objective of the Switch on Gas ten-year strategic plan is to implement a
nationally consistent regulation scheme for energy efficiency of gas
appliances and equipment. This strategy is an important part of
the package of measures being implemented by the MCE under the
National Framework for Energy Efficiency (NFEE).
er ef
Sup
ficiency ratin
g
The more
stars the more
energy efficient
The more
stars the more
energy efficient
ENERGY
RATING
ENERGY
RATING
A joint government and industry program
Kustom Kooler refrigerator Model 480
A joint government and industry program
Kustom Kooler refrigerator Model 480
Energy consumption
Energy consumption
384
153
kWh per year
kWh per year
Compare models at
www.energyrating.gov.au
FIGURE 6.14
Sample of the Australian energy labels for refrigerators and freezers AS/NZS 4474.2:2009.
156
Energy Efficiency in the Urban Environment
The more
stars the more
energy efficient
The more
stars the more
energy efficient
ENERGY
RATING
ENERGY
RATING
A joint government and industry program
Kustom Kooler refrigerator Model 480
A joint government and industry program
Kustom Kooler refrigerator Model 480
Energy consumption
Energy consumption
Warm with
Cold with
399
kWh per year
Warm with
66
399
kWh per year
For more informations, refer to
www.energyrating.gov.au
For more informations, refer to
www.energyrating.gov.au
FIGURE 6.15
Sample of the Australian energy labels for clothes washers AS/NZS 2040.2:2005.
Cooling
Heating
The more stars the
more energy efficient
The more stars the
more energy efficient
ENERGY RATING
ENERGY RATING
Capacity output kW Power input kW
Capacity output kW Power input kW
A joint government and industry program
A joint government and industry program
4.45
1.25
Variable output compressor
Yes
No
4.75
Variable output compressor
Demand response (A54755)
Model 1
Model 2
Model 3
1.23
Yes
No
Demand response (A54755)
Model 1
Model 2
Model 3
Compare models at www.energyrating.gov.au
Compare models at www.energyrating.gov.au
Cooling only
Heating only
FIGURE 6.16
Sample of the Australian energy labels for room air conditioners AS/NZS 3823.2:2009.
157
Energy in Buildings
Cooling
Heating
The more stars the
more energy efficient
The more stars the
more energy efficient
ENERGY RATING
ENERGY RATING
Capacity output kW
Power input kW
Capacity output kW
Power input kW
4.45
1.25
4.75
1.23
Yes
Variable output compressor
(Heating and cooling)
A joint government and industry program
No
When tested in accordance with AS/NZS 4474.2
Actual energy use and running costs will depend
on how you use the appliance
Demand response (A54755)
Compare models at www.energyrating.gov.au
Model 1
Model 2
Model 3
FIGURE 6.17
Cooling only, heating only and reverse cycle labels.
efficiency ratin
Super
g
Cooling
Heating
The more stars the
more energy efficient
The more stars the
more energy efficient
ENERGY RATING
ENERGY RATING
Capacity output kW
Power input kW
4.45
0.86
Capacity output kW
Power input kW
4.75
0.82
3.60 kW heating capacity at 2˚C
Demand response (A54755)
Compare models at www.energyrating.gov.au
FIGURE 6.18
Energy labels for super efficiency units.
Model 1
Model 2
Model 3
158
Energy Efficiency in the Urban Environment
r efficiency ratin
Supe
g
Cooling
r efficiency ratin
Supe
g
Heating
The more stars the
more energy efficient
The more stars the
more energy efficient
ENERGY RATING
ENERGY RATING
Capacity output kW Power input kW
Capacity output kW Power input kW
4.75
0.82
4.90
3.60 kW heating capacity at 2° C
0.8
FIGURE 6.19
Reverse cycle (super efficiency rating).
By progressively increasing the energy efficiency of gas appliances and
equipment beyond business as usual levels, Switch on Gas responds to the
evolving needs of the community by providing world class energy-efficient
gas products. Switch on Gas will also make a contribution to national efforts
to reduce greenhouse gas emissions. Natural gas currently supplies about
30% of total household energy in Australia. Within 20 years it is projected
that Switch on Gas has the potential to reduce Australian consumers’ expenditures on natural gas by up to $115 million per annum and to reduce their
consumption by more than 5% below business as usual.
The Australian and New Zealand Equipment Energy Efficiency Program
released its inaugural work plan for Switch on Gas in April 2005, outlining products targeted for potential regulation in both countries for
the three-year period, 2005/06 to 2007/08. An updated version of this
work plan was released for comment in October 2006 (2006/12) and is a
consequence of
1. The administrative and regulatory basis of the gas appliance efficiency programme
2. New information about gas appliance technology and testing
3. Gas consumer response to energy labels
4. Changes to the gas labelling and MEPS scheme for appliances
In 2002, the Sustainable Energy Authority of Victoria (SEAV) (now
Sustainability Victoria, or SV), the Victorian Office of Gas Safety (OGS),
and the Australian Greenhouse Office (AGO) commenced working together
to review the gas appliance labelling and MEPS scheme and to explore
159
Energy in Buildings
options for enhancing its effectiveness at driving energy efficiency improvements. The first step in this process was to commission a consultant study on
the gas appliance scheme.
A joint government–industry working group comprising SEAV, OGS,
AGO, AGA and the GAMAA agreed to work cooperatively to enhance the
effectiveness of the gas appliance efficiency scheme. A discussion paper
developed on behalf of the joint working group sets out a range of options
for the future direction of the gas appliance efficiency scheme. The aim of
the discussion paper ‘Driving Energy Efficiency Improvements to Domestic
Gas Appliances’ is to stimulate debate on the future directions of the gas
appliance efficiency programme and to canvas views from a broad spectrum of industry and other stakeholders. In 2006 and 2007, work has been
undertaken on the development of a revised energy test method for gas
water heaters which is expected to be released for public comment in late
2007 of early 2008. An example of the gas appliance energy label is shown in
Figure 6.20.
Cooling
The more stars the
more energy efficient
GAS
Energy rating
Use this label to compare
different model water heaters
The Australian
Gas Association
Comparitive energy consumption
This insert heater make and model used
MJ
PER
YEAR
• When tested to as 455-2/AGi 102
22 200
• Actual energy used will depend on where
you live and how the appliances are used
• Appliance running cost information is
available from your local gas supplier
FIGURE 6.20
Gas appliance label.
160
Energy Efficiency in the Urban Environment
6.3.2.8 U.S. Energy Star
Energy Star is an international standard for energy-efficient consumer
products that originated in the United States. It was first created as a U.S.
government programme by the Clinton administration in 1992, but Australia,
Canada, Japan, New Zealand, Taiwan, and the EU have also adopted the programme. Devices carrying the Energy Star logo, such as computer products
and peripherals, kitchen appliances, buildings and other products, generally
use 20%–30% less energy than required by federal standards. However, many
European targeted products are labelled using a different standard, a combined energy usage and ergonomics rating from the Swedish Confederation
of Professional Employees (TCO) instead of Energy Star.
6.3.2.8.1 History
The Energy Star programme was created in 1992 by the U.S. EPA in an
attempt to reduce energy consumption and greenhouse gas emission by
power plants; the programme’s goal was to demonstrate the potential for
profit in reducing greenhouse gases and to facilitate further steps in reducing global warming gases.
Initiated as a voluntary labelling programme designed to identify and promote energy-efficient products, Energy Star began with labels for computer
products. In 1995, the programme was significantly expanded, introducing
labels for residential heating and cooling systems and for new homes. As of
2012, more than 65,000 Energy Star products were available in a wide range
of items including major appliances, office equipment, lighting, home electronics and more. In addition, the label can also be found on new homes and
on commercial and industrial buildings. In 2012, about 25% of new housing
in the United States was labelled Energy Star.
The EPA estimates that it saved about $20 billion in energy costs in 2012
alone. The Energy Star programme has helped spread the use of light-emitting
diode (LED) traffic lights, efficient fluorescent lighting, power management
systems for office equipment and low standby energy use.
In 2008, the EPA announced the Green Power Partnership programme,
which was designed to help achieve its goal of encouraging the use of renewable power sources. The renewable energy credits allow companies without
direct access to renewable power to achieve their goals. However, to avoid
companies buying Renewable Energy Centers (RECs) years in advance of
any of the hypothetical power ever being produced, RECs are only accepted
into the programme when the actual equivalent renewable power will be
produced.
6.3.2.8.2 Specifications
Energy Star specifications differ with each item and are set by either the EPA
or the U.S. DOE. The following sections highlight product and specification
information available on the Energy Star website.
Energy in Buildings
161
6.3.2.8.3 Computers
New Energy Star 4.0 specifications for computers became effective on 20 July
2007. They require the use of 80 PLUS bronze level or higher power supplies.
Energy Star 5.0 became effective on 1 July 2009.
6.3.2.8.4 Servers
The EPA released Version 1.0 of the Computer Server specifications on
15 May 2009. It covers stand-alone servers with one to four processor sockets.
A second tier to the specification covering servers with more than four
processor sockets, as well as blade servers and fault-tolerant machines was
revised in 2011.
6.3.2.8.5 Appliances
Recently, average refrigerators need 20% savings over the minimum standard. Dishwashers need at least 41% savings. Most appliances as well as
heating and cooling systems have a yellow energy guide label showing
the annual cost of operation compared to other models. This label is created through the DOE and often shows if an appliance is Energy Star [7].
Although an Energy Star label indicates that the appliance is more energy
efficient than the minimum guidelines, purchasing an Energy Star
labelled product does not always mean you are getting the most energyefficient option available. For example, dehumidifiers that are rated under
25 US pints (12 L) per day of water extraction receive an Energy Star rating if they have an energy factor of 1.2 (higher is better), while those rated
25 US pints (12 L) to 35 US pints (17 L) per day receive an Energy Star rating for an energy factor of 1.4 or higher. Thus a higher capacity but non–
Energy Star rated dehumidifier may be a more energy-efficient alternative
than an Energy Star rated but lower capacity model [8]. The Energy Star
programme’s savings calculator has also been criticised for unrealistic
assumptions in its model that tend to magnify savings benefits to the average consumer [9].
Another factor yet to be considered by the EPA and DOE is the overall effect of energy-saving requirements on the durability and expected
service life of a mass market appliance built to a consumer-level cost
standard. For example, a refrigerator may be made more efficient by the
use of more insulative spacing and a smaller capacity compressor using
electronics to control operation and temperature. However, this may come
at the cost of reduced interior storage (or increased exterior mass) or a
reduced service life due to compressor and/or electronic failures. In particular, electronic controls used on new generation appliances are subject
to damage from shock, vibration, moisture, or power spikes on the electrical circuit to which they are attached. Critics have pointed out that even
if a new appliance is energy efficient, any consumer appliance that does
not provide customer satisfaction or that must be replaced twice as often
162
Energy Efficiency in the Urban Environment
as its predecessor contributes to landfill pollution and wastage of natural
resources used to construct its replacement [10].
6.3.2.8.6 Heating and Cooling Systems
Energy Star qualified heat pumps, boilers, air-conditioning systems and
furnaces are available. In addition, cooling and heating bills can be significantly lowered with air sealing and duct sealing. Air sealing reduces the
outdoor air that penetrates a building, and duct sealing prevents attic or
basement air from entering ducts and lessening the heating/cooling system’s efficiency. Energy Star–qualified room air conditioners are at least
10% more energy efficient than the minimum U.S. federal government
standards [11].
6.3.2.8.7 Home Electronics
Energy Star–qualified televisions [12] use 30% less energy than average.
In November 2008, television specifications were improved to limit onmode power use in addition to standby power, which is limited by the
current specifications. A wider range of Energy Star qualified televisions
will be available. Other qualified home electronics include cordless phones,
battery chargers, and external power adapters, most of which use 90% less
energy.
6.3.2.8.8 Lighting
The Energy Star is awarded to only certain bulbs that meet strict efficiency,
quality and lifetime criteria. Energy Star qualified fluorescent lighting uses
75% less energy and lasts up to ten times longer than normal incandescent
lights.
Energy Star Qualified LED Lighting:
1. Reduces energy costs: uses at least 75% less energy than incandescent lighting, saving on operating expenses.
2. Reduces maintenance costs: lasts 35–50 times longer than incandescent lighting and about two to five times longer than fluorescent
lighting—no bulb replacements, no ladders, no on-going disposal
programme.
3. Reduces cooling costs: LEDs produce very little heat.
4. Is guaranteed: comes with a minimum three-year warranty, far
beyond the industry standard.
5. Offers convenient features: available with dimming on some indoor
models and automatic daylight shut-off and motion sensors on some
outdoor models.
6. Is durable: will not break like a bulb.
Energy in Buildings
163
To qualify for Energy Star certification, LED lighting products must
pass a variety of tests to prove that the products will display the following
characteristics:
1. Brightness is equal to or greater than existing lighting technologies
(incandescent or fluorescent), and light is well distributed over the
area lighted by the fixture.
2. Light output remains constant over time, only decreasing towards
the end of the rated lifetime (at least 35,000 hours or 12 years, based
on use of eight hours per day).
3. Excellent colour quality; the shade of white light appears clear and
consistent over time.
4. Efficiency is as good as or better than fluorescent lighting.
5. Light comes on instantly when turned on.
6. No flicker when dimmed.
7. No off-state power draw: the fixture does not use power when it is
turned off, with the exception of external controls, whose power
should not exceed 0.5 W in the off state.
6.3.2.8.9 Desktop Computers
A new Energy Star specification for desktop computers went into effect
in July 2007 [13]. The requirements are more stringent than the previous
specification, and existing equipment designs can no longer use the
logo unless re-qualified. The power requirements are for 80% or greater
AC power supply efficiency using the standards defined by the 80 Plus
Program [14].
6.3.2.8.10 New Homes
New homes that meet strict guidelines for energy efficiency can qualify for
Energy Star certification. An Energy Star qualified home uses at least 15%
less energy than standard homes built to the 2004 International Residential
Code (IRC). They usually include properly installed insulation, high performance windows, tight construction and ducts, energy-efficient cooling and
heating systems, and Energy Star–qualified appliances, lighting and water
heaters [15].
6.3.2.9 Energy Performance Ratings
The EPA’s Energy Star programme has developed energy performance rating systems for several commercial and institutional building types and
manufacturing facilities. These ratings, on a scale of 1–100, provide a means
for benchmarking the energy efficiency of specific buildings and industrial
164
Energy Efficiency in the Urban Environment
plants against the energy performance of similar facilities. The ratings are
used by building and energy managers to evaluate the energy performance
of existing buildings and industrial plants. The rating systems are also used
by the EPA to determine if a building or plant can qualify to earn Energy Star
recognition [16].
For many types of commercial buildings, you can enter energy information into EPA’s free online tool, Portfolio Manager [2], and it will calculate a
score for your building on a scale of 1–100. Buildings that score a 75 or greater
may qualify for the Energy Star. Portfolio Manager is an interactive energy
management tool that allows you to track and assess energy and water consumption across your entire portfolio of buildings in a secure online environment. Whether you own, manage or hold properties for investment, Portfolio
Manager can help you set investment p
riorities, identify under-performing
buildings, verify efficiency improvements and receive EPA recognition for
superior energy performance [17].
6.3.2.9.1 Buildings
The number of space types that can receive the energy performance rating
in Portfolio Manager is expanding and now includes [18]: banks/financial
institutions, courthouses, hospitals (acute care and children’s), hotels and
motels, house of worship, K-12 schools, medical offices, offices, residence
halls/dormitories, retail stores, supermarkets, and warehouses (refrigerated and non-refrigerated) [19]. Technical descriptions for models used in
the rating system are available for review [3]. These documents provide
detailed information on the methodologies used to create the energy performance ratings, including details on rating objectives, regression techniques and the steps applied to compute a rating. Energy Star energy
performance ratings have been incorporated into some green buildings
standards, such as Leadership in Energy and Environmental Design for
existing buildings.
6.3.2.9.2 Industrial Facilities
Energy performance ratings have been released for the following industrial
facilities [20–25]:
1. Automobile assembly plants, cement plants, wet corn mills, container glass manufacturing, flat glass manufacturing, frozen fried
potato processing plants, juice processing petroleum refineries, and
pharmaceutical manufacturing plants [19].
6.3.3 Summary of Energy Standards and Labelling
Table 6.3 summarises the international energy labelling activities in
recent years that had achieved their goals and their impact on the national
economy.
165
Energy in Buildings
TABLE 6.3
Summary of Pioneering International Programmes and Their Achievements
Country or Region
Programme
Australia
Mandatory Standards
and Labelling
Europe
Mandatory Standards
and Labelling
Philippines
Mandatory Standards
and Labelling
Egypt
Mandatory Standards
and Labelling
Thailand
Voluntary Labelling
United States
Mandatory Standards
and Labelling
Achievements
• 11% reduction in energy consumption
of labelled appliances in 1992
• Approximately equals 94 GWh of
saved energy or 1.6% decrease in total
household electricity consumption
• Germany: 16.1% increase in market
efficiency (1993–1996)
• Netherlands: 12.6% increase in market
efficiency (1992–1995)
• United Kingdom: 7.3% increase in
refrigerator/freezer efficiency
(1994–1996)
• 25% increase in average efficiency of
all air conditioners (after first year)
• Energy savings: 6 MW in demand and
17 GWh in consumption (after first
year)
• 10% decrease in refrigerator energy
consumption (after three years)
• 20% decrease in air-conditioner energy
consumption (after three years)
• 14% decrease in refrigerator energy
consumption (after three years)
• Energy savings: 65 MW in demand
and 643 GWh in consumption
• 98% increase in refrigerator efficiency
(1972–1988)
• More than 3% reduction in U.S. annual
residential consumption from
appliances and lighting equipment
Reference Standards
Act
Directive
92/75/EEC
Amending Act(s)
Regulation (EC)
No 1882/2003
Regulation (EC)
No 1137/2008
Entry into Force –
Date of Expiry
Deadline for Transposition
in the Member States
Official
Journal
2.10.1992
1.7.1993
OJ L 297 of
13.10.1992
20.11.2003
–
11.12.2008
–
OJ L 284 of
31.10.2003
OJ L 311 of
21.11.2008
166
Energy Efficiency in the Urban Environment
Related Acts
Proposal for a Directive of the European Parliament and of the Council
of 13 November 2008 on the indication by labeling and standard product
information of the consumption of energy and other resources by energyrelated products [COM(2008) 778 final—Non-published in the Official
Journal].
The Commission proposes a recast of Directive 92/75/EEC and an
extension of its scope, currently restricted to household appliances, to all
energy-related products, excluding means of transport. The Commission
defines energy-related products as those having an impact on energy consumption during use. The Commission also proposes that products which
do not comply with minimum requirements in terms of energy e fficiency
should not be eligible for public procurement or incentives. The recast of
the Energy Labeling Directive is among the p
riorities of the Sustainable
Consumption and Production and Sustainable Industrial Policy Action
Plan presented by the Commission in June 2008.
Codecision Procedure (COD/2008/0222)
Implementing rules
1. Commission Directive 2003/66/EC (energy labeling of household
electric refrigerators, freezers, and their combinations) [Official
Journal L 170 of 9.7.2003].
2. Commission Directive 2002/40/EC (energy labeling of household
electric ovens) [Official Journal L 128 of 15.5.2002].
3. Commission Directive 2002/31/EC (energy labeling of household air
conditioners) [Official Journal L 86 of 3.4.2002].
4. Commission Directive 1999/9/EC (energy labeling of household
dishwashers) [Official Journal L 56 of 4.3.1999].
5. Commission Directive 98/11/EC (energy labeling of household
lamps) [Official Journal L 71 of 10.3.1998].
6. Commission Directive 96/60/EC (energy labeling of household combined washer dryers) [Official Journal L 266 of 18.10.1996].
7. Commission Directive 95/13/EC (energy labeling of household electric tumble dryers) [Official Journal L 136 of 21.6.1995].
8. Commission Directive 95/12/EC (energy labeling of household
washing machines) [Official Journal L 136 of 21.6.1995].
9. Amended by Directive 96/89/EC—[Official Journal L 388,
28.12.1996].
Energy in Buildings
167
Energy Efficiency
1. Directive 2005/32/EC of the European Parliament and of the Council
of 6 July 2005 establishing a framework for the settings of ecodesign
requirements for energy-using products and amending Council
Directive 92/42/EEC and Directives 96/57/EC and 2000/55/EC of
the European Parliament and of the Council [Official Journal L 191 of
22.7.2005].
2. Regulation (EC) No 2422/2001 of the European Parliament and of
the Council of 6 November 2001 on a Community energy efficiency
labeling programme for office equipment [Official Journal L 332 of
15.12.2001].
3. Communications in the framework of the implementation.
4. Commission communication (energy labeling of household air
conditioners—Publication of titles and references of harmonized
standards under the Directive) [Official Journal C 115 of 30.4.2004].
5. Commission communication (energy labeling of household combined washer-driers) [Official Journal C 161 of 28.5.1997].
6. Commission communication (energy labeling of household electric refrigerators, freezers and their combinations) [Official Journal
C 065 of 1.3.1997].
7. Commission communication (energy labeling of household washing
machines) [Official Journal C 312 of 23.11.1995].
8. Commission communication (energy labeling of household electric
tumble driers) [Official Journal C 312 of 23.11.1995].
References
1. Tugend, A. (2008). If your appliances are avocado, they’re probably not
green, New York Times, Retrieved June 29, 2008, from http://www.nytimes.
com/2008/05/10/business/yourmoney/10shortcuts.html?scp=1&sq=
appliances%20avocado%20green&st=cse
2. EnergyStar.gov. (2007). Milestones: ENERGY STAR, Retrieved March 1, 2008,
from www.energystar.gov/.
3. U.S. Environmental Protection Agency. 2006 Annual Report: Energy Star and Other
Climate Protection Partnerships, Retrieved March 1, 2008, from www.EPA.gov/.
4. EnergyStar.gov. History: ENERGY STAR. Retrieved March 1, 2008, from www.
energystar.gov.
5. Timmer, J. (2008). EPA tightens rules on its Green Power Partners, Arstechnica.com,
Retrieved March 23, 2009, from http://arstechnica.com/old/content/2008/12/
epa-tightens-rules-on-its-green-power-partners.ars
168
Energy Efficiency in the Urban Environment
6. Ng, J. (2009). New Energy Star 5.0 Specs for Computers Become Effective Today,
DailyTech, Retrieved July 1, 2009, from http://www.dailytech.com/New+Energy
+Star+50+Specs+for+Computers+Become+Effective+Today/article15559.htm
7. EnergyStar.gov. Learn More about Energy Guide: Energy Star, Retrieved March 1,
2008, from www.energystar.gov/.
8. Green Energy Efficient Homes, Energy Efficient Dehumidifiers, www.solar-aid.
org/Green-Energy, 2010.
9. Belzer, R. (2008). Energy Star appliances: EPA’s savings calculator exaggerates
savings, Regulatory Economics, Retrieved March 5, 2008, from neutralsource.
org/archives/595.
10. Muñoz, S. S. (2007). Do ‘green’ appliances live up to their billing, The Wall Street
Journal, Business, pp. 46–50.
11. EnergyStar.gov. (2008). Room Air Conditioners Key Product Criteria, Energystar.
gov, Retrieved March 23, 2009, from http://www.energystar.gov/index.
cfm?c=roomac.pr_crit_room_ac
12. California Sustainability Alliance Energy Star Televisions, Retrieved July 24, 2010, from
www.sustainca.org.
13. PowerPulse.net, New Energy Star Promoting New Specs at APEC and PPDC,
Retrieved March 20, 2006, from PowerPulse.net.
14. 80plus.org. (2007). The 80 Plus Program | About, Retrieved March 3, 2007, from
https://neea.org/docs/default-source/.../neea-success-story-80-plus.pdf.
15. ENERGYSTAR Qualified Homes: ENERGYSTAR. (2009). Energystar.gov, Retrieved
March 23, 2009, from http://www.energystar.gov/homes
16. Energystar.gov. (2010). Performance Evaluation. Retrieved March 2010.
17. Energystar.gov. (2011). Retrieved June 2011, from http://www.energystar.gov/
index.cfm?c=evaluate_performance.bus_portfoliomanager
18. Criteria for Rating Building Energy Performance, Energystar.gov, Retrieved
March 23, 2009, http://www.energystar.gov/index.cfm?c=eligibility.bus_
portfoliomanager_eligibility
19. Energystar.gov. (2011). Retrieved April 2011, from www.energystar.gov. http://
www.energystar.gov/index.cfm?c = business.bus_bldgs
20. Industries in Focus: ENERGYSTAR. (2009). Energystar.gov, Retrieved March 23,
2009, from http://www.energystar.gov/index.cfm?c=in_focus.bus_industries_
focus#plant
21. Environmental News Service. (2008). Energy Star Climate Change Claims
Misleading, Audit Finds, Environmental News Service, Washington, DC.
22. Energy Stars May Not be All They Say They Are, Housingzone.com, Retrieved March
23, 2009, from http://www.housingzone.com/articleXml/LN888056763.html
23. Why Obama’s Energy Savings Estimate May Be Skewed, from www.nytimes.
com/2009/02/07/.../07energy.htm
24. Hruska, J. (2009). Sony LCD Exceeds Energy Star Power Draw 75% of Time,
Arstechnica.com, Retrieved March 23, 2009, http://arstechnica.com/gadgets/
news/2009/02/sony-lcd-exceeds-energy-star-power-draw-75-of-time.ars
25. Hruska, J. (2010). Fake Products and Companies Certified by Energy Star, Popular
Mechanics, Retrieved March 26, 2010, http://www.popularmechanics.com/
technology/industry/4350335.html
7
Low Carbon Buildings
7.1 Energy-Efficient Designs of Low Carbon Buildings
7.1.1 Summary
Developing communities on their path toward rapid development are
endeavouring to make all necessary and appropriate measures to enhance
the efficiency of energy utilisation and to increase the beneficiation of the
energy resources. Energy production, transmission, distribution and utilisation efficiency become vital factors and measures of national development.
Governmental organisations have been established that are responsible
energy planning and efficient utilisation, information
dissemination and
capacity building as well as for devising the necessary codes and standards.
Throughout the nation, energy resources are widely used and consumption
rates are, in general, exceeding the internationally accepted values. Energy
rationalisation and audit exercises have been developed and monitored by
governmental authorities, universities and research centres over the past two
decades with definitive positive energy reduction and beneficiation. The development of the relevant codes for residential and c ommercial energy efficiency
in buildings is underway through the governmental bodies responsible for
research and development in the b
uilding technology s ector; it is under this
umbrella that the National and Unified Arab Codes are developed and issued.
A proposed new Energy Performance in Buildings Directive would fulfil the
following main targets of the Energy Performance Directive:
Legislative authorities shall ensure that, when buildings are constructed,
sold or rented out, an energy performance certificate is made available to
the owner or by the owner to the prospective buyer or tenant, as the case
might be. …
The energy performance certificate for buildings shall include reference values such as currant legal standards and benchmarks in order
to make it possible for consumers to compare and assess the energy
performance of the building. The certificate shall be accompanied by
recommendations for cost-effective improvement of the energy performance… [Available at www.epbd.eu]
169
170
Energy Efficiency in the Urban Environment
The following steps are required for the energy certification:
1. Develop methodologies for energy declaration of the buildings
2. Develop reference values (key numbers) and/or systems for
benchmarking
3. Provide a labelling system for selected buildings
4. Describe an energy signature for the building
As the world becomes increasingly dependent on electrical appliances
and equipment, energy consumption rapidly rises every year. Many programmes have been established in various countries to increase end-use
equipment energy efficiency. One of the most cost-effective and proven
methods for increasing energy efficiency of electrical appliances and equipment is to establish energy efficiency standards and labels. Energy efficiency
standards are a set of procedures and regulations that prescribe the energy
performance of manufactured products, sometimes prohibiting the sale of
products less energy efficient than the minimum standard. The term ‘standard’ commonly encompasses two possible meanings:
1. A well-defined protocol (or laboratory test procedure) by which to
obtain a sufficiently accurate estimate of the energy performance of
a product in the way it is typically used or at least a relative ranking
of the energy performance compared to other models
2. A target limit on energy performance (usually a maximum use or
minimum efficiency) formally established by a government-based
agency upon a specified test standard
Energy efficiency labels are informative labels affixed to manufactured
products indicating a product’s energy performance (usually in the form
of energy use, efficiency and/or cost) in order to provide consumers with
the data necessary for making informed purchases. Energy labels serve as a
complement to energy standards. They provide consumers with information
that allows those who care to be able to select more efficient models. Labels
also allow utility companies and government energy conservation agencies
to offer incentives to consumers to buy the most energy-efficient products.
The effectiveness of energy labels is highly dependent on how information
is presented to the consumer.
7.1.2 Rationale and Benefits
Energy efficiency in developed and developing countries plays an important role in achieving global sustainable development. Energy consumption is growing rapidly in these countries, yet energy efficiency remains far
below levels in developed countries. Energy efficiency improvements can
slow the growth in energy consumption, save consumers money and can
Low Carbon Buildings
171
reduce capital expenses for energy infrastructure [1–11]. For most developing
countries, the foreign exchange needed to finance energy sector expansion is
a significant drain on reserves. Additionally, energy efficiency reduces local
environmental impacts, such as water and air pollution from power plants,
and mitigates greenhouse gas emissions. Standards and labelling programmes provide enormous energy-saving potential that can direct developing countries toward sustainable energy use. Improved end-use efficiency
from standards and labelling programmes can contribute significantly to
developing economies. The main benefits are
1. Less need to build new power plants: The cost of saving 1 kWh of
energy through energy efficiency programmes has proven much
less expensive than producing 1 kWh of energy by building a new
power plant.
2. Reduced greenhouse gas emissions: Less energy production means
less carbon dioxide emissions from power plants. This contributes to
environmental benefits such as slowing down environmental pollution and global warming and preserving natural resources and the
ecosystem.
3. Improved competitiveness for local manufacturers: Local companies
that upgrade the efficiency of their products can compete better with
multinational companies, especially with lower production costs.
4. Higher consumer disposable income: Lower spending on electric
bills increases consumer purchasing power for other products,
which helps local businesses.
5. Increased cash flow in the local economy: With higher disposable income, consumers are more willing to spend, thus injecting
money into the local economy.
6. Improved trade balance: Decrease in energy demand will reduce
the consumption of indigenous resources (i.e. natural gas and oil),
allowing more to be exported (for Lebanon, less to be imported).
Increased export earnings (or less import spending) help alleviate
trade deficits of Arabian countries.
7. Avoid future energy deficit as power demand rises: Energy exporting countries have become net importers due to dramatic increases
in electricity demand. Energy efficiency programmes can help slow
down the demand and prevent energy deficit in the future.
7.1.3 The Holistic Approach: Think ‘Pyramids’
The assessment of the overall energy performance of a building, including
the technical building systems, comprises a number of successive steps,
which can be schematically visualised as a pyramid (Figure 7.1) [11].
172
Energy Efficiency in the Urban Environment
Energy performance (EP)
EP
EP
expressions
ms
ter
, de
fin
itio
Boundaries,
classification
on
EP
aggregation
mm
Co
Overall energy
performance of the
building, including its
technical building
systems
ns
sym
bol
s
Building energy needs
and system energy losses
and
Collect all energy elements
Component input data
Boundary conditions
FIGURE 7.1
Overall building energy performance. (From Van Dijk, D. and Khalil, E. E., ISO Focus.,
25–27, 2011.)
Sets of common terms, definitions and symbols are essential for all
s egments from top to bottom. These include energy needs, technical building systems, auxiliary energy use, recoverable system losses, primary energy
and renewable energy (Figure 7.2) [11].
The top segment of the pyramid is the main output: the energy performance and the energy performance certificate of the building.
The second segment provides the inputs for the top segment: one or more
numerical indicators expressing the energy performance (such as overall
energy use per square meter conditioned floor area, EP), a classification
and ways to express the minimum energy performance requirements (EPmax)
(Figure 7.3) [9].
The third segment describes the principles and procedures on the weighting of different energy carriers (such as electricity, gas, oil or wood) when
they are aggregated to overall amount of delivered (and exported) energy.
For instance, this may be expressed as total primary energy (EP) or carbon
dioxide emission ( ECO2 ).
The fourth segment specifies the categorisation of building types (for
e.g. office spaces, residential or retail) and specification of the boundaries of
the building (Figure 7.4) [11].
173
Low Carbon Buildings
The fifth segment provides procedures on the breakdown of the building
energy needs and system energy losses, aiming to gain clear insights into
where energy is used.
The sixth segment provides the building energy needs and energy use for
each application (heating, cooling etc.) and the interactions between them.
The seventh segment provides the input data on components, such as thermal transmission properties, air infiltration, solar properties of windows
and energy performance of system components and efficiency of lighting.
FIGURE 7.2
Harmonisation of terms is essential. (From Van Dijk, D. and Khalil, E. E., ISO Focus., 25–27, 2011.)
Building energy performance
As built
Space to make reference to the
certification scheme used
Very energy efficient
Asset
rating
A
B
Energy certificate
C
C
D
E
F
G
Not energy efficient
Units used
kWh/m2
130
Space to include additional information
on building energy consumption
FIGURE 7.3
Example of energy performance certificate. (From ISO publications ISO 23045_2009, January 2009.)
174
Energy Efficiency in the Urban Environment
ISO/TC 163/WG 4 (Joint TC 163 – TC 205 WG)
= Conversion factors,
needed to aggregate
energy to one numerical
indicator, e.g. “EP”, “ECO ”,..
2
Delivered to or
exported from
technical system
Building “needs”
Systems part
Electric
appliances
Lighting
Delivered
Gas, oil, coal, wood, ...
District heating
or cooling
Input dh/dc
(district heating
and cooling)
Exported
Heating/
cooling
systems
(incl.
BCHP*)
PV**, local
Solar
thermal
Electricity
Ventilation***
Distribution and transport
Electricity
Hot water
Cooling
Heating
Cooking, ..
Heat
Building
* BCHP = building combined heat and power
** PV = photovoltaic
*** Air transport for ventilation
Renewable
FIGURE 7.4
Boundaries and main building energy performance elements. (From Van Dijk, D. and Khalil,
E. E., ISO Focus., 25–27, 2011.)
The standards that provide the procedures on boundary conditions comprise external climatic conditions, indoor environment conditions (thermal
and visual comfort, indoor air quality etc.), standard operating assumptions
(occupation) and national legal restrictions.
7.2 Energy-Efficient Buildings
7.2.1 Energy Declaration of Buildings
The primary use of energy declarations is
1. To create consciousness of energy efficiency in buildings and also
improve the knowledge of energy use in buildings
2. To determine if a building works as well as possible with regard to
its technical design
3. For benchmarking
Low Carbon Buildings
175
4. For suggesting measures and recommendations for reducing the
energy use
5. To provide the information necessary to make calculations of the
environmental impact due to the energy use (e.g. CO2 emissions)
6. To describe selected energy properties of the building
7. Give the basis for a common energy performance certification of a
building
Depending on the purpose of the energy declaration, different procedures can be of interest. Different actors need different information. For
example, for benchmarking and for explaining the CO2 emissions, it can
be enough to read the total energy supply to the building and only adjust
these figures to normal outdoor climate and to the heated area. For giving
relevant advice to the property owner regarding cost-effective measures, a
very careful examination and calculation of the building’s energy balance
is necessary.
One way to proceed is to make the energy calculation in different steps
for existing buildings. The first is to collect measured energy use (e.g. from
energy bills) and create a benchmark to decide if the actual building is
better or worse compared to similar buildings. If the energy use seems to
be higher than the average for a comparable grouping of buildings, a second step is to make a careful energy calculation that can be compared to
the measured energy use. This has to be done to identify what measures
can be recommended in order to reduce the energy use in the building.
For benchmarking, it might also be of interest to compare the measured
energy use in the building examined with the estimated energy use in
a building that is built with the best available technology. Alternatively,
it could be compared with a building that meets the requirement in the
existing building codes. Some important aspects necessary to take into
consideration when developing a common tool for energy declaration of
buildings are discussed in the next section. The discussion here is focused
on residential buildings, but similar principles are relevant for other types
of buildings.
7.2.2 Energy Declaration of Existing Buildings
For most existing buildings, the energy use usually is well known via the
energy bills. On the other hand, the construction details usually are not very
well documented. Calculations of the energy use will thus in most cases be
very uncertain, and difficulties will occur when giving relevant recommendations of cost-effective energy conservation measures.
The energy declaration needs a combination of tools for calculations based
on the information from the energy bills. For existing buildings, the energy
declarations can be based on measurements and calculations in order to
176
Energy Efficiency in the Urban Environment
fulfil the purposes mentioned earlier. Normally, the heating bills are based
on measured heat delivered to the building. In most cases, the energy for
domestic hot water is included in the heating bill. To get the total energy use
in a b
uilding, the electricity to run the building and household electricity
have to be added. In electrically heated houses (common in, e.g. Sweden),
the homeowner just has one bill covering the total energy use. To make the
measured values objective and comparable, several corrections and calculations are necessary:
1. Verify that the indoor thermal comfort and air quality meet agreed
requirements
2. Make corrections for the heat use to normal outdoor climate—
primarily outdoor temperature (maybe also solar heat gain)
3. Make necessary corrections for internal heat gains (e.g. differences
in household electricity)
7.2.3 Energy Declaration of New Buildings
The energy declaration of a new building has to be based on calculations.
In comparison with existing buildings, details of the building construction
are available. The most critical part for the outcome of calculations is the
choice of input data. To achieve good comparability, a common procedure
to determine input data (such as energy for domestic hot water, household
electricity or electricity for the activity in the building, choice of indoor temperature, electricity for operating the building, energy for lighting etc.) has
to be developed.
In many countries, numerous new buildings have very low energy
demand for heating. The solar heat gain, internal gains and energy losses
from equipment and so forth cover the major part of the heating demand.
In several buildings, the internal gains are so large that cooling is necessary even in temperate climate. For buildings with large glassed areas
and/or large internal gains, the energy calculations need to be done
on an hourly basis. Many modern apartment blocks, offices, education
buildings and restaurants need very little heat supply from the heating
system but very often need air-conditioning to attain acceptable thermal
comfort.
7.2.4 Issues for International Collaboration
1. Develop standardised tools for the calculation of the energy performance of buildings taking into account the factors outlined in ISO
13790 that cover many aspects but still have to be completed.
2. Define system boundaries for the different building categories and
different heating systems.
177
Low Carbon Buildings
3. Prepare models for expressing requirements on indoor air quality,
thermal comfort in winter and when appropriate in summer, visual
comfort and so on.
4. Develop transparent systems to determine necessary input data for
the calculations, including default values on internal gains.
5. Provide transparent information regarding output data (reference
values, benchmarks etc.)
6. Define comparable energy-related key values (kWh/m2, kWh per
person, kWh per apartment, kWh per produced unit etc.) The areas/
volumes need to be defined.
7. Develop a method to translate net energy used in the building to
primary energy and CO2 emissions.
8. Develop a common procedure for an energy performance certificate.
9. Develop and compile relevant standards applicable for each individual building category.
An example of the energy efficiency indication in buildings is highlighted
in ISO 23045 as shown in Figure 7.5 [9].
Passive solar heating;
passive cooling;
natural ventilation;
daylight
1
Renewable
energy (RE)
5
Transformation
2
3
8
RE
contribution
in primary
or CO2 terms
CO2
emissions
4
Transformation
System
part
Building part
7
Primary
energy
Electricity for other uses
Internal
gains
System
losses
Key to symbols
Electricity
Gas, oil, coal, biomass etc.
6
Generated
energy
Primary
Trans- or CO savings
2
form- for generated
ation energy
9
Heat, cold
FIGURE 7.5
Global energy scheme (ISO 23045_2009). (From ISO publications ISO 23045_2009, January
2009.)
178
Energy Efficiency in the Urban Environment
7.2.5 Concluding Remarks
It is important to incorporate an energy performance directive as a standard
in this region; such a goal will aid energy savings in large buildings and will
help set regulations for energy-efficient designs that are based on standard
calculation methods. Recommendations include
1. Develop standardised tools for the calculation of the energy performance of buildings.
2. Define system boundaries for the different building categories and
different heating systems.
3. Prepare models for expressing requirements on indoor air quality,
thermal comfort in winter and when appropriate in summer, visual
comfort and so forth.
4. Define comparable energy related key values (kWh/m2, kWh
per person, kWh per apartment, kWh per produced unit etc.) in
order to develop a common procedure for an energy performance
certificate.
5. Design, construct and operate a solar decathlon (building) that can
meet the rural and desert requirements and save the diminishing
fossil fuel sources
a. Is the energy needed to fulfil the user’s requirements for heating,
lighting, cooling and so on, according to levels that are specified
for the purposes of the calculation?
b. Do the natural energy gains (passive solar, ventilation cooling,
daylighting and so on) together with internal gains (occupants,
lighting, electrical equipment, etc.) reduce energy demand in
the winter season but increase energy demand in the summer
season?
c. Is the building’s net energy use, obtained from (1) and (2) along
with the characteristics of the building itself? [In winter season,
(2) is lower than (1), but in summer, (2) is greater than (1).]
d. Is the delivered energy, represented separately for each energy
carrier, inclusive of auxiliary energy, used by heating, cooling,
ventilation, hot water and lighting systems, taking into account
renewable energy sources and cogeneration? This may be
expressed in energy units or in units of the energy ware (kg, m³,
kWh etc.).
e. Is renewable energy produced on the building premises?
f. Is generated energy produced on the premises and exported to
the market? This can include part of (5).
g. Does it represent the primary energy usage or the CO2 emissions
associated with the building.
Low Carbon Buildings
179
h. Does it represent the primary energy or emissions associated
with on-site generation that is used on-site and so is not subtracted from (7).
i. Does it represent the primary energy or CO2 saving associated
with exported energy, which is subtracted from (7).
7.3 New Design Practices
7.3.1 General
One of the Egyptian Department of Energy’s greatest efficiency accomplishments is the Residential Air Conditioner Standards and Labelling programme.
After years of coordination with manufacturers and the Department of Trade
and Industry’s EOS (Egyptian Standards Organisation), energy labelling was
devised for air conditioners (whether split or window units, see Figure 7.6).
Work is underway to incorporate energy labelling for the air-conditioning
business. The programme has the potential to become a powerful platform
for subsequent energy efficiency efforts not only in Egypt but also in other
Arab countries. Air conditioners, both imported and domestic models, are
required to meet a minimum efficiency standard and to be labelled. Although
only in use in a small fraction of households, air conditioners are given priority because they represent one of the fastest growing electricity end uses in
the residential sector. The impact of the programme will increase with time
because the number of air conditioners in the country is rising dramatically.
Standards and labelling programmes provide enormous energy-saving
potential that can direct developing countries toward sustainable energy
use. Improved end-use efficiency programmes can contribute significantly
to developing economies. The main benefits are
1. Less need to build new power plants
2. Reduced greenhouse gas emissions
3. Improved competitiveness for local manufacturers
FIGURE 7.6
Egyptian energy air conditioner label.
180
Energy Efficiency in the Urban Environment
4. Higher consumer disposable income
5. Increased cash flow in the local economy
6. Improved trade balance by increased export earnings (or less import
spending) helps alleviate trade deficit of Arabian countries
7. Avoid future energy deficit as power demand rises
7.3.2 Comfort Levels
7.3.2.1 Introduction
Thermal comfort is satisfaction with the thermal environment. Because
there are large variations, both physiologically and psychologically from
person to person, it is difficult to satisfy everyone in a space. The environmental conditions required for comfort are not the same for everyone.
Extensive laboratory and field data have been collected that provide the
necessary statistical data to define conditions that a specified percentage of
occupants will find thermally comfortable. This is used to determine the
thermal environmental conditions in a space that are necessary to achieve
acceptance by a specified percentage of occupants of that space. There are
six primary factors that must be addressed when defining conditions for
thermal comfort. A number of other, secondary factors affect comfort in
some circumstances [2].
The temperature regulatory centre in the brain is about 36.8°C at rest
in comfort and increases to about 37.4°C when walking and 37.9°C when
jogging [2]. High temperatures may cause increased out gassing of toxins
from furnishings, finishes, building materials and so forth. Alternatively,
ambient temperatures that are too cool can cause occupant discomfort
such as shivering, inattentiveness and muscular and joint tension. Relative
humidity plays an important role in the comfort feeling, affecting the
comfort feeling directly or indirectly by its influence on the temperature.
Excessive relative humidity levels are known to reduce human comfort.
Most guidelines s pecify the range of 35%–50% as the optimum conditions
for relative humidity. The airflow pattern plays an important role in the
comfort sensation and also in the scavenging of the hazards and airborne
particles. According to the results of research and the standards specifications, the optimum airflow velocity falls within the range of 0.2–0.25 m/s in
the o
ccupied zone.
7.3.2.2 Problem Identification
Many of the HVAC applications suffer from poor distribution of the indoor
air temperature and relative humidity as well as from incorrect airflow
velocities. This poor distribution arises from poor airflow distribution and
the presence of thermal drift due to the buoyancy effect.
Low Carbon Buildings
181
7.3.2.3 Status Quo
At present, most research recommends experimental and numerical simulation as the perfect tools to obtain the optimum design. The optimisation
procedure of the HVAC airside design depends on the predictions of the
air temperature distribution based on the simulation of different parametric designs using experimentally verified numerical tools. The influence of
various ventilation strategies and vapour generation rate on the characteristics of temperature and moisture distribution is investigated [12,13]. The
vast majority of the available thermal comfort data pertains to sedentary or
near-sedentary physical activity levels typical of office work. The body of
available data does not contain significant information regarding the comfort requirements of children, the disabled or the infirm.
Airside design and room furnishing were found influential in order to
ensure a comfortable environment, especially in the displacement ventilation configuration [14]. The airflow velocity influence was investigated, and
it was found that acceptable velocity could be as high as 0.35 m/s in the occupied zone [15]. The configurations of the conditioned space affect the comfort
level as well as the space applications, such as healthcare facilities, which are
so complex [16,17]. The correct specifications of outdoor ambient conditions
affect thermal loads, as shown in Figure 7.1, and consequently, the comfort
level [18]. Some research recommends changing the focus on the effect of
building envelope to reduce the thermal load to enhance the thermal comfort [1,19–21].
7.3.2.4 Closure
The comfort conditions depend on many factors beyond the indoor air temperature, relative humidity and airflow velocity. Comfort conditions depend
also on the air distribution pattern and the air movement [20], but the effect
of these factors can be considered close to the air quality more than the comfort level. Indeed, the comfort criteria affect the air quality and the energy
conservation in the ventilated and conditioned spaces, as shown in the
following sections. The relation between the comfort and air quality is an
interchange or a mutual relation.
7.3.3 Air Quality
7.3.3.1 Introduction
Most guidelines consider that the air quality is the result of a collaborative
effort among environmental conditions (those presented in the introductory section). Indeed, in the present literature, the air quality is specified by
a collaborative effort of the pressure relationship, air movement efficiency
and contaminant concentration. These conditions play an important role in
182
Energy Efficiency in the Urban Environment
achieving optimum air quality. The ventilation system design must, as much
as possible, provide air movement from the clean to the less clean areas.
This rule requires great care in designing the airside system and in selecting the design of the airside system of neighbourhoods. There are relative
interactions among the conditioned neighbouring spaces. The air distribution and movement efficiency can be considered as the simultaneous indicators of comfort and air quality. There are several important considerations
that characterise the air distribution in air-conditioned spaces. First, the flow
is generally turbulent, and buoyancy effects are often significant. Then the
transverse transport effects are of particular interest in these flows. In that
case, combined heat and mass transfer processes prevail, and coupled transport mechanisms are generally present. Undesirable airflow between rooms
and floors is often difficult to control because of open doors, movement of
staff and patients, temperature differentials and stack effect. Although some
of these factors are beyond practical control, the effect of other factors may be
minimised by terminating shaft openings in enclosed rooms and by designing and balancing air systems to create positive or negative air pressure
within certain rooms and certain areas (Figure 7.7).
Contaminants can be classified in four broad headings, each of which
represents a wide variety of pollutants: organic compounds, inorganic
compounds, particulate matter and biological contaminants. It should be
understood that these classifications are intended to facilitate the categorisation of contaminants. Although the pollutants are classified into these
categories, certain contaminants may belong to two or more classifications,
ASHRAE design conditions
DB 38.9 °C, WB 24.4 °C
Gymnasium hall
Calculated loads, kW cooling
350
300
4.5
Gymnasium hall
4
3.5
Guest room
250
200
3
2.5
ASHRAE design conditions
DB 38.9 °C, WB 24.4 °C
Guest room
150
ASHRAE design conditions
DB 38.9 °C, WB 24.4 °C
Operating theatre
100
50
0
5
2
1.5
Operating theatre
1
0.5
At 40 °C DB
24
26
30
28
Outdoor wetbulb temperature, °C
FIGURE 7.7
Outdoor conditions and thermal loads.
32
0
Calculated loads, kW cooling
400
Low Carbon Buildings
183
depending upon their nature. The classification of organic compounds
represents chemical compounds that contain carbon–hydrogen bonds in
their basic molecular structure. Their sources can be either natural products
or s ynthetics, especially those derived from oil, gas and coal. Organic contaminants may exist in the form of gas (vapour), liquid or as solid particles in
the atmosphere, food and/or water. Inorganic compounds are those that do
not contain carbon–hydrogen bonds in their molecular structure.
The danger of particulate matter is its ability to become contaminated by
other ambient sources, increasing health risks to individuals who are exposed
to respirable suspended particles. Particles in this category are, usually, less
than 10 mm in aerodynamic diameter. As mentioned previously, p
articles
smaller than 5 mm are capable of bypassing the respiratory defences.
Biological contaminants are generally referred to as microbes or microorganisms. Biological contaminants are minute particles of living matter p
roduced
from a variety of sources. The variety of biological compounds that may be
present in the ambient environment is immense. Sources of pollution exist
in the internal and external environment. The air quality is controlled by
removal of the contaminant or by dilution. American Society of Heating,
Refrigerating and Air conditioning Engineers (ASHRAE) [22] prescribes necessary quantities of ventilation for various types of occupancies and methods
of determining the proportions of outside air and recirculated air. If the level of
contaminants in outdoor air exceeds that for minimum air quality standards,
extraordinary measures must be used. Although proper air-conditioning
designs are helpful in the prevention and treatment of diseases, the application of air-conditioning to health facilities presents many specific problems.
Those are not encountered in the conventional comfort conditioning design.
7.3.3.2 Problem Identification
The contaminant concentration mainly depends on two factors: air pressure
relationship and air movement efficiency. So the optimum design of these
two factors leads to accepted concentration and safe distribution of the contaminant. Actually, most guidelines to date do not restrict any airside design
for each application. This gives a large tolerance and many design alternatives that are not totally perfect.
7.3.3.3 Status Quo
Comfort and air quality are investigated with the aid of experimental
and numerical techniques to represent the relation between the thermal conditions and the air quality [1]. Thermal conditions affect the air
quality; therefore, any recommended numerical models should account for
balanced thermal conditions. This would affect the discrepancies between
measured and simulated results and consequently create a more generalised numerical formula for the air characteristics. The effect of thermal loads
184
Energy Efficiency in the Urban Environment
and cooling strategies on the airflow pattern in an office was investigated
by
applying mixing v
entilation [21] as well as those results indicating
the effect of supply conditions on the airflow pattern [16]. The ventilation
performance represents the capabilities of the airside design for providing
a clean space. The effect of the heat and contaminant source location on the
ventilation
performance is also important. Optimum ventilation performance is achieved when these sources are located near the exhaust opening [22]. In healthcare applications, the air quality is generally influenced by
airborne and contaminant generation, especially in critical sites such as the
isolation and surgery rooms. Several studies have investigated airborne particle control in operating rooms using numerical techniques [23–26].
7.3.3.4 Closure
Air movement efficiency is mainly based on two factors: the air pressure
relationship with the other neighbourhood spaces and the airside design.
Differential air pressure can be maintained only in an entirely sealed room.
Therefore, it is important to obtain a reasonably close fit of all doors and seal
all walls and floor penetrations within pressurised areas. This is best accomplished by using weather stripping and drop bottoms on doors. The opening
of a door between two areas instantaneously reduces any existing pressure
differential between them to such a degree that its effectiveness is nullified.
When such openings occur, a natural interchange of air takes place between
the two rooms due to turbulence created by the door opening and closing
combined with personal ingress/egress.
7.3.4 Energy-Efficient Building Design
7.3.4.1 Introduction
In the early 1970s, the energy crisis forced the development of conservation
strategies in a variety of industries. Sustainability and energy efficiency
continue to be strong issues in this time of limited resources. Therefore,
the implementation of energy-conserving strategies in HVAC systems must
be balanced with occupant comfort and health. A few guidelines gave specific recommendations about energy saving in HVAC systems, but these
recommendations do not meet all requirements and design varieties. Indeed,
in hot and humid climates, outdoor conditions play an important role in the
energy consumption.
7.3.4.2 Problem Identification: Pyramid Concept
Until now, the guidelines and design standards have not provided restricted
utilisation strategies for the conditioned air in spaces. This results in inefficient systems and expensive energy invoices. In some critical facilities,
such as hospitals, HVAC designers face the problem of balancing healthy
185
Low Carbon Buildings
EP
Overall energy
performance (EP):
Energy performance
of the building
including its technical
building systems
Overall
EP of
buildings
ations
Specific
Specificat
io
ns
Subsystem
properties
Compon
ent prop
erties
Boundary conditions
FIGURE 7.8
Overall building energy performance indicators.
conditions with energy utilisation. The assessment of the overall energy
performance of a particular building, including the technical building systems, comprises a number of successive steps, which can be schematically
visualised as a pyramid. Figure 7.8 shows various energy performance indicators of buildings.
7.3.4.3 Status Quo
The relation between the HVAC system design and optimum conditions
and energy utilisation is still under investigation even today. Recent
research [27] has investigated the effect of ventilation design on comfort
and energy. The effect of displacement ventilation on the humidity gradient
in a factory located in a hot and humid region has also been illustrated [27].
It was found that there is a strong dependence relationship between the
correct supplying conditions and comfort. Indeed, displacement ventilation is recommended as an energy-efficient system, because this system
gives the designers the suitable tolerance to select more economical supply conditions. In recent years, new ventilation system designs, such as
186
Energy Efficiency in the Urban Environment
under-floor ventilation systems, are slowly overcoming the problems of
current systems. Under-floor air supply is recommended as an alternative
to ceiling air supply in office buildings to overcome the lack of flexibility
in ceiling systems and to improve comfort conditions [27,28]. The underfloor system is recommended it due to its capability of reducing energy
consumption due to the operational characteristics of supplied air.
7.3.4.4 Closure
Because energy consumption optimisation is the new trend, new investigations are needed in the scientific research in order to achieve success.
Actually, energy utilisation mainly depends on optimum utilisation of conditioned air in conditioned spaces. Sets of common terms, definitions and
symbols are essential for all segments from top to bottom. These include
energy needs, technical building systems, auxiliary energy use, recoverable
system losses, primary energy and renewable energy.
7.3.5 Air-Conditioning System Design of Commercial Buildings
In theory, if properly applied, every system can be successful in any building. However, in practice, such factors as initial and operating costs, space
allocation, architectural design, location and the engineer’s evaluation and
experience limit the proper choices for a given building type. Heating and
air-conditioning systems should be simple in design and of proper size
for a given building, should involve generally fairly low maintenance and
low operating costs and should have optimal inherent thermal control as
is economically possible. Such control might include materials with high
thermal properties, insulation and multiple or special glazing and shading
devices.
An example of commercial building application is provided here for libraries and museums. In general, libraries have storage areas, working and office
areas, a main circulation desk, reading rooms, rare book vaults and small
study rooms. In general, museums have exhibit areas, work areas, back
offices and storage areas. Some larger museums may have souvenir shops,
a restaurant or cafeterias and so forth.
7.3.5.1 Load Characteristics
Many libraries, especially college libraries, operate up to 12 hours per day
and may run the air-conditioning equipment about 4200 hours per year.
Such constant usage requires the selection of heavy duty, long-life equipment that requires little maintenance. Museums are generally open about
8–10 hours per day, 5–7 days per week. The ambient conditions should not
vary in temperature or relative humidity. The conditions should remain constant 24 hours per day, year-round. Cold or hot walls and windows and hot
Low Carbon Buildings
187
steam or water pipes should be avoided. Object humidity may be d
estructive,
even if the ambient relative humidity is under control.
1. Sun gain: Libraries and museums usually have windows, s ometimes
of stained glass and skylights—more are in traffic areas than in book
stacks or storage areas. Care must be taken to minimise the effects of
the sun; shortwave (actinic) rays are particularly injurious. Heat gain
from skylights, often over artificially lighted frosted glass ceilings,
can be reduced by a separate forced ventilation system.
2. Transmission: In winter, effects on objects located close to outside
walls and possible condensation of moisture on the objects and the
surface of outside walls must be evaluated. In summer, possible radiant effects from exposure should be considered.
3. People: Some areas may have concentrations as high as 1.0 m2 per
person, although office space will have closer to 10 or 15 m2 per
person, and book stack areas up to 100 m2 per person.
4. Lights: Careful analyses of the required lighting intensity should be
made in various rooms and in view of daylighting availability.
5. Stratification: In reading rooms, large entrance halls and large art galleries with high natural or false ceilings, air temperature may stratify.
7.3.5.2 Design Concepts
All air ducted systems are preferred in library public areas, but careful
evaluation of relative humidity is essential. This is also true for museums
because exhibit items are generally irreplaceable. In museums, people loads
vary, depending on whether there is a new exhibit and on the time of day, the
weather and other factors. Thus, individually controlled zones are required
to maintain optimal environmental conditions. Attempts to establish a modular system for partitions have been only partially successful because of the
wide range of sizes of items in the exhibits. In art museums, particularly,
partitions may create local pockets with hot air supply or exhaust; transfer
grilles may be placed in the partitions to obtain some air flow movement.
Another problem is the location of room thermostats and humidistats.
7.3.5.3 Special Considerations
Many old manuscripts, books and artefacts [11,26–31] have been damaged
or destroyed because they were not kept in a properly air-conditioned
environment. The need for better preservation of such valuable materials,
together with a rising popular interest in the use of libraries and museums,
requires that most of them, whether new or existing, be air-conditioned. Airconditioning problems for museums and libraries are generally similar but
differ in design concept and application. Figure 7.9 depicts an example of
artefact deterioration due to excessive humidity [26,32].
188
Energy Efficiency in the Urban Environment
FIGURE 7.9
Effect of moisture content on the colour of artefacts.
7.3.5.4 Design Criteria
In an average library or museum, less stringent design criteria are usually
provided than for archives because the value of the books and collections
does not justify the higher initial and operating costs. Low-efficiency air
filters are often provided. Relative humidity is held below 55%. Room temperatures are held within the 20–21.5°C range. Archival libraries and museums should have 85% or better air filtration, a relative humidity of 35% for
books and temperatures of 16°C in book stacks and 20°C in reading rooms.
7.3.5.5 Building Contents
The reaction of museum contents and collections to room conditions should
be carefully considered and critically examined. For example, paper used
in books and manuscripts prior to the 18th century is very stable and is not
significantly affected by the room environment. For archival preservation,
this paper should be stored at very low temperatures. It is estimated that for
each 5°C dry bulb the room temperature is lowered, the life of the paper will
double and that any humidity reduction will also lengthen the life of paper.
7.3.5.6 Effect of Ambient Atmosphere
The temperature and, particularly, the relative humidity of the air have a
marked influence on the appearance, behaviour and general quality of
hygroscopic materials such as paper, textiles, wood and leather because the
moisture content of these substances comes into equilibrium with the moisture content of the surrounding air. The object humidity is usually defined
as the relative humidity of the thin film of air in close contact with the
surface of an object and at a temperature cooler or warmer than the ambient
dry bulb. If artefacts are permitted to cool overnight, the next day they will
be enveloped by layers of air having progressively higher relative h
umidity.
This may range from the ambient of 45% to 60% to 97% immediately next
Low Carbon Buildings
189
to the object surface, thus effecting a change in material regain or even
condensation. This, combined with the hygroscopic or salty dust often found
on objects recovered from excavations, can be destructive.
7.3.5.7 Sound and Vibration
Air-conditioning equipment should be treated with sound and vibration
isolation to ensure quiet comfort for visitors and staff as per the ASHRAE
standards and local environmental laws.
7.3.6 Evaluation Indices
7.3.6.1 Introduction
The evaluation indices of the comfort, air quality and energy utilisation efficiency can be divided into two main categories—empirical indices based on
experimental techniques and numerical indices based on numerical techniques. The most common indices provide the required evaluation of the air
characteristics at individual positions (or in other scope, at individual points)
in the indoor environment.
7.3.6.2 Problem Identification
Until now, the evaluation of the comfort, air quality and energy utilisation
efficiency was performed only at individual positions (local evaluation).
There still is no general global evaluation index for several characteristics
such as the airflow movement and the contaminant concentration and its
influence on the occupancy health. Actually, the air flow distribution pattern
plays the role of the global evaluation index up today. On the other hand,
there is no global evaluation index capable of evaluating comfort, air quality
and energy utilisation efficiency simultaneously. Actually, this global index
will aid the HVAC designers in achieving the optimum design according to
the optimum indoor air quality levels [27–29].
7.3.6.3 Status Quo
Energy efficiency is better characterised in buildings through the energy
efficiency ratio (EER), an index that is mandatory in all air-conditioning and
refrigeration systems. The EER is defined as the useful output divided by the
energy input, a form of coefficient of performance. International standards
dictate that EER is greater than a pre-set value in an energy label (as shown
here in Figure 7.10) [33]. It is classified in efficiency categories from A to G,
giving the cooling output at full load in kW and the EER in cooling mode at
full load.
Countries set their own energy labels based on local industry and on
energy generation potentials and strategies. The minimum EER in Egypt,
for example, is 2.65 for split air conditioners [33]. The minimum efficiencies
190
Energy Efficiency in the Urban Environment
Air conditioners, cooling EER in W/W
A
>3.2
B
C
D
E
F
3.0–3.2 2.8–3.0 2.6–2.8 2.4–2.6 2.2–2.4
G
<2.2
(a)
Energy
Fridge-Freezer
Manufacturer
Model
More efficient
A
A
B
C
D
E
F
G
Less efficient
Noise
(dB(A) re 1 pW)
Further information is contained in
product brochures
Norm (N 15) May 1990
Refridgerator Label Directive 94/2CC
(b)
FIGURE 7.10
Examples of energy efficiency ratio for products. (a) Energy efficiency ratio classifications
for room air conditioners. (b) Energy efficiency ratio classifications for refrigerators. (From
European Commission Energy Labeling, 2010.)
of mechanical systems are commonly known as MEPS and are also set to
rationalise the energy use in fossil fuel equipment and to reduce the carbon
footprint. Assessment of energy performance of buildings as a whole are
generally use energy rating systems; one example is the Green Pyramids
Rating System (GRPS) [33], Leadership in Energy and Environmental Design
(LEED) [34].
The GPRS Green Pyramid Category Weightings as specified are as follows:
1.
2.
3.
4.
Sustainable site, accessibility and ecology
Energy efficiency
Water utilisation efficiency
Materials and resources
10%
20%
30%
10%
191
Low Carbon Buildings
5. Indoor environmental quality
6. Management
7. Innovation and added value
10%
10%
10%
The first group of assessment points goes to site and ecology. These were
set to encourage development in desert areas and redevelopment in informal
areas and to avoid projects that negatively affect archaeological, historical
and protected areas. This is also to minimise pollution and traffic congestion
from car use and to conserve non-renewable energy by encouraging public
and alternative transport. Ultimately, this would minimise the environmental
impact of the project on the site and its surroundings; it would protect existing
natural systems, such as fauna and flora (including wildlife corridors and seasonal uses), soil, hydrology and groundwater from damage and would promote biodiversity. Ten points were given for that group, while 20 points were
given for energy-efficient building designs utilising the concepts highlighted
here and by Van Dijk and Khalil [11,31] and Ashrae [29]. The water energy
nexus was realised in a 30 point assessment for the water efficiency procedures. Materials and resources were given 10 points as well. Indoor environmental quality as dedicated by human thermal comfort and acoustics and by
natural and artificial lighting was given 10 points as well. Proper management
and innovation harvest the remaining 20 points. A balance of all the important and influential factors was accounted for with these rating systems. The
building would be certified green if attaining a minimum of 80 points and
would just be certified if attaining up to 49 points, as indicated in Figure 7.11.
The final credits are calculated and are categorised within the following
rating:
1.
2.
3.
4.
GPRS Certified: 40–49 credits
Silver Pyramid: 50–59 credits
Gold Pyramid: 60–79 credits
Green Pyramid: 80 credits and above
7.3.6.4 Closure
Because optimisation of energy consumption is the new trend, the achievement of this level needs new investigation in scientific studies. Actually,
energy utilisation mainly depends on the optimum utilisation of conditioned
air in c onditioned spaces. Sets of common terms, definitions and symbols
are e ssential for all segments from top to bottom. The target of this s ection
is to highlight procedures to control the alteration, repair, maintenance
and operation of existing building sites and the alteration of building site
improvements where additions are made to, or changes of occupancy occur
within, the existing buildings on the site. Building sites shall be operated
and maintained in conformance with the national green building code.
192
Energy Efficiency in the Urban Environment
Green
>80 credits
Gold
60–79 credits
Silver
50–59 credits
Certified
40–49 credits
FIGURE 7.11
Green building rating system.
The owner or the owner’s designated agent shall be responsible for the
operation and maintenance of building sites. The requirements of the green
building code shall be incorporated and implemented in new and renovation work. Alterations and repairs to building sites shall comply with the
code provisions. Building materials used for building site development shall
comply with the requirements of the code materials; systems already in use
on a building site that are in conformance with the requirements or approvals
in effect at the time of their installation shall be permitted to remain in use
unless determined by the code official to be dangerous to the environment,
life, health or safety. Where such conditions are determined to be dangerous
to the environment, life, health or safety, they shall be mitigated or made safe.
References
1. Khalil, E. E. (2005). Energy performance of buildings directive in Egypt: A new
direction, HBRC Journal, Vol. 1, pp. 197–213.
2. Medhat, A. A. and Khalil, E. E. (2006). Thermal comfort meets human acclimatization in Egypt, Proceeding of Healthy Building, Vol. 2, p. 25.
3. Khalil, E. E. (2006). Energy performance of commercial buildings in Egypt:
A new direction, Proceedings, Energy2030, Abu Dhabi, November 2006.
Low Carbon Buildings
193
4. Kosonen, R. (2002). Displacement ventilation for room air moisture control in
hot and humid climate, ROOMVENT 2002, pp. 241–244.
5. Leite, B. C. C. and Tribess, A. (2002). Analysis of under floor air distribution system: Thermal comfort and energy consumption, ROOMVENT 2002,
pp. 245–248.
6. Kameel, R. and Khalil, E. E. (2002). Prediction of turbulence behavior using k-ε
model in operating theatres, ROOMVENT 2002, pp. 73–76.
7. Khalil, E. E. (2008). Arab-air conditioning and refrigeration code for energyefficient buildings, Arab Construction World, Vol. 28, No. 8, pp. 24–26.
8. Khalil, E. E. (2008). Air conditioning and refrigeration code for energy-efficient
buildings in the Arab world, Journal of Kuwait Society of Engineers, Vol. 100,
pp. 94–95.
9. ISO publications ISO 23045_2009, January 2009.
10. Federal Register/Vol. 72, No. 245/Friday, December 21, 2007/Rules and
Regulations 72565.
11. Van Dijk, D. and Khalil, E. E. (2011). Future cities—Building on energy efficiency, ISO Focus, pp. 25–27.
12. EPD, European Energy Performance Code, CEN, 2006.
13. Olesen, B. W., Koschenz, M. and Johansson, C. (2003). New European standard
proposal for design and dimensioning of embedded radiant surface heating
and cooling systems, ASHRAE Transactions, Vol. 109, p. KC-03-07-4.
14. Kameel, R. and Khalil, E. E. (2003). Energy efficiency, merits, and advantages of
various air-conditioning system in commercial buildings, in Egypt, Proceedings
of ASHRAE-RAL, Paper Ral.3-5, Cairo.
15. Khalil, E. E. (2003). HVAC in energy efficiency building code, Egypt, Proceedings
of ASHRAE-RAL, Paper Ral.3-6, Cairo.
16. PrEN ISO 10077-2, Thermal performance of windows, doors and shutters—
Calculation of thermal transmittance—Part 2: Numerical methods for frames,
2005.
17. PrEN 13363-1, Solar protection devices combined with glazing—Calculation of
solar energy and light transmittance—Part 1: Simplified method, 2005.
18. ISO 13790, Thermal performance of buildings—Calculation of energy use for
space heating, 2010.
19. Khalil, E. E. (2004). Energy efficiency in air conditioned buildings: An overview,
Proceedings of 6th JIMEC, Amman.
20. Khalil, E. E. (2004). Energy efficiency in air conditioned buildings in Egypt,
Proceedings of the 6th JIMEC, Amman.
21. USA DOE (2002). Department of Energy.
22. ASHRAE Handbook, Fundamentals 2013, ASHRAE, Atlanta, GA.
23. Naydenov, K., Pitchurov, G., Langkilde, G. and Melikov, A. K. (2002). Performance
of displacement ventilation in practice, ROOMVENT 2002, pp. 483–486.
24. Jacobsen, T. S., Hansen, R., Mathiesen, E., Nielsen, P. V. and Topp, C. (2002).
Design method and evaluation of thermal comfort for mixing and displacement
ventilation, ROOMVENT 2002, pp. 209–212.
25. Kameel, R. and Khalil, E. E. (2001). Numerical computations of the fluid flow
and heat transfer in air-conditioned spaces, NHTC2001-20084, 35th National Heat
Transfer Conference, Anaheim, CA.
26. Khalil, E. E. (2009). Thermal management in hospitals: Comfort, air quality and
energy utilization, Proceedings ASHRAE, RAL, Kuwait.
194
Energy Efficiency in the Urban Environment
27. Nakamura, Y. and Fujikawa, A. (2002). Evaluation of thermal comfort and
energy conservation of an ecological village office, ROOMVENT 2002,
pp. 413–416.
28. ASHRAE, Applications, 2011, ASHRAE, Atlanta, GA.
29. ASHRAE standards 55-2013, ASHRAE, Atlanta, GA.
30. Holmberg, S. and Einberg, G. (2002). Flow behavior in a ventilated room—
Measurements and simulations, ROOMVENT 2002, pp. 197–200.
31. Van Dijk, D. and Khalil, E. E. (2009). Energy efficiency in buildings, ISO Focus,
September 2009, pp. 16–20.
32. Khalil, E. E. (2011). Ventilation of the archaeological tombs of the valley of
kings, Luxor, Egypt, Proceedings of International Conference on Air-Conditioning &
Refrigeration 2011, ICACR2011, ICACR2011-00102, Korea.
33. European Commission Energy Labeling, 2010, at www.epbd.eu.
34. Khalil, E. E. (2012). International focus on emerging technologies & opportunities, ASME Congress, Paper Number IMECE2012-94127.
Further Readings
1. ASHRAE Guideline 1.1—HVAC&R Technical Requirements for The
Commissioning Process, Latest Edition.
2. ASHRAE Standard 52.2—Method of Testing General Ventilation Air-Cleaning
Devices for Removal Efficiency by Particle Size, Latest Edition 2007.
3. ASHRAE Standard 55—Thermal Environmental Conditions for Human
Occupancy, Latest Edition.
4. ASHRAE Standard 62.1—Ventilation for Acceptable Indoor Air Quality—Sets
the minimum acceptable ventilation requirements, Latest Edition.
5. ASHRAE Standard 90.1—Energy Standard for Buildings Except Low-Rise
Residential Buildings.
6. Department of Defense.
7. Air Force Engineering Technical Letter ETL04-3 Design Criteria for Prevention
of Mold in Air Force Facilities, by U.S. Air Force, 2004.
8. U.S. General Services Administration.
9. P100 Facilities Standards for the Public Buildings Service, 2010.
8
Green Buildings
8.1 General
Green construction (or sustainable building) is a structural process that is
environmentally responsible and resource efficient throughout a building’s
life cycle, from laying down the design principles, construction, operation,
maintenance, renovation, to demolition. This requires close cooperation
among the design team, the architects, the engineers and the client at all
project stages. Green building practices expand and complement the classical building design concerns of economy, utility, durability and comfort.
Although new technologies are constantly being developed to complement current practices in creating greener structures, the common objective
is that green buildings are designed to reduce the overall impact of the built
environment on human health and on the natural environment by
1. Efficiently using energy, water and other resources
2. Protecting occupant health and improving employee productivity
3. Reducing waste, pollution and environmental degradation
A similar concept is natural building, which is usually on a smaller scale
and tends to focus on the use of natural materials that are available locally [1].
Other related topics include sustainable design and green architecture.
Sustainability may be defined as meeting the needs of present generations
without compromising the ability of future generations to meet their own
needs. Although some green building programmes do not address the issue
of retrofitting existing homes, others do. Green construction principles can
easily be applied to retrofit work as well as to new construction.
A 2009 report by the U.S. General Services Administration [2–4] found 12
sustainably designed buildings cost less to operate and had excellent energy
performance. In addition, occupants were more satisfied with the overall
building than were those in typical commercial buildings.
195
196
Energy Efficiency in the Urban Environment
Although the definition of sustainable building design is constantly c hanging,
six fundamental principles persist.
1. Optimise site potential: Creating sustainable buildings starts with
proper site selection, including consideration of the reuse or rehabilitation of existing buildings. The location, orientation and landscaping
of a building affects local ecosystems, transportation methods and
energy use. It is important to incorporate smart growth principles into
the project development process, whether the project is a single building, a campus or a military base. Siting for physical security is a critical issue in optimising site design, including locations of access roads,
parking, vehicle barriers and perimeter lighting. Whether designing
a new building or retrofitting an existing building, site design must
integrate with sustainable design to achieve a successful project. The
site of a sustainable building should reduce, control and/or treat storm
water runoff. If possible, planners should strive to support native flora
and fauna of the region in the landscape design.
2. Optimise energy use: With the continually increasing demand on
the world’s fossil fuel resources, concerns for energy independence
and security are increasing, and the impacts of global climate
change are becoming more evident. Therefore, it is essential to find
ways to reduce energy load, increase efficiency and maximise the
use of renewable energy sources in federal facilities. Improving the
energy performance of existing buildings is important to increasing
our energy independence. Government and private sector organisations are increasingly committed to building and operating net zero
energy buildings as a way to significantly reduce our dependence on
fossil fuel-derived energy.
3. Protect and conserve water: In many parts of the country, fresh
water is an increasingly scarce resource. A sustainable building
should use water efficiently and should reuse or recycle water for
on-site use, when feasible. The effort to bring drinkable water to our
household faucets consumes enormous energy resources in pumping, transport and treatment. Often potentially toxic chemicals are
used to make water potable. The environmental and financial costs
of sewage treatment are significant.
4. Optimise building space and material use: The materials used in
a sustainable building minimise life cycle environmental impacts
such as global warming, resource depletion and human toxicity.
Environmentally preferable materials have a reduced effect on
human health and the environment and contribute to improved
worker safety and health, reduced liabilities, reduced disposal costs
and achievement of environmental goals.
5. Enhance indoor environmental quality: The indoor e nvironmental
quality (IEQ) [2–4] of a building has a significant impact on occupant
Green Buildings
197
health, comfort and productivity. Among other attributes, a sustainable building maximises day lighting, has appropriate ventilation and
moisture control, optimises acoustic performance and avoids the use
of m
aterials with high-volatile organic compounds (VOC) e missions.
Principles of IEQ also emphasise occupant control over systems such
as lighting and temperature.
6. Optimise operational and maintenance practices: Considering a
building’s operating and maintenance issues during the preliminary design phase of a facility will contribute to improved working environments, higher productivity and reduced energy and
resource costs, and will prevent system failures. Encourage building
operators and maintenance personnel to participate in the design
and development phases to ensure optimal operations and maintenance of the building. Designers can specify materials and systems
that simplify and reduce maintenance requirements; that require
less water, energy, and toxic chemicals and cleaners to maintain;
and that are cost-effective and reduce life cycle costs. Additionally,
design facilities to include meters in order to track the progress of
sustainability initiatives, including reductions in energy and water
use and waste generation, in the facility and on site.
8.2 Concepts
The concept of sustainable development can be traced to the energy (especially fossil oil) crisis and the environment pollution concerns in the 1970s.
The U.S. green building movement originated with the need and desire
for more energy-efficient and environment-friendly construction practices.
There are a number of motives for building green, including environmental, economic and social benefits. However, modern sustainability i nitiatives
call for an integrated and synergistic design in new construction and in the
retrofitting of existing structures. Also known as sustainable design, this
approach integrates the building life cycle with each green practice employed
following a design-purpose of creating a synergy among the practices used.
Green building brings together a vast array of practices, techniques and
skills to reduce and ultimately eliminate the impacts of buildings on the
environment and on human health. It often emphasises taking advantage
of renewable resources, such as using sunlight through passive solar, active
solar, and photovoltaic equipment, and using plants and trees through green
roofs, rain gardens and reduction of rainwater runoff. Many other techniques
are used, such as using low-impact building materials or using packed gravel
or permeable concrete instead of conventional concrete or asphalt to enhance
replenishment of ground water.
198
Energy Efficiency in the Urban Environment
Although the practices or technologies employed in green building are constantly evolving and may differ from region to region, fundamental principles
persist from which the method is derived: sitting and structure design efficiency,
energy efficiency, water efficiency, materials efficiency, IEQ enhancement,
operations and maintenance optimisation, and waste and toxics reduction. The
essence of green building is an optimisation of one or more of these principles.
Also, with the proper synergistic design, individual green building technologies may work together to produce a greater cumulative effect.
On the aesthetic side of green architecture or sustainable design is the
philosophy of designing a building that is in harmony with the natural
features and resources surrounding the site. There are several key steps in
designing sustainable buildings: specify ‘green’ building materials from
local sources, reduce loads, optimise systems and generate on-site renewable energy.
8.2.1 Life Cycle Assessment
A life cycle assessment (LCA) can help avoid a narrow outlook on environmental, social and economic concerns by assessing a full range of impacts
associated with all cradle-to-grave stages of a process: from extraction of
raw materials through materials processing, manufacture, distribution, use,
repair and maintenance, and disposal or recycling [5,6]. Impacts taken into
account include (among others) embodied energy, global warming potential,
resource use, air pollution, water pollution and waste.
In terms of green building, the last few years have seen a shift away from
a prescriptive approach, which assumes that certain prescribed practices are
better for the environment, toward the scientific evaluation of actual performance through LCA.
Although LCA is widely recognised as the best way to evaluate the environmental impacts of buildings (ISO 14040 provides a recognised LCA
methodology), it is not yet a consistent requirement of green building rating
systems and codes, despite the fact that embodied energy and other life cycle
impacts are critical to the design of environmentally responsible buildings.
In North America, LCA is rewarded to some extent in the Green Globes®
rating system, and it is part of the new American National Standard based
on Green Globes, ANSI/GBI 01-2010: Green Building Protocol for Commercial
Buildings. LCA is also included as a pilot credit in the Leadership in Energy
and Environmental Design (LEED) system, though a decision has not been
made as to whether it will be incorporated fully into the next major revision.
The state of California also included LCA as a voluntary measure in its 2010
draft Green Building Standards Code.
Although LCA is often perceived as overly complex and time consuming
for regular use by design professionals, research organisations such as BRE
in the UK and the Athena Sustainable Materials Institute in North America
are working to make it more accessible.
199
Green Buildings
In the UK, the BRE Green Guide to Specifications offers ratings for 1,500
building materials based on LCA.
In North America, the ATHENA® EcoCalculator for Assemblies provides LCA
results for several hundred common building assembles based on data generated by its more complex parent software, the ATHENA® Impact Estimator
for Buildings. (The EcoCalculator is available free at www.athenasmi.org.)
Athena software tools are especially useful early in the design process when
material choices have far-reaching implications for overall environmental
impact. They allow designers to experiment with different material mixes to
achieve the most effective combination.
8.3 Measures and Assessments
Measures and assessments of green building performance and energy
efficiency can be effected through
1. Design considerations and enforcements
2. Code compliance
3. Post-occupancy assessment
The five guiding principles with which buildings must comply are as
follows:
1. Employ integrated assessment, operation
principles
2. Optimise energy performance
3. Protect and conserve water
4. Enhance IEQ
5. Reduce environmental impact of materials
and
management
8.3.1 Guiding Principles for Sustainable Existing Buildings
1. Employ Integrated Assessment, Operation and Management
Principles
a. Integrated assessment, operation and management. Use an integrated
team to develop and implement policy regarding sustainable
operations and maintenance.
i. Incorporate sustainable operations and maintenance practices
within the appropriate Environmental Management System.
200
Energy Efficiency in the Urban Environment
ii. Assess existing condition and operational procedures of the
building and major building systems and identify areas for
improvement.
iii. Establish operational performance goals for energy, water,
material use and recycling, and IEQ, and ensure incorporation of these goals throughout the remaining life cycle of the
building.
iv. Incorporate a building management plan to ensure that operating decisions and tenant education are carried out with
regard to integrated, sustainable building operations and
maintenance.
v. Augment building operations and maintenance as needed
using occupant feedback on work space satisfaction.
b. Commissioning. Employ recommissioning, tailored to the size and
complexity of the building and its system components, in order
to optimise and verify performance of fundamental building
systems. Commissioning must be performed by an experienced
commissioning provider. When building commissioning has
been performed, the commissioning report, summary of actions
taken and schedule for recommissioning must be documented.
Building recommissioning must have been performed within
four years prior to reporting a building as meeting the guiding
principles.
2. Optimise Energy Performance
a. Energy efficiency. Three options can be used to measure energy
efficiency performance:
i. Option 1: Receive an ENERGY STAR® rating of 75 or higher
or an equivalent Labs21 Benchmarking Tool score for laboratory buildings.
ii. Option 2: Reduce measured building energy use by 20%
compared to building energy use in 2003 or a year thereafter
with quality energy use data.
iii. Option 3: Reduce energy use by 20% compared to the ASHRAE
90.1-2007 baseline building design if design information is
available. Use ENERGY STAR and FEMP-designated energyefficient products, where available.
b. On-site renewable energy. Per E.O. 13423, implement renewable
energy generation projects on agency property for agency use,
when life cycle is cost-effective.
c. Measurement and verification. Per the Energy Policy Act of 2005
Section 103, install building level electricity meters to track and
Green Buildings
201
continuously optimise performance. Per the EISA 2007, the utility
meters must also include natural gas and steam, where natural
gas and steam are used.
d. Benchmarking. Compare annual performance data with previous
years’ performance data, preferably by entering annual performance data into the ENERGY STAR Portfolio Manager. For building and space types not available in ENERGY STAR, use an
equivalent benchmarking tool such as the Labs21 benchmarking
tool for laboratory buildings.
3. Protect and Conserve Water
a. Indoor water. Two options can be used to measure indoor potable
water use performance:
i. Option 1: Reduce potable water use by 20% compared to a
water baseline calculated for the building. The water baseline, for buildings with plumbing fixtures installed in 1994
or later, is 120% of the Uniform Plumbing Codes 2012 or
the International Plumbing Codes 2012 fixture performance
requirements. The water baseline for plumbing fixtures older
than 1994 is 160% of the Uniform Plumbing Codes 2012 or
the International Plumbing Codes 2006 fixture performance
requirements.
ii. Option 2: Reduce building measured potable water use by
20% compared to building water use in 2003 or a year thereafter with quality water data.
b. Outdoor water. Three options can be used to measure outdoor
potable water use performance:
i. Option 1: Reduce potable irrigation water use by 50% compared to conventional methods.
ii. Option 2: Reduce building-related potable irrigation water
use by 50% compared to measured irrigation water use in
2003 or a year thereafter with quality water data.
iii. Option 3: Use no potable irrigation water.
c. Measurement of water use. The installation of water meters for
building sites with significant indoor and outdoor water use is
encouraged. If only one meter is installed, reduce potable water
use (indoor and outdoor combined) by at least 20% compared to
building water use in 2003 or a year thereafter with quality water
data. Employ strategies that reduce storm water runoff and discharges of polluted water offsite. Per EISA Section 438, where
redevelopment affects site hydrology, use site planning, design,
construction and maintenance strategies to maintain hydrologic
202
Energy Efficiency in the Urban Environment
conditions during development, or to restore hydrologic conditions following development, to the maximum extent that is
technically feasible.
d. Process water. Per the EP Act 2005 Section 109, when potable water
is used to improve a building’s energy efficiency, deploy life cycle
cost-effective water conservation measures.
e. Water-efficient products. Where available, use EPA’s WaterSenselabelled products or other water-conserving products, where
available. Choose irrigation contractors who are certified through
a WaterSense-labelled programme.
4. Enhance IEQ
a. Ventilation and thermal comfort. Meet ASHRAE Standard 55-2013,
Thermal Environmental Conditions for Human Occupancy and
ASHRAE Standard 62.1-2010: Ventilation for Acceptable Indoor
Air Quality.
b. Moisture control. Provide policy and illustrate the use of an appropriate moisture control strategy to prevent building damage,
minimise mould contamination and reduce health risks related
to moisture. For facade renovations, Dew Point analysis and a
plan for clean up or infiltration of moisture into building materials are required.
c. Daylighting and lighting controls. Automated lighting controls
(occupancy/vacancy sensors with manual-off capability) are
provided for appropriate spaces including restrooms, conference and meeting rooms, employee lunch and break rooms,
training classrooms and offices. Two options can be used to
meet additional daylighting and lighting controls performance
expectations:
i. Option 1: Achieve a minimum daylight factor of 2% (excluding
all direct sunlight penetration) in 50% of all space occupied
for critical visual tasks.
ii. Option 2: Provide occupant controlled lighting, allowing
adjustments to suit individual task needs, for 50% of regularly occupied spaces.
d. Low-emitting materials. Use low-emitting materials for building
modifications, maintenance and cleaning. In particular, specify
the following materials and products to have low pollutant emissions: composite wood products, adhesives, sealants, interior
paints and finishes, s olvents, carpet systems, janitorial supplies
and furnishings.
e. Integrated pest management. Use integrated pest management techniques as appropriate to minimise pesticide usage. Use EPAregistered pesticides only when needed.
Green Buildings
203
f. Environmental tobacco smoke control. Prohibit smoking within the
building and within 25 feet of all building entrances, operable
windows and building ventilation intakes.
5. Reduce Environmental Impact of Materials
a. Recycled content. Per Section 6002 of the Resource Conservation
and Recovery Act (RCRA), for EPA-designated products, use
products meeting or exceeding EPA’s recycled content recommendations for building modifications, maintenance and
cleaning. For other products, use materials with recycled
content such that the sum of post-consumer recycled content
plus one-half of the pre-consumer content constitutes at least
10% (based on cost or weight) of the total value of the materials in the project. If EPA-designated products meet performance requirements and are available at a reasonable cost,
a preference for purchasing them shall be included in all solicitations relevant to construction, operation, maintenance of or
use in the building. EPA’s recycled content product designations and recycled content recommendations are available on
relevant websites.
b. Biobased content. Per Section 9002 of the Farm Security and
Rural Investment Act (FSRIA), for USDA-designated products, use products with the highest content level per USDA’s
biobased content recommendations. For other products, use
biobased products made from rapidly renewable resources
and certified sustainable wood products. If these designated
products meet performance requirements and are available at
a reasonable cost, a preference for purchasing them should be
included in all solicitations relevant to construction, operation,
maintenance of or use in the building.
c. Environmentally preferable product. Use products that have a lesser
or reduced effect on human health and the environment over
their life cycle when compared with competing products or services that serve the same purpose. A number of standards and
eco labels are available in the marketplace to assist specifiers in
making environmentally preferable decisions.
d. Waste and materials management. Provide reuse and recycling services for building occupants, where markets or on-site recycling
exist. Provide salvage, reuse and recycling services for waste
generated from building operations, maintenance, repair and
minor renovations, and discarded furnishings, equipment and
property. This could include such things as beverage containers
and paper from building occupants, batteries, toner cartridges,
outdated computers from an equipment update and construction materials from a minor renovation.
204
Energy Efficiency in the Urban Environment
e. Ozone-depleting compounds. Eliminate the use of ozone-depleting
compounds where alternative environmentally preferable products are available, consistent with either the Montreal Protocol and
Title VI of the Clean Air Act Amendments of 1990, or equivalent
overall air quality benefits that take into account life cycle impacts.
8.3.2 Design Considerations and Enforcement
During the design stage of buildings projects that require and use energy
extensively, the designers should follow all known techniques, options and
codes to end up with an energy-efficient design.
Rating systems are groups of requirements for projects that want to
achieve LEED certification. Each group is geared toward the unique needs of
a project or building type.
LEED is flexible enough to apply to all project types including healthcare
facilities, schools, homes and even entire neighbourhoods. The rating system
selection guidance will help you determine which specific rating system is
right for your project.
Projects earn points to satisfy green building requirements.
Within each of the LEED credit categories, projects must satisfy prerequisites and earn points. The number of points the project earns determines its
level of LEED certification. The main credit categories are as follows.
1. Sustainable site credits encourage strategies that minimise the impact
on ecosystems and water resources.
2. Water efficiency credits promote smarter use of water, inside and out,
to reduce potable water consumption.
3. Energy and atmosphere credits promote better building energy performance through innovative strategies.
4. Materials and resources credits encourage using sustainable building
materials and reducing waste.
5. IEQ credits promote better indoor air quality and access to daylight
and views.
Additional LEED for Neighbourhood Development credit categories are
1. Smart location and linkage credits promote walkable neighbourhoods with efficient transportation options and open space.
2. Neighbourhood pattern and design credits emphasise compact,
walkable, vibrant, mixed-use neighbourhoods with good connections to nearby communities.
3. Green infrastructure and buildings credits reduce the environmental consequences of the construction and operation of buildings and
infrastructure.
Green Buildings
205
Additional LEED for Homes credit categories are:
1. Location and linkage credits encourage construction on previously
developed or infill sites and promote walkable neighbourhoods with
access to efficient transportation options and open space.
2. Awareness and education credits encourage home builders and real
estate professionals to provide homeowners, tenants and building
managers with the education and tools they need to understand and
make the most of the green building features of their home.
In addition, there are two bonus credit categories:
1. Innovation in design or innovation in operations credits addresses
sustainable building expertise as well as design measures not
covered under the five LEED credit categories. Six bonus points are
available in this category.
2. Regional priority credits address regional environmental priorities
for buildings in different geographic regions. Four bonus points are
available in this category.
8.4 New Design Practices and Renewable Energy Blends
Various countries currently rely heavily on coal, oil and natural gas for their
energy. Fossil fuels are non-renewable; that is, they draw on finite resources
that will eventually dwindle, becoming too expensive or too environmentally damaging to retrieve. In contrast, the many types of renewable energy
resources—such as wind and solar energy—are constantly replenished and
will never run out. Most renewable energy comes either directly or indirectly
from the sun. Sunlight, or solar energy, can be used directly for heating and
lighting homes and other buildings, for generating electricity, and for hot
water heating, solar cooling, and a variety of commercial and industrial uses
(Figure 8.1).
Solar heat also drives the winds, whose energy is captured with wind turbines. Then the winds and the sun’s heat cause water to evaporate. When
this water vapour turns into rain or snow and flows downhill into rivers or
streams, its energy can be captured using hydroelectric power.
Along with the rain and snow, sunlight causes plants to grow. The organic
matter that makes up those plants is known as biomass. Biomass can be used
to produce electricity, transportation fuels or chemicals. The use of biomass
for any of these purposes is called bioenergy.
Hydrogen also can be found in many organic compounds as well as in
water. It is the most abundant element on the Earth. But it does not occur
206
Energy Efficiency in the Urban Environment
FIGURE 8.1
Solar shingles are installed on a rooftop.
naturally as a gas. It is always combined with other elements, such as with
oxygen to make water. Once separated from another element, hydrogen can
be burned as a fuel or can be converted into electricity.
Not all renewable energy resources come from the sun. Geothermal energy
taps the Earth’s internal heat for a variety of uses, including electric power production and the heating and cooling of buildings. And the energy of the ocean’s
tides come from the gravitational pull of the moon and the sun upon the Earth.
8.4.1 Ocean and Alternative Energies
In fact, ocean energy comes from a number of sources. In addition to tidal
energy, there is the energy of the ocean’s waves, which are driven by tides
and winds. The sun also warms the surface of the ocean more than the
ocean depths, creating a temperature difference that can be used as an
energy source. All these forms of ocean energy can be used to produce
electricity.
Why Is Renewable Energy Important?
Renewable energy technology content for this section provided in part
by the National Renewable Energy Laboratory and the Department of
Energy.
Cost-effective energy efficiency programmes have been delivered by large
and small utilities and third-party programme administrators in some
parts of the country since the late 1980s. The rationale for utility investment in efficiency programming is that within certain existing markets for
energy-efficient products and services, there are barriers that can be overcome to ensure that customers from all sectors of the economy choose more
energy-efficient products and practices. Successful programmes have developed s trategies to overcome these barriers, in many cases partnering with
industry and voluntary national and regional programmes so that efficiency
Green Buildings
207
programme spending is used not only to acquire demand-side resources but
also to accelerate market-based purchases by consumers [4].
8.5 Closure
Energy efficient best practices can be summaries as
1. Recognise energy efficiency as a high-priority energy resource
2. Make a strong, long-term commitment to cost-effective energy efficiency as a resource
3. Broadly communicate the benefits of, and opportunities for, energy
efficiency
4. Provide sufficient and stable programme funding to deliver energy
efficiency where cost-effective
A list of options for promoting best practice energy efficiency appears at
the end of this chapter. Challenges that limit greater utility investment in
energy efficiency include the following:
1. The majority of utilities recover fixed operating costs and earn profits based on the volume of energy they sell.
2. There is a lack of standard approaches on how to quantify and
incorporate the benefits of energy efficiency into resource planning
efforts and institutional barriers at many utilities that stem from
the historical business model of acquiring generation assets and
building transmission and distribution systems. Strategies for overcoming these challenges were addressed by incorporating energy
efficiency into resource planning.
3. Some rate designs that are counterproductive to energy efficiency
might limit greater efficiency investment by large customer groups
where effective opportunities for efficiency programming exist.
Strategies for encouraging rate designs that are compatible with
energy efficiency are needed.
4. Efficiency programmes need to address multiple customer needs
and stakeholder perspectives while simultaneously addressing
multiple system needs, in many cases while competing for internal resources.
This chapter focuses on strategies for making energy efficiency a resource,
developing a cost-effective portfolio of energy efficiency programmes for
208
Energy Efficiency in the Urban Environment
all customer classes, designing and delivering efficiency programmes that
optimise budgets, and ensuring that those programmes deliver results with
the goal of creating a sustainable, aggressive national commitment to energy
efficiency.
Programmes that have been operating over the past decade, and longer,
have a history of proven savings in megawatts (MW), megawatt-hours
(MWh), and therms, as well as on customer bills. These programmes show
that energy efficiency can compare very favourably to supply-side options.
This chapter summarises key findings from a portfolio-level review of many
of the energy efficiency programmes that have been operating successfully
for a number of years. It provides an overview of best practices in the following areas:
1. Political and human factors that have led to increased reliance on
energy efficiency as a resource
2. Key considerations used in identifying target measures for energy
efficiency programming in the near term and long term
3. Programme design and delivery strategies that can maximise
programme impacts and increase cost-effectiveness
4. The role of monitoring and evaluation in ensuring that programme
dollars are optimised and that energy efficiency in planning, design
and implementation, and evaluation was derived from a review of
energy efficiency programmes at the portfolio level across a range of
policy models (e.g. public benefit charge administration, integrated
resource planning)
A sustained history of successful energy efficiency programme implementation summarised and shared the following characteristics:
1. Significant investment in energy efficiency as a resource within their
policy context
2. Development of cost-effective programmes that deliver results
3. Incorporation of programme design strategies that work to remove
near-and long-term market barriers to investment in energy efficiency
4. Willingness to devote the necessary resources to make programmes
successful
Most of the organisations reviewed also have conducted full-scale impact
evaluations of their portfolio of energy efficiency investments within the last
few years. The best practices gleaned from a review of these organisations
can assist utilities, their commissions, state energy offices and other stakeholders in overcoming barriers to significant energy efficiency programming, and can help to begin tapping into energy efficiency as a valuable and
clean resource to effectively meet future supply needs.
Green Buildings
209
References
1. EnergyStar.gov. (2007). Milestones: ENERGY STAR, Retrieved March 1, 2008,
from www.energystar.org
2. U.S. Environmental Protection Agency. 2006 Annual Report: ENERGY STAR
and Other Climate Protection Partnerships, Retrieved March 1, 2008, from
www.EPA.org
3. EnergyStar.gov. History: ENERGY STAR. Retrieved March 1, 2008, from www.
energystar.org
4. Green Energy Efficient Homes. Energy Efficient Dehumidifiers, www.
energystar.org
5. EnergyStar.gov. Business. Retrieved March 2010, from www.energystar.gov
6. Industries in Focus: ENERGY STAR, Energystar.gov, 2009, Retrieved March 23,
2009, from http://www.energystar.gov/index.cfm?c=in_focus.bus_industries_
focus#plant
9
Current Energy Leakages in
Egyptian Buildings
9.1 Examples of Public and Residential Buildings
9.1.1 Building Blocks of a National Standards and Labelling Programme
A national standards and labelling programme is defined as a set of elements that ensure that energy efficiency standards and labelling efforts are
effective, appropriate, strengthened over time and sustained [1–5]. The building blocks fall into two categories: technical/policy and process and should
include the following.
9.1.2 Technical/Policy
1. Accredited testing facilities: Facilities should be internationally
accredited and staffed with competent testing personnel; they
should have the capacity to test models in a timely manner.
2. Appropriate testing procedures: Testing procedures are the methods
by which the energy efficiency level of a product is deduced. The
selected procedures should reasonably reflect the usage patterns and
climate particular to a country. This builds consumer confidence that
test results accurately reflect the energy usage he/she will experience.
3. Energy labels: Standards and labels can be established separately
or as complementary programmes. Many types of labelling programmes exist.
4. Energy efficiency standards can be mandatory or voluntary and
can be based either on maximum energy consumption or minimum
energy efficiency.
5. An energy policy framework that is conducive to energy efficiency is
critical to the longevity of a national standards programme. Supportive
policies include government procurement requirements, voluntary
programmes, incentives to manufacturers, consumer awareness campaigns, demand side management and integrated resource planning.
211
212
Energy Efficiency in the Urban Environment
9.1.3 Proposed Process
1. Compliance with voluntary and mandatory standards and labelling requirements must be ensured through a credible enforcement scheme to guarantee programme effectiveness. Programme
evaluation will inform necessary programme modifications,
justify further activities and provide the documentation necessary to sustain the standards and labelling programmes over the
long term.
2. The legislative process should ensure that standards and labels are
periodically reviewed and raised (‘ratcheted’ upward) as the overall
product efficiency on the market improves. The changes will mostly
depend on the results of programme evaluation.
3. In the programme design and improvement process, input from
all stakeholders (government, private companies, consumer associations etc.) should be considered. Cooperation among the stakeholders is the key to the success of programmes. However, the local
and national governments must also hold their decisions final, after
carefully considering all suggestions.
9.2 Measures and Assessments
9.2.1 Proposed Labels for Egypt: Major Appliances
The proposed energy labels are separated into at least four categories:
1. The appliance’s details: Specific details of the model and its materials for each appliance.
2. Energy class: A colour code associated with a letter (from A to G)
that gives an idea of the appliance’s electrical consumption.
3. Consumption, efficiency, capacity and so forth: This section gives
information according to appliance type.
4. Noise: The noise emitted by the appliance is described in decibels.
9.2.1.1 Refrigerators, Freezers and Combined Appliances
There should be a summary that indicates the energy efficiency; the index is
calculated for each appliance according to its consumption and its compartments’ volume taking into account the appliance type. The index is thus not
calculated in kWh (Figure 9.1).
213
Current Energy Leakages in Egyptian Buildings
The label also contains:
1. The annual energy consumption in kWh per year
2. The capacity of fresh foods in litres for refrigerators and combined
appliances
3. The capacity of frozen foods in litres for freezers and combined
appliances
4. The noise in dB(A)
For cold appliance models (and this product alone) that are more economical than those of category A, categories A+ and A++ have been
assigned.
9.2.1.2 Washing Machines and Tumble Dryers
For washing machines, the energy efficiency scale is calculated using a cotton
cycle at 60°C with a maximum declared load. This load is typically 6 kg.
The energy efficiency index is in kWh per kilograms of washing (Figure 9.2).
The energy label also contains information on
1.
2.
3.
4.
5.
6.
7.
Total consumption per cycle
Washing performance, with a class from A to G
Spin drying performance, with a class from A to G
Maximum spin speed
The total cotton capacity in kg
Water consumption per cycle in litres
Noise in the washing and spinning cycles in dB(A)
A++
A+
A
B
C
D
E
F
G
<30
<42
<55
<75
<90
<100
<110
<125
>125
B
C
D
E
F
G
<0.39
>0.39
FIGURE 9.1
Energy labels for refrigerators.
A
<0.19 <0.23 <0.27 <0.31 <0.35
FIGURE 9.2
Energy labels for washing machines.
214
Energy Efficiency in the Urban Environment
For tumble dryers, the energy efficiency scale is calculated using the cotton
drying cycle with a maximum declared load. The energy efficiency index
is in kWh per kilograms of load. Different scales apply for condenser and
vented dryers (Figure 9.3).
The label also contains:
1.
2.
3.
4.
The energy consumption per cycle
The total cotton capacity
Whether the unit is vented or condensing
Noise in dB(A)
For combined washer/dryers, the energy efficiency scale is calculated
using the cotton drying cycle with a maximum declared load. The energy
efficiency index is in kWh per kilograms of load. Different scales apply for
condenser and vented dryers (Figure 9.4).
The label also contains:
1.
2.
3.
4.
5.
The energy consumption per cycle (washing and drying)
The energy consumption per cycle (washing only)
Washing performance, with a class from A to G
The maximum spin speed
The total cotton capacity (washing and drying separately)
Condenser dryers
A
B
C
D
E
<0.55 <0.64 <0.73 <0.82 <0.91
F
G
<1.00
>1.00
F
G
<0.91
>0.91
F
G
<1.29
>1.29
Vented dryers
A
B
C
D
E
<0.51 <0.59 <0.67 <0.75 <0.83
FIGURE 9.3
Energy labels for dryers.
A
B
C
D
E
<0.68 <0.81 <0.93 <1.05 <1.17
FIGURE 9.4
Energy labels for combined washer/dryers.
215
Current Energy Leakages in Egyptian Buildings
6. Water consumption for a full load washed and dried; note that condenser dryers may use significant amounts of water on the drying
cycle
7. Noise in dB (A) (separately for washing, spinning and drying)
9.2.1.3 Dishwashers
The energy efficiency is calculated according to the number of place settings.
For the most common size of appliance (the 12 place setting machine), the
following classes apply. The unit is expressed in kWh per 12 place settings
(Figure 9.5).
The label also contains:
1.
2.
3.
4.
5.
6.
The energy consumption in kWh per cycle
The efficiency of the washing cycle, with a class from A to G
The efficiency of the drying cycle, with a class from A to G
The capacity as a number of place settings
The water consumption in litres per cycle
Noise in dB(A)
9.2.1.4 Air Conditioners
The directive applies only to units under 12 kW. On every label, you
will find:
1.
2.
3.
4.
5.
6.
7.
8.
The model
The energy efficiency category from A to G
The annual energy consumption (full load at 500 hours per year)
The cooling output at full load in kW
The energy efficiency ratio in cooling mode at full load
The appliance type (cooling only, cooling/heating)
The cooling mode (air or water-cooled)
The noise rating in dB (where applicable)
A
B
C
D
E
<1.06 <1.25 <1.45 <1.65 <1.85
FIGURE 9.5
Energy labels for dishwashers.
F
G
<2.05
>2.05
216
Energy Efficiency in the Urban Environment
A
B
C
D
E
F
G
Cooling EER W/W
>3.2
3.0–3.2
2.8–3.0
2.6–2.8
2.4–2.6
2.2–2.4
<2.2
Heating COP W/W
>3.6
3.4–3.6
3.2–3.4
2.8–3.2
2.6–2.8
2.4–2.6
<2.4
FIGURE 9.6
Energy labels for air conditioners.
For air conditioners with heating capability (Figure 9.6), one can also find:
1. The heat output at full load in kW
2. The heating mode energy efficiency category
Note that there exist units with EER and COP greater than 5, so take a note
of the actual number when it is A rated.
9.2.1.5 Light Bulbs
On every label, you will find:
1.
2.
3.
4.
The energy efficiency category from A to G
The luminous flux of the bulb in lumens
The electricity consumption of the lamp in watts
The average life length in hours
9.2.2 Concluding Remarks
It can be concluded that it is important to incorporate an energy performance directive as a standard in this region; such a goal will aid energy
savings in large buildings and will set regulations for energy-efficient
designs that are based on standard calculation methods. It is recommended to
1. Develop standardised tools for the calculation of the energy performance of buildings
2. Define system boundaries for the different building categories and
different heating systems
3. Prepare models for expressing requirements on indoor air quality,
thermal comfort in winter and, when appropriate, in summer, visual
comfort and so on
Current Energy Leakages in Egyptian Buildings
217
4. Define comparable energy related key values (kWh/m2, kWh per
person, kWh per apartment, kWh per produced unit etc.) and
develop a common procedure for an ‘energy performance certificate’
5. Design, construct and operate a solar decathlon (building) that can
meet rural and desert requirements and save diminishing fossil fuel
sources
9.3 Laws, Codes and Standards
9.3.1 Building Mechanical Systems
Prescriptive Option Heating, Ventilating and Air Conditioning
Scope
This section specifies requirements for heating, ventilating and air-
conditioning equipment efficiencies.
Compliance
The heating, ventilating and air conditioning shall comply with Section 5 of
Egyptian Energy Efficiency Commercial Building Code (EEECBC) [6] with
the following modifications and additions:
Minimum Equipment Efficiencies
Projects shall comply with one of the following:
1. Energy Code Baseline. Products with minimum efficiencies
addressed in the HVAC Egyptian Code [6] provided that the building project contains:
a. On-site renewable energy systems with 1.5 times the minimum capacity of that specified in Building Renewable Energy
Systems [6].
b. Peak load reduction systems with twice the peak load reduction
specified in Peak Load Reduction/Load Factor. Building projects
shall contain automatic systems such as demand limiting or
load shifting to reduce Electric Peak demand of the building by
not less than 5%. Standby power generation shall not be used to
achieve the reduction in peak capacity.
2. Higher Efficiency. For those products where there is an Energy
Saving programme, the minimum efficiency shall be the greater of
the Energy Star requirements [5]. For other products, the equipment
efficiency shall be a minimum of the values in Tables 9.1 through 9.7.
218
Energy Efficiency in the Urban Environment
TABLE 9.1
Electrical Operated Unitary Air Conditioners and Condensing Units
Equipment
Type
Size
Category
Air
conditioners,
air cooled
<19 kW
Through-thewall air
cooled
<9 kW
Small-duct
high-velocity,
air cooled
<19 kW
Air
conditioners,
air cooled
≥19 kW
and
<40 kW
Minimum
Efficiency
Test
Procedure
4.10 SCOP
3.52 COP
ARI 210/240
Single
packaged
4.10 SCOP
3.52 COP
ARI 210/240
Split systems
3.52 SCOP
ARI 210/240
Single
packaged
3.52 SCOP
ARI 210/240
All
Split systems
2.93 SCOP
ARI 210/240
Electric
resistance
(or none)
Split systems
and single
package
3.37 COP
3.52 ICOP
ARI 340/360
All other
Split systems
and single
package
3.31 COP
3.46 ICOP
ARI 340/360
Electric
resistance
(or none)
Split systems
and single
package
3.37 COP
3.52 ICOP
ARI 340/360
All other
Split systems
and single
package
3.31 COP
3.46 ICOP
ARI 340/360
Electric
resistance
(or none)
Split systems
and single
package
2.93 COP
3.08 ICOP
ARI 340/360
All other
Split systems
and single
package
2.87 COP
3.02 ICOP
ARI 340/360
Electric
resistance
(or none)
Split systems
and single
package
2.84 COP
2.99 ICOP
ARI 340/360
All other
Split systems
and single
package
2.78 COP
2.93 ICOP
ARI 340/360
<19 kW
All
Split systems
and single
package
4.10 COP
4.19 ICOP
ARI 210/240
≥19 kW
and
<40 kW
Electric
resistance
(or none)
Split systems
and single
package
4.10 COP
4.19 ICOP
ARI 340/360
≥70 kW
and
<223 kW
≥223 kW
All
Subcategory
or Rating
Conditions
Split systems
≥40 kW
and
<70 kW
Air
conditioners,
water and
evaporative
cooled
Heating
Section
Type
All
219
Current Energy Leakages in Egyptian Buildings
TABLE 9.1 (Continued)
Electrical Operated Unitary Air Conditioners and Condensing Units
Equipment
Type
Size
Category
≥40 kW
and
<70 kW
≥70 kW
Heating
Section
Type
Subcategory
or Rating
Conditions
Minimum
Efficiency
Test
Procedure
All other
Split systems
and single
package
4.04 COP
4.13 ICOP
ARI 340/360
Electric
resistance
(or none)
Split systems
and single
package
4.10 COP
4.19 ICOP
ARI 340/360
All other
Split systems
and single
package
3.81 COP
4.13 ICOP
ARI 340/360
Electric
resistance
(or none)
Split systems
and single
package
4.10 COP
4.10 ICOP
ARI 340/360
All other
Split systems
and single
package
3.81 COP
3.81 ICOP
ARI 340/360
Condensing
units, air
cooled
≥40 kW
[Not
applicable
match with
indoor
coil]
ARI 365
Condensing,
water or
evaporative
cooled
≥40 kW
[Not
applicable
match with
indoor coil]
ARI 365
9.3.2 Ventilation Controls for High-Occupancy Areas
Demand control ventilation (DCV) is required for densely occupied spaces. This
requirement supersedes the occupant density threshold in Section 4 of
EEECBC [6].
If CO2 sensors are used as part of a DCV system, they shall be designed
and installed as defined in the following section.
CO2 Sensors
Spaces with CO2 sensors or air-sampling probes leading to a central CO2
monitoring station shall have one sensor or probe for each 10,000 ft² ( 1000 m²)
of floor space and shall be located in the room between 3 ft and 6 ft (1 m
and 2 m) above the floor. CO2 sensors must be accurate to ±50 ppm at
1000 ppm. For all spaces with CO2 sensors, target concentrations shall be calculated for full and part load conditions (to include no less than 25%, 50%,
75% and 100%). Metabolic rate, occupancy, ceiling height and outdoor air CO2
All
Electric
resistance
(or none)
All other
Electric
resistance
(or none)
All other
Electric
resistance
(or none)
All other
<9 kW
≥19 kW and
<40 kW
≥40 kW and
<70 kW
≥70 kW
Small-duct high velocity, air
cooled (cooling mode)
Air conditioners, air cooled
(cooling mode)
All
<9 kW
Through-the-wall air cooled
(cooling mode)
All
Heating Section
Type
<19 kW
Size Category
Air conditioners, air cooled
(cooling mode)
Equipment Type
3.52 SCOPC
2.93 SCOPC
Single packaged
Split systems
3.31 COPC 3.46
ICOPC
3.25 COPC 3.40
ICOPC
3.32 COPC 3.46
ICOPC
3.25 COPC 3.40
ICOPC
2.87 COPC 2.87
ICOPC
2.81 COPC 2.81
ICOPC
Split systems and
single package
Split systems and
single package
Split systems and
single package
Split systems and
single package
Split systems and
single package
Split systems and
single package
Split systems
Single packaged
Minimum
Efficiency
4.10 SCOPC 3.52
COPC
4.10 SCOPC 3.40
COPC
3.52 SCOPC
Split systems
Subcategory or Rating
Conditions
Electrically Operated Unitary and Applied Heat Pumps, Minimum Efficiency Requirements
TABLE 9.2
ARI 340/360
ARI 210/240
Test Procedure
220
Energy Efficiency in the Urban Environment
<19 kW
Small-duct high velocity,
air cooled (heating mode)
Air cooled (heating mode)
Groundwater source (heating
mode)
Water source (heating mode)
<9 kW
Through-the-wall air cooled
(heating mode)
<40 kW (cooling
capacity)
<19 kW (cooling
capacity)
≥40 kW (cooling
capacity)
≥19 kW and
<40 kW
(cooling capacity)
<19 kW
<5 kW
≥5 kW and
<19 kW
>19 kW and
<40 kW
<40 kW
Air conditioners, air cooled
(heating mode)
Groundwater source (cooling
mode)
Water source (cooling mode)
All
All
10°C Entering water
0°C Entering fluid
8°C DB/6 C WB
outdoor air
−8°C DB/−9 C WB
outdoor Air
8°C DB/6 C WB
outdoor air
−8°C DB/−9 C WB
outdoor air
19°C Entering water
15°C Entering water
25°C Entering water
Split systems
Single packaged
Split systems
Single packaged
Split systems
30°C Entering water
All
All
All
All
30°C Entering water
30°C Entering water
All
All
3.6 COPH
3.1 COPH
4.2 COPH
2.0 COPH
3.2 COPH
2.2 COPH
3.3 COPH
4.75 COPC
13.4 COPC
2.49 SCOPH
2.34 SCOPH
2.17 SCOPH
2.17 SCOPH
1.99 SCOPH
4.10 COPC
4.10 COPC
4.10 COPC
ISO-13256-1
ARI 340/360
ARI 210/240
ISO-13256-1
Current Energy Leakages in Egyptian Buildings
221
COP
COP
COP
COP
COP
COP
COP
COP
COP
COP
COP
COP
COP
COP
COP
COP
All capacities
<264 kW
≥264 kW and 528 kW
≥528 kW and <1055 kW
≥1055 kW
<528 kW
≥528 kW and <1055 kW
≥1055 kW and <2110 kW
≥2110 kW
All capacities
All capacities
All capacities
All capacities
Units
<528 kW
≥528 kW
All capacities
Size Category
IPLV
Full Load
Path B
IPLV
2.931
3.664
NA
NA
2.931
3.737
NA
NA
Condenser-less units shall be rated with matched
condensers
Reciprocating units required to comply with
water-cooled positive displacement requirements
4.509
5.583
4.396
5.862
4.538
5.719
4.452
6.002
5.172
6.064
4.898
6.513
5.673
6.513
5.504
7.178
5.547
5.901
5.504
7.816
5.547
5.901
5.504
7.816
6.106
6.406
5.862
8.792
6.170
6.525
5.961
8.792
0.600
NR
NA
NA
0.700
NR
NA
NA
1.000
1.050
NA
NA
1.000
1.000
NA
NA
Full Load
Path A
Minimum Efficiency
ARI 560
ARI 550/590
ARI 550/590
ARI 550/590
ARI 550/590
ARI 550/590
Test
Procedure
Note: Where there is a Column A and Column B requirement, either column can be used for compliance, but both the full and IPLV values shall be complied, with Path A intended for applications where significant operating time is expected at full load and design ambient and Path B intended for
applications with significant operating time at part load. All Path B machines shall be equipped with demand-limiting capable controls; NA means
that this requirement is not applicable and cannot be used for compliance; NR means that for this category there are no minimum requirements
allowed to be used in heat recovery applications.
Air cooled absorption single effect
Water-cooled absorption single effect
Absorption double effect indirect-fired
Absorption double effect direct fired
Water-cooled electrically operated,
centrifugal
Air cooled without condenser, electrical
operated
Water-cooled, electrically operated,
positive displacement (reciprocating)
Water-cooled electrically operated,
positive displacement
Air cooled chillers with condenser,
electrically operated
Equipment Type
Water Chilling Packages – Minimum Efficiency Requirements
TABLE 9.3
222
Energy Efficiency in the Urban Environment
PTHP (heating mode) replacement
SPVAC (cooling mode)
PTHP (heating mode) new construction
PTHP (cooling mode) replacement
PTHP (cooling mode) new construction
PTAC (cooling mode) replacement
PTAC (cooling mode) new construction
Equipment Type
<2.0 kW
≥2.0 kW and <2.9 kW
≥2.9 kW and <3.8 kW
≥3.8 kW
<2.0 kW
≥2.0 kW and <2.9 kW
≥2.9 kW and <3.8 kW
≥3.8 kW
<2.0 kW
≥2.0 kW and <2.9 kW
≥2.9 kW and <3.8 kW
≥3.8 kW
All capacities
<2.0 kW
≥2.0 kW and <2.9 kW
≥2.9 kW and <3.8 kW
≥3.8 kW
All capacities
<19 kW
>19 kW and <40 kW Btu/h
>40 kW and <70 kW
Size Category (Input)
35°C DB outdoor air
35°C DB outdoor air
35°C DB outdoor air
35°C DB outdoor air
35°C DB outdoor air
35°C DB outdoor air
35°C DB outdoor air
35°C DB outdoor air
35°C DB outdoor air
35°C DB outdoor air
35°C DB outdoor air
35°C DB outdoor air
35°C DB outdoor air
35°C DB outdoor air
35°C DB outdoor air
35°C DB outdoor air
35°C DB outdoor air
35°C DB outdoor air
35°C DB/23.9 C WB outdoor air
35°C DB/23.9 C WB outdoor air
35°C DB/23.9 C WB outdoor air
Subcategory or Rating
Condition
3.49 COPC
3.31 COPC
3.14 COPC
3.48 COPC
3.49 COPC
3.31 COPC
3.14 COPC
3.48 COPC
3.48 COPC
3.48 COPC
3.48 COPC
3.48 COPC
2.8 COPH
3.43 COPC
3.25 COPC
3.08 COPC
2.73 COPC
2.8 COPH
3.81 SCOPC
3.37 COPC
3.37 COPC
Minimum
Efficiency (SI)
ARI 310/380
ARI 390
ARI 310/380
ARI 310/380
ARI 310/380
ARI 310/380
ARI 310/380
Continued
Test Procedure
Electrically Packaged Terminal Air Conditioners, Packaged Terminal Heat Pumps, Packaged Vertical Air Conditioners, Single
Packaged Vertical Heat Pumps, Room Air Conditioners and Room Air Conditioner Heat Pumps – Minimum Efficiency Requirements
TABLE 9.4
Current Energy Leakages in Egyptian Buildings
223
Room air conditioner heat pump with
louvred sides
Room air conditioner heat pump
without louvred sides
Room air conditioner, casement only
Room air conditioner, casement-slider
Room air conditioners, without louvred
sides
Room air conditioners, with louvred
sides
SPVHP (heating mode)
SPVHP (cooling mode)
Equipment Type
<19 kW
>19 kW and 40 kW Btu/h
>40 kW and <70 kW
<19 kW
>19 kW and <40 kW Btu/h
>40 kW and <70 kW
<1.8 kW
>1.8 kW and <2.3 kW
>2.3 kW and <4.1 kW
>4.1 kW and <5.9 kW
>5.9 kW
<2.3 kW
>2.3 kW and <5.9 kW
>5.9 kW
<5.9 kW
>5.9 kW
<4.1 kW
>4.1 kW
All capacities
All capacities
Size Category (Input)
35°C DB/23.9 C WB outdoor air
35°C DB/23.9 C WB outdoor air
35°C DB/23.9 C WB outdoor air
8.3°C DB/6.1 C WB outdoor air
8.3°C DB/6.1 C WB outdoor air
8.3°C DB/6.1 C WB outdoor air
Subcategory or Rating
Condition
3.81 SCOPC
3.37 COPC
3.37 COPC
3.0 COPH
3.0 COPH
2.9 COPH
3.14 SCOPC
3.14 COPC
3.17 COPC
3.14 COPC
2.73 COPC
2.90 COPC
2.73 COPC
2.73 COPC
2.90 COPC
2.73 COPC
2.73 COPC
2.58 COPC
2.81 COPC
3.05 COPC
Minimum
Efficiency (SI)
ANSI/AHAM RAC-1
Test Procedure
Electrically Packaged Terminal Air Conditioners, Packaged Terminal Heat Pumps, Packaged Vertical Air Conditioners, Single
Packaged Vertical Heat Pumps, Room Air Conditioners and Room Air Conditioner Heat Pumps – Minimum Efficiency Requirements
TABLE 9.4 (Continued)
224
Energy Efficiency in the Urban Environment
225
Current Energy Leakages in Egyptian Buildings
TABLE 9.5
Warm Air Furnaces and Combustion Warm Air Furnaces/Air-Conditioning Units,
Warm Air Duct Furnaces and Unit Heaters
Equipment Type
Warm air furnace, gas fired
(outdoor installation)
Warm air furnace, gas fired
(indoor installation)
Warm air furnace, oil fired
(outdoor installation)
Warm air furnace, oil fired
(indoor Installation)
Warm air duct furnaces, gas
fired (outdoor installation)
Warm air duct furnaces, gas
fired (indoor installation)
Warm air unit heaters, gas
fired (indoor installation)
Warm air unit heaters, oil
fired (indoor installation)
Size Category
(Input)e
Subcategory
or Rating
Condition
<65.9 kW
>65.9 kW
<65.9 kW
>65.9 kW
<65.9 kW
>65.9 kW
<65.9 kW
>65.9 kW
All capacities
All capacities
All capacities
All capacities
Maximum
capacityd
Maximum
capacityd
Maximum
capacityc
Maximum
capacityc
Maximum
capacityc
Maximum
capacityc
Maximum
capacityc
Maximum
capacityc
Test
Procedureb
Minimum
Efficiency
DOE 10 CFR
Part 430 or
ANSI Z21.47
ANSI Z21.47
DOE 10 CFR
Part 430 or
ANSI Z21.47
ANSI Z21.47
DOE 10 CFR
Part 430 or
UL 727
UL 727
DOE 10 CFR
Part 430 or
UL 727
UL 727
ANSI Z83.9
78% AFUE
or 80% Eta
ANSI Z83.9
90% Eca
ANSI Z83.8
90% Eca
UL 731
90% Eca
80% Ecc
90% AFUE
or 92% Eta
92% Eca
78% AFUE
or 80% Eta
81% Eta
90% AFUE
or 92% Eta
92% Eta
80% Eca
Note: a. Efficiencies: Et = thermal efficiency. Ec = combustion efficiency. b. Units shall also
include an interrupted or intermittent ignition device, have jacket lasses not exceeding
0.75% of the input rating and have either power venting or flue damper. c. A vent
damper is an acceptable alternative to the fuel damper for those furnaces where
combustion air is drawn from the conditioned space. d. Combustion units not covered
by NAECA (3-phase power or cooling capacity greater than or equal to 19.0 kW) may
comply with either rating. e. Minimum and maximum ratings as provided for and
allowed by the unit’s controls.
c oncentrations assumptions and target concentrations shall be shown in the
design documents. Outdoor air CO2 concentrations shall be determined by
one of the following:
1. CO2 concentration shall be assumed to be 400 ppm without any
direct measurement.
2. CO2 concentration shall be dynamically measured using a CO2 sensor
located near the position of the outdoor air intake.
226
Energy Efficiency in the Urban Environment
TABLE 9.6
Gas and Oil Fired Boilers – Minimum Efficiency Requirements
Equipment Type
Boilers, hot
water
Subcategory or
Rating
Condition
Gas fired
Efficiency
Test Procedure
<87.9 kW
89% AFUE
10 CFR Part 430
.87.9 kW and
<732.7 kW
89% Et
10 CFR Part 431
.732.7 kW
91% Ec
<87.9 kW
89% AFUE
10 CFR Part 430
.87.9 kW and
<732.7 kW
89% Et
10 CFR Part 431
.732.7 kW
91% Ec
Gas fired
<87.9 kW
75% AFUE
10 CFR Part 430
Gas fired all,
except natural
draft
.87.9 kW
and <732.7 kW
79% Et
10 CFR Part 431
.732.7 kW
79% Et
Gas fired,
natural draft
.87.9 kW and
<732.7 kW
77% Et
.732.7 kW
77% Et
<87.9 kW
80% Et
10 CFR Part 430
.87.9 kW and
<732.7 kW
81% Et
10 CFR Part 431
.732.7 kW
81% Et
Oil fired
Boilers, steam
Size Category
(Input)
Oil fired
Ec = combustion efficiency (100% less flue losses).
Note: Units shall also include an interrupted or intermittent ignition device, have jacket losses
not exceeding 0.75% of the input rating and have either power venting or flue damper.
A vent damper is an acceptable alternative to the fuel damper for those furnaces where
combustion air is drawn from the conditioned space.
As of August 8, 2008, according to the Energy Policy Act of 2005, units shall also
include an interrupted or intermittent ignition devices and have either power venting or automatic flue dampers. A vent damper is an acceptable alternative to a flue
damper for those unit heaters where combustion air is drawn from the conditioned
space.
Ducts and Plenum Leakage
For duct sealing, Seal Level A shall be used. This requirement supersedes
the requirements in Section 5.3.4.6.2 of EEECBC.
Economisers
Systems shall have economisers as specified in Table 9.8 [6] and high-limit
controls as specified in Table 9.9 [6]. Rooftop units with a capacity of less
than 60,000 Btu/h (18 kW) shall have two stages of capacity control, with the
first stage used for cooling with the economiser and the second stage to add
mechanical cooling.
227
Current Energy Leakages in Egyptian Buildings
TABLE 9.7
Performance Requirements for Heat Rejection Equipment
Equipment
Type
Total
System
Heat
Rejection
Capacity at
Rated
Conditions
Rating
Standard
Rating
Conditions
(Annual
Cooling Design,
ASHRAE
Standard 169,
Table A1,
Column 10c)
Performance
Required
Full Load
Maximum
Approach C
Open loop
propeller
or axial fan
cooling
towers
All
CTI
ATC105 and
CTI
STD201
1.0% design
evaporation
WB
temperature
>4.06 L/skW
3.3 C above
1.0% design
evaporation
WB
temperature
Closed loop
propeller
or axial fan
cooling
towers
All
CTI
ATC105 and
CTI
STD201
1.0% design
evaporation
WB
temperature
>1.52 L/skW
4.4 C above
1.0% design
evaporation
WB
temperature
Open loop
centrifugal
fan cooling
towers
All
CTI
ATC105 and
CTI
STD201
1.0% design
evaporation
WB
temperature
>2.23 L/skW
3.3 C above
1.0% design
evaporation
WB
temperature
Closed loop
centrifugal
fan cooling
towers
All
CTI
ATC105 and
CTI
STD201
1.0% design
evaporation
WB
temperature
>0.81 L/skW
4.4 C above
1.0% design
evaporation
WB
temperature
Air-cooled
condensers
All
ARI 460
[Not applicable, air cooled
condenser shall be matched
to the HVAC system and
rated per tables C3]
Note: These requirements apply to boilers with a rated input of 2344 kW or less that are not
packaged boilers and to all packaged boilers. Minimum efficiency requirements for boilers cover all capacities of packaged boilers. Ec = thermal efficiency (100% less flue losses).
See reference document for detailed information. Et = thermal efficiency. See reference
document for detailed information. Maximum capacity—minimum and maximum ratings as provided for and allowed by the unit’s controls includes oil fired (residual).
Systems shall be designed with lower operating return hot water temperatures (<55°C)
and use hot water reset to take advantage of the higher efficiencies of condensing boilers.
For purposes of this table, cooling tower performance is defined as the maximum flow
rating of the tower divided by the fan nameplate rated motor power. For purposes of this
table, air-cooled condenser performance is defined as the heat rejected from the refrigerant divided by the fan nameplate rated motor power. The approach is the design tower
leaving water temperature—the building 1.0% annual cooling design evaporation WB
temperature from ASHRAE standard.
228
Energy Efficiency in the Urban Environment
TABLE 9.8
Minimum System Size for Which an Economiser Is Required
Climate Zones
1A, 1B, 2A
2B, 3A, 3B, 3C, 4A, 4B, 4C, 5A, 5B,
5C, 6A, 6B, 7, 8
Cooling Capacity for Which an
Economiser Is Required
No economiser requirement
≥33,000 Btu/h (9.7 kW)a
Source: EEECBC EGYPTIAN Energy Efficiency Code, HBRC, 2012.
a Where economisers are required, the total capacity of all systems
without economisers shall not exceed 480,000 Btu/h (140 kW) per
building or 20% of the building’s air economiser capacity, whichever
is greater.
TABLE 9.9
High-Limit Shutoff Control Options for Air Economiser
Climate Zones
1A, 2A, 3A, 4A
1B, 2B, 3B, 3C, 4B, 4C, 5A, 5B, 5C,
6A, 6B, 7, 8
Allowable Control Types
Differential enthalpya
Differential enthalpy or differential
drybulb
Source: EEECBC EGYPTIAN Energy Efficiency Code, HBRC, 2012.
a Differential enthalpy is that between the return air and the outside air.
Zone Controls
Exception (a) to Section 6.5.2.1 of ASHRAE/IESNA Standard 90.1 [5] shall be
replaced by the following: zones for which the volume of air that is reheated,
re-cooled or mixed is not greater than the larger of (i) the design outdoor airflow
rate for the zone, or (ii) 15% of the zone design peak supply rate.
Fan System Power Limitation Controls
Systems shall have fan power limitations 10% below limitations specified in
Section 5.4.1 of EEECBC.
Exhaust Air Energy Recovery
The system shall comply with the energy recovery requirements within the
threshold limits in Table 9.10. Where a single room or space is supplied by
multiple units, the aggregate supply cfm (L/s) of those units shall be used in
applying this requirement.
Energy recovery systems shall have a minimum of 60% recovery effectiveness. Sixty percent recovery effectiveness shall mean a change in the enthalpy
of the outdoor air supply equal to the 60% of the difference between the outdoor air and return air enthalpies at design conditions. For equipment with
airside economisers, provision shall be made for all o
utdoor and exhaust air
to bypass the energy recovery device when not being used.
229
Current Energy Leakages in Egyptian Buildings
TABLE 9.10
Energy Recovery Requirement (SI)
% Outside Air at Full Design Flow
≥10%
and
<20%
Zone
3B, 3C,
4B, 4C,
5B
1B, 2B, 5C
6B
1A, 2A,
3A, 4A,
5A, 6A
7, 8
≥20%
and
<30%
≥30%
and
<40%
≥40%
and
<50%
≥50%
and
<60%
≥60%
and
<70%
≥70%
and
<80%
≥80%
Design Supply Fan Flow L/s
NR
NR
NR
NR
NR
NR
≥2360
≥2360
NR
NR
≥14,158
NR
≥10,619
≥6135
NR
≥5191
≥2596
NR
≥2596
≥2124
≥12,271
≥2124
≥1652
≥5663
≥1652
≥944
≥2360
≥1180
≥472
≥1888
≥708
>0
≥1888
≥1416
≥1180
≥472
>0
>0
>0
>0
Variable Speed Fan Control for Commercial Kitchen Hoods
In addition to the requirements in Section 6.5.7.1 of ASHRAE/IESNA
Standard 90.1 [5], commercial kitchen Type I and Type II hood systems
shall have variable speed control for exhaust and make-up air fans to
reduce hood airflow rates at least 50% during those times when the cooking equipment is under no-load conditions.
Duct Insulation
Duct insulation shall comply with the minimum requirements in Tables 9.11
and 9.12 [6].
Pipe Insulation
Pipe insulation shall comply with the minimum requirements in Table 9.13 [5].
These requirements supersede the requirements in Table 6.8.3 of ASHRAE/
IESNA Standard 90.1 [5].
Automatic Control of HVAC in Hotel/Motel Guest Rooms
A minimum of one of the following control technologies shall be required
in hotel/motel guest rooms with over 50 guest rooms such that all the
power to the lights and switched outlets in a hotel or motel guest room
would be turned off when the occupant is not in the room and the space
temperature would automatically setback (winter) or set up (summer) by
no less than 20°C:
1. Controls that are activated by the room occupant via the primary
room access method—key, card, deadbolt etc.
2. Occupancy sensor controls that are activated by the occupant’s presence in the room.
R-1.06
Return Ducts
1–8
R-1.06
R-1.06
R-10
R-10
R-1.41
R-1.41
R-1.06
R-0.62
None
None
None
None
R-1.06
R-1.41
R-1.41
Unvented Attic above
Insulated Ceiling
None
R-1.06
R-1.06
R-1.06
R-0.62
R-0.62
R-0.62
None
None
None
None
None
None
None
Unvented Attic with
Roof Insulation
None
R-1.06
R-1.06
R-0.62
R-0.62
R-0.62
R-0.62
None
R-1.06
R-1.06
R 1.06
R 1.06
R-1.06
R-1.41
Unconditioned
Space
None
None
None
None
None
None
None
None
None
None
None
None
None
None
Indirectly
Conditioned Space
None
R-1.06
R-1.06
None
None
None
None
None
None
None
R-1.06
R-1.06
R-1.06
R-1.41
Buried
Source: EEECBC EGYPTIAN Energy Efficiency Code, HBRC, 2012.
Note: Insulation R-values, measured in m2 k/kW, are for the insulation as installed and do not include film resistance. The required minimum
thicknesses do not consider water vapour transmission and possible surface condensation. Where exterior walls are used as plenum walls,
wall insulation shall be as required by the most restrictive condition of 6.4.4.2 or Section 5. Insulation resistance measured on a horizontal
plane in accordance with ASTM C518 at a mean temperature of 23.8°C at the installed thickness. Includes crawl spaces, both ventilated and
non-ventilated. Includes return air plenums with or without exposed roofs above.
R-1.41
R-1.41
R-1.41
R-1.06
R-0.62
R-0.62
Cooling Only Ducts
1
R-1.06
2
R-1.06
3
R-1.06
4
R-0.62
5, 6
R-0.62
7, 8
R-1.9
Ventilated
Attic
None
None
None
R-1.06
R-1.41
R-1.41
R-10
Exterior
Heating Ducts Only
1, 2
None
3
R-1.06
4
R-1.06
5
R-1.41
6
R-1.41
7
R-1.76
8
R-1.76
Climate
Zone
Duct Location
Minimum Duct Insulation R-Value, Cooling and Heating Only Supply Ducts and Return Ducts
TABLE 9.11
230
Energy Efficiency in the Urban Environment
R-1.06
R-1.76
R-1.41
R-1.41
R-1.41
R-1.41
R-1.41
R-1.41
R-1.94
Unvented Attic above
Insulated Ceiling
None
R-1.06
R-1.06
R-1.06
R-1.06
R-0.62
R-0.62
R-0.62
R-0.62
Unvented Attic with
Roof Insulation
None
R-1.06
R-1.41
R-1.41
R-1.41
R-1.41
R-1.41
R-1.41
R-1.41
Unconditioned
Space
None
None
None
None
None
None
None
None
None
Indirectly
Conditioned Space
None
R-1.06
R-1.06
R-1.06
R-1.06
R-1.06
R-1.06
R-1.06
R-1.41
Buried
Source: EEECBC EGYPTIAN Energy Efficiency Code, HBRC, 2012.
Note: Insulation R-values, measured in m2 k/kW, are for the insulation as installed and do not include film resistance. The required minimum
thicknesses do not consider water vapour transmission and possible surface condensation. Where exterior walls are used as plenum walls,
wall insulation shall be as required by the most restrictive condition of 6.4.4 2 or Section 5. Insulation resistance measured on a horizontal
plane in accordance with ASTM C518 at a mean temperature of 23.8°C at the installed thickness. Includes crawl spaces, both ventilated and
non-ventilated. Includes return air plenums with or without exposed roofs above.
R-1.06
Return Ducts
1–8
R-1.06
Ventilated
Attic
R-1.41
R-1.41
R-1.41
R-1.41
R-1.41
R-1.41
R-1.41
R-1.94
Exterior
Supply Ducts
1
R-1.41
2
R-1.41
3
R-1.41
4
R-1.41
5
R-1.41
6
R-1.76
7
R-1.76
8
R-1.76
Climate
Zone
Duct Location
Minimum Duct Insulation R-Values, Combined Heating and Cooling Supply Ducts and Return Ducts
TABLE 9.12
Current Energy Leakages in Egyptian Buildings
231
232
Energy Efficiency in the Urban Environment
TABLE 9.13
Minimum Pipe Thermal Insulation Thicknessa
Pipe Insulation Thickness
Fluid Design
Operating
Temp.
Range, °C
Insulation Conductivity
Conductivity,
kW/(h-m2 °K)
Mean Rating
Temp, °C
Nominal Pipe or Tube Size, mm
<25
25 to
<38
38 to
<102
102 to
<203
>203
25
25
38
38
38
Domestic and Service Hot Water Systemsa,b
40.6+
1.25–1.59
100
Heating Systems (Steam, Steam Condensate and Hot Water)c,d
>176.7
1.82–1.93
121.1
76
89
89
114
114
121.7–176.7
1.65–1.82
200
51
76
89
89
89
93.9–121.1
1.53–1.70
150
51
51
63
63
63
60.6–93.3
1.42–1.65
125
38
38
38
51
51
40.6–60.0
1.25–1.59
100
25
25
38
38
38
Cooling Systems (Chilled Water, Brine and Refrigerant)d
4.4–15.6
1.25–1.59
100
25
25
38
38
38
<4.4
1.25–1.59
100
25
38
38
38
51
Source: ASHRAE Standard 90.1—Energy Standard for Buildings Except Low-Rise Residential
Buildings.
Note: a. For insulation outside the stated conductivity range, the minimum thickness (T) shall
be determined as follows: T = r{(1 + t/r)K/k – 1}, where T = minimum insulation thickness (mm), r = actual outside radius of pipe (mm), t = insulation thickness listed in this
table for applicable fluid temperature and pipe size, K = conductivity of alternate material at mean rating temperature indicated for the applicable fluid temperature (kW/h-m2
K), and k = the upper value of the conductivity range listed in this table for the applicable
fluid temperature. b. These thicknesses are based on energy efficiency considerations
only. Additional insulation is sometimes required relative to safety issues/surface temperature. c. Piping insulation is not required between the control valve and coil on runouts when the control valve is located within 1.2 m of the coil and the pipe size is 25 mm
or less. d. These thicknesses are based on energy efficiency considerations only. Issues
such as water vapour permeability surface condensation sometimes require vapour
retarders or additional insulation.
9.3.3 Building Service Water-Heating Systems
1. Service water heating: The service water heating shall comply with
Section 6 of EEECBC [6] with the following modifications and
additions:
2. Equipment efficiency: Equipment shall comply with the minimum
efficiencies in Table 9.14 [6].
3. Service hot-water piping insulation: Pipe insulation shall comply
with Table 9.13 above.
233
Current Energy Leakages in Egyptian Buildings
TABLE 9.14
Performance Requirements for Water-Heating Equipment
Equipment
Type
Electric water
heaters
Size Category
(Input)
12 kW
>12 kW
Gas storage
water heaters
24 Amps and
≤250 Volts
≤75,000 Btu/h
>75,000 Btu/h
Gas
instantaneous
water heaters
>50,000 Btu/
hand <2000,000
Btu/h
≥200,000 Btu/h
≥200,000 Btu/h
Oil storage
water heaters
≤105,000 Btu/h
>105,000 Btu/h
Oil
instantaneous
water heaters
≤210,000 Btu/h
>210,000 Btu/h
>210,000 Btu/h
Hot water
supply boilers,
gas and oil
Hot water
supply boilers,
gas
Hot water
supply boilers,
oil
Pool heaters oil
and gas
Heat pump
pool heaters
Unfired storage
tanks
300,000 Btu/hand
<12,500,000
Btu/h
Subcategory or
Rating
Condition
Performance
Required
Resistance
≥75.7L
Resistance
≥75.7L
Heat Pump
0.93–0.00132V EF
Resistance
≥75.7L
<310.1 (kW/L)
0.62–0.0019V EF
≥310.1 kWQ/L
and <7.56 L
≥310.1 kWQ/L
and <37.8 L
≥310.1 kWQ/L
and <37.8 L
Resistance
≥75.7L
<310.1 (kW/L)
≥310.1 kWQ/L
and <7.56 L
≥310.1 kWQ/L
and <37.8 L
≥310.1 kWQ/L
and <37.8 L
≥310.1 kWQ/L
and <37.8 L
20 + 35 V.5 SL,
Btu/h
0.93–0.00132V EF
80% Et (Q/800 +
110 V.5) SL, Btu/h
0.62–0.0019V EF
80% Et
80% Et (Q/800 +
110 V.5) SL, Btu/h
0.59–0.0019V EF
78% Et (Q/800 +
110 V.5) SL, Btu/h
0.59–0.0019V EF
80% Et
78% Et (Q/800 +
110 V.5) SL, Btu/h
80% Et
≥310.1 kWQ/L
and <37.8 L
80% Et (Q/800 +
110 V.5) SL, Btu/h
≥310.1 kWQ/L
and <37.8 L
78% Et (Q/800 +
110 V.5) SL, Btu/h
All
78% Et
All
4.0 COP
All
R-12.5
Source: EEECBC EGYPTIAN Energy Efficiency Code, HBRC, 2012.
Test
Procedure
DOE 10 CFR
Part 430
ANSI
Z21.10.3
DOE 10 CFR
Part 430
DOE 10 CFR
Part 430
ANSI
Z21.10.3
DOE 10 CFR
Part 430
ANSI
Z21.10.3
DOE 10 CFR
Part 430
ANSI
Z21.10.3
DOE 10 CFR
Part 430
ANSI
Z21.10.3
ANSI
Z21.10.3
ASHRAE
146
ASHRAE
146
(None)
234
Energy Efficiency in the Urban Environment
4. Insulation for spa pools: Pools heated to more than 90°F (32°C)
shall have side and bottom surfaces insulated on the exterior with a
minimum insulation value of R-12 (R-2.1).
9.3.4 Energy-Saving Equipment
The following equipment within the scope of the applicable energy-saving
programme shall comply with the equivalent criteria required to achieve
the energy-saving label if installed prior to the issuance of the certificate of
occupancy:
1. Appliances
a. Clothes washers
b. Dishwashers
c. Refrigerators and freezers
d. Room air conditioners
e. Room air cleaners
f. Water coolers
2. Heating and cooling
a. Boilers
b. Central air conditioners
c. Ceiling fans
d. Ventilating fans
3. Electronics
a. Cordless phones
b. Combination units (TV/VCR/DVD)
c. DVD products
d. Audio
e. Televisions
4. Office Equipment
a. Computers
b. Copiers
c. Fax machines
d. Laptops
e. Mailing machines
f. Monitors
g. Multifunction devices (printer/fax/scanner)
Current Energy Leakages in Egyptian Buildings
235
h. Printers
i. Scanners
5. Water heaters
6. Lighting
a. Compact fluorescent light bulbs (CFLs)
7. Commercial food service
a. Commercial fryers
b. Commercial hot food holding cabinets
c. Commercial solid door refrigerators and freezers
d. Commercial steam cookers
e. Commercial ice machines
f. Commercial dishwashers
8. Other products
a. Battery charging systems
b. External power adapters
c. Vending machines
9.4 Energy Auditing
9.4.1 General
An energy audit is an inspection, survey and analysis [7] of energy flows for
energy conservation in a building, process or system to reduce the amount
of energy input into the system without negatively affecting the output(s).
When the object of study is an occupied building, reducing energy consumption while maintaining or improving human comfort, health and safety is of
primary concern. Beyond identifying the sources of energy use, an energy
audit seeks to prioritise the energy uses according to the greatest to least
cost-effective opportunities for energy savings.
A home energy audit is a service where the energy efficiency of a house [7]
is evaluated by a person using professional equipment (such as blower doors
and infrared cameras) with the aim of suggesting the best ways to improve
energy efficiency in heating and cooling the house.
An energy audit of a home may involve recording information about various characteristics of the building envelope including the walls, ceilings,
floors, doors, windows and skylights. For each of these components, the area
and resistance to heat flow (R-value) is measured or estimated. The leakage
236
Energy Efficiency in the Urban Environment
rate or infiltration of air through the building envelope is of concern; both
of which are strongly affected by window construction and quality of door
seals such as weather stripping. The goal of this exercise is to quantify the
building’s overall thermal performance. The audit may also assess the efficiency, physical condition and programming of mechanical systems such as
the heating, ventilation, air-conditioning equipment and thermostat.
A home energy audit may include a written report estimating energy use
given local climate criteria, thermostat settings, roof overhang and solar orientation. This could show energy use for a given time period, say a year, and
the impact of any suggested improvements per year. The accuracy of energy
estimates are greatly improved when the homeowner’s billing history is available showing the quantities of electricity, natural gas, fuel oil or other energy
sources consumed over a one- or two-year period. Some of the greatest effects
on energy use are user behaviour, climate and age of the home. An energy
audit may therefore include an interview of the homeowners to understand
their patterns of use over time. The energy billing history from the local utility company can be calibrated using heating degree day and cooling degree
day data obtained from recent, local weather data in combination with the
thermal energy model of the building. Advances in computer-based thermal
modelling can take into account many variables affecting energy use.
A home energy audit is often used to identify cost-effective ways to improve
the comfort and efficiency of buildings. In addition, homes may qualify for
energy efficiency grants from the central government.
Recently, improvements in smartphone technology have enabled homeowners to perform relatively sophisticated energy audits of their own
homes. This technique has been identified as a method to accelerate energy
efficiency improvements.
The term energy audit is commonly used to describe a broad spectrum of
energy studies ranging from a quick walk-through of a facility to identify
major problem areas to a comprehensive analysis of the implications of alternative energy efficiency measures sufficient to satisfy the financial criteria of
sophisticated investors. Numerous audit procedures have been developed for
non-residential (tertiary) buildings (ASHRAE [1–5]). An audit is required to
identify the most efficient and cost-effective energy conservation opportunities (ECOs) or measures (ECMs). ECOs (or ECMs) can consist of more efficient
use of energy or of partial or global replacement of the existing installation.
When looking at existing audit methodologies, the main issues of an audit
process are
1. The analysis of building and utility data, including study of the
installed equipment and analysis of energy bills
2. The survey of the real operating conditions
3. The understanding of the building behaviour and of the interactions
with weather, occupancy and operating schedules
Current Energy Leakages in Egyptian Buildings
237
4. The selection and the evaluation of ECMs
5. The estimation of energy-saving potential
6. The identification of customer concerns and needs
Common types/levels of energy audits are distinguished here, although
the actual tasks performed and level of effort may vary with the consultant
providing services under these broad headings. The only way to ensure that
a proposed audit will meet your specific needs is to spell out those requirements in a detailed scope of the work. Taking the time to prepare a formal
solicitation will also assure the building owner of receiving competitive
and comparable proposals. Generally, four levels of analysis can be outlined
(ASHRAE):
1. Level 0—Benchmarking: This first analysis consists of a preliminary
whole building energy use (WBEU) analysis based on historic utility use and costs and on the comparison of the performance of the
buildings to those of similar buildings. This benchmarking of the
studied installation allows the determination of whether further
analysis is required.
2. Level I—Walk-through audit: A preliminary analysis is made to
assess building energy efficiency to identify not only simple and
low-cost improvements but also a list of ECMs or ECOs to orient
the future detailed audit. This inspection is based on visual verifications, study of installed equipment and operating data and detailed
analysis of recorded energy consumption collected during the
benchmarking phase.
3. Level II—Detailed/general energy audit: Based on the results of the
pre-audit, this type of energy audit consists of an energy use survey to provide a comprehensive analysis of the studied installation,
a more detailed analysis of the facility, a breakdown of the energy
use and a first quantitative evaluation of the ECOs/ECMs selected
to correct the defects or to improve the existing installation. This
level of analysis can involve advanced on-site measurements and
sophisticated computer-based simulation tools to evaluate precisely
the selected energy retrofits.
4. Level III—Investment-grade audit: This is a detailed analysis of
capital-intensive modifications focusing on potential costly ECOs
requiring rigorous engineering study.
9.4.2 Benchmarking
The impossibility of describing all possible situations that might be encountered during an audit means that it is necessary to find a way of describing
what constitutes good, average and bad energy performance across a range
238
Energy Efficiency in the Urban Environment
of situations [7–8]. The aim of benchmarking is to answer this question.
Benchmarking mainly consists of comparing the measured consumption
with reference consumption of other similar buildings, or it is generated
by simulation tools to identify excessive or unacceptable running costs.
As mentioned before, benchmarking is also necessary to identify buildings presenting interesting energy-saving potential. An important issue
in benchmarking is the use of performance indexes to characterise the
building.
These indexes can be
1. Comfort indexes, comparing the actual comfort conditions to the
comfort requirements
2. Energy indexes, consisting of energy demands divided by heated/
conditioned area, allowing comparison with reference values of
indexes coming from regulations or from similar buildings
3. Energy demands, directly compared to ‘reference’ energy demands
generated by means of simulation tools
9.4.2.1 Walk-Through or Preliminary Audit
The preliminary audit (alternatively called a simple audit, screening audit
or walk-through audit) is the simplest and quickest type of audit. It involves
minimal interviews with site operating personnel, a brief review of facility
utility bills and other operating data and a walk-through of the facility to
become familiar with the building operation and to identify any glaring
areas of energy waste or inefficiency.
Typically, only major problem areas will be covered during this type of
audit. Corrective measures are briefly described, and quick estimates of
implementation cost, potential operating cost savings and simple payback
periods are provided. A list of ECMs or ECOs requiring further consideration is also provided. This level of detail, although not sufficient for reaching a final decision on implementing a proposed measure, is adequate to
prioritise energy efficiency projects and to determine the need for a more
detailed audit.
9.4.2.2 General Audit
The general audit (alternatively called a mini-audit, site energy audit,
detailed energy audit or a complete site energy audit) expands on the preliminary audit described earlier by collecting more detailed information
about facility operation and by performing a more detailed evaluation of
ECMs. Utility bills are collected for a 12- to 36-month period to allow the
auditor to evaluate the facility’s energy demand rate structures and energy
usage profiles. If interval meter data are available, the detailed energy
Current Energy Leakages in Egyptian Buildings
239
profiles that such data make possible will typically be analysed for signs of
energy waste. Additional metering of specific energy-consuming systems is
often performed to supplement utility data. In-depth interviews with facility operating personnel are conducted to provide a better understanding of
major energy-consuming systems and to gain insight into short and longer
term energy consumption patterns. This type of audit will be able to identify all ECMs appropriate for the facility, given its operating parameters.
A detailed financial analysis is performed for each measure based on
detailed implementation cost estimates, site-specific o
perating cost savings
and the customer’s investment criteria. Sufficient detail is provided to justify project implementation. The evolution of cloud-based energy auditing
software platforms is enabling the managers of commercial buildings to
collaborate with general and specialty trades contractors in performing general and energy system-specific audits [6–8]. The benefit of s oftware-enabled
collaboration is the ability to identify the full range of energy efficiency
options that may be applicable to the specific building under study with
‘live time’ cost and benefit estimates supplied by local contractors.
9.4.2.3 Investment-Grade Audit
In most corporate settings, upgrades to a facility’s energy infrastructure
must compete for capital funding with non-energy-related investments.
Both energy and non-energy investments are rated on a single set of financial criteria that generally stress the expected return on i nvestment. The projected operating savings from the implementation of energy projects must
be developed such that they provide a high level of confidence. In fact, investors often demand guaranteed savings. The investment-grade audit expands
on the detailed audit described earlier and relies on a complete engineering
study in order to detail technical and economical issues necessary to justify
the investment related to the transformations.
9.4.2.3.1 Simulation-Based Energy Audit Procedure for Non-Residential Buildings
The following procedure proposes to make an intensive use of modern
building energy systems tools at each step of the audit process, from benchmarking to detailed audit and financial study:
1. Benchmarking stage: Although normalisation is required to allow
comparison between data recorded on the studied installation and
reference values deduced from case studies or statistics, the use
of simulation models to perform a code-compliant simulation of
the installation under study allows direct assessment of the studied
installation, without any normalisation needed. Indeed, applying a
simulation-based benchmarking tool allows an individual normalisation and avoids size and climate normalisation.
240
Energy Efficiency in the Urban Environment
2. Preliminary audit stage: Global monthly consumptions are generally
insufficient to allow an accurate understanding of the building’s
behaviour. Even if the analysis of the energy bills does not allow
identifying with accuracy the different energy consumers present in
the facility, the consumption records can be used to calibrate building and system simulation models. To assess the existing system
and to simulate correctly the building’s thermal behaviour, the
simulation model has to be calibrated on the studied installation.
The iterations needed to perform the calibration of the model can
also be fully integrated in the audit process and can help in identifying required measurements and critical issues [7].
3. Detailed audit stage: At this stage, on-site measurements, sub-
metering and monitoring data are used to refine the calibration
of the Building Energy Systems (BES) tool. Extensive attention is
given to understanding not only the operating characteristics of
all energy-consuming systems but also situations that cause load
profile variations on short and longer term bases (e.g. daily, weekly,
monthly, annually). When the calibration criteria is s atisfied, the savings related to the selected ECOs/ECMs can be quantified [7–9].
4. Investment-grade audit stage: At this stage, the results provided by
the calibrated BES tool can be used to assess the selected ECOs/
ECMs and to orient the detailed engineering study.
5. Infrared thermography audit: The advent of high-resolution thermography has enabled inspectors to identify potential issues within
the building envelope by taking a thermal image of the various
surfaces of a building. For purposes of an energy audit, the thermographer will analyse the patterns within the surface temperatures to identify heat transfer through convection, radiation or
conduction. It is important to note that the thermography ONLY
identifies SURFACE temperatures, and analysis must be applied to
determine the reasons for the patterns within the surface temperatures. Thermal analysis of a home generally costs between US$300
and US$600. For those who cannot afford a thermal inspection, it
is possible to get a general feel for the heat loss with a non-contact
infrared thermometer and several sheets of reflective insulation. The
method involves measuring the temperatures on the inside surfaces
of several exterior walls to establish baseline temperatures. After
this, reflective barrier insulation is taped securely to the walls in
8-foot (2.4 m) by 1.5-foot (0.46 m) strips, and the temperatures are
measured in the centre of the insulated areas at 1-hour intervals for
12 hours. (The reflective barrier is pulled away from the wall to measure the temperature in the centre of the area that it has covered.)
The best manner in which to do this is when the temperature differential (Delta T) between the inside and outside of the structure
Current Energy Leakages in Egyptian Buildings
241
is at least 40 degrees. A well-insulated wall will commonly change
approximately one degree per hour if the difference between external and internal temperatures is an average of 40 degrees. A poorly
insulated wall can drop as much as 10 degrees in an hour.
9.4.2.4 Pollution Audits
With increases in carbon dioxide emissions or other greenhouse gases, pollution audits are now a prominent factor in most energy audits. Implementing
energy-efficient technologies helps prevent utility-generated pollution.
Online pollution and emission calculators can help approximate the
emissions of other prominent air pollutants in addition to carbon dioxide.
Pollution audits generally take electricity and heating fuel consumption
numbers over a two-year period and provide approximations for carbon
dioxide, VOCs, nitrous oxides, carbon monoxide, sulphur dioxide, mercury, cadmium, lead, mercury compounds, cadmium compounds and lead
compounds.
References
1. ASHRAE Guideline 1.1—HVAC and R Technical Requirements for The
Commissioning Process, Latest Edition, 2013.
2. ASHRAE Standard 52.2—Method of Testing General Ventilation Air-Cleaning
Devices for Removal Efficiency by Particle Size, Latest Edition 2010.
3. ASHRAE Standard 55—Thermal Environmental Conditions for Human
Occupancy, 2013.
4. ASHRAE Standard 62.1—Ventilation for Acceptable Indoor Air Quality—Sets
the minimum acceptable ventilation requirements, 2010.
5. ASHRAE Standard 90.1—Energy Standard for Buildings Except Low-Rise
Residential Buildings.
6. EEECBC EGYPTIAN Energy Efficiency Code, HBRC, 2012.
7. ISO 16818: Energy Definitions, 2008.
8. Khalil, E. E. (2012). International focus on emerging technologies & opportunities, ASME Congress, Paper Number IMECE2012-94127.
9. Khalil, E. E. (2012). An international outlook of innovative design of low carbon
buildings, Keynote Paper at 3rd International Symposium on Low Carbon Buildings
(ISLCB), Ningbo-China, October 2012.
10
Future Prospects
10.1 Continuous Urbanisation and Climate Change
Climate change is the current focus of urban debates because it is becoming
a reality and not just anticipated at some future date. Urban areas are major
contributors to the phenomenon as well as victims of it. Major urbanisation
activities take place in cities of the developing world, where informalisation
is synonymous with urbanisation.
This current process of urbanisation is seen by many scientists as one
of the reasons for climate change; urban areas are where most of the CO2
emissions from the built environment are produced and where the greatest consumers live, resulting in very high ecological footprints. The recent
report, Working Group I Contribution to the IPCC Fifth Assessment Report:
Climate Change 2013, states that ‘It is extremely likely that human influence
has been the dominant cause of the observed warming since the mid-20th
century’ [1]. Of course, cities are suffering to different extents from the consequences of climate change, whether from unprecedented heat waves, cold
weather, storms, tsunamis and so on. Thus, the issue of investigating the
mutual relationship between cities and climate change becomes more vital.
It is widely known that energy use is the major contributor to climate
change. Cities are the major consumers of energy, which makes the issue of
energy efficiency vital to limiting, if not reversing, the effects of climate
change.
10.2 Energy Efficiency and Urban Expansion
Currently, urban expansion takes one of three forms: new cities being built,
cites expanding through new suburbs or cities growing through informal
expansion. All these forms pose a great threat to the city in the urban century. However, they require different approaches as to whether to confine
or to improve their use of different resources, with energy as the prime
resource. There is a need for a shift away from the car-based urban planning
243
244
Energy Efficiency in the Urban Environment
that dominated the last century to urban planning on a more human scale.
New cities should be planned as self-sufficient units that offer a variety of
housing and job opportunities to maximise walkability and minimise car
dependency. Expanding cities should follow a more polycentric trend, where
new districts are created and not exclusive residential areas. This can help
create more jobs and, again, minimise commuting, thus decreasing energy
consumption. Moreover, a shift toward public transit systems is essential to
enhance the efficient use of available energy and resources. This is a notion
well addressed by transit-oriented development.
Regarding informal expansion, the people’s way of developing is ‘smart’;
however, their settlements need a more comprehensive approach to ensure
the provision of needs (such as housing and services) in a more environmentally responsive pattern. This must be the basis for projects whether they are
upgrades or redevelopment. During redevelopment, it is important to maintain high densities, walkability, mixed uses, mixed housing and to integrate
with nearby open spaces. Providing access to safe water, sanitation, secure
tenure, durable housing and sufficient living area should not divert projects
from attending to other aspects of sustainability.
Some studies have shown that informal areas consume less energy due
to their compact design. However, this compactness and extensive use of
bricks, concrete and asphalt increases the effect of the urban heat island in
the area, thus reducing comfort in outdoor spaces and increasing thermal
loads on buildings. There is still a need to further investigate this issue in
order to identify adequate intervention to improve environmental performance and to reduce energy use.
10.3 Integrating Renewable Energies into Urban Planning
Globally, there is a growing concern with reaching the 20% renewable energy
targets of 2020* and going beyond that to 30% or to doubling the current share
of renewables in the energy mix by 2030† and afterward. This target should
be integrated in the urban planning system whether relating to decentralised production (by various users) or centralised production in power plants.
In both cases, this could include regulations to facilitate installation of solar
and wind energy production equipment. Currently, in some countries, urban
regulations might restrict the installation of photovoltaic (PV) modules on
* The EU target for 2020 is 20% of the energy demand from renewable energy as stated in
European Union [2].
† Within the upcoming Sustainable Development Goals (post 2015), Goal 7 states: Ensure access
to affordable, sustainable and reliable modern energy services for all. Relevant targets are: 7.2
double the share of renewable energy in the global energy mix by 2030; 7.3 double the global
rate of improvement in energy efficiency by 2030 as stated in Ref. [3].
Future Prospects
245
roofs or on facades. This is especially apparent in new suburbs or in h
istoric
districts where regulations regarding heights and facade colours and materials might need to change to accommodate the new installations.
On the urban scale, a new paradigm should govern how we plan our c ities,
orient our buildings and plot our roads. Different variations are needed to
improve the environmental performance of the city and to reduce thermal
loads on buildings, thereby reducing the need for future cooling/heating and
the accompanying consumption of energy. Other issues are how to smartly
plan the locations for needed renewable power plants and how to connect
them efficiently to different buildings. Planning new cities should have these
criteria embedded in the infrastructure of the city and not simply as later
add-ons. This approach is extensively adopted in city of Masdar in the United
Arab Emirates.
10.4 Energy-Efficient Building Envelopes
The building envelope, also known as the building shell, fabric or e nclosure,
is the boundary between the conditioned interior of a building and the outdoors. The energy performance of building envelope components, including
external walls, floors, roofs, ceilings, windows and doors, is critical in determining how much energy is required for heating and cooling. The building
envelope’s impact on energy consumption should not be underestimated: globally, space heating and cooling account for more than one-third of all energy
consumed in buildings, rising to as much as 50% in cold climates and more
than 60% in the residential subsector in cold climate countries.
Overall, one can conclude that buildings are responsible for more than
35% of global energy consumption. It is very alarming that, although wholebuilding approaches are ideal, every day building envelope components are
upgraded or replaced using technologies that are less efficient than the best
options available. These advanced options, which are among the primary
focus of this book, are needed not only to support whole-building approaches
but also to improve the energy efficiency of individual components.
Building envelopes are expected to save almost 6 exajoules (EJ) in 2050
under the two-degree Celsius scenario (equivalent to the current energy
consumption of the United Kingdom). The goal is to change the way of constructing building to save energy: an inevitable solution.
The main issues are as follows:
1. The construction of new buildings should offer the best opportunity
to deploy passive heating and cooling designs, which make use of
energy-efficient building materials to minimise energy required for
heating and cooling.
246
Energy Efficiency in the Urban Environment
2. Transforming typical building renovation to make way for deep
reductions in energy consumption, known as deep renovation,
should be a high priority.
3. Well-planned building envelope design improvements can enhance
occupant comfort and the quality of life of millions of citizens, while
offering significant non-energy benefits such as reduced health care
costs and reduced mortality of ‘at risk’ populations.
4. Airtight sealed buildings—restricting the passage of air through the
building envelope—are key ways of increasing energy efficiency
during new construction and deep renovation. Energy audits, such
as the energy performance certificates that are mandatory in the
European Union, should include regular, validated testing of air leakage (e.g. at least every ten years) in addition to worldwide enforcement.
5. New office buildings should be fitted with integrated facade systems
that optimise daylight while minimising energy requirements for
heating, cooling, artificial lighting and peak electricity use.
6. It is vital to increase global collaboration on developing more affordable zero-energy buildings, especially in cold climates.
Recommendations would foster the following technologies that would
lead to greater returns on investment:
1.
2.
3.
4.
5.
Highly insulated windows
Advanced, high-performance, ‘thin’ insulation
Less labour-intensive air sealing and lower-cost validation testing
Lower-cost automated dynamic shading and glazing
More durable and lower-cost reflective roof materials and reflective
coatings
10.5 Providing Integrated Solutions for Low-Income
Areas Constituting Most Urbanisation Activities
Climate change is gradually beginning to dominate urban debates of the
21st century. It is widely discussed in the domain of developed countries.
Moreover, when it is rarely discussed in developing countries, the debates
focus on the adaptation and mitigation necessary for risk zones. However,
debates concerning improving the performance of cities in these countries
have received minimum attention up till now. The challenge that lies in these
cities is that they are mostly informal, thus requiring different approaches
and solutions. It is estimated that more than 60% of Cairo is made up of
Future Prospects
247
informal areas, with more areas added daily. This poses a number of
concerns, such as how these areas contribute to the growing phenomenon
of climate change, how these areas will be affected, and most importantly,
how these areas can assist in improving the environmental conditions and
reversing the effects of climate change.
This area is yet to be developed because, currently, it lacks adequate
research. There are some initiatives worldwide to address this issue; however,
they are still individual instances that have not yet formed policies. Growing
recognition of this issue was addressed by the Sustainable Development Goals
(SDGs). Target 7.6 requires ‘By 2030, expand and upgrade as appropriate infrastructure for supply, transmission, and distribution of modern and renewable
energy services in rural and urban areas, including with a view to doubling
primary energy supply per capita for Least Developing Countries (LDCs’) [3].
10.6 Awareness Regarding Climate Change, Energy
Crisis and Resource-Efficient Urbanism
Climate change is a driving issue in current debates regarding sustainable
urban development. It is closely linked to issues of resilience and to the ability
to withstand shocks, especially regarding weather catastrophes. It is apparent that informal areas are more efficient than other areas; however, they
contribute to increasing the causes of climate change by their continuous
encroachment on agricultural land or on risk zones and by their emission of
CO2 without any absorption. It is vital to note that these areas are efficient in
reusing their products; however, garbage separation and recycling has not
received much attention. This is an issue that accentuates their contribution
to climate change.
A number of interventions could help improve the performance of urban
areas (of which informal areas comprise a majority in the developing countries’ cities) in combating climate change. However, a vital issue is awareness regarding the importance of climate change, its magnitude and its
effects.
1. Many efforts should be directed toward raising awareness about
climate change plans for both municipalities and residents.
2. Enhancing cyclability and promoting cycling through awareness
campaigns would highlight its benefits and its trendiness worldwide.
3. The use of solar energy should be encouraged, especially because
many cities in the developing world have very good solar exposure, in many applications (such as water heaters or street lighting).
This could be done through a government initiative to subsidise the
initial cost or to offer other appropriate incentives.
248
Energy Efficiency in the Urban Environment
4. Another effort would be to promote interventions that can help c ombat
climate change and reduce heat island effects and that can contribute
to better use of energy, such as roof top planting (green roofs).
5. In arid zones, awareness could be promoted regarding the use of the
ecological landscape to ensure shading in arid zones and to reduce
the use of water.
6. Encouraging garbage separation and recycling would preserve
resources and maximise the benefit from latent energy used during
initial manufacturing.
10.7 Bottom-Up Approaches versus Top-Down Interventions
Awareness and initiatives related to energy efficiency and the use of renewables are not limited to national governments and to international organisations and policies.* They are gaining wide recognition on the local levels
too. There are numerous efforts in the field, including local government;
civic organisations such as community-based organisations (CBOs), non-
governmental organisations (NGOs), or customers’ rights protection organisations; research institutes; the private sector and its Small and Medium
Enterprises (SMEs); or individual interest groups. Some of these initiatives
are emerging in Cairo, the second most polluted city of the world. One of
these initiatives, the Participatory Development Programme in Urban Areas,
has been undertaken by the German Technical Cooperation (GIZ). The overall objective of this initiative is to promote resilient communities and their
efforts to adapt to the changing climate conditions and to increase information levels among public administration and civil society regarding the consequences of climate change, particularly in informal areas.†,‡
* Current international efforts include: The Millennium Development Goals and the Post 2015
Sustainable Development Goals promoted by the UN. On the regional level, there is the Arab
strategy for Housing and Sustainable Urban Development promoted by the Arab League,
and the EU Growth Strategy 2020.
† Main objectives of this programme are (1) development of a participatory and c
ommunity-
based adaptation strategy for informal areas in collaboration with Egyptian partners;
(2) implementation of small-scale adaptation measures in informal areas in collaboration
with residents and civil society in order to enhance urban resilience; and (3) awareness raising and capacity development among local residents, civil society, ministries, public agencies
and local administration on climate change adaptation and urban resilience.
‡ Other partners are the Egyptian Environmental Affairs Agency (EEAA), the Egyptian
Meteorological Authority (EMA), the Governorates of Cairo and Giza, the United Nations
International Strategy for Disaster Reduction (UN-ISDR) and the Information and Decision
Support Center (IDSC), www.egypt-urban.net; Contact: Carl Philipp Schuck, carl-philipp.
schuck@giz.de
Future Prospects
249
Another initiative is the Ecocitizen World Map project comprising a
ublic–private partnership that is led by the U.S. NGO Ecocity Builders and
p
joined by Esri, the Association of American Geographers, Eye on Earth (a partnership of United Nations Environment Programme (UNEP) and Abu Dhabi
Environmental Data Initiative), Cairo University, Mundiapolis University,
University of California at Berkeley and a number of local NGOs and community partners. The project, which started in 2013, provides tools and training
to citizens, public officials and others who want to ensure a more sustainable
and resilient urban environment through more informed decision making.
The project is intended to offer training that will provide hands-on experience with spatial data collection using smartphones and tablets as well as
low-cost open source tools for civic science in order to increase public participation and legibility around the collection of high-quality, environmentally
and socially relevant data. Citizen reports will be layered over authoritative
data for visualisation and analysis through an online map portal to provide
decision makers at every level with additional insights and bottom-up motivation for more sustainable living, planning and urban design. The project
is based on broader scientific research defined by the International Ecocity
Framework and Standards (IEFS) initiative currently under development
by the U.S. NGO Ecocity Builders and its international expert advisory, and
in consultation with the United Nations International Strategy for Disaster
Reduction (UNISDR’s) ‘Making Cities Resilient Campaign’ and UN-Habitat’s
World Urban Campaign and Resilient Cities Profiling Program [4,5].
In addition, awareness campaigns led by local CBOs are numerous,
whether promoting energy-efficient behaviour or encouraging the use of
more energy-efficient appliances. Moreover, there is a growing market for
Small and Medium Enterprises (SMEs) in the field of renewable energy, especially solar water heaters and Photo Voltaic (PV) modules that contribute to
decentralised energy production.
10.8 New Business Models of Green Economy that
Support Energy-Efficient Urban Development
There is still much to be studied to identify possible tailored solutions and
how to implement them in a financially viable manner to ensure their continuity. Currently, there is a need to support the emerging businesses within
the sought green economy. A set of enabling legislations and incentives is
vital to promote new business models that can effectively contribute to the
conversion into an energy-efficient urban development. There is a great need
for the contribution and participation of various organisations, international and local, governmental and non-governmental, to move effectively
250
Energy Efficiency in the Urban Environment
toward achieving energy efficiency and renewable energy targets. This is
mandatory in order to ensure a better environment for current and future
generations.
References
1. IPCC, 2013: Summary for Policymakers. In: Climate Change 2013: The Physical
Science Basis. Contribution of Working Group I to the Fifth Assessment Report
of the Intergovernmental Panel on Climate Change [Stocker, T.F., D. Qin, G.-K.
Plattner, M. Tignor, S.K. Allen, J. Boschung, A. Nauels, Y. Xia, V. Bex and P.M.
Midgley (eds.)]. Cambridge University Press, Cambridge, United Kingdom and
New York, NY, USA.
2. European Union. (2013). The European Union Explained: Europe 2020: Europe’s
Growth Strategy, European Commission Directorate-General for Communication
Publications, Brussels.
3. UN General Assembly. (2014). Report of the Open Working Group of the General
Assembly on Sustainable Development Goals, Sixty – eighth session, A/68/970,
Retrieved August 15, 2014, from http://undocs.org/A/68/970.
4. The Project. (2014). Ecocitizen World Map Project, Retrieved June 2, 2014, from
http://ecocitizenworldmap.org/about/the-project/.
5. IEFS Indicator Development. (2014), International Ecocity Framework and
Standards, Retrieved June 2, 2014, from http://www.ecocitystandards.org/
ecocity-level-1-conditions/iefs-indicator-development/.
Bibliography
80plus.org. (2007). The 80 plus program: About, Retrieved March 3, 2007, from http://
www.plugloadsolutions.com/About.
Andrey, J., Johnson, L. C., Moos, M., and Whitfield, J. (2008). Does design matter?
The ecological footprint as a planning tool at the local level, Journal of Urban
Design, Vol. 11, No. 2, pp. 195–224.
Arandel, C. and El Batran, M. (1997). The Informal Housing Development Process in
Egypt, Centre Nacional de la Recherche Scientifique, Bordeaux.
ASHRAE. (2011). Applications, ASHRAE, Atlanta, GA.
ASHRAE. (2013). Handbook, Fundamentals, ASHRAE, Atlanta, GA.
ASHRAE Standards 55-2010, ASHRAE, Atlanta.
Associated Consultants. (2008). Strategic Planning for Ashmun City, Menoufia, Egypt,
Ministry of Housing, Utilities and Urban Communities and General Orga
nization of Physical Planning (GOPP), Cairo, Egypt.
Associated Consultants and Little, A. D. (2010). 10th of Ramadan Strategic Plan, General
Organisation of Physical Planning and Ministry of Housing, Utilities and
Urban Development, Cairo.
Banister, D. (1992). Energy use, transport and settlement patterns, In M. Breheny, ed.,
Sustainable Development and Urban Form, Pion Ltd, London, pp. 160–181.
Belzer, R. (2008). Energy Star appliances: EPA’s savings calculator exaggerates savings,
Regulatory Economics, Retrieved March 5, 2008, from www.neutralsource.org/
archives/595.
Ben-Hamouche, M. (2008). Climate, cities and sustainability in the Arabian region:
Compactness as a new paradigm in urban design and planning, Archnet-IJAR,
International Journal of Architectural Research, Vol. 2, No. 2, pp. 196–208.
Berridge Lewinberg Greenberg, Ltd. (1991a). Guidelines for the Reurbanisation of
Metropolitan Toronto, Municipality of Metropolitan Toronto Corporate Printing
Services, Toronto, Canada.
Berridge Lewinberg Greenberg, Ltd. (1991b). Study of the Reurbanisation of Metropolitan
Toronto, Municipality of Metropolitan Toronto Corporate Printing Services,
Toronto, Canada.
Blomquist, G., Berger, M., and Hoehn, J. (1988). New estimates of the quality of life in
urban areas. American Economic Review, Vol. 78, No. 1, pp. 89–107.
Boarnet, M. G. and Crane, R. (2001). Travel by Design. The Influence of Urban Form on
Travel, Oxford University Press, New York.
Breheny, M. (1992a). The contradictions of compact city: A review, In M. Breheny, ed.,
Sustainable Development and Urban Form, Pion Ltd, London, pp. 138–159.
Breheny, M., ed. (1992b). Sustainable Development and Urban Form, Pion Ltd, London.
Breheny, M. (1996). Centrists, decentrists and compromisers: Views on the future of
urban form, In M. Jenks, E. Burton, and K. Williams, eds., The Compact City:
A Sustainable Urban Form? E & FN Spon, London, pp. 13–35.
Brindle, R. E. (1994). Lies, damned lies and ‘automobile dependence’—Some hyperbolic reflections, Australian Transport Research Forum, Vol. 94, pp. 117–131.
251
252
Bibliography
Buxton, M. (2000). Energy, transport and urban form in Australia, In M. Jenks,
E. Burton, and K. Williams, eds., Achieving Sustainable Urban Form, E & FN Spon,
London, pp. 54–63.
Cairo Governorate; Housing and Utilities Sector. (2009). Zeinhom Gardens Housing
Project, Cairo Governorate, Cairo.
California Sustainability Alliance Energy Star Televisions, Retrieved July 24, 2010, from
http://sustainca.org/techshowcase/est/overview.
Calthorpe, P. (1992). The pedestrian pocket: New strategies for suburban growth,
In B. Walter et al., eds., Sustainable Cities: Concepts and Strategies for Eco-City
Development, Eco-Home Media, Los Angeles, CA, pp. 27–35.
Calthorpe, P. (1993). The Next American Metropolis, Princeton Architectural Press,
New York.
Chambers, N., Simmons, C., and Wackernagel, M. (2000). Sharing Nature’s Interest:
Ecological Footprints as an Indicator of Sustainability, Earthscan, London.
Chen, Q., Cheung, G., Hu, Y., Shen, Q., Tang, B., and Yeung, S. (2009). A system
dynamics model for the sustainable land use planning and development,
Habitat International, Vol. 33, pp. 15–25.
Cho, Y. and Awbi, H. B. (2002). Effect of heat source location in a room on the ventilation performance, ROOMVENT 2002, pp. 445–448.
Churchman, A. (1993). A differentiated perspective on urban quality of life:
Women, children and the elderly, In M. Bonnes, ed., Perception and Evaluation
of Environmental Quality, UNESCO Programme on Man and Biosphere, Rome,
pp. 165–178.
Churchman, A. (1999). Disentangling the concept of density, Journal of Planning
Literature, Vol. 13, No. 4, pp. 389–411.
Commission of the European Communities (CEC). (1990). Green Paper on the Urban
Environment, European Commission, Brussels.
Committee for The Development of Environmental Performance Assessment Tool
for Cities and Institute for Building Environment and Energy Conservation.
(2011). Overview of CASBEE for Cities, Japan Sustainable Building Consortium
(JSBC), Tokyo.
Congress for the New Urbanism, Natural Resources Defense Council, and U.S. Green
Building Council. (2012). LEED 2009 for Neighborhood Development Rating System,
U.S. Green Building Council, Washington, DC.
Corgnati, S. P., Fracastoro, G. V., and Perino, M. 2002. Influence of cooling strategies
on the air flow pattern in an office with mixing ventilation, ROOMVENT 2002,
pp. 165–168.
Costanza, R., Fisher, B., Ali, S., Beer, C., Bond, L., Boumans, R., Danigelis, N. L., et al.
(2008). An integrative approach to quality of life measurement, research and policy, Surveys and Perspectives Integrating Environment and Society, Vol. 1, pp. 11–15.
Crilly, M. (1999). Novocastrian urbanism, Urban Design Quarterly, Vol. 72, p. 10.
Criteria for Rating Building Energy Performance, Energystar.gov. Retrieved
March 23, 2009, from http://www.energystar.gov/index.cfm?c = eligibility.bus_
portfoliomanager_eligibility
Cummins, R. (1997). Comprehensive quality of life scale—Adult, School of Psychology,
Deakin University, Melbourne.
Cummins, R. A., Eckersley, R., Pallant, J., Vugt, J. V., and Misajon, R. (2003). Developing
a national index of subjective wellbeing: The Australian unity wellbeing index.
Social Indicators Research, Vol. 64, pp. 159–190.
Bibliography
253
DEFRA. (2002). Energy Resources. Sustainable Development and Environment, Department
of Environment, Food and Rural Affairs (DEFRA), Doncaster, UK.
Deutsch, L., Jansson, A., Troell, M., Ronnback, P., Folke, C., and Kautsky, N. (2000).
The ecological footprint: Communicating human dependence on nature’s work,
Ecological Economics, Vol. 32, No. 3, pp. 351–356.
Devuyst, D., Hens, L., and De Lannoy, W. (2003). How Green is the City? Sustainability
Assessment and the Management of Urban Environments, Columbia University
Press, New York.
Diener, E. and Suh, E. (1997). Measuring quality of life: Economic, social, and subjective indicators, Social Indicators Research, Vol. 40, pp. 189–216.
Dramstad, W. E., Olson, J., and Forman, R. (1996). Landscape Ecology Principles in
Landscape Architecture and Land Use Planning, Island Press, Washington, DC.
Draper, D. (1998). Our Environment, A Canadian Perspective, Thomson Nelson, Toronto.
Drewnowski, J. (1974). On Measuring and Planning the Quality of Live, Mouton, published for the Institute of Social Studies, The Hague.
Eckersley, R. (1998). Perspectives on progress: Economic growth, quality of life and
ecological sustainability, In R. Eckersley, ed., Measuring Progress: Is Life Getting
Better? CSIRO Publishing, Melbourne, pp. 3–34.
Ecocity Standards. (2011). International Ecocity Framework and Standards, Retrieved
January 15, 2014, from http://www.ecocitystandards.org/
Edahiro, J. (2009). Conceptual Basis of The Movement to Create and Propagate ‘Eco-Model
Cities’ Initiatives of the Japanese Government, JFS Newsletter No. 78, Retrieved
June 8, 2011, from http://www.japanfs.org/en/mailmagazine/newsletter/
pages/028824.html
Elkin, T., Mclaren, D., and Hillman, M. (1991). Reviving the City: Towards Sustainable
Urban Development, Friends of the Earth, London.
ENERGY STAR. (2009). Qualified Homes: ENERGY STAR, Energystar.gov. Retrieved
March 23, 2009, from http://www.energystar.gov/homes
EnergyStar.gov. History: ENERGY STAR, Retrieved March 1, 2008, from www.
energystar.gov
EnergyStar.gov. Learn More about Energy Guide: Energy Star, Retrieved March 1, 2008,
from www.energystar.gov
EnergyStar.gov. (2007). Milestones: ENERGY STAR, Retrieved March 1, 2008, from
www.energystar.gov
EnergyStar.gov. Room Air Conditioners Key Product Criteria, Retrieved July 17, 2008,
Energystar.gov; Retrieved March 23, 2009, from http://www.energystar.gov/
index.cfm?c = roomac.pr_crit_room_ac
Energy Stars May Not be All They Say They Are, Housingzone.com. Retrieved March 23,
2009, http://www.housingzone.com/articleXml/LN888056763.html
Environmental News Service, Energy Star Climate Change Claims Misleading,
Audit Finds, Washington, DC., December 31, 2008.
Enwicht, D. (1992). Towards an Eco-city: Calming the Traffic, Envirobook, Sydney.
EPD. (2006). European Energy Performance Code, CEN, Brussels.
Erikson, R. (1993). Descriptions of inequality: The Swedish approach to welfare
research, In M. Nussbaum and A. Sen, eds., The Quality of Life, Clarendon Press,
Oxford, pp. 67–87.
Erikson, R. and Uusitalo, H. (1987). The Scandinavian approach to welfare research,
In R. Erikson, E. Hansen, S. Ringen, and H. Uusitalo, eds., The Scandinavian
Model: Welfare States and Welfare Research, M. E. Sharpe, New York, pp. 177–193.
254
Bibliography
European Commission Energy Labeling, EPBD, Brussels, 2010.
European Union. (2013). The European Union Explained: Europe 2020: Europe’s Growth
Strategy, European Commission Directorate-General for Communication
Publications, Brussels.
Evill, B. (1995). Population, urban density, and fuel use: Eliminating spurious correlation, Urban Policy and Research, Vol. 13, No. 1, pp. 29–36.
Ewing, B., Moore, D., Goldfinger, S., Oursler, A., Reed, A., and Wackernagel, M. (2010).
The Ecological Footprint Atlas 2010, Global Footprint Network, Oakland, CA.
Expert group meeting on cities in climate change, Urban Environment Newsletter,
February 2008, Urban Environment Section, UN-HABITAT, Nairobi, Kenya,
in collaboration with UNEP, DTIE, Urban Environment Unit, Retrieved
February 15, 2009, from http://www.unhabitat.org/scp
Farr, D. (2008). Sustainable Urbanism: Urban Design with Nature, John Wiley, Hoboken, NJ.
Federal Register/Vol. 72, No. 245/Friday, December 21, 2007/Rules and Regulations
72565, Retrieved www.gpo.gov/
Forum for The Future and General Electric GE. (2010). The Sustainability Cities Index
2010, Forum for The Future and GE, London.
Frey, H. (1999). Designing the City: Towards a More Sustainable Urban Form, Spon Press,
London.
Gabriel, S. A., Mattey, J., and Wascher, W. L. (2003). Compensating differentials and
evolution in the quality-of-life among U.S. states, Regional Science and Urban
Economics, Vol. 33, No. 5, pp. 619–649.
Gabriel, S. A. and Rosenthal, S. S. (2004). Quality of the business environment v
ersus
quality of life: Do firms and households like the same cities? The Review of
Economics and Statistics, Vol. 86, No. 1, 438–444.
General Organisation of Physical Planning, Giza Governorate, GTZ, and Ministry of
Housing, Utilities and Urban Development. (2004). Boulaq Al-Dakrour District
Guide Plan 2004–2017, GTZ, Cairo.
General Organization of Physical Planning (GOPP) and United Nations Development
Program (UNDP). (2007). Improving Living Condition within Informal Settlements
through Adopting Participatory Planning: General Framework for Upgrading and
Controling Informal Areas, GOPP, Cairo.
General Organization for Physical Planning (GOPP) and United Nations Human
Settlements Project (UN-Habitat). (2008). Terms of Reference for Preparing Strategic
Urban Planning for Small Cities in Egypt, UN-Habitat, Cairo, Egypt.
Gerardet, H. (2008). Cities People Planet: Urban Development and Climate Change, 2nd
ed., John Wiley, West Sussex, England.
Girardet, H. (2004). Urban Planning and Sustainable Energy: Theory and Practice, Forum
Barcelona, Retrieved May 12, 2009, from http://www.barcelona2004.org/eng/
banco_del_conocimiento/dialogos/fichac390.html
GlobeScan and MRC McLean Hazel. (2007). Megacity Challenges: A stakeholder perspective, Siemens AG, Munich.
Gordon, D. and Tamminga, K. (2002). Large-scale traditional neighbourhood
development and pre-emptive ecosystem planning: The markham experience,
1989–2001, Journal of Urban Design, Vol. 7, No. 3, pp. 321–340.
Gordon, P. and Richardson, H. (1997). Are compact cities a desirable planning goal?
Journal of the American Planning Association, Vol. 63, No. 1, pp. 95–106.
Gordon, P. and Richardson, H. (1998). Farmland preservation and ecological footprints: A critique, Planning and Markets, Vol. 1, No. 1, pp. 1–7.
Bibliography
255
Gordon, P. and Richardson, H. W. (1989). Gasoline consumption and cities—A reply,
Journal of the American Planning Association, Vol. 55, No. 3, pp. 342–345.
Gowling, D. and Penny, L. (1988). Urbanisation, planning and administration in the
London region: Processes of a metropolitan culture, In H. van der Cammen, ed.,
Four Metropolises in Western Europe, Van Gorcum, Maastricht, The Netherlands,
pp. 5–59.
Green City Index. (2012). Siemens, Retrieved May 7, 2012, from http://www.siemens.
com/entry/cc/en/greencityindex.htm
GTZ. (2007). Participatory Development in Urban Areas Program, Boulaq AlDakrour
District, GTZ, Cairo.
Gyourko, J. and Tracy, J. (1991). The structure of local public finance and the quality
of life, Journal of Political Economy, Vol. 99, No. 4, pp. 774–806.
Handy, S. (1996). Understanding the link between urban form and nonwork travel
behavior, Journal of Planning Education and Research, Vol. 15, No. 3, pp. 183–198.
Hasic, T. (2000). A sustainable urban matrix: Achieving sustainable urban form in
residential buildings, In M. Jenks, E. Burton, and K. Williams, eds., Achieving
Sustainable Urban Form, E & FN Spon, London, pp. 329–336.
Herendeen, R. (2000). Ecological footprint is a vivid indicator of indirect effects,
Ecological Economics, Vol. 32, No. 3, pp. 357–358.
Hitchcock, J. (1994). A Primer on The Use of Density in Land Use Planning, Papers on
Planning and Design no. 41, Program in Planning, University of Toronto, Toronto,
Canada.
Holden, E. (2004). Ecological footprints and sustainable urban form, Journal of Housing
and the Built Environment, Vol. 19, No. 1, pp. 91–109.
Holden, E. and Norland, I. T. (2005). Three challenges for the compact city as a
sustainable urban form: Household consumption of energy and transport in
eight residential areas in the greater Oslo region, Urban Studies, Vol. 42, No. 12,
pp. 2145–2166.
Holmberg, J., Lundqvist, U., Robert, K. H. and Wackernagel, M. (1999). The ecological footprint from a systems perspective of sustainability, International Journal of
Sustainable Development and World Ecology, Vol. 6, No. 1, pp. 17–33.
Holmberg, S. and Einberg, G. (2002). Flow behavior in a ventilated room—
Measurements and simulations, ROOMVENT 2002, pp. 197–200.
Hough, M. (1995). Cities and Natural Process, Routledge, London.
Høyer, K. G. and Holden, E. (2003). Household consumption and ecological footprints in Norway: Does urban form matter? Journal of Consumer Policy, Vol. 26,
pp. 327–349.
Hruska, J. (2009). Sony LCD Exceeds Energy Star Power Draw 75% of Time, Arstechnica.com,
Retrieved March 23, 2009, from http://arstechnica.com/gadgets/news/2009/
02/sony-lcd-exceeds-energy-star-power-draw-75-of-time.ars
Hruska, J. (2010). Fake Products and Companies Certified by Energy Star, Popular
Mechanics. Retrieved March, 2010, from http://www.popularmechanics.com/
technology/industry/4350335.html
http://www.energystar.gov/index.cfm?c=business.bus_bldgs
http://www.energystar.gov/index.cfm?c=evaluate_performance.bus_portfoliomanager
http://www.iclei.org/our-activities/our-agendas/low-carbon-city/gcc.html
ICLEI Local Governments for Sustainability is the world’s leading association of
more than 1000 metropolises, cities, urban regions and towns representing
over 660 million people in 86 countries. ICLEI promotes local action for global
256
Bibliography
sustainability and supports cities to become sustainable, resilient, resource
efficient, biodiverse, low carbon; to build a smart infrastructure; and to develop
an inclusive, green urban economy with the ultimate aim of achieving healthy
and happy communities, Retrieved January 30, 2014, from http://www.iclei.org
Imperato, I. and Ruster, J. (2003). Slum Upgrading and Participation: Lessons from Latin
America, The World Bank, Washington, DC.
Industries in Focus: ENERGY STAR, Energystar.gov, 2009, Retrieved March 23, 2009, from
http://www.energystar.gov/index.cfm?c = in_focus.bus_industries_focus#plant
IPCC, 2013: Summary for Policymakers. In Climate Change 2013: The Physical
Science Basis. Contribution of Working Group I to the Fifth Assessment Report
of the Intergovernmental Panel on Climate Change [T. F. Stocker, D. Qin, G.-K.
Plattner, M. Tignor, S. K. Allen, J. Boschung, A. Nauels, Y. Xia, V. Bex, and
P. M. Midgley, eds.]. Cambridge University Press, Cambridge, United Kingdom
and New York, NY, USA.
ISO 13790, Thermal Performance of Buildings—Calculation of Energy Use for Space
Heating, ISO, 2010.
ISO publications ISO 23045_2009, ISO, Geneva, Switzerland, January 2009.
Jacobs, J. (1961). The Death and Life of Great American Cities: The Failure of Town Planning,
Random House, New York.
Jacobsen, T. S., Hansen, R., Mathiesen, E., Nielsen, P. V., and Topp, C. (2002). Design
method and evaluation of thermal comfort for mixing and displacement ventilation, ROOMVENT 2002, pp. 209–212.
Jenks, M., Burton, E., and Williams, K., eds. (1996). The Compact City: A Sustainable
Urban Form? E & FN Spon, London.
Jenks, M., Burton, E., and Williams, K., eds. (2000a). Achieving Sustainable Urban Form,
E & FN Spon, London.
Jenks, M., Burton, E., and Williams, K. (2000b). Achieving sustainable urban form:
An introduction, In M. Jenks, E. Burton, and K. Williams, eds., Achieving
Sustainable Urban Form, E & FN Spon, London, pp. 1–6.
Jenks, M., Burton, E., and Williams, K. (2000c). Achieving sustainable urban form:
Conclusions, In M. Jenks, E. Burton, and K. Williams, eds., Achieving Sustainable
Urban Form, E & FN Spon, London, pp. 347–355.
Kahn, M. (1995). A revealed preference approach to ranking city quality of life, Journal
of Urban Economics, Vol. 38, pp. 221–235.
Kameel, R. (2002). Computer Aided Design of Flow Regimes in Air-Conditioned Operating
Theatres, PhD thesis, Cairo University.
Kameel, R. and Khalil, E. E. (2001). Numerical computations of the fluid flow and heat
transfer in air-conditioned spaces, NHTC2001-20084, 35th National Heat Transfer
Conference, Anaheim, CA.
Kameel, R. and Khalil, E. E. (2002a). Prediction of flow, turbulence, heat-transfer and
air humidity patterns in operating theatres, ROOMVENT 2002, pp. 69–72.
Kameel, R. and Khalil, E. E. (2002b). Prediction of turbulence behaviour using k-ε
model in operating theatres, ROOMVENT 2002, pp. 73–76.
Kameel, R. and Khalil, E. E. (2003). Energy efficiency, merits, and advantages of various air-conditioning system in commercial buildings, in Egypt, Proceedings of
ASHRAE-RAL, Paper Ral.3-5, Cairo.
Kennedy, M. (1995). Ekologisk stadsplanering I Europa, In Den miljövänliga staden—
en Utopi? [Ecological urban planning in Europe], Rapport fra n en seminarserie,
Miljöprosjekt Sankt Jörgen, Gøteborg.
Bibliography
257
Khalil, E. E. (2003). HVAC in energy efficiency building code, Egypt, Proceedings of
ASHRAE-RAL, Paper Ral.3-6, Cairo.
Khalil, E. E. (2004a). Energy efficiency in air conditioned buildings: An overview,
Proceedings of 6th JIMEC, Amman.
Khalil, E. E. (2004b). Energy efficiency in air conditioned buildings in Egypt,
Proceedings of 6th JIMEC, Amman.
Khalil, E. E. (2005). Energy performance of buildings directive in Egypt: A new direction, HBRC Journal, Vol. 1, pp. 15–27.
Khalil, E. E. (2006). Energy performance of commercial buildings in Egypt: A new
direction, Proceedings, Energy2030, Abu Dhabi, November 2006.
Khalil, E. E. (2008a). Air conditioning and refrigeration code for energy-efficient buildings in the Arab world, Journal of Kuwait Society of Engineers, Vol. 100, pp. 94–95.
Khalil, E. E. (2008b). Arab-air conditioning and refrigeration code for energy-efficient
buildings, Arab Construction World, Vol. 28, No. 8, pp. 24–26.
Khalil, E. E. (2009). Thermal management in hospitals: Comfort, air quality and
energy utilization, Proceedings ASHRAE, RAL, Kuwait, October 2009.
Khalil, E. E. (2010). Ten tips for energy-efficient air-conditioned buildings, Proceedings
of DETC, ASME International Design Engineering Technology Conference,
DETC2010-28348, Montreal, Canada, August 2010.
Khalil, E. E. (2011). Ventilation of the archaeological tombs of the valley of kings,
Luxor, Egypt, Proceedings of International Conference on Air-Conditioning &
Refrigeration 2011, ICACR2011, ICACR2011-00102, Korea.
Khalil, E. E. (2012a). An international outlook of innovative design of low carbon
buildings, Keynote paper at 3rd International symposium on low carbon buildings
(ISLCB), Ningbo, China, October 2012.
Khalil, E. E. (2012b). Energy performance of commercial buildings: A new direction,
Proceedings, ASME IMECE, November 2012.
Khalil, E. E. (2012c). International focus on emerging technologies & opportunities,
ASME Congress, Paper Number IMECE2012-94127.
Khalil, E. E., Medhat, A. A., Morkos, S. M., and Salem, M. Y. (2012). Applications of
neural network in predicting energy consumption in administrative buildings,
AIAA Annual Meeting, January 2012.
Khalil, H. (2009a). Energy efficiency strategies in urban planning of cites, 7th Inter
national Energy Conversion Engineering Conference IECEC 2009. AIAA, Orlando.
Khalil, H. (2009b). Energy efficiency strategies in urban planning of cities, 45th
AIAA/ASME/SAE/ASEE Joint Propulsion Conference & Exhibit and 7th Annual
International Energy Conversion Engineering Conference, 2–5 August, 2009, Denver,
Co, USA, paper No. AIAA 2009-4622.
Khalil, H. (2010). New urbanism, smart growth and informal areas: A quest for sustainability, In Steffen Lehmann, Husam AlWaer, and Jamal Al-Qawasmi, eds.,
Sustainable Architecture & Urban Development, CSAAR, Amman, pp. 137–156.
Khalil, H. (2012a). Affordable housing: Quantifying the concept in the Egyptian context, Journal of Engineering and Applied Science, Vol. 59, No. 2, pp. 129–148.
Khalil, H. (2012b). Enhancing quality of life through strategic urban planning,
Sustianable Cities and Society, Vol. 5, pp. 77–86.
Khalil, H. (2012c). Sustainable urbanism: Theories and green rating systems, 48th
AIAA/ASME/SAE/ASEE Joint Propulsion Conference & Exhibit and 10th Annual
International Energy Conversion Engineering Conference, 30 July–1 August, 2012,
Atlanta, GA, USA, paper No. AIAA 2012-4248.
258
Bibliography
Kosonen, R. (2002). Displacement ventilation for room air moisture control in hot and
humid climate, ROOMVENT 2002, pp. 241–244.
Land, K. C. (1996). Social indicators and the quality of life: Where do we stand in the
mid-1990s? SINET, Vol. 45, pp. 5–8.
Lehman and Associates. (1995). Urban Density Study: General Report, Office for the
Greater Toronto Area, Toronto, Canada.
Leite, B. C. C. and Tribess, A. (2002). Analysis of under floor air distribution system:
Thermal comfort and energy consumption, ROOMVENT 2002, pp. 245–248.
Leite, C. and Tello, R. (2011). Megacity Sustainability Indicators. Retrieved April 15,
2012, from http://www.stuchileite.com
Leung, H. L. (2003). Land Use Planning Made Plain, 2nd ed., University of Toronto
Press, Toronto.
Liu, Y. and Moser, A. (2002). Airborne particle concentration control for an operating
room, ROOMVENT 2002, pp. 229–232.
Llewelyn-Davies, South Bank University, Environment Trust Associates, and London
Planning Advisory Committee. (1994). The Quality of London’s Residential
Environment, London Planning Advisory Committee, London.
Madanipour, A. (1996). Design of Urban Space, John Wiley, New York.
McGranahan, G. (2005). An overview of urban environmental burdens at three scales:
Intra-urban, urban-regional, and global, special feature on the environmentally
sustainable city, International Review for Environmental Strategies, Vol. 5, No. 2,
pp. 335–356.
McGregor, J. A., Camfield, L., and Woodcock, A. (2009). Needs, wants and goals:
Wellbeing, quality of life and public policy, Applied Research Quality Life, Vol. 4,
pp. 135–154.
McHarg, I. (1969). Design with Nature, The Natural History Press, Garden City, NY.
McLaren, D. (1992). Compact or dispersed? Dilution is no solution, Built Environment,
Vol. 18, No. 4, pp. 268–284.
McMullen, D. (2000). High densities—Key to meeting housing needs, Urban
Environment Today, 10 February, p. 9.
Medhat, A. A. and Khalil, E. E. (2006). Thermal comfort meets human acclimatization
in Egypt, Proceeding of Healthy Building, Vol. 2, p. 25.
Mercer. (2011). Mercer 2011 Quality of Living Survey Highlights—Defining ‘Quality of
Living’, Mercer, Retrieved January 25, 2012, from http://www.mercer.com/
articles/quality-of-living-definition-1436405
Milford, E. (2009). Masdar city: A source of inspiration, Renewable Energy World Magazine,
Vol. 12, No. 2, Retrieved March 15, 2009, from http://www.renewableenergyworld.
com/rea/news/article/2009/04/masdar-city-a-source-of-inspiration
Ministry of Economic Development. (2008). Egypt Achieving The Millennium
Development Goals: A Midpoint Assessment, Ministry of Economic Development,
Cairo, Egypt.
Ministry of Housing, Utitilties and Urban Development. (2008). Project for Giza
Northern Sector Development and Reuse of Imbaba Airport Site, Ministry of Housing,
Utilities and Urban Development, Cairo.
Ministry of State for Environmental Affairs and Egyptian Environmental Affairs
Agency. (2009). Climate change 2001–2009, Retrieved May 3, 2009, from http://
www.eeaa.gov.eg
Moffatt, I. (2000). Ecological footprints and sustainable development, Ecological
Economics, Vol. 32, No. 3, pp. 359–362.
Bibliography
259
Moos, M., Whitfield, J., Johnson, L. C., and Andrey, J. (2006). Does design matter?
The ecological footprint as a planning tool at the local level, Journal of Urban
Design, Vol. 11, No. 2, pp. 195–224.
Morris, W. and Kaufman, J. (1998). The new urbanism: An introduction to the
movement and its potential impact on travel demand with an outline of its
application in Western Australia, Urban Design International, Vol. 3, No. 4,
pp. 207–221.
Muñoz, S. S. (2007). Do ‘green’ appliances live up to their billing, The Wall Street
Journal, p. 360.
Murakami, S. (2008). Promoting eco-model cities to create a low-carbon society,
International Seminar on Promoting the Eco-Model Cities for The Low Carbon Society,
Tokyo, Japan.
NÆSS, P. (1997). Fysisk Planlegging Og Energibruk [Physical planning and energy use],
Tano Aschehoug, Oslo.
Nakamura, Y. and Fujikawa, A. (2002). Evaluation of thermal comfort and energy
conservation of an ecological village office, ROOMVENT 2002, pp. 413–416.
Nasar, J. (1997). Neo-traditional development, auto-dependency and sense of community, In M. Amiel and J. Vischer, eds., Space Design and Management for Place
Making, EDRA 28, EDRA, Edmond, OK, pp. 39–43.
Nation Ranking. (2011). Quality of Life Index 2011 Rankings, Nation Ranking:
Quantifying the World of Sovereign States, Retrieved January 21, 2012, from
https://nationranking.wordpress.com/category/quality-of-life-index/
Naydenov, K., Pitchurov, G., Langkilde, G., and Melikov, A. K. (2002). Performance of
displacement ventilation in practice, ROOMVENT 2002, pp. 483–486.
Newman, P. (2006). The environmental impact of cities, Environment and Urbanization,
Vol. 18, No. 2, pp. 275–295.
Newman, P. and Kenworthy, J. (1989a). Cities and Automobile Dependence: An
International Sourcebook, Gower Technical Press, Brookfield, VT.
Newman, P. and Kenworthy, J. (1989b). Gasoline consumption and cities: A comparison of US cities with a global survey, Journal of the American Planning Association,
Vol. 55, No. 1, pp. 24–37.
Newman, P. and Kenworthy, J. R. (1999). Sustainability and Cities: Overcoming
Automobile Dependence, Island Press, Washington, DC.
Ng, J. (2009). New Energy Star 5.0 Specs for Computers Become Effective Today. DailyTech.
Retrieved July 1, 2009, from http://www.dailytech.com/New+Energy+Star+
50+Specs+for+Computers+Become+Effective+Today/article15559.htm
Oldfield King Planning Ltd. (1998). Car Parking and Social Housing: National Planning
and Housing Policy, National Housing Federation, London.
Oldham, L., Shorter, F., and Tekçe, B. (1994). A Place to Live, Families and Child
Health in a Cairo Neighbourhood, The American University in Cairo Press,
Cairo, p. 10.
Olesen, B. W., Koschenz, M., and Johansson, C. (2003). New European standard proposal for design and dimensioning of embedded radiant surface heating and
cooling systems, ASHRAE Transactions, Vol. 109, pp. 107–120.
Omer, A. M. (2008). Energy, environment and sustainable development, Renewable
and Sustainable Energy Reviews, Vol. 12, No. 9, pp. 2265–2300.
Orchard, L. (1995). National urban policy in the 1990’s, In P. Troy, ed., Australian
Cities: Issues, Strategies and Policies for Urban Australia in The 1990’s, University of
Cambridge Press, Cambridge, pp. 65–86.
260
Bibliography
Organization for Economic Cooperation and Development (OECD). (2011). Better Life
Initiative Executive Summary, OECD Better Life Initiative, Retrieved January 20,
2012, from http://oecdbetterlifeindex.org/
Our Human Development Initiative. (2011). Global Footprint Network, Retrieved
April 30, 2012, from http://www.footprintnetwork.org/en/index.php/GFN/
page/fighting_poverty_our_human_development_initiative/
Owens, S. (1992). Energy, environmental sustainability and land use planning, In M. J.
Breheny, ed., Sustainable Development and Urban Form, Pion Ltd, London, pp. 79–105.
Panão, M. O., Gonçalves, H. J., and Ferrão, P. M. (2008). Optimization of the urban
building efficiency potential for mid-latitude climates using a genetic algorithm
approach, Renewable Energy, Vol. 33, No. 5, pp. 887–896.
Pickup, L. (1984). Women’s gender-role and its influence on travel behavior, Built
Environment, Vol. 10, No. 1, pp. 61–68.
Pollard, T. (2001). Greening the American dream? Planning, Vol. 67, No. 10, pp. 10–16.
PowerPulse.net. (1948). New Energy Star Promoting New Specs at APEC and PPDC,
Retrieved June 8, 2006, from 80plus.org
PrEN 13363-1, Solar protection devices combined with glazing—Calculation of solar
energy and light transmittance—Part 1: Simplified method, Brussels, 2005.
PrEN ISO 10077-2, Thermal performance of windows, doors and shutters—Calculation
of thermal transmittance—Part 2: Numerical methods for frames, Brussels, 2005.
Principles of New Urbanism. (n.d.). New Urbanism, Retrieved December 24, 2009,
from http://www.newurbanism.org/newurbanism
Radberg, J. (1998). Ebenezer Howard’s dream: 100 years after. Paper presented at the
44th International Federation of Housing and Planning World Congress, September
13–17, Lisbon, Portugal.
Rapley, M. (2003). Quality of Life Research: A Critical Introduction, Sage, London.
Rapport, D. J. (2000). Ecological footprints and ecosystem health: Complementary
approaches to a sustainable future, Ecological Economics, Vol. 32, No. 3, pp. 367–370.
Rees, W. (1992). Ecological footprints and appropriated carrying capacity, Environment
& Urbanization, Vol. 4, No. 2, pp. 121–130.
Rees, W. (2000). Eco-footprint analysis: Merits and brickbats, Ecological Economics,
Vol. 32, No. 3, pp. 371–374.
REN21 Renewable Energy Policy Network for the 21st Century. (2014). Renewables
2014, Global Status Report, REN21 Secretariat, UNEP, Paris, France.
Roback, J. (1982). Wages, rents, and the quality of life, Journal of Political Economy,
Vol. 90, pp. 1257–1278.
Roy, A. (2005). Urban informality: Toward an epistemology of planning, Journal of
The American Planning Association, Vol. 71, No. 2, pp. 147–158.
Ruta, D. (1998). Patient generated assessment: The next generation, MAPI Quality of
Life Newsletter, Vol. 20, pp. 461–489.
Ruta, D., Camfield, L., and Martin, F. (2004). Assessing individual quality of life in
developing countries: Piloting a global PGI in Ethiopia and Bangladesh. Quality
of Life Research, Vol. 13, No. 9, p. 1545.
Ruta, D. A., Garratt, A. M., Leng, M., Russell, I. T., and MacDonald, L. M. (1994).
A new approach to the measurement of quality of life: The patient generated
index (PGI). Medical Care, Vol. 32, No. 11, pp. 1109–1126.
Rydin, Y. (1992). Environmental dimensions of residential development and the
implications for local planning practice, Journal of Environmental Planning and
Management, Vol. 35, No. 1, pp. 43–61.
Bibliography
261
Scully, V. (1994). The architecture of community, In P. Katz, ed., The New Urbanism:
Toward an Architecture of Community, McGraw-Hill, New York, pp. 221–230.
Self, P. (1997). Environmentalism and Cities. Newsletter Urban Research Program
no. 32, Research School of Social Sciences, Australian National University,
Canberra.
Shannon, G. and Cromley, E. (1985). Settlement and density patterns: Toward the 21st
century, In J. Wohlwill and W. Van Vliet, eds., Habitats for Children: The Impacts of
Density, Lawrence Erlbaum, Hillsdale, NJ, pp. 1–16.
Shea, W. (1976). Introduction: The quest for a high quality of life, In J. King-Farlow
and W. Shea, eds., Values and The Quality of Life, Science History Publications,
New York, pp. 1–5.
Sherlock, H. (1991). Cities are Good for Us, Paladin, London.
Shireman, W. (1992). How to use the market to reduce sprawl, congestion and waste
in our cities, In B. Walter et al., eds., Sustainable Cities: Concepts And Strategies for
Eco-City Development, Eco-Home Media, Los Angeles, CA, pp. 1–354.
Simmonds, D. and Coombe, D. (2000). The transport implications of alternative urban
forms, In M. Jenks, E. Burton, and K. Williams, eds., Achieving Sustainable Urban
Form, E & FN Spon, London, pp. 115–123.
Smyth, H. (1996). Running the gauntlet: A compact city within a doughnut of decay,
In M. Jenks, E. Burton, and K. Williams, eds., The Compact City. A Sustainable
Urban Form? E & FN Spon, London, pp. 101–113.
Smyth, J. (1992). The economic power of sustainable development: Building the
new American dream, In B. Walter et al., eds., Sustainable Cities: Concepts
And Strategies for Eco-City Development, Eco-Home Media, Los Angeles, CA,
pp. 1–354.
Spangenberg, J. H. and Lorek, S. (2002). Environmentally sustainable household consumption: From aggregate environmental pressures to priority fields of action,
Ecological Economics, Vol. 43, pp. 127–140.
Stead, D., Williams, J., and Titheridge, H. (2000). Land use, transport and people:
Identifying the connections, In M. Jenks, E. Burton, and K. Williams, eds.,
Achieving Sustainable Urban Form, E & FN Spon, London, pp. 174–186.
Stenhouse, D. (1992). Energy conservation benefits of high density mixed-use
land development, In B. Walter et al., eds., Sustainable Cities: Concepts And
Strategies for Eco-City Development, Eco-Home Media, Los Angeles, CA,
pp. 1–354.
Stoel, T. B., Jr. (1999). Reining in urban sprawl, Environment, Vol. 41, No. 4, pp. 6–11.
Stubbs, M. (2002). Car parking and residential development: Sustainability, design
and planning policy, and public perceptions of parking provision, Journal of
Urban Design, Vol. 7, No. 2, pp. 213–237.
Templet, P. (2000). Externalities, subsidies, and the ecological footprint: An empirical
analysis, Ecological Economics, Vol. 32, No. 3, pp. 381–384.
The Academy of Urbanism. (2010). The Frieburg Charter of Sustainable Urbanism:
Learning from Place, The Academy of Urbanism, London.
The Economist Intelligence Unit (EIU). (2007). The Economist Intelligence Unit’s
quality-of-life index, THE WORLD IN 2005, The Economist, Retrieved
January 20, 2012, from http://www.economist.com/media/pdf/QUALITY_
OF_LIFE.pdf
The Economist Intelligence Unit. (2009). European Green City Index: Assessing
The Environmental Impact of Europe’s Major Cities, Siemens AG, Munich.
262
Bibliography
The Economist Intelligence Unit. (2010). Latin American Green City Index: Assessing
The Environmental Performance of Latin America’s Major Cities, Siemens AG, Munich.
The Economist Intelligence Unit. (2011a). African Green City Index: Assessing
The Environmental Performance of Africa’s Major Cities, Siemens AG, Munich.
The Economist Intelligence Unit. (2011b). Asian Green City Index: Assessing
The Environmental Performance of Asia’s Major Cities, Siemens AG, Munich.
The Economist Intelligence Unit. (2011c). US and Canada Green City Index: Assessing The
Environmental Performance of 27 Major US and Canadian Cities, Siemens AG, Munich.
The Prince’s Foundation. (2000). Sustainable Urban Extensions: Planned Through Design.
A Collaborative Approach to Developing Sustainable Town Extensions through Enquiry
by Design, The Prince’s Foundation, London, p. 1.
The United Nations Centre for Human Settlements (UNCHS) and the United Nations
Environment Programme (UNEP). (1999). The SCP Source Book Series, Volume 5
Institutionalising the Environmental Planning and Management (EPM) Process,
UNCHS, Nairobi, Kenya.
The United Nations Economic Commission for Africa (UNECA) and North Africa
Office. (2003). The fight against desertification and drought in North Africa,
The Eighteenth Meeting of the Intergovernmental Committee of Experts, United
Nations Economic Commission for Africa, Tangiers, Morocco.
Thompson-Fawcett, M. (2000). The contribution of urban villages to sustainable
development, In M. Jenks, E. Burton, and K. Williams, eds., Achieving Sustainable
Urban Form, E & FN Spon, London, pp. 275–285.
Timmer, J. (2008). EPA Tightens Rules on its Green Power Partners, Arstechnica.com,
Retrieved March 23, 2009, from http://arstechnica.com/old/content/2008/12/
epa-tightens-rules-on-its-green-power-partners.ars
Tirado, J. (n.d.). Smart Growth Advances Nationally, New Urbanism, Retrieved
December 24, 2009, from http://www.newurbanism.org
Titheridge, H., Hall, S., and Banister, D. (2000). Assessing the sustainability of urban
development policies, In M. Jenks, E. Burton, and K. Williams, eds., Achieving
Sustainable Urban Form, E & FN Spon, London, pp. 149–159.
Transit Oriented Development. (n.d.). Design for a Livable Sustainable Future, Transit
Oriented Development, Retrieved January 29, 2010, from http://www.
transitorienteddevelopment.org
Tugend, A. (2008). If your appliances are avocado, they’ re probably not green, New York
Times. Retrieved June 29, 2008, from http://www.nytimes.com/2008/05/10/
business/yourmoney/10shortcuts.html?scp = 1&sq = appliances%20avocado%
20green&st = cse
UN General Assembly. (2014). Report of the Open Working Group of the General
Assembly on Sustainable Development Goals, Sixty – eighth session, A/68/970,
Retrieved August 15, 2014, from http://undocs.org/A/68/970
United Nations Development Programme (UNDP). (2010). Human Development Report
2010, 20th Anniversary Edition, The Real Wealth of Nations: Pathways to Human
Development, UNDP, New York.
United Nations Environment Programme (UNEP). Activities: Urban—Energy for Cities,
Retrieved May 14, 2009, from http://www.unep.or.jp/Ietc/Activities/Urban/
energy_city.asp
United Nations Human Settlements Programme (UN-HABITAT). (2006). The State
of The World’s Cities Report 2006/2007: 30 Years of Shaping The Habitat Agenda,
Earthscan, London, UK.
Bibliography
263
United Nations Human Settlements Programme (UN-HABITAT). (2008). State of the
World’s Cities 2008/2009: Harmonious Cities, Earthscan, London, UK.
United Nations Human Settlements Programme (UN-HABITAT). (2009). Planning
Sustainable Cities: Policy Directions, Global Report On Human Settlements, Abridged
Edition, Earthscan, London, UK.
United Nations Human Settlements Programme (UN-HABITAT). (2012a). Evaluation
Report 2/2012 Mid-Term Evaluation of the Cities and Climate Change Initiative,
UN-Habitat, Nairobi.
United Nations Human Settlements Programme (UN-HABITAT). (2012b). State of
the World’s Cities Report 2012/2013: Prosperity of Cities, UN-HABITAT, Nairobi,
Kenya.
United Nations Human Settlements Programme (UN-HABITAT). (2013). State of the
World’s Cities 2012/2013: Prosperity of Cities, Routledge, New York.
USA DOE, 2002, Retrieved www.energy.gov
U.S. Environmental Protection Agency. 2006 Annual Report: Energy Star and Other
Climate Protection Partnerships. Retrieved March 1, 2008, from http://www.
energystar.gov/ia/news/downloads/annual_report_2006.pdf.
US-Green Building Council, 2012, Retrieved www.usgbc.org
Van den Bergh, J. and Verbruggen, H. (1999). Spatial sustainability, trade and indicators: An evaluation of the ecological footprint, Ecological Economics, Vol. 29,
pp. 61–72.
Van der Ryn, S. (1986). The suburban context, In S. Van der Ryn and P. Calthorpe, eds.,
Sustainable Communities: A New Design Synthesis for Cities, Suburbs and Towns,
Sierra Club Books, San Francisco, CA, pp. 1–238.
Van Dijk, D. and Khalil, E. E. (2009). Energy efficiency in buildings, ISO Focus, pp. 16–20.
Van Dijk, D. and Khalil, E. E. (2011). Future cities—Building on energy efficiency,
ISO Focus, pp. 25–27.
Veenhoven, R. (1996). The study of life satisfaction, In W. Saris, R. Veenhoven, A. C.
Scherpenzeel, and B. Bunting, eds., A Comparative Study of Satisfaction with Life
in Europe, Eötvös University Press, Budapest, pp. 11–48.
Veenhoven, R. (2007). Subjective measures of well-being, In M. McGillivray, ed.,
Human Well-being, Concept and Measurement, Palgrave/McMillan, Houndmills,
NH, pp. 214–239.
Vilhelmson, B. (1990). Va r dagliga rørlighet: om resandes utveckling, førdelning
och gränser [Our Daily Mobility: On the Development, Distribution and
Limits of Travelling]. TFB report 1990: 16, The Swedish Transport Board,
Stockholm.
Wackernagel, M. (2009). Securing human development in a resource-constrained
world, DAC News, Retrieved April 30, 2012, from http://www.oecd.org/
dataoecd/52/1/43844294.htm#H56
Wackernagel, M. and Rees, W. (1996). Our Ecological Footprint: Reducing Human Impact
on the Earth, New Society Publishers, Gabriola Island, BC.
Walsh, B. (1997). The right mix for urban living, Urban Environment Today, Vol. 14,
No. 20, pp. 8–9.
Walter, B., Lois, A. and Crenshaw, R., eds. (1992). Sustainable Cities: Concepts and
Strategies for Eco-City Development, Eco-Home Media, Los Angeles, CA.
WHOQOL Group. (1998). Development of the World Health Organization WHOQOLBREF quality of life assessment, Psychological Medicine, Vol. 28, pp. 551–558.
Why Obama’s Energy Savings Estimate May Be Skewed, New York Times, 2010.
264
Bibliography
Wilbanks, T. J. and Kates, R. W. (1999). Global change in local places: How scale
matters, Climatic Change Vol. 43, No. 3, pp. 601–628.
Woodcock, A., Camfield, L., McGregor, J. A., and Martin, F. (2009). Validation of the
WeDQoL-goals-Thailand measure: Culture-specific individualized quality of
life, Social Indicators Research, Vol. 94, No. 1, pp. 135–171
Woodhull, J. (1992). How alternative forms of development can reduce traffic congestion, In B. Walter et al., eds., Sustainable Cities: Concepts and Strategies for Eco-City
Development, Eco-Home Media, Los Angeles, CA, pp. 1–354.
World Energy Council (WEC). (2013). World Energy Resources: 2013 Survey, World
Energy Council, London. www.worldenergy.org
www.ecocitizenworldmap.org
www.ecocitystandards.org
www.egypt-urban.net
www.energystar.gov/index.cfm?c=evaluate_performance.pt_neprs_learn
www.energystar.gov/benchmark
www.masdar.ae/en/
Renewable Energy
ENERGY EFFICIENCY
in the URBAN ENVIRONMENT
Heba Allah Essam E. Khalil • Essam E. Khalil
Energy Efficiency in the Urban Environment is a study of energy crisis,
urbanisation, and climate change, as well as a discussion of how to combat these global challenges. With a special focus on Egypt, this book
addresses the macroscale of urbanism from the perspective of city dwellers’ quality of life and explores the microscale of buildings and the perspective of ensuring indoor air quality within the boundaries of energy
efficiency.
Offering an integrated view of energy systems and urban planning supported by extensive data, references, and case studies, this text:
•
•
•
•
•
Examines the energy efficiency performance of cities following
sustainable urbanism principles
Investigates how informal areas in developing countries achieve
sustainable development
Presents energy-efficient urban planning as a tool for improving city
energy performance
Proposes the development of a common procedure for obtaining
an energy performance certificate
Calculates the energy performance of buildings, accounting for
heating/cooling systems and other variables
Energy Efficiency in the Urban Environment demonstrates the importance
of implementing an energy performance directive to aid energy savings
in large buildings and set regulations for energy-efficient designs based
on standard calculation methods. This book provides engineers working
with sustainable energy systems, urban planners needing information on
energy systems and optimisation, and professors and students of engineering, environmental science, and urban planning with a valuable
reference on energy sustainability.
K23782
an informa business
www.taylorandfrancisgroup.com
6000 Broken Sound Parkway, NW
Suite 300, Boca Raton, FL 33487
711 Third Avenue
New York, NY 10017
2 Park Square, Milton Park
Abingdon, Oxon OX14 4RN, UK