/


Текст
Chart Reading
for
Professional
Traders
by
Michael S. Jenkins
TRADERS PRESS, INC.
INCORPOK ATED
PO BOX 6206
UREENVILLE, SC 29606
Books and (itfits
for investors and Traders
I
&'■■
s
A
'?%&&
-Si \v
^
. ^^v
%i
*tt
^■l
\\
Michwl S. Jenim.-.
Biographical Sketch
of
Michael S. Jenkins
Michael S, Jenkins was bom in Schenectady, New York on March 12, 1949. Prom earliest
childhood, he was fascinated with the stock market and studied every book and publication he
could find regarding the subject. He studied Economics and Business Administration at Washington
& Lee University and graduated witti a BS in Commerce in 1971. Tn 1975, he received an MR A
from George Mason University, lie passed the Uniform CPA Examination the same year.
Mr Jenkins held positions at various bank trust departments from 1971 -75H and in 1976. he was
appointed portfolio manager for three mutual funds in Washington, 1X\
Tn 1984, Mr. Jenkins moved to New York City to become a professional trader for a number
of specialist firms on the NYSE. In 19K.1), he founded the investment newsletter "Stock
Cycles Forecast" Because of the widespread notoriety this leiter received in precisely
predicting the final stock market high in August 1987 and specifically calling for a 500 point
drop in the Dow that would end by October 19th of that year, Mr. Jenkins has become a
frequent commentator on television and radio and is often the subject of numerous popular
financial magazine and newspaper articles.
Nearly eveiy major high and low of .significance in the past several years has been successfully
forecasted in the "Stock Cycles Forecast" newsletter—many down to the ex act day and in a
few cases, the exact hour on those dates! Mr. Jenkins is considered an authority on cycles in
the financial markets and often lectures on this subject, as well as providing investment
seminars where his proprietary hading methods aTe taught. He is the author of The Geometry
of Stack Market Profits, A Guide To Professional Trading For A Living. Til is new book,
Chart Reading For Professional Traders, is an attempt to provide the investing public with
a basic reference work for reading charts to forecast and trade the speculative markets, using
his proprietary discoveries in the area of technical analysis.
Acknowledgments
/ H-rjft to thank the following chart services far use of their charts in the various iUusttatmns:
Daily Graphs MetaStock
PO Box 66919 EQ1T1S International, Inc,
Los Angles, CA 90066-0919 3950 South 700 East
Salt Lake City, UT 84107
Securities Research Company Dollar Link Software
J 01 Prescott Street 1407 Douglas Street
Wellesley Hills, MA 02181-3319 San Francisco, CA 94131
M.C- Horsey & Company, Inc.
120 South Blvd.
Salisbury, MD 2180J
Special thanks and appreciation are also extended to the following individuals from
Traders Press, who have spent countless hours in revising the original edition of this
book:
Allan McGill Dobson
Margaret Rox Hudson
Theresa Putyer
35
INCORPORATED
P.O. BOX 6206
GREENVILLE, S.C. 29606
BOOKS AND GIFTS FOR
TRADERS AND INVESTORS
TRADERS PRESS, INC. stocks hundreds of titles of interest to investors and traders in
stoc ks, option s, and futu re s. In add i lion, we carry a fu 111 ine of g ift items for i n v est< ir$. P! e ase
contact us, and we will gladly forward you our current "TRADER'S CATALOG" by return
mail.
800-927-8222 Fa* 064-298-0221
Tradersprc@aol .torn
Table of Contents
Introduction ., 11
Basic Concepts 14
Trend 19
Forecast! ng 28
Circular Arcs , , 38
Su pport & Rcsi stance , 48
Waves 58
Angles 63
The Hourly Chart. 73
Emotional Charts 79
Common Pattern is ♦ ♦ ♦, ,..... 82
Long Term Charts 90
Mirror Im ages , 96
Volume Ml
Strategy 106
1 ntra Day Patterns Ill
Step By Step 115
S&P Futures Trpd ing 117
Trading Stocks 128
Advanced 1 ech ntques , 134
Appendix A Examples 140
Introduction
There has always been a debate about whether one should invest as a fundamentalist or as a
technician, The fundamentalist, of course, docs not look a( charts but concentrates on analyzing
hardeconnmic figures in the belief that an improving fundamental situation will lead to higher
prices. Although this sounds: quite logical and perhaps 98% of all investors invest this way, it is
nevertheless wrung. Only in a general sense do the undarnentals concern traders or investors who
are looking for capital gains on an annual basis, and certainly day traders can easily go bankrupt
from short enn correct ons against the fu damentai bias. Unless major accumulation of an issue
takes place, no matter how good the fundamentals, the price is ikely to move very little, and it is
this price movement that makes money for us.
Charts and technical analysis, on the other hand, arc mostly concerned with price movement.
When secur'tics orcommodi ies are fluctuating, we can trade hem and make money. Any truly
fundamental developme it of i nportance will first show up in the price and volume data long before
outsiders will learn about the undan cntal development causing it. One docs not need illegal
*rj format i on to see illegal accumulation or major developments within a corporation or commodity
supply derm id factors that may be chang ing. Money moves the markets and big money is id way s
right no matter what the reason. The skilled chart reader will always see this price movement and
be alerted long before others. Tilts is the fundamental argument fo chart reading, but more importint
is the fact thatcycte vex'st and recur over and over again, showing up in the histo ica! record of the
price data and can be analyzed from such data to make future predictions.
Wall Street would like to deny tl e existence of cycles because no one needs a highly paid analyst
or a full service broker if cycles indicate that a stock or commodity is going Lip or down the next
\ear, regardless of perceived fundamentals. Only by having a price history can we truly say we
know what toexpect from our investment, the nature of its personality, the extremes it has traded
o over the yeais, and where it is deviating from its past patterns, which could indicate a new
significant development in the life cycle of the company.
For years I have heard the a guments about long term investing and the many people who have
made fortunes in the market using a buy and hold strategy. What is not said very often, however, is
the lens of millions of investors who bought and held the wrong stock and after thirty years have
only broken even or wot se saw then company go bankrupt. Books are not written about these
i ommate multitudes, li ! 965, Genera Motors was the most popular stock, and "what was
ill
11
good for GM was good for the country.*1 But, did you know tli.it it took unti 1 January 1994 for GM
to finally exceed the price it sold at in 1965!!! It took nearly 30 years for those 1965 buyers to
breakeven?
The idea of buy and hold is a fundamental strategy. It assumes the *ssue you hold is going up every
year. In these cases, you could get rich over time. But. the modem version of buy and hold has
been perverted by the big brokerage firms and mutual funds to lock the customer into their particular
investment program without emphasis on whether the issue is 'ictua.ll> maki ig money.The person
who buys and ho ds a declining issue is not an investor but a ool. Believ"ng the fundamental
argument that improving earnings will eventually mean a rising stock pi ice has been the death knell
for many an investor. Only technical analysis and chart reading can save these sorts of individuals.
The chart clearly shows us the objective trend whether up or down, and we can then develop
some sort of strategy to limit losses at a reasonable level if the fundamental s do not kick in.
It has been rightfully said that chart" sis sell too soon out of fear of heights and miss the big move
that often makes millionaires of fundamentalists. The corollary, of course, is that he chartists do
not go down with the ship when they see a sinking chart pattern. I am sure the number of rich buy
and hold fundamentalists is a lot smaller than the number who held on and lost everything. The
obvious solution, of course, is a marriage of the two concepts. I have no problem with the person
who strongly believes in his investment and wants to hold it forever, using a common sense strategy
to sell it when he gets a tcchnica sell signal, but imn ediately takes steps to repurchase it if it again
reverses with a buy signal. This kind of long term strategy will be infinitely more rewarding in those
cases where a stock goes up for years and truly does mnkc millionaires out of its owners.
This Book
The purpose of this book is to demonstrate the principles of chart reading and technical analysis as
applied to general chart reading for trading purposes. Advanced techniques to nd cycles, project
price targets, and time periods for reversals will be examined at length. Many of m> orignal
discoveries in this field will now, for the first time, be published in an effo t to help the investing
public make a success of trading and allow the average person the ability to consistently make
profits in the speculative markets. 1 will not coverall areas of technical analysis, nor will I teach the
basics of stocks, options, or futures I assume you can learn these things ftom a thousand other
books at your local library. What I will show you, however, is a comprehensive method to make
money each and every month. Making money each month, of course, means tli.it with a reasonable
amount of capital you can become independent and live the kiiu of life you choose not fettered
with the burdens of everyday work drudgery.
These principles always work. That s why they arc called principles, I have no lime to
spend lengthy chapters explaining to you the reasons bch'nri these principles or the f indumenta
cause and effect behind price move nents. My purpose here is to simph reveal these methods
for making money. I have been a professional trader for over twenty-three ye,irs now and can
12
assure you that these principles aic well worth learning! For those of you who must know the
reasons, 1 direct you to my book The Geometry of Stock Market FrofUs, A Guide To
Professional Trading For A I iving.
The e are many esoteric t ulhs handed down to s from ancient times, and many of these are
applicable to the speculative markets. 1 le professional trader knows that the objective is to make
money, not espo se a particular ph'losophy or do it "the right way." Keeping an open mind is the
key.
From the cirliest days, great spiritual leaders have spent lifetimes trying toe mquerthe subconscious
mind and the body. Often rigid disciplines of starvation, flagellation, meditation, or deprivation
were used to teach the body and subconscious to respond withoi t question. If you propose to
enter the largest arena in the world tha exhibits ear and greed (the speculative markets), and you
ire brought there motivated by the emotion of greed to make money, you will surely fail. This is
why there are few rich stock analysts on Wall Street. They are deluded into thinking they are
intellectual and rational jn their behavior, but the reality is still emotional greed. The sol lion, and
this may he theg eatest lesson in this book, is that in an emotional market you must use your brains
not to make money, but toe ontrol your emotions. Your logical reasoning should be put to use
developing strategics apart from the emotions of the trade. Chart reading with this in mind will yield
mfini e results. Pr nciples tin be appl'ed na cold, hard, non-emotional fashion and a stop loss
discipline is then ig dly applied when the strategy goes awry. Of course, this makes trading a
business and not an emotional thrill, but it will be a consistently profitable business!
13
Basic Concepts
The tlieory behind technical analysis is that all relevant information that concerns the appreciation
or decline of stock prices is reflected in the chart of the price and volume. All information* no
matter how secretive, must first surface in the buying and selling uf the stock and thereby moves
the price of the issue if it is of significance to the capital gains' investor. Fundamental analysis,
although possibly relevant to long term trends, may or may not generate current buying enthusiasm
and, in that case, has no effect on the price of the security.
The idea of stock price movements as a process of accumulation and distribution is the backbone
of chart analysis. Major insiders accumulating large positions prior to significant upward price
movements readily show their characteristic footprints in the chart patterns prior to the big moves,
and Ihese patterns have been shown to have high forecasting reliability. Similarly, distribution periods
where insiders slowly sell out major positions prior to big market breakdowns also have telltale
character sties that are of extreme value to the knowledgeable chart reader. Since these trends are
usually long term in nature, at least the significant price movement ones, their characteristic patterns
can be broken down into subtle waves or fractal patterns for each movement, and many of even
the slightest counter-trend movements can be captured by the astute chart reader A stock or
commodity that has an annual range of 20% between the yearly low extreme to the high extreme
oftonhas three or four minor movements of !0to 15% within that larger yearly range. The active
trader can therefore often achieve rates of return several times the annual range if a comprehensive
trading discipline is utilized to exploit the known facts. Recent advances in technical analysis have
opened the way to the possibilities of spectacular returns, and the purpose of this book is to
acquaint you with many of my own proprietary discoveries in this area, along with the traditional
methods that I have found to be most reliable in my professional trading career
Knowledge is only the beginning. Strategy and patience are equally important. In the end, only a
few will truly succeed in a spectacular fashion. However, I would say that the vast majority will
immensely improve their trading with just a casual reading of this book. Eliminating easy mistakes
can often double annual tares of return, and I am sure that this book will point out many principles
that you will find can easily change your bad habits into profitable careers.
iTm
14
The Basic Accumulation, Distribution Pattern
Most traders want to trade every day. In reality, you can only take what the market will give, and
each day is not an equal probability for success, Professional traders cars readily size up a market
in the first hour and tell if the day is worth bothering with or whether the daily strategy is for small
scalping trades with frequent reversals or for more leveraged majo" moves lasting several days. If
you find yourself buying or selling every day in the first twenty minutes, you have a problem. Many
good trades come mid <lay or at the close when most traders have already committed. Make sure
you are not so emotional that you cannot keep from the action past the first hour Knowing that
each market movement has a reliable shape and time duratwnczm help.
The hssvo, accumulation, distribution pattern looks like the statistical bell shaped curve. The
base has an extended period of "backing and filling" in a sideways fashion, then comes theupsicTe"
hrcakout or run, then cotnes the topping phase. After that/there is eiTher^notfieFiipsidt!"
breakoutoja^ra^omiback to the base. Good traders do not want to trade in trie base or the
top, but only the breakaway or run phase. Once the momentum dies and a consolidation range is
hit, traders should move to the sidelines and wait.
Typical Accumulation / Distribution Pattern:
No trading In the base
\
/
15
Longlerm Bull and Bear Market, Accumulation/ Distribution
The typical pattern is the same, regardless of the time period. In other words, the above pattern
could be seen on an hourly, daily, or weekly chart. Obviously, d"ffering trading strategies are
emp oyed for longer term movements, lasting days to months, rather than on an hourly chart.
Leveraged traders using options and futures will work with hourly charts, and this pattern will often
rise and fall over a single day ns duration. The "run'1 phase, where one owns put or call options or
futures, wil ideally be limited to8 to 13 HOURS. Holding positions longer than that is not
trading but investing. Longer term traders using daily and week ly charts wi 1! find their hori .on 3-
6 days to extremes of three weeks, lliese are stock trades and options, and futures would not be
appropriate.
It is one o the more difficult aspects of trading to "sUy out" of the base or top and wait for
the real move to get started. Most traders hunger for the cheapest entry point and usually
waste days and several stops before the real move begins, when ,if they concentrated on the
"easy" 10% of the move during the run p lase, they would never get stopped out and would
make quick safe profits in the shortest time possible. Most techniques in this book are used
for identifying this most rewarding pari of the pattern (run or breakout).
16
Remember that the "flat" areas of the base or top that we want to avoid tracking in can be
spotted by loss of momentum. Momentum is simply the amount of price movement per time
period. Large momentum is nothing nure than big price fluctuations n a short time period.
When the momentum dies down, we exit our positio is until activity picks up again. If you
keep in mind the bars on a bar chart, the areas to avoid have a^eriesjofccjiial si^ed bars with
high and 3ow jointsjrandotnjy_ spread^ in a_sideways fashion fr ad able _move^nre
characteri7*d by elongated 'Trig" bars showing much momentum. Yon must train yourself
tn make a trade during these big bars. As traders, we can only take what the market gives,
and these big bars are the piyoff. Failure to trade out o fear is a mortal sin for a professional
trader.
The Bar Chart
There arc many types of charts one can use in trading, but the primary basic one is the simple bar
chart. Throughout t lis book, I will refer to these k'ncjs of charts and use the n in the examples. A
good chart reader after some practice can easily visualize the other kinds in his head without having
to keep up numerous chart papers. Even Japanese Candlesticks, which seem to be the current
rage, give no information not found on a regular bar chart but are marketed as being easier to
interpret. Iliis is not the case if you know \hc principles behind chart reading, and the simplest bar
chart wil yield infinite amounts of information if you know where to took.
In its basic form, a bar chart is simply a line drawn from the high of the time period to the low
represented by a straight vertical line. More information c^nbeobuined by adding a mark on the
vertical [ineto represent the opening and closing levels. These opening and closing levels can telhis"
a lot about (he current day's probabilities. For instance, a close at the extreme high or low of the
day will usually carry well into the icxt. Similarly, several bars or days in sequence that close strong
represent accumulation goin^ on. T could probably write several chapters alone on the meanings of
opening and closing ranges, but br the vast majority of traders the trend is more important than the
projection, and I will leave the study of those ^tiges to you if you want to master intra diy trading.
Many of the charts [ will use in this book will omit the opening find closing marks on the vertical
bars so as to cut out all but The simple trend information that is contained within the ruige on each
bar. For most trading purposes, knowing the trend and the momentum shown by the size of the
individual oar's range is enough, le typical bar chart looks as follows
17
Personalities
When you look at a chart, one of the first considerations is the type of personality the chart
has. By this, 1 mean its trading characteristics. Some stocks are glamorous and big movers,
while others are slow mov'ng snails, lops and botto s usually form individual characteristics
with some stocks "spiking" into a solitary high bar *ind rapidly declining, while others gradually
"roll over" and go down. You must adapt your trading strategy to these 'ndividmil
characteristics to be successful. Quickly buying into a gradually rounding base is a waste
of time, but a buy at a spike bottom on a signal bar reversal is a good practice. Only a first
look at the most recent history will alert you (o these trading chaiacteristies, earn to scan all
the markets to find ones with personalities that fit your trading style and profit objee iyes
rather than just taking any trade that s kws up. A corollary to this is to only trade the most
active maikets and only when they are ltoving, Trading wheat,com, bonds or stocks simply
because you have a big account is a mistake. You should concent ate on the active ones to
maximi ,e your return over the shortest time period. Identifying the personality characteristics
is one of the first things you should do. Only after you note the l>pe of character and see if it
will satisfy your particular object'ves should you then spend time on a niorede ailed look at
the trend, cycles, and projection targets. Examining (he past is always a good first exercise,
so you will have an idea ahead of time as to what is possible or ikely and what is hased on
factual past trading patterns. Looking for a huge up or down movement that t^ oM of character
w'll tic up yot r capital needlessly.
IS
Trend
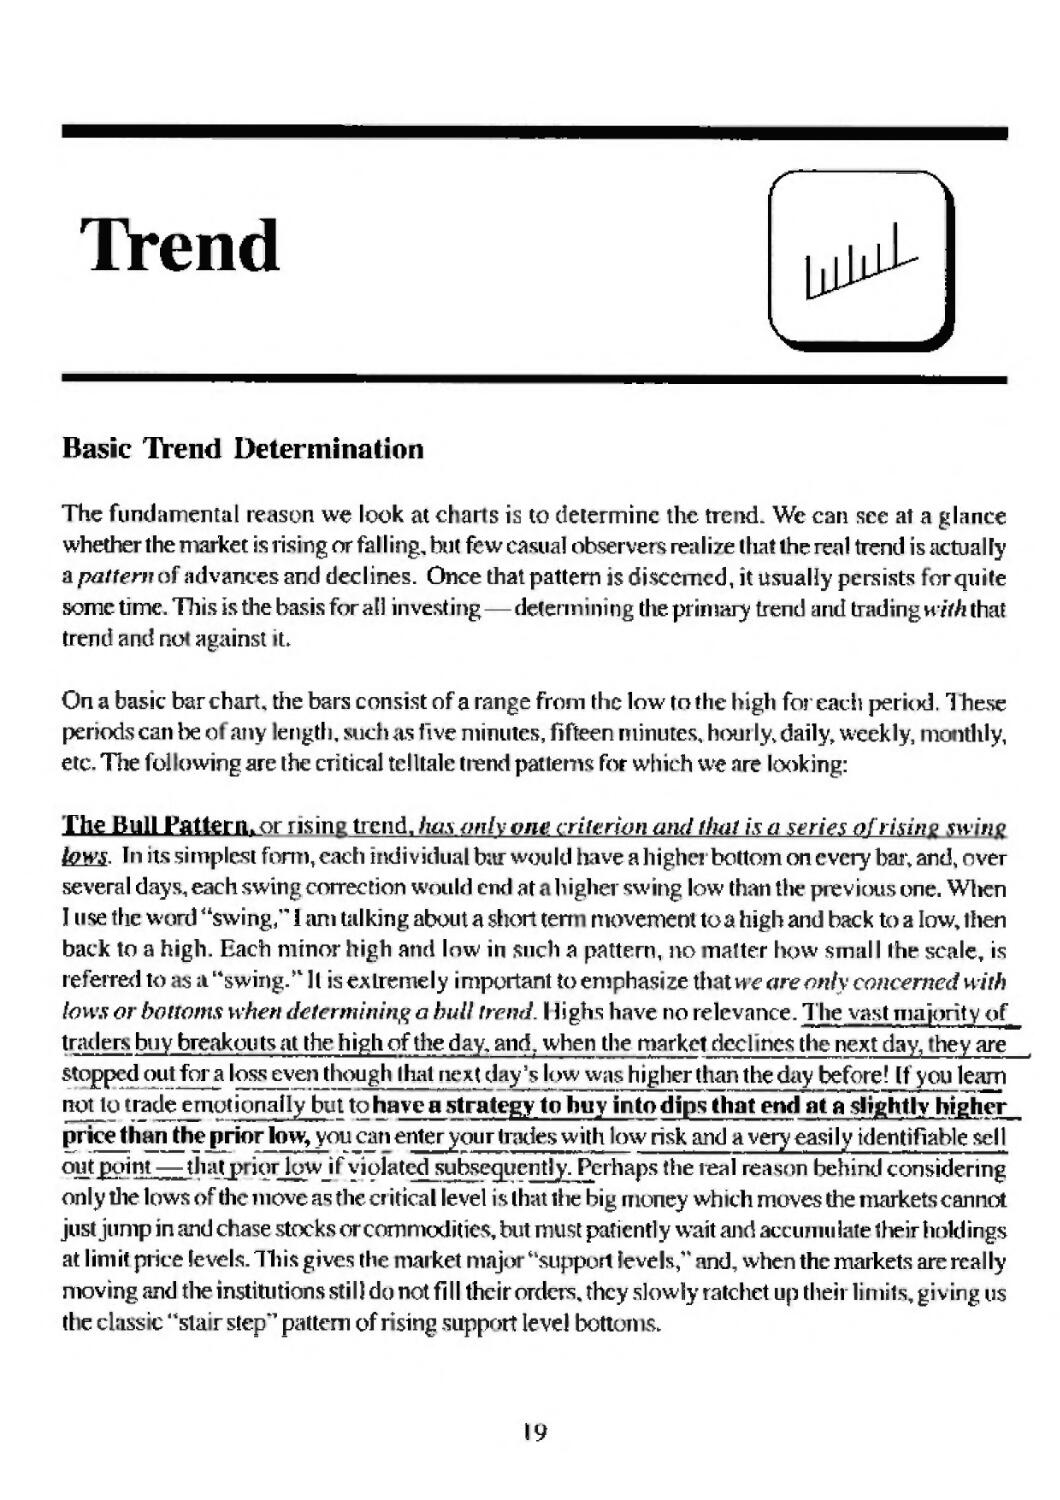
Basic Trend Determination
The fundamental reason we look at cl ar s is to determine the tre id. Wc can see at a glance
whether the market is rising or falling, bu( few casual observers realize that the real trend is actually
a pattern of advances and declines. Once that pattern is discerned, it usually persists or quite
some time. This Is the basis for a El investing—determining the primary trend anil trading with that
trend and no against L
On a basic bar chart, the bars consist of a range from the low to the high for each period. These
periods can lie o any ength, such as five minutes, fifteen minutes, houi ly, daily, weekly, no ithly,
etc. The fol owing are the critical telltale trend patterns for which we are looking:
The Bull Fatterntor risin trend, has only vne criterion and that is a series ofrisin j uv'h
tows. In its simplest form, each individual bar would h ive a higlici bottom on every bar, and, over
several days, each swing correction would end at < higher swing low than the previous one. When
I use the word "swing," i am talking about a short ten movement to a high and back to a low, ihen
back to a high. Each minor high and low in such a pattern, no miter how small Ihe scale, is
referred to ■ s a "swing." ll is eAlremely important to emphasize th twe are only concerned with
lows or bottoms when detc running o hull trend. I lighs have no re 1 evance. The vast niaj<>njyof
traders buy breakouts at the high of the day, and, when the market riccl'ncs the next day, hey are
stopped out for a loss even though I hat next day's low was higher than the day before! If yon learn
not to trade emotionally but to have a strategy to huy into dip^that^end at_a_sjightlv_hj£,hgr[
price than the prior low, you can enter your h ades with low risk and a very easily identifiable sell
°HtJ^riL3ZLM1:l-(.IJ iyrjow if violated subsequently. Perhaps the real reason behind considering
only the lows of the move as thecr itical level is that the big money wh ch moves the markets cannot
just jump in and chase stocks or commodities, but must patiently wait and accumulate their holdings
at limit price levels. Hi is gives the racket majo "support levels," ind, when the markets are really
moving and the institutions stil) do not fill their orders, they slowly ratchet up their limits, giv ing us
tl e cl'iss'c "sla'r step"' pattern of r'sing support level botton s.
19
I ■...■■ : nsisis oftw critical elements: lowe r highs and I >w Jr lows! Iliis simply
means that in a cyclical downtrend each high on every individual bur will tie lower than tlie preceding
bar, and each low will likewise be lower than the preceding low. On a 'swing* basis, each little rally
will fail at a slightly lower level than he prior rally, and each new swing low wi II hit a new low farthe
entire move. The reasoning here is that the big money is selling at limit levels and lowers them as
they do not finish at each level. In addition, since the market is weak, there are few buyers around,
and each decline will usually have to go to a slight new low to ant act bargain hunters or shorts to
cover at profitable levels, creating temporary buying.
Basic TYeiids
M
ih' i
Simple Uptrend
hi
Simple Downtrend
P
"I
H
B
P
^
Swing Uplicnd with
4 higher bottoms, 1, 2, X 4
Swiflg Downtrend w\\h lower tops 1 2, 3 ard lower lows Af B. C
Tlie idea that trend \s&pattern is tlie most important concept in this book — indeed, in all of
technical anah sis. 1 find that, over the years, T have tried to make this point oyer and over, and '^
seems that only a Yaction of a percentage of the .people irnhjejTiaricet grasps .this ,sjmple but^
powerfurconcej^^s_aresult^evcry time the market plunges 50 points or even 100 Dmvpoims,
people ask if it is a crash. My esponsejs always,flic sameMt is impgssibletQ know until we mlly^
then fai , andjo midei the first plunge low. At that point. wchave s bearish patterned we go^
short on every rally. PJungcs/vr se are not particularly bearisl. Only the Ion er lows and lower
tops pattern. Hie same holds true on intra-day charts. S&P futures traders continually get s iakcn_
out of a bullish trend on a fifteen minute plunge that turns out to be a single bar decline and nota
20
pattern of several declining bats. You must continually look for multi bar pattemsjojudgejhe
market unci not rely on a single bar extreme.
Remember that at the heart of the theory is the idea o.f accumulation or distribution,and these
are ongomgprocesxesihzH do not culminate on a single day. I arge I tends are cyclic in nature and
cannot change overnight. The single day movement would have to be so extreme as to change
everyone's long term opinion in order to change from an accumulation to distribution process and
vice versa. Also, remember that Bull and Bear Markets, in general, arepsychologhaiprui esses
by the masses as a whole and cannot be changed vernighi. IXL'-^^iJIIStMiSIll^ibE^^J^SL
period of day after day buying to genhcirwock positions during a, Kilhriarket, you cannotexpect
them to^ljever^thingjind end a new Bear Market in only six weeks. After years of a continuing^
trend, eyery hank sind institution around the world will have millions of shares of popular stocks,
and scattered sel! mg from these glubal^ources_wilUnke years to compfete. Every day into trie"^
future, someone somewhere, will wakej.ip and be tired of waiting for yesterday's leadei to go_
back up and will sejl. This is why trendspersisl, and the distribution process is a pattern of rallies
that fail and then rcsultjn new lows to attract bargain hunters. Hie early Bull Market acts the same.
Tiere are long periods of graduftf creeping, while institutions arc s owly buying, and eachjadure _
will stop at a higher level as^ipjiortjncreases^Knowin^ that a solitary^big bar" isnatjjjrpttdcan
make ynu a fortune, it you going against that bar when it is counter to the long term trend,and it
tdoes not form a pattern. The following two exhibits demonstrate the bull ind bear patterns:
\
l>cw Jul ■■■ Awm
Buic Lptt end with higher
bottomi 1-14
h.f.
11
,A(*'
hI
rf
10
il rl!
mi
'13
12
rV
lit
*1X
Net* wp are duly tone STUB d Vitih
bottom* howld^l tfa« tapi an
if nT<!lHr«nt id dBlarminaiE Lhn trattd.
v1lliu|i!llij!lli;lliJiillli!llilllllj[l1i'Jllli
111
lf»*l J S^%
llil.l|...ll...»inil
MllliH
21
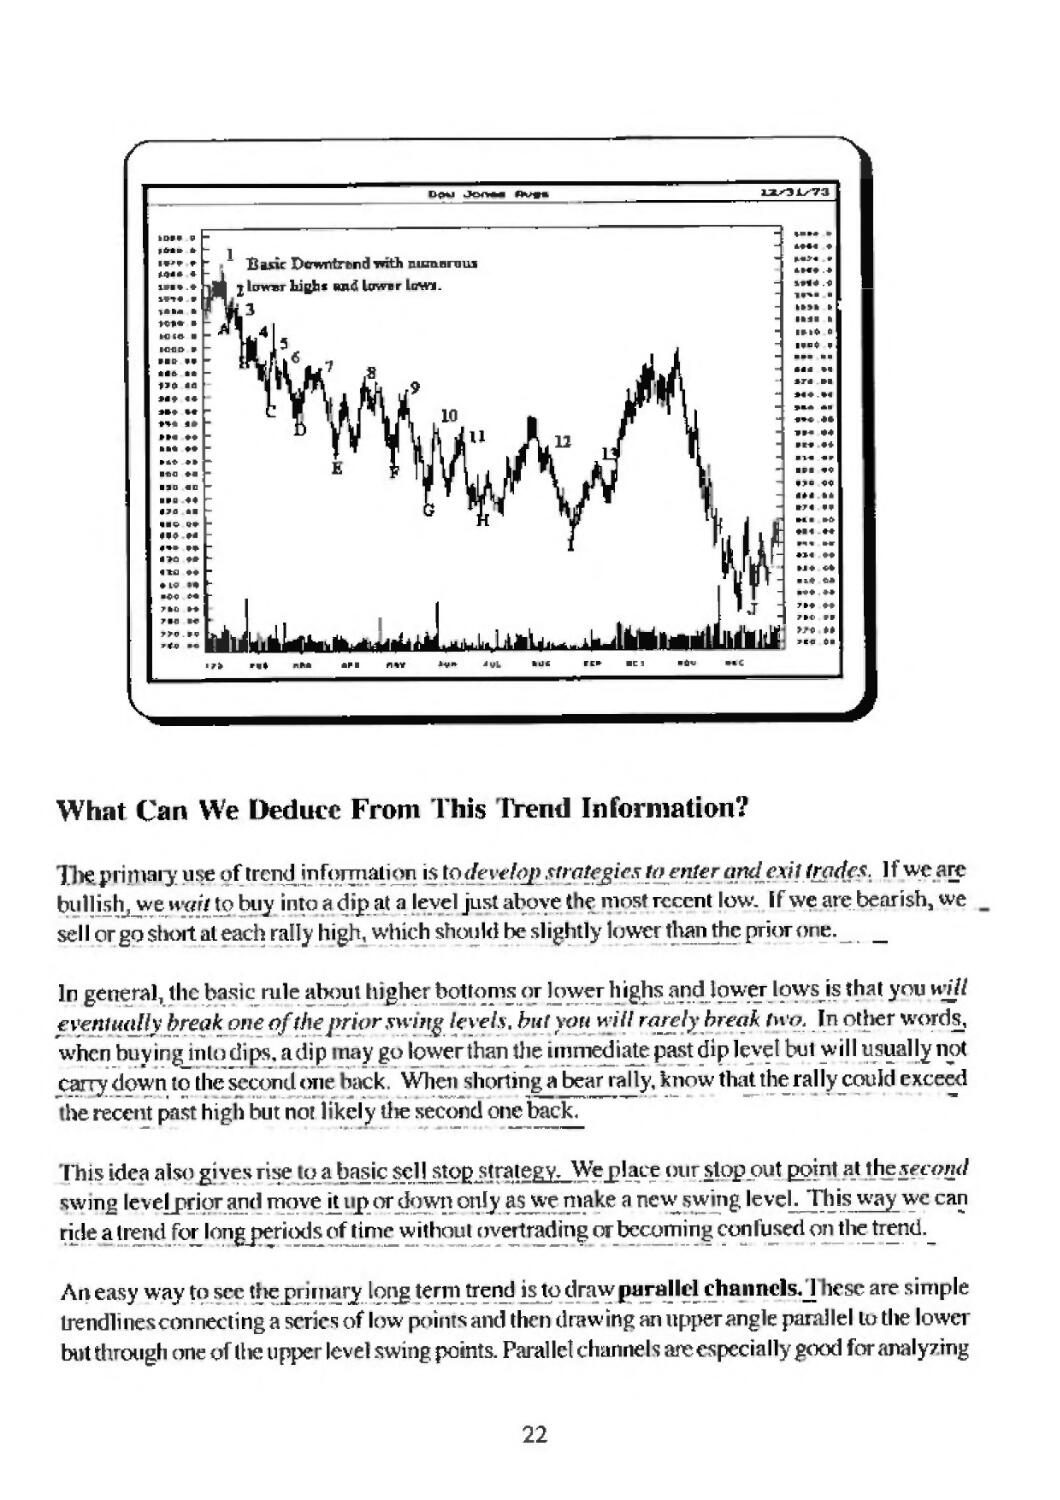
What Can We Deduce From This Frend Information?
J. ie primary use of (rend mf<im\aii»ri is todevef^istrate^iesjq^enler andjexti'trades.■ If we arc
bi 11ishj_yve wwl to buy into a dip at a level just above t if most recent low. If we are bearish, we
sell or go short at each rally high, which should be slightly lower thanthc prior one._ _
In general, the tasic rule about tiighet ,hottoms or lower highsjind[lower lows is that you will
eventutdfa break oneoftheprh rwwg levels, but you will rarely break twtt. In other words,
when buying into dips, a dip nay go lower than the immediate past dip level bul will usually not
carry down to the second one iack. When shorting a bear ra I ly, know that theral lycould exceed
he recent past hig i but not fkely the second one back.
This idea also gives rise o a ba^jelj^topJitrategy^WejiLiLe our slop out point at thesfcond
swing leveljriorand move jlij>or downi^only;a^^ji)a ;e a new swjig level. This way we can
ride a trend fojjongjreriods of time without ovef trading or becoming conTused onJhetrend._
An easy way to see the primary long term trend isjo draw parallel channels. J lesc are simple
Lreudlines connecting a scries of low points and then drawing an upper angle parallel Lo the lower
but through one of the uppe level swing points. Parallel channels are especially good for analy7tng
22
long term trends, such as over five to ten years. They give you good perspective in that for both
upper and lower trendlines to hold parallel over long periods, the trend would have lobe extremely
strong, and one would I ave to think twice before assum'ng the existing trend was ahout to turn.
Mu I ti -year paral le I diaiine Is or d i 11 ering industrial groups is one way to determ i ne an o veral I market s
BullorBca trend.
Down
Note that these are
only approx illations
used to get a rough
idea of l e trend
Reversa of Trend
We know that a bullish trend has a series of hig icr bottoms and that the bearish tren t ms a series
of both lower tops and lower lows. Since Mir basic goal is to invest with the primary trend, how
do we determine ust when one trend un s 1 o mother? Hiercare anumberoJtcdinioj.ic^biitth^
niosjbasic ^ in esignalre\ersaf bar,Thisisdefined as ullows:
In an uptrend, when you lave a se ies of higher bottoms each day or for that matter any time
period and each few days you see a new high bar for the rtove, the reversal comes when vou find
tl e highest higl bar tor the move. We am not concerned wth tha high but wjth ihehivofthat h igli
individual bar. The bar after that must have a JmivHiigh to set up u possible signal. The actual
sigrtal comes that next day or a xub&etfunU one when rhclow of the high day is broken. For
example, you might have a high bar and the next day you have a lower high, but the low is higher
orat the same price asjhe ow q then igh bar period, Yoii then liavc to wajjorjlie ncxjjbar to see
if that bar breaks below the low of that high ban Whcni/wr low is finally penetrated, you get your
sell signal with a logical stop poin^bemg theprevious high bar high, Theteasoningjjehind the
iheory is that the support level (low) of Jic enp jqna1ivdiarged|u^h_dayjstlie critical level and.
whe that goes the trend is exhausted.
T\
In a downtrend, you have a series ofjower low bars, andyou are hokitigforJh Jowest low
bar for the move. When you find that bar, you need to/tote the hi&h of that low fr&rt When on
a subsequent day the new bar has both a higher low and the high of the low paris exceeded,
you get the reversal buy signal with a sell stop at the low of that lowest bar.
Reversal Bar Signal Pattern
Lov^_tjf high bar
Sell signal
generated at this
point
^
Obviously this type of simple reversal signal happens quite often and, iftaken indiscriminately, win
lead to quick and sure bankruptcy, The best signals arc comhined with other techniques, such as
trendline breaks, cycle counts overbought oversold readings, and just plain common sense. The
longer the trend has been in effect whenthe reversal cqmes,_the morejikeiy it will be a valid sjgnal
indicating exhaustion.
ITie importance of the signal cannot be overemphasizxd. I find the vast majority of traders are
quick to pull the trigger and reverse in a nervous choppy market. Waiting for at least this basic
signal will greatly discipline oneself. You will also note that,.since^this si^naljir^ra^ p^the bij^st
bar or lowest bar for the ringe and does not come until the opposite extreme.erf that barjs
exceeded, jt is_very unjikejyjvu will get a buyor sell signal following a large elongated bar with a
bijj range It wilhisually come ater on a small range bar period^
Most traders make the fatal mistake of trading for a reversal on a big day movement, such as a 50
point up day in the stock market, whereas this signal coul t not possibly come until the low of thai
50 point run up was broken! 'litis is highly unlikely for a few days. Likewise, it is highly unlikely that
buying into a big down day will result n an up move. Futures traders typically want to sell or short
into a big up bar on a strong opening, but this kind of momentum will usually last all day. Knowing
of the reversal pattern would save them a lot of money, and knowing this signal will keep you with
the current trend throughout lliese big bat range movements and warn you when they Eire followed
by a small range bar that could lead to a reversal.
24
Note that t is method usua lyis only executed after the reversal high or ow bar because we
must wait for the next bar to penetrate the extreme high or ow of a previous bar to get ou£
confirmation. This is still valuable information, since trends persist for quite some time, and
the new rend will give us plenty of time toexploi it, A 1 ttle co mo sense and some tape
reading sk 11, however, can actually allow us to trade at the exact extreme. W iat we do is
make a professional guess that the current bar*s the extreme, lake onr position counter to it,
and use a very close stop that \\-ill be confirmed by the next bar. We would want to see an
extended run with the current bar being a "tiny' range bar with little momentum before we
made this_£ucs5. We then know that ary decline in a subsequent period would generate a sell
signal, so we guess, take a posit'or, and see what hap 5ens. Keep in m"nd that professional
trading is a process of playing percentages much as a professional gambler does. Hie difference
of course in speculation versus gambling is that in speculation you set your own odds as to
when you will trade and what you will risk- In gamb ing, the house sets the odds against yqi_.
In professiona^specLijation, we can often get odds as high as 80-90^ asjo the trend, and
using simple mo ey management clisciplines nnd close stop points our losses can be very
i nsig nificant.
The following are some examples of s'mp e buy and sell reversal bars. Please note hat these are
sim pie signals, and add it ional analysis is usually performed coincident with these signal developments
to see if they are worth taking. These other factors could be duration of trend in existence when
Signal given, prices at major support or resistance levels o gles.or ea i upon time cycle
change expectations. Please study these examples carefully.
25
«VE.B»
^
I,«1*V5 1BV7 tn It Ii>13 UV15 loVl9 m^l »»V25 11V» It
*
iuiiii|iiiiJNiHiiiiiiiprniii:piiiitiiJ|iiiD.|iu|iiip jh |TTpniii|iHLiii,iiniiiinrir|jFniTimp^TjiiiiEiiiiijiiiiniii
26
In these examples, I have not circled every possible signal generated, so as lot to confuse
you at this stage. You could cut down dramatically on "false" signals bywaitjng „0 days_
after a signal was generated to see *f it was confirmed and then buying the first dip.
The idea of reversal ot rend brings up the i^uestiot^of itersistem^of trend,and[charts lend
themselves to a good ru c for defining such persistence. This is thetjiree bar rule^.This, simply^
stated, means that a new trend willj>p at least three bans n ike new direction before re versing.^
For trading purposes, we naturally would want to pay attention to reversals on hourly, daily and
weekly charts because of this three bar persistence, rather than, say, a five minute chart. Also,
keep in mind that these c arts are all nested tike Chinese boxes, so, if we get a turn on an hourly
chart that is good for at least three hours, then we might r ave enough to turn the daily chart three
days and the weekly chart for t iree weeks. These fractal chart turns at big cycle pivot points is
what causes explosive impt Ise wave movements in the markets.
Resides reversal of trend in terms nf price patterns, we also can confirm a reversal through
timing or ycle a tutlies. The biggest pi oblern in chart interpretation involves these Chinese nested
box patterns. A reversal on an hourly chart or daily chart is one thing, but how do we know the
trend will last six months to a year? This is a difficult sub'ect that is covered in the cycle's section,
but you should keep in mind when looking at a persistent chart pattern thalextended counts
vali la e the longer term trend. For instance, when ('"adingjiptipns or futuj;cs_with^n hourly__
chart, most reversals come at I'ibonacci' count inter vajsj ike 3,5,8,13, 2_L_L34,_551cte:.._Bul,
minor reversals usually only lasl 5^or fThours, rarely 13. If The trend lasts 4 or morejioursjhe _
odds increase dramatical 1 y Jlutt th is is a new ong term trend that w il last several days jo weeks. _
ty,
Fibonacc' numbers will be discussed at length in the hourly chart section.
27
The rise and fall of stock and commodity prices are a study ii 1 l an emotion Alt lough, in a
broad general sense, fundamental economic factors are (he underlying cause for valuation, the
actual day to day fluctuations that we as professional traders exploit to make our livings are really
emotional extremes of the masses. I would guess that perhaps 30 to 7Q°/r of all market movement
relates to this emotional cot iponent, rather than the actual raw economic fundament'ils. The vast
majority of people attracted to the markets arc done so out of greed, JTiis is the motivating influence.
Since greed to make money and get rich motivates, it is only logical that people buy or sell at
emotional extremes in the market. Buying and selling in this manner causes llie vast majority of
trading losses that people sustain. The purpose of chart reading and the philosophy of trading set
down in this work attempt to constnict a system of rational entry and ex it points to eliminate the
handicap of fear and greed.
In theory, the emotions of the masses are statistically quant ill able and uniform over long periods of
time. The investment community changes little,day today. Perhaps, over several years, the makeup
of traders and institutions playing the market vary, but, in the short run of six months to two years,
the buyers and sellers are the same group. This being the case, we can actually "measure" the
emotional extremes of this group over the past few years and use as a rough guide such "benchmark*"
extremes to better predict when the current emotion of either fearer greed will subside and reverse.
Keep in i lind that emotional'srn in stock charts shows up in a number of dimensions. For instance
price "spikes" are certainly emotional, but what about volume extremes, gap movements, or extended
time periods of optimism? What we have to do in order to measure Ihe effect of emotional extremes
is to find acammon denominator m our charts to measure We leave volume out of the discussion,
for now, since mat is a separate t iscussion with its own statistics. What we will focus on fctime
and price.The concept of price emotion is simple— a big move is mote emotional than a small
one. We can measure the price difference from a high or low to get that extreme, fhat is only half
of the story, however, s'nee time is at} emotional factor too, such as it is for the man facing the
electric chair in an hour, or football players down a few poinls in the championship game with the
clock running out.
Forecasting
2H
In the spec lative maikets, we r leasure time horizontally across our chart page, and we measure
price vertically. This is the familiar bar chart re pre sent a! ion tha yet will see throughout mis hook.
Because emotional i sm can ake iany ton 1S, we must use the universal measurement of vector
i'rections to balance our lime and price axis. In physics, vectors arc merely sums of energy
spent in different directions thai combine to form anewdirect'on. ITiink of the ice skater sliding in
one direct on but will a strong wind pi sh ng from a right angle. The new direction will be a vecto
diagonal, and its energy will be the sum of the two orccs. On ou stock and commodity charts, we
can likewise use vectors to combine p ice and time. At first, you might have difficulty with this
concept because it h* sas its assumption that a unit of emotional ime is equal to a unit of price.
Statistically, this can he readily proven, bul, for now, you will have to take my word for it. Obviously,
if time and price were equal all the time, the vectors on our c larts would -always be diagonals. The
emotions manifesting, however, arc seldom equal, and so we get big price movements and then
long periods of t me but little price movement. Suppose a Slock went from 50 to 100. We would
normally link that it would meet resistance at that price, since it had doubled. But, whit about a
stock that goes from 50 to 75, and then goes sideways for two months? Docs that two month
sideways equal 25 price units, so the resistance is the same in the two cases?
If we can "measure" time in this way, we can know when prices will break out of trading ranges
ind consolidation /ones. The solution to this problem is to use circular arc measure. This
way time and price components are equal at any point on the circular circumference, and
we can forecast a coming change in direction. Should the emotionalism be so extreme as to exceed
such circumference, it will usually go to an even multipleaf such measurement, and so, here too,
we can make a g<xxl estimate for the coming change n d'rection. These circular arc measurements
are known as "measuret moves." Circular arcs are so important that thccntiie next chapter is
devoted to thejn'
Since the e,\trcmc.\ of emotionalism tn the market do not changeover time, we merely need to
neview the recent past few yeirs of h istory to see and measure sucl historic extremes and come up
with our ben hmarks. Our analysis then takes the existing swing movement and extends these by
our historical observations, siaiting with the most frequent observations^ in an effort to estimate the
duration of the current swing. The idea o the measured move, although simple, can lead to incredibly
complex forecasts. In ny trading, I rely almost exclusively on these sw'ngs on my hourly charts to
tzet a first approximation and, only (hen, refine my technique to counting bars or using trendlines. \
cotinuai ly ind traders expecting swing movements total ly at odds with the simple historical record
jof fluctuations on the chart they are usintj:. You should always first examine the past few weeks,
such as^in an hourly chart or fifteen minute chart, to see the larger movements over the immediate
past weeks: before you jump to the conclusion thai Ihe existing move is deviating from the typical
norm.
29
Natural Time Period Durations
In ru)stmarkets,but part'cularly the stock.market, the naturalI cycle mos^fr^juentlycna^yjTt^ed^
Is the frrcc and a quarter week cycle This works for individual stocks, but the market averages, as
a whole, frequently demunstiatc cycles that are twice this or six and a half weeks in length. These
cycles come from the natural division of the year o S2 weeks by sixteenths and eighths. Almost
every movement you will f nd will be a combination of these basic cycles strung together These arc
the facts if you look. There is no such thing as a two week cycle or a four or five week cycle. The
ten week cycle is really three cycles of three and a quarter or nine and three quarters. To find
where you are, just look to the prior major high or low and count lo the present to look for yow
three and a quarter week pivot. Tor example:
s^^dVhaFwj*^
uj^rricive eause^byj^e^s j^ejii.^ recommendation and- when I sec the first top,
ijjatiently wait three and a quarter wreks andjftgjib^^
upwards nianojher impu I Sj^ejgjyjrtTiiiij^^ track of these Hrnjng point dates, in_a
tickler_h|e or calendar, is he jphi 1.
30
lrjJo^jking atJt£i^Tmn bd^ the genera! ruje ]£tha£maJOT tends never go
^H^Il^^J^'^l^llil-^'y discounter tr?iidj]&\ ^lU?.^."]1 market, a decline will never
exceed 90daysj^fore resuming theuptrend,jind. in a bear trend, rallies never Inst more than three
months. In fact, the basic def nition of a bear market trend is that you have broken a swing low
from a time period past three months ago. You generally arc safe being along term investor, as king
as your holding does not go below any price level seen_(. U days back or further, and, if you ace
looking to sell slocks short, you want to choose issues that have not seen a new high for at least 90
days and arc under a low price level from 90 days ago. 1 hose issues are almost certai ily in long
teun downtrends that could last a year or mo e. (I am using 90 days here as a practical cutoff for
the Bull or Bea Market definition, s* ice that works 80% of the time. Re aware, however, the J
extreme cutoff is 4 months, and one or two exceptions this century have gone 6 months.)
T^<?jdeal conjectipmo btiy_into in a bnl | trend is one that hasasted about six weeks, hut prices
are weilaboye levels seen WJ tfay.yaga You will note that the bullish charts usually spike up and
quickly puilback from the high, but no low evels a t ever broken. Onlv the new high recent
advane is co rected over the full th ee or six weeks and then the next upward spike. Many
strong stocks can "ohow this type of pattern foT years without a three month correction.
Other cycles most commonly fou id are the n li men) logical "Ciann" cycles. Iliis theory is covered at
length jn my other book, and indeed T have spent a i e itire lifetime developing it.uBasjcalJ3\the_
premise is lha the price of the stock, at the final high or final low, i? exactly the same as he
time cycle operating. That is, a high of $50 means a time c\cle of SO units, such as 50 hours, SO
days, 50 weeks, etc. At each numero logical tui e period of 50 or the fFaHional parts of fIffy,"you"
will find a turning point. This sot nds strange to those unfamiliar with the concept, hut, in over"
weiily years of challenging people in large audiences to find just one exception to th sp inciple on
any stock or commcxliLy, no one has ever found an exception nor will ihey. Again, I refer you to my
other book for the reasons behind the theory. Strategy here is to count the bars on the chart you
are using until youreach the count equal to the high or low pi icejeyel and then look for a reversal
signal.
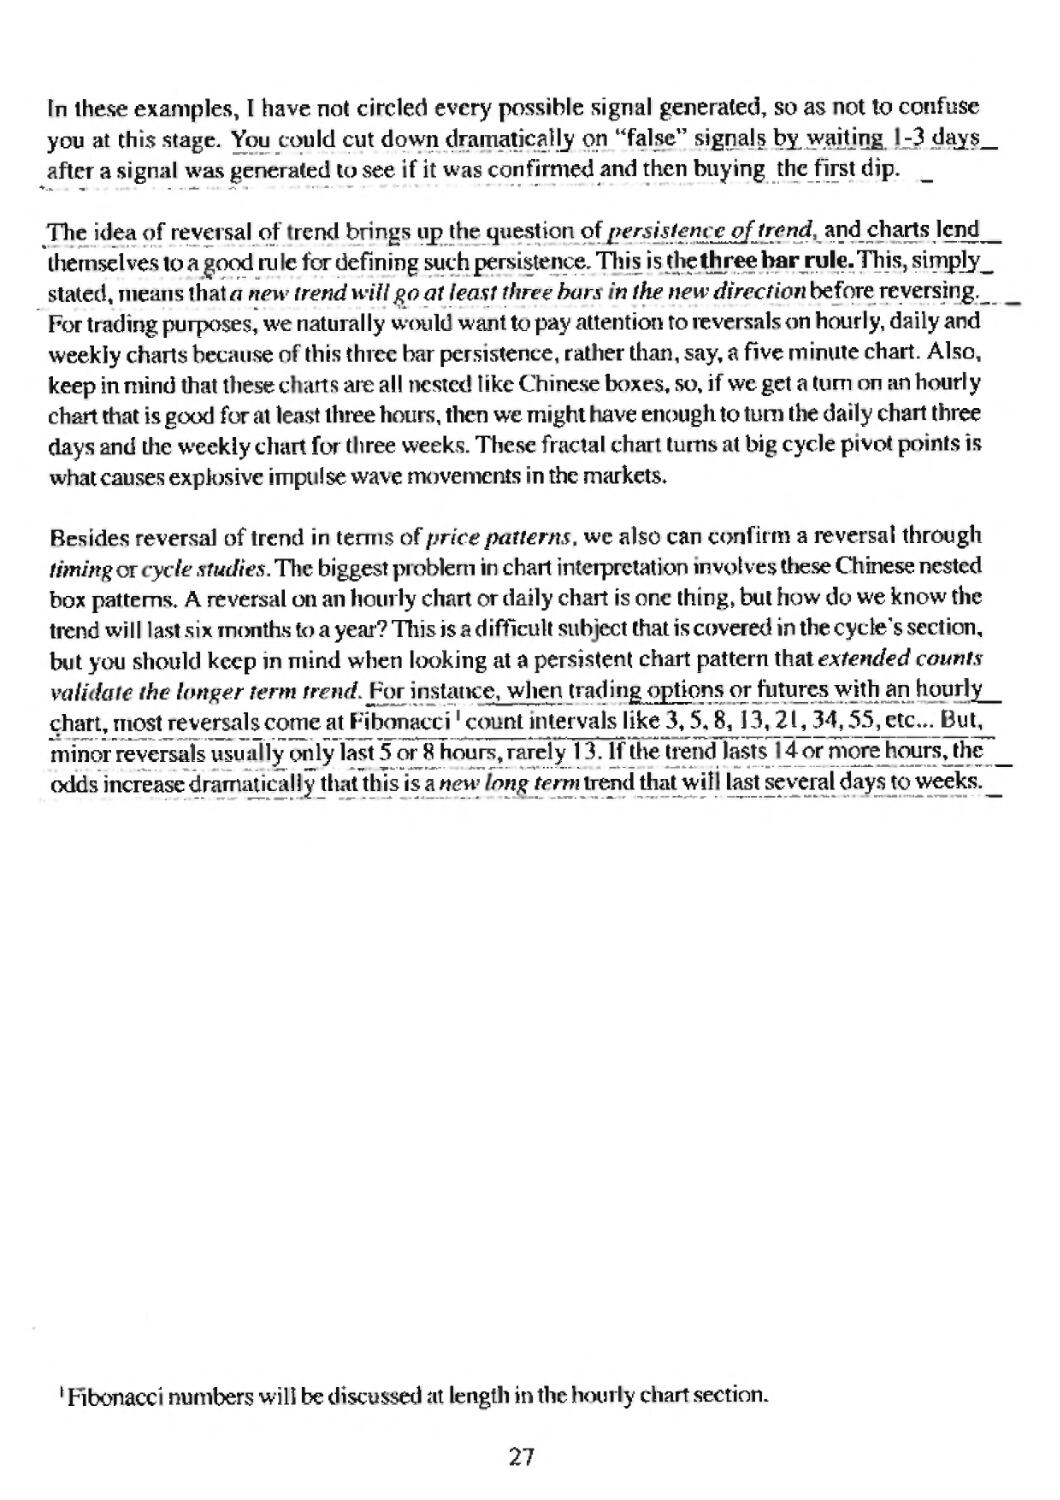
Natural Squares
Another common forecasting method for determining cycles sthat ofnumerical natural squares.
This isi simply thewhole numbers squared as 3 s uared is 9,4 st uared is 16,5 squared is 25,6
squaret^|s 16, ctc: You start your count ft imi each major Yigh and low, Ti le periods can be hours,__
days, weeks, months, o years, but weeks work particularly well as the next chart demonstiates.
31
Basic Concepts
I ength of the base...equal to the height of the move
This phrase originally comes from the area of technical analysis that special! es in point and
figure charts Point and figure charts are pure price charts showing only up ward and downward
price movements. There is no volume nor any time periods on these charts other than incidental
footnotes to mark the beginnings and endings of movements after the fact. Prices themselves
are what make us money, so point and figure charts clearly point out ssues that arc in definable
trends. I do not suggest you use point and figure charts as a trader since Time is most important,
and return on capital requires a gain every t tonth, w lereas a po'nt ind figure chirt could
Took gtxxl, but may not move for months on end. One of the grctt uses, however, of point and
figure charts is to point out periods of basing or topping patterns The consta l reversals, up
and down, in a narrow price range clearly show accumulation or distribution, and the longer
hi*: period, or the more frequent the reversals, the more powerfu I the subsequent move^onjj
ago, analysts discovered that if you measured the sideways area of the $ypj5ori urResistance
gnes^tjhenthe_su^equent advance or d^ magnitude
ofV'measured move" before exhausting itself— hence ,_the phme:J*the length ofthe base is
equal to the height of the move."1
32
For many years, when I ran \ number of mutual funds, I would rely on this rule to pick dozens
of issues tha would mere than double over the coming year. I simply found charts that had
been confined to a narrow range, such as 12 In Ifi, for the past three, but preferably five,
years an waited until a big volume breakout occu red lh;ii took (he stock at least $3 above
the prior high, such as $19 in the prior example. In these cases, 1 could reasor ;ibly forecast a
TRIPLE from the base price nnge. In the case of the point and figure chart, the measured
base is an exact figure, whereas in the normal bar chart it is more of an estimate, hut one that
is certainly worth making. The reason this works falls in a subject outside the scope of this
book, and one covered extensively in my book The Geometry of Stock Market Profits, A
Guide To Professional Trading For A Living. Suffice it to say, it is related to "Gann
squares" and time cycles. In general, you "measure" the horizontal distance of 1he basing or
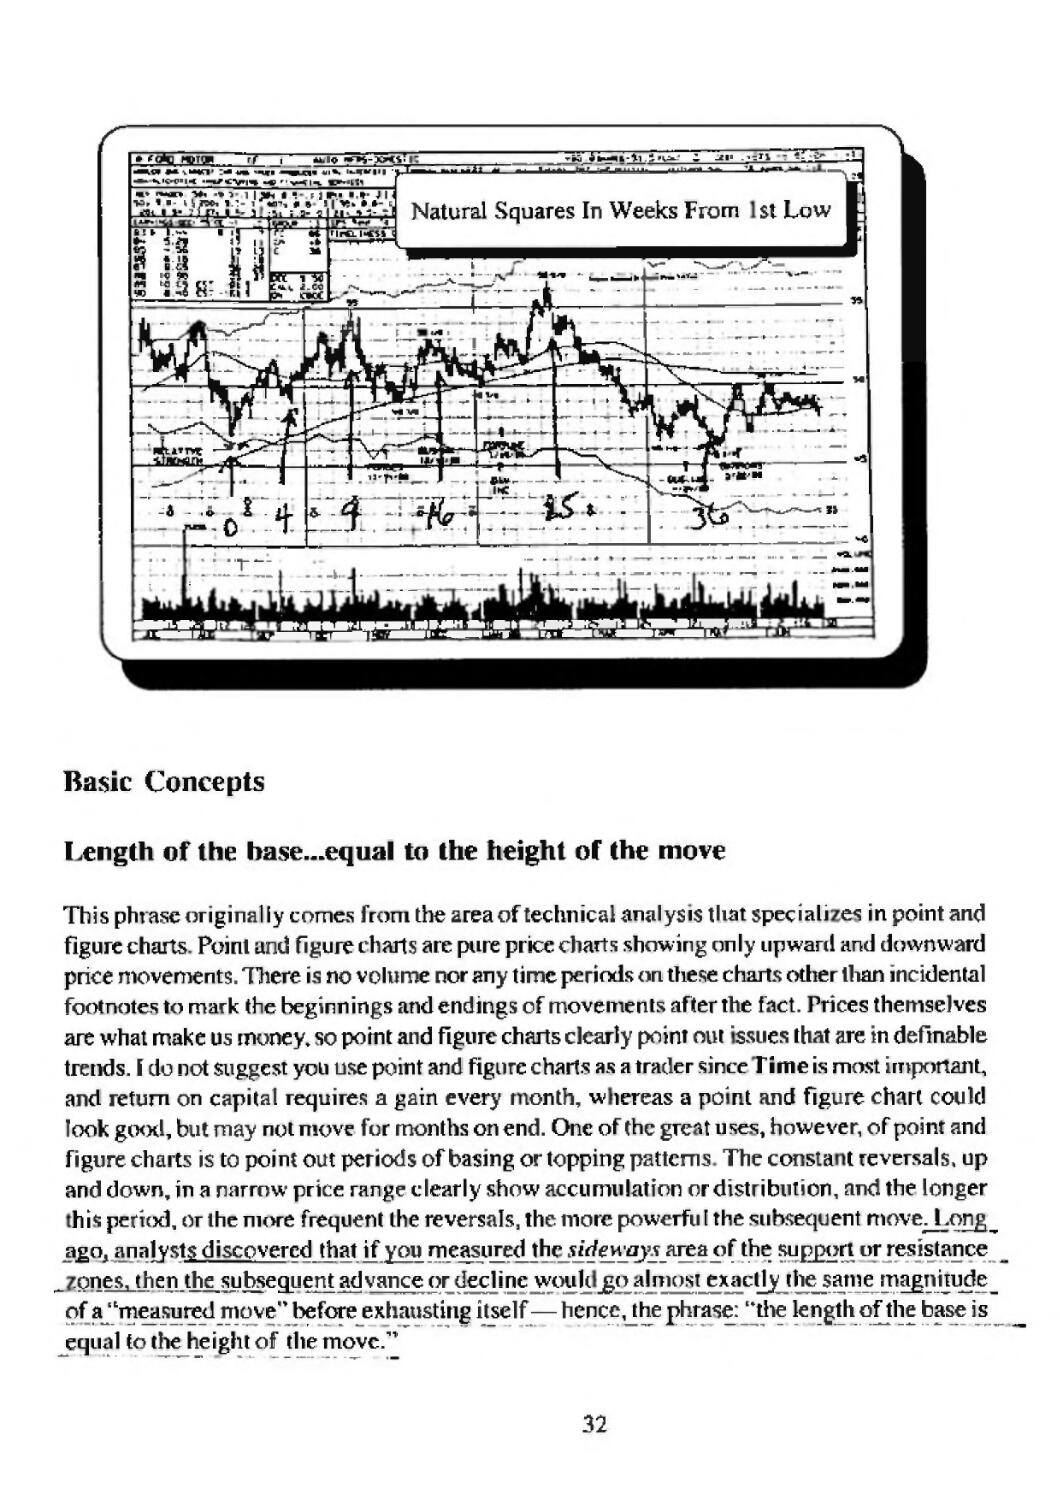
topping area, and, when the breakout or breakdown occurs, you reapply that measurement
along an angle of momentum to get the probab e area of exrr ustion.
Length of Base
"i 'n ii|i|li
Target Area
Length of base measured
along angle of momuUum
^w
This Is a rough method, hut it is used to quickly scan a number of charts to pick out ones with
potential for \ ig moves and avoid less profitable minor movements. The theory, of course, is that
stagnant economic fundamentals have suddenly changed or the better to break out of the trailing
range, and few people bother to take note because of the past numerous yenrs of disappointment.
Ibe rule works cornl ly well with hourly charts when trading options and futures, so that a congestion
or consolidation area of two days can lead to a significant three day move, whereas'** two hour top"
or bottom will probably lead to only a two hour advance or decline.,
33
A lesser known corollary to this is"the height of the move is equal to the ength of Ihe top."
In other words, a "big" momentum bar on a chart cannot be reversed from quickly. Momentum
takes time to lose its energy. Often, after a big up move, the momentum generated requires abroad
topping phase before a down trend tan get started. One of the tchI secrets I will now tell jmi is_
that the range of theJittal low or final top individual fair,, when placed on its side
tiori^ntaljyj wHl oQcn tell you when the movement isoverHlie individual bars on a chart can
tell you a lot about the emotionalism present in the market, during that time period. Obviously, "big"
ban* are emotional, but the single bar at the final high or low is the most' nportant.That bar is similar
othe UNA molecule in living creatures. Ours'grtal reversal buy/sell bar uses the opposite extreme
low or high of that bar, instead of the extreme, because, when that level goes, complete emotion a
exhaustion s reached. Note that these signal bars give completely t ifferent support or resistance
levels than most traders use — they use the extrei ie high or low tick, (f you look at the charts, you
will find that only works half the time at best. LyjAii&anhe range, of' thc^e. hars^pa culajJx
monthly extreme bars, will be quite rewart jng! Jurn them sideways for time counts and apply
numerology to those sideways counts. You could be greatly surprised as tojusl how much information
s i 1 those solitary bi s.
34
I H4
I I4-H-
uia
L hl«
!<*•
Lira ■
llli '
!.■«* -
1114.
LE»J
I±l4-
L1Q-P--
1 i*^-
U** '
J LPt.i
11*0 <
11*4 i
inc.
L|ftfi,
LB-ie -■
l-PIO .'
Ifl4 J
iw
I
Dew Jones Averages
Thla bar turned ■Idcwrya
lndlC4tec turn
wm
Big Bpic Area = (eight ctf Stibacquctit Unu-e
'HI *UL
*
]*he concept that the Length of the base is equal to the height of the muv incorporates the notion
flint ei vector distance (base) cart be applied in a ew direct"on to forecast wj ere the market is
going. This works because ofthe existence o time cycles. Common cyclic tin c periods repeRt
over and over, and each cycle m sapproxi nately tlie same duratic n. Since markets are emotioin,
and IntniHn nature does not change, an examination of nmrkei history gives us our benchmarks.
Great cycles recur mfretjiLenlly but usually consist of multiple legs of con mon length cycles. I Isually,
there will be a consolidation or resting period at these multiple leg extensions, and we measure
another equal leg up or down at these visible resistance areas. One rule to keeg in [Pi!idj|vhen_
Jooking al charts is that straight line nuves without these consolidation '"wiggles" w II die out as
soon as the measured move is rcac icd, v. hereas a big move with a numBer 6T ITttle corrections or-
consolidation periods will have enough strength to go multiple Jengihs.
Since this idea of cyclic emotionality encompasses hoth lime and space (that is how we chart
prices), the actual measurcmei 1 of fiese eye es is in vector distances. Simply put^tuiieasured^
move of any givemmgnitut e can manifest as ^circle ofrtsi?; once around an origin point. The
circumference of that circle represcn_s_the potential reversglpoint of a riove that has reached a
prevHiusW observed nieasu red move.Tftjs is one ofthe mostprofound principles of investing T_
have ever discovered, and its implications have ^iniosi no limit as to trading uses. Once we find our
average measured move that^eeinsjo^e the working c^cle^ we merely sketch owc'rcle around
each successive high or low to approximate potential turns.
35
j* OCOEffb PBIVI lh StSTUTT |t>WH1 HCl^ll. mTJk*-dr^__ljt_<T_J; fcjjHl JJ 1na> .~* *^ L l(i& T6(_
iL-fn ewtxt% rf m*+ ^m anifcjMn w m m i^i ti I
»l} l.H" -Ml
•-»■ a* mil
Example of Taking Highest
Dar and Turning II Sideways
To Give Us Recurring Turns
Dots Are Each Cycle Point
*
This circular measure accomplishes a number of things for us. First, it measures potential price
targets at the c"rcu llerence points. But, more importantly n many cases, it shows the extreme
36
limt of time duration, where the current trend wi 1 end. Often a p ice advance will quickly
go up to the ci cum lercncc and top, and then go sideways into a conso idatio pattern. At this
point, wc look to the extreme right axis or at 3 o'clock figuratively on the cirtu i ference to
see the time limit of the move- When the price readies that extreme with the passage of time,
the market will change di ection
Measured Moves
Remember that although these measured moves; can be very precise, we are only trading for
the safe 70 to 80% of the move and need only make an approximation. On an hourly chart,
trad'ng options and futures will be much more exact, but here too. other indicator*; will be
used as we approach the area of termination. Spec" fie ally, we watch closely for a signal
reversal buy or sell w near the measured extremes, and we also watch our time counts
closely. Strategy here is to find la gc measured moves that are at work and will give us lots
of trading room when we nitiate a position. A good analyst wiijjilso note jhat at the_ends of,
large daily and weekly measurement^ jpqst/Hhe markets Iike bonds^gold _andJlie cuiTcncjes.
wi 1 also nd cateaturn simultaneously with the stock narket.
The measured move kea is simple and perhaps crude, hut the real principle behind it is
extraordinarily powerful and that is what we will now examine at length as we turn to the study of
circular arcs.
37
Circular Arcs
Finding The Natural Cycle Length
Since cycles give rise to measured moves or an emotional time period that can be measured in a
vector distance, we can deduce from this thatiwknown cycles ope rating within our charts will
reveal I lathematical structures that will give us a clue to the cycle's length. Hie simplest form this
takes is a visible circular tire. When we see an arc forming in our data, it implies that a long term
cycle is operating and that arc is but a part of it If we use geometry to recreate the actual arc, wc
will discover its actual length and size.
the word cycles implies a reti rn through a 360 degree rotation back to the origin. We view this as
a circle on our charts, but in reality circles arc only a close approximation of conic sections or si ccs
through a cone. I'hesc are what are really known as ellipses and are closer to the real nature of
cycles. You can v'suai'zc co lie scctio is by imag'ning an ice cream cone. TI e cune, f cut directly
across its height, will yield a round circle, but if cut at a slant, will yield an ellipse whose "flatness"
will vary depending on how steep or slanted our cross cu is. Although the ellipse s the key tu our
trading, it is a subject a litlle too advanced for this book, and I will leave that investigation to your
curiosity. Circles are easier k) deal with and will suit txirpuqxises just fine in most cases. Additionally;
although cycles expand and contrac to yield ellipses on lany charts, if we use a slightly larger
chart such .is going from a daily to a weekly, we find that these small expansions and contractions
in our cycles drop out, and a large circle becomes a very close fit to the data to mark our major
beginnings and endings of the cycles.
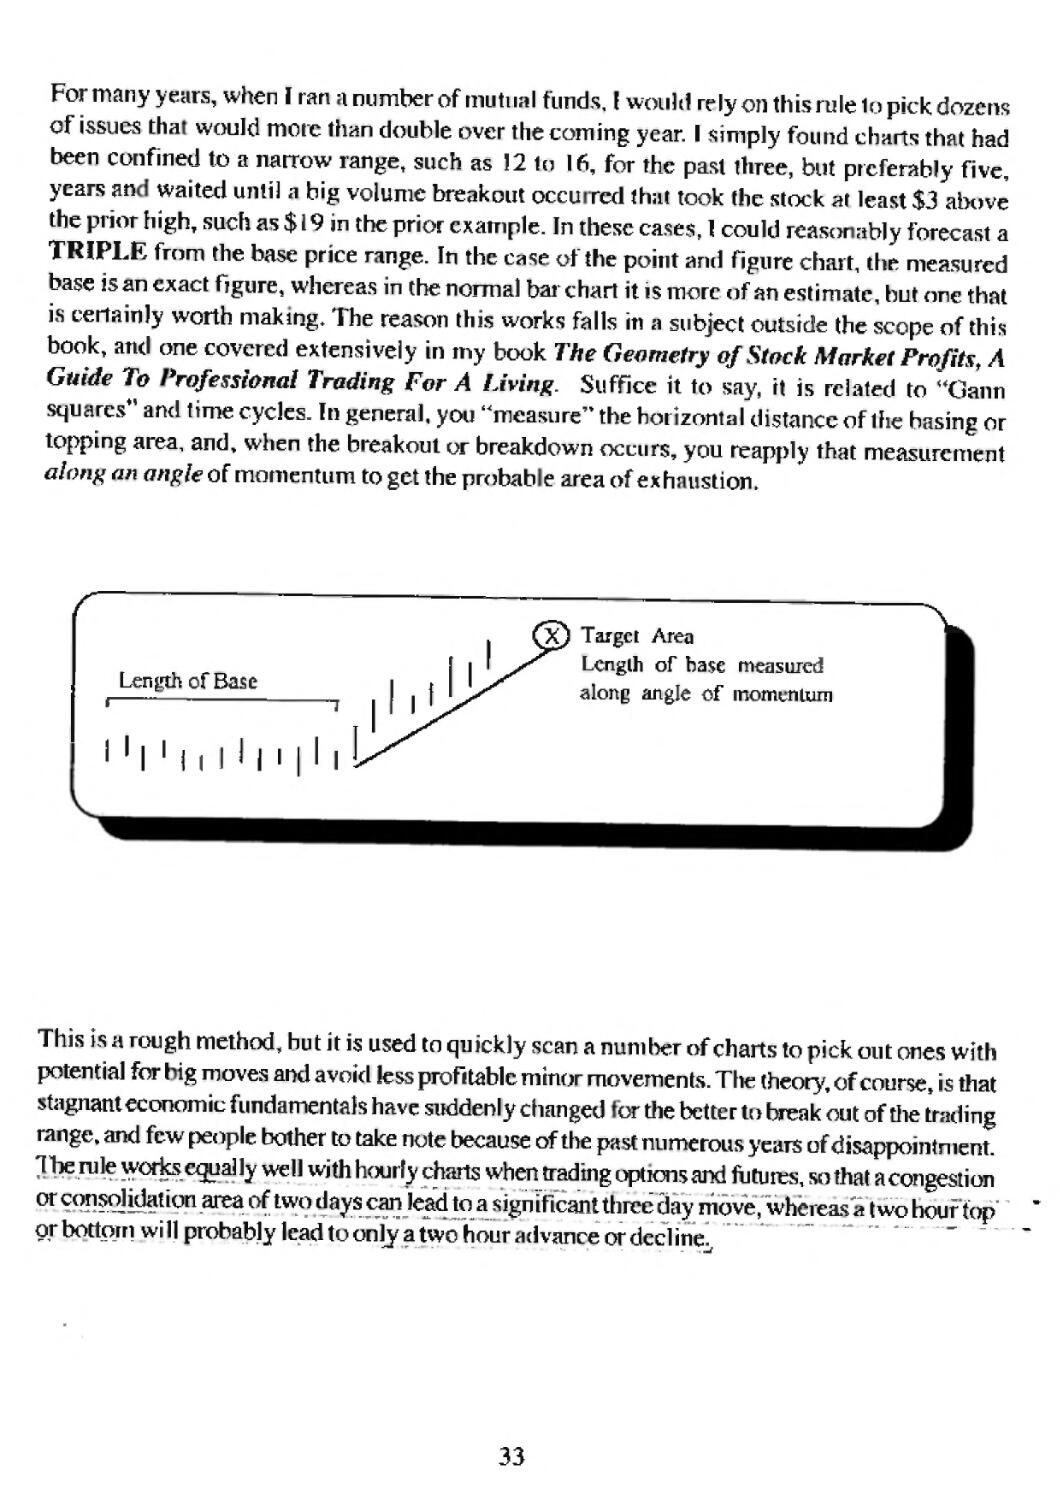
The standard textbook method for constructing an arc that lies on the circ mference of a
circle is as follows: first, you must "eyeball" three points that look to you like they fall on a
circle. You must hfwe three, and, if Ihey arc not reallv on a circle, your axis lines will be
parallel a d not intersect. Hie irs step is to pick the three "dots1* on our chart. Then, yot
take a drawing compass, put the point at dot # I, and draw an arc not i^uiie the length to dot #2
Sw ng this arc about a half citcle ai d then move the compass point to dot #2 without changing
U)
38
its separation. Now, swing an arc hick toward dot #1, also about a hatTcircle so that the two
arc swings from each point intersect at two opposite ends. Where these two arcs intersect,
you draw an axis line through the intersecting points. Note that this is also a method to exactly
find any midpoint between two points, which we will use later to discover support and
resistance at the midpoint of swings. This axis line will point to the center of the circle. Next,
you repeat the same process be ween clots #2 and #3 to find heir midpoints and axis line.
Where the two axis lines fror i points # and #2 and #2 ind #3 intersect will he the exact
center of a circle whose circumference goes through the three points. You, then, merely nove
your compass point to that center, adjust the separation to any one of the dots, and swing an
arc or a complete circle around al I three dots, 1 he radius, diameter, an upper and horizontal
boundaries cf this circle give us our important cycle turning points on that chart, if we have
ac ually found a ca] circle. Sometimes what looks like a circle on shott term charts s only a
curve, so in picking your thice dols to work with, you actually want to see five, ten. or nore dots
that appear to be connected. W hen the three important ones are mathematically connected, they
will join up all the others, and we have n ore reliability with our pattern. The real solution of course
is to use very long term charts over several years because the v'siblc s lapes fon ling on those
cha s are much mo c j eliahle and long last ing.
39
Implications of Circular Arcs and Circles
Circular arcs tell us a lot about trend, support and resistance, and even where to expect big
momentum moves. Remembe , wc want to pick chart patterns to trade that have big poiential and
are moving, not stuck "n a base or top The ti si mportant observation to note about arcs is the
physical properly of acceleration. These arcs describe human emotionaibehavior, and as we go
up the arc this behavior is intensified. aginc a graph of a car going at a constant speed of
50 rnph. This graph would be a diagonal upward sloping straight line. Now, 1 jagine a
spaceship launch that is accelerating at a rate of change of 50 miles per second per second.
I his graph is a parabolic increasing lire where the slope gets steeper and steeper until it
"goes vertical" or accelerates at an infinite rate or at maximum physical capacity. The emotions
of the masses, when chasing a stock or commodity, act like these parabolic curves. Our
circular arcs also describe this maximum emotion when the side of the circle is hit, and the
a c "goes vertical." At that point, the maximum amount of buying emotion i* present, and
whoever wilt buy has bought. The move is then over and must decline. Similarly, a decline
will accelerate to a point where maximum fear is present, and that pattern will exhibit a
circular arc turning down until it drops vertically. At that point, the maximum fear is past, and
abasing pattern ensues.
When trad ing, we want to be lot £ as »'tf go into the maximum up phase and time our exit near
the arcs" maximum vertical movement. Likewise, shorts are held until the arc climaxes on the
downside. It cannot be emphasized enough how important a knowledge of these arcs can be.
When fear or greed is at its extreme, it takes a very cool head to do the right thing in a fast moving
market. By an^zm^thescarcsas tjie move unfolds^ we_get theccmfjdencejo act when we know
the.tum iscomingjmd only r^^ljQic sli.ghtes.t.technipal reversal^ such as a sign«|reversal bar on a
5 or \5 mi utechartjo validateonr hypothesis These"yjiturHTJtiovjwnjtfural]y occurorithe
edges of a circle, such asmovi igjromj^clockjo .Ic/chick in. 'in up mpve^or J_o_*clrwlrto 3
o^clock for thedovvn move.jiutj what about .Hand 6 p [c los&jtJhesfjir <f«Lm^JfIL suEl?Pil
jii^wjHtont-f^wiwiS. As a market ^woes^mjyjo^rjcarthe bottom .of the circle, it will first
^ meet massive resistance at the center point or "gravity center.' Getting abovcthat which usual ly_
takes several tries, it will go to the top of the circle and usually end the move at that point. Big
. moves that get past the top of the arc will usual y go I and 1/2 to3 full crele diameters in that
direction.
40
Having first drawn an accurate circle, we can now forecast with extreme accuracy all possible
future points of support or resistance.
Parabolic
Arc
Area of maximum
-"""" acceleration
Move is 9
over at this
point
Circular Arc
j 2 Maximum
downside
area
3
Maximum
up area
>
Common sensejsjiecded when using arts. TTyou find a major Ion errn arc and arejiredictjng a_
low for a stock as it declines from^o'clock.to6_o_*clock ftwrjhe low, know that a bi£ basing rxrkx]_
may be necessary before any upside is possible. You can certainly cover shons atthejow, but
trading long is not possible until we get towards 5 or4 o'clock on the circle. On a lo g term dajly
chart, this may represent six weeks to three_ months before a decent rallyjs possible.Keep th ism .
mind.
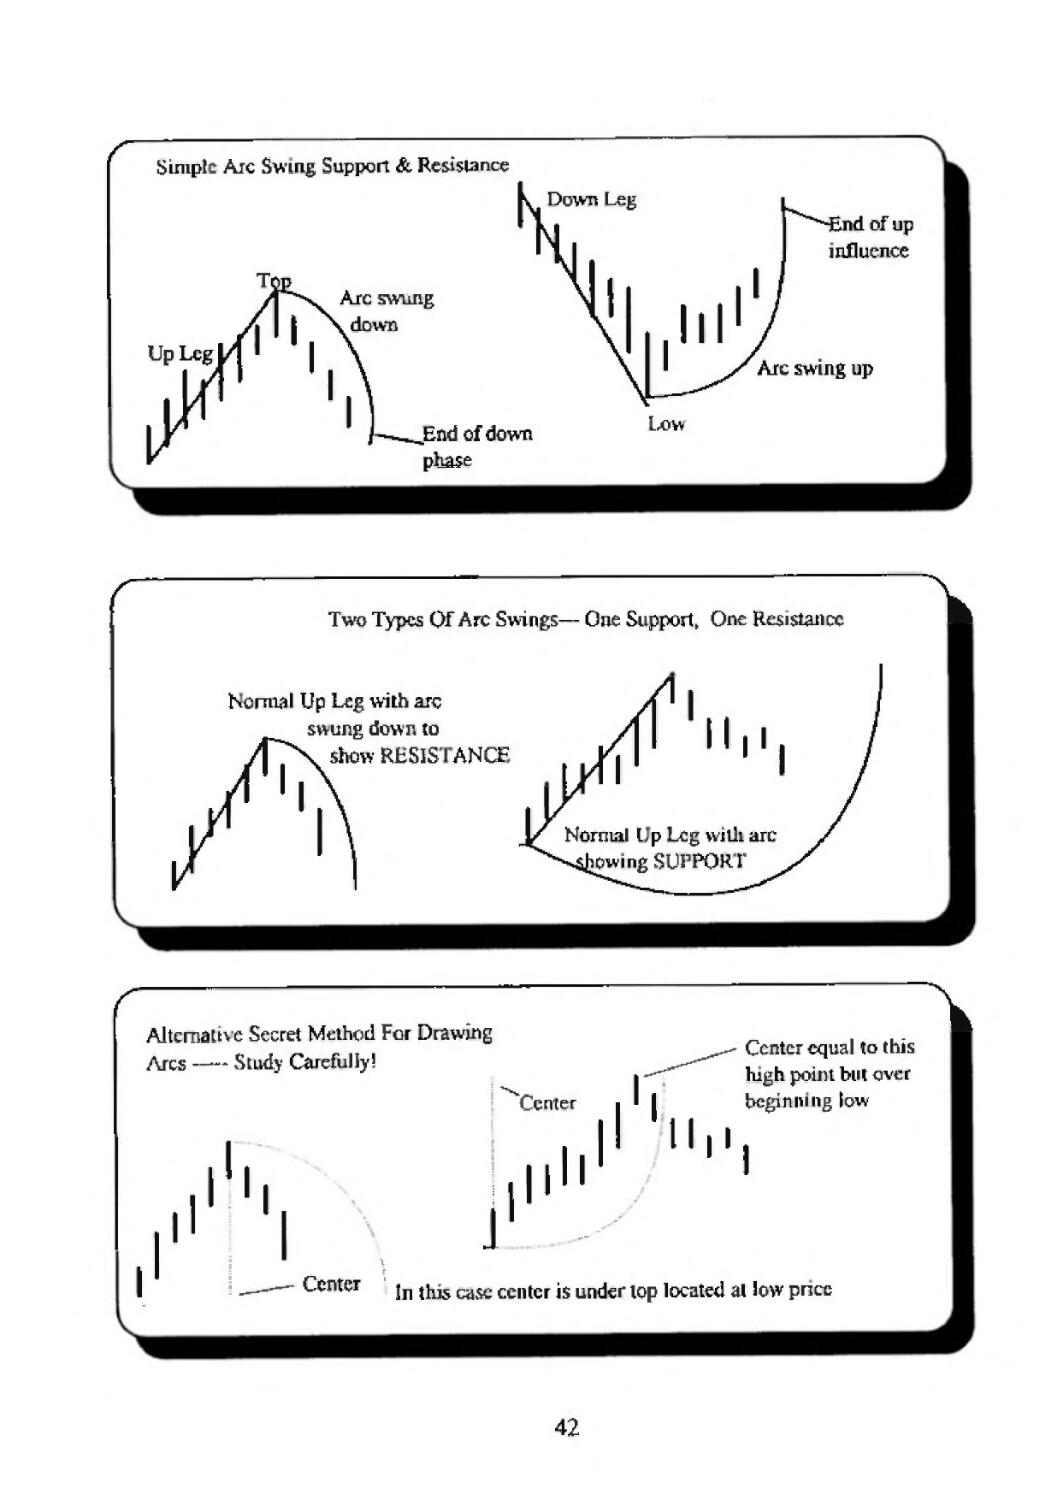
Tips O Drawing Circular Arcs
Although most arcs are drawn by inspection, that is looking at the chart and ether trend fitting a
circle or by just seeing an obvious circular symmetry, most arcs that I use in trading are not regular
circles but circular "influences" of a radius vector sw ung up from a recent low lo the high, and then
the arc is swung down to the vertical. No matter how bullish you are, it usually pays to wait for the
price consolidation period to move sideways enough to get past that downward arc before it is a
safe long. That arc usually times the low, but oftentimes a secondary "crash" starts at the very end
of the arc and the price damage can be severe. Likewise, an upward ir flue ice is generated by
swinging an arc up, using the prior top as the center point, and swinging up from the recent low.
Th s defines at least a time period where a rally could occur
41
Simple Arc Swing Support & Resistance
Up Leg
Arc swung
down
End of down
phase
,nd of up
influence
Arc swing up
L,ow
r
Two Types Of Arc Swings— One Support, One Resistance
"k
Normal Up Leg with arc
swung down to
^ show KESlS ANCF
Alternative Secret Method For Drawing
Arcs —- Study Carefully!
''Center
I'l
! ,n"
J
i
Center equal to this
high point but over
I beginning low
II,',
\
Center
In this case center is under top located ai low pnee
42
r
Fxamples of Arcs On Intra-day Charts
lfcJM»-
t3».l»-
»5T-ti^
'— Uf fa* l#***PMC
Dma Fr*a f ^
43
1
»-tf
• lj m t r ] 111 m i m r | n j ■ 111111111111 m r_f 11 j i; j 11 r | i 111 i i r * m i ■■ i i r
GILLETTE COMPANY
' | | HI I I ] i n-lU44U-U4-14XU-n HUM HTTTTO
■*■ Larg*ac KfT, of iLifor*, Rl^iM:, "TC, — *J.»o Kir
mm* I c*r rtoducLi, nTArni hatt" Ball ?■**. «c".
*++H+f-H"H-r++t+t H-
Debt S72S.OO0.0O0
Pr»£M . l«,OM
Co*1* 219.3Ja.0OO
11 PIT
^
YEAR
44
3449.9
'"III I I I I i T i'i I ' \ i i i i i i j ' ' L' '' ' I i ' i i ■ M 11 M r i i I' nin—n .
"k
hEpct Kil t ft4*
L
FLnli
Note that the air drawn on the above chart misses the actual timing for the subsequent low. But, if
/ou use the secret alternative method shown on the prior exhibit whereby the center is located just
left of the low and directly under he first top, the arc drawn that way catc les the low perfectly,
'ITiis is not shown o \ the chart, but you may want to draw it to prove it to yourself.
45
lp/£* •l-'Z
r r '—■i i—I—i—>—r
II 4 lis* 11^11 U/12 ll.-li
i—1—i t—i—n—i—i—f—r
Is-iB1 11^2 U/Z^il/Z? li 1
3725.0
DtwjDnci HrjurTy
am Iran rirdi high
Vtvt lb*
3T1III .B-
JbTTl
atsa.
3625 B
■Idf • of irct. Thut > e
not rjriwn Inbulfkne »
EKtmlnE tiieii HKfurly
1
~\—i—i—1~i—i—i—i—i—|—I—i—I—i—] t t^h—n—i"t—r
lfti-W 'i'2 «"* 1-1^ "'« 11 12 ill* ll/is' 11/22 11^1l.l/n 12/1
46
"N.
iqiiilinT^nT'TiT' i|ii'4i^i I iDi"i|ii|:riiiriin|n \ [H"^^|iivii|ii|iiH.iHi.l.(iini,.'H.,^|.|]M!fiTifr,i|iin.ra|"iTmriiri1
"~ ^TTTiTiifniiTr|<iiii^-iTinir-nTmiiiiiiiirr|rir|iii^'nririTif'7tB'n"i|iii|iiH uiin|Bn[]nn-iii|irqi:ii[T3ri;Tnji|U(n
M 3^1ft5^Z5 B^3lB>ii ' 3*-i 7^£rt. ]B^1 ' Z^Zl 3vl 7^18 3 IB l2fll -is bbSZT-
47
Support & Resistance
Support and resistance levels can be determined from three basic methods: 1) Actual historical
price clusterings, 2) numerologically, based on common harmonics of 360, and 3) calculated or
projected methods. Tills last includes well-known Fibonacci retraeements and projections but for
my purposes 1 usually use derivatives of arcs and roots of the swings themselves. We will start first
wit i the basics of typical support and resistance visually seen in the chart patterns from past
history.
Patterns: The^pica] jupport area isanarea ma^was a prior Jow or high for a considerable ti me,
jffHJl hpy Pf'£<L5_haye dec!I ined back to that area. The area of that prior congestion will give us a hint
as to how strong that support might be. Keep in mind that in trading, wc are only concerned with
identifying these areas but w tin not trade within them'In trading, we are looking for maximum
return over time, so entering a support or resistance area js an opportunity to sell out along or
cover a short and patiently wajt until momentum picks up again and takesjprices ou^ of that zone,
hese historical support and resistance zones are obvious to all who have a chart, and for that
reason we ca not always be certain they are meaningful on the first test. In reality, these 7ones arc
located whe e they arc because they are mathematically related to the price structure of the stock
or commodity. If you have read my Geometry book, you know that these areas are related to past
highs and lows and va ious "squares" o the price structu re. For our present purposes, however,
we merely note them since our trading strategy dictates we get out of the market when we arri ve at
one,
TJiej^maixriJlejn^ kecorncfuture tows and
yj£g_ycr_sa after a breakriowirpetting above or below a resistance zone does not change the
mathematical underpinnings of that 7one. That particular price structu -e is intimately connected
with that particular security for all time, and indeed all highs and lows in the entire historical record
for the issue h&vtperpctual significance. This is another reason for examining long term charts
before trading a security for the first time. You can a,lso use a common mjilliptc_5U£hjj^_25 or 1,5
or 2, etc., times these; resistance zone average prices to rojtxt future zones of significant resistance.
48
*d3.
US.»
«<..»
Support inilftcalifaiMe^aau
tf-
IB II
1 1
b*nyriJT
IB' 1+
"■
ft 4ZS rti
CL.
Numerologkal Support and Resistance
Natural cycles repeat over <ind over, and like any physical law, these fluctuations can be desci ibed
in mathematical terms related to the 360 degrees of a circle Most actively traded stocks and
commtxlllies will eventually gravitate tn the common denominators of numbers related to 360. 'f tie
most commonly observed numbers are the divisional parts of quarters and thirds o 360, or 360
divided by 2 and 360 divided by 3. This sequence starts as 360f2 or i 80, w Vch s then divided by
2 to get 90, then divided by 2-45, divided hy 2 -22.5,/2 .25, etc. The thirds are 360/3 or
120, and this starting point is then divided by 2 or i 20/2-60, /2-30, /2-I5./2-7.5, etc. The
numbers resulting ftom such divisio s are natural Inrrnonk numbers that can be used in trading.
Tlicse are considered bo h from a price perspective and a time pcrs ective. That is to say, 45 is
both a number and a time period, such as 45 bars, or hour?, days, weeks, etc. The ollowing table
summaries these 360 harmonic natural divisions. You can suhdi vide these levels even farther, but
J have stopped at the major numbers to give you the idea.
49
Fable of Numerological Breakpoints
360/2
5.63
11.26
33J5
56.25
7B.75
101.25
123.75
146.25
168.75
both (doubly stroPy}
22.5
45
67 5
90
112,5
135
157.5
180
3M0
360/3
7.5
15
30
37.5
52.5
60
75
62.5
97.5
105
120
127
142.5
150
165
172 5
Most people are aware that these numbers farm natural resistance and support, and most
traders will easily recall stocks and commodities that reversed al prices of 45,90,30,60, or
120. Not so obviously, however, is the natural incremental effect of these numbers. For
instance, i a stock hits a major low At 17, we add these increments of 7.5, 11.25, etc., to the
price to get this particular stock's natural support and resistance. From a low of 17, we
would get 24 5 (17 + 1.5), and 28.25 (17 + 1.25). All other nun bers would be added
accordingly. Remember too,fs hat the time periods of 17 plus these increments would be
*mporlan(. On a typical bar c iart of any time periodicity, we would coun these time numbers
as individual bars to look tor turns when these periods tame out. If you need a logical
expla lation for th's (which is dangerous when you re t ading), you can visualize cycles as
sine waves that alternate through 360 degrees and start at a number. The 90 degree rotations
then merely add an increment to the starting point until the full circle of 360 is reached- By
the way, the broad market averages will usually be multiples of 360 or 180, and any of the
individual bull and bear waves will equal these total points. For instance, some familiar
Dow Jones numbers would be: 3240 (9*360)t 3600, 3780 (10x360 + 180), 3960 (11x360),
2520 (7x360), 1800 (5x360), 720 (2x360), 900 (720+180), and 1080 (3x360). An entire
book could be write alone or the importance of these number combinations, bu I will have
to leave that to your investigation and point you to my other books in that regard.
bhri>rvl> D.lty Oi*f1 Sh»J»( N*t-ji*l ktntfiik glm I Lrvila
tar..
1M1.
ion.
vs.
V--
T2.
7B.
fc2
ft.
5*
54
54.
S7.
91,
it
K
N-
•tfatil
2^t
^/i#_
sr
mtin|ajpi|BL|iniiimmiiu|<i|Jl|Hi| i|uii|i11li<iu|1411qrrmrciiqmri.11rmrjjti|■ \m\\i\u\\\\ uipiipji u^ 11
\
TV
1 -* A
-U-*-
—ef"
m" fitJi*
=*t
T---1^-^^ ■*■-'
iA^|jLj|i
r»
This is a c art of
lime resistance
based on 360 day
counts. The 30 day
listings are calendar
d«ysandasyou
can see, time the
market very nicely.
51
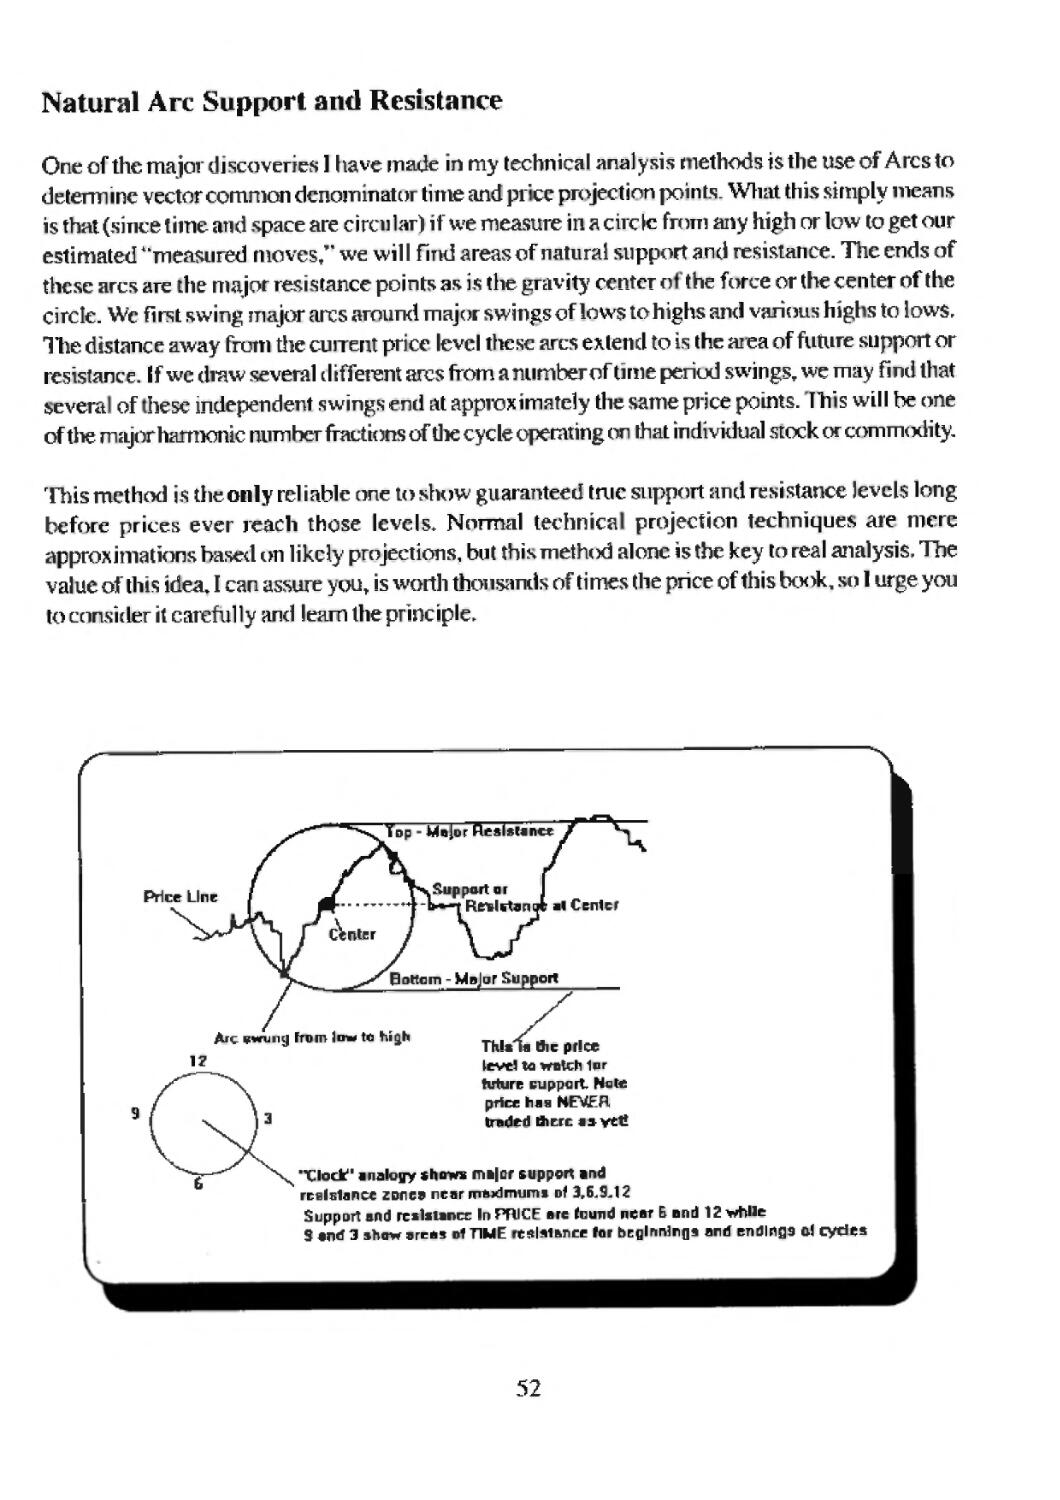
Natural Arc Support and Resistance
One of the major discoveries 1 have made in my technical analysis < lethods is the use of Arcs to
determine vector common denominator time and pice projection points. What this simply means
is that (.since lime and .space are circn lar) if we measure in a cii c \c from any high or low to get our
estimated '"measured moves," we will find areas of natural support and resistance. The ends of
these arcs are the major resistance points as is the gravity center o the force or the center of the
circle. We first swing major arcs around major swings of lows to highs and various higl s to lows.
Hie distance away from the current price level these arcs exlend to is the aiea of future support or
resistance. If we draw several different arcs from a number of time period swings, we may find that
!>evera of hese independent swings end at approxinnately the same price points. fh"s will be one
of the major harmonic number fractions of the cycle operating on that individual stock or comm<xlity.
rrhis method is die only reliable one to show guaranteed true support and resistance levels long
before prices ever reach those levels. Normal technica projection techniques are mere
approximations based on likely projections, but tbismethod alone is the key to real analysis. The
value of this idea. I can assure yuu, is worth thousands of times the price of this book, so I urge you
to consider it carefully and learn the principle.
Price Line
Thl*ia flic p flee
level to watch 1pr
future Etippart Nate
price tiflB NEVER
traded Acre is vtC
Tlock" inaloffy shows mi|or support and
resistance zones near m*id mum » of 3,6,9 J 2
Support and rebalance In PRICF are found near E and 12 while
S m€ 3 show orras of TIME tfllsinnce far brfllrminna arid endings ol cydes
52
tito
II1C
TXDD
11*4
11*4
±174
lilt
tit*
1 l«*
1 116
alio
i Lit
1 L««
toic
IO40
H'O
l4*c .
iese
icto.
tore
10t«
toio
1IM.
ixO
i»»4
11[«
lilt .
|>1«
■ 110
bllC .
L ■ 10 .
IPQC
1114
lilt .
IMTI)
UK
me
i»to
L«)C
LfftC ,
In i ^ii ■ i 11 i'm i. ii ■ ■ ■ l ,1 liWifyUM*..,^ j|il*< <
^
■ X ID O
It00.-ft
lite t
«'« o
nit «
int>.i>
1L1D 4
1 lift.
It ID.
ill*.
1 ICC.
io in
IMS .
10*4 .
z«e .
■tvi-tl.
■*Q*«.
JO *fl
ZQDQ V
1114.V
l*>f> A
l»*4 .»
liCO A
l*t<> «
lilt
■ »■>»
■ ■■ft.
■ ••&.
ilia.
LlIOi.
LI tft.
1110 .
If ID .
Natural Squares and Square Roots
emlmgsofjiiill mid Dear Markets arc ,.uroj^sj:h_at are natural squares, o more precisely, the
square root increment of prior h'ghs and lows. It \s the squares ojFnujnbcrsjhat account for ail
natural expansionandLcontracTjorim the speculative markets. This concept is by fai the single most ,
Important one you will ever encounter and time s^jen mder stand irie the principle will make you
n^h. Since my Teomet y book deals at length with Ihc underlying principle bellind why this wotks,
I will not go into (hat 1 ere but give a brief overview.
le natural theory of cycles states that thejwice JeyeHlse! f tej Isy ou what Ihcjiiathcmat tcs of the „
under ying cycle is. That is to say, a stock that hits a Ingh at $50 and then deel jncs tel Is you that 50
is themaster mathematical hnwujnic: fifty minutes, fifty hours, fifty days, fifty weeks, etc. will have
important time cycle irilTuences on th,it particular stock. This theory goes on to demonstrate that a
"square" drawn from that top of 50 in anv time period unit such as hours, days, weeks jiipnths^ ^
53
years, etc., will reflect all ejelic harm£mcs ft^ tan be halved and
jyuariered by tt c use ol diagonals to bisect the 50 time unit master syuare dpwii to the smallcst_
radable unit lhat is practicable. These diagonals, that subdivide rtu's squareLgjye_me to_^
trend] ines that are the critical timing lines for that pajicuhr s1ock_pr commodity. These
trendlines can be subsequently continued nto the future or any length of time, so you will
know all possible support and resistance levels lor any foreseeable lime period. Because
this pri icipic is the basis of all charting, wc can use a facet (if it 10 quickly determine where
highs and ows wTl come oui in the future or meet massive resistance and support. 11 is
application con es froi 1 the observation that, in constructing a square out of building blocks
(more commonly known as a cube), the sma lest divisible unit of that cube is each side, or the
square root (actually it is the cube root, but we are o Iv looking at the two dimensional side,
since that is all we chart on paper). There is no other fundamental mit that wilt construct the
square. On a more minute level, the reciprocal of the square root represents a single building
block, but, for our purposes, the mam side of the square is the foundat on Jlsiacdsio reason
that this square root being oneof the iindanientalI building blocks^of the cycle will appear as
a unit ur an expa siojiTactor in all su bscqjjcnt man i festalions oftbat cycle. Iw instance, it our
stock Kips at $ 100 and we know the scjlt root is j0, we can surmisethat minimum fluctuations _
will approach $10.1 arge_r tnqvemcnts will te_ addjtivc sumsMike_$ 10, $20, $30, etc. __
liis type of simple increment |s easily uiih_ ed. ()na more, dvanced leycj^wejwk at expansion^
sequences by starting with the root and incrementing it, then satiating the incremented sum. We
could jakeJO and add Ho^et^jcvcn, then square _U tn^et our target of 121 as being the firsts
niassive resistance number after 100. Lorjmo.sMrailcrs, however, 21 jlhi its from 100 to 12 s too _
large a trading unit, w wc wouk want to mcrement the root JO by fractions such as .25, or 10.25^
squ ai ed i s 105.06. J hen \0+J5t) squared is 110,25. Many o( you will immediately jump to the
enhghicncd conclusion of using Fibonacci increments like .618t 1.3 82,1.618, etc., and thai would
be a step in the right direction. _
In rega d to the nnrkct averages, almost all the past hiphs and lows in history are related to one
another by a square root sequence. For years, it was an addition o 5 to the root, but lately it h,is
advanced to double digit increment levels. The rea] key, of course^ mains to match boththe_
increment suppoi t and csistance jevels to a comme sunte jjtie cycle, so thatbtnh_time und_^
price come together at the endof the cycle Only then ^ ii I you see flic finajhighor !ow._
W.D. Gann formalized this pnxess in a chart he called the Square of Nine chart, since it ha I it its
core the first ni c umbers. These numbers were arranged in a circh and a large cross. North,
south, east and west weredt awn through the number spirals.The numbers incremented until they
made a full ci vie, then ju iped to another rung o make the next larger circle. 1 am sure most
trai ets have seen 1 us wheel or even use it daily. A whole book could be written about its origin,
but. for our purposes, you should know lhat it is a simple squ are rootcalciilatoi and to go completely
around one lull e'rele from any starting point and back, you s mply take the squ a e root of the
starting number, add 2 and square, f you want to go 90 degrees from any origin, take the root,
54
add .50 and square. To go exactly opposite the origin nu Tiber, add 1 to the square root and
square, Fich of the 90 degree rotations rovide resistance to both price and time, so here too you
would like to have multiple correspondences for accurate results. The beauty of the drawn
circle arrangement is that all numbers line up *n the four cardinal points on a straight line, and
one mere y draws a circle around the past high and low numbers to sec if they fall in a line or
obvious sequence. Once this sequence is determined, you have the eternal key to that stock or
commodity.
Gann Square Of Nine Chart
■
— ■
57
56
55
5
S3
52
51
50
58
31
30
29
2S
27
26
80
59
32
13
12
11
10
48
79
60
33
>
/l
2
K9
24-
47
78
61
34
05
8
^2T
46
77
62
35
6
y
"22
45
76
63
17
IS
19
20
21
44
75
i
37
38
39
40
41
42
43
74
6$
66
67
68
69
70
71
72
73
—
The above Gann chart starts in thecenter(bJank) and proceeds outward by the numbers. Especially
note that the first circ le of nu mbet s stops at 9 and then starts a new circle with 10 to 25. Hach circle
ends at the square of o d numbers, as shown in the line drawn down from 9 through 25,49,R1t
etc. lite opposite part of the chart shows the even squares of 2,4, 16, 36,64, etc. Note that if you
take a number such as 46, calculate he square root, ant add 2, you will get 77, the next number
down on the chart. If you add 1 to the square root, you get 61, which isdiiectly above 46 on the
upper half of the chnrt.
If you can imagine the orbits of an electron am the fact that the electrons when stimulated can
* "jump" to higher or lower states, then you will have a better appreciation for what happens to
stocks when they enter one of the&e new circles. Alsn,notr the natural phenomena tl at higher
55
priced stocks move quickly and further between corrections than lower priced ones. On the
chart, these are the numbers n each "runV of the circles which have more numbers as you go
to higher cycles. Finally, note the chart is not complete but can be continued to nf nity, and
you should make your own up to 4fl00 or so, if you trade the Dow Jones Averages. In theory,
this is a generalized chart based on the natural numbers. In the case of specific stocks, you
might want to start your chart with the multi-year extreme high or low price in the center and
cycle up or down from that price to get very specific price pattern identities.
Day traders will note the simple but extremely powerful technique of incrementing the roots
o the S&P futures or the OhX. An S&P number, such as 465 whose root is 2 J ,5638, can be
incremented or decremented by sixteenths to get the following sequence* 465,467.70,470.40,
or 473.12 for the upside targets, and the decrement would be; 465, 462.31, 459.62, and
456,95 for three sixteenths. Number sequences other than sixteenths could be used if you find
them more appropriate. The root increments of .25 represent a 45 degree rotation around the
Garni Square Of N'uk Chart.
Again, I wish to stress that the information in the above tew paragraphs is quite valuable, and you
should make sure you thoroughly understand the concept bef ire going on. The following are
examples:
irt ae-i
1?1.UI-
471.54
1U.3A
S&P Futures
Hourly
i y\j
rms Chart Is WortJi
1000 Tl cs The Cost
Of This Book! Be Sure
You Understand It.
IT
HT]!'
M
n\\* Note Highest Prfce=483.1u '
Lowest Pr1ce-46S.5D
Sq Root 4K3.10^21.9795
minus .382 (Fib) J82
Equals
lyfcj 1S3A
—r ——i 1 1-
\sZ? I/2B 1V31 a,, Z/Z
21.5975, That Squared - J66.«!
—i-
—r [ 1 i r
Z>7 J^B 2r9 irlB
S30 Top
" '''V'll,
50 time unit square
Ends of square are time cycles
and support and resistance
Note Trend lines arise from
diagonals of 50 unit square
56
My Geometry hook go^sjnto^reatjength construeling^Gami S^uarcs^arid.^youjliouId study
that work if you want to grasp the reality behind the idea, hor our purposes here, however,
know that on your chart? you want tg keep track of time cycle counts jrom important highs and
lows, and die easiest way is to construct a "square" around the price level equal to that price
level in either a time period of hours, days, weeks, or months, related to prce units. As each
square of the fundamental time un Stands, a major cyclic turn will manifest in the stock or
Commodity. Sometimes the simple geometric square or circle figure will point to the price
target, but one of the real secret keys to forecasting is to use t eGann Master Time and Price
Calculators. Few people understand these, so be careful if you spend a ot of n oney acquiring
them. In principle, lliey work off the Square of Nine or the "Octagon Chart". As previously
explained, this is a root calculator, but more important than^he price levels shown on this
chart (which is all 99% of the traders bother with) is the fact that these numbers represent
harmonic time period* from past highs and lows. The procedure is to find where you currently
are in terms of time, by noting the numbers in the wheel and converting them to days, weeks,
or months, from a past major high o ow Once you know where you cuncntly are located on
the chart in terms of an angle radiating out from the center, you can then move along that angle
back to the previous cycle in the immediate rung prior to whe e you now are. You then go
back to a chart on that prior calculated date and find out if it was a high or low. Your current
forecast on the present calculated number rung will likewise be the same - that is a high if
the prior one was high or a low if the prior one was low. It is important to note that, going
back to the prior theoretical date on the wheel, you may find, on you actual historical chart, no
high or low on tha date. This is w rat confuses most people who use this method. What you do is
look forward or backwards from that theoretical date by usually 5 to 8 trading days to find the
actual high or low, and then you forecast that the current cycle w'll co e out plus or minus that
same amount of time t lis year as it did in the prior cycle. If it wis 4days early last time, it will be
4 days early this time. Importantly, it wi 11 usually be the same character — a high o ow. Once
again, 1 wil I not show an example n th's book because i is too importan ■ If you desire knowledge,
you must do the work. I will ust point.
57
Waves
1
Waves are ically just recurring patterns that have a specific shape and can be used for predictive
purposes. Although there are an infinite number and type of waves, the must common have
traditionally been classified as (he wave movements foraprinwrx trend anil three wave movements
for the counter trvrtd. A five wave pattern realistically has but three upward movements separated
by two downward thrusts for five in tola], but three going up and two going down. Al Urc end of all
five, the big counter trend movement takes place in three waves or two down separated with one
up. This is foi a primary up trend. A prim* ry downtrend would have five waves down and, at the
end oft! at. three counter waves up, Basica1lyTthe most important p<iint is that whetryou see five
waves clear! y know a big change in trend is at hand-
Waves can often be difficult to see in complex pi ice structures, but when obvious do give added
value to the overall than interpretation. Ofte itimes, the use of parallel cha mels on the data will
make counting the waves easier, since each t' tie the prices hit the top of the chani el and turn
down, that is a ^ave top. The touching of the lower parallel channel is the counter trend wave "n an
uptrend. Hie \lea, o course, is to buy dips and sell rallies, so knowing where wayes; end and begin
te Is us whe e to buy and sell. The typical pattern looks as ollows.
5 Wave Uptrend
note 1, 3, 5 are up
5 Wave Downtrend
note 1, 3,5 are down
58
Usual jy waves can be identified quickly, through the use or parallel channels, ITie touch points of
the channel lines are where the waves peak, and yon can make a quick ipproximatiort of the
number of zigzags that way.
Most waves form these I_± 3, structures in the primary trendLthat ,is aJ5 se^uencejpf .a
main up trend and a 5 seq icnce when the main trend is down. If you ^ee a dramatic movementof
only 3 waves, i t i s probably a counter movement to the primary trend which wi 11 shortly reverse^
This idea of waves and paral le I channels gives rise to a concept c£retravement level*. Remember,
our strategy is to identify the primary trend and enter our trade wilhthc pi imaty (tend but enter it
on the little counter trends. fhat is, buy the dips or sell he allies. Obviously, the *'dip" cannot
exceed he primary impulse movement or it would not be 'idip So, we watch for retracemenis.
J^gtraccmcnt^arc usually,25%, 33%, 38.2%t and even 50%. Normal counter trend movements
stop it these ret ace went levels and then resume the main trend again.
Ouj strategy, therefore, becomes one of judging the momentum of the counter trend correction
iato which wc will m keour e try ito the tmf e. Then guess its most likely percentage and buy in^
(if it is an uptrend), placing otn sel I stop down at he percentage whet c wc know we at c w ong on
our guess, bor instance, it a stock advances from 20 to 30 and wc think a 50% re trace me nt is
likely, wc buy on a dip to 25 and use 22 (down RQ%) as our stop, s'nee a correction that big is
probably ot a correction at all but the primary trend and 20 wilt soon be broken, litis strategy
yccor lplishes two very important things and will be the key oour success as tiaders. First, if
forces us to buy against the minor trend and Thereby mitigates against our becoming emotional and
impulsively buying just to satisfy our greed, hul forces us to have a plan. And second, we can
dearly define our nsk on the trade to only a dollar to two. Whereas others may be holding stock
from 30 and have a big Toss by the time it hits 2 . we only have a TtKxIesl lews of S1 and can easily
handle that situation without getting emotional. When we later look at cycles, wc will add a third"
clcmenl 1o the buy equation: time. That will Furl her define our risk to a set num icr of hours of
-Jipkling regardless of price damage.
59
Impulse Waves
Impulse waves are the "nilial thrusts in each wave sciics. This first prim-try thrust can tell us
a lot about future price trends and targets. Obviously, an impulse wave implies, by its very
name, a powerful momentum thrust. When you see an impulse wave, do not think the current
trend will reverse any time soon! RecogmVing an impulse wave will keep you with the
primary trend and even help identify it for you. hor example, when prices seem to be rant amly
bouncing around in a flat, usually a big impulse bar will occur every so often. The direction"
this *'b g" bar takes points to the primary direction of the movement, even though it quickly
seems to reverse. Unless you gel a complete 100% retraecment of the impulse, do not assume
the trend has changed. These big ba s are also often accor lpanied by "gaps'* in the chart, and
looking for gaps is a good practice when first picking up a chart. The gaps indicate extremes^
of emotions and big supply demand imbalances.
Remember that the purpose of identify "tig the impulse wave is to not only respect the trend, but
once we identify it as an impulse, we know there will be five waves coming. So we can set up long
term trading strategies to buy into wa\ es 2 and 4 and watch for the end after five.
Impulse waves frequently rise along strong angles, such as geometric angles of 4 x 1 or R x I.
These big momentum angles are also a tip off as to the strength of the move i i progress. In S&P
futures trading as well as other leveraged futures markets, the big mpulse wave bar on the chart
signifies a time period to buy every dip over the next several bars on the chart. Trends usually
persist, and the number of bars after the impulse that the trend continues is at least th ee bars but
usually afibonacci number like 5,8,13 or 21 ba s in the same direction. II is nice to have the
confidence that a move will last this long and stay with it, and identifying impulse waves gives us
that.
The second major help impulse waves give us is^for measuring the distance of the move. Usually,
the final high or low is a multiple of the initial impulse distance. If the Dow Jones Averages impulse
up 50 points, we could multiple that amoun by ratios like 1,1.61 R, 2, 3,3.618, etc., times the
initial thrust. Remember, also, our previously mentioned secret of laying the signal har on its side
horizontally to measure the time distance of die move.
60
Examples of Impulse Waves:
t gy vjv OP lrt£ reeri_^:r*tL-«^^tJ ELiCT _» Own 1*3 nm -*■ «l nj.boc
Ti i ir «rsici iv ^ *T*in «u m uw n*-#vto«, 11—.-ma m^ ■ *
m mn^na. p^fmjmctk. iCTiTi.n*-&w ute^c _.
»■ H rV«H r I ■:-%- ■ I— I-*—-**** «■ U* w^ h*>* A*V ' JKftL *"■ * n"" " ■■**
■j1-"'ir ^- ■t* "* -—8-
iqi,MHn -iflu
£
I
0* I
] Typical Tmpulsc Wave Arising
Out of A Multiple Bottom Flat
And Then Exploding Upwards
j At A 60 Or 90 Degree Angle
i£i±:J£uiirfe
4L*m uM/ifu^ v f tip^wj aPMiri wirv^.
r»7I B. "53 11*1 Ih u,,i Clti 1TC
SU -"-9<
I J5 ES* N/*
"HI [*Hiilil| Ii iw *l( f l.«. * .M I <*u-* IK
""** |i ii i i »m I mn i'-1*1 | M ■».cr f >'imi» imca ] —-» in
Initial Impulse Followed By A 5 Wave
Decline Back To The Low To Close
A Gap And Make A Double Bottom
I :■" Mr :ff", |if|
Jn,".1.: iii:in.ii i. .ij'Ji;n..'*"i
i v i| l-F, ■" . li hi ii ih;! i . ■■inflow '
■Mh< Jiiiii|i 1 «i!i. "innH'iw '^'B lii'ij.^i r'j'ir.L ii.!'-(r!i»s:'r. liif ■ f.«m
■An
IJJi
ii!
K
Hiii.ll Jl1-1 M.w
",l'!||[-
i .if
-=1
61
fcJ.Mil
Irt. a6t<g* -rTj-'i
■■■■■■■ ■ 1 ■ "^ ' f-l*! ■ 1S^ ' M ■-■■ M.1M _ I
"^ l^^~~ ■"• t f"% *" 111 ^- > Vl I -rpn— — itCi
l_J-i bib rmihtt V «^» na || ll I »m.-i pj> >| I ^(^ n ^ p]
1
_ataali_<ifLC h» <r ' *™ l*-i* *-w^'? _ •»'?-* r> ivr^^_-'« ™
hUk
wg »ifr- -1>
f,_ .i i^-^ —!ilL>31J
nt vgi 112 »«<.,[ trie* 4 t
H ;-*4 a 5jti>i«..ZiJ.
% 1-3b;.;s:t r
!fc£fcfc£
Multiple Impulses
With Big Bars And
-n; *.T frits- p HUlll1 »
■ .^ ^ Gaps With Volume
62
Angles
Retraccments are easily calculated,; nd although > ou could spe id nust of your fi ne calculating
them and recalculating them, 1 cannot spend loo much time in this book on such a simple subject.
What T can point to, however, is a simple technique that actually keeps track of retraccments
automatically and requires almost no work. This is nothing more than angles. Not simple trend! mes
most traders use but "geometric timing" a gles. These a c called geometric angles because they
subdiv de time and space or price movements into pi oport innate fractional parts. These fractional
parts are our percentage retrace lie ts, and when a geometric angle breaks, we know the trend
will most likely continue to the next angle retracement.
' Tie most basic correction is the 50% retracement. This is represented by the 45 degree angle.
Til is angle is the diagonal of the square, and we know that a diagonal everly divides a square, so
we know il represents a 50% measurement. This angle is referred to as a I x 1 angle because of
this equal itv of ti nc and price.
One_«rT_he most difficult coi cepts >ou must grasp is the idea that time and price must/wf/rbe
accounted for. Remember, we are measuring vector distance of time and space, oi price! w'a"
sideways movement coupled with an advance or decline represents nore than just the price
movemen . You w II have to contemplate this concept ong and hard i you want in make real™
progress. Hiis is the reason that any price decline to a 45 degree angle represents a 5(r*3> rch acemenlT
no matter whal the price decline has been. Along that 45 degree angle, time and price are equal
with the origin point of the angle. We are over the exact same amount we are down. If a stock goes"
up 10dollars, sideways two months, and hits the 45 degree angle coming up from the low, it HAS
corrected 50% when it hits that angle. You may have to take a few years to contemplate thtT
nuances of this principle^ but for ntny pleasejrnemori/^il. Since geometric angles evenly ividc
tune and space, they are represented as divisions of a sqnare and designated as one by one, two
by ot e. four by one, etc. These are Ihe units up versus over or time and pi ice.
\AA /a \^A I^lj IixnJ V^
j
63
"\
These angles are timing lines in that prices falling along these angles are at a i exact fractional
proportional movement from the origin to that point. Jheprirrijary mje is that whenjou break one
angle, you must go to the next. That can ether be a drop or rally to the next <wg1e or a long
cor solidat ion until the next timing angle reaches up to hit the current price. In either event, the
currcit rale of
advance or dec Ii ie is
over, and that would
require a change in
trading strategy. If
one were to merely
draw these angles
with a compass, you
would find the 8x1,
4x1,2x1,1x1,1*
2, 1 x 4, and 1 x 8
angles equal to 7.5
degrees, 15 degrees,
26.25 degrees, 45
degrees, 63.75
degrees, 75 degrees,
and 82.5 degrees,
respectively. This is
shown as follows:
Jj«un A**i
\
64
Angles arc a very important means of measu ing momentum ii d thcstcepcr the angle, the more
powerful {he move. By measuring the steepness of angles, we arc forewarned of etnnges in
momentum and coming changes in trend.
A_igles are usually drawn Lip from lows ^djjpwji from topSj xiniming angles arejised to measure
precise luirfng^omtsuVren? they mtersectjyricej'iarm mics. Por nstance, an ingle drawn down
jrom a top at 50 on a stock would identify a time area to expect a mm when it readier the major
pi ice harmonics of fifty, like 37.5,25, 12.5, and 0 These are quarters of the price of 50, and even
though the price itself mav be Jcwcated on the chart elsewhere* when the timing angle hits rhese_
important numbers, a turn is indicated in that time period. Major movements occur when time and
price "square out" or reach the full price, such as a decline of the top angle all the way down to 0
or an angle started up from zero dircctlyunder the high o/50and at a later time imerset ting the^
price of 50. At these times, in particular with the 45 degree angle, lime and price a e in perfect
balance, being over the exact number of units as the price was i the top. Tl esc "square outs*' look
like diagonals of squares and as thus called square outs, since they represent a square or balanced
harmonic of the p ice. An angle coming down from a top and one coming up f om a co npfetely
differ cnt lower price would intersect at die common mathematical vectors of the two prices, and a
major Ttt n would he indicated af that point. 1 Ins is called "squaring the range" or the price
difference between the high and low sw \t\^_
It is extremely important tojdraw angles both upfront zero and ttown frqmjeach higJi to zero to
see major turns. Most charts do not continue the scale down to zero hut only use the relevant
trading range. In these cases, you MUST find t ie ocaliun of the actual zero price and co itinue
your angles until they reach that critical point. Additionally, an angle coming up from zero, stalling
under any high, will almost guarantee major support the first lime it rises high cnougl to In the
current price level. The vast majority of traders do not do this and miss out on the easiest and
strongest support point for the stock or commodity. Keep in mind that if your papei or scale does
not have room to draw down to zero, you an "tic tae" back and forth r up and down at price
harmonics unt'l they add to the appropriate amount to reach /.ero. For example in the 50 price
example, a 45 degree angle drawn rom 50 down to its quarter point of 37.5 con d then be turned
back up to 50 again which would be he midpoint, then down to 37.5 again to represent 25% and
finally back up to 50 to get 100% or the ero angle point. Most people do nut realize it, but this is
w iere you often find c} cles of""*" units which are really just ihese lie lac harmonic points from a
past major high or low being worked out. Whole bwks have been written on angles and \ hesitate
to rewrite thern, so refer you to my other w i itings ant other books on the subject. 1 urge ynu to
do so because the information obtained will be valuable.
65
Fhe above chart ofJBM shows the importance of the "zero" angle technique. You should draw
your angles up from the ei o line under every major high and low of significance. When you do
thts.you will finally see for yourself why every single fluctuation into the future is accounted for bv_
a fluctuation from the past, Pjea.se spend some time with this technique. It will change your life!
What is not shown on the chart, sn as to not make it too confus'ng, are the t x \, 2 x 1,4 x 1, and
8 x I ingles, or the 30 and 60 degree ones. If you draw these in, you will see some startling results.
Also, remember that the 45 degree angle is the master timing line, so if ym witch to sec where this
angle intersects the price harmonics of its origin price (about 50 in the above example), you will see
turns at each proport'onal price level.
66
T would point out one .other common _nii sap_p1icnfi cm of angles to charts, and that is the proper
orientation. Just because wetraditionally draw c larts horizontally does not mean the prices are^
going in that direction. Remembe to think in terms of time a id sptwe vector or c'Tcular distance.
Tor example, most traders d aw a 45 degree angle w'rh n p otractor from any hig \ or low. ITtis_
may or may not, however, be the r ght slope. Hie real geoinet ic single bi seels a square, ;md the
only valid way o get an accurate angle is to find the directional orientation of the side of the
square first, ["his side in vector distance is ■ straight fine from the last major low up to that high. /
is this angle that the 45 degree angle must be of set against to measure true support or resistance,
f you adjust yo ] c laris for ihis critical slope, you will see a majordi Terence! Porexample:
slope
i t^t—i—i—I i—i—i—i—I i i r_T -i—i—i—i—n—I—i—I—i-
i»SF} l\/Z iiv* iiy© U/lfl nili tl>-lfi ll^lB ' ll^ZZ li./Z*us&} 12^1 ,-T **
67
"7—t1 ■■■ i t f r—r—t—t—I—i 1—t~t—l 1—r—l—rn—r r—r
llrt 1LH ' 1L1 UslM H/I2 IIh-IA U/1B 11/22 W/14 \.\slri 13/1
3-725.».
3760 B
3&73.B-
3U«
aKffi.n
. "i—i—i—i—■—i—i—\~~\—i—i—i—i—v\—\ - i~i
iq n 11/2 IIjH \\/9 1141 u^LZ U'lb M/10* 11/22 11/2* j,^ L2/1
fiK
The important angles to use are the geometric angles mentioned previously along with the
normal Trigono metric angles of 30,45,60, and 90 degrees. The sti ongesl angles of all arc the
90and 45 degree, in thai order. All right angle (90°)
slopes hold powerful support and resistance levels and should be noted. _Kcep in mind that
angles thermelyeSj, while^useful^arcjnuch better analyzed in conjunc ion with our other
toolKj like circular arcs coining to an end it an angle or a signal bar reversal occurring at an
angle These tools, in combination, lead to very I igh probab Iity trades.
Another very important point concerns frntfjn^ off of angles. Most traders buy or .sell when angles
are broken, and this is often profitable. This strategy misses the point, however, hat angles are
really timing tmes or types of moving averages a id should be actually interpreted aschanges in
momentum rather than direction. After a t'ming line is broken, we should watch for a technical
signal to prove thai the trend has reversed before making a trade. The angle warns us of this but
does in itself not change the trend. Remember that an upward sloping angle will be broken sooner
oi later, but that our definition of trend in a hull pattern is that of ^pattern which makes higher
bottoms. The*^ bottoms are from a horizontal perspective so the price level could decline under
an angle but not break low enough to violate a prior horizontal swing low, and we should remain
long in the trade. Thi ik about this, and you will see the most common t listake all traders make
when trading off of angles. Tliis princ pie is also the main stumbling block when deciding if a long
term Bui Marke has come to an end. To he sure, prices must break a prior swing low, but
trend line angles are often broken hundreds of Dow Jones points higher. Th s is one of the main
advan ages to using cycles or circular arcs. In a cyclical analysis, we can make a highly probabilistic
estimate that the top is in long tefore either angles are broken or swing lows reached. Nevertheless,
swing lows usually offer strong support when reached, and a final bounce off of them usually gives
one ample time to go short for a big break.
when each geometric angle hits
that first topf These are the cycles!
69
I spent a great many years of my life studying angles, and many a book could be written about
using them. You must not assume they are not important just because 1 have only devoted a
few pages to the subject in this book- My object here is to simp y give you an introduction
and hope you will follow up, Sufi ice it tosay, thegreatest secjelofal I techjiicahuiidysis is to
J^-Ittuntjjnjhe sUjtly i'Langlesn cannot afford to reveal it in a hook such as this meant for
mass exposure, but if you follow up on the ideas herein, you may tind it for yourself.
The following points are nost important and need careful attention. Keeping in mind that time and
price must be linked, and we must match up our natural calendar time with our work, you will note
that the basic primary angles used for technical analysis consist of points per day, points per week,
and points per month. AH basic interpretation must begin with the geometric angles of 1 x 1,1 x 1,
3 x 1,4 x I, and 8 x 11 in terms of day.s, weeks, and months. AllhiiH and bear markets begin and^
JrCilonJllcs? ^IfiJ^, &speci_ally monthly angles, If jsjhe intersection of these_angles frgTiipast hlghs_
and lowsthai bring our cycles to a common tinje and price point. J .wiijjnol^demonstrate this po nt
in an exhibit because tt is too valuable, and those not willing to do some work do not deserve to
know the truth. You can take my word that it wilt work every time, if applied. From each beginning
an ending o major bull or bear i Eukets. y on lust stTrt and maintain these angles,
Another point about angles concerns, where to stan them from bes i de 5. t he oh v i on s tii^.ojjcjw^
TJlPlil£pry of angles is that lime ai dp_rice_ are linked, in an_exac t re lationsh ip, an tl pur idea of
Pleasured _mgye_s_of emotion. 11 nicely with the slope of angles describing those emoijkjn_sr Asji
re s idl^y ou wjMjiote that_anglesjjloyjURu_gw_ard_s£roni aspike high yyij 1 d efjne a_fj.iture_top/I he
eniqtiqnalis n seen at he first top ca \ never be exceeded^ andsotf we draw an ajngle up frotii that
lorvthenext time that angleisreached that sameeniotionalextreme will again here ached jind the_
rna rket w 111[top aga i ru, The_ Jia_me_ t ec ti n i i_li e i s_ap£l je d to liej n i tja .sp i ke__ ows in a down tie nd,
Angles declining from such luws will define the ei lOlicmal extreme and will "catch" future drops
when prices reach those eve Is, Typically, we use the 45 degree angle as the primary guide, but in
big momentum moves sTcepcr ones may be evident. Parallel channels are often formed by these 45
degree angles corning down from a top and likewise coming down from the first bottom or last
bottom just before the top. litis pai allet channel wi II define the downward movement, '(lie upward
parallel movement is created with an angle up from the low and a parallel one up from cither the
first top or the last top just before the prj\rnary_o\y.
WherHisji£aty^lt^ lortjmejwid Jncc.diarigeJi|s^aje,puJ[sJ"j^Hi w>1] notethreej^rjmary square out
intersections^These^are thc_45degree down from a top intersecting a 45 up_from a low, the 45^
dqwnjroni [he top hitting ^he bottom level and the45 degree up from aj<iw hitting a top level
Indeed, each past high and low will create cycle turns when angles down or up from those levels
intersect. Since these intersections are numerous, we want to concentrate on only the larger ones
for their greaterinfluence, his is inipl icd in the prior paragraph when I mentioned that all bu II and
bear markets begin andend on these angle intersect ions particularlywe ekly n I monthly angles!
70
Examples of angle tec hniques:
474.1
4?4. 5B-
ATZ.
Vfll.S*-
3tP I'ulures 1 Minute Chart
«*_:*-
\
45 From Tup Hk*
"i
i'H
Z--15
I~"
71
4:111 pMf •> w:> . •,■« vtM :■ i "Fi . (—.j-ai-i ,^M I- :i -n mi 'ffiivi* »■** ; t—^ III
FrtKMlInc T":fc«qii* LtJite MM point OF
AdJuLcd A*K W>J Crossing « wid « dcfrtr
AnEl«. |V'or» Thl» C^» Both tl™ A Prfc.
ObJeTllvril
. p*=r_ it = ~yj --I
■ .-uiinrii: J1.i ■■ it,- i- '-t'U .':". u -13 b=i-.i i I i: 4 - ■ ;i - ' liJjsSL*?!-*- ■ h. : j
-U^iJ
IW3-1
72
The Hourly Chart i
he primary chart used for forecasting and day trading the markets is the hourly chart. ITiis is
smply a chart where each period bar is one hour's duration. '\ li ere is some debate as to how many
hours should be in a daily hourly chart. At present the stock market opens at 9:30 AM and closes
at 4 PM, or a period of s'x and one half hours. Many people use 10 AM as. the first hour even
though it is only a lalf hour. Others use U):30 AM but end up with an extra half hour at 4 PM. The_
correct solution is to use a half hour chart since that correctly shows each period in an equal
fashion, but the half hour chart is not as good for long term forecasting. My method is to use an
hourly chart with six hours in a day with the first hour being 11 AM. ITns givesjhc first hour one
jnd a half hours, but this is far superior to the 10 AM method. Many times that first half hour
ending at 10 AM does not include all the openings due to delays. Additionally I find tliat a half hour
is si mply not enough ti rnc to get traders to make a commitment for the morning. I have found that
it takes about 45 minutes to a full hour to get day traders to commit a d readings laken before that
lime period are often erroneous. Specialist openings where the specialist m:inipulatcs his stock up
or down irtificia ly to get rid of, or purchase inventory also affects the reading. This is done at the
opening but is still often going on by 10 AM. J find that the 11 AM reading represen s a smooth
continuation from the prior day's 3 to 4 PM hourly reading while the 10 AM usually gives an
erroneous one that is erased by 11 AM. Suffice it to say I have made a study of the two charts and
the six hour chart is infinitely superior. After several thousand hours have passed from a major high
or low, the six hour chart still turns die market at the calculated hour, whereas the seven hour does
not.
11 link at lot of the basic truth behind this has to do with the numerology of the number 6. This is
one of the master numbers. In Genesis, God worked for six days and rested on the seventh. Six
times six is .16 and ten times that is 360 the perfect circle and number of degrees o all cycles. I
could go on and on about the number six but will have to leave some of tliat work to you. Basically
yi.th.is book whenJ_rcfcr.toan hourly chart jt_wil.L have sjxjipurs_nnted jn a day. Thosc_hoyrs_are IJ f _t
J 2,_!, 2,3,.and 4 PM Eastern Times. __
73
The reason these hourly times aie important is thai trading can ic very precise and the market wil]
tum at cyclic intervals that are extremely precise. I have seen hou ly culmination's to the exact hour
several thousands of hours after an important high or low. For example if the Dow J ones hada_
majk.r h'gh at 3400, you could Jjet. anyone that EXACTLY ,3400 HOURS.latcr a major turn would
manifesHn the.rnarket wgrth trading J.hc reason for his is not the pn pose 0 this book but is
covered at length in my other works. Incidentally I doubt many traders other than myself know this
fact, but in August of19H2 the Bull Market started fror i a Dow Jones closing low of 770. In
August 1987 when the market lopped it was 7700 trading HOURS from that low! Coincidence?
As traders we know the famous Hbonacc sequence of i mbers that arc an additive series
starting with I and adding each number to its neighbor to geuhe nex number jn the sequence.
It goes Tke this I, I, 2,3.5, X, 13,21,34.55,89, 144,233,377,610 This sequence
has the important property of demonstrating the golden ratio between its adjacent members
(divide any two adjacent numbers into each other and you ^et 0.618 and i 61 R). The golden
ratio 1.6t8 ias or all eternity been considered o ie of the key building blocks of the universe
and si ows up in all of laiure, mathematics, and stock and commodity market data. The
lengths of various market i oveitien s aie often Fi onacci ratios, and the simple abso ute
numbers menlionei above usually manifest like c ockwork in luming the markets for trading
purposes w icn using an hour y chart. Thai is in my that franie_Yejv hi^h and low we countJ_,
3,5,8, 13 21. 34.„ hours, and we w'll find that most_of the turns will come almost exactly_on_
om of these Fibonacci hour|y counts. It is extremely important therefore to keep track of
these counts on our charts. Most people are shocked at this simple fact when it is fiist pointed
out but I assure you it is true and has woiked for hund eds of years that 1 lave examined data
or This greatly improves our trading since we now are not afraid of a reversal each and
every hour that we are in a trade. Fo instance it we buy in o a dip and the market does
revc sc back up, when do we sell? Most traders become shaken out o a position the very
next hour with a small profit. Using Hbonacc' hours, however, allows ts to only lake a look
3, 5, K. or 13 hours later and forgel about wonying about the other hourly intervals. If the^
market eoes into the sixth hour, we will expeci it toco at least to the eighth, and if into the
ninth, it will go to the 13th. 1 c^nno emphasise enough liow^valuabje: thisjnn^mation swhen
trading fu ures and_options. My experience is that die vast majority of dayjrading moves last
13 to 11 hours. If you make aji^bjt of paying clo^e aUentjon to horns 8,13, and 21 from major
turns, ii will improve your trading d amatically.
Our basic strategy is now refmed to looking for an entry pout with a reversal bar signal, then
con rng our Ikxi s pay i ng attention at the Fibonacci luming points, noting if circu lar arcs or trendlines
intersect at certain time per'ods that also cqrresp; _ndJ/> aTTtx hi ace i time zone and therefore hold"
high promise [or a turn in trend. We also need for future reference a connnuousco int of the exact
number of hours transpired fro neacli significant high orJow over tjie year. Major market moves
occur AlJIK* hour intervals lut parficu lady at the 5(X> n iu It iplcji Jike. J QiX), JL5U0,.2O0Q,25.0G. etc _
Also of greatest importance is the long Fibonacci .counts of 1382 anil J 61R hours. You will he . .
startled if you examine these facts.
74
Since these Fibonacci hourly turns work all the time, it sometin es can get confusing as to
which hourly turn is the most important. The rule is generalty the longer the sequence the
morejmportarit the Turn, Three anc[five hour movements sually cannot generate enough
momentum to make big profits, but 13 and 2i or more hours in aftrend is a good move.
(Remember with 6 hours in a ay a 2i hour movement is over 3 full trading daysf)^
Additionally, counter trend movements will usually manifest for a Fibonaec' period one or
two less than the main trend, such as a counter trend starting at the 13th hour and lasting 8 or
5 hours, not 1, 2, or 3; and a 21 hour turn giving rise to an 8 o 13 hour reversal.
Ficli of these main trends and counter trends arises at Fibonacci intervals and this leads to another
important observation rule. This is.^hatajt, major turns wortti tradmg wcwill see clustering of
mam/ Fjbonacchurns, For^examnle we mayvyajit tojnark_on our charts the Fibonacci hourly_
sequence ahead of ti rie we] J in to t_he fu lure so as to be prepare for fulu re tunis. Trom each high
and low in sequence we make a "tickjriark" on our paper evej^J, 3,5,8, 13,21... lours from
each swing. What we wdl soon observe is time period clustering such as 13 hours from a low
coinciding with 55 hours from a past top and also 21 hours from another top. In this case we
would have three turns {13,55,21) all coming due at the same hour. That hour will very likely be
a major turn of significance. To plot hese efficiently we usually make up a tape measure conMSting
of a 5t ip of our graph paper taken off the bottom edge and on this tape we mark each Fibo lacci"
hourof 1,3,5, 8, 13,21 out into the hundreds if not thousands of hours. We then merely line up
his tape across our chart and quickly tick off the times from each high and low in sequence and
note the clustering. Additionally this method affords us the opportunity to run the tape RACK WARDS
with the jera ime at the present hour ant) the F bonacci lours going back into the past in an effort
to observe whether past highs and lows line up on the tape. If that happens and we have several
"hits" we know the current hour is important- Usually this method w'll pinpo nt a t" ne soon to be
reached in the future where numerous hits will coincide <ind we can be ready or it. As market
movements expand a ong the Fibonacci number sequence, we wiil also observe contraction along
this rat*o also. Using the tape measure approach backwards warns us of these contracting phases.
Note also another techn que that arises from this. Since (he Fibonacci series is additive and each
number added to i s neighbor eventually y ields the golden ralio of 1.6 H, you should be aw;tre that
Al I additive series eventually end in the Fibonacci series or golden ratio. Fven a series like 1)
plus 50 equals 66 plus 50 equals 11 6,.,. will eventually yield a ratio of 1.618 of each number to its
adjacent number. Knowing this we can pro'ect future turns by multiplying 1,618 times the time
interval between two adjacent hig is or lows, or even a high and low, a id the subsequent time
period indicated will lie in Fibonacci ratio to the two and give us a turn. Likewise we can ADD the
two t me intervals between three points to get the forth point in time! Tiis easy technique should
rjot bcovcrlookcd.
75
FIBONACCI I OUR J
The above chait is a reproduction of my Dow Jones hourly chart using six 1 ours in a day and
showing an "X" for each daily close. Note that litis is not a bar chart but afrwchart with a straight
line connecting each "dot" that represents each o the six hourly closing prices atcxactly H, 12,1,
2,3, and 4 PM. The grid cannot be seen on this drawing but the graph paper can be either 10 or
20 it j die inch but it must beone Dow Point to one hour. This particulai illustration shows Fibonacci
hour y counts from the maor low and how they "cluste " at big turns. Note too, that the farther
away trom the origin you go. the more powerful the cycle turn is when yo reach a large Fibonacci
number. You will also note the easily identifiably "stair steps" from each swing low lhat defines the
bull or bear trend and how the "crash" occurred when several small lower highs and lower lows
developed, and then t le last significant swing low was broken near August 16-19,
Before leaving Fibonacci ratios I should note that the use of timing angles for square outs between
highs ind lows can also be accomplished by using Hbonacc" angles. These angles when run down
to zero or up fromzero w 11 always yield a Fibonacci relationship w lenthcy square out a high or
ow with a prior one. A timing I'neof 1.618 points per one unit of time will yield a Mbonacc'
relationship as will a simple angle of 38.2 degrees, or 61.8 degrees! The master secret of the great
pyramid atCiizeh of course is that the angle down from he top is ^8.2 degrees and this relates the
circle to the square to the triangle and ties in the orbit of the sun, moon, and earth[ Much more
could be said, but I wo d give away th store.
76
A more pract'cal aspect of hourly chart readings to note the intra day highs and lows each
day paying attention to theJiour^A gocdjTiethoc! 's to construct on a separate piece of paper a
taM*LwJth tjhchoijrsjj T 12, \x2t 3^4 and check off each as to whether a daily high or Inw was
^,ni)IUn0^e noVr^ A.5eA^n ttoyj&cs by and fhcsecokmin^are lined up, you will soon note
two to three dayjjatterns of strong openings and strong closes and_which midday hour is the
jisual low. These intra-day patterns follow almost exactly for three days at ajime andjhen
reverse almost precisely at the opposite hotirs^ You wj Jhen_note_haXwJn^^yer hourmid^_
day is the low orhigli hniir, that hf'iir_has very goodjfo£ccastin£ abilityjis^tojiow ttieday wiU
endjind whether or not the following day will be up or dq_wn-_ __
^L£2™miI!I In,*tel n 's ^?rAulinIoves to_show sirength early and late. This means a strong
opening and a strong close. The midday is the counter trend pull back. Most bull moves have
an up 11 AM hour, ai nd day decline and a strongly up 3 to 4 hour. On a slightly larger scale,
a^ weekly bull trend will have a strong Monday, TuesdayTand pull back into Wednesday,
Thursday morning then a strong Thursday afternoon and_strong Friday. The bear trends are _
just the opposite. Please note that these patterns are "nested" so base* on strong Monday we
could then forecast & possible up week and expect hourly strong turns at 11 and 3 to 4 When
^thesc hourly turns first start to miss thejriark, we get_car[y warning that thejdaily pattern may
be turning and iJntjn turn may change the whole week's character. It goes withou saying that
^y_oushould note these patterns when entering fradesjp_s_et up yourentry and exit strategies on
more than just a trendline break or circular arc. All technical took and time cycles will fit
together when \ou have made a correct analysis.
Perhaps 1 he most basic principle of hourly trading is to respect the Specialist. On the floor of the
NYSF this man opens and closes the book on each individual stock andean clearly sec all the
floor brokers standing in front of him. His job is to make money for himself and to avoid risk while
Jiayingat times to bike in inventory hedocs not want simply because that's one df his responsibilities
togo countcrto the market nnd provide liquidity. The opening price and the closing price are_
yiereforeveiyjmportant to note especia My frorn^a vantage point several hours later in the day. As
a rule of thumb you never w<int to buy_stocks that are lowertharuheir opening^ levelJinj^thjs^ajn_
, jKSualJYj>e extended to theirM AM print. In these cases the Specialist often sees many sellers
-^yr^iL11^ quickly opens his stock up on light volume before the sellers put in their orders. He
then slums the opening and letsjhe sellei s^work the stock down all day where he covers his short
M? lowerj^rice._ Wlienjic_open^lus_book down it frequently means there are no sellers around
and he wantsjo attract some sellers so he can buy their stock. These principles lead to the strategy
of buying sticks downjjn the day perhaps a dol lar or fifty cents BUT which Are not ftelowlhe v"
opening level (i.z., they tipcned on a gap down). These issues usually come back to close unchanged
on the day with aj?ig up<psrimg the t extday wjiereyou would normally sell. Compare this witii£
stock that opens unchanged and rhengaes down fifty cents on the day. This is usually a case
when sellers have entered the market and will be there for quite some time. ~~
Also note thai on big down days, nobody, espcchily the Specialist wants to own stock. As a
resuJthe will usually "be stuck" with inventory by midday and knows if he does not get out of
77
it lie w'U end up w th a lot more at the end of the day when day traders stick him with market-
on-close sell orders. As a group the Special'sts then usually engineer a late midday ally to
at ract shorts to cover thinking the market's going up, the specialists then sell out and go short
themselves to get ready for the closing sell off. The end result is the normal pattern where in
a downtrend t at closes at the low of the prior day (meaning the Specialist was forced into
buying on the close) the openings the next day are frequently up on light volume as the
Specialists work quickly to get rid of the inventory and set up shorts for the day. Because of
this you will almost never get a reversal buy signal from an up opening after a weak doxe.
However, when you get another down opening, you can get a reversal buy signal, in these
cases the Specialists come in with stock from the night before but do not see any sellers.
They then open their stocks down to "test the waters" to see if sel ers are there. If not, they
hold onto their inventory and proceed to mark it up to hook shorts into covering and get the
rally going, t is these natural a d ormal inventory adjustments by the Specialists as a group
that often profoundly effect the market but whose actions clearly show up in an examination
of the first and last hours.
Similar to the Specialists are the large institutional stock brokers in their combined effect on the
first and last hourreadings. In (he normal situation a large mutual fund calls a broker and gives him
a 100,000 share order. The broker seeing a large commission is impalient to get the trade done
knowing that unfinished orders are often canceled by the fund n anagc * jd the cornm' ssion escapes.
In these situations (almost always) as soon as the market opens the broker forces the trade to get
at least 20 to 30,000 shares done. Once he reports that back to the hind manager essentially
notifying him it is too late to pull the order, he only then becomes "re sponsible "and tries "to work"
the order for the customer to get htm a better price, IF its a bullish day he will just lay back for a few
hours to see if any stock conies in fo sale but by 2:30 he's getting worried that T he does not
complete by 4 he could lose the remaining shates the next day so he usually get aggressive and
forces the issue from 3 to 4 PM. In the "old days" when be ing a stock broker meant hav ircg some
integrity the broker would s"mplc lay back and bid for very s all amou Us of stock not forcing the
issue and often the order could tike a week or so to fill but the markets would be less volatile and
the customer would get a better pi ice. Of course the funds are them selves to blame for this practice
by having driven the average co miiss'o down to 2 to 3 cents on size orders compared with
former 10 to 18 cents. The result has been a brokerage community which no longer cares for the
customer's orders since they arc not profitable but who now trade for their own accounts against
the eu s t ome r' s o rd er. In any event intra-day pa t ternsj a rt icu lar lyjjh e f\ r stand Ja s t hou r s need
careful study.
78
Emotional Charts
Often I sec a chart, freqi ent I y an i ntrn day ou rly, or eve 1 fi ve m i mite cl i art that I ook s cxtraort I in ari 1 y
volatile. 1 often remark at these times that the chart is too scary to go down. When you see
frequent whipsaw moves in a chart it reveals emotiomlism where the participants, both buyers and
se 1 lers are crvous. The. rule of th irnbjs thanhe_ch art_e ve ntua 11 y breaks put oi'j)r_e_ak sji< nyn in the
direction that it i s gra d u at ] y_trenri i t ig [ lie y a st majority of these pat temjoccnr just befpre bi^ up
moves, especially if the series of plunging lows are each slightly higher on cacj^succc^s^eplunge^^
This emutional's n usually forces one side or the other to capitulate and reverse position during a
runaway straighhimemove, just after the emotional period. After rhai move, the market usually
reverses and theot iginal nervous pla>ers Inally are proven right.
Q n hpu r ly c h arts I find t h at the nip.s t po werfu 1 ]i py e s arc a I w ay s prec ederi by a per i od of a fe w
days of extreme emotional up and down reversals, t now have learned to seek out these pattern^
knowing that theirresolulion means a quick and certain big move. 'Hiese-ajcthe kindqf moves you^
want to use leverage on such as with futures and options. Many of these are short covering squeezes
where the entire futures pit is be t"ng in one direction but uncertain. Often one short covers, driving
the narket up only to have a new short put on a big position and send it right back down. Only
after everyone eventually gets short is the entir pit trapped, and a stampede usually results. On
indi v dual stocks these up and down choppy periods arc the tug of w;ir between the last u the
bears and tl e new bulls or a busted stock just before a new bull leg up.
The key seems to be five alternating higher bottoms to be certain that a genifnc uptrend has
ictually started. On an iour!y chart, as soon as I see at least five higher bottoms after am a'or
break, I know the uptrend has tsumed. These 1 ighcr bottoms naturally require a good 2 to \ 8
hours ofact i vity, since each m inor fluctuation might last one to three hours before reversing and in _
order o get at least five consecutive higher bottoms on plunges, we also need at leasi four rallies^
up that fail, five is the key number to remember. Many a market movement lasts until three
bottoms have been made and then collapse. and occasionally four higher lows are seen,but when
five bottoms are seen it is almost a certainly that tbe trend is up. This is a mosrirnpoiiaM^rrricrple"^
of i vesting and will make you huge amounts of money 7 paid attention to. Most traders think a
Ireud reversal can only occur a ~1er a price level is exceeded or a downward sloping trend line from
the last top is exceeded. We know from our basic trend principle, however, that he trend is a
pattern of I ighcr bottoms and higher highs for an up trend and thispattenunay appea significantly"'
m
79
below any resistance level from a trendline. In these areas I often find myself comfortably invested
while most traders are nervouslywaiting to see if"theirendline will be exceeded and are often
forced into breakout buying just when they_ should be selling. Option premiums at these levels are
likewise very favorable.
Always keep in mind that the "wiggles" on the tape are emotionalism of the crowd and it examined
from the safety of an analytical vantage point a sensible trading strategy can often be constructed
with an almost certain knowledge of the trend.
Most intra-day patterns have an emotional tug of w;ir during the mid-day hours of 12:00 to 2:30
PM EST. These daily emotional patterns arc caused by the pit day traders who never know if the
market will reverse on them or not. In these cases it is helpful to note where the emotional action
takes place. That is whether it is a consolidation zone just above a breakout or is it a consolidation
just after a breakdown. The odds usually favor a resumption of the major trend in these cases,
One of the easiest trades is when emotional trend reversals take place within a powerful upward
sloping parabolic arc formation. This is the last accelerationphasejust before ammportant top and
the market is afraid of_heJ^ht^orjiistjhe number„oJTc_qr^e£utjy^
without a technical pullback. In these creeping moves it is almost a certainty that a huge up move
^wiHjakej^lace to stampede the market into a "blow off top" where everyone capitulates and
simultaneouslv^goes long It is ama .ingj^se^thatt^csejp^ ^traj^ hiwesnliui^
risk from a stopJoss vjewpoinjL l^se_moyeg are rapidly cl riibim^a parabolic arc that is clearly
defined and a simple sell stop placed below that arc is almost ne\ er hit until the final high is in Ihat
trade appears to thejartidpant;; uio dangerous to undertake and so fewpeople really makebig^
money j^njha^ioves that arejather easy technically and rewinding with big price moves in very
shortperiodsof time. Only a study of these patterns will iliow^ou tohaye the confidence to trade
ihese culmination moves. The downward sloping crash arc is nearly^ identicalland likewise prevents
people from shorting because of ajpig fcar_of a Q.inc^ reversa_ to the upsjde^As long as the arc
holds you can assume it will go tojts maximum verticalj:xhaiistm real
Jtey in these moves is to observe abnormally s nail "creeps"/'"' many continuous ixirs in a raw.
This is almost tl ways the sign of a very powerful move that will not be exhausted until the "big
bars" materialize.
In the final analysis, learn that all of trading is an emotional experience. Good traders have disciplines
thai prevent them from getting caught up in the greed or fe- r of the trade. If you sense the market
is "too dangerous" to do something, know it's not. It is only your greed for money that prevents
you from analyzing the situation. The trend is your friend and if you trade with the trend the market
is never dangerous. What is dangerous is not to realize you are caught up in emotionalism and you
are making financial decisions that will affect your life.
K0
469 -SB
1t>?.iJh.
4CS.WJ
4b3_fJV
Major Downtrend
Just Starting-Great
Uncertainty
w
S<&P Futures *
5 Minute Chart
Very Volatile
Numerous
Whinsaws
3^7
3/h
—r~
3^9
■MfT'TinE
3 it
The above chart while only a five minute chart s howeve ,iy ska! of nervous imrkets where a
major change in trend may be taking place. On the above chut a major down! rend rns just started
and undoubtedly 1 he entire pit is agg essively short and nervous. A big rally 's like y, b t just as
likely is a bigger break after that rally comes and relieves the psychological pressure. Remember
we need ligher bottoms to turn this trend up and a solitary big spike rallv w I ol do that. During
nervous markets like (Ms, t pays to md the average measured moves and also the extremes. Quite
a few trades can be made before this nervousness dissipates, or the trend de mi vely cl anges.
81
Common Patterns
The most co union proble for the trader"s determining if the existing trend is changing. After a
long deci'ne or advance, one naturally gets nervous about a position reversing and what kind of
trading strategy to employ. Common situations are a straight 1 ine plunge dec! ine and trying to figure
out what kind ot bottoming pattern will emerge to turn the trend back up. Bottoms can be "V"
bottom spikes; rounding into a bowl; or double, triple, or rnu Itiple testing, plunges to the same area
before the real advance gets underway*
Hie item to note about patterns developing is where the first "wiggle" occurs. By this I mean^
visible counter trend movement thatjhe^iibj^juent^ the exi sting main trend con tin ties,
JJsually there will be three or five such waves before a low is reached, although I have often seen
LSLa™!everjJ3-15 in strong trends before a big reversal is made What is not usual!y known is ^
that these waves Areextrerttefaprecise as to whereJh&y_occtir: 1 "hey are not random at all but are
a mathematical harmonic of the total distance the final movement will extend to. Sometimes they"
Occur aMhc exact midpointLortheone tjiji d rrm k, hnt often arc at t:ibonacci_rati_os of ■_2^61-3S2>
or .61 fi of the total distance. With our technique of "measured moves" we can usually estimate
earlyjnto the new iretul exactly how far it will travel based on past measured moves that have a
similarly placed "wiggle". larger waves areiijiialiy proportionate so the same symmetry on a
smal erpast obscrvatiorican be applied to the existing larger movement deriving the appropriate
ratio expansion factor from the first counter trend mark.
The.most basic principle 1 wish to convey to you is that the more "w'Kgles" a trend haythe^
stronger it will be and the more difficult to reverse, fna Hull Market these nervous uptrends with
lots of wiggles are frequently refcrrecTto as "climbing a wall of worry." The "worry'1 part is the
numerous mino counter trend movements the shake traders out of their pos lions. These patterns
are extremely reliable, so much so that I make a habit of searching for trends with frequent
whipsaws to trade in. Once the inn in trend is determined, yt u merely buy every dip, or short every
rally, ami this will be successful for a great many trades in a row. Traders hfive a practical Rile toth
th< same thing until if loses moneyed this is based ot this principle of the reliability of *' wiggles".
Recently the stock market broke and plunged about 100 Dew Points i i two days. Many people
were Inghtct edand called me for advice. On my htMirly chart I noticed a "straight line" decline that
dropped almost 8 to 10 points every our for he two days or about 50 points each day. There
R2
was only one two hourtottnter roily of about 10 points "n flic entire move and that occulted at
about the tidpo" nt of 50 points down, S^cingihsX^atterri,^ kne_w that the t end was not very
powerful because it was ajvmickyj>lunce withoiit^rwrtter trend self correcting rallies Without
the counter trend ralliesJbr the shorts to coyer^ and iheba^am hunters"toHi'yTtrte 67TnsTa"voTed a
climax/V* bottom lgw,winj ajmmsyy npttend as soo as a technical buy signal was generated.
Sure enough tlie_ni?I few hourly rallies off the luwpmduced1 rj^eroi^rierv™^wigg1es"t_iat resu tecT
in higher Urttoms. As sow) as 1 saw five complete wigglesthat were highe l?ottomsJ knew_with
absolute cermtnjytjiat the„trend was up and a complete retraccment to new all time highs was just
ahead. J"hisjnfc rmatjon was.£iver]_Ctt.ths hourly chart one before even a 38.2% rctraccmcnt was
n „.r - I -■■■ --■ , ■■■■-■ J-J-.^^^,. „ ^ _mmm -tt-mt^^
evident and most, fradexs simply sLoiledJjUQtherisjpgJrend and lost money a^the marketwent
higher and higher.
The principle here of the rising bottom sjteUem with reijuent srriaU counter trend plunges is i very
powerful_tool. Th_cvast mjyonty^oXiradbrs know sojittje aLK^thejxwer of cjiar^ntej^etation_
that they must wait for at least a50^%ret^acemen^beforc t <^ihitik^hcJrcn^a^han^cJonrj_
again. This is simply noUm^-JYij^iie^oj^^hjgtjer bottomsjojbe certam and jhese can occur
within 10 % ofthe lowprice. T)Kj^tterny/?ujnusifear wh£J^|^|vj"J into_arafly off a low is i big
rally that is a straight hneaJfairwrtkoutj:ounter^rndJn^ is a sign of the Bear
Market trend shortsqueeze rally^and it can only be shojledjri those jillics the shorts are forced^
out and the movementjs extreme buujsualjy cojlarjses as soon as the shorts are out.
Patterns
Weak
Remember that the strung numerous "wiggle" patterns assume that each wiggle is higher or lower
than the last to confirm its strength. Numerous wiggles that occur at the sarrr level do not necessarily
tell us much. What we are looking for is minute bullish or bearish patterns of liglier^bottotns to Ee
bullish, or lower tops and lower bottoms for a declining pattern. Even though these may occur on
a very n inute basis such as on an infra-day tick chart or a five minute chart, the patterns are reliable
for much longer term trends. ~
83
In looking ;it the above types of bottoms, the main question is: At what point do we know it is a
bottom and not a mi or upward * ipgle? The usual solutions are three. The first is the use of
Xe^acement perceiit^ages. Down trends can rj]lv back one quarter to one third of the 1rop; nd in
extremes, one hal ~oreven .61B. This type of analysis is most common and docs not give is a
position until well off the bottom. }-o that reason 1 try not to rely on rctraccmcn s.
The secondjnethqd ismomentum, and the most common application "s Oie useoffljigfcj/Vhe _
basic principle is that a declining trend r^relvjegainfi the 45 degree angle coming down from the
top u ntiJ the trend has changed. 'I "h' s methral r lay a Iso on ly wc irk w hen a ral Ly i s a g reat d i stance oft
of (he bottom and not give us a l4cheap^entry point, but sometimes a long side ways bot om flat
breaks through th<- 45 degree ;ingje just by going sideways and docs give issn entry right at the __
1 ow. icsc ang! e tec hrt tqu.es arc based c in t he as sum pt i <m of tth micniu t I c K I in u si h m and {in e; bi i y s
when the ai i g I c i s broken with a_st op loss at the low Th e three most coi n moi i ly u Red its i g les a e 30 _
degrees, 45 degrees, jnd 60 degrees. But yon wUl also note the geometric angles of X* 1j 1 x 2Vi
1 X 4, I x H, etc... w<jrk nicely. Angles are especially, suited for coverings! iojts jaMicr Ihari going_
long, but i yon do go long on the assumption the trend has changed, you then use a riving angle
from the low point to cqnfijn the assumed uptrend ..and lhat ris'ng angle is your stop out point.
The best technique of coursejo determine, rcvci sal of I rend is lo spot a.i/#'w' rrverytif f strand
tJien watch for a series of higher bottoms to identify the bull pattern, "his is the single most i el iable
method of determining the trend.
84
Three Methods To Buy Off A Low
^
Retn cement
Percentage
I inc.
gle
Method
Buy
Point
Angjes uc 30, 41.« 60
The above methods apply equally well to selling at tops. Just turn the ch at ts upside down am
apply the same pt inciplcs..
In trying to deterrnin£ whethera low has been made keep in jrimd the overall symmetry of the chart
pa tern. If a long term detl ine has -ce in c tea lor say nine onths, a d the deel ne was n cety
deli ed w th parallel di<* nels.donot th nk an uptrend reversal will cone easily. Usually to break
out of a parallel channel decline you will need an advance to at least twice the width of Ehc channc
and the advance will norma ly take on a rig it angle (90 degree) slope upwards rom the plane of
the decli ic The lime element is usually similar in ret raceme nt percentages as are the prices. ln_
other words, a decline tliat lias been going on for ten months may have to base for one quarter (2.5 _
moil I is), to one third (3 months) before a major up move begins again. Explosive upside reversals
come rarely, only at the beginnings of new bull market trends. Most other advances require an
appropriate base building period and a rounding bottom.
No ISasc
Will Fai
Double Bottoms
At Distance Equal To
Decline— Usually Good Low
85
Three Drives To A Low {or High)
M:iny bottoms and tops are only complete after three attempts art made lo break to a new
extreme price. These patterns are often called " lead and shoulders" or "triple bottoms or triple
tops." Bfl^caJJ^ieJjriUttc^T^^ ejidis on|y£artiaI]y,R_y ec^^u]jndjiejyqus_
traders are quick to abam on_ 1 he trade andjiric.es settle ba^ to_w_ie e theywere before the
nttenipL Keep in mind our principle of counting higher bottoms Ihnl starrs jhpi th^jif^^gQg^
sometimes four, but if you sec five higher lows you can rely on the new trend. Triple movements
work at least half of the time, however, so ihree drivesJo_a_bw or high shoujdbe watcbed closely.
Three Bottoming
Thrusts
1
Three Top Probes
Another Irequenf by seen patteiTi js i[ie;'W"J«)l|orn tind the '*VT top In the case of the W bottom,
it u suaTly ^cpresentsji £ot>J low for an advance, butj h _ M top is almost never a top? n S&P
futures trading an M top usually gives a scary decline toa slight Jyjiigher bottom atthejioiui of the
J'£llIM^gv^lfib^blB1^Ih^i!irJei][.M '^g^iiadvance^tpnew.liglis.^boycjhctotqflheMis"
then the usual result This is wo2^rc__ejiibering sirice this rjattem is easy to spot and is ve y
emoti nl but reliable. "
R6
A, B, C Corrections
At the end of many p» imary trends wc find counter trend movemen stalled "A B C" comet: tons.
'Phis is Tea\]yjiL\tti three count alternating ir jirthal is very symmetrical. I Isually the A and the
C tegs go in the same direct] >n and arc approximately the same si/e. After this pattern completes,
ie primary trend resumes. This is another reason to favor the five higher bottoms co nt before
going Jong, so you don't buy into an ABC just before the next hlg dccli ic These counts take he
usual form as follows:
These patterns arc very symmetrical and represent simple counter tren rally attempts that are a
dead give away that ihe mam trend is quite strong and is not going to reverse any time soon. Note
hat the A and C cgs arc usually the same length, and sometimes the B teg also. The rcjraccnent
levels obtained on these le^s are usually very small at id this loo is a sign that the c ninter trend has
little strength. When you see this three wave pattern with little price movement counter to the main
trend you should be prepared to go with the main trend as soon as a new breakout extreme is hit.
These pattern s.ofte, show up at the midpo nt of the bigger leg so a trade at the end of ihe C eg is
usually quite profitable..
Bowls and Arcs
Wc have talked aboutc* culararcs previously but we have not discussed the general principles of
T leir resolutions. Basically, a gradual roll pycT_"dqrti€"pc forming an apparent high is actually
bullish, and when (lie dome is broken out of. a hip lee up usually ensues. A html[formation on the
other hand that appears to form a bottom, is yuitc dangc ous i broken down f om,>1 downside
breakout ft om a bowl eads to a crash collapse. Especially vulnerable are bowls that are only half
toti rec quarters formed. These bowls would look like a figurative clock from eight o'clock to five
orfou o]clock.when the breakdown occurs. rniej?nty bowls that arc bulMsli are the ones that
make it past four o'clock headed for three. These are nore usually referred to as "cup^with a
fl7
handle" patterns, whereby after the cup pattern is fonnedj rom nine oj:lock.to three ojclock, a big_^
* spike" handle is seen to the upside before the first correction, these patterns look as follows:
Usually you can sec the symmetry of Ihe pattern unfolding and know if the lx>wl will collapse or
comp Icte. For ex ample, du ri n g a major dec 1 ] ne of several mon tits a m i no bow I m ay fonn, but i the
time period for the completion of the bowl is small, then that might be inappropriate for a major
boltom and will only serve as temporary support unfl the shorts cover and when the bowl breaks
the next leg down will start.
m
The ive Basic Bull and Bear Patterns
Although many technicians have studied charts over the years and have their own favorite patterns,
I have come to the conclusion that these standard patterns ate the nost basic and repeal over and
over. These top and bottom patterns arc really the inverse mirror images of each other and with
subtle variatio s seem to cover a myriad of possibilities but nevertheless if you memorize these yi m
wil I have a big he-id start.
Note these lower patterns are just the inverse of the patterns above Ihem. These arc complete
patterns and then you would expect a new trend to emerge. Tliese may be seen on short term
charts as well as very long term ones but the basic completion wave structure is almost always the
same.
You could make a study of just these patterns for (he rest of your life and that alone v, on Id be a
rewarding exercise! 1 suggest you s >end some time with these before going on.
89
Long Term Charts
*The difference between long term and short term charts is thc importance of cyclical influences on
the long tenti chart. Short term charts are filled with numerous emotional reversals that although
likew'sc due to cycles are much more random and subject to "slippage" and "whipsaw" news
items. I monger term patterns stretching over many years show accurate trends and those trends are
not easily changed. This should make chart interpretation easier, but so many people get caught up
in the short term minor reversals they easily lose sight of the bigger picture unless they have a firm
grounding in Jong term cycles.
XhfilmiiiJiixumiiMiorio^ the fo m of hree.yearsi up and one_
year down, or five years up and one and a half to two years down. Major highs andjowsj.usually^
co lie out near anniversaries of prior highs and lows at cycle lengths of f ve years, seven.years, ten_
years, twelve years, fifteen years, eighteen, nineteen and twenty years, thirty years, fifty years, si\ty_
ye^iNinety^eflra, antj.gne hundred ^years. These are complete long cycles and each individual
stock will tend to follow one or a few of these different lengths hurnotall. I only mention a I (or at
least the more important) long term cycles so you can quickly check the histo ical record and spot
those cycle lengths o see if obvi jus "measured moves" are at work neanng those anniversaries.
Chart books with long tet n charts are not real ly that hard to find and many have typical chart tin e
periods of twenty to thirty-five years for nany issues, linger term histories can be looked up in
libraries or on computer data bases. Often a good place to start is with a chart of (he market
averages and you would spot the major highs and lows in history that seem to be currently repeating
and then go back to newspapers near those anniversary dates and just look for the most active
ssucs that are being written about in the popular press. '[Tiese issues are the ones that have com non
cycle lengths as the overall market for the current market repetition.
Basic analy s[s_wyii]d_begin with he obscrvation <if a possihIe fi vc or ten \eai anni versary coining
to an end near a measured price move and aj^pssjble long tenn irendline j>enetration. Strategy is
to then assume that the new reversal trend will last for a few^ycars and then goto the shot erjength_
chartssuch as_thej>asj_fewjiiynlhsof daiIiesa^d_vyatch theswrnglows and highs. Reniembei our
basic principle is that deel ines C< mot ast njore than ninety days in a long temi Bull tnend, nor can
rat es last past ninety days in H^enuine Beai.trend. Ojicc__wjejiavea line yday_penetiation we can
assume that the new longjenn tnyid will go injlmt.dircc.tion for at least a year and we can start to
projcct_sgine^yerage me-jsu ed moves oreircuJar arcs from the past few years. Keep injnHjd thai _
near the end o a lon^temi cycle wc.wiM find asigrmi'reversalbars&U or buy signal on a monthly
90
chartjiyou do not have inunthly charts yoii can easily visualize such a final h igh oijow bar by
noting the extreme price high or low during if iefast/our weeks ot the existing trend, and when
that four week extreme is broken, that would be the monthly reversal signal, lliisjprinciple is a
good one to keep in mind all the time as we note large price impulses on our shorter term charts
such as hourly ov dailies. If these big price changes exceed the extremes of the past five days for
example on a daily dnrt, ijjs_aj200d projbabi lityjhe move is the result of a breakoyj on a.
week y chart and you might want In refer to a larger scalc£hai1.
The oth^rprinciple to keep in mind at Ihcse ti tes is the support and resistance levels generated
_Yom the monthly signah^versa^ bar at the tumingpoirtt extreme. On a monthly bar chart the
range from the.high .to low oiMluit.veryjast bar can often be ten or more dol ars, but we know
that once the breakout, occurs the secondary test will only'pull back tolhe high cV low of that"
extreme bar depending oi whether a buy or sell signal was given. Knowing and recordi ig
when; that prjcejevcl wasal the[.breakout will come in handy many weeks later on the subsequent
test when most traders arc afraid of prices going all the way back to the extreme low or high
price. 7"h|sjs a very imporlajilj^oiint toconsjder when looking at long term clnrts and yoIT
should review the Trend Sect" on aga n i these reversa signals are still unclear.
Knowing thtit long lemi cycles tend to come out near cycle lengths of 5, 10,15. etc.. years, we
also can expect to find reve sal points *n our cycles near subdivisions of these primary cycle
lengths. Tn other words if a ten year cycle is present, expect to see turns at 2.5 years, 5 years,
and 7.5 years in addition to 10, Near the turns we watch out dailies for our na ural common
cycle lengths of 3.25 and 6.5 week cycles. Once we find these turns wc can drop down to any
s allcr scale to trade within the now clearly defined five oi ten year pattern. This type of
analysis is best used for long term investors and fi nd managers who arc looking to double large
amounts of money over a few years. Traders o course will mostly stick to hourly charts and
occasionally dailies, but it s still nice to have a f mi grasp on the longer tenn outlook first to give
us a it le more conviction in a whippy market.
Another gtxxl techjncjuc for looking_aMcmg_terni patterns isto follow our numc o logical 360
cycle numbers. Common cycles arc often found At 30,45, GO, 90, etc... weeks and mon hs all
the way out to 360 for the end of a big cycle. Espoc^a!ly i portant are 45,90,1 BO, and 360
weeks and months. If you ever jjcI lost in the patterns it usually pays to just look back t tcse 45
_and 90 hannonics of weeks arid months until you see an identLCal_pattern!!ThiVhappens much
more frequently and more precisely as to exact price movements, than most people could ever
imagine, "fry it some tinicand you will be hoth shexked and elated
I^ong term atnlysis in particular lends tseil to subjeclive sociological analysis of cycle influences
on the masses. That is to say, at common known cycles like twenty, f fty, sixty, unety, and one
hundred years, most common social practices return often with inc< cny similarity. The building
of the Berlin Wall and" s cstruclion 45 years later is an example, fhe hundred years between
the Lincoln and Kennedy assassinations is another. Many similar events such as labor strikes,
91
industrial bankruptcies, or wars also color the historical event <ind give reliability to our cycle
choice as the dominant one operating at he present time. Once we see he similar sociological
underpinnings, we can forecast a similar outcome. Keep in minii^ejmnciple of alternation
winch JRcyfJes means that the past w'll repeat ether exactly or exactly backwards. The cycjc_
begi mines and endings will hav^hesame time periodsbut oftenjwith exactly opposite outcomes.
The actual outcome can usually be deduced, however, from an analysis of the individual elements
that make up the larger theme at work in the cycle.
In keeping with the dea of alternation of cycles, one of the most powerful techniques in al! chart
pattern interpretation is that of mirror image foldbacks.Th s is a very important idea, and L
devote a complete section of this book to it. Suffice it to say, on long term charts, patter is ate
often easily recognized as being exactly backwards to a prior pattern. These slnpes are often
symmetrical about a major high or low which becomes Ihe foldback and each "wiggle" or wave in
the up pattern is m rrored with a similar wiggle in the down pattern. When you see the obvious
patterns, be sure you use them! They ane highly rel iable and can last for years before d'sappeiring.
Long Term Chart Examples:
_ —
^ J
92
■■Y
CROWN CENTRAL PEROLEUM "A"
1X1.1. N ■■MM I.i U4T1T1TI 1-M. fT HTl imCTtU-UJUJ-l M UOTOI
Production. Trmnjpertlfi£. Refining fr TUrheElag PrtrqleLm L Hit tHoducti. p
11TMIT
Funded Debt $*l,S0(
Sha"B *"'"* ' ' Mirror J mage Holdback
Shares Co*mori J ,63
$3 per
Pattern Terming Jn Early
1985
h
H
J_LLL1
~Y
SCALE: Ea.
block « $£
:p::
f
80
JO
60
SO
40
30
?0
ID
ft Aft
Axis Orientation
Angles On ,
Term Chan
Offset Of Angl
From 45 Deg:
'-^BBBBJBBBl
MERRIU. LYNCH & CO., INC
TTrmrrr- ■ 11:.' i mi :ti
!■£££. LI4T) L S»I(H I9™1'*» | !Bg
jj»S nwTwwi ig?>T»aa i iwi nwl l^wiiwoilwi
llrtillMM I' . ItfJ
93
Long Term Fibonacci Monthly
Counts from A Majoi I op And
Then The Next Low. Each 12 Year
Cycle Should Repeat Similarly.
KIMBERLY CLARK CORP. [RMBl -MJ^ t
-L , '1—t M ; i 1 ...»
t ri ~~*'i ■ ■ ■ —i
,_J.
Jjft!|*i^b^l^^ *J!;" ;,.
This Section Should
J Be A Replay Of f he
First 12 Years
1
The above chart shows a ong 12 year span encompassing 144 Fibonacci Months. This was one
of W.D. Gann's master cycles. Often yo will see the sa nc k nd of up and down bull and bear
markets repenting at this time cycle length, line repetition \vt I not be exact but the subtleties of the
wave forms will be similar. It is important to note Ihatwwr, but not exactly on, these time counts a
major trend line was usually broken, and bsignaf reversal monthly bar was gencr atcd. In al I
technical analysis, particularly cycles, we need confirmation of a change in trend. If you study The
above chart you will see multiple confirmations from ingles being broken, time coumsup, reversal
bars, mirror images, and circular arcs or measured moves being completed. It usually pays to
spend some time (several hours) on a Jong term chart first. Once that analyst is done rig it, you
don't need to look too c osely for many more months.
Long term chart analysis is ideally sui cd to cyclic pattern recognition. By this I mean that, since
cycles repeat, it is usually ev'dent visually on longer term charts that a near identical pattern is
forming again If you take the time to look you will see spectacular reproductions of prior cycles
often own to the slightest subtlety. Once you make a thorough study of a stock on a ong term
chart and have identified its common king term cycles such as 5 years, 7 years, 10 years o other,
you look closely at those time intervals to watch for wave structure and patte is repeating. Once
you f nd a good fit yon can hade with incredible success for months at i time. Often these patterns
will ft low exact replications for up to s'x months or even longer and if you are lucky enough to
have noticed the pattern forming, you can become rich. The following twoexar iples are General
94
Motors following a six year pattern in 198' and 1990, atui Motorola following a nine year pattern
in 1981 and 1990 PJease note that it is the wave structure or puttem that is being reproduced and
not just the time count of so many days from high to fow^ etc* An^armryRTs^rFhc^p^sM^aveT
alternations in terms of percentage fluctuations and rctracemerits isthe key ns pt"it;eTe veFs are'often
different but cycles follow circular motion so pe centage fluctuation's should bFclose on eacTT
^pattern.
95
Mirror Images
Time has always been a study for philosophers and scientists. Being a market philosopher,
however, lends itself to the perfect study of the subject. As Einstein believed, time is a relative concept
distorted by ones own internal frame of reference. Our biological electrical nervous system and the
speed of brain impulse synapses are our only reference guideline for time in the waking state. In
sleep, time disappears. In the stock market, time goes both backwards andforwards!
Charts clearly seem to indicate that time goes in one direction, stops, and then goes in the opposite
direction causing price patterns to repeat over and over again with the exact same subtle nuances
but backwards. The only difficulty in this type of analysis is that time also appears to have a
variable speed so when going forwards and creating a price pattern, the speed may change when
going backwards and the pattern repeats but appears distorted due to the change in speed on our
constant time plotted axis of our chart.
^
96
ft has often been noted that the pattern going up to (he top repeats as. a mirror image on the
downside afte he top is in and the top itself (or bottom) heroines the reflection point for the
c itire detailed chart pattern. Hie proof of this can easily be seen on the above chart pallem wf ich
recreates the 19K2 bottom from the 1981 top. The fact that this pattern is almost exat. tty back
wards clearly shows that the emotional greed at the op J.s r> e m inur reflection of the emotional fear
at the bottom. This chart is created by taking ihc bottoming pattern in l°H2and flipping it upside
down and backwards and then comparing it with t ic pi io top in 1981, When the two are lined p
under each other we see that all the "waves" match up showing that the en ot'tmaj greed at the fop
is reflected in the emotional fear at the bottom.
IBM C lart showing 1987 (op and
You may at first have a difficult time understanding this idea especially if you are not familiar w'th
charts. 1 can assure you, however, that T have spent most of my adult life studying t lis concept and_
it amounts to roughly 60% of my entire chart analysis time. It is he only way to draw long term
accurate chart drawings often years ahead of time that come remarkably close to actual future
price fluctuations. Basic analysis begins by finding an obvious reflection point that looks symmcti i-
cah Sinuejattcrns tend fopersist for king periods of time we can ti ace an obvious pattern
backwards and_ forwards for matryycMS and still get reliable resu Its. The first step is to start with a
major_ugh or low and count the days to \hcfirst significant t han^e indirection in a backwards
jashion. In other words, from a low count back to the previous high, back beyond that to a prior
low then back beyond that to a prior top, etc. We now go forward in time and note the same
number ofdays from t xlay where each of the past changes took place and we can make a "stick
figure" drawing of the up and down sw'ngs from the past and extend tJ cm into the future, if we find
97
foat_i pi iot high becomes a Future low we tlien expect tbejiextj^rjOj^ llovv
be a high. We do this exact same procedure jrom each niajorhij;h_and_low over the course oftFe
year and continue these counts backwards and forwards imojiieJuture_jiryears and years. On
my work papers I have often traced back fifteen to twenty years of history and retraced these '
\
Down
Foldbacl<
Point "
In This Case The Top
Is The Pivot And The
Decline Is The Image
Of The Advance
r
^
Each Of These Mirror
Projections Start
At A Time Period
Fqual In Distance
From The Pivot
And Point In The
Same Direction
same fluetuationsjbrvy^rd irt lime another fifteen to twenty years and have often found many exact
correspondences. This works of course because of the existence of cycles that return again and
again in a circle at recurring intervals. Ifjve tnyE_backw^rds enough, eventually we wTTI hit tfie
I ength of the eye c and the fluctuations w i 11 rcpe at_aga i n. f "i nd i n g the major beg inni ng_and ending
points is the more difficult aspect hut obvious symmetries are usually uite visible to most people.
The best analysis usually consists of making a largei wonVpapei tind start on January 1st eact^year.
You count back wards in calendai days to each major high and low over the p_ast decade orjiiore,
and then project that count forward in time butppjiiositc "J. direction to thc_pnor movement. This
can be done on ten or more lines down thc-papcr so you have a series of forward moving "stick
figure" graphs, each of which is continued into the future as far as you want to go. Hie real analysis
comes in when deciding die direction of the swing moves foi.die comingjear. You wilj[.have a
number of differing conclusions based on each individual stick figure graph, but in most cases a
number will "cluster1* around a coimtion time period pivot You the watch the currcn market as it
enters that p'vot area and ollow the stick figure that most closely resemb cs the graph of the
current move. For example:
98
Original Movement
~V
Inverted Mirror Projections Using "ach
Consccmivc High Poor To The Pivot Point
And Folding Back Into 1 he l:uture
This Is Not A Good
Example Since Its
Not A Real Price
History, But J fit
Were You Would
See Common
Clusterings Of High
And Lows Into The
'Uturc And Those
Pivots Would Be
Your Cycle Turns
»JW 'i-^-lfUSl
"■ }"■■*! l*ni cr "<>4i u «i
« S3 & a L'ini!_" <*_*
it : ^ a; :± p. : T^
I r
*«J [ *v llll.WU*!
14 I w iw* 1 1 Lh
ni.n'f -Vn
■ t mw jt jjttjhi^ i
M - -:
99
Hie above drawing shows two different species of lish. It is clearly implied in the drawirg that
somewhere in the genetic ancestry of these two, a warping of the ^enes took place as the second
fish appears to be a distorted image of the first created by twisting the major axis lines of the
rawing. This picture is what I believe we are actual y looking at when we see chart patterns. The
m'rror image symmetry we often see is just a minor warping of the axis lines of the plotting of price
and t'me while the lore frequent complex structures arc nothing but more exotic twisting of the
time ixis with different speeds. 1 am certai that some time in the future t\ ree dimensional
computer drawings will be able to inteipiet all our common stock price patterns, making the first users
of such technology quite rich!
100
It has been r ghtfully said that volume precedes price. Most significant noves in the markets are
caused by large supply demand imbalances and it is volume that makes the difference and moves
prices in the direction of the large orders. Ire most cases, volume is said to he positively correlated.
Fbat means that volume goes up with the real trend of the price act'on. O , if prices are in a Bull
Trend, prices will rise with rising volume and a ight volume decline is bull sh, and a heavy volume
advances the nonnal condition. For the Dear Trend, volume increases as prices decline and ight
volu le allies are seen on the counter trends, tine merely observes diechartpattern to note the
large volume spikes over several months to see if ihe overall pattern is rising with increasing
volume (Bu lishj or falling with heavy vo u c (Bearish). More than that, volume does not tell us
much. Many o the biggest price movements in history have frequent!) taken place on ligl t volu ie
with large volurnecjly appearing nearer tical turns and time eye eendings.
Ihe most frequently held belief seems to be thai volume is Bullish. This is almost completely false. ^
It is true that, in takeover situations, volume indicates the move is underway, but in almost all other
sanations, volume is indicative of a top^Only intimations w icre the i larket has been declining for
some time and volume dries up to its lowest level in weeks and rhen the prices rise on increasing ~
volume, i_s the situation bullish. Thejypjcat case where heavy volu & s seen s verv near the top of
amove where buyers and sellers meet in a tug of war and when the volume declines prices usually ~~
do too Noimally this is only a small correction that will last tftFw^Vs'tolhreVweeEs.Tjiir"
nevertheless it will be a top. Big price movements usually take place without too many pcopfe"
noticing. The typical stock will creep up a quarter of a point per day (or several days until heavy
volume comes in as everyone jumps aboard the move and on that final day the stock goes up a
dollar or so and then tops out. Most people need instant gratification *uid frequently buy or sel at "
these heavy volume extremes and get trapped o i the wrong side of th market, lire better trades
are to buy the light volume declining days and to sell on the heavier volume rallies. _
Keep Hind when looking for voli me signs mat bu 11 and beir market movemen s are parts of the
psychological process known at accumulation or tIi\trihuiinn.The accumulation cycle is the
Bull Market and the distribution is the Bear Market. These accumulation/distribution periods often
last for months to years because it takes innumerable institutions that long to icqu re t ie' shares or
to completely sell out after a bull move is over. When looking at the chart you would want to look _
101
for the tell tale volume spikes to see whether accumulation or dishibution is underway. When these
spikes are present there is a good trending market to actively trade. Much later in the cycle, the
volume spikes disappear, the stock goes flat for many weeks to months, and these periods are not
conducive to good trading opportunities.
The above chart of Lotus shows the basic volume accumulation pattern of big spikes correlating
with breakout advances and then sideways corrections on lessening volume. Note the classic
"stair step" pattern of higher prices over months with continued heavy volume near each advance.
When volume reaches its lowest level the price advance again resumes. As long as these spikes
continue the basic accumu lation process is at work and you do not have to worry about a major
break in the long term trend. Only after a long period of little volume activity, and then declining
prices on heavier volume, would one become concerned. Keep in mind that institutions who buy
stocks showing these positive volume correlations have no intention of day trading but are looking
out six months to a year or more and price levels at least 50% higher, or the trade wouldn *t make
sense to them. Unless the fundamentals charge dramatically, you can assume that you haveat least
six months of clear sailing to buy dips on these patterns before the long term trend will change.
If you do see a pattern with heavy volume declines you may want to go back over the history of the
past year or two to see when the big volume buyers got in and at what price. This is not to say you
102
will not sec big volume dec lines *n a bullish pattern - you will, but you should ul see consistently
heavy vo un e breakdowns that last more than six weeks on a dai y chart. Remember our definition
of a Bear Trend includes breakdowns to price levels not seen jn 90 days or more, so heavy volume
on lower levels more than three months from the top prof ably spcl trouble.
Another fundamental rule of technical analysis is that ''distribution always takes place after ihe
top." What this means is that you don't have to be concerned with guessing the high pr ce for a~
move. Only after a good correction of 10 to 20% will the rallies hack occur on very heavy
volume To e uninitiated this looks like pes live volume correlating with a rising market. Tft
howevei, the top is in and the slock is making a series of lower tops a id lower lows' pattern, any
volume occurring even on up days's co tsidered distribution or liquidation by the big institutions.
Institutions have very large positions in stocks and frequently a big fund might own 3 to 5 million
shares or more of an indiv klual issue. These "nvestors ire in for the long haul and can only get in
and out of positions over many weeks to months. Once the break is big enough so that they bcl ieve
the ups'de is r ited, they wi 11 patiently wa' t tor the lext ml iy to un load. 1 his is called distribution
and is done after the final top is in. Bargain hunters and shorts usually buy the stock rom the large
institutional sellers but these new traders have short term investment horizons and the stock will be
back on the market for sale within days to a few weeks.
The distribution phase is just like the bullish accumu at ion phase only backwards. Heavy volume
breakdown spikes will he consistently seen over many months as the stock moves lower and
lower. You do nol wan to own hese types of stocks unl "1 a period of several weeks has assed
since the last volume spike and the stock is now rising for at least three months w thout making a
new low. _
Jn re^cird to the market averages, increasing vol nneo ten accompanies advances and when an
average of say; 5 trading day s or so of volume starts to decline the lop is usually in and a correction
. is due. As long as the volume is increasing the advance may continue but look for the change in
volume to note the cyclical change taking place. Cyclical s the key word to remember about
volume since it is only on cycle rums that there is widespread participation and volume can change
hands. If you are look ng foi cycles, look to the active issues.
[Tie dec iningphase likewise is measured by i lereasing volume and when that dries up the decline
is over. For years I kept an hot rly chart of the Dow Jones Averages -ind noted the volume for each
tour under each closing hourly price. The volume almost always: gave a clear cut indication of the
change coming (lie next hour as volume dried up to the lowest level in a few days. This light volume
was obvious if noted hour by hour but often the last hoi rot the move would be a big price decline
on light volu ne. Hie big price decline scared everyone from buying into the di), but die volume dry
up was the telling key to the big reversal to be seen by the next tour,
103
Besides stock volume, option volume is even more important, Although this is a subject requiring
a book by itself and isc >vered in myGemwirytxTok, 1 will mention that volume in options is both
bull'sh and bearish depending on wheit er the volume o 1 the option is reflected in the stoc /s price
action, fhat is to say a Targe option trade such as a thousand options on IBM would tie bullish if the
option price is up but the stock price is quiet/lli's usually signifies big leveraged money racing the
tape ahead of a big stock buyer asking around for stock, or it could be just illegal inside information
about a takeover or upcoming analyst recommendation. 1"his is to be compared with 1IIM up a
dollar or so on an obvious bullish day with everyone participating, and the options are also up on
heavy volume. This usually means a top as people are buying both stock and options but someone
is selling 1 he options to those people otherwise the option volume would not be seen. A light
volume opliot day with a heavy stock volume (fay wo; Id be more bullish. Also keep in mind the
fact that most aibitrage buy or sell programs in the market these days are preceded bv big OEX or
index option volume. Most firms trade for their own account and when they get a big buy or sell
program the first thing they do is stock up on puts oi ca Is, You will almost NbVER see m. rket
movement when these trms buy or sell their options because they al w ay s race the tape and only
hours later show up with the program to execute. What you mi st do is constantly ote large
option transactions and particularly note the time and price they trade so you can refer back to
those statistics later in the day or the next day when you $rc the big program hit. From that point on
you wi 11 low that the program will not end unt i I at least a half hour AFTBR you see those same
options being traded out with the same volume of contracts!
I would say that for most ct art reading volume is strictly a secondary consideration. Prices are
much moie important and cycles in the final analysis arc what cause volume to come into the
maiket and begin and end moves. Volume is often the cyclic tip off to a change but the volume itself
is not tha important.
Presently volume 'sloe important than in the past since it frequently indicates the presence of
large institutional investors and this kind of sponsorship is what is needed to cause large price
movements. Long term investors particularly need institutional sponsorship to keep prices rising
and periodic volume spikes indicate that presence.
In the final analysis volume is needed to change direction and indicates cyclic turning points, but
prices themselves are what make us money. We watch volume patterns to ote the coming change
but trade off the p( ice reversal buy or sell bar. At flic end of the trading day it is the pr'ce we must
adjust our balance sheet to and not the daily volume.
One final important po'nt: 11 is point is too important to mention i i a book as inexpensive as this,
but 1 know the vast majority of yoi are too Wy to fol low up on it any way. Tor the selectedfevj,
here it is: the market always changes d irectjpn vA\e the total capitalization o a stock turns oyer jn_
proportionate increments. lfaSOmi(iJ.ojn_s_hare issue trades 50 million shares^ thcjnarket^vilIJum^
04
In an active market this could take two months—in amnactiye one, six urejght months. Ihisis the
The chart ahnw is jj^cjayig "^gcto^cjgi^t^g^5_a_nc^j3Mll move just starting with anmjljal
Impulse wave mnypifi up ata near 90 degree angle accompanied with heavy volume. There are
several more suchJmpuJses_ove^ the next few weeks—all on good volume and at the end of each^
pull back correction, the stairstep lows arc all nicely higher. There is also the general aprranmceof
a circular arc in the making with rapid acceleration to the up^
^memorized. Whenever you see jtjou will make ajotof money being^long on it.
105
E)
Read'ng chart patterns is an art. ltis a lot like chess. Millions of people play chess and millions of
people read charts hut there are only a handful of grandmasters at each vocation. Anyone can
learn common chart patterns and anticipate when a trend line will break. But, it w only the
grandmaster who cm hink fourteen moves on the chart pattern into the future. What separates the_
professional from the novice is the ability to see the possible chart patterns forming /F such and
such an event unfolds. The breaking of the trendline is rrelevant. It is the possible regaining that
trendline, or the magnitude and time duration of the change in trend that is important. In this regard
professional stntegy is what separates winners from losers.
TTie average investor has no idea what strategy is, 1 le seems to think that you buy or sell what the
people on TV recommend, or what the analysts at big brokerage firms think are going to do well.
He does not even conceive of the idea that for every buyer of stock there is a seller. Only one w'll
be right on the trade. If everybody is making money, who is 1 ising? It might be better to th ink in
terms of entering the ancient Roman Gladiator pit and knowing only one comes out alive. Trading
on a professional basis is like that. You must use strategy like an army general to trick the enemy
into making a mistake if you are to steal his money.
Up to this point I have tried to train you in some basic good habits like etemiining the main trend
and then waiting for a counter trend movement to en er t ie trade. At least this way you will not
jump in emotionally without even thinking about what you plan to accomplish. Wrhat is really
required, however, is an entirely different frame of mind. Vo the Professional, and I mean that
term as it's defined —one who makes his living doing it, stocks or commodities, futures and
options, are but mere pieces of paper in a greater fool theory, game. That is, there is no real value
to these pieces of paper- they are only valuable if someone is willing to pay more than you did to
buy them from you. It is a i ever ending source of amazement to mc to w'tness the extreme confidence
the public has in their government and the capitalistic system of paper money. Anyway these
pieces of paper we buy and sell every day are only valuable o" short periods of time, or I should
say their value is only perceived to be constant over short periods of time
106
lie person who falls in love with the "investment story" will never nnke a success at
trading. You must be like a retailer who buyscbcap and sells with a reasonable markup,but sells
often and changes inventory with the latest "fashion." Getting stuck with old merchandise will
requ're a loss liqu'dil'on sale.
Stocks change in value every day based on em rfioml perceptions. There is no value perse. It is
the emolions of the masses that drives the supply demand equation. The professional chart reader
knows how tn look ar a chart nndtt?c emotions. Measured moves, arcs, trend?ines, and a host of
other tools are used to constantly redefine that emot'o lal perception to exploit trends by buying
fashionable merchandi se and waiting for the store opening a few ours la e or the next day when
the buyers wi 11 be emotional ly anx ious to buy. The idea here is to turn over the inventory frequently
w'Lh a small reasonable profit that will compo nd into significant sums overtime. The grocer does
not buy a head of lettuce at $ I and expect to get $3 o $4 fo it. Me expects to mark it up 10cents
and sell jt as often as possible and in large volume. '1 he delivery truck comes back everyday.
Stock speculation is no different
Til is being the case, you as the retuilerand in business to make a livingcannot afford to just buy
and sell every day and at every price level. You must have the patience to specialize in wholesale
buying and_re^M^clljtT£j^arls.tcll us what the market will jjear. Steep angles show very popular
merchandise whose fashionability will not change overnight. A broken trendline shows a change in
buying habits. Arcs show- the cu I m i nation of a shoppin_g_spre&.
,Wlien lookingai_a_slimi£tejdjng[market that has a parallel channej detinnig die^moye^you shoutd
measure the avei age width o the cliannel to see the average range between high and lowfluctuatjons.
Being a humble grocer we have to frequently buy and sell at the most popular and frequent fluctuation
jevj&n jfj.hat seems asr rA\ reward, Tt is all the market will give us. We cannot afford to make a big
play and try to double our money over six months on something not seen in the chart history at
present. That's an entirely different game than professional trading. We must buy dips from each
high at the overage norma!ohserv&i' amounts t*v d i n lediately offer for sale his merchandise
on the rack at the ittt mat markup fluctuation price. Prying lo get more will mean fewer trades and
greater chance of loss.
If" you trade options you wilt have a choice of buying a $1 call and selling it at $1.25 or
wait ng and trying to get $3, Which is better? There is no question the better strategy is to get
the 25% markup and sell at $1.25! If >ou put odds on it you would find that the chance ot
predicting the direction of the move (being right on the trend) might be 70-80 percent. But,
w lai about (he odds once the move starts? 'lliey d amaticaNy change! Once the move starts
they start to decline so that when your option goes from $1 to $1.25 the odds of the NEXT 25
CENTS BfclNG UP m'ght only be 50-50. These kinds o txlds are gambling, not speculation!
Remember as professional s lecula ors we want to set i tl c odds in our favor. We want to
107
choose when to trade, what to trade, how much money to trade with, and what odds of
success we need* If wc let the market dictate the odds we twr t aw<iy finm professionalism to
crude gan bling. Returning to the option examp eT if we watch our call go from $ J to $ J .50,
$2, $2.50, to $3, we would see the odds go from 80% down to less than 10% on finally
banking the money. This is the whole point of this book. "Vou are supposed to bank profits
every night. If that takes lowering your sights and getting small gains, so be it. By the way
jTTakjn£25_cerits on a $1 call is 25 percent and, if that can_bc.compounded[with ten successful
tradesthe capital w_'ll increase jnine times from $1 to over $9! ! ! And, tl 's is with odds of
70-80per cenL Only a fqo] would ignore this to_wail_for the one in ten chance to increase his
caE^5i-^-^
In setting the odds at which we will trade, we must consider time as well as price. We cannot get
caught trading a large nventory when the markets are inactive and quiet nor can we infuse to carry
a full shelf of inventory when the hordes of Christmas panic buyers surface. We trade t te active
markets and use the charts to show us the active ones wth big volume o sales and very steep
angles of ascent. We also cannot allow ourselves the emotional luxury of jumping into a trade evefy
day in the first half hou and not having any capital left or a good midday reversa or end of
day dramatic finish. We must constantly be alert for the wholesale truck making drop off
deliveries.
Almost all strategies encompass the deliberate undertaking of risk. Good trades almost always
occur when we tf.unk.we will lose ,aliUle.Qn the entry point, because we are taking a position aga'nsl
the m'nor.countcr Ufiodmoyernenland we.expecj it topossjbly^ojh^rough us before reversing.
We buy into a dip near known, support, qlscII atiesistan.ee !cvel^.jye_4eljhe^tdytake on this risk
because we have clearly defined it ahead of tjme^_We knowjwben_we enleMhe, trade jw hat the
extreme movement might be^and the normal time period for reversals. We are wilting to use a one
or t iree dollar stojp loss on ou reentry point and we expect to face our maximum risk immediately at
entry poin . In interpreting our chart patterns, we have calculated ahead of time ihe three or four
possible outcomes from any chart reversal and have planned accord ing ly. Ff we du not lave a
clear entry point or [t is too far away from o r pre-defined risk management poi t, then we do not
make the trade. Remember it .isjHjrbusiriesSj and wejnake r ie_ mles.
The most common mistake fiitures traders make is with stop oss points^ The trailing stop should
only be used forthe entry point or the immediate fiftee i or so minutes after that entiy. This is
because as professionals we b j ■ • « i t - cl i n e a n d / fjw earewre>ng \t wi 31 be
painful. After a few.minutes inthe trade we will kjiowJFy^jycjiejglitand will be making moneys
we ore wrong on our guess and must cl ose out to try again later. If we are pot making _noney_on
the trade after a half hour, we shoujd cjose jt_out_or ti^ to scratch. If the trade is in the money in the
first fifteen mi nutes, we always move the stop up to our entry price and try and get a "free ride1' on
the trade. If we do this, the odds go to wejl.aboye 90 fc in our favor of ankiuft money on the
108
transaction, 1o arbitrarily .use a trailing stop for hours or even days is just plain stupid. Then
again most S&P Futures.traders have sights set way t^oohigh.They usually expccuo trade for
300 to 500 r>asis_or $ 1500 to $2500j£ofu per contract so they are willing to risk $500 on~a~ _
trailing stop of 100 basis. This seems logical but does not fit the facts. Most of the time the
daily fluctuations in the S&P*s will not reach 300-500 basis so the profit target isunreasonab1e.__
W hat is reasonable though, is the 100 basis trailing stop which is hit daily and most of these
trade s consistently bank $500 losses every day. What should be clone is to Jqwer ones'
sights to scalping $500 profits with 100 basis targets and using timing stops of fifteen minutea,
in ihe trade or 30 o 50 basis trailing^tops. Often by lowering ones/expectationsto smaller
average dai y gains, the rate of successful hits rises from 50-50 to over 90% and the
compounding effect is mind boggling. ^
Another rule that will el imjnate 9Q% of all tosses is to raise our stop immediately to our cost or cost _ _
plus commissionjust <is axm as we have a smal. profit or arcjn ajion-losin^trad.e for riorc than 15 „
minutesXommissions on futures transactions are practically nil compared to average profit
expectations. To let a winning trade turn into a loser and get stopped out with a trailing loss stop
when we could have scratched or made money is perhaps the most grievous sin any trader can
make and has absolutely no reason to make.
Over the vears, I have had the privilege of working with and knowing some of the worlds nest
traders. What I observed most of the time was that the truly successful ones were "gimmicky"
traders. In other words they really treated the market as if it were a# ime and the only rules were
to lose as little as possible and to bank a profit every tingle day no matter how small. In one
case I knew a very successful trader who made millions every year, but would be scared to death
to make the first trade every day and c lose little ones that would only net $ LOO or so and to get
that in the ban is soon as possihle. Only after that trade was si ccessfu I would he become more
venturesome. Another trader watched the tape for hours on end obse™ngj^sjnj^areM_wjieiE
everyone knew a big breakout was com'ng After a three to fivejiour trading range in the S&P's
was broken out of, he would quickly enter the trade, and although it was obvious to everyo e that _
an S&P breakout of that duration would yield at least a 200 basis move,Jie would jump|nt buy _
and immediately offer his contracts for sa e up only 30 basis higher. This had the affect of allowing
hi n to have a success ratio of over 99% profitable trades. AJthough the profits were small, there^
were almost certain and it was like found money on the sidewalk to him. In only a few years he ran
a few thousand to over 10 million with this technique^! im consistently reminded of this strategy
almost every day when I see customers get stopped out for 100 basis losses because they "nsiston
getting 150 to 300 basis gains and just miss cashing in before getting stopped out for a loss.
Please note that this traders' success was entirely due to strategy since his^omcp an was to
scalp a small profit when everyone else would not even remotely want to do that. Because the
market is not as predictable as most people believe, this strategy yielded 99% ttades when the
109
obvious big neve only worked half the ti ne and the losses and gains ended tip in a break ~
even with no real net profit in the bank for the masses I hat expected big th ngs.
One of the reasons most people do not take the smal I trades that add up to real mo ey is the
fear of commiss'ons and "churning." In truth this is what wholesaling is all iboui — rapid
turnover and small margins, rommissions are the same whether you bank a small profit
every day, or a large Joss every several days. Preconceived attitudes about what is right or
fair will ruin you. Putting more money in the bank than you had the day before is the o ly
consideration.
Chart read' ng can very easily pick the winners fo you. You must uwrto execute and then take the
money, and patiently regroup for the next offensive. Remember we are using charts to point out the
emoiionarsm of die masses. That is our adv intage as technicians. Not to use that advantage by
just "jumping in" is a waste of your intelligence. Once wc see the major long term emotional
Situat on, we plot a strategy to go opposite the minor temporary emotionalism. Hence we "buy the
dips" or "sell the rallies"depending on whether we are bullish or hearish. Furthermore, once we
set our strategy as to exploiting ihetrendby buying or selling, we rtiusl now lave a strategy KaUmit
losses if we are wrong, and we must have a strategy ax to when we take profits. All of this
requires thinking ahead of time. Wc are rcsponsihle for setling ihe odds of our play and we must be
constantly aware that these odds change all Ihe times Wi hout a prcconcerved strategy we would
end up executing in an emotional fashion like all the other "also rans."
When using strategy to enter a trade, du not forget the strategy to exit the trade after entry. Many-
traders watch for a base breakout and jump in long knowing t ley will make 30 80 basis on the
trade What usually happens is that jump n and then just watches and waits to see what develops.
It light be a better strategy lo place a sell order 30- 80 basis above the en try point at the t r le of
entry, if indeed that was the strategy. Most people get caught up in the err otionahsm of the trade
after the entry and often lose sight of why they really went in and foi what profit objec ive. As a
result, they get (tapped looking for more and end up with a loss, when the original strategy thought
out before the trade was entered was the correct one.
You must learn to think like a gamto^GjmiN^ "fjQdds-Wjth good technical
analysis ot our chart patterns we can probably he right on the trend JO-80% of the time. But, this
_i_s only one set of odds. "[Tie re's alsojhe probabiliTyjjj^irjftr a njovejvHltmrry- Betting ona$l
Mvjy]ce_is one Jh ingjuit r£ttin^on_ajy_0 advancejs something else, in each case, the initial odds
forgetting the trend nghli^e pexhaj)S R^ is Xobarth the profits.
These odds rapidly decrease as the move .gets underway 80% initial odd am ay be 50jS0 when the
stock is up S3 and only 10%jwhen up _$& You si. ou d const: ntiy be thinking what are thr odds
of the next $1 move;' If you f nd that your answer is .S0-.S0 or less, you are a gambler, not a
professional speculator. You must stop trading as soon as you find you are no longer speculating
and you have let the game d ictate the odds to you.
110
Intra Day Patterns
Most futures and options traders are day traders. That is they buy in the morning and sell by the
close. ETie vast majority do not carry positions overnight. As a resu t tl ere is a rush o get in and
out in the first and last 15 to 20 minutes each day. 'ITiis busy period "s called the "opening bu ge" or
the "closing bulge/1 Hie nontial pattern of day tra krs buying or selling with the trend oflhe market
usually sets the daily theme right from the start. Not only are fun res and options professionals
better ski I led at trading but in recent years mere has been a tremendous amount of "front running"'
large orders and entering trades with illegal inside in ormafion. Wont running is the practice of
quickly entering orders ahead of Jirge Jock transaction?! or in Front of soon to be executed arbitrage
prognm orders. In tecenf years, the rise of behemoth mutual funds and pension funds who come
to market with orders for 200,000 to 500.OCX) shares of as man) as 200 different issues at one
time, have given rise to massive n mounts of front running. These huge institutional orders can take
several days to fill and arc carefully executed secretly to imtntain market order. Unfortuna ely, at
least 50 to 100 important traders and individuals a s always tipped off ahead of time when these
programs are ope ating, since the knowledge of such orders "s worth millions in ihe right hands and
the right hands always get the information. That s 'list low the system works. In any event we as
independent traders can easily spot such activity in our charts and trade along with f e big inside
money. Remember that people who have near certain information, either illegal or just in the course
of executing large trades; these people do not waste valuable capital on these trades since they are
virtual ly guaranteed, fhey se lots of leverage Lj ke futures and opt fons o get the greatest return in
the shortest time. As a result these trades show up in the i lorning bulge. Oui job is to decipher
from t e early morning pattern if these knowledgable people arc buyei s or sellers so we can jo n
them.
The typical bull market pattern as mentioned previously is early strength (opening lo 11 AM)
and late strength (3- PM). Bear patterns arc the opposite. The actual ntra day pattern for a
^uJ]ish_day_woiildJy.an_urj opening that goes straight up for at least 20 minutes and sometimes
anJioi]/J3_y JJ_AM[most hulls are committed and tl e pattern creTtes a cor solvation trading"
range with some several swings up and down in a relracen ent^oncot the nomlngs" advance.
111
These swings usu^TJh^qr^t take out the daily high nor approach the low.Usualjy aroundj :30
J^i^O^EST) there '* a "false^brcajcdowrrjplungc tua slightly lower low than seen st^far
since 11 AM. After this false breakdown the big ndjy of the d_ay_ensuesam j*oes_straigbtup
into the close and a new nigJiJo^JthejJa^TrjeJ^^ M?_n.e?rly tJ^sametype of pattern
but opjiosite. A rough sketch of the daily tick chart would look as follows:
10:30- 11 AM
Bullish Day Pattern
Close 4 PM
1:30-2:30 PM
3 PM
Opening
Opening
Bearish Pattern
1:30-2:30 PM
3 PM
Close 4 PM
10:30 - 11 AM
These above patterns are very typical. Even so there are to my estimate about 7 or 8 basic
permutations, but all usually fol ow the opening closing same direction, midday counter,
rule. The most obvious feature of these patterns gives rise to the important "opening bulge"
™ic ■ Trnsnjle works 70-80% of the time and basically goes I ike this: The EXTREME HIGH
(^LOWjor_the entire day is made in the first 20 minutes of trading At first this does not
seem to be worth much but if you stop to think about STRATEGY fot the midday and end of
day, the rule gives two very pood trades and perhaps a third. The opening trade is the trickiest.
We will not know if it is a high or low for at least 20 minutes, so what do we do? Cautious
traders will do nothing or go with the obvious bullish/hearish daily trend. You could also
guess using a tim'ng slop of lerhaps 15 minutes to make money on the guess or close riout
112
arid reverse. The more reliable information is after we see the 1 AM high or low. We now
know w h icli way the £K ma^y iremf[sjm^ jigw(htl^yayj^l jJ,9jSe^Vjfc_a) so kno w_iowjhat 3_
false counter move w'lloccu! mid-day and _w_i]!JVilj^yjjyiJlise Ic^a^oj^Ji^i^lniritliexlose^
Wc may want toshortjhe^alsc^hrcakoiit attempt on a bearish day that comes from 11 '30 toj ^
PM and stay short until ihe clt se.
It s Uie characteristics of these countei trend moves that accounts for why most S&P trailers who
use a 1 fK> basis trailing stop are always si opped out tn id-day for a loss and lose their positions
when Their early mom ing o tlook was u sual Iv right. Tn ihe cjmietmid day lu ichhours, it is easy fur
the pit traders to run the stops and load up on these false bottom breakdowns, at which point we_
double up and go nng forthe close. jJnfortunate doctors and lawyers seem to only trade S&Ps
with stops and badly ai that. I can say from experience that if you are not making money day
trading, try NO V trading until at Tcast 2 PM. Ihe vast majority of people e-mnot because they are
so emotionally involved ant must be n it i i the irst minutes. Often those trades are not the good
ones.
Reversals of liend days arcmorc tricky. With ourstrong tipeni ^gi^ron^clorep^terjiftjrbul^
moves, we normally expect the rjarket to open upor be up w'th'n the fr^20 minutes the next da y._
Good reversals in trend, however, usually come byjeversing the tuning bulge aftejMwenty or so
m'nutes but first opening in tjiejanic direction as the 3-4 PM trend theday hefoie. Tn other words^
if 3-4 was down, only a down opening thai later went upjjvpuld reverse % tmig^n ujn^opoiing
fol lowing a ctawnprior close almost never reverses a niai ket at is usuallyj^speeial isl opefiirigjQ_
attract short covering that will unload inventory from the night beforehand once: itis ynloaded^the -
specialist goes short himself and then towers his quotes foi the restjnf the day. In Biilj trends, _
traders know instinctively to go long a_ strong 3-4 dose and hold overnight to sell into an uj\_
opening, I "his can usually reverse a marked back down but the Iradei who sells out on tl_ ej^jjentng
bulge does not ni iss anything by doing so because even if the trend doesnot J cvcrs£( we kntjw' _
there wil be a counter trend dip mid day to get back aboard for the end of day rally. Strategy is to
dl ways remember the 3-4 closing the n ight before <ind assume a c .mtinuattan by |1 A M but to then _
watch out for the reversal.
If a bullish day is going to turn into a weak close and a down next day, you usually have an
abbreviated phmgejw I PM and an immediate rally that is at a new daityhigh hv 2 PM. This's
usually a weak point of the day with the finning up part not unhl_2:30 to 3 PM so ? 2 o*cjock high_
is_a good sign of a weaker 3 PM reading and a "busted'Mast 1 our reversing the trend
These intra day patterns, although ideatly suited for utiues and_optipns, are also very good ^
for stock tradcs.A deel ining issue will usually hit bottom hy 11 AM and base and show good
sys?£th hY ?,PM:iBy_% 'Li.s_us_ua!lv. back u^on the day, then has a st ongclnse, and fellows ^
113
thru the nex ^lay. Jy^s to wajdn _theJ2 PMreadmg onstocks andxgin^arerjl5iiithJhe 11 A.M_
re^djn^to s£e_i£th^rea^lwi^_s are stronger or weake .
Keep in mind that the big money likes to trade with,a sujejli'ng^and wilLcQnc£ntRte_buying^
£r_sclling jn thejast hour so as to be as closeJoih£dosrp£ trend _V iderway asjgossible.
CPiL^ai1?rilly:.n29.siItraders start j2JTiaJ^j2^£^^?-n,t^^^b^.3LlIi.PMIoxlhe_^al trend.
Additionally^ the btfl mutual funds and pension funds thai are alwa^IuJly lirvestfid longjwill ^
often hedgeji st after 3 PM if it looks like a weak close and a marketdecJLine toming. Many
funds se 1 S&P futures short against longs, or sell ORX options against the portfo io to hedge.
I*he selling oft lose highly leveraged futures and options in itself will often exacerbate the
downward trend and make the nervousness a self-fulfilling event. Day t aders should therefore
keep an eye lowa ds not only t c trend at 3 PM but the actim in the futures and options pit to
judge whether the leveraged players are making a bet against the existing trend. It does not
usually pay to go against those with big pockets.
One of the overriding keys to ntra day trading is the position of the "leveraged" money such as_
options and futures. When trying ojpalyze the intra day patterns, you should know that these
leveraged players will go in the same direction as the general market If you fndVaposs ble deviation
from (he usual pattern as to ope ing and mid-day lighs and lows, you should look to the option
premiums to see if the calls are expanding in premium with a rising market or the puts going up with
a falling market. If you see the oppos te happening, be prepared for a reversal in trend. These days
with the large institutional dominance of the market, almost all reversals will be forecasted first with
the_futurcs and options, and only then show up in thebroacler averages and stock prices.
Typical Intra Day Tick Ctiurt Of The S Si P Futures
4&>.BB
4b5.a&
4&4.ee-
Hta.ae
lez.aa
Intfo OiySftF Futurti 12/03/31
CI icJUHJQh
Oprnlng
Bulge
[Extreme
Wa*L0W|
^1
Rack To High h
T«Ibc Brcikour' Ql:3D By 3 PU ,A
■
"F^lvc Breakdown"
9 2:3D PM
in:
irtE or dav
114
Step By Step
Putting it into practice
Some aspects of chart reading are skills and some are subjective interpretations. 1 honestly think,
however, that the vast majority of people are capable of successfully day trading if the principles in
th is book are studied. Some are obviously more important han others, tn an effort to sum arize
the book 1 will attempt to chronologically list the first and most important steps you should follow
w ien you first pick up a chart.
1 - Look at the entire chart history and see the broad general trend, whether flat, or sloping
up or down. Imagine parallel trend lines if possible. If a very long term chart (5 or more years) is
available, see if accumulation (bull market) or distribution (bear market) is going on and what
strategy will be needed (buy dips or sell rallies).
2-Note the "big bar" impulses to make sure they follow your assumed treni direction. Note
volume to see if it confirms. Make sure the weekly and daily "stair steps" that define the bull or
bear pa terns are evident in your assumed trend. Note the type of "personality " the chart has
(spike highs and lows, rounding bottoms, kamikaze, etc.).
3-1 j(Kik fur obvious symmetries and mirror image foIdbacks.This could be eons'dered the
firs step but symmetries are often so subtle they only show up after a much closer examination.
This search for symmetr'es should i elude bowls and arc patterns developing.
4- Note the high and low ranges to see if the pattern is volatile enough to trade and where in that
range die current price is located. This also includes examining the average measured moves in the
h i story, and noting if big potential exi sts such as a breakout from a large base (length of base equal
to height of move).
□
J15
5- Check for time counts. Three and one quarter week cycles, Fibonacci hours, 30,45,60,90,
etc., calendar and trading days from major highs and lows. This will warn us of impending cycle
urns.
6- Look for trendhnes and liming angles such as 1x1,2x1,4x1, etc. Are we breaking out
or breaking down? Momentum? Is the move just starting or fit ishing?
7- Wave counts and specific known patterns. Obvious patterns are more reliable for good
entry and exit points.
8- Find the most recent impulse wave and try to locate where you are in terms of wave
t.2,3,4,,5. Note prior rctmeernent percentages at each prior wave culmination.
9- Is the pattern obvious to everyone? Ilnw are the masses currently reacting to this chart
pattern, and what strategy will be employed to exploit their weakness \n interpretation? Usually
the best trades arc ihe typical "wave 4" mini crashes that Itx>k sea y bul always lead to spectacular
up legs. Learn to exploit the masses' fears.
10 Decide on a strategy, chose entry and exit points. Calculate projections ami alternatives.
11 - Look at the last 5-10 reversals and see who "won." Traders know to do the same thing over
and over until it does not work. What strategy -- buy dips, or sell rallies - actually made the most
money over the last several swings? Trade with the winner's strategy. The vast majority of
people want to plan for future trades. Very few will take the time o examine the past. It can be
very beneficial to review the last several days first, and see who did what based on what ihe
patterns looked like at that time, and find out whv the losers lost,
12- Look for huy or sell signals that dn not work. A pattern's potential that s not exploited
tells you much none than the pattern that wo ks Pay attention to technical signals thai have little
influence- This usually means a much more powerful underlying cycle is present than realized.
Remember that one of the basic tenants of cyclic forecasting is that in a bull I love the up parts of
he cycle are exaggerated and the down parts are atfemntcd In i bear move the down cycles
show the stronger influence. If you are following a6.5 week cycle and suddenly find the lows arc
lower than the last cyclic low, it probably indicates a bigger and longer lasting down cycle is
starting to manifest. You con Id now predict that the up phase would be weaker tha l the last
observation.
116
S&P Futures Trading
Perhaps the mos important market for using technical analysis and chart reading is the S&P
Futures market. Fundamentals mean nothing here since the average volatility is so great that by ihe
time the fundamentals are truly known most traders would go broke. Additionally this market is
dr've by a great number of diverse players whose objectives may be opposite to the general
marke *s direction or trend Basket programs may buy stocks but sell futures making the SAP's
appear to be going down when the stocks are clearly going up. A other times, ratio strategies may
require either the purchase or sale of futures, while taking the exact opposite position w ith twice as
many call or put options, hi the final analysisil will usually be nearly impossible to learn the motives
of the SAP traders as to why they bought or sold and these motives may be completely irrelevant
to yo ir particular objectives, ic only thing that is important is the direction of the trend during the
[' ne period you will be trading. Whether it reverses tomorrow or next week or whether il is part of
an elaborate hedging operation has no bearing on your decision to buy or sell — on y the price
direct ion.
Forihesered.sc ns chart read ing is the only means to consistently win in this market. Since arbitrage
programs are frequently active in this market, it does not pay to have a very long term perspective.
Huge moves can take place in only a few hours to a day or m > and be completely gone w thin a day.
Because of lis, strategy must emphasize tndingand not positioning for a long term trade. Most
traders who arc successful in this area ave age three to ive trades per day, and on very act ve
davs, may Irade 1 ^ to 20 times. As mentioned elsewhere in this book, you will probably do better
in this market if you lower you sights an scalp small trades than insist on getting the bigger moves
of 300 to ^00 basis or more thm at best only come once a week. Most winning strategics focus on
scalping 80 to 100 basis per day, but often that total may take three individual trades. Trailing stops
are only used for the first fifteen minutes when you are usually entering a counter trend movement
and do not know as yet how ar it will travel. After fifteen minutes, however, you shnu Id be able to
tell if you are rigt t or wrong on the trade. Lither way it is usually time by then to scalp a prof t or
scratch or eliminate a bad trade. Holding futures for hours and not making money is a good w ay to
lose money!
I 7
You must constantly try to avoid reasoning why the futures are doing something. As mentioned
above, many arbitrageurs have differing motives than you a d must execute orders to facilitate
various Strategies, aj d iJiis may only be a minor temporary influence.
Ncvertheless you lust trade with the size order i n the pi t or you wi 11 end u p tos in g. The successful
traders will therefore always follow rules and chart reading principles with a very rigid interpretation
of these rules. Thinking should be limited to entry a d exit point strateg'es and possible chart
misinterpretations.
Since trades arc frequent and small, elaborate sophistication is not needed to become a success at
scalping, but many of the principles in this book could make you spectacularly successful due to
the nu nerous opportunities to identify good trades when more traditional methods are confused as
to the actual trend, Basic principles should be our starting point. These are as follows: trend, arcs,
measured moves, bar counts, waves, and angles, fnese methods have been explained previously
but a quick review seems in order:
1) Trend
I ligher bottoms, or lower tops and lower bottoms'.' What period do these trend bai s encompass?
Is there a possible reversal bar sig tal due or just seen?
2) Arcs
Can we draw an arc to determine support and resistance? At least we can draw a circle
around a significant low to high orhigh to low to get possible measured moves and radius and
diameter lengths for future movements. What shape do our arcs describe? Are they just
starting or maxing out? Js there an arc intersecting with a angle or support or resistance
point? Where do t le tops and bottoms of our circles create support and resistance?
3) Measured Moves
In co junction wit our arc analysis we can use a compass or ruler to "measure41 normal
fluctuations over the. period relevant to our trading. 1 "hat is if wc arc trading on a five minute
chart, we learn the most likely 5 minute reversal patterns, but at the same time we must at least
exam ine an hourly chart of three weeks or so to get a feel for the max inm m exlremes we are
likely to sec at some point. Remember our basic scalp should be conl ined to the tun phase of
the accumulation.distribut on pattern and even on a minute scale such as five rn'iiutes, these
measured moves are the run phases and once they are done we will end up "n a support or
resistance area and we do not trade in those areas!
4) Bar Counts
Numei oJogy is extremely important. Although T cannot even begin to scratch ihe surface of
such a subject in a simple book such as this. 1 will tell you lhat numbers tl emselves are ahve
118
and ive in another dimension distinct and apart from us whether or not you know it! They
have the power to reverse markets. Yol must keep number counts from every important high
and low! At a minimum, keep trick of Fibonacci numbers and square outs where major highs
and owsare equal in titrie counts to ther price levels. Because human beings on a subconscious
basis convert numbers into circular measure, all highs ami lows in history will be proportionally
related. If you believe an important turn may be at hand, you should be able to confirm it with
number counts and proportions of previous highs and lows.
5) Waves
At the end of all big moves watch for wave formation and patterns. A, B, C patterns are easy
transitions to large move resumptions and usually appear at the end of normal measured
moves. Measured moves with clear five wave segments bear close watching. Three's, five's,
and eight's are also important wave pattern segments. Remember the purpose of the wave
count is to project prices for the move and our strategy should be ready for a major change in
trend if such a probable projection pattern shows up.
* 6) Angles
If we are trading a move that is some distance from its origin, we would want to watch angles
closely for change in momentum and time cycle intersections. After an initial impulse wave,
we can usually re y on a secondary impulse from the 45 degree angle or from an angle rising
from the "zero" point. Measured moves should be apparent at these points of support or
resistance also. Remember to adjust the axis of your primary angle to the major thrust vector
of the movement. This is a very important point when trading on intra-day charts! Forty-five
and ninety degree angles out from these adjusted axes are deadly.
The following charts will demonstrate the analytical process for trading. 'We start with the houi ly
chart. /•*
~V
119
The first thing we note on this hourly chart s the trend, and that appea 5 to be down. A major
break occurred some nine days back but the price structure still has not regained the breakdown
level. The topo the recent rallies at the end of legs "*A" and "B" were near 18.2 percent — a
normal bearish retracement, and even if a 50% retraccment goes to a slight new high above "C" it
will just hit the massive resistance line labele 1 "crash res "stance" and it will also be nc- r the 90
degree max i inu n i resi st anee ral ly 1 i nc d rawn up fron 11 he first 1 ow. [ Tie obv iou s A t B t C, ct irrcct i ve
pattern is evident so we can poss'bly expect another blg do will eg once C is officially completed.
As of the last bar "n this chart a signal har reversal sell signal was given 4 bars back and the current
price is re sting at that failure levH. Strategy is to think beansh <md si mil, but he aware that if the 50
% re r cement level can be regained, then the A, B. C pan em could actually tx: a double botlo n
and a new alt lime high could result. 1 en "e we want to short a weak market but not arrwijjone.
If we do short a failure we can use the current high hs the stop out point and project lower prices
below anything shown on the chart because that is what an A,BC failure implies. Usually, it
occu s at the midpoint o tl e bigger move, so as much ,ts ihe all ti me high was above the A leg
starling point thai distance will be J leasured down from the C ending point.
This next chart s a tick chart (every tick printed) of the S&P futures the next day We come into
the day look ing for weakness to short or a ni I ly that pene rites the 50% retraccment level @476
to change to a bullish bhrc. We now remember the mosl important aspect of all of day trading - the
120
open!ng buIge rule. To repeat tliis rule states tba the extreme high or low for t he entire trading
day will be seen in the firm 20 minutes of trading (wit! 70-80% probability). Once we can get a
legitimate trend (zigzag pattern) we can trust the bulge. By ! 0 AM, it appears to be a to j and we
go short, or we have guessed and shorted at the 50% retracement approach looking to cover if a
higher high is made after the opening bulge rule period We can immediately see several powerft 1
impulse waves to the downside even on this very short term chart. Those are the "plumb line"
drops that break to each new low. This ind'eates serious selling. Indeed in the fit si full hour of
trading we do not even see one full fifteen minute rally! If we are seal >ing, we cover each 80 basis
and look for a AT\ basis rally back to re-short. If we arc very bearish and arc looking for a full day
to three day swing trade wc will lot think about taking our first profit until we get towards the low
point where the first signal reversal bar buy signal was generated on the hourly chart (see I st chart
start of A). This level is near 469-470. Keep in mind that we must hike our profits at each
potential reversal point and not wait to s > if the market will turn. Most of the time this kind
of exit will give us die maximum profit before we sec the reversal buy signal ban fhat buy signal bar
is usually used to go long but taking profits where we expect low probability of further progress is
our discipline Remember w e are constantly th inking — i s th is trade for the next 50 basis a 50-50
trade or an 80% prohahiliiv. We close out immediately when we gel a 50 50 trade. Also remember
we can always re-enter the trade if it keeps going and we will always consider having a sell stop at
the low of the day anytime we exit a short trade guessing about a reversal in trend.
As we enter the m'rj-day per iod we are thinking about the normal intra-day paltems for a down
day which ll is appears to be. In these situations we expect a rally phase anywhere from 1 to 2:30
PM Eastern Time so we are thinking about a strategy to exit our short and where to re-short. We
know we want to be slum by the close and possibly have a big break again from 3-4 PM. Our
chart, however, rs not rallying and is declining in a wedge and if whose flat bottom breaks, we will
see a big drop back to the lows. We also have some data now to calculate the possible low. The
major high seems to be clearly in with the opening bulge at @ 475.2*5. We now c Iculate our
expected Ciann square of nine chart support levels by subtracting root increments from this level.
The square root of 475.25 is 21.80 so we can subtract one eighth or .125 to get 21.675 and
square to get 469.80 as a target. A stronger level would be the Fibonacci increment of. 1459
(1.618 rose to the negative 4th power) or 21.80 minus. 1459 equals 21.654, and that squared is
468.90. If these are broken, the major .236 level and the quarter (-25) would give us 465 even
and 464.40. One of these should do for the current days operation. Especially, keep in mind the
next larger frame of reference. The final high was reached some two weeks prior at a level of
481.10 and the major .25, JK2, and .50 ratios equal 472.15,466.45, and 461.40. Any expected
major reversal will most likely combine common harmonics of each of these swings. Our next
chart shows the outcome.
121
Tliis chart shows the waterfall culmination of the day s dcterio ation. After such a bjg climax we
cannot rely too heavily on the normal day pattern of a small rally and then another big break into
the close. It is more likely to see a "whippy" tug of waT between the <wpcr bears and the bargain
hunters with several whipsaws. Strategy now must be to only trade rally spikes since a big break
always leaves a "lingering memory" and the market w'll be quick to piungc on any future sign of
weakness.
The arc drawn here *s drawn after the fact using the actual low for tf c center point. This is mere y
to confirm that the arc influence is indeed dead for the rest ot the day. If the arc had not gone
maximum vertical down, wc would expect another waterfall decline before day's end. Because it
is ewer, we can now expect a normal retracement rally of one third to one half the distance back
hut most likely a one-sixteenth root up from the low, or 468.20 square root equals 21.6J?6 plus
one sixteenth or .0625 equals 21.70 squared, equals 470.90 for the expected top. Note this is
almost exactly where the ml [y went. We would now swing sonic support arcs up from the low to
watch for when t e rally starts to fail again. The next chart shows the si ppo tare and the markets
extremely weak read ion to that support arc.
122
*75-Si,
474.20
473.
4Tfl.3B-
4t*.a
The Fact Thai The Imroedtete Rally l
Back From The Wfrterlall Did Not
Repair The Oarnagc (regain the price lever)
Means The Potential Lows Are FVobabty
lothfir Set Of A. B, C LegsTTiat Will
-nJI Again And ReiuH In Annmfer Wunge
it a Yet New Lows For he Move.
Center Ot Support Arc
/ Arc OeuW Have Quen Drawn
From 1st top But This Slope
Wto Be LC55 Ste^p And Mofe
Uoc Wtfi A "Scary" Recovery
A Creeping
Recovery Of
i«:z«
Tim or m*
Failure Here Shows Fjareme
Weakness And Another
dreafcWU Ge Needed
In this chart 1 have used a slight variation of the arc radius, measuring from tt e "obvious"
mid-point and the last important high prior to the waterfall. This complete circle will now
describe all the behavior from the final high to the final low, even if that low has not been
seen yet. If it has not, it will occur as the rising arc near 4 o'c ock reaches up to the maxin um
3 o'clock. We now see a pattern almost identical to our first one on the hourly chart which
was labeled A, B, C Our strategy is to short the next sizable break back under the arc that the
current price is climbing. Since this appears to be an A, D, C leg again we expect prices to
fall to yet new lows again before we will look to take profits. Keep in mind, however, that
this will be the third such breakdown and wc are pressing our luck to expect the market to
drop forever. Any double bottom or slightly lower or higher low from this point on could be
a good stop and reverse lung point for a more significant rally both in price and time duration.
We also are reminded of the bigger picture that projects a possible final low near 466,45
(483.10 -.382 sq. rt.). Our plunges so far have been ugly, but, until that (466,45) number is
decisively broken, we are still jist in a minor coi reel ion in a long term bull move. Things
could radically change, but for now we will take what the market and our arcs give us.
123
TIM * Hl«
fhe next day, we see anotheropening bulge high and waterfall pattern. Clearly the market is
beginning to act bearish but on a daily basis oversold. Note we hit a new low for the move but
regained the a d. This is a potential major buy signal crossing 466.45 and wc would take it. The
vast majority of big reversals go to a new low under a recent one and then reverse after the stops
have been cleaned out ITie chart below is the result of the projection above.
4M.S0*
4V7.S*-
ftf.3*
ur* or vi
124
Hie next day, we see a typical bullish day and a very strong bullish pattern. This is a classic
bullish chart And it is so basic and simple you would think no one would lose money trading
thai day. The problem of course is our emotional ism and rationality We think too much most
of he time and need "reasons" why something has to occur. The prior three days' action was
extremely bearish so now the entire trading community is aggressively short and wants to
stay short. Hecnuse of this we see a classic very bul ish pattern with no pullbacks and yet
evetyone in this kind o environment refuses to objectively look at the partem to see the
technical strength caused by all the shorts choking to death, It may on y last a day or so, but as
chart technicians wc do not care. We are only in this tor the money! If the trend ts up we
should note it.
Also note the obvious "measured moves" of each impulse up move. As Iraders we would measure
these movements each day and enter or exit trades when thes normal extremes are reached
Keep in mind we do this daily to fit that particular day, but we have also previously noted the
average fluctuation ranges for the past hree weeks on the hourly and daily charts also so we are
prepared for any surprising extremes. I lave often had conversations with traders who use three or
five minute moving average crossover lines to trade S&P's. What typically happens is several days
to weeks of great success and then a big wipeout when the extreme hits. You must know the
extremes seen over the past few months and be cautious about becoming trapped in a mechanical
125
system based on a very short term moving average which is c mly working off data from the
last couple of hours.
This next chart is just a beautiful example of a circular arc and how profitable a knowledge
of them can he when intra day trading. This arc is simply drawn from the opening high to he
mid-day low and swung up. This information would certain y have provided you with at
least two good trades of significance with very close slops and little risk.
tfcjh Arid Center
'Loi Arc
w,
U3.)»
Max
Vertical
T Low Broki
ArcGfDkfrn
Swlrn
Broken
*
»:»
It-IB
tins or bh-i
This next chart is the same tick chart hut with our axisoi ienlatif m technique and various angles.
Remember the lajor axis thrusts on any chart are very significant for determining the rue trend.
We can ake iny major up or down move a id draw a straight line from the high to the low to get
the true ax is orientation and then we apply o timing angles. The most basic angles would be the
126
45 and 90 degree major resistance lines. Aftei that, you could add 2 x l,4x 1, or 8 x I and
even 10 and 60 degrees, but most of the time a few basic ones are all we need.
I am sure much of this is new to many of you and you can easily become fascin-rted with the
aspect of exactly predicting each high and low. After having done that myself for sonic 23
years now and o ten getting the exact high or low within five r nnutes and 20 basis in price, 1
can tell you it is not worth the time to be so precise. As traders we are only interested in
making the easy money and avoiding risk. Getting the exact high and fnw can be done but
violates Ihe basic principle of taking on more risk. The odds of success get sma lerthe more
precise we get. In the final analysis, a few simple arcs, angles, time counts, and support and
resistance numbers will make all of you rich if you do not get tuo emotional y i ivolved.
r
127
Trading Stocks
Stock tr* ding analysis is not much different rotn intra day S&P Futures trading, but since the
average time horizon foi trading stocks can be 3 davs to 6 weeks or even six months in the case of
mutual funds, time analysis is weighed more heavily than just simple buy or sell technical signals.
That is to say,a daily reversal bar signal may not always be taken, depending on the long term
outlook for the issue. Hie complete bull cycle often lasts 3 to5 years and within the waves making
up that cycle, the counter trends occur every 9-10 months on average, and they last 90 days or so
before the main trend again esumes. Our first consideration js jhereforeJo see where the major_
high or low for the past twelve months has occurred and determine whether it is indeed a high or
low. Oni e that has been determined it is a simp e process to buy dips or sell rallies for 3 MA or 6
/2\vec..s at a time and use trendhncs and resistance numbers for guidance.
1 have chosen UAl as the example for This study since it is a goof trading stock. Often the higher
pricedsttKks 3Br.aV? fn.?Tlv day tradeisdue lothe f equent dollar fluctuations and these movers
u st ally respect the cprnmon principles of trend lines, support and resistance numbers, and time_
cycles^ln the olio wing d scussion, p ease fo low the explanatio is by referring to the chart. It
seems like a simple exercise and you may he tempted to skip it, but I urge you to ollow along to
see the reasoning behind the strategy.
The chart on the next page is a daily chart from 1991 to 1992. For demonstration purposes we
have o star! somewhere so we will just assume we want to sta t trading near the high in April, This
is an obvious choree because t ic high price is $161.50. A little numerology and decimal point
moving should quickly point out that this is the gulden ratio of 1.618 or 16 .80— a good place to
find an end to a movement! Reviewing the "information box1* in the upper left hand comer of the
graph, we sec that last year's low was approximately $H4„ so S160+ isa double and a good place
to sec a high. The actual high was due about a week before the reference point # I because that
was the period that was exactly 3.25 weeks up from the ust low and a signal reversal bar sell
signa had just been given three days before the final high. But, after seeing the $ 161.50 false
breakout price and then ano her reversal signal sell bar, we must n rw sell out and go short us'ng
12R
that high as <iur stop out poini. Our minimii n expectation i ow wiw Id be a typical .1.25 week down
cycle from the high, ticsi typical cycles of 3.25 and 6.5 weeks or aboiii 22.5 ami 45 days arc the
most tiequcnt trading cycles and the larget 6.5 week component is draw i on tl 1 c ch;irl siai t i n g w ith
\hc high and represen ed as "waves" with the low being the beginning and end of each cycle. Our
minimum pike targets are the square root decrements of 0f£_jl'gjl°lllfi!-5Q or .50=5149.
.618-$ 146, .75-5143, and 1 =$ I3Z
We also relieve he seasonal tendency for this slock is Tor highs and lows in April and October
since we are 3.5 years from the Ociober 9, 19H7, crash low and 18 no tlis Irorn the infamous
UAL collapse in October 1989 which led In a 200 point Dow Jones decline, t/onsequenily, we
are now short with a stop at $ 16_ .50 and we see 5 d.iys later a ra! ly hack ancjiipUfiat fails exactly
j,t the low of the high signal neversul bar, validating thai as ag[x>d signal. Six days later we again
see a lasJjittejiQpMor^pisHhe tow of the h jgh bar and that fai It e results in a swif 1110 plunge
tPJjhc week. VVeare now looking to the following week fora possible low sincr it will be 3-25
weeks from ihc top. Reference £o|nt#2 sho^s that low with a nice clean signal reversal buy jar
tkitalH^^iTidd^wjtha double bottom support area from ciglil weeks earlier. Recall novvjcover
and go long 11 singling newjowjisjiiir stop but will al waysu se alrnii ing rising stop al ong a 45
degreeangle comingup from any low we buy. That 45 degree angle defines the ha sic uptrend and
at a minimum should be our stop, iiring b is advance ,jx>t ajtingjc;_tlay^sjow js^rokenjwhtflimg.
a strong trend
129
^"Jjy.l^t" LI lU.U^T «*■**'[« (*Ct1t "*a H 91 I ftuiflltn tHOtU Jun ib- ti \ Ou*"'t" IX^B VH ^n 91 _i. CPS ^*L*.J_Ll! .
b» we expect resistance as we approach the low ranges for the week of the final top. Remembe
lhat on a weekly and monthly chart we now have a signal reversal bar too, anda ral ly back to the
felSf tljosejjars wjlj most likely result in a failure and confirm another sell signal. At point #3jve
hit resistance and generate a signaj reversal[seM bar lwo weeks 'iito the trend. Atjhjp \25 weej^
ttme mark we sec one final spike up failure and another swift decline sets in. We are now shorty
from the signal reversal price zone of @ $156. Coming down off of that we break the price low _
fro t.point#2_andno^wejiaye^longjcrmsellvalidaUonof[owerhighsnndlowerto ws_*pread__
over two months. It couk? yet be an A, f^C correction, but my ^}jyJ}}^S^!LJ^}t^LL^lh^ >£*
anojhertow would confirm a long term top ind a down trend foraHeast.six fn^ths^diiration lrotti_
the April highs. Atjpoint #4jvecover because it's 3.2^ weeks from thejast^gh aiul weget a signal
reversal bar coming after four days of holding the same price level ol'support/We cover andgo
long @ $138. Please lote the four day low at ihisjpJ.c^Mitdted_because jit _wa_s J .382 _
T^meruIo^ic^My^nd_tjiat fitjr^[tii th^jhipaM^fi. At point #5 we forma 3 _4da£tupatLlheexact _
50% retraccnicnr of the last swing down from $ 158 o $1_36 or @ $ 147 ind we break down. The
JlPJLl hiph at point #5 is only 5/8 weeks from the low, or 112 of the 3,25 week cyclt_ljii_s usual I y__
happens at the midpoint of a 6.5 week cycle down so we can expect the original _sc!Hrojni point #3
to last a till 16.5 weeks before we wil see anothci rally. ITiis low comes in as scheduled at point #6.__
jjtjjni #6 j also a double bottom that stops at the high of buy^signaTjH confirming it as a goodjup
jrend and there is also trend line breakout from, the jjasjjwojwcck^decljne^Qjvejiu^t^oJon^ __
again with a stojp at
130
,ln?_r^^?nt. (^.The rally is short lived, however, because ai pnini #7 we hit the ow of the
point U reversal sell bar and we go down. There is now a one week tug of war befween the
bulls andbears from #7 lo #K because rhe top it #7 does not exceed the low of the sell from
#5 and the low after #7 does not bieak under the ligh of the bi y signal har <d poinT #6. l'iimt ~
_#8,resolves this Jnr the bears and we return short once the high of point #6 is broken,
invalidating t_hn_t_signa_1 ami indicating a new low for the move just ahead. This s the gap
down and the penetration of the 200 da> i loving average which also validates the long teim
sell signal we saw at point #i hasedjun lejwccklv and monthly reversal sell bars. Point #9
is afeebfc attempt to close the down gap and r_e.gs.in #6 but another sel I is generate and we
slide mto the low just before point #10. Wc ;j_ejbqking for a tajor low hen__5ince It Is 3
cycles of a full 6.5 weeks from the all time high at poml I or 19.5 weeks Ajeeble rally
ensues tha reverses 3 days ale am we e ode i ito die low at point #11. Point # 11 .generates
Hie best looking laTly so farJoi it regains the lasr lop at #10 but cannot regain the 2nd one
back at #9 - which s ry >iea bear markel stair steps, fwo and a half weeks of sideways
trading results in a sell signal which declines to point #13 ant rests on the ligh of the point
#11 buy signal. I ong hefore lliis moment, however, we sho ild have been able tu so ve the_
puzzle ant know with almost absolute certainty the day and p ice of the inal low and the
start of the new bull leg up. This is point #14,1 low do we know tha the low on that date, af
that particulai price, is it? There are innumerable clues.
131
First the top was 161 .5 and the low day indicated at #14 was 162 trading bars later lor a major
Gann square based on the high. Next the price of the low was 116.5 ant if ^c use numerology
here we see that 1J 6.5 is a transpos'tion of the digits in 161.5! You may not want to believe in this
but 1 have seen it too many times not to lake notice* Also note the top of 161.5 divided by the
Fibonacci ratio 1.382 equals 116.85 for Ihe low. Also note 161.5 minus 45 equals \ 6,5, Also
note that on the Gann Square of Nine chart a high of 162 would have 115 aslhc low, one full cycle
atound the chart. The date of the low is near a natural si ware (25) in months from the October
9R9 low, and it is R Fibonacci months from the top. It is also 5 Fibonacci cycles of 6.5 weeks
exactly from hi pi to low. Additionally 1 would note that the price on the low day finally closed a
gdple t open from January when the last leg up began. There are many other reasons for ihe final
low and date to coine'de but you get the point.
On the next ext ibit we look at the same decline but from the perspective of angles and arcs. You
can instantly sec why all the highs and lows came out where and when they did on this chart! livery
time an angle was hit, wc got a rally until the angle intersected the are. These rerriptice angles will
make you rich tTpjiyjimcs,gyer if you just look fonheml If you spend some time looking at tins
chart and studying tlw e^icUiimsjitcacji and every anRk^you will finally grasp the rcalizatto l that
newsrtetis<^d earnings have absolutely nothjng to do with investing! All human behavior is emotional
132
and cyclic in origin, What this chart really shows is die hopelessness of the human condition for the
masses. They arc const; ly deluded into thinking some news item or event is*-1 tfmglfw stock
fluctuation. One look at this chart will tell yon that is impossible. All J have done here 's I ft you
above the crowd, for pe haps a mote divine perspective.
I could have also shown a nice chait with the angles from the top of one point per week, per
month, etc., and it would give the same results, lliis one s lows them a little more elegantly.
All o these methodologies work together and you should try several to find strong correlations
before you i west your money. At the end and beginning of all great cycles, all numbmajigMime_
periods come together. Only a geometr c and eye lie approach will identify them for you. Vow
today to throw away your newspapers and stock brokerage reports. You only need charts1
133
Advanced Techniques
Basic principles can he elaborated upon to acquire an infinite amount of time and price data with
w rich to make forecasts. T le naturai fo ices operati lg in the speculative markets through the
mechanism of human emotions can be defined with very good precision. Just as with mathematics,
we can apply irinciples and axoms to develop theories and hypotheses, that will shed light on
possible outcomes to our slock tnaikct riddle. Starting with the basics of trend and impulscdircction,
we then use measured move vectors to get rough appi ox [nations or eventt al exhaustion and
price targets. Circular arcs more closely define our measured move limits and expansion of other
geometric shapes like circles, squares and triangles will give us the rest. In this section we wi 1
examine some of the basic expansion techniques todefine and identify points for orecasting long
wave sequences.
Our basic premise of the natura cyclic movement of human emotions through the markets is
analogous to the tides al the beach. In an advancing market (Bull) each thrust or impulse wave
penetrates to higher and higher levels just tike waves at the beach. Our higher bottoms" definition
describes the low- point of each wave swell pr"or to the ncx surge. Once the high tide $ reached,
the wavesdimmish or recede (Hear) hut still ebb and flow in a cyclic ashion and out lower highs
and lower lows* pattern descr ibes this movement also. What we need as an additional model is
something that will project he size and amplitude of the possible tide thrusts and ebbs w'thout
having measured all the moves ur having a table if high t'des. fhere are a number of ways to do
tins hut the most natural way, and the logical corollary to our geometric analysis of time and price,
is to expand ourgeumetre structures by known natural laws of physics-
There arc basically two types of cycles operating in the markets and these are usually referred to
as sialic and dy namic. Sialic cycles are just fixed length cycles that repeat over and over such as
every 00 hours, or every 30 days. Dynam c cycles are growth cycles where each cyclic return is
elongated in time. The most well known dynamic series is the Fibonacci series ol each number
added to its neighbor to get a sequence like 1.2,3,5.8, 13,21,34,55,89, etc. Another would
be the natural square series of 4,9,16,25,36,49,64,81, ete. When working in geometry we find
another dynamic expansion cycle which equates to the roots ol the geomeiric object. Square roots
have been njejitjonetj as the basis of tjeCmmi St^ire of Nine Chart, but niost common expansions^
0
134
used in the market can be jiniitedjojhe square root of 2. X ^fKi^.JJicse.arelhc most JJttportariL _ ^
Flie rest work, but a knowledge of these is essential.
The best and cjisjej;R wayjto us^hese^^
3ns^fro2TiOTej;^>iir^!iajt.T]^way_^ij will sccall thejtey support and Resistance numbeis as_
wel as thctrend I ines and mig!csj.ti£if po rit to culminations. Hre jJjhcr way h to simply take thc_
naturajjaliossuch asj A\ 4 (sguare root of 2), ]J3{3), an^Z236 (5), ind multiply these ratios
J2\t alxive.liiait show? an i >jtia] [rnpu|se_wave thai is "boxed in" by drawinga>quarcjup_und the _
low and first high. That first box s our primary expansion seed. Knowing nePytliafiOjian Theorem
states that in a right triangle the diagonal squared is equal tothe snmof ^^(jiiarcd^des. we _
therefore know thatthe diagonal pf this first square of "1" unit sides wi 1 be he square rpotof 2.
If wc now swing the diagonal down tothe hori/wnta and elongate thejiase of our iisctan^Te to this
Jength of the_s(juare rupt_of 2 but kecpjngjhe^ height constant at 1^ we canjipw seejhaMht: next _
diagonal of this^box js_lh_e -sxjuare_ruot of three, or_ _squarcd_plu.s square root of 2_.squarcdl2J is__
equal to 3 so the .diagonal ^^st_bj:Jhe s^are rot^ofj'lree- Wc tl15.Ji^'!l^j!2!^IlIf.,(^^.^y —
swinging down each arc mseqtience, and go ng back up to (le top and swinging dqwiHhe tiejtt._
fcycil arc_will now define the squares oj^ whole nuttibers. Numerology can be applied tothe number
of the arc swingjto *?c iL°lie is more important than the other. In this drawing I have emphasized
the ruotjjf 5 since I hat is a Fibonacci number and I be basis of ihe golden ratio. *S winging thrit
complete arc_of the rout of 5 up, we see it deseri bes the price pattern resistance aodj^retjie ajc_
135
tops htirizt jntallyj it defines tjic eventual projected top for die move! There are.niariy other $ubllelies_
JE?.It!I>UccJinic|iic_]hiir I cannot show you everything. Fsxpei -iment! Keep in mind tha circles d awn
around high and lows can also be expanded by inci easing the tadius and djametcr.
The next technkjugjsan offshoot to the 45 degiee tmiing 1 ne ana]y*rs. Sjnce a 45 degree i /agonal _
equally divides time andpr'ce, it stands tpreasorr that if_adm"ng nnglc is placed at a major higher
low and extended, we sliould be able to see ALL ttimsjhat ate harmonically related to thai origin
price and time. In this chart have drawn in angle upwardsand put "dots" on the angle Ijtie whrre^
harmonics (fract'ons) of the low price intersect that particular p_iice on die graph For example the
low was 23 5/8 so 1.25 times that price is 29.53 and at that price we place a dot The other
expansions are noted along the timing line. The' iiportant thing ^o note is dial at the point of
intersection of the timing angle and a strong price harmonic (50%, 00%, JS2, .618, etc.) we see
a cyclic turn in direction of the price andjhat area also defines future support or res'stance levels.
Please note the little "anowfT going both to the right and down lo poi it out this time cycle turns
and the price level areas. Obviously this technique can be expanded to include other angles. ITiis
ted iiiqnc is one of the onlyones that wjl work ona chart that is "flat" or having few fluctuations,
or not enough data to d aw arcs or other trcndlines. In those cases this is quile handy.
136
Ttlj r np.xt tpf.Vmirjiip shyipl v demonstrates the fact thai circu lar arcs drawn trom e\cr\ rriaior sw'ne
wil| create the major high and low resistance price areas to watch for when the stock reaches that _
pjjee level at a later date. I fere we swing an arc from the low to the previous high to find out just
how highpur target will he if that first top is ever exceeded, hi th'scase the final high actuall}
"overshot" the arc target (which is rare) but came dose enough to warn us of an impe idingdrop.
Rut, riff[e that The 4.S degree timing line from the low intersected the arc target price level almost at
tlippxart higfr, That would give us added conrmnatbn that the major time cycle had run out arid we
would look for to wer .prices as soon as we saw a gcxxltcchnical sell signal to confirm the projection.
N^t, sr|f^wn. hut just as important (especially in fiear Ma ketsj, is the case of drawing an arc from
thejiigh dywTLt^^ us the next breakdown bottoi linp target. On this chart _
you w uld dxaw il froraIhchi£hsQ9.3/8 in September down thrqu&h the low in June nearfi3 3/4 ..
Eind down under that final.hi^h. That approximate level would be_S8 3/4 for the correction low.
Please practice this jechnique.with yourchartsas it ts very .simple and always wofkjj
^
Our next exhibit requires a little more thinking and logical reasoning about the implications of
circular arcs. Since we know that arcs drawn from Tiajor swings will exhjbttjprice reversals at their
endSi we can tl^omejhaj_orice_we deterjnine the radius of an arc .(horizontal mcasi remerit), we
137
will be able to section off that radius into fractions and prop^^on^and see many »iinqrbut
valuable trend changes prior to the big change at the arc's termination point tn the drawing below,
I havejwung an obvious arc from the first major high to the previous low and then around and up
U3the right. (rhis is the same as the bear technique just explainedjjut rio^ shown. [What we want
to measure 's the distance from the high to the 3 o'clock point where the arc goes maximum__
vertical and ends On this chart I have divided the radius at the .382, ,50, .618, and 7 ^DJe.Tits.___
These are common harmonics but you could useot iers. Please note the price^act[on directjv^_
below each of^hese segmenjj. Thjsjechmque coul^d_g|ve you numerous trades depending on the
length of the arc. This technique is particularly deadly on intra-day hourly charts! Please understand
that this chart is compjetely shows the final results for yr>u to compare, but the beauty of Jhe_ -
method is that you can identify all the fi lure turns whi le you arc stil f at the first top point and have
nojmp^cdgpjqfjm)! future price possibilities. The im llications of thisjdea are staggering and 1 _
cannot afford to say more, but you could experiment!
138
lTie next chart is the foundation of all analysis. I will keep i simple so you will just see the basics
and not become gojifusgclwUh 'he ejaborcite details that are spawned from this structure. Basically,
¥£ ^HSi^i0.^c?i^? ^rorn A to B, and one from B to A. We connect lines between A and B and
between C and D. We now have four primary fundamental chords from this pattern. These are
lengths; A-B A to mid-point B, C to 13, and C to mid-point D. Note that these arise from a major
swing A I). What we have are the theoretically perfect measured moves forthis particular
ytock/y/c need onVy_one swing observation to get them all. Note that segment length C to D is
exactly equal to the distance A to po'nt 2. This was known before that length was ever seen!
Measure it to prove it to yourself. Also note the up impulse just before number I and culminating
at 1. That length is mid-point A B. Much more could he said, but (his is a very advanced technique
and reserved for special students,
The above techniques are only a few of (he ones I find useful, but they should give you enough
ideas to follow up this analysis and find more uses of your own. n the final analysis, chart reading
i.v (i science, but (his science ays good wages!
139
Appendix A Examples
The chart at the right is the
basic pattern of an uptrend.
Note the "big bar" impulse
thrusts showing emotional
buying. After each impulse the
ensuing correction drifts
sideways to end at a higher
bolto n just before the next
impulse. Volatility increases as
the size of the trading bars
increase and the stock moves
up in price Trend!ine angles
connecting tlie lows increase in
steepness and start to form a
circular arc.
If you have a computer, you
can use three or five day
moving ivcragcs of the LOW
to get a quick fee for the trend.
rf - \tt ttjm «rt/*ks*i t» oi^rrf^t
KH
3L.I0
Union C.rWdc Oiltjr Whh >0*v
JkvzngF Of L_*w 8«f
TMc Typ« Of ftvenge *1 I Or ! Dwyt
' Of TNe linr Ti'A'CiaiJWiy T* Ste
TVR»ITn (.Fvjiniiln Rmtami
Bui Trrn<. The Mntaf Avtri|E Lire
Wll tWtiy Ever Sncik• Ptlw LvwOi
Thc*¥r:r*st rtWis rWsri fjm T>c
trttoe Hlffh* ThM An Vtalfcfr Bid
Lirrl evi n L Fat DelEnnl nl gTHlTrrnd
140
These averages of the
lows can point out trends
more objecti vely without
as muuh contusion.
n.cuL
7X.H
«.»
2i-et
Ktcn
■ L»
[IV
inw mxaa^j I,. Bijviyt*
3wm Unlort Caft-lrfc Dllfy
VVKhaul Prim To Show Clear
Upfrrnd The Average Of The
Law* Hrvtil*
—E=T
Tic-
This chart of Alcoa
follows a three year
sideways pattern. N >te
lie two big impulse
thrusts that gave early
warning be ore any
discern ble trend
developed. After trie last
bottom, see how a tight
"creep ng" pattern
developed showing
nervousness, but this
held a very angula
paralle channel, 'his
type of pattern will
usually double or triple
he base price within a
year or so.
,**.»
HM - Tren lUtH-TJ t«» OIJJT^J*
Eirfy Breakout F*«rn
Early Import
Wavea That
Ait Hebucd
is
Wen Qc&ftrd Parallel
Channel -Ci ft ping
Uptrend
141
This example is the
classic Bull Trend.
Although very advanced
in terms of the number uf
stair steps jt is still bul lish
until at least one step is
broken. Fven then we
would know that, "You
can break one step back
but not wo/' Until we
break two, the trend
would generally be
considered up.
Th*s is an obvious
example of a foldback
pattern. Once you see
the beginnings of a ve ry
symmetrica fa Id hack
you can trade unfl you
come to each potential
foldback point. Usually if
the attern is going to fail,
it w' 11 do so only at the
foldback points ami not
in (he middle of the
pattern. For th is reason,
"luri£ legs'" are ideal fo
trad'ng because of the
length of time before a
change can occur.
Foldback
142
Here we see a breakout
from a base starting with
a I gap impulse wave.
Gaps are often closed as
tliis first one was but the
second one in succession
shows tremendous
strength and will not
likely be closed for
weeks lo yeais. Volume
is not shown on this chart
but tins is the type of
pattern you would want
to see huge I dvancing
volume to confirm a new
bull move with
institutional sponsorship.
SIM
This chart of CPQ shows
one of the most difficult
patterns to trade — a
simple uptrend! Traders
Eire always quick lo look
for tops and "extended"
patterns. If you can
identify this as a "fifth"
wave from prior monthly
charts you can make a
multiple estimate of leg
one or three o
approximate the upside.
The best approach is to
look or TIMF
corrections such as three
days or five days. When
you see a larger time
correction than the norm*
the end could be near.
CW -
fn» nUVJfcj-TJ to Ol^3»,'V*
Major Bull Trend
/;
i
"TwoE[(| Impul
Start Run
Welt Defined
Trend
rena ii
V*'
/
j.ggcil TlfflE
Perlsd Carrecilnn
It Hflrizrrnfil
Alc<= Uirvitncnt
d MijcX Swing Lcnn
Broken
And Time Periods Limited Tt
3b! Dsyi.
-KS"
"53"
143
Big winners always show
big momentum and most
double within six months
of a fundamental turn
around.' liese situations
usually go up 3 to 6 times
their low prices. Volume
is also necessary with
these pattern s 1 o c on fi mi
"nstitutional sponsorship,
without which no big
advance is ever possible.
ri-n»» (H/lt/T3 tE> Oj_^3*^*<
Hlg percent Urn/era Arc Uvw/t Kry
LEidcn FarTtis HcXtVeiM
I
fcfc
\A^^\.
When Thrynau4bl'
In Three Won
Ih^y (JaubJc Again!
Tine CoTTcdlon
Eldcw«y» Price
■ rtully No
Flttratemrnl Correction
~sr
Is"
Tl is is anothe big
Tnomennim play, but also
note the possible miiror
imagc foldback forming
around the 1 st top spike.
If the low in July and
August was the bottom
ofamanyniontl decline,
then the left foldback
going towards June,
May. April, etc...
confirms a many month
advance that the initial
impulses project.
p«po
lAW
— fl
rrnw Q+SLlSTl to GUMjW
Biafc Momentum Principle"
•VflicnThEyDDulilt In TTirtr Months
Thty Um»lrY Deufclc Aj*Jn In The
Ncmt Six Uantfiir
I it Cnii-blr
Xhu
Big Ciln Enrly
WnfllOO Of -m
U*|DfAirvMncb[p
Ji.liH AhEld J
-\jfVt,
ints pnuhie
V^ -^
"V
w
rufi
TuT
T2
~W
44
Here we have an
exhaustion downside
climax during the June to
July per'od. Even ihough
the low was made at that
time and a "creep' ng"
advance started, the
basing period required
lad to be commensurate
with the size of the break.
If you measure the June
high spike down to the
July low and swing that
sideways from July, you
will see the base was
equal to the decline and
the uptrend could finally
begin in earnest.
?i.tx
!*,»
Lh»
UiwTiiiidc
£ip IlidLcMtinQ
Fin. LUrt* Pa •itlhli
? Uuttlp t HTgfitr £t»lf Steps
n*j
-jst
ij-
*fcH
T5T
|or StilH
tn Angle
Slcepneia
Tf
This is a typical triple
bottom, reverse heal
and shoulders formation.
The key is the secondary
decline after the first
impulse a following the
lowest low. That decline
was only half the first and
it ended ar the sgnal
reversal bar buy point
confirming that as a
legitimate buy signal. Not
shown on the drawing is
a beautiful arc swung
from the low at 2 up
through the prior high
and then down where it
hits bottom at point 3 to
time the up move.
frm tXJl*riJ tp OI^Ml
<7.W
(moo
"Triple Hrttdmi"
hevETie Head t Skeulde™
Tremcntfciia
SteepnEEE
Ol Advance
Dig Wove
1 5
This chart of Tandy is
typical of early impulse
moves and usually
creates an almosphe e
of fear of heights. Most
traders want to short
such a big nin up. but
these rarely decline, or
at lease take several
weeks to mont is
before a reasonable
short is indicated.
Strategy should
concentrate on
calcu lating
rerracements' areas to
buy into dips for the
next upward impulse
wave.
I lere 1 have labeled a
5 wave sequence to
show that the usual
meaning of five waves
is completion of the
current trend. After 5
waves of correction, a
new impu se wave
starts after the ^ wave
low slops at the prior
signal reversal bar buy
point. Note the first
small top in ecember
after the 5th wave low.
At the time almost
everyone was lert itied
will get, and you must
if SO
frm. imlt.'W to *t\Sa*S+*
ttter A Ml [Of Run W*»l I finks Like ATtp Never la
Unit Malar Mnvr j AciuH
In Ulnar n«rjic*m«iitt A*i<3
the 2di Impulie SVrvr
StirUVVbtftTTtt Hex)
GromctHeAjifllE Up rrjm
T>,t LuwIiHiL
Frrsl few PfDbtl
UsuilSy _^-.
Oeflnc tvenlSw
Low Arc i
tr.-to
JrMW
mot
M
W/lilAjiSle
n»j Jiiv rJT
^a
m^aijti3 to pl/ac.f^M
X*LI»
»?-M
rtl»
V*[ut Lin* Inrfr*
■Sliming SWivt Dedlnc To
$ui rl Kuw Pilmi ry U pur nd
Prim »ny Uptrend
Resumes
IW-rfl
V I
I
Possible
'last Lr<f"
Sinie Advinc*
Com** Aftti
FuIISWbv
Decline
Welt SAWivi Lvw
Al I nil La' Elgnil Revefs*! ( «i
Suiting Point Lrr«f
Slgr.l Rrvcfjil Sir
UrvcE Buy Sign pi
After 5 Cleir Waver;
VrT
7-^
of a break, but there is losuch thing as4 tops! Waves J ,3,5 are all vou
be ready to buy srf tei the next.
146
Here we sec the early
signs of a reversal in
trend. A last impulse
wave up with gaps is
completely c ra \e (/with
big bar downward
impulses. A 50%
retracement is then
quickly erased with more
big bar liquidations. At
this po'nt we would
expect at east 6 weeks
to three months of price
dec ine just ahead.
bcv - rm or ^»j to nj^jayg*
Fjdinuitifin
Tap Willi
Gepa
Ptfmary
Downtrend
'Vlff' Bir Dcdlnra Shorn
Imjurlthr: Ni&its
1*
5tieNcwRilHe*WHfi
Lows And L hwk Topt
I h 11 bnnne
yt ''il'''' '|T'
¥ WA
Y
TTT
tct
This pattern is a typical
"'busted chart"' or one
hat has a sudden break
of large magnitude. The
momentum of such a
break wiJl last months.
Never bottom fish in
such patterns! Expect the
basing pattern to last as
long sideways as the
downward price break
vector. Busted patterns
show a change n
nstitutional thinking and
can completely reverse
t e outlook for a stock
for a long time to come
30.09
It 00
mjl
UBS
IMS
lo.tr.
ilh
[-',»
ii«
■ Led
T w CH^.lfcj'9J -tn PL.Tt »«
tx*mpi]cO<ACli-»i1 TTial Cfiats Utc Ft hUghiTuriiUp Bui Hurry Is
Not C.rnpEctf. Bowl Wont jr<irn Up Far Support For Miry Wrrlri
IV'
^
V
U*|flr Rcitilancf j£nnc
End Of Bfj Q«r I* RnlaUncc
FMif L*w Could
Eitamc Future Tap
HNrt Rci^ncd
On Current riUy
T3-
147
«^ec
1LTH
KLftO
frnn tH^JAj^W In fl l/H/W
Big'VPungrBThai Start a Recover Wtth A
"Creeping* AJvancr Nearly AJway* Rciumc
Tlic Wajif Uptrend And Have Com pic tt nccovcrkl
1
IPntslbl* iilwrat Image
FaldbadcPtuvt
"EnlBlilUFe-'
UfiwiTFrtetl
Movement
taHOTPDwcrhi
They Indicate A
tnaj Move Coming
ro Am End
This is a key chart to
study. It shows the
typical breakdown
pattern often seen
culminating n longbai
"crashes." It is the
"creeping" uptrend
after the decline which
should be noted. The
more "wiggles" in that
pattern, the more li ely
a complete recovery
will be seen. In the vxsf
majority of times when
a complete recovery
pattern is seen, the
subsequent advance
will go twice the
distance from the low to the high. Or, as much as the price goes below the old high, it wi II subsequently
go that much above the old high!
'■Small Wlflfllti"Th»t
Retrace A Straight Unc
0*dine ALWAYS Mean
A Cofnplrtf Recovery
And Nm High a
n*j
"T5T
"XT
ruv
"KT
148
SECRET OF FRACTIONAL HARMONIC TRKNDUNES
(( \ir n's .secret ttfivhy Time and Price are the same thing/)
This cliEirt clearly demonstrates beftc than words t1>e_ helplessness of the human condition and why
peopfc lose m the markets—Reality is completely different from perceptions — i.e., news
items, hrokerage reco miiendahons, etc. have no bearing on stock price movement.
See how the top nea $100 spins out suppatt and resistance angles at 1/8 increments. The
intersections of these angles (down and up) give rise toall revc si Is in the price pattern and cannot
possibly be related to random news orreconimen tat ions.
Hu nan beings are controlled by mathemaiica cyclic emotional behavior—not
rational choices!
_. s
"i^y>v~il:^LE.jri«»r clgtr^ l«in H.W ' t>l -Jill I
t Ml Thl!/&t|nu|i mi■ i «H4ha it h«t m^^II *
it bw4 i
I'tllWl'll
- Ill
* 3M JSO -ni / ?.gl ir»ll rr VM **~* H K<i «
~i .".C I l!i/ti',l[ I0i »■■ •[ V* V.I- 0 I ti •.)■ l|l|il'
149
Dow 2503
As of today's date, the market has still not exceeded my resistance number of
2520 mentioned in the last report. If we exceed i I in the next ew days, we wil I
probably go to 2580 for the top, otherwise the correction w 11 start when we
h eak 2480 and take us down to perhaps 2371,1 e gravity center and pivot of
this year s move. Hie correction should lake three weeks tocomplete. Should
we start the correction from the higher level the low will be 2442. Please
remember that if we are in a truly gigantic up move(2R00to ^200), we may not
see a correction at all. So do not ju ip I he gun unl ss we break at least 40
Dow points from any extreme high price reached.
I ""mm a cycle's pei s pec t i ve. [ t:ai now gj ve y ou some valu able^ in format ion as
to the most probable outcome for the rest of the year. First If we get into the
second week of July AND we gel to or are above 2500, lb odds
overwhelimnglyfavor the FINAL l'(JP bcina maifj^flu^iw* ^ L '9S9. Qi
»;e t m ApHth a price of at least 2800, Second, a 4gsh like 19g^ill agajn-
take place in October and not bottom until the seconcTwTPft tJf November
Third, another important top and the last placeJo^jeLcwiiinbeforelhe massive
1 iqu idation begins will be January 1990. Thiftopin Januaifcou Id be a double
top all the way back to the hiahs.
Can yo*J honestly say JmJ
have ever seen iuth An ictural*
published Cycle pnediiljcm? Four
consccutJ vc predJtliciu thai were 100%
correct widmaifc six month* ahead
D*i= of letter
■^ i^V '■' >■?*■ ' ''' 1 , 'H-' ■ *■"-■■•'•• of lime
_^ ■ b l ,:wtrmirngmMm * _ ■ t .
Oitobcr Crash UV.t U7 Lafl Top
Cyclic Top
150
<u
1.
,<5
■*<
w
<u
■~.
-*-.
■o
-a
tj
a
*M
""I
1-
<\>
OJ
it
u
X
-
r
-**H
^
n
■—i
Lh
£
^>
l-r
"3
'J
*-/
i»
C
■u
Pi
r*%
■~\
3i
^
,
.r
!L)
k-i
rn
^
"3
Sj
■H
•n
in
■—<
!U
-)
^1
Jl
oc
Zi
h
u
,o
.->
-H
«
CL,
■H
« O
M C
IS
*«
«!i!»
2
HJiKBrBBiSLa
Copyright 1S94 Slock Cjdes Forecast. Tills publkalion nihy not be repnfduced for any purpose with nut
the written permission of (he publisher - Michael S. Jenkins.
151
S&P Futures Daily Tick Chan
41,9-45
*&,
+bi.j*-
443.5»
h;»j
ie=2B
1Z:ZW
Tim of (mh
1
152