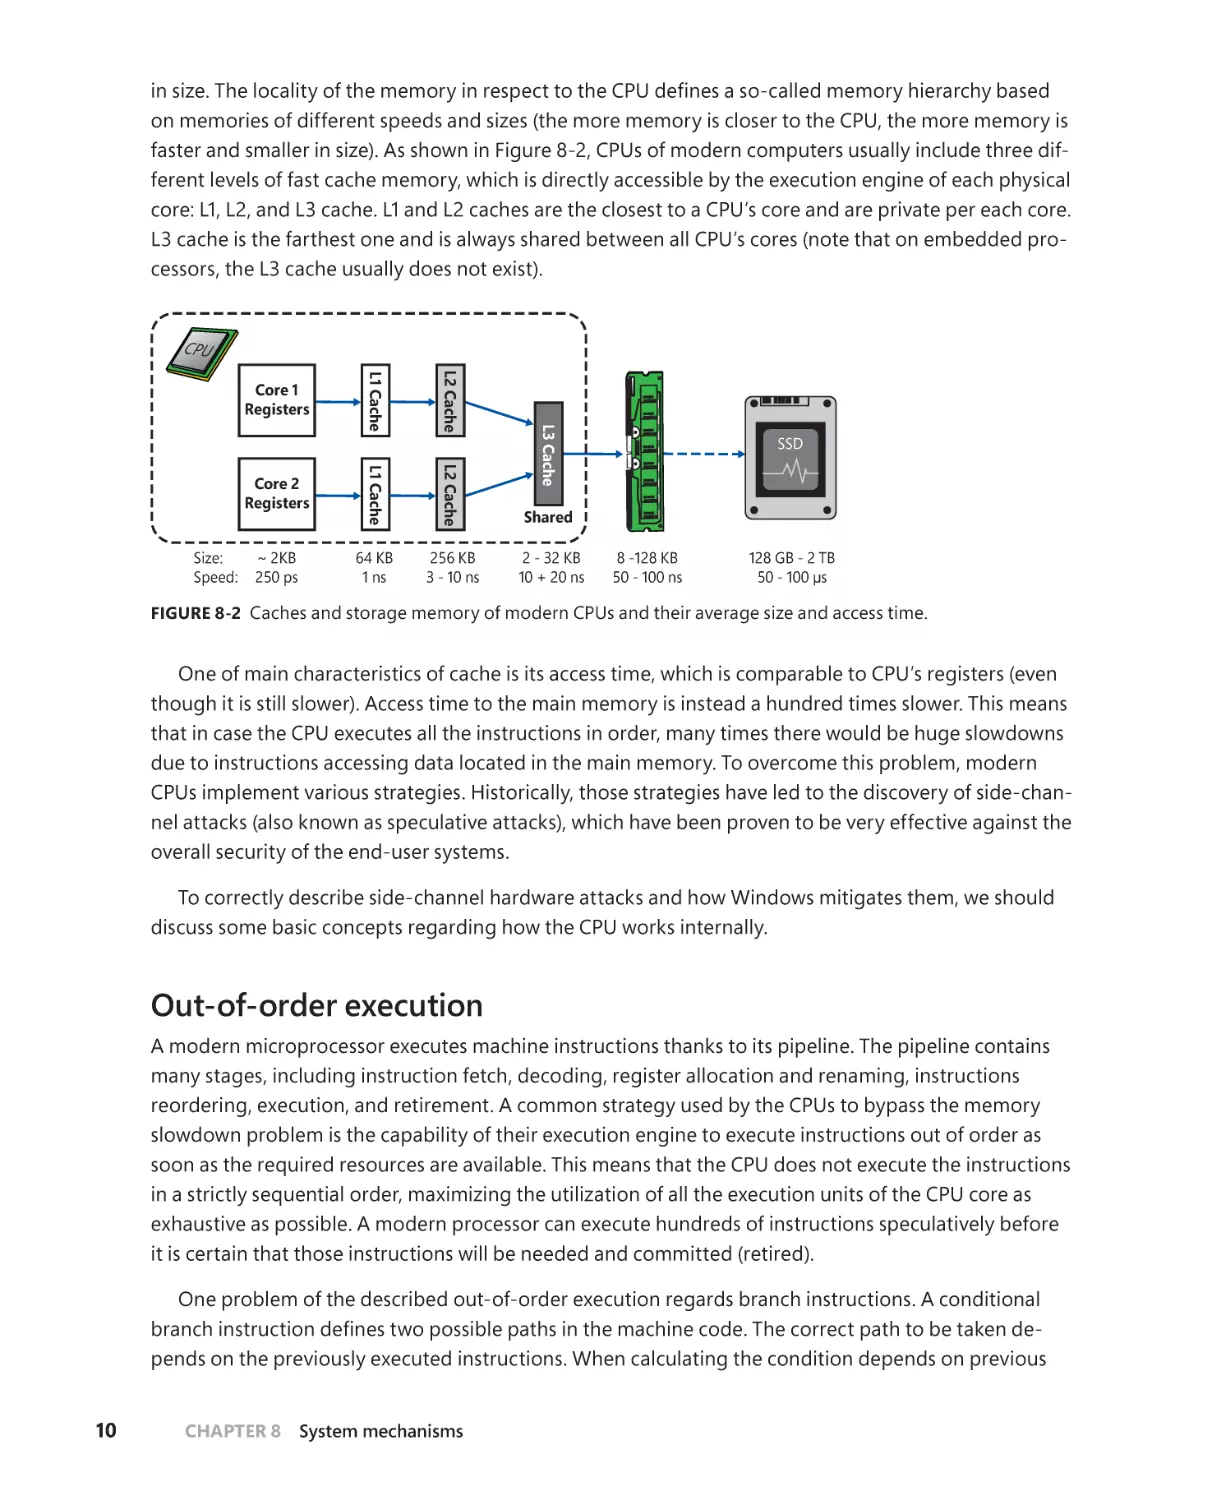
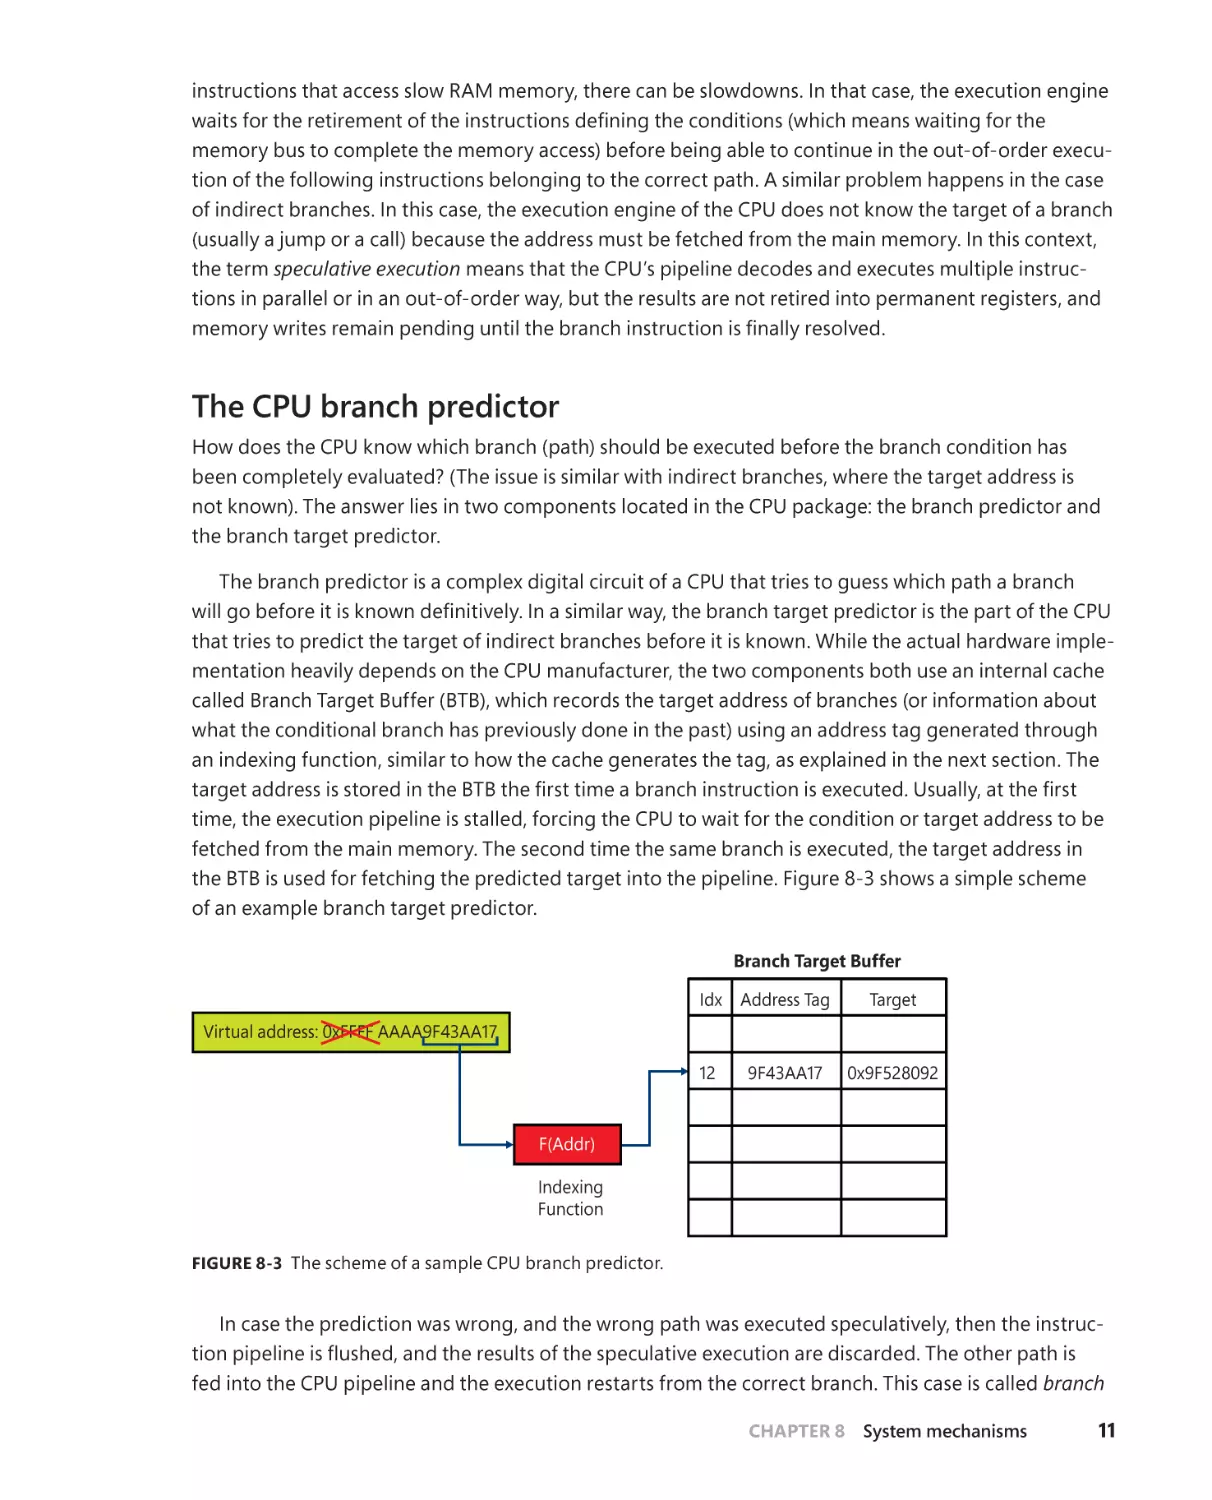
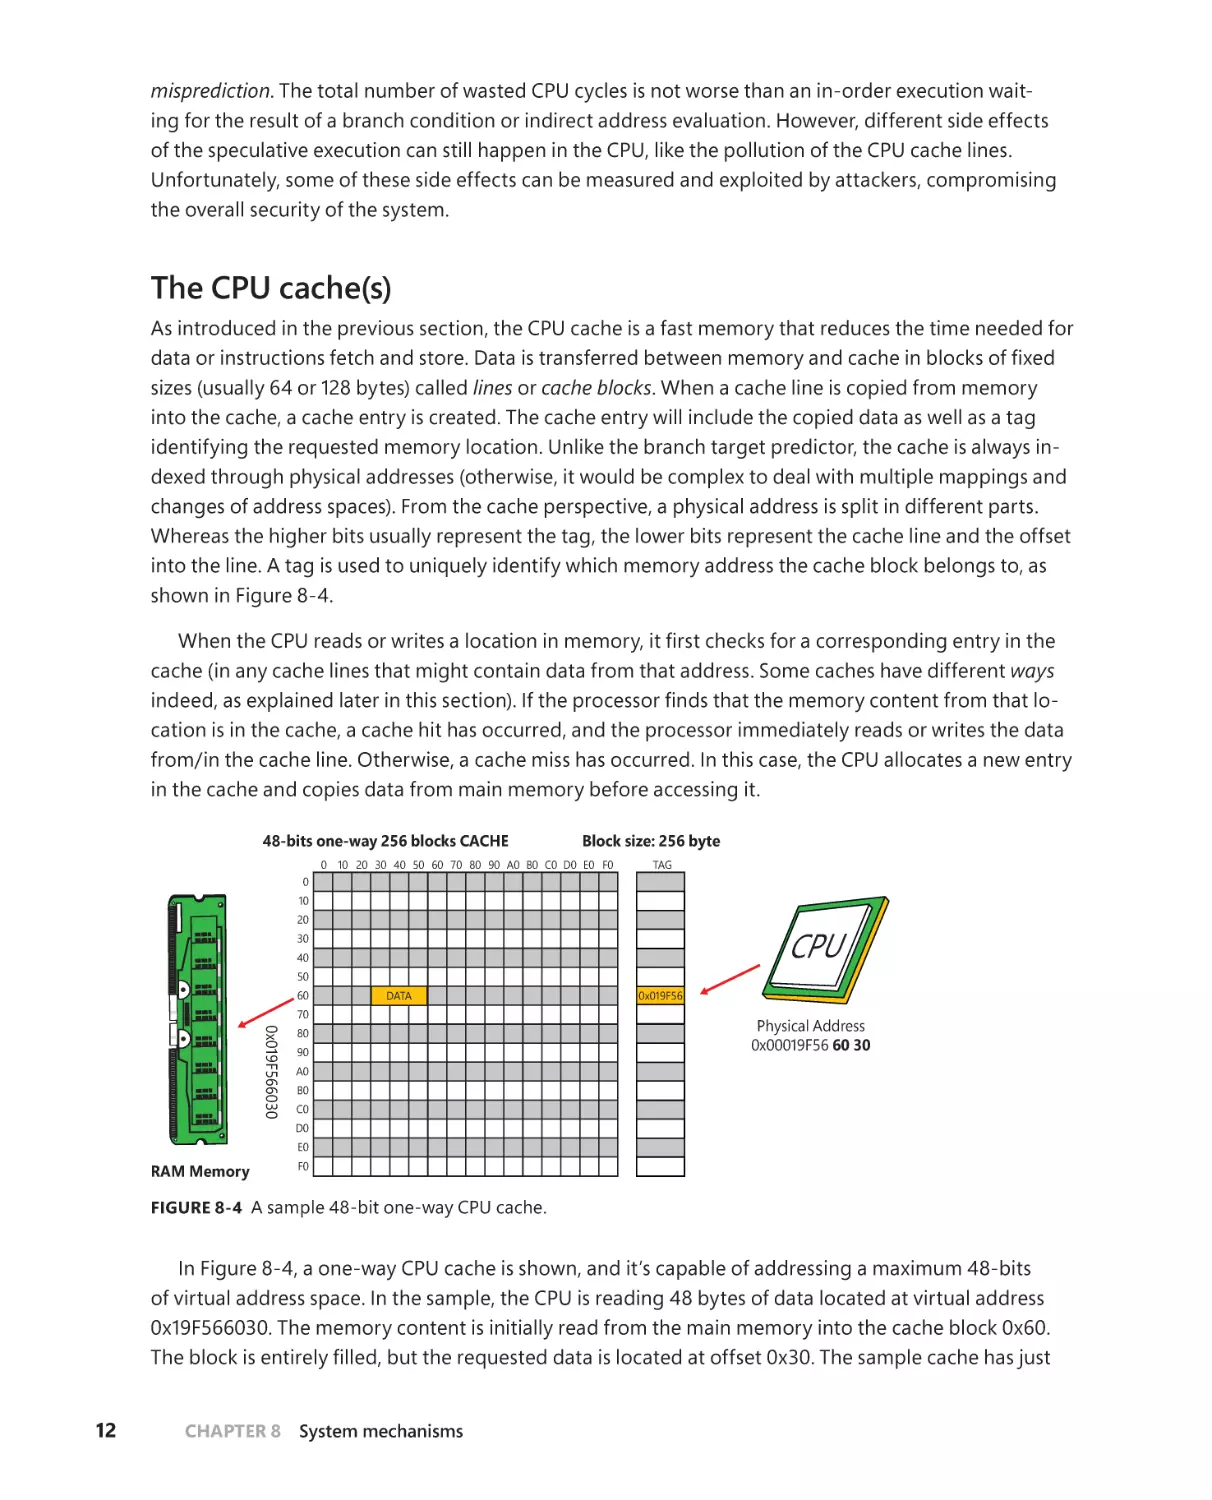
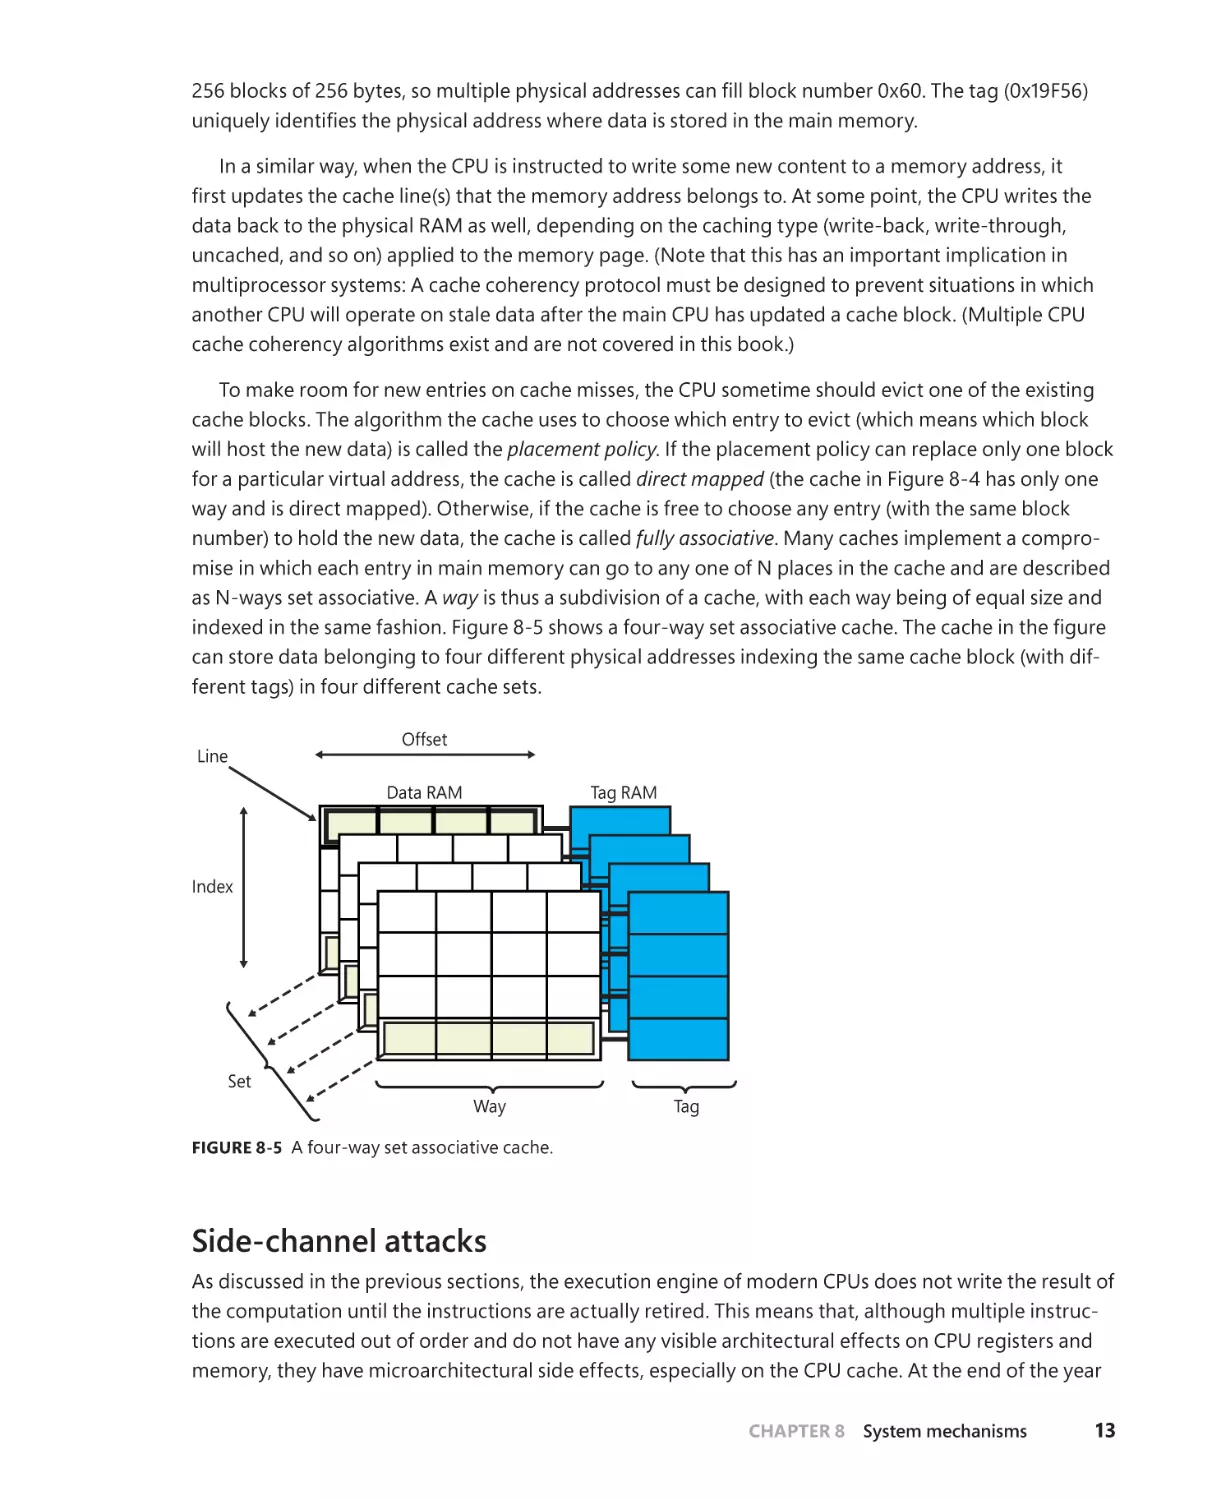
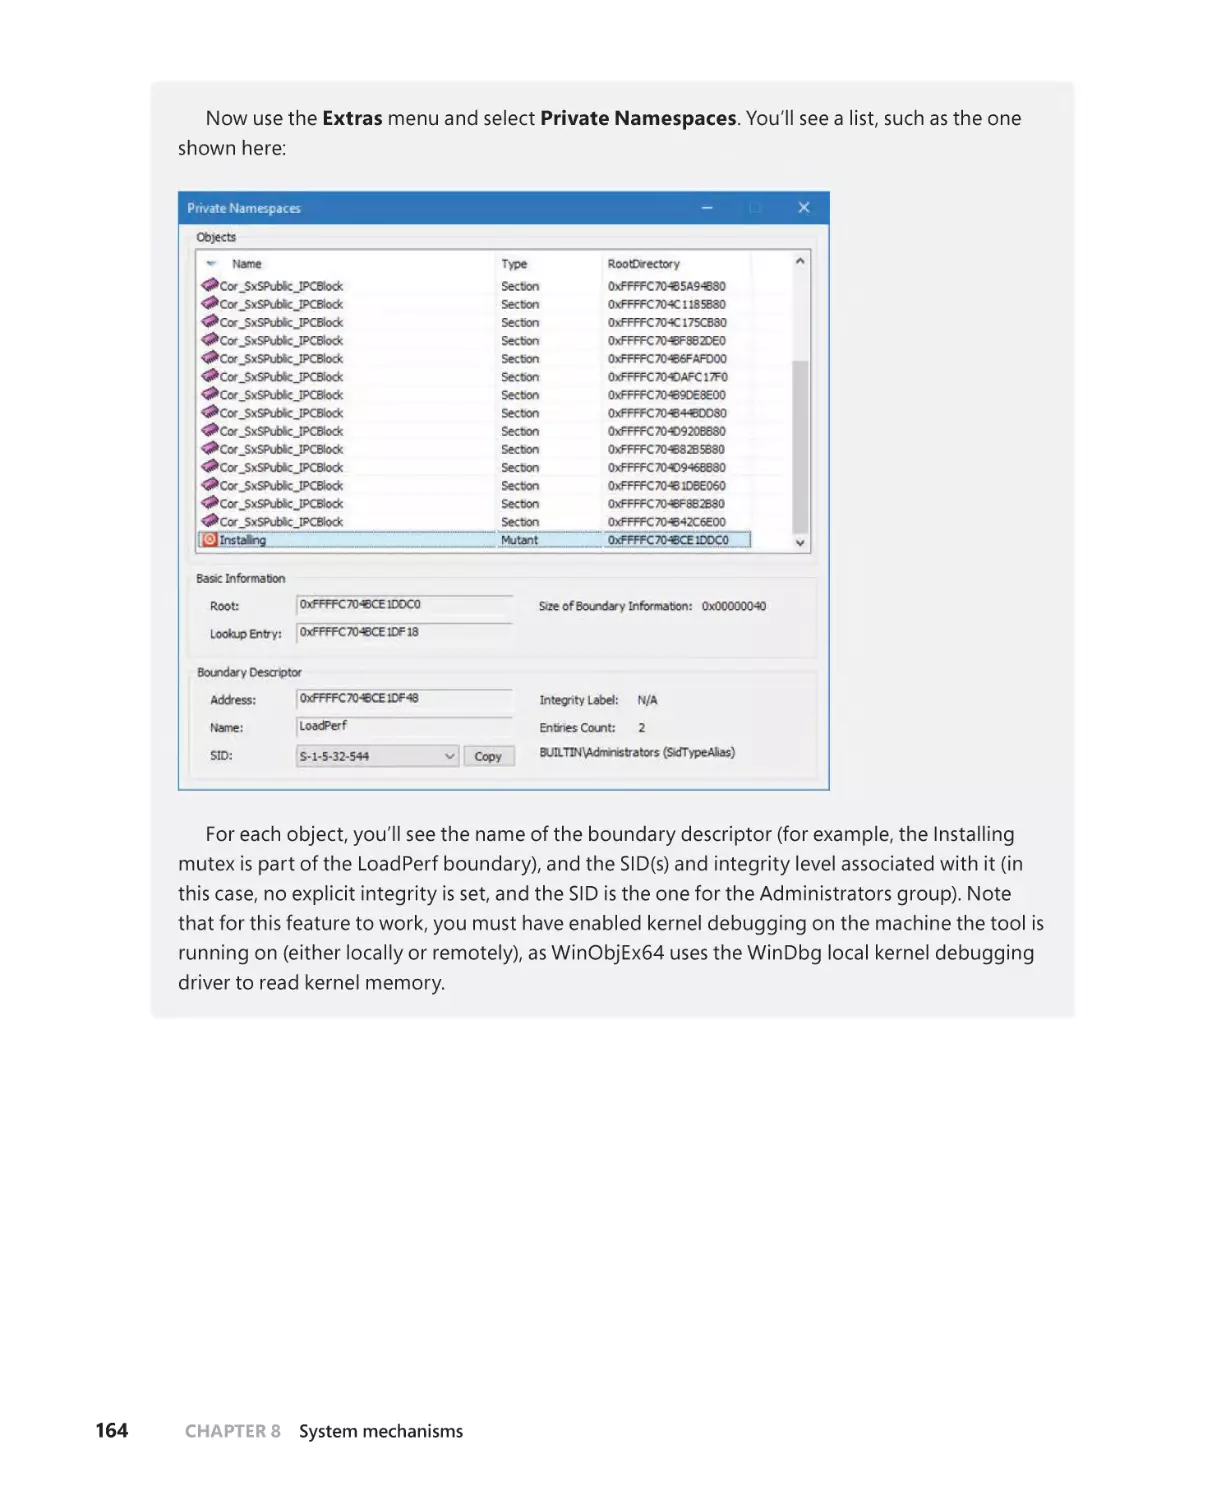
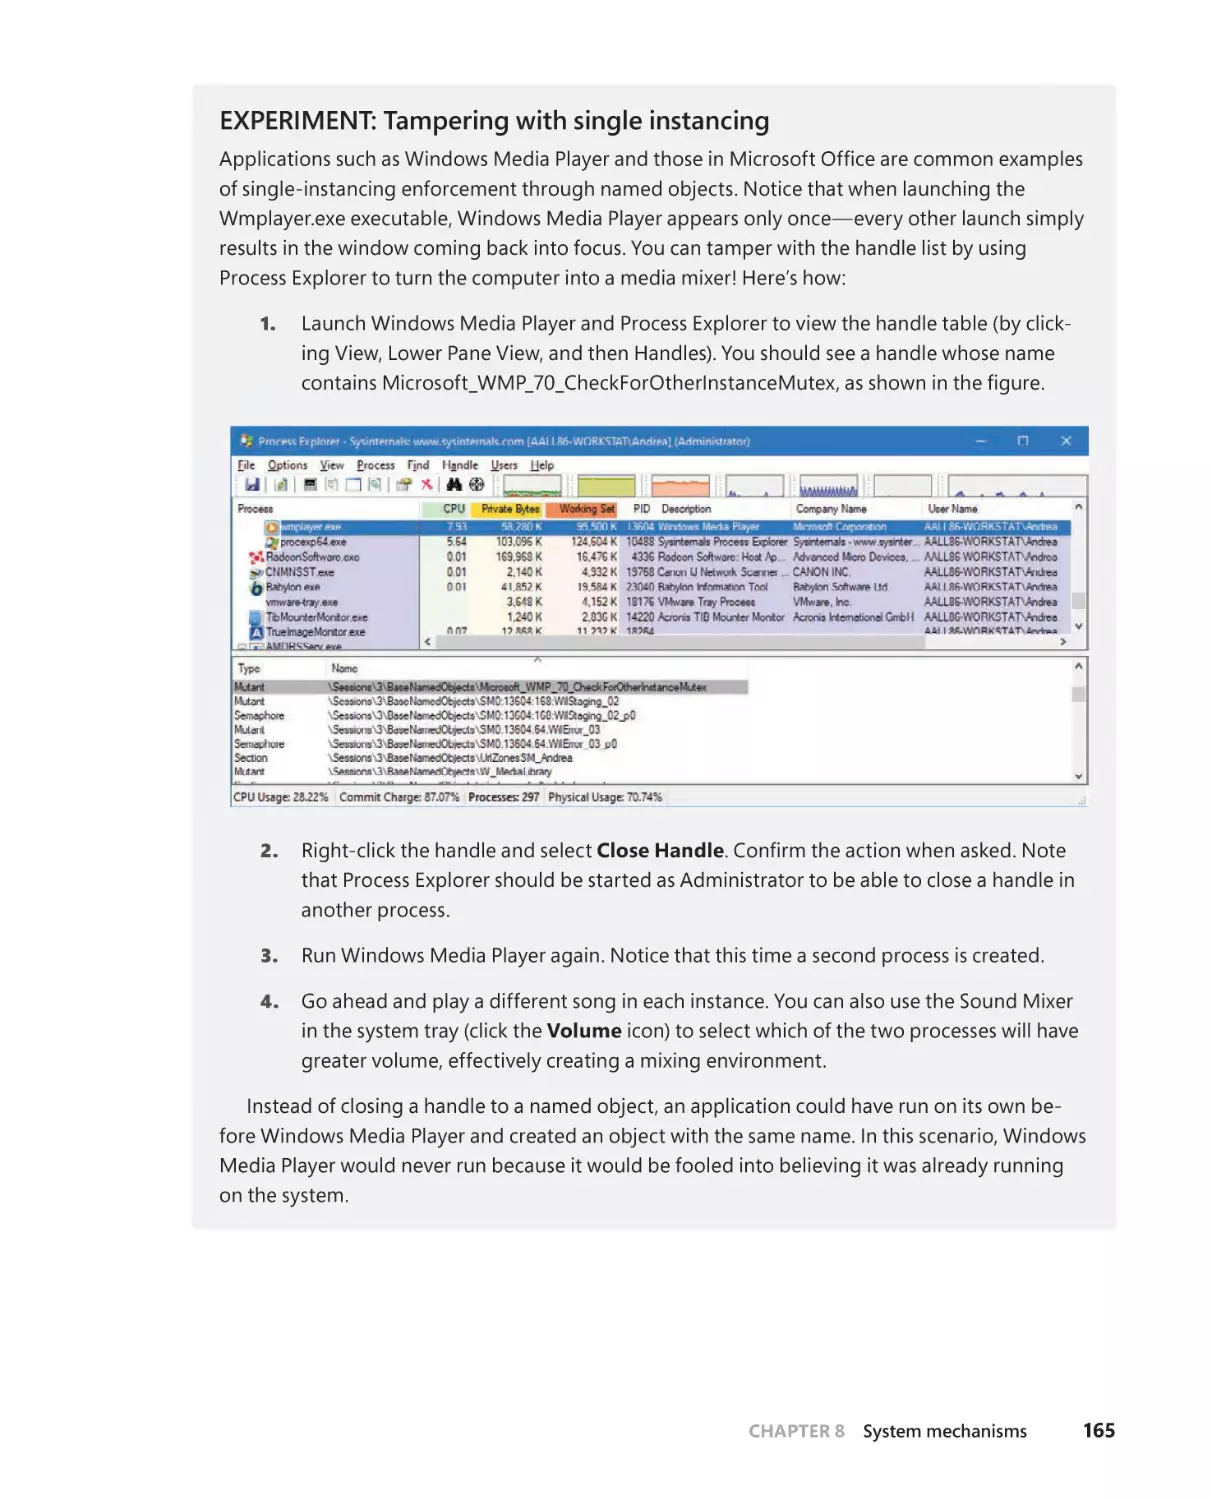
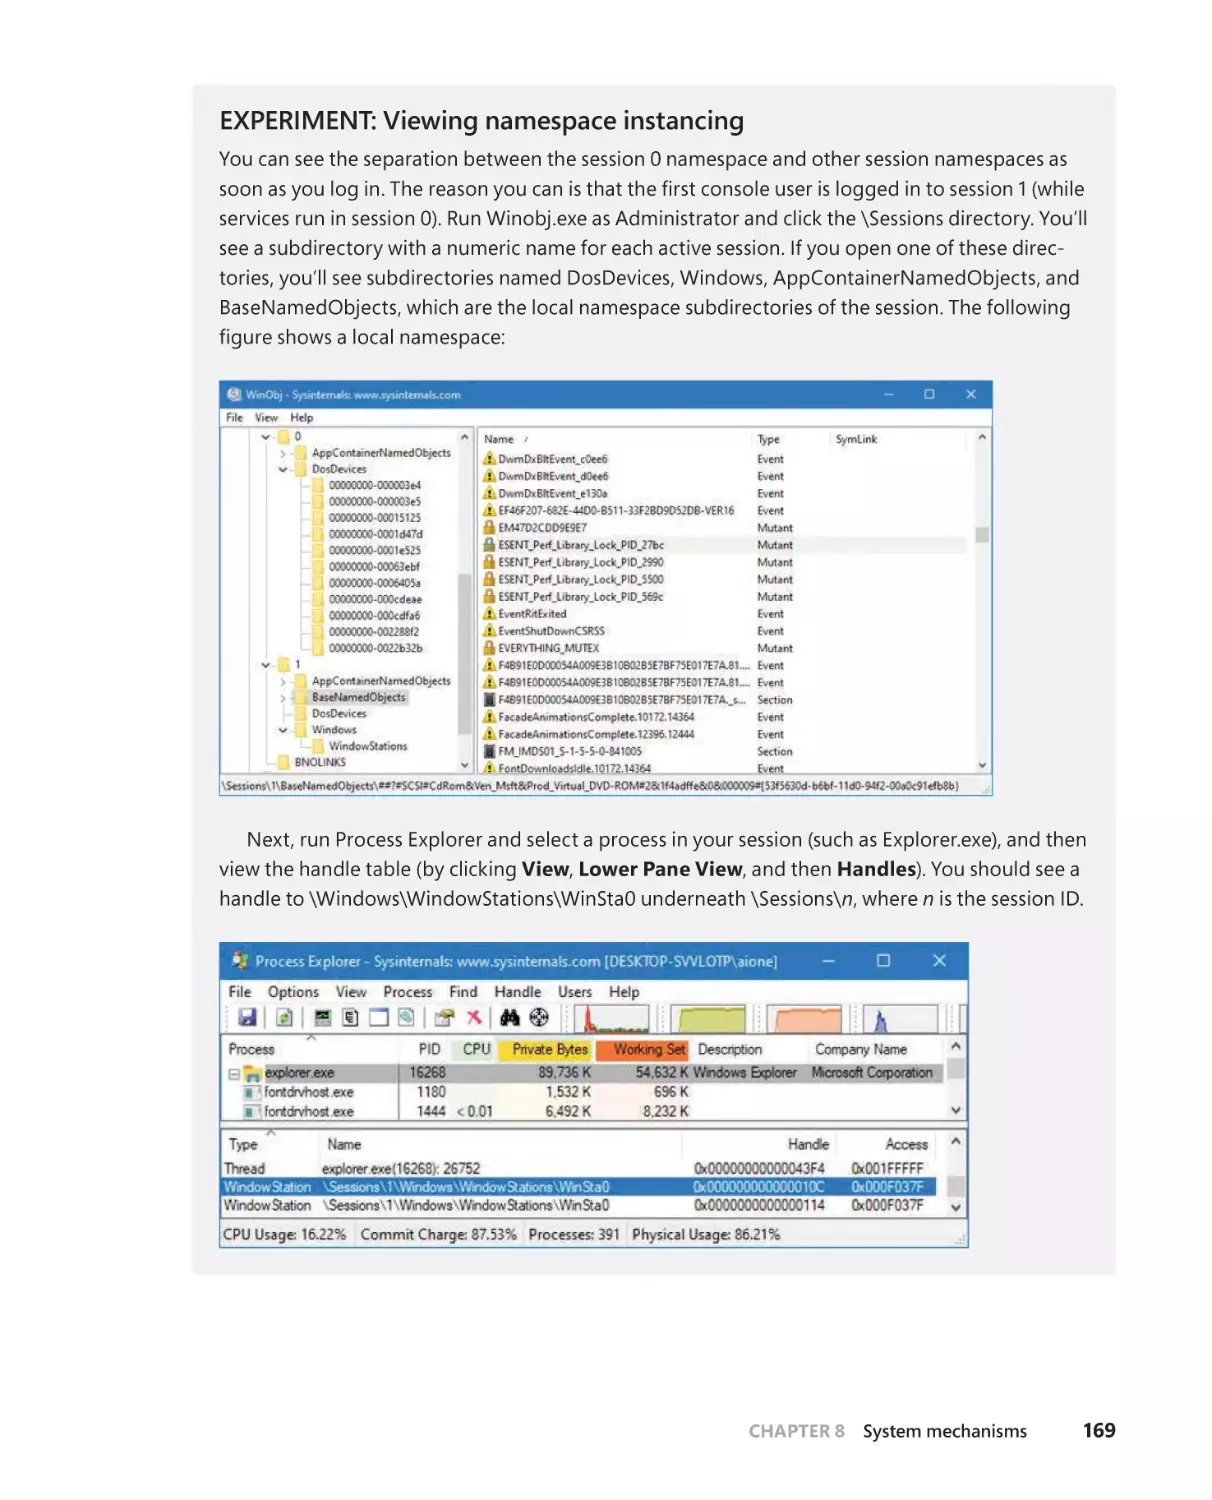
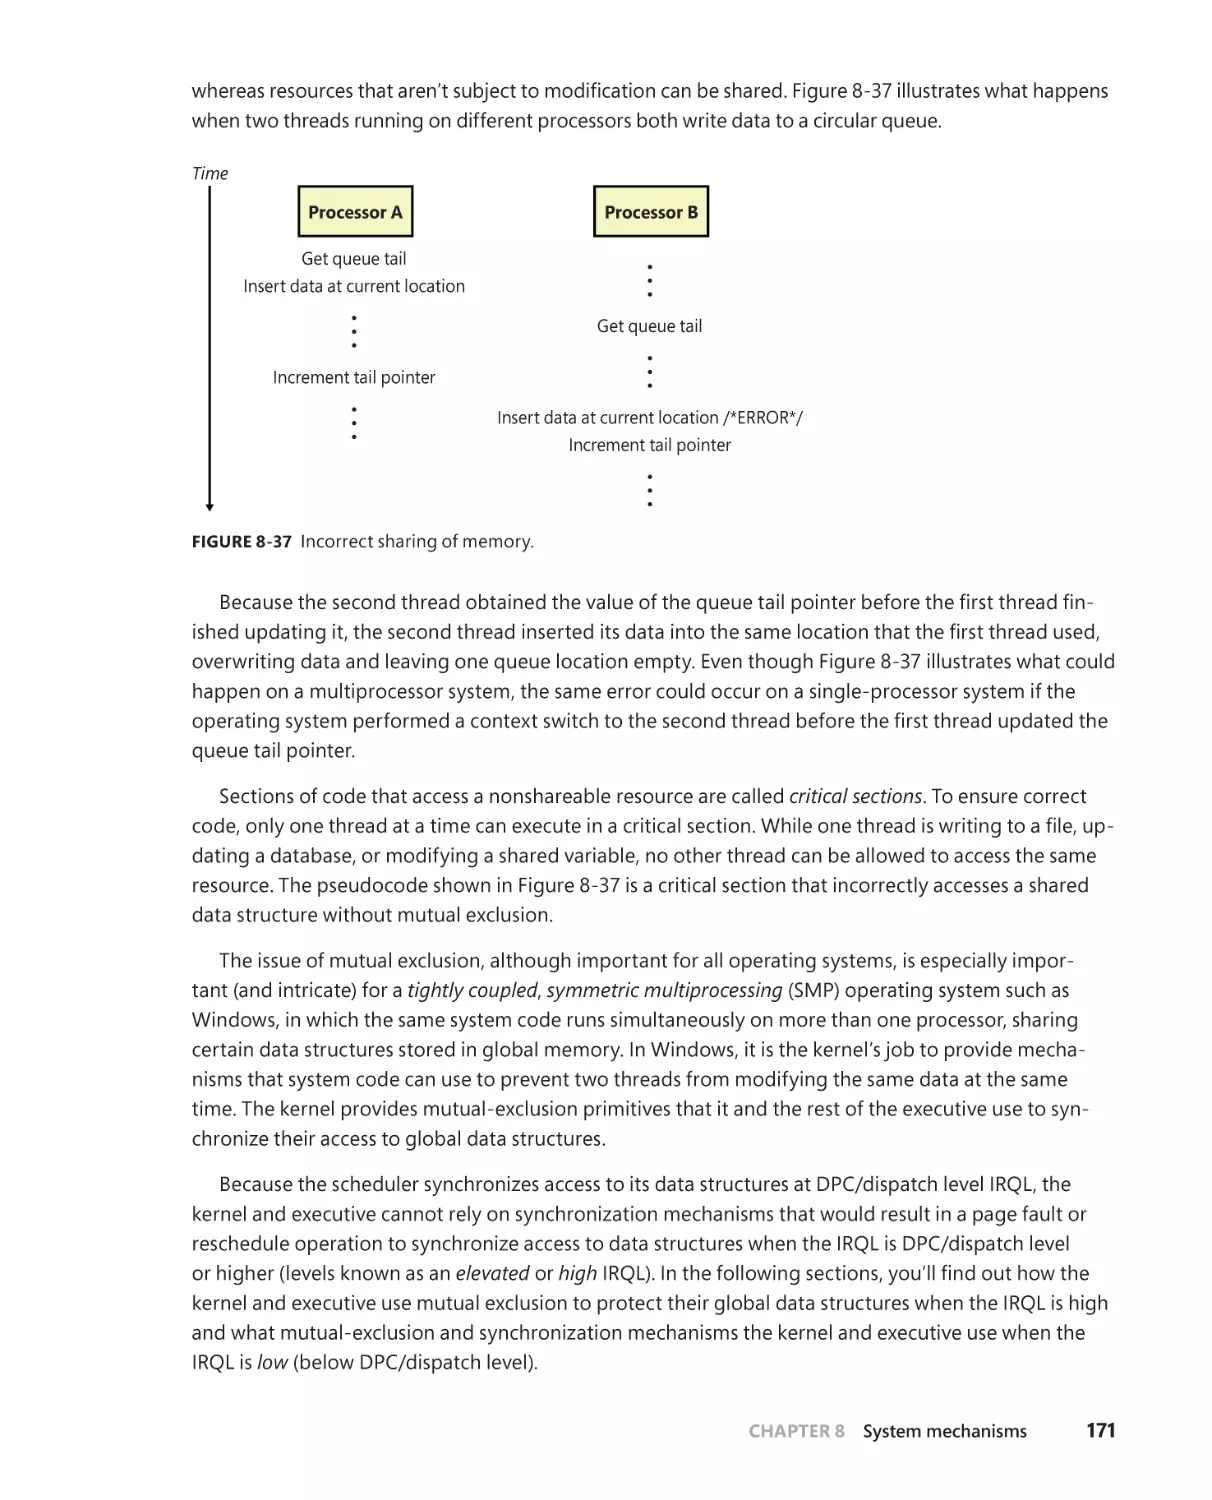
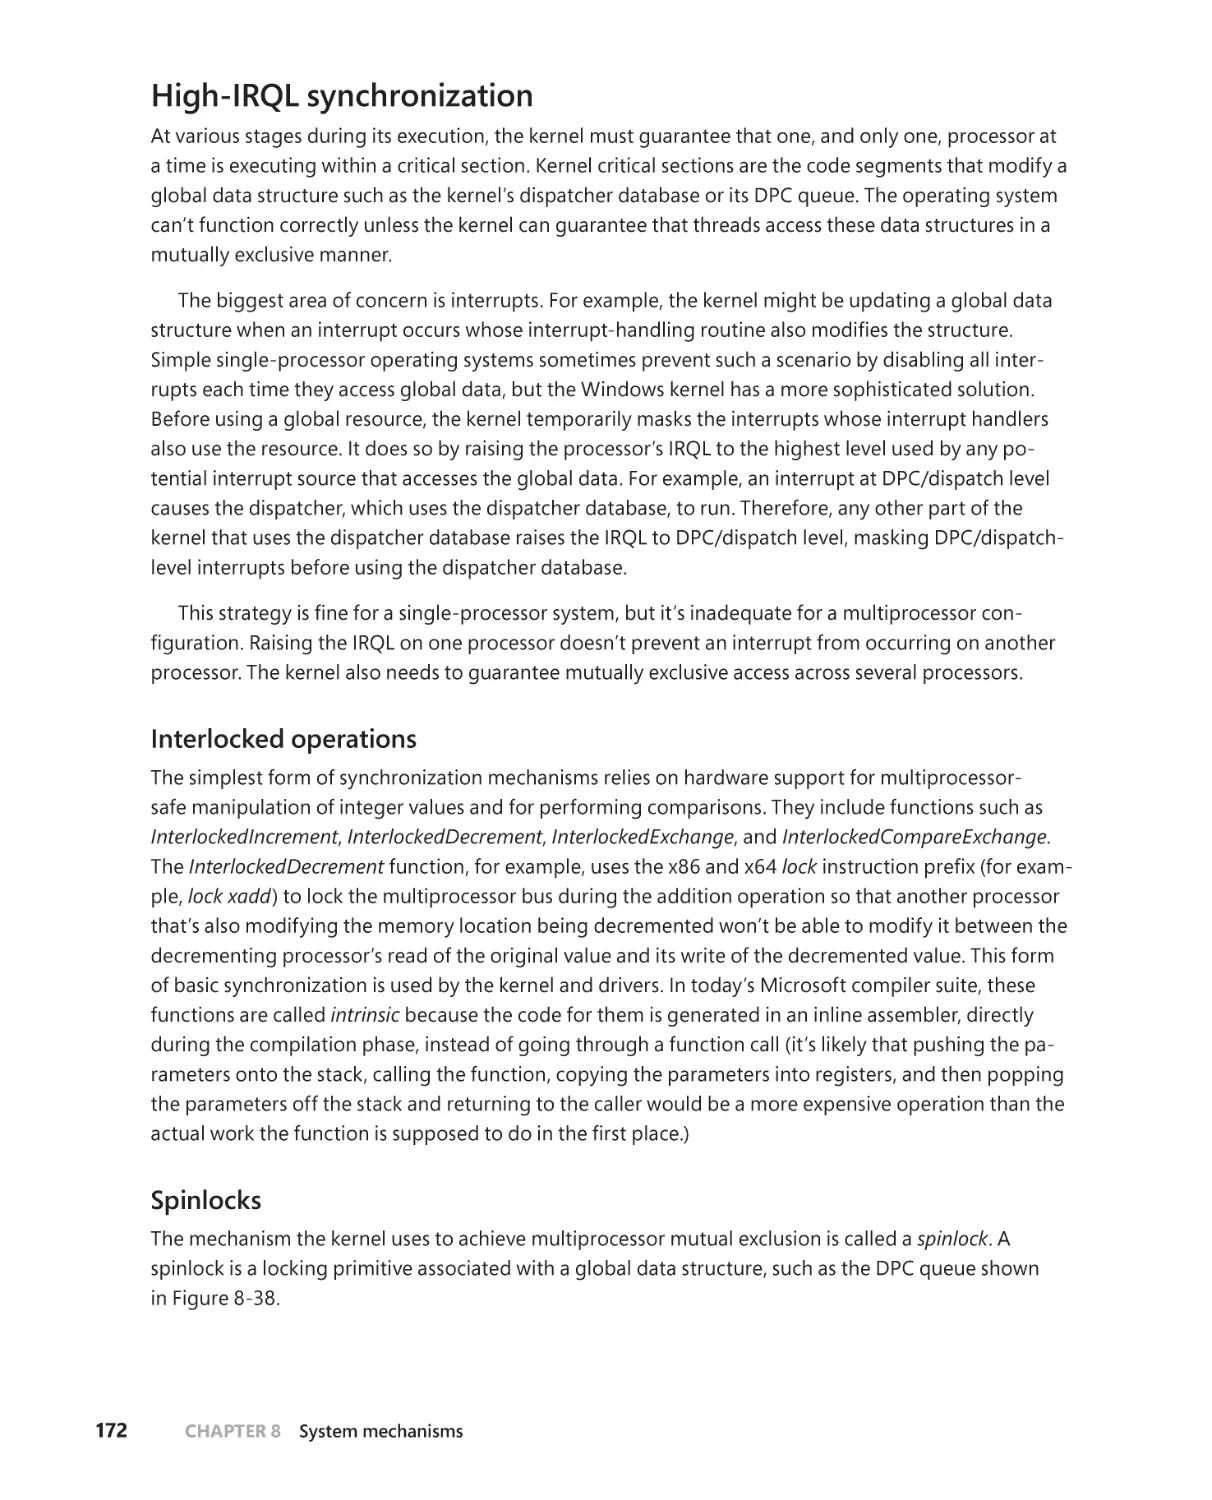
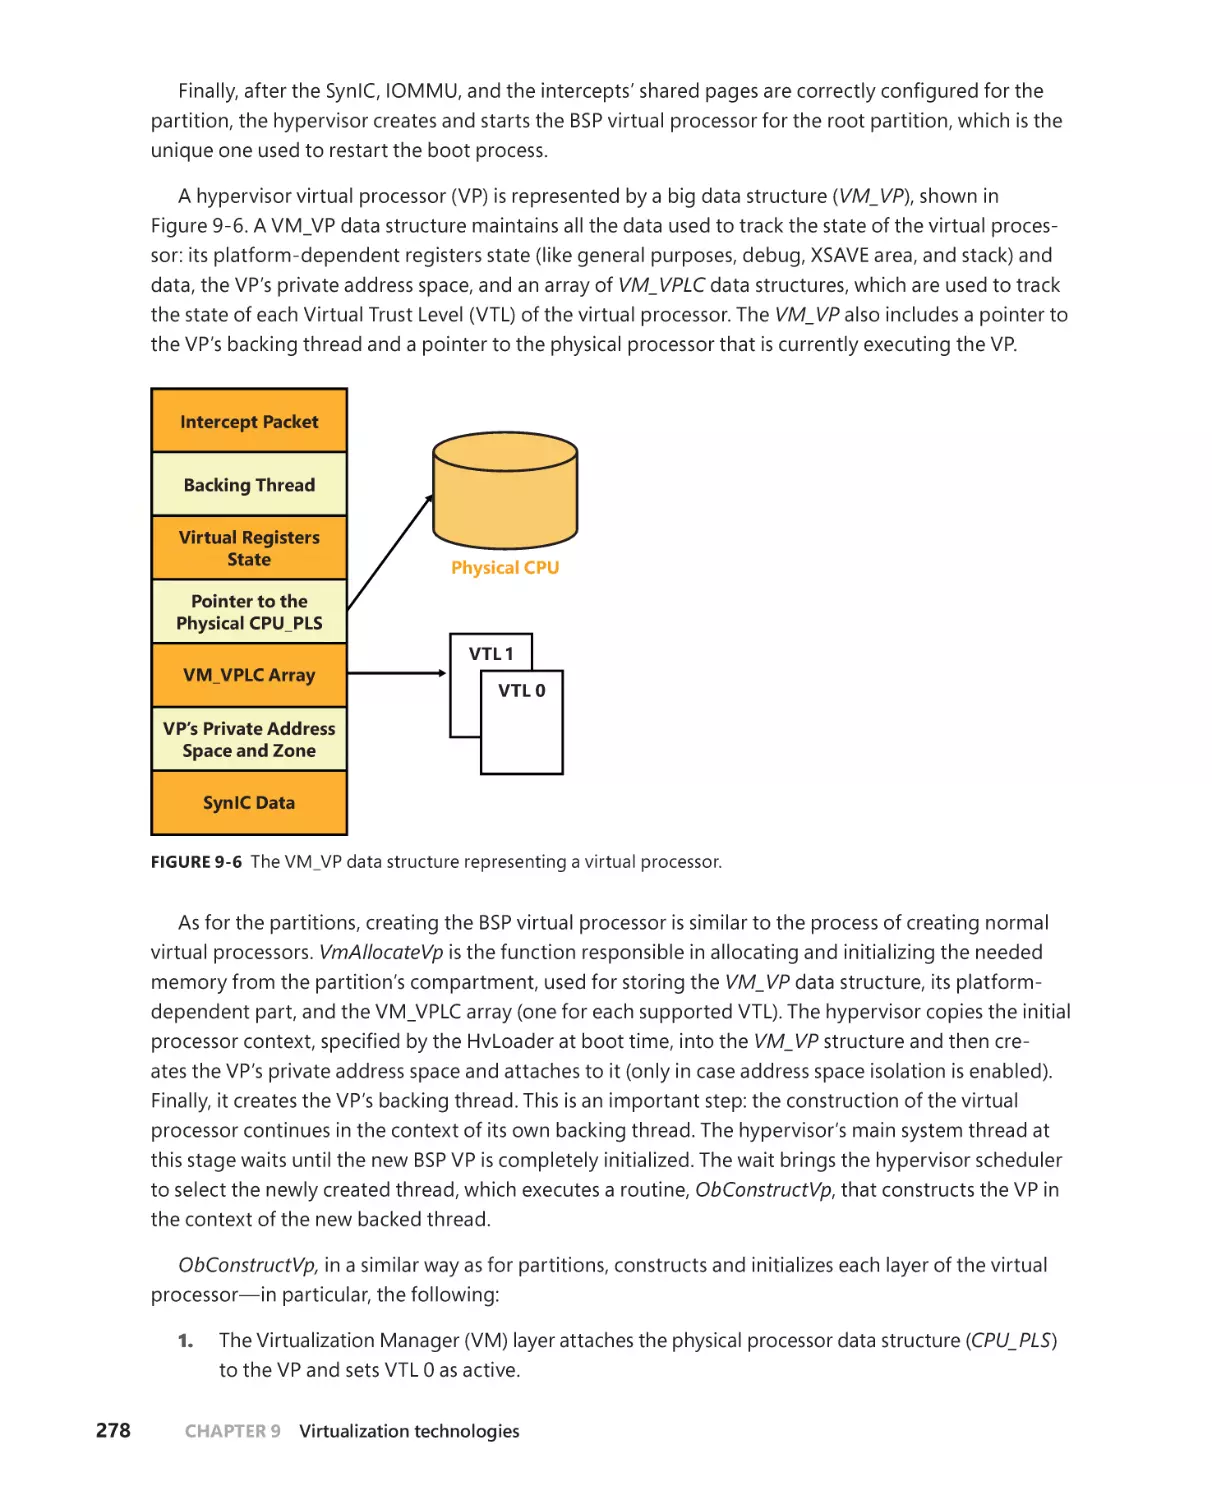
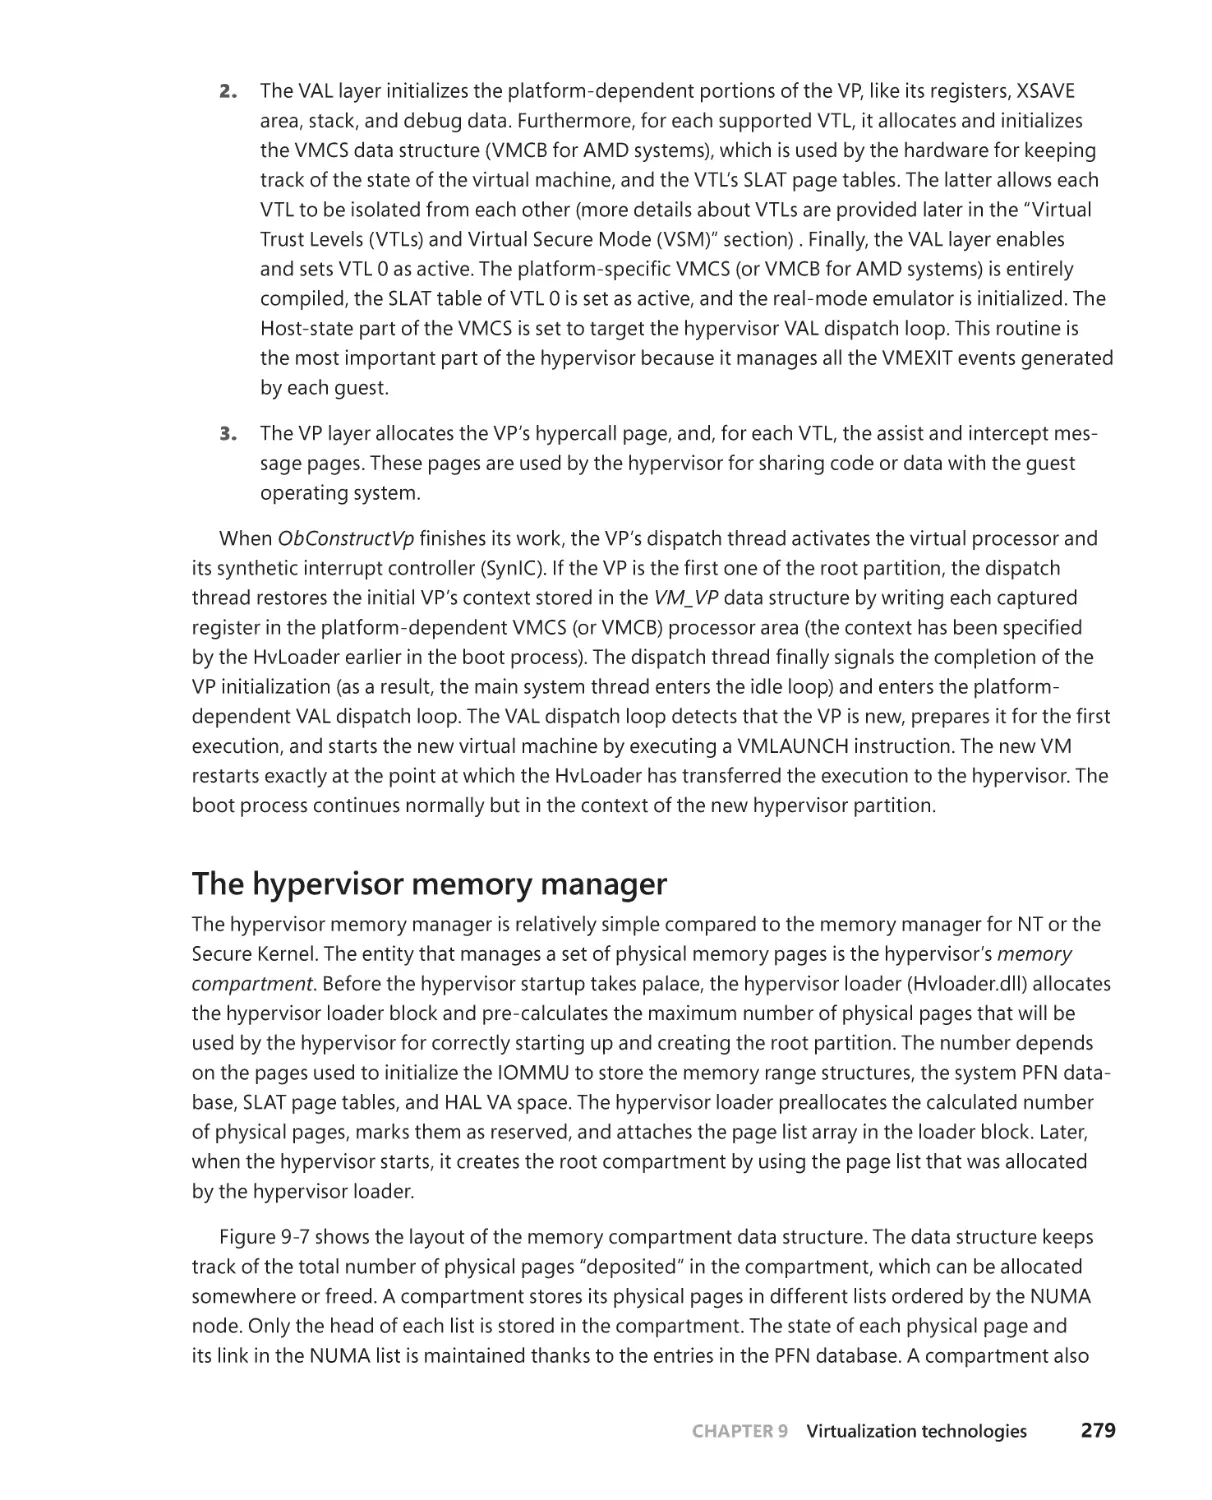
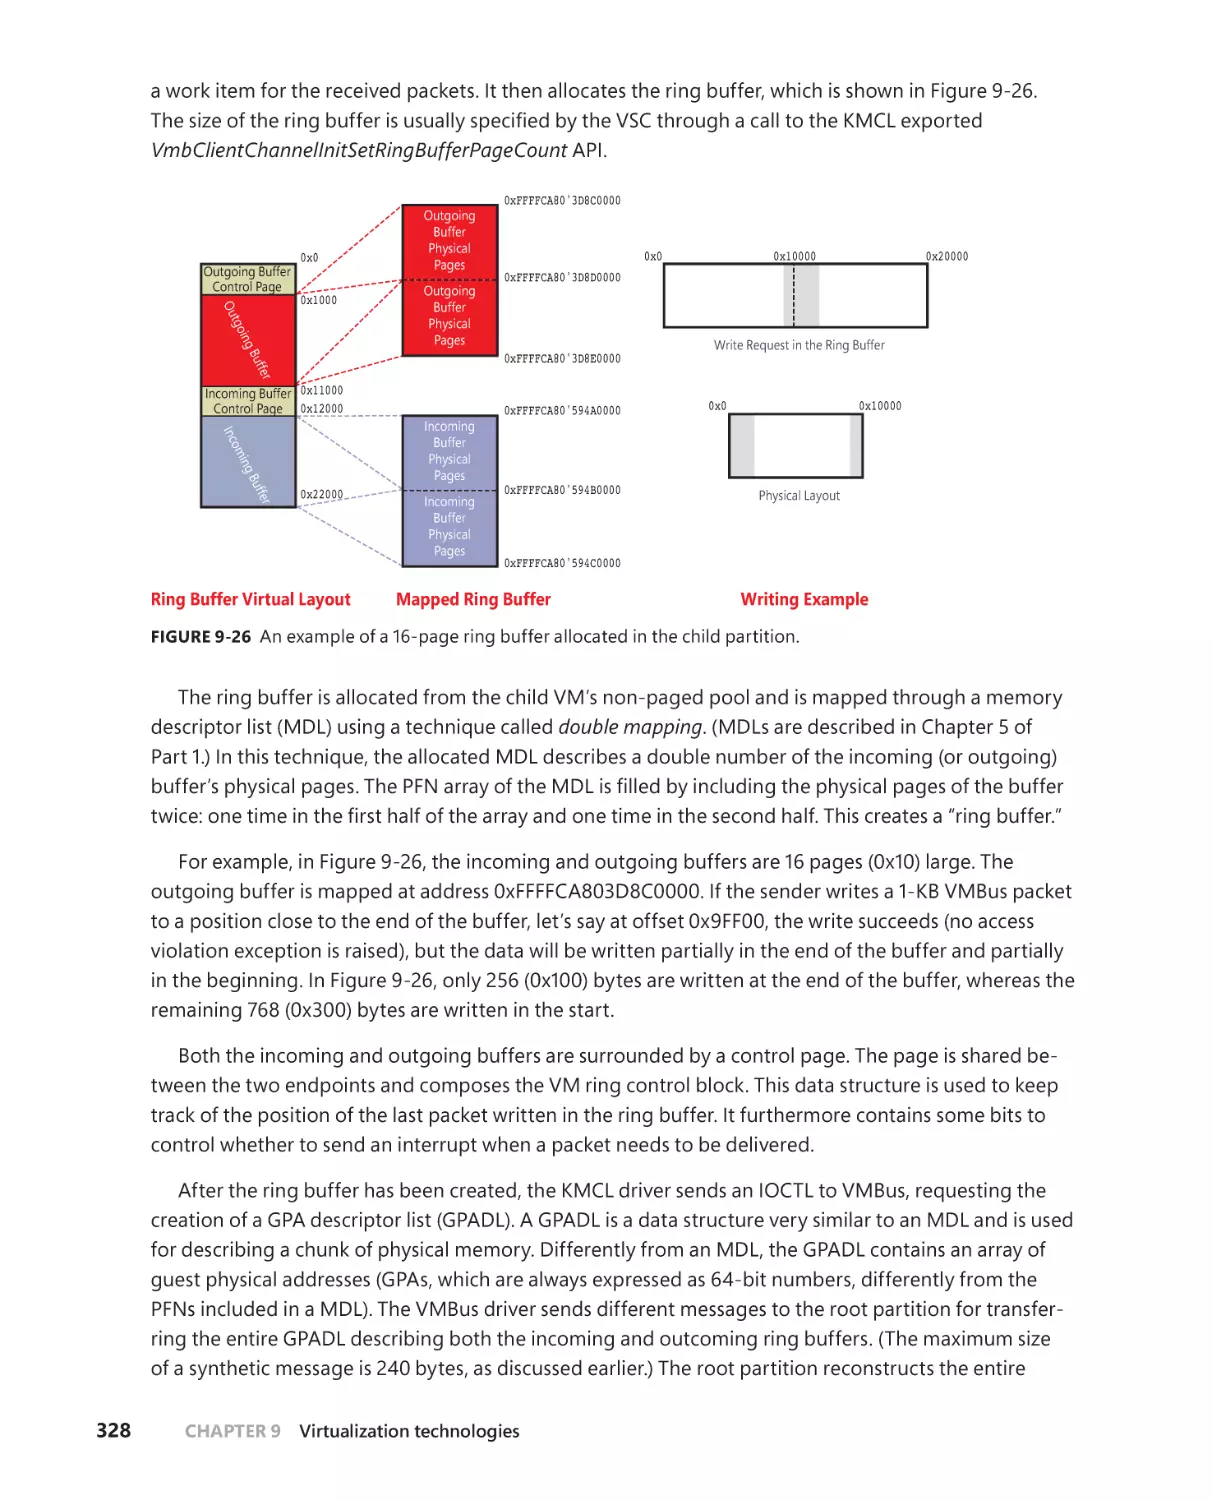
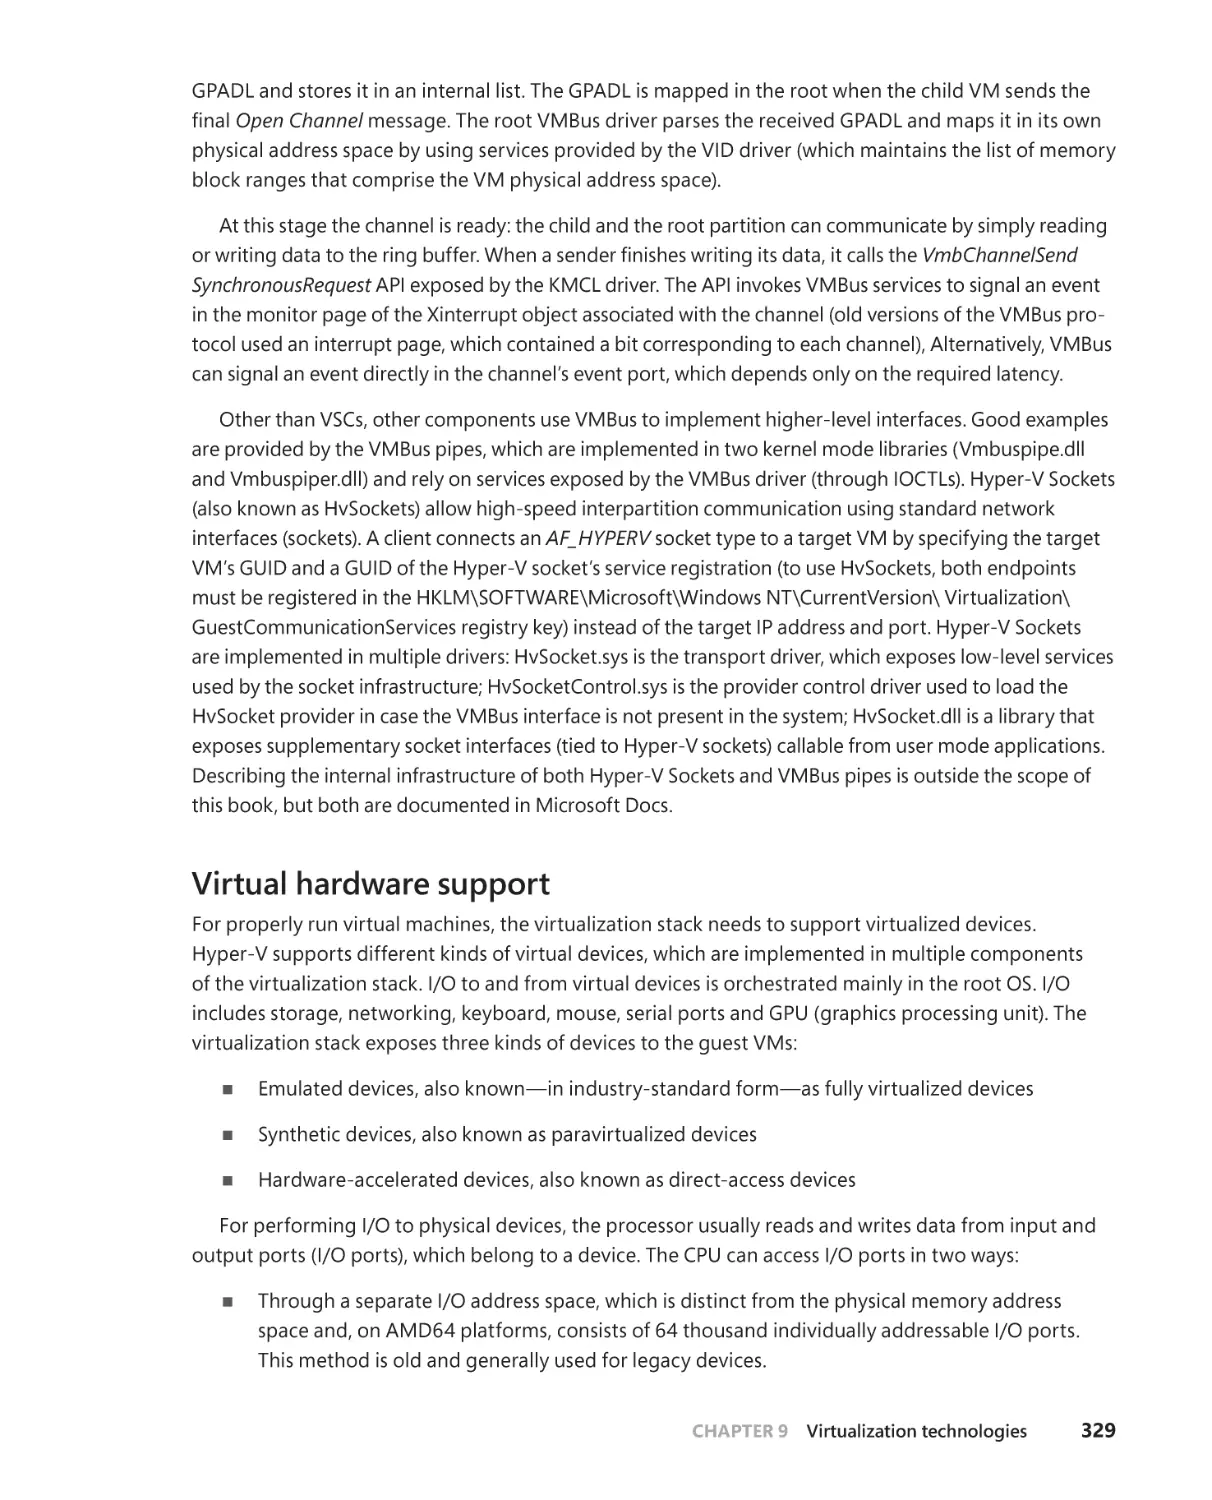
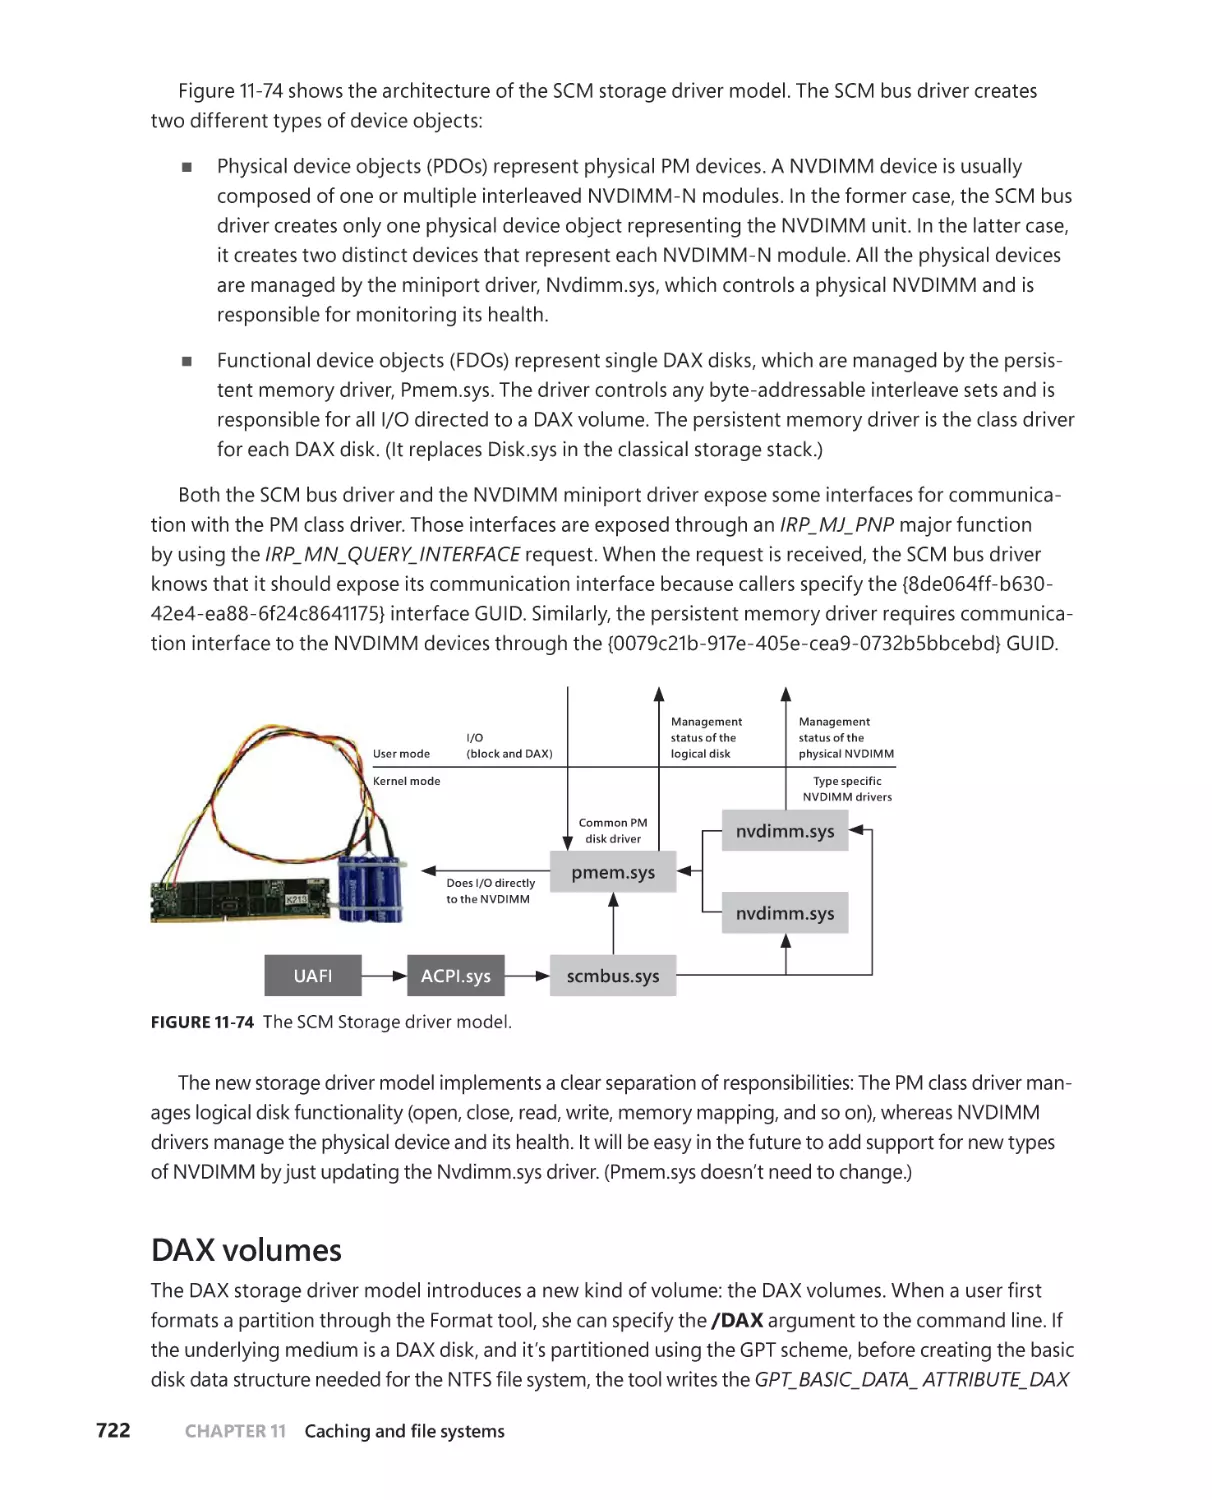
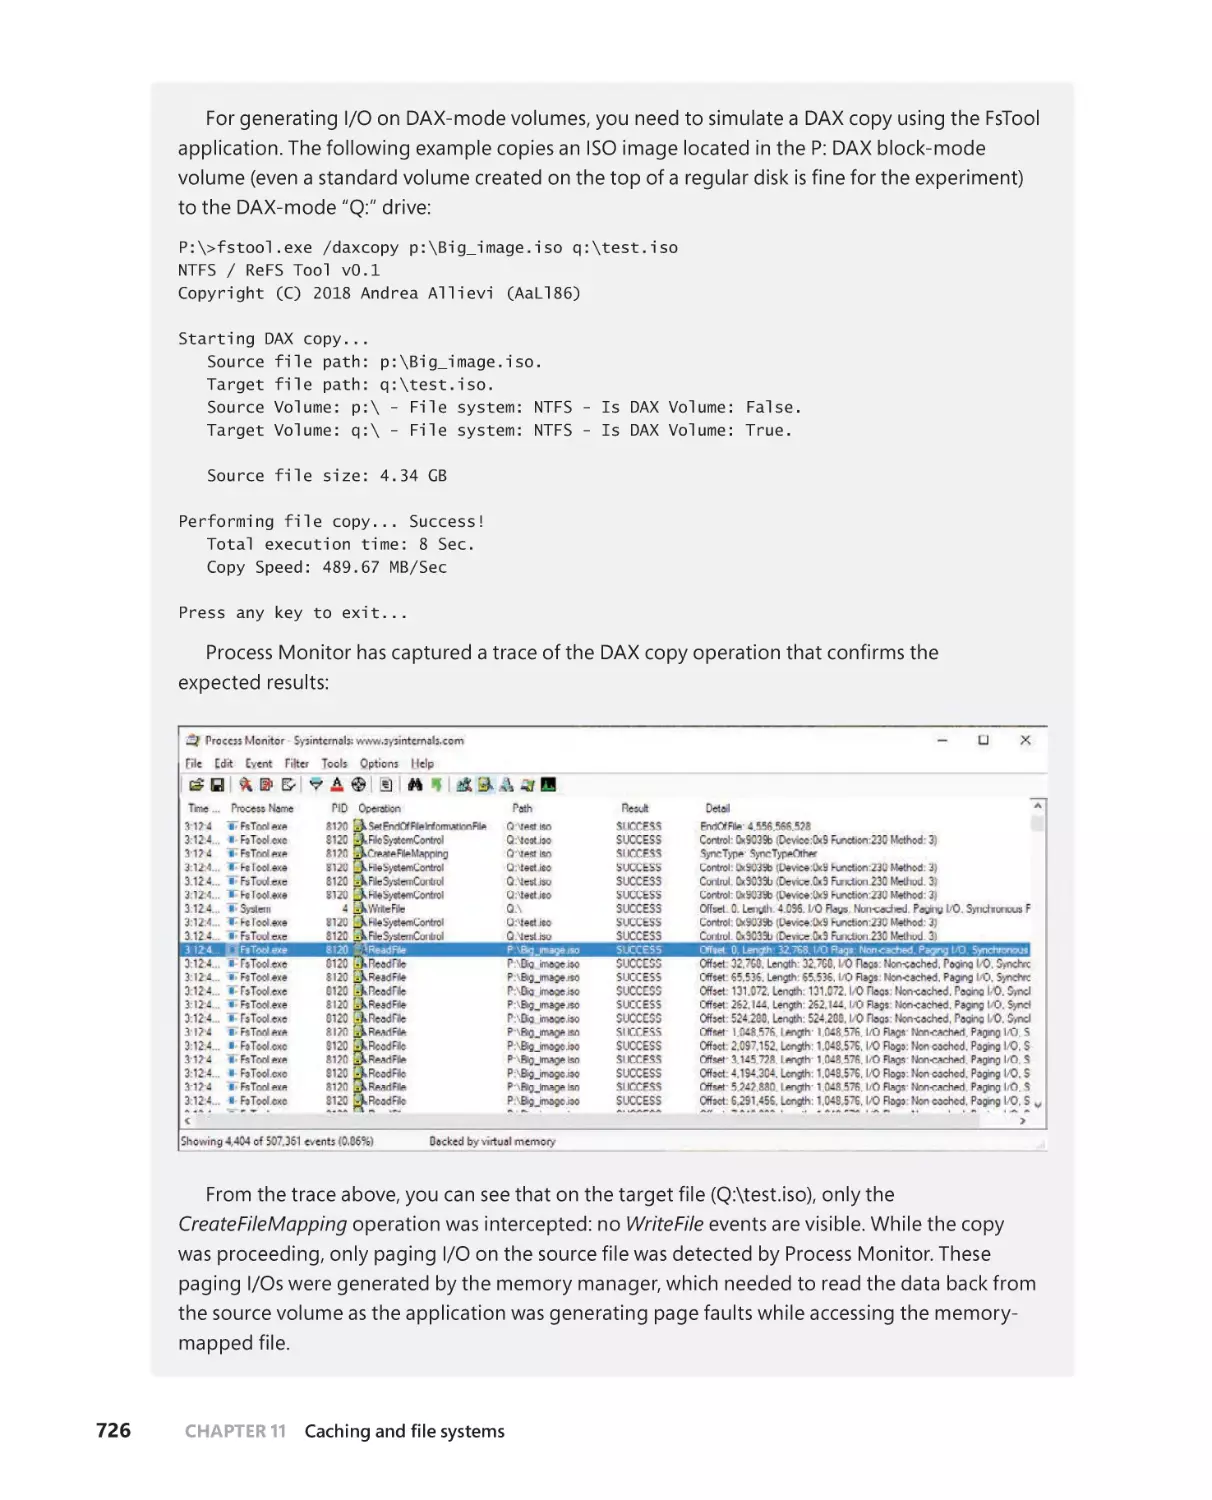
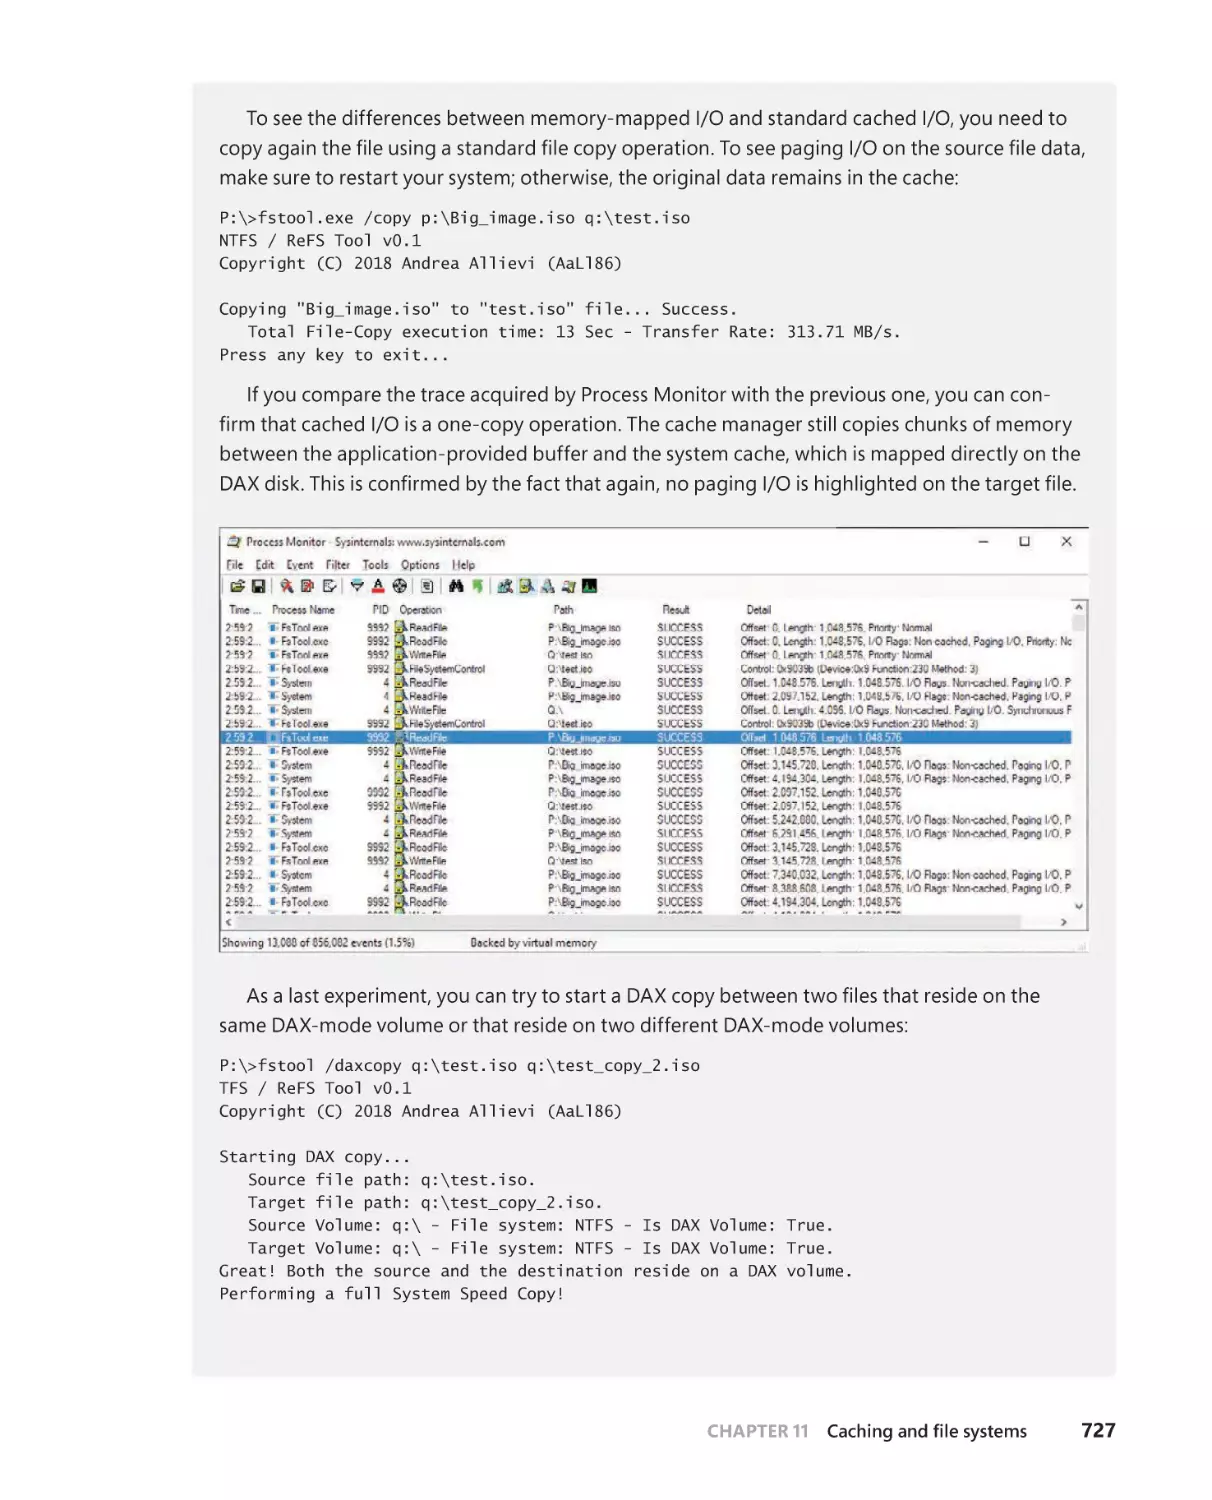
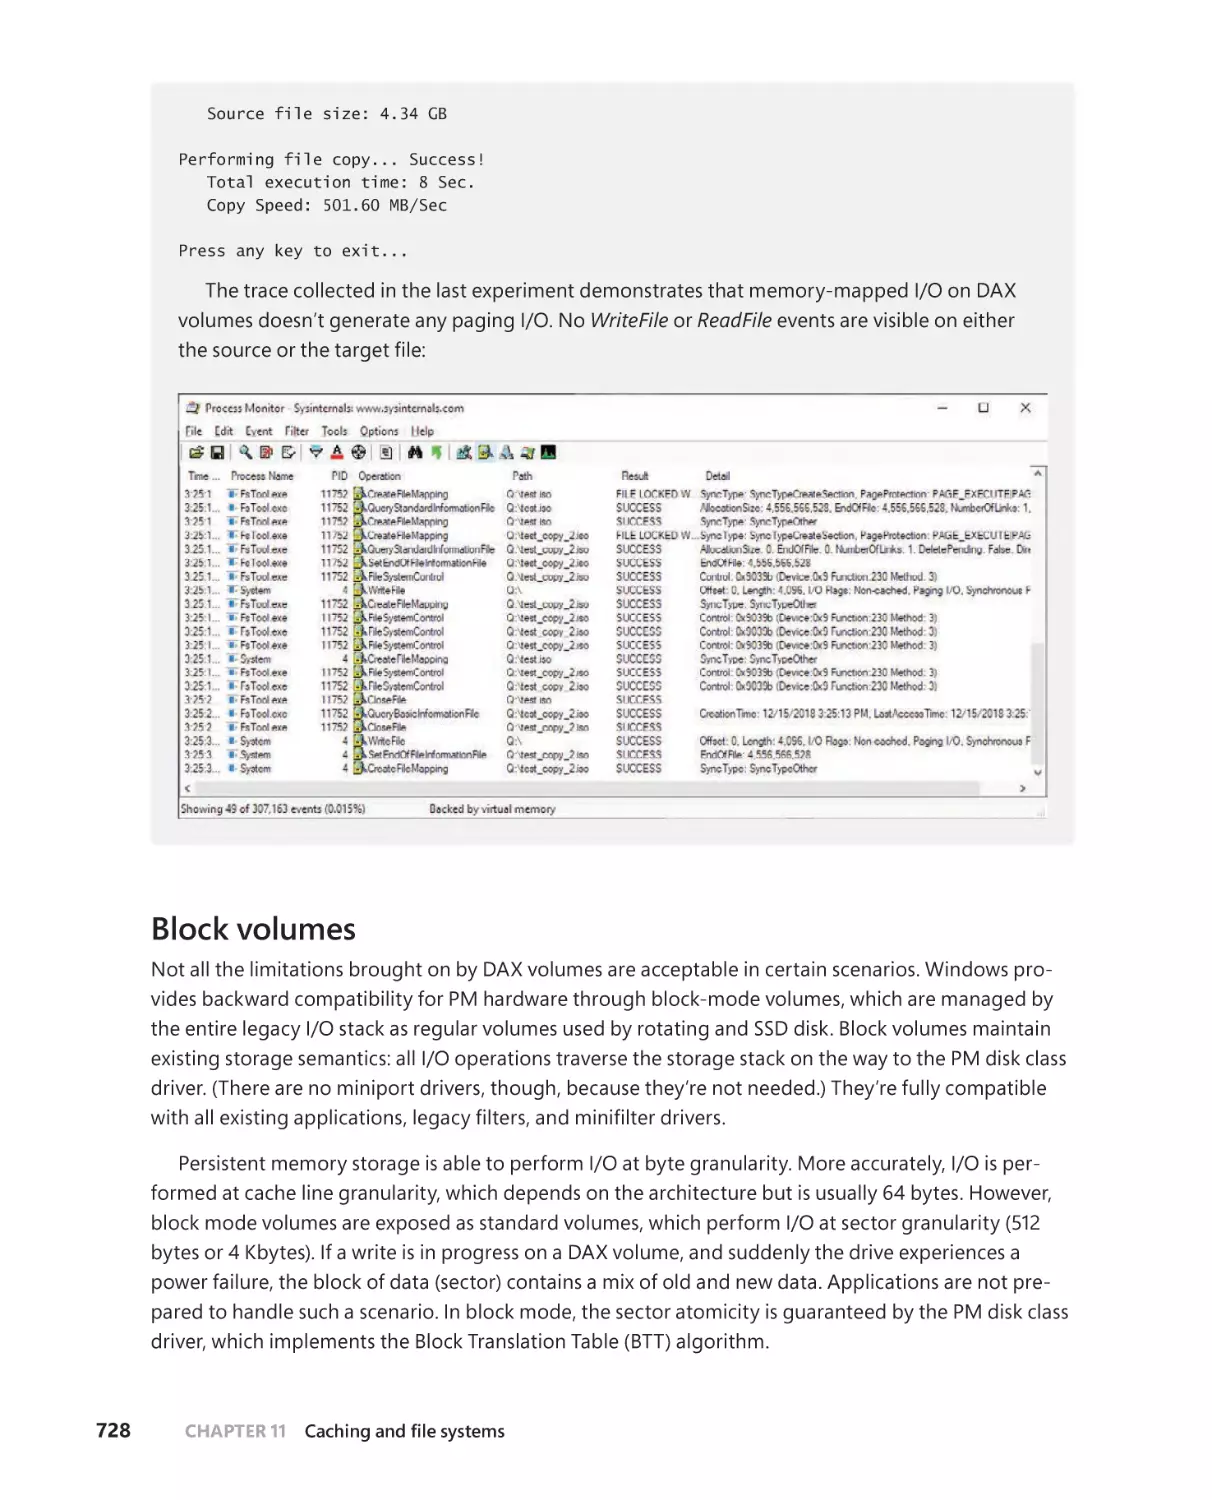
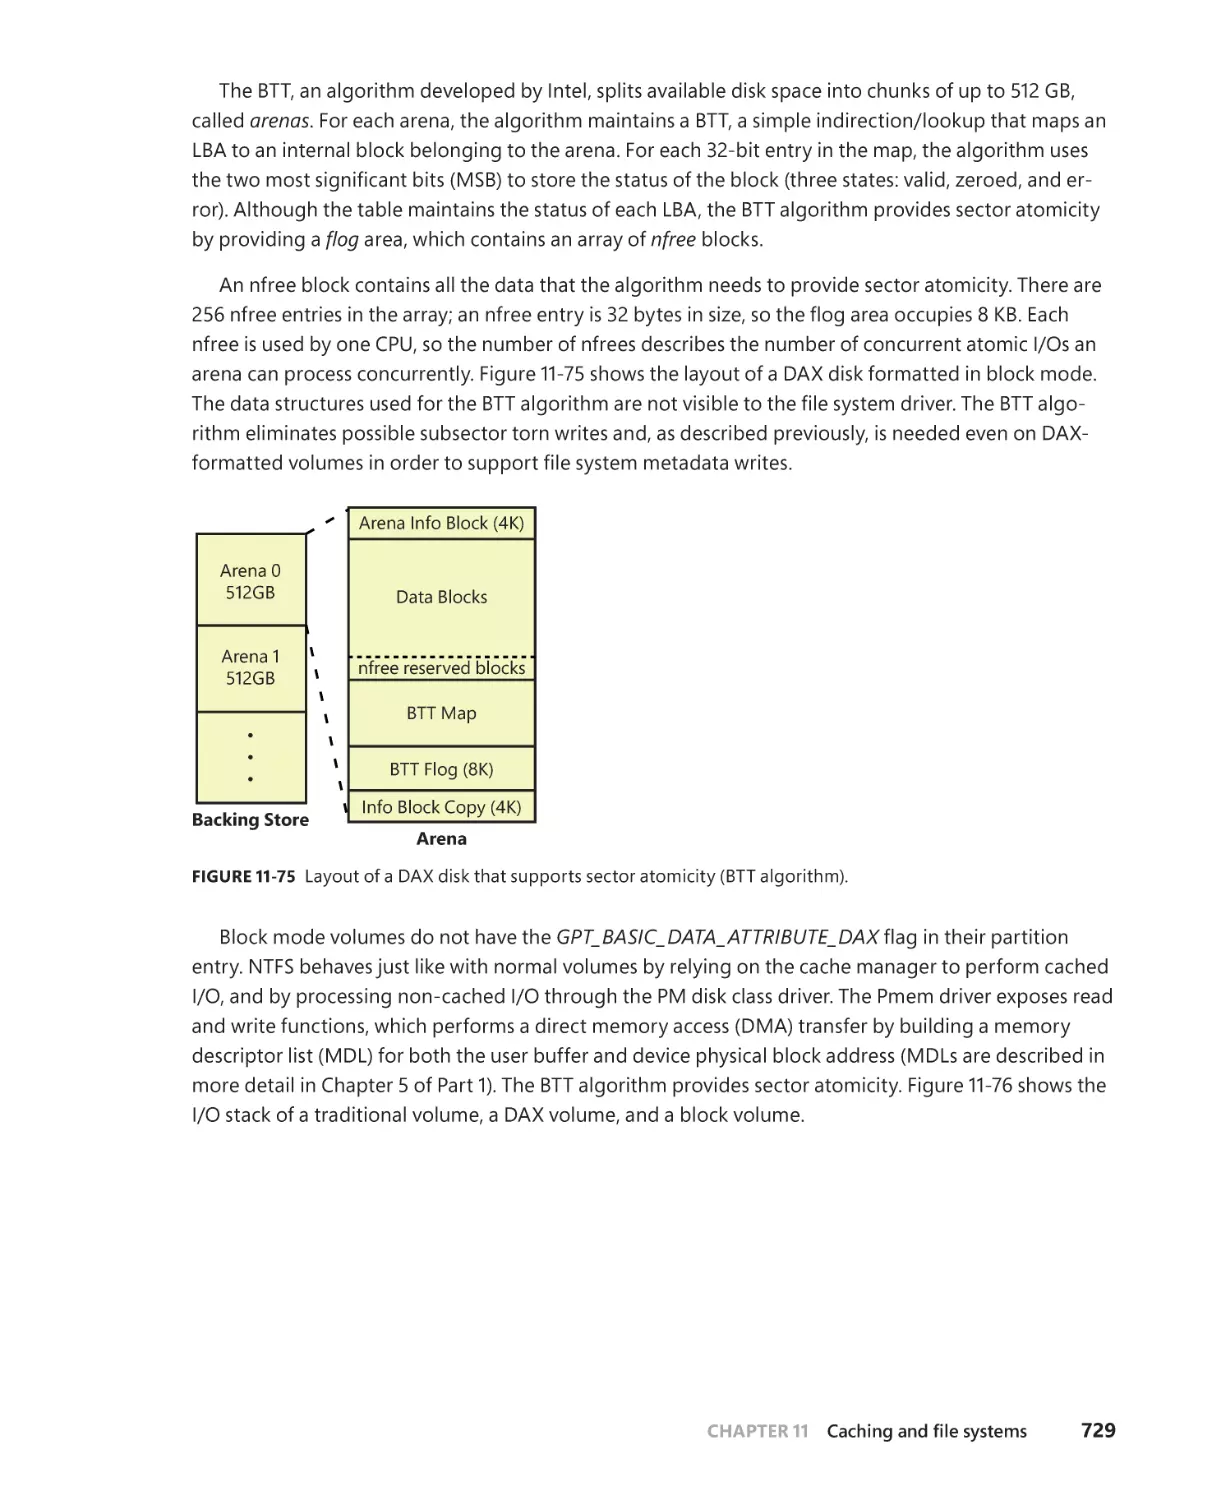
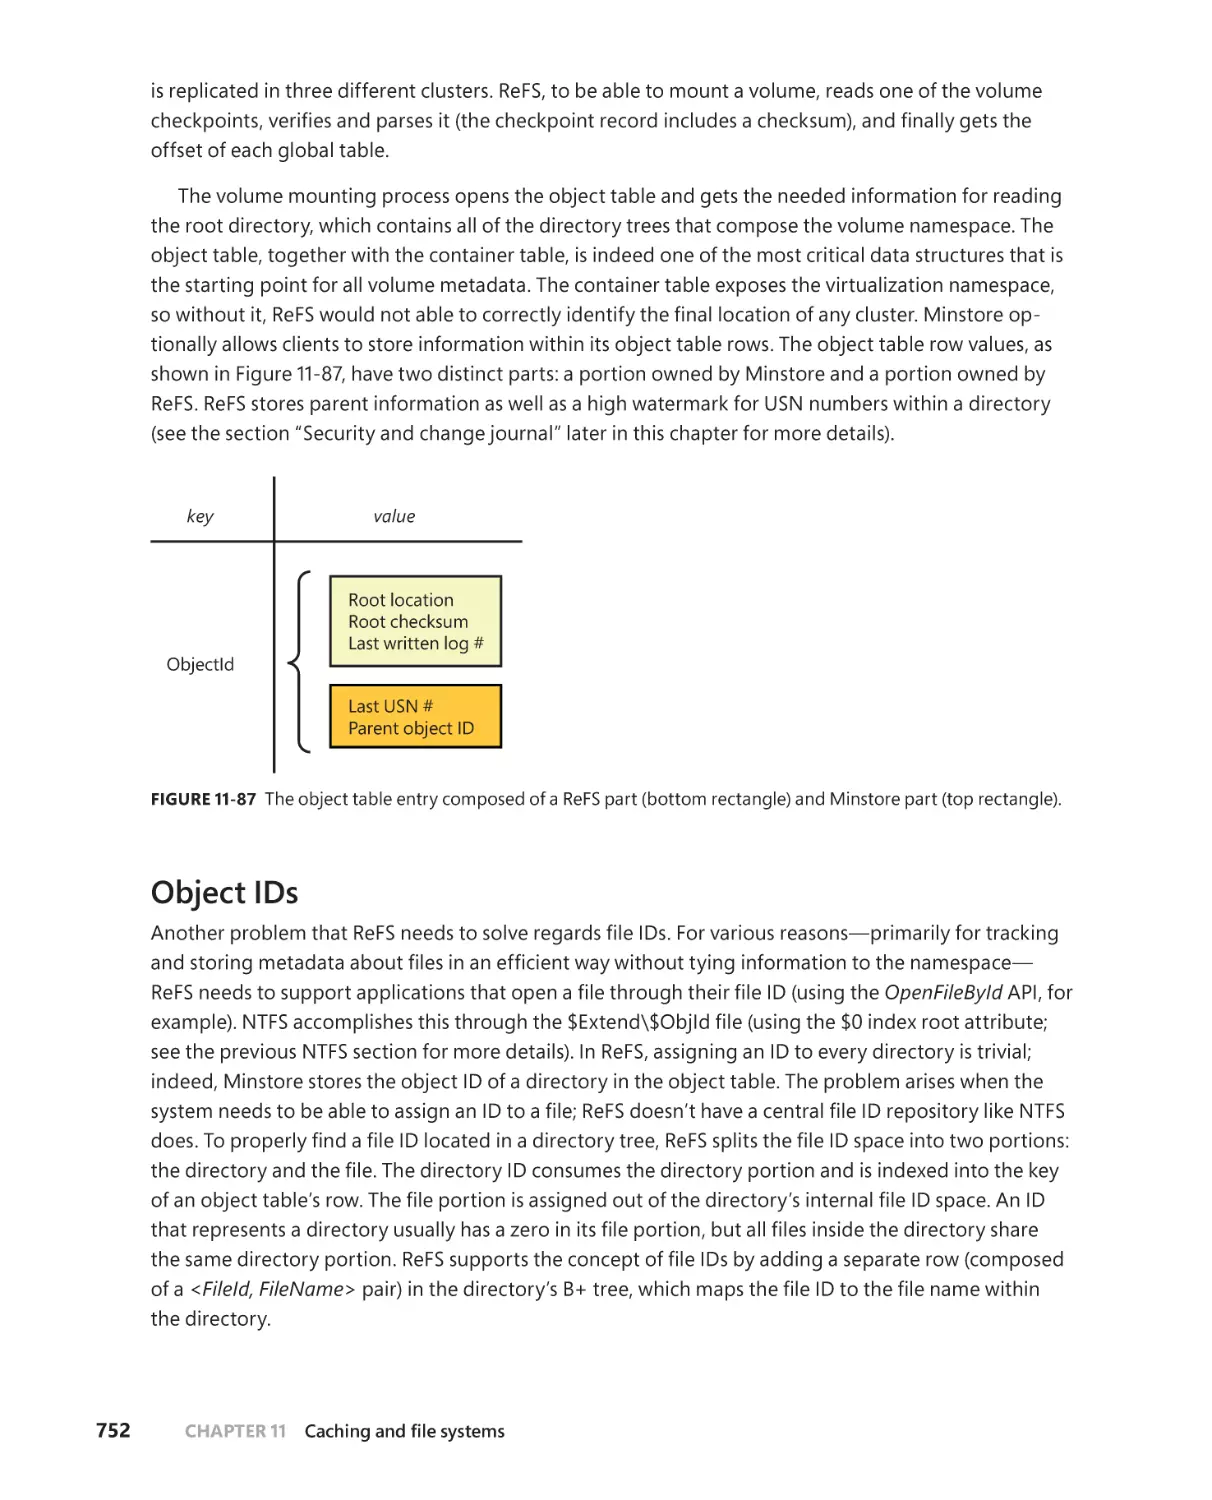
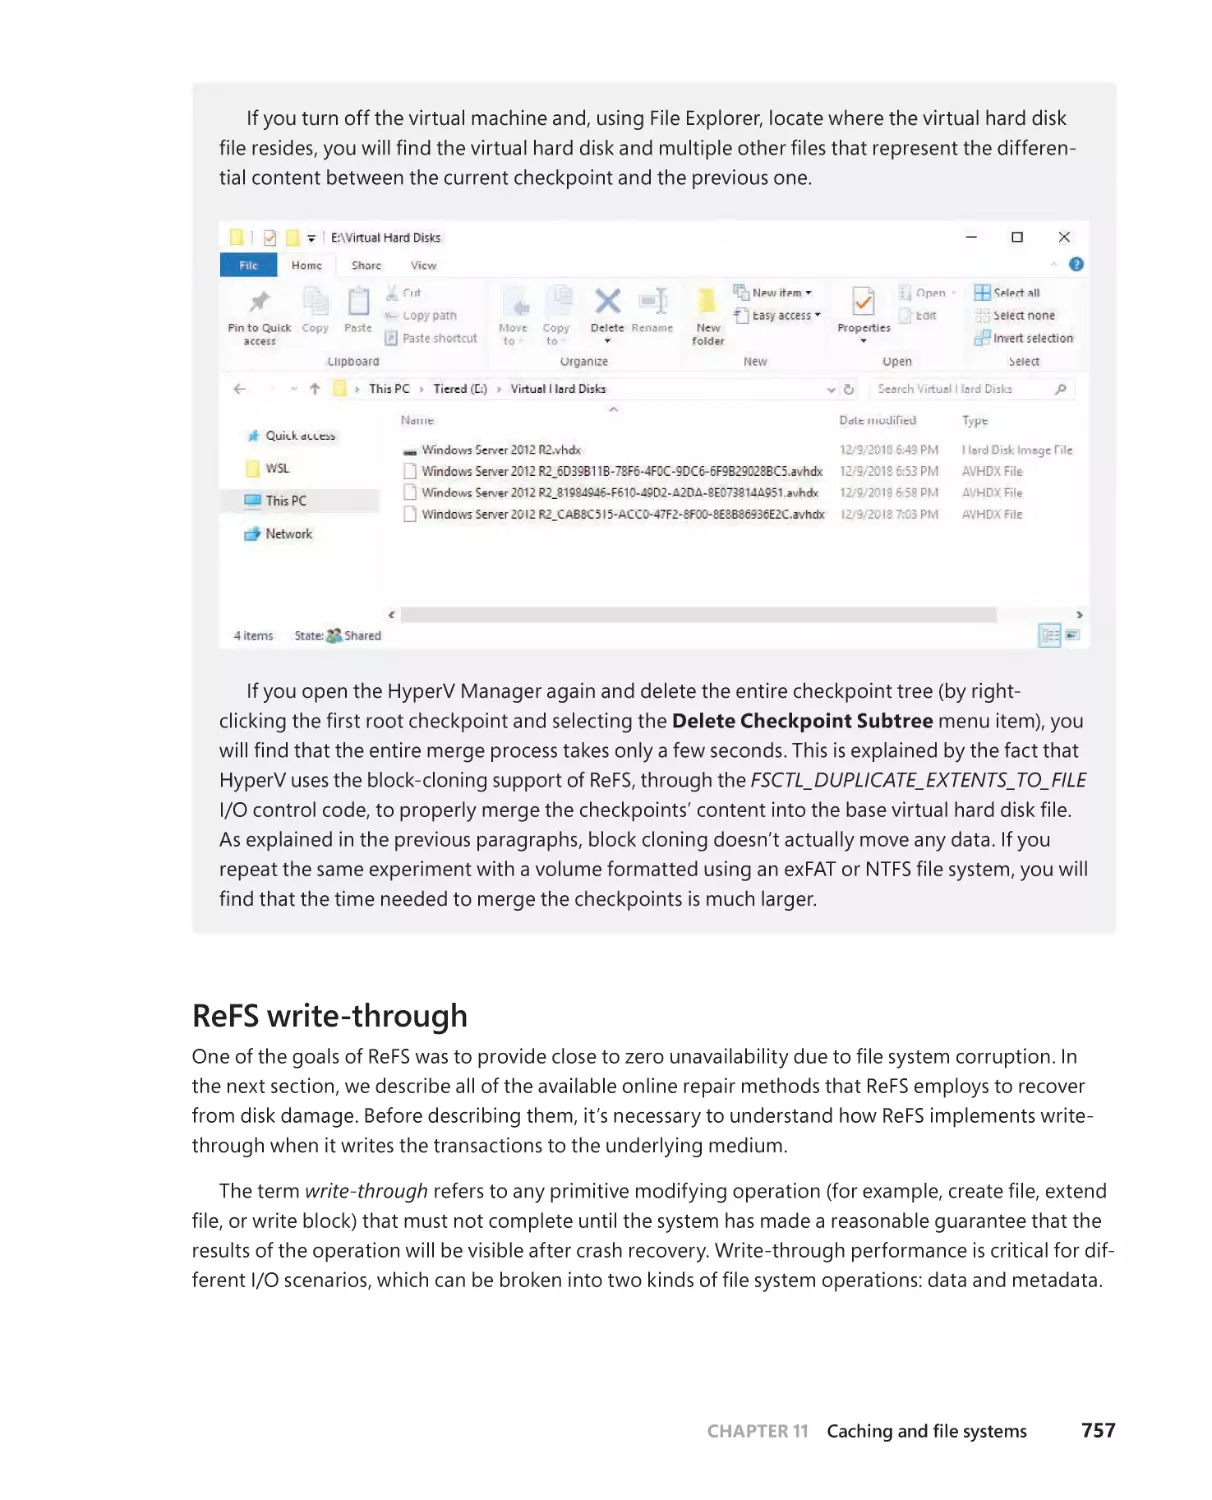
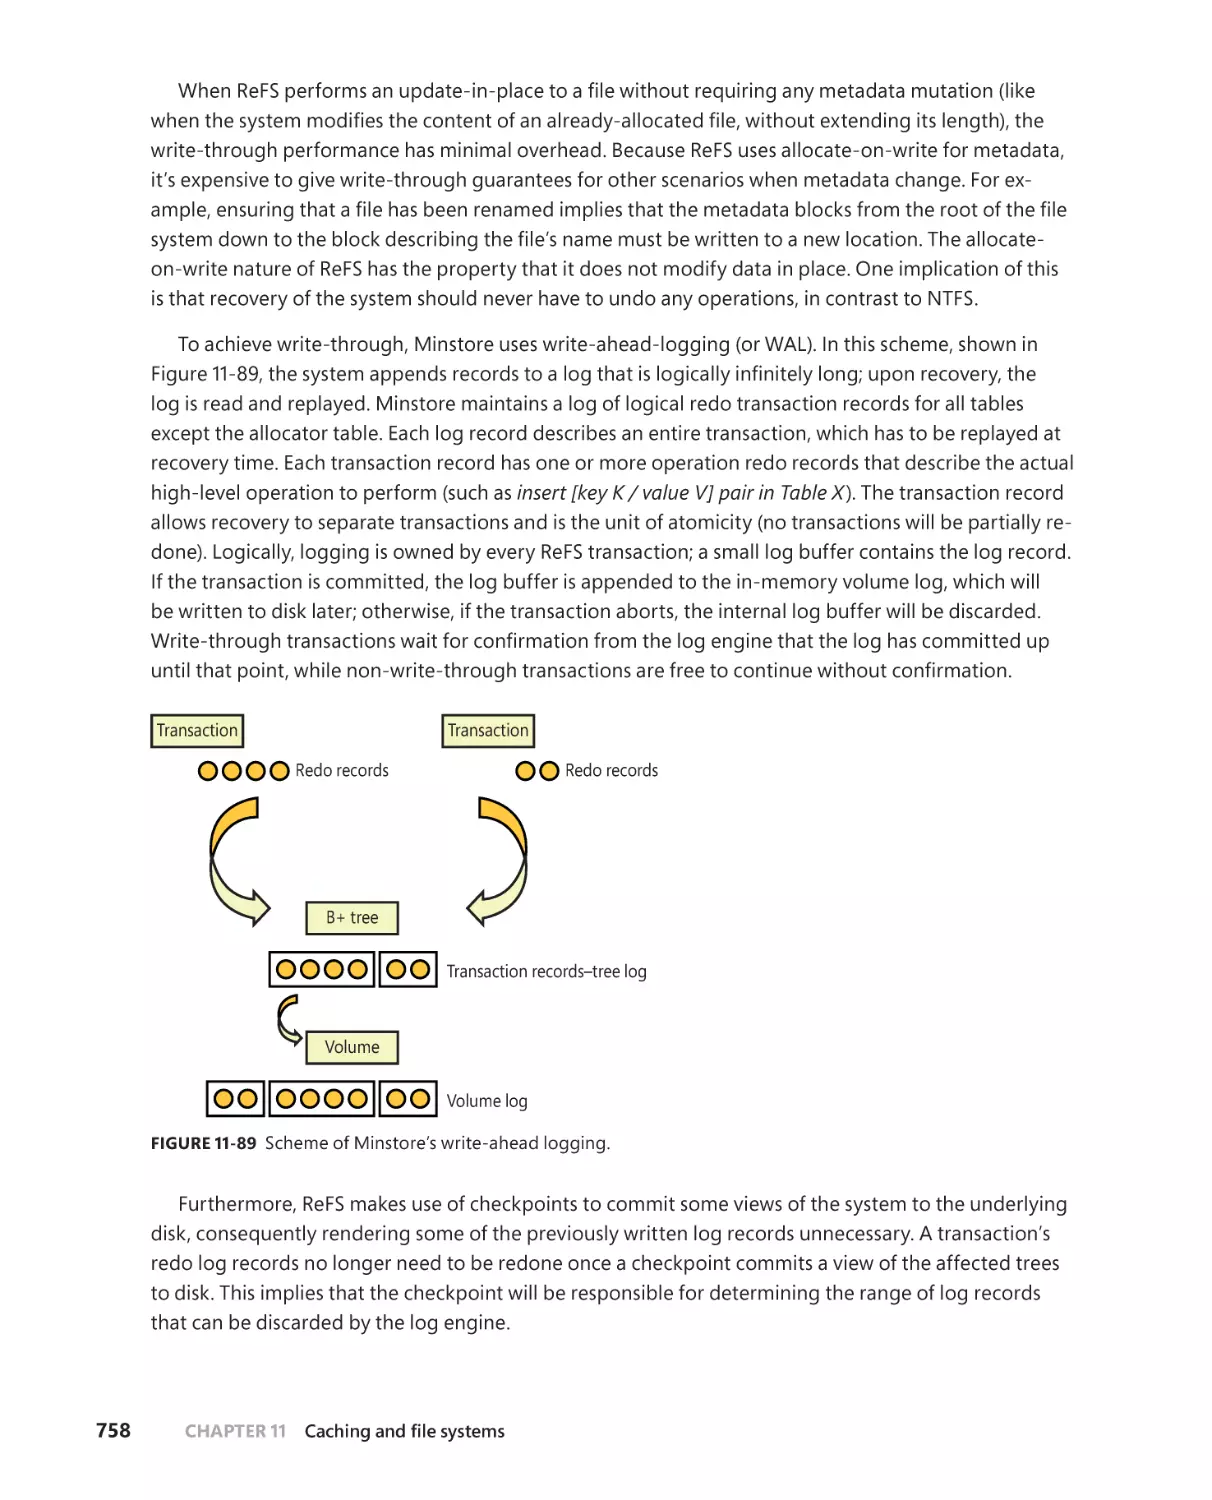
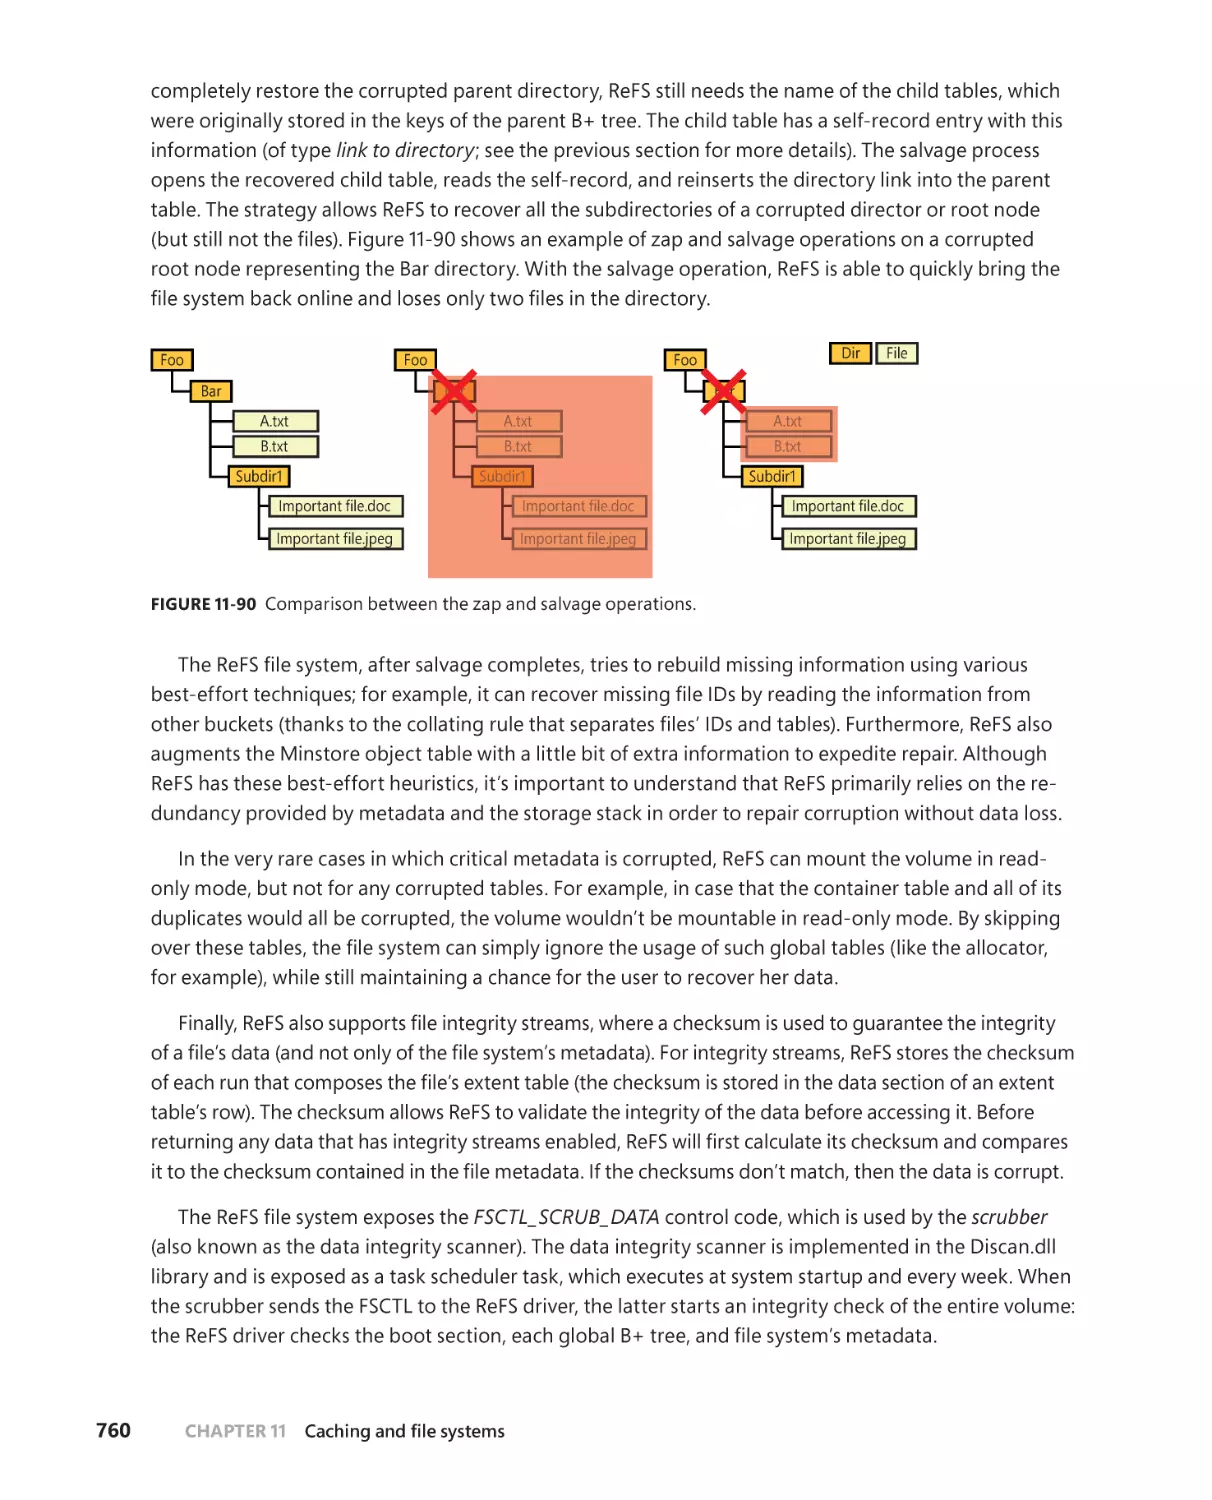
/


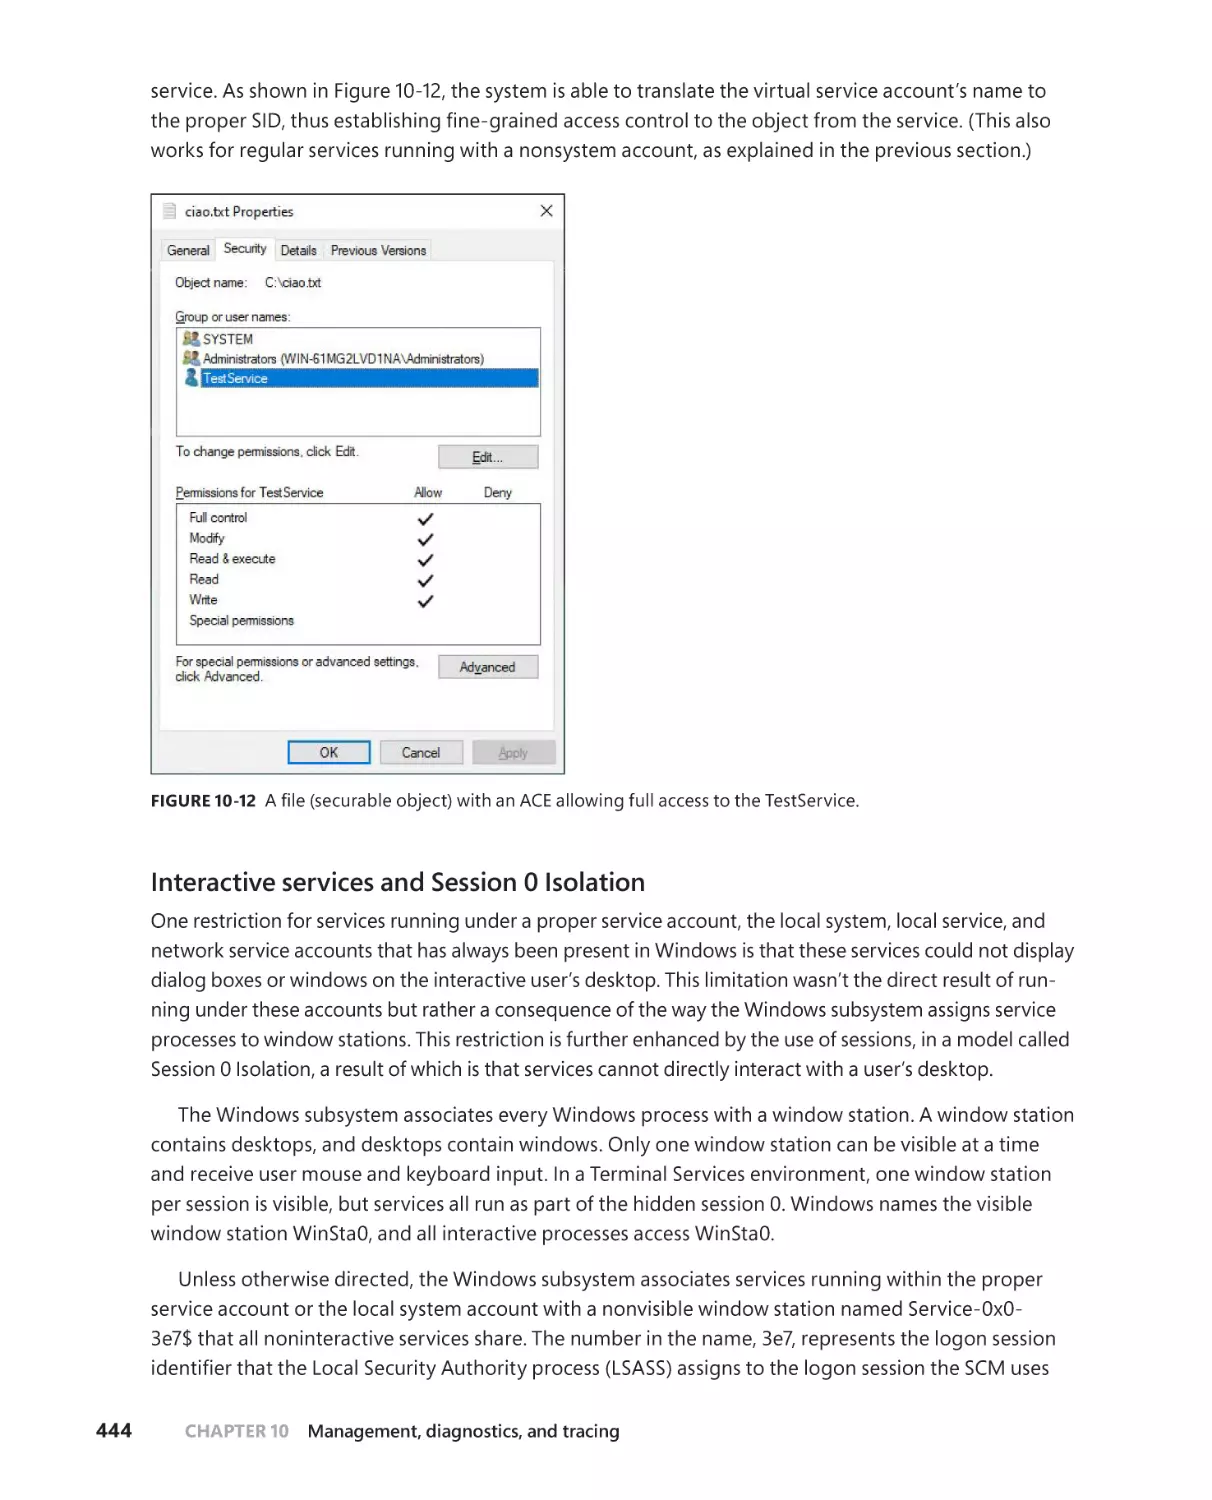


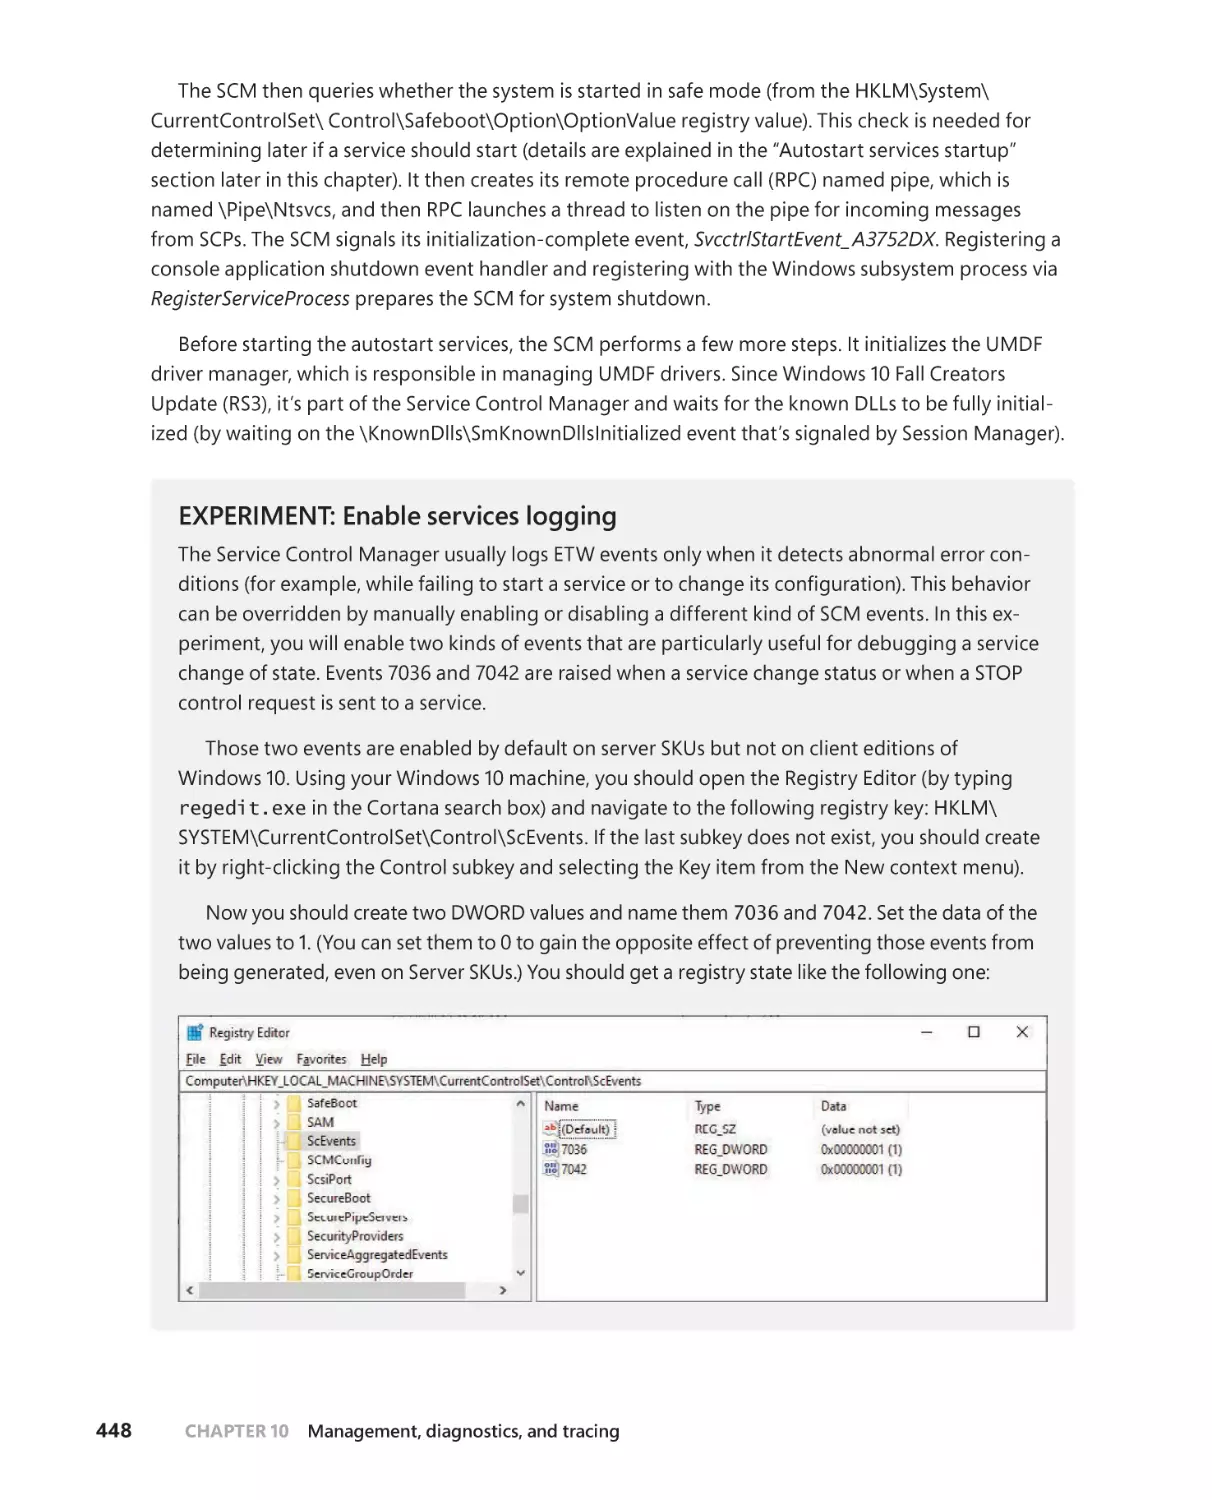


Автор: Ionescu A. Russinovich M.E. Solomon D.A. Allievi A.
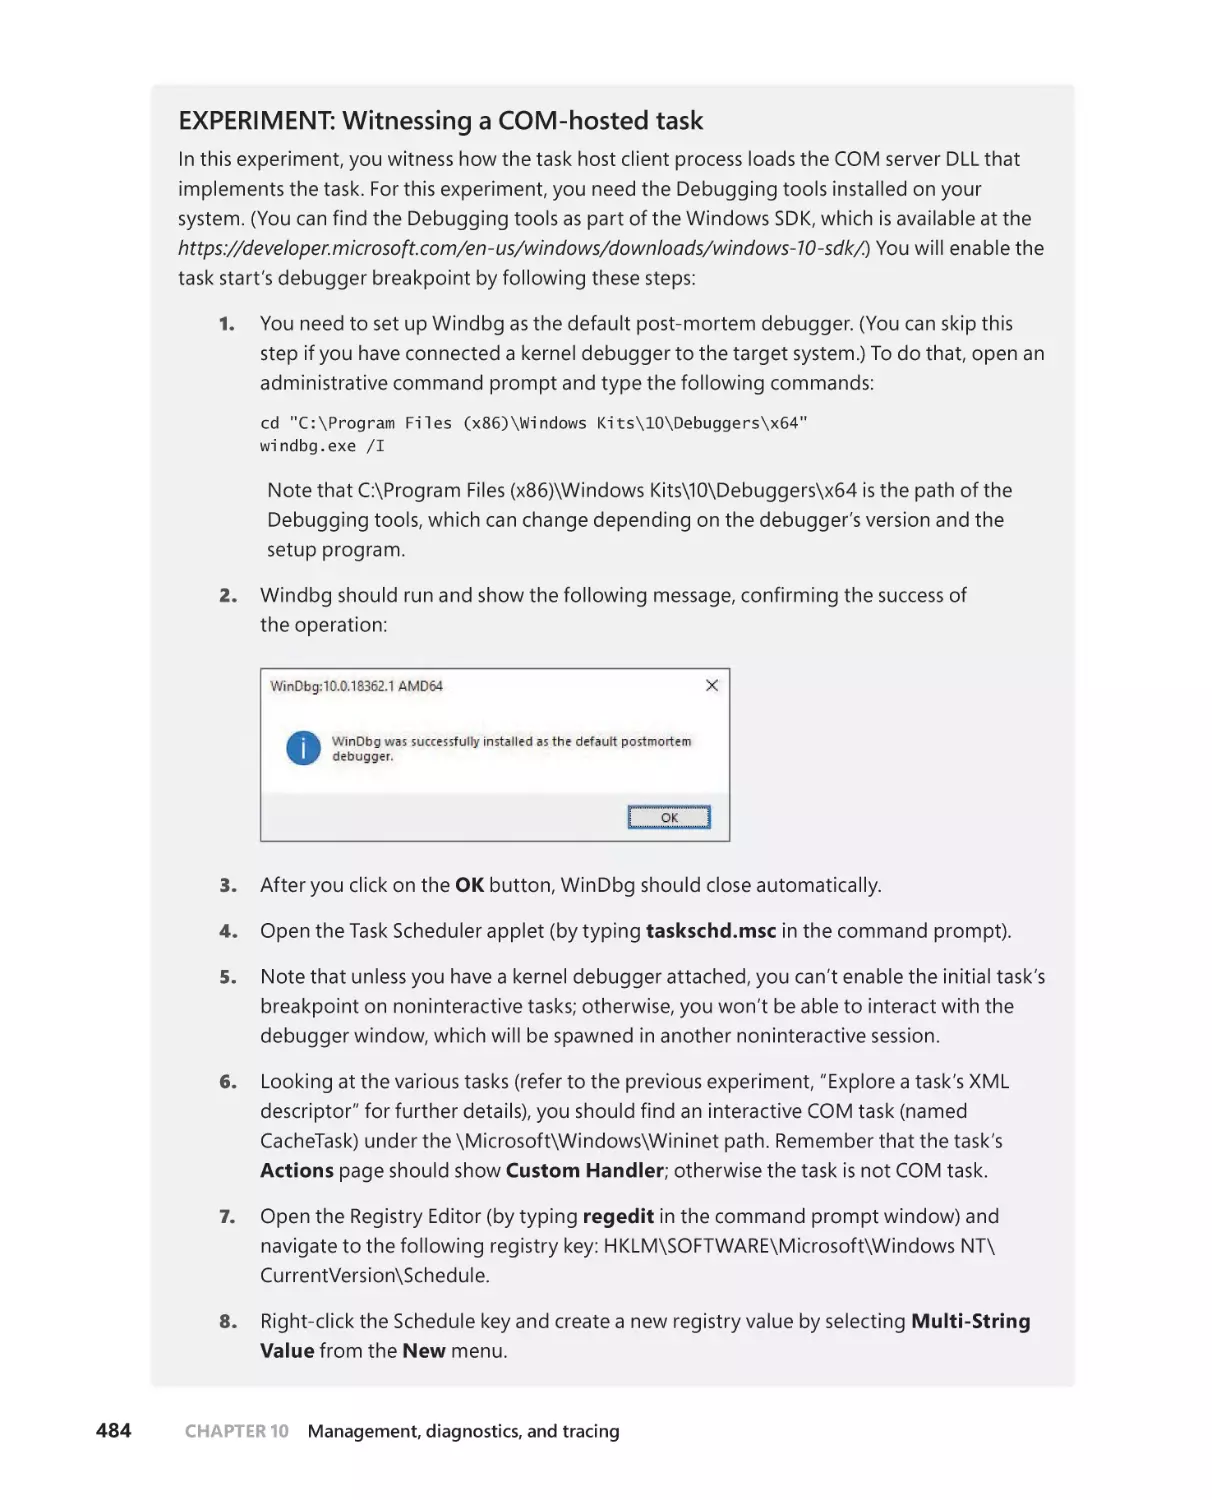
Теги: windows computer science operating systems
ISBN: 978-0-13-546240-9
Год: 2022


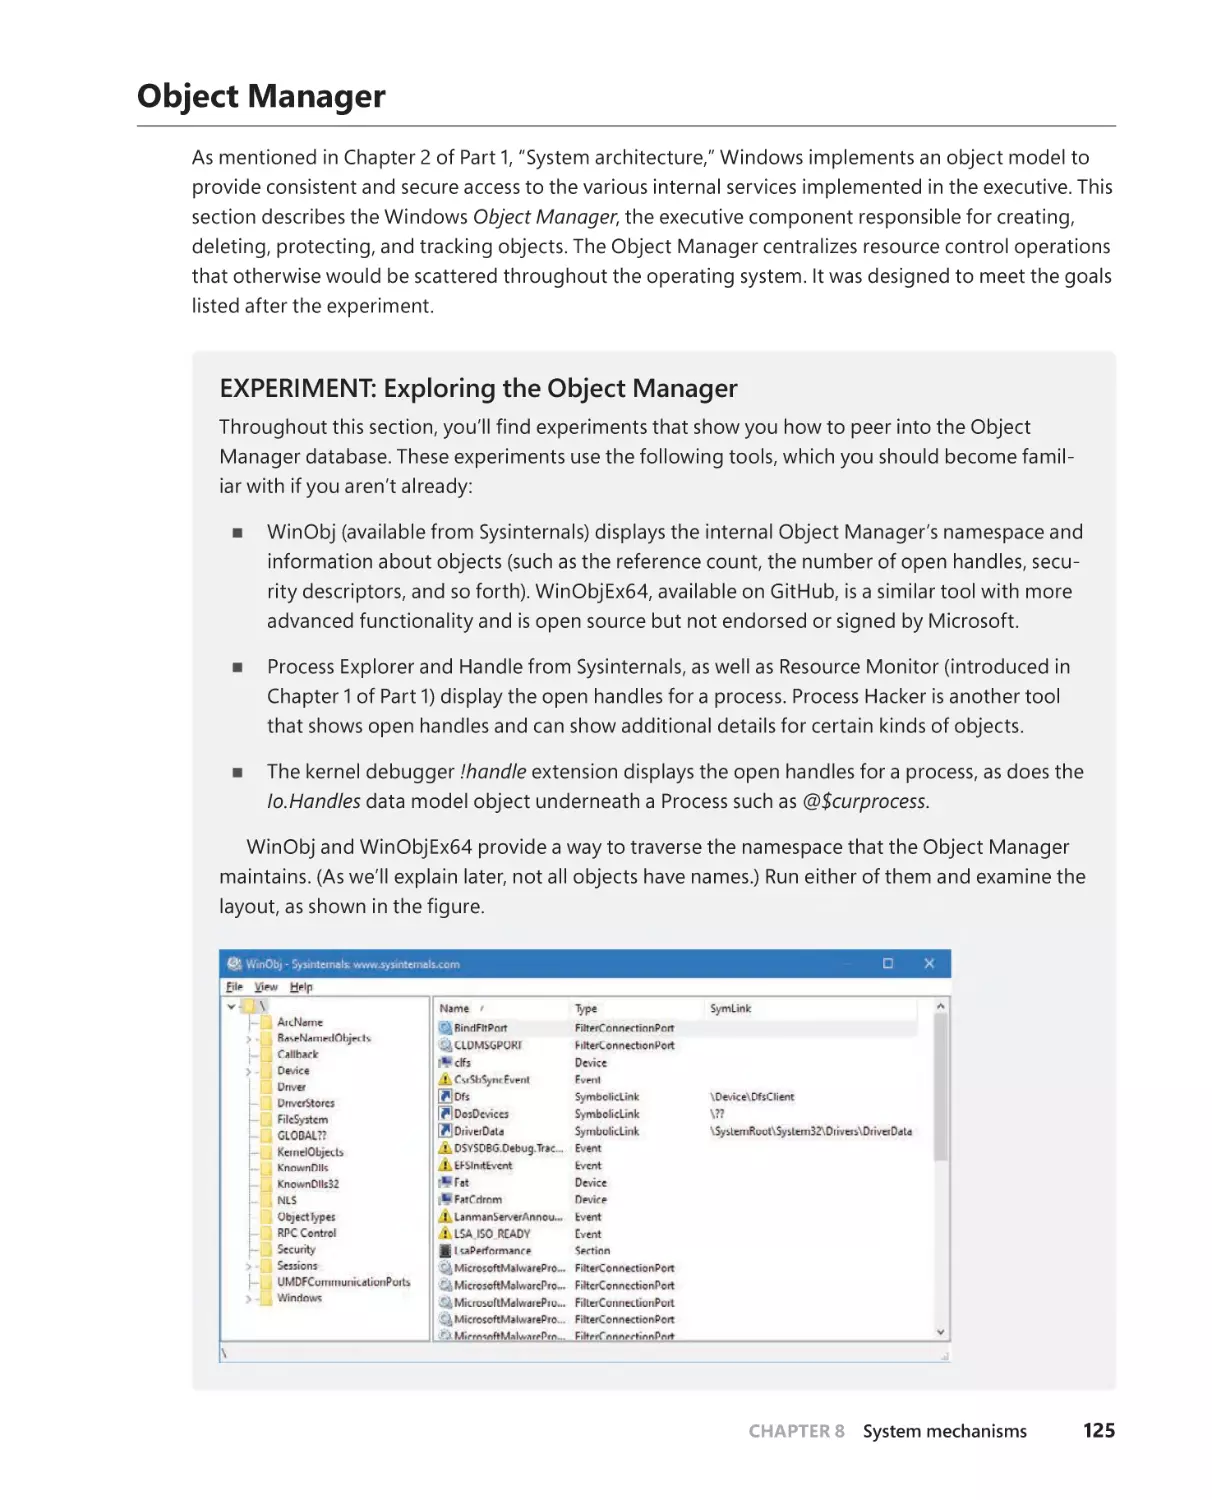
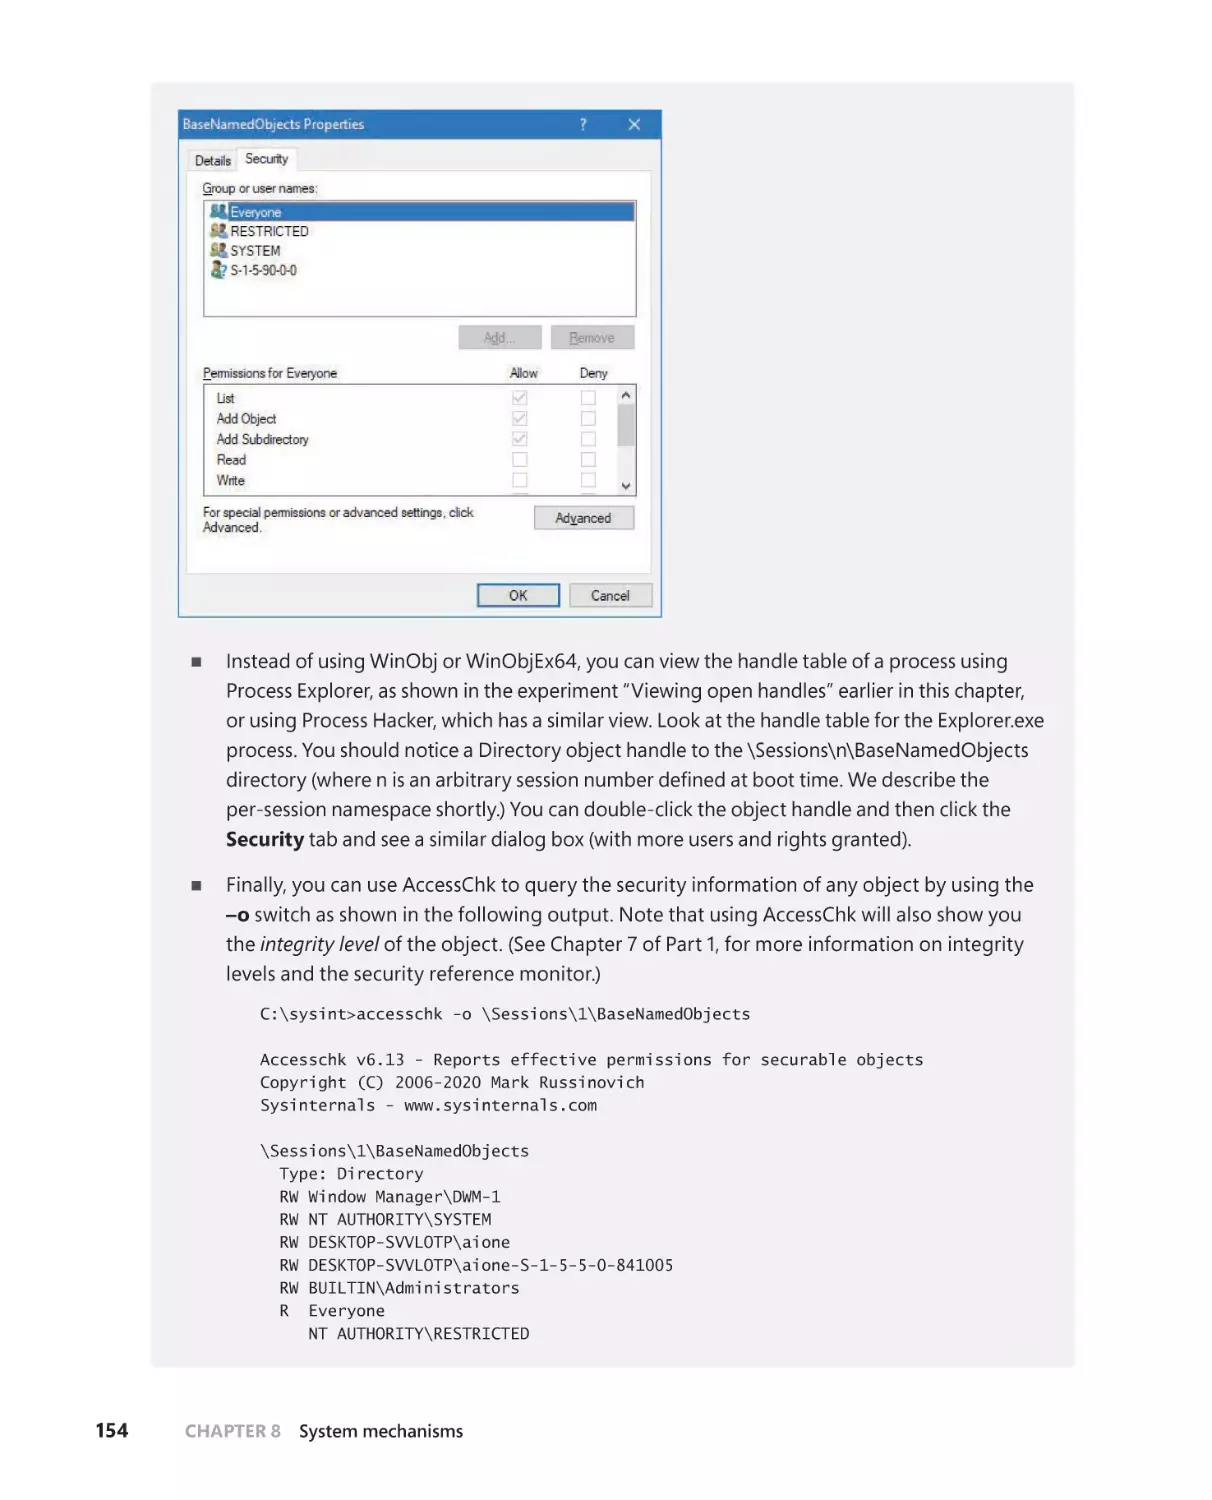
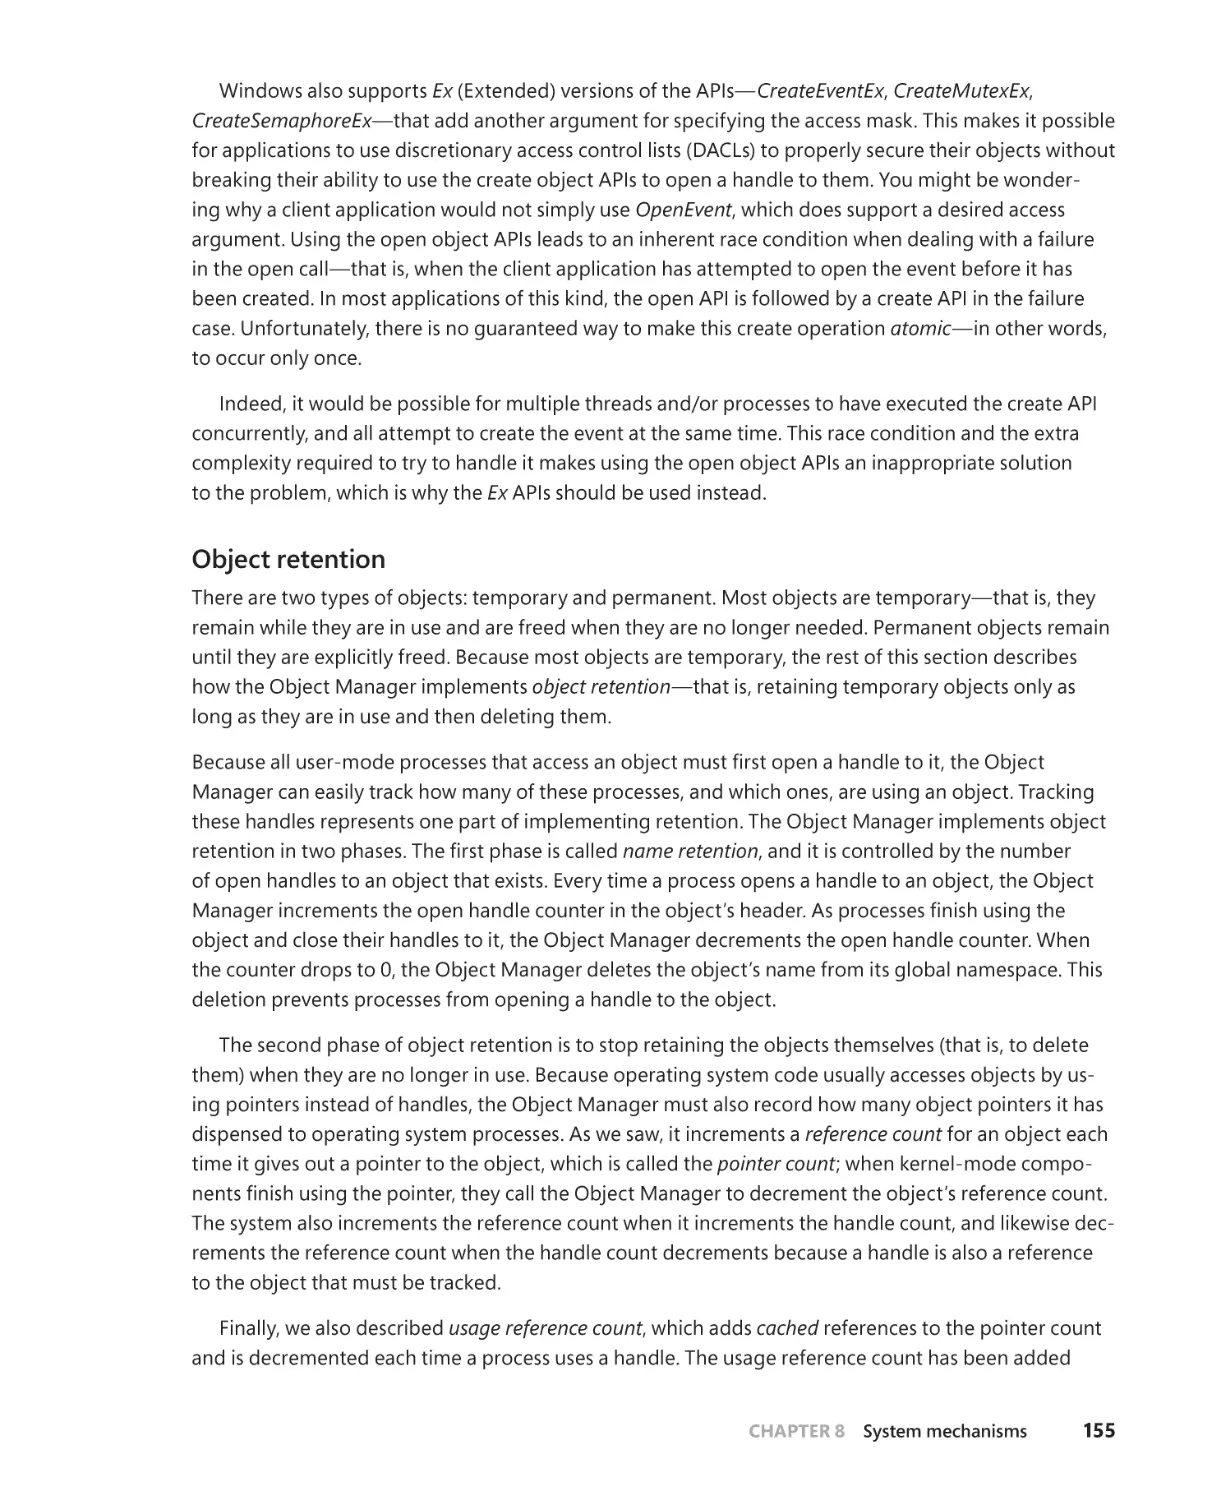
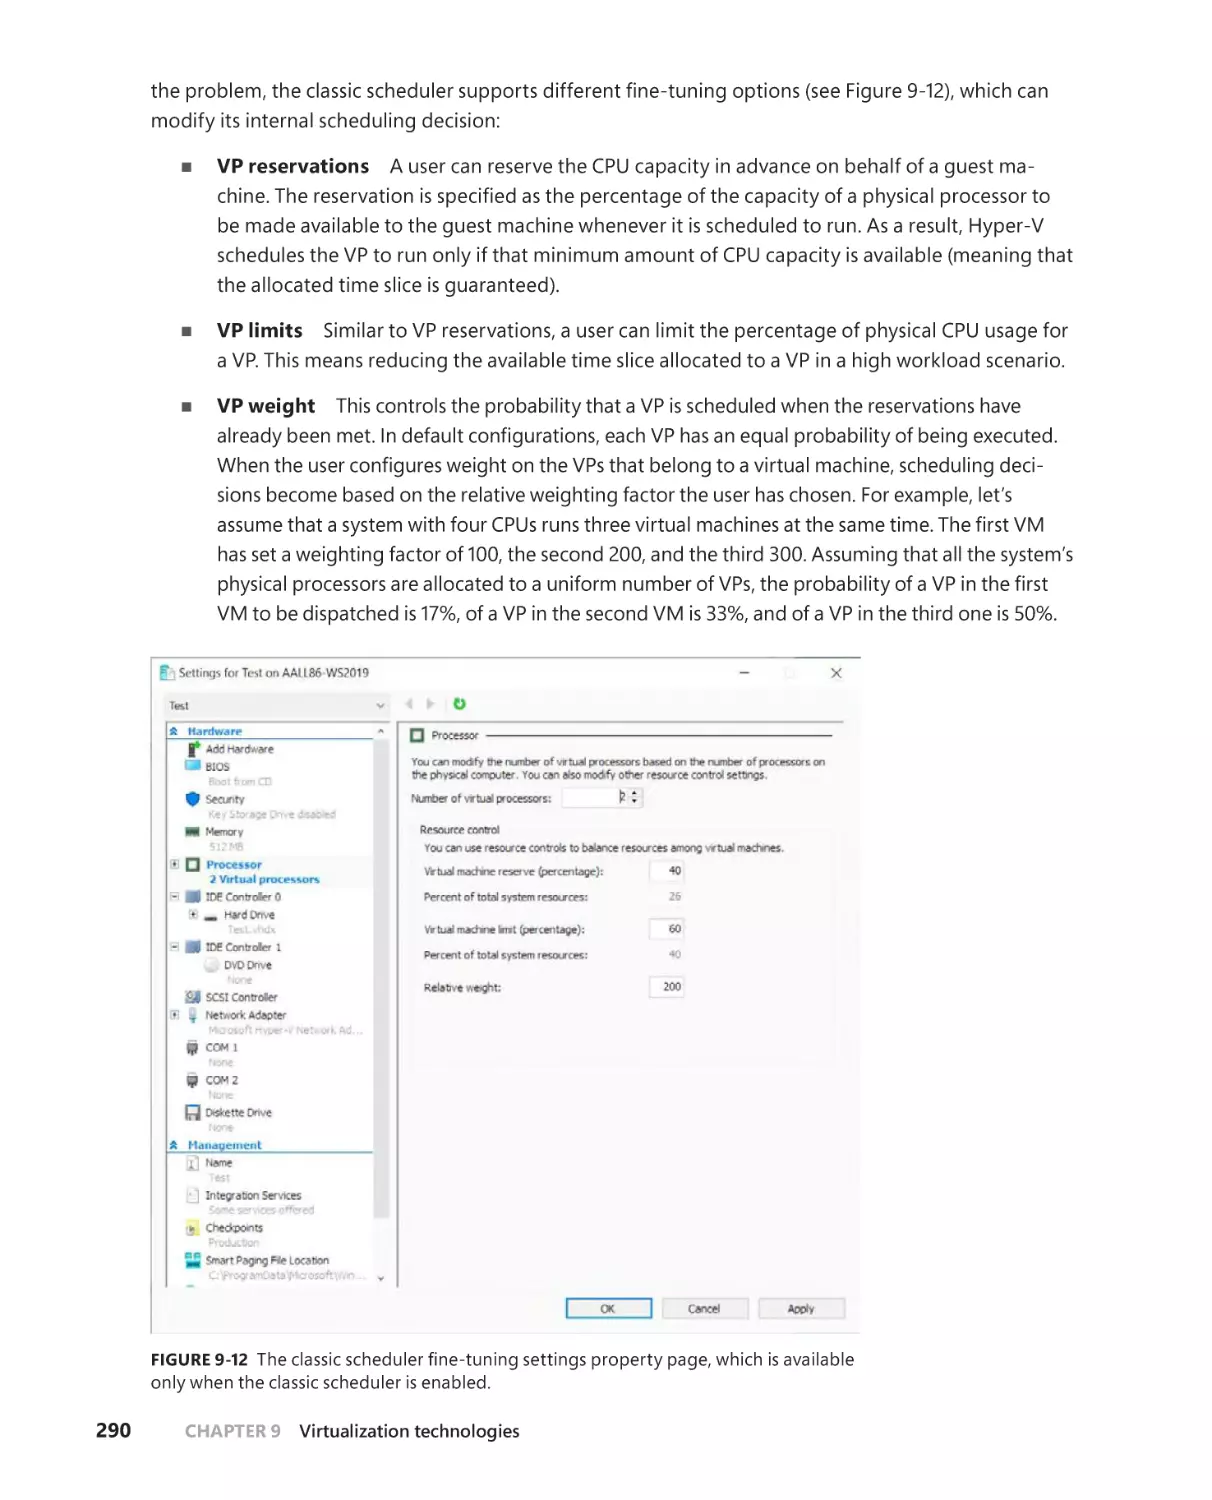
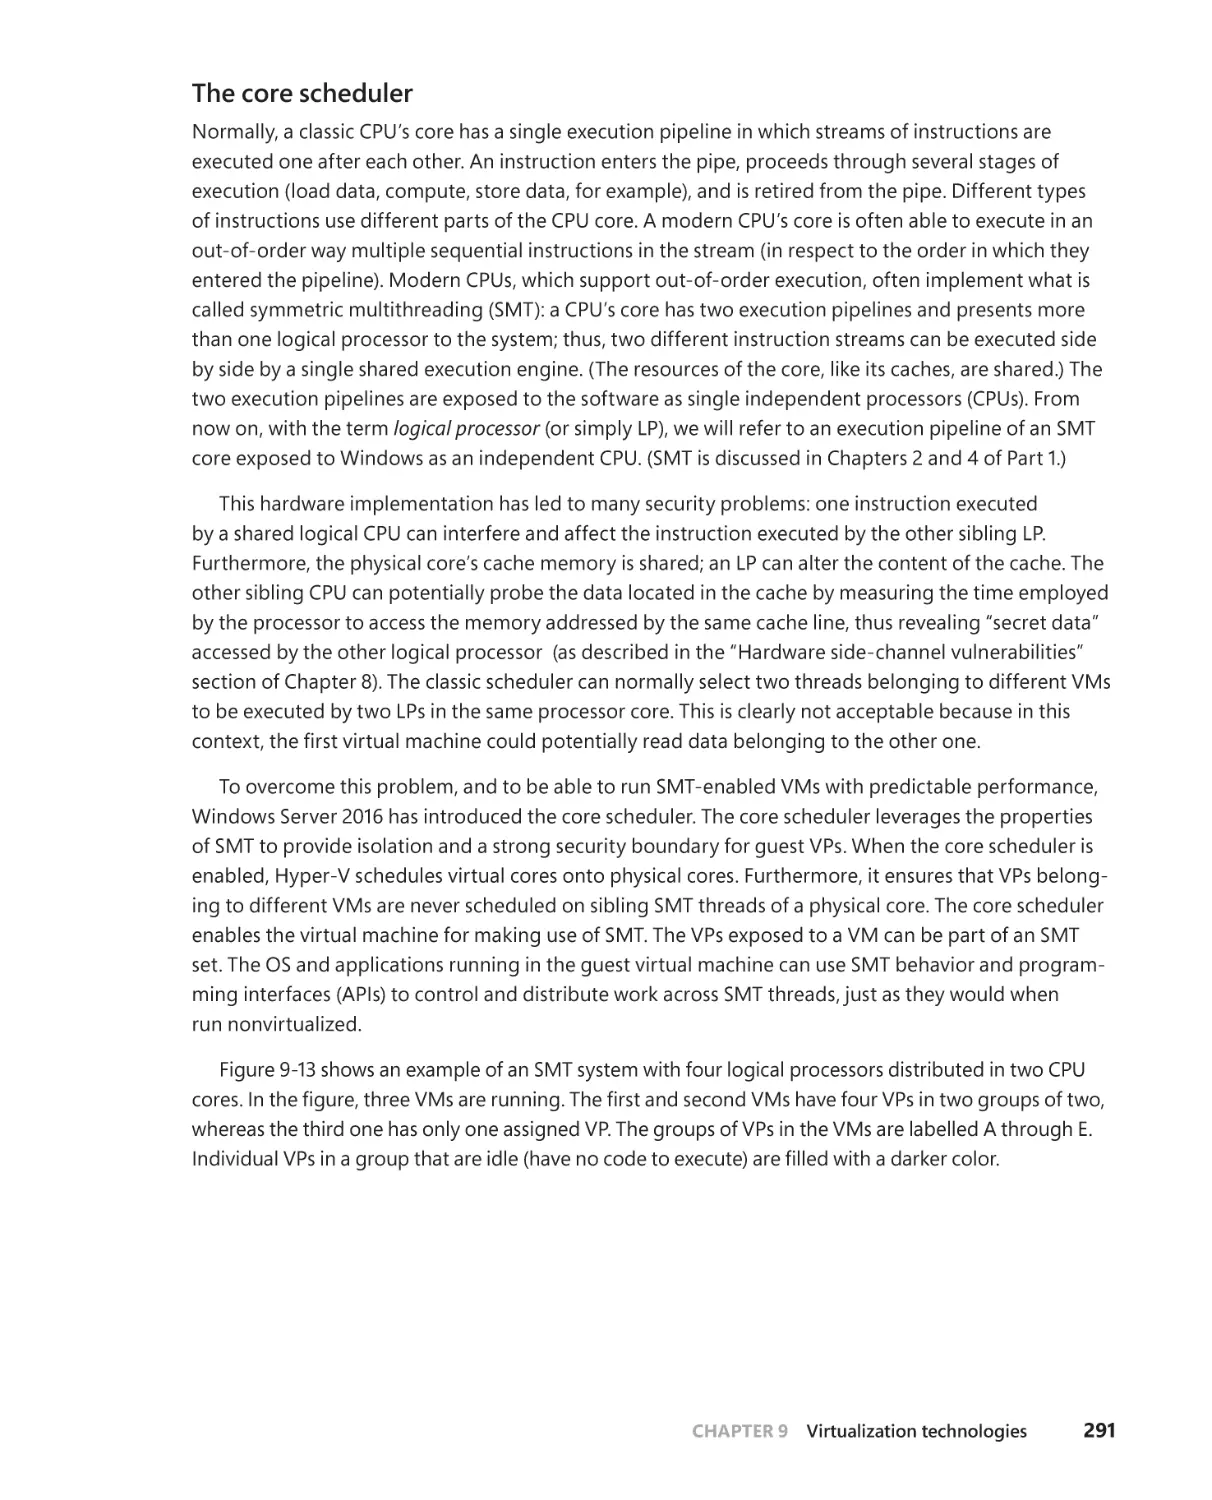
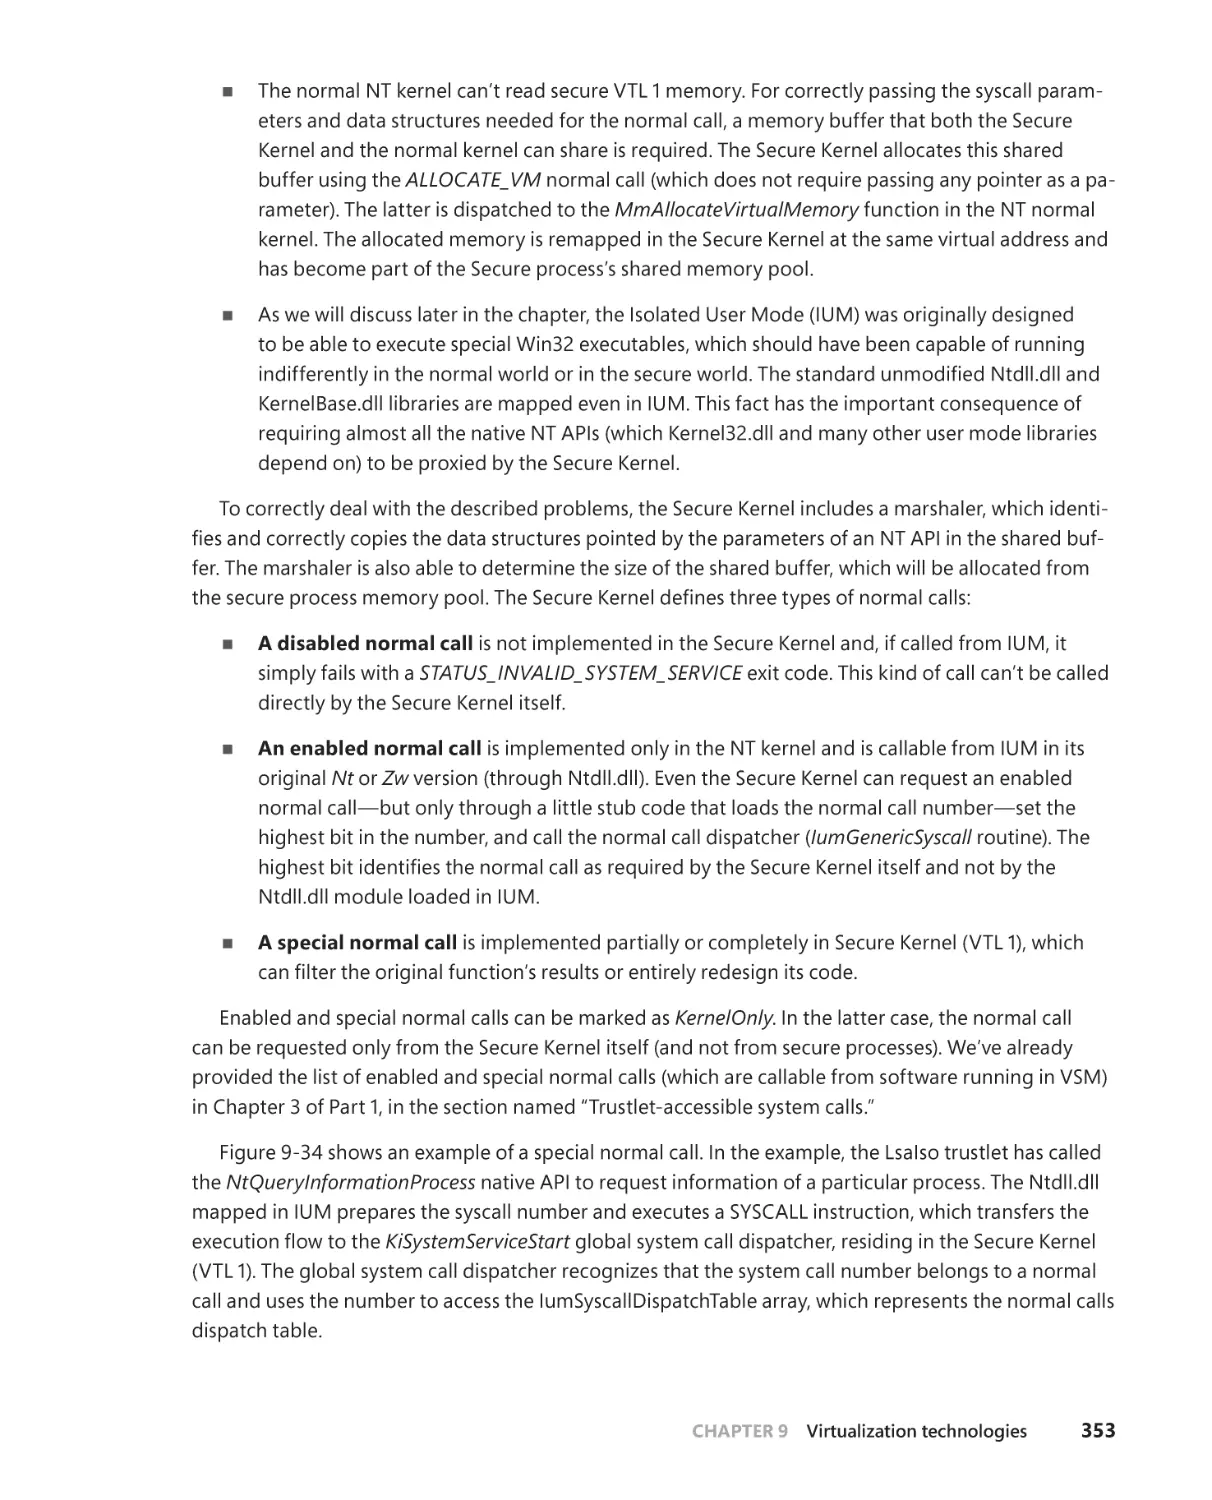
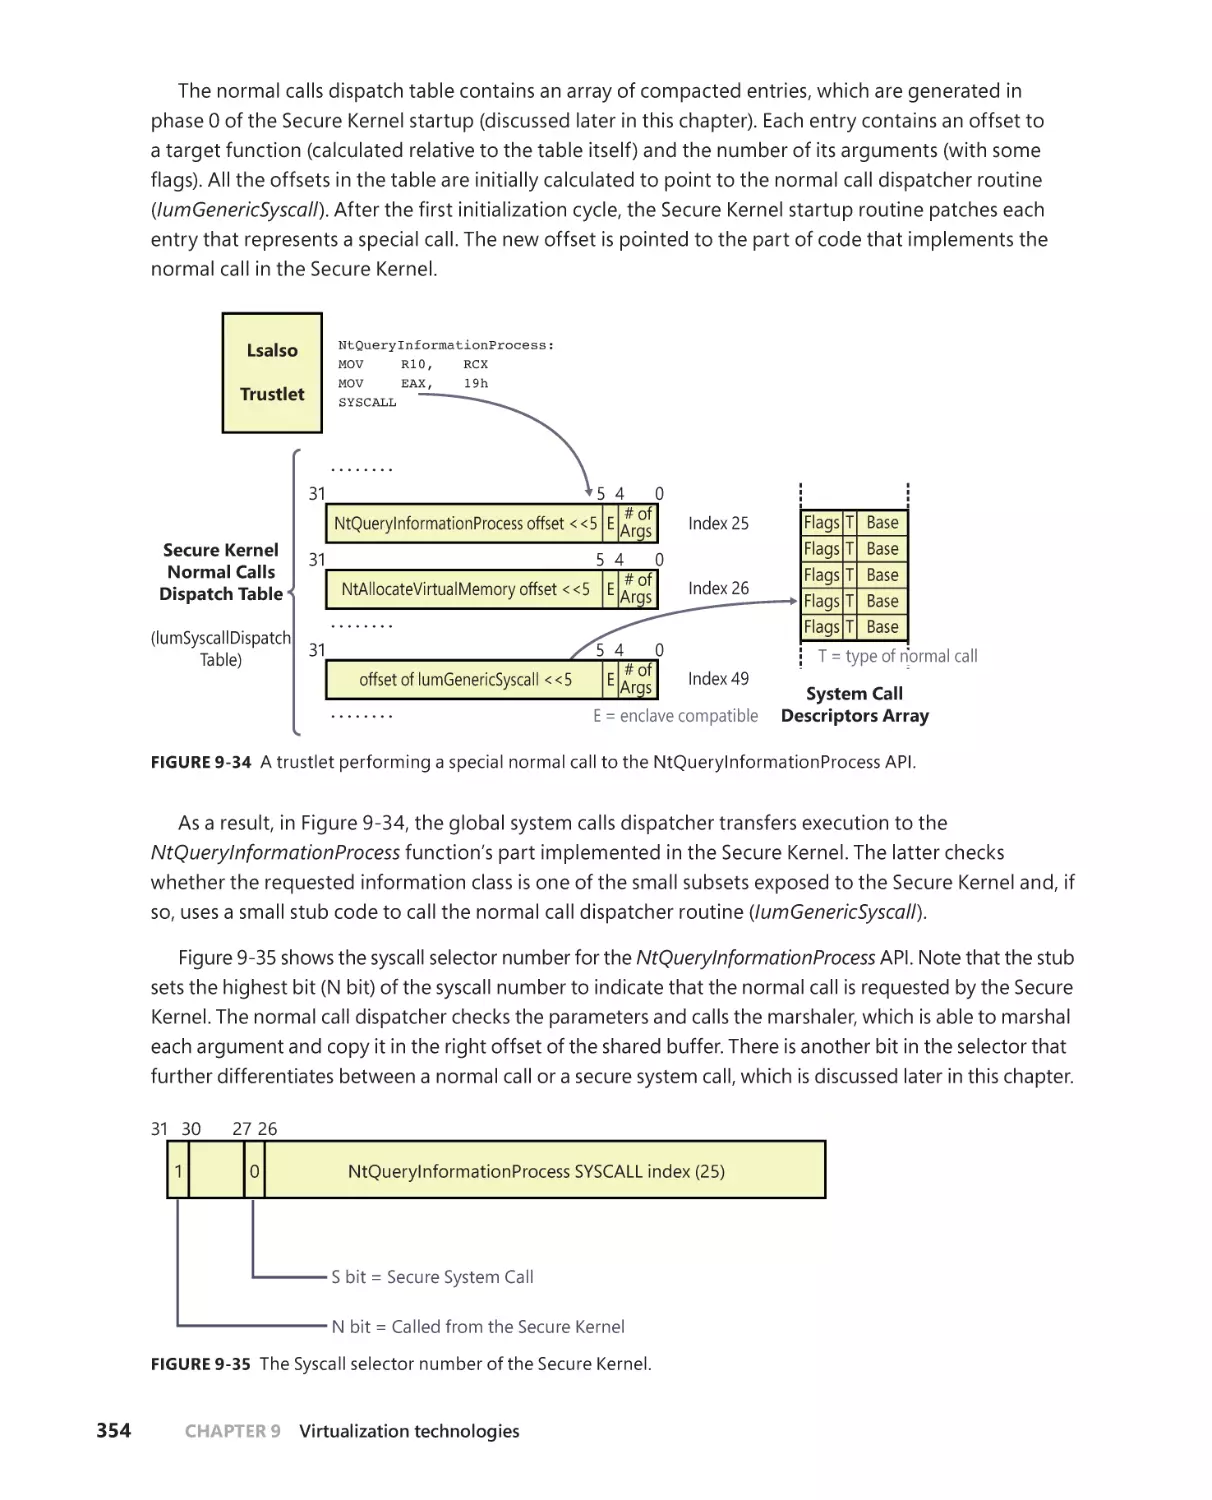
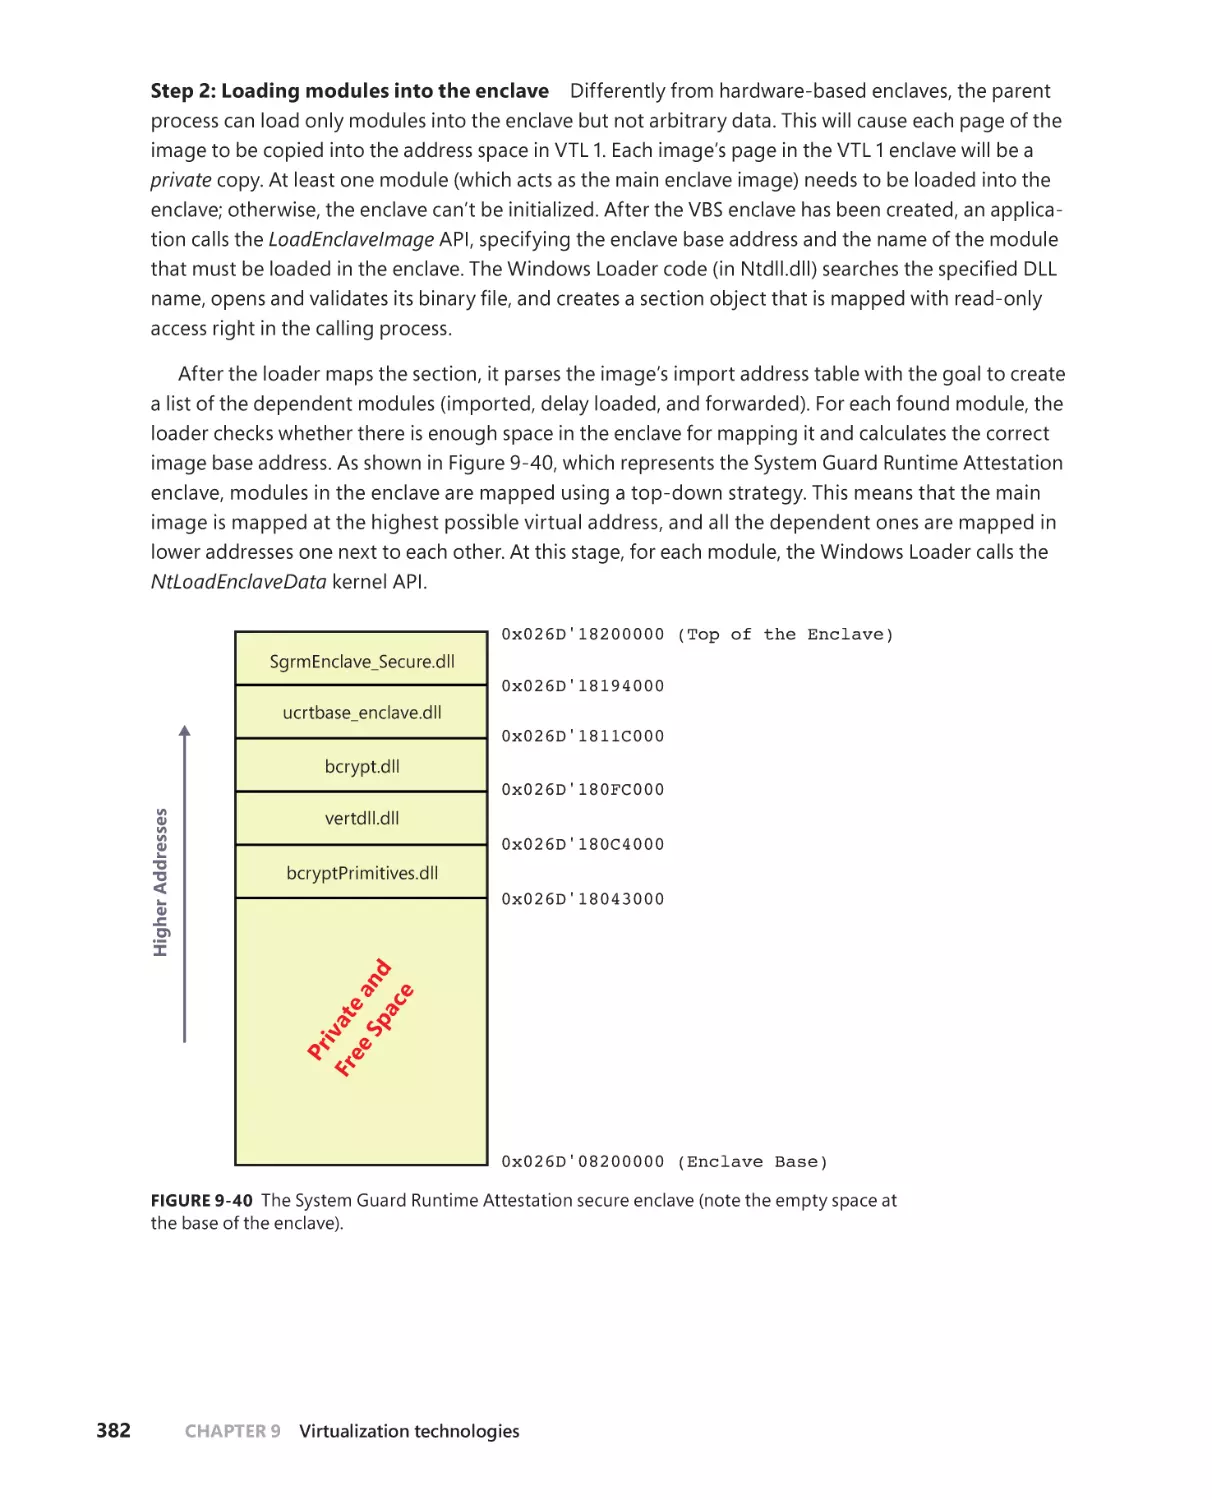
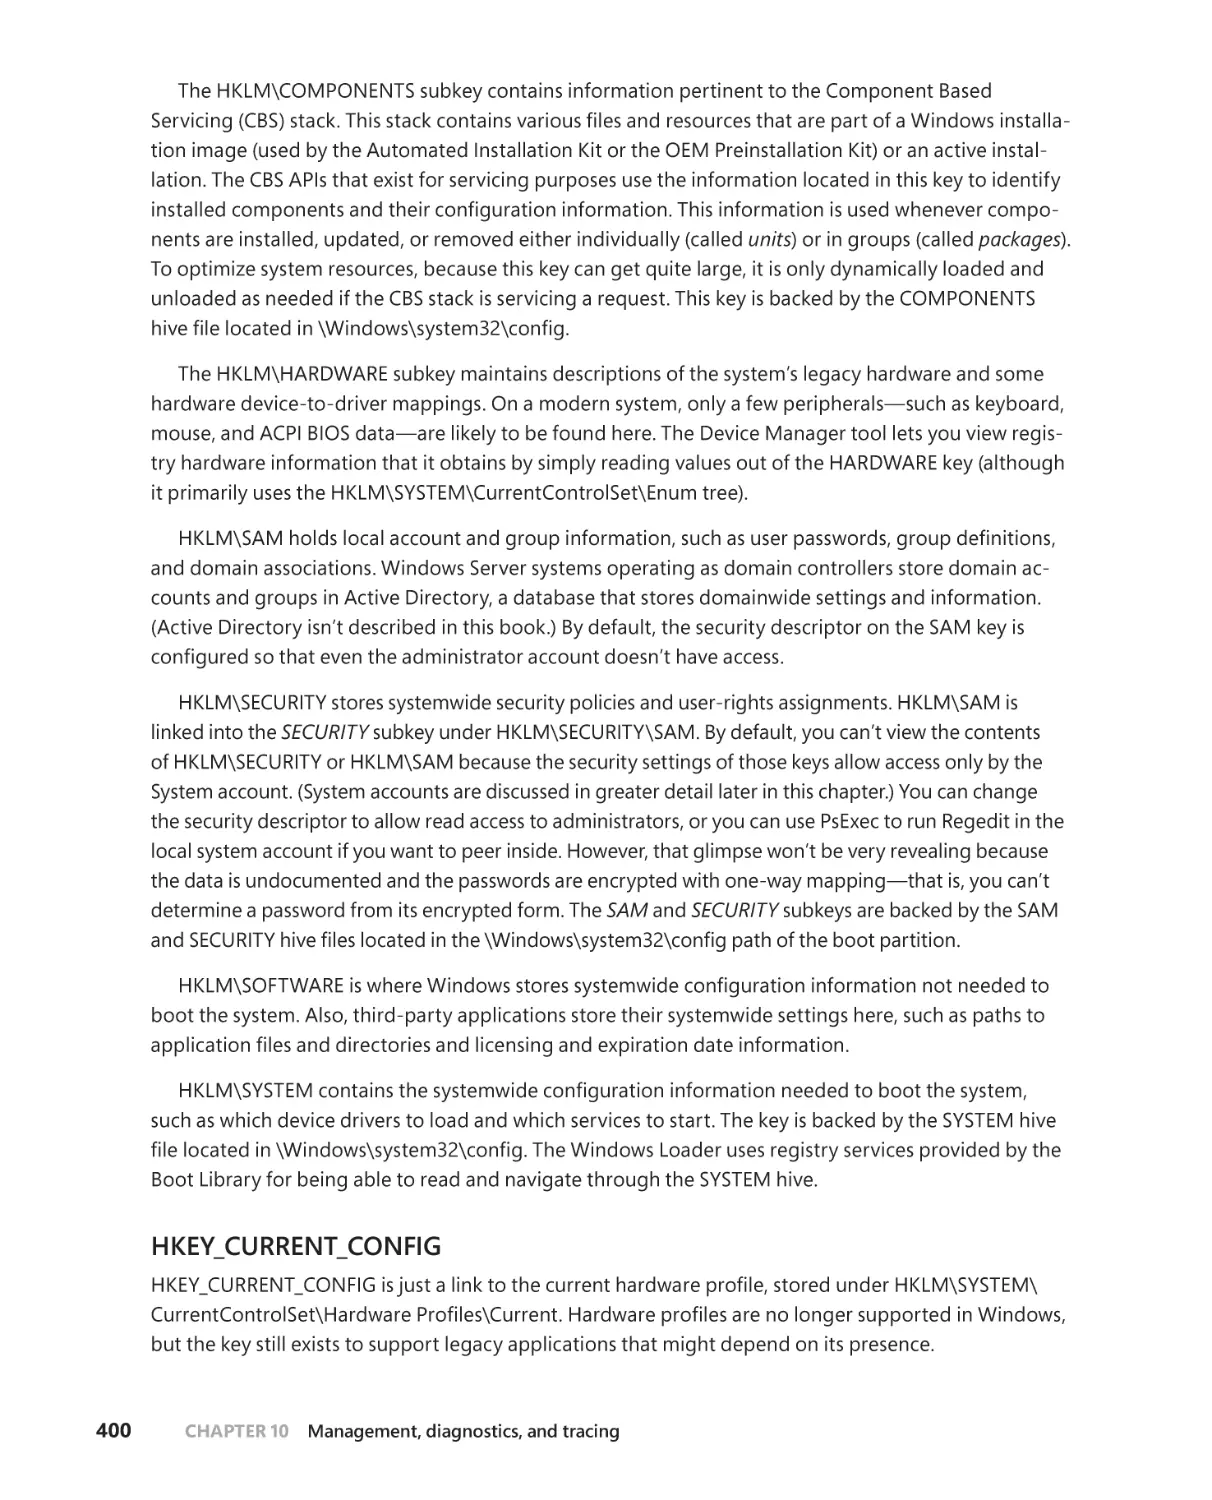
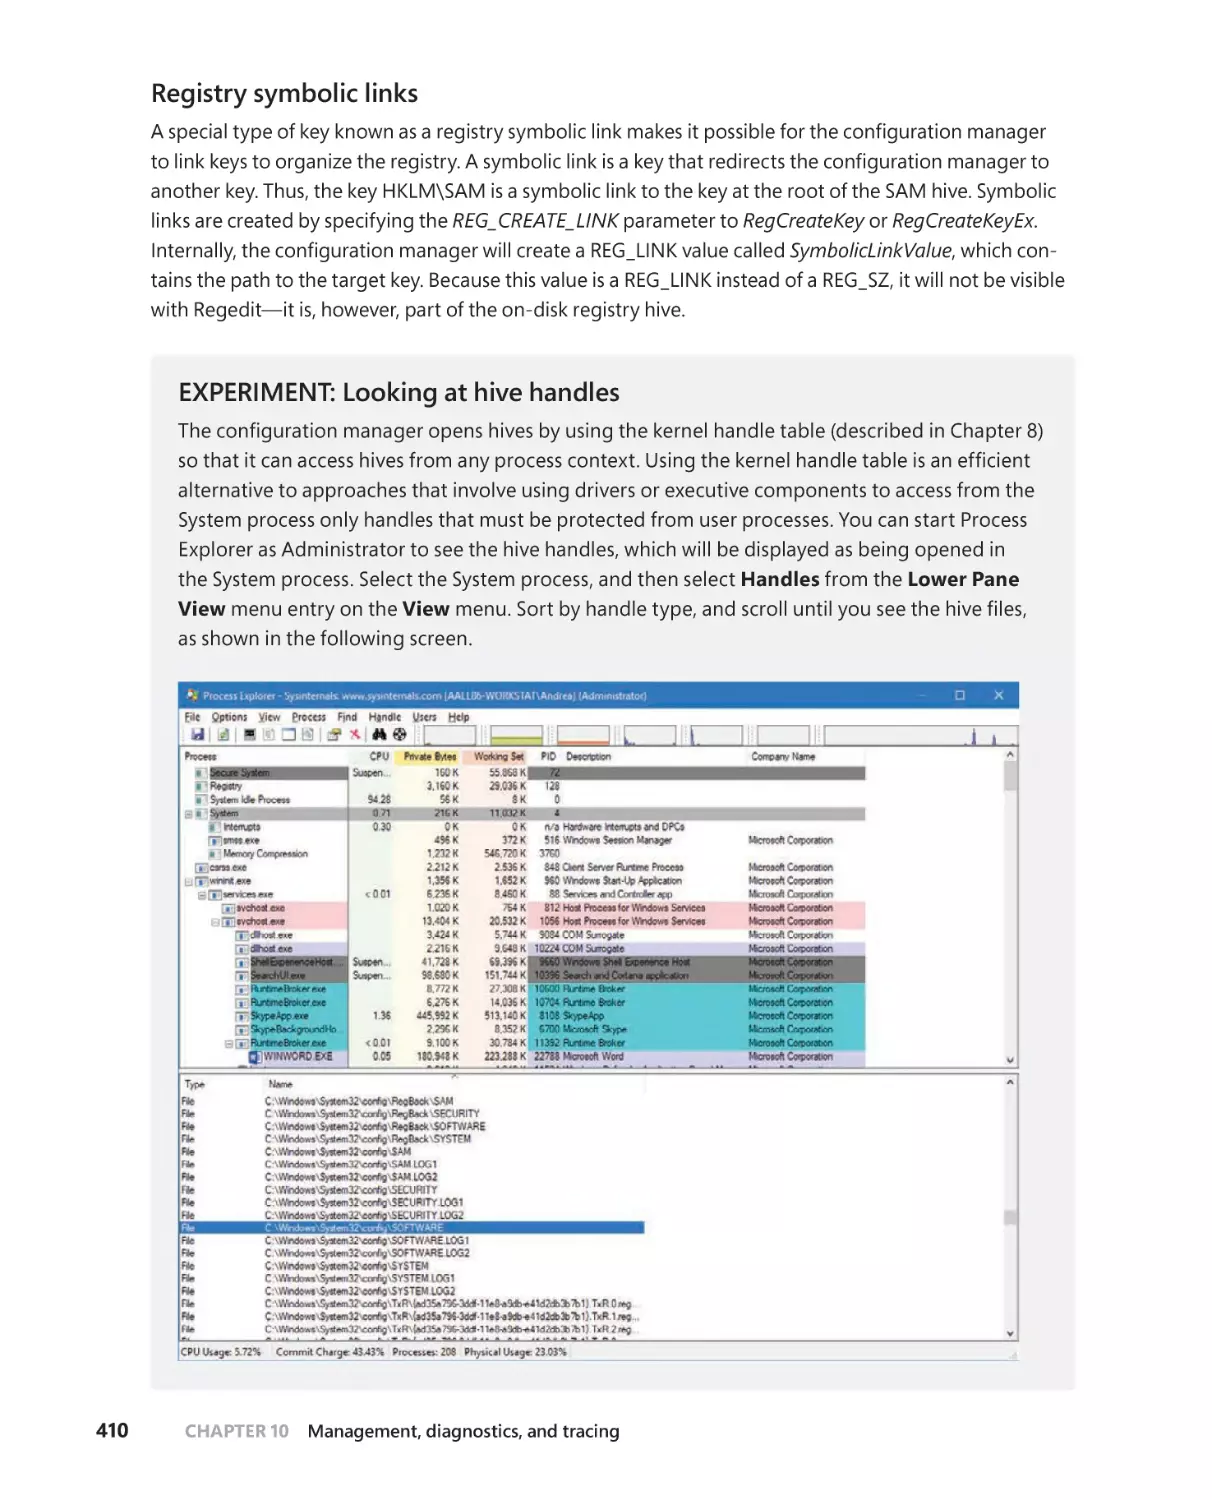
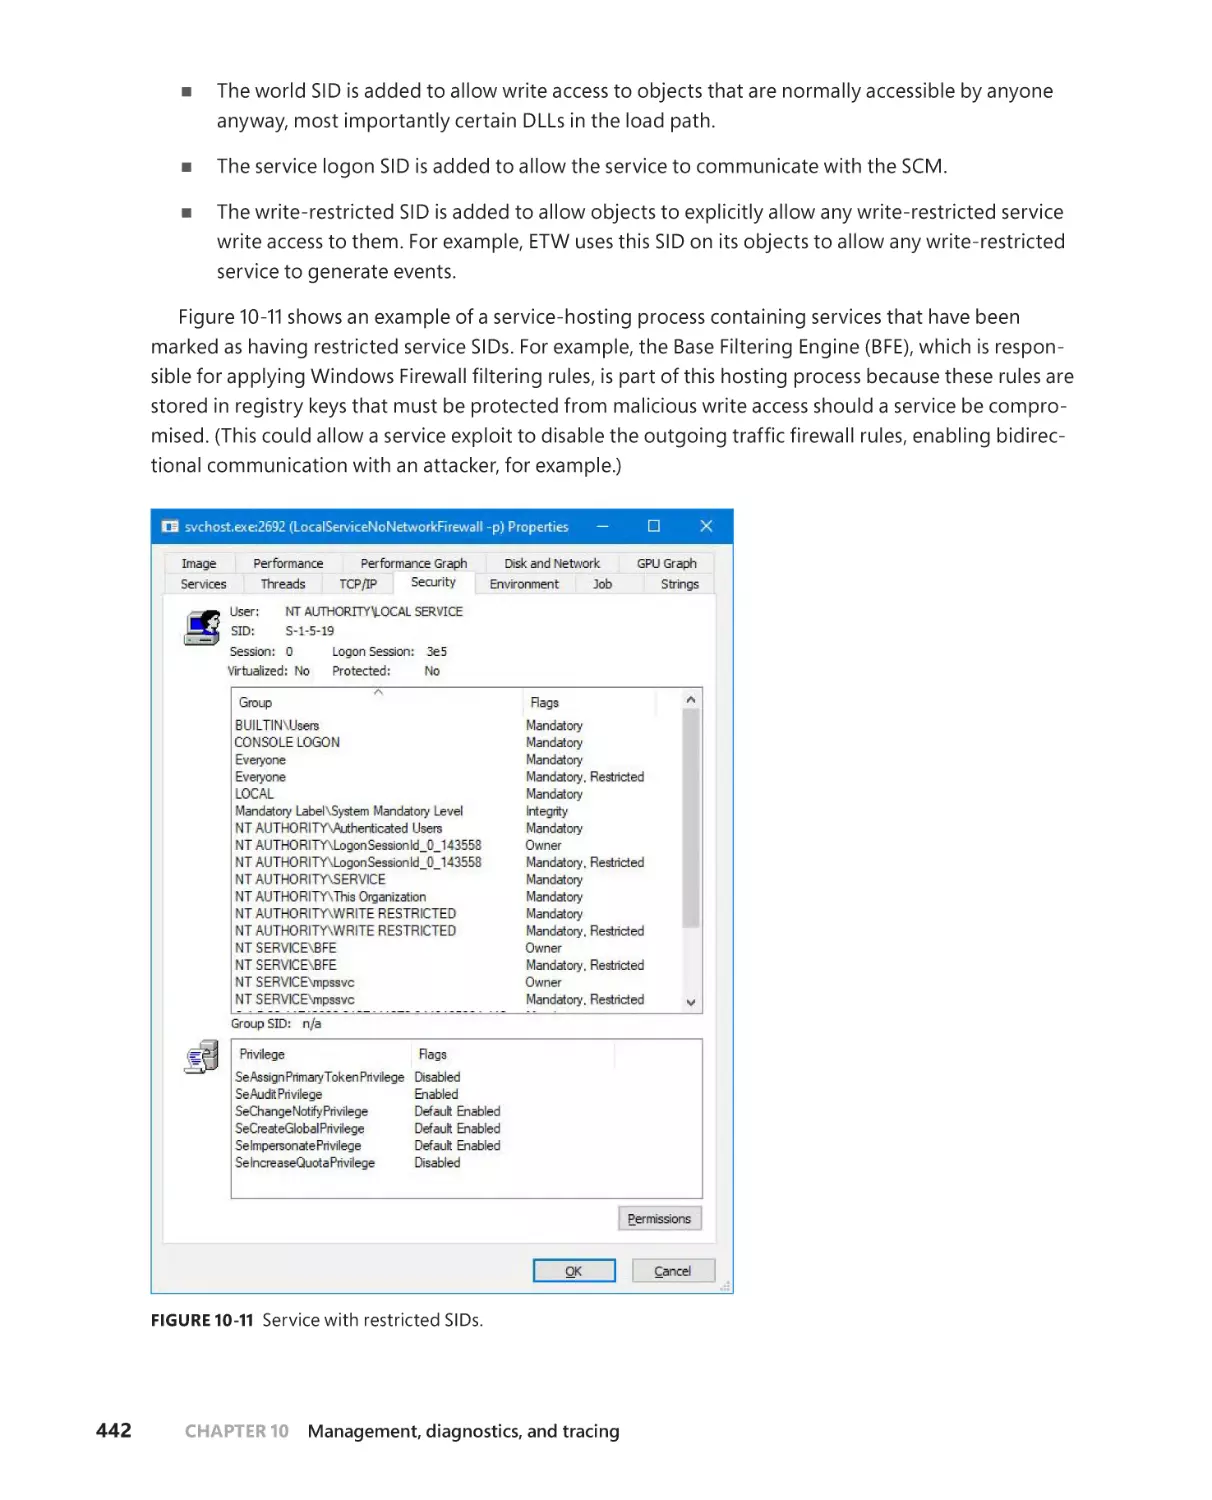
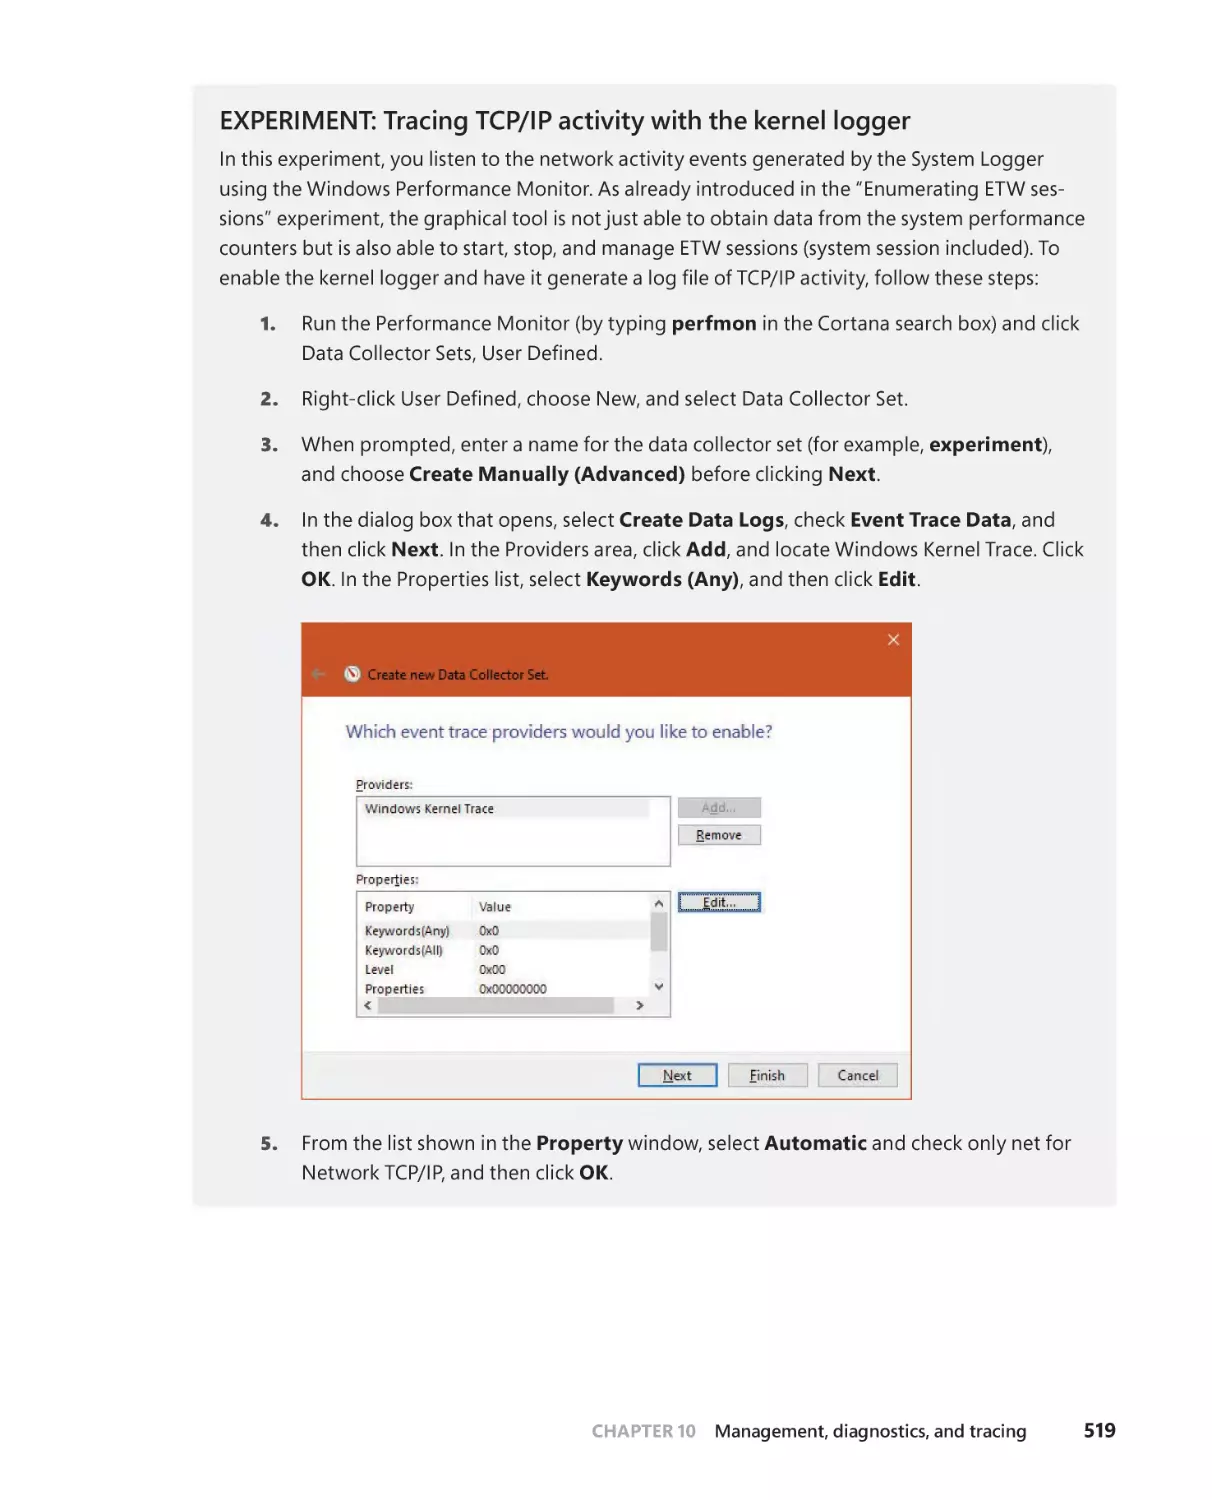
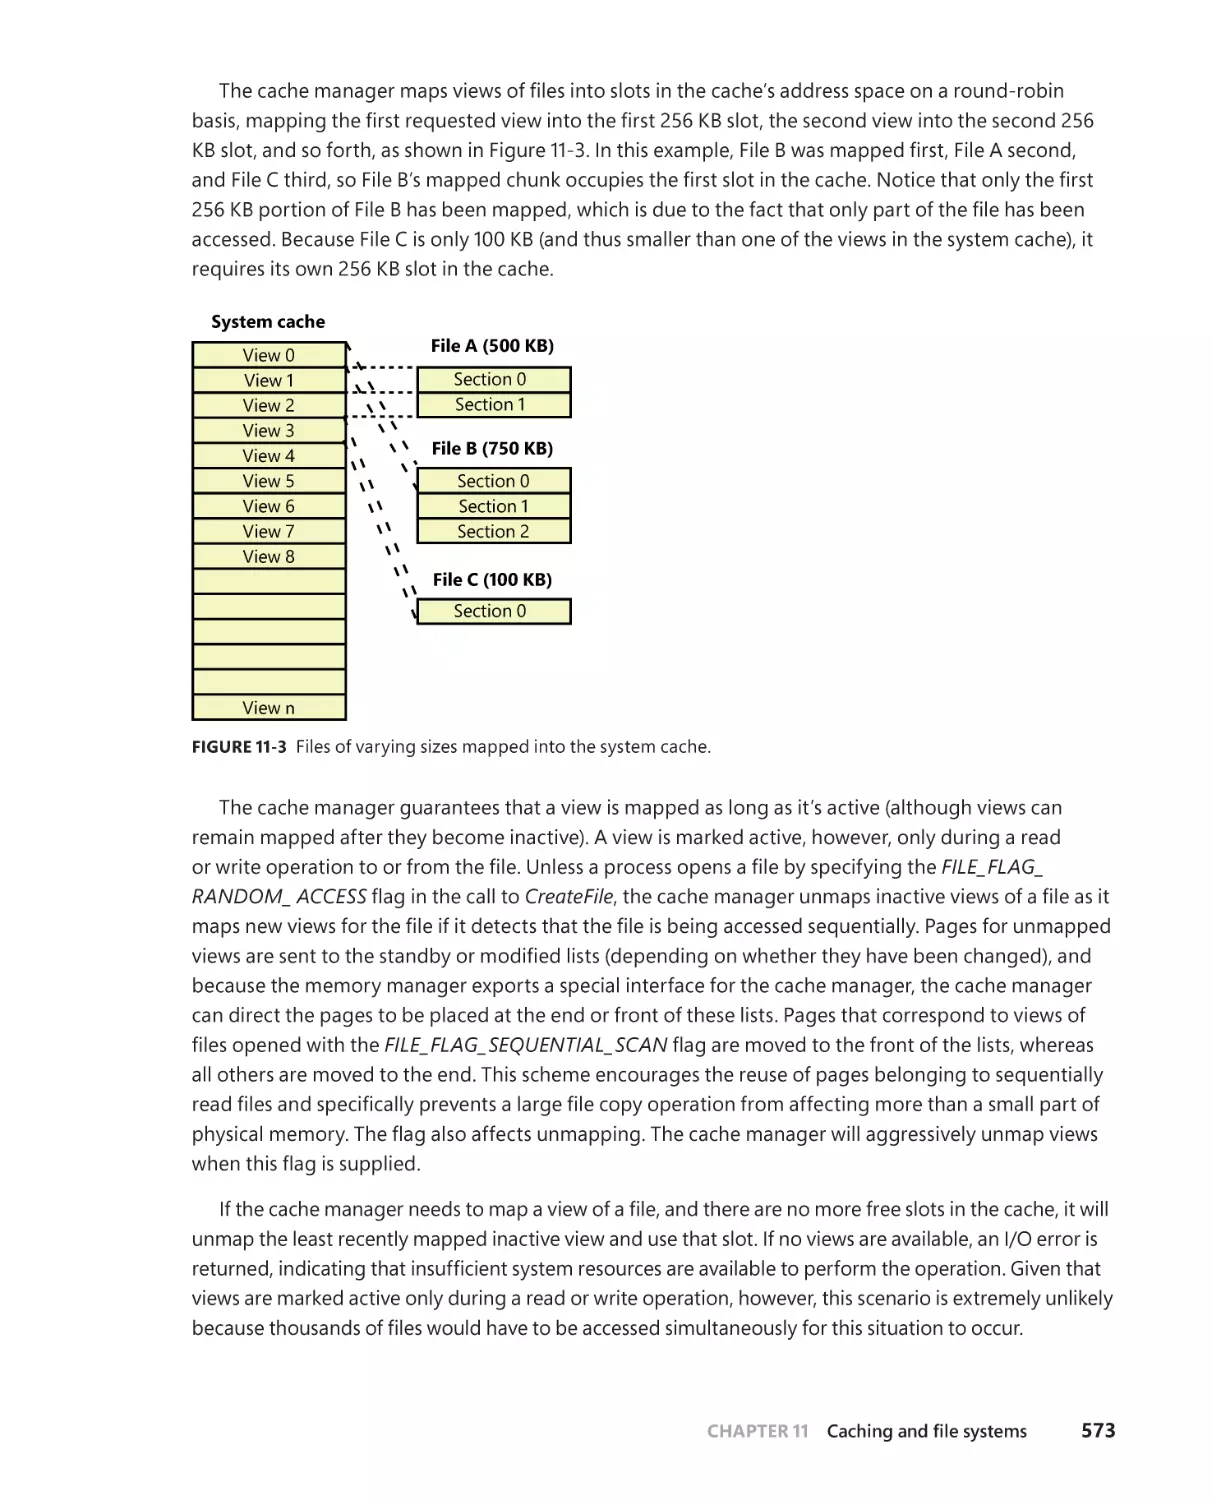
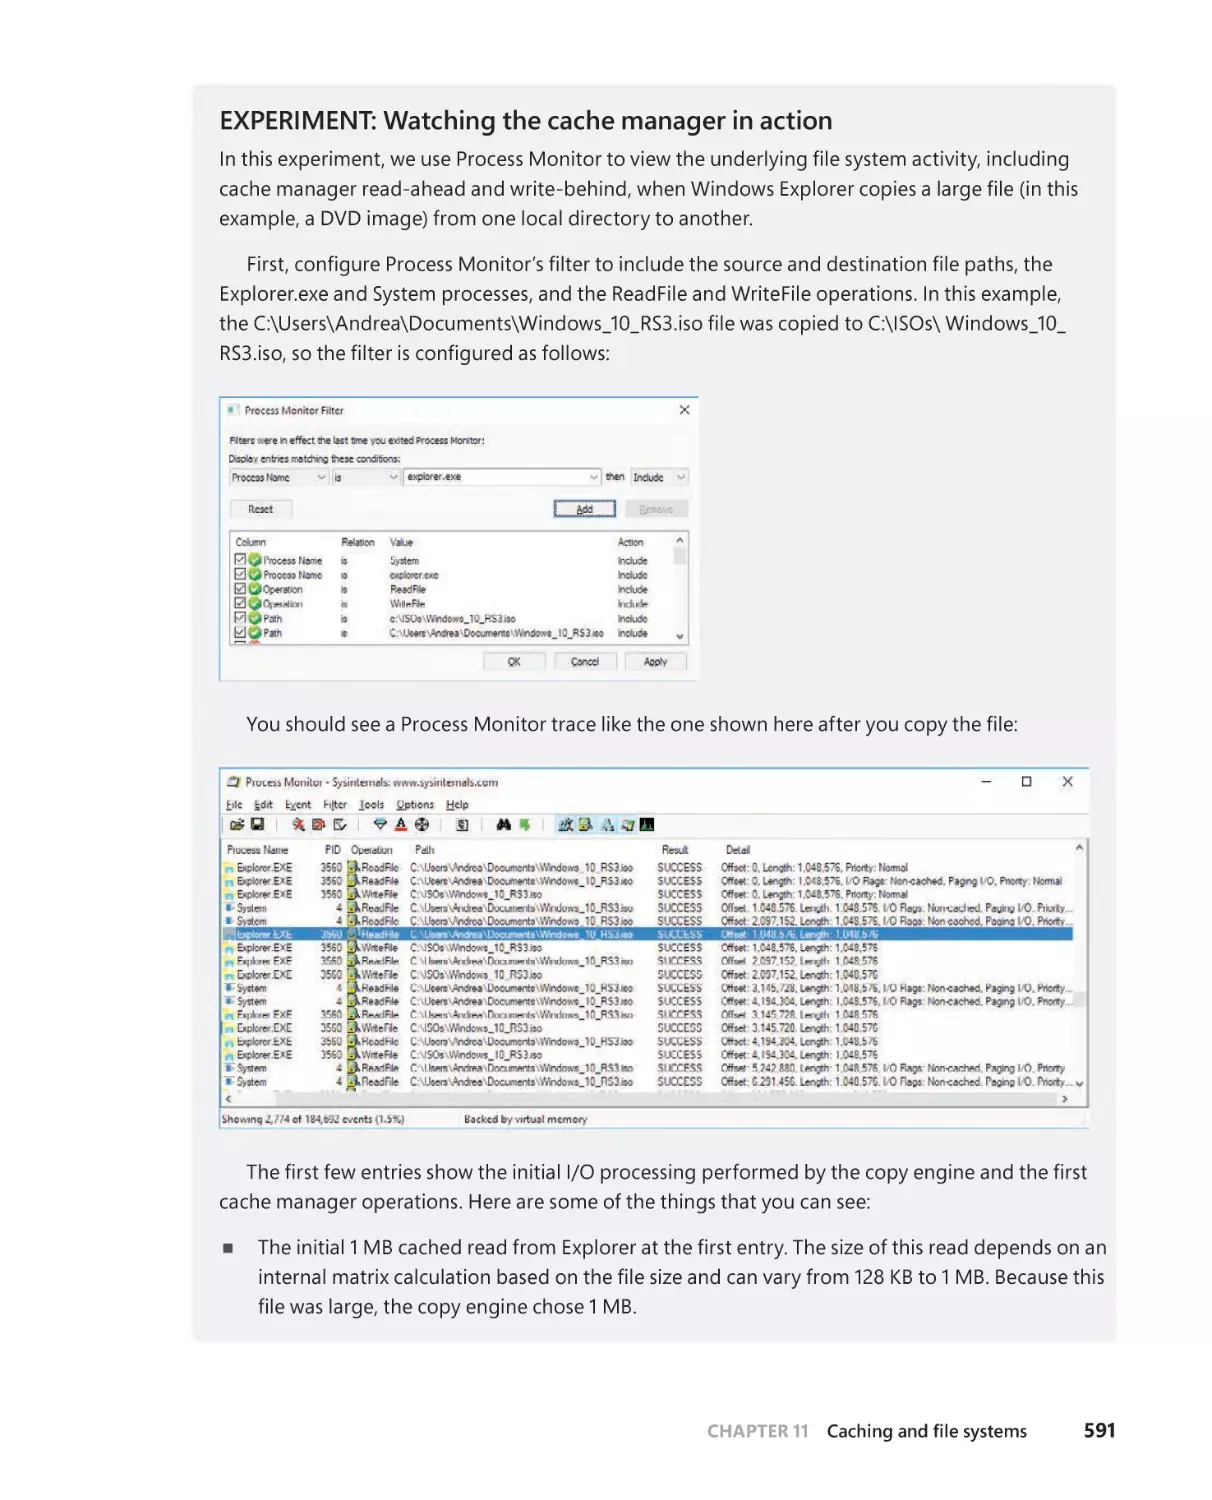
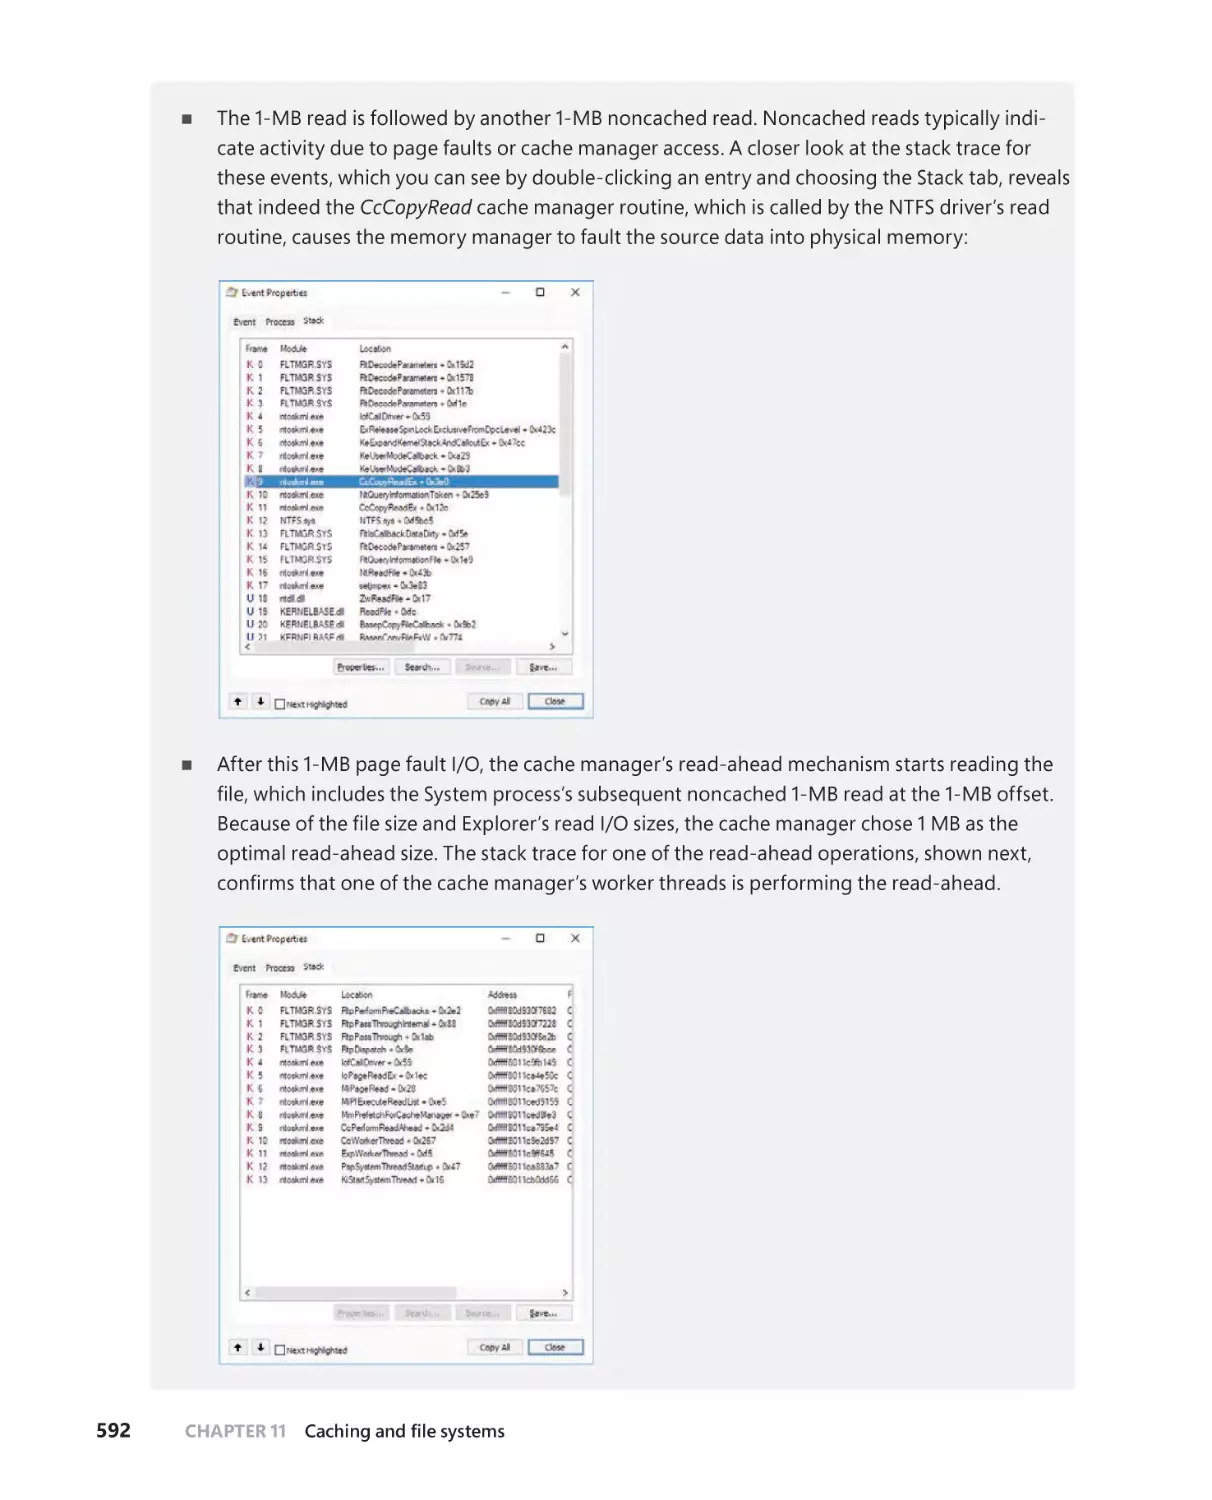
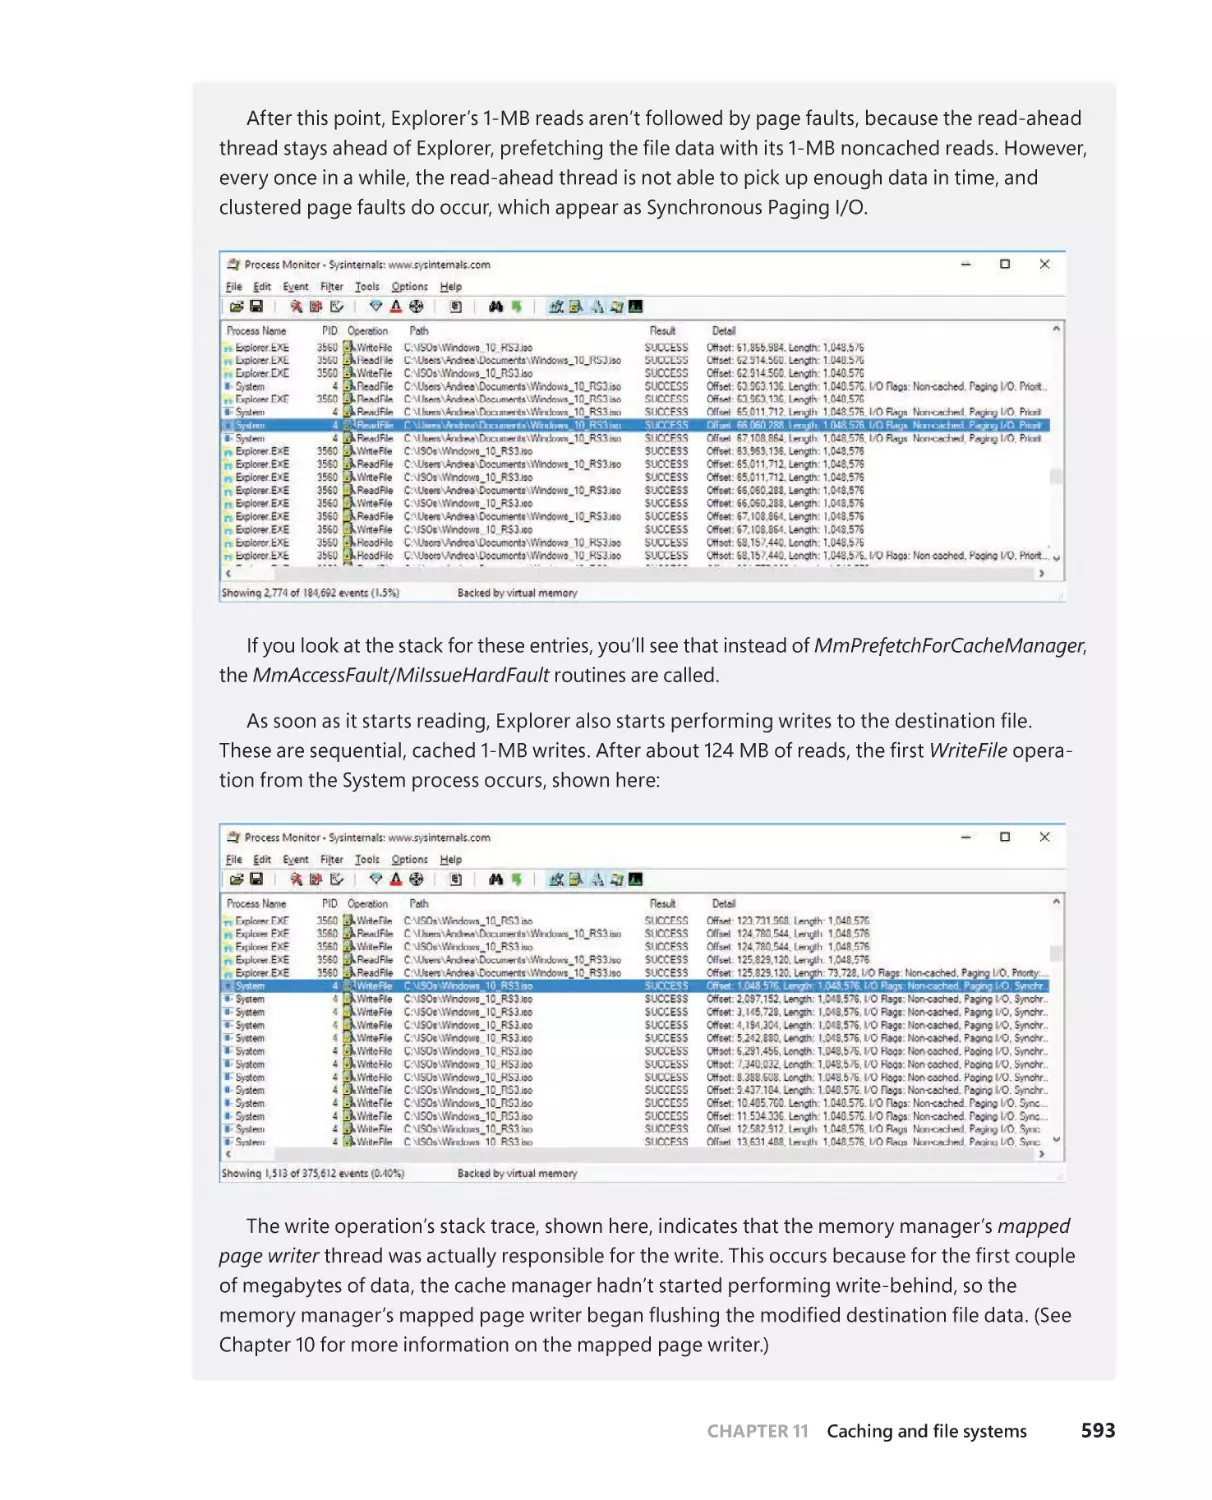
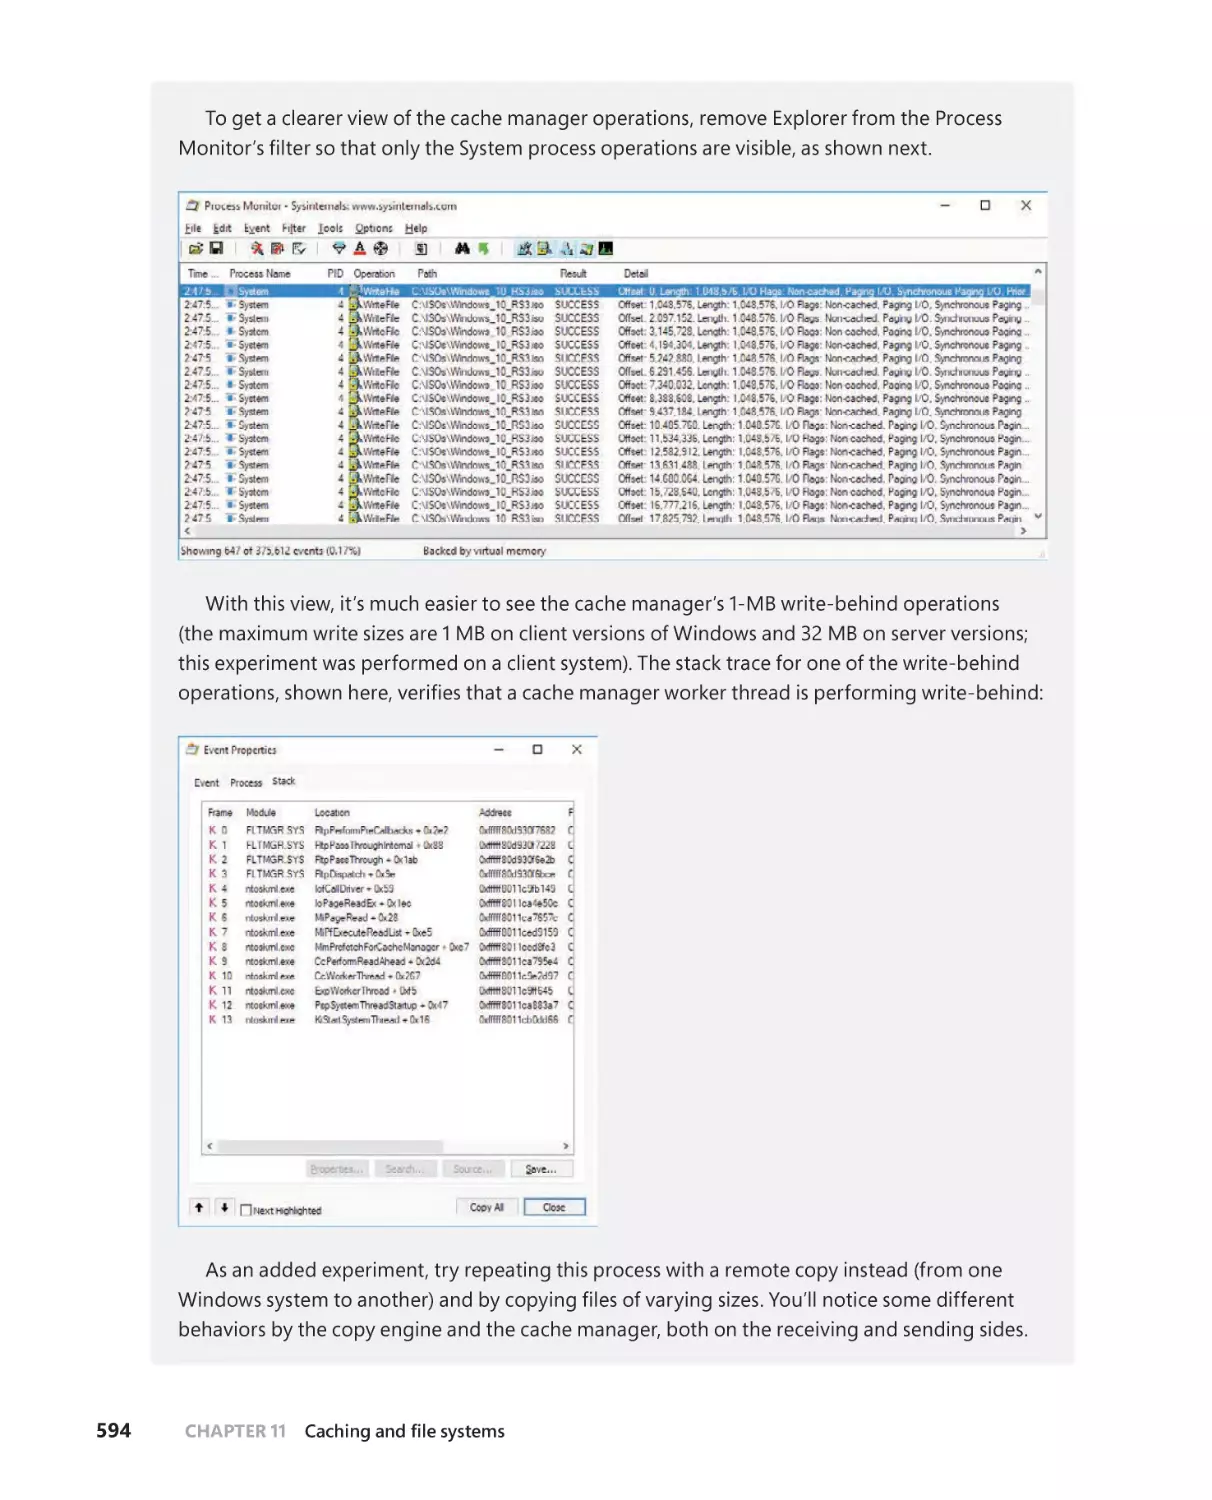
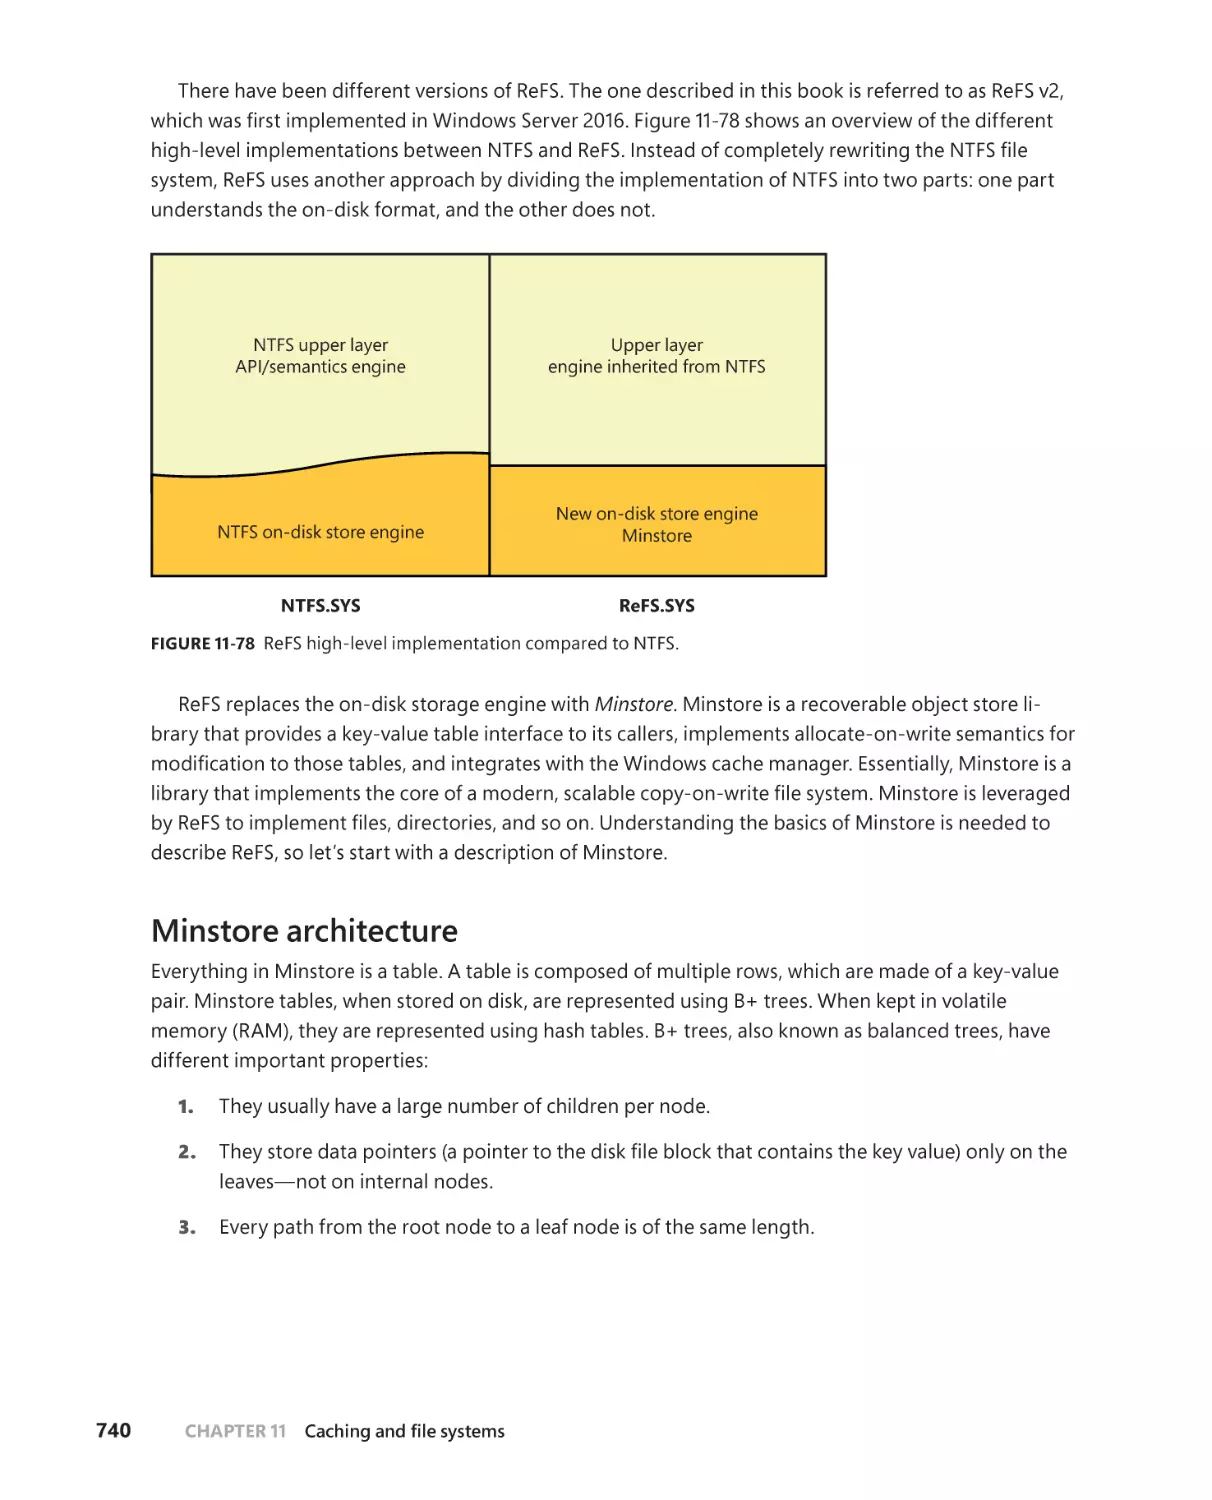
Текст
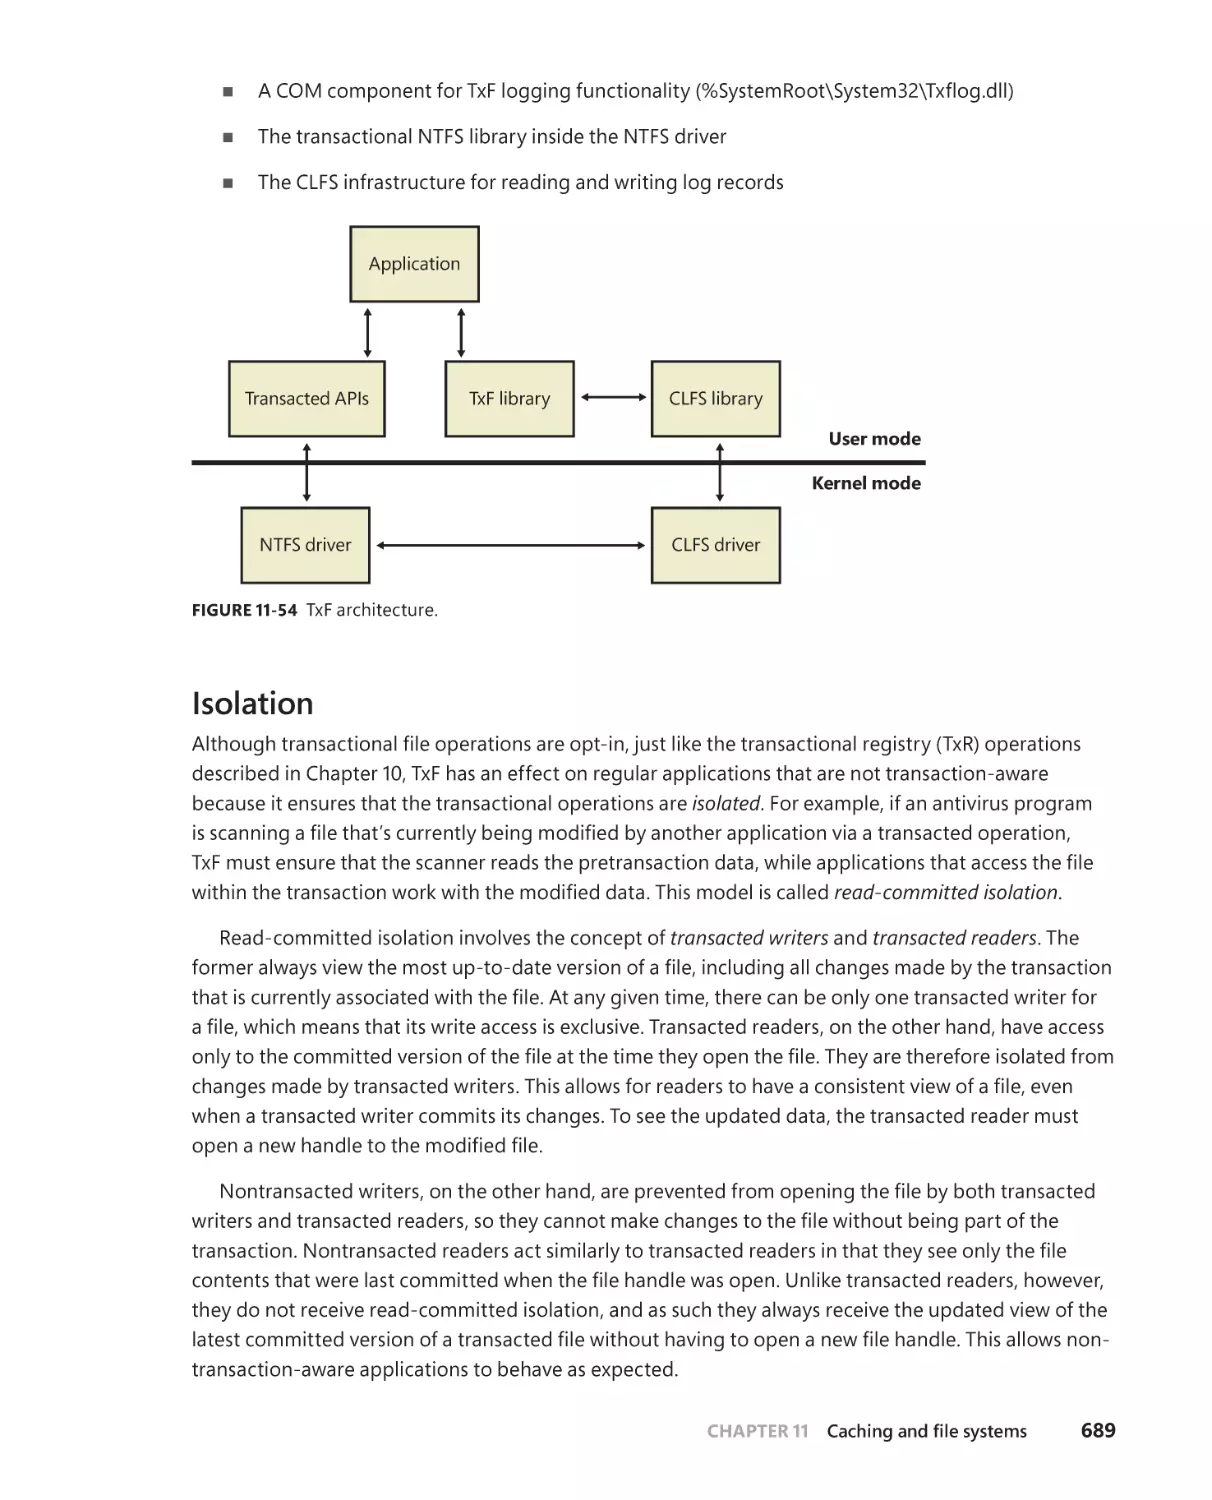
Windows Internals
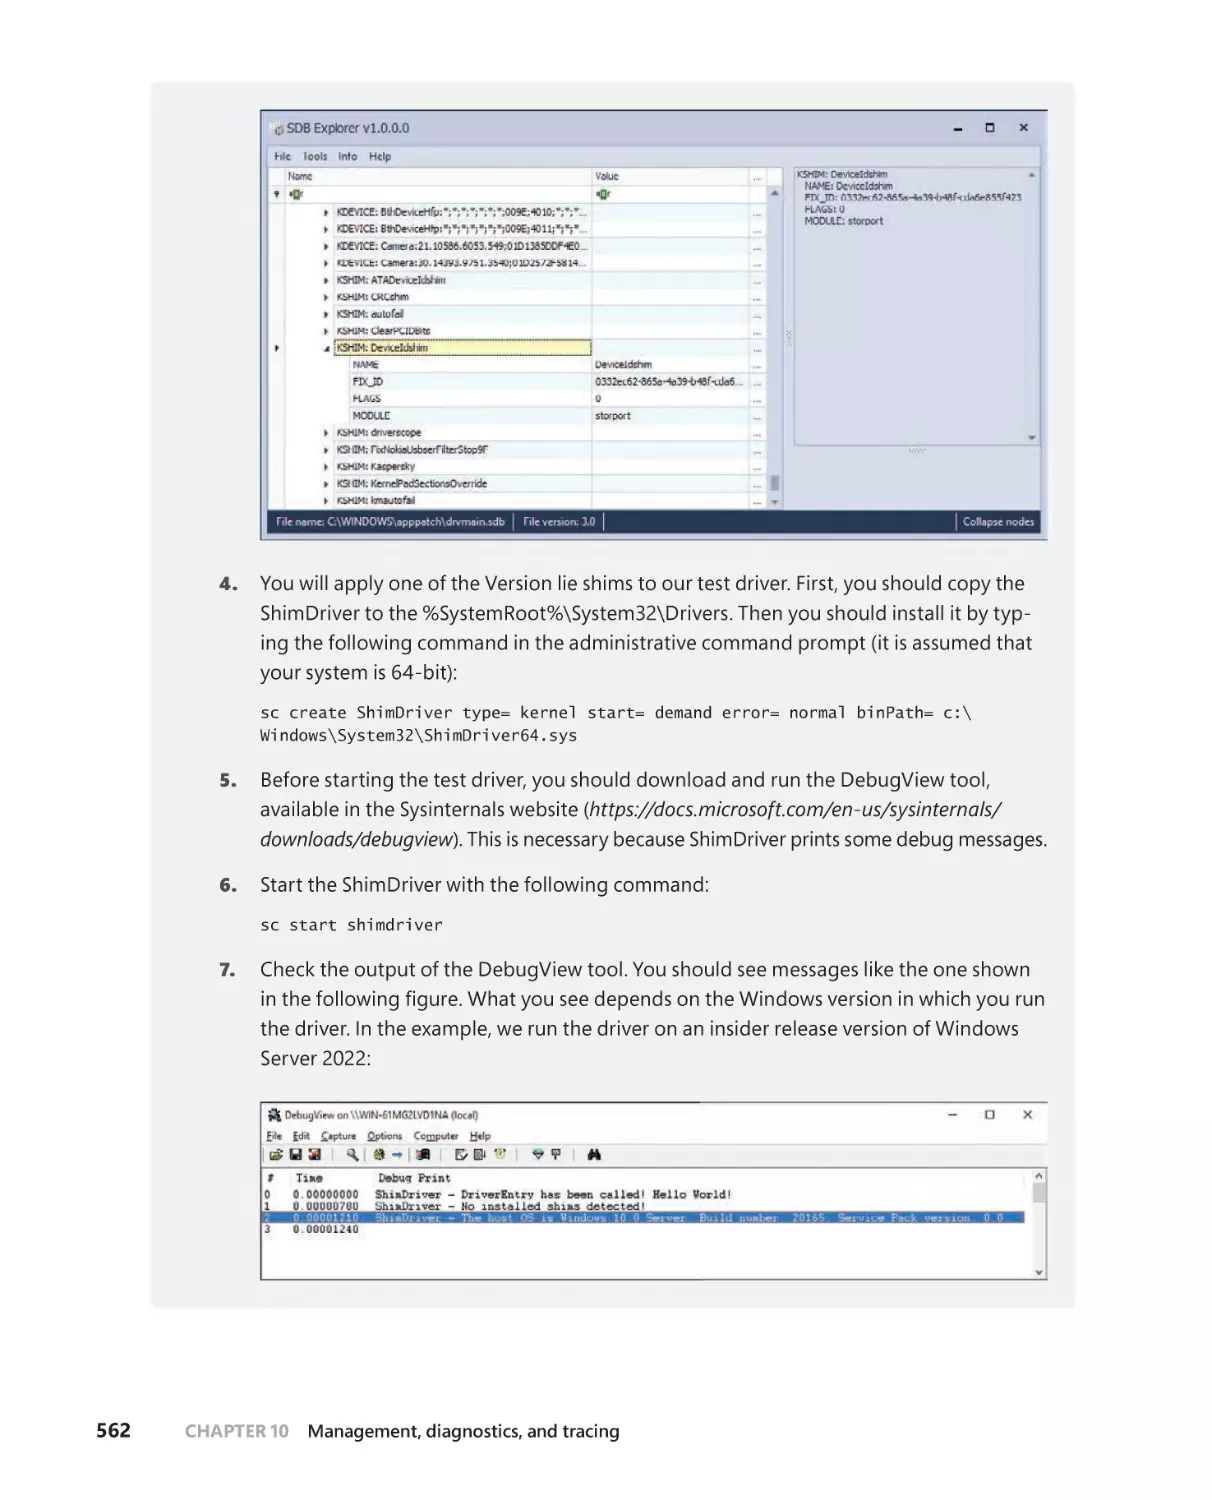
Seventh Edition
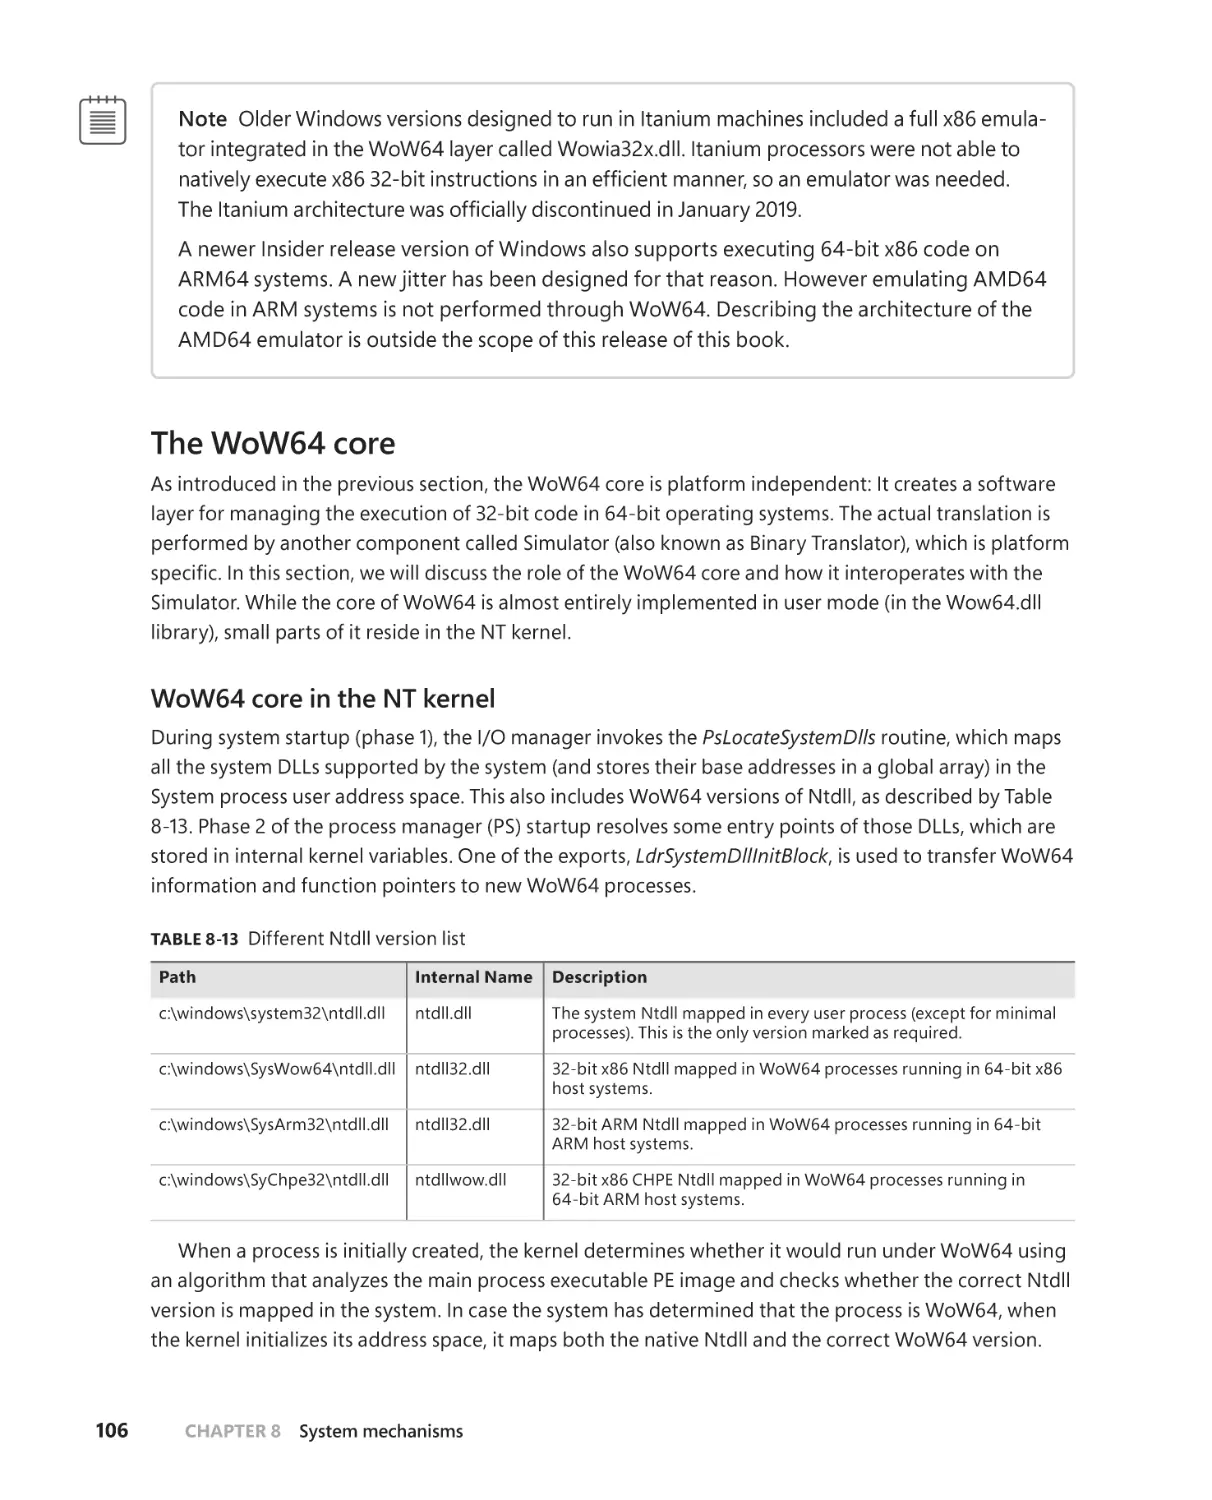
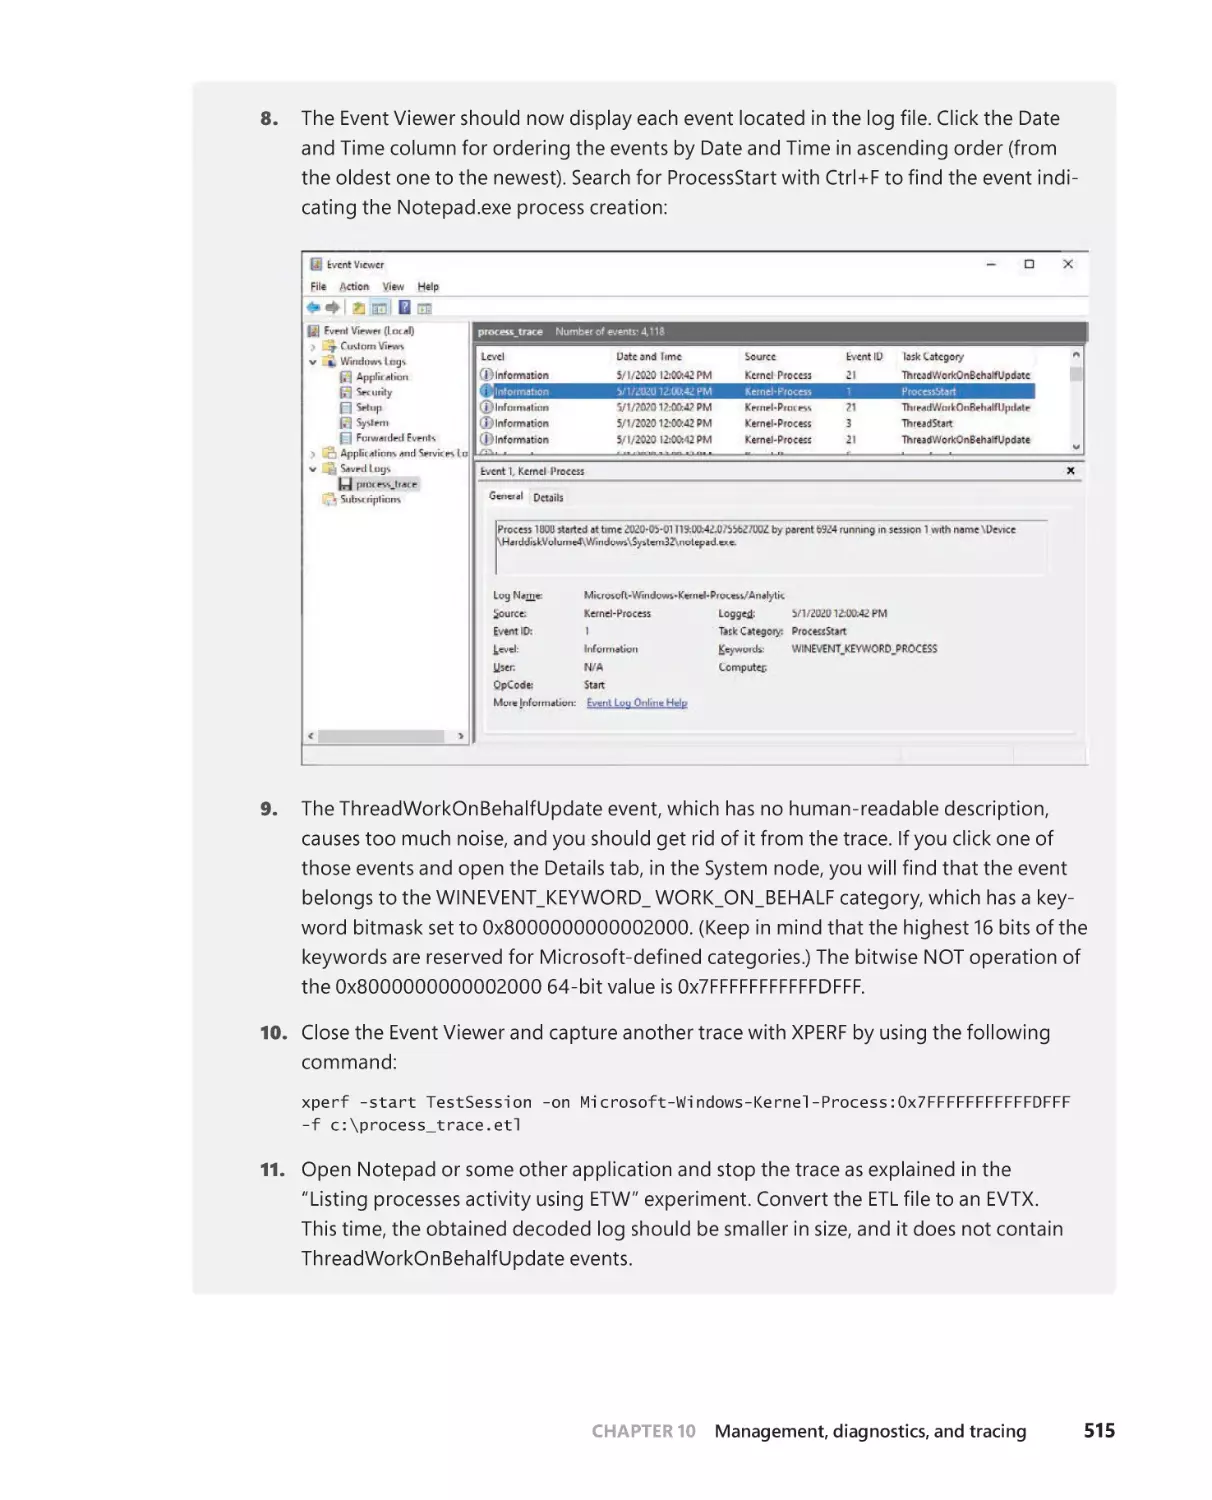
Part 2
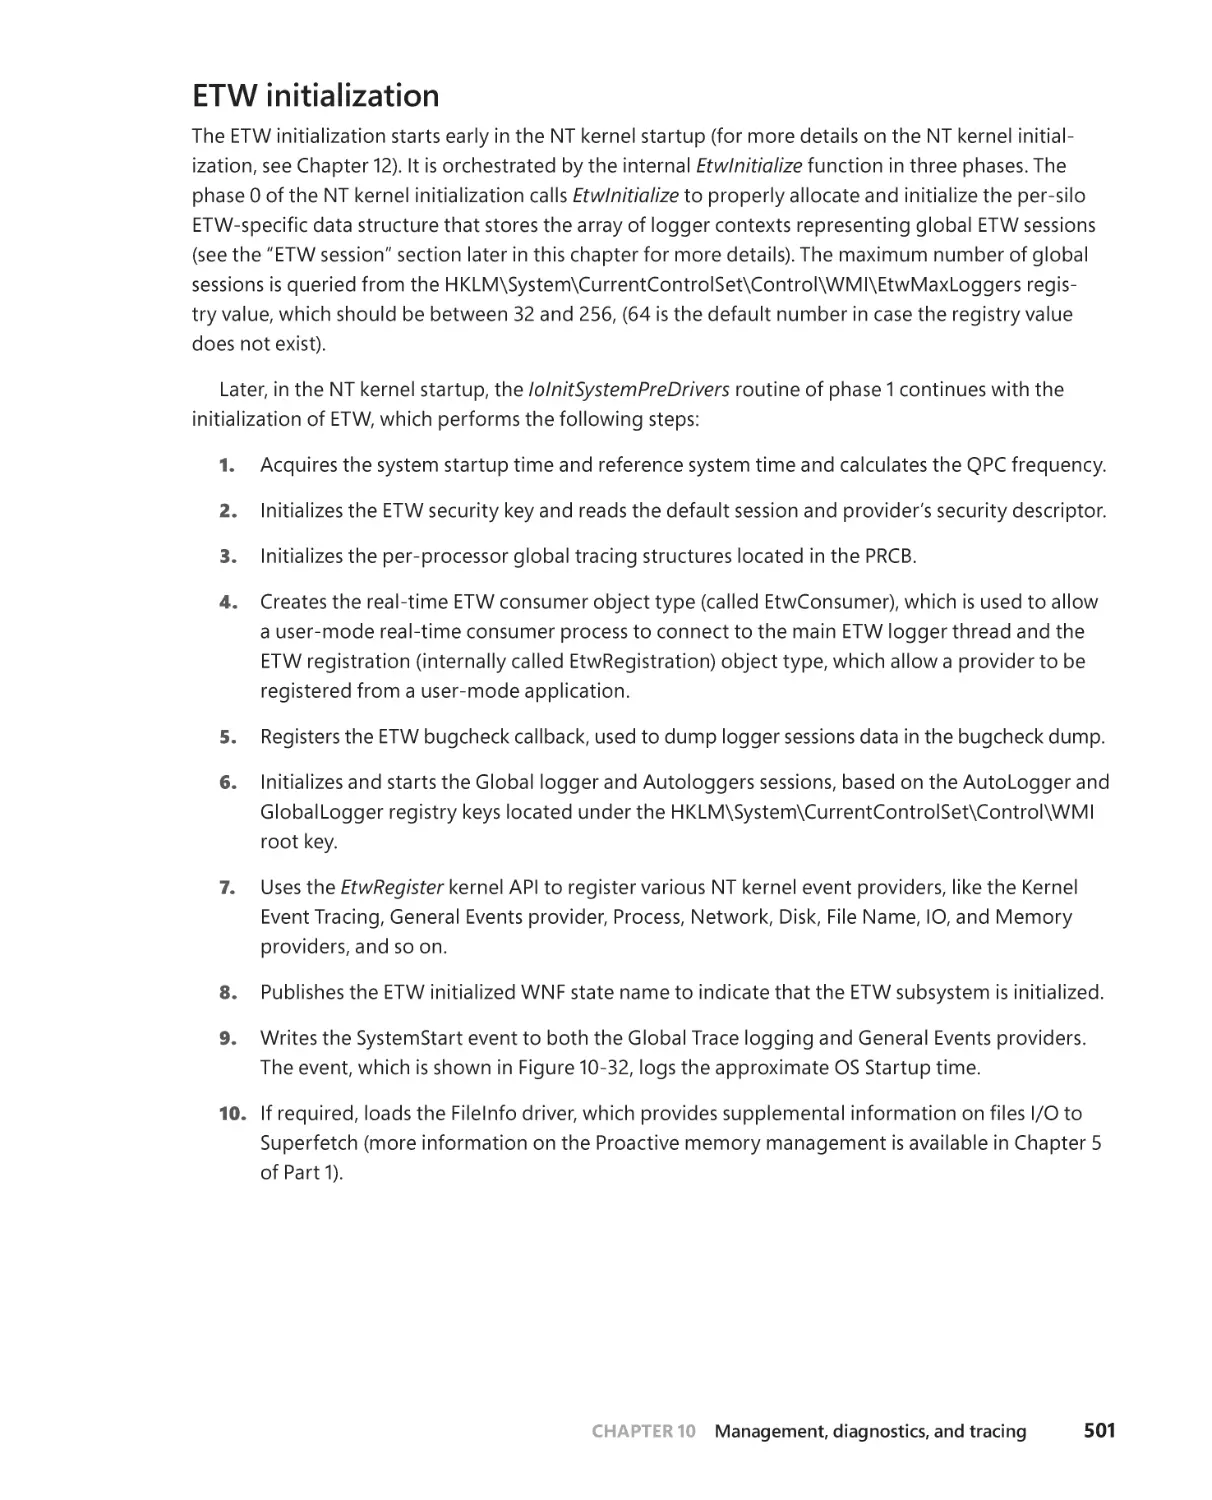
Andrea Allievi
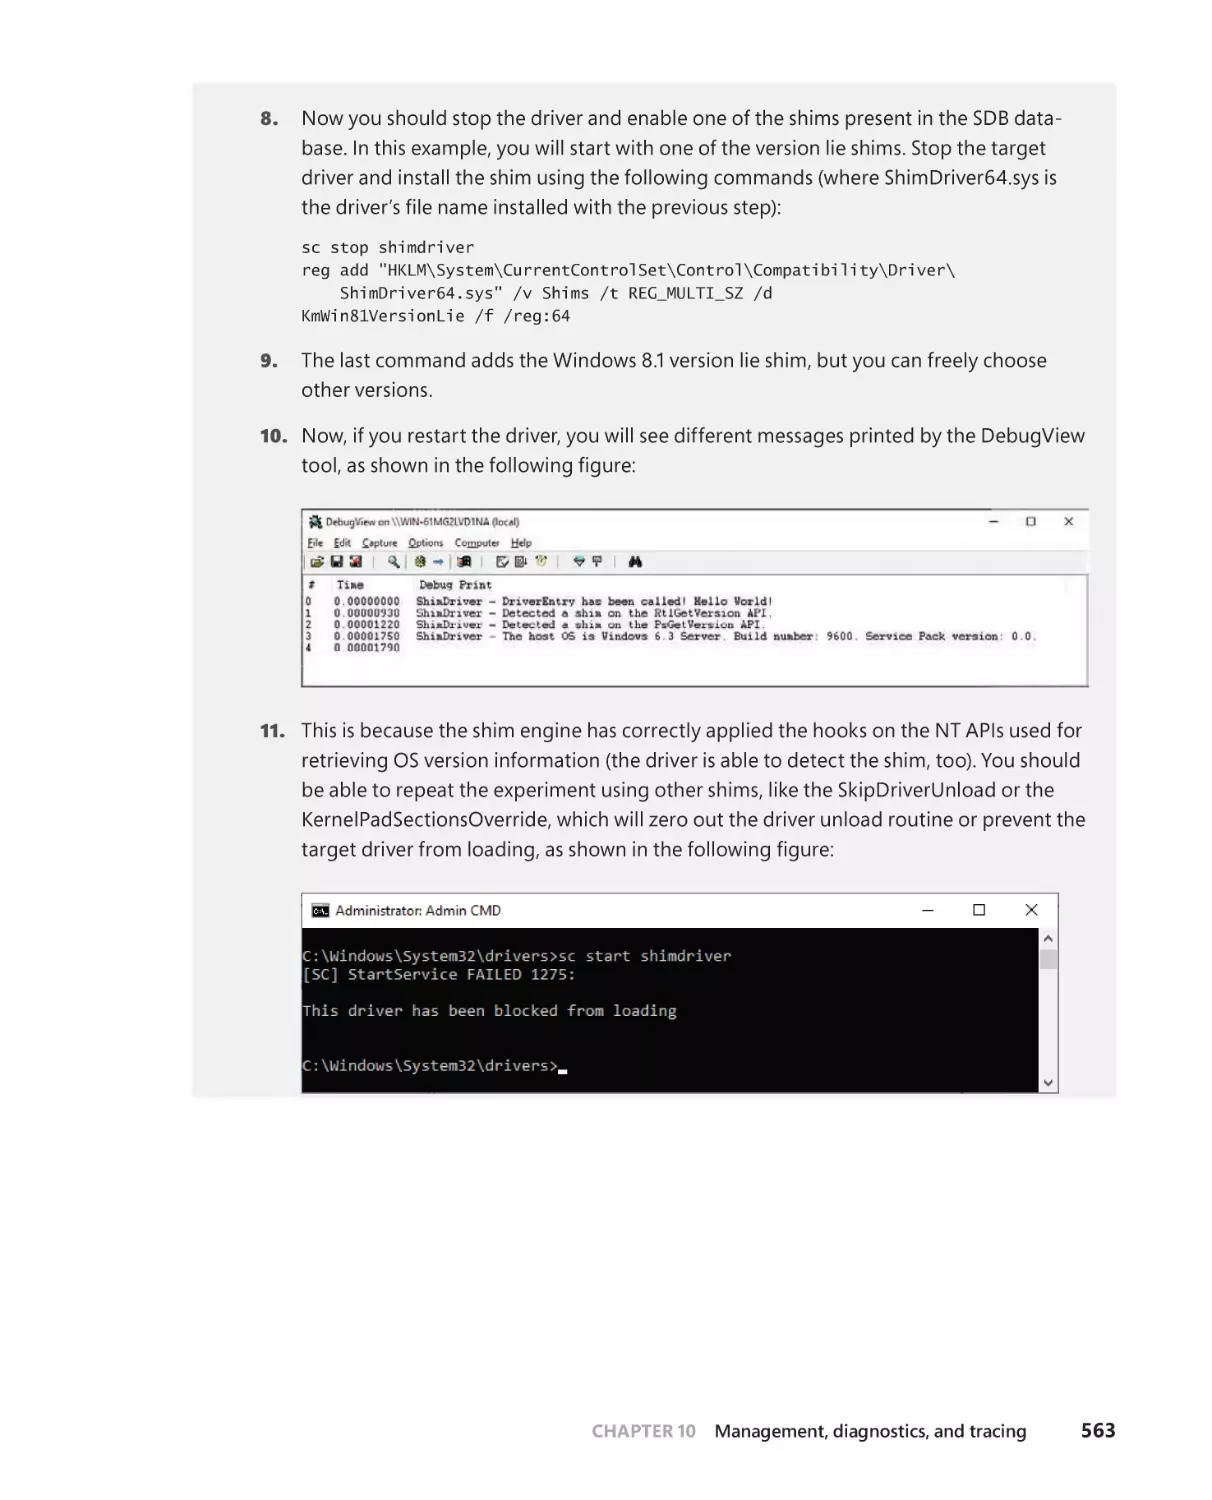
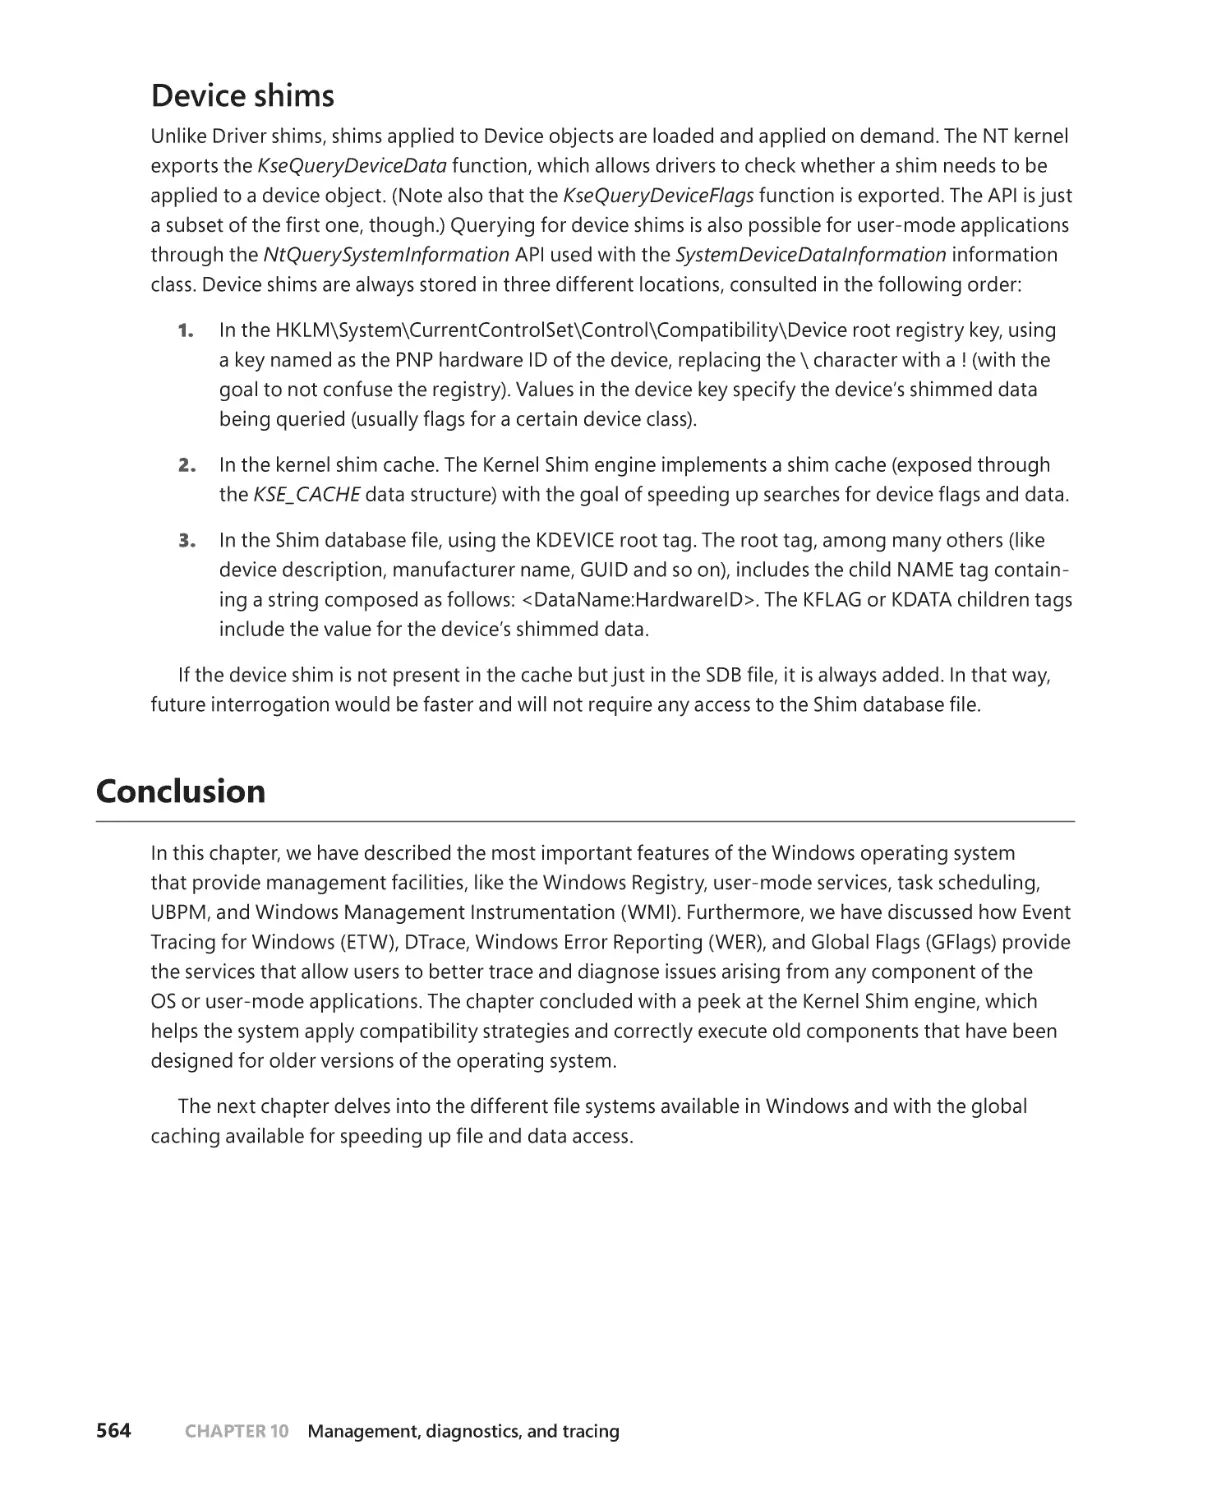
Alex Ionescu
Mark E. Russinovich
David A. Solomon
© WINDOWS INTERNALS, SEVENTH EDITION, PART 2
Published with the authorization of Microsoft Corporation by:
Pearson Education, Inc.
Copyright © 2022 by Pearson Education, Inc.
All rights reserved. This publication is protected by copyright, and permission
must be obtained from the publisher prior to any prohibited reproduction,
storage in a retrieval system, or transmission in any form or by any means,
electronic, mechanical, photocopying, recording, or likewise. For information
regarding permissions, request forms, and the appropriate contacts within
the Pearson Education Global Rights & Permissions Department, please visit
www.pearson.com/permissions.
No patent liability is assumed with respect to the use of the information contained herein. Although every precaution has been taken in the preparation
of this book, the publisher and author assume no responsibility for errors or
omissions. Nor is any liability assumed for damages resulting from the use of
the information contained herein.
ISBN-13: 978-0-13-546240-9
ISBN-10: 0-13-546240-1
Library of Congress Control Number: 2021939878
Editor-in-Chief: Brett Bartow
ScoutAutomatedPrintCode
Development Editor: Mark Renfrow
TRADEMARKS
Microsoft and the trademarks listed at http://www.microsoft.com on the
“Trademarks” webpage are trademarks of the Microsoft group of companies.
All other marks are property of their respective owners.
Managing Editor: Sandra Schroeder
WARNING AND DISCLAIMER
Every effort has been made to make this book as complete and as accurate
Production Editor: Dan Foster
on an “as is” basis. The author, the publisher, and Microsoft Corporation shall
have neither liability nor responsibility to any person or entity with respect to
any loss or damages arising from the information contained in this book or
from the use of the programs accompanying it.
Indexer: Valerie Haynes Perry
SPECIAL SALES
For information about buying this title in bulk quantities, or for special sales
opportunities (which may include electronic versions; custom cover designs;
and content particular to your business, training goals, marketing focus, or
branding interests), please contact our corporate sales department at corpsales@pearsoned.com or (800) 382-3419.
Editorial Assistant: Cindy Teeters
For government sales inquiries,
please contact governmentsales@pearsoned.com.
For questions about sales outside the U.S.,
please contact intlcs@pearson.com.
Senior Project Editor: Tracey Croom
Executive Editor: Loretta Yates
Copy Editor: Charlotte Kughen
Proofreader: Dan Foster
Technical Editor: Christophe Nasarre
Cover Designer: Twist Creative, Seattle
Compositor: Danielle Foster
Graphics: Vived Graphics
To my parents, Gabriella and Danilo, and to my brother,
Luca, who all always believed in me and pushed me in following
my dreams.
—ANDREA ALLIEVI
To my wife and daughter, who never give up on me and are a
constant source of love and warmth. To my parents, for inspiring
me to chase my dreams and making the sacrifices that gave me
opportunities.
—ALEX IONESCU
Contents at a Glance
About the Authors
Foreword
Introduction
xviii
xx
xxiii
CHAPTER 8
System mechanisms
CHAPTER 9
Virtualization technologies
267
CHAPTER 10
Management, diagnostics, and tracing
391
CHAPTER 11
CHAPTER 12
1
aching and file s stems
Startup and shutdown
777
Contents of Windows Internals, Seventh Edition, Part 1
851
Index
861
Contents
About the Authors . . . . . . . . . . . . . . . . . . . . . . . . . . . . . . . . . . . . . . . . . . . . . . . . . . xviii
Foreword . . . . . . . . . . . . . . . . . . . . . . . . . . . . . . . . . . . . . . . . . . . . . . . . . . . . . . . . . . . . .xx
Introduction . . . . . . . . . . . . . . . . . . . . . . . . . . . . . . . . . . . . . . . . . . . . . . . . . . . . . . . . xxiii
Chapter 8
System mechanisms
1
Processor execution model . . . . . . . . . . . . . . . . . . . . . . . . . . . . . . . . . . . . . . . . . . . . 2
Segmentation . . . . . . . . . . . . . . . . . . . . . . . . . . . . . . . . . . . . . . . . . . . . . . . . . . . 2
Task state segments . . . . . . . . . . . . . . . . . . . . . . . . . . . . . . . . . . . . . . . . . . . . . 6
Hardware side-channel vulnerabilities . . . . . . . . . . . . . . . . . . . . . . . . . . . . . . . . . . 9
Out-of-order execution . . . . . . . . . . . . . . . . . . . . . . . . . . . . . . . . . . . . . . . . . 10
The CPU branch predictor . . . . . . . . . . . . . . . . . . . . . . . . . . . . . . . . . . . . . . . .11
The CPU cache(s) . . . . . . . . . . . . . . . . . . . . . . . . . . . . . . . . . . . . . . . . . . . . . . . 12
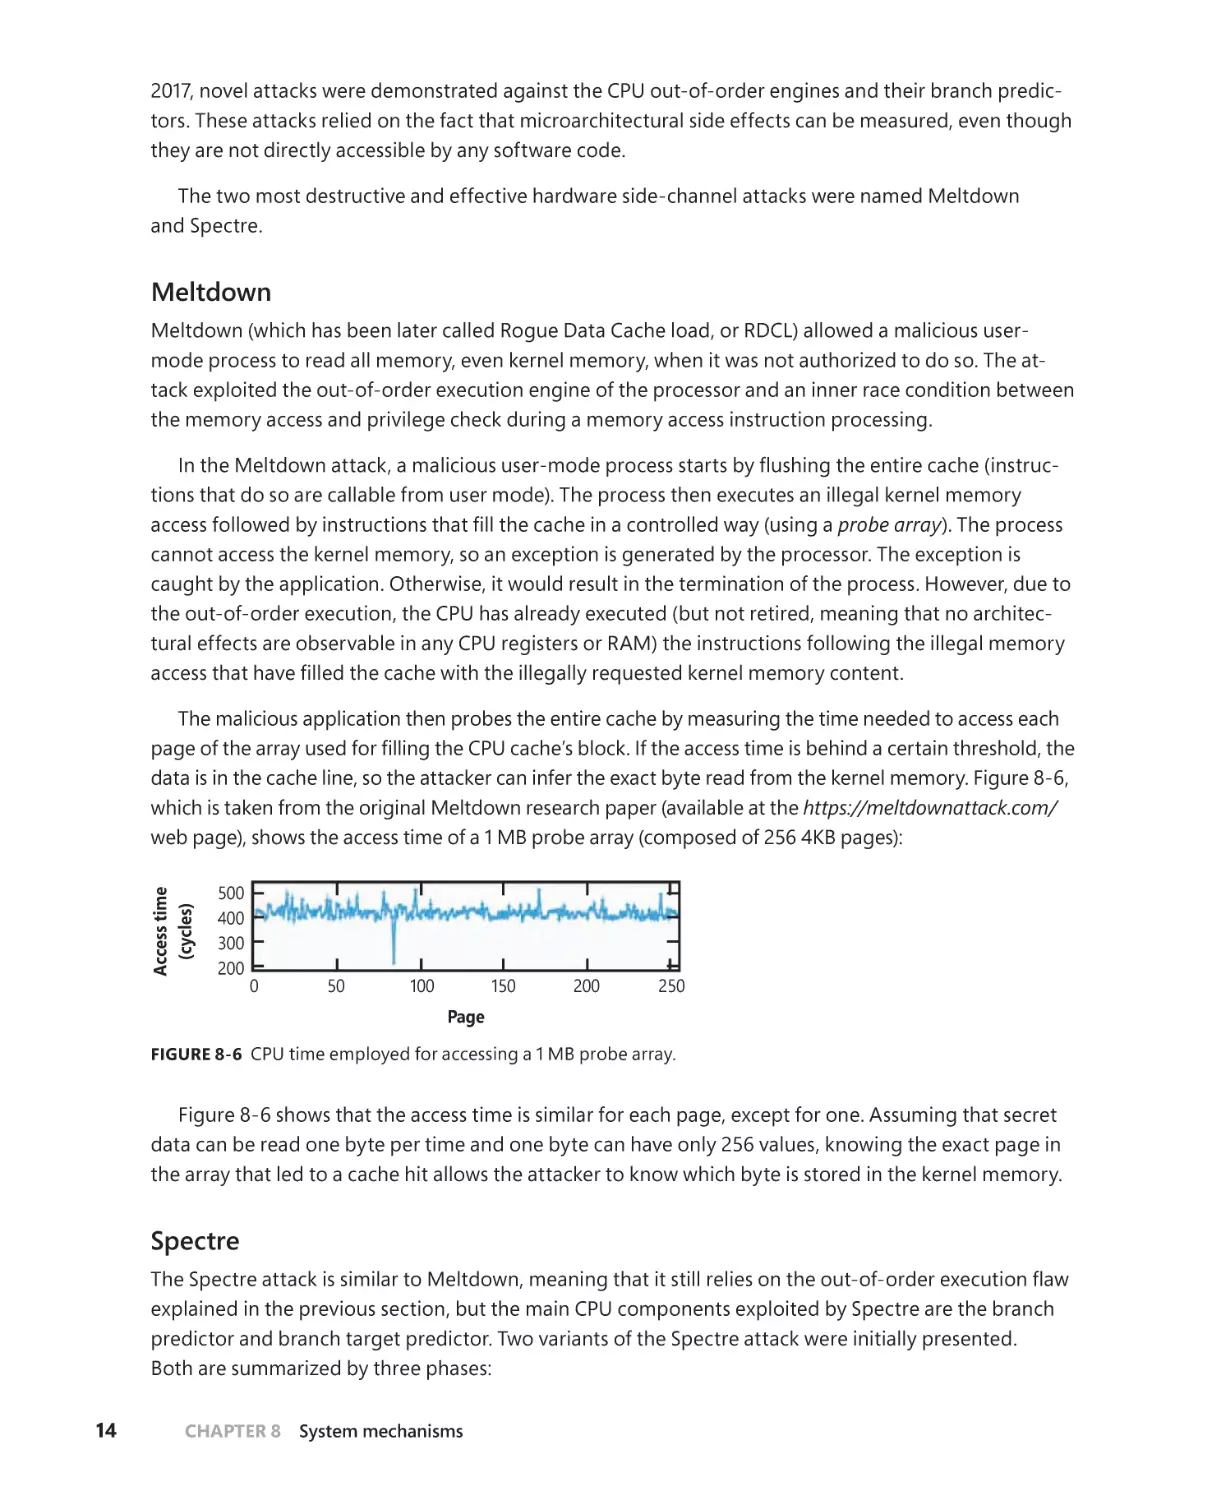
Side-channel attacks . . . . . . . . . . . . . . . . . . . . . . . . . . . . . . . . . . . . . . . . . . . 13
Side-channel mitigations in Windows . . . . . . . . . . . . . . . . . . . . . . . . . . . . . . . . . . 18
KVA Shadow . . . . . . . . . . . . . . . . . . . . . . . . . . . . . . . . . . . . . . . . . . . . . . . . . . . 18
Hardware indirect branch controls (IBRS, IBPB, STIBP, SSBD) . . . . . . . 21
Retpoline and import optimization . . . . . . . . . . . . . . . . . . . . . . . . . . . . . . 23
STIBP pairing . . . . . . . . . . . . . . . . . . . . . . . . . . . . . . . . . . . . . . . . . . . . . . . . . . . 26
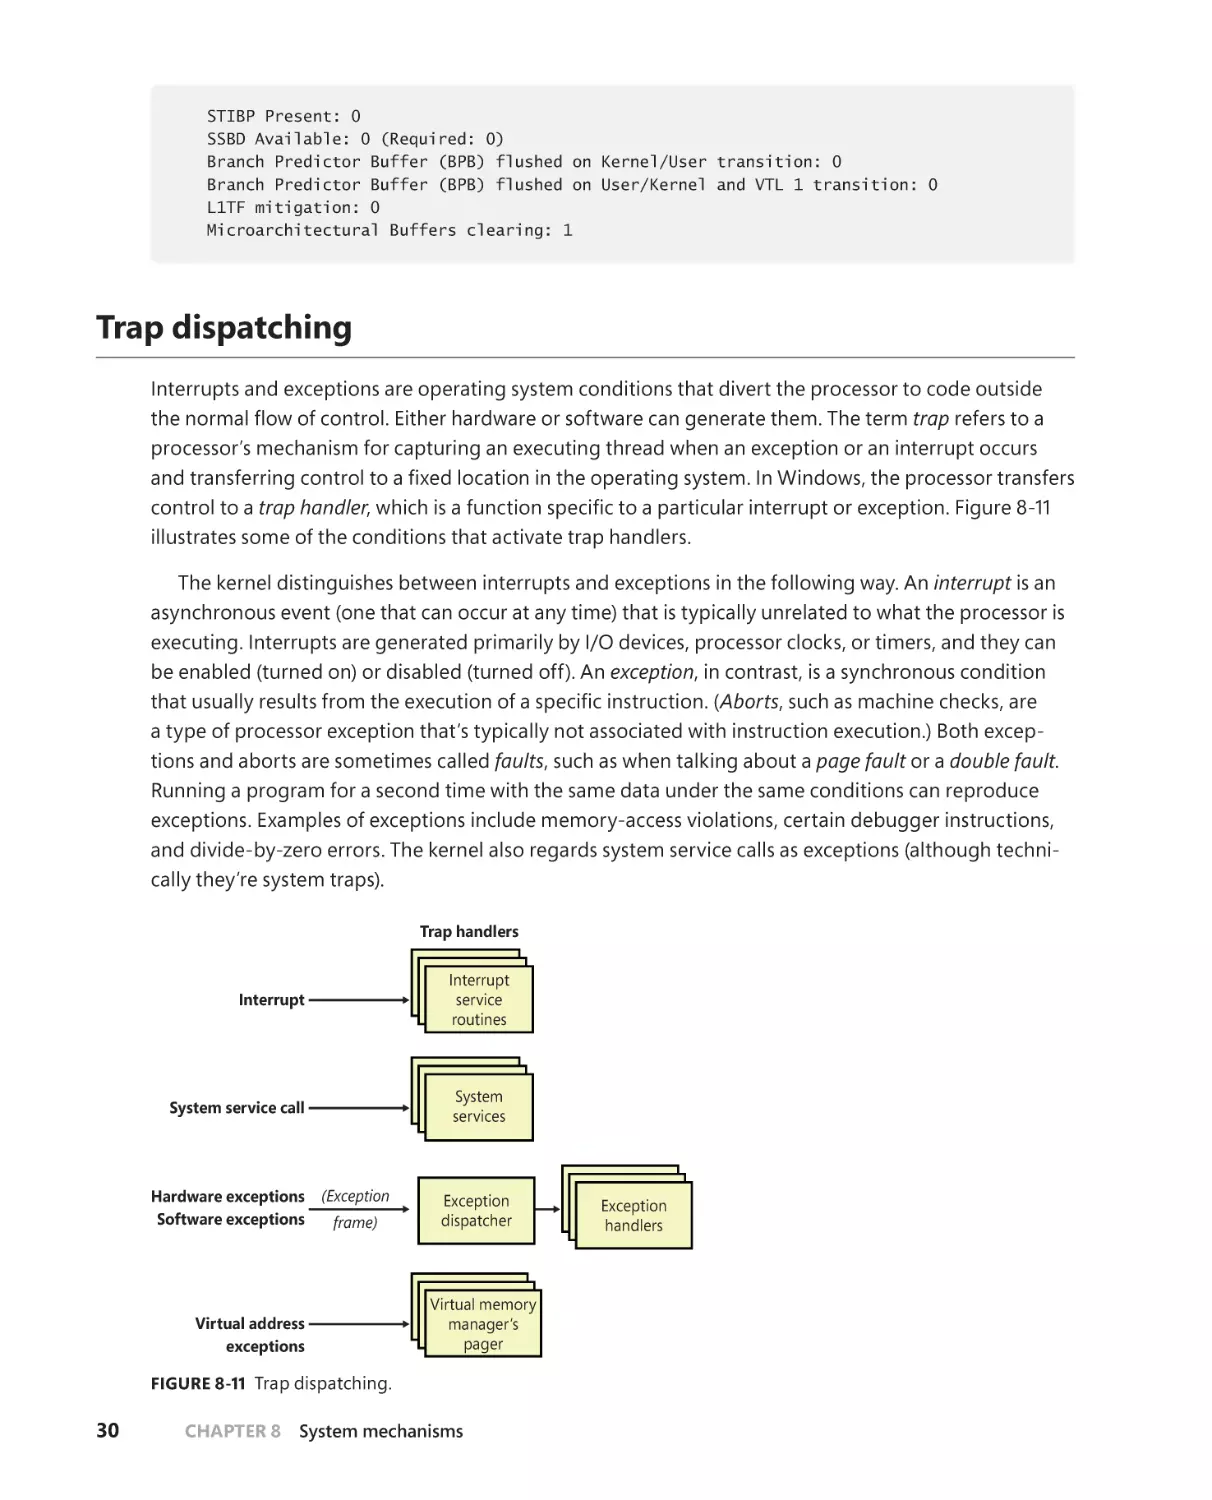
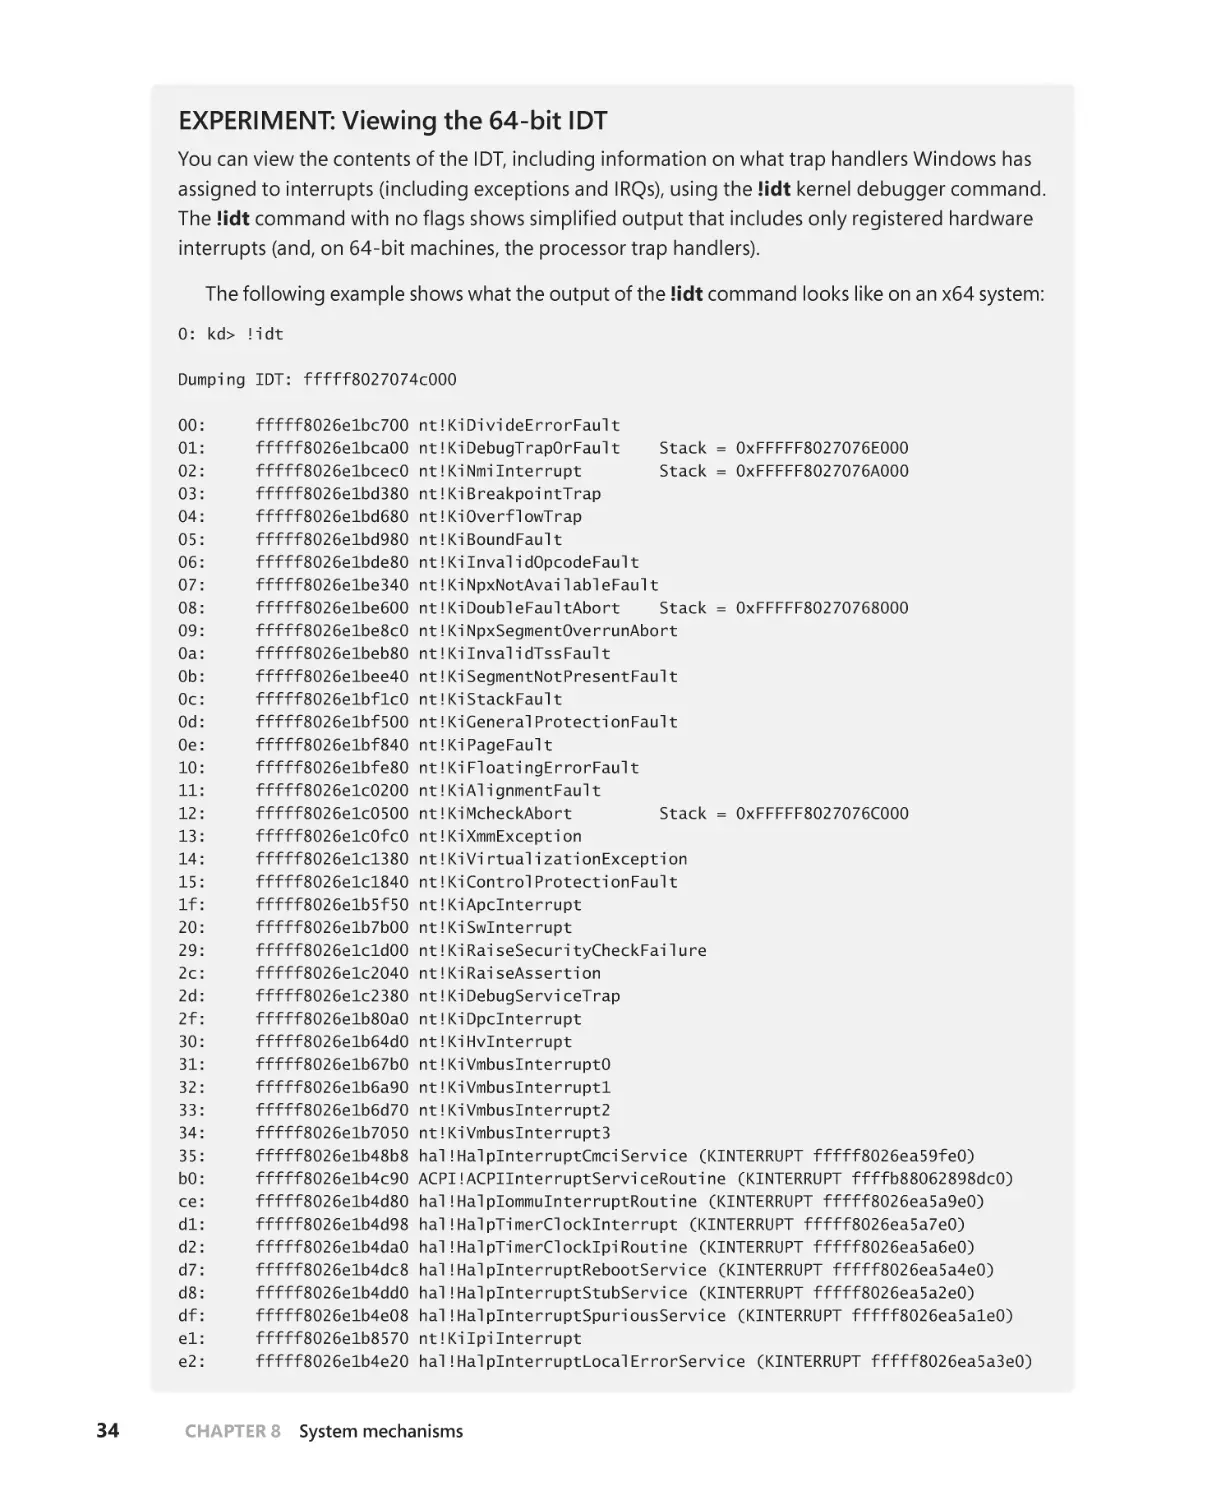
Trap dispatching . . . . . . . . . . . . . . . . . . . . . . . . . . . . . . . . . . . . . . . . . . . . . . . . . . . . . . 30
Interrupt dispatching . . . . . . . . . . . . . . . . . . . . . . . . . . . . . . . . . . . . . . . . . . . 32
Line-based versus message signaled–based interrupts . . . . . . . . . . . 50
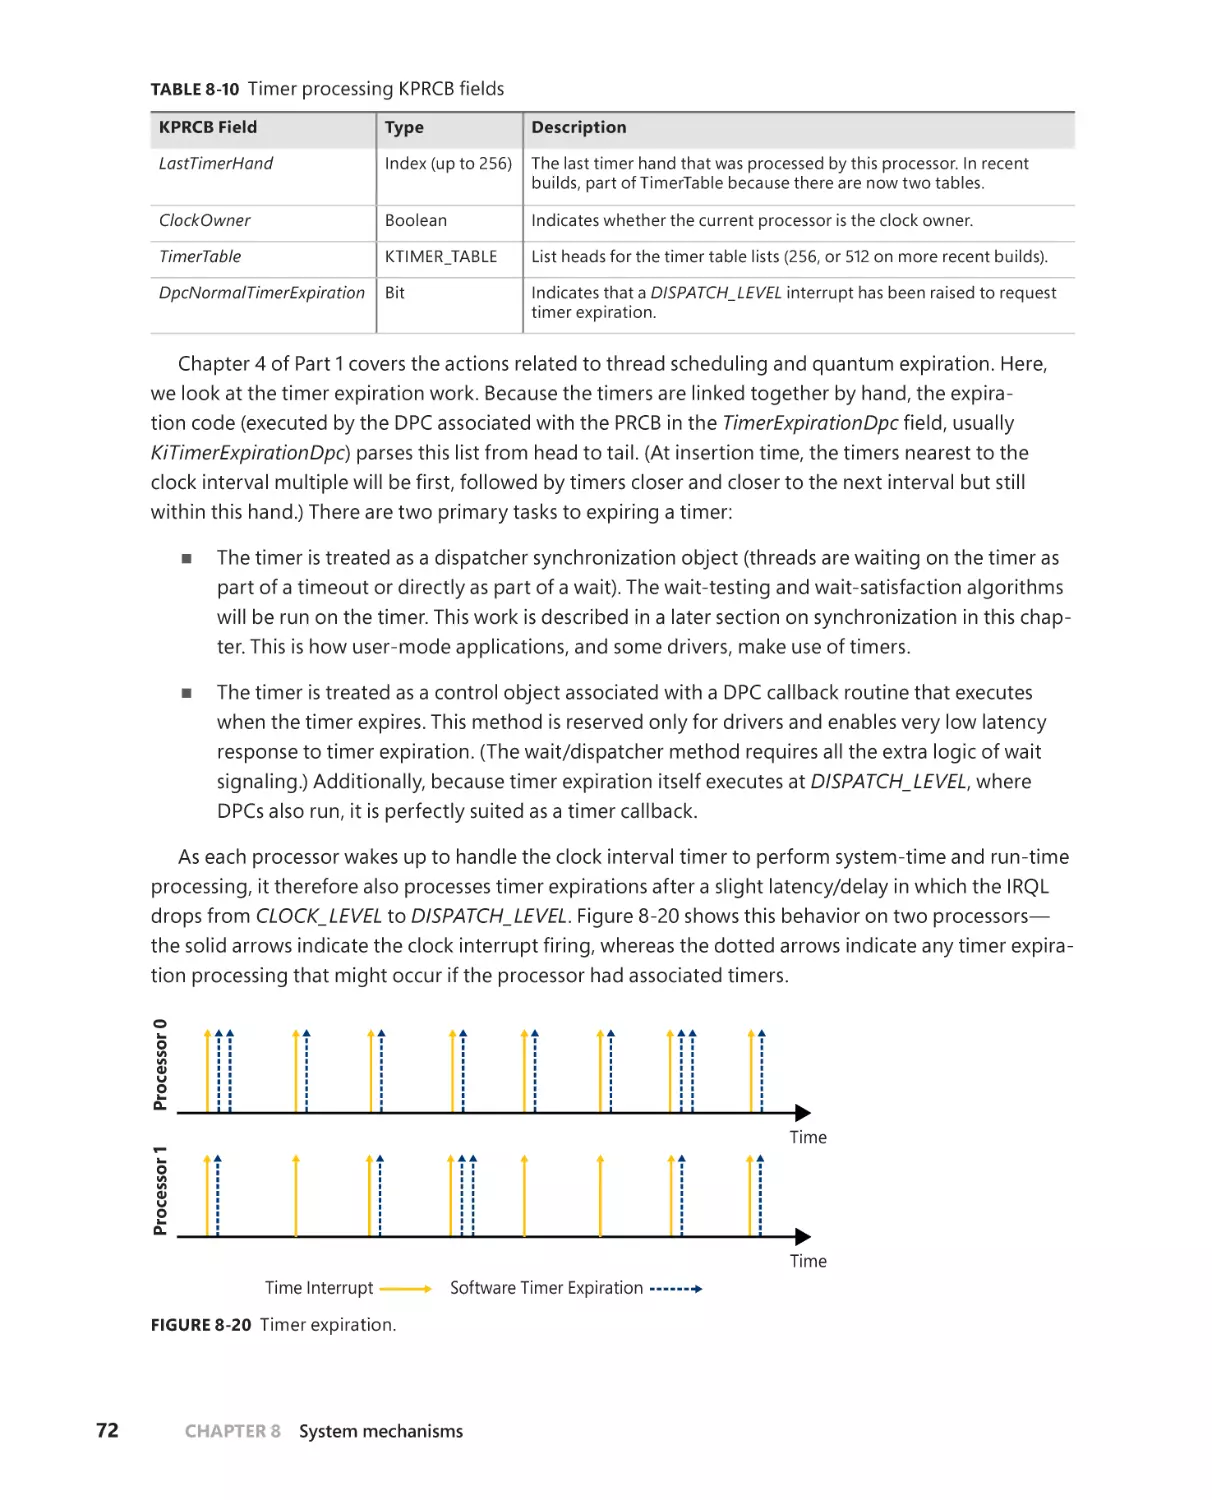
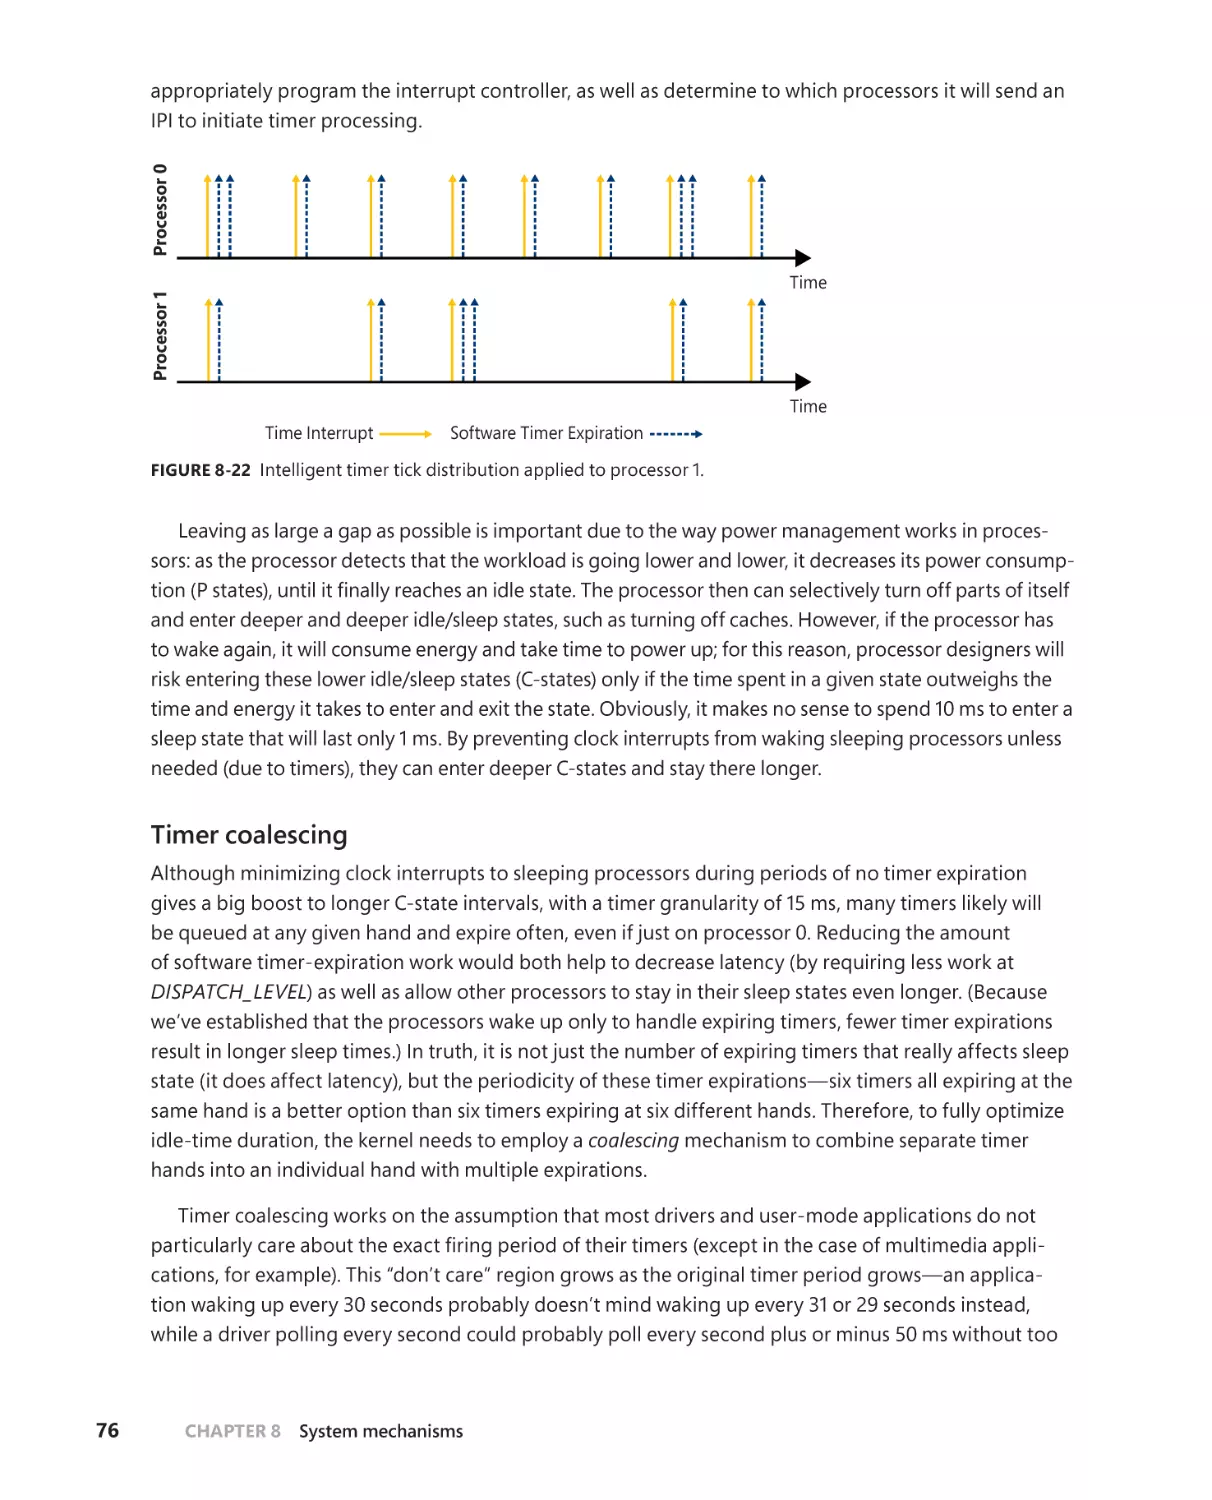
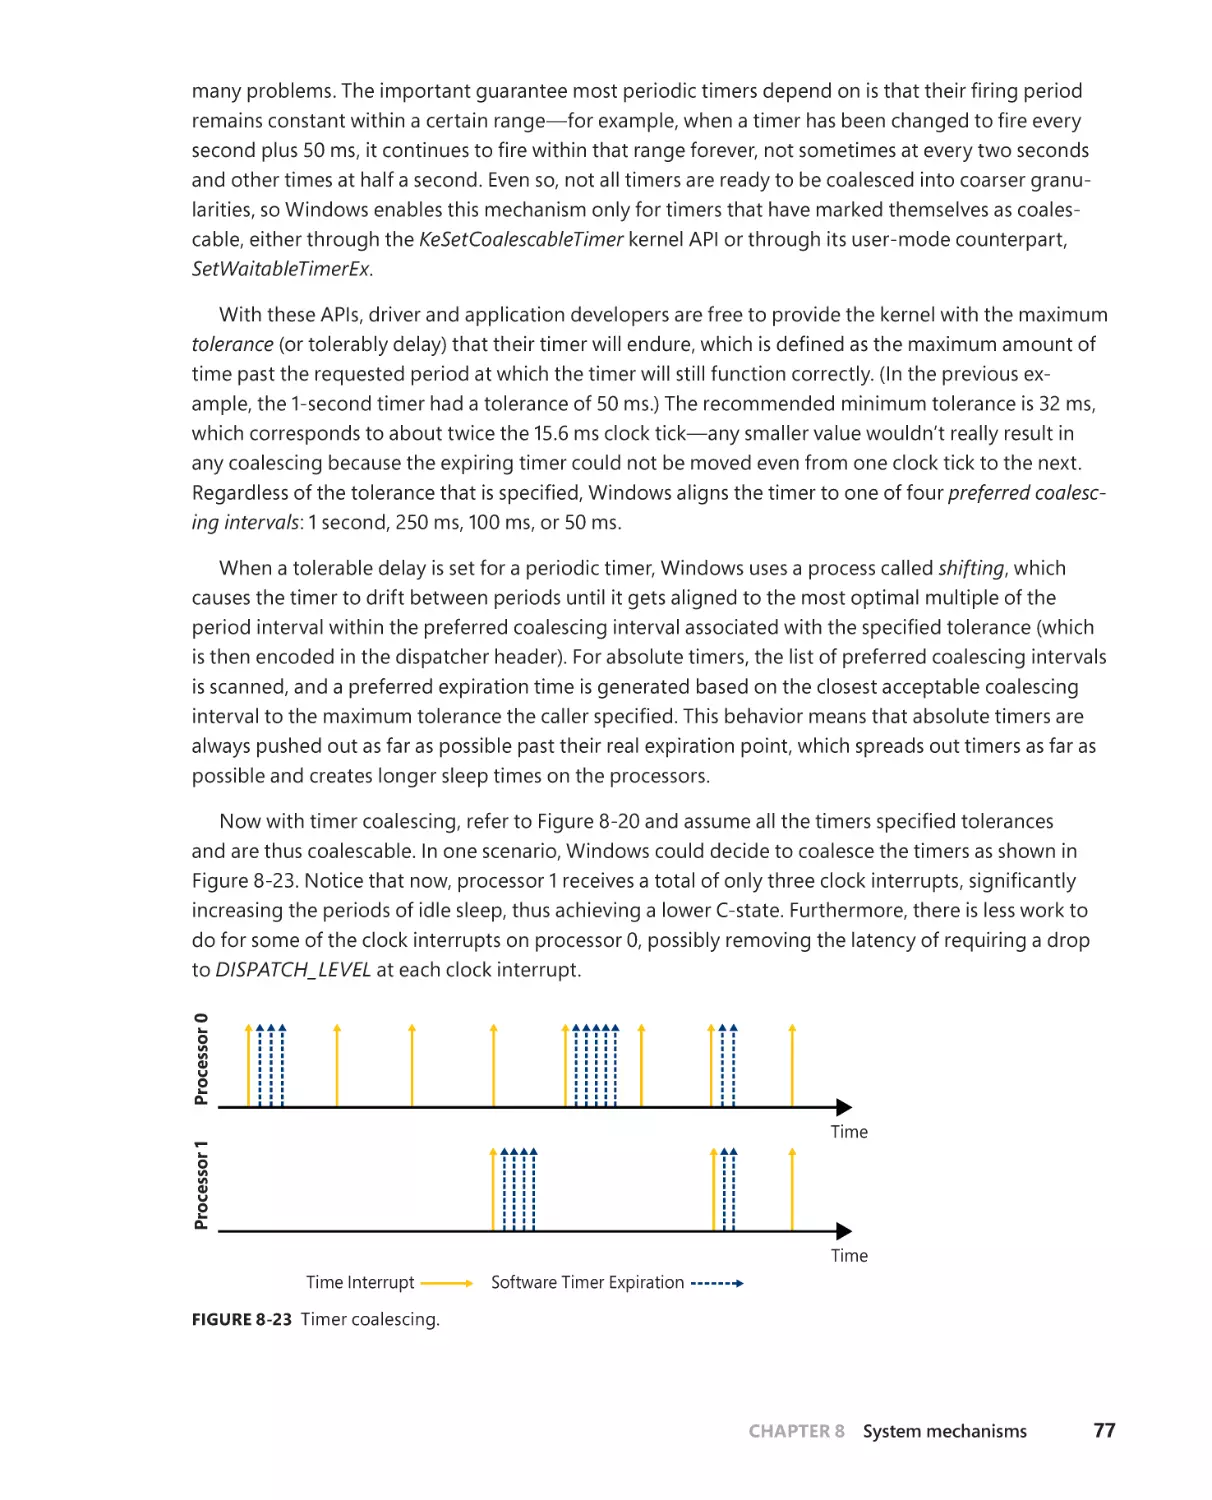
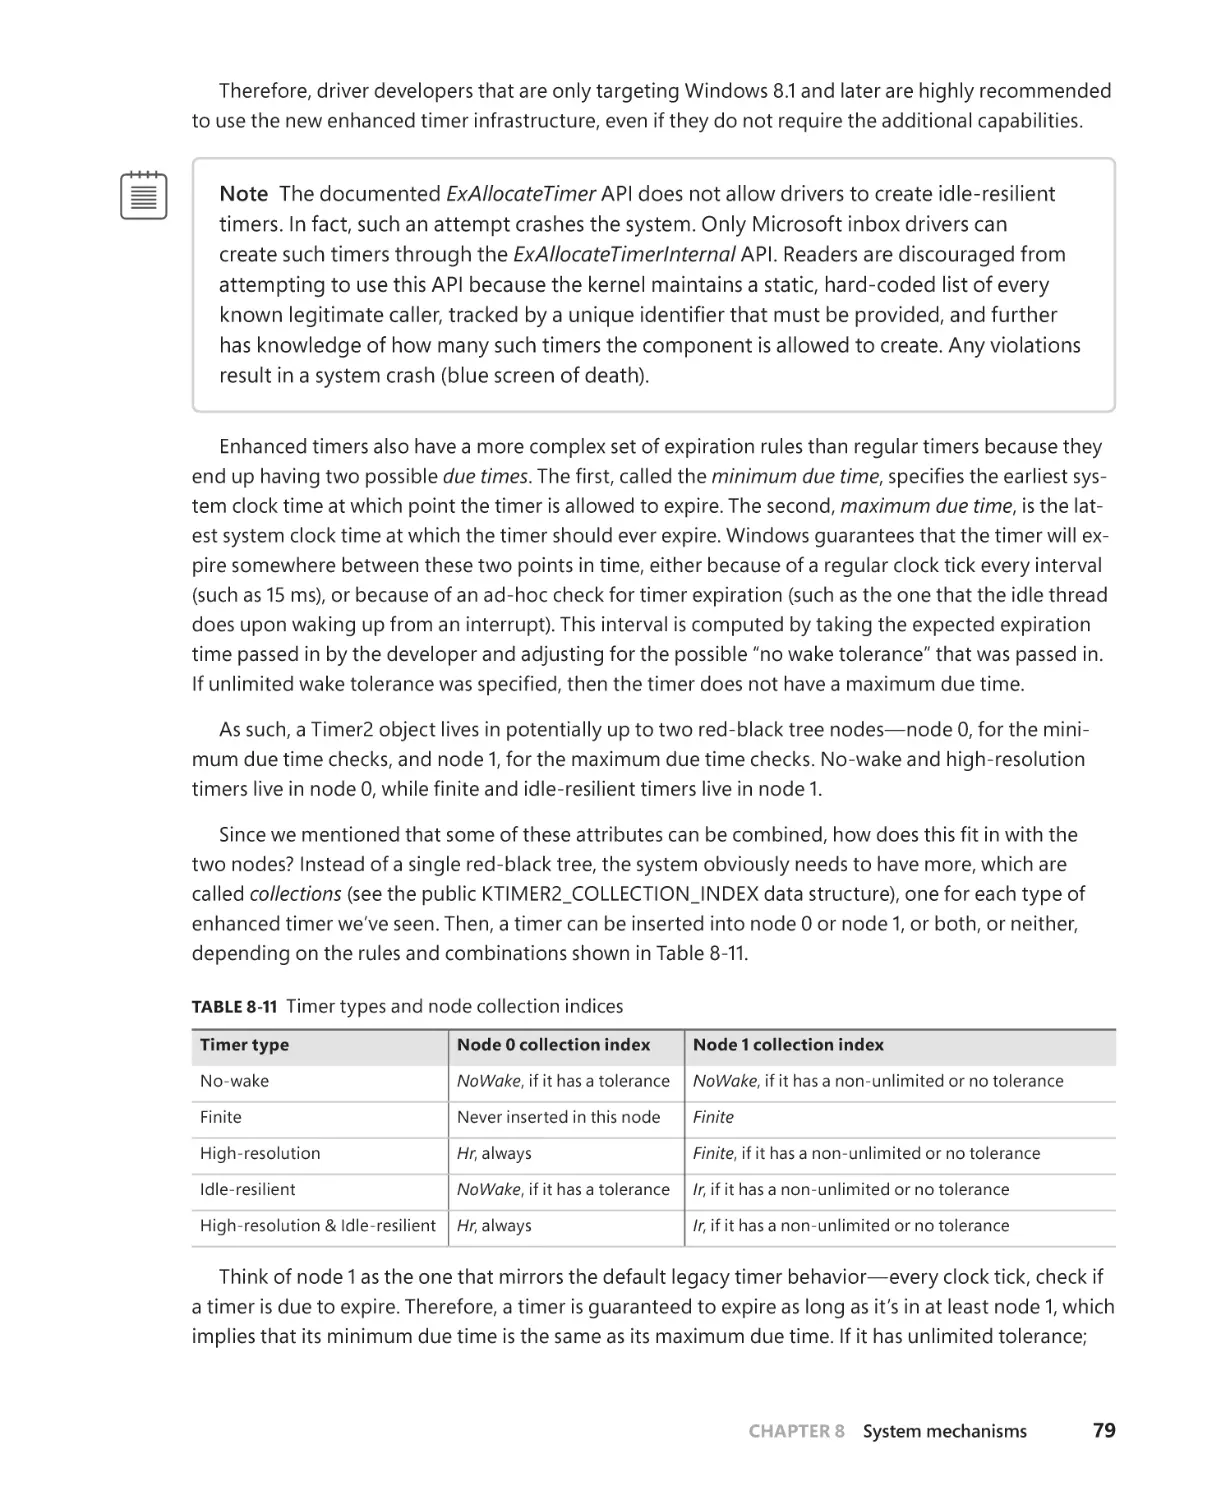
Timer processing . . . . . . . . . . . . . . . . . . . . . . . . . . . . . . . . . . . . . . . . . . . . . . . 66
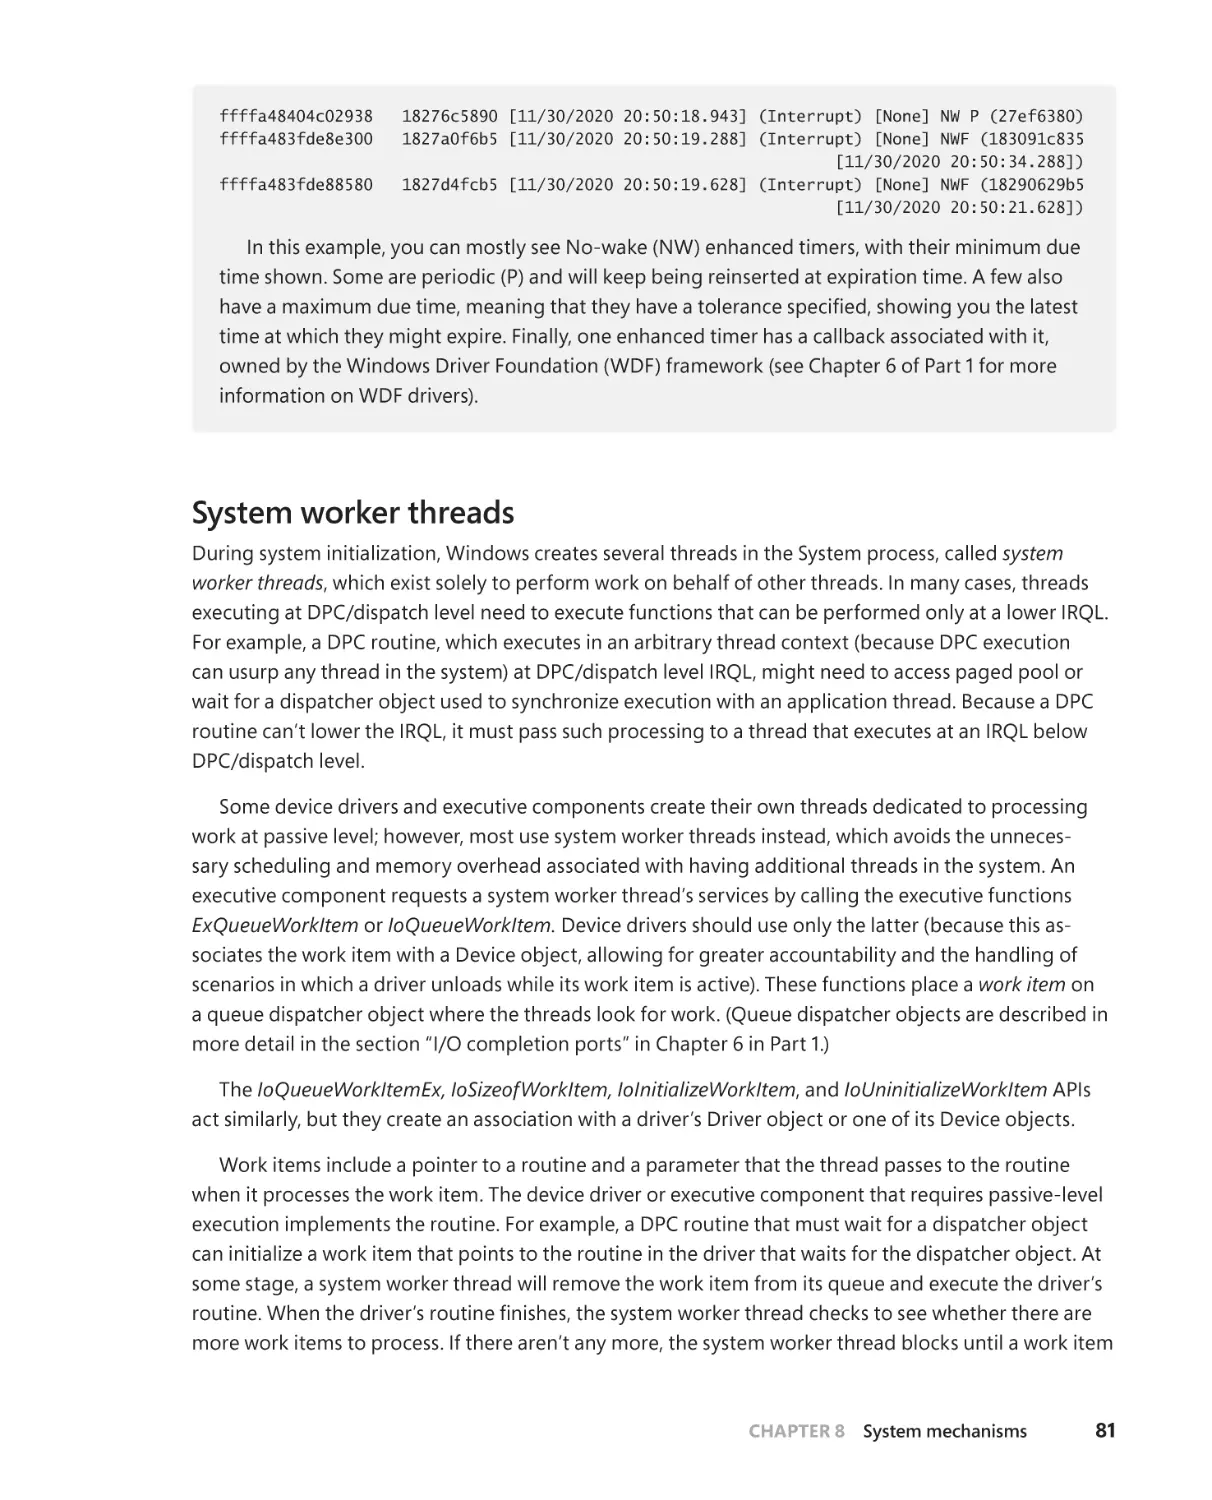
System worker threads . . . . . . . . . . . . . . . . . . . . . . . . . . . . . . . . . . . . . . . . . . 81
Exception dispatching . . . . . . . . . . . . . . . . . . . . . . . . . . . . . . . . . . . . . . . . . . 85
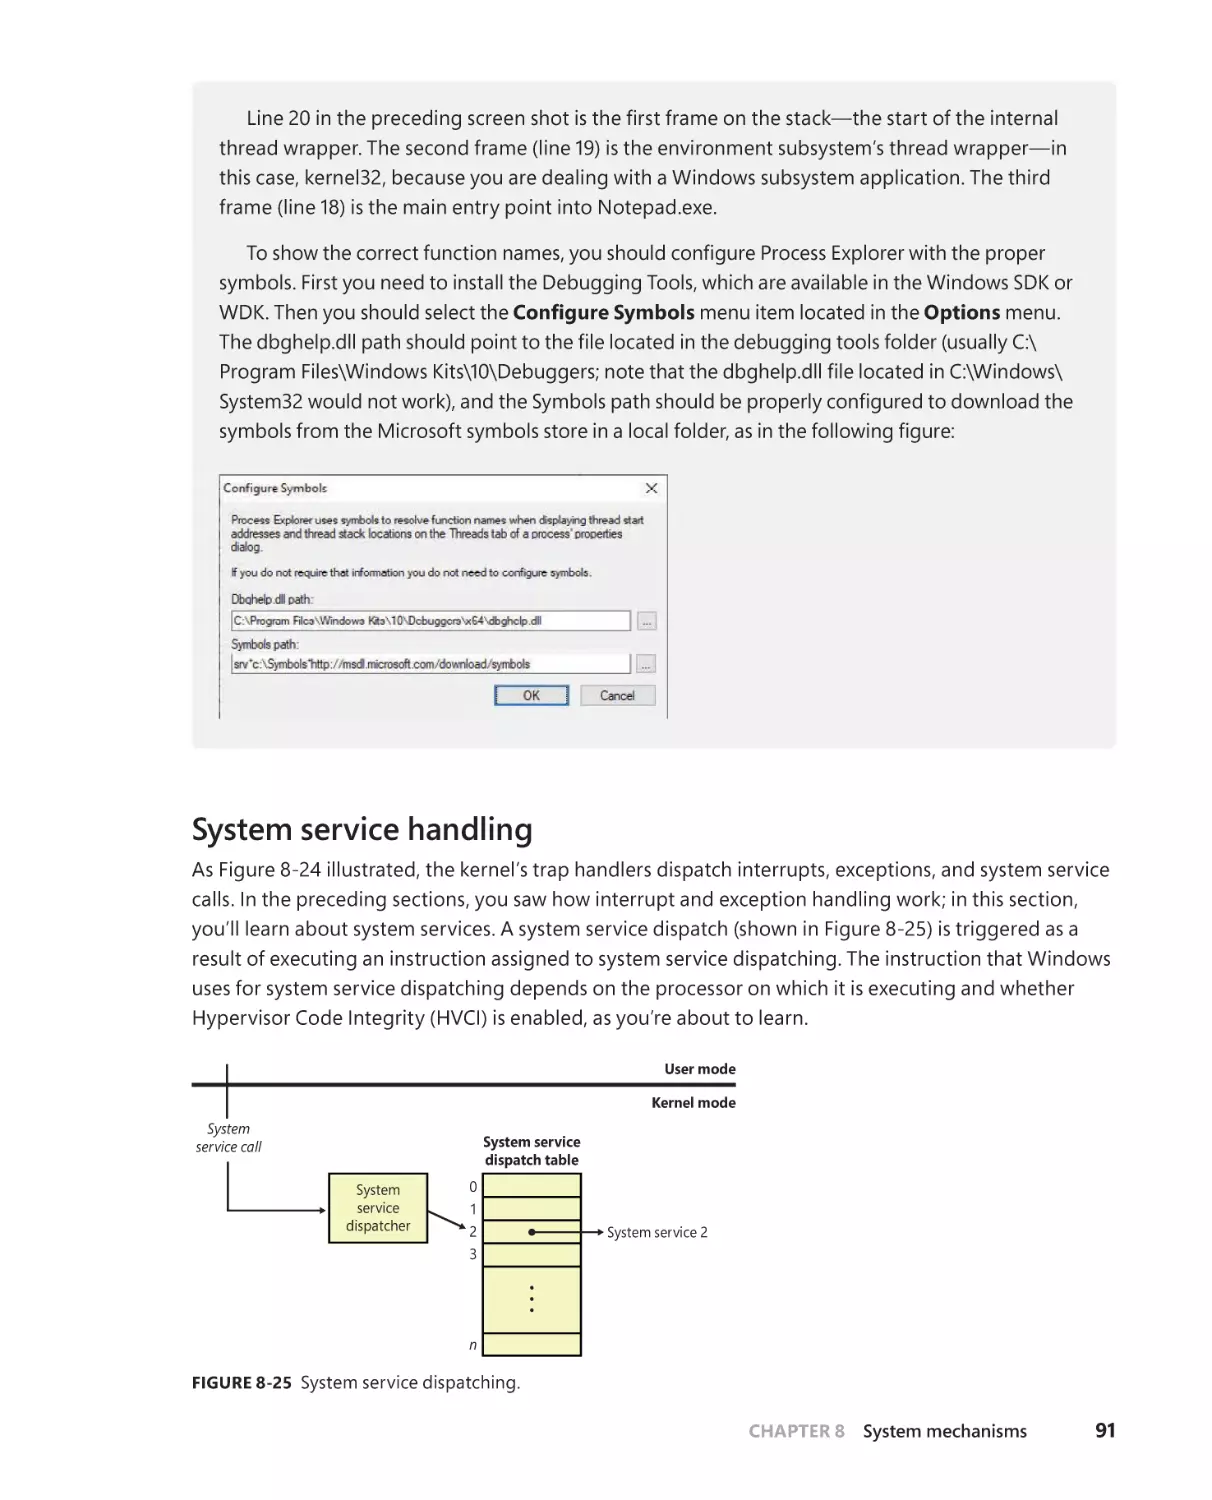
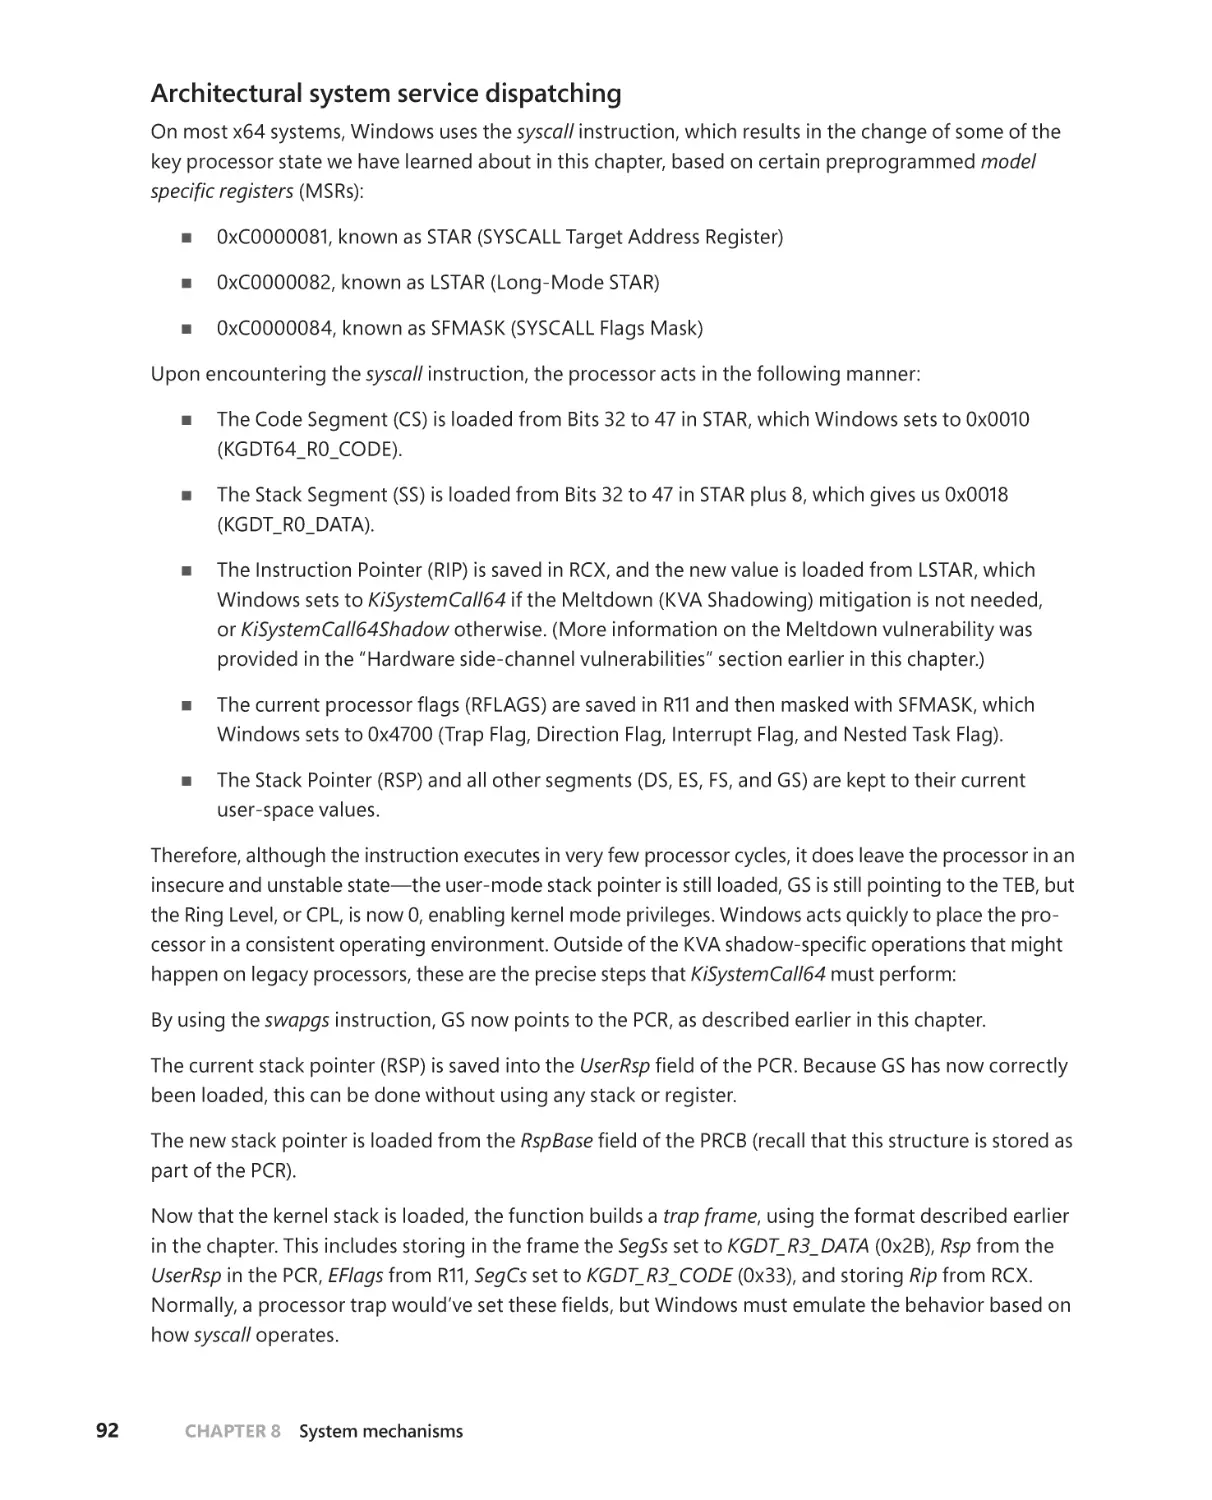
System service handling . . . . . . . . . . . . . . . . . . . . . . . . . . . . . . . . . . . . . . . . 91
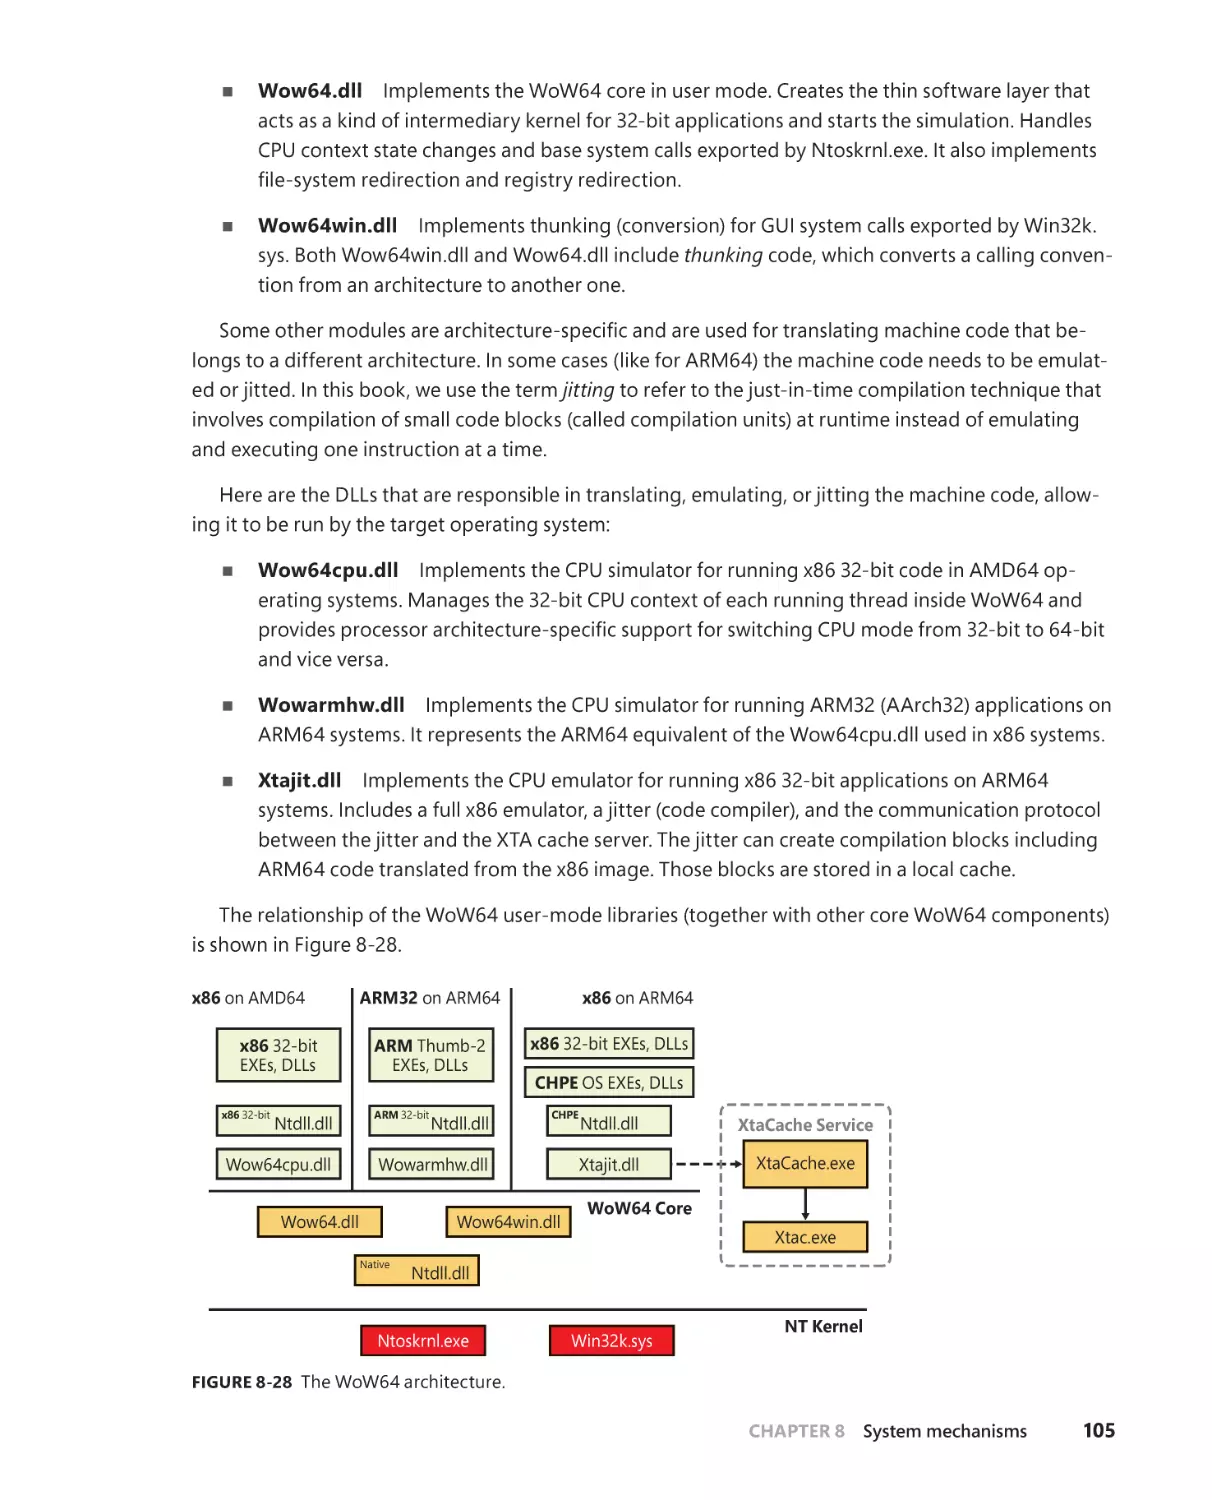
WoW64 (Windows-on-Windows). . . . . . . . . . . . . . . . . . . . . . . . . . . . . . . . . . . . . 104
The WoW64 core . . . . . . . . . . . . . . . . . . . . . . . . . . . . . . . . . . . . . . . . . . . . . 106
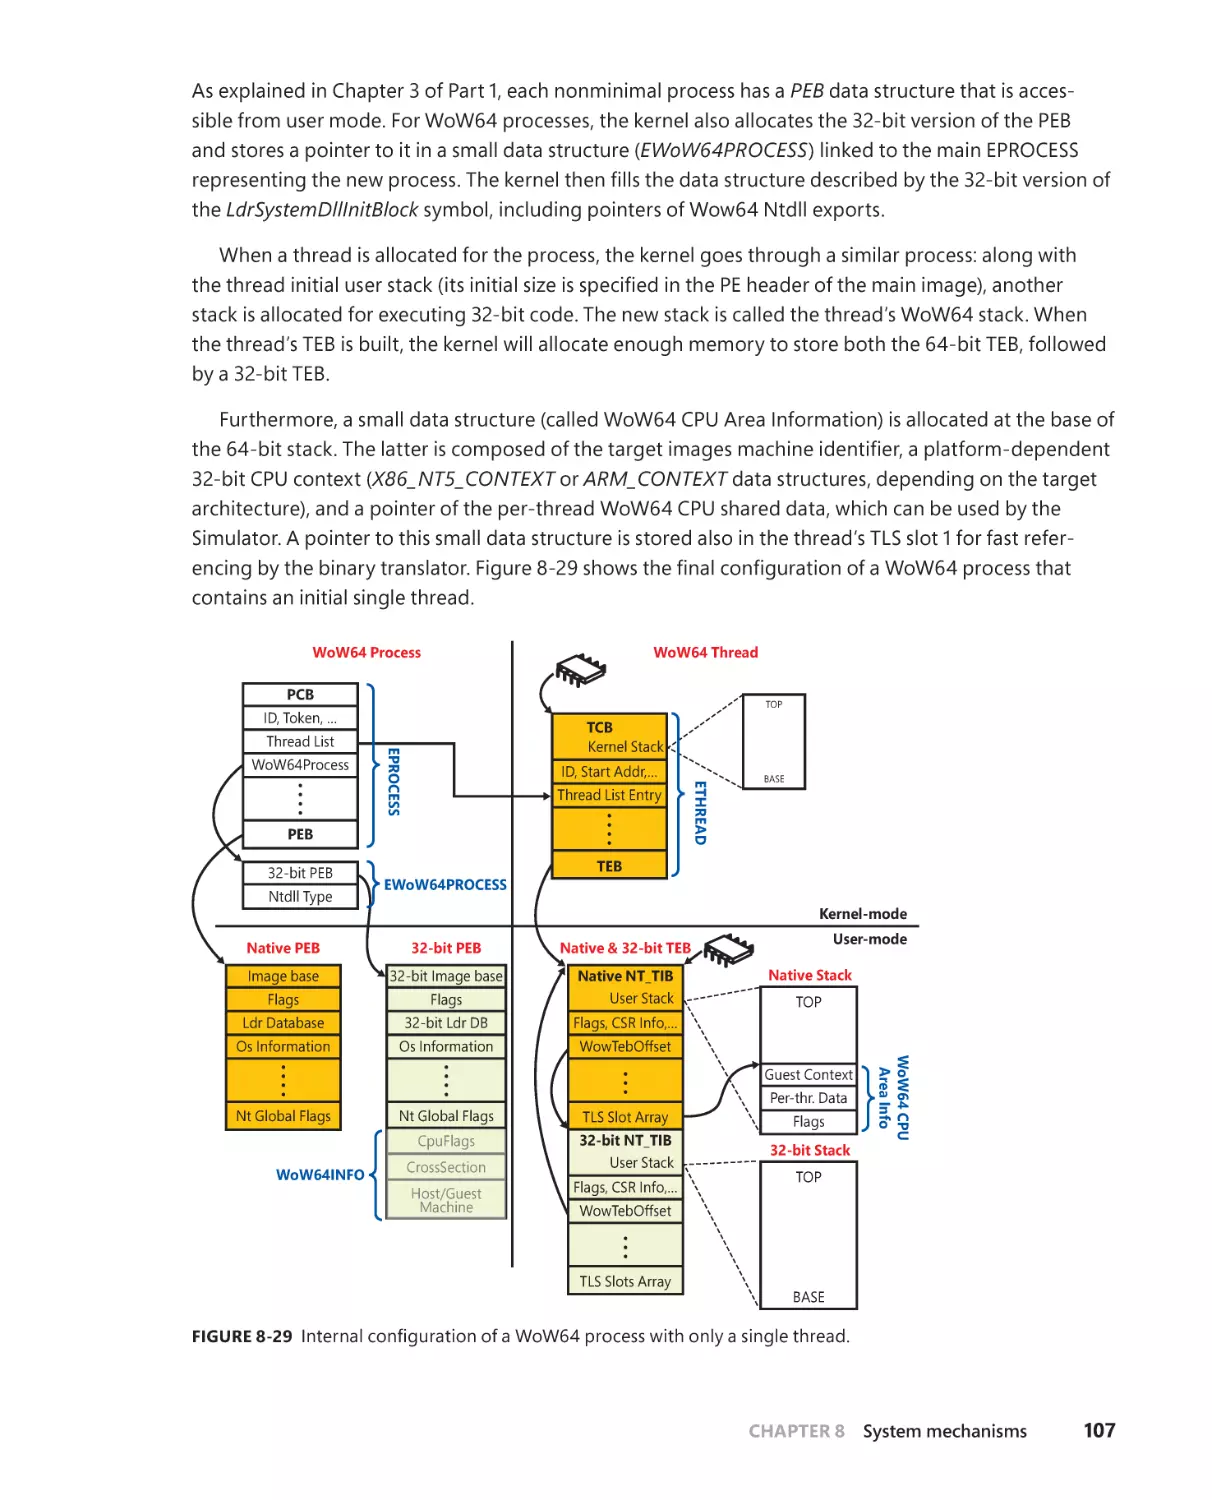
File system redirection . . . . . . . . . . . . . . . . . . . . . . . . . . . . . . . . . . . . . . . . . 109
Registry redirection. . . . . . . . . . . . . . . . . . . . . . . . . . . . . . . . . . . . . . . . . . . . 110
X86 simulation on AMD64 platforms . . . . . . . . . . . . . . . . . . . . . . . . . . . .111
ARM . . . . . . . . . . . . . . . . . . . . . . . . . . . . . . . . . . . . . . . . . . . . . . . . . . . . . . . . . . 113
vii
Memory models . . . . . . . . . . . . . . . . . . . . . . . . . . . . . . . . . . . . . . . . . . . . . . . 114
ARM32 simulation on ARM64 platforms . . . . . . . . . . . . . . . . . . . . . . . . 115
X86 simulation on ARM64 platforms. . . . . . . . . . . . . . . . . . . . . . . . . . . . 115
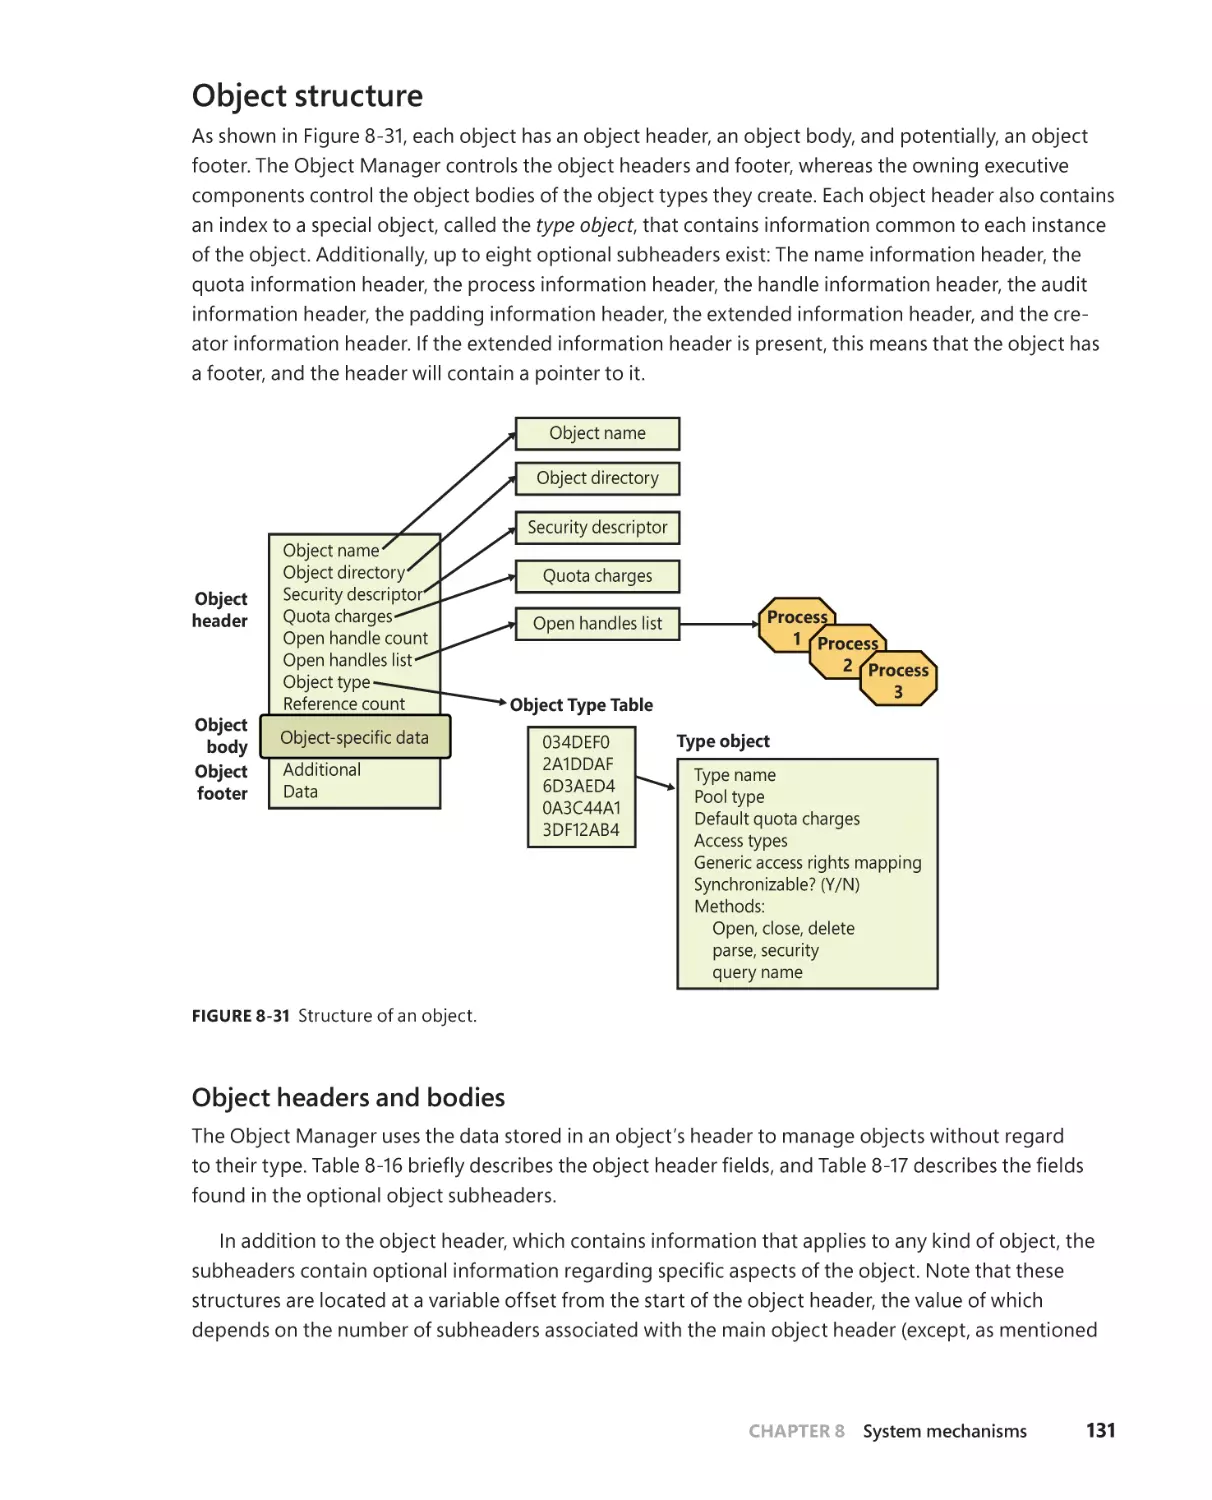
Object Manager . . . . . . . . . . . . . . . . . . . . . . . . . . . . . . . . . . . . . . . . . . . . . . . . . . . . . 125
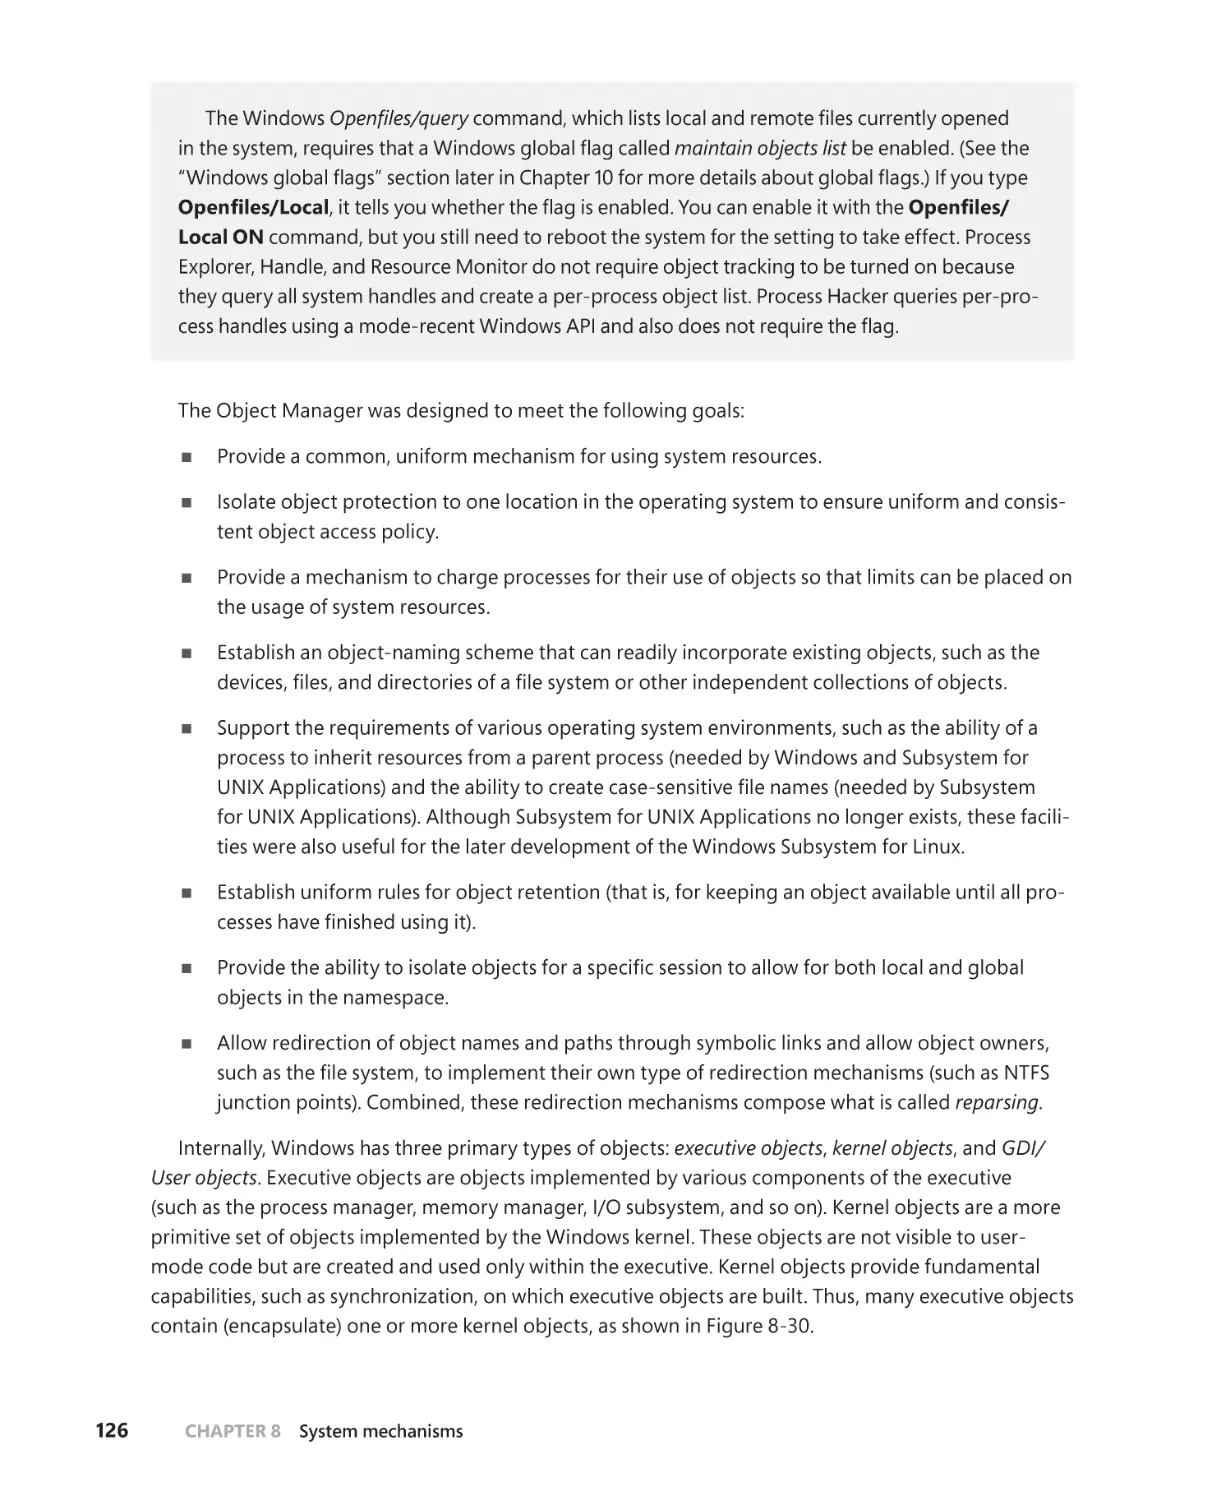
Executive objects . . . . . . . . . . . . . . . . . . . . . . . . . . . . . . . . . . . . . . . . . . . . . . 127
Object structure . . . . . . . . . . . . . . . . . . . . . . . . . . . . . . . . . . . . . . . . . . . . . . . 131
Synchronization . . . . . . . . . . . . . . . . . . . . . . . . . . . . . . . . . . . . . . . . . . . . . . . . . . . . . 170
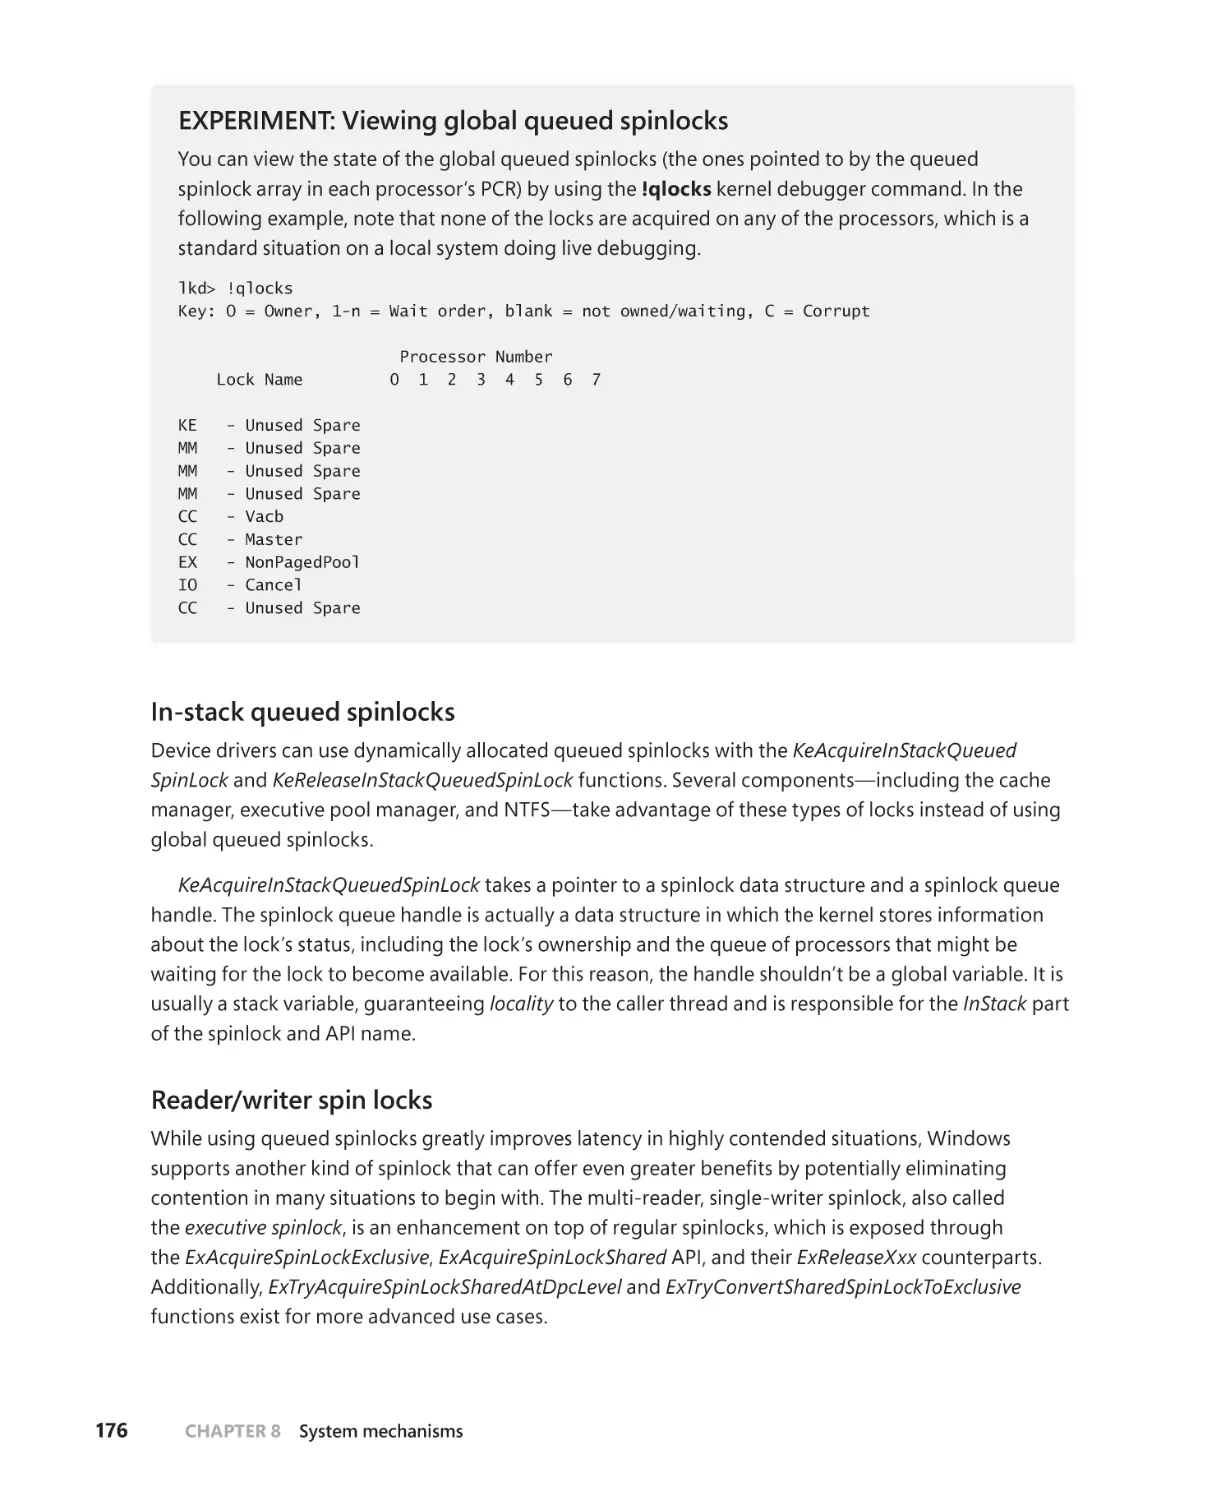
High-IRQL synchronization . . . . . . . . . . . . . . . . . . . . . . . . . . . . . . . . . . . . 172
Low-IRQL synchronization . . . . . . . . . . . . . . . . . . . . . . . . . . . . . . . . . . . . . 177
Advanced local procedure call . . . . . . . . . . . . . . . . . . . . . . . . . . . . . . . . . . . . . . .209
Connection model . . . . . . . . . . . . . . . . . . . . . . . . . . . . . . . . . . . . . . . . . . . . . 210
Message model . . . . . . . . . . . . . . . . . . . . . . . . . . . . . . . . . . . . . . . . . . . . . . . 212
Asynchronous operation . . . . . . . . . . . . . . . . . . . . . . . . . . . . . . . . . . . . . . . 214
Views, regions, and sections . . . . . . . . . . . . . . . . . . . . . . . . . . . . . . . . . . . . 215
Attributes . . . . . . . . . . . . . . . . . . . . . . . . . . . . . . . . . . . . . . . . . . . . . . . . . . . . . 216
Blobs, handles, and resources . . . . . . . . . . . . . . . . . . . . . . . . . . . . . . . . . . 217
Handle passing . . . . . . . . . . . . . . . . . . . . . . . . . . . . . . . . . . . . . . . . . . . . . . . . 218
Security . . . . . . . . . . . . . . . . . . . . . . . . . . . . . . . . . . . . . . . . . . . . . . . . . . . . . . . 219
Performance . . . . . . . . . . . . . . . . . . . . . . . . . . . . . . . . . . . . . . . . . . . . . . . . . .220
Power management . . . . . . . . . . . . . . . . . . . . . . . . . . . . . . . . . . . . . . . . . . . 221
ALPC direct event attribute . . . . . . . . . . . . . . . . . . . . . . . . . . . . . . . . . . . .222
Debugging and tracing . . . . . . . . . . . . . . . . . . . . . . . . . . . . . . . . . . . . . . . .222
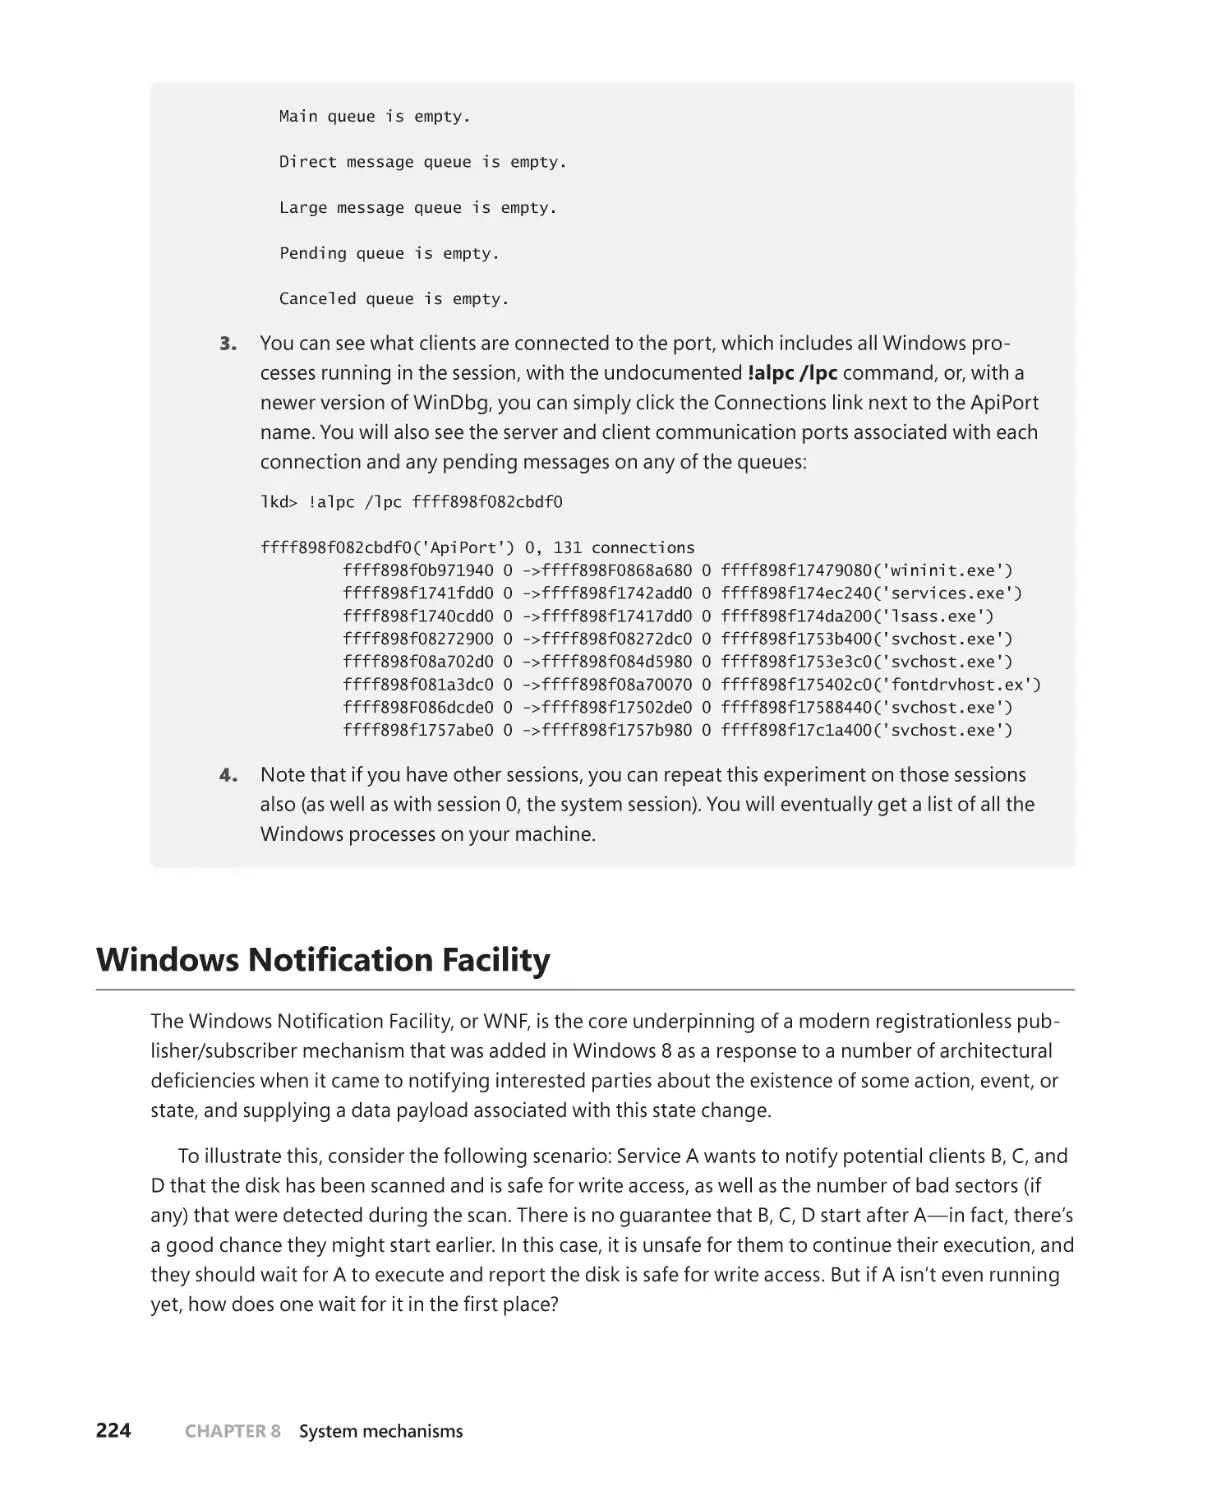
. . . . . . . . . . . . . . . . . . . . . . . . . . . . . . . . . . . . . . . .224
WNF features. . . . . . . . . . . . . . . . . . . . . . . . . . . . . . . . . . . . . . . . . . . . . . . . . .225
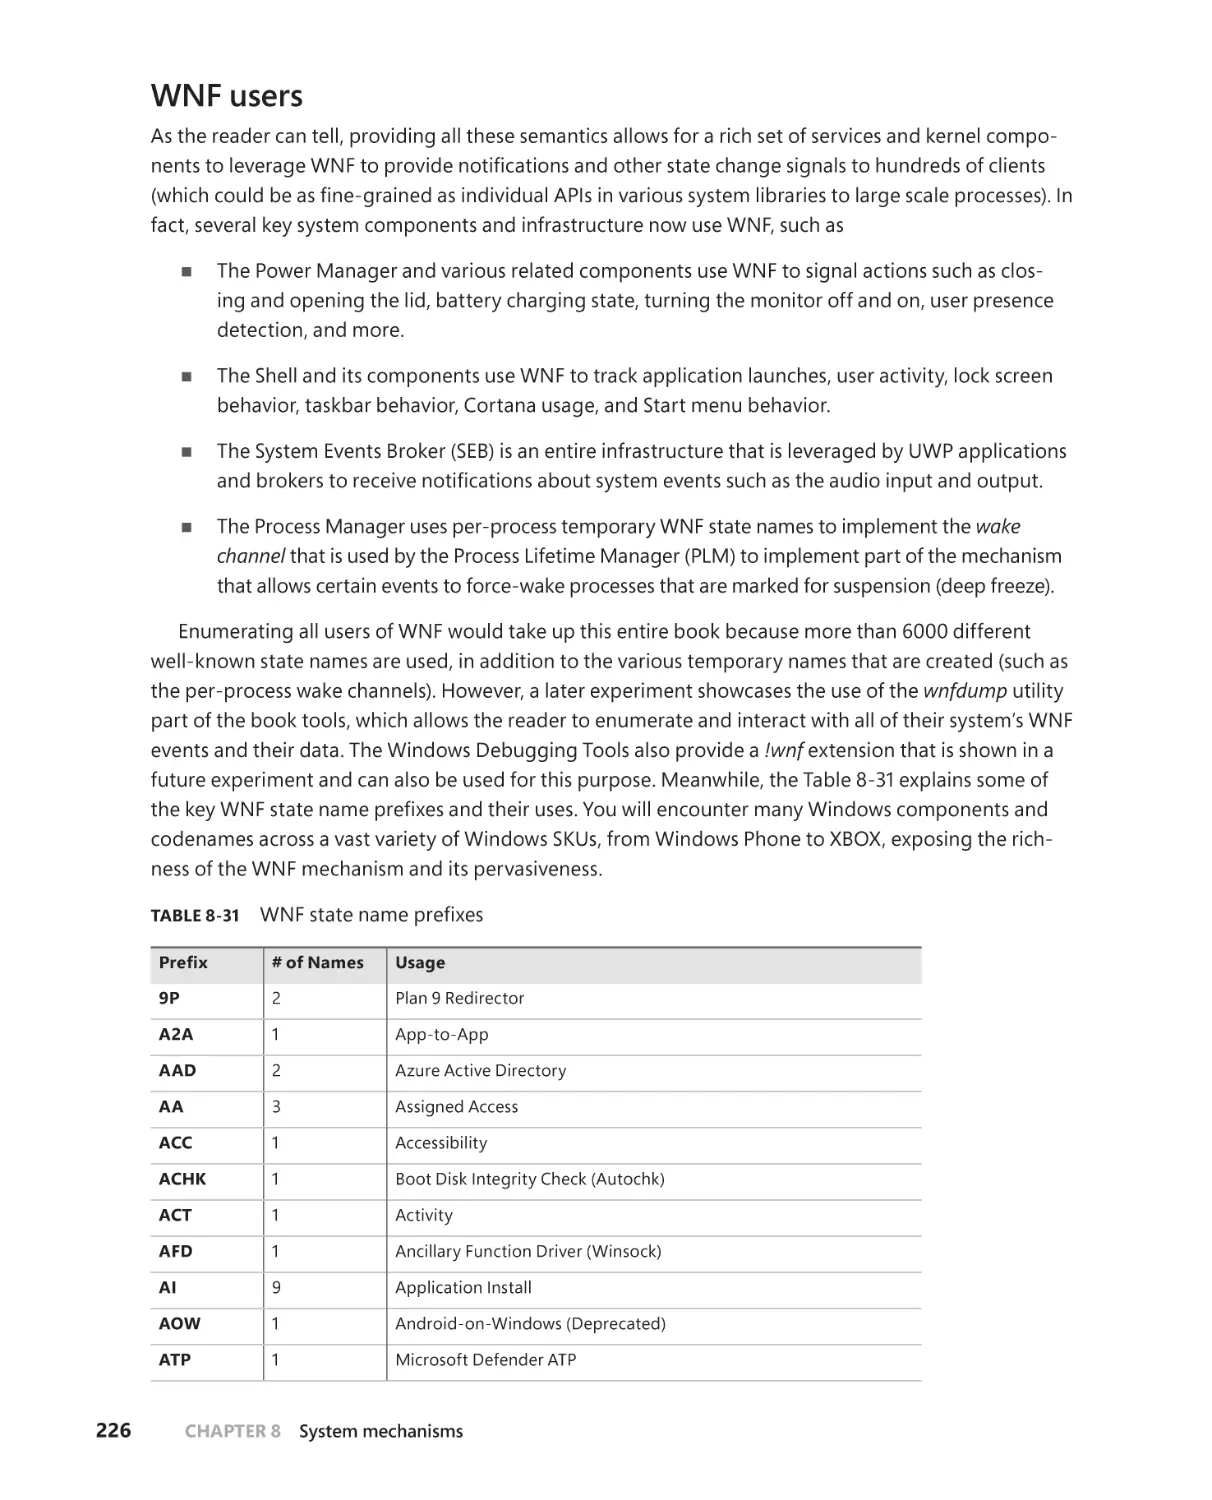
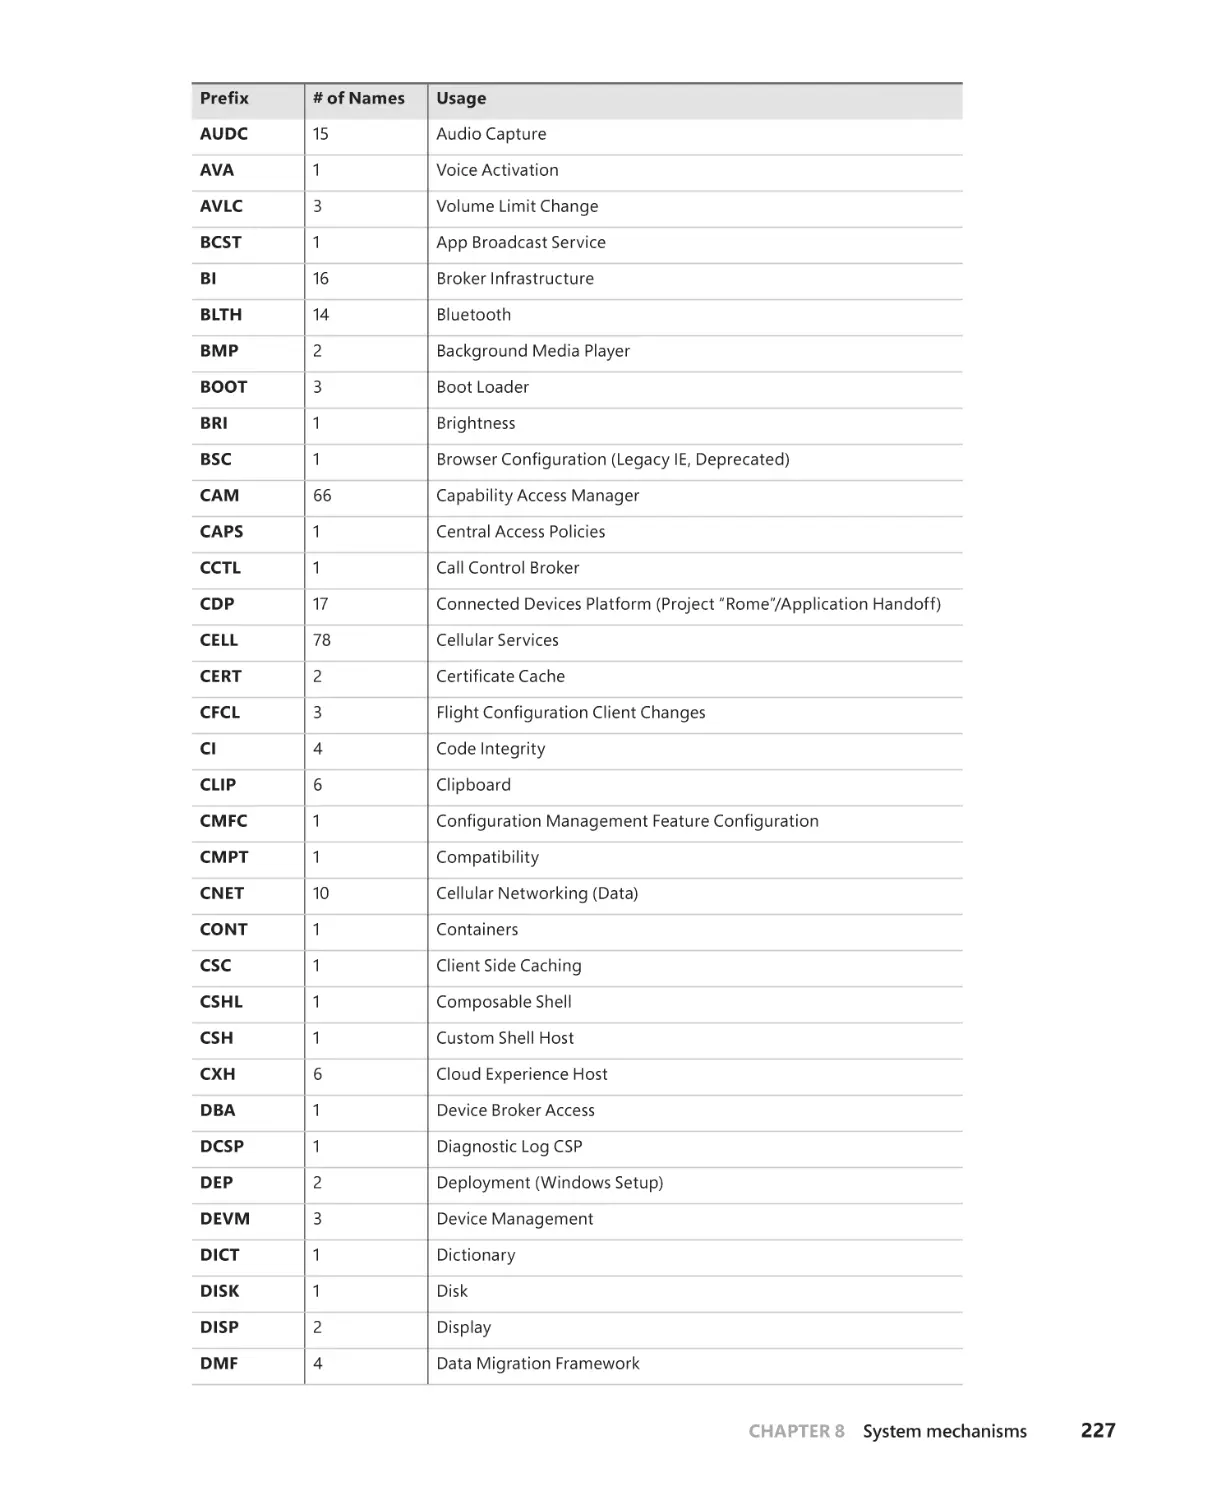
WNF users . . . . . . . . . . . . . . . . . . . . . . . . . . . . . . . . . . . . . . . . . . . . . . . . . . . .226
WNF state names and storage . . . . . . . . . . . . . . . . . . . . . . . . . . . . . . . . .233
WNF event aggregation . . . . . . . . . . . . . . . . . . . . . . . . . . . . . . . . . . . . . . .237
User-mode debugging . . . . . . . . . . . . . . . . . . . . . . . . . . . . . . . . . . . . . . . . . . . . . .239
Kernel support . . . . . . . . . . . . . . . . . . . . . . . . . . . . . . . . . . . . . . . . . . . . . . . .239
Native support . . . . . . . . . . . . . . . . . . . . . . . . . . . . . . . . . . . . . . . . . . . . . . . .240
Windows subsystem support . . . . . . . . . . . . . . . . . . . . . . . . . . . . . . . . . . .242
Packaged applications . . . . . . . . . . . . . . . . . . . . . . . . . . . . . . . . . . . . . . . . . . . . . . .243
UWP applications . . . . . . . . . . . . . . . . . . . . . . . . . . . . . . . . . . . . . . . . . . . . . .245
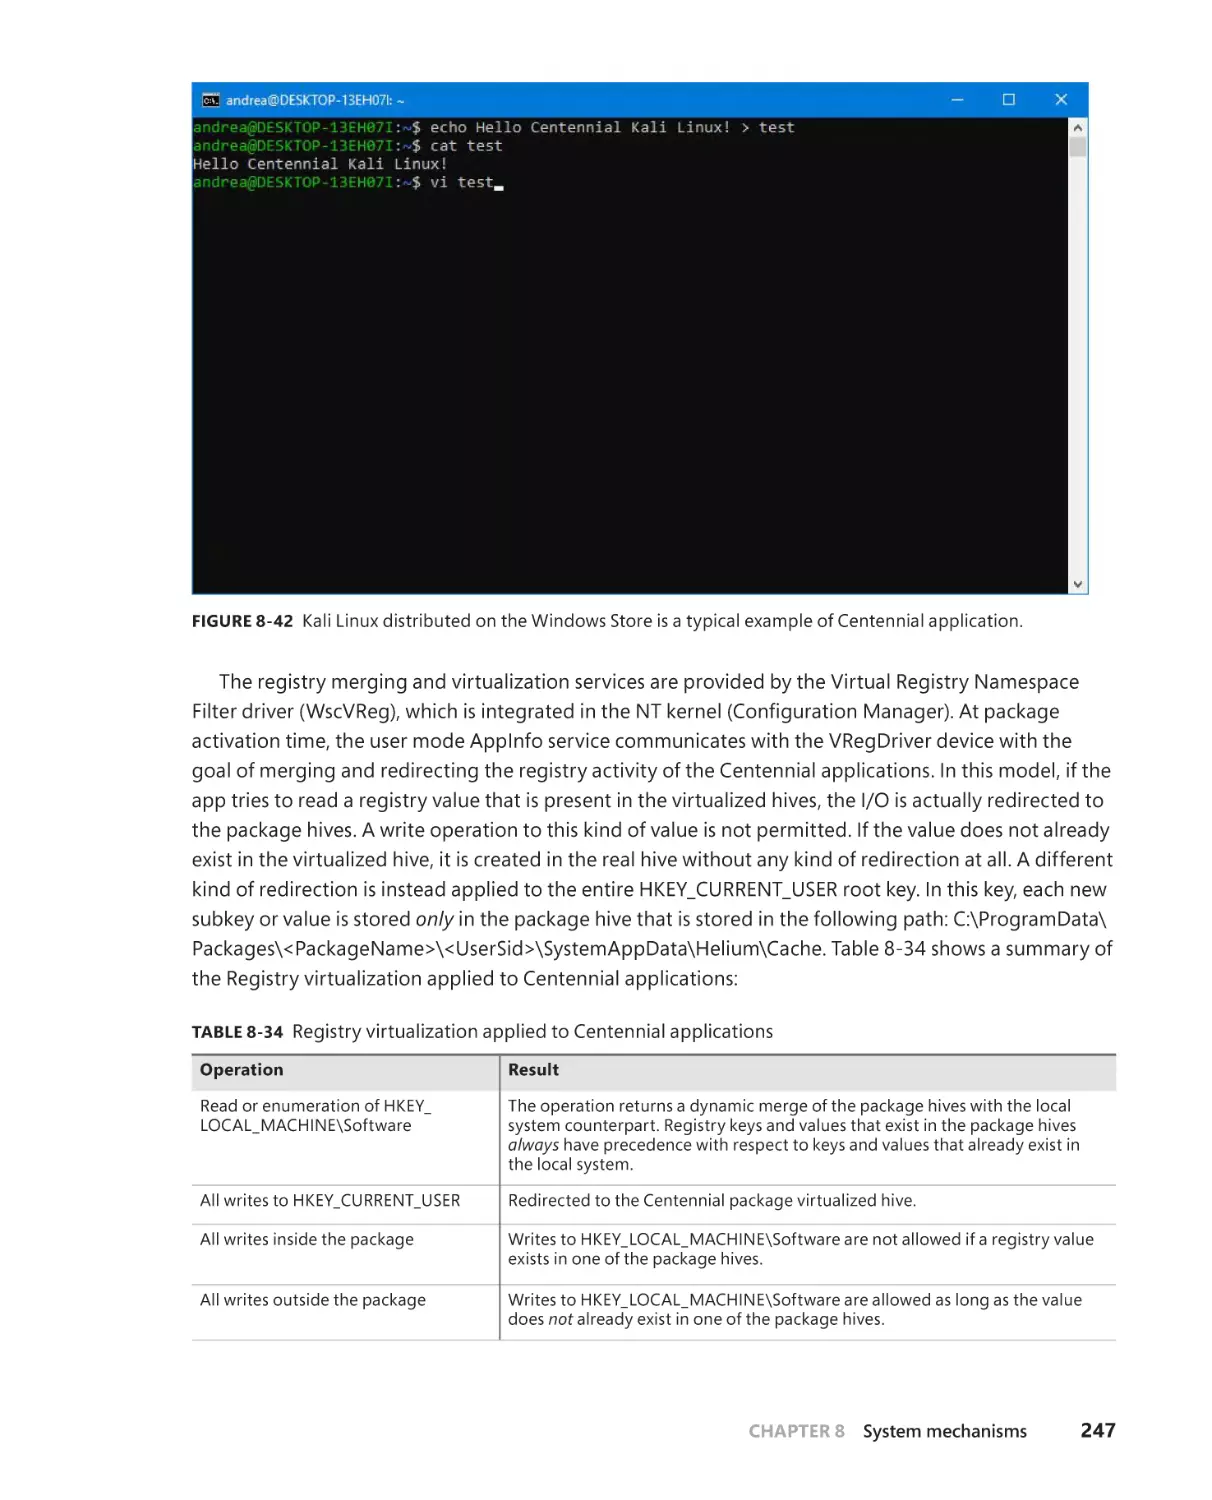
Centennial applications . . . . . . . . . . . . . . . . . . . . . . . . . . . . . . . . . . . . . . . .246
viii
Contents
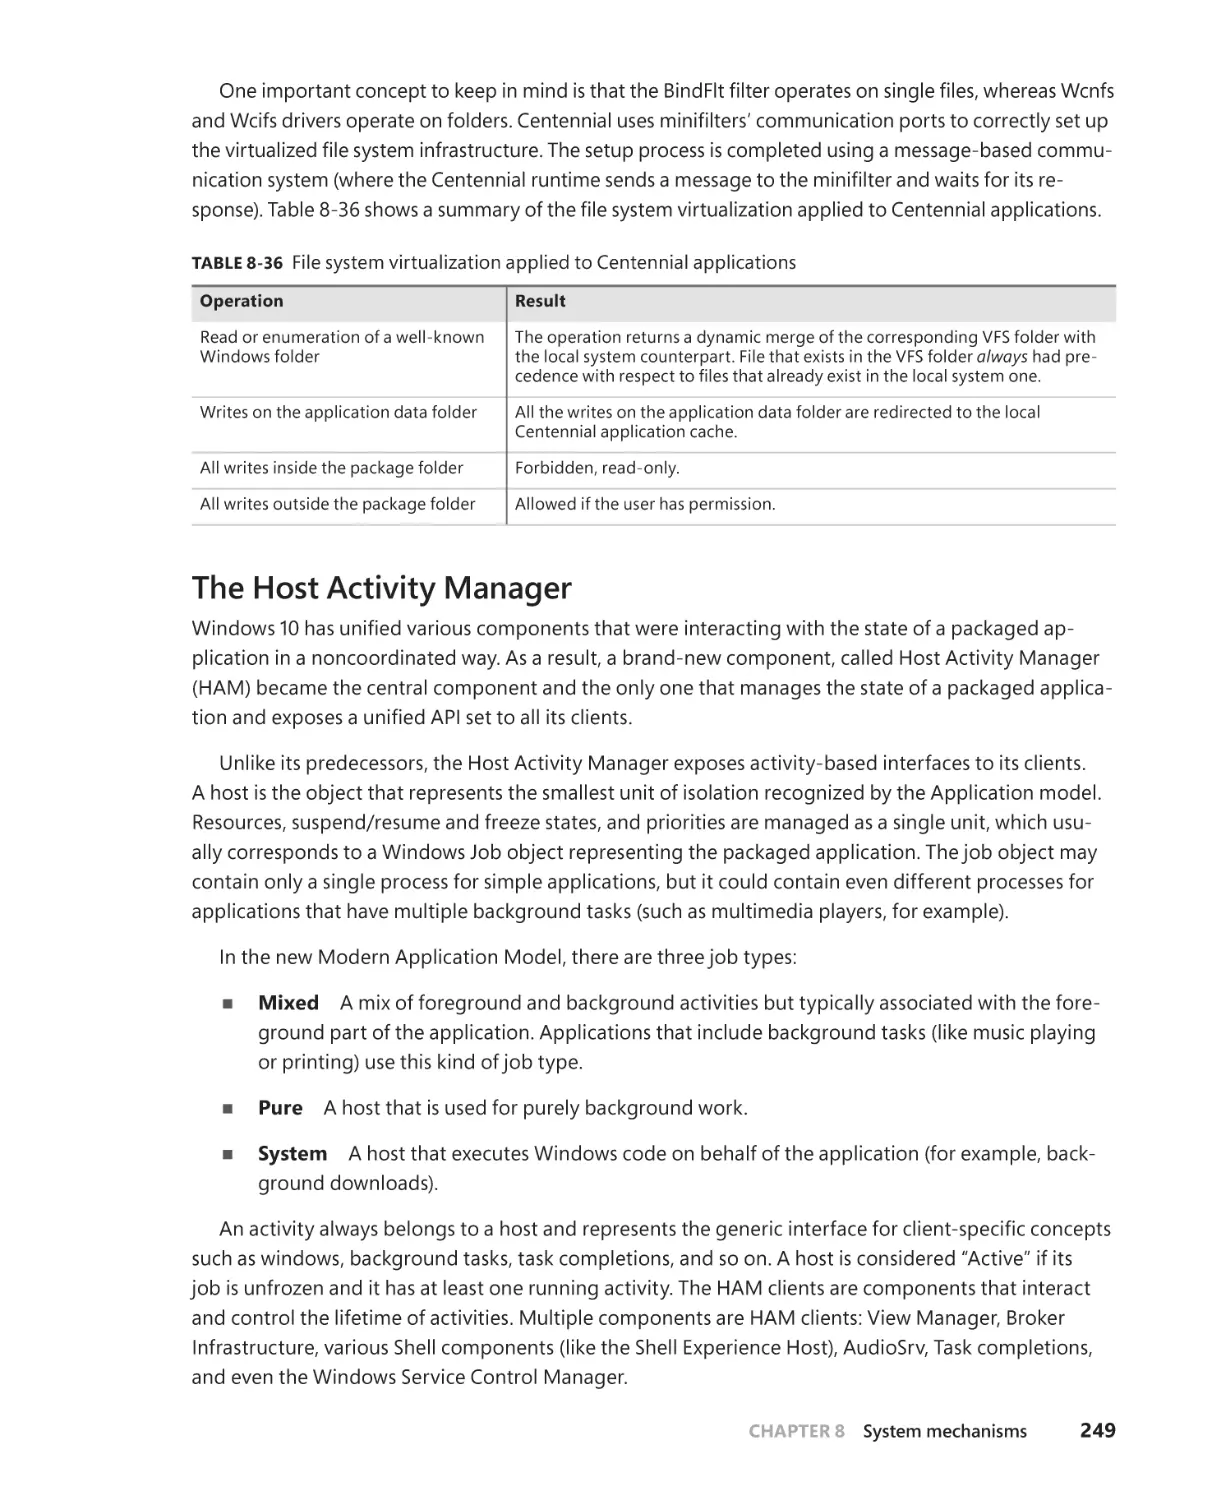
The Host Activity Manager . . . . . . . . . . . . . . . . . . . . . . . . . . . . . . . . . . . . .249
The State Repository . . . . . . . . . . . . . . . . . . . . . . . . . . . . . . . . . . . . . . . . . . . 251
The Dependency Mini Repository . . . . . . . . . . . . . . . . . . . . . . . . . . . . . .255
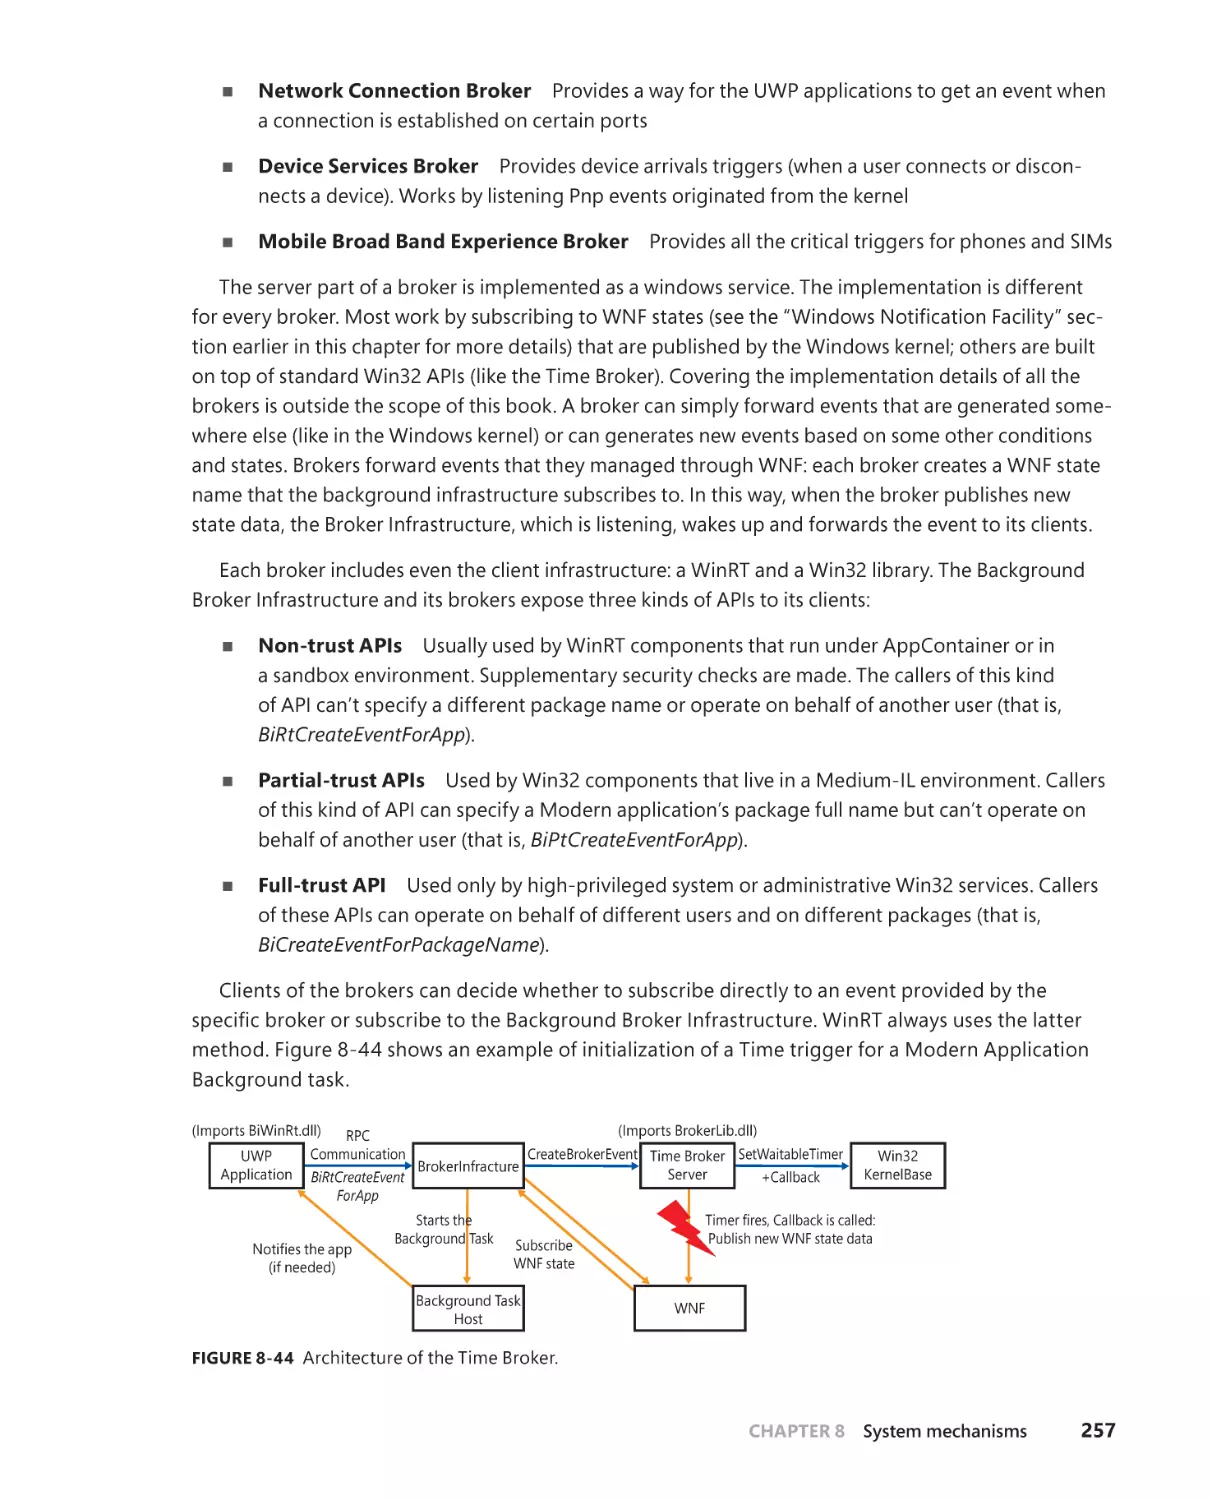
Background tasks and the Broker Infrastructure . . . . . . . . . . . . . . . . .256
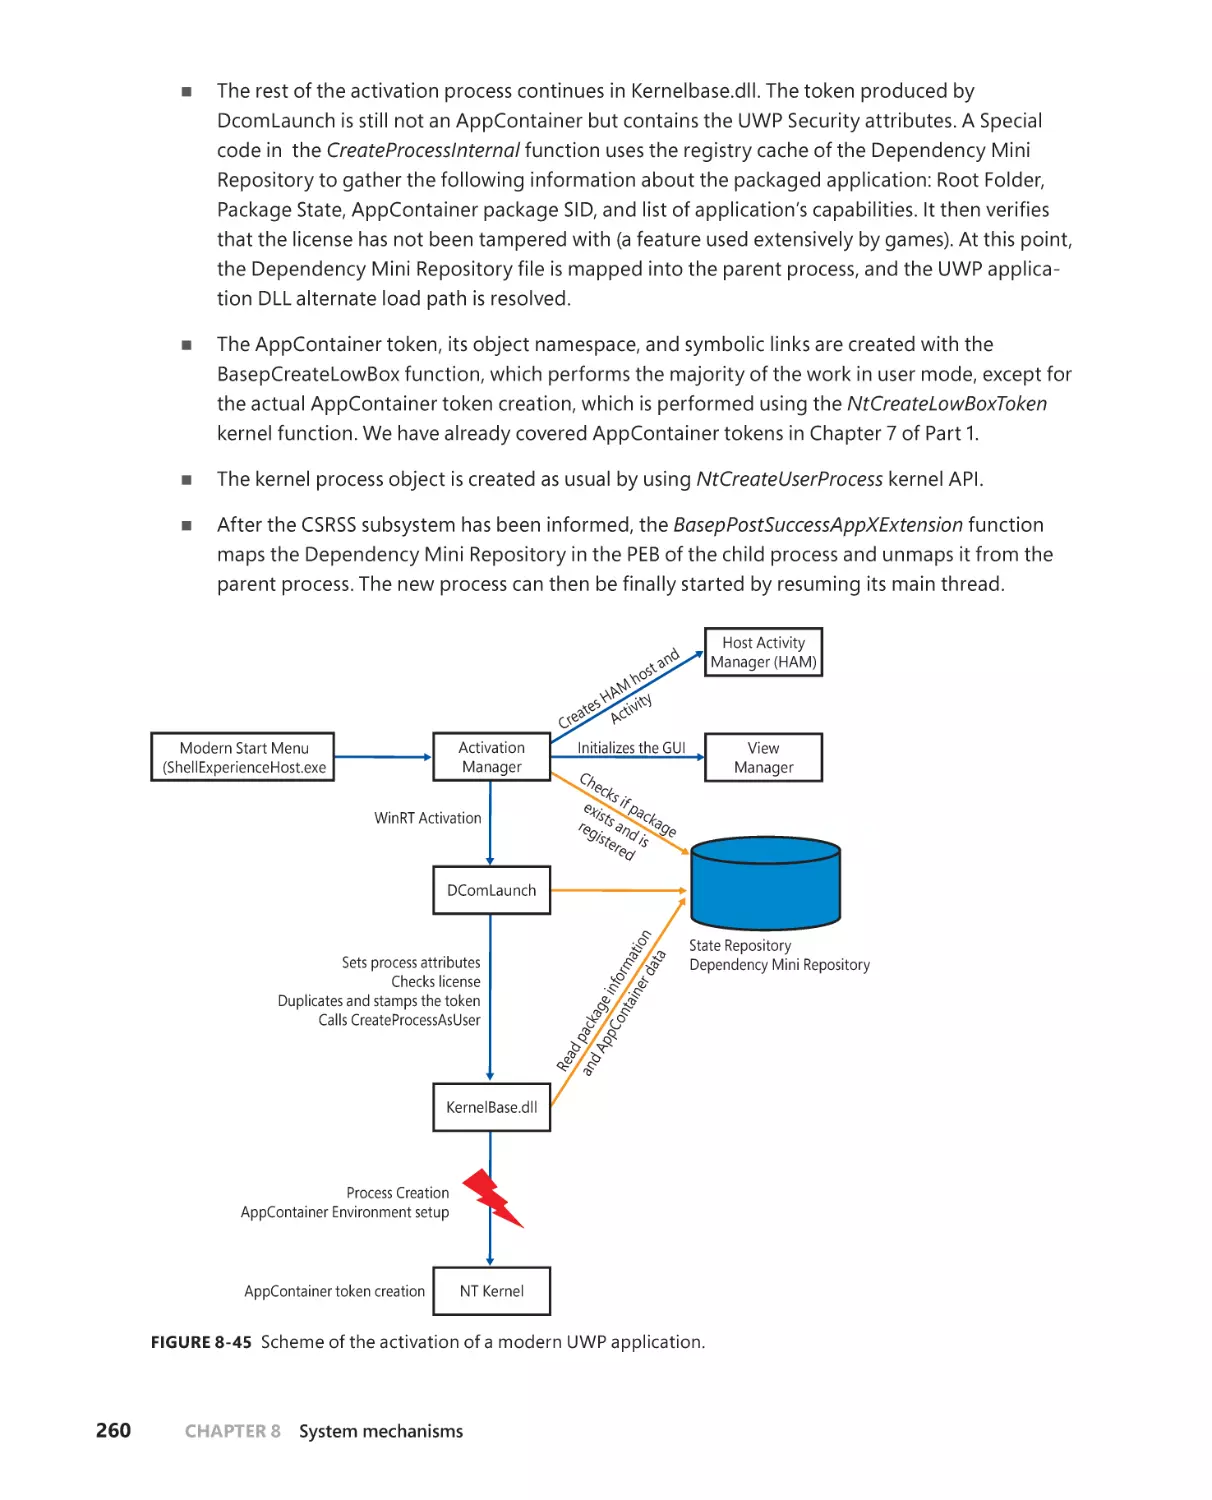
Packaged applications setup and startup . . . . . . . . . . . . . . . . . . . . . . .258
Package activation. . . . . . . . . . . . . . . . . . . . . . . . . . . . . . . . . . . . . . . . . . . . .259
Package registration . . . . . . . . . . . . . . . . . . . . . . . . . . . . . . . . . . . . . . . . . . .265
Conclusion . . . . . . . . . . . . . . . . . . . . . . . . . . . . . . . . . . . . . . . . . . . . . . . . . . . . . . . . . .266
Chapter 9
Virtualization technologies
267
The Windows hypervisor . . . . . . . . . . . . . . . . . . . . . . . . . . . . . . . . . . . . . . . . . . . . .267
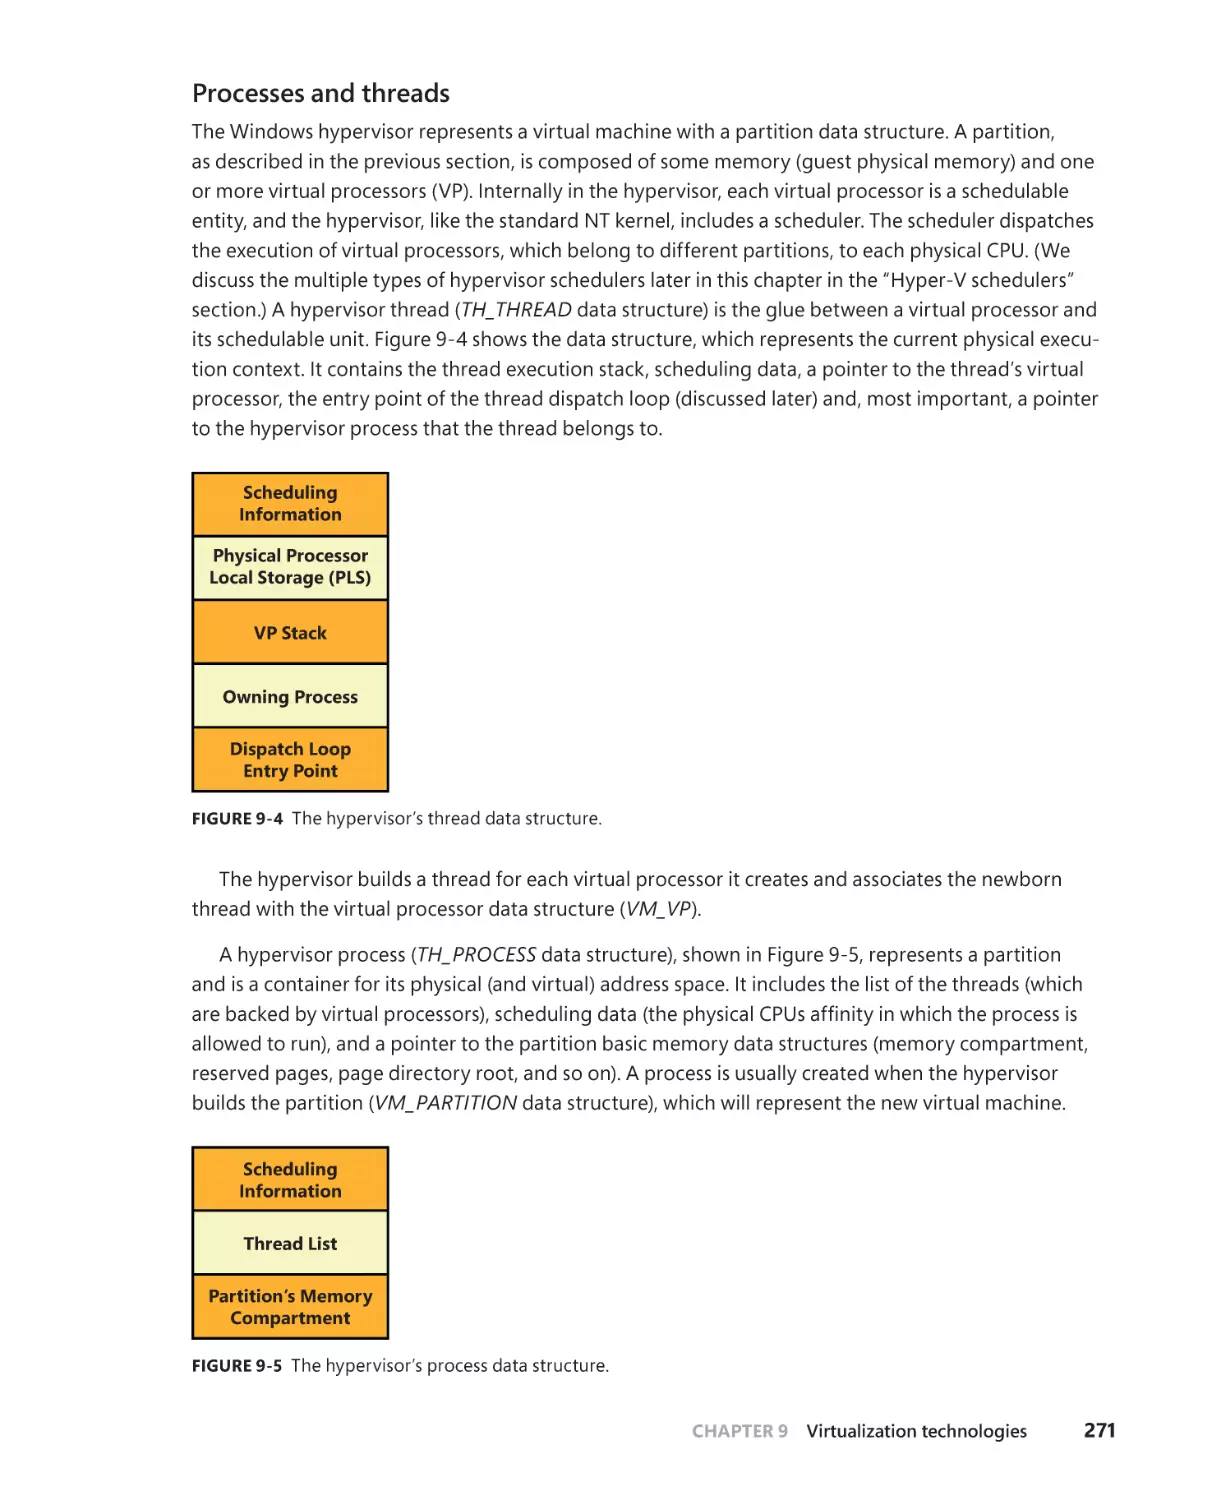
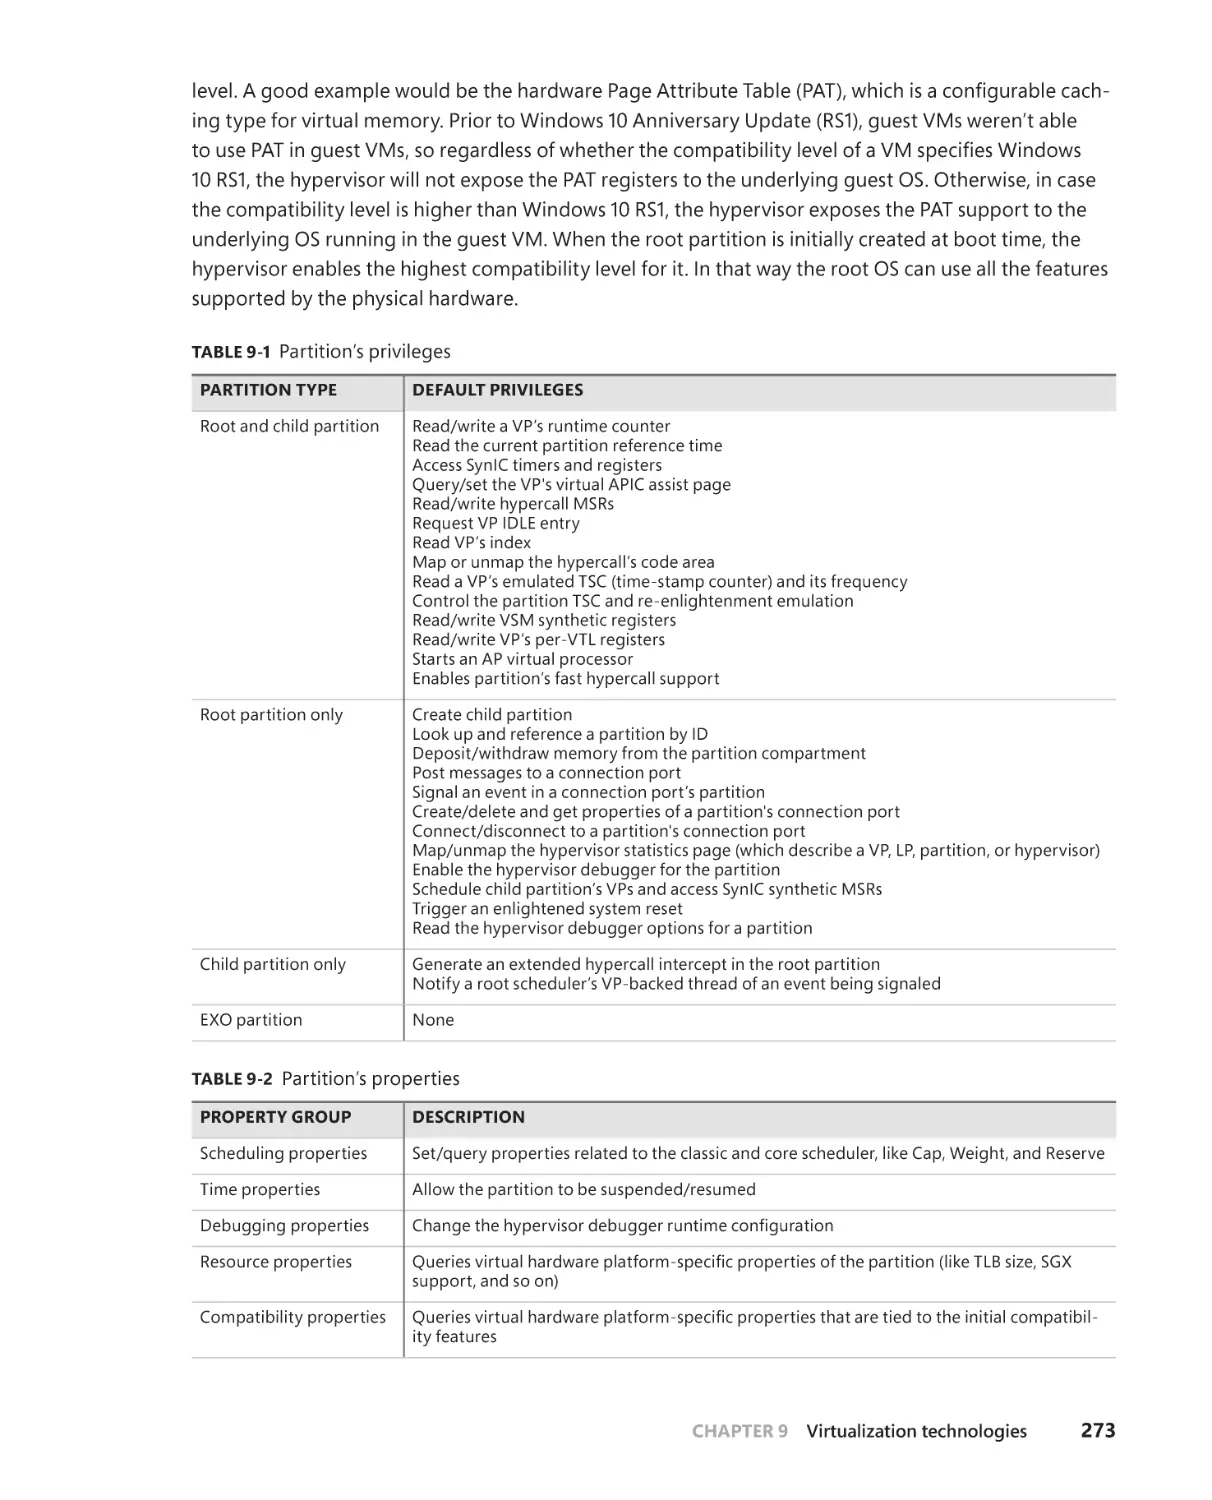
Partitions, processes, and threads . . . . . . . . . . . . . . . . . . . . . . . . . . . . . .269
The hypervisor startup . . . . . . . . . . . . . . . . . . . . . . . . . . . . . . . . . . . . . . . . . 274
The hypervisor memory manager . . . . . . . . . . . . . . . . . . . . . . . . . . . . . .279
Hyper-V schedulers . . . . . . . . . . . . . . . . . . . . . . . . . . . . . . . . . . . . . . . . . . . .287
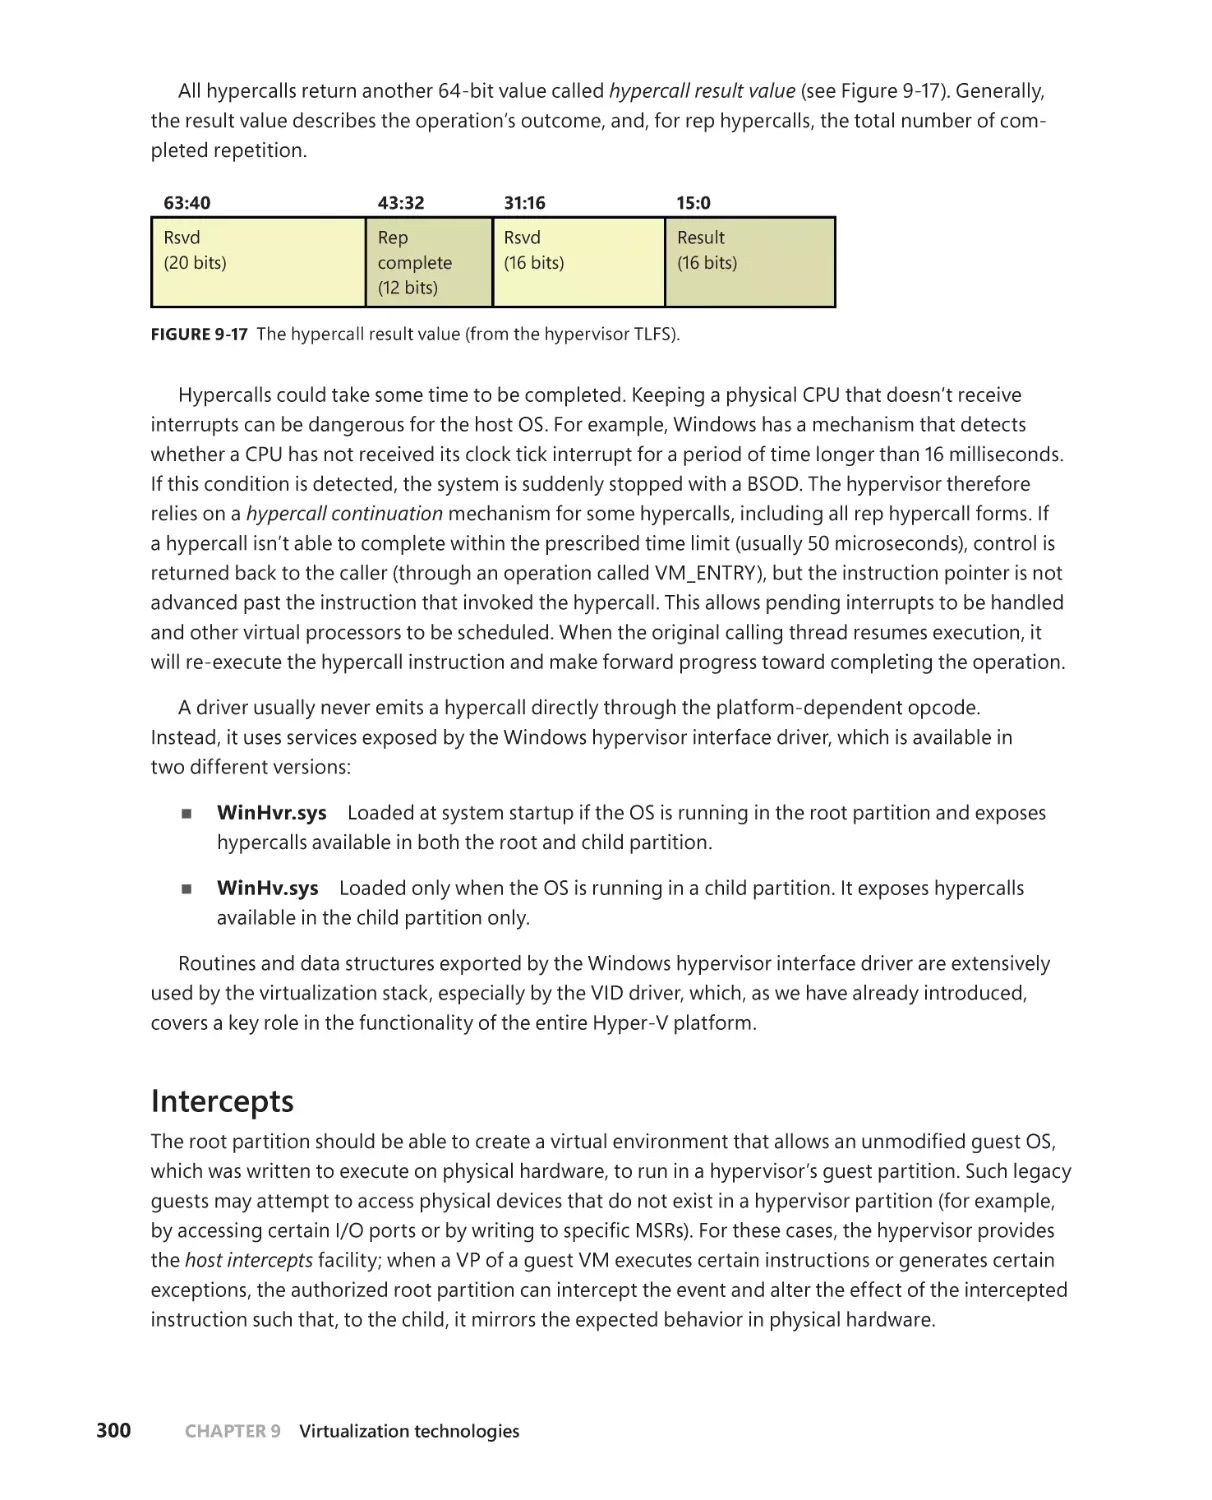
Hypercalls and the hypervisor TLFS . . . . . . . . . . . . . . . . . . . . . . . . . . . . .299
Intercepts . . . . . . . . . . . . . . . . . . . . . . . . . . . . . . . . . . . . . . . . . . . . . . . . . . . . .300
The synthetic interrupt controller (SynIC) . . . . . . . . . . . . . . . . . . . . . . . 301
The Windows hypervisor platform API and EXO partitions . . . . . . .304
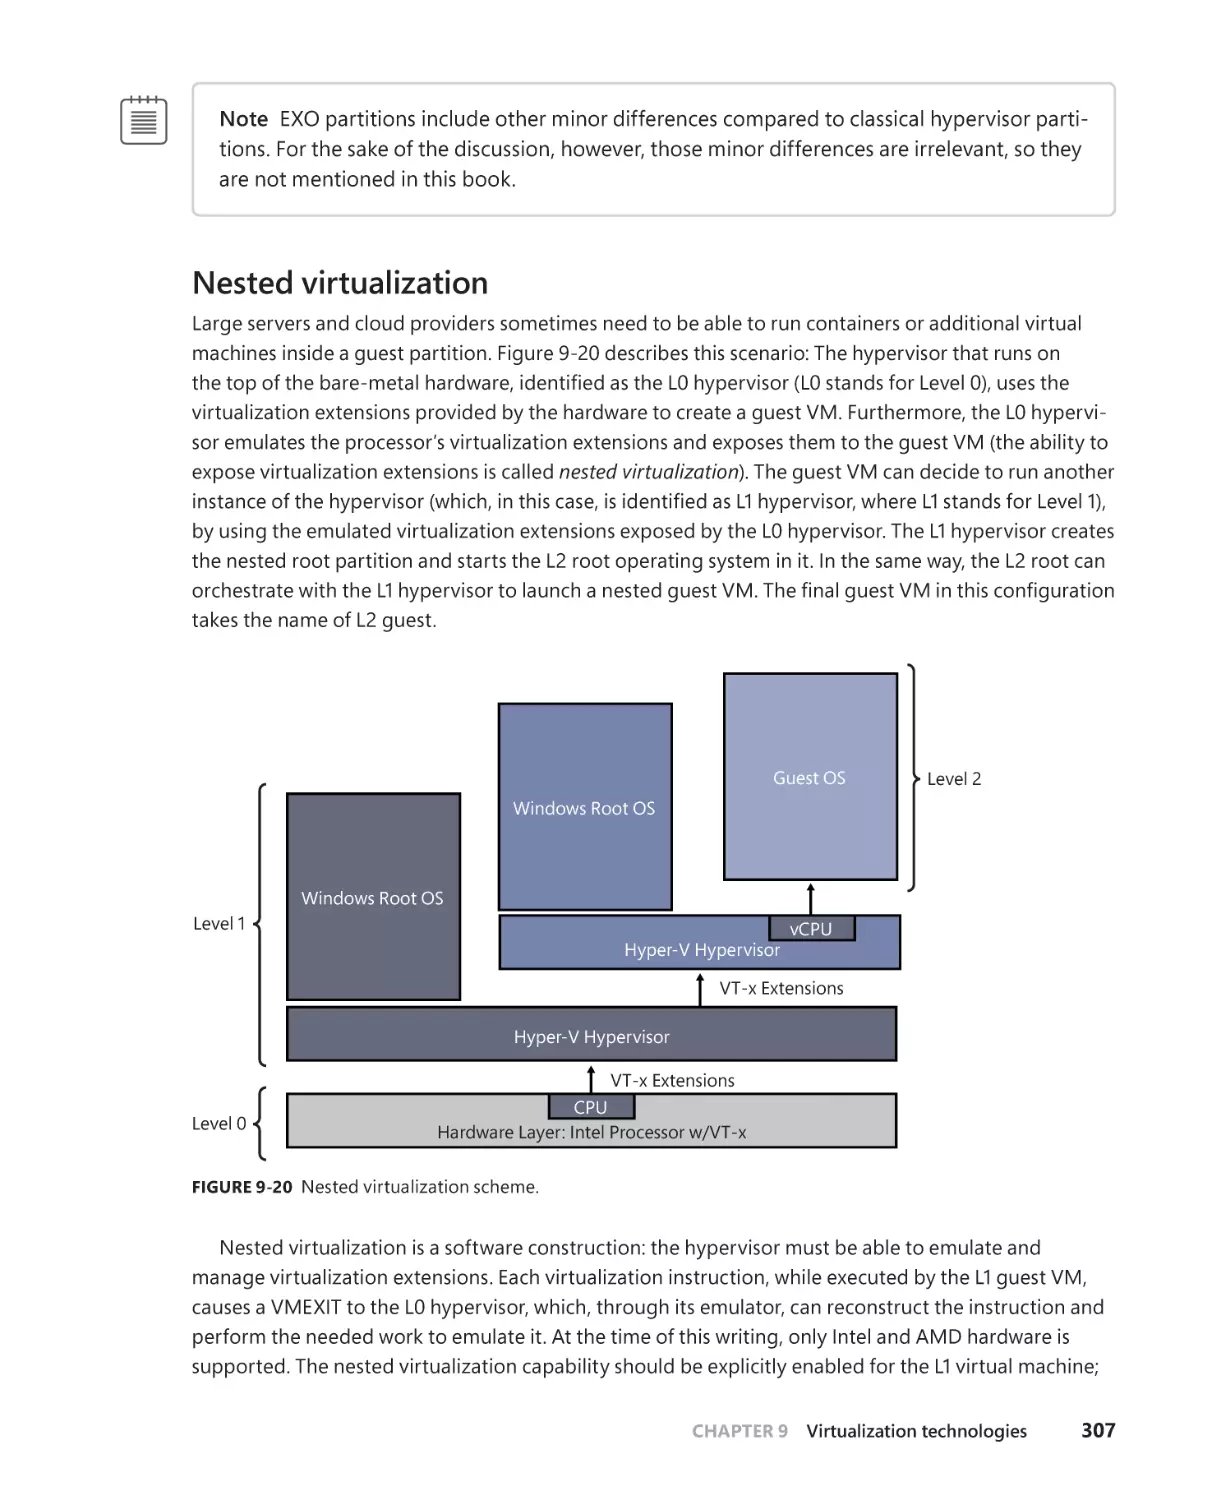
Nested virtualization . . . . . . . . . . . . . . . . . . . . . . . . . . . . . . . . . . . . . . . . . .307
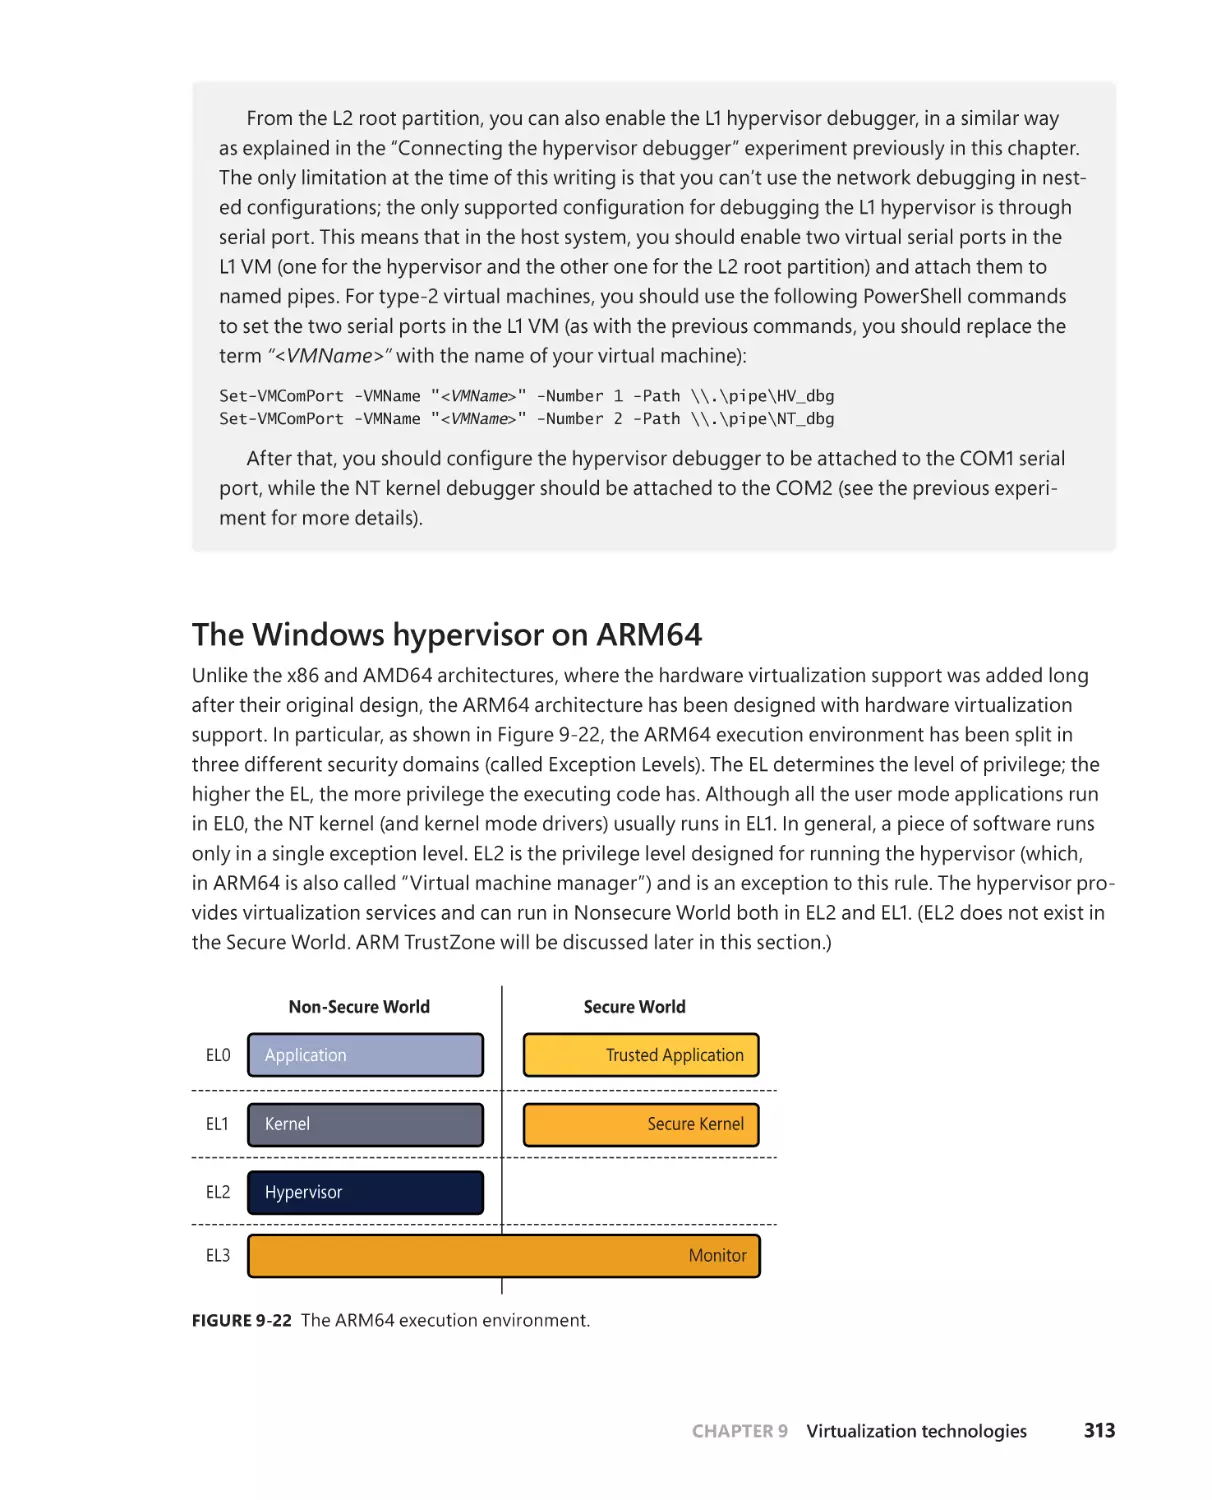
The Windows hypervisor on ARM64 . . . . . . . . . . . . . . . . . . . . . . . . . . . . 313
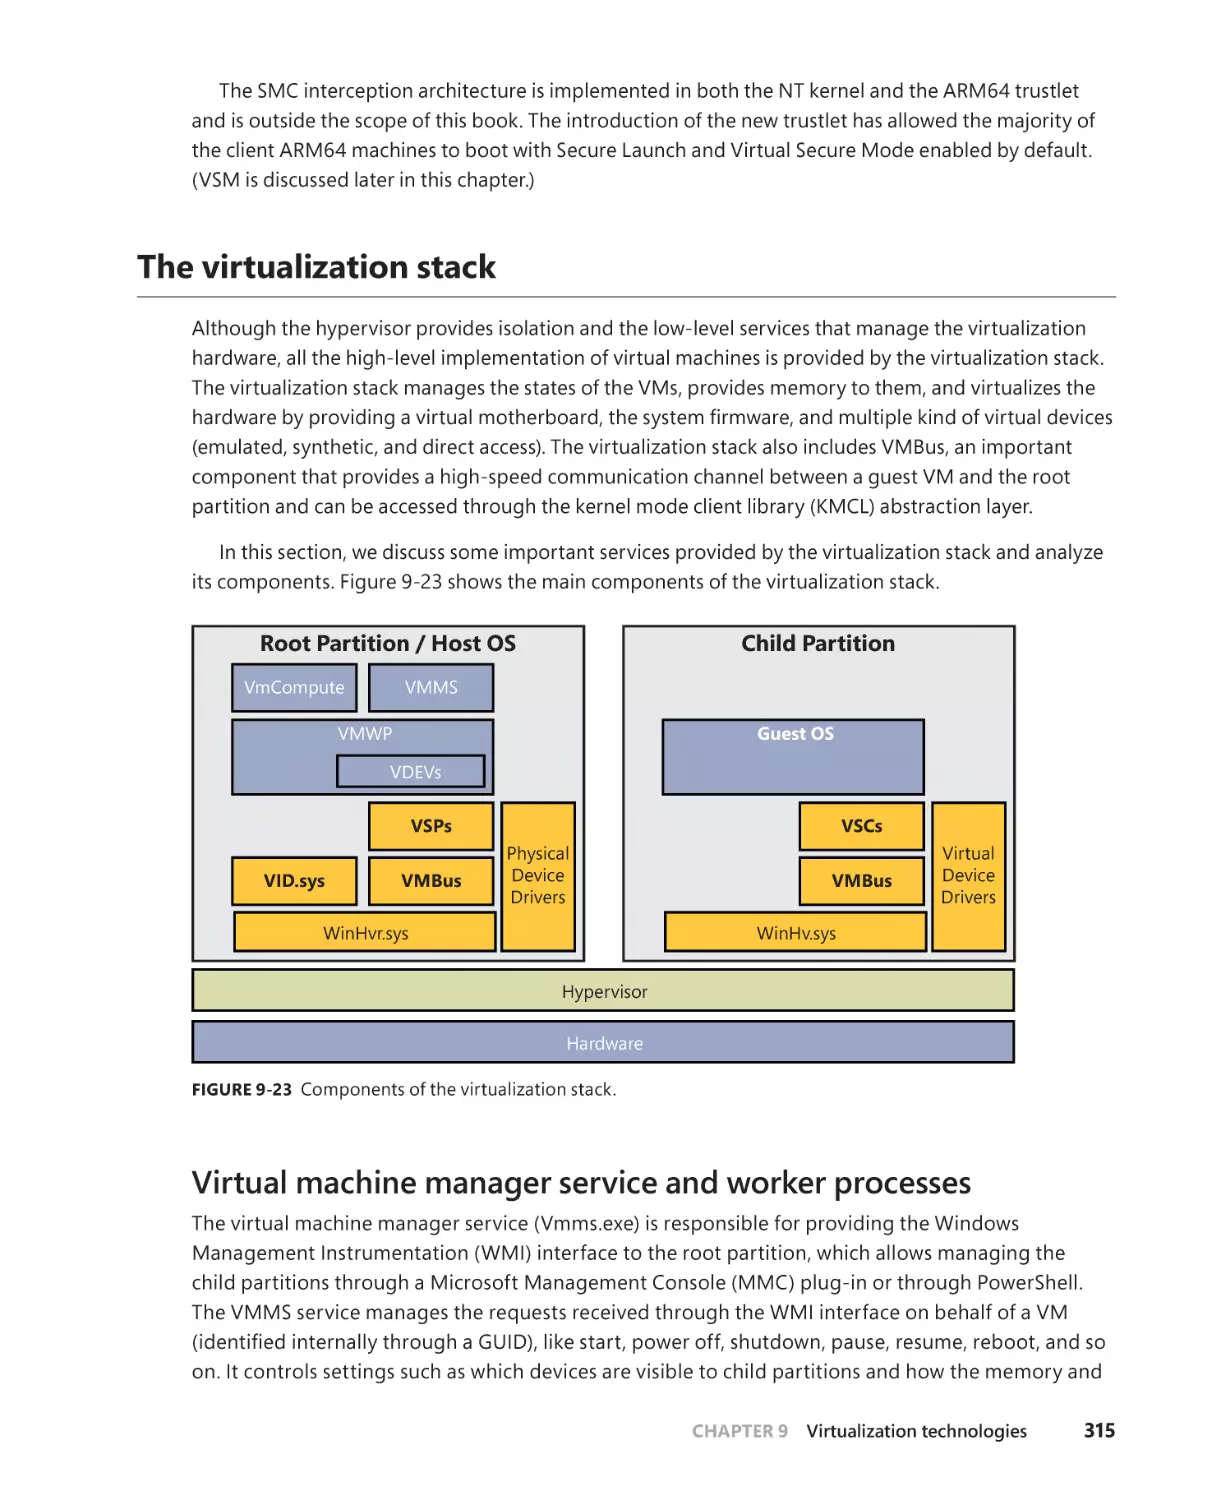
The virtualization stack . . . . . . . . . . . . . . . . . . . . . . . . . . . . . . . . . . . . . . . . . . . . . . 315
Virtual machine manager service and worker processes . . . . . . . . . 315
The VID driver and the virtualization stack memory manager . . . . 317
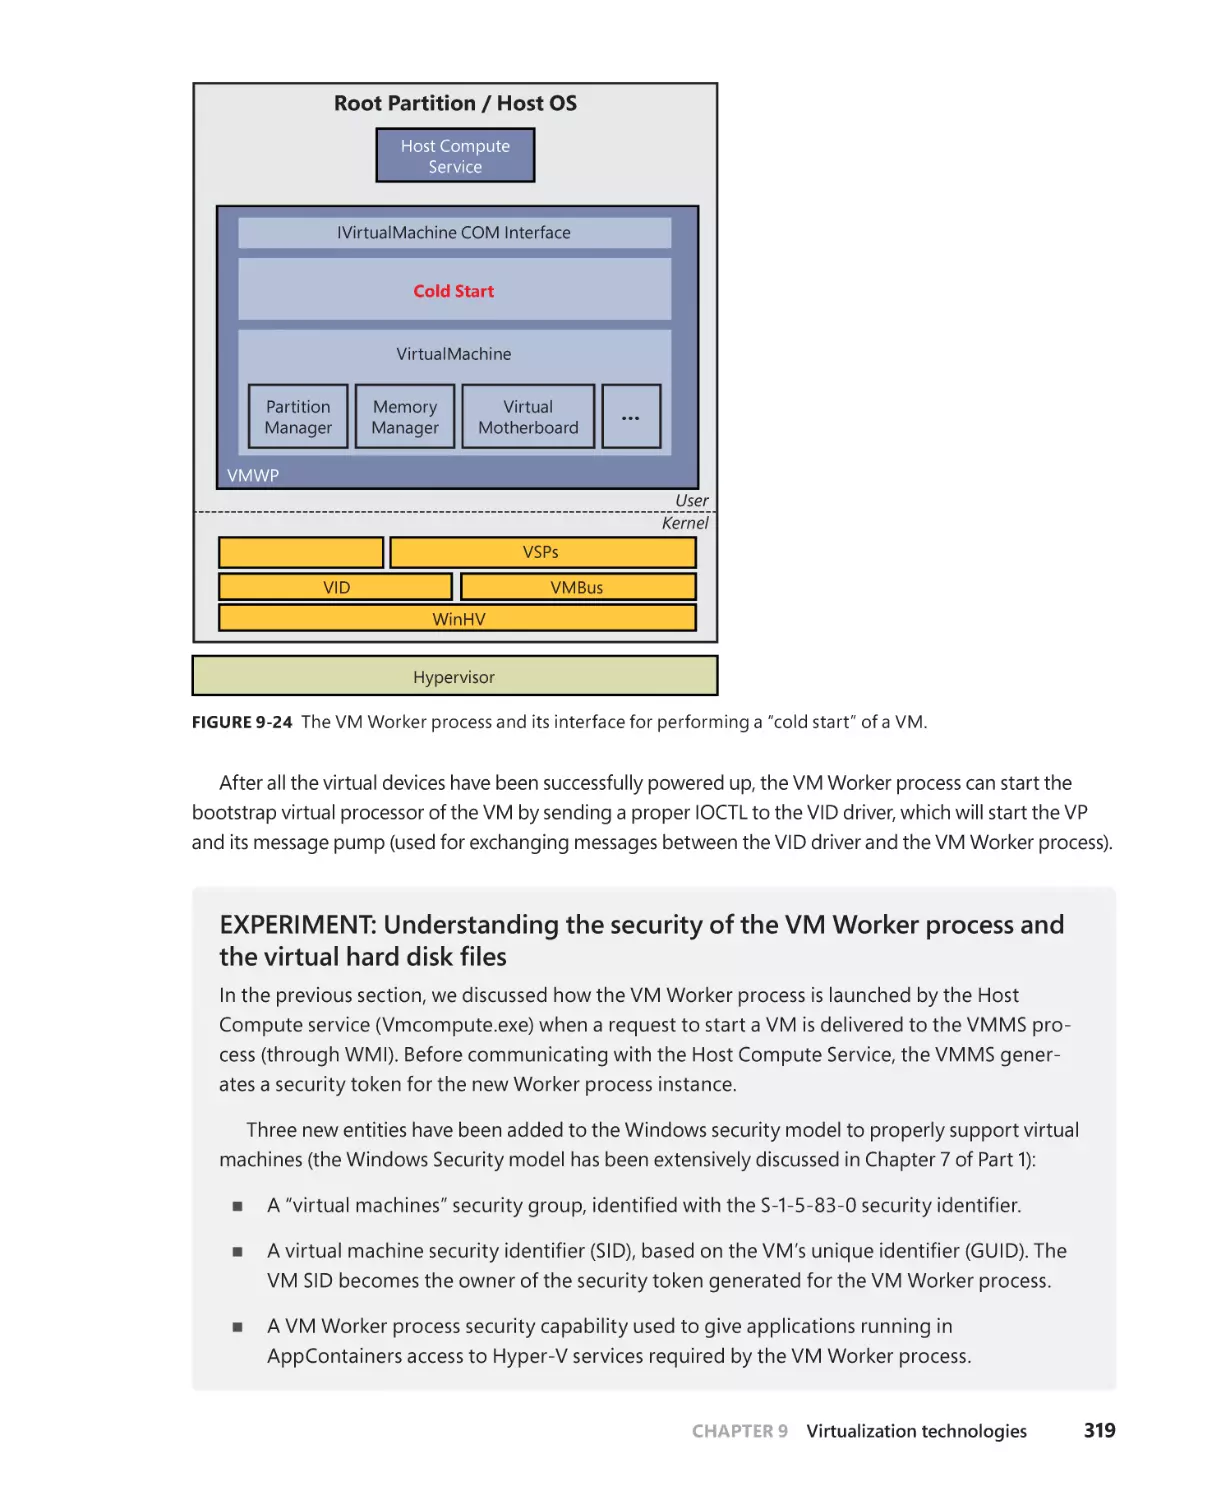
The birth of a Virtual Machine (VM) . . . . . . . . . . . . . . . . . . . . . . . . . . . . 318
VMBus . . . . . . . . . . . . . . . . . . . . . . . . . . . . . . . . . . . . . . . . . . . . . . . . . . . . . . . .323
Virtual hardware support . . . . . . . . . . . . . . . . . . . . . . . . . . . . . . . . . . . . . .329
VA-backed virtual machines . . . . . . . . . . . . . . . . . . . . . . . . . . . . . . . . . . . .336
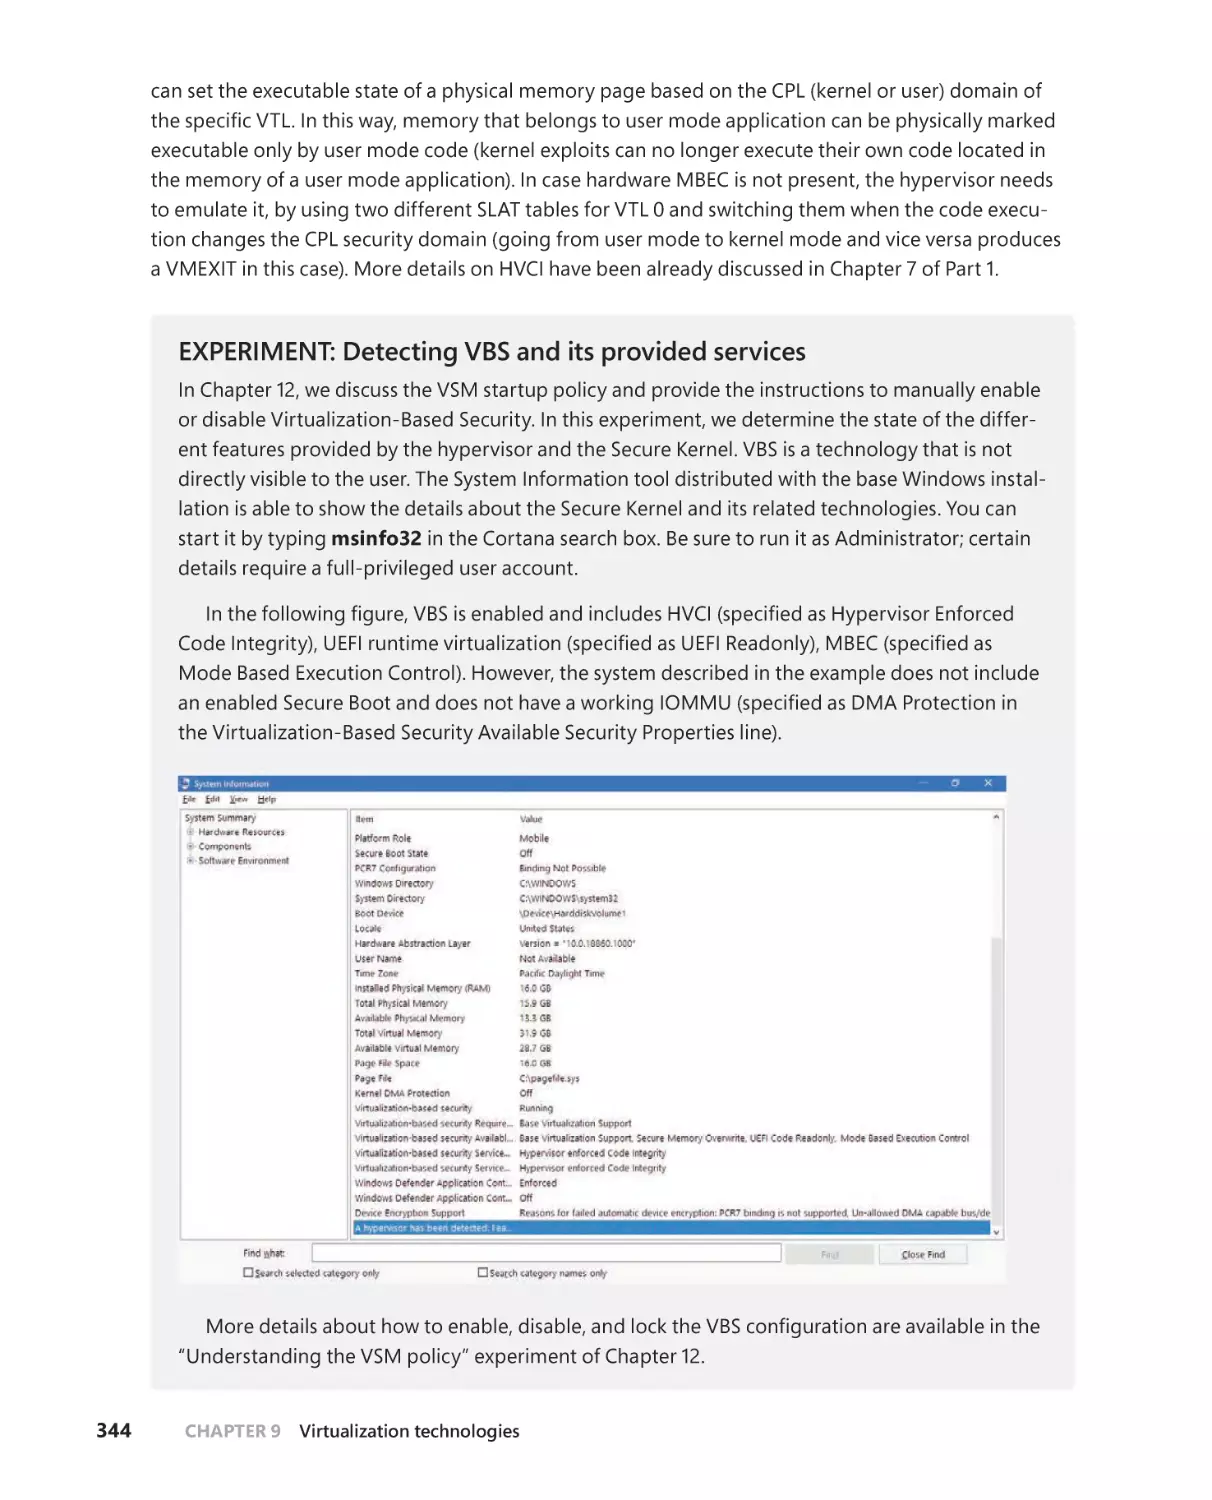
Virtualization-based security (VBS) . . . . . . . . . . . . . . . . . . . . . . . . . . . . . . . . . . .340
Virtual trust levels (VTLs) and Virtual Secure Mode (VSM) . . . . . . . .340
Services provided by the VSM and requirements . . . . . . . . . . . . . . . .342
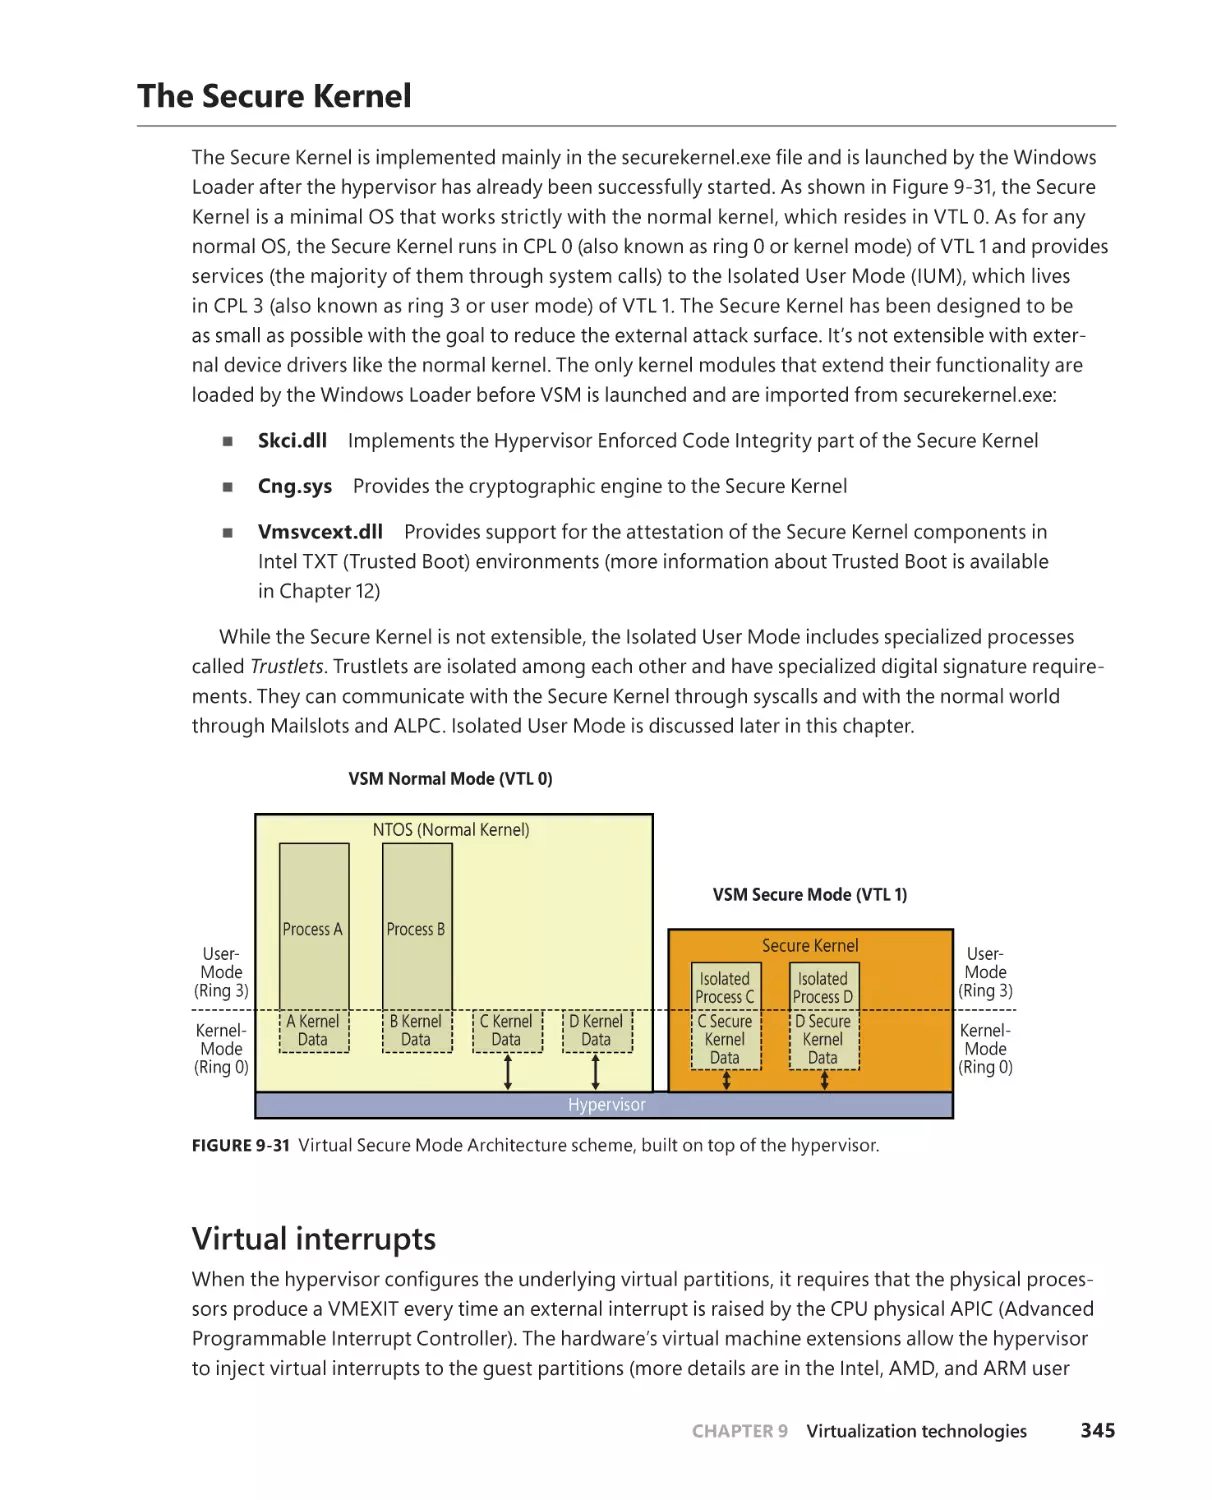
The Secure Kernel . . . . . . . . . . . . . . . . . . . . . . . . . . . . . . . . . . . . . . . . . . . . . . . . . . .345
Virtual interrupts . . . . . . . . . . . . . . . . . . . . . . . . . . . . . . . . . . . . . . . . . . . . . .345
Secure intercepts . . . . . . . . . . . . . . . . . . . . . . . . . . . . . . . . . . . . . . . . . . . . . .348
Contents
ix
VSM system calls . . . . . . . . . . . . . . . . . . . . . . . . . . . . . . . . . . . . . . . . . . . . . .349
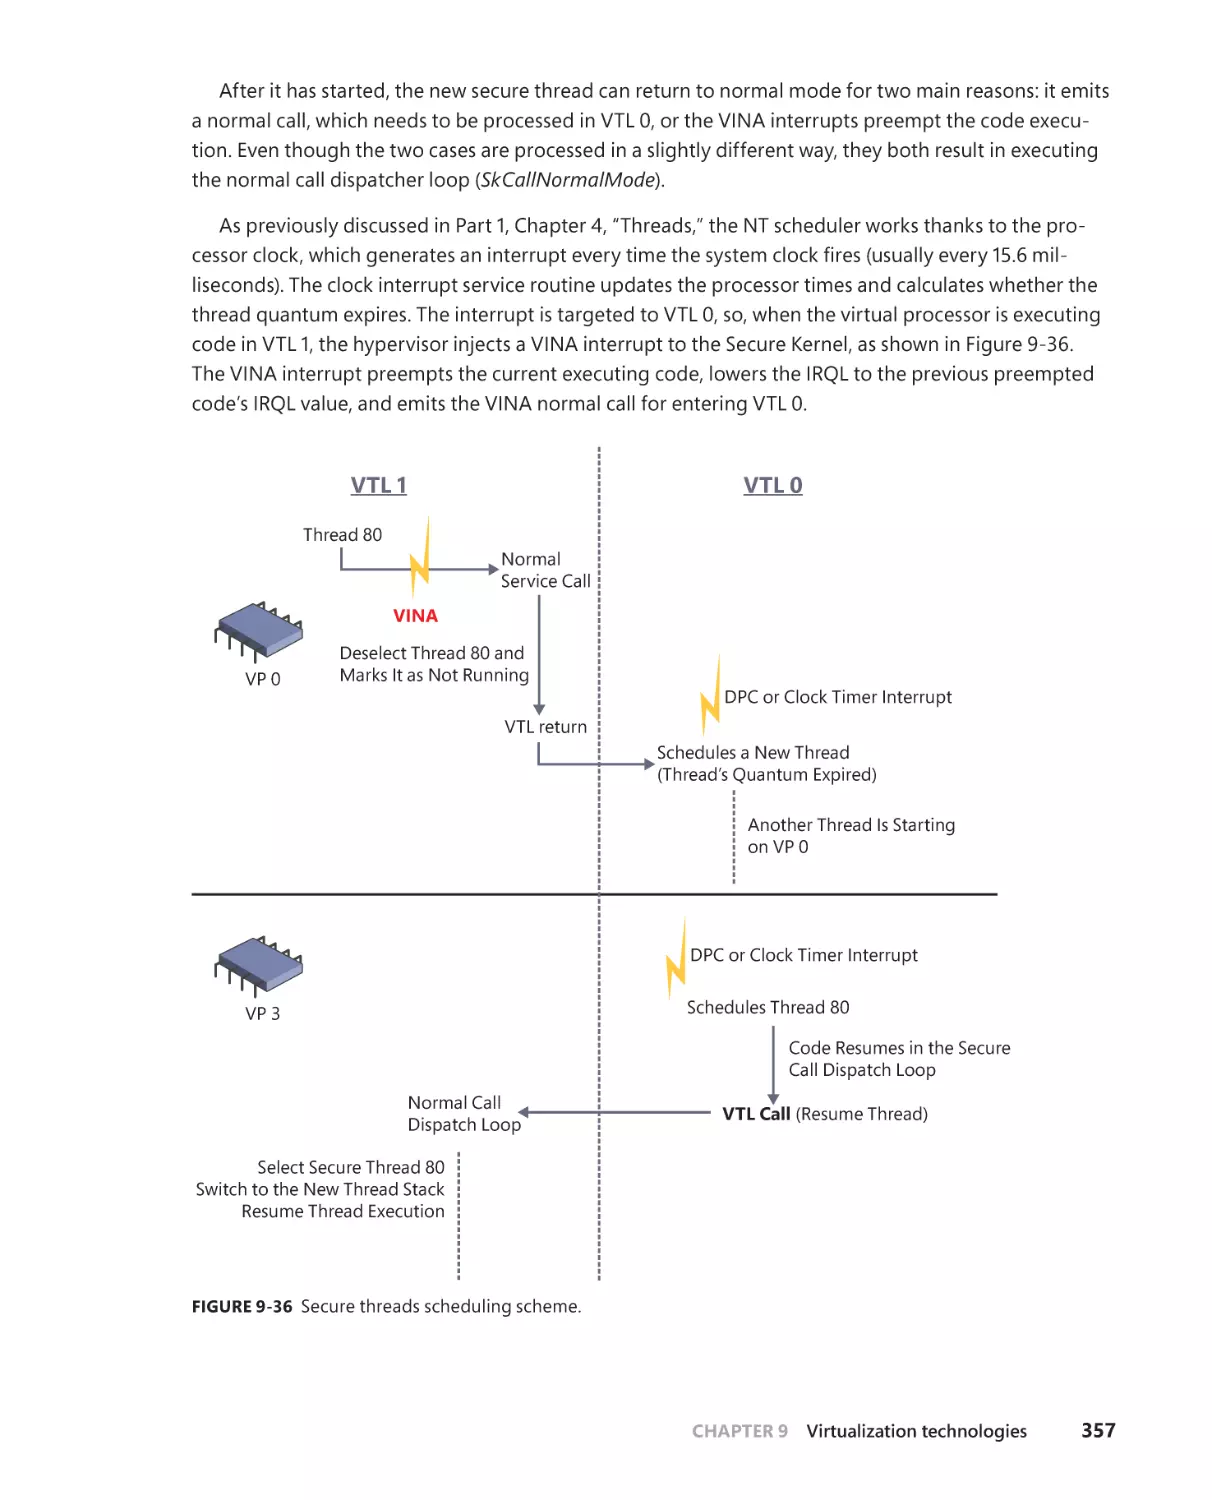
Secure threads and scheduling . . . . . . . . . . . . . . . . . . . . . . . . . . . . . . . . .356
The Hypervisor Enforced Code Integrity . . . . . . . . . . . . . . . . . . . . . . . .358
UEFI runtime virtualization . . . . . . . . . . . . . . . . . . . . . . . . . . . . . . . . . . . . .358
VSM startup . . . . . . . . . . . . . . . . . . . . . . . . . . . . . . . . . . . . . . . . . . . . . . . . . . .360
The Secure Kernel memory manager . . . . . . . . . . . . . . . . . . . . . . . . . . .363
Hot patching . . . . . . . . . . . . . . . . . . . . . . . . . . . . . . . . . . . . . . . . . . . . . . . . . .368
Isolated User Mode . . . . . . . . . . . . . . . . . . . . . . . . . . . . . . . . . . . . . . . . . . . . . . . . . . 371
Trustlets creation . . . . . . . . . . . . . . . . . . . . . . . . . . . . . . . . . . . . . . . . . . . . . .372
Secure devices. . . . . . . . . . . . . . . . . . . . . . . . . . . . . . . . . . . . . . . . . . . . . . . . . 376
VBS-based enclaves . . . . . . . . . . . . . . . . . . . . . . . . . . . . . . . . . . . . . . . . . . .378
System Guard runtime attestation . . . . . . . . . . . . . . . . . . . . . . . . . . . . . .386
Conclusion . . . . . . . . . . . . . . . . . . . . . . . . . . . . . . . . . . . . . . . . . . . . . . . . . . . . . . . . . .390
Chapter 10 Management, diagnostics, and tracing
391
The registry . . . . . . . . . . . . . . . . . . . . . . . . . . . . . . . . . . . . . . . . . . . . . . . . . . . . . . . . . 391
Viewing and changing the registry . . . . . . . . . . . . . . . . . . . . . . . . . . . . . 391
Registry usage. . . . . . . . . . . . . . . . . . . . . . . . . . . . . . . . . . . . . . . . . . . . . . . . .392
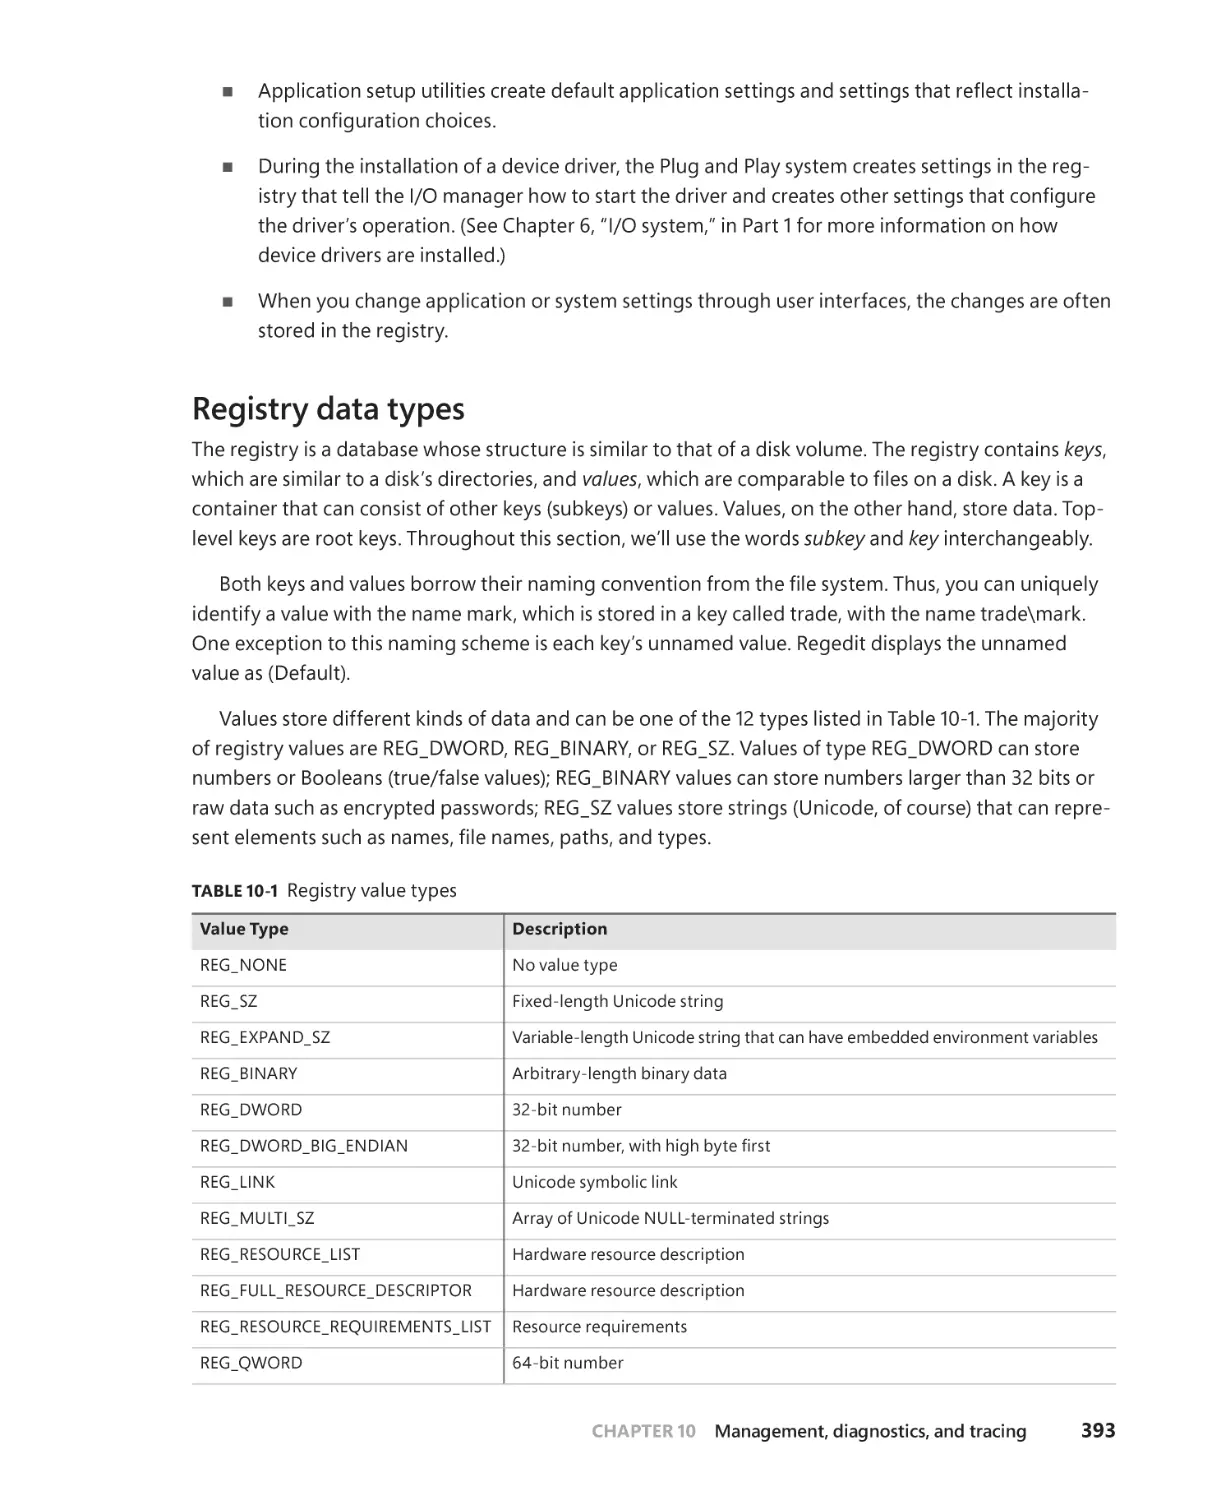
Registry data types . . . . . . . . . . . . . . . . . . . . . . . . . . . . . . . . . . . . . . . . . . . .393
Registry logical structure. . . . . . . . . . . . . . . . . . . . . . . . . . . . . . . . . . . . . . .394
Application hives . . . . . . . . . . . . . . . . . . . . . . . . . . . . . . . . . . . . . . . . . . . . . .402
Transactional Registry (TxR) . . . . . . . . . . . . . . . . . . . . . . . . . . . . . . . . . . . .403
Monitoring registry activity . . . . . . . . . . . . . . . . . . . . . . . . . . . . . . . . . . . 404
Process Monitor internals . . . . . . . . . . . . . . . . . . . . . . . . . . . . . . . . . . . . . .405
Registry internals . . . . . . . . . . . . . . . . . . . . . . . . . . . . . . . . . . . . . . . . . . . . . 406
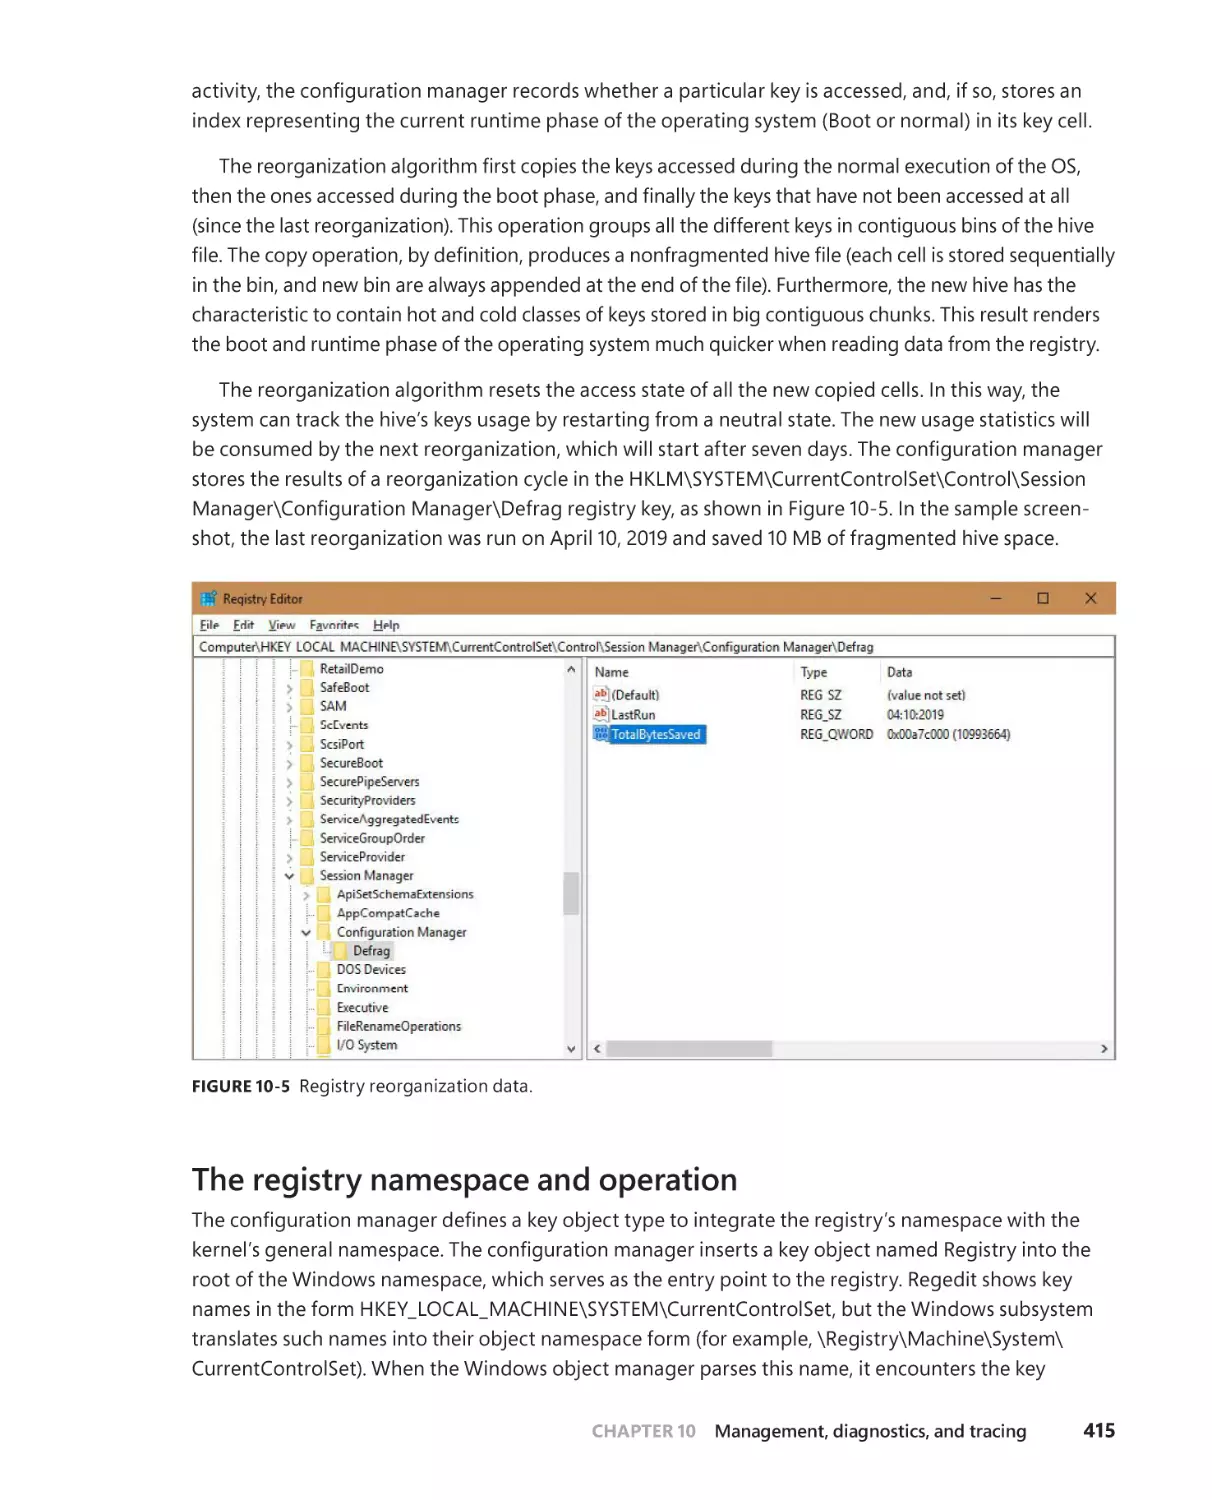
Hive reorganization. . . . . . . . . . . . . . . . . . . . . . . . . . . . . . . . . . . . . . . . . . . . 414
The registry namespace and operation . . . . . . . . . . . . . . . . . . . . . . . . . 415
Stable storage . . . . . . . . . . . . . . . . . . . . . . . . . . . . . . . . . . . . . . . . . . . . . . . . 418
. . . . . . . . . . . . . . . . . . . . . . . . . . . . . . . . . . . . . . . . . . . . . . .422
Registry virtualization. . . . . . . . . . . . . . . . . . . . . . . . . . . . . . . . . . . . . . . . . .422
Registry optimizations . . . . . . . . . . . . . . . . . . . . . . . . . . . . . . . . . . . . . . . . .425
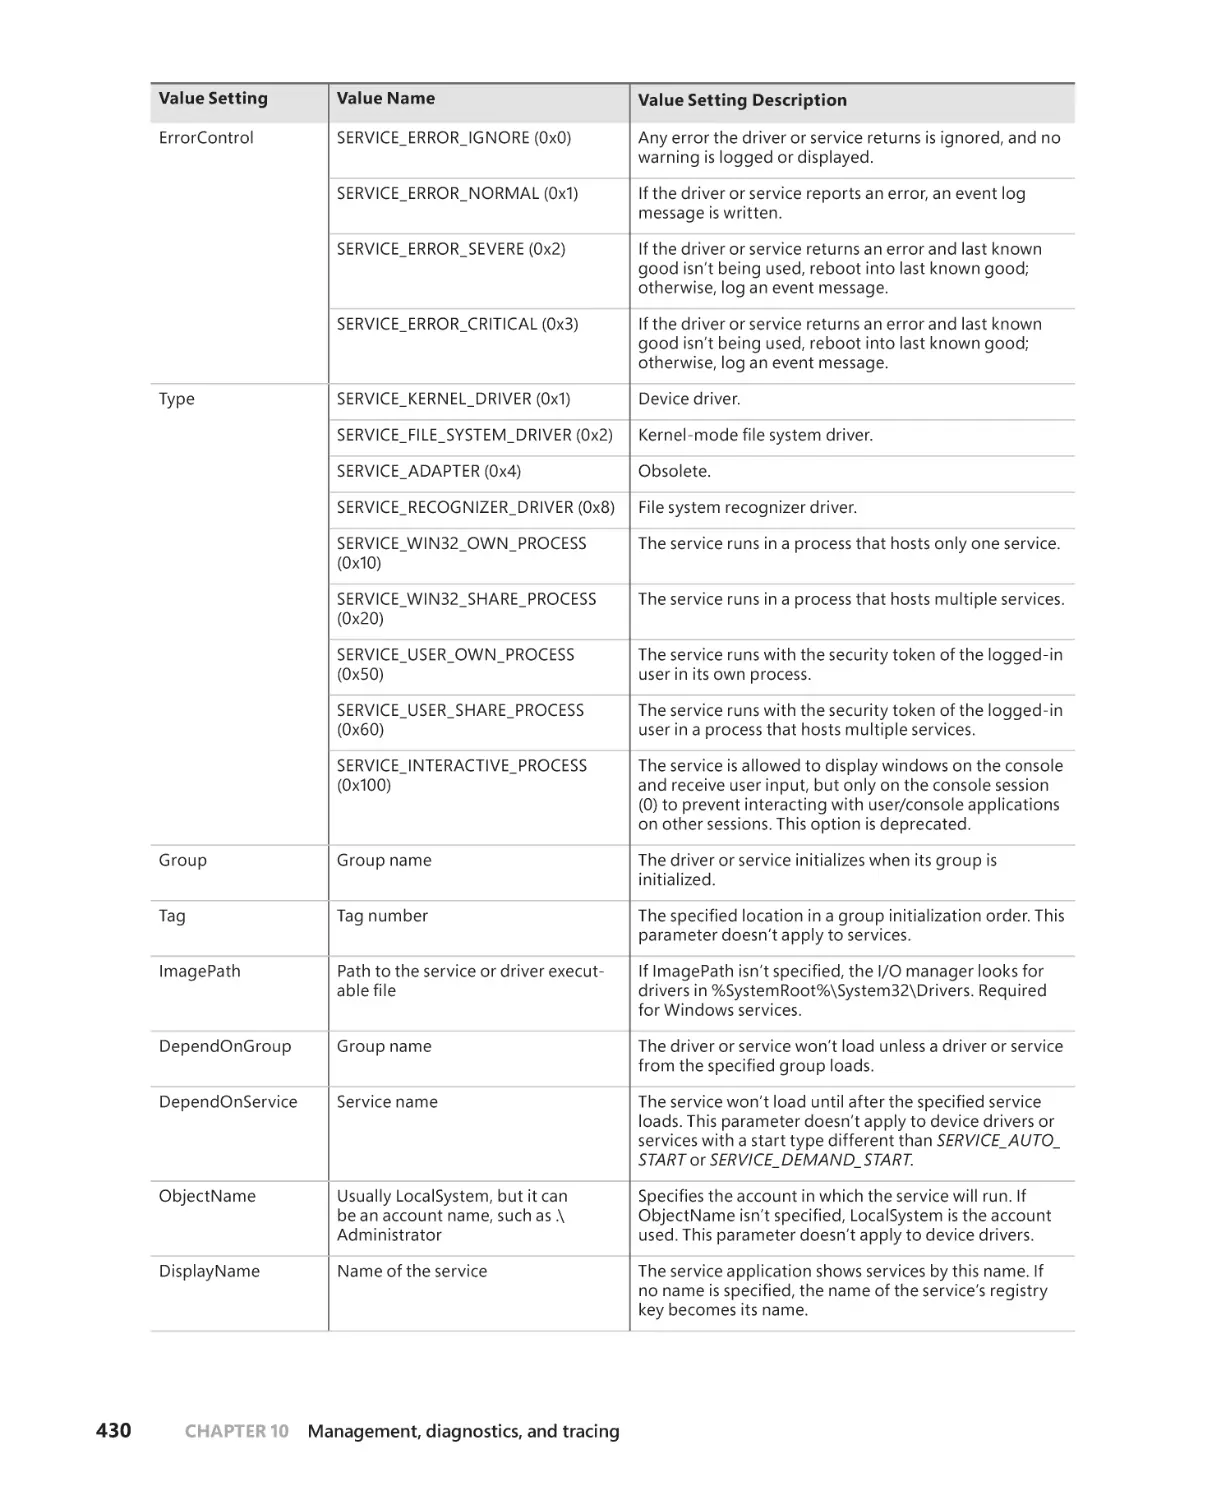
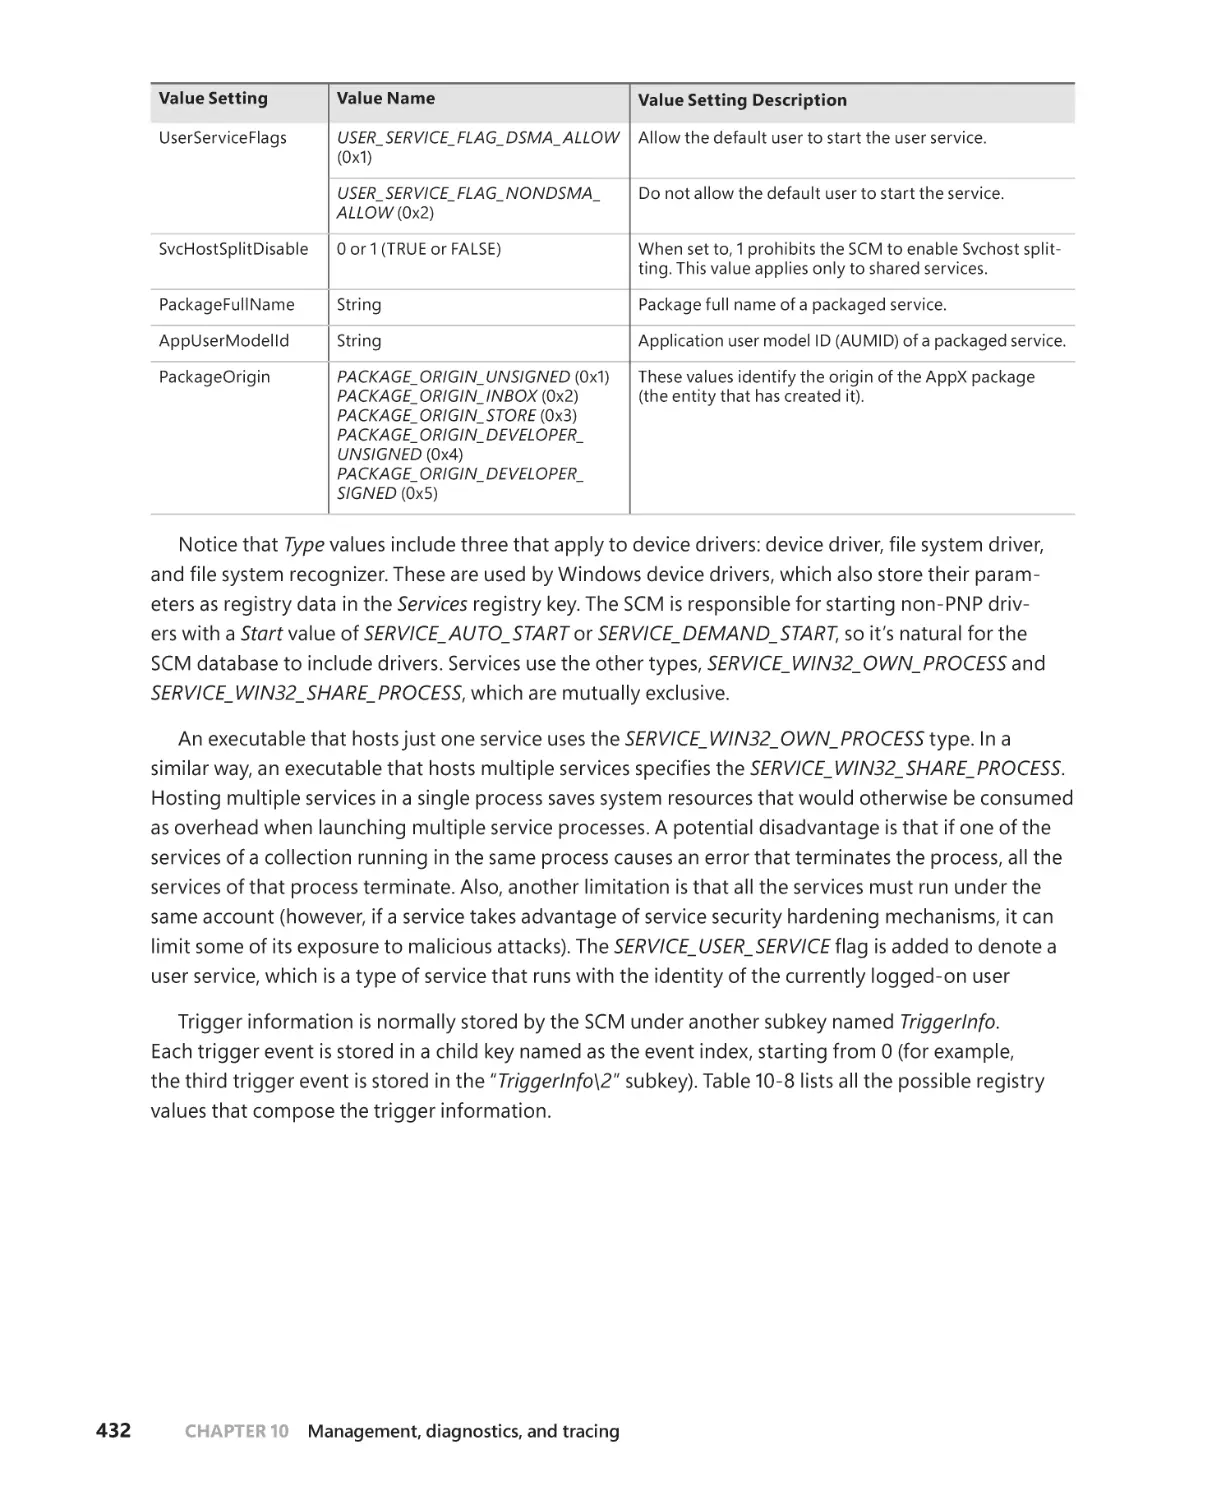
Windows services. . . . . . . . . . . . . . . . . . . . . . . . . . . . . . . . . . . . . . . . . . . . . . . . . . . .426
Service applications. . . . . . . . . . . . . . . . . . . . . . . . . . . . . . . . . . . . . . . . . . . .426
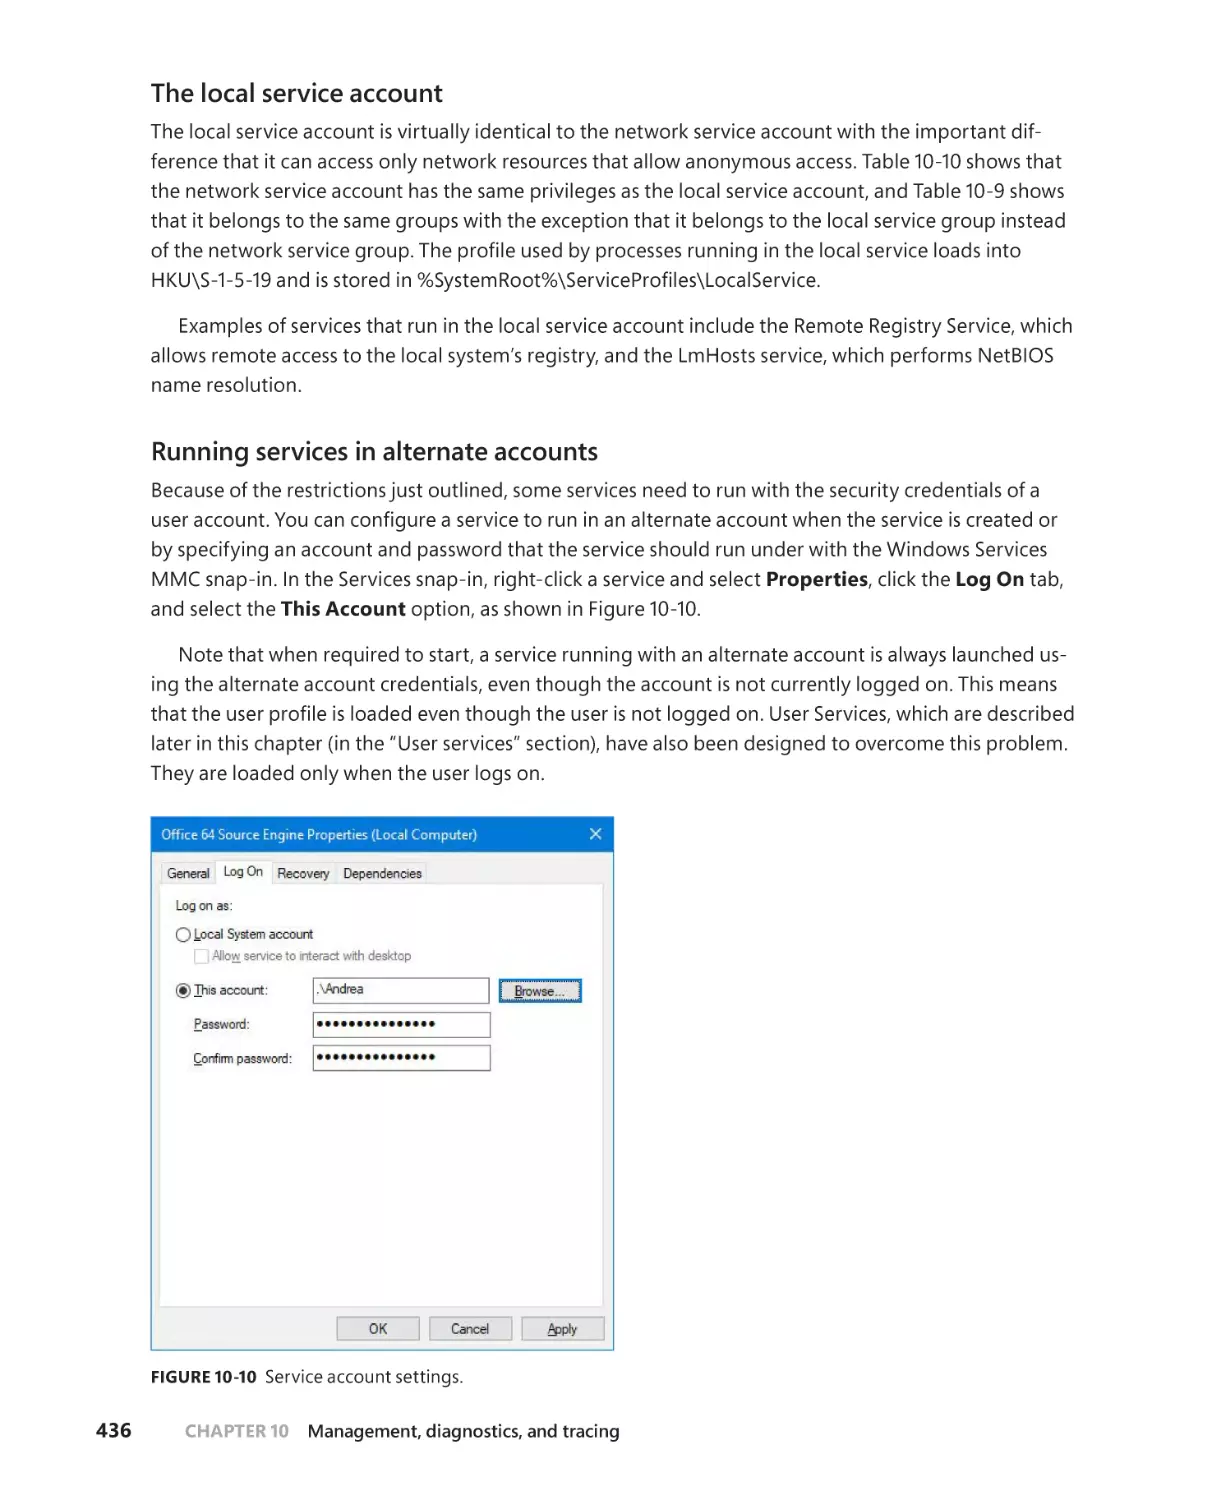
Service accounts . . . . . . . . . . . . . . . . . . . . . . . . . . . . . . . . . . . . . . . . . . . . . . .433
The Service Control Manager (SCM) . . . . . . . . . . . . . . . . . . . . . . . . . . . 446
x
Contents
Service control programs . . . . . . . . . . . . . . . . . . . . . . . . . . . . . . . . . . . . . .450
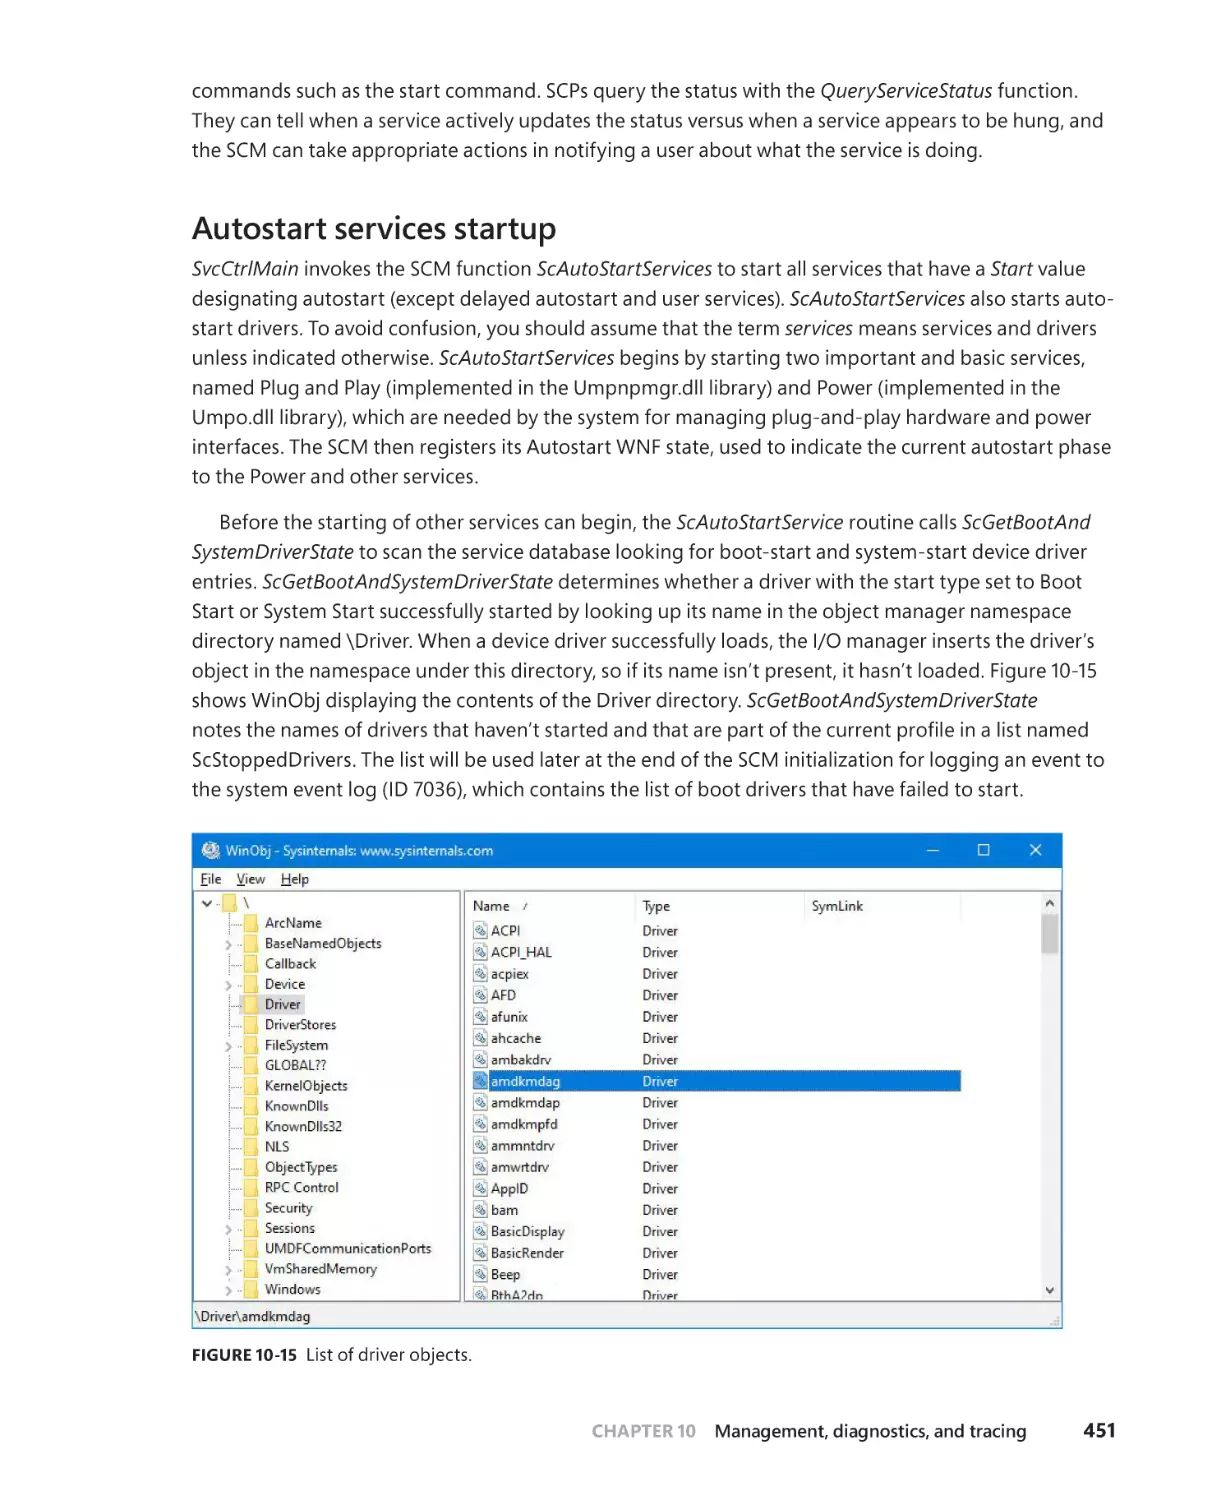
Autostart services startup . . . . . . . . . . . . . . . . . . . . . . . . . . . . . . . . . . . . . . 451
Delayed autostart services . . . . . . . . . . . . . . . . . . . . . . . . . . . . . . . . . . . . .457
Triggered-start services . . . . . . . . . . . . . . . . . . . . . . . . . . . . . . . . . . . . . . . .458
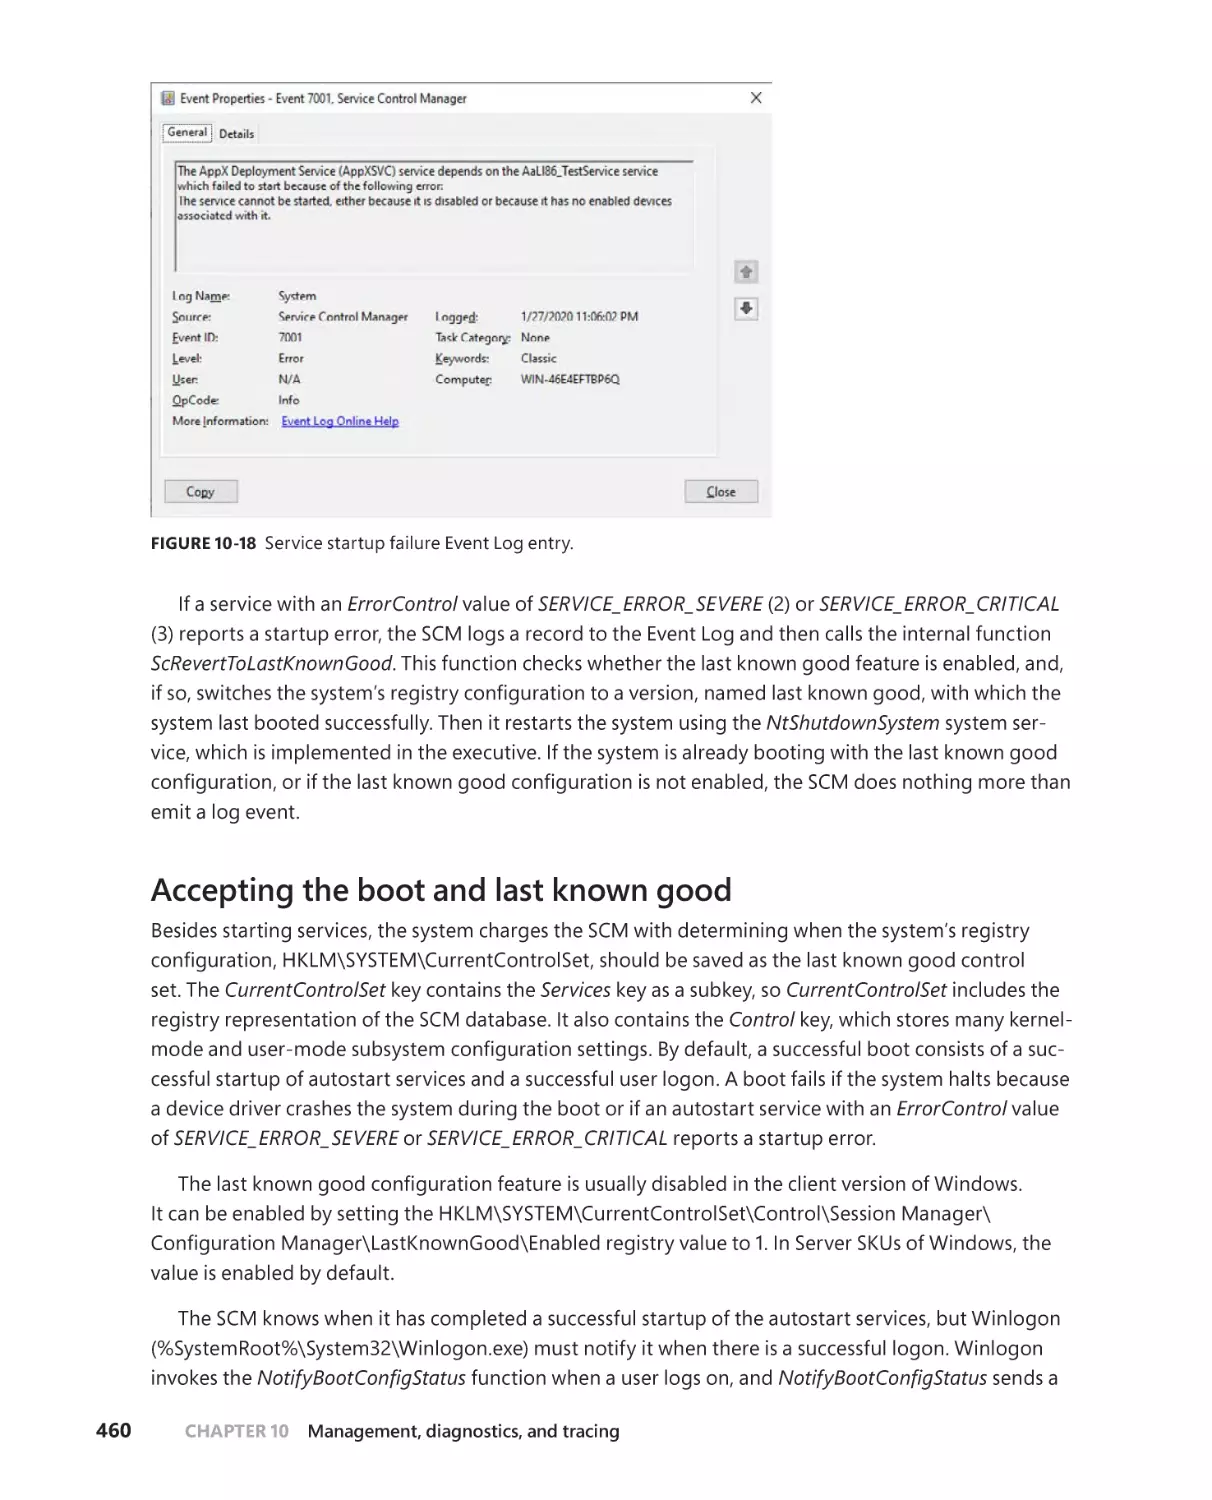
Startup errors . . . . . . . . . . . . . . . . . . . . . . . . . . . . . . . . . . . . . . . . . . . . . . . . .459
Accepting the boot and last known good . . . . . . . . . . . . . . . . . . . . . . .460
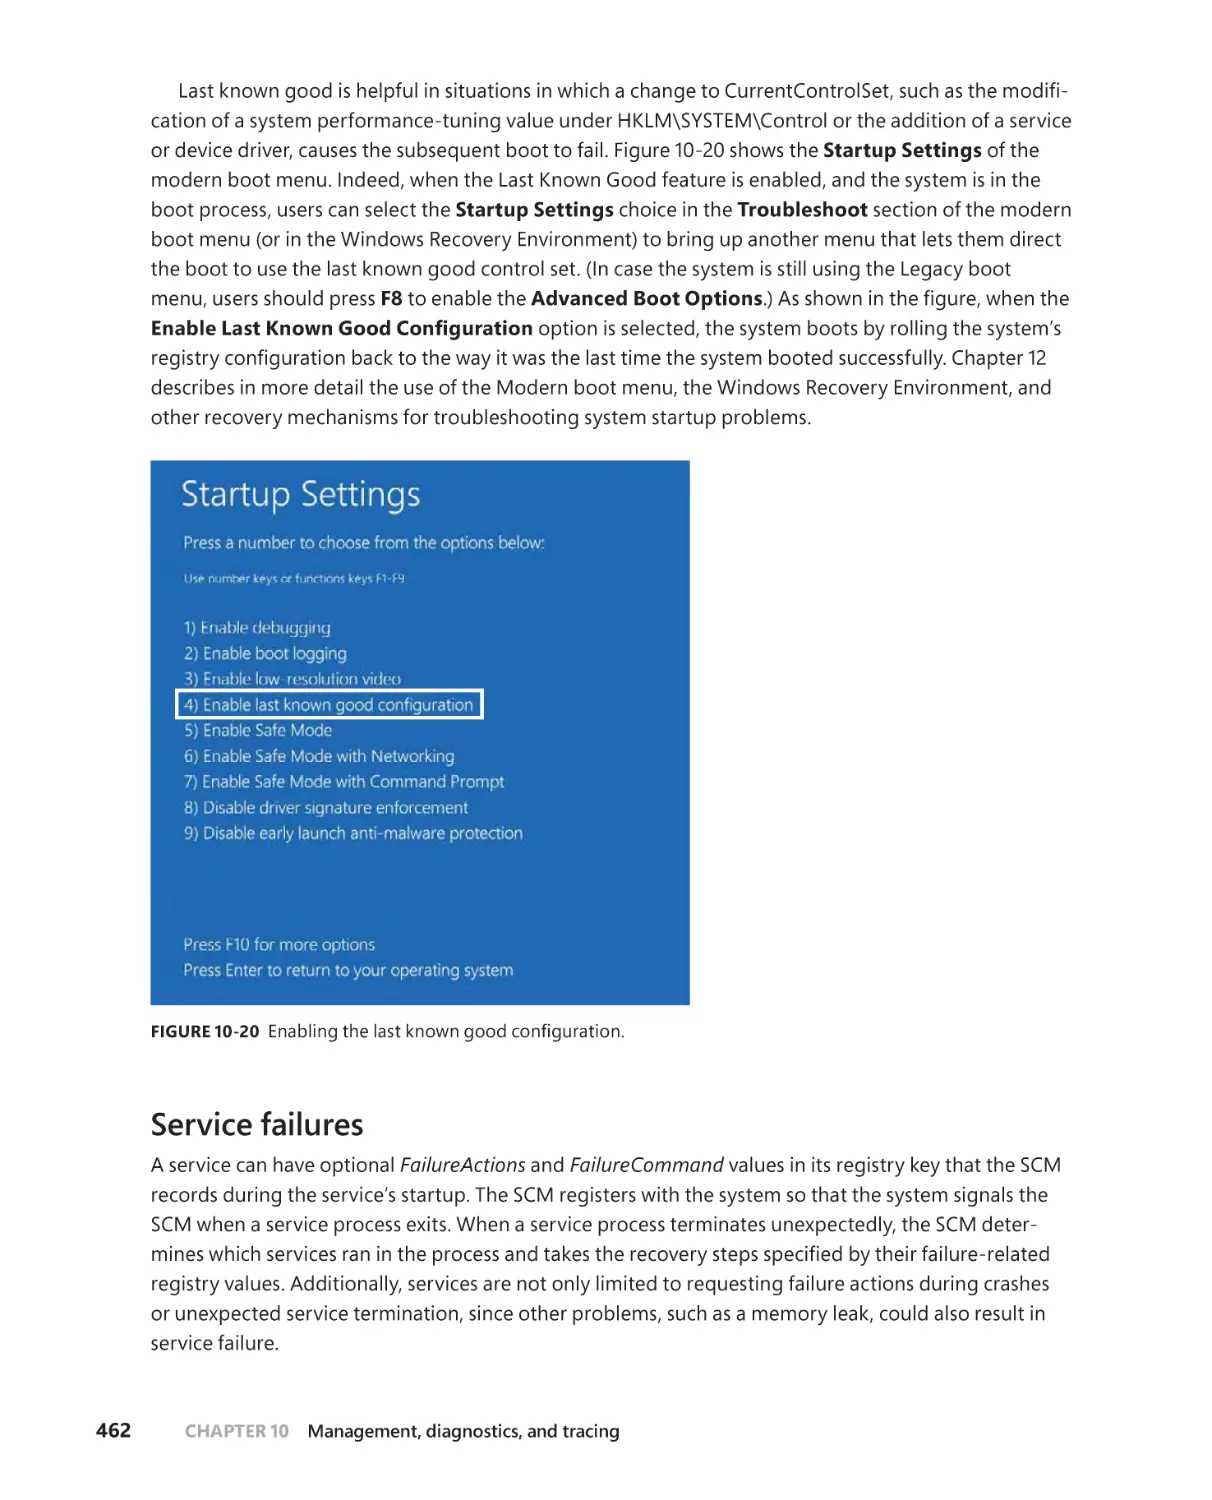
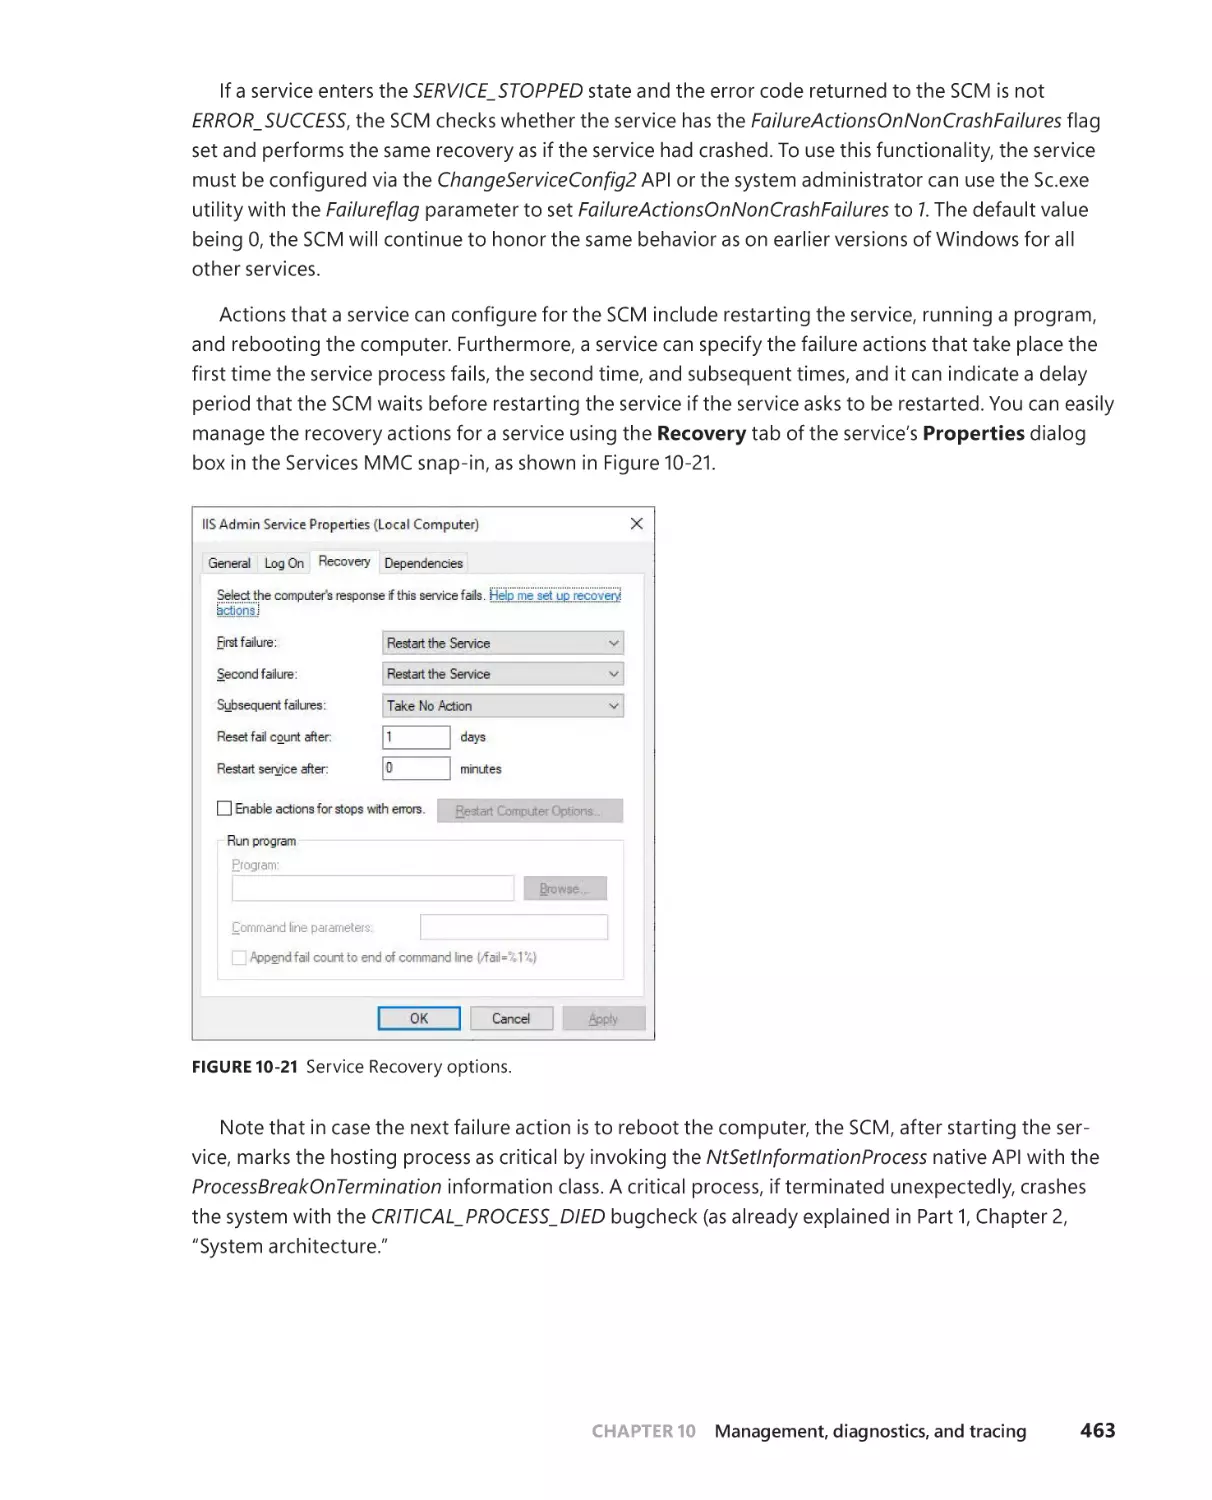
Service failures . . . . . . . . . . . . . . . . . . . . . . . . . . . . . . . . . . . . . . . . . . . . . . . .462
Service shutdown . . . . . . . . . . . . . . . . . . . . . . . . . . . . . . . . . . . . . . . . . . . . . 464
Shared service processes . . . . . . . . . . . . . . . . . . . . . . . . . . . . . . . . . . . . . . .465
Service tags . . . . . . . . . . . . . . . . . . . . . . . . . . . . . . . . . . . . . . . . . . . . . . . . . . .468
User services . . . . . . . . . . . . . . . . . . . . . . . . . . . . . . . . . . . . . . . . . . . . . . . . . .469
Packaged services . . . . . . . . . . . . . . . . . . . . . . . . . . . . . . . . . . . . . . . . . . . . .473
Protected services . . . . . . . . . . . . . . . . . . . . . . . . . . . . . . . . . . . . . . . . . . . . . 474
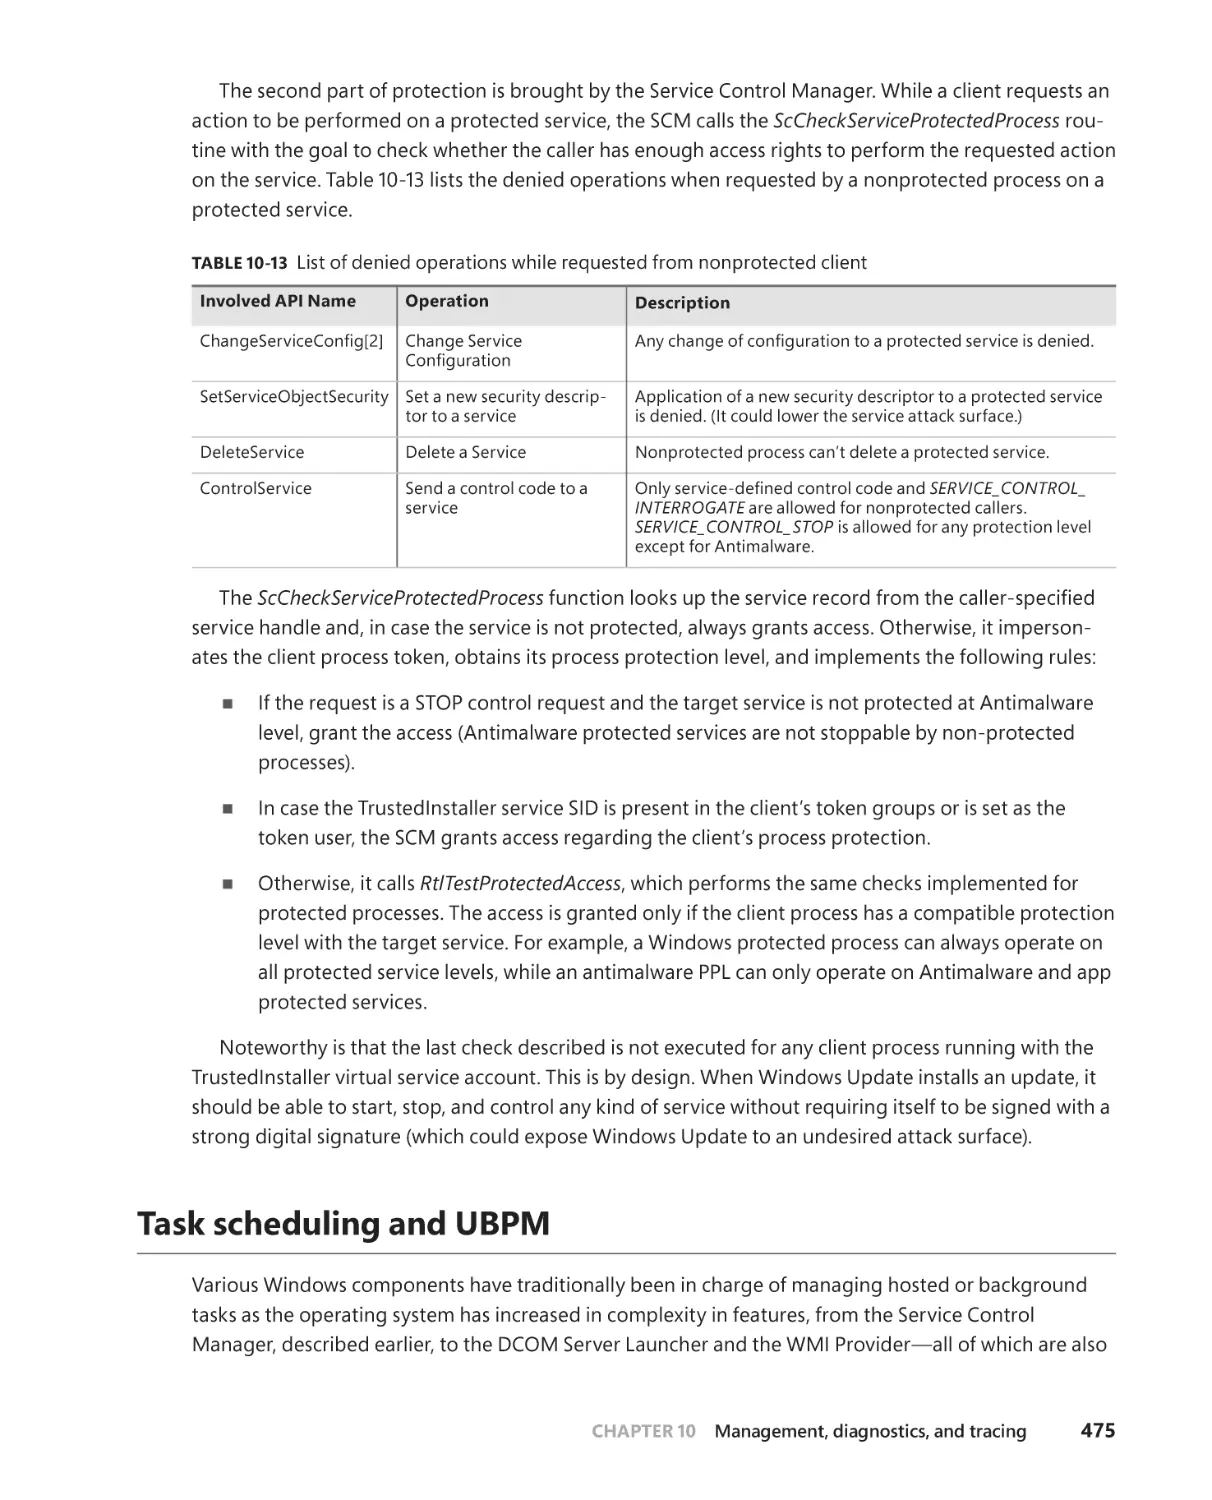
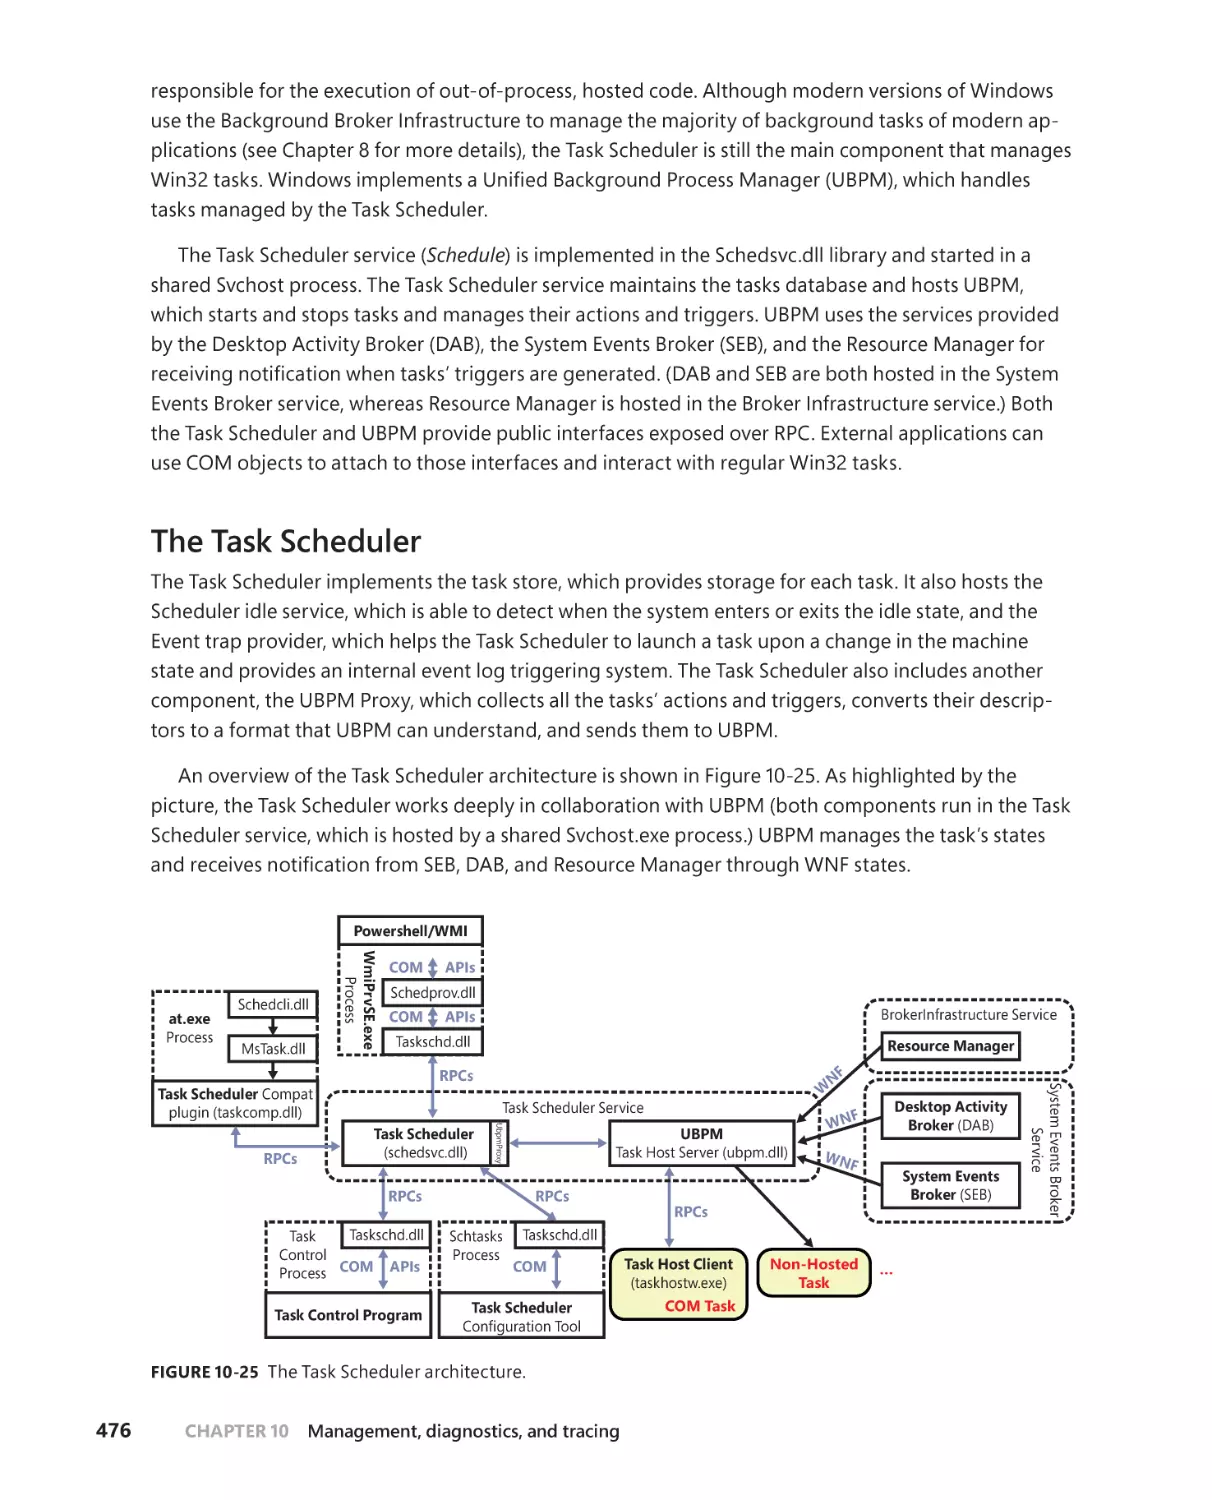
Task scheduling and UBPM . . . . . . . . . . . . . . . . . . . . . . . . . . . . . . . . . . . . . . . . . . .475
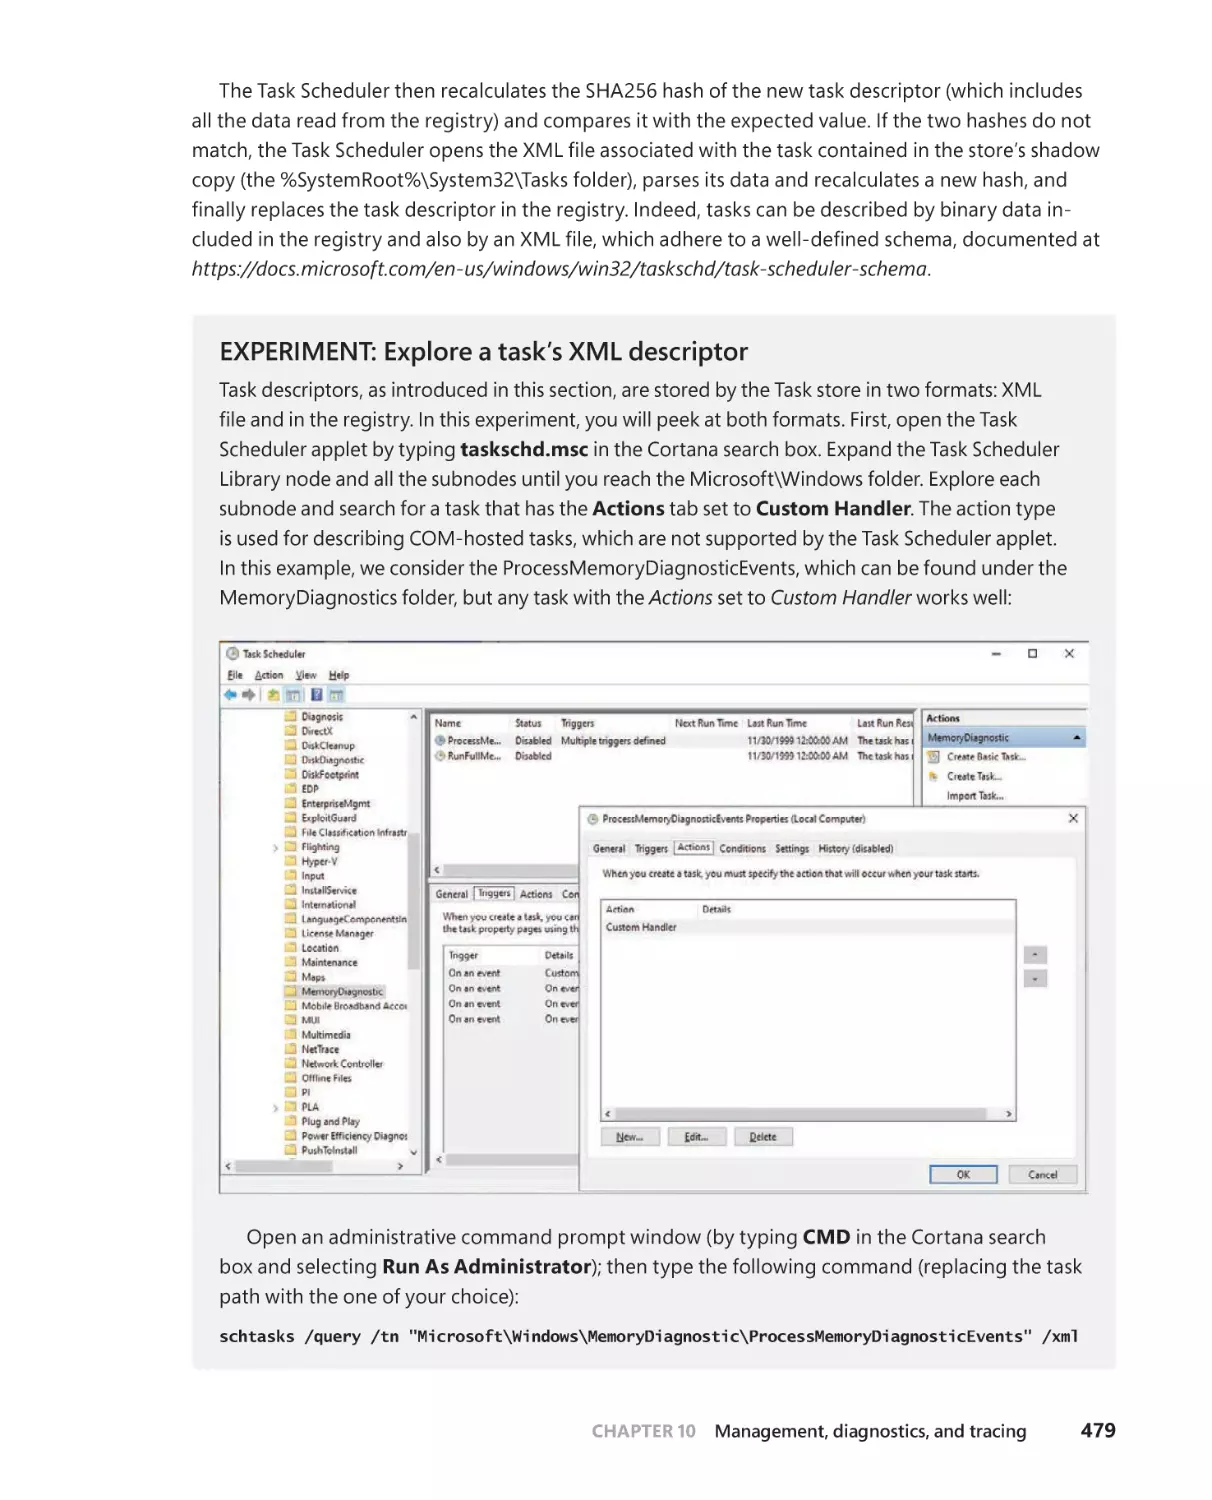
The Task Scheduler . . . . . . . . . . . . . . . . . . . . . . . . . . . . . . . . . . . . . . . . . . . .476
. . . . . . . . . . . . . . . . . . 481
Task Scheduler COM interfaces . . . . . . . . . . . . . . . . . . . . . . . . . . . . . . . . .486
Windows Management Instrumentation . . . . . . . . . . . . . . . . . . . . . . . . . . . . . .486
WMI architecture . . . . . . . . . . . . . . . . . . . . . . . . . . . . . . . . . . . . . . . . . . . . . .487
WMI providers . . . . . . . . . . . . . . . . . . . . . . . . . . . . . . . . . . . . . . . . . . . . . . . .488
The Common Information Model and the Managed
Object Format Language . . . . . . . . . . . . . . . . . . . . . . . . . . . . . . . . . . . . . .489
Class association . . . . . . . . . . . . . . . . . . . . . . . . . . . . . . . . . . . . . . . . . . . . . . .493
WMI implementation . . . . . . . . . . . . . . . . . . . . . . . . . . . . . . . . . . . . . . . . . .496
WMI security . . . . . . . . . . . . . . . . . . . . . . . . . . . . . . . . . . . . . . . . . . . . . . . . . .498
Event Tracing for Windows (ETW) . . . . . . . . . . . . . . . . . . . . . . . . . . . . . . . . . . . .499
ETW initialization . . . . . . . . . . . . . . . . . . . . . . . . . . . . . . . . . . . . . . . . . . . . . . 501
ETW sessions . . . . . . . . . . . . . . . . . . . . . . . . . . . . . . . . . . . . . . . . . . . . . . . . . .502
ETW providers. . . . . . . . . . . . . . . . . . . . . . . . . . . . . . . . . . . . . . . . . . . . . . . . .506
Providing events. . . . . . . . . . . . . . . . . . . . . . . . . . . . . . . . . . . . . . . . . . . . . . .509
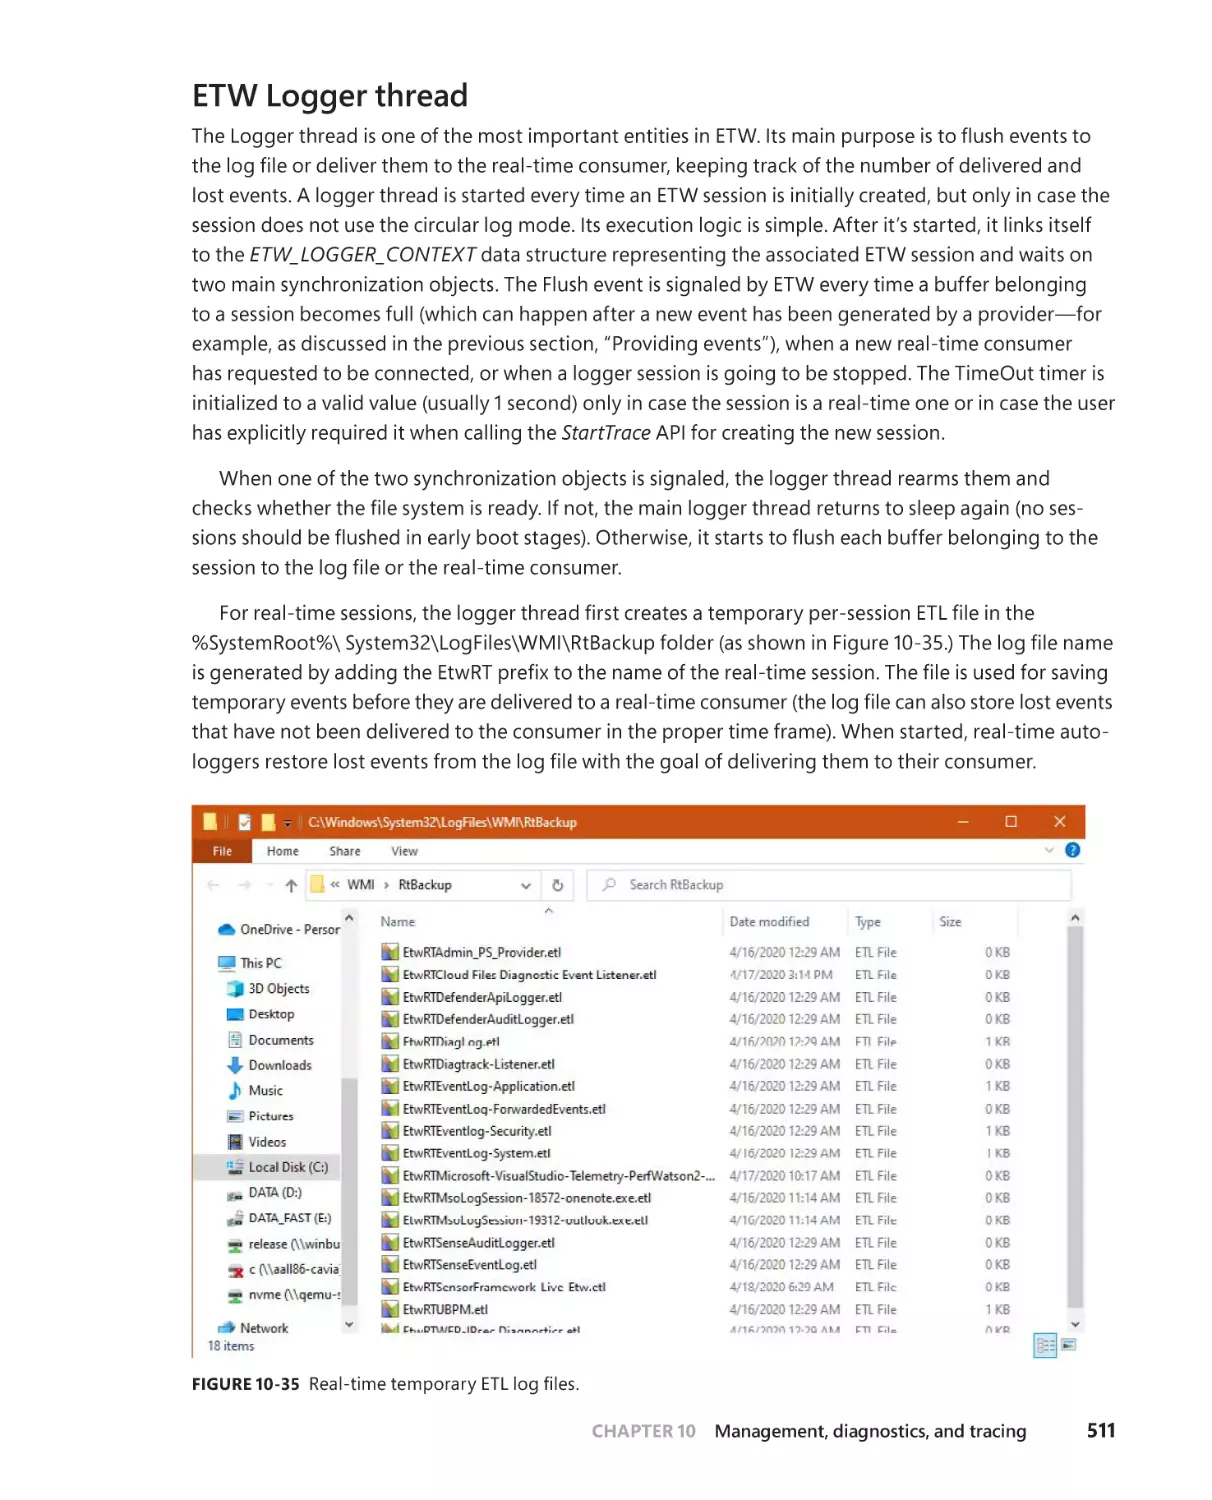
ETW Logger thread . . . . . . . . . . . . . . . . . . . . . . . . . . . . . . . . . . . . . . . . . . . . 511
Consuming events . . . . . . . . . . . . . . . . . . . . . . . . . . . . . . . . . . . . . . . . . . . . . 512
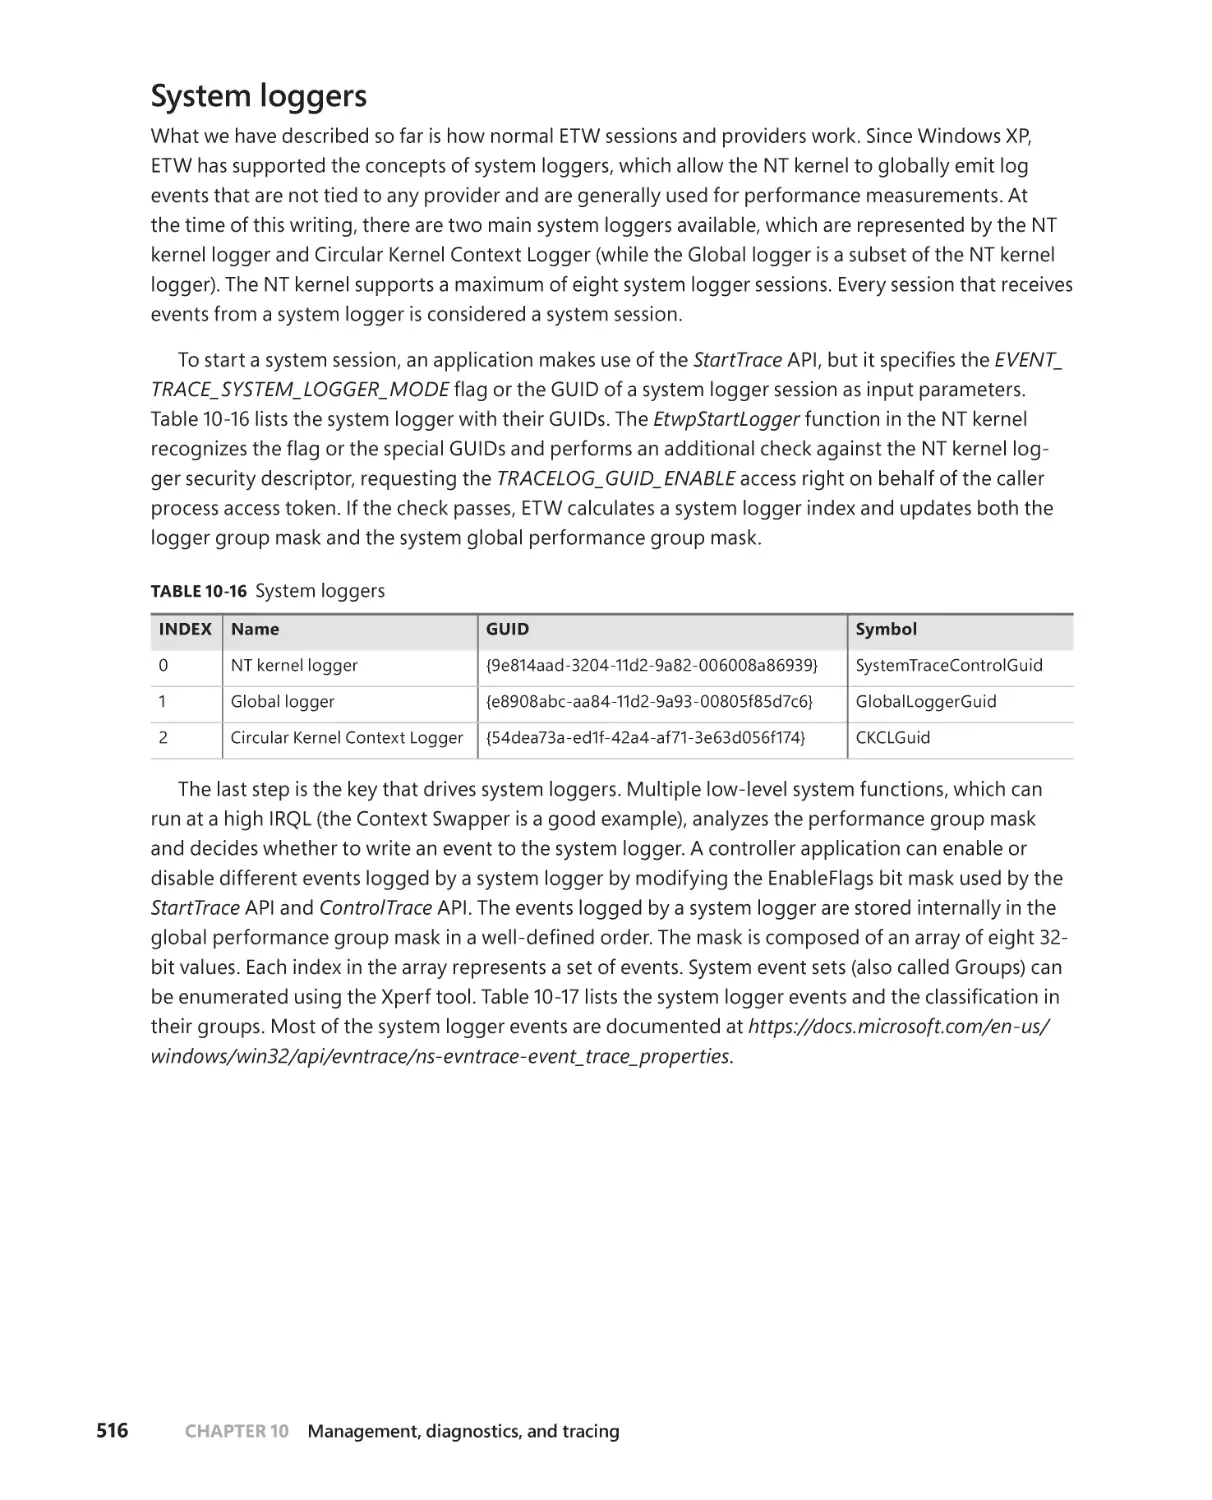
System loggers . . . . . . . . . . . . . . . . . . . . . . . . . . . . . . . . . . . . . . . . . . . . . . . 516
ETW security . . . . . . . . . . . . . . . . . . . . . . . . . . . . . . . . . . . . . . . . . . . . . . . . . .522
Contents
xi
Dynamic tracing (DTrace) . . . . . . . . . . . . . . . . . . . . . . . . . . . . . . . . . . . . . . . . . . . .525
Internal architecture . . . . . . . . . . . . . . . . . . . . . . . . . . . . . . . . . . . . . . . . . . .528
DTrace type library . . . . . . . . . . . . . . . . . . . . . . . . . . . . . . . . . . . . . . . . . . . .534
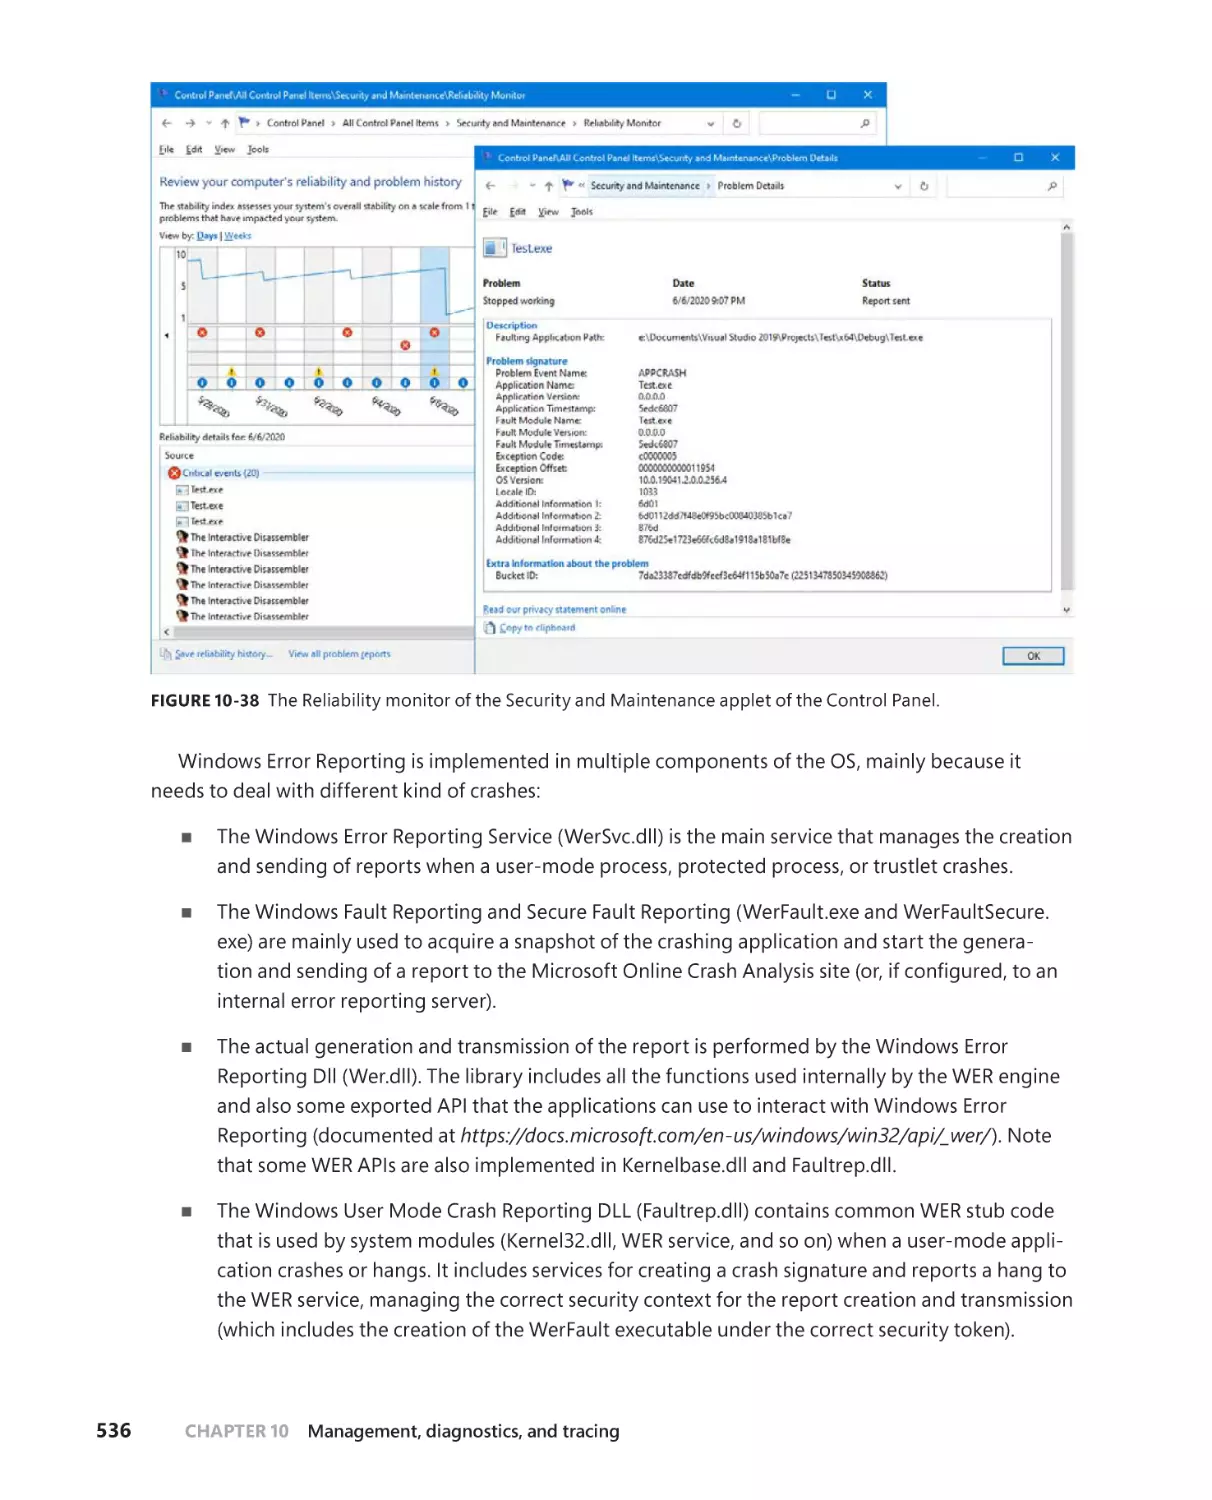
Windows Error Reporting (WER) . . . . . . . . . . . . . . . . . . . . . . . . . . . . . . . . . . . . . .535
User applications crashes . . . . . . . . . . . . . . . . . . . . . . . . . . . . . . . . . . . . . .537
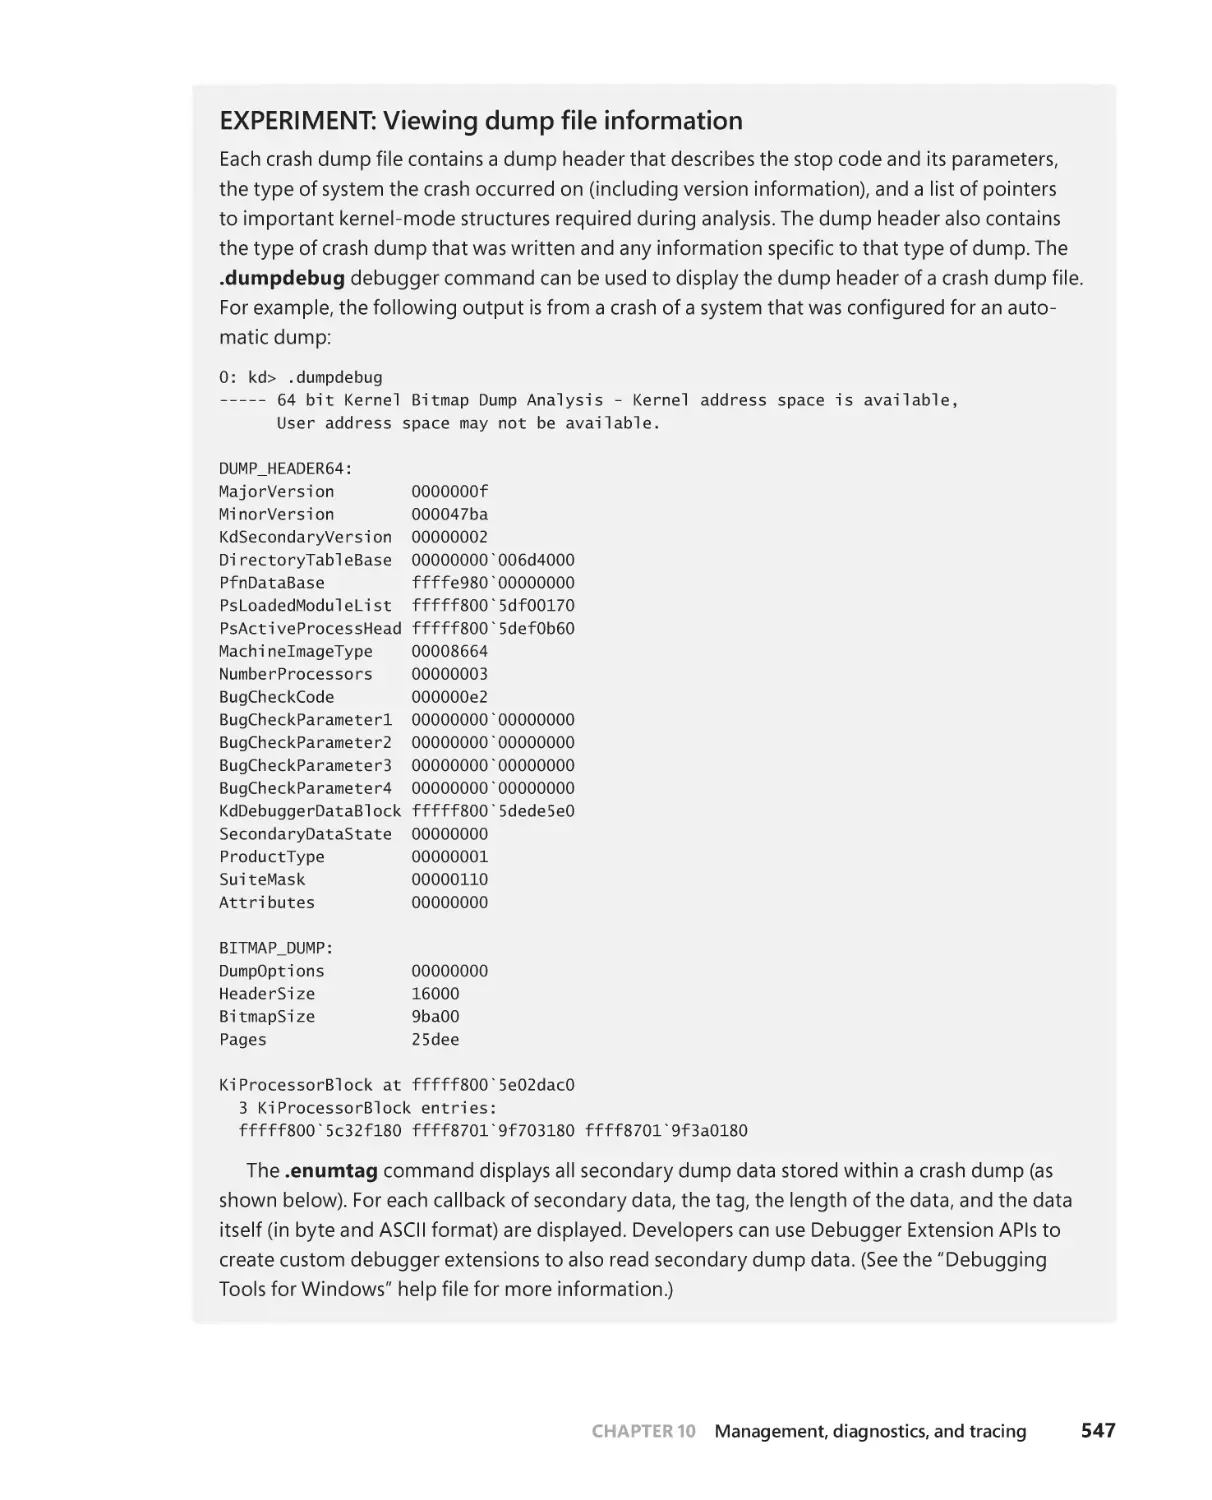
Kernel-mode (system) crashes . . . . . . . . . . . . . . . . . . . . . . . . . . . . . . . . . .543
Process hang detection . . . . . . . . . . . . . . . . . . . . . . . . . . . . . . . . . . . . . . . . 551
. . . . . . . . . . . . . . . . . . . . . . . . . . . . . . . . . . . . . . . . . . . . . . . . . . . . . . . . .554
Kernel shims . . . . . . . . . . . . . . . . . . . . . . . . . . . . . . . . . . . . . . . . . . . . . . . . . . . . . . . .557
Shim engine initialization . . . . . . . . . . . . . . . . . . . . . . . . . . . . . . . . . . . . . .557
The shim database . . . . . . . . . . . . . . . . . . . . . . . . . . . . . . . . . . . . . . . . . . . .559
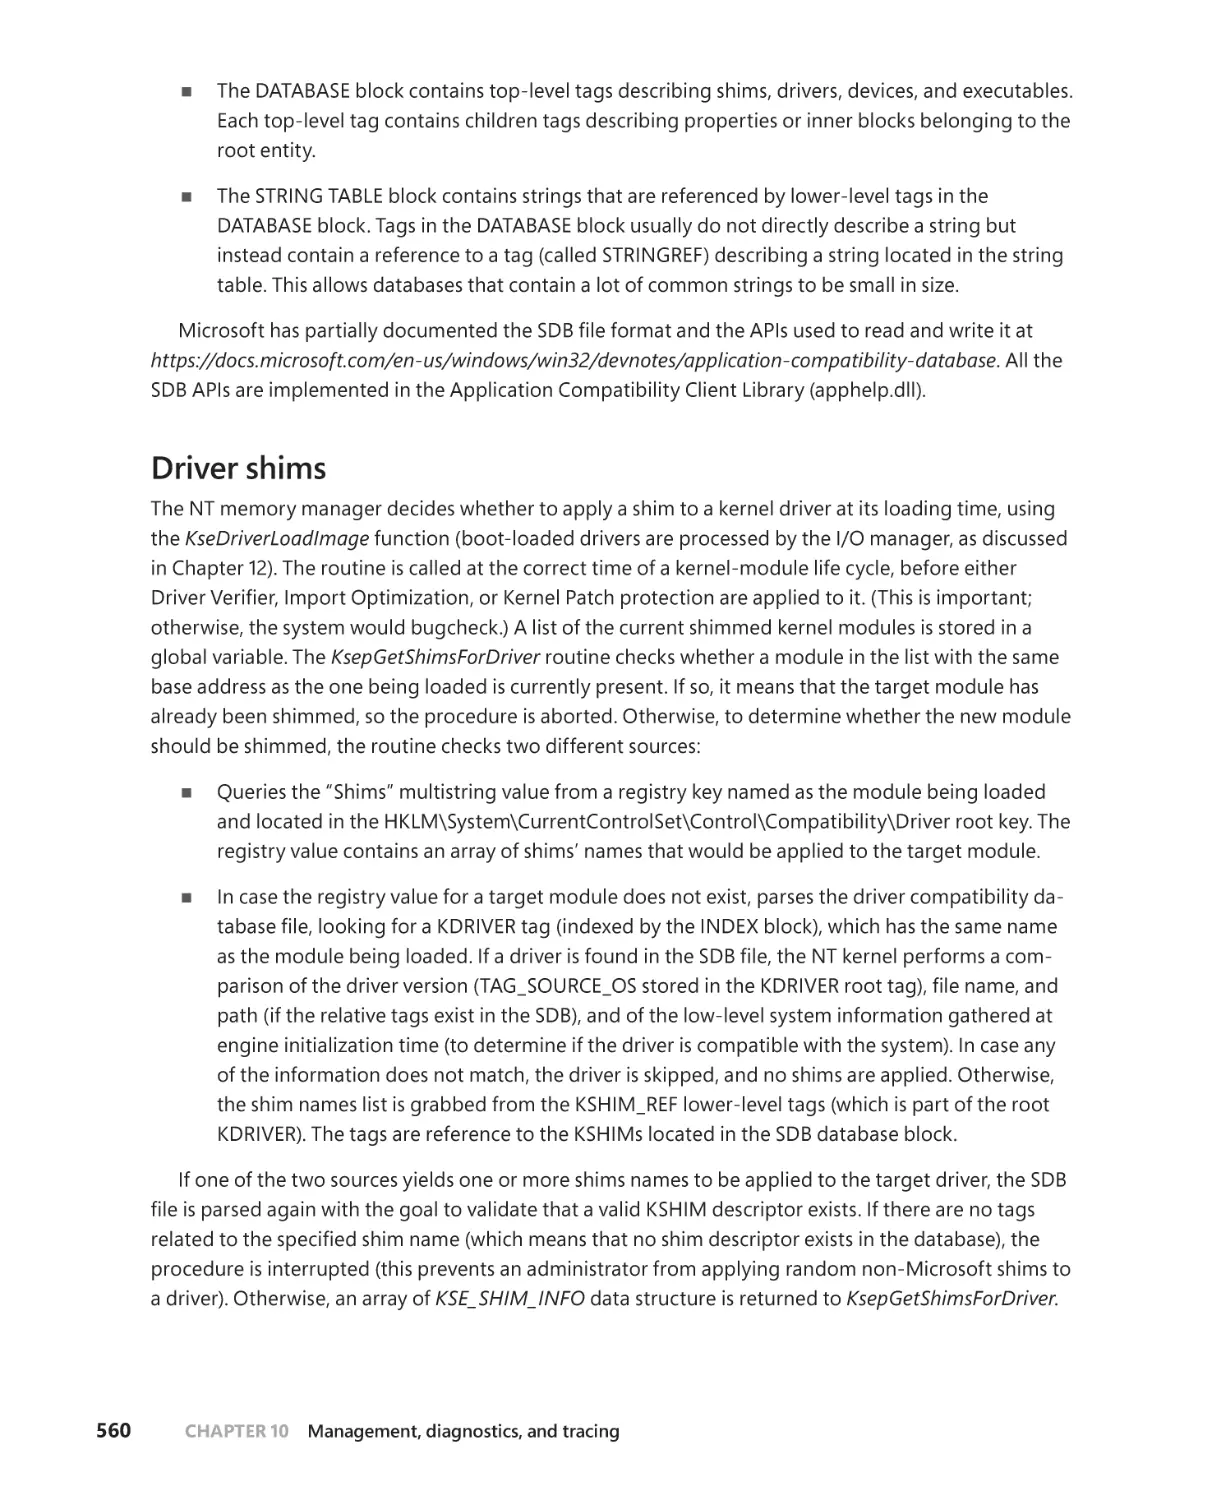
Driver shims . . . . . . . . . . . . . . . . . . . . . . . . . . . . . . . . . . . . . . . . . . . . . . . . . . .560
Device shims . . . . . . . . . . . . . . . . . . . . . . . . . . . . . . . . . . . . . . . . . . . . . . . . . .564
Conclusion . . . . . . . . . . . . . . . . . . . . . . . . . . . . . . . . . . . . . . . . . . . . . . . . . . . . . . . . . .564
Chapter 11 Caching and file systems
Terminology . . . . . . . . . . . . . . . . . . . . . . . . . . . . . . . . . . . . . . . . . . . . . . . . . . . . . . . .565
Key features of the cache manager . . . . . . . . . . . . . . . . . . . . . . . . . . . . . . . . . . .566
Single, centralized system cache . . . . . . . . . . . . . . . . . . . . . . . . . . . . . . . .567
The memory manager . . . . . . . . . . . . . . . . . . . . . . . . . . . . . . . . . . . . . . . . .567
Cache coherency . . . . . . . . . . . . . . . . . . . . . . . . . . . . . . . . . . . . . . . . . . . . . .568
Virtual block caching . . . . . . . . . . . . . . . . . . . . . . . . . . . . . . . . . . . . . . . . . .569
Stream-based caching . . . . . . . . . . . . . . . . . . . . . . . . . . . . . . . . . . . . . . . . .569
. . . . . . . . . . . . . . . . . . . . . . . . . . . . . . . .570
NTFS MFT working set enhancements . . . . . . . . . . . . . . . . . . . . . . . . . . 571
Memory partitions support . . . . . . . . . . . . . . . . . . . . . . . . . . . . . . . . . . . . 571
Cache virtual memory management . . . . . . . . . . . . . . . . . . . . . . . . . . . . . . . . . .572
Cache size . . . . . . . . . . . . . . . . . . . . . . . . . . . . . . . . . . . . . . . . . . . . . . . . . . . . . . . . . . . 574
Cache virtual size . . . . . . . . . . . . . . . . . . . . . . . . . . . . . . . . . . . . . . . . . . . . . . 574
Cache working set size . . . . . . . . . . . . . . . . . . . . . . . . . . . . . . . . . . . . . . . . . 574
Cache physical size . . . . . . . . . . . . . . . . . . . . . . . . . . . . . . . . . . . . . . . . . . . . 574
Cache data structures . . . . . . . . . . . . . . . . . . . . . . . . . . . . . . . . . . . . . . . . . . . . . . . . 576
Systemwide cache data structures . . . . . . . . . . . . . . . . . . . . . . . . . . . . . . 576
. . . . . . . . . . . . . . . . . . . . . . . . . . . . . . . . . . .579
xii
Contents
File system interfaces . . . . . . . . . . . . . . . . . . . . . . . . . . . . . . . . . . . . . . . . . . . . . . . .582
Copying to and from the cache . . . . . . . . . . . . . . . . . . . . . . . . . . . . . . . . .584
Caching with the mapping and pinning interfaces . . . . . . . . . . . . . . .584
Caching with the direct memory access interfaces . . . . . . . . . . . . . . .584
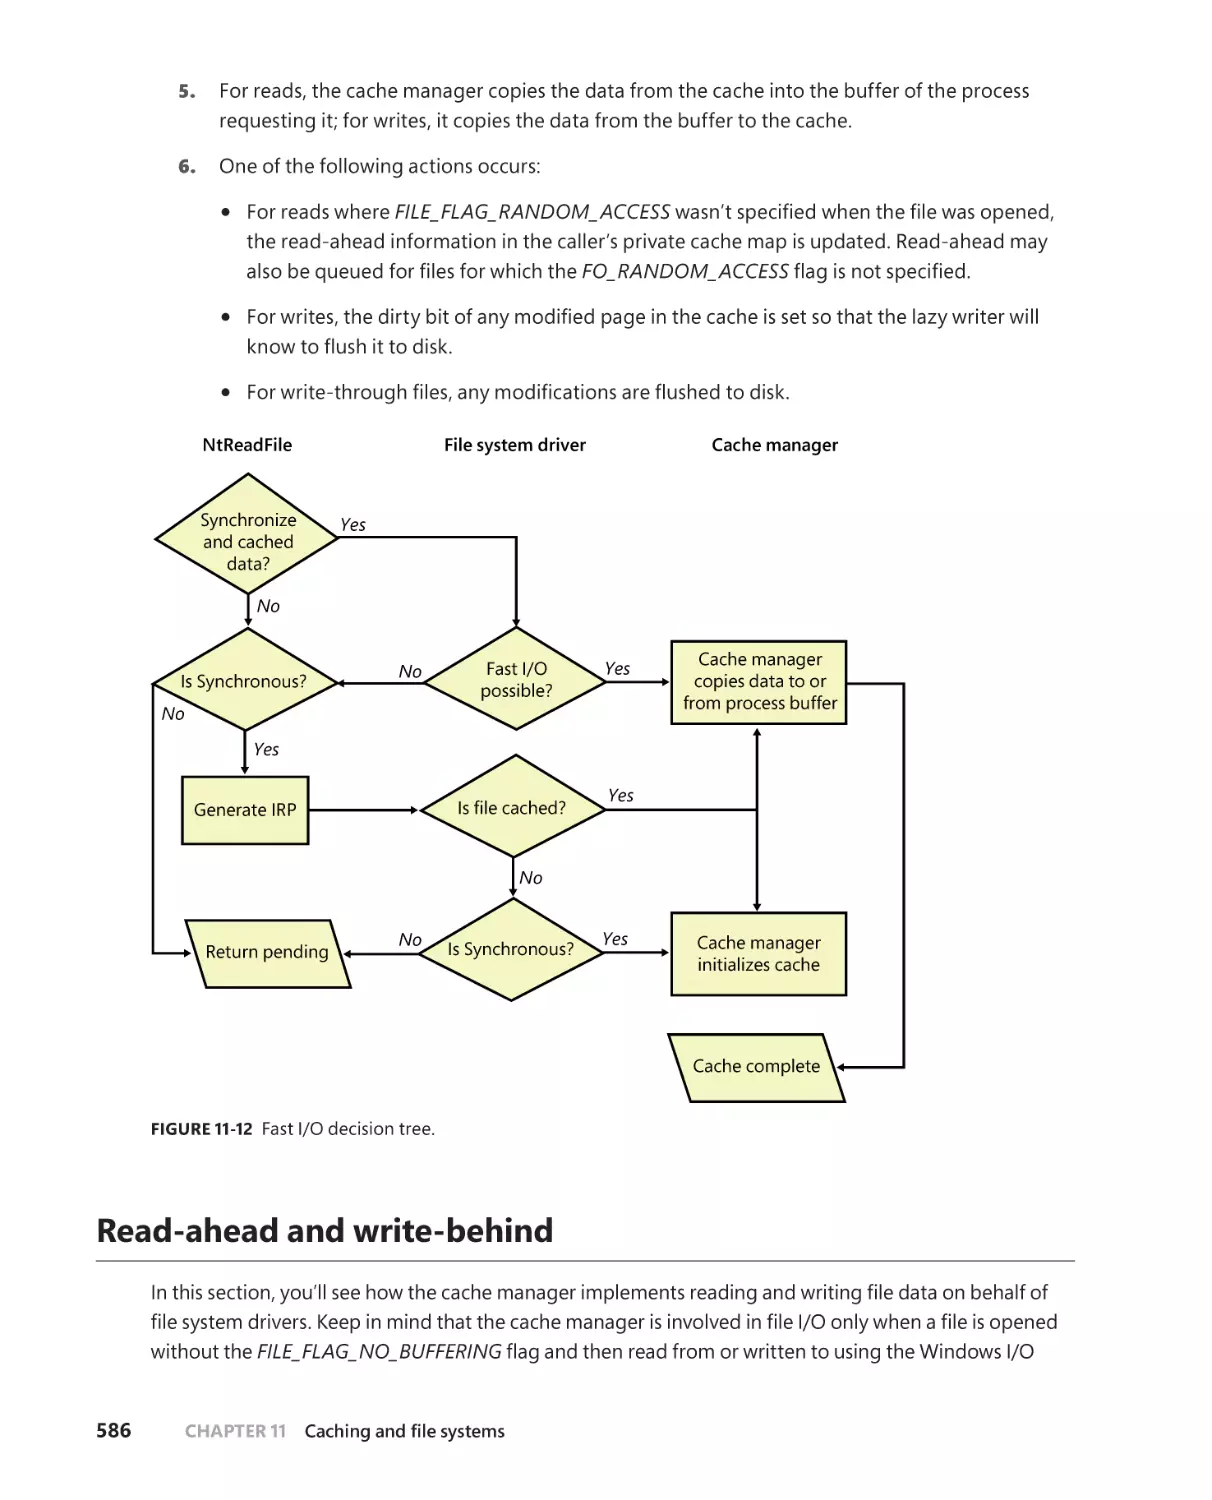
Fast I/O . . . . . . . . . . . . . . . . . . . . . . . . . . . . . . . . . . . . . . . . . . . . . . . . . . . . . . . . . . . . .585
Read-ahead and write-behind . . . . . . . . . . . . . . . . . . . . . . . . . . . . . . . . . . . . . . .586
Intelligent read-ahead . . . . . . . . . . . . . . . . . . . . . . . . . . . . . . . . . . . . . . . . .587
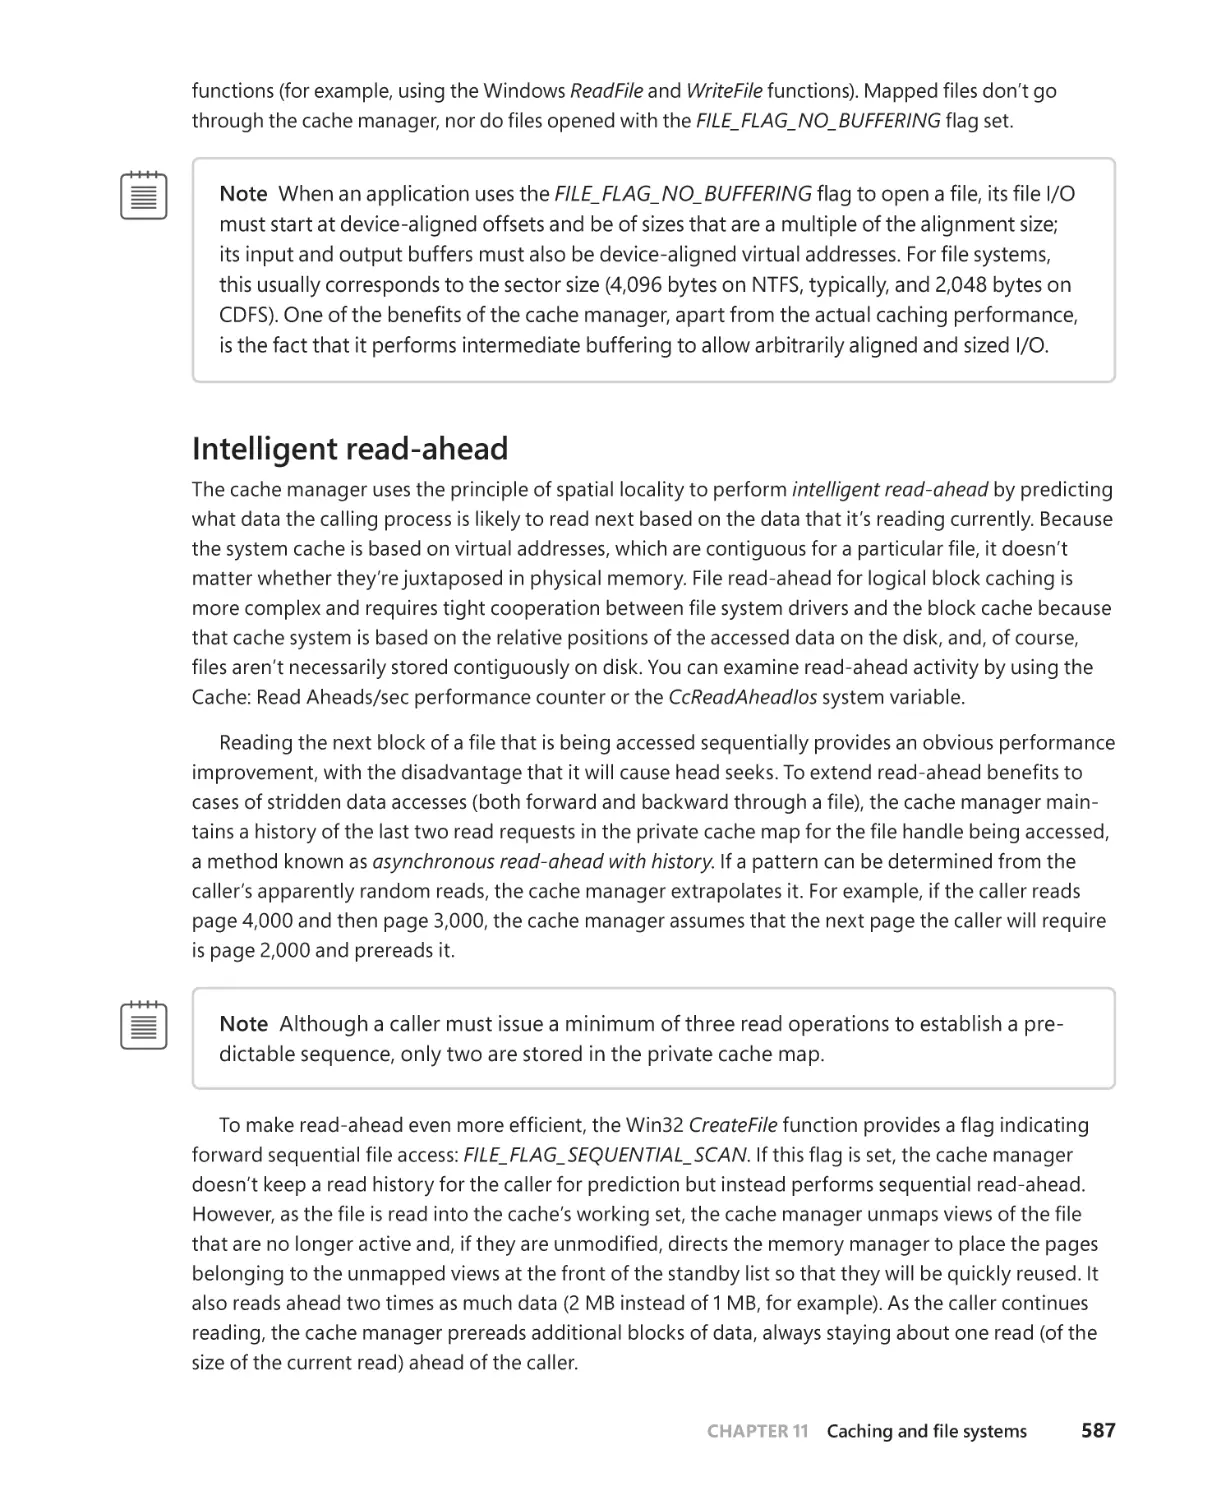
Read-ahead enhancements . . . . . . . . . . . . . . . . . . . . . . . . . . . . . . . . . . . .588
Write-back caching and lazy writing . . . . . . . . . . . . . . . . . . . . . . . . . . . .589
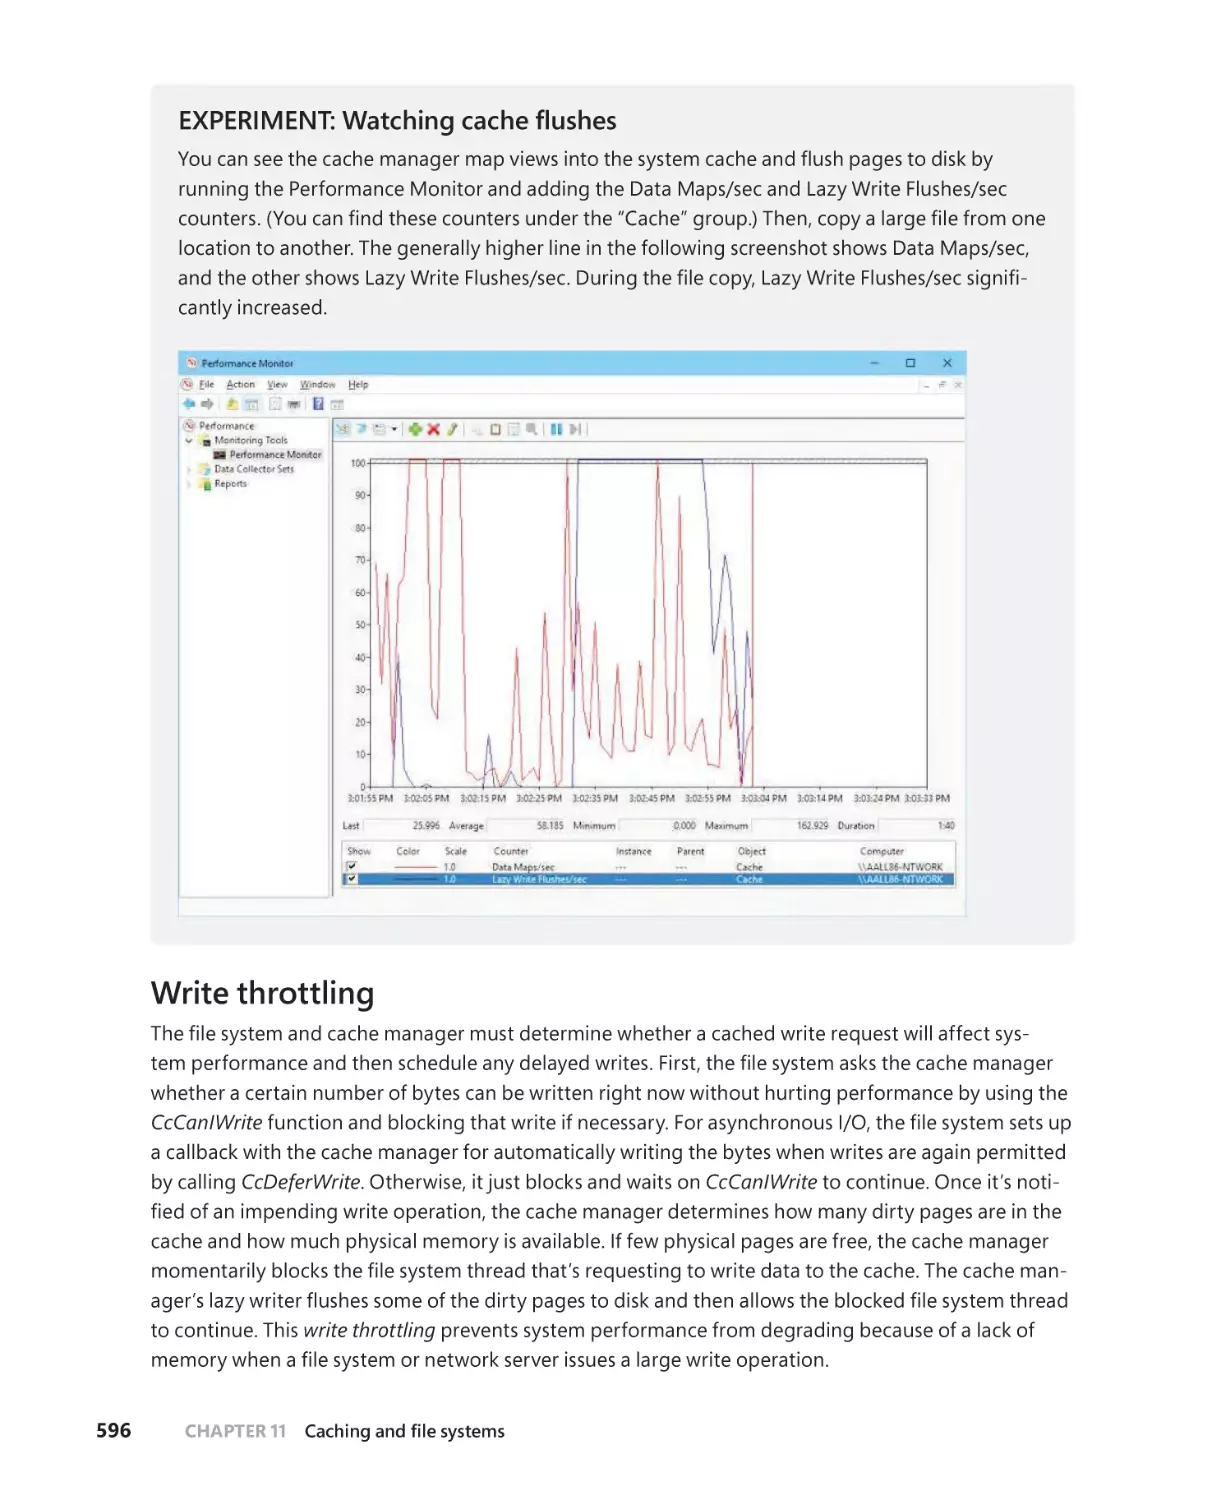
. . . . . . . . . . . . . . . . . . . . . . . . . . . . . . . . .595
Forcing the cache to write through to disk . . . . . . . . . . . . . . . . . . . . . .595
. . . . . . . . . . . . . . . . . . . . . . . . . . . . . . . . . . . . . . . . . .595
Write throttling . . . . . . . . . . . . . . . . . . . . . . . . . . . . . . . . . . . . . . . . . . . . . . . .596
System threads . . . . . . . . . . . . . . . . . . . . . . . . . . . . . . . . . . . . . . . . . . . . . . . .597
Aggressive write behind and low-priority lazy writes . . . . . . . . . . . .598
Dynamic memory . . . . . . . . . . . . . . . . . . . . . . . . . . . . . . . . . . . . . . . . . . . . .599
Cache manager disk I/O accounting . . . . . . . . . . . . . . . . . . . . . . . . . . . .600
File systems . . . . . . . . . . . . . . . . . . . . . . . . . . . . . . . . . . . . . . . . . . . . . . . . . . . . . . . . .602
. . . . . . . . . . . . . . . . . . . . . . . . . . . . . . . . . . .602
CDFS . . . . . . . . . . . . . . . . . . . . . . . . . . . . . . . . . . . . . . . . . . . . . . . . . . . . . . . . . .602
UDF. . . . . . . . . . . . . . . . . . . . . . . . . . . . . . . . . . . . . . . . . . . . . . . . . . . . . . . . . . .603
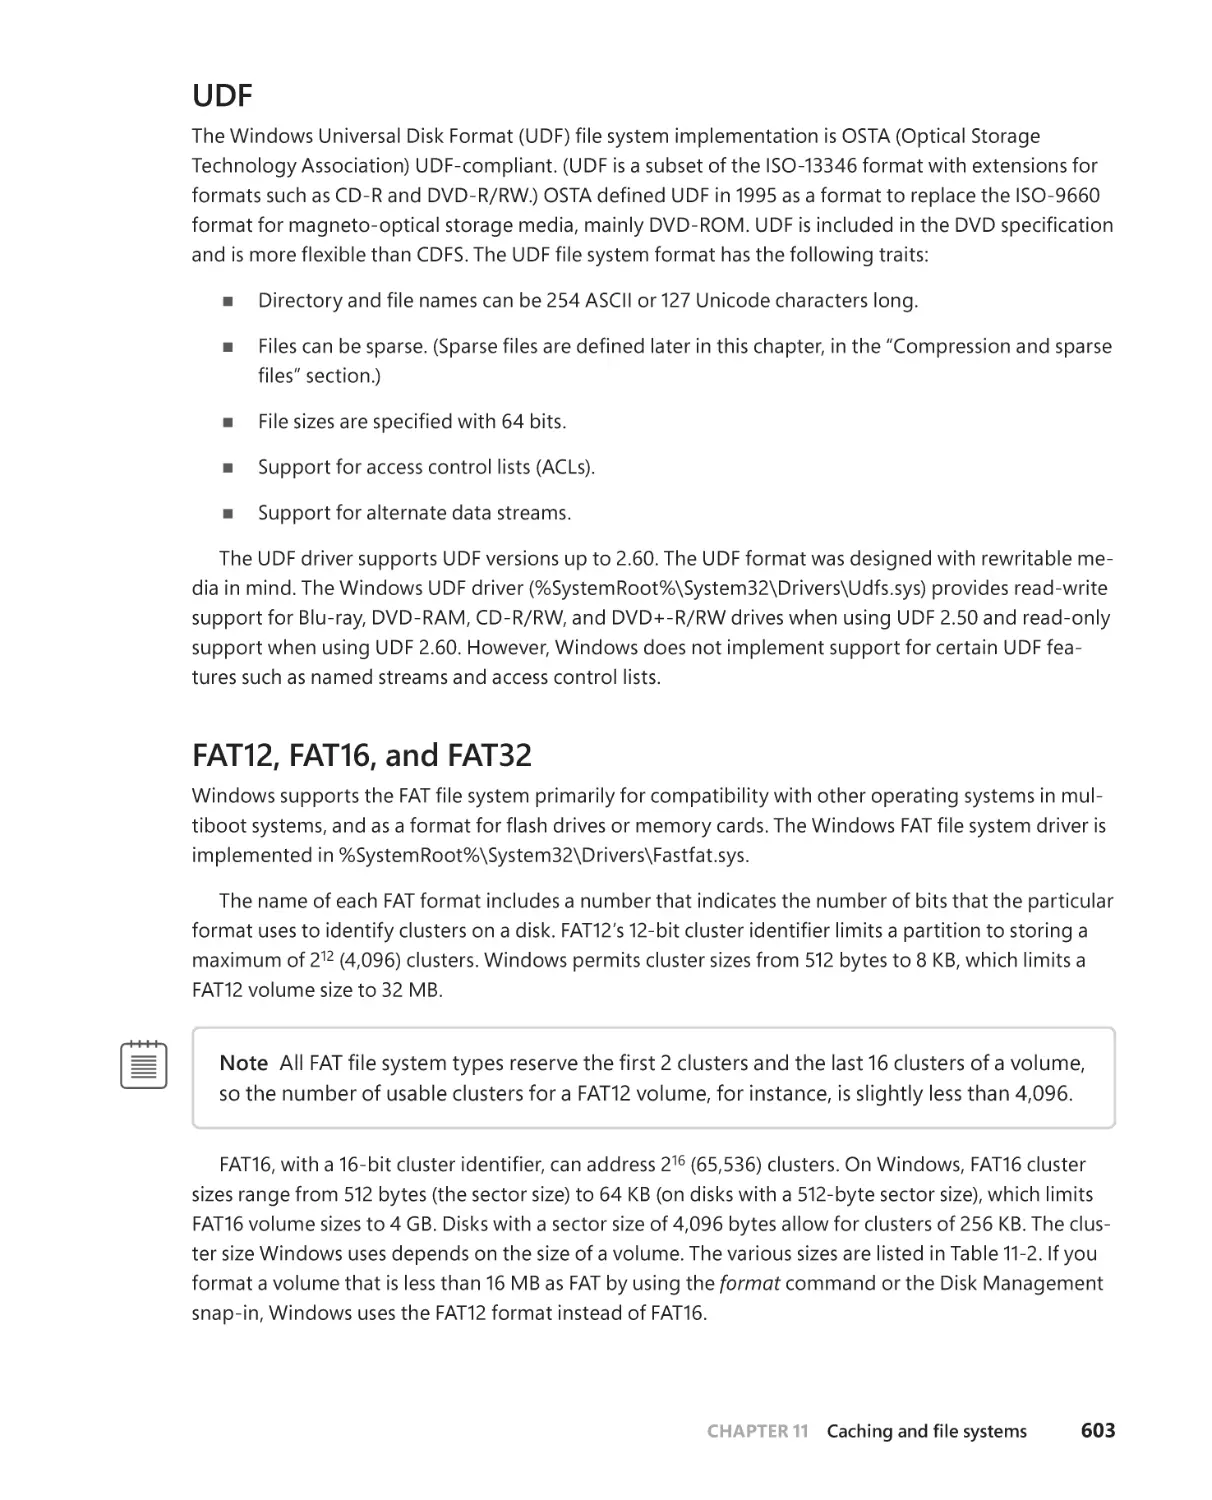
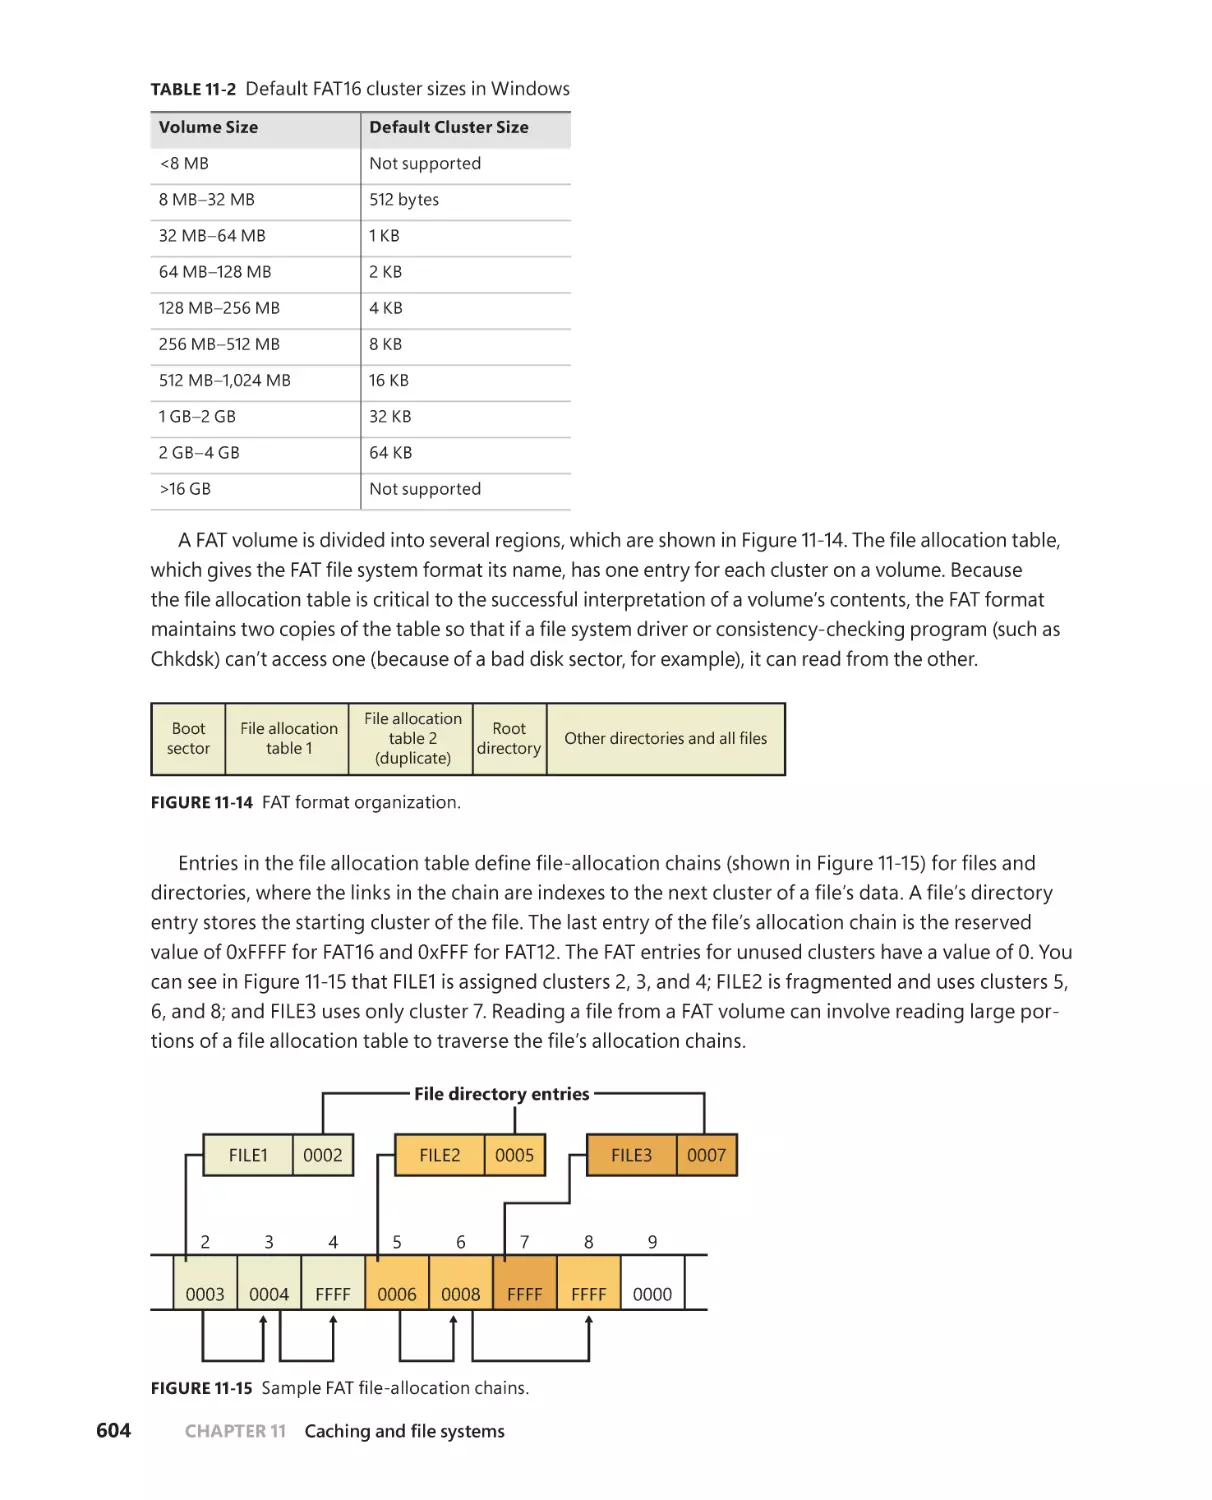
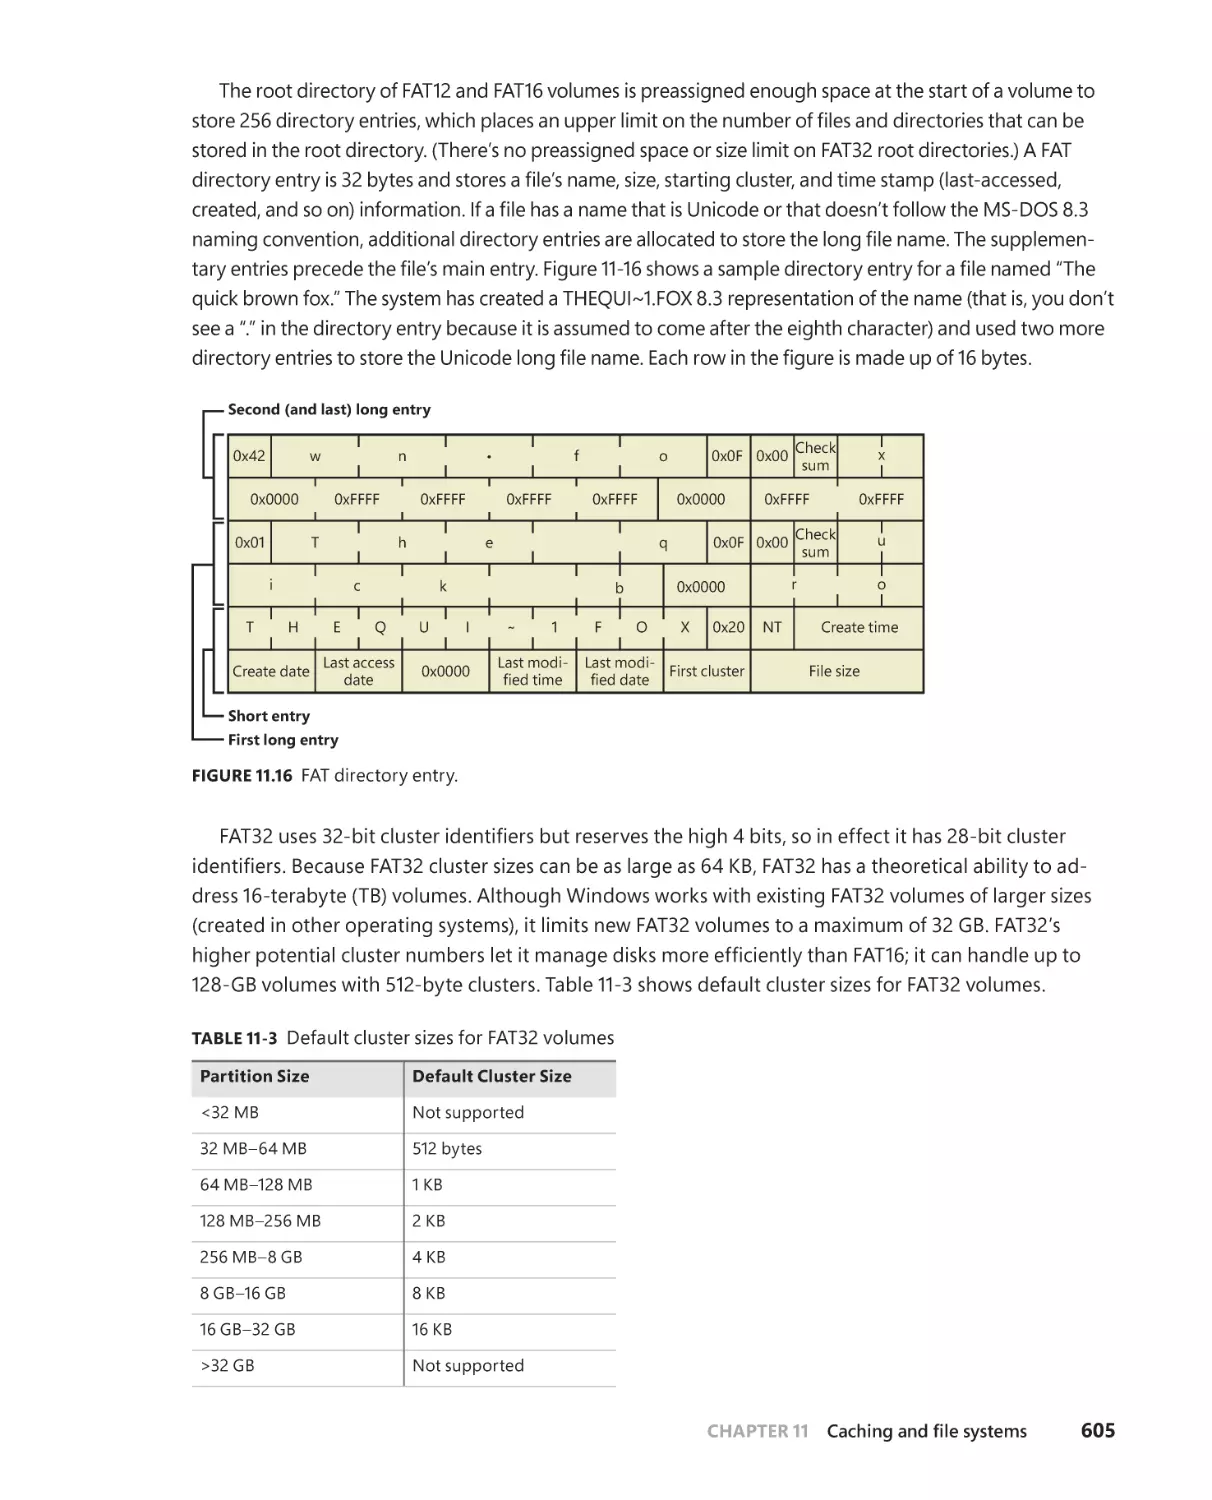
FAT12, FAT16, and FAT32 . . . . . . . . . . . . . . . . . . . . . . . . . . . . . . . . . . . . . . .603
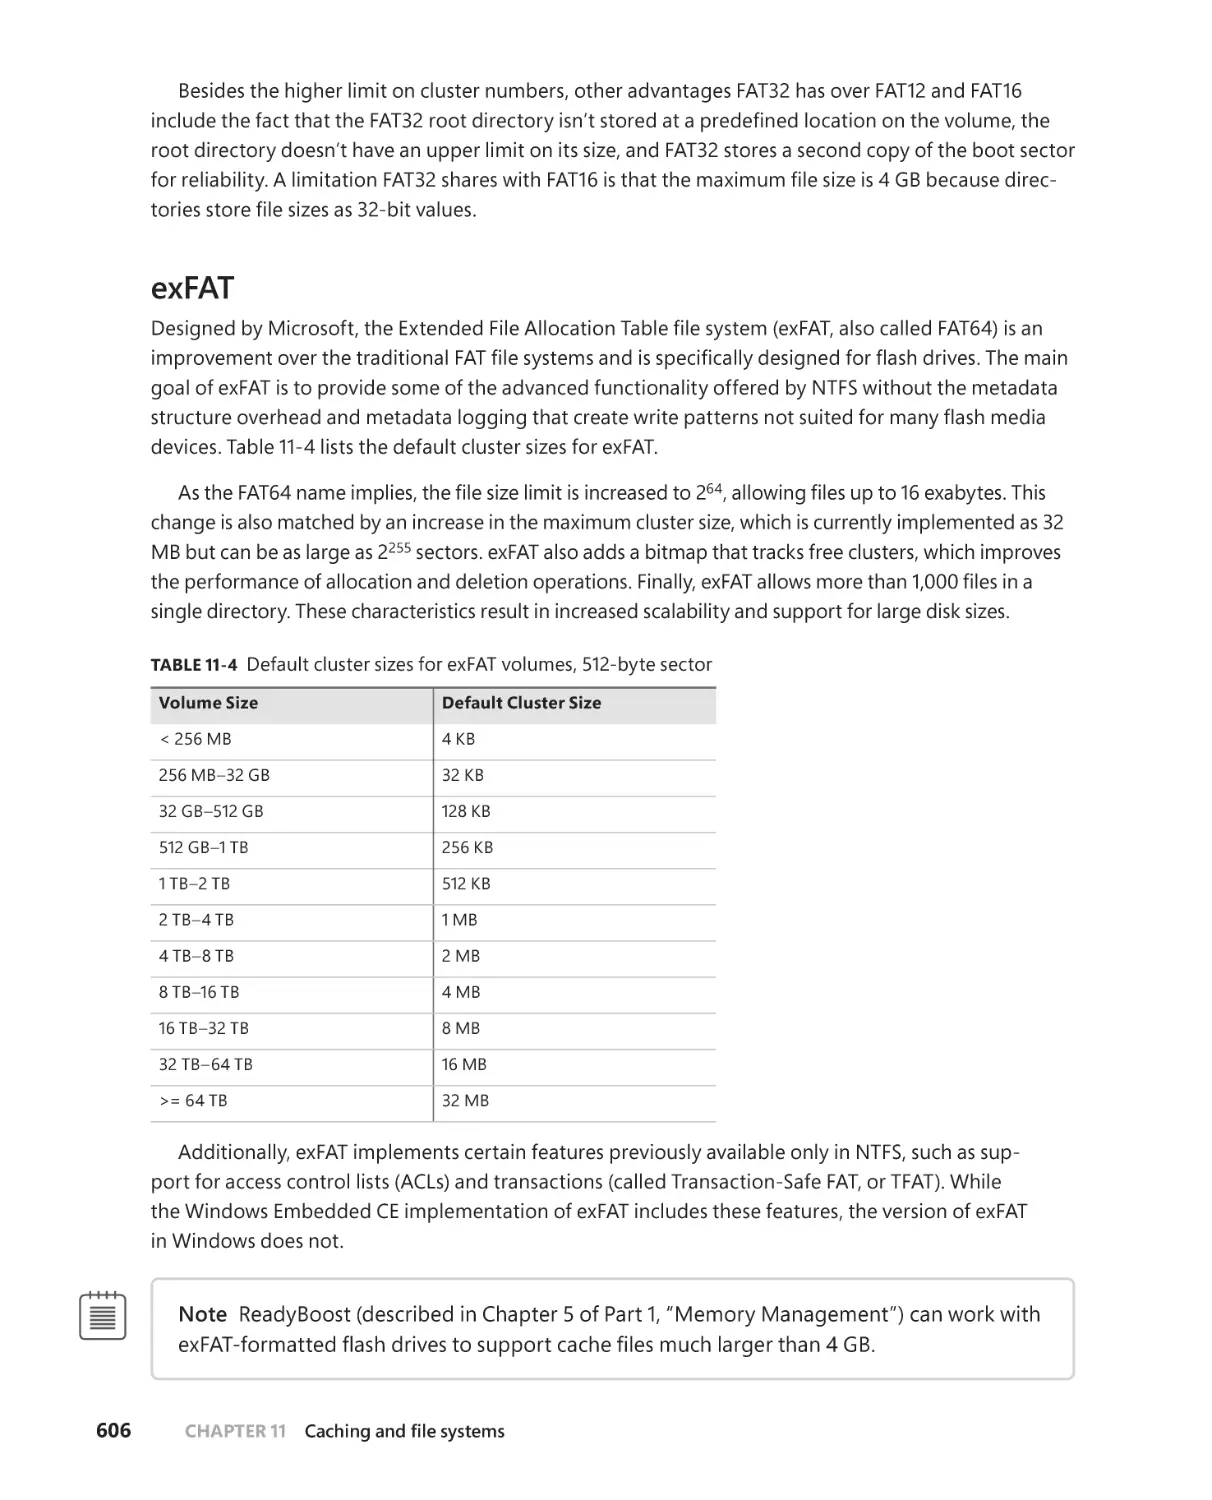
exFAT . . . . . . . . . . . . . . . . . . . . . . . . . . . . . . . . . . . . . . . . . . . . . . . . . . . . . . . . .606
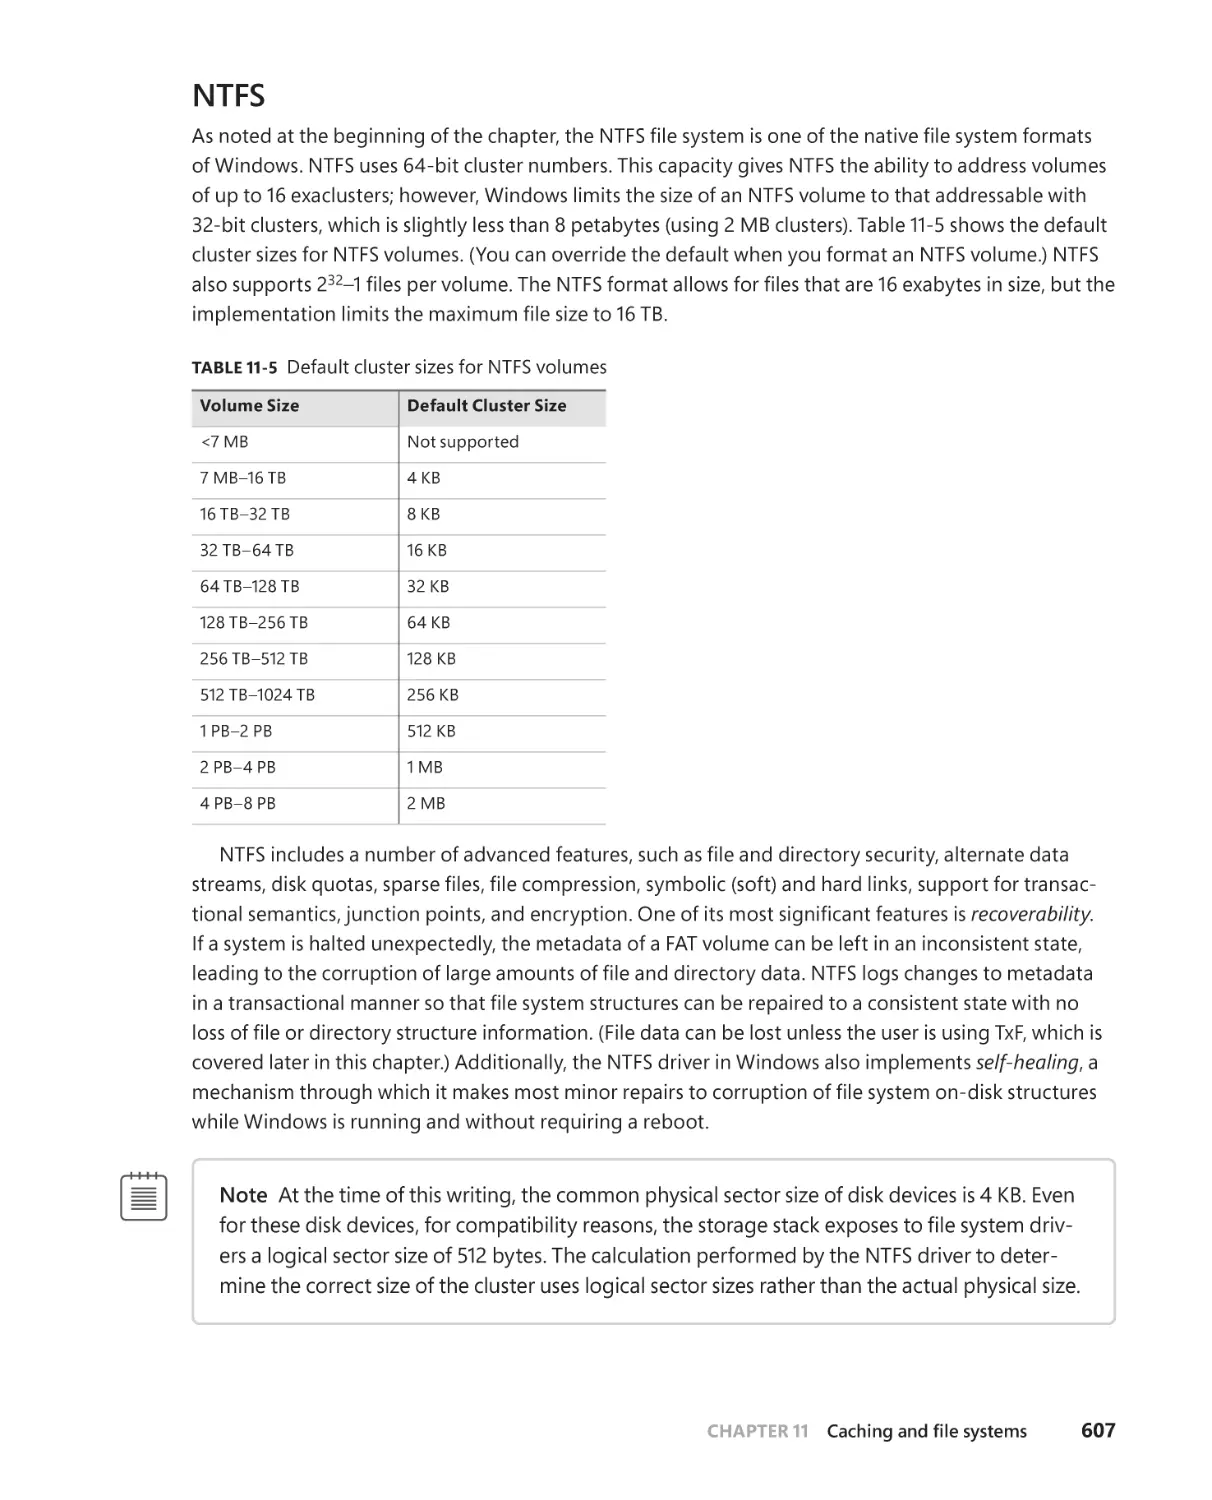
NTFS . . . . . . . . . . . . . . . . . . . . . . . . . . . . . . . . . . . . . . . . . . . . . . . . . . . . . . . . . .606
ReFS . . . . . . . . . . . . . . . . . . . . . . . . . . . . . . . . . . . . . . . . . . . . . . . . . . . . . . . . . .608
File system driver architecture . . . . . . . . . . . . . . . . . . . . . . . . . . . . . . . . . .608
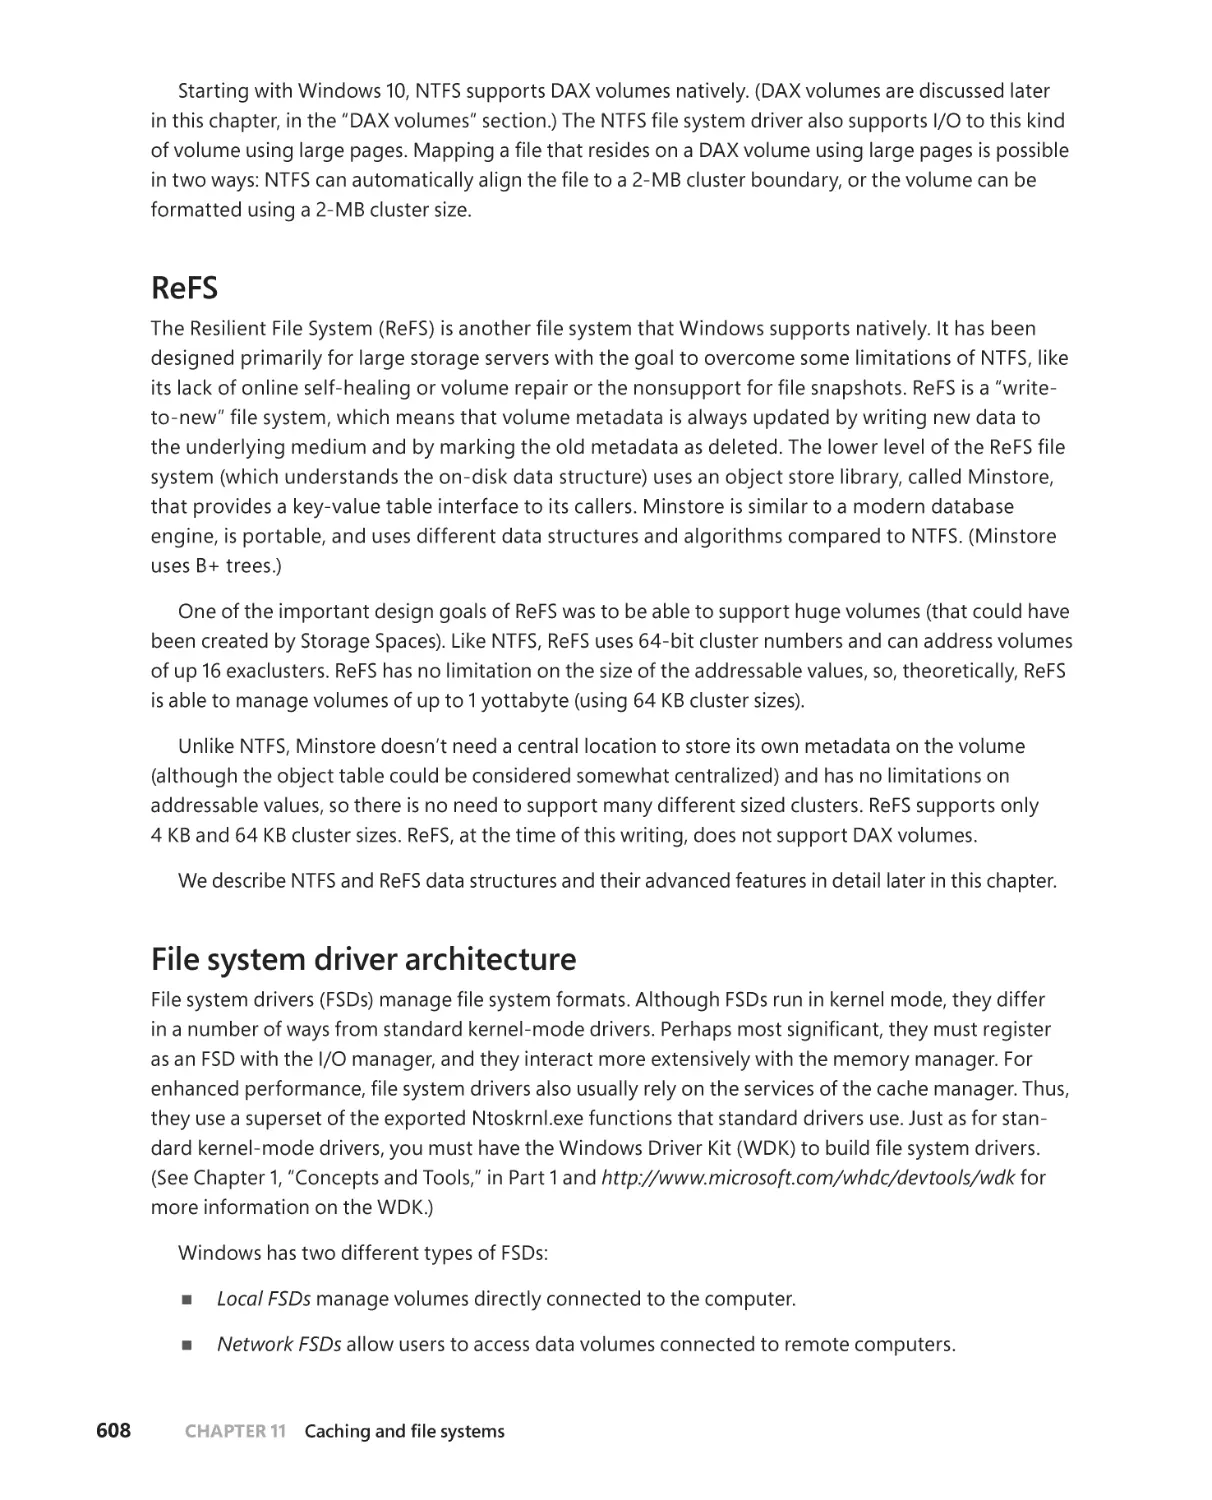
Local FSDs. . . . . . . . . . . . . . . . . . . . . . . . . . . . . . . . . . . . . . . . . . . . . . . . . . . . .608
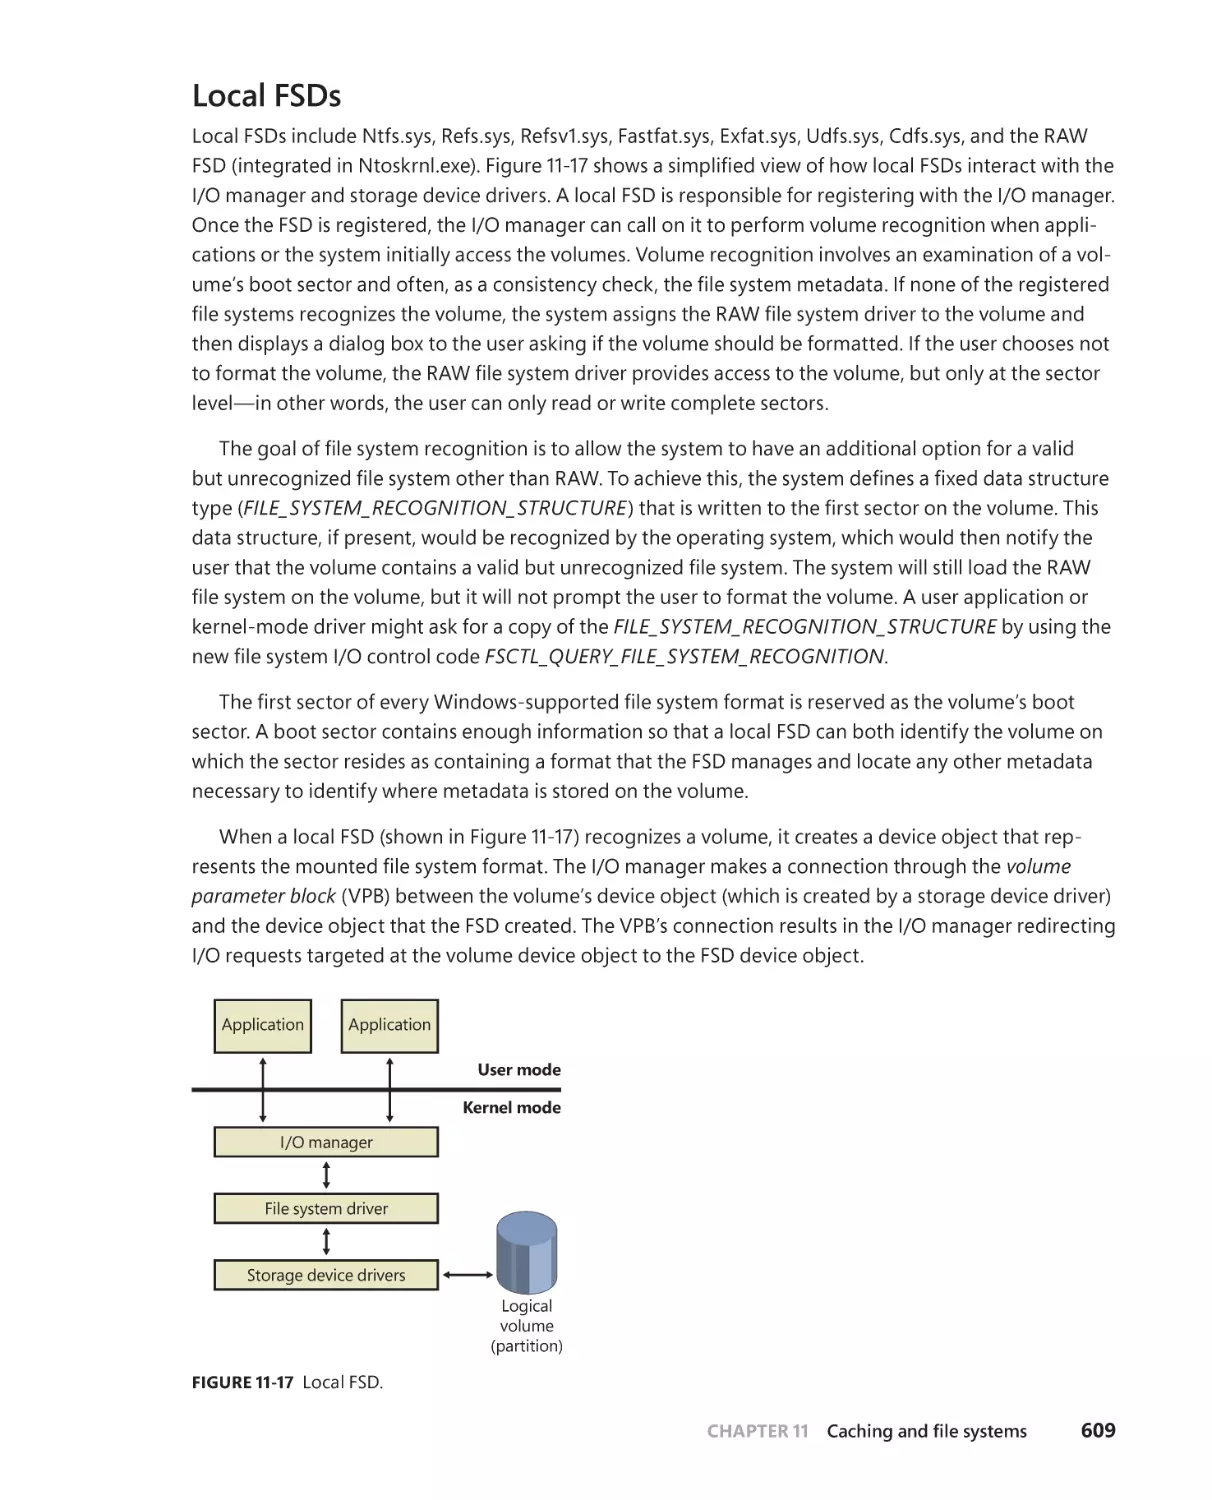
Remote FSDs . . . . . . . . . . . . . . . . . . . . . . . . . . . . . . . . . . . . . . . . . . . . . . . . . . 610
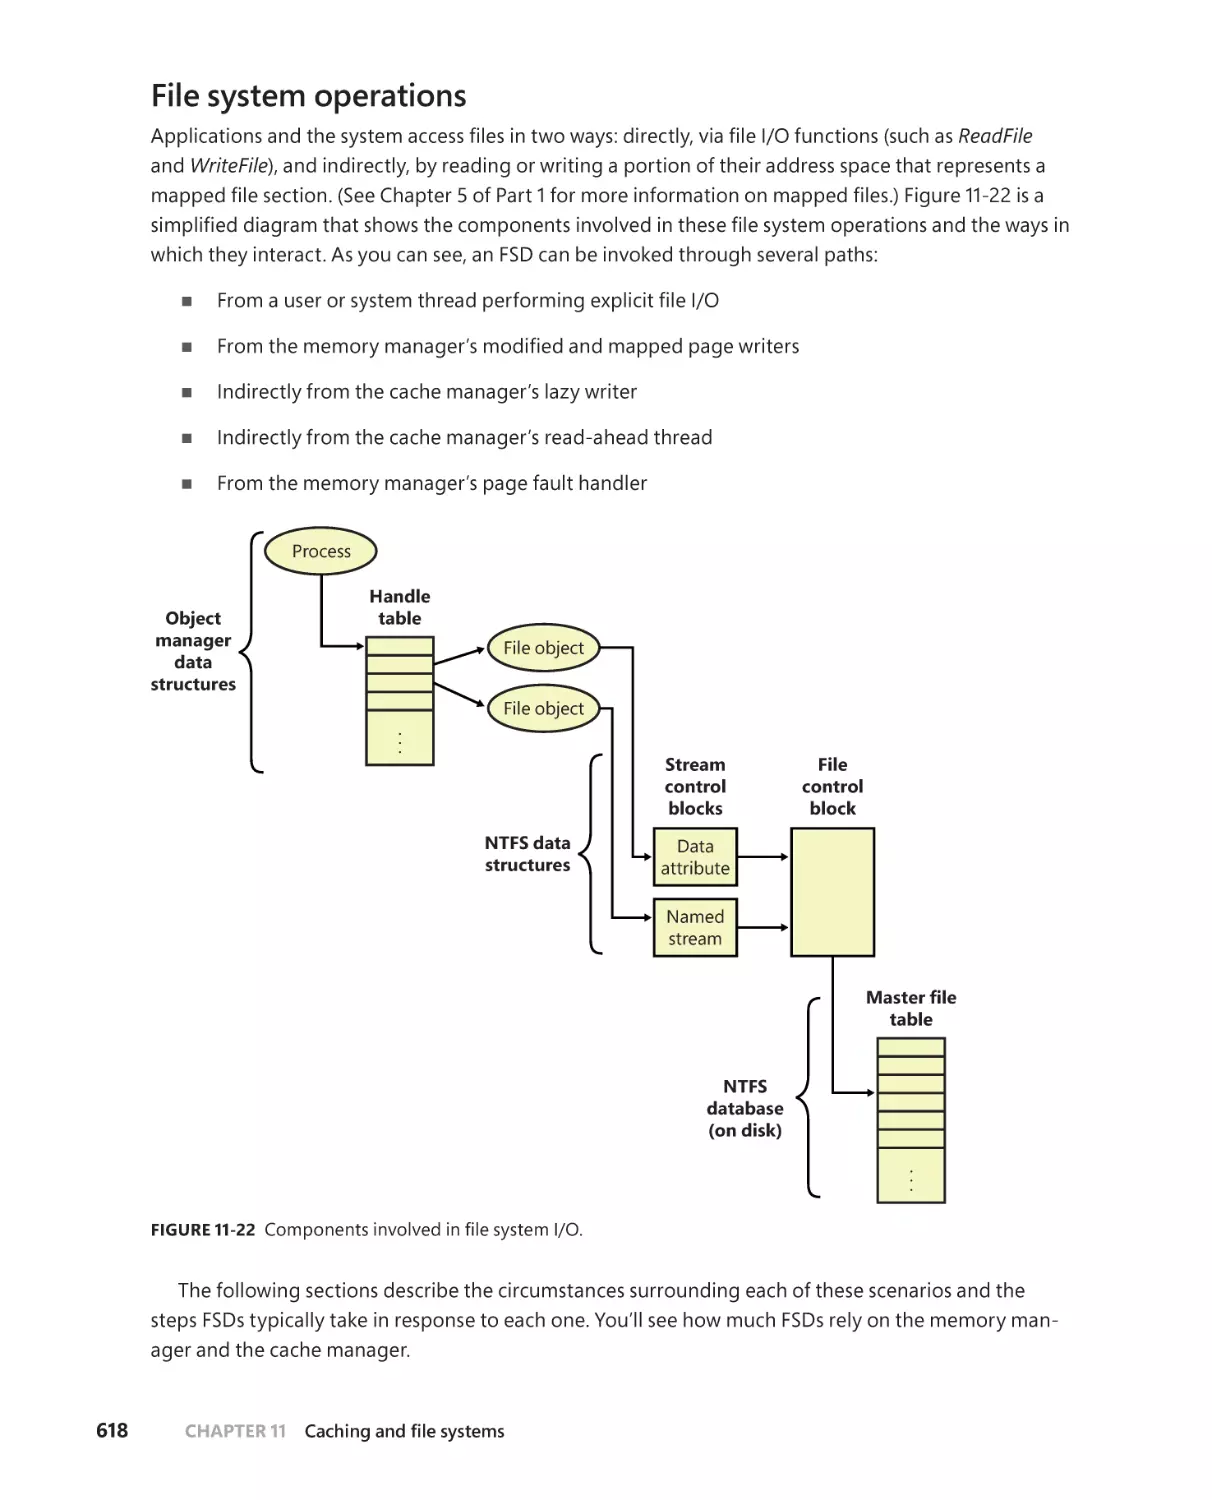
File system operations . . . . . . . . . . . . . . . . . . . . . . . . . . . . . . . . . . . . . . . . . 618
. . . . . . . . . . . . . . . . . . . . . . . . . . . . . . . . . . . . . . . . . . . . . . . . . 619
. . . . . . . . . .622
Cache manager’s lazy writer. . . . . . . . . . . . . . . . . . . . . . . . . . . . . . . . . . . .622
Cache manager’s read-ahead thread . . . . . . . . . . . . . . . . . . . . . . . . . . .622
Memory manager’s page fault handler . . . . . . . . . . . . . . . . . . . . . . . . .623
. . . . . . . . . . . . . . . . . . . . . . . . . .623
Contents
xiii
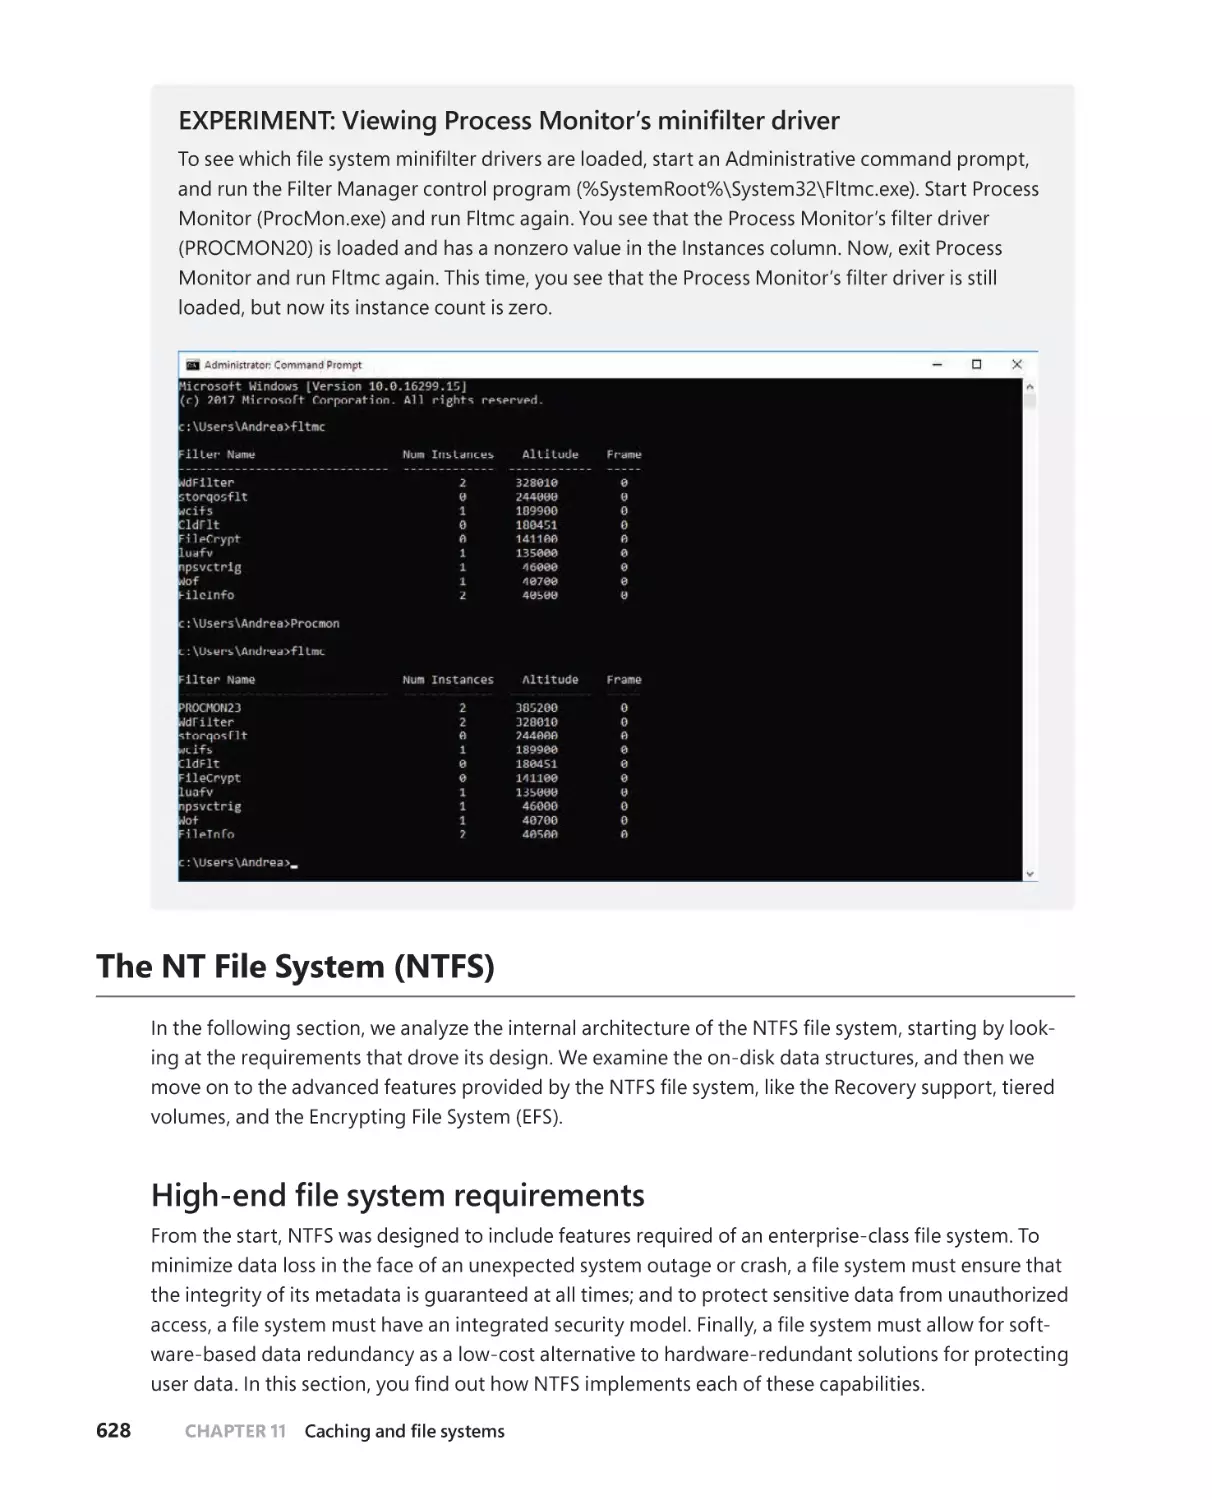
Filtering named pipes and mailslots . . . . . . . . . . . . . . . . . . . . . . . . . . . .625
Controlling reparse point behavior . . . . . . . . . . . . . . . . . . . . . . . . . . . . .626
Process Monitor . . . . . . . . . . . . . . . . . . . . . . . . . . . . . . . . . . . . . . . . . . . . . . .627
The NT File System (NTFS). . . . . . . . . . . . . . . . . . . . . . . . . . . . . . . . . . . . . . . . . . . .628
. . . . . . . . . . . . . . . . . . . . . . . . . . . . .628
Recoverability . . . . . . . . . . . . . . . . . . . . . . . . . . . . . . . . . . . . . . . . . . . . . . . . .629
Security . . . . . . . . . . . . . . . . . . . . . . . . . . . . . . . . . . . . . . . . . . . . . . . . . . . . . . .629
Data redundancy and fault tolerance . . . . . . . . . . . . . . . . . . . . . . . . . . .629
Advanced features of NTFS. . . . . . . . . . . . . . . . . . . . . . . . . . . . . . . . . . . . .630
Multiple data streams . . . . . . . . . . . . . . . . . . . . . . . . . . . . . . . . . . . . . . . . . . 631
Unicode-based names . . . . . . . . . . . . . . . . . . . . . . . . . . . . . . . . . . . . . . . . .633
General indexing facility . . . . . . . . . . . . . . . . . . . . . . . . . . . . . . . . . . . . . . .633
Dynamic bad-cluster remapping . . . . . . . . . . . . . . . . . . . . . . . . . . . . . . .633
Hard links . . . . . . . . . . . . . . . . . . . . . . . . . . . . . . . . . . . . . . . . . . . . . . . . . . . . .634
Symbolic (soft) links and junctions . . . . . . . . . . . . . . . . . . . . . . . . . . . . . .634
. . . . . . . . . . . . . . . . . . . . . . . . . . . . . . . . . . .637
Change logging . . . . . . . . . . . . . . . . . . . . . . . . . . . . . . . . . . . . . . . . . . . . . . .637
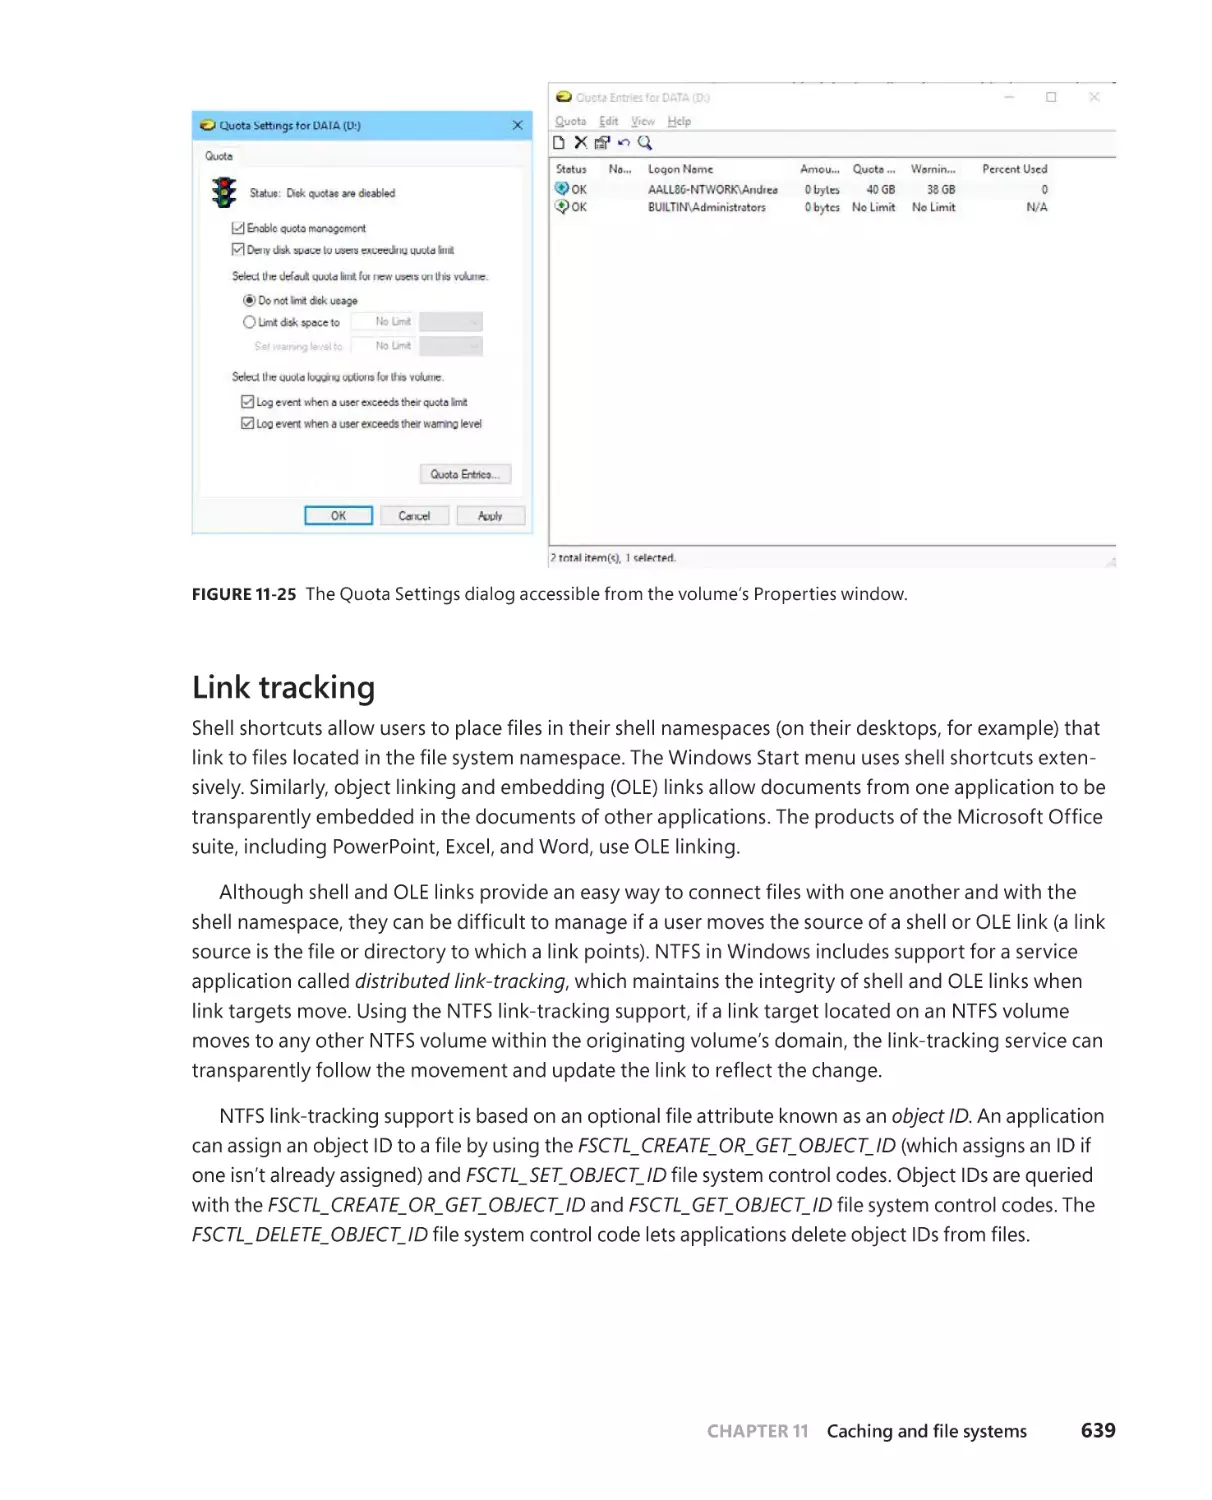
Per-user volume quotas . . . . . . . . . . . . . . . . . . . . . . . . . . . . . . . . . . . . . . . .638
Link tracking . . . . . . . . . . . . . . . . . . . . . . . . . . . . . . . . . . . . . . . . . . . . . . . . . .639
Encryption . . . . . . . . . . . . . . . . . . . . . . . . . . . . . . . . . . . . . . . . . . . . . . . . . . . 640
POSIX-style delete semantics . . . . . . . . . . . . . . . . . . . . . . . . . . . . . . . . . . . 641
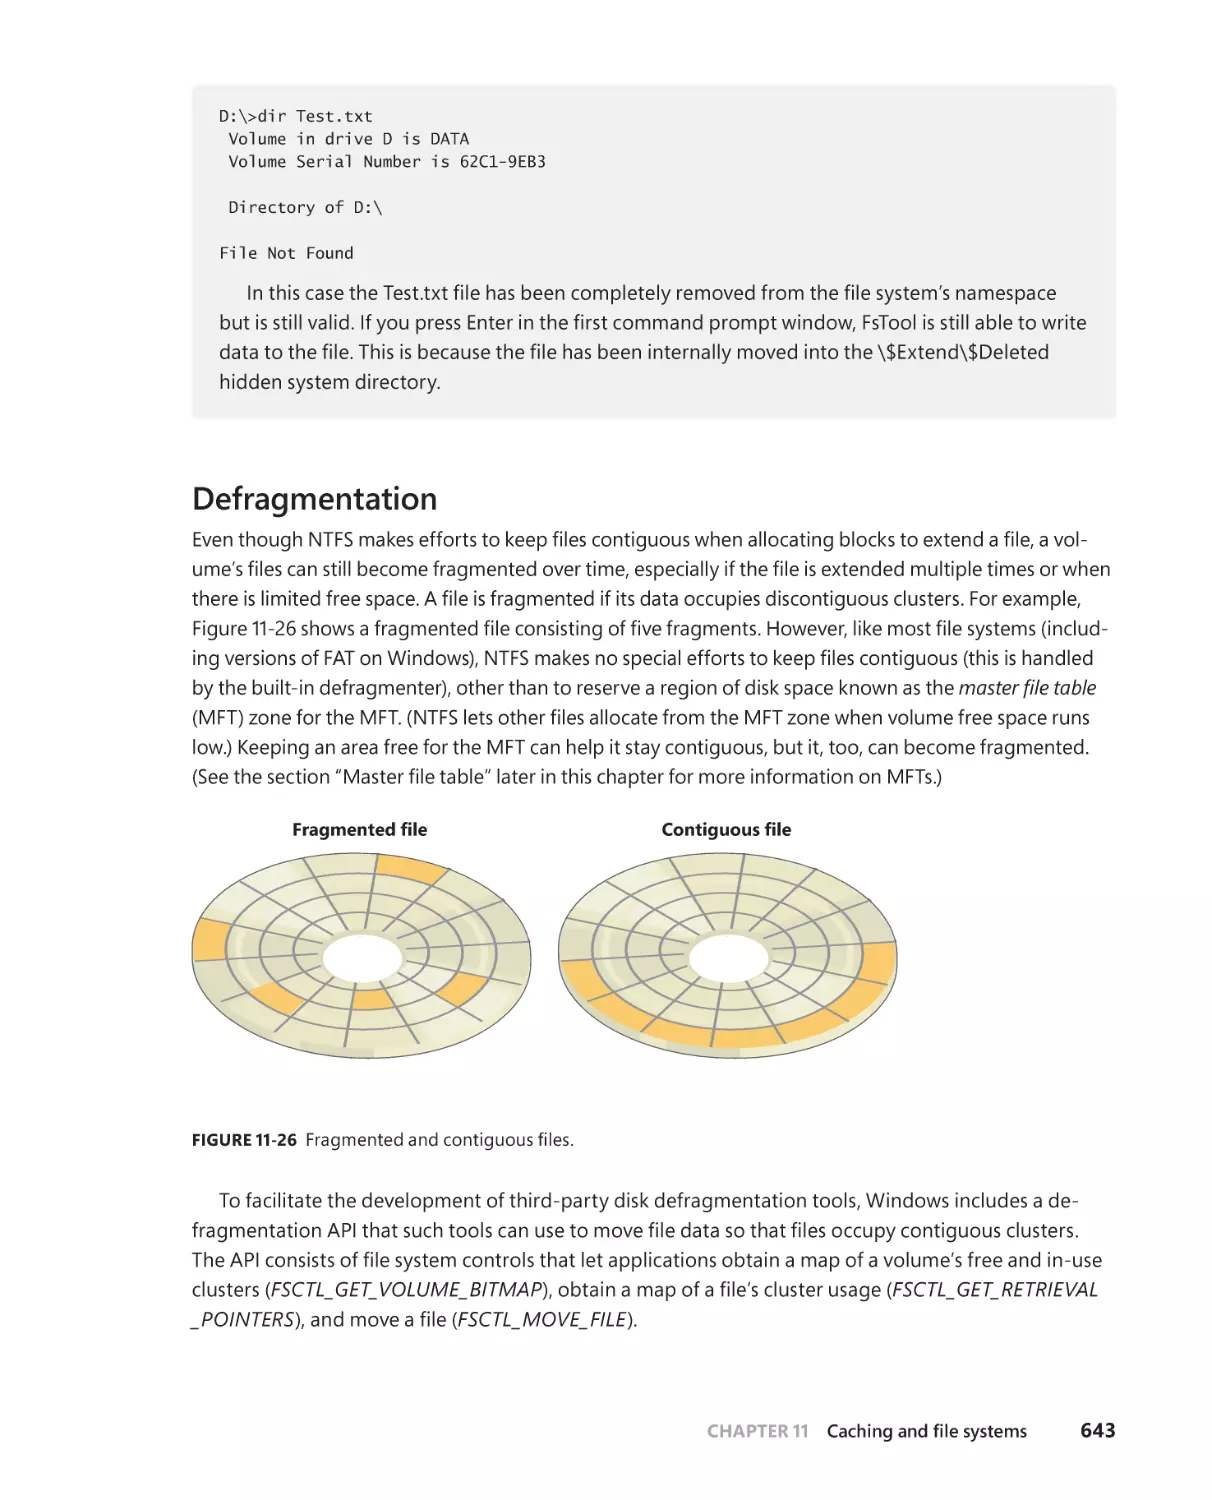
Defragmentation . . . . . . . . . . . . . . . . . . . . . . . . . . . . . . . . . . . . . . . . . . . . . .643
Dynamic partitioning . . . . . . . . . . . . . . . . . . . . . . . . . . . . . . . . . . . . . . . . . .646
NTFS support for tiered volumes . . . . . . . . . . . . . . . . . . . . . . . . . . . . . . .647
. . . . . . . . . . . . . . . . . . . . . . . . . . . . . . . . . . . . . . . . . . . . . . .652
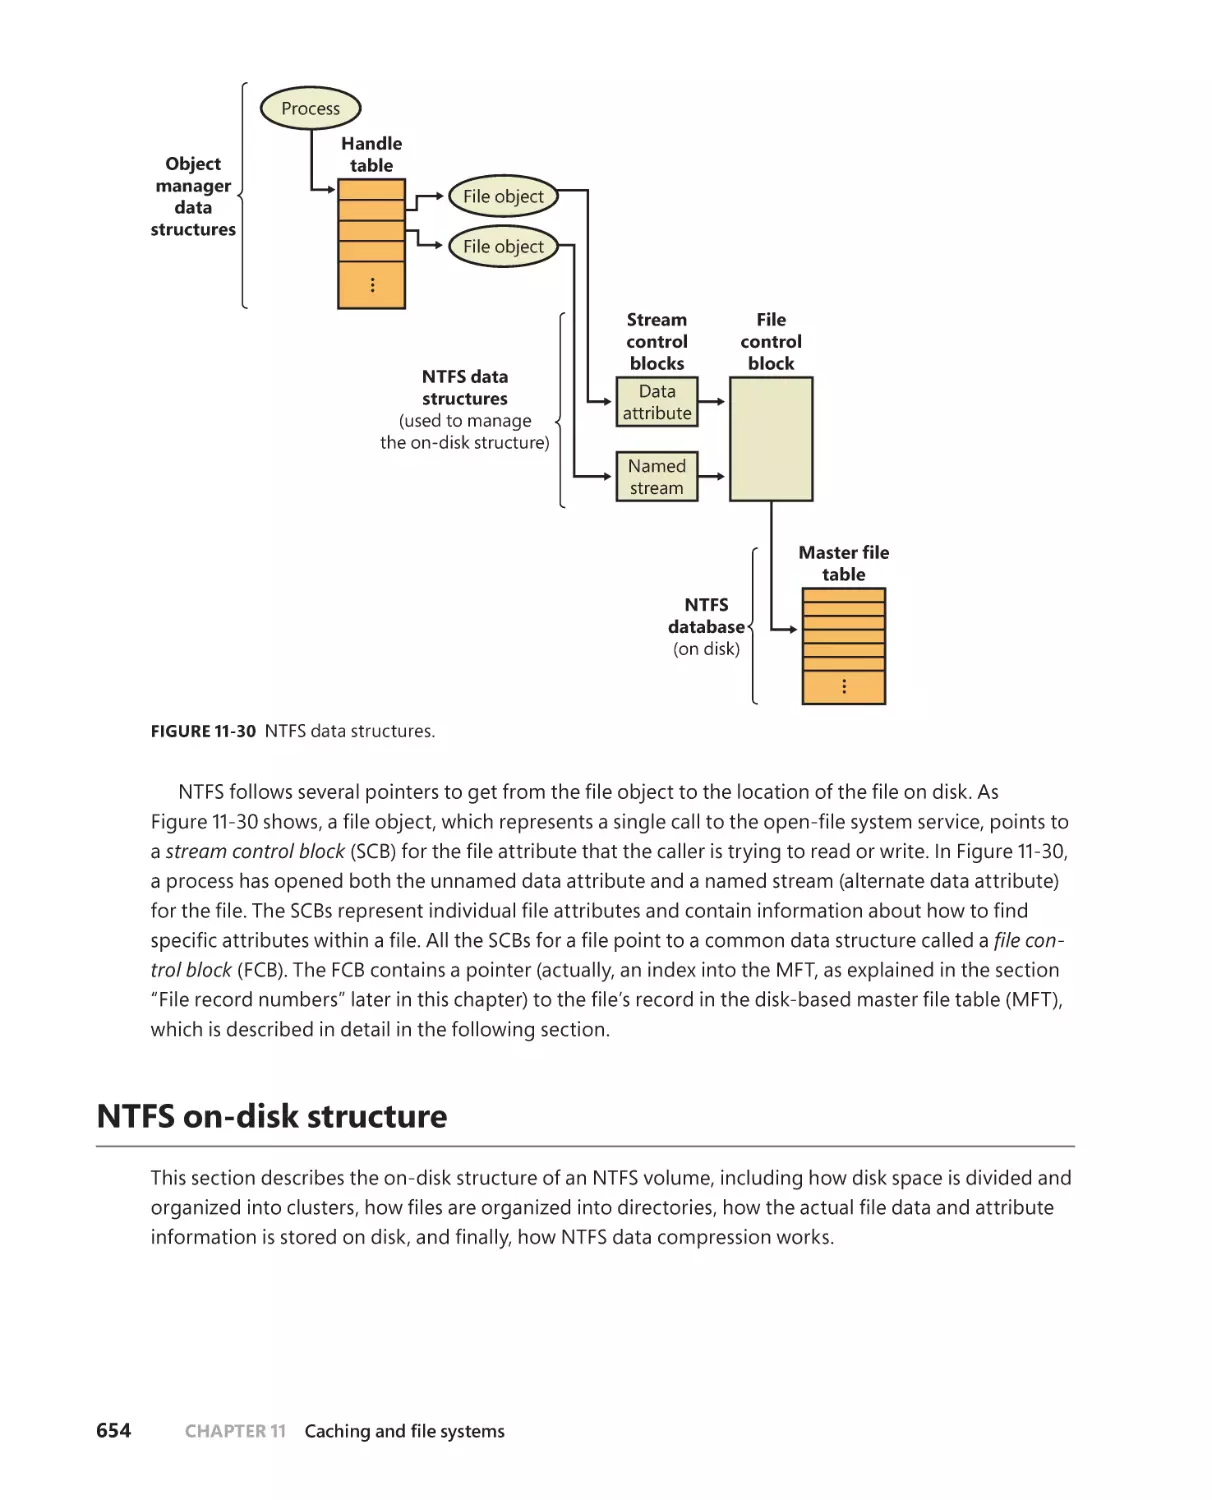
NTFS on-disk structure. . . . . . . . . . . . . . . . . . . . . . . . . . . . . . . . . . . . . . . . . . . . . . .654
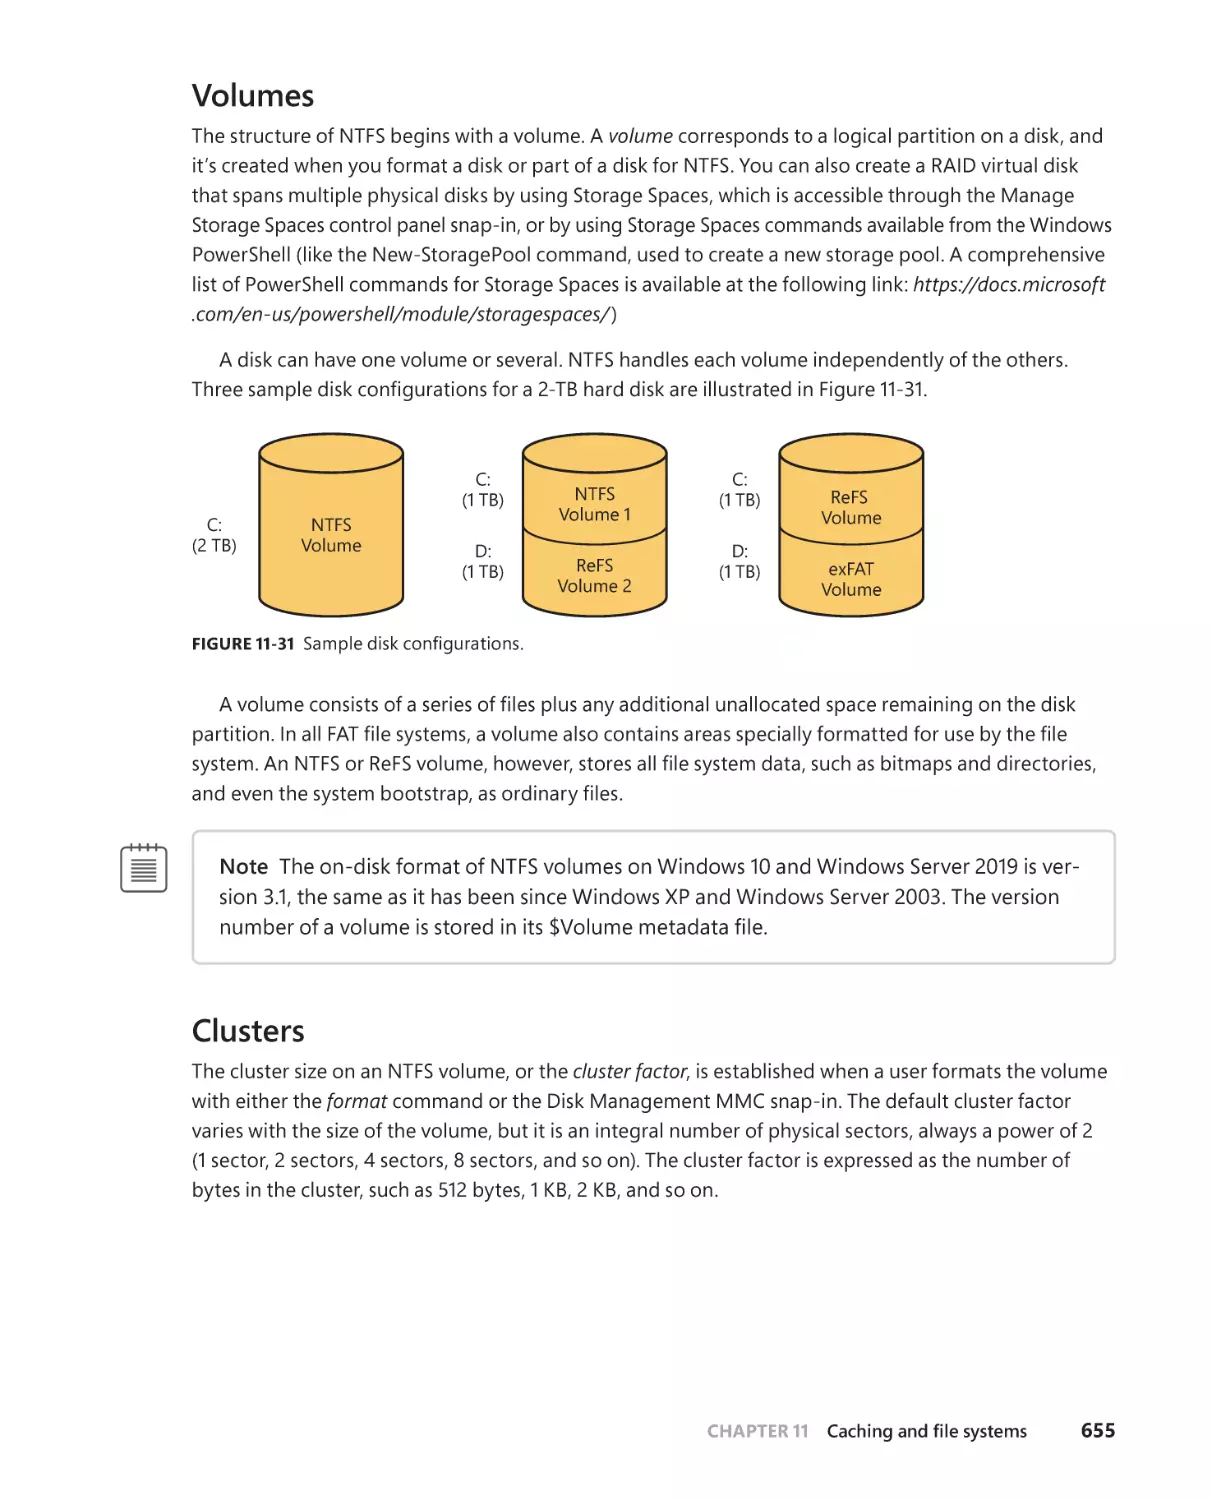
Volumes . . . . . . . . . . . . . . . . . . . . . . . . . . . . . . . . . . . . . . . . . . . . . . . . . . . . . .655
Clusters . . . . . . . . . . . . . . . . . . . . . . . . . . . . . . . . . . . . . . . . . . . . . . . . . . . . . . .655
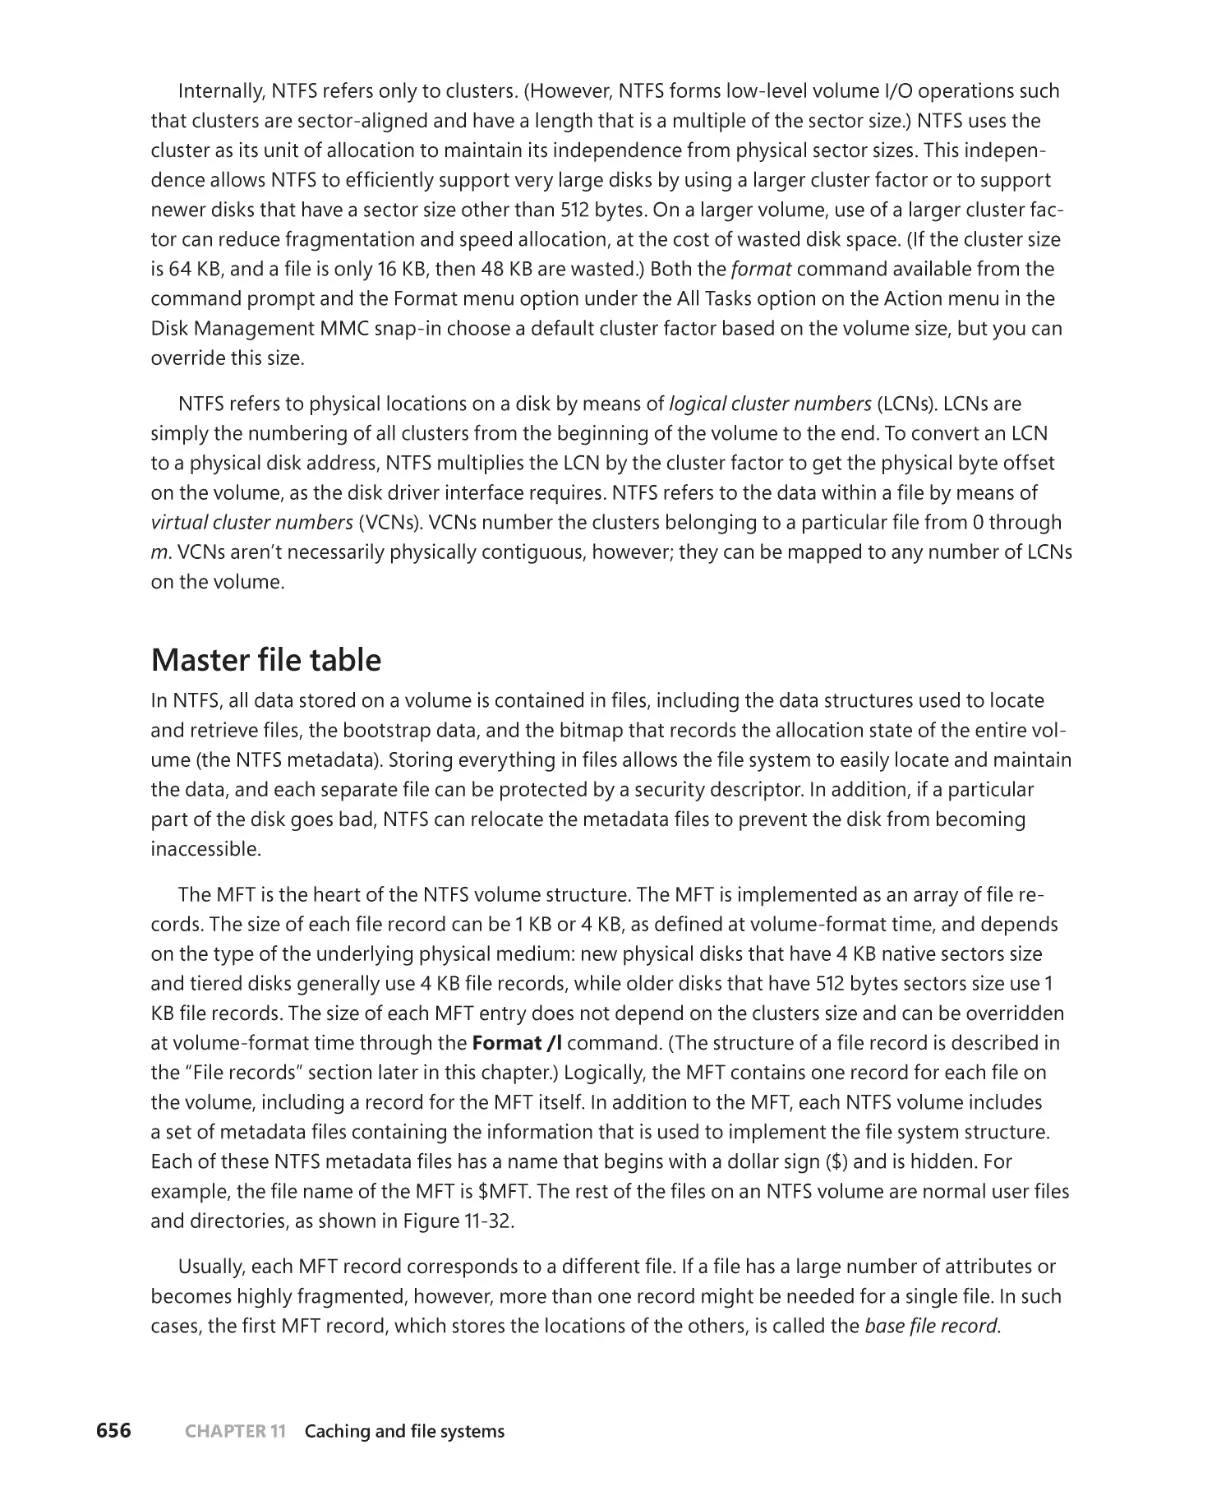
. . . . . . . . . . . . . . . . . . . . . . . . . . . . . . . . . . . . . . . . . . . . . . .656
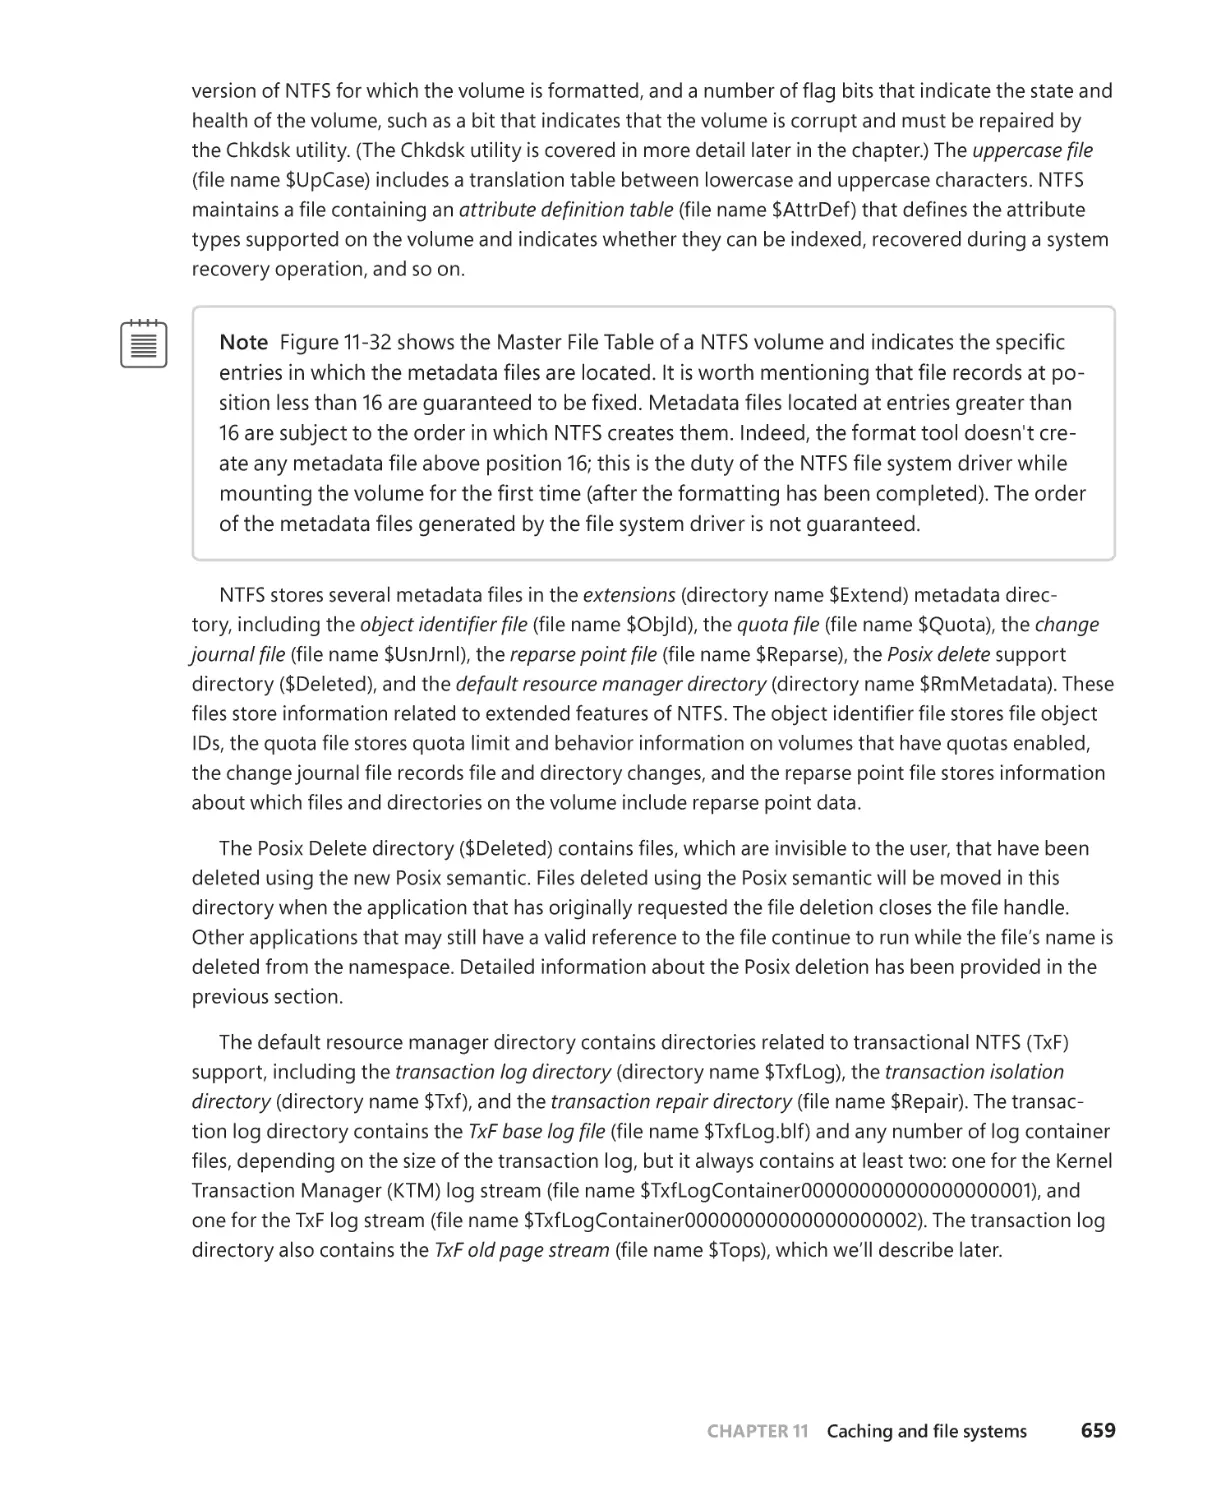
File record numbers . . . . . . . . . . . . . . . . . . . . . . . . . . . . . . . . . . . . . . . . . . .660
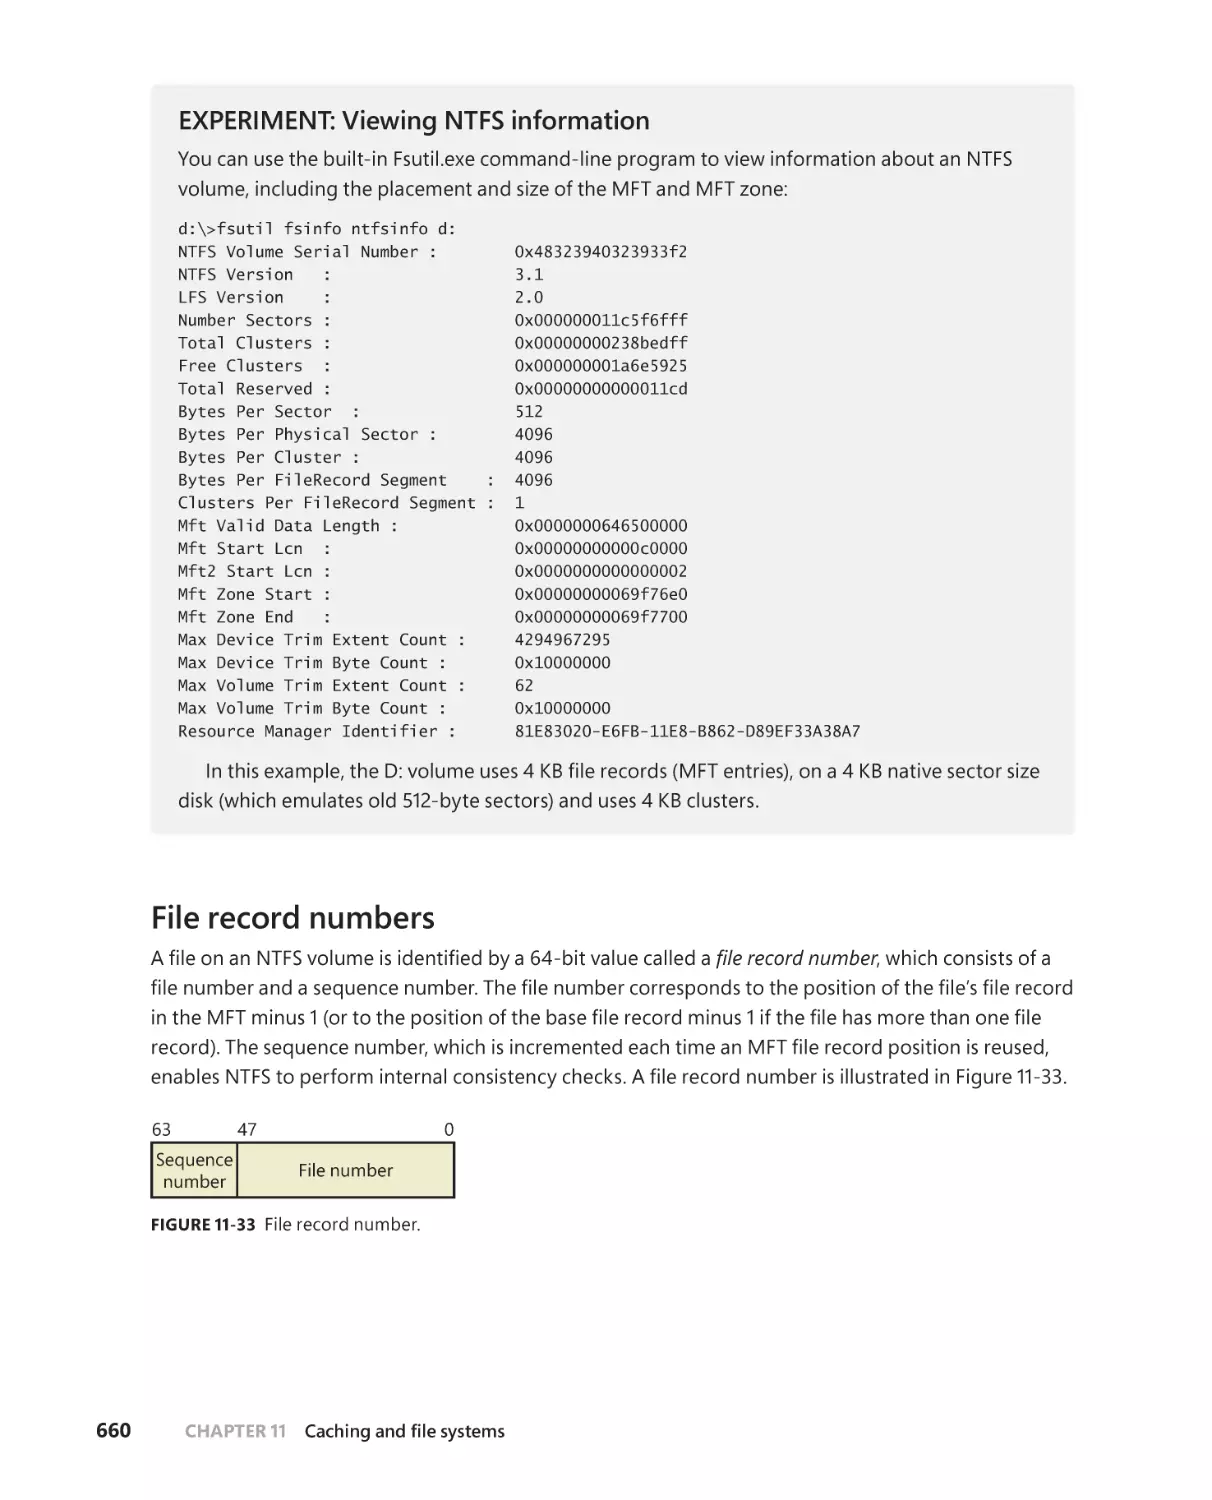
File records . . . . . . . . . . . . . . . . . . . . . . . . . . . . . . . . . . . . . . . . . . . . . . . . . . . . 661
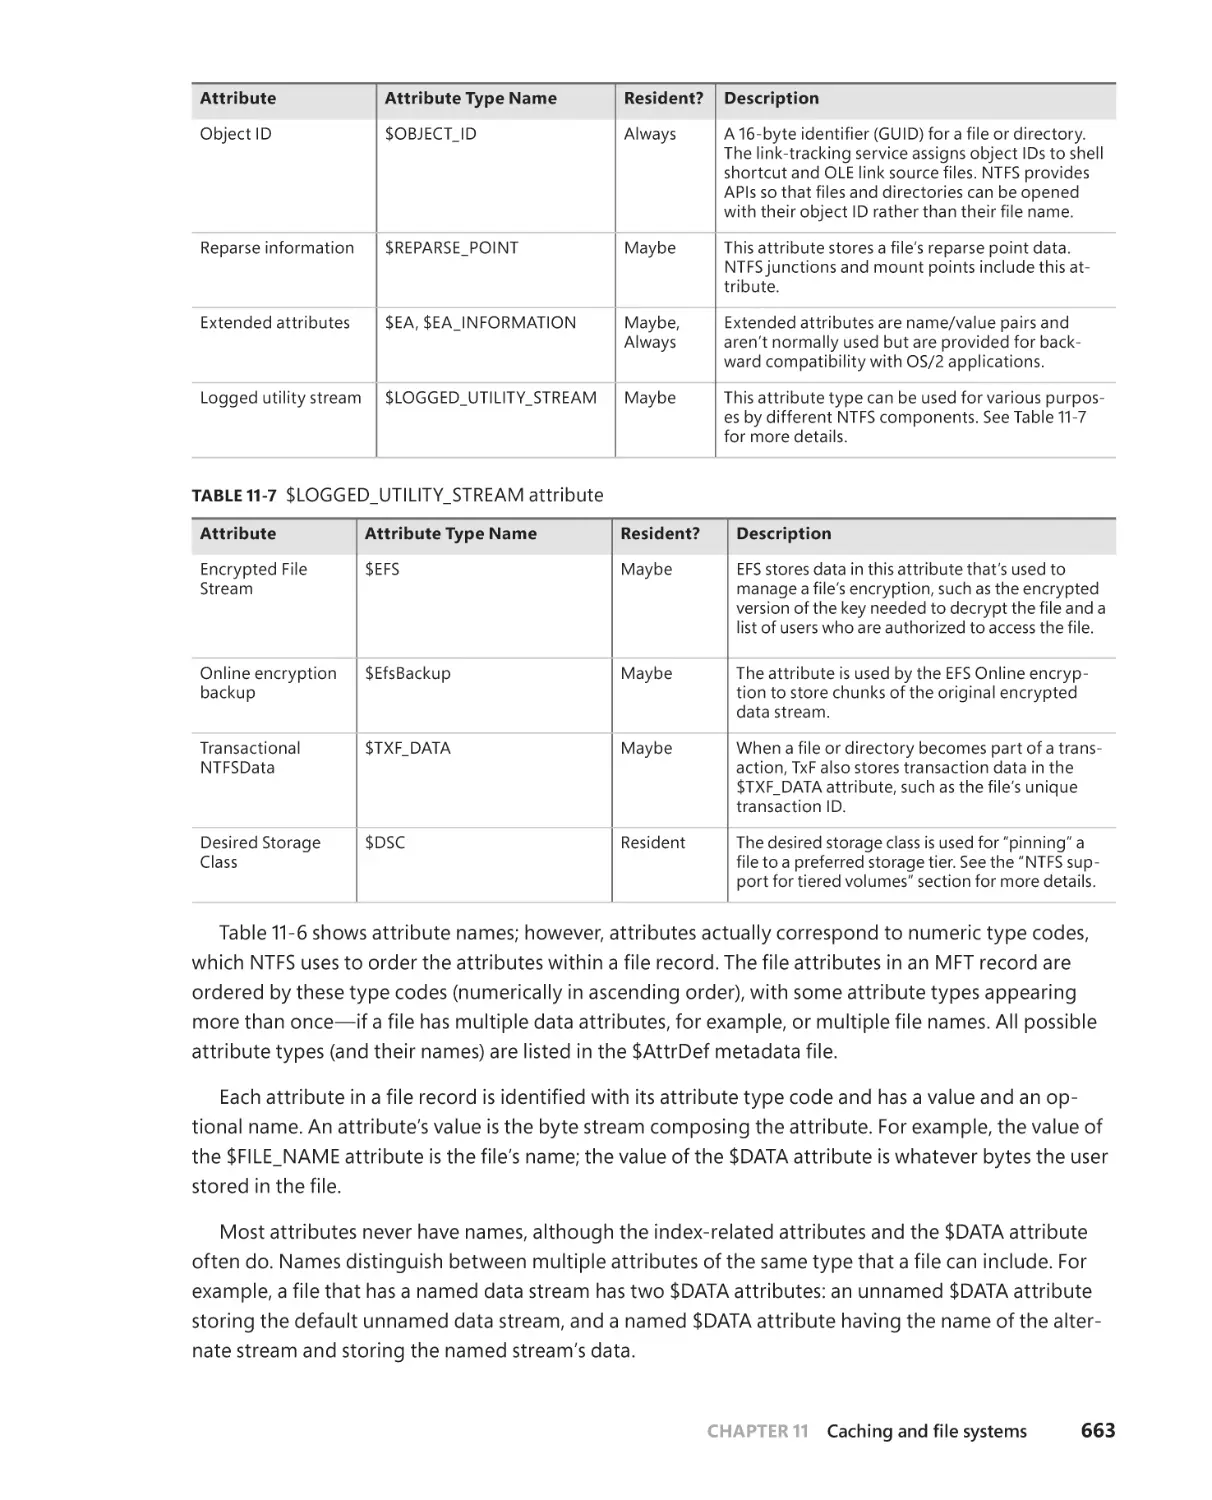
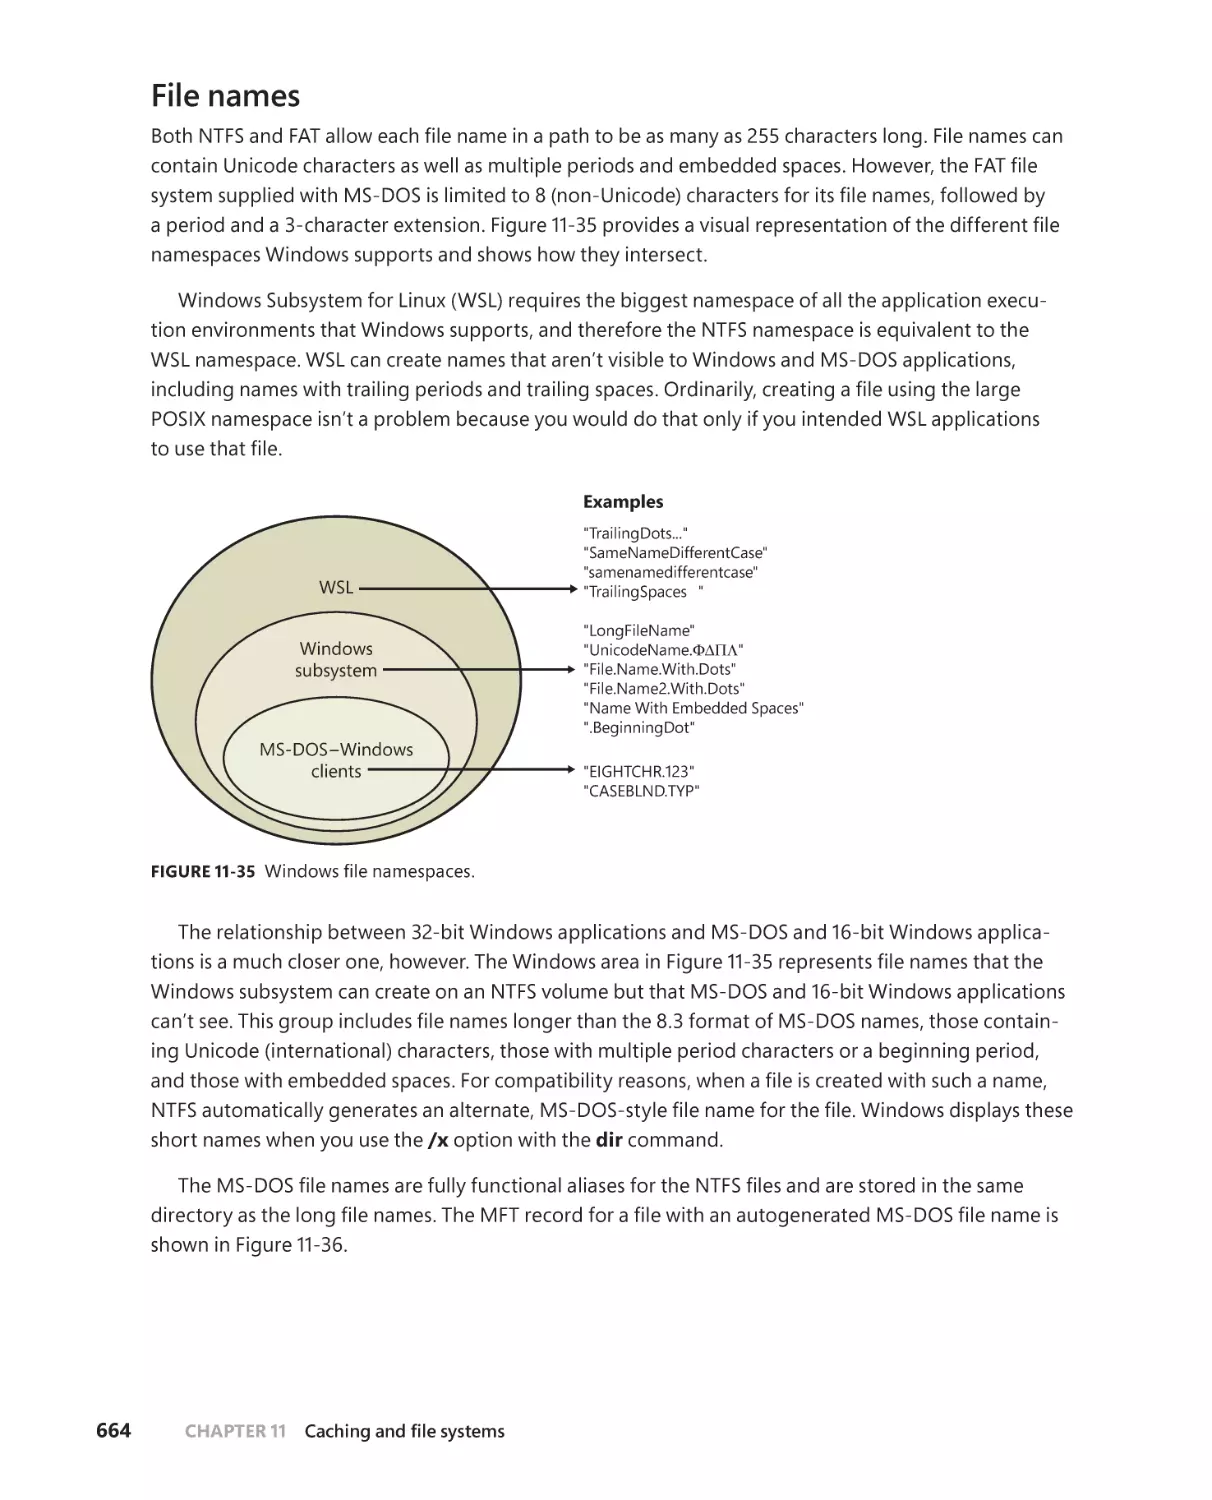
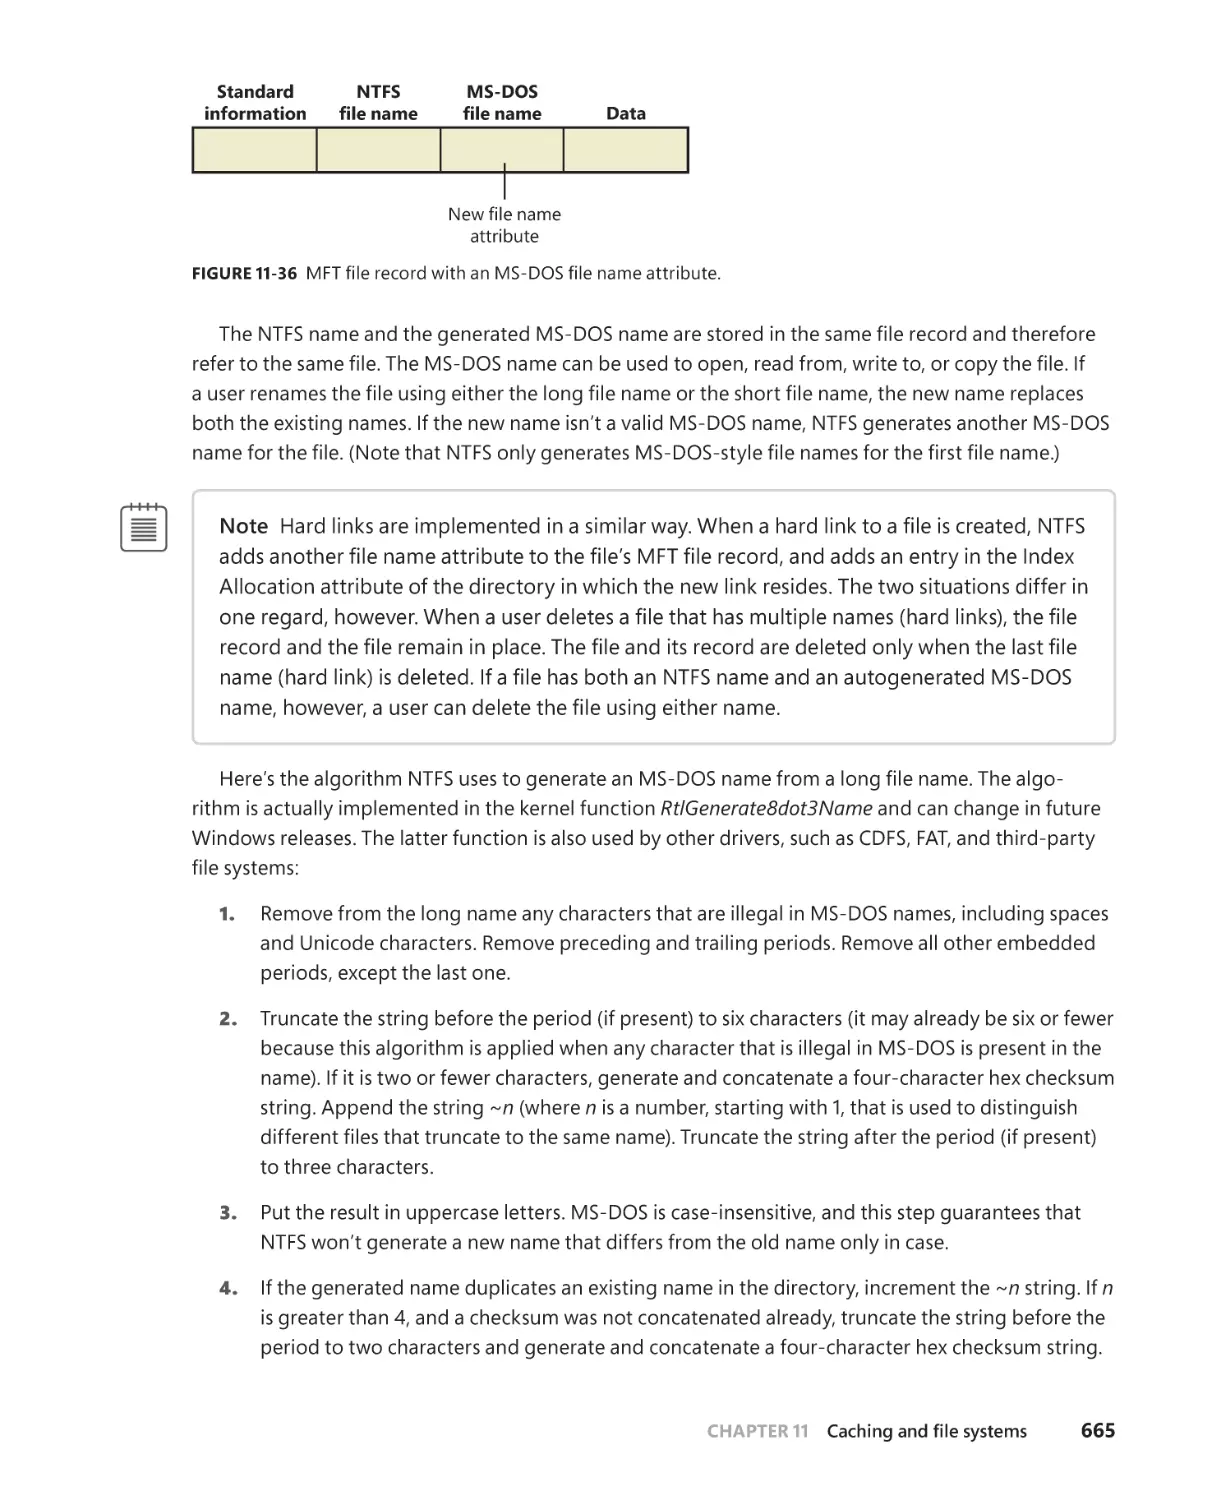
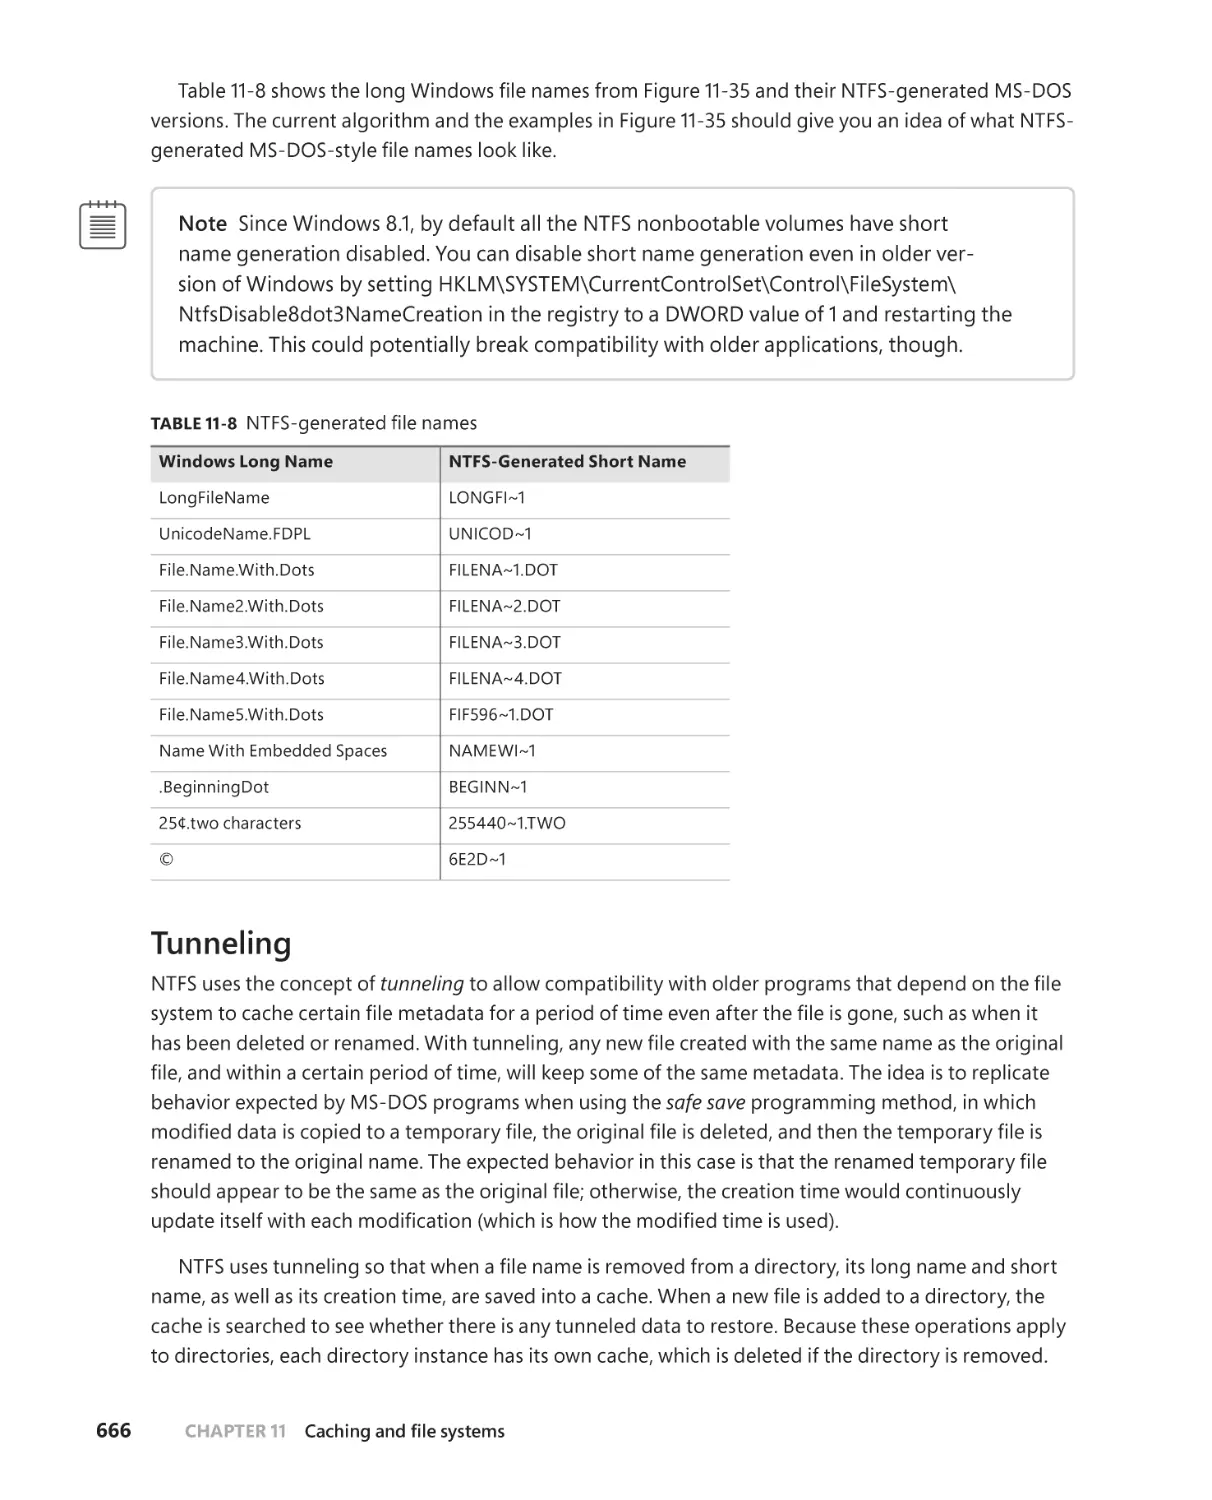
File names. . . . . . . . . . . . . . . . . . . . . . . . . . . . . . . . . . . . . . . . . . . . . . . . . . . . .664
Tunneling . . . . . . . . . . . . . . . . . . . . . . . . . . . . . . . . . . . . . . . . . . . . . . . . . . . . .666
Resident and nonresident attributes . . . . . . . . . . . . . . . . . . . . . . . . . . . .667
. . . . . . . . . . . . . . . . . . . . . . . . . . . . . .670
xiv
Contents
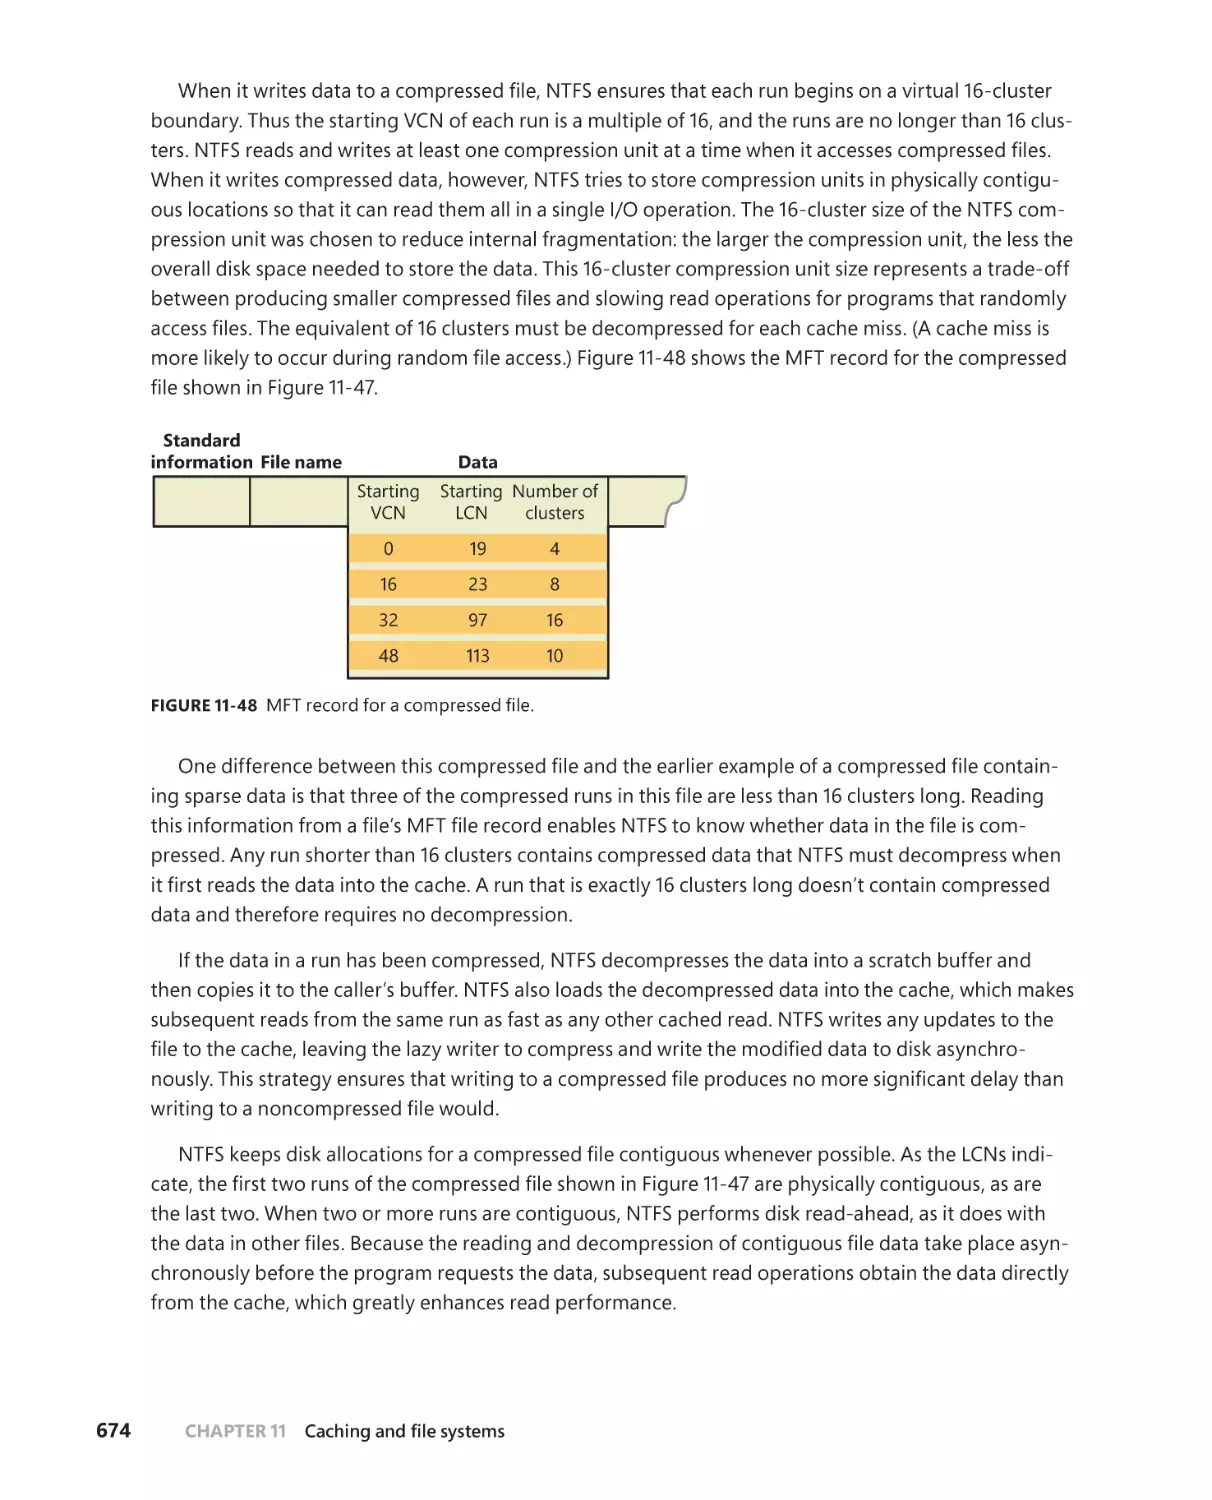
Compressing sparse data . . . . . . . . . . . . . . . . . . . . . . . . . . . . . . . . . . . . . . 671
Compressing nonsparse data. . . . . . . . . . . . . . . . . . . . . . . . . . . . . . . . . . .673
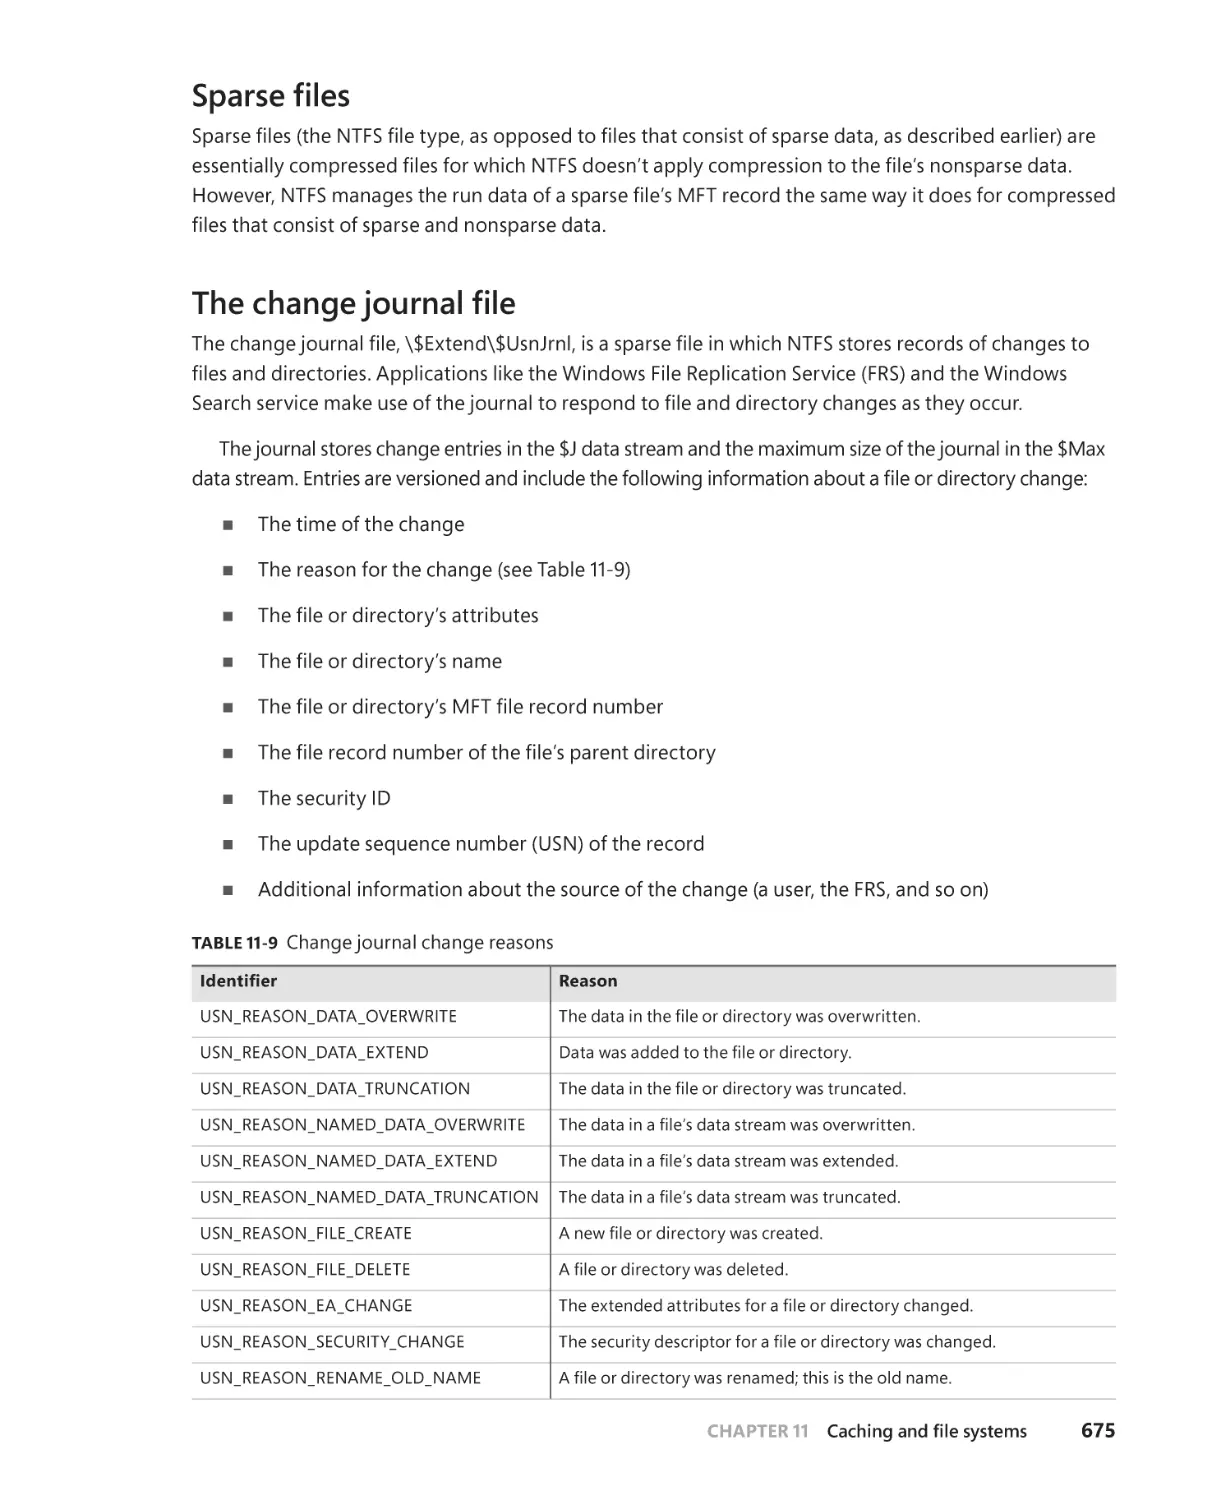
. . . . . . . . . . . . . . . . . . . . . . . . . . . . . . . . . . . . . . . . . . . . . . . . . . . .675
. . . . . . . . . . . . . . . . . . . . . . . . . . . . . . . . . . . . . . . . .675
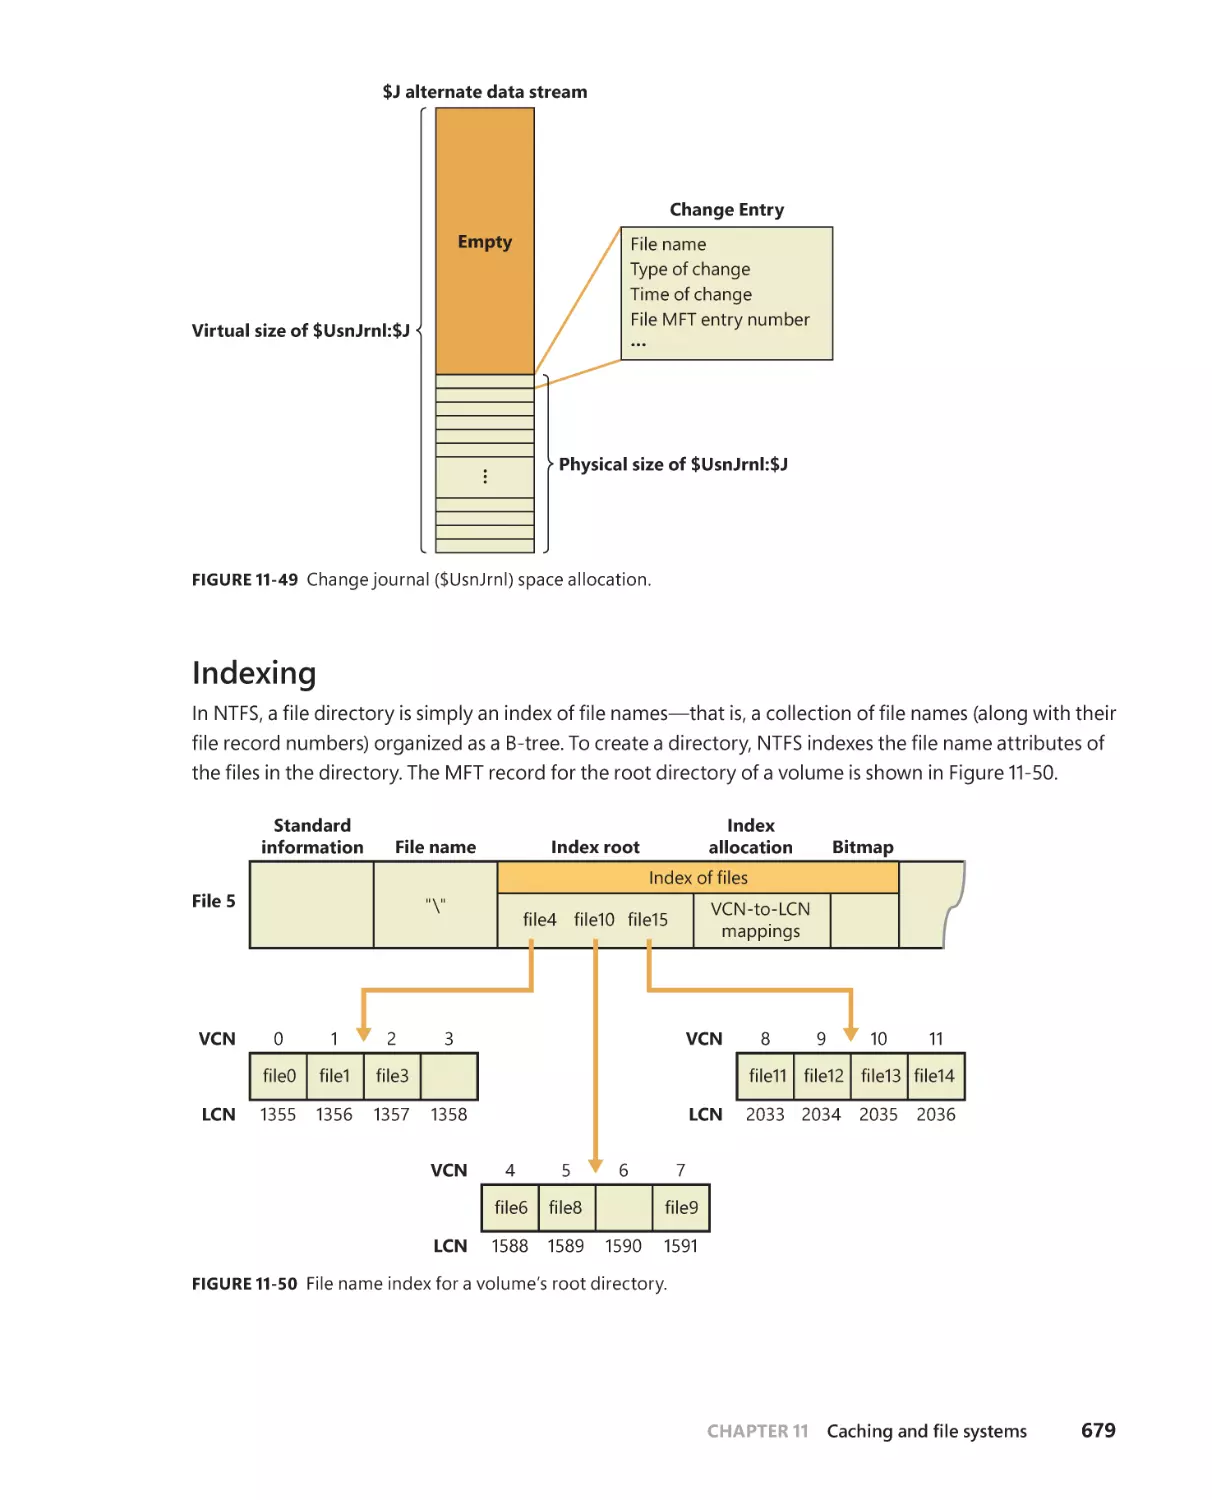
Indexing . . . . . . . . . . . . . . . . . . . . . . . . . . . . . . . . . . . . . . . . . . . . . . . . . . . . . .679
Object IDs . . . . . . . . . . . . . . . . . . . . . . . . . . . . . . . . . . . . . . . . . . . . . . . . . . . . . 681
Quota tracking . . . . . . . . . . . . . . . . . . . . . . . . . . . . . . . . . . . . . . . . . . . . . . . . 681
Consolidated security . . . . . . . . . . . . . . . . . . . . . . . . . . . . . . . . . . . . . . . . . .682
Reparse points . . . . . . . . . . . . . . . . . . . . . . . . . . . . . . . . . . . . . . . . . . . . . . . .684
Storage reserves and NTFS reservations. . . . . . . . . . . . . . . . . . . . . . . . .685
Transaction support . . . . . . . . . . . . . . . . . . . . . . . . . . . . . . . . . . . . . . . . . . .688
Isolation . . . . . . . . . . . . . . . . . . . . . . . . . . . . . . . . . . . . . . . . . . . . . . . . . . . . . .689
Transactional APIs . . . . . . . . . . . . . . . . . . . . . . . . . . . . . . . . . . . . . . . . . . . . .690
On-disk implementation . . . . . . . . . . . . . . . . . . . . . . . . . . . . . . . . . . . . . . . 691
Logging implementation . . . . . . . . . . . . . . . . . . . . . . . . . . . . . . . . . . . . . .693
NTFS recovery support . . . . . . . . . . . . . . . . . . . . . . . . . . . . . . . . . . . . . . . . . . . . . .694
Design . . . . . . . . . . . . . . . . . . . . . . . . . . . . . . . . . . . . . . . . . . . . . . . . . . . . . . . .694
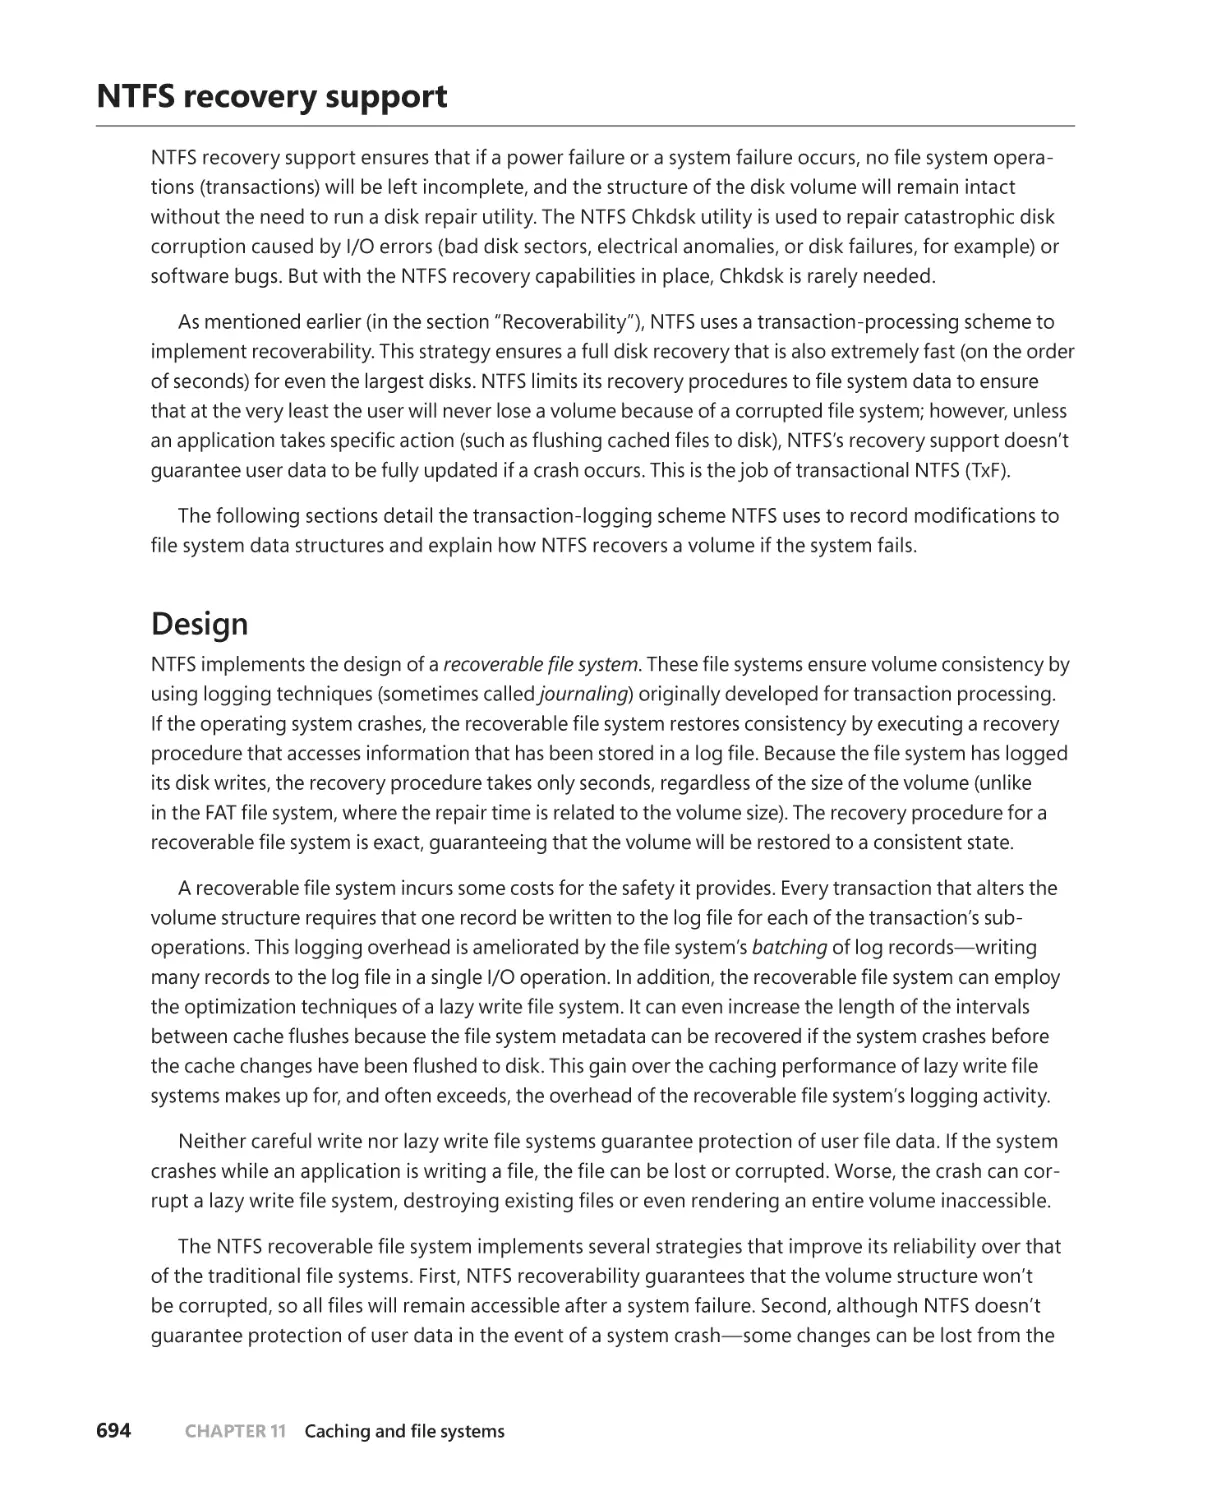
Metadata logging . . . . . . . . . . . . . . . . . . . . . . . . . . . . . . . . . . . . . . . . . . . . .695
. . . . . . . . . . . . . . . . . . . . . . . . . . . . . . . . . . . . . . . . . . . . . . . .695
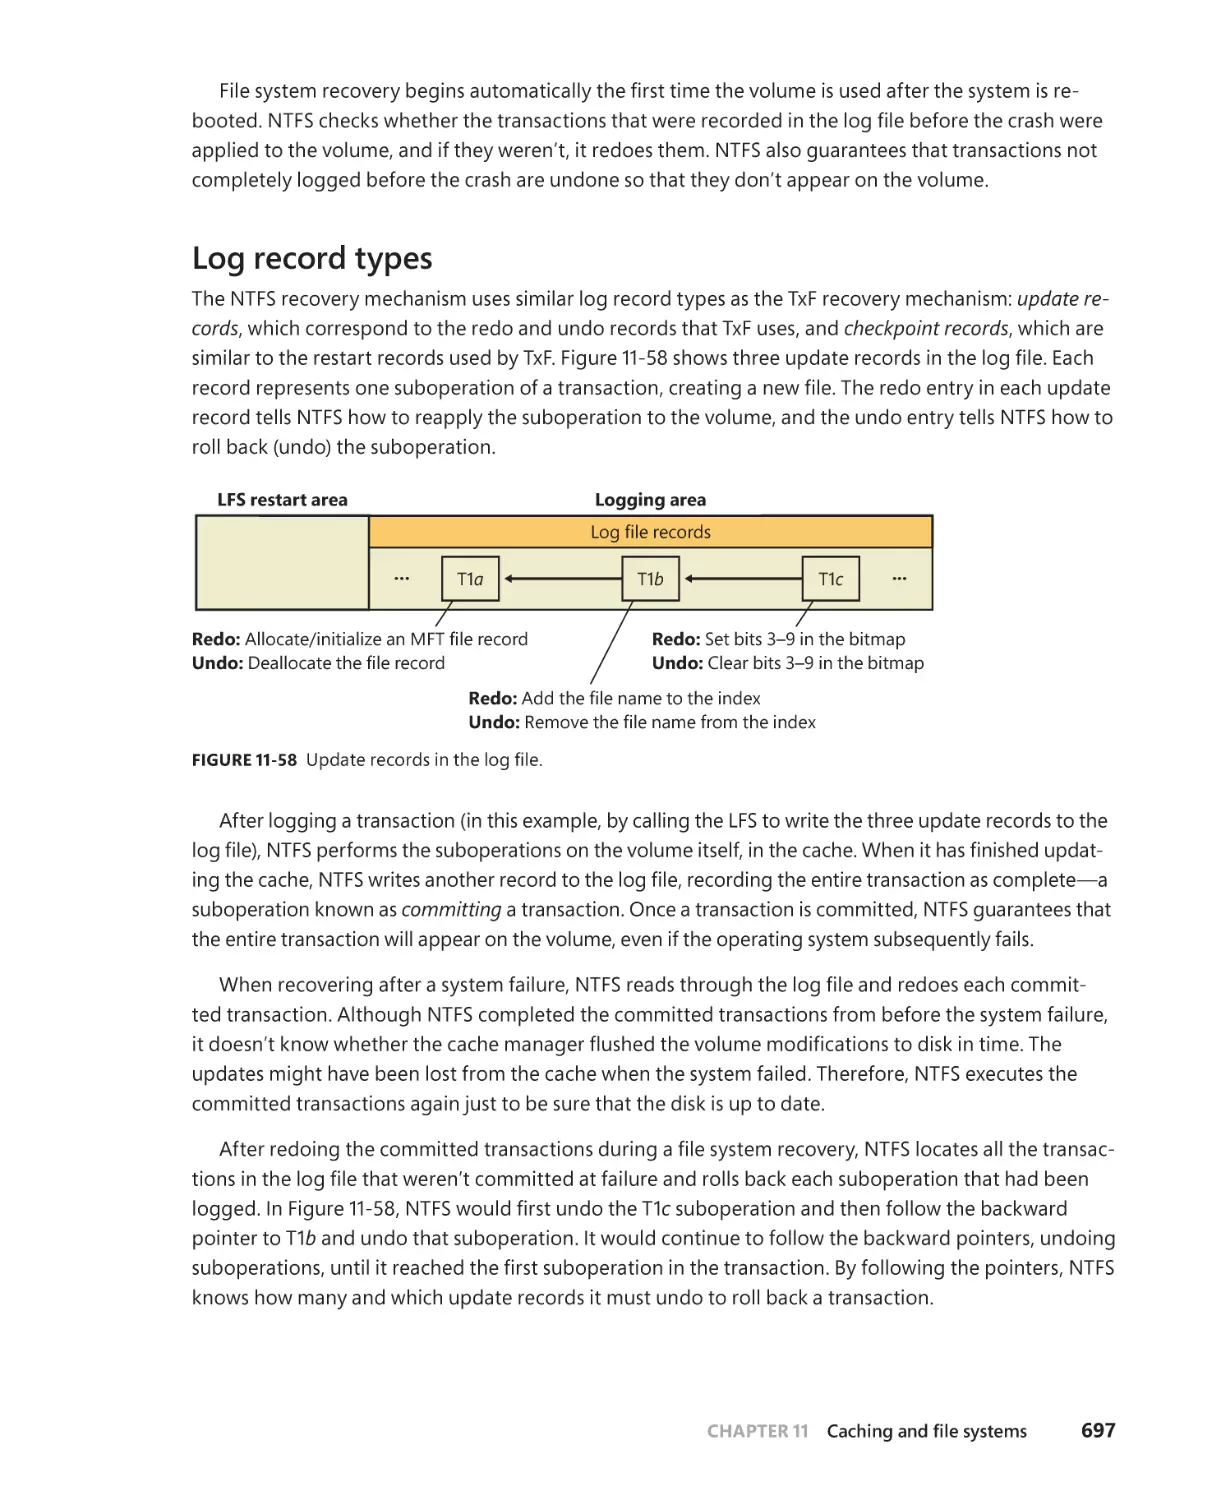
Log record types . . . . . . . . . . . . . . . . . . . . . . . . . . . . . . . . . . . . . . . . . . . . . .697
Recovery . . . . . . . . . . . . . . . . . . . . . . . . . . . . . . . . . . . . . . . . . . . . . . . . . . . . . .699
Analysis pass . . . . . . . . . . . . . . . . . . . . . . . . . . . . . . . . . . . . . . . . . . . . . . . . . .700
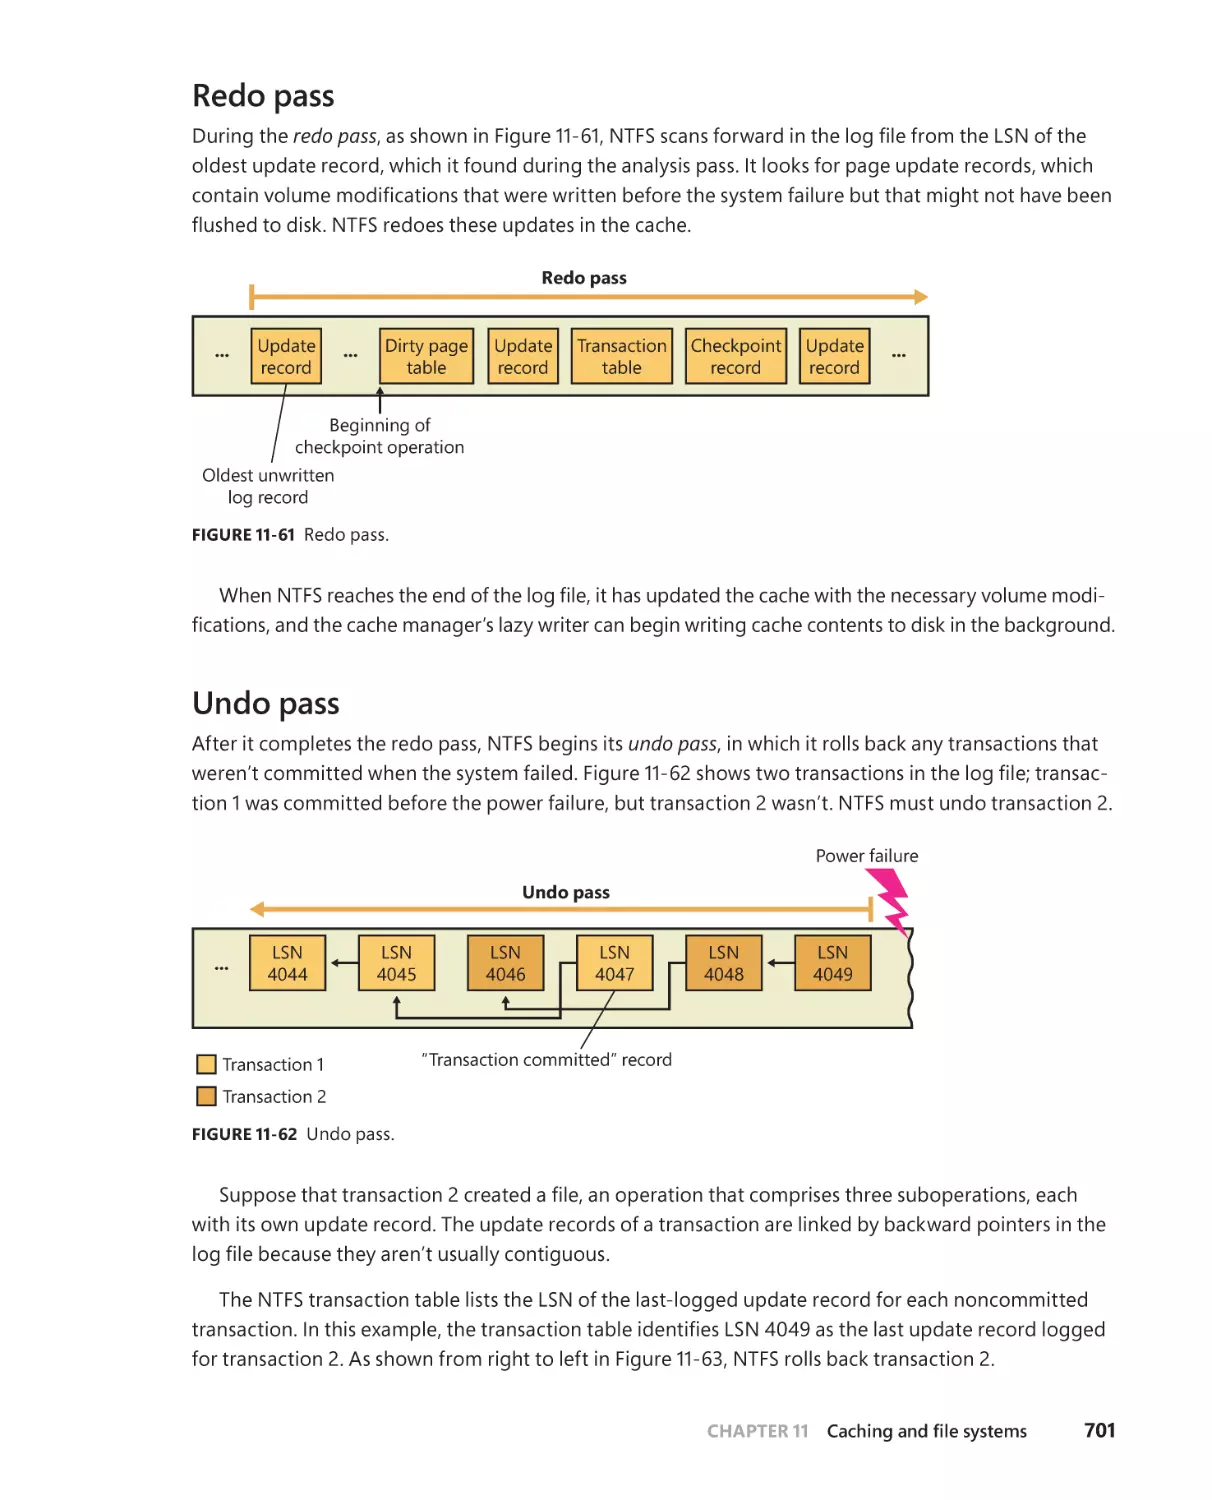
Redo pass . . . . . . . . . . . . . . . . . . . . . . . . . . . . . . . . . . . . . . . . . . . . . . . . . . . . . 701
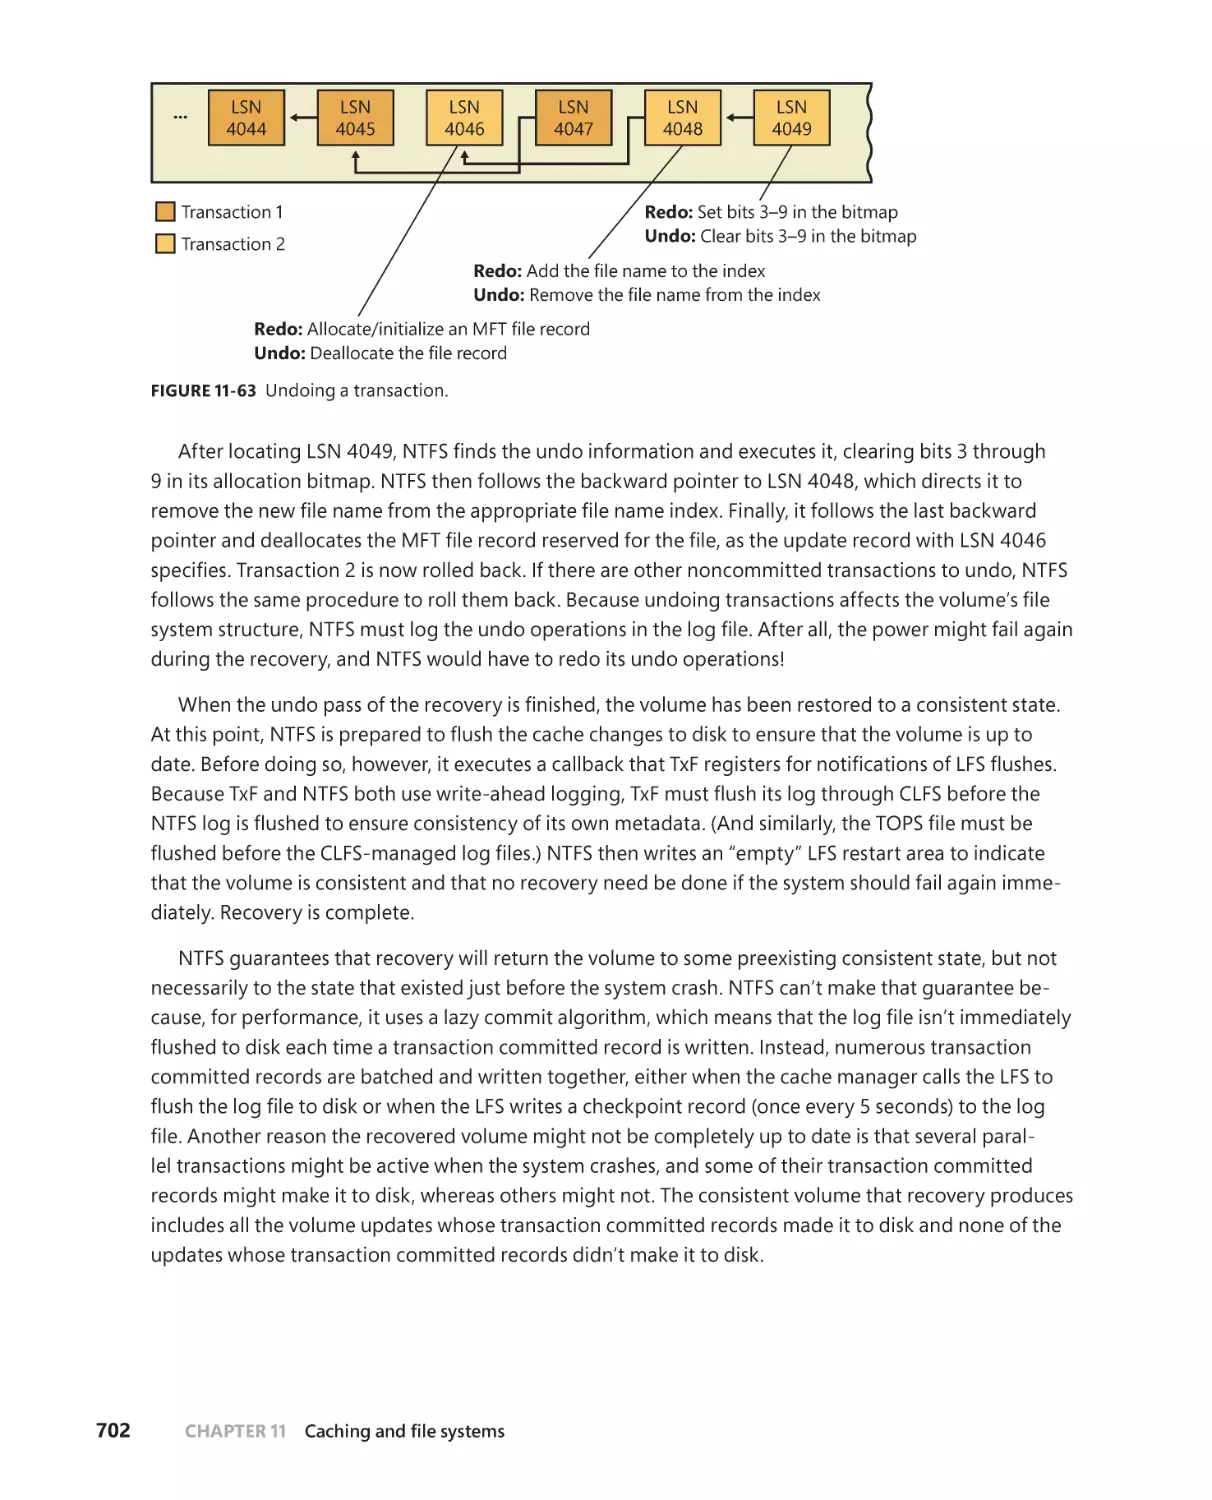
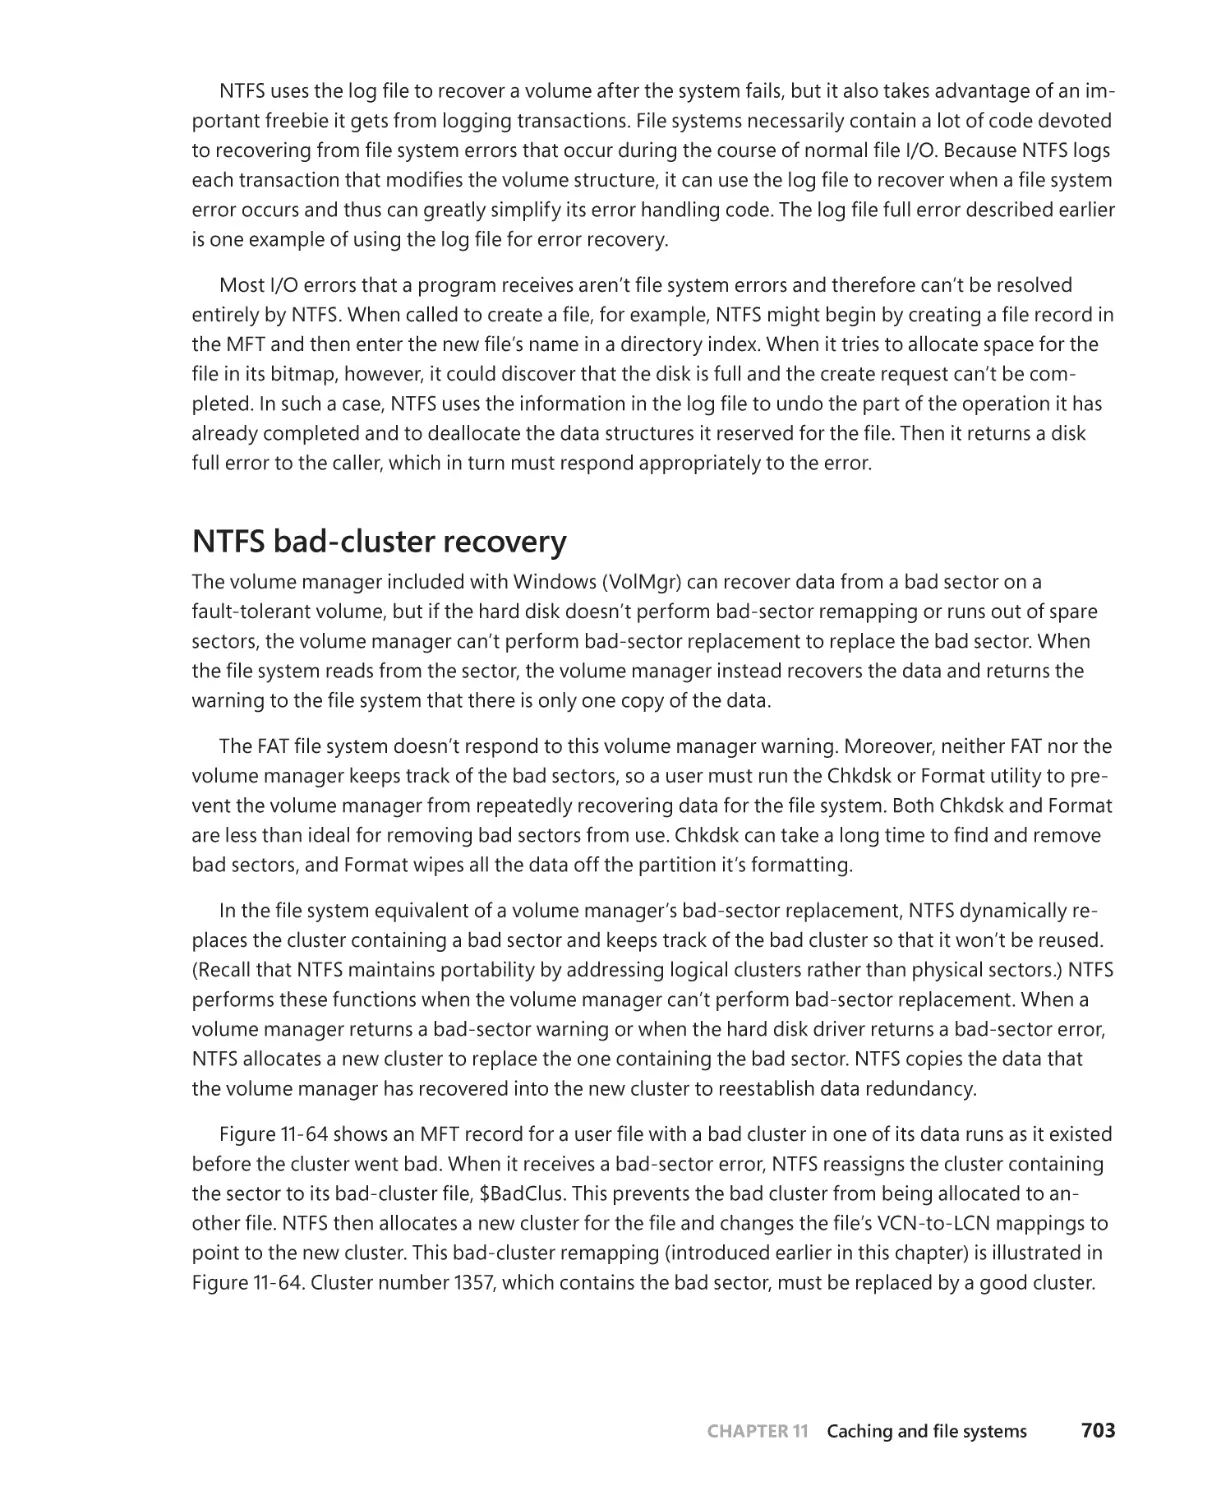
Undo pass . . . . . . . . . . . . . . . . . . . . . . . . . . . . . . . . . . . . . . . . . . . . . . . . . . . . . 701
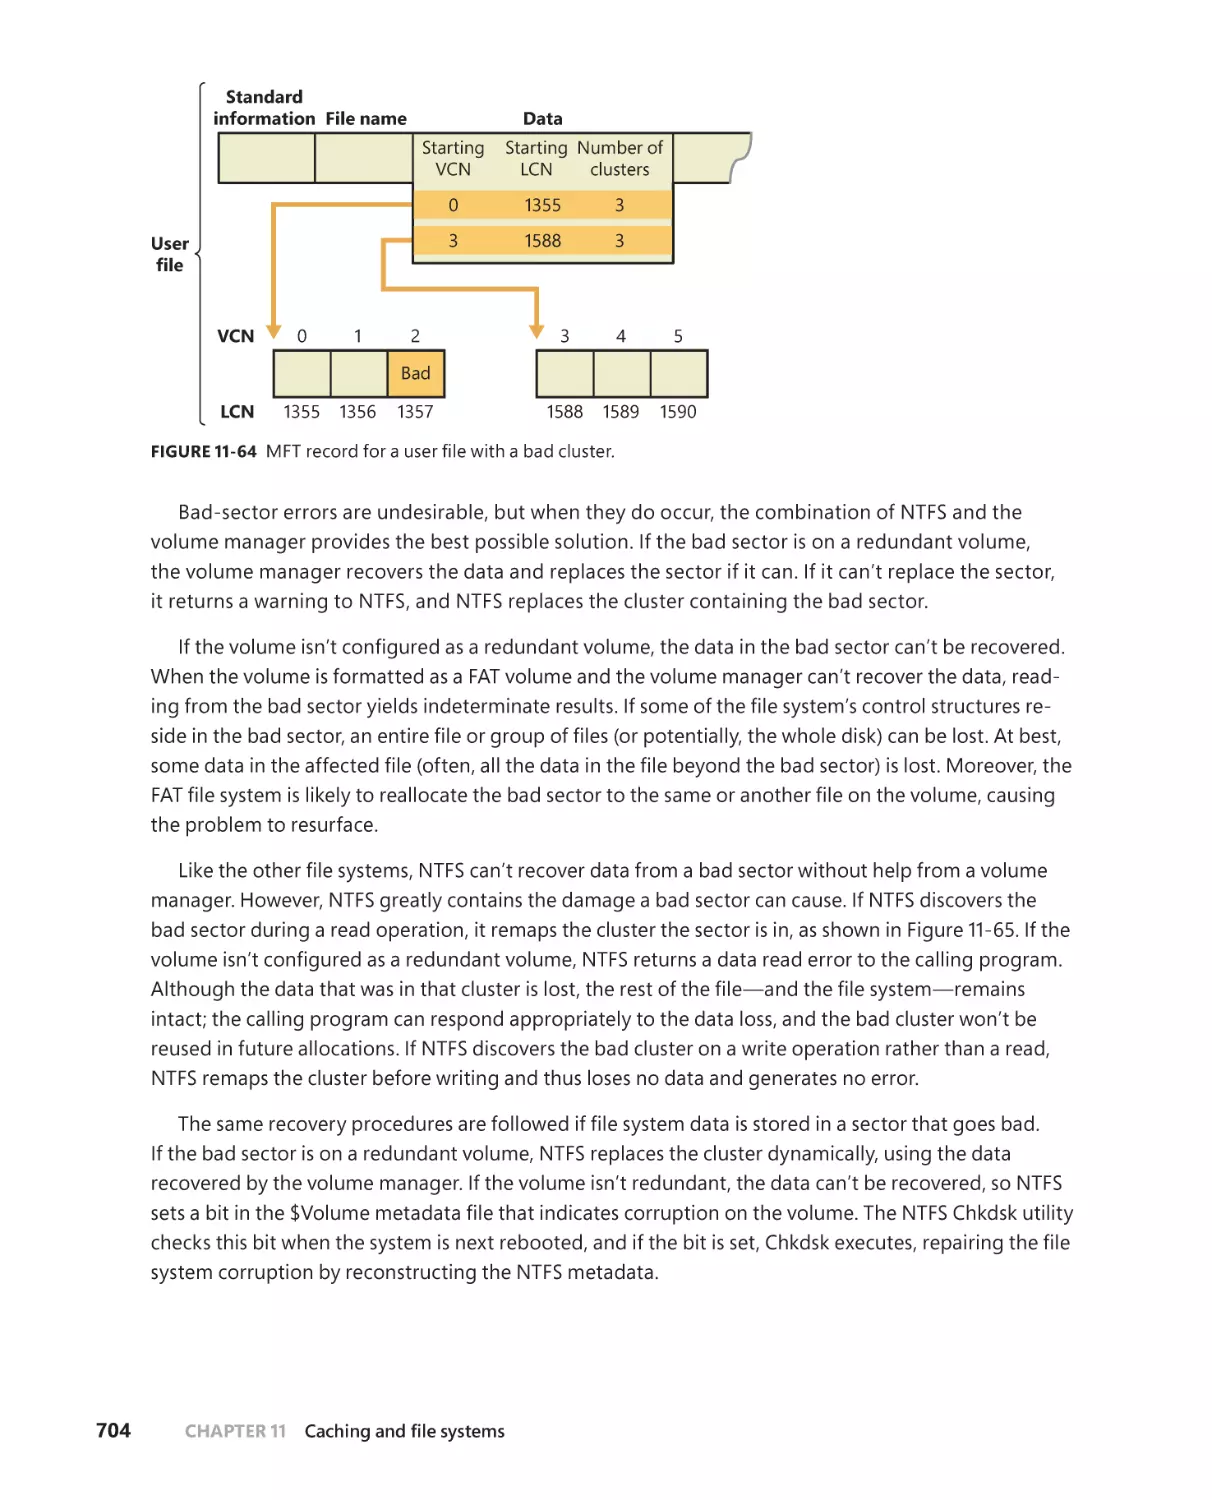
NTFS bad-cluster recovery . . . . . . . . . . . . . . . . . . . . . . . . . . . . . . . . . . . . .703
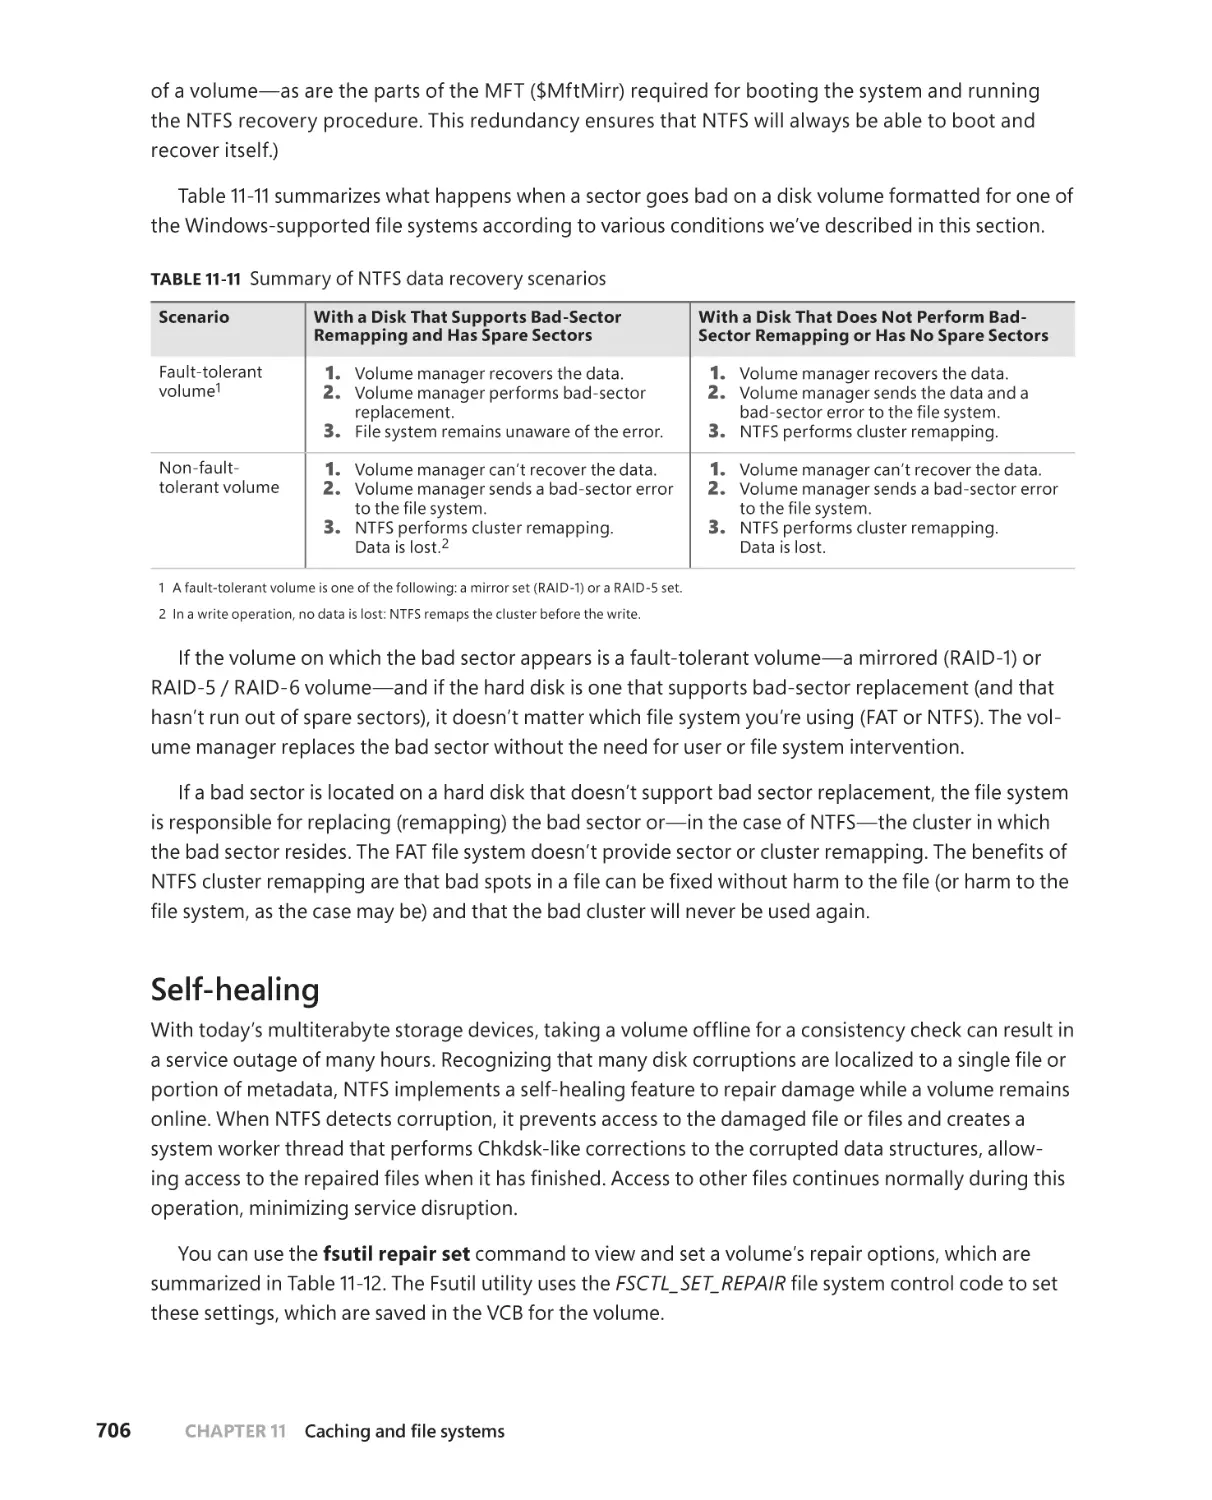
Self-healing . . . . . . . . . . . . . . . . . . . . . . . . . . . . . . . . . . . . . . . . . . . . . . . . . . .706
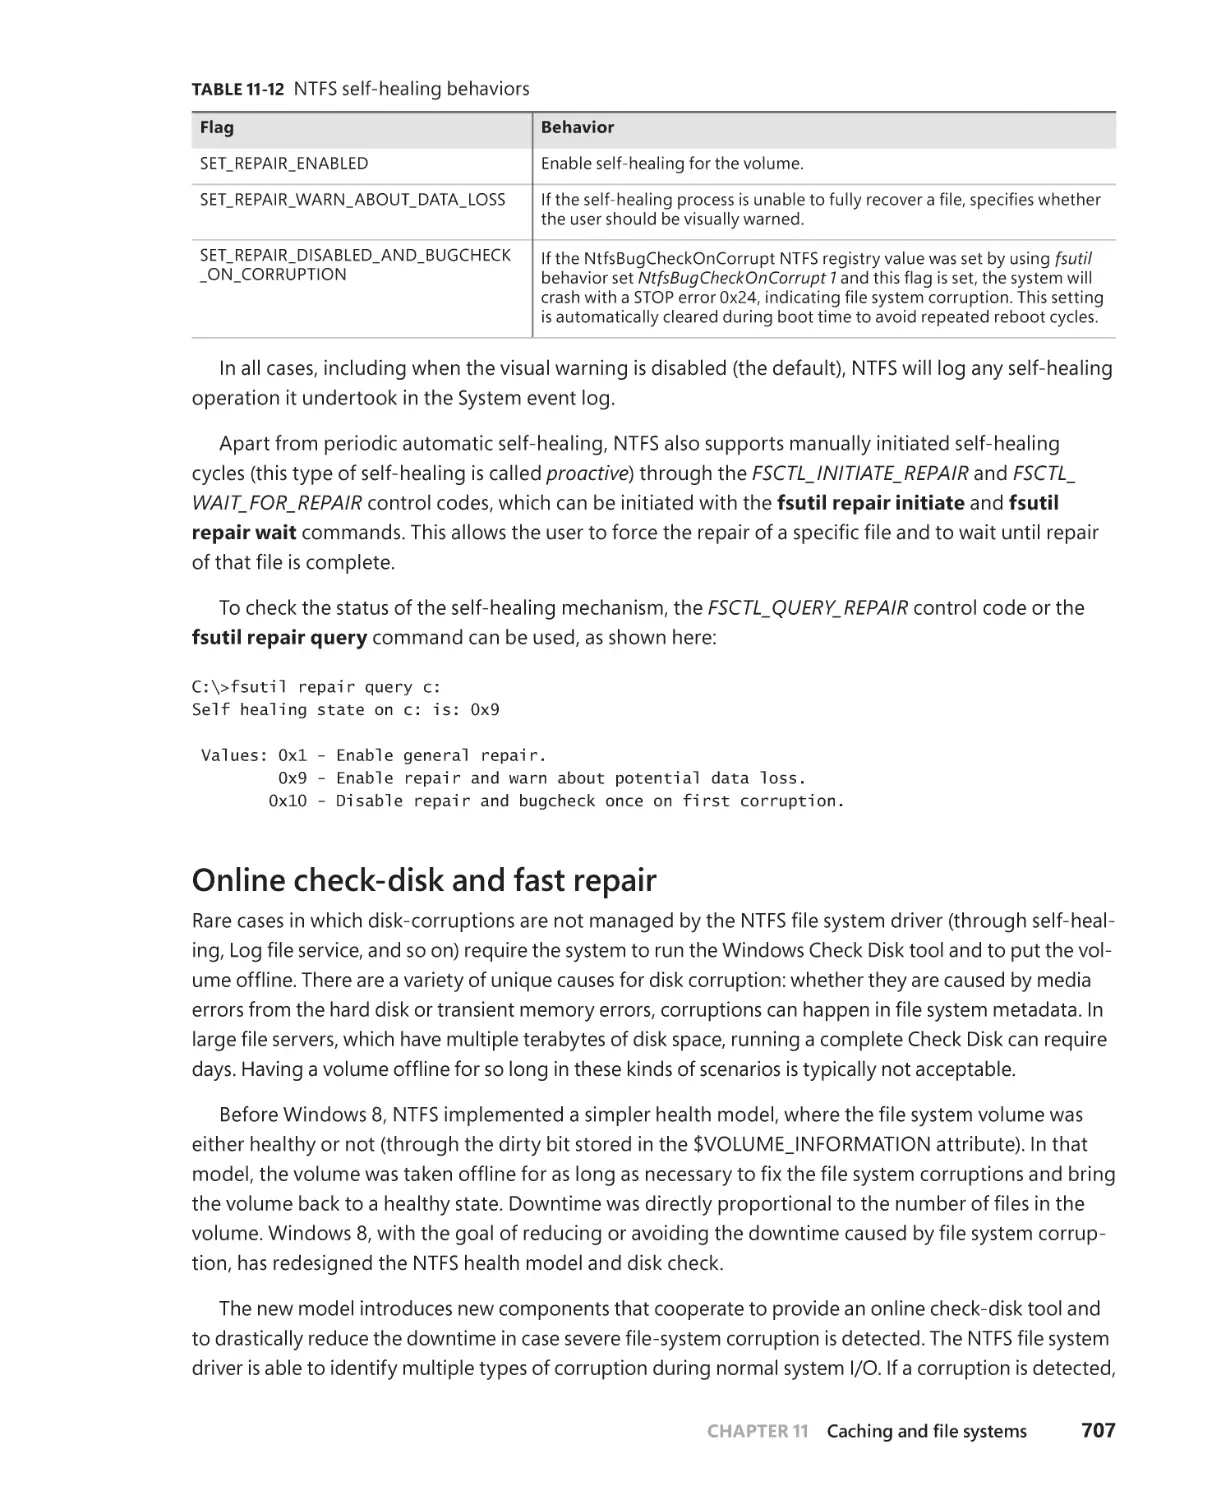
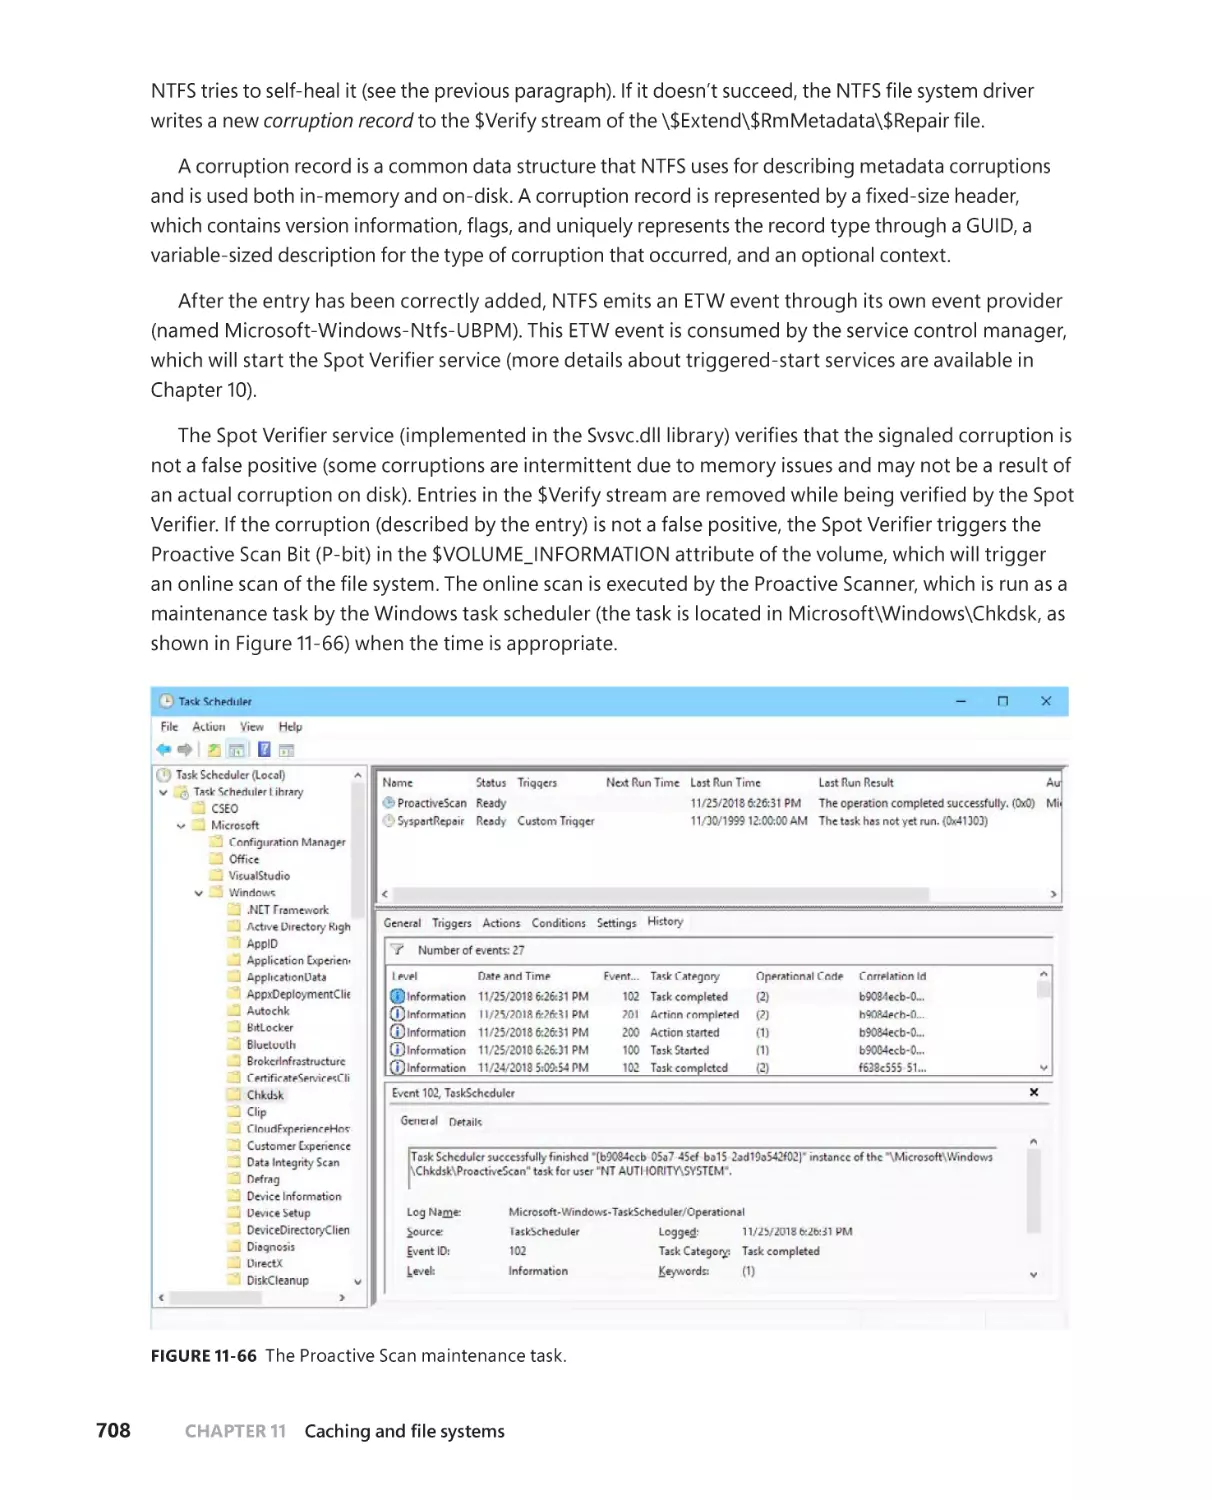
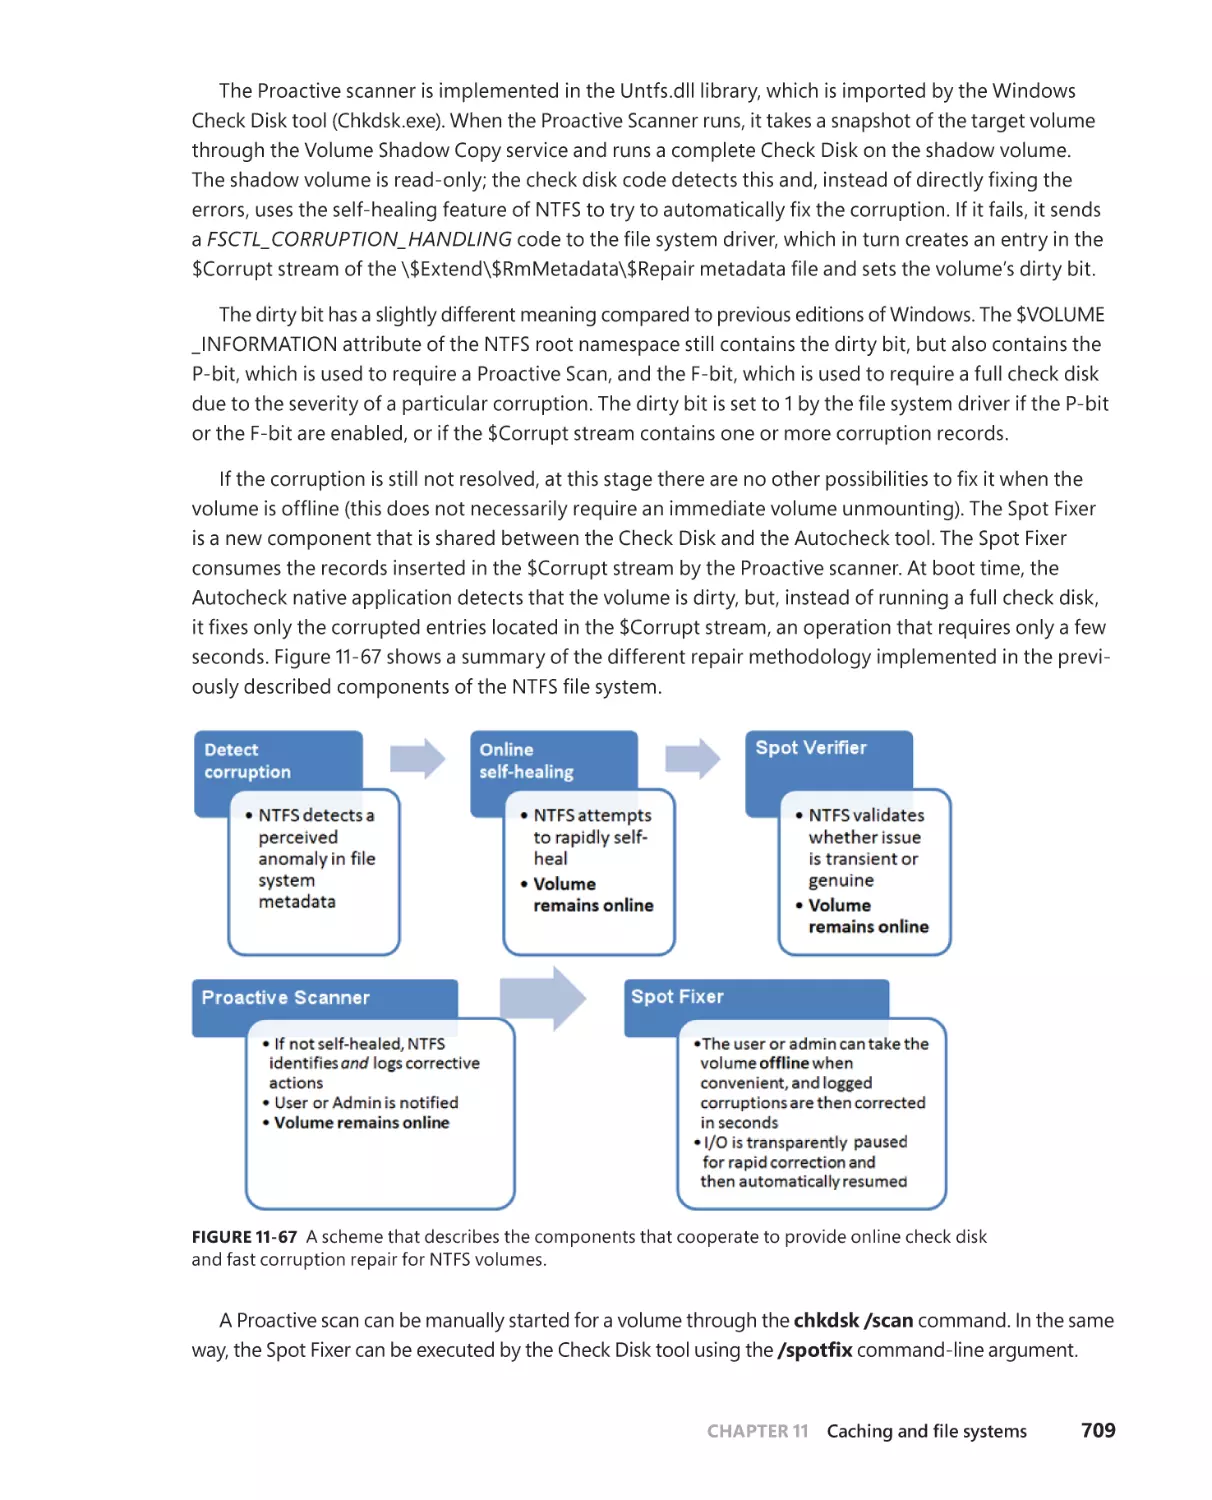
Online check-disk and fast repair . . . . . . . . . . . . . . . . . . . . . . . . . . . . . . . 707
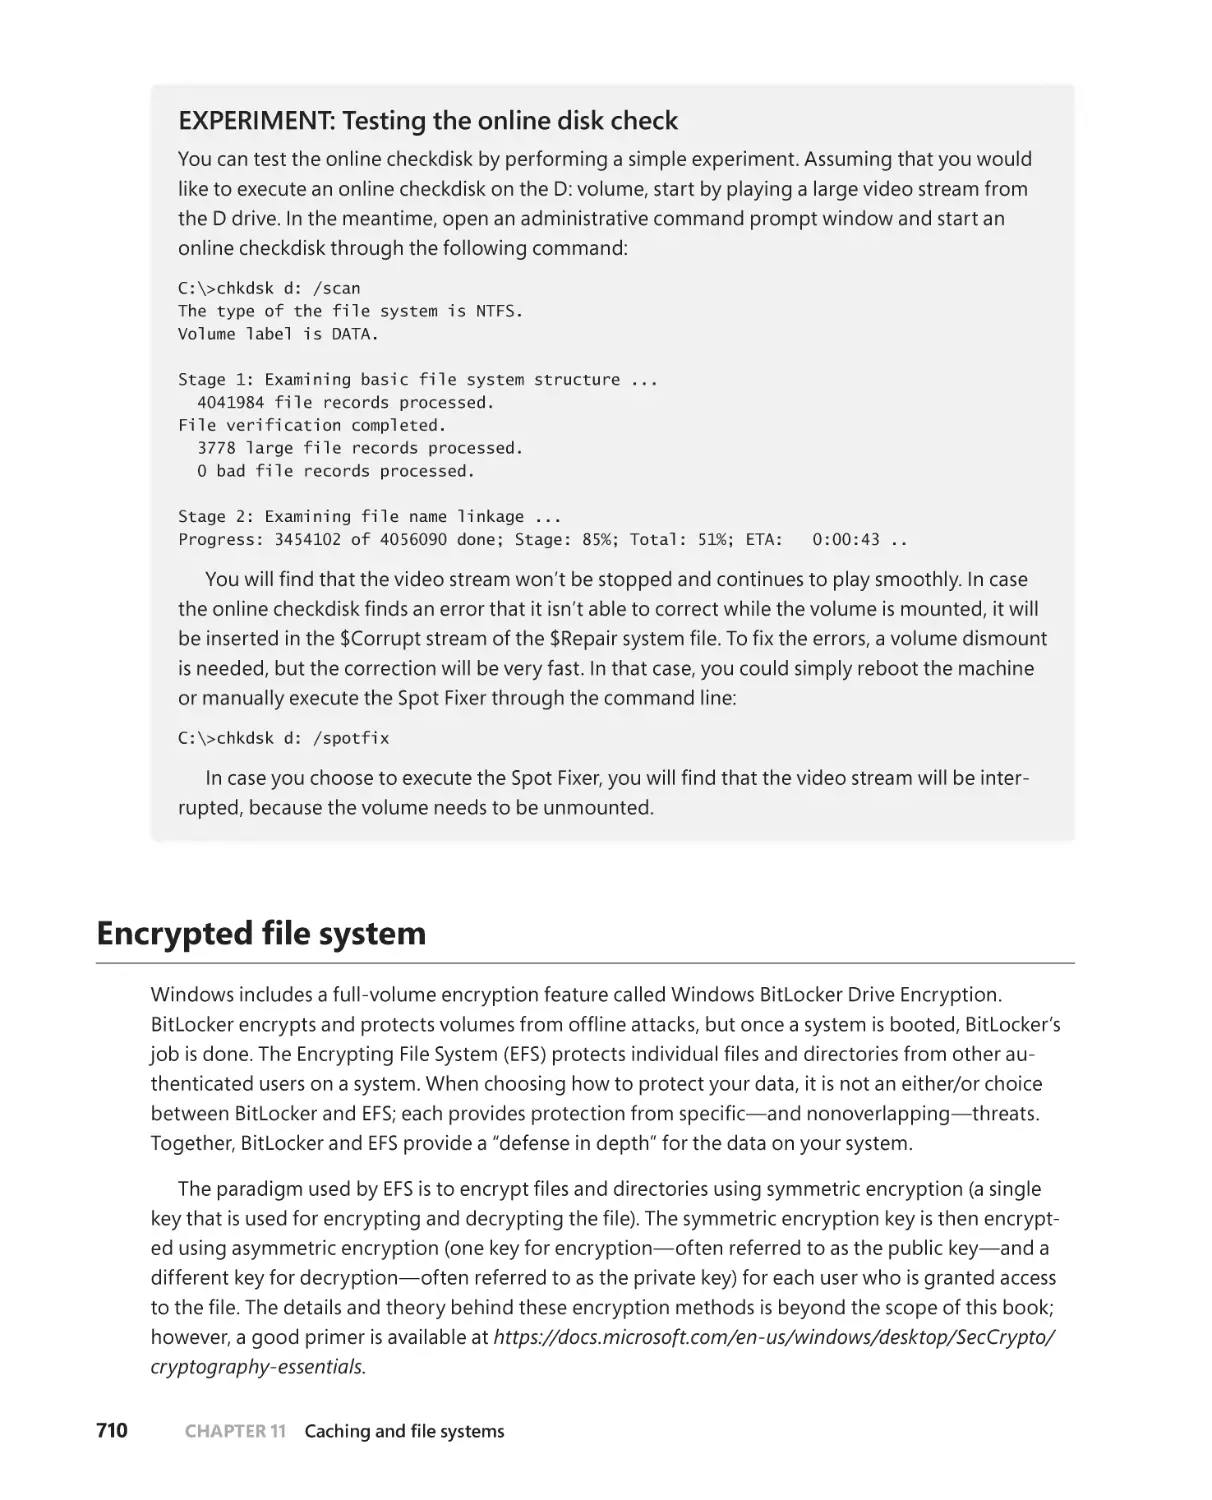
. . . . . . . . . . . . . . . . . . . . . . . . . . . . . . . . . . . . . . . . . . . . . . . . 710
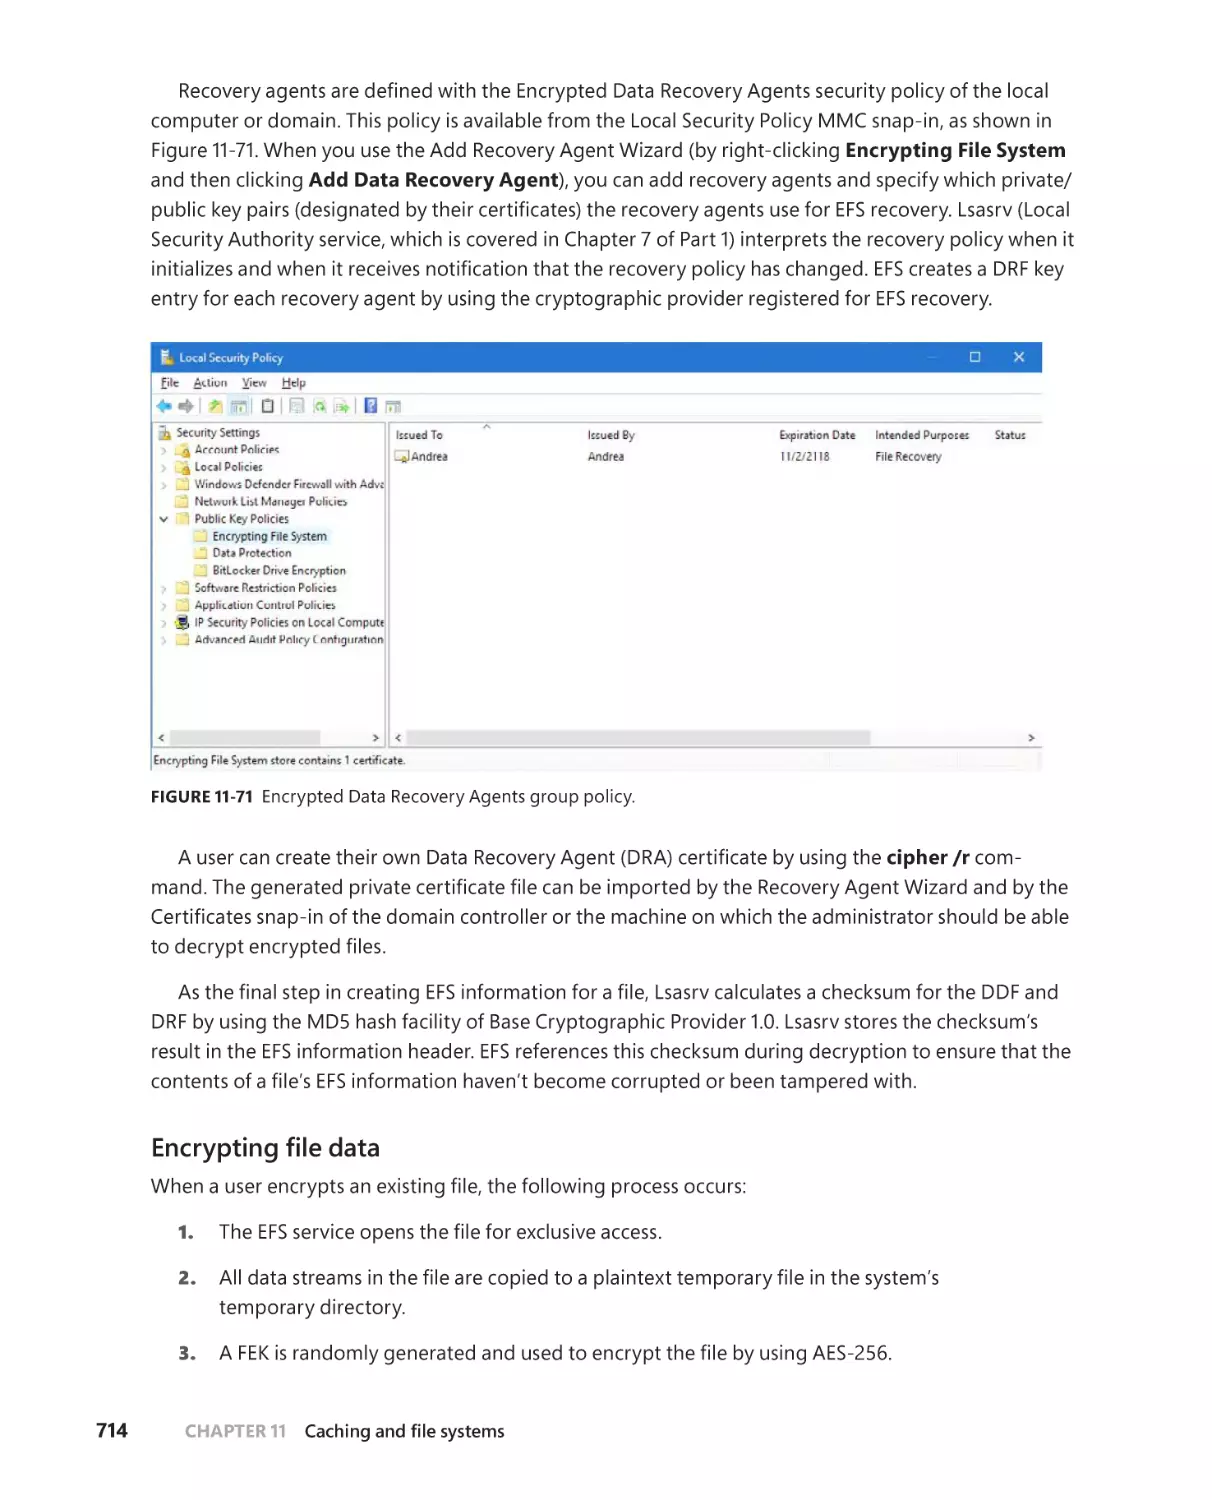
. . . . . . . . . . . . . . . . . . . . . . . . . . . . . . . 713
The decryption process . . . . . . . . . . . . . . . . . . . . . . . . . . . . . . . . . . . . . . . . 715
. . . . . . . . . . . . . . . . . . . . . . . . . . . . . . . . . . . . . 716
. . . . . . . . . . . . . . . . . . . . . . . . . . . . . . . . . . . . . . . . 717
. . . . . . . . . . . . . . . . . . . . . . . . . . . . . . . . . . . 717
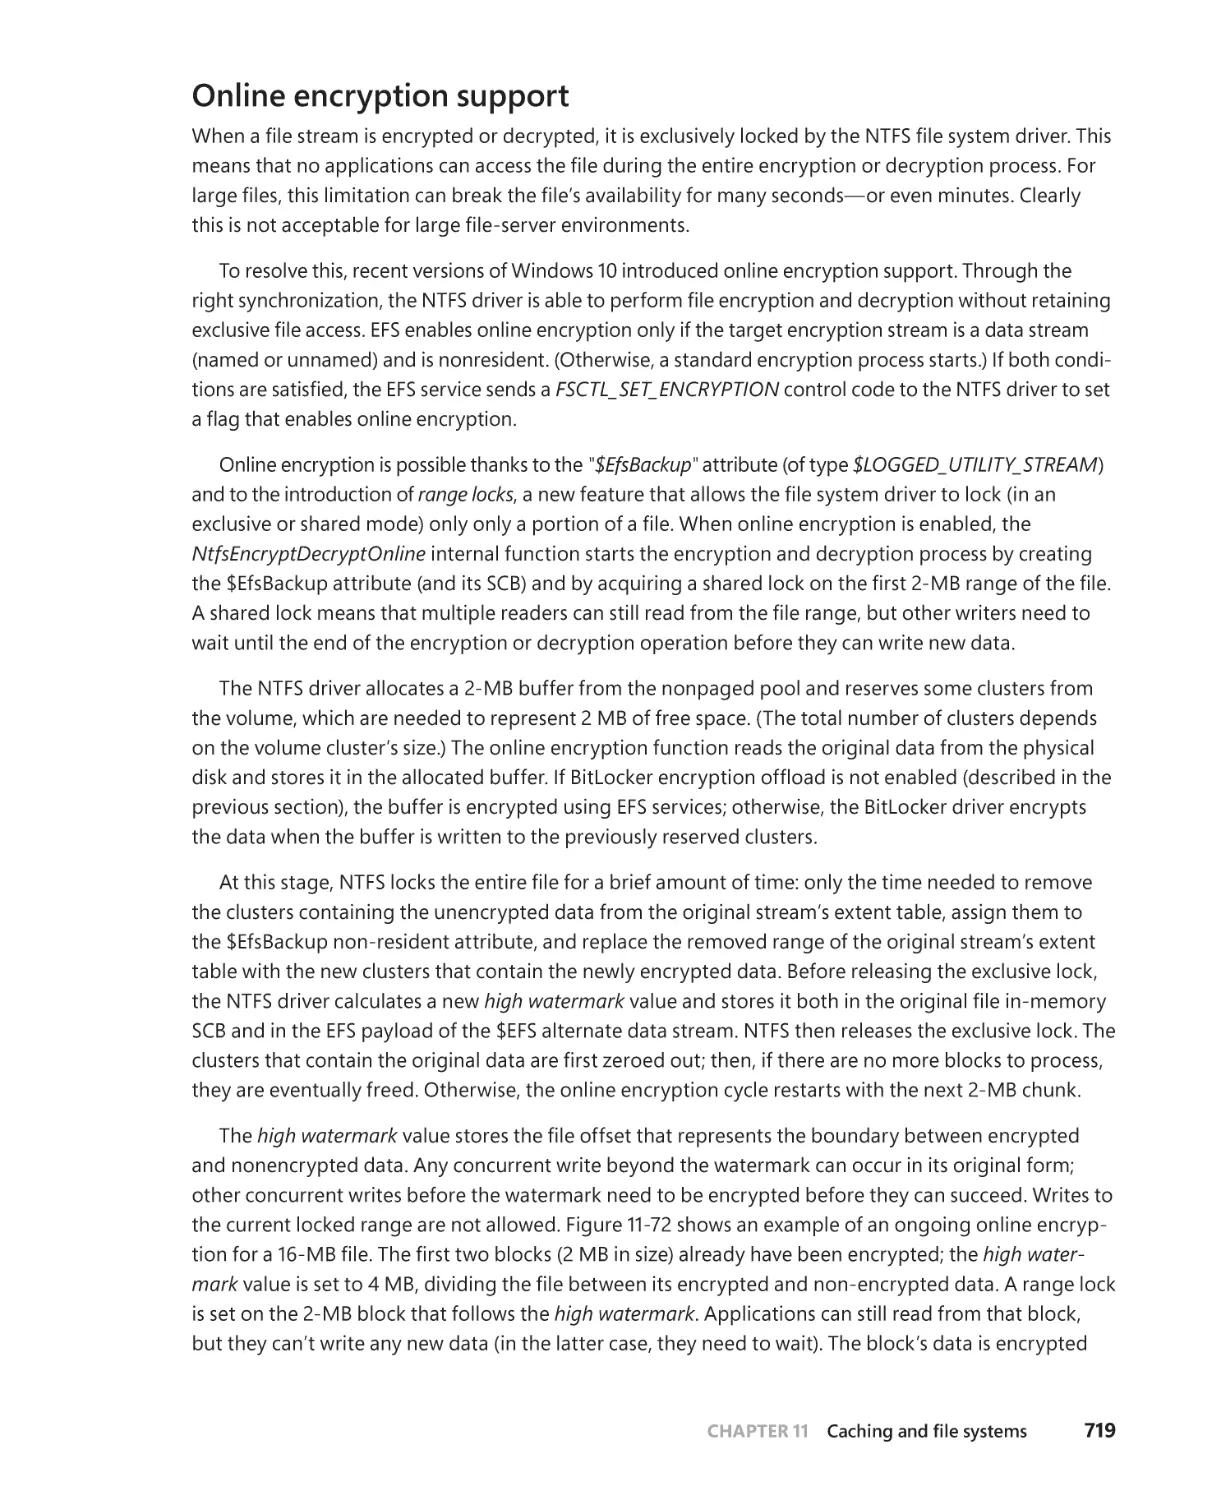
Online encryption support . . . . . . . . . . . . . . . . . . . . . . . . . . . . . . . . . . . . . 719
Contents
xv
Direct Access (DAX) disks . . . . . . . . . . . . . . . . . . . . . . . . . . . . . . . . . . . . . . . . . . . .720
DAX driver model . . . . . . . . . . . . . . . . . . . . . . . . . . . . . . . . . . . . . . . . . . . . . 721
DAX volumes . . . . . . . . . . . . . . . . . . . . . . . . . . . . . . . . . . . . . . . . . . . . . . . . . .722
Cached and noncached I/O in DAX volumes . . . . . . . . . . . . . . . . . . . .723
Mapping of executable images . . . . . . . . . . . . . . . . . . . . . . . . . . . . . . . . .724
Block volumes . . . . . . . . . . . . . . . . . . . . . . . . . . . . . . . . . . . . . . . . . . . . . . . . .728
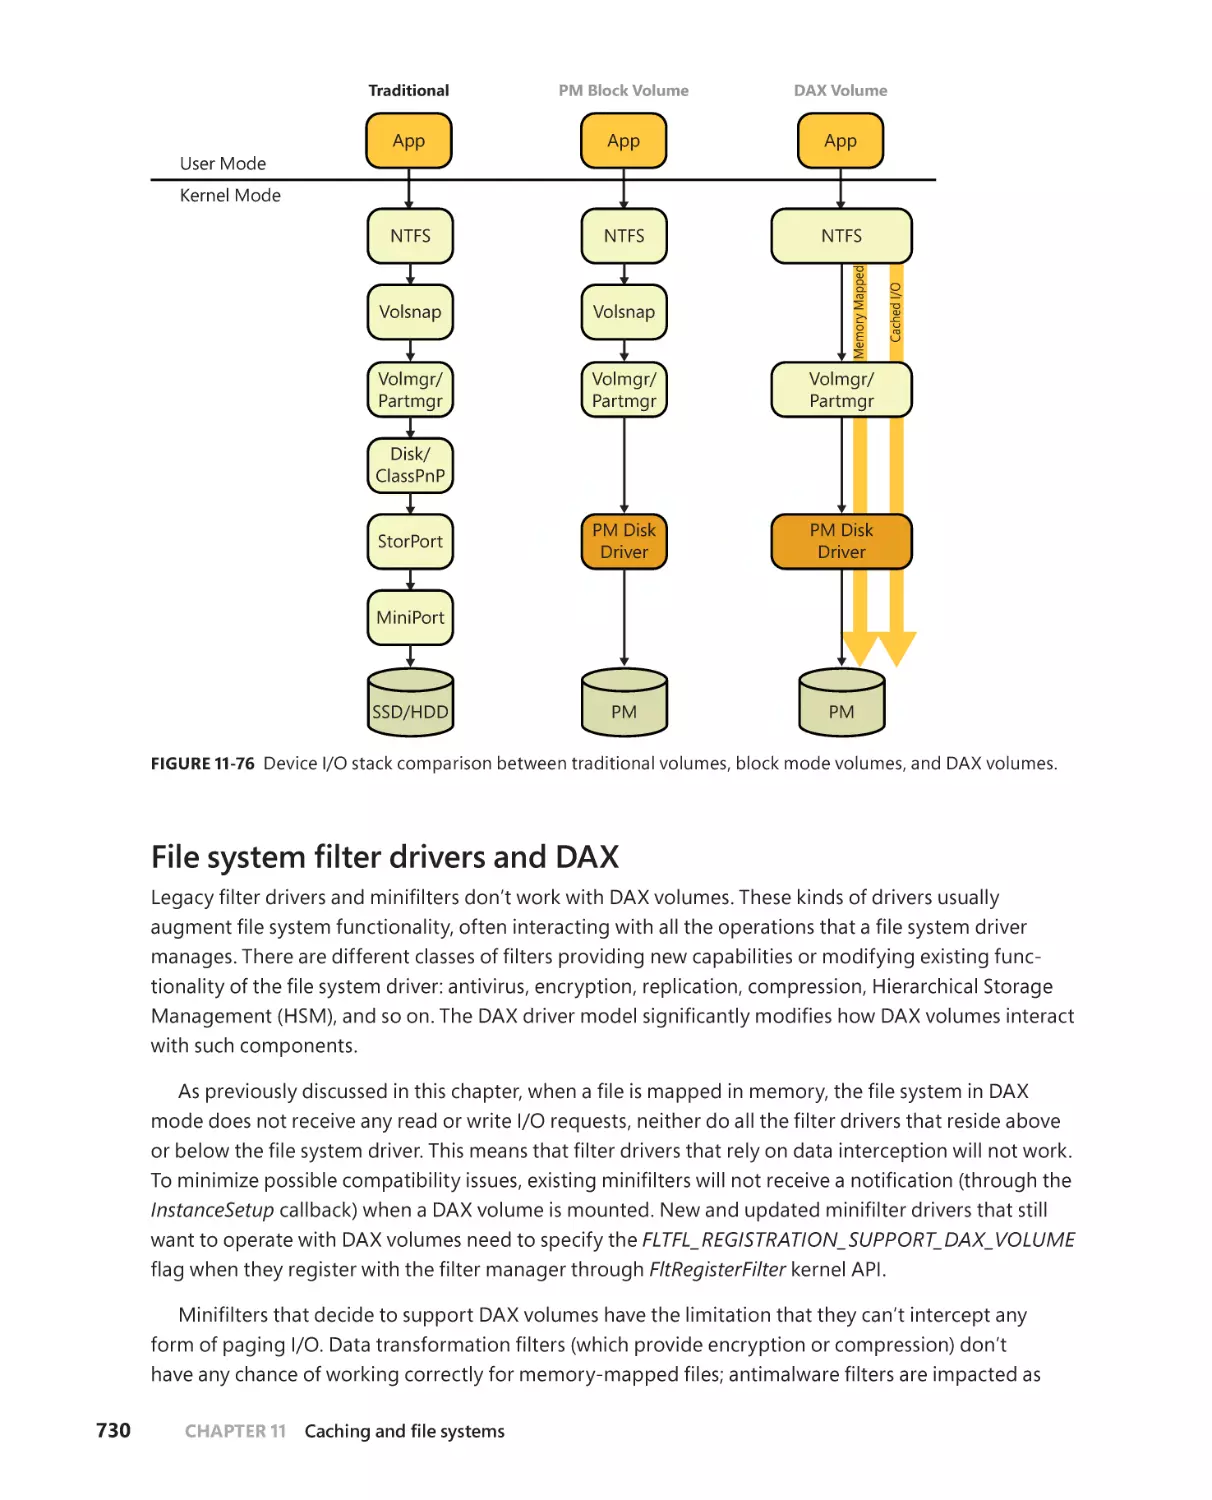
. . . . . . . . . . . . . . . . . . . . . . . . . . . . . . .730
Flushing DAX mode I/Os . . . . . . . . . . . . . . . . . . . . . . . . . . . . . . . . . . . . . . . 731
Large and huge pages support . . . . . . . . . . . . . . . . . . . . . . . . . . . . . . . . .732
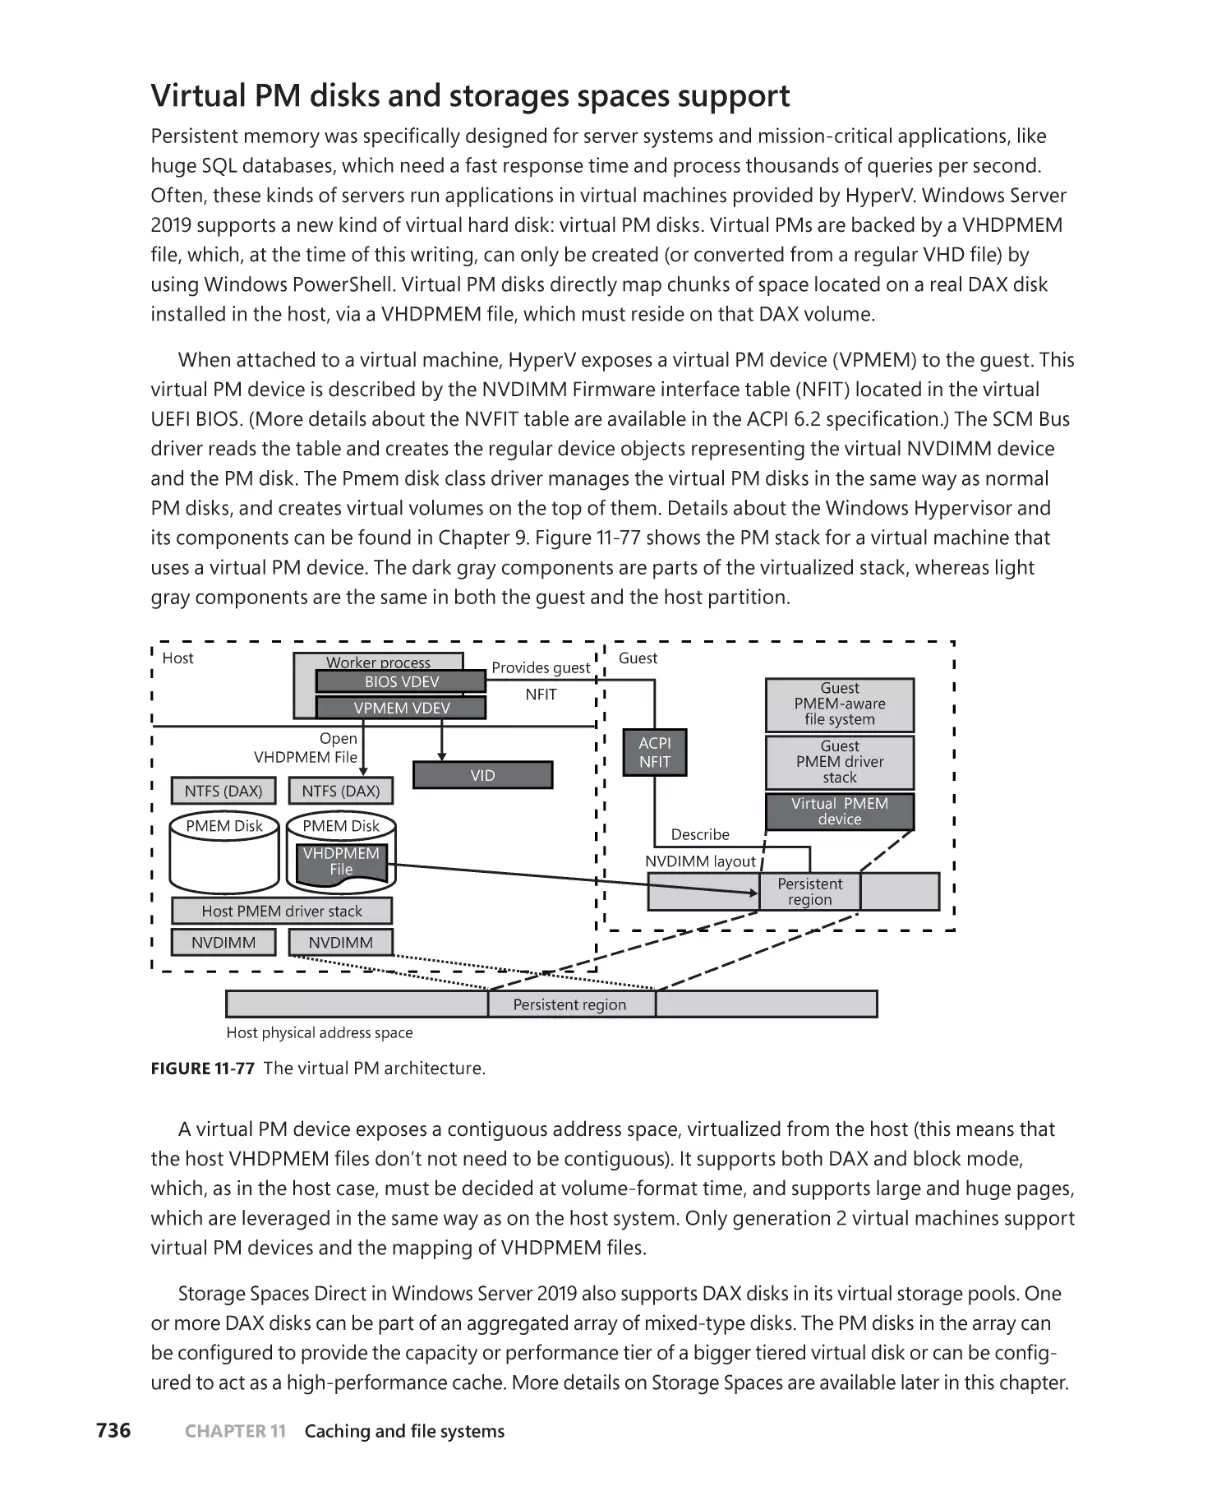
Virtual PM disks and storages spaces support . . . . . . . . . . . . . . . . . . .736
Resilient File System (ReFS) . . . . . . . . . . . . . . . . . . . . . . . . . . . . . . . . . . . . . . . . . . .739
Minstore architecture . . . . . . . . . . . . . . . . . . . . . . . . . . . . . . . . . . . . . . . . . .740
B+ tree physical layout . . . . . . . . . . . . . . . . . . . . . . . . . . . . . . . . . . . . . . . . . 742
Allocators . . . . . . . . . . . . . . . . . . . . . . . . . . . . . . . . . . . . . . . . . . . . . . . . . . . . . 743
Page table . . . . . . . . . . . . . . . . . . . . . . . . . . . . . . . . . . . . . . . . . . . . . . . . . . . . 745
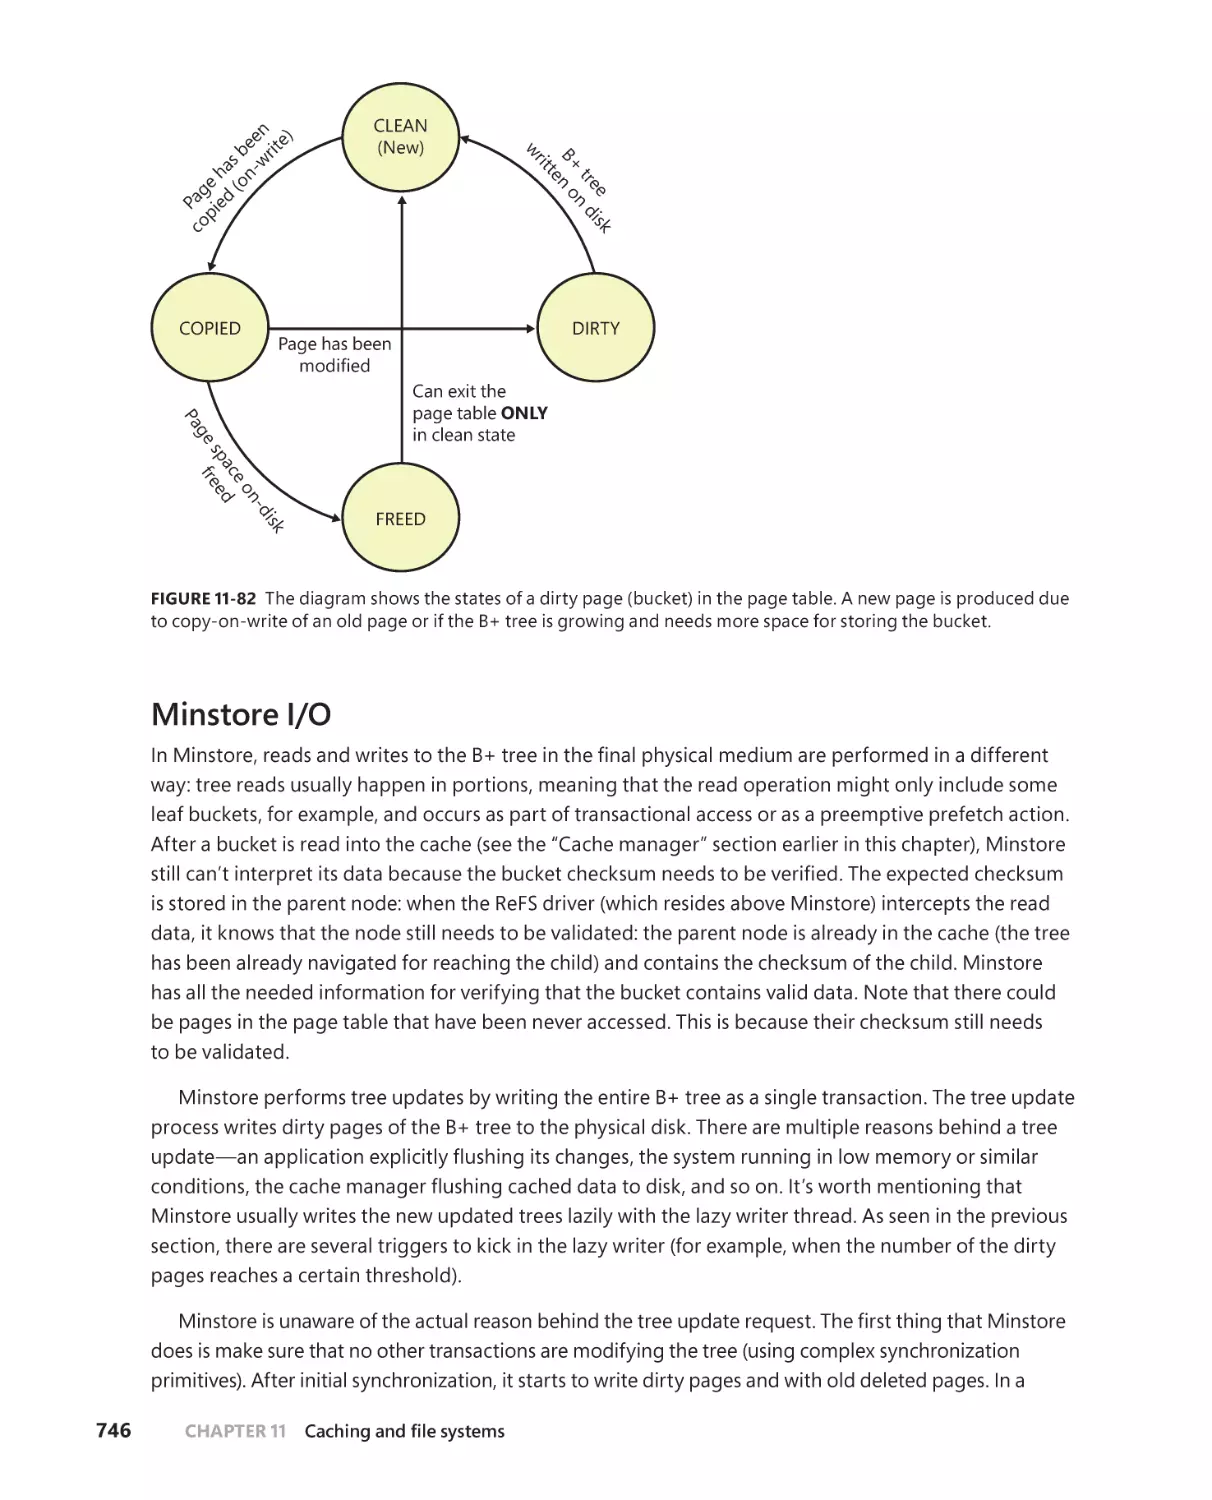
Minstore I/O . . . . . . . . . . . . . . . . . . . . . . . . . . . . . . . . . . . . . . . . . . . . . . . . . .746
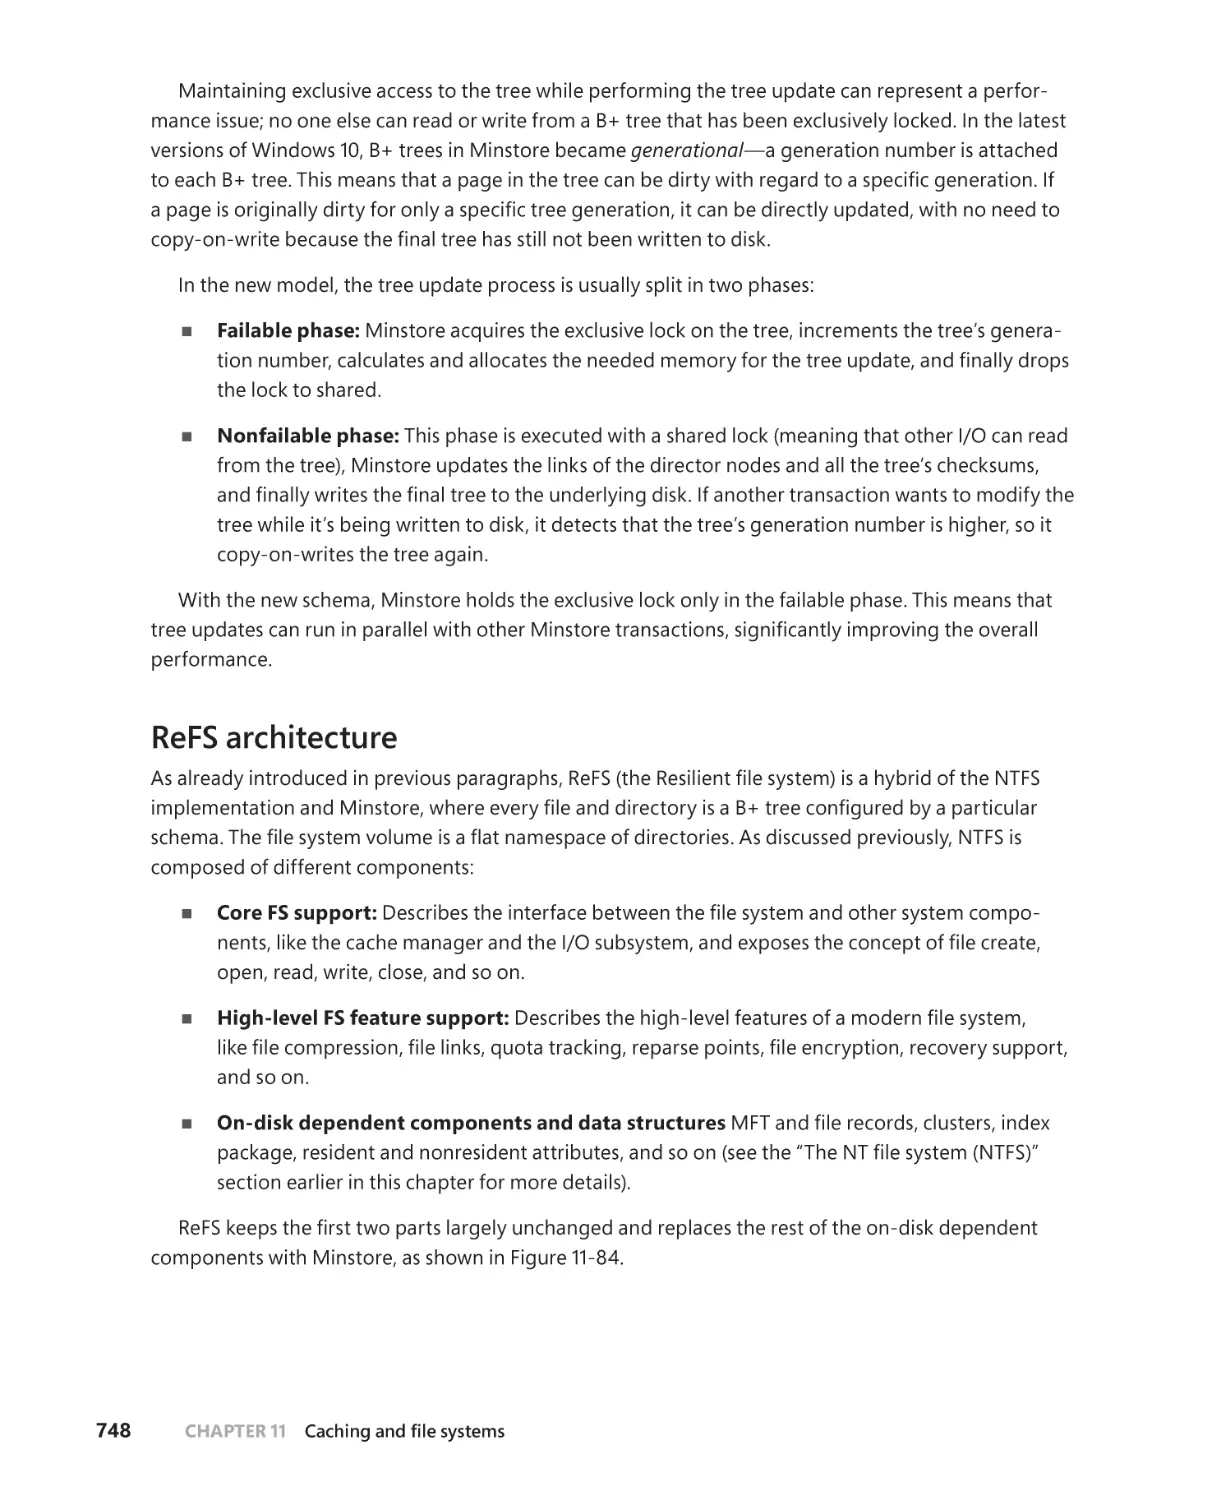
ReFS architecture . . . . . . . . . . . . . . . . . . . . . . . . . . . . . . . . . . . . . . . . . . . . . .748
ReFS on-disk structure . . . . . . . . . . . . . . . . . . . . . . . . . . . . . . . . . . . . . . . . . 751
Object IDs . . . . . . . . . . . . . . . . . . . . . . . . . . . . . . . . . . . . . . . . . . . . . . . . . . . . .752
Security and change journal . . . . . . . . . . . . . . . . . . . . . . . . . . . . . . . . . . .753
ReFS advanced features . . . . . . . . . . . . . . . . . . . . . . . . . . . . . . . . . . . . . . . . . . . . . .754
File’s block cloning (snapshot support) and sparse VDL . . . . . . . . . .754
ReFS write-through . . . . . . . . . . . . . . . . . . . . . . . . . . . . . . . . . . . . . . . . . . . 757
ReFS recovery support . . . . . . . . . . . . . . . . . . . . . . . . . . . . . . . . . . . . . . . . . 759
Leak detection . . . . . . . . . . . . . . . . . . . . . . . . . . . . . . . . . . . . . . . . . . . . . . . . 761
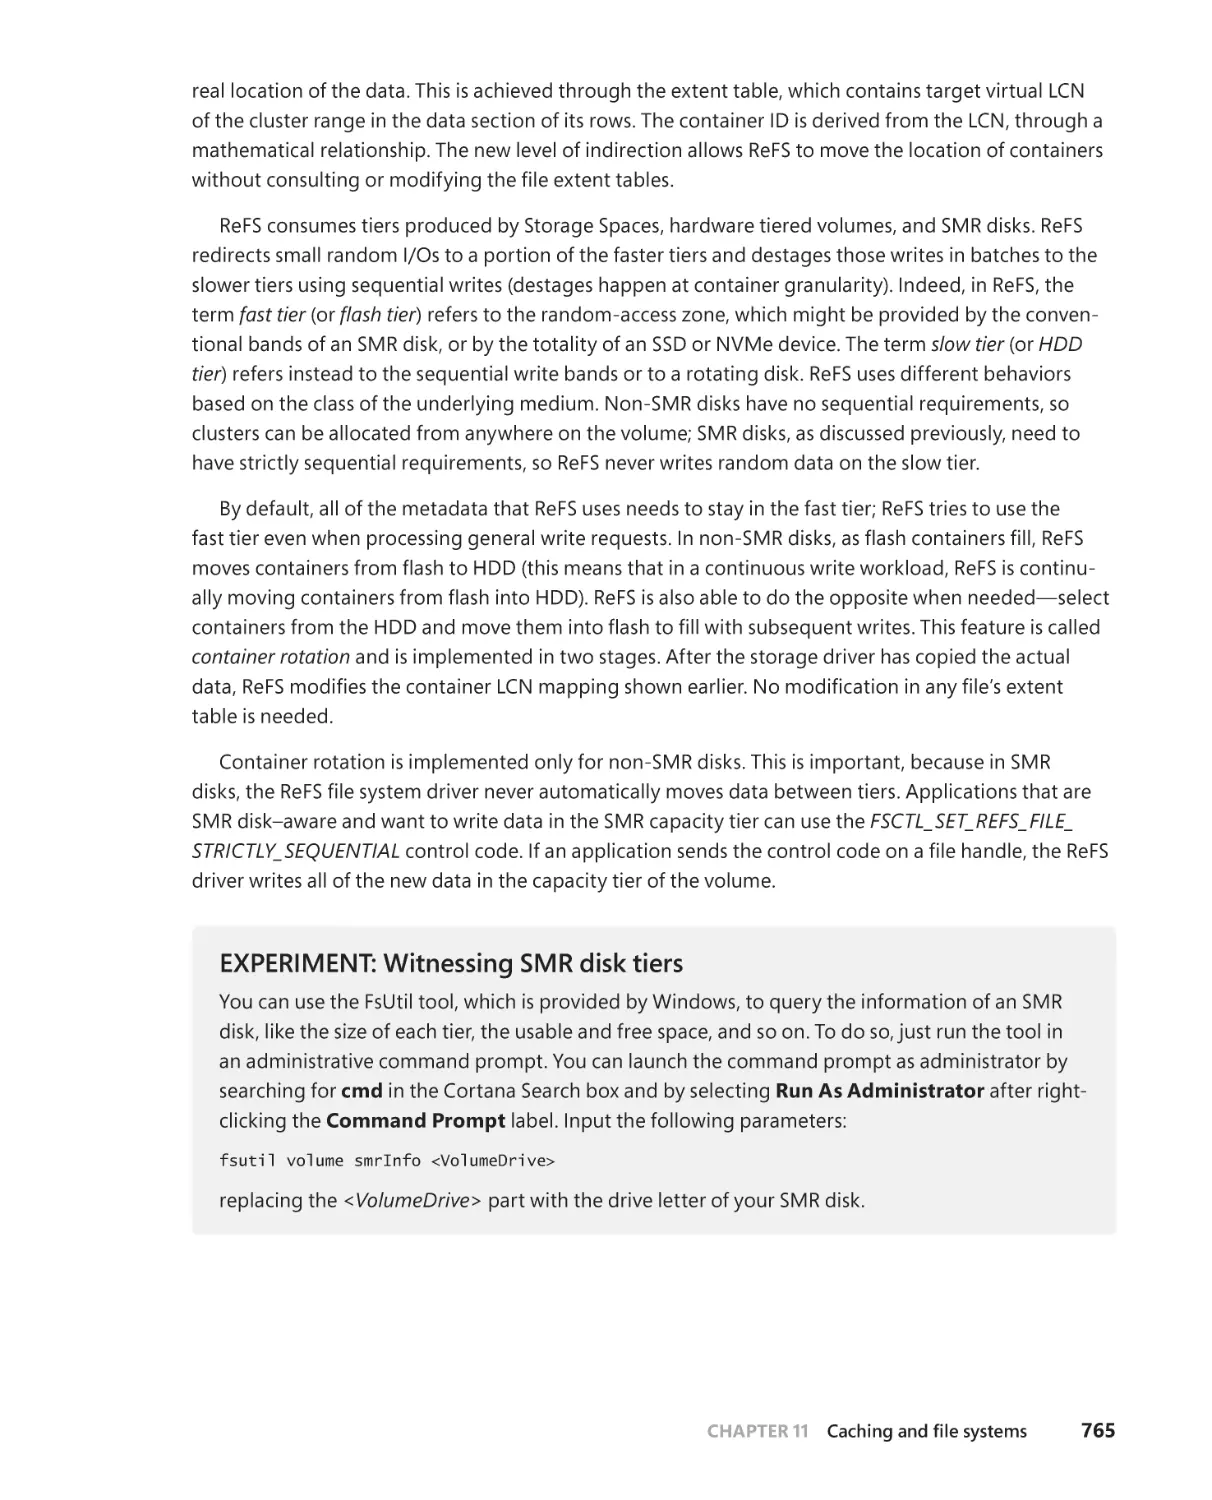
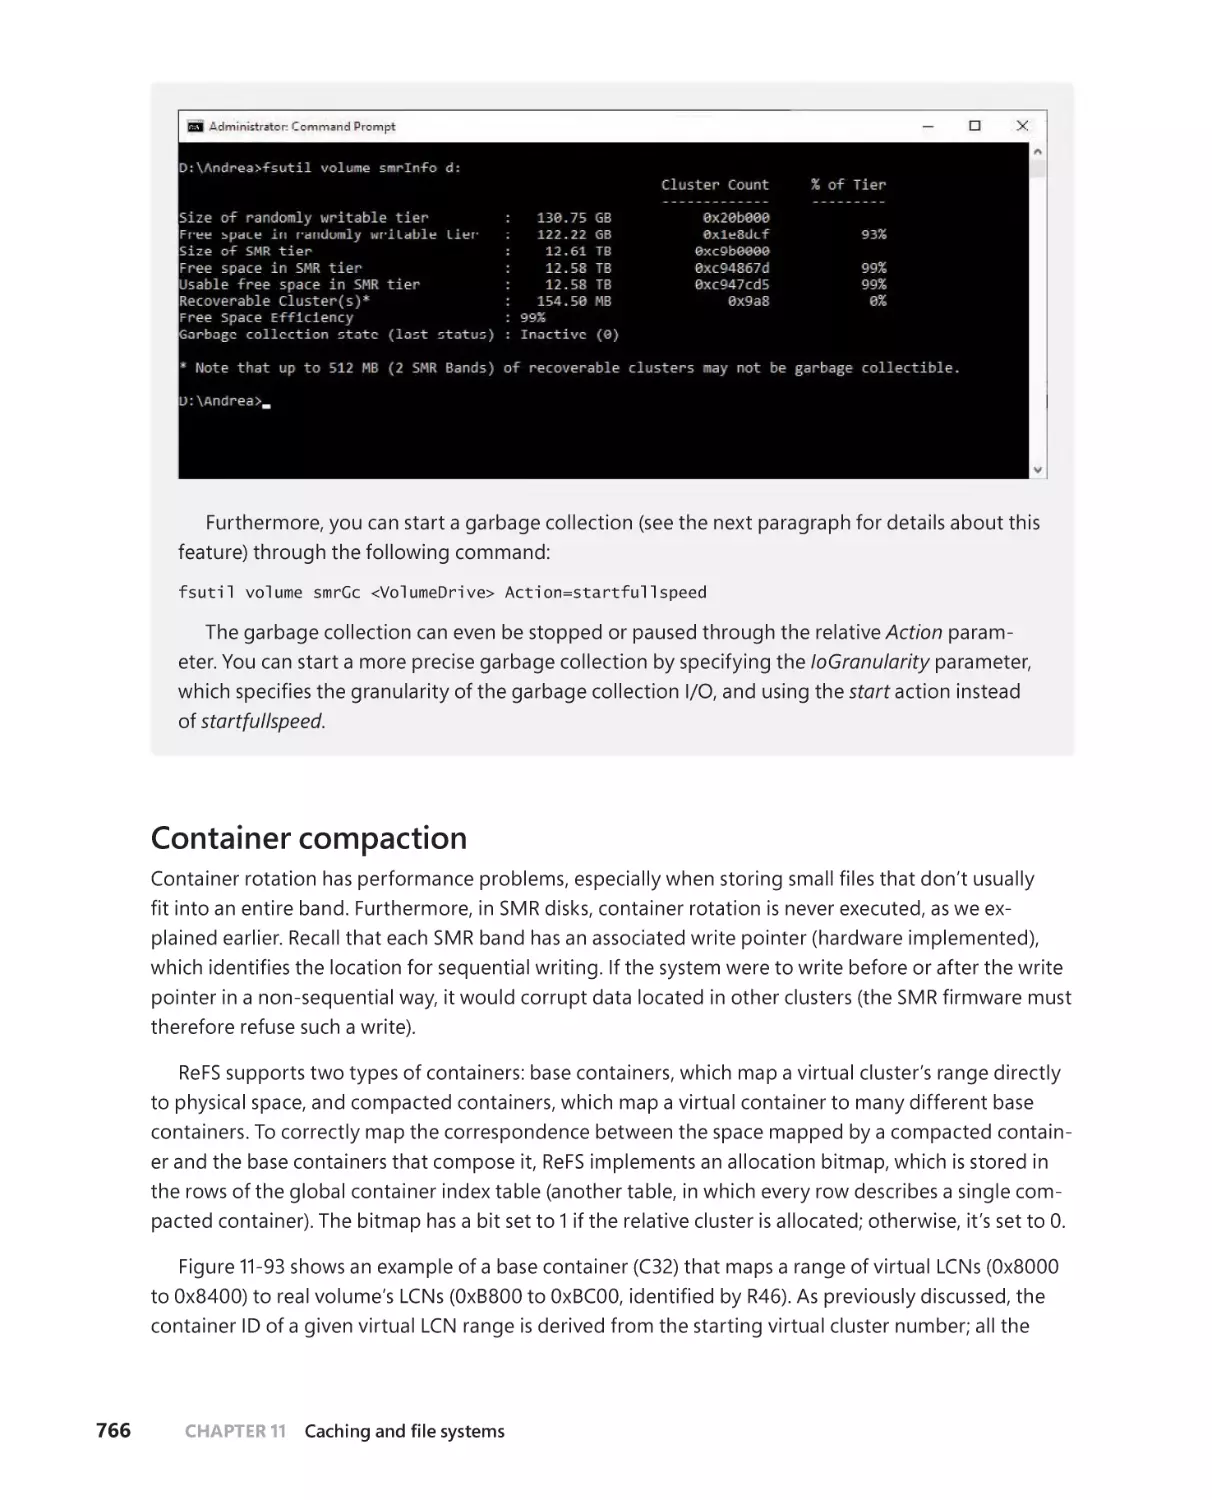
Shingled magnetic recording (SMR) volumes . . . . . . . . . . . . . . . . . . . 762
ReFS support for tiered volumes and SMR. . . . . . . . . . . . . . . . . . . . . . .764
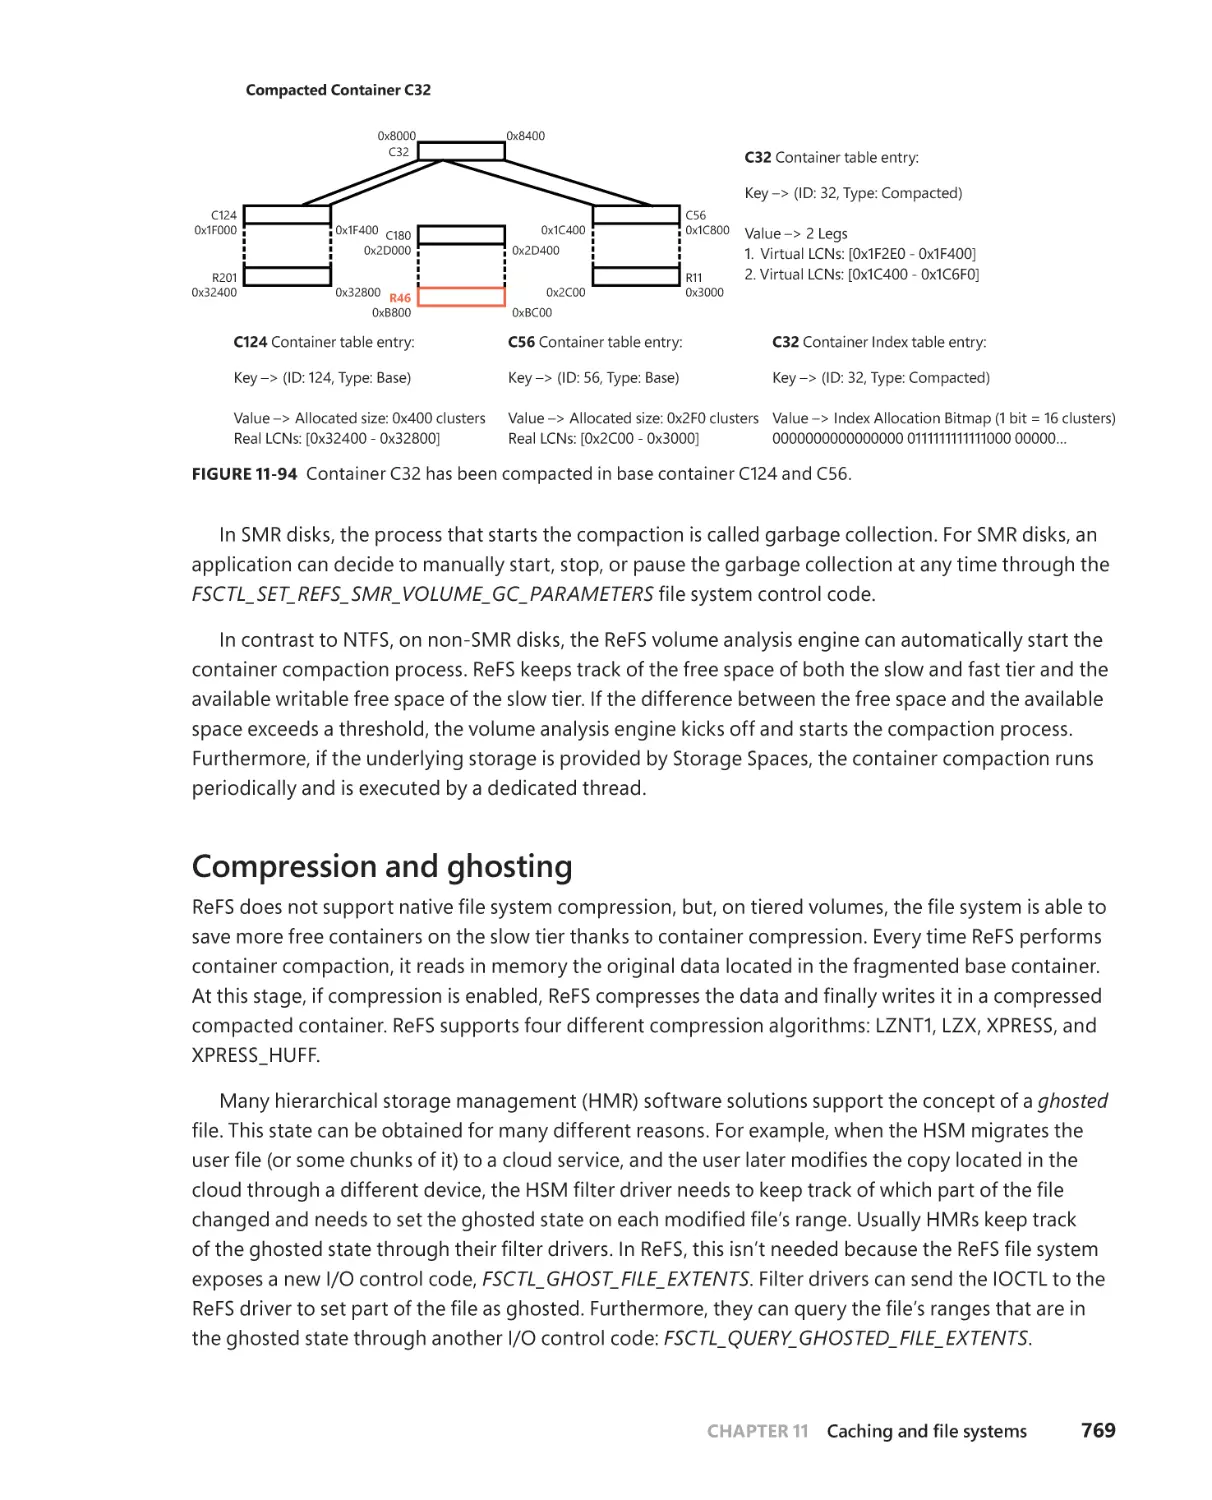
Container compaction . . . . . . . . . . . . . . . . . . . . . . . . . . . . . . . . . . . . . . . . .766
Compression and ghosting . . . . . . . . . . . . . . . . . . . . . . . . . . . . . . . . . . . . . 769
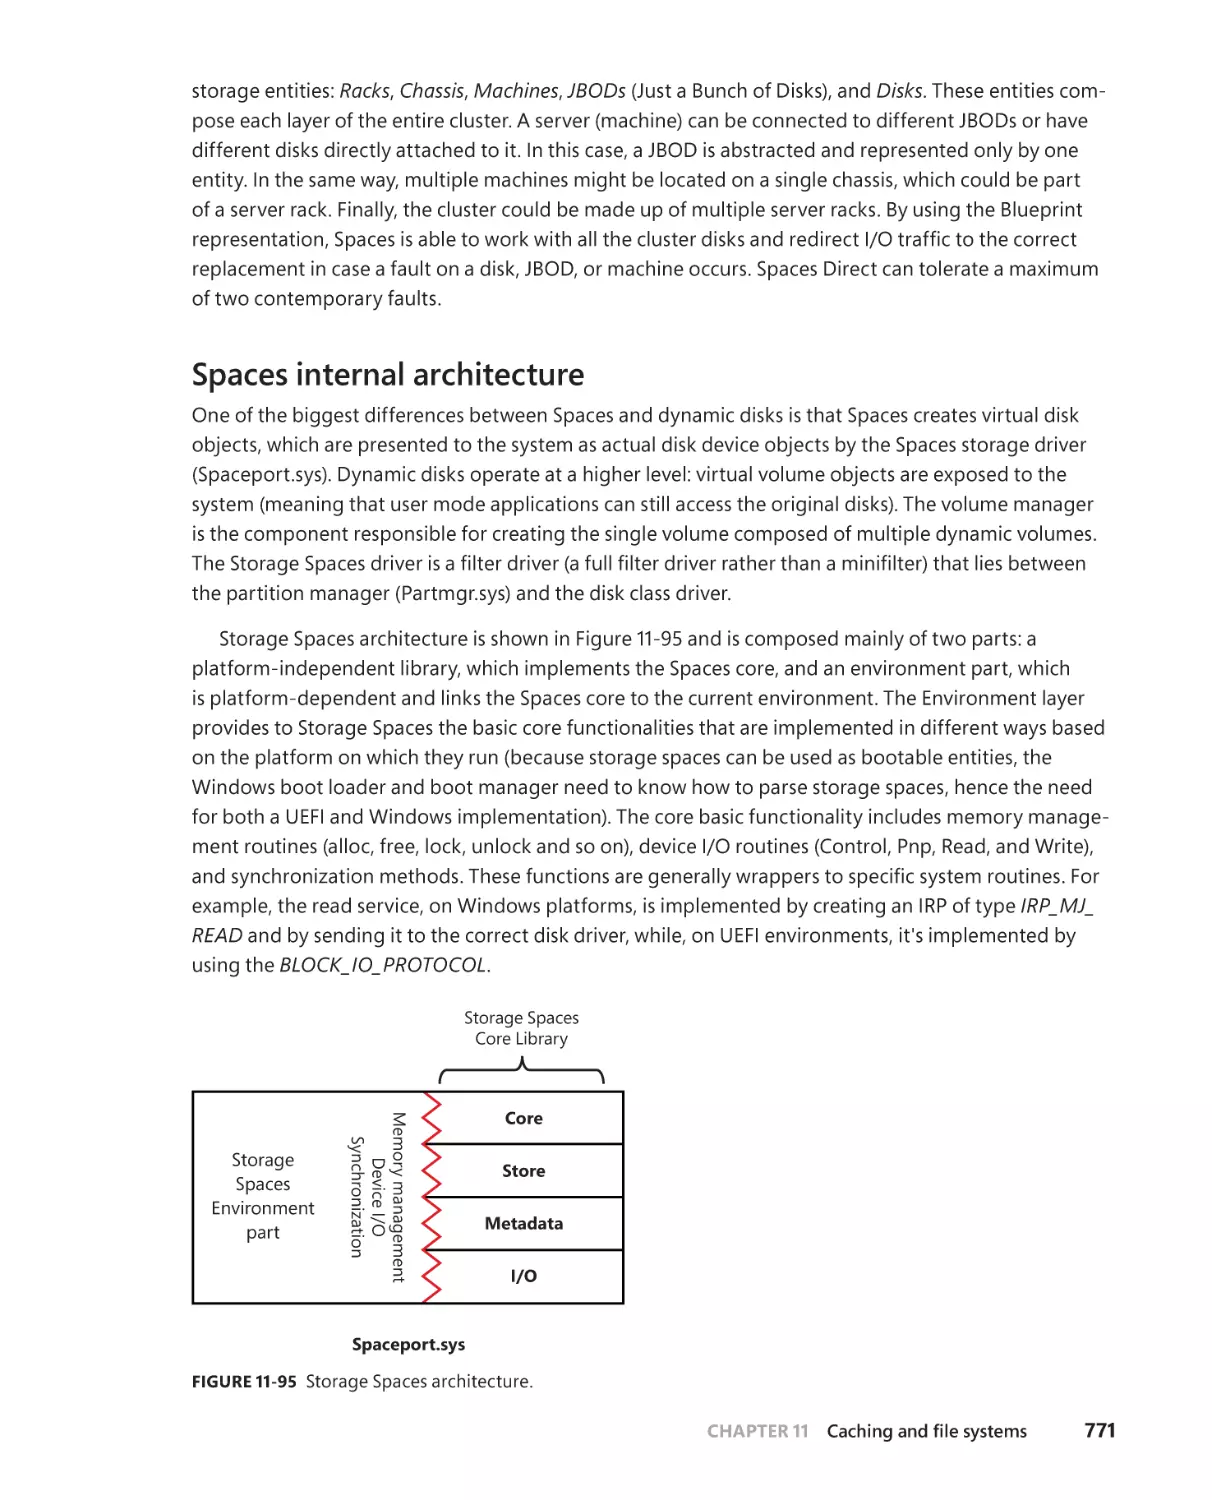
Storage Spaces . . . . . . . . . . . . . . . . . . . . . . . . . . . . . . . . . . . . . . . . . . . . . . . . . . . . . .770
Spaces internal architecture . . . . . . . . . . . . . . . . . . . . . . . . . . . . . . . . . . . . 771
Services provided by Spaces. . . . . . . . . . . . . . . . . . . . . . . . . . . . . . . . . . . .772
Conclusion . . . . . . . . . . . . . . . . . . . . . . . . . . . . . . . . . . . . . . . . . . . . . . . . . . . . . . . . . .776
xvi
Contents
Chapter 12 Startup and shutdown
777
Boot process . . . . . . . . . . . . . . . . . . . . . . . . . . . . . . . . . . . . . . . . . . . . . . . . . . . . . . . .777
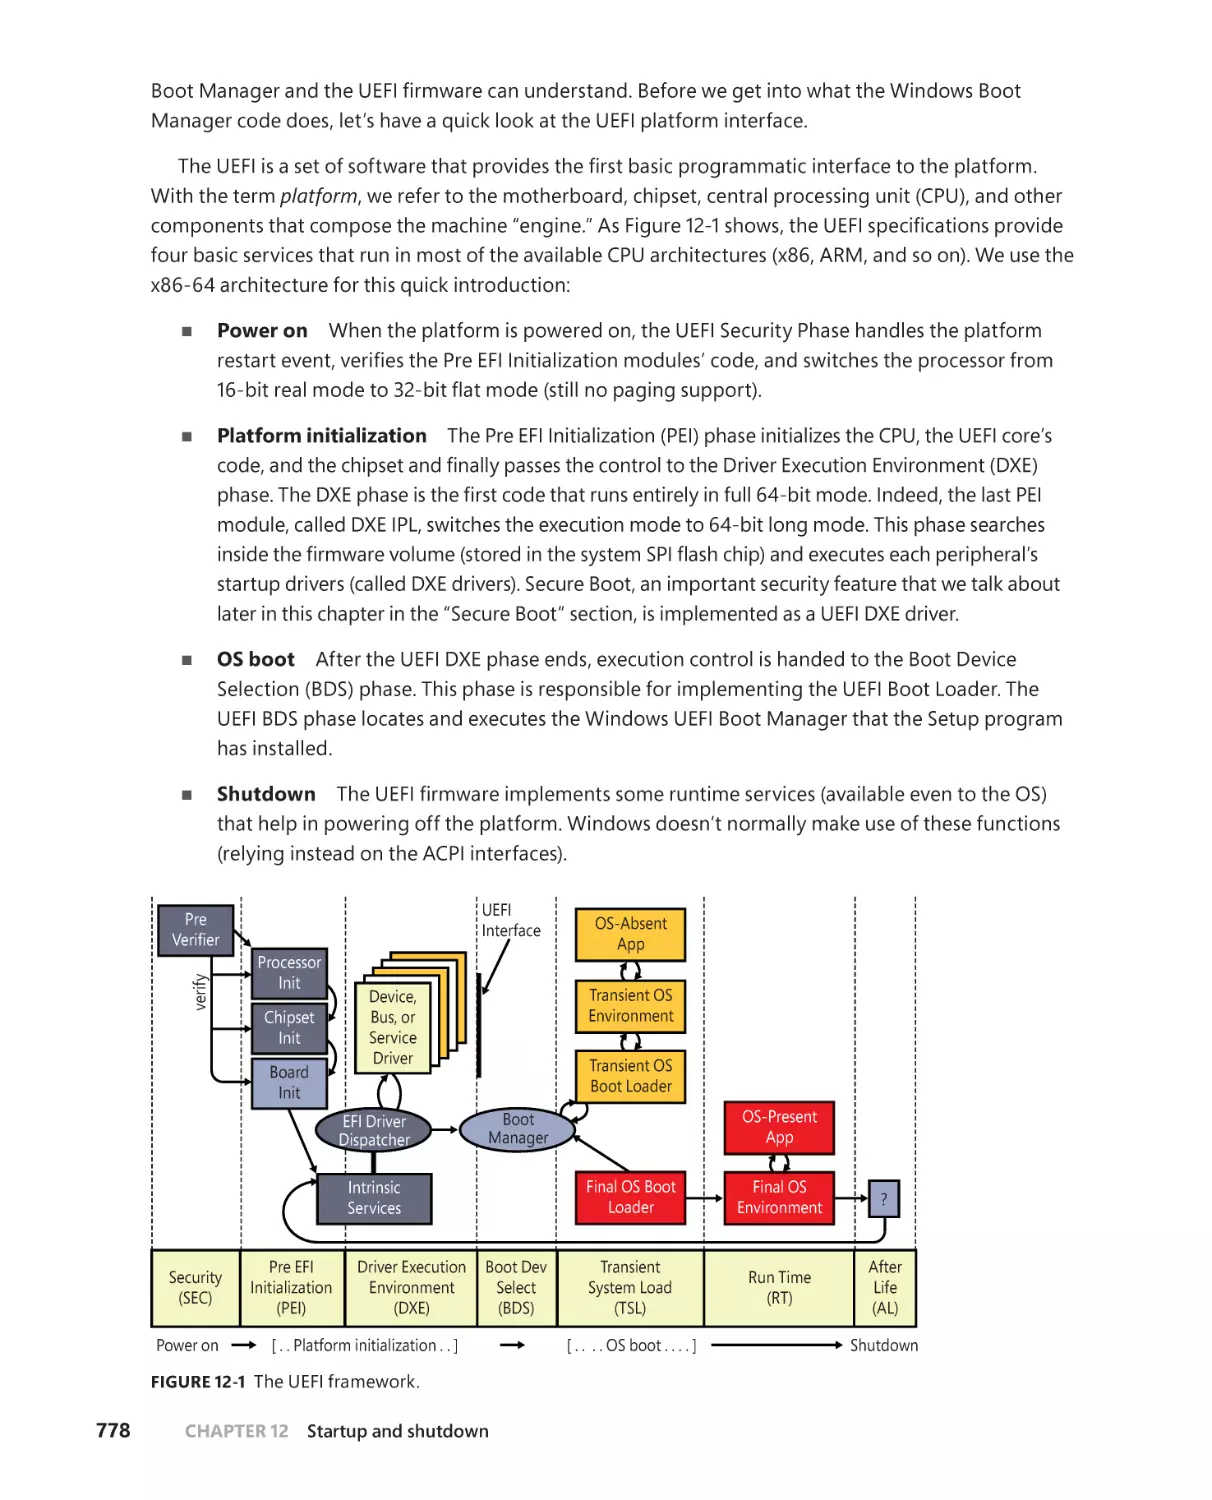
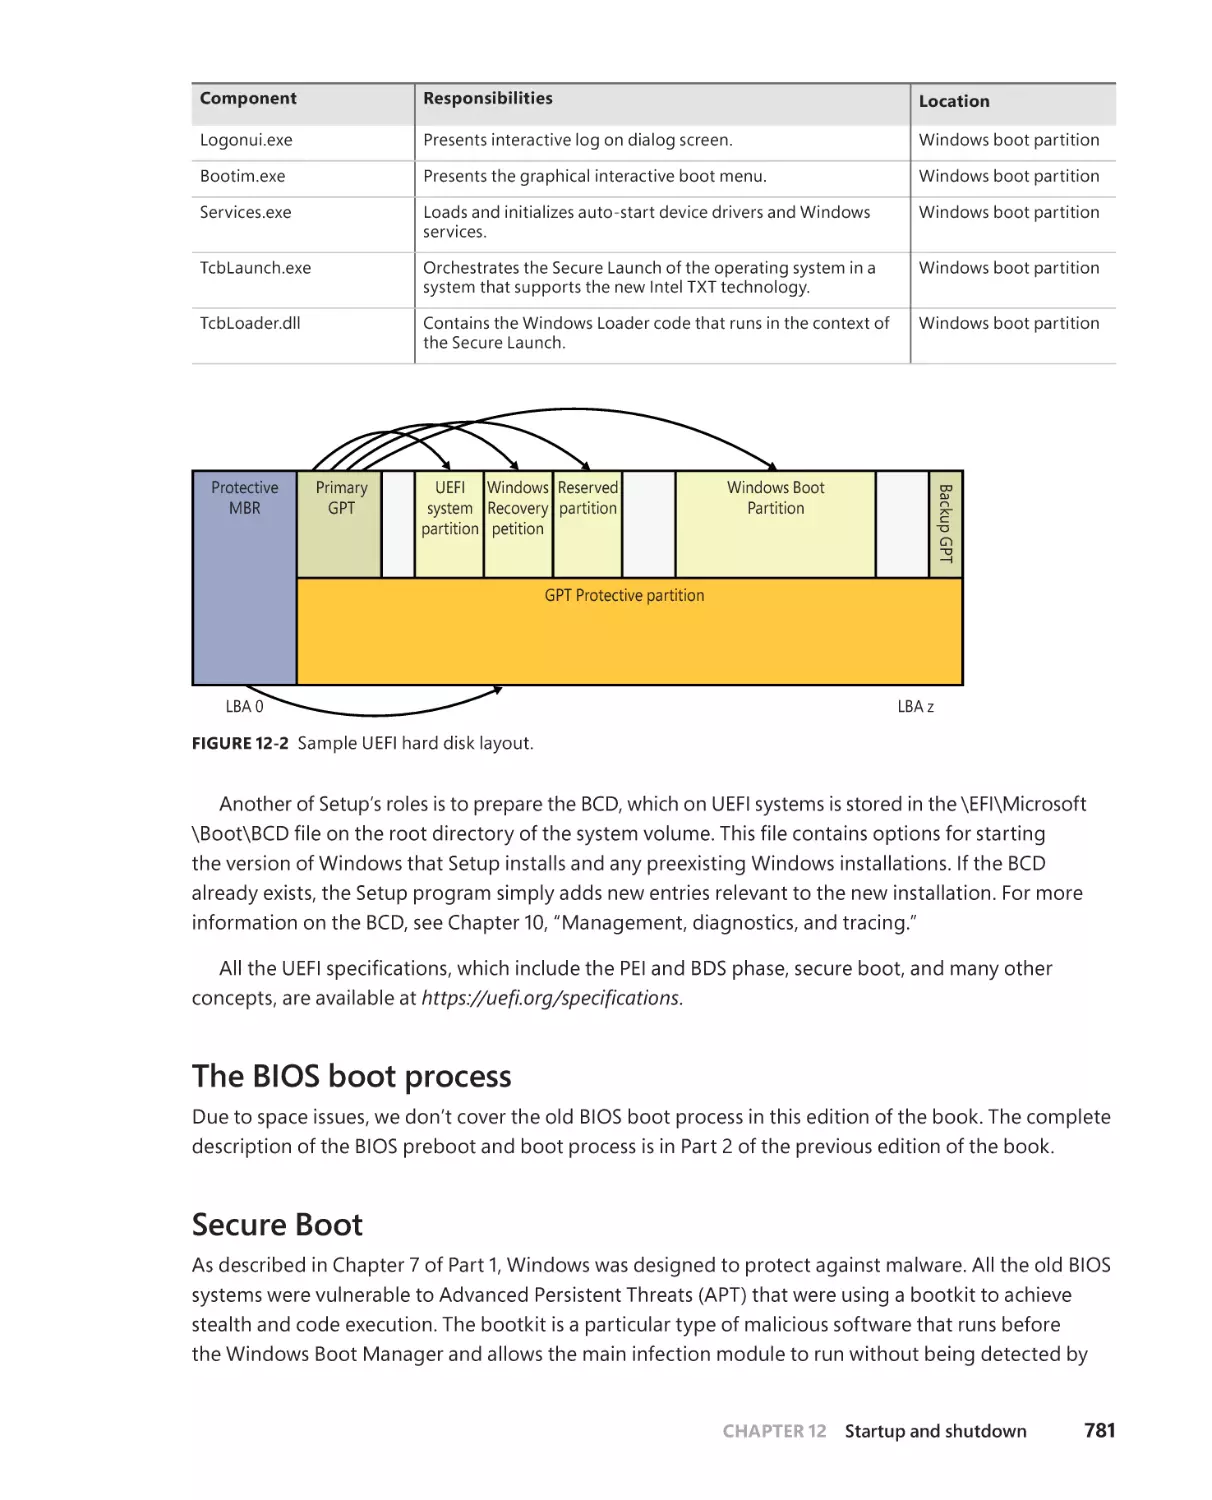
The UEFI boot . . . . . . . . . . . . . . . . . . . . . . . . . . . . . . . . . . . . . . . . . . . . . . . . .777
The BIOS boot process . . . . . . . . . . . . . . . . . . . . . . . . . . . . . . . . . . . . . . . . . 781
Secure Boot . . . . . . . . . . . . . . . . . . . . . . . . . . . . . . . . . . . . . . . . . . . . . . . . . . . 781
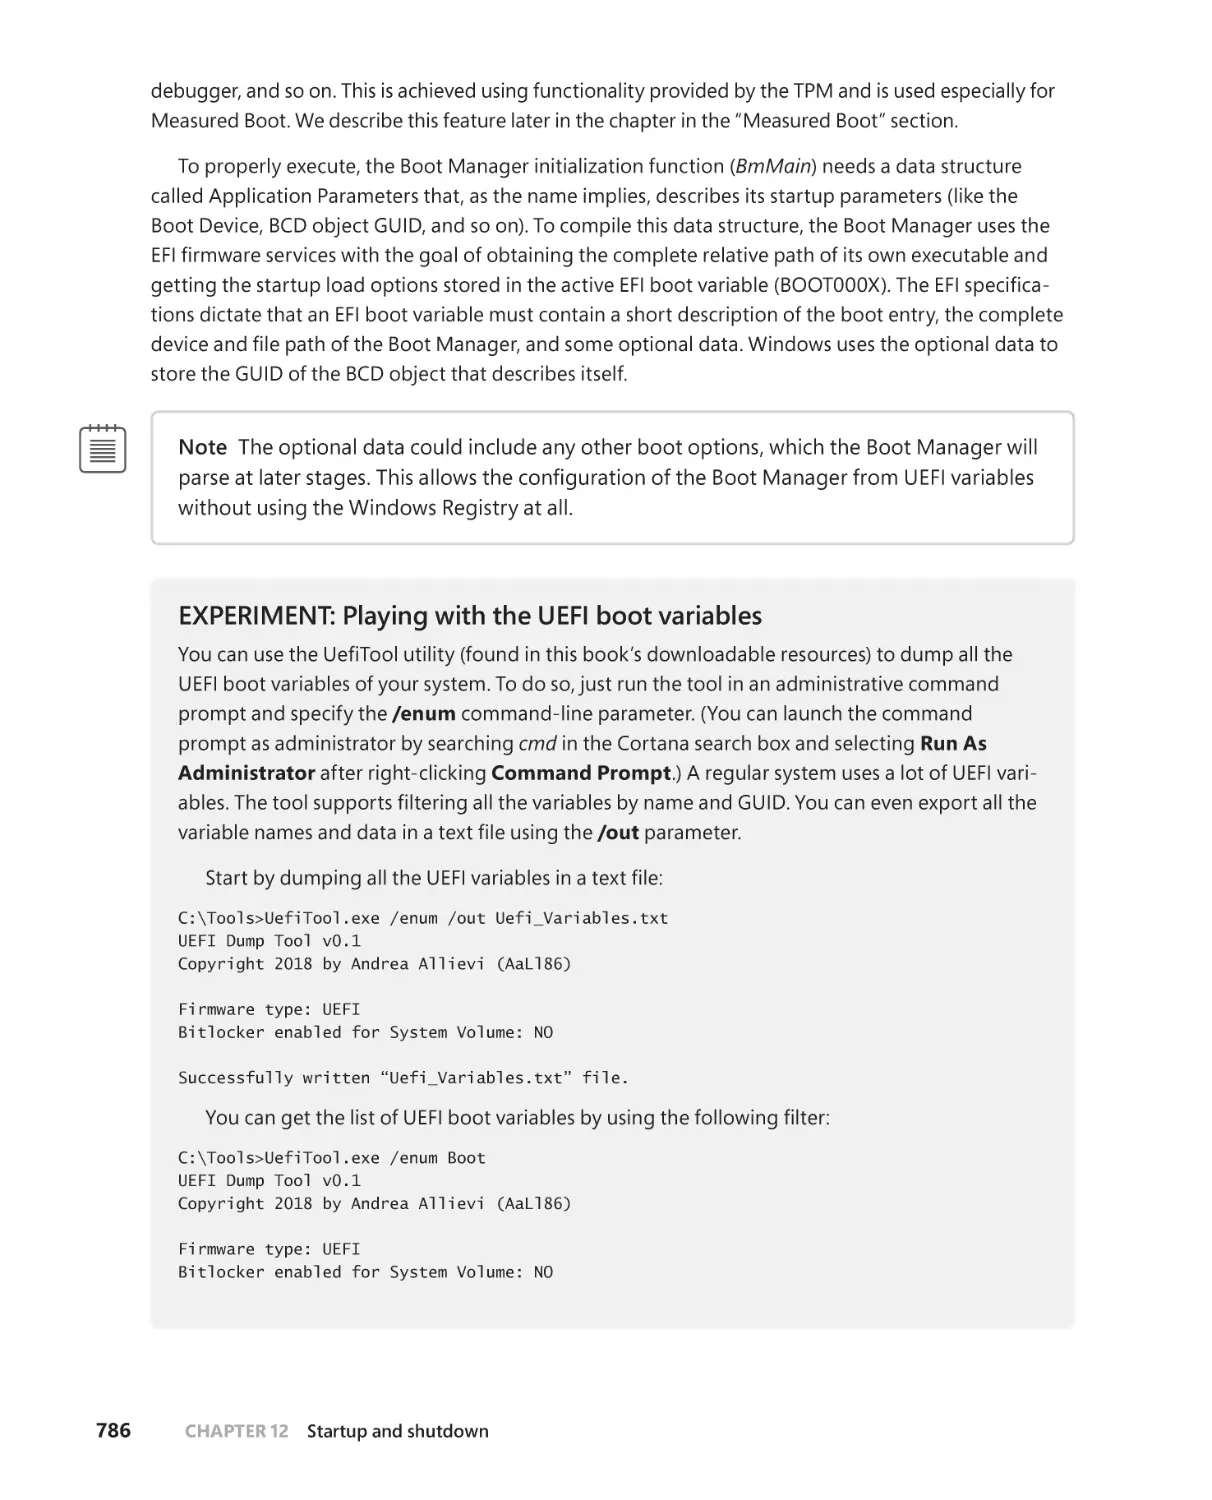
The Windows Boot Manager . . . . . . . . . . . . . . . . . . . . . . . . . . . . . . . . . . .785
The Boot menu . . . . . . . . . . . . . . . . . . . . . . . . . . . . . . . . . . . . . . . . . . . . . . . .799
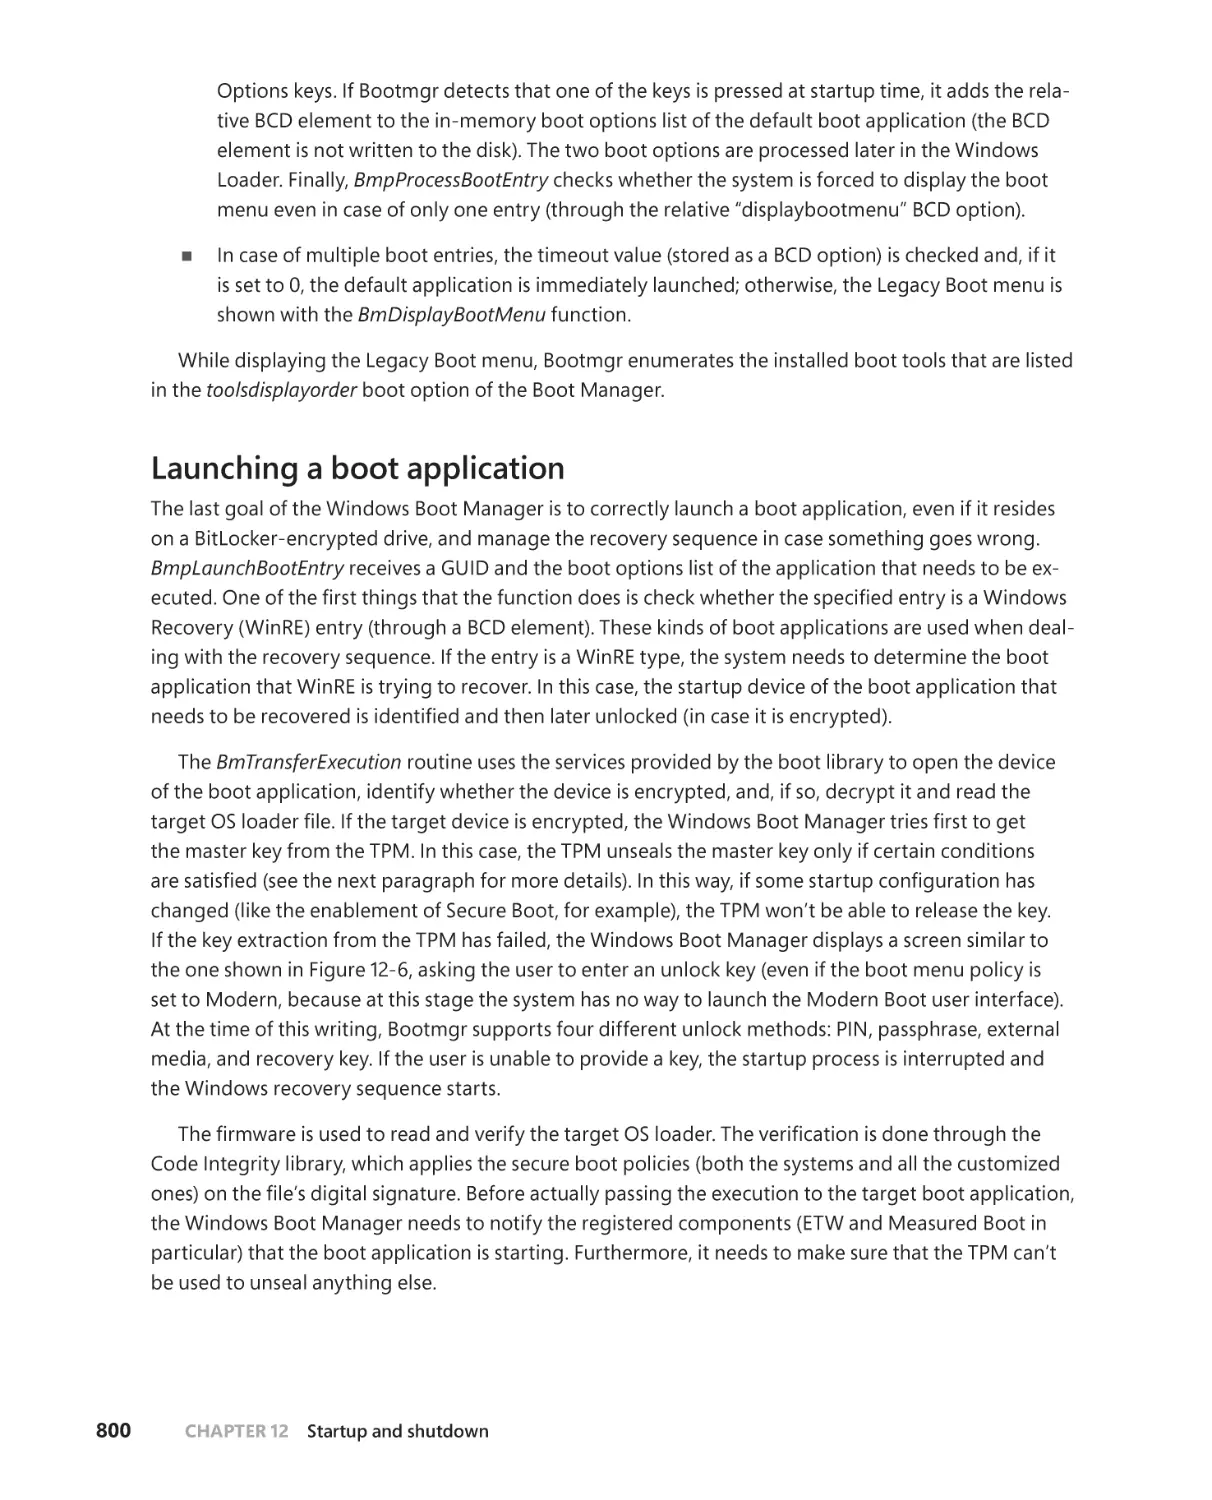
Launching a boot application . . . . . . . . . . . . . . . . . . . . . . . . . . . . . . . . . .800
Measured Boot . . . . . . . . . . . . . . . . . . . . . . . . . . . . . . . . . . . . . . . . . . . . . . . . 801
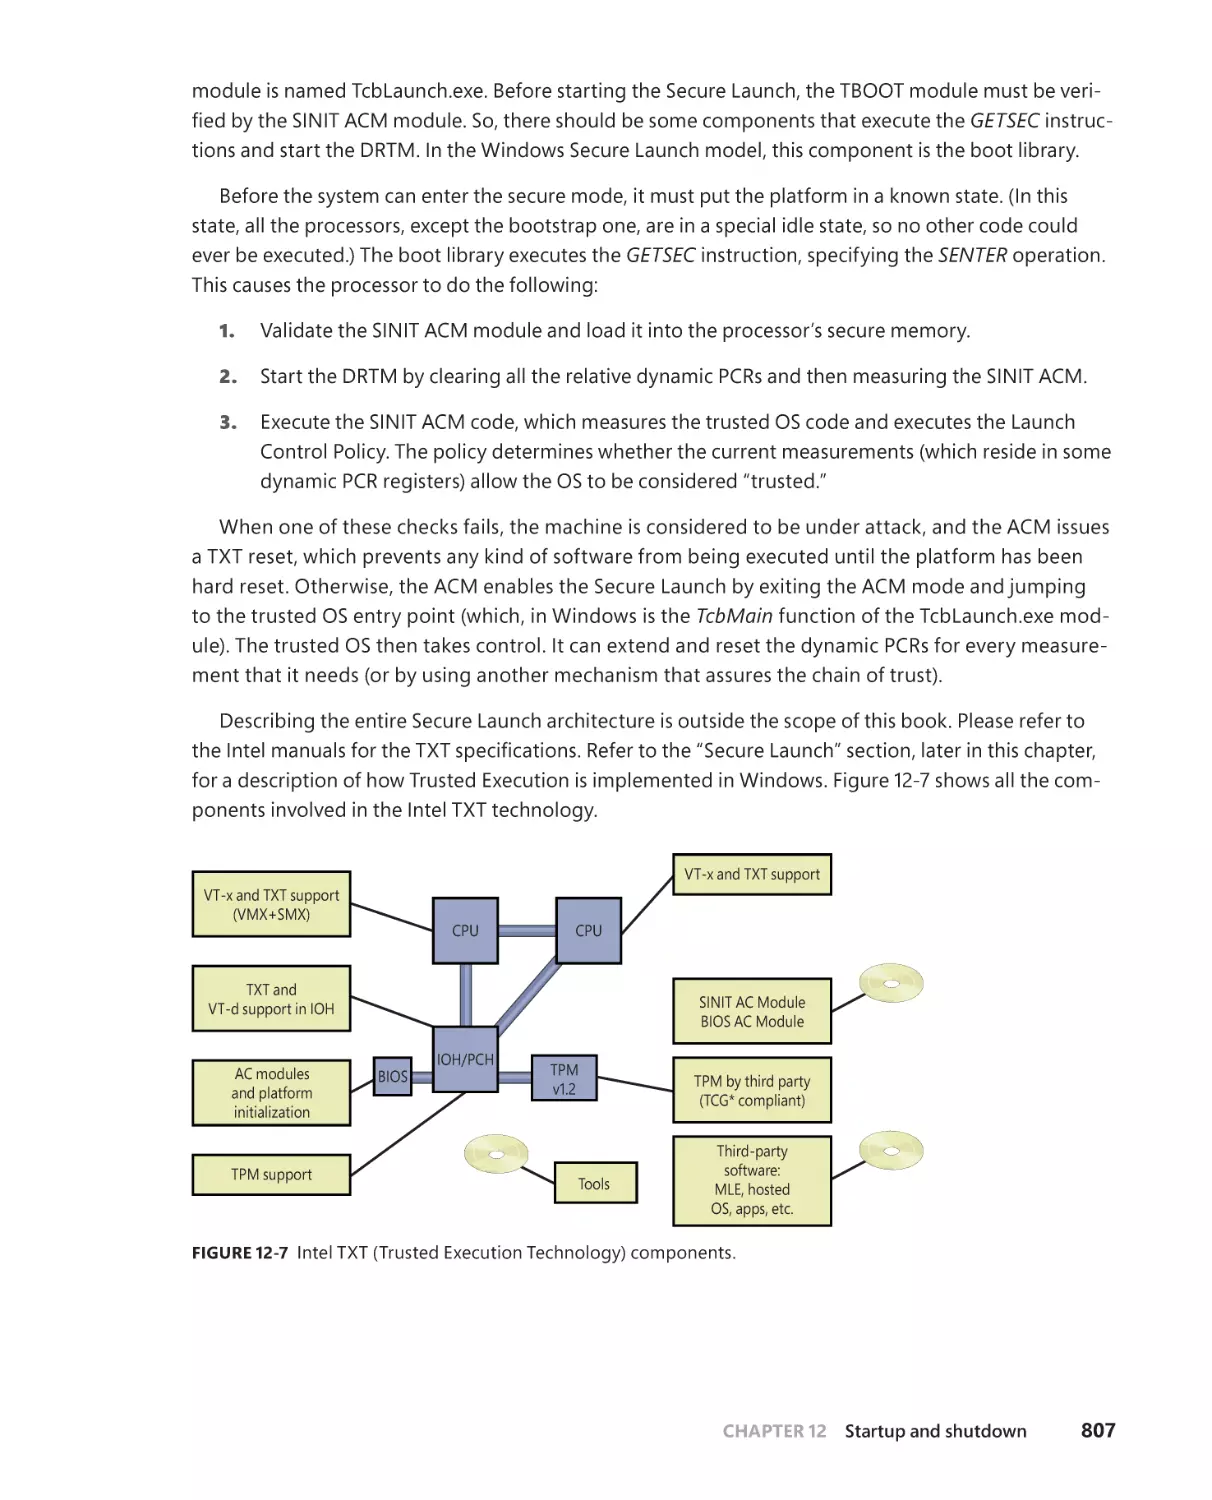
Trusted execution . . . . . . . . . . . . . . . . . . . . . . . . . . . . . . . . . . . . . . . . . . . . .805
The Windows OS Loader . . . . . . . . . . . . . . . . . . . . . . . . . . . . . . . . . . . . . . .808
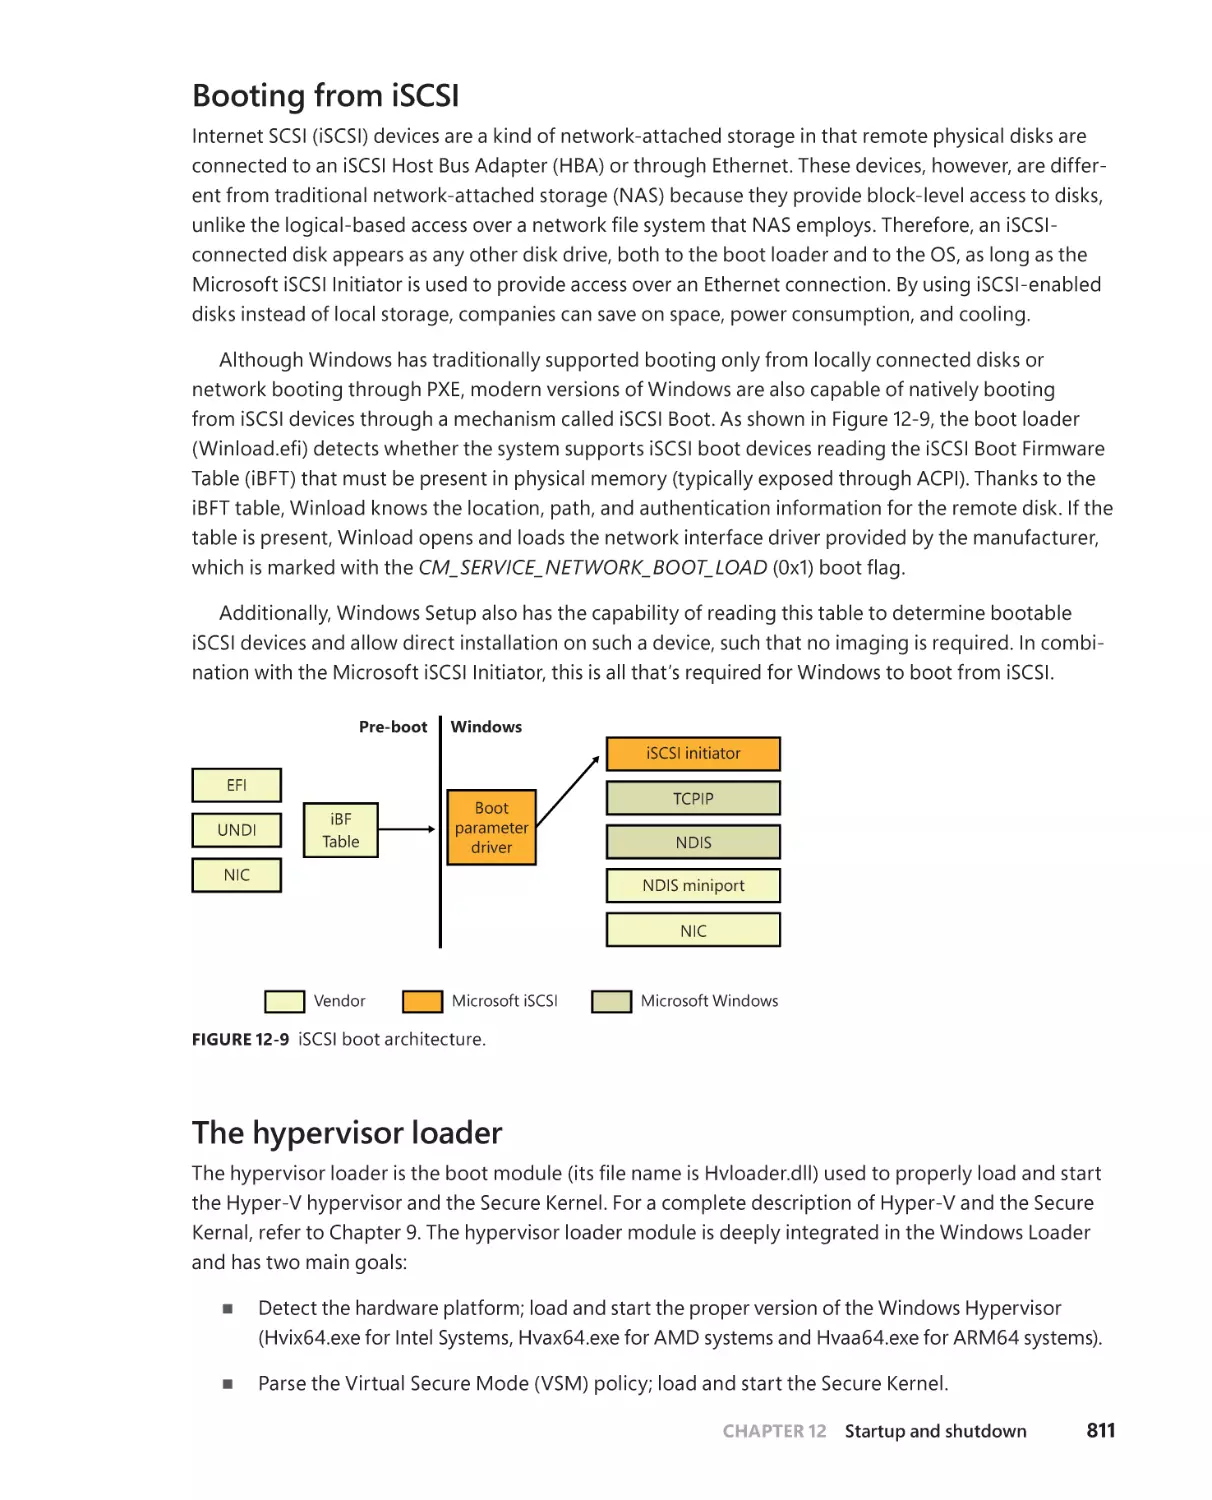
Booting from iSCSI . . . . . . . . . . . . . . . . . . . . . . . . . . . . . . . . . . . . . . . . . . . . 811
The hypervisor loader. . . . . . . . . . . . . . . . . . . . . . . . . . . . . . . . . . . . . . . . . . 811
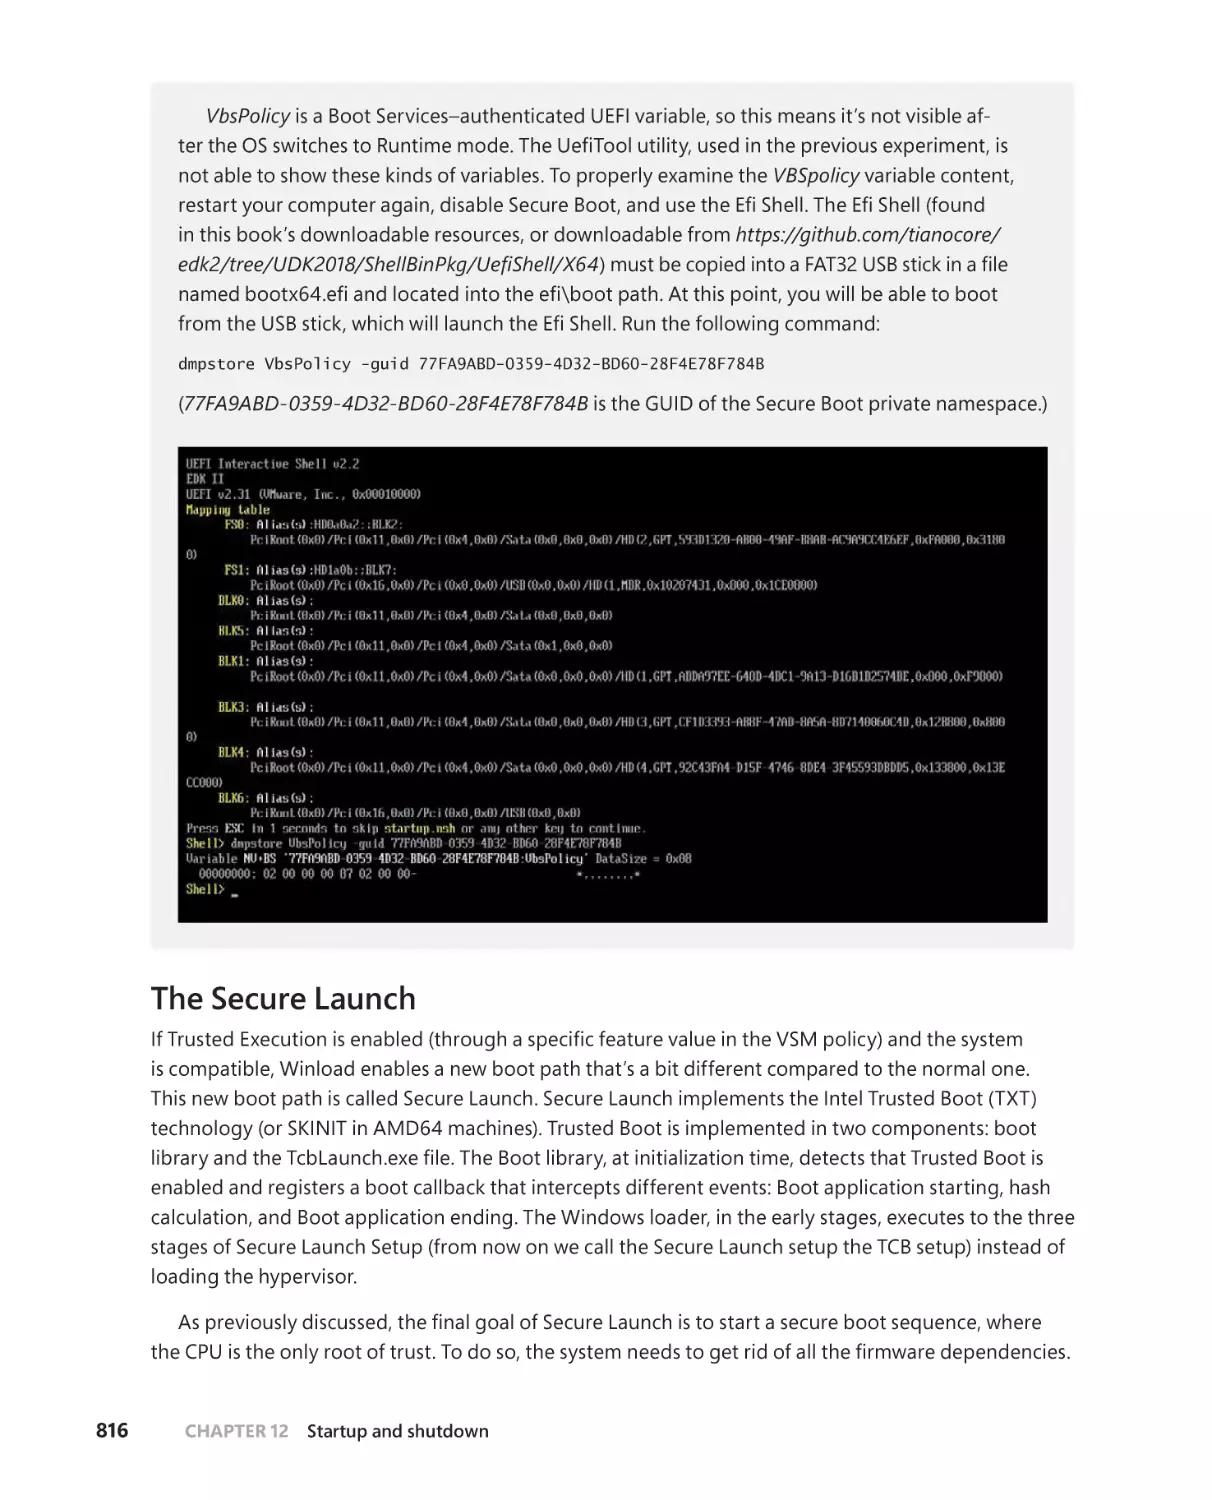
VSM startup policy . . . . . . . . . . . . . . . . . . . . . . . . . . . . . . . . . . . . . . . . . . . . 813
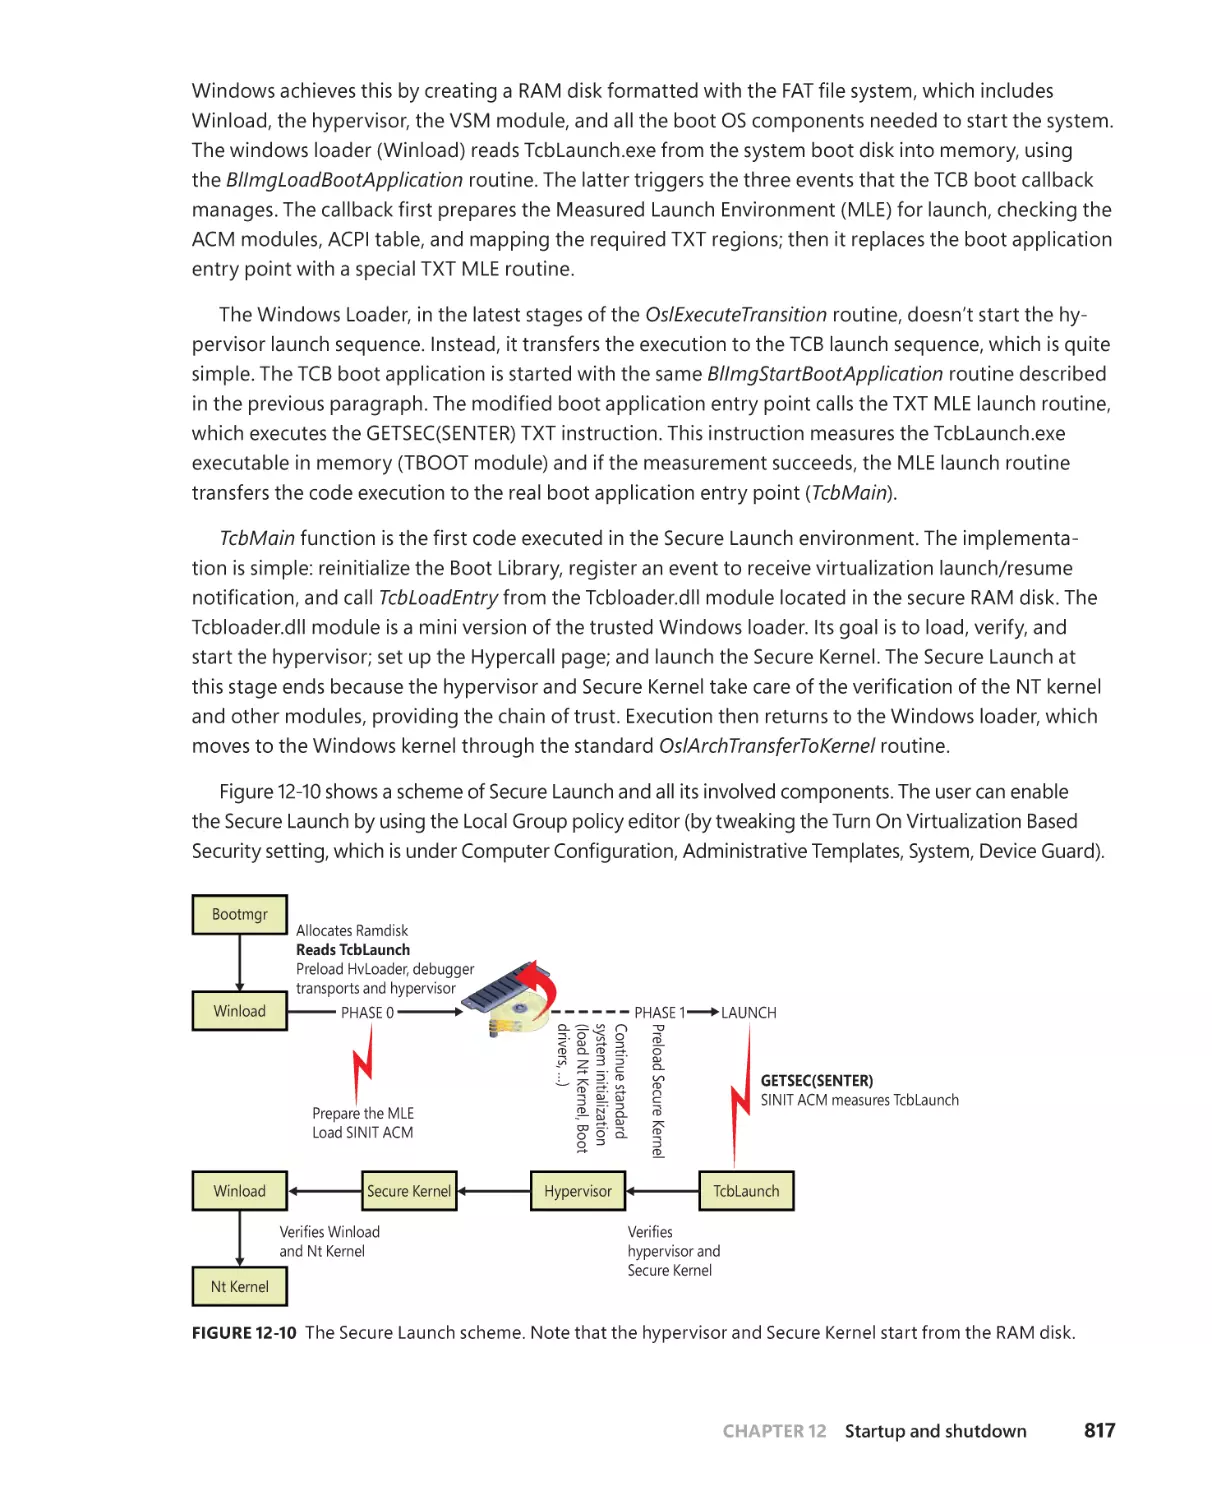
The Secure Launch. . . . . . . . . . . . . . . . . . . . . . . . . . . . . . . . . . . . . . . . . . . . . 816
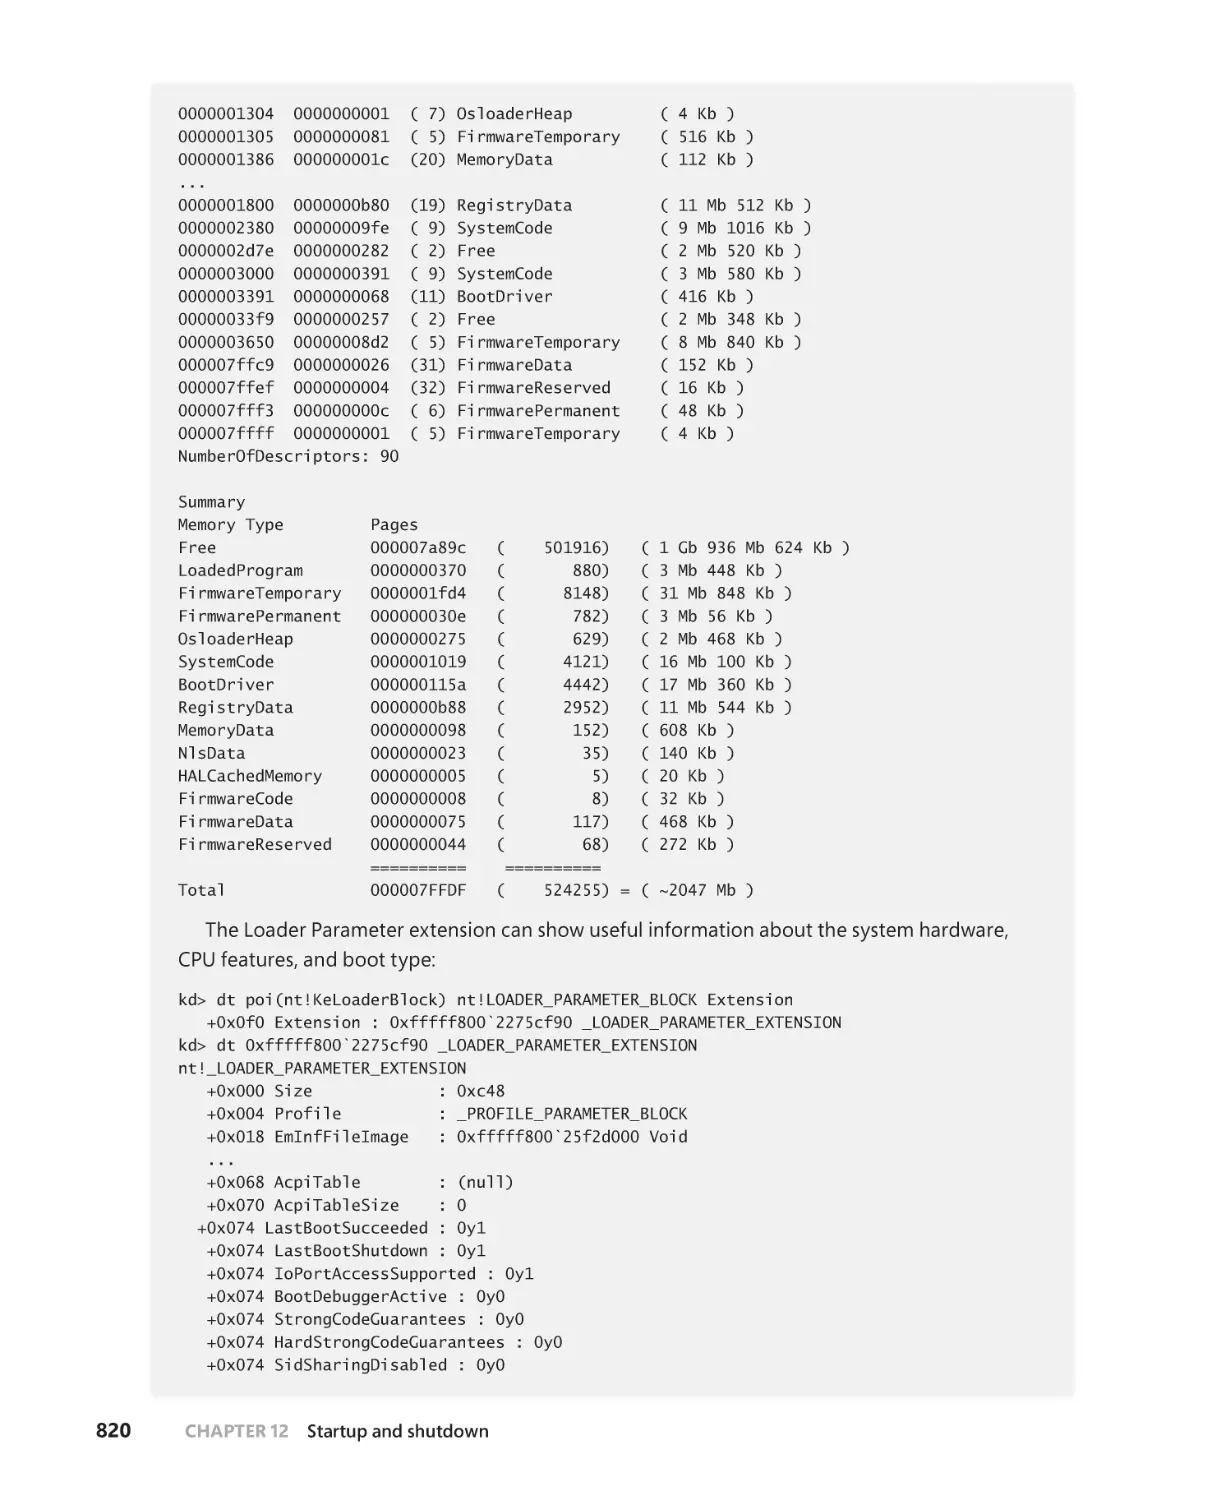
Initializing the kernel and executive subsystems . . . . . . . . . . . . . . . . . 818
Kernel initialization phase 1 . . . . . . . . . . . . . . . . . . . . . . . . . . . . . . . . . . . .824
Smss, Csrss, and Wininit . . . . . . . . . . . . . . . . . . . . . . . . . . . . . . . . . . . . . . . .830
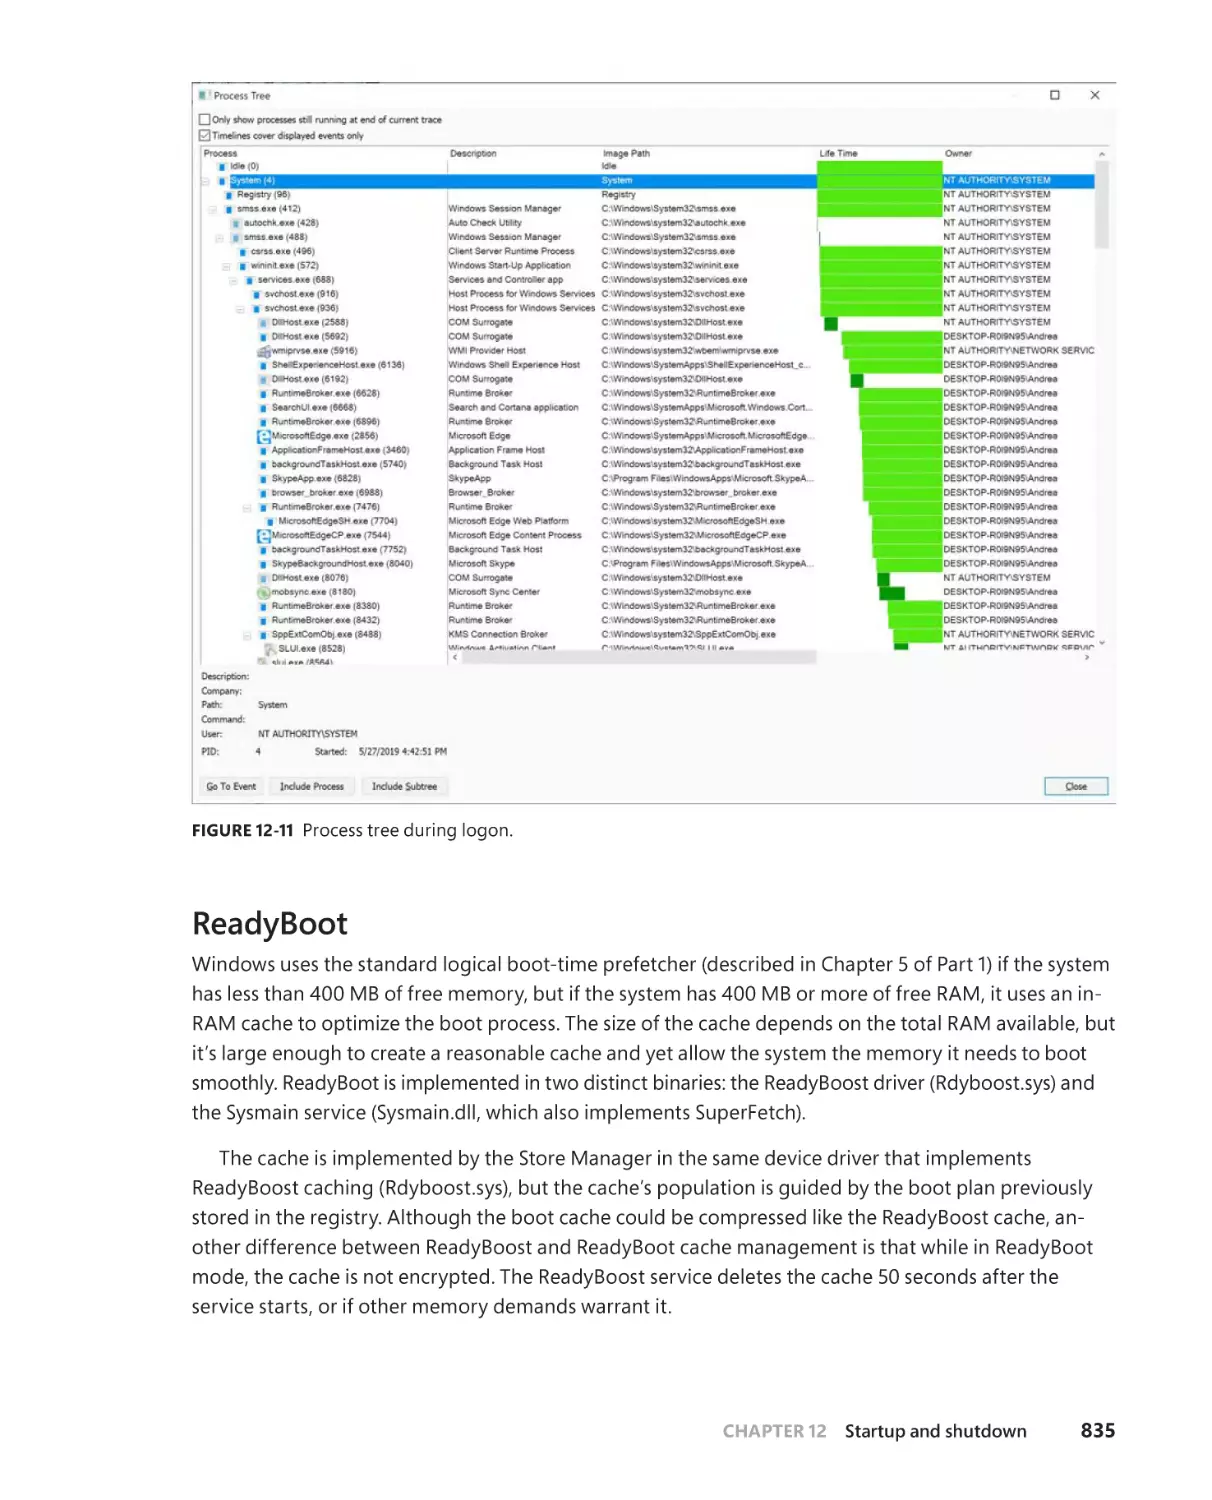
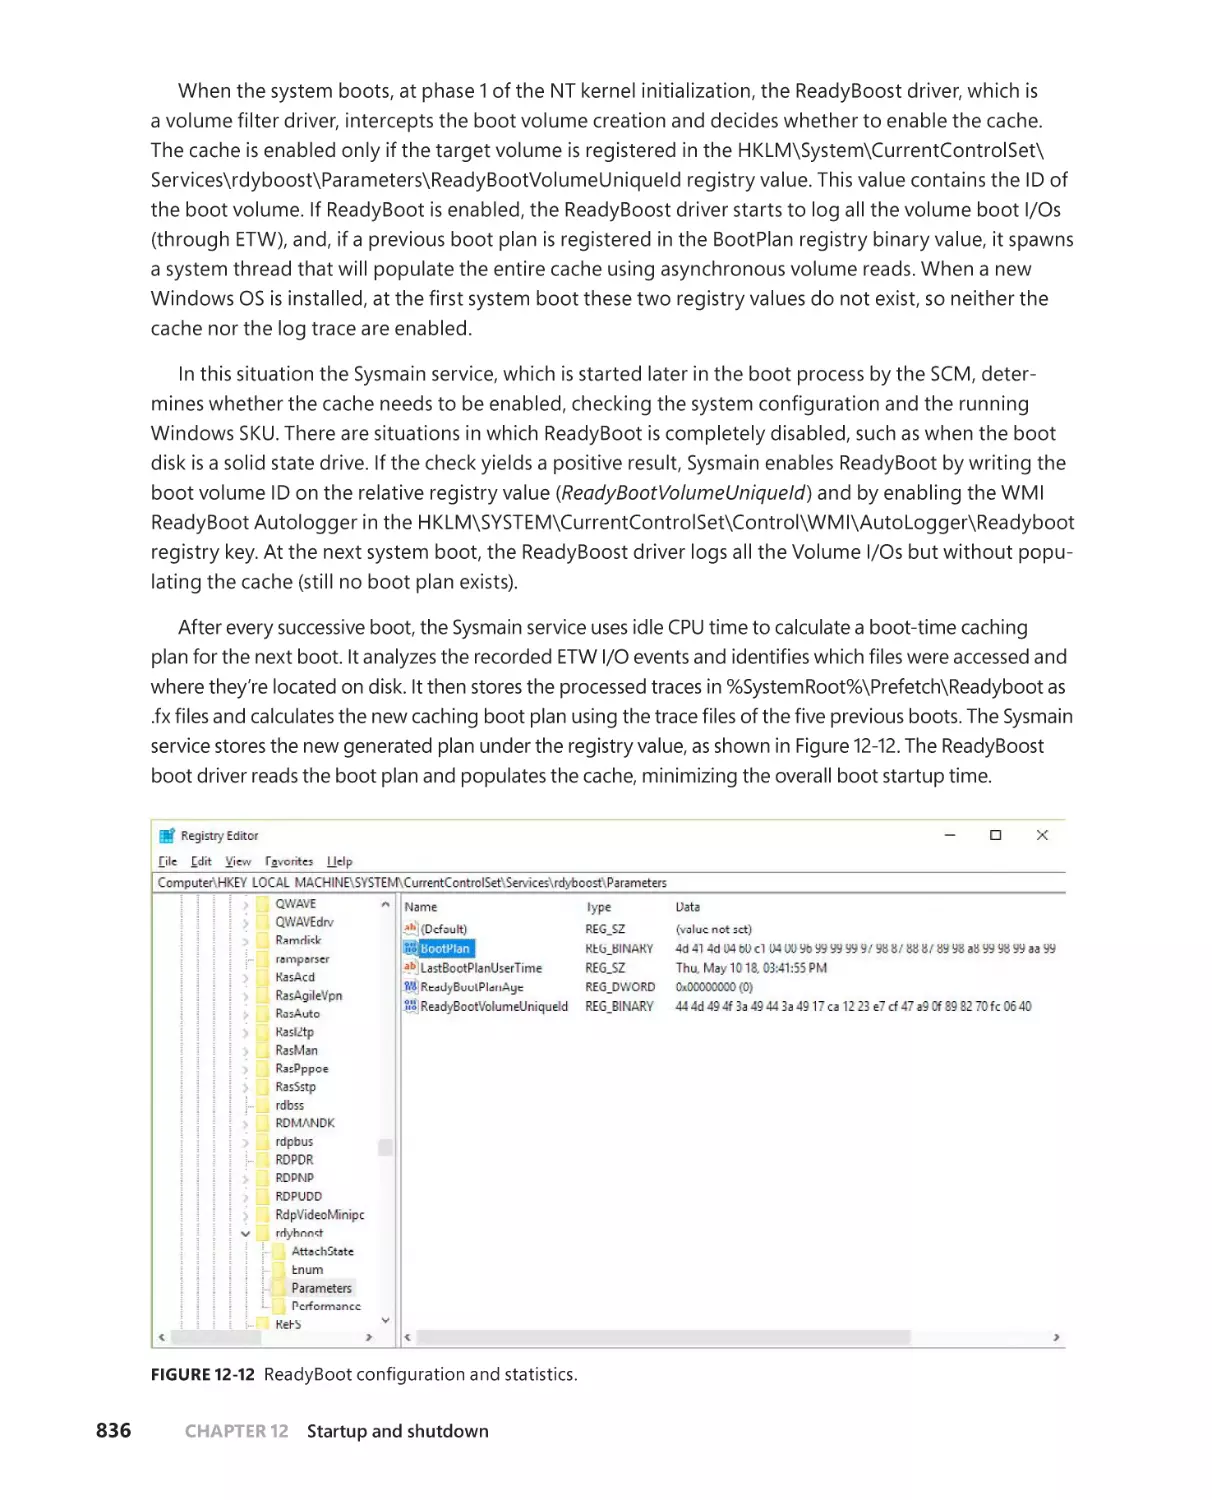
ReadyBoot . . . . . . . . . . . . . . . . . . . . . . . . . . . . . . . . . . . . . . . . . . . . . . . . . . . .835
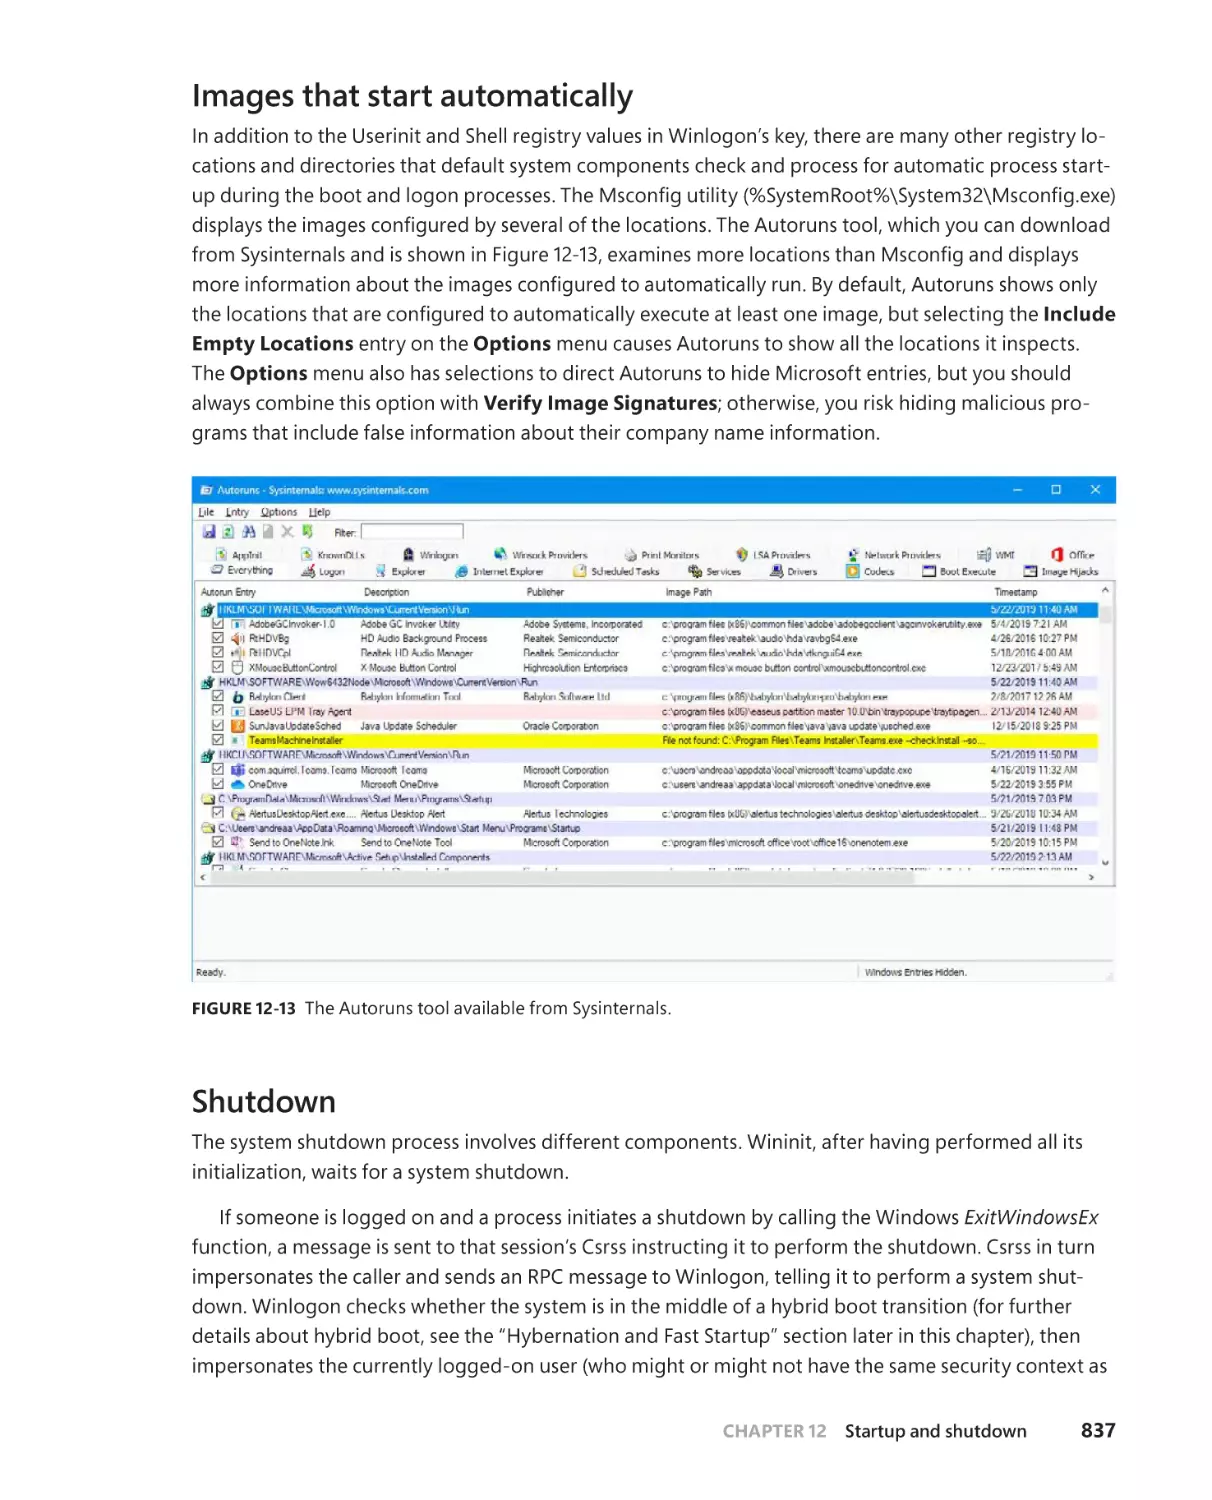
Images that start automatically . . . . . . . . . . . . . . . . . . . . . . . . . . . . . . . . .837
Shutdown . . . . . . . . . . . . . . . . . . . . . . . . . . . . . . . . . . . . . . . . . . . . . . . . . . . . .837
Hibernation and Fast Startup . . . . . . . . . . . . . . . . . . . . . . . . . . . . . . . . . . 840
Windows Recovery Environment (WinRE) . . . . . . . . . . . . . . . . . . . . . . .845
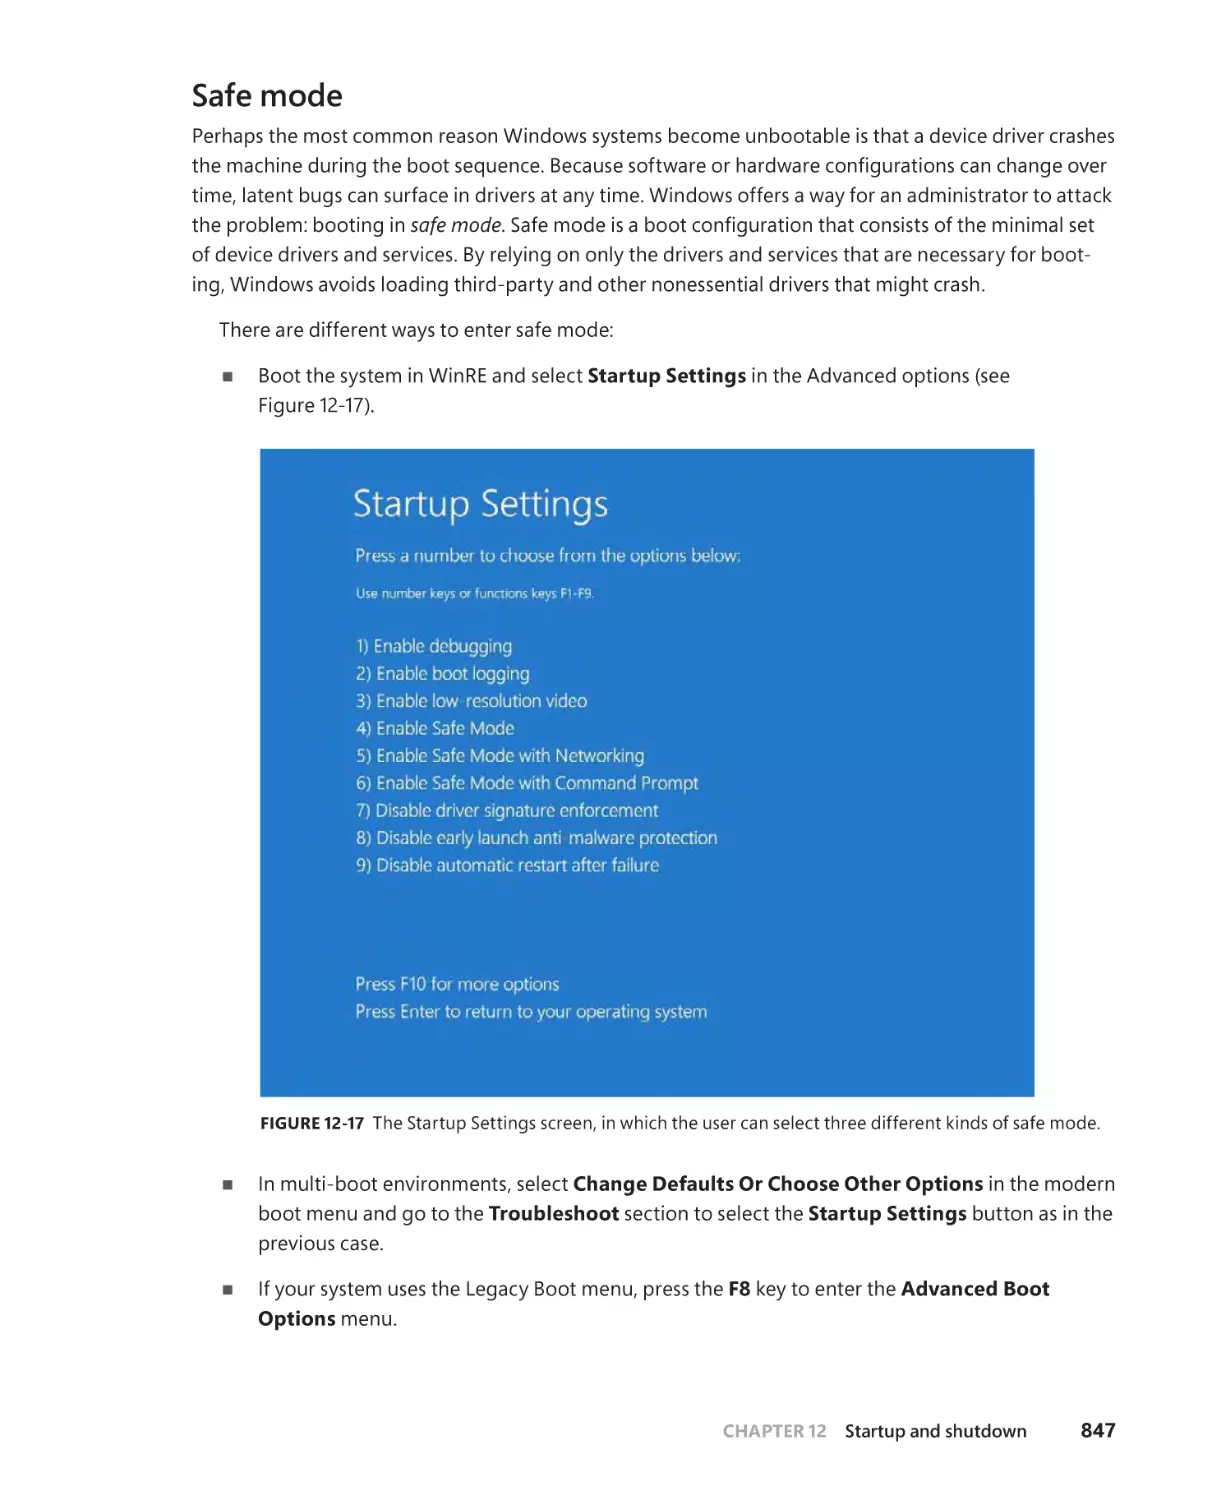
Safe mode . . . . . . . . . . . . . . . . . . . . . . . . . . . . . . . . . . . . . . . . . . . . . . . . . . . .847
Driver loading in safe mode . . . . . . . . . . . . . . . . . . . . . . . . . . . . . . . . . . . 848
Safe-mode-aware user programs . . . . . . . . . . . . . . . . . . . . . . . . . . . . . . .849
. . . . . . . . . . . . . . . . . . . . . . . . . . . . . . . . . . . . . . . . . . . . . . . .850
Conclusion . . . . . . . . . . . . . . . . . . . . . . . . . . . . . . . . . . . . . . . . . . . . . . . . . . . . . . . . . .850
Contents of Windows Internals, Seventh Edition, Part 1 . . . . . . . . . . . . . . . . .851
Index . . . . . . . . . . . . . . . . . . . . . . . . . . . . . . . . . . . . . . . . . . . . . . . . . . . . . . . . . . . . . . . .861
Contents
xvii
About the Authors
ANDRE A ALLIE VI is a system-level developer and security research
engineer with more than 15 years of experience. He graduated from
the University of Milano-Bicocca in 2010 with a bachelor’s degree in
computer science. For his thesis, he developed a Master Boot Record
(MBR) Bootkit entirely in 64-bits, capable of defeating all the Windows
7 kernel-protections (PatchGuard and Driver Signing enforcement).
Andrea is also a reverse engineer who specializes in operating systems
internals, from kernel-level code all the way to user-mode code. He
published in 2012), multiple PatchGuard bypasses, and many other research papers and
articles. He is the author of multiple system tools and software used for removing malware and advanced persistent threads. In his career, he has worked in various computer
security companies—Italian TgSoft, Saferbytes (now MalwareBytes), and Talos group of
Cisco Systems Inc. He originally joined Microsoft in 2016 as a security research engineer
in the Microsoft Threat Intelligence Center (MSTIC) group. Since January 2018, Andrea
has been a senior core OS engineer in the Kernel Security Core team of Microsoft,
where he mainly maintains and develops new features (like Retpoline or the Speculation
Mitigations) for the NT and Secure Kernel.
Andrea continues to be active in the security research community, authoring technical
articles on new kernel features of Windows in the Microsoft Windows Internals blog, and
speaking at multiple technical conferences, such as Recon and Microsoft BlueHat. Follow
Andrea on Twitter at @aall86.
ALE X IONE SCU is the vice president of endpoint engineering at
CrowdStrike, Inc., where he started as its founding chief architect. Alex is
a world-class security architect and consultant expert in low-level system
software, kernel development, security training, and reverse engineering.
Over more than two decades, his security research work has led to the
repair of dozens of critical security vulnerabilities in the Windows kernel
and its related components, as well as multiple behavioral bugs.
Previously, Alex was the lead kernel developer for ReactOS, an open-source Windows
clone written from scratch, for which he wrote most of the Windows NT-based subsystems. During his studies in computer science, Alex worked at Apple on the iOS kernel,
boot loader, and drivers on the original core platform team behind the iPhone, iPad, and
AppleTV. Alex is also the founder of Winsider Seminars & Solutions, Inc., a company that
specializes in low-level system software, reverse engineering, and security training for
various institutions.
Alex continues to be active in the community and has spoken at more than two dozen
events around the world. He offers Windows Internals training, support, and resources
to organizations and individuals worldwide. Follow Alex on Twitter at @aionescu and his
blogs at www.alex-ionescu.com and www.windows-internals.com/blog.
About the Authors
xix
Foreword
H
aving used and explored the internals of the wildly successful Windows 3.1 operating system, I immediately recognized the world-changing nature of Windows NT 3.1
when Microsoft released it in 1993. David Cutler, the architect and engineering leader for
Windows NT, had created a version of Windows that was secure, reliable, and scalable,
but with the same user interface and ability to run the same software as its older yet
more immature sibling. Helen Custer’s book Inside Windows NT was a fantastic guide to
its design and architecture, but I believed that there was a need for and interest in a book
that went deeper into its working details. VAX/VMS Internals and Data Structures, the
you could get with text, and I decided that I was going to write the Windows NT version
of that book.
ware company. To learn about Windows NT, I read documentation, reverse-engineered
its code, and wrote systems monitoring tools like Regmon and Filemon that helped me
understand the design by coding them and using them to observe the under-the-hood
views they gave me of Windows NT’s operation. As I learned, I shared my newfound
knowledge in a monthly “NT Internals” column in Windows NT Magazine, the magazine
for Windows NT administrators. Those columns would serve as the basis for the chapterlength versions that I’d publish in Windows Internals, the book I’d contracted to write
with IDG Press.
My book deadlines came and went because my book writing was further slowed by
my full-time job and time I spent writing Sysinternals (then NTInternals) freeware and
commercial software for Winternals Software, my startup. Then, in 1996, I had a shock
when Dave Solomon published Inside Windows NT, 2nd Edition. I found the book both
impressive and depressing. A complete rewrite of the Helen’s book, it went deeper and
broader into the internals of Windows NT like I was planning on doing, and it incorporated novel labs that used built-in tools and diagnostic utilities from the Windows NT
Resource Kit and Device Driver Development Kit (DDK) to demonstrate key concepts and
behaviors. He’d raised the bar so high that I knew that writing a book that matched the
quality and depth he’d achieved was even more monumental than what I had planned.
As the saying goes, if you can’t beat them, join them. I knew Dave from the Windows
conference speaking circuit, so within a couple of weeks of the book’s publication I
sent him an email proposing that I join him to coauthor the next edition, which would
document what was then called Windows NT 5 and would eventually be renamed as
Windows 2000. My contribution would be new chapters based on my NT Internals
column about topics Dave hadn’t included, and I’d also write about new labs that used
my Sysinternals tools. To sweeten the deal, I suggested including the entire collection of
Sysinternals tools on a CD that would accompany the book—a common way to distribute
software with books and magazines.
Dave was game. First, though, he had to get approval from Microsoft. I had caused
Microsoft some public relations complications with my public revelations that Windows NT
Workstation and Windows NT Server were the same exact code with different behaviors
based on a Registry setting. And while Dave had full Windows NT source access, I didn’t,
and I wanted to keep it that way so as not to create intellectual property issues with the
software I was writing for Sysinternals or Winternals, which relied on undocumented APIs.
The timing was fortuitous because by the time Dave asked Microsoft, I’d been repairing my
relationship with key Windows engineers, and Microsoft tacitly approved.
Writing Inside Windows 2000 with Dave was incredibly fun. Improbably and
completely coincidentally, he lived about 20 minutes from me (I lived in Danbury,
Connecticut and he lived in Sherman, Connecticut). We’d visit each other’s houses for
marathon writing sessions where we’d explore the internals of Windows together, laugh
at geeky jokes and puns, and pose technical questions that would pit him and me in
bugger, and Sysinternals tools. (Don’t rub it in if you talk to him, but I always won.)
one of the most commercially successful operating systems of all time. We brought in
Vista. Alex is among the best reverse engineers and operating systems experts in the
world, and he added both breadth and depth to the book, matching or exceeding our
high standards for legibility and detail. The increasing scope of the book, combined with
Windows itself growing with new capabilities and subsystems, resulted in the 6th Edition
exceeding the single-spine publishing limit we’d run up against with the 5th Edition, so
we split it into two volumes.
I had already moved to Azure when writing for the sixth edition got underway, and by
the time we were ready for the seventh edition, I no longer had time to contribute to the
book. Dave Solomon had retired, and the task of updating the book became even more
challenging when Windows went from shipping every few years with a major release and
version number to just being called Windows 10 and releasing constantly with feature
and functionality upgrades. Pavel Yosifovitch stepped in to help Alex with Part 1, but he
too became busy with other projects and couldn’t contribute to Part 2. Alex was also
busy with his startup CrowdStrike, so we were unsure if there would even be a Part 2.
Foreword
xxi
Fortunately, Andrea came to the rescue. He and Alex have updated a broad swath of
the system in Part 2, including the startup and shutdown process, Registry subsystem,
and UWP. Not just content to provide a refresh, they’ve also added three new chapters
the Windows Internals book series being the most technically deep and accurate word on
the inner workings on Windows, one of the most important software releases in history,
is secure, and I’m proud to have my name still listed on the byline.
A memorable moment in my career came when we asked David Cutler to write the
foreword for Inside Windows 2000. Dave Solomon and I had visited Microsoft a few times
to meet with the Windows engineers and had met David on a few of the trips. However,
we had no idea if he’d agree, so were thrilled when he did. It’s a bit surreal to now be
on the other side, in a similar position to his when we asked David, and I’m honored to
be given the opportunity. I hope the endorsement my foreword represents gives you
Cutler’s did for buyers of Inside Windows 2000.
Mark Russinovich
Microsoft
March 2021
Bellevue, Washington
xxii
Foreword
Introduction
W
indows Internals, Seventh Edition, Part 2 is intended for advanced computer
professionals (developers, security researchers, and system administrators) who
want to understand how the core components of the Microsoft Windows 10 (up to and
including the May 2021 Update, a.k.a. 21H1) and Windows Server (from Server 2016 up
to Server 2022) operating systems work internally, including many components that are
shared with Windows 11X and the Xbox Operating System.
With this knowledge, developers can better comprehend the rationale behind design
decisions to create more powerful, scalable, and secure software. They will also improve
their skills at debugging complex problems rooted deep in the heart of the system, all
System administrators can leverage this information as well because understanding how the operating system works “under the hood” facilitates an understanding of
the expected performance behavior of the system. This makes troubleshooting system
problems much easier when things go wrong and empowers the triage of critical issues
from the mundane.
ing system can misbehave and be misused, causing undesirable behavior, while also understanding the mitigations and security features offered by modern Windows systems
against such scenarios. Forensic experts can learn which data structures and mechanisms
Whoever the reader might be, after reading this book, they will have a better understanding of how Windows works and why it behaves the way it does.
History of the book
This is the seventh edition of a book that was originally called Inside Windows NT
(Microsoft Press, 1992), written by Helen Custer (prior to the initial release of Microsoft
Windows NT 3.1). Inside Windows NT
NT and provided key insights into the architecture and design of the system. Inside
Windows NT, Second Edition (Microsoft Press, 1998) was written by David Solomon. It
updated the original book to cover Windows NT 4.0 and had a greatly increased level of
technical depth.
xxiii
Inside Windows 2000, Third Edition (Microsoft Press, 2000) was authored by David
Solomon and Mark Russinovich. It added many new topics, such as startup and shutdown,
kernel changes in Windows 2000, such as the Windows Driver Model (WDM), Plug and
Play, power management, Windows Management Instrumentation (WMI), encryption, the
job object, and Terminal Services. Windows Internals, Fourth Edition (Microsoft Press, 2004)
was the Windows XP and Windows Server 2003 update and added more content focused
on helping IT professionals make use of their knowledge of Windows internals, such as using key tools from Windows SysInternals and analyzing crash dumps.
Windows Internals, Fifth Edition (Microsoft Press, 2009) was the update for Windows
Vista and Windows Server 2008. It saw Mark Russinovich move on to a full-time job
at Microsoft (where he is now the Azure CTO) and the addition of a new co-author,
Alex Ionescu. New content included the image loader, user-mode debugging facility, Advanced Local Procedure Call (ALPC), and Hyper-V. The next release, Windows
Internals, Sixth Edition (Microsoft Press, 2012), was fully updated to address the many
kernel changes in Windows 7 and Windows Server 2008 R2, with many new hands-on
Seventh edition changes
of allowing the authors to publish parts of the book more quickly than others (March
2012 for Part 1, and September 2012 for Part 2). At the time, however, this split was purely
based on page counts, with the same overall chapters returning in the same order as
prior editions.
brought together the Windows 8 and Windows Phone 8 kernels, and eventually incorporated the modern application environment in Windows 8.1, Windows RT, and Windows
Phone 8.1. The convergence story was complete with Windows 10, which runs on desktops, laptops, cell phones, servers, Xbox One, HoloLens, and various Internet of Things
With the seventh edition (Microsoft Press, 2017), the authors did just that, joined for
insider” and overall book manager. Working alongside Alex Ionescu, who like Mark,
had moved on to his own full-time job at CrowdStrike (where is now the VP of endpoint
xxiv
Introduction
engineering), Pavel made the decision to refactor the book’s chapters so that the two
parts could be more meaningfully cohesive manuscripts instead of forcing readers to
wait for Part 2 to understand concepts introduced in Part 1. This allowed Part 1 to stand
fully on its own, introducing readers to the key concepts of Windows 10’s system architecture, process management, thread scheduling, memory management, I/O handling,
plus user, data, and platform security. Part 1 covered aspects of Windows 10 up to and
including Version 1703, the May 2017 Update, as well as Windows Server 2016.
Changes in Part 2
With Alex Ionescu and Mark Russinovich consumed by their full-time jobs, and Pavel
champion. The authors are grateful to Andrea Allievi for having eventually stepped up
to carry on the mantle and complete the series. Working with advice and guidance from
book around and brought his own vision to the series.
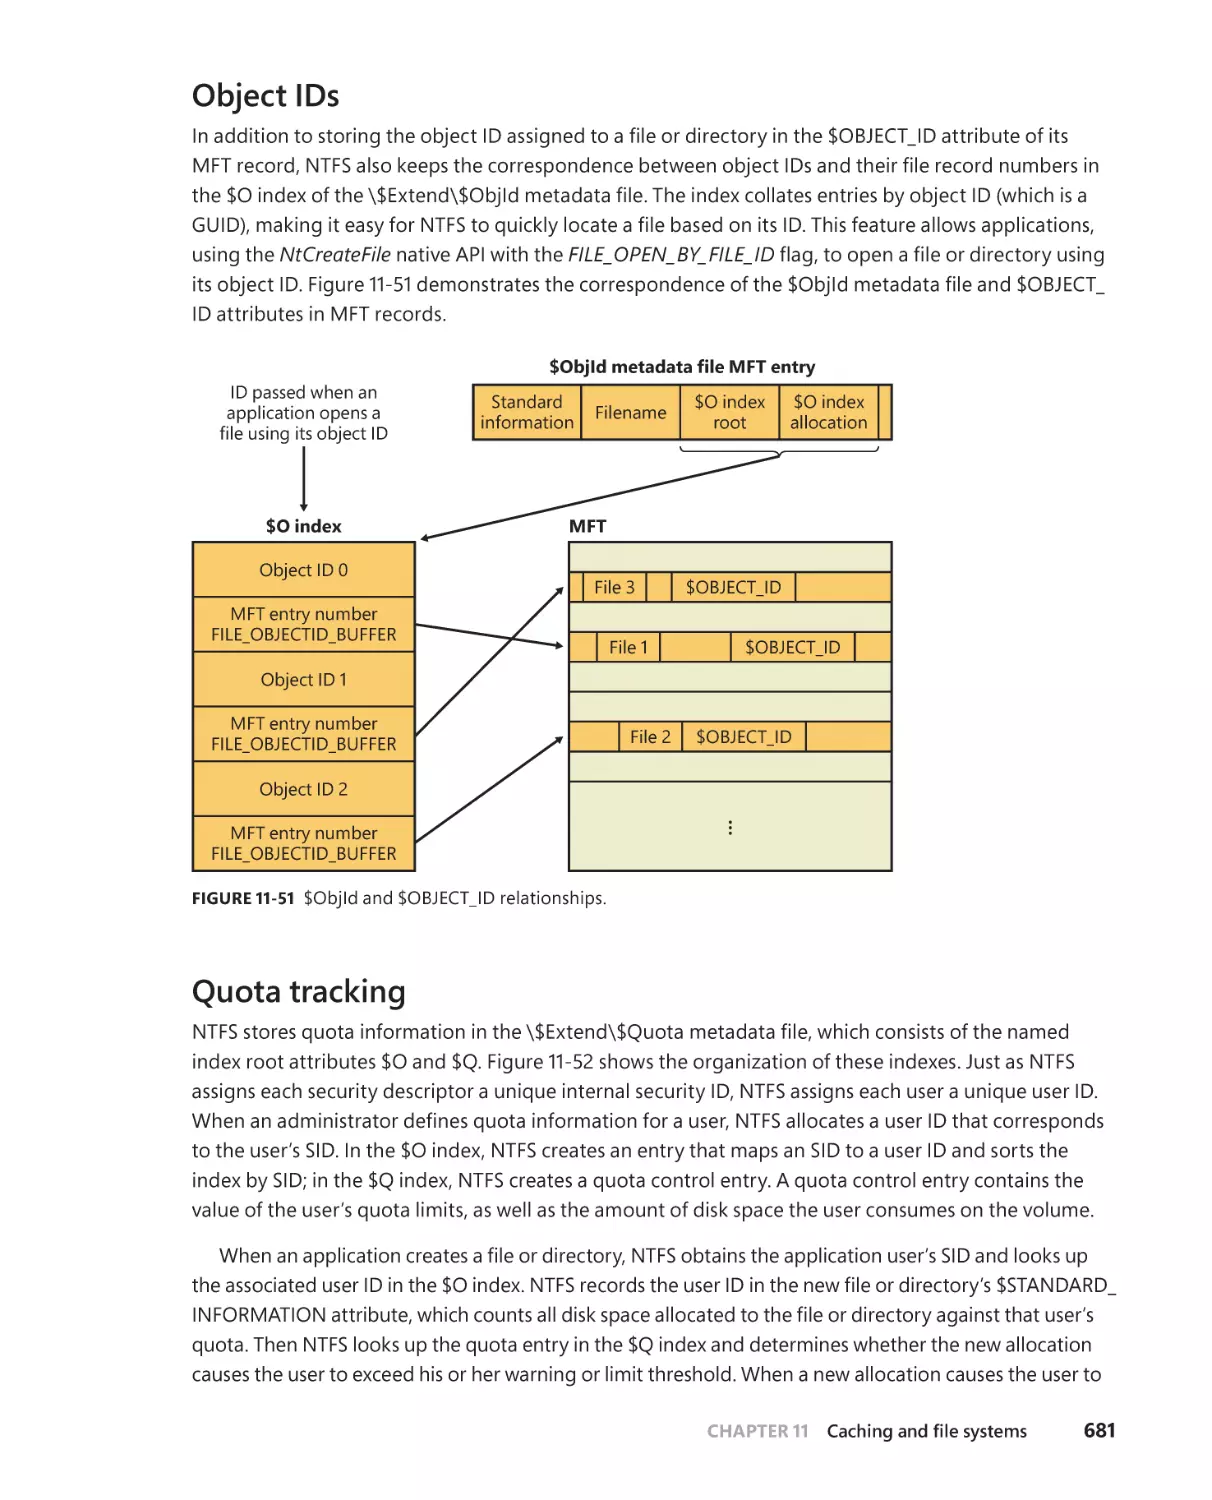
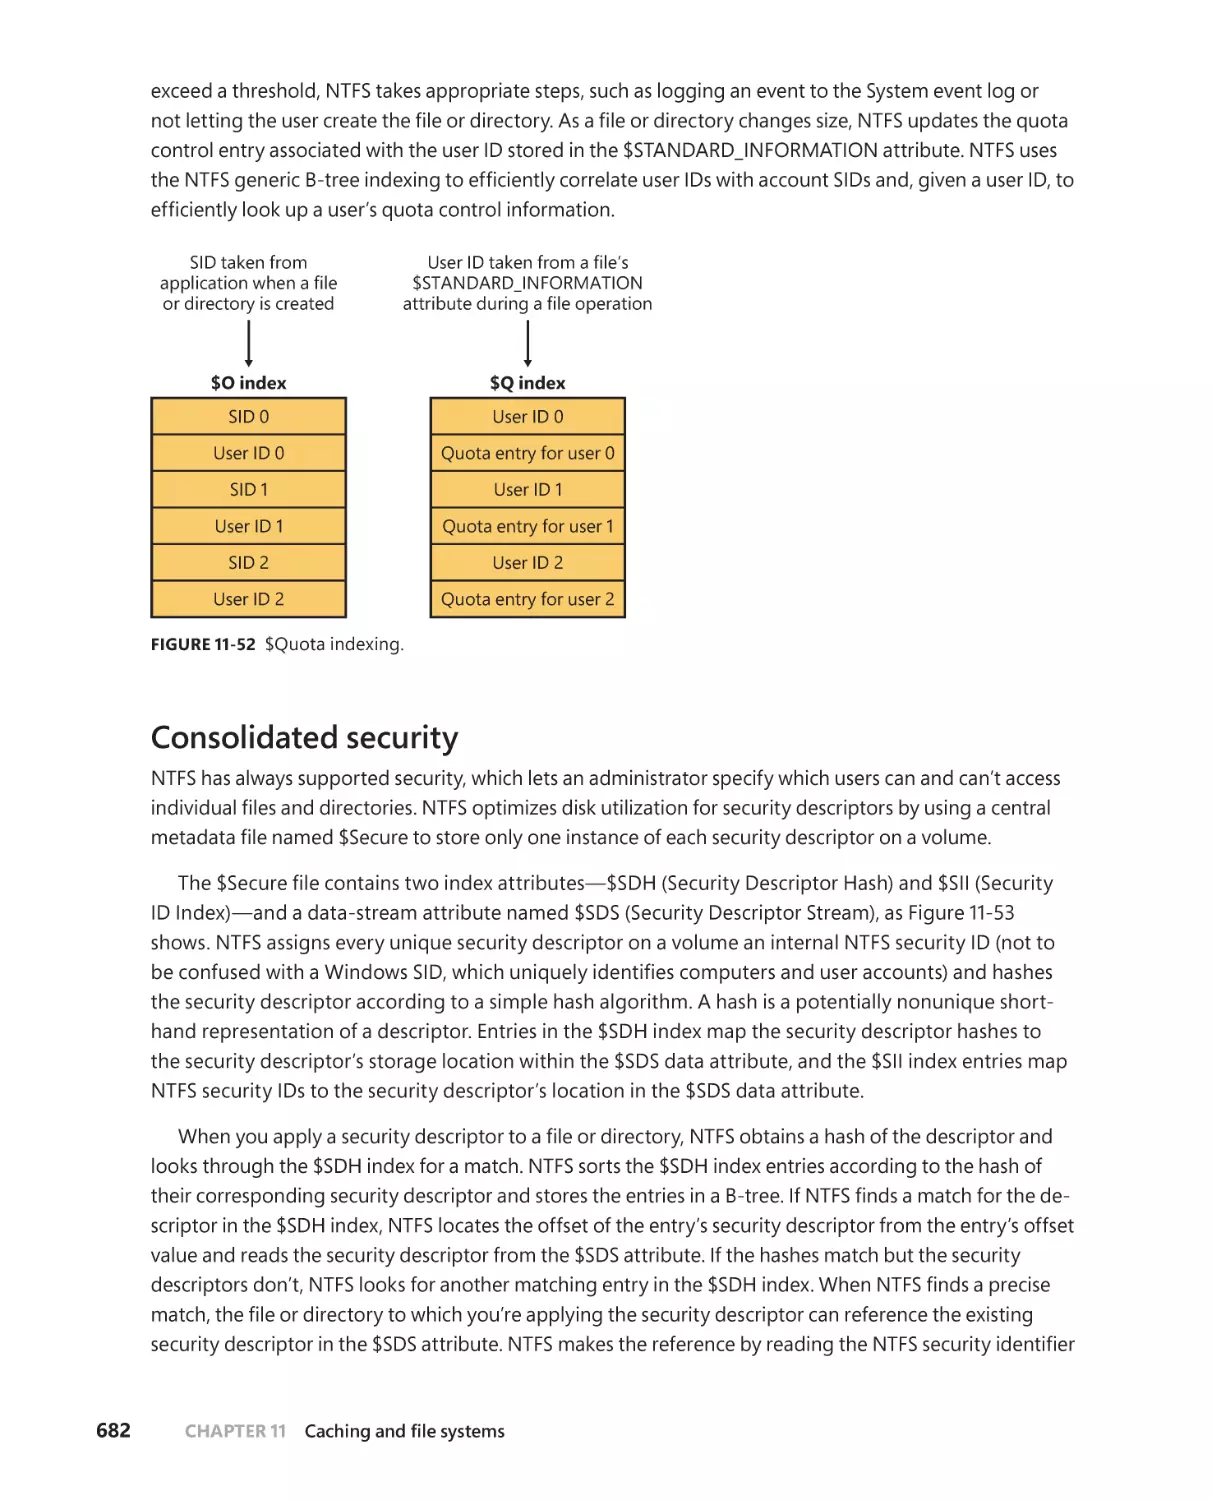
Realizing that chapters on topics such as networking and crash dump analysis were
beyond today’s readers’ interests, Andrea instead added exciting new content around
Hyper-V, which is now a key part of the Windows platform strategy, both on Azure and
on client systems. This complements fully rewritten chapters on the boot process, on
new storage technologies such as ReFS and DAX, and expansive updates on both system
and management mechanisms, alongside the usual hands-on experiments, which have
been fully updated to take advantage of new debugger technologies and tooling.
The long delay between Parts 1 and 2 made it possible to make sure the book was
fully updated to cover the latest public build of Windows 10, Version 2103 (May 2021
Update / 21H1), including Windows Server 2019 and 2022, such that readers would not be
“behind” after such a long gap long gap. As Windows 11 builds upon the foundation of
the same operating system kernel, readers will be adequately prepared for this upcoming version as well.
Hands-on experiments
Even without access to the Windows source code, you can glean much about Windows
internals from the kernel debugger, tools from SysInternals, and the tools developed
aspect of the internal behavior of Windows, the steps for trying the tool yourself are
listed in special “EXPERIMENT” sections. These appear throughout the book, and we
Introduction
xxv
encourage you to try them as you’re reading. Seeing visible proof of how Windows works
internally will make much more of an impression on you than just reading about it will.
Topics not covered
Windows is a large and complex operating system. This book doesn’t cover everything
relevant to Windows internals but instead focuses on the base system components. For
example, this book doesn’t describe COM+, the Windows distributed object-oriented programming infrastructure, or the Microsoft .NET Framework, the foundation of managed
code applications. Because this is an “internals” book and not a user, programming, or sys-
A warning and a caveat
Because this book describes undocumented behavior of the internal architecture and
the operation of the Windows operating system (such as internal kernel structures and
functions), this content is subject to change between releases. By “subject to change,” we
don’t necessarily mean that details described in this book will change between releases,
but you can’t count on them not changing. Any software that uses these undocumented
interfaces, or insider knowledge about the operating system, might not work on future
releases of Windows. Even worse, software that runs in kernel mode (such as device
drivers) and uses these undocumented interfaces might experience a system crash when
running on a newer release of Windows, resulting in potential loss of data to users of
such software.
In short, you should never use any internal Windows functionality, registry key,
behavior, API, or other undocumented detail mentioned in this book during the development of any kind of software designed for end-user systems or for any other purpose
other than research and documentation. Always check with the Microsoft Software
Assumptions about you
The book assumes the reader is comfortable with working on Windows at a power-user
level and has a basic understanding of operating system and hardware concepts, such as
CPU registers, memory, processes, and threads. Basic understanding of functions, point-
xxvi
Introduction
Organization of this book
The book is divided into two parts (as was the sixth edition), the second of which you’re
holding in your hands.
■
■
■
Chapter 8, “System mechanisms,” provides information about the important
internal mechanisms that the operating system uses to provide key services to
device drivers and applications, such as ALPC, the Object Manager, and synchronization routines. It also includes details about the hardware architecture that
Windows runs on, including trap processing, segmentation, and side channel
vulnerabilities, as well as the mitigations required to address them.
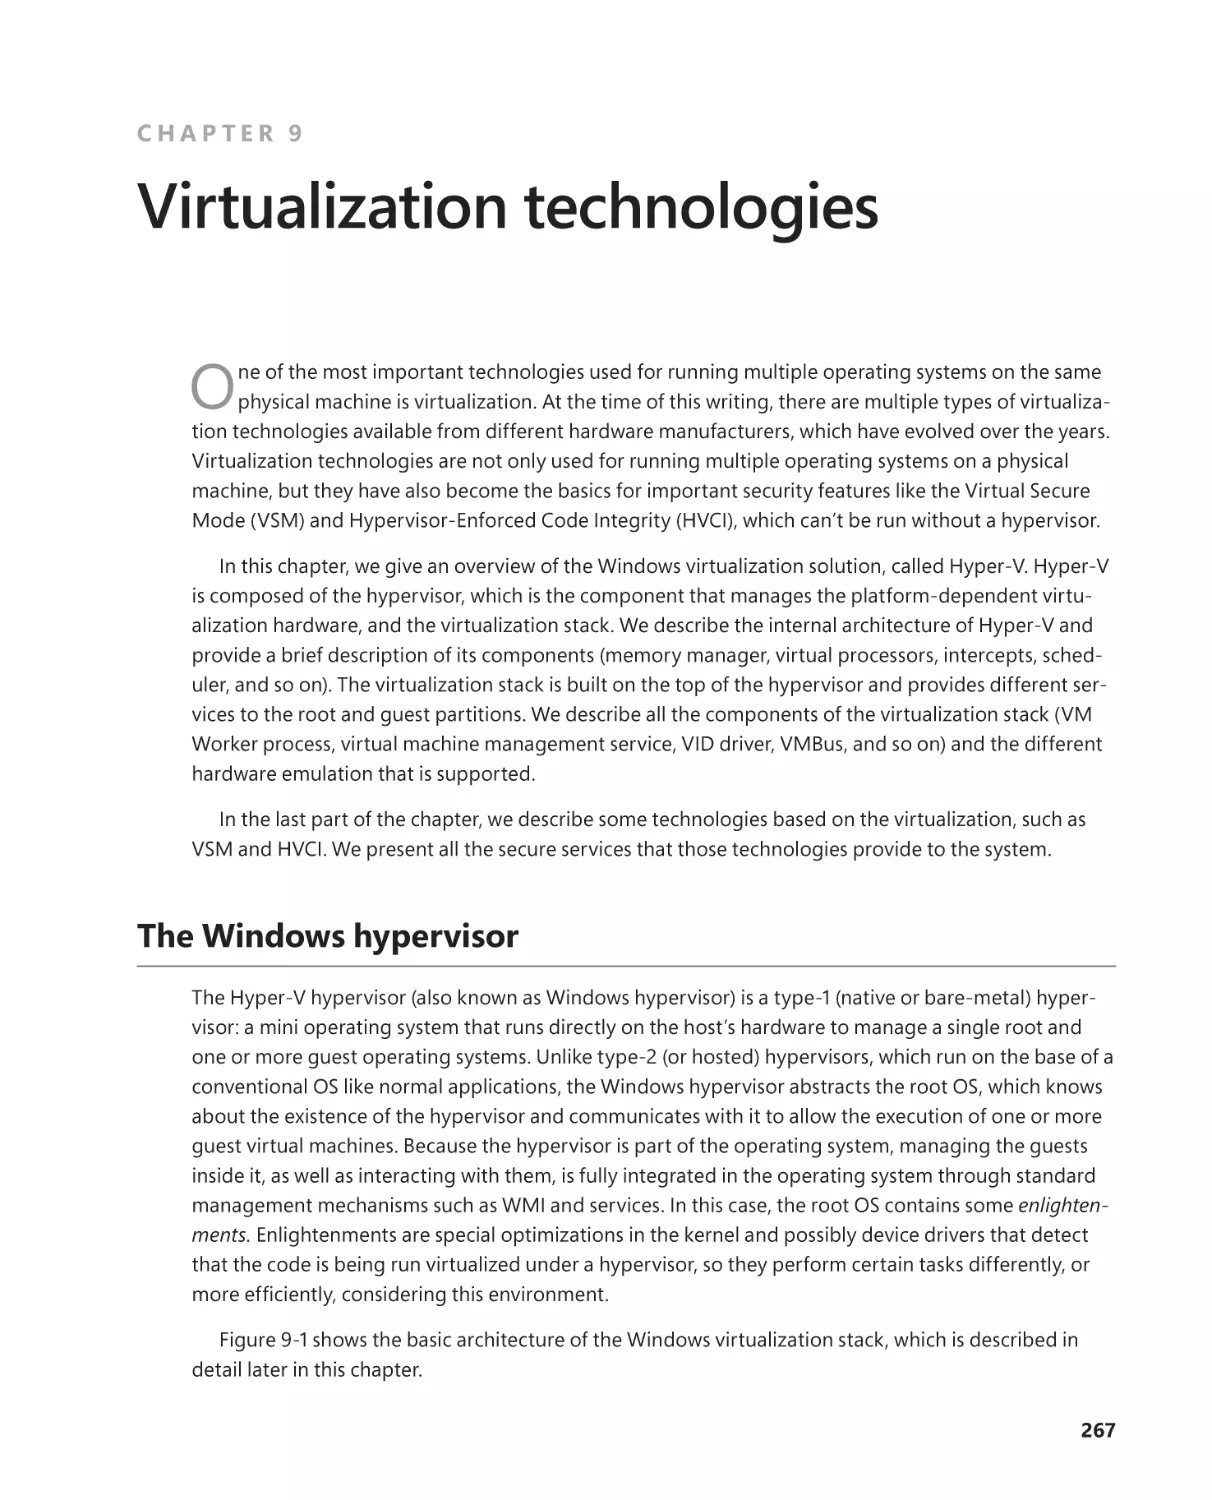
Chapter 9, “Virtualization technologies,” describes how the Windows OS uses the
virtualization technologies exposed by modern processors to allow users to create and use multiple virtual machines on the same system. Virtualization is also
extensively used by Windows to provide a new level of security. Thus, the Secure
Kernel and Isolated User Mode are extensively discussed in this chapter.
Chapter 10, “Management, diagnostics, and tracing,” details the fundamental
tion, and diagnostics. In particular, the Windows registry, Windows services, WMI,
and Task Scheduling are introduced along with diagnostics services like Event
Tracing for Windows (ETW) and DTrace.
■
ports, with particular detail on NTFS and ReFS.
■
when the system starts and shuts down, and the operating system components
brought on by UEFI, such as Secure Boot, Measured Boot, and Secure Launch.
Conventions
The following conventions are used in this book:
■
Boldface type is used to indicate text that you type as well as interface items that
you are instructed to click or buttons that you are instructed to press.
Introduction
xxvii
■
Italic type is used to indicate new terms.
■
Code elements appear in italics or in a monospaced font, depending on context.
-
■
talized—for example, the Save As dialog box.
■
Keyboard shortcuts are indicated by a plus sign (+) separating the key names. For
example, Ctrl+Alt+Delete means that you press the Ctrl, Alt, and Delete keys at
the same time.
About the companion content
We have included companion content to enrich your learning experience. You can download the companion content for this book from the following page:
MicrosoftPressStore.com/WindowsInternals7ePart2/downloads
Acknowledgments
The book contains complex technical details, as well as their reasoning, which are often
hard to describe and understand from an outsider’s perspective. Throughout its history,
to provide access to the vast swath of knowledge that exists within the company and
the rich development history behind the Windows operating system. For this Seventh
Edition, Part 2, the authors are grateful to Andrea Allievi for having joined as a main
author and having helped spearhead most of the book and its updated content.
Apart from Andrea, this book wouldn’t contain the depth of technical detail or the
level of accuracy it has without the review, input, and support of key members of the
Windows development team, other experts at Microsoft, and other trusted colleagues,
friends, and experts in their own domains.
It is worth noting that the newly written Chapter 9, “Virtualization technologies”
wouldn’t have been so complete and detailed without the help of Alexander Grest and
Jon Lange, who are world-class subject experts and deserve a special thanks, in particular for the days that they spent helping Andrea understand the inner details of the most
obscure features of the hypervisor and the Secure Kernel.
xxviii
Introduction
Alex would like to particularly bring special thanks to Arun Kishan, Mehmet Iyigun,
David Weston, and Andy Luhrs, who continue to be advocates for the book and Alex’s
inside access to people and information to increase the accuracy and completeness
of the book.
Furthermore, we want to thank the following people, who provided technical
review and/or input to the book or were simply a source of support and help to the
authors: Saar Amar, Craig Barkhouse, Michelle Bergeron, Joe Bialek, Kevin Broas, Omar
Carey, Neal Christiansen, Chris Fernald, Stephen Finnigan, Elia Florio, James Forshaw,
Andrew Harper, Ben Hillis, Howard Kapustein, Saruhan Karademir, Chris Kleynhans,
John Lambert, Attilio Mainetti, Bill Messmer, Matt Miller, Jake Oshins, Simon Pope,
Matthew Woolman, and Adam Zabrocki.
We continue to thank Ilfak Guilfanov of Hex-Rays (http://www.hex-rays.com) for
the IDA Pro Advanced and Hex-Rays licenses granted to Alex Ionescu, including most
recently a lifetime license, which is an invaluable tool for speeding up the reverse engineering of the Windows kernel. The Hex-Rays team continues to support Alex’s research
and builds relevant new decompiler features in every release, which make writing a book
such as this possible without source code access.
Finally, the authors would like to thank the great staff at Microsoft Press (Pearson)
who have been behind turning this book into a reality. Loretta Yates, Charvi Arora, and
their support staff all deserve a special mention for their unlimited patience from turning
a contract signed in 2018 into an actual book two and a half years later.
Errata and book support
We’ve made every effort to ensure the accuracy of this book and its companion content.
You can access updates to this book—in the form of a list of submitted errata and their
related corrections at
MicrosoftPressStore.com/WindowsInternals7ePart2/errata
If you discover an error that is not already listed, please submit it to us at the
same page.
For additional book support and information, please visit
http://www.MicrosoftPressStore.com/Support.
Introduction
xxix
Please note that product support for Microsoft software and hardware is not offered
through the previous addresses. For help with Microsoft software or hardware, go to
http://support.microsoft.com.
Stay in touch
Let’s keep the conversation going! We’re on Twitter: @MicrosoftPress.
xxx
Introduction
CHAPTER 8
System mechanisms
T
he Windows operating system provides several base mechanisms that kernel-mode components
such as the executive, the kernel, and device drivers use. This chapter explains the following system
mechanisms and describes how they are used:
■
Processor execution model, including ring levels, segmentation, task states, trap dispatching,
including interrupts, deferred procedure calls (DPCs), asynchronous procedure calls (APCs),
timers, system worker threads, exception dispatching, and system service dispatching
■
Speculative execution barriers and other software-side channel mitigations
■
The executive Object Manager
■
Synchronization, including spinlocks, kernel dispatcher objects, wait dispatching, and userand slim reader-writer (SRW) locks
■
Advanced Local Procedure Call (ALPC) subsystem
■
■
WoW64
■
User-mode debugging framework
Additionally, this chapter also includes detailed information on the Universal Windows Platform
(UWP) and the set of user-mode and kernel-mode services that power it, such as the following:
■
Packaged Applications and the AppX Deployment Service
■
Centennial Applications and the Windows Desktop Bridge
■
Process State Management (PSM) and the Process Lifetime Manager (PLM)
■
Host Activity Moderator (HAM) and Background Activity Moderator (BAM)
1
Processor execution model
This section takes a deep look at the internal mechanics of Intel i386–based processor architecture and
its extension, the AMD64-based architecture used on modern systems. Although the two respective
We discuss concepts such as segmentation, tasks, and ring levels, which are critical mechanisms, and
we discuss the concept of traps, interrupts, and system calls.
Segmentation
High-level programming languages such as C/C++ and Rust are compiled down to machine-level code,
often called assembler or assembly code. In this low-level language, processor registers are accessed
directly, and there are often three primary types of registers that programs access (which are visible
when debugging code):
■
■
■
The Program Counter (PC), which in x86/x64 architecture is called the Instruction Pointer (IP)
and is represented by the EIP (x86) and RIP (x64) register. This register always points to the line
of assembly code that is executing (except for certain 32-bit ARM architectures).
The Stack Pointer (SP), which is represented by the ESP (x86) and RSP (x64) register. This register
points to the location in memory that is holding the current stack location.
Other General Purpose Registers (GPRs) include registers such as EAX/RAX, ECX/RCX, EDX/RDX,
ESI/RSI and R8, R14, just to name a few examples.
Although these registers can contain address values that point to memory, additional registers
are involved when accessing these memory locations as part of a mechanism called protected mode
segmentation. This works by checking against various segment registers, also called selectors:
■
segment (CS) register.
■
segment (SS) register.
■
Accesses to other registers are determined by a segment override, which encoding can be used
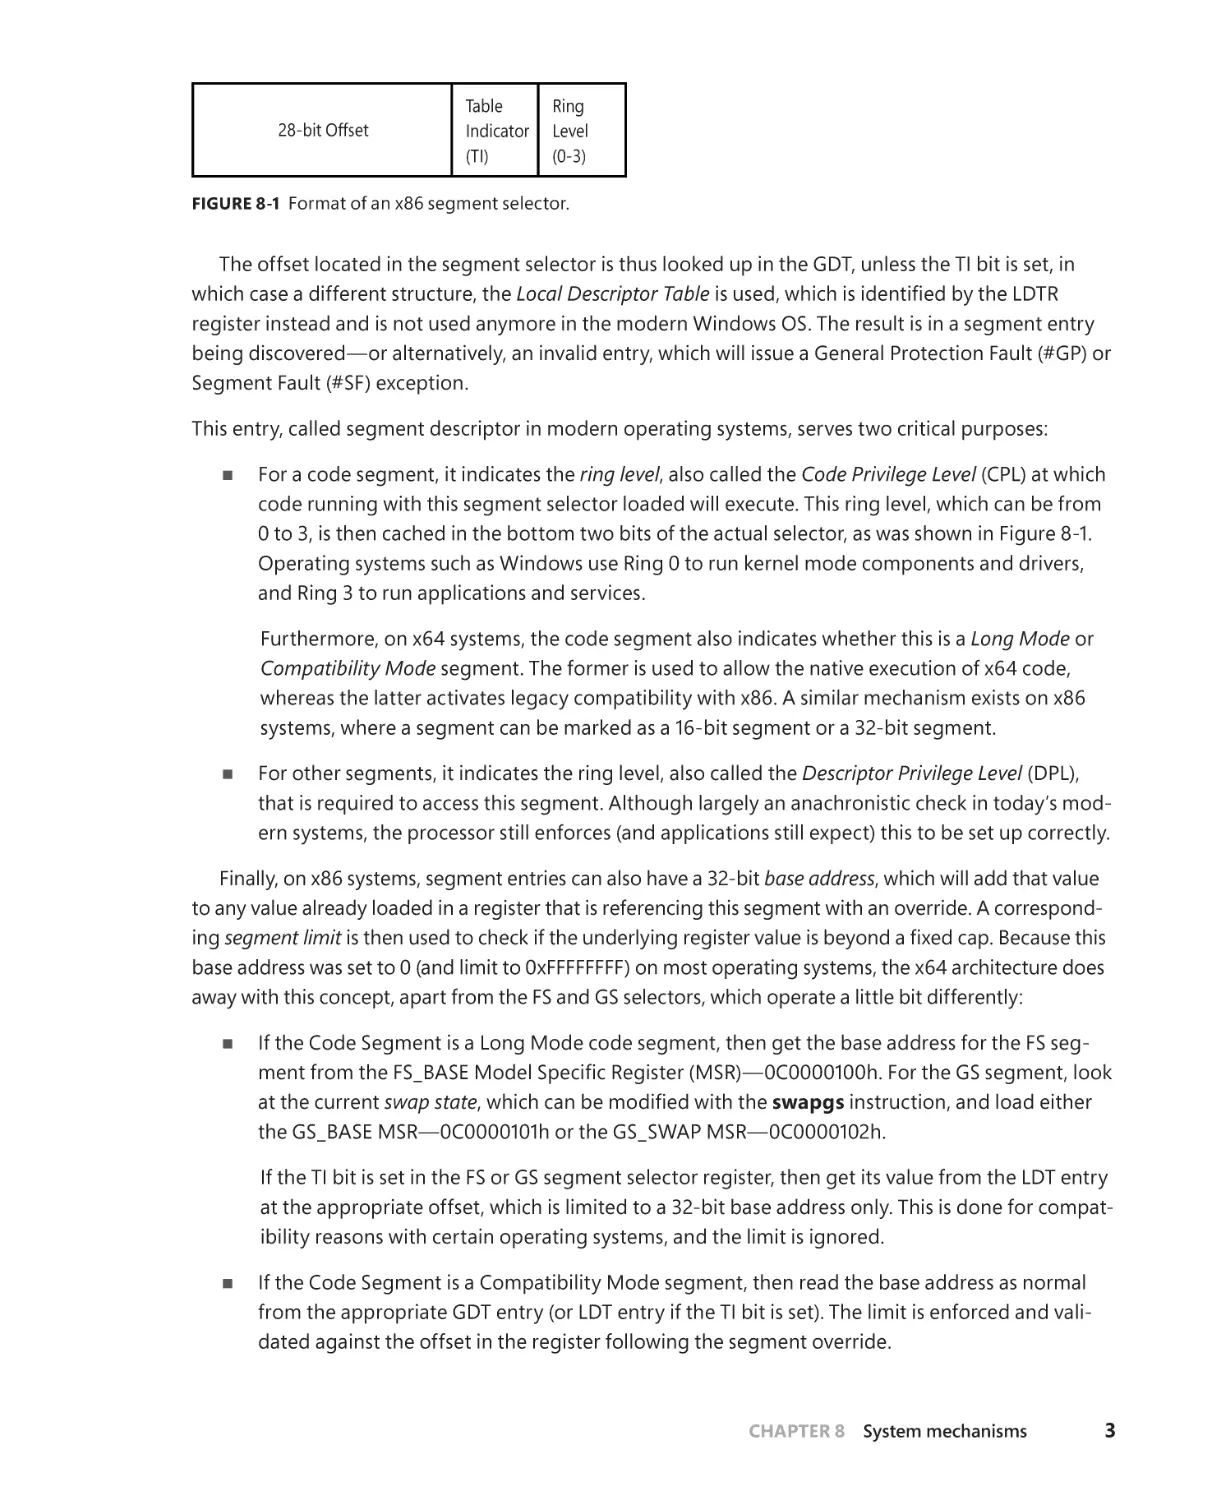
These selectors live in 16-bit segment registers and are looked up in a data structure called the
Global Descriptor Table (GDT). To locate the GDT, the processor uses yet another CPU register, the GDT
2
CHAPTER 8
System mechanisms
28-bit Offset
Table
Indicator
(TI)
Ring
Level
(0-3)
FIGURE 8-1
The offset located in the segment selector is thus looked up in the GDT, unless the TI bit is set, in
which case a different structure, the Local Descriptor Table
register instead and is not used anymore in the modern Windows OS. The result is in a segment entry
This entry, called segment descriptor in modern operating systems, serves two critical purposes:
■
ring level, also called the Code Privilege Level (CPL) at which
code running with this segment selector loaded will execute. This ring level, which can be from
Operating systems such as Windows use Ring 0 to run kernel mode components and drivers,
and Ring 3 to run applications and services.
Long Mode or
Compatibility Mode segment. The former is used to allow the native execution of x64 code,
whereas the latter activates legacy compatibility with x86. A similar mechanism exists on x86
systems, where a segment can be marked as a 16-bit segment or a 32-bit segment.
Descriptor Privilege Level (DPL),
■
ern systems, the processor still enforces (and applications still expect) this to be set up correctly.
base address, which will add that value
to any value already loaded in a register that is referencing this segment with an override. A corresponding segment limit
-
■
at the current swap state
swapgs instruction, and load either
at the appropriate offset, which is limited to a 32-bit base address only. This is done for compatibility reasons with certain operating systems, and the limit is ignored.
■
If the Code Segment is a Compatibility Mode segment, then read the base address as normal
from the appropriate GDT entry (or LDT entry if the TI bit is set). The limit is enforced and validated against the offset in the register following the segment override.
CHAPTER 8
System mechanisms
3
to achieve a sort of thread-local register
-
Therefore, segmentation is used to achieve these two effects on Windows—encode and enforce the
level of privilege that a piece of code can execute with at the processor level and provide direct access to
since the GDT is pointed to by a CPU register—the GDTR—each CPU can have its own GDT. In fact, this is
that the TEB of the currently executing thread on the current processor is equally present in its segment.
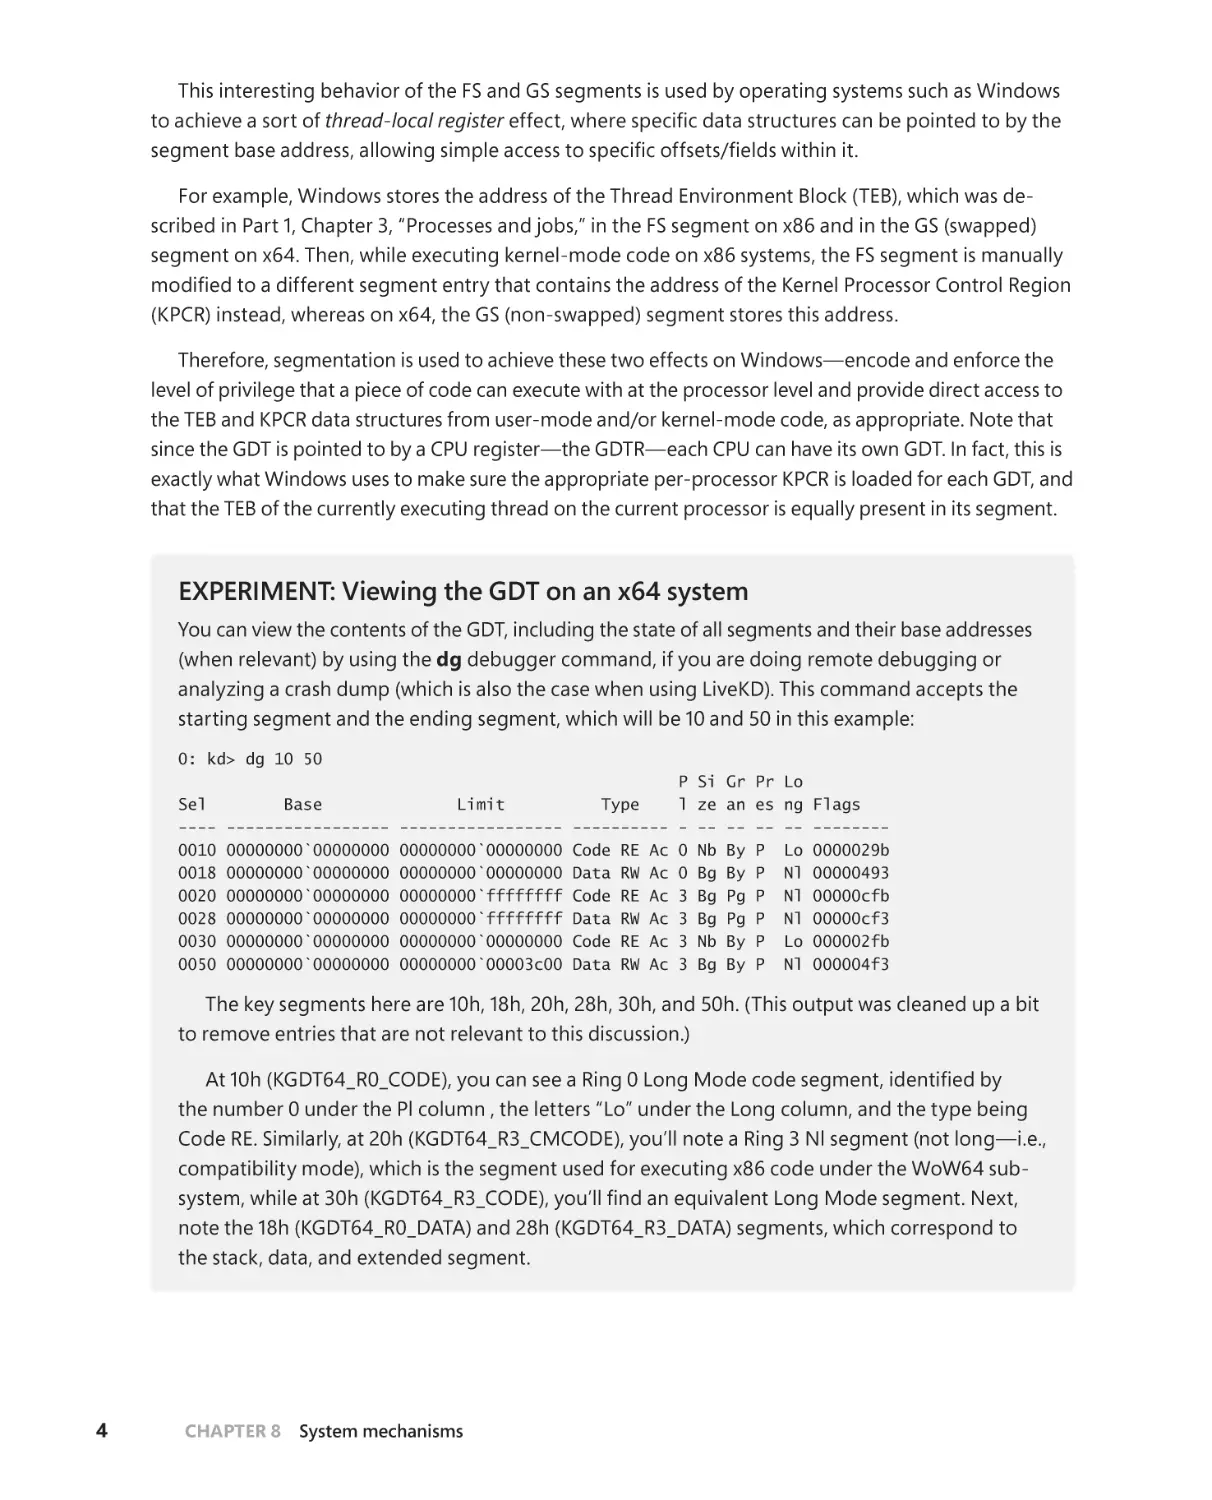
EXPERIMENT: Viewing the GDT on an x64 system
You can view the contents of the GDT, including the state of all segments and their base addresses
(when relevant) by using the dg debugger command, if you are doing remote debugging or
starting segment and the ending segment, which will be 10 and 50 in this example:
0: kd> dg 10 50
Sel
---0010
0018
0020
0028
0030
0050
Base
----------------00000000`00000000
00000000`00000000
00000000`00000000
00000000`00000000
00000000`00000000
00000000`00000000
Limit
----------------00000000`00000000
00000000`00000000
00000000`ffffffff
00000000`ffffffff
00000000`00000000
00000000`00003c00
Type
---------Code RE Ac
Data RW Ac
Code RE Ac
Data RW Ac
Code RE Ac
Data RW Ac
P
l
0
0
3
3
3
3
Si
ze
-Nb
Bg
Bg
Bg
Nb
Bg
Gr
an
-By
By
Pg
Pg
By
By
Pr
es
-P
P
P
P
P
P
Lo
ng
-Lo
Nl
Nl
Nl
Lo
Nl
Flags
-------0000029b
00000493
00000cfb
00000cf3
000002fb
000004f3
The key segments here are 10h, 18h, 20h, 28h, 30h, and 50h. (This output was cleaned up a bit
to remove entries that are not relevant to this discussion.)
the number 0 under the Pl column , the letters “Lo” under the Long column, and the type being
compatibility mode), which is the segment used for executing x86 code under the WoW64 sub-
the stack, data, and extended segment.
4
CHAPTER 8
System mechanisms
address of the TEB will be stored when running under compatibility mode, as was explained earlier.
which can be done with the following commands if you are doing local or remote kernel debugging (these commands will not work with a crash dump):
lkd> rdmsr c0000101
msr[c0000101] = ffffb401`a3b80000
lkd> rdmsr c0000102
msr[c0000102] = 000000e5`6dbe9000
You can compare these values with those of @$pcr and @$teb, which should show you the
same values, as below:
lkd> dx -r0 @$pcr
@$pcr
: 0xffffb401a3b80000 [Type: _KPCR *]
lkd> dx -r0 @$teb
@$teb
: 0xe56dbe9000 [Type: _TEB *]
EXPERIMENT: Viewing the GDT on an x86 system
On an x86 system, the GDT is laid out with similar segments, but at different selectors, additionswapgs functionality, and due to the lack of
Long Mode, the number of selectors is a little different, as you can see here:
kd> dg 8 38
Sel
---0008
0010
0018
0020
0030
0038
Base
-------00000000
00000000
00000000
00000000
80a9e000
00000000
Limit
-------ffffffff
ffffffff
ffffffff
ffffffff
00006020
00000fff
Type
---------Code RE Ac
Data RW Ac
Code RE
Data RW Ac
Data RW Ac
Data RW
P
l
0
0
3
3
0
3
Si
ze
-Bg
Bg
Bg
Bg
Bg
Bg
Gr
an
-Pg
Pg
Pg
Pg
By
By
Pr
es
-P
P
P
P
P
P
Lo
ng
-Nl
Nl
Nl
Nl
Nl
Nl
Flags
-------00000c9b
00000c93
00000cfa
00000cf3
00000493
000004f2
data, and extended segment.
for segmentation on these systems.
CHAPTER 8
System mechanisms
5
Lazy segment loading
Based on the description and values of the segments described earlier, it may be surprising to investi-
the following segments:
CS = 1Bh (18h | 3)
ES, DS = 23 (20h | 3)
Yet, during a system call in Ring 0, the following segments would be found:
CS = 08h (08h | 0)
ES, DS = 23 (20h | 3)
Similarly, an x64 thread executing in kernel mode would also have its ES and DS segments set to 2Bh
(28h | 3). This discrepancy is due to a feature known as lazy segment loading
lessness of the Descriptor Privilege Level (DPL) of a data segment when the current Code Privilege Level
access data of a lower DPL—but not the contrary—setting DS and/or ES to their “proper” values upon
entering the kernel would also require restoring them when returning to user mode.
ing costs to system call and interrupt handling. As such, Windows always uses the Ring 3 data segment
values, avoiding these associated costs.
Task state segments
Other than the code and data segment registers, there is an additional special register on both x86 and
x64 architectures: the Task Register (TR), which is also another 16-bit selector that acts as an offset in
the GDT. In this case, however, the segment entry is not associated with code or data, but rather with
a task
is called the Task State—in the case of Windows, the current thread. These task states, represented
by segments (Task State Segment, or TSS), are used in modern x86 operating systems to construct a
section). At minimum, a TSS represents a page directory (through the CR3 register), such as a PML4 on
x64 systems (see Part 1, Chapter 5, “Memory management,” for more information on paging), a Code
Segment, a Stack Segment, an Instruction Pointer, and up to four Stack Pointers (one for each ring
level). Such TSSs are used in the following scenarios:
■
used by the processor to correctly handle interrupts and exceptions by loading the Ring 0 stack
from the TSS if the processor was currently running in Ring 3.
6
CHAPTER 8
System mechanisms
■
requires a dedicated TSS with a custom debug fault handler and kernel stack.
■
■
occurs. Similarly, this is used to load the NMI handler on a safe kernel stack.
■
the same reasons, can run on a dedicated, safe, kernel stack.
On x64 systems, the ability to have multiple TSSs was removed because the functionality had been
relegated to mostly this one need of executing trap handlers that run on a dedicated kernel stack. As
such, only a single TSS is now used (in the case of Windows, at 040h), which now has an array of eight
possible stack pointers, called the Interrupt Stack Table (IST). Each of the preceding traps is now associated with an IST Index instead of a custom TSS. In the next section, as we dump a few IDT entries, you
will see the difference between x86 and x64 systems and their handling of these traps.
EXPERIMENT: Viewing the TSSs on an x86 system
On an x86 system, we can look at the system-wide TSS at 28h by using the same dg command
utilized earlier:
kd> dg 28 28
P
Sel
Base
Limit
Type
l
---- -------- -------- ---------- 0028 8116e400 000020ab TSS32 Busy 0
Si
ze
-Nb
Gr
an
-By
Pr
es
-P
Lo
ng Flags
-- -------Nl 0000008b
the dx or dt commands:
kd> dx (nt!_KTSS*)0x8116e400
(nt!_KTSS*)0x8116e400
[+0x000] Backlink
[+0x002] Reserved0
[+0x004] Esp0
[+0x008] Ss0
:
:
:
:
: 0x8116e400 [Type: _KTSS *]
0x0 [Type: unsigned short]
0x0 [Type: unsigned short]
0x81174000 [Type: unsigned long]
0x10 [Type: unsigned short]
Esp0 and Ss0
Windows never uses hardware-based task switching outside of the trap conditions described
earlier. As such, the only use for this particular TSS is to load the appropriate kernel stack during
a hardware interrupt.
CHAPTER 8
System mechanisms
7
“Meltdown” architectural processor vulnerability, this stack pointer will be the kernel stack
whereas on systems that are vulnerable, this will point to the transition stack inside of the
dg
to look at it:
kd> dg a0 a0
P
Sel
Base
Limit
Type
l
---- -------- -------- ---------- 00A0 81170590 00000067 TSS32 Avl 0
Si
ze
-Nb
Gr
an
-By
Pr
es
-P
Lo
ng Flags
-- -------Nl 00000089
.tss command instead of dx, which will format the various
case, the input parameter is the task selector (A0h).
kd> .tss a0
eax=00000000 ebx=00000000 ecx=00000000 edx=00000000 esi=00000000 edi=00000000
eip=81e1a718 esp=820f5470 ebp=00000000 iopl=0
nv up di pl nz na po nc
cs=0008 ss=0010 ds=0023 es=0023 fs=0030 gs=0000
efl=00000000
hal!HalpMcaExceptionHandlerWrapper:
81e1a718 fa
cli
Note how the segment registers are set up as described in the “Lazy segment loading” section
.tss
Directory. In the “Trap dispatching” section, we revisit this TSS when using the !idt command.
EXPERIMENT: Viewing the TSS and the IST on an x64 system
On an x64 system, the dg command unfortunately has a bug that does not correctly show 64-bit
segment base addresses, so obtaining the TSS segment (40h) base address requires dumping
what appear to be two segments, and combining the high, middle, and low base address bytes:
0: kd> dg 40 48
Sel
Base
Limit
Type
---- ----------------- ----------------- ---------0040 00000000`7074d000 00000000`00000067 TSS32 Busy
0048 00000000`0000ffff 00000000`0000f802 <Reserved>
8
CHAPTER 8
System mechanisms
P
l
0
0
Si
ze
-Nb
Nb
Gr
an
-By
By
Pr
es
-P
Np
Lo
ng
-Nl
Nl
Flags
-------0000008b
00000000
0xFFFFF8027074D000. To showcase yet another
TssBase, which con0: kd> dx @$pcr->TssBase
@$pcr->TssBase
[+0x000] Reserved0
[+0x004] Rsp0
: 0xfffff8027074d000 [Type: _KTSS64 *]
: 0x0 [Type: unsigned long]
: 0xfffff80270757c90 [Type: unsigned __int64]
RSP0, which, similarly to x86, contains the address of the
kernel stack for the current thread (on systems without the “Meltdown” hardware vulnerability)
or the address of the transition stack in the Processor Descriptor Area.
On the system on which this experiment was done, a 10th Generation Intel processor was
used; therefore, RSP0 is the current kernel stack:
0: kd> dx @$thread->Tcb.InitialStack
@$thread->Tcb.InitialStack : 0xfffff80270757c90 [Type: void *]
the Interrupt Dispatch Table (IDT) references these stacks:
0: kd> dx @$pcr->TssBase->Ist
@$pcr->TssBase->Ist
[Type: unsigned __int64 [8]]
[0]
: 0x0 [Type: unsigned __int64]
[1]
: 0xfffff80270768000 [Type: unsigned
[2]
: 0xfffff8027076c000 [Type: unsigned
[3]
: 0xfffff8027076a000 [Type: unsigned
[4]
: 0xfffff8027076e000 [Type: unsigned
__int64]
__int64]
__int64]
__int64]
Now that the relationship between ring level, code execution, and some of the key segments in the
segments (and their ring level) in the upcoming section on trap dispatching. Before discussing trap
the Meltdown hardware side-channels attack.
Hardware side-channel vulnerabilities
Modern CPUs can compute and move data between their internal registers very quickly (in the order
instruct the CPU to move data from the CPU registers into the main memory and vice versa. There
are different kinds of memory that are accessible from the main CPU. Memory located inside the CPU
package and accessible directly from the CPU execution engine is called cache and has the characteristic of being fast and expensive. Memory that is accessible from the CPU through an external bus is
usually the RAM (Random Access Memory) and has the characteristic of being slower, cheaper, and big
CHAPTER 8
System mechanisms
9
on memories of different speeds and sizes (the more memory is closer to the CPU, the more memory is
ferent levels of fast cache memory, which is directly accessible by the execution engine of each physical
cessors, the L3 cache usually does not exist).
CPU
L2 Cache
L3 Cache
L2 Cache
Core 2
Registers
L1 Cache
Size:
Speed:
L1 Cache
Core 1
Registers
Shared
~ 2KB
250 ps
64 KB
1 ns
256 KB
3 - 10 ns
2 - 32 KB
10 + 20 ns
SSD
8 -128 KB
50 - 100 ns
128 GB - 2 TB
50 - 100 µs
FIGURE 8-2 Caches and storage memory of modern CPUs and their average size and access time.
though it is still slower). Access time to the main memory is instead a hundred times slower. This means
that in case the CPU executes all the instructions in order, many times there would be huge slowdowns
due to instructions accessing data located in the main memory. To overcome this problem, modern
CPUs implement various strategies. Historically, those strategies have led to the discovery of side-channel attacks (also known as speculative attacks), which have been proven to be very effective against the
overall security of the end-user systems.
To correctly describe side-channel hardware attacks and how Windows mitigates them, we should
discuss some basic concepts regarding how the CPU works internally.
Out-of-order execution
A modern microprocessor executes machine instructions thanks to its pipeline. The pipeline contains
many stages, including instruction fetch, decoding, register allocation and renaming, instructions
reordering, execution, and retirement. A common strategy used by the CPUs to bypass the memory
slowdown problem is the capability of their execution engine to execute instructions out of order as
soon as the required resources are available. This means that the CPU does not execute the instructions
in a strictly sequential order, maximizing the utilization of all the execution units of the CPU core as
exhaustive as possible. A modern processor can execute hundreds of instructions speculatively before
it is certain that those instructions will be needed and committed (retired).
One problem of the described out-of-order execution regards branch instructions. A conditional
pends on the previously executed instructions. When calculating the condition depends on previous
10
CHAPTER 8
System mechanisms
instructions that access slow RAM memory, there can be slowdowns. In that case, the execution engine
memory bus to complete the memory access) before being able to continue in the out-of-order execution of the following instructions belonging to the correct path. A similar problem happens in the case
of indirect branches. In this case, the execution engine of the CPU does not know the target of a branch
(usually a jump or a call) because the address must be fetched from the main memory. In this context,
the term speculative execution
tions in parallel or in an out-of-order way, but the results are not retired into permanent registers, and
The CPU branch predictor
How does the CPU know which branch (path) should be executed before the branch condition has
been completely evaluated? (The issue is similar with indirect branches, where the target address is
not known). The answer lies in two components located in the CPU package: the branch predictor and
the branch target predictor.
The branch predictor is a complex digital circuit of a CPU that tries to guess which path a branch
that tries to predict the target of indirect branches before it is known. While the actual hardware implementation heavily depends on the CPU manufacturer, the two components both use an internal cache
called Branch Target Buffer (BTB), which records the target address of branches (or information about
what the conditional branch has previously done in the past) using an address tag generated through
an indexing function, similar to how the cache generates the tag, as explained in the next section. The
time, the execution pipeline is stalled, forcing the CPU to wait for the condition or target address to be
fetched from the main memory. The second time the same branch is executed, the target address in
of an example branch target predictor.
Branch Target Buffer
Idx Address Tag
Target
Virtual address: 0xFFFF AAAA9F43AA17
12
9F43AA17
0x9F528092
F(Addr)
Indexing
Function
FIGURE 8-3 The scheme of a sample CPU branch predictor.
In case the prediction was wrong, and the wrong path was executed speculatively, then the instrucfed into the CPU pipeline and the execution restarts from the correct branch. This case is called branch
CHAPTER 8
System mechanisms
11
misprediction. The total number of wasted CPU cycles is not worse than an in-order execution waiting for the result of a branch condition or indirect address evaluation. However, different side effects
of the speculative execution can still happen in the CPU, like the pollution of the CPU cache lines.
Unfortunately, some of these side effects can be measured and exploited by attackers, compromising
the overall security of the system.
The CPU cache(s)
As introduced in the previous section, the CPU cache is a fast memory that reduces the time needed for
sizes (usually 64 or 128 bytes) called lines or cache blocks. When a cache line is copied from memory
into the cache, a cache entry is created. The cache entry will include the copied data as well as a tag
identifying the requested memory location. Unlike the branch target predictor, the cache is always indexed through physical addresses (otherwise, it would be complex to deal with multiple mappings and
Whereas the higher bits usually represent the tag, the lower bits represent the cache line and the offset
into the line. A tag is used to uniquely identify which memory address the cache block belongs to, as
cache (in any cache lines that might contain data from that address. Some caches have different ways
cation is in the cache, a cache hit has occurred, and the processor immediately reads or writes the data
from/in the cache line. Otherwise, a cache miss has occurred. In this case, the CPU allocates a new entry
in the cache and copies data from main memory before accessing it.
48-bits one-way 256 blocks CACHE
Block size: 256 byte
0 10 20 30 40 50 60 70 80 90 A0 B0 C0 D0 E0 F0
TAG
0
10
20
CPU
30
40
50
60
DATA
70
0x019F566030
80
90
0x019F56
Physical Address
0x00019F56 60 30
A0
B0
C0
D0
E0
RAM Memory
F0
FIGURE 8-4 A sample 48-bit one-way CPU cache.
of virtual address space. In the sample, the CPU is reading 48 bytes of data located at virtual address
12
CHAPTER 8
System mechanisms
In a similar way, when the CPU is instructed to write some new content to a memory address, it
data back to the physical RAM as well, depending on the caching type (write-back, write-through,
uncached, and so on) applied to the memory page. (Note that this has an important implication in
multiprocessor systems: A cache coherency protocol must be designed to prevent situations in which
another CPU will operate on stale data after the main CPU has updated a cache block. (Multiple CPU
cache coherency algorithms exist and are not covered in this book.)
To make room for new entries on cache misses, the CPU sometime should evict one of the existing
cache blocks. The algorithm the cache uses to choose which entry to evict (which means which block
will host the new data) is called the placement policy. If the placement policy can replace only one block
for a particular virtual address, the cache is called direct mapped
way and is direct mapped). Otherwise, if the cache is free to choose any entry (with the same block
number) to hold the new data, the cache is called fully associative. Many caches implement a compromise in which each entry in main memory can go to any one of N places in the cache and are described
as N-ways set associative. A way is thus a subdivision of a cache, with each way being of equal size and
can store data belonging to four different physical addresses indexing the same cache block (with different tags) in four different cache sets.
Line
Offset
Data RAM
Tag RAM
Index
Set
Way
Tag
FIGURE 8-5 A four-way set associative cache.
Side-channel attacks
As discussed in the previous sections, the execution engine of modern CPUs does not write the result of
the computation until the instructions are actually retired. This means that, although multiple instructions are executed out of order and do not have any visible architectural effects on CPU registers and
memory, they have microarchitectural side effects, especially on the CPU cache. At the end of the year
CHAPTER 8
System mechanisms
13
2017, novel attacks were demonstrated against the CPU out-of-order engines and their branch predictors. These attacks relied on the fact that microarchitectural side effects can be measured, even though
they are not directly accessible by any software code.
The two most destructive and effective hardware side-channel attacks were named Meltdown
and Spectre.
Meltdown
Meltdown (which has been later called Rogue Data Cache load, or RDCL) allowed a malicious usermode process to read all memory, even kernel memory, when it was not authorized to do so. The attack exploited the out-of-order execution engine of the processor and an inner race condition between
the memory access and privilege check during a memory access instruction processing.
tions that do so are callable from user mode). The process then executes an illegal kernel memory
probe array). The process
cannot access the kernel memory, so an exception is generated by the processor. The exception is
caught by the application. Otherwise, it would result in the termination of the process. However, due to
the out-of-order execution, the CPU has already executed (but not retired, meaning that no architectural effects are observable in any CPU registers or RAM) the instructions following the illegal memory
The malicious application then probes the entire cache by measuring the time needed to access each
Access time
(cycles)
which is taken from the original Meltdown research paper (available at the https://meltdownattack.com/
500
400
300
200
0
50
100
150
200
250
Page
FIGURE 8-6 CPU time employed for accessing a 1 MB probe array.
data can be read one byte per time and one byte can have only 256 values, knowing the exact page in
the array that led to a cache hit allows the attacker to know which byte is stored in the kernel memory.
Spectre
explained in the previous section, but the main CPU components exploited by Spectre are the branch
predictor and branch target predictor. Two variants of the Spectre attack were initially presented.
Both are summarized by three phases:
14
CHAPTER 8
System mechanisms
1.
In the setup phase, from a low-privileged process (which is attacker-controlled), the attacker
performs multiple repetitive operations that mistrain the CPU branch predictor. The goal is to
indirect branch.
2.
In the second phase, the attacker forces a victim high-privileged application (or the same process) to speculatively execute instructions that are part of a mispredicted branch. Those instrucchannel (usually the CPU cache).
3.
tion stored in the CPU cache (microarchitectural channel) by probing the entire cache (the same
methods employed in the Meltdown attack). This reveals secrets that should be secured in the
victim high-privileged address space.
(which can be the same or different than the address space that the attacker controls), by forcing the CPU
branch predictor to execute the wrong branch of a conditional branch speculatively. The branch is usually part of a function that performs a bound check before accessing some nonsecret data contained
in a memory buffer. If the buffer is located adjacent to some secret data, and if the attacker controls
the offset supplied to the branch condition, she can repetitively train the branch predictor supplying
that implements the bound check branch. The CPU branch predictor is trained to always follow the
initial legit path. However, this time, the path would be wrong (the other should be taken). The instructions accessing the memory buffer are thus speculatively executed and result in a read outside the
boundaries, which targets the secret data. The attacker can thus read back the secrets by probing the
entire cache (similar to the Meltdown attack).
The second variant of Spectre exploits the CPU branch target predictor; indirect branches can be
poisoned by an attacker. The mispredicted path of an indirect branch can be used to read arbitrary
memory of a victim process (or the OS kernel) from an attacker-controlled context. As shown in
ing the CPU to build enough information in the BTB to speculatively execute instructions located at
an address chosen by the attacker. In the victim address space, that address should point to a gadget. A gadget is a group of instructions that access a secret and store it in a buffer that is cached in a
controlled way (the attacker needs to indirectly control the content of one or more CPU registers in the
victim, which is a common case when an API accepts untrusted input data).
a service provided by the target higher-privileged entity (a process or the OS kernel). The code that
implements the service must implement similar indirect branches as the attacker-controlled process.
The CPU branch target predictor in this case speculatively executes the gadget located at the wrong
target address. This, as for Variant 1 and Meltdown, creates microarchitectural side effects in the CPU
cache, which can be read from the low-privileged context.
CHAPTER 8
System mechanisms
15
kernelbase.dll
kernelbase.dll
0x105F0 + ∆
_imp_NtSetEvent:
dl @ntdll!gadget
0x105F0 + Ω
_imp_NtSetEvent:
dl @ntdll!NtSetEvent
0x110BC + ∆
SetEvent:
call [_imp_NtSetEvent]
0x110BC + Ω
SetEvent:
call [_imp_NtSetEvent]
CALL
ntdll.dll
0x2147A + ∆
gadget:
ret
0x24026 + ∆
NtSetEvent:
mov
eax,0Eh
sysenter
CPU
Speculate
ntdll.dll
CPU Branch 0x2147A + Ω
Predictor
0x24026 + Ω
gadget:
mov eax, array$[esp-4]
mov d1, [eax+ecx*4]
mov eax, _array2$[esp-4]
NtSetEvent:
mov
eax,0Eh
sysenter
Attacker process
(low privileged)
Victim process
(high privileged)
FIGURE 8-7 A scheme of Spectre attack Variant 2.
Other side-channel attacks
After Spectre and Meltdown attacks were originally publicly released, multiple similar side-channel
hardware attacks were discovered. Even though they were less destructive and effective compared to
Meltdown and Spectre, it is important to at least understand the overall methodology of those new
side-channel attacks.
Speculative store bypass (SSB) arises due to a CPU optimization that can allow a load instruction,
which the CPU evaluated not to be dependent on a previous store, to be speculatively executed before
the results of the store are retired. If the prediction is not correct, this can result in the load operation
reading stale data, which can potentially store secrets. The data can be forwarded to other operations
executed during speculation. Those operations can access memory and generate microarchitectural
side effects (usually in the CPU cache). An attacker can thus measure the side effects and recover the
secret value.
The Foreshadow (also known as L1TF) is a more severe attack that was originally designed for
stealing secrets from a hardware enclave (SGX) and then generalized also for normal user-mode
speculative execution engine of modern CPUs. In particular:
■
16
Speculation on inaccessible virtual memory. In this scenario, when the CPU accesses some data
stored at a virtual address described by a Page table entry (PTE) that does not include the present bit (meaning that the address is is not valid) an exception is correctly generated. However,
if the entry contains a valid address translation, the CPU can speculatively execute the instructions that depend on the read data. As for all the other side-channel attacks, those instructions
are not retired by the processor, but they produce measurable side effects. In this scenario, a
user-mode application would be able to read secret data stored in kernel memory. More seriously, the application, under certain circumstances, would also be able to read data belonging
CHAPTER 8
System mechanisms
to another virtual machine: when the CPU encounters a nonpresent entry in the Second Level
Address Translation table (SLAT) while translating a guest physical address (GPA), the same side
effects can happen. (More information on the SLAT, GPAs, and translation mechanisms are present in Chapter 5 of Part 1 and in Chapter 9, “Virtualization technologies”).
■
more than one execution pipeline per physical core, which can execute in an out-of-order way
multiple instruction streams using a single shared execution engine (this is Symmetric multithreading, or SMT, as explained later in Chapter 9.) In those processors, two logical processors
(LPs) share a single cache. Thus, while an LP is executing some code in a high-privileged context,
the other sibling LP can read the side effects produced by the high-privileged code executed
by the other LP. This has very severe effects on the global security posture of a system. Similar to
even spoil secrets stored in another high-security virtual-machine just by waiting for the virtual
is part of the Group 4 vulnerabilities.
Microarchitectural side effects are not always targeting the CPU cache. Intel CPUs use other
intermediate high-speed buffers with the goal to better access cached and noncached memory
and reorder micro-instructions. (Describing all those buffers is outside the scope of this book.) The
Microarchitectural Data Sampling (MDS) group of attacks exposes secrets data located in the following
microarchitectural structures:
■
■
Store buffers While performing store operations, processors write data into an internal temporary microarchitectural structure called store buffer, enabling the CPU to continue to execute
instructions before the data is actually written in the cache or main memory (for noncached
memory access). When a load operation reads data from the same memory address as an earlier store, the processor may be able to forward data directly from the store buffer.
Fill buffers
mediary between the CPU cache and the CPU out-of-order execution engine. They may retain
data from prior memory requests, which may be speculatively forwarded to a load operation.
■
Load ports Load ports are temporary internal CPU structures used to perform load operations from memory or I/O ports.
Microarchitectural buffers usually belong to a single CPU core and are shared between SMT threads.
This implies that, even if attacks on those structures are hard to achieve in a reliable way, the speculative extraction of secret data stored into them is also potentially possible across SMT threads (under
In general, the outcome of all the hardware side-channel vulnerabilities is the same: secrets will be
spoiled from the victim address space. Windows implements various mitigations for protecting against
Spectre, Meltdown, and almost all the described side-channel attacks.
CHAPTER 8
System mechanisms
17
Side-channel mitigations in Windows
This section takes a peek at how Windows implements various mitigations for defending against sidechannel attacks. In general, some side-channel mitigations are implemented by CPU manufacturers
through microcode updates. Not all of them are always available, though; some mitigations need to
be enabled by the software (Windows kernel).
KVA Shadow
tween the kernel and user page tables. Speculative execution allows the CPU to spoil kernel data when
the processor is not at the correct privilege level to access it, but it requires that a valid page frame
number be present in the page table translating the target kernel page. The kernel memory targeted
by the Meltdown attack is generally translated by a valid leaf entry in the system page table, which
indicates only supervisor privilege level is allowed. (Page tables and virtual address translation are covpage tables for each process:
■
■
The kernel page tables map the entire process address space, including kernel and user pages.
In Windows, user pages are mapped as nonexecutable to prevent kernel code to execute memory allocated in user mode (an effect similar to the one brought by the hardware SMEP feature).
The User page tables (also called shadow page tables) map only user pages and a minimal set
of kernel pages, which do not contain any sort of secrets and are used to provide a minimal
functionality for switching page tables, kernel stacks, and to handle interrupts, system calls, and
other transitions and traps. This set of kernel pages is called transition address space.
In the transition address space, the NT kernel usually maps a data structure included in the proces-
shadow
Administrator-level privileges) in processes that do not have mapped any kernel page that may contain
secrets. The Meltdown attack is not effective anymore; kernel pages are not mapped as valid in the
happen. When the user process invokes a system call, or when an interrupt happens while the CPU is
executing code in the user-mode process, the CPU builds a trap frame on a transition stack, which, as
of the shadow trap handler that handles the interrupt or system call. The latter normally switches to
the kernel page tables, copies the trap frame on the kernel stack, and then jumps to the original trap
executed with the entire address space mapped.
18
CHAPTER 8
System mechanisms
Initialization
The NT kernel determines whether the CPU is susceptible to Meltdown attack early in phase -1 of its
initialization, after the processor feature bits are calculated, using the internal KiDetectKvaLeakage
KiKvaLeakage variable to 1 for
all Intel processors except Atoms (which are in-order processors).
In case the internal KiKvaLeakage
KiEnableKvaShadowing
stacks. Transition stacks (which are 512 bytes in size) are prepared by writing a small data structure,
linked against its nontransition kernel stack (accessible only after the page tables have been switched),
thread has a proper kernel stack. The scheduler set a kernel stack as active by linking it in the processor
PRCB when a new thread is selected to be executed. This is a key difference compared to the IST stacks,
which exist as one per processor.
0
Transition Space
…
+ 0x200
+
…
IST 2
+ 0x1D0
+ 0x200 KIST_BASE_FRAME
IoMapBase
+ 0x1D0
Processor’s TSS
+ 0x200
IST
Transition
Stack
KIST_BASE_FRAME
TOP
BASE
+ 0x5FE0
+ 0x6000
TOP
BASE
0
TOP
BASE
KIST_LINK_FRAME
+ 0x5FE0
+ 0x6000
IST Stack
0
…
Memory
IST
Transition
Stack
KTHREAD
0
KIST_LINK_FRAME
+ 0x6000
Kernel Stack*
0
IST 0
BASE/TOP
Kernel Space
IST Stack
RSP 0
0
n
io
sit
an tack
r
T S
BASE/TOP
TOP
BASE
FIGURE 8-8
The KiEnableKvaShadowing
algorithm (explained later in this section). The result of the determination (global entries or PCIDs) is
stored in the global KiKvaShadowMode
KiShadowProcessorAllocation, which maps the per-processor shared data structures in the shadow page
shadow page tables are created (and the IRQL is dropped to passive level). The shadow trap handlers are
Shadow page tables
Shadow (or user) page tables are allocated by the memory manager using the internal MiAllocate
ProcessShadow
for the new process are initially created empty. The memory manager then copies all the kernel
shadow top-level page table entries of the SYSTEM process in the new process shadow page table.
CHAPTER 8
System mechanisms
19
This allows the OS to quickly map the entire transition address space (which lives in kernel and is
KiShadowProcessorAllocation routine, which uses memory manager services to map individual chunks
of memory in the shadow page tables and to rebuild the entire page hierarchy.
can write in the process page tables to map or unmap chunks of memory. When a request to allocate
or map new memory into a user process address space, it may happen that the top-level page table
entry for a particular address would be missing. In this case, the memory manager allocates all the
pages for the entire page-table hierarchy and stores the new top-level PTE in the kernel page tables.
top-level PTE on the shadow page table. Otherwise, the address will be not present in the user-mapping after the trap handler correctly switches the page tables before returning to user mode.
kernel page tables. To prevent false sharing of addresses close to the chunk of memory being mapped
in the transition address space, the memory manager always recreates the page table hierarchy mapping for the PTE(s) being shared. This implies that every time the kernel needs to map some new pages
in the transition address space of a process, it must
page tables (the internal MiCopyTopLevelMappings routine performs exactly this operation).
TLB flushing algorithm
(translation look-aside buffer). The TLB is a cache used by the processor to quickly translate the virtual addresses that are used while executing code or accessing data. A valid entry in the TLB allows the processor
nel address space is mostly unique and shared between all processes. Intel and AMD introduced differ-
detail in the Intel and AMD architecture manuals and are not further discussed in this book.
-
lowing two goals:
■
No valid kernel entries will be ever maintained in the TLB when executing a thread user-code.
Otherwise, this could be leveraged by an attacker with the same speculation techniques used in
Meltdown, which could lead her to read secret kernel data.
■
20
CHAPTER 8
System mechanisms
trap exit. It can run on a system that either supports only the global/non-global bit or also PCIDs. In the
while a page table switch happens (the system changes the value of the CR3 register). Systems with
PCID support labels kernel pages with PCID 2, whereas user pages are labelled with PCID 1. The global
and non-global bits are ignored in this case.
When the current-executing thread ends its quantum, a context switch is initialized. When the
kernel schedules execution for a thread belonging to another process address space, the TLB algorithm
assures that all the user pages are removed from the TLB (which means that in systems with global/
kernel entries are removed (or invalidated) from the TLB. This is easily achievable: on processors with
global/non-global bit support, just a reload of the page tables forces the processor to invalidate all the
non-global pages, whereas on systems with PCID support, the user-page tables are reloaded using the
User PCID, which automatically invalidates all the stale kernel TLB entries.
The strategy allows kernel trap entries, which can happen when an interrupt is generated while the
system was executing user code or when a thread invokes a system call, not to invalidate anything in
TABLE 8-1
Configuration Type
User Pages
Kernel Pages
Transition Pages
Non-global
Global
N/D
PCID 1, non-global
PCID 2, non-global
PCID 1, non-global
Global
Non-global
Global
Hardware indirect branch controls (IBRS, IBPB, STIBP, SSBD)
Processor manufacturers have designed hardware mitigations for various side-channel attacks. Those
mitigations have been designed to be used with the software ones. The hardware mitigations for sidechannel attacks are mainly implemented in the following indirect branch controls mechanisms, which
■
Indirect Branch Restricted Speculation (IBRS) completely disables the branch predictor (and
clears the branch predictor buffer) on switches to a different security context (user vs kernel
mode or VM root vs VM non-root). If the OS sets IBRS after a transition to a more privileged
mode, predicted targets of indirect branches cannot be controlled by software that was executed in a less privileged mode. Additionally, when IBRS is on, the predicted targets of indirect
branches cannot be controlled by another logical processor. The OS usually sets IBRS to 1 and
keeps it on until it returns to a less privileged security context.
The implementation of IBRS depends on the CPU manufacturer: some CPUs completely disable
branch predictors buffers when IBRS is set to on (describing an inhibit behavior), while some
CHAPTER 8
System mechanisms
21
mitigation control works in a very similar way to IBPB, so usually the CPU implement only IBRS.
■
■
■
Indirect Branch Predictor Barrier (IBPB)
it is set to 1, creating a barrier that prevents software that executed previously from controlling
the predicted targets of indirect branches on the same logical processor.
Single Thread Indirect Branch Predictors (STIBP) restricts the sharing of branch prediction
between logical processors on a physical CPU core. Setting STIBP to 1 on a logical processor
prevents the predicted targets of indirect branches on a current executing logical processor
from being controlled by software that executes (or executed previously) on another logical
processor of the same core.
Speculative Store Bypass Disable (SSBD) instructs the processor to not speculatively execute
loads until the addresses of all older stores are known. This ensures that a load operation does
not speculatively consume stale data values due to bypassing an older store on the same logical processor, thus protecting against Speculative Store Bypass attack (described earlier in the
“Other side-channel attacks” section).
The NT kernel employs a complex algorithm to determine the value of the described indirect branch
trap entries, and trap exits. On compatible systems, the system runs kernel code with IBRS always on (except when Retpoline is enabled). When no IBRS is available (but IBPB and STIBP are supported), the kernel
another security context). SSBD, when supported by the CPU, is always enabled in kernel mode.
mitigations enabled or just with STIBP on (depending on STIBP pairing being enabled, as explained in
the next section). The protection against Speculative Store Bypass must be manually enabled if needed
through the global or per-process Speculation feature. Indeed, all the speculation mitigations can be
to an individual setting. Table 8-2 describes individual feature settings and their meaning.
TABLE 8-2
Name
Value
Meaning
0x1
Disable IBRS except for non-nested root partition
0x2
0x4
22
CHAPTER 8
System mechanisms
0x8
Always set SSBD in kernel and user
0x10
Set SSBD only in kernel mode (leaving user-mode
code to be vulnerable to SSB attacks)
0x20
Always keep STIBP on for user-threads, regardless of
STIBP pairing
Name
Value
Meaning
0x40
Disables the default speculation mitigation strategy
(for AMD systems only) and enables the user-to-user
controls are set when running in kernel mode.
0x80
Always disable STIBP pairing
0x100
Always disable Retpoline
0x200
Enable Retpoline regardless of the CPU support of
IBPB or IBRS (Retpoline needs at least IBPB to properly protect against Spectre v2)
0x20000 Disable Import Optimization regardless of Retpoline
Retpoline and import optimization
not acceptable for games and mission-critical applications, which were running with a lot of performance degradation. The mitigation that was bringing most of the performance degradation was IBRS
possible without using any hardware mitigations thanks to the memory fence instructions. A good
execute any new operations speculatively before the fence itself completes. Only when the fence comto execute (and to speculate) new opcodes. The second variant of Spectre was still requiring hardware
mitigations, though, which implies all the performance problems brought by IBRS and IBPB.
speculative execution. Instead of performing a vulnerable indirect call, the processor jumps to a safe
the new target thanks to a “return” operation.
FIGURE 8-9 Retpoline code sequence of x86 CPUs.
In Windows, Retpoline is implemented in the NT kernel, which can apply the Retpoline code sequence to itself and to external driver images dynamically through the Dynamic Value Relocation Table
(DVRT). When a kernel image is compiled with Retpoline enabled (through a compatible compiler), the
CHAPTER 8
System mechanisms
23
but augmented with a variable size padding. The entry in the DVRT includes all the information that
external drivers compiled with Retpoline support can run also on older OS versions, which will simply
skip parsing the entries in the DVRT table.
Note The DVRT was originally developed for supporting kernel ASLR (Address Space Layout
Randomization, discussed in Chapter 5 of Part 1). The table was later extended to include
Retpoline descriptors. The system can identify which version of the table an image includes.
In phase -1 of its initialization, the kernel detects whether the processor is vulnerable to Spectre, and,
in case the system is compatible and enough hardware mitigations are available, it enables Retpoline
and applies it to the NT kernel image and the HAL. The RtlPerformRetpolineRelocationsOnImage routine scans the DVRT and replaces each indirect branch described by an entry in the table with a direct
branch, which is not vulnerable to speculative attacks, targeting the Retpoline code sequence. The
original target address of the indirect branch is saved in a CPU register (R10 in AMD and Intel processors), with a single instruction that overwrites the padding generated by the compiler. The Retpoline
Before being started, boot drivers are physically relocated by the internal MiReloadBootLoadedDrivers
boot drivers, the NT kernel, and HAL images are allocated in a contiguous virtual address space by
the Windows Loader and do not have an associated control area, rendering them not pageable. This
means that all the memory backing the images is always resident, and the NT kernel can use the same
RtlPerformRetpolineRelocationsOnImage function to modify each indirect branch in the code directly.
PERFORM_
RETPOLINE_RELOCATIONS
-
Note
for further details) initializes and protects some of them. It is illegal for drivers and the NT
kernel itself to modify code sections of protected drivers.
Runtime drivers, as explained in Chapter 5 of Part 1, are loaded by the NT memory manager, which
24
CHAPTER 8
System mechanisms
page fault handler. Windows applies Retpoline on the shared pages pointed by the prototype PTEs. If
the same section is also mapped by a user-mode application, the memory manager creates new private
pages and copies the content of the shared pages in the private ones, reverting Retpoline (and Import
Note
Retpoline cannot be enabled because it would not be able to protect against Spectre v2. In
this situation, only hardware mitigations can be applied. Enhanced IBRS (a new hardware
mitigation) solves the performance problems of IBRS.
The Retpoline bitmap
One of the original design goals (restraints) of the Retpoline implementation in Windows was to support a mixed environment composed of drivers compatible with Retpoline and drivers not compatible
with it, while maintaining the overall system protection against Spectre v2. This implies that drivers
that do not support Retpoline should be executed with IBRS on (or STIBP followed by an IBPB on kernel
entry, as discussed previously in the ”Hardware indirect branch controls” section), whereas others can
run without any hardware speculation mitigations enabled (the protection is brought by the Retpoline
code sequences and memory fences).
To dynamically achieve compatibility with older drivers, in the phase 0 of its initialization, the NT
space contains Retpoline compatible code; a 0 means the opposite. The NT kernel then sets to 1 the
bits referring to the address spaces of the HAL and NT images (which are always Retpoline compatible).
Every time a new kernel image is loaded, the system tries to apply Retpoline to it. If the application succeeds, the respective bits in the Retpoline bitmap are set to 1.
The Retpoline code sequence is augmented to include a bitmap check: Every time an indirect branch
is performed, the system checks whether the original call target resides in a Retpoline-compatible
module. In case the check succeeds (and the relative bit is 1), the system executes the Retpoline code
Retpoline bitmap is 0), a Retpoline exit sequence is initialized. The RUNNING_NON_RETPOLINE_CODE
SPEC_CONTROL
ware mitigations provide the needed protection).
When the thread quantum ends, and the scheduler selects a new thread, it saves the Retpoline
status (represented by the presence of the RUNNING_NON_RETPOLINE_CODE
processors in the KTHREAD data structure of the old thread. In this way, when the old thread is selected
again for execution (or a kernel trap entry happens), the system knows that it needs to re-enable the
needed hardware speculation mitigations with the goal of keeping the system always protected.
CHAPTER 8
System mechanisms
25
Import optimization
Retpoline entries in the DVRT also describe indirect branches targeting imported functions. An imported control transfer entry in the DVRT describes this kind of branch by using an index referring to
pointers compiled by the loader.) After the Windows loader has compiled the IAT, it is unlikely that its
it is not needed to transform an indirect branch targeting an imported function to a Retpoline one because the NT kernel can ensure that the virtual addresses of the two images (caller and callee) are close
enough to directly invoke the target (less than 2 GB).
FIGURE 8-10 Different indirect branches on the ExAllocatePool function.
Import optimization (internally also known as “import linking”) is the feature that uses Retpoline
dynamic relocations to transform indirect calls targeting imported functions into direct branches. If
a direct branch is used to divert code execution to an imported function, there is no need to apply
Retpoline because direct branches are not vulnerable to speculation attacks. The NT kernel applies Import Optimization at the same time it applies Retpoline, and even though the two features
Optimization, Windows has been able to gain a performance boost even on systems that are not vulnerable to Spectre v2. (A direct branch does not require any additional memory access.)
STIBP pairing
In hyperthreaded systems, for protecting user-mode code against Spectre v2, the system should run
user threads with at least STIBP on. On nonhyperthreaded systems, this is not needed: protection
against a previous user-mode thread speculation is already achieved thanks to the IBRS being enabled
while previously executing kernel-mode code. In case Retpoline is enabled, the needed IBPB is emitted
branch prediction buffer is empty before executing the code of the user thread.
Leaving STIBP enabled in a hyper-threaded system has a performance penalty, so by default
it is disabled for user-mode threads, leaving a thread to be potentially vulnerable by speculation
from a sibling SMT thread. The end-user can manually enable STIBP for user threads through the
26
CHAPTER 8
System mechanisms
mitigation option.
The described scenario is not ideal. A better solution is implemented in the STIBP pairing mechanism. STIBP pairing is enabled by the I/O manager in phase 1 of the NT kernel initialization (using the
KeOptimizeSpecCtrlSettings function) only under certain conditions. The system should have hyperible only on non-nested virtualized environments or when Hyper-V is disabled (refer to Chapter 9 for
further details.)
in the EPROCESS data structure), which is represented by a 64-bit number. The system security domain
istrative token. Nonsystem security domains are assigned at process creation time (by the internal
PspInitializeProcessSecurity function) following these rules:
■
If the new process is created without a new primary token explicitly assigned to it, it obtains the
same security domain of the parent process that creates it.
■
CreateProcessAsUser or CreateProcessWithLogon APIs, for example), a new user security domain
ID is generated for the new process, starting from the internal PsNextSecurityDomain symbol.
The latter is incremented every time a new domain ID is generated (this ensures that during the
system lifetime, no security domains can collide).
■
Note that a new primary token can be also assigned using the NtSetInformationProcess API
(with the ProcessAccessToken
the API to succeed, the process should have been created as suspended (no threads run in it). At
this stage, the process still has its original token in an unfrozen state. A new security domain is
assigned following the same rules described earlier.
Security domains can also be assigned manually to different processes belonging to the
same group. An application can replace the security domain of a process with another one
of a process belonging to the same group using the NtSetInformationProcess API with the
ProcessCombineSecurityDomainsInformation class. The API accepts two process handles and replaces
open each other with the PROCESS_VM_WRITE and PROCESS_VM_OPERATION access rights.
Security domains allow the STIBP pairing mechanism to work. STIBP pairing links a logical processor (LP) with its sibling (both share the same physical core. In this section, we use the term LP and CPU
interchangeably). Two LPs are paired by the STIBP pairing algorithm (implemented in the internal
KiUpdateStibpPairing function) only when the security domain of the local CPU is the same as the one
of the remote CPU, or one of the two LPs is Idle. In these cases, both the LPs can run without STIBP being set and still be implicitly protected against speculation (there is no advantage in attacking a sibling
CPU running in the same security context).
CHAPTER 8
System mechanisms
27
The STIBP pairing algorithm is implemented in the KiUpdateStibpPairing function and includes a full
state machine. The routine is invoked by the trap exit handler (invoked when the system exits the kernel
pairing state of an LP can become stale mainly for two reasons:
■
The NT scheduler has selected a new thread to be executed in the current CPU. If the new thread
This allows the STIBP pairing algorithm to re-evaluate the pairing state of the two.
■
When the sibling CPU exits from its idle state, it requests the remote CPU to re-evaluate its
STIBP pairing state.
Note that when an LP is running code with STIBP enabled, it is protected from the sibling CPU
speculation. STIBP pairing has been developed based also on the opposite notion: when an LP executes
with STIBP enabled, it is guaranteed that its sibling CPU is protected against itself. This implies that
when a context switches to a different security domain, there is no need to interrupt the sibling CPU
even though it is running user-mode code with STIBP disabled.
The described scenario is not true only when the scheduler selects a VP-dispatch thread (backing
a virtual processor of a VM in case the Root scheduler is enabled; see Chapter 9 for further details)
belonging to the VMMEM process. In this case, the system immediately sends an IPI to the sibling
thread for updating its STIBP pairing state. Indeed, a VP-dispatch thread runs guest-VM code, which
can always decide to disable STIBP, moving the sibling thread in an unprotected state (both runs with
STIBP disabled).
EXPERIMENT: Querying system side-channel mitigation status
Windows exposes side-channel mitigation information through the SystemSpeculationControl
Information and SystemSecureSpeculationControlInformation information classes used by the
NtQuerySystemInformation native API. Multiple tools exist that interface with this API and show
to the end user the system side-channel mitigation status:
■
supported by Microsoft, which is open source and available at the following GitHub
repository: https://github.com/microsoft/SpeculationControl
■
■
The SpecuCheck tool, developed by Alex Ionescu (one of the authors of this book),
which is open source and available at the following GitHub repository:
https://github.com/ionescu007/SpecuCheck
The SkTool, developed by Andrea Allievi (one of the authors of this book) and distributed
(at the time of this writing) in newer Insider releases of Windows.
All of the three tools yield more or less the same results. Only the SkTool is able to show the
28
CHAPTER 8
System mechanisms
mitigations have been enabled in your system. Download SpecuCheck and execute it by opening a command prompt window (type cmd in the Cortana search box). You should get output like
the following:
SpecuCheck v1.1.1
-Copyright(c) 2018 Alex Ionescu
https://ionescu007.github.io/SpecuCheck/ -@aionescu
-------------------------------------------------------Mitigations for CVE-2017-5754 [rogue data cache load]
-------------------------------------------------------[-] Kernel VA Shadowing Enabled:
yes
> Unnecessary due lack of CPU vulnerability:
no
> With User Pages Marked Global:
no
> With PCID Support:
yes
> With PCID Flushing Optimization (INVPCID):
yes
Mitigations for CVE-2018-3620 [L1 terminal fault]
[-] L1TF Mitigation Enabled:
> Unnecessary due lack of CPU vulnerability:
> CPU Microcode Supports Data Cache Flush:
> With KVA Shadow and Invalid PTE Bit:
yes
no
yes
yes
(The output has been trimmed for space reasons.)
You can also download the latest Windows Insider release and try the SkTool. When launched
with no command-line arguments, by default the tool displays the status of the hypervisor and
with the /mitigations command-line argument:
Hypervisor / Secure Kernel / Secure Mitigations Parser Tool 1.0
Querying Speculation Features... Success!
This system supports Secure Speculation Controls.
System Speculation Features.
Enabled: 1
Hardware support: 1
IBRS Present: 1
STIBP Present: 1
SMEP Enabled: 1
Speculative Store Bypass Disable (SSBD) Available: 1
Speculative Store Bypass Disable (SSBD) Supported by OS: 1
Branch Predictor Buffer (BPB) flushed on Kernel/User transition: 1
Retpoline Enabled: 1
Import Optimization Enabled: 1
SystemGuard (Secure Launch) Enabled: 0 (Capable: 0)
SystemGuard SMM Protection (Intel PPAM / AMD SMI monitor) Enabled: 0
Secure system Speculation Features.
KVA Shadow supported: 1
KVA Shadow enabled: 1
KVA Shadow TLB flushing strategy: PCIDs
Minimum IBPB Hardware support: 0
IBRS Present: 0 (Enhanced IBRS: 0)
CHAPTER 8
System mechanisms
29
STIBP Present: 0
SSBD Available: 0 (Required: 0)
Branch Predictor Buffer (BPB) flushed on Kernel/User transition: 0
Branch Predictor Buffer (BPB) flushed on User/Kernel and VTL 1 transition: 0
L1TF mitigation: 0
Microarchitectural Buffers clearing: 1
Trap dispatching
Interrupts and exceptions are operating system conditions that divert the processor to code outside
trap refers to a
control to a trap handler
illustrates some of the conditions that activate trap handlers.
The kernel distinguishes between interrupts and exceptions in the following way. An interrupt is an
asynchronous event (one that can occur at any time) that is typically unrelated to what the processor is
executing. Interrupts are generated primarily by I/O devices, processor clocks, or timers, and they can
be enabled (turned on) or disabled (turned off). An exception, in contrast, is a synchronous condition
Aborts, such as machine checks, are
tions and aborts are sometimes called faults, such as when talking about a page fault or a double fault.
Running a program for a second time with the same data under the same conditions can reproduce
exceptions. Examples of exceptions include memory-access violations, certain debugger instructions,
and divide-by-zero errors. The kernel also regards system service calls as exceptions (although techni-
Trap handlers
Interrupt
System service call
Hardware exceptions (Exception
Software exceptions
frame)
Virtual address
exceptions
Interrupt
Interrupt
Interrupt
service
service
service
routines
routines
routines
Interrupt
Interrupt
service
System
service
routines
services
routines
Exception
dispatcher
Interrupt
Interrupt
Virtual
memory
service
service
manager’s
routines
routines
pager
FIGURE 8-11 Trap dispatching.
30
CHAPTER 8
System mechanisms
Interrupt
Interrupt
service
Exception
service
routines
handlers
routines
tion is caused by a hardware problem, whereas a divide-by-zero exception is the result of a software
bug. Likewise, an I/O device can generate an interrupt, or the kernel itself can issue a software interrupt
(such as an APC or DPC, both of which are described later in this chapter).
current Code Segment (CS) is in CPL 0 or below (i.e., if the current thread was running in kernel mode or
user mode). In the case where the thread was already running in Ring 0, the processor saves (or pushes)
on the current stack the following information, which represents a kernel-to-kernel transition.
■
■
The current code segment (CS)
■
The current program counter (EIP/RIP)
■
Optionally, for certain kind of exceptions, an error code
looks up the current TSS based on the Task Register (TR) and switches to the SS0/ESP0 on x86 or simply
RSP0 on x64, as described in the “Task state segments” section earlier in this chapter. Now that the processor is executing on the kernel stack, it saves the previous SS (the user-mode value) and the previous
had happened. Second, it allows the operating system to know (based on the saved CS value) where
the trap came from—for example, to know if an exception came from user-mode code or from a
kernel system call.
machine state—including registers such as EAX, EBX, ECX, EDI, and so on is saved in a trap frame, a
data structure allocated by Windows in the thread's kernel stack. The trap frame stores the execution
dt nt!_KTRAP_FRAME command in the kernel debugger, or,
Part 1.) The kernel handles software interrupts either as part of hardware interrupt handling or synchronously when a thread invokes kernel functions related to the software interrupt.
In most cases, the kernel installs front-end, trap-handling functions that perform general trapif the condition was a device interrupt, a kernel hardware interrupt trap handler transfers control to the
interrupt service routine (ISR) that the device driver provided for the interrupting device. If the condition
was caused by a call to a system service, the general system service trap handler transfers control to the
handle. These are sometimes called spurious or unexpected traps. The trap handlers typically execute
CHAPTER 8
System mechanisms
31
the system function KeBugCheckEx, which halts the computer when the kernel detects problematic
or incorrect behavior that, if left unchecked, could result in data corruption. The following sections
describe interrupt, exception, and system service dispatching in greater detail.
Interrupt dispatching
Hardware-generated interrupts typically originate from I/O devices that must notify the processor
when they need service. Interrupt-driven devices allow the operating system to get the maximum
use out of the processor by overlapping central processing with I/O operations. A thread starts an I/O
transfer to or from a device and then can execute other useful work while the device completes the
keyboards, disk drives, and network cards are generally interrupt driven.
to initiate thread dispatching and to break into the execution of a thread asynchronously. The kernel can
The kernel installs interrupt trap handlers to respond to device interrupts. Interrupt trap handlers
transfer control either to an external routine (the ISR) that handles the interrupt or to an internal kernel
routine that responds to the interrupt. Device drivers supply ISRs to service device interrupts, and the
kernel provides interrupt-handling routines for other types of interrupts.
rupts, the types of interrupts the kernel supports, how device drivers interact with the kernel (as a part
of interrupt processing), and the software interrupts the kernel recognizes (plus the kernel objects that
are used to implement them).
Hardware interrupt processing
On the hardware platforms supported by Windows, external I/O interrupts come into one of the inputs
on an interrupt controller, for example an I/O Advanced Programmable Interrupt Controller (IOAPIC).
Controllers (LAPIC), which ultimately interrupt the processor on a single input line.
Once the processor is interrupted, it queries the controller to get the global system interrupt vector
(GSIV), which is sometimes represented as an interrupt request (IRQ) number. The interrupt controller
translates the GSIV to a processor interrupt vector, which is then used as an index into a data structure
called the interrupt dispatch table
the matching IDT entry for the interrupt vector.
Based on the information in the IDT entry, the processor can transfer control to an appropriate interrupt dispatch routine running in Ring 0 (following the process described at the start of this section), or
it can even load a new TSS and update the Task Register (TR), using a process called an interrupt gate.
32
CHAPTER 8
System mechanisms
kernel and HAL routines for each exception and internally handled interrupt, as well as with pointers to
thunk
interrupt vectors 0–31 are marked as reserved for processor traps, which are described in Table 8-3.
TABLE 8-3 Processor traps
Vector (Mnemonic)
Meaning
0 (#DE)
Divide error
1 (#DB)
Debug trap
2 (NMI)
Nonmaskable interrupt
3 (#BP)
Breakpoint trap
4 (#OF)
5 (#BR)
Bound fault
6 (#UD)
7 (#NM)
8 (#DF)
Double fault
9 (#MF)
Coprocessor fault (no longer used)
10 (#TS)
TSS fault
11 (#NP)
Segment fault
12 (#SS)
Stack fault
13 (#GP)
General protection fault
14 (#PF)
Page fault
15
Reserved
16 (#MF)
17 (#AC)
Alignment check fault
18 (#MC)
Machine check abort
19 (#XM)
SIMD fault
20 (#VE)
Virtualization exception
21 (#CP)
Control protection exception
22-31
Reserved
The remainder of the IDT entries are based on a combination of hardcoded values (for example,
vectors 30 to 34 are always used for Hyper-V-related VMBus interrupts) as well as negotiated values
example, a keyboard controller might send interrupt vector 82 on one particular Windows system and
67 on a different one.
CHAPTER 8
System mechanisms
33
EXPERIMENT: Viewing the 64-bit IDT
You can view the contents of the IDT, including information on what trap handlers Windows has
assigned to interrupts (including exceptions and IRQs), using the !idt kernel debugger command.
The !idt
interrupts (and, on 64-bit machines, the processor trap handlers).
The following example shows what the output of the !idt command looks like on an x64 system:
0: kd> !idt
Dumping IDT: fffff8027074c000
00:
01:
02:
03:
04:
05:
06:
07:
08:
09:
0a:
0b:
0c:
0d:
0e:
10:
11:
12:
13:
14:
15:
1f:
20:
29:
2c:
2d:
2f:
30:
31:
32:
33:
34:
35:
b0:
ce:
d1:
d2:
d7:
d8:
df:
e1:
e2:
34
fffff8026e1bc700
fffff8026e1bca00
fffff8026e1bcec0
fffff8026e1bd380
fffff8026e1bd680
fffff8026e1bd980
fffff8026e1bde80
fffff8026e1be340
fffff8026e1be600
fffff8026e1be8c0
fffff8026e1beb80
fffff8026e1bee40
fffff8026e1bf1c0
fffff8026e1bf500
fffff8026e1bf840
fffff8026e1bfe80
fffff8026e1c0200
fffff8026e1c0500
fffff8026e1c0fc0
fffff8026e1c1380
fffff8026e1c1840
fffff8026e1b5f50
fffff8026e1b7b00
fffff8026e1c1d00
fffff8026e1c2040
fffff8026e1c2380
fffff8026e1b80a0
fffff8026e1b64d0
fffff8026e1b67b0
fffff8026e1b6a90
fffff8026e1b6d70
fffff8026e1b7050
fffff8026e1b48b8
fffff8026e1b4c90
fffff8026e1b4d80
fffff8026e1b4d98
fffff8026e1b4da0
fffff8026e1b4dc8
fffff8026e1b4dd0
fffff8026e1b4e08
fffff8026e1b8570
fffff8026e1b4e20
CHAPTER 8
nt!KiDivideErrorFault
nt!KiDebugTrapOrFault
Stack = 0xFFFFF8027076E000
nt!KiNmiInterrupt
Stack = 0xFFFFF8027076A000
nt!KiBreakpointTrap
nt!KiOverflowTrap
nt!KiBoundFault
nt!KiInvalidOpcodeFault
nt!KiNpxNotAvailableFault
nt!KiDoubleFaultAbort
Stack = 0xFFFFF80270768000
nt!KiNpxSegmentOverrunAbort
nt!KiInvalidTssFault
nt!KiSegmentNotPresentFault
nt!KiStackFault
nt!KiGeneralProtectionFault
nt!KiPageFault
nt!KiFloatingErrorFault
nt!KiAlignmentFault
nt!KiMcheckAbort
Stack = 0xFFFFF8027076C000
nt!KiXmmException
nt!KiVirtualizationException
nt!KiControlProtectionFault
nt!KiApcInterrupt
nt!KiSwInterrupt
nt!KiRaiseSecurityCheckFailure
nt!KiRaiseAssertion
nt!KiDebugServiceTrap
nt!KiDpcInterrupt
nt!KiHvInterrupt
nt!KiVmbusInterrupt0
nt!KiVmbusInterrupt1
nt!KiVmbusInterrupt2
nt!KiVmbusInterrupt3
hal!HalpInterruptCmciService (KINTERRUPT fffff8026ea59fe0)
ACPI!ACPIInterruptServiceRoutine (KINTERRUPT ffffb88062898dc0)
hal!HalpIommuInterruptRoutine (KINTERRUPT fffff8026ea5a9e0)
hal!HalpTimerClockInterrupt (KINTERRUPT fffff8026ea5a7e0)
hal!HalpTimerClockIpiRoutine (KINTERRUPT fffff8026ea5a6e0)
hal!HalpInterruptRebootService (KINTERRUPT fffff8026ea5a4e0)
hal!HalpInterruptStubService (KINTERRUPT fffff8026ea5a2e0)
hal!HalpInterruptSpuriousService (KINTERRUPT fffff8026ea5a1e0)
nt!KiIpiInterrupt
hal!HalpInterruptLocalErrorService (KINTERRUPT fffff8026ea5a3e0)
System mechanisms
e3:
fd:
fe:
fffff8026e1b4e28 hal!HalpInterruptDeferredRecoveryService
(KINTERRUPT fffff8026ea5a0e0)
fffff8026e1b4ef8 hal!HalpTimerProfileInterrupt (KINTERRUPT fffff8026ea5a8e0)
fffff8026e1b4f00 hal!HalpPerfInterrupt (KINTERRUPT fffff8026ea5a5e0)
On the system used to provide the output for this experiment, the ACPI SCI ISR is at interrupt
number B0h. You can also see that interrupt 14 (0Eh) corresponds to KiPageFault
KiPageFault, which is a type
pointer next to them. These correspond to the traps explained in the section on “Task state segments” from earlier, which require dedicated safe kernel stacks for processing. The debugger
knows these stack pointers by dumping the IDT entry, which you can do as well by using the dx
command and dereferencing one of the interrupt vectors in the IDT. Although you can obtain the
IdtBase.
0: kd> dx @$pcr->IdtBase[2].IstIndex
@$pcr->IdtBase[2].IstIndex : 0x3 [Type: unsigned short]
0: kd> dx @$pcr->IdtBase[0x12].IstIndex
@$pcr->IdtBase[0x12].IstIndex : 0x2 [Type: unsigned short]
If you compare the IDT Index values seen here with the previous experiment on dumping the
Each processor has a separate IDT (pointed to by their own IDTR) so that different processors can
clock interrupt, but only one processor updates the system clock in response to this interrupt. All the
processors, however, use the interrupt to measure thread quantum and to initiate rescheduling when a
handle certain device interrupts.
Programmable interrupt controller architecture
Traditional x86 systems relied on the i8259A Programmable Interrupt Controller (PIC), a standard that originated with the original IBM PC. The i8259A PIC worked only with uniprocessor systems and had only eight
secondary
Because PICs had such a quirky way of handling more than 8 devices, and because even 15 became a bottleneck, as well as due to various electrical issues (they were prone to spurious interrupts) and the limitations of
uniprocessor support, modern systems eventually phased out this type of interrupt controller, replacing it
with a variant called the i82489 Advanced Programmable Interrupt Controller (APIC).
CHAPTER 8
System mechanisms
35
APIC and the integration of both an I/O APIC (IOAPIC) connected to external hardware devices to a
Local APIC (LAPIC), connected to the processor core. With time, the MPS standard was folded into the
compatibility with uniprocessor operating systems and boot code that starts a multiprocessor system
in uniprocessor mode, APICs support a PIC compatibility mode with 15 interrupts and delivery of interAs mentioned, the APIC consists of several components: an I/O APIC that receives interrupts from
devices, local APICs that receive interrupts from the I/O APIC on the bus and that interrupt the CPU
they are associated with, and an i8259A-compatible interrupt controller that translates APIC input into
PIC-equivalent signals. Because there can be multiple I/O APICs on the system, motherboards typically
have a piece of core logic that sits between them and the processors. This logic is responsible for implementing interrupt routing algorithms that both balance the device interrupt load across processors and
attempt to take advantage of locality, delivering device interrupts to the same processor that has just
the I/O APIC with its own routing logic to support various features such as interrupt steering, but device
Because the x64 architecture is compatible with x86 operating systems, x64 systems must provide
Windows refused to run on systems that did not have an APIC because they use the APIC for interrupt control, whereas x86 versions of Windows supported both PIC and APIC hardware. This changed
with Windows 8 and later versions, which only run on APIC hardware regardless of CPU architecture.
this register to store the current software interrupt priority level (in the case of Windows, called the
IRQL) and to inform the IOAPIC when it makes routing decisions. More information on IRQL handling
will follow shortly.
CPU 0
CPU 1
Processor Core
Processor Core
Local APIC
Local APIC
Device
interrupts
I/O
APIC
FIGURE 8-12 APIC architecture.
36
CHAPTER 8
System mechanisms
i8259Aequivalent
PIC
EXPERIMENT: Viewing the PIC and APIC
multiprocessor by using the !pic and !apic
output of the !pic command on a uniprocessor. Note that even on a system with an APIC, this
command still works because APIC systems always have an associated PIC-equivalent for emulating legacy hardware.
lkd> !pic
----- IRQ Number ----- 00 01 02 03 04 05 06 07 08 09 0A 0B 0C 0D 0E 0F
Physically in service: Y . . . . . . . . Y Y Y . . . .
Physically masked:
Y Y Y Y Y Y Y Y Y Y Y Y Y Y Y Y
Physically requested:
Y . . . . . . . . Y Y Y . . . .
Level Triggered:
. . . . . . . . . . . . . . . .
!apic command on a system running with Hyper-V enabled, which
you can see due to the presence of the SINTI
Controller (SynIC), described in Chapter 9. Note that during local kernel debugging, this command shows the APIC associated with the current processor—in other words, whichever procesat a crash dump or remote system, you can use the ~ (tilde) command followed by the processor
number to switch the processor of whose local APIC you want to see. In either case, the number
next to the ID: label will tell you which processor you are looking at.
lkd> !apic
Apic (x2Apic mode) ID:1 (50014) LogDesc:00000002 TPR 00
TimeCnt: 00000000clk SpurVec:df FaultVec:e2 error:0
Ipi Cmd: 00000000`0004001f Vec:1F FixedDel
Dest=Self
Timer..: 00000000`000300d8 Vec:D8 FixedDel
Dest=Self
Linti0.: 00000000`000100d8 Vec:D8 FixedDel
Dest=Self
Linti1.: 00000000`00000400 Vec:00 NMI
Dest=Self
Sinti0.: 00000000`00020030 Vec:30 FixedDel
Dest=Self
Sinti1.: 00000000`00010000 Vec:00 FixedDel
Dest=Self
Sinti2.: 00000000`00010000 Vec:00 FixedDel
Dest=Self
Sinti3.: 00000000`000000d1 Vec:D1 FixedDel
Dest=Self
Sinti4.: 00000000`00020030 Vec:30 FixedDel
Dest=Self
Sinti5.: 00000000`00020031 Vec:31 FixedDel
Dest=Self
Sinti6.: 00000000`00020032 Vec:32 FixedDel
Dest=Self
Sinti7.: 00000000`00010000 Vec:00 FixedDel
Dest=Self
Sinti8.: 00000000`00010000 Vec:00 FixedDel
Dest=Self
Sinti9.: 00000000`00010000 Vec:00 FixedDel
Dest=Self
Sintia.: 00000000`00010000 Vec:00 FixedDel
Dest=Self
Sintib.: 00000000`00010000 Vec:00 FixedDel
Dest=Self
Sintic.: 00000000`00010000 Vec:00 FixedDel
Dest=Self
Sintid.: 00000000`00010000 Vec:00 FixedDel
Dest=Self
Sintie.: 00000000`00010000 Vec:00 FixedDel
Dest=Self
Sintif.: 00000000`00010000 Vec:00 FixedDel
Dest=Self
TMR: 95, A5, B0
IRR:
ISR:
edg
edg
edg
edg
edg
edg
edg
edg
edg
edg
edg
edg
edg
edg
edg
edg
edg
edg
edg
edg
CHAPTER 8
high
high
high
high
high
high
high
high
high
high
high
high
high
high
high
high
high
high
high
high
m
m
m
m
m
m
m
m
m
m
m
m
m
System mechanisms
37
The various numbers following the Vec labels indicate the associated vector in the IDT with
Interrupt Processor Interrupt (IPI) vector, and interrupt number 0xE2 handles APIC errors. Going
back to the !idt
Interrupt (meaning that an IPI was recently used to send an APC from one processor to another),
The following output is for the !ioapic
IRQ 9 (the System Control Interrupt, or SCI) is associated with vector B0h, which in the !idt output
from the earlier experiment was associated with ACPI.SYS.
0: kd> !ioapic
Controller at 0xfffff7a8c0000898 I/O APIC at VA 0xfffff7a8c0012000
IoApic @ FEC00000 ID:8 (11) Arb:0
Inti00.: 00000000`000100ff Vec:FF FixedDel Ph:00000000
edg
Inti01.: 00000000`000100ff Vec:FF FixedDel Ph:00000000
edg
Inti02.: 00000000`000100ff Vec:FF FixedDel Ph:00000000
edg
Inti03.: 00000000`000100ff Vec:FF FixedDel Ph:00000000
edg
Inti04.: 00000000`000100ff Vec:FF FixedDel Ph:00000000
edg
Inti05.: 00000000`000100ff Vec:FF FixedDel Ph:00000000
edg
Inti06.: 00000000`000100ff Vec:FF FixedDel Ph:00000000
edg
Inti07.: 00000000`000100ff Vec:FF FixedDel Ph:00000000
edg
Inti08.: 00000000`000100ff Vec:FF FixedDel Ph:00000000
edg
Inti09.: ff000000`000089b0 Vec:B0 LowestDl Lg:ff000000
lvl
Inti0A.: 00000000`000100ff Vec:FF FixedDel Ph:00000000
edg
Inti0B.: 00000000`000100ff Vec:FF FixedDel Ph:00000000
edg
high
high
high
high
high
high
high
high
high
high
high
high
m
m
m
m
m
m
m
m
m
m
m
Software interrupt request levels (IRQLs)
Although interrupt controllers perform interrupt prioritization, Windows imposes its own interrupt
priority scheme known as interrupt request levels (IRQLs). The kernel represents IRQLs internally as a
number from 0 through 31 on x86 and from 0 to 15 on x64 (and ARM/ARM64), with higher numbers
Interrupts are serviced in priority order, and a higher-priority interrupt preempts the servicing of
a lower-priority interrupt. When a high-priority interrupt occurs, the processor saves the interrupted
saved machine state. The interrupted thread resumes executing where it left off. When the kernel lowers the IRQL, lower-priority interrupts that were masked might materialize. If this happens, the kernel
repeats the process to handle the new interrupts.
38
CHAPTER 8
System mechanisms
x86
31
30
29
28
27
26
x64
High
Power fail
Interprocessor interrupt
Clock
Profile/Synch
Device n
Hardware
interrupts
•
•
•
5 Corrected Machine Check Interrupt
••
4
•
Device 1
3
DPC/dispatch
2
APC
1
Passive/Low
0
15
High/Profile
14
Interprocessor interrupt/Power
13
Clock
12
Synch
11
Device n
4
••
•
3
Device 1
Software
interrupts
2
Dispatch/DPC
1
APC
Normal thread
execution
0
Passive/Low
FIGURE 8-13 x86 and x64 interrupt request levels (IRQLs).
IRQL priority levels have a completely different meaning than thread-scheduling priorities (which
are described in Chapter 5 of Part 1). A scheduling priority is an attribute of a thread, whereas an IRQL
is an attribute of an interrupt source, such as a keyboard or a mouse. In addition, each processor has an
IRQL setting that changes as operating system code executes. As mentioned earlier, on x64 systems,
the IRQL is stored in the CR8 register that maps back to the TPR on the APIC.
by calling KeRaiseIrql and KeLowerIrql or, more commonly, indirectly via calls to functions that acquire
the current level interrupt the processor, whereas interrupts from sources with IRQLs equal to or below the current level are masked until an executing thread lowers the IRQL.
IRQL setting
Processor A
IRQL = Clock
High/Profile
Interprocessor interrupt/Power
Clock
Synch
Device n
Interrupts masked on
Processor A
••
•
Device 1
Dispatch/DPC
APC
Passive/Low
Processor B
IRQL = DPC/dispatch
Interrupts masked on
Processor B
FIGURE 8-14 Masking interrupts.
CHAPTER 8
System mechanisms
39
rupt source. This elevation masks all interrupts at and below that IRQL (on that processor only), which
lower level. The masked interrupts are either handled by another processor or held back until the IRQL
drops. Therefore, all components of the system, including the kernel and device drivers, attempt to
keep the IRQL at passive level (sometimes called low level). They do this because device drivers can reperiods. Thus, when the system is not performing any interrupt work (or needs to synchronize with it)
or handling a software interrupt such as a DPC or APC, the IRQL is always 0. This obviously includes any
fects on system operation. In fact, returning to a user-mode thread with the IRQL above 0 results in an
immediate system crash (bugcheck) and is a serious driver bug.
another due to preemption—run at IRQL 2 (hence the name dispatch level), meaning that the processor behaves in a single-threaded, cooperative fashion at this level and above. It is, for example, illegal to
wait on a dispatcher object (more on this in the “Synchronization” section that follows) at this IRQL, as
a context switch to a different thread (or the idle thread) would never occur. Another restriction is that
only nonpaged memory can be accessed at IRQL DPC/dispatch level or higher.
resident results in a page fault. When a page fault occurs, the memory manager initiates a disk I/O and
the scheduler to perform a context switch (perhaps to the idle thread if no user thread is waiting to
level or higher at the time of the disk read). A further problem results in the fact that I/O completion
complete because the completion APC would not get a chance to run.
If either of these two restrictions is violated, the system crashes with an IRQL_NOT_LESS_OR_EQUAL
or a DRIVER_IRQL_NOT_LESS_OR_EQUAL crash code. (See Chapter 10, “Management, diagnostics, and
tracing” for a thorough discussion of system crashes.) Violating these restrictions is a common bug in
type of bug.
Conversely, this also means that when working at IRQL 1 (also called APC level), preemption is still
active and context switching can occur. This makes IRQL 1 essentially behave as a thread-local IRQL
instead of a processor-local IRQL, since a wait operation or preemption operation at IRQL 1 will cause
KTHREAD structure, as seen
thread at passive level (IRQL 0) can still preempt a thread running at APC level (IRQL 1), because below
IRQL 2, the scheduler decides which thread controls the processor.
40
CHAPTER 8
System mechanisms
EXPERIMENT: Viewing the IRQL
!irql debugger command. The saved IRQL represents the IRQL at the time just before the break-in to the debugger, which raises the IRQL to a
static, meaningless value:
kd> !irql
Debugger saved IRQL for processor 0x0 -- 0 (LOW_LEVEL)
is the processor control region (PCR), whereas its extension, the processor region control block
(PRCB), contains the saved IRQL in the DebuggerSavedIRQL
a remote kernel debugger will raise the IRQL to HIGH_LEVEL to stop any and all asynchronous
processor operations while the user is debugging the machine, which would cause the output
of !irql to be meaningless. This “saved” value is thus used to indicate the IRQL right before the
debugger is attached.
interprocessor interrupt (IPI) to request that another processor perform an action, such as dispatching a particular
thread for execution or updating its translation look-aside buffer (TLB) cache. The system clock
generates an interrupt at regular intervals, and the kernel responds by updating the clock and
measuring thread execution time. The HAL provides interrupt levels for use by interrupt-driven
software interrupts (described later in this chapter) to initiate thread scheduling and to asynchro-
Mapping interrupt vectors to IRQLs
On systems without an APIC-based architecture, the mapping between the GSIV/IRQ and the IRQL had
to be strict. To avoid situations where the interrupt controller might think an interrupt line is of higher
terrupt is not tied to its GSIV/IRQ, but rather to the interrupt vector: the upper 4 bits of the vector map
back to the priority. Since the IDT can have up to 256 entries, this gives a space of 16 possible priorities
(for example, vector 0x40 would be priority 4), which are the same 16 numbers that the TPR can hold,
which map back to the same 16 IRQLs that Windows implements!
appropriate interrupt vector for the interrupt, and program the IOAPIC to use that vector for the assochoose an interrupt vector that maps back to that priority. These decisions are performed by the Plug
and Play manager working in concert with a type of device driver called a bus driver, which determines
the presence of devices on its bus (PCI, USB, and so on) and what interrupts can be assigned to a device.
CHAPTER 8
System mechanisms
41
The bus driver reports this information to the Plug and Play manager, which decides—after taking into
account the acceptable interrupt assignments for all other devices—which interrupt will be assigned to
each device. Then it calls a Plug and Play interrupt arbiter, which maps interrupts to IRQLs. This arbiter
is exposed by the HAL, which also works with the ACPI bus driver and the PCI bus driver to collectively
determine the appropriate mapping. In most cases, the ultimate vector number is selected in a roundlater in this section shows how the debugger can query this information from the interrupt arbiter.
Outside of arbitered interrupt vectors associated with hardware interrupts, Windows also has a numTable 8-4.
TABLE 8-4
Vector
Usage
APC interrupt
0x2F
DPC interrupt
0x30
Hypervisor interrupt
0x31-0x34
VMBus interrupt(s)
0x35
CMCI interrupt
0xCD
Thermal interrupt
0xCE
IOMMU interrupt
0xCF
DMA interrupt
0xD1
Clock timer interrupt
0xD2
Clock IPI interrupt
0xD3
Clock always on interrupt
0xD7
Reboot Interrupt
0xD8
Stub interrupt
0xD9
Test interrupt
0xDF
Spurious interrupt
0xE1
IPI interrupt
0xE2
LAPIC error interrupt
0xE3
DRS interrupt
0xF0
Watchdog interrupt
0xFB
Hypervisor HPET interrupt
0xFD
0xFE
42
Performance interrupt
CHAPTER 8
System mechanisms
Predefined IRQLs
■
The kernel typically uses high
KeBugCheckEx and masking out all interrupts or when a remote kernel debugger is attached. The profile level shares the
enabled. The performance interrupt, associated with such features as Intel Processor Trace (Intel
PT) and other hardware performance monitoring unit (PMU) capabilities, also runs at this level.
■
Interprocessor interrupt level is used to request another processor to perform an action, such
Deferred Recovery Service (DRS) level also shares the same value and is used on x64 systems
by the Windows Hardware Error Architecture (WHEA) for performing recovery from certain
Machine Check Errors (MCE).
■
■
Clock
to measure and allot CPU time to threads.
The synchronization IRQL is internally used by the dispatcher and scheduler code to protect
highest level right after the device IRQLs.
■
■
The device IRQLs are used to prioritize device interrupts. (See the previous section for how hardware interrupt levels are mapped to IRQLs.)
The corrected machine check interrupt level is used to signal the operating system after a serious
the Machine Check Error (MCE) interface.
■
■
DPC/dispatch-level and APC-level interrupts are software interrupts that the kernel and device
drivers generate. (DPCs and APCs are explained in more detail later in this chapter.)
The lowest IRQL, passive
thread execution takes place and all interrupts can occur.
Interrupt objects
The kernel provides a portable mechanism—a kernel control object called an interrupt object, or
KINTERRUPT—that allows device drivers to register ISRs for their devices. An interrupt object contains
all the information the kernel needs to associate a device ISR with a particular hardware interrupt,
including the address of the ISR, the polarity and trigger mode of the interrupt, the IRQL at which the
device interrupts, sharing state, the GSIV and other interrupt controller data, as well as a host of performance statistics.
CHAPTER 8
System mechanisms
43
These interrupt objects are allocated from a common pool of memory, and when a device driver
registers an interrupt (with IoConnectInterrupt or IoConnectInterruptEx), one is initialized with all the
necessary information. Based on the number of processors eligible to receive the interrupt (which is
indicated by the device driver when specifying the interrupt affinity
for each one—in the typical case, this means for every processor on the machine. Next, once an interInterruptObject) of each eligible processor
kernel updates the DispatchAddress
KiChainedDispatch
KINTERRUPT data structure) to point to the function
InterruptListEntry
then KiInterruptDispatch is used instead.
The interrupt object also stores the IRQL associated with the interrupt so that KiInterruptDispatch or
KiChainedDispatch can raise the IRQL to the correct level before calling the ISR and then lower the IRQL
to the interrupt object (or any other argument for that matter) on the initial dispatch because the initial
dispatch is done by hardware.
When an interrupt occurs, the IDT points to one of 256 copies of the KiIsrThunk function, each one
having a different line of assembly code that pushes the interrupt vector on the kernel stack (because
this is not provided by the processor) and then calling a shared KiIsrLinkage function, which does the
rest of the processing. Among other things, the function builds an appropriate trap frame as explained
InterruptObject array and using
the interrupt vector on the stack as an index, dereferencing the matching pointer. On the other hand,
value of the registry value BugCheckUnexpectedInterrupts
KeBugCheckEx, or the interrupt is silently ignored, and execution is restored back to the original control point.
KiInterruptDispatchNoLock,
which is used for interrupts that do not have an associated kernel-managed spinlock (typically used by
drivers that want to synchronize with their ISRs), KiInterruptDispatchNoLockNoEtw for interrupts that do
not want ETW performance tracing, and KiSpuriousDispatchNoEOI for interrupts that are not required
to send an end-of-interrupt signal since they are spurious.
KiInterruptDispatchNoEOI, which is used for interrupts that have programmed the APIC in
Auto-End-of-Interrupt (Auto-EOI) mode—because the interrupt controller will send the EOI signal auinterrupt routines take advantage of the “no-lock” dispatch code because the HAL does not require the
kernel to synchronize with its ISR.
44
CHAPTER 8
System mechanisms
Another kernel interrupt handler is KiFloatingDispatch, which is used for interrupts that require
ISRs might need to use these registers (such as the video card ISR performing a quick drawing operation). When connecting an interrupt, drivers can set the FloatingSave argument to TRUE, requesting
this greatly increases interrupt latency.) Note that this is supported only on 32-bit systems.
Regardless of which dispatch routine is used, ultimately a call to the ServiceRoutine
message signaled
interrupts (MSI), which are explained later, this is a pointer to KiInterruptMessageDispatch, which will
then call the MessageServiceRoutine
those based on NDIS or StorPort (more on driver frameworks is explained in Chapter 6 of Part 1, “I/O
Peripheral Device
Controller
0
2
3
CPU
CPU
I/O APIC
CPU Local
APIC
ISR Address
Spinlock
Dispatcher
0
2
3
n
CPU Interrupt
Dispatch Table
Interrupt
Object
n
CPU KPRCB
Dispatch
Code
KilsrLinkage
Raise IRQL
Grab Spinlock
Drop Spinlock
Lower IRQL
KiInterruptDispatch
Read from device
AcknowledgeInterrupt
Request DPC
Driver ISR
FIGURE 8-15
CHAPTER 8
System mechanisms
45
Associating an ISR with a particular level of interrupt is called connecting an interrupt object, and dissociating an ISR from an IDT entry is called disconnecting an interrupt object. These operations, accomplished by
calling the kernel functions IoConnectInterruptEx and IoDisconnectInterruptEx, allow a device driver to “turn
on” an ISR when the driver is loaded into the system and to “turn off” the ISR if the driver is unloaded.
dling directly with interrupt hardware (which differs among processor architectures) and from needing
to know any details about the IDT. This kernel feature aids in creating portable device drivers because it
nize the execution of the ISR with other parts of a device driver that might share data with the ISR. (See
Chapter 6 in Part 1 for more information about how device drivers respond to interrupts.)
We also described the concept of a chained dispatch, which allows the kernel to easily call more than
one ISR for any interrupt level. If multiple device drivers create interrupt objects and connect them
to the same IDT entry, the KiChainedDispatch routine calls each ISR when an interrupt occurs at the
daisy-chain
in which several devices share the same interrupt line. The chain breaks when one of the ISRs claims
ownership for the interrupt by returning a status to the interrupt dispatcher.
If multiple devices sharing the same interrupt require service at the same time, devices not acknowledged by their ISRs will interrupt the system again once the interrupt dispatcher has lowered the IRQL.
Chaining is permitted only if all the device drivers wanting to use the same interrupt indicate to the kernel that they can share the interrupt (indicated by the ShareVector
the sharing requirements of each.
EXPERIMENT: Examining interrupt internals
Using the kernel debugger, you can view details of an interrupt object, including its IRQL, ISR
!idt debugger command and
check whether you can locate an entry that includes a reference to I8042KeyboardInterruptService,
the ISR routine for the PS2 keyboard device. Alternatively, you can look for entries pointing to
Stornvme.sys or Scsiport.sys or any other third-party driver you recognize. In a Hyper-V virtual
device entry:
70:
fffff8045675a600 i8042prt!I8042KeyboardInterruptService (KINTERRUPT ffff8e01cbe3b280)
To view the contents of the interrupt object associated with the interrupt, you can simply click
on the link that the debugger offers, which uses the dt command, or you can manually use the
dx
6: kd> dt
+0x000
+0x002
+0x008
46
nt!_KINTERRUPT ffff8e01cbe3b280
Type
: 0n22
Size
: 0n256
InterruptListEntry : _LIST_ENTRY [ 0x00000000`00000000 - 0x00000000`00000000 ]
CHAPTER 8
System mechanisms
+0x018 ServiceRoutine
+0x020
+0x028
+0x030
+0x038
+0x040
+0x048
+0x050
+0x058
+0x05c
+0x05d
+0x05e
+0x05f
+0x060
+0x064
+0x065
+0x066
+0x068
+0x06c
+0x070
+0x074
+0x078
+0x080
+0x088
+0x090
+0x098
+0x0a0
+0x0a8
+0x0b0
+0x0f0
+0x0f8
: 0xfffff804`65e56820
unsigned char i8042prt!I8042KeyboardInterruptService
MessageServiceRoutine : (null)
MessageIndex
: 0
ServiceContext
: 0xffffe50f`9dfe9040 Void
SpinLock
: 0
TickCount
: 0
ActualLock
: 0xffffe50f`9dfe91a0 -> 0
DispatchAddress : 0xfffff804`565ca320
void nt!KiInterruptDispatch+0
Vector
: 0x70
Irql
: 0x7 ''
SynchronizeIrql : 0x7 ''
FloatingSave
: 0 ''
Connected
: 0x1 ''
Number
: 6
ShareVector
: 0 ''
EmulateActiveBoth : 0 ''
ActiveCount
: 0
InternalState
: 0n4
Mode
: 1 ( Latched )
Polarity
: 0 ( InterruptPolarityUnknown )
ServiceCount
: 0
DispatchCount
: 0
PassiveEvent
: (null)
TrapFrame
: (null)
DisconnectData
: (null)
ServiceThread
: (null)
ConnectionData
: 0xffffe50f`9db3bd90 _INTERRUPT_CONNECTION_DATA
IntTrackEntry
: 0xffffe50f`9d091d90 Void
IsrDpcStats
: _ISRDPCSTATS
RedirectObject
: (null)
Padding
: [8] ""
In this example, the IRQL that Windows assigned to the interrupt is 7, which matches the fact
from the DispatchAddress
additional optimizations or sharing.
KiInterruptDispatch-style interrupt with no
If you wanted to see which GSIV (IRQ) was associated with the interrupt, there are two ways
INTERRUPT_CONNECTION_DATA structure embedded in the ConnectionData
dt command to dump the
pointer from your system as follows:
6: kd> dt 0xffffe50f`9db3bd90 _INTERRUPT_CONNECTION_DATA Vectors[0]..
nt!_INTERRUPT_CONNECTION_DATA
+0x008 Vectors
: [0]
+0x000 Type
: 0 ( InterruptTypeControllerInput )
+0x004 Vector
: 0x70
+0x008 Irql
: 0x7 ''
+0x00c Polarity
: 1 ( InterruptActiveHigh )
+0x010 Mode
: 1 ( Latched )
+0x018 TargetProcessors :
CHAPTER 8
System mechanisms
47
+0x000 Mask
: 0xff
+0x008 Group
: 0
+0x00a Reserved
: [3] 0
+0x028 IntRemapInfo :
+0x000 IrtIndex
: 0y000000000000000000000000000000 (0)
+0x000 FlagHalInternal : 0y0
+0x000 FlagTranslated : 0y0
+0x004 u
: <anonymous-tag>
+0x038 ControllerInput :
+0x000 Gsiv
: 1
The Type indicates that this is a traditional line/controller-based input, and the Vector
and Irql
ControllerInput
different kind of interrupt, such as a Message Signaled Interrupt (more on this later), you would
dereference the MessageRequest
Another way to map GSIV to interrupt vectors is to recall that Windows keeps track of this
translation when managing device resources through what are called arbiters
type, an arbiter maintains the relationship between virtual resource usage (such as an interrupt
vector) and physical resources (such as an interrupt line). As such, you can query the ACPI IRQ
arbiter and obtain this mapping. Use the !apciirqarb command to obtain information on the
ACPI IRQ arbiter:
6: kd> !acpiirqarb
Processor 0 (0, 0):
Device Object: 0000000000000000
Current IDT Allocation:
...
000000070 - 00000070 D ffffe50f9959baf0 (i8042prt) A:ffffce0717950280 IRQ(GSIV):1
...
Note that the GSIV for the keyboard is IRQ 1, which is a legacy number from back in the IBM
PC/AT days that has persisted to this day. You can also use !arbiter 4 (4 tells the debugger to
6: kd> !arbiter 4
DEVNODE ffffe50f97445c70 (ACPI_HAL\PNP0C08\0)
Interrupt Arbiter "ACPI_IRQ" at fffff804575415a0
Allocated ranges:
0000000000000001 - 0000000000000001
ffffe50f9959baf0
(i8042prt)
note that in either output, you are given the owner of the vector, in the type of a device object (in
!devobj command to get information on
the i8042prt device in this example (which corresponds to the PS/2 driver):
6: kd> !devobj 0xFFFFE50F9959BAF0
Device object (ffffe50f9959baf0) is for:
00000049 \Driver\ACPI DriverObject ffffe50f974356f0
48
CHAPTER 8
System mechanisms
Current Irp 00000000 RefCount 1 Type 00000032 Flags 00001040
SecurityDescriptor ffffce0711ebf3e0 DevExt ffffe50f995573f0 DevObjExt ffffe50f9959bc40
DevNode ffffe50f9959e670
ExtensionFlags (0x00000800) DOE_DEFAULT_SD_PRESENT
Characteristics (0x00000080) FILE_AUTOGENERATED_DEVICE_NAME
AttachedDevice (Upper) ffffe50f9dfe9040 \Driver\i8042prt
Device queue is not busy.
The device object is associated to a device node
es. You can now dump these resources with the !devnode
ask for both raw and translated resource information:
-
6: kd> !devnode ffffe50f9959e670 f
DevNode 0xffffe50f9959e670 for PDO 0xffffe50f9959baf0
InstancePath is "ACPI\LEN0071\4&36899b7b&0"
ServiceName is "i8042prt"
TargetDeviceNotify List - f 0xffffce0717307b20 b 0xffffce0717307b20
State = DeviceNodeStarted (0x308)
Previous State = DeviceNodeEnumerateCompletion (0x30d)
CmResourceList at 0xffffce0713518330 Version 1.1 Interface 0xf Bus #0
Entry 0 - Port (0x1) Device Exclusive (0x1)
Flags (PORT_MEMORY PORT_IO 16_BIT_DECODE
Range starts at 0x60 for 0x1 bytes
Entry 1 - Port (0x1) Device Exclusive (0x1)
Flags (PORT_MEMORY PORT_IO 16_BIT_DECODE
Range starts at 0x64 for 0x1 bytes
Entry 2 - Interrupt (0x2) Device Exclusive (0x1)
Flags (LATCHED
Level 0x1, Vector 0x1, Group 0, Affinity 0xffffffff
...
TranslatedResourceList at 0xffffce0713517bb0 Version 1.1 Interface 0xf
Entry 0 - Port (0x1) Device Exclusive (0x1)
Flags (PORT_MEMORY PORT_IO 16_BIT_DECODE
Range starts at 0x60 for 0x1 bytes
Entry 1 - Port (0x1) Device Exclusive (0x1)
Flags (PORT_MEMORY PORT_IO 16_BIT_DECODE
Range starts at 0x64 for 0x1 bytes
Entry 2 - Interrupt (0x2) Device Exclusive (0x1)
Flags (LATCHED
Level 0x7, Vector 0x70, Group 0, Affinity 0xff
Bus #0
The device node tells you that this device has a resource list with three entries, one of which
is an interrupt entry corresponding to IRQ 1. (The level and vector numbers represent the GSIV
IRQL as 7 (this is the level number) and the interrupt vector as 0x70.
On ACPI systems, you can also obtain this information in a slightly easier way by reading the
extended output of the !acpiirqarb command introduced earlier. As part of its output, it displays
the IRQ to IDT mapping table:
Interrupt Controller (Inputs: 0x0-0x77):
(01)Cur:IDT-70 Ref-1 Boot-0 edg hi
(02)Cur:IDT-80 Ref-1 Boot-1 edg hi
(08)Cur:IDT-90 Ref-1 Boot-0 edg hi
Pos:IDT-00 Ref-0 Boot-0 lev unk
Pos:IDT-00 Ref-0 Boot-1 lev unk
Pos:IDT-00 Ref-0 Boot-0 lev unk
CHAPTER 8
System mechanisms
49
(09)Cur:IDT-b0
(0e)Cur:IDT-a0
(10)Cur:IDT-b5
(11)Cur:IDT-a5
(12)Cur:IDT-95
(14)Cur:IDT-64
(17)Cur:IDT-54
(1f)Cur:IDT-a6
(41)Cur:IDT-96
Ref-1
Ref-1
Ref-2
Ref-1
Ref-1
Ref-2
Ref-1
Ref-1
Ref-1
Boot-0
Boot-0
Boot-0
Boot-0
Boot-0
Boot-0
Boot-0
Boot-0
Boot-0
lev
lev
lev
lev
lev
lev
lev
lev
edg
hi
low
low
low
low
low
low
low
hi
Pos:IDT-00
Pos:IDT-00
Pos:IDT-00
Pos:IDT-00
Pos:IDT-00
Pos:IDT-00
Pos:IDT-00
Pos:IDT-00
Pos:IDT-00
Ref-0
Ref-0
Ref-0
Ref-0
Ref-0
Ref-0
Ref-0
Ref-0
Ref-0
Boot-0
Boot-0
Boot-0
Boot-0
Boot-0
Boot-0
Boot-0
Boot-0
Boot-0
lev
lev
lev
lev
lev
lev
lev
lev
lev
unk
unk
unk
unk
unk
unk
unk
unk
unk
resources, and other related concepts, see Chapter 6 in Part 1.
Line-based versus message signaled–based interrupts
Shared interrupts are often the cause of high interrupt latency and can also cause stability issues. They
are typically undesirable and a side effect of the limited number of physical interrupt lines on a comMemory Stick, Secure Digital, and other formats, all the controllers that are part of the same physical
ent device drivers as a shared interrupt vector. This adds latency as each one is called in a sequence to
determine the actual controller that is sending the interrupt for the media device.
A much better solution is for each device controller to have its own interrupt and for one driver to
manage the different interrupts, knowing which device they came from. However, consuming four traditional IRQ lines for a single device quickly leads to IRQ line exhaustion. Additionally, PCI devices are
each connected to only one IRQ line anyway, so the media card reader cannot use more than one IRQ
Other problems with generating interrupts through an IRQ line is that incorrect management of the
IRQ signal can lead to interrupt storms or other kinds of deadlocks on the machine because the signal
cally receive an EOI signal as well.) If either of these does not happen due to a bug, the system can end
interrupts provide poor scalability in multiprocessor environments. In many cases, the hardware has
manager selected for this interrupt, and device drivers can do little about it.
message-signaled
interrupts (MSI). Although it was an optional component of the standard that was seldom found in
client machines (and mostly found on servers for network card and storage controller performance),
most modern systems, thanks to PCI Express 3.0 and later, fully embrace this model. In the MSI world, a
this is essentially treated like a Direct Memory Access (DMA) operation as far as hardware is concerned.
This action causes an interrupt, and Windows then calls the ISR with the message content (value) and
50
CHAPTER 8
System mechanisms
the address where the message was delivered. A device can also deliver multiple messages (up to 32) to
the memory address, delivering different payloads based on the event.
which is introduced in PCI 3.0, adds support for 32-bit messages (instead of 16-bit), a maximum of 2048
different messages (instead of just 32), and more importantly, the ability to use a different address
(which can be dynamically determined) for each of the MSI payloads. Using a different address allows
the MSI payload to be written to a different physical address range that belongs to a different processor, or a different set of target processors, effectively enabling nonuniform memory access (NUMA)aware interrupt delivery by sending the interrupt to the processor that initiated the related device
request. This improves latency and scalability by monitoring both load and the closest NUMA node
during interrupt completion.
In either model, because communication is based across a memory value, and because the content
is delivered with the interrupt, the need for IRQ lines is removed (making the total system limit of MSIs
equal to the number of interrupt vectors, not IRQ lines), as is the need for a driver ISR to query the
device for data related to the interrupt, decreasing latency. Due to the large number of device interlatency further by directly delivering the interrupt data to the concerned ISR.
utilize the term “GSIV” instead of IRQ because it more generically describes an MSI vector (which is
(GPIO) pin on an embedded device. And, additionally, on ARM and ARM64 systems, neither of these
8-16, you can see the Device Manager on two computer systems showing both traditional IRQ-based
GSIV assignments, as well as MSI values, which are negative.
FIGURE 8-16 IRQ and MSI-based GSIV assignment.
CHAPTER 8
System mechanisms
51
Interrupt steering
tween 2 and 16 processors in a single processor group, Windows enables a piece of functionality called
interrupt steering to help with power and latency needs on modern consumer systems. Thanks to this feature, interrupt load can be spread across processors as needed to avoid bottlenecking a single CPU, and
the core parking engine, which was described in Chapter 6 of Part 1, can also steer interrupts away from
parked cores to avoid interrupt distribution from keeping too many processors awake at the same time.
Interrupt steering capabilities are dependent on interrupt controllers— for example, on ARM systems
with a GIC, both level sensitive and edge (latched) triggered interrupts can be steered, whereas on APIC
systems (unless running under Hyper-V), only level-sensitive interrupts can be steered. Unfortunately,
why Windows also implements an additional interrupt redirection model to handle these situations.
When steering is enabled, the interrupt controller is simply reprogrammed to deliver the GSIV to a
redirection must be used, then
all processors are delivery targets for the GSIV, and whichever processor received the interrupt manually issues an IPI to the target processor to which the interrupt should be steered toward.
ity through a system information class that is handled by KeIntSteerAssignCpuSetForGsiv as part of the
Real-Time Audio capabilities of Windows 10 and the CPU Set feature that was described in the “Thread
of processors that can be chosen by the user-mode application, as long as it has the Increase Base
Priority privilege, which is normally only granted to administrators or local service accounts.
Interrupt affinity and priority
InterruptPolicyValue in the
https://docs.
microsoft.com/en-us/windows-hardware/drivers/kernel/interrupt-affinity-and-priority.
52
CHAPTER 8
System mechanisms
TABLE 8-5
Policy
Meaning
IrqPolicyMachineDefault
default machine policy, which (for machines with less than eight logical
processors) is to select any available processor on the machine.
IrqPolicyAllCloseProcessors
On a NUMA machine, the Plug and Play manager assigns the interrupt to all the processors that are close to the device (on
the same node). On non-NUMA machines, this is the same as
IrqPolicyAllProcessorsInMachine.
IrqPolicyOneCloseProcessor
On a NUMA machine, the Plug and Play manager assigns the interrupt
to one processor that is close to the device (on the same node). On nonNUMA machines, the chosen processor will be any available processor
on the system.
IrqPolicyAllProcessorsInMachine
The interrupt is processed by any available processor on the machine.
IrqPolicySpecifiedProcessors
IrqPolicySpreadMessagesAcrossAllProcessors
Different message-signaled interrupts are distributed across an optimal
set of eligible processors, keeping track of NUMA topology issues, if possible. This requires MSI-X support on the device and platform.
IrqPolicyAllProcessorsInGroupWhenSteered
The interrupt is subject to interrupt steering, and as such, the interrupt
should be assigned to all processor IDTs as the target processor will be
dynamically selected based on steering rules.
priority, based on the values in Table 8-6.
TABLE 8-6 IRQ priorities
Priority
Meaning
IrqPriorityUndefined
No particular priority is required by the device. It receives the default priority (IrqPriorityNormal).
IrqPriorityLow
The device can tolerate high latency and should receive a lower IRQL than usual (3 or 4).
IrqPriorityNormal
The device expects average latency. It receives the default IRQL associated with its interrupt vector (5 to 11).
IrqPriorityHigh
The device requires as little latency as possible. It receives an elevated IRQL beyond its normal
assignment (12).
As discussed earlier, it is important to note that Windows is not a real-time operating system, and
as such, these IRQ priorities are hints given to the system that control only the IRQL associated with
the interrupt and provide no extra priority other than the Windows IRQL priority-scheme mechanism.
Because the IRQ priority is also stored in the registry, administrators are free to set these values for
drivers should there be a requirement of lower latency for a driver not taking advantage of this feature.
CHAPTER 8
System mechanisms
53
Software interrupts
Although hardware generates most interrupts, the Windows kernel also generates software interrupts
for a variety of tasks, including these:
■
Initiating thread dispatching
■
Non-time-critical interrupt processing
■
Handling timer expiration
■
Asynchronously executing a procedure in the context of a particular thread
■
Supporting asynchronous I/O operations
These tasks are described in the following subsections.
Dispatch or deferred procedure call (DPC) interrupts
A DPC is typically an interrupt-related function that performs a processing task after all device interrupts have already been handled. The functions are called deferred because they might not execute
immediately. The kernel uses DPCs to process timer expiration (and release threads waiting for the
DPC IRQL but not really through a regular kernel DPC). Device drivers use DPCs to process interrupts
and perform actions not available at higher IRQLs. To provide timely service for hardware interrupts,
Windows—with the cooperation of device drivers—attempts to keep the IRQL below device IRQL levels. One way that this goal is achieved is for device driver ISRs to perform the minimal work necessary
to acknowledge their device, save volatile interrupt state, and defer data transfer or other less timecritical interrupt processing activity for execution in a DPC at DPC/dispatch IRQL. (See Chapter 6 in Part
1 for more information on the I/O system.)
In the case where the IRQL is passive or at APC level, DPCs will immediately execute and block all
other non-hardware-related processing, which is why they are also often used to force immediate
execution of high-priority system code. Thus, DPCs provide the operating system with the capability
can no longer continue executing, perhaps because it has terminated or because it voluntarily enters a
wait state, the kernel calls the dispatcher directly to perform an immediate context switch. Sometimes,
however, the kernel detects that rescheduling should occur when it is deep within many layers of code.
In this situation, the kernel requests dispatching but defers its occurrence until it completes its current
activity. Using a DPC software interrupt is a convenient way to achieve this delayed processing.
synchronize access to scheduling-related kernel structures. This disables additional software interrupts
and thread dispatching. When the kernel detects that dispatching should occur, it requests a DPC/dispatch-level interrupt; but because the IRQL is at or above that level, the processor holds the interrupt in
check. When the kernel completes its current activity, it sees that it will lower the IRQL below DPC/dispatch level and checks to see whether any dispatch interrupts are pending. If there are, the IRQL drops
to DPC/dispatch level, and the dispatch interrupts are processed. Activating the thread dispatcher by
54
CHAPTER 8
System mechanisms
using a software interrupt is a way to defer dispatching until conditions are right. A DPC is represented
by a DPC object, a kernel control object that is not visible to user-mode programs but is visible to device drivers and other system code. The most important piece of information the DPC object contains
is the address of the system function that the kernel will call when it processes the DPC interrupt. DPC
routines that are waiting to execute are stored in kernel-managed queues, one per processor, called
DPC queues. To request a DPC, system code calls the kernel to initialize a DPC object and then places it
in a DPC queue.
By default, the kernel places DPC objects at the end of one of two DPC queues belonging to the
processor on which the DPC was requested (typically the processor on which the ISR executed). A
device driver can override this behavior, however, by specifying a DPC priority (low, medium, mediumhigh, or high, where medium is the default) and by targeting the DPC at a particular processor. A DPC
targeted DPC. If the DPC has a high priority, the kernel inserts the
DPC object at the front of the queue; otherwise, it is placed at the end of the queue for all other priorities.
IRQL (APC or passive level), the kernel processes DPCs. Windows ensures that the IRQL remains at DPC/
is, the kernel “drains” the queue), calling each DPC function in turn. Only when the queue is empty will
the kernel let the IRQL drop below DPC/dispatch level and let regular thread execution continue. DPC
DPC
IRQL setting
1 A timer expires, and the kernel
table
queues a DPC that will release
any threads waiting on the
High
timer. The kernel then
Power failure
requests a software interrupt.
3 After the DPC interrupt,
•
control transfers to the
•
(thread) dispatcher.
•
2 When the IRQL drops below
DPC/dispatch
Dispatcher
DPC/dispatch level, a DPC
interrupt occurs.
APC
Passive
DPC
DPC
DPC
queue
4 The dispatcher executes each DPC routine
in the DPC queue, emptying the queue as
it proceeds. If required, the dispatcher also
reschedules the processor.
FIGURE 8-17 Delivering a DPC.
DPC priorities can affect system behavior another way. The kernel usually initiates DPC queue
draining with a DPC/dispatch-level interrupt. The kernel generates such an interrupt only if the DPC is
directed at the current processor (the one on which the ISR executes) and the DPC has a priority higher
than low. If the DPC has a low priority, the kernel requests the interrupt only if the number of outstanding DPC requests (stored in the DpcQueueDepth
threshold (called MaximumDpcQueueDepth
processor within a time window is low.
CHAPTER 8
System mechanisms
55
is either high or medium-high, the kernel immediately signals the target CPU (by sending it a dispatch IPI)
to drain its DPC queue, but only as long as the target processor is idle. If the priority is medium or low, the
number of DPCs queued on the target processor (this being the DpcQueueDepth again) must exceed a
threshold (the MaximumDpcQueueDepth) for the kernel to trigger a DPC/dispatch interrupt. The system
idle thread also drains the DPC queue for the processor it runs on. Although DPC targeting and priority
8-7 summarizes the situations that initiate DPC queue draining. Medium-high and high appear, and are,
in fact, equal priorities when looking at the generation rules. The difference comes from their insertion in
the list, with high interrupts being at the head and medium-high interrupts at the tail.
TABLE 8-7 DPC interrupt generation rules
DPC Priority
DPC Targeted at ISR’s Processor
DPC Targeted at Another Processor
Low
DPC queue length exceeds maximum DPC queue
length, or DPC request rate is less than minimum
DPC request rate
DPC queue length exceeds maximum DPC queue
length, or system is idle
Medium
Always
DPC queue length exceeds maximum DPC queue
length, or system is idle
Medium-High
Always
Target processor is idle
High
Always
Target processor is idle
Additionally, Table 8-8 describes the various DPC adjustment variables and their default values, as
set by using the SystemDpcBehaviorInformation system information class.
TABLE 8-8 DPC interrupt generation variables
Variable
Definition
Default Override Value
Number of DPCs queued before an interrupt will be
sent even for Medium or below DPCs
4
DpcQueueDepth
Number of DPCs per clock tick where low DPCs will
not cause a local interrupt to be generated
3
MinimumDpcRate
Number of DPCs per clock tick before the maximum
DPC queue depth is decremented if DPCs are pending
but no interrupt was generated
20
IdealDpcRate
Number of clock ticks before the maximum DPC
20
AdjustDpcThreshold
Because user-mode threads execute at low IRQL, the chances are good that a DPC will interrupt
-
faults, or create or wait for dispatcher objects (explained later in this chapter). They can, however, access nonpaged system memory addresses, because system address space is always mapped regardless
of what the current process is.
56
CHAPTER 8
System mechanisms
Because all user-mode memory is pageable and the DPC executes in an arbitrary process context,
DPC code should never access user-mode memory in any way. On systems that support Supervisor
Mode Access Protection (SMAP) or Privileged Access Neven (PAN), Windows activates these features
for the duration of the DPC queue processing (and routine execution), ensuring that any user-mode
memory access will immediately result in a bugcheck.
Another side effect of DPCs interrupting the execution of threads is that they end up “stealing”
from the run time of the thread; while the scheduler thinks that the current thread is executing, a DPC
is executing instead. In Chapter 4, Part 1, we discussed mechanisms that the scheduler uses to make
up for this lost time by tracking the precise number of CPU cycles that a thread has been running and
deducting DPC and ISR time, when applicable.
wall time (also sometimes called clock time—the real-life passage of time) is still
being spent on something else. Imagine a user currently streaming their favorite song off the Internet:
If a DPC were to take 2 seconds to run, those 2 seconds would result in the music skipping or repeating in a small loop. Similar impacts can be felt on video streaming or even keyboard and mouse input.
Because of this, DPCs are a primary cause for perceived system unresponsiveness of client systems or
workstation workloads because even the highest-priority thread will be interrupted by a running DPC.
threaded DPCs. Threaded DPCs,
as their name implies, function by executing the DPC routine at passive level on a real-time priority
(priority 31) thread. This allows the DPC to preempt most user-mode threads (because most application
and other priority 31 threads to preempt the routine.
The threaded DPC mechanism is enabled by default, but you can disable it by adding a DWORD value named ThreadDpcEnable
KeInitializeThreadedDpc API, which sets the DPC internal type to ThreadedDpcObject. Because threaded
DPCs can be disabled, driver developers who make use of threaded DPCs must write their routines
following the same rules as for nonthreaded DPC routines and cannot access paged memory, perform
dispatcher waits, or make assumptions about the IRQL level at which they are executing. In addition,
they must not use the KeAcquire/ReleaseSpinLockAtDpcLevel APIs because the functions assume the
CPU is at dispatch level. Instead, threaded DPCs must use KeAcquire/ReleaseSpinLockForDpc, which
performs the appropriate action after checking the current IRQL.
system administrator. As such, the vast majority of DPCs still execute nonthreaded and can result in
perceived system lag. Windows employs a vast arsenal of performance tracking mechanisms to diagthrough performance counters, as well as through precise ETW tracing.
CHAPTER 8
System mechanisms
57
EXPERIMENT: Monitoring DPC activity
You can use Process Explorer to monitor DPC activity by opening the System Information dialog
box and switching to the CPU tab, where it lists the number of interrupts and DPCs executed each
time Process Explorer refreshes the display (1 second by default):
58
CHAPTER 8
System mechanisms
with Dpc, such as DpcRequestRate, DpcLastCount,
DpcLastCount DpcTime, and DpcData (which contains the
DpcQueueDepth and DpcCount for both nonthreaded and threaded DPCs). Additionally, newer
versions of Windows also include an IsrDpcStats
_ISRDPCSTATS
nonthreaded) versus the number that have executed:
lkd> dx new { QueuedDpcCount = @$prcb->DpcData[0].DpcCount + @$prcb->DpcData[1].DpcCount,
ExecutedDpcCount = ((nt!_ISRDPCSTATS*)@$prcb->IsrDpcStats)->DpcCount },d
QueuedDpcCount
: 3370380
ExecutedDpcCount : 1766914 [Type: unsigned __int64]
The discrepancy you see in the example output is expected; drivers might have queued a DPC
that was already in the queue, a condition that Windows handles safely. Additionally, a DPC
execute on a different processor, such as when the driver uses KeSetTargetProcessorDpc (the API
allows a driver to target the DPC to a particular processor.)
DPCTimeout, DpcWatchdogPeriod, and DpcWatchdogProfileOffset.
The DPC Watchdog is responsible for monitoring all execution of code at DISPATCH_LEVEL or
above, where a drop in IRQL has not been registered for quite some time. The DPC Timeout, on the
20 seconds, and all DISPATCH_LEVEL (and above) execution times out after 2 minutes. Both limits are
DPCTimeout
limit, whereas the DpcWatchdogPeriod controls the combined execution of all the code running at
high IRQL). When these thresholds are hit, the system will either bugcheck with DPC_WATCHDOG_
VIOLATION (indicating which of the situations was encountered), or, if a kernel debugger is attached,
raise an assertion that can be continued.
Driver developers who want to do their part in avoiding these situations can use the
KeQueryDpcWatchdogInformation
KeShouldYieldProcessor API takes these values (and other system state values) into
consideration and returns to the driver a hint used for making a decision whether to continue its DPC
work later, or if possible, drop the IRQL back to PASSIVE_LEVEL
ing, but the driver was holding a lock or synchronizing with a DPC in some way).
On the latest builds of Windows 10, each PRCB also contains a DPC Runtime History Table
(DpcRuntimeHistoryHashTable
functions that have recently executed and the amount of CPU cycles that they spent running. When
CHAPTER 8
System mechanisms
59
access to a UI tool, but more importantly, this data is also now used by the kernel.
When a driver developer queues a DPC through KeInsertQueueDpc, the API will enumerate the
LongDpcRuntimeThreshold registhis is the case, the LongDpcPresent
DpcData structure mentioned earlier.
thread), the kernel now also creates a DPC Delegate Thread. These are highly unique threads that
thread selection algorithms. They are merely kept in the back pocket of the kernel for its own purposes.
delegate threads. Note that in this case, these threads have a real Thread ID (TID), and the Processor
column should be treated as such for them.
FIGURE 8-18 The DPC delegate threads on a 16-CPU system.
60
CHAPTER 8
System mechanisms
Whenever the kernel is dispatching DPCs, it checks whether the DPC queue depth has passed the
threshold of such long-running
by looking at the properties of the currently executing thread: Is it idle? Is it a real-time thread? Does
kernel may decide to schedule the DPC delegate thread instead, essentially swapping the DPC from its
thread-starving position into a dedicated thread, which has the highest priority possible (still executing at DISPATCH_LEVEL). This gives a chance to the old preempted thread (or any other thread in the
standby list) to be rescheduled to some other CPU.
This mechanism is similar to the Threaded DPCs we explained earlier, with some exceptions. The
delegate thread still runs at DISPATCH_LEVEL. Indeed, when it is created and started in phase 1 of the
NT kernel initialization (see Chapter 12 for more details), it raises its own IRQL to DISPATCH level, saves
it in the WaitIrql
a context switch to another standby or ready thread (via the KiSwapThread routine.) Thus, the delegate
DPCs provide an automatic balancing action that the system takes, instead of an opt-in that driver
developers must judiciously leverage on their own.
If you have a newer Windows 10 system with this capability, you can run the following command in
the kernel debugger to take a look at how often the delegate thread was needed, which you can infer
from the amount of context switches that have occurred since boot:
lkd> dx @$cursession.Processes[0].Threads.Where(t => t.KernelObject.ThreadName->
ToDisplayString().Contains("DPC Delegate Thread")).Select(t => t.KernelObject.Tcb.
ContextSwitches),d
[44]
: 2138 [Type: unsigned long]
[52]
: 4 [Type: unsigned long]
[60]
: 11 [Type: unsigned long]
[68]
: 6 [Type: unsigned long]
[76]
: 13 [Type: unsigned long]
[84]
: 3 [Type: unsigned long]
[92]
: 16 [Type: unsigned long]
[100]
: 19 [Type: unsigned long]
[108]
: 2 [Type: unsigned long]
[116]
: 1 [Type: unsigned long]
[124]
: 2 [Type: unsigned long]
[132]
: 2 [Type: unsigned long]
[140]
: 3 [Type: unsigned long]
[148]
: 2 [Type: unsigned long]
[156]
: 1 [Type: unsigned long]
[164]
: 1 [Type: unsigned long]
Asynchronous procedure call interrupts
Asynchronous procedure calls (APCs) provide a way for user programs and system code to execute
in the context of a particular user thread (and hence a particular process address space). Because
APCs are queued to execute in the context of a particular thread, they are subject to thread scheduling rules and do not operate within the same environment as DPCs—namely, they do not operate at
DISPATCH_LEVEL and can be preempted by higher priority threads, perform blocking waits, and access
pageable memory.
CHAPTER 8
System mechanisms
61
That being said, because APCs are still a type of software interrupt, they must somehow still be able
APC_LEVEL
operate under the same restrictions as a DPC, there are still certain limitations imposed that developers
APCs are described by a kernel control object, called an APC object. APCs waiting to execute reside
in one of two kernel-managed APC queues. Unlike the DPC queues, which are per-processor (and divided into threaded and nonthreaded), the APC queues are per-thread—with each thread having two
APC queues: one for kernel APCs and one for user APCs.
When asked to queue an APC, the kernel looks at the mode (user or kernel) of the APC and then
inserts it into the appropriate queue belonging to the thread that will execute the APC routine. Before
When an APC is queued against a thread, that thread may be in one of the three following situations:
■
The thread is currently running (and may even be the current thread).
■
The thread is currently waiting.
■
The thread is doing something else (ready, standby, and so on).
alertable
state whenever performing a wait. Unless APCs have been completely disabled for a thread, for kernel
APCs, this state is ignored—the APC always aborts the wait, with consequences that will be explained
user APCs however, the thread is interrupted only if the wait was alertable and
instantiated on behalf of a user-mode component or if there are other pending user APCs that already
started aborting the wait (which would happen if there were lots of processors trying to queue an APC
to the same thread).
either perform an alertable wait or go through a ring transition or context switch that revisits the User
raising the IRQL to APC_LEVEL, notifying the processor that it must look at the kernel APC queue of its
currently running thread. And, in both scenarios, if the thread was doing “something else,” some transition that takes it into either the running or waiting state needs to occur. As a practical result of this,
We mentioned that APCs could be disabled for a thread, outside of the previously described scenarbeing to simply keep their IRQL at APC_LEVEL or above while executing some piece of code. Because
plained, if the processor is already at APC_LEVEL (or higher), the interrupt is masked out. Therefore, it is
only once the IRQL has dropped to PASSIVE_LEVEL that the pending interrupt is delivered, causing the
APC to execute.
62
CHAPTER 8
System mechanisms
The second mechanism, which is strongly preferred because it avoids changing interrupt controller
state, is to use the kernel API KeEnterGuardedRegion, pairing it with KeLeaveGuardedRegion when you
want to restore APC delivery back to the thread. These APIs are recursive and can be called multiple
times in a nested fashion. It is safe to context switch to another thread while still in such a region
SpecialApcDisable and
not per-processor state.
Similarly, context switches can occur while at APC_LEVEL, even though this is per-processor state.
WaitIrql and then sets the processor
IRQL to the WaitIrql of the new incoming thread (which could be PASSIVE_LEVEL). This creates an
Such a possibility is common and entirely normal, proving that when it comes to thread execution, the
scheduler outweighs any IRQL considerations. It is only by raising to DISPATCH_LEVEL, which disables
thread preemption, that IRQLs supersede the scheduler. Since APC_LEVEL is the only IRQL that ends up
behaving this way, it is often called a thread-local IRQL
approximation for the behavior described herein.
Regardless of how APCs are disabled by a kernel developer, one rule is paramount: Code can neither
return to user mode with the APC at anything above PASSIVE_LEVEL nor can SpecialApcDisable be set
to anything but 0. Such situations result in an immediate bugcheck, typically meaning some driver has
forgotten to release a lock or leave its guarded region.
In addition to two APC modes, there are two types of APCs for each mode—normal APCs and special APCs—both of which behave differently depending on the mode. We describe each combination:
■
■
■
Special Kernel APC This combination results in an APC that is always inserted at the tail of
all other existing special kernel APCs in the APC queue but before any normal kernel APCs. The
kernel routine receives a pointer to the arguments and to the normal routine of the APC and
operates at APC_LEVEL, where it can choose to queue a new, normal APC.
Normal Kernel APC This type of APC is always inserted at the tail end of the APC queue, allowing for a special kernel APC to queue a new normal kernel APC that will execute soon thereafter, as described in the earlier example. These kinds of APCs can not only be disabled through
the mechanisms presented earlier but also through a third API called KeEnterCriticalRegion
(paired with KeLeaveCriticalRegion), which updates the KernelApcDisable counter in KTHREAD
but not SpecialApcDisable.
kernel routine at APC_LEVEL, sending it pointers to the arguments and the normal routine
drop the IRQL to PASSIVE_LEVEL and execute the normal routine as well, with the input arguments passed in by value this time. Once the normal routine returns, the IRQL is raised back to
APC_LEVEL again.
■
Normal User APC This typical combination causes the APC to be inserted at the tail of the
APC queue and for the kernel routine
APC_LEVEL in the same way as the
preceding bullet. If a normal routine is still present, then the APC is prepared for user-mode
CHAPTER 8
System mechanisms
63
delivery (obviously, at PASSIVE_LEVEL) through the creation of a trap frame and exception
frame that will eventually cause the user-mode APC dispatcher in Ntdll.dll to take control of the
thread once back in user mode, and which will call the supplied user pointer. Once the usermode APC returns, the dispatcher uses the NtContinue or NtContinueEx system call to return to
the original trap frame.
■
Note that if the kernel routine ended up clearing out the normal routine, then the thread, if
alerted, loses that state, and, conversely, if not alerted, becomes alerted, and the user APC
performed by the KeTestAlertThread
executed in user mode, even though the kernel routine cancelled the dispatch.
■
Special User APC This combination of APC is a recent addition to newer builds of Windows 10
and generalizes a special dispensation that was done for the thread termination APC such that
(noncurrent) thread requires the use of an APC, but it must also only occur once all kernel-mode
quite well, but it would mean that a user-mode developer could avoid termination by perform-
kernel routine of a User
APC was KiSchedulerApcTerminate. In this situation, the User APC was recognized as being “special”
pending” state was always set, which forced execution of the APC at the next user-mode ring transition or context switch to this thread.
This functionality, however, being solely reserved for the termination code path, meant that developers who want to similarly guarantee the execution of their User APC, regardless of alertability state,
had to resort to using more complex mechanisms such as manually changing the context of the
thread using SetThreadContext, which is error-prone at best. In response, the QueueUserAPC2 API was
created, which allows passing in the QUEUE_USER_APC_FLAGS_SPECIAL_USER_APC
exposing similar functionality to developers as well. Such APCs will always be added before any other
user-mode APCs (except the termination APC, which is now extra special) and will ignore the alertable
as a special user APC.
Table 8-9 summarizes the APC insertion and delivery behavior for each type of APC.
The executive uses kernel-mode APCs to perform operating system work that must be completed
within the address space (in the context) of a particular thread. It can use special kernel-mode APCs to
direct a thread to stop executing an interruptible system service, for example, or to record the results
kernel-mode APCs to make a thread suspend or terminate itself or to get or set its user-mode execution context. The Windows Subsystem for Linux (WSL) uses kernel-mode APCs to emulate the delivery
of UNIX signals to Subsystem for UNIX Application processes.
64
CHAPTER 8
System mechanisms
TABLE 8-9 APC insertion and delivery
APC Type
Insertion Behavior
Delivery Behavior
Special (kernel)
Inserted right after the last special APC (at the head of all other
normal APCs)
drops, and the thread is not in a guarded region. It is
Inserted at the tail of the kernelmode APC list
APC_LEVEL as soon as IRQL
drops, and the thread is not in a critical (or guarded)
Normal (kernel)
the APC.
inserting the APC. Executes the normal routine, if any,
at PASSIVE_LEVEL after the associated kernel routine
was executed. It is given arguments returned by the associated kernel routine (which can be the original arguments used during insertion or new ones).
Normal (user)
Inserted at the tail of the usermode APC list
APC_LEVEL as soon as IRQL
set (indicating that an APC was queued while the thread
was in an alertable wait state). It is given pointers to
Executes the normal routine, if any, in user mode at
PASSIVE_LEVEL after the associated kernel routine is
executed. It is given arguments returned by the associated kernel routine (which can be the original arguments used during insertion or new ones). If the normal
routine was cleared by the kernel routine, it performs a
test-alert against the thread.
Inserted at the head of the userUser Thread
mode APC list
Terminate APC
(KiSchedulerApcTerminate)
Special (user)
Inserted at the head of the
user-mode APC list but after the
thread terminates APC, if any.
lows similar rules as described earlier but delivered
at PASSIVE_LEVEL on return to user mode, no matter
what. It is given arguments returned by the threadtermination special APC.
-
Same as above, but arguments are controlled by the caller of QueueUserAPC2
(NtQueueApcThreadEx2
KeSpecialUserApcKernelRoutine function that re-inserts
the APC, converting it from the initial special kernel
APC to a special user APC.
Another important use of kernel-mode APCs is related to thread suspension and termination. Because
these operations can be initiated from arbitrary threads and directed to other arbitrary threads, the
kernel uses an APC to query the thread context as well as to terminate the thread. Device drivers often
block APCs or enter a critical or guarded region to prevent these operations from occurring while they are
holding a lock; otherwise, the lock might never be released, and the system would hang.
goes into a wait state, another thread in another process can be scheduled to run. When the device
initiated the I/O so that it can copy the results of the I/O operation to the buffer in the address space
of the process containing that thread. The I/O system uses a special kernel-mode APC to perform this
action unless the application used the SetFileIoOverlappedRange API or I/O completion ports. In that
case, the buffer will either be global in memory or copied only after the thread pulls a completion item
from the port. (The use of APCs in the I/O system is discussed in more detail in Chapter 6 of Part 1.)
CHAPTER 8
System mechanisms
65
Several Windows APIs—such as ReadFileEx, WriteFileEx, and QueueUserAPC—use user-mode APCs.
ReadFileEx and WriteFileEx functions allow the caller to specify a completion routine
alertable wait state. A thread can enter a wait state either by waiting for an object handle and specifying that its wait is alertable (with the Windows WaitForMultipleObjectsEx function) or by testing directly
whether it has a pending APC (using SleepEx). In both cases, if a user-mode APC is pending, the kernel
when the APC routine completes. Unlike kernel-mode APCs, which can execute at APC_LEVEL, usermode APCs execute at PASSIVE_LEVEL.
APC delivery can reorder the wait queues—the lists of which threads are waiting for what, and in
what order they are waiting. (Wait resolution is described in the section “Low-IRQL synchronization,”
later in this chapter.) If the thread is in a wait state when an APC is delivered, after the APC routine
are used to suspend a thread from execution, if the thread is waiting for any objects, its wait is removed
until the thread is resumed, after which that thread will be at the end of the list of threads waiting to
access the objects it was waiting for. A thread performing an alertable kernel-mode wait will also be
woken up during thread termination, allowing such a thread to check whether it woke up as a result of
termination or for a different reason.
Timer processing
denced by its high IRQL value (CLOCK_LEVEL) and due to the critical nature of the work it is responsible
for. Without this interrupt, Windows would lose track of time, causing erroneous results in calculations of uptime and clock time—and worse, causing timers to no longer expire, and threads never to
consume their quantum. Windows would also not be a preemptive operating system, and unless the
current running thread yielded the CPU, critical background tasks and scheduling could never occur on
a given processor.
Timer types and intervals
chine, and subsequently allowed drivers, applications, and administrators to modify the clock interval
Programmable Interrupt Timer (PIT) chip that has been present on all computers since the PC/AT or
the Real Time Clock (RTC). The PIT works on a crystal that is tuned at one-third the NTSC color carrier
various achievable multiples to reach millisecond-unit intervals, starting at 1 ms all the way up to 15 ms.
run at various intervals that are also powers of two. On RTC-based systems, the APIC Multiprocessor
66
CHAPTER 8
System mechanisms
The PIT and RTC have numerous issues: They are slow, external devices on legacy buses, have poor
granularity, force all processors to synchronize access to their hardware registers, are a pain to emulate, and are increasingly no longer found on embedded hardware devices, such as IoT and mobile. In
response, hardware vendors created new types of timers, such as the ACPI Timer, also sometimes called
the Power Management (PM) Timer, and the APIC Timer (which lives directly on the processor). The
Timer, or HPET, which a much-improved version of the RTC. On systems with an HPET, it is used instead
of the RTC or PIC. Additionally, ARM64 systems have their own timer architecture, called the Generic
on a given system, using the following order:
1.
virtual machine.
2.
3.
4.
kind of HPET.
5.
If no HPET was found, use the RTC.
6.
7.
which should never happen.
The HPET and the LAPIC Timer have one more advantage—other than only supporting the typical
periodic
one shot mode. This capability will
allow recent versions of Windows to leverage a dynamic tick model, which we explain later.
Timer granularity
Some types of Windows applications require very fast response times, such as multimedia applications.
rate (that functionality was added later, through enhanced timers, which we cover in an upcoming section); instead, they end up increasing the resolution of all timers in the system, potentially causing other
timers to expire more frequently, too.
CHAPTER 8
System mechanisms
67
That being said, Windows tries its best to restore the clock timer back to its original value whenever
it can. Each time a process requests a clock interval change, Windows increases an internal reference
count and associates it with the process. Similarly, drivers (which can also change the clock rate) get
added to the global reference count. When all drivers have restored the clock and all processes that
EXPERIMENT: Identifying high-frequency timers
Due to the problems that high-frequency timers can cause, Windows uses Event Tracing for
interval, displaying the time of the occurrence and the requested interval. The current interval
is also shown. This data is of great use to both developers and system administrators in identifying the causes of poor battery performance on otherwise healthy systems, as well as to decrease
overall power consumption on large systems. To obtain it, simply run powercfg /energy
/energy, and
energy-report.html, similar to the one shown here:
energy-report.html
68
CHAPTER 8
System mechanisms
Scroll down to the Platform Timer Resolution section, and you see all the applications that
call. Timer resolutions are shown in hundreds of nanoseconds, so a period of 20,000 corresponds
to 2 ms. In the sample shown, two applications—namely, Microsoft Edge and the TightVNC
remote desktop server—each requested a higher resolution.
EPROCESS
+0x4a8
+0x4b8
+0x4bc
+0x4c0
+0x4c8
TimerResolutionLink : _LIST_ENTRY [ 0xfffffa80'05218fd8 - 0xfffffa80'059cd508 ]
RequestedTimerResolution : 0
ActiveThreadsHighWatermark : 0x1d
SmallestTimerResolution : 0x2710
TimerResolutionStackRecord : 0xfffff8a0'0476ecd0 _PO_DIAG_STACK_RECORD
Note that the debugger shows you an additional piece of information: the smallest timer resolution that was ever requested by a given process. In this example, the process shown corresponds
to PowerPoint 2010, which typically requests a lower timer resolution during slideshows but not
during slide editing mode. The EPROCESS
this, and the stack could be parsed by dumping the PO_DIAG_STACK_RECORD structure.
TimerResolutionLink
resolution, through the ExpTimerResolutionListHead doubly linked list. Parsing this list with the
debugger data model can reveal all processes on the system that have, or had, made changes to
the timer resolution, when the powercfg command is unavailable or information on past proresolution, as did the Remote Desktop Client, and Cortana. WinDbg Preview, however, now only
previously requested it but is still requesting it at the moment this command was written.
lkd> dx -g Debugger.Utility.Collections.FromListEntry(*(nt!_LIST_ENTRY*)&nt!ExpTimerReso
lutionListHead, "nt!_EPROCESS", "TimerResolutionLink").Select(p => new { Name = ((char*)
p.ImageFileName).ToDisplayString("sb"), Smallest = p.SmallestTimerResolution, Requested =
p.RequestedTimerResolution}),d
======================================================
=
= Name
= Smallest = Requested =
======================================================
= [0]
- msedge.exe
- 10000
- 0
=
= [1]
- msedge.exe
- 10000
- 0
=
= [2]
- msedge.exe
- 10000
- 0
=
= [3]
- msedge.exe
- 10000
- 0
=
= [4]
- mstsc.exe
- 10000
- 0
=
= [5]
- msedge.exe
- 10000
- 0
=
= [6]
- msedge.exe
- 10000
- 0
=
= [7]
- msedge.exe
- 10000
- 0
=
= [8]
- DbgX.Shell.exe
- 10000
- 10000
=
= [9]
- msedge.exe
- 10000
- 0
=
= [10]
- msedge.exe
- 10000
- 0
=
= [11]
- msedge.exe
- 10000
- 0
=
= [12]
- msedge.exe
- 10000
- 0
=
= [13]
- msedge.exe
- 10000
- 0
=
= [14]
- msedge.exe
- 10000
- 0
=
CHAPTER 8
System mechanisms
69
= [15]
- msedge.exe
- 10000
- 0
=
= [16]
- msedge.exe
- 10000
- 0
=
= [17]
- msedge.exe
- 10000
- 0
=
= [18]
- msedge.exe
- 10000
- 0
=
= [19]
- SearchApp.exe
- 40000
- 0
=
======================================================
Timer expiration
As we said, one of the main tasks of the ISR associated with the interrupt that the clock source generates is to keep track of system time, which is mainly done by the KeUpdateSystemTime routine. Its second job is to keep track of logical run time, such as process/thread execution times and the system tick
time, which is the underlying number used by APIs such as GetTickCount that developers use to time
operations in their applications. This part of the work is performed by KeUpdateRunTime. Before doing
any of that work, however, KeUpdateRunTime checks whether any timers have expired.
Windows timers can be either absolute timers, which implies a distinct expiration time in the future,
or relative timers, which contain a negative expiration value used as a positive offset from the current
time during timer insertion. Internally, all timers are converted to an absolute expiration time, although
the system keeps track of whether this is the “true” absolute time or a converted relative time. This difference is important in certain scenarios, such as Daylight Savings Time (or even manual clock changes).
but a relative timer—say, one set to expire “in two hours”—would not feel the effect of the clock
the kernel reprograms the absolute time associated with relative timers to match the new settings.
tiples, each multiple of the system time that a timer could be associated with is an index called a hand,
which is stored in the timer object's dispatcher header. Windows used that fact to organize all driver
and application timers into linked lists based on an array where each entry corresponds to a possible
multiple of the system time. Because modern versions of Windows 10 no longer necessarily run on a
periodic tick (due to the dynamic tick
46 bits of the due time (which is in 100 ns units). This gives each hand an approximate “time” of 28 ms.
hands could have expiring timers, Windows can no longer just check the current hand. Instead, a bitthe bitmap and checked during every clock interrupt.
Regardless of method, these 256 linked lists live in what is called the timer table—which is in the
PRCB—enabling each processor to perform its own independent timer expiration without needing to
tables, for a total of 512 linked lists.
Because each processor has its own timer table, each processor also does its own timer expiration
70
CHAPTER 8
System mechanisms
tion time to avoid any incoherent state. Therefore, to determine whether a clock has expired, it is only
necessary to check if there are any timers on the linked list associated with the current hand.
Driver
Process
Timer 1
31
Timer 2
Timer 3
Timer 4
CPU 0
Timer Table
CPU 1
Timer Table
255
255
0
0
Timer Hand
Timer Hand
0
31
0
FIGURE 8-19 Example of per-processor timer lists.
Although updating counters and checking a linked list are fast operations, going through every
timer and expiring it is a potentially costly operation—keep in mind that all this work is currently being
performed at CLOCK_LEVEL, an exceptionally elevated IRQL. Similar to how a driver ISR queues a DPC
draining mechanism knows timers need expiration. Likewise, when updating process/thread runtime, if
the clock ISR determines that a thread has expired its quantum, it also queues a DPC software interrupt
processing of run-time updates because each processor is running a different thread and has different
DPCs are provided primarily for device drivers, but the kernel uses them, too. The kernel most frequently uses a DPC to handle quantum expiration. At every tick of the system clock, an interrupt occurs
at clock IRQL. The clock interrupt handler (running at clock IRQL) updates the system time and then
decrements a counter that tracks how long the current thread has run. When the counter reaches 0, the
priority task that should be done at DPC/dispatch IRQL. The clock interrupt handler queues a DPC to
interrupt has a lower priority than do device interrupts, any pending device interrupts that surface
before the clock interrupt completes are handled before the DPC interrupt occurs.
Once the IRQL eventually drops back to DISPATCH_LEVEL, as part of DPC processing, these two
CHAPTER 8
System mechanisms
71
TABLE 8-10
KPRCB Field
Type
Description
LastTimerHand
Index (up to 256)
The last timer hand that was processed by this processor. In recent
builds, part of TimerTable because there are now two tables.
ClockOwner
Boolean
Indicates whether the current processor is the clock owner.
TimerTable
List heads for the timer table lists (256, or 512 on more recent builds).
DpcNormalTimerExpiration
Bit
Indicates that a DISPATCH_LEVEL interrupt has been raised to request
timer expiration.
Chapter 4 of Part 1 covers the actions related to thread scheduling and quantum expiration. Here,
we look at the timer expiration work. Because the timers are linked together by hand, the expiration code (executed by the DPC associated with the PRCB in the TimerExpirationDpc
KiTimerExpirationDpc) parses this list from head to tail. (At insertion time, the timers nearest to the
within this hand.) There are two primary tasks to expiring a timer:
■
■
The timer is treated as a dispatcher synchronization object (threads are waiting on the timer as
part of a timeout or directly as part of a wait). The wait-testing and wait-satisfaction algorithms
will be run on the timer. This work is described in a later section on synchronization in this chapter. This is how user-mode applications, and some drivers, make use of timers.
The timer is treated as a control object associated with a DPC callback routine that executes
when the timer expires. This method is reserved only for drivers and enables very low latency
response to timer expiration. (The wait/dispatcher method requires all the extra logic of wait
signaling.) Additionally, because timer expiration itself executes at DISPATCH_LEVEL, where
DPCs also run, it is perfectly suited as a timer callback.
Processor 0
As each processor wakes up to handle the clock interval timer to perform system-time and run-time
processing, it therefore also processes timer expirations after a slight latency/delay in which the IRQL
drops from CLOCK_LEVEL to DISPATCH_LEVEL
tion processing that might occur if the processor had associated timers.
Processor 1
Time
Time
Time Interrupt
Software Timer Expiration
FIGURE 8-20 Timer expiration.
72
CHAPTER 8
System mechanisms
Processor selection
A critical determination that must be made when a timer is inserted is to pick the appropriate table to
timer serialization is disabled. If it is, it then checks whether the timer has a DPC associated with its expiration, and
If the timer has no DPC associated with it, or if the DPC has not been bound to a processor, the kernel
tion on core parking, see Chapter 4 of Part 1.) If the current processor is parked, it picks the next closest
neighboring unparked processor in the same NUMA node; otherwise, the current processor is used.
This behavior is intended to improve performance and scalability on server systems that make use
of Hyper-V, although it can improve performance on any heavily loaded system. As system timers pile
with the execution of timer expiration code, which increases latency and can even cause heavy delays
or missed DPCs. Additionally, timer expiration can start competing with DPCs typically associated with
driver interrupt processing, such as network packet code, causing systemwide slowdowns. This process
is exacerbated in a Hyper-V scenario, where CPU 0 must process the timers and DPCs associated with
potentially numerous virtual machines, each with their own timers and associated devices.
tion load is fully distributed among unparked logical processors. The timer object stores its associated
processor number in the dispatcher header on 32-bit systems and in the object itself on 64-bit systems.
CPU
0
CPU
1
CPU
2
CPU
3
Timers Queue on CPU 0
CPU
0
CPU
1
CPU
2
CPU
3
Timers Queued on Current CPU
FIGURE 8-21 Timer queuing behaviors.
much. Additionally, it makes each timer expiration event (such as a clock tick) more complex because a
processor may have gone idle but still have had timers associated with it, meaning that the processor(s)
asynchronous behaviors in timer expiration, which may not always be desired. This complexity makes
can ultimately remain to manage the clock. Therefore, on client systems, timer serialization is enabled if
Modern Standby is available, which causes the kernel to choose CPU 0 no matter what. This allows CPU
0 to behave as the default clock owner—the processor that will always be active to pick up clock interrupts (more on this later).
CHAPTER 8
System mechanisms
73
Note This behavior is controlled by the kernel variable KiSerializeTimerExpiration, which is
initialized based on a registry setting whose value is different between a server and client
installation. By modifying or creating the value SerializeTimerExpiration
other than 0 or 1, serialization can be disabled, enabling timers to be distributed among
processors. Deleting the value, or keeping it as 0, allows the kernel to make the decision
based on Modern Standby availability, and setting it to 1 permanently enables serialization
even on non-Modern Standby systems.
EXPERIMENT: Listing system timers
You can use the kernel debugger to dump all the current registered timers on the system, as well as
information on the DPC associated with each timer (if any). See the following output for a sample:
0: kd> !timer
Dump system timers
Interrupt time: 250fdc0f 00000000 [12/21/2020 03:30:27.739]
PROCESSOR 0 (nt!_KTIMER_TABLE fffff8011bea6d80 - Type 0 - High precision)
List Timer
Interrupt Low/High Fire Time
DPC/thread
PROCESSOR 0 (nt!_KTIMER_TABLE fffff8011bea6d80 - Type 1 - Standard)
List Timer
Interrupt Low/High Fire Time
DPC/thread
1 ffffdb08d6b2f0b0
0807e1fb 80000000 [
NEVER
] thread ffffdb08d748f480
4 ffffdb08d7837a20
6810de65 00000008 [12/21/2020 04:29:36.127]
6 ffffdb08d2cfc6b0
4c18f0d1 00000000 [12/21/2020 03:31:33.230] netbt!TimerExpiry
(DPC @ ffffdb08d2cfc670)
fffff8011fd3d8a8 A fc19cdd1 00589a19 [ 1/ 1/2100 00:00:00.054] nt!ExpCenturyDpcRoutine
(DPC @ fffff8011fd3d868)
7 ffffdb08d8640440
3b22a3a3 00000000 [12/21/2020 03:31:04.772] thread ffffdb08d85f2080
ffffdb08d0fef300
7723f6b5 00000001 [12/21/2020 03:39:54.941]
FLTMGR!FltpIrpCtrlStackProfilerTimer (DPC @ ffffdb08d0fef340)
11 fffff8011fcffe70
6c2d7643 00000000 [12/21/2020 03:32:27.052] nt!KdpTimeSlipDpcRoutine
(DPC @ fffff8011fcffe30)
ffffdb08d75f0180
c42fec8e 00000000 [12/21/2020 03:34:54.707] thread ffffdb08d75f0080
14 fffff80123475420
283baec0 00000000 [12/21/2020 03:30:33.060] tcpip!IppTimeout
(DPC @ fffff80123475460)
. . .
58 ffffdb08d863e280 P 3fec06d0 00000000 [12/21/2020 03:31:12.803] thread ffffdb08d8730080
fffff8011fd3d948 A 90eb4dd1 00000887 [ 1/ 1/2021 00:00:00.054] nt!ExpNextYearDpcRoutine
(DPC @ fffff8011fd3d908)
. . .
104 ffffdb08d27e6d78 P 25a25441 00000000 [12/21/2020 03:30:28.699]
tcpip!TcpPeriodicTimeoutHandler (DPC @ ffffdb08d27e6d38)
ffffdb08d27e6f10 P 25a25441 00000000 [12/21/2020 03:30:28.699]
tcpip!TcpPeriodicTimeoutHandler (DPC @ ffffdb08d27e6ed0)
106 ffffdb08d29db048 P 251210d3 00000000 [12/21/2020 03:30:27.754]
CLASSPNP!ClasspCleanupPacketTimerDpc (DPC @ ffffdb08d29db088)
74
CHAPTER 8
System mechanisms
fffff80122e9d110
258f6e00 00000000 [12/21/2020 03:30:28.575]
Ntfs!NtfsVolumeCheckpointDpc (DPC
108 fffff8011c6e6560
19b1caef 00000002 [12/21/2020 03:44:27.661]
tm!TmpCheckForProgressDpcRoutine (DPC
111 ffffdb08d27d5540 P 25920ab5 00000000 [12/21/2020 03:30:28.592]
storport!RaidUnitPendingDpcRoutine (DPC
ffffdb08d27da540 P 25920ab5 00000000 [12/21/2020 03:30:28.592]
storport!RaidUnitPendingDpcRoutine (DPC
. . .
@ fffff80122e9d0d0)
@ fffff8011c6e65a0)
@ ffffdb08d27d5580)
@ ffffdb08d27da580)
Total Timers: 221, Maximum List: 8
Current Hand: 139
In this example, which has been shortened for space reasons, there are multiple driverassociated timers, due to expire shortly, associated with the Netbt.sys and Tcpip.sys drivers (both
related to networking), as well as Ntfs, the storage controller driver drivers. There are also background housekeeping timers due to expire, such as those related to power management, ETW,
kernel-mode timers that are used for wait dispatching. You can use !thread on the thread pointers to verify this.
that checks for Daylight Savings Time time-zone changes, the timer that checks for the arrival
of the upcoming year, and the timer that checks for entry into the next century. One can easily
locate them based on their typically distant expiration time, unless this experiment is performed
on the eve of one of these events.
Intelligent timer tick distribution
wakes up several times (the solid arrows) even when there are no associated expiring timers (the dotted
arrows). Although that behavior is required as long as processor 1 is running (to update the thread/process run times and scheduling state), what if processor 1 is idle (and has no expiring timers)? Does it still
need to handle the clock interrupt? Because the only other work required that was referenced earlier is to
keeping processor (in this case, processor 0) and allow other processors to remain in their sleep state; if
they wake, any time-related adjustments can be performed by resynchronizing with processor 0.
Windows does, in fact, make this realization (internally called intelligent timer tick distribution),
to handle its expiring timers, creating a much larger gap (sleeping period). The kernel uses a variable
KiPendingTimerBitmaps
processors need to receive a clock interval for the given timer hand (clock-tick interval). It can then
CHAPTER 8
System mechanisms
75
Processor 0
appropriately program the interrupt controller, as well as determine to which processors it will send an
IPI to initiate timer processing.
Processor 1
Time
Time
Time Interrupt
Software Timer Expiration
FIGURE 8-22 Intelligent timer tick distribution applied to processor 1.
Leaving as large a gap as possible is important due to the way power management works in processors: as the processor detects that the workload is going lower and lower, it decreases its power consumpand enter deeper and deeper idle/sleep states, such as turning off caches. However, if the processor has
to wake again, it will consume energy and take time to power up; for this reason, processor designers will
risk entering these lower idle/sleep states (C-states) only if the time spent in a given state outweighs the
time and energy it takes to enter and exit the state. Obviously, it makes no sense to spend 10 ms to enter a
sleep state that will last only 1 ms. By preventing clock interrupts from waking sleeping processors unless
needed (due to timers), they can enter deeper C-states and stay there longer.
Timer coalescing
Although minimizing clock interrupts to sleeping processors during periods of no timer expiration
gives a big boost to longer C-state intervals, with a timer granularity of 15 ms, many timers likely will
be queued at any given hand and expire often, even if just on processor 0. Reducing the amount
of software timer-expiration work would both help to decrease latency (by requiring less work at
DISPATCH_LEVEL) as well as allow other processors to stay in their sleep states even longer. (Because
result in longer sleep times.) In truth, it is not just the number of expiring timers that really affects sleep
state (it does affect latency), but the periodicity of these timer expirations—six timers all expiring at the
same hand is a better option than six timers expiring at six different hands. Therefore, to fully optimize
idle-time duration, the kernel needs to employ a coalescing mechanism to combine separate timer
hands into an individual hand with multiple expirations.
Timer coalescing works on the assumption that most drivers and user-mode applications do not
while a driver polling every second could probably poll every second plus or minus 50 ms without too
76
CHAPTER 8
System mechanisms
and other times at half a second. Even so, not all timers are ready to be coalesced into coarser granularities, so Windows enables this mechanism only for timers that have marked themselves as coalescable, either through the KeSetCoalescableTimer kernel API or through its user-mode counterpart,
SetWaitableTimerEx.
With these APIs, driver and application developers are free to provide the kernel with the maximum
tolerance
time past the requested period at which the timer will still function correctly. (In the previous example, the 1-second timer had a tolerance of 50 ms.) The recommended minimum tolerance is 32 ms,
any coalescing because the expiring timer could not be moved even from one clock tick to the next.
preferred coalescing intervals: 1 second, 250 ms, 100 ms, or 50 ms.
When a tolerable delay is set for a periodic timer, Windows uses a process called shifting, which
causes the timer to drift between periods until it gets aligned to the most optimal multiple of the
is scanned, and a preferred expiration time is generated based on the closest acceptable coalescing
always pushed out as far as possible past their real expiration point, which spreads out timers as far as
possible and creates longer sleep times on the processors.
and are thus coalescable. In one scenario, Windows could decide to coalesce the timers as shown in
Processor 0
do for some of the clock interrupts on processor 0, possibly removing the latency of requiring a drop
to DISPATCH_LEVEL at each clock interrupt.
Processor 1
Time
Time
Time Interrupt
Software Timer Expiration
FIGURE 8-23 Timer coalescing.
CHAPTER 8
System mechanisms
77
Enhanced timers
Enhanced timers were introduced to satisfy a long list of requirements that previous timer system
also made timers have inconsistent expiration times, even when there was no need to reduce power (in
other words, coalescing was an all-or-nothing proposition). Second, the only mechanism in Windows
for high-resolution timers was for applications and drivers to lower the clock tick globally, which, as
these timers was now higher, they were not necessarily more precise because regular time expiration
can happen before
added features such as timer virtualization and the Desktop Activity Moderator (DAM), which actively delay the expiration of timers during the resiliency phase of Modern Standby to simulate S3 sleep. However,
some key system timer activity must still be permitted to periodically run even during this phase.
These three requirements led to the creation of enhanced timers, which are also internally known as
Timer2 objects, and the creation of new system calls such as NtCreateTimer2 and NtSetTimer2, as well
as driver APIs such as ExAllocateTimer and ExSetTimer. Enhanced timers support four modes of behavior, some of which are mutually exclusive:
■
■
■
■
No-wake This type of enhanced timer is an improvement over timer coalescing because it
provides for a tolerable delay that is only used in periods of sleep.
High-resolution This type of enhanced timer corresponds to a high-resolution timer with a
precise clock rate that is dedicated to it. The clock rate will only need to run at this speed when
approaching the expiration of the timer.
Idle-resilient This type of enhanced timer is still active even during deep sleep, such as the
resiliency phase of modern standby.
Finite This is the type for enhanced timers that do not share one of the previously described
properties.
“special” behavior, why create them at all? It turns out that since the new Timer2 infrastructure was a
■
■
■
■
78
It uses self-balancing red-black binary trees instead of the linked lists that form the timer table.
It allows drivers to specify an enable and disable callback without worrying about manually
creating DPCs.
It includes new, clean, ETW tracing entries for each operation, aiding in troubleshooting.
It provides additional security-in-depth through certain pointer obfuscation techniques and
additional assertions, hardening against data-only exploits and corruption.
CHAPTER 8
System mechanisms
Therefore, driver developers that are only targeting Windows 8.1 and later are highly recommended
to use the new enhanced timer infrastructure, even if they do not require the additional capabilities.
Note The documented ExAllocateTimer API does not allow drivers to create idle-resilient
timers. In fact, such an attempt crashes the system. Only Microsoft inbox drivers can
create such timers through the ExAllocateTimerInternal API. Readers are discouraged from
attempting to use this API because the kernel maintains a static, hard-coded list of every
has knowledge of how many such timers the component is allowed to create. Any violations
result in a system crash (blue screen of death).
Enhanced timers also have a more complex set of expiration rules than regular timers because they
end up having two possible due times
minimum due time
tem clock time at which point the timer is allowed to expire. The second, maximum due time, is the latest system clock time at which the timer should ever expire. Windows guarantees that the timer will expire somewhere between these two points in time, either because of a regular clock tick every interval
(such as 15 ms), or because of an ad-hoc check for timer expiration (such as the one that the idle thread
does upon waking up from an interrupt). This interval is computed by taking the expected expiration
time passed in by the developer and adjusting for the possible “no wake tolerance” that was passed in.
As such, a Timer2 object lives in potentially up to two red-black tree nodes—node 0, for the minimum due time checks, and node 1, for the maximum due time checks. No-wake and high-resolution
two nodes? Instead of a single red-black tree, the system obviously needs to have more, which are
called collections
depending on the rules and combinations shown in Table 8-11.
TABLE 8-11 Timer types and node collection indices
Timer type
Node 0 collection index
Node 1 collection index
No-wake
NoWake, if it has a tolerance
NoWake, if it has a non-unlimited or no tolerance
Never inserted in this node
Finite
High-resolution
Hr, always
Finite, if it has a non-unlimited or no tolerance
Idle-resilient
NoWake, if it has a tolerance
Ir, if it has a non-unlimited or no tolerance
High-resolution & Idle-resilient
Hr, always
Ir, if it has a non-unlimited or no tolerance
Think of node 1 as the one that mirrors the default legacy timer behavior—every clock tick, check if
implies that its minimum due time is the same as its maximum due time. If it has unlimited tolerance;
CHAPTER 8
System mechanisms
79
sleeping forever.
posed to expire and never earlier, so node 0 is used for them. However, if their precise expiration time is
“too early” for the check in node 0, they might be in node 1 as well, at which point they are treated like
caller provided a tolerance, the system is idle, and there is an opportunity to coalesce the timer.
NoWake collecHr collection otherwise. However, on the clock tick, which checks node 1, it must be in the special Ir collection to recognize
that the timer needs to execute even though the system is in deep sleep.
ers to behave correctly when checked either at the system clock tick (node 1—enforcing a maximum
due time) or at the next closest due time computation (node 0—enforcing a minimum due time).
As each timer is inserted into the appropriate collection (KTIMER2_COLLECTION) and associated
next due time is updated to be the earliest due time of any timer
in the collection, whereas a global variable (KiNextTimer2Due)
timer in any collection.
EXPERIMENT: Listing enhanced system timers
which are shown at the bottom of the output:
KTIMER2s:
Address,
ffffa4840f6070b0
Due time,
Exp. Type
Callback, Attributes,
1825b8f1f4 [11/30/2020 20:50:16.089] (Interrupt) [None] NWF (1826ea1ef4
[11/30/2020 20:50:18.089])
ffffa483ff903e48
1825c45674 [11/30/2020 20:50:16.164] (Interrupt) [None] NW P (27ef6380)
ffffa483fd824960
1825dd19e8 [11/30/2020 20:50:16.326] (Interrupt) [None] NWF (1828d80a68
[11/30/2020 20:50:21.326])
ffffa48410c07eb8
1825e2d9c6 [11/30/2020 20:50:16.364] (Interrupt) [None] NW P (27ef6380)
ffffa483f75bde38
1825e6f8c4 [11/30/2020 20:50:16.391] (Interrupt) [None] NW P (27ef6380)
ffffa48407108e60
1825ec5ae8 [11/30/2020 20:50:16.426] (Interrupt) [None] NWF (1828e74b68
[11/30/2020 20:50:21.426])
ffffa483f7a194a0
1825fe1d10 [11/30/2020 20:50:16.543] (Interrupt) [None] NWF (18272f4a10
[11/30/2020 20:50:18.543])
ffffa483fd29a8f8
18261691e3 [11/30/2020 20:50:16.703] (Interrupt) [None] NW P (11e1a300)
ffffa483ffcc2660
18261707d3 [11/30/2020 20:50:16.706] (Interrupt) [None] NWF (18265bd903
[11/30/2020 20:50:17.157])
ffffa483f7a19e30
182619f439 [11/30/2020 20:50:16.725] (Interrupt) [None] NWF (182914e4b9
[11/30/2020 20:50:21.725])
ffffa483ff9cfe48
182745de01 [11/30/2020 20:50:18.691] (Interrupt) [None] NW P (11e1a300)
ffffa483f3cfe740
18276567a9 [11/30/2020 20:50:18.897] (Interrupt)
Wdf01000!FxTimer::_FxTimerExtCallbackThunk (Context @ ffffa483f3db7360) NWF
(1827fdfe29 [11/30/2020 20:50:19.897]) P (02faf080)
80
CHAPTER 8
System mechanisms
ffffa48404c02938
ffffa483fde8e300
ffffa483fde88580
18276c5890 [11/30/2020 20:50:18.943] (Interrupt) [None] NW P (27ef6380)
1827a0f6b5 [11/30/2020 20:50:19.288] (Interrupt) [None] NWF (183091c835
[11/30/2020 20:50:34.288])
1827d4fcb5 [11/30/2020 20:50:19.628] (Interrupt) [None] NWF (18290629b5
[11/30/2020 20:50:21.628])
In this example, you can mostly see No-wake (NW) enhanced timers, with their minimum due
time shown. Some are periodic (P) and will keep being reinserted at expiration time. A few also
System worker threads
During system initialization, Windows creates several threads in the System process, called system
worker threads, which exist solely to perform work on behalf of other threads. In many cases, threads
executing at DPC/dispatch level need to execute functions that can be performed only at a lower IRQL.
can usurp any thread in the system) at DPC/dispatch level IRQL, might need to access paged pool or
wait for a dispatcher object used to synchronize execution with an application thread. Because a DPC
DPC/dispatch level.
Some device drivers and executive components create their own threads dedicated to processing
work at passive level; however, most use system worker threads instead, which avoids the unnecessary scheduling and memory overhead associated with having additional threads in the system. An
ExQueueWorkItem or IoQueueWorkItem. Device drivers should use only the latter (because this associates the work item with a Device object, allowing for greater accountability and the handling of
scenarios in which a driver unloads while its work item is active). These functions place a work item on
a queue dispatcher object where the threads look for work. (Queue dispatcher objects are described in
more detail in the section “I/O completion ports” in Chapter 6 in Part 1.)
The IoQueueWorkItemEx, IoSizeofWorkItem, IoInitializeWorkItem, and IoUninitializeWorkItem APIs
Work items include a pointer to a routine and a parameter that the thread passes to the routine
when it processes the work item. The device driver or executive component that requires passive-level
can initialize a work item that points to the routine in the driver that waits for the dispatcher object. At
CHAPTER 8
System mechanisms
81
worker thread processes its work item.
There are many types of system worker threads:
■
■
■
Normal worker threads execute at priority 8 but otherwise behave like delayed worker threads.
Background worker threads execute at priority 7 and inherit the same behaviors as normal
worker threads.
Delayed worker threads
time-critical.
■
Critical worker threads execute at priority 13 and are meant to process time-critical work items.
■
Super-critical worker threads execute at priority 14, otherwise mirroring their critical counterparts.
■
Hyper-critical worker threads execute at priority 15 and are otherwise just like other critical threads.
■
Real-time worker threads execute at priority 18, which gives them the distinction of operating in
the real-time scheduling range (see Chapter 4 of Part 1 for more information), meaning they are
not subject to priority boosting nor regular time slicing.
Because the naming of all of these worker queues started becoming confusing, recent versions of
Windows introduced custom priority worker threads, which are now recommended for all driver developers and allow the driver to pass in their own priority level.
A special kernel function, ExpLegacyWorkerInitialization, which is called early in the boot process,
optional registry parameters. You may even have seen these details in an earlier edition of this book.
Note, however, that these variables are there only for compatibility with external instrumentation tools
and are not actually utilized by any part of the kernel on modern Windows 10 systems and later. This is
because recent kernels implemented a new kernel dispatcher object, the priority queue (KPRIQUEUE),
coupled it with a fully dynamic number of kernel worker threads, and further split what used to be a
single queue of worker threads into per-NUMA node worker threads.
On Windows 10 and later, the kernel dynamically creates additional worker threads as needed,
with a default maximum limit of 4096 (see ExpMaximumKernelWorkerThreads
ured through the registry up to a maximum of 16,384 threads and down to a minimum of 32. You
can set this using the MaximumKernelWorkerThreads
Each partition object, which we described in Chapter 5 of Part 1, contains an executive partition,
which is the portion of the partition object relevant to the executive—namely, the system worker
thread logic. It contains a data structure tracking the work queue manager for each NUMA node part
of the partition (a queue manager is made up of the deadlock detection timer, the work queue item
reaper, and a handle to the actual thread doing the management). It then contains an array of pointers
to each of the eight possible work queues (EX_WORK_QUEUE). These queues are associated with an
individual index and track the number of minimum (guaranteed) and maximum threads, as well as how
many work items have been processed so far.
82
CHAPTER 8
System mechanisms
Every system includes two default work queues: the ExPool queue and the IoPool queue. The former
is used by drivers and system components using the ExQueueWorkItem API, whereas the latter is meant
for IoAllocateWorkItem
meant to be used by the internal (non-exported) ExQueueWorkItemToPrivatePool API, which takes in
a pool identifier
Store Manager (see Chapter 5 of Part 1 for more information) leverages this capability.
The executive tries to match the number of critical worker threads with changing workloads as the system executes. Whenever work items are being processed or queued, a check is
made to see if a new worker thread might be needed. If so, an event is signaled, waking up the
ExpWorkQueueManagerThread for the associated NUMA node and partition. An additional worker
thread is created in one of the following conditions:
■
There are fewer threads than the minimum number of threads for this queue.
■
pending work items in the queue, or the last attempt to try to queue a work item failed.
Additionally, once every second, for each worker queue manager (that is, for each NUMA node on
each partition) the ExpWorkQueueManagerThread can also try to determine whether a deadlock may
matching increase in the number of work items processed. If this is occurring, an additional worker
thread will be created, regardless of any maximum thread limits, hoping to clear out the potential
deadlock. This detection will then be disabled until it is deemed necessary to check again (such as if
the maximum number of threads has been reached). Since processor topologies can change due to hot
add
keep track of the new processors as well.
worker thread timeout minutes (by default 10, so once every 20
minutes), this thread also checks if it should destroy any system worker threads. Through the same
WorkerThreadTimeoutInSeconds. This is called reaping and ensures that system worker thread counts
do not get out of control. A system worker thread is reaped if it has been waiting for a long time
(meaning the current number of threads are clearing them all out in a timely fashion).
EXPERIMENT: Listing system worker threads
ity (which is no longer per-NUMA node as before, and certainly no longer global), the kernel
!exqueue command can no longer be used to see a listing of system worker threads
Since the EPARTITION, EX_PARTITION, and EX_WORK_QUEUE data structures are all available
in the public symbols, the debugger data model can be used to explore the queues and their
CHAPTER 8
System mechanisms
83
for the main (default) system partition:
lkd> dx ((nt!_EX_PARTITION*)(*(nt!_EPARTITION**)&nt!PspSystemPartition)->ExPartition)->
WorkQueueManagers[0]
((nt!_EX_PARTITION*)(*(nt!_EPARTITION**)&nt!PspSystemPartition)->ExPartition)->
WorkQueueManagers[0]
: 0xffffa483edea99d0 [Type: _EX_WORK_QUEUE_MANAGER *]
[+0x000] Partition
: 0xffffa483ede51090 [Type: _EX_PARTITION *]
[+0x008] Node
: 0xfffff80467f24440 [Type: _ENODE *]
[+0x010] Event
[Type: _KEVENT]
[+0x028] DeadlockTimer
[Type: _KTIMER]
[+0x068] ReaperEvent
[Type: _KEVENT]
[+0x080] ReaperTimer
[Type: _KTIMER2]
[+0x108] ThreadHandle
: 0xffffffff80000008 [Type: void *]
[+0x110] ExitThread
: 0x0 [Type: unsigned long]
[+0x114] ThreadSeed
: 0x1 [Type: unsigned short]
Alternatively, here is the ExPool for NUMA Node 0, which currently has 15 threads and has
processed almost 4 million work items so far!
lkd> dx ((nt!_EX_PARTITION*)(*(nt!_EPARTITION**)&nt!PspSystemPartition)->ExPartition)->
WorkQueues[0][0],d
((nt!_EX_PARTITION*)(*(nt!_EPARTITION**)&nt!PspSystemPartition)->ExPartition)->
WorkQueues[0][0],d
: 0xffffa483ede4dc70 [Type: _EX_WORK_QUEUE *]
[+0x000] WorkPriQueue
[Type: _KPRIQUEUE]
[+0x2b0] Partition
: 0xffffa483ede51090 [Type: _EX_PARTITION *]
[+0x2b8] Node
: 0xfffff80467f24440 [Type: _ENODE *]
[+0x2c0] WorkItemsProcessed : 3942949 [Type: unsigned long]
[+0x2c4] WorkItemsProcessedLastPass : 3931167 [Type: unsigned long]
[+0x2c8] ThreadCount
: 15 [Type: long]
[+0x2cc (30: 0)] MinThreads
: 0 [Type: long]
[+0x2cc (31:31)] TryFailed
: 0 [Type: unsigned long]
[+0x2d0] MaxThreads
: 4096 [Type: long]
[+0x2d4] QueueIndex
: ExPoolUntrusted (0) [Type: _EXQUEUEINDEX]
[+0x2d8] AllThreadsExitedEvent : 0x0 [Type: _KEVENT *]
You could then look into the ThreadList
threads associated with this queue:
WorkPriQueue to enumerate the worker
lkd> dx -r0 @$queue = ((nt!_EX_PARTITION*)(*(nt!_EPARTITION**)&nt!PspSystemPartition)->
ExPartition)->WorkQueues[0][0]
@$queue = ((nt!_EX_PARTITION*)(*(nt!_EPARTITION**)&nt!PspSystemPartition)->ExPartition)->
WorkQueues[0][0]
: 0xffffa483ede4dc70 [Type: _EX_WORK_QUEUE *]
lkd> dx Debugger.Utility.Collections.FromListEntry(@$queue->WorkPriQueue.ThreadListHead,
"nt!_KTHREAD", "QueueListEntry")
Debugger.Utility.Collections.FromListEntry(@$queue->WorkPriQueue.ThreadListHead,
"nt!_KTHREAD", "QueueListEntry")
[0x0]
[Type: _KTHREAD]
[0x1]
[Type: _KTHREAD]
[0x2]
[Type: _KTHREAD]
[0x3]
[Type: _KTHREAD]
[0x4]
[Type: _KTHREAD]
[0x5]
[Type: _KTHREAD]
[0x6]
[Type: _KTHREAD]
84
CHAPTER 8
System mechanisms
[0x7]
[0x8]
[0x9]
[0xa]
[0xb]
[0xc]
[0xd]
[0xe]
[0xf]
[Type:
[Type:
[Type:
[Type:
[Type:
[Type:
[Type:
[Type:
[Type:
_KTHREAD]
_KTHREAD]
_KTHREAD]
_KTHREAD]
_KTHREAD]
_KTHREAD]
_KTHREAD]
_KTHREAD]
_KTHREAD]
That was only the ExPool. Recall that the system also has an IoPool, which would be the next
index (1) on this NUMA Node (0). You can also continue the experiment by looking at private
lkd> dx ((nt!_EX_PARTITION*)(*(nt!_EPARTITION**)&nt!PspSystemPartition)->ExPartition)->
WorkQueues[0][1],d
((nt!_EX_PARTITION*)(*(nt!_EPARTITION**)&nt!PspSystemPartition)->ExPartition)->
WorkQueues[0][1],d
: 0xffffa483ede77c50 [Type: _EX_WORK_QUEUE *]
[+0x000] WorkPriQueue
[Type: _KPRIQUEUE]
[+0x2b0] Partition
: 0xffffa483ede51090 [Type: _EX_PARTITION *]
[+0x2b8] Node
: 0xfffff80467f24440 [Type: _ENODE *]
[+0x2c0] WorkItemsProcessed : 1844267 [Type: unsigned long]
[+0x2c4] WorkItemsProcessedLastPass : 1843485 [Type: unsigned long]
[+0x2c8] ThreadCount
: 5 [Type: long]
[+0x2cc (30: 0)] MinThreads
: 0 [Type: long]
[+0x2cc (31:31)] TryFailed
: 0 [Type: unsigned long]
[+0x2d0] MaxThreads
: 4096 [Type: long]
[+0x2d4] QueueIndex
: IoPoolUntrusted (1) [Type: _EXQUEUEINDEX]
[+0x2d8] AllThreadsExitedEvent : 0x0 [Type: _KEVENT *]
Exception dispatching
In contrast to interrupts, which can occur at any time, exceptions are conditions that result directly from
the execution of the program that is running. Windows uses a facility known as structured exception
handling, which allows applications to gain control when exceptions occur. The application can then
execution of the subroutine that raised the exception), or declare back to the system that the exception
book Windows via C/C++
exception handling is made accessible through language extensions (for example, the __try construct
respond to the entry in the IDT that points to the trap handler for a particular exception. Table 8-12 shows
used for exceptions, hardware interrupts are assigned entries later in the table, as mentioned earlier.
CHAPTER 8
System mechanisms
85
All exceptions, except those simple enough to be resolved by the trap handler, are serviced by a
kernel module called the exception dispatcher
handler that can dispose of the exception. Examples of architecture-independent exceptions that the
-
TABLE 8-12 x86 exceptions and their interrupt numbers
Interrupt Number
Exception
0
Divide Error
1
Debug (Single Step)
2
Non-Maskable Interrupt (NMI)
3
Breakpoint
Mnemonic
-
4
5
Bounds Check (Range Exceeded)
6
Invalid Opcode
7
NPX Not Available
8
9
NPX Segment Overrun
10
Invalid Task State Segment (TSS)
11
Segment Not Present
-
12
13
General Protection
14
15
Intel Reserved
-
16
17
Alignment Check
18
Machine Check
19
20
Virtualization Exception
21
Control Protection (CET)
encountering a breakpoint while executing a program being debugged generates an exception, which
the kernel handles by calling the debugger. The kernel handles certain other exceptions by returning
an unsuccessful status code to the caller.
86
CHAPTER 8
System mechanisms
frame-based exception handlers to deal with these exceptions. The term frame-based
activation. When a procedure is invoked, a stack frame representing that activation of the procedure
is pushed onto the stack. A stack frame can have one or more exception handlers associated with it,
each of which protects a particular block of code in the source program. When an exception occurs,
the kernel searches for an exception handler associated with the current stack frame. If none exists, the
kernel searches for an exception handler associated with the previous stack frame, and so on, until it
exception handlers.
frame-based technology has been proven to be attackable by malicious users). Instead, a table of
handlers for each function is built into the image during compilation. The kernel looks for handlers associated with each function and generally follows the same algorithm we described for 32-bit code.
Structured exception handling is heavily used within the kernel itself so that it can safely verify
whether pointers from user mode can be safely accessed for read or write access. Drivers can make
use of this same technique when dealing with pointers sent during I/O control codes (IOCTLs).
Another mechanism of exception handling is called vectored exception handling. This method can be
Microsoft Docs at https://docs.microsoft.com/en-us/windows/win32/debug/vectored-exception-handling.
When an exception occurs, whether it is explicitly raised by software or implicitly raised by hardware, a chain of events begins in the kernel. The CPU hardware transfers control to the kernel trap
handler, which creates a trap frame (as it does when an interrupt occurs). The trap frame allows the
system to resume where it left off if the exception is resolved. The trap handler also creates an exception record that contains the reason for the exception and other pertinent information.
If the exception occurred in kernel mode, the exception dispatcher simply calls a routine to locate a
frame-based exception handler that will handle the exception. Because unhandled kernel-mode excepexception handler. Some traps, however, do not lead into an exception handler because the kernel always assumes such errors to be fatal; these are errors that could have been caused only by severe bugs
in the internal kernel code or by major inconsistencies in driver code (that could have occurred only
fatal errors will result in a bug check with the UNEXPECTED_KERNEL_MODE_TRAP code.
If the exception occurred in user mode, the exception dispatcher does something more elaborate. The Windows subsystem has a debugger port (this is actually a debugger object, which will be
processes. (In this case, by “port” we mean an ALPC port object, which will be discussed later in this
dispatcher takes is to see whether the process that incurred the exception has an associated debugger
CHAPTER 8
System mechanisms
87
process. If it does, the exception dispatcher sends a debugger object message to the debug object associated with the process (which internally the system refers to as a “port” for compatibility with programs
that might rely on behavior in Windows 2000, which used an LPC port instead of a debug object).
Debugger
port
Trap
handler
Frame-based
handlers
Exception
record
Exception
dispatcher
Function call
ALPC
Debugger
(first chance)
Debugger
port
Debugger
(second chance)
Exception
port
Environment
subsystem
Error
port
Windows Error
Reporting
Kernel default
handler
FIGURE 8-24 Dispatching an exception.
the exception dispatcher switches into user mode, copies the trap frame to the user stack formatted
as a CONTEXT
tured or vectored exception handler. If none is found or if none handles the exception, the exception
dispatcher switches back into kernel mode and calls the debugger again to allow the user to do more
debugging. (This is called the second-chance notification.)
was registered by the environment subsystem that controls this thread. The exception port gives the
environment subsystem, which presumably is listening at the port, the opportunity to translate the
sage to a systemwide error port that Csrss (Client/Server Run-Time Subsystem) uses for Windows Error
Reporting (WER)—which is discussed in Chapter 10—and executes a default exception handler that
simply terminates the process whose thread caused the exception.
88
CHAPTER 8
System mechanisms
Unhandled exceptions
All Windows threads have an exception handler that processes unhandled exceptions. This exception
handler is declared in the internal Windows start-of-thread function. The start-of-thread function runs
when a user creates a process or any additional threads. It calls the environment-supplied thread start
CreateThread call.
The generic code for the internal start-of-thread functions is shown here:
VOID RtlUserThreadStart(VOID)
{
LPVOID StartAddress = RCX;
// Located in the initial thread context structure
LPVOID Argument = RDX;
// Located in the initial thread context structure
LPVOID Win32StartAddr;
if (Kernel32ThreadInitThunkFunction != NULL) {
Win32StartAddr = Kernel32ThreadInitThunkFunction;
} else {
Win32StartAddr = StartAddress;
}
__try
{
DWORD ThreadExitCode = Win32StartAddr(Argument);
RtlExitUserThread(ThreadExitCode);
}
__except(RtlpGetExceptionFilter(GetExceptionInformation()))
{
NtTerminateProcess(NtCurrentProcess(), GetExceptionCode());
}
}
EXPERIMENT: Viewing the real user start address for Windows threads
The fact that each Windows thread begins execution in a system-supplied function (and not
the user-supplied function) explains why the start address for thread 0 is the same for every
Windows process in the system (and why the start addresses for secondary threads are also the
same). To see the user-supplied function address, use Process Explorer or the kernel debugger.
Because most threads in Windows processes start at one of the system-supplied wrapper
functions, Process Explorer, when displaying the start address of threads in a process, skips the
initial call frame that represents the wrapper function and instead shows the second frame on the
CHAPTER 8
System mechanisms
89
Process Explorer does display the complete call hierarchy when it displays the call stack.
Notice the following results when the Stack button is clicked:
90
CHAPTER 8
System mechanisms
this case, kernel32, because you are dealing with a Windows subsystem application. The third
frame (line 18) is the main entry point into Notepad.exe.
Configure Symbols menu item located in the Options menu.
System service handling
calls. In the preceding sections, you saw how interrupt and exception handling work; in this section,
result of executing an instruction assigned to system service dispatching. The instruction that Windows
uses for system service dispatching depends on the processor on which it is executing and whether
User mode
Kernel mode
System
service call
System service
dispatch table
System
service
dispatcher
0
1
2
3
System service 2
•
•
•
n
FIGURE 8-25 System service dispatching.
CHAPTER 8
System mechanisms
91
Architectural system service dispatching
On most x64 systems, Windows uses the syscall instruction, which results in the change of some of the
key processor state we have learned about in this chapter, based on certain preprogrammed model
specific registers (MSRs):
■
0xC0000081, known as STAR (SYSCALL Target Address Register)
■
0xC0000082, known as LSTAR (Long-Mode STAR)
■
Upon encountering the syscall instruction, the processor acts in the following manner:
■
The Code Segment (CS) is loaded from Bits 32 to 47 in STAR, which Windows sets to 0x0010
■
The Stack Segment (SS) is loaded from Bits 32 to 47 in STAR plus 8, which gives us 0x0018
■
The Instruction Pointer (RIP) is saved in RCX, and the new value is loaded from LSTAR, which
Windows sets to KiSystemCall64
or KiSystemCall64Shadow otherwise. (More information on the Meltdown vulnerability was
provided in the “Hardware side-channel vulnerabilities” section earlier in this chapter.)
■
■
user-space values.
Therefore, although the instruction executes in very few processor cycles, it does leave the processor in an
insecure and unstable state—the user-mode stack pointer is still loaded, GS is still pointing to the TEB, but
the Ring Level, or CPL, is now 0, enabling kernel mode privileges. Windows acts quickly to place the prohappen on legacy processors, these are the precise steps that KiSystemCall64 must perform:
By using the swapgs instruction, GS now points to the PCR, as described earlier in this chapter.
The current stack pointer (RSP) is saved into the UserRsp
been loaded, this can be done without using any stack or register.
The new stack pointer is loaded from the RspBase
part of the PCR).
Now that the kernel stack is loaded, the function builds a trap frame, using the format described earlier
in the chapter. This includes storing in the frame the SegSs set to KGDT_R3_DATA (0x2B), Rsp from the
UserRsp in the PCR, EFlags from R11, SegCs set to KGDT_R3_CODE (0x33), and storing Rip from RCX.
how syscall operates.
92
CHAPTER 8
System mechanisms
a syscall) be placed in RCX—yet the syscall instruction overrides RCX with the instruction pointer of the
caller, as shown earlier. Windows is aware of this behavior and copies RCX into R10 before issuing the
syscall
The next steps have to do with processor mitigations such as Supervisor Mode Access Prevention
(SMAP)—such as issuing the stac instruction—and the myriad processor side-channel mitigations, such
as clearing the branch tracing buffers (BTB) or return store buffer (RSB). Additionally, on processors
chronized correctly. Beyond this point, additional elements of the trap frame are stored, such as various
nonvolatile registers and debug registers, and the nonarchitectural handling of the system call begins,
which we discuss in more detail in just a bit.
different instruction is used, which is called sysenter
spend too much time digging into this instruction other than mentioning that its behavior is similar—a
certain amount of processor state is loaded from various MSRs, and the kernel does some additional
work, such as setting up the trap frame. More details can be found in the relevant Intel processor
manuals. Similarly, ARM-based processors use the svc instruction, which has its own behavior and OSlevel handling, but these systems still represent only a small minority of Windows installations.
There is one more corner case that Windows must handle: processors without Mode Base Execution
Controls (MBEC) operating while Hypervisor Code Integrity (HVCI) is enabled suffer from a design issue
that violates the promises HVCI provides. (Chapter 9 covers HVCI and MBEC.) Namely, an attacker could
allocate user-space executable memory, which HVCI allows (by marking the respective SLAT entry as
the virtual address appear as a kernel page. Because the MMU would see the page as being kernel,
Supervisor Mode Execution Prevention (SMEP) would not prohibit execution of the code, and because
The attacker has now achieved arbitrary kernel-mode code execution, violating the basic tenet of HVCI.
versus user executable bits in the SLAT entry data structures, allowing the hypervisor (or the Secure
kernel non executable but user executable. Unfortunately, on processors without this capability, the hypervisor has no choice but to trap all
code privilege level changes and swap between two different sets of SLAT entries—ones marking all
user physical pages as nonexecutable, and ones marking them as executable. The hypervisor traps CPL
changes by making the IDT appear empty (effectively setting its limit to 0) and decoding the underlying instruction, which is an expensive operation. However, as interrupts can directly be trapped by the
hypervisor, avoiding these costs, the system call dispatch code in user space prefers issuing an interrupt
if it detects an HVCI-enabled system without MBEC-like capabilities. The SystemCall bit in the Shared
User Data structure described in Chapter 4, Part 1, is what determines this situation.
Therefore, when SystemCall is set to 1, x64 Windows uses the int 0x2e instruction, which results in a
trap, including a fully built-out trap frame that does not require OS involvement. Interestingly, this
happens to be the same instruction that was used on ancient x86 processors prior to the Pentium Pro,
CHAPTER 8
System mechanisms
93
and continues to still be supported on x86 systems for backward compatibility with three-decade-old
software that had unfortunately hardcoded this behavior. On x64, however, int 0x2e can be used only
Regardless of which instruction is ultimately used, the user-mode system call dispatching code always
stores a system call index in a register—EAX on x86 and x64, R12 on 32-bit ARM, and X8 on ARM64—
make things easy, the standard function call processor ABI (application binary interface) is maintained
across the boundary—for example, arguments are placed on the stack on x86, and RCX (technically R10
due to the behavior of syscall
calls that occurred through int 0x2e, the iret instruction restores the processor state based on the
syscall and sysenter, though, the processor once again leverages
the MSRs and hardcoded registers we saw on entry, through specialized instructions called sysret and
sysexit
■
■
■
The Stack Segment (SS) is loaded from bits 48 to 63 in STAR, which Windows sets to 0x0023
(KGDT_R3_DATA).
The Code Segment (CS) is loaded from bits 48 to 63 in STAR plus 0x10, which gives us 0x0033
(KGDT64_R3_CODE).
The Instruction Pointer (RIP) is loaded from RCX.
■
■
kernel-space values.
Therefore, just like for system call entry, the exit mechanics must also clean up some processor state.
Namely, RSP is restored to the Rsp
the entry code we analyzed, similar to all the other saved registers. RCX register is loaded from the
saved Rip, R11 is loaded from EFlags, and the swapgs instruction is used right before issuing the sysret
from the trap frame before the sysret instruction. Equivalent actions are taken on for sysexit and
eret). Additionally, if CET is enabled, just like in the entry path, the shadow
stack must correctly be synchronized on the exit path.
EXPERIMENT: Locating the system service dispatcher
As mentioned, x64 system calls occur based on a series of MSRs, which you can use the rdmsr
KGDT_R0_CODE (0x0010)
and KGDT64_R3_DATA (0x0023).
lkd> rdmsr c0000081
msr[c0000081] = 00230010`00000000
94
CHAPTER 8
System mechanisms
Next, you can investigate LSTAR, and then use the ln
KiSystemCall64
those that do):
KiSystemCall64Shadow (for
lkd> rdmsr c0000082
msr[c0000082] = fffff804`7ebd3740
lkd> ln fffff804`7ebd3740
(fffff804`7ebd3740)
nt!KiSystemCall64
lkd> rdmsr c0000084
msr[c0000084] = 00000000`00004700
x86 system calls occur through sysenter,
sysenter which uses a different set of MSRs, including 0x176,
which stores the 32-bit system call handler:
lkd> rdmsr 176
msr[176] = 00000000'8208c9c0
lkd> ln 00000000'8208c9c0
(8208c9c0)
nt!KiFastCallEntry
the int 0x2e handler registered in the IDT with the !idt 2e debugger command:
lkd> !idt 2e
Dumping IDT: fffff8047af03000
2e:
fffff8047ebd3040 nt!KiSystemService
You can disassemble the KiSystemService or KiSystemCall64 routine with the u
nt!KiSystemService+0x227:
fffff804`7ebd3267 4883c408
add
fffff804`7ebd326b 0faee8
lfence
fffff804`7ebd326e 65c604255308000000 mov
fffff804`7ebd3277 e904070000
jmp
rsp,8
byte ptr gs:[853h],0
nt!KiSystemServiceUser (fffff804`7ebd3980)
while the MSR handler will fall in
nt!KiSystemCall64+0x227:
fffff804`7ebd3970 4883c408
add
fffff804`7ebd3974 0faee8
lfence
fffff804`7ebd3977 65c604255308000000 mov
nt!KiSystemServiceUser:
fffff804`7ebd3980 c645ab02
mov
rsp,8
byte ptr gs:[853h],0
byte ptr [rbp-55h],2
This shows you that eventually both code paths arrive in KiSystemServiceUser,
KiSystemServiceUser which then does
most common actions across all processors, as discussed in the next section.
CHAPTER 8
System mechanisms
95
Nonarchitectural system service dispatching
tion in the system service dispatch table. On x86 systems, this table is like the interrupt dispatch table
described earlier in the chapter except that each entry contains a pointer to a system service rather
than to an interrupt-handling routine. On other platforms, including 32-bit ARM and ARM64, the table
is implemented slightly differently; instead of containing pointers to the system service, it contains
offsets relative to the table itself. This addressing mechanism is more suited to the x64 and ARM64
application binary interface (ABI) and instruction-encoding format, and the RISC nature of ARM processors in general.
Note System service numbers frequently change between OS releases. Not only does
Microsoft occasionally add or remove system services, but the table is also often random-
Regardless of architecture, the system service dispatcher performs a few common actions on
all platforms:
■
■
■
If this thread belongs to a pico process, forward to the system call pico provider routine
(see Chapter 3, Part 1, for more information on pico providers).
If this thread is an UMS scheduled thread, call KiUmsCallEntry to synchronize with the priUmsPerformingSyscall
FirstArgument
■
the system call number in SystemCallNumber.
■
Call the shared user/kernel system call handler (KiSystemServiceStart), which sets the TrapFrame
■
Enable interrupt delivery.
can be interrupted. The next step is to select the correct system call table and potentially upgrade the
thread to a GUI thread, details of which will be based on the GuiThread and RestrictedGuiThread
GdiBatchCount
stack. This is needed to avoid having each system call manually copy the arguments (which would
as the kernel is accessing them. This operation is done within a special code block that is recognized
by the exception handlers as being associated to user stack copying, ensuring that the kernel does not
96
CHAPTER 8
System mechanisms
crash in the case that an attacker, or incorrectly written program, is messing with the user stack. Since
system calls can take an arbitrary number of arguments (well, almost), you see in the next section how
the kernel knows how many to copy.
Note that this argument copying is shallow: If any of the arguments passed to a system service
points to a buffer in user space, it must be probed for safe accessibility before kernel-mode code can
read and/or write from it. If the buffer will be accessed multiple times, it may also need to be captured,
or copied, into a local kernel buffer. The responsibility of this probe and capture operation lies with each
individual system call and is not performed by the handler. However, one of the key operations that the
system call dispatcher must perform is to set the previous mode of the thread. This value corresponds
to either KernelMode or UserMode and must be synchronized whenever the current thread executes
a trap, identifying the privilege level of the incoming exception, trap, or system call. This will allow the
system call, using ExGetPreviousMode, to correctly handle user versus kernel callers.
system call tracing is enabled, the appropriate entry/exit callbacks are called around the system call.
Alternatively, if ETW tracing is enabled but not DTrace, the appropriate ETW events are logged around
KeSystemCalls variable in the PRCB, which
is exposed as a performance counter that you can track in the Performance & Reliability Monitor.
At this point, system call dispatching is complete, and the opposite steps will then be taken as part
of system call exit. These steps will restore and copy user-mode state as appropriate, handle user-mode
APC delivery as needed, address side-channel mitigations around various architectural buffers, and
eventually return with one of the CPU instructions relevant for this platform.
Kernel-issued system call dispatching
Because system calls can be performed both by user-mode code and kernel mode, any pointers,
handles, and behaviors should be treated as if coming from user mode—which is clearly not correct.
To solve this, the kernel exports specialized Zw versions of these calls—that is, instead of
NtCreateFile, the kernel exports ZwCreateFile. Additionally, because Zw functions must be manually
exported by the kernel, only the ones that Microsoft wishes to expose for third-party use are present.
ZwCreateUserProcess is not exported by name because kernel drivers are not expected to
launch user applications. These exported APIs are not actually simple aliases or wrappers around the Nt
versions. Instead, they are “trampolines” to the appropriate Nt system call, which use the same system
call-dispatching mechanism.
Like KiSystemCall64 does, they too build a fake hardware trap frame (pushing on the stack the
data that the CPU would generate after an interrupt coming from kernel mode), and they also disable
interrupts, just like a trap would. On x64 systems, for example, the KGDT64_R0_CODE (0x0010) selector is pushed as CS, and the current kernel stack as RSP. Each of the trampolines places the system call
number in the appropriate register (for example, EAX on x86 and x64), and then calls KiServiceInternal,
which saves additional data in the trap frame, reads the current previous mode, stores it in the trap
frame, and then sets the previous mode to KernelMode (this is an important difference).
CHAPTER 8
System mechanisms
97
User-issued system call dispatching
As was already introduced in Chapter 1 of Part 1, the system service dispatch instructions for Windows
executive services exist in the system library Ntdll.dll. Subsystem DLLs call functions in Ntdll to
implement their documented functions. The exception is Windows USER and GDI functions, includ-
WriteFile
WriteFile
for more information on API redirection), which in turn calls the WriteFile
NtWriteFile function in Ntdll.dll, which in turn executes the appropriate instruction to cause a system
service trap, passing the system service number representing NtWriteFile.
The system service dispatcher in Ntoskrnl.exe (in this example, KiSystemService) then calls the real
NtWriteFile
tions, the system service dispatch calls the function in the loadable kernel-mode part of the Windows
either Win32kbase.sys or Win32kfull.sys on Desktop systems, Win32kmin.sys on Windows 10X systems,
or Dxgkrnl.sys if this was a DirectX call.
Windows USER, GDI
or DirectX APIs
Windows kernel APIs
Windows
application
Call WriteFile(…)
Application
WriteFile in
Kernelbase.dll
Call NtWriteFile
Return to caller
Windowsspecific
Gdi32.dll
or User32.dll
Call NtGdiBitBlt
Return to caller
Windowsspecific
NtWriteFile in
Ntdll.dll
Return to caller
Used by all NtGdiBitBlt in
subsystems
Win32u.dll
Return to caller
Windowsspecific
Call BitBlt(…)
User mode
Software trap
KiSystemService
in Ntoskrnl.exe
Software trap
Call NtWriteFile
Dismiss trap
NtWriteFile in Do the operation
Ntoskrnl.exe Return to caller
KiSystemService
in Ntoskrnl.exe
Kernel mode
Call NtGdiBitBlt
Routine
Dismiss trap
Service entry point If not filtered call
NtGdiBitBlt
in Win32k.sys Return to caller
NtGdiBitBlt in Do the operation
Win32kfull.sys Return to caller
FIGURE 8-26 System service dispatching.
98
CHAPTER 8
System mechanisms
System call security
Since the kernel has the mechanisms that it needs for correctly synchronizing the previous mode for
system call operations, each system call service can rely on this value as part of processing. We previprobe
buffer of any sort. By probe, we mean the following:
1.
Making sure that the address is below MmUserProbeAddress
2.
Making sure that the address is aligned to a boundary matching how the caller intends to access
its data—for example, 2 bytes for Unicode characters, 8 bytes for a 64-bit pointer, and so on.
3.
If the buffer is meant to be used for output, making sure that, at the time the system call begins,
it is actually writable.
Note that output buffers could become invalid or read-only at any future point in time, and the
system call must always access them using SEH, which we described earlier in this chapter, to avoid
they will likely be imminently used anyway, SEH must be used to ensure they can be safely read. SEH
must still be taken.
UserMode calls, and all
that a system call must perform, however, because some other dangerous situations can arise:
■
■
The caller may have supplied a handle to an object. The kernel normally bypasses all security
access checks when referencing objects, and it also has full access to kernel handles (which we
describe later in the “Object Manager” section of this chapter), whereas user-mode code does
not. The previous mode is used to inform the Object Manager that it should still perform access
checks because the request came from user space.
OBJ_FORCE_ACCESS_CHECK need
to be used by a driver to indicate that even though it is using the Zw API, which sets the previous mode to KernelMode, the Object Manager should still treat the request as if coming from
UserMode.
■
IO_FORCE_ACCESS_CHECKING
ZwCreateFile
would change the previous mode to KernelMode and bypass access checks. Potentially, a driver
■
redirection attacks, where privileged kernel-mode code might be incorrectly using various
CHAPTER 8
System mechanisms
99
■
with the Zw interface, must keep in mind that this will reset the previous mode to KernelMode
and respond accordingly.
Service descriptor tables
We previously mentioned that before performing a system call, the user-mode or kernel-mode tram-
the bottom 12 bits, represents the system call index. The second, which uses the next higher 2 bits (1213), is the table identifier
types of system services, each stored in a table that can house up to 4096 system calls.
Table Index
System service number
Index into table
31
0
13 11
0
0
Native API
1
Native API
1
Unused
KeServiceDescriptorTable
Win32k.sys API
KeServiceDescriptorTableShadow
FIGURE 8-27 System service number to system service translation.
The kernel keeps track of the system service tables using three possible arrays—KeServiceDescriptor
Table, KeServiceDescriptorTableShadow, and KeServiceDescriptorTableFilter. Each of these arrays can
have up to two entries, which store the following three pieces of data:
■
A pointer to the array of system calls implemented by this service table
■
The number of system calls present in this service table, called the limit
■
A pointer to the array of argument bytes for each of the system calls in this service table
KiServiceTable and KiArgumentTable, with a
little over 450 system calls (the precise number depends on your version of Windows). All threads, by
default, issue system calls that only access this table. On x86, this is enforced by the ServiceTable pointer
in the thread object, while all other platforms hardcode the symbol KeServiceDescriptorTable in the
system call dispatcher.
100
CHAPTER 8
System mechanisms
PsConvertTo
GuiThread
GuiThread
RestrictedGuiThread
one is used depends on whether the EnableFilteredWin32kSystemCalls process mitigation option is
enabled, which we described in the “Process-mitigation policies” section of Chapter 7, Part 1. On x86
ServiceTable pointer now changes to KeServiceDescriptorTableShadow or
KeServiceDescriptorTableFilter
hardcoded symbol chosen at each system call. (Although less performant, the latter avoids an obvious
hooking point for malicious software to abuse.)
As you can probably guess, these other arrays include a second entry, which represents the
Windows USER and GDI services implemented in the kernel-mode part of the Windows subsystem,
albeit these still transit through Win32k.sys initially. This second entry points to W32pServiceTable or
W32pServiceTableFilter and W32pArgumentTable or W32pArgumentTableFilter, respectively, and has
about 1250 system calls or more, depending on your version of Windows.
Note Because the kernel does not link against Win32k.sys, it exports a
KeAddSystemServiceTable function that allows the addition of an additional entry into
the KeServiceDescriptorTableShadow and the KeServiceDescriptorTableFilter table if it has
and PatchGuard protects the arrays once this function has been called, so that the structures
effectively become read only.
The only material difference between the Filter entries is that they point to system calls in Win32k.sys
with names like stub_UserGetThreadState, while the real array points to NtUserGetThreadState. The for-
STATUS_INVALID_SYSTEM_SERVICE
(such as NtUserGetThreadState), with potential telemetry if auditing is enabled.
The argument tables, on the other hand, are what help the kernel to know how many stack bytes need
to be copied from the user stack into the kernel stack, as explained in the dispatching section earlier.
Each entry in the argument table corresponds to the matching system call with that index and stores
the count of bytes to copy (up to 255). However, kernels for platforms other than x86 employ a mechanism called system call table compaction, which combines the system call pointer from the call table
with the byte count from the argument table into a single value. The feature works as follows:
1.
Take the system call function pointer and compute the 32-bit difference from the beginning of
the system call table itself. Because the tables are global variables inside of the same module
that contains the functions, this range of ±2 GB should be more than enough.
CHAPTER 8
System mechanisms
101
2.
Take the stack byte count from the argument table and divide it by 4, converting it into an
argument count
simply be considered as two “arguments”).
3.
bitwise or operation to add the argument count from the second step.
4.
Override the system call function pointer with the value obtained in step 3.
-
pointer dereferences, and it acts as a layer of obfuscation, which makes it harder to hook or patch the
system call table while making it easier for PatchGuard to defend it.
EXPERIMENT: Mapping system call numbers to functions and arguments
You can duplicate the same lookup performed by the kernel when dealing with a system call
On an x86 system, you can just ask the debugger to dump each system call table, such as
actu-KiServiceTable with the dps command, which stands for dump pointer symbol
symbol, which will actu
ally perform a lookup for you. You can then similarly dump the KiArgumentTable (or any of the
Win32k.sys ones) with the db command or dump bytes.
A more interesting exercise, however, is dumping this data on an ARM64 or x64 system, due
to the encoding we described earlier. The following steps will help you do that.
1.
NtMapUserPhysicalPagesScatter:
lkd> ?? ((ULONG)(nt!KiServiceTable[3]) >> 4) + (int64)nt!KiServiceTable
unsigned int64 0xfffff803`1213e030
lkd> ln 0xfffff803`1213e030
(fffff803`1213e030)
nt!NtMapUserPhysicalPagesScatter
2.
You can see the number of stack-based 4-byte arguments this system call takes by
taking the 4-bit argument count:
lkd> dx (((int*)&(nt!KiServiceTable))[3] & 0xF)
(((int*)&(nt!KiServiceTable))[3] & 0xF) : 0
3.
system, the call could take anywhere between 0 and 4 arguments, all of which are in
registers (RCX, RDX, R8, and R9).
102
CHAPTER 8
System mechanisms
4.
You could also use the debugger data model to create a LINQ predicate using projection,
dumping the entire table, leveraging the fact that the KiServiceLimit variable corresponds
W32pServiceLimit for the
Win32k.sys entries in the shadow descriptor table). The output would look like this:
lkd> dx @$table = &nt!KiServiceTable
@$table = &nt!KiServiceTable : 0xfffff8047ee24800 [Type: void *]
lkd> dx (((int(*)[90000])&(nt!KiServiceTable)))->Take(*(int*)&nt!KiServiceLimit)->
Select(x => (x >> 4) + @$table)
(((int(*)[90000])&(nt!KiServiceTable)))->Take(*(int*)&nt!KiServiceLimit)->Select
(x => (x >> 4) + @$table)
[0]
: 0xfffff8047eb081d0 [Type: void *]
[1]
: 0xfffff8047eb10940 [Type: void *]
[2]
: 0xfffff8047f0b7800 [Type: void *]
[3]
: 0xfffff8047f299f50 [Type: void *]
[4]
: 0xfffff8047f012450 [Type: void *]
[5]
: 0xfffff8047ebc5cc0 [Type: void *]
[6]
: 0xfffff8047f003b20 [Type: void *]
5.
You could use a more complex version of this command that would also allow you to
convert the pointers into their symbolic forms, essentially reimplementing the dps
command that works on x86 Windows:
lkd> dx @$symPrint = (x => Debugger.Utility.Control.ExecuteCommand(".printf \"%y\\n\"," +
((unsigned __int64)x).ToDisplayString("x")).First())
@$symPrint = (x => Debugger.Utility.Control.ExecuteCommand(".printf \"%y\\n\"," +
((unsigned __int64)x).ToDisplayString("x")).First())
lkd> dx (((int(*)[90000])&(nt!KiServiceTable)))->Take(*(int*)&nt!KiServiceLimit)->Select
(x => @$symPrint((x >> 4) + @$table))
(((int(*)[90000])&(nt!KiServiceTable)))->Take(*(int*)&nt!KiServiceLimit)->Select(x =>
@$symPrint((x >> 4) + @$table))
[0]
: nt!NtAccessCheck (fffff804`7eb081d0)
[1]
: nt!NtWorkerFactoryWorkerReady (fffff804`7eb10940)
[2]
: nt!NtAcceptConnectPort (fffff804`7f0b7800)
[3]
: nt!NtMapUserPhysicalPagesScatter (fffff804`7f299f50)
[4]
: nt!NtWaitForSingleObject (fffff804`7f012450)
[5]
: nt!NtCallbackReturn (fffff804`7ebc5cc0)
6.
Win32k.sys entries, you can also use the !chksvctbl -v command in the debugger,
whose output will include all of this data while also checking for inline hooks that a
rootkit may have attached:
lkd> !chksvctbl -v
#
ServiceTableEntry
DecodedEntryTarget(Address)
CompactedOffset
==========================================================================================
0
0xfffff8047ee24800
nt!NtAccessCheck(0xfffff8047eb081d0) 0n-52191996
1
0xfffff8047ee24804
nt!NtWorkerFactoryWorkerReady(0xfffff8047eb10940) 0n-51637248
2
0xfffff8047ee24808
nt!NtAcceptConnectPort(0xfffff8047f0b7800) 0n43188226
3
0xfffff8047ee2480c
nt!NtMapUserPhysicalPagesScatter(0xfffff8047f299f50) 0n74806528
4
0xfffff8047ee24810
nt!NtWaitForSingleObject(0xfffff8047f012450) 0n32359680
CHAPTER 8
System mechanisms
103
EXPERIMENT: Viewing system service activity
You can monitor system service activity by watching the System Calls/Sec performance counter in
the System object. Run the Performance Monitor, click Performance Monitor under Monitoring
Tools, and click the Add button to add a counter to the chart. Select the System object, select the
System Calls/Sec counter, and then click the Add button to add the counter to the chart.
to have hundreds of thousands of system calls a second, especially the more processors the system
WoW64 (Windows-on-Windows)
WoW64 (Win32 emulation on 64-bit Windows) refers to the software that permits the execution of
32-bit applications on 64-bit platforms (which can also belong to a different architecture). WoW64 was
originally a research project for running x86 code in old alpha and MIPS version of Windows NT 3.51. It
has drastically evolved since then (that was around the year 1995). When Microsoft released Windows
XP 64-bit edition in 2001, WoW64 was included in the OS for running old x86 32-bit applications in
the new 64-bit OS. In modern Windows releases, WoW64 has been expanded to support also running
ARM32 applications and x86 applications on ARM64 systems.
WoW64 core is implemented as a set of user-mode DLLs, with some support from the kernel for cresuch as the process environment block (PEB) and thread environment block (TEB). Changing WoW64
contexts through Get/SetThreadContext is also implemented by the kernel. Here are the core usermode DLLs responsible for WoW64:
104
CHAPTER 8
System mechanisms
■
■
Wow64.dll Implements the WoW64 core in user mode. Creates the thin software layer that
acts as a kind of intermediary kernel for 32-bit applications and starts the simulation. Handles
CPU context state changes and base system calls exported by Ntoskrnl.exe. It also implements
Wow64win.dll Implements thunking (conversion) for GUI system calls exported by Win32k.
sys. Both Wow64win.dll and Wow64.dll include thunking code, which converts a calling convention from an architecture to another one.
longs to a different architecture. In some cases (like for ARM64) the machine code needs to be emulated or jitted. In this book, we use the term jitting to refer to the just-in-time compilation technique that
involves compilation of small code blocks (called compilation units) at runtime instead of emulating
and executing one instruction at a time.
Here are the DLLs that are responsible in translating, emulating, or jitting the machine code, allowing it to be run by the target operating system:
■
Wow64cpu.dll Implements the CPU simulator for running x86 32-bit code in AMD64 operating systems. Manages the 32-bit CPU context of each running thread inside WoW64 and
and vice versa.
■
■
Wowarmhw.dll Implements the CPU simulator for running ARM32 (AArch32) applications on
ARM64 systems. It represents the ARM64 equivalent of the Wow64cpu.dll used in x86 systems.
Xtajit.dll Implements the CPU emulator for running x86 32-bit applications on ARM64
systems. Includes a full x86 emulator, a jitter (code compiler), and the communication protocol
between the jitter and the XTA cache server. The jitter can create compilation blocks including
ARM64 code translated from the x86 image. Those blocks are stored in a local cache.
The relationship of the WoW64 user-mode libraries (together with other core WoW64 components)
x86 on AMD64
x86 32-bit
EXEs, DLLs
x86 32-bit
Ntdll.dll
Wow64cpu.dll
ARM32 on ARM64
ARM Thumb-2
EXEs, DLLs
ARM 32-bit
Ntdll.dll
x86 on ARM64
x86 32-bit EXEs, DLLs
CHPE OS EXEs, DLLs
CHPE
Wowarmhw.dll
Wow64.dll
Wow64win.dll
Native
Ntdll.dll
XtaCache Service
Xtajit.dll
XtaCache.exe
WoW64 Core
Xtac.exe
Ntdll.dll
Ntoskrnl.exe
Win32k.sys
NT Kernel
FIGURE 8-28 The WoW64 architecture.
CHAPTER 8
System mechanisms
105
Note Older Windows versions designed to run in Itanium machines included a full x86 emulator integrated in the WoW64 layer called Wowia32x.dll. Itanium processors were not able to
A newer Insider release version of Windows also supports executing 64-bit x86 code on
ARM64 systems. A new jitter has been designed for that reason. However emulating AMD64
code in ARM systems is not performed through WoW64. Describing the architecture of the
AMD64 emulator is outside the scope of this release of this book.
The WoW64 core
As introduced in the previous section, the WoW64 core is platform independent: It creates a software
layer for managing the execution of 32-bit code in 64-bit operating systems. The actual translation is
performed by another component called Simulator (also known as Binary Translator), which is platform
Simulator. While the core of WoW64 is almost entirely implemented in user mode (in the Wow64.dll
library), small parts of it reside in the NT kernel.
WoW64 core in the NT kernel
During system startup (phase 1), the I/O manager invokes the PsLocateSystemDlls routine, which maps
all the system DLLs supported by the system (and stores their base addresses in a global array) in the
System process user address space. This also includes WoW64 versions of Ntdll, as described by Table
8-13. Phase 2 of the process manager (PS) startup resolves some entry points of those DLLs, which are
stored in internal kernel variables. One of the exports, LdrSystemDllInitBlock, is used to transfer WoW64
information and function pointers to new WoW64 processes.
TABLE 8-13 Different Ntdll version list
Path
Internal Name
Description
ntdll.dll
The system Ntdll mapped in every user process (except for minimal
processes). This is the only version marked as required.
ntdll32.dll
32-bit x86 Ntdll mapped in WoW64 processes running in 64-bit x86
host systems.
ntdll32.dll
32-bit ARM Ntdll mapped in WoW64 processes running in 64-bit
ARM host systems.
ntdllwow.dll
32-bit x86 CHPE Ntdll mapped in WoW64 processes running in
64-bit ARM host systems.
When a process is initially created, the kernel determines whether it would run under WoW64 using
an algorithm that analyzes the main process executable PE image and checks whether the correct Ntdll
version is mapped in the system. In case the system has determined that the process is WoW64, when
the kernel initializes its address space, it maps both the native Ntdll and the correct WoW64 version.
106
CHAPTER 8
System mechanisms
As explained in Chapter 3 of Part 1, each nonminimal process has a PEB data structure that is accesand stores a pointer to it in a small data structure (EWoW64PROCESS) linked to the main EPROCESS
the LdrSystemDllInitBlock symbol, including pointers of Wow64 Ntdll exports.
When a thread is allocated for the process, the kernel goes through a similar process: along with
by a 32-bit TEB.
32-bit CPU context (X86_NT5_CONTEXT or ARM_CONTEXT data structures, depending on the target
architecture), and a pointer of the per-thread WoW64 CPU shared data, which can be used by the
contains an initial single thread.
WoW64 Process
WoW64 Thread
PCB
TOP
ID, Token, …
Ntdll Type
ID, Start Addr,…
Thread List Entry
•
•
•
•
EWoW64PROCESS
ETHREAD
32-bit PEB
EPROCESS
Thread List
WoW64Process
•
•
•
•
PEB
TCB
Kernel Stack
TEB
Kernel-mode
32-bit PEB
Native & 32-bit TEB
Image base
32-bit Image base
Flags
Flags
Native NT_TIB
User Stack
Ldr Database
32-bit Ldr DB
Flags, CSR Info,…
Os Information
•
•
•
•
Nt Global Flags
Os Information
•
•
•
•
Nt Global Flags
WowTebOffset
CpuFlags
32-bit NT_TIB
User Stack
CrossSection
Host/Guest
Machine
•
•
•
TLS Slot Array
Flags, CSR Info,…
User-mode
Native Stack
TOP
Guest Context
Per-thr. Data
Flags
32-bit Stack
WoW64 CPU
Area Info
Native PEB
WoW64INFO
BASE
TOP
WowTebOffset
•
•
•
TLS Slots Array
BASE
FIGURE 8-29
CHAPTER 8
System mechanisms
107
User-mode WoW64 core
Aside from the differences described in the previous section, the birth of the process and its initial
thread happen in the same way as for non-WoW64 processes, until the main thread starts its execution by invoking the loader initialization function, LdrpInitialize, in the native version of Ntdll. When the
the process initialization routine, LdrpInitializeProcess, which, along with a lot of different things (see
the “Early process initialization” section of Chapter 3 in Part 1 for further details), determines whether
the process is a WoW64 one, based on the presence of the 32-bit TEB (located after the native TEB and
linked to it). In case the check succeeded, the native Ntdll sets the internal UseWoW64 global variable
to 1, builds the path of the WoW64 core library, wow64.dll, and maps it above the 4 GB virtual address
gets the address of some WoW64 functions that deal with process/thread suspension and APC and
exception dispatching and stores them in some of its internal variables.
When the process initialization routine ends, the Windows loader transfers the execution to the
WoW64 Core via the exported Wow64LdrpInitialize
new thread starts through that entry point (instead of the classical RtlUserThreadStart). The WoW64
core obtains a pointer to the CPU WoW64 area stored by the kernel at the TLS slot 1. In case the thread
lowing steps:
1.
Tries to load the WoW64 Thunk Logging DLL (wow64log.dll). The Dll is used for logging
WoW64 calls and is not included in commercial Windows releases, so it is simply skipped.
2.
Looks up the Ntdll32 base address and function pointers thanks to the LdrSystemDllInitBlock
3.
tem requests and translates their path before invoking the native system calls.
4.
Initializes the WoW64 service tables, which contains pointers to system services belonging to
the NT kernel and Win32k GUI subsystem (similar to the standard kernel system services), but
also Console and NLS service call (both WoW64 system service calls and redirection are covered later in this chapter.)
5.
arch
arch> can be
exported functions are resolved and stored in an internal array called BtFuncs. The array is the
BtCpuProcessInit function, for example, represents
108
CHAPTER 8
System mechanisms
6.
section. A synthesized work item is posted on the section when a WoW64 process calls an
API targeting another 32-bit process (this operation propagates thunk operations across
different processes).
7.
The WoW64 layer informs the simulator (by invoking the exported BtCpuNotifyMapViewOfSection)
that the main module, and the 32-bit version of Ntdll have been mapped in the address space.
8.
Wow64Transition exported variable of the 32-bit version of Ntdll. This allows the system call
dispatcher to work.
When the process initialization routine ends, the thread is ready to start the CPU simulation. It
stack for executing the 32-bit version of the LdrInitializeThunk function. The simulation is started via the
BTCpuSimulate exported function, which will never return to the caller (unless a critical error
in the simulator happens).
File system redirection
To maintain application compatibility and to reduce the effort of porting applications from Win32 to
contains native 64-bit images. WoW64, as it intercepts all the system calls, translates all the path related APIs and replaces various system paths with the WoW64 equivalent (which depends on the target
TABLE 8-14 WoW64 redirected paths
Path
Architecture
Redirected Location
X86 on AMD64
X86 on ARM64
does not exist in SyChpe32)
ARM32
Native
X86
ARM32
Native
X86
ARM32
CHAPTER 8
System mechanisms
109
X86
ARM32
X86
ARM32
are exempted from being redirected such that access attempts to them made by 32-bit applications
actually access the real one. These directories include the following:
■
■
■
■
■
■
per-thread basis through the Wow64DisableWow64FsRedirection and Wow64RevertWow64FsRedirection
functions. This mechanism works by storing an enabled/disabled value on the TLS index 8, which is
consulted by the internal WoW64 RedirectPath function. However, the mechanism can have issues
because once redirection is disabled, the system no longer uses it during internal loading either, and
the other consistent paths introduced earlier is usually a safer methodology for developers to use.
Note Because certain 32-bit applications might indeed be aware and able to deal with
even from an application running under WoW64.
Registry redirection
component is installed and registered both as a 32-bit binary and a 64-bit binary, the last component
registered will override the registration of the previous component because they both write to the
same location in the registry.
110
CHAPTER 8
System mechanisms
To help solve this problem transparently without introducing any code changes to 32-bit components, the registry is split into two portions: Native and WoW64. By default, 32-bit components access
the 32-bit view, and 64-bit components access the 64-bit view. This provides a safe execution environment for 32-bit and 64-bit components and separates the 32-bit application state from the 64-bit one,
if it exists.
As discussed later in the “System calls” section, the WoW64 system call layer intercepts all the system
calls invoked by a 32-bit process. When WoW64 intercepts the registry system calls that open or create a
registry key, it translates the key path to point to the WoW64 view of the registry (unless the caller explicitly asks for the 64-bit view.) WoW64 can keep track of the redirected keys thanks to multiple tree data
where the system should begin the redirection). WoW64 redirects the registry at these points:
■
■
Not the entire hive is split. Subkeys belonging to those root keys can be stored in the private
WoW64 part of the registry (in this case, the subkey is a split key). Otherwise, the subkey can be kept
shared between 32-bit and 64-bit apps (in this case, the subkey is a shared key). Under each of the split
keys (in the position tracked by an anchor node), WoW64 creates a key called WoW6432Node (for x86
application) or WowAA32Node
information. All other portions of the registry are shared between 32-bit and 64-bit applications (for
rection and layout explained earlier. The 32-bit application must write exactly these strings using this
case—any other data will be ignored and written normally.
RegOpenKeyEx, RegCreateKeyEx, RegOpenKeyTransacted, RegCreateKeyTransacted, and
RegDeleteKeyEx functions permit this:
■
KEY_WoW64_64KEY Explicitly opens a 64-bit key from either a 32-bit or 64-bit application
■
KEY_WoW64_32KEY Explicitly opens a 32-bit key from either a 32-bit or 64-bit application
X86 simulation on AMD64 platforms
The interface of the x86 simulator for AMD64 platforms (Wow64cpu.dll) is pretty simple. The simulator
process initialization function enables the fast system call interface, depending on the presence of software MBEC (Mode Based Execute Control is discussed in Chapter 9). When the WoW64 core starts the
simulation by invoking the BtCpuSimulate
frame (based on the 32-bit CPU context provided by the WoW64 core), initializes the Turbo thunks
CHAPTER 8
System mechanisms
111
set to the 32-bit version of the LdrInitializeThunk loader function). When the CPU executes the far jump,
it detects that the call gate targets a 32-bit segment, thus it changes the CPU execution mode to 32-bit.
The code execution exits 32-bit mode only in case of an interrupt or a system call being dispatched.
More details about call gates are available in the Intel and AMD software development manuals.
Note
to be initialized.
System calls
DLLs that perform interprocess communication, such as Rpcrt4.dll). When a 32-bit application requires
assistance from the OS, it invokes functions located in the special 32-bit versions of the OS libraries.
Like their 64-bit counterparts, the OS routines can perform their job directly in user mode, or they can
require assistance from the NT kernel. In the latter case, they invoke system calls through stub functions like the one implemented in the regular 64-bit Ntdll. The stub places the system call index into a
register, but, instead of issuing the native 32-bit system call instruction, it invokes the WoW64 system
call dispatcher (through the Wow64Transition variable compiled by the WoW64 core).
It emits another far jump for transitioning to the native 64-bit execution mode, exiting from the simulacaptures the parameters associated with the system call and converts them. The conversion process is
called “thunking” and allows machine code executed following the 32-bit ABI to interoperate with 64-bit
values are passed in parameters of each function and accessed through the machine code.
complex data structures provided by the client (but deal with simple input and output values), the
Turbo thunks (small conversion routines implemented in the simulator) take care of the conversion and
directly invoke the native 64-bit API. Other complex APIs need the Wow64SystemServiceEx
assistance, which extracts the correct WoW64 system call table number from the system call index and
invokes the correct WoW64 system call function. WoW64 system calls are implemented in the WoW64
core library and in Wow64win.dll and have the same name as the native system calls but with the
whNtCreateFile WoW64 API is called whNtCreateFile.)
After the conversion has been correctly performed, the simulator issues the corresponding native 64-bit system call. When the native system call returns, WoW64 converts (or thunks) any output
parameters if necessary, from 64-bit to 32-bit formats, and restarts the simulation.
112
CHAPTER 8
System mechanisms
Exception dispatching
Similar to WoW64 system calls, exception dispatching forces the CPU simulation to exit. When an exception happens, the NT kernel determines whether it has been generated by a thread executing usermode code. If so, the NT kernel builds an extended exception frame on the active stack and dispatches
the exception by returning to the user-mode KiUserExceptionDispatcher function in the 64-bit Ntdll (for
more information about exceptions, refer to the “Exception dispatching” section earlier in this chapter).
Note that a 64-bit exception frame (which includes the captured CPU context) is allocated
in the 32-bit stack that was currently active when the exception was generated. Thus, it needs
to be converted before being dispatched to the CPU simulator. This is exactly the role of the
Wow64PrepareForException function (exported by the WoW64 core library), which allocates space on
the native 64-bit stack and copies the native exception frame from the 32-bit stack in it. It then switches
to the 64-bit stack and converts both the native exception and context records to their relative 32-bit
counterpart, storing the result on the 32-bit stack (replacing the 64-bit exception frame). At this point,
the WoW64 Core can restart the simulation from the 32-bit version of the KiUserExceptionDispatcher
function, which dispatches the exception in the same way the native 32-bit Ntdll would.
32-bit user-mode APC delivery follows a similar implementation. A regular user-mode APC is
KiUserApcDispatcher. When the 64-bit kernel is about to dispatch
a user-mode APC to a WoW64 process, it maps the 32-bit APC address to a higher range of 64-bit address space. The 64-bit Ntdll then invokes the Wow64ApcRoutine routine exported by the WoW64 core
library, which captures the native APC and context record in user mode and maps it back in the 32-bit
stack. It then prepares a 32-bit user-mode APC and context record and restarts the CPU simulation
from the 32-bit version of the KiUserApcDispatcher function, which dispatches the APC the same way
the native 32-bit Ntdll would.
ARM
ARM is a family of Reduced Instruction Set Computing (RISC) architectures originally designed by
result, there have been multiple releases and versions of the ARM architecture, which have quickly
evolved during the years, starting from very simple 32-bit CPUs, initially brought by the ARMv3 generation in the year 1993, up to the latest ARMv8. The, latest ARM64v8.2 CPUs natively support multiple
execution modes (or states), most commonly AArch32, Thumb-2, and AArch64:
■
■
■
AArch32 is the most classical execution mode, where the CPU executes 32-bit code only and
transfers data to and from the main memory through a 32-bit bus using 32-bit registers.
Thumb-2 is an execution state that is a subset of the AArch32 mode. The Thumb instruction set has
been designed for improving code density in low-power embedded systems. In this mode, the CPU
can execute a mix of 16-bit and 32-bit instructions, while still accessing 32-bit registers and memory.
AArch64 is the modern execution mode. The CPU in this execution state has access to 64-bit
general purpose registers and can transfer data to and from the main memory through a
64-bit bus.
CHAPTER 8
System mechanisms
113
Windows 10 for ARM64 systems can operate in the AArch64 or Thumb-2 execution mode (AArch32
is generally not used). Thumb-2 was especially used in old Windows RT systems. The current state of
discussed more in depth in Chapter 9 and in the ARM Architecture Reference Manual.
Memory models
In the “Hardware side-channel vulnerabilities” earlier in this chapter, we introduced the concept of
observed while accessed by multiple processors (MESI is one of the most famous cache coherency
protocols). Like the cache coherency protocol, modern CPUs also should provide a memory consistency (or ordering) model for solving another problem that can arise in multiprocessor environments:
memory reordering. Some architectures (ARM64 is an example) are indeed free to re-order memory
access instructions (achieving better performance while accessing the slower memory bus). This kind
of architecture follows a weak memory model, unlike the AMD64 architecture, which follows a strong
memory model, in which memory access instructions are generally executed in program order. Weak
lot of synchronization issues when developing multiprocessor software. In contrast, a strong model is
more intuitive and stable, but it has the big drawback of being slower.
CPUs that can do memory reordering (following the weak model) provide some machine instructions that act as memory barriers. A barrier prevents the processor from reordering memory accesses
before and after the barrier, helping multiprocessors synchronization issues. Memory barriers are slow;
thus, they are used only when strictly needed by critical multiprocessor code in Windows, especially in
synchronization primitives (like spinlocks, mutexes, pushlocks, and so on).
As we describe in the next section, the ARM64 jitter always makes use of memory barriers while
execute could be run by multiple threads in parallel at the same time (and thus have potential synchronization issues. X86 follows a strong memory model, so it does not have the reordering issue, a part of
generic out-of-order execution as explained in the previous section).
Note Other than the CPU, memory reordering can also affect the compiler, which, during
compilation time, can reorder (and possibly remove) memory references in the source
compiler reordering,
whereas the type described in the previous section is processor reordering.
114
CHAPTER 8
System mechanisms
ARM32 simulation on ARM64 platforms
The simulation of ARM32 applications under ARM64 is performed in a very similar way as for x86 under
AMD64. As discussed in the previous section, an ARM64v8 CPU is capable of dynamic switching between
the AArch64 and Thumb-2 execution state (so it can execute 32-bit instructions directly in hardware).
struction, so the WoW64 layer needs to invoke the NT kernel to request the execution mode switch. To do
this, the BtCpuSimulate function, exported by the ARM-on-ARM64 CPU simulator (Wowarmhw.dll), saves
the nonvolatile AArch64 registers in the 64-bit stack, restores the 32-bit context stored in WoW64 CPU
The NT kernel exception handler (which, on ARM64, is the same as the syscall handler), detects that
the exception has been raised due to a system call, thus it checks the syscall number. In case the number is the special –1, the NT kernel knows that the request is due to an execution mode change coming
from WoW64. In that case, it invokes the KiEnter32BitMode routine, which sets the new execution state
for the lower EL (exception level) to AArch32, dismisses the exception, and returns to user mode.
The code starts the execution in AArch32 state. Like the x86 simulator for AMD64 systems, the execution controls return to the simulator only in case an exception is raised or a system call is invoked. Both
exceptions and system calls are dispatched in an identical way as for the x86 simulator under AMD64.
X86 simulation on ARM64 platforms
The x86-on-ARM64 CPU simulator (Xtajit.dll) is different from other binary translators described in the
previous sections, mostly because it cannot directly execute x86 instructions using the hardware. The
ARM64 processor is simply not able to understand any x86 instruction. Thus, the x86-on-ARM simulator implements a full x86 emulator and a jitter, which can translate blocks of x86 opcodes in AArch64
code and execute the translated blocks directly.
When the simulator process initialization function (BtCpuProcessInit) is invoked for a new WoW64 pro-
compatibility database.) The simulator then allocates and compiles the Syscall page, which, as the name
implies, is used for emitting x86 syscalls (the page is then linked to Ntdll thanks to the Wow64Transition
variable). At this point, the simulator determines whether the process can use the XTA cache.
The simulator uses two different caches for storing precompiled code blocks: The internal cache is
allocated per-thread and contains code blocks generated by the simulator while compiling x86 code
executed by the thread (those code blocks are called jitted blocks); the external XTA cache is managed
by the XtaCache service and contains all the jitted blocks generated lazily for an x86 image by the
later in this chapter.) The process initialization routine allocates also the Compile Hybrid Executable
(CHPE) bitmap, which covers the entire 4-GB address space potentially used by a 32-bit process. The
bitmap uses a single bit to indicate that a page of memory contains CHPE code (CHPE is described later
in this chapter.)
CHAPTER 8
System mechanisms
115
The simulator thread initialization routine (BtCpuThreadInit) initializes the compiler and allocates
the per-thread CPU state on the native stack, an important data structure that contains the per-thread
compiler state, including the x86 thread context, the x86 code emitter state, the internal code cache,
Simulator’s image load notification
Unlike any other binary translator, the x86-on-ARM64 CPU simulator must be informed any time a new
image is mapped in the process address space, including for the CHPE Ntdll. This is achieved thanks to
the WoW64 core, which intercepts when the NtMapViewOfSection native API is called from the 32-bit
code and informs the Xtajit simulator through the exported BTCpuNotifyMapViewOfSection routine. It
data, such as
■
The CHPE bitmap (which needs to be updated by setting bits to 1 when the target image
contains CHPE code pages)
■
■
The XTA cache state for the image
In particular, whenever a new x86 or CHPE image is loaded, the simulator determines whether it
should use the XTA cache for the module (through registry and application compatibility shim.) In case
the check succeeded, the simulator updates the global per-process XTA cache state by requesting to
the XtaCache service the updated cache for the image. In case the XtaCache service is able to identify
used to speed up the execution of the image. (The section contains precompiled ARM64 code blocks.)
Compiled Hybrid Portable Executables (CHPE)
enough performance to maintain the application responsiveness. One of the major issues is tied to the
memory ordering differences between the two architectures. The x86 emulator does not know how
the original x86 code has been designed, so it is obliged to aggressively use memory barriers between
each memory access made by the x86 image. Executing memory barriers is a slow operation. On aver-
These are the motivations behind the design of Compiled Hybrid Portable Executables (CHPE). A
CHPE binary is a special hybrid executable that contains both x86 and ARM64-compatible code, which
has been generated with full awareness of the original source code (the compiler knew exactly where
to use memory barriers). The ARM64-compatible machine code is called hybrid (or CHPE) code: it is
still executed in AArch64 mode but is generated following the 32-bit ABI for a better interoperability
with x86 code.
CHPE binaries are created as standard x86 executables (the machine ID is still 014C as for x86); the
main difference is that they include hybrid code, described by a table in the Hybrid Image metadata
116
CHAPTER 8
System mechanisms
page containing hybrid code described by the Hybrid metadata. When the jitter compiles the x86 code
block and detects that the code is trying to invoke a hybrid function, it directly executes it (using the
32-bit stack), without wasting any time in any compilation.
The jitted x86 code is executed following a custom ABI, which means that there is a nonstandard
convention on how the ARM64 registers are used and how parameters are passed between functions.
CHPE code does not follow the same register conventions as jitted code (although hybrid code still
follows a 32-bit ABI). This means that directly invoking CHPE code from the jitted blocks built by the
compiler is not directly possible. To overcome this problem, CHPE binaries also include three different
kinds of thunk functions, which allow the interoperability of CHPE with x86 code:
■
■
■
A pop thunk allows x86 code to invoke a hybrid function by converting incoming (or outgoing) arguments from the guest (x86) caller to the CHPE convention and by directly transferring
execution to the hybrid code.
A push thunk allows CHPE code to invoke an x86 routine by converting incoming (or outgoing)
arguments from the hybrid code to the guest (x86) convention and by calling the emulator to
resume execution on the x86 code.
An export thunk is a compatibility thunk created for supporting applications that detour x86
exported from CHPE modules still contain a little amount of x86 code (usually 8 bytes), which
semantically does not provide any sort of functionality but allows detours to be inserted by the
external application.
The x86-on-ARM simulator makes the best effort to always load CHPE system binaries instead of standard x86 ones, but this is not always possible. In case a CHPE binary does not exist, the simulator will load
the standard x86 one from the SysWow64 folder. In this case, the OS module will be jitted entirely.
EXPERIMENT: Dumping the hybrid code address range table
of a CHPE image. More information about the tool and how to install it are available in Chapter 9.
In this experiment, you will dump the hybrid metadata of kernelbase.dll, a system library that
also has been compiled with CHPE support. You also can try the experiment with other CHPE
cd c:\Windows\SyChpe32
link /dump /loadconfig kernelbase.dll > kernelbase_loadconfig.txt
CHAPTER 8
System mechanisms
117
with Notepad and scroll down until you reach the following text:
Section contains the following hybrid metadata:
4
102D900C
102D9000
102D9004
102D9008
102D9010
102D9014
102D9018
102DE000
1011DAC8
4
Version
Address of WowA64 exception handler function pointer
Address of WowA64 dispatch call function pointer
Address of WowA64 dispatch indirect call function pointer
Address of WowA64 dispatch indirect call function pointer (with CFG check)
Address of WowA64 dispatch return function pointer
Address of WowA64 dispatch leaf return function pointer
Address of WowA64 dispatch jump function pointer
Address of WowA64 auxiliary import address table pointer
Hybrid code address range table
Hybrid code address range count
Hybrid Code Address Range Table
Address Range
---------------------x86
10001000 - 1000828F
arm64 1011E2E0 - 1029E09E
x86
102BA000 - 102BB865
arm64 102BC000 - 102C0097
(00001000
(0011E2E0
(002BA000
(002BC000
-
0000828F)
0029E09E)
002BB865)
002C0097)
range table: two sections contain x86 code (actually not used by the simulator), and two contain
CHPE code (the tool shows the term “arm64” erroneously.)
The XTA cache
As introduced in the previous sections, the x86-on-ARM64 simulator, other than its internal per-thread
cache, uses an external global cache called XTA cache, managed by the XtaCache protected service,
which implements the lazy jitter. The service is an automatic start service, which, when started, opens
service and members of the Administrators group have access to the folder). The service starts its own
locates the ALPC and lazy jit worker threads before exiting.
The ALPC worker thread is responsible in dispatching all the incoming requests to the ALPC server.
In particular, when the simulator (the client), running in the context of a WoW64 process, connects to
the XtaCache service, a new data structure tracking the x86 process is created and stored in an internal
(the memory backing the section is internally called Trace buffer). The section is used by the simulator
to send hints about the x86 code that has been jitted to execute the application and was not present in
any cache, together with the module ID to which they belong. The information stored in the section is
118
CHAPTER 8
System mechanisms
processed every 1 second by the XTA cache or in case the buffer becomes full. Based on the number of
valid entries in the list, the XtaCache can decide to directly start the lazy jitter.
When a new image is mapped into an x86 process, the WoW64 layer informs the simulator, which
generated based on the executable image path and its internal binary data. The hashes are important because they avoid the execution of jitted blocks compiled for an old stale version of the executable image.
module name module
header hash module path hash multi/uniproc
cache file version
The lazy jitter is the engine of the XtaCache. When the service decides to invoke it, a new version of
low-privileged environment (AppContainer process), which runs in low-priority mode. The only job of
the compiler is to compile the x86 code executed by the simulator. The new code blocks are added to the
EXPERIMENT: Witnessing the XTA cache
Newer versions of Process Monitor can run natively on ARM64 environments. You can use
In this experiment, you need an ARM64 system running at least Windows 10 May 2019 update
(1903). Initially, you need to be sure that the x86 application used for the experiment has never
before been executed by the system. In this example, we will install an old x86 version of MPC-HC
media player, which can be downloaded from https://sourceforge.net/projects/mpc-hc/files/latest/download. Any x86 application is well suited for this experiment though.
Install MPC-HC (or your preferred x86 application), but, before running it, open Process
CHAPTER 8
System mechanisms
119
Then launch MPC-HC and try to play some video. Exit MPC-HC and stop the event capturing in
this experiment, you are not interested in the registry).
compile the x86 image on its own and periodically sent information to the XtaCache. Later, the
lazy jitter would have been invoked by a worker thread in the XtaCache. The latter created a new
both itself and Xtac:
If you restart the experiment, you would see different events in Process Monitor: The cache
execute it directly. As a result, the execution time should be faster. You can also try to delete the
MPC-HC x86 application again.
command prompt window and insert the following commands:
takeown /f c:\windows\XtaCache
icacls c:\Windows\XtaCache /grant Administrators:F
120
CHAPTER 8
System mechanisms
Jitting and execution
To start the guest process, the x86-on-ARM64 CPU simulator has no other chances than interpreting
or jitting the x86 code. Interpreting the guest code means translating and executing one machine
instruction at time, which is a slow process, so the emulator supports only the jitting strategy: it
dynamically compiles x86 code to ARM64 and stores the result in a guest “code block” until certain
conditions happen:
■
An illegal opcode or a data or instruction breakpoint have been detected.
■
A branch instruction targeting an already-visited block has been encountered.
■
The block is bigger than a predetermined limit (512 bytes).
(indexed by its RVA) already exists. If the block exists in the cache, the simulator directly executes it
using a dispatcher routine, which builds the ARM64 context (containing the host registers values) and
stores it in the 64-bit stack, switches to the 32-bit stack, and prepares it for the guest x86 thread state.
pop thunk used for transferring the execution from a CHPE to an x86 context.
When the execution of the code block ends, the dispatcher does the opposite: It saves the new x86
context in the 32-bit stack, switches to the 64-bit stack, and restores the old ARM64 context containing
the state of the simulator. When the dispatcher exits, the simulator knows the exact x86 virtual address
where the execution was interrupted. It can then restart the emulation starting from that new memory
address. Similar to cached entries, the simulator checks whether the target address points to a memory
page containing CHPE code (it knows this information thanks to the global CHPE bitmap). If that is the
cache, and directly executes it.
executing native images. Otherwise, it needs to invoke the compiler for building the native translated
code block. The compilation process is split into three phases:
1.
The parsing stage builds instructions descriptors for each opcode that needs to be added in
the code block.
2.
The optimization
3.
code generation
The generated code block is then added to the per-thread local cache. Note that the simulator
cannot add it in the XTA cache, mainly for security and performance reasons. Otherwise, an attacker
would be allowed to pollute the cache of a higher-privileged process (as a result, the malicious code
the simulator does not have enough CPU time to generate highly optimized code (even though there is
CHAPTER 8
System mechanisms
121
However, information about the compiled x86 blocks, together with the ID of the binary hosting
the x86 code, are inserted into the list mapped by the shared Trace buffer. The lazy jitter of the XTA
cache knows that it needs to compile the x86 code jitted by the simulator thanks to the Trace buffer. As
than the others.
System calls and exception dispatching
Under the x86-on-ARM64 CPU simulator, when an x86 thread performs a system call, it invokes the
code located in the syscall page allocated by the simulator, which raises the exception 0x2E. Each x86
exception forces the code block to exit. The dispatcher, while exiting from the code block, dispatches
the exception through an internal function that ends up in invoking the standard WoW64 exception
handler or system call dispatcher (depending on the exception vector number.) Those have been already discussed in the previous X86 simulation on AMD64 platforms section of this chapter.
EXPERIMENT: Debugging WoW64 in ARM64 environments
Newer releases of WinDbg (the Windows Debugger) are able to debug machine code run under
any simulator. This means that in ARM64 systems, you will be able to debug native ARM64, ARM
Thumb-2, and x86 applications, whereas in AMD64 systems, you can debug only 32- and 64-bit
x86 programs. The debugger is also able to easily switch between the native 64-bit and 32-bit
stacks, which allows the user to debug both native (including the WoW64 layer and the emulator)
and guest code (furthermore, the debugger also supports CHPE.)
In this experiment, you will open an x86 application using an ARM64 machine and switch
installing one of the kits, open the ARM64 version of Windbg (available from the Start menu.)
generates, like Data Misaligned and in-page I/O errors (these exceptions are already handled
Data
Debug menu, click Event Filters
Misaligned event and check the Ignore option box from the Execution group. Repeat the same
for the In-page I/O
-
122
CHAPTER 8
System mechanisms
Click Close, and then from the main debugger interface, select Open Executable from the
File
folder. (In this example, we are using notepad.exe, but any x86 application works.) Also open
correctly (refer to the https://docs.microsoft.com/en-us/windows-hardware/drivers/debugger/
symbol-path
k command:
-
0:000> k
# Child-SP
RetAddr
Call Site
00 00000000`001eec70 00007ffb`bd47de00 ntdll!LdrpDoDebuggerBreak+0x2c
01 00000000`001eec90 00007ffb`bd47133c ntdll!LdrpInitializeProcess+0x1da8
02 00000000`001ef580 00007ffb`bd428180 ntdll!_LdrpInitialize+0x491ac
03 00000000`001ef660 00007ffb`bd428134 ntdll!LdrpInitialize+0x38
04 00000000`001ef680 00000000`00000000 ntdll!LdrInitializeThunk+0x14
The simulator is still not loaded at this time: The native and CHPE Ntdll have been mapped
into the target binary by the NT kernel, while the WoW64 core binaries have been loaded by the
native Ntdll just before the breakpoint via the LdrpLoadWow64 function. You can check that by
enumerating the currently loaded modules (via the lm command) and by moving to the next
frame in the stack via the .f+ command. In the disassembly window, you should see the invocation of the LdrpLoadWow64 routine:
00007ffb`bd47dde4 97fed31b bl
ntdll!LdrpLoadWow64 (00007ffb`bd432a50)
CHAPTER 8
System mechanisms
123
Now resume the execution with the g command (or F5 key). You should see multiple modules
being loaded in the process address space and another breakpoint raising, this time under the
x86 context. If you again display the stack via the k command, you can notice that a new column
0:000:x86> k
#
Arch ChildEBP
00
x86 00acf7b8
01
CHPE 00acf7c0
02
CHPE 00acf820
03
CHPE 00acfad0
04
CHPE 00acfb60
05
CHPE 00acfb80
RetAddr
77006fb8
77006fb8
76f44054
76f43e9c
76f43e34
76ffc3cc
ntdll_76ec0000!LdrpDoDebuggerBreak+0x2b
ntdll_76ec0000!#LdrpDoDebuggerBreak$push_thunk+0x48
ntdll_76ec0000!#LdrpInitializeProcess+0x20ec
ntdll_76ec0000!#_LdrpInitialize+0x1a4
ntdll_76ec0000!#LdrpInitialize+0x3c
ntdll_76ec0000!LdrInitializeThunk+0x14
If you compare the new stack to the old one, you will see that the stack addresses have drastically changed (because the process is now executing using the 32-bit stack). Note also that some
containing CHPE code. At this point, you can step into and over x86 code, as in regular x86
operating systems. The simulator takes care of the emulation and hides all the details. To observe
how the simulator is running, you should move to the 64-bit context through the .effmach
command. The command accepts different parameters: x86 for the 32-bit x86 context; arm64 or
amd64 for the native 64-bit context (depending on the target platform); arm for the 32-bit ARM
Thumb2 context; CHPE for the 32-bit CHPE context. Switching to the 64-bit stack in this case is
achieved via the arm64 parameter:
0:000:x86> .effmach arm64
Effective machine: ARM 64-bit (AArch64) (arm64)
0:000> k
# Child-SP
RetAddr
Call Site
00 00000000`00a8df30 00007ffb`bd3572a8 wow64!Wow64pNotifyDebugger+0x18f54
01 00000000`00a8df60 00007ffb`bd3724a4 wow64!Wow64pDispatchException+0x108
02 00000000`00a8e2e0 00000000`76e1e9dc wow64!Wow64RaiseException+0x84
03 00000000`00a8e400 00000000`76e0ebd8 xtajit!BTCpuSuspendLocalThread+0x24c
04 00000000`00a8e4c0 00000000`76de04c8 xtajit!BTCpuResetFloatingPoint+0x4828
05 00000000`00a8e530 00000000`76dd4bf8 xtajit!BTCpuUseChpeFile+0x9088
06 00000000`00a8e640 00007ffb`bd3552c4 xtajit!BTCpuSimulate+0x98
07 00000000`00a8e6b0 00007ffb`bd353788 wow64!RunCpuSimulation+0x14
08 00000000`00a8e6c0 00007ffb`bd47de38 wow64!Wow64LdrpInitialize+0x138
09 00000000`00a8e980 00007ffb`bd47133c ntdll!LdrpInitializeProcess+0x1de0
0a 00000000`00a8f270 00007ffb`bd428180 ntdll!_LdrpInitialize+0x491ac
0b 00000000`00a8f350 00007ffb`bd428134 ntdll!LdrpInitialize+0x38
0c 00000000`00a8f370 00000000`00000000 ntdll!LdrInitializeThunk+0x14
thunk has been invoked to restart the simulation to the LdrpDoDebuggerBreak x86 function,
which caused an exception (managed through the native Wow64RaiseException
debugger via the Wow64pNotifyDebugger routine. With Windbg and the .effmach command,
you can effectively debug multiple contexts: native, CHPE, and x86 code. Using the g @$exentry command, you can move to the x86 entry point of Notepad and continue the debug session
of x86 code or the emulator itself. You can restart this experiment also in different environments,
debugging an app located in SysArm32, for example.
124
CHAPTER 8
System mechanisms
Object Manager
As mentioned in Chapter 2 of Part 1, “System architecture,” Windows implements an object model to
provide consistent and secure access to the various internal services implemented in the executive. This
section describes the Windows Object Manager, the executive component responsible for creating,
deleting, protecting, and tracking objects. The Object Manager centralizes resource control operations
that otherwise would be scattered throughout the operating system. It was designed to meet the goals
listed after the experiment.
EXPERIMENT: Exploring the Object Manager
Manager database. These experiments use the following tools, which you should become famil-
■
information about objects (such as the reference count, the number of open handles, security descriptors, and so forth). WinObjEx64, available on GitHub, is a similar tool with more
advanced functionality and is open source but not endorsed or signed by Microsoft.
■
■
Process Explorer and Handle from Sysinternals, as well as Resource Monitor (introduced in
Chapter 1 of Part 1) display the open handles for a process. Process Hacker is another tool
that shows open handles and can show additional details for certain kinds of objects.
The kernel debugger !handle extension displays the open handles for a process, as does the
Io.Handles data model object underneath a Process such as @$curprocess.
WinObj and WinObjEx64 provide a way to traverse the namespace that the Object Manager
CHAPTER 8
System mechanisms
125
The Windows Openfiles/query
maintain objects list be enabled. (See the
Openfiles/Local
Openfiles/
Local ON command, but you still need to reboot the system for the setting to take effect. Process
Explorer, Handle, and Resource Monitor do not require object tracking to be turned on because
they query all system handles and create a per-process object list. Process Hacker queries per-pro-
The Object Manager was designed to meet the following goals:
■
■
■
■
■
Provide a common, uniform mechanism for using system resources.
Isolate object protection to one location in the operating system to ensure uniform and consistent object access policy.
Provide a mechanism to charge processes for their use of objects so that limits can be placed on
the usage of system resources.
Establish an object-naming scheme that can readily incorporate existing objects, such as the
Support the requirements of various operating system environments, such as the ability of a
process to inherit resources from a parent process (needed by Windows and Subsystem for
for UNIX Applications). Although Subsystem for UNIX Applications no longer exists, these facilities were also useful for the later development of the Windows Subsystem for Linux.
■
Establish uniform rules for object retention (that is, for keeping an object available until all pro-
■
objects in the namespace.
■
Allow redirection of object names and paths through symbolic links and allow object owners,
junction points). Combined, these redirection mechanisms compose what is called reparsing.
Internally, Windows has three primary types of objects: executive objects, kernel objects, and GDI/
User objects. Executive objects are objects implemented by various components of the executive
primitive set of objects implemented by the Windows kernel. These objects are not visible to usercapabilities, such as synchronization, on which executive objects are built. Thus, many executive objects
126
CHAPTER 8
System mechanisms
Note The vast majority of GDI/User objects, on the other hand, belong to the Windows
outside the scope of this book, but you can get more information on them from the
are wrapped in executive objects, as well as the majority of DirectX objects (Shaders,
Surfaces, Compositions), which are also wrapped as executive objects.
Owned by the
object manager
Name
HandleCount
ReferenceCount
Type
Owned by the
kernel
Kernel object
Owned by the
executive
Executive object
FIGURE 8-30 Executive objects that contain kernel objects.
Details about the structure of kernel objects and how they are used to implement synchronization
are given later in this chapter. The remainder of this section focuses on how the Object Manager works
objects are involved in implementing Windows security access checking; Chapter 7 of Part 1 thoroughly
covers that topic.
Executive objects
Each Windows environment subsystem projects to its applications a different image of the operating
system. The executive objects and object services are primitives that the environment subsystems use
to construct their own versions of objects and other resources.
Executive objects are typically created either by an environment subsystem on behalf of a user
CreateFileW function, implemented
CreateFileW in
turn calls the native Windows service NtCreateFile
CHAPTER 8
System mechanisms
127
The set of objects an environment subsystem supplies to its applications might be larger or smaller
than the set the executive provides. The Windows subsystem uses executive objects to export its own
mutexes and semaphores are directly based on executive objects (which, in turn, are based on corresponding kernel objects). In addition, the Windows subsystem supplies named pipes and mailslots,
(WSL), its subsystem driver (Lxcore.sys) uses executive objects and services as the basis for presenting
Linux-style processes, pipes, and other resources to its applications.
components (or in the case of executive objects directly exported to Windows, in the Windows API reference documentation). You can see the full list of object types by running Winobj with elevated rights
and navigating to the ObjectTypes directory.
Note The executive implements a total of about 69 object types (depending on the
Windows version). Some of these objects are for use only by the executive component that
include Driver, Callback, and Adapter.
TABLE 8-15 Executive objects exposed to the Windows API
Object Type
Represents
Process
The virtual address space and control information necessary for the execution of
a set of thread objects.
Thread
An executable entity within a process.
A collection of processes manageable as a single entity through the job.
Section
Token
An object with a persistent state (signaled or not signaled) that can be used for
key to be used to reference the underlying synchronization primitive, avoiding memory usage, making
it usable in low-memory conditions by avoiding an allocation.
Semaphore
A counter that provides a resource gate by allowing some maximum number of
threads to access the resources protected by the semaphore.
Mutex
A synchronization mechanism used to serialize access to a resource.
Timer, IRTimer
objects, called Idle Resilient Timers, are used by UWP applications and certain
services to create timers that are not affected by Connected Standby.
IoCompletion, IoCompletionReserve
128
CHAPTER 8
I/O operations (known as an I/O completion port in the Windows API). The latter
allows preallocation of the port to combat low-memory situations.
System mechanisms
A mechanism to refer to data in the registry. Although keys appear in the Object
values are associated with a key object; key values contain data about the key.
Directory
SymbolicLink
-
ing other objects or object directories.
A virtual name redirection link between an object in the namespace and another
manage the number of work items that will be performed on the queue, how
many threads should be responsible for the work, and dynamic creation and termination of worker threads, respecting certain limits the caller can set. Windows
exposes the worker factory object through thread pools.
TmRm (Resource Manager), TmTx
(Transaction), TmTm (Transaction
Manager), TmEn (Enlistment)
transactions
and/or enlistments as part of a resource manager or transaction manager. Objects
can be created through the CreateTransactionManager, CreateResourceManager,
CreateTransaction, and CreateEnlistment APIs.
RegistryTransaction
Object used by the low-level lightweight registry transaction API that does not
registry keys.
WindowStation
An object that contains a clipboard, a set of global atoms, and a group of
Desktop objects.
Desktop
An object contained within a window station. A desktop has a logical display
surface and contains windows, menus, and hooks.
PowerRequest
An object associated with a thread that executes, among other things, a call
to SetThreadExecutionState to request a given power change, such as blocking
sleeps (due to a movie being played, for example).
EtwConsumer
Represents a connected ETW real-time consumer that has registered with the
StartTrace API (and can call ProcessTrace to receive the events on the object queue).
CoverageSampler
Created by ETW when enabling code coverage tracing on a given ETW session.
EtwRegistration
Represents the registration object associated with a user-mode (or kernel-mode)
ETW provider that registered with the EventRegister API.
ActivationObject
Represents the object that tracks foreground state for window handles that are
managed by the Raw Input Manager in Win32k.sys.
ActivityReference
Tracks processes managed by the Process Lifetime Manager (PLM) and that
should be kept awake during Connected Standby scenarios.
ALPC Port
Used mainly by the Remote Procedure Call (RPC) library to provide Local RPC
(LRPC) capabilities when using the ncalrpc transport. Also available to internal
services as a generic IPC mechanism between processes and/or the kernel.
Composition,
DxgkCompositionObject,
DxgkCurrentDxgProcessObject,
DxgkDisplayManagerObject,
DxgkSharedBundleObject,
Used by DirectX 12 APIs in user-space as part of advanced shader and GPGPU
capabilities, these executive objects wrap the underlying DirectX handle(s).
DxgkShartedProtectedSessionObject,
DgxkSharedResource,
DxgkSwapChainObject,
DxgkSharedSyncObject
CHAPTER 8
System mechanisms
129
CoreMessaging
Represents a CoreMessaging IPC object that wraps an ALPC port with its own
customized namespace and capabilities; used primarily by the modern Input
Manager but also exposed to any MinUser component on WCOS systems.
EnergyTracker
Exposed to the User Mode Power (UMPO) service to allow tracking and aggregation of energy usage across a variety of hardware and associating it on a perapplication basis.
Manager API, which allows communication between user-mode services and
when using FilterSendMessage.
Partition
Enables the memory manager, cache manager, and executive to treat a region
of physical memory as unique from a management perspective vis-à-vis the rest
of system RAM, giving it its own instance of management threads, capabilities,
paging, caching, etc. Used by Game Mode and Hyper-V, among others, to better
distinguish the system from the underlying workloads.
that track anything from the Instruction Pointer (IP) all the way to low-level processor caching information stored in the PMU counters.
RawInputManager
Represents the object that is bound to an HID device such as a mouse, keyboard,
or tablet and allows reading and managing the window manager input that is
being received by it. Used by modern UI management code such as when Core
Messaging is involved.
Session
off/logon for third-party driver usage.
Terminal
Only enabled if the terminal thermal manager (TTM) is enabled, this represents
a user terminal on a device, which is managed by the user mode power manager
(UMPO).
TerminalEventQueue
Only enabled on TTM systems, like the preceding object type, this represents
events being delivered to a terminal on a device, which UMPO communicates
UserApcReserve
Similar to IoCompletionReserve in that it allows precreating a data structure
to be reused during low-memory conditions, this object encapsulates an APC
WaitCompletionPacket
Used by the new asynchronous wait capabilities that were introduced in the usermode Thread Pool API, this object wraps the completion of a dispatcher wait as
an I/O packet that can be delivered to an I/O completion port.
WmiGuid
Used by the Windows Management Instrumentation (WMI) APIs when opening
WMI Data Blocks by GUID, either from user mode or kernel mode, such as with
IoWMIOpenBlock.
Note Because Windows NT was originally supposed to support the OS/2 operating system,
the mutex had to be compatible with the existing design of OS/2 mutual-exclusion objects,
a design that required that a thread be able to abandon the object, leaving it inaccessible.
Because this behavior was considered unusual for such an object, another kernel object—the
mutant—was created. Eventually, OS/2 support was dropped, and the object became used by
the Windows 32 subsystem under the name mutex (but it is still called mutant internally).
130
-
CHAPTER 8
System mechanisms
Object structure
footer. The Object Manager controls the object headers and footer, whereas the owning executive
components control the object bodies of the object types they create. Each object header also contains
an index to a special object, called the type object, that contains information common to each instance
of the object. Additionally, up to eight optional subheaders exist: The name information header, the
quota information header, the process information header, the handle information header, the audit
information header, the padding information header, the extended information header, and the creator information header. If the extended information header is present, this means that the object has
a footer, and the header will contain a pointer to it.
Object name
Object directory
Object
header
Object
body
Object
footer
Object name
Object directory
Security descriptor
Quota charges
Open handle count
Open handles list
Object type
Reference count
Object-specific data
Additional
Data
Security descriptor
Quota charges
Open handles list
Object Type Table
034DEF0
2A1DDAF
6D3AED4
0A3C44A1
3DF12AB4
Process
1 Process
2 Process
3
Type object
Type name
Pool type
Default quota charges
Access types
Generic access rights mapping
Synchronizable? (Y/N)
Methods:
Open, close, delete
parse, security
query name
FIGURE 8-31 Structure of an object.
Object headers and bodies
found in the optional object subheaders.
In addition to the object header, which contains information that applies to any kind of object, the
structures are located at a variable offset from the start of the object header, the value of which
depends on the number of subheaders associated with the main object header (except, as mentioned
CHAPTER 8
System mechanisms
131
InfoMask
corresponding bit is set in the InfoMask and then uses the remaining bits to select the correct offset
into the global ObpInfoMaskToOffset
the object header.
TABLE 8-16
Field
Purpose
Handle count
Maintains a count of the number of currently opened handles to the object.
Pointer count
Maintains a count of the number of references to the object (including one reference for each
handle), and the number of usage references for each handle (up to 32 for 32-bit systems, and
by pointer without
using a handle.
Security descriptor
Determines who can use the object and what they can do with it. Note that unnamed objects, by
Object type index
Contains the index to a type object that contains attributes common to objects of this type. The
table that stores all the type objects is ObTypeIndexTable. Due to a security mitigation, this index is
ObHeaderCookie and the bottom 8
bits of the address of the object header itself.
Info mask
Bitmask describing which of the optional subheader structures described in Table 8-17 are present,
except for the creator information subheader, which, if present, always precedes the object. The
bitmask is converted to a negative offset by using the ObpInfoMaskToOffset table, with each subheader being associated with a 1-byte index that places it relative to the other subheaders present.
Lock
Object Create Info
Ephemeral information about the creation of the object that is stored until the object is fully in-
These offsets exist for all possible combinations of subheader presence, but because the subhead-
hand, the handle information subheader (which is allocated third) has three possible locations because
it might or might not have been allocated after the quota subheader, itself having possibly been allocated after the name information. Table 8-17 describes all the optional object subheaders and their
132
CHAPTER 8
System mechanisms
TABLE 8-17 Optional object subheaders
Name
Purpose
Bit
Offset
Creator
information
Links the object into a list for all the objects of the
same type and records the process that created the
object, along with a back trace.
0 (0x1)
ObpInfoMaskToOffset[0])
Name
information
Contains the object name, responsible for making
an object visible to other processes for sharing,
and a pointer to the object directory, which provides the hierarchical structure in which the object
names are stored.
1 (0x2)
ObpInfoMaskToOffset[InfoMask & 0x3]
Handle
information
Contains a database of entries (or just a single
entry) for a process that has an open handle to the
object (along with a per-process handle count).
2 (0x4)
ObpInfoMaskToOffset[InfoMask & 0x7]
Quota
information
Lists the resource charges levied against a process
when it opens a handle to the object.
3 (0x8)
ObpInfoMaskToOffset
Process
information
Contains a pointer to the owning process if this is
an exclusive object. More information on exclusive
objects follows later in the chapter.
4 (0x10)
ObpInfoMaskToOffset
Audit
information
Contains a pointer to the original security descrip-
5 (0x20)
ObpInfoMaskToOffset
6 (0x40)
ObpInfoMaskToOffset
7 (0x80)
ObpInfoMaskToOffset
enabled to guarantee consistency.
Extended
information
Stores the pointer to the object footer for objects
Padding
information
Stores nothing—empty junk space—but is used to
align the object body on a cache boundary, if this
was requested.
Objects.
Each of these subheaders is optional and is present only under certain conditions, either during
system boot or at object creation time. Table 8-18 describes each of these conditions.
TABLE 8-18 Conditions required for presence of object subheaders
Name
Condition
Creator information
The object type must have enabled the maintain type list
maintain object type list
cussed earlier) enables this for all objects, and Type
Name information
The object must have been created with a name.
Handle information
The object type must have enabled the maintain handle count
Quota information
The object must not have been created by the initial (or idle) system process.
Process information
The object must have been created with the exclusive object
-
-
Audit Information
Extended information
Padding Information
The object type must have enabled the cache aligned
CHAPTER 8
System mechanisms
133
As indicated, if the extended information header is present, an object footer is allocated at the tail of
the object body. Unlike object subheaders, the footer is a statically sized structure that is preallocated
for all possible footer types. There are two such footers, described in Table 8-19.
TABLE 8-19 Conditions required for presence of object footer
Name
Condition
Handle Revocation
Information
The object must be created with ObCreateObjectEx, passing in AllowHandleRevocation in the
OB_EXTENDED_CREATION_INFO
Extended User
Information
The object must be created with ObCreateObjectEx, passing in AllowExtendedUserInfo in the
OB_EXTENDED_CREATION_INFO structure. Silo Context objects are created this way.
object is being created, in a structure called the object attributes
name, the root object directory where it should be inserted, the security descriptor for the object, and
the object attribute flags
Note When an object is being created through an API in the Windows subsystem (such
as CreateEvent or CreateFile), the caller does not specify any object attributes—the
created through Win32 go in the BaseNamedObjects directory, either the global or perpart of the object attributes structure. More information on BaseNamedObjects and how
it relates to the per-session namespace follows later in this chapter.
TABLE 8-20
Attributes Flag
Header Flag Bit
Purpose
OBJ_INHERIT
Saved in the handle table entry
Determines whether the handle to the object will be
inherited by child processes and whether a process
can use DuplicateHandle to make a copy.
OBJ_PERMANENT
PermanentObject
OBJ_EXCLUSIVE
ExclusiveObject
OBJ_CASE_INSENSITIVE
Not stored, used at run time
OBJ_OPENIF
Not stored, used at run time
OBJ_OPENLINK
Not stored, used at run time
OBJ_KERNEL_HANDLE
134
CHAPTER 8
System mechanisms
ence counts, described later.
-
process that created it.
namespace should be case insensitive. It can be overridden by the case insensitive
name should result in an open, if the object exists,
instead of a failure.
handle to the symbolic link, not the target.
kernel handle (more on this later).
Attributes Flag
Header Flag Bit
OBJ_FORCE_ACCESS_CHECK
Not stored, used at run time
OBJ_KERNEL_EXCLUSIVE
OBJ_IGNORE_IMPERSONATED_
DEVICEMAP
Purpose
from kernel mode, full access checks should be
performed.
Disables any user-mode process from opening a
handle to the object; used to protect the \Device\
PhysicalMemory and \Win32kSessionGlobals section objects.
Not stored, used at run time
Indicates that when a token is being impersonated,
the DOS Device Map of the source user should not
DOS Device Map should be maintained for object
lookup. This is a security mitigation for certain types
OBJ_DONT_REPARSE
Not stored, used at run time
N/A
DefaultSecurityQuota
N/A
SingleHandleEntry
N/A
NewObject
N/A
DeletedInline
Disables any kind of reparsing situation (symbolic
tion), and returns STATUS_REPARSE_POINT_
ENCOUNTERED if any such situation occurs. This is a
security mitigation for certain types of path redirection attacks.
-
contains only a single entry and not a database.
yet inserted into the object namespace.
not being deleted through the deferred deletion worker
thread but rather inline through a call to
ObDereferenceObject(Ex).
In addition to an object header, each object has an object body whose format and contents are
unique to its object type; all objects of the same type share the same object body format. By creating
an object type and supplying services for it, an executive component can control the manipulation of
data in all object bodies of that type. Because the object header has a static and well-known size, the
Object Manager can easily look up the object header for an object simply by subtracting the size of
the header from the pointer of the object. As explained earlier, to access the subheaders, the Object
Because of the standardized object header, footer, and subheader structures, the Object Manager
is able to provide a small set of generic services that can operate on the attributes stored in any object
certain objects). These generic services, some of which the Windows subsystem makes available to
Windows applications, are listed in Table 8-21.
Although all of these services are not generally implemented by most object types, they typically
service for its process objects.
CHAPTER 8
System mechanisms
135
However, some objects may not directly expose such services and could be internally created as
WmiGuid object is created, but no handle is exposed to the application for any kind of close or query
services. The key thing to understand, however, is that there is no single generic creation routine.
Such a routine would have been quite complicated because the set of parameters required to initialthe Object Manager would have incurred additional processing overhead each time a thread called an
object service to determine the type of object the handle referred to and to call the appropriate version of the service.
TABLE 8-21 Generic object services
Service
Purpose
Close
Closes a handle to an object, if allowed (more on this later).
Duplicate
Shares an object by duplicating a handle and giving it to another process (if
allowed, as described later).
Inheritance
If a handle is marked as inheritable, and a child process is spawned with handle
inheritance enabled, this behaves like duplication for those handles.
Make permanent/temporary
Changes the retention of an object (described later).
Query object
aged at the Object Manager level.
-
Query security
Set security
Changes the protection on an object.
Wait for a single object
execution or be associated with an I/O completion port through a wait completion packet.
Signal an object and wait for another
Signals the object, performing wake semantics on the dispatcher object backing
it, and then waits on a single object as per above. The wake/wait operation is
Wait for multiple objects
Associates a wait block with one or more objects, up to a limit (64), which can
port through a wait completion packet.
Type objects
Object headers contain data that is common to all objects but that can take on different values for
descriptor. However, objects also contain some data that remains constant for all objects of a particular
a handle to objects of that type. The executive supplies terminate and suspend access (among others)
when creating a new object type. It uses an object of its own, a type object, to record this data. As
136
CHAPTER 8
System mechanisms
section later in this chapter) is set, a type object also links together all objects of the same type (in this
functionality takes advantage of the creator information subheader discussed previously.
Process
type
object
Process
Object 1
Process
Object 2
Process
Object 3
Process
Object 4
FIGURE 8-32 Process objects and the process type object.
EXPERIMENT: Viewing object headers and type objects
a process object with the dx @$cursession.Processes debugger data model command:
lkd> dx -r0 &@$cursession.Processes[4].KernelObject
&@$cursession.Processes[4].KernelObject
: 0xffff898f0327d300 [Type: _EPROCESS *]
Then execute the !object command with the process object address as the argument:
lkd> !object 0xffff898f0327d300
Object: ffff898f0327d300 Type: (ffff898f032954e0) Process
ObjectHeader: ffff898f0327d2d0 (new version)
HandleCount: 6 PointerCount: 215645
Notice that on 32-bit Windows, the object header starts 0x18 (24 decimal) bytes prior to the
start of the object body, and on 64-bit Windows, it starts 0x30 (48 decimal) bytes prior—the size
of the object header itself. You can view the object header with this command:
lkd> dx (nt!_OBJECT_HEADER*)0xffff898f0327d2d0
(nt!_OBJECT_HEADER*)0xffff898f0327d2d0
: 0xffff898f0327d2d0 [Type: _OBJECT_HEADER *]
[+0x000] PointerCount
: 214943 [Type: __int64]
[+0x008] HandleCount
: 6 [Type: __int64]
[+0x008] NextToFree
: 0x6 [Type: void *]
[+0x010] Lock
[Type: _EX_PUSH_LOCK]
[+0x018] TypeIndex
: 0x93 [Type: unsigned char]
[+0x019] TraceFlags
: 0x0 [Type: unsigned char]
[+0x019 ( 0: 0)] DbgRefTrace
: 0x0 [Type: unsigned char]
CHAPTER 8
System mechanisms
137
[+0x019 ( 1: 1)] DbgTracePermanent : 0x0 [Type: unsigned char]
[+0x01a] InfoMask
: 0x80 [Type: unsigned char]
[+0x01b] Flags
: 0x2 [Type: unsigned char]
[+0x01b ( 0: 0)] NewObject
: 0x0 [Type: unsigned char]
[+0x01b ( 1: 1)] KernelObject
: 0x1 [Type: unsigned char]
[+0x01b ( 2: 2)] KernelOnlyAccess : 0x0 [Type: unsigned char]
[+0x01b ( 3: 3)] ExclusiveObject : 0x0 [Type: unsigned char]
[+0x01b ( 4: 4)] PermanentObject : 0x0 [Type: unsigned char]
[+0x01b ( 5: 5)] DefaultSecurityQuota : 0x0 [Type: unsigned char]
[+0x01b ( 6: 6)] SingleHandleEntry : 0x0 [Type: unsigned char]
[+0x01b ( 7: 7)] DeletedInline
: 0x0 [Type: unsigned char]
[+0x01c] Reserved
: 0xffff898f [Type: unsigned long]
[+0x020] ObjectCreateInfo : 0xfffff8047ee6d500 [Type: _OBJECT_CREATE_INFORMATION *]
[+0x020] QuotaBlockCharged : 0xfffff8047ee6d500 [Type: void *]
[+0x028] SecurityDescriptor : 0xffffc704ade03b6a [Type: void *]
[+0x030] Body
[Type: _QUAD]
ObjectType
: Process
UnderlyingObject [Type: _EPROCESS]
Now look at the object type data structure by copying the pointer that !object showed
you earlier:
lkd> dx (nt!_OBJECT_TYPE*)0xffff898f032954e0
(nt!_OBJECT_TYPE*)0xffff898f032954e0
: 0xffff898f032954e0 [Type: _OBJECT_TYPE *]
[+0x000] TypeList
[Type: _LIST_ENTRY]
[+0x010] Name
: "Process" [Type: _UNICODE_STRING]
[+0x020] DefaultObject
: 0x0 [Type: void *]
[+0x028] Index
: 0x7 [Type: unsigned char]
[+0x02c] TotalNumberOfObjects : 0x2e9 [Type: unsigned long]
[+0x030] TotalNumberOfHandles : 0x15a1 [Type: unsigned long]
[+0x034] HighWaterNumberOfObjects : 0x2f9 [Type: unsigned long]
[+0x038] HighWaterNumberOfHandles : 0x170d [Type: unsigned long]
[+0x040] TypeInfo
[Type: _OBJECT_TYPE_INITIALIZER]
[+0x0b8] TypeLock
[Type: _EX_PUSH_LOCK]
[+0x0c0] Key
: 0x636f7250 [Type: unsigned long]
[+0x0c8] CallbackList
[Type: _LIST_ENTRY]
The output shows that the object type structure includes the name of the object type, tracks
the total number of active objects of that type, and tracks the peak number of handles and
objects of that type. The CallbackList
that are associated with this object type. The TypeInfo
lkd> dx ((nt!_OBJECT_TYPE*)0xffff898f032954e0)->TypeInfo
((nt!_OBJECT_TYPE*)0xffff898f032954e0)->TypeInfo
[Type: _OBJECT_TYPE_INITIALIZER]
[+0x000] Length
: 0x78 [Type: unsigned short]
[+0x002] ObjectTypeFlags : 0xca [Type: unsigned short]
[+0x002 ( 0: 0)] CaseInsensitive : 0x0 [Type: unsigned char]
[+0x002 ( 1: 1)] UnnamedObjectsOnly : 0x1 [Type: unsigned char]
[+0x002 ( 2: 2)] UseDefaultObject : 0x0 [Type: unsigned char]
[+0x002 ( 3: 3)] SecurityRequired : 0x1 [Type: unsigned char]
[+0x002 ( 4: 4)] MaintainHandleCount : 0x0 [Type: unsigned char]
[+0x002 ( 5: 5)] MaintainTypeList : 0x0 [Type: unsigned char]
138
CHAPTER 8
System mechanisms
[+0x002 ( 6: 6)] SupportsObjectCallbacks : 0x1 [Type: unsigned char]
[+0x002 ( 7: 7)] CacheAligned
: 0x1 [Type: unsigned char]
[+0x003 ( 0: 0)] UseExtendedParameters : 0x0 [Type: unsigned char]
[+0x003 ( 7: 1)] Reserved
: 0x0 [Type: unsigned char]
[+0x004] ObjectTypeCode
: 0x20 [Type: unsigned long]
[+0x008] InvalidAttributes : 0xb0 [Type: unsigned long]
[+0x00c] GenericMapping
[Type: _GENERIC_MAPPING]
[+0x01c] ValidAccessMask : 0x1fffff [Type: unsigned long]
[+0x020] RetainAccess
: 0x101000 [Type: unsigned long]
[+0x024] PoolType
: NonPagedPoolNx (512) [Type: _POOL_TYPE]
[+0x028] DefaultPagedPoolCharge : 0x1000 [Type: unsigned long]
[+0x02c] DefaultNonPagedPoolCharge : 0x8d8 [Type: unsigned long]
[+0x030] DumpProcedure
: 0x0 [Type: void (__cdecl*)(void *,_OBJECT_DUMP_CONTROL *)]
[+0x038] OpenProcedure
: 0xfffff8047f062f40 [Type: long (__cdecl*)
(_OB_OPEN_REASON,char,_EPROCESS *,void *,unsigned long *,unsigned long)]
[+0x040] CloseProcedure
: 0xfffff8047F087a90 [Type: void (__cdecl*)
(_EPROCESS *,void *,unsigned __int64,unsigned __int64)]
[+0x048] DeleteProcedure : 0xfffff8047f02f030 [Type: void (__cdecl*)(void *)]
[+0x050] ParseProcedure
: 0x0 [Type: long (__cdecl*)(void *,void *,_ACCESS_STATE *,
char,unsigned long,_UNICODE_STRING *,_UNICODE_STRING *,void *,
_SECURITY_QUALITY_OF_SERVICE *,void * *)]
[+0x050] ParseProcedureEx : 0x0 [Type: long (__cdecl*)(void *,void *,_ACCESS_STATE *,
char,unsigned long,_UNICODE_STRING *,_UNICODE_STRING *,void *,
_SECURITY_QUALITY_OF_SERVICE *,_OB_EXTENDED_PARSE_PARAMETERS *,void * *)]
[+0x058] SecurityProcedure : 0xfffff8047eff57b0 [Type: long (__cdecl*)
(void *,_SECURITY_OPERATION_CODE,unsigned long *,void *,unsigned long *,
void * *,_POOL_TYPE,_GENERIC_MAPPING *,char)]
[+0x060] QueryNameProcedure : 0x0 [Type: long (__cdecl*)(void *,unsigned char,_
OBJECT_NAME_INFORMATION *,unsigned long,unsigned long *,char)]
[+0x068] OkayToCloseProcedure : 0x0 [Type: unsigned char (__cdecl*)(_EPROCESS *,
void *,void *,char)]
[+0x070] WaitObjectFlagMask : 0x0 [Type: unsigned long]
[+0x074] WaitObjectFlagOffset : 0x0 [Type: unsigned short]
[+0x076] WaitObjectPointerOffset : 0x0 [Type: unsigned short]
through Windows API routines. The information stored in the type initializers is described in Table 8-22.
TABLE 8-22
Attribute
Purpose
Type name
The name for objects of this type (Process, Event, ALPC Port, and so on).
Pool type
Indicates whether objects of this type should be allocated from paged or nonpaged memory.
Default quota charges
Default paged and non-paged pool values to charge to process quotas.
Valid access mask
The types of access a thread can request when opening a handle to an object of this
type (read, write, terminate, suspend, and so on).
Generic access rights mapping
A mapping between the four generic access rights (read, write, execute, and all) to the
CHAPTER 8
System mechanisms
139
Attribute
Purpose
Retain access
Access rights that can never be removed by any third-party Object Manager callbacks
(part of the callback list described earlier).
Indicate whether objects must never have names (such as process objects), whether
their names are case-sensitive, whether they require a security descriptor, whether
they should be cache aligned (requiring a padding subheader), whether they supsubheader) and/or a type-list linkage (creator information subheader) should be
maintained. The use default object
default object
use extended parameters
of the extended parse procedure method, described later.
Object type code
Used to describe the type of object this is (versus comparing with a well-known name
1, synchronization objects set this to 2, and thread objects set this to 4
associated with a message.
Invalid attributes
object type.
Default object
object, if the object type creator requested one. Note that certain objects, such as
Allows the Object Manager to generically locate the underlying kernel dispatcher
object that should be used for synchronization when one of the generic wait services
shown earlier (WaitForSingleObject, etc.) is called on the object.
Methods
One or more routines that the Object Manager calls automatically at certain points in
Synchronization
to synchronize its execution by waiting for an object to change from one state to another. A thread can
ity to support synchronization is based on three possibilities:
■
The executive object is a wrapper for a dispatcher object and contains a dispatcher header, a
kernel structure that is covered in the section “Low-IRQL synchronization” later in this chapter.
■
The creator of the object type requested a default object, and the Object Manager provided one.
■
The executive object has an embedded dispatcher object, such as an event somewhere inside
when registering the object type (described in Table 8-14).
Object methods
The last attribute in Table 8-22, methods, comprises a set of internal routines that are similar to C++
constructors and destructors—that is, routines that are automatically called when an object is created
or destroyed. The Object Manager extends this idea by calling an object method in other situations
as well, such as when someone opens or closes a handle to an object or when someone attempts to
pending on how the object type is to be used.
140
CHAPTER 8
System mechanisms
When an executive component creates a new object type, it can register one or more methods with
The methods that the Object Manager supports are listed in Table 8-23.
TABLE 8-23 Object methods
Method
When Method Is Called
Open
When an object handle is created, opened, duplicated, or inherited
Close
When an object handle is closed
Delete
Before the Object Manager deletes an object
Query name
When a thread requests the name of an object
Parse
When the Object Manager is searching for an object name
Dump
Not used
Okay to close
When the Object Manager is instructed to close a handle
Security
object namespace
tines would have required the designers of the Object Manager to anticipate all object types. Not only
would this add extreme complexity to the kernel, but the routines to create an object type are actually
exported by the kernel! Because this enables external kernel components to create their own object
types, the kernel would be unable to anticipate potential custom behaviors. Although this functionality is not documented for driver developers, it is internally used by Pcw.sys, Dxgkrnl.sys, Win32k.sys,
ConnectionPort, NdisCmState, and other objects. Through object-method extensibility, these drivers
Another reason for these methods is simply to allow a sort of virtual constructor and destructor
additional actions during handle creation and closure, as well as during object destruction. They even
allow prohibiting handle closure and creation, when such actions are undesired—for example, the protected process mechanism described in Part 1, Chapter 3, leverages a custom handle creation method
to prevent less protected processes from opening handles to more protected ones. These methods
also provide visibility into internal Object Manager APIs such as duplication and inheritance, which are
delivered through generic services.
be used to implement a secondary namespace outside of the purview of the Object Manager. In
-
these methods.
CHAPTER 8
System mechanisms
141
The Object Manager only calls routines if their pointer is not set to NULL in the type initializer—with
one exception: the security routine, which defaults to SeDefaultObjectMethod. This routine does not
need to know the internal structure of the object because it deals only with the security descriptor for the
not inside the object body. However, if an object does require its own additional security checks, it can
The Object Manager calls the open method whenever it creates a handle to an object, which it does
Desktop objects provide an open method. Indeed, the WindowStation object type requires an open
method so that Win32k.sys can share a piece of memory with the process that serves as a desktoprelated memory pool.
An example of the use of a close method occurs in the I/O system. The I/O manager registers a close
Object Manager itself can or should do.
The Object Manager calls a delete method, if one is registered, before it deletes a temporary object
from memory. The memory manager, for example, registers a delete method for the section object
tures the memory manager has allocated for a section are deleted before the section object is deleted.
ings of the memory manager. Delete methods for other types of objects perform similar functions.
The parse method (and similarly, the query name method) allows the Object Manager to relinquish
Object Manager namespace. When the Object Manager looks up an object name, it suspends its search
when it encounters an object in the path that has an associated parse method. The Object Manager
calls the parse method, passing to it the remainder of the object name it is looking for. There are two
-
resume.doc, the Object Manager traverses its name tree until it reaches the device object named
HarddiskVolume1. It sees that a parse method is associated with this object, and it calls the method,
passing to it the rest of the object name it was searching for—in this case, the string docs\resume.doc.
142
CHAPTER 8
System mechanisms
The security method, which the I/O system also uses, is similar to the parse method. It is called
change it.
has a handle to the Desktop object or objects on which its thread or threads have windows visible.
Under the standard security model, it is possible for those threads to close their handles to their desktops because the process has full control of its own objects. In this scenario, the threads end up without
a desktop associated with them—a violation of the windowing model. Win32k.sys registers an okay-toclose routine for the Desktop and WindowStation objects to prevent this behavior.
Object handles and the process handle table
When a process creates or opens an object by name, it receives a handle that represents its access
to the object. Referring to an object by its handle is faster than using its name because the Object
can also acquire handles to objects by inheriting handles at process creation time (if the creator speciCreateProcess call and the handle was marked as inheritable, either
at the time it was created or afterward by using the Windows SetHandleInformation function) or by
receiving a duplicated handle from another process. (See the Windows DuplicateHandle function.)
All user-mode processes must own a handle to an object before their threads can use the object.
face to reference objects, regardless of their type. Second, the Object Manager has the exclusive right
to create handles and to locate an object that a handle refers to. This means that the Object Manager
caller allows the operation requested on the object in question.
CHAPTER 8
System mechanisms
143
Note Executive components and device drivers can access objects directly because they
are running in kernel mode and therefore have access to the object structures in system
memory. However, they must declare their usage of the object by incrementing the refertion “Object retention” later in this chapter for more details.) To successfully make use of
object, and this is not provided for most objects. Instead, device drivers are encouraged to
although device drivers can get a pointer to the Process object (EPROCESS), the structure is
opaque, and the Ps*
(such as most executive objects that wrap a dispatcher object—for example, events or muend up calling (such as ZwCreateEvent) and use handles instead of object pointers.
EXPERIMENT: Viewing open handles
handles. (Click on View, Lower Pane View, and then Handles.) Then open a command prompt
Explorer shows the following:
Now pause Process Explorer by pressing the spacebar or selecting View, Update Speed
and choosing Pause. Then change the current directory with the cd command and press F5 to
refresh the display. You will see in Process Explorer that the handle to the previous current directory is closed, and a new handle is opened to the new current directory. The previous handle is
highlighted in red, and the new handle is highlighted in green.
144
CHAPTER 8
System mechanisms
can quickly show what handle or handles are being opened but not closed. (Typically, you see
handle leak.
Resource Monitor also shows open handles to named handles for the processes you select by
You can also display the open handle table by using the command-line Handle tool from
object handles located in the handle table for a Cmd.exe process before and after changing
–a switch is used, which
displays all the handles in the process, similar to Process Explorer.
C:\Users\aione>\sysint\handle.exe -p 8768 -a users
Nthandle v4.22 - Handle viewer
Copyright (C) 1997-2019 Mark Russinovich
Sysinternals - www.sysinternals.com
cmd.exe
pid: 8768
type: File
150: C:\Users\Public
CHAPTER 8
System mechanisms
145
An object handle
handle table, pointed to by the executive process
(EPROCESS) block (described in Chapter 3 of Part 1). The index is multiplied by 4 (shifted 2 bits) to make
is 4, the second 8, and so on. Using handle 5, 6, or 7 simply redirects to the same object as handle 4,
while 9, 10, and 11 would reference the same object as handle 8.
a handle to, and handle values are aggressively reused, such that the next new handle index will reuse
a three-level scheme, similar to the way that the legacy x86 memory management unit implemented
virtual-to-physical address translation but with a cap of 24 bits for compatibility reasons, resulting in a
try layout on Windows. To save on kernel memory costs, only the lowest-level handle table is allocated
on process creation—the other levels are created as needed. The subhandle table consists of as many
tems, a page is 4096 bytes, divided by the size of a handle table entry (16 bytes), which is 256, minus 1,
which is a total of 255 entries in the lowest-level handle table. The mid-level handle table contains a full
page of pointers to subhandle tables, so the number of subhandle tables depends on the size of the
page and the size of a pointer for the platform. Again using 64-bit systems as an example, this gives
us 4096/8, or 512 entries. Due to the cap of 24 bits, only 32 entries are allowed in the top-level pointer
Process
Handle
table
Top-level
pointers
Middle-level
pointers
FIGURE 8-33 Windows process handle table architecture.
146
CHAPTER 8
System mechanisms
Subhandle
table
EXPERIMENT: Creating the maximum number of handles
The test program Testlimit from Sysinternals has an option to open handles to an object until it
cannot open any more handles. You can use this to see how many handles can be created in a
single process on your system. Because handle tables are allocated from paged pool, you might
run out of paged pool before you hit the maximum number of handles that can be created in a
single process. To see how many handles you can create on your system, follow these steps:
1.
need from https://docs.microsoft.com/en-us/sysinternals/downloads/testlimit.
2.
Run Process Explorer, click View, and then click System Information. Then click the
Memory tab. Notice the current and maximum size of paged pool. (To display the
symbols for the kernel image, Ntoskrnl.exe.) Leave this system information display running so that you can see pool utilization when you run the Testlimit program.
3.
Open a command prompt.
4.
Run the Testlimit program with the –h switch (do this by typing testlimit –h). When
Testlimit fails to open a new handle, it displays the total number of handles it was able
to create. If the number is less than approximately 16 million, you are probably running
out of paged pool before hitting the theoretical per-process handle limit.
5.
Close the Command Prompt window; doing this kills the Testlimit process, thus closing
all the open handles.
objects are 8-byte aligned, and these bits can be assumed to be 0), and the granted access mask (out of
which only 25 bits are needed, since generic rights are never stored in the handle entry) combined with
reference usage count, which we describe shortly.
Audit on close
Inheritable
Lock
Pointer to object header
A I L
No Rights Upgrade
Protect from close
Access mask
U P Usage Count
32 bits
FIGURE 8-34 Structure of a 32-bit handle table entry.
CHAPTER 8
System mechanisms
147
ple, 44 bits are now needed to encode the object pointer (assuming a processor with four-level paging
and 48-bits of virtual memory), since objects are 16-byte aligned, and thus the bottom four bits can
that the reference usage count is encoded in the remaining 16 bits next to the pointer, instead of next to
ing 6 bits are spare, and there are still 32-bits of alignment that are also currently spare, for a total of 16
must now be 53 bits, reducing the usage count bits to only 7.
should expect the bottom bit to normally be set
is, it indicates whether processes created by this process will get a copy of this handle in their handle
SetHandleInformation
be set with the SetHandleInformation
access rights should be upgraded if the handle is duplicated to a process with higher privileges.
OBJECT_HANDLE_INFORMATION structure
that is passed in to APIs such as ObReferenceObjectByHandle, and map to OBJ_INHERIT (0x2), OBJ_
AUDIT_OBJECT_CLOSE (0x4), OBJ_PROTECT_CLOSE (0x1), and OBJ_NO_RIGHTS_UPGRADE (0x8), which
reference usage count in both the encoding of the pointer
cached number (based on the number of available bits) of preexisting references as part of each handle
entry and then adds up the usage counts of all processes that have a handle to the object into the
ences through ObReferenceObject, and the number of cached references for each handle.
ing any Windows API that takes a handle as input and ends up converting it into an object—the cached
number of references is dropped, which is to say that the usage count decreases by 1, until it reaches
0, at which point it is no longer tracked. This allows one to infer exactly the number of times a given
The debugger command !trueref, when executed with the -v
each handle referencing an object and exactly how many times it was used (if you count the number
148
CHAPTER 8
System mechanisms
System components and device drivers often need to open handles to objects that user-mode
with. This is done by creating handles in the kernel handle table (referenced internally with the name
ObpKernelHandleTable), which is associated with the System process. The handles in this table are accessible only from kernel mode and in any process context. This means that a kernel-mode function
can reference the handle in any process context with no performance impact.
The Object Manager recognizes references to handles from the kernel handle table when the high
bit of the handle is set—that is, when references to kernel-handle-table handles have values greater
The kernel handle table also serves as the handle table for the System and minimal processes, and as
such, all handles created by the System process (such as code running in system threads) are implicitly kernel handles because the ObpKernelHandleTable symbol is set the as ObjectTable of the EPROCESS structure
the DuplicateHandle API to extract a kernel handle out into user mode, but this attack has been mitigated
since Windows Vista with the introduction of protected processes, which were described in Part 1.
any handle created by a kernel driver, with the previous mode
vent handles from inadvertently leaking to user space applications.
EXPERIMENT: Viewing the handle table with the kernel debugger
The !handle command in the kernel debugger takes three arguments:
!handle <handle index> <flags> <processid>
!handle 4
handle entry,” bit 1 means “display free handles (not just used handles),” and bit 2 means “display
information about the object that the handle refers to.” The following command displays full
details about the handle table for process ID 0x1540:
lkd> !handle 0 7 1540
PROCESS ffff898f239ac440
SessionId: 0 Cid: 1540
Peb: 1ae33d000 ParentCid: 03c0
DirBase: 211e1d000 ObjectTable: ffffc704b46dbd40 HandleCount: 641.
Image: com.docker.service
Handle table at ffffc704b46dbd40 with 641 entries in use
0004: Object: ffff898f239589e0
ffffc704b45ff010
GrantedAccess: 001f0003 (Protected) (Inherit) Entry:
CHAPTER 8
System mechanisms
149
Object: ffff898f239589e0 Type: (ffff898f032e2560) Event
ObjectHeader: ffff898f239589b0 (new version)
HandleCount: 1 PointerCount: 32766
0008: Object: ffff898f23869770 GrantedAccess: 00000804 (Audit) Entry: ffffc704b45ff020
Object: ffff898f23869770 Type: (ffff898f033f7220) EtwRegistration
ObjectHeader: ffff898f23869740 (new version)
HandleCount: 1 PointerCount: 32764
Instead of having to remember what all these bits mean, and convert process IDs to hexadecimal, you can also use the debugger data model to access handles through the Io.Handles
dx @$curprocess.Io.Handles[4]
handle for the current process, including the access rights and name, while the following command displays full details about the handles in PID 5440 (that is, 0x1540):
lkd> dx -r2 @$cursession.Processes[5440].Io.Handles
@$cursession.Processes[5440].Io.Handles
[0x4]
Handle
: 0x4
Type
: Event
GrantedAccess
: Delete | ReadControl | WriteDac | WriteOwner | Synch |
QueryState | ModifyState
Object
[Type: _OBJECT_HEADER]
[0x8]
Handle
: 0x8
Type
: EtwRegistration
GrantedAccess
Object
[Type: _OBJECT_HEADER]
[0xc]
Handle
: 0xc
Type
: Event
GrantedAccess
: Delete | ReadControl | WriteDac | WriteOwner | Synch |
QueryState | ModifyState
Object
[Type: _OBJECT_HEADER]
You can use the debugger data model with a LINQ predicate to perform more interesting
searches, such as looking for named section object mappings that are Read/Write:
lkd> dx @$cursession.Processes[5440].Io.Handles.Where(h => (h.Type == "Section") &&
(h.GrantedAccess.MapWrite) && (h.GrantedAccess.MapRead)).Select(h => h.ObjectName)
@$cursession.Processes[5440].Io.Handles.Where(h => (h.Type == "Section") &&
(h.GrantedAccess.MapWrite) && (h.GrantedAccess.MapRead)).Select(h => h.ObjectName)
[0x16c]
: "Cor_Private_IPCBlock_v4_5440"
[0x170]
: "Cor_SxSPublic_IPCBlock"
[0x354]
: "windows_shell_global_counters"
[0x3b8]
: "UrlZonesSM_DESKTOP-SVVLOTP$"
[0x680]
: "NLS_CodePage_1252_3_2_0_0"
150
CHAPTER 8
System mechanisms
EXPERIMENT: Searching for open files with the kernel debugger
a system remotely. You can instead use the !devhandles command to search for handles opened to
1.
Device object. You can use the !object command as shown here:
lkd> !object \Global??\C:
Object: ffffc704ae684970 Type: (ffff898f03295a60) SymbolicLink
ObjectHeader: ffffc704ae684940 (new version)
HandleCount: 0 PointerCount: 1
Directory Object: ffffc704ade04ca0 Name: C:
Flags: 00000000 ( Local )
Target String is '\Device\HarddiskVolume3'
Drive Letter Index is 3 (C:)
2.
Next, use the !object command to get the Device object of the target volume name:
1: kd> !object \Device\HarddiskVolume1
Object: FFFF898F0820D8F0 Type: (fffffa8000ca0750) Device
3.
Now you can use the pointer of the Device object with the !devhandles command.
lkd> !devhandles 0xFFFF898F0820D8F0
Checking handle table for process 0xffff898f0327d300
Kernel handle table at ffffc704ade05580 with 7047 entries in use
PROCESS ffff898f0327d300
SessionId: none Cid: 0004
Peb: 00000000 ParentCid: 0000
DirBase: 001ad000 ObjectTable: ffffc704ade05580 HandleCount: 7023.
Image: System
019c: Object: ffff898F080836a0 GrantedAccess: 0012019f (Protected) (Inherit)
(Audit) Entry: ffffc704ade28670
Object: ffff898F080836a0 Type: (ffff898f032f9820) File
ObjectHeader: ffff898F08083670 (new version)
HandleCount: 1 PointerCount: 32767
Directory Object: 00000000 Name: \$Extend\$RmMetadata\$TxfLog\
$TxfLog.blf {HarddiskVolume4}
achieve the same effect with a LINQ predicate, which instantly starts returning results:
lkd> dx -r2 @$cursession.Processes.Select(p => p.Io.Handles.Where(h =>
h.Type == "File").Where(f => f.Object.UnderlyingObject.DeviceObject ==
(nt!_DEVICE_OBJECT*)0xFFFF898F0820D8F0).Select(f =>
f.Object.UnderlyingObject.FileName))
@$cursession.Processes.Select(p => p.Io.Handles.Where(h => h.Type == "File").
CHAPTER 8
System mechanisms
151
Where(f => f.Object.UnderlyingObject.DeviceObject == (nt!_DEVICE_OBJECT*)
0xFFFF898F0820D8F0).Select(f => f.Object.UnderlyingObject.FileName))
[0x0]
[0x19c]
: "\$Extend\$RmMetadata\$TxfLog\$TxfLog.blf" [Type: _UNICODE_STRING]
[0x2dc]
: "\$Extend\$RmMetadata\$Txf:$I30:$INDEX_ALLOCATION" [Type: _UNICODE_STRING]
[0x2e0]
: "\$Extend\$RmMetadata\$TxfLog\$TxfLogContainer00000000000000000002"
[Type: _UNICODE_STRING]
Reserve Objects
cations and kernel code to create objects is essential to the normal and desired runtime behavior of any
piece of Windows code. If an object allocation fails, this usually causes anything from loss of functionaltion object). Worse, in certain situations, the reporting of errors that led to object creation failure might
themselves require new objects to be allocated. Windows implements two special reserve objects to
deal with such situations: the User APC reserve object and the I/O Completion packet reserve object.
Note that the reserve-object mechanism is fully extensible, and future versions of Windows might add
other reserve object types—from a broad view, the reserve object is a mechanism enabling any kernelmode data structure to be wrapped as an object (with an associated handle, name, and security) for
later use.
As was discussed earlier in this chapter, APCs are used for operations such as suspension, termination, and I/O completion, as well as communication between user-mode applications that want to
provide asynchronous callbacks. When a user-mode application requests a User APC to be targeted
to another thread, it uses the QueueUserApc
NtQueueApcThread
system call. In the kernel, this system call attempts to allocate a piece of paged pool in which to store
the KAPC control object structure associated with an APC. In low-memory situations, this operation
fails, preventing the delivery of the APC, which, depending on what the APC was used for, could cause
loss of data or functionality.
To prevent this, the user-mode application, can, on startup, use the NtAllocateReserveObject system
call to request the kernel to preallocate the KAPC structure. Then the application uses a different system call, NtQueueApcThreadEx, that contains an extra parameter that is used to store the handle to the
reserve object. Instead of allocating a new structure, the kernel attempts to acquire the reserve object
(by setting its InUse bit to true
the reserve object is released back to the system. Currently, to prevent mismanagement of system
resources by third-party developers, the reserve object API is available only internally through system
guarantee that asynchronous callbacks will still be able to return in low-memory situations.
A similar scenario can occur when applications need failure-free delivery of an I/O completion port
message or packet. Typically, packets are sent with the PostQueuedCompletionStatus
dll, which calls the NtSetIoCompletion API. Like the user APC, the kernel must allocate an I/O manager
structure to contain the completion-packet information, and if this allocation fails, the packet cannot
152
CHAPTER 8
System mechanisms
be created. With reserve objects, the application can use the NtAllocateReserveObject API on startup
to have the kernel preallocate the I/O completion packet, and the NtSetIoCompletionEx system call
APC reserve objects, this functionality is reserved for system components and is used both by the RPC
library and the Windows Peer-To-Peer BranchCache service to guarantee completion of asynchronous
I/O operations.
Object security
object or opens a handle to an existing object, the process must specify a set of desired access rights—
that is, what it wants to do with the object. It can request either a set of standard access rights (such as
Similarly, it might require the ability to suspend or terminate a thread object.
When a process opens a handle to an object, the Object Manager calls the security reference monitor
access the process is requesting. If it does, the reference monitor returns a set of granted access rights
that the process is allowed, and the Object Manager stores them in the object handle it creates. How
the security system determines who gets access to which objects is explored in Chapter 7 of Part 1.
Manager can quickly check whether the set of granted access rights stored in the handle corresponds
read access to a section object but then calls a service to write to it, the service fails.
EXPERIMENT: Looking at object security
You can look at the various permissions on an object by using either Process Hacker, Process
Explorer, WinObj, WinObjEx64, or AccessChk, which are all tools from Sysinternals or openlist (ACL) for an object:
■
You can use WinObj or WinObjEx64 to navigate to any object on the system, including
object directories, right-click the object, and select Properties
BaseNamedObjects directory, select Properties, and click the Security tab. You should
see a dialog box like the one shown next. Because WinObjEx64 supports a wider variety of
delete access to the directory, for example, but the SYSTEM account does (because this is where
session 0 services with SYSTEM privileges will store their objects).
CHAPTER 8
System mechanisms
153
■
Instead of using WinObj or WinObjEx64, you can view the handle table of a process using
Process Explorer, as shown in the experiment “Viewing open handles” earlier in this chapter,
or using Process Hacker, which has a similar view. Look at the handle table for the Explorer.exe
per-session namespace shortly.) You can double-click the object handle and then click the
Security tab and see a similar dialog box (with more users and rights granted).
■
–o switch as shown in the following output. Note that using AccessChk will also show you
the integrity level of the object. (See Chapter 7 of Part 1, for more information on integrity
levels and the security reference monitor.)
C:\sysint>accesschk -o \Sessions\1\BaseNamedObjects
Accesschk v6.13 - Reports effective permissions for securable objects
Copyright (C) 2006-2020 Mark Russinovich
Sysinternals - www.sysinternals.com
\Sessions\1\BaseNamedObjects
Type: Directory
RW Window Manager\DWM-1
RW NT AUTHORITY\SYSTEM
RW DESKTOP-SVVLOTP\aione
RW DESKTOP-SVVLOTP\aione-S-1-5-5-0-841005
RW BUILTIN\Administrators
R Everyone
NT AUTHORITY\RESTRICTED
154
CHAPTER 8
System mechanisms
Windows also supports Ex (Extended) versions of the APIs—CreateEventEx, CreateMutexEx,
CreateSemaphoreEx—that add another argument for specifying the access mask. This makes it possible
for applications to use discretionary access control lists (DACLs) to properly secure their objects without
breaking their ability to use the create object APIs to open a handle to them. You might be wondering why a client application would not simply use OpenEvent, which does support a desired access
argument. Using the open object APIs leads to an inherent race condition when dealing with a failure
in the open call—that is, when the client application has attempted to open the event before it has
been created. In most applications of this kind, the open API is followed by a create API in the failure
case. Unfortunately, there is no guaranteed way to make this create operation atomic—in other words,
to occur only once.
Indeed, it would be possible for multiple threads and/or processes to have executed the create API
concurrently, and all attempt to create the event at the same time. This race condition and the extra
complexity required to try to handle it makes using the open object APIs an inappropriate solution
to the problem, which is why the Ex APIs should be used instead.
Object retention
There are two types of objects: temporary and permanent. Most objects are temporary—that is, they
remain while they are in use and are freed when they are no longer needed. Permanent objects remain
until they are explicitly freed. Because most objects are temporary, the rest of this section describes
how the Object Manager implements object retention—that is, retaining temporary objects only as
long as they are in use and then deleting them.
Manager can easily track how many of these processes, and which ones, are using an object. Tracking
these handles represents one part of implementing retention. The Object Manager implements object
name retention, and it is controlled by the number
of open handles to an object that exists. Every time a process opens a handle to an object, the Object
object and close their handles to it, the Object Manager decrements the open handle counter. When
deletion prevents processes from opening a handle to the object.
The second phase of object retention is to stop retaining the objects themselves (that is, to delete
them) when they are no longer in use. Because operating system code usually accesses objects by using pointers instead of handles, the Object Manager must also record how many object pointers it has
dispensed to operating system processes. As we saw, it increments a reference count for an object each
time it gives out a pointer to the object, which is called the pointer count; when kernel-mode compoThe system also increments the reference count when it increments the handle count, and likewise decrements the reference count when the handle count decrements because a handle is also a reference
to the object that must be tracked.
usage reference count, which adds cached references to the pointer count
and is decremented each time a process uses a handle. The usage reference count has been added
CHAPTER 8
System mechanisms
155
since Windows 8 for performance reasons. When the kernel is asked to obtain the object pointer from
its handle, it can do the resolution without acquiring the global handle table lock. This means that in
newer versions of Windows, the handle table entry described in the “Object handles and the process
handle table” section earlier in this chapter contains a usage reference counter, which is initialized the
verb use refers to the act of resolving the object pointer from its handle, an operation performed in
kernel by APIs like the ObReferenceObjectByHandle.
ing a handle to it. The event has a name, which implies that the Object Manager inserts it in the correct
usage reference count
count is still 1.)
Process A
Handles
System space
Event object
Handle Table
HandleCount=2
ReferenceCount=65536
Index
Other structure
DuplicateHandle
Process B
Event object
Handle Table
HandleCount=1
ReferenceCount=32770
FIGURE 8-35 Handles and reference counts.
Process B initializes, creates the second named event, and signals it. The last operation uses (references) the second event, allowing it also to reach a reference value of 32,770. Process B then opens
object, bringing its counters to 2 and 32,771. (Remember, the new handle table entry still has its usage
156
CHAPTER 8
System mechanisms
usage reference count to 32,767. The value is added to the
object reference count, which is further increased by 1 unit, and reaches the overall value of 65,539.
Subsequent operations on the handle simply decreases the usage reference count without touching the
though—an operation that releases a reference count on the kernel object. Thus, after the four uses
When a process closes a handle to an object (an operation that causes the NtClose routine to be
executed in the kernel), the Object Manager knows that it needs to subtract the handle usage reference
tinue to exist because its reference count will become 1 (while its handle count would be 0). However,
when Process B closes its handle to the second event object, the object would be deallocated, because
its reference count reaches 0.
ence count might remain positive, indicating that the operating system is still using the object in some
way. Ultimately, it is only when the reference count drops to 0 that the Object Manager deletes the
object from memory. This deletion has to respect certain rules and also requires cooperation from the
memory (depending on the settings located in their object types), if a dereference occurs at an IRQL
level of DISPATCH_LEVEL or higher and this dereference causes the pointer count to drop to 0, the system would crash if it attempted to immediately free the memory of a paged-pool object. (Recall that
such access is illegal because the page fault will never be serviced.) In this scenario, the Object Manager
performs a deferred delete operation, queuing the operation on a worker thread running at passive
ing to delete the object will result in the system attempting to acquire this lock. However, the driver
driver developers must use ObDereferenceObjectDeferDelete to force deferred deletion regardless of
complete more quickly, instead of waiting for the Object Manager to delete the object.
Because of the way object retention works, an application can ensure that an object and its name
remain in memory simply by keeping a handle open to the object. Programmers who write applications
that contain two or more cooperating processes need not be concerned that one process might delete an
might create a second process to execute a program in the background; it then immediately closes its
handle to the process. Because the operating system needs the second process to run the program, it
CHAPTER 8
System mechanisms
157
Because object leaks can be dangerous to the system by leaking kernel pool memory and eventually causing systemwide memory starvation—and can break applications in subtle ways—Windows
includes a number of debugging mechanisms that can be enabled to monitor, analyze, and debug
issues with handles and objects. Additionally, WinDbg comes with two extensions that tap into these
mechanisms and provide easy graphical analysis. Table 8-24 describes them.
TABLE 8-24 Debugging mechanisms for object handles
Mechanism
Enabled By
Handle Tracing Database
Object Reference Tracing
with the User Stack Trace option checked with
Per-process-name(s), or per-object-type-pool-tag(s),
Object Reference Tagging Drivers must call appropriate API
Kernel Debugger Extension
!htrace <handle value> <process ID>
!obtrace <object pointer>
N/A
Enabling the handle-tracing database is useful when attempting to understand the use of each
handle within an application or the system context. The !htrace debugger extension can display the
the stack trace can pinpoint the code that is creating the handle, and it can be analyzed for a missing
call to a function such as CloseHandle.
The object-reference-tracing !obtrace extension monitors even more by showing the stack trace for
each new handle created as well as each time a handle is referenced by the kernel (and each time it is
opened, duplicated, or inherited) and dereferenced. By analyzing these patterns, misuse of an object
at the system level can be more easily debugged. Additionally, these reference traces provide a way to
understand the behavior of the system when dealing with certain objects. Tracing processes, for ex(such as Process Monitor) and help detect rogue or buggy third-party drivers that might be referencing
handles in kernel mode but never dereferencing them.
Note
the name of its pool tag by looking at the key member of the OBJECT_TYPE structure when
using the dx command. Each object type on the system has a global variable that references
this structure—for example, PsProcessType. Alternatively, you can use the !object command,
which displays the pointer to this structure.
Unlike the previous two mechanisms, object-reference tagging is not a debugging feature that must
driver developers to reference and dereference objects, including ObReferenceObjectWithTag and
ObDereferenceObjectWithTag. Similar to pool tagging (see Chapter 5 in Part 1 for more information on pool
tagging), these APIs allow developers to supply a four-character tag identifying each reference/dereference
pair. When using the !obtrace extension just described, the tag for each reference or dereference operation
is also shown, which avoids solely using the call stack as a mechanism to identify where leaks or underreferences might occur, especially if a given call is performed thousands of times by the driver.
158
CHAPTER 8
System mechanisms
Resource accounting
Resource accounting, like object retention, is closely related to the use of object handles. A positive
open handle count indicates that some process is using that resource. It also indicates that some proence count drop to 0, the process that was using the object should no longer be charged for it.
the types of quotas imposed on processes are sometimes diverse and complicated, and the code to
process component might limit users to some maximum number of new processes they can create
or a maximum number of threads within a process. Each of these limits is tracked and enforced in
different parts of the operating system.
In contrast, the Windows Object Manager provides a central facility for resource accounting. Each
object header contains an attribute called quota charges that records how much the Object Manager
opens a handle to the object.
Each process on Windows points to a quota structure that records the limits and current values
NonPagedPoolQuota, PagedPoolQuota,
and PagingFileQuota
Management.) Note that all the processes in an interactive session share the same quota block (and
Object names
An important consideration in creating a multitude of objects is the need to devise a successful system
for keeping track of them. The Object Manager requires the following information to help you do so:
■
A way to distinguish one object from another
■
shared memory, for example. The executive, in contrast, allows any resource represented by an object
Object names also satisfy a third requirement, which is to allow processes to share objects. The exate an object and place its name in the global namespace, and a second process can open a handle to
CHAPTER 8
System mechanisms
159
before storing the new name in the global namespace. The second is when a process opens a handle to
handle to the caller; thereafter, the caller uses the handle to refer to the object. When looking up a
name, the Object Manager allows the caller to select either a case-sensitive or case-insensitive search,
a feature that supports Windows Subsystem for Linux (WSL) and other environments that use case-
Object directories
possibly even other object directories. The object directory object maintains enough information to
translate these object names into pointers to the object headers of the objects themselves. The Object
Manager uses the pointers to construct the object handles that it returns to user-mode callers. Both
kernel-mode code (including executive components and device drivers) and user-mode code (such as
subsystems) can create object directories in which to store objects.
Objects can be stored anywhere in the namespace, but certain object types will always appear in
component responsible for the creation of Driver objects (through the IoCreateDriver API), only Driver
objects should exist there.
Table 8-25 lists the standard object directories found on all Windows systems and what types of obplications that stick to documented APIs. (See the “Session namespace” section later in this chapter for
more information.)
TABLE 8-25 Standard object directories
Directory
Types of Object Names Stored
contains the named kernel objects created by Win32 or UWP APIs from within processes
that are running in an App Container.
Symbolic links mapping ARC-style paths to NT-style paths.
Global mutexes, events, semaphores, waitable timers, jobs, ALPC ports, symbolic links,
and section objects.
Callback objects (which only drivers can create).
160
CHAPTER 8
System mechanisms
Directory
Types of Object Names Stored
SystemPartition and BootPartition. Also contains the PhysicalMemory section object
directories, such as Http used by the Http.sys accelerator driver, and HarddiskN directories for each physical hard drive.
(SERVICE_FILE_SYSTEM_DRIVER or SERVICE_RECOGNIZER_DRIVER).
Symbolic links for locations where OS drivers can be installed and managed from.
Windows 10X devices.
SERVICE_FILE_SYSTEM_DRIVER
(SERVICE_RECOGNIZER_DRIVER) driver and
-
Contains event objects that signal kernel pool resource conditions, the completion of
certain operating system tasks, as well as Session objects (at least Session0) representing each interactive session, and Partition objects (at least MemoryPartition0) for each
memory partition. Also contains the mutex used to synchronize access to the Boot
callback to refer to the correct partition for physical memory and commit resource conditions, and for memory error detection.
Section objects for the known DLLs mapped by SMSS at startup time, and a symbolic
link containing the path for known DLLs.
directory is used instead to store WoW64 32-bit versions of those DLLs.
Section objects for mapped national language support (NLS) tables.
Object type objects for each object type created by ObCreateObjectTypeEx.
ALPC ports created to represent remote procedure call (RPC) endpoints when Local RPC
(ncalrpc) is used. This includes explicitly named endpoints, as well as auto-generated
COM (OLEXXXXX) port names and unnamed ports (LRPC-XXXX, where XXXX is a randomly generated hexadecimal value).
Per-session namespace directory. (See the next subsection.)
If at least one Windows Server Container has been created, such as by using Docker for
ID of the root job for the container), which then contain the object namespace local to
that Silo.
Section objects used by virtualized instances (VAIL) of Win32k.sys and other window
manager components on Windows 10X devices when launching legacy Win32
applications. Also contains the Host object directory to represent the other side
of the connection.
Windows subsystem ALPC ports, shared section, and window stations in the
WindowStations object directory. Desktop Window Manager (DWM) also stores its
ALPC ports, events, and shared sections in this directory, for non-Session 0 sessions.
CHAPTER 8
System mechanisms
161
Object names are global to a single computer (or to all processors on a multiprocessor computer),
-
network. Server code on the remote Windows system calls the Object Manager and the I/O manager
Because the kernel objects created by non-app-container processes, through the Win32 and UWP API,
such as mutexes, events, semaphores, waitable timers, and sections, have their names stored in a single
object directory, no two of these objects can have the same name, even if they are of a different type. This
The issue with name collision may seem innocuous, but one security consideration to keep in mind
when dealing with named objects is the possibility of malicious object name squatting. Although object
current session namespace that can be set with the standard Windows API. This makes it possible for an
unprivileged application running in the same session as a privileged application to access its objects,
as described earlier in the object security subsection. Unfortunately, even if the object creator used
squatting attack, in which the unprivileged application creates the object before the privileged application, thus denying access to the
legitimate application.
Windows exposes the concept of a private namespace to alleviate this issue. It allows user-mode
applications to create object directories through the CreatePrivateNamespace API and associate these
directories with boundary descriptors created by the CreateBoundaryDescriptor API, which are special
data structures protecting the directories. These descriptors contain SIDs describing which security
principals are allowed access to the object directory. In this manner, a privileged application can be
sure that unprivileged applications will not be able to conduct a denial-of-service attack against its obAdditionally, a boundary descriptor can also contain an integrity level, protecting objects possibly
belonging to the same user account as the application based on the integrity level of the process. (See
Chapter 7 of Part 1 for more information on integrity levels.)
One of the things that makes boundary descriptors effective mitigations against squatting attacks
is that unlike objects, the creator of a boundary descriptor must have access (through the SID and
integrity level) to the boundary descriptor. Therefore, an unprivileged application can only create an
unprivileged boundary descriptor. Similarly, when an application wants to open an object in a private
namespace, it must open the namespace using the same boundary descriptor that was used to create
it. Therefore, a privileged application or service would provide a privileged boundary descriptor, which
would not match the one created by the unprivileged application.
162
CHAPTER 8
System mechanisms
EXPERIMENT: Looking at the base named objects and private objects
You can see the list of base objects that have names with the WinObj tool from Sysinternals or
with WinObjEx64. However, in this experiment, we use WinObjEx64 because it supports additional object types and because it can also show private namespaces. Run Winobjex64.exe, and
click the BaseNamedObjects node in the tree, as shown here:
The named objects are listed on the right. The icons indicate the object type:
■
Mutexes are indicated with a stop sign.
■
■
Events are shown as exclamation points.
■
■
Symbolic links have icons that are curved arrows.
■
■
Power/network plugs represent ALPC ports.
■
Timers are shown as Clocks.
■
Other icons such as various types of gears, locks, and chips are used for other object types.
CHAPTER 8
System mechanisms
163
Now use the Extras menu and select Private Namespaces
shown here:
mutex is part of the LoadPerf boundary), and the SID(s) and integrity level associated with it (in
this case, no explicit integrity is set, and the SID is the one for the Administrators group). Note
that for this feature to work, you must have enabled kernel debugging on the machine the tool is
running on (either locally or remotely), as WinObjEx64 uses the WinDbg local kernel debugging
driver to read kernel memory.
164
CHAPTER 8
System mechanisms
EXPERIMENT: Tampering with single instancing
of single-instancing enforcement through named objects. Notice that when launching the
Wmplayer.exe executable, Windows Media Player appears only once—every other launch simply
results in the window coming back into focus. You can tamper with the handle list by using
1.
Launch Windows Media Player and Process Explorer to view the handle table (by clicking View, Lower Pane View, and then Handles). You should see a handle whose name
2.
Right-click the handle and select Close Handle
that Process Explorer should be started as Administrator to be able to close a handle in
another process.
3.
Run Windows Media Player again. Notice that this time a second process is created.
4.
Go ahead and play a different song in each instance. You can also use the Sound Mixer
in the system tray (click the Volume icon) to select which of the two processes will have
greater volume, effectively creating a mixing environment.
Instead of closing a handle to a named object, an application could have run on its own before Windows Media Player and created an object with the same name. In this scenario, Windows
Media Player would never run because it would be fooled into believing it was already running
on the system.
CHAPTER 8
System mechanisms
165
Symbolic links
narily hierarchical directory structure.
The Object Manager implements an object called a symbolic link object, which performs a similar
function for object names in its object namespace. A symbolic link can occur anywhere within an object
string that it substitutes for the symbolic link name. It then restarts its name lookup.
One place in which the executive uses symbolic link objects is in translating MS-DOS-style device
names into Windows internal device names. In Windows, a user refers to hard disk drives using the names
C:, D:, and so on, and serial ports as COM1, COM2, and so on. The Windows subsystem creates these
tory, which can also be done for additional drive letters through the DefineDosDevice API.
LowMemoryCondition, but due to the introduction of memory partitions (described in Chapter 5 of
Part 1), the condition that the event signals are now dependent on which partition the caller is running
in (and should have visibility of). As such, there is now a LowMemoryCondition event for each memory
partition, and callers must be redirected to the correct event for their partition. This is achieved with
executed each time the link is parsed by the Object Manager. With WinObjEx64, you can see the
doing a !object \KernelObjects\LowMemoryCondition command and then dumping the _OBJECT_
SYMBOLIC_LINK structure with the dx command.)
FIGURE 8-36 The LowMemoryCondition symbolic link redirection callback.
166
CHAPTER 8
System mechanisms
Session namespace
Services have full access to the global
the namespace. Regular user applications then have read-write (but not delete) access to the global
namespace (minus some exceptions we explain soon.) In turn, however, interactive user sessions are
then given a session-private view of the namespace known as a local namespace. This namespace
provides full read/write access to the base named objects by all applications running within that
-
Making separate copies of the same parts of the namespace is known as instancing the namespace.
are running an application that creates a named object, each user session must have a private version
ing the same object. If the Win32 application is running under an AppContainer, however, or is a UWP
whose names correspond to the Package SID of the AppContainer (see Chapter 7 of Part 1, for more
information on AppContainer and the Windows sandboxing model).
The Object Manager implements a local namespace by creating the private versions of the four
n (where
n
event, for example, the Win32 subsystem (as part of the BaseGetNamedObjectDirectory API in
One more way through which name objects can be accessed is through a security feature called
Base Named Object (BNO) Isolation. Parent processes can launch a child with the ProcThreadAttribute
BnoIsolation
tory and initial set of objects (such as symbolic links) to support it, and then have NtCreateUserProcess
BnoIsolationHandlesEntry
CHAPTER 8
System mechanisms
167
Later, BaseGetNamedObjectDirectory queries the Token object to check if BNO Isolation is enabled,
sort of sandbox for a process without having to use the AppContainer functionality.
All object-manager functions related to namespace management are aware of the instanced directories and participate in providing the illusion that all sessions use the same namespace. Windows subdirectory with \??
named DeviceMap in the executive process object (EPROCESS, which is described further in Chapter 3
of Part 1) that points to a data structure shared by other processes in the same session.
The DosDevicesDirectory
DeviceMap structure points at the Object Manager directory
DosDevicesDirectory
DeviceMap. If the
DeviceMap
GlobalDosDevicesDirectory
DeviceMap
Under certain circumstances, session-aware applications need to access objects in the global session
even if the application is running in another session. The application might want to do this to synchronize with instances of itself running in other remote sessions or with the console session (that is, session
Session directories are isolated from each other, but as mentioned earlier, regular user applications
Section and symbolic link objects cannot be globally created unless the caller is running in Session
0 or if the caller possesses a special privilege named create global object
ObUnsecureGlobalNames value. By default, these names
are usually listed:
■
netfxcustomperfcounters.1.0
■
SharedPerfIPCBlock
■
■
168
CHAPTER 8
System mechanisms
EXPERIMENT: Viewing namespace instancing
You can see the separation between the session 0 namespace and other session namespaces as
see a subdirectory with a numeric name for each active session. If you open one of these direcBaseNamedObjects, which are the local namespace subdirectories of the session. The following
Next, run Process Explorer and select a process in your session (such as Explorer.exe), and then
view the handle table (by clicking View, Lower Pane View, and then Handles). You should see a
n, where n is the session ID.
CHAPTER 8
System mechanisms
169
Object filtering
ability to use the altitude
ers are permitted to intercept calls such as NtOpenThread and NtOpenProcess and even to modify the
access masks being requested from the process manager. This allows protection against certain operations on an open handle—such as preventing a piece of malware from terminating a benevolent security
process or stopping a password dumping application from obtaining read memory permissions on the
LSA process. Note, however, that an open operation cannot be entirely blocked due to compatibility issues, such as making Task Manager unable to query the command line or image name of a process.
pre and post callbacks, allowing them to prepare
which can be returned across all calls to the driver or across a pre/post pair. These callbacks can be
registered with the ObRegisterCallbacks API and unregistered with the ObUnregisterCallbacks API—it is
the responsibility of the driver to ensure deregistration happens.
Use of the APIs is restricted to images that have certain characteristics:
■
■
The image must be signed, even on 32-bit computers, according to the same rules set forth in
/integritycheck
IMAGE_DLLCHARACTERISTICS_FORCE_INTEGRITY value in the
PE header. This instructs the memory manager to check the signature of the image regardless of
any other defaults that might not normally result in a check.
The image must be signed with a catalog containing cryptographic per-page hashes of the
executable code. This allows the system to detect changes to the image after it has been loaded
in memory.
Before executing a callback, the Object Manager calls the MmVerifyCallbackFunction on the target
function pointer, which in turn locates the loader data table entry associated with the module owning
LDRP_IMAGE_INTEGRITY_FORCED
Synchronization
The concept of mutual exclusion is a crucial one in operating systems development. It refers to the guarantee that one, and only one, thread can access a particular resource at a time. Mutual exclusion is neces-
170
CHAPTER 8
System mechanisms
when two threads running on different processors both write data to a circular queue.
Time
Processor A
Processor B
Get queue tail
Insert data at current location
•
•
•
•
•
•
Get queue tail
•
•
•
Increment tail pointer
•
•
•
Insert data at current location /*ERROR*/
Increment tail pointer
•
•
•
FIGURE 8-37 Incorrect sharing of memory.
-
happen on a multiprocessor system, the same error could occur on a single-processor system if the
queue tail pointer.
Sections of code that access a nonshareable resource are called critical sections. To ensure correct
dating a database, or modifying a shared variable, no other thread can be allowed to access the same
data structure without mutual exclusion.
The issue of mutual exclusion, although important for all operating systems, is especially important (and intricate) for a tightly coupled, symmetric multiprocessing (SMP) operating system such as
Windows, in which the same system code runs simultaneously on more than one processor, sharing
nisms that system code can use to prevent two threads from modifying the same data at the same
time. The kernel provides mutual-exclusion primitives that it and the rest of the executive use to synchronize their access to global data structures.
Because the scheduler synchronizes access to its data structures at DPC/dispatch level IRQL, the
kernel and executive cannot rely on synchronization mechanisms that would result in a page fault or
reschedule operation to synchronize access to data structures when the IRQL is DPC/dispatch level
or higher (levels known as an elevated or high
kernel and executive use mutual exclusion to protect their global data structures when the IRQL is high
and what mutual-exclusion and synchronization mechanisms the kernel and executive use when the
IRQL is low (below DPC/dispatch level).
CHAPTER 8
System mechanisms
171
High-IRQL synchronization
At various stages during its execution, the kernel must guarantee that one, and only one, processor at
mutually exclusive manner.
Simple single-processor operating systems sometimes prevent such a scenario by disabling all interrupts each time they access global data, but the Windows kernel has a more sophisticated solution.
Before using a global resource, the kernel temporarily masks the interrupts whose interrupt handlers
causes the dispatcher, which uses the dispatcher database, to run. Therefore, any other part of the
kernel that uses the dispatcher database raises the IRQL to DPC/dispatch level, masking DPC/dispatchlevel interrupts before using the dispatcher database.
processor. The kernel also needs to guarantee mutually exclusive access across several processors.
Interlocked operations
The simplest form of synchronization mechanisms relies on hardware support for multiprocessorsafe manipulation of integer values and for performing comparisons. They include functions such as
InterlockedIncrement, InterlockedDecrement, InterlockedExchange, and InterlockedCompareExchange.
The InterlockedDecrement function, for example, uses the x86 and x64 lock
ple, lock xadd) to lock the multiprocessor bus during the addition operation so that another processor
functions are called intrinsic because the code for them is generated in an inline assembler, directly
rameters onto the stack, calling the function, copying the parameters into registers, and then popping
the parameters off the stack and returning to the caller would be a more expensive operation than the
Spinlocks
The mechanism the kernel uses to achieve multiprocessor mutual exclusion is called a spinlock. A
spinlock is a locking primitive associated with a global data structure, such as the DPC queue shown
172
CHAPTER 8
System mechanisms
Processor A
Processor B
•
•
•
•
•
•
Do
Try to acquire
DPC queue
spinlock
Until SUCCESS
Begin
Remove DPC from queue
End
Release DPC queue spinlock
Do
Try to acquire
DPC queue
spinlock
Until SUCCESS
Spinlock
DPC
DPC
DPC queue
Begin
Add DPC from queue
End
Release DPC queue spinlock
Critical section
FIGURE 8-38 Using a spinlock.
lock until it succeeds. The spinlock gets its name from the fact that the kernel (and thus, the processor)
waits, “spinning,” until it gets the lock.
Spinlocks, like the data structures they protect, reside in nonpaged memory mapped into the
system address space. The code to acquire and release a spinlock is written in assembly language for
speed and to exploit whatever locking mechanism the underlying processor architecture provides. On
many architectures, spinlocks are implemented with a hardware-supported test-and-set operation,
which tests the value of a lock variable and acquires the lock in one atomic instruction. Testing and acquiring the lock in one instruction prevents a second thread from grabbing the lock between the time
such the lock instruction mentioned earlier can also be used on the test-and-set operation, resulting in
the combined lock bts opcode on x86 and x64 processors, which also locks the multiprocessor bus; otherwise, it would be possible for more than one processor to perform the operation atomically. (Without
the lock, the operation is guaranteed to be atomic only on the current processor.) Similarly, on ARM
processors, instructions such as ldrex and strex can be used in a similar fashion.
All kernel-mode spinlocks in Windows have an associated IRQL that is always DPC/dispatch level or
lower ceases on that processor. Because thread dispatching happens at DPC/dispatch level, a thread
that holds a spinlock is never preempted because the IRQL masks the dispatching mechanisms. This
masking allows code executing in a critical section protected by a spinlock to continue executing so
that it will release the lock quickly. The kernel uses spinlocks with great care, minimizing the number of
instructions it executes while it holds a spinlock. Any processor that attempts to acquire the spinlock
and performing no actual work.
CHAPTER 8
System mechanisms
173
On x86 and x64 processors, a special pause assembly instruction can be inserted in busy wait loops,
and on ARM processors, yield
hint to the processor
that the loop instructions it is processing are part of a spinlock (or a similar construct) acquisition loop.
■
looping.
■
■
On SMT cores, it allows the CPU to realize that the “work” being done by the spinning logical
core is not terribly important and awards more CPU time to the second logical core instead.
Because a busy wait loop results in a storm of read requests coming to the bus from the waiting
thread (which might be generated out of order), the CPU attempts to correct for violations of
memory order as soon as it detects a write (that is, when the owning thread releases the lock).
Thus, as soon as the spinlock is released, the CPU reorders any pending memory read operations to ensure proper ordering. This reordering results in a large penalty in system performance and can be avoided with the pause instruction.
If the kernel detects that it is running under a Hyper-V compatible hypervisor, which supports the spinlock enlightenment (described in Chapter 9), the spinlock facility can use the
HvlNotifyLongSpinWait library function when it detects that the spinlock is currently owned
by another CPU, instead of contiguously spinning and use the pause instruction. The function emits a HvCallNotifyLongSpinWait hypercall to indicate to the hypervisor scheduler that
another VP should take over instead of emulating the spin.
The kernel makes spinlocks available to other parts of the executive through a set of kernel functions, including KeAcquireSpinLock and KeReleaseSpinLock. Device drivers, for example, require spinlocks to guarantee that device registers and other global data structures are accessed by only one part
of a device driver (and from only one processor) at a time. Spinlocks are not for use by user programs—
user programs should use the objects described in the next section. Device drivers also need to protect
access to their own data structures from interrupts associated with themselves. Because the spinlock
KeAcquireInterruptSpinLock and KeReleaseInterruptSpinLock
system looks inside the interrupt object for the associated DIRQL with the interrupt and raises the IRQL
to the appropriate level to ensure correct access to structures shared with the ISR.
Devices can also use the KeSynchronizeExecution API to synchronize an entire function with an ISR
instead of just a critical section. In all cases, the code protected by an interrupt spinlock must execute
negative performance effects.
an IRQL of DPC/dispatch level or higher, as explained earlier, code holding a spinlock will crash the
system if it attempts to make the scheduler perform a dispatch operation or if it causes a page fault.
174
CHAPTER 8
System mechanisms
Queued spinlocks
To increase the scalability of spinlocks, a special type of spinlock, called a queued spinlock, is used in
many circumstances instead of a standard spinlock, especially when contention is expected, and fairness is required.
A queued spinlock works like this: When a processor wants to acquire a queued spinlock that is
the meantime, a processor waiting for a busy spinlock checks the status not of the spinlock itself but of
-
synchronization, and the memory location of the bit is not in a single NUMA node that then has to be
snooped through the caches of each logical processor. The second is that instead of a random pro-
queued spinlocks do require additional overhead, including extra interlocked operations, which do add
decide if a queued spinlock is worth it for them.
global
control region
data structure.
LockArray
processor
KPCR
A global spinlock can be acquired by calling KeAcquireQueuedSpinLock with the index into the array
at which the pointer to the spinlock is stored. The number of global spinlocks originally grew in each
KSPIN_LOCK_QUEUE_NUMBER enumeration, but note, however,
that acquiring one of these queued spinlocks from a device driver is an unsupported and heavily
CHAPTER 8
System mechanisms
175
EXPERIMENT: Viewing global queued spinlocks
You can view the state of the global queued spinlocks (the ones pointed to by the queued
!qlocks kernel debugger command. In the
following example, note that none of the locks are acquired on any of the processors, which is a
standard situation on a local system doing live debugging.
lkd> !qlocks
Key: O = Owner, 1-n = Wait order, blank = not owned/waiting, C = Corrupt
Lock Name
KE
MM
MM
MM
CC
CC
EX
IO
CC
-
0
Processor Number
1 2 3 4 5 6
7
Unused Spare
Unused Spare
Unused Spare
Unused Spare
Vacb
Master
NonPagedPool
Cancel
Unused Spare
In-stack queued spinlocks
Device drivers can use dynamically allocated queued spinlocks with the KeAcquireInStackQueued
SpinLock and KeReleaseInStackQueuedSpinLock functions. Several components—including the cache
global queued spinlocks.
KeAcquireInStackQueuedSpinLock takes a pointer to a spinlock data structure and a spinlock queue
handle. The spinlock queue handle is actually a data structure in which the kernel stores information
usually a stack variable, guaranteeing locality to the caller thread and is responsible for the InStack part
of the spinlock and API name.
Reader/writer spin locks
While using queued spinlocks greatly improves latency in highly contended situations, Windows
contention in many situations to begin with. The multi-reader, single-writer spinlock, also called
the executive spinlock, is an enhancement on top of regular spinlocks, which is exposed through
the ExAcquireSpinLockExclusive, ExAcquireSpinLockShared API, and their ExReleaseXxx counterparts.
Additionally, ExTryAcquireSpinLockSharedAtDpcLevel and ExTryConvertSharedSpinLockToExclusive
functions exist for more advanced use cases.
176
CHAPTER 8
System mechanisms
As the name suggests, this type of lock allows noncontended shared acquisition of a spinlock if no
writer is present. When a writer is interested in the lock, readers must eventually release the lock, and
no further readers will be allowed while the writer is active (nor additional writers). If a driver developer
items, this type of lock can remove contention in the majority of cases, removing the need for the complexity of a queued spinlock.
Executive interlocked operations
The kernel supplies some simple synchronization functions constructed on spinlocks for more
advanced operations, such as adding and removing entries from singly and doubly linked lists.
Examples include ExInterlockedPopEntryList and ExInterlockedPushEntryList for singly linked lists,
and ExInterlockedInsertHeadList and ExInterlockedRemoveHeadList for doubly linked lists. A few
other functions, such as ExInterlockedAddUlong and ExInterlockedAddLargeInteger also exist. All
these functions require a standard spinlock as a parameter and are used throughout the kernel and
Instead of relying on the standard APIs to acquire and release the spinlock parameter, these functions place the code required inline and also use a different ordering scheme. Whereas the Ke spinlock
test-and-set operation to make the acquisition, these routines disable interrupts on the processor and
immediately attempt an atomic test-and-set. If the initial attempt fails, interrupts are enabled again,
and the standard busy waiting algorithm continues until the test-and-set operation returns 0—in which
case the whole function is restarted again. Because of these subtle differences, a spinlock used for the
executive interlocked functions must not be used with the standard kernel APIs discussed previously.
Naturally, noninterlocked list operations must not be mixed with interlocked operations.
Note Certain executive interlocked operations silently ignore the spinlock when possible.
ExInterlockedIncrementLong or ExInterlockedCompareExchange APIs use
the same lock
These functions were useful on older systems (or non-x86 systems) where the lock operation
inlined in favor of the intrinsic functions.
Low-IRQL synchronization
Executive software outside the kernel also needs to synchronize access to global data structures in a
which it accesses as a global data structure, and device drivers need to ensure that they can gain exclusive access to their devices. By calling kernel functions, the executive can create a spinlock, acquire it,
and release it.
CHAPTER 8
System mechanisms
177
waiting for a spinlock literally stalls a processor, spinlocks can be used only under the following strictly
limited circumstances:
■
The protected resource must be accessed quickly and without complicated interactions with
other code.
■
exceptions.
tive needs to perform other types of synchronization in addition to mutual exclusion, and it must also
provide synchronization mechanisms to user mode.
There are several additional synchronization mechanisms for use when spinlocks are not suitable:
■
■
■
Pushlocks
■
Executive resources
■
Run-once initialization (InitOnce)
Additionally, user-mode code, which also executes at low IRQL, must be able to have its own locking
■
System calls that refer to kernel dispatcher objects (mutants, semaphores, events, and timers)
■
Condition variables (CondVars)
■
Slim Reader-Writer Locks (SRW Locks)
■
Address-based waiting
■
Run-once initialization (InitOnce)
■
Critical sections
We look at the user-mode primitives and their underlying kernel-mode support later; for now, we
focus on kernel-mode objects. Table 8-26 compares and contrasts the capabilities of these mechanisms
and their interaction with kernel-mode APC delivery.
178
CHAPTER 8
System mechanisms
TABLE 8-26
Exposed for
Use by Device
Drivers
Disables
Normal KernelMode APCs
Disables Special Supports
Kernel-Mode
Recursive
APCs
Acquisition
Supports
Shared and
Exclusive
Acquisition
Yes
Yes
No
Yes
No
Yes
No
No
No
No
Yes
Yes
Yes
No
No
Guarded mutexes
Yes
Yes
Yes
No
No
Pushlocks
Yes
No
No
No
Yes
Executive resources
Yes
No
No
Yes
Yes
Rundown protections
Yes
No
No
Yes
No
mutexes
semaphores, events,
timers
Kernel dispatcher objects
The kernel furnishes additional synchronization mechanisms to the executive in the form of kernel
objects, known collectively as dispatcher objects. The Windows API-visible synchronization objects acquire their synchronization capabilities from these kernel dispatcher objects. Each Windows API-visible
object that supports synchronization encapsulates at least one kernel dispatcher object. The execuWaitForSingleObject
and WaitForMultipleObjects functions, which the Windows subsystem implements by calling analogous
system services that the Object Manager supplies. A thread in a Windows application can synchronize
with a variety of objects, including a Windows process, thread, event, semaphore, mutex, waitable
the kernel can be waited on. Some of these are proper dispatcher objects, whereas others are larger
chapter in the section “What signals an object?”) shows the proper dispatcher objects, so any other
object that the Windows API allows waiting on probably internally contains one of those primitives.
Two other types of executive synchronization mechanisms worth noting are the executive resource
and the pushlock. These mechanisms provide exclusive access (like a mutex) as well as shared read
they have an API exposed through raw pointers and Ex APIs, and the Object Manager and its handle
system are not involved. The remaining subsections describe the implementation details of waiting for
dispatcher objects.
Waiting for dispatcher objects
NtWaitForXxx class
KeWaitForXxx APIs
deal directly with the dispatcher object.
CHAPTER 8
System mechanisms
179
Because the Nt API communicates with the Object Manager (ObWaitForXxx class of functions), it
goes through the abstractions that were explained in the section on object types earlier in this chapter.
Nt
the information in the object type to redirect the wait to the Event
FILE_OBJECT. The Ke
API, on the other hand, only works with true dispatcher objects—that is to say, those that begin with
a DISPATCHER_HEADER structure. Regardless of the approach taken, these calls ultimately cause the
kernel to put the thread in a wait state.
A completely different, and more modern, approach to waiting on dispatcher objects is to rely on
asynchronous waiting. This approach leverages the existing I/O completion port infrastructure to associate a dispatcher object with the kernel queue backing the I/O completion port, by going through
an intermediate object called a wait completion packet. Thanks to this mechanism, a thread essentially
registers a wait but does not directly block on the dispatcher object and does not enter a wait state.
This allows one or more threads to register wait indications on various objects, which a separate thread
CreateThreadPoolWait
and SetThreadPoolWait.
Windows 10, through the DPC Wait Event functionality that is currently reserved for Hyper-V (although
reserved for kernel-mode drivers, in which a deferred procedure call (DPC, explained earlier in this
chapter) can be associated with a dispatcher object, instead of a thread or I/O completion port. Similar
to the mechanism described earlier, the DPC is registered with the object, and when the wait is satisKeInsertQueueDpc). When the dispatcher lock is dropped and the IRQL returns below DISPATCH_
LEVEL, the DPC executes on the current processor, which is the driver-supplied callback that can now
react to the signal state of the object.
Irrespective of the waiting mechanism, the synchronization object(s) being waited on can be in one
of two states: signaled state or nonsignaled state
undergoes a state change, from the nonsignaled state to the signaled state (when another thread sets
an event object, for example).
To synchronize with an object, a thread calls one of the wait system services that the Object
Manager supplies, passing a handle to the object it wants to synchronize with. The thread can wait for
signal routines checks to see whether any threads are waiting for the object and not also waiting for
other objects to become signaled. If there are, the kernel releases one or more of the threads from their
waiting state so that they can continue executing.
180
CHAPTER 8
System mechanisms
port, and then calls NtCreateWaitCompletionPacket to create a wait completion packet object and receive a handle back to it. Then, it calls NtAssociateWaitCompletionPacket, passing in both the handle to
the I/O completion port as well as the handle to the wait completion packet it just created, combined
signaled state, the signal routines realize that no thread is currently waiting on the object, and instead
check whether an I/O completion port has been associated with the wait. If so, it signals the queue object associated with the port, which causes any threads currently waiting on it to wake up and consume
the wait completion packet (or, alternatively, the queue simply becomes signaled until a thread comes
in and attempts to wait on it). Alternatively, if no I/O completion port has been associated with the wait,
then a check is made to see whether a DPC is associated instead, in which case it will be queued on the
current processor. This part handles the kernel-only DPC Wait Event mechanism described earlier.
The following example of setting an event illustrates how synchronization interacts with thread
dispatching:
■
■
threads waiting for the event.
■
Another thread sets the event.
■
details on thread scheduling, see Chapter 4 of Part 1.)
Note Some threads might be waiting for more than one object, so they continue waiting,
WaitAny wait, which will wake them up as soon as one object (instead
of all) is signaled.
What signals an object?
during its lifetime and is set to the signaled state by the kernel when the thread terminates. Similarly,
trast, the timer object, like an alarm, is set to “go off” at a certain time. When its time expires, the kernel
sets the timer object to the signaled state.
When choosing a synchronization mechanism, a programmer must take into account the rules
object is set to the signaled state varies with the type of object the thread is waiting for, as Table 8-27
illustrates.
CHAPTER 8
System mechanisms
181
TABLE 8-27
Object Type
Set to Signaled State When
Effect on Waiting Threads
Process
Last thread terminates.
All are released.
Thread
Thread terminates.
All are released.
Thread sets the event.
All are released.
Event (synchronization type)
Thread sets the event.
One thread is released and might receive a
boost; the event object is reset.
Gate (locking type)
Thread signals the gate.
Gate (signaling type)
Thread signals the type.
Thread sets event with a key.
Semaphore
a boost.
is of the same process as the signaler is
released.
Semaphore count drops by 1.
One thread is released.
Set time arrives or time interval expires.
All are released.
Timer (synchronization type)
Set time arrives or time interval expires.
One thread is released.
Mutex
Thread releases the mutex.
One thread is released and takes ownership
of the mutex.
Queue
Item is placed on queue.
One thread is released.
When an object is set to the signaled state, waiting threads are generally released from their wait
states immediately.
manual reset event in the Windows API) is used to
announce the occurrence of some event. When the event object is set to the signaled state, all threads
waiting for the event are released. The exception is any thread that is waiting for more than one object
at a time; such a thread might be required to continue waiting until additional objects reach the signaled state.
In contrast to an event object, a mutex object has ownership associated with it (unless it was acquired during a DPC). It is used to gain mutually exclusive access to a resource, and only one thread at
a time can hold the mutex. When the mutex object becomes free, the kernel sets it to the signaled state
and then selects one waiting thread to execute, while also inheriting any priority boost that had been
applied. (See Chapter 4 of Part 1 for more information on priority boosting.) The thread selected by the
kernel acquires the mutex object, and all other threads continue waiting.
A mutex object can also be abandoned, something that occurs when the thread currently owning
it becomes terminated. When a thread terminates, the kernel enumerates all mutexes owned by the
thread and sets them to the abandoned state, which, in terms of signaling logic, is treated as a signaled
state in that ownership of the mutex is transferred to a waiting thread.
182
CHAPTER 8
System mechanisms
information on how to put these objects to use in Windows programs, see the Windows reference
Windows
via C/C++ from Microsoft Press.
Object-less waiting (thread alerts)
condition to occur, and another thread
needs to signal the occurrence of the condition. Although this can be achieved by tying an event to
the condition, this requires resources (memory and handles, to name a couple), and acquisition and
creation of resources can fail while also taking time and being complex. The Windows kernel provides
two mechanisms for synchronization that are not tied to dispatcher objects:
■
Thread alerts
■
Thread alert by ID
alertable sleep by using SleepEx (ultimately
resulting in NtDelayExecutionThread). A kernel thread could also choose to use KeDelayExecutionThread.
We previously explained the concept of alertability earlier in the section on software interrupts and APCs.
side uses the NtAlertThread (or KeAlertThread) API to alert the thread, which causes the sleep to abort,
returning the status code STATUS_ALERTED
thread can choose not to enter an alertable sleep state, but instead, at a later time of its choosing, call the
NtTestAlert (or KeTestAlertThread
by suspending itself instead (NtSuspendThread or KeSuspendThread). In this case, the other side can use
NtAlertResumeThread to both alert the thread and then resume it.
Although this mechanism is elegant and simple, it does suffer from a few issues, beginning with the
fact that there is no way to identify whether the alert was the one related to the wait—in other words,
also alerted the waiting thread, which has no way of distinguishing between
user services can leverage this mechanism, third-party developers are not meant to use alerts. Third,
once a thread becomes alerted, any pending queued APCs also begin executing—such as user-mode
NtAlertThread still requires opening a
handle to the target thread—an operation that technically counts as acquiring a resource, an operation
which can fail. Callers could theoretically open their handles ahead of time, guaranteeing that the alert
will succeed, but that still does add the cost of a handle in the whole mechanism.
To respond to these issues, the Windows kernel received a more modern mechanism starting with Windows 8, which is the alert by ID. Although the system calls behind this mechanism—
NtAlertThreadByThreadId and NtWaitForAlertByThreadId—are not documented, the Win32 user-mode
wait API that we describe later is. These system calls are extremely simple and require zero resources,
CHAPTER 8
System mechanisms
183
using only the Thread ID as input. Of course, since without a handle, this could be a security issue, the
one disadvantage to these APIs is that they can only be used to synchronize with threads within the
current process.
NtWaitForAlertByThreadId API, passing in an optional timeout. This makes the thread enter a real wait,
without alertability being a concern. In fact, in spite of the name, this type of wait is non-alertable, by
design. Next, the other thread calls the NtAlertThreadByThreadId API, which causes the kernel to look
up the Thread ID, make sure it belongs to the calling process, and then check whether the thread is indeed blocking on a call to NtWaitForAlertByThreadId
This simple, elegant mechanism is the heart of a number of user-mode synchronization primitives later
in this chapter and can be used to implement anything from barriers to more complex synchronization
methods.
Data structures
Three data structures are key to tracking who is waiting, how they are waiting, what they are waiting for,
and which state the entire wait operation is at. These three structures are the dispatcher header, the wait
block, and the wait status register
KWAIT_
STATUS_REGISTER (and the Flags
KWAIT_STATE enumeration).
The dispatcher header
union
in programming theory. By using the Type
example, a mutex can be Abandoned, but a timer can be Relative. Similarly, a timer can be Inserted
into the timer list, but debugging can only be Active
Signaled state and the Wait List Head for the wait blocks associated with the object.
These wait blocks are what represents that a thread (or, in the case of asynchronous waiting, an I/O
completion port) is tied to an object. Each thread that is in a wait state has an array of up to 64 wait
blocks that represent the object(s) the thread is waiting for (including, potentially, a wait block pointAlternatively, if the alert-by-ID primitives are used, there is a single block with a special indication that
this is not a dispatcher-based wait. The Object
Hint
NtWaitForAlertByThreadId. This array is maintained for two main purposes:
■
When a thread terminates, all objects that it was waiting on must be dereferenced, and the wait
blocks deleted and disconnected from the object(s).
■
and satisfying the wait), all the other objects it may have been waiting on must be dereferenced
and the wait blocks deleted and disconnected.
184
CHAPTER 8
System mechanisms
each dispatcher object also has a linked list of wait blocks tied to it. This list is kept so that when a dispatcher object is signaled, the kernel can quickly determine who is waiting on (or which I/O completion
port is tied to) that object and apply the wait satisfaction logic we explain shortly.
balance set manager thread running on each CPU (see Chapter 5 of Part 1 for
more information about the balance set manager) needs to analyze the time that each thread has
been waiting for (to decide whether to page out the kernel stack), each PRCB has a list of eligible waiting threads that last ran on that processor. This reuses the Ready List
KTHREAD structure
following three conditions:
■
to be time-sensitive and not worth the cost of stack swapping).
■
The thread must have the EnableStackSwap
KeSetKernelStackSwapEnable API).
■
default for a normal thread in the “real-time” process priority class).
on, but as we pointed out earlier, for an alert-by-ID wait, there is no object involved, so this represents
the Hint
waiting on the object, it can also point to the queue of an I/O completion port, in the case where a wait
completion packet was associated with the object as part of an asynchronous wait.
wait type and the wait block state, and,
depending on the type, a wait key can also be present. The wait type is very important during wait
wait any, the kernel does not care about the state of any other object because at least one of them (the
current one!) is now signaled. On the other hand, for a wait all, the kernel can only wake the thread if
all the other objects are also in a signaled state at the same time, which requires iterating over the wait
blocks and their associated objects.
Alternatively, a wait dequeue is a specialized case for situations where the dispatcher object is
actually a queue (I/O completion port), and there is a thread waiting on it to have completion packets available (by calling KeRemoveQueue(Ex) or (Nt)IoRemoveIoCompletion). Wait blocks attached to
is signaled, this allows the correct actions to be taken (keep in mind that a thread could be waiting
on multiple objects, so it could have other wait blocks, in a wait any or wait all state, that must still be
handled regularly).
wait notification, the kernel knows that no thread is associated with the object at all and that
this is an asynchronous wait with an associated I/O completion port whose queue will be signaled.
(Because a queue is itself a dispatcher object, this causes a second order wait satisfaction for the queue
and any threads potentially waiting on it.)
CHAPTER 8
System mechanisms
185
wait DPC, which is the newest wait type introduced, lets the kernel know that there is no
thread nor I/O completion port associated with this wait, but a DPC object instead. In this case, the
immediate execution once the dispatcher lock is dropped.
The wait block also contains a volatile wait block state (KWAIT_BLOCK_STATE
rent state of this wait block in the transactional wait operation it is currently engaged in. The different
states, their meaning, and their effects in the wait logic code are explained in Table 8-28.
TABLE 8-28 Wait block states
State
Meaning
Effect
WaitBlockActive (4)
This wait block is actively linked to an
object as part of a thread that is in a
wait state.
During wait satisfaction, this wait
block will be unlinked from the wait
block list.
WaitBlockInactive (5)
The thread wait associated with this
During wait satisfaction, this wait
block will not be unlinked from the
wait block list because the wait satisfaction must have already unlinked it
during its active state.
timeout has already expired while
setting it up).
WaitBlockSuspended (6)
The thread associated with this wait
block is undergoing a lightweight suspend operation.
Essentially treated the same as
WaitBlockActive but only ever used
when resuming a thread. Ignored during regular wait satisfaction (should
never be seen, as suspended threads
WaitBlockBypassStart (0)
A signal is being delivered to the
thread while the wait has not yet been
committed.
During wait satisfaction (which would
be immediate, before the thread
enters the true wait state), the waiting thread must synchronize with the
signaler because there is a risk that the
wait object might be on the stack—
marking the wait block as inactive
would cause the waiter to unwind the
stack while the signaler might still be
accessing it.
WaitBlockBypassComplete (1)
The thread wait associated with this
wait block has now been properly
synchronized (the wait satisfaction has
completed), and the bypass scenario is
now completed.
The wait block is now essentially
treated the same as an inactive wait
block (ignored).
WaitBlockSuspendBypassStart (2)
A signal is being delivered to the
thread while the lightweight suspend
has not yet been committed.
The wait block is treated essentially
the same as a WaitBlockBypassStart.
WaitBlockSuspendBypassComplete (3)
The lightweight suspend associated
with this wait block has now been
properly synchronized.
The wait block now behaves like a
WaitBlockSuspended.
dispatcher lock in Windows 7, the overall state of the thread (or any of the objects it is being required
any global state synchronization, there is nothing to stop another thread—executing on a different
logical processor—from signaling one of the objects being waited, or alerting the thread, or even
sending it an APC. As such, the kernel dispatcher keeps track of a couple of additional data points for
186
CHAPTER 8
System mechanisms
KWAIT_STATE, not to
be confused with the wait block state) and any pending state changes that could modify the result
of an ongoing wait operation. These two pieces of data are what make up the wait status register
(KWAIT_STATUS_REGISTER).
When a thread is instructed to wait for a given object (such as due to a WaitForSingleObject
attempts to enter the in-progress wait state (WaitInProgress) by beginning the wait. This operation succeeds if there are no pending alerts to the thread at the moment (based on the alertability of the wait and
the current processor mode of the wait, which determine whether the alert can preempt the wait). If there
is an alert, the wait is not entered at all, and the caller receives the appropriate status code; otherwise, the
thread now enters the WaitInProgress state, at which point the main thread state is set to Waiting, and the
Once the wait is in progress, the thread can initialize the wait blocks as needed (and mark them
as WaitBlockActive in the process) and then proceed to lock all the objects that are part of this wait.
Because each object has its own lock, it is important that the kernel be able to maintain a consistent
locking ordering scheme when multiple processors might be analyzing a wait chain consisting of many
objects (caused by a WaitForMultipleObjects call). The kernel uses a technique known as address ordering to achieve this: because each object has a distinct and static kernel-mode address, the objects can
be ordered in monotonically increasing address order, guaranteeing that locks are always acquired
and released in the same order by all callers. This means that the caller-supplied array of objects will be
duplicated and sorted accordingly.
The next step is to check for immediate satisfaction of the wait, such as when a thread is being told to
wait on a mutex that has already been released or an event that is already signaled. In such cases, the wait
blocks have yet been inserted) and performing a wait exit (processing any pending scheduler operations
marked in the wait status register). If this shortcut fails, the kernel next attempts to check whether the
“timed out,” which results in slightly faster processing of the exit code, albeit with the same result.
the thread now attempts to commit its wait. (Meanwhile, the object lock or locks have been released,
allowing other processors to modify the state of any of the objects that the thread is now supposed to
attempt waiting on.) Assuming a noncontended scenario, where other processors are not interested in
this thread or its wait objects, the wait switches into the committed state as long as there are no pending changes marked by the wait status register. The commit operation links the waiting thread in the
PRCB list, activates an extra wait queue thread if needed, and inserts the timer associated with the wait
timeout, if any. Because potentially quite a lot of cycles have elapsed by this point, it is again possible
that the timeout has already elapsed. In this scenario, inserting the timer causes immediate signaling of
the thread and thus a wait satisfaction on the timer and the overall timeout of the wait. Otherwise, in
the much more common scenario, the CPU now context-switches away to the next thread that is ready
for execution. (See Chapter 4 of Part 1 for more information on scheduling.)
In highly contended code paths on multiprocessor machines, it is possible and likely that the
thread attempting to commit its wait has experienced a change while its wait was still in progress. One
CHAPTER 8
System mechanisms
187
possible scenario is that one of the objects it was waiting on has just been signaled. As touched upon
earlier, this causes the associated wait block to enter the WaitBlockBypassStart
wait status register now shows the WaitAborted wait state. Another possible scenario is for an alert or
APC to have been issued to the waiting thread, which does not set the WaitAborted state but enables
one of the corresponding bits in the wait status register. Because APCs can break waits (depending on
the type of APC, wait mode, and alertability), the APC is delivered, and the wait is aborted. Other op-
as with the previous cases mentioned.
versions of Windows implemented a lightweight suspend mechanism when SuspendThread and
ResumeThread are used, which no longer always queues an APC that then acquires the suspend event
embedded in the thread object. Instead, if the following conditions are true, an existing wait is instead
converted into a suspend state:
■
KiDisableLightWeightSuspend is 0 (administrators can use the DisableLightWeightSuspend value
optimization).
■
■
■
■
■
The thread state is Waiting—that is, the thread is already in a wait state.
The wait status register is set to WaitCommitted
engaged.
The thread is not an UMS primary or scheduled thread (see Chapter 4 of Part 1 for more information on User Mode Scheduling) because these require additional logic implemented in the
The thread issued a wait while at IRQL 0 (passive level) because waits at APC_LEVEL require
special handling that only the suspend APC can provide.
The thread does not have APCs currently disabled, nor is there an APC in progress, because
suspend APC can achieve.
■
The thread is not currently attached to a different process due to a call to KeStackAttachProcess
because this requires special handling just like the preceding bullet.
WaitBlockInactive block
■
state, its wait type must be WaitAll
WaitAny block.
As the preceding list of criteria is hinting, this conversion happens by taking any currently active wait
blocks and converting them to a WaitBlockSuspended state instead. If the wait block is currently pointno longer wake up this thread). If the thread had a timer associated with it, it is canceled and removed
188
CHAPTER 8
System mechanisms
Because it no longer uses a true wait object, this mechanism required the introduction the three
additional wait block states shown in Table 8-28 as well as four new wait states: WaitSuspendInProgress,
WaitSuspended, WaitResumeInProgress, and WaitResumeAborted. These new states behave in a similar
manner to their regular counterparts but address the same possible race conditions described earlier
during a lightweight suspend operation.
suspend state and essentially undoes the operation, setting the wait register to WaitResumeInProgress.
Each wait block is then enumerated, and for any block in the WaitBlockSuspended state, it is placed in
WaitBlockActive
became signaled in the meantime, in which case it is made WaitBlockInactive instead, just like in a regu-
sumes the threads are eligible for stack swapping). In this example, CPU 0 has two waiting (committed)
threads: Thread 1 is waiting for object B, and thread 2 is waiting for objects A and B. If object A is sigfor execution. On the other hand, if object B is signaled, the kernel can ready thread 1 for execution
other objects but its wait type was a WaitAny, the kernel could still wake it up.)
Thread object
Thread 1
Thread 2
PRCB 0
Wait block list
Wait block list
Wait list head
List entry
List entry
Dispatcher objects
Size
Object A
Type
State
Wait blocks
Wait list head
List entry
Object-typespecific data
Thread
Object
Key
Type
Next link
Size
Object B
Type
State
Thread 2 wait block
Wait list head
List entry
List entry
Object-typespecific data
Thread
Thread
Object
Key
Type
Object
Key
Type
Next link
Next link
Thread 1 wait block
Thread 2 wait block
FIGURE 8-39 Wait data structures.
CHAPTER 8
System mechanisms
189
EXPERIMENT: Looking at wait queues
!thread command.
!process command shows that the
thread is waiting for an event object:
lkd> !process 0 4 explorer.exe
THREAD ffff898f2b345080 Cid 27bc.137c Teb: 00000000006ba000
Win32Thread: 0000000000000000 WAIT: (UserRequest) UserMode Non-Alertable
ffff898f2b64ba60 SynchronizationEvent
You can use the dx command to interpret the dispatcher header of the object like this:
lkd> dx (nt!_DISPATCHER_HEADER*)0xffff898f2b64ba60
(nt!_DISPATCHER_HEADER*)0xffff898f2b64ba60: 0xffff898f2b64ba60 [Type: _DISPATCHER_HEADER*]
[+0x000] Lock
: 393217 [Type: long]
[+0x000] LockNV
: 393217 [Type: long]
[+0x000] Type
: 0x1 [Type: unsigned char]
[+0x001] Signalling
: 0x0 [Type: unsigned char]
[+0x002] Size
: 0x6 [Type: unsigned char]
[+0x003] Reserved1
: 0x0 [Type: unsigned char]
[+0x000] TimerType
: 0x1 [Type: unsigned char]
[+0x001] TimerControlFlags : 0x0 [Type: unsigned char]
[+0x001 ( 0: 0)] Absolute
: 0x0 [Type: unsigned char]
[+0x001 ( 1: 1)] Wake
: 0x0 [Type: unsigned char]
[+0x001 ( 7: 2)] EncodedTolerableDelay : 0x0 [Type: unsigned char]
[+0x002] Hand
: 0x6 [Type: unsigned char]
[+0x003] TimerMiscFlags
: 0x0 [Type: unsigned char]
[+0x003 ( 5: 0)] Index
: 0x0 [Type: unsigned char]
[+0x003 ( 6: 6)] Inserted
: 0x0 [Type: unsigned char]
[+0x003 ( 7: 7)] Expired
: 0x0 [Type: unsigned char]
[+0x000] Timer2Type
: 0x1 [Type: unsigned char]
[+0x001] Timer2Flags
: 0x0 [Type: unsigned char]
[+0x001 ( 0: 0)] Timer2Inserted
: 0x0 [Type: unsigned char]
[+0x001 ( 1: 1)] Timer2Expiring
: 0x0 [Type: unsigned char]
[+0x001 ( 2: 2)] Timer2CancelPending : 0x0 [Type: unsigned char]
[+0x001 ( 3: 3)] Timer2SetPending : 0x0 [Type: unsigned char]
[+0x001 ( 4: 4)] Timer2Running
: 0x0 [Type: unsigned char]
[+0x001 ( 5: 5)] Timer2Disabled
: 0x0 [Type: unsigned char]
[+0x001 ( 7: 6)] Timer2ReservedFlags : 0x0 [Type: unsigned char]
[+0x002] Timer2ComponentId : 0x6 [Type: unsigned char]
[+0x003] Timer2RelativeId : 0x0 [Type: unsigned char]
[+0x000] QueueType
: 0x1 [Type: unsigned char]
[+0x001] QueueControlFlags : 0x0 [Type: unsigned char]
[+0x001 ( 0: 0)] Abandoned
: 0x0 [Type: unsigned char]
[+0x001 ( 1: 1)] DisableIncrement : 0x0 [Type: unsigned char]
[+0x001 ( 7: 2)] QueueReservedControlFlags : 0x0 [Type: unsigned char]
[+0x002] QueueSize
: 0x6 [Type: unsigned char]
[+0x003] QueueReserved
: 0x0 [Type: unsigned char]
[+0x000] ThreadType
: 0x1 [Type: unsigned char]
[+0x001] ThreadReserved
: 0x0 [Type: unsigned char]
[+0x002] ThreadControlFlags : 0x6 [Type: unsigned char]
[+0x002 ( 0: 0)] CycleProfiling
: 0x0 [Type: unsigned char]
[+0x002 ( 1: 1)] CounterProfiling : 0x1 [Type: unsigned char]
190
CHAPTER 8
System mechanisms
[+0x002 ( 2: 2)] GroupScheduling : 0x1 [Type: unsigned char]
[+0x002 ( 3: 3)] AffinitySet
: 0x0 [Type: unsigned char]
[+0x002 ( 4: 4)] Tagged
: 0x0 [Type: unsigned char]
[+0x002 ( 5: 5)] EnergyProfiling : 0x0 [Type: unsigned char]
[+0x002 ( 6: 6)] SchedulerAssist : 0x0 [Type: unsigned char]
[+0x002 ( 7: 7)] ThreadReservedControlFlags : 0x0 [Type: unsigned char]
[+0x003] DebugActive
: 0x0 [Type: unsigned char]
[+0x003 ( 0: 0)] ActiveDR7
: 0x0 [Type: unsigned char]
[+0x003 ( 1: 1)] Instrumented
: 0x0 [Type: unsigned char]
[+0x003 ( 2: 2)] Minimal
: 0x0 [Type: unsigned char]
[+0x003 ( 5: 3)] Reserved4
: 0x0 [Type: unsigned char]
[+0x003 ( 6: 6)] UmsScheduled
: 0x0 [Type: unsigned char]
[+0x003 ( 7: 7)] UmsPrimary
: 0x0 [Type: unsigned char]
[+0x000] MutantType
: 0x1 [Type: unsigned char]
[+0x001] MutantSize
: 0x0 [Type: unsigned char]
[+0x002] DpcActive
: 0x6 [Type: unsigned char]
[+0x003] MutantReserved
: 0x0 [Type: unsigned char]
[+0x004] SignalState
: 0 [Type: long]
[+0x008] WaitListHead
[Type: _LIST_ENTRY]
[+0x000] Flink
: 0xffff898f2b3451c0 [Type: _LIST_ENTRY *]
[+0x008] Blink
: 0xffff898f2b3451c0 [Type: _LIST_ENTRY *]
Because this structure is a union, you should ignore any values that do not correspond to the
given object type because they are not relevant to it. Unfortunately, it is not easy to tell which
the objects to which they apply.
TABLE 8-29
Flag
Applies To
Meaning
Type
All dispatcher objects
Lock
All objects
Used for locking an object during wait operations that need
to modify its state or linkage; actually corresponds to bit 7
(0x80) of the Type
Signaling
Gates
A priority boost should be applied to the woken thread when
the gate is signaled.
Size
Events, Semaphores,
Gates, Processes
Timer2Type
Idle Resilient Timers
Mapping of the Type
Timer2Inserted
Idle Resilient Timers
Set if the timer was inserted into the timer handle table.
Timer2Expiring
Idle Resilient Timers
Set if the timer is undergoing expiration.
Timer2CancelPending
Idle Resilient Timers
Set if the timer is being canceled.
Timer2SetPending
Idle Resilient Timers
Set if the timer is being registered.
Timer2Running
Idle Resilient Timers
Timer2Disabled
Idle Resilient Timers
type of dispatcher object that this is.
Set if the timer has been disabled.
CHAPTER 8
System mechanisms
191
Flag
Applies To
Meaning
Timer2ComponentId
Idle Resilient Timers
Timer2RelativeId
Idle Resilient Timers
TimerType
Timers
Absolute
Timers
The expiration time is absolute, not relative.
Wake
Timers
This is a wakeable timer, meaning it should exit a standby
state when signaled.
EncodedTolerableDelay
Timers
The maximum amount of tolerance (shifted as a power of
two) that the timer can support when running outside of its
expected periodicity.
Hand
Timers
Index into the timer handle table.
Index
Timers
Index into the timer expiration table.
Inserted
Timers
Set if the timer was inserted into the timer handle table.
Expired
Timers
Set if the timer has already expired.
ThreadType
Threads
Mapping of the Type
ThreadReserved
Threads
Unused.
CycleProfiling
Threads
CounterProfiling
Threads
GroupScheduling
Threads
timer.
its timers this is.
has been enabled for this thread.
Scheduling groups have been enabled for this thread, such
tling.
-
AffinitySet
Threads
The thread has a CPU Set associated with it.
Tagged
Threads
The thread has been assigned a property tag.
EnergyProfiling
Threads
Energy estimation is enabled for the process that this thread
belongs to.
SchedulerAssist
Threads
The Hyper-V XTS (eXTended Scheduler) is enabled, and this
thread belongs to a virtual processor (VP) thread inside of a
VM minimal process.
Instrumented
Threads
ActiveDR7
Threads
instrumentation callback.
Hardware breakpoints are being used, so DR7 is active and
also sometimes called DebugActive.
192
Minimal
Threads
This thread belongs to a minimal process.
AltSyscall
Threads
An alternate system call handler has been registered for the
process that owns this thread, such as a Pico Provider or a
Windows CE PAL.
CHAPTER 8
System mechanisms
Flag
Applies To
Meaning
UmsScheduled
Threads
This thread is a UMS Worker (scheduled) thread.
UmsPrimary
Threads
This thread is a UMS Scheduler (primary) thread.
MutantType
Mutants
Mapping of the Type
MutantSize
Mutants
Unused.
DpcActive
Mutants
The mutant was acquired during a DPC.
MutantReserved
Mutants
Unused.
QueueType
Queues
Mapping of the Type
Abandoned
Queues
The queue no longer has any threads that are waiting on it.
DisableIncrement
Queues
No priority boost should be given to a thread waking up to
handle a packet on the queue.
SignalState
and the WaitListHead
pointers are identical, this can either mean that there are no threads waiting or that one thread
is waiting on this object. You can tell the difference if the identical pointer happens to be the ad-
lkd> dx (nt!_KWAIT_BLOCK*)0xffff898f2b3451c0
(nt!_KWAIT_BLOCK*)0xffff898f2b3451c0
: 0xffff898f2b3451c0 [Type: _KWAIT_BLOCK *]
[+0x000] WaitListEntry
[Type: _LIST_ENTRY]
[+0x010] WaitType
: 0x1 [Type: unsigned char]
[+0x011] BlockState
: 0x4 [Type: unsigned char]
[+0x012] WaitKey
: 0x0 [Type: unsigned short]
[+0x014] SpareLong
: 6066 [Type: long]
[+0x018] Thread
: 0xffff898f2b345080 [Type: _KTHREAD *]
[+0x018] NotificationQueue : 0xffff898f2b345080 [Type: _KQUEUE *]
[+0x020] Object
: 0xffff898f2b64ba60 [Type: void *]
[+0x028] SparePtr
: 0x0 [Type: void *]
In this case, the wait type indicates a WaitAny
WaitAny, so we know that there is a thread blocking on
the event, whose pointer we are given. We also see that the wait block is active. Next, we can
lkd> dt nt!_KTHREAD 0xffff898f2b345080 WaitRegister.State WaitIrql WaitMode WaitBlockCount
WaitReason WaitTime
+0x070 WaitRegister
:
+0x000 State
: 0y001
+0x186 WaitIrql
: 0 ''
+0x187 WaitMode
: 1 ''
+0x1b4 WaitTime
: 0x39b38f8
+0x24b WaitBlockCount
: 0x1 ''
+0x283 WaitReason
: 0x6 ''
CHAPTER 8
System mechanisms
193
The data shows that this is a committed wait that was performed at IRQL 0 (Passive Level)
with a wait mode of UserMode, at the time shown in 15 ms clock ticks since boot, with the reason
indicating a user-mode application request. We can also see that this is the only wait block this
thread has, meaning that it is not waiting for any other object.
the second pointer value in the WaitListEntry
!thread on the thread pointer in the wait block) to traverse the list and see what other threads
look at their WaitBlockCount to see how many other wait blocks were present, and simply keep
incrementing the pointer by sizeof(KWAIT_BLOCK).
Another possibility is that the wait type would have been WaitNotification
KQUEUE) structure, which is
itself a dispatcher object. Potentially, it would also have had its own nonempty wait block list, which
would have revealed the wait block associated with the worker thread that will be asynchronously
eventually execute, you would have to dump user-mode thread pool data structures.
Keyed events
A synchronization object called a keyed event bears special mention because of the role it played in
user-mode-exclusive synchronization primitives and the development of the alert-by-ID primitive,
futex in the Linux operating system (a wellwith low-memory situations when using critical sections, which are user-mode synchronization objects
a “key” for which it waits, where the thread wakes when another thread of the same process signals
the event with the same key. As we pointed out, if this sounds familiar to the alerting mechanism, it is
because keyed events were its precursor.
If there was contention, EnterCriticalSection would dynamically allocate an event object, and the
thread wanting to acquire the critical section would wait for the thread that owns the critical section to
signal it in LeaveCriticalSection. Clearly, this introduces a problem during low-memory conditions: critical section acquisition could fail because the system was unable to allocate the event object required.
In a pathological case, the low-memory condition itself might have been caused by the application trythe only scenario that could cause this to fail—a less likely scenario was handle exhaustion. If the process reached its handle limit, the new handle for the event object could fail.
It might seem that preallocating a global standard event object, similar to the reserve objects we
tions, each of which can have its own locking state, this would require an unknown number of prealkeyed events, however, was
194
CHAPTER 8
System mechanisms
that a single event could be reused among different threads, as long as each one provided a different
key to distinguish itself. By providing the virtual address of the critical section itself as the key, this effectively allows multiple critical sections (and thus, waiters) to use the same keyed event handle, which
can be preallocated at process startup time.
key
critical section). When the owner thread releases the keyed event by signaling it, only a single thread
waiting on the key is woken up (the same behavior as synchronization events, in contrast to notification events). Going back to our use case of critical sections using their address as a key, this would imply that each process still needs its own keyed event because virtual addresses are obviously unique
to a single process address space. However, it turns out that the kernel can wake only the waiters in
the current process so that the key is even isolated across processes, meaning that there can be only
a single keyed event object for the entire system.
As such, when EnterCriticalSection called NtWaitForKeyedEvent to perform a wait on the keyed
event, it gave a NULL handle as parameter for the keyed event, telling the kernel that it was unable
to create a keyed event. The kernel recognizes this behavior and uses a global keyed event named
ExpCritSecOutOfMemoryEvent
a named keyed event anymore because the kernel keeps track of the object and its references.
However, keyed events were more than just a fallback object for low-memory conditions. When
multiple waiters are waiting on the same key and need to be woken up, the key is signaled multiple
times, which requires the object to keep a list of all the waiters so that it can perform a “wake” operation on each of them. (Recall that the result of signaling a keyed event is the same as that of signaling a
synchronization event.) However, a thread can signal a keyed event without any threads on the waiter
list. In this scenario, the signaling thread instead waits on the event itself.
Without this fallback, a signaling thread could signal the keyed event during the time that the usermode code saw the keyed event as unsignaled and attempt a wait. The wait might have come after
the signaling thread signaled the keyed event, resulting in a missed pulse, so the waiting thread would
deadlock. By forcing the signaling thread to wait in this scenario, it actually signals the keyed event only
when someone is looking (waiting). This behavior made them similar, but not identical, to the Linux
futex
Slim Read Writer (SRW) Locks.
Note When the keyed-event wait code needs to perform a wait, it uses a built-in semaphore located in the kernel-mode thread object (ETHREAD) called KeyedWaitSemaphore.
(This semaphore shares its location with the ALPC wait semaphore.) See Chapter 4 of Part 1
for more information on thread objects.
tion. The initial reason, during the Windows XP timeframe, was that keyed events did not offer scalable
performance in heavy-usage scenarios. Recall that all the algorithms described were meant to be used
CHAPTER 8
System mechanisms
195
ed to handle. The primary performance bottleneck was that keyed events maintained the list of waiters
described in a doubly linked list. This kind of list has poor traversal speed, meaning the time required
to loop through the list. In this case, this time depended on the number of waiter threads. Because the
object is global, dozens of threads could be on the list, requiring long traversal times every single time
a key was set or waited on.
Note The head of the list is kept in the keyed event object, whereas the threads are linked
through the KeyedWaitChain
LARGE_INTEGER, the same size as a doubly linked list) in the kernel-mode thread object
(ETHREAD). See Chapter 4 of Part 1 for more information on this object.
Windows Vista improved keyed-event performance by using a hash table instead of a linked list
to hold the waiter threads. This optimization is what ultimately allowed Windows to include the three
new lightweight user-mode synchronization primitives (to be discussed shortly) that all depended on
the keyed event. Critical sections, however, continued to use event objects, primarily for application
compatibility and debugging, because the event object and internals are well known and documented,
whereas keyed events are opaque and not exposed to the Win32 API.
With the introduction of the new alerting by Thread ID capabilities in Windows 8, however, this all
changed again, removing the usage of keyed events across the system (save for one situation in init
once
structure eventually dropped its usage of a regular event object and moved toward using this new capability as well (with an application compatibility shim that can revert to using the original event object
if needed).
Fast mutexes and guarded mutexes
objects because, although they are still built on a dispatcher object—an event—they perform a wait
only if the fast mutex is contended. Unlike a standard mutex, which always attempts the acquisition
through the dispatcher, this gives the fast mutex especially good performance in contended environall kernel-mode
APC (described earlier in this chapter) delivery can be disabled, unlike regular mutex objects that block
only normal
ExAcquireFastMutex and ExAcquireFastMutexUnsafe. The former function blocks all APC delivery by
raising the IRQL of the processor to APC level. The latter, “unsafe” function, expects to be called with
all kernel-mode APC delivery already disabled, which can be done by raising the IRQL to APC level.
ExTryToAcquireFastMutex
recursively, unlike mutex objects.
196
CHAPTER 8
System mechanisms
In Windows 8 and later, guarded mutexes are identical to fast mutexes but are acquired
with KeAcquireGuardedMutex and KeAcquireGuardedMutexUnsafe. Like fast mutexes, a
KeTryToAcquireGuardedMutex method also exists.
Prior to Windows 8, these functions did not disable APCs by raising the IRQL to APC level, but by
able APC delivery until the region was exited, as we saw earlier. On older systems with a PIC (which we
also talked about earlier in this chapter), this was faster than touching the IRQL. Additionally, guarded
mutexes used a gate dispatcher object, which was slightly faster than an event—another difference that
is no longer true.
Another problem related to the guarded mutex was the kernel function KeAreApcsDisabled. Prior to
Windows Server 2003, this function indicated whether normal APCs were disabled by checking whether
the code was running inside a critical section. In Windows Server 2003, this function was changed to
indicate whether the code was in a critical or guarded region, changing the functionality to also return
TRUE if special kernel APCs are also disabled.
Because there are certain operations that drivers should not perform when special kernel APCs
are disabled, it made sense to call KeGetCurrentIrql to check whether the IRQL is APC level or not,
which was the only way special kernel APCs could have been disabled. However, with the introduction of guarded regions and guarded mutexes, which were heavily used even by the memory
manager, this check failed because guarded mutexes did not raise IRQL. Drivers then had to call
KeAreAllApcsDisabled for this purpose, which also checked whether special kernel APCs were disabled
false positives, ultimately all led to the decision to simply make guarded mutexes revert to just being
fast mutexes.
Executive resources
Executive resources are a synchronization mechanism that supports shared and exclusive access; like
fast mutexes, they require that all kernel-mode APC delivery be disabled before they are acquired.
They are also built on dispatcher objects that are used only when there is contention. Executive rehave long-lasting wait periods in which I/O should still be allowed to some extent (such as reads).
Threads waiting to acquire an executive resource for shared access wait for a semaphore associated
with the resource, and threads waiting to acquire an executive resource for exclusive access wait for an
event. A semaphore with unlimited count is used for shared waiters because they can all be woken and
granted access to the resource when an exclusive holder releases the resource simply by signaling the
semaphore. When a thread waits for exclusive access of a resource that is currently owned, it waits on
a synchronization event object because only one of the waiters will wake when the event is signaled. In
the earlier section on synchronization events, it was mentioned that some event unwait operations can
actually cause a priority boost. This scenario occurs when executive resources are used, which is one
reason why they also track ownership like mutexes do. (See Chapter 4 of Part 1 for more information on
the executive resource priority boost.)
CHAPTER 8
System mechanisms
197
acquiring resources: ExAcquireResourceSharedLite, ExAcquireResourceExclusiveLite, ExAcquireShared
StarveExclusive, and ExAcquireShareWaitForExclusive
Recent versions of Windows also added fast executive resources that use identical API names but
add the word “fast,” such as ExAcquireFastResourceExclusive, ExReleaseFastResource, and so on. These
are meant to be faster replacements due to different handling of lock ownership, but no component
EXPERIMENT: Listing acquired executive resources
The kernel debugger !locks
dumps their state. By default, the command lists only executive resources that are currently
owned, but the –d option is documented as listing all executive resources—unfortunately, this
is no longer the case. However, you can still use the -v
resources instead. Here is partial output of the command:
lkd> !locks -v
**** DUMP OF ALL RESOURCE OBJECTS ****
Resource @ nt!ExpFirmwareTableResource (0xfffff8047ee34440)
Available
Resource @ nt!PsLoadedModuleResource (0xfffff8047ee48120)
Available
Contention Count = 2
Resource @ nt!SepRmDbLock (0xfffff8047ef06350)
Available
Contention Count = 93
Resource @ nt!SepRmDbLock (0xfffff8047ef063b8)
Available
Resource @ nt!SepRmDbLock (0xfffff8047ef06420)
Available
Resource @ nt!SepRmDbLock (0xfffff8047ef06488)
Available
Resource @ nt!SepRmGlobalSaclLock (0xfffff8047ef062b0)
Available
Resource @ nt!SepLsaAuditQueueInfo (0xfffff8047ee6e010)
Available
Resource @ nt!SepLsaDeletedLogonQueueInfo (0xfffff8047ee6ded0)
Available
Resource @ 0xffff898f032a8550
Available
Resource @ nt!PnpRegistryDeviceResource (0xfffff8047ee62b00)
Available
Contention Count = 27385
Resource @ nt!PopPolicyLock (0xfffff8047ee458c0)
Available
Contention Count = 14
Resource @ 0xffff898f032a8950
Available
Resource @ 0xffff898f032a82d0
Available
Note that the contention count, which is extracted from the resource structure, records
the number of times threads have tried to acquire the resource and had to wait because it was
already owned. On a live system where you break in with the debugger, you might be lucky
enough to catch a few held resources, as shown in the following output:
2: kd> !locks
**** DUMP OF ALL RESOURCE OBJECTS ****
KD: Scanning for held locks.....
Resource @ 0xffffde07a33d6a28
Shared 1 owning threads
Contention Count = 28
Threads: ffffde07a9374080-01<*>
198
CHAPTER 8
System mechanisms
KD: Scanning for held locks....
Resource @ 0xffffde07a2bfb350
Shared 1 owning threads
Contention Count = 2
Threads: ffffde07a9374080-01<*>
KD: Scanning for held locks...........................................................
Resource @ 0xffffde07a8070c00
Shared 1 owning threads
Threads: ffffde07aa3f1083-01<*> *** Actual Thread ffffde07aa3f1080
KD: Scanning for held locks...........................................................
Resource @ 0xffffde07a8995900
Exclusively owned
Threads: ffffde07a9374080-01<*>
KD: Scanning for held locks...........................................................
9706 total locks, 4 locks currently held
resource and any threads that are waiting for the resource, by specifying the –v switch and the
2: kd> !locks -v 0xffffde07a33d6a28
Resource @ 0xffffde07a33d6a28
Shared 1 owning threads
Contention Count = 28
Threads: ffffde07a9374080-01<*>
THREAD ffffde07a9374080 Cid 0544.1494 Teb: 000000ed8de12000
Win32Thread: 0000000000000000 WAIT: (Executive) KernelMode Non-Alertable
ffff8287943a87b8 NotificationEvent
IRP List:
ffffde07a936da20: (0006,0478) Flags: 00020043 Mdl: ffffde07a8a75950
ffffde07a894fa20: (0006,0478) Flags: 00000884 Mdl: 00000000
Not impersonating
DeviceMap
ffff8786fce35840
Owning Process
ffffde07a7f990c0
Image:
svchost.exe
Attached Process
N/A
Image:
N/A
Wait Start TickCount
3649
Ticks: 0
Context Switch Count
31
IdealProcessor: 1
UserTime
00:00:00.015
KernelTime
00:00:00.000
Win32 Start Address 0x00007ff926812390
Stack Init ffff8287943aa650 Current ffff8287943a8030
Base ffff8287943ab000 Limit ffff8287943a4000 Call 0000000000000000
Priority 7 BasePriority 6 PriorityDecrement 0 IoPriority 0 PagePriority 1
Child-SP
RetAddr
Call Site
ffff8287`943a8070 fffff801`104a423a nt!KiSwapContext+0x76
ffff8287`943a81b0 fffff801`104a5d53 nt!KiSwapThread+0x5ba
ffff8287`943a8270 fffff801`104a6579 nt!KiCommitThreadWait+0x153
ffff8287`943a8310 fffff801`1263e962 nt!KeWaitForSingleObject+0x239
ffff8287`943a8400 fffff801`1263d682 Ntfs!NtfsNonCachedIo+0xa52
ffff8287`943a86b0 fffff801`1263b756 Ntfs!NtfsCommonRead+0x1d52
ffff8287`943a8850 fffff801`1049a725 Ntfs!NtfsFsdRead+0x396
ffff8287`943a8920 fffff801`11826591 nt!IofCallDriver+0x55
CHAPTER 8
System mechanisms
199
Pushlocks
Pushlocks are another optimized synchronization mechanism built on event objects; like fast and
tages over them, however, in that they can also be acquired in shared or exclusive mode, just like an
executive resource. Unlike the latter, however, they provide an additional advantage due to their size:
a resource object is 104 bytes, but a pushlock is pointer sized. Because of this, pushlocks do not require
allocation nor initialization and are guaranteed to work in low-memory conditions. Many components
inside of the kernel moved away from executive resources to pushlocks, and modern third-party drivers all use pushlocks as well.
There are four types of pushlocks: normal, cache-aware, auto-expand, and address-based. Normal
pushlocks require only the size of a pointer in storage (4 bytes on 32-bit systems, and 8 bytes on 64-bit
systems). When a thread acquires a normal pushlock, the pushlock code marks the pushlock as owned
if it is not currently owned. If the pushlock is owned exclusively or the thread wants to acquire the
thread exclusively and the pushlock is owned on a shared basis, the thread allocates a wait block on
associated with the pushlock. When a thread releases a pushlock, the thread wakes a waiter, if any are
Because a pushlock is only pointer-sized, it actually contains a variety of bits to describe its state.
The meaning of those bits changes as the pushlock changes from being contended to noncontended.
In its initial state, the pushlock contains the following structure:
■
One lock bit, set to 1 if the lock is acquired
■
One waiting bit, set to 1 if the lock is contended and someone is waiting on it
■
optimized
■
■
One multiple shared bit, set to 1 if the pushlock is shared and currently acquired by more than
one thread
28 (on 32-bit Windows) or 60 (on 64-bit Windows) share count bits, containing the number of
threads that have acquired the pushlock
As discussed previously, when a thread acquires a pushlock exclusively while the pushlock is already
acquired by either multiple readers or a writer, the kernel allocates a pushlock wait block. The structure
of the pushlock value itself changes. The share count bits now become the pointer to the wait block.
tive to force it to be 16-byte aligned, the bottom 4 bits of any pushlock wait-block structure will be all
zeros. Therefore, those bits are ignored for the purposes of pointer dereferencing; instead, the 4 bits
shown earlier are combined with the pointer value. Because this alignment removes the share count
bits, the share count is now stored in the wait block instead.
A cache-aware pushlock adds layers to the normal (basic) pushlock by allocating a pushlock for each
processor in the system and associating it with the cache-aware pushlock. When a thread wants to
200
CHAPTER 8
System mechanisms
acquire a cache-aware pushlock for shared access, it simply acquires the pushlock allocated for its current processor in shared mode; to acquire a cache-aware pushlock exclusively, the thread acquires the
pushlock for each processor in exclusive mode.
As you can imagine, however, with Windows now supporting systems of up to 2560 processors, the
number of potential cache-padded slots in the cache-aware pushlock would require immense fixed allocations, even on systems with few processors. Support for dynamic hot-add of processors makes the
problem even harder because it would technically require the preallocation of all 2560 slots ahead of
time, creating multi-KB lock structures. To solve this, modern versions of Windows also implement the
auto-expand push lock. As the name suggests, this type of cache-aware pushlock can dynamically grow
the number of cache slots as needed, both based on contention and processor count, while guaranteeing forward progress, leveraging the executive’s slot allocator, which pre-reserves paged or nonpaged
pool (depending on flags that were passed in when allocating the auto-expand pushlock).
Unfortunately for third-party developers, cache-aware (and their newer cousins, auto-expand)
pushlocks are not officially documented for use, although certain data structures, such as FCB Headers in
Windows 10 21H1 and later, do opaquely use them (more information about the FCB structure is available
in Chapter 11.) Internal parts of the kernel in which auto-expand pushlocks are used include the memory
manager, where they are used to protect Address Windowing Extension (AWE) data structures.
Finally, another kind of nondocumented, but exported, push-lock is the address-based pushlock,
which rounds out the implementation with a mechanism similar to the address-based wait we’ll shortly
see in user mode. Other than being a different “kind” of pushlock, the address-based pushlock refers
more to the interface behind its usage. On one end, a caller uses ExBlockOnAddressPushLock, passing
in a pushlock, the virtual address of some variable of interest, the size of the variable (up to 8 bytes),
and a comparison address containing the expected, or desired, value of the variable. If the variable
does not currently have the expected value, a wait is initialized with ExTimedWaitForUnblockPushLock.
This behaves similarly to contended pushlock acquisition, with the difference that a timeout value can
be specified. On the other end, a caller uses ExUnblockOnAddressPushLockEx after making a change
to an address that is being monitored to signal a waiter that the value has changed. This technique
is especially useful when dealing with changes to data protected by a lock or interlocked operation,
so that racing readers can wait for the writer’s notification that their change is complete, outside of a
lock. Other than a much smaller memory footprint, one of the large advantages that pushlocks have
over executive resources is that in the noncontended case they do not require lengthy accounting and
integer operations to perform acquisition or release. By being as small as a pointer, the kernel can use
atomic CPU instructions to perform these tasks. (For example, on x86 and x64 processors, lock cmpxchg
is used, which atomically compares and exchanges the old lock with a new lock.) If the atomic compare
and exchange fails, the lock contains values the caller did not expect (callers usually expect the lock to
be unused or acquired as shared), and a call is then made to the more complex contended version.
To improve performance even further, the kernel exposes the pushlock functionality as inline
functions, meaning that no function calls are ever generated during noncontended acquisition—the
assembly code is directly inserted in each function. This increases code size slightly, but it avoids the
slowness of a function call. Finally, pushlocks use several algorithmic tricks to avoid lock convoys (a
situation that can occur when multiple threads of the same priority are all waiting on a lock and little
CHAPTER 8
System mechanisms
201
actual work gets done), and they are also self-optimizing: the list of threads waiting on a pushlock will
be periodically rearranged to provide fairer behavior when the pushlock is released.
One more performance optimization that is applicable to pushlock acquisition (including for addressbased pushlocks) is the opportunistic spinlock-like behavior during contention, before performing the
dispatcher object wait on the pushlock wait block’s event. If the system has at least one other unparked
processor (see Chapter 4 of Part 1 for more information on core parking), the kernel enters a tight spinbased loop for ExpSpinCycleCount cycles just like a spinlock would, but without raising the IRQL, issuing
a yield instruction (such as a pause on x86/x64) for each iteration. If during any of the iterations, the pushlock now appears to be released, an interlocked operation to acquire the pushlock is performed.
If the spin cycle times out, or the interlocked operation failed (due to a race), or if the system does
not have at least one additional unparked processor, then KeWaitForSingleObject is used on the event
object in the pushlock wait block. ExpSpinCycleCount is set to 10240 cycles on any machine with more
than one logical processor and is not configurable. For systems with an AMD processor that implements the MWAITT (MWAIT Timer) specification, the monitorx and mwaitx instructions are used
instead of a spin loop. This hardware-based feature enables waiting, at the CPU level, for the value at an
address to change without having to enter a loop, but they allow providing a timeout value so that the
wait is not indefinite (which the kernel supplies based on ExpSpinCycleCount).
On a final note, with the introduction of the AutoBoost feature (explained in Chapter 4 of Part 1),
pushlocks also leverage its capabilities by default, unless callers use the newer ExXxxPushLockXxxEx,
functions, which allow passing in the EX_PUSH_LOCK_FLAG_DISABLE_AUTOBOOST flag that disables
the functionality (which is not officially documented). By default, the non-Ex functions now call the
newer Ex functions, but without supplying the flag.
Address-based waits
Based on the lessons learned with keyed events, the key synchronization primitive that the Windows
kernel now exposes to user mode is the alert-by-ID system call (and its counterpart to wait-on-alert-byID). With these two simple system calls, which require no memory allocations or handles, any number
of process-local synchronizations can be built, which will include the addressed-based waiting mechanism we’re about to see, on top of which other primitives, such as critical sections and SRW locks, are
based upon.
Address-based waiting is based on three documented Win32 API calls: WaitOnAddress, WakeBy
AddressSingle, and WakeByAddressAll. These functions in KernelBase.dll are nothing more than forwarders into Ntdll.dll, where the real implementations are present under similar names beginning with
Rtl, standing for Run Time Library. The Wait API takes in an address pointing to a value of interest, the
size of the value (up to 8 bytes), and the address of the undesired value, plus a timeout. The Wake APIs
take in the address only.
First, RtlWaitOnAddress builds a local address wait block tracking the thread ID and address and
inserts it into a per-process hash table located in the Process Environment Block (PEB). This mirrors the work done by ExBlockOnAddressPushLock as we saw earlier, except that a hash table wasn’t
needed because the caller had to store a push lock pointer somewhere. Next, just like the kernel API,
RtlWaitOnAddress checks whether the target address already has a value different than the undesirable
202
CHAPTER 8
System mechanisms
one and, if so, removes the address wait block, returning FALSE. Otherwise, it will call an internal function to block.
If there is more than one unparked processor available, the blocking function will first attempt to
avoid entering the kernel by spinning in user mode on the value of the address wait block bit indicating
availability, based on the value of RtlpWaitOnAddressSpinCount, which is hardcoded to 1024 as long as
the system has more than one processor. If the wait block still indicates contention, a system call is now
made to the kernel using NtWaitForAlertByThreadId, passing in the address as the hint parameter, as
well as the timeout.
If the function returns due to a timeout, a flag is set in the address wait block to indicate this, and
the block is removed, with the function returning STATUS_TIMEOUT. However, there is a subtle race
condition where the caller may have called the Wake function just a few cycles after the wait has timed
out. Because the wait block flag is modified with a compare-exchange instruction, the code can detect
this and actually calls NtWaitForAlertByThreadId a second time, this time without a timeout. This is
guaranteed to return because the code knows that a wake is in progress. Note that in nontimeout
cases, there’s no need to remove the wait block, because the waker has already done so.
On the writer’s side, both RtlWakeOnAddressSingle and RtlWakeOnAddressAll leverage the same
helper function, which hashes the input address and looks it up in the PEB’s hash table introduced
earlier in this section. Carefully synchronizing with compare-exchange instructions, it removes the
address wait block from the hash table, and, if committed to wake up any waiters, it iterates over all
matching wait blocks for the same address, calling NtAlertThreadByThreadId for each of them, in the
All usage of the API, or only the first one, in the Single version of the API.
With this implementation, we essentially now have a user-mode implementation of keyed events
that does not rely on any kernel object or handle, not even a single global one, completely removing
any failures in low-resource conditions. The only thing the kernel is responsible for is putting the thread
in a wait state or waking up the thread from that wait state.
The next few sections cover various primitives that leverage this functionality to provide synchronization during contention.
Critical sections
Critical sections are one of the main synchronization primitives that Windows provides to user-mode
application developers on top of the kernel-based synchronization primitives. Critical sections and the
other user-mode primitives you’ll see later have one major advantage over their kernel counterparts,
which is saving a round trip to kernel mode in cases in which the lock is noncontended (which is typically 99 percent of the time or more). Contended cases still require calling the kernel, however, because
it is the only piece of the system that can perform the complex waking and dispatching logic required
to make these objects work.
Critical sections can remain in user mode by using a local bit to provide the main exclusive locking
logic, much like a pushlock. If the bit is 0, the critical section can be acquired, and the owner sets the bit
to 1. This operation doesn’t require calling the kernel but uses the interlocked CPU operations discussed earlier. Releasing the critical section behaves similarly, with bit state changing from 1 to 0 with
CHAPTER 8
System mechanisms
203
an interlocked operation. On the other hand, as you can probably guess, when the bit is already 1 and
another caller attempts to acquire the critical section, the kernel must be called to put the thread in a
wait state.
Akin to pushlocks and address-based waits, critical sections implement a further optimization to avoid entering the kernel: spinning, much like a spinlock (albeit at IRQL 0—Passive Level)
on the lock bit, hoping it clears up quickly enough to avoid the blocking wait. By default, this
is set to 2000 cycles, but it can be configured differently by using the InitializeCriticalSectionEx
or InitializeCriticalSectionAndSpinCount API at creation time, or later, by calling
SetCriticalSectionSpinCount.
Note As we discussed, because WaitForAddressSingle already implements a busy spin wait
as an optimization, with a default 1024 cycles, technically there are 3024 cycles spent spinning by default—first on the critical sections’ lock bit and then on the wait address block’s
lock bit, before actually entering the kernel.
When they do need to enter the true contention path, critical sections will, the first time they’re
called, attempt to initialize their LockSemaphore field. On modern versions of Windows, this is only done
if RtlpForceCSToUseEvents is set, which is the case if the KACF_ALLOCDEBUGINFOFORCRITSECTIONS
(0x400000) flag is set through the Application Compatibility Database on the current process. If the flag
is set, however, the underlying dispatcher event object will be created (even if the field refers to semaphore, the object is an event). Then, assuming that the event was created, a call to WaitForSingleObject is
performed to block on the critical section (typically with a per-process configurable timeout value, to aid
in the debugging of deadlocks, after which the wait is reattempted).
In cases where the application compatibility shim was not requested, or in extreme low-memory
conditions where the shim was requested but the event could not be created, critical sections no
longer use the event (nor any of the keyed event functionality described earlier). Instead, they directly
leverage the address-based wait mechanism described earlier (also with the same deadlock detection
timeout mechanism from the previous paragraph). The address of the local bit is supplied to the call
to WaitOnAddress, and as soon as the critical section is released by LeaveCriticalSection, it either calls
SetEvent on the event object or WakeAddressSingle on the local bit.
Note Even though we’ve been referring to APIs by their Win32 name, in reality, critical
sections are implemented by Ntdll.dll, and KernelBase.dll merely forwards the functions
to identical functions starting with Rtl instead, as they are part of the Run Time Library.
Therefore, RtlLeaveCriticalSection calls NtSetEvent. RtlWakeAddressSingle, and so on.
Finally, because critical sections are not kernel objects, they have certain limitations. The primary
one is that you cannot obtain a kernel handle to a critical section; as such, no security, naming, or other
Object Manager functionality can be applied to a critical section. Two processes cannot use the same
critical section to coordinate their operations, nor can duplication or inheritance be used.
204
CHAPTER 8
System mechanisms
User-mode resources
User-mode resources also provide more fine-grained locking mechanisms than kernel primitives. A
resource can be acquired for shared mode or for exclusive mode, allowing it to function as a multiplereader (shared), single-writer (exclusive) lock for data structures such as databases. When a resource is
acquired in shared mode and other threads attempt to acquire the same resource, no trip to the kernel
is required because none of the threads will be waiting. Only when a thread attempts to acquire the
resource for exclusive access, or the resource is already locked by an exclusive owner, is this required.
To make use of the same dispatching and synchronization mechanism you saw in the kernel, resources
make use of existing kernel primitives. A resource data structure (RTL_RESOURCE) contains handles
to two kernel semaphore objects. When the resource is acquired exclusively by more than one thread,
the resource releases the exclusive semaphore with a single release count because it permits only one
owner. When the resource is acquired in shared mode by more than one thread, the resource releases
the shared semaphore with as many release counts as the number of shared owners. This level of detail
is typically hidden from the programmer, and these internal objects should never be used directly.
Resources were originally implemented to support the SAM (or Security Account Manager, which is
discussed in Chapter 7 of Part 1) and not exposed through the Windows API for standard applications.
Slim Reader-Writer Locks (SRW Locks), described shortly, were later implemented to expose a similar
but highly optimized locking primitive through a documented API, although some system components
still use the resource mechanism.
Condition variables
Condition variables provide a Windows native implementation for synchronizing a set of threads that
are waiting on a specific result to a conditional test. Although this operation was possible with other
user-mode synchronization methods, there was no atomic mechanism to check the result of the conditional test and to begin waiting on a change in the result. This required that additional synchronization
be used around such pieces of code.
A user-mode thread initializes a condition variable by calling InitializeConditionVariable to set up the
initial state. When it wants to initiate a wait on the variable, it can call SleepConditionVariableCS, which
uses a critical section (that the thread must have initialized) to wait for changes to the variable, or, even
better, SleepConditionVariableSRW, which instead uses a Slim Reader/Writer (SRW) lock, which we describe next, giving the caller the advantage to do a shared (reader) of exclusive (writer) acquisition.
Meanwhile, the setting thread must use WakeConditionVariable (or WakeAllConditionVariable) after
it has modified the variable. This call releases the critical section or SRW lock of either one or all waiting
threads, depending on which function was used. If this sounds like address-based waiting, it’s because
it is—with the additional guarantee of the atomic compare-and-wait operation. Additionally, condition
variables were implemented before address-based waiting (and thus, before alert-by-ID) and had to
rely on keyed events instead, which were only a close approximation of the desired behavior.
Before condition variables, it was common to use either a notification event or a synchronization
event (recall that these are referred to as auto-reset or manual-reset in the Windows API) to signal the
CHAPTER 8
System mechanisms
205
change to a variable, such as the state of a worker queue. Waiting for a change required a critical section
to be acquired and then released, followed by a wait on an event. After the wait, the critical section
had to be reacquired. During this series of acquisitions and releases, the thread might have switched
contexts, causing problems if one of the threads called PulseEvent (a similar problem to the one that
keyed events solve by forcing a wait for the signaling thread if there is no waiter). With condition
variables, acquisition of the critical section or SRW lock can be maintained by the application while
SleepConditionVariableCS/SRW is called and can be released only after the actual work is done. This
makes writing work-queue code (and similar implementations) much simpler and predictable.
With both SRW locks and critical sections moving to the address-based wait primitives, however,
conditional variables can now directly leverage NtWaitForAlertByThreadId and directly signal the
thread, while building a conditional variable wait block that’s structurally similar to the address wait
block we described earlier. The need for keyed events is thus completely elided, and they remain only
for backward compatibility.
Slim Reader/Writer (SRW) locks
Although condition variables are a synchronization mechanism, they are not fully primitive locks
because they do implicit value comparisons around their locking behavior and rely on higherlevel abstractions to be provided (namely, a lock!). Meanwhile, address-based waiting is a primitive
operation, but it provides only the basic synchronization primitive, not true locking. In between these
two worlds, Windows has a true locking primitive, which is nearly identical to a pushlock: the Slim
Reader/Writer lock (SRW lock).
Like their kernel counterparts, SRW locks are also pointer sized, use atomic operations for acquisition
and release, rearrange their waiter lists, protect against lock convoys, and can be acquired both in
shared and exclusive mode. Just like pushlocks, SRW locks can be upgraded, or converted, from shared
to exclusive and vice versa, and they have the same restrictions around recursive acquisition. The only
real difference is that SRW locks are exclusive to user-mode code, whereas pushlocks are exclusive to
kernel-mode code, and the two cannot be shared or exposed from one layer to the other. Because
SRW locks also use the NtWaitForAlertByThreadId primitive, they require no memory allocation and are
guaranteed never to fail (other than through incorrect usage).
Not only can SRW locks entirely replace critical sections in application code, which reduces the need to
allocate the large CRITICAL_SECTION structure (and which previously required the creation of an event
object), but they also offer multiple-reader, single-writer functionality. SRW locks must first be initialized
with InitializeSRWLock or can be statically initialized with a sentinel value, after which they can be acquired or released in either exclusive or shared mode with the appropriate APIs: AcquireSRWLockExclusive,
ReleaseSRWLockExclusive, AcquireSRWLockShared, and ReleaseSRWLockShared. APIs also exist for opportunistically trying to acquire the lock, guaranteeing that no blocking operation will occur, as well as
converting the lock from one mode to another.
206
CHAPTER 8
System mechanisms
Note Unlike most other Windows APIs, the SRW locking functions do not return with a
value—instead, they generate exceptions if the lock could not be acquired. This makes
it obvious that an acquisition has failed so that code that assumes success will terminate
instead of potentially proceeding to corrupt user data. Since SRW locks do not fail due to
resource exhaustion, the only such exception possible is STATUS_RESOURCE_NOT_OWNED
in the case that a nonshared SRW lock is incorrectly being released in shared mode.
The Windows SRW locks do not prefer readers or writers, meaning that the performance for either
case should be the same. This makes them great replacements for critical sections, which are writeronly or exclusive synchronization mechanisms, and they provide an optimized alternative to resources.
If SRW locks were optimized for readers, they would be poor exclusive-only locks, but this isn’t the
case. This is why we earlier mentioned that conditional variables can also use SRW locks through the
SleepConditionVariableSRW API. That being said, since keyed events are no longer used in one mechanism (SRW) but are still used in the other (CS), address-based waiting has muted most benefits other
than code size—and the ability to have shared versus exclusive locking. Nevertheless, code targeting
older versions of Windows should use SRW locks to guarantee the increased benefits are there on
kernels that still used keyed events.
Run once initialization
The ability to guarantee the atomic execution of a piece of code responsible for performing some sort
of initialization task—such as allocating memory, initializing certain variables, or even creating objects
on demand—is a typical problem in multithreaded programming. In a piece of code that can be called
simultaneously by multiple threads (a good example is the DllMain routine, which initializes a DLL), there
are several ways of attempting to ensure the correct, atomic, and unique execution of initialization tasks.
For this scenario, Windows implements init once, or one-time initialization (also called run once initialization internally). The API exists both as a Win32 variant, which calls into Ntdll.dll’s Run Time Library
(Rtl) as all the other previously seen mechanisms do, as well as the documented Rtl set of APIs, which
are exposed to kernel programmers in Ntoskrnl.exe instead (obviously, user-mode developers could
bypass Win32 and use the Rtl functions in Ntdll.dll too, but that is never recommended). The only difference between the two implementations is that the kernel ends up using an event object for synchronization, whereas user mode uses a keyed event instead (in fact, it passes in a NULL handle to use the
low-memory keyed event that was previously used by critical sections).
Note Since recent versions of Windows now implement an address-based pushlock in
kernel mode, as well as the address-based wait primitive in user mode, the Rtl library could
probably be updated to use RtlWakeAddressSingle and ExBlockOnAddressPushLock, and in
fact a future version of Windows could always do that—the keyed event merely provided a
more similar interface to a dispatcher event object in older Windows versions. As always, do
not rely on the internal details presented in this book, as they are subject to change.
CHAPTER 8
System mechanisms
207
The init once mechanism allows for both synchronous (meaning that the other threads must wait for
initialization to complete) execution of a certain piece of code, as well as asynchronous (meaning that
the other threads can attempt to do their own initialization and race) execution. We look at the logic
behind asynchronous execution after explaining the synchronous mechanism.
In the synchronous case, the developer writes the piece of code that would normally execute after
double-checking the global variable in a dedicated function. Any information that this routine needs
can be passed through the parameter variable that the init once routine accepts. Any output information is returned through the context variable. (The status of the initialization itself is returned as
a Boolean.) All the developer has to do to ensure proper execution is call InitOnceExecuteOnce with
the parameter, context, and run-once function pointer after initializing an INIT_ONCE object with
InitOnceInitialize API. The system takes care of the rest.
For applications that want to use the asynchronous model instead, the threads call
InitOnceBeginInitialize and receive a BOOLEAN pending status and the context described earlier. If the
pending status is FALSE, initialization has already taken place, and the thread uses the context value
for the result. (It’s also possible for the function to return FALSE, meaning that initialization failed.)
However, if the pending status comes back as TRUE, the thread should race to be the first to create the
object. The code that follows performs whatever initialization tasks are required, such as creating objects or allocating memory. When this work is done, the thread calls InitOnceComplete with the result of
the work as the context and receives a BOOLEAN status. If the status is TRUE, the thread won the race,
and the object that it created or allocated is the one that will be the global object. The thread can now
save this object or return it to a caller, depending on the usage.
In the more complex scenario when the status is FALSE, this means that the thread lost the race.
The thread must undo all the work it did, such as deleting objects or freeing memory, and then call
InitOnceBeginInitialize again. However, instead of requesting to start a race as it did initially, it uses the
INIT_ONCE_CHECK_ONLY flag, knowing that it has lost, and requests the winner’s context instead (for
example, the objects or memory that were created or allocated by the winner). This returns another
status, which can be TRUE, meaning that the context is valid and should be used or returned to the
caller, or FALSE, meaning that initialization failed and nobody has been able to perform the work (such
as in the case of a low-memory condition, perhaps).
In both cases, the mechanism for run-once initialization is similar to the mechanism for condition
variables and SRW locks. The init once structure is pointer-size, and inline assembly versions of the SRW
acquisition/release code are used for the noncontended case, whereas keyed events are used when
contention has occurred (which happens when the mechanism is used in synchronous mode) and the
other threads must wait for initialization. In the asynchronous case, the locks are used in shared mode,
so multiple threads can perform initialization at the same time. Although not as highly efficient as the
alert-by-ID primitive, the usage of a keyed event still guarantees that the init once mechanism will function even in most cases of memory exhaustion.
208
CHAPTER 8
System mechanisms
Advanced local procedure call
All modern operating systems require a mechanism for securely and efficiently transferring data
between one or more processes in user mode, as well as between a service in the kernel and clients in
user mode. Typically, UNIX mechanisms such as mailslots, files, named pipes, and sockets are used for
portability, whereas in other cases, developers can use OS-specific functionality, such as the ubiquitous
window messages used in Win32 graphical applications. In addition, Windows also implements an
internal IPC mechanism called Advanced (or Asynchronous) Local Procedure Call, or ALPC, which is a
high-speed, scalable, and secured facility for message passing arbitrary-size messages.
Note ALPC is the replacement for an older IPC mechanism initially shipped with the very
first kernel design of Windows NT, called LPC, which is why certain variables, fields, and
functions might still refer to “LPC” today. Keep in mind that LPC is now emulated on top of
ALPC for compatibility and has been removed from the kernel (legacy system calls still exist,
which get wrapped into ALPC calls).
Although it is internal, and thus not available for third-party developers, ALPC is widely used in various parts of Windows:
■
■
■
■
■
■
■
Windows applications that use remote procedure call (RPC), a documented API, indirectly use
ALPC when they specify local-RPC over the ncalrpc transport, a form of RPC used to communicate between processes on the same system. This is now the default transport for almost all RPC
clients. In addition, when Windows drivers leverage kernel-mode RPC, this implicitly uses ALPC
as well as the only transport permitted.
Whenever a Windows process and/or thread starts, as well as during any Windows subsystem
operation, ALPC is used to communicate with the subsystem process (CSRSS). All subsystems
communicate with the session manager (SMSS) over ALPC.
When a Windows process raises an exception, the kernel’s exception dispatcher communicates
with the Windows Error Reporting (WER) Service by using ALPC. Processes also can communicate with WER on their own, such as from the unhandled exception handler. (WER is discussed
later in Chapter 10.)
Winlogon uses ALPC to communicate with the local security authentication process, LSASS.
The security reference monitor (an executive component explained in Chapter 7 of Part 1) uses
ALPC to communicate with the LSASS process.
The user-mode power manager and power monitor communicate with the kernel-mode power
manager over ALPC, such as whenever the LCD brightness is changed.
The User-Mode Driver Framework (UMDF) enables user-mode drivers to communicate with the
kernel-mode reflector driver by using ALPC.
CHAPTER 8
System mechanisms
209
■
■
■
The new Core Messaging mechanism used by CoreUI and modern UWP UI components use
ALPC to both register with the Core Messaging Registrar, as well as to send serialized message
objects, which replace the legacy Win32 window message model.
The Isolated LSASS process, when Credential Guard is enabled, communicates with LSASS by
using ALPC. Similarly, the Secure Kernel transmits trustlet crash dump information through
ALPC to WER.
As you can see from these examples, ALPC communication crosses all possible types of security boundaries—from unprivileged applications to the kernel, from VTL 1 trustlets to VTL 0
services, and everything in between. Therefore, security and performance were critical requirements in its design.
Connection model
Typically, ALPC messages are used between a server process and one or more client processes of that
server. An ALPC connection can be established between two or more user-mode processes or between
a kernel-mode component and one or more user-mode processes, or even between two kernel-mode
components (albeit this would not be the most efficient way of communicating). ALPC exposes a single
executive object called the port object to maintain the state needed for communication. Although this
is just one object, there are several kinds of ALPC ports that it can represent:
■
■
■
■
Server connection port A named port that is a server connection request point. Clients can
connect to the server by connecting to this port.
Server communication port An unnamed port a server uses to communicate with one of its
clients. The server has one such port per active client.
Client communication port An unnamed port each client uses to communicate with its server.
Unconnected communication port An unnamed port a client can use to communicate
locally with itself. This model was abolished in the move from LPC to ALPC but is emulated for
Legacy LPC for compatibility reasons.
ALPC follows a connection and communication model that’s somewhat reminiscent of BSD socket
programming. A server first creates a server connection port (NtAlpcCreatePort), whereas a client attempts to connect to it (NtAlpcConnectPort). If the server was in a listening state (by using
NtAlpcSendWaitReceivePort), it receives a connection request message and can choose to accept it
(NtAlpcAcceptConnectPort). In doing so, both the client and server communication ports are created,
and each respective endpoint process receives a handle to its communication port. Messages are
then sent across this handle (still by using NtAlpcSendWaitReceivePort), which the server continues to
receive by using the same API. Therefore, in the simplest scenario, a single server thread sits in a loop
calling NtAlpcSendWaitReceivePort and receives with connection requests, which it accepts, or messages, which it handles and potentially responds to. The server can differentiate between messages by
reading the PORT_HEADER structure, which sits on top of every message and contains a message type.
The various message types are shown in Table 8-30.
210
CHAPTER 8
System mechanisms
TABLE 8-30 ALPC message types
pe
Meaning
LPC_REQUEST
A normal ALPC message, with a potential synchronous reply
LPC_REPLY
An ALPC message datagram, sent as an asynchronous reply to a previous datagram
LPC_DATAGRAM
An ALPC message datagram, which is immediately released and cannot be synchronously replied to
LPC_LOST_REPLY
Deprecated, used by Legacy LPC Reply API
LPC_PORT_CLOSED
Sent whenever the last handle of an ALPC port is closed, notifying clients and servers
that the other side is gone
LPC_CLIENT_DIED
Sent by the process manager (PspExitThread) using Legacy LPC to the registered termination port(s) of the thread and the registered exception port of the process
LPC_EXCEPTION
Sent by the User-Mode Debugging Framework (DbgkForwardException) to the exception port through Legacy LPC
LPC_DEBUG_EVENT
Deprecated, used by the legacy user-mode debugging services when these were part
of the Windows subsystem
LPC_ERROR_EVENT
Sent whenever a hard error is generated from user-mode (NtRaiseHardError) and sent
using Legacy LPC to exception port of the target thread, if any, otherwise to the error
port, typically owned by CSRSS
LPC_CONNECTION_REQUEST
An ALPC message that represents an attempt by a client to connect to the server’s connection port
LPC_CONNECTION_REPLY
The internal message that is sent by a server when it calls NtAlpcAcceptConnectPort to
accept a client’s connection request
LPC_CANCELED
The received reply by a client or server that was waiting for a message that has now
been canceled
LPC_UNREGISTER_PROCESS
Sent by the process manager when the exception port for the current process is
swapped to a different one, allowing the owner (typically CSRSS) to unregister its data
structures for the thread switching its port to a different one
The server can also deny the connection, either for security reasons or simply due to protocol or
versioning issues. Because clients can send a custom payload with a connection request, this is usually used by various services to ensure that the correct client, or only one client, is talking to the server.
If any anomalies are found, the server can reject the connection and, optionally, return a payload
containing information on why the client was rejected (allowing the client to take corrective action, if
possible, or for debugging purposes).
Once a connection is made, a connection information structure (actually, a blob, as we describe
shortly) stores the linkage between all the different ports, as shown in Figure 8-40.
CHAPTER 8
System mechanisms
211
Client address
space
Kernel address space
Server address
space
Connection port
Message
queue
Client process
Server process
Handle
Handle
Client
communication
port
Client view
of section
Server
communication
port
Handle
Server view
of section
Shared
section
FIGURE 8-40 Use of ALPC ports.
Message model
Using ALPC, a client and thread using blocking messages each take turns performing a loop around the
NtAlpcSendWaitReceivePort system call, in which one side sends a request and waits for a reply while
the other side does the opposite. However, because ALPC supports asynchronous messages, it’s possible for either side not to block and choose instead to perform some other runtime task and check for
messages later (some of these methods will be described shortly). ALPC supports the following three
methods of exchanging payloads sent with a message:
■
■
A message can be sent to another process through the standard double-buffering mechanism, in which the kernel maintains a copy of the message (copying it from the source process),
switches to the target process, and copies the data from the kernel’s buffer. For compatibility, if
legacy LPC is being used, only messages of up to 256 bytes can be sent this way, whereas ALPC
can allocate an extension buffer for messages up to 64 KB.
A message can be stored in an ALPC section object from which the client and server processes
map views. (See Chapter 5 in Part 1 for more information on section mappings.)
An important side effect of the ability to send asynchronous messages is that a message can be canceled—for example, when a request takes too long or if the user has indicated that they want to cancel
the operation it implements. ALPC supports this with the NtAlpcCancelMessage system call.
212
CHAPTER 8
System mechanisms
An ALPC message can be on one of five different queues implemented by the ALPC port object:
■
■
■
Main queue
A message has been sent, and the client is processing it.
Pending queue A message has been sent and the caller is waiting for a reply, but the reply
has not yet been sent.
Large message queue A message has been sent, but the caller’s buffer was too small to
receive it. The caller gets another chance to allocate a larger buffer and request the message
payload again.
■
Canceled queue
■
Direct queue
A message that was sent to the port but has since been canceled.
A message that was sent with a direct event attached.
Note that a sixth queue, called the wait queue, does not link messages together; instead, it links all
the threads waiting on a message.
EXPERIMENT: Viewing subsystem ALPC port objects
You can see named ALPC port objects with the WinObj tool from Sysinternals or WinObjEx64
from GitHub. Run one of the two tools elevated as Administrator and select the root directory. A
gear icon identifies the port objects in WinObj, and a power plug in WinObjEx64, as shown here
(you can also click on the Type field to easily sort all the objects by their type):
CHAPTER 8
System mechanisms
213
You should see the ALPC ports used by the power manager, the security manager, and
other internal Windows services. If you want to see the ALPC port objects used by RPC, you can
select the \RPC Control directory. One of the primary users of ALPC, outside of Local RPC, is the
Windows subsystem, which uses ALPC to communicate with the Windows subsystem DLLs that
are present in all Windows processes. Because CSRSS loads once for each session, you will find its
ALPC port objects under the appropriate \Sessions\X\Windows directory, as shown here:
Asynchronous operation
The synchronous model of ALPC is tied to the original LPC architecture in the early NT design and is
similar to other blocking IPC mechanisms, such as Mach ports. Although it is simple to design, a blocking IPC algorithm includes many possibilities for deadlock, and working around those scenarios creates
complex code that requires support for a more flexible asynchronous (nonblocking) model. As such,
ALPC was primarily designed to support asynchronous operation as well, which is a requirement for
scalable RPC and other uses, such as support for pending I/O in user-mode drivers. A basic feature of
ALPC, which wasn’t originally present in LPC, is that blocking calls can have a timeout parameter. This
allows legacy applications to avoid certain deadlock scenarios.
However, ALPC is optimized for asynchronous messages and provides three different models for
asynchronous notifications. The first doesn’t actually notify the client or server but simply copies the
data payload. Under this model, it’s up to the implementor to choose a reliable synchronization method. For example, the client and the server can share a notification event object, or the client can poll for
data arrival. The data structure used by this model is the ALPC completion list (not to be confused with
214
CHAPTER 8
System mechanisms
the Windows I/O completion port). The ALPC completion list is an efficient, nonblocking data structure that enables atomic passing of data between clients, and its internals are described further in the
upcoming “Performance” section.
The next notification model is a waiting model that uses the Windows completion-port mechanism
(on top of the ALPC completion list). This enables a thread to retrieve multiple payloads at once, control
the maximum number of concurrent requests, and take advantage of native completion-port functionality. The user-mode thread pool implementation provides internal APIs that processes use to manage
ALPC messages within the same infrastructure as worker threads, which are implemented using this
model. The RPC system in Windows, when using Local RPC (over ncalrpc), also makes use of this functionality to provide efficient message delivery by taking advantage of this kernel support, as does the
kernel mode RPC runtime in Msrpc.sys.
Finally, because drivers can run in arbitrary context and typically do not like creating dedicated
system threads for their operation, ALPC also provides a mechanism for a more basic, kernel-based
notification using executive callback objects. A driver can register its own callback and context with
NtSetInformationAlpcPort, after which it will get called whenever a message is received. The Power
Dependency Coordinator (Pdc.sys) in the kernel employs this mechanism for communicating with its
clients, for example. It’s worth noting that using an executive callback object has potential advantages—but also security risks—in terms of performance. Because the callbacks are executed in a blocking
fashion (once signaled), and inline with the signaling code, they will always run in the context of an
ALPC message sender (that is, inline with a user-mode thread calling NtAlpcSendWaitReceivePort). This
means that the kernel component can have the chance to examine the state of its client without the
cost of a context switch and can potentially consume the payload in the context of the sender.
The reason these are not absolute guarantees, however (and this becomes a risk if the implementor
is unaware), is that multiple clients can send a message to the port at the same time and existing messages can be sent by a client before the server registers its executive callback object. It’s also possible
for another client to send yet another message while the server is still processing the first message from
a different client. In all these cases, the server will run in the context of one of the clients that sent a
message but may be analyzing a message sent by a different client. The server should distinguish this
situation (since the Client ID of the sender is encoded in the PORT_HEADER of the message) and attach/
analyze the state of the correct sender (which now has a potential context switch cost).
Views, regions, and sections
Instead of sending message buffers between their two respective processes, a server and client
can choose a more efficient data-passing mechanism that is at the core of the memory manager in
Windows: the section object. (More information is available in Chapter 5 in Part 1.) This allows a piece of
memory to be allocated as shared and for both client and server to have a consistent, and equal, view
of this memory. In this scenario, as much data as can fit can be transferred, and data is merely copied
into one address range and immediately available in the other. Unfortunately, shared-memory communication, such as LPC traditionally provided, has its share of drawbacks, especially when considering
security ramifications. For one, because both client and server must have access to the shared memory,
an unprivileged client can use this to corrupt the server’s shared memory and even build executable
CHAPTER 8
System mechanisms
215
payloads for potential exploits. Additionally, because the client knows the location of the server’s data,
it can use this information to bypass ASLR protections. (See Chapter 5 in Part 1 for more information.)
ALPC provides its own security on top of what’s provided by section objects. With ALPC, a specific
ALPC section object must be created with the appropriate NtAlpcCreatePortSection API, which creates
the correct references to the port, as well as allows for automatic section garbage collection. (A manual
API also exists for deletion.) As the owner of the ALPC section object begins using the section, the allocated chunks are created as ALPC regions, which represent a range of used addresses within the section and add an extra reference to the message. Finally, within a range of shared memory, the clients
obtain views to this memory, which represents the local mapping within their address space.
Regions also support a couple of security options. First, regions can be mapped either using
a secure mode or an unsecure mode. In the secure mode, only two views (mappings) are allowed
to the region. This is typically used when a server wants to share data privately with a single client process. Additionally, only one region for a given range of shared memory can be opened from
within the context of a given port. Finally, regions can also be marked with write-access protection, which enables only one process context (the server) to have write access to the view (by using
MmSecureVirtualMemoryAgainstWrites). Other clients, meanwhile, will have read-only access only.
These settings mitigate many privilege-escalation attacks that could happen due to attacks on shared
memory, and they make ALPC more resilient than typical IPC mechanisms.
Attributes
ALPC provides more than simple message passing; it also enables specific contextual information to
be added to each message and have the kernel track the validity, lifetime, and implementation of
that information. Users of ALPC can assign their own custom context information as well. Whether it’s
system-managed or user-managed, ALPC calls this data attributes. There are seven attributes that the
kernel manages:
■
■
■
■
■
216
The security attribute, which holds key information to allow impersonation of clients, as well as
advanced ALPC security functionality (which is described later).
The data view attribute, responsible for managing the different views associated with the
regions of an ALPC section. It is also used to set flags such as the auto-release flag, and when
replying, to unmap a view manually.
The context attribute, which allows user-managed context pointers to be placed on a port, as
well as on a specific message sent across the port. In addition, a sequence number, message ID,
and callback ID are stored here and managed by the kernel, which allows uniqueness, messagebased hashing, and sequencing to be implemented by users of ALPC.
The handle attribute, which contains information about which handles to associate with the
message (which is described in more detail later in the “Handle passing” section).
The token attribute, which can be used to get the Token ID, Authentication ID, and Modified ID
of the message sender, without using a full-blown security attribute (but which does not, on its
own, allow impersonation to occur).
CHAPTER 8
System mechanisms
■
■
The direct attribute, which is used when sending direct messages that have a synchronization
object associated with them (described later in the “Direct event” section).
The work-on-behalf-of attribute, which is used to encode a work ticket used for better power
management and resource management decisions (see the “Power management” section later).
Some of these attributes are initially passed in by the server or client when the message is sent and
converted into the kernel’s own internal ALPC representation. If the ALPC user requests this data back,
it is exposed back securely. In a few cases, a server or client can always request an attribute, because it
is ALPC that internally associates it with a message and always makes it available (such as the context
or token attributes). By implementing this kind of model and combining it with its own internal handle
table, described next, ALPC can keep critical data opaque between clients and servers while still maintaining the true pointers in kernel mode.
To define attributes correctly, a variety of APIs are available for internal ALPC consumers, such as
AlpcInitializeMessageAttribute and AlpcGetMessageAttribute.
Blobs, handles, and resources
Although the ALPC subsystem exposes only one Object Manager object type (the port), it internally
must manage a number of data structures that allow it to perform the tasks required by its mechanisms. For example, ALPC needs to allocate and track the messages associated with each port, as well
as the message attributes, which it must track for the duration of their lifetime. Instead of using the
Object Manager’s routines for data management, ALPC implements its own lightweight objects called
blobs. Just like objects, blobs can automatically be allocated and garbage collected, reference tracked,
and locked through synchronization. Additionally, blobs can have custom allocation and deallocation
callbacks, which let their owners control extra information that might need to be tracked for each blob.
Finally, ALPC also uses the executive’s handle table implementation (used for objects and PIDs/TIDs) to
have an ALPC-specific handle table, which allows ALPC to generate private handles for blobs, instead of
using pointers.
In the ALPC model, messages are blobs, for example, and their constructor generates a message ID,
which is itself a handle into ALPC’s handle table. Other ALPC blobs include the following:
■
■
■
■
■
The connection blob, which stores the client and server communication ports, as well as the
server connection port and ALPC handle table.
The security blob, which stores the security data necessary to allow impersonation of a client.
It stores the security attribute.
The section, region, and view blobs, which describe ALPC’s shared-memory model. The view
blob is ultimately responsible for storing the data view attribute.
The reserve blob, which implements support for ALPC Reserve Objects. (See the “Reserve
objects” section earlier in this chapter.)
The handle data blob, which contains the information that enables ALPC’s handle attribute support.
CHAPTER 8
System mechanisms
217
Because blobs are allocated from pageable memory, they must carefully be tracked to ensure their
deletion at the appropriate time. For certain kinds of blobs, this is easy: for example, when an ALPC
message is freed, the blob used to contain it is also deleted. However, certain blobs can represent
numerous attributes attached to a single ALPC message, and the kernel must manage their lifetime
appropriately. For example, because a message can have multiple views associated with it (when many
clients have access to the same shared memory), the views must be tracked with the messages that
reference them. ALPC implements this functionality by using a concept of resources. Each message
is associated with a resource list, and whenever a blob associated with a message (that isn’t a simple
pointer) is allocated, it is also added as a resource of the message. In turn, the ALPC library provides
functionality for looking up, flushing, and deleting associated resources. Security blobs, reserve blobs,
and view blobs are all stored as resources.
Handle passing
A key feature of Unix Domain Sockets and Mach ports, which are the most complex and most used
IPC mechanisms on Linux and macOS, respectively, is the ability to send a message that encodes a file
descriptor which will then be duplicated in the receiving process, granting it access to a UNIX-style file
(such as a pipe, socket, or actual file system location). With ALPC, Windows can now also benefit from
this model, with the handle attribute exposed by ALPC. This attribute allows a sender to encode an
object type, some information about how to duplicate the handle, and the handle index in the table of
the sender. If the handle index matches the type of object the sender is claiming to send, a duplicated
handle is created, for the moment, in the system (kernel) handle table. This first part guarantees that
the sender truly is sending what it is claiming, and that at this point, any operation the sender might
undertake does not invalidate the handle or the object beneath it.
Next, the receiver requests exposing the handle attribute, specifying the type of object they expect.
If there is a match, the kernel handle is duplicated once more, this time as a user-mode handle in the
table of the receiver (and the kernel copy is now closed). The handle passing has been completed, and
the receiver is guaranteed to have a handle to the exact same object the sender was referencing and of
the type the receiver expects. Furthermore, because the duplication is done by the kernel, it means a
privileged server can send a message to an unprivileged client without requiring the latter to have any
type of access to the sending process.
This handle-passing mechanism, when first implemented, was primarily used by the Windows
subsystem (CSRSS), which needs to be made aware of any child processes created by existing Windows
processes, so that they can successfully connect to CSRSS when it is their turn to execute, with CSRSS
already knowing about their creation from the parent. It had several issues, however, such as the inability to send more than a single handle (and certainly not more than one type of object). It also forced
receivers to always receive any handle associated with a message on the port without knowing ahead
of time if the message should have a handle associated with it to begin with.
To rectify these issues, Windows 8 and later now implement the indirect handle passing mechanism,
which allows sending multiple handles of different types and allows receivers to manually retrieve handles on a per-message basis. If a port accepts and enables such indirect handles (non-RPC-based ALPC
servers typically do not use indirect handles), handles will no longer be automatically duplicated based
218
CHAPTER 8
System mechanisms
on the handle attribute passed in when receiving a new message with NtAlpcSendWaitReceivePort—
instead, ALPC clients and servers will have to manually query how many handles a given message contains, allocate sufficient data structures to receive the handle values and their types, and then request
the duplication of all the handles, parsing the ones that match the expected types (while closing/dropping unexpected ones) by using NtAlpcQueryInformationMessage and passing in the received message.
This new behavior also introduces a security benefit—instead of handles being automatically duplicated as soon as the caller specifies a handle attribute with a matching type, they are only duplicated
when requested on a per-message basis. Because a server might expect a handle for message A, but
not necessarily for all other messages, nonindirect handles can be problematic if the server doesn’t
think of closing any possible handle even while parsing message B or C. With indirect handles, the
server would never call NtAlpcQueryInformationMessage for such messages, and the handles would
never be duplicated (or necessitate closing them).
Due to these improvements, the ALPC handle-passing mechanism is now exposed beyond just the
limited use-cases described and is integrated with the RPC runtime and IDL compiler. It is now possible
to use the system_handle(sh_type) syntax to indicate more than 20 different handle types that the RPC
runtime can marshal from a client to a server (or vice-versa). Furthermore, although ALPC provides
the type checking from the kernel’s perspective, as described earlier, the RPC runtime itself also does
additional type checking—for example, while both named pipes, sockets, and actual files are all “File
Objects” (and thus handles of type “File”), the RPC runtime can do marshalling and unmarshalling
checks to specifically detect whether a Socket handle is being passed when the IDL file indicates system_handle(sh_pipe), for example (this is done by calling APIs such as GetFileAttribute, GetDeviceType,
and so on).
This new capability is heavily leveraged by the AppContainer infrastructure and is the key way
through which the WinRT API transfers handles that are opened by the various brokers (after doing capability checks) and duplicated back into the sandboxed application for direct use. Other
RPC services that leverage this functionality include the DNS Client, which uses it to populate the
ai_resolutionhandle field in the GetAddrInfoEx API.
Security
ALPC implements several security mechanisms, full security boundaries, and mitigations to prevent attacks in case of generic IPC parsing bugs. At a base level, ALPC port objects are managed by the same
Object Manager interfaces that manage object security, preventing nonprivileged applications from
obtaining handles to server ports with ACL. On top of that, ALPC provides a SID-based trust model,
inherited from the original LPC design. This model enables clients to validate the server they are connecting to by relying on more than just the port name. With a secured port, the client process submits
to the kernel the SID of the server process it expects on the side of the endpoint. At connection time,
the kernel validates that the client is indeed connecting to the expected server, mitigating namespace
squatting attacks where an untrusted server creates a port to spoof a server.
ALPC also allows both clients and servers to atomically and uniquely identify the thread and process
responsible for each message. It also supports the full Windows impersonation model through the
CHAPTER 8
System mechanisms
219
NtAlpcImpersonateClientThread API. Other APIs give an ALPC server the ability to query the SIDs associated with all connected clients and to query the LUID (locally unique identifier) of the client’s security
token (which is further described in Chapter 7 of Part 1).
ALPC port ownership
The concept of port ownership is important to ALPC because it provides a variety of security guarantees to interested clients and servers. First and foremost, only the owner of an ALPC connection port
can accept connections on the port. This ensures that if a port handle were to be somehow duplicated
or inherited into another process, it would not be able to illegitimately accept incoming connections.
Additionally, when handle attributes are used (direct or indirect), they are always duplicated in the context of the port owner process, regardless of who may be currently parsing the message.
These checks are highly relevant when a kernel component might be communicating with a client
using ALPC—the kernel component may currently be attached to a completely different process (or
even be operating as part of the System process with a system thread consuming the ALPC port messages), and knowledge of the port owner means ALPC does not incorrectly rely on the current process.
Conversely, however, it may be beneficial for a kernel component to arbitrarily accept incoming
connections on a port regardless of the current process. One poignant example of this issue is when an
executive callback object is used for message delivery. In this scenario, because the callback is synchronously called in the context of one or more sender processes, whereas the kernel connection port was
likely created while executing in the System context (such as in DriverEntry), there would be a mismatch
between the current process and the port owner process during the acceptance of the connection.
ALPC provides a special port attribute flag—which only kernel callers can use—that marks a connection port as a system port; in such a case, the port owner checks are ignored.
Another important use case of port ownership is when performing server SID validation checks if
a client has requested it, as was described in the “Security” section. This validation is always done by
checking against the token of the owner of the connection port, regardless of who may be listening for
messages on the port at this time.
Performance
ALPC uses several strategies to enhance performance, primarily through its support of completion lists,
which were briefly described earlier. At the kernel level, a completion list is essentially a user Memory
Descriptor List (MDL) that’s been probed and locked and then mapped to an address. (For more information on MDLs, see Chapter 5 in Part 1.) Because it’s associated with an MDL (which tracks physical pages),
when a client sends a message to a server, the payload copy can happen directly at the physical level
instead of requiring the kernel to double-buffer the message, as is common in other IPC mechanisms.
The completion list itself is implemented as a 64-bit queue of completed entries, and both usermode and kernel-mode consumers can use an interlocked compare-exchange operation to insert and
remove entries from the queue. Furthermore, to simplify allocations, once an MDL has been initialized,
a bitmap is used to identify available areas of memory that can be used to hold new messages that are
still being queued. The bitmap algorithm also uses native lock instructions on the processor to provide
220
CHAPTER 8
System mechanisms
atomic allocation and deallocation of areas of physical memory that can be used by completion lists.
Completion lists can be set up with NtAlpcSetInformationPort.
A final optimization worth mentioning is that instead of copying data as soon as it is sent, the kernel
sets up the payload for a delayed copy, capturing only the needed information, but without any copying. The message data is copied only when the receiver requests the message. Obviously, if shared
memory is being used, there’s no advantage to this method, but in asynchronous, kernel-buffer message passing, this can be used to optimize cancellations and high-traffic scenarios.
Power management
As we’ve seen previously, when used in constrained power environments, such as mobile platforms,
Windows uses a number of techniques to better manage power consumption and processor availability, such as by doing heterogenous processing on architectures that support it (such as ARM64’s big.
LITTLE) and by implementing Connected Standby as a way to further reduce power on user systems
when under light use.
To play nice with these mechanisms, ALPC implements two additional features: the ability for ALPC
clients to push wake references onto their ALPC server’s wake channel and the introduction of the Work
On Behalf Of Attribute. The latter is an attribute that a sender can choose to associate with a message
when it wants to associate the request with the current work ticket that it is associated with, or to create
a new work ticket that describes the sending thread.
Such work tickets are used, for example, when the sender is currently part of a Job Object (either
due to being in a Silo/Windows Container or by being part of a heterogenous scheduling system and/
or Connected Standby system) and their association with a thread will cause various parts of the system
to attribute CPU cycles, I/O request packets, disk/network bandwidth attribution, and energy estimation to be associated to the “behalf of” thread and not the acting thread.
Additionally, foreground priority donation and other scheduling steps are taken to avoid big.LITTLE
priority inversion issues, where an RPC thread is stuck on the small core simply by virtue of being a
background service. With a work ticket, the thread is forcibly scheduled on the big core and receives a
foreground boost as a donation.
Finally, wake references are used to avoid deadlock situations when the system enters a connected
standby (also called Modern Standby) state, as was described in Chapter 6 of Part 1, or when a UWP
application is targeted for suspension. These references allow the lifetime of the process owning the
ALPC port to be pinned, preventing the force suspend/deep freeze operations that the Process Lifetime
Manager (PLM) would attempt (or the Power Manager, even for Win32 applications). Once the message has been delivered and processed, the wake reference can be dropped, allowing the process to
be suspended if needed. (Recall that termination is not a problem because sending a message to a
terminated process/closed port immediately wakes up the sender with a special PORT_CLOSED reply,
instead of blocking on a response that will never come.)
CHAPTER 8
System mechanisms
221
ALPC direct event attribute
Recall that ALPC provides two mechanisms for clients and servers to communicate: requests, which are
bidirectional, requiring a response, and datagrams, which are unidirectional and can never be synchronously replied to. A middle ground would be beneficial—a datagram-type message that cannot be
replied to but whose receipt could be acknowledged in such a way that the sending party would know
that the message was acted upon, without the complexity of having to implement response processing. In fact, this is what the direct event attribute provides.
By allowing a sender to associate a handle to a kernel event object (through CreateEvent) with the
ALPC message, the direct event attribute captures the underlying KEVENT and adds a reference to it,
tacking it onto the KALPC_MESSAGE structure. Then, when the receiving process gets the message,
it can expose this direct event attribute and cause it to be signaled. A client could either have a Wait
Completion Packet associated with an I/O completion port, or it could be in a synchronous wait call
such as with WaitForSingleObject on the event handle and would now receive a notification and/or wait
satisfaction, informing it of the message’s successful delivery.
This functionality was previously manually provided by the RPC runtime, which allows clients calling RpcAsyncInitializeHandle to pass in RpcNotificationTypeEvent and associate a HANDLE to an event
object with an asynchronous RPC message. Instead of forcing the RPC runtime on the other side to
respond to a request message, such that the RPC runtime on the sender’s side would then signal the
event locally to signal completion, ALPC now captures it into a Direct Event attribute, and the message
is placed on a Direct Message Queue instead of the regular Message Queue. The ALPC subsystem will
signal the message upon delivery, efficiently in kernel mode, avoiding an extra hop and context-switch.
Debugging and tracing
On checked builds of the kernel, ALPC messages can be logged. All ALPC attributes, blobs, message
zones, and dispatch transactions can be individually logged, and undocumented !alpc commands
in WinDbg can dump the logs. On retail systems, IT administrators and troubleshooters can enable
the ALPC events of the NT kernel logger to monitor ALPC messages, (Event Tracing for Windows, also
known as ETW, is discussed in Chapter 10.) ETW events do not include payload data, but they do contain connection, disconnection, and send/receive and wait/unblock information. Finally, even on retail
systems, certain !alpc commands obtain information on ALPC ports and messages.
222
CHAPTER 8
System mechanisms
EXPERIMENT: Dumping a connection port
In this experiment, you use the CSRSS API port for Windows processes running in Session 1, which
is the typical interactive session for the console user. Whenever a Windows application launches,
it connects to CSRSS’s API port in the appropriate session.
1.
Start by obtaining a pointer to the connection port with the !object command:
lkd> !object \Sessions\1\Windows\ApiPort
Object: ffff898f172b2df0 Type: (ffff898f032f9da0) ALPC Port
ObjectHeader: ffff898f172b2dc0 (new version)
HandleCount: 1 PointerCount: 7898
Directory Object: ffffc704b10d9ce0 Name: ApiPort
2.
Dump information on the port object itself with !alpc /p. This will confirm, for example,
that CSRSS is the owner:
lkd> !alpc /P ffff898f172b2df0
Port ffff898f172b2df0
Type
: ALPC_CONNECTION_PORT
CommunicationInfo
: ffffc704adf5d410
ConnectionPort
: ffff898f172b2df0 (ApiPort), Connections
ClientCommunicationPort : 0000000000000000
ServerCommunicationPort : 0000000000000000
OwnerProcess
: ffff898f17481140 (csrss.exe), Connections
SequenceNo
: 0x0023BE45 (2342469)
CompletionPort
: 0000000000000000
CompletionList
: 0000000000000000
ConnectionPending
: No
ConnectionRefused
: No
Disconnected
: No
Closed
: No
FlushOnClose
: Yes
ReturnExtendedInfo
: No
Waitable
: No
Security
: Static
Wow64CompletionList
: No
5 thread(s) are waiting on the port:
THREAD ffff898f3353b080 Cid 0288.2538
Win32Thread: ffff898f340cde60 WAIT
THREAD ffff898f313aa080 Cid 0288.19ac
Win32Thread: ffff898f35584e40 WAIT
THREAD ffff898f191c3080 Cid 0288.060c
Win32Thread: ffff898f17c5f570 WAIT
THREAD ffff898f174130c0 Cid 0288.0298
Win32Thread: ffff898f173f6ef0 WAIT
THREAD ffff898f1b5e2080 Cid 0288.0590
Win32Thread: ffff898f173f82a0 WAIT
THREAD ffff898f3353b080 Cid 0288.2538
Win32Thread: ffff898f340cde60 WAIT
Teb: 00000090bce88000
Teb: 00000090bcf0e000
Teb: 00000090bcff1000
Teb: 00000090bcfd7000
Teb: 00000090bcfe9000
Teb: 00000090bce88000
CHAPTER 8
System mechanisms
223
Main queue is empty.
Direct message queue is empty.
Large message queue is empty.
Pending queue is empty.
Canceled queue is empty.
3.
You can see what clients are connected to the port, which includes all Windows processes running in the session, with the undocumented !alpc /lpc command, or, with a
newer version of WinDbg, you can simply click the Connections link next to the ApiPort
name. You will also see the server and client communication ports associated with each
connection and any pending messages on any of the queues:
lkd> !alpc /lpc ffff898f082cbdf0
ffff898f082cbdf0('ApiPort')
ffff898f0b971940 0
ffff898f1741fdd0 0
ffff898f1740cdd0 0
ffff898f08272900 0
ffff898f08a702d0 0
ffff898f081a3dc0 0
ffff898F086dcde0 0
ffff898f1757abe0 0
4.
indows
0, 131 connections
->ffff898F0868a680
->ffff898f1742add0
->ffff898f17417dd0
->ffff898f08272dc0
->ffff898f084d5980
->ffff898f08a70070
->ffff898f17502de0
->ffff898f1757b980
0
0
0
0
0
0
0
0
ffff898f17479080('wininit.exe')
ffff898f174ec240('services.exe')
ffff898f174da200('lsass.exe')
ffff898f1753b400('svchost.exe')
ffff898f1753e3c0('svchost.exe')
ffff898f175402c0('fontdrvhost.ex')
ffff898f17588440('svchost.exe')
ffff898f17c1a400('svchost.exe')
Note that if you have other sessions, you can repeat this experiment on those sessions
also (as well as with session 0, the system session). You will eventually get a list of all the
Windows processes on your machine.
otification acilit
The Windows Notification Facility, or WNF, is the core underpinning of a modern registrationless publisher/subscriber mechanism that was added in Windows 8 as a response to a number of architectural
deficiencies when it came to notifying interested parties about the existence of some action, event, or
state, and supplying a data payload associated with this state change.
To illustrate this, consider the following scenario: Service A wants to notify potential clients B, C, and
D that the disk has been scanned and is safe for write access, as well as the number of bad sectors (if
any) that were detected during the scan. There is no guarantee that B, C, D start after A—in fact, there’s
a good chance they might start earlier. In this case, it is unsafe for them to continue their execution, and
they should wait for A to execute and report the disk is safe for write access. But if A isn’t even running
yet, how does one wait for it in the first place?
224
CHAPTER 8
System mechanisms
A typical solution would be for B to create an event “CAN_I_WAIT_FOR_A_YET” and then have A look
for this event once started, create the “A_SAYS_DISK_IS_SAFE” event and then signal “CAN_I_WAIT_
FOR_A_YET,” allowing B to know it’s now safe to wait for “A_SAYS_DISK_IS_SAFE”. In a single client scenario, this is feasible, but things become even more complex once we think about C and D, which might
all be going through this same logic and could race the creation of the “CAN_I_WAIT_FOR_A_YET” event,
at which point they would open the existing event (in our example, created by B) and wait on it to be
signaled. Although this can be done, what guarantees that this event is truly created by B? Issues around
malicious “squatting” of the name and denial of service attacks around the name now arise. Ultimately, a
safe protocol can be designed, but this requires a lot of complexity for the developer(s) of A, B, C, and D—
and we haven’t even discussed how to get the number of bad sectors.
WNF features
The scenario described in the preceding section is a common one in operating system design—and the
correct pattern for solving it clearly shouldn’t be left to individual developers. Part of a job of an operating system is to provide simple, scalable, and performant solutions to common architectural challenges
such as these, and this is what WNF aims to provide on modern Windows platforms, by providing:
■
■
■
■
■
■
■
The ability to define a state name that can be subscribed to, or published to by arbitrary processes, secured by a standard Windows security descriptor (with a DACL and SACL)
The ability to associate such a state name with a payload of up to 4 KB, which can be retrieved
along with the subscription to a change in the state (and published with the change)
The ability to have well-known state names that are provisioned with the operating system and
do not need to be created by a publisher while potentially racing with consumers—thus consumers will block on the state change notification even if a publisher hasn’t started yet
The ability to persist state data even between reboots, such that consumers may be able to see
previously published data, even if they were not yet running
The ability to assign state change timestamps to each state name, such that consumers can
know, even across reboots, if new data was published at some point without the consumer being active (and whether to bother acting on previously published data)
The ability to assign scope to a given state name, such that multiple instances of the same state
name can exist either within an interactive session ID, a server silo (container), a given user
token/SID, or even within an individual process.
Finally, the ability to do all of the publishing and consuming of WNF state names while crossing
the kernel/user boundary, such that components can interact with each other on either side.
CHAPTER 8
System mechanisms
225
WNF users
As the reader can tell, providing all these semantics allows for a rich set of services and kernel components to leverage WNF to provide notifications and other state change signals to hundreds of clients
(which could be as fine-grained as individual APIs in various system libraries to large scale processes). In
fact, several key system components and infrastructure now use WNF, such as
■
■
■
■
The Power Manager and various related components use WNF to signal actions such as closing and opening the lid, battery charging state, turning the monitor off and on, user presence
detection, and more.
The Shell and its components use WNF to track application launches, user activity, lock screen
behavior, taskbar behavior, Cortana usage, and Start menu behavior.
The System Events Broker (SEB) is an entire infrastructure that is leveraged by UWP applications
and brokers to receive notifications about system events such as the audio input and output.
The Process Manager uses per-process temporary WNF state names to implement the wake
channel that is used by the Process Lifetime Manager (PLM) to implement part of the mechanism
that allows certain events to force-wake processes that are marked for suspension (deep freeze).
Enumerating all users of WNF would take up this entire book because more than 6000 different
well-known state names are used, in addition to the various temporary names that are created (such as
the per-process wake channels). However, a later experiment showcases the use of the wnfdump utility
part of the book tools, which allows the reader to enumerate and interact with all of their system’s WNF
events and their data. The Windows Debugging Tools also provide a !wnf extension that is shown in a
future experiment and can also be used for this purpose. Meanwhile, the Table 8-31 explains some of
the key WNF state name prefixes and their uses. You will encounter many Windows components and
codenames across a vast variety of Windows SKUs, from Windows Phone to XBOX, exposing the richness of the WNF mechanism and its pervasiveness.
TABLE 8-31
226
WNF state name prefixes
Prefi
# of Names
Usage
9P
2
Plan 9 Redirector
A2A
1
App-to-App
AAD
2
Azure Active Directory
AA
3
Assigned Access
ACC
1
Accessibility
ACHK
1
Boot Disk Integrity Check (Autochk)
ACT
1
Activity
AFD
1
Ancillary Function Driver (Winsock)
AI
9
Application Install
AOW
1
Android-on-Windows (Deprecated)
ATP
1
Microsoft Defender ATP
CHAPTER 8
System mechanisms
Prefi
# of Names
Usage
AUDC
15
Audio Capture
AVA
1
Voice Activation
AVLC
3
Volume Limit Change
BCST
1
App Broadcast Service
BI
16
Broker Infrastructure
BLTH
14
Bluetooth
BMP
2
Background Media Player
BOOT
3
Boot Loader
BRI
1
Brightness
BSC
1
Browser Configuration (Legacy IE, Deprecated)
CAM
66
Capability Access Manager
CAPS
1
Central Access Policies
CCTL
1
Call Control Broker
CDP
17
Connected Devices Platform (Project “Rome”/Application Handoff)
CELL
78
Cellular Services
CERT
2
Certificate Cache
CFCL
3
Flight Configuration Client Changes
CI
4
Code Integrity
CLIP
6
Clipboard
CMFC
1
Configuration Management Feature Configuration
CMPT
1
Compatibility
CNET
10
Cellular Networking (Data)
CONT
1
Containers
CSC
1
Client Side Caching
CSHL
1
Composable Shell
CSH
1
Custom Shell Host
CXH
6
Cloud Experience Host
DBA
1
Device Broker Access
DCSP
1
Diagnostic Log CSP
DEP
2
Deployment (Windows Setup)
DEVM
3
Device Management
DICT
1
Dictionary
DISK
1
Disk
DISP
2
Display
DMF
4
Data Migration Framework
CHAPTER 8
System mechanisms
227
228
Prefi
# of Names
Usage
DNS
1
DNS
DO
2
Delivery Optimization
DSM
2
Device State Manager
DUMP
2
Crash Dump
DUSM
2
Data Usage Subscription Management
DWM
9
Desktop Window Manager
DXGK
2
DirectX Kernel
DX
24
DirectX
EAP
1
Extensible Authentication Protocol
EDGE
4
Edge Browser
EDP
15
Enterprise Data Protection
EDU
1
Education
EFS
2
Encrypted File Service
EMS
1
Emergency Management Services
ENTR
86
Enterprise Group Policies
EOA
8
Ease of Access
ETW
1
Event Tracing for Windows
EXEC
6
Execution Components (Thermal Monitoring)
FCON
1
Feature Configuration
FDBK
1
Feedback
FLTN
1
Flighting Notifications
FLT
2
Filter Manager
FLYT
1
Flight ID
FOD
1
Features on Demand
FSRL
2
File System Runtime (FsRtl)
FVE
15
Full Volume Encryption
GC
9
Game Core
GIP
1
Graphics
GLOB
3
Globalization
GPOL
2
Group Policy
HAM
1
Host Activity Manager
HAS
1
Host Attestation Service
HOLO
32
Holographic Services
HPM
1
Human Presence Manager
HVL
1
Hypervisor Library (Hvl)
CHAPTER 8
System mechanisms
Prefi
# of Names
Usage
HYPV
2
Hyper-V
IME
4
Input Method Editor
IMSN
7
Immersive Shell Notifications
IMS
1
Entitlements
INPUT
5
Input
IOT
2
Internet of Things
ISM
4
Input State Manager
IUIS
1
Immersive UI Scale
KSR
2
Kernel Soft Reboot
KSV
5
Kernel Streaming
LANG
2
Language Features
LED
1
LED Alert
LFS
12
Location Framework Service
LIC
9
Licensing
LM
7
License Manager
LOC
3
Geolocation
LOGN
8
Logon
MAPS
3
Maps
MBAE
1
MBAE
MM
3
Memory Manager
MON
1
Monitor Devices
MRT
5
Microsoft Resource Manager
MSA
7
Microsoft Account
MSHL
1
Minimal Shell
MUR
2
Media UI Request
MU
1
Unknown
NASV
5
Natural Authentication Service
NCB
1
Network Connection Broker
NDIS
2
Kernel NDIS
NFC
1
Near Field Communication (NFC) Services
NGC
12
Next Generation Crypto
NLA
2
Network Location Awareness
NLM
6
Network Location Manager
NLS
4
Nationalization Language Services
CHAPTER 8
System mechanisms
229
230
Prefi
# of Names
Usage
NPSM
1
Now Playing Session Manager
NSI
1
Network Store Interface Service
OLIC
4
OS Licensing
OOBE
4
Out-Of-Box-Experience
OSWN
8
OS Storage
OS
2
Base OS
OVRD
1
Window Override
PAY
1
Payment Broker
PDM
2
Print Device Manager
PFG
2
Pen First Gesture
PHNL
1
Phone Line
PHNP
3
Phone Private
PHN
2
Phone
PMEM
1
Persistent Memory
PNPA-D
13
Plug-and-Play Manager
PO
54
Power Manager
PROV
6
Runtime Provisioning
PS
1
Kernel Process Manager
PTI
1
Push to Install Service
RDR
1
Kernel SMB Redirector
RM
3
Game Mode Resource Manager
RPCF
1
RPC Firewall Manager
RTDS
2
Runtime Trigger Data Store
RTSC
2
Recommended Troubleshooting Client
SBS
1
Secure Boot State
SCH
3
Secure Channel (SChannel)
SCM
1
Service Control Manager
SDO
1
Simple Device Orientation Change
SEB
61
System Events Broker
SFA
1
Secondary Factor Authentication
SHEL
138
Shell
SHR
3
Internet Connection Sharing (ICS)
SIDX
1
Search Indexer
SIO
2
Sign-In Options
CHAPTER 8
System mechanisms
Prefi
# of Names
Usage
SYKD
2
SkyDrive (Microsoft OneDrive)
SMSR
3
SMS Router
SMSS
1
Session Manager
SMS
1
SMS Messages
SPAC
2
Storage Spaces
SPCH
4
Speech
SPI
1
System Parameter Information
SPLT
4
Servicing
SRC
1
System Radio Change
SRP
1
System Replication
SRT
1
System Restore (Windows Recovery Environment)
SRUM
1
Sleep Study
SRV
2
Server Message Block (SMB/CIFS)
STOR
3
Storage
SUPP
1
Support
SYNC
1
Phone Synchronization
SYS
1
System
TB
1
Time Broker
TEAM
4
TeamOS Platform
TEL
5
Microsoft Defender ATP Telemetry
TETH
2
Tethering
THME
1
Themes
TKBN
24
Touch Keyboard Broker
TKBR
3
Token Broker
TMCN
1
Tablet Mode Control Notification
TOPE
1
Touch Event
TPM
9
Trusted Platform Module (TPM)
TZ
6
Time Zone
UBPM
4
User Mode Power Manager
UDA
1
User Data Access
UDM
1
User Device Manager
UMDF
2
User Mode Driver Framework
UMGR
9
User Manager
USB
8
Universal Serial Bus (USB) Stack
CHAPTER 8
System mechanisms
231
232
Prefi
# of Names
Usage
USO
16
Update Orchestrator
UTS
2
User Trusted Signals
UUS
1
Unknown
UWF
4
Unified Write Filter
VAN
1
Virtual Area Networks
VPN
1
Virtual Private Networks
VTSV
2
Vault Service
WAAS
2
Windows-as-a-Service
WBIO
1
Windows Biometrics
WCDS
1
Wireless LAN
WCM
6
Windows Connection Manager
WDAG
2
Windows Defender Application Guard
WDSC
1
Windows Defender Security Settings
WEBA
2
Web Authentication
WER
3
Windows Error Reporting
WFAS
1
Windows Firewall Application Service
WFDN
3
WiFi Display Connect (MiraCast)
WFS
5
Windows Family Safety
WHTP
2
Windows HTTP Library
WIFI
15
Windows Wireless Network (WiFi) Stack
WIL
20
Windows Instrumentation Library
WNS
1
Windows Notification Service
WOF
1
Windows Overlay Filter
WOSC
9
Windows One Setting Configuration
WPN
5
Windows Push Notifications
WSC
1
Windows Security Center
WSL
1
Windows Subsystem for Linux
WSQM
1
Windows Software Quality Metrics (SQM)
WUA
6
Windows Update
WWAN
5
Wireless Wire Area Network (WWAN) Service
XBOX
116
XBOX Services
CHAPTER 8
System mechanisms
WNF state names and storage
WNF state names are represented as random-looking 64-bit identifiers such as 0xAC41491908517835 and
then defined to a friendly name using C preprocessor macros such as WNF_AUDC_CAPTURE_ACTIVE. In
reality, however, these numbers are used to encode a version number (1), a lifetime (persistent versus
temporary), a scope (process-instanced, container-instanced, user-instanced, session-instanced, or
machine-instanced), a permanent data flag, and, for well-known state names, a prefix identifying the
owner of the state name followed by a unique sequence number. Figure 8-41 below shows this format.
Owner Tag
Sequence Number
Permanent
Data
Data
Scope
Name
Lifetime
Version
32 bits
21 bits
1 bit
4 bits
2 bits
4 bits
FIGURE 8-41 Format of a WNF state name.
As mentioned earlier, state names can be well-known, which means that they are preprovisioned
for arbitrary out-of-order use. WNF achieves this by using the registry as a backing store, which will
encode the security descriptor, maximum data size, and type ID (if any) under the HKLM\SYSTEM\
CurrentControlSet\Control\Notifications registry key. For each state name, the information is stored
under a value matching the 64-bit encoded WNF state name identifier.
Additionally, WNF state names can also be registered as persistent, meaning that they will remain
registered for the duration of the system’s uptime, regardless of the registrar’s process lifetime. This
mimics permanent objects that were shown in the “Object Manager” section of this chapter, and
similarly, the SeCreatePermanentPrivilege privilege is required to register such state names. These
WNF state names also live in the registry, but under the HKLM\SOFTWARE\Microsoft\Windows NT\
CurrentVersion\VolatileNotifications key, and take advantage of the registry’s volatile flag to simply
disappear once the machine is rebooted. You might be confused to see “volatile” registry keys being
used for “persistent” WNF data—keep in mind that, as we just indicated, the persistence here is within
a boot session (versus attached to process lifetime, which is what WNF calls temporary, and which
we’ll see later).
Furthermore, a WNF state name can be registered as permanent, which endows it with the ability to persist even across reboots. This is the type of “persistence” you may have been expecting
earlier. This is done by using yet another registry key, this time without the volatile flag set, present at HKLM\SOFTWARE\Microsoft\Windows NT\CurrentVersion\Notifications. Suffice it to say, the
SeCreatePermanentPrivilege is needed for this level of persistence as well. For these types of WNF
states, there is an additional registry key found below the hierarchy, called Data, which contains, for
each 64-bit encoded WNF state name identifier, the last change stamp, and the binary data. Note that
if the WNF state name was never written to on your machine, the latter information might be missing.
CHAPTER 8
System mechanisms
233
Experiment: View WNF state names and data in the registry
In this experiment, you use the Registry Editor to take a look at the well-known WNF names as
well as some examples of permanent and persistent names. By looking at the raw binary registry
data, you will be able to see the data and security descriptor information.
Open Registry Editor and navigate to the HKEY_LOCAL_MACHINE\SYSTEM\
CurrentControlSet\Control\Notifications key.
Take a look at the values you see, which should look like the screenshot below.
Double-click the value called 41950C3EA3BC0875 (WNF_SBS_UPDATE_AVAILABLE), which
opens the raw registry data binary editor.
Note how in the following figure, you can see the security descriptor (the highlighted binary
data, which includes the SID S-1-5-18), as well as the maximum data size (0 bytes).
234
CHAPTER 8
System mechanisms
Be careful not to change any of the values you see because this could make your system inoperable or open it up to attack.
Finally, if you want to see some examples of permanent WNF state, use the Registry Editor to go
to the HKEY_LOCAL_MACHINE\SOFTWARE\Microsoft\Windows NT\CurrentVersion\Notifications\
Data key, and look at the value 418B1D29A3BC0C75 (WNF_DSM_DSMAPPINSTALLED). An example
is shown in the following figure, in which you can see the last application that was installed on this
system (MicrosoftWindows.UndockedDevKit).
Finally, a completely arbitrary state name can be registered as a temporary name. Such names have
a few distinctions from what was shown so far. First, because their names are not known in advance,
they do require the consumers and producers to have some way of passing the identifier between
each other. Normally, whoever either attempts to consume the state data first or to produce state data
instead ends up internally creating and/or using the matching registry key to store the data. However,
with temporary WNF state names, this isn’t possible because the name is based on a monotonically
increasing sequence number.
CHAPTER 8
System mechanisms
235
Second, and related to this fact, no registry keys are used to encode temporary state names—they
are tied to the process that registered a given instance of a state name, and all the data is stored in
kernel pool only. These types of names, for example, are used to implement the per-process wake
channels described earlier. Other uses include power manager notifications, and direct service triggers
used by the SCM.
WNF publishing and subscription model
When publishers leverage WNF, they do so by following a standard pattern of registering the state
name (in the case of non-well-known state names) and publishing some data that they want to expose.
They can also choose not to publish any data but simply provide a 0-byte buffer, which serves as a way
to “light up” the state and signals the subscribers anyway, even though no data was stored.
Consumers, on the other hand, use WNF’s registration capabilities to associate a callback with a
given WNF state name. Whenever a change is published, this callback is activated, and, for kernel
mode, the caller is expected to call the appropriate WNF API to retrieve the data associated with the
state name. (The buffer size is provided, allowing the caller to allocate some pool, if needed, or perhaps
choose to use the stack.) For user mode, on the other hand, the underlying WNF notification mechanism inside of Ntdll.dll takes care of allocating a heap-backed buffer and providing a pointer to this
data directly to the callback registered by the subscriber.
In both cases, the callback also provides the change stamp, which acts as a unique monotonic sequence number that can be used to detect missed published data (if a subscriber was inactive, for some
reason, and the publisher continued to produce changes). Additionally, a custom context can be associated with the callback, which is useful in C++ situations to tie the static function pointer to its class.
Note WNF provides an API for querying whether a given WNF state name has been registered yet (allowing a consumer to implement special logic if it detects the producer must
not yet be active), as well as an API for querying whether there are any subscriptions currently active for a given state name (allowing a publisher to implement special logic such as
perhaps delaying additional data publication, which would override the previous state data).
WNF manages what might be thousands of subscriptions by associating a data structure with each
kernel and/or user-mode subscription and tying all the subscriptions for a given WNF state name
together. This way, when a state name is published to, the list of subscriptions is parsed, and, for user
mode, a delivery payload is added to a linked list followed by the signaling of a per-process notification
event—this instructs the WNF delivery code in Ntdll.dll to call the API to consume the payload (and any
other additional delivery payloads that were added to the list in the meantime). For kernel mode, the
mechanism is simpler—the callback is synchronously executed in the context of the publisher.
Note that it’s also possible to subscribe to notifications in two modes: data-notification mode, and
meta-notification mode. The former does what one might expect—executing the callback when new
data has been associated with a WNF state name. The latter is more interesting because it sends notifications when a new consumer has become active or inactive, as well as when a publisher has terminated (in the case of a volatile state name, where such a concept exists).
236
CHAPTER 8
System mechanisms
Finally, it’s worth pointing out that user-mode subscriptions have an additional wrinkle: Because
Ntdll.dll manages the WNF notifications for the entire process, it’s possible for multiple components
(such as dynamic libraries/DLLs) to have requested their own callback for the same WNF state name
(but for different reasons and with different contexts). In this situation, the Ntdll.dll library needs to
associate registration contexts with each module, so that the per-process delivery payload can be
translated into the appropriate callback and only delivered if the requested delivery mode matches the
notification type of the subscriber.
Experiment: Using the WnfDump utility to dump WNF state names
In this experiment, you use one of the book tools (WnfDump) to register a WNF subscription to
the WNF_SHEL_DESKTOP_APPLICATION_STARTED state name and the WNF_AUDC_RENDER
state name.
Execute wnfdump on the command line with the following flags:
-i WNF_SHEL_DESKTOP_APPLICATION_STARTED -v
The tool displays information about the state name and reads its data, such as shown in the
following output:
C:\>wnfdump.exe -i WNF_SHEL_DESKTOP_APPLICATION_STARTED -v
WNF State Name
| S | L | P | AC | N | CurSize | MaxSize
------------------------------------------------------------------------------------------WNF_SHEL_DESKTOP_APPLICATION_STARTED
| S | W | N | RW | I |
28 |
512
65 00 3A 00 6E 00 6F 00-74 00 65 00 70 00 61 00 e.:.n.o.t.e.p.a.
64 00 2E 00 65 00 78 00-65 00 00 00
d...e.x.e...
Because this event is associated with Explorer (the shell) starting desktop applications, you will
see one of the last applications you double-clicked, used the Start menu or Run menu for, or, in
general, anything that the ShellExecute API was used on. The change stamp is also shown, which
will end up a counter of how many desktop applications have been started this way since booting
this instance of Windows (as this is a persistent
persistent, but not permanent
permanent, event).
Launch a new desktop application such as Paint by using the Start menu and try the wnfdump
command again. You should see the change stamp incremented and new binary data shown.
WNF event aggregation
Although WNF on its own provides a powerful way for clients and services to exchange state information and be notified of each other’s statuses, there may be situations where a given client/subscriber is
interested in more than a single WNF state name.
For example, there may be a WNF state name that is published whenever the screen backlight
is off, another when the wireless card is powered off, and yet another when the user is no longer
physically present. A subscriber may want to be notified when all of these WNF state names have
CHAPTER 8
System mechanisms
237
been published—yet another may require a notification when either the first two or the latter
has been published.
Unfortunately, the WNF system calls and infrastructure provided by Ntdll.dll to user-mode clients (and equally, the API surface provided by the kernel) only operate on single WNF state names.
Therefore, the kinds of examples given would require manual handling through a state machine that
each subscriber would need to implement.
To facilitate this common requirement, a component exists both in user mode as well as in kernel
mode that handles the complexity of such a state machine and exposes a simple API: the Common
Event Aggregator (CEA) implemented in CEA.SYS for kernel-mode callers and EventAggregation.dll
for user-mode callers. These libraries export a set of APIs (such as EaCreateAggregatedEvent and
EaSignalAggregatedEvent), which allow an interrupt-type behavior (a start callback while a WNF state
is true, and a stop callback once the WNF state if false) as well as the combination of conditions with
operators such as AND, OR, and NOT.
Users of CEA include the USB Stack as well as the Windows Driver Foundation (WDF), which exposes
a framework callback for WNF state name changes. Further, the Power Delivery Coordinator (Pdc.sys)
uses CEA to build power state machines like the example at the beginning of this subsection. The
Unified Background Process Manager (UBPM) described in Chapter 9 also relies on CEA to implement
capabilities such as starting and stopping services based on low power and/or idle conditions.
Finally, WNF is also integral to a service called the System Event Broker (SEB), implemented in
SystemEventsBroker.dll and whose client library lives in SystemEventsBrokerClient.dll. The latter exports
APIs such as SebRegisterPrivateEvent, SebQueryEventData, and SebSignalEvent, which are then passed
through an RPC interface to the service. In user mode, SEB is a cornerstone of the Universal Windows
Platform (UWP) and the various APIs that interrogate system state, and services that trigger themselves
based on certain state changes that WNF exposes. Especially on OneCore-derived systems such as
Windows Phone and XBOX (which, as was shown earlier, make up more than a few hundred of the wellknown WNF state names), SEB is a central powerhouse of system notification capabilities, replacing
the legacy role that the Window Manager provided through messages such as WM_DEVICEARRIVAL,
WM_SESSIONENDCHANGE, WM_POWER, and others.
SEB pipes into the Broker Infrastructure (BI) used by UWP applications and allows applications, even
when running under an AppContainer, to access WNF events that map to systemwide state. In turn, for
WinRT applications, the Windows.ApplicationModel.Background namespace exposes a SystemTrigger
class, which implements IBackgroundTrigger, that pipes into the SEB’s RPC services and C++ API, for
certain well-known system events, which ultimately transforms to WNF_SEB_XXX event state names.
It serves as a perfect example of how something highly undocumented and internal, such as WNF, can
ultimately be at the heart of a high-level documented API for Modern UWP application development.
SEB is only one of the many brokers that UWP exposes, and at the end of the chapter, we cover background tasks and the Broker Infrastructure in full detail.
238
CHAPTER 8
System mechanisms
User-mode debugging
Support for user-mode debugging is split into three different modules. The first one is located in the
executive itself and has the prefix Dbgk, which stands for Debugging Framework. It provides the necessary internal functions for registering and listening for debug events, managing the debug object, and
packaging the information for consumption by its user-mode counterpart. The user-mode component
that talks directly to Dbgk is located in the native system library, Ntdll.dll, under a set of APIs that begin
with the prefix DbgUi. These APIs are responsible for wrapping the underlying debug object implementation (which is opaque), and they allow all subsystem applications to use debugging by wrapping their
own APIs around the DbgUi implementation. Finally, the third component in user-mode debugging
belongs to the subsystem DLLs. It is the exposed, documented API (located in KernelBase.dll for the
Windows subsystem) that each subsystem supports for performing debugging of other applications.
Kernel support
The kernel supports user-mode debugging through an object mentioned earlier: the debug object. It
provides a series of system calls, most of which map directly to the Windows debugging API, typically
accessed through the DbgUi layer first. The debug object itself is a simple construct, composed of a
series of flags that determine state, an event to notify any waiters that debugger events are present,
a doubly linked list of debug events waiting to be processed, and a fast mutex used for locking the
object. This is all the information that the kernel requires for successfully receiving and sending debugger events, and each debugged process has a debug port member in its executive process structure
pointing to this debug object.
Once a process has an associated debug port, the events described in Table 8-32 can cause a debug
event to be inserted into the list of events.
Apart from the causes mentioned in the table, there are a couple of special triggering cases outside
the regular scenarios that occur at the time a debugger object first becomes associated with a process. The first create process and create thread messages will be manually sent when the debugger is
attached, first for the process itself and its main thread and followed by create thread messages for all
the other threads in the process. Finally, load dll events for the executable being debugged, starting
with Ntdll.dll and then all the current DLLs loaded in the debugged process will be sent. Similarly, if a
debugger is already attached, but a cloned process (fork) is created, the same events will also be sent
for the first thread in the clone (as instead of just Ntdll.dll, all other DLLs are also present in the cloned
address space).
There also exists a special flag that can be set on a thread, either during creation or dynamically,
called hide from debugger. When this flag is turned on, which results in the HideFromDebugger flag in
the TEB to be set, all operations done by the current thread, even if the debug port has a debug port,
will not result in a debugger message.
CHAPTER 8
System mechanisms
239
TABLE 8-32 Kernel-mode debugging events
Event dentifier
Meaning
riggered
DbgKmExceptionApi
An exception has occurred.
KiDispatchException during an exception that occurred in
user mode.
DbgKmCreateThreadApi
A new thread has been created.
Startup of a user-mode thread.
DbgKmCreateProcessApi
A new process has been created.
Startup of a user-mode thread that is the first thread in
the process, if the CreateReported flag is not already set
in EPROCESS.
DbgKmExitThreadApi
A thread has exited.
Death of a user-mode thread, if the ThreadInserted flag is
set in ETHREAD.
DbgKmExitProcessApi
A process has exited.
Death of a user-mode thread that was the last thread in
the process, if the ThreadInserted flag is set in ETHREAD.
DbgKmLoadDllApi
A DLL was loaded.
NtMapViewOfSection when the section is an image file
(could be an EXE as well), if the SuppressDebugMsg flag is
not set in the TEB.
DbgKmUnloadDllApi
A DLL was unloaded.
NtUnmapViewOfSection when the section is an image file
(could be an EXE as well), if the SuppressDebugMsg flag is
not set in the TEB.
DbgKmErrorReportApi
A user-mode exception must be
forwarded to WER.
This special case message is sent over ALPC, not the debug object, if the DbgKmExceptionApi message returned
DBG_EXCEPTION_NOT_HANDLED, so that WER can now
take over exception processing.
Once a debugger object has been associated with a process, the process enters the deep freeze state
that is also used for UWP applications. As a reminder, this suspends all threads and prevents any new
remote thread creation. At this point, it is the debugger’s responsibility to start requesting that debug
events be sent through. Debuggers usually request that debug events be sent back to user mode by
performing a wait on the debug object. This call loops the list of debug events. As each request is removed from the list, its contents are converted from the internal DBGK structure to the native structure
that the next layer up understands. As you’ll see, this structure is different from the Win32 structure as
well, and another layer of conversion has to occur. Even after all pending debug messages have been
processed by the debugger, the kernel does not automatically resume the process. It is the debugger’s
responsibility to call the ContinueDebugEvent function to resume execution.
Apart from some more complex handling of certain multithreading issues, the basic model for
the framework is a simple matter of producers—code in the kernel that generates the debug events
in the previous table—and consumers—the debugger waiting on these events and acknowledging
their receipt.
Native support
Although the basic protocol for user-mode debugging is quite simple, it’s not directly usable by
Windows applications—instead, it’s wrapped by the DbgUi functions in Ntdll.dll. This abstraction is
required to allow native applications, as well as different subsystems, to use these routines (because
code inside Ntdll.dll has no dependencies). The functions that this component provides are mostly
analogous to the Windows API functions and related system calls. Internally, the code also provides
the functionality required to create a debug object associated with the thread. The handle to a debug
240
CHAPTER 8
System mechanisms
object that is created is never exposed. It is saved instead in the thread environment block (TEB) of the
debugger thread that performs the attachment. (For more information on the TEB, see Chapter 4 of
Part 1.) This value is saved in the DbgSsReserved[1] field.
When a debugger attaches to a process, it expects the process to be broken into—that is, an int 3
(breakpoint) operation should have happened, generated by a thread injected into the process. If this
didn’t happen, the debugger would never actually be able to take control of the process and would
merely see debug events flying by. Ntdll.dll is responsible for creating and injecting that thread into the
target process. Note that this thread is created with a special flag, which the kernel sets on the TEB, which
results in the SkipThreadAttach flag to be set, avoiding DLL_THREAD_ATTACH notifications and TLS slot
usage, which could cause unwanted side effects each time a debugger would break into the process.
Finally, Ntdll.dll also provides APIs to convert the native structure for debug events into the structure that the Windows API understands. This is done by following the conversions in Table 8-33.
TABLE 8-33 Native to Win32 conversions
Native State Change
Win32 State Change
Details
DbgCreateThreadStateChange
CREATE_THREAD_DEBUG_EVENT
DbgCreateProcessStateChange
CREATE_PROCESS_DEBUG_EVENT
DbgExitThreadStateChange
EXIT_THREAD_DEBUG_EVENT
DbgExitProcessStateChange
EXIT_PROCESS_DEBUG_EVENT
DbgExceptionStateChange
DbgBreakpointStateChange
DbgSingleStepStateChange
OUTPUT_DEBUG_STRING_EVENT,
RIP_EVENT, or
EXCEPTION_DEBUG_EVENT
Determination is based on the Exception Code
(which can be DBG_PRINTEXCEPTION_C /
DBG_PRINTEXCEPTION_WIDE_C,
DBG_RIPEXCEPTION, or something else).
DbgLoadDllStateChange
LOAD_DLL_DEBUG_EVENT
fUnicode is always TRUE
DbgUnloadDllStateChange
UNLOAD_DLL_DEBUG_EVENT
lpImageName is always NULL, and fUnicode is
always TRUE.
EXPERIMENT: Viewing debugger objects
Although you’ve been using WinDbg to do kernel-mode debugging, you can also use it to debug user-mode programs. Go ahead and try starting Notepad.exe with the debugger attached
using these steps:
1.
Run WinDbg, and then click File, Open Executable.
2.
Navigate to the \Windows\System32\ directory and choose Notepad.exe.
3.
You’re not going to do any debugging, so simply ignore whatever might come up.
You can type g in the command window to instruct WinDbg to continue executing
Notepad.
Now run Process Explorer and be sure the lower pane is enabled and configured to show
open handles. (Select View, Lower Pane View, and then Handles.) You also want to look at unnamed handles, so select View, Show Unnamed Handles And Mappings.
CHAPTER 8
System mechanisms
241
Next, click the Windbg.exe (or EngHost.exe, if you’re using the WinDbg Preview) process
and look at its handle table. You should see an open, unnamed handle to a debug object. (You
can organize the table by Type to find this entry more readily.) You should see something like
the following:
You can try right-clicking the handle and closing it. Notepad should disappear, and the
following message should appear in WinDbg:
ERROR: WaitForEvent failed, NTSTATUS 0xC0000354
This usually indicates that the debuggee has been
killed out from underneath the debugger.
You can use .tlist to see if the debuggee still exists.
In fact, if you look at the description for the NTSTATUS code given, you will find the text: “An
attempt to do an operation on a debug port failed because the port is in the process of being
deleted,” which is exactly what you’ve done by closing the handle.
As you can see, the native DbgUi interface doesn’t do much work to support the framework except
for this abstraction. The most complicated task it does is the conversion between native and Win32
debugger structures. This involves several additional changes to the structures.
Windows subsystem support
The final component responsible for allowing debuggers such as Microsoft Visual Studio or WinDbg to
debug user-mode applications is in KernelBase.dll. It provides the documented Windows APIs. Apart
from this trivial conversion of one function name to another, there is one important management
job that this side of the debugging infrastructure is responsible for: managing the duplicated file and
thread handles.
Recall that each time a load DLL event is sent, a handle to the image file is duplicated by the kernel
and handed off in the event structure, as is the case with the handle to the process executable during the create process event. During each wait call, KernelBase.dll checks whether this is an event that
242
CHAPTER 8
System mechanisms
results in a new duplicated process and/or thread handles from the kernel (the two create events). If so,
it allocates a structure in which it stores the process ID, thread ID, and the thread and/or process handle
associated with the event. This structure is linked into the first DbgSsReserved array index in the TEB,
where we mentioned the debug object handle is stored. Likewise, KernelBase.dll also checks for exit
events. When it detects such an event, it “marks” the handles in the data structure.
Once the debugger is finished using the handles and performs the continue call, KernelBase.dll
parses these structures, looks for any handles whose threads have exited, and closes the handles for
the debugger. Otherwise, those threads and processes would never exit because there would always be
open handles to them if the debugger were running.
Packaged applications
Starting with Windows 8, there was a need for some APIs that run on different kind of devices, from a
mobile phone, up to an Xbox and to a fully-fledged personal computer. Windows was indeed starting
to be designed even for new device types, which use different platforms and CPU architectures (ARM
is a good example). A new platform-agnostic application architecture, Windows Runtime (also known
as “WinRT”) was first introduced in Windows 8. WinRT supported development in C++, JavaScript, and
managed languages (C#, VB.Net, and so on), was based on COM, and supported natively both x86,
AMD64, and ARM processors. Universal Windows Platform (UWP) is the evolution of WinRT. It has
been designed to overcome some limitations of WinRT and it is built on the top of it. UWP applications
no longer need to indicate which OS version has been developed for in their manifest, but instead they
target one or more device families.
UWP provides Universal Device Family APIs, which are guaranteed to be present in all device families, and Extension APIs, which are device specific. A developer can target one device type, adding the
extension SDK in its manifest; furthermore, she can conditionally test the presence of an API at runtime
and adapt the app’s behavior accordingly. In this way, a UWP app running on a smartphone may start
behaving the way it would if it were running on a PC when the phone is connected to a desktop computer or a suitable docking station.
UWP provides multiple services to its apps:
■
■
Adaptive controls and input—the graphical elements respond to the size and DPI of the screen
by adjusting their layout and scale. Furthermore, the input handling is abstracted to the underlying app. This means that a UWP app works well on different screens and with different kinds
of input devices, like touch, a pen, a mouse, keyboard, or an Xbox controller
One centralized store for every UWP app, which provides a seamless install, uninstall, and
upgrade experience
■
A unified design system, called Fluent (integrated in Visual Studio)
■
A sandbox environment, which is called AppContainer
CHAPTER 8
System mechanisms
243
AppContainers were originally designed for WinRT and are still used for UWP applications. We
already covered the security aspects of AppContainers in Chapter 7 of Part 1.
To properly execute and manage UWP applications, a new application model has been built in
Windows, which is internally called AppModel and stands for “Modern Application Model.” The
Modern Application Model has evolved and has been changed multiple times during each release of
the OS. In this book, we analyze the Windows 10 Modern Application Model. Multiple components are
part of the new model and cooperate to correctly manage the states of the packaged application and
its background activities in an energy-efficient manner.
■
■
■
■
■
ost Activit
anager A
The Host activity manager is a new component, introduced
in Windows 10, which replaces and integrates many of the old components that control the
life (and the states) of a UWP application (Process Lifetime Manager, Foreground Manager,
Resource Policy, and Resource Manager). The Host Activity Manager lives in the Background
Task Infrastructure service (BrokerInfrastructure), not to be confused with the Background
Broker Infrastructure component, and works deeply tied to the Process State Manager. It is
implemented in two different libraries, which represent the client (Rmclient.dll) and server
(PsmServiceExtHost.dll) interface.
Process State Manager (PSM) PSM has been partly replaced by HAM and is considered
part of the latter (actually PSM became a HAM client). It maintains and stores the state of
each host of the packaged application. It is implemented in the same service of the HAM
(BrokerInfrastructure), but in a different DLL: Psmsrv.dll.
Application Activation Manager (AAM) AAM is the component responsible in the different kinds and types of activation of a packaged application. It is implemented in the
ActivationManager.dll library, which lives in the User Manager service. Application Activation
Manager is a HAM client.
View Manager (VM) VM detects and manages UWP user interface events and activities
and talks with HAM to keep the UI application in the foreground and in a nonsuspended state.
Furthermore, VM helps HAM in detecting when a UWP application goes into background
state. View Manager is implemented in the CoreUiComponents.dll .Net managed library, which
depends on the Modern Execution Manager client interface (ExecModelClient.dll) to properly
register with HAM. Both libraries live in the User Manager service, which runs in a Sihost process
(the service needs to proper manage UI events)
Background Broker Infrastructure (BI) BI manages the applications background tasks, their
execution policies, and events. The core server is implemented mainly in the bisrv.dll library,
manages the events that the brokers generate, and evaluates the policies used to decide whether
to run a background task. The Background Broker Infrastructure lives in the BrokerInfrastructure
service and, at the time of this writing, is not used for Centennial applications.
There are some other minor components that compose the new application model that we have not
mentioned here and are beyond the scope of this book.
244
CHAPTER 8
System mechanisms
With the goal of being able to run even standard Win32 applications on secure devices like
Windows 10 S, and to enable the conversion of old application to the new model, Microsoft has designed the Desktop Bridge (internally called Centennial). The bridge is available to developers through
Visual Studio or the Desktop App Converter. Running a Win32 application in an AppContainer, even if
possible, is not recommended, simply because the standard Win32 applications are designed to access
a wider system API surface, which is much reduced in AppContainers.
UWP applications
We already covered an introduction of UWP applications and described the security environment in
which they run in Chapter 7 of Part 1. To better understand the concepts expressed in this chapter, it is
useful to define some basic properties of the modern UWP applications. Windows 8 introduced significant new properties for processes:
■
Package identity
■
Application identity
■
AppContainer
■
Modern UI
We have already extensively analyzed the AppContainer (see Chapter 7 in Part 1). When the user
downloads a modern UWP application, the application usually came encapsulated in an AppX package.
A package can contain different applications that are published by the same author and are linked together. A package identity is a logical construct that uniquely defines a package. It is composed of five
parts: name, version, architecture, resource id, and publisher. The package identity can be represented
in two ways: by using a Package Full Name (formerly known as Package Moniker), which is a string
composed of all the single parts of the package identity, concatenated by an underscore character; or
by using a Package Family name, which is another string containing the package name and publisher.
The publisher is represented in both cases by using a Base32-encoded string of the full publisher name.
In the UWP world, the terms “Package ID” and “Package full name” are equivalent. For example, the
Adobe Photoshop package is distributed with the following full name:
AdobeSystemsIncorporated.AdobePhotoshopExpress_2.6.235.0_neutral_split.scale-125_
ynb6jyjzte8ga, where
■
AdobeSystemsIncorporated.AdobePhotoshopExpress is the name of the package.
■
2.6.235.0 is the version.
■
neutral is the targeting architecture.
■
split_scale is the resource id.
■
ynb6jyjzte8ga is the base32 encoding (Crockford’s variant, which excludes the letters i, l, u, and
o to avoid confusion with digits) of the publisher.
CHAPTER 8
System mechanisms
245
Its package family name is the simpler “AdobeSystemsIncorporated.AdobePhotoshopExpress
_ynb6jyjzte8ga” string.
Every application that composes the package is represented by an application identity. An application identity uniquely identifies the collection of windows, processes, shortcuts, icons, and functionality
that form a single user-facing program, regardless of its actual implementation (so this means that in
the UWP world, a single application can be composed of different processes that are still part of the
same application identity). The application identity is represented by a simple string (in the UWP world,
called Package Relative Application ID, often abbreviated as PRAID). The latter is always combined with
the package family name to compose the Application User Model ID (often abbreviated as AUMID). For
example, the Windows modern Start menu application has the following AUMID: Microsoft.Windows.
ShellExperienceHost_cw5n1h2txyewy!App, where the App part is the PRAID.
Both the package full name and the application identity are located in the WIN://SYSAPPID Security
attribute of the token that describes the modern application security context. For an extensive description of the security environment in which the UWP applications run, refer to Chapter 7 in Part 1.
Centennial applications
Starting from Windows 10, the new application model became compatible with standard Win32 applications. The only procedure that the developer needs to do is to run the application installer program with
a special Microsoft tool called Desktop App Converter. The Desktop App Converter launches the installer
under a sandboxed server Silo (internally called Argon Container) and intercepts all the file system and
registry I/O that is needed to create the application package, storing all its files in VFS (virtualized file
system) private folders. Entirely describing the Desktop App Converter application is outside the scope of
this book. You can find more details of Windows Containers and Silos in Chapter 3 of Part 1.
The Centennial runtime, unlike UWP applications, does not create a sandbox where Centennial
processes are run, but only applies a thin virtualization layer on the top of them. As result, compared
to standard Win32 programs, Centennial applications don’t have lower security capabilities, nor do
they run with a lower integrity-level token. A Centennial application can even be launched under
an administrative account. This kind of application runs in application silos (internally called Helium
Container), which, with the goal of providing State separation while maintaining compatibility, provides
two forms of “jails”: Registry Redirection and Virtual File System (VFS). Figure 8-42 shows an example of
a Centennial application: Kali Linux.
At package activation, the system applies registry redirection to the application and merges the
main system hives with the Centennial Application registry hives. Each Centennial application can
include three different registry hives when installed in the user workstation: registry.dat, user.dat,
and (optionally) userclasses.dat. The registry files generated by the Desktop Convert represent “immutable” hives, which are written at installation time and should not change. At application startup,
the Centennial runtime merges the immutable hives with the real system registry hives (actually, the
Centennial runtime executes a “detokenizing” procedure because each value stored in the hive contains relative values).
246
CHAPTER 8
System mechanisms
FIGURE 8-42 Kali Linux distributed on the Windows Store is a typical example of Centennial application.
The registry merging and virtualization services are provided by the Virtual Registry Namespace
Filter driver (WscVReg), which is integrated in the NT kernel (Configuration Manager). At package
activation time, the user mode AppInfo service communicates with the VRegDriver device with the
goal of merging and redirecting the registry activity of the Centennial applications. In this model, if the
app tries to read a registry value that is present in the virtualized hives, the I/O is actually redirected to
the package hives. A write operation to this kind of value is not permitted. If the value does not already
exist in the virtualized hive, it is created in the real hive without any kind of redirection at all. A different
kind of redirection is instead applied to the entire HKEY_CURRENT_USER root key. In this key, each new
subkey or value is stored only in the package hive that is stored in the following path: C:\ProgramData\
Packages\<PackageName>\<UserSid>\SystemAppData\Helium\Cache. Table 8-34 shows a summary of
the Registry virtualization applied to Centennial applications:
TABLE 8-34 Registry virtualization applied to Centennial applications
Operation
Result
Read or enumeration of HKEY_
LOCAL_MACHINE\Software
The operation returns a dynamic merge of the package hives with the local
system counterpart. Registry keys and values that exist in the package hives
always have precedence with respect to keys and values that already exist in
the local system.
All writes to HKEY_CURRENT_USER
Redirected to the Centennial package virtualized hive.
All writes inside the package
Writes to HKEY_LOCAL_MACHINE\Software are not allowed if a registry value
exists in one of the package hives.
All writes outside the package
Writes to HKEY_LOCAL_MACHINE\Software are allowed as long as the value
does not already exist in one of the package hives.
CHAPTER 8
System mechanisms
247
When the Centennial runtime sets up the Silo application container, it walks all the file and directories located into the VFS folder of the package. This procedure is part of the Centennial Virtual File
System configuration that the package activation provides. The Centennial runtime includes a list of
mapping for each folder located in the VFS directory, as shown in Table 8-35.
TABLE 8-35 List of system folders that are virtualized for Centennial apps
Folder Name
Redirection Target
Architecture
SystemX86
C:\Windows\SysWOW64
32-bit/64-bit
System
C:\Windows\System32
32-bit/64-bit
SystemX64
C:\Windows\System32
64-bit only
ProgramFilesX86
C:\Program Files (x86)
32-bit/64-bit
ProgramFilesX64
C:\Program Files
64-bit only
ProgramFilesCommonX86
C:\Program Files (x86)\Common Files
32-bit/64-bit
ProgramFilesCommonX64
C:\Program Files\Common Files
64-bit only
Windows
C:\Windows
Neutral
CommonAppData
C:\ProgramData
Neutral
The File System Virtualization is provided by three different drivers, which are heavily used for
Argon containers:
■
■
■
248
indows ind inifilter driver ind lt Manages the redirection of the Centennial application’s files. This means that if the Centennial app wants to read or write to one of its existing
virtualized files, the I/O is redirected to the file’s original position. When the application creates
instead a file on one of the virtualized folders (for example, in C:\Windows), and the file does
not already exist, the operation is allowed (assuming that the user has the needed permissions)
and the redirection is not applied.
indows Container solation inifilter driver
ci s Responsible for merging the
content of different virtualized folders (called layers) and creating a unique view. Centennial
applications use this driver to merge the content of the local user’s application data folder
(usually C:\Users\<UserName>\AppData) with the app’s application cache folder, located in C:\
User\<UserName>\Appdata\Local\Packages\<Package Full Name\LocalCache. The driver is
even able to manage the merge of multiple packages, meaning that each package can operate
on its own private view of the merged folders. To support this feature, the driver stores a Layer
ID of each package in the Reparse point of the target folder. In this way, it can construct a layer
map in memory and is able to operate on different private areas (internally called Scratch areas).
This advanced feature, at the time of this writing, is configured only for related set, a feature
described later in the chapter.
indows Container a e irtuali ation inifilter driver
cn s While Wcifs driver
merges multiple folders, Wcnfs is used by Centennial to set up the name redirection of the local
user application data folder. Unlike from the previous case, when the app creates a new file or
folder in the virtualized application data folder, the file is stored in the application cache folder,
and not in the real one, regardless of whether the file already exists.
CHAPTER 8
System mechanisms
One important concept to keep in mind is that the BindFlt filter operates on single files, whereas Wcnfs
and Wcifs drivers operate on folders. Centennial uses minifilters’ communication ports to correctly set up
the virtualized file system infrastructure. The setup process is completed using a message-based communication system (where the Centennial runtime sends a message to the minifilter and waits for its response). Table 8-36 shows a summary of the file system virtualization applied to Centennial applications.
TABLE 8-36 File system virtualization applied to Centennial applications
Operation
Result
Read or enumeration of a well-known
Windows folder
The operation returns a dynamic merge of the corresponding VFS folder with
the local system counterpart. File that exists in the VFS folder always had precedence with respect to files that already exist in the local system one.
Writes on the application data folder
All the writes on the application data folder are redirected to the local
Centennial application cache.
All writes inside the package folder
Forbidden, read-only.
All writes outside the package folder
Allowed if the user has permission.
The Host Activity Manager
Windows 10 has unified various components that were interacting with the state of a packaged application in a noncoordinated way. As a result, a brand-new component, called Host Activity Manager
(HAM) became the central component and the only one that manages the state of a packaged application and exposes a unified API set to all its clients.
Unlike its predecessors, the Host Activity Manager exposes activity-based interfaces to its clients.
A host is the object that represents the smallest unit of isolation recognized by the Application model.
Resources, suspend/resume and freeze states, and priorities are managed as a single unit, which usually corresponds to a Windows Job object representing the packaged application. The job object may
contain only a single process for simple applications, but it could contain even different processes for
applications that have multiple background tasks (such as multimedia players, for example).
In the new Modern Application Model, there are three job types:
■
■
■
Mixed A mix of foreground and background activities but typically associated with the foreground part of the application. Applications that include background tasks (like music playing
or printing) use this kind of job type.
Pure
A host that is used for purely background work.
ste
A host that executes Windows code on behalf of the application (for example, background downloads).
An activity always belongs to a host and represents the generic interface for client-specific concepts
such as windows, background tasks, task completions, and so on. A host is considered “Active” if its
job is unfrozen and it has at least one running activity. The HAM clients are components that interact
and control the lifetime of activities. Multiple components are HAM clients: View Manager, Broker
Infrastructure, various Shell components (like the Shell Experience Host), AudioSrv, Task completions,
and even the Windows Service Control Manager.
CHAPTER 8
System mechanisms
249
The Modern application’s lifecycle consists of four states: running, suspending, suspend-complete,
and suspended (states and their interactions are shown in Figure 8-43.)
■
■
■
■
Running The state where an application is executing part of its code, other than when it's
suspending. An application could be in “running” state not only when it is in a foreground state
but even when it is running background tasks, playing music, printing, or any number of other
background scenarios.
Suspending This state represents a time-limited transition state that happens where HAM
asks the application to suspend. HAM can do this for different reasons, like when the application loses the foreground focus, when the system has limited resources or is entering a batterysafe mode, or simply because an app is waiting for some UI event. When this happens, an
app has a limited amount of time to go to the suspended state (usually 5 seconds maximum);
otherwise, it will be terminated.
SuspendComplete This state represents an application that has finished suspending and
notifies the system that it is done. Therefore, its suspend procedure is considered completed.
Suspended Once an app completes suspension and notifies the system, the system freezes the application’s job object using the NtSetInformationJobObject API call (through the
JobObjectFreezeInformation information class) and, as a result, none of the app code can run.
Suspending
SuspendComplete
Running
(Active)
Suspended
(Halted)
FIGURE 8-43 Scheme of the lifecycle of a packaged application.
With the goal of preserving system efficiency and saving system resources, the Host Activity
Manager by default will always require an application to suspend. HAM clients need to require keeping an application alive to HAM. For foreground applications, the component responsible in keeping
the app alive is the View Manager. The same applies for background tasks: Broker Infrastructure is the
component responsible for determining which process hosting the background activity should remain
alive (and will request to HAM to keep the application alive).
Packaged applications do not have a Terminated state. This means that an application does not
have a real notion of an Exit or Terminate state and should not try to terminate itself. The actual model
for terminating a Packaged application is that first it gets suspended, and then HAM, if required, calls
NtTerminateJobObject API on the application's job object. HAM automatically manages the app lifetime and destroys the process only as needed. HAM does not decide itself to terminate the application;
instead, its clients are required to do so (the View Manager or the Application Activation Manager are
good examples). A packaged application can’t distinguish whether it has been suspended or terminated. This allows Windows to automatically restore the previous state of the application even if it has
been terminated or if the system has been rebooted. As a result, the packaged application model is
completely different from the standard Win32 application model.
250
CHAPTER 8
System mechanisms
To properly suspend and resume a Packaged application, the Host Activity manager uses the new
PsFreezeProcess and PsThawProcess kernel APIs. The process Freeze and Thaw operations are similar to
suspend and resume, with the following two major differences:
■
■
A new thread that is injected or created in a context of a deep-frozen process will not
run even in case the CREATE_SUSPENDED flag is not used at creation time or in case the
NtResumeProcess API is called to start the thread.
A new Freeze counter is implemented in the EPROCESS data structures. This means that a process could be frozen multiple times. To allow a process to be thawed, the total number of thaw
requests must be equal to the number of freeze requests. Only in this case are all the nonsuspended threads allowed to run.
The State Repository
The Modern Application Model introduces a new way for storing packaged applications’ settings,
package dependencies, and general application data. The State Repository is the new central store
that contains all this kind of data and has an important central rule in the management of all modern
applications: Every time an application is downloaded from the store, installed, activated, or removed,
new data is read or written to the repository. The classical usage example of the State Repository is
represented by the user clicking on a tile in the Start menu. The Start menu resolves the full path of
the application’s activation file (which could be an EXE or a DLL, as already seen in Chapter 7 of Part 1),
reading from the repository. (This is actually simplified, because the ShellExecutionHost process enumerates all the modern applications at initialization time.)
The State Repository is implemented mainly in two libraries: Windows.StateRepository.dll and
Windows.StateRepositoryCore.dll. Although the State Repository Service runs the server part of the
repository, UWP applications talk with the repository using the Windows.StateRepositoryClient.dll
library. (All the repository APIs are full trust, so WinRT clients need a Proxy to correctly communicate
with the server. This is the rule of another DLL, named Windows.StateRepositoryPs.dll.) The root location of the State Repository is stored in the HKLM\SOFTWARE\Microsoft\Windows\CurrentVersion\
Appx\ PackageRepositoryRoot registry value, which usually points to the C:\ProgramData\Microsoft\
Windows\ AppRepository path.
The State Repository is implemented across multiple databases, called partitions. Tables in the database are called entities. Partitions have different access and lifetime constraints:
■
■
Machine This database includes package definitions, an application’s data and identities, and
primary and secondary tiles (used in the Start menu), and it is the master registry that defines
who can access which package. This data is read extensively by different components (like
the TileDataRepository library, which is used by Explorer and the Start menu to manage the
different tiles), but it’s written primarily by the AppX deployment (rarely by some other minor
components). The Machine partition is usually stored in a file called StateRepository-Machine.
srd located into the state repository root folder.
eplo ent Stores machine-wide data mostly used only by the deployment service
(AppxSvc) when a new package is registered or removed from the system. It includes the
CHAPTER 8
System mechanisms
251
applications file list and a copy of each modern application’s manifest file. The Deployment
partition is usually stored in a file called StateRepository-Deployment.srd.
All partitions are stored as SQLite databases. Windows compiles its own version of SQLite into the
StateRepository.Core.dll library. This library exposes the State Repository Data Access Layer (also known
as DAL) APIs that are mainly wrappers to the internal database engine and are called by the State
Repository service.
Sometimes various components need to know when some data in the State Repository is written
or modified. In Windows 10 Anniversary update, the State Repository has been updated to support
changes and events tracking. It can manage different scenarios:
■
■
■
A component wants to subscribe for data changes for a certain entity. The component receives
a callback when the data is changed and implemented using a SQL transaction. Multiple SQL
transactions are part of a Deployment operation. At the end of each database transaction,
the State Repository determines if a Deployment operation is completed, and, if so, calls each
registered listener.
A process is started or wakes from Suspend and needs to discover what data has changed since
it was last notified or looked at. State Repository could satisfy this request using the ChangeId
field, which, in the tables that supports this feature, represents a unique temporal identifier
of a record.
A process retrieves data from the State Repository and needs to know if the data has changed
since it was last examined. Data changes are always recorded in compatible entities via a new
table called Changelog. The latter always records the time, the change ID of the event that created the data, and, if applicable, the change ID of the event that deleted the data.
The modern Start menu uses the changes and events tracking feature of the State Repository to work
properly. Every time the ShellExperienceHost process starts, it requests the State Repository to notify
its controller (NotificationController.dll) every time a tile is modified, created, or removed. When the
user installs or removes a modern application through the Store, the application deployment server
executes a DB transaction for inserting or removing the tile. The State Repository, at the end of the
transaction, signals an event that wakes up the controller. In this way, the Start menu can modify its appearance almost in real time.
Note In a similar way, the modern Start menu is automatically able to add or remove an
entry for every new standard Win32 application installed. The application setup program
usually creates one or more shortcuts in one of the classic Start menu folder locations
(systemwide path: C:\ProgramData\Microsoft\ Windows\Start Menu, or per-user path:
C:\Users\<UserName>\AppData\Roaming\Microsoft\Windows\Start Menu). The modern
Start menu uses the services provided by the AppResolver library to register file system
notifications on all the Start menu folders (through the ReadDirectoryChangesW Win32 API).
In this way, whenever a new shortcut is created in the monitored folders, the library can get
a callback and signal the Start menu to redraw itself.
252
CHAPTER 8
System mechanisms
EXPERIMENT: Witnessing the state repository
You can open each partition of the state repository fairly easily using your preferred SQLite
browser application. For this experiment, you need to download and install an SQLite browser,
like the open-source DB Browser for SQLite, which you can download from http://sqlitebrowser.
parti-org/. The State Repository path is not accessible by standard users. Furthermore, each parti
org/
tion’s file could be in use in the exact moment that you will access it. Thus, you need to copy
the database file in another folder before trying to open it with the SQLite browser. Open
an administrative command prompt (by typing cmd in the Cortana search box and selecting Run As Administrator after right-clicking the Command Prompt label) and insert the
following commands:
C:\WINDOWS\system32>cd “C:\ProgramData\Microsoft\Windows\AppRepository”
C:\ProgramData\Microsoft\Windows\AppRepository>copy StateRepository-Machine.srd
"%USERPROFILE%\Documents"
In this way, you have copied the State Repository machine partition into your Documents
folder. The next stage is to open it. Start DB Browser for SQLite using the link created in the
Start menu or the Cortana search box and click the Open Database button. Navigate to the
Documents folder, select All Files (*) in the ile pe combo box (the state repository database
doesn’t use a standard SQLite file extension), and open the copied StateRepository-machine.
CHAPTER 8
System mechanisms
253
srd file. The main view of DB Browser for SQLite is the database structure. For this experiment
you need to choose the Browse Data sheet and navigate through the tables like Package,
Application, PackageLocation, and PrimaryTile.
The Application Activation Manager and many other components of the Modern Application
Model use standard SQL queries to extract the needed data from the State Repository. For example, to extract the package location and the executable name of a modern application, a SQL
query like the following one could be used:
SELECT p.DisplayName, p.PackageFullName, pl.InstalledLocation, a.Executable, pm.Name
FROM Package AS p
INNER JOIN PackageLocation AS pl ON p._PackageID=pl.Package
INNER JOIN PackageFamily AS pm ON p.PackageFamily=pm._PackageFamilyID
INNER JOIN Application AS a ON a.Package=p._PackageID
WHERE pm.PackageFamilyName="<Package Family Name>"
The DAL (Data Access Layer) uses similar queries to provide services to its clients.
You can annotate the total number of records in the table and then install a new application
from the store. If, after the deployment process is completed, you again copy the database file,
you will find that number of the records change. This happens in multiple tables. Especially if the
new app installs a new tile, even the PrimaryTile table adds a record for the new tile shown in the
Start menu.
254
CHAPTER 8
System mechanisms
The Dependency Mini Repository
Opening an SQLite database and extracting the needed information through an SQL query could be
an expensive operation. Furthermore, the current architecture requires some interprocess communication done through RPC. Those two constraints sometimes are too restrictive to be satisfied. A classic
example is represented by a user launching a new application (maybe an Execution Alias) through the
command-line console. Checking the State Repository every time the system spawns a process introduces a big performance issue. To fix these problems, the Application Model has introduced another
smaller store that contains Modern applications’ information: the Dependency Mini Repository (DMR).
Unlike from the State Repository, the Dependency Mini Repository does not make use of any
database but stores the data in a Microsoft-proprietary binary format that can be accessed by any file
system in any security context (even a kernel-mode driver could possibly parse the DMR data). The
System Metadata directory, which is represented by a folder named Packages in the State Repository
root path, contains a list of subfolders, one for every installed package. The Dependency Mini Repository
is represented by a .pckgdep file, named as the user’s SID. The DMR file is created by the Deployment
service when a package is registered for a user (for further details, see the “Package registration” section later in this chapter).
The Dependency Mini Repository is heavily used when the system creates a process that belongs to
a packaged application (in the AppX Pre-CreateProcess extension). Thus, it’s entirely implemented in
the Win32 kernelbase.dll (with some stub functions in kernel.appcore.dll). When a DMR file is opened
at process creation time, it is read, parsed, and memory-mapped into the parent process. After the
child process is created, the loader code maps it even in the child process. The DMR file contains various information, including
■
■
■
■
Package information, like the ID, full name, full path, and publisher
Application information: application user model ID and relative ID, description, display name,
and graphical logos
Security context: AppContainer SID and capabilities
Target platform and the package dependencies graph (used in case a package depends on one
or more others)
The DMR file is designed to contain even additional data in future Windows versions, if required.
Using the Dependency Mini Repository file, the process creation is fast enough and does not require a
query into the State Repository. Noteworthy is that the DMR file is closed after the process creation. So,
it is possible to rewrite the .pckgdep file, adding an optional package even when the Modern application is executing. In this way, the user can add a feature to its modern application without restarting
it. Some small parts of the package mini repository (mostly only the package full name and path) are
replicated into different registry keys as cache for a faster access. The cache is often used for common
operations (like understanding if a package exists).
CHAPTER 8
System mechanisms
255
Background tasks and the Broker Infrastructure
UWP applications usually need a way to run part of their code in the background. This code doesn’t
need to interact with the main foreground process. UWP supports background tasks, which provide
functionality to the application even when the main process is suspended or not running. There are
multiple reasons why an application may use background tasks: real-time communications, mails, IM,
multimedia music, video player, and so on. A background task could be associated by triggers and
conditions. A trigger is a global system asynchronous event that, when it happens, signals the starting
of a background task. The background task at this point may or may be not started based on its applied
conditions. For example, a background task used in an IM application could start only when the user
logs on (a system event trigger) and only if the Internet connection is available (a condition).
In Windows 10, there are two types of background tasks:
■
■
In-process background task The application code and its background task run in the same
process. From a developer’s point of view, this kind of background task is easier to implement, but
it has the big drawback that if a bug hits its code, the entire application crashes. The in-process
background task doesn’t support all triggers available for the out-of-process background tasks.
Out-of-process background task The application code and its background task run in different processes (the process could run in a different job object, too). This type of background
task is more resilient, runs in the backgroundtaskhost.exe host process, and can use all the triggers and the conditions. If a bug hits the background task, this will never kill the entire application. The main drawback is originated from the performance of all the RPC code that needs to
be executed for the interprocess communication between different processes.
To provide the best user experience for the user, all background tasks have an execution time
limit of 30 seconds total. After 25 seconds, the Background Broker Infrastructure service calls the
task’s Cancellation handler (in WinRT, this is called OnCanceled event). When this event happens,
the background task still has 5 seconds to completely clean up and exit. Otherwise, the process that
contains the Background Task code (which could be BackgroundTaskHost.exe in case of out-of-process tasks; otherwise, it’s the application process) is terminated. Developers of personal or business
UWP applications can remove this limit, but such an application could not be published in the official
Microsoft Store.
The Background Broker Infrastructure (BI) is the central component that manages all the
Background tasks. The component is implemented mainly in bisrv.dll (the server side), which lives in
the Broker Infrastructure service. Two types of clients can use the services provided by the Background
Broker Infrastructure: Standard Win32 applications and services can import the bi.dll Background Broker
Infrastructure client library; WinRT applications always link to biwinrt.dll, the library that provides WinRT
APIs to modern applications. The Background Broker Infrastructure could not exist without the brokers.
The brokers are the components that generate the events that are consumed by the Background Broker
Server. There are multiple kinds of brokers. The most important are the following:
■
■
256
ste Event ro er Provides triggers for system events like network connections’ state
changes, user logon and logoff, system battery state changes, and so on
Time Broker
CHAPTER 8
Provides repetitive or one-shot timer support
System mechanisms
■
■
■
Network Connection Broker Provides a way for the UWP applications to get an event when
a connection is established on certain ports
Device Services Broker Provides device arrivals triggers (when a user connects or disconnects a device). Works by listening Pnp events originated from the kernel
Mobile Broad Band Experience Broker
Provides all the critical triggers for phones and SIMs
The server part of a broker is implemented as a windows service. The implementation is different
for every broker. Most work by subscribing to WNF states (see the “Windows Notification Facility” section earlier in this chapter for more details) that are published by the Windows kernel; others are built
on top of standard Win32 APIs (like the Time Broker). Covering the implementation details of all the
brokers is outside the scope of this book. A broker can simply forward events that are generated somewhere else (like in the Windows kernel) or can generates new events based on some other conditions
and states. Brokers forward events that they managed through WNF: each broker creates a WNF state
name that the background infrastructure subscribes to. In this way, when the broker publishes new
state data, the Broker Infrastructure, which is listening, wakes up and forwards the event to its clients.
Each broker includes even the client infrastructure: a WinRT and a Win32 library. The Background
Broker Infrastructure and its brokers expose three kinds of APIs to its clients:
■
■
■
Non-trust APIs Usually used by WinRT components that run under AppContainer or in
a sandbox environment. Supplementary security checks are made. The callers of this kind
of API can’t specify a different package name or operate on behalf of another user (that is,
BiRtCreateEventForApp).
Partial-trust APIs Used by Win32 components that live in a Medium-IL environment. Callers
of this kind of API can specify a Modern application’s package full name but can’t operate on
behalf of another user (that is, BiPtCreateEventForApp).
Full-trust API Used only by high-privileged system or administrative Win32 services. Callers
of these APIs can operate on behalf of different users and on different packages (that is,
BiCreateEventForPackageName).
Clients of the brokers can decide whether to subscribe directly to an event provided by the
specific broker or subscribe to the Background Broker Infrastructure. WinRT always uses the latter
method. Figure 8-44 shows an example of initialization of a Time trigger for a Modern Application
Background task.
(Imports BiWinRt.dll)
UWP
Application
(Imports BrokerLib.dll)
RPC
Communication
CreateBrokerEvent Time Broker SetWaitableTimer
BrokerInfracture
Server
BiRtCreateEvent
+Callback
ForApp
Notifies the app
(if needed)
Starts the
Background Task
Subscribe
WNF state
Background Task
Host
Win32
KernelBase
Timer fires, Callback is called:
Publish new WNF state data
WNF
FIGURE 8-44 Architecture of the Time Broker.
CHAPTER 8
System mechanisms
257
Another important service that the Background Broker Infrastructure provides to the Brokers
and to its clients is the storage capability for background tasks. This means that when the user shuts
down and then restarts the system, all the registered background tasks are restored and rescheduled
as before the system was restarted. To achieve this properly, when the system boots and the Service
Control Manager (for more information about the Service Control Manager, refer to Chapter 10) starts
the Broker Infrastructure service, the latter, as a part of its initialization, allocates a root storage GUID,
and, using NtLoadKeyEx native API, loads a private copy of the Background Broker registry hive. The
service tells NT kernel to load a private copy of the hive using a special flag (REG_APP_HIVE). The
BI hive resides in the C:\Windows\System32\Config\BBI file. The root key of the hive is mounted as
\Registry\A\<Root Storage GUID> and is accessible only to the Broker Infrastructure service’s process
(svchost.exe, in this case; Broker Infrastructure runs in a shared service host). The Broker Infrastructure
hive contains a list of events and work items, which are ordered and identified using GUIDs:
■
■
An event represents a Background task’s trigger It is associated with a broker ID (which
represents the broker that provides the event type), the package full name, and the user of the
UWP application that it is associated with, and some other parameters.
A work item represents a scheduled Background task It contains a name, a list of conditions, the task entry point, and the associated trigger event GUID.
The BI service enumerates each subkey and then restores all the triggers and background tasks. It
cleans orphaned events (the ones that are not associated with any work items). It then finally publishes
a WNF ready state name. In this way, all the brokers can wake up and finish their initialization.
The Background Broker Infrastructure is deeply used by UWP applications. Even regular Win32
applications and services can make use of BI and brokers, through their Win32 client libraries. Some
notable examples are provided by the Task Scheduler service, Background Intelligent Transfer service,
Windows Push Notification service, and AppReadiness.
Packaged applications setup and startup
Packaged application lifetime is different than standard Win32 applications. In the Win32 world,
the setup procedure for an application can vary from just copying and pasting an executable file to
executing complex installation programs. Even if launching an application is just a matter of running
an executable file, the Windows loader takes care of all the work. The setup of a Modern application is
instead a well-defined procedure that passes mainly through the Windows Store. In Developer mode,
an administrator is even able to install a Modern application from an external .Appx file. The package
file needs to be digitally signed, though. This package registration procedure is complex and involves
multiple components.
Before digging into package registration, it’s important to understand another key concept that
belongs to Modern applications: package activation. Package activation is the process of launching a
Modern application, which can or cannot show a GUI to the user. This process is different based on the
type of Modern application and involves various system components.
258
CHAPTER 8
System mechanisms
Package activation
A user is not able to launch a UWP application by just executing its .exe file (excluding the case of the
new AppExecution aliases, created just for this reason. We describe AppExecution aliases later in this
chapter). To correctly activate a Modern application, the user needs to click a tile in the modern menu,
use a special link file that Explorer is able to parse, or use some other activation points (double-click
an application’s document, invoke a special URL, and so on). The ShellExperienceHost process decides
which activation performs based on the application type.
UWP applications
The main component that manages this kind of activation is the Activation Manager, which is implemented in ActivationManager.dll and runs in a sihost.exe service because it needs to interact with the
user’s desktop. The activation manager strictly cooperates with the View Manager. The modern menu
calls into the Activation Manager through RPC. The latter starts the activation procedure, which is schematized in Figure 8-45:
■
■
■
■
■
■
Gets the SID of the user that is requiring the activation, the package family ID, and PRAID of the
package. In this way, it can verify that the package is actually registered in the system (using the
Dependency Mini Repository and its registry cache).
If the previous check yields that the package needs to be registered, it calls into the AppX
Deployment client and starts the package registration. A package might need to be registered
in case of “on-demand registration,” meaning that the application is downloaded but not
completely installed (this saves time, especially in enterprise environments) or in case the application needs to be updated. The Activation Manager knows if one of the two cases happens
thanks to the State Repository.
It registers the application with HAM and creates the HAM host for the new package and its
initial activity.
Activation Manager talks with the View Manager (through RPC), with the goal of initializing the
GUI activation of the new session (even in case of background activations, the View Manager
always needs to be informed).
The activation continues in the DcomLaunch service because the Activation Manager at this
stage uses a WinRT class to launch the low-level process creation.
The DcomLaunch service is responsible in launching COM, DCOM, and WinRT servers in response to object activation requests and is implemented in the rpcss.dll library. DcomLaunch
captures the activation request and prepares to call the CreateProcessAsUser Win32 API. Before
doing this, it needs to set the proper process attributes (like the package full name), ensure
that the user has the proper license for launching the application, duplicate the user token, set
the low integrity level to the new one, and stamp it with the needed security attributes. (Note
that the DcomLaunch service runs under a System account, which has TCB privilege. This kind
of token manipulation requires TCB privilege. See Chapter 7 of Part 1 for further details.) At this
point, DcomLaunch calls CreateProcessAsUser, passing the package full name through one of
the process attributes. This creates a suspended process.
CHAPTER 8
System mechanisms
259
■
■
■
■
The rest of the activation process continues in Kernelbase.dll. The token produced by
DcomLaunch is still not an AppContainer but contains the UWP Security attributes. A Special
code in the CreateProcessInternal function uses the registry cache of the Dependency Mini
Repository to gather the following information about the packaged application: Root Folder,
Package State, AppContainer package SID, and list of application’s capabilities. It then verifies
that the license has not been tampered with (a feature used extensively by games). At this point,
the Dependency Mini Repository file is mapped into the parent process, and the UWP application DLL alternate load path is resolved.
The AppContainer token, its object namespace, and symbolic links are created with the
BasepCreateLowBox function, which performs the majority of the work in user mode, except for
the actual AppContainer token creation, which is performed using the NtCreateLowBoxToken
kernel function. We have already covered AppContainer tokens in Chapter 7 of Part 1.
The kernel process object is created as usual by using NtCreateUserProcess kernel API.
After the CSRSS subsystem has been informed, the BasepPostSuccessAppXExtension function
maps the Dependency Mini Repository in the PEB of the child process and unmaps it from the
parent process. The new process can then be finally started by resuming its main thread.
Host Activity
Manager (HAM)
nd
a
ost
h
AM
s H tivity
c
A
ate
Cre
Activation
Manager
Modern Start Menu
(ShellExperienceHost.exe
WinRT Activation
Initializes the GUI
View
Manager
Ch
eck
s
exi if pa
c
s
reg ts and kage
iste
i
s
red
Sets process attributes
Checks license
Duplicates and stamps the token
Calls CreateProcessAsUser
Re
ad
an pack
dA
a
pp ge in
Co
nta form
ine atio
rd
n
ata
DComLaunch
State Repository
Dependency Mini Repository
KernelBase.dll
Process Creation
AppContainer Environment setup
AppContainer token creation
NT Kernel
FIGURE 8-45 Scheme of the activation of a modern UWP application.
260
CHAPTER 8
System mechanisms
Centennial applications
The Centennial applications activation process is similar to the UWP activation but is implemented
in a totally different way. The modern menu, ShellExperienceHost, always calls into Explorer.exe for
this kind of activation. Multiple libraries are involved in the Centennial activation type and mapped in
Explorer, like Daxexec.dll, Twinui.dll, and Windows.Storage.dll. When Explorer receives the activation
request, it gets the package full name and application id, and, through RPC, grabs the main application
executable path and the package properties from the State Repository. It then executes the same steps
(2 through 4) as for UWP activations. The main difference is that, instead of using the DcomLaunch
service, Centennial activation, at this stage, it launches the process using the ShellExecute API of the
Shell32 library. ShellExecute code has been updated to recognize Centennial applications and to use
a special activation procedure located in Windows.Storage.dll (through COM). The latter library uses
RPC to call the RAiLaunchProcessWithIdentity function located in the AppInfo service. AppInfo uses the
State Repository to verify the license of the application, the integrity of all its files, and the calling process’s token. It then stamps the token with the needed security attributes and finally creates the process
in a suspended state. AppInfo passes the package full name to the CreateProcessAsUser API using the
PROC_THREAD_ATTRIBUTE_PACKAGE_FULL_NAME process attribute.
Unlike the UWP activation, no AppContainer is created at all, AppInfo calls the PostCreateProcess
DesktopAppXActivation function of DaxExec.dll, with the goal of initializing the virtualization layer of
Centennial applications (registry and file system). Refer to the “Centennial application” section earlier in
this chapter for further information.
EXPERIMENT: Activate Modern apps through the command line
In this experiment, you will understand better the differences between UWP and Centennial, and
you will discover the motivation behind the choice to activate Centennial applications using the
ShellExecute API. For this experiment, you need to install at least one Centennial application. At
the time of this writing, a simple method to recognize this kind of application exists by using the
Windows Store. In the store, after selecting the target application, scroll down to the “Additional
Information” section. If you see “This app can: Uses all system resources,” which is usually located
before the “Supported languages” part, it means that the application is Centennial type.
In this experiment, you will use Notepad++. Search and install the “(unofficial) Notepad++”
application from the Windows Store. Then open the Camera application and Notepad++. Open
an administrative command prompt (you can do this by typing cmd in the Cortana search box
and selecting Run As Administrator after right-clicking the Command Prompt label). You need to
find the full path of the two running packaged applications using the following commands:
wmic process where "name='WindowsCamera.exe'" get ExecutablePath
wmic process where "name='notepad++.exe’" get ExecutablePath
CHAPTER 8
System mechanisms
261
Now you can create two links to the application’s executables using the commands:
mklink "%USERPROFILE%\Desktop\notepad.exe" "<Notepad++ executable Full Path>"
mklink "%USERPROFILE%\Desktop\camera.exe" "<WindowsCamera executable full path>
replacing the content between the < and > symbols with the real executable path discovered
by the first two commands.
You can now close the command prompt and the two applications. You should have created
two new links in your desktop. Unlike with the Notepad.exe link, if you try to launch the Camera
application from your desktop, the activation fails, and Windows returns an error dialog box like
the following:
This happens because Windows Explorer uses the Shell32 library to activate executable links.
In the case of UWP, the Shell32 library has no idea that the executable it will launch is a UWP
application, so it calls the CreateProcessAsUser API without specifying any package identity.
In a different way, Shell32 can identify Centennial apps; thus, in this case, the entire activation
process is executed, and the application correctly launched. If you try to launch the two links
using the command prompt, none of them will correctly start the application. This is explained
by the fact that the command prompt doesn’t make use of Shell32 at all. Instead, it invokes the
CreateProcess API directly from its own code. This demonstrates the different activations of each
type of packaged application.
Note Starting with Windows 10 Creators Update (RS2), the Modern Application Model
supports the concept of Optional packages (internally called RelatedSet). Optional packages
are heavily used in games, where the main game supports even DLC (or expansions), and in
packages that represent suites: Microsoft Office is a good example. A user can download
and install Word and implicitly the framework package that contains all the Office common
code. When the user wants to install even Excel, the deployment operation could skip the
download of the main Framework package because Word is an optional package of its main
Office framework.
Optional packages have relationship with their main packages through their manifest files.
In the manifest file, there is the declaration of the dependency to the main package (using
AMUID). Deeply describing Optional packages architecture is beyond the scope of this book.
262
CHAPTER 8
System mechanisms
AppExecution aliases
As we have previously described, packaged applications could not be activated directly through their
executable file. This represents a big limitation, especially for the new modern Console applications.
With the goal of enabling the launch of Modern apps (Centennial and UWP) through the command
line, starting from Windows 10 Fall Creators Update (build 1709), the Modern Application Model has
introduced the concept of AppExecution aliases. With this new feature, the user can launch Edge or
any other modern applications through the console command line. An AppExecution alias is basically a 0-bytes length executable file located in C:\Users\<UserName>\AppData\Local\Microsoft\
WindowsApps (as shown in Figure 8-46.). The location is added in the system executable search path
list (through the PATH environment variable); as a result, to execute a modern application, the user
could specify any executable file name located in this folder without the complete path (like in the Run
dialog box or in the console command line).
FIGURE 8-46 The AppExecution aliases main folder.
How can the system execute a 0-byte file? The answer lies in a little-known feature of the file system:
reparse points. Reparse points are usually employed for symbolic links creation, but they can store any
data, not only symbolic link information. The Modern Application Model uses this feature to store the
packaged application’s activation data (package family name, Application user model ID, and application path) directly into the reparse point.
CHAPTER 8
System mechanisms
263
When the user launches an AppExecution alias executable, the CreateProcess API is used as usual.
The NtCreateUserProcess system call, used to orchestrate the kernel-mode process creation (see the
“Flow of CreateProcess” section of Chapter 3 in Part 1, for details) fails because the content of the file is
empty. The file system, as part of normal process creation, opens the target file (through IoCreateFileEx
API), encounters the reparse point data (while parsing the last node of the path) and returns a STATUS_
REPARSE code to the caller. NtCreateUserProcess translates this code to the STATUS_IO_REPARSE_TAG_
NOT_HANDLED error and exits. The CreateProcess API now knows that the process creation has failed
due to an invalid reparse point, so it loads and calls into the ApiSetHost.AppExecutionAlias.dll library,
which contains code that parses modern applications’ reparse points.
The library’s code parses the reparse point, grabs the packaged application activation data, and
calls into the AppInfo service with the goal of correctly stamping the token with the needed security attributes. AppInfo verifies that the user has the correct license for running the packaged application and
checks the integrity of its files (through the State Repository). The actual process creation is done by the
calling process. The CreateProcess API detects the reparse error and restarts its execution starting with
the correct package executable path (usually located in C:\Program Files\WindowsApps\). This time, it
correctly creates the process and the AppContainer token or, in case of Centennial, initializes the virtualization layer (actually, in this case, another RPC into AppInfo is used again). Furthermore, it creates the
HAM host and its activity, which are needed for the application. The activation at this point is complete.
EXPERIMENT: Reading the AppExecution alias data
In this experiment, you extract AppExecution alias data from the 0-bytes executable file. You
can use the FsReparser utility (found in this book’s downloadable resources) to parse both the
reparse points or the extended attributes of the NTFS file system. Just run the tool in a command
prompt window and specify the READ command-line parameter:
C:\Users\Andrea\AppData\Local\Microsoft\WindowsApps>fsreparser read MicrosoftEdge.exe
File System Reparse Point / Extended Attributes Parser 0.1
Copyright 2018 by Andrea Allievi (AaLl86)
Reading UWP attributes...
Source file: MicrosoftEdge.exe.
The source file does not contain any Extended Attributes.
The file contains a valid UWP Reparse point (version 3).
Package family name: Microsoft.MicrosoftEdge_8wekyb3d8bbwe
Application User Model Id: Microsoft.MicrosoftEdge_8wekyb3d8bbwe!MicrosoftEdge
UWP App Target full path: C:\Windows\System32\SystemUWPLauncher.exe
Alias Type: UWP Single Instance
As you can see from the output of the tool, the CreateProcess API can extract all the information that it needs to properly execute a modern application’s activation. This explains why you
can launch Edge from the command line.
264
CHAPTER 8
System mechanisms
Package registration
When a user wants to install a modern application, usually she opens the AppStore, looks for the application, and clicks the Get button. This action starts the download of an archive that contains a bunch
of files: the package manifest file, the application digital signature, and the block map, which represent
the chain of trust of the certificates included in the digital signature. The archive is initially stored in the
C:\Windows\SoftwareDistribution\Download folder. The AppStore process (WinStore.App.exe) communicates with the Windows Update service (wuaueng.dll), which manages the download requests.
The downloaded files are manifests that contain the list of all the modern application’s files, the
application dependencies, the license data, and the steps needed to correctly register the package.
The Windows Update service recognizes that the download request is for a modern application, verifies the calling process token (which should be an AppContainer), and, using services provided by the
AppXDeploymentClient.dll library, verifies that the package is not already installed in the system. It
then creates an AppX Deployment request and, through RPC, sends it to the AppX Deployment Server.
The latter runs as a PPL service in a shared service host process (which hosts even the Client License
Service, running as the same protected level). The Deployment Request is placed into a queue, which
is managed asynchronously. When the AppX Deployment Server sees the request, it dequeues it and
spawns a thread that starts the actual modern application deployment process.
Note Starting with Windows 8.1, the UWP deployment stack supports the concept of
bundles. Bundles are packages that contain multiple resources, like different languages
or features that have been designed only for certain regions. The deployment stack
implements an applicability logic that can download only the needed part of the
compressed bundle after checking the user profile and system settings.
A modern application deployment process involves a complex sequence of events. We summarize
here the entire deployment process in three main phases.
Phase 1: Package staging
After Windows Update has downloaded the application manifest, the AppX Deployment Server verifies
that all the package dependencies are satisfied, checks the application prerequisites, like the target
supported device family (Phone, Desktop, Xbox, and so on) and checks whether the file system of
the target volume is supported. All the prerequisites that the application needs are expressed in the
manifest file with each dependency. If all the checks pass, the staging procedure creates the package root directory (usually in C:\Program Files\WindowsApps\<PackageFullName>) and its subfolders. Furthermore, it protects the package folders, applying proper ACLs on all of them. If the modern
application is a Centennial type, it loads the daxexec.dll library and creates VFS reparse points needed
by the Windows Container Isolation minifilter driver (see the “Centennial applications” section earlier
in this chapter) with the goal of virtualizing the application data folder properly. It finally saves the
package root path into the HKLM\SOFTWARE\Classes\LocalSettings\Software\Microsoft\Windows\
CurrentVersion\AppModel\PackageRepository\Packages\<PackageFullName> registry key, in the Path
registry value.
CHAPTER 8
System mechanisms
265
The staging procedure then preallocates the application’s files on disk, calculates the final download size, and extracts the server URL that contains all the package files (compressed in an AppX file). It
finally downloads the final AppX from the remote servers, again using the Windows Update service.
Phase 2: User data staging
This phase is executed only if the user is updating the application. This phase simply restores the user
data of the previous package and stores them in the new application path.
Phase 3: Package registration
The most important phase of the deployment is the package registration. This complex phase uses
services provided by AppXDeploymentExtensions.onecore.dll library (and AppXDeploymentExtensions
.desktop.dll for desktop-specific deployment parts). We refer to it as Package Core Installation. At this
stage, the AppX Deployment Server needs mainly to update the State Repository. It creates new entries
for the package, for the one or more applications that compose the package, the new tiles, package capabilities, application license, and so on. To do this, the AppX Deployment server uses database transactions, which it finally commits only if no previous errors occurred (otherwise, they will be discarded).
When all the database transactions that compose a State Repository deployment operation are committed, the State Repository can call the registered listeners, with the goal of notifying each client that
has requested a notification. (See the “State Repository” section in this chapter for more information
about the change and event tracking feature of the State Repository.)
The last steps for the package registration include creating the Dependency Mini Repository file and
updating the machine registry to reflect the new data stored in the State Repository. This terminates
the deployment process. The new application is now ready to be activated and run.
Note For readability reasons, the deployment process has been significantly simplified.
For example, in the described staging phase, we have omitted some initial subphases, like
the Indexing phase, which parses the AppX manifest file; the Dependency Manager phase,
used to create a work plan and analyze the package dependencies; and the Package In Use
phase, which has the goal of communicating with PLM to verify that the package is not
already installed and in use.
Furthermore, if an operation fails, the deployment stack must be able to revert all the
changes. The other revert phases have not been described in the previous section.
Conclusion
In this chapter, we have examined the key base system mechanisms on which the Windows executive
is built. In the next chapter, we introduce the virtualization technologies that Windows supports with
the goal of improving the overall system security, providing a fast execution environment for virtual
machines, isolated containers, and secure enclaves.
266
CHAPTER 8
System mechanisms
CHAPTER 9
Virtualization technologies
O
ne of the most important technologies used for running multiple operating systems on the same
physical machine is virtualization. At the time of this writing, there are multiple types of virtualization technologies available from different hardware manufacturers, which have evolved over the years.
Virtualization technologies are not only used for running multiple operating systems on a physical
machine, but they have also become the basics for important security features like the Virtual Secure
Mode (VSM) and Hypervisor-Enforced Code Integrity (HVCI), which can’t be run without a hypervisor.
In this chapter, we give an overview of the Windows virtualization solution, called Hyper-V. Hyper-V
is composed of the hypervisor, which is the component that manages the platform-dependent virtualization hardware, and the virtualization stack. We describe the internal architecture of Hyper-V and
provide a brief description of its components (memory manager, virtual processors, intercepts, scheduler, and so on). The virtualization stack is built on the top of the hypervisor and provides different services to the root and guest partitions. We describe all the components of the virtualization stack (VM
Worker process, virtual machine management service, VID driver, VMBus, and so on) and the different
hardware emulation that is supported.
In the last part of the chapter, we describe some technologies based on the virtualization, such as
VSM and HVCI. We present all the secure services that those technologies provide to the system.
The Windows hypervisor
The Hyper-V hypervisor (also known as Windows hypervisor) is a type-1 (native or bare-metal) hypervisor: a mini operating system that runs directly on the host’s hardware to manage a single root and
one or more guest operating systems. Unlike type-2 (or hosted) hypervisors, which run on the base of a
conventional OS like normal applications, the Windows hypervisor abstracts the root OS, which knows
about the existence of the hypervisor and communicates with it to allow the execution of one or more
guest virtual machines. Because the hypervisor is part of the operating system, managing the guests
inside it, as well as interacting with them, is fully integrated in the operating system through standard
management mechanisms such as WMI and services. In this case, the root OS contains some enlightenments. Enlightenments are special optimizations in the kernel and possibly device drivers that detect
that the code is being run virtualized under a hypervisor, so they perform certain tasks differently, or
more efficiently, considering this environment.
Figure 9-1 shows the basic architecture of the Windows virtualization stack, which is described in
detail later in this chapter.
267
Root Partition
VMWPs
Enlightened
Windows
Child Partition
Enlightened
Linux
Child Partition
Unenlightened
Child Partition
VMMS WMI
User Applications
User Applications
User Applications
VSCs/ICs
Linux
VSCs/ICs
VSps
VID
I/O
Stack
Drivers
WinHv
I/O
Stack
Drivers
VMBus
WinHv
VMBus
Hypervisor Hypercalls
MSRs
APIC
I/O
Stack
Drivers
LinuxHv
Kernel
VMBus
Scheduler
Processors
Address Management
Partition Manager
Memory
FIGURE 9-1 The Hyper-V architectural stack (hypervisor and virtualization stack).
At the bottom of the architecture is the hypervisor, which is launched very early during the system
boot and provides its services for the virtualization stack to use (through the use of the hypercall interface). The early initialization of the hypervisor is described in Chapter 12, “Startup and shutdown.” The
hypervisor startup is initiated by the Windows Loader, which determines whether to start the hypervisor
and the Secure Kernel; if the hypervisor and Secure Kernel are started, the hypervisor uses the services
of the Hvloader.dll to detect the correct hardware platform and load and start the proper version of
the hypervisor. Because Intel and AMD (and ARM64) processors have differing implementations of
hardware-assisted virtualization, there are different hypervisors. The correct one is selected at boot-up
time after the processor has been queried through CPUID instructions. On Intel systems, the Hvix64.exe
binary is loaded; on AMD systems, the Hvax64.exe image is used. As of the Windows 10 May 2019
Update (19H1), the ARM64 version of Windows supports its own hypervisor, which is implemented in
the Hvaa64.exe image.
At a high level, the hardware virtualization extension used by the hypervisor is a thin layer that
resides between the OS kernel and the processor. This layer, which intercepts and emulates in a safe
manner sensitive operations executed by the OS, is run in a higher privilege level than the OS kernel.
(Intel calls this mode VMXROOT. Most books and literature define the VMXROOT security domain as
“Ring -1.”) When an operation executed by the underlying OS is intercepted, the processor stops to run
the OS code and transfer the execution to the hypervisor at the higher privilege level. This operation is
commonly referred to as a VMEXIT event. In the same way, when the hypervisor has finished processing the intercepted operation, it needs a way to allow the physical CPU to restart the execution of the
OS code. New opcodes have been defined by the hardware virtualization extension, which allow a
VMENTER event to happen; the CPU restarts the execution of the OS code at its original privilege level.
268
CHAPTER 9
Virtualization technologies
Partitions, processes, and threads
One of the key architectural components behind the Windows hypervisor is the concept of a partition.
A partition essentially represents the main isolation unit, an instance of an operating system installation, which can refer either to what’s traditionally called the host or the guest. Under the Windows
hypervisor model, these two terms are not used; instead, we talk of either a root partition or a child
partition, respectively. A partition is composed of some physical memory and one or more virtual
processors (VPs) with their local virtual APICs and timers. (In the global term, a partition also includes
a virtual motherboard and multiple virtual peripherals. These are virtualization stack concepts, which
do not belong to the hypervisor.)
At a minimum, a Hyper-V system has a root partition—in which the main operating system controlling the machine runs—the virtualization stack, and its associated components. Each operating system
running within the virtualized environment represents a child partition, which might contain certain
additional tools that optimize access to the hardware or allow management of the operating system.
Partitions are organized in a hierarchical way. The root partition has control of each child and receives
some notifications (intercepts) for certain kinds of events that happen in the child. The majority of the
physical hardware accesses that happen in the root are passed through by the hypervisor; this means
that the parent partition is able to talk directly to the hardware (with some exceptions). As a counterpart, child partitions are usually not able to communicate directly with the physical machine’s hardware
(again with some exceptions, which are described later in this chapter in the section “The virtualization
stack”). Each I/O is intercepted by the hypervisor and redirected to the root if needed.
One of the main goals behind the design of the Windows hypervisor was to have it be as small and
modular as possible, much like a microkernel—no need to support any hypervisor driver or provide a
full, monolithic module. This means that most of the virtualization work is actually done by a separate
virtualization stack (refer to Figure 9-1). The hypervisor uses the existing Windows driver architecture
and talks to actual Windows device drivers. This architecture results in several components that provide
and manage this behavior, which are collectively called the virtualization stack. Although the hypervisor is read from the boot disk and executed by the Windows Loader before the root OS (and the parent
partition) even exists, it is the parent partition that is responsible for providing the entire virtualization
stack. Because these are Microsoft components, only a Windows machine can be a root partition. The
Windows OS in the root partition is responsible for providing the device drivers for the hardware on the
system, as well as for running the virtualization stack. It’s also the management point for all the child
partitions. The main components that the root partition provides are shown in Figure 9-2.
CHAPTER 9
Virtualization technologies
269
Virtualization stack
WMI provider
VM worker
processes
VMM service
User mode
Kernel mode
Windows 10
Windows
kernel
Virtualization
service
providers
(VSPs)
Device
drivers
FIGURE 9-2 Components of the root partition.
Child partitions
A child partition is an instance of any operating system running parallel to the parent partition.
(Because you can save or pause the state of any child, it might not necessarily be running.) Unlike the
parent partition, which has full access to the APIC, I/O ports, and its physical memory (but not access
to the hypervisor’s and Secure Kernel’s physical memory), child partitions are limited for security and
management reasons to their own view of address space (the Guest Physical Address, or GPA, space,
which is managed by the hypervisor) and have no direct access to hardware (even though they may
have direct access to certain kinds of devices; see the “Virtualization stack” section for further details).
In terms of hypervisor access, a child partition is also limited mainly to notifications and state changes.
For example, a child partition doesn’t have control over other partitions (and can’t create new ones).
Child partitions have many fewer virtualization components than a parent partition because they
aren’t responsible for running the virtualization stack—only for communicating with it. Also, these
components can also be considered optional because they enhance performance of the environment but
aren’t critical to its use. Figure 9-3 shows the components present in a typical Windows child partition.
Guest applications
User mode
Kernel mode
Virtualization
service
clients
(VSCs)
Windows
kernel
Enlightenments
FIGURE 9-3 Components of a child partition.
270
CHAPTER 9
Virtualization technologies
Processes and threads
The Windows hypervisor represents a virtual machine with a partition data structure. A partition,
as described in the previous section, is composed of some memory (guest physical memory) and one
or more virtual processors (VP). Internally in the hypervisor, each virtual processor is a schedulable
entity, and the hypervisor, like the standard NT kernel, includes a scheduler. The scheduler dispatches
the execution of virtual processors, which belong to different partitions, to each physical CPU. (We
discuss the multiple types of hypervisor schedulers later in this chapter in the “Hyper-V schedulers”
section.) A hypervisor thread (TH_THREAD data structure) is the glue between a virtual processor and
its schedulable unit. Figure 9-4 shows the data structure, which represents the current physical execution context. It contains the thread execution stack, scheduling data, a pointer to the thread’s virtual
processor, the entry point of the thread dispatch loop (discussed later) and, most important, a pointer
to the hypervisor process that the thread belongs to.
Scheduling
Information
Physical Processor
Local Storage (PLS)
VP Stack
Owning Process
Dispatch Loop
Entry Point
FIGURE 9-4 The hypervisor’s thread data structure.
The hypervisor builds a thread for each virtual processor it creates and associates the newborn
thread with the virtual processor data structure (VM_VP).
A hypervisor process (TH_PROCESS data structure), shown in Figure 9-5, represents a partition
and is a container for its physical (and virtual) address space. It includes the list of the threads (which
are backed by virtual processors), scheduling data (the physical CPUs affinity in which the process is
allowed to run), and a pointer to the partition basic memory data structures (memory compartment,
reserved pages, page directory root, and so on). A process is usually created when the hypervisor
builds the partition (VM_PARTITION data structure), which will represent the new virtual machine.
Scheduling
Information
Thread List
Partition’s Memory
Compartment
FIGURE 9-5 The hypervisor’s process data structure.
CHAPTER 9
Virtualization technologies
271
Enlightenments
Enlightenments are one of the key performance optimizations that Windows virtualization takes advantage of. They are direct modifications to the standard Windows kernel code that can detect that the
operating system is running in a child partition and perform work differently. Usually, these optimizations are highly hardware-specific and result in a hypercall to notify the hypervisor.
An example is notifying the hypervisor of a long busy–wait spin loop. The hypervisor can keep some
state on the spin wait and decide to schedule another VP on the same physical processor until the wait
can be satisfied. Entering and exiting an interrupt state and access to the APIC can be coordinated with
the hypervisor, which can be enlightened to avoid trapping the real access and then virtualizing it.
Another example has to do with memory management, specifically translation lookaside buffer
(TLB) flushing. (See Part 1, Chapter 5, “Memory management,” for more information on these concepts.) Usually, the operating system executes a CPU instruction to flush one or more stale TLB entries,
which affects only a single processor. In multiprocessor systems, usually a TLB entry must be flushed
from every active processor’s cache (the system sends an inter-processor interrupt to every active
processor to achieve this goal). However, because a child partition could be sharing physical CPUs with
many other child partitions, and some of them could be executing a different VM’s virtual processor
at the time the TLB flush is initiated, such an operation would also flush this information for those VMs.
Furthermore, a virtual processor would be rescheduled to execute only the TLB flushing IPI, resulting
in noticeable performance degradation. If Windows is running under a hypervisor, it instead issues a
hypercall to have the hypervisor flush only the specific information belonging to the child partition.
Partition’s privileges, properties, and version features
When a partition is initially created (usually by the VID driver), no virtual processors (VPs) are associated
with it. At that time, the VID driver is free to add or remove some partition’s privileges. Indeed, when
the partition is first created, the hypervisor assigns some default privileges to it, depending on its type.
A partition’s privilege describes which action—usually expressed through hypercalls or synthetic
MSRs (model specific registers)—the enlightened OS running inside a partition is allowed to perform
on behalf of the partition itself. For example, the Access Root Scheduler privilege allows a child partition to notify the root partition that an event has been signaled and a guest’s VP can be rescheduled
(this usually increases the priority of the guest’s VP-backed thread). The Access VSM privilege instead
allows the partition to enable VTL 1 and access its properties and configuration (usually exposed
through synthetic registers). Table 9-1 lists all the privileges assigned by default by the hypervisor.
Partition privileges can only be set before the partition creates and starts any VPs; the hypervisor
won’t allow requests to set privileges after a single VP in the partition starts to execute. Partition properties are similar to privileges but do not have this limitation; they can be set and queried at any time.
There are different groups of properties that can be queried or set for a partition. Table 9-2 lists the
properties groups.
When a partition is created, the VID infrastructure provides a compatibility level (which is specified
in the virtual machine’s configuration file) to the hypervisor. Based on that compatibility level, the hypervisor enables or disables specific virtual hardware features that could be exposed by a VP to the underlying OS. There are multiple features that tune how the VP behaves based on the VM’s compatibility
272
CHAPTER 9
Virtualization technologies
level. A good example would be the hardware Page Attribute Table (PAT), which is a configurable caching type for virtual memory. Prior to Windows 10 Anniversary Update (RS1), guest VMs weren’t able
to use PAT in guest VMs, so regardless of whether the compatibility level of a VM specifies Windows
10 RS1, the hypervisor will not expose the PAT registers to the underlying guest OS. Otherwise, in case
the compatibility level is higher than Windows 10 RS1, the hypervisor exposes the PAT support to the
underlying OS running in the guest VM. When the root partition is initially created at boot time, the
hypervisor enables the highest compatibility level for it. In that way the root OS can use all the features
supported by the physical hardware.
TABLE 9-1 Partition’s privileges
PARTITION TYPE
DEFAULT PRIVILEGES
Root and child partition
Read/write a VP’s runtime counter
Read the current partition reference time
Access SynIC timers and registers
Query/set the VP's virtual APIC assist page
Read/write hypercall MSRs
Request VP IDLE entry
Read VP’s index
Map or unmap the hypercall’s code area
Read a VP’s emulated TSC (time-stamp counter) and its frequency
Control the partition TSC and re-enlightenment emulation
Read/write VSM synthetic registers
Read/write VP’s per-VTL registers
Starts an AP virtual processor
Enables partition’s fast hypercall support
Root partition only
Create child partition
Look up and reference a partition by ID
Deposit/withdraw memory from the partition compartment
Post messages to a connection port
Signal an event in a connection port’s partition
Create/delete and get properties of a partition's connection port
Connect/disconnect to a partition's connection port
Map/unmap the hypervisor statistics page (which describe a VP, LP, partition, or hypervisor)
Enable the hypervisor debugger for the partition
Schedule child partition’s VPs and access SynIC synthetic MSRs
Trigger an enlightened system reset
Read the hypervisor debugger options for a partition
Child partition only
Generate an extended hypercall intercept in the root partition
Notify a root scheduler’s VP-backed thread of an event being signaled
EXO partition
None
TABLE 9-2 Partition’s properties
PROPERTY GROUP
DESCRIPTION
Scheduling properties
Set/query properties related to the classic and core scheduler, like Cap, Weight, and Reserve
Time properties
Allow the partition to be suspended/resumed
Debugging properties
Change the hypervisor debugger runtime configuration
Resource properties
Queries virtual hardware platform-specific properties of the partition (like TLB size, SGX
support, and so on)
Compatibility properties
Queries virtual hardware platform-specific properties that are tied to the initial compatibility features
CHAPTER 9
Virtualization technologies
273
The hypervisor startup
In Chapter 12, we analyze the modality in which a UEFI-based workstation boots up, and all the components engaged in loading and starting the correct version of the hypervisor binary. In this section, we
briefly discuss what happens in the machine after the HvLoader module has transferred the execution
to the hypervisor, which takes control for the first time.
The HvLoader loads the correct version of the hypervisor binary image (depending on the CPU
manufacturer) and creates the hypervisor loader block. It captures a minimal processor context, which
the hypervisor needs to start the first virtual processor. The HvLoader then switches to a new, justcreated, address space and transfers the execution to the hypervisor image by calling the hypervisor
image entry point, KiSystemStartup, which prepares the processor for running the hypervisor and initializes the CPU_PLS data structure. The CPU_PLS represents a physical processor and acts as the PRCB
data structure of the NT kernel; the hypervisor is able to quickly address it (using the GS segment).
Differently from the NT kernel, KiSystemStartup is called only for the boot processor (the application
processors startup sequence is covered in the “Application Processors (APs) Startup” section later in this
chapter), thus it defers the real initialization to another function, BmpInitBootProcessor.
BmpInitBootProcessor starts a complex initialization sequence. The function examines the system
and queries all the CPU’s supported virtualization features (such as the EPT and VPID; the queried
features are platform-specific and vary between the Intel, AMD, or ARM version of the hypervisor). It
then determines the hypervisor scheduler, which will manage how the hypervisor will schedule virtual
processors. For Intel and AMD server systems, the default scheduler is the core scheduler, whereas the
root scheduler is the default for all client systems (including ARM64). The scheduler type can be manually overridden through the hypervisorschedulertype BCD option (more information about the different
hypervisor schedulers is available later in this chapter).
The nested enlightenments are initialized. Nested enlightenments allow the hypervisor to be executed in nested configurations, where a root hypervisor (called L0 hypervisor), manages the real hardware, and another hypervisor (called L1 hypervisor) is executed in a virtual machine. After this stage, the
BmpInitBootProcessor routine performs the initialization of the following components:
■
Memory manager (initializes the PFN database and the root compartment).
■
The hypervisor’s hardware abstraction layer (HAL).
■
■
■
274
The hypervisor’s process and thread subsystem (which depends on the chosen scheduler type).
The system process and its initial thread are created. This process is special; it isn’t tied to any
partition and hosts threads that execute the hypervisor code.
The VMX virtualization abstraction layer (VAL). The VAL’s purpose is to abstract differences between all the supported hardware virtualization extensions (Intel, AMD, and ARM64). It includes
code that operates on platform-specific features of the machine’s virtualization technology in
use by the hypervisor (for example, on the Intel platform the VAL layer manages the “unrestricted guest” support, the EPT, SGX, MBEC, and so on).
The Synthetic Interrupt Controller (SynIC) and I/O Memory Management Unit (IOMMU).
CHAPTER 9
Virtualization technologies
■
The Address Manager (AM), which is the component responsible for managing the physical
memory assigned to a partition (called guest physical memory, or GPA) and its translation to
real physical memory (called system physical memory). Although the first implementation of
Hyper-V supported shadow page tables (a software technique for address translation), since
Windows 8.1, the Address manager uses platform-dependent code for configuring the hypervisor address translation mechanism offered by the hardware (extended page tables for Intel,
nested page tables for AMD). In hypervisor terms, the physical address space of a partition is
called address domain. The platform-independent physical address space translation is commonly called Second Layer Address Translation (SLAT). The term refers to the Intel’s EPT, AMD’s
NPT or ARM 2-stage address translation mechanism.
The hypervisor can now finish constructing the CPU_PLS data structure associated with the boot
processor by allocating the initial hardware-dependent virtual machine control structures (VMCS for
Intel, VMCB for AMD) and by enabling virtualization through the first VMXON operation. Finally, the
per-processor interrupt mapping data structures are initialized.
EXPERIMENT: Connecting the hypervisor debugger
In this experiment, you will connect the hypervisor debugger for analyzing the startup sequence
of the hypervisor, as discussed in the previous section. The hypervisor debugger is supported
only via serial or network transports. Only physical machines can be used to debug the hypervisor, or virtual machines in which the “nested virtualization” feature is enabled (see the “Nested
virtualization” section later in this chapter). In the latter case, only serial debugging can be enabled for the L1 virtualized hypervisor.
For this experiment, you need a separate physical machine that supports virtualization extensions and has the Hyper-V role installed and enabled. You will use this machine as the debugged
system, attached to your host system (which acts as the debugger) where you are running the
debugging tools. As an alternative, you can set up a nested VM, as shown in the “Enabling nested
virtualization on Hyper-V” experiment later in this chapter (in that case you don’t need another
physical machine).
As a first step, you need to download and install the “Debugging Tools for Windows” in the
host system, which are available as part of the Windows SDK (or WDK), downloadable from
https://developer.microsoft.com/en-us/windows/downloads/windows-10-sdk. As an alternative,
for this experiment you also can use the WinDbgX, which, at the time of this writing, is available
in the Windows Store by searching “WinDbg Preview.”
The debugged system for this experiment must have Secure Boot disabled. The hypervisor debugging is not compatible with Secure Boot. Refer to your workstation user manual for
understanding how to disable Secure Boot (usually the Secure Boot settings are located in the
UEFI Bios). For enabling the hypervisor debugger in the debugged system, you should first open
an administrative command prompt (by typing cmd in the Cortana search box and selecting Run
as administrator).
CHAPTER 9
Virtualization technologies
275
In case you want to debug the hypervisor through your network card, you should type the
following commands, replacing the terms <HostIp> with the IP address of the host system;
<HostPort>” with a valid port in the host (from 49152); and <NetCardBusParams> with the
bus parameters of the network card of the debugged system, specified in the XX.YY.ZZ format
(where XX is the bus number, YY is the device number, and ZZ is the function number). You
can discover the bus parameters of your network card through the Device Manager applet or
through the KDNET.exe tool available in the Windows SDK:
bcdedit
bcdedit
bcdedit
bcdedit
/hypervisorsettings net hostip:<HostIp> port:<HostPort>
/set {hypervisorsettings} hypervisordebugpages 1000
/set {hypervisorsettings} hypervisorbusparams <NetCardBusParams>
/set hypervisordebug on
The following figure shows a sample system in which the network interface used for debugging the hypervisor is located in the 0.25.0 bus parameters, and the debugger is targeting a host
system configured with the IP address 192.168.0.56 on the port 58010.
Take note of the returned debugging key. After you reboot the debugged system, you should
run Windbg in the host, with the following command:
windbg.exe -d -k net:port=<HostPort>,key=<DebuggingKey>
You should be able to debug the hypervisor, and follow its startup sequence, even though
Microsoft may not release the symbols for the main hypervisor module:
276
CHAPTER 9
Virtualization technologies
In a VM with nested virtualization enabled, you can enable the L1 hypervisor debugger only
through the serial port by using the following command in the debugged system:
bcdedit /hypervisorsettings SERIAL DEBUGPORT:1 BAUDRATE:115200
The creation of the root partition and the boot virtual processor
The first steps that a fully initialized hypervisor needs to execute are the creation of the root partition
and the first virtual processor used for starting the system (called BSP VP). Creating the root partition
follows almost the same rules as for child partitions; multiple layers of the partition are initialized one
after the other. In particular:
1.
The VM-layer initializes the maximum allowed number of VTL levels and sets up the partition
privileges based on the partition’s type (see the previous section for more details). Furthermore,
the VM layer determines the partition’s allowable features based on the specified partition’s
compatibility level. The root partition supports the maximum allowable features.
2.
The VP layer initializes the virtualized CPUID data, which all the virtual processors of the partition use when a CPUID is requested from the guest operating system. The VP layer creates the
hypervisor process, which backs the partition.
3.
The Address Manager (AM) constructs the partition’s initial physical address space by using
machine platform-dependent code (which builds the EPT for Intel, NPT for AMD). The constructed physical address space depends on the partition type. The root partition uses identity
mapping, which means that all the guest physical memory corresponds to the system physical
memory (more information is provided later in this chapter in the “Partitions’ physical address
space” section).
CHAPTER 9
Virtualization technologies
277
Finally, after the SynIC, IOMMU, and the intercepts’ shared pages are correctly configured for the
partition, the hypervisor creates and starts the BSP virtual processor for the root partition, which is the
unique one used to restart the boot process.
A hypervisor virtual processor (VP) is represented by a big data structure (VM_VP), shown in
Figure 9-6. A VM_VP data structure maintains all the data used to track the state of the virtual processor: its platform-dependent registers state (like general purposes, debug, XSAVE area, and stack) and
data, the VP’s private address space, and an array of VM_VPLC data structures, which are used to track
the state of each Virtual Trust Level (VTL) of the virtual processor. The VM_VP also includes a pointer to
the VP’s backing thread and a pointer to the physical processor that is currently executing the VP.
Intercept Packet
Backing Thread
Virtual Registers
State
Physical CPU
Pointer to the
Physical CPU_PLS
VM_VPLC Array
VTL 1
VTL 0
VP’s Private Address
Space and Zone
SynIC Data
FIGURE 9-6 The VM_VP data structure representing a virtual processor.
As for the partitions, creating the BSP virtual processor is similar to the process of creating normal
virtual processors. VmAllocateVp is the function responsible in allocating and initializing the needed
memory from the partition’s compartment, used for storing the VM_VP data structure, its platformdependent part, and the VM_VPLC array (one for each supported VTL). The hypervisor copies the initial
processor context, specified by the HvLoader at boot time, into the VM_VP structure and then creates the VP’s private address space and attaches to it (only in case address space isolation is enabled).
Finally, it creates the VP’s backing thread. This is an important step: the construction of the virtual
processor continues in the context of its own backing thread. The hypervisor’s main system thread at
this stage waits until the new BSP VP is completely initialized. The wait brings the hypervisor scheduler
to select the newly created thread, which executes a routine, ObConstructVp, that constructs the VP in
the context of the new backed thread.
ObConstructVp, in a similar way as for partitions, constructs and initializes each layer of the virtual
processor—in particular, the following:
1.
278
The Virtualization Manager (VM) layer attaches the physical processor data structure (CPU_PLS)
to the VP and sets VTL 0 as active.
CHAPTER 9
Virtualization technologies
2.
The VAL layer initializes the platform-dependent portions of the VP, like its registers, XSAVE
area, stack, and debug data. Furthermore, for each supported VTL, it allocates and initializes
the VMCS data structure (VMCB for AMD systems), which is used by the hardware for keeping
track of the state of the virtual machine, and the VTL’s SLAT page tables. The latter allows each
VTL to be isolated from each other (more details about VTLs are provided later in the “Virtual
Trust Levels (VTLs) and Virtual Secure Mode (VSM)” section) . Finally, the VAL layer enables
and sets VTL 0 as active. The platform-specific VMCS (or VMCB for AMD systems) is entirely
compiled, the SLAT table of VTL 0 is set as active, and the real-mode emulator is initialized. The
Host-state part of the VMCS is set to target the hypervisor VAL dispatch loop. This routine is
the most important part of the hypervisor because it manages all the VMEXIT events generated
by each guest.
3.
The VP layer allocates the VP’s hypercall page, and, for each VTL, the assist and intercept message pages. These pages are used by the hypervisor for sharing code or data with the guest
operating system.
When ObConstructVp finishes its work, the VP’s dispatch thread activates the virtual processor and
its synthetic interrupt controller (SynIC). If the VP is the first one of the root partition, the dispatch
thread restores the initial VP’s context stored in the VM_VP data structure by writing each captured
register in the platform-dependent VMCS (or VMCB) processor area (the context has been specified
by the HvLoader earlier in the boot process). The dispatch thread finally signals the completion of the
VP initialization (as a result, the main system thread enters the idle loop) and enters the platformdependent VAL dispatch loop. The VAL dispatch loop detects that the VP is new, prepares it for the first
execution, and starts the new virtual machine by executing a VMLAUNCH instruction. The new VM
restarts exactly at the point at which the HvLoader has transferred the execution to the hypervisor. The
boot process continues normally but in the context of the new hypervisor partition.
The hypervisor memory manager
The hypervisor memory manager is relatively simple compared to the memory manager for NT or the
Secure Kernel. The entity that manages a set of physical memory pages is the hypervisor’s memory
compartment. Before the hypervisor startup takes palace, the hypervisor loader (Hvloader.dll) allocates
the hypervisor loader block and pre-calculates the maximum number of physical pages that will be
used by the hypervisor for correctly starting up and creating the root partition. The number depends
on the pages used to initialize the IOMMU to store the memory range structures, the system PFN database, SLAT page tables, and HAL VA space. The hypervisor loader preallocates the calculated number
of physical pages, marks them as reserved, and attaches the page list array in the loader block. Later,
when the hypervisor starts, it creates the root compartment by using the page list that was allocated
by the hypervisor loader.
Figure 9-7 shows the layout of the memory compartment data structure. The data structure keeps
track of the total number of physical pages “deposited” in the compartment, which can be allocated
somewhere or freed. A compartment stores its physical pages in different lists ordered by the NUMA
node. Only the head of each list is stored in the compartment. The state of each physical page and
its link in the NUMA list is maintained thanks to the entries in the PFN database. A compartment also
CHAPTER 9
Virtualization technologies
279
tracks its relationship with the root. A new compartment can be created using the physical pages that
belongs to the parent (the root). Similarly, when the compartment is deleted, all its remaining physical
pages are returned to the parent.
PFN 5B
PFN A4
PFN B6
# of Free Pages
PFN 5A
# of Deposited Pages
PFN 7A
Node N
Physical Pages Lists
PFN 25
Node 0
PFN CB
Parent
Compartment
PFN 24
Global Zone
PFN Database
FIGURE 9-7 The hypervisor’s memory compartment. Virtual address space for the global zone is reserved from
the end of the compartment data structure
When the hypervisor needs some physical memory for any kind of work, it allocates from the active compartment (depending on the partition). This means that the allocation can fail. Two possible
scenarios can arise in case of failure:
■
■
If the allocation has been requested for a service internal to the hypervisor (usually on behalf
of the root partition), the failure should not happen, and the system is crashed. (This explains
why the initial calculation of the total number of pages to be assigned to the root compartment
needs to be accurate.)
If the allocation has been requested on behalf of a child partition (usually through a hypercall),
the hypervisor will fail the request with the status INSUFFICIENT_MEMORY. The root partition
detects the error and performs the allocation of some physical page (more details are discussed
later in the “Virtualization stack” section), which will be deposited in the child compartment
through the HvDepositMemory hypercall. The operation can be finally reinitiated (and usually
will succeed).
The physical pages allocated from the compartment are usually mapped in the hypervisor using a
virtual address. When a compartment is created, a virtual address range (sized 4 or 8 GB, depending on
whether the compartment is a root or a child) is allocated with the goal of mapping the new compartment, its PDE bitmap, and its global zone.
A hypervisor’s zone encapsulates a private VA range, which is not shared with the entire hypervisor
address space (see the “Isolated address space” section later in this chapter). The hypervisor executes
with a single root page table (differently from the NT kernel, which uses KVA shadowing). Two entries in
the root page table page are reserved with the goal of dynamically switching between each zone and
the virtual processors’ address spaces.
280
CHAPTER 9
Virtualization technologies
Partitions’ physical address space
As discussed in the previous section, when a partition is initially created, the hypervisor allocates a
physical address space for it. A physical address space contains all the data structures needed by the
hardware to translate the partition’s guest physical addresses (GPAs) to system physical addresses
(SPAs). The hardware feature that enables the translation is generally referred to as second level address translation (SLAT). The term SLAT is platform-agnostic: hardware vendors use different names:
Intel calls it EPT for extended page tables; AMD uses the term NPT for nested page tables; and ARM
simply calls it Stage 2 Address Translation.
The SLAT is usually implemented in a way that’s similar to the implementation of the x64 page
tables, which uses four levels of translation (the x64 virtual address translation has already been discussed in detail in Chapter 5 of Part 1). The OS running inside the partition uses the same virtual address
translation as if it were running by bare-metal hardware. However, in the former case, the physical
processor actually executes two levels of translation: one for virtual addresses and one for translating
physical addresses. Figure 9-8 shows the SLAT set up for a guest partition. In a guest partition, a GPA is
usually translated to a different SPA. This is not true for the root partition.
Host Physical Memory
Guest A
Process A
CR 3
EPT A
Page Tables A
1
2
3
4
1
560
2
564
3
568
560
4
570
564
568
Guide Physical
Memory
570
FIGURE 9-8 Address translation for a guest partition.
When the hypervisor creates the root partition, it builds its initial physical address space by using
identity mapping. In this model, each GPA corresponds to the same SPA (for example, guest frame
0x1000 in the root partition is mapped to the bare-metal physical frame 0x1000). The hypervisor preallocates the memory needed for mapping the entire physical address space of the machine (which has
been discovered by the Windows Loader using UEFI services; see Chapter 12 for details) into all the
allowed root partition’s virtual trust levels (VTLs). (The root partition usually supports two VTLs.) The
SLAT page tables of each VTL belonging to the partition include the same GPA and SPA entries but usually with a different protection level set. The protection level applied to each partition’s physical frame
allows the creation of different security domains (VTL), which can be isolated one from each other. VTLs
are explained in detail in the section “The Secure Kernel” later in this chapter. The hypervisor pages
are marked as hardware-reserved and are not mapped in the partition’s SLAT table (actually they are
mapped using an invalid entry pointing to a dummy PFN).
CHAPTER 9
Virtualization technologies
281
Note For performance reasons, the hypervisor, while building the physical
memory mapping, is able to detect large chunks of contiguous physical memory, and, in a similar way as for virtual memory, is able to map those chunks by
using large pages. If for some reason the OS running in the partition decides to
apply a more granular protection to the physical page, the hypervisor would
use the reserved memory for breaking the large page in the SLAT table.
Earlier versions of the hypervisor also supported another technique for mapping a partition’s physical address space: shadow paging. Shadow paging was
used for those machines without the SLAT support. This technique had a very
high-performance overhead; as a result, it’s not supported anymore. (The machine must support SLAT; otherwise, the hypervisor would refuse to start.)
The SLAT table of the root is built at partition-creation time, but for a guest partition, the situation is
slightly different. When a child partition is created, the hypervisor creates its initial physical address space
but allocates only the root page table (PML4) for each partition’s VTL. Before starting the new VM, the
VID driver (part of the virtualization stack) reserves the physical pages needed for the VM (the exact
number depends on the VM memory size) by allocating them from the root partition. (Remember, we
are talking about physical memory; only a driver can allocate physical pages.) The VID driver maintains
a list of physical pages, which is analyzed and split in large pages and then is sent to the hypervisor
through the HvMapGpaPages Rep hypercall.
Before sending the map request, the VID driver calls into the hypervisor for creating the needed
SLAT page tables and internal physical memory space data structures. Each SLAT page table hierarchy
is allocated for each available VTL in the partition (this operation is called pre-commit). The operation
can fail, such as when the new partition’s compartment could not contain enough physical pages. In
this case, as discussed in the previous section, the VID driver allocates more memory from the root partition and deposits it in the child’s partition compartment. At this stage, the VID driver can freely map
all the child’s partition physical pages. The hypervisor builds and compiles all the needed SLAT page
tables, assigning different protection based on the VTL level. (Large pages require one less indirection
level.) This step concludes the child partition’s physical address space creation.
Address space isolation
Speculative execution vulnerabilities discovered in modern CPUs (also known as Meltdown, Spectre,
and Foreshadow) allowed an attacker to read secret data located in a more privileged execution
context by speculatively reading the stale data located in the CPU cache. This means that software
executed in a guest VM could potentially be able to speculatively read private memory that belongs to
the hypervisor or to the more privileged root partition. The internal details of the Spectre, Meltdown,
and all the side-channel vulnerabilities and how they are mitigated by Windows have been covered in
detail in Chapter 8.
282
CHAPTER 9
Virtualization technologies
The hypervisor has been able to mitigate most of these kinds of attacks by implementing the
HyperClear mitigation. The HyperClear mitigation relies on three key components to ensure strong
Inter-VM isolation: core scheduler, Virtual-Processor Address Space Isolation, and sensitive data scrubbing. In modern multicore CPUs, often different SMT threads share the same CPU cache. (Details about
the core scheduler and symmetric multithreading are provided in the “Hyper-V schedulers” section.) In
the virtualization environment, SMT threads on a core can independently enter and exit the hypervisor
context based on their activity. For example, events like interrupts can cause an SMT thread to switch
out of running the guest virtual processor context and begin executing the hypervisor context. This can
happen independently for each SMT thread, so one SMT thread may be executing in the hypervisor
context while its sibling SMT thread is still running a VM’s guest virtual processor context. An attacker
running code in a less trusted guest VM’s virtual processor context on one SMT thread can then use a
side channel vulnerability to potentially observe sensitive data from the hypervisor context running on
the sibling SMT thread.
The hypervisor provides strong data isolation to protect against a malicious guest VM by maintaining separate virtual address ranges for each guest SMT thread (which back a virtual processor). When
the hypervisor context is entered on a specific SMT thread, no secret data is addressable. The only data
that can be brought into the CPU cache is associated with that current guest virtual processor or represent shared hypervisor data. As shown in Figure 9-9, when a VP running on an SMT thread enters the
hypervisor, it is enforced (by the root scheduler) that the sibling LP is running another VP that belongs
to the same VM. Furthermore, no shared secrets are mapped in the hypervisor. In case the hypervisor
needs to access secret data, it assures that no other VP is scheduled in the other sibling SMT thread.
Core 0
Core 1
LP 0
LP 1
LP 0
HV
HV
HV
VM A
(VP 0)
VM A
(VP 1)
VM B
(VP 0)
L1 Data Cache
LP 1
L1 Data Cache
FIGURE 9-9 The Hyperclear mitigation.
Unlike the NT kernel, the hypervisor always runs with a single page table root, which creates a single
global virtual address space. The hypervisor defines the concept of private address space, which has
a misleading name. Indeed, the hypervisor reserves two global root page table entries (PML4 entries,
which generate a 1-TB virtual address range) for mapping or unmapping a private address space. When
the hypervisor initially constructs the VP, it allocates two private page table root entries. Those will be
used to map the VP’s secret data, like its stack and data structures that contain private data. Switching
the address space means writing the two entries in the global page table root (which explains why the
term private address space has a misleading name—actually it is private address range). The hypervisor
switches private address spaces only in two cases: when a new virtual processor is created and during
CHAPTER 9
Virtualization technologies
283
thread switches. (Remember, threads are backed by VPs. The core scheduler assures that no sibling SMT
threads execute VPs from different partitions.) During runtime, a hypervisor thread has mapped only
its own VP’s private data; no other secret data is accessible by that thread.
Mapping secret data in the private address space is achieved by using the memory zone, represented by an MM_ZONE data structure. A memory zone encapsulates a private VA subrange of the private
address space, where the hypervisor usually stores per-VP’s secrets.
The memory zone works similarly to the private address space. Instead of mapping root page table
entries in the global page table root, a memory zone maps private page directories in the two root
entries used by the private address space. A memory zone maintains an array of page directories, which
will be mapped and unmapped into the private address space, and a bitmap that keeps track of the
used page tables. Figure 9-10 shows the relationship between a private address space and a memory
zone. Memory zones can be mapped and unmapped on demand (in the private address space) but are
usually switched only at VP creation time. Indeed, the hypervisor does not need to switch them during
thread switches; the private address space encapsulates the VA range exposed by the memory zone.
Zone's Page
Table
Zone PDE #128
Zone PDE #256
0x200'00000000
Zone PDPTE #257
PML4 Entry #2
Zone PDPTE #258
PML4 Entry #3
Invalid
Invalid
PMLA Entry #192
Invalid
Zone PDE #384
•
•
•
•
PMLA Entry #320
Hypervisor's
Shared PDPT
0xFFFFF80'000000
PMLA Entry #480
Hypervisor's
Shared PDPT
•
•
•
•
Hypervisor’s Page
Table Root
(Maps the Entire HV)
Private Address Space
and Shared Page
Directory Pointers Tables
Private Zones
and Shared Page
Directories
FIGURE 9-10 The hypervisor’s private address spaces and private memory zones.
284
CHAPTER 9
Virtualization technologies
Shared Page
Table
Hypervisor's
Shared PDPT
Shared Page
Directory
0xFFFFFFFF'FFFFFFF
•
•
•
•
Shared Page
Table
Invalid
Shared Page
Directory
•
•
•
Shared Page
Table
0x7FFF'FFFFFFFF
0xFFFF8000'000000
Zone's Page
Table
•
•
•
•
Zone's Page
Table
Zone PDPTE #256
0
0x100'00000000
•
•
•
•
Private Zones
and Share
Page Tables
In Figure 9-10, the page table's structures related to the private address space are filled with a pattern, the ones related to the memory zone are shown in gray, and the shared ones belonging to the hypervisor are drawn with a dashed line. Switching private address spaces is a relatively cheap operation
that requires the modification of two PML4 entries in the hypervisor’s page table root. Attaching or
detaching a memory zone from the private address space requires only the modification of the zone’s
PDPTE (a zone VA size is variable; the PDTPE are always allocated contiguously).
Dynamic memory
Virtual machines can use a different percentage of their allocated physical memory. For example,
some virtual machines use only a small amount of their assigned guest physical memory, keeping a lot
of it freed or zeroed. The performance of other virtual machines can instead suffer for high-memory
pressure scenarios, where the page file is used too often because the allocated guest physical memory
is not enough. With the goal to prevent the described scenario, the hypervisor and the virtualization
stack supports the concept of dynamic memory. Dynamic memory is the ability to dynamically assign
and remove physical memory to a virtual machine. The feature is provided by multiple components:
■
■
■
The NT kernel’s memory manager, which supports hot add and hot removal of physical memory
(on bare-metal system too)
The hypervisor, through the SLAT (managed by the address manager)
The VM Worker process, which uses the dynamic memory controller module, Vmdynmem.dll,
to establish a connection to the VMBus Dynamic Memory VSC driver (Dmvsc.sys), which runs in
the child partition
To properly describe dynamic memory, we should quickly introduce how the page frame number
(PFN) database is created by the NT kernel. The PFN database is used by Windows to keep track of
physical memory. It was discussed in detail in Chapter 5 of Part 1. For creating the PFN database, the
NT kernel first calculates the hypothetical size needed to map the highest possible physical address
(256 TB on standard 64-bit systems) and then marks the VA space needed to map it entirely as reserved
(storing the base address to the MmPfnDatabase global variable). Note that the reserved VA space still
has no page tables allocated. The NT kernel cycles between each physical memory descriptor discovered by the boot manager (using UEFI services), coalesces them in the longest ranges possible and,
for each range, maps the underlying PFN database entries using large pages. This has an important
implication; as shown in Figure 9-11, the PFN database has space for the highest possible amount of
physical memory but only a small subset of it is mapped to real physical pages (this technique is called
sparse memory).
CHAPTER 9
Virtualization technologies
285
MmPfnDatabase
Physical Memory
Page 0x500
Pfn 0x500
Pfn 0x5FF
...
Page 0x5FF
Memory Hole*
Pfn 0x800
Pfn 0x8FF
Hot Removed
Memory
(set as Bad)
No
Map
Page 0x800
...
Page 0x8FF
FIGURE 9-11 An example of a PFN database where some physical memory has been removed.
Hot add and removal of physical memory works thanks to this principle. When new physical
memory is added to the system, the Plug and Play memory driver (Pnpmem.sys) detects it and calls
the MmAddPhysicalMemory routine, which is exported by the NT kernel. The latter starts a complex
procedure that calculates the exact number of pages in the new range and the Numa node to which
they belong, and then it maps the new PFN entries in the database by creating the necessary page
tables in the reserved VA space. The new physical pages are added to the free list (see Chapter 5 in
Part 1 for more details).
When some physical memory is hot removed, the system performs an inverse procedure. It checks
that the pages belong to the correct physical page list, updates the internal memory counters (like the
total number of physical pages), and finally frees the corresponding PFN entries, meaning that they
all will be marked as “bad.” The memory manager will never use the physical pages described by them
anymore. No actual virtual space is unmapped from the PFN database. The physical memory that was
described by the freed PFNs can always be re-added in the future.
When an enlightened VM starts, the dynamic memory driver (Dmvsc.sys) detects whether the child
VM supports the hot add feature; if so, it creates a worker thread that negotiates the protocol and
connects to the VMBus channel of the VSP. (See the “Virtualization stack” section later in this chapter
for details about VSC and VSP.) The VMBus connection channel connects the dynamic memory driver
running in the child partition to the dynamic memory controller module (Vmdynmem.dll), which is
mapped in the VM Worker process in the root partition. A message exchange protocol is started. Every
one second, the child partition acquires a memory pressure report by querying different performance
counters exposed by the memory manager (global page-file usage; number of available, committed,
286
CHAPTER 9
Virtualization technologies
and dirty pages; number of page faults per seconds; number of pages in the free and zeroed page list).
The report is then sent to the root partition.
The VM Worker process in the root partition uses the services exposed by the VMMS balancer, a
component of the VmCompute service, for performing the calculation needed for determining the
possibility to perform a hot add operation. If the memory status of the root partition allowed a hot add
operation, the VMMS balancer calculates the proper number of pages to deposit in the child partition
and calls back (through COM) the VM Worker process, which starts the hot add operation with the assistance of the VID driver:
1.
Reserves the proper amount of physical memory in the root partition
2.
Calls the hypervisor with the goal to map the system physical pages reserved by the root partition to some guest physical pages mapped in the child VM, with the proper protection
3.
Sends a message to the dynamic memory driver for starting a hot add operation on some guest
physical pages previously mapped by the hypervisor
The dynamic memory driver in the child partition uses the MmAddPhysicalMemory API exposed by
the NT kernel to perform the hot add operation. The latter maps the PFNs describing the new guest
physical memory in the PFN database, adding new backing pages to the database if needed.
In a similar way, when the VMMS balancer detects that the child VM has plenty of physical pages
available, it may require the child partition (still through the VM Worker process) to hot remove some
physical pages. The dynamic memory driver uses the MmRemovePhysicalMemory API to perform the
hot remove operation. The NT kernel verifies that each page in the range specified by the balancer is
either on the zeroed or free list, or it belongs to a stack that can be safely paged out. If all the conditions apply, the dynamic memory driver sends back the “hot removal” page range to the VM Worker
process, which will use services provided by the VID driver to unmap the physical pages from the child
partition and release them back to the NT kernel.
Note Dynamic memory is not supported when nested virtualization is enabled.
Hyper-V schedulers
The hypervisor is a kind of micro operating system that runs below the root partition’s OS (Windows).
As such, it should be able to decide which thread (backing a virtual processor) is being executed by
which physical processor. This is especially true when the system runs multiple virtual machines composed in total by more virtual processors than the physical processors installed in the workstation. The
hypervisor scheduler role is to select the next thread that a physical CPU is executing after the allocated
time slice of the current one ends. Hyper-V can use three different schedulers. To properly manage all
the different schedulers, the hypervisor exposes the scheduler APIs, a set of routines that are the only
entries into the hypervisor scheduler. Their sole purpose is to redirect API calls to the particular scheduler implementation.
CHAPTER 9
Virtualization technologies
287
EXPERIMENT: Controlling the hypervisor’s scheduler type
Whereas client editions of Windows start by default with the root scheduler, Windows Server 2019
runs by default with the core scheduler. In this experiment, you figure out the hypervisor scheduler
enabled on your system and find out how to switch to another kind of hypervisor scheduler on the
next system reboot.
The Windows hypervisor logs a system event after it has determined which scheduler to enable. You can search the logged event by using the Event Viewer tool, which you can run by typing eventvwr in the Cortana search box. After the applet is started, expand the Windows Logs
key and click the System log. You should search for events with ID 2 and the Event sources set to
Hyper-V-Hypervisor. You can do that by clicking the Filter Current Log button located on the
right of the window or by clicking the Event ID column, which will order the events in ascending
order by their ID (keep in mind that the operation can take a while). If you double-click a found
event, you should see a window like the following:
The launch event ID 2 denotes indeed the hypervisor scheduler type, where
1 = Classic scheduler, SMT disabled
2 = Classic scheduler
3 = Core scheduler
4 = Root scheduler
288
CHAPTER 9
Virtualization technologies
The sample figure was taken from a Windows Server system, which runs by default with the
Core Scheduler. To change the scheduler type to the classic one (or root), you should open an administrative command prompt window (by typing cmd in the Cortana search box and selecting
Run As Administrator) and type the following command:
bcdedit /set hypervisorschedulertype <Type>
where <Type> is Classic for the classic scheduler, Core for the core scheduler, or Root for the
root scheduler. You should restart the system and check again the newly generated Hyper-VHypervisor event ID 2. You can also check the current enabled hypervisor scheduler by using an
administrative PowerShell window with the following command:
Get-WinEvent -FilterHashTable @{ProviderName="Microsoft-Windows-Hyper-V-Hypervisor"; ID=2}
-MaxEvents 1
The command extracts the last Event ID 2 from the System event log.
The classic scheduler
The classic scheduler has been the default scheduler used on all versions of Hyper-V since its initial
release. The classic scheduler in its default configuration implements a simple, round-robin policy in
which any virtual processor in the current execution state (the execution state depends on the total
number of VMs running in the system) is equally likely to be dispatched. The classic scheduler supports
also setting a virtual processor’s affinity and performs scheduling decisions considering the physical
processor’s NUMA node. The classic scheduler doesn’t know what a guest VP is currently executing.
The only exception is defined by the spin-lock enlightenment. When the Windows kernel, which is running in a partition, is going to perform an active wait on a spin-lock, it emits a hypercall with the goal
to inform the hypervisor (high IRQL synchronization mechanisms are described in Chapter 8, “System
mechanisms”). The classic scheduler can preempt the current executing virtual processor (which
hasn’t expired its allocated time slice yet) and can schedule another one. In this way it saves the active
CPU spin cycles.
The default configuration of the classic scheduler assigns an equal time slice to each VP. This means
that in high-workload oversubscribed systems, where multiple virtual processors attempt to execute,
and the physical processors are sufficiently busy, performance can quickly degrade. To overcome
CHAPTER 9
Virtualization technologies
289
the problem, the classic scheduler supports different fine-tuning options (see Figure 9-12), which can
modify its internal scheduling decision:
■
■
■
VP reservations A user can reserve the CPU capacity in advance on behalf of a guest machine. The reservation is specified as the percentage of the capacity of a physical processor to
be made available to the guest machine whenever it is scheduled to run. As a result, Hyper-V
schedules the VP to run only if that minimum amount of CPU capacity is available (meaning that
the allocated time slice is guaranteed).
VP limits Similar to VP reservations, a user can limit the percentage of physical CPU usage for
a VP. This means reducing the available time slice allocated to a VP in a high workload scenario.
VP weight This controls the probability that a VP is scheduled when the reservations have
already been met. In default configurations, each VP has an equal probability of being executed.
When the user configures weight on the VPs that belong to a virtual machine, scheduling decisions become based on the relative weighting factor the user has chosen. For example, let’s
assume that a system with four CPUs runs three virtual machines at the same time. The first VM
has set a weighting factor of 100, the second 200, and the third 300. Assuming that all the system’s
physical processors are allocated to a uniform number of VPs, the probability of a VP in the first
VM to be dispatched is 17%, of a VP in the second VM is 33%, and of a VP in the third one is 50%.
FIGURE 9-12 The classic scheduler fine-tuning settings property page, which is available
only when the classic scheduler is enabled.
290
CHAPTER 9
Virtualization technologies
The core scheduler
Normally, a classic CPU’s core has a single execution pipeline in which streams of instructions are
executed one after each other. An instruction enters the pipe, proceeds through several stages of
execution (load data, compute, store data, for example), and is retired from the pipe. Different types
of instructions use different parts of the CPU core. A modern CPU’s core is often able to execute in an
out-of-order way multiple sequential instructions in the stream (in respect to the order in which they
entered the pipeline). Modern CPUs, which support out-of-order execution, often implement what is
called symmetric multithreading (SMT): a CPU’s core has two execution pipelines and presents more
than one logical processor to the system; thus, two different instruction streams can be executed side
by side by a single shared execution engine. (The resources of the core, like its caches, are shared.) The
two execution pipelines are exposed to the software as single independent processors (CPUs). From
now on, with the term logical processor (or simply LP), we will refer to an execution pipeline of an SMT
core exposed to Windows as an independent CPU. (SMT is discussed in Chapters 2 and 4 of Part 1.)
This hardware implementation has led to many security problems: one instruction executed
by a shared logical CPU can interfere and affect the instruction executed by the other sibling LP.
Furthermore, the physical core’s cache memory is shared; an LP can alter the content of the cache. The
other sibling CPU can potentially probe the data located in the cache by measuring the time employed
by the processor to access the memory addressed by the same cache line, thus revealing “secret data”
accessed by the other logical processor (as described in the “Hardware side-channel vulnerabilities”
section of Chapter 8). The classic scheduler can normally select two threads belonging to different VMs
to be executed by two LPs in the same processor core. This is clearly not acceptable because in this
context, the first virtual machine could potentially read data belonging to the other one.
To overcome this problem, and to be able to run SMT-enabled VMs with predictable performance,
Windows Server 2016 has introduced the core scheduler. The core scheduler leverages the properties
of SMT to provide isolation and a strong security boundary for guest VPs. When the core scheduler is
enabled, Hyper-V schedules virtual cores onto physical cores. Furthermore, it ensures that VPs belonging to different VMs are never scheduled on sibling SMT threads of a physical core. The core scheduler
enables the virtual machine for making use of SMT. The VPs exposed to a VM can be part of an SMT
set. The OS and applications running in the guest virtual machine can use SMT behavior and programming interfaces (APIs) to control and distribute work across SMT threads, just as they would when
run nonvirtualized.
Figure 9-13 shows an example of an SMT system with four logical processors distributed in two CPU
cores. In the figure, three VMs are running. The first and second VMs have four VPs in two groups of two,
whereas the third one has only one assigned VP. The groups of VPs in the VMs are labelled A through E.
Individual VPs in a group that are idle (have no code to execute) are filled with a darker color.
CHAPTER 9
Virtualization technologies
291
VM # 1
VP
VP
A
VP
VP
B
Run List
CPU Core #1
LP
VM # 2
LP
Deferred List
VP
VP
C
VP
VP
D
VP
A
VP
VP
C
VP
B
Run List
CPU Core #2
LP
VP
VP
LP
Deferred List
VP
VM # 3
VP
VP
E
E
FIGURE 9-13 A sample SMT system with two processors’ cores and three VMs running.
Each core has a run list containing groups of VPs that are ready to execute, and a deferred list of
groups of VPs that are ready to run but have not been added to the core’s run list yet. The groups of
VPs execute on the physical cores. If all VPs in a group become idle, then the VP group is descheduled
and does not appear on any run list. (In Figure 9-13, this is the situation for VP group D.) The only VP of
the group E has recently left the idle state. The VP has been assigned to the CPU core 2. In the figure,
a dummy sibling VP is shown. This is because the LP of core 2 never schedules any other VP while its
sibling LP of its core is executing a VP belonging to the VM 3. In the same way, no other VPs are scheduled on a physical core if one VP in the LP group became idle but the other is still executing (such as for
group A, for example). Each core executes the VP group that is at the head of its run list. If there are no
VP groups to execute, the core becomes idle and waits for a VP group to be deposited onto its deferred
run list. When this occurs, the core wakes up from idle and empties its deferred run list, placing the
contents onto its run list.
292
CHAPTER 9
Virtualization technologies
The core scheduler is implemented by different components (see Figure 9-14) that provide strict
layering between each other. The heart of the core scheduler is the scheduling unit, which represents a
virtual core or group of SMT VPs. (For non-SMT VMs, it represents a single VP.) Depending on the VM’s
type, the scheduling unit has either one or two threads bound to it. The hypervisor’s process owns a list
of scheduling units, which own threads backing up to VPs belonging to the VM. The scheduling unit is
the single unit of scheduling for the core scheduler to which scheduling settings—such as reservation,
weight, and cap—are applied during runtime. A scheduling unit stays active for the duration of a time
slice, can be blocked and unblocked, and can migrate between different physical processor cores. An
important concept is that the scheduling unit is analogous to a thread in the classic scheduler, but it
doesn’t have a stack or VP context in which to run. It’s one of the threads bound to a scheduling unit
that runs on a physical processor core. The thread gang scheduler is the arbiter for each scheduling unit.
It’s the entity that decides which thread from the active scheduling unit gets run by which LP from the
physical processor core. It enforces thread affinities, applies thread scheduling policies, and updates
the related counters for each thread.
Scheduler Service
TH_PROCESS
Scheduling Unit
Scheduler Manager
Scheduling Unit
Unit Scheduler
Scheduling Unit
Thread Gang Scheduler
Core Dispatcher
Logical Processor Dispatcher
TH_THREAD
CPU_PLS
FIGURE 9-14 The components of the core scheduler.
CHAPTER 9
Virtualization technologies
293
Each LP of the physical processor’s core has an instance of a logical processor dispatcher associated
with it. The logical processor dispatcher is responsible for switching threads, maintaining timers, and
flushing the VMCS (or VMCB, depending on the architecture) for the current thread. Logical processor dispatchers are owned by the core dispatcher, which represents a physical single processor core
and owns exactly two SMT LPs. The core dispatcher manages the current (active) scheduling unit. The
unit scheduler, which is bound to its own core dispatcher, decides which scheduling unit needs to run
next on the physical processor core the unit scheduler belongs to. The last important component of
the core scheduler is the scheduler manager, which owns all the unit schedulers in the system and has
a global view of all their states. It provides load balancing and ideal core assignment services to the
unit scheduler.
The root scheduler
The root scheduler (also known as integrated scheduler) was introduced in Windows 10 April 2018
Update (RS4) with the goal to allow the root partition to schedule virtual processors (VPs) belonging
to guest partitions. The root scheduler was designed with the goal to support lightweight containers
used by Windows Defender Application Guard. Those types of containers (internally called Barcelona
or Krypton containers) must be managed by the root partition and should consume a small amount of
memory and hard-disk space. (Deeply describing Krypton containers is outside the scope of this book.
You can find an introduction of server containers in Part 1, Chapter 3, “Processes and jobs”). In addition,
the root OS scheduler can readily gather metrics about workload CPU utilization inside the container
and use this data as input to the same scheduling policy applicable to all other workloads in the system.
The NT scheduler in the root partition’s OS instance manages all aspects of scheduling work to
system LPs. To achieve that, the integrated scheduler’s root component inside the VID driver creates
a VP-dispatch thread inside of the root partition (in the context of the new VMMEM process) for each
guest VP. (VA-backed VMs are discussed later in this chapter.) The NT scheduler in the root partition
schedules VP-dispatch threads as regular threads subject to additional VM/VP-specific scheduling policies and enlightenments. Each VP-dispatch thread runs a VP-dispatch loop until the VID driver terminates the corresponding VP.
The VP-dispatch thread is created by the VID driver after the VM Worker Process (VMWP), which is
covered in the “Virtualization stack” section later in this chapter, has requested the partition and VPs
creation through the SETUP_PARTITION IOCTL. The VID driver communicates with the WinHvr driver,
which in turn initializes the hypervisor’s guest partition creation (through the HvCreatePartition hypercall). In case the created partition represents a VA-backed VM, or in case the system has the root scheduler active, the VID driver calls into the NT kernel (through a kernel extension) with the goal to create
the VMMEM minimal process associated with the new guest partition. The VID driver also creates a VPdispatch thread for each VP belonging to the partition. The VP-dispatch thread executes in the context
of the VMMEM process in kernel mode (no user mode code exists in VMMEM) and is implemented in
the VID driver (and WinHvr). As shown in Figure 9-15, each VP-dispatch thread runs a VP-dispatch loop
until the VID terminates the corresponding VP or an intercept is generated from the guest partition.
294
CHAPTER 9
Virtualization technologies
VmWp Worker
Thread
VP-Dispatch
Thread
Calls into VID to Get
a Message
Waits for the
ThreadWork
Event
VidVpRun
Signals the
ThreadWork
Event
Run Root
Schedule
Dispatch Loop
Wakes Up the VPdispatch Thread
Send
HvDispatchVp *Using the WinHvr Driver
to the Hypervisor
Waits for the
DispatchDone
Event
NO
Process the
Intercept
Intercept
Requires UserMode Processing
Intercept
Completed?
YES
Complete the
IOCTL and
Exit to VmWp
*Run by the VID Driver in the
VMMEM Process Context
YES
NO
Wakes Up the VmWp
Worker Thread
Signals the
DispatchDone
Event
FIGURE 9-15 The root scheduler’s VP-dispatch thread and the associated VMWP worker thread
that processes the hypervisor’s messages.
While in the VP-dispatch loop, the VP-dispatch thread is responsible for the following:
1.
Call the hypervisor’s new HvDispatchVp hypercall interface to dispatch the VP on the current
processor. On each HvDispatchVp hypercall, the hypervisor tries to switch context from the current root VP to the specified guest VP and let it run the guest code. One of the most important
characteristics of this hypercall is that the code that emits it should run at PASSIVE_LEVEL IRQL.
The hypervisor lets the guest VP run until either the VP blocks voluntarily, the VP generates an
intercept for the root, or there is an interrupt targeting the root VP. Clock interrupts are still
processed by the root partitions. When the guest VP exhausts its allocated time slice, the VPbacking thread is preempted by the NT scheduler. On any of the three events, the hypervisor
switches back to the root VP and completes the HvDispatchVp hypercall. It then returns to the
root partition.
CHAPTER 9
Virtualization technologies
295
2.
Block on the VP-dispatch event if the corresponding VP in the hypervisor is blocked. Anytime
the guest VP is blocked voluntarily, the VP-dispatch thread blocks itself on a VP-dispatch event
until the hypervisor unblocks the corresponding guest VP and notifies the VID driver. The VID
driver signals the VP-dispatch event, and the NT scheduler unblocks the VP-dispatch thread
that can make another HvDispatchVp hypercall.
3.
Process all intercepts reported by the hypervisor on return from the dispatch hypercall. If the
guest VP generates an intercept for the root, the VP-dispatch thread processes the intercept
request on return from the HvDispatchVp hypercall and makes another HvDispatchVp request
after the VID completes processing of the intercept. Each intercept is managed differently. If
the intercept requires processing from the user mode VMWP process, the WinHvr driver exits
the loop and returns to the VID, which signals an event for the backed VMWP thread and waits
for the intercept message to be processed by the VMWP process before restarting the loop.
To properly deliver signals to VP-dispatch threads from the hypervisor to the root, the integrated
scheduler provides a scheduler message exchange mechanism. The hypervisor sends scheduler messages to the root partition via a shared page. When a new message is ready for delivery, the hypervisor
injects a SINT interrupt into the root, and the root delivers it to the corresponding ISR handler in the
WinHvr driver, which routes the message to the VID intercept callback (VidInterceptIsrCallback). The
intercept callback tries to handle the intercept message directly from the VID driver. In case the direct
handling is not possible, a synchronization event is signaled, which allows the dispatch loop to exit and
allows one of the VmWp worker threads to dispatch the intercept in user mode.
Context switches when the root scheduler is enabled are more expensive compared to other hypervisor scheduler implementations. When the system switches between two guest VPs, for example, it
always needs to generate two exits to the root partitions. The integrated scheduler treats hypervisor’s
root VP threads and guest VP threads very differently (they are internally represented by the same
TH_THREAD data structure, though):
■
■
Only the root VP thread can enqueue a guest VP thread to its physical processor. The root VP
thread has priority over any guest VP that is running or being dispatched. If the root VP is not
blocked, the integrated scheduler tries its best to switch the context to the root VP thread as
soon as possible.
A guest VP thread has two sets of states: thread internal states and thread root states. The thread
root states reflect the states of the VP-dispatch thread that the hypervisor communicates to
the root partition. The integrated scheduler maintains those states for each guest VP thread to
know when to send a wake-up signal for the corresponding VP-dispatch thread to the root.
Only the root VP can initiate a dispatch of a guest VP for its processor. It can do that either because
of HvDispatchVp hypercalls (in this situation, we say that the hypervisor is processing “external work”),
or because of any other hypercall that requires sending a synchronous request to the target guest VP
(this is what is defined as “internal work”). If the guest VP last ran on the current physical processor, the
296
CHAPTER 9
Virtualization technologies
scheduler can dispatch the guest VP thread right away. Otherwise, the scheduler needs to send a flush
request to the processor on which the guest VP last ran and wait for the remote processor to flush the
VP context. The latter case is defined as “migration” and is a situation that the hypervisor needs to track
(through the thread internal states and root states, which are not described here).
EXPERIMENT: Playing with the root scheduler
The NT scheduler decides when to select and run a virtual processor belonging to a VM and for
how long. This experiment demonstrates what we have discussed previously: All the VP dispatch threads execute in the context of the VMMEM process, created by the VID driver. For the
experiment, you need a workstation with at least Windows 10 April 2018 update (RS4) installed,
along with the Hyper-V role enabled and a VM with any operating system installed ready for use.
The procedure for creating a VM is explained in detail here: https://docs.microsoft.com/en-us/
virtualization/hyper-v-on-windows/quick-start/quick-create-virtual-machine.
First, you should verify that the root scheduler is enabled. Details on the procedure are available in the “Controlling the hypervisor’s scheduler type” experiment earlier in this chapter. The
VM used for testing should be powered down.
Open the Task Manager by right-clicking on the task bar and selecting Task Manager
Manager, click the
Details sheet, and verify how many VMMEM processes are currently active. In case no VMs are
running, there should be none of them; in case the Windows Defender Application Guard (WDAG)
role is installed, there could be an existing VMMEM process instance, which hosts the preloaded
WDAG container. (This kind of VM is described later in the “VA-backed virtual machines” section.) In
case a VMMEM process instance exists, you should take note of its process ID (PID).
Open the Hyper-V Manager by typing Hyper-V Manager in the Cortana search box and start
your virtual machine. After the VM has been started and the guest operating system has successfully booted, switch back to the Task Manager and search for a new VMMEM process. If you click
the new VMMEM process and expand the User Name column, you can see that the process has
been associated with a token owned by a user named as the VM’s GUID. You can obtain your VM’s
GUID by executing the following command in an administrative PowerShell window (replace the
term “<VmName>” with the name of your VM):
Get-VM -VmName "<VmName>" | ft VMName, VmId
CHAPTER 9
Virtualization technologies
297
The VM ID and the VMMEM process’s user name should be the same, as shown in the following figure.
Install Process Explorer (by downloading it from https://docs.microsoft.com/en-us/sysinternals/downloads/process-explorer),
ternals/downloads/process-explorer and run it as administrator. Search the PID of the correct
VMMEM process identified in the previous step (27312 in the example), right-click it, and select
Suspend”. The CPU tab of the VMMEM process should now show “Suspended” instead of the
correct CPU time.
If you switch back to the VM, you will find that it is unresponsive and completely stuck. This is
because you have suspended the process hosting the dispatch threads of all the virtual processors belonging to the VM. This prevented the NT kernel from scheduling those threads, which
won’t allow the WinHvr driver to emit the needed HvDispatchVp hypercall used to resume the
VP execution.
If you right-click the suspended VMMEM and select Resume, your VM resumes its execution
and continues to run correctly.
298
CHAPTER 9
Virtualization technologies
Hypercalls and the hypervisor TLFS
Hypercalls provide a mechanism to the operating system running in the root or the in the child partition to request services from the hypervisor. Hypercalls have a well-defined set of input and output
parameters. The hypervisor Top Level Functional Specification (TLFS) is available online (https://docs
.microsoft.com/en-us/virtualization/hyper-v-on-windows/reference/tlfs); it defines the different calling conventions used while specifying those parameters. Furthermore, it lists all the publicly available
hypervisor features, partition’s properties, hypervisor, and VSM interfaces.
Hypercalls are available because of a platform-dependent opcode (VMCALL for Intel systems,
VMMCALL for AMD, HVC for ARM64) which, when invoked, always cause a VM_EXIT into the hypervisor. VM_EXITs are events that cause the hypervisor to restart to execute its own code in the hypervisor
privilege level, which is higher than any other software running in the system (except for firmware’s
SMM context), while the VP is suspended. VM_EXIT events can be generated from various reasons. In
the platform-specific VMCS (or VMCB) opaque data structure the hardware maintains an index that
specifies the exit reason for the VM_EXIT. The hypervisor gets the index, and, in case of an exit caused
by a hypercall, reads the hypercall input value specified by the caller (generally from a CPU’s generalpurpose register—RCX in the case of 64-bit Intel and AMD systems). The hypercall input value (see
Figure 9-16) is a 64-bit value that specifies the hypercall code, its properties, and the calling convention
used for the hypercall. Three kinds of calling conventions are available:
■
■
■
Standard hypercalls Store the input and output parameters on 8-byte aligned guest physical
addresses (GPAs). The OS passes the two addresses via general-purposes registers (RDX and R8
on Intel and AMD 64-bit systems).
Fast hypercalls Usually don’t allow output parameters and employ the two general-purpose
registers used in standard hypercalls to pass only input parameters to the hypervisor (up to
16 bytes in size).
Extended fast hypercalls (or XMM fast hypercalls) Similar to fast hypercalls, but these use an
additional six floating-point registers to allow the caller to pass input parameters up to 112 bytes
in size.
63:60
59:48
47:44
43:32
31:27
26:17
16
15:0
RsvdZ
(4 bits)
Rep start index
(12 bits)
RsvdZ
(4 bits)
Rep count
(12 bits)
RsvdZ
(5 bits)
Variable
header size
(9 bits)
Fast
(1 bit)
Call Code
(16 bits)
FIGURE 9-16 The hypercall input value (from the hypervisor TLFS).
There are two classes of hypercalls: simple and rep (which stands for “repeat”). A simple hypercall
performs a single operation and has a fixed-size set of input and output parameters. A rep hypercall
acts like a series of simple hypercalls. When a caller initially invokes a rep hypercall, it specifies a rep
count that indicates the number of elements in the input or output parameter list. Callers also specify
a rep start index that indicates the next input or output element that should be consumed.
CHAPTER 9
Virtualization technologies
299
All hypercalls return another 64-bit value called hypercall result value (see Figure 9-17). Generally,
the result value describes the operation’s outcome, and, for rep hypercalls, the total number of completed repetition.
63:40
43:32
31:16
15:0
Rsvd
(20 bits)
Rep
complete
(12 bits)
Rsvd
(16 bits)
Result
(16 bits)
FIGURE 9-17 The hypercall result value (from the hypervisor TLFS).
Hypercalls could take some time to be completed. Keeping a physical CPU that doesn‘t receive
interrupts can be dangerous for the host OS. For example, Windows has a mechanism that detects
whether a CPU has not received its clock tick interrupt for a period of time longer than 16 milliseconds.
If this condition is detected, the system is suddenly stopped with a BSOD. The hypervisor therefore
relies on a hypercall continuation mechanism for some hypercalls, including all rep hypercall forms. If
a hypercall isn’t able to complete within the prescribed time limit (usually 50 microseconds), control is
returned back to the caller (through an operation called VM_ENTRY), but the instruction pointer is not
advanced past the instruction that invoked the hypercall. This allows pending interrupts to be handled
and other virtual processors to be scheduled. When the original calling thread resumes execution, it
will re-execute the hypercall instruction and make forward progress toward completing the operation.
A driver usually never emits a hypercall directly through the platform-dependent opcode.
Instead, it uses services exposed by the Windows hypervisor interface driver, which is available in
two different versions:
■
■
WinHvr.sys Loaded at system startup if the OS is running in the root partition and exposes
hypercalls available in both the root and child partition.
WinHv.sys Loaded only when the OS is running in a child partition. It exposes hypercalls
available in the child partition only.
Routines and data structures exported by the Windows hypervisor interface driver are extensively
used by the virtualization stack, especially by the VID driver, which, as we have already introduced,
covers a key role in the functionality of the entire Hyper-V platform.
Intercepts
The root partition should be able to create a virtual environment that allows an unmodified guest OS,
which was written to execute on physical hardware, to run in a hypervisor’s guest partition. Such legacy
guests may attempt to access physical devices that do not exist in a hypervisor partition (for example,
by accessing certain I/O ports or by writing to specific MSRs). For these cases, the hypervisor provides
the host intercepts facility; when a VP of a guest VM executes certain instructions or generates certain
exceptions, the authorized root partition can intercept the event and alter the effect of the intercepted
instruction such that, to the child, it mirrors the expected behavior in physical hardware.
300
CHAPTER 9
Virtualization technologies
When an intercept event occurs in a child partition, its VP is suspended, and an intercept message
is sent to the root partition by the Synthetic Interrupt Controller (SynIC; see the following section
for more details) from the hypervisor. The message is received thanks to the hypervisor’s Synthetic
ISR (Interrupt Service Routine), which the NT kernel installs during phase 0 of its startup only in case
the system is enlightened and running under the hypervisor (see Chapter 12 for more details). The
hypervisor synthetic ISR (KiHvInterrupt), usually installed on vector 0x30, transfers its execution
to an external callback, which the VID driver has registered when it started (through the exposed
HvlRegisterInterruptCallback NT kernel API).
The VID driver is an intercept driver, meaning that it is able to register host intercepts with the
hypervisor and thus receives all the intercept events that occur on child partitions. After the partition
is initialized, the WM Worker process registers intercepts for various components of the virtualization
stack. (For example, the virtual motherboard registers I/O intercepts for each virtual COM ports of the
VM.) It sends an IOCTL to the VID driver, which uses the HvInstallIntercept hypercall to install the intercept on the child partition. When the child partition raises an intercept, the hypervisor suspends the VP
and injects a synthetic interrupt in the root partition, which is managed by the KiHvInterrupt ISR. The
latter routine transfers the execution to the registered VID Intercept callback, which manages the event
and restarts the VP by clearing the intercept suspend synthetic register of the suspended VP.
The hypervisor supports the interception of the following events in the child partition:
■
Access to I/O ports (read or write)
■
Access to VP’s MSR (read or write)
■
Execution of CPUID instruction
■
Exceptions
■
Accesses to general purposes registers
■
Hypercalls
The synthetic interrupt controller (SynIC)
The hypervisor virtualizes interrupts and exceptions for both the root and guest partitions through
the synthetic interrupt controller (SynIC), which is an extension of a virtualized local APIC (see the Intel
or AMD software developer manual for more details about the APIC). The SynIC is responsible for
dispatching virtual interrupts to virtual processors (VPs). Interrupts delivered to a partition fall into two
categories: external and synthetic (also known as internal or simply virtual interrupts). External interrupts originate from other partitions or devices; synthetic interrupts are originated from the hypervisor
itself and are targeted to a partition’s VP.
When a VP in a partition is created, the hypervisor creates and initializes a SynIC for each supported
VTL. It then starts the VTL 0’s SynIC, which means that it enables the virtualization of a physical CPU’s
CHAPTER 9
Virtualization technologies
301
APIC in the VMCS (or VMCB) hardware data structure. The hypervisor supports three kinds of APIC
virtualization while dealing with external hardware interrupts:
■
■
■
In standard configuration, the APIC is virtualized through the event injection hardware support.
This means that every time a partition accesses the VP’s local APIC registers, I/O ports, or MSRs
(in the case of x2APIC), it produces a VMEXIT, causing hypervisor codes to dispatch the interrupt through the SynIC, which eventually “injects” an event to the correct guest VP by manipulating VMCS/VMCB opaque fields (after it goes through the logic similar to a physical APIC,
which determines whether the interrupt can be delivered).
The APIC emulation mode works similar to the standard configuration. Every physical interrupt sent by the hardware (usually through the IOAPIC) still causes a VMEXIT, but the hypervisor does not have to inject any event. Instead, it manipulates a virtual-APIC page used by the
processor to virtualize certain access to the APIC registers. When the hypervisor wants to inject
an event, it simply manipulates some virtual registers mapped in the virtual-APIC page. The
event is delivered by the hardware when a VMENTRY happens. At the same time, if a guest VP
manipulates certain parts of its local APIC, it does not produce any VMEXIT, but the modification will be stored in the virtual-APIC page.
Posted interrupts allow certain kinds of external interrupts to be delivered directly in the guest
partition without producing any VMEXIT. This allows direct access devices to be mapped directly
in the child partition without incurring any performance penalties caused by the VMEXITs. The
physical processor processes the virtual interrupts by directly recording them as pending on the
virtual-APIC page. (For more details, consult the Intel or AMD software developer manual.)
When the hypervisor starts a processor, it usually initializes the synthetic interrupt controller module
for the physical processor (represented by a CPU_PLS data structure). The SynIC module of the physical
processor is an array of an interrupt’s descriptors, which make the connection between a physical interrupt and a virtual interrupt. A hypervisor interrupt descriptor (IDT entry), as shown in Figure 9-18, contains
the data needed for the SynIC to correctly dispatch the interrupt, in particular the entity the interrupt is
delivered to (a partition, the hypervisor, a spurious interrupt), the target VP (root, a child, multiple VPs, or
a synthetic interrupt), the interrupt vector, the target VTL, and some other interrupt characteristics.
Dispatch Type
Target VP & VTL
Virtual Vector
Interrupt
Characteristics
Hypervisor
Reserved
FIGURE 9-18 The hypervisor physical interrupt descriptor.
302
CHAPTER 9
Virtualization technologies
In default configurations, all the interrupts are delivered to the root partition in VTL 0 or to the
hypervisor itself (in the second case, the interrupt entry is Hypervisor Reserved). External interrupts
can be delivered to a guest partition only when a direct access device is mapped into a child partition;
NVMe devices are a good example.
Every time the thread backing a VP is selected for being executed, the hypervisor checks whether
one (or more) synthetic interrupt needs to be delivered. As discussed previously, synthetic interrupts
aren’t generated by any hardware; they’re usually generated from the hypervisor itself (under certain
conditions), and they are still managed by the SynIC, which is able to inject the virtual interrupt to the
correct VP. Even though they’re extensively used by the NT kernel (the enlightened clock timer is a
good example), synthetic interrupts are fundamental for the Virtual Secure Mode (VSM). We discuss
them in in the section “The Secure Kernel” later in this chapter.
The root partition can send a customized virtual interrupt to a child by using the HvAssertVirtualInterrupt
hypercall (documented in the TLFS).
Inter-partition communication
The synthetic interrupt controller also has the important role of providing inter-partition communication facilities to the virtual machines. The hypervisor provides two principal mechanisms for one partition to communicate with another: messages and events. In both cases, the notifications are sent to the
target VP using synthetic interrupts. Messages and events are sent from a source partition to a target
partition through a preallocated connection, which is associated with a destination port.
One of the most important components that uses the inter-partition communication services provided by the SynIC is VMBus. (VMBus architecture is discussed in the “Virtualization stack” section later
in this chapter.) The VMBus root driver (Vmbusr.sys) in the root allocates a port ID (ports are identified
by a 32-bit ID) and creates a port in the child partition by emitting the HvCreatePort hypercall through
the services provided by the WinHv driver.
A port is allocated in the hypervisor from the receiver’s memory pool. When a port is created, the
hypervisor allocates sixteen message buffers from the port memory. The message buffers are maintained in a queue associated with a SINT (synthetic interrupt source) in the virtual processor’s SynIC.
The hypervisor exposes sixteen interrupt sources, which can allow the VMBus root driver to manage a
maximum of 16 message queues. A synthetic message has the fixed size of 256 bytes and can transfer
only 240 bytes (16 bytes are used as header). The caller of the HvCreatePort hypercall specifies which
virtual processor and SINT to target.
To correctly receive messages, the WinHv driver allocates a synthetic interrupt message page
(SIMP), which is then shared with the hypervisor. When a message is enqueued for a target partition,
the hypervisor copies the message from its internal queue to the SIMP slot corresponding to the correct SINT. The VMBus root driver then creates a connection, which associates the port opened in the
child VM to the parent, through the HvConnectPort hypercall. After the child has enabled the reception of synthetic interrupts in the correct SINT slot, the communication can start; the sender can post
a message to the client by specifying a target Port ID and emitting the HvPostMessage hypercall. The
hypervisor injects a synthetic interrupt to the target VP, which can read from the message page (SIMP)
the content of the message.
CHAPTER 9
Virtualization technologies
303
The hypervisor supports ports and connections of three types:
■
■
■
Message ports Transmit 240-byte messages from and to a partition. A message port is associated with a single SINT in the parent and child partition. Messages will be delivered in order
through a single port message queue. This characteristic makes messages ideal for VMBus
channel setup and teardown (further details are provided in the “Virtualization stack” section
later in this chapter).
Event ports Receive simple interrupts associated with a set of flags, set by the hypervisor
when the opposite endpoint makes a HvSignalEvent hypercall. This kind of port is normally
used as a synchronization mechanism. VMBus, for example, uses an event port to notify that a
message has been posted on the ring buffer described by a particular channel. When the event
interrupt is delivered to the target partition, the receiver knows exactly to which channel the
interrupt is targeted thanks to the flag associated with the event.
Monitor ports An optimization to the Event port. Causing a VMEXIT and a VM context switch
for every single HvSignalEvent hypercall is an expensive operation. Monitor ports are set up by
allocating a shared page (between the hypervisor and the partition) that contains a data structure indicating which event port is associated with a particular monitored notification flag (a bit
in the page). In that way, when the source partition wants to send a synchronization interrupt, it
can just set the corresponding flag in the shared page. Sooner or later the hypervisor will notice
the bit set in the shared page and will trigger an interrupt to the event port.
The Windows hypervisor platform API and EXO partitions
Windows increasingly uses Hyper-V’s hypervisor for providing functionality not only related to running
traditional VMs. In particular, as we will discuss discuss in the second part of this chapter, VSM, an important security component of modern Windows versions, leverages the hypervisor to enforce a higher
level of isolation for features that provide critical system services or handle secrets such as passwords.
Enabling these features requires that the hypervisor is running by default on a machine.
External virtualization products, like VMware, Qemu, VirtualBox, Android Emulator, and many others use the virtualization extensions provided by the hardware to build their own hypervisors, which is
needed for allowing them to correctly run. This is clearly not compatible with Hyper-V, which launches
its hypervisor before the Windows kernel starts up in the root partition (the Windows hypervisor is a
native, or bare-metal hypervisor).
As for Hyper-V, external virtualization solutions are also composed of a hypervisor, which provides
generic low-level abstractions for the processor’s execution and memory management of the VM, and a
virtualization stack, which refers to the components of the virtualization solution that provide the emulated environment for the VM (like its motherboard, firmware, storage controllers, devices, and so on).
The Windows Hypervisor Platform API, which is documented at https://docs.microsoft.com/en-us
/virtualization/api/, has the main goal to enable running third-party virtualization solutions on the
Windows hypervisor. Specifically, a third-party virtualization product should be able to create, delete,
start, and stop VMs with characteristics (firmware, emulated devices, storage controllers) defined by its
304
CHAPTER 9
Virtualization technologies
own virtualization stack. The third-party virtualization stack, with its management interfaces, continues
to run on Windows in the root partition, which allows for an unchanged use of its VMs by their client.
As shown in Figure 9-19, all the Windows hypervisor platform’s APIs run in user mode and are
implemented on the top of the VID and WinHvr driver in two libraries: WinHvPlatform.dll and
WinHvEmulation.dll (the latter implements the instruction emulator for MMIO).
Root Partition
Guest Partition
Virtualization Stack Process
CreateThread
VirtualAlloc
MapViewOfFile
Hypervisor Instruction
Emulator
Windows Hypervisor
Platform API
WHvRun VirtualProcessor
WHvMapGpaRange
User
Kernel
VID driver
WinHv
DispatchVp
Intercept
Routine
MicroVm
WinHvMap
GpaPages
Guest VPs
GPA Space
WinHvr
Hypervisor
FIGURE 9-19 The Windows hypervisor platform API architecture.
A user mode application that wants to create a VM and its relative virtual processors usually should
do the following:
1.
Create the partition in the VID library (Vid.dll) with the WHvCreatePartition API.
2.
Configure various internal partition’s properties—like its virtual processor count, the APIC emulation mode, the kind of requested VMEXITs, and so on—using the WHvSetPartitionProperty API.
3.
Create the partition in the VID driver and the hypervisor using the WHvSetupPartition API. (This
kind of partition in the hypervisor is called an EXO partition, as described shortly.) The API also
creates the partition’s virtual processors, which are created in a suspended state.
4.
Create the corresponding virtual processor(s) in the VID library through the WHvCreateVirtualProcessor API. This step is important because the API sets up and maps a message buffer into
the user mode application, which is used for asynchronous communication with the hypervisor
and the thread running the virtual CPUs.
5.
Allocate the address space of the partition by reserving a big range of virtual memory with the
classic VirtualAlloc function (read more details in Chapter 5 of Part 1) and map it in the hypervisor through the WHvMapGpaRange API. A fine-grained protection of the guest physical
memory can be specified when allocating guest physical memory in the guest virtual address
space by committing different ranges of the reserved virtual memory.
CHAPTER 9
Virtualization technologies
305
6.
Create the page-tables and copy the initial firmware code in the committed memory.
7.
Set the initial VP’s registers content using the WHvSetVirtualProcessorRegisters API.
8.
Run the virtual processor by calling the WHvRunVirtualProcessor blocking API. The function
returns only when the guest code executes an operation that requires handling in the virtualization stack (a VMEXIT in the hypervisor has been explicitly required to be managed by the
third-party virtualization stack) or because of an external request (like the destroying of the
virtual processor, for example).
The Windows hypervisor platform APIs are usually able to call services in the hypervisor by sending
different IOCTLs to the \Device\VidExo device object, which is created by the VID driver at initialization
time, only if the HKLM\System\CurrentControlSet\Services\Vid\Parameters\ExoDeviceEnabled registry
value is set to 1. Otherwise, the system does not enable any support for the hypervisor APIs.
Some performance-sensitive hypervisor platform APIs (a good example is provided by WHvRun
VirtualProcessor) can instead call directly into the hypervisor from user mode thanks to the Doorbell
page, which is a special invalid guest physical page, that, when accessed, always causes a VMEXIT. The
Windows hypervisor platform API obtains the address of the doorbell page from the VID driver. It
writes to the doorbell page every time it emits a hypercall from user mode. The fault is identified and
treated differently by the hypervisor thanks to the doorbell page’s physical address, which is marked
as “special” in the SLAT page table. The hypervisor reads the hypercall’s code and parameters from the
VP’s registers as per normal hypercalls, and ultimately transfers the execution to the hypercall’s handler
routine. When the latter finishes its execution, the hypervisor finally performs a VMENTRY, landing on
the instruction following the faulty one. This saves a lot of clock cycles to the thread backing the guest
VP, which no longer has a need to enter the kernel for emitting a hypercall. Furthermore, the VMCALL
and similar opcodes always require kernel privileges to be executed.
The virtual processors of the new third-party VM are dispatched using the root scheduler. In case
the root scheduler is disabled, any function of the hypervisor platform API can’t run. The created partition in the hypervisor is an EXO partition. EXO partitions are minimal partitions that don’t include any
synthetic functionality and have certain characteristics ideal for creating third-party VMs:
■
■
■
306
They are always VA-backed types. (More details about VA-backed or micro VMs are provided
later in the “Virtualization stack” section.) The partition’s memory-hosting process is the user
mode application, which created the VM, and not a new instance of the VMMEM process.
They do not have any partition’s privilege or support any VTL (virtual trust level) other than 0.
All of a classical partition’s privileges refer to synthetic functionality, which is usually exposed
by the hypervisor to the Hyper-V virtualization stack. EXO partitions are used for third-party
virtualization stacks. They do not need the functionality brought by any of the classical partition’s privilege.
They manually manage timing. The hypervisor does not provide any virtual clock interrupt
source for EXO partition. The third-party virtualization stack must take over the responsibility of providing this. This means that every attempt to read the virtual processor’s time-stamp
counter will cause a VMEXIT in the hypervisor, which will route the intercept to the user mode
thread that runs the VP.
CHAPTER 9
Virtualization technologies
Note EXO partitions include other minor differences compared to classical hypervisor partitions. For the sake of the discussion, however, those minor differences are irrelevant, so they
are not mentioned in this book.
Nested virtualization
Large servers and cloud providers sometimes need to be able to run containers or additional virtual
machines inside a guest partition. Figure 9-20 describes this scenario: The hypervisor that runs on
the top of the bare-metal hardware, identified as the L0 hypervisor (L0 stands for Level 0), uses the
virtualization extensions provided by the hardware to create a guest VM. Furthermore, the L0 hypervisor emulates the processor’s virtualization extensions and exposes them to the guest VM (the ability to
expose virtualization extensions is called nested virtualization). The guest VM can decide to run another
instance of the hypervisor (which, in this case, is identified as L1 hypervisor, where L1 stands for Level 1),
by using the emulated virtualization extensions exposed by the L0 hypervisor. The L1 hypervisor creates
the nested root partition and starts the L2 root operating system in it. In the same way, the L2 root can
orchestrate with the L1 hypervisor to launch a nested guest VM. The final guest VM in this configuration
takes the name of L2 guest.
Guest OS
Level 2
Windows Root OS
Windows Root OS
Level 1
Hyper-V Hypervisor
vCPU
VT-x Extensions
Hyper-V Hypervisor
Level 0
VT-x Extensions
CPU
Hardware Layer: Intel Processor w/VT-x
FIGURE 9-20 Nested virtualization scheme.
Nested virtualization is a software construction: the hypervisor must be able to emulate and
manage virtualization extensions. Each virtualization instruction, while executed by the L1 guest VM,
causes a VMEXIT to the L0 hypervisor, which, through its emulator, can reconstruct the instruction and
perform the needed work to emulate it. At the time of this writing, only Intel and AMD hardware is
supported. The nested virtualization capability should be explicitly enabled for the L1 virtual machine;
CHAPTER 9
Virtualization technologies
307
otherwise, the L0 hypervisor injects a general protection exception in the VM in case a virtualization
instruction is executed by the guest operating system.
On Intel hardware, Hyper-V allows nested virtualization to work thanks to two main concepts:
■
Emulation of the VT-x virtualization extensions
■
Nested address translation
As discussed previously in this section, for Intel hardware, the basic data structure that describes
a virtual machine is the virtual machine control structure (VMCS). Other than the standard physical
VMCS representing the L1 VM, when the L0 hypervisor creates a VP belonging to a partition that supports nested virtualization, it allocates some nested VMCS data structures (not to be confused with a
virtual VMCS, which is a different concept). The nested VMCS is a software descriptor that contains all
the information needed by the L0 hypervisor to start and run a nested VP for a L2 partition. As briefly
introduced in the “Hypervisor startup” section, when the L1 hypervisor boots, it detects whether it’s
running in a virtualized environment and, if so, enables various nested enlightenments, like the enlightened VMCS or the direct virtual flush (discussed later in this section).
As shown in Figure 9-21, for each nested VMCS, the L0 hypervisor also allocates a Virtual VMCS and a
hardware physical VMCS, two similar data structures representing a VP running the L2 virtual machine.
The virtual VMCS is important because it has the key role in maintaining the nested virtualized data. The
physical VMCS instead is loaded by the L0 hypervisor when the L2 virtual machine is started; this happens
when the L0 hypervisor intercepts a VMLAUNCH instruction executed by the L1 hypervisor.
Nested VMCS Cache
Virtual
VMCS*
Physical
VMCS*
Nested VMCS
L1 VP 1
Physical
VMCS
L0
Physical
VMCS*
L1 VP 0
Virtual
VMCS*
Physical
VMCS*
Nested VMCS
Virtual
VMCS*
Nested VMCS
L1
L1 VP 2
…
*-Represents a VP in the L2 VM
-Represents a VP in the L1 Hypervisor
VP 2
FIGURE 9-21 A L0 hypervisor running a L2 VM by virtual processor 2.
In the sample picture, the L0 hypervisor has scheduled the VP 2 for running a L2 VM managed by
the L1 hypervisor (through the nested virtual processor 1). The L1 hypervisor can operate only on virtualization data replicated in the virtual VMCS.
308
CHAPTER 9
Virtualization technologies
Emulation of the VT-x virtualization extensions
On Intel hardware, the L0 hypervisor supports both enlightened and nonenlightened L1 hypervisors.
The only official supported configuration is Hyper-V running on the top of Hyper-V, though.
In a nonenlightened hypervisor, all the VT-x instructions executed in the L1 guest causes a VMEXIT.
After the L1 hypervisor has allocated the guest physical VMCS for describing the new L2 VM, it usually
marks it as active (through the VMPTRLD instruction on Intel hardware). The L0 hypervisor intercepts
the operation and associates an allocated nested VMCS with the guest physical VMCS specified by the
L1 hypervisor. Furthermore, it fills the initial values for the virtual VMCS and sets the nested VMCS as
active for the current VP. (It does not switch the physical VMCS though; the execution context should
remain the L1 hypervisor.) Each subsequent read or write to the physical VMCS performed by the L1
hypervisor is always intercepted by the L0 hypervisor and redirected to the virtual VMCS (refer to
Figure 9-21).
When the L1 hypervisor launches the VM (performing an operation called VMENTRY), it executes a
specific hardware instruction (VMLAUNCH on Intel hardware), which is intercepted by the L0 hypervisor. For nonenlightened scenarios, the L0 hypervisor copies all the guest fields of the virtual VMCS to
another physical VMCS representing the L2 VM, writes the host fields by pointing them to L0 hypervisor’s entry points, and sets it as active (by using the hardware VMPTRLD instruction on Intel platforms).
In case the L1 hypervisor uses the second level address translation (EPT for Intel hardware), the L0
hypervisor then shadows the currently active L1 extended page tables (see the following section for
more details). Finally, it performs the actual VMENTRY by executing the specific hardware instruction.
As a result, the hardware executes the L2 VM’s code.
While executing the L2 VM, each operation that causes a VMEXIT switches the execution context back to the L0 hypervisor (instead of the L1). As a response, the L0 hypervisor performs another
VMENTRY on the original physical VMCS representing the L1 hypervisor context, injecting a synthetic
VMEXIT event. The L1 hypervisor restarts the execution and handles the intercepted event as for regular non-nested VMEXITs. When the L1 completes the internal handling of the synthetic VMEXIT event, it
executes a VMRESUME operation, which will be intercepted again by the L0 hypervisor and managed in
a similar way of the initial VMENTRY operation described earlier.
Producing a VMEXIT each time the L1 hypervisor executes a virtualization instruction is an expensive
operation, which could definitively contribute in the general slowdown of the L2 VM. For overcoming
this problem, the Hyper-V hypervisor supports the enlightened VMCS, an optimization that, when enabled, allows the L1 hypervisor to load, read, and write virtualization data from a memory page shared
between the L1 and L0 hypervisor (instead of a physical VMCS). The shared page is called enlightened
VMCS. When the L1 hypervisor manipulates the virtualization data belonging to a L2 VM, instead of
using hardware instructions, which cause a VMEXIT into the L0 hypervisor, it directly reads and writes
from the enlightened VMCS. This significantly improves the performance of the L2 VM.
In enlightened scenarios, the L0 hypervisor intercepts only VMENTRY and VMEXIT operations (and
some others that are not relevant for this discussion). The L0 hypervisor manages VMENTRY in a similar
way to the nonenlightened scenario, but, before doing anything described previously, it copies the
virtualization data located in the shared enlightened VMCS memory page to the virtual VMCS representing the L2 VM.
CHAPTER 9
Virtualization technologies
309
Note It is worth mentioning that for nonenlightened scenarios, the L0 hypervisor supports
another technique for preventing VMEXITs while managing nested virtualization data, called
shadow VMCS. Shadow VMCS is a hardware optimization very similar to the enlightened VMCS.
Nested address translation
As previously discussed in the “Partitions’ physical address space” section, the hypervisor uses the SLAT
for providing an isolated guest physical address space to a VM and to translate GPAs to real SPAs. Nested
virtual machines would require another hardware layer of translation on top of the two already existing.
For supporting nested virtualization, the new layer should have been able to translate L2 GPAs to L1 GPAs.
Due to the increased complexity in the electronics needed to build a processor’s MMU that manages
three layers of translations, the Hyper-V hypervisor adopted another strategy for providing the additional
layer of address translation, called shadow nested page tables. Shadow nested page tables use a technique similar to the shadow paging (see the previous section) for directly translating L2 GPAs to SPAs.
When a partition that supports nested virtualization is created, the L0 hypervisor allocates and initializes a nested page table shadowing domain. The data structure is used for storing a list of shadow nested
page tables associated with the different L2 VMs created in the partition. Furthermore, it stores the partition’s active domain generation number (discussed later in this section) and nested memory statistics.
When the L0 hypervisor performs the initial VMENTRY for starting a L2 VM, it allocates the shadow
nested page table associated with the VM and initializes it with empty values (the resulting physical
address space is empty). When the L2 VM begins code execution, it immediately produces a VMEXIT
to the L0 hypervisor due to a nested page fault (EPT violation in Intel hardware). The L0 hypervisor,
instead of injecting the fault in the L1, walks the guest’s nested page tables built by the L1 hypervisor. If
it finds a valid entry for the specified L2 GPA, it reads the corresponding L1 GPA, translates it to an SPA,
and creates the needed shadow nested page table hierarchy to map it in the L2 VM. It then fills the leaf
table entry with the valid SPA (the hypervisor uses large pages for mapping shadow nested pages) and
resumes the execution directly to the L2 VM by setting the nested VMCS that describes it as active.
For the nested address translation to work correctly, the L0 hypervisor should be aware of any modifications that happen to the L1 nested page tables; otherwise, the L2 VM could run with stale entries.
This implementation is platform specific; usually hypervisors protect the L2 nested page table for readonly access. In that way they can be informed when the L1 hypervisor modifies it. The Hyper-V hypervisor adopts another smart strategy, though. It guarantees that the shadow nested page table describing
the L2 VM is always updated because of the following two premises:
■
■
310
When the L1 hypervisor adds new entries in the L2 nested page table, it does not perform any
other action for the nested VM (no intercepts are generated in the L0 hypervisor). An entry in
the shadow nested page table is added only when a nested page fault causes a VMEXIT in the
L0 hypervisor (the scenario described previously).
As for non-nested VM, when an entry in the nested page table is modified or deleted, the
hypervisor should always emit a TLB flush for correctly invalidating the hardware TLB. In case
CHAPTER 9
Virtualization technologies
of nested virtualization, when the L1 hypervisor emits a TLB flush, the L0 intercepts the request
and completely invalidates the shadow nested page table. The L0 hypervisor maintains a virtual
TLB concept thanks to the generation IDs stored in both the shadow VMCS and the nested
page table shadowing domain. (Describing the virtual TLB architecture is outside the scope
of the book.)
Completely invalidating the shadow nested page table for a single address changed seems to be
redundant, but it’s dictated by the hardware support. (The INVEPT instruction on Intel hardware does
not allow specifying which single GPA to remove from the TLB.) In classical VMs, this is not a problem
because modifications on the physical address space don’t happen very often. When a classical VM is
started, all its memory is already allocated. (The “Virtualization stack” section will provide more details.) This is not true for VA-backed VMs and VSM, though.
For improving performance in nonclassical nested VMs and VSM scenarios (see the next section
for details), the hypervisor supports the “direct virtual flush” enlightenment, which provides to the L1
hypervisor two hypercalls to directly invalidate the TLB. In particular, the HvFlushGuestPhysicalAddress
List hypercall (documented in the TLFS) allows the L1 hypervisor to invalidate a single entry in the
shadow nested page table, removing the performance penalties associated with the flushing of the
entire shadow nested page table and the multiple VMEXIT needed to reconstruct it.
EXPERIMENT: Enabling nested virtualization on Hyper-V
As explained in this section, for running a virtual machine into a L1 Hyper-V VM, you should first
enable the nested virtualization feature in the host system. For this experiment, you need a workstation with an Intel or AMD CPU and Windows 10 or Windows Server 2019 installed (Anniversary
Update RS1 minimum version). You should create a Type-2 VM using the Hyper-V Manager or
Windows PowerShell with at least 4 GB of memory. In the experiment, you’re creating a nested L2
VM into the created VM, so enough memory needs to be assigned.
After the first startup of the VM and the initial configuration, you should shut down the VM
and open an administrative PowerShell window (type Windows PowerShell in the Cortana
search box. Then right-click the PowerShell icon and select Run As Administrator). You should
then type the following command, where the term “<VmName>” must be replaced by your
virtual machine name:
Set-VMProcessor -VMName "<VmName>" -ExposeVirtualizationExtension $true
To properly verify that the nested virtualization feature is correctly enabled, the command
$(Get-VMProcessor -VMName "<VmName>").ExposeVirtualizationExtensions
should return True.
After the nested virtualization feature has been enabled, you can restart your VM. Before
being able to run the L1 hypervisor in the virtual machine, you should add the necessary component through the Control panel. In the VM, search Control Panel in the Cortana box, open it,
click Programs, and the select Turn Windows Features On Or Off. You should check the entire
Hyper-V tree, as shown in the next figure.
CHAPTER 9
Virtualization technologies
311
Click OK. After the procedure finishes, click Restart to reboot the virtual machine (this step
is needed). After the VM restarts, you can verify the presence of the L1 hypervisor through
the System Information application (type msinfo32 in the Cortana search box. Refer to the
“Detecting VBS and its provided services” experiment later in this chapter for further details).
If the hypervisor has not been started for some reason, you can force it to start by opening an
administrative command prompt in the VM (type cmd in the Cortana search box and select Run
As Administrator) and insert the following command:
bcdedit /set {current} hypervisorlaunchtype Auto
At this stage, you can use the Hyper-V Manager or Windows PowerShell to create a L2 guest
VM directly in your virtual machine. The result can be something similar to the following figure.
312
CHAPTER 9
Virtualization technologies
From the L2 root partition, you can also enable the L1 hypervisor debugger, in a similar way
as explained in the “Connecting the hypervisor debugger” experiment previously in this chapter.
The only limitation at the time of this writing is that you can’t use the network debugging in nested configurations; the only supported configuration for debugging the L1 hypervisor is through
serial port. This means that in the host system, you should enable two virtual serial ports in the
L1 VM (one for the hypervisor and the other one for the L2 root partition) and attach them to
named pipes. For type-2 virtual machines, you should use the following PowerShell commands
to set the two serial ports in the L1 VM (as with the previous commands, you should replace the
term “<VMName>” with the name of your virtual machine):
Set-VMComPort -VMName "<VMName>" -Number 1 -Path \\.\pipe\HV_dbg
Set-VMComPort -VMName "<VMName>" -Number 2 -Path \\.\pipe\NT_dbg
After that, you should configure the hypervisor debugger to be attached to the COM1 serial
port, while the NT kernel debugger should be attached to the COM2 (see the previous experiment for more details).
The Windows hypervisor on ARM64
Unlike the x86 and AMD64 architectures, where the hardware virtualization support was added long
after their original design, the ARM64 architecture has been designed with hardware virtualization
support. In particular, as shown in Figure 9-22, the ARM64 execution environment has been split in
three different security domains (called Exception Levels). The EL determines the level of privilege; the
higher the EL, the more privilege the executing code has. Although all the user mode applications run
in EL0, the NT kernel (and kernel mode drivers) usually runs in EL1. In general, a piece of software runs
only in a single exception level. EL2 is the privilege level designed for running the hypervisor (which,
in ARM64 is also called “Virtual machine manager”) and is an exception to this rule. The hypervisor provides virtualization services and can run in Nonsecure World both in EL2 and EL1. (EL2 does not exist in
the Secure World. ARM TrustZone will be discussed later in this section.)
Non-Secure World
EL0
Application
EL1
Kernel
EL2
Hypervisor
Secure World
EL3
Trusted Application
Secure Kernel
Monitor
FIGURE 9-22 The ARM64 execution environment.
CHAPTER 9
Virtualization technologies
313
Unlike from the AMD64 architecture, where the CPU enters the root mode (the execution domain
in which the hypervisor runs) only from the kernel context and under certain assumptions, when a
standard ARM64 device boots, the UEFI firmware and the boot manager begin their execution in EL2.
On those devices, the hypervisor loader (or Secure Launcher, depending on the boot flow) is able to
start the hypervisor directly and, at later time, drop the exception level to EL1 (by emitting an exception
return instruction, also known as ERET).
On the top of the exception levels, TrustZone technology enables the system to be partitioned between two execution security states: secure and non-secure. Secure software can generally access both
secure and non-secure memory and resources, whereas normal software can only access non-secure
memory and resources. The non-secure state is also referred to as the Normal World. This enables an
OS to run in parallel with a trusted OS on the same hardware and provides protection against certain
software attacks and hardware attacks. The secure state, also referred as Secure World, usually runs secure devices (their firmware and IOMMU ranges) and, in general, everything that requires the processor to be in the secure state.
To correctly communicate with the Secure World, the non-secure OS emits secure method calls
(SMC), which provide a mechanism similar to standard OS syscalls. SMC are managed by the TrustZone.
TrustZone usually provides separation between the Normal and the Secure Worlds through a thin
memory protection layer, which is provided by well-defined hardware memory protection units
(Qualcomm calls these XPUs). The XPUs are configured by the firmware to allow only specific execution environments to access specific memory locations. (Secure World memory can’t be accessed by
Normal World software.)
In ARM64 server machines, Windows is able to directly start the hypervisor. Client machines often
do not have XPUs, even though TrustZone is enabled. (The majority of the ARM64 client devices in
which Windows can run are provided by Qualcomm.) In those client devices, the separation between
the Secure and Normal Worlds is provided by a proprietary hypervisor, named QHEE, which provides
memory isolation using stage-2 memory translation (this layer is the same as the SLAT layer used by the
Windows hypervisor). QHEE intercepts each SMC emitted by the running OS: it can forward the SMC
directly to TrustZone (after having verified the necessary access rights) or do some work on its behalf. In
these devices, TrustZone also has the important responsibility to load and verify the authenticity of the
machine firmware and coordinates with QHEE for correctly executing the Secure Launch boot method.
Although in Windows the Secure World is generally not used (a distinction between Secure/Non
secure world is already provided by the hypervisor through VTL levels), the Hyper-V hypervisor still
runs in EL2. This is not compatible with the QHEE hypervisor, which runs in EL2, too. To solve the problem correctly, Windows adopts a particular boot strategy; the Secure launch process is orchestrated
with the aid of QHEE. When the Secure Launch terminates, the QHEE hypervisor unloads and gives up
execution to the Windows hypervisor, which has been loaded as part of the Secure Launch. In later
boot stages, after the Secure Kernel has been launched and the SMSS is creating the first user mode
session, a new special trustlet is created (Qualcomm named it as “QcExt”). The trustlet acts as the original ARM64 hypervisor; it intercepts all the SMC requests, verifies the integrity of them, provides the
needed memory isolations (through the services exposed by the Secure Kernel) and is able to send and
receive commands from the Secure Monitor in EL3.
314
CHAPTER 9
Virtualization technologies
The SMC interception architecture is implemented in both the NT kernel and the ARM64 trustlet
and is outside the scope of this book. The introduction of the new trustlet has allowed the majority of
the client ARM64 machines to boot with Secure Launch and Virtual Secure Mode enabled by default.
(VSM is discussed later in this chapter.)
The virtualization stack
Although the hypervisor provides isolation and the low-level services that manage the virtualization
hardware, all the high-level implementation of virtual machines is provided by the virtualization stack.
The virtualization stack manages the states of the VMs, provides memory to them, and virtualizes the
hardware by providing a virtual motherboard, the system firmware, and multiple kind of virtual devices
(emulated, synthetic, and direct access). The virtualization stack also includes VMBus, an important
component that provides a high-speed communication channel between a guest VM and the root
partition and can be accessed through the kernel mode client library (KMCL) abstraction layer.
In this section, we discuss some important services provided by the virtualization stack and analyze
its components. Figure 9-23 shows the main components of the virtualization stack.
Root Partition / Host OS
VmCompute
Child Partition
VMMS
Guest OS
VMWP
VDEVs
VSPs
VID.sys
VMBus
VSCs
Physical
Device
Drivers
WinHvr.sys
VMBus
Virtual
Device
Drivers
WinHv.sys
Hypervisor
Hardware
FIGURE 9-23 Components of the virtualization stack.
Virtual machine manager service and worker processes
The virtual machine manager service (Vmms.exe) is responsible for providing the Windows
Management Instrumentation (WMI) interface to the root partition, which allows managing the
child partitions through a Microsoft Management Console (MMC) plug-in or through PowerShell.
The VMMS service manages the requests received through the WMI interface on behalf of a VM
(identified internally through a GUID), like start, power off, shutdown, pause, resume, reboot, and so
on. It controls settings such as which devices are visible to child partitions and how the memory and
CHAPTER 9
Virtualization technologies
315
processor allocation for each partition is defined. The VMMS manages the addition and removal of
devices. When a virtual machine is started, the VMM Service also has the crucial role of creating a
corresponding Virtual Machine Worker Process (VMWP.exe). The VMMS manages the VM snapshots
by redirecting the snapshot requests to the VMWP process in case the VM is running or by taking the
snapshot itself in the opposite case.
The VMWP performs various virtualization work that a typical monolithic hypervisor would perform (similar to the work of a software-based virtualization solution). This means managing the state
machine for a given child partition (to allow support for features such as snapshots and state transitions), responding to various notifications coming in from the hypervisor, performing the emulation
of certain devices exposed to child partitions (called emulated devices), and collaborating with the VM
service and configuration component. The Worker process has the important role to start the virtual
motherboard and to maintain the state of each virtual device that belongs to the VM. It also includes
components responsible for remote management of the virtualization stack, as well as an RDP component that allows using the remote desktop client to connect to any child partition and remotely view its
user interface and interact with it. The VM Worker process exposes the COM objects that provide the
interface used by the Vmms (and the VmCompute service) to communicate with the VMWP instance
that represents a particular virtual machine.
The VM host compute service (implemented in the Vmcompute.exe and Vmcompute.dll binaries) is
another important component that hosts most of the computation-intensive operations that are not
implemented in the VM Manager Service. Operation like the analysis of a VM’s memory report (for
dynamic memory), management of VHD and VHDX files, and creation of the base layers for containers
are implemented in the VM host compute service. The Worker Process and Vmms can communicate
with the host compute service thanks the COM objects that it exposes.
The Virtual Machine Manager Service, the Worker Process, and the VM compute service are able to
open and parse multiple configuration files that expose a list of all the virtual machines created in the
system, and the configuration of each of them. In particular:
■
■
The configuration repository stores the list of virtual machines installed in the system, their
names, configuration file and GUID in the data.vmcx file located in C:\ProgramData\Microsoft
\Windows Hyper-V.
The VM Data Store repository (part of the VM host compute service) is able to open, read, and
write the configuration file (usually with “.vmcx” extension) of a VM, which contains the list of
virtual devices and the virtual hardware’s configuration.
The VM data store repository is also used to read and write the VM Save State file. The VM State file
is generated while pausing a VM and contains the save state of the running VM that can be restored
at a later time (state of the partition, content of the VM’s memory, state of each virtual device). The
configuration files are formatted using an XML representation of key/value pairs. The plain XML data
is stored compressed using a proprietary binary format, which adds a write-journal logic to make it
resilient against power failures. Documenting the binary format is outside the scope of this book.
316
CHAPTER 9
Virtualization technologies
The VID driver and the virtualization stack memory manager
The Virtual Infrastructure Driver (VID.sys) is probably one of the most important components of the
virtualization stack. It provides partition, memory, and processor management services for the virtual
machines running in the child partition, exposing them to the VM Worker process, which lives in the
root. The VM Worker process and the VMMS services use the VID driver to communicate with the
hypervisor, thanks to the interfaces implemented in the Windows hypervisor interface driver (WinHv.
sys and WinHvr.sys), which the VID driver imports. These interfaces include all the code to support the
hypervisor’s hypercall management and allow the operating system (or generic kernel mode drivers) to
access the hypervisor using standard Windows API calls instead of hypercalls.
The VID driver also includes the virtualization stack memory manager. In the previous section, we
described the hypervisor memory manager, which manages the physical and virtual memory of the
hypervisor itself. The guest physical memory of a VM is allocated and managed by the virtualization
stack’s memory manager. When a VM is started, the spawned VM Worker process (VMWP.exe) invokes
the services of the memory manager (defined in the IMemoryManager COM interface) for constructing
the guest VM’s RAM. Allocating memory for a VM is a two-step process:
1.
The VM Worker process obtains a report of the global system’s memory state (by using services
from the Memory Balancer in the VMMS process), and, based on the available system memory,
determines the size of the physical memory blocks to request to the VID driver (through the
VID_RESERVE IOCTL. Sizes of the block vary from 64 MB up to 4 GB). The blocks are allocated by
the VID driver using MDL management functions (MmAllocatePartitionNodePagesForMdlEx in
particular). For performance reasons, and to avoid memory fragmentation, the VID driver implements a best-effort algorithm to allocate huge and large physical pages (1 GB and 2 MB) before
relying on standard small pages. After the memory blocks are allocated, their pages are deposited to an internal “reserve” bucket maintained by the VID driver. The bucket contains page lists
ordered in an array based on their quality of service (QOS). The QOS is determined based on the
page type (huge, large, and small) and the NUMA node they belong to. This process in the VID
nomenclature is called “reserving physical memory” (not to be confused with the term “reserving
virtual memory,” a concept of the NT memory manager).
2.
From the virtualization stack perspective, physical memory commitment is the process of
emptying the reserved pages in the bucket and moving them in a VID memory block (VSMM_
MEMORY_BLOCK data structure), which is created and owned by the VM Worker process
using the VID driver’s services. In the process of creating a memory block, the VID driver
first deposits additional physical pages in the hypervisor (through the Winhvr driver and the
HvDepositMemory hypercall). The additional pages are needed for creating the SLAT table
page hierarchy of the VM. The VID driver then requests to the hypervisor to map the physical
pages describing the entire guest partition’s RAM. The hypervisor inserts valid entries in the
SLAT table and sets their proper permissions. The guest physical address space of the partition
is created. The GPA range is inserted in a list belonging to the VID partition. The VID memory
block is owned by the VM Worker process. It’s also used for tracking guest memory and in DAX
file-backed memory blocks. (See Chapter 11, “Caching and file system support,” for more details
about DAX volumes and PMEM.) The VM Worker process can later use the memory block for
multiple purposes—for example, to access some pages while managing emulated devices.
CHAPTER 9
Virtualization technologies
317
The birth of a Virtual Machine (VM)
The process of starting up a virtual machine is managed primarily by the VMMS and VMWP process. When a request to start a VM (internally identified by a GUID) is delivered to the VMMS service
(through PowerShell or the Hyper-V Manager GUI application), the VMMS service begins the starting
process by reading the VM’s configuration from the data store repository, which includes the VM’s
GUID and the list of all the virtual devices (VDEVs) comprising its virtual hardware. It then verifies that
the path containing the VHD (or VHDX) representing the VM’s virtual hard disk has the correct access control list (ACL, more details provided later). In case the ACL is not correct, if specified by the VM
configuration, the VMMS service (which runs under a SYSTEM account) rewrites a new one, which is
compatible with the new VMWP process instance. The VMMS uses COM services to communicate with
the Host Compute Service to spawn a new VMWP process instance.
The Host Compute Service gets the path of the VM Worker process by querying its COM registration data located in the Windows registry (HKCU\CLSID\{f33463e0-7d59-11d9-9916-0008744f51f3}
key). It then creates the new process using a well-defined access token, which is built using the virtual
machine SID as the owner. Indeed, the NT Authority of the Windows Security model defines a wellknown subauthority value (83) to identify VMs (more information on system security components
are available in Part 1, Chapter 7, “Security”). The Host Compute Service waits for the VMWP process
to complete its initialization (in this way the exposed COM interfaces become ready). The execution
returns to the VMMS service, which can finally request the starting of the VM to the VMWP process
(through the exposed IVirtualMachine COM interface).
As shown in Figure 9-24, the VM Worker process performs a “cold start” state transition for the
VM. In the VM Worker process, the entire VM is managed through services exposed by the “Virtual
Motherboard.” The Virtual Motherboard emulates an Intel i440BX motherboard on Generation 1
VMs, whereas on Generation 2, it emulates a proprietary motherboard. It manages and maintains the
list of virtual devices and performs the state transitions for each of them. As covered in the next section, each virtual device is implemented as a COM object (exposing the IVirtualDevice interface) in a
DLL. The Virtual Motherboard enumerates each virtual device from the VM’s configuration and loads
the relative COM object representing the device.
The VM Worker process begins the startup procedure by reserving the resources needed by each
virtual device. It then constructs the VM guest physical address space (virtual RAM) by allocating physical memory from the root partition through the VID driver. At this stage, it can power up the virtual
motherboard, which will cycle between each VDEV and power it up. The power-up procedure is different for each device: for example, synthetic devices usually communicate with their own Virtualization
Service Provider (VSP) for the initial setup.
One virtual device that deserves a deeper discussion is the virtual BIOS (implemented in the
Vmchipset.dll library). Its power-up method allows the VM to include the initial firmware executed
when the bootstrap VP is started. The BIOS VDEV extracts the correct firmware for the VM (legacy BIOS
in the case of Generation 1 VMs; UEFI otherwise) from the resource section of its own backing library,
builds the volatile configuration part of the firmware (like the ACPI and the SRAT table), and injects it
in the proper guest physical memory by using services provided by the VID driver. The VID driver is
indeed able to map memory ranges described by the VID memory block in user mode memory, accessible by the VM Worker process (this procedure is internally called “memory aperture creation”).
318
CHAPTER 9
Virtualization technologies
Root Partition / Host OS
Host Compute
Service
IVirtualMachine COM Interface
Cold Start
VirtualMachine
Partition
Manager
Memory
Manager
Virtual
Motherboard
…
VMWP
User
Kernel
VSPs
VID
VMBus
WinHV
Hypervisor
FIGURE 9-24 The VM Worker process and its interface for performing a “cold start” of a VM.
After all the virtual devices have been successfully powered up, the VM Worker process can start the
bootstrap virtual processor of the VM by sending a proper IOCTL to the VID driver, which will start the VP
and its message pump (used for exchanging messages between the VID driver and the VM Worker process).
EXPERIMENT: Understanding the security of the VM Worker process and
the irtual hard disk files
In the previous section, we discussed how the VM Worker process is launched by the Host
Compute service (Vmcompute.exe) when a request to start a VM is delivered to the VMMS process (through WMI). Before communicating with the Host Compute Service, the VMMS generates a security token for the new Worker process instance.
Three new entities have been added to the Windows security model to properly support virtual
machines (the Windows Security model has been extensively discussed in Chapter 7 of Part 1):
■
■
■
A “virtual machines” security group, identified with the S-1-5-83-0 security identifier.
A virtual machine security identifier (SID), based on the VM’s unique identifier (GUID). The
VM SID becomes the owner of the security token generated for the VM Worker process.
A VM Worker process security capability used to give applications running in
AppContainers access to Hyper-V services required by the VM Worker process.
CHAPTER 9
Virtualization technologies
319
In this experiment, you will create a new virtual machine through the Hyper-V manager in a
location that’s accessible only to the current user and to the administrators group, and you will
check how the security of the VM files and the VM Worker process change accordingly.
First, open an administrative command prompt and create a folder in one of the workstation’s
volumes (in the example we used C:\TestVm), using the following command:
md c:\TestVm
Then you need to strip off all the inherited ACEs (Access control entries; see Chapter 7 of Part 1
for further details) and add full access ACEs for the administrators group and the current loggedon user. The following commands perform the described actions (you need to replace C:\TestVm
with the path of your directory and <UserName> with your currently logged-on user name):
icacls c:\TestVm /inheritance:r
icacls c:\TestVm /grant Administrators:(CI)(OI)F
icacls c:\TestVm /grant <UserName>:(CI)(OI)F
To verify that the folder has the correct ACL, you should open File Explorer (by pressing Win+E
on your keyboard), right-click the folder, select Properties, and finally click the Security tab. You
should see a window like the following one:
Open the Hyper-V Manager, create a VM (and its relative virtual disk), and store it in the newly
created folder (procedure available at the following page: https://docs.microsoft.com/en-us
/virtualization/hyper-v-on-windows/quick-start/create-virtual-machine). For this experiment, you
don’t really need to install an OS on the VM. After the New Virtual Machine Wizard ends, you
should start your VM (in the example, the VM is VM1).
320
CHAPTER 9
Virtualization technologies
Open a Process Explorer as administrator and locate the vmwp.exe process. Right-click it
and select Properties. As expected, you can see that the parent process is vmcompute.exe (Host
Compute Service). If you click the Security tab, you should see that the VM SID is set as the
owner of the process, and the token belongs to the Virtual Machines group:
The SID is composed by reflecting the VM GUID. In the example, the VM’s GUID is {F156B42C4AE6-4291-8AD6-EDFE0960A1CE}. (You can verify it also by using PowerShell, as explained in
the “Playing with the Root scheduler” experiment earlier in this chapter). A GUID is a sequence of
16-bytes, organized as one 32-bit (4 bytes) integer, two 16-bit (2 bytes) integers, and 8 final bytes.
The GUID in the example is organized as:
■
■
■
0xF156B42C as the first 32-bit integer, which, in decimal, is 4048991276.
0x4AE6 and 0x4291 as the two 16-bit integers, which, combined as one 32-bit value, is
0x42914AE6, or 1116818150 in decimal (remember that the system is little endian, so the less
significant byte is located at the lower address).
The final byte sequence is 0x8A, 0xD6, 0xED, 0xFE, 0x09, 0x60, 0xA1 and 0xCE (the third
part of the shown human readable GUID, 8AD6, is a byte sequence, and not a 16-bit value),
which, combined as two 32-bit values is 0xFEEDD68A and 0xCEA16009, or 4276999818 and
3466682377 in decimal.
CHAPTER 9
Virtualization technologies
321
If you combine all the calculated decimal numbers with a general SID identifier emitted by the
NT authority (S-1-5) and the VM base RID (83), you should obtain the same SID shown in Process
Explorer (in the example, S-1-5-83-4048991276-1116818150-4276999818-3466682377).
As you can see from Process Explorer, the VMWP process’s security token does not include the
Administrators group, and it hasn’t been created on behalf of the logged-on user. So how is it possible that the VM Worker process can access the virtual hard disk and the VM configuration files?
The answer resides in the VMMS process, which, at VM creation time, scans each component
of the VM’s path and modifies the DACL of the needed folders and files. In particular, the root
folder of the VM (the root folder has the same name of the VM, so you should find a subfolder in
the created directory with the same name of your VM) is accessible thanks to the added virtual
machines security group ACE. The virtual hard disk file is instead accessible thanks to an accessallowed ACE targeting the virtual machine’s SID.
You can verify this by using File Explorer: Open the VM’s virtual hard disk folder (called Virtual
Hard Disks and located in the VM root folder), right-click the VHDX (or VHD) file, select Properties,
and then click the Security page. You should see two new ACEs other than the one set initially. (One
is the virtual machine ACE; the other one is the VmWorker process Capability for AppContainers.)
If you stop the VM and you try to delete the virtual machine ACE from the file, you will
see that the VM is not able to start anymore. For restoring the correct ACL for the virtual
hard disk, you can run a PowerShell script available at https://gallery.technet.microsoft.com/
Hyper-V-Restore-ACL-e64dee58.
322
CHAPTER 9
Virtualization technologies
VMBus
VMBus is the mechanism exposed by the Hyper-V virtualization stack to provide interpartition communication between VMs. It is a virtual bus device that sets up channels between the guest and the host.
These channels provide the capability to share data between partitions and set up paravirtualized (also
known as synthetic) devices.
The root partition hosts Virtualization Service Providers (VSPs) that communicate over VMBus
to handle device requests from child partitions. On the other end, child partitions (or guests) use
Virtualization Service Consumers (VSCs) to redirect device requests to the VSP over VMBus. Child partitions require VMBus and VSC drivers to use the paravirtualized device stacks (more details on virtual
hardware support are provided later in this chapter in the ”Virtual hardware support” section). VMBus
channels allow VSCs and VSPs to transfer data primarily through two ring buffers: upstream and downstream. These ring buffers are mapped into both partitions thanks to the hypervisor, which, as discussed in the previous section, also provides interpartition communication services through the SynIC.
One of the first virtual devices (VDEV) that the Worker process starts while powering up a VM is the
VMBus VDEV (implemented in Vmbusvdev.dll). Its power-on routine connects the VM Worker process
to the VMBus root driver (Vmbusr.sys) by sending VMBUS_VDEV_SETUP IOCTL to the VMBus root
device (named \Device\RootVmBus). The VMBus root driver orchestrates the parent endpoint of the
bidirectional communication to the child VM. Its initial setup routine, which is invoked at the time the
target VM isn’t still powered on, has the important role to create an XPartition data structure, which is
used to represent the VMBus instance of the child VM and to connect the needed SynIC synthetic interrupt sources (also known as SINT, see the “Synthetic Interrupt Controller” section earlier in this chapter
for more details). In the root partition, VMBus uses two synthetic interrupt sources: one for the initial
message handshaking (which happens before the channel is created) and another one for the synthetic
events signaled by the ring buffers. Child partitions use only one SINT, though. The setup routine allocates the main message port in the child VM and the corresponding connection in the root, and, for
each virtual processor belonging to the VM, allocates an event port and its connection (used for receiving synthetic events from the child VM).
The two synthetic interrupt sources are mapped using two ISR routines, named KiVmbusInterrupt0
and KiVmbusInterrupt1. Thanks to these two routines, the root partition is ready to receive synthetic
interrupts and messages from the child VM. When a message (or event) is received, the ISR queues a
deferred procedure call (DPC), which checks whether the message is valid; if so, it queues a work item,
which will be processed later by the system running at passive IRQL level (which has further implications on the message queue).
Once VMBus in the root partition is ready, each VSP driver in the root can use the services exposed
by the VMBus kernel mode client library to allocate and offer a VMBus channel to the child VM. The
VMBus kernel mode client library (abbreviated as KMCL) represents a VMBus channel through an
opaque KMODE_CLIENT_CONTEXT data structure, which is allocated and initialized at channel creation
time (when a VSP calls the VmbChannelAllocate API). The root VSP then normally offers the channel
to the child VM by calling the VmbChannelEnabled API (this function in the child establishes the actual
connection to the root by opening the channel). KMCL is implemented in two drivers: one running in
the root partition (Vmbkmclr.sys) and one loaded in child partitions (Vmbkmcl.sys).
CHAPTER 9
Virtualization technologies
323
Offering a channel in the root is a relatively complex operation that involves the following steps:
1.
The KMCL driver communicates with the VMBus root driver through the file object initialized in
the VDEV power-up routine. The VMBus driver obtains the XPartition data structure representing the child partition and starts the channel offering process.
2.
Lower-level services provided by the VMBus driver allocate and initialize a LOCAL_OFFER data
structure representing a single “channel offer” and preallocate some SynIC predefined messages.
VMBus then creates the synthetic event port in the root, from which the child can connect to
signal events after writing data to the ring buffer. The LOCAL_OFFER data structure representing the offered channel is added to an internal server channels list.
3.
After VMBus has created the channel, it tries to send the OfferChannel message to the child
with the goal to inform it of the new channel. However, at this stage, VMBus fails because the
other end (the child VM) is not ready yet and has not started the initial message handshake.
After all the VSPs have completed the channel offering, and all the VDEV have been powered up
(see the previous section for details), the VM Worker process starts the VM. For channels to be completely initialized, and their relative connections to be started, the guest partition should load and start
the VMBus child driver (Vmbus.sys).
Initial VMBus message handshaking
In Windows, the VMBus child driver is a WDF bus driver enumerated and started by the Pnp manager
and located in the ACPI root enumerator. (Another version of the VMBus child driver is also available
for Linux. VMBus for Linux is not covered in this book, though.) When the NT kernel starts in the child
VM, the VMBus driver begins its execution by initializing its own internal state (which means allocating the needed data structure and work items) and by creating the \Device\VmBus root functional
device object (FDO). The Pnp manager then calls the VMBus’s resource assignment handler routine.
The latter configures the correct SINT source (by emitting a HvSetVpRegisters hypercall on one of the
HvRegisterSint registers, with the help of the WinHv driver) and connects it to the KiVmbusInterrupt2
ISR. Furthermore, it obtains the SIMP page, used for sending and receiving synthetic messages to and
from the root partition (see the “Synthetic Interrupt Controller” section earlier in this chapter for more
details), and creates the XPartition data structure representing the parent (root) partition.
When the request of starting the VMBus’ FDO comes from the Pnp manager, the VMBus driver starts
the initial message handshaking. At this stage, each message is sent by emitting the HvPostMessage
hypercall (with the help of the WinHv driver), which allows the hypervisor to inject a synthetic interrupt
to a target partition (in this case, the target is the partition). The receiver acquires the message by simply reading from the SIMP page; the receiver signals that the message has been read from the queue
by setting the new message type to MessageTypeNone. (See the hypervisor TLFS for more details.) The
reader can think of the initial message handshake, which is represented in Figure 9-25, as a process
divided in two phases.
324
CHAPTER 9
Virtualization technologies
VM
CHILD VM
ROOT PARTITION
Initiate Contact
Version Response
Request Offers
Offer Channel (Multiple Messages)
Time
First Phase:
All Channels Enumerated and
Offers Delivered to the
Child VM
All Offers Delivered
GPADL Header
GPDAL Body
GPDAL Created
Open Channel
Channel Opening
and Ring Buffer Creation
Open Channel Result
FIGURE 9-25 VMBus initial message handshake.
The first phase is represented by the Initiate Contact message, which is delivered once in the lifetime
of the VM. This message is sent from the child VM to the root with the goal to negotiate the VMBus
protocol version supported by both sides. At the time of this writing, there are five main VMBus protocol versions, with some additional slight variations. The root partition parses the message, asks the
hypervisor to map the monitor pages allocated by the client (if supported by the protocol), and replies
by accepting the proposed protocol version. Note that if this is not the case (which happens when the
Windows version running in the root partition is lower than the one running in the child VM), the child
VM restarts the process by downgrading the VMBus protocol version until a compatible version is established. At this point, the child is ready to send the Request Offers message, which causes the root
partition to send the list of all the channels already offered by the VSPs. This allows the child partition
to open the channels later in the handshaking protocol.
Figure 9-25 highlights the different synthetic messages delivered through the hypervisor for setting
up the VMBus channel or channels. The root partition walks the list of the offered channels located in
the Server Channels list (LOCAL_OFFER data structure, as discussed previously), and, for each of them,
sends an Offer Channel message to the child VM. The message is the same as the one sent at the final
stage of the channel offering protocol, which we discussed previously in the “VMBus” section. So, while
CHAPTER 9
Virtualization technologies
325
the first phase of the initial message handshake happens only once per lifetime of the VM, the second
phase can start any time when a channel is offered. The Offer Channel message includes important
data used to uniquely identify the channel, like the channel type and instance GUIDs. For VDEV channels, these two GUIDs are used by the Pnp Manager to properly identify the associated virtual device.
The child responds to the message by allocating the client LOCAL_OFFER data structure representing the channel and the relative XInterrupt object, and by determining whether the channel requires
a physical device object (PDO) to be created, which is usually always true for VDEVs’ channels. In this
case, the VMBus driver creates an instance PDO representing the new channel. The created device is
protected through a security descriptor that renders it accessible only from system and administrative accounts. The VMBus standard device interface, which is attached to the new PDO, maintains
the association between the new VMBus channel (through the LOCAL_OFFER data structure) and
the device object. After the PDO is created, the Pnp Manager is able to identify and load the correct
VSC driver through the VDEV type and instance GUIDs included in the Offer Channel message. These
interfaces become part of the new PDO and are visible through the Device Manager. See the following
experiment for details. When the VSC driver is then loaded, it usually calls the VmbEnableChannel API
(exposed by KMCL, as discussed previously) to “open” the channel and create the final ring buffer.
EXPERIMENT: Listing virtual devices (VDEVs) exposed through VMBus
Each VMBus channel is identified through a type and instance GUID. For channels belonging to
VDEVs, the type and instance GUID also identifies the exposed device. When the VMBus child
driver creates the instance PDOs, it includes the type and instance GUID of the channel in multiple devices’ properties, like the instance path, hardware ID, and compatible ID. This experiment
shows how to enumerate all the VDEVs built on the top of VMBus.
For this experiment, you should build and start a Windows 10 virtual machine through the
Hyper-V Manager. When the virtual machine is started and runs, open the Device Manager (by
typing its name in the Cortana search box, for example). In the Device Manager applet, click the
View menu, and select Device by Connection. The VMBus bus driver is enumerated and started
through the ACPI enumerator, so you should expand the ACPI x64-based PC root node and then
the ACPI Module Device located in the Microsoft ACPI-Compliant System child node, as shown in
the following figure:
326
CHAPTER 9
Virtualization technologies
By opening the ACPI Module Device, you should find another node, called Microsoft Hyper-V
Virtual Machine Bus, which represents the root VMBus PDO. Under that node, the Device
Manager shows all the instance devices created by the VMBus FDO after their relative VMBus
channels have been offered from the root partition.
Now right-click one of the Hyper-V devices, such as the Microsoft Hyper-V Video device, and
select Properties. For showing the type and instance GUIDs of the VMBus channel backing the
virtual device, open the Details tab of the Properties window. Three device properties include
the channel’s type and instance GUID (exposed in different formats): Device Instance path,
Hardware ID, and Compatible ID. Although the compatible ID contains only the VMBus channel
type GUID ({da0a7802-e377-4aac-8e77-0558eb1073f8} in the figure), the hardware ID and device
instance path contain both the type and instance GUIDs.
Opening a VMBus channel and creating the ring buffer
For correctly starting the interpartition communication and creating the ring buffer, a channel
must be opened. Usually VSCs, after having allocated the client side of the channel (still through
VmbChannel Allocate), call the VmbChannelEnable API exported from the KMCL driver. As introduced in the previous section, this API in the child partitions opens a VMBus channel, which has
already been offered by the root. The KMCL driver communicates with the VMBus driver, obtains
the channel parameters (like the channel’s type, instance GUID, and used MMIO space), and creates
CHAPTER 9
Virtualization technologies
327
a work item for the received packets. It then allocates the ring buffer, which is shown in Figure 9-26.
The size of the ring buffer is usually specified by the VSC through a call to the KMCL exported
VmbClientChannelInitSetRingBufferPageCount API.
Outgoing Buffer
Control Page
0x0
Outgoing
Buffer
Physical
Pages
0xFFFFCA80'3D8C0000
0x0
0x10000
0x20000
0xFFFFCA80'3D8D0000
0xFFFFCA80'3D8E0000
Write Request in the Ring Buffer
er
uff
gB
in
tgo
Ou
0x1000
Outgoing
Buffer
Physical
Pages
Incoming Buffer 0x11000
Control Page 0x12000
er
uff
gB
min
o
Inc
0x22000
Ring Buffer Virtual Layout
Incoming
Buffer
Physical
Pages
Incoming
Buffer
Physical
Pages
0xFFFFCA80'594A0000
0xFFFFCA80'594B0000
0x0
0x10000
Physical Layout
0xFFFFCA80'594C0000
Mapped Ring Buffer
Writing Example
FIGURE 9-26 An example of a 16-page ring buffer allocated in the child partition.
The ring buffer is allocated from the child VM’s non-paged pool and is mapped through a memory
descriptor list (MDL) using a technique called double mapping. (MDLs are described in Chapter 5 of
Part 1.) In this technique, the allocated MDL describes a double number of the incoming (or outgoing)
buffer’s physical pages. The PFN array of the MDL is filled by including the physical pages of the buffer
twice: one time in the first half of the array and one time in the second half. This creates a “ring buffer.”
For example, in Figure 9-26, the incoming and outgoing buffers are 16 pages (0x10) large. The
outgoing buffer is mapped at address 0xFFFFCA803D8C0000. If the sender writes a 1-KB VMBus packet
to a position close to the end of the buffer, let’s say at offset 0x9FF00, the write succeeds (no access
violation exception is raised), but the data will be written partially in the end of the buffer and partially
in the beginning. In Figure 9-26, only 256 (0x100) bytes are written at the end of the buffer, whereas the
remaining 768 (0x300) bytes are written in the start.
Both the incoming and outgoing buffers are surrounded by a control page. The page is shared between the two endpoints and composes the VM ring control block. This data structure is used to keep
track of the position of the last packet written in the ring buffer. It furthermore contains some bits to
control whether to send an interrupt when a packet needs to be delivered.
After the ring buffer has been created, the KMCL driver sends an IOCTL to VMBus, requesting the
creation of a GPA descriptor list (GPADL). A GPADL is a data structure very similar to an MDL and is used
for describing a chunk of physical memory. Differently from an MDL, the GPADL contains an array of
guest physical addresses (GPAs, which are always expressed as 64-bit numbers, differently from the
PFNs included in a MDL). The VMBus driver sends different messages to the root partition for transferring the entire GPADL describing both the incoming and outcoming ring buffers. (The maximum size
of a synthetic message is 240 bytes, as discussed earlier.) The root partition reconstructs the entire
328
CHAPTER 9
Virtualization technologies
GPADL and stores it in an internal list. The GPADL is mapped in the root when the child VM sends the
final Open Channel message. The root VMBus driver parses the received GPADL and maps it in its own
physical address space by using services provided by the VID driver (which maintains the list of memory
block ranges that comprise the VM physical address space).
At this stage the channel is ready: the child and the root partition can communicate by simply reading
or writing data to the ring buffer. When a sender finishes writing its data, it calls the VmbChannelSend
SynchronousRequest API exposed by the KMCL driver. The API invokes VMBus services to signal an event
in the monitor page of the Xinterrupt object associated with the channel (old versions of the VMBus protocol used an interrupt page, which contained a bit corresponding to each channel), Alternatively, VMBus
can signal an event directly in the channel’s event port, which depends only on the required latency.
Other than VSCs, other components use VMBus to implement higher-level interfaces. Good examples
are provided by the VMBus pipes, which are implemented in two kernel mode libraries (Vmbuspipe.dll
and Vmbuspiper.dll) and rely on services exposed by the VMBus driver (through IOCTLs). Hyper-V Sockets
(also known as HvSockets) allow high-speed interpartition communication using standard network
interfaces (sockets). A client connects an AF_HYPERV socket type to a target VM by specifying the target
VM’s GUID and a GUID of the Hyper-V socket’s service registration (to use HvSockets, both endpoints
must be registered in the HKLM\SOFTWARE\Microsoft\Windows NT\CurrentVersion\ Virtualization\
GuestCommunicationServices registry key) instead of the target IP address and port. Hyper-V Sockets
are implemented in multiple drivers: HvSocket.sys is the transport driver, which exposes low-level services
used by the socket infrastructure; HvSocketControl.sys is the provider control driver used to load the
HvSocket provider in case the VMBus interface is not present in the system; HvSocket.dll is a library that
exposes supplementary socket interfaces (tied to Hyper-V sockets) callable from user mode applications.
Describing the internal infrastructure of both Hyper-V Sockets and VMBus pipes is outside the scope of
this book, but both are documented in Microsoft Docs.
Virtual hardware support
For properly run virtual machines, the virtualization stack needs to support virtualized devices.
Hyper-V supports different kinds of virtual devices, which are implemented in multiple components
of the virtualization stack. I/O to and from virtual devices is orchestrated mainly in the root OS. I/O
includes storage, networking, keyboard, mouse, serial ports and GPU (graphics processing unit). The
virtualization stack exposes three kinds of devices to the guest VMs:
■
Emulated devices, also known—in industry-standard form—as fully virtualized devices
■
Synthetic devices, also known as paravirtualized devices
■
Hardware-accelerated devices, also known as direct-access devices
For performing I/O to physical devices, the processor usually reads and writes data from input and
output ports (I/O ports), which belong to a device. The CPU can access I/O ports in two ways:
■
Through a separate I/O address space, which is distinct from the physical memory address
space and, on AMD64 platforms, consists of 64 thousand individually addressable I/O ports.
This method is old and generally used for legacy devices.
CHAPTER 9
Virtualization technologies
329
■
Through memory mapped I/O. Devices that respond like memory components can be accessed
through the processor’s physical memory address space. This means that the CPU accesses
memory through standard instructions: the underlying physical memory is mapped to a device.
Figure 9-27 shows an example of an emulated device (the virtual IDE controller used in Generation 1
VMs), which uses memory-mapped I/O for transferring data to and from the virtual processor.
Root Partition / Host OS
HCS
VM1
VMMS
96GB
Guest Physical
Address Space
64GB
VMWP
IDE VDEV
Processes
VSPs
VID
VMBus
Physical
Device
Drivers
WinHV
File System/Vol
Disk Driver
IDE Storage Driver
4GB
Hypervisor
CPU
Memory
I/O Devices
0
Hardware
FIGURE 9-27 The virtual IDE controller, which uses emulated I/O to perform data transfer.
In this model, every time the virtual processor reads or writes to the device MMIO space or emits
instructions to access the I/O ports, it causes a VMEXIT to the hypervisor. The hypervisor calls the
proper intercept routine, which is dispatched to the VID driver. The VID driver builds a VID message
and enqueues it in an internal queue. The queue is drained by an internal VMWP’s thread, which waits
and dispatches the VP’s messages received from the VID driver; this thread is called the message pump
thread and belongs to an internal thread pool initialized at VMWP creation time. The VM Worker
process identifies the physical address causing the VMEXIT, which is associated with the proper virtual
device (VDEV), and calls into one of the VDEV callbacks (usually read or write callback). The VDEV code
uses the services provided by the instruction emulator to execute the faulting instruction and properly
emulate the virtual device (an IDE controller in the example).
NOTE The full instructions emulator located in the VM Worker process is also used for other
different purposes, such as to speed up cases of intercept-intensive code in a child partition.
The emulator in this case allows the execution context to stay in the Worker process between
intercepts, as VMEXITs have serious performance overhead. Older versions of the hardware
virtualization extensions prohibit executing real-mode code in a virtual machine; for those
cases, the virtualization stack was using the emulator for executing real-mode code in a VM.
330
CHAPTER 9
Virtualization technologies
Paravirtualized devices
While emulated devices always produce VMEXITs and are quite slow, Figure 9-28 shows an example
of a synthetic or paravirtualized device: the synthetic storage adapter. Synthetic devices know to run
in a virtualized environment; this reduces the complexity of the virtual device and allows it to achieve
higher performance. Some synthetic virtual devices exist only in virtual form and don’t emulate any
real physical hardware (an example is synthetic RDP).
VM1
Root Partition / Host OS
HCS
VMMS
VMWP
SynthStor VDEV
Processes
StorVSP
Physical
Device
Drivers
vhdmp
Filesystem
File System/Vol
VMBus
VID
Disk Driver
WinHV
StorVSC
Hypervisor
Memory
CPU
Hardware
FIGURE 9-28 The storage controller paravirtualized device.
Paravirtualized devices generally require three main components:
■
■
■
A virtualization service provider (VSP) driver runs in the root partition and exposes virtualization-specific interfaces to the guest thanks to the services provided by VMBus (see the previous
section for details on VMBus).
A synthetic VDEV is mapped in the VM Worker process and usually cooperates only in the startup, teardown, save, and restore of the virtual device. It is generally not used during the regular
work of the device. The synthetic VDEV initializes and allocates device-specific resources (in the
example, the SynthStor VDEV initializes the virtual storage adapter), but most importantly allows
the VSP to offer a VMBus communication channel to the guest VSC. The channel will be used for
communication with the root and for signaling device-specific notifications via the hypervisor.
A virtualization service consumer (VSC) driver runs in the child partition, understands the virtualization-specific interfaces exposed by the VSP, and reads/writes messages and notifications
from the shared memory exposed through VMBus by the VSP. This allows the virtual device to
run in the child VM faster than an emulated device.
CHAPTER 9
Virtualization technologies
331
Hardware-accelerated devices
On server SKUs, hardware-accelerated devices (also known as direct-access devices) allow physical devices to be remapped in the guest partition, thanks to the services exposed by the VPCI infrastructure.
When a physical device supports technologies like single-root input/output virtualization (SR IOV) or
Discrete Device Assignment (DDA), it can be mapped to a guest partition. The guest partition can directly access the MMIO space associated with the device and can perform DMA to and from the guest
memory directly without any interception by the hypervisor. The IOMMU provides the needed security
and ensures that the device can initiate DMA transfers only in the physical memory that belong to the
virtual machine.
Figure 9-29 shows the components responsible in managing the hardware-accelerated devices:
■
■
■
■
The VPci VDEV (Vpcievdev.dll) runs in the VM Worker process. Its rule is to extract the list of
hardware-accelerated devices from the VM configuration file, set up the VPCI virtual bus, and
assign a device to the VSP.
The PCI Proxy driver (Pcip.sys) is responsible for dismounting and mounting a DDA-compatible
physical device from the root partition. Furthermore, it has the key role in obtaining the list of
resources used by the device (through the SR-IOV protocol) like the MMIO space and interrupts.
The proxy driver provides access to the physical configuration space of the device and renders
an “unmounted” device inaccessible to the host OS.
The VPCI virtual service provider (Vpcivsp.sys) creates and maintains the virtual bus object,
which is associated to one or more hardware-accelerated devices (which in the VPCI VSP are
called virtual devices). The virtual devices are exposed to the guest VM through a VMBus channel created by the VSP and offered to the VSC in the guest partition.
The VPCI virtual service client (Vpci.sys) is a WDF bus driver that runs in the guest VM. It connects to the VMBus channel exposed by the VSP, receives the list of the direct access devices
exposed to the VM and their resources, and creates a PDO (physical device object) for each of
them. The devices driver can then attach to the created PDOs in the same way as they do in
nonvirtualized environments.
When a user wants to map a hardware-accelerated device to a VM, it uses some PowerShell commands (see the following experiment for further details), which start by “unmounting” the device
from the root partition. This action forces the VMMS service to communicate with the standard PCI
driver (through its exposed device, called PciControl). The VMMS service sends a PCIDRIVE_ADD
_VMPROXYPATH IOCTL to the PCI driver by providing the device descriptor (in form of bus, device,
and function ID). The PCI driver checks the descriptor, and, if the verification succeeded, adds it in the
HKLM\System\CurrentControlSet\Control\PnP\Pci\VmProxy registry value. The VMMS then starts a
PNP device (re)enumeration by using services exposed by the PNP manager. In the enumeration phase,
the PCI driver finds the new proxy device and loads the PCI proxy driver (Pcip.sys), which marks the
device as reserved for the virtualization stack and renders it invisible to the host operating system.
332
CHAPTER 9
Virtualization technologies
Root Partition / Host OS
HCS
96GB
64GB
VPci VDEV
vPCI VSP
VID
Pci
VM 1
VMMS
VMWP
Pcip
Guest Physical
Address Space
VMBus
vPCI VSC
Processes
File System/Vol
Disk Driver
4GB
NVME Driver
WinHV
Hypervisor
Memory
Hardware
IOMMU
CPU
0
FIGURE 9-29 Hardware-accelerated devices.
The second step requires assigning the device to a VM. In this case, the VMMS writes the device
descriptor in the VM configuration file. When the VM is started, the VPCI VDEV (vpcievdev.dll) reads the
direct-access device’s descriptor from the VM configuration, and starts a complex configuration phase
that is orchestrated mainly by the VPCI VSP (Vpcivsp.sys). Indeed, in its “power on” callback, the VPCI
VDEV sends different IOCTLs to the VPCI VSP (which runs in the root partition), with the goal to perform
the creation of the virtual bus and the assignment of hardware-accelerated devices to the guest VM.
A “virtual bus” is a data structure used by the VPCI infrastructure as a “glue” to maintain the connection between the root partition, the guest VM, and the direct-access devices assigned to it. The
VPCI VSP allocates and starts the VMBus channel offered to the guest VM and encapsulates it in the
virtual bus. Furthermore, the virtual bus includes some pointers to important data structures, like some
allocated VMBus packets used for the bidirectional communication, the guest power state, and so on.
After the virtual bus is created, the VPCI VSP performs the device assignment.
A hardware-accelerated device is internally identified by a LUID and is represented by a virtual
device object, which is allocated by the VPCI VSP. Based on the device’s LUID, the VPCI VSP locates the
proper proxy driver, which is also known as Mux driver—it’s usually Pcip.sys). The VPCI VSP queries
the SR-IOV or DDA interfaces from the proxy driver and uses them to obtain the Plug and Play information (hardware descriptor) of the direct-access device and to collect the resource requirements (MMIO
space, BAR registers, and DMA channels). At this point, the device is ready to be attached to the guest
VM: the VPCI VSP uses the services exposed by the WinHvr driver to emit the HvAttachDevice hypercall
to the hypervisor, which reconfigures the system IOMMU for mapping the device’s address space in the
guest partition.
The guest VM is aware of the mapped device thanks to the VPCI VSC (Vpci.sys). The VPCI VSC is
a WDF bus driver enumerated and launched by the VMBus bus driver located in the guest VM. It is
CHAPTER 9
Virtualization technologies
333
composed of two main components: a FDO (functional device object) created at VM boot time, and
one or more PDOs (physical device objects) representing the physical direct-access devices remapped
in the guest VM. When the VPCI VSC bus driver is executed in the guest VM, it creates and starts the client part of the VMBus channel used to exchange messages with the VSP. “Send bus relations” is the first
message sent by the VPCI VSC thorough the VMBus channel. The VSP in the root partition responds by
sending the list of hardware IDs describing the hardware-accelerated devices currently attached to the
VM. When the PNP manager requires the new device relations to the VPCI VSC, the latter creates a new
PDO for each discovered direct-access device. The VSC driver sends another message to the VSP with
the goal of requesting the resources used by the PDO.
After the initial setup is done, the VSC and VSP are rarely involved in the device management. The
specific hardware-accelerated device’s driver in the guest VM attaches to the relative PDO and manages the peripheral as if it had been installed on a physical machine.
EXPERIMENT: Mapping a hardware-accelerated NVMe disk to a VM
As explained in the previous section, physical devices that support SR-IOV and DDE technologies
can be directly mapped in a guest VM running in a Windows Server 2019 host. In this experiment,
we are mapping an NVMe disk, which is connected to the system through the PCI-Ex bus and
supports DDE, to a Windows 10 VM. (Windows Server 2019 also supports the direct assignment
of a graphics card, but this is outside the scope of this experiment.)
As explained at https://docs.microsoft.com/en-us/virtualization/community/team-blog/2015
/20151120-discrete-device-assignment-machines-and-devices, for being able to be reassigned,
a device should have certain characteristics, such as supporting message-signaled interrupts
and memory-mapped I/O. Furthermore, the machine in which the hypervisor runs should support SR-IOV and have a proper I/O MMU. For this experiment, you should start by verifying that
the SR-IOV standard is enabled in the system BIOS (not explained here; the procedure varies
based on the manufacturer of your machine).
The next step is to download a PowerShell script that verifies whether your NVMe controller is compatible with Discrete Device Assignment. You should download the survey-dda.ps1
PowerShell script from https://github.com/MicrosoftDocs/Virtualization-Documentation/tree
/master/hyperv-samples/benarm-powershell/DDA. Open an administrative PowerShell window
(by typing PowerShell in the Cortana search box and selecting Run As Administrator) and
check whether the PowerShell script execution policy is set to unrestricted by running the GetExecutionPolicy command. If the command yields some output different than Unrestricted,
you should type the following: Set-ExecutionPolicy -Scope LocalMachine -ExecutionPolicy
Unrestricted, press Enter
Enter, and confirm with Y.
Y
If you execute the downloaded survey-dda.ps1 script, its output should highlight whether
your NVMe device can be reassigned to the guest VM. Here is a valid output example:
Standard NVM Express Controller
Express Endpoint -- more secure.
And its interrupts are message-based, assignment can work.
PCIROOT(0)#PCI(0302)#PCI(0000)
334
CHAPTER 9
Virtualization technologies
Take note of the location path (the PCIROOT(0)#PCI(0302)#PCI(0000) string in the example).
Now we will set the automatic stop action for the target VM as turned-off (a required step for
DDA) and dismount the device. In our example, the VM is called “Vibranium.” Write the following
commands in your PowerShell window (by replacing the sample VM name and device location
with your own):
Set-VM -Name "Vibranium" -AutomaticStopAction TurnOff
Dismount-VMHostAssignableDevice -LocationPath "PCIROOT(0)#PCI(0302)#PCI(0000)"
In case the last command yields an operation failed error, it is likely that you haven’t disabled the
device. Open the Device Manager
Manager, locate your NVMe controller (Standard NVMe Express Controller
in this example), right-click it, and select Disable Device. Then you can type the last command again.
It should succeed this time. Then assign the device to your VM by typing the following:
Add-VMAssignableDevice -LocationPath "PCIROOT(0)#PCI(0302)#PCI(0000)" -VMName "Vibranium"
The last command should have completely removed the NVMe controller from the host. You
should verify this by checking the Device Manager in the host system. Now it’s time to power
up the VM. You can use the Hyper-V Manager tool or PowerShell. If you start the VM and get an
error like the following, your BIOS is not properly configured to expose SR-IOV, or your I/O MMU
doesn’t have the required characteristics (most likely it does not support I/O remapping).
Otherwise, the VM should simply boot as expected. In this case, you should be able to see
both the NVMe controller and the NVMe disk listed in the Device Manager applet of the child
VM. You can use the disk management tool to create partitions in the child VM in the same way
you do in the host OS. The NVMe disk will run at full speed with no performance penalties (you
can confirm this by using any disk benchmark tool).
To properly remove the device from the VM and remount it in the host OS, you should first
shut down the VM and then use the following commands (remember to always change the virtual machine name and NVMe controller location):
Remove-VMAssignableDevice -LocationPath "PCIROOT(0)#PCI(0302)#PCI(0000)" -VMName
"Vibranium"
Mount-VMHostAssignableDevice -LocationPath "PCIROOT(0)#PCI(0302)#PCI(0000)"
After the last command, the NVMe controller should reappear listed in the Device Manager of
the host OS. You just need to reenable it for restarting to use the NVMe disk in the host.
CHAPTER 9
Virtualization technologies
335
VA-backed virtual machines
Virtual machines are being used for multiple purposes. One of them is to properly run traditional
software in isolated environments, called containers. (Server and application silos, which are two types
of containers, have been introduced in Part 1, Chapter 3, “Processes and jobs.”) Fully isolated containers
(internally named Xenon and Krypton) require a fast-startup type, low overhead, and the possibility of
getting the lowest possible memory footprint. Guest physical memory of this type of VM is generally
shared between multiple containers. Good examples of containers are provided by Windows Defender
Application Guard, which uses a container to provide the full isolation of the browser, or by Windows
Sandbox, which uses containers to provide a fully isolated virtual environment. Usually a container
shares the same VM’s firmware, operating system, and, often, also some applications running in it (the
shared components compose the base layer of a container). Running each container in its private guest
physical memory space would not be feasible and would result in a high waste of physical memory.
To solve the problem, the virtualization stack provides support for VA-backed virtual machines.
VA-backed VMs use the host’s operating system’s memory manager to provide to the guest partition’s physical memory advanced features like memory deduplication, memory trimming, direct maps,
memory cloning and, most important, paging (all these concepts have been extensively covered in
Chapter 5 of Part 1). For traditional VMs, guest memory is assigned by the VID driver by statically allocating system physical pages from the host and mapping them in the GPA space of the VM before any
virtual processor has the chance to execute, but for VA-backed VMs, a new layer of indirection is added
between the GPA space and SPA space. Instead of mapping SPA pages directly into the GPA space, the
VID creates a GPA space that is initially blank, creates a user mode minimal process (called VMMEM) for
hosting a VA space, and sets up GPA to VA mappings using MicroVM. MicroVM is a new component of
the NT kernel tightly integrated with the NT memory manager that is ultimately responsible for managing the GPA to SPA mapping by composing the GPA to VA mapping (maintained by the VID) with the
VA to SPA mapping (maintained by the NT memory manager).
The new layer of indirection allows VA-backed VMs to take advantage of most memory management features that are exposed to Windows processes. As discussed in the previous section, the VM
Worker process, when it starts the VM, asks the VID driver to create the partition’s memory block. In
case the VM is VA-backed, it creates the Memory Block Range GPA mapping bitmap, which is used to
keep track of the allocated virtual pages backing the new VM’s RAM. It then creates the partition’s RAM
memory, backed by a big range of VA space. The VA space is usually as big as the allocated amount of
VM’s RAM memory (note that this is not a necessary condition: different VA-ranges can be mapped
as different GPA ranges) and is reserved in the context of the VMMEM process using the native
NtAllocateVirtualMemory API.
If the “deferred commit” optimization is not enabled (see the next section for more details), the VID
driver performs another call to the NtAllocateVirtualMemory API with the goal of committing the entire VA range. As discussed in Chapter 5 of Part 1, committing memory charges the system commit limit
but still doesn’t allocate any physical page (all the PTE entries describing the entire range are invalid
demand-zero PTEs). The VID driver at this stage uses Winhvr to ask the hypervisor to map the entire
partition’s GPA space to a special invalid SPA (by using the same HvMapGpaPages hypercall used for
standard partitions). When the guest partition accesses guest physical memory that is mapped in the
336
CHAPTER 9
Virtualization technologies
SLAT table by the special invalid SPA, it causes a VMEXIT to the hypervisor, which recognizes the special
value and injects a memory intercept to the root partition.
The VID driver finally notifies MicroVM of the new VA-backed GPA range by invoking the VmCreate
MemoryRange routine (MicroVM services are exposed by the NT kernel to the VID driver through a
Kernel Extension). MicroVM allocates and initializes a VM_PROCESS_CONTEXT data structure, which
contains two important RB trees: one describing the allocated GPA ranges in the VM and one describing the corresponding system virtual address (SVA) ranges in the root partition. A pointer to the allocated data structure is then stored in the EPROCESS of the VMMEM instance.
When the VM Worker process wants to write into the memory of the VA-backed VM, or when a
memory intercept is generated due to an invalid GPA to SPA translation, the VID driver calls into the
MicroVM page fault handler (VmAccessFault). The handler performs two important operations: first,
it resolves the fault by inserting a valid PTE in the page table describing the faulting virtual page (more
details in Chapter 5 of Part 1) and then updates the SLAT table of the child VM (by calling the WinHvr
driver, which emits another HvMapGpaPages hypercall). Afterward, the VM’s guest physical pages can
be paged out simply because private process memory is normally pageable. This has the important
implication that it requires the majority of the MicroVM’s function to operate at passive IRQL.
Multiple services of the NT memory manager can be used for VA-backed VMs. In particular, clone
templates allow the memory of two different VA-backed VMs to be quickly cloned; direct map allows
shared executable images or data files to have their section objects mapped into the VMMEM process
and into a GPA range pointing to that VA region. The underlying physical pages can be shared between
different VMs and host processes, leading to improved memory density.
VA-backed VMs optimizations
As introduced in the previous section, the cost of a guest access to dynamically backed memory that
isn’t currently backed, or does not grant the required permissions, can be quite expensive: when a
guest access attempt is made to inaccessible memory, a VMEXIT occurs, which requires the hypervisor
to suspend the guest VP, schedule the root partition’s VP, and inject a memory intercept message to
it. The VID’s intercept callback handler is invoked at high IRQL, but processing the request and calling into MicroVM requires running at PASSIVE_LEVEL. Thus, a DPC is queued. The DPC routine sets an
event that wakes up the appropriate thread in charge of processing the intercept. After the MicroVM
page fault handler has resolved the fault and called the hypervisor to update the SLAT entry (through
another hypercall, which produces another VMEXIT), it resumes the guest’s VP.
Large numbers of memory intercepts generated at runtime result in big performance penalties.
With the goal to avoid this, multiple optimizations have been implemented in the form of guest
enlightenments (or simple configurations):
■
Memory zeroing enlightenments
■
Memory access hints
■
Enlightened page fault
■
Deferred commit and other optimizations
CHAPTER 9
Virtualization technologies
337
Memory-zeroing enlightenments
To avoid information disclosure to a VM of memory artifacts previously in use by the root partition
or another VM, memory-backing guest RAM is zeroed before being mapped for access by the guest.
Typically, an operating system zeroes all physical memory during boot because on a physical system
the contents are nondeterministic. For a VM, this means that memory may be zeroed twice: once by the
virtualization host and again by the guest operating system. For physically backed VMs, this is at best a
waste of CPU cycles. For VA-backed VMs, the zeroing by the guest OS generates costly memory intercepts. To avoid the wasted intercepts, the hypervisor exposes the memory-zeroing enlightenments.
When the Windows Loader loads the main operating system, it uses services provided by the UEFI
firmware to get the machine’s physical memory map. When the hypervisor starts a VA-backed VM, it
exposes the HvGetBootZeroedMemory hypercall, which the Windows Loader can use to query the list
of physical memory ranges that are actually already zeroed. Before transferring the execution to the
NT kernel, the Windows Loader merges the obtained zeroed ranges with the list of physical memory
descriptors obtained through EFI services and stored in the Loader block (further details on startup
mechanisms are available in Chapter 12). The NT kernel inserts the merged descriptor directly in the
zeroed pages list by skipping the initial memory zeroing.
In a similar way, the hypervisor supports the hot-add memory zeroing enlightenment with a simple
implementation: When the dynamic memory VSC driver (dmvsc.sys) initiates the request to add physical memory to the NT kernel, it specifies the MM_ADD_PHYSICAL_MEMORY_ALREADY_ZEROED flag,
which hints the Memory Manager (MM) to add the new pages directly to the zeroed pages list.
Memory access hints
For physically backed VMs, the root partition has very limited information about how guest MM
intends to use its physical pages. For these VMs, the information is mostly irrelevant because almost
all memory and GPA mappings are created when the VM is started, and they remain statically mapped.
For VA-backed VMs, this information can instead be very useful because the host memory manager
manages the working set of the minimal process that contains the VM’s memory (VMMEM).
The hot hint allows the guest to indicate that a set of physical pages should be mapped into the
guest because they will be accessed soon or frequently. This implies that the pages are added to the
working set of the minimal process. The VID handles the hint by telling MicroVM to fault in the physical
pages immediately and not to remove them from the VMMEM process’s working set.
In a similar way, the cold hint allows the guest to indicate that a set of physical pages should be unmapped from the guest because it will not be used soon. The VID driver handles the hint by forwarding
it to MicroVM, which immediately removes the pages from the working set. Typically, the guest uses
the cold hint for pages that have been zeroed by the background zero page thread (see Chapter 5 of
Part 1 for more details).
The VA-backed guest partition specifies a memory hint for a page by using the HvMemoryHeatHint
hypercall.
338
CHAPTER 9
Virtualization technologies
Enlightened page fault (EPF)
Enlightened page fault (EPF) handling is a feature that allows the VA-backed guest partition to reschedule threads on a VP that caused a memory intercept for a VA-backed GPA page. Normally, a memory
intercept for such a page is handled by synchronously resolving the access fault in the root partition
and resuming the VP upon access fault completion. When EPF is enabled and a memory intercept occurs for a VA-backed GPA page, the VID driver in the root partition creates a background worker thread
that calls the MicroVM page fault handler and delivers a synchronous exception (not to be confused by
an asynchronous interrupt) to the guest’s VP, with the goal to let it know that the current thread caused
a memory intercept.
The guest reschedules the thread; meanwhile, the host is handling the access fault. Once the access
fault has been completed, the VID driver will add the original faulting GPA to a completion queue and
deliver an asynchronous interrupt to the guest. The interrupt causes the guest to check the completion
queue and unblock any threads that were waiting on EPF completion.
Deferred commit and other optimizations
Deferred commit is an optimization that, if enabled, forces the VID driver not to commit each backing
page until first access. This potentially allows more VMs to run simultaneously without increasing the
size of the page file, but, since the backing VA space is only reserved, and not committed, the VMs may
crash at runtime due to the commitment limit being reached in the root partition. In this case, there is
no more free memory available.
Other optimizations are available to set the size of the pages which will be allocated by the MicroVM
page fault handler (small versus large) and to pin the backing pages upon first access. This prevents
aging and trimming, generally resulting in more consistent performance, but consumes more memory
and reduces the memory density.
The VMMEM process
The VMMEM process exists mainly for two main reasons:
■
■
Hosts the VP-dispatch thread loop when the root scheduler is enabled, which represents the
guest VP schedulable unit
Hosts the VA space for the VA-backed VMs
The VMMEM process is created by the VID driver while creating the VM’s partition. As for regular
partitions (see the previous section for details), the VM Worker process initializes the VM setup through
the VID.dll library, which calls into the VID through an IOCTL. If the VID driver detects that the new partition is VA-backed, it calls into the MicroVM (through the VsmmNtSlatMemoryProcessCreate function)
to create the minimal process. MicroVM uses the PsCreateMinimalProcess function, which allocates
the process, creates its address space, and inserts the process into the process list. It then reserves the
bottom 4 GB of address space to ensure that no direct-mapped images end up there (this can reduce
the entropy and security for the guest). The VID driver applies a specific security descriptor to the new
VMMEM process; only the SYSTEM and the VM Worker process can access it. (The VM Worker process
is launched with a specific token; the token’s owner is set to a SID generated from the VM’s unique
CHAPTER 9
Virtualization technologies
339
GUID.) This is important because the virtual address space of the VMMEM process could have been
accessible to anyone otherwise. By reading the process virtual memory, a malicious user could read the
VM private guest physical memory.
Virtualization-based security (VBS)
As discussed in the previous section, Hyper-V provides the services needed for managing and running
virtual machines on Windows systems. The hypervisor guarantees the necessary isolation between
each partition. In this way, a virtual machine can’t interfere with the execution of another one. In this
section, we describe another important component of the Windows virtualization infrastructure: the
Secure Kernel, which provides the basic services for the virtualization-based security.
First, we list the services provided by the Secure Kernel and its requirements, and then we describe
its architecture and basic components. Furthermore, we present some of its basic internal data structures. Then we discuss the Secure Kernel and Virtual Secure Mode startup method, describing its high
dependency on the hypervisor. We conclude by analyzing the components that are built on the top
of Secure Kernel, like the Isolated User Mode, Hypervisor Enforced Code Integrity, the secure software
enclaves, secure devices, and Windows kernel hot-patching and microcode services.
Virtual trust levels (VTLs) and Virtual Secure Mode (VSM)
As discussed in the previous section, the hypervisor uses the SLAT to maintain each partition in its
own memory space. The operating system that runs in a partition accesses memory using the standard way (guest virtual addresses are translated in guest physical addresses by using page tables).
Under the cover, the hardware translates all the partition GPAs to real SPAs and then performs the
actual memory access. This last translation layer is maintained by the hypervisor, which uses a separate SLAT table per partition. In a similar way, the hypervisor can use SLAT to create different security
domains in a single partition. Thanks to this feature, Microsoft designed the Secure Kernel, which is
the base of the Virtual Secure Mode.
Traditionally, the operating system has had a single physical address space, and the software running at ring 0 (that is, kernel mode) could have access to any physical memory address. Thus, if any
software running in supervisor mode (kernel, drivers, and so on) becomes compromised, the entire
system becomes compromised too. Virtual secure mode leverages the hypervisor to provide new trust
boundaries for systems software. With VSM, security boundaries (described by the hypervisor using
SLAT) can be put in place that limit the resources supervisor mode code can access. Thus, with VSM,
even if supervisor mode code is compromised, the entire system is not compromised.
VSM provides these boundaries through the concept of virtual trust levels (VTLs). At its core, a VTL is
a set of access protections on physical memory. Each VTL can have a different set of access protections.
In this way, VTLs can be used to provide memory isolation. A VTL’s memory access protections can be
340
CHAPTER 9
Virtualization technologies
configured to limit what physical memory a VTL can access. With VSM, a virtual processor is always
running at a particular VTL and can access only physical memory that is marked as accessible through
the hypervisor SLAT. For example, if a processor is running at VTL 0, it can only access memory as
controlled by the memory access protections associated with VTL 0. This memory access enforcement
happens at the guest physical memory translation level and thus cannot be changed by supervisor
mode code in the partition.
VTLs are organized as a hierarchy. Higher levels are more privileged than lower levels, and higher
levels can adjust the memory access protections for lower levels. Thus, software running at VTL 1 can
adjust the memory access protections of VTL 0 to limit what memory VTL 0 can access. This allows
software at VTL 1 to hide (isolate) memory from VTL 0. This is an important concept that is the basis of
the VSM. Currently the hypervisor supports only two VTLs: VTL 0 represents the Normal OS execution
environment, which the user interacts with; VTL 1 represents the Secure Mode, where the Secure Kernel
and Isolated User Mode (IUM) runs. Because VTL 0 is the environment in which the standard operating
system and applications run, it is often referred to as the normal mode.
Note The VSM architecture was initially designed to support a maximum of 16 VTLs. At
the time of this writing, only 2 VTLs are supported by the hypervisor. In the future, it could
be possible that Microsoft will add one or more new VTLs. For example, latest versions
of Windows Server running in Azure also support Confidential VMs, which run their Host
Compatibility Layer (HCL) in VTL 2.
Each VTL has the following characteristics associated with it:
■
■
■
Memory access protection As already discussed, each virtual trust level has a set of guest
physical memory access protections, which defines how the software can access memory.
Virtual processor state A virtual processor in the hypervisor share some registers with each
VTL, whereas some other registers are private per each VTL. The private virtual processor state
for a VTL cannot be accessed by software running at a lower VTL. This allows for isolation of the
processor state between VTLs.
Interrupt subsystem Each VTL has a unique interrupt subsystem (managed by the hypervisor synthetic interrupt controller). A VTL’s interrupt subsystem cannot be accessed by software
running at a lower VTL. This allows for interrupts to be managed securely at a particular VTL
without risk of a lower VTL generating unexpected interrupts or masking interrupts.
Figure 9-30 shows a scheme of the memory protection provided by the hypervisor to the Virtual
Secure Mode. The hypervisor represents each VTL of the virtual processor through a different VMCS
data structure (see the previous section for more details), which includes a specific SLAT table. In this
way, software that runs in a particular VTL can access just the physical memory pages assigned to its
level. The important concept is that the SLAT protection is applied to the physical pages and not to the
virtual pages, which are protected by the standard page tables.
CHAPTER 9
Virtualization technologies
341
System Physical Memory
Guest Physical to System Physical Memory Map (GPA -> SPA map)
Secure Mode Device
Normal Mode Device
Normal Mode (VTL 0) Memory Access Protections
Normal Mode
(VTL 0)
Secure Mode (VTL 1) Memory Access Protections
Secure Mode
(VTL 1)
Normal Mode
(VTL 0)
VP 0
VP 1
User
Kernel
User
Kernel
Local APIC
Secure Mode
(VTL 1)
Local APIC
Shared Registers
User
Kernel
User
Kernel
Local APIC
Local APIC
Shared Registers
Host Partition
VMCS
VP 0
VTL 0
VP 0
VMCS
VP 0
VTL 1
VMCS
VP 1
VTL 0
VP 1
VMCS
VP 1
VTL 1
VTL 0 EPT
VTL 1 EPT
Hypervisor
FIGURE 9-30 Scheme of the memory protection architecture provided by the hypervisor to VSM.
Services provided by the VSM and requirements
Virtual Secure Mode, which is built on the top of the hypervisor, provides the following services to the
Windows ecosystem:
■
■
342
Isolation IUM provides a hardware-based isolated environment for each software that runs
in VTL 1. Secure devices managed by the Secure Kernel are isolated from the rest of the system
and run in VTL 1 user mode. Software that runs in VTL 1 usually stores secrets that can’t be intercepted or revealed in VTL 0. This service is used heavily by Credential Guard. Credential Guard
is the feature that stores all the system credentials in the memory address space of the LsaIso
trustlet, which runs in VTL 1 user mode.
Control over VTL 0 The Hypervisor Enforced Code Integrity (HVCI) checks the integrity and
the signing of each module that the normal OS loads and runs. The integrity check is done
entirely in VTL 1 (which has access to all the VTL 0 physical memory). No VTL 0 software can interfere with the signing check. Furthermore, HVCI guarantees that all the normal mode memory
pages that contain executable code are marked as not writable (this feature is called W^X. Both
HVCI and W^X have been discussed in Chapter 7 of Part 1).
CHAPTER 9
Virtualization technologies
■
■
■
Secure intercepts VSM provides a mechanism to allow a higher VTL to lock down critical system resources and prevent access to them by lower VTLs. Secure intercepts are used extensively
by HyperGuard, which provides another protection layer for the VTL 0 kernel by stopping malicious modifications of critical components of the operating systems.
VBS-based enclaves A security enclave is an isolated region of memory within the address
space of a user mode process. The enclave memory region is not accessible even to higher
privilege levels. The original implementation of this technology was using hardware facilities
to properly encrypt memory belonging to a process. A VBS-based enclave is a secure enclave
whose isolation guarantees are provided using VSM.
Kernel Control Flow Guard VSM, when HVCI is enabled, provides Control Flow Guard
(CFG) to each kernel module loaded in the normal world (and to the NT kernel itself). Kernel
mode software running in normal world has read-only access to the bitmap, so an exploit
can’t potentially modify it. Thanks to this reason, kernel CFG in Windows is also known as
Secure Kernel CFG (SKCFG).
Note CFG is the Microsoft implementation of Control Flow Integrity, a technique that prevents a wide variety of malicious attacks from redirecting the flow of the execution of a program. Both user mode and Kernel mode CFG have been discussed extensively in Chapter 7
of Part 1.
■
Secure devices Secure devices are a new kind of devices that are mapped and managed entirely by the Secure Kernel in VTL 1. Drivers for these kinds of devices work entirely in VTL 1 user
mode and use services provided by the Secure Kernel to map the device I/O space.
To be properly enabled and work correctly, the VSM has some hardware requirements. The host
system must support virtualization extensions (Intel VT-x, AMD SVM, or ARM TrustZone) and the SLAT.
VSM won’t work if one of the previous hardware features is not present in the system processor. Some
other hardware features are not strictly necessary, but in case they are not present, some security
premises of VSM may not be guaranteed:
■
■
An IOMMU is needed to protect against physical device DMA attacks. If the system processors
don’t have an IOMMU, VSM can still work but is vulnerable to these physical device attacks.
A UEFI BIOS with Secure Boot enabled is needed for protecting the boot chain that leads to
the startup of the hypervisor and the Secure Kernel. If Secure Boot is not enabled, the system is
vulnerable to boot attacks, which can modify the integrity of the hypervisor and Secure Kernel
before they have the chances to get executed.
Some other components are optional, but when they’re present they increase the overall security
and responsiveness of the system. The TPM presence is a good example. It is used by the Secure Kernel
to store the Master Encryption key and to perform Secure Launch (also known as DRTM; see Chapter 12
for more details). Another hardware component that can improve VSM responsiveness is the processor’s Mode-Based Execute Control (MBEC) hardware support: MBEC is used when HVCI is enabled to
protect the execution state of user mode pages in kernel mode. With Hardware MBEC, the hypervisor
CHAPTER 9
Virtualization technologies
343
can set the executable state of a physical memory page based on the CPL (kernel or user) domain of
the specific VTL. In this way, memory that belongs to user mode application can be physically marked
executable only by user mode code (kernel exploits can no longer execute their own code located in
the memory of a user mode application). In case hardware MBEC is not present, the hypervisor needs
to emulate it, by using two different SLAT tables for VTL 0 and switching them when the code execution changes the CPL security domain (going from user mode to kernel mode and vice versa produces
a VMEXIT in this case). More details on HVCI have been already discussed in Chapter 7 of Part 1.
EXPERIMENT: Detecting VBS and its provided services
In Chapter 12, we discuss the VSM startup policy and provide the instructions to manually enable
or disable Virtualization-Based Security. In this experiment, we determine the state of the different features provided by the hypervisor and the Secure Kernel. VBS is a technology that is not
directly visible to the user. The System Information tool distributed with the base Windows installation is able to show the details about the Secure Kernel and its related technologies. You can
start it by typing msinfo32 in the Cortana search box. Be sure to run it as Administrator; certain
details require a full-privileged user account.
In the following figure, VBS is enabled and includes HVCI (specified as Hypervisor Enforced
Code Integrity), UEFI runtime virtualization (specified as UEFI Readonly), MBEC (specified as
Mode Based Execution Control). However, the system described in the example does not include
an enabled Secure Boot and does not have a working IOMMU (specified as DMA Protection in
the Virtualization-Based Security Available Security Properties line).
More details about how to enable, disable, and lock the VBS configuration are available in the
“Understanding the VSM policy” experiment of Chapter 12.
344
CHAPTER 9
Virtualization technologies
The Secure Kernel
The Secure Kernel is implemented mainly in the securekernel.exe file and is launched by the Windows
Loader after the hypervisor has already been successfully started. As shown in Figure 9-31, the Secure
Kernel is a minimal OS that works strictly with the normal kernel, which resides in VTL 0. As for any
normal OS, the Secure Kernel runs in CPL 0 (also known as ring 0 or kernel mode) of VTL 1 and provides
services (the majority of them through system calls) to the Isolated User Mode (IUM), which lives
in CPL 3 (also known as ring 3 or user mode) of VTL 1. The Secure Kernel has been designed to be
as small as possible with the goal to reduce the external attack surface. It’s not extensible with external device drivers like the normal kernel. The only kernel modules that extend their functionality are
loaded by the Windows Loader before VSM is launched and are imported from securekernel.exe:
■
Skci.dll
Implements the Hypervisor Enforced Code Integrity part of the Secure Kernel
■
Cng.sys
Provides the cryptographic engine to the Secure Kernel
■
Vmsvcext.dll Provides support for the attestation of the Secure Kernel components in
Intel TXT (Trusted Boot) environments (more information about Trusted Boot is available
in Chapter 12)
While the Secure Kernel is not extensible, the Isolated User Mode includes specialized processes
called Trustlets. Trustlets are isolated among each other and have specialized digital signature requirements. They can communicate with the Secure Kernel through syscalls and with the normal world
through Mailslots and ALPC. Isolated User Mode is discussed later in this chapter.
VSM Normal Mode (VTL 0)
NTOS (Normal Kernel)
VSM Secure Mode (VTL 1)
Process A
Process B
Secure Kernel
UserMode
(Ring 3)
KernelMode
(Ring 0)
A Kernel
Data
B Kernel
Data
C Kernel
Data
D Kernel
Data
Isolated
Process C
C Secure
Kernel
Data
Isolated
Process D
D Secure
Kernel
Data
UserMode
(Ring 3)
KernelMode
(Ring 0)
Hypervisor
FIGURE 9-31 Virtual Secure Mode Architecture scheme, built on top of the hypervisor.
Virtual interrupts
When the hypervisor configures the underlying virtual partitions, it requires that the physical processors produce a VMEXIT every time an external interrupt is raised by the CPU physical APIC (Advanced
Programmable Interrupt Controller). The hardware’s virtual machine extensions allow the hypervisor
to inject virtual interrupts to the guest partitions (more details are in the Intel, AMD, and ARM user
CHAPTER 9
Virtualization technologies
345
manuals). Thanks to these two facts, the hypervisor implements the concept of a Synthetic Interrupt
Controller (SynIC). A SynIC can manage two kind of interrupts. Virtual interrupts are interrupts delivered to a guest partition’s virtual APIC. A virtual interrupt can represent and be associated with a
physical hardware interrupt, which is generated by the real hardware. Otherwise, a virtual interrupt can
represent a synthetic interrupt, which is generated by the hypervisor itself in response to certain kinds
of events. The SynIC can map physical interrupts to virtual ones. A VTL has a SynIC associated with each
virtual processor in which the VTL runs. At the time of this writing, the hypervisor has been designed to
support 16 different synthetic interrupt vectors (only 2 are actually in use, though).
When the system starts (phase 1 of the NT kernel’s initialization) the ACPI driver maps each interrupt to the correct vector using services provided by the HAL. The NT HAL is enlightened and knows
whether it’s running under VSM. In that case, it calls into the hypervisor for mapping each physical interrupt to its own VTL. Even the Secure Kernel could do the same. At the time of this writing, though, no
physical interrupts are associated with the Secure Kernel (this can change in the future; the hypervisor
already supports this feature). The Secure Kernel instead asks the hypervisor to receive only the following virtual interrupts: Secure Timers, Virtual Interrupt Notification Assist (VINA), and Secure Intercepts.
Note It’s important to understand that the hypervisor requires the underlying hardware to
produce a VMEXIT while managing interrupts that are only of external types. Exceptions are
still managed in the same VTL the processor is executing at (no VMEXIT is generated). If an
instruction causes an exception, the latter is still managed by the structured exception handling (SEH) code located in the current VTL.
To understand the three kinds of virtual interrupts, we must first introduce how interrupts are managed by the hypervisor.
In the hypervisor, each VTL has been designed to securely receive interrupts from devices associated
with its own VTL, to have a secure timer facility which can’t be interfered with by less secure VTLs, and to
be able to prevent interrupts directed to lower VTLs while executing code at a higher VTL. Furthermore, a
VTL should be able to send IPI interrupts to other processors. This design produces the following scenarios:
■
■
■
346
When running at a particular VTL, reception of interrupts targeted at the current VTL results in
standard interrupt handling (as determined by the virtual APIC controller of the VP).
When an interrupt is received that is targeted at a higher VTL, receipt of the interrupt results in
a switch to the higher VTL to which the interrupt is targeted if the IRQL value for the higher VTL
would allow the interrupt to be presented. If the IRQL value of the higher VTL does not allow
the interrupt to be delivered, the interrupt is queued without switching the current VTL. This
behavior allows a higher VTL to selectively mask interrupts when returning to a lower VTL. This
could be useful if the higher VTL is running an interrupt service routine and needs to return to a
lower VTL for assistance in processing the interrupt.
When an interrupt is received that is targeted at a lower VTL than the current executing VTL
of a virtual processor, the interrupt is queued for future delivery to the lower VTL. An interrupt
targeted at a lower VTL will never preempt execution of the current VTL. Instead, the interrupt is
presented when the virtual processor next transitions to the targeted VTL.
CHAPTER 9
Virtualization technologies
Preventing interrupts directed to lower VTLs is not always a great solution. In many cases, it could
lead to the slowing down of the normal OS execution (especially in mission-critical or game environments). To better manage these conditions, the VINA has been introduced. As part of its normal event
dispatch loop, the hypervisor checks whether there are pending interrupts queued to a lower VTL. If so,
the hypervisor injects a VINA interrupt to the current executing VTL. The Secure Kernel has a handler
registered for the VINA vector in its virtual IDT. The handler (ShvlVinaHandler function) executes a normal call (NORMALKERNEL_VINA) to VTL 0 (Normal and Secure Calls are discussed later in this chapter).
This call forces the hypervisor to switch to the normal kernel (VTL 0). As long as the VTL is switched, all
the queued interrupts will be correctly dispatched. The normal kernel will reenter VTL 1 by emitting a
SECUREKERNEL_RESUMETHREAD Secure Call.
Secure IRQLs
The VINA handler will not always be executed in VTL 1. Similar to the NT kernel, this depends on the
actual IRQL the code is executing into. The current executing code’s IRQL masks all the interrupts that are
associated with an IRQL that’s less than or equal to it. The mapping between an interrupt vector and the
IRQL is maintained by the Task Priority Register (TPR) of the virtual APIC, like in case of real physical APICs
(consult the Intel Architecture Manual for more information). As shown in Figure 9-32, the Secure Kernel
supports different levels of IRQL compared to the normal kernel. Those IRQL are called Secure IRQL.
15
High/Intercept
14
IPI
Unused
Vectors
5
Synthetic Interrupts
(Hypervisor Generated)
Timer
4
VINA
3
Normal Raised
2
DPC/Dispatch
1
APC
0
Passive/Low
Software Interrupts
Normal Thread Execution
FIGURE 9-32 Secure Kernel interrupts request levels (IRQL).
The first three secure IRQL are managed by the Secure Kernel in a way similar to the normal world.
Normal APCs and DPCs (targeting VTL 0) still can’t preempt code executing in VTL 1 through the hypervisor, but the VINA interrupt is still delivered to the Secure Kernel (the operating system manages the
three software interrupts by writing in the target processor’s APIC Task-Priority Register, an operation
that causes a VMEXIT to the hypervisor. For more information about the APIC TPR, see the Intel, AMD,
or ARM manuals). This means that if a normal-mode DPC is targeted at a processor while it is executing
VTL 1 code (at a compatible secure IRQL, which should be less than Dispatch), the VINA interrupt will
be delivered and will switch the execution context to VTL 0. As a matter of fact, this executes the DPC
in the normal world and raises for a while the normal kernel’s IRQL to dispatch level. When the DPC
queue is drained, the normal kernel’s IRQL drops. Execution flow returns to the Secure Kernel thanks to
CHAPTER 9
Virtualization technologies
347
the VSM communication loop code that is located in the VslpEnterIumSecureMode routine. The loop
processes each normal call originated from the Secure Kernel.
The Secure Kernel maps the first three secure IRQLs to the same IRQL of the normal world. When
a Secure call is made from code executing at a particular IRQL (still less or equal to dispatch) in the
normal world, the Secure Kernel switches its own secure IRQL to the same level. Vice versa, when the
Secure Kernel executes a normal call to enter the NT kernel, it switches the normal kernel’s IRQL to the
same level as its own. This works only for the first three levels.
The normal raised level is used when the NT kernel enters the secure world at an IRQL higher than
the DPC level. In those cases, the Secure Kernel maps all of the normal-world IRQLs, which are above
DPC, to its normal raised secure level. Secure Kernel code executing at this level can’t receive any VINA
for any kind of software IRQLs in the normal kernel (but it can still receive a VINA for hardware interrupts). Every time the NT kernel enters the secure world at a normal IRQL above DPC, the Secure Kernel
raises its secure IRQL to normal raised.
Secure IRQLs equal to or higher than VINA can never be preempted by any code in the normal
world. This explains why the Secure Kernel supports the concept of secure, nonpreemptable timers
and Secure Intercepts. Secure timers are generated from the hypervisor’s clock interrupt service routine (ISR). This ISR, before injecting a synthetic clock interrupt to the NT kernel, checks whether there
are one or more secure timers that are expired. If so, it injects a synthetic secure timer interrupt to VTL 1.
Then it proceeds to forward the clock tick interrupt to the normal VTL.
Secure intercepts
There are cases where the Secure Kernel may need to prevent the NT kernel, which executes at a lower
VTL, from accessing certain critical system resources. For example, writes to some processor’s MSRs
could potentially be used to mount an attack that would disable the hypervisor or subvert some of its
protections. VSM provides a mechanism to allow a higher VTL to lock down critical system resources
and prevent access to them by lower VTLs. The mechanism is called secure intercepts.
Secure intercepts are implemented in the Secure Kernel by registering a synthetic interrupt, which
is provided by the hypervisor (remapped in the Secure Kernel to vector 0xF0). The hypervisor, when
certain events cause a VMEXIT, injects a synthetic interrupt to the higher VTL on the virtual processor
that triggered the intercept. At the time of this writing, the Secure Kernel registers with the hypervisor
for the following types of intercepted events:
■
■
■
■
348
Write to some vital processor’s MSRs (Star, Lstar, Cstar, Efer, Sysenter, Ia32Misc, and APIC base
on AMD64 architectures) and special registers (GDT, IDT, LDT)
Write to certain control registers (CR0, CR4, and XCR0)
Write to some I/O ports (ports 0xCF8 and 0xCFC are good examples; the intercept manages the
reconfiguration of PCI devices)
Invalid access to protected guest physical memory
CHAPTER 9
Virtualization technologies
When VTL 0 software causes an intercept that will be raised in VTL 1, the Secure Kernel needs to
recognize the intercept type from its interrupt service routine. For this purpose, the Secure Kernel uses
the message queue allocated by the SynIC for the “Intercept” synthetic interrupt source (see the “Interpartition communication” section previously in this section for more details about the SynIC and SINT).
The Secure Kernel is able to discover and map the physical memory page by checking the SIMP synthetic MSR, which is virtualized by the hypervisor. The mapping of the physical page is executed at the
Secure Kernel initialization time in VTL 1. The Secure Kernel’s startup is described later in this chapter.
Intercepts are used extensively by HyperGuard with the goal to protect sensitive parts of the normal
NT kernel. If a malicious rootkit installed in the NT kernel tries to modify the system by writing a particular value to a protected register (for example to the syscall handlers, CSTAR and LSTAR, or modelspecific registers), the Secure Kernel intercept handler (ShvlpInterceptHandler) filters the new register’s
value, and, if it discovers that the value is not acceptable, it injects a General Protection Fault (GPF)
nonmaskable exception to the NT kernel in VLT 0. This causes an immediate bugcheck resulting in the
system being stopped. If the value is acceptable, the Secure Kernel writes the new value of the register
using the hypervisor through the HvSetVpRegisters hypercall (in this case, the Secure Kernel is proxying
the access to the register).
Control over hypercalls
The last intercept type that the Secure Kernel registers with the hypervisor is the hypercall intercept.
The hypercall intercept’s handler checks that the hypercall emitted by the VTL 0 code to the hypervisor is legit and is originated from the operating system itself, and not through some external modules. Every time in any VTL a hypercall is emitted, it causes a VMEXIT in the hypervisor (by design).
Hypercalls are the base service used by kernel components of each VTL to request services between
each other (and to the hypervisor itself). The hypervisor injects a synthetic intercept interrupt to the
higher VTL only for hypercalls used to request services directly to the hypervisor, skipping all the hypercalls used for secure and normal calls to and from the Secure Kernel.
If the hypercall is not recognized as valid, it won’t be executed: the Secure Kernel in this case
updates the lower VTL’s registers with the goal to signal the hypercall error. The system is not crashed
(although this behavior can change in the future); the calling code can decide how to manage the error.
VSM system calls
As we have introduced in the previous sections, VSM uses hypercalls to request services to and from
the Secure Kernel. Hypercalls were originally designed as a way to request services to the hypervisor,
but in VSM the model has been extended to support new types of system calls:
■
■
Secure calls are emitted by the normal NT kernel in VTL 0 to require services to the Secure Kernel.
Normal calls are requested by the Secure Kernel in VTL 1 when it needs services provided by
the NT kernel, which runs in VTL 0. Furthermore, some of them are used by secure processes
(trustlets) running in Isolated User Mode (IUM) to request services from the Secure Kernel or
the normal NT kernel.
CHAPTER 9
Virtualization technologies
349
These kinds of system calls are implemented in the hypervisor, the Secure Kernel, and the normal
NT kernel. The hypervisor defines two hypercalls for switching between different VTLs: HvVtlCall and
HvVtlReturn. The Secure Kernel and NT kernel define the dispatch loop used for dispatching Secure and
Normal Calls.
Furthermore, the Secure Kernel implements another type of system call: secure system calls. They
provide services only to secure processes (trustlets), which run in IUM. These system calls are not exposed
to the normal NT kernel. The hypervisor is not involved at all while processing secure system calls.
Virtual processor state
Before delving into the Secure and Normal calls architecture, it is necessary to analyze how the virtual
processor manages the VTL transition. Secure VTLs always operate in long mode (which is the execution model of AMD64 processors where the CPU accesses 64-bit-only instructions and registers), with
paging enabled. Any other execution model is not supported. This simplifies launch and management
of secure VTLs and also provides an extra level of protection for code running in secure mode. (Some
other important implications are discussed later in the chapter.)
For efficiency, a virtual processor has some registers that are shared between VTLs and some other
registers that are private to each VTL. The state of the shared registers does not change when switching
between VTLs. This allows a quick passing of a small amount of information between VTLs, and it also
reduces the context switch overhead when switching between VTLs. Each VTL has its own instance of
private registers, which could only be accessed by that VTL. The hypervisor handles saving and restoring the contents of private registers when switching between VTLs. Thus, when entering a VTL on a
virtual processor, the state of the private registers contains the same values as when the virtual processor last ran that VTL.
Most of a virtual processor’s register state is shared between VTLs. Specifically, general purpose
registers, vector registers, and floating-point registers are shared between all VTLs with a few exceptions, such as the RIP and the RSP registers. Private registers include some control registers, some
architectural registers, and hypervisor virtual MSRs. The secure intercept mechanism (see the previous
section for details) is used to allow the Secure environment to control which MSR can be accessed by
the normal mode environment. Table 9-3 summarizes which registers are shared between VTLs and
which are private to each VTL.
350
CHAPTER 9
Virtualization technologies
TABLE 9-3 Virtual processor per-VTL register states
Type
General Registers
MSRs
Shared
Rax, Rbx, Rcx, Rdx, Rsi, Rdi, Rbp
CR2
R8 – R15
DR0 – DR5
X87 floating point state
XMM registers
AVX registers
XCR0 (XFEM)
DR6 (processor-dependent)
HV_X64_MSR_TSC_FREQUENCY
HV_X64_MSR_VP_INDEX
HV_X64_MSR_VP_RUNTIME
HV_X64_MSR_RESET
HV_X64_MSR_TIME_REF_COUNT
HV_X64_MSR_GUEST_IDLE
HV_X64_MSR_DEBUG_DEVICE_OPTIONS
HV_X64_MSR_BELOW_1MB_PAGE
HV_X64_MSR_STATS_PARTITION_RETAIL_PAGE
HV_X64_MSR_STATS_VP_RETAIL_PAGE
MTRR’s and PAT
MCG_CAP
MCG_STATUS
Private
RIP, RSP
RFLAGS
CR0, CR3, CR4
DR7
IDTR, GDTR
CS, DS, ES, FS, GS, SS, TR, LDTR
TSC
DR6 (processor-dependent)
SYSENTER_CS, SYSENTER_ESP, SYSENTER_EIP, STAR, LSTAR, CSTAR,
SFMASK, EFER, KERNEL_GSBASE, FS.BASE, GS.BASE
HV_X64_MSR_HYPERCALL
HV_X64_MSR_GUEST_OS_ID
HV_X64_MSR_REFERENCE_TSC
HV_X64_MSR_APIC_FREQUENCY
HV_X64_MSR_EOI
HV_X64_MSR_ICR
HV_X64_MSR_TPR
HV_X64_MSR_APIC_ASSIST_PAGE
HV_X64_MSR_NPIEP_CONFIG
HV_X64_MSR_SIRBP
HV_X64_MSR_SCONTROL
HV_X64_MSR_SVERSION
HV_X64_MSR_SIEFP
HV_X64_MSR_SIMP
HV_X64_MSR_EOM
HV_X64_MSR_SINT0 – HV_X64_MSR_SINT15
HV_X64_MSR_STIMER0_CONFIG – HV_X64_MSR_STIMER3_CONFIG
HV_X64_MSR_STIMER0_COUNT -HV_X64_MSR_STIMER3_COUNT
Local APIC registers (including CR8/TPR)
Secure calls
When the NT kernel needs services provided by the Secure Kernel, it uses a special function,
VslpEnterIumSecureMode. The routine accepts a 104-byte data structure (called SKCALL), which is used
to describe the kind of operation (invoke service, flush TB, resume thread, or call enclave), the secure
call number, and a maximum of twelve 8-byte parameters. The function raises the processor’s IRQL,
if necessary, and determines the value of the Secure Thread cookie. This value communicates to the
Secure Kernel which secure thread will process the request. It then (re)starts the secure calls dispatch
loop. The executability state of each VTL is a state machine that depends on the other VTL.
The loop described by the VslpEnterIumSecureMode function manages all the operations shown
on the left side of Figure 9-33 in VTL 0 (except the case of Secure Interrupts). The NT kernel can decide
to enter the Secure Kernel, and the Secure Kernel can decide to enter the normal NT kernel. The loop
starts by entering the Secure Kernel through the HvlSwitchToVsmVtl1 routine (specifying the operation requested by the caller). The latter function, which returns only if the Secure Kernel requests a VTL
switch, saves all the shared registers and copies the entire SKCALL data structure in some well-defined
CPU registers: RBX and the SSE registers XMM10 through XMM15. Finally, it emits an HvVtlCall hypercall
to the hypervisor. The hypervisor switches to the target VTL (by loading the saved per-VTL VMCS) and
CHAPTER 9
Virtualization technologies
351
writes a VTL secure call entry reason to the VTL control page. Indeed, to be able to determine why a secure VTL was entered, the hypervisor maintains an informational memory page that is shared by each
secure VTL. This page is used for bidirectional communication between the hypervisor and the code
running in a secure VTL on a virtual processor.
NT Kernel
Start/Resume a Secure Thread OR
Emit a Secure Call OR
VINA Processed OR
Normal Call Processed OR
Secure Interrupt*
Secure Kernel
NT Kernel
Terminate a Secure Thread OR
Secure Call Processed OR
Process the VINA OR
Emits a Normal Call OR
VTL 0
VTL 1
Secure Interrupt Processed *
Secure Kernel
FIGURE 9-33 The VSM dispatch loop.
The virtual processor restarts the execution in VTL 1 context, in the SkCallNormalMode function of
the Secure Kernel. The code reads the VTL entry reason; if it’s not a Secure Interrupt, it loads the current
processor SKPRCB (Secure Kernel processor control block), selects a thread on which to run (starting
from the secure thread cookie), and copies the content of the SKCALL data structure from the CPU
shared registers to a memory buffer. Finally, it calls the IumInvokeSecureService dispatcher routine,
which will process the requested secure call, by dispatching the call to the correct function (and implements part of the dispatch loop in VTL 1).
An important concept to understand is that the Secure Kernel can map and access VTL 0 memory, so
there’s no need to marshal and copy any eventual data structure, pointed by one or more parameters, to
the VTL 1 memory. This concept won’t apply to a normal call, as we will discuss in the next section.
As we have seen in the previous section, Secure Interrupts (and intercepts) are dispatched by the
hypervisor, which preempts any code executing in VTL 0. In this case, when the VTL 1 code starts the execution, it dispatches the interrupt to the right ISR. After the ISR finishes, the Secure Kernel immediately
emits a HvVtlReturn hypercall. As a result, the code in VTL 0 restarts the execution at the point in which
it has been previously interrupted, which is not located in the secure calls dispatch loop. Therefore,
Secure Interrupts are not part of the dispatch loop even if they still produce a VTL switch.
Normal calls
Normal calls are managed similarly to the secure calls (with an analogous dispatch loop located in
VTL 1, called normal calls loop), but with some important differences:
■
352
All the shared VTL registers are securely cleaned up by the Secure Kernel before emitting the
HvVtlReturn to the hypervisor for switching the VTL. This prevents leaking any kind of secure
data to normal mode.
CHAPTER 9
Virtualization technologies
■
■
The normal NT kernel can’t read secure VTL 1 memory. For correctly passing the syscall parameters and data structures needed for the normal call, a memory buffer that both the Secure
Kernel and the normal kernel can share is required. The Secure Kernel allocates this shared
buffer using the ALLOCATE_VM normal call (which does not require passing any pointer as a parameter). The latter is dispatched to the MmAllocateVirtualMemory function in the NT normal
kernel. The allocated memory is remapped in the Secure Kernel at the same virtual address and
has become part of the Secure process’s shared memory pool.
As we will discuss later in the chapter, the Isolated User Mode (IUM) was originally designed
to be able to execute special Win32 executables, which should have been capable of running
indifferently in the normal world or in the secure world. The standard unmodified Ntdll.dll and
KernelBase.dll libraries are mapped even in IUM. This fact has the important consequence of
requiring almost all the native NT APIs (which Kernel32.dll and many other user mode libraries
depend on) to be proxied by the Secure Kernel.
To correctly deal with the described problems, the Secure Kernel includes a marshaler, which identifies and correctly copies the data structures pointed by the parameters of an NT API in the shared buffer. The marshaler is also able to determine the size of the shared buffer, which will be allocated from
the secure process memory pool. The Secure Kernel defines three types of normal calls:
■
■
■
A disabled normal call is not implemented in the Secure Kernel and, if called from IUM, it
simply fails with a STATUS_INVALID_SYSTEM_SERVICE exit code. This kind of call can’t be called
directly by the Secure Kernel itself.
An enabled normal call is implemented only in the NT kernel and is callable from IUM in its
original Nt or Zw version (through Ntdll.dll). Even the Secure Kernel can request an enabled
normal call—but only through a little stub code that loads the normal call number—set the
highest bit in the number, and call the normal call dispatcher (IumGenericSyscall routine). The
highest bit identifies the normal call as required by the Secure Kernel itself and not by the
Ntdll.dll module loaded in IUM.
A special normal call is implemented partially or completely in Secure Kernel (VTL 1), which
can filter the original function’s results or entirely redesign its code.
Enabled and special normal calls can be marked as KernelOnly. In the latter case, the normal call
can be requested only from the Secure Kernel itself (and not from secure processes). We’ve already
provided the list of enabled and special normal calls (which are callable from software running in VSM)
in Chapter 3 of Part 1, in the section named “Trustlet-accessible system calls.”
Figure 9-34 shows an example of a special normal call. In the example, the LsaIso trustlet has called
the NtQueryInformationProcess native API to request information of a particular process. The Ntdll.dll
mapped in IUM prepares the syscall number and executes a SYSCALL instruction, which transfers the
execution flow to the KiSystemServiceStart global system call dispatcher, residing in the Secure Kernel
(VTL 1). The global system call dispatcher recognizes that the system call number belongs to a normal
call and uses the number to access the IumSyscallDispatchTable array, which represents the normal calls
dispatch table.
CHAPTER 9
Virtualization technologies
353
The normal calls dispatch table contains an array of compacted entries, which are generated in
phase 0 of the Secure Kernel startup (discussed later in this chapter). Each entry contains an offset to
a target function (calculated relative to the table itself) and the number of its arguments (with some
flags). All the offsets in the table are initially calculated to point to the normal call dispatcher routine
(IumGenericSyscall). After the first initialization cycle, the Secure Kernel startup routine patches each
entry that represents a special call. The new offset is pointed to the part of code that implements the
normal call in the Secure Kernel.
NtQueryInformationProcess:
MOV
R10,
RCX
MOV
EAX,
19h
SYSCALL
Lsalso
Trustlet
........
31
Secure Kernel
Normal Calls
Dispatch Table
31
(lumSyscallDispatch
31
Table)
5 4
0
# of
NtQueryInformationProcess offset <<5 E Args
5 4
# of
NtAllocateVirtualMemory offset <<5 E Args
Index 25
0
Index 26
........
5 4
offset of lumGenericSyscall <<5
........
# of
E Args
0
Index 49
E = enclave compatible
Flags
Flags
Flags
Flags
Flags
T
T
T
T
T
Base
Base
Base
Base
Base
T = type of normal call
System Call
Descriptors Array
FIGURE 9-34 A trustlet performing a special normal call to the NtQueryInformationProcess API.
As a result, in Figure 9-34, the global system calls dispatcher transfers execution to the
NtQueryInformationProcess function’s part implemented in the Secure Kernel. The latter checks
whether the requested information class is one of the small subsets exposed to the Secure Kernel and, if
so, uses a small stub code to call the normal call dispatcher routine (IumGenericSyscall).
Figure 9-35 shows the syscall selector number for the NtQueryInformationProcess API. Note that the stub
sets the highest bit (N bit) of the syscall number to indicate that the normal call is requested by the Secure
Kernel. The normal call dispatcher checks the parameters and calls the marshaler, which is able to marshal
each argument and copy it in the right offset of the shared buffer. There is another bit in the selector that
further differentiates between a normal call or a secure system call, which is discussed later in this chapter.
31 30
27 26
1
0
NtQueryInformationProcess SYSCALL index (25)
S bit = Secure System Call
N bit = Called from the Secure Kernel
FIGURE 9-35 The Syscall selector number of the Secure Kernel.
354
CHAPTER 9
Virtualization technologies
The marshaler works thanks to two important arrays that describe each normal call: the descriptors
array (shown in the right side of Figure 9-34) and the arguments descriptors array. From these arrays,
the marshaler can fetch all the information that it needs: normal call type, marshalling function index,
argument type, size, and type of data pointed to (if the argument is a pointer).
After the shared buffer has been correctly filled by the marshaler, the Secure Kernel compiles the
SKCALL data structure and enters the normal call dispatcher loop (SkCallNormalMode). This part
of the loop saves and clears all the shared virtual CPU registers, disables interrupts, and moves the
thread context to the PRCB thread (more about thread scheduling later in the chapter). It then copies
the content of the SKCALL data structure in some shared register. As a final stage, it calls the hypervisor through the HvVtlReturn hypercall.
Then the code execution resumes in the secure call dispatch loop in VTL 0. If there are some pending
interrupts in the queue, they are processed as normal (only if the IRQL allows it). The loop recognizes
the normal call operation request and calls the NtQueryInformationProcess function implemented in
VTL 0. After the latter function finished its processing, the loop restarts and reenters the Secure Kernel
again (as for Secure Calls), still through the HvlSwitchToVsmVtl1 routine, but with a different operation
request: Resume thread. This, as the name implies, allows the Secure Kernel to switch to the original
secure thread and to continue the execution that has been preempted for executing the normal call.
The implementation of enabled normal calls is the same except for the fact that those calls have
their entries in the normal calls dispatch table, which point directly to the normal call dispatcher
routine, IumGenericSyscall. In this way, the code will transfer directly to the handler, skipping any
API implementation code in the Secure Kernel.
Secure system calls
The last type of system calls available in the Secure Kernel is similar to standard system calls provided
by the NT kernel to VTL 0 user mode software. The secure system calls are used for providing services
only to the secure processes (trustlets). VTL 0 software can’t emit secure system calls in any way. As
we will discuss in the “Isolated User Mode” section later in this chapter, every trustlet maps the IUM
Native Layer Dll (Iumdll.dll) in its address space. Iumdll.dll has the same job as its counterpart in VTL
0, Ntdll.dll: implement the native syscall stub functions for user mode application. The stub copies the
syscall number in a register and emits the SYSCALL instruction (the instruction uses different opcodes
depending on the platform).
Secure system calls numbers always have the twenty-eighth bit set to 1 (on AMD64 architectures,
whereas ARM64 uses the sixteenth bit). In this way, the global system call dispatcher (KiSystemServiceStart)
recognizes that the syscall number belongs to a secure system call (and not a normal call) and switches
to the SkiSecureServiceTable, which represents the secure system calls dispatch table. As in the case of
normal calls, the global dispatcher verifies that the call number is in the limit, allocates stack space for
the arguments (if needed), calculates the system call final address, and transfers the code execution to it.
Overall, the code execution remains in VTL 1, but the current privilege level of the virtual processor
raises from 3 (user mode) to 0 (kernel mode). The dispatch table for secure system calls is compacted—
similarly to the normal calls dispatch table—at phase 0 of the Secure Kernel startup. However, entries in
this table are all valid and point to functions implemented in the Secure Kernel.
CHAPTER 9
Virtualization technologies
355
Secure threads and scheduling
As we will describe in the “Isolated User Mode” section, the execution units in VSM are the secure
threads, which live in the address space described by a secure process. Secure threads can be kernel
mode or user mode threads. VSM maintains a strict correspondence between each user mode secure
thread and normal thread living in VTL 0.
Indeed, the Secure Kernel thread scheduling depends completely on the normal NT kernel; the
Secure Kernel doesn’t include a proprietary scheduler (by design, the Secure Kernel attack surface
needs to be small). In Chapter 3 of Part 1, we described how the NT kernel creates a process and the
relative initial thread. In the section that describes Stage 4, “Creating the initial thread and its stack
and context,” we explain that a thread creation is performed in two parts:
■
■
The executive thread object is created; its kernel and user stack are allocated. The
KeInitThread routine is called for setting up the initial thread context for user mode threads.
KiStartUserThread is the first routine that will be executed in the context of the new thread,
which will lower the thread’s IRQL and call PspUserThreadStartup.
The execution control is then returned to NtCreateUserProcess, which, at a later stage, calls
PspInsertThread to complete the initialization of the thread and insert it into the object manager namespace.
As a part of its work, when PspInsertThread detects that the thread belongs to a secure process, it
calls VslCreateSecureThread, which, as the name implies, uses the Create Thread secure service call to
ask to the Secure Kernel to create an associated secure thread. The Secure Kernel verifies the parameters and gets the process’s secure image data structure (more details about this later in this chapter).
It then allocates the secure thread object and its TEB, creates the initial thread context (the first routine
that will run is SkpUserThreadStartup), and finally makes the thread schedulable. Furthermore, the secure service handler in VTL 1, after marking the thread as ready to run, returns a specific thread cookie,
which is stored in the ETHREAD data structure.
The new secure thread still starts in VTL 0. As described in the “Stage 7” section of Chapter 3 of
Part 1, PspUserThreadStartup performs the final initialization of the user thread in the new context.
In case it determines that the thread’s owning process is a trustlet, PspUserThreadStartup calls the
VslStartSecureThread function, which invokes the secure calls dispatch loop through the VslpEnterIum
SecureMode routine in VTL 0 (passing the secure thread cookie returned by the Create Thread secure
service handler). The first operation that the dispatch loop requests to the Secure Kernel is to resume
the execution of the secure thread (still through the HvVtlCall hypercall).
The Secure Kernel, before the switch to VTL 0, was executing code in the normal call dispatcher
loop (SkCallNormalMode). The hypercall executed by the normal kernel restarts the execution in the
same loop routine. The VTL 1 dispatcher loop recognizes the new thread resume request; it switches
its execution context to the new secure thread, attaches to its address spaces, and makes it runnable.
As part of the context switching, a new stack is selected (which has been previously initialized by the
Create Thread secure call). The latter contains the address of the first secure thread system function,
SkpUserThreadStartup, which, similarly to the case of normal NT threads, sets up the initial thunk context to run the image-loader initialization routine (LdrInitializeThunk in Ntdll.dll).
356
CHAPTER 9
Virtualization technologies
After it has started, the new secure thread can return to normal mode for two main reasons: it emits
a normal call, which needs to be processed in VTL 0, or the VINA interrupts preempt the code execution. Even though the two cases are processed in a slightly different way, they both result in executing
the normal call dispatcher loop (SkCallNormalMode).
As previously discussed in Part 1, Chapter 4, “Threads,” the NT scheduler works thanks to the processor clock, which generates an interrupt every time the system clock fires (usually every 15.6 milliseconds). The clock interrupt service routine updates the processor times and calculates whether the
thread quantum expires. The interrupt is targeted to VTL 0, so, when the virtual processor is executing
code in VTL 1, the hypervisor injects a VINA interrupt to the Secure Kernel, as shown in Figure 9-36.
The VINA interrupt preempts the current executing code, lowers the IRQL to the previous preempted
code’s IRQL value, and emits the VINA normal call for entering VTL 0.
VTL 1
VTL 0
Thread 80
Normal
Service Call
VINA
VP 0
Deselect Thread 80 and
Marks It as Not Running
DPC or Clock Timer Interrupt
VTL return
Schedules a New Thread
(Thread’s Quantum Expired)
Another Thread Is Starting
on VP 0
DPC or Clock Timer Interrupt
Schedules Thread 80
VP 3
Code Resumes in the Secure
Call Dispatch Loop
Normal Call
Dispatch Loop
VTL Call (Resume Thread)
Select Secure Thread 80
Switch to the New Thread Stack
Resume Thread Execution
FIGURE 9-36 Secure threads scheduling scheme.
CHAPTER 9
Virtualization technologies
357
As the standard process of normal call dispatching, before the Secure Kernel emits the HvVtlReturn
hypercall, it deselects the current execution thread from the virtual processor’s PRCB. This is important:
The VP in VTL 1 is not tied to any thread context anymore and, on the next loop cycle, the Secure Kernel
can switch to a different thread or decide to reschedule the execution of the current one.
After the VTL switch, the NT kernel resumes the execution in the secure calls dispatch loop and still
in the context of the new thread. Before it has any chance to execute any code, the code is preempted
by the clock interrupt service routine, which can calculate the new quantum value and, if the latter has
expired, switch the execution of another thread. When a context switch occurs, and another thread
enters VTL 1, the normal call dispatch loop schedules a different secure thread depending on the value
of the secure thread cookie:
■
■
A secure thread from the secure thread pool if the normal NT kernel has entered VTL 1 for dispatching a secure call (in this case, the secure thread cookie is 0).
The newly created secure thread if the thread has been rescheduled for execution (the secure
thread cookie is a valid value). As shown in Figure 9-36, the new thread can be also rescheduled
by another virtual processor (VP 3 in the example).
With the described schema, all the scheduling decisions are performed only in VTL 0. The secure
call loop and normal call loops cooperate to correctly switch the secure thread context in VTL 1. All the
secure threads have an associated a thread in the normal kernel. The opposite is not true, though; if a
normal thread in VTL 0 decides to emit a secure call, the Secure Kernel dispatches the request by using
an arbitrary thread context from a thread pool.
The Hypervisor Enforced Code Integrity
Hypervisor Enforced Code Integrity (HVCI) is the feature that powers Device Guard and provides the
W^X (pronounced double-you xor ex) characteristic of the VTL 0 kernel memory. The NT kernel can’t
map and executes any kind of executable memory in kernel mode without the aid of the Secure Kernel.
The Secure Kernel allows only proper digitally signed drivers to run in the machine’s kernel. As we discuss in the next section, the Secure Kernel keeps track of every virtual page allocated in the normal NT
kernel; memory pages marked as executable in the NT kernel are considered privileged pages. Only the
Secure Kernel can write to them after the SKCI module has correctly verified their content.
You can read more about HVCI in Chapter 7 of Part 1, in the “Device Guard” and “Credential
Guard” sections.
UEFI runtime virtualization
Another service provided by the Secure Kernel (when HVCI is enabled) is the ability to virtualize and
protect the UEFI runtime services. As we discuss in Chapter 12, the UEFI firmware services are mainly
implemented by using a big table of function pointers. Part of the table will be deleted from memory
after the OS takes control and calls the ExitBootServices function, but another part of the table, which
represents the Runtime services, will remain mapped even after the OS has already taken full control
of the machine. Indeed, this is necessary because sometimes the OS needs to interact with the UEFI
configuration and services.
358
CHAPTER 9
Virtualization technologies
Every hardware vendor implements its own UEFI firmware. With HVCI, the firmware should cooperate to provide the nonwritable state of each of its executable memory pages (no firmware page can be
mapped in VTL 0 with read, write, and execute state). The memory range in which the UEFI firmware
resides is described by multiple MEMORY_DESCRIPTOR data structures located in the EFI memory map.
The Windows Loader parses this data with the goal to properly protect the UEFI firmware’s memory.
Unfortunately, in the original implementation of UEFI, the code and data were stored mixed in a single
section (or multiple sections) and were described by relative memory descriptors. Furthermore, some
device drivers read or write configuration data directly from the UEFI’s memory regions. This clearly
was not compatible with HVCI.
For overcoming this problem, the Secure Kernel employs the following two strategies:
■
■
New versions of the UEFI firmware (which adhere to UEFI 2.6 and higher specifications) maintain a new configuration table (linked in the boot services table), called memory attribute table
(MAT). The MAT defines fine-grained sections of the UEFI Memory region, which are subsections of the memory descriptors defined by the EFI memory map. Each section never has both
the executable and writable protection attribute.
For old firmware, the Secure Kernel maps in VTL 0 the entire UEFI firmware region’s physical
memory with a read-only access right.
In the first strategy, at boot time, the Windows Loader merges the information found both in the EFI
memory map and in the MAT, creating an array of memory descriptors that precisely describe the entire
firmware region. It then copies them in a reserved buffer located in VTL 1 (used in the hibernation path)
and verifies that each firmware’s section doesn’t violate the W X assumption. If so, when the Secure
Kernel starts, it applies a proper SLAT protection for every page that belongs to the underlying UEFI
firmware region. The physical pages are protected by the SLAT, but their virtual address space in VTL 0
is still entirely marked as RWX. Keeping the virtual memory’s RWX protection is important because the
Secure Kernel must support resume-from-hibernation in a scenario where the protection applied in the
MAT entries can change. Furthermore, this maintains the compatibility with older drivers, which read or
write directly from the UEFI memory region, assuming that the write is performed in the correct sections.
(Also, the UEFI code should be able to write in its own memory, which is mapped in VTL 0.) This strategy
allows the Secure Kernel to avoid mapping any firmware code in VTL 1; the only part of the firmware that
remains in VTL 1 is the Runtime function table itself. Keeping the table in VTL 1 allows the resume-fromhibernation code to update the UEFI runtime services’ function pointer directly.
The second strategy is not optimal and is used only for allowing old systems to run with HVCI
enabled. When the Secure Kernel doesn’t find any MAT in the firmware, it has no choice except to map
the entire UEFI runtime services code in VTL 1. Historically, multiple bugs have been discovered in the
UEFI firmware code (in SMM especially). Mapping the firmware in VTL 1 could be dangerous, but it’s the
only solution compatible with HVCI. (New systems, as stated before, never map any UEFI firmware code
in VTL 1.) At startup time, the NT Hal detects that HVCI is on and that the firmware is entirely mapped
in VTL 1. So, it switches its internal EFI service table’s pointer to a new table, called UEFI wrapper table.
Entries of the wrapper table contain stub routines that use the INVOKE_EFI_RUNTIME_SERVICE secure
call to enter in VTL 1. The Secure Kernel marshals the parameters, executes the firmware call, and yields
the results to VTL 0. In this case, all the physical memory that describes the entire UEFI firmware is still
CHAPTER 9
Virtualization technologies
359
mapped in read-only mode in VTL 0. The goal is to allow drivers to correctly read information from the
UEFI firmware memory region (like ACPI tables, for example). Old drivers that directly write into UEFI
memory regions are not compatible with HVCI in this scenario.
When the Secure Kernel resumes from hibernation, it updates the in-memory UEFI service table
to point to the new services’ location. Furthermore, in systems that have the new UEFI firmware, the
Secure Kernel reapplies the SLAT protection on each memory region mapped in VTL 0 (the Windows
Loader is able to change the regions’ virtual addresses if needed).
VSM startup
Although we describe the entire Windows startup and shutdown mechanism in Chapter 12, this section describes the way in which the Secure Kernel and all the VSM infrastructure is started. The Secure
Kernel is dependent on the hypervisor, the Windows Loader, and the NT kernel to properly start up.
We discuss the Windows Loader, the hypervisor loader, and the preliminary phases by which the Secure
Kernel is initialized in VTL 0 by these two modules in Chapter 12. In this section, we focus on the VSM
startup method, which is implemented in the securekernel.exe binary.
The first code executed by the securekernel.exe binary is still running in VTL 0; the hypervisor already
has been started, and the page tables used for VTL 1 have been built. The Secure Kernel initializes the
following components in VTL 0:
■
The memory manager’s initialization function stores the PFN of the VTL 0 root-level pagelevel structure, saves the code integrity data, and enables HVCI, MBEC (Mode-Based Execution
Control), kernel CFG, and hot patching.
■
Shared architecture-specific CPU components, like the GDT and IDT.
■
Normal calls and secure system calls dispatch tables (initialization and compaction).
■
The boot processor. The process of starting the boot processor requires the Secure Kernel to
allocate its kernel and interrupt stacks; initialize the architecture-specific components, which
can’t be shared between different processors (like the TSS); and finally allocate the processor’s
SKPRCB. The latter is an important data structure, which, like the PRCB data structure in VTL 0, is
used to store important information associated to each CPU.
The Secure Kernel initialization code is ready to enter VTL 1 for the first time. The hypervisor subsystem
initialization function (ShvlInitSystem routine) connects to the hypervisor (through the hypervisor CPUID
classes; see the previous section for more details) and checks the supported enlightenments. Then it saves
the VTL 1’s page table (previously created by the Windows Loader) and the allocated hypercall pages
(used for holding hypercall parameters). It finally initializes and enters VTL 1 in the following way:
360
1.
Enables VTL 1 for the current hypervisor partition through the HvEnablePartitionVtl hypercall.
The hypervisor copies the existing SLAT table of normal VTL to VTL 1 and enables MBEC and
the new VTL 1 for the partition.
2.
Enables VTL 1 for the boot processor through HvEnableVpVtl hypercall. The hypervisor initializes a new per-level VMCS data structure, compiles it, and sets the SLAT table.
CHAPTER 9
Virtualization technologies
3.
Asks the hypervisor for the location of the platform-dependent VtlCall and VtlReturn hypercall
code. The CPU opcodes needed for performing VSM calls are hidden from the Secure Kernel
implementation. This allows most of the Secure Kernel’s code to be platform-independent.
Finally, the Secure Kernel executes the transition to VTL 1, through the HvVtlCall hypercall. The
hypervisor loads the VMCS for the new VTL and switches to it (making it active). This basically
renders the new VTL runnable.
The Secure Kernel starts a complex initialization procedure in VTL 1, which still depends on the
Windows Loader and also on the NT kernel. It is worth noting that, at this stage, VTL 1 memory is still
identity-mapped in VTL 0; the Secure Kernel and its dependent modules are still accessible to the normal world. After the switch to VTL 1, the Secure Kernel initializes the boot processor:
1.
Gets the virtual address of the Synthetic Interrupt controller shared page, TSC, and VP assist
page, which are provided by the hypervisor for sharing data between the hypervisor and VTL 1
code. Maps in VTL 1 the Hypercall page.
2.
Blocks the possibility for other system virtual processors to be started by a lower VTL and
requests the memory to be zero-filled on reboot to the hypervisor.
3.
Initializes and fills the boot processor Interrupt Descriptor Table (IDT). Configures the IPI,
callbacks, and secure timer interrupt handlers and sets the current secure thread as the default
SKPRCB thread.
4.
Starts the VTL 1 secure memory manager, which creates the boot table mapping and maps the
boot loader’s memory in VTL 1, creates the secure PFN database and system hyperspace, initializes the secure memory pool support, and reads the VTL 0 loader block to copy the module
descriptors of the Secure Kernel’s imported images (Skci.dll, Cnf.sys, and Vmsvcext.sys). It finally
walks the NT loaded module list to establish each driver state, creating a NAR (normal address
range) data structure for each one and compiling an Normal Table Entry (NTE) for every page
composing the boot driver’s sections. Furthermore, the secure memory manager initialization
function applies the correct VTL 0 SLAT protection to each driver’s sections.
5.
Initializes the HAL, the secure threads pool, the process subsystem, the synthetic APIC, Secure
PNP, and Secure PCI.
6.
Applies a read-only VTL 0 SLAT protection for the Secure Kernel pages, configures MBEC, and
enables the VINA virtual interrupt on the boot processor.
When this part of the initialization ends, the Secure Kernel unmaps the boot-loaded memory. The
secure memory manager, as we discuss in the next section, depends on the VTL 0 memory manager for
being able to allocate and free VTL 1 memory. VTL 1 does not own any physical memory; at this stage,
it relies on some previously allocated (by the Windows Loader) physical pages for being able to satisfy
memory allocation requests. When the NT kernel later starts, the Secure Kernel performs normal calls for
requesting memory services to the VTL 0 memory manager. As a result, some parts of the Secure Kernel
initialization must be deferred after the NT kernel is started. Execution flow returns to the Windows
Loader in VTL 0. The latter loads and starts the NT kernel. The last part of the Secure Kernel initialization happens in phase 0 and phase 1 of the NT kernel initialization (see Chapter 12 for further details).
CHAPTER 9
Virtualization technologies
361
Phase 0 of the NT kernel initialization still has no memory services available, but this is the last
moment in which the Secure Kernel fully trusts the normal world. Boot-loaded drivers still have not
been initialized and the initial boot process should have been already protected by Secure Boot. The
PHASE3_INIT secure call handler modifies the SLAT protections of all the physical pages belonging
to Secure Kernel and to its depended modules, rendering them inaccessible to VTL 0. Furthermore, it
applies a read-only protection to the kernel CFG bitmaps. At this stage, the Secure Kernel enables the
support for pagefile integrity, creates the initial system process and its address space, and saves all the
“trusted” values of the shared CPU registers (like IDT, GDT, Syscall MSR, and so on). The data structures
that the shared registers point to are verified (thanks to the NTE database). Finally, the secure thread
pool is started and the object manager, the secure code integrity module (Skci.dll), and HyperGuard
are initialized (more details on HyperGuard are available in Chapter 7 of Part 1).
When the execution flow is returned to VTL 0, the NT kernel can then start all the other application
processors (APs). When the Secure Kernel is enabled, the AP’s initialization happens in a slightly different way (we discuss AP initialization in the next section).
As part of the phase 1 of the NT kernel initialization, the system starts the I/O manager. The I/O manager, as discussed in Part 1, Chapter 6, “I/O system,” is the core of the I/O system and defines the model
within which I/O requests are delivered to device drivers. One of the duties of the I/O manager is to initialize and start the boot-loaded and ELAM drivers. Before creating the special sections for mapping the
user mode system DLLs, the I/O manager initialization function emits a PHASE4_INIT secure call to start
the last initialization phase of the Secure Kernel. At this stage, the Secure Kernel does not trust the VTL 0
anymore, but it can use the services provided by the NT memory manager. The Secure Kernel initializes
the content of the Secure User Shared data page (which is mapped both in VTL 1 user mode and kernel
mode) and finalizes the executive subsystem initialization. It reclaims any resources that were reserved
during the boot process, calls each of its own dependent module entry points (in particular, cng.sys and
vmsvcext.sys, which start before any normal boot drivers). It allocates the necessary resources for the
encryption of the hibernation, crash-dump, paging files, and memory-page integrity. It finally reads and
maps the API set schema file in VTL 1 memory. At this stage, VSM is completely initialized.
Application processors (APs) startup
One of the security features provided by the Secure Kernel is the startup of the application processors
(APs), which are the ones not used to boot up the system. When the system starts, the Intel and AMD
specifications of the x86 and AMD64 architectures define a precise algorithm that chooses the boot
strap processor (BSP) in multiprocessor systems. The boot processor always starts in 16-bit real mode
(where it’s able to access only 1 MB of physical memory) and usually executes the machine’s firmware
code (UEFI in most cases), which needs to be located at a specific physical memory location (the location is called reset vector). The boot processor executes almost all of the initialization of the OS, hypervisor, and Secure Kernel. For starting other non-boot processors, the system needs to send a special IPI
(inter-processor interrupt) to the local APICs belonging to each processor. The startup IPI (SIPI) vector
contains the physical memory address of the processor start block, a block of code that includes the
instructions for performing the following basic operations:
1.
362
Load a GDT and switch from 16-bit real-mode to 32-bit protected mode (with no paging enabled).
CHAPTER 9
Virtualization technologies
2.
Set a basic page table, enable paging, and enter 64-bit long mode.
3.
Load the 64-bit IDT and GDT, set the proper processor registers, and jump to the OS startup
function (KiSystemStartup).
This process is vulnerable to malicious attacks. The processor startup code could be modified by
external entities while it is executing on the AP processor (the NT kernel has no control at this point).
In this case, all the security promises brought by VSM could be easily fooled. When the hypervisor
and the Secure Kernel are enabled, the application processors are still started by the NT kernel but
using the hypervisor.
KeStartAllProcessors, which is the function called by phase 1 of the NT kernel initialization (see
Chapter 12 for more details), with the goal of starting all the APs, builds a shared IDT and enumerates
all the available processors by consulting the Multiple APIC Description Table (MADT) ACPI table. For
each discovered processor, it allocates memory for the PRCB and all the private CPU data structures for
the kernel and DPC stack. If the VSM is enabled, it then starts the AP by sending a START_PROCESSOR
secure call to the Secure Kernel. The latter validates that all the data structures allocated and filled
for the new processor are valid, including the initial values of the processor registers and the startup
routine (KiSystemStartup) and ensures that the APs startups happen sequentially and only once per
processor. It then initializes the VTL 1 data structures needed for the new application processor (the
SKPRCB in particular). The PRCB thread, which is used for dispatching the Secure Calls in the context
of the new processor, is started, and the VTL 0 CPU data structures are protected by using the SLAT.
The Secure Kernel finally enables VTL 1 for the new application processor and starts it by using the
HvStartVirtualProcessor hypercall. The hypervisor starts the AP in a similar way described in the beginning of this section (by sending the startup IPI). In this case, however, the AP starts its execution in the
hypervisor context, switches to 64-bit long mode execution, and returns to VTL 1.
The first function executed by the application processor resides in VTL 1. The Secure Kernel’s CPU
initialization routine maps the per-processor VP assist page and SynIC control page, configures MBEC,
and enables the VINA. It then returns to VTL 0 through the HvVtlReturn hypercall. The first routine executed in VTL 0 is KiSystemStartup, which initializes the data structures needed by the NT kernel to manage the AP, initializes the HAL, and jumps to the idle loop (read more details in Chapter 12). The Secure
Call dispatch loop is initialized later by the normal NT kernel when the first secure call is executed.
An attacker in this case can’t modify the processor startup block or any initial value of the CPU’s
registers and data structures. With the described secure AP start-up, any modification would have been
detected by the Secure Kernel and the system bug checked to defeat any attack effort.
The Secure Kernel memory manager
The Secure Kernel memory manager heavily depends on the NT memory manager (and on the
Windows Loader memory manager for its startup code). Entirely describing the Secure Kernel memory
manager is outside the scope of this book. Here we discuss only the most important concepts and data
structures used by the Secure Kernel.
CHAPTER 9
Virtualization technologies
363
As mentioned in the previous section, the Secure Kernel memory manager initialization is divided
into three phases. In phase 1, the most important, the memory manager performs the following:
1.
Maps the boot loader firmware memory descriptor list in VTL 1, scans the list, and determines
the first physical page that it can use for allocating the memory needed for its initial startup
(this memory type is called SLAB). Maps the VTL 0’s page tables in a virtual address that is
located exactly 512 GB before the VTL 1’s page table. This allows the Secure Kernel to perform
a fast conversion between an NT virtual address and one from the Secure Kernel.
2.
Initializes the PTE range data structures. A PTE range contains a bitmap that describes each
chunk of allocated virtual address range and helps the Secure Kernel to allocate PTEs for its
own address space.
3.
Creates the Secure PFN database and initializes the Memory pool.
4.
Initializes the sparse NT address table. For each boot-loaded driver, it creates and fills a NAR,
verifies the integrity of the binary, fills the hot patch information, and, if HVCI is on, protects
each executable section of driver using the SLAT. It then cycles between each PTE of the
memory image and writes an NT Address Table Entry (NTE) in the NT address table.
5.
Initializes the page bundles.
The Secure Kernel keeps track of the memory that the normal NT kernel uses. The Secure Kernel
memory manager uses the NAR data structure for describing a kernel virtual address range that
contains executable code. The NAR contains some information of the range (such as its base address
and size) and a pointer to a SECURE_IMAGE data structure, which is used for describing runtime drivers
(in general, images verified using Secure HVCI, including user mode images used for trustlets) loaded
in VTL 0. Boot-loaded drivers do not use the SECURE_IMAGE data structure because they are treated
by the NT memory manager as private pages that contain executable code. The latter data structure
contains information regarding a loaded image in the NT kernel (which is verified by SKCI), like the address of its entry point, a copy of its relocation tables (used also for dealing with Retpoline and Import
Optimization), the pointer to its shared prototype PTEs, hot-patch information, and a data structure
that specifies the authorized use of its memory pages. The SECURE_IMAGE data structure is very
important because it’s used by the Secure Kernel to track and verify the shared memory pages that
are used by runtime drivers.
For tracking VTL 0 kernel private pages, the Secure Kernel uses the NTE data structure. An NTE exists for every virtual page in the VTL 0 address space that requires supervision from the Secure Kernel;
it’s often used for private pages. An NTE tracks a VTL 0 virtual page’s PTE and stores the page state and
protection. When HVCI is enabled, the NTE table divides all the virtual pages between privileged and
non-privileged. A privileged page represents a memory page that the NT kernel is not able to touch on
its own because it’s protected through SLAT and usually corresponds to an executable page or to a kernel
CFG read-only page. A nonprivileged page represents all the other types of memory pages that the NT
kernel has full control over. The Secure Kernel uses invalid NTEs to represent nonprivileged pages. When
HVCI is off, all the private pages are nonprivileged (the NT kernel has full control of all its pages indeed).
In HVCI-enabled systems, the NT memory manager can’t modify any protected pages. Otherwise,
an EPT violation exception will raise in the hypervisor, resulting in a system crash. After those systems
364
CHAPTER 9
Virtualization technologies
complete their boot phase, the Secure Kernel has already processed all the nonexecutable physical
pages by SLAT-protecting them only for read and write access. In this scenario, new executable pages
can be allocated only if the target code has been verified by Secure HVCI.
When the system, an application, or the Plug and Play manager require the loading of a new runtime driver, a complex procedure starts that involves the NT and the Secure Kernel memory manager,
summarized here:
1.
The NT memory manager creates a section object, allocates and fills a new Control area (more
details about the NT memory manager are available in Chapter 5 of Part 1), reads the first page
of the binary, and calls the Secure Kernel with the goal to create the relative secure image,
which describe the new loaded module.
2.
The Secure Kernel creates the SECURE_IMAGE data structure, parses all the sections of the
binary file, and fills the secure prototype PTEs array.
3.
The NT kernel reads the entire binary in nonexecutable shared memory (pointed by the
prototype PTEs of the control area). Calls the Secure Kernel, which, using Secure HVCI, cycles
between each section of the binary image and calculates the final image hash.
4.
If the calculated file hash matches the one stored in the digital signature, the NT memory walks
the entire image and for each page calls the Secure Kernel, which validates the page (each page
hash has been already calculated in the previous phase), applies the needed relocations (ASLR,
Retpoline, and Import Optimization), and applies the new SLAT protection, allowing the page
to be executable but not writable anymore.
5.
The Section object has been created. The NT memory manager needs to map the driver in its
address space. It calls the Secure Kernel for allocating the needed privileged PTEs for describing the driver’s virtual address range. The Secure Kernel creates the NAR data structure. It
then maps the physical pages of the driver, which have been previously verified, using the
MiMapSystemImage routine.
Note When a NARs is initialized for a runtime driver, part of the NTE table is filled for describing the new driver address space. The NTEs are not used for keeping track of a runtime
driver’s virtual address range (its virtual pages are shared and not private), so the relative
part of the NT address table is filled with invalid “reserved” NTEs.
While VTL 0 kernel virtual address ranges are represented using the NAR data structure, the Secure
Kernel uses secure VADs (virtual address descriptors) to track user-mode virtual addresses in VTL 1.
Secure VADs are created every time a new private virtual allocation is made, a binary image is mapped
in the address space of a trustlet (secure process), and when a VBS-enclave is created or a module is
mapped into its address space. A secure VAD is similar to the NT kernel VAD and contains a descriptor
of the VA range, a reference counter, some flags, and a pointer to the Secure section, which has been
created by SKCI. (The secure section pointer is set to 0 in case of secure VADs describing private virtual
allocations.) More details about Trustlets and VBS-based enclaves will be discussed later in this chapter.
CHAPTER 9
Virtualization technologies
365
Page identity and the secure PFN database
After a driver is loaded and mapped correctly into VTL 0 memory, the NT memory manager needs to
be able to manage its memory pages (for various reasons, like the paging out of a pageable driver’s
section, the creation of private pages, the application of private fixups, and so on; see Chapter 5 in
Part 1 for more details). Every time the NT memory manager operates on protected memory, it needs
the cooperation of the Secure Kernel. Two main kinds of secure services are offered to the NT memory
manager for operating with privileged memory: protected pages copy and protected pages removal.
A PAGE_IDENTITY data structure is the glue that allows the Secure Kernel to keep track of all the
different kinds of pages. The data structure is composed of two fields: an Address Context and a Virtual
Address. Every time the NT kernel calls the Secure Kernel for operating on privileged pages, it needs
to specify the physical page number along with a valid PAGE_IDENTITY data structure describing what
the physical page is used for. Through this data structure, the Secure Kernel can verify the requested
page usage and decide whether to allow the request.
Table 9-4 shows the PAGE_IDENTITY data structure (second and third columns), and all the types of
verification performed by the Secure Kernel on different memory pages:
■
■
■
■
If the Secure Kernel receives a request to copy or to release a shared executable page of a
runtime driver, it validates the secure image handle (specified by the caller) and gets its relative
data structure (SECURE_IMAGE). It then uses the relative virtual address (RVA) as an index into
the secure prototype array to obtain the physical page frame (PFN) of the driver’s shared page.
If the found PFN is equal to the caller’s specified one, the Secure Kernel allows the request;
otherwise it blocks it.
In a similar way, if the NT kernel requests to operate on a trustlet or an enclave page (more
details about trustlets and secure enclaves are provided later in this chapter), the Secure Kernel
uses the caller’s specified virtual address to verify that the secure PTE in the secure process page
table contains the correct PFN.
As introduced earlier in the section ”The Secure Kernel memory manager” , for private kernel
pages, the Secure Kernel locates the NTE starting from the caller’s specified virtual address and
verifies that it contains a valid PFN, which must be the same as the caller’s specified one.
Placeholder pages are free pages that are SLAT protected. The Secure Kernel verifies the state of
a placeholder page by using the PFN database.
TABLE 9-4 Different page identities managed by the Secure Kernel
366
Page Type
Address Context
Virtual Address
Kernel Shared
Secure Image Handle
RVA of the page
Secure Prototype PTE
Trustlet/Enclave
Secure Process Handle
Virtual Address of the Secure Process
Secure PTE
Kernel Private
0
Kernel Virtual Address of the page
NT address table entry (NTE)
Placeholder
0
0
PFN entry
CHAPTER 9
Virtualization technologies
erification tructure
The Secure Kernel memory manager maintains a PFN database to represent the state of each physical page. A PFN entry in the Secure Kernel is much smaller compared to its NT equivalent; it basically
contains the page state and the share counter. A physical page, from the Secure Kernel perspective, can
be in one of the following states: invalid, free, shared, I/O, secured, or image (secured NT private).
The secured state is used for physical pages that are private to the Secure Kernel (the NT kernel can
never claim them) or for physical pages that have been allocated by the NT kernel and later SLATprotected by the Secure Kernel for storing executable code verified by Secure HVCI. Only secured
nonprivate physical pages have a page identity.
When the NT kernel is going to page out a protected page, it asks the Secure Kernel for a page removal operation. The Secure Kernel analyzes the specified page identity and does its verification (as explained
earlier). In case the page identity refers to an enclave or a trustlet page, the Secure Kernel encrypts the
page’s content before releasing it to the NT kernel, which will then store the page in the paging file. In this
way, the NT kernel still has no chance to intercept the real content of the private memory.
Secure memory allocation
As discussed in previous sections, when the Secure Kernel initially starts, it parses the firmware’s memory descriptor lists, with the goal of being able to allocate physical memory for its own use. In phase
1 of its initialization, the Secure Kernel can’t use the memory services provided by the NT kernel (the
NT kernel indeed is still not initialized), so it uses free entries of the firmware’s memory descriptor lists
for reserving 2-MB SLABs. A SLAB is a 2-MB contiguous physical memory, which is mapped by a single
nested page table directory entry in the hypervisor. All the SLAB pages have the same SLAT protection. SLABs have been designed for performance considerations. By mapping a 2-MB chunk of physical
memory using a single nested page entry in the hypervisor, the additional hardware memory address
translation is faster and results in less cache misses on the SLAT table.
The first Secure Kernel page bundle is filled with 1 MB of the allocated SLAB memory. A page bundle
is the data structure shown in Figure 9-37, which contains a list of contiguous free physical page frame
numbers (PFNs). When the Secure Kernel needs memory for its own purposes, it allocates physical
pages from a page bundle by removing one or more free page frames from the tail of the bundle’s
PFNs array. In this case, the Secure Kernel doesn’t need to check the firmware memory descriptors list
until the bundle has been entirely consumed. When the phase 3 of the Secure Kernel initialization is
done, memory services of the NT kernel become available, and so the Secure Kernel frees any boot
memory descriptor lists, retaining physical memory pages previously located in bundles.
Future secure memory allocations use normal calls provided by the NT kernel. Page bundles have
been designed to minimize the number of normal calls needed for memory allocation. When a bundle
gets fully allocated, it contains no pages (all its pages are currently assigned), and a new one will be
generated by asking the NT kernel for 1 MB of contiguous physical pages (through the ALLOC_PHYSICAL
_PAGES normal call). The physical memory will be allocated by the NT kernel from the proper SLAB.
CHAPTER 9
Virtualization technologies
367
In the same way, every time the Secure Kernel frees some of its private memory, it stores the corresponding physical pages in the correct bundle by growing its PFN array until the limit of 256 free
pages. When the array is entirely filled, and the bundle becomes free, a new work item is queued. The
work item will zero-out all the pages and will emit a FREE_PHYSICAL_PAGES normal call, which ends up
in executing the MmFreePagesFromMdl function of the NT memory manager.
Every time enough pages are moved into and out of a bundle, they are fully protected in VTL 0 by
using the SLAT (this procedure is called “securing the bundle”). The Secure Kernel supports three kinds
of bundles, which all allocate memory from different SLABs: No access, Read-only, and Read-Execute.
Valid
Bundle Page
Invalid
PTE Entries
Header
NumberOfPages: 80
Next Bundle PFN: 0x4560
Flags: 0
PFN Array
Entry 1: PFN 0x3590
Entry 2: PFN 0xA8F01
Entry 3: PFN 0x80D4
…
Entry 79: PFN 0x5012
Entry 80: Invalid (in use)
…
Entry 255: Invalid (in use)
Page Bundle
FIGURE 9-37 A secure page bundle with 80 available pages. A bundle is composed of a
header and a free PFNs array.
Hot patching
Several years ago, the 32-bit versions of Windows were supporting the hot patch of the operatingsystem’s components. Patchable functions contained a redundant 2-byte opcode in their prolog and
some padding bytes located before the function itself. This allowed the NT kernel to dynamically
replace the initial opcode with an indirect jump, which uses the free space provided by the padding, to
divert the code to a patched function residing in a different module. The feature was heavily used by
Windows Update, which allowed the system to be updated without the need for an immediate reboot
of the machine. When moving to 64-bit architectures, this was no longer possible due to various
problems. Kernel patch protection was a good example; there was no longer a reliable way to modify
a protected kernel mode binary and to allow PatchGuard to be updated without exposing some of its
private interfaces, and exposed PatchGuard interfaces could have been easily exploited by an attacker
with the goal to defeat the protection.
368
CHAPTER 9
Virtualization technologies
The Secure Kernel has solved all the problems related to 64-bit architectures and has reintroduced
to the OS the ability of hot patching kernel binaries. While the Secure Kernel is enabled, the following
types of executable images can be hot patched:
■
VTL 0 user-mode modules (both executables and libraries)
■
Kernel mode drivers, HAL, and the NT kernel binary, protected or not by PatchGuard
■
The Secure Kernel binary and its dependent modules, which run in VTL 1 Kernel mode
■
The hypervisor (Intel, AMD, and the ARM version).
Patch binaries created for targeting software running in VTL 0 are called normal patches, whereas
the others are called secure patches. If the Secure Kernel is not enabled, only user mode applications
can be patched.
A hot patch image is a standard Portable Executable (PE) binary that includes the hot patch table, the
data structure used for tracking the patch functions. The hot patch table is linked in the binary through
the image load configuration data directory. It contains one or more descriptors that describe each
patchable base image, which is identified by its checksum and time date stamp. (In this way, a hot patch
is compatible only with the correct base images. The system can’t apply a patch to the wrong image.) The
hot patch table also includes a list of functions or global data chunks that needs to be updated in the base
or in the patch image; we describe the patch engine shortly. Every entry in this list contains the functions’
offsets in the base and patch images and the original bytes of the base function that will be replaced.
Multiple patches can be applied to a base image, but the patch application is idempotent. The same
patch may be applied multiple times, or different patches may be applied in sequence. Regardless, the
last applied patch will be the active patch for the base image. When the system needs to apply a hot
patch, it uses the NtManageHotPatch system call, which is employed to install, remove, or manage hot
patches. (The system call supports different “patch information” classes for describing all the possible
operations.) A hot patch can be installed globally for the entire system, or, if a patch is for user mode
code (VTL 0), for all the processes that belong to a specific user session.
When the system requests the application of a patch, the NT kernel locates the hot patch table in
the patch binary and validates it. It then uses the DETERMINE_HOT_PATCH_TYPE secure call to securely
determine the type of patch. In the case of a secure patch, only the Secure Kernel can apply it, so the
APPLY_HOT_PATCH secure call is used; no other processing by the NT kernel is needed. In all the other
cases, the NT kernel first tries to apply the patch to a kernel driver. It cycles between each loaded kernel
module, searching for a base image that has the same checksum described by one of the patch image’s
hot patch descriptors.
Hot patching is enabled only if the HKEY_LOCAL_MACHINE\SYSTEM\CurrentControlSet\Control
\Session Manager\Memory Management\HotPatchTableSize registry value is a multiple of a standard
memory page size (4,096). Indeed, when hot patching is enabled, every image that is mapped in the
virtual address space needs to have a certain amount of virtual address space reserved immediately
after the image itself. This reserved space is used for the image’s hot patch address table (HPAT, not to
be confused with the hot patch table). The HPAT is used to minimize the amount of padding necessary for each function to be patched by storing the address of the new function in the patched image.
CHAPTER 9
Virtualization technologies
369
When patching a function, the HPAT location will be used to perform an indirect jump from the original
function in the base image to the patched function in the patch image (note that for Retpoline compatibility, another kind of Retpoline routine is used instead of an indirect jump).
When the NT kernel finds a kernel mode driver suitable for the patch, it loads and maps the patch
binary in the kernel address space and creates the related loader data table entry (for more details,
see Chapter 12). It then scans each memory page of both the base and the patch images and locks in
memory the ones involved in the hot patch (this is important; in this way, the pages can’t be paged out
to disk while the patch application is in progress). It finally emits the APPLY_HOT_PATCH secure call.
The real patch application process starts in the Secure Kernel. The latter captures and verifies the hot
patch table of the patch image (by remapping the patch image also in VTL 1) and locates the base image’s NAR (see the previous section, “The Secure Kernel memory manager” for more details about the
NARs), which also tells the Secure Kernel whether the image is protected by PatchGuard. The Secure
Kernel then verifies whether enough reserved space is available in the image HPAT. If so, it allocates
one or more free physical pages (getting them from the secure bundle or using the ALLOC_PHYSICAL_
PAGES normal call) that will be mapped in the reserved space. At this point, if the base image is protected, the Secure Kernel starts a complex process that updates the PatchGuard’s internal state for the
new patched image and finally calls the patch engine.
The kernel's patch engine performs the following high-level operations, which are all described by a
different entry type in the hot patch table:
1.
Patches all calls from patched functions in the patch image with the goal to jump to the corresponding functions in the base image. This ensures that all unpatched code always executes
in the original base image. For example, if function A calls B in the base image and the patch
changes function A but not function B, then the patch engine will update function B in the
patch to jump to function B in the base image.
2.
Patches the necessary references to global variables in patched functions to point to the corresponding global variables in the base image.
3.
Patches the necessary import address table (IAT) references in the patch image by copying the
corresponding IAT entries from the base image.
4.
Atomically patches the necessary functions in the base image to jump to the corresponding function in the patch image. As soon as this is done for a given function in the base image, all new invocations of that function will execute the new patched function code in the patch image. When
the patched function returns, it will return to the caller of the original function in the base image.
Since the pointers of the new functions are 64 bits (8 bytes) wide, the patch engine inserts each
pointer in the HPAT, which is located at the end of the binary. In this way, it needs only 5 bytes for placing the indirect jump in the padding space located in the beginning of each function (the process has
been simplified. Retpoline compatible hot-patches requires a compatible Retpoline. Furthermore, the
HPAT is split in code and data page).
As shown in Figure 9-38, the patch engine is compatible with different kinds of binaries. If the NT
kernel has not found any patchable kernel mode module, it restarts the search through all the user
370
CHAPTER 9
Virtualization technologies
mode processes and applies a procedure similar to properly hot patching a compatible user mode
executable or library.
• Load patch binary
• Point patched functions to patch binary
atomically
• Unpatched code always executes in
original binary
User
Kerner
DriverA.sys
DriverB.sys
Process 1
Process 2
Process 3
Foo.dll
Foo.dll
Foo.dll
FooPatch1.dll
FooPatch1.dll
FooPatch1.dll
VTL0
VTL1
DriverADriverAPatch2.sys
Patch1.sys
Ntoskrnl.exe
SecureKernel.
exe
DriverBPatch1.sys
NtoskrnlPatch1.exe
SecureKernelPatch1.exe
FIGURE 9-38 A schema of the hot patch engine executing on different types of binaries.
Isolated User Mode
Isolated User Mode (IUM), the services provided by the Secure Kernel to its secure processes (trustlets),
and the trustlets general architecture are covered in Chapter 3 of Part 1. In this section, we continue
the discussion starting from there, and we move on to describe some services provided by the Isolated
User Mode, like the secure devices and the VBS enclaves.
As introduced in Chapter 3 of Part 1, when a trustlet is created in VTL 1, it usually maps in its address
space the following libraries:
■
■
■
■
Iumdll.dll The IUM Native Layer DLL implements the secure system call stub. It’s the equivalent of Ntdll.dll of VTL 0.
Iumbase.dll The IUM Base Layer DLL is the library that implements most of the secure APIs
that can be consumed exclusively by VTL 1 software. It provides various services to each secure
process, like secure identification, communication, cryptography, and secure memory management. Trustlets do not usually call secure system calls directly, but they pass through Iumbase.
dll, which is the equivalent of kernelbase.dll in VTL 0.
IumCrypt.dll Exposes public/private key encryption functions used for signing and integrity
verification. Most of the crypto functions exposed to VTL 1 are implemented in Iumbase.dll; only a
small number of specialized encryption routines are implemented in IumCrypt. LsaIso is the main
consumer of the services exposed by IumCrypt, which is not loaded in many other trustlets.
Ntdll.dll, Kernelbase.dll, and Kernel32.dll A trustlet can be designed to run both in VTL
1 and VTL 0. In that case, it should only use routines implemented in the standard VTL 0 API
surface. Not all the services available to VTL 0 are also implemented in VTL 1. For example, a
trustlet can never do any registry I/O and any file I/O, but it can use synchronization routines,
ALPC, thread APIs, and structured exception handling, and it can manage virtual memory and
CHAPTER 9
Virtualization technologies
371
section objects. Almost all the services offered by the kernelbase and kernel32 libraries perform
system calls through Ntdll.dll. In VTL 1, these kinds of system calls are “translated” in normal
calls and redirected to the VTL 0 kernel. (We discussed normal calls in detail earlier in this chapter.) Normal calls are often used by IUM functions and by the Secure Kernel itself. This explains
why ntdll.dll is always mapped in every trustlet.
■
Vertdll.dll The VSM enclave runtime DLL is the DLL that manages the lifetime of a VBS enclave. Only limited services are provided by software executing in a secure enclave. This library
implements all the enclave services exposed to the software enclave and is normally not loaded
for standard VTL 1 processes.
With this knowledge in mind, let’s look at what is involved in the trustlet creation process, starting
from the CreateProcess API in VTL 0, for which its execution flow has already been described in detail
in Chapter 3.
Trustlets creation
As discussed multiple times in the previous sections, the Secure Kernel depends on the NT kernel for performing various operations. Creating a trustlet follows the same rule: It is an operation that is managed
by both the Secure Kernel and NT kernel. In Chapter 3 of Part 1, we presented the trustlet structure and
its signing requirement, and we described its important policy metadata. Furthermore, we described the
detailed flow of the CreateProcess API, which is still the starting point for the trustlet creation.
To properly create a trustlet, an application should specify the CREATE_SECURE_PROCESS creation flag
when calling the CreateProcess API. Internally, the flag is converted to the PS_CP_SECURE_ PROCESS
NT attribute and passed to the NtCreateUserProcess native API. After the NtCreateUserProcess has
successfully opened the image to be executed, it creates the section object of the image by specifying
a special flag, which instructs the memory manager to use the Secure HVCI to validate its content. This
allows the Secure Kernel to create the SECURE_IMAGE data structure used to describe the PE image
verified through Secure HVCI.
The NT kernel creates the required process’s data structures and initial VTL 0 address space (page
directories, hyperspace, and working set) as for normal processes, and if the new process is a trustlet, it
emits a CREATE_PROCESS secure call. The Secure Kernel manages the latter by creating the secure process object and relative data structure (named SEPROCESS). The Secure Kernel links the normal process
object (EPROCESS) with the new secure one and creates the initial secure address space by allocating
the secure page table and duplicating the root entries that describe the kernel portion of the secure
address space in the upper half of it.
The NT kernel concludes the setup of the empty process address space and maps the Ntdll library
into it (see Stage 3D of Chapter 3 of Part 1 for more details). When doing so for secure processes, the
NT kernel invokes the INITIALIZE_PROCESS secure call to finish the setup in VTL 1. The Secure Kernel
copies the trustlet identity and trustlet attributes specified at process creation time into the new secure
process, creates the secure handle table, and maps the secure shared page into the address space.
The last step needed for the secure process is the creation of the secure thread. The initial thread
object is created as for normal processes in the NT kernel: When the NtCreateUserProcess calls
372
CHAPTER 9
Virtualization technologies
PspInsertThread, it has already allocated the thread kernel stack and inserted the necessary data to
start from the KiStartUserThread kernel function (see Stage 4 in Chapter 3 of Part 1 for further details). If the process is a trustlet, the NT kernel emits a CREATE_THREAD secure call for performing the
final secure thread creation. The Secure Kernel attaches to the new secure process’s address space
and allocates and initializes a secure thread data structure, a thread’s secure TEB, and kernel stack.
The Secure Kernel fills the thread’s kernel stack by inserting the thread-first initial kernel routine:
SkpUserThreadStart. It then initializes the machine-dependent hardware context for the secure thread,
which specifies the actual image start address and the address of the first user mode routine. Finally, it
associates the normal thread object with the new created secure one, inserts the thread into the secure
threads list, and marks the thread as runnable.
When the normal thread object is selected to run by the NT kernel scheduler, the execution still
starts in the KiStartUserThread function in VTL 0. The latter lowers the thread’s IRQL and calls the system initial thread routine (PspUserThreadStartup). The execution proceeds as for normal threads, until
the NT kernel sets up the initial thunk context. Instead of doing that, it starts the Secure Kernel dispatch
loop by calling the VslpEnterIumSecureMode routine and specifying the RESUMETHREAD secure call.
The loop will exit only when the thread is terminated. The initial secure call is processed by the normal
call dispatcher loop in VTL 1, which identifies the “resume thread” entry reason to VTL 1, attaches to
the new process’s address space, and switches to the new secure thread stack. The Secure Kernel in
this case does not call the IumInvokeSecureService dispatcher function because it knows that the initial
thread function is on the stack, so it simply returns to the address located in the stack, which points to
the VTL 1 secure initial routine, SkpUserThreadStart.
SkpUserThreadStart, similarly to standard VTL 0 threads, sets up the initial thunk context to run the image loader initialization routine (LdrInitializeThunk in Ntdll.dll), as well as the system-wide thread startup
stub (RtlUserThreadStart in Ntdll.dll). These steps are done by editing the context of the thread in place
and then issuing an exit from system service operation, which loads the specially crafted user context and
returns to user mode. The newborn secure thread initialization proceeds as for normal VTL 0 threads; the
LdrInitializeThunk routine initializes the loader and its needed data structures. Once the function returns,
NtContinue restores the new user context. Thread execution now truly starts: RtlUserThreadStart uses the
address of the actual image entry point and the start parameter and calls the application’s entry point.
Note A careful reader may have noticed that the Secure Kernel doesn’t do anything to protect the new trustlet’s binary image. This is because the shared memory that describes the
trustlet’s base binary image is still accessible to VTL 0 by design.
Let’s assume that a trustlet wants to write private data located in the image’s global data.
The PTEs that map the writable data section of the image global data are marked as copyon-write. So, an access fault will be generated by the processor. The fault belongs to a user
mode address range (remember that no NAR are used to track shared pages). The Secure
Kernel page fault handler transfers the execution to the NT kernel (through a normal call),
which will allocate a new page, copy the content of the old one in it, and protect it through
the SLAT (using a protected copy operation; see the section “The Secure Kernel memory
manager” earlier in this chapter for further details).
CHAPTER 9
Virtualization technologies
373
EXPERIMENT: Debugging a trustlet
Debugging a trustlet with a user mode debugger is possible only if the trustlet explicitly allows it
through its policy metadata (stored in the .tPolicy section). In this experiment, we try to debug a
trustlet through the kernel debugger. You need a kernel debugger attached to a test system (a local kernel debugger works, too), which must have VBS enabled. HVCI is not strictly needed, though.
First, find the LsaIso.exe trustlet:
lkd> !process 0 0 lsaiso.exe
PROCESS ffff8904dfdaa080
SessionId: 0 Cid: 02e8
Peb: 8074164000 ParentCid: 0250
DirBase: 3e590002 ObjectTable: ffffb00d0f4dab00 HandleCount:
Image: LsaIso.exe
42.
Analyzing the process’s PEB reveals that some information is set to 0 or nonreadable:
lkd> .process /P ffff8904dfdaa080
lkd> !peb 8074164000
PEB at 0000008074164000
InheritedAddressSpace:
No
ReadImageFileExecOptions: No
BeingDebugged:
No
ImageBaseAddress:
00007ff708750000
NtGlobalFlag:
0
NtGlobalFlag2:
0
Ldr
0000000000000000
*** unable to read Ldr table at 0000000000000000
SubSystemData:
0000000000000000
ProcessHeap:
0000000000000000
ProcessParameters: 0000026b55a10000
CurrentDirectory: 'C:\Windows\system32\'
WindowTitle: '< Name not readable >'
ImageFile:
'\??\C:\Windows\system32\lsaiso.exe'
CommandLine: '\??\C:\Windows\system32\lsaiso.exe'
DllPath:
'< Name not readable >'lkd
Reading from the process image base address may succeed, but it depends on whether the
LsaIso image mapped in the VTL 0 address space has been already accessed. This is usually the
case just for the first page (remember that the shared memory of the main image is accessible in
VTL 0). In our system, the first page is mapped and valid, whereas the third one is invalid:
lkd> db 0x7ff708750000 l20
00007ff7`08750000 4d 5a 90 00 03 00
00007ff7`08750010 b8 00 00 00 00 00
lkd> db (0x7ff708750000 + 2000) l20
00007ff7`08752000 ?? ?? ?? ?? ?? ??
00007ff7`08752010 ?? ?? ?? ?? ?? ??
lkd> !pte (0x7ff708750000 + 2000)
1: kd> !pte (0x7ff708750000 + 2000)
374
CHAPTER 9
Virtualization technologies
00 00-04 00 00 00 ff 00 00 MZ..............
00 00-40 00 00 00 00 00 00 00 ........@.......
?? ??-?? ?? ?? ?? ?? ?? ?? ??
?? ??-?? ?? ?? ?? ?? ?? ?? ??
????????????????
????????????????
PXE at FFFFD5EAF57AB7F8
contains 0A0000003E58D867
pfn 3e58d
---DA--UWEV
VA 00007ff708752000
PPE at FFFFD5EAF56FFEE0
PDE at FFFFD5EADFFDC218
contains 0A0000003E58E867 contains 0A0000003E58F867
pfn 3e58e
---DA--UWEV pfn 3e58f
---DA--UWEV
PTE at FFFFD5BFFB843A90
contains 00000000000000
not valid
Dumping the process’s threads reveals important information that confirms what we have
discussed in the previous sections:
!process ffff8904dfdaa080 2
PROCESS ffff8904dfdaa080
SessionId: 0 Cid: 02e8
Peb: 8074164000 ParentCid: 0250
DirBase: 3e590002 ObjectTable: ffffb00d0f4dab00 HandleCount:
Image: LsaIso.exe
42.
THREAD ffff8904dfdd9080 Cid 02e8.02f8 Teb: 0000008074165000
Win32Thread: 0000000000000000 WAIT: (UserRequest) UserMode Non-Alertable
ffff8904dfdc5ca0 NotificationEvent
THREAD ffff8904e12ac040 Cid 02e8.0b84 Teb: 0000008074167000
Win32Thread: 0000000000000000 WAIT: (WrQueue) UserMode Alertable
ffff8904dfdd7440 QueueObject
lkd> .thread /p ffff8904e12ac040
Implicit thread is now ffff8904`e12ac040
Implicit process is now ffff8904`dfdaa080
.cache forcedecodeuser done
lkd> k
*** Stack trace for last set context - .thread/.cxr resets it
# Child-SP
RetAddr
Call Site
00 ffffe009`1216c140 fffff801`27564e17 nt!KiSwapContext+0x76
01 ffffe009`1216c280 fffff801`27564989 nt!KiSwapThread+0x297
02 ffffe009`1216c340 fffff801`275681f9 nt!KiCommitThreadWait+0x549
03 ffffe009`1216c3e0 fffff801`27567369 nt!KeRemoveQueueEx+0xb59
04 ffffe009`1216c480 fffff801`27568e2a nt!IoRemoveIoCompletion+0x99
05 ffffe009`1216c5b0 fffff801`2764d504 nt!NtWaitForWorkViaWorkerFactory+0x99a
06 ffffe009`1216c7e0 fffff801`276db75f nt!VslpDispatchIumSyscall+0x34
07 ffffe009`1216c860 fffff801`27bab7e4 nt!VslpEnterIumSecureMode+0x12098b
08 ffffe009`1216c8d0 fffff801`276586cc nt!PspUserThreadStartup+0x178704
09 ffffe009`1216c9c0 fffff801`27658640 nt!KiStartUserThread+0x1c
0a ffffe009`1216cb00 00007fff`d06f7ab0 nt!KiStartUserThreadReturn
0b 00000080`7427fe18 00000000`00000000 ntdll!RtlUserThreadStart
The stack clearly shows that the execution begins in VTL 0 at the KiStartUserThread routine.
PspUserThreadStartup has invoked the secure call dispatch loop, which never ended and has
been interrupted by a wait operation. There is no way for the kernel debugger to show any
Secure Kernel’s data structures or trustlet’s private data.
CHAPTER 9
Virtualization technologies
375
Secure devices
VBS provides the ability for drivers to run part of their code in the secure environment. The Secure
Kernel itself can’t be extended to support kernel drivers; its attack surface would become too large.
Furthermore, Microsoft wouldn’t allow external companies to introduce possible bugs in a component
used primarily for security purposes.
The User-Mode Driver Framework (UMDF) solves the problem by introducing the concept of driver
companions, which can run both in user mode VTL 0 or VTL 1. In this case, they take the name of secure
companions. A secure companion takes the subset of the driver’s code that needs to run in a different
mode (in this case IUM) and loads it as an extension, or companion, of the main KMDF driver. Standard
WDM drivers are also supported, though. The main driver, which still runs in VTL 0 kernel mode, continues to manage the device’s PnP and power state, but it needs the ability to reach out to its companion
to perform tasks that must be performed in IUM.
Although the Secure Driver Framework (SDF) mentioned in Chapter 3 is deprecated, Figure 9-39
shows the architecture of the new UMDF secure companion model, which is still built on top of the
same UMDF core framework (Wudfx02000.dll) used in VTL 0 user mode. The latter leverages services
provided by the UMDF secure companion host (WUDFCompanionHost.exe) for loading and managing
the driver companion, which is distributed through a DLL. The UMDF secure companion host manages the lifetime of the secure companion and encapsulates many UMDF functions that deal specifically
with the IUM environment.
Normal Mode (VTL 0)
Secure Mode (VTL 1)
Trustlet
WDF Binding Stub Lib
Driver Companion
UMDF Driver
Manager
Service
ALPC
UMDF Core Fx
UMDF SecureHost
ALPC
User Mode
Kernel Mode
KMDF Driver
WDF
APIs
KMDF Core Fx
ALPC
FIGURE 9-39 The WDF driver’s secure companion architecture.
376
CHAPTER 9
Virtualization technologies
A secure companion usually comes associated with the main driver that runs in the VTL 0 kernel. It
must be properly signed (including the IUM EKU in the signature, as for every trustlet) and must declare its capabilities in its metadata section. A secure companion has the full ownership of its managed
device (this explains why the device is often called secure device). A secure device controller by a secure
companion supports the following features:
■
■
■
Secure DMA The driver can instruct the device to perform DMA transfer directly in protected
VTL 1 memory, which is not accessible to VTL 0. The secure companion can process the data
sent or received through the DMA interface and can then transfer part of the data to the VTL 0
driver through the standard KMDF communication interface (ALPC). The IumGetDmaEnabler
and IumDmaMapMemory secure system calls, exposed through Iumbase.dll, allow the secure
companion to map physical DMA memory ranges directly in VTL 1 user mode.
Memory mapped IO (MMIO) The secure companion can request the device to map its
accessible MMIO range in VTL 1 (user mode). It can then access the memory-mapped device’s
registers directly in IUM. MapSecureIo and the ProtectSecureIo APIs expose this feature.
Secure sections The companion can create (through the CreateSecureSection API) and map
secure sections, which represent memory that can be shared between trustlets and the main
driver running in VTL 0. Furthermore, the secure companion can specify a different type of SLAT
protection in case the memory is accessed through the secure device (via DMA or MMIO).
A secure companion can’t directly respond to device interrupts, which need to be mapped and
managed by the associated kernel mode driver in VTL 0. In the same way, the kernel mode driver still
needs to act as the high-level interface for the system and user mode applications by managing all the
received IOCTLs. The main driver communicates with its secure companion by sending WDF tasks using
the UMDF Task Queue object, which internally uses the ALPC facilities exposed by the WDF framework.
A typical KMDF driver registers its companion via INF directives. WDF automatically starts the driver’s
companion in the context of the driver’s call to WdfDeviceCreate—which, for plug and play drivers usually
happens in the AddDevice callback— by sending an ALPC message to the UMDF driver manager service,
which spawns a new WUDFCompanionHost.exe trustlet by calling the NtCreateUserProcess native API.
The UMDF secure companion host then loads the secure companion DLL in its address space. Another
ALPC message is sent from the UMDF driver manager to the WUDFCompanionHost, with the goal to actually start the secure companion. The DriverEntry routine of the companion performs the driver’s secure
initialization and creates the WDFDRIVER object through the classic WdfDriverCreate API.
The framework then calls the AddDevice callback routine of the companion in VTL 1, which usually
creates the companion’s device through the new WdfDeviceCompanionCreate UMDF API. The latter
transfers the execution to the Secure Kernel (through the IumCreateSecureDevice secure system call),
which creates the new secure device. From this point on, the secure companion has full ownership of its
managed device. Usually, the first thing that the companion does after the creation of the secure device is to create the task queue object (WDFTASKQUEUE) used to process any incoming tasks delivered
by its associated VTL 0 driver. The execution control returns to the kernel mode driver, which can now
send new tasks to its secure companion.
CHAPTER 9
Virtualization technologies
377
This model is also supported by WDM drivers. WDM drivers can use the KMDF’s miniport mode to
interact with a special filter driver, WdmCompanionFilter.sys, which is attached in a lower-level position
of the device’s stack. The Wdm Companion filter allows WDM drivers to use the task queue object for
sending tasks to the secure companion.
VBS-based enclaves
In Chapter 5 of Part 1, we discuss the Software Guard Extension (SGX), a hardware technology that allows
the creation of protected memory enclaves, which are secure zones in a process address space where
code and data are protected (encrypted) by the hardware from code running outside the enclave. The
technology, which was first introduced in the sixth generation Intel Core processors (Skylake), has suffered from some problems that prevented its broad adoption. (Furthermore, AMD released another
technology called Secure Encrypted Virtualization, which is not compatible with SGX.)
To overcome these issues, Microsoft released VBS-based enclaves, which are secure enclaves whose
isolation guarantees are provided using the VSM infrastructure. Code and data inside of a VBS-based
enclave is visible only to the enclave itself (and the VSM Secure Kernel) and is inaccessible to the NT
kernel, VTL 0 processes, and secure trustlets running in the system.
A secure VBS-based enclave is created by establishing a single virtual address range within a normal
process. Code and data are then loaded into the enclave, after which the enclave is entered for the first
time by transferring control to its entry point via the Secure Kernel. The Secure Kernel first verifies that
all code and data are authentic and are authorized to run inside the enclave by using image signature
verification on the enclave image. If the signature checks pass, then the execution control is transferred
to the enclave entry point, which has access to all of the enclave’s code and data. By default, the system
only supports the execution of enclaves that are properly signed. This precludes the possibility that unsigned malware can execute on a system outside the view of anti-malware software, which is incapable
of inspecting the contents of any enclave.
During execution, control can transfer back and forth between the enclave and its containing process. Code executing inside of an enclave has access to all data within the virtual address range of the
enclave. Furthermore, it has read and write access of the containing unsecure process address space. All
memory within the enclave’s virtual address range will be inaccessible to the containing process. If multiple enclaves exist within a single host process, each enclave will be able to access only its own memory
and the memory that is accessible to the host process.
As for hardware enclaves, when code is running in an enclave, it can obtain a sealed enclave report,
which can be used by a third-party entity to validate that the code is running with the isolation guarantees of a VBS enclave, and which can further be used to validate the specific version of code running.
This report includes information about the host system, the enclave itself, and all DLLs that may have
been loaded into the enclave, as well as information indicating whether the enclave is executing with
debugging capabilities enabled.
378
CHAPTER 9
Virtualization technologies
A VBS-based enclave is distributed as a DLL, which has certain specific characteristics:
■
■
■
It is signed with an authenticode signature, and the leaf certificate includes a valid EKU that permits the image to be run as an enclave. The root authority that has emitted the digital certificate
should be Microsoft, or a third-party signing authority covered by a certificate manifest that’s
countersigned by Microsoft. This implies that third-party companies could sign and run their own
enclaves. Valid digital signature EKUs are the IUM EKU (1.3.6.1.4.1.311.10.3.37) for internal Windowssigned enclaves or the Enclave EKU (1.3.6.1.4.1.311.10.3.42) for all the third-party enclaves.
It includes an enclave configuration section (represented by an IMAGE_ENCLAVE_CONFIG data
structure), which describes information about the enclave and which is linked to its image’s load
configuration data directory.
It includes the correct Control Flow Guard (CFG) instrumentation.
The enclave’s configuration section is important because it includes important information needed
to properly run and seal the enclave: the unique family ID and image ID, which are specified by the
enclave’s author and identify the enclave binary, the secure version number and the enclave’s policy
information (like the expected virtual size, the maximum number of threads that can run, and the
debuggability of the enclave). Furthermore, the enclave’s configuration section includes the list of
images that may be imported by the enclave, included with their identity information. An enclave’s
imported module can be identified by a combination of the family ID and image ID, or by a combination of the generated unique ID, which is calculated starting from the hash of the binary, and author ID,
which is derived from the certificate used to sign the enclave. (This value expresses the identity of who
has constructed the enclave.) The imported module descriptor must also include the minimum secure
version number.
The Secure Kernel offers some basic system services to enclaves through the VBS enclave runtime
DLL, Vertdll.dll, which is mapped in the enclave address space. These services include: a limited subset
of the standard C runtime library, the ability to allocate or free secure memory within the address range
of the enclave, synchronization services, structured exception handling support, basic cryptographic
functions, and the ability to seal data.
EXPERIMENT: Dumping the encla e configuration
In this experiment, we use the Microsoft Incremental linker (link.exe) included in the Windows
SDK and WDK to dump software enclave configuration data. Both packages are downloadable
from the web. You can also use the EWDK, which contains all the necessary tools and does not
require any installation. It’s available at https://docs.microsoft.com/ en-us/windows-hardware/
drivers/download-the-wdk.
Open the Visual Studio Developer Command Prompt through the Cortana search box or
by executing the LaunchBuildEnv.cmd script file contained in the EWDK’s Iso image. We will
analyze the configuration data of the System Guard Routine Attestation enclave—which is
shown in Figure 9-40 and will be described later in this chapter—with the link.exe /dump
/loadconfig command:
CHAPTER 9
Virtualization technologies
379
The command’s output is large. So, in the example shown in the preceding figure, we have
redirected it to the SgrmEnclave_secure_loadconfig.txt file. If you open the new output file, you
see that the binary image contains a CFG table and includes a valid enclave configuration pointer,
which targets the following data:
Enclave Configuration
00000050
0000004C
00000000
00000003
0004FA04
00000050
00000001
00000001
0000000010000000
00000008
00000001
size
minimum required config size
policy flags
number of enclave import descriptors
RVA to enclave import descriptors
size of an enclave import descriptor
image version
security version
enclave size
number of threads
enclave flags
family ID : B1 35 7C 2B 69 9F 47 F9 BB C9 4F 44 F2 54 DB 9D
image ID : 24 56 46 36 CD 4A D8 86 A2 F4 EC 25 A9 72 02
ucrtbase_enclave.dll
0 minimum security version
0 reserved
match type
family ID
image ID
unique/author ID
:
:
:
:
image
00 00
F0 3C
00 00
00 00
bcrypt.dll
380
CHAPTER 9
Virtualization technologies
ID
00
CD
00
00
00
A7
00
00
00
E8
00
00
00
7B
00
00
00
46
00
00
00
EB
00
00
00
AA
00
00
00
E7
00
00
00
1F
00
00
00
13
00
00
00
D5
00
00
00
CD
00
00
00
DE
00
00
00
5D
00
00
0 minimum security version
0 reserved
match type
family ID
image ID
unique/author ID
:
:
:
:
image
00 00
20 27
00 00
00 00
ID
00
BD
00
00
00
68
00
00
00
75
00
00
00
59
00
00
00
49
00
00
00
B7
00
00
00
BE
00
00
00
06
00
00
00
34
00
00
00
50
00
00
00
E2
00
00
00
16
00
00
00
D7
00
00
00
ED
00
00
...
The configuration section contains the binary image’s enclave data (like the family ID, image
ID, and security version number) and the import descriptor array, which communicates to the
Secure Kernel from which library the main enclave’s binary can safely depend on. You can redo
the experiment with the Vertdll.dll library and with all the binaries imported from the System
Guard Routine Attestation enclave.
Enclave lifecycle
In Chapter 5 of Part 1, we discussed the lifecycle of a hardware enclave (SGX-based). The lifecycle of a
VBS-based enclave is similar; Microsoft has enhanced the already available enclave APIs to support the
new type of VBS-based enclaves.
Step 1: Creation An application creates a VBS-based enclave by specifying the ENCLAVE_TYPE_VBS
flag to the CreateEnclave API. The caller should specify an owner ID, which identifies the owner of
the enclave. The enclave creation code, in the same way as for hardware enclaves, ends up calling the
NtCreateEnclave in the kernel. The latter checks the parameters, copies the passed-in structures, and
attaches to the target process in case the enclave is to be created in a different process than the caller’s.
The MiCreateEnclave function allocates an enclave-type VAD describing the enclave virtual memory
range and selects a base virtual address if not specified by the caller. The kernel allocates the memory
manager’s VBS enclave data structure and the per-process enclave hash table, used for fast lookup of
the enclave starting by its number. If the enclave is the first created for the process, the system also creates an empty secure process (which acts as a container for the enclaves) in VTL 1 by using the CREATE
_PROCESS secure call (see the earlier section “Trustlets creation” for further details).
The CREATE_ENCLAVE secure call handler in VTL 1 performs the actual work of the enclave creation:
it allocates the secure enclave key data structure (SKMI_ENCLAVE), sets the reference to the container
secure process (which has just been created by the NT kernel), and creates the secure VAD describing the entire enclave virtual address space (the secure VAD contains similar information to its VTL 0
counterpart). This VAD is inserted in the containing process’s VAD tree (and not in the enclave itself).
An empty virtual address space for the enclave is created in the same way as for its containing process:
the page table root is filled by system entries only.
CHAPTER 9
Virtualization technologies
381
Step 2: Loading modules into the enclave Differently from hardware-based enclaves, the parent
process can load only modules into the enclave but not arbitrary data. This will cause each page of the
image to be copied into the address space in VTL 1. Each image’s page in the VTL 1 enclave will be a
private copy. At least one module (which acts as the main enclave image) needs to be loaded into the
enclave; otherwise, the enclave can’t be initialized. After the VBS enclave has been created, an application calls the LoadEnclaveImage API, specifying the enclave base address and the name of the module
that must be loaded in the enclave. The Windows Loader code (in Ntdll.dll) searches the specified DLL
name, opens and validates its binary file, and creates a section object that is mapped with read-only
access right in the calling process.
After the loader maps the section, it parses the image’s import address table with the goal to create
a list of the dependent modules (imported, delay loaded, and forwarded). For each found module, the
loader checks whether there is enough space in the enclave for mapping it and calculates the correct
image base address. As shown in Figure 9-40, which represents the System Guard Runtime Attestation
enclave, modules in the enclave are mapped using a top-down strategy. This means that the main
image is mapped at the highest possible virtual address, and all the dependent ones are mapped in
lower addresses one next to each other. At this stage, for each module, the Windows Loader calls the
NtLoadEnclaveData kernel API.
0x026D'18200000 (Top of the Enclave)
SgrmEnclave_Secure.dll
ucrtbase_enclave.dll
bcrypt.dll
0x026D'18194000
0x026D'1811C000
0x026D'180FC000
Higher Addresses
vertdll.dll
0x026D'180C4000
bcryptPrimitives.dll
Pr
i
Fr vat
ee e a
Sp nd
ac
e
0x026D'18043000
0x026D'08200000 (Enclave Base)
FIGURE 9-40 The System Guard Runtime Attestation secure enclave (note the empty space at
the base of the enclave).
382
CHAPTER 9
Virtualization technologies
For loading the specified image in the VBS enclave, the kernel starts a complex process that allows the shared pages of its section object to be copied in the private pages of the enclave in VTL 1.
The MiMapImageForEnclaveUse function gets the control area of the section object and validates it
through SKCI. If the validation fails, the process is interrupted, and an error is returned to the caller. (All
the enclave’s modules should be correctly signed as discussed previously.) Otherwise, the system attaches to the secure system process and maps the image’s section object in its address space in VTL 0.
The shared pages of the module at this time could be valid or invalid; see Chapter 5 of Part 1 for further
details. It then commits the virtual address space of the module in the containing process. This creates
private VTL 0 paging data structures for demand-zero PTEs, which will be later populated by the Secure
Kernel when the image is loaded in VTL 1.
The LOAD_ENCLAVE_MODULE secure call handler in VTL 1 obtains the SECURE_IMAGE of the new
module (created by SKCI) and verifies whether the image is suitable for use in a VBS-based enclave (by
verifying the digital signature characteristics). It then attaches to the secure system process in VTL 1
and maps the secure image at the same virtual address previously mapped by the NT kernel. This allows the sharing of the prototype PTEs from VTL 0. The Secure Kernel then creates the secure VAD that
describes the module and inserts it into the VTL 1 address space of the enclave. It finally cycles between
each module’s section prototype PTE. For each nonpresent prototype PTE, it attaches to the secure
system process and uses the GET_PHYSICAL_PAGE normal call to invoke the NT page fault handler
(MmAccessFault), which brings in memory the shared page. The Secure Kernel performs a similar
process for the private enclave pages, which have been previously committed by the NT kernel in VTL 0
by demand-zero PTEs. The NT page fault handler in this case allocates zeroed pages. The Secure Kernel
copies the content of each shared physical page into each new private page and applies the needed
private relocations if needed.
The loading of the module in the VBS-based enclave is complete. The Secure Kernel applies the SLAT
protection to the private enclave pages (the NT kernel has no access to the image’s code and data in
the enclave), unmaps the shared section from the secure system process, and yields the execution to
the NT kernel. The Loader can now proceed with the next module.
Step 3: Enclave initialization After all the modules have been loaded into the enclave, an application initializes the enclave using the InitializeEnclave API, and specifies the maximum number of threads
supported by the enclave (which will be bound to threads able to perform enclave calls in the containing process). The Secure Kernel’s INITIALIZE_ENCLAVE secure call’s handler verifies that the policies
specified during enclave creation are compatible with the policies expressed in the configuration information of the primary image, verifies that the enclave’s platform library is loaded (Vertdll.dll), calculates
the final 256-bit hash of the enclave (used for generating the enclave sealed report), and creates all the
secure enclave threads. When the execution control is returned to the Windows Loader code in VTL 0,
the system performs the first enclave call, which executes the initialization code of the platform DLL.
Step 4: Enclave calls (inbound and outbound) After the enclave has been correctly initialized, an
application can make an arbitrary number of calls into the enclave. All the callable functions in the enclave need to be exported. An application can call the standard GetProcAddress API to get the address
of the enclave’s function and then use the CallEnclave routine for transferring the execution control to
the secure enclave. In this scenario, which describes an inbound call, the NtCallEnclave kernel routine
CHAPTER 9
Virtualization technologies
383
performs the thread selection algorithm, which binds the calling VTL 0 thread to an enclave thread,
according to the following rules:
■
■
If the normal thread was not previously called by the enclave (enclaves support nested calls),
then an arbitrary idle enclave thread is selected for execution. In case no idle enclave threads
are available, the call blocks until an enclave thread becomes available (if specified by the caller;
otherwise the call simply fails).
In case the normal thread was previously called by the enclave, then the call into the enclave is
made on the same enclave thread that issued the previous call to the host.
A list of enclave thread’s descriptors is maintained by both the NT and Secure Kernel. When a
normal thread is bound to an enclave thread, the enclave thread is inserted in another list, which is
called the bound threads list. Enclave threads tracked by the latter are currently running and are not
available anymore.
After the thread selection algorithm succeeds, the NT kernel emits the CALLENCLAVE secure call.
The Secure Kernel creates a new stack frame for the enclave and returns to user mode. The first user
mode function executed in the context of the enclave is RtlEnclaveCallDispatcher. The latter, in case the
enclave call was the first one ever emitted, transfers the execution to the initialization routine of the
VSM enclave runtime DLL (Vertdll.dll), which initializes the CRT, the loader, and all the services provided
to the enclave; it finally calls the DllMain function of the enclave’s main module and of all its dependent
images (by specifying a DLL_PROCESS_ATTACH reason).
In normal situations, where the enclave platform DLL has been already initialized, the enclave
dispatcher invokes the DllMain of each module by specifying a DLL_THREAD_ATTACH reason, verifies
whether the specified address of the target enclave’s function is valid, and, if so, finally calls the target
function. When the target enclave’s routine finishes its execution, it returns to VTL 0 by calling back into
the containing process. For doing this, it still relies on the enclave platform DLL, which again calls the
NtCallEnclave kernel routine. Even though the latter is implemented slightly differently in the Secure
Kernel, it adopts a similar strategy for returning to VTL 0. The enclave itself can emit enclave calls for
executing some function in the context of the unsecure containing process. In this scenario (which
describes an outbound call), the enclave code uses the CallEnclave routine and specifies the address of
an exported function in the containing process’s main module.
Step 5: Termination and destruction When termination of an entire enclave is requested through
the TerminateEnclave API, all threads executing inside the enclave will be forced to return to VTL 0.
Once termination of an enclave is requested, all further calls into the enclave will fail. As threads terminate, their VTL1 thread state (including thread stacks) is destroyed. Once all threads have stopped
executing, the enclave can be destroyed. When the enclave is destroyed, all remaining VTL 1 state
associated with the enclave is destroyed, too (including the entire enclave address space), and all pages
are freed in VTL 0. Finally, the enclave VAD is deleted and all committed enclave memory is freed.
Destruction is triggered when the containing process calls VirtualFree with the base of the enclave’s address range. Destruction is not possible unless the enclave has been terminated or was never initialized.
384
CHAPTER 9
Virtualization technologies
Note As we have discussed previously, all the memory pages that are mapped into the
enclave address space are private. This has multiple implications. No memory pages that
belong to the VTL 0 containing process are mapped in the enclave address space, though
(and also no VADs describing the containing process’s allocation is present). So how can the
enclave access all the memory pages of the containing process?
The answer is in the Secure Kernel page fault handler (SkmmAccessFault). In its code, the
fault handler checks whether the faulting process is an enclave. If it is, the fault handler
checks whether the fault happens because the enclave tried to execute some code outside its region. In this case, it raises an access violation error. If the fault is due to a read
or write access outside the enclave’s address space, the secure page fault handler emits a
GET_PHYSICAL_PAGE normal service, which results in the VTL 0 access fault handler to be
called. The VTL 0 handler checks the containing process VAD tree, obtains the PFN of the
page from its PTE—by bringing it in memory if needed—and returns it to VTL 1. At this
stage, the Secure Kernel can create the necessary paging structures to map the physical
page at the same virtual address (which is guaranteed to be available thanks to the property
of the enclave itself) and resumes the execution. The page is now valid in the context of the
secure enclave.
Sealing and attestation
VBS-based enclaves, like hardware-based enclaves, support both the sealing and attestation of the
data. The term sealing refers to the encryption of arbitrary data using one or more encryption keys
that aren’t visible to the enclave’s code but are managed by the Secure Kernel and tied to the machine and to the enclave’s identity. Enclaves will never have access to those keys; instead, the Secure
Kernel offers services for sealing and unsealing arbitrary contents (through the EnclaveSealData and
EnclaveUnsealData APIs) using an appropriate key designated by the enclave. At the time the data is
sealed, a set of parameters is supplied that controls which enclaves are permitted to unseal the data.
The following policies are supported:
■
■
■
■
Security version number (SVN) of the Secure Kernel and of the primary image No enclave can unseal any data that was sealed by a later version of the enclave or the Secure Kernel.
Exact code The data can be unsealed only by an enclave that maps the same identical modules of the enclave that has sealed it. The Secure Kernel verifies the hash of the Unique ID of
every image mapped in the enclave to allow a proper unsealing.
Same image, family, or author The data can be unsealed only by an enclave that has the
same author ID, family ID, and/or image ID.
Runtime policy The data can be unsealed only if the unsealing enclave has the same debugging policy of the original one (debuggable versus nondebuggable).
CHAPTER 9
Virtualization technologies
385
It is possible for every enclave to attest to any third party that it is running as a VBS enclave with all the
protections offered by the VBS-enclave architecture. An enclave attestation report provides proof that
a specific enclave is running under the control of the Secure Kernel. The attestation report contains the
identity of all code loaded into the enclave as well as policies controlling how the enclave is executing.
Describing the internal details of the sealing and attestation operations is outside the scope of this
book. An enclave can generate an attestation report through the EnclaveGetAttestationReport API. The
memory buffer returned by the API can be transmitted to another enclave, which can “attest” the integrity of the environment in which the original enclave ran by verifying the attestation report through
the EnclaveVerifyAttestationReport function.
System Guard runtime attestation
System Guard runtime attestation (SGRA) is an operating system integrity component that leverages
the aforementioned VBS-enclaves—together with a remote attestation service component—to provide strong guarantees around its execution environment. This environment is used to assert sensitive
system properties at runtime and allows for a relying party to observe violations of security promises
that the system provides. The first implementation of this new technology was introduced in Windows
10 April 2018 Update (RS4).
SGRA allows an application to view a statement about the security posture of the device. This statement is composed of three parts:
■
A session report, which includes a security level describing the attestable boot-time properties
of the device
■
A runtime report, which describes the runtime state of the device
■
A signed session certificate, which can be used to verify the reports
The SGRA service, SgrmBroker.exe, hosts a component (SgrmEnclave_secure.dll) that runs in a VTL
1 as a VBS enclave that continually asserts the system for runtime violations of security features. These
assertions are surfaced in the runtime report, which can be verified on the backend by a relying part. As
the assertions run in a separate domain-of-trust, attacking the contents of the runtime report directly
becomes difficult.
SGRA internals
Figure 9-41 shows a high-level overview of the architecture of Windows Defender System Guard runtime attestation, which consists of the following client-side components:
■
The VTL-1 assertion engine: SgrmEnclave_secure.dll
■
A VTL-0 kernel mode agent: SgrmAgent.sys
■
A VTL-0 WinTCB Protected broker process hosting the assertion engine: SgrmBroker.exe
■
386
A VTL-0 LPAC process used by the WinTCBPP broker process to interact with the networking
stack: SgrmLpac.exe
CHAPTER 9
Virtualization technologies
Attestation
service
Windows
Defender
ATP cloud
Windows
Defender
ATP
Windows
Defender
AV
Critical
Services
Third party
software
Windows Defender System Guard API
Windows Defender System Guard
runtime monitor enclave
(Assertion engine)
Windows Defender System Guard
runtime monitor broker
Windows Defender System Guard
runtime monitor agent
VTL0
VTL1
FIGURE 9-41 Windows Defender System Guard runtime attestation’s architecture.
To be able to rapidly respond to threats, SGRA includes a dynamic scripting engine (Lua) forming
the core of the assertion mechanism that executes in a VTL 1 enclave—an approach that allows frequent assertion logic updates.
Due to the isolation provided by the VBS enclave, threads executing in VTL 1 are limited in terms of
their ability to access VTL 0 NT APIs. Therefore, for the runtime component of SGRA to perform meaningful work, a way of working around the limited VBS enclave API surface is necessary.
An agent-based approach is implemented to expose VTL 0 facilities to the logic running in VTL 1;
these facilities are termed assists and are serviced by the SgrmBroker user mode component or by an
agent driver running in VTL 0 kernel mode (SgrmAgent.sys). The VTL 1 logic running in the enclave can
call out to these VTL 0 components with the goal of requesting assists that provide a range of facilities,
including NT kernel synchronize primitives, page mapping capabilities, and so on.
As an example of how this mechanism works, SGRA is capable of allowing the VTL 1 assertion
engine to directly read VTL 0–owned physical pages. The enclave requests a mapping of an arbitrary
page via an assist. The page would then be locked and mapped into the SgrmBroker VTL 0 address
space (making it resident). As VBS enclaves have direct access to the host process address space, the
secure logic can read directly from the mapped virtual addresses. These reads must be synchronized
with the VTL 0 kernel itself. The VTL 0 resident broker agent (SgrmAgent.sys driver) is also used to
perform synchronization.
Assertion logic
As mentioned earlier, SGRA asserts system security properties at runtime. These assertions are executed within the assertion engine hosted in the VBS-based enclave. Signed Lua bytecode describing the
assertion logic is provided to the assertion engine during start up.
CHAPTER 9
Virtualization technologies
387
Assertions are run periodically. When a violation of an asserted property is discovered (that is, when
the assertion “fails”), the failure is recorded and stored within the enclave. This failure will be exposed
to a relying party in the runtime report that is generated and signed (with the session certificate) within
the enclave.
An example of the assertion capabilities provided by SGRA are the asserts surrounding various executive process object attributes—for example, the periodic enumeration of running processes and the
assertion of the state of a process’s protection bits that govern protected process policies.
The flow for the assertion engine performing this check can be approximated to the following steps:
1.
The assertion engine running within VTL 1 calls into its VTL 0 host process (SgrmBroker) to
request that an executive process object be referenced by the kernel.
2.
The broker process forwards this request to the kernel mode agent (SgrmAgent), which services
the request by obtaining a reference to the requested executive process object.
3.
The agent notifies the broker that the request has been serviced and passes any necessary
metadata down to the broker.
4.
The broker forwards this response to the requesting VTL 1 assertion logic.
5.
The logic can then elect to have the physical page backing the referenced executive process
object locked and mapped into its accessible address space; this is done by calling out of the
enclave using a similar flow as steps 1 through 4.
6.
Once the page is mapped, the VTL 1 engine can read it directly and check the executive process
object protection bit against its internally held context.
7.
The VTL 1 logic again calls out to VTL 0 to unwind the page mapping and kernel object reference.
Reports and trust establishment
A WinRT-based API is exposed to allow relying parties to obtain the SGRA session certificate and the
signed session and runtime reports. This API is not public and is available under NDA to vendors that
are part of the Microsoft Virus Initiative (note that Microsoft Defender Advanced Threat Protection is
currently the only in-box component that interfaces directly with SGRA via this API).
The flow for obtaining a trusted statement from SGRA is as follows:
388
1.
A session is created between the relying party and SGRA. Establishment of the session requires
a network connection. The SgrmEnclave assertion engine (running in VTL-1) generates a publicprivate key pair, and the SgrmBroker protected process retrieves the TCG log and the VBS attestation report, sending them to Microsoft’s System Guard attestation service with the public
component of the key generated in the previous step.
2.
The attestation service verifies the TCG log (from the TPM) and the VBS attestation report (as
proof that the logic is running within a VBS enclave) and generates a session report describing
the attested boot time properties of the device. It signs the public key with an SGRA attestation
service intermediate key to create a certificate that will be used to verify runtime reports.
CHAPTER 9
Virtualization technologies
3.
The session report and the certificate are returned to the relying party. From this point, the
relying party can verify the validity of the session report and runtime certificate.
4.
Periodically, the relying party can request a runtime report from SGRA using the established
session: the SgrmEnclave assertion engine generates a runtime report describing the state of
the assertions that have been run. The report will be signed using the paired private key generated during session creation and returned to the relying party (the private key never leaves
the enclave).
5.
The relying party can verify the validity of the runtime report against the runtime certificate
obtained earlier and make a policy decision based on both the contents of the session report
(boot-time attested state) and the runtime report (asserted state).
SGRA provides some API that relying parties can use to attest to the state of the device at a point
in time. The API returns a runtime report that details the claims that Windows Defender System Guard
runtime attestation makes about the security posture of the system. These claims include assertions,
which are runtime measurements of sensitive system properties. For example, an app could ask
Windows Defender System Guard to measure the security of the system from the hardware-backed
enclave and return a report. The details in this report can be used by the app to decide whether it
performs a sensitive financial transaction or displays personal information.
As discussed in the previous section, a VBS-based enclave can also expose an enclave attestation
report signed by a VBS-specific signing key. If Windows Defender System Guard can obtain proof that
the host system is running with VSM active, it can use this proof with a signed session report to ensure
that the particular enclave is running. Establishing the trust necessary to guarantee that the runtime
report is authentic, therefore, requires the following:
1.
Attesting to the boot state of the machine; the OS, hypervisor, and Secure Kernel (SK) binaries
must be signed by Microsoft and configured according to a secure policy.
2.
Binding trust between the TPM and the health of the hypervisor to allow trust in the Measured
Boot Log.
3.
Extracting the needed key (VSM IDKs) from the Measured Boot Log and using these to verify
the VBS enclave signature (see Chapter 12 for further details).
4.
Signing of the public component of an ephemeral key-pair generated within the enclave with
a trusted Certificate Authority to issue a session certificate.
5.
Signing of the runtime report with the ephemeral private key.
Networking calls between the enclave and the Windows Defender System Guard attestation service
are made from VTL 0. However, the design of the attestation protocol ensures that it is resilient against
tampering even over untrusted transport mechanisms.
Numerous underlying technologies are required before the chain of trust described earlier can be
sufficiently established. To inform a relying party of the level of trust in the runtime report that they can
expect on any particular configuration, a security level is assigned to each Windows Defender System
Guard attestation service-signed session report. The security level reflects the underlying technologies
CHAPTER 9
Virtualization technologies
389
enabled on the platform and attributes a level of trust based on the capabilities of the platform.
Microsoft is mapping the enablement of various security technologies to security levels and will share
this when the API is published for third-party use. The highest level of trust is likely to require the following features, at the very least:
■
VBS-capable hardware and OEM configuration.
■
Dynamic root-of-trust measurements at boot.
■
Secure boot to verify hypervisor, NT, and SK images.
■
■
Secure policy ensuring Hypervisor Enforced Code Integrity (HVCI) and kernel mode code integrity (KMCI), test-signing is disabled, and kernel debugging is disabled.
The ELAM driver is present.
Conclusion
Windows is able to manage and run multiple virtual machines thanks to the Hyper-V hypervisor and
its virtualization stack, which, combined together, support different operating systems running in a
VM. Over the years, the two components have evolved to provide more optimizations and advanced
features for the VMs, like nested virtualization, multiple schedulers for the virtual processors, different
types of virtual hardware support, VMBus, VA-backed VMs, and so on.
Virtualization-based security provides to the root operating system a new level of protection
against malware and stealthy rootkits, which are no longer able to steal private and confidential information from the root operating system’s memory. The Secure Kernel uses the services supplied by the
Windows hypervisor to create a new execution environment (VTL 1) that is protected and not accessible to the software running in the main OS. Furthermore, the Secure Kernel delivers multiple services
to the Windows ecosystem that help to maintain a more secure environment.
The Secure Kernel also defines the Isolated User Mode, allowing user mode code to be executed
in the new protected environment through trustlets, secure devices, and enclaves. The chapter ended
with the analysis of System Guard Runtime Attestation, a component that uses the services exposed by
the Secure Kernel to measure the workstation’s execution environment and to provide strong guarantees about its integrity.
In the next chapter, we look at the management and diagnostics components of Windows and
discuss important mechanisms involved with their infrastructure: the registry, services, Task scheduler,
Windows Management Instrumentation (WMI), kernel Event Tracing, and so on.
390
CHAPTER 9
Virtualization technologies
CHAPTER 10
Management, diagnostics,
and tracing
T
his chapter describes fundamental mechanisms in the Microsoft Windows operating system that
are critical to its management and configuration. In particular, we describe the Windows registry,
services, the Unified Background process manager, and Windows Management Instrumentation (WMI).
The chapter also presents some fundamental components used for diagnosis and tracing purposes like
Event Tracing for Windows (ETW), Windows Notification Facility (WNF), and Windows Error Reporting
(WER). A discussion on the Windows Global flags and a brief introduction on the kernel and User Shim
Engine conclude the chapter.
The registry
The registry plays a key role in the configuration and control of Windows systems. It is the repository
for both systemwide and per-user settings. Although most people think of the registry as static data
stored on the hard disk, as you’ll see in this section, the registry is also a window into various inmemory structures maintained by the Windows executive and kernel.
We’re starting by providing you with an overview of the registry structure, a discussion of the data
types it supports, and a brief tour of the key information Windows maintains in the registry. Then we
look inside the internals of the configuration manager, the executive component responsible for implementing the registry database. Among the topics we cover are the internal on-disk structure of the
registry, how Windows retrieves configuration information when an application requests it, and what
measures are employed to protect this critical system database.
Viewing and changing the registry
In general, you should never have to edit the registry directly. Application and system settings stored in
the registry that require changes should have a corresponding user interface to control their modification. However, as we mention several times in this book, some advanced and debug settings have
no editing user interface. Therefore, both graphical user interface (GUI) and command-line tools are
included with Windows to enable you to view and modify the registry.
Windows comes with one main GUI tool for editing the registry—Regedit.exe—and several
command-line registry tools. Reg.exe, for instance, has the ability to import, export, back up, and
391
restore keys, as well as to compare, modify, and delete keys and values. It can also set or query flags
used in UAC virtualization. Regini.exe, on the other hand, allows you to import registry data based on
text files that contain ASCII or Unicode configuration data.
The Windows Driver Kit (WDK) also supplies a redistributable component, Offregs.dll, which hosts
the Offline Registry Library. This library allows loading registry hive files (covered in the “Hives” section
later in the chapter) in their binary format and applying operations on the files themselves, bypassing
the usual logical loading and mapping that Windows requires for registry operations. Its use is primarily to assist in offline registry access, such as for purposes of integrity checking and validation. It can also
provide performance benefits if the underlying data is not meant to be visible by the system because
the access is done through local file I/O instead of registry system calls.
Registry usage
There are four principal times at which configuration data is read:
■
■
■
■
During the initial boot process, the boot loader reads configuration data and the list of boot device drivers to load into memory before initializing the kernel. Because the Boot Configuration
Database (BCD) is really stored in a registry hive, one could argue that registry access happens
even earlier, when the Boot Manager displays the list of operating systems.
During the kernel boot process, the kernel reads settings that specify which device drivers to
load and how various system elements—such as the memory manager and process manager—
configure themselves and tune system behavior.
During logon, Explorer and other Windows components read per-user preferences from the
registry, including network drive-letter mappings, desktop wallpaper, screen saver, menu behavior, icon placement, and, perhaps most importantly, which startup programs to launch and
which files were most recently accessed.
During their startup, applications read systemwide settings, such as a list of optionally installed
components and licensing data, as well as per-user settings that might include menu and toolbar placement and a list of most-recently accessed documents.
However, the registry can be read at other times as well, such as in response to a modification of a
registry value or key. Although the registry provides asynchronous callbacks that are the preferred way
to receive change notifications, some applications constantly monitor their configuration settings in the
registry through polling and automatically take updated settings into account. In general, however, on
an idle system there should be no registry activity and such applications violate best practices. (Process
Monitor, from Sysinternals, is a great tool for tracking down such activity and the applications at fault.)
The registry is commonly modified in the following cases:
■
392
Although not a modification, the registry’s initial structure and many default settings are
defined by a prototype version of the registry that ships on the Windows setup media that is
copied onto a new installation.
CHAPTER 10
Management, diagnostics, and tracing
■
■
■
Application setup utilities create default application settings and settings that reflect installation configuration choices.
During the installation of a device driver, the Plug and Play system creates settings in the registry that tell the I/O manager how to start the driver and creates other settings that configure
the driver’s operation. (See Chapter 6, “I/O system,” in Part 1 for more information on how
device drivers are installed.)
When you change application or system settings through user interfaces, the changes are often
stored in the registry.
Registry data types
The registry is a database whose structure is similar to that of a disk volume. The registry contains keys,
which are similar to a disk’s directories, and values, which are comparable to files on a disk. A key is a
container that can consist of other keys (subkeys) or values. Values, on the other hand, store data. Toplevel keys are root keys. Throughout this section, we’ll use the words subkey and key interchangeably.
Both keys and values borrow their naming convention from the file system. Thus, you can uniquely
identify a value with the name mark, which is stored in a key called trade, with the name trade\mark.
One exception to this naming scheme is each key’s unnamed value. Regedit displays the unnamed
value as (Default).
Values store different kinds of data and can be one of the 12 types listed in Table 10-1. The majority
of registry values are REG_DWORD, REG_BINARY, or REG_SZ. Values of type REG_DWORD can store
numbers or Booleans (true/false values); REG_BINARY values can store numbers larger than 32 bits or
raw data such as encrypted passwords; REG_SZ values store strings (Unicode, of course) that can represent elements such as names, file names, paths, and types.
TABLE 10-1 Registry value types
Value Type
Description
REG_NONE
No value type
REG_SZ
Fixed-length Unicode string
REG_EXPAND_SZ
Variable-length Unicode string that can have embedded environment variables
REG_BINARY
Arbitrary-length binary data
REG_DWORD
32-bit number
REG_DWORD_BIG_ENDIAN
32-bit number, with high byte first
REG_LINK
Unicode symbolic link
REG_MULTI_SZ
Array of Unicode NULL-terminated strings
REG_RESOURCE_LIST
Hardware resource description
REG_FULL_RESOURCE_DESCRIPTOR
Hardware resource description
REG_RESOURCE_REQUIREMENTS_LIST
Resource requirements
REG_QWORD
64-bit number
CHAPTER 10
Management, diagnostics, and tracing
393
The REG_LINK type is particularly interesting because it lets a key transparently point to another
key. When you traverse the registry through a link, the path searching continues at the target of the
link. For example, if \Root1\Link has a REG_LINK value of \Root2\RegKey and RegKey contains the value
RegValue, two paths identify RegValue: \Root1\Link\RegValue and \Root2\RegKey\RegValue. As explained in the next section, Windows prominently uses registry links: three of the six registry root keys
are just links to subkeys within the three nonlink root keys.
Registry logical structure
You can chart the organization of the registry via the data stored within it. There are nine root keys
(and you can’t add new root keys or delete existing ones) that store information, as shown in Table 10-2.
TABLE 10-2 The nine root keys
Root Key
Description
HKEY_CURRENT_USER
Stores data associated with the currently logged-on user
HKEY_CURRENT_USER_LOCAL_SETTINGS
Stores data associated with the currently logged-on user that are local to the
machine and are excluded from a roaming user profile
HKEY_USERS
Stores information about all the accounts on the machine
HKEY_CLASSES_ROOT
Stores file association and Component Object Model (COM) object registration information
HKEY_LOCAL_MACHINE
Stores system-related information
HKEY_PERFORMANCE_DATA
Stores performance information
HKEY_PERFORMANCE_NLSTEXT
Stores text strings that describe performance counters in the local language
of the area in which the computer system is running
HKEY_PERFORMANCE_TEXT
Stores text strings that describe performance counters in US English.
HKEY_CURRENT_CONFIG
Stores some information about the current hardware profile (deprecated)
Why do root-key names begin with an H? Because the root-key names represent Windows handles
(H) to keys (KEY). As mentioned in Chapter 1, “Concepts and tools” of Part 1, HKLM is an abbreviation
used for HKEY_LOCAL_MACHINE. Table 10-3 lists all the root keys and their abbreviations. The following sections explain in detail the contents and purpose of each of these root keys.
TABLE 10-3 Registry root keys
394
Root Key
Abbreviation
Description
Link
HKEY_CURRENT_USER
HKCU
Points to the user profile
of the currently logged-on
user
Subkey under HKEY_USERS
corresponding to currently
logged-on user
HKEY_CURRENT_USER_LOCAL_SETTINGS
HKCULS
Points to the local settings
of the currently logged-on
user
Link to HKCU\Software\
Classes\Local Settings
HKEY_USERS
HKU
Contains subkeys for all
loaded user profiles
Not a link
CHAPTER 10
Management, diagnostics, and tracing
Root Key
Abbreviation
Description
Link
HKEY_CLASSES_ROOT
HKCR
Contains file association and
Not a direct link, but rather
COM registration information a merged view of HKLM\
SOFTWARE\Classes and
HKEY_USERS\<SID>\
SOFTWARE\Classes
HKEY_LOCAL_MACHINE
HKLM
Global settings for the
machine
Not a link
HKEY_CURRENT_CONFIG
HKCC
Current hardware profile
HKLM\SYSTEM\
CurrentControlSet\
Hardware Profiles\Current
HKEY_PERFORMANCE_DATA
HKPD
Performance counters
Not a link
HKEY_PERFORMANCE_NLSTEXT
HKPNT
Performance counters
text strings
Not a link
HKEY_PERFORMANCE_TEXT
HKPT
Performance counters text
strings in US English
Not a link
HKEY_CURRENT_USER
The HKCU root key contains data regarding the preferences and software configuration of the locally
logged-on user. It points to the currently logged-on user’s user profile, located on the hard disk at
\Users\<username>\Ntuser.dat. (See the section “Registry internals” later in this chapter to find out how
root keys are mapped to files on the hard disk.) Whenever a user profile is loaded (such as at logon time
or when a service process runs under the context of a specific username), HKCU is created to map to
the user’s key under HKEY_USERS (so if multiple users are logged on in the system, each user would see
a different HKCU). Table 10-4 lists some of the subkeys under HKCU.
TABLE 10-4 HKEY_CURRENT_USER subkeys
Subkey
Description
AppEvents
Sound/event associations
Console
Command window settings (for example, width, height, and colors)
Control Panel
Screen saver, desktop scheme, keyboard, and mouse settings, as well as accessibility and
regional settings
Environment
Environment variable definitions
EUDC
Information on end-user defined characters
Keyboard Layout
Keyboard layout setting (for example, United States or United Kingdom)
Network
Network drive mappings and settings
Printers
Printer connection settings
Software
User-specific software preferences
Volatile Environment
Volatile environment variable definitions
CHAPTER 10
Management, diagnostics, and tracing
395
HKEY_USERS
HKU contains a subkey for each loaded user profile and user class registration database on the system. It
also contains a subkey named HKU\.DEFAULT that is linked to the profile for the system (which is used by
processes running under the local system account and is described in more detail in the section “Services”
later in this chapter). This is the profile used by Winlogon, for example, so that changes to the desktop
background settings in that profile will be implemented on the logon screen. When a user logs on to a
system for the first time and her account does not depend on a roaming domain profile (that is, the user’s
profile is obtained from a central network location at the direction of a domain controller), the system
creates a profile for her account based on the profile stored in %SystemDrive%\Users\Default.
The location under which the system stores profiles is defined by the registry value HKLM\
Software\Microsoft\Windows NT\CurrentVersion\ProfileList\ProfilesDirectory, which is by default
set to %SystemDrive%\Users. The ProfileList key also stores the list of profiles present on a system.
Information for each profile resides under a subkey that has a name reflecting the security identifier
(SID) of the account to which the profile corresponds. (See Chapter 7, “Security,” of Part 1 for more
information on SIDs.) Data stored in a profile’s key includes the time of the last load of the profile in the
LocalProfileLoadTimeLow value, the binary representation of the account SID in the Sid value, and the
path to the profile’s on-disk hive (Ntuser.dat file, described later in this chapter in the “Hives” section)
in the directory given by the ProfileImagePath value. Windows shows profiles stored on a system in the
User Profiles management dialog box, shown in Figure 10-1, which you access by clicking Configure
Advanced User Profile Properties in the User Accounts Control Panel applet.
FIGURE 10-1 The User Profiles management dialog box.
396
CHAPTER 10
Management, diagnostics, and tracing
EXPERIMENT: Watching profile loading and unloading
You can see a profile load into the registry and then unload by using the Runas command to
launch a process in an account that’s not currently logged on to the machine. While the new
process is running, run Regedit and note the loaded profile key under HKEY_USERS. After terminating the process, perform a refresh in Regedit by pressing the F5 key, and the profile should no
longer be present.
HKEY_CLASSES_ROOT
HKCR consists of three types of information: file extension associations, COM class registrations, and
the virtualized registry root for User Account Control (UAC). (See Chapter 7 of Part 1 for more information on UAC.) A key exists for every registered file name extension. Most keys contain a REG_SZ value
that points to another key in HKCR containing the association information for the class of files that
extension represents.
For example, HKCR\.xls would point to information on Microsoft Office Excel files. For example,
the default value contains “Excel.Sheet.8” that is used to instantiate the Excel COM object. Other keys
contain configuration details for all COM objects registered on the system. The UAC virtualized registry
is located in the VirtualStore key, which is not related to the other kinds of data stored in HKCR.
The data under HKEY_CLASSES_ROOT comes from two sources:
■
■
The per-user class registration data in HKCU\SOFTWARE\Classes (mapped to the file on hard
disk \Users\<username>\AppData\Local\Microsoft\Windows\Usrclass.dat)
Systemwide class registration data in HKLM\SOFTWARE\Classes
CHAPTER 10
Management, diagnostics, and tracing
397
There is a separation of per-user registration data from systemwide registration data so that roaming profiles can contain customizations. Nonprivileged users and applications can read systemwide
data and can add new keys and values to systemwide data (which are mirrored in their per-user data),
but they can only modify existing keys and values in their private data. It also closes a security hole:
a nonprivileged user cannot change or delete keys in the systemwide version HKEY_CLASSES_ROOT;
thus, it cannot affect the operation of applications on the system.
HKEY_LOCAL_MACHINE
HKLM is the root key that contains all the systemwide configuration subkeys: BCD00000000, COMPONENTS
(loaded dynamically as needed), HARDWARE, SAM, SECURITY, SOFTWARE, and SYSTEM.
The HKLM\BCD00000000 subkey contains the Boot Configuration Database (BCD) information
loaded as a registry hive. This database replaces the Boot.ini file that was used before Windows Vista
and adds greater flexibility and isolation of per-installation boot configuration data. The BCD00000000
subkey is backed by the hidden BCD file, which, on UEFI systems, is located in \EFI\Microsoft\Boot. (For
more information on the BCD, see Chapter 12, "Startup and shutdown”).
Each entry in the BCD, such as a Windows installation or the command-line settings for the installation, is stored in the Objects subkey, either as an object referenced by a GUID (in the case of a boot
entry) or as a numeric subkey called an element. Most of these raw elements are documented in the
BCD reference in Microsoft Docs and define various command-line settings or boot parameters. The
value associated with each element subkey corresponds to the value for its respective command-line
flag or boot parameter.
The BCDEdit command-line utility allows you to modify the BCD using symbolic names for the elements and objects. It also provides extensive help for all the boot options available. A registry hive can
be opened remotely as well as imported from a hive file: you can modify or read the BCD of a remote
computer by using the Registry Editor. The following experiment shows you how to enable kernel debugging by using the Registry Editor.
EXPERIMENT: Remote BCD editing
Although you can modify offline BCD stores by using the bcdedit /store command, in this
experiment you will enable debugging through editing the BCD store inside the registry. For the
purposes of this example, you edit the local copy of the BCD, but the point of this technique is
that it can be used on any machine’s BCD hive. Follow these steps to add the /DEBUG commandline flag:
1.
398
Open the Registry Editor and then navigate to the HKLM\BCD00000000 key. Expand
every subkey so that the numerical identifiers of each Elements key are fully visible.
CHAPTER 10
Management, diagnostics, and tracing
2.
Identify the boot entry for your Windows installation by locating the Description with
a Type value of 0x10200003, and then select the 12000004 key in the Elements tree. In
the Element value of that subkey, you should find the name of your version of Windows,
such as Windows 10. In recent systems, you may have more than one Windows installation or various boot applications, like the Windows Recovery Environment or Windows
Resume Application. In those cases, you may need to check the 22000002 Elements
subkey, which contains the path, such as \Windows.
3.
Now that you’ve found the correct GUID for your Windows installation, create a new
subkey under the Elements subkey for that GUID and name it 0x260000a0. If this subkey
already exists, simply navigate to it. The found GUID should correspond to the identifier value under the Windows Boot Loader section shown by the bcdedit /v command
(you can use the /store command-line option to inspect an offline store file).
4.
If you had to create the subkey, now create a binary value called Element inside it.
5.
Edit the value and set it to 1. This will enable kernel-mode debugging. Here’s what these
changes should look like:
Note The 0x12000004 ID corresponds to BcdLibraryString_ApplicationPath, whereas the
0x22000002 ID corresponds to BcdOSLoaderString_SystemRoot. Finally, the ID you added,
0x260000a0, corresponds to BcdOSLoaderBoolean_KernelDebuggerEnabled. These values
are documented in the BCD reference in Microsoft Docs.
CHAPTER 10
Management, diagnostics, and tracing
399
The HKLM\COMPONENTS subkey contains information pertinent to the Component Based
Servicing (CBS) stack. This stack contains various files and resources that are part of a Windows installation image (used by the Automated Installation Kit or the OEM Preinstallation Kit) or an active installation. The CBS APIs that exist for servicing purposes use the information located in this key to identify
installed components and their configuration information. This information is used whenever components are installed, updated, or removed either individually (called units) or in groups (called packages).
To optimize system resources, because this key can get quite large, it is only dynamically loaded and
unloaded as needed if the CBS stack is servicing a request. This key is backed by the COMPONENTS
hive file located in \Windows\system32\config.
The HKLM\HARDWARE subkey maintains descriptions of the system’s legacy hardware and some
hardware device-to-driver mappings. On a modern system, only a few peripherals—such as keyboard,
mouse, and ACPI BIOS data—are likely to be found here. The Device Manager tool lets you view registry hardware information that it obtains by simply reading values out of the HARDWARE key (although
it primarily uses the HKLM\SYSTEM\CurrentControlSet\Enum tree).
HKLM\SAM holds local account and group information, such as user passwords, group definitions,
and domain associations. Windows Server systems operating as domain controllers store domain accounts and groups in Active Directory, a database that stores domainwide settings and information.
(Active Directory isn’t described in this book.) By default, the security descriptor on the SAM key is
configured so that even the administrator account doesn’t have access.
HKLM\SECURITY stores systemwide security policies and user-rights assignments. HKLM\SAM is
linked into the SECURITY subkey under HKLM\SECURITY\SAM. By default, you can’t view the contents
of HKLM\SECURITY or HKLM\SAM because the security settings of those keys allow access only by the
System account. (System accounts are discussed in greater detail later in this chapter.) You can change
the security descriptor to allow read access to administrators, or you can use PsExec to run Regedit in the
local system account if you want to peer inside. However, that glimpse won’t be very revealing because
the data is undocumented and the passwords are encrypted with one-way mapping—that is, you can’t
determine a password from its encrypted form. The SAM and SECURITY subkeys are backed by the SAM
and SECURITY hive files located in the \Windows\system32\config path of the boot partition.
HKLM\SOFTWARE is where Windows stores systemwide configuration information not needed to
boot the system. Also, third-party applications store their systemwide settings here, such as paths to
application files and directories and licensing and expiration date information.
HKLM\SYSTEM contains the systemwide configuration information needed to boot the system,
such as which device drivers to load and which services to start. The key is backed by the SYSTEM hive
file located in \Windows\system32\config. The Windows Loader uses registry services provided by the
Boot Library for being able to read and navigate through the SYSTEM hive.
HKEY_CURRENT_CONFIG
HKEY_CURRENT_CONFIG is just a link to the current hardware profile, stored under HKLM\SYSTEM\
CurrentControlSet\Hardware Profiles\Current. Hardware profiles are no longer supported in Windows,
but the key still exists to support legacy applications that might depend on its presence.
400
CHAPTER 10
Management, diagnostics, and tracing
HKEY_PERFORMANCE_DATA and HKEY_PERFORMANCE_TEXT
The registry is the mechanism used to access performance counter values on Windows, whether those
are from operating system components or server applications. One of the side benefits of providing
access to the performance counters via the registry is that remote performance monitoring works “for
free” because the registry is easily accessible remotely through the normal registry APIs.
You can access the registry performance counter information directly by opening a special key
named HKEY_PERFORMANCE_DATA and querying values beneath it. You won’t find this key by looking in the Registry Editor; this key is available only programmatically through the Windows registry
functions, such as RegQueryValueEx. Performance information isn’t actually stored in the registry; the
registry functions redirect access under this key to live performance information obtained from performance data providers.
The HKEY_PERFORMANCE_TEXT is another special key used to obtain performance counter
information (usually name and description). You can obtain the name of any performance counter by
querying data from the special Counter registry value. The Help special registry value yields all the
counters description instead. The information returned by the special key are in US English. The HKEY_
PERFORMANCE_NLSTEXT retrieves performance counters names and descriptions in the language in
which the OS runs.
You can also access performance counter information by using the Performance Data Helper (PDH)
functions available through the Performance Data Helper API (Pdh.dll). Figure 10-2 shows the components involved in accessing performance counter information.
Performance
monitoring
applications
Custom
application A
Custom
application B
Performance
tool
Pdh.dll
Programming
interfaces
Windows Management Instrumentation
RegQueryValueEx
High-performance provider interface
Advapi32.dll
System
System
performance
System
performance
DLL
performance
DLL
DLL
PerfLib
Registry DLL provider
Performance
Performance
extension
Performance
extension
DLL
extension
DLL
DLL
HighHighHighperformance
performance
performance
data
provider
data
provider
data
provider
object
object
object
FIGURE 10-2 Registry performance counter architecture.
As shown in Figure 10-2, this registry key is abstracted by the Performance Library (Perflib),
which is statically linked in Advapi32.dll. The Windows kernel has no knowledge about the
HKEY_PERFORMANCE_DATA registry key, which explains why it is not shown in the Registry Editor.
CHAPTER 10
Management, diagnostics, and tracing
401
Application hives
Applications are normally able to read and write data from the global registry. When an application
opens a registry key, the Windows kernel performs an access check verification against the access token
of its process (or thread in case the thread is impersonating; see Chapter 7 in Part 1 for more details)
and the ACL that a particular key contains. An application is also able to load and save registry hives by
using the RegSaveKeyEx and RegLoadKeyEx APIs. In those scenarios, the application operates on data
that other processes running at a higher or same privilege level can interfere with. Furthermore, for
loading and saving hives, the application needs to enable the Backup and Restore privileges. The two
privileges are granted only to processes that run with an administrative account.
Clearly this was a limitation for most applications that want to access a private repository for storing
their own settings. Windows 7 has introduced the concept of application hives. An application hive is a
standard hive file (which is linked to the proper log files) that can be mounted visible only to the application that requested it. A developer can create a base hive file by using the RegSaveKeyEx API (which
exports the content of a regular registry key in an hive file). The application can then mount the hive
privately using the RegLoadAppKey function (specifying the REG_PROCESS_APPKEY flag prevents other
applications from accessing the same hive). Internally, the function performs the following operations:
1.
Creates a random GUID and assigns it to a private namespace, in the form of \Registry\
A\<Random Guid>. (\Registry forms the NT kernel registry namespace, described in the
“The registry namespace and operation” section later in this chapter.)
2.
Converts the DOS path of the specified hive file name in NT format and calls the NtLoadKeyEx
native API with the proper set of parameters.
The NtLoadKeyEx function calls the regular registry callbacks. However, when it detects that the
hive is an application hive, it uses CmLoadAppKey to load it (and its associated log files) in the private
namespace, which is not enumerable by any other application and is tied to the lifetime of the calling
process. (The hive and log files are still mapped in the “registry process,” though. The registry process
will be described in the “Startup and registry process” section later in this chapter.) The application can
use standard registry APIs to read and write its own private settings, which will be stored in the application hive. The hive will be automatically unloaded when the application exits or when the last handle to
the key is closed.
Application hives are used by different Windows components, like the Application Compatibility
telemetry agent (CompatTelRunner.exe) and the Modern Application Model. Universal Windows
Platform (UWP) applications use application hives for storing information of WinRT classes that can be
instantiated and are private for the application. The hive is stored in a file called ActivationStore.dat
and is consumed primarily by the Activation Manager when an application is launched (or more precisely, is “activated”). The Background Infrastructure component of the Modern Application Model uses
the data stored in the hive for storing background tasks information. In that way, when a background
task timer elapses, it knows exactly in which application library the task’s code resides (and the activation type and threading model).
Furthermore, the modern application stack provides to UWP developers the concept of Application
Data containers, which can be used for storing settings that can be local to the device in which the
402
CHAPTER 10
Management, diagnostics, and tracing
application runs (in this case, the data container is called local) or can be automatically shared between
all the user’s devices that the application is installed on. Both kinds of containers are implemented in
the Windows.Storage.ApplicationData.dll WinRT library, which uses an application hive, local to the application (the backing file is called settings.dat), to store the settings created by the UWP application.
Both the settings.dat and the ActivationStore.dat hive files are created by the Modern Application
Model’s Deployment process (at app-installation time), which is covered extensively in Chapter 8,
“System mechanisms,” (with a general discussion of packaged applications). The Application
Data containers are documented at https://docs.microsoft.com/en-us/windows/uwp/get-started/
settings-learning-track.
Transactional Registry (TxR)
Thanks to the Kernel Transaction Manager (KTM; for more information see the section about the KTM
in Chapter 8), developers have access to a straightforward API that allows them to implement robust
error-recovery capabilities when performing registry operations, which can be linked with nonregistry
operations, such as file or database operations.
Three APIs support transactional modification of the registry: RegCreateKeyTransacted,
RegOpenKeyTransacted, and RegDeleteKeyTransacted. These new routines take the same parameters
as their nontransacted analogs except that a new transaction handle parameter is added. A developer
supplies this handle after calling the KTM function CreateTransaction.
After a transacted create or open operation, all subsequent registry operations—such as creating, deleting, or modifying values inside the key—will also be transacted. However, operations on
the subkeys of a transacted key will not be automatically transacted, which is why the third API,
RegDeleteKeyTransacted exists. It allows the transacted deletion of subkeys, which RegDeleteKeyEx
would not normally do.
Data for these transacted operations is written to log files using the common logging file system
(CLFS) services, similar to other KTM operations. Until the transaction is committed or rolled back
(both of which might happen programmatically or as a result of a power failure or system crash, depending on the state of the transaction), the keys, values, and other registry modifications performed
with the transaction handle will not be visible to external applications through the nontransacted APIs.
Also, transactions are isolated from each other; modifications made inside one transaction will not be
visible from inside other transactions or outside the transaction until the transaction is committed.
Note A nontransactional writer will abort a transaction in case of conflict—for example, if
a value was created inside a transaction and later, while the transaction is still active, a nontransactional writer tries to create a value under the same key. The nontransactional operation will succeed, and all operations in the conflicting transaction will be aborted.
The isolation level (the “I” in ACID) implemented by TxR resource managers is read-commit, which
means that changes become available to other readers (transacted or not) immediately after being
committed. This mechanism is important for people who are familiar with transactions in databases,
CHAPTER 10
Management, diagnostics, and tracing
403
where the isolation level is predictable-reads (or cursor-stability, as it is called in database literature).
With a predictable-reads isolation level, after you read a value inside a transaction, subsequent reads
returns the same data. Read-commit does not make this guarantee. One of the consequences is that
registry transactions can’t be used for “atomic” increment/decrement operations on a registry value.
To make permanent changes to the registry, the application that has been using the transaction
handle must call the KTM function CommitTransaction. (If the application decides to undo the changes,
such as during a failure path, it can call the RollbackTransaction API.) The changes are then visible
through the regular registry APIs as well.
Note If a transaction handle created with CreateTransaction is closed before the transaction
is committed (and there are no other handles open to that transaction), the system rolls back
that transaction.
Apart from using the CLFS support provided by the KTM, TxR also stores its own internal log files in
the %SystemRoot%\System32\Config\Txr folder on the system volume; these files have a .regtrans-ms
extension and are hidden by default. There is a global registry resource manager (RM) that services all
the hives mounted at boot time. For every hive that is mounted explicitly, an RM is created. For applications that use registry transactions, the creation of an RM is transparent because KTM ensures that all
RMs taking part in the same transaction are coordinated in the two-phase commit/abort protocol. For
the global registry RM, the CLFS log files are stored, as mentioned earlier, inside System32\Config\Txr.
For other hives, they are stored alongside the hive (in the same directory). They are hidden and follow
the same naming convention, ending in .regtrans-ms. The log file names are prefixed with the name of
the hive to which they correspond.
Monitoring registry activity
Because the system and applications depend so heavily on configuration settings to guide their behavior, system and application failures can result from changing registry data or security. When the system
or an application fails to read settings that it assumes it will always be able to access, it might not function properly, display error messages that hide the root cause, or even crash. It’s virtually impossible
to know what registry keys or values are misconfigured without understanding how the system or the
application that’s failing is accessing the registry. In such situations, the Process Monitor utility from
Windows Sysinternals (https://docs.microsoft.com/en-us/sysinternals/ ) might provide the answer.
Process Monitor lets you monitor registry activity as it occurs. For each registry access, Process
Monitor shows you the process that performed the access; the time, type, and result of the access; and
the stack of the thread at the moment of the access. This information is useful for seeing how applications and the system rely on the registry, discovering where applications and the system store configuration settings, and troubleshooting problems related to applications having missing registry keys
or values. Process Monitor includes advanced filtering and highlighting so that you can zoom in on
activity related to specific keys or values or to the activity of particular processes.
404
CHAPTER 10
Management, diagnostics, and tracing
Process Monitor internals
Process Monitor relies on a device driver that it extracts from its executable image at runtime before
starting it. Its first execution requires that the account running it has the Load Driver privilege as well as
the Debug privilege; subsequent executions in the same boot session require only the Debug privilege
because, once loaded, the driver remains resident.
EXPERIMENT: Viewing registry activity on an idle system
Because the registry implements the RegNotifyChangeKey function that applications can use
to request notification of registry changes without polling for them, when you launch Process
Monitor on a system that’s idle you should not see repetitive accesses to the same registry keys
or values. Any such activity identifies a poorly written application that unnecessarily negatively
affects a system’s overall performance.
Run Process Monitor, make sure that only the Show Registry Activity icon is enabled in the
toolbar (with the goal to remove noise generated by the File system, network, and processes or
threads) and, after several seconds, examine the output log to see whether you can spot polling
behavior. Right-click an output line associated with polling and then choose Process Properties
from the context menu to view details about the process performing the activity.
EXPERIMENT: Using Process Monitor to locate application registry settings
In some troubleshooting scenarios, you might need to determine where in the registry the system or an application stores particular settings. This experiment has you use Process Monitor to
discover the location of Notepad’s settings. Notepad, like most Windows applications, saves user
preferences—such as word-wrap mode, font and font size, and window position—across executions. By having Process Monitor watching when Notepad reads or writes its settings, you can
identify the registry key in which the settings are stored. Here are the steps for doing this:
1.
Have Notepad save a setting you can easily search for in a Process Monitor trace.
You can do this by running Notepad, setting the font to Times New Roman, and then
exiting Notepad.
2.
Run Process Monitor. Open the filter dialog box and the Process Name filter, and type
notepad.exe as the string to match. Confirm by clicking the Add button. This step
specifies that Process Monitor will log only activity by the notepad.exe process.
3.
Run Notepad again, and after it has launched, stop Process Monitor’s event capture by
toggling Capture Events on the Process Monitor File menu.
4.
Scroll to the top line of the resultant log and select it.
CHAPTER 10
Management, diagnostics, and tracing
405
5.
Press Ctrl+F to open a Find dialog box, and search for times new. Process Monitor
should highlight a line like the one shown in the following screen that represents
Notepad reading the font value from the registry. Other operations in the immediate
vicinity should relate to other Notepad settings.
6.
Right-click the highlighted line and click Jump To. Process Monitor starts Regedit (if it’s
not already running) and causes it to navigate to and select the Notepad-referenced
registry value.
Registry internals
This section describes how the configuration manager—the executive subsystem that implements the
registry—organizes the registry’s on-disk files. We’ll examine how the configuration manager manages
the registry as applications and other operating system components read and change registry keys and
values. We’ll also discuss the mechanisms by which the configuration manager tries to ensure that the
registry is always in a recoverable state, even if the system crashes while the registry is being modified.
Hives
On disk, the registry isn’t simply one large file but rather a set of discrete files called hives. Each hive
contains a registry tree, which has a key that serves as the root or starting point of the tree. Subkeys
and their values reside beneath the root. You might think that the root keys displayed by the Registry
Editor correlate to the root keys in the hives, but such is not the case. Table 10-5 lists registry hives and
their on-disk file names. The path names of all hives except for user profiles are coded into the configuration manager. As the configuration manager loads hives, including system profiles, it notes each
hive’s path in the values under the HKLM\SYSTEM\CurrentControlSet\Control\Hivelist subkey, removing the path if the hive is unloaded. It creates the root keys, linking these hives together to build the
registry structure you’re familiar with and that the Registry Editor displays.
406
CHAPTER 10
Management, diagnostics, and tracing
TABLE 10-5 On-disk files corresponding to paths in the registry
Hive Registry Path
Hive File Path
HKEY_LOCAL_MACHINE\BCD00000000
\EFI\Microsoft\Boot
HKEY_LOCAL_MACHINE\COMPONENTS
%SystemRoot%\System32\Config\Components
HKEY_LOCAL_MACHINE\SYSTEM
%SystemRoot%\System32\Config\System
HKEY_LOCAL_MACHINE\SAM
%SystemRoot%\System32\Config\Sam
HKEY_LOCAL_MACHINE\SECURITY
%SystemRoot%\System32\Config\Security
HKEY_LOCAL_MACHINE\SOFTWARE
%SystemRoot%\System32\Config\Software
HKEY_LOCAL_MACHINE\HARDWARE
Volatile hive
\HKEY_LOCAL_MACHINE\WindowsAppLockerCache
%SystemRoot%\System32\AppLocker\AppCache.dat
HKEY_LOCAL_MACHINE\ELAM
%SystemRoot%\System32\Config\Elam
HKEY_USERS\<SID of local service account>
%SystemRoot%\ServiceProfiles\LocalService\Ntuser.dat
HKEY_USERS\<SID of network service account>
%SystemRoot%\ServiceProfiles\NetworkService\NtUser.dat
HKEY_USERS\<SID of username>
\Users\<username>\Ntuser.dat
HKEY_USERS\<SID of username>_Classes
\Users\<username>\AppData\Local\Microsoft\Windows\
Usrclass.dat
HKEY_USERS\.DEFAULT
%SystemRoot%\System32\Config\Default
Virtualized HKEY_LOCAL_MACHINE\SOFTWARE
Different paths. Usually
\ProgramData\Packages\<PackageFullName>\<UserSid>\
SystemAppData\Helium\Cache\<RandomName>.dat for
Centennial
Virtualized HKEY_CURRENT_USER
Different paths. Usually
\ProgramData\Packages\<PackageFullName>\<UserSid>\
SystemAppData\Helium\User.dat for Centennial
Virtualized HKEY_LOCAL_MACHINE\SOFTWARE\Classes Different paths. Usually
\ProgramData\Packages\<PackageFullName>\<UserSid>\
SystemAppData\Helium\UserClasses.dat for Centennial
You’ll notice that some of the hives listed in Table 10-5 are volatile and don’t have associated files.
The system creates and manages these hives entirely in memory; the hives are therefore temporary. The system creates volatile hives every time it boots. An example of a volatile hive is the HKLM\
HARDWARE hive, which stores information about physical devices and the devices’ assigned resources.
Resource assignment and hardware detection occur every time the system boots, so not storing this
data on disk is logical. You will also notice that the last three entries in the table represent virtualized
hives. Starting from Windows 10 Anniversary Update, the NT kernel supports the Virtualized Registry
(VReg), with the goal to provide support for Centennial packaged applications, which runs in a Helium
container. Every time the user runs a centennial application (like the modern Skype, for example), the
system mounts the needed package hives. Centennial applications and the Modern Application Model
have been extensively discussed in Chapter 8.
CHAPTER 10
Management, diagnostics, and tracing
407
EXPERIMENT: Manually loading and unloading hives
Regedit has the ability to load hives that you can access through its File menu. This capability can
be useful in troubleshooting scenarios where you want to view or edit a hive from an unbootable
system or a backup medium. In this experiment, you’ll use Regedit to load a version of the
HKLM\SYSTEM hive that Windows Setup creates during the install process.
1.
Hives can be loaded only underneath HKLM or HKU, so open Regedit, select HKLM,
and choose Load Hive from the Regedit File menu.
2.
Navigate to the %SystemRoot%\System32\Config\RegBack directory in the Load Hive
dialog box, select System, and open it. Some newer systems may not have any file in
the RegBack folder. In that case, you can try the same experiment by opening the ELAM
hive located in the Config folder. When prompted, type Test as the name of the key
under which it will load.
3.
Open the newly created HKLM\Test key and explore the contents of the hive.
4.
Open HKLM\SYSTEM\CurrentControlSet\Control\Hivelist and locate the entry
\Registry\Machine\Test, which demonstrates how the configuration manager lists
loaded hives in the Hivelist key.
5.
Select HKLM\Test and then choose Unload Hive from the Regedit File menu to unload
the hive.
Hive size limits
In some cases, hive sizes are limited. For example, Windows places a limit on the size of the
HKLM\SYSTEM hive. It does so because Winload reads the entire HKLM\SYSTEM hive into physical
memory near the start of the boot process when virtual memory paging is not enabled. Winload also
loads Ntoskrnl and boot device drivers into physical memory, so it must constrain the amount of physical memory assigned to HKLM\SYSTEM. (See Chapter 12 for more information on the role Winload
plays during the startup process.) On 32-bit systems, Winload allows the hive to be as large as 400 MB
or half the amount of physical memory on the system, whichever is lower. On x64 systems, the lower
bound is 2 GB.
Startup and the registry process
Before Windows 8.1, the NT kernel was using paged pool for storing the content of every loaded hive
file. Most of the hives loaded in the system remained in memory until the system shutdown (a good
example is the SOFTWARE hive, which is loaded by the Session Manager after phase 1 of the System
startup is completed and sometimes could be multiple hundreds of megabytes in size). Paged pool
memory could be paged out by the balance set manager of the memory manager, if it is not accessed
for a certain amount of time (see Chapter 5, “Memory management,” in Part 1 for more details). This
implies that unused parts of a hive do not remain in the working set for a long time. Committed virtual
408
CHAPTER 10
Management, diagnostics, and tracing
memory is backed by the page file and requires the system Commit charge to be increased, reducing
the total amount of virtual memory available for other purposes.
To overcome this problem, Windows 10 April 2018 Update (RS4) introduced support for the sectionbacked registry. At phase 1 of the NT kernel initialization, the Configuration manager startup routine
initializes multiple components of the Registry: cache, worker threads, transactions, callbacks support,
and so on. It then creates the Key object type, and, before loading the needed hives, it creates the
Registry process. The Registry process is a fully-protected (same protection as the SYSTEM process:
WinSystem level), minimal process, which the configuration manager uses for performing most of the
I/Os on opened registry hives. At initialization time, the configuration manager maps the preloaded
hives in the Registry process. The preloaded hives (SYSTEM and ELAM) continue to reside in nonpaged
memory, though (which is mapped using kernel addresses). Later in the boot process, the Session
Manager loads the Software hive by invoking the NtInitializeRegistry system call.
A section object backed by the “SOFTWARE” hive file is created: the configuration manager divides
the file in 2-MB chunks and creates a reserved mapping in the Registry process’s user-mode address
space for each of them (using the NtMapViewOfSection native API. Reserved mappings are tracked by
valid VADs, but no actual pages are allocated. See Chapter 5 in Part 1 for further details). Each 2-MB
view is read-only protected. When the configuration manager wants to read some data from the hive,
it accesses the view’s pages and produces an access fault, which causes the shared pages to be brought
into memory by the memory manager. At that time, the system working set charge is increased, but
not the commit charge (the pages are backed by the hive file itself, and not by the page file).
At initialization time, the configuration manager sets the hard-working set limit to the Registry process at 64 MB. This means that in high memory pressure scenarios, it is guaranteed that no more than
64 MB of working set is consumed by the registry. Every time an application or the system uses the
APIs to access the registry, the configuration manager attaches to the Registry process address space,
performs the needed work, and returns the results. The configuration manager doesn’t always need to
switch address spaces: when the application wants to access a registry key that is already in the cache
(a Key control block already exists), the configuration manager skips the process attach and returns the
cached data. The registry process is primarily used for doing I/O on the low-level hive file.
When the system writes or modifies registry keys and values stored in a hive, it performs a copyon-write operation (by first changing the memory protection of the 2 MB view to PAGE_WRITECOPY).
Writing to memory marked as copy-on-write creates new private pages and increases the system
commit charge. When a registry update is requested, the system immediately writes new entries in
the hive’s log, but the writing of the actual pages belonging to the primary hive file is deferred. Dirty
hive’s pages, as for every normal memory page, can be paged out to disk. Those pages are written to
the primary hive file when the hive is being unloaded or by the Reconciler: one of the configuration
manager’s lazy writer threads that runs by default once every hour (the time period is configurable
by setting the HKLM\SYSTEM\ CurrentControlSet\Control\Session Manager\Configuration Manager\
RegistryLazyReconcileInterval registry value).
The Reconciler and the Incremental logging are discussed in the “Incremental logging” section later
in this chapter.
CHAPTER 10
Management, diagnostics, and tracing
409
Registry symbolic links
A special type of key known as a registry symbolic link makes it possible for the configuration manager
to link keys to organize the registry. A symbolic link is a key that redirects the configuration manager to
another key. Thus, the key HKLM\SAM is a symbolic link to the key at the root of the SAM hive. Symbolic
links are created by specifying the REG_CREATE_LINK parameter to RegCreateKey or RegCreateKeyEx.
Internally, the configuration manager will create a REG_LINK value called SymbolicLinkValue, which contains the path to the target key. Because this value is a REG_LINK instead of a REG_SZ, it will not be visible
with Regedit—it is, however, part of the on-disk registry hive.
EXPERIMENT: Looking at hive handles
The configuration manager opens hives by using the kernel handle table (described in Chapter 8)
so that it can access hives from any process context. Using the kernel handle table is an efficient
alternative to approaches that involve using drivers or executive components to access from the
System process only handles that must be protected from user processes. You can start Process
Explorer as Administrator to see the hive handles, which will be displayed as being opened in
the System process. Select the System process, and then select Handles from the Lower Pane
View menu entry on the View menu. Sort by handle type, and scroll until you see the hive files,
as shown in the following screen.
410
CHAPTER 10
Management, diagnostics, and tracing
Hive structure
The configuration manager logically divides a hive into allocation units called blocks in much the same
way that a file system divides a disk into clusters. By definition, the registry block size is 4096 bytes
(4 KB). When new data expands a hive, the hive always expands in block-granular increments. The first
block of a hive is the base block.
The base block includes global information about the hive, including a signature—regf—that identifies the file as a hive, two updated sequence numbers, a time stamp that shows the last time a write
operation was initiated on the hive, information on registry repair or recovery performed by Winload,
the hive format version number, a checksum, and the hive file’s internal file name (for example,
\Device\HarddiskVolume1\WINDOWS\SYSTEM32\CONFIG\SAM). We’ll clarify the significance of the
two updated sequence numbers and time stamp when we describe how data is written to a hive file.
The hive format version number specifies the data format within the hive. The configuration manager uses hive format version 1.5, which supports large values (values larger than 1 MB are supported)
and improved searching (instead of caching the first four characters of a name, a hash of the entire
name is used to reduce collisions). Furthermore, the configuration manager supports differencing hives
introduced for container support. Differencing hives uses hive format 1.6.
Windows organizes the registry data that a hive stores in containers called cells. A cell can hold a
key, a value, a security descriptor, a list of subkeys, or a list of key values. A four-byte character tag at
the beginning of a cell’s data describes the data’s type as a signature. Table 10-6 describes each cell
data type in detail. A cell’s header is a field that specifies the cell’s size as the 1’s complement (not present in the CM_ structures). When a cell joins a hive and the hive must expand to contain the cell, the
system creates an allocation unit called a bin.
A bin is the size of the new cell rounded up to the next block or page boundary, whichever is higher.
The system considers any space between the end of the cell and the end of the bin to be free space
that it can allocate to other cells. Bins also have headers that contain a signature, hbin, and a field that
records the offset into the hive file of the bin and the bin’s size.
TABLE 10-6 Cell data types
Data Type
Structure Type
Description
Key cell
CM_KEY_NODE
A cell that contains a registry key, also called a key node. A key cell contains a signature (kn for a key, kl for a link node), the time stamp of the
most recent update to the key, the cell index of the key’s parent key cell,
the cell index of the subkey-list cell that identifies the key’s subkeys, a cell
index for the key’s security descriptor cell, a cell index for a string key that
specifies the class name of the key, and the name of the key (for example,
CurrentControlSet). It also saves cached information such as the number
of subkeys under the key, as well as the size of the largest key, value name,
value data, and class name of the subkeys under this key.
Value cell
CM_KEY_VALUE
A cell that contains information about a key’s value. This cell includes
a signature (kv), the value’s type (for example, REG_ DWORD or
REG_BINARY), and the value’s name (for example, Boot-Execute).
A value cell also contains the cell index of the cell that contains the
value’s data.
CHAPTER 10
Management, diagnostics, and tracing
411
Data Type
Structure Type
Description
Big Value cell
CM_BIG_DATA
A cell that represents a registry value bigger than 16 kB. For this kind of
cell type, the cell content is an array of cell indexes each pointing to a
16-kB cell, which contains a chunk of the registry value.
Subkey-list cell
CM_KEY_INDEX
A cell composed of a list of cell indexes for key cells that are all subkeys
of a common parent key.
Value-list cell
CM_KEY_INDEX
A cell composed of a list of cell indexes for value cells that are all values
of a common parent key.
Security-descriptor cell
CM_KEY_SECURITY
A cell that contains a security descriptor. Security-descriptor cells include a signature (ks) at the head of the cell and a reference count that
records the number of key nodes that share the security descriptor.
Multiple key cells can share security-descriptor cells.
By using bins instead of cells, to track active parts of the registry, Windows minimizes some management chores. For example, the system usually allocates and deallocates bins less frequently than it
does cells, which lets the configuration manager manage memory more efficiently. When the configuration manager reads a registry hive into memory, it reads the whole hive, including empty bins, but it
can choose to discard them later. When the system adds and deletes cells in a hive, the hive can contain
empty bins interspersed with active bins. This situation is similar to disk fragmentation, which occurs
when the system creates and deletes files on the disk. When a bin becomes empty, the configuration
manager joins to the empty bin any adjacent empty bins to form as large a contiguous empty bin as
possible. The configuration manager also joins adjacent deleted cells to form larger free cells. (The configuration manager shrinks a hive only when bins at the end of the hive become free. You can compact
the registry by backing it up and restoring it using the Windows RegSaveKey and RegReplaceKey functions, which are used by the Windows Backup utility. Furthermore, the system compacts the bins at hive
initialization time using the Reorganization algorithm, as described later.)
The links that create the structure of a hive are called cell indexes. A cell index is the offset of a cell
into the hive file minus the size of the base block. Thus, a cell index is like a pointer from one cell to another cell that the configuration manager interprets relative to the start of a hive. For example, as you
saw in Table 10-6, a cell that describes a key contains a field specifying the cell index of its parent key; a
cell index for a subkey specifies the cell that describes the subkeys that are subordinate to the specified
subkey. A subkey-list cell contains a list of cell indexes that refer to the subkey’s key cells. Therefore, if
you want to locate, for example, the key cell of subkey A whose parent is key B, you must first locate the
cell containing key B’s subkey list using the subkey-list cell index in key B’s cell. Then you locate each of
key B’s subkey cells by using the list of cell indexes in the subkey-list cell. For each subkey cell, you check
to see whether the subkey’s name, which a key cell stores, matches the one you want to locate—in this
case, subkey A.
The distinction between cells, bins, and blocks can be confusing, so let’s look at an example of a
simple registry hive layout to help clarify the differences. The sample registry hive file in Figure 10-3
contains a base block and two bins. The first bin is empty, and the second bin contains several cells.
Logically, the hive has only two keys: the root key Root and a subkey of Root, Sub Key. Root has two values, Val 1 and Val 2. A subkey-list cell locates the root key’s subkey, and a value-list cell locates the root
key’s values. The free spaces in the second bin are empty cells. Figure 10-3 doesn’t show the security
cells for the two keys, which would be present in a hive.
412
CHAPTER 10
Management, diagnostics, and tracing
Block boundaries
Base block
Empty bin
Root
Vol 1
Sub
Vol 2
Key
Bin 1
Key cell (key node)
Value cell
Value-list cell
Subkey-list cell
Free space
Bin 2
FIGURE 10-3 Internal structure of a registry hive.
To optimize searches for both values and subkeys, the configuration manager sorts subkey-list cells
alphabetically. The configuration manager can then perform a binary search when it looks for a subkey
within a list of subkeys. The configuration manager examines the subkey in the middle of the list, and
if the name of the subkey the configuration manager is looking for alphabetically precedes the name
of the middle subkey, the configuration manager knows that the subkey is in the first half of the subkey
list; otherwise, the subkey is in the second half of the subkey list. This splitting process continues until
the configuration manager locates the subkey or finds no match. Value-list cells aren’t sorted, however,
so new values are always added to the end of the list.
Cell maps
If hives never grew, the configuration manager could perform all its registry management on the inmemory version of a hive as if the hive were a file. Given a cell index, the configuration manager could
calculate the location in memory of a cell simply by adding the cell index, which is a hive file offset, to
the base of the in-memory hive image. Early in the system boot, this process is exactly what Winload
does with the SYSTEM hive: Winload reads the entire SYSTEM hive into memory as a read-only hive and
adds the cell indexes to the base of the in-memory hive image to locate cells. Unfortunately, hives grow
as they take on new keys and values, which means the system must allocate new reserved views and
extend the hive file to store the new bins that contain added keys and values. The reserved views that
keep the registry data in memory aren’t necessarily contiguous.
To deal with noncontiguous memory addresses referencing hive data in memory, the configuration manager adopts a strategy similar to what the Windows memory manager uses to map virtual
memory addresses to physical memory addresses. While a cell index is only an offset in the hive file, the
configuration manager employs a two-level scheme, which Figure 10-4 illustrates, when it represents
the hive using the mapped views in the registry process. The scheme takes as input a cell index (that is,
a hive file offset) and returns as output both the address in memory of the block the cell index resides
in and the address in memory of the block the cell resides in. Remember that a bin can contain one or
more blocks and that hives grow in bins, so Windows always represents a bin with a contiguous region
of memory. Therefore, all blocks within a bin occur within the same 2-MB hive’s mapped view.
CHAPTER 10
Management, diagnostics, and tracing
413
Cell index
Directory index
Table index
Byte offset
32
0
Hive’s cell map
directory
0
0
Cell map table
Target block
Cell
1023
511
Hive cell map directory pointer
FIGURE 10-4 Structure of a cell index.
To implement the mapping, the configuration manager divides a cell index logically into fields, in
the same way that the memory manager divides a virtual address into fields. Windows interprets a
cell index’s first field as an index into a hive’s cell map directory. The cell map directory contains 1024
entries, each of which refers to a cell map table that contains 512 map entries. An entry in this cell map
table is specified by the second field in the cell index. That entry locates the bin and block memory addresses of the cell.
In the final step of the translation process, the configuration manager interprets the last field of the
cell index as an offset into the identified block to precisely locate a cell in memory. When a hive initializes, the configuration manager dynamically creates the mapping tables, designating a map entry for
each block in the hive, and it adds and deletes tables from the cell directory as the changing size of the
hive requires.
Hive reorganization
As for real file systems, registry hives suffer fragmentation problems: when cells in the bin are freed
and it is not possible to coalescence them in a contiguous manner, fragmented little chunks of free
space are created into various bins. If there is not enough available contiguous space for new cells, new
bins are appended at the end of the hive file, while the fragmented ones will be rarely repurposed. To
overcome this problem, starting from Windows 8.1, every time the configuration manager mounts a
hive file, it checks whether a hive’s reorganization needs to be performed. The configuration manager
records the time of the last reorganization in the hive’s basic block. If the hive has valid log files, is not
volatile, and if the time passed after the previous reorganization is greater than seven days, the reorganization operation is started. The reorganization is an operation that has two main goals: shrink the
hive file and optimize it. It starts by creating a new empty hive that is identical to the original one but
does not contains any cells in it. The created clone is used to copy the root key of the original hive, with
all its values (but no subkeys). A complex algorithm analyzes all the child keys: indeed, during its normal
414
CHAPTER 10
Management, diagnostics, and tracing
activity, the configuration manager records whether a particular key is accessed, and, if so, stores an
index representing the current runtime phase of the operating system (Boot or normal) in its key cell.
The reorganization algorithm first copies the keys accessed during the normal execution of the OS,
then the ones accessed during the boot phase, and finally the keys that have not been accessed at all
(since the last reorganization). This operation groups all the different keys in contiguous bins of the hive
file. The copy operation, by definition, produces a nonfragmented hive file (each cell is stored sequentially
in the bin, and new bin are always appended at the end of the file). Furthermore, the new hive has the
characteristic to contain hot and cold classes of keys stored in big contiguous chunks. This result renders
the boot and runtime phase of the operating system much quicker when reading data from the registry.
The reorganization algorithm resets the access state of all the new copied cells. In this way, the
system can track the hive’s keys usage by restarting from a neutral state. The new usage statistics will
be consumed by the next reorganization, which will start after seven days. The configuration manager
stores the results of a reorganization cycle in the HKLM\SYSTEM\CurrentControlSet\Control\Session
Manager\Configuration Manager\Defrag registry key, as shown in Figure 10-5. In the sample screenshot, the last reorganization was run on April 10, 2019 and saved 10 MB of fragmented hive space.
FIGURE 10-5 Registry reorganization data.
The registry namespace and operation
The configuration manager defines a key object type to integrate the registry’s namespace with the
kernel’s general namespace. The configuration manager inserts a key object named Registry into the
root of the Windows namespace, which serves as the entry point to the registry. Regedit shows key
names in the form HKEY_LOCAL_MACHINE\SYSTEM\CurrentControlSet, but the Windows subsystem
translates such names into their object namespace form (for example, \Registry\Machine\System\
CurrentControlSet). When the Windows object manager parses this name, it encounters the key
CHAPTER 10
Management, diagnostics, and tracing
415
object by the name of Registry first and hands the rest of the name to the configuration manager. The
configuration manager takes over the name parsing, looking through its internal hive tree to find the
desired key or value. Before we describe the flow of control for a typical registry operation, we need
to discuss key objects and key control blocks. Whenever an application opens or creates a registry key,
the object manager gives a handle with which to reference the key to the application. The handle corresponds to a key object that the configuration manager allocates with the help of the object manager.
By using the object manager’s object support, the configuration manager takes advantage of the
security and reference-counting functionality that the object manager provides.
For each open registry key, the configuration manager also allocates a key control block. A key
control block stores the name of the key, includes the cell index of the key node that the control block
refers to, and contains a flag that notes whether the configuration manager needs to delete the key
cell that the key control block refers to when the last handle for the key closes. Windows places all key
control blocks into a hash table to enable quick searches for existing key control blocks by name. A key
object points to its corresponding key control block, so if two applications open the same registry key,
each receives a key object, and both key objects point to a common key control block.
When an application opens an existing registry key, the flow of control starts with the application specifying the name of the key in a registry API that invokes the object manager’s name-parsing
routine. The object manager, upon encountering the configuration manager’s registry key object in the
namespace, hands the path name to the configuration manager. The configuration manager performs
a lookup on the key control block hash table. If the related key control block is found there, there’s no
need for any further work (no registry process attach is needed); otherwise, the lookup provides the
configuration manager with the closest key control block to the searched key, and the lookup continues by attaching to the registry process and using the in-memory hive data structures to search
through keys and subkeys to find the specified key. If the configuration manager finds the key cell, the
configuration manager searches the key control block tree to determine whether the key is open (by
the same application or another one). The search routine is optimized to always start from the closest ancestor with a key control block already opened. For example, if an application opens \Registry\
Machine\Key1\Subkey2, and \Registry\Machine is already open, the parse routine uses the key control
block of \Registry\Machine as a starting point. If the key is open, the configuration manager increments the existing key control block’s reference count. If the key isn’t open, the configuration manager
allocates a new key control block and inserts it into the tree. Then the configuration manager allocates
a key object, points the key object at the key control block, detaches from the Registry process, and
returns control to the object manager, which returns a handle to the application.
When an application creates a new registry key, the configuration manager first finds the key cell
for the new key’s parent. The configuration manager then searches the list of free cells for the hive in
which the new key will reside to determine whether cells exist that are large enough to hold the new
key cell. If there aren’t any free cells large enough, the configuration manager allocates a new bin and
uses it for the cell, placing any space at the end of the bin on the free cell list. The new key cell fills with
pertinent information—including the key’s name—and the configuration manager adds the key cell to
the subkey list of the parent key’s subkey-list cell. Finally, the system stores the cell index of the parent
cell in the new subkey’s key cell.
416
CHAPTER 10
Management, diagnostics, and tracing
The configuration manager uses a key control block’s reference count to determine when to delete
the key control block. When all the handles that refer to a key in a key control block close, the reference
count becomes 0, which denotes that the key control block is no longer necessary. If an application that
calls an API to delete the key sets the delete flag, the configuration manager can delete the associated
key from the key’s hive because it knows that no application is keeping the key open.
EXPERIMENT: Viewing key control blocks
You can use the kernel debugger to list all the key control blocks allocated on a system with the
!reg openkeys command. Alternatively, if you want to view the key control block for a particular
open key, use !reg querykey:
0: kd> !reg querykey \Registry\machine\software\microsoft
Found KCB = ffffae08c156ae60 :: \REGISTRY\MACHINE\SOFTWARE\MICROSOFT
Hive
KeyNode
ffffae08c03b0000
00000225e8c3475c
[SubKeyAddr]
225e8d23e64
225e8d24074
225e8d240d4
225ec530f54
225e8d241d4
225e8d2422c
225e8d24294
225e8d242ec
225e8d24354
225e8d243f4
225e8d2448c
225ec661f4c
225e8d2451c
225e8d2458c
...
[SubKeyName]
.NETFramework
AccountsControl
Active Setup
ActiveSync
Ads
Advanced INF Setup
ALG
AllUserInstallAgent
AMSI
Analog
AppServiceProtocols
AppV
Assistance
AuthHost
You can then examine a reported key control block with the !reg kcb command:
kd> !reg kcb ffffae08c156ae60
Key
:
RefCount
:
Flags
:
ExtFlags
:
Parent
:
KeyHive
:
KeyCell
:
TotalLevels
:
DelayedCloseIndex:
MaxNameLen
:
MaxValueNameLen :
MaxValueDataLen :
LastWriteTime
:
KeyBodyListHead :
\REGISTRY\MACHINE\SOFTWARE\MICROSOFT
1f
CompressedName, Stable
0xe1997368
0xe1c8a768
0x64e598 [cell index]
4
2048
0x3c
0x0
0x0
0x1c42501:0x7eb6d470
0xe1034d70 0xe1034d70
CHAPTER 10
Management, diagnostics, and tracing
417
SubKeyCount
ValueCache.Count
KCBLock
KeyLock
:
:
:
:
137
0
0xe1034d40
0xe1034d40
The Flags field indicates that the name is stored in compressed form, and the SubKeyCount
field shows that the key has 137 subkeys.
Stable storage
To make sure that a nonvolatile registry hive (one with an on-disk file) is always in a recoverable state,
the configuration manager uses log hives. Each nonvolatile hive has an associated log hive, which is a
hidden file with the same base name as the hive and a logN extension. To ensure forward progress, the
configuration manager uses a dual-logging scheme. There are potentially two log files: .log1 and .log2.
If, for any reason, .log1 was written but a failure occurred while writing dirty data to the primary log
file, the next time a flush happens, a switch to .log2 occurs with the cumulative dirty data. If that fails
as well, the cumulative dirty data (the data in .log1 and the data that was dirtied in between) is saved in
.log2. As a consequence, .log1 will be used again next time around, until a successful write operation is
done to the primary log file. If no failure occurs, only .log1 is used.
For example, if you look in your %SystemRoot%\System32\Config directory (and you have the
Show Hidden Files And Folders folder option selected and Hide Protected Operating System
Files unselected; otherwise, you won’t see any file), you’ll see System.log1, Sam.log1, and other .log1
and .log2 files. When a hive initializes, the configuration manager allocates a bit array in which each bit
represents a 512-byte portion, or sector, of the hive. This array is called the dirty sector array because a
bit set in the array means that the system has modified the corresponding sector in the hive in memory
and must write the sector back to the hive file. (A bit not set means that the corresponding sector is up
to date with the in-memory hive’s contents.)
When the creation of a new key or value or the modification of an existing key or value takes place, the
configuration manager notes the sectors of the primary hive that change and writes them in the hive’s
dirty sectors array in memory. Then the configuration manager schedules a lazy flush operation, or a log
sync. The hive lazy writer system thread wakes up one minute after the request to synchronize the hive’s
log. It generates new log entries from the in-memory hive sectors referenced by valid bits of the dirty
sectors array and writes them to the hive log files on disk. At the same time, the system flushes all the registry modifications that take place between the time a hive sync is requested and the time the hive sync
occurs. The lazy writer uses low priority I/Os and writes dirty sectors to the log file on disk (and not to the
primary hive). When a hive sync takes place, the next hive sync occurs no sooner than one minute later.
If the lazy writer simply wrote all a hive’s dirty sectors to the hive file and the system crashed in midoperation, the hive file would be in an inconsistent (corrupted) and unrecoverable state. To prevent
such an occurrence, the lazy writer first dumps the hive’s dirty sector array and all the dirty sectors to
the hive’s log file, increasing the log file’s size if necessary. A hive’s basic block contains two sequence
numbers. After the first flush operation (and not in the subsequent flushes), the configuration manager
updates one of the sequence number, which become bigger than the second one. Thus, if the system
418
CHAPTER 10
Management, diagnostics, and tracing
crashes during the write operations to the hive, at the next reboot the configuration manager notices
that the two sequence numbers in the hive’s base block don’t match. The configuration manager can
update the hive with the dirty sectors in the hive’s log file to roll the hive forward. The hive is then up
to date and consistent.
After writing log entries in the hive’s log, the lazy flusher clears the corresponding valid bits in the
dirty sector array but inserts those bits in another important vector: the unreconciled array. The latter
is used by the configuration manager to understand which log entries to write in the primary hive.
Thanks to the new incremental logging support (discussed later), the primary hive file is rarely written
during the runtime execution of the operating system. The hive’s sync protocol (not to be confused by
the log sync) is the algorithm used to write all the in-memory and in-log registry’s modifications to the
primary hive file and to set the two sequence numbers in the hive. It is indeed an expensive multistage
operation that is described later.
The Reconciler, which is another type of lazy writer system thread, wakes up once every hour, freezes up the log, and writes all the dirty log entries in the primary hive file. The reconciliation algorithm
knows which parts of the in-memory hive to write to the primary file thanks to both the dirty sectors
and unreconciled array. Reconciliation happens rarely, though. If a system crashes, the configuration
manager has all the information needed to reconstruct a hive, thanks to the log entries that have been
already written in the log files. Performing registry reconciliation only once per hour (or when the size
of the log is behind a threshold, which depends on the size of the volume in which the hive reside) is a
big performance improvement. The only possible time window in which some data loss could happen
in the hive is between log flushes.
Note that the Reconciliation still does not update the second sequence number in the main hive file.
The two sequence numbers will be updated with an equal value only in the “validation” phase (another
form of hive flushing), which happens only at the hive’s unload time (when an application calls the
RegUnloadKey API), when the system shuts down, or when the hive is first loaded. This means that in
most of the lifetime of the operating system, the main registry hive is in a dirty state and needs its log
file to be correctly read.
The Windows Boot Loader also contains some code related to registry reliability. For example, it can
parse the System.log file before the kernel is loaded and do repairs to fix consistency. Additionally, in
certain cases of hive corruption (such as if a base block, bin, or cell contains data that fails consistency
checks), the configuration manager can reinitialize corrupted data structures, possibly deleting subkeys
in the process, and continue normal operation. If it must resort to a self-healing operation, it pops up a
system error dialog box notifying the user.
Incremental logging
As mentioned in the previous section, Windows 8.1 introduced a big improvement on the performance
of the hive sync algorithm thanks to incremental logging. Normally, cells in a hive file can be in four
different states:
■
Clean
The cell’s data is in the hive’s primary file and has not been modified.
■
Dirty
The cell’s data has been modified but resides only in memory.
CHAPTER 10
Management, diagnostics, and tracing
419
■
■
Unreconciled The cell’s data has been modified and correctly written to a log file but isn’t in
the primary file yet.
Dirty and Unreconciled After the cell has been written to the log file, it has been modified
again. Only the first modification is on the log file, whereas the last one resides in memory only.
The original pre-Windows 8.1 synchronization algorithm was executing five seconds after one or
more cells were modified. The algorithm can be summarized in four steps:
1.
The configuration manager writes all the modified cells signaled by the dirty vector in a single
entry in the log file.
2.
It invalidates the hive’s base block (by setting only one sequence number with an incremented
value than the other one).
3.
It writes all the modified data on the primary hive’s file.
4.
It performs the validation of the primary hive (the validation sets the two sequence numbers
with an identical value in the primary hive file).
To maintain the integrity and the recoverability of the hive, the algorithm should emit a flush operation to the file system driver after each phase; otherwise, corruption could happen. Flush operations on
random access data can be very expensive (especially on standard rotation disks).
Incremental logging solved the performance problem. In the legacy algorithm, one single log entry
was written containing all the dirty data between multiple hive validations; the incremental model
broke this assumption. The new synchronization algorithm writes a single log entry every time the
lazy flusher executes, which, as discussed previously, invalidates the primary hive’s base block only in
the first time it executes. Subsequent flushes continue to write new log entries without touching the
hive’s primary file. Every hour, or if the space in the log exhausts, the Reconciler writes all the data
stored in the log entries to the primary hive’s file without performing the validation phase. In this way,
space in the log file is reclaimed while maintaining the recoverability of the hive. If the system crashes
at this stage, the log contains original entries that will be reapplied at hive loading time; otherwise,
new entries are reapplied at the beginning of the log, and, in case the system crashes later, at hive load
time only the new entries in the log are applied.
Figure 10-6 shows the possible crash situations and how they are managed by the incremental logging scheme. In case A, the system has written new data to the hive in memory, and the lazy flusher
has written the corresponding entries in the log (but no reconciliation happened). When the system
restarts, the recovery procedure applies all the log entries to the primary hive and validates the hive file
again. In case B, the reconciler has already written the data stored in the log entries to the primary hive
before the crash (no hive validation happened). At system reboot, the recovery procedure reapplies the
existing log entries, but no modification in the primary hive file are made. Case C shows a similar situation of case B but where a new entry has been written to the log after the reconciliation. In this case,
the recovery procedure writes only the last modification that is not in the primary file.
420
CHAPTER 10
Management, diagnostics, and tracing
A. Non reconciled invalid hive
SEQ 1
9431
SEQ 2
9434
BASE Block
BIN
BIN
BIN
Key Cell
Big Value
Value list
Sec Desc
Key Cell
Unreconcil
Big value
Sec Desc
Key Cell
Sec Desc
Value list
Subkey list
Value Cell
SubKey list
Unreconcil
…
Big value
SubKey list
Key Cell
…
Value Cell
Unreconcil
Key Cell
…
B. Reconciled invalid hive
SEQ 1
9550
SEQ 2
9550
SEQ 1
9431
Log BASE Block
BASE Block
BIN
Entry 9560
Entry 9561
Entry 9562
SEQ 2
9434
BIN
Last valid
entry
BIN
Key Cell
Big Value
Value list
Sec Desc
Key Cell
Value list
Big value
Sec Desc
Key Cell
Sec Desc
Value list
Subkey list
Value Cell
SubKey list
Key Cell
…
Big value
SubKey list
Key Cell
…
Value Cell
Big value
Key Cell
…
SEQ 1
9550
SEQ 2
9550
Log BASE Block
…
Entry 9560
Entry 9561
Entry 9562
Last valid
entry
C. Reconciled invalid hive with new data
SEQ 1
9431
SEQ 2
9434
BASE Block
BIN
BIN
BIN
Key Cell
Big Value
Value list
Sec Desc
Key Cell
Value list
Big value
Sec Desc
Key Cell
Sec Desc
Value list
Subkey list
Value Cell
SubKey list
Key Cell
…
Big value
SubKey list
Unreconcil
…
Value Cell
Big value
Key Cell
…
SEQ 1
9563
SEQ 2
9563
Log BASE Block
Entry 9563
Invalid
Last valid
entry
End of log
FIGURE 10-6 Consequences of possible system crashes in different times.
The hive’s validation is performed only in certain (rare) cases. When a hive is unloaded, the system
performs reconciliation and then validates the hive’s primary file. At the end of the validation, it sets the
two sequence numbers of the hive’s primary file to a new identical value and emits the last file system
flush request before unloading the hive from memory. When the system restarts, the hive load’s code
detects that the hive primary is in a clean state (thanks to the two sequence numbers having the same
value) and does not start any form of the hive’s recovery procedure. Thanks to the new incremental
synchronization protocol, the operating system does not suffer any longer for the performance penalties brought by the old legacy logging protocol.
Note Loading a hive created by Windows 8.1 or a newer operating system in older machines
is problematic in case the hive’s primary file is in a non-clean state. The old OS (Windows 7,
for example) has no idea how to process the new log files. For this reason, Microsoft created
the RegHiveRecovery minifilter driver, which is distributed through the Windows Assessment
and Deployment Kit (ADK). The RegHiveRecovery driver uses Registry callbacks, which intercept “hive load” requests from the system and determine whether the hive’s primary file
needs recovery and uses incremental logs. If so, it performs the recovery and fixes the hive’s
primary file before the system has a chance to read it.
CHAPTER 10
Management, diagnostics, and tracing
421
Registry filtering
The configuration manager in the Windows kernel implements a powerful model of registry filtering,
which allows for monitoring of registry activity by tools such as Process Monitor. When a driver uses
the callback mechanism, it registers a callback function with the configuration manager. The configuration manager executes the driver’s callback function before and after the execution of registry system
services so that the driver has full visibility and control over registry accesses. Antivirus products that
scan registry data for viruses or prevent unauthorized processes from modifying the registry are other
users of the callback mechanism.
Registry callbacks are also associated with the concept of altitudes. Altitudes are a way for different vendors to register a “height” on the registry filtering stack so that the order in which the system
calls each callback routine can be deterministic and correct. This avoids a scenario in which an antivirus product would scan encrypted keys before an encryption product would run its own callback
to decrypt them. With the Windows registry callback model, both types of tools are assigned a base
altitude corresponding to the type of filtering they are doing—in this case, encryption versus scanning.
Secondly, companies that create these types of tools must register with Microsoft so that within their
own group, they will not collide with similar or competing products.
The filtering model also includes the ability to either completely take over the processing of the
registry operation (bypassing the configuration manager and preventing it from handling the request)
or redirect the operation to a different operation (such as WoW64’s registry redirection). Additionally,
it is also possible to modify the output parameters as well as the return value of a registry operation.
Finally, drivers can assign and tag per-key or per-operation driver-defined information for their own
purposes. A driver can create and assign this context data during a create or open operation, which the
configuration manager remembers and returns during each subsequent operation on the key.
Registry virtualization
Windows 10 Anniversary Update (RS1) introduced registry virtualization for Argon and Helium containers and the possibility to load differencing hives, which adhere to the new hive version 1.6. Registry
virtualization is provided by both the configuration manager and the VReg driver (integrated in the
Windows kernel). The two components provide the following services:
■
■
422
Namespace redirection An application can redirect the content of a virtual key to a real one
in the host. The application can also redirect a virtual key to a key belonging to a differencing
hive, which is merged to a root key in the host.
Registry merging Differencing hives are interpreted as a set of differences from a base hive.
The base hive represents the Base Layer, which contains the Immutable registry view. Keys in
a differencing hive can be an addition to the base one or a subtraction. The latter are called
thumbstone keys.
CHAPTER 10
Management, diagnostics, and tracing
The configuration manager, at phase 1 of the OS initialization, creates the VRegDriver device
object (with a proper security descriptor that allows only SYSTEM and Administrator access) and
the VRegConfigurationContext object type, which represents the Silo context used for tracking the
namespace redirection and hive merging, which belongs to the container. Server silos have been covered already in Chapter 3, “Processes and jobs,” of Part 1.
Namespace redirection
Registry namespace redirection can be enabled only in a Silo container (both Server and applications
silos). An application, after it has created the silo (but before starting it), sends an initialization IOCTL
to the VReg device object, passing the handle to the silo. The VReg driver creates an empty configuration context and attaches it to the Silo object. It then creates a single namespace node, which remaps
the \Registry\WC root key of the container to the host key because all containers share the same view
of it. The \Registry\WC root key is created for mounting all the hives that are virtualized for the silo
containers.
The VReg driver is a registry filter driver that uses the registry callbacks mechanism for properly
implementing the namespace redirection. At the first time an application initializes a namespace redirection, the VReg driver registers its main RegistryCallback notification routine (through an internal API
similar to CmRegisterCallbackEx). To properly add namespace redirection to a root key, the application
sends a Create Namespace Node IOCTL to the VReg’s device and specifies the virtual key path (which
will be seen by the container), the real host key path, and the container’s job handle. As a response,
the VReg driver creates a new namespace node (a small data structure that contains the key’s data and
some flags) and adds it to the silo’s configuration context.
After the application has finished configuring all the registry redirections for the container, it attaches its own process (or a new spawned process) to the silo object (using AssignProcessToJobObject—
see Chapter 3 in Part 1 for more details). From this point forward, each registry I/O emitted by the
containerized process will be intercepted by the VReg registry minifilter. Let’s illustrate how namespace
redirection works through an example.
Let’s assume that the modern application framework has set multiple registry namespace redirections for a Centennial application. In particular, one of the redirection nodes redirect keys from HKCU
to the host \Registry\WC\ a20834ea-8f46-c05f-46e2-a1b71f9f2f9cuser_sid key. At a certain point
in time, the Centennial application wants to create a new key named AppA in the HKCU\Software\
Microsoft parent key. When the process calls the RegCreateKeyEx API, the Vreg registry callback intercepts the request and gets the job’s configuration context. It then searches in the context the closest
namespace node to the key’s path specified by the caller. If it does not find anything, it returns an
object not found error: Operating on nonvirtualized paths is not allowed for a container. Assuming that
a namespace node describing the root HKCU key exists in the context, and the node is a parent of the
HKCU\Software\Microsoft subkey, the VReg driver replaces the relative path of the original virtual key
with the parent host key name and forwards the request to the configuration manager. So, in this case
the configuration manager really sees a request to create \Registry\WC\a20834ea-8f46-c05f-46e2a1b71f9f2f9cuser_sid\Software\Microsoft\ AppA and succeeds. The containerized application does not
really detect any difference. From the application side, the registry key is in the host HKCU.
CHAPTER 10
Management, diagnostics, and tracing
423
Differencing hives
While namespace redirection is implemented in the VReg driver and is available only in containerized environments, registry merging can also work globally and is implemented mainly in the
configuration manager itself. (However, the VReg driver is still used as an entry-point, allowing the
mounting of differencing hives to base keys.) As stated in the previous section, differencing hives use
hive version 1.6, which is very similar to version 1.5 but supports metadata for the differencing keys.
Increasing the hive version also prevents the possibility of mounting the hive in systems that do not
support registry virtualization.
An application can create a differencing hive and mount it globally in the system or in a silo container by sending IOCTLs to the VReg device. The Backup and Restore privileges are needed, though,
so only administrative applications can manage differencing hives. To mount a differencing hive, the
application fills a data structure with the name of the base key (called the base layer; a base layer is the
root key from which all the subkeys and values contained in the differencing hive applies), the path of
the differencing hive, and a mount point. It then sends the data structure to the VReg driver through
the VR_LOAD_DIFFERENCING_HIVE control code. The mount point contains a merge of the data contained in the differencing hive and the data contained in the base layer.
The VReg driver maintains a list of all the loaded differencing hives in a hash table. This allows the
VReg driver to mount a differencing hive in multiple mount points. As introduced previously, the
Modern Application Model uses random GUIDs in the \Registry\WC root key with the goal to mount
independent Centennial applications’ differencing hives. After an entry in the hash table is created,
the VReg driver simply forwards the request to the CmLoadDifferencingKey internal configuration
manager’s function. The latter performs the majority of the work. It calls the registry callbacks and
loads the differencing hive. The creation of the hive proceeds in a similar way as for a normal hive. After
the hive is created by the lower layer of the configuration manager, a key control block data structure
is also created. The new key control block is linked to the base layer key control block.
When a request is directed to open or read values located in the key used as a mount point, or
in a child of it, the configuration manager knows that the associated key control block represents a
differencing hive. So, the parsing procedure starts from the differencing hive. If the configuration
manager encounters a subkey in the differencing hive, it stops the parsing procedure and yields the
keys and data stored in the differencing hive. Otherwise, in case no data is found in the differencing
hive, the configuration manager restarts the parsing procedure from the base hive. Another case verifies whether a thumbstone key is found in the differencing hive: the configuration manager hides the
searched key and returns no data (or an error). Thumb stones are indeed used to mark a key as deleted
in the base hive.
The system supports three kinds of differencing hives:
■
■
424
Mutable hives can be written and updated. All the write requests directed to the mount point
(or to its children keys) are stored in the differencing hive.
Immutable hives can’t be modified. This means that all the modifications requested on a key
that is located in the differencing hive will fail.
CHAPTER 10
Management, diagnostics, and tracing
■
Write-through hives represent differencing hives that are immutable, but write requests
directed to the mount point (or its children keys) are redirected to the base layer (which is not
immutable anymore).
The NT kernel and applications can also mount a differencing hive and then apply namespace
redirection on the top of its mount point, which allows the implementation of complex virtualized
configurations like the one employed for Centennial applications (shown in Figure 10-7). The Modern
Application Model and the architecture of Centennial applications are covered in Chapter 8.
Mount
points
Centennial App 12
Centennial App 24
Silo 12
HKLM\Software
Silo 24
HKLM\Software
Silo12Software
Silo12Software
Host HKLM\Software
Namespace redirection
Registry merging
Host\Registry\WC
Loaded from
C:\ProgramData\Packages\Centennial.Test.App12
*Loaded from
C:\ProgramData\Packages\Centennial.Test.App24
FIGURE 10-7 Registry virtualization of the software hive in the Modern Application Model for
Centennial applications.
Registry optimizations
The configuration manager makes a few noteworthy performance optimizations. First, virtually every
registry key has a security descriptor that protects access to the key. However, storing a unique security
descriptor copy for every key in a hive would be highly inefficient because the same security settings
often apply to entire subtrees of the registry. When the system applies security to a key, the configuration manager checks a pool of the unique security descriptors used within the same hive as the key
to which new security is being applied, and it shares any existing descriptor for the key, ensuring that
there is at most one copy of every unique security descriptor in a hive.
The configuration manager also optimizes the way it stores key and value names in a hive. Although
the registry is fully Unicode-capable and specifies all names using the Unicode convention, if a name
contains only ASCII characters, the configuration manager stores the name in ASCII form in the hive.
CHAPTER 10
Management, diagnostics, and tracing
425
When the configuration manager reads the name (such as when performing name lookups), it converts
the name into Unicode form in memory. Storing the name in ASCII form can significantly reduce the
size of a hive.
To minimize memory usage, key control blocks don’t store full key registry path names. Instead,
they reference only a key’s name. For example, a key control block that refers to \Registry\System\
Control would refer to the name Control rather than to the full path. A further memory optimization is
that the configuration manager uses key name control blocks to store key names, and all key control
blocks for keys with the same name share the same key name control block. To optimize performance,
the configuration manager stores the key control block names in a hash table for quick lookups.
To provide fast access to key control blocks, the configuration manager stores frequently accessed
key control blocks in the cache table, which is configured as a hash table. When the configuration
manager needs to look up a key control block, it first checks the cache table. Finally, the configuration
manager has another cache, the delayed close table, that stores key control blocks that applications
close so that an application can quickly reopen a key it has recently closed. To optimize lookups, these
cache tables are stored for each hive. The configuration manager removes the oldest key control blocks
from the delayed close table because it adds the most recently closed blocks to the table.
Windows services
Almost every operating system has a mechanism to start processes at system startup time not tied
to an interactive user. In Windows, such processes are called services or Windows services. Services
are similar to UNIX daemon processes and often implement the server side of client/server applications. An example of a Windows service might be a web server because it must be running regardless
of whether anyone is logged on to the computer, and it must start running when the system starts so
that an administrator doesn’t have to remember, or even be present, to start it.
Windows services consist of three components: a service application, a service control program
(SCP), and the Service Control Manager (SCM). First, we describe service applications, service accounts,
user and packaged services, and all the operations of the SCM. Then we explain how autostart services
are started during the system boot. We also cover the steps the SCM takes when a service fails during
its startup and the way the SCM shuts down services. We end with the description of the Shared service
process and how protected services are managed by the system.
Service applications
Service applications, such as web servers, consist of at least one executable that runs as a Windows
service. A user who wants to start, stop, or configure a service uses a SCP. Although Windows supplies
built-in SCPs (the most common are the command-line tool sc.exe and the user interface provided
by the services.msc MMC snap-in) that provide generic start, stop, pause, and continue functionality,
some service applications include their own SCP that allows administrators to specify configuration settings particular to the service they manage.
426
CHAPTER 10
Management, diagnostics, and tracing
Service applications are simply Windows executables (GUI or console) with additional code to
receive commands from the SCM as well as to communicate the application’s status back to the SCM.
Because most services don’t have a user interface, they are built as console programs.
When you install an application that includes a service, the application’s setup program (which
usually acts as an SCP too) must register the service with the system. To register the service, the setup
program calls the Windows CreateService function, a services-related function exported in Advapi32.
dll (%SystemRoot%\System32\ Advapi32.dll). Advapi32, the Advanced API DLL, implements only a
small portion of the client-side SCM APIs. All the most important SCM client APIs are implemented in
another DLL, Sechost.dll, which is the host library for SCM and LSA client APIs. All the SCM APIs not
implemented in Advapi32.dll are simply forwarded to Sechost.dll. Most of the SCM client APIs communicate with the Service Control Manager through RPC. SCM is implemented in the Services.exe binary.
More details are described later in the “Service Control Manager” section.
When a setup program registers a service by calling CreateService, an RPC call is made to the SCM
instance running on the target machine. The SCM then creates a registry key for the service under
HKLM\SYSTEM\CurrentControlSet\Services. The Services key is the nonvolatile representation of the
SCM’s database. The individual keys for each service define the path of the executable image that contains the service as well as parameters and configuration options.
After creating a service, an installation or management application can start the service via the
StartService function. Because some service-based applications also must initialize during the boot
process to function, it’s not unusual for a setup program to register a service as an autostart service,
ask the user to reboot the system to complete an installation, and let the SCM start the service as the
system boots.
When a program calls CreateService, it must specify a number of parameters describing the service’s
characteristics. The characteristics include the service’s type (whether it’s a service that runs in its own
process rather than a service that shares a process with other services), the location of the service’s
executable image file, an optional display name, an optional account name and password used to start
the service in a particular account’s security context, a start type that indicates whether the service
starts automatically when the system boots or manually under the direction of an SCP, an error code
that indicates how the system should react if the service detects an error when starting, and, if the
service starts automatically, optional information that specifies when the service starts relative to other
services. While delay-loaded services are supported since Windows Vista, Windows 7 introduced support for Triggered services, which are started or stopped when one or more specific events are verified.
An SCP can specify trigger event information through the ChangeServiceConfig2 API.
A service application runs in a service process. A service process can host one or more service
applications. When the SCM starts a service process, the process must immediately invoke the
StartServiceCtrlDispatcher function (before a well-defined timeout expires—see the “Service logon”
section for more details). StartServiceCtrlDispatcher accepts a list of entry points into services, with one
entry point for each service in the process. Each entry point is identified by the name of the service
the entry point corresponds to. After making a local RPC (ALPC) communications connection to the
SCM (which acts as a pipe), StartServiceCtrlDispatcher waits in a loop for commands to come through
the pipe from the SCM. Note that the handle of the connection is saved by the SCM in an internal
CHAPTER 10
Management, diagnostics, and tracing
427
list, which is used for sending and receiving service commands to the right process. The SCM sends
a service-start command each time it starts a service the process owns. For each start command it
receives, the StartServiceCtrlDispatcher function creates a thread, called a service thread, to invoke
the starting service’s entry point (Service Main) and implement the command loop for the service.
StartServiceCtrlDispatcher waits indefinitely for commands from the SCM and returns control to the
process’s main function only when all the process’s services have stopped, allowing the service process
to clean up resources before exiting.
A service entry point’s (ServiceMain) first action is to call the RegisterServiceCtrlHandler function.
This function receives and stores a pointer to a function, called the control handler, which the service implements to handle various commands it receives from the SCM. RegisterServiceCtrlHandler
doesn’t communicate with the SCM, but it stores the function in local process memory for the
StartServiceCtrlDispatcher function. The service entry point continues initializing the service, which can
include allocating memory, creating communications end points, and reading private configuration
data from the registry. As explained earlier, a convention most services follow is to store their parameters under a subkey of their service registry key, named Parameters.
While the entry point is initializing the service, it must periodically send status messages, using the
SetServiceStatus function, to the SCM indicating how the service’s startup is progressing. After the
entry point finishes initialization (the service indicates this to the SCM through the SERVICE_RUNNING
status), a service thread usually sits in a loop waiting for requests from client applications. For example,
a web server would initialize a TCP listen socket and wait for inbound HTTP connection requests.
A service process’s main thread, which executes in the StartServiceCtrlDispatcher function, receives
SCM commands directed at services in the process and invokes the target service’s control handler
function (stored by RegisterServiceCtrlHandler). SCM commands include stop, pause, resume, interrogate, and shutdown or application-defined commands. Figure 10-8 shows the internal organization of
a service process—the main thread and the service thread that make up a process hosting one service.
Main thread
Pipe to
SCM
3
Service thread
Main
1
RegisterServiceCtrlHandler
StartServiceCtrlDispatcher
2
Initialize
3
Service control handler
Process client requests
4
1.
2.
3.
4.
StartServiceCtrlDispatcher launches service thread.
Service thread registers control handler.
StartServiceCtrlDispatcher calls handlers in response to SCM commands.
Service thread processes client requests.
FIGURE 10-8 Inside a service process.
428
CHAPTER 10
Management, diagnostics, and tracing
Connections to
service clients
Service characteristics
The SCM stores each characteristic as a value in the service’s registry key. Figure 10-9 shows an example
of a service registry key.
FIGURE 10-9 Example of a service registry key.
Table 10-7 lists all the service characteristics, many of which also apply to device drivers. (Not every
characteristic applies to every type of service or device driver.)
Note The SCM does not access a service’s Parameters subkey until the service is deleted,
at which time the SCM deletes the service’s entire key, including subkeys like Parameters.
TABLE 10-7 Service and Driver Registry Parameters
Value Setting
Value Name
Value Setting Description
Start
SERVICE_BOOT_START (0x0)
Winload preloads the driver so that it is in memory during the boot. These drivers are initialized just prior to
SERVICE_SYSTEM_START drivers.
SERVICE_SYSTEM_START (0x1)
The driver loads and initializes during kernel initialization after SERVICE_BOOT_START drivers have initialized.
SERVICE_AUTO_START (0x2)
The SCM starts the driver or service after the SCM process, Services.exe, starts.
SERVICE_DEMAND_START (0x3)
The SCM starts the driver or service on demand (when a
client calls StartService on it, it is trigger started, or when
another starting service is dependent on it.)
SERVICE_DISABLED (0x4)
The driver or service cannot be loaded or initialized.
CHAPTER 10
Management, diagnostics, and tracing
429
Value Setting
Value Name
Value Setting Description
ErrorControl
SERVICE_ERROR_IGNORE (0x0)
Any error the driver or service returns is ignored, and no
warning is logged or displayed.
SERVICE_ERROR_NORMAL (0x1)
If the driver or service reports an error, an event log
message is written.
SERVICE_ERROR_SEVERE (0x2)
If the driver or service returns an error and last known
good isn’t being used, reboot into last known good;
otherwise, log an event message.
SERVICE_ERROR_CRITICAL (0x3)
If the driver or service returns an error and last known
good isn’t being used, reboot into last known good;
otherwise, log an event message.
SERVICE_KERNEL_DRIVER (0x1)
Device driver.
SERVICE_FILE_SYSTEM_DRIVER (0x2)
Kernel-mode file system driver.
SERVICE_ADAPTER (0x4)
Obsolete.
SERVICE_RECOGNIZER_DRIVER (0x8)
File system recognizer driver.
SERVICE_WIN32_OWN_PROCESS
(0x10)
The service runs in a process that hosts only one service.
SERVICE_WIN32_SHARE_PROCESS
(0x20)
The service runs in a process that hosts multiple services.
SERVICE_USER_OWN_PROCESS
(0x50)
The service runs with the security token of the logged-in
user in its own process.
SERVICE_USER_SHARE_PROCESS
(0x60)
The service runs with the security token of the logged-in
user in a process that hosts multiple services.
SERVICE_INTERACTIVE_PROCESS
(0x100)
The service is allowed to display windows on the console
and receive user input, but only on the console session
(0) to prevent interacting with user/console applications
on other sessions. This option is deprecated.
Group
Group name
The driver or service initializes when its group is
initialized.
Tag
Tag number
The specified location in a group initialization order. This
parameter doesn’t apply to services.
ImagePath
Path to the service or driver executable file
If ImagePath isn’t specified, the I/O manager looks for
drivers in %SystemRoot%\System32\Drivers. Required
for Windows services.
DependOnGroup
Group name
The driver or service won’t load unless a driver or service
from the specified group loads.
DependOnService
Service name
The service won’t load until after the specified service
loads. This parameter doesn’t apply to device drivers or
services with a start type different than SERVICE_AUTO_
START or SERVICE_DEMAND_START.
ObjectName
Usually LocalSystem, but it can
be an account name, such as .\
Administrator
Specifies the account in which the service will run. If
ObjectName isn’t specified, LocalSystem is the account
used. This parameter doesn’t apply to device drivers.
DisplayName
Name of the service
The service application shows services by this name. If
no name is specified, the name of the service’s registry
key becomes its name.
Type
430
CHAPTER 10
Management, diagnostics, and tracing
Value Setting
Value Name
Value Setting Description
DeleteFlag
0 or 1 (TRUE or FALSE)
Temporary flag set by the SCM when a service is marked
to be deleted.
Description
Description of service
Up to 32,767-byte description of the service.
FailureActions
Description of actions the SCM
should take when the service process
exits unexpectedly
Failure actions include restarting the service process,
rebooting the system, and running a specified program.
This value doesn’t apply to drivers.
FailureCommand
Program command line
The SCM reads this value only if FailureActions specifies
that a program should execute upon service failure. This
value doesn’t apply to drivers.
DelayedAutoStart
0 or 1 (TRUE or FALSE)
Tells the SCM to start this service after a certain delay
has passed since the SCM was started. This reduces
the number of services starting simultaneously during
startup.
PreshutdownTimeout Timeout in milliseconds
This value allows services to override the default preshutdown notification timeout of 180 seconds. After this
timeout, the SCM performs shutdown actions on the
service if it has not yet responded.
ServiceSidType
SERVICE_SID_TYPE_NONE (0x0)
Backward-compatibility setting.
SERVICE_SID_TYPE_UNRESTRICTED
(0x1)
The SCM adds the service SID as a group owner to the
service process’s token when it is created.
SERVICE_SID_TYPE_RESTRICTED
(0x3)
The SCM runs the service with a write-restricted token,
adding the service SID to the restricted SID list of the
service process, along with the world, logon, and writerestricted SIDs.
Alias
String
Name of the service’s alias.
RequiredPrivileges
List of privileges
This value contains the list of privileges that the service
requires to function. The SCM computes their union
when creating the token for the shared process related
to this service, if any.
Security
Security descriptor
This value contains the optional security descriptor that
defines who has what access to the service object created internally by the SCM. If this value is omitted, the
SCM applies a default security descriptor.
LaunchProtected
SERVICE_LAUNCH_PROTECTED_
NONE (0x0)
The SCM launches the service unprotected (default value).
SERVICE_LAUNCH_PROTECTED_
WINDOWS (0x1)
The SCM launches the service in a Windows protected
process.
SERVICE_LAUNCH_PROTECTED_
WINDOWS_ LIGHT (0x2)
The SCM launches the service in a Windows protected
process light.
SERVICE_LAUNCH_PROTECTED_
ANTIMALWARE_LIGHT (0x3)
The SCM launches the service in an Antimalware protected process light.
SERVICE_LAUNCH_PROTECTED_
APP_LIGHT (0x4)
The SCM launches the service in an App protected process light (internal only).
CHAPTER 10
Management, diagnostics, and tracing
431
Value Setting
Value Name
Value Setting Description
UserServiceFlags
USER_SERVICE_FLAG_DSMA_ALLOW
(0x1)
Allow the default user to start the user service.
USER_SERVICE_FLAG_NONDSMA_
ALLOW (0x2)
Do not allow the default user to start the service.
SvcHostSplitDisable
0 or 1 (TRUE or FALSE)
When set to, 1 prohibits the SCM to enable Svchost splitting. This value applies only to shared services.
PackageFullName
String
Package full name of a packaged service.
AppUserModelId
String
Application user model ID (AUMID) of a packaged service.
PackageOrigin
PACKAGE_ORIGIN_UNSIGNED (0x1)
PACKAGE_ORIGIN_INBOX (0x2)
PACKAGE_ORIGIN_STORE (0x3)
PACKAGE_ORIGIN_DEVELOPER_
UNSIGNED (0x4)
PACKAGE_ORIGIN_DEVELOPER_
SIGNED (0x5)
These values identify the origin of the AppX package
(the entity that has created it).
Notice that Type values include three that apply to device drivers: device driver, file system driver,
and file system recognizer. These are used by Windows device drivers, which also store their parameters as registry data in the Services registry key. The SCM is responsible for starting non-PNP drivers with a Start value of SERVICE_AUTO_START or SERVICE_DEMAND_START, so it’s natural for the
SCM database to include drivers. Services use the other types, SERVICE_WIN32_OWN_PROCESS and
SERVICE_WIN32_SHARE_PROCESS, which are mutually exclusive.
An executable that hosts just one service uses the SERVICE_WIN32_OWN_PROCESS type. In a
similar way, an executable that hosts multiple services specifies the SERVICE_WIN32_SHARE_PROCESS.
Hosting multiple services in a single process saves system resources that would otherwise be consumed
as overhead when launching multiple service processes. A potential disadvantage is that if one of the
services of a collection running in the same process causes an error that terminates the process, all the
services of that process terminate. Also, another limitation is that all the services must run under the
same account (however, if a service takes advantage of service security hardening mechanisms, it can
limit some of its exposure to malicious attacks). The SERVICE_USER_SERVICE flag is added to denote a
user service, which is a type of service that runs with the identity of the currently logged-on user
Trigger information is normally stored by the SCM under another subkey named TriggerInfo.
Each trigger event is stored in a child key named as the event index, starting from 0 (for example,
the third trigger event is stored in the “TriggerInfo 2” subkey). Table 10-8 lists all the possible registry
values that compose the trigger information.
432
CHAPTER 10
Management, diagnostics, and tracing
TABLE 10-8 Triggered services registry parameters
Value Setting
Value Name
Value Setting Description
Action
SERVICE_TRIGGER_ACTION_
SERVICE_ START (0x1)
Start the service when the trigger event occurs.
SERVICE_TRIGGER_ACTION_
SERVICE_ STOP (0x2)
Stop the service when the trigger event occurs.
SERVICE_TRIGGER_TYPE_DEVICE_
INTERFACE_ARRIVAL (0x1)
Specifies an event triggered when a device of the specified device interface class arrives or is present when the
system starts.
SERVICE_TRIGGER_TYPE_IP_
ADDRESS_AVAILABILITY (0x2)
Specifies an event triggered when an IP address becomes available or unavailable on the network stack.
SERVICE_TRIGGER_TYPE_DOMAIN_
JOIN (0x3)
Specifies an event triggered when the computer joins or
leaves a domain.
SERVICE_TRIGGER_TYPE_FIREWALL_
PORT_EVENT (0x4)
Specifies an event triggered when a firewall port is
opened or closed.
SERVICE_TRIGGER_TYPE_GROUP_
POLICY (0x5)
Specifies an event triggered when a machine or user
policy change occurs.
SERVICE_TRIGGER_TYPE_NETWORK_
ENDPOINT (0x6)
Specifies an event triggered when a packet or request
arrives on a particular network protocol.
SERVICE_TRIGGER_TYPE_CUSTOM
(0x14)
Specifies a custom event generated by an ETW provider.
Guid
Trigger subtype GUID
A GUID that identifies the trigger event subtype. The
GUID depends on the Trigger type.
Data Index
Trigger-specific data
Trigger-specific data for the service trigger event. This
value depends on the trigger event type.
DataType Index
SERVICE_TRIGGER_DATA_TYPE_
BINARY (0x1)
The trigger-specific data is in binary format.
SERVICE_TRIGGER_DATA_TYPE_
STRING (0x2)
The trigger-specific data is in string format.
SERVICE_TRIGGER_DATA_TYPE_
LEVEL (0x3)
The trigger-specific data is a byte value.
SERVICE_TRIGGER_DATA_TYPE_
KEYWORD_ANY (0x4)
The trigger-specific data is a 64-bit (8 bytes) unsigned
integer value.
SERVICE_TRIGGER_DATA_TYPE_
KEYWORD_ALL (0x5)
The trigger-specific data is a 64-bit (8 bytes) unsigned
integer value.
Type
Service accounts
The security context of a service is an important consideration for service developers as well as for system
administrators because it dictates which resource the process can access. Most built-in services run in the
security context of an appropriate Service account (which has limited access rights, as described in the
following subsections). When a service installation program or the system administrator creates a service,
it usually specifies the security context of the local system account (displayed sometimes as SYSTEM and
other times as LocalSystem), which is very powerful. Two other built-in accounts are the network service
and local service accounts. These accounts have fewer capabilities than the local system account from a security standpoint. The following subsections describe the special characteristics of all the service accounts.
CHAPTER 10
Management, diagnostics, and tracing
433
The local system account
The local system account is the same account in which core Windows user-mode operating system components run, including the Session Manager (%SystemRoot%\System32\Smss.exe), the Windows subsystem process (Csrss.exe), the Local Security Authority process (%SystemRoot%\System32\Lsass.exe), and
the Logon process (%SystemRoot%\System32\Winlogon.exe). For more information on these processes,
see Chapter 7 in Part 1.
From a security perspective, the local system account is extremely powerful—more powerful than
any local or domain account when it comes to security ability on a local system. This account has the
following characteristics:
■
■
■
■
■
■
It is a member of the local Administrators group. Table 10-9 shows the groups to which the local
system account belongs. (See Chapter 7 in Part 1 for information on how group membership is
used in object access checks.)
It has the right to enable all privileges (even privileges not normally granted to the local administrator account, such as creating security tokens). See Table 10-10 for the list of privileges
assigned to the local system account. (Chapter 7 in Part 1 describes the use of each privilege.)
Most files and registry keys grant full access to the local system account. Even if they don’t grant
full access, a process running under the local system account can exercise the take-ownership
privilege to gain access.
Processes running under the local system account run with the default user profile (HKU\.
DEFAULT). Therefore, they can’t directly access configuration information stored in the user
profiles of other accounts (unless they explicitly use the LoadUserProfile API).
When a system is a member of a Windows domain, the local system account includes the machine security identifier (SID) for the computer on which a service process is running. Therefore,
a service running in the local system account will be automatically authenticated on other
machines in the same forest by using its computer account. (A forest is a grouping of domains.)
Unless the machine account is specifically granted access to resources (such as network shares,
named pipes, and so on), a process can access network resources that allow null sessions—that
is, connections that require no credentials. You can specify the shares and pipes on a particular
computer that permit null sessions in the NullSessionPipes and NullSessionShares registry values
under HKLM\SYSTEM\CurrentControlSet\Services\LanmanServer\Parameters.
TABLE 10-9 Service account group membership (and integrity level)
434
Local System
Network Service
Local Service
Service Account
Administrators
Everyone
Authenticated users
Everyone
Users
Authenticated users
Local
Network service
Console logon
Everyone
Users
Authenticated users
Local
Local service
Console logon
UWP capabilities groups
Everyone
Users
Authenticated users
Local
Local service
All services
Write restricted
Console logon
System integrity level
System integrity level
System integrity level
High integrity Level
CHAPTER 10
Management, diagnostics, and tracing
TABLE 10-10 Service account privileges
Local System
Local Service / Network Service
Service Account
SeAssignPrimaryTokenPrivilege
SeAuditPrivilege
SeBackupPrivilege
SeChangeNotifyPrivilege
SeCreateGlobalPrivilege
SeCreatePagefilePrivilege
SeCreatePermanentPrivilege
SeCreateSymbolicLinkPrivilege
SeCreateTokenPrivilege
SeDebugPrivilege
SeDelegateSessionUserImpersonatePrivilege
SeImpersonatePrivilege
SeIncreaseBasePriorityPrivilege
SeIncreaseQuotaPrivilege
SeIncreaseWorkingSetPrivilege
SeLoadDriverPrivilege
SeLockMemoryPrivilege
SeManageVolumePrivilege
SeProfileSingleProcessPrivilege
SeRestorePrivilege
SeSecurityPrivilege
SeShutdownPrivilege
SeSystemEnvironmentPrivilege
SeSystemProfilePrivilege
SeSystemtimePrivilege
SeTakeOwnershipPrivilege
SeTcbPrivilege
SeTimeZonePrivilege
SeTrustedCredManAccessPrivilege
SeRelabelPrivilege
SeUndockPrivilege (client only)
SeAssignPrimaryTokenPrivilege
SeAuditPrivilege
SeChangeNotifyPrivilege
SeCreateGlobalPrivilege
SeImpersonatePrivilege
SeIncreaseQuotaPrivilege
SeIncreaseWorkingSetPrivilege
SeShutdownPrivilege
SeSystemtimePrivilege
SeTimeZonePrivilege
SeUndockPrivilege (client only)
SeChangeNotifyPrivilege
SeCreateGlobalPrivilege
SeImpersonatePrivilege
SeIncreaseWorkingSetPrivilege
SeShutdownPrivilege
SeTimeZonePrivilege
SeUndockPrivilege
The network service account
The network service account is intended for use by services that want to authenticate to other machines on the network using the computer account, as does the local system account, but do not have
the need for membership in the Administrators group or the use of many of the privileges assigned to
the local system account. Because the network service account does not belong to the Administrators
group, services running in the network service account by default have access to far fewer registry keys,
file system folders, and files than the services running in the local system account. Further, the assignment of few privileges limits the scope of a compromised network service process. For example, a process running in the network service account cannot load a device driver or open arbitrary processes.
Another difference between the network service and local system accounts is that processes running in the network service account use the network service account’s profile. The registry component
of the network service profile loads under HKU\S-1-5-20, and the files and directories that make up the
component reside in %SystemRoot%\ServiceProfiles\NetworkService.
A service that runs in the network service account is the DNS client, which is responsible for resolving DNS names and for locating domain controllers.
CHAPTER 10
Management, diagnostics, and tracing
435
The local service account
The local service account is virtually identical to the network service account with the important difference that it can access only network resources that allow anonymous access. Table 10-10 shows that
the network service account has the same privileges as the local service account, and Table 10-9 shows
that it belongs to the same groups with the exception that it belongs to the local service group instead
of the network service group. The profile used by processes running in the local service loads into
HKU\S-1-5-19 and is stored in %SystemRoot%\ServiceProfiles\LocalService.
Examples of services that run in the local service account include the Remote Registry Service, which
allows remote access to the local system’s registry, and the LmHosts service, which performs NetBIOS
name resolution.
Running services in alternate accounts
Because of the restrictions just outlined, some services need to run with the security credentials of a
user account. You can configure a service to run in an alternate account when the service is created or
by specifying an account and password that the service should run under with the Windows Services
MMC snap-in. In the Services snap-in, right-click a service and select Properties, click the Log On tab,
and select the This Account option, as shown in Figure 10-10.
Note that when required to start, a service running with an alternate account is always launched using the alternate account credentials, even though the account is not currently logged on. This means
that the user profile is loaded even though the user is not logged on. User Services, which are described
later in this chapter (in the “User services” section), have also been designed to overcome this problem.
They are loaded only when the user logs on.
FIGURE 10-10 Service account settings.
436
CHAPTER 10
Management, diagnostics, and tracing
Running with least privilege
A service’s process typically is subject to an all-or-nothing model, meaning that all privileges available
to the account the service process is running under are available to a service running in the process that
might require only a subset of those privileges. To better conform to the principle of least privilege, in
which Windows assigns services only the privileges they require, developers can specify the privileges
their service requires, and the SCM creates a security token that contains only those privileges.
Service developers use the ChangeServiceConfig2 API (specifying the SERVICE_CONFIG_REQUIRED_
PRIVILEGES _INFO information level) to indicate the list of privileges they desire. The API saves that
information in the registry into the RequiredPrivileges value of the root service key (refer to Table 10-7).
When the service starts, the SCM reads the key and adds those privileges to the token of the process in
which the service is running.
If there is a RequiredPrivileges value and the service is a stand-alone service (running as a dedicated
process), the SCM creates a token containing only the privileges that the service needs. For services
running as part of a shared service process (as are a subset of services that are part of Windows) and
specifying required privileges, the SCM computes the union of those privileges and combines them
for the service-hosting process’s token. In other words, only the privileges not specified by any of the
services that are hosted in the same service process will be removed. In the case in which the registry
value does not exist, the SCM has no choice but to assume that the service is either incompatible with
least privileges or requires all privileges to function. In this case, the full token is created, containing all
privileges, and no additional security is offered by this model. To strip almost all privileges, services can
specify only the Change Notify privilege.
Note The privileges a service specifies must be a subset of those that are available to the
service account in which it runs.
EXPERIMENT: Viewing privileges required by services
You can view the privileges a service requires with the Service Control utility, sc.exe, and the
qprivs option. Additionally, Process Explorer can show you information about the security token
of any service process on the system, so you can compare the information returned by sc.exe
with the privileges part of the token. The following steps show you how to do this for some of the
best locked-down services on the system.
1.
Use sc.exe to look at the required privileges specified by CryptSvc by typing the following into a command prompt:
sc qprivs cryptsvc
You should see three privileges being requested: the SeChangeNotifyPrivilege,
SeCreateGlobalPrivilege, and the SeImpersonatePrivilege.
CHAPTER 10
Management, diagnostics, and tracing
437
2.
Run Process Explorer as administrator and look at the process list.
You should see multiple Svchost.exe processes that are hosting the services on your
machine (in case Svchost splitting is enabled, the number of Svchost instances are even
more). Process Explorer highlights these in pink.
438
3.
CryptSvc is a service that runs in a shared hosting process. In Windows 10, locating the correct process instance is easily achievable through Task Manager. You do
not need to know the name of the Service DLL, which is listed in the HKLM\SYSTEM\
CurrentControlSet\Services\CryptSvc \Parameters registry key.
4.
Open Task Manager and look at the Services tab. You should easily find the PID of the
CryptSvc hosting process.
5.
Return to Process Explorer and double-click the Svchost.exe process that has the same
PID found by Task Manager to open the Properties dialog box.
6.
Double check that the Services tab includes the CryptSvc service. If service splitting is enabled, it should contain only one service; otherwise, it will contain multiple services. Then
click the Security tab. You should see security information similar to the following figure:
CHAPTER 10
Management, diagnostics, and tracing
Note that although the service is running as part of the local service account, the list of privileges Windows assigned to it is much shorter than the list available to the local service account
shown in Table 10-10.
For a service-hosting process, the privileges part of the token is the union of the privileges
requested by all the services running inside it, so this must mean that services such as DnsCache
and LanmanWorkstation have not requested privileges other than the ones shown by Process
Explorer. You can verify this by running the Sc.exe tool on those other services as well (only if
Svchost Service Splitting is disabled).
Service isolation
Although restricting the privileges that a service has access to helps lessen the ability of a compromised
service process to compromise other processes, it does nothing to isolate the service from resources
that the account in which it is running has access under normal conditions. As mentioned earlier, the
local system account has complete access to critical system files, registry keys, and other securable
objects on the system because the access control lists (ACLs) grant permissions to that account.
At times, access to some of these resources is critical to a service’s operation, whereas other objects
should be secured from the service. Previously, to avoid running in the local system account to obtain
access to required resources, a service would be run under a standard user account, and ACLs would be
added on the system objects, which greatly increased the risk of malicious code attacking the system.
Another solution was to create dedicated service accounts and set specific ACLs for each account (associated to a service), but this approach easily became an administrative hassle.
Windows now combines these two approaches into a much more manageable solution: it allows
services to run in a nonprivileged account but still have access to specific privileged resources without
lowering the security of those objects. Indeed, the ACLs on an object can now set permissions directly for
a service, but not by requiring a dedicated account. Instead, Windows generates a service SID to represent a service, and this SID can be used to set permissions on resources such as registry keys and files.
The Service Control Manager uses service SIDs in different ways. If the service is configured to be
launched using a virtual service account (in the NT SERVICE\ domain), a service SID is generated and
assigned as the main user of the new service’s token. The token will also be part of the NT SERVICE\ALL
SERVICES group. This group is used by the system to allow a securable object to be accessed by any
service. In the case of shared services, the SCM creates the service-hosting processes (a process that
contains more than one service) with a token that contains the service SIDs of all services that are part
of the service group associated with the process, including services that are not yet started (there is no
way to add new SIDs after a token has been created). Restricted and unrestricted services (explained
later in this section) always have a service SID in the hosting process’s token.
CHAPTER 10
Management, diagnostics, and tracing
439
EXPERIMENT: Understanding Service SIDs
In Chapter 9, we presented an experiment (“Understanding the security of the VM worker process and the virtual hard disk files”) in which we showed how the system generates VM SIDs for
different VM worker processes. Similar to the VM worker process, the system generates Service
SIDs using a well-defined algorithm. This experiment uses Process Explorer to show service SIDs
and explains how the system generates them.
First, you need to choose a service that runs with a virtual service account or under a restricted/nonrestricted access token. Open the Registry Editor (by typing regedit in the Cortana
search box) and navigate to the HKLM\SYSTEM\CurrentControlSet\Services registry key. Then
select Find from the Edit menu. As discussed previously in this section, the service account is
stored in the ObjectName registry value. Unfortunately, you would not find a lot of services running in a virtual service account (those accounts begin with the NT SERVICE\ virtual domain), so it
is better if you look at a restricted token (unrestricted tokens work, too). Type ServiceSidType
(the value of which is stored whether the Service should run with a restricted or unrestricted
token) and click the Find Next button.
For this experiment, you are looking for a restricted service account (which has the
ServiceSidType value set to 3), but unrestricted services work well, too (the value is set to 1).
If the desired value does not match, you can use the F3 button to find the next service. In this
experiment, use the BFE service.
Open Process Explorer, search the BFE hosting process (refer to the previous experiment for
understanding how to find the correct one), and double-click it. Select the Security tab and click
the NT SERVICE\BFE Group (the human-readable notation of the service SID) or the service SID of
your service if you have chosen another one. Note the extended group SID, which appears under
the group list (if the service is running under a virtual service account, the service SID is instead
shown by Process Explorer in the second line of the Security Tab):
S-1-5-80-1383147646-27650227-2710666058-1662982300-1023958487
The NT authority (ID 5) is responsible for the service SIDs, generated by using the service base
RID (80) and by the SHA-1 hash of the uppercased UTF-16 Unicode string of the service name.
SHA-1 is an algorithm that produces a 160-bit (20-bytes) value. In the Windows security world,
this means that the SID will have 5 (4-bytes) sub-authority values. The SHA-1 hash of the Unicode
(UTF-16) BFE service name is:
7e 28 71 52 b3 e8 a5 01 4a 7b 91 a1 9c 18 1f 63 d7 5d 08 3d
If you divide the produced hash in five groups of eight hexadecimal digits, you will find
the following:
■
■
440
0x5271287E (first DWORD value), which equals 1383147646 in decimal (remember that
Windows is a little endian OS)
0x01A5E8B3 (second DWORD value), which equals 27650227 in decimal
CHAPTER 10
Management, diagnostics, and tracing
■
0xA1917B4A (third DWORD value), which equals 2710666058 in decimal
■
0x631F189C (fourth DWORD value), which equals 1662982300 in decimal
■
0x3D085DD7 (fifth DWORD value), which equals 1023958487 in decimal
If you combine the numbers and add the service SID authority value and first RID (S-1-5-80),
you build the same SID shown by Process Explorer. This demonstrates how the system generates
service SIDs.
The usefulness of having a SID for each service extends beyond the mere ability to add ACL entries and
permissions for various objects on the system as a way to have fine-grained control over their access. Our
discussion initially covered the case in which certain objects on the system, accessible by a given account,
must be protected from a service running within that same account. As we’ve previously described,
service SIDs prevent that problem only by requiring that Deny entries associated with the service SID
be placed on every object that needs to be secured, which is a clearly an unmanageable approach.
To avoid requiring Deny access control entries (ACEs) as a way to prevent services from having access to resources that the user account in which they run does have access, there are two types of service SIDs: the restricted service SID (SERVICE_SID_TYPE_RESTRICTED) and the unrestricted service SID
(SERVICE_SID_TYPE_UNRESTRICTED), the latter being the default and the case we’ve looked at up to
now. The names are a little misleading in this case. The service SID is always generated in the same way
(see the previous experiment). It is the token of the hosting process that is generated in a different way.
Unrestricted service SIDs are created as enabled-by-default, group owner SIDs, and the process
token is also given a new ACE that provides full permission to the service logon SID, which allows the
service to continue communicating with the SCM. (A primary use of this would be to enable or disable
service SIDs inside the process during service startup or shutdown.) A service running with the SYSTEM
account launched with an unrestricted token is even more powerful than a standard SYSTEM service.
A restricted service SID, on the other hand, turns the service-hosting process’s token into a writerestricted token. Restricted tokens (see Chapter 7 of Part 1 for more information on tokens) generally
require the system to perform two access checks while accessing securable objects: one using the standard token’s enabled group SIDs list, and another using the list of restricted SIDs. For a standard restricted
token, access is granted only if both access checks allow the requested access rights. On the other hand,
write-restricted tokens (which are usually created by specifying the WRITE_RESTRICTED flag to the
CreateRestrictedToken API) perform the double access checks only for write requests: read-only access
requests raise just one access check on the token’s enabled group SIDs as for regular tokens.
The service host process running with a write-restricted token can write only to objects granting
explicit write access to the service SID (and the following three supplemental SIDs added for compatibility), regardless of the account it’s running. Because of this, all services running inside that process (part of the same service group) must have the restricted SID type; otherwise, services with the
restricted SID type fail to start. Once the token becomes write-restricted, three more SIDs are added
for compatibility reasons:
CHAPTER 10
Management, diagnostics, and tracing
441
■
■
■
The world SID is added to allow write access to objects that are normally accessible by anyone
anyway, most importantly certain DLLs in the load path.
The service logon SID is added to allow the service to communicate with the SCM.
The write-restricted SID is added to allow objects to explicitly allow any write-restricted service
write access to them. For example, ETW uses this SID on its objects to allow any write-restricted
service to generate events.
Figure 10-11 shows an example of a service-hosting process containing services that have been
marked as having restricted service SIDs. For example, the Base Filtering Engine (BFE), which is responsible for applying Windows Firewall filtering rules, is part of this hosting process because these rules are
stored in registry keys that must be protected from malicious write access should a service be compromised. (This could allow a service exploit to disable the outgoing traffic firewall rules, enabling bidirectional communication with an attacker, for example.)
FIGURE 10-11 Service with restricted SIDs.
442
CHAPTER 10
Management, diagnostics, and tracing
By blocking write access to objects that would otherwise be writable by the service (through inheriting the permissions of the account it is running as), restricted service SIDs solve the other side of the
problem we initially presented because users do not need to do anything to prevent a service running
in a privileged account from having write access to critical system files, registry keys, or other objects,
limiting the attack exposure of any such service that might have been compromised.
Windows also allows for firewall rules that reference service SIDs linked to one of the three behaviors described in Table 10-11.
TABLE 10-11 Network restriction rules
Scenario
Example
Restrictions
Network access blocked
The shell hardware detection service
(ShellHWDetection).
All network communications are blocked
(both incoming and outgoing).
Network access statically
port-restricted
The RPC service (Rpcss) operates on port
135 (TCP and UDP).
Network communications are restricted to
specific TCP or UDP ports.
Network access dynamically
port-restricted
The DNS service (Dns) listens on variable
ports (UDP).
Network communications are restricted to
configurable TCP or UDP ports.
The virtual service account
As introduced in the previous section, a service SID also can be set as the owner of the token of a
service running in the context of a virtual service account. A service running with a virtual service account has fewer privileges than the LocalService or NetworkService service types (refer to Table 10-10
for the list of privileges) and no credentials available to authenticate it through the network. The
Service SID is the token’s owner, and the token is part of the Everyone, Users, Authenticated Users, and
All Services groups. This means that the service can read (or write, unless the service uses a restricted
SID type) objects that belong to standard users but not to high-privileged ones belonging to the
Administrator or System group. Unlike the other types, a service running with a virtual service account has a private profile, which is loaded by the ProfSvc service (Profsvc.dll) during service logon, in
a similar way as for regular services (more details in the “Service logon” section). The profile is initially
created during the first service logon using a folder with the same name as the service located in the
%SystemRoot%\ServiceProfiles path. When the service’s profile is loaded, its registry hive is mounted
in the HKEY_USERS root key, under a key named as the virtual service account’s human readable SID
(starting with S-1-5-80 as explained in the “Understanding service SIDs” experiment).
Users can easily assign a virtual service account to a service by setting the log-on account to NT
SERVICE\<ServiceName>, where <ServiceName> is the name of the service. At logon time, the Service
Control Manager recognizes that the log-on account is a virtual service account (thanks to the NT
SERVICE logon provider) and verifies that the account’s name corresponds to the name of the service. A service can’t be started using a virtual service account that belongs to another one, and this
is enforced by SCM (through the internal ScIsValidAccountName function). Services that share a host
process cannot run with a virtual service account.
While operating with securable objects, users can add to the object’s ACL using the service log-on
account (in the form of NT SERVICE\<ServiceName>), an ACE that allows or denies access to a virtual
CHAPTER 10
Management, diagnostics, and tracing
443
service. As shown in Figure 10-12, the system is able to translate the virtual service account’s name to
the proper SID, thus establishing fine-grained access control to the object from the service. (This also
works for regular services running with a nonsystem account, as explained in the previous section.)
FIGURE 10-12 A file (securable object) with an ACE allowing full access to the TestService.
Interactive services and Session 0 Isolation
One restriction for services running under a proper service account, the local system, local service, and
network service accounts that has always been present in Windows is that these services could not display
dialog boxes or windows on the interactive user’s desktop. This limitation wasn’t the direct result of running under these accounts but rather a consequence of the way the Windows subsystem assigns service
processes to window stations. This restriction is further enhanced by the use of sessions, in a model called
Session 0 Isolation, a result of which is that services cannot directly interact with a user’s desktop.
The Windows subsystem associates every Windows process with a window station. A window station
contains desktops, and desktops contain windows. Only one window station can be visible at a time
and receive user mouse and keyboard input. In a Terminal Services environment, one window station
per session is visible, but services all run as part of the hidden session 0. Windows names the visible
window station WinSta0, and all interactive processes access WinSta0.
Unless otherwise directed, the Windows subsystem associates services running within the proper
service account or the local system account with a nonvisible window station named Service-0x03e7$ that all noninteractive services share. The number in the name, 3e7, represents the logon session
identifier that the Local Security Authority process (LSASS) assigns to the logon session the SCM uses
444
CHAPTER 10
Management, diagnostics, and tracing
for noninteractive services running in the local system account. In a similar way, services running in the
Local service account are associated with the window station generated by the logon session 3e5, while
services running in the network service account are associated with the window station generated by
the logon session 3e4.
Services configured to run under a user account (that is, not the local system account) are run in a
different nonvisible window station named with the LSASS logon identifier assigned for the service’s
logon session. Figure 10-13 shows a sample display from the Sysinternals WinObj tool that shows the
object manager directory in which Windows places window station objects. Visible are the interactive
window station (WinSta0) and the three noninteractive services window stations.
FIGURE 10-13 List of window stations.
Regardless of whether services are running in a user account, the local system account, or the local
or network service accounts, services that aren’t running on the visible window station can’t receive
input from a user or display visible windows. In fact, if a service were to pop up a modal dialog box,
the service would appear hung because no user would be able to see the dialog box, which of course
would prevent the user from providing keyboard or mouse input to dismiss it and allow the service to
continue executing.
A service could have a valid reason to interact with the user via dialog boxes or windows. Services
configured using the SERVICE_INTERACTIVE_PROCESS flag in the service’s registry key’s Type parameter
are launched with a hosting process connected to the interactive WinSta0 window station. (Note that
services configured to run under a user account can’t be marked as interactive.) Were user processes to
run in the same session as services, this connection to WinSta0 would allow the service to display dialog
CHAPTER 10
Management, diagnostics, and tracing
445
boxes and windows and enable those windows to respond to user input because they would share the
window station with the interactive services. However, only processes owned by the system and Windows
services run in session 0; all other logon sessions, including those of console users, run in different sessions. Therefore, any window displayed by processes in session 0 is not visible to the user.
This additional boundary helps prevent shatter attacks, whereby a less-privileged application sends
window messages to a window visible on the same window station to exploit a bug in a more privileged process that owns the window, which permits it to execute code in the more privileged process.
In the past, Windows included the Interactive Services Detection service (UI0Detect), which notified
users when a service had displayed a window on the main desktop of the WinSta0 window station of
Session 0. This would allow the user to switch to the session 0’s window station, making interactive
services run properly. For security purposes, this feature was first disabled; since Windows 10 April 2018
Update (RS4), it has been completely removed.
As a result, even though interactive services are still supported by the Service Control Manager (only
by setting the HKLM\SYSTEM\CurrentControlSet\Control\Windows\NoInteractiveServices registry
value to 0), access to session 0 is no longer possible. No service can display any window anymore (at
least without some undocumented hack).
The Service Control Manager (SCM)
The SCM’s executable file is %SystemRoot%\System32\Services.exe, and like most service processes, it
runs as a Windows console program. The Wininit process starts the SCM early during the system boot.
(Refer to Chapter 12 for details on the boot process.) The SCM’s startup function, SvcCtrlMain, orchestrates the launching of services that are configured for automatic startup.
SvcCtrlMain first performs its own initialization by setting its process secure mitigations and
unhandled exception filter and by creating an in-memory representation of the well-known SIDs. It
then creates two synchronization events: one named SvcctrlStartEvent_A3752DX and the other named
SC_AutoStartComplete. Both are initialized as nonsignaled. The first event is signaled by the SCM after
all the steps necessary to receive commands from SCPs are completed. The second is signaled when the
entire initialization of the SCM is completed. The event is used for preventing the system or other users
from starting another instance of the Service Control Manager. The function that an SCP uses to establish a dialog with the SCM is OpenSCManager. OpenSCManager prevents an SCP from trying to contact
the SCM before the SCM has initialized by waiting for SvcctrlStartEvent_A3752DX to become signaled.
Next, SvcCtrlMain gets down to business, creates a proper security descriptor, and calls
ScGenerateServiceDB, the function that builds the SCM’s internal service database. ScGenerateServiceDB
reads and stores the contents of HKLM\SYSTEM\CurrentControlSet\Control\ServiceGroupOrder\List,
a REG_MULTI_SZ value that lists the names and order of the defined service groups. A service’s registry
key contains an optional Group value if that service or device driver needs to control its startup ordering with respect to services from other groups. For example, the Windows networking stack is built
from the bottom up, so networking services must specify Group values that place them later in the
startup sequence than networking device drivers. The SCM internally creates a group list that preserves
the ordering of the groups it reads from the registry. Groups include (but are not limited to) NDIS, TDI,
Primary Disk, Keyboard Port, Keyboard Class, Filters, and so on. Add-on and third-party applications
446
CHAPTER 10
Management, diagnostics, and tracing
can even define their own groups and add them to the list. Microsoft Transaction Server, for example,
adds a group named MS Transactions.
ScGenerateServiceDB then scans the contents of HKLM\SYSTEM\CurrentControlSet\Services, creating an entry (called “service record”) in the service database for each key it encounters. A database
entry includes all the service-related parameters defined for a service as well as fields that track the
service’s status. The SCM adds entries for device drivers as well as for services because the SCM starts
services and drivers marked as autostart and detects startup failures for drivers marked boot-start and
system-start. It also provides a means for applications to query the status of drivers. The I/O manager
loads drivers marked boot-start and system-start before any user-mode processes execute, and therefore any drivers having these start types load before the SCM starts.
ScGenerateServiceDB reads a service’s Group value to determine its membership in a group and
associates this value with the group’s entry in the group list created earlier. The function also reads and
records in the database the service’s group and service dependencies by querying its DependOnGroup
and DependOnService registry values. Figure 10-14 shows how the SCM organizes the service entry
and group order lists. Notice that the service list is sorted alphabetically. The reason this list is sorted
alphabetically is that the SCM creates the list from the Services registry key, and Windows enumerates
registry keys alphabetically.
Service database
Group order list
Group1
Group2
Group3
Service entry list
Service1
Type
Start
DependOnGroup
DependOnService
Status
Group
…
Service2
Service3
Type
Start
DependOnGroup
DependOnService
Status
Group
…
Type
Start
DependOnGroup
DependOnService
Status
Group
…
FIGURE 10-14 Organization of the service database.
During service startup, the SCM calls on LSASS (for example, to log on a service in a nonlocal system
account), so the SCM waits for LSASS to signal the LSA_RPC_SERVER_ACTIVE synchronization event,
which it does when it finishes initializing. Wininit also starts the LSASS process, so the initialization of
LSASS is concurrent with that of the SCM, and the order in which LSASS and the SCM complete initialization can vary. The SCM cleans up (from the registry, other than from the database) all the services
that were marked as deleted (through the DeleteFlag registry value) and generates the dependency list
for each service record in the database. This allows the SCM to know which service is dependent on a
particular service record, which is the opposite dependency information compared to the one stored
in the registry.
CHAPTER 10
Management, diagnostics, and tracing
447
The SCM then queries whether the system is started in safe mode (from the HKLM\System\
CurrentControlSet\ Control\Safeboot\Option\OptionValue registry value). This check is needed for
determining later if a service should start (details are explained in the “Autostart services startup”
section later in this chapter). It then creates its remote procedure call (RPC) named pipe, which is
named \Pipe\Ntsvcs, and then RPC launches a thread to listen on the pipe for incoming messages
from SCPs. The SCM signals its initialization-complete event, SvcctrlStartEvent_A3752DX. Registering a
console application shutdown event handler and registering with the Windows subsystem process via
RegisterServiceProcess prepares the SCM for system shutdown.
Before starting the autostart services, the SCM performs a few more steps. It initializes the UMDF
driver manager, which is responsible in managing UMDF drivers. Since Windows 10 Fall Creators
Update (RS3), it’s part of the Service Control Manager and waits for the known DLLs to be fully initialized (by waiting on the \KnownDlls\SmKnownDllsInitialized event that’s signaled by Session Manager).
EXPERIMENT: Enable services logging
The Service Control Manager usually logs ETW events only when it detects abnormal error conditions (for example, while failing to start a service or to change its configuration). This behavior
can be overridden by manually enabling or disabling a different kind of SCM events. In this experiment, you will enable two kinds of events that are particularly useful for debugging a service
change of state. Events 7036 and 7042 are raised when a service change status or when a STOP
control request is sent to a service.
Those two events are enabled by default on server SKUs but not on client editions of
Windows 10. Using your Windows 10 machine, you should open the Registry Editor (by typing
regedit.exe in the Cortana search box) and navigate to the following registry key: HKLM\
SYSTEM\CurrentControlSet\Control\ScEvents. If the last subkey does not exist, you should create
it by right-clicking the Control subkey and selecting the Key item from the New context menu).
Now you should create two DWORD values and name them 7036 and 7042. Set the data of the
two values to 1. (You can set them to 0 to gain the opposite effect of preventing those events from
being generated, even on Server SKUs.) You should get a registry state like the following one:
448
CHAPTER 10
Management, diagnostics, and tracing
Restart your workstation, and then start and stop a service (for example, the AppXSvc service)
using the sc.exe tool by opening an administrative command prompt and typing the following
commands:
sc stop AppXSvc
sc start AppXSvc
Open the Event Viewer (by typing eventvwr in the Cortana search box) and navigate to
Windows Logs and then System. You should note different events from the Service Control
Manager with Event ID 7036 and 7042. In the top ones, you should find the stop event generated
by the AppXSvc service, as shown in the following figure:
Note that the Service Control Manager by default logs all the events generated by services
started automatically at system startup. This can generate an undesired number of events flooding the System event log. To mitigate the problem, you can disable SCM autostart events by
creating a registry value named EnableAutostartEvents in the HKLM\System\CurrentControlSet\
Control key and set it to 0 (the default implicit value is 1 in both client and server SKUs). As a
result, this will log only events generated by service applications when starting, pausing, or stopping a target service.
CHAPTER 10
Management, diagnostics, and tracing
449
Network drive letters
In addition to its role as an interface to services, the SCM has another totally unrelated responsibility: It notifies GUI applications in a system whenever the system creates or deletes a network driveletter connection. The SCM waits for the Multiple Provider Router (MPR) to signal a named event,
\BaseNamedObjects\ScNetDrvMsg, which MPR signals whenever an application assigns a drive letter
to a remote network share or deletes a remote-share drive-letter assignment. When MPR signals the
event, the SCM calls the GetDriveType Windows function to query the list of connected network drive
letters. If the list changes across the event signal, the SCM sends a Windows broadcast message of type
WM_DEVICECHANGE. The SCM uses either DBT_DEVICEREMOVECOMPLETE or DBT_DEVICEARRIVAL
as the message’s subtype. This message is primarily intended for Windows Explorer so that it can update any open computer windows to show the presence or absence of a network drive letter.
Service control programs
As introduced in the “Service applications” section, service control programs (SCPs) are standard Windows applications that use SCM service management functions, including CreateService,
OpenService, StartService, ControlService, QueryServiceStatus, and DeleteService. To use the SCM functions, an SCP must first open a communications channel to the SCM by calling the OpenSCManager
function to specify what types of actions it wants to perform. For example, if an SCP simply wants
to enumerate and display the services present in the SCM’s database, it requests enumerate-service
access in its call to OpenSCManager. During its initialization, the SCM creates an internal object that
represents the SCM database and uses the Windows security functions to protect the object with a
security descriptor that specifies what accounts can open the object with what access permissions. For
example, the security descriptor indicates that the Authenticated Users group can open the SCM object
with enumerate-service access. However, only administrators can open the object with the access
required to create or delete a service.
As it does for the SCM database, the SCM implements security for services themselves. When an
SCP creates a service by using the CreateService function, it specifies a security descriptor that the
SCM associates internally with the service’s entry in the service database. The SCM stores the security
descriptor in the service’s registry key as the Security value, and it reads that value when it scans the
registry’s Services key during initialization so that the security settings persist across reboots. In the
same way that an SCP must specify what types of access it wants to the SCM database in its call to
OpenSCManager, an SCP must tell the SCM what access it wants to a service in a call to OpenService.
Accesses that an SCP can request include the ability to query a service’s status and to configure, stop,
and start a service.
The SCP you’re probably most familiar with is the Services MMC snap-in that’s included in Windows,
which resides in %SystemRoot%\System32\Filemgmt.dll. Windows also includes Sc.exe (Service
Controller tool), a command-line service control program that we’ve mentioned multiple times.
SCPs sometimes layer service policy on top of what the SCM implements. A good example is the
timeout that the Services MMC snap-in implements when a service is started manually. The snap-in
presents a progress bar that represents the progress of a service’s startup. Services indirectly interact with SCPs by setting their configuration status to reflect their progress as they respond to SCM
450
CHAPTER 10
Management, diagnostics, and tracing
commands such as the start command. SCPs query the status with the QueryServiceStatus function.
They can tell when a service actively updates the status versus when a service appears to be hung, and
the SCM can take appropriate actions in notifying a user about what the service is doing.
Autostart services startup
SvcCtrlMain invokes the SCM function ScAutoStartServices to start all services that have a Start value
designating autostart (except delayed autostart and user services). ScAutoStartServices also starts autostart drivers. To avoid confusion, you should assume that the term services means services and drivers
unless indicated otherwise. ScAutoStartServices begins by starting two important and basic services,
named Plug and Play (implemented in the Umpnpmgr.dll library) and Power (implemented in the
Umpo.dll library), which are needed by the system for managing plug-and-play hardware and power
interfaces. The SCM then registers its Autostart WNF state, used to indicate the current autostart phase
to the Power and other services.
Before the starting of other services can begin, the ScAutoStartService routine calls ScGetBootAnd
SystemDriverState to scan the service database looking for boot-start and system-start device driver
entries. ScGetBootAndSystemDriverState determines whether a driver with the start type set to Boot
Start or System Start successfully started by looking up its name in the object manager namespace
directory named \Driver. When a device driver successfully loads, the I/O manager inserts the driver’s
object in the namespace under this directory, so if its name isn’t present, it hasn’t loaded. Figure 10-15
shows WinObj displaying the contents of the Driver directory. ScGetBootAndSystemDriverState
notes the names of drivers that haven’t started and that are part of the current profile in a list named
ScStoppedDrivers. The list will be used later at the end of the SCM initialization for logging an event to
the system event log (ID 7036), which contains the list of boot drivers that have failed to start.
FIGURE 10-15 List of driver objects.
CHAPTER 10
Management, diagnostics, and tracing
451
The algorithm in ScAutoStartServices for starting services in the correct order proceeds in phases,
whereby a phase corresponds to a group and phases proceed in the sequence defined by the group
ordering stored in the HKLM\SYSTEM\CurrentControlSet\Control\ServiceGroupOrder\List registry
value. The List value, shown in Figure 10-16, includes the names of groups in the order that the SCM
should start them. Thus, assigning a service to a group has no effect other than to fine-tune its startup
with respect to other services belonging to different groups.
FIGURE 10-16 ServiceGroupOrder registry key.
When a phase starts, ScAutoStartServices marks all the service entries belonging to the phase’s
group for startup. Then ScAutoStartServices loops through the marked services to see whether it can
start each one. Part of this check includes seeing whether the service is marked as delayed autostart or
a user template service; in both cases, the SCM will start it at a later stage. (Delayed autostart services
must also be ungrouped. User services are discussed later in the “User services” section.) Another part
of the check it makes consists of determining whether the service has a dependency on another group,
as specified by the existence of the DependOnGroup value in the service’s registry key. If a dependency
exists, the group on which the service is dependent must have already initialized, and at least one
service of that group must have successfully started. If the service depends on a group that starts later
than the service’s group in the group startup sequence, the SCM notes a “circular dependency” error
for the service. If ScAutoStartServices is considering a Windows service or an autostart device driver,
it next checks to see whether the service depends on one or more other services; if it is dependent, it
determines whether those services have already started. Service dependencies are indicated with the
DependOnService registry value in a service’s registry key. If a service depends on other services that
belong to groups that come later in the ServiceGroupOrder\List, the SCM also generates a “circular
dependency” error and doesn’t start the service. If the service depends on any services from the same
group that haven’t yet started, the service is skipped.
452
CHAPTER 10
Management, diagnostics, and tracing
When the dependencies of a service have been satisfied, ScAutoStartServices makes a final check
to see whether the service is part of the current boot configuration before starting the service. When
the system is booted in safe mode, the SCM ensures that the service is either identified by name or by
group in the appropriate safe boot registry key. There are two safe boot keys, Minimal and Network,
under HKLM\SYSTEM\CurrentControlSet\Control\SafeBoot, and the one that the SCM checks depends
on what safe mode the user booted. If the user chose Safe Mode or Safe Mode With Command Prompt
at the modern or legacy boot menu, the SCM references the Minimal key; if the user chose Safe Mode
With Networking, the SCM refers to Network. The existence of a string value named Option under the
SafeBoot key indicates not only that the system booted in safe mode but also the type of safe mode the
user selected. For more information about safe boots, see the section “Safe mode” in Chapter 12.
Service start
Once the SCM decides to start a service, it calls StartInternal, which takes different steps for services
than for device drivers. When StartInternal starts a Windows service, it first determines the name of
the file that runs the service’s process by reading the ImagePath value from the service’s registry key.
If the service file corresponds to LSASS.exe, the SCM initializes a control pipe, connects to the alreadyrunning LSASS process, and waits for the LSASS process response. When the pipe is ready, the LSASS
process connects to the SCM by calling the classical StartServiceCtrlDispatcher routine. As shown in
Figure 10-17, some services like Credential Manager or Encrypting File System need to cooperate with
the Local Security Authority Subsystem Service (LSASS)—usually for performing cryptography operation for the local system policies (like passwords, privileges, and security auditing. See Chapter 7 of Part
1 for more details).
FIGURE 10-17 Services hosted by the Local Security Authority Subsystem Service (LSASS) process.
CHAPTER 10
Management, diagnostics, and tracing
453
The SCM then determines whether the service is critical (by analyzing the FailureAction registry value)
or is running under WoW64. (If the service is a 32-bit service, the SCM should apply file system redirection. See the “WoW64” section of Chapter 8 for more details.) It also examines the service’s Type value. If
the following conditions apply, the SCM initiates a search in the internal Image Record Database:
■
The service type value includes SERVICE_WINDOWS_SHARE_PROCESS (0x20).
■
The service has not been restarted after an error.
■
Svchost service splitting is not allowed for the service (see the “Svchost service splitting” section
later in this chapter for further details).
An Image record is a data structure that represents a launched process hosting at least one service.
If the preceding conditions apply, the SCM searches an image record that has the same process executable’s name as the new service ImagePath value.
If the SCM locates an existing image database entry with matching ImagePath data, the service can
be shared, and one of the hosting processes is already running. The SCM ensures that the found hosting process is logged on using the same account as the one specified for the service being started. (This
is to ensure that the service is not configured with the wrong account, such as a LocalService account,
but with an image path pointing to a running Svchost, such as netsvcs, which runs as LocalSystem.) A
service’s ObjectName registry value stores the user account in which the service should run. A service
with no ObjectName or an ObjectName of LocalSystem runs in the local system account. A process can
be logged on as only one account, so the SCM reports an error when a service specifies a different account name than another service that has already started in the same process.
If the image record exists, before the new service can be run, another final check should be performed: The SCM opens the token of the currently executing host process and checks whether the necessary service SID is located in the token (and all the required privileges are enabled). Even in this case,
the SCM reports an error if the condition is not verified. Note that, as we describe in the next section
(“Service logon”), for shared services, all the SIDs of the hosted services are added at token creation
time. It is not possible for any user-mode component to add group SIDs in a token after the token has
already been created.
If the image database doesn’t have an entry for the new service ImagePath value, the SCM creates
one. When the SCM creates a new entry, it stores the logon account name used for the service and
the data from the service’s ImagePath value. The SCM requires services to have an ImagePath value.
If a service doesn’t have an ImagePath value, the SCM reports an error stating that it couldn’t find the
service’s path and isn’t able to start the service. After the SCM creates an image record, it logs on the
service account and starts the new hosting process. (The procedure is described in the next section,
“Service logon.”)
After the service has been logged in, and the host process correctly started, the SCM waits for the
initial “connection” message from the service. The service connects to SCM thanks to the SCM RPC pipe
(\Pipe\Ntsvcs, as described in the “The Service Control Manager” section) and to a Channel Context
data structure built by the LogonAndStartImage routine. When the SCM receives the first message, it
proceeds to start the service by posting a SERVICE_CONTROL_START control message to the service
process. Note that in the described communication protocol is always the service that connects to SCM.
454
CHAPTER 10
Management, diagnostics, and tracing
The service application is able to process the message thanks to the message loop located in the
StartServiceCtrlDispatcher API (see the “Service applications” section earlier in this chapter for more details). The service application enables the service group SID in its token (if needed) and creates the new
service thread (which will execute the Service Main function). It then calls back into the SCM for creating a handle to the new service, storing it in an internal data structure (INTERNAL_DISPATCH_TABLE)
similar to the service table specified as input to the StartServiceCtrlDispatcher API. The data structure is
used for tracking the active services in the hosting process. If the service fails to respond positively to
the start command within the timeout period, the SCM gives up and notes an error in the system Event
Log that indicates the service failed to start in a timely manner.
If the service the SCM starts with a call to StartInternal has a Type registry value of SERVICE_KERNEL_
DRIVER or SERVICE_FILE_SYSTEM_DRIVER, the service is really a device driver, so StartInternal enables
the load driver security privilege for the SCM process and then invokes the kernel service NtLoadDriver,
passing in the data in the ImagePath value of the driver’s registry key. Unlike services, drivers don’t
need to specify an ImagePath value, and if the value is absent, the SCM builds an image path by appending the driver’s name to the string %SystemRoot%\System32\ Drivers\.
Note A device driver with the start value of SERVICE_AUTO_START or SERVICE_DEMAND_
START is started by the SCM as a runtime driver, which implies that the resulting loaded
image uses shared pages and has a control area that describes them. This is different than
drivers with the start value of SERVICE_BOOT_START or SERVICE_SYSTEM_START, which are
loaded by the Windows Loader and started by the I/O manager. Those drivers all use private
pages and are neither sharable nor have an associated Control Area.
More details are available in Chapter 5 in Part 1.
ScAutoStartServices continues looping through the services belonging to a group until all the
services have either started or generated dependency errors. This looping is the SCM’s way of automatically ordering services within a group according to their DependOnService dependencies. The SCM
starts the services that other services depend on in earlier loops, skipping the dependent services until
subsequent loops. Note that the SCM ignores Tag values for Windows services, which you might come
across in subkeys under the HKLM\SYSTEM\CurrentControlSet\Services key; the I/O manager honors
Tag values to order device driver startup within a group for boot-start and system-start drivers. Once
the SCM completes phases for all the groups listed in the ServiceGroupOrder\List value, it performs
a phase for services belonging to groups not listed in the value and then executes a final phase for
services without a group.
After handling autostart services, the SCM calls ScInitDelayStart, which queues a delayed work item
associated with a worker thread responsible for processing all the services that ScAutoStartServices
skipped because they were marked delayed autostart (through the DelayedAutostart registry value).
This worker thread will execute after the delay. The default delay is 120 seconds, but it can be overridden by the creating an AutoStartDelay value in HKLM\SYSTEM\CurrentControlSet\Control. The SCM
performs the same actions as those executed during startup of nondelayed autostart services.
CHAPTER 10
Management, diagnostics, and tracing
455
When the SCM finishes starting all autostart services and drivers, as well as setting up the delayed
autostart work item, the SCM signals the event \BaseNamedObjects\SC_AutoStartComplete. This event
is used by the Windows Setup program to gauge startup progress during installation.
Service logon
During the start procedure, if the SCM does not find any existing image record, it means that the host
process needs to be created. Indeed, the new service is not shareable, it’s the first one to be executed,
it has been restarted, or it’s a user service. Before starting the process, the SCM should create an access
token for the service host process. The LogonAndStartImage function’s goal is to create the token and
start the service’s host process. The procedure depends on the type of service that will be started.
User services (more precisely user service instances) are started by retrieving the current
logged-on user token (through functions implemented in the UserMgr.dll library). In this case, the
LogonAndStartImage function duplicates the user token and adds the “WIN://ScmUserService” security
attribute (the attribute value is usually set to 0). This security attribute is used primarily by the Service
Control Manager when receiving connection requests from the service. Although SCM can recognize
a process that’s hosting a classical service through the service SID (or the System account SID if the
service is running under the Local System Account), it uses the SCM security attribute for identifying a
process that’s hosting a user service.
For all other type of services, the SCM reads the account under which the service will be started
from the registry (from the ObjectName value) and calls ScCreateServiceSids with the goal to create a
service SID for each service that will be hosted by the new process. (The SCM cycles between each service in its internal service database.) Note that if the service runs under the LocalSystem account (with
no restricted nor unrestricted SID), this step is not executed.
The SCM logs on services that don’t run in the System account by calling the LSASS function
LogonUserExEx. LogonUserExEx normally requires a password, but normally the SCM indicates to LSASS
that the password is stored as a service’s LSASS “secret” under the key HKLM\SECURITY\Policy\Secrets
in the registry. (Keep in mind that the contents of SECURITY aren’t typically visible because its default
security settings permit access only from the System account.) When the SCM calls LogonUserExEx, it
specifies a service logon as the logon type, so LSASS looks up the password in the Secrets subkey that
has a name in the form _SC_<Service Name>.
Note Services running with a virtual service account do not need a password for having
their service token created by the LSA service. For those services, the SCM does not provide
any password to the LogonUserExEx API.
The SCM directs LSASS to store a logon password as a secret using the LsaStorePrivateData function
when an SCP configures a service’s logon information. When a logon is successful, LogonUserEx returns
a handle to an access token to the caller. The SCM adds the necessary service SIDs to the returned
token, and, if the new service uses restricted SIDs, invokes the ScMakeServiceTokenWriteRestricted
456
CHAPTER 10
Management, diagnostics, and tracing
function, which transforms the token in a write-restricted token (adding the proper restricted SIDs).
Windows uses access tokens to represent a user’s security context, and the SCM later associates the
access token with the process that implements the service.
Next, the SCM creates the user environment block and security descriptor to associate with the
new service process. In case the service that will be started is a packaged service, the SCM reads all the
package information from the registry (package full name, origin, and application user model ID) and
calls the Appinfo service, which stamps the token with the necessary AppModel security attributes and
prepares the service process for the modern package activation. (See the “Packaged applications” section in Chapter 8 for more details about the AppModel.)
After a successful logon, the SCM loads the account’s profile information, if it’s not already loaded,
by calling the User Profile Basic Api DLL’s (%SystemRoot%\System32\Profapi.dll) LoadProfileBasic
function. The value HKLM\SOFTWARE\Microsoft\Windows NT\CurrentVersion\ProfileList\<user profile
key>\ProfileImagePath contains the location on disk of a registry hive that LoadUserProfile loads into
the registry, making the information in the hive the HKEY_CURRENT_USER key for the service.
As its next step, LogonAndStartImage proceeds to launch the service’s process. The SCM starts the
process in a suspended state with the CreateProcessAsUser Windows function. (Except for a process
hosting services under a local system account, which are created through the standard CreateProcess
API. The SCM already runs with a SYSTEM token, so there is no need of any other logon.)
Before the process is resumed, the SCM creates the communication data structure that allows the
service application and the SCM to communicate through asynchronous RPCs. The data structure contains a control sequence, a pointer to a control and response buffer, service and hosting process data
(like the PID, the service SID, and so on), a synchronization event, and a pointer to the async RPC state.
The SCM resumes the service process via the ResumeThread function and waits for the service to connect to its SCM pipe. If it exists, the registry value HKLM\SYSTEM\CurrentControlSet\
Control\ServicesPipeTimeout determines the length of time that the SCM waits for a service to call
StartServiceCtrlDispatcher and connect before it gives up, terminates the process, and concludes
that the service failed to start (note that in this case the SCM terminates the process, unlike when the
service doesn’t respond to the start request, discussed previously in the “Service start” section). If
ServicesPipeTimeout doesn’t exist, the SCM uses a default timeout of 30 seconds. The SCM uses the
same timeout value for all its service communications.
Delayed autostart services
Delayed autostart services enable Windows to cope with the growing number of services that are
being started when a user logs on, which bogs down the boot-up process and increases the time
before a user is able to get responsiveness from the desktop. The design of autostart services was
primarily intended for services required early in the boot process because other services depend on
them, a good example being the RPC service, on which all other services depend. The other use was to
allow unattended startup of a service, such as the Windows Update service. Because many autostart
CHAPTER 10
Management, diagnostics, and tracing
457
services fall in this second category, marking them as delayed autostart allows critical services to start
faster and for the user’s desktop to be ready sooner when a user logs on immediately after booting.
Additionally, these services run in background mode, which lowers their thread, I/O, and memory
priority. Configuring a service for delayed autostart requires calling the ChangeServiceConfig2 API. You
can check the state of the flag for a service by using the qc option of sc.exe.
Note If a nondelayed autostart service has a delayed autostart service as one of its
dependencies, the delayed autostart flag is ignored and the service is started immediately
to satisfy the dependency.
Triggered-start services
Some services need to be started on demand, after certain system events occur. For that reason,
Windows 7 introduced the concept of triggered-start service. A service control program can use the
ChangeServiceConfig2 API (by specifying the SERVICE_CONFIG_TRIGGER_INFO information level) for
configuring a demand-start service to be started (or stopped) after one or more system events occur.
Examples of system events include the following:
■
A specific device interface is connected to the system.
■
The computer joins or leaves a domain.
■
A TCP/IP port is opened or closed in the system firewall.
■
A machine or user policy has been changed.
■
An IP address on the network TCP/IP stack becomes available or unavailable.
■
A RPC request or Named pipe packet arrives on a particular interface.
■
An ETW event has been generated in the system.
The first implementation of triggered-start services relied on the Unified Background Process
Manager (see the next section for details). Windows 8.1 introduced the Broker Infrastructure, which had
the main goal of managing multiple system events targeted to Modern apps. All the previously listed
events have been thus begun to be managed by mainly three brokers, which are all parts of the Broker
Infrastructure (with the exception of the Event Aggregation): Desktop Activity Broker, System Event
Broker, and the Event Aggregation. More information on the Broker Infrastructure is available in the
“Packaged applications” section of Chapter 8.
After the first phase of ScAutoStartServices is complete (which usually starts critical services listed
in the HKLM\SYSTEM\CurrentControlSet\Control\EarlyStartServices registry value), the SCM calls
ScRegisterServicesForTriggerAction, the function responsible in registering the triggers for each triggered-start service. The routine cycles between each Win32 service located in the SCM database. For
each service, the function generates a temporary WNF state name (using the NtCreateWnfStateName
458
CHAPTER 10
Management, diagnostics, and tracing
native API), protected by a proper security descriptor, and publishes it with the service status stored as
state data. (WNF architecture is described in the “Windows Notification Facility” section of Chapter 8.)
This WNF state name is used for publishing services status changes. The routine then queries all the
service triggers from the TriggerInfo registry key, checking their validity and bailing out in case no triggers are available.
Note The list of supported triggers, described previously, together with their parameters,
is documented at https://docs.microsoft.com/en-us/windows/win32/api/winsvc/ns-winsvcservice_trigger.
If the check succeeded, for each trigger the SCM builds an internal data structure containing all the
trigger information (like the targeted service name, SID, broker name, and trigger parameters) and
determines the correct broker based on the trigger type: external devices events are managed by the
System Events broker, while all the other types of events are managed by the Desktop Activity broker.
The SCM at this stage is able to call the proper broker registration routine. The registration process is
private and depends on the broker: multiple private WNF state names (which are broker specific) are
generated for each trigger and condition.
The Event Aggregation broker is the glue between the private WNF state names published by the
two brokers and the Service Control Manager. It subscribes to all the WNF state names corresponding
to the triggers and the conditions (by using the RtlSubscribeWnfStateChangeNotification API). When
enough WNF state names have been signaled, the Event Aggregation calls back the SCM, which can
start or stop the triggered start service.
Differently from the WNF state names used for each trigger, the SCM always independently publishes
a WNF state name for each Win32 service whether or not the service has registered some triggers. This
is because an SCP can receive notification when the specified service status changes by invoking the
NotifyServiceStatusChange API, which subscribes to the service’s status WNF state name. Every time the
SCM raises an event that changes the status of a service, it publishes new state data to the “service status
change” WNF state, which wakes up a thread running the status change callback function in the SCP.
Startup errors
If a driver or a service reports an error in response to the SCM’s startup command, the ErrorControl
value of the service’s registry key determines how the SCM reacts. If the ErrorControl value is SERVICE_
ERROR_IGNORE (0) or the ErrorControl value isn’t specified, the SCM simply ignores the error and
continues processing service startups. If the ErrorControl value is SERVICE_ERROR_NORMAL (1), the
SCM writes an event to the system Event Log that says, “The <service name> service failed to start due
to the following error.” The SCM includes the textual representation of the Windows error code that the
service returned to the SCM as the reason for the startup failure in the Event Log record. Figure 10-18
shows the Event Log entry that reports a service startup error.
CHAPTER 10
Management, diagnostics, and tracing
459
FIGURE 10-18 Service startup failure Event Log entry.
If a service with an ErrorControl value of SERVICE_ERROR_SEVERE (2) or SERVICE_ERROR_CRITICAL
(3) reports a startup error, the SCM logs a record to the Event Log and then calls the internal function
ScRevertToLastKnownGood. This function checks whether the last known good feature is enabled, and,
if so, switches the system’s registry configuration to a version, named last known good, with which the
system last booted successfully. Then it restarts the system using the NtShutdownSystem system service, which is implemented in the executive. If the system is already booting with the last known good
configuration, or if the last known good configuration is not enabled, the SCM does nothing more than
emit a log event.
Accepting the boot and last known good
Besides starting services, the system charges the SCM with determining when the system’s registry
configuration, HKLM\SYSTEM\CurrentControlSet, should be saved as the last known good control
set. The CurrentControlSet key contains the Services key as a subkey, so CurrentControlSet includes the
registry representation of the SCM database. It also contains the Control key, which stores many kernelmode and user-mode subsystem configuration settings. By default, a successful boot consists of a successful startup of autostart services and a successful user logon. A boot fails if the system halts because
a device driver crashes the system during the boot or if an autostart service with an ErrorControl value
of SERVICE_ERROR_SEVERE or SERVICE_ERROR_CRITICAL reports a startup error.
The last known good configuration feature is usually disabled in the client version of Windows.
It can be enabled by setting the HKLM\SYSTEM\CurrentControlSet\Control\Session Manager\
Configuration Manager\LastKnownGood\Enabled registry value to 1. In Server SKUs of Windows, the
value is enabled by default.
The SCM knows when it has completed a successful startup of the autostart services, but Winlogon
(%SystemRoot%\System32\Winlogon.exe) must notify it when there is a successful logon. Winlogon
invokes the NotifyBootConfigStatus function when a user logs on, and NotifyBootConfigStatus sends a
460
CHAPTER 10
Management, diagnostics, and tracing
message to the SCM. Following the successful start of the autostart services or the receipt of the message from NotifyBootConfigStatus (whichever comes last), if the last known good feature is enabled, the
SCM calls the system function NtInitializeRegistry to save the current registry startup configuration.
Third-party software developers can supersede Winlogon’s definition of a successful logon
with their own definition. For example, a system running Microsoft SQL Server might not consider
a boot successful until after SQL Server is able to accept and process transactions. Developers impose their definition of a successful boot by writing a boot-verification program and installing the
program by pointing to its location on disk with the value stored in the registry key HKLM\SYSTEM\
CurrentControlSet\Control\BootVerificationProgram. In addition, a boot-verification program’s installation must disable Winlogon’s call to NotifyBootConfigStatus by setting HKLM\SOFTWARE\Microsoft\
Windows NT\CurrentVersion\Winlogon\ReportBootOk to 0. When a boot-verification program is
installed, the SCM launches it after finishing autostart services and waits for the program’s call to
NotifyBootConfigStatus before saving the last known good control set.
Windows maintains several copies of CurrentControlSet, and CurrentControlSet is really a symbolic
registry link that points to one of the copies. The control sets have names in the form HKLM\SYSTEM\
ControlSetnnn, where nnn is a number such as 001 or 002. The HKLM\SYSTEM\Select key contains values
that identify the role of each control set. For example, if CurrentControlSet points to ControlSet001, the
Current value under Select has a value of 1. The LastKnownGood value under Select contains the number
of the last known good control set, which is the control set last used to boot successfully. Another value
that might be on your system under the Select key is Failed, which points to the last control set for which
the boot was deemed unsuccessful and aborted in favor of an attempt at booting with the last known
good control set. Figure 10-19 displays a Windows Server system’s control sets and Select values.
NtInitializeRegistry takes the contents of the last known good control set and synchronizes it with
that of the CurrentControlSet key’s tree. If this was the system’s first successful boot, the last known
good won’t exist, and the system will create a new control set for it. If the last known good tree exists,
the system simply updates it with differences between it and CurrentControlSet.
FIGURE 10-19 Control set selection key on Windows Server 2019.
CHAPTER 10
Management, diagnostics, and tracing
461
Last known good is helpful in situations in which a change to CurrentControlSet, such as the modification of a system performance-tuning value under HKLM\SYSTEM\Control or the addition of a service
or device driver, causes the subsequent boot to fail. Figure 10-20 shows the Startup Settings of the
modern boot menu. Indeed, when the Last Known Good feature is enabled, and the system is in the
boot process, users can select the Startup Settings choice in the Troubleshoot section of the modern
boot menu (or in the Windows Recovery Environment) to bring up another menu that lets them direct
the boot to use the last known good control set. (In case the system is still using the Legacy boot
menu, users should press F8 to enable the Advanced Boot Options.) As shown in the figure, when the
Enable Last Known Good Configuration option is selected, the system boots by rolling the system’s
registry configuration back to the way it was the last time the system booted successfully. Chapter 12
describes in more detail the use of the Modern boot menu, the Windows Recovery Environment, and
other recovery mechanisms for troubleshooting system startup problems.
FIGURE 10-20 Enabling the last known good configuration.
Service failures
A service can have optional FailureActions and FailureCommand values in its registry key that the SCM
records during the service’s startup. The SCM registers with the system so that the system signals the
SCM when a service process exits. When a service process terminates unexpectedly, the SCM determines which services ran in the process and takes the recovery steps specified by their failure-related
registry values. Additionally, services are not only limited to requesting failure actions during crashes
or unexpected service termination, since other problems, such as a memory leak, could also result in
service failure.
462
CHAPTER 10
Management, diagnostics, and tracing
If a service enters the SERVICE_STOPPED state and the error code returned to the SCM is not
ERROR_SUCCESS, the SCM checks whether the service has the FailureActionsOnNonCrashFailures flag
set and performs the same recovery as if the service had crashed. To use this functionality, the service
must be configured via the ChangeServiceConfig2 API or the system administrator can use the Sc.exe
utility with the Failureflag parameter to set FailureActionsOnNonCrashFailures to 1. The default value
being 0, the SCM will continue to honor the same behavior as on earlier versions of Windows for all
other services.
Actions that a service can configure for the SCM include restarting the service, running a program,
and rebooting the computer. Furthermore, a service can specify the failure actions that take place the
first time the service process fails, the second time, and subsequent times, and it can indicate a delay
period that the SCM waits before restarting the service if the service asks to be restarted. You can easily
manage the recovery actions for a service using the Recovery tab of the service’s Properties dialog
box in the Services MMC snap-in, as shown in Figure 10-21.
FIGURE 10-21 Service Recovery options.
Note that in case the next failure action is to reboot the computer, the SCM, after starting the service, marks the hosting process as critical by invoking the NtSetInformationProcess native API with the
ProcessBreakOnTermination information class. A critical process, if terminated unexpectedly, crashes
the system with the CRITICAL_PROCESS_DIED bugcheck (as already explained in Part 1, Chapter 2,
“System architecture.”
CHAPTER 10
Management, diagnostics, and tracing
463
Service shutdown
When Winlogon calls the Windows ExitWindowsEx function, ExitWindowsEx sends a message to
Csrss, the Windows subsystem process, to invoke Csrss’s shutdown routine. Csrss loops through the
active processes and notifies them that the system is shutting down. For every system process except
the SCM, Csrss waits up to the number of seconds specified in milliseconds by HKCU\Control Panel\
Desktop\WaitToKillTimeout (which defaults to 5 seconds) for the process to exit before moving on to the
next process. When Csrss encounters the SCM process, it also notifies it that the system is shutting down
but employs a timeout specific to the SCM. Csrss recognizes the SCM using the process ID Csrss saved
when the SCM registered with Csrss using the RegisterServicesProcess function during its initialization.
The SCM’s timeout differs from that of other processes because Csrss knows that the SCM communicates with services that need to perform cleanup when they shut down, so an administrator might need
to tune only the SCM’s timeout. The SCM’s timeout value in milliseconds resides in the HKLM\SYSTEM\
CurrentControlSet\Control\WaitToKillServiceTimeout registry value, and it defaults to 20 seconds.
The SCM’s shutdown handler is responsible for sending shutdown notifications to all the services that requested shutdown notification when they initialized with the SCM. The SCM function
ScShutdownAllServices first queries the value of the HKLM\SYSTEM\CurrentControlSet\Control\
ShutdownTimeout (by setting a default of 20 seconds in case the value does not exists). It then loops
through the SCM services database. For each service, it unregisters eventual service triggers and determines whether the service desires to receive a shutdown notification, sending a shutdown command
(SERVICE_CONTROL_SHUTDOWN) if that is the case. Note that all the notifications are sent to services
in parallel by using thread pool work threads. For each service to which it sends a shutdown command,
the SCM records the value of the service’s wait hint, a value that a service also specifies when it registers
with the SCM. The SCM keeps track of the largest wait hint it receives (in case the maximum calculated
wait hint is below the Shutdown timeout specified by the ShutdownTimeout registry value, the shutdown
timeout is considered as maximum wait hint). After sending the shutdown messages, the SCM waits either
until all the services it notified of shutdown exit or until the time specified by the largest wait hint passes.
While the SCM is busy telling services to shut down and waiting for them to exit, Csrss waits
for the SCM to exit. If the wait hint expires without all services exiting, the SCM exits, and Csrss
continues the shutdown process. In case Csrss’s wait ends without the SCM having exited (the
WaitToKillServiceTimeout time expired), Csrss kills the SCM and continues the shutdown process. Thus,
services that fail to shut down in a timely manner are killed. This logic lets the system shut down with
the presence of services that never complete a shutdown as a result of flawed design, but it also means
that services that require more than 5 seconds will not complete their shutdown operations.
Additionally, because the shutdown order is not deterministic, services that might depend on other
services to shut down first (called shutdown dependencies) have no way to report this to the SCM and
might never have the chance to clean up either.
To address these needs, Windows implements preshutdown notifications and shutdown ordering
to combat the problems caused by these two scenarios. A preshutdown notification is sent to a service
that has requested it via the SetServiceStatus API (through the SERVICE_ACCEPT_PRESHUTDOWN accepted control) using the same mechanism as shutdown notifications. Preshutdown notifications are
sent before Wininit exits. The SCM generally waits for them to be acknowledged.
464
CHAPTER 10
Management, diagnostics, and tracing
The idea behind these notifications is to flag services that might take a long time to clean up (such as
database server services) and give them more time to complete their work. The SCM sends a progress
query request and waits 10 seconds for a service to respond to this notification. If the service does not
respond within this time, it is killed during the shutdown procedure; otherwise, it can keep running as
long as it needs, as long as it continues to respond to the SCM.
Services that participate in the preshutdown can also specify a shutdown order with respect to
other preshutdown services. Services that depend on other services to shut down first (for example,
the Group Policy service needs to wait for Windows Update to finish) can specify their shutdown dependencies in the HKLM\SYSTEM\CurrentControlSet\Control\PreshutdownOrder registry value.
Shared service processes
Running every service in its own process instead of having services share a process whenever possible
wastes system resources. However, sharing processes means that if any of the services in the process
has a bug that causes the process to exit, all the services in that process terminate.
Of the Windows built-in services, some run in their own process and some share a process with
other services. For example, the LSASS process contains security-related services—such as the Security
Accounts Manager (SamSs) service, the Net Logon (Netlogon) service, the Encrypting File System (EFS)
service, and the Crypto Next Generation (CNG) Key Isolation (KeyIso) service.
There is also a generic process named Service Host (SvcHost - %SystemRoot%\System32\Svchost.
exe) to contain multiple services. Multiple instances of SvcHost run as different processes. Services
that run in SvcHost processes include Telephony (TapiSrv), Remote Procedure Call (RpcSs), and Remote
Access Connection Manager (RasMan). Windows implements services that run in SvcHost as DLLs and
includes an ImagePath definition of the form %SystemRoot%\System32\svchost.exe –k netsvcs in the
service’s registry key. The service’s registry key must also have a registry value named ServiceDll under
a Parameters subkey that points to the service’s DLL file.
All services that share a common SvcHost process specify the same parameter (–k netsvcs in the example in the preceding paragraph) so that they have a single entry in the SCM’s image database. When
the SCM encounters the first service that has a SvcHost ImagePath with a particular parameter during
service startup, it creates a new image database entry and launches a SvcHost process with the parameter. The parameter specified with the -k switch is the name of the service group. The entire command
line is parsed by the SCM while creating the new shared hosting process. As discussed in the “Service
logon” section, in case another service in the database shares the same ImagePath value, its service SID
will be added to the new hosting process’s group SIDs list.
The new SvcHost process takes the service group specified in the command line and looks for a value having the same name under HKLM\SOFTWARE\Microsoft\Windows NT\CurrentVersion\Svchost.
SvcHost reads the contents of the value, interpreting it as a list of service names, and notifies the SCM
that it’s hosting those services when SvcHost registers with the SCM.
When the SCM encounters another shared service (by checking the service type value) during
service startup with an ImagePath matching an entry it already has in the image database, it doesn’t
launch a second process but instead just sends a start command for the service to the SvcHost it
CHAPTER 10
Management, diagnostics, and tracing
465
already started for that ImagePath value. The existing SvcHost process reads the ServiceDll parameter
in the service’s registry key, enables the new service group SID in its token, and loads the DLL into its
process to start the service.
Table 10-12 lists all the default service groupings on Windows and some of the services that are
registered for each of them.
TABLE 10-12 Major service groupings
466
Service Group
Services
Notes
LocalService
Network Store Interface, Windows
Diagnostic Host, Windows Time,
COM+ Event System, HTTP AutoProxy Service, Software Protection
Platform UI Notification, Thread Order
Service, LLDT Discovery, SSL, FDP
Host, WebClient
Services that run in the local service
account and make use of the network
on various ports or have no network
usage at all (and hence no restrictions).
LocalServiceAndNoImpersonation
UPnP and SSDP, Smart Card, TPM,
Font Cache, Function Discovery,
AppID, qWAVE, Windows Connect
Now, Media Center Extender,
Adaptive Brightness
Services that run in the local service
account and make use of the network
on a fixed set of ports. Services run
with a write-restricted token.
LocalServiceNetworkRestricted
DHCP, Event Logger, Windows Audio,
NetBIOS, Security Center, Parental
Controls, HomeGroup Provider
Services that run in the local service
account and make use of the network
on a fixed set of ports.
LocalServiceNoNetwork
Diagnostic Policy Engine, Base
Filtering Engine, Performance Logging
and Alerts, Windows Firewall, WWAN
AutoConfig
Services that run in the local service
account but make no use of the network at all. Services run with a writerestricted token.
LocalSystemNetworkRestricted
DWM, WDI System Host, Network
Connections, Distributed Link
Tracking, Windows Audio Endpoint,
Wired/WLAN AutoConfig, Pnp-X, HID
Access, User-Mode Driver Framework
Service, Superfetch, Portable Device
Enumerator, HomeGroup Listener,
Tablet Input, Program Compatibility,
Offline Files
Services that run in the local system
account and make use of the network
on a fixed set of ports.
NetworkService
Cryptographic Services, DHCP Client,
Terminal Services, WorkStation,
Network Access Protection, NLA, DNS
Client, Telephony, Windows Event
Collector, WinRM
Services that run in the network
service account and make use of the
network on various ports (or have no
enforced network restrictions).
NetworkServiceAndNoImpersonation
KTM for DTC
Services that run in the network service account and make use of the network on a fixed set of ports. Services
run with a write-restricted token.
NetworkServiceNetworkRestricted
IPSec Policy Agent
Services that run in the network service account and make use of the network on a fixed set of ports.
CHAPTER 10
Management, diagnostics, and tracing
Svchost service splitting
As discussed in the previous section, running a service in a shared host process saves system resources
but has the big drawback that a single unhandled error in a service obliges all the other services shared
in the host process to be killed. To overcome this problem, Windows 10 Creators Update (RS2) has
introduced the Svchost Service splitting feature.
When the SCM starts, it reads three values from the registry representing the services global commit
limits (divided in: low, medium, and hard caps). These values are used by the SCM to send “low resources”
messages in case the system runs under low-memory conditions. It then reads the Svchost Service
split threshold value from the HKLM\SYSTEM\CurrentControlSet\Control\SvcHostSplitThresholdInKB
registry value. The value contains the minimum amount of system physical memory (expressed in KB)
needed to enable Svchost Service splitting (the default value is 3.5 GB on client systems and around
3.7 GB on server systems). The SCM then obtains the value of the total system physical memory using
the GlobalMemoryStatusEx API and compares it with the threshold previously read from the registry.
If the total physical memory is above the threshold, it enables Svchost service splitting (by setting an
internal global variable).
Svchost service splitting, when active, modifies the behavior in which SCM starts the host Svchost
process of shared services. As already discussed in the “Service start” section earlier in this chapter, the
SCM does not search for an existing image record in its database if service splitting is allowed for a service. This means that, even though a service is marked as sharable, it is started using its private hosting
process (and its type is changed to SERVICE_WIN32_OWN_PROCESS). Service splitting is allowed only
if the following conditions apply:
■
■
■
■
Svchost Service splitting is globally enabled.
The service is not marked as critical. A service is marked as critical if its next recovery action
specifies to reboot the machine (as discussed previously in the “Service failures” section).
The service host process name is Svchost.exe.
Service splitting is not explicitly disabled for the service through the SvcHostSplitDisable registry
value in the service control key.
Memory manager’s technologies like Memory Compression and Combining help in saving as much
of the system working set as possible. This explains one of the motivations behind the enablement
of Svchost service splitting. Even though many new processes are created in the system, the memory
manager assures that all the physical pages of the hosting processes remain shared and consume as
little system resources as possible. Memory combining, compression, and memory sharing are explained in detail in Chapter 5 of Part 1.
CHAPTER 10
Management, diagnostics, and tracing
467
EXPERIMENT: Playing with Svchost service splitting
In case you are using a Windows 10 workstation equipped with 4 GB or more of memory, when you
open the Task Manager, you may notice that a lot of Svchost.exe process instances are currently
executing. As explained in this section, this doesn’t produce a memory waste problem, but you
could be interested in disabling Svchost splitting. First, open Task Manager and count how many
svchost process instances are currently running in the system. On a Windows 10 May 2019 Update
(19H1) system, you should have around 80 Svchost process instances. You can easily count them by
opening an administrative PowerShell window and typing the following command:
(get-process -Name "svchost" | measure).Count
On the sample system, the preceding command returned 85.
Open the Registry Editor (by typing regedit.exe in the Cortana search box) and navigate to the HKLM\SYSTEM\CurrentControlSet\Control key. Note the current value of the
SvcHostSplitThresholdInKB DWORD value. To globally disable Svchost service splitting, you
should modify the registry value by setting its data to 0. (You change it by double-clicking the
registry value and entering 0.) After modifying the registry value, restart the system and repeat
the previous step: counting the number of Svchost process instances. The system now runs with
much fewer of them:
PS C:\> (get-process -Name "svchost" | measure).Count
26
To return to the previous behavior, you should restore the previous content of the
SvcHostSplitThresholdInKB registry value. By modifying the DWORD value, you can also fine-tune
the amount of physical memory needed by Svchost splitting for correctly being enabled.
Service tags
One of the disadvantages of using service-hosting processes is that accounting for CPU time and usage, as well as for the usage of resources by a specific service is much harder because each service is
sharing the memory address space, handle table, and per-process CPU accounting numbers with the
other services that are part of the same service group. Although there is always a thread inside the
service-hosting process that belongs to a certain service, this association might not always be easy to
make. For example, the service might be using worker threads to perform its operation, or perhaps the
start address and stack of the thread do not reveal the service’s DLL name, making it hard to figure out
what kind of work a thread might be doing and to which service it might belong.
Windows implements a service attribute called the service tag (not to be confused with the driver
tag), which the SCM generates by calling ScGenerateServiceTag when a service is created or when the
service database is generated during system boot. The attribute is simply an index identifying the service. The service tag is stored in the SubProcessTag field of the thread environment block (TEB) of each
thread (see Chapter 3 of Part 1 for more information on the TEB) and is propagated across all threads
that a main service thread creates (except threads created indirectly by thread-pool APIs).
468
CHAPTER 10
Management, diagnostics, and tracing
Although the service tag is kept internal to the SCM, several Windows utilities, like Netstat.exe
(a utility you can use for displaying which programs have opened which ports on the network), use
undocumented APIs to query service tags and map them to service names. Another tool you can use
to look at service tags is ScTagQuery from Winsider Seminars & Solutions Inc. (www.winsiderss.com/
tools/sctagquery/sctagquery.htm). It can query the SCM for the mappings of every service tag and
display them either systemwide or per-process. It can also show you to which services all the threads
inside a service-hosting process belong. (This is conditional on those threads having a proper service
tag associated with them.) This way, if you have a runaway service consuming lots of CPU time, you can
identify the culprit service in case the thread start address or stack does not have an obvious service
DLL associated with it.
User services
As discussed in the “Running services in alternate accounts” section, a service can be launched using
the account of a local system user. A service configured in that way is always loaded using the specified
user account, regardless of whether the user is currently logged on. This could represent a limitation
in multiuser environments, where a service should be executed with the access token of the currently
logged-on user. Furthermore, it can expose the user account at risk because malicious users can potentially inject into the service process and use its token to access resources they are not supposed to
(being able also to authenticate on the network).
Available from Windows 10 Creators Update (RS2), User Services allow a service to run with the
token of the currently logged-on user. User services can be run in their own process or can share a
process with one or more other services running in the same logged-on user account as for standard
services. They are started when a user performs an interactive logon and stopped when the user logs
off. The SCM internally supports two additional type flags—SERVICE_USER_SERVICE (64) and SERVICE_
USERSERVICE_INSTANCE (128)—which identify a user service template and a user service instance.
One of the states of the Winlogon finite-state machine (see Chapter 12 for details on Winlogon
and the boot process) is executed when an interactive logon has been initiated. The state creates the
new user’s logon session, window station, desktop, and environment; maps the HKEY_CURRENT_USER
registry hive; and notifies the logon subscribers (LogonUI and User Manager). The User Manager
service (Usermgr.dll) through RPC is able to call into the SCM for delivering the WTS_SESSION_LOGON
session event.
The SCM processes the message through the ScCreateUserServicesForUser function, which calls
back into the User Manager for obtaining the currently logged-on user’s token. It then queries the list
of user template services from the SCM database and, for each of them, generates the new name of
the user instance service.
CHAPTER 10
Management, diagnostics, and tracing
469
EXPERIMENT: Witnessing user services
A kernel debugger can easily show the security attributes of a process’s token. In this experiment, you need a Windows 10 machine with a kernel debugger enabled and attached to a host
(a local debugger works, too). In this experiment, you choose a user service instance and analyze
its hosting process’s token. Open the Services tool by typing its name in the Cortana search box.
The application shows standard services and also user services instances (even though it erroneously displays Local System as the user account), which can be easily identified because they
have a local unique ID (LUID, generated by the User Manager) attached to their displayed names.
In the example, the Connected Device User Service is displayed by the Services application as
Connected Device User Service_55d01:
If you double-click the identified service, the tool shows the actual name of the user service
instance (CDPUserSvc_55d01 in the example). If the service is hosted in a shared process, like the
one chosen in the example, you should use the Registry Editor to navigate in the service root key
of the user service template, which has the same name as the instance but without the LUID (the
user service template name is CDPUserSvc in the example). As explained in the “Viewing privileges required by services” experiment, under the Parameters subkey, the Service DLL name is
stored. The DLL name should be used in Process Explorer for finding the correct hosting process
ID (or you can simply use Task Manager in the latest Windows 10 versions).
After you have found the PID of the hosting process, you should break into the kernel debugger and type the following commands (by replacing the <ServicePid> with the PID of the
service’s hosting process):
!process <ServicePid> 1
470
CHAPTER 10
Management, diagnostics, and tracing
The debugger displays several pieces of information, including the address of the associated
security token object:
Kd: 0> !process 0n5936 1
Searching for Process with Cid == 1730
PROCESS ffffe10646205080
SessionId: 2 Cid: 1730
Peb: 81ebbd1000 ParentCid: 0344
DirBase: 8fe39002 ObjectTable: ffffa387c2826340 HandleCount: 313.
Image: svchost.exe
VadRoot ffffe1064629c340 Vads 108 Clone 0 Private 962. Modified 214. Locked 0.
DeviceMap ffffa387be1341a0
Token
ffffa387c2bdc060
ElapsedTime
00:35:29.441
...
<Output omitted for space reasons>
To show the security attributes of the token, you just need to use the !token command followed by the address of the token object (which internally is represented with a _TOKEN data
structure) returned by the previous command. You should easily confirm that the process is
hosting a user service by seeing the WIN://ScmUserService security attribute, as shown in the
following output:
0: kd> !token ffffa387c2bdc060
_TOKEN 0xffffa387c2bdc060
TS Session ID: 0x2
User: S-1-5-21-725390342-1520761410-3673083892-1001
User Groups:
00 S-1-5-21-725390342-1520761410-3673083892-513
Attributes - Mandatory Default Enabled
... <Output omitted for space reason> ...
OriginatingLogonSession: 3e7
PackageSid: (null)
CapabilityCount: 0
Capabilities: 0x0000000000000000
LowboxNumberEntry: 0x0000000000000000
Security Attributes:
00 Claim Name
: WIN://SCMUserService
Claim Flags: 0x40 - UNKNOWN
Value Type
: CLAIM_SECURITY_ATTRIBUTE_TYPE_UINT64
Value Count: 1
Value[0]
: 0
01 Claim Name
: TSA://ProcUnique
Claim Flags: 0x41 - UNKNOWN
Value Type
: CLAIM_SECURITY_ATTRIBUTE_TYPE_UINT64
Value Count: 2
Value[0]
: 102
Value[1]
: 352550
Process Hacker, a system tool similar to Process Explorer and available at https://processhacker.
sourceforge.io/ is able to extract the same information.
CHAPTER 10
Management, diagnostics, and tracing
471
As discussed previously, the name of a user service instance is generated by combining the
original name of the service and a local unique ID (LUID) generated by the User Manager for
identifying the user’s interactive session (internally called context ID). The context ID for the
interactive logon session is stored in the volatile HKLM\SOFTWARE\Microsoft\Windows NT\
CurrentVersion\Winlogon\VolatileUserMgrKey\ <Session ID>\<User SID>\contextLuid registry
value, where <Session ID> and <User SID> identify the logon session ID and the user SID. If you
open the Registry Editor and navigate to this key, you will find the same context ID value as the
one used for generating the user service instance name.
Figure 10-22 shows an example of a user service instance, the Clipboard User Service, which is run
using the token of the currently logged-on user. The generated context ID for session 1 is 0x3a182, as
shown by the User Manager volatile registry key (see the previous experiment for details). The SCM
then calls ScCreateService, which creates a service record in the SCM database. The new service record
represents a new user service instance and is saved in the registry as for normal services. The service
security descriptor, all the dependent services, and the triggers information are copied from the user
service template to the new user instance service.
FIGURE 10-22 The Clipboard User Service instance running in the context ID 0x3a182.
472
CHAPTER 10
Management, diagnostics, and tracing
The SCM registers the eventual service triggers (see the “Triggered-start services” section earlier in
this chapter for details) and then starts the service (if its start type is set to SERVICE_AUTO_START). As
discussed in the “Service logon” section, when SCM starts a process hosting a user service, it assigns the
token of the current logged-on user and the WIN://ScmUserService security attribute used by the SCM
to recognize that the process is really hosting a service. Figure 10-23 shows that, after a user has logged
in to the system, both the instance and template subkeys are stored in the root services key representing the same user service. The instance subkey is deleted on user logoff and ignored if it’s still present
at system startup time.
FIGURE 10-23 User service instance and template registry keys.
Packaged services
As briefly introduced in the “Service logon” section, since Windows 10 Anniversary Update (RS1), the
Service Control Manager has supported packaged services. A packaged service is identified through the
SERVICE_PKG_SERVICE (512) flag set in its service type. Packaged services have been designed mainly to
support standard Win32 desktop applications (which may run with an associated service) converted to
the new Modern Application Model. The Desktop App Converter is indeed able to convert a Win32 application to a Centennial app, which runs in a lightweight container, internally called Helium. More details
on the Modern Application Model are available in the “Packaged application” section of Chapter 8.
When starting a packaged service, the SCM reads the package information from the registry, and, as
for standard Centennial applications, calls into the AppInfo service. The latter verifies that the package
information exists in the state repository and the integrity of all the application package files. It then
stamps the new service’s host process token with the correct security attributes. The process is then
launched in a suspended state using CreateProcessAsUser API (including the Package Full Name attribute) and a Helium container is created, which will apply registry redirection and Virtual File System
(VFS) as for regular Centennial applications.
CHAPTER 10
Management, diagnostics, and tracing
473
Protected services
Chapter 3 of Part 1 described in detail the architecture of protected processes and protected processes
light (PPL). The Windows 8.1 Service Control Manager supports protected services. At the time of this
writing, a service can have four levels of protection: Windows, Windows light, Antimalware light, and
App. A service control program can specify the protection of a service using the ChangeServiceConfig2
API (with the SERVICE_CONFIG_LAUNCH_ PROTECTED information level). A service’s main executable (or
library in the case of shared services) must be signed properly for running as a protected service, following the same rules as for protected processes (which means that the system checks the digital signature’s
EKU and root certificate and generates a maximum signer level, as explained in Chapter 3 of Part 1).
A service’s hosting process launched as protected guarantees a certain kind of protection with
respect to other nonprotected processes. They can’t acquire some access rights while trying to access
a protected service’s hosting process, depending on the protection level. (The mechanism is identical
to standard protected processes. A classic example is a nonprotected process not being able to inject
any kind of code in a protected service.)
Even processes launched under the SYSTEM account can’t access a protected process. However,
the SCM should be fully able to access a protected service’s hosting process. So, Wininit.exe launches the
SCM by specifying the maximum user-mode protection level: WinTcb Light. Figure 10-24 shows the
digital signature of the SCM main executable, services.exe, which includes the Windows TCB Component
EKU (1.3.6.1.4.1.311.10.3.23).
FIGURE 10-24 The Service Control Manager main executable (service.exe) digital certificate.
474
CHAPTER 10
Management, diagnostics, and tracing
The second part of protection is brought by the Service Control Manager. While a client requests an
action to be performed on a protected service, the SCM calls the ScCheckServiceProtectedProcess routine with the goal to check whether the caller has enough access rights to perform the requested action
on the service. Table 10-13 lists the denied operations when requested by a nonprotected process on a
protected service.
TABLE 10-13 List of denied operations while requested from nonprotected client
Involved API Name
Operation
Description
ChangeServiceConfig 2
Change Service
Configuration
Any change of configuration to a protected service is denied.
SetServiceObjectSecurity Set a new security descriptor to a service
Application of a new security descriptor to a protected service
is denied. (It could lower the service attack surface.)
DeleteService
Delete a Service
Nonprotected process can’t delete a protected service.
ControlService
Send a control code to a
service
Only service-defined control code and SERVICE_CONTROL_
INTERROGATE are allowed for nonprotected callers.
SERVICE_CONTROL_STOP is allowed for any protection level
except for Antimalware.
The ScCheckServiceProtectedProcess function looks up the service record from the caller-specified
service handle and, in case the service is not protected, always grants access. Otherwise, it impersonates the client process token, obtains its process protection level, and implements the following rules:
■
■
■
If the request is a STOP control request and the target service is not protected at Antimalware
level, grant the access (Antimalware protected services are not stoppable by non-protected
processes).
In case the TrustedInstaller service SID is present in the client’s token groups or is set as the
token user, the SCM grants access regarding the client’s process protection.
Otherwise, it calls RtlTestProtectedAccess, which performs the same checks implemented for
protected processes. The access is granted only if the client process has a compatible protection
level with the target service. For example, a Windows protected process can always operate on
all protected service levels, while an antimalware PPL can only operate on Antimalware and app
protected services.
Noteworthy is that the last check described is not executed for any client process running with the
TrustedInstaller virtual service account. This is by design. When Windows Update installs an update, it
should be able to start, stop, and control any kind of service without requiring itself to be signed with a
strong digital signature (which could expose Windows Update to an undesired attack surface).
Task scheduling and UBPM
Various Windows components have traditionally been in charge of managing hosted or background
tasks as the operating system has increased in complexity in features, from the Service Control
Manager, described earlier, to the DCOM Server Launcher and the WMI Provider—all of which are also
CHAPTER 10
Management, diagnostics, and tracing
475
responsible for the execution of out-of-process, hosted code. Although modern versions of Windows
use the Background Broker Infrastructure to manage the majority of background tasks of modern applications (see Chapter 8 for more details), the Task Scheduler is still the main component that manages
Win32 tasks. Windows implements a Unified Background Process Manager (UBPM), which handles
tasks managed by the Task Scheduler.
The Task Scheduler service (Schedule) is implemented in the Schedsvc.dll library and started in a
shared Svchost process. The Task Scheduler service maintains the tasks database and hosts UBPM,
which starts and stops tasks and manages their actions and triggers. UBPM uses the services provided
by the Desktop Activity Broker (DAB), the System Events Broker (SEB), and the Resource Manager for
receiving notification when tasks’ triggers are generated. (DAB and SEB are both hosted in the System
Events Broker service, whereas Resource Manager is hosted in the Broker Infrastructure service.) Both
the Task Scheduler and UBPM provide public interfaces exposed over RPC. External applications can
use COM objects to attach to those interfaces and interact with regular Win32 tasks.
The Task Scheduler
The Task Scheduler implements the task store, which provides storage for each task. It also hosts the
Scheduler idle service, which is able to detect when the system enters or exits the idle state, and the
Event trap provider, which helps the Task Scheduler to launch a task upon a change in the machine
state and provides an internal event log triggering system. The Task Scheduler also includes another
component, the UBPM Proxy, which collects all the tasks’ actions and triggers, converts their descriptors to a format that UBPM can understand, and sends them to UBPM.
An overview of the Task Scheduler architecture is shown in Figure 10-25. As highlighted by the
picture, the Task Scheduler works deeply in collaboration with UBPM (both components run in the Task
Scheduler service, which is hosted by a shared Svchost.exe process.) UBPM manages the task’s states
and receives notification from SEB, DAB, and Resource Manager through WNF states.
Powershell/WMI
Schedcli.dll
MsTask.dll
WmiPrvSE.exe
Process
at.exe
Process
COM
COM
BrokerInfrastructure Service
APIs
Taskschd.dll
Resource Manager
UbpmProxy
UBPM
Task Host Server (ubpm.dll)
RPCs
Taskschd.dll
Task
Control
Process COM APIs
Task Control Program
RPCs
Schtasks
Process
CHAPTER 10
Desktop Activity
Broker (DAB)
F
WN
WN
F
System Events
Broker (SEB)
RPCs
Taskschd.dll
COM
Task Scheduler
Configuration Tool
FIGURE 10-25 The Task Scheduler architecture.
476
W
Task Scheduler Service
Task Scheduler
(schedsvc.dll)
F
N
Management, diagnostics, and tracing
Task Host Client
(taskhostw.exe)
COM Task
Non-Hosted
Task
…
System Events Broker
Service
RPCs
Task Scheduler Compat
plugin (taskcomp.dll)
RPCs
APIs
Schedprov.dll
The Task Scheduler has the important job of exposing the server part of the COM Task Scheduler
APIs. When a Task Control program invokes one of those APIs, the Task Scheduler COM API library
(Taskschd.dll) is loaded in the address space of the application by the COM engine. The library requests
services on behalf of the Task Control Program to the Task Scheduler through RPC interfaces.
In a similar way, the Task Scheduler WMI provider (Schedprov.dll) implements COM classes and
methods able to communicate with the Task Scheduler COM API library. Its WMI classes, properties,
and events can be called from Windows PowerShell through the ScheduledTasks cmdlet (documented
at https://docs.microsoft.com/en-us/powershell/module/scheduledtasks/ ). Note that the Task Scheduler
includes a Compatibility plug-in, which allows legacy applications, like the AT command, to work with
the Task Scheduler. In the May 2019 Update edition of Windows 10 (19H1), the AT tool has been declared deprecated, and you should instead use schtasks.exe.
Initialization
When started by the Service Control Manager, the Task Scheduler service begins its initialization procedure. It starts by registering its manifest-based ETW event provider (that has the DE7B24EA-73C84A09-985D-5BDADCFA9017 global unique ID). All the events generated by the Task Scheduler are consumed by UBPM. It then initializes the Credential store, which is a component used to securely access
the user credentials stored by the Credential Manager and the Task store. The latter checks that all the
XML task descriptors located in the Task store’s secondary shadow copy (maintained for compatibility
reasons and usually located in %SystemRoot%\System32\Tasks path) are in sync with the task descriptors located in the Task store cache. The Task store cache is represented by multiple registry keys, with
the root being HKLM\SOFTWARE\Microsoft\Windows NT\CurrentVersion\Schedule\TaskCache.
The next step in the Task Scheduler initialization is to initialize UBPM. The Task Scheduler service uses
the UbpmInitialize API exported from UBPM.dll for starting the core components of UBPM. The function registers an ETW consumer of the Task Scheduler’s event provider and connects to the Resource
Manager. The Resource Manager is a component loaded by the Process State Manager (Psmsrv.dll, in the
context of the Broker Infrastructure service), which drives resource-wise policies based on the machine
state and global resource usage. Resource Manager helps UBPM to manage maintenance tasks. Those
types of tasks run only in particular system states, like when the workstation CPU usage is low, when
game mode is off, the user is not physically present, and so on. UBPM initialization code then retrieves
the WNF state names representing the task’s conditions from the System Event Broker: AC power, Idle
Workstation, IP address or network available, Workstation switching to Battery power. (Those conditions
are visible in the Conditions sheet of the Create Task dialog box of the Task Scheduler MMC plug-in.)
UBPM initializes its internal thread pool worker threads, obtains system power capabilities, reads a
list of the maintenance and critical task actions (from the HKLM\System\CurrentControlSet\Control\
Ubpm registry key and group policy settings) and subscribes to system power settings notifications
(in that way UBPM knows when the system changes its power state).
The execution control returns to the Task Scheduler, which finally registers the global RPC interfaces
of both itself and UBPM. Those interfaces are used by the Task Scheduler API client-side DLL (Taskschd.dll)
to provide a way for client processes to interact via the Task Scheduler via the Task Scheduler COM
interfaces, which are documented at https://docs.microsoft.com/en-us/windows/win32/api/taskschd/.
CHAPTER 10
Management, diagnostics, and tracing
477
After the initialization is complete, the Task store enumerates all the tasks that are installed in the
system and starts each of them. Tasks are stored in the cache in four groups: Boot, logon, plain, and
Maintenance task. Each group has an associated subkey, called Index Group Tasks key, located in the
Task store’s root registry key (HKLM\ SOFTWARE\Microsoft\Windows NT\CurrentVersion\Schedule\
TaskCache, as introduced previously). Inside each Index Tasks group key is one subkey per each task,
identified through a global unique identifier (GUID). The Task Scheduler enumerates the names of all
the group’s subkeys, and, for each of them, opens the relative Task’s master key, which is located in the
Tasks subkey of the Task store’s root registry key. Figure 10-26 shows a sample boot task, which has the
{0C7D8A27-9B28-49F1-979C-AD37C4D290B1} GUID. The task GUID is listed in the figure as one of the
first entries in the Boot index group key. The figure also shows the master Task key, which stores binary
data in the registry to entirely describe the task.
FIGURE 10-26 A boot task master key.
The task’s master key contains all the information that describes the task. Two properties of the task
are the most important: Triggers, which describe the conditions that will trigger the task, and Actions,
which describe what happen when the task is executed. Both properties are stored in binary registry
values (named “Triggers” and “Actions,”, as shown in Figure 10-26). The Task Scheduler first reads the
hash of the entire task descriptor (stored in the Hash registry value); then it reads all the task’s configuration data and the binary data for triggers and actions. After parsing this data, it adds each identified
trigger and action descriptor to an internal list.
478
CHAPTER 10
Management, diagnostics, and tracing
The Task Scheduler then recalculates the SHA256 hash of the new task descriptor (which includes
all the data read from the registry) and compares it with the expected value. If the two hashes do not
match, the Task Scheduler opens the XML file associated with the task contained in the store’s shadow
copy (the %SystemRoot%\System32\Tasks folder), parses its data and recalculates a new hash, and
finally replaces the task descriptor in the registry. Indeed, tasks can be described by binary data included in the registry and also by an XML file, which adhere to a well-defined schema, documented at
https://docs.microsoft.com/en-us/windows/win32/taskschd/task-scheduler-schema.
EXPERIMENT: Explore a task’s XML descriptor
Task descriptors, as introduced in this section, are stored by the Task store in two formats: XML
file and in the registry. In this experiment, you will peek at both formats. First, open the Task
Scheduler applet by typing taskschd.msc in the Cortana search box. Expand the Task Scheduler
Library node and all the subnodes until you reach the Microsoft\Windows folder. Explore each
subnode and search for a task that has the Actions tab set to Custom Handler. The action type
is used for describing COM-hosted tasks, which are not supported by the Task Scheduler applet.
In this example, we consider the ProcessMemoryDiagnosticEvents, which can be found under the
MemoryDiagnostics folder, but any task with the Actions set to Custom Handler works well:
Open an administrative command prompt window (by typing CMD in the Cortana search
box and selecting Run As Administrator); then type the following command (replacing the task
path with the one of your choice):
schtasks /query /tn "Microsoft\Windows\MemoryDiagnostic\ProcessMemoryDiagnosticEvents" /xml
CHAPTER 10
Management, diagnostics, and tracing
479
The output shows the task’s XML descriptor, which includes the Task’s security descriptor
(used to protect the task for being opened by unauthorized identities), the task’s author and description, the security principal that should run it, the task settings, and task triggers and actions:
<?xml version="1.0" encoding="UTF-16"?>
<Task xmlns="http://schemas.microsoft.com/windows/2004/02/mit/task">
<RegistrationInfo>
<Version>1.0</Version>
<SecurityDescriptor>D:P(A;;FA;;;BA)(A;;FA;;;SY)(A;;FR;;;AU)</SecurityDescriptor>
<Author>$(@%SystemRoot%\system32\MemoryDiagnostic.dll,-600)</Author>
<Description>$(@%SystemRoot%\system32\MemoryDiagnostic.dll,-603)</Description>
<URI>\Microsoft\Windows\MemoryDiagnostic\ProcessMemoryDiagnosticEvents</URI>
</RegistrationInfo>
<Principals>
<Principal id="LocalAdmin">
<GroupId>S-1-5-32-544</GroupId>
<RunLevel>HighestAvailable</RunLevel>
</Principal>
</Principals>
<Settings>
<AllowHardTerminate>false</AllowHardTerminate>
<DisallowStartIfOnBatteries>true</DisallowStartIfOnBatteries>
<StopIfGoingOnBatteries>true</StopIfGoingOnBatteries>
<Enabled>false</Enabled>
<ExecutionTimeLimit>PT2H</ExecutionTimeLimit>
<Hidden>true</Hidden>
<MultipleInstancesPolicy>IgnoreNew</MultipleInstancesPolicy>
<StartWhenAvailable>true</StartWhenAvailable>
<RunOnlyIfIdle>true</RunOnlyIfIdle>
<IdleSettings>
<StopOnIdleEnd>true</StopOnIdleEnd>
<RestartOnIdle>true</RestartOnIdle>
</IdleSettings>
<UseUnifiedSchedulingEngine>true</UseUnifiedSchedulingEngine>
</Settings>
<Triggers>
<EventTrigger>
<Subscription><QueryList><Query Id="0" Path="System"><Select Pa
th="System">*[System[Provider[@Name='Microsoft-Windows-WER-SystemErrorReporting']
and (EventID=1000 or EventID=1001 or EventID=1006)]]</Select></Query></
QueryList></Subscription>
</EventTrigger>
. . . [cut for space reasons] . . .
</Triggers>
<Actions Context="LocalAdmin">
<ComHandler>
<ClassId>{8168E74A-B39F-46D8-ADCD-7BED477B80A3}</ClassId>
<Data><![CDATA[Event]]></Data>
</ComHandler>
</Actions>
</Task>
480
CHAPTER 10
Management, diagnostics, and tracing
In the case of the ProcessMemoryDiagnosticEvents task, there are multiple ETW triggers (which
allow the task to be executed only when certain diagnostics events are generated. Indeed, the
trigger descriptors include the ETW query specified in XPath format). The only registered action
is a ComHandler, which includes just the CLSID (class ID) of the COM object representing the task.
Open the Registry Editor and navigate to the HKEY_LOCAL_MACHINE\SOFTWARE\Classes\CLSID
key. Select Find... from the Edit menu and copy and paste the CLSID located after the ClassID XML
tag of the task descriptor (with or without the curly brackets). You should be able to find the DLL
that implements the ITaskHandler interface representing the task, which will be hosted by the Task
Host client application (Taskhostw.exe, described later in the “Task host client” section):
If you navigate in the HKLM\SOFTWARE\Microsoft\Windows NT\CurrentVersion\Schedule\
TaskCache\Tasks registry key, you should also be able to find the GUID of the task descriptor
stored in the Task store cache. To find it, you should search using the task’s URI. Indeed, the
task’s GUID is not stored in the XML configuration file. The data belonging to the task descriptor in the registry is identical to the one stored in the XML configuration file located in the
store’s shadow copy (%systemroot%\System32\Tasks\Microsoft\ Windows\MemoryDiagnostic\
ProcessMemoryDiagnosticEvents). Only the binary format in which it is stored changes.
Enabled tasks should be registered with UBPM. The Task Scheduler calls the RegisterTask function
of the Ubpm Proxy, which first connects to the Credential store, for retrieving the credential used to
start the task, and then processes the list of all actions and triggers (stored in an internal list), converting them in a format that UBPM can understand. Finally, it calls the UbpmTriggerConsumerRegister API
exported from UBPM.dll. The task is ready to be executed when the right conditions are verified.
Unified Background Process Manager (UBPM)
Traditionally, UBPM was mainly responsible in managing tasks’ life cycles and states (start, stop, enable/
disable, and so on) and to provide notification and triggers support. Windows 8.1 introduced the Broker
Infrastructure and moved all the triggers and notifications management to different brokers that can
CHAPTER 10
Management, diagnostics, and tracing
481
be used by both Modern and standard Win32 applications. Thus, in Windows 10, UBPM acts as a proxy
for standard Win32 Tasks’ triggers and translates the trigger consumers request to the correct broker.
UBPM is still responsible for providing COM APIs available to applications for the following:
■
Registering and unregistering a trigger consumer, as well as opening and closing a handle to one
■
Generating a notification or a trigger
■
Sending a command to a trigger provider
Similar to the Task Scheduler’s architecture, UBPM is composed of various internal components: Task
Host server and client, COM-based Task Host library, and Event Manager.
Task host server
When one of the System brokers raises an event registered by a UBPM trigger consumer (by publishing
a WNF state change), the UbpmTriggerArrived callback function is executed. UBPM searches the internal list of a registered task’s triggers (based on the WNF state name) and, when it finds the correct one,
processes the task’s actions. At the time of this writing, only the Launch Executable action is supported.
This action supports both hosted and nonhosted executables. Nonhosted executables are regular
Win32 executables that do not directly interact with UBPM; hosted executables are COM classes that
directly interact with UBPM and need to be hosted by a task host client process. After a host-based
executable (taskhostw.exe) is launched, it can host different tasks, depending on its associated token.
(Host-based executables are very similar to shared Svchost services.)
Like SCM, UBPM supports different types of logon security tokens for task’s host processes. The
UbpmTokenGetTokenForTask function is able to create a new token based on the account information
stored in the task descriptor. The security token generated by UBPM for a task can have one of the following owners: a registered user account, Virtual Service account, Network Service account, or Local
Service account. Unlike SCM, UBPM fully supports Interactive tokens. UBPM uses services exposed by
the User Manager (Usermgr.dll) to enumerate the currently active interactive sessions. For each session,
it compares the User SID specified in the task’s descriptor with the owner of the interactive session. If
the two match, UBPM duplicates the token attached to the interactive session and uses it to log on the
new executable. As a result, interactive tasks can run only with a standard user account. (Noninteractive
tasks can run with all the account types listed previously.)
After the token has been generated, UBPM starts the task’s host process. In case the task is a hosted
COM task, the UbpmFindHost function searches inside an internal list of Taskhostw.exe (task host client) process instances. If it finds a process that runs with the same security context of the new task, it
simply sends a Start Task command (which includes the COM task’s name and CLSID) through the task
host local RPC connection and waits for the first response. The task host client process and UBPM are
connected through a static RPC channel (named ubpmtaskhostchannel) and use a connection protocol
similar to the one implemented in the SCM.
482
CHAPTER 10
Management, diagnostics, and tracing
If a compatible client process instance has not been found, or if the task’s host process is a regular
non-COM executable, UBPM builds a new environment block, parses the command line, and creates a
new process in a suspended state using the CreateProcessAsUser API. UBPM runs each task’s host process in a Job object, which allows it to quickly set the state of multiple tasks and fine-tune the resources
allocated for background tasks. UBPM searches inside an internal list for Job objects containing host
processes belonging to the same session ID and the same type of tasks (regular, critical, COM-based,
or non-hosted). If it finds a compatible Job, it simply assigns the new process to the Job (by using the
AssignProcessToJobObject API). Otherwise, it creates a new one and adds it to its internal list.
After the Job object has been created, the task is finally ready to be started: the initial process’s
thread is resumed. For COM-hosted tasks, UBPM waits for the initial contact from the task host client
(performed when the client wants to open a RPC communication channel with UBPM, similar to the
way in which Service control applications open a channel to the SCM) and sends the Start Task command. UBPM finally registers a wait callback on the task’s host process, which allow it to detect when
a task host’s process terminates unexpectedly.
Task Host client
The Task Host client process receives commands from UBPM (Task Host Server) living in the Task
Scheduler service. At initialization time, it opens the local RPC interface that was created by UBPM during
its initialization and loops forever, waiting for commands to come through the channel. Four commands
are currently supported, which are sent over the TaskHostSendResponseReceiveCommand RPC API:
■
Stopping the host
■
Starting a task
■
Stopping a task
■
Terminating a task
All task-based commands are internally implemented by a generic COM task library, and they
essentially result in the creation and destruction of COM components. In particular, hosted tasks
are COM objects that inherit from the ITaskHandler interface. The latter exposes only four required
methods, which correspond to the different task’s state transitions: Start, Stop, Pause, and Resume.
When UBPM sends the command to start a task to its client host process, the latter (Taskhostw.exe)
creates a new thread for the task. The new task worker thread uses the CoCreateInstance function to create an instance of the ITaskHandler COM object representing the task and calls its Start
method. UBPM knows exactly which CLSID (class unique ID) identifies a particular task: The task’s
CLSID is stored by the Task store in the task’s configuration and is specified at task registration time.
Additionally, hosted tasks use the functions exposed by the ITaskHandlerStatus COM interface to
notify UBPM of their current execution state. The interface uses RPCs to call UbpmReportTaskStatus
and report the new state back to UBPM.
CHAPTER 10
Management, diagnostics, and tracing
483
EXPERIMENT: Witnessing a COM-hosted task
In this experiment, you witness how the task host client process loads the COM server DLL that
implements the task. For this experiment, you need the Debugging tools installed on your
system. (You can find the Debugging tools as part of the Windows SDK, which is available at the
https://developer.microsoft.com/en-us/windows/downloads/windows-10-sdk/.) You will enable the
https://developer.microsoft.com/en-us/windows/downloads/windows-10-sdk/
task start’s debugger breakpoint by following these steps:
1.
You need to set up Windbg as the default post-mortem debugger. (You can skip this
step if you have connected a kernel debugger to the target system.) To do that, open an
administrative command prompt and type the following commands:
cd "C:\Program Files (x86)\Windows Kits\10\Debuggers\x64"
windbg.exe /I
Note that C:\Program Files (x86)\Windows Kits\10\Debuggers\x64 is the path of the
Debugging tools, which can change depending on the debugger’s version and the
setup program.
484
2.
Windbg should run and show the following message, confirming the success of
the operation:
3.
After you click on the OK button, WinDbg should close automatically.
4.
Open the Task Scheduler applet (by typing taskschd.msc in the command prompt).
5.
Note that unless you have a kernel debugger attached, you can’t enable the initial task’s
breakpoint on noninteractive tasks; otherwise, you won’t be able to interact with the
debugger window, which will be spawned in another noninteractive session.
6.
Looking at the various tasks (refer to the previous experiment, “Explore a task’s XML
descriptor” for further details), you should find an interactive COM task (named
CacheTask) under the \Microsoft\Windows\Wininet path. Remember that the task’s
Actions page should show Custom Handler; otherwise the task is not COM task.
7.
Open the Registry Editor (by typing regedit in the command prompt window) and
navigate to the following registry key: HKLM\SOFTWARE\Microsoft\Windows NT\
CurrentVersion\Schedule.
8.
Right-click the Schedule key and create a new registry value by selecting Multi-String
Value from the New menu.
CHAPTER 10
Management, diagnostics, and tracing
9.
Name the new registry value as EnableDebuggerBreakForTaskStart. To enable the initial
task breakpoint, you should insert the full path of the task. In this case, the full path is
\Microsoft\Windows\Wininet\CacheTask. In the previous experiment, the task path has
been referred as the task’s URI.
10. Close the Registry Editor and switch back to the Task Scheduler.
11. Right-click the CacheTask task and select Run.
12. If you have configured everything correctly, a new WinDbg window should appear.
13. Configure the symbols used by the debugger by selecting the Symbol File Path item
from the File menu and by inserting a valid path to the Windows symbol server (see
https://docs.microsoft.com/en-us/windows-hardware/drivers/debugger/ microsoftpublic-symbols for more details).
14. You should be able to peek at the call stack of the Taskhostw.exe process just before
it was interrupted using the k command:
0:000> k
# Child-SP
RetAddr
Call Site
00 000000a7`01a7f610 00007ff6`0b0337a8 taskhostw!ComTaskMgrBase::[ComTaskMgr]::Sta
rtComTask+0x2c4
01 000000a7`01a7f960 00007ff6`0b033621 taskhostw!StartComTask+0x58
02 000000a7`01a7f9d0 00007ff6`0b033191 taskhostw!UbpmTaskHostWaitForCommands+0x2d1
3 000000a7`01a7fb00 00007ff6`0b035659 taskhostw!wWinMain+0xc1
04 000000a7`01a7fb60 00007ffa`39487bd4 taskhostw!__wmainCRTStartup+0x1c9
05 000000a7`01a7fc20 00007ffa`39aeced1 KERNEL32!BaseThreadInitThunk+0x14
06 000000a7`01a7fc50 00000000`00000000 ntdll!RtlUserThreadStart+0x21
15. The stack shows that the task host client has just been spawned by UBPM and has re-
ceived the Start command requesting to start a task.
16. In the Windbg console, insert the ~. command and press Enter. Note the current execut-
ing thread ID.
17. You should now put a breakpoint on the CoCreateInstance COM API and resume the
execution, using the following commands:
bp combase!CoCreateInstance
g
18. After the debugger breaks, again insert the ~. command in the Windbg console, press
Enter, and note that the thread ID has completely changed.
19. This demonstrates that the task host client has created a new thread for executing the
task entry point. The documented CoCreateInstance function is used for creating a single
COM object of the class associated with a particular CLSID, specified as a parameter. Two
GUIDs are interesting for this experiment: the GUID of the COM class that represents the
Task and the interface ID of the interface implemented by the COM object.
CHAPTER 10
Management, diagnostics, and tracing
485
20. In 64-bit systems, the calling convention defines that the first four function parameters
are passed through registers, so it is easy to extract those GUIDs:
0:004> dt combase!CLSID @rcx
{0358b920-0ac7-461f-98f4-58e32cd89148}
+0x000 Data1
: 0x358b920
+0x004 Data2
: 0xac7
+0x006 Data3
: 0x461f
+0x008 Data4
: [8] "???"
0:004> dt combase!IID @r9
{839d7762-5121-4009-9234-4f0d19394f04}
+0x000 Data1
: 0x839d7762
+0x004 Data2
: 0x5121
+0x006 Data3
: 0x4009
+0x008 Data4
: [8] "???"
As you can see from the preceding output, the COM server CLSID is {0358b920-0ac7-461f98f4-58e32cd89148}. You can verify that it corresponds to the GUID of the only COM action
located in the XML descriptor of the “CacheTask” task (see the previous experiment for details).
The requested interface ID is “{839d7762-5121-4009-9234-4f0d19394f04}”, which correspond to
the GUID of the COM task handler action interface (ITaskHandler).
ITaskHandler
ITaskHandler).
Task Scheduler COM interfaces
As we have discussed in the previous section, a COM task should adhere to a well-defined interface,
which is used by UBPM to manage the state transition of the task. While UBPM decides when to start
the task and manages all of its state, all the other interfaces used to register, remove, or just manually
start and stop a task are implemented by the Task Scheduler in its client-side DLL (Taskschd.dll).
ITaskService is the central interface by which clients can connect to the Task Scheduler and perform
multiple operations, like enumerate registered tasks; get an instance of the Task store (represented by
the ITaskFolder COM interface); and enable, disable, delete, or register a task and all of its associated
triggers and actions (by using the ITaskDefinition COM interface). When a client application invokes for
the first time a Task Scheduler APIs through COM, the system loads the Task Scheduler client-side DLL
(Taskschd.dll) into the client process’s address space (as dictated by the COM contract: Task Scheduler
COM objects live in an in-proc COM server). The COM APIs are implemented by routing requests
through RPC calls into the Task Scheduler service, which processes each request and forwards it to
UBPM if needed. The Task Scheduler COM architecture allows users to interact with it via scripting
languages like PowerShell (through the ScheduledTasks cmdlet) or VBScript.
Windows Management Instrumentation
Windows Management Instrumentation (WMI) is an implementation of Web-Based Enterprise
Management (WBEM), a standard that the Distributed Management Task Force (DMTF—an industry consortium) defines. The WBEM standard encompasses the design of an extensible enterprise
486
CHAPTER 10
Management, diagnostics, and tracing
data-collection and data-management facility that has the flexibility and extensibility required to manage local and remote systems that comprise arbitrary components.
WMI architecture
WMI consists of four main components, as shown in Figure 10-27: management applications, WMI
infrastructure, providers, and managed objects. Management applications are Windows applications
that access and display or process data about managed objects. A simple example of a management
application is a performance tool replacement that relies on WMI rather than the Performance API to
obtain performance information. A more complex example is an enterprise-management tool that lets
administrators perform automated inventories of the software and hardware configuration of every
computer in their enterprise.
Database
application
VbScript/
Perl
ODBC
ActiveX
controls
.NET
application
C/C++
application
Management
applications
Windows
PowerShell
Windows Management API
COM/DCOM
CIM repository
CIM Object Manager (CIMOM)
WMI infrastructure
COM/DCOM
SNM
provider
Windows
provider
Registry
provider
Providers
SNMP
objects
Windows
objects
Registry
objects
Managed objects
FIGURE 10-27 WMI architecture.
Developers typically must target management applications to collect data from and manage
specific objects. An object might represent one component, such as a network adapter device, or a collection of components, such as a computer. (The computer object might contain the network adapter
object.) Providers need to define and export the representation of the objects that management applications are interested in. For example, the vendor of a network adapter might want to add adapterspecific properties to the network adapter WMI support that Windows includes, querying and setting
the adapter’s state and behavior as the management applications direct. In some cases (for example,
for device drivers), Microsoft supplies a provider that has its own API to help developers leverage the
provider’s implementation for their own managed objects with minimal coding effort.
CHAPTER 10
Management, diagnostics, and tracing
487
The WMI infrastructure, the heart of which is the Common Information Model (CIM) Object
Manager (CIMOM), is the glue that binds management applications and providers. (CIM is described
later in this chapter.) The infrastructure also serves as the object-class store and, in many cases, as
the storage manager for persistent object properties. WMI implements the store, or repository, as an
on-disk database named the CIMOM Object Repository. As part of its infrastructure, WMI supports
several APIs through which management applications access object data and providers supply data
and class definitions.
Windows programs and scripts (such as Windows PowerShell) use the WMI COM API, the primary
management API, to directly interact with WMI. Other APIs layer on top of the COM API and include an
Open Database Connectivity (ODBC) adapter for the Microsoft Access database application. A database developer uses the WMI ODBC adapter to embed references to object data in the developer’s database. Then the developer can easily generate reports with database queries that contain WMI-based
data. WMI ActiveX controls support another layered API. Web developers use the ActiveX controls to
construct web-based interfaces to WMI data. Another management API is the WMI scripting API, for
use in script-based applications (like Visual Basic Scripting Edition). WMI scripting support exists for all
Microsoft programming language technologies.
Because WMI COM interfaces are for management applications, they constitute the primary API
for providers. However, unlike management applications, which are COM clients, providers are COM
or Distributed COM (DCOM) servers (that is, the providers implement COM objects that WMI interacts
with). Possible embodiments of a WMI provider include DLLs that load into a WMI’s manager process
or stand-alone Windows applications or Windows services. Microsoft includes a number of built-in
providers that present data from well-known sources, such as the Performance API, the registry, the
Event Manager, Active Directory, SNMP, and modern device drivers. The WMI SDK lets developers
develop third-party WMI providers.
WMI providers
At the core of WBEM is the DMTF-designed CIM specification. The CIM specifies how management
systems represent, from a systems management perspective, anything from a computer to an application or device on a computer. Provider developers use the CIM to represent the components that make
up the parts of an application for which the developers want to enable management. Developers use
the Managed Object Format (MOF) language to implement a CIM representation.
In addition to defining classes that represent objects, a provider must interface WMI to the objects.
WMI classifies providers according to the interface features the providers supply. Table 10-14 lists WMI
provider classifications. Note that a provider can implement one or more features; therefore, a provider
can be, for example, both a class and an event provider. To clarify the feature definitions in Table 10-14,
let’s look at a provider that implements several of those features. The Event Log provider supports
several objects, including an Event Log Computer, an Event Log Record, and an Event Log File. The
Event Log is an Instance provider because it can define multiple instances for several of its classes. One
class for which the Event Log provider defines multiple instances is the Event Log File class (Win32_
NTEventlogFile); the Event Log provider defines an instance of this class for each of the system’s event
logs (that is, System Event Log, Application Event Log, and Security Event Log).
488
CHAPTER 10
Management, diagnostics, and tracing
TABLE 10-14 Provider classifications
Classification
Description
Class
Can supply, modify, delete, and enumerate a provider-specific class. It can also support query
processing. Active Directory is a rare example of a service that is a class provider.
Instance
Can supply, modify, delete, and enumerate instances of system and provider-specific classes.
An instance represents a managed object. It can also support query processing.
Property
Can supply and modify individual object property values.
Method
Supplies methods for a provider-specific class.
Event
Generates event notifications.
Event consumer
Maps a physical consumer to a logical consumer to support event notification.
The Event Log provider defines the instance data and lets management applications enumerate the
records. To let management applications use WMI to back up and restore the Event Log files, the Event
Log provider implements backup and restore methods for Event Log File objects. Doing so makes the
Event Log provider a Method provider. Finally, a management application can register to receive notification whenever a new record writes to one of the Event Logs. Thus, the Event Log provider serves as
an Event provider when it uses WMI event notification to tell WMI that Event Log records have arrived.
The Common Information Model and the Managed Object
Format Language
The CIM follows in the steps of object-oriented languages such as C++ and C , in which a modeler
designs representations as classes. Working with classes lets developers use the powerful modeling
techniques of inheritance and composition. Subclasses can inherit the attributes of a parent class, and
they can add their own characteristics and override the characteristics they inherit from the parent
class. A class that inherits properties from another class derives from that class. Classes also compose: a
developer can build a class that includes other classes. CIM classes consist of properties and methods.
Properties describe the configuration and state of a WMI-managed resource, and methods are executable functions that perform actions on the WMI-managed resource.
The DMTF provides multiple classes as part of the WBEM standard. These classes are CIM’s basic
language and represent objects that apply to all areas of management. The classes are part of the
CIM core model. An example of a core class is CIM_ManagedSystemElement. This class contains a
few basic properties that identify physical components such as hardware devices and logical components such as processes and files. The properties include a caption, description, installation date, and
status. Thus, the CIM_LogicalElement and CIM_PhysicalElement classes inherit the attributes of the
CIM_ManagedSystemElement class. These two classes are also part of the CIM core model. The WBEM
standard calls these classes abstract classes because they exist solely as classes that other classes inherit
(that is, no object instances of an abstract class exist). You can therefore think of abstract classes as templates that define properties for use in other classes.
A second category of classes represents objects that are specific to management areas but independent of a particular implementation. These classes constitute the common model and are considered
an extension of the core model. An example of a common-model class is the CIM_FileSystem class,
CHAPTER 10
Management, diagnostics, and tracing
489
which inherits the attributes of CIM_LogicalElement. Because virtually every operating system—including Windows, Linux, and other varieties of UNIX—rely on file system–based structured storage, the
CIM_FileSystem class is an appropriate constituent of the common model.
The final class category, the extended model, comprises technology-specific additions to the
common model. Windows defines a large set of these classes to represent objects specific to the
Windows environment. Because all operating systems store data in files, the CIM model includes the
CIM_LogicalFile class. The CIM_DataFile class inherits the CIM_LogicalFile class, and Windows adds the
Win32_PageFile and Win32_ShortcutFile file classes for those Windows file types.
Windows includes different WMI management applications that allow an administrator to interact with WMI namespaces and classes. The WMI command-line utility (WMIC.exe) and Windows
PowerShell are able to connect to WMI, execute queries, and invoke WMI class object methods.
Figure 10-28 shows a PowerShell window extracting information of the Win32_NTEventlogFile class,
part of the Event Log provider. This class makes extensive use of inheritance and derives from CIM_
DataFile. Event Log files are data files that have additional Event Log–specific attributes such as a log
file name (LogfileName) and a count of the number of records that the file contains (NumberOfRecords).
The Win32_NTEventlogFile is based on several levels of inheritance, in which CIM_DataFile derives
from CIM_LogicalFile, which derives from CIM_LogicalElement, and CIM_LogicalElement derives from
CIM_ManagedSystemElement.
FIGURE 10-28 Windows PowerShell extracting information from the Win32_NTEventlogFile class.
490
CHAPTER 10
Management, diagnostics, and tracing
As stated earlier, WMI provider developers write their classes in the MOF language. The following
output shows the definition of the Event Log provider’s Win32_NTEventlogFile, which has been queried
in Figure 10-28:
[dynamic: ToInstance, provider("MS_NT_EVENTLOG_PROVIDER"): ToInstance, SupportsUpdate,
Locale(1033): ToInstance, UUID("{8502C57B-5FBB-11D2-AAC1-006008C78BC7}"): ToInstance]
class Win32_NTEventlogFile : CIM_DataFile
{
[Fixed: ToSubClass, read: ToSubClass] string LogfileName;
[read: ToSubClass, write: ToSubClass] uint32 MaxFileSize;
[read: ToSubClass] uint32 NumberOfRecords;
[read: ToSubClass, volatile: ToSubClass, ValueMap{"0", "1..365", "4294967295"}:
ToSubClass] string OverWritePolicy;
[read: ToSubClass, write: ToSubClass, Range("0-365 | 4294967295"): ToSubClass]
uint32 OverwriteOutDated;
[read: ToSubClass] string Sources[];
[ValueMap{"0", "8", "21", ".."}: ToSubClass, implemented, Privileges{
"SeSecurityPrivilege", "SeBackupPrivilege"}: ToSubClass]
uint32 ClearEventlog([in] string ArchiveFileName);
[ValueMap{"0", "8", "21", "183", ".."}: ToSubClass, implemented, Privileges{
"SeSecurityPrivilege", "SeBackupPrivilege"}: ToSubClass]
uint32 BackupEventlog([in] string ArchiveFileName);
};
One term worth reviewing is dynamic, which is a descriptive designator for the Win32_NTEventlogFile
class that the MOF file in the preceding output shows. Dynamic means that the WMI infrastructure
asks the WMI provider for the values of properties associated with an object of that class whenever a
management application queries the object’s properties. A static class is one in the WMI repository; the
WMI infrastructure refers to the repository to obtain the values instead of asking a provider for the values. Because updating the repository is a relatively expensive operation, dynamic providers are more
efficient for objects that have properties that change frequently.
EXPERIMENT: Viewing the MOF definitions of WMI classes
You can view the MOF definition for any WMI class by using the Windows Management
Instrumentation Tester tool (WbemTest) that comes with Windows. In this experiment, we
look at the MOF definition for the Win32_NTEventLogFile class:
1.
Type Wbemtest in the Cortana search box and press Enter. The Windows Management
Instrumentation Tester should open.
2.
Click the Connect button, change the Namespace to root\cimv2, and connect. The tool
should enable all the command buttons, as shown in the following figure:
CHAPTER 10
Management, diagnostics, and tracing
491
3.
Click the Enum Classes button, select the Recursive option button, and then click OK.
4.
Find Win32_NTEventLogFile in the list of classes, and then double-click it to see its class
properties.
5.
Click the Show MOF button to open a window that displays the MOF text.
After constructing classes in MOF, WMI developers can supply the class definitions to WMI in several
ways. WDM driver developers compile a MOF file into a binary MOF (BMF) file—a more compact
binary representation than an MOF file—and can choose to dynamically give the BMF files to the WDM
infrastructure or to statically include it in their binary. Another way is for the provider to compile the
MOF and use WMI COM APIs to give the definitions to the WMI infrastructure. Finally, a provider can
use the MOF Compiler (Mofcomp.exe) tool to give the WMI infrastructure a classes-compiled representation directly.
Note Previous editions of Windows (until Windows 7) provided a graphical tool, called
WMI CIM Studio, shipped with the WMI Administrative Tool. The tool was able to graphically show WMI namespaces, classes, properties, and methods. Nowadays, the tool is not
supported or available for download because it was superseded by the WMI capacities of
Windows PowerShell. PowerShell is a scripting language that does not run with a GUI. Some
third-party tools present a similar interface of CIM Studio. One of them is WMI Explorer,
which is downloadable from https://github.com/vinaypamnani/wmie2/releases.
492
CHAPTER 10
Management, diagnostics, and tracing
The Common Information Model (CIM) repository is stored in the %SystemRoot%\System32\wbem\
Repository path and includes the following:
■
Index.btr
■
MappingX.map Transaction control files (X is a number starting from 1)
■
Objects.data
Binary-tree (btree) index file
CIM repository where managed resource definitions are stored
The WMI namespace
Classes define objects, which are provided by a WMI provider. Objects are class instances on a system. WMI uses a namespace that contains several subnamespaces that WMI arranges hierarchically to
organize objects. A management application must connect to a namespace before the application can
access objects within the namespace.
WMI names the namespace root directory ROOT. All WMI installations have four predefined
namespaces that reside beneath root: CIMV2, Default, Security, and WMI. Some of these namespaces
have other namespaces within them. For example, CIMV2 includes the Applications and ms_409
namespaces as subnamespaces. Providers sometimes define their own namespaces; you can see the
WMI namespace (which the Windows device driver WMI provider defines) beneath ROOT in Windows.
Unlike a file system namespace, which comprises a hierarchy of directories and files, a WMI
namespace is only one level deep. Instead of using names as a file system does, WMI uses object
properties that it defines as keys to identify the objects. Management applications specify class names
with key names to locate specific objects within a namespace. Thus, each instance of a class must be
uniquely identifiable by its key values. For example, the Event Log provider uses the Win32_NTLogEvent
class to represent records in an Event Log. This class has two keys: Logfile, a string; and RecordNumber,
an unsigned integer. A management application that queries WMI for instances of Event Log records
obtains them from the provider key pairs that identify records. The application refers to a record using
the syntax that you see in this sample object path name:
\\ANDREA-LAPTOP\root\CIMV2:Win32_NTLogEvent.Logfile="Application",
RecordNumber="1"
The first component in the name (\\ANDREA-LAPTOP) identifies the computer on which the object
is located, and the second component (\root\CIMV2) is the namespace in which the object resides. The
class name follows the colon, and key names and their associated values follow the period. A comma
separates the key values.
WMI provides interfaces that let applications enumerate all the objects in a particular class or to
make queries that return instances of a class that match a query criterion.
Class association
Many object types are related to one another in some way. For example, a computer object has a
processor, software, an operating system, active processes, and so on. WMI lets providers construct an
association class to represent a logical connection between two different classes. Association classes
CHAPTER 10
Management, diagnostics, and tracing
493
associate one class with another, so the classes have only two properties: a class name and the Ref
modifier. The following output shows an association in which the Event Log provider’s MOF file associates the Win32_NTLogEvent class with the Win32_ComputerSystem class. Given an object, a management application can query associated objects. In this way, a provider defines a hierarchy of objects.
[dynamic: ToInstance, provider("MS_NT_EVENTLOG_PROVIDER"): ToInstance, EnumPrivileges{"SeSe
curityPrivilege"}: ToSubClass, Privileges{"SeSecurityPrivilege"}: ToSubClass, Locale(1033):
ToInstance, UUID("{8502C57F-5FBB-11D2-AAC1-006008C78BC7}"): ToInstance, Association:
DisableOverride ToInstance ToSubClass]
class Win32_NTLogEventComputer
{
[key, read: ToSubClass] Win32_ComputerSystem ref Computer;
[key, read: ToSubClass] Win32_NTLogEvent ref Record;
};
Figure 10-29 shows a PowerShell window displaying the first Win32_NTLogEventComputer class
instance located in the CIMV2 namespace. From the aggregated class instance, a user can query the associated Win32_ComputerSystem object instance WIN-46E4EFTBP6Q, which generated the event with
record number 1031 in the Application log file.
FIGURE 10-29 The Win32_NTLogEventComputer association class.
494
CHAPTER 10
Management, diagnostics, and tracing
EXPERIMENT: Using WMI scripts to manage systems
A powerful aspect of WMI is its support for scripting languages. Microsoft has generated hundreds of scripts that perform common administrative tasks for managing user accounts, files, the
registry, processes, and hardware devices. The Microsoft TechNet Scripting Center website serves
as the central location for Microsoft scripts. Using a script from the scripting center is as easy as
copying its text from your Internet browser, storing it in a file with a .vbs extension, and running
it with the command cscript script.vbs, where script is the name you gave the script.
Cscript is the command-line interface to Windows Script Host (WSH).
Here’s a sample TechNet script that registers to receive events when Win32_Process object
instances are created, which occur whenever a process starts and prints a line with the name of
the process that the object represents:
strComputer = "."
Set objWMIService = GetObject("winmgmts:" _
& "{impersonationLevel=impersonate}!\\" & strComputer & "\root\cimv2")
Set colMonitoredProcesses = objWMIService. _
ExecNotificationQuery("SELECT * FROM __InstanceCreationEvent " _
& " WITHIN 1 WHERE TargetInstance ISA 'Win32_Process'")
i = 0
Do While i = 0
Set objLatestProcess = colMonitoredProcesses.NextEvent
Wscript.Echo objLatestProcess.TargetInstance.Name
Loop
The line that invokes ExecNotificationQuery does so with a parameter that includes a select
statement, which highlights WMI’s support for a read-only subset of the ANSI standard Structured
Query Language (SQL), known as WQL, to provide a flexible way for WMI consumers to specify the
information they want to extract from WMI providers. Running the sample script with Cscript and
then starting Notepad results in the following output:
C:\>cscript monproc.vbs
Microsoft (R) Windows Script Host Version 5.812
Copyright (C) Microsoft Corporation. All rights reserved.
NOTEPAD.EXE
PowerShell supports the same functionality through the Register-WmiEvent and Get-Event
commands:
PS C:\> Register-WmiEvent -Query “SELECT * FROM __InstanceCreationEvent WITHIN 1 WHERE
TargetInstance ISA 'Win32_Process'” -SourceIdentifier “TestWmiRegistration”
PS C:\> (Get-Event)[0].SourceEventArgs.NewEvent.TargetInstance | Select-Object -Property
ProcessId, ExecutablePath
ProcessId ExecutablePath
--------- -------------76016 C:\WINDOWS\system32\notepad.exe
PS C:\> Unregister-Event -SourceIdentifier "TestWmiRegistration"
CHAPTER 10
Management, diagnostics, and tracing
495
WMI implementation
The WMI service runs in a shared Svchost process that executes in the local system account. It loads
providers into the WmiPrvSE.exe provider-hosting process, which launches as a child of the DCOM
Launcher (RPC service) process. WMI executes Wmiprvse in the local system, local service, or network
service account, depending on the value of the HostingModel property of the WMI Win32Provider object instance that represents the provider implementation. A Wmiprvse process exits after the provider
is removed from the cache, one minute following the last provider request it receives.
EXPERIMENT: Viewing Wmiprvse creation
You can see WmiPrvSE being created by running Process Explorer and executing Wmic. A
WmiPrvSE process will appear beneath the Svchost process that hosts the DCOM Launcher
service. If Process Explorer job highlighting is enabled, it will appear with the job highlight color
because, to prevent a runaway provider from consuming all virtual memory resources on a
system, Wmiprvse executes in a job object that limits the number of child processes it can create
and the amount of virtual memory each process and all the processes of the job can allocate.
(See Chapter 5 for more information on job objects.)
Most WMI components reside by default in %SystemRoot%\System32 and %SystemRoot%\System32\
Wbem, including Windows MOF files, built-in provider DLLs, and management application WMI DLLs.
Look in the %SystemRoot%\System32\Wbem directory, and you’ll find Ntevt.mof, the Event Log provider
MOF file. You’ll also find Ntevt.dll, the Event Log provider’s DLL, which the WMI service uses.
496
CHAPTER 10
Management, diagnostics, and tracing
Providers are generally implemented as dynamic link libraries (DLLs) exposing COM servers that
implement a specified set of interfaces (IWbemServices is the central one. Generally, a single provider is
implemented as a single COM server). WMI includes many built-in providers for the Windows family of
operating systems. The built-in providers, also known as standard providers, supply data and management functions from well-known operating system sources such as the Win32 subsystem, event logs,
performance counters, and registry. Table 10-15 lists several of the standard WMI providers included
with Windows.
TABLE 10-15 Standard WMI providers included with Windows
Provider
Binary
Namespace
Description
Active Directory
provider
dsprov.dll
root\directory\ldap
Maps Active Directory objects to WMI
Event Log provider
ntevt.dll
root\cimv2
Manages Windows event logs—for example, read,
backup, clear, copy, delete, monitor, rename, compress, uncompress, and change event log settings
Performance Counter
provider
wbemperf.dll
root\cimv2
Provides access to raw performance data
Registry provider
stdprov.dll
root\default
Reads, writes, enumerates, monitors, creates, and
deletes registry keys and values
Virtualization
provider
vmmsprox.dll
root\virtualization\v2
Provides access to virtualization services implemented
in vmms.exe, like managing virtual machines in the
host system and retrieving information of the host
system peripherals from a guest VM
WDM provider
wmiprov.dll
root\wmi
Provides access to information on WDM device drivers
Win32 provider
cimwin32.dll
root\cimv2
Provides information about the computer, disks, peripheral devices, files, folders, file systems, networking
components, operating system, printers, processes,
security, services, shares, SAM users and groups, and
more
Windows Installer
provider
msiprov.dll
root\cimv2
Provides access to information about installed
software
Ntevt.dll, the Event Log provider DLL, is a COM server, registered in the HKLM\Software\Classes\
CLSID registry key with the {F55C5B4C-517D-11d1-AB57-00C04FD9159E} CLSID. (You can find it in the
MOF descriptor.) Directories beneath %SystemRoot%\System32\Wbem store the repository, log files,
and third-party MOF files. WMI implements the repository—named the CIMOM object repository—
using a proprietary version of the Microsoft JET database engine. The database file, by default, resides
in SystemRoot%\System32\Wbem\Repository\.
WMI honors numerous registry settings that the service’s HKLM\SOFTWARE\Microsoft\WBEM\
CIMOM registry key stores, such as thresholds and maximum values for certain parameters.
Device drivers use special interfaces to provide data to and accept commands—called the WMI
System Control commands—from WMI. These interfaces are part of the WDM, which is explained in
Chapter 6 of Part 1. Because the interfaces are cross-platform, they fall under the \root\WMI namespace.
CHAPTER 10
Management, diagnostics, and tracing
497
WMI security
WMI implements security at the namespace level. If a management application successfully connects
to a namespace, the application can view and access the properties of all the objects in that namespace.
An administrator can use the WMI Control application to control which users can access a namespace.
Internally, this security model is implemented by using ACLs and Security Descriptors, part of the
standard Windows security model that implements Access Checks. (See Chapter 7 of Part 1 for more
information on access checks.)
To start the WMI Control application, open the Control Panel by typing Computer Management
in the Cortana search box. Next, open the Services And Applications node. Right-click WMI Control
and select Properties to launch the WMI Control Properties dialog box, as shown in Figure 10-30. To
configure security for namespaces, click the Security tab, select the namespace, and click Security.
The other tabs in the WMI Control Properties dialog box let you modify the performance and backup
settings that the registry stores.
FIGURE 10-30 The WMI Control Properties application and the Security tab of the root\virtualization\v2 namespace.
498
CHAPTER 10
Management, diagnostics, and tracing
Event Tracing for Windows (ETW)
Event Tracing for Windows (ETW) is the main facility that provides to applications and kernel-mode
drivers the ability to provide, consume, and manage log and trace events. The events can be stored in
a log file or in a circular buffer, or they can be consumed in real time. They can be used for debugging
a driver, a framework like the .NET CLR, or an application and to understand whether there could be
potential performance issues. The ETW facility is mainly implemented in the NT kernel, but an application can also use private loggers, which do not transition to kernel-mode at all. An application that uses
ETW can be one of the following categories:
■
■
■
Controller A controller starts and stops event tracing sessions, manages the size of the buffer
pools, and enables providers so they can log events to the session. Example controllers include
Reliability and Performance Monitor and XPerf from the Windows Performance Toolkit (now
part of the Windows Assessment and Deployment Kit, available for download from https://docs.
microsoft.com/en-us/windows-hardware/get-started/adk-install).
Provider A provider is an application or a driver that contains event tracing instrumentation.
A provider registers with ETW a provider GUID (globally unique identifiers), which defines the
events it can produce. After the registration, the provider can generate events, which can be
enabled or disabled by the controller application through an associated trace session.
Consumer A consumer is an application that selects one or more trace sessions for which it
wants to read trace data. Consumers can receive events stored in log files, in a circular buffer,
or from sessions that deliver events in real time.
It’s important to mention that in ETW, every provider, session, trait, and provider’s group is represented by a GUID (more information about these concepts are provided later in this chapter). Four
different technologies used for providing events are built on the top of ETW. They differ mainly in the
method in which they store and define events (there are other distinctions though):
■
■
■
■
MOF (or classic) providers are the legacy ones, used especially by WMI. MOF providers store the
events descriptor in MOF classes so that the consumer knows how to consume them.
WPP (Windows software trace processor) providers are used for tracing the operations of an
application or driver (they are an extension of WMI event tracing) and use a TMF (trace message
format) file for allowing the consumer to decode trace events.
Manifest-based providers use an XML manifest file to define events that can be decoded by
the consumer.
TraceLogging providers, which, like WPP providers are used for fast tracing the operation of an
application of driver, use self-describing events that contain all the required information for the
consumption by the controller.
CHAPTER 10
Management, diagnostics, and tracing
499
When first installed, Windows already includes dozens of providers, which are used by each component of the OS for logging diagnostics events and performance traces. For example, Hyper-V has
multiple providers, which provide tracing events for the Hypervisor, Dynamic Memory, Vid driver, and
Virtualization stack. As shown in Figure 10-31, ETW is implemented in different components:
■
■
■
■
■
Most of the ETW implementation (global session creation, provider registration and enablement, main logger thread) resides in the NT kernel.
The Host for SCM/SDDL/LSA Lookup APIs library (sechost.dll) provides to applications the main
user-mode APIs used for creating an ETW session, enabling providers and consuming events.
Sechost uses services provided by Ntdll to invoke ETW in the NT kernel. Some ETW user-mode
APIs are implemented directly in Ntdll without exposing the functionality to Sechost. Provider
registration and events generation are examples of user-mode functionalities that are implemented in Ntdll (and not in Sechost).
The Event Trace Decode Helper Library (TDH.dll) implements services available for consumers
to decode ETW events.
The Eventing Consumption and Configuration library (WevtApi.dll) implements the Windows
Event Log APIs (also known as Evt APIs), which are available to consumer applications for managing providers and events on local and remote machines. Windows Event Log APIs support
XPath 1.0 or structured XML queries for parsing events produced by an ETW session.
The Secure Kernel implements basic secure services able to interact with ETW in the NT kernel
that lives in VTL 0. This allows trustlets and the Secure Kernel to use ETW for logging their own
secure events.
Consumer App.
Decode Consume
Events Events
Controller App.
Provider App.
WevtApi.dll
TDH.dll
Sechost.dll
NTDLL.DLL
User Mode
Kernel
Drivers
Kernel
KernelDrivers
Drivers
ETW
(NT Kernel)
FIGURE 10-31 ETW architecture.
500
CHAPTER 10
Management, diagnostics, and tracing
Kernel Mode
Secure Kernel
ETW initialization
The ETW initialization starts early in the NT kernel startup (for more details on the NT kernel initialization, see Chapter 12). It is orchestrated by the internal EtwInitialize function in three phases. The
phase 0 of the NT kernel initialization calls EtwInitialize to properly allocate and initialize the per-silo
ETW-specific data structure that stores the array of logger contexts representing global ETW sessions
(see the “ETW session” section later in this chapter for more details). The maximum number of global
sessions is queried from the HKLM\System\CurrentControlSet\Control\WMI\EtwMaxLoggers registry value, which should be between 32 and 256, (64 is the default number in case the registry value
does not exist).
Later, in the NT kernel startup, the IoInitSystemPreDrivers routine of phase 1 continues with the
initialization of ETW, which performs the following steps:
1.
Acquires the system startup time and reference system time and calculates the QPC frequency.
2.
Initializes the ETW security key and reads the default session and provider’s security descriptor.
3.
Initializes the per-processor global tracing structures located in the PRCB.
4.
Creates the real-time ETW consumer object type (called EtwConsumer), which is used to allow
a user-mode real-time consumer process to connect to the main ETW logger thread and the
ETW registration (internally called EtwRegistration) object type, which allow a provider to be
registered from a user-mode application.
5.
Registers the ETW bugcheck callback, used to dump logger sessions data in the bugcheck dump.
6.
Initializes and starts the Global logger and Autologgers sessions, based on the AutoLogger and
GlobalLogger registry keys located under the HKLM\System\CurrentControlSet\Control\WMI
root key.
7.
Uses the EtwRegister kernel API to register various NT kernel event providers, like the Kernel
Event Tracing, General Events provider, Process, Network, Disk, File Name, IO, and Memory
providers, and so on.
8.
Publishes the ETW initialized WNF state name to indicate that the ETW subsystem is initialized.
9.
Writes the SystemStart event to both the Global Trace logging and General Events providers.
The event, which is shown in Figure 10-32, logs the approximate OS Startup time.
10. If required, loads the FileInfo driver, which provides supplemental information on files I/O to
Superfetch (more information on the Proactive memory management is available in Chapter 5
of Part 1).
CHAPTER 10
Management, diagnostics, and tracing
501
FIGURE 10-32 The SystemStart ETW event displayed by the Event Viewer.
In early boot phases, the Windows registry and I/O subsystems are still not completely initialized. So
ETW can’t directly write to the log files. Late in the boot process, after the Session Manager (SMSS.exe)
has correctly initialized the software hive, the last phase of ETW initialization takes place. The purpose
of this phase is just to inform each already-registered global ETW session that the file system is ready,
so that they can flush out all the events that are recorded in the ETW buffers to the log file.
ETW sessions
One of the most important entities of ETW is the Session (internally called logger instance), which is a
glue between providers and consumers. An event tracing session records events from one or more providers that a controller has enabled. A session usually contains all the information that describes which
events should be recorded by which providers and how the events should be processed. For example,
a session might be configured to accept all events from the Microsoft-Windows-Hyper-V-Hypervisor
provider (which is internally identified using the {52fc89f8-995e-434c-a91e-199986449890} GUID). The
user can also configure filters. Each event generated by a provider (or a provider group) can be filtered
based on event level (information, warning, error, or critical), event keyword, event ID, and other characteristics. The session configuration can also define various other details for the session, such as what
time source should be used for the event timestamps (for example, QPC, TSC, or system time), which
events should have stack traces captured, and so on. The session has the important rule to host the
ETW logger thread, which is the main entity that flushes the events to the log file or delivers them to
the real-time consumer.
502
CHAPTER 10
Management, diagnostics, and tracing
Sessions are created using the StartTrace API and configured using ControlTrace and EnableTraceEx2.
Command-line tools such as xperf, logman, tracelog, and wevtutil use these APIs to start or control
trace sessions. A session also can be configured to be private to the process that creates it. In this case,
ETW is used for consuming events created only by the same application that also acts as provider. The
application thus eliminates the overhead associated with the kernel-mode transition. Private ETW sessions can record only events for the threads of the process in which it is executing and cannot be used
with real-time delivery. The internal architecture of private ETW is not described in this book.
When a global session is created, the StartTrace API validates the parameters and copies them in a
data structure, which the NtTraceControl API uses to invoke the internal function EtwpStartLogger in the
kernel. An ETW session is represented internally through an ETW_LOGGER_CONTEXT data structure,
which contains the important pointers to the session memory buffers, where the events are written
to. As discussed in the “ETW initialization” section, a system can support a limited number of ETW sessions, which are stored in an array located in a global per-SILO data structure. EtwpStartLogger checks
the global sessions array, determining whether there is free space or if a session with the same name
already exists. If that is the case, it exits and signals an error. Otherwise, it generates a session GUID (if
not already specified by the caller), allocates and initializes an ETW_LOGGER_CONTEXT data structure
representing the session, assigns to it an index, and inserts it in the per-silo array.
ETW queries the session’s security descriptor located in the HKLM\System\CurrentControlSet\
Control\Wmi\Security registry key. As shown in Figure 10-33, each registry value in the key is named as
the session GUID (the registry key, however, also contains the provider’s GUID) and contains the binary
representation of a self-relative security descriptor. If a security descriptor for the session does not exist, a default one is returned for the session (see the “Witnessing the default security descriptor of ETW
sessions” experiment later in this chapter for details).
FIGURE 10-33 The ETW security registry key.
CHAPTER 10
Management, diagnostics, and tracing
503
The EtwpStartLogger function performs an access check on the session’s security descriptor, requesting the TRACELOG_GUID_ENABLE access right (and the TRACELOG_CREATE_REALTIME or TRACELOG_
CREATE_ONDISK depending on the log file mode) using the current process’s access token. If the check
succeeds, the routine calculates the default size and numbers of event buffers, which are calculated
based on the size of the system physical memory (the default buffer size is 8, 16, or 64KB). The number
of buffers depends on the number of system processors and on the presence of the EVENT_TRACE_
NO_PER_PROCESSOR_BUFFERING logger mode flag, which prevents events (which can be generated
from different processors) to be written to a per-processor buffer.
ETW acquires the session’s initial reference time stamp. Three clock resolutions are currently supported: Query performance counter (QPC, a high-resolution time stamp not affected by the system clock),
System time, and CPU cycle counter. The EtwpAllocateTraceBuffer function is used to allocate each buffer
associated with the logger session (the number of buffers was calculated before or specified as input
from the user). A buffer can be allocated from the paged pool, nonpaged pool, or directly from physical
large pages, depending on the logging mode. Each buffer is stored in multiple internal per-session lists,
which are able to provide fast lookup both to the ETW main logger thread and ETW providers. Finally,
if the log mode is not set to a circular buffer, the EtwpStartLogger function starts the main ETW logger
thread, which has the goal of flushing events written by the providers associated with the session to the
log file or to the real-time consumer. After the main thread is started, ETW sends a session notification to
the registered session notification provider (GUID 2a6e185b-90de-4fc5-826c-9f44e608a427), a special
provider that allows its consumers to be informed when certain ETW events happen (like a new session
being created or destroyed, a new log file being created, or a log error being raised).
EXPERIMENT: Enumerating ETW sessions
In Windows 10, there are multiple ways to enumerate active ETW sessions. In this and all the
next experiments regarding ETW, you will use the XPERF tool, which is part of the Windows
Performance Toolkit distributed in the Windows Assessment and Deployment Kit (ADK), which
is freely downloadable from https://docs.microsoft.com/en-us/windows-hardware/get-started/
adk-install.
Enumerating active ETW sessions can be done in multiple ways. XPERF can do it while
executed with the following command (usually XPERF is installed in C:\Program Files
(x86)\Windows Kits\10\Windows Performance Toolkit):
xperf -Loggers
The output of the command can be huge, so it is strongly advised to redirect the output in
a TXT file:
xperf -Loggers > ETW_Sessions.txt
504
CHAPTER 10
Management, diagnostics, and tracing
The tool can decode and show in a human-readable form all the session configuration data.
An example is given from the EventLog-Application session, which is used by the Event logger
service (Wevtsvc.dll) to write events in the Application.evtx file shown by the Event Viewer:
Logger Name
: EventLog-Application
Logger Id
: 9
Logger Thread Id
: 000000000000008C
Buffer Size
: 64
Maximum Buffers
: 64
Minimum Buffers
: 2
Number of Buffers
: 2
Free Buffers
: 2
Buffers Written
: 252
Events Lost
: 0
Log Buffers Lost
: 0
Real Time Buffers Lost: 0
Flush Timer
: 1
Age Limit
: 0
Real Time Mode
: Enabled
Log File Mode
: Secure PersistOnHybridShutdown PagedMemory IndependentSession
NoPerProcessorBuffering
Maximum File Size
: 100
Log Filename
:
Trace Flags
: "Microsoft-Windows-CertificateServicesClient-Lifecycle-User":0x800
0000000000000:0xff+"Microsoft-Windows-SenseIR":0x8000000000000000:0xff+
... (output cut for space reasons)
The tool is also able to decode the name of each provider enabled in the session and the
bitmask of event categories that the provider should write to the sessions. The interpretation of
the bitmask (shown under “Trace Flags”) depends on the provider. For example, a provider can
define that the category 1 (bit 0 set) indicates the set of events generated during initialization
and cleanup, category 2 (bit 1 set) indicates the set of events generated when registry I/O is performed, and so on. The trace flags are interpreted differently for System sessions (see the “System
loggers” section for more details.) In that case, the flags are decoded from the enabled kernel
flags that specify which kind of kernel events the system session should log.
The Windows Performance Monitor, in addition to dealing with system performance counters,
can easily enumerate the ETW sessions. Open Performance Monitor (by typing perfmon in the
Cortana search box), expand the Data Collector Sets, and click Event Trace Sessions. The application should list the same sessions listed by XPERF. If you right-click a session’s name and select
Properties, you should be able to navigate between the session’s configurations. In particular, the
Security property sheet decodes the security descriptor of the ETW session.
CHAPTER 10
Management, diagnostics, and tracing
505
Finally, you also can use the Microsoft Logman console tool (%SystemRoot%\System32\
logman.exe) to enumerate active ETW sessions (by using the -ets command-line argument).
ETW providers
As stated in the previous sections, a provider is a component that produces events (while the application that includes the provider contains event tracing instrumentation). ETW supports different kinds
of providers, which all share a similar programming model. (They are mainly different in the way in
which they encode events.) A provider must be initially registered with ETW before it can generate any
event. In a similar way, a controller application should enable the provider and associate it with an ETW
session to be able to receive events from the provider. If no session has enabled a provider, the provider will not generate any event. The provider defines its interpretation of being enabled or disabled.
Generally, an enabled provider generates events, and a disabled provider does not.
Providers registration
Each provider’s type has its own API that needs to be called by a provider application (or driver) for registering a provider. For example, manifest-based providers rely on the EventRegister API for user-mode
registrations, and EtwRegister for kernel-mode registrations. All the provider types end up calling the
internal EtwpRegisterProvider function, which performs the actual registration process (and is implemented in both the NT kernel and NTDLL). The latter allocates and initializes an ETW_GUID_ENTRY data
structure, which represents the provider (the same data structure is used for notifications and traits).
The data structure contains important information, like the provider GUID, security descriptor, reference counter, enablement information (for each ETW session that enables the provider), and a list of
provider’s registrations.
506
CHAPTER 10
Management, diagnostics, and tracing
For user-mode provider registrations, the NT kernel performs an access check on the calling process’s token, requesting the TRACELOG_REGISTER_GUIDS access right. If the check succeeds, or if the
registration request originated from kernel code, ETW inserts the new ETW_GUID_ENTRY data structure in a hash table located in the global ETW per-silo data structure, using a hash of the provider’s
GUID as the table’s key (this allows fast lookup of all the providers registered in the system.) In case an
entry with the same GUID already exists in the hash table, ETW uses the existing entry instead of the
new one. A GUID could already exist in the hash table mainly for two reasons:
■
■
Another driver or application has enabled the provider before it has been actually registered
(see the “Providers enablement” section later in this chapter for more details) .
The provider has been already registered once. Multiple registration of the same provider GUID
are supported.
After the provider has been successfully added into the global list, ETW creates and initializes an
ETW registration object, which represents a single registration. The object encapsulates an ETW_REG_
ENTRY data structure, which ties the provider to the process and session that requested its registration.
(ETW also supports registration from different sessions.) The object is inserted in a list located in the
ETW_GUID_ENTRY (the EtwRegistration object type has been previously created and registered with
the NT object manager at ETW initialization time). Figure 10-34 shows the two data structures and their
relationships. In the figure, two providers’ processes (process A, living in session 4, and process B, living
in session 16) have registered for provider 1. Thus two ETW_REG_ENTRY data structures have been created and linked to the ETW_GUID_ENTRY representing provider 1.
ETW_Global
per-SILO hash-table
ETW_GUID List
entry
ETW_GUID List
entry
Provider’s
GUID
Provider’s
GUID
ETW registrations
List head
Security
Descriptor
Enablement
Information [8]
Ref.
Counter
Filter
Data
ETW_GUID_ENTRY
(for provider 1)
Reg. List Entry
ETW_GUID ptr.
Process A
Session ID 0x4
Callback’s Info
Flags
Reg. Enablement
Mask
Traits
Reg. List Entry
ETW_GUID ptr.
Process B
Session ID 0x10
Callback’s Info
Flags
Reg. Enablement
Mask
Traits
ETW_REG_ENTRY
ETW_REG_ENTRY
for provider app. B
for provider app. A
which registered provider 1 which registered provider 1
ETW registrations
List head
…
…
Security
Descriptor
Enablement
Information [8]
Ref.
Counter
Filter
Data
ETW_GUID_ENTRY
(for provider 2)
FIGURE 10-34 The ETW_GUID_ENTRY data structure and the ETW_REG_ENTRY.
At this stage, the provider is registered and ready to be enabled in the session(s) that requested it
(through the EnableTrace API). In case the provider has been already enabled in at least one session before
its registration, ETW enables it (see the next section for details) and calls the Enablement callback, which can
be specified by the caller of the EventRegister (or EtwRegister) API that started the registration process.
CHAPTER 10
Management, diagnostics, and tracing
507
EXPERIMENT: Enumerating ETW providers
As for ETW sessions, XPERF can enumerate the list of all the current registered providers (the
WEVTUTIL tool, installed with Windows, can do the same). Open an administrative command
prompt window and move to the Windows Performance Toolkit path. To enumerate the registered providers, use the -providers command option. The option supports different flags.
For this experiment, you will be interested in the I and R flags, which tell XPERF to enumerate
the installed or registered providers. As we will discuss in the “Decoding events” section later
in this chapter, the difference is that a provider can be registered (by specifying a GUID) but
not installed in the HKLM\SOFTWARE\Microsoft\Windows\CurrentVersion\WINEVT\Publishers
registry key. This will prevent any consumer from decoding the event using TDH routines. The
following commands
cd /d “C:\Program Files (x86)\Windows Kits\10\Windows Performance Toolkit”
xperf -providers R > registered_providers.txt
xperf -providers I > installed_providers.txt
produce two text files with similar information. If you open the registered_providers.txt file,
you will find a mix of names and GUIDs. Names identify providers that are also installed in the
Publisher registry key, whereas GUID represents providers that have just been registered through
the EventRegister API discussed in this section. All the names are present also in the installed_
providers.txt file with their respective GUIDs, but you won’t find any GUID listed in the first text
file in the installed providers list.
XPERF also supports the enumeration of all the kernel flags and groups supported by system
loggers (discussed in the “System loggers” section later in this chapter) through the K flag (which
is a superset of the KF and KG flags).
Provider Enablement
As introduced in the previous section, a provider should be associated with an ETW session to be able
to generate events. This association is called Provider Enablement, and it can happen in two ways:
before or after the provider is registered. A controller application can enable a provider on a session
through the EnableTraceEx API. The API allows you to specify a bitmask of keywords that determine the
category of events that the session wants to receive. In the same way, the API supports advanced filters
on other kinds of data, like the process IDs that generate the events, package ID, executable name,
and so on. (You can find more information at https://docs.microsoft.com/en-us/windows/win32/api/
evntprov/ns-evntprov-event_filter_descriptor.)
Provider Enablement is managed by ETW in kernel mode through the internal EtwpEnableGuid
function. For user-mode requests, the function performs an access check on both the session and
provider security descriptors, requesting the TRACELOG_GUID_ENABLE access right on behalf of
the calling process’s token. If the logger session includes the SECURITY_TRACE flag, EtwpEnableGuid
requires that the calling process is a PPL (see the “ETW security” section later in this chapter for more
details). If the check succeeds, the function performs a similar task to the one discussed previously for
provider registrations:
508
CHAPTER 10
Management, diagnostics, and tracing
■
■
It allocates and initializes an ETW_GUID_ENTRY data structure to represent the provider or use
the one already linked in the global ETW per-silo data structure in case the provider has been
already registered.
Links the provider to the logger session by adding the relative session enablement information
in the ETW_GUID_ENTRY.
In case the provider has not been previously registered, no ETW registration object exists that’s
linked in the ETW_GUID_ENTRY data structure, so the procedure terminates. (The provider will be
enabled after it is first registered.) Otherwise, the provider is enabled.
While legacy MOF providers and WPP providers can be enabled only to one session at time,
Manifest-based and Tracelogging providers can be enabled on a maximum of eight sessions. As previously shown in Figure 10-32, the ETW_GUID_ENTRY data structure contains enablement information
for each possible ETW session that enabled the provider (eight maximum). Based on the enabled sessions, the EtwpEnableGuid function calculates a new session enablement mask, storing it in the ETW_
REG_ENTRY data structure (representing the provider registration). The mask is very important because
it’s the key for event generations. When an application or driver writes an event to the provider, a
check is made: if a bit in the enablement mask equals 1, it means that the event should be written to the
buffer maintained by a particular ETW session; otherwise, the session is skipped and the event is not
written to its buffer.
Note that for secure sessions, a supplemental access check is performed before updating the session enablement mask in the provider registration. The ETW session’s security descriptor should allow
the TRACELOG_LOG_EVENT access right to the calling process’s access token. Otherwise, the relative
bit in the enablement mask is not set to 1. (The target ETW session will not receive any event from the
provider registration.) More information on secure sessions is available in the “Secure loggers and ETW
security” section later in this chapter.
Providing events
After registering one or more ETW providers, a provider application can start to generate events. Note
that events can be generated even though a controller application hasn’t had the chance to enable the
provider in an ETW session. The way in which an application or driver can generate events depends on
the type of the provider. For example, applications that write events to manifest-based providers usually directly create an event descriptor (which respects the XML manifest) and use the EventWrite API
to write the event to the ETW sessions that have the provider enabled. Applications that manage MOF
and WPP providers rely on the TraceEvent API instead.
Events generated by manifest-based providers, as discussed previously in the “ETW session” section, can be filtered by multiple means. ETW locates the ETW_GUID_ENTRY data structure from the
provider registration object, which is provided by the application through a handle. The internal
EtwpEventWriteFull function uses the provider’s registration session enablement mask to cycle between
all the enabled ETW sessions associated with the provider (represented by an ETW_LOGGER_CONTEXT).
For each session, it checks whether the event satisfies all the filters. If so, it calculates the full size of the
event’s payload and checks whether there is enough free space in the session’s current buffer.
CHAPTER 10
Management, diagnostics, and tracing
509
If there is no available space, ETW checks whether there is another free buffer in the session: free
buffers are stored in a FIFO (first-in, first-out) queue. If there is a free buffer, ETW marks the old buffer
as “dirty” and switches to the new free one. In this way, the Logger thread can wake up and flush the
entire buffer to a log file or deliver it to a real-time consumer. If the session’s log mode is a circular logger, no logger thread is ever created: ETW simply links the old full buffer at the end of the free buffers
queue (as a result the queue will never be empty). Otherwise, if there isn’t a free buffer in the queue,
ETW tries to allocate an additional buffer before returning an error to the caller.
After enough space in a buffer is found, EtwpEventWriteFull atomically writes the entire event
payload in the buffer and exits. Note that in case the session enablement mask is 0, it means that no
sessions are associated with the provider. As a result, the event is lost and not logged anywhere.
MOF and WPP events go through a similar procedure but support only a single ETW session and
generally support fewer filters. For these kinds of providers, a supplemental check is performed on the
associated session: If the controller application has marked the session as secure, nobody can write
any events. In this case, an error is yielded back to the caller (secure sessions are discussed later in the
“Secure loggers and ETW security” section).
EXPERIMENT: Listing processes activity using ETW
In this experiment, will use ETW to monitor system’s processes activity. Windows 10 has two providers that can monitor this information: Microsoft-Windows-Kernel-Process and the NT kernel logger through the PROC_THREAD kernel flags. You will use the former, which is a classic provider and
already has all the information for decoding its events. You can capture the trace with multiple tools.
You still use XPERF (Windows Performance Monitor can be used, too).
Open a command prompt window and type the following commands:
cd /d “C:\Program Files (x86)\Windows Kits\10\Windows Performance Toolkit”
xperf -start TestSession -on Microsoft-Windows-Kernel-Process -f c:\process_trace.etl
The command starts an ETW session called TestSession (you can replace the name) that will
consume events generated by the Kernel-Process provider and store them in the C:\process_
trace.etl log file (you can also replace the file name).
To verify that the session has actually started, repeat the steps described previously in the
“Enumerating ETW sessions” experiment. (The TestSession trace session should be listed by both
XPERF and the Windows Performance Monitor.) Now, you should start some new processes or
applications (like Notepad or Paint, for example).
To stop the ETW session, use the following command:
xperf -stop TestSession
The steps used for decoding the ETL file are described later in the “Decoding an ETL file”
experiment. Windows includes providers for almost all its components. The Microsoft-WindowsMSPaint provider, for example, generates events based on Paint’s functionality. You can try this
experiment by capturing events from the MsPaint provider.
510
CHAPTER 10
Management, diagnostics, and tracing
ETW Logger thread
The Logger thread is one of the most important entities in ETW. Its main purpose is to flush events to
the log file or deliver them to the real-time consumer, keeping track of the number of delivered and
lost events. A logger thread is started every time an ETW session is initially created, but only in case the
session does not use the circular log mode. Its execution logic is simple. After it’s started, it links itself
to the ETW_LOGGER_CONTEXT data structure representing the associated ETW session and waits on
two main synchronization objects. The Flush event is signaled by ETW every time a buffer belonging
to a session becomes full (which can happen after a new event has been generated by a provider—for
example, as discussed in the previous section, “Providing events”), when a new real-time consumer
has requested to be connected, or when a logger session is going to be stopped. The TimeOut timer is
initialized to a valid value (usually 1 second) only in case the session is a real-time one or in case the user
has explicitly required it when calling the StartTrace API for creating the new session.
When one of the two synchronization objects is signaled, the logger thread rearms them and
checks whether the file system is ready. If not, the main logger thread returns to sleep again (no sessions should be flushed in early boot stages). Otherwise, it starts to flush each buffer belonging to the
session to the log file or the real-time consumer.
For real-time sessions, the logger thread first creates a temporary per-session ETL file in the
%SystemRoot%\ System32\LogFiles\WMI\RtBackup folder (as shown in Figure 10-35.) The log file name
is generated by adding the EtwRT prefix to the name of the real-time session. The file is used for saving
temporary events before they are delivered to a real-time consumer (the log file can also store lost events
that have not been delivered to the consumer in the proper time frame). When started, real-time autologgers restore lost events from the log file with the goal of delivering them to their consumer.
FIGURE 10-35 Real-time temporary ETL log files.
CHAPTER 10
Management, diagnostics, and tracing
511
The logger thread is the only entity able to establish a connection between a real-time consumer
and the session. The first time that a consumer calls the ProcessTrace API for receiving events from a
real-time session, ETW sets up a new RealTimeConsumer object and uses it with the goal of creating a
link between the consumer and the real-time session. The object, which resolves to an ETW_REALTIME_
CONSUMER data structure in the NT kernel, allows events to be “injected” in the consumer’s process
address space (another user-mode buffer is provided by the consumer application).
For non–real-time sessions, the logger thread opens (or creates, in case the file does not exist) the
initial ETL log file specified by the entity that created the session. The logger thread can also create a
brand-new log file in case the session’s log mode specifies the EVENT_TRACE_FILE_MODE_NEWFILE
flag, and the current log file reaches the maximum size.
At this stage, the ETW logger thread initiates a flush of all the buffers associated with the session
to the current log file (which, as discussed, can be a temporary one for real-time sessions). The flush is
performed by adding an event header to each event in the buffer and by using the NtWriteFile API for
writing the binary content to the ETL log file. For real-time sessions, the next time the logger thread
wakes up, it is able to inject all the events stored in the temporary log file to the target user-mode realtime consumer application. Thus, for real-time sessions, ETW events are never delivered synchronously.
Consuming events
Events consumption in ETW is performed almost entirely in user mode by a consumer application,
thanks to the services provided by the Sechost.dll. The consumer application uses the OpenTrace API
for opening an ETL log file produced by the main logger thread or for establishing the connection to
a real-time logger. The application specifies an event callback function, which is called every time ETW
consumes a single event. Furthermore, for real-time sessions, the application can supply an optional
buffer-callback function, which receives statistics for each buffer that ETW flushes and is called every
time a single buffer is full and has been delivered to the consumer.
The actual event consumption is started by the ProcessTrace API. The API works for both standard
and real-time sessions, depending on the log file mode flags passed previously to OpenTrace.
For real-time sessions, the API uses kernel mode services (accessed through the NtTraceControl
system call) to verify that the ETW session is really a real-time one. The NT kernel verifies that the security descriptor of the ETW session grants the TRACELOG_ACCESS_REALTIME access right to the caller
process’s token. If it doesn’t have access, the API fails and returns an error to the controller application. Otherwise, it allocates a temporary user-mode buffer and a bitmap used for receiving events and
connects to the main logger thread (which creates the associated EtwConsumer object; see the “ETW
logger thread” section earlier in this chapter for details). Once the connection is established, the API
waits for new data arriving from the session’s logger thread. When the data comes, the API enumerates
each event and calls the event callback.
For normal non–real-time ETW sessions, the ProcessTrace API performs a similar processing, but
instead of connecting to the logger thread, it just opens and parses the ETL log file, reading each buffer one by one and calling the event callback for each found event (events are sorted in chronological
order). Differently from real-time loggers, which can be consumed one per time, in this case the API
512
CHAPTER 10
Management, diagnostics, and tracing
can work even with multiple trace handles created by the OpenTrace API, which means that it can parse
events from different ETL log files.
Events belonging to ETW sessions that use circular buffers are not processed using the described
methodology. (There is indeed no logger thread that dumps any event.) Usually a controller application uses the FlushTrace API when it wants to dump a snapshot of the current buffers belonging to an
ETW session configured to use a circular buffer into a log file. The API invokes the NT kernel through
the NtTraceControl system call, which locates the ETW session and verifies that its security descriptor grants the TRACELOG_CREATE_ONDISK access right to the calling process’s access token. If so,
and if the controller application has specified a valid log file name, the NT kernel invokes the internal
EtwpBufferingModeFlush routine, which creates the new ETL file, adds the proper headers, and writes
all the buffers associated with the session. A consumer application can then parse the events written in
the new log file by using the OpenTrace and ProcessTrace APIs, as described earlier.
Events decoding
When the ProcessTrace API identifies a new event in an ETW buffer, it calls the event callback, which
is generally located in the consumer application. To be able to correctly process the event, the consumer application should decode the event payload. The Event Trace Decode Helper Library (TDH.dll)
provides services to consumer applications for decoding events. As discussed in the previous sections,
a provider application (or driver), should include information that describes how to decode the events
generated by its registered providers.
This information is encoded differently based on the provider type. Manifest-based providers, for
example, compile the XML descriptor of their events in a binary file and store it in the resource section
of their provider application (or driver). As part of provider registration, a setup application should
register the provider’s binary in the HKLM\SOFTWARE\Microsoft\Windows\CurrentVersion\WINEVT\
Publishers registry key. The latter is important for event decoding, especially for the following reasons:
■
■
The system consults the Publishers key when it wants to resolve a provider name to its GUID
(from an ETW point of view, providers do not have a name). This allows tools like Xperf to display readable provider names instead of their GUIDs.
The Trace Decode Helper Library consults the key to retrieve the provider’s binary file, parse its
resource section, and read the binary content of the events descriptor.
After the event descriptor is obtained, the Trace Decode Helper Library gains all the needed information for decoding the event (by parsing the binary descriptor) and allows consumer applications
to use the TdhGetEventInformation API to retrieve all the fields that compose the event’s payload and
the correct interpretation the data associated with them. TDH follows a similar procedure for MOF and
WPP providers (while TraceLogging incorporates all the decoding data in the event payload, which follows a standard binary format).
Note that all events are natively stored by ETW in an ETL log file, which has a well-defined uncompressed binary format and does not contain event decoding information. This means that if an ETL file
is opened by another system that has not acquired the trace, there is a good probability that it will not
be able to decode the events. To overcome these issues, the Event Viewer uses another binary format:
CHAPTER 10
Management, diagnostics, and tracing
513
EVTX. This format includes all the events and their decoding information and can be easily parsed by
any application. An application can use the EvtExportLog Windows Event Log API to save the events
included in an ETL file with their decoding information in an EVTX file.
EXPERIMENT: Decoding an ETL file
Windows has multiple tools that use the EvtExportLog API to automatically convert an ETL log file
and include all the decoding information. In this experiment, you use netsh.exe, but TraceRpt.exe
also works well:
1.
Open a command prompt and move to the folder where the ETL file produced by the
previous experiment (“Listing processes activity using ETW”) resides and insert
netsh trace convert input=process_trace.etl output=process_trace.txt dump=txt
overwrite=yes
2.
where process_trace.etl is the name of the input log file, and process_trace.
txt file is the name of the output decoded text file.
3.
If you open the text file, you will find all the decoded events (one for each line) with a
description, like the following:
[2]1B0C.1154::2020-05-01 12:00:42.075601200 [Microsoft-Windows-Kernel-Process]
Process 1808 started at time 2020 - 05 - 01T19:00:42.075562700Z by parent 6924
running in session 1 with name \Device\HarddiskVolume4\Windows\System32\notepad.
exe.
4.
From the log, you will find that rarely some events are not decoded completely or do
not contain any description. This is because the provider manifest does not include the
needed information (a good example is given from the ThreadWorkOnBehalfUpdate
event). You can get rid of those events by acquiring a trace that does not include their
keyword. The event keyword is stored in the CSV or EVTX file.
5.
Use netsh.exe to produce an EVTX file with the following command:
netsh trace convert input=process_trace.etl output=process_trace.evtx dump=evtx
overwrite=yes
514
6.
Open the Event Viewer. On the console tree located in the left side of the window,
right-click the Event Viewer (Local) root node and select Open Saved Logs. Choose the
just-created process_trace.evtx file and click Open.
7.
In the Open Saved Log window, you should give the log a name and select a folder
to display it. (The example accepted the default name, process_trace and the default
Saved Logs folder.)
CHAPTER 10
Management, diagnostics, and tracing
8.
The Event Viewer should now display each event located in the log file. Click the Date
and Time column for ordering the events by Date and Time in ascending order (from
the oldest one to the newest). Search for ProcessStart with Ctrl+F to find the event indicating the Notepad.exe process creation:
9.
The ThreadWorkOnBehalfUpdate event, which has no human-readable description,
causes too much noise, and you should get rid of it from the trace. If you click one of
those events and open the Details tab, in the System node, you will find that the event
belongs to the WINEVENT_KEYWORD_ WORK_ON_BEHALF category, which has a keyword bitmask set to 0x8000000000002000. (Keep in mind that the highest 16 bits of the
keywords are reserved for Microsoft-defined categories.) The bitwise NOT operation of
the 0x8000000000002000 64-bit value is 0x7FFFFFFFFFFFDFFF.
10. Close the Event Viewer and capture another trace with XPERF by using the following
command:
xperf -start TestSession -on Microsoft-Windows-Kernel-Process:0x7FFFFFFFFFFFDFFF
-f c:\process_trace.etl
11. Open Notepad or some other application and stop the trace as explained in the
“Listing processes activity using ETW” experiment. Convert the ETL file to an EVTX.
This time, the obtained decoded log should be smaller in size, and it does not contain
ThreadWorkOnBehalfUpdate events.
CHAPTER 10
Management, diagnostics, and tracing
515
System loggers
What we have described so far is how normal ETW sessions and providers work. Since Windows XP,
ETW has supported the concepts of system loggers, which allow the NT kernel to globally emit log
events that are not tied to any provider and are generally used for performance measurements. At
the time of this writing, there are two main system loggers available, which are represented by the NT
kernel logger and Circular Kernel Context Logger (while the Global logger is a subset of the NT kernel
logger). The NT kernel supports a maximum of eight system logger sessions. Every session that receives
events from a system logger is considered a system session.
To start a system session, an application makes use of the StartTrace API, but it specifies the EVENT_
TRACE_SYSTEM_LOGGER_MODE flag or the GUID of a system logger session as input parameters.
Table 10-16 lists the system logger with their GUIDs. The EtwpStartLogger function in the NT kernel
recognizes the flag or the special GUIDs and performs an additional check against the NT kernel logger security descriptor, requesting the TRACELOG_GUID_ENABLE access right on behalf of the caller
process access token. If the check passes, ETW calculates a system logger index and updates both the
logger group mask and the system global performance group mask.
TABLE 10-16 System loggers
INDEX
Name
GUID
Symbol
0
NT kernel logger
{9e814aad-3204-11d2-9a82-006008a86939}
SystemTraceControlGuid
1
Global logger
{e8908abc-aa84-11d2-9a93-00805f85d7c6}
GlobalLoggerGuid
2
Circular Kernel Context Logger
{54dea73a-ed1f-42a4-af71-3e63d056f174}
CKCLGuid
The last step is the key that drives system loggers. Multiple low-level system functions, which can
run at a high IRQL (the Context Swapper is a good example), analyzes the performance group mask
and decides whether to write an event to the system logger. A controller application can enable or
disable different events logged by a system logger by modifying the EnableFlags bit mask used by the
StartTrace API and ControlTrace API. The events logged by a system logger are stored internally in the
global performance group mask in a well-defined order. The mask is composed of an array of eight 32bit values. Each index in the array represents a set of events. System event sets (also called Groups) can
be enumerated using the Xperf tool. Table 10-17 lists the system logger events and the classification in
their groups. Most of the system logger events are documented at https://docs.microsoft.com/en-us/
windows/win32/api/evntrace/ns-evntrace-event_trace_properties.
516
CHAPTER 10
Management, diagnostics, and tracing
TABLE 10-17 System logger events (kernel flags) and their group
Name
Description
Group
ALL_FAULTS
All page faults including hard, copy-on-write, demandzero faults, and so on
None
ALPC
Advanced Local Procedure Call
None
CACHE_FLUSH
Cache flush events
None
CC
Cache manager events
None
CLOCKINT
Clock interrupt events
None
COMPACT_CSWITCH Compact context switch
Diag
CONTMEMGEN
Contiguous memory generation
None
CPU_CONFIG
NUMA topology, processor group, and processor index
None
CSWITCH
Context switch
IOTrace
DEBUG_EVENTS
Debugger scheduling events
None
DISK_IO
Disk I/O
All except SysProf, ReferenceSet,
and Network
DISK_IO_INIT
Disk I/O initiation
None
DISPATCHER
CPU scheduler
None
DPC
DPC events
Diag, DiagEasy, and Latency
DPC_QUEUE
DPC queue events
None
DRIVERS
Driver events
None
FILE_IO
File system operation end times and results
FileIO
FILE_IO_INIT
File system operation (create/open/close/read/write)
FileIO
FILENAME
FileName (e.g., FileName create/delete/rundown)
None
FLT_FASTIO
Minifilter fastio callback completion
None
FLT_IO
Minifilter callback completion
None
FLT_IO_FAILURE
Minifilter callback completion with failure
None
FLT_IO_INIT
Minifilter callback initiation
None
FOOTPRINT
Support footprint analysis
ReferenceSet
HARD_FAULTS
Hard page faults
All except SysProf and Network
HIBERRUNDOWN
Rundown(s) during hibernate
None
IDLE_STATES
CPU idle states
None
INTERRUPT
Interrupt events
Diag, DiagEasy, and Latency
INTERRUPT_STEER
Interrupt steering events
Diag, DiagEasy, and Latency
IPI
Inter-processor interrupt events
None
KE_CLOCK
Clock configuration events
None
KQUEUE
Kernel queue enqueue/dequeue
None
LOADER
Kernel and user mode image load/unload events
Base
CHAPTER 10
Management, diagnostics, and tracing
517
Name
Description
Group
MEMINFO
Memory list info
Base, ResidentSet, and
ReferenceSet
MEMINFO_WS
Working set info
Base and ReferenceSet
MEMORY
Memory tracing
ResidentSet and ReferenceSet
NETWORKTRACE
Network events (e.g., tcp/udp send/receive)
Network
OPTICAL_IO
Optical I/O
None
OPTICAL_IO_INIT
Optical I/O initiation
None
PERF_COUNTER
Process perf counters
Diag and DiagEasy
PMC_PROFILE
PMC sampling events
None
POOL
Pool tracing
None
POWER
Power management events
ResumeTrace
PRIORITY
Priority change events
None
PROC_THREAD
Process and thread create/delete
Base
PROFILE
CPU sample profile
SysProf
REFSET
Support footprint analysis
ReferenceSet
REG_HIVE
Registry hive tracing
None
REGISTRY
Registry tracing
None
SESSION
Session rundown/create/delete events
ResidentSet and ReferenceSet
SHOULDYIELD
Tracing for the cooperative DPC mechanism
None
SPINLOCK
Spinlock collisions
None
SPLIT_IO
Split I/O
None
SYSCALL
System calls
None
TIMER
Timer settings and its expiration
None
VAMAP
MapFile info
ResidentSet and ReferenceSet
VIRT_ALLOC
Virtual allocation reserve and release
ResidentSet and ReferenceSet
WDF_DPC
WDF DPC events
None
WDF_INTERRUPT
WDF Interrupt events
None
When the system session starts, events are immediately logged. There is no provider that needs
to be enabled. This implies that a consumer application has no way to generically decode the event.
System logger events use a precise event encoding format (called NTPERF), which depends on the
event type. However, most of the data structures representing different NT kernel logger events are
usually documented in the Windows platform SDK.
518
CHAPTER 10
Management, diagnostics, and tracing
EXPERIMENT: Tracing TCP/IP activity with the kernel logger
In this experiment, you listen to the network activity events generated by the System Logger
using the Windows Performance Monitor. As already introduced in the “Enumerating ETW sessions” experiment, the graphical tool is not just able to obtain data from the system performance
counters but is also able to start, stop, and manage ETW sessions (system session included). To
enable the kernel logger and have it generate a log file of TCP/IP activity, follow these steps:
1.
Run the Performance Monitor (by typing perfmon in the Cortana search box) and click
Data Collector Sets, User Defined.
2.
Right-click User Defined, choose New, and select Data Collector Set.
3.
When prompted, enter a name for the data collector set (for example, experiment),
and choose Create Manually (Advanced) before clicking Next.
4.
In the dialog box that opens, select Create Data Logs, check Event Trace Data, and
then click Next. In the Providers area, click Add, and locate Windows Kernel Trace. Click
OK. In the Properties list, select Keywords (Any), and then click Edit.
5.
From the list shown in the Property window, select Automatic and check only net for
Network TCP/IP, and then click OK.
CHAPTER 10
Management, diagnostics, and tracing
519
6.
Click Next to select a location where the files are saved. By default, this location is
%SystemDrive%\PerfLogs\Admin\experiment\, if this is how you named the data
collector set. Click Next, and in the Run As edit box, enter the Administrator account
name and set the password to match it. Click Finish. You should now see a window
similar to the one shown here:
7.
Right-click the name you gave your data collector set (experiment in our example), and
then click Start. Now generate some network activity by opening a browser and visiting
a website.
8.
Right-click the data collector set node again and then click Stop.
If you follow the steps listed in the “Decoding an ETL file” experiment to decode the acquired
ETL trace file, you will find that the best way to read the results is by using a CSV file type. This
is because the System session does not include any decoding information for the events, so the
netsh.exe has no regular way to encode the customized data structures representing events in
the EVTX file.
Finally, you can repeat the experiment using XPERF with the following command (optionally
replacing the C:\network.etl file with your preferred name):
xperf -on NETWORKTRACE -f c:\network.etl
After you stop the system trace session and you convert the obtained trace file, you will get
similar events as the ones obtained with the Performance Monitor.
520
CHAPTER 10
Management, diagnostics, and tracing
The Global logger and Autologgers
Certain logger sessions start automatically when the system boots. The Global logger session records
events that occur early in the operating system boot process, including events generated by the NT
kernel logger. (The Global logger is actually a system logger, as shown in Table 10-16.) Applications
and device drivers can use the Global logger session to capture traces before the user logs in (some
device drivers, such as disk device drivers, are not loaded at the time the Global logger session begins.) While the Global logger is mostly used to capture traces produced by the NT kernel provider
(see Table 10-17), Autologgers are designed to capture traces from classic ETW providers (and not
from the NT kernel logger).
You can configure the Global logger by setting the proper registry values in the GlobalLogger key, which
is located in the HKLM\SYSTEM\CurrentControlSet\Control\WMI root key. In the same way, Autologgers
can be configured by creating a registry subkey, named as the logging session, in the Autologgers key (located in the WMI root key). The procedure for configuring and starting Autologgers is documented at
https://docs.microsoft.com/en-us/windows/win32/etw/configuring-and-starting-an-Autologger-session.
As introduced in the “ETW initialization” section previously in this chapter, ETW starts the Global logger and Autologgers almost at the same time, during the early phase 1 of the NT kernel initialization. The
EtwStartAutoLogger internal function queries all the logger configuration data from the registry, validates
it, and creates the logger session using the EtwpStartLogger routine, which has already been extensively
discussed in the “ETW sessions” section. The Global logger is a system logger, so after the session is created, no further providers are enabled. Unlike the Global logger, Autologgers require providers to be
enabled. They are started by enumerating each session’s name from the Autologger registry key. After a
session is created, ETW enumerates the providers that should be enabled in the session, which are listed
as subkeys of the Autologger key (a provider is identified by a GUID). Figure 10-36 shows the multiple providers enabled in the EventLog-System session. This session is one of the main Windows Logs displayed
by the Windows Event Viewer (captured by the Event Logger service).
FIGURE 10-36 The EventLog-System Autologger’s enabled providers.
After the configuration data of a provider is validated, the provider is enabled in the session through
the internal EtwpEnableTrace function, as for classic ETW sessions.
CHAPTER 10
Management, diagnostics, and tracing
521
ETW security
Starting and stopping an ETW session is considered a high-privilege operation because events can include system data that can be used to exploit the system integrity (this is especially true for system loggers). The Windows Security model has been extended to support ETW security. As already introduced
in previous sections, each operation performed by ETW requires a well-defined access right that must
be granted by a security descriptor protecting the session, provider, or provider’s group (depending on
the operation). Table 10-18 lists all the new access rights introduced for ETW and their usage.
TABLE 10-18 ETW security access rights and their usage
Value
Description
Applied to
WMIGUID_QUERY
Allows the user to query information about the trace session
Session
WMIGUID_NOTIFICATION
Allows the user to send a notification to the session’s notification provider Session
TRACELOG_CREATE_
REALTIME
Allows the user to start or update a real-time session
Session
TRACELOG_CREATE_ONDISK
Allows the user to start or update a session that writes events to a log file
Session
TRACELOG_GUID_ENABLE
Allows the user to enable the provider
Provider
TRACELOG_LOG_EVENT
Allows the user to log events to a trace session if the session is running in
SECURE mode
Session
TRACELOG_ACCESS_
REALTIME
Allows a consumer application to consume events in real time
Session
TRACELOG_REGISTER_GUIDS
Allows the user to register the provider (creating the EtwRegistration
object backed by the ETW_REG_ENTRY data structure)
Provider
TRACELOG_JOIN_GROUP
Allows the user to insert a manifest-based or tracelogging provider to
a Providers group (part of the ETW traits, which are not described in
this book)
Provider
Most of the ETW access rights are automatically granted to the SYSTEM account and to members of
the Administrators, Local Service, and Network Service groups. This implies that normal users are not
allowed to interact with ETW (unless an explicit session and provider security descriptor allows it). To
overcome the problem, Windows includes the Performance Log Users group, which has been designed
to allow normal users to interact with ETW (especially for controlling trace sessions). Although all the
ETW access rights are granted by the default security descriptor to the Performance Log Users group,
Windows supports another group, called Performance Monitor Users, which has been designed only
to receive or send notifications to the session notification provider. This is because the group has been
designed to access system performance counters, enumerated by tools like Performance Monitor and
Resource Monitor, and not to access the full ETW events. The two tools have been already described in
the “Performance monitor and resource monitor” section of Chapter 1 in Part 1.
As previously introduced in the “ETW Sessions” section of this chapter, all the ETW security descriptors are stored in the HKLM\System\CurrentControlSet\Control\Wmi\Security registry key in a binary
format. In ETW, everything that is represented by a GUID can be protected by a customized security
descriptor. To manage ETW security, applications usually do not directly interact with security descriptors stored in the registry but use the EventAccessControl and EventAccessQuery APIs implemented
in Sechost.dll.
522
CHAPTER 10
Management, diagnostics, and tracing
EXPERIMENT: Witnessing the default security descriptor of ETW sessions
A kernel debugger can easily show the default security descriptor associated with ETW sessions
that do not have a specific one associated with them. In this experiment, you need a Windows 10
machine with a kernel debugger already attached and connected to a host system. Otherwise,
you can use a local kernel debugger, or LiveKd (downloadable from https://docs.microsoft.com/
en-us/sysinternals/downloads/livekd.) After the correct symbols are configured, you should be
able to dump the default SD using the following command:
!sd poi(nt!EtwpDefaultTraceSecurityDescriptor)
The output should be similar to the following (cut for space reasons):
->Revision: 0x1
->Sbz1
: 0x0
->Control : 0x8004
SE_DACL_PRESENT
SE_SELF_RELATIVE
->Owner
: S-1-5-32-544
->Group
: S-1-5-32-544
->Dacl
:
->Dacl
: ->AclRevision: 0x2
->Dacl
: ->Sbz1
: 0x0
->Dacl
: ->AclSize
: 0xf0
->Dacl
: ->AceCount
: 0x9
->Dacl
: ->Sbz2
: 0x0
->Dacl
: ->Ace[0]: ->AceType: ACCESS_ALLOWED_ACE_TYPE
->Dacl
: ->Ace[0]: ->AceFlags: 0x0
->Dacl
: ->Ace[0]: ->AceSize: 0x14
->Dacl
: ->Ace[0]: ->Mask : 0x00001800
->Dacl
: ->Ace[0]: ->SID: S-1-1-0
->Dacl
->Dacl
->Dacl
->Dacl
->Dacl
:
:
:
:
:
->Ace[1]:
->Ace[1]:
->Ace[1]:
->Ace[1]:
->Ace[1]:
->AceType: ACCESS_ALLOWED_ACE_TYPE
->AceFlags: 0x0
->AceSize: 0x14
->Mask : 0x00120fff
->SID: S-1-5-18
->Dacl
->Dacl
->Dacl
->Dacl
->Dacl
:
:
:
:
:
->Ace[2]:
->Ace[2]:
->Ace[2]:
->Ace[2]:
->Ace[2]:
->AceType: ACCESS_ALLOWED_ACE_TYPE
->AceFlags: 0x0
->AceSize: 0x14
->Mask : 0x00120fff
->SID: S-1-5-19
->Dacl
->Dacl
->Dacl
->Dacl
->Dacl
:
:
:
:
:
->Ace[3]:
->Ace[3]:
->Ace[3]:
->Ace[3]:
->Ace[3]:
->AceType: ACCESS_ALLOWED_ACE_TYPE
->AceFlags: 0x0
->AceSize: 0x14
->Mask : 0x00120fff
->SID: S-1-5-20
->Dacl
->Dacl
->Dacl
->Dacl
->Dacl
:
:
:
:
:
->Ace[4]:
->Ace[4]:
->Ace[4]:
->Ace[4]:
->Ace[4]:
->AceType: ACCESS_ALLOWED_ACE_TYPE
->AceFlags: 0x0
->AceSize: 0x18
->Mask : 0x00120fff
->SID: S-1-5-32-544
CHAPTER 10
Management, diagnostics, and tracing
523
->Dacl
->Dacl
->Dacl
->Dacl
->Dacl
:
:
:
:
:
->Ace[5]:
->Ace[5]:
->Ace[5]:
->Ace[5]:
->Ace[5]:
->AceType: ACCESS_ALLOWED_ACE_TYPE
->AceFlags: 0x0
->AceSize: 0x18
->Mask : 0x00000ee5
->SID: S-1-5-32-559
->Dacl
->Dacl
->Dacl
->Dacl
->Dacl
:
:
:
:
:
->Ace[6]:
->Ace[6]:
->Ace[6]:
->Ace[6]:
->Ace[6]:
->AceType: ACCESS_ALLOWED_ACE_TYPE
->AceFlags: 0x0
->AceSize: 0x18
->Mask : 0x00000004
->SID: S-1-5-32-558
You can use the Psgetsid tool (available at https://docs.microsoft.com/en-us/sysinternals/
downloads/psgetsid) to translate the SID to human-readable names. From the preceding output,
you can see that all ETW access is granted to the SYSTEM (S-1-5-18), LOCAL SERVICE (S-1-5-19),
NETWORK SERVICE (S-1-5-18), and Administrators (S-1-5-32-544) groups. As explained in the previous section, the Performance Log Users group (S-1-5-32-559) has almost all ETW access, whereas the Performance Monitor Users group (S-1-5-32-558) has only the WMIGUID_NOTIFICATION
access right granted by the session’s default security descriptor.
C:\Users\andrea>psgetsid64 S-1-5-32-559
PsGetSid v1.45 - Translates SIDs to names and vice versa
Copyright (C) 1999-2016 Mark Russinovich
Sysinternals - www.sysinternals.com
Account for AALL86-LAPTOP\S-1-5-32-559:
Alias: BUILTIN\Performance Log Users
Security Audit logger
The Security Audit logger is an ETW session used by the Windows Event logger service (wevtsvc.dll) to
listen for events generated by the Security Lsass Provider. The Security Lsass provider (which is identified by the {54849625-5478-4994-a5ba-3e3b0328c30d} GUID) can be registered only by the NT kernel
at ETW initialization time and is never inserted in the global provider’s hash table. Only the Security
audit logger and Autologgers configured with the EnableSecurityProvider registry value set to 1 can receive events from the Security Lsass Provider. When the EtwStartAutoLogger internal function encounters the value set to 1, it enables the SECURITY_TRACE flag on the associated ETW session, adding the
session to the list of loggers that can receive Security audit events.
The flag also has the important effect that user-mode applications can’t query, stop, flush, or control
the session anymore, unless they are running as protected process light (at the antimalware, Windows,
or WinTcb level; further details on protected processes are available in Chapter 3 of Part 1).
Secure loggers
Classic (MOF) and WPP providers have not been designed to support all the security features implemented for manifest-based and tracelogging providers. An Autologger or a generic ETW session can
524
CHAPTER 10
Management, diagnostics, and tracing
thus be created with the EVENT_TRACE_SECURE_MODE flag, which marks the session as secure. A
secure session has the goal of ensuring that it receives events only from trusted identities. The flag has
two main effects:
■
■
Prevents classic (MOF) and WPP providers from writing any event to the secure session. If a classic provider is enabled in a secure section, the provider won’t be able to generate any events.
Requires the supplemental TRACELOG_LOG_EVENT access right, which should be granted by
the session’s security descriptor to the controller application’s access token while enabling a
provider to the secure session.
The TRACE_LOG_EVENT access right allows a more-granular security to be specified in a session’s
security descriptor. If the security descriptor grants only the TRACELOG_GUID_ENABLE to an untrusted
user, and the ETW session is created as secure by another entity (a kernel driver or a more privileged
application), the untrusted user can’t enable any provider on the secure section. If the section is created
as nonsecure, the untrusted user can enable any providers on it.
Dynamic tracing (DTrace)
As discussed in the previous section, Event Tracing for Windows is a powerful tracing technology integrated into the OS, but it’s static, meaning that the end user can only trace and log events that are generated by well-defined components belonging to the operating system or to third-party frameworks/
applications (.NET CLR, for example.) To overcome the limitation, the May 2019 Update of Windows
10 (19H1) introduced DTrace, the dynamic tracing facility built into Windows. DTrace can be used by
administrators on live systems to examine the behavior of both user programs and of the operating
system itself. DTrace is an open-source technology that was developed for the Solaris operating system
(and its descendant, illumos, both of which are Unix-based) and ported to several operating systems
other than Windows.
DTrace can dynamically trace parts of the operating system and user applications at certain locations
of interest, called probes. A probe is a binary code location or activity to which DTrace can bind a request
to perform a set of actions, like logging messages, recording a stack trace, a timestamp, and so on. When
a probe fires, DTrace gathers the data from the probe and executes the actions associated with the probe.
Both the probes and the actions are specified in a script file (or directly in the DTrace application through
the command line), using the D programming language. Support for probes are provided by kernel modules, called providers. The original illumos DTrace supported around 20 providers, which were deeply tied
to the Unix-based OS. At the time of this writing, Windows supports the following providers:
■
■
■
SYSCALL Allows the tracing of the OS system calls (both on entry and on exit) invoked from
user-mode applications and kernel-mode drivers (through Zw APIs).
FBT (Function Boundary tracing) Through FBT, a system administrator can trace the execution
of individual functions implemented in all the modules that run in the NT kernel.
PID (User-mode process tracing) The provider is similar to FBT and allows tracing of individual
functions of a user-mode process and application.
CHAPTER 10
Management, diagnostics, and tracing
525
■
■
■
ETW (Event Tracing for Windows) DTrace can use this provider to attach to manifest-based and
TraceLogging events fired from the ETW engine. DTrace is able to define new ETW providers and
provide associated ETW events via the etw_trace action (which is not part of any provider).
PROFILE Provides probes associated with a time-based interrupt firing every fixed, specified
time interval.
DTRACE Built-in provider is implicitly enabled in the DTrace engine.
The listed providers allow system administrators to dynamically trace almost every component of
the Windows operating system and user-mode applications.
Note There are big differences between the first version of DTrace for Windows, which
appeared in the May 2019 Update of Windows 10, and the current stable release (distributed
at the time of this writing in the May 2021 edition of Windows 10). One of the most notable
differences is that the first release required a kernel debugger to be set up to enable the FBT
provider. Furthermore, the ETW provider was not completely available in the first release
of DTrace.
EXPERIMENT: Enabling DTrace and listing the installed providers
In this experiment, you install and enable DTrace and list the providers that are available for
dynamically tracing various Windows components. You need a system with Windows 10 May
2020 Update (20H1) or later installed. As explained in the Microsoft documentation (https://docs.
microsoft.com/en-us/windows-hardware/drivers/devtest/dtrace), you should first enable DTrace
by opening an administrative command prompt and typing the following command (remember
to disable Bitlocker, if it is enabled):
bcdedit /set dtrace ON
After the command succeeds, you can download the DTrace package from https://www.
microsoft.com/download/details.aspx?id=100441 and install it. Restart your computer (or virtual
machine) and open an administrative command prompt (by typing CMD in the Cortana search
box and selecting Run As Administrator). Type the following commands (replacing providers.txt with another file name if desired):
cd /d “C:\Program Files\DTrace”
dtrace -l > providers.txt
Open the generated file (providers.txt in the example). If DTrace has been successfully
installed and enabled, a list of probes and providers (DTrace, syscall, and ETW) should be listed in
the output file. Probes are composed of an ID and a human-readable name. The human-readable
name is composed of four parts. Each part may or may not exist, depending on the provider. In
general, providers try to follow the convention as close as possible, but in some cases the meaning of each part can be overloaded with something different:
■
526
Provider The name of the DTrace provider that is publishing the probe.
CHAPTER 10
Management, diagnostics, and tracing
■
■
■
Module If the probe corresponds to a specific program location, the name of the module
in which the probe is located. The module is used only for the PID (which is not shown in the
output produced by the dtrace -l command) and ETW provider.
Function If the probe corresponds to a specific program location, the name of the
program function in which the probe is located.
Name The final component of the probe name is a name that gives you some idea of the
probe’s semantic meaning, such as BEGIN or END.
When writing out the full human-readable name of a probe, all the parts of the name are
separated by colons. For example,
syscall::NtQuerySystemInformation:entry
specifies a probe on the NtQueryInformation function entry provided by the syscall provider.
Note that in this case, the module name is empty because the syscall provider does not specify
any name (all the syscalls are implicitly provided by the NT kernel).
The PID and FBT providers instead dynamically generate probes based on the process or
kernel image to which they are applied (and based on the currently available symbols). For example, to correctly list the PID probes of a process, you should first get the process ID (PID) of the
process that you want to analyze (by simply opening the Task Manager and selecting the Details
property sheet; in this example, we are using Notepad, which in the test system has PID equal to
8020). Then execute DTrace with the following command:
dtrace -ln pid8020:::entry > pid_notepad.txt
This lists all the probes on function entries generated by the PID provider for the Notepad
process. The output will contain a lot of entries. Note that if you do not have the symbol store
path set, the output will not contain any probes generated by private functions. To restrict the
output, you can add the name of the module:
dtrace.exe -ln pid8020:kernelbase::entry >pid_kernelbase_notepad.txt
This yields all the PID probes generated for function entries of the kernelbase.dll module
mapped in Notepad. If you repeat the previous two commands after having set the symbol store
path with the following command,
set _NT_SYMBOL_PATH=srv*C:\symbols*http://msdl.microsoft.com/download/symbols
you will find that the output is much different (and also probes on private functions).
As explained in the “The Function Boundary Tracing (FBT) and Process (PID) providers” section
later in this chapter, the PID and FBT provider can be applied to any offset in a function’s code.
The following command returns all the offsets (always located at instruction boundary) in which
the PID provider can generate probes on the SetComputerNameW function of Kernelbase.dll:
dtrace.exe -ln pid8020:kernelbase:SetComputerNameW:
CHAPTER 10
Management, diagnostics, and tracing
527
Internal architecture
As explained in the “Enabling DTrace and listing the installed providers” experiment earlier in this chapter, in Windows 10 May 2020 Update (20H1), some components of DTrace should be installed through
an external package. Future versions of Windows may integrate DTrace completely in the OS image.
Even though DTrace is deeply integrated in the operating system, it requires three external components to work properly. These include both the NT-specific implementation and the original DTrace
code released under the free Common Development and Distribution License (CDDL), which is downloadable from https://github.com/microsoft/DTrace-on-Windows/tree/windows.
As shown in Figure 10-37, DTrace in Windows is composed of the following components:
■
■
■
DTrace.sys The DTrace extension driver is the main component that executes the actions associated with the probes and stores the results in a circular buffer that the user-mode application obtains via IOCTLs.
DTrace.dll The module encapsulates LibDTrace, which is the DTrace user-mode engine.
It implements the Compiler for the D scripts, sends the IOCTLs to the DTrace driver, and is the
main consumer of the circular DTrace buffer (where the DTrace driver stores the output of
the actions).
DTrace.exe The entry point executable that dispatches all the possible commands (specified
through the command line) to the LibDTrace.
.d
DTrace.exe
LibDTrace
(DTrace.dll)
Dbghelp.dll
Symbol
Store
User Mode
Kernel Mode
DTrace.sys
Windload
FBT
SYSCALL
PID
ETW
NT Kernel
FIGURE 10-37 DTrace internal architecture.
To start the dynamic trace of the Windows kernel, a driver, or a user-mode application, the user
just invokes the DTrace.exe main executable specifying a command or an external D script. In both
cases, the command or the file contain one or more probes and additional actions expressed in the D
programming language. DTrace.exe parses the input command line and forwards the proper request
528
CHAPTER 10
Management, diagnostics, and tracing
to the LibDTrace (which is implemented in DTrace.dll). For example, when started for enabling one or
more probes, the DTrace executable calls the internal dtrace_program_fcompile function implemented
in LibDTrace, which compiles the D script and produces the DTrace Intermediate Format (DIF) bytecode
in an output buffer.
Note Describing the details of the DIF bytecode and how a D script (or D commands) is
compiled is outside the scope of this book. Interested readers can find detailed documentation in the OpenDTrace Specification book (released by the University of Cambridge), which
is available at https://www.cl.cam.ac.uk/techreports/UCAM-CL-TR-924.pdf.
While the D compiler is entirely implemented in user-mode in LibDTrace, to execute the compiled DIF
bytecode, the LibDtrace module just sends the DTRACEIOC_ENABLE IOCTL to the DTrace driver, which
implements the DIF virtual machine. The DIF virtual machine is able to evaluate each D clause expressed
in the bytecode and to execute optional actions associated with them. A limited set of actions are available, which are executed through native code and not interpreted via the D virtual machine.
As shown earlier in Figure 10-37, the DTrace extension driver implements all the providers. Before
discussing how the main providers work, it is necessary to present an introduction of the DTrace initialization in the Windows OS.
DTrace initialization
The DTrace initialization starts in early boot stages, when the Windows loader is loading all the modules needed for the kernel to correctly start. One important part to load and validate is the API set file
(apisetschema.dll), which is a key component of the Windows system. (API Sets are described in Chapter
3 of part 1.) If the DTRACE_ENABLED BCD element is set in the boot entry (value 0x26000145, which
can be set through the dtrace readable name; see Chapter 12 for more details about BCD objects),
the Windows loader checks whether the dtrace.sys driver is present in the %SystemRoot%\System32\
Drivers path. If so, it builds a new API Set schema extension named ext-ms-win-ntos-trace-l1-1-0. The
schema targets the Dtrace.sys driver and is merged into the system API set schema (OslApiSetSchema).
Later in the boot process, when the NT kernel is starting its phase 1 of initialization, the TraceInitSystem
function is called to initialize the Dynamic Tracing subsystem. The API is imported in the NT kernel
through the ext-ms-win-ntos-trace-l1-1-0.dll API set schema. This implies that if DTrace is not enabled by
the Windows loader, the name resolution would fail, and the function will be basically a no op.
The TraceInitSystem has the important duty of calculating the content of the trace callouts array,
which contains the functions that will be called by the NT kernel when a trace probe fires. The array is
stored in the KiDynamicTraceCallouts global symbol, which will be later protected by Patchguard to
prevent malicious drivers from illegally redirecting the flow of execution of system routines. Finally,
through the TraceInitSystem function, the NT kernel sends to the DTrace driver another important array, which contains private system interfaces used by the DTrace driver to apply the probes. (The array
is exposed in a trace extension context data structure.) This kind of initialization, where both the DTrace
driver and the NT kernel exchange private interfaces, is the main motivation why the DTrace driver is
called an extension driver.
CHAPTER 10
Management, diagnostics, and tracing
529
The Pnp manager later starts the DTrace driver, which is installed in the system as boot driver, and
calls its main entry point (DriverEntry). The routine registers the \Device\DTrace control device and its
symbolic link (\GLOBAL??\DTrace). It then initializes the internal DTrace state, creating the first DTrace
built-in provider. It finally registers all the available providers by calling the initialization function of
each of them. The initialization method depends on each provider and usually ends up calling the
internal dtrace_register function, which registers the provider with the DTrace framework. Another
common action in the provider initialization is to register a handler for the control device. User-mode
applications can communicate with DTrace and with a provider through the DTrace control device,
which exposes virtual files (handlers) to providers. For example, the user-mode LibDTrace communicates directly with the PID provider by opening a handle to the \\.\DTrace\Fasttrap virtual file (handler).
The syscall provider
When the syscall provider gets activated, DTrace ends up calling the KeSetSystemServiceCallback
routine, with the goal of activating a callback for the system call specified in the probe. The routine is
exposed to the DTrace driver thanks to the NT system interfaces array. The latter is compiled by the
NT kernel at DTrace initialization time (see the previous section for more details) and encapsulated in
an extension context data structure internally called KiDynamicTraceContext. The first time that the
KeSetSystemServiceCallback is called, the routine has the important task of building the global service
trace table (KiSystemServiceTraceCallbackTable), which is an RB (red-black) tree containing descriptors of all the available syscalls. Each descriptor includes a hash of the syscall’s name, its address, and
number of parameters and flags indicating whether the callback is enabled on entry or on exit. The NT
kernel includes a static list of syscalls exposed through the KiServicesTab internal array.
After the global service trace table has been filled, the KeSetSystemServiceCallback calculates the
hash of the syscall’s name specified by the probe and searches the hash in the RB tree. If there are
no matches, the probe has specified a wrong syscall name (so the function exits signaling an error).
Otherwise, the function modifies the enablement flags located in the found syscall’s descriptor and
increases the number of the enabled trace callbacks (which is stored in an internal variable).
When the first DTrace syscall callback is enabled, the NT kernel sets the syscall bit in the global
KiDynamicTraceMask bitmask. This is very important because it enables the system call handler
(KiSystemCall64) to invoke the global trace handlers. (System calls and system service dispatching have
been discussed extensively in Chapter 8.)
This design allows DTrace to coexist with the system call handling mechanism without having any
sort of performance penalty. If no DTrace syscall probe is active, the trace handlers are not invoked. A
trace handler can be called on entry and on exit of a system call. Its functionality is simple. It just scans
the global service trace table looking for the descriptor of the system call. When it finds the descriptor, it checks whether the enablement flag is set and, if so, invokes the correct callout (contained in the
global dynamic trace callout array, KiDynamicTraceCallouts, as specified in the previous section). The
callout, which is implemented in the DTrace driver, uses the generic internal dtrace_probe function to
fire the syscall probe and execute the actions associated with it.
530
CHAPTER 10
Management, diagnostics, and tracing
The Function Boundary Tracing (FBT) and Process (PID) providers
Both the FBT and PID providers are similar because they allow a probe to be enabled on any function
entry and exit points (not necessarily a syscall). The target function can reside in the NT kernel or as
part of a driver (for these cases, the FBT provider is used), or it can reside in a user-mode module, which
should be executed by a process. (The PID provider can trace user-mode applications.) An FBT or PID
probe is activated in the system through breakpoint opcodes (INT 3 in x86, BRK in ARM64) that are
written directly in the target function’s code. This has the following important implications:
■
■
■
When a PID or FBT probe raises, DTrace should be able to re-execute the replaced instruction
before calling back the target function. To do this, DTrace uses an instruction emulator, which,
at the time of this writing, is compatible with the AMD64 and ARM64 architecture. The emulator is implemented in the NT kernel and is normally invoked by the system exception handler
while dealing with a breakpoint exception.
DTrace needs a way to identify functions by name. The name of a function is never compiled in
the final binary (except for exported functions). DTrace uses multiple techniques to achieve this,
which will be discussed in the “DTrace type library” section later in this chapter.
A single function can exit (return) in multiple ways from different code branches. To identify the
exit points, a function graph analyzer is required to disassemble the function’s instructions and
find each exit point. Even though the original function graph analyzer was part of the Solaris
code, the Windows implementation of DTrace uses a new optimized version of it, which still lives
in the LibDTrace library (DTrace.dll). While user-mode functions are analyzed by the function
graph analyzer, DTrace uses the PDATA v2 unwind information to reliably find kernel-mode
function exit points (more information on function unwinds and exception dispatching is available in Chapter 8). If the kernel-mode module does not make use of PDATA v2 unwind information, the FBT provider will not create any probes on function returns for it.
DTrace installs FBT or PID probes by calling the KeSetTracepoint function of the NT kernel exposed
through the NT System interfaces array. The function validates the parameters (the callback pointer
in particular) and, for kernel targets, verifies that the target function is located in an executable code
section of a known kernel-mode module. Similar to the syscall provider, a KI_TRACEPOINT_ENTRY data
structure is built and used for keeping track of the activated trace points. The data structure contains
the owning process, access mode, and target function address. It is inserted in a global hash table,
KiTpHashTable, which is allocated at the first time an FBT or PID probe gets activated. Finally, the single
instruction located in the target code is parsed (imported in the emulator) and replaced with a breakpoint opcode. The trap bit in the global KiDynamicTraceMask bitmask is set.
For kernel-mode targets, the breakpoint replacement can happen only when VBS (Virtualization
Based Security) is enabled. The MmWriteSystemImageTracepoint routine locates the loader data table
entry associated with the target function and invokes the SECURESERVICE_SET_TRACEPOINT secure
call. The Secure Kernel is the only entity able to collaborate with HyperGuard and thus to render the
breakpoint application a legit code modification. As explained in Chapter 7 of Part 1, Kernel Patch
protection (also known as Patchguard) prevents any code modification from being performed on the
NT kernel and some essential kernel drivers. If VBS is not enabled on the system, and a debugger is not
attached, an error code is returned, and the probe application fails. If a kernel debugger is attached,
CHAPTER 10
Management, diagnostics, and tracing
531
the breakpoint opcode is applied by the NT kernel through the MmDbgCopyMemory function.
(Patchguard is not enabled on debugged systems.)
When called for debugger exceptions, which may be caused by a DTrace’s FTB or PID probe firing,
the system exception handler (KiDispatchException) checks whether the “trap” bit is set in the global
KiDynamicTraceMask bitmask. If it is, the exception handler calls the KiTpHandleTrap function, which
searches into the KiTpHashTable to determine whether the exception occurred thanks to a registered
FTB or PID probe firing. For user-mode probes, the function checks whether the process context is
the expected one. If it is, or if the probe is a kernel-mode one, the function directly invokes the DTrace
callback, FbtpCallback, which executes the actions associated with the probe. When the callback
completes, the handler invokes the emulator, which emulates the original first instruction of the target
function before transferring the execution context to it.
EXPERIMENT: Tracing dynamic memory
In this experiment, you dynamically trace the dynamic memory applied to a VM. Using Hyper-V
Manager, you need to create a generation 2 Virtual Machine and apply a minimum of 768 MB
and an unlimited maximum amount of dynamic memory (more information on dynamic memory
and Hyper-V is available in Chapter 9). The VM should have the May 2019 (19H1) or May 2020
(20H1) Update of Windows 10 or later installed as well as the DTrace package (which should be
enabled as explained in the “Enabling DTrace and listing the installed providers” experiment from
earlier in this chapter).
The dynamic_memory.d script, which can be found in this book’s downloadable resources,
needs to be copied in the DTrace directory and started by typing the following commands in an
administrative command prompt window:
cd /d "c:\Program Files\DTrace"
dtrace.exe -s dynamic_memory.d
With only the preceding commands, DTrace will refuse to compile the script because of an
error similar to the following:
dtrace: failed to compile script dynamic_memory.d: line 62: probe description fbt:nt:MiRem
ovePhysicalMemory:entry does not match any probes
This is because, in standard configurations, the path of the symbols store is not set. The script
attaches the FBT provider on two OS functions: MmAddPhysicalMemory
MmAddPhysicalMemory, which is exported from
the NT kernel binary, and MiRemovePhysicalMemory
MiRemovePhysicalMemory, which is not exported or published in the
public WDK. For the latter, the FBT provider has no way to calculate its address in the system.
DTrace can obtain types and symbol information from different sources, as explained in the
“DTrace type library” section later in this chapter. To allow the FBT provider to correctly work with
internal OS functions, you should set the Symbol Store’s path to point to the Microsoft public
symbol server, using the following command:
set _NT_SYMBOL_PATH=srv*C:\symbols*http://msdl.microsoft.com/download/symbols
532
CHAPTER 10
Management, diagnostics, and tracing
After the symbol store’s path is set, if you restart DTrace targeting the dynamic_memory.d
script, it should be able to correctly compile it and show the following output:
The Dynamic Memory script has begun.
Now you should simulate a high-memory pressure scenario. You can do this in multiple
ways—for example, by starting your favorite browser and opening a lot of tabs, by starting a 3D
game, or by simply using the TestLimit tool with the -d command switch, which forces the system
to contiguously allocate memory and write to it until all the resources are exhausted. The VM
worker process in the root partition should detect the scenario and inject new memory in the
child VM. This would be detected by DTrace:
Physical memory addition request intercepted. Start physical address 0x00112C00, Number of
pages: 0x00000400.
Addition of 1024 memory pages starting at PFN 0x00112C00 succeeded!
In a similar way, if you close all the applications in the guest VM and you recreate a highmemory pressure scenario in your host system, the script would be able to intercept dynamic
memory’s removal requests:
Physical memory removal request intercepted. Start physical address 0x00132000, Number of
pages: 0x00000200.
Removal of 512 memory pages starting at PFN 0x00132000 succeeded!
After interrupting DTrace using Ctrl+C, the script prints out some statistics information:
Dynamic Memory script ended.
Numbers of Hot Additions: 217
Numbers of Hot Removals: 1602
Since starts the system has gained 0x00017A00 pages (378 MB).
If you open the dynamic_memory.d script using Notepad, you will find that it installs a total of
six probes (four FBT and two built-in) and performs logging and counting actions. For example,
fbt:nt:MmAddPhysicalMemory:return
/ self->pStartingAddress != 0 /
installs a probe on the exit points of the MmAddPhysicalMemory function only if the starting
physical address obtained at function entry point is not 0. More information on the D programming language applied to DTrace is available in the The illumos Dynamic Tracing Guide book,
which is freely accessible at http://dtrace.org/guide/preface.html.
The ETW provider
DTrace supports both an ETW provider, which allows probes to fire when certain ETW events are generated by particular providers, and the etw_trace action, which allows DTrace scripts to generate new
customized TraceLogging ETW events. The etw_trace action is implemented in LibDTrace, which uses
TraceLogging APIs to dynamically register a new ETW provider and generate events associated with it.
More information on ETW has been presented in the “Event Tracing for Windows (ETW)” section previously in this chapter.
CHAPTER 10
Management, diagnostics, and tracing
533
The ETW provider is implemented in the DTrace driver. When the Trace engine is initialized by the
Pnp manager, it registers all providers with the DTrace engine. At registration time, the ETW provider
configures an ETW session called DTraceLoggingSession, which is set to write events in a circular buffer. When DTrace is started from the command line, it sends an IOCTL to DTrace driver. The IOCTL
handler calls the provide function of each provider; the DtEtwpCreate internal function invokes the
NtTraceControl API with the EtwEnumTraceGuidList function code. This allows DTrace to enumerate all
the ETW providers registered in the system and to create a probe for each of them. (dtrace -l is also
able to display ETW probes.)
When a D script targeting the ETW provider is compiled and executed, the internal DtEtwEnable
routine gets called with the goal of enabling one or more ETW probes. The logging session configured
at registration time is started, if it’s not already running. Through the trace extension context (which,
as previously discussed, contains private system interfaces), DTrace is able to register a kernel-mode
callback called every time a new event is logged in the DTrace logging session. The first time that the
session is started, there are no providers associated with it. Similar to the syscall and FBT provider, for
each probe DTrace creates a tracking data structure and inserts it in a global RB tree (DtEtwpProbeTree)
representing all the enabled ETW probes. The tracking data structure is important because it represents the link between the ETW provider and the probes associated with it. DTrace calculates the
correct enablement level and keyword bitmask for the provider (see the “Provider Enablement” section
previously in this chapter for more details) and enables the provider in the session by invoking the
NtTraceControl API.
When an event is generated, the ETW subsystem calls the callback routine, which searches into
the global ETW probe tree the correct context data structure representing the probe. When found,
DTrace can fire the probe (still using the internal dtrace_probe function) and execute all the actions
associated with it.
DTrace type library
DTrace works with types. System administrators are able to inspect internal operating system data
structures and use them in D clauses to describe actions associated with probes. DTrace also supports
supplemental data types compared to the ones supported by the standard D programming language.
To be able to work with complex OS-dependent data types and allow the FBT and PID providers to set
probes on internal OS and application functions, DTrace obtains information from different sources:
■
■
534
Function names, signatures, and data types are initially extracted from information embedded
in the executable binary (which adheres to the Portable Executable file format), like from the
export table and debug information.
For the original DTrace project, the Solaris operating system included support for Compact C
Type Format (CTF) in its executable binary files (which adhere to the Executable and Linkable
Format - ELF). This allowed the OS to store the debug information needed by DTrace to run directly into its modules (the debug information can also be stored using the deflate compression
format). The Windows version of DTrace still supports a partial CTF, which has been added as a
resource section of the LibDTrace library (Dtrace.dll). CTF in the LibDTrace library stores the type
CHAPTER 10
Management, diagnostics, and tracing
information contained in the public WDK (Windows Driver Kit) and SDK (Software Development
Kit) and allows DTrace to work with basic OS data types without requiring any symbol file.
■
Most of the private types and internal OS function signatures are obtained from PDB symbols.
Public PDB symbols for the majority of the operating system’s modules are downloadable
from the Microsoft Symbol Server. (These symbols are the same as those used by the Windows
Debugger.) The symbols are deeply used by the FBT provider to correctly identify internal OS
functions and by DTrace to be able to retrieve the correct type of parameters for each syscall
and function.
The DTrace symbol server
DTrace includes an autonomous symbol server that can download PDB symbols from the Microsoft public Symbol store and render them available to the DTrace subsystem. The symbol server is implemented
mainly in LibDTrace and can be queried by the DTrace driver using the Inverted call model. As part of the
providers’ registration, the DTrace driver registers a SymServer pseudo-provider. The latter is not a real
provider but just a shortcut for allowing the symsrv handler to the DTrace control device to be registered.
When DTrace is started from the command line, the LibDTrace library starts the symbols server
by opening a handle to the \\.\dtrace\symsrv control device (using the standard CreateFile API). The
request is processed by the DTrace driver through the Symbol server IRP handler, which registers the
user-mode process, adding it in an internal list of symbols server processes. LibDTrace then starts a
new thread, which sends a dummy IOCTL to the DTrace symbol server device and waits indefinitely for
a reply from the driver. The driver marks the IRP as pending and completes it only when a provider (or
the DTrace subsystem), requires new symbols to be parsed.
Every time the driver completes the pending IRP, the DTrace symbols server thread wakes up and
uses services exposed by the Windows Image Helper library (Dbghelp.dll) to correctly download and
parse the required symbol. The driver then waits for a new dummy IOCTL to be sent from the symbols
thread. This time the new IOCTL will contain the results of the symbol parsing process. The user-mode
thread wakes up again only when the DTrace driver requires it.
Windows Error Reporting (WER)
Windows Error Reporting (WER) is a sophisticated mechanism that automates the submission of both
user-mode process crashes as well as kernel-mode system crashes. Multiple system components have
been designed for supporting reports generated when a user-mode process, protected process, trustlet, or the kernel crashes.
Windows 10, unlike from its predecessors, does not include a graphical dialog box in which the
user can configure the details that Windows Error Reporting acquires and sends to Microsoft (or to
an internal server configured by the system administrator) when an application crashes. As shown in
Figure 10-38, in Windows 10, the Security and Maintenance applet of the Control Panel can show the
user a history of the reports generated by Windows Error Reporting when an application (or the kernel)
crashes. The applet can show also some basic information contained in the report.
CHAPTER 10
Management, diagnostics, and tracing
535
FIGURE 10-38 The Reliability monitor of the Security and Maintenance applet of the Control Panel.
Windows Error Reporting is implemented in multiple components of the OS, mainly because it
needs to deal with different kind of crashes:
■
■
■
■
536
The Windows Error Reporting Service (WerSvc.dll) is the main service that manages the creation
and sending of reports when a user-mode process, protected process, or trustlet crashes.
The Windows Fault Reporting and Secure Fault Reporting (WerFault.exe and WerFaultSecure.
exe) are mainly used to acquire a snapshot of the crashing application and start the generation and sending of a report to the Microsoft Online Crash Analysis site (or, if configured, to an
internal error reporting server).
The actual generation and transmission of the report is performed by the Windows Error
Reporting Dll (Wer.dll). The library includes all the functions used internally by the WER engine
and also some exported API that the applications can use to interact with Windows Error
Reporting (documented at https://docs.microsoft.com/en-us/windows/win32/api/_wer/ ). Note
that some WER APIs are also implemented in Kernelbase.dll and Faultrep.dll.
The Windows User Mode Crash Reporting DLL (Faultrep.dll) contains common WER stub code
that is used by system modules (Kernel32.dll, WER service, and so on) when a user-mode application crashes or hangs. It includes services for creating a crash signature and reports a hang to
the WER service, managing the correct security context for the report creation and transmission
(which includes the creation of the WerFault executable under the correct security token).
CHAPTER 10
Management, diagnostics, and tracing
■
■
The Windows Error Reporting Dump Encoding Library (Werenc.dll) is used by the Secure Fault
Reporting to encrypt the dump files generated when a trustlet crashes.
The Windows Error Reporting Kernel Driver (WerKernel.sys) is a kernel library that exports
functions to capture a live kernel memory dump and submit the report to the Microsoft Online
Crash Analysis site. Furthermore, the driver includes APIs for creating and submitting reports for
user-mode faults from a kernel-mode driver.
Describing the entire architecture of WER is outside the scope of this book. In this section, we mainly
describe error reporting for user-mode applications and the NT kernel (or kernel-driver) crashes.
User applications crashes
As discussed in Chapter 3 of Part 1, all the user-mode threads in Windows start with the RtlUserThreadStart
function located in Ntdll. The function does nothing more than calling the real thread start routine
under a structured exception handler. (Structured exception handling is described in Chapter 8.)
The handler protecting the real start routine is internally called Unhandled Exception Handler
because it is the last one that can manage an exception happening in a user-mode thread (when the
thread does not already handle it). The handler, if executed, usually terminates the process with the
NtTerminateProcess API. The entity that decides whether to execute the handler is the unhandled
exception filter, RtlpThreadExceptionFilter. Noteworthy is that the unhandled exception filter and
handler are executed only under abnormal conditions; normally, applications should manage their
own exceptions with inner exception handlers.
When a Win32 process is starting, the Windows loader maps the needed imported libraries.
The kernelbase initialization routine installs its own unhandled exception filter for the process, the
UnhandledExceptionFilter routine. When a fatal unhandled exception happens in a process’s thread,
the filter is called to determine how to process the exception. The kernelbase unhandled exception
filter builds context information (such as the current value of the machine’s registers and stack, the
faulting process ID, and thread ID) and processes the exception:
■
■
■
If a debugger is attached to the process, the filter lets the exception happen (by returning
CONTINUE_SEARCH). In this way, the debugger can break and see the exception.
If the process is a trustlet, the filter stops any processing and invokes the kernel to start the
Secure Fault Reporting (WerFaultSecure.exe).
The filter calls the CRT unhandled exception routine (if it exists) and, in case the latter does not
know how to handle the exception, it calls the internal WerpReportFault function, which connects to the WER service.
Before opening the ALPC connection, WerpReportFault should wake up the WER service and
prepare an inheritable shared memory section, where it stores all the context information previously
acquired. The WER service is a direct triggered-start service, which is started by the SCM only in case
the WER_SERVICE_START WNF state is updated or in case an event is written in a dummy WER activation ETW provider (named Microsoft-Windows-Feedback-Service-Triggerprovider). WerpReportFault
CHAPTER 10
Management, diagnostics, and tracing
537
updates the relative WNF state and waits on the \KernelObjects\SystemErrorPortReady event, which is
signaled by the WER service to indicate that it is ready to accept new connections. After a connection
has been established, Ntdll connects to the WER service’s \WindowsErrorReportingServicePort ALPC
port, sends the WERSVC_REPORT_CRASH message, and waits indefinitely for its reply.
The message allows the WER service to begin to analyze the crashed program’s state and performs
the appropriate actions to create a crash report. In most cases, this means launching the WerFault.exe
program. For user-mode crashes, the Windows Fault Reporting process is invoked two times using the
faulting process’s credentials. The first time is used to acquire a “snapshot” of the crashing process. This
feature was introduced in Windows 8.1 with the goal of rendering the crash report generation of UWP
applications (which, at that time, were all single-instance applications) faster. In that way, the user could
have restarted a crashed UWP application without waiting for the report being generated. (UWP and
the modern application stack are discussed in Chapter 8.)
Snapshot creation
WerFault maps the shared memory section containing the crash data and opens the faulting process
and thread. When invoked with the -pss command-line argument (used for requesting a process snapshot), it calls the PssNtCaptureSnapshot function exported by Ntdll. The latter uses native APIs to query
multiple information regarding the crashing process (like basic information, job information, process
times, secure mitigations, process file name, and shared user data section). Furthermore, the function
queries information regarding all the memory sections baked by a file and mapped in the entire usermode address space of the process. It then saves all the acquired data in a PSS_SNAPSHOT data structure representing a snapshot. It finally creates an identical copy of the entire VA space of the crashing
process into another dummy process (cloned process) using the NtCreateProcessEx API (providing a
special combination of flags). From now on, the original process can be terminated, and further operations needed for the report can be executed on the cloned process.
Note WER does not perform any snapshot creation for protected processes and trustlets.
In these cases, the report is generated by obtaining data from the original faulting process,
which is suspended and resumed only after the report is completed.
Crash report generation
After the snapshot is created, execution control returns to the WER service, which initializes the environment for the crash report creation. This is done mainly in two ways:
■
■
538
If the crash happened to a normal, unprotected process, the WER service directly invokes the
WerpInitiateCrashReporting routine exported from the Windows User Mode Crash Reporting
DLL (Faultrep.dll).
Crashes belonging to protected processes need another broker process, which is spawned under the SYSTEM account (and not the faulting process credentials). The broker performs some
verifications and calls the same routine used for crashes happening in normal processes.
CHAPTER 10
Management, diagnostics, and tracing
The WerpInitiateCrashReporting routine, when called from the WER service, prepares the environment for executing the correct Fault Reporting process. It uses APIs exported from the WER library to
initialize the machine store (which, in its default configuration, is located in C:\ProgramData\Microsoft\
Windows\WER) and load all the WER settings from the Windows registry. WER indeed contains many
customizable options that can be configured by the user through the Group Policy editor or by manually making changes to the registry. At this stage, WER impersonates the user that has started the faulting application and starts the correct Fault Reporting process using the -u main command-line switch,
which indicates to the WerFault (or WerFaultSecure) to process the user crash and create a new report.
Note If the crashing process is a Modern application running under a low-integrity level
or AppContainer token, WER uses the User Manager service to generate a new medium-IL
token representing the user that has launched the faulting application.
Table 10-19 lists the WER registry configuration options, their use, and possible values. These values
are located under the HKLM\SOFTWARE\Microsoft\Windows\Windows Error Reporting subkey for
computer configuration and in the equivalent path under HKEY_CURRENT_USER for per-user configuration (some values can also be present in the \Software\Policies\Microsoft\Windows\Windows Error
Reporting key).
TABLE 10-19 WER registry settings
Settings
Meaning
Values
ConfigureArchive
Contents of archived data
1 for parameters, 2 for all data
Consent DefaultConsent
What kind of data should require
consent
1 for any data, 2 for parameters only,
3 for parameters and safe data, 4 for
all data.
Consent DefaultOverrideBehavior Whether the DefaultConsent overrides
WER plug-in consent values
1 to enable override
Consent PluginName
Consent value for a specific WER plug-in
Same as DefaultConsent
CorporateWERDirectory
Directory for a corporate WER store
String containing the path
CorporateWERPortNumber
Port to use for a corporate WER store
Port number
CorporateWERServer
Name to use for a corporate WER store
String containing the name
CorporateWERUseAuthentication
Use Windows Integrated Authentication
for corporate WER store
1 to enable built-in authentication
CorporateWERUseSSL
Use Secure Sockets Layer (SSL) for
corporate WER store
1 to enable SSL
DebugApplications
List of applications that require the user
to choose between Debug and Continue
1 to require the user to choose
DisableArchive
Whether the archive is enabled
1 to disable archive
Disabled
Whether WER is disabled
1 to disable WER
DisableQueue
Determines whether reports are to be
queued
1 to disable queue
DontShowUI
Disables or enables the WER UI
1 to disable UI
CHAPTER 10
Management, diagnostics, and tracing
539
Settings
Meaning
Values
DontSendAdditionalData
Prevents additional crash data from being sent
1 not to send
ExcludedApplications AppName
List of applications excluded from WER
String containing the application list
ForceQueue
Whether reports should be sent to the
user queue
1 to send reports to the queue
LocalDumps DumpFolder
Path at which to store the dump files
String containing the path
LocalDumps DumpCount
Maximum number of dump files in the
path
Count
LocalDumps DumpType
Type of dump to generate during a crash
0 for a custom dump, 1 for a minidump, 2
for a full dump
LocalDumps CustomDumpFlags
For custom dumps, specifies custom
options
Values defined in MINIDUMP_TYPE (see
Chapter 12 for more information)
LoggingDisabled
Enables or disables logging
1 to disable logging
MaxArchiveCount
Maximum size of the archive (in files)
Value between 1–5000
MaxQueueCount
Maximum size of the queue
Value between 1–500
QueuePesterInterval
Days between requests to have the user
check for solutions
Number of days
The Windows Fault Reporting process started with the -u switch starts the report generation:
the process maps again the shared memory section containing the crash data, identifies the exception’s
record and descriptor, and obtains the snapshot taken previously. In case the snapshot does not
exist, the WerFault process operates directly on the faulting process, which is suspended. WerFault
first determines the nature of the faulting process (service, native, standard, or shell process). If the
faulting process has asked the system not to report any hard errors (through the SetErrorMode API),
the entire process is aborted, and no report is created. Otherwise, WER checks whether a default
post-mortem debugger is enabled through settings stored in the AeDebug subkey (AeDebugProtected
for protected processes) under the HKLM\SOFTWARE\Microsoft\Windows NT\CurrentVersion\ root
registry key. Table 10-20 describes the possible values of both keys.
TABLE 10-20 Valid registry values used for the AeDebug and AeDebugProtected root keys
540
Value name
Meaning
Data
Debugger
Specify the debugger executable to be
launched when an application crashes.
Full path of the debugger executable, with
eventual command-line arguments. The -p
switch is automatically added by WER, pointing
it to the crashing process ID.
ProtectedDebugger
Same as Debugger but for protected
processes only.
Full path of the debugger executable. Not valid
for the AeDebug key.
Auto
Specify the Autostartup mode
1 to enable the launching of the debugger in
any case, without any user consent, 0 otherwise.
LaunchNonProtected
Specify whether the debugger should be executed as unprotected.
This setting applies only to the
AeDebugProtected key.
1 to launch the debugger as a standard
process.
CHAPTER 10
Management, diagnostics, and tracing
If the debugger start type is set to Auto, WER starts it and waits for a debugger event to be signaled before continuing the report creation. The report generation is started through the internal
GenerateCrashReport routine implemented in the User Mode Crash Reporting DLL (Faultrep.dll).
The latter configures all the WER plug-ins and initializes the report using the WerReportCreate
API, exported from the WER.dll. (Note that at this stage, the report is only located in memory.) The
GenerateCrashReport routine calculates the report ID and a signature and adds further diagnostics
data to the report, like the process times and startup parameters or application-defined data. It then
checks the WER configuration to determine which kind of memory dump to create (by default, a
minidump is acquired). It then calls the exported WerReportAddDump API with the goal to initialize the
dump acquisition for the faulting process (it will be added to the final report). Note that if a snapshot
has been previously acquired, it is used for acquiring the dump.
The WerReportSubmit API, exported from WER.dll, is the central routine that generates the dump
of the faulting process, creates all the files included in the report, shows the UI (if configured to do so
by the DontShowUI registry value), and sends the report to the Online Crash server. The report usually
includes the following:
■
■
■
A minidump file of the crashing process (usually named memory.hdmp)
A human-readable text report, which includes exception information, the calculated signature
of the crash, OS information, a list of all the files associated with the report, and a list of all the
modules loaded in the crashing process (this file is usually named report.wer)
A CSV (comma separated values) file containing a list of all the active processes at the time of
the crash and basic information (like the number of threads, the private working set size, hard
fault count, and so on)
■
A text file containing the global memory status information
■
A text file containing application compatibility information
The Fault Reporting process communicates through ALPC to the WER service and sends commands
to allow the service to generate most of the information present in the report. After all the files have
been generated, if configured appropriately, the Windows Fault Reporting process presents a dialog
box (as shown in Figure 10-39) to the user, notifying that a critical error has occurred in the target
process. (This feature is disabled by default in Windows 10.)
FIGURE 10-39 The Windows Error Reporting dialog box.
CHAPTER 10
Management, diagnostics, and tracing
541
In environments where systems are not connected to the Internet or where the administrator wants
to control which error reports are submitted to Microsoft, the destination for the error report can
be configured to be an internal file server. The System Center Desktop Error Monitoring (part of the
Microsoft Desktop Optimization Pack) understands the directory structure created by Windows Error
Reporting and provides the administrator with the option to take selective error reports and submit
them to Microsoft.
As previously discussed, the WER service uses an ALPC port for communicating with crashed
processes. This mechanism uses a systemwide error port that the WER service registers through
NtSetInformationProcess (which uses DbgkRegisterErrorPort). As a result, all Windows processes have
an error port that is actually an ALPC port object registered by the WER service. The kernel and the
unhandled exception filter in Ntdll use this port to send a message to the WER service, which then
analyzes the crashing process. This means that even in severe cases of thread state damage, WER is still
able to receive notifications and launch WerFault.exe to log the detailed information of the critical error in a Windows Event log (or to display a user interface to the user) instead of having to do this work
within the crashing thread itself. This solves all the problems of silent process death: Users are notified,
debugging can occur, and service administrators can see the crash event.
EXPERIMENT: Enabling the WER user interface
Starting with the initial release of Windows 10, the user interface displayed by WER when an application crashes has been disabled by default. This is primarily because of the introduction of the
Restart Manager (part of the Application Recovery and Restart technology). The latter allows applications to register a restart or recovery callback invoked when an application crashes, hangs,
or just needs to be restarted for servicing an update. As a result, classic applications that do
not register any recovery callback when they encounter an unhandled exception just terminate
without displaying any message to the user (but correctly logging the error in the system log).
As discussed in this section, WER supports a user interface, which can be enabled by just adding a
value in one of the WER keys used for storing settings. For this experiment, you will re-enable the
WER UI using the global system key.
From the book’s downloadable resources, copy the BuggedApp executable and run it. After
pressing a key, the application generates a critical unhandled exception that WER intercepts
and reports. In default configurations, no error message is displayed. The process is terminated,
an error event is stored in the system log, and the report is generated and sent without any
user intervention. Open the Registry Editor (by typing regedit in the Cortana search box) and
navigate to the HKLM\SOFTWARE\Microsoft\Windows \Windows Error Reporting registry key.
If the DontShowUI value does not exist, create it by right-clicking the root key and selecting New,
DWORD (32 bit) Value and assign 0 to it.
If you restart the bugged application and press a key, WER displays a user interface similar
to the one shown in Figure 10-39 before terminating the crashing application. You can repeat
the experiment by adding a debugger to the AeDebug key. Running Windbg with the -I switch
performs the registration automatically, as discussed in the “Witnessing a COM-hosted task”
experiment earlier in this chapter.
542
CHAPTER 10
Management, diagnostics, and tracing
Kernel-mode (system) crashes
Before discussing how WER is involved when a kernel crashes, we need to introduce how the kernel records crash information. By default, all Windows systems are configured to attempt to record
information about the state of the system before the Blue Screen of Death (BSOD) is displayed, and
the system is restarted. You can see these settings by opening the System Properties tool in Control
Panel (under System and Security, System, Advanced System Settings), clicking the Advanced tab,
and then clicking the Settings button under Startup and Recovery. The default settings for a Windows
system are shown in Figure 10-40.
FIGURE 10-40 Crash dump settings.
Crash dump files
Different levels of information can be recorded on a system crash:
■
Active memory dump An active memory dump contains all physical memory accessible and
in use by Windows at the time of the crash. This type of dump is a subset of the complete memory dump; it just filters out pages that are not relevant for troubleshooting problems on the
host machine. This dump type includes memory allocated to user-mode applications and active
pages mapped into the kernel or user space, as well as selected Pagefile-backed Transition,
Standby, and Modified pages such as the memory allocated with VirtualAlloc or page-file
backed sections. Active dumps do not include pages on the free and zeroed lists, the file cache,
guest VM pages, and various other types of memory that are not useful during debugging.
CHAPTER 10
Management, diagnostics, and tracing
543
■
■
■
■
Complete memory dump A complete memory dump is the largest kernel-mode dump file
that contains all the physical pages accessible by Windows. This type of dump is not fully supported on all platforms (the active memory dump superseded it). Windows requires that a page
file be at least the size of physical memory plus 1 MB for the header. Device drivers can add up
to 256 MB for secondary crash dump data, so to be safe, it’s recommended that you increase
the size of the page file by an additional 256 MB.
Kernel memory dump A kernel memory dump includes only the kernel-mode pages allocated by the operating system, the HAL, and device drivers that are present in physical memory
at the time of the crash. This type of dump does not contain pages belonging to user processes.
Because only kernel-mode code can directly cause Windows to crash, however, it’s unlikely that
user process pages are necessary to debug a crash. In addition, all data structures relevant for
crash dump analysis—including the list of running processes, the kernel-mode stack of the current thread, and list of loaded drivers—are stored in nonpaged memory that saves in a kernel
memory dump. There is no way to predict the size of a kernel memory dump because its size
depends on the amount of kernel-mode memory allocated by the operating system and drivers
present on the machine.
Automatic memory dump This is the default setting for both Windows client and server
systems. An automatic memory dump is similar to a kernel memory dump, but it also saves
some metadata of the active user-mode process (at the time of the crash). Furthermore, this
dump type allows better management of the system paging file’s size. Windows can set the size
of the paging file to less than the size of RAM but large enough to ensure that a kernel memory
dump can be captured most of the time.
Small memory dump A small memory dump, which is typically between 128 KB and 1 MB in
size and is also called a minidump or triage dump, contains the stop code and parameters, the
list of loaded device drivers, the data structures that describe the current process and thread
(called the EPROCESS and ETHREAD—described in Chapter 3 of Part 1), the kernel stack for the
thread that caused the crash, and additional memory considered potentially relevant by crash
dump heuristics, such as the pages referenced by processor registers that contain memory addresses and secondary dump data added by drivers.
Note Device drivers can register a secondary dump data callback routine by calling
KeRegisterBugCheckReasonCallback. The kernel invokes these callbacks after a crash and a
callback routine can add additional data to a crash dump file, such as device hardware memory or device information for easier debugging. Up to 256 MB can be added systemwide by
all drivers, depending on the space required to store the dump and the size of the file into
which the dump is written, and each callback can add at most one-eighth of the available
additional space. Once the additional space is consumed, drivers subsequently called are
not offered the chance to add data.
The debugger indicates that it has limited information available to it when it loads a minidump, and
basic commands like !process, which lists active processes, don’t have the data they need. A kernel
544
CHAPTER 10
Management, diagnostics, and tracing
memory dump includes more information, but switching to a different process’s address space mappings won’t work because required data isn’t in the dump file. While a complete memory dump is a
superset of the other options, it has the drawback that its size tracks the amount of physical memory on
a system and can therefore become unwieldy. Even though user-mode code and data usually are not
used during the analysis of most crashes, the active memory dump overcame the limitation by storing
in the dump only the memory that is actually used (excluding physical pages in the free and zeroed
list). As a result, it is possible to switch address space in an active memory dump.
An advantage of a minidump is its small size, which makes it convenient for exchange via email,
for example. In addition, each crash generates a file in the directory %SystemRoot%\Minidump with
a unique file name consisting of the date, the number of milliseconds that have elapsed since the
system was started, and a sequence number (for example, 040712-24835-01.dmp). If there's a conflict,
the system attempts to create additional unique file names by calling the Windows GetTickCount
function to return an updated system tick count, and it also increments the sequence number. By
default, Windows saves the last 50 minidumps. The number of minidumps saved is configurable
by modifying the MinidumpsCount value under the HKLM\SYSTEM\CurrentControlSet\Control\
CrashControl registry key.
A significant disadvantage is that the limited amount of data stored in the dump can hamper effective
analysis. You can also get the advantages of minidumps even when you configure a system to generate
kernel, complete, active, or automatic crash dumps by opening the larger crash with WinDbg and using
the .dump /m command to extract a minidump. Note that a minidump is automatically created even if
the system is set for full or kernel dumps.
Note You can use the .dump command from within LiveKd to generate a memory image
of a live system that you can analyze offline without stopping the system. This approach is
useful when a system is exhibiting a problem but is still delivering services, and you want to
troubleshoot the problem without interrupting service. To prevent creating crash images
that aren’t necessarily fully consistent because the contents of different regions of memory
reflect different points in time, LiveKd supports the –m flag. The mirror dump option produces a consistent snapshot of kernel-mode memory by leveraging the memory manager’s
memory mirroring APIs, which give a point-in-time view of the system.
The kernel memory dump option offers a practical middle ground. Because it contains all kernelmode-owned physical memory, it has the same level of analysis-related data as a complete memory
dump, but it omits the usually irrelevant user-mode data and code, and therefore can be significantly
smaller. As an example, on a system running a 64-bit version of Windows with 4 GB of RAM, a kernel
memory dump was 294 MB in size.
When you configure kernel memory dumps, the system checks whether the paging file is large
enough, as described earlier. There isn’t a reliable way to predict the size of a kernel memory dump.
The reason you can’t predict the size of a kernel memory dump is that its size depends on the amount
of kernel-mode memory in use by the operating system and drivers present on the machine at the time
of the crash. Therefore, it is possible that at the time of the crash, the paging file is too small to hold a
CHAPTER 10
Management, diagnostics, and tracing
545
kernel dump, in which case the system will switch to generating a minidump. If you want to see the size
of a kernel dump on your system, force a manual crash either by configuring the registry option to allow you to initiate a manual system crash from the console (documented at https://docs.microsoft.com/
en-us/windows-hardware/drivers/debugger/forcing-a-system-crash-from-the-keyboard) or by using
the Notmyfault tool (https://docs.microsoft.com/en-us/sysinternals/downloads/notmyfault).
The automatic memory dump overcomes this limitation, though. The system will be indeed able
to create a paging file large enough to ensure that a kernel memory dump can be captured most of
the time. If the computer crashes and the paging file is not large enough to capture a kernel memory
dump, Windows increases the size of the paging file to at least the size of the physical RAM installed.
To limit the amount of disk space that is taken up by crash dumps, Windows needs to determine
whether it should maintain a copy of the last kernel or complete dump. After reporting the kernel
fault (described later), Windows uses the following algorithm to decide whether it should keep the
Memory.dmp file. If the system is a server, Windows always stores the dump file. On a Windows client
system, only domain-joined machines will always store a crash dump by default. For a non-domainjoined machine, Windows maintains a copy of the crash dump only if there is more than 25 GB of
free disk space on the destination volume (4 GB on ARM64, configurable via the HKLM\SYSTEM\
CurrentControlSet\Control\CrashControl\PersistDumpDiskSpaceLimit registry value)—that is, the
volume where the system is configured to write the Memory.dmp file. If the system, due to disk space
constraints, is unable to keep a copy of the crash dump file, an event is written to the System event
log indicating that the dump file was deleted, as shown in Figure 10-41. This behavior can be overridden by creating the DWORD registry value HKLM\SYSTEM\CurrentControlSet\Control\CrashControl\
AlwaysKeepMemoryDump and setting it to 1, in which case Windows always keeps a crash dump,
regardless of the amount of free disk space.
FIGURE 10-41 Dump file deletion event log entry.
546
CHAPTER 10
Management, diagnostics, and tracing
EXPERIMENT: Viewing dump file information
Each crash dump file contains a dump header that describes the stop code and its parameters,
the type of system the crash occurred on (including version information), and a list of pointers
to important kernel-mode structures required during analysis. The dump header also contains
the type of crash dump that was written and any information specific to that type of dump. The
.dumpdebug debugger command can be used to display the dump header of a crash dump file.
For example, the following output is from a crash of a system that was configured for an automatic dump:
0: kd> .dumpdebug
----- 64 bit Kernel Bitmap Dump Analysis - Kernel address space is available,
User address space may not be available.
DUMP_HEADER64:
MajorVersion
MinorVersion
KdSecondaryVersion
DirectoryTableBase
PfnDataBase
PsLoadedModuleList
PsActiveProcessHead
MachineImageType
NumberProcessors
BugCheckCode
BugCheckParameter1
BugCheckParameter2
BugCheckParameter3
BugCheckParameter4
KdDebuggerDataBlock
SecondaryDataState
ProductType
SuiteMask
Attributes
0000000f
000047ba
00000002
00000000`006d4000
ffffe980`00000000
fffff800`5df00170
fffff800`5def0b60
00008664
00000003
000000e2
00000000`00000000
00000000`00000000
00000000`00000000
00000000`00000000
fffff800`5dede5e0
00000000
00000001
00000110
00000000
BITMAP_DUMP:
DumpOptions
HeaderSize
BitmapSize
Pages
00000000
16000
9ba00
25dee
KiProcessorBlock at fffff800`5e02dac0
3 KiProcessorBlock entries:
fffff800`5c32f180 ffff8701`9f703180 ffff8701`9f3a0180
The .enumtag command displays all secondary dump data stored within a crash dump (as
shown below). For each callback of secondary data, the tag, the length of the data, and the data
itself (in byte and ASCII format) are displayed. Developers can use Debugger Extension APIs to
create custom debugger extensions to also read secondary dump data. (See the “Debugging
Tools for Windows” help file for more information.)
CHAPTER 10
Management, diagnostics, and tracing
547
{E83B40D2-B0A0-4842-ABEA71C9E3463DD1}
46 41 43 50 14 01 00 00 06 98 56 52
4D 49 43 52 4F 53 46 54 01 00 00 00
53 52 41 54 A0 01 00 00 02 C6 56 52
4D 49 43 52 4F 53 46 54 01 00 00 00
57 41 45 54 28 00 00 00 01 22 56 52
4D 49 43 52 4F 53 46 54 01 00 00 00
41 50 49 43 60 00 00 00 04 F7 56 52
...
- 0x100 bytes
54 55 41 4C FACP......VRTUAL
4D 53 46 54 MICROSFT....MSFT
54 55 41 4C SRAT......VRTUAL
4D 53 46 54 MICROSFT....MSFT
54 55 41 4C WAET(...."VRTUAL
4D 53 46 54 MICROSFT....MSFT
54 55 41 4C APIC`.....VRTUAL
Crash dump generation
Phase 1 of the system boot process allows the I/O manager to check the configured crash dump options by reading the HKLM\SYSTEM\CurrentControlSet\Control\CrashControl registry key. If a dump
is configured, the I/O manager loads the crash dump driver (Crashdmp.sys) and calls its entry point.
The entry point transfers back to the I/O manager a table of control functions, which are used by the
I/O manager for interacting with the crash dump driver. The I/O manager also initializes the secure
encryption needed by the Secure Kernel to store the encrypted pages in the dump. One of the control
functions in the table initializes the global crash dump system. It gets the physical sectors (file extent)
where the page file is stored and the volume device object associated with it.
The global crash dump initialization function obtains the miniport driver that manages the physical
disk in which the page file is stored. It then uses the MmLoadSystemImageEx routine to make a copy
of the crash dump driver and the disk miniport driver, giving them their original names prefixed by the
dump_ string. Note that this implies also creating a copy of all the drivers imported by the miniport
driver, as shown in the Figure 10-42.
FIGURE 10-42 Kernel modules copied for use to generate and write a crash dump file.
548
CHAPTER 10
Management, diagnostics, and tracing
The system also queries the DumpFilters value for any filter drivers that are required for writing to
the volume, an example being Dumpfve.sys, the BitLocker Drive Encryption Crashdump Filter driver. It
also collects information related to the components involved with writing a crash dump—including the
name of the disk miniport driver, the I/O manager structures that are necessary to write the dump, and
the map of where the paging file is on disk—and saves two copies of the data in dump-context structures. The system is ready to generate and write a dump using a safe, noncorrupted path.
Indeed, when the system crashes, the crash dump driver (%SystemRoot%\System32\Drivers\
Crashdmp.sys) verifies the integrity of the two dump-context structures obtained at boot by performing a memory comparison. If there’s not a match, it does not write a crash dump because doing so
would likely fail or corrupt the disk. Upon a successful verification match, Crashdmp.sys, with support from the copied disk miniport driver and any required filter drivers, writes the dump information
directly to the sectors on disk occupied by the paging file, bypassing the file system driver and storage
driver stack (which might be corrupted or even have caused the crash).
Note Because the page file is opened early during system startup for crash dump use,
most crashes that are caused by bugs in system-start driver initialization result in a dump
file. Crashes in early Windows boot components such as the HAL or the initialization of boot
drivers occur too early for the system to have a page file, so using another computer to
debug the startup process is the only way to perform crash analysis in those cases.
During the boot process, the Session Manager (Smss.exe) checks the registry value HKLM\SYSTEM\
CurrentControlSet\Control\Session Manager\Memory Management\ExistingPageFiles for a list of existing page files from the previous boot. (See Chapter 5 of Part 1 for more information on page files.) It
then cycles through the list, calling the function SmpCheckForCrashDump on each file present, looking
to see whether it contains crash dump data. It checks by searching the header at the top of each paging
file for the signature PAGEDUMP or PAGEDU64 on 32-bit or 64-bit systems, respectively. (A match indicates that the paging file contains crash dump information.) If crash dump data is present, the Session
Manager then reads a set of crash parameters from the HKLM\SYSTEM\CurrentControlSet\Control\
CrashControl registry key, including the DumpFile value that contains the name of the target dump file
(typically %SystemRoot%\Memory.dmp, unless configured otherwise).
Smss.exe then checks whether the target dump file is on a different volume than the paging file.
If so, it checks whether the target volume has enough free disk space (the size required for the crash
dump is stored in the dump header of the page file) before truncating the paging file to the size of the
crash data and renaming it to a temporary dump file name. (A new page file will be created later when
the Session Manager calls the NtCreatePagingFile function.) The temporary dump file name takes the
format DUMPxxxx.tmp, where xxxx is the current low-word value of the system’s tick count (The system
attempts 100 times to find a nonconflicting value.) After renaming the page file, the system removes
both the hidden and system attributes from the file and sets the appropriate security descriptors to
secure the crash dump.
Next, the Session Manager creates the volatile registry key HKLM\SYSTEM\CurrentControlSet\
Control\CrashControl\MachineCrash and stores the temporary dump file name in the value DumpFile.
CHAPTER 10
Management, diagnostics, and tracing
549
It then writes a DWORD to the TempDestination value indicating whether the dump file location is only
a temporary destination. If the paging file is on the same volume as the destination dump file, a temporary dump file isn’t used because the paging file is truncated and directly renamed to the target dump
file name. In this case, the DumpFile value will be that of the target dump file, and TempDestination
will be 0.
Later in the boot, Wininit checks for the presence of the MachineCrash key, and if it exists, launches
the Windows Fault Reporting process (Werfault.exe) with the -k -c command-line switches (the k
flag indicates kernel error reporting, and the c flag indicates that the full or kernel dump should
be converted to a minidump). WerFault reads the TempDestination and DumpFile values. If the
TempDestination value is set to 1, which indicates a temporary file was used, WerFault moves the
temporary file to its target location and secures the target file by allowing only the System account
and the local Administrators group access. WerFault then writes the final dump file name to the
FinalDumpFileLocation value in the MachineCrash key. These steps are shown in Figure 10-43.
“MachineCrash”
Memory.dmp
5
Wininit
4
7 WerFault
6
Session
Manager
WerFault
Dumpxxxx.tmp
3 SMSS
1
SmpCheckForCrashDump
2
Paging file
FIGURE 10-43 Crash dump file generation.
To provide more control over where the dump file data is written to—for example, on systems
that boot from a SAN or systems with insufficient disk space on the volume where the paging file
is configured—Windows also supports the use of a dedicated dump file that is configured in the
DedicatedDumpFile and DumpFileSize values under the HKLM\SYSTEM\CurrentControlSet\Control\
CrashControl registry key. When a dedicated dump file is specified, the crash dump driver creates
the dump file of the specified size and writes the crash data there instead of to the paging file. If no
DumpFileSize value is given, Windows creates a dedicated dump file using the largest file size that
would be required to store a complete dump. Windows calculates the required size as the size of the
total number of physical pages of memory present in the system plus the size required for the dump
header (one page on 32-bit systems, and two pages on 64-bit systems), plus the maximum value for
secondary crash dump data, which is 256 MB. If a full or kernel dump is configured but there is not
enough space on the target volume to create the dedicated dump file of the required size, the system
falls back to writing a minidump.
550
CHAPTER 10
Management, diagnostics, and tracing
Kernel reports
After the WerFault process is started by Wininit and has correctly generated the final dump file,
WerFault generates the report to send to the Microsoft Online Crash Analysis site (or, if configured,
an internal error reporting server). Generating a report for a kernel crash is a procedure that involves
the following:
1.
If the type of dump generated was not a minidump, it extracts a minidump from the dump file and
stores it in the default location of %SystemRoot%\Minidump, unless otherwise configured through
the MinidumpDir value in the HKLM\SYSTEM\CurrentControlSet\Control\CrashControl key.
2.
It writes the name of the minidump files to HKLM\SOFTWARE\Microsoft\Windows\Windows
Error Reporting\KernelFaults\Queue.
3.
It adds a command to execute WerFault.exe (%SystemRoot%\System32\WerFault.exe) with the
–k –rq flags (the rq flag specifies to use queued reporting mode and that WerFault should be
restarted) to HKLM\SOFTWARE\Microsoft\Windows\CurrentVersion\RunOnce so that WerFault
is executed during the first user’s logon to the system for purposes of actually sending the
error report.
When the WerFault utility executes during logon, as a result of having configured itself to start, it
launches itself again using the –k –q flags (the q flag on its own specifies queued reporting mode) and
terminates the previous instance. It does this to prevent the Windows shell from waiting on WerFault
by returning control to RunOnce as quickly as possible. The newly launched WerFault.exe checks the
HKLM\SOFTWARE\Microsoft\Windows\Windows Error Reporting\KernelFaults\Queue key to look
for queued reports that may have been added in the previous dump conversion phase. It also checks
whether there are previously unsent crash reports from previous sessions. If there are, WerFault.exe
generates two XML-formatted files:
■
■
The first contains a basic description of the system, including the operating system version,
a list of drivers installed on the machine, and the list of devices present in the system.
The second contains metadata used by the OCA service, including the event type that triggered
WER and additional configuration information, such as the system manufacturer.
WerFault then sends a copy of the two XML files and the minidump to Microsoft OCA server, which
forwards the data to a server farm for automated analysis. The server farm’s automated analysis uses
the same analysis engine that the Microsoft kernel debuggers use when you load a crash dump file into
them. The analysis generates a bucket ID, which is a signature that identifies a particular crash type.
Process hang detection
Windows Error reporting is also used when an application hangs and stops work because of some
defect or bug in its code. An immediate effect of an application hanging is that it would not react to
any user interaction. The algorithm used for detecting a hanging application depends on the application type: the Modern application stack detects that a Centennial or UWP application is hung when
a request sent from the HAM (Host Activity Manager) is not processed after a well-defined timeout
(usually 30 seconds); the Task manager detects a hung application when an application does not reply
CHAPTER 10
Management, diagnostics, and tracing
551
to the WM_QUIT message; Win32 desktop applications are considered not responding and hung when
a foreground window stops to process GDI messages for more than 5 seconds.
Describing all the hung detection algorithms is outside the scope of this book. Instead, we will consider the most likely case of a classical Win32 desktop application that stopped to respond to any user
input. The detection starts in the Win32k kernel driver, which, after the 5-second timeout, sends a message to the DwmApiPort ALPC port created by the Desktop Windows Manager (DWM.exe). The DWM
processes the message using a complex algorithm that ends up creating a “ghost” window on top of the
hanging window. The ghost redraws the window’s original content, blurring it out and adding the (Not
Responding) string in the title. The ghost window processes GDI messages through an internal message
pump routine, which intercepts the close, exit, and activate messages by calling the ReportHang routine
exported by the Windows User Mode Crash Reporting DLL (faultrep.dll). The ReportHang function simply
builds a WERSVC_REPORT_HANG message and sends it to the WER service to wait for a reply.
The WER service processes the message and initializes the Hang reporting by reading settings values
from the HKLM\Software\Microsoft\Windows\Windows Error Reporting\Hangs root registry key. In particular, the MaxHangrepInstances value is used to indicate how many hanging reports can be generated
in the same time (the default number is eight if the value does not exist), while the TerminationTimeout
value specifies the time that needs to pass after WER has tried to terminate the hanging process before
considering the entire system to be in hanging situation (10 seconds by default). This situation can happen
for various reasons—for example, an application has an active pending IRP that is never completed by
a kernel driver. The WER service opens the hanging process and obtains its token, and some other basic
information. It then creates a shared memory section object to store them (similar to user application
crashes; in this case, the shared section has a name: Global\<Random GUID>).
A WerFault process is spawned in a suspended state using the faulting process’s token and the -h
command-line switch (which is used to specify to generate a report for a hanging process). Unlike
with user application crashes, a snapshot of the hanging process is taken from the WER service using
a full SYSTEM token by invoking the the PssNtCaptureSnapshot API exported in Ntdll. The snapshot’s
handle is duplicated in the suspended WerFault process, which is resumed after the snapshot has been
successfully acquired. When the WerFault starts, it signals an event indicating that the report generation has started. From this stage, the original process can be terminated. Information for the report is
grabbed from the cloned process.
The report for a hanging process is similar to the one acquired for a crashing process: The WerFault
process starts by querying the value of the Debugger registry value located in the global HKLM\
Software\Microsoft\Windows\Windows Error Reporting\Hangs root registry key. If there is a valid
debugger, it is launched and attached to the original hanging process. In case the Disable registry value
is set to 1, the procedure is aborted and the WerFault process exits without generating any report.
Otherwise, WerFault opens the shared memory section, validates it, and grabs all the information
previously saved by the WER service. The report is initialized by using the WerReportCreate function exported in WER.dll and used also for crashing processes. The dialog box for a hanging process
(shown in Figure 10-44) is always displayed independently on the WER configuration. Finally, the
WerReportSubmit function (exported in WER.dll) is used to generate all the files for the report (including the minidump file) similarly to user applications crashes (see the “Crash report generation” section
earlier in this chapter). The report is finally sent to the Online Crash Analysis server.
552
CHAPTER 10
Management, diagnostics, and tracing
FIGURE 10-44 The Windows Error Reporting dialog box for hanging applications.
After the report generation is started and the WERSVC_HANG_REPORTING_STARTED message
is returned to DWM, WER kills the hanging process using the TerminateProcess API. If the process
is not terminated in an expected time frame (generally 10 seconds, but customizable through the
TerminationTimeout setting as explained earlier), the WER service relaunches another WerFault instance
running under a full SYSTEM token and waits another longer timeout (usually 60 seconds but customizable through the LongTerminationTimeout setting). If the process is not terminated even by the end
of the longer timeout, WER has no other chances than to write an ETW event on the Application event
log, reporting the impossibility to terminate the process. The ETW event is shown in Figure 10-45.
Note that the event description is misleading because WER hasn’t been able to terminate the hanging
application.
FIGURE 10-45 ETW error event written to the Application log for a nonterminating hanging application.
CHAPTER 10
Management, diagnostics, and tracing
553
Global flags
Windows has a set of flags stored in two systemwide global variables named NtGlobalFlag and
NtGlobalFlag2 that enable various internal debugging, tracing, and validation support in the
operating system. The two system variables are initialized from the registry key HKLM\SYSTEM\
CurrentControlSet\Control\Session Manager in the values GlobalFlag and GlobalFlag2 at system boot
time (phase 0 of the NT kernel initialization). By default, both registry values are 0, so it’s likely that
on your systems, you’re not using any global flags. In addition, each image has a set of global flags
that also turn on internal tracing and validation code (although the bit layout of these flags is slightly
different from the systemwide global flags).
Fortunately, the debugging tools contain a utility named Gflags.exe that you can use to view and
change the system global flags (either in the registry or in the running system) as well as image global
flags. Gflags has both a command-line and a GUI interface. To see the command-line flags, type
gflags /?. If you run the utility without any switches, the dialog box shown in Figure 10-46 is displayed.
FIGURE 10-46 Setting system debugging options with GFlags.
554
CHAPTER 10
Management, diagnostics, and tracing
Flags belonging to the Windows Global flags variables can be split in different categories:
■
Kernel flags are processed directly by various components of the NT kernel (the heap manager,
exceptions, interrupts handlers, and so on).
■
User flags are processed by components running in user-mode applications (usually Ntdll).
■
Boot-only flags are processed only when the system is starting.
■
Per-image file global flags (which have a slightly different meaning than the others) are processed by the loader, WER, and some other user-mode components, depending on the usermode process context in which they are running.
The names of the group pages shown by the GFlags tool is a little misleading. Kernel, boot-only, and
user flags are mixed together in each page. The main difference is that the System Registry page allows
the user to set global flags on the GlobalFlag and GlobalFlag2 registry values, parsed at system boot time.
This implies that eventual new flags will be enabled only after the system is rebooted. The Kernel Flags
page, despite its name, does not allow kernel flags to be applied on the fly to a live system. Only certain
user-mode flags can be set or removed (the enable page heap flag is a good example) without requiring
a system reboot: the Gflags tool sets those flags using the NtSetSystemInformation native API (with the
SystemFlagsInformation information class). Only user-mode flags can be set in that way.
EXPERIMENT: Viewing and setting global flags
You can use the !gflag kernel debugger command to view and set the state of the NtGlobalFlag
kernel variable. The !gflag command lists all the flags that are enabled. You can use !gflag -? to
get the entire list of supported global flags. At the time of this writing, the !gflag extension has
not been updated to display the content of the NtGlobalFlag2 variable.
The Image File page requires you to fill in the file name of an executable image. Use this option
to change a set of global flags that apply to an individual image (rather than to the whole system).
The page is shown in Figure 10-47. Notice that the flags are different from the operating system ones
shown in Figure 10-46. Most of the flags and the setting available in the Image File and Silent Process
Exit pages are applied by storing new values in a subkey with the same name as the image file (that is,
notepad.exe for the case shown in Figure 10-47) under the HKLM\SOFTWARE\Microsoft\Windows NT\
CurrentVersion\Image File Execution Options registry key (also known as the IFEO key). In particular,
the GlobalFlag (and GlobalFlag2) value represents a bitmask of all the available per-image global flags.
CHAPTER 10
Management, diagnostics, and tracing
555
FIGURE 10-47 Setting per-image global flags with GFlags.
When the loader initializes a new process previously created and loads all the dependent libraries of the main base executable (see Chapter 3 of Part 1 for more details about the birth of a process),
the system processes the per-image global flags. The LdrpInitializeExecutionOptions internal function
opens the IFEO key based on the name of the base image and parses all the per-image settings and
flags. In particular, after the per-image global flags are retrieved from the registry, they are stored in
the NtGlobalFlag (and NtGlobalFlag2) field of the process PEB. In this way, they can be easily accessed
by any image mapped in the process (including Ntdll).
Most of the available global flags are documented at https://docs.microsoft.com/en-us/
windows-hardware/drivers/debugger/gflags-flag-table.
EXPERIMENT: Troubleshooting Windows loader issues
In the “Watching the image loader” experiment in Chapter 3 of Part 1, you used the GFlags tool
to display the Windows loader runtime information. That information can be useful for understanding why an application does not start at all (without returning any useful error information). You can retry the same experiment on mspaint.exe by renaming the Msftedit.dll file (the
Rich Text Edit Control library) located in %SystemRoot%\system32. Indeed, Paint depends on
that DLL indirectly. The Msftedit library is loaded dynamically by MSCTF.dll. (It is not statically
556
CHAPTER 10
Management, diagnostics, and tracing
linked in the Paint executable.) Open an administrative command prompt window and type the
following commands:
cd /d c:\windows\system32
takeown /f msftedit.dll
icacls msftedit.dll /grant Administrators:F
ren msftedit.dll msftedit.disabled
Then enable the loader snaps using the Gflags tool, as specified in the “Watching the image
loader” experiment. If you start mspaint.exe using Windbg, the loader snaps would be able to
highlight the problem almost immediately, returning the following text:
142c:1e18 @ 00056578 - LdrpInitializeNode - INFO: Calling init routine 00007FFC79258820 for
DLL "C:\Windows\System32\MSCTF.dll"142c:133c @ 00229625 - LdrpResolveDllName - ENTER: DLL
name: .\MSFTEDIT.DLL
142c:133c @ 00229625 - LdrpResolveDllName - RETURN: Status: 0xc0000135
142c:133c @ 00229625 - LdrpResolveDllName - ENTER: DLL name: C:\Program Files\Debugging Tools
for Windows (x64)\MSFTEDIT.DLL
142c:133c @ 00229625 - LdrpResolveDllName - RETURN: Status: 0xc0000135
142c:133c @ 00229625 - LdrpResolveDllName - ENTER: DLL name: C:\Windows\system32\MSFTEDIT.DLL
142c:133c @ 00229625 - LdrpResolveDllName - RETURN: Status: 0xc0000135
. . .
C:\Users\test\AppData\Local\Microsoft\WindowsApps\MSFTEDIT.DLL
142c:133c @ 00229625 - LdrpResolveDllName - RETURN: Status: 0xc0000135
142c:133c @ 00229625 - LdrpSearchPath - RETURN: Status: 0xc0000135
142c:133c @ 00229625 - LdrpProcessWork - ERROR: Unable to load DLL: "MSFTEDIT.DLL", Parent
Module: "(null)", Status: 0xc0000135
142c:133c @ 00229625 - LdrpLoadDllInternal - RETURN: Status: 0xc0000135
142c:133c @ 00229625 - LdrLoadDll - RETURN: Status: 0xc0000135
Kernel shims
New releases of the Windows operating system can sometime bring issues with old drivers, which
can have difficulties in operating in the new environment, producing system hangs or blue screens of
death. To overcome the problem, Windows 8.1 introduced a Kernel Shim engine that’s able to dynamically modify old drivers, which can continue to run in the new OS release. The Kernel Shim engine is
implemented mainly in the NT kernel. Driver’s shims are registered through the Windows Registry and
the Shim Database file. Drivers’ shims are provided by shim drivers. A shim driver uses the exported
KseRegisterShimEx API to register a shim that can be applied to target drivers that need it. The Kernel
Shim engine supports mainly two kinds of shims applied to devices or drivers.
Shim engine initialization
In early OS boot stages, the Windows Loader, while loading all the boot-loaded drivers, reads and
maps the driver compatibility database file, located in %SystemRoot%\apppatch\Drvmain.sdb (and, if
it exists, also in the Drvpatch.sdb file). In phase 1 of the NT kernel initialization, the I/O manager starts
the two phases of the Kernel Shim engine initialization. The NT kernel copies the binary content of
CHAPTER 10
Management, diagnostics, and tracing
557
the database file(s) in a global buffer allocated from the paged pool (pointed by the internal global
KsepShimDb variable). It then checks whether Kernel Shims are globally disabled. In case the system
has booted in Safe or WinPE mode, or in case Driver verifier is enabled, the shim engine wouldn’t
be enabled. The Kernel Shim engine is controllable also using system policies or through the HKLM\
System\CurrentControlSet\Control\Compatibility\DisableFlags registry value. The NT kernel then gathers low-level system information needed when applying device shims, like the BIOS information and
OEM ID, by checking the System Fixed ACPI Descriptor Table (FADT). The shim engine registers the first
built-in shim provider, named DriverScope, using the KseRegisterShimEx API. Built-in shims provided by
Windows are listed in Table 10-21. Some of them are indeed implemented in the NT kernel directly and
not in any external driver. DriverScope is the only shim registered in phase 0.
TABLE 10-21 Windows built-in kernel shims
558
Shim Name
GUID
Purpose
Module
DriverScope
{BC04AB45-EA7E-4A11-A7BB977615F4CAAE}
The driver scope shim is used to collect
health ETW events for a target driver. Its
hooks do nothing other than writing an
ETW event before or after calling the original nonshimmed callbacks.
NT kernel
Version Lie
{3E28B2D1-E633-408C-8E9B2AFA6F47FCC3} (7.1)
(47712F55-BD93-43FC-9248B9A83710066E} (8)
{21C4FB58-D477-4839-A7EAAD6918FBC518} (8.1)
The version lie shim is available for
Windows 7, 8, and 8.1. The shim communicates a previous version of the OS when
required by a driver in which it is applied.
NT kernel
SkipDriverUnload
{3E8C2CA6-34E2-4DE6-8A1E9692DD3E316B}
The shim replaces the driver’s unload
routine with one that doesn’t do anything
except logging an ETW event.
NT kernel
ZeroPool
{6B847429-C430-4682-B55FFD11A7B55465}
Replace the ExAllocatePool API with a
function that allocates the pool memory
and zeroes it out.
NT kernel
ClearPCIDBits
{B4678DFF-BD3E-46C9923B-B5733483B0B3}
Clear the PCID bits when some antivirus
drivers are mapping physical memory
referred by CR3.
NT kernel
Kaspersky
{B4678DFF-CC3E-46C9923B-B5733483B0B3}
Shim created for specific Kaspersky filter
drivers for masking the real value of the
UseVtHardware registry value, which could
have caused bug checks on old versions of
the antivirus.
NT kernel
Memcpy
{8A2517C1-35D6-4CA8-9EC8- Provides a safer (but slower) memory copy
98A12762891B}
implementation that always zeroes out the
destination buffer and can be used with
device memory.
NT kernel
KernelPadSectionsOverride
{4F55C0DB-73D3-43F2-97238A9C7F79D39D}
Prevents discardable sections of any
kernel module to be freed by the memory
manager and blocks the loading of the
target driver (where the shim is applied).
NT kernel
NDIS Shim
{49691313-1362-4e75-8c2a2dd72928eba5}
NDIS version compatibility shim (returns
6.40 where applied to a driver).
Ndis.sys
SrbShim
{434ABAFD-08FA-4c3dA88D-D09A88E2AB17}
SCSI Request Block compatibility shim that
intercepts the IOCTL_STORAGE_QUERY_
PROPERTY.
Storport.sys
CHAPTER 10
Management, diagnostics, and tracing
Shim Name
GUID
Purpose
Module
DeviceIdShim
{0332ec62-865a-4a39-b48fcda6e855f423}
Compatibility shim for RAID devices.
Storport.sys
ATADeviceIdShim
{26665d57-2158-4e4b-a959c917d03a0d7e}
Compatibility shim for serial ATA devices.
Storport.sys
Bluetooth Filter Power shim
{6AD90DAD-C144-4E9DA0CF-AE9FCB901EBD}
Compatibility shim for Bluetooth filter
drivers.
Bthport.sys
UsbShim
{fd8fd62e-4d94-4fc7-8a68bff7865a706b}
Compatibility shim for old Conexant USB
modem.
Usbd.sys
Nokia Usbser Filter Shim
{7DD60997-651F-4ECB-B893BEC8050F3BD7}
Compatibility shim for Nokia Usbser filter
drivers (used by Nokia PC Suite).
Usbd.sys
A shim is internally represented through the KSE_SHIM data structure (where KSE stands for Kernel
Shim Engine). The data structure includes the GUID, the human-readable name of the shim, and an
array of hook collection (KSE_HOOK_COLLECTION data structures). Driver shims support different
kinds of hooks: hooks on functions exported by the NT kernel, HAL, and by driver libraries, and on
driver’s object callback functions. In phase 1 of its initialization, the Shim Engine registers the MicrosoftWindows-Kernel-ShimEngine ETW provider (which has the {0bf2fb94-7b60-4b4d-9766-e82f658df540}
GUID), opens the driver shim database, and initializes the remaining built-in shims implemented in the
NT kernel (refer to Table 10-21).
To register a shim (through KseRegisterShimEx), the NT kernel performs some initial integrity checks
on both the KSE_SHIM data structure, and each hook in the collection (all the hooks must reside in the
address space of the calling driver). It then allocates and fills a KSE_REGISTERED_SHIM_ENTRY data
structure which, as the name implies, represents the registered shim. It contains a reference counter
and a pointer back to the driver object (used only in case the shim is not implemented in the NT kernel).
The allocated data structure is linked in a global linked list, which keeps track of all the registered shims
in the system.
The shim database
The shim database (SDB) file format was first introduced in the old Windows XP for Application
Compatibility. The initial goal of the file format was to store a binary XML-style database of programs
and drivers that needed some sort of help from the operating system to work correctly. The SDB file
has been adapted to include kernel-mode shims. The file format describes an XML database using tags.
A tag is a 2-byte basic data structure used as unique identifier for entries and attributes in the database. It is made of a 4-bit type, which identifies the format of the data associated with the tag, and a
12-bit index. Each tag indicates the data type, size, and interpretation that follows the tag itself. An SDB
file has a 12-byte header and a set of tags. The set of tags usually defines three main blocks in the shim
database file:
■
The INDEX block contains index tags that serve to fast-index elements in the database. Indexes
in the INDEX block are stored in increasing order. Therefore, searching an element in the indexes is a fast operation (using a binary search algorithm). For the Kernel Shim engine, the elements
are stored in the INDEXES block using an 8-byte key derived from the shim name.
CHAPTER 10
Management, diagnostics, and tracing
559
■
■
The DATABASE block contains top-level tags describing shims, drivers, devices, and executables.
Each top-level tag contains children tags describing properties or inner blocks belonging to the
root entity.
The STRING TABLE block contains strings that are referenced by lower-level tags in the
DATABASE block. Tags in the DATABASE block usually do not directly describe a string but
instead contain a reference to a tag (called STRINGREF) describing a string located in the string
table. This allows databases that contain a lot of common strings to be small in size.
Microsoft has partially documented the SDB file format and the APIs used to read and write it at
https://docs.microsoft.com/en-us/windows/win32/devnotes/application-compatibility-database. All the
SDB APIs are implemented in the Application Compatibility Client Library (apphelp.dll).
Driver shims
The NT memory manager decides whether to apply a shim to a kernel driver at its loading time, using
the KseDriverLoadImage function (boot-loaded drivers are processed by the I/O manager, as discussed
in Chapter 12). The routine is called at the correct time of a kernel-module life cycle, before either
Driver Verifier, Import Optimization, or Kernel Patch protection are applied to it. (This is important;
otherwise, the system would bugcheck.) A list of the current shimmed kernel modules is stored in a
global variable. The KsepGetShimsForDriver routine checks whether a module in the list with the same
base address as the one being loaded is currently present. If so, it means that the target module has
already been shimmed, so the procedure is aborted. Otherwise, to determine whether the new module
should be shimmed, the routine checks two different sources:
■
■
Queries the “Shims” multistring value from a registry key named as the module being loaded
and located in the HKLM\System\CurrentControlSet\Control\Compatibility\Driver root key. The
registry value contains an array of shims’ names that would be applied to the target module.
In case the registry value for a target module does not exist, parses the driver compatibility database file, looking for a KDRIVER tag (indexed by the INDEX block), which has the same name
as the module being loaded. If a driver is found in the SDB file, the NT kernel performs a comparison of the driver version (TAG_SOURCE_OS stored in the KDRIVER root tag), file name, and
path (if the relative tags exist in the SDB), and of the low-level system information gathered at
engine initialization time (to determine if the driver is compatible with the system). In case any
of the information does not match, the driver is skipped, and no shims are applied. Otherwise,
the shim names list is grabbed from the KSHIM_REF lower-level tags (which is part of the root
KDRIVER). The tags are reference to the KSHIMs located in the SDB database block.
If one of the two sources yields one or more shims names to be applied to the target driver, the SDB
file is parsed again with the goal to validate that a valid KSHIM descriptor exists. If there are no tags
related to the specified shim name (which means that no shim descriptor exists in the database), the
procedure is interrupted (this prevents an administrator from applying random non-Microsoft shims to
a driver). Otherwise, an array of KSE_SHIM_INFO data structure is returned to KsepGetShimsForDriver.
560
CHAPTER 10
Management, diagnostics, and tracing
The next step is to determine if the shims described by their descriptors have been registered in the
system. To do this, the Shim engine searches into the global linked list of registered shims (filled every
time a new shim is registered, as explained previously in the “Shim Engine initialization” section). If a
shim is not registered, the shim engine tries to load the driver that provides it (its name is stored in the
MODULE child tag of the root KSHIM entry) and tries again. When a shim is applied for the first time,
the Shim engine resolves the pointers of all the hooks described by the KSE_HOOK_COLLECTION data
structures’ array belonging to the registered shim (KSE_SHIM data structure). The shim engine allocates
and fills a KSE_SHIMMED_MODULE data structure representing the target module to be shimmed
(which includes the base address) and adds it to the global list checked in the beginning.
At this stage, the shim engine applies the shim to the target module using the internal
KsepApplyShimsToDriver routine. The latter cycles between each hook described by the KSE_HOOK_
COLLECTION array and patches the import address table (IAT) of the target module, replacing the
original address of the hooked functions with the new ones (described by the hook collection). Note
that the driver’s object callback functions (IRP handlers) are not processed at this stage. They are modified later by the I/O manager before the DriverInit routine of the target driver is called. The original
driver’s IRP callback routines are saved in the Driver Extension of the target driver. In that way, the
hooked functions have a simple way to call back into the original ones when needed.
EXPERIMENT: Witnessing kernel shims
While the official Microsoft Application Compatibility Toolkit distributed with the Windows
Assessment and Deployment Kit allows you to open, modify, and create shim database files, it
does not work with system database files (identified through to their internal GUIDs), so it won’t
be able to parse all the kernel shims that are described by the drvmain.sdb database. Multiple
third-party SDB parsers exist. One in particular, called SDB explorer, is freely downloadable from
https://ericzimmerman.github.io/.
https://ericzimmerman.github.io/
In this experiment, you get a peek at the drvmain system database file and apply a kernel shim
to a test driver, ShimDriver, which is available in this book’s downloadable resources. For this experiment, you need to enable test signing (the ShimDriver is signed with a test self-signed certificate):
1.
Open an administrative command prompt and type the following command:
bcdedit /set testsigning on
2.
Restart your computer, download SDB Explorer from its website, run it, and open the
drvmain.sdb database located in %SystemRoot%\apppatch.
3.
From the SDB Explorer main window, you can explore the entire database file, organized in three main blocks: Indexes, Databases, and String table. Expand the DATABASES
root block and scroll down until you can see the list of KSHIMs (they should be located
after the KDEVICEs). You should see a window similar to the following:
CHAPTER 10
Management, diagnostics, and tracing
561
4.
You will apply one of the Version lie shims to our test driver. First, you should copy the
ShimDriver to the %SystemRoot%\System32\Drivers. Then you should install it by typing the following command in the administrative command prompt (it is assumed that
your system is 64-bit):
sc create ShimDriver type= kernel start= demand error= normal binPath= c:\
Windows\System32\ShimDriver64.sys
5.
Before starting the test driver, you should download and run the DebugView tool,
available in the Sysinternals website (https://docs.microsoft.com/en-us/sysinternals/
downloads/debugview). This is necessary because ShimDriver prints some debug messages.
downloads/debugview
6.
Start the ShimDriver with the following command:
sc start shimdriver
7.
562
Check the output of the DebugView tool. You should see messages like the one shown
in the following figure. What you see depends on the Windows version in which you run
the driver. In the example, we run the driver on an insider release version of Windows
Server 2022:
CHAPTER 10
Management, diagnostics, and tracing
8.
Now you should stop the driver and enable one of the shims present in the SDB database. In this example, you will start with one of the version lie shims. Stop the target
driver and install the shim using the following commands (where ShimDriver64.sys is
the driver’s file name installed with the previous step):
sc stop shimdriver
reg add "HKLM\System\CurrentControlSet\Control\Compatibility\Driver\
ShimDriver64.sys" /v Shims /t REG_MULTI_SZ /d
KmWin81VersionLie /f /reg:64
9.
The last command adds the Windows 8.1 version lie shim, but you can freely choose
other versions.
10. Now, if you restart the driver, you will see different messages printed by the DebugView
tool, as shown in the following figure:
11. This is because the shim engine has correctly applied the hooks on the NT APIs used for
retrieving OS version information (the driver is able to detect the shim, too). You should
be able to repeat the experiment using other shims, like the SkipDriverUnload or the
KernelPadSectionsOverride, which will zero out the driver unload routine or prevent the
target driver from loading, as shown in the following figure:
CHAPTER 10
Management, diagnostics, and tracing
563
Device shims
Unlike Driver shims, shims applied to Device objects are loaded and applied on demand. The NT kernel
exports the KseQueryDeviceData function, which allows drivers to check whether a shim needs to be
applied to a device object. (Note also that the KseQueryDeviceFlags function is exported. The API is just
a subset of the first one, though.) Querying for device shims is also possible for user-mode applications
through the NtQuerySystemInformation API used with the SystemDeviceDataInformation information
class. Device shims are always stored in three different locations, consulted in the following order:
1.
In the HKLM\System\CurrentControlSet\Control\Compatibility\Device root registry key, using
a key named as the PNP hardware ID of the device, replacing the \ character with a ! (with the
goal to not confuse the registry). Values in the device key specify the device’s shimmed data
being queried (usually flags for a certain device class).
2.
In the kernel shim cache. The Kernel Shim engine implements a shim cache (exposed through
the KSE_CACHE data structure) with the goal of speeding up searches for device flags and data.
3.
In the Shim database file, using the KDEVICE root tag. The root tag, among many others (like
device description, manufacturer name, GUID and so on), includes the child NAME tag containing a string composed as follows: <DataName:HardwareID>. The KFLAG or KDATA children tags
include the value for the device’s shimmed data.
If the device shim is not present in the cache but just in the SDB file, it is always added. In that way,
future interrogation would be faster and will not require any access to the Shim database file.
Conclusion
In this chapter, we have described the most important features of the Windows operating system
that provide management facilities, like the Windows Registry, user-mode services, task scheduling,
UBPM, and Windows Management Instrumentation (WMI). Furthermore, we have discussed how Event
Tracing for Windows (ETW), DTrace, Windows Error Reporting (WER), and Global Flags (GFlags) provide
the services that allow users to better trace and diagnose issues arising from any component of the
OS or user-mode applications. The chapter concluded with a peek at the Kernel Shim engine, which
helps the system apply compatibility strategies and correctly execute old components that have been
designed for older versions of the operating system.
The next chapter delves into the different file systems available in Windows and with the global
caching available for speeding up file and data access.
564
CHAPTER 10
Management, diagnostics, and tracing
CHAPTER 11
Caching and file systems
T
he cache manager is a set of kernel-mode functions and system threads that cooperate with the
memory manager to provide data caching for all Windows file system drivers (both local and
network). In this chapter, we explain how the cache manager, including its key internal data structures
and functions, works; how it is sized at system initialization time; how it interacts with other elements
of the operating system; and how you can observe its activity through performance counters. We also
describe the five flags on the Windows CreateFile function that affect file caching and DAX volumes,
which are memory-mapped disks that bypass the cache manager for certain types of I/O.
The services exposed by the cache manager are used by all the Windows File System drivers, which
cooperate strictly with the former to be able to manage disk I/O as fast as possible. We describe the different file systems supported by Windows, in particular with a deep analysis of NTFS and ReFS (the two
most used file systems). We present their internal architecture and basic operations, including how they
interact with other system components, such as the memory manager and the cache manager.
The chapter concludes with an overview of Storage Spaces, the new storage solution designed to
replace dynamic disks. Spaces can create tiered and thinly provisioned virtual disks, providing features
that can be leveraged by the file system that resides at the top.
Terminology
To fully understand this chapter, you need to be familiar with some basic terminology:
■
■
■
■
Disks are physical storage devices such as a hard disk, CD-ROM, DVD, Blu-ray, solid-state disk
(SSD), Non-volatile Memory disk (NVMe), or flash drive.
Sectors are hardware-addressable blocks on a storage medium. Sector sizes are determined
by hardware. Most hard disk sectors are 4,096 or 512 bytes, DVD-ROM and Blu-ray sectors are
typically 2,048 bytes. Thus, if the sector size is 4,096 bytes and the operating system wants to
modify the 5120th byte on a disk, it must write a 4,096-byte block of data to the second sector
on the disk.
Partitions are collections of contiguous sectors on a disk. A partition table or other diskmanagement database stores a partition’s starting sector, size, and other characteristics and
is located on the same disk as the partition.
Volumes are objects that represent sectors that file system drivers always manage as a single
unit. Simple volumes represent sectors from a single partition, whereas multipartition volumes
565
represent sectors from multiple partitions. Multipartition volumes offer performance, reliability,
and sizing features that simple volumes do not.
■
■
File system formats define the way that file data is stored on storage media, and they affect a
file system’s features. For example, a format that doesn’t allow user permissions to be associated with files and directories can’t support security. A file system format also can impose limits
on the sizes of files and storage devices that the file system supports. Finally, some file system
formats efficiently implement support for either large or small files or for large or small disks.
NTFS, exFAT, and ReFS are examples of file system formats that offer different sets of features
and usage scenarios.
Clusters are the addressable blocks that many file system formats use. Cluster size is always a
multiple of the sector size, as shown in Figure 11-1, in which eight sectors make up each cluster,
which are represented by a yellow band. File system formats use clusters to manage disk space
more efficiently; a cluster size that is larger than the sector size divides a disk into more manageable blocks. The potential trade-off of a larger cluster size is wasted disk space, or internal
fragmentation, that results when file sizes aren’t exact multiples of the cluster size.
Sector
Cluster (8 sectors)
FIGURE 11-1 Sectors and clusters on a classical spinning disk.
■
Metadata is data stored on a volume in support of file system format management. It isn’t typically made accessible to applications. Metadata includes the data that defines the placement of
files and directories on a volume, for example.
Key features of the cache manager
The cache manager has several key features:
■
■
■
566
Supports all file system types (both local and network), thus removing the need for each file
system to implement its own cache management code.
Uses the memory manager to control which parts of which files are in physical memory (trading
off demands for physical memory between user processes and the operating system).
Caches data on a virtual block basis (offsets within a file)—in contrast to many caching systems,
which cache on a logical block basis (offsets within a disk volume)—allowing for intelligent
CHAPTER 11
Caching and file systems
read-ahead and high-speed access to the cache without involving file system drivers. (This
method of caching, called fast I/O, is described later in this chapter.)
■
■
■
Supports “hints” passed by applications at file open time (such as random versus sequential
access, temporary file creation, and so on).
Supports recoverable file systems (for example, those that use transaction logging) to recover
data after a system failure.
Supports solid state, NVMe, and direct access (DAX) disks.
Although we talk more throughout this chapter about how these features are used in the cache
manager, in this section we introduce you to the concepts behind these features.
Single, centralized system cache
Some operating systems rely on each individual file system to cache data, a practice that results either in
duplicated caching and memory management code in the operating system or in limitations on the kinds
of data that can be cached. In contrast, Windows offers a centralized caching facility that caches all externally stored data, whether on local hard disks, USB removable drives, network file servers, or DVD-ROMs.
Any data can be cached, whether it’s user data streams (the contents of a file and the ongoing read and
write activity to that file) or file system metadata (such as directory and file headers). As we discuss in this
chapter, the method Windows uses to access the cache depends on the type of data being cached.
The memory manager
One unusual aspect of the cache manager is that it never knows how much cached data is actually in
physical memory. This statement might sound strange because the purpose of a cache is to keep a subset of frequently accessed data in physical memory as a way to improve I/O performance. The reason
the cache manager doesn’t know how much data is in physical memory is that it accesses data by mapping views of files into system virtual address spaces, using standard section objects (or file mapping objects in Windows API terminology). (Section objects are a basic primitive of the memory manager and
are explained in detail in Chapter 5, “Memory Management” of Part 1). As addresses in these mapped
views are accessed, the memory manager pages-in blocks that aren’t in physical memory. And when
memory demands dictate, the memory manager unmaps these pages out of the cache and, if the data
has changed, pages the data back to the files.
By caching on the basis of a virtual address space using mapped files, the cache manager avoids generating read or write I/O request packets (IRPs) to access the data for files it’s caching. Instead, it simply
copies data to or from the virtual addresses where the portion of the cached file is mapped and relies on
the memory manager to fault in (or out) the data in to (or out of) memory as needed. This process allows
the memory manager to make global trade-offs on how much RAM to give to the system cache versus
how much to give to user processes. (The cache manager also initiates I/O, such as lazy writing, which we
describe later in this chapter; however, it calls the memory manager to write the pages.) Also, as we discuss in the next section, this design makes it possible for processes that open cached files to see the same
data as do other processes that are mapping the same files into their user address spaces.
CHAPTER 11
Caching and file systems
567
Cache coherency
One important function of a cache manager is to ensure that any process that accesses cached data will
get the most recent version of that data. A problem can arise when one process opens a file (and hence
the file is cached) while another process maps the file into its address space directly (using the Windows
MapViewOfFile function). This potential problem doesn’t occur under Windows because both the cache
manager and the user applications that map files into their address spaces use the same memory management file mapping services. Because the memory manager guarantees that it has only one representation of each unique mapped file (regardless of the number of section objects or mapped views), it maps
all views of a file (even if they overlap) to a single set of pages in physical memory, as shown in Figure 11-2.
(For more information on how the memory manager works with mapped files, see Chapter 5 of Part 1.)
4 GB
Process 1
virtual memory
System
cache
2 GB
View 2
System address
space
User address
space
Mapped file
Size
View 1
Control area
0
4 GB
File
Process 2
virtual memory
System
cache
2 GB
Physical
memory
0
View 2
System address
space
User address
space
0
FIGURE 11-2 Coherent caching scheme.
So, for example, if Process 1 has a view (View 1) of the file mapped into its user address space, and
Process 2 is accessing the same view via the system cache, Process 2 sees any changes that Process
1 makes as they’re made, not as they’re flushed. The memory manager won’t flush all user-mapped
568
CHAPTER 11
Caching and file systems
pages—only those that it knows have been written to (because they have the modified bit set).
Therefore, any process accessing a file under Windows always sees the most up-to-date version of that
file, even if some processes have the file open through the I/O system and others have the file mapped
into their address space using the Windows file mapping functions.
Note Cache coherency in this case refers to coherency between user-mapped data and
cached I/O and not between noncached and cached hardware access and I/Os, which are
almost guaranteed to be incoherent. Also, cache coherency is somewhat more difficult for
network redirectors than for local file systems because network redirectors must implement additional flushing and purge operations to ensure cache coherency when accessing
network data.
Virtual block caching
The Windows cache manager uses a method known as virtual block caching, in which the cache manager
keeps track of which parts of which files are in the cache. The cache manager is able to monitor these
file portions by mapping 256 KB views of files into system virtual address spaces, using special system
cache routines located in the memory manager. This approach has the following key benefits:
■
■
It opens up the possibility of doing intelligent read-ahead; because the cache tracks which parts
of which files are in the cache, it can predict where the caller might be going next.
It allows the I/O system to bypass going to the file system for requests for data that is already
in the cache (fast I/O). Because the cache manager knows which parts of which files are in the
cache, it can return the address of cached data to satisfy an I/O request without having to call
the file system.
Details of how intelligent read-ahead and fast I/O work are provided later in this chapter in the
“Fast I/O” and “Read-ahead and write-behind” sections.
Stream-based caching
The cache manager is also designed to do stream caching rather than file caching. A stream is a
sequence of bytes within a file. Some file systems, such as NTFS, allow a file to contain more than one
stream; the cache manager accommodates such file systems by caching each stream independently.
NTFS can exploit this feature by organizing its master file table (described later in this chapter in the
“Master file table” section) into streams and by caching these streams as well. In fact, although the
cache manager might be said to cache files, it actually caches streams (all files have at least one stream
of data) identified by both a file name and, if more than one stream exists in the file, a stream name.
Note Internally, the cache manager is not aware of file or stream names but uses pointers to
these structures.
CHAPTER 11
Caching and file systems
569
Recoverable file system support
Recoverable file systems such as NTFS are designed to reconstruct the disk volume structure after a
system failure. This capability means that I/O operations in progress at the time of a system failure must
be either entirely completed or entirely backed out from the disk when the system is restarted. Halfcompleted I/O operations can corrupt a disk volume and even render an entire volume inaccessible.
To avoid this problem, a recoverable file system maintains a log file in which it records every update
it intends to make to the file system structure (the file system’s metadata) before it writes the change
to the volume. If the system fails, interrupting volume modifications in progress, the recoverable file
system uses information stored in the log to reissue the volume updates.
To guarantee a successful volume recovery, every log file record documenting a volume update must
be completely written to disk before the update itself is applied to the volume. Because disk writes are
cached, the cache manager and the file system must coordinate metadata updates by ensuring that the
log file is flushed ahead of metadata updates. Overall, the following actions occur in sequence:
1.
The file system writes a log file record documenting the metadata update it intends to make.
2.
The file system calls the cache manager to flush the log file record to disk.
3.
The file system writes the volume update to the cache—that is, it modifies its cached metadata.
4.
The cache manager flushes the altered metadata to disk, updating the volume structure. (Actually, log file records are batched before being flushed to disk, as are volume
modifications.)
Note The term metadata applies only to changes in the file system structure: file and directory creation, renaming, and deletion.
When a file system writes data to the cache, it can supply a logical sequence number (LSN) that
identifies the record in its log file, which corresponds to the cache update. The cache manager keeps
track of these numbers, recording the lowest and highest LSNs (representing the oldest and newest
log file records) associated with each page in the cache. In addition, data streams that are protected by
transaction log records are marked as “no write” by NTFS so that the mapped page writer won’t inadvertently write out these pages before the corresponding log records are written. (When the mapped
page writer sees a page marked this way, it moves the page to a special list that the cache manager
then flushes at the appropriate time, such as when lazy writer activity takes place.)
When it prepares to flush a group of dirty pages to disk, the cache manager determines the highest
LSN associated with the pages to be flushed and reports that number to the file system. The file system
can then call the cache manager back, directing it to flush log file data up to the point represented by
the reported LSN. After the cache manager flushes the log file up to that LSN, it flushes the corresponding volume structure updates to disk, thus ensuring that it records what it’s going to do before actually
doing it. These interactions between the file system and the cache manager guarantee the recoverability of the disk volume after a system failure.
570
CHAPTER 11
Caching and file systems
NTFS MFT working set enhancements
As we have described in the previous paragraphs, the mechanism that the cache manager uses to
cache files is the same as general memory mapped I/O interfaces provided by the memory manager
to the operating system. For accessing or caching a file, the cache manager maps a view of the file in
the system virtual address space. The contents are then accessed simply by reading off the mapped
virtual address range. When the cached content of a file is no longer needed (for various reasons—see
the next paragraphs for details), the cache manager unmaps the view of the file. This strategy works
well for any kind of data files but has some problems with the metadata that the file system maintains
for correctly storing the files in the volume.
When a file handle is closed (or the owning process dies), the cache manager ensures that the cached
data is no longer in the working set. The NTFS file system accesses the Master File Table (MFT) as a big file,
which is cached like any other user files by the cache manager. The problem with the MFT is that, since
it is a system file, which is mapped and processed in the System process context, nobody will ever close
its handle (unless the volume is unmounted), so the system never unmaps any cached view of the MFT.
The process that initially caused a particular view of MFT to be mapped might have closed the handle or
exited, leaving potentially unwanted views of MFT still mapped into memory consuming valuable system
cache (these views will be unmapped only if the system runs into memory pressure).
Windows 8.1 resolved this problem by storing a reference counter to every MFT record in a dynamically allocated multilevel array, which is stored in the NTFS file system Volume Control Block (VCB)
structure. Every time a File Control Block (FCB) data structure is created (further details on the FCB
and VCB are available later in this chapter), the file system increases the counter of the relative MFT
index record. In the same way, when the FCB is destroyed (meaning that all the handles to the file or
directory that the MFT entry refers to are closed), NTFS dereferences the relative counter and calls the
CcUnmapFileOffsetFromSystemCache cache manager routine, which will unmap the part of the MFT
that is no longer needed.
Memory partitions support
Windows 10, with the goal to provide support for Hyper-V containers containers and game mode,
introduced the concept of partitions. Memory partitions have already been described in Chapter
5 of Part 1. As seen in that chapter, memory partitions are represented by a large data structure
(MI_PARTITION), which maintains memory-related management structures related to the partition,
such as page lists (standby, modified, zero, free, and so on), commit charge, working set, page trimmer, modified page writer, and zero-page thread. The cache manager needs to cooperate with the
memory manager in order to support partitions. During phase 1 of NT kernel initialization, the system
creates and initializes the cache manager partition (for further details about Windows kernel initialization, see Chapter 12, “Startup and shutdown”), which will be part of the System Executive partition (MemoryPartition0). The cache manager’s code has gone through a big refactoring to support
partitions; all the global cache manager data structures and variables have been moved in the cache
manager partition data structure (CC_PARTITION).
CHAPTER 11
Caching and file systems
571
The cache manager’s partition contains cache-related data, like the global shared cache maps list,
the worker threads list (read-ahead, write-behind, and extra write-behind; lazy writer and lazy writer
scan; async reads), lazy writer scan events, an array that holds the history of write-behind throughout,
the upper and lower limit for the dirty pages threshold, the number of dirty pages, and so on. When
the cache manager system partition is initialized, all the needed system threads are started in the
context of a System process which belongs to the partition. Each partition always has an associated
minimal System process, which is created at partition-creation time (by the NtCreatePartition API).
When the system creates a new partition through the NtCreatePartition API, it always creates and
initializes an empty MI_PARTITION object (the memory is moved from a parent partition to the child,
or hot-added later by using the NtManagePartition function). A cache manager partition object is
created only on-demand. If no files are created in the context of the new partition, there is no need to
create the cache manager partition object. When the file system creates or opens a file for caching access, the CcinitializeCacheMap(Ex) function checks which partition the file belongs to and whether the
partition has a valid link to a cache manager partition. In case there is no cache manager partition, the
system creates and initializes a new one through the CcCreatePartition routine. The new partition starts
separate cache manager-related threads (read-ahead, lazy writers, and so on) and calculates the new
values of the dirty page threshold based on the number of pages that belong to the specific partition.
The file object contains a link to the partition it belongs to through its control area, which is initially
allocated by the file system driver when creating and mapping the Stream Control Block (SCB). The
partition of the target file is stored into a file object extension (of type MemoryPartitionInformation)
and is checked by the memory manager when creating the section object for the SCB. In general, files
are shared entities, so there is no way for File System drivers to automatically associate a file to a different partition than the System Partition. An application can set a different partition for a file using the
NtSetInformationFileKernel API, through the new FileMemoryPartitionInformation class.
Cache virtual memory management
Because the Windows system cache manager caches data on a virtual basis, it uses up regions of system virtual address space (instead of physical memory) and manages them in structures called virtual
address control blocks, or VACBs. VACBs define these regions of address space into 256 KB slots called
views. When the cache manager initializes during the bootup process, it allocates an initial array of
VACBs to describe cached memory. As caching requirements grow and more memory is required, the
cache manager allocates more VACB arrays, as needed. It can also shrink virtual address space as other
demands put pressure on the system.
At a file’s first I/O (read or write) operation, the cache manager maps a 256 KB view of the 256 KBaligned region of the file that contains the requested data into a free slot in the system cache address
space. For example, if 10 bytes starting at an offset of 300,000 bytes were read into a file, the view that
would be mapped would begin at offset 262144 (the second 256 KB-aligned region of the file) and
extend for 256 KB.
572
CHAPTER 11
Caching and file systems
The cache manager maps views of files into slots in the cache’s address space on a round-robin
basis, mapping the first requested view into the first 256 KB slot, the second view into the second 256
KB slot, and so forth, as shown in Figure 11-3. In this example, File B was mapped first, File A second,
and File C third, so File B’s mapped chunk occupies the first slot in the cache. Notice that only the first
256 KB portion of File B has been mapped, which is due to the fact that only part of the file has been
accessed. Because File C is only 100 KB (and thus smaller than one of the views in the system cache), it
requires its own 256 KB slot in the cache.
System cache
View 0
View 1
View 2
View 3
View 4
View 5
View 6
View 7
View 8
File A (500 KB)
Section 0
Section 1
File B (750 KB)
Section 0
Section 1
Section 2
File C (100 KB)
Section 0
View n
FIGURE 11-3 Files of varying sizes mapped into the system cache.
The cache manager guarantees that a view is mapped as long as it’s active (although views can
remain mapped after they become inactive). A view is marked active, however, only during a read
or write operation to or from the file. Unless a process opens a file by specifying the FILE_FLAG_
RANDOM_ ACCESS flag in the call to CreateFile, the cache manager unmaps inactive views of a file as it
maps new views for the file if it detects that the file is being accessed sequentially. Pages for unmapped
views are sent to the standby or modified lists (depending on whether they have been changed), and
because the memory manager exports a special interface for the cache manager, the cache manager
can direct the pages to be placed at the end or front of these lists. Pages that correspond to views of
files opened with the FILE_FLAG_SEQUENTIAL_SCAN flag are moved to the front of the lists, whereas
all others are moved to the end. This scheme encourages the reuse of pages belonging to sequentially
read files and specifically prevents a large file copy operation from affecting more than a small part of
physical memory. The flag also affects unmapping. The cache manager will aggressively unmap views
when this flag is supplied.
If the cache manager needs to map a view of a file, and there are no more free slots in the cache, it will
unmap the least recently mapped inactive view and use that slot. If no views are available, an I/O error is
returned, indicating that insufficient system resources are available to perform the operation. Given that
views are marked active only during a read or write operation, however, this scenario is extremely unlikely
because thousands of files would have to be accessed simultaneously for this situation to occur.
CHAPTER 11
Caching and file systems
573
Cache size
In the following sections, we explain how Windows computes the size of the system cache, both virtually and physically. As with most calculations related to memory management, the size of the system
cache depends on a number of factors.
Cache virtual size
On a 32-bit Windows system, the virtual size of the system cache is limited solely by the amount of
kernel-mode virtual address space and the SystemCacheLimit registry key that can be optionally configured. (See Chapter 5 of Part 1 for more information on limiting the size of the kernel virtual address
space.) This means that the cache size is capped by the 2-GB system address space, but it is typically
significantly smaller because the system address space is shared with other resources, including system
paged table entries (PTEs), nonpaged and paged pool, and page tables. The maximum virtual cache
size is 64 TB on 64-bit Windows, and even in this case, the limit is still tied to the system address space
size: in future systems that will support the 56-bit addressing mode, the limit will be 32 PB (petabytes).
Cache working set size
As mentioned earlier, one of the key differences in the design of the cache manager in Windows from
that of other operating systems is the delegation of physical memory management to the global
memory manager. Because of this, the existing code that handles working set expansion and trimming,
as well as managing the modified and standby lists, is also used to control the size of the system cache,
dynamically balancing demands for physical memory between processes and the operating system.
The system cache doesn’t have its own working set but shares a single system set that includes
cache data, paged pool, pageable kernel code, and pageable driver code. As explained in the section
“System working sets” in Chapter 5 of Part 1, this single working set is called internally the system cache
working set even though the system cache is just one of the components that contribute to it. For the
purposes of this book, we refer to this working set simply as the system working set. Also explained in
Chapter 5 is the fact that if the LargeSystemCache registry value is 1, the memory manager favors the
system working set over that of processes running on the system.
Cache physical size
While the system working set includes the amount of physical memory that is mapped into views in the
cache’s virtual address space, it does not necessarily reflect the total amount of file data that is cached
in physical memory. There can be a discrepancy between the two values because additional file data
might be in the memory manager’s standby or modified page lists.
Recall from Chapter 5 that during the course of working set trimming or page replacement, the
memory manager can move dirty pages from a working set to either the standby list or the modified
page list, depending on whether the page contains data that needs to be written to the paging file or
another file before the page can be reused. If the memory manager didn’t implement these lists, any
time a process accessed data previously removed from its working set, the memory manager would
574
CHAPTER 11
Caching and file systems
have to hard-fault it in from disk. Instead, if the accessed data is present on either of these lists, the
memory manager simply soft-faults the page back into the process’s working set. Thus, the lists serve
as in-memory caches of data that are stored in the paging file, executable images, or data files. Thus,
the total amount of file data cached on a system includes not only the system working set but the combined sizes of the standby and modified page lists as well.
An example illustrates how the cache manager can cause much more file data than that containable
in the system working set to be cached in physical memory. Consider a system that acts as a dedicated
file server. A client application accesses file data from across the network, while a server, such as the
file server driver (%SystemRoot%\System32\Drivers\Srv2.sys, described later in this chapter), uses
cache manager interfaces to read and write file data on behalf of the client. If the client reads through
several thousand files of 1 MB each, the cache manager will have to start reusing views when it runs out
of mapping space (and can’t enlarge the VACB mapping area). For each file read thereafter, the cache
manager unmaps views and remaps them for new files. When the cache manager unmaps a view, the
memory manager doesn’t discard the file data in the cache’s working set that corresponds to the view;
it moves the data to the standby list. In the absence of any other demand for physical memory, the
standby list can consume almost all the physical memory that remains outside the system working set.
In other words, virtually all the server’s physical memory will be used to cache file data, as shown in
Figure 11-4.
8 GB physical memory
Other
System working set
assigned to
virtual cache
Standby list
960 MB
~7 GB
FIGURE 11-4 Example in which most of physical memory is being used by the file cache.
Because the total amount of file data cached includes the system working set, modified page list,
and standby list—the sizes of which are all controlled by the memory manager—it is in a sense the real
cache manager. The cache manager subsystem simply provides convenient interfaces for accessing
file data through the memory manager. It also plays an important role with its read-ahead and writebehind policies in influencing what data the memory manager keeps present in physical memory, as
well as with managing system virtual address views of the space.
To try to accurately reflect the total amount of file data that’s cached on a system, Task Manager
shows a value named “Cached” in its performance view that reflects the combined size of the system working set, standby list, and modified page list. Process Explorer, on the other hand, breaks up
these values into Cache WS (system cache working set), Standby, and Modified. Figure 11-5 shows the
system information view in Process Explorer and the Cache WS value in the Physical Memory area in
the lower left of the figure, as well as the size of the standby and modified lists in the Paging Lists area
near the middle of the figure. Note that the Cache value in Task Manager also includes the Paged WS,
CHAPTER 11
Caching and file systems
575
Kernel WS, and Driver WS values shown in Process Explorer. When these values were chosen, the vast
majority of System WS came from the Cache WS. This is no longer the case today, but the anachronism
remains in Task Manager.
FIGURE 11-5 Process Explorer’s System Information dialog box.
Cache data structures
The cache manager uses the following data structures to keep track of cached files:
■
■
■
Each 256 KB slot in the system cache is described by a VACB.
Each separately opened cached file has a private cache map, which contains information used
to control read-ahead (discussed later in the chapter in the “Intelligent read-ahead” section).
Each cached file has a single shared cache map structure, which points to slots in the system
cache that contain mapped views of the file.
These structures and their relationships are described in the next sections.
Systemwide cache data structures
As previously described, the cache manager keeps track of the state of the views in the system cache
by using an array of data structures called virtual address control block (VACB) arrays that are stored in
nonpaged pool. On a 32-bit system, each VACB is 32 bytes in size and a VACB array is 128 KB, resulting
576
CHAPTER 11
Caching and file systems
in 4,096 VACBs per array. On a 64-bit system, a VACB is 40 bytes, resulting in 3,276 VACBs per array. The
cache manager allocates the initial VACB array during system initialization and links it into the systemwide list of VACB arrays called CcVacbArrays. Each VACB represents one 256 KB view in the system
cache, as shown in Figure 11-6. The structure of a VACB is shown in Figure 11-7.
VACB array list
System cache
VACB 0 entry
VACB 1 entry
VACB 2 entry
VACB 3 entry
VACB 4 entry
VACB 5 entry
VACB 6 entry
VACB 7 entry
...
...
...
...
...
...
VACB n entry
View 0
View 1
View 2
View 3
View 4
View 5
View 6
View 7
...
...
...
...
...
...
View n
VACB array list
System cache
VACB 0 entry
VACB 1 entry
VACB 2 entry
VACB 3 entry
VACB 4 entry
VACB 5 entry
VACB 6 entry
VACB 7 entry
...
...
...
...
...
...
VACB n entry
View 0
View 1
View 2
View 3
View 4
View 5
View 6
View 7
...
...
...
...
...
...
View n
System VACB array list
VACB 0 array
VACB 1 array
FIGURE 11-6 System VACB array.
Virtual address of data in system cache
Pointer to shared cache map
File offset
Active count
Link entry to LRU list head
Pointer to owning VACB array
FIGURE 11-7 VACB data structure.
CHAPTER 11
Caching and file systems
577
Additionally, each VACB array is composed of two kinds of VACB: low priority mapping VACBs and high
priority mapping VACBs. The system allocates 64 initial high priority VACBs for each VACB array. High
priority VACBs have the distinction of having their views preallocated from system address space. When
the memory manager has no views to give to the cache manager at the time of mapping some data, and
if the mapping request is marked as high priority, the cache manager will use one of the preallocated
views present in a high priority VACB. It uses these high priority VACBs, for example, for critical file system
metadata as well as for purging data from the cache. After high priority VACBs are gone, however, any
operation requiring a VACB view will fail with insufficient resources. Typically, the mapping priority is set
to the default of low, but by using the PIN_HIGH_PRIORITY flag when pinning (described later) cached
data, file systems can request a high priority VACB to be used instead, if one is needed.
As you can see in Figure 11-7, the first field in a VACB is the virtual address of the data in the system
cache. The second field is a pointer to the shared cache map structure, which identifies which file is
cached. The third field identifies the offset within the file at which the view begins (always based on
256 KB granularity). Given this granularity, the bottom 16 bits of the file offset will always be zero, so
those bits are reused to store the number of references to the view—that is, how many active reads
or writes are accessing the view. The fourth field links the VACB into a list of least-recently-used (LRU)
VACBs when the cache manager frees the VACB; the cache manager first checks this list when allocating a new VACB. Finally, the fifth field links this VACB to the VACB array header representing the array
in which the VACB is stored.
During an I/O operation on a file, the file’s VACB reference count is incremented, and then it’s
decremented when the I/O operation is over. When the reference count is nonzero, the VACB is active.
For access to file system metadata, the active count represents how many file system drivers have the
pages in that view locked into memory.
EXPERIMENT: Looking at VACBs and VACB statistics
The cache manager internally keeps track of various values that are useful to developers and
support engineers when debugging crash dumps. All these debugging variables start with the
CcDbg prefix, which makes it easy to see the whole list, thanks to the x command:
1: kd> x nt!*ccdbg*
fffff800`d052741c nt!CcDbgNumberOfFailedWorkQueueEntryAllocations = <no type information>
fffff800`d05276ec nt!CcDbgNumberOfNoopedReadAheads = <no type information>
fffff800`d05276e8 nt!CcDbgLsnLargerThanHint = <no type information>
fffff800`d05276e4 nt!CcDbgAdditionalPagesQueuedCount = <no type information>
fffff800`d0543370 nt!CcDbgFoundAsyncReadThreadListEmpty = <no type information>
fffff800`d054336c nt!CcDbgNumberOfCcUnmapInactiveViews = <no type information>
fffff800`d05276e0 nt!CcDbgSkippedReductions = <no type information>
fffff800`d0542e04 nt!CcDbgDisableDAX = <no type information>
...
Some systems may show differences in variable names due to 32-bit versus 64-bit implementations. The exact variable names are irrelevant in this experiment—focus instead on the
methodology that is explained. Using these variables and your knowledge of the VACB array
header data structures, you can use the kernel debugger to list all the VACB array headers.
578
CHAPTER 11
Caching and file systems
The CcVacbArrays variable is an array of pointers to VACB array headers, which you dereference
to dump the contents of the _VACB_ARRAY_HEADERs. First, obtain the highest array index:
1: kd> dd nt!CcVacbArraysHighestUsedIndex
fffff800`d0529c1c 00000000
l1
And now you can dereference each index until the maximum index. On this system (and this is
the norm), the highest index is 0, which means there’s only one header to dereference:
1: kd> ?? (*((nt!_VACB_ARRAY_HEADER***)@@(nt!CcVacbArrays)))[0]
struct _VACB_ARRAY_HEADER * 0xffffc40d`221cb000
+0x000 VacbArrayIndex
: 0
+0x004 MappingCount
: 0x302
+0x008 HighestMappedIndex : 0x301
+0x00c Reserved
: 0
If there were more, you could change the array index at the end of the command with a
higher number, until you reach the highest used index. The output shows that the system has
only one VACB array with 770 (0x302) active VACBs.
Finally, the CcNumberOfFreeVacbs variable stores the number of VACBs on the free VACB list.
Dumping this variable on the system used for the experiment results in 2,506 (0x9ca):
1: kd> dd nt!CcNumberOfFreeVacbs
fffff800`d0527318 000009ca
l1
As expected, the sum of the free (0x9ca—2,506 decimal) and active VACBs (0x302—770
decimal) on a 64-bit system with one VACB array equals 3,276, the number of VACBs in one VACB
array. If the system were to run out of free VACBs, the cache manager would try to allocate a new
VACB array. Because of the volatile nature of this experiment, your system may create and/or
free additional VACBs between the two steps (dumping the active and then the free VACBs). This
might cause your total of free and active VACBs to not match exactly 3,276. Try quickly repeating
the experiment a couple of times if this happens, although you may never get stable numbers,
especially if there is lots of file system activity on the system.
Per-file cache data structures
Each open handle to a file has a corresponding file object. (File objects are explained in detail in
Chapter 6 of Part 1, “I/O system.”) If the file is cached, the file object points to a private cache map structure that contains the location of the last two reads so that the cache manager can perform intelligent
read-ahead (described later, in the section “Intelligent read-ahead”). In addition, all the private cache
maps for open instances of a file are linked together.
Each cached file (as opposed to file object) has a shared cache map structure that describes the state
of the cached file, including the partition to which it belongs, its size, and its valid data length. (The
function of the valid data length field is explained in the section “Write-back caching and lazy writing.”)
The shared cache map also points to the section object (maintained by the memory manager and which
describes the file’s mapping into virtual memory), the list of private cache maps associated with that
CHAPTER 11
Caching and file systems
579
file, and any VACBs that describe currently mapped views of the file in the system cache. (See Chapter
5 of Part 1 for more about section object pointers.) All the opened shared cache maps for different files
are linked in a global linked list maintained in the cache manager’s partition data structure. The relationships among these per-file cache data structures are illustrated in Figure 11-8.
File object
Private cache map
Read-ahead information
Next private
cache map
for this file
Section object pointers
Shared cache map
List of private
cache maps
Open count
File size
Valid data length
Entry 0
Entry 1
Entry 2
Entry 3
Pointer to
additional VACB
index array
File object
Next shared
cache map
VACB
VACB index array
VACB index
array
FIGURE 11-8 Per-file cache data structures.
When asked to read from a particular file, the cache manager must determine the answers to
two questions:
1.
Is the file in the cache?
2.
If so, which VACB, if any, refers to the requested location?
In other words, the cache manager must find out whether a view of the file at the desired address is
mapped into the system cache. If no VACB contains the desired file offset, the requested data isn’t currently mapped into the system cache.
To keep track of which views for a given file are mapped into the system cache, the cache manager
maintains an array of pointers to VACBs, which is known as the VACB index array. The first entry in the
VACB index array refers to the first 256 KB of the file, the second entry to the second 256 KB, and so
on. The diagram in Figure 11-9 shows four different sections from three different files that are currently
mapped into the system cache.
580
CHAPTER 11
Caching and file systems
When a process accesses a particular file in a given location, the cache manager looks in the appropriate entry in the file’s VACB index array to see whether the requested data has been mapped into the
cache. If the array entry is nonzero (and hence contains a pointer to a VACB), the area of the file being
referenced is in the cache. The VACB, in turn, points to the location in the system cache where the view
of the file is mapped. If the entry is zero, the cache manager must find a free slot in the system cache
(and therefore a free VACB) to map the required view.
As a size optimization, the shared cache map contains a VACB index array that is four entries in size.
Because each VACB describes 256 KB, the entries in this small, fixed-size index array can point to VACB
array entries that together describe a file of up to 1 MB. If a file is larger than 1 MB, a separate VACB index
array is allocated from nonpaged pool, based on the size of the file divided by 256 KB and rounded up
in the case of a remainder. The shared cache map then points to this separate structure.
File A VACB
Index array
File A (500 KB)
Section 0
Section 1
File B (750 KB)
Section 0
Section 1
Section 2
File C (100 KB)
Section 0
Entry 0
Entry 1
Entry 2
Entry 3
File B VACB
Index array
Entry 0
Entry 1
Entry 2
Entry 3
System cache
System VACB array
VACB 0
VACB 1
VACB 2
VACB 3
VACB 4
VACB 5
VACB 6
VACB 7
View 0
View 1
View 2
View 3
View 4
View 5
View 6
View 7
View 8
File C VACB
Index array
Entry 0
Entry 1
Entry 2
Entry 3
VACB n
View n
FIGURE 11-9 VACB index arrays.
As a further optimization, the VACB index array allocated from nonpaged pool becomes a sparse
multilevel index array if the file is larger than 32 MB, where each index array consists of 128 entries. You
can calculate the number of levels required for a file with the following formula:
(Number of bits required to represent file size – 18) / 7
Round up the result of the equation to the next whole number. The value 18 in the equation comes
from the fact that a VACB represents 256 KB, and 256 KB is 2^18. The value 7 comes from the fact that
each level in the array has 128 entries and 2^7 is 128. Thus, a file that has a size that is the maximum that
can be described with 63 bits (the largest size the cache manager supports) would require only seven
levels. The array is sparse because the only branches that the cache manager allocates are ones for
which there are active views at the lowest-level index array. Figure 11-10 shows an example of a multilevel VACB array for a sparse file that is large enough to require three levels.
CHAPTER 11
Caching and file systems
581
0
VACB
0
Shared
cache map
0
Pointer to
additional VACB
index array
127
127
127
0
0
VACB
127
127
0
VACB
127
FIGURE 11-10 Multilevel VACB arrays.
This scheme is required to efficiently handle sparse files that might have extremely large file sizes
with only a small fraction of valid data because only enough of the array is allocated to handle the
currently mapped views of a file. For example, a 32-GB sparse file for which only 256 KB is mapped into
the cache’s virtual address space would require a VACB array with three allocated index arrays because
only one branch of the array has a mapping and a 32-GB file requires a three-level array. If the cache
manager didn’t use the multilevel VACB index array optimization for this file, it would have to allocate
a VACB index array with 128,000 entries, or the equivalent of 1,000 VACB index arrays.
File system interfaces
The first time a file’s data is accessed for a cached read or write operation, the file system driver is
responsible for determining whether some part of the file is mapped in the system cache. If it’s not,
the file system driver must call the CcInitializeCacheMap function to set up the per-file data structures
described in the preceding section.
582
CHAPTER 11
Caching and file systems
Once a file is set up for cached access, the file system driver calls one of several functions to access
the data in the file. There are three primary methods for accessing cached data, each intended for a
specific situation:
■
■
■
The copy method copies user data between cache buffers in system space and a process buffer
in user space.
The mapping and pinning method uses virtual addresses to read and write data directly from
and to cache buffers.
The physical memory access method uses physical addresses to read and write data directly
from and to cache buffers.
File system drivers must provide two versions of the file read operation—cached and noncached—
to prevent an infinite loop when the memory manager processes a page fault. When the memory
manager resolves a page fault by calling the file system to retrieve data from the file (via the device
driver, of course), it must specify this as a paging read operation by setting the “no cache” and “paging
IO” flags in the IRP.
Figure 11-11 illustrates the typical interactions between the cache manager, the memory manager, and file system drivers in response to user read or write file I/O. The cache manager is invoked
by a file system through the copy interfaces (the CcCopyRead and CcCopyWrite paths). To process a
CcFastCopyRead or CcCopyRead read, for example, the cache manager creates a view in the cache to
map a portion of the file being read and reads the file data into the user buffer by copying from the
view. The copy operation generates page faults as it accesses each previously invalid page in the view,
and in response the memory manager initiates noncached I/O into the file system driver to retrieve the
data corresponding to the part of the file mapped to the page that faulted.
IRP
FastloRead, FastloWrite
File system
driver
loPageRead
loAsynchronousPageWrite
Page fault
handler
Virtual
memory
manager
Modified and
mapped page
writer
Noncached
and paging I/O
Storage
device
driver
Page fault
NtCreateSection
NtReadFile/NtWriteFile
MmCreateSection
MmFlushSection
CcCopyRead
CcCopyWrite
CcFastCopyRead
CcFastCopyWrite
Lazy writer
Cache
manager Read-ahead
Page fault
FIGURE 11-11 File system interaction with cache and memory managers.
The next three sections explain these cache access mechanisms, their purpose, and how they’re used.
CHAPTER 11
Caching and file systems
583
Copying to and from the cache
Because the system cache is in system space, it’s mapped into the address space of every process. As
with all system space pages, however, cache pages aren’t accessible from user mode because that
would be a potential security hole. (For example, a process might not have the rights to read a file
whose data is currently contained in some part of the system cache.) Thus, user application file reads
and writes to cached files must be serviced by kernel-mode routines that copy data between the
cache’s buffers in system space and the application’s buffers residing in the process address space.
Caching with the mapping and pinning interfaces
Just as user applications read and write data in files on a disk, file system drivers need to read and write
the data that describes the files themselves (the metadata, or volume structure data). Because the file
system drivers run in kernel mode, however, they could, if the cache manager were properly informed,
modify data directly in the system cache. To permit this optimization, the cache manager provides
functions that permit the file system drivers to find where in virtual memory the file system metadata
resides, thus allowing direct modification without the use of intermediary buffers.
If a file system driver needs to read file system metadata in the cache, it calls the cache manager’s
mapping interface to obtain the virtual address of the desired data. The cache manager touches all the
requested pages to bring them into memory and then returns control to the file system driver. The file
system driver can then access the data directly.
If the file system driver needs to modify cache pages, it calls the cache manager’s pinning services,
which keep the pages active in virtual memory so that they can’t be reclaimed. The pages aren’t actually locked into memory (such as when a device driver locks pages for direct memory access transfers).
Most of the time, a file system driver will mark its metadata stream as no write, which instructs the
memory manager’s mapped page writer (explained in Chapter 5 of Part 1) to not write the pages to
disk until explicitly told to do so. When the file system driver unpins (releases) them, the cache manager
releases its resources so that it can lazily flush any changes to disk and release the cache view that the
metadata occupied.
The mapping and pinning interfaces solve one thorny problem of implementing a file system: buffer
management. Without directly manipulating cached metadata, a file system must predict the maximum number of buffers it will need when updating a volume’s structure. By allowing the file system to
access and update its metadata directly in the cache, the cache manager eliminates the need for buffers, simply updating the volume structure in the virtual memory the memory manager provides. The
only limitation the file system encounters is the amount of available memory.
Caching with the direct memory access interfaces
In addition to the mapping and pinning interfaces used to access metadata directly in the cache, the
cache manager provides a third interface to cached data: direct memory access (DMA). The DMA
functions are used to read from or write to cache pages without intervening buffers, such as when a
network file system is doing a transfer over the network.
584
CHAPTER 11
Caching and file systems
The DMA interface returns to the file system the physical addresses of cached user data (rather than
the virtual addresses, which the mapping and pinning interfaces return), which can then be used to
transfer data directly from physical memory to a network device. Although small amounts of data (1 KB
to 2 KB) can use the usual buffer-based copying interfaces, for larger transfers the DMA interface can
result in significant performance improvements for a network server processing file requests from remote systems. To describe these references to physical memory, a memory descriptor list (MDL) is used.
(MDLs are introduced in Chapter 5 of Part 1.)
Fast I/O
Whenever possible, reads and writes to cached files are handled by a high-speed mechanism named
fast I/O. Fast I/O is a means of reading or writing a cached file without going through the work of
generating an IRP. With fast I/O, the I/O manager calls the file system driver’s fast I/O routine to see
whether I/O can be satisfied directly from the cache manager without generating an IRP.
Because the cache manager is architected on top of the virtual memory subsystem, file system drivers can use the cache manager to access file data simply by copying to or from pages mapped to the
actual file being referenced without going through the overhead of generating an IRP.
Fast I/O doesn’t always occur. For example, the first read or write to a file requires setting up the
file for caching (mapping the file into the cache and setting up the cache data structures, as explained
earlier in the section “Cache data structures”). Also, if the caller specified an asynchronous read or write,
fast I/O isn’t used because the caller might be stalled during paging I/O operations required to satisfy
the buffer copy to or from the system cache and thus not really providing the requested asynchronous
I/O operation. But even on a synchronous I/O operation, the file system driver might decide that it can’t
process the I/O operation by using the fast I/O mechanism—say, for example, if the file in question has
a locked range of bytes (as a result of calls to the Windows LockFile and UnlockFile functions). Because
the cache manager doesn’t know what parts of which files are locked, the file system driver must check
the validity of the read or write, which requires generating an IRP. The decision tree for fast I/O is
shown in Figure 11-12.
These steps are involved in servicing a read or a write with fast I/O:
1.
A thread performs a read or write operation.
2.
If the file is cached and the I/O is synchronous, the request passes to the fast I/O entry point of
the file system driver stack. If the file isn’t cached, the file system driver sets up the file for caching so that the next time, fast I/O can be used to satisfy a read or write request.
3.
If the file system driver’s fast I/O routine determines that fast I/O is possible, it calls the cache
manager’s read or write routine to access the file data directly in the cache. (If fast I/O isn’t possible, the file system driver returns to the I/O system, which then generates an IRP for the I/O
and eventually calls the file system’s regular read routine.)
4.
The cache manager translates the supplied file offset into a virtual address in the cache.
CHAPTER 11
Caching and file systems
585
5.
For reads, the cache manager copies the data from the cache into the buffer of the process
requesting it; for writes, it copies the data from the buffer to the cache.
6.
One of the following actions occurs:
•
For reads where FILE_FLAG_RANDOM_ACCESS wasn’t specified when the file was opened,
the read-ahead information in the caller’s private cache map is updated. Read-ahead may
also be queued for files for which the FO_RANDOM_ACCESS flag is not specified.
•
For writes, the dirty bit of any modified page in the cache is set so that the lazy writer will
know to flush it to disk.
•
For write-through files, any modifications are flushed to disk.
NtReadFile
File system driver
Synchronize
and cached
data?
Cache manager
Yes
No
Is Synchronous?
No
No
Fast I/O
possible?
Yes
Cache manager
copies data to or
from process buffer
Yes
Is file cached?
Generate IRP
Yes
No
Return pending
No
Is Synchronous?
Yes
Cache manager
initializes cache
Cache complete
FIGURE 11-12 Fast I/O decision tree.
Read-ahead and write-behind
In this section, you’ll see how the cache manager implements reading and writing file data on behalf of
file system drivers. Keep in mind that the cache manager is involved in file I/O only when a file is opened
without the FILE_FLAG_NO_BUFFERING flag and then read from or written to using the Windows I/O
586
CHAPTER 11
Caching and file systems
functions (for example, using the Windows ReadFile and WriteFile functions). Mapped files don’t go
through the cache manager, nor do files opened with the FILE_FLAG_NO_BUFFERING flag set.
Note When an application uses the FILE_FLAG_NO_BUFFERING flag to open a file, its file I/O
must start at device-aligned offsets and be of sizes that are a multiple of the alignment size;
its input and output buffers must also be device-aligned virtual addresses. For file systems,
this usually corresponds to the sector size (4,096 bytes on NTFS, typically, and 2,048 bytes on
CDFS). One of the benefits of the cache manager, apart from the actual caching performance,
is the fact that it performs intermediate buffering to allow arbitrarily aligned and sized I/O.
Intelligent read-ahead
The cache manager uses the principle of spatial locality to perform intelligent read-ahead by predicting
what data the calling process is likely to read next based on the data that it’s reading currently. Because
the system cache is based on virtual addresses, which are contiguous for a particular file, it doesn’t
matter whether they’re juxtaposed in physical memory. File read-ahead for logical block caching is
more complex and requires tight cooperation between file system drivers and the block cache because
that cache system is based on the relative positions of the accessed data on the disk, and, of course,
files aren’t necessarily stored contiguously on disk. You can examine read-ahead activity by using the
Cache: Read Aheads/sec performance counter or the CcReadAheadIos system variable.
Reading the next block of a file that is being accessed sequentially provides an obvious performance
improvement, with the disadvantage that it will cause head seeks. To extend read-ahead benefits to
cases of stridden data accesses (both forward and backward through a file), the cache manager maintains a history of the last two read requests in the private cache map for the file handle being accessed,
a method known as asynchronous read-ahead with history. If a pattern can be determined from the
caller’s apparently random reads, the cache manager extrapolates it. For example, if the caller reads
page 4,000 and then page 3,000, the cache manager assumes that the next page the caller will require
is page 2,000 and prereads it.
Note Although a caller must issue a minimum of three read operations to establish a predictable sequence, only two are stored in the private cache map.
To make read-ahead even more efficient, the Win32 CreateFile function provides a flag indicating
forward sequential file access: FILE_FLAG_SEQUENTIAL_SCAN. If this flag is set, the cache manager
doesn’t keep a read history for the caller for prediction but instead performs sequential read-ahead.
However, as the file is read into the cache’s working set, the cache manager unmaps views of the file
that are no longer active and, if they are unmodified, directs the memory manager to place the pages
belonging to the unmapped views at the front of the standby list so that they will be quickly reused. It
also reads ahead two times as much data (2 MB instead of 1 MB, for example). As the caller continues
reading, the cache manager prereads additional blocks of data, always staying about one read (of the
size of the current read) ahead of the caller.
CHAPTER 11
Caching and file systems
587
The cache manager’s read-ahead is asynchronous because it’s performed in a thread separate
from the caller’s thread and proceeds concurrently with the caller’s execution. When called to retrieve cached data, the cache manager first accesses the requested virtual page to satisfy the request
and then queues an additional I/O request to retrieve additional data to a system worker thread. The
worker thread then executes in the background, reading additional data in anticipation of the caller’s
next read request. The preread pages are faulted into memory while the program continues executing
so that when the caller requests the data it’s already in memory.
For applications that have no predictable read pattern, the FILE_FLAG_RANDOM_ACCESS flag can
be specified when the CreateFile function is called. This flag instructs the cache manager not to attempt
to predict where the application is reading next and thus disables read-ahead. The flag also stops the
cache manager from aggressively unmapping views of the file as the file is accessed so as to minimize
the mapping/unmapping activity for the file when the application revisits portions of the file.
Read-ahead enhancements
Windows 8.1 introduced some enhancements to the cache manager read-ahead functionality. File system
drivers and network redirectors can decide the size and growth for the intelligent read-ahead with the
CcSetReadAheadGranularityEx API function. The cache manager client can decide the following:
■
Read-ahead granularity Sets the minimum read-ahead unit size and the end file-offset of
the next read-ahead. The cache manager sets the default granularity to 4 Kbytes (the size of a
memory page), but every file system sets this value in a different way (NTFS, for example, sets
the cache granularity to 64 Kbytes).
Figure 11-13 shows an example of read-ahead on a 200 Kbyte-sized file, where the cache granularity has been set to 64 KB. If the user requests a nonaligned 1 KB read at offset 0x10800, and
if a sequential read has already been detected, the intelligent read-ahead will emit an I/O that
encompasses the 64 KB of data from offset 0x10000 to 0x20000. If there were already more
than two sequential reads, the cache manager emits another supplementary read from offset
0x20000 to offset 0x30000 (192 Kbytes).
FIGURE 11-13 Read-ahead on a 200 KB file, with granularity set to 64KB.
■
588
Pipeline size For some remote file system drivers, it may make sense to split large read-ahead I/
Os into smaller chunks, which will be emitted in parallel by the cache manager worker threads. A
network file system can achieve a substantial better throughput using this technique.
CHAPTER 11
Caching and file systems
■
Read-ahead aggressiveness File system drivers can specify the percentage used by the
cache manager to decide how to increase the read-ahead size after the detection of a third sequential read. For example, let’s assume that an application is reading a big file using a 1 Mbyte
I/O size. After the tenth read, the application has already read 10 Mbytes (the cache manager
may have already prefetched some of them). The intelligent read-ahead now decides by how
much to grow the read-ahead I/O size. If the file system has specified 60% of growth, the formula used is the following:
(Number of sequential reads * Size of last read) * (Growth percentage / 100)
So, this means that the next read-ahead size is 6 MB (instead of being 2 MB, assuming that the
granularity is 64 KB and the I/O size is 1 MB). The default growth percentage is 50% if not modified by any cache manager client.
Write-back caching and lazy writing
The cache manager implements a write-back cache with lazy write. This means that data written to
files is first stored in memory in cache pages and then written to disk later. Thus, write operations are
allowed to accumulate for a short time and are then flushed to disk all at once, reducing the overall
number of disk I/O operations.
The cache manager must explicitly call the memory manager to flush cache pages because otherwise the memory manager writes memory contents to disk only when demand for physical memory
exceeds supply, as is appropriate for volatile data. Cached file data, however, represents nonvolatile
disk data. If a process modifies cached data, the user expects the contents to be reflected on disk in a
timely manner.
Additionally, the cache manager has the ability to veto the memory manager’s mapped writer
thread. Since the modified list (see Chapter 5 of Part 1 for more information) is not sorted in logical
block address (LBA) order, the cache manager’s attempts to cluster pages for larger sequential I/Os to
the disk are not always successful and actually cause repeated seeks. To combat this effect, the cache
manager has the ability to aggressively veto the mapped writer thread and stream out writes in virtual
byte offset (VBO) order, which is much closer to the LBA order on disk. Since the cache manager now
owns these writes, it can also apply its own scheduling and throttling algorithms to prefer read-ahead
over write-behind and impact the system less.
The decision about how often to flush the cache is an important one. If the cache is flushed too
frequently, system performance will be slowed by unnecessary I/O. If the cache is flushed too rarely,
you risk losing modified file data in the cases of a system failure (a loss especially irritating to users
who know that they asked the application to save the changes) and running out of physical memory
(because it’s being used by an excess of modified pages).
CHAPTER 11
Caching and file systems
589
To balance these concerns, the cache manager’s lazy writer scan function executes on a system
worker thread once per second. The lazy writer scan has different duties:
■
■
■
Checks the number of average available pages and dirty pages (that belongs to the current
partition) and updates the dirty page threshold’s bottom and the top limits accordingly. The
threshold itself is updated too, primarily based on the total number of dirty pages written in the
previous cycle (see the following paragraphs for further details). It sleeps if there are no dirty
pages to write.
Calculates the number of dirty pages to write to disk through the CcCalculatePagesToWrite internal routine. If the number of dirty pages is more than 256 (1 MB of data), the cache manager
queues one-eighth of the total dirty pages to be flushed to disk. If the rate at which dirty pages
are being produced is greater than the amount the lazy writer had determined it should write,
the lazy writer writes an additional number of dirty pages that it calculates are necessary to
match that rate.
Cycles between each shared cache map (which are stored in a linked list belonging to the current partition), and, using the internal CcShouldLazyWriteCacheMap routine, determines if the
current file described by the shared cache map needs to be flushed to disk. There are different
reasons why a file shouldn’t be flushed to disk: for example, an I/O could have been already
initialized by another thread, the file could be a temporary file, or, more simply, the cache map
might not have any dirty pages. In case the routine determined that the file should be flushed
out, the lazy writer scan checks whether there are still enough available pages to write, and, if
so, posts a work item to the cache manager system worker threads.
Note The lazy writer scan uses some exceptions while deciding the number of dirty pages
mapped by a particular shared cache map to write (it doesn’t always write all the dirty pages
of a file): If the target file is a metadata stream with more than 256 KB of dirty pages, the cache
manager writes only one-eighth of its total pages. Another exception is used for files that have
more dirty pages than the total number of pages that the lazy writer scan can flush.
Lazy writer system worker threads from the systemwide critical worker thread pool actually perform
the I/O operations. The lazy writer is also aware of when the memory manager’s mapped page writer
is already performing a flush. In these cases, it delays its write-back capabilities to the same stream to
avoid a situation where two flushers are writing to the same file.
Note The cache manager provides a means for file system drivers to track when and how
much data has been written to a file. After the lazy writer flushes dirty pages to the disk,
the cache manager notifies the file system, instructing it to update its view of the valid data
length for the file. (The cache manager and file systems separately track in memory the valid
data length for a file.)
590
CHAPTER 11
Caching and file systems
EXPERIMENT: Watching the cache manager in action
In this experiment, we use Process Monitor to view the underlying file system activity, including
cache manager read-ahead and write-behind, when Windows Explorer copies a large file (in this
example, a DVD image) from one local directory to another.
First, configure Process Monitor’s filter to include the source and destination file paths, the
Explorer.exe and System processes, and the ReadFile and WriteFile operations. In this example,
the C:\Users\Andrea\Documents\Windows_10_RS3.iso file was copied to C:\ISOs\ Windows_10_
RS3.iso, so the filter is configured as follows:
You should see a Process Monitor trace like the one shown here after you copy the file:
The first few entries show the initial I/O processing performed by the copy engine and the first
cache manager operations. Here are some of the things that you can see:
■
The initial 1 MB cached read from Explorer at the first entry. The size of this read depends on an
internal matrix calculation based on the file size and can vary from 128 KB to 1 MB. Because this
file was large, the copy engine chose 1 MB.
CHAPTER 11
Caching and file systems
591
■
■
592
The 1-MB read is followed by another 1-MB noncached read. Noncached reads typically indicate activity due to page faults or cache manager access. A closer look at the stack trace for
these events, which you can see by double-clicking an entry and choosing the Stack tab, reveals
that indeed the CcCopyRead cache manager routine, which is called by the NTFS driver’s read
routine, causes the memory manager to fault the source data into physical memory:
After this 1-MB page fault I/O, the cache manager’s read-ahead mechanism starts reading the
file, which includes the System process’s subsequent noncached 1-MB read at the 1-MB offset.
Because of the file size and Explorer’s read I/O sizes, the cache manager chose 1 MB as the
optimal read-ahead size. The stack trace for one of the read-ahead operations, shown next,
confirms that one of the cache manager’s worker threads is performing the read-ahead.
CHAPTER 11
Caching and file systems
After this point, Explorer’s 1-MB reads aren’t followed by page faults, because the read-ahead
thread stays ahead of Explorer, prefetching the file data with its 1-MB noncached reads. However,
every once in a while, the read-ahead thread is not able to pick up enough data in time, and
clustered page faults do occur, which appear as Synchronous Paging I/O.
If you look at the stack for these entries, you’ll see that instead of MmPrefetchForCacheManager,
MmPrefetchForCacheManager
the MmAccessFault/MiIssueHardFault
MmAccessFault/MiIssueHardFault
MmAccessFault/
/MiIssueHardFault routines are called.
As soon as it starts reading, Explorer also starts performing writes to the destination file.
These are sequential, cached 1-MB writes. After about 124 MB of reads, the first WriteFile operation from the System process occurs, shown here:
The write operation’s stack trace, shown here, indicates that the memory manager’s mapped
page writer thread was actually responsible for the write. This occurs because for the first couple
of megabytes of data, the cache manager hadn’t started performing write-behind, so the
memory manager’s mapped page writer began flushing the modified destination file data. (See
Chapter 10 for more information on the mapped page writer.)
CHAPTER 11
Caching and file systems
593
To get a clearer view of the cache manager operations, remove Explorer from the Process
Monitor’s filter so that only the System process operations are visible, as shown next.
With this view, it’s much easier to see the cache manager’s 1-MB write-behind operations
(the maximum write sizes are 1 MB on client versions of Windows and 32 MB on server versions;
this experiment was performed on a client system). The stack trace for one of the write-behind
operations, shown here, verifies that a cache manager worker thread is performing write-behind:
As an added experiment, try repeating this process with a remote copy instead (from one
Windows system to another) and by copying files of varying sizes. You’ll notice some different
behaviors by the copy engine and the cache manager, both on the receiving and sending sides.
594
CHAPTER 11
Caching and file systems
Disabling lazy writing for a file
If you create a temporary file by specifying the flag FILE_ATTRIBUTE_TEMPORARY in a call to the
Windows CreateFile function, the lazy writer won’t write dirty pages to the disk unless there is a severe shortage of physical memory or the file is explicitly flushed. This characteristic of the lazy writer
improves system performance—the lazy writer doesn’t immediately write data to a disk that might
ultimately be discarded. Applications usually delete temporary files soon after closing them.
Forcing the cache to write through to disk
Because some applications can’t tolerate even momentary delays between writing a file and seeing
the updates on disk, the cache manager also supports write-through caching on a per-file object basis;
changes are written to disk as soon as they’re made. To turn on write-through caching, set the FILE_
FLAG_WRITE_THROUGH flag in the call to the CreateFile function. Alternatively, a thread can explicitly
flush an open file by using the Windows FlushFileBuffers function when it reaches a point at which the
data needs to be written to disk.
Flushing mapped files
If the lazy writer must write data to disk from a view that’s also mapped into another process’s address
space, the situation becomes a little more complicated because the cache manager will only know
about the pages it has modified. (Pages modified by another process are known only to that process
because the modified bit in the page table entries for modified pages is kept in the process private
page tables.) To address this situation, the memory manager informs the cache manager when a user
maps a file. When such a file is flushed in the cache (for example, as a result of a call to the Windows
FlushFileBuffers function), the cache manager writes the dirty pages in the cache and then checks to
see whether the file is also mapped by another process. When the cache manager sees that the file is
also mapped by another process, the cache manager then flushes the entire view of the section to write
out pages that the second process might have modified. If a user maps a view of a file that is also open
in the cache, when the view is unmapped, the modified pages are marked as dirty so that when the lazy
writer thread later flushes the view, those dirty pages will be written to disk. This procedure works as
long as the sequence occurs in the following order:
1.
A user unmaps the view.
2.
A process flushes file buffers.
If this sequence isn’t followed, you can’t predict which pages will be written to disk.
CHAPTER 11
Caching and file systems
595
EXPERIMENT: Watching cache flushes
You can see the cache manager map views into the system cache and flush pages to disk by
running the Performance Monitor and adding the Data Maps/sec and Lazy Write Flushes/sec
counters. (You can find these counters under the “Cache” group.) Then, copy a large file from one
location to another. The generally higher line in the following screenshot shows Data Maps/sec,
and the other shows Lazy Write Flushes/sec. During the file copy, Lazy Write Flushes/sec significantly increased.
Write throttling
The file system and cache manager must determine whether a cached write request will affect system performance and then schedule any delayed writes. First, the file system asks the cache manager
whether a certain number of bytes can be written right now without hurting performance by using the
CcCanIWrite function and blocking that write if necessary. For asynchronous I/O, the file system sets up
a callback with the cache manager for automatically writing the bytes when writes are again permitted
by calling CcDeferWrite. Otherwise, it just blocks and waits on CcCanIWrite to continue. Once it’s notified of an impending write operation, the cache manager determines how many dirty pages are in the
cache and how much physical memory is available. If few physical pages are free, the cache manager
momentarily blocks the file system thread that’s requesting to write data to the cache. The cache manager’s lazy writer flushes some of the dirty pages to disk and then allows the blocked file system thread
to continue. This write throttling prevents system performance from degrading because of a lack of
memory when a file system or network server issues a large write operation.
596
CHAPTER 11
Caching and file systems
Note The effects of write throttling are volume-aware, such that if a user is copying a large
file on, say, a RAID-0 SSD while also transferring a document to a portable USB thumb drive,
writes to the USB disk will not cause write throttling to occur on the SSD transfer.
The dirty page threshold is the number of pages that the system cache will allow to be dirty before
throttling cached writers. This value is computed when the cache manager partition is initialized (the
system partition is created and initialized at phase 1 of the NT kernel startup) and depends on the
product type (client or server). As seen in the previous paragraphs, two other values are also computed—the top dirty page threshold and the bottom dirty page threshold. Depending on memory
consumption and the rate at which dirty pages are being processed, the lazy writer scan calls the
internal function CcAdjustThrottle, which, on server systems, performs dynamic adjustment of the current threshold based on the calculated top and bottom values. This adjustment is made to preserve the
read cache in cases of a heavy write load that will inevitably overrun the cache and become throttled.
Table 11-1 lists the algorithms used to calculate the dirty page thresholds.
TABLE 11-1 Algorithms for calculating the dirty page thresholds
Product Type
Dirty Page Threshold
Top Dirty Page Threshold
Bottom Dirty Page Threshold
Client
Physical pages / 8
Physical pages / 8
Physical pages / 8
Server
Physical pages / 2
Physical pages / 2
Physical pages / 8
Write throttling is also useful for network redirectors transmitting data over slow communication lines. For example, suppose a local process writes a large amount of data to a remote file system
over a slow 640 Kbps line. The data isn’t written to the remote disk until the cache manager’s lazy
writer flushes the cache. If the redirector has accumulated lots of dirty pages that are flushed to disk
at once, the recipient could receive a network timeout before the data transfer completes. By using
the CcSetDirtyPageThreshold function, the cache manager allows network redirectors to set a limit on
the number of dirty cache pages they can tolerate (for each stream), thus preventing this scenario. By
limiting the number of dirty pages, the redirector ensures that a cache flush operation won’t cause a
network timeout.
System threads
As mentioned earlier, the cache manager performs lazy write and read-ahead I/O operations by
submitting requests to the common critical system worker thread pool. However, it does limit the use
of these threads to one less than the total number of critical system worker threads. In client systems,
there are 5 total critical system worker threads, whereas in server systems there are 10.
Internally, the cache manager organizes its work requests into four lists (though these are serviced
by the same set of executive worker threads):
■
■
The express queue is used for read-ahead operations.
The regular queue is used for lazy write scans (for dirty data to flush), write-behinds, and
lazy closes.
CHAPTER 11
Caching and file systems
597
■
■
The fast teardown queue is used when the memory manager is waiting for the data section
owned by the cache manager to be freed so that the file can be opened with an image section
instead, which causes CcWriteBehind to flush the entire file and tear down the shared cache map.
The post tick queue is used for the cache manager to internally register for a notification after
each “tick” of the lazy writer thread—in other words, at the end of each pass.
To keep track of the work items the worker threads need to perform, the cache manager creates
its own internal per-processor look-aside list—a fixed-length list (one for each processor) of worker
queue item structures. (Look-aside lists are discussed in Chapter 5 of Part 1.) The number of worker
queue items depends on system type: 128 for client systems, and 256 for server systems. For crossprocessor performance, the cache manager also allocates a global look-aside list at the same sizes as
just described.
Aggressive write behind and low-priority lazy writes
With the goal of improving cache manager performance, and to achieve compatibility with low-speed
disk devices (like eMMC disks), the cache manager lazy writer has gone through substantial improvements in Windows 8.1 and later.
As seen in the previous paragraphs, the lazy writer scan adjusts the dirty page threshold and its
top and bottom limits. Multiple adjustments are made on the limits, by analyzing the history of the
total number of available pages. Other adjustments are performed to the dirty page threshold itself
by checking whether the lazy writer has been able to write the expected total number of pages in the
last execution cycle (one per second). If the total number of written pages in the last cycle is less than
the expected number (calculated by the CcCalculatePagesToWrite routine), it means that the underlying disk device was not able to support the generated I/O throughput, so the dirty page threshold is
lowered (this means that more I/O throttling is performed, and some cache manager clients will wait
when calling CcCanIWrite API). In the opposite case, in which there are no remaining pages from the
last cycle, the lazy writer scan can easily raise the threshold. In both cases, the threshold needs to stay
inside the range described by the bottom and top limits.
The biggest improvement has been made thanks to the Extra Write Behind worker threads. In server
SKUs, the maximum number of these threads is nine (which corresponds to the total number of critical
system worker threads minus one), while in client editions it is only one. When a system lazy write scan
is requested by the cache manager, the system checks whether dirty pages are contributing to memory
pressure (using a simple formula that verifies that the number of dirty pages are less than a quarter of
the dirty page threshold, and less than half of the available pages). If so, the systemwide cache manager
thread pool routine (CcWorkerThread) uses a complex algorithm that determines whether it can add
another lazy writer thread that will write dirty pages to disk in parallel with the others.
To correctly understand whether it is possible to add another thread that will emit additional I/Os,
without getting worse system performance, the cache manager calculates the disk throughput of
the old lazy write cycles and keeps track of their performance. If the throughput of the current cycles
is equal or better than the previous one, it means that the disk can support the overall I/O level, so
it makes sense to add another lazy writer thread (which is called an Extra Write Behind thread in this
598
CHAPTER 11
Caching and file systems
case). If, on the other hand, the current throughput is lower than the previous cycle, it means that the
underlying disk is not able to sustain additional parallel writes, so the Extra Write Behind thread is
removed. This feature is called Aggressive Write Behind.
In Windows client editions, the cache manager enables an optimization designed to deal with lowspeed disks. When a lazy writer scan is requested, and when the file system drivers write to the cache,
the cache manager employs an algorithm to decide if the lazy writers threads should execute at low
priority. (For more information about thread priorities, refer to Chapter 4 of Part 1.) The cache manager
applies by-default low priority to the lazy writers if the following conditions are met (otherwise, the
cache manager still uses the normal priority):
■
The caller is not waiting for the current lazy scan to be finished.
■
The total size of the partition’s dirty pages is less than 32 MB.
If the two conditions are satisfied, the cache manager queues the work items for the lazy writers in
the low-priority queue. The lazy writers are started by a system worker thread, which executes at priority 6 – Lowest. Furthermore, the lazy writer set its I/O priority to Lowest just before emitting the actual
I/O to the correct file-system driver.
Dynamic memory
As seen in the previous paragraph, the dirty page threshold is calculated dynamically based on the
available amount of physical memory. The cache manager uses the threshold to decide when to
throttle incoming writes and whether to be more aggressive about writing behind.
Before the introduction of partitions, the calculation was made in the CcInitializeCacheManager
routine (by checking the MmNumberOfPhysicalPages global value), which was executed during the
kernel’s phase 1 initialization. Now, the cache manager Partition’s initialization function performs the
calculation based on the available physical memory pages that belong to the associated memory partition. (For further details about cache manager partitions, see the section “Memory partitions support,”
earlier in this chapter.) This is not enough, though, because Windows also supports the hot-addition
of physical memory, a feature that is deeply used by HyperV for supporting dynamic memory for
child VMs.
During memory manager phase 0 initialization, MiCreatePfnDatabase calculates the maximum
possible size of the PFN database. On 64-bit systems, the memory manager assumes that the maximum possible amount of installed physical memory is equal to all the addressable virtual memory
range (256 TB on non-LA57 systems, for example). The system asks the memory manager to reserve
the amount of virtual address space needed to store a PFN for each virtual page in the entire address
space. (The size of this hypothetical PFN database is around 64 GB.) MiCreateSparsePfnDatabase then
cycles between each valid physical memory range that Winload has detected and maps valid PFNs into
the database. The PFN database uses sparse memory. When the MiAddPhysicalMemory routines detect
new physical memory, it creates new PFNs simply by allocating new regions inside the PFN databases.
Dynamic Memory has already been described in Chapter 9, “Virtualization technologies”; further details are available there.
CHAPTER 11
Caching and file systems
599
The cache manager needs to detect the new hot-added or hot-removed memory and adapt to the
new system configuration, otherwise multiple problems could arise:
■
■
In cases where new memory has been hot-added, the cache manager might think that the system
has less memory, so its dirty pages threshold is lower than it should be. As a result, the cache manager doesn’t cache as many dirty pages as it should, so it throttles writes much sooner.
If large portions of available memory are locked or aren’t available anymore, performing
cached I/O on the system could hurt the responsiveness of other applications (which, after the
hot-remove, will basically have no more memory).
To correctly deal with this situation, the cache manager doesn’t register a callback with the memory
manager but implements an adaptive correction in the lazy writer scan (LWS) thread. Other than
scanning the list of shared cache map and deciding which dirty page to write, the LWS thread has the
ability to change the dirty pages threshold depending on foreground rate, its write rate, and available
memory. The LWS maintains a history of average available physical pages and dirty pages that belong
to the partition. Every second, the LWS thread updates these lists and calculates aggregate values.
Using the aggregate values, the LWS is able to respond to memory size variations, absorbing the spikes
and gradually modifying the top and bottom thresholds.
Cache manager disk I/O accounting
Before Windows 8.1, it wasn’t possible to precisely determine the total amount of I/O performed by a
single process. The reasons behind this were multiple:
■
■
■
Lazy writes and read-aheads don’t happen in the context of the process/thread that caused the
I/O. The cache manager writes out the data lazily, completing the write in a different context
(usually the System context) of the thread that originally wrote the file. (The actual I/O can even
happen after the process has terminated.) Likewise, the cache manager can choose to readahead, bringing in more data from the file than the process requested.
Asynchronous I/O is still managed by the cache manager, but there are cases in which the cache
manager is not involved at all, like for non-cached I/Os.
Some specialized applications can emit low-level disk I/O using a lower-level driver in the disk stack.
Windows stores a pointer to the thread that emitted the I/O in the tail of the IRP. This thread is not
always the one that originally started the I/O request. As a result, a lot of times the I/O accounting was
wrongly associated with the System process. Windows 8.1 resolved the problem by introducing the
PsUpdateDiskCounters API, used by both the cache manager and file system drivers, which need to
tightly cooperate. The function stores the total number of bytes read and written and the number of
I/O operations in the core EPROCESS data structure that is used by the NT kernel to describe a process.
(You can read more details in Chapter 3 of Part 1.)
The cache manager updates the process disk counters (by calling the PsUpdateDiskCounters function) while performing cached reads and writes (through all of its exposed file system interfaces) and
while emitting read-aheads I/O (through CcScheduleReadAheadEx exported API). NTFS and ReFS file
systems drivers call the PsUpdateDiskCounters while performing non-cached and paging I/O.
600
CHAPTER 11
Caching and file systems
Like CcScheduleReadAheadEx, multiple cache manager APIs have been extended to accept a pointer
to the thread that has emitted the I/O and should be charged for it (CcCopyReadEx and CcCopyWriteEx
are good examples). In this way, updated file system drivers can even control which thread to charge in
case of asynchronous I/O.
Other than per-process counters, the cache manager also maintains a Global Disk I/O counter,
which globally keeps track of all the I/O that has been issued by file systems to the storage stack. (The
counter is updated every time a non-cached and paging I/O is emitted through file system drivers.)
Thus, this global counter, when subtracted from the total I/O emitted to a particular disk device (a value
that an application can obtain by using the IOCTL_DISK_PERFORMANCE control code), represents the
I/O that could not be attributed to any particular process (paging I/O emitted by the Modified Page
Writer for example, or I/O performed internally by Mini-filter drivers).
The new per-process disk counters are exposed through the NtQuerySystemInformation API using
the SystemProcessInformation information class. This is the method that diagnostics tools like Task
Manager or Process Explorer use for precisely querying the I/O numbers related to the processes currently running in the system.
EXPERIMENT: Counting disk I/Os
You can see a precise counting of the total system I/Os by using the different counters exposed
by the Performance Monitor. Open Performance Monitor and add the FileSystem Bytes Read
and FileSystem Bytes Written counters, which are available in the FileSystem Disk Activity group.
Furthermore, for this experiment you need to add the per-process disk I/O counters that are
available in the Process group, named IO Read Bytes/sec and IO Write Bytes/sec. When you
add these last two counters, make sure that you select the Explorer process in the Instances Of
Selected Object box.
When you start to copy a big file, you see the counters belonging to Explorer processes
increasing until they reach the counters showed in the global file System Disk activity.
CHAPTER 11
Caching and file systems
601
File systems
In this section, we present an overview of the supported file system formats supported by Windows.
We then describe the types of file system drivers and their basic operation, including how they interact
with other system components, such as the memory manager and the cache manager. Following that,
we describe in detail the functionality and the data structures of the two most important file systems:
NTFS and ReFS. We start by analyzing their internal architectures and then focus on the on-disk layout
of the two file systems and their advanced features, such as compression, recoverability, encryption,
tiering support, file-snapshot, and so on.
Windows file system formats
Windows includes support for the following file system formats:
■
CDFS
■
UDF
■
FAT12, FAT16, and FAT32
■
exFAT
■
NTFS
■
ReFS
Each of these formats is best suited for certain environments, as you’ll see in the following sections.
CDFS
CDFS (%SystemRoot%\System32\Drivers\Cdfs.sys), or CD-ROM file system, is a read-only file system
driver that supports a superset of the ISO-9660 format as well as a superset of the Joliet disk format.
Although the ISO-9660 format is relatively simple and has limitations such as ASCII uppercase names
with a maximum length of 32 characters, Joliet is more flexible and supports Unicode names of arbitrary length. If structures for both formats are present on a disk (to offer maximum compatibility), CDFS
uses the Joliet format. CDFS has a couple of restrictions:
■
A maximum file size of 4 GB
■
A maximum of 65,535 directories
CDFS is considered a legacy format because the industry has adopted the Universal Disk Format
(UDF) as the standard for optical media.
602
CHAPTER 11
Caching and file systems
UDF
The Windows Universal Disk Format (UDF) file system implementation is OSTA (Optical Storage
Technology Association) UDF-compliant. (UDF is a subset of the ISO-13346 format with extensions for
formats such as CD-R and DVD-R/RW.) OSTA defined UDF in 1995 as a format to replace the ISO-9660
format for magneto-optical storage media, mainly DVD-ROM. UDF is included in the DVD specification
and is more flexible than CDFS. The UDF file system format has the following traits:
■
■
Directory and file names can be 254 ASCII or 127 Unicode characters long.
Files can be sparse. (Sparse files are defined later in this chapter, in the “Compression and sparse
files” section.)
■
File sizes are specified with 64 bits.
■
Support for access control lists (ACLs).
■
Support for alternate data streams.
The UDF driver supports UDF versions up to 2.60. The UDF format was designed with rewritable media in mind. The Windows UDF driver (%SystemRoot%\System32\Drivers\Udfs.sys) provides read-write
support for Blu-ray, DVD-RAM, CD-R/RW, and DVD+-R/RW drives when using UDF 2.50 and read-only
support when using UDF 2.60. However, Windows does not implement support for certain UDF features such as named streams and access control lists.
FAT12, FAT16, and FAT32
Windows supports the FAT file system primarily for compatibility with other operating systems in multiboot systems, and as a format for flash drives or memory cards. The Windows FAT file system driver is
implemented in %SystemRoot%\System32\Drivers\Fastfat.sys.
The name of each FAT format includes a number that indicates the number of bits that the particular
format uses to identify clusters on a disk. FAT12’s 12-bit cluster identifier limits a partition to storing a
maximum of 212 (4,096) clusters. Windows permits cluster sizes from 512 bytes to 8 KB, which limits a
FAT12 volume size to 32 MB.
Note All FAT file system types reserve the first 2 clusters and the last 16 clusters of a volume,
so the number of usable clusters for a FAT12 volume, for instance, is slightly less than 4,096.
FAT16, with a 16-bit cluster identifier, can address 216 (65,536) clusters. On Windows, FAT16 cluster
sizes range from 512 bytes (the sector size) to 64 KB (on disks with a 512-byte sector size), which limits
FAT16 volume sizes to 4 GB. Disks with a sector size of 4,096 bytes allow for clusters of 256 KB. The cluster size Windows uses depends on the size of a volume. The various sizes are listed in Table 11-2. If you
format a volume that is less than 16 MB as FAT by using the format command or the Disk Management
snap-in, Windows uses the FAT12 format instead of FAT16.
CHAPTER 11
Caching and file systems
603
TABLE 11-2 Default FAT16 cluster sizes in Windows
Volume Size
Default Cluster Size
<8 MB
Not supported
8 MB–32 MB
512 bytes
32 MB–64 MB
1 KB
64 MB–128 MB
2 KB
128 MB–256 MB
4 KB
256 MB–512 MB
8 KB
512 MB–1,024 MB
16 KB
1 GB–2 GB
32 KB
2 GB–4 GB
64 KB
>16 GB
Not supported
A FAT volume is divided into several regions, which are shown in Figure 11-14. The file allocation table,
which gives the FAT file system format its name, has one entry for each cluster on a volume. Because
the file allocation table is critical to the successful interpretation of a volume’s contents, the FAT format
maintains two copies of the table so that if a file system driver or consistency-checking program (such as
Chkdsk) can’t access one (because of a bad disk sector, for example), it can read from the other.
Boot
sector
File allocation
table 1
File allocation
Root
table 2
directory
(duplicate)
Other directories and all files
FIGURE 11-14 FAT format organization.
Entries in the file allocation table define file-allocation chains (shown in Figure 11-15) for files and
directories, where the links in the chain are indexes to the next cluster of a file’s data. A file’s directory
entry stores the starting cluster of the file. The last entry of the file’s allocation chain is the reserved
value of 0xFFFF for FAT16 and 0xFFF for FAT12. The FAT entries for unused clusters have a value of 0. You
can see in Figure 11-15 that FILE1 is assigned clusters 2, 3, and 4; FILE2 is fragmented and uses clusters 5,
6, and 8; and FILE3 uses only cluster 7. Reading a file from a FAT volume can involve reading large portions of a file allocation table to traverse the file’s allocation chains.
File directory entries
FILE1
0002
FILE2
0005
2
3
4
5
6
7
8
9
0003
0004
FFFF
0006
0008
FFFF
FFFF
0000
FIGURE 11-15 Sample FAT file-allocation chains.
604
FILE3
CHAPTER 11
Caching and file systems
0007
The root directory of FAT12 and FAT16 volumes is preassigned enough space at the start of a volume to
store 256 directory entries, which places an upper limit on the number of files and directories that can be
stored in the root directory. (There’s no preassigned space or size limit on FAT32 root directories.) A FAT
directory entry is 32 bytes and stores a file’s name, size, starting cluster, and time stamp (last-accessed,
created, and so on) information. If a file has a name that is Unicode or that doesn’t follow the MS-DOS 8.3
naming convention, additional directory entries are allocated to store the long file name. The supplementary entries precede the file’s main entry. Figure 11-16 shows a sample directory entry for a file named “The
quick brown fox.” The system has created a THEQUI 1.FOX 8.3 representation of the name (that is, you don’t
see a “.” in the directory entry because it is assumed to come after the eighth character) and used two more
directory entries to store the Unicode long file name. Each row in the figure is made up of 16 bytes.
Second (and last) long entry
0x42
w
0x0000
0x01
0xFFFF
T
0xFFFF
h
i
T
.
n
Create date
E
0xFFFF
o
0xFFFF
e
c
H
f
Last access
date
U
0x0000
˜
1
Last modified time
F
O
0x0F 0x00
X
0x20
Last modiFirst cluster
fied date
Check
sum
0xFFFF
0x0000
b
I
0x0000
q
k
Q
0x0F 0x00
x
0xFFFF
Check
sum
u
r
o
NT
Create time
File size
Short entry
First long entry
FIGURE 11.16 FAT directory entry.
FAT32 uses 32-bit cluster identifiers but reserves the high 4 bits, so in effect it has 28-bit cluster
identifiers. Because FAT32 cluster sizes can be as large as 64 KB, FAT32 has a theoretical ability to address 16-terabyte (TB) volumes. Although Windows works with existing FAT32 volumes of larger sizes
(created in other operating systems), it limits new FAT32 volumes to a maximum of 32 GB. FAT32’s
higher potential cluster numbers let it manage disks more efficiently than FAT16; it can handle up to
128-GB volumes with 512-byte clusters. Table 11-3 shows default cluster sizes for FAT32 volumes.
TABLE 11-3 Default cluster sizes for FAT32 volumes
Partition Size
Default Cluster Size
<32 MB
Not supported
32 MB–64 MB
512 bytes
64 MB–128 MB
1 KB
128 MB–256 MB
2 KB
256 MB–8 GB
4 KB
8 GB–16 GB
8 KB
16 GB–32 GB
16 KB
>32 GB
Not supported
CHAPTER 11
Caching and file systems
605
Besides the higher limit on cluster numbers, other advantages FAT32 has over FAT12 and FAT16
include the fact that the FAT32 root directory isn’t stored at a predefined location on the volume, the
root directory doesn’t have an upper limit on its size, and FAT32 stores a second copy of the boot sector
for reliability. A limitation FAT32 shares with FAT16 is that the maximum file size is 4 GB because directories store file sizes as 32-bit values.
exFAT
Designed by Microsoft, the Extended File Allocation Table file system (exFAT, also called FAT64) is an
improvement over the traditional FAT file systems and is specifically designed for flash drives. The main
goal of exFAT is to provide some of the advanced functionality offered by NTFS without the metadata
structure overhead and metadata logging that create write patterns not suited for many flash media
devices. Table 11-4 lists the default cluster sizes for exFAT.
As the FAT64 name implies, the file size limit is increased to 264, allowing files up to 16 exabytes. This
change is also matched by an increase in the maximum cluster size, which is currently implemented as 32
MB but can be as large as 2255 sectors. exFAT also adds a bitmap that tracks free clusters, which improves
the performance of allocation and deletion operations. Finally, exFAT allows more than 1,000 files in a
single directory. These characteristics result in increased scalability and support for large disk sizes.
TABLE 11-4 Default cluster sizes for exFAT volumes, 512-byte sector
Volume Size
Default Cluster Size
< 256 MB
4 KB
256 MB–32 GB
32 KB
32 GB–512 GB
128 KB
512 GB–1 TB
256 KB
1 TB–2 TB
512 KB
2 TB–4 TB
1 MB
4 TB–8 TB
2 MB
8 TB–16 TB
4 MB
16 TB–32 TB
8 MB
32 TB–64 TB
16 MB
> 64 TB
32 MB
Additionally, exFAT implements certain features previously available only in NTFS, such as support for access control lists (ACLs) and transactions (called Transaction-Safe FAT, or TFAT). While
the Windows Embedded CE implementation of exFAT includes these features, the version of exFAT
in Windows does not.
Note ReadyBoost (described in Chapter 5 of Part 1, “Memory Management”) can work with
exFAT-formatted flash drives to support cache files much larger than 4 GB.
606
CHAPTER 11
Caching and file systems
NTFS
As noted at the beginning of the chapter, the NTFS file system is one of the native file system formats
of Windows. NTFS uses 64-bit cluster numbers. This capacity gives NTFS the ability to address volumes
of up to 16 exaclusters; however, Windows limits the size of an NTFS volume to that addressable with
32-bit clusters, which is slightly less than 8 petabytes (using 2 MB clusters). Table 11-5 shows the default
cluster sizes for NTFS volumes. (You can override the default when you format an NTFS volume.) NTFS
also supports 232–1 files per volume. The NTFS format allows for files that are 16 exabytes in size, but the
implementation limits the maximum file size to 16 TB.
TABLE 11-5 Default cluster sizes for NTFS volumes
Volume Size
Default Cluster Size
<7 MB
Not supported
7 MB–16 TB
4 KB
16 TB–32 TB
8 KB
32 TB–64 TB
16 KB
64 TB–128 TB
32 KB
128 TB–256 TB
64 KB
256 TB–512 TB
128 KB
512 TB–1024 TB
256 KB
1 PB–2 PB
512 KB
2 PB–4 PB
1 MB
4 PB–8 PB
2 MB
NTFS includes a number of advanced features, such as file and directory security, alternate data
streams, disk quotas, sparse files, file compression, symbolic (soft) and hard links, support for transactional semantics, junction points, and encryption. One of its most significant features is recoverability.
If a system is halted unexpectedly, the metadata of a FAT volume can be left in an inconsistent state,
leading to the corruption of large amounts of file and directory data. NTFS logs changes to metadata
in a transactional manner so that file system structures can be repaired to a consistent state with no
loss of file or directory structure information. (File data can be lost unless the user is using TxF, which is
covered later in this chapter.) Additionally, the NTFS driver in Windows also implements self-healing, a
mechanism through which it makes most minor repairs to corruption of file system on-disk structures
while Windows is running and without requiring a reboot.
Note At the time of this writing, the common physical sector size of disk devices is 4 KB. Even
for these disk devices, for compatibility reasons, the storage stack exposes to file system drivers a logical sector size of 512 bytes. The calculation performed by the NTFS driver to determine the correct size of the cluster uses logical sector sizes rather than the actual physical size.
CHAPTER 11
Caching and file systems
607
Starting with Windows 10, NTFS supports DAX volumes natively. (DAX volumes are discussed later
in this chapter, in the “DAX volumes” section.) The NTFS file system driver also supports I/O to this kind
of volume using large pages. Mapping a file that resides on a DAX volume using large pages is possible
in two ways: NTFS can automatically align the file to a 2-MB cluster boundary, or the volume can be
formatted using a 2-MB cluster size.
ReFS
The Resilient File System (ReFS) is another file system that Windows supports natively. It has been
designed primarily for large storage servers with the goal to overcome some limitations of NTFS, like
its lack of online self-healing or volume repair or the nonsupport for file snapshots. ReFS is a “writeto-new” file system, which means that volume metadata is always updated by writing new data to
the underlying medium and by marking the old metadata as deleted. The lower level of the ReFS file
system (which understands the on-disk data structure) uses an object store library, called Minstore,
that provides a key-value table interface to its callers. Minstore is similar to a modern database
engine, is portable, and uses different data structures and algorithms compared to NTFS. (Minstore
uses B+ trees.)
One of the important design goals of ReFS was to be able to support huge volumes (that could have
been created by Storage Spaces). Like NTFS, ReFS uses 64-bit cluster numbers and can address volumes
of up 16 exaclusters. ReFS has no limitation on the size of the addressable values, so, theoretically, ReFS
is able to manage volumes of up to 1 yottabyte (using 64 KB cluster sizes).
Unlike NTFS, Minstore doesn’t need a central location to store its own metadata on the volume
(although the object table could be considered somewhat centralized) and has no limitations on
addressable values, so there is no need to support many different sized clusters. ReFS supports only
4 KB and 64 KB cluster sizes. ReFS, at the time of this writing, does not support DAX volumes.
We describe NTFS and ReFS data structures and their advanced features in detail later in this chapter.
File system driver architecture
File system drivers (FSDs) manage file system formats. Although FSDs run in kernel mode, they differ
in a number of ways from standard kernel-mode drivers. Perhaps most significant, they must register
as an FSD with the I/O manager, and they interact more extensively with the memory manager. For
enhanced performance, file system drivers also usually rely on the services of the cache manager. Thus,
they use a superset of the exported Ntoskrnl.exe functions that standard drivers use. Just as for standard kernel-mode drivers, you must have the Windows Driver Kit (WDK) to build file system drivers.
(See Chapter 1, “Concepts and Tools,” in Part 1 and http://www.microsoft.com/whdc/devtools/wdk for
more information on the WDK.)
Windows has two different types of FSDs:
608
■
Local FSDs manage volumes directly connected to the computer.
■
Network FSDs allow users to access data volumes connected to remote computers.
CHAPTER 11
Caching and file systems
Local FSDs
Local FSDs include Ntfs.sys, Refs.sys, Refsv1.sys, Fastfat.sys, Exfat.sys, Udfs.sys, Cdfs.sys, and the RAW
FSD (integrated in Ntoskrnl.exe). Figure 11-17 shows a simplified view of how local FSDs interact with the
I/O manager and storage device drivers. A local FSD is responsible for registering with the I/O manager.
Once the FSD is registered, the I/O manager can call on it to perform volume recognition when applications or the system initially access the volumes. Volume recognition involves an examination of a volume’s boot sector and often, as a consistency check, the file system metadata. If none of the registered
file systems recognizes the volume, the system assigns the RAW file system driver to the volume and
then displays a dialog box to the user asking if the volume should be formatted. If the user chooses not
to format the volume, the RAW file system driver provides access to the volume, but only at the sector
level—in other words, the user can only read or write complete sectors.
The goal of file system recognition is to allow the system to have an additional option for a valid
but unrecognized file system other than RAW. To achieve this, the system defines a fixed data structure
type (FILE_SYSTEM_RECOGNITION_STRUCTURE) that is written to the first sector on the volume. This
data structure, if present, would be recognized by the operating system, which would then notify the
user that the volume contains a valid but unrecognized file system. The system will still load the RAW
file system on the volume, but it will not prompt the user to format the volume. A user application or
kernel-mode driver might ask for a copy of the FILE_SYSTEM_RECOGNITION_STRUCTURE by using the
new file system I/O control code FSCTL_QUERY_FILE_SYSTEM_RECOGNITION.
The first sector of every Windows-supported file system format is reserved as the volume’s boot
sector. A boot sector contains enough information so that a local FSD can both identify the volume on
which the sector resides as containing a format that the FSD manages and locate any other metadata
necessary to identify where metadata is stored on the volume.
When a local FSD (shown in Figure 11-17) recognizes a volume, it creates a device object that represents the mounted file system format. The I/O manager makes a connection through the volume
parameter block (VPB) between the volume’s device object (which is created by a storage device driver)
and the device object that the FSD created. The VPB’s connection results in the I/O manager redirecting
I/O requests targeted at the volume device object to the FSD device object.
Application
Application
User mode
Kernel mode
I/O manager
File system driver
Storage device drivers
Logical
volume
(partition)
FIGURE 11-17 Local FSD.
CHAPTER 11
Caching and file systems
609
To improve performance, local FSDs usually use the cache manager to cache file system data, including metadata. FSDs also integrate with the memory manager so that mapped files are implemented correctly. For example, FSDs must query the memory manager whenever an application attempts to
truncate a file to verify that no processes have mapped the part of the file beyond the truncation point.
(See Chapter 5 of Part 1 for more information on the memory manager.) Windows doesn’t permit file
data that is mapped by an application to be deleted either through truncation or file deletion.
Local FSDs also support file system dismount operations, which permit the system to disconnect the
FSD from the volume object. A dismount occurs whenever an application requires raw access to the
on-disk contents of a volume or the media associated with a volume is changed. The first time an application accesses the media after a dismount, the I/O manager reinitiates a volume mount operation
for the media.
Remote FSDs
Each remote FSD consists of two components: a client and a server. A client-side remote FSD allows
applications to access remote files and directories. The client FSD component accepts I/O requests
from applications and translates them into network file system protocol commands (such as SMB)
that the FSD sends across the network to a server-side component, which is a remote FSD. A serverside FSD listens for commands coming from a network connection and fulfills them by issuing I/O
requests to the local FSD that manages the volume on which the file or directory that the command
is intended for resides.
Windows includes a client-side remote FSD named LANMan Redirector (usually referred to as
just the redirector) and a server-side remote FSD named LANMan Server (%SystemRoot%\System32
\Drivers\Srv2.sys). Figure 11-18 shows the relationship between a client accessing files remotely from a
server through the redirector and server FSDs.
Client
Server
Client
application Kernel32.dll
Ntdll.dll
Cache
manager
User mode
User mode
Kernel mode
Kernel mode
Redirector
FSD
Cache
manager
Protocol driver
(WSK transport)
Protocol driver
(WSK transport)
Server
FSD
Local FSD
(NTFS, FAT)
File data
Network
Disk
FIGURE 11-18 Common Internet File System file sharing.
610
CHAPTER 11
Caching and file systems
Windows relies on the Common Internet File System (CIFS) protocol to format messages exchanged
between the redirector and the server. CIFS is a version of Microsoft’s Server Message Block (SMB)
protocol. (For more information on SMB, go to https://docs.microsoft.com/en-us/windows/win32/fileio
/microsoft-smb-protocol-and-cifs-protocol-overview.)
Like local FSDs, client-side remote FSDs usually use cache manager services to locally cache file data
belonging to remote files and directories, and in such cases both must implement a distributed locking
mechanism on the client as well as the server. SMB client-side remote FSDs implement a distributed cache
coherency protocol, called oplock (opportunistic locking), so that the data an application sees when it
accesses a remote file is the same as the data applications running on other computers that are accessing
the same file see. Third-party file systems may choose to use the oplock protocol, or they may implement
their own protocol. Although server-side remote FSDs participate in maintaining cache coherency across
their clients, they don’t cache data from the local FSDs because local FSDs cache their own data.
It is fundamental that whenever a resource can be shared between multiple, simultaneous accessors, a serialization mechanism must be provided to arbitrate writes to that resource to ensure that only
one accessor is writing to the resource at any given time. Without this mechanism, the resource may
be corrupted. The locking mechanisms used by all file servers implementing the SMB protocol are the
oplock and the lease. Which mechanism is used depends on the capabilities of both the server and the
client, with the lease being the preferred mechanism.
Oplocks The oplock functionality is implemented in the file system run-time library (FsRtlXxx
functions) and may be used by any file system driver. The client of a remote file server uses an oplock to
dynamically determine which client-side caching strategy to use to minimize network traffic. An oplock
is requested on a file residing on a share, by the file system driver or redirector, on behalf of an application when it attempts to open a file. The granting of an oplock allows the client to cache the file rather
than send every read or write to the file server across the network. For example, a client could open a
file for exclusive access, allowing the client to cache all reads and writes to the file, and then copy the
updates to the file server when the file is closed. In contrast, if the server does not grant an oplock to a
client, all reads and writes must be sent to the server.
Once an oplock has been granted, a client may then start caching the file, with the type of oplock
determining what type of caching is allowed. An oplock is not necessarily held until a client is finished
with the file, and it may be broken at any time if the server receives an operation that is incompatible with
the existing granted locks. This implies that the client must be able to quickly react to the break of the
oplock and change its caching strategy dynamically.
Prior to SMB 2.1, there were four types of oplocks:
■
■
Level 1, exclusive access This lock allows a client to open a file for exclusive access. The client
may perform read-ahead buffering and read or write caching.
Level 2, shared access This lock allows multiple, simultaneous readers of a file and no writers.
The client may perform read-ahead buffering and read caching of file data and attributes. A
write to the file will cause the holders of the lock to be notified that the lock has been broken.
CHAPTER 11
Caching and file systems
611
■
■
Batch, exclusive access This lock takes its name from the locking used when processing
batch (.bat) files, which are opened and closed to process each line within the file. The client
may keep a file open on the server, even though the application has (perhaps temporarily)
closed the file. This lock supports read, write, and handle caching.
Filter, exclusive access This lock provides applications and file system filters with a mechanism to give up the lock when other clients try to access the same file, but unlike a Level 2 lock,
the file cannot be opened for delete access, and the other client will not receive a sharing violation. This lock supports read and write caching.
In the simplest terms, if multiple client systems are all caching the same file shared by a server,
then as long as every application accessing the file (from any client or the server) tries only to read the
file, those reads can be satisfied from each system’s local cache. This drastically reduces the network
traffic because the contents of the file aren’t sent to each system from the server. Locking information
must still be exchanged between the client systems and the server, but this requires very low network
bandwidth. However, if even one of the clients opens the file for read and write access (or exclusive
write), then none of the clients can use their local caches and all I/O to the file must go immediately
to the server, even if the file is never written. (Lock modes are based upon how the file is opened, not
individual I/O requests.)
An example, shown in Figure 11-19, will help illustrate oplock operation. The server automatically
grants a Level 1 oplock to the first client to open a server file for access. The redirector on the client
caches the file data for both reads and writes in the file cache of the client machine. If a second client
opens the file, it too requests a Level 1 oplock. However, because there are now two clients accessing
the same file, the server must take steps to present a consistent view of the file’s data to both clients.
If the first client has written to the file, as is the case in Figure 11-19, the server revokes its oplock and
grants neither client an oplock. When the first client’s oplock is revoked, or broken, the client flushes
any data it has cached for the file back to the server.
Time
Client 1
Client 2
Server
Oplock request
File open
Cached read(s)
Cached write(s)
Flushes cached
modified data
Grant Level 1
oplock to Client 1
Level 1 grant
Oplock
request
Oplock break
to none
Data flush
File open
No oplock
granted
Noncached read(s)
Noncached write(s)
Noncached read(s)
Noncached write(s)
FIGURE 11-19 Oplock example.
612
CHAPTER 11
Break Client 1
to no oplock
Caching and file systems
Do not grant
Client 2 oplock
If the first client hadn’t written to the file, the first client’s oplock would have been broken to a
Level 2 oplock, which is the same type of oplock the server would grant to the second client. Now both
clients can cache reads, but if either writes to the file, the server revokes their oplocks so that noncached operation commences. Once oplocks are broken, they aren’t granted again for the same open
instance of a file. However, if a client closes a file and then reopens it, the server reassesses what level of
oplock to grant the client based on which other clients have the file open and whether at least one of
them has written to the file.
EXPERIMENT: Viewing the list of registered file systems
When the I/O manager loads a device driver into memory, it typically names the driver object
it creates to represent the driver so that it’s placed in the \Driver object manager directory. The
driver objects for any driver the I/O manager loads that have a Type attribute value of SERVICE_
FILE_SYSTEM_DRIVER (2) are placed in the \FileSystem directory by the I/O manager. Thus, using
a tool such as WinObj (from Sysinternals), you can see the file systems that have registered on a
system, as shown in the following screenshot. Note that file system filter drivers will also show up
in this list. Filter drivers are described later in this section.
Another way to see registered file systems is to run the System Information viewer. Run
Msinfo32 from the Start menu’s Run dialog box and select System Drivers under Software
Environment. Sort the list of drivers by clicking the Type column, and drivers with a Type attribute of SERVICE_FILE_SYSTEM_DRIVER group together.
CHAPTER 11
Caching and file systems
613
Note that just because a driver registers as a file system driver type doesn’t mean that it is
a local or remote FSD. For example, Npfs (Named Pipe File System) is a driver that implements
named pipes through a file system-like private namespace. As mentioned previously, this list will
also include file system filter drivers.
Leases Prior to SMB 2.1, the SMB protocol assumed an error-free network connection between
the client and the server and did not tolerate network disconnections caused by transient network
failures, server reboot, or cluster failovers. When a network disconnect event was received by the client, it orphaned all handles opened to the affected server(s), and all subsequent I/O operations on the
orphaned handles were failed. Similarly, the server would release all opened handles and resources
associated with the disconnected user session. This behavior resulted in applications losing state and in
unnecessary network traffic.
614
CHAPTER 11
Caching and file systems
In SMB 2.1, the concept of a lease is introduced as a new type of client caching mechanism, similar to
an oplock. The purpose of a lease and an oplock is the same, but a lease provides greater flexibility and
much better performance.
■
■
■
■
Read (R), shared access Allows multiple simultaneous readers of a file, and no writers. This
lease allows the client to perform read-ahead buffering and read caching.
Read-Handle (RH), shared access This is similar to the Level 2 oplock, with the added
benefit of allowing the client to keep a file open on the server even though the accessor on the
client has closed the file. (The cache manager will lazily flush the unwritten data and purge the
unmodified cache pages based on memory availability.) This is superior to a Level 2 oplock because the lease does not need to be broken between opens and closes of the file handle. (In this
respect, it provides semantics similar to the Batch oplock.) This type of lease is especially useful
for files that are repeatedly opened and closed because the cache is not invalidated when the
file is closed and refilled when the file is opened again, providing a big improvement in performance for complex I/O intensive applications.
Read-Write (RW), exclusive access This lease allows a client to open a file for exclusive access. This lock allows the client to perform read-ahead buffering and read or write caching.
Read-Write-Handle (RWH), exclusive access This lock allows a client to open a file
for exclusive access. This lease supports read, write, and handle caching (similar to the
Read-Handle lease).
Another advantage that a lease has over an oplock is that a file may be cached, even when there are
multiple handles opened to the file on the client. (This is a common behavior in many applications.) This
is implemented through the use of a lease key (implemented using a GUID), which is created by the client
and associated with the File Control Block (FCB) for the cached file, allowing all handles to the same file to
share the same lease state, which provides caching by file rather than caching by handle. Prior to the introduction of the lease, the oplock was broken whenever a new handle was opened to the file, even from
the same client. Figure 11-20 shows the oplock behavior, and Figure 11-21 shows the new lease behavior.
Prior to SMB 2.1, oplocks could only be granted or broken, but leases can also be converted. For
example, a Read lease may be converted to a Read-Write lease, which greatly reduces network traffic
because the cache for a particular file does not need to be invalidated and refilled, as would be the case
with an oplock break (of the Level 2 oplock), followed by the request and grant of a Level 1 oplock.
CHAPTER 11
Caching and file systems
615
Client
Application A
opens a file on
a server
Application A
receives a handle
to the file on
the server
Application A
issues a read
to the file
Application A
receives only the
amount of data
it requested
Application A
issues a read to
the file within
the area cached
Windows
Network
Server
CreateFile (with
FILE_GENERIC_READ and
FILE_GENERIC_WRITE)
Batch oplock granted
First handle
on the
file opened
Handle
ReadFile
I/O complete
Data given to application
ReadFile
Read data and
read-ahead from server
Read-ahead data written
to cache
Read data returned
No network packets
Server unaware
No network packets
Server unaware
Data read
from file
I/O complete
Cached data given to application
Application A
issues a write to
the file within
the area cached
Application B
opens the same
file on the server
for read access
Application B
receives a handle
to the file on
the server
Application A
issues a read to
the file for an
area that was
previously cached
WriteFile
I/O complete
CreateFile (same file with
FILE_GENERIC_READ)
Handle
Cache flushed and no more
caching allowed on the file
ReadFile
Read data from server
Read data returned
I/O complete
Data given to application
Application A
issues a write to
the file in an
area that was
previously
cached
Write data to server
FIGURE 11-20 Oplock with multiple handles from the same client.
CHAPTER 11
Data read
from file
WriteFile
I/O complete
616
Batch oplock broken
Server
opens
second
handle
to file
Caching and file systems
Data
written
to file
Client
Application A
opens a file on
a server
Application A
receives a handle
to the file on
the server
Application A
issues a read
to the file
Application A
receives only the
amount of data
it requested
Application A
issues a read to
the file within
the area cached
Application A
issues a write to
the file within
the area cached
Windows
Server
CreateFile (with
FILE_GENERIC_READ and
FILE_GENERIC_WRITE)
Read-Handle lease granted
First handle
on the
file opened
Handle
ReadFile
I/O complete
Data given to application
ReadFile
Read data and
read-ahead from server
Read-ahead data written
to cache
Read data returned
No network packets
Server unaware
No network packets
Server unaware
Data read
from file
I/O complete
Cached data given to application
WriteFile
I/O complete
Application B
opens the same
file on the server
for read access
CreateFile (same file with
FILE_GENERIC_READ)
Application B
receives a handle
to the file on
the server
Handle
Application B
issues a read to
the file to an area
that is cached
ReadFile
Application A
issues a write to
the file in an area
that is cached
Network
Server
opens
second
handle
to file; lease
remains
Cache flushed and no more
caching allowed on the file
No network packets
Server unaware
I/O complete
Cache data given to application
WriteFile
No network packets
Server unaware
I/O complete
Data written
to the
cache will
eventually
be flushed
to the
server by
the client
FIGURE 11-21 Lease with multiple handles from the same client.
CHAPTER 11
Caching and file systems
617
File system operations
Applications and the system access files in two ways: directly, via file I/O functions (such as ReadFile
and WriteFile), and indirectly, by reading or writing a portion of their address space that represents a
mapped file section. (See Chapter 5 of Part 1 for more information on mapped files.) Figure 11-22 is a
simplified diagram that shows the components involved in these file system operations and the ways in
which they interact. As you can see, an FSD can be invoked through several paths:
■
From a user or system thread performing explicit file I/O
■
From the memory manager’s modified and mapped page writers
■
Indirectly from the cache manager’s lazy writer
■
Indirectly from the cache manager’s read-ahead thread
■
From the memory manager’s page fault handler
Process
Object
manager
data
structures
Handle
table
File object
..
.
File object
Stream
control
blocks
NTFS data
structures
File
control
block
Data
attribute
Named
stream
Master file
table
NTFS
database
(on disk)
..
.
FIGURE 11-22 Components involved in file system I/O.
The following sections describe the circumstances surrounding each of these scenarios and the
steps FSDs typically take in response to each one. You’ll see how much FSDs rely on the memory manager and the cache manager.
618
CHAPTER 11
Caching and file systems
Explicit file I/O
The most obvious way an application accesses files is by calling Windows I/O functions such as
CreateFile, ReadFile, and WriteFile. An application opens a file with CreateFile and then reads, writes,
or deletes the file by passing the handle returned from CreateFile to other Windows functions. The
CreateFile function, which is implemented in the Kernel32.dll Windows client-side DLL, invokes the
native function NtCreateFile, forming a complete root-relative path name for the path that the application passed to it (processing “.” and “..” symbols in the path name) and prefixing the path with “\??” (for
example, \??\C:\Daryl\Todo.txt).
The NtCreateFile system service uses ObOpenOb ectByName to open the file, which parses the
name starting with the object manager root directory and the first component of the path name (“??”).
Chapter 8, “System mechanisms”, includes a thorough description of object manager name resolution
and its use of process device maps, but we’ll review the steps it follows here with a focus on volume
drive letter lookup.
The first step the object manager takes is to translate \?? to the process’s per-session namespace directory that the DosDevicesDirectory field of the device map structure in the process object references
(which was propagated from the first process in the logon session by using the logon session references field in the logon session’s token). Only volume names for network shares and drive letters mapped
by the Subst.exe utility are typically stored in the per-session directory, so on those systems when a
name (C: in this example) is not present in the per-session directory, the object manager restarts its
search in the directory referenced by the GlobalDosDevicesDirectory field of the device map associated
with the per-session directory. The GlobalDosDevicesDirectory field always points at the \GLOBAL?? directory, which is where Windows stores volume drive letters for local volumes. (See the section “Session
namespace” in Chapter 8 for more information.) Processes can also have their own device map, which is
an important characteristic during impersonation over protocols such as RPC.
The symbolic link for a volume drive letter points to a volume device object under \Device, so when
the object manager encounters the volume object, the object manager hands the rest of the path
name to the parse function that the I/O manager has registered for device objects, IopParseDevice.
(In volumes on dynamic disks, a symbolic link points to an intermediary symbolic link, which points
to a volume device object.) Figure 11-23 shows how volume objects are accessed through the object
manager namespace. The figure shows how the \GLOBAL??\C: symbolic link points to the \Device\
HarddiskVolume6 volume device object.
After locking the caller’s security context and obtaining security information from the caller’s token,
IopParseDevice creates an I/O request packet (IRP) of type IRP_M _CREATE, creates a file object that
stores the name of the file being opened, follows the VPB of the volume device object to find the volume’s mounted file system device object, and uses IoCallDriver to pass the IRP to the file system driver
that owns the file system device object.
When an FSD receives an IRP_M _CREATE IRP, it looks up the specified file, performs security validation, and if the file exists and the user has permission to access the file in the way requested, returns
a success status code. The object manager creates a handle for the file object in the process’s handle
table, and the handle propagates back through the calling chain, finally reaching the application as a
CHAPTER 11
Caching and file systems
619
return parameter from CreateFile. If the file system fails the create operation, the I/O manager deletes
the file object it created for the file.
We’ve skipped over the details of how the FSD locates the file being opened on the volume, but
a ReadFile function call operation shares many of the FSD’s interactions with the cache manager and
storage driver. Both ReadFile and CreateFile are system calls that map to I/O manager functions, but
the NtReadFile system service doesn’t need to perform a name lookup; it calls on the object manager
to translate the handle passed from ReadFile into a file object pointer. If the handle indicates that the
caller obtained permission to read the file when the file was opened, NtReadFile proceeds to create an
IRP of type IRP_M _READ and sends it to the FSD for the volume on which the file resides. NtReadFile
obtains the FSD’s device object, which is stored in the file object, and calls IoCallDriver, and the I/O
manager locates the FSD from the device object and gives the IRP to the FSD.
FIGURE 11-23 Drive-letter name resolution.
620
CHAPTER 11
Caching and file systems
If the file being read can be cached (that is, the FILE_FLAG_NO_BUFFERING flag wasn’t passed to
CreateFile when the file was opened), the FSD checks to see whether caching has already been initiated
for the file object. The PrivateCacheMap field in a file object points to a private cache map data structure (which we described in the previous section) if caching is initiated for a file object. If the FSD hasn’t
initialized caching for the file object (which it does the first time a file object is read from or written to),
the PrivateCacheMap field will be null. The FSD calls the cache manager’s CcInitializeCacheMap function
to initialize caching, which involves the cache manager creating a private cache map and, if another file
object referring to the same file hasn’t initiated caching, a shared cache map and a section object.
After it has verified that caching is enabled for the file, the FSD copies the requested file data from
the cache manager’s virtual memory to the buffer that the thread passed to the ReadFile function. The
file system performs the copy within a try/except block so that it catches any faults that are the result of
an invalid application buffer. The function the file system uses to perform the copy is the cache manager’s CcCopyRead function. CcCopyRead takes as parameters a file object, file offset, and length.
When the cache manager executes CcCopyRead, it retrieves a pointer to a shared cache map, which
is stored in the file object. Recall that a shared cache map stores pointers to virtual address control
blocks (VACBs), with one VACB entry for each 256 KB block of the file. If the VACB pointer for a portion
of a file being read is null, CcCopyRead allocates a VACB, reserving a 256 KB view in the cache manager’s virtual address space, and maps (using MmMapViewInSystemCache) the specified portion of the
file into the view. Then CcCopyRead simply copies the file data from the mapped view to the buffer it
was passed (the buffer originally passed to ReadFile). If the file data isn’t in physical memory, the copy
operation generates page faults, which are serviced by MmAccessFault.
When a page fault occurs, MmAccessFault examines the virtual address that caused the fault and
locates the virtual address descriptor (VAD) in the VAD tree of the process that caused the fault. (See
Chapter 5 of Part 1 for more information on VAD trees.) In this scenario, the VAD describes the cache
manager’s mapped view of the file being read, so MmAccessFault calls MiDispatchFault to handle a page
fault on a valid virtual memory address. MiDispatchFault locates the control area (which the VAD points
to) and through the control area finds a file object representing the open file. (If the file has been opened
more than once, there might be a list of file objects linked through pointers in their private cache maps.)
With the file object in hand, MiDispatchFault calls the I/O manager function IoPageRead to build
an IRP (of type IRP_M _READ) and sends the IRP to the FSD that owns the device object the file object
points to. Thus, the file system is reentered to read the data that it requested via CcCopyRead, but this
time the IRP is marked as noncached and paging I/O. These flags signal the FSD that it should retrieve
file data directly from disk, and it does so by determining which clusters on disk contain the requested
data (the exact mechanism is file-system dependent) and sending IRPs to the volume manager that
owns the volume device object on which the file resides. The volume parameter block (VPB) field in the
FSD’s device object points to the volume device object.
The memory manager waits for the FSD to complete the IRP read and then returns control to
the cache manager, which continues the copy operation that was interrupted by a page fault. When
CcCopyRead completes, the FSD returns control to the thread that called NtReadFile, having copied the
requested file data, with the aid of the cache manager and the memory manager, to the thread’s buffer.
CHAPTER 11
Caching and file systems
621
The path for WriteFile is similar except that the NtWriteFile system service generates an IRP of type
IRP_M _WRITE, and the FSD calls CcCopyWrite instead of CcCopyRead. CcCopyWrite, like CcCopyRead,
ensures that the portions of the file being written are mapped into the cache and then copies to the
cache the buffer passed to WriteFile.
If a file’s data is already cached (in the system’s working set), there are several variants on the
scenario we’ve just described. If a file’s data is already stored in the cache, CcCopyRead doesn’t incur
page faults. Also, under certain conditions, NtReadFile and NtWriteFile call an FSD’s fast I/O entry point
instead of immediately building and sending an IRP to the FSD. Some of these conditions follow: the
portion of the file being read must reside in the first 4 GB of the file, the file can have no locks, and
the portion of the file being read or written must fall within the file’s currently allocated size.
The fast I/O read and write entry points for most FSDs call the cache manager’s CcFastCopyRead
and CcFastCopyWrite functions. These variants on the standard copy routines ensure that the file’s
data is mapped in the file system cache before performing a copy operation. If this condition isn’t met,
CcFastCopyRead and CcFastCopyWrite indicate that fast I/O isn’t possible. When fast I/O isn’t possible,
NtReadFile and NtWriteFile fall back on creating an IRP. (See the earlier section “Fast I/O” for a more
complete description of fast I/O.)
Memory manager’s modified and mapped page writer
The memory manager’s modified and mapped page writer threads wake up periodically (and when
available memory runs low) to flush modified pages to their backing store on disk. The threads call
IoAsynchronousPageWrite to create IRPs of type IRP_M _WRITE and write pages to either a paging file
or a file that was modified after being mapped. Like the IRPs that MiDispatchFault creates, these IRPs
are flagged as noncached and paging I/O. Thus, an FSD bypasses the file system cache and issues IRPs
directly to a storage driver to write the memory to disk.
Cache manager’s lazy writer
The cache manager’s lazy writer thread also plays a role in writing modified pages because it periodically flushes views of file sections mapped in the cache that it knows are dirty. The flush operation,
which the cache manager performs by calling MmFlushSection, triggers the memory manager to write
any modified pages in the portion of the section being flushed to disk. Like the modified and mapped
page writers, MmFlushSection uses IoSynchronousPageWrite to send the data to the FSD.
Cache manager’s read-ahead thread
A cache uses two artifacts of how programs reference code and data: temporal locality and spatial
locality. The underlying concept behind temporal locality is that if a memory location is referenced,
it is likely to be referenced again soon. The idea behind spatial locality is that if a memory location is
referenced, other nearby locations are also likely to be referenced soon. Thus, a cache typically is very
good at speeding up access to memory locations that have been accessed in the near past, but it’s terrible at speeding up access to areas of memory that have not yet been accessed (it has zero lookahead
622
CHAPTER 11
Caching and file systems
capability). In an attempt to populate the cache with data that will likely be used soon, the cache manager implements two mechanisms: a read-ahead thread and Superfetch.
As we described in the previous section, the cache manager includes a thread that is responsible for
attempting to read data from files before an application, a driver, or a system thread explicitly requests
it. The read-ahead thread uses the history of read operations that were performed on a file, which
are stored in a file object’s private cache map, to determine how much data to read. When the thread
performs a read-ahead, it simply maps the portion of the file it wants to read into the cache (allocating
VACBs as necessary) and touches the mapped data. The page faults caused by the memory accesses
invoke the page fault handler, which reads the pages into the system’s working set.
A limitation of the read-ahead thread is that it works only on open files. Superfetch was added to
Windows to proactively add files to the cache before they’re even opened. Specifically, the memory
manager sends page-usage information to the Superfetch service (%SystemRoot%\System32\Sysmain.
dll), and a file system minifilter provides file name resolution data. The Superfetch service attempts
to find file-usage patterns—for example, payroll is run every Friday at 12:00, or Outlook is run every
morning at 8:00. When these patterns are derived, the information is stored in a database and timers are requested. Just prior to the time the file would most likely be used, a timer fires and tells the
memory manager to read the file into low-priority memory (using low-priority disk I/O). If the file is
then opened, the data is already in memory, and there’s no need to wait for the data to be read from
disk. If the file isn’t opened, the low-priority memory will be reclaimed by the system. The internals and
full description of the Superfetch service were previously described in Chapter 5, Part 1.
Memory manager’s page fault handler
We described how the page fault handler is used in the context of explicit file I/O and cache manager
read-ahead, but it’s also invoked whenever any application accesses virtual memory that is a view of
a mapped file and encounters pages that represent portions of a file that aren’t yet in memory. The
memory manager’s MmAccessFault handler follows the same steps it does when the cache manager
generates a page fault from CcCopyRead or CcCopyWrite, sending IRPs via IoPageRead to the file system on which the file is stored.
File system filter drivers and minifilters
A filter driver that layers over a file system driver is called a file system filter driver. Two types of file
system filter drivers are supported by the Windows I/O model:
■
Legacy file system filter drivers usually create one or multiple device objects and attach them
on the file system device through the IoAttachDeviceToDeviceStack API. Legacy filter drivers
intercept all the requests coming from the cache manager or I/O manager and must implement
both standard IRP dispatch functions and the Fast I/O path. Due to the complexity involved in
the development of this kind of driver (synchronization issues, undocumented interfaces, dependency on the original file system, and so on), Microsoft has developed a unified filter model
that makes use of special drivers, called minifilters, and deprecated legacy file system drivers.
(The IoAttachDeviceToDeviceStack API fails when it’s called for DAX volumes).
CHAPTER 11
Caching and file systems
623
■
Minifilters drivers are clients of the Filesystem Filter Manager (Fltmgr.sys). The Filesystem Filter
Manager is a legacy file system filter driver that provides a rich and documented interface for the
creation of file system filters, hiding the complexity behind all the interactions between the file
system drivers and the cache manager. Minifilters register with the filter manager through the
FltRegisterFilter API. The caller usually specifies an instance setup routine and different operation
callbacks. The instance setup is called by the filter manager for every valid volume device that a
file system manages. The minifilter has the chance to decide whether to attach to the volume.
Minifilters can specify a Pre and Post operation callback for every major IRP function code, as well
as certain “pseudo-operations” that describe internal memory manager or cache manager semantics that are relevant to file system access patterns. The Pre callback is executed before the I/O
is processed by the file system driver, whereas the Post callback is executed after the I/O operation
has been completed. The Filter Manager also provides its own communication facility that can be
employed between minifilter drivers and their associated user-mode application.
The ability to see all file system requests and optionally modify or complete them enables a range
of applications, including remote file replication services, file encryption, efficient backup, and licensing. Every anti-malware product typically includes at least a minifilter driver that intercepts applications
opening or modifying files. For example, before propagating the IRP to the file system driver to which
the command is directed, a malware scanner examines the file being opened to ensure that it’s clean.
If the file is clean, the malware scanner passes the IRP on, but if the file is infected, the malware scanner quarantines or cleans the file. If the file can’t be cleaned, the driver fails the IRP (typically with an
access-denied error) so that the malware cannot become active.
Deeply describing the entire minifilter and legacy filter driver architecture is outside the scope
of this chapter. You can find more information on the legacy filter driver architecture in Chapter 6,
“I/O System,” of Part 1. More details on minifilters are available in MSDN (https://docs.microsoft.com
/en-us/windows-hardware/drivers/ifs/file-system-minifilter-drivers).
Data-scan sections
Starting with Windows 8.1, the Filter Manager collaborates with file system drivers to provide data-scan
section objects that can be used by anti-malware products. Data-scan section objects are similar to
standard section objects (for more information about section objects, see Chapter 5 of Part 1) except
for the following:
■
■
624
Data-scan section objects can be created from minifilter callback functions, namely from callbacks that manage the IRP_M _CREATE function code. These callbacks are called by the filter
manager when an application is opening or creating a file. An anti-malware scanner can create
a data-scan section and then start scanning before completing the callback.
FltCreateSectionForDataScan, the API used for creating data-scan sections, accepts a FILE_
OB ECT pointer. This means that callers don’t need to provide a file handle. The file handle
typically doesn’t yet exist, and would thus need to be (re)created by using FltCreateFile API,
which would then have created other file creation IRPs, recursively interacting with lower level
file system filters once again. With the new API, the process is much faster because these extra
recursive calls won’t be generated.
CHAPTER 11
Caching and file systems
A data-scan section can be mapped like a normal section using the traditional API. This allows antimalware applications to implement their scan engine either as a user-mode application or in a kernelmode driver. When the data-scan section is mapped, IRP_M _READ events are still generated in the minifilter driver, but this is not a problem because the minifilter doesn’t have to include a read callback at all.
Filtering named pipes and mailslots
When a process belonging to a user application needs to communicate with another entity (a process, kernel driver, or remote application), it can leverage facilities provided by the operating system.
The most traditionally used are named pipes and mailslots, because they are portable among other
operating systems as well. A named pipe is a named, one-way communication channel between a pipe
server and one or more pipe clients. All instances of a named pipe share the same pipe name, but each
instance has its own buffers and handles, and provides a separate channel for client/server communication. Named pipes are implemented through a file system driver, the NPFS driver (Npfs.sys).
A mailslot is a multi-way communication channel between a mailslot server and one or more clients.
A mailslot server is a process that creates a mailslot through the CreateMailslot Win32 API, and can only
read small messages (424 bytes maximum when sent between remote computers) generated by one or
more clients. Clients are processes that write messages to the mailslot. Clients connect to the mailslot
through the standard CreateFile API and send messages through the WriteFile function. Mailslots are
generally used for broadcasting messages within a domain. If several server processes in a domain each
create a mailslot using the same name, every message that is addressed to that mailslot and sent to the
domain is received by the participating processes. Mailslots are implemented through the Mailslot file
system driver, Msfs.sys.
Both the mailslot and NPFS driver implement simple file systems. They manage namespaces composed of files and directories, which support security, can be opened, closed, read, written, and so on.
Describing the implementation of the two drivers is outside the scope of this chapter.
Starting with Windows 8, mailslots and named pipes are supported by the Filter Manager. Minifilters
are able to attach to the mailslot and named pipe volumes (\Device\NamedPipe and \Device\Mailslot,
which are not real volumes), through the FLTFL_REGISTRATION_SUPPORT_NPFS_MSFS flag specified
at registration time. A minifilter can then intercept and modify all the named pipe and mailslot I/O
that happens between local and remote process and between a user application and its kernel driver.
Furthermore, minifilters can open or create a named pipe or mailslot without generating recursive
events through the FltCreateNamedPipeFile or FltCreateMailslotFile APIs.
Note One of the motivations that explains why the named pipe and mailslot file system
drivers are simpler compared to NTFS and ReFs is that they do not interact heavily with
the cache manager. The named pipe driver implements the Fast I/O path but with no
cached read or write-behind support. The mailslot driver does not interact with the cache
manager at all.
CHAPTER 11
Caching and file systems
625
Controlling reparse point behavior
The NTFS file system supports the concept of reparse points, blocks of 16 KB of application and systemdefined reparse data that can be associated to single files. (Reparse points are discussed more in multiple sections later in this chapter.) Some types of reparse points, like volume mount points or symbolic
links, contain a link between the original file (or an empty directory), used as a placeholder, and another file, which can even be located in another volume. When the NTFS file system driver encounters
a reparse point on its path, it returns an error code to the upper driver in the device stack. The latter
(which could be another filter driver) analyzes the reparse point content and, in the case of a symbolic
link, re-emits another I/O to the correct volume device.
This process is complex and cumbersome for any filter driver. Minifilters drivers can intercept the
STATUS_REPARSE error code and reopen the reparse point through the new FltCreateFileEx2 API,
which accepts a list of Extra Create Parameters (also known as ECPs), used to fine-tune the behavior
of the opening/creation process of a target file in the minifilter context. In general, the Filter Manager
supports different ECPs, and each of them is uniquely identified by a GUID. The Filter Manager provides multiple documented APIs that deal with ECPs and ECP lists. Usually, minifilters allocate an
ECP with the FltAllocateExtraCreateParameter function, populate it, and insert it into a list (through
FltInsertExtraCreateParameter) before calling the Filter Manager’s I/O APIs.
The FLT_CREATEFILE_TARGET extra creation parameter allows the Filter Manager to manage crossvolume file creation automatically (the caller needs to specify a flag). Minifilters don’t need to perform
any other complex operation.
With the goal of supporting container isolation, it’s also possible to set a reparse point on nonempty
directories and, in order to support container isolation, create new files that have directory reparse
points. The default behavior that the file system has while encountering a nonempty directory reparse
point depends on whether the reparse point is applied in the last component of the file full path. If this
is the case, the file system returns the STATUS_REPARSE error code, just like for an empty directory;
otherwise, it continues to walk the path.
The Filter Manager is able to correctly deal with this new kind of reparse point through another ECP
(named TYPE_OPEN_REPARSE). The ECP includes a list of descriptors (OPEN_REPARSE_LIST_ ENTRY
data structure), each of which describes the type of reparse point (through its Reparse Tag), and the
behavior that the system should apply when it encounters a reparse point of that type while parsing
a path. Minifilters, after they have correctly initialized the descriptor list, can apply the new behavior in
different ways:
■
■
626
Issue a new open (or create) operation on a file that resides in a path that includes a reparse
point in any of its components, using the FltCreateFileEx2 function. This procedure is similar to
the one used by the FLT_CREATEFILE_TARGET ECP.
Apply the new reparse point behavior globally to any file that the Pre-Create callback intercepts. The FltAddOpenReparseEntry and FltRemoveOpenReparseEntry APIs can be used to set
the reparse point behavior to a target file before the file is actually created (the pre-creation
callback intercepts the file creation request before the file is created). The Windows Container
Isolation minifilter driver (Wcifs.sys) uses this strategy.
CHAPTER 11
Caching and file systems
Process Monitor
Process Monitor (Procmon), a system activity-monitoring utility from Sysinternals that has been used
throughout this book, is an example of a passive minifilter driver, which is one that does not modify the
flow of IRPs between applications and file system drivers.
Process Monitor works by extracting a file system minifilter device driver from its executable image
(stored as a resource inside Procmon.exe) the first time you run it after a boot, installing the driver in
memory, and then deleting the driver image from disk (unless configured for persistent boot-time
monitoring). Through the Process Monitor GUI, you can direct the driver to monitor file system activity
on local volumes that have assigned drive letters, network shares, named pipes, and mail slots. When
the driver receives a command to start monitoring a volume, it registers filtering callbacks with the
Filter Manager, which is attached to the device object that represents a mounted file system on the
volume. After an attach operation, the I/O manager redirects an IRP targeted at the underlying device
object to the driver owning the attached device, in this case the Filter Manager, which sends the event
to registered minifilter drivers, in this case Process Monitor.
When the Process Monitor driver intercepts an IRP, it records information about the IRP’s command, including target file name and other parameters specific to the command (such as read and
write lengths and offsets) to a nonpaged kernel buffer. Every 500 milliseconds, the Process Monitor GUI
program sends an IRP to Process Monitor’s interface device object, which requests a copy of the buffer containing the latest activity, and then displays the activity in its output window. Process Monitor
shows all file activity as it occurs, which makes it an ideal tool for troubleshooting file system–related
system and application failures. To run Process Monitor the first time on a system, an account must
have the Load Driver and Debug privileges. After loading, the driver remains resident, so subsequent
executions require only the Debug privilege.
When you run Process Monitor, it starts in basic mode, which shows the file system activity most
often useful for troubleshooting. When in basic mode, Process Monitor omits certain file system operations from being displayed, including
■
I/O to NTFS metadata files
■
I/O to the paging file
■
I/O generated by the System process
■
I/O generated by the Process Monitor process
While in basic mode, Process Monitor also reports file I/O operations with friendly names rather
than with the IRP types used to represent them. For example, both IRP_M _WRITE and FASTIO_WRITE
operations display as WriteFile, and IRP_M _CREATE operations show as Open if they represent an open
operation and as Create for the creation of new files.
CHAPTER 11
Caching and file systems
627
EXPERIMENT: Viewing Process Monitor’s minifilter driver
To see which file system minifilter drivers are loaded, start an Administrative command prompt,
and run the Filter Manager control program (%SystemRoot%\System32\Fltmc.exe). Start Process
Monitor (ProcMon.exe) and run Fltmc again. You see that the Process Monitor’s filter driver
(PROCMON20) is loaded and has a nonzero value in the Instances column. Now, exit Process
Monitor and run Fltmc again. This time, you see that the Process Monitor’s filter driver is still
loaded, but now its instance count is zero.
The NT File System (NTFS)
In the following section, we analyze the internal architecture of the NTFS file system, starting by looking at the requirements that drove its design. We examine the on-disk data structures, and then we
move on to the advanced features provided by the NTFS file system, like the Recovery support, tiered
volumes, and the Encrypting File System (EFS).
High-end file system requirements
From the start, NTFS was designed to include features required of an enterprise-class file system. To
minimize data loss in the face of an unexpected system outage or crash, a file system must ensure that
the integrity of its metadata is guaranteed at all times; and to protect sensitive data from unauthorized
access, a file system must have an integrated security model. Finally, a file system must allow for software-based data redundancy as a low-cost alternative to hardware-redundant solutions for protecting
user data. In this section, you find out how NTFS implements each of these capabilities.
628
CHAPTER 11
Caching and file systems
Recoverability
To address the requirement for reliable data storage and data access, NTFS provides file system recovery based on the concept of an atomic transaction. Atomic transactions are a technique for handling
modifications to a database so that system failures don’t affect the correctness or integrity of the
database. The basic tenet of atomic transactions is that some database operations, called transactions,
are all-or-nothing propositions. (A transaction is defined as an I/O operation that alters file system data
or changes the volume’s directory structure.) The separate disk updates that make up the transaction
must be executed atomically—that is, once the transaction begins to execute, all its disk updates must
be completed. If a system failure interrupts the transaction, the part that has been completed must be
undone, or rolled back. The rollback operation returns the database to a previously known and consistent state, as if the transaction had never occurred.
NTFS uses atomic transactions to implement its file system recovery feature. If a program initiates
an I/O operation that alters the structure of an NTFS volume—that is, changes the directory structure,
extends a file, allocates space for a new file, and so on—NTFS treats that operation as an atomic transaction. It guarantees that the transaction is either completed or, if the system fails while executing the
transaction, rolled back. The details of how NTFS does this are explained in the section “NTFS recovery
support” later in the chapter. In addition, NTFS uses redundant storage for vital file system information
so that if a sector on the disk goes bad, NTFS can still access the volume’s critical file system data.
Security
Security in NTFS is derived directly from the Windows object model. Files and directories are protected
from being accessed by unauthorized users. (For more information on Windows security, see Chapter
7, “Security,” in Part 1.) An open file is implemented as a file object with a security descriptor stored on
disk in the hidden Secure metafile, in a stream named SDS (Security Descriptor Stream). Before a
process can open a handle to any object, including a file object, the Windows security system verifies
that the process has appropriate authorization to do so. The security descriptor, combined with the
requirement that a user log on to the system and provide an identifying password, ensures that no process can access a file unless it is given specific permission to do so by a system administrator or by the
file’s owner. (For more information about security descriptors, see the section “Security descriptors and
access control” in Chapter 7 in Part 1).
Data redundancy and fault tolerance
In addition to recoverability of file system data, some customers require that their data not be endangered by a power outage or catastrophic disk failure. The NTFS recovery capabilities ensure that the
file system on a volume remains accessible, but they make no guarantees for complete recovery of user
files. Protection for applications that can’t risk losing file data is provided through data redundancy.
Data redundancy for user files is implemented via the Windows layered driver, which provides
fault-tolerant disk support. NTFS communicates with a volume manager, which in turn communicates
with a disk driver to write data to a disk. A volume manager can mirror, or duplicate, data from one disk
onto another disk so that a redundant copy can always be retrieved. This support is commonly called
CHAPTER 11
Caching and file systems
629
RAID level 1. Volume managers also allow data to be written in stripes across three or more disks, using
the equivalent of one disk to maintain parity information. If the data on one disk is lost or becomes
inaccessible, the driver can reconstruct the disk’s contents by means of exclusive-OR operations. This
support is called RAID level 5.
In Windows 7, data redundancy for NTFS implemented via the Windows layered driver was provided
by Dynamic Disks. Dynamic Disks had multiple limitations, which have been overcome in Windows 8.1
by introducing a new technology that virtualizes the storage hardware, called Storage Spaces. Storage
Spaces is able to create virtual disks that already provide data redundancy and fault tolerance. The
volume manager doesn’t differentiate between a virtual disk and a real disk (so user mode components
can’t see any difference between the two). The NTFS file system driver cooperates with Storage Spaces
for supporting tiered disks and RAID virtual configurations. Storage Spaces and Spaces Direct will be
covered later in this chapter.
Advanced features of NTFS
In addition to NTFS being recoverable, secure, reliable, and efficient for mission-critical systems, it
includes the following advanced features that allow it to support a broad range of applications. Some
of these features are exposed as APIs for applications to leverage, and others are internal features:
■
Multiple data streams
■
Unicode-based names
■
General indexing facility
■
Dynamic bad-cluster remapping
■
Hard links
■
Symbolic (soft) links and junctions
■
Compression and sparse files
■
Change logging
■
Per-user volume quotas
■
Link tracking
■
Encryption
■
POSIX support
■
Defragmentation
■
Read-only support and dynamic partitioning
■
Tiered volume support
The following sections provide an overview of these features.
630
CHAPTER 11
Caching and file systems
Multiple data streams
In NTFS, each unit of information associated with a file—including its name, its owner, its time stamps,
its contents, and so on—is implemented as a file attribute (NTFS object attribute). Each attribute consists of a single stream—that is, a simple sequence of bytes. This generic implementation makes it easy
to add more attributes (and therefore more streams) to a file. Because a file’s data is “just another attribute” of the file and because new attributes can be added, NTFS files (and file directories) can contain
multiple data streams.
An NTFS file has one default data stream, which has no name. An application can create additional,
named data streams and access them by referring to their names. To avoid altering the Windows I/O
APIs, which take a string as a file name argument, the name of the data stream is specified by appending a colon (:) to the file name. Because the colon is a reserved character, it can serve as a separator
between the file name and the data stream name, as illustrated in this example:
myfile.dat:stream2
Each stream has a separate allocation size (which defines how much disk space has been reserved
for it), actual size (which is how many bytes the caller has used), and valid data length (which is how
much of the stream has been initialized). In addition, each stream is given a separate file lock that is
used to lock byte ranges and to allow concurrent access.
One component in Windows that uses multiple data streams is the Attachment Execution Service,
which is invoked whenever the standard Windows API for saving internet-based attachments is used by
applications such as Edge or Outlook. Depending on which zone the file was downloaded from (such as
the My Computer zone, the Intranet zone, or the Untrusted zone), Windows Explorer might warn the
user that the file came from a possibly untrusted location or even completely block access to the file.
For example, Figure 11-24 shows the dialog box that’s displayed when executing Process Explorer after
it was downloaded from the Sysinternals site. This type of data stream is called the Zone.Identifier and
is colloquially referred to as the “Mark of the Web.”
Note If you clear the check box for Always Ask Before Opening This File, the zone identifier
data stream will be removed from the file.
FIGURE 11-24 Security warning for files downloaded from the internet.
CHAPTER 11
Caching and file systems
631
Other applications can use the multiple data stream feature as well. A backup utility, for example,
might use an extra data stream to store backup-specific time stamps on files. Or an archival utility
might implement hierarchical storage in which files that are older than a certain date or that haven’t
been accessed for a specified period of time are moved to offline storage. The utility could copy the file
to offline storage, set the file’s default data stream to 0, and add a data stream that specifies where the
file is stored.
EXPERIMENT: Looking at streams
Most Windows applications aren’t designed to work with alternate named streams, but both the
echo and more commands are. Thus, a simple way to view streams in action is to create a named
stream using echo and then display it using more. The following command sequence creates a
file named test with a stream named stream:
c:\Test>echo Hello from a named stream! > test:stream
c:\Test>more < test:stream
Hello from a named stream!
c:\Test>
If you perform a directory listing, Test’s file size doesn’t reflect the data stored in the alternate
stream because NTFS returns the size of only the unnamed data stream for file query operations,
including directory listings.
c:\Test>dir test
Volume in drive C is OS.
Volume Serial Number is F080-620F
Directory of c:\Test
12/07/2018
05:33 PM
0 test
1 File(s)
0 bytes
0 Dir(s) 18,083,577,856 bytes free
c:\Test>
You can determine what files and directories on your system have alternate data streams
with the Streams utility from Sysinternals (see the following output) or by using the /r switch
in the dir command.
c:\Test>streams test
streams v1.60 - Reveal NTFS alternate streams.
Copyright (C) 2005-2016 Mark Russinovich
Sysinternals - www.sysinternals.com
c:\Test\test:
:stream:$DATA 29
632
CHAPTER 11
Caching and file systems
Unicode-based names
Like Windows as a whole, NTFS supports 16-bit Unicode 1.0/UTF-16 characters to store names of files,
directories, and volumes. Unicode allows each character in each of the world’s major languages to be
uniquely represented (Unicode can even represent emoji, or small drawings), which aids in moving data
easily from one country to another. Unicode is an improvement over the traditional representation of
international characters—using a double-byte coding scheme that stores some characters in 8 bits and
others in 16 bits, a technique that requires loading various code pages to establish the available characters. Because Unicode has a unique representation for each character, it doesn’t depend on which code
page is loaded. Each directory and file name in a path can be as many as 255 characters long and can
contain Unicode characters, embedded spaces, and multiple periods.
General indexing facility
The NTFS architecture is structured to allow indexing of any file attribute on a disk volume using a
B-tree structure. (Creating indexes on arbitrary attributes is not exported to users.) This structure
enables the file system to efficiently locate files that match certain criteria—for example, all the files in
a particular directory. In contrast, the FAT file system indexes file names but doesn’t sort them, making
lookups in large directories slow.
Several NTFS features take advantage of general indexing, including consolidated security descriptors, in which the security descriptors of a volume’s files and directories are stored in a single internal
stream, have duplicates removed, and are indexed using an internal security identifier that NTFS
defines. The use of indexing by these features is described in the section “NTFS on-disk structure” later
in this chapter.
Dynamic bad-cluster remapping
Ordinarily, if a program tries to read data from a bad disk sector, the read operation fails and the data
in the allocated cluster becomes inaccessible. If the disk is formatted as a fault-tolerant NTFS volume,
however, the Windows volume manager—or Storage Spaces, depending on the component that
provides data redundancy—dynamically retrieves a good copy of the data that was stored on the
bad sector and then sends NTFS a warning that the sector is bad. NTFS will then allocate a new cluster,
replacing the cluster in which the bad sector resides, and copies the data to the new cluster. It adds
the bad cluster to the list of bad clusters on that volume (stored in the hidden metadata file BadClus)
and no longer uses it. This data recovery and dynamic bad-cluster remapping is an especially useful
feature for file servers and fault-tolerant systems or for any application that can’t afford to lose data. If
the volume manager or Storage Spaces is not used when a sector goes bad (such as early in the boot
sequence), NTFS still replaces the cluster and doesn’t reuse it, but it can’t recover the data that was on
the bad sector.
CHAPTER 11
Caching and file systems
633
Hard links
A hard link allows multiple paths to refer to the same file. (Hard links are not supported on directories.)
If you create a hard link named C:\Documents\Spec.doc that refers to the existing file C:\Users
\Administrator\Documents\Spec.doc, the two paths link to the same on-disk file, and you can make changes to the file using either path. Processes can create hard links with the Windows CreateHardLink function.
NTFS implements hard links by keeping a reference count on the actual data, where each time
a hard link is created for the file, an additional file name reference is made to the data. This means
that if you have multiple hard links for a file, you can delete the original file name that referenced
the data (C:\Users\Administrator\Documents\Spec.doc in our example), and the other hard links
(C:\Documents\Spec.doc) will remain and point to the data. However, because hard links are on-disk
local references to data (represented by a file record number), they can exist only within the same volume and can’t span volumes or computers.
EXPERIMENT: Creating a hard link
There are two ways you can create a hard link: the fsutil hardlink create command or the mklink
utility with the /H option. In this experiment we’ll use mklink because we’ll use this utility later to create a symbolic link as well. First, create a file called test.txt and add some text to it, as shown here.
C:\>echo Hello from a Hard Link > test.txt
Now create a hard link called hard.txt as shown here:
C:\>mklink hard.txt test.txt /H
Hardlink created for hard.txt <<===>> test.txt
If you list the directory’s contents, you’ll notice that the two files will be identical in every way,
with the same creation date, permissions, and file size; only the file names differ.
c:\>dir *.txt
Volume in drive C is OS
Volume Serial Number is F080-620F
Directory of c:\
12/07/2018
12/07/2018
05:46 PM
26 hard.txt
05:46 PM
26 test.txt
2 File(s)
52 bytes
0 Dir(s) 15,150,333,952 bytes free
Symbolic (soft) links and junctions
In addition to hard links, NTFS supports another type of file-name aliasing called symbolic links or soft
links. Unlike hard links, symbolic links are strings that are interpreted dynamically and can be relative or absolute paths that refer to locations on any storage device, including ones on a different local
volume or even a share on a different system. This means that symbolic links don’t actually increase the
reference count of the original file, so deleting the original file will result in the loss of the data, and a
symbolic link that points to a nonexisting file will be left behind. Finally, unlike hard links, symbolic links
can point to directories, not just files, which gives them an added advantage.
634
CHAPTER 11
Caching and file systems
For example, if the path C:\Drivers is a directory symbolic link that redirects to %SystemRoot%\
System32\Drivers, an application reading C:\Drivers\Ntfs.sys actually reads %SystemRoot%\System\
Drivers\Ntfs.sys. Directory symbolic links are a useful way to lift directories that are deep in a directory tree to a more convenient depth without disturbing the original tree’s structure or contents. The
example just cited lifts the Drivers directory to the volume’s root directory, reducing the directory
depth of Ntfs.sys from three levels to one when Ntfs.sys is accessed through the directory symbolic
link. File symbolic links work much the same way—you can think of them as shortcuts, except they’re
actually implemented on the file system instead of being .lnk files managed by Windows Explorer. Just
like hard links, symbolic links can be created with the mklink utility (without the /H option) or through
the CreateSymbolicLink API.
Because certain legacy applications might not behave securely in the presence of symbolic links,
especially across different machines, the creation of symbolic links requires the SeCreateSymbolicLink
privilege, which is typically granted only to administrators. Starting with Windows 10, and only if
Developer Mode is enabled, callers of CreateSymbolicLink API can additionally specify the SYMBOLIC_
LINK_FLAG _ ALLOW_UNPRIVILEGED_CREATE flag to overcome this limitation (this allows a standard
user is still able to create symbolic links from the command prompt window). The file system also has a
behavior option called SymLinkEvaluation that can be configured with the following command:
fsutil behavior set SymLinkEvaluation
By default, the Windows default symbolic link evaluation policy allows only local-to-local and localto-remote symbolic links but not the opposite, as shown here:
D:\>fsutil behavior query SymLinkEvaluation
Local to local symbolic links are enabled
Local to remote symbolic links are enabled.
Remote to local symbolic links are disabled.
Remote to Remote symbolic links are disabled.
Symbolic links are implemented using an NTFS mechanism called reparse points. (Reparse points are
discussed further in the section “Reparse points” later in this chapter.) A reparse point is a file or directory that has a block of data called reparse data associated with it. Reparse data is user-defined data
about the file or directory, such as its state or location that can be read from the reparse point by the
application that created the data, a file system filter driver, or the I/O manager. When NTFS encounters
a reparse point during a file or directory lookup, it returns the STATUS_REPARSE status code, which
signals file system filter drivers that are attached to the volume and the I/O manager to examine the
reparse data. Each reparse point type has a unique reparse tag. The reparse tag allows the component
responsible for interpreting the reparse point’s reparse data to recognize the reparse point without
having to check the reparse data. A reparse tag owner, either a file system filter driver or the I/O manager, can choose one of the following options when it recognizes reparse data:
■
■
The reparse tag owner can manipulate the path name specified in the file I/O operation
that crosses the reparse point and let the I/O operation reissue with the altered path name.
Junctions (described shortly) take this approach to redirect a directory lookup, for example.
The reparse tag owner can remove the reparse point from the file, alter the file in some way,
and then reissue the file I/O operation.
CHAPTER 11
Caching and file systems
635
There are no Windows functions for creating reparse points. Instead, processes must use the FSCTL_
SET_REPARSE_POINT file system control code with the Windows DeviceIoControl function. A process
can query a reparse point’s contents with the FSCTL_GET_REPARSE_POINT file system control code.
The FILE_ATTRIBUTE_REPARSE_POINT flag is set in a reparse point’s file attributes, so applications can
check for reparse points by using the Windows GetFileAttributes function.
Another type of reparse point that NTFS supports is the junction (also known as Volume Mount
point). Junctions are a legacy NTFS concept and work almost identically to directory symbolic links,
except they can only be local to a volume. There is no advantage to using a junction instead of a directory symbolic link, except that junctions are compatible with older versions of Windows, while directory
symbolic links are not.
As seen in the previous section, modern versions of Windows now allow the creation of reparse points
that can point to non-empty directories. The system behavior (which can be controlled from minifilters
drivers) depends on the position of the reparse point in the target file’s full path. The filter manager, NTFS,
and ReFS file system drivers use the exposed FsRtlIsNonEmptyDirectoryReparsePointAllowed API to detect
if a reparse point type is allowed on non-empty directories.
EXPERIMENT: Creating a symbolic link
This experiment shows you the main difference between a symbolic link and a hard link, even
when dealing with files on the same volume. Create a symbolic link called soft.txt as shown here,
pointing to the test.txt file created in the previous experiment:
C:\>mklink soft.txt test.txt
symbolic link created for soft.txt <<===>> test.txt
If you list the directory’s contents, you’ll notice that the symbolic link doesn’t have a file size
and is identified by the <SYMLINK> type. Furthermore, you’ll note that the creation time is that
of the symbolic link, not of the target file. The symbolic link can also have security permissions
that are different from the permissions on the target file.
C:\>dir *.txt
Volume in drive C is OS
Volume Serial Number is 38D4-EA71
Directory of C:\
05/12/2012
05/13/2012
05/12/2012
11:55 PM
8 hard.txt
12:28 AM
<SYMLINK>
soft.txt [test.txt]
11:55 PM
8 test.txt
3 File(s)
16 bytes
0 Dir(s) 10,636,480,512 bytes free
Finally, if you delete the original test.txt file, you can verify that both the hard link and symbolic link still exist but that the symbolic link does not point to a valid file anymore, while the hard
link references the file data.
636
CHAPTER 11
Caching and file systems
Compression and sparse files
NTFS supports compression of file data. Because NTFS performs compression and decompression
procedures transparently, applications don’t have to be modified to take advantage of this feature.
Directories can also be compressed, which means that any files subsequently created in the directory
are compressed.
Applications compress and decompress files by passing DeviceIoControl the FSCTL_SET_
COMPRESSION file system control code. They query the compression state of a file or directory
with the FSCTL_GET_COMPRESSION file system control code. A file or directory that is compressed
has the FILE_ATTRIBUTE_COMPRESSED flag set in its attributes, so applications can also determine a
file or directory’s compression state with GetFileAttributes.
A second type of compression is known as sparse files. If a file is marked as sparse, NTFS doesn’t allocate space on a volume for portions of the file that an application designates as empty. NTFS returns
0-filled buffers when an application reads from empty areas of a sparse file. This type of compression
can be useful for client/server applications that implement circular-buffer logging, in which the server
records information to a file, and clients asynchronously read the information. Because the information
that the server writes isn’t needed after a client has read it, there’s no need to store the information
in the file. By making such a file sparse, the client can specify the portions of the file it reads as empty,
freeing up space on the volume. The server can continue to append new information to the file without
fear that the file will grow to consume all available space on the volume.
As with compressed files, NTFS manages sparse files transparently. Applications specify a file’s
sparseness state by passing the FSCTL_SET_SPARSE file system control code to DeviceIoControl. To set
a range of a file to empty, applications use the FSCTL_SET_ZERO_DATA code, and they can ask NTFS
for a description of what parts of a file are sparse by using the control code FSCTL_QUERY_ALLOCATED
_RANGES. One application of sparse files is the NTFS change ournal, described next.
Change logging
Many types of applications need to monitor volumes for file and directory changes. For example, an
automatic backup program might perform an initial full backup and then incremental backups based
on file changes. An obvious way for an application to monitor a volume for changes is for it to scan the
volume, recording the state of files and directories, and on a subsequent scan detect differences. This
process can adversely affect system performance, however, especially on computers with thousands or
tens of thousands of files.
An alternate approach is for an application to register a directory notification by using the FindFirst
ChangeNotification or ReadDirectoryChangesW Windows function. As an input parameter, the application
specifies the name of a directory it wants to monitor, and the function returns whenever the contents
of the directory change. Although this approach is more efficient than volume scanning, it requires
the application to be running at all times. Using these functions can also require an application to scan
directories because FindFirstChangeNotification doesn’t indicate what changed—just that something
in the directory has changed. An application can pass a buffer to ReadDirectoryChangesW that the FSD
CHAPTER 11
Caching and file systems
637
fills in with change records. If the buffer overflows, however, the application must be prepared to fall
back on scanning the directory.
NTFS provides a third approach that overcomes the drawbacks of the first two: an application can
configure the NTFS change journal facility by using the DeviceIoControl function’s FSCTL_CREATE_
USN_ JOURNAL file system control code (USN is update sequence number) to have NTFS record information about file and directory changes to an internal file called the change ournal. A change journal is
usually large enough to virtually guarantee that applications get a chance to process changes without
missing any. Applications use the FSCTL_QUERY_USN_ OURNAL file system control code to read records from a change journal, and they can specify that the DeviceIoControl function not complete until
new records are available.
Per-user volume quotas
Systems administrators often need to track or limit user disk space usage on shared storage volumes,
so NTFS includes quota-management support. NTFS quota-management support allows for per-user
specification of quota enforcement, which is useful for usage tracking and tracking when a user reaches
warning and limit thresholds. NTFS can be configured to log an event indicating the occurrence to the
System event log if a user surpasses his warning limit. Similarly, if a user attempts to use more volume
storage then her quota limit permits, NTFS can log an event to the System event log and fail the application file I/O that would have caused the quota violation with a “disk full” error code.
NTFS tracks a user’s volume usage by relying on the fact that it tags files and directories with the security ID (SID) of the user who created them. (See Chapter 7, “Security,” in Part 1 for a definition of SIDs.)
The logical sizes of files and directories a user owns count against the user’s administrator-defined
quota limit. Thus, a user can’t circumvent his or her quota limit by creating an empty sparse file that is
larger than the quota would allow and then fill the file with nonzero data. Similarly, whereas a 50 KB file
might compress to 10 KB, the full 50 KB is used for quota accounting.
By default, volumes don’t have quota tracking enabled. You need to use the Quota tab of a volume’s Properties dialog box, shown in Figure 11-25, to enable quotas, to specify default warning and
limit thresholds, and to configure the NTFS behavior that occurs when a user hits the warning or limit
threshold. The Quota Entries tool, which you can launch from this dialog box, enables an administrator to specify different limits and behavior for each user. Applications that want to interact with NTFS
quota management use COM quota interfaces, including IDiskQuotaControl, IDiskQuotaUser, and
IDiskQuotaEvents.
638
CHAPTER 11
Caching and file systems
FIGURE 11-25 The Quota Settings dialog accessible from the volume’s Properties window.
Link tracking
Shell shortcuts allow users to place files in their shell namespaces (on their desktops, for example) that
link to files located in the file system namespace. The Windows Start menu uses shell shortcuts extensively. Similarly, object linking and embedding (OLE) links allow documents from one application to be
transparently embedded in the documents of other applications. The products of the Microsoft Office
suite, including PowerPoint, Excel, and Word, use OLE linking.
Although shell and OLE links provide an easy way to connect files with one another and with the
shell namespace, they can be difficult to manage if a user moves the source of a shell or OLE link (a link
source is the file or directory to which a link points). NTFS in Windows includes support for a service
application called distributed link-tracking, which maintains the integrity of shell and OLE links when
link targets move. Using the NTFS link-tracking support, if a link target located on an NTFS volume
moves to any other NTFS volume within the originating volume’s domain, the link-tracking service can
transparently follow the movement and update the link to reflect the change.
NTFS link-tracking support is based on an optional file attribute known as an object ID. An application
can assign an object ID to a file by using the FSCTL_CREATE_OR_GET_OB ECT_ID (which assigns an ID if
one isn’t already assigned) and FSCTL_SET_OB ECT_ID file system control codes. Object IDs are queried
with the FSCTL_CREATE_OR_GET_OB ECT_ID and FSCTL_GET_OB ECT_ID file system control codes. The
FSCTL_DELETE_OB ECT_ID file system control code lets applications delete object IDs from files.
CHAPTER 11
Caching and file systems
639
Encryption
Corporate users often store sensitive information on their computers. Although data stored on company servers is usually safely protected with proper network security settings and physical access control, data stored on laptops can be exposed when a laptop is lost or stolen. NTFS file permissions don’t
offer protection because NTFS volumes can be fully accessed without regard to security by using NTFS
file-reading software that doesn’t require Windows to be running. Furthermore, NTFS file permissions
are rendered useless when an alternate Windows installation is used to access files from an administrator account. Recall from Chapter 6 in Part 1 that the administrator account has the take-ownership
and backup privileges, both of which allow it to access any secured object by overriding the object’s
security settings.
NTFS includes a facility called Encrypting File System (EFS), which users can use to encrypt sensitive
data. The operation of EFS, as that of file compression, is completely transparent to applications, which
means that file data is automatically decrypted when an application running in the account of a user
authorized to view the data reads it and is automatically encrypted when an authorized application
changes the data.
Note NTFS doesn’t permit the encryption of files located in the system volume’s root directory or in the \Windows directory because many files in these locations are required during
the boot process, and EFS isn’t active during the boot process. BitLocker is a technology
much better suited for environments in which this is a requirement because it supports fullvolume encryption. As we will describe in the next paragraphs, Bitlocker collaborates with
NTFS for supporting file-encryption.
EFS relies on cryptographic services supplied by Windows in user mode, so it consists of both a
kernel-mode component that tightly integrates with NTFS as well as user-mode DLLs that communicate with the Local Security Authority Subsystem (LSASS) and cryptographic DLLs.
Files that are encrypted can be accessed only by using the private key of an account’s EFS private/
public key pair, and private keys are locked using an account’s password. Thus, EFS-encrypted files on
lost or stolen laptops can’t be accessed using any means (other than a brute-force cryptographic attack) without the password of an account that is authorized to view the data.
Applications can use the EncryptFile and DecryptFile Windows API functions to encrypt and decrypt
files, and FileEncryptionStatus to retrieve a file or directory’s EFS-related attributes, such as whether the
file or directory is encrypted. A file or directory that is encrypted has the FILE_ATTRIBUTE_ENCRYPTED
flag set in its attributes, so applications can also determine a file or directory’s encryption state with
GetFileAttributes.
640
CHAPTER 11
Caching and file systems
POSIX-style delete semantics
The POSIX Subsystem has been deprecated and is no longer available in the Windows operating
system. The Windows Subsystem for Linux (WSL) has replaced the original POSIX Subsystem. The NTFS
file system driver has been updated to unify the differences between I/O operations supported in
Windows and those supported in Linux. One of these differences is provided by the Linux unlink (or rm)
command, which deletes a file or a folder. In Windows, an application can’t delete a file that is in use by
another application (which has an open handle to it); conversely, Linux usually supports this: other processes continue to work well with the original deleted file. To support WSL, the NTFS file system driver
in Windows 10 supports a new operation: POSIX Delete.
The Win32 DeleteFile API implements standard file deletion. The target file is opened (a new handle
is created), and then a disposition label is attached to the file through the NtSetInformationFile native
API. The label just communicates to the NTFS file system driver that the file is going to be deleted. The
file system driver checks whether the number of references to the FCB (File Control Block) is equal to 1,
meaning that there is no other outstanding open handle to the file. If so, the file system driver marks
the file as “deleted on close” and then returns. Only when the handle to the file is closed does the IRP_
M _CLEANUP dispatch routine physically remove the file from the underlying medium.
A similar architecture is not compatible with the Linux unlink command. The WSL subsystem, when
it needs to erase a file, employs POSIX-style deletion; it calls the NtSetInformationFile native API with
the new FileDispositionInformationEx information class, specifying a flag (FILE_DISPOSITION_POSIX_
SEMANTICS). The NTFS file system driver marks the file as POSIX deleted by inserting a flag in its
Context Control Block (CCB, a data structure that represents the context of an open instance of an
on-disk object). It then re-opens the file with a special internal routine and attaches the new handle
(which we will call the PosixDeleted handle) to the SCB (stream control block). When the original handle
is closed, the NTFS file system driver detects the presence of the PosixDeleted handle and queues a
work item for closing it. When the work item completes, the Cleanup routine detects that the handle
is marked as POSIX delete and physically moves the file in the “\ Extend\ Deleted” hidden directory.
Other applications can still operate on the original file, which is no longer in the original namespace
and will be deleted only when the last file handle is closed (the first delete request has marked the FCB
as delete-on-close).
If for any unusual reason the system is not able to delete the target file (due to a dangling reference
in a defective kernel driver or due to a sudden power interruption), the next time that the NTFS file system has the chance to mount the volume, it checks the \ Extend\ Deleted directory and deletes every
file included in it by using standard file deletion routines.
Note Starting with the May 2019 Update (19H1), Windows 10 now uses POSIX delete as the
default file deletion method. This means that the DeleteFile API uses the new behavior.
CHAPTER 11
Caching and file systems
641
EXPERIMENT: Witnessing POSIX delete
In this experiment, you’re going to witness a POSIX delete through the FsTool application, which
is available in this book’s downloadable resources. Make sure you’re using a copy of Windows
Server 2019 (RS5). Indeed, newer client releases of Windows implement POSIX deletions by
default. Start by opening a command prompt window. Use the /touch FsTool command-line
argument to generate a txt file that’s exclusively used by the application:
D:\>FsTool.exe /touch d:\Test.txt
NTFS / ReFS Tool v0.1
Copyright (C) 2018 Andrea Allievi (AaLl86)
Touching "d:\Test.txt" file... Success.
The File handle is valid... Press Enter to write to the file.
When requested, instead of pressing the Enter key, open another command prompt window
and try to open and delete the file:
D:\>type Test.txt
The process cannot access the file because it is being used by another process.
D:\>del Test.txt
D:\>dir Test.txt
Volume in drive D is DATA
Volume Serial Number is 62C1-9EB3
Directory of D:\
12/13/2018
12:34 AM
49 Test.txt
1 File(s)
49 bytes
0 Dir(s) 1,486,254,481,408 bytes free
As expected, you can’t open the file while FsTool has exclusive access to it. When you try to
delete the file, the system marks it for deletion, but it’s not able to remove it from the file system
namespace. If you try to delete the file again with File Explorer, you can witness the same behavior. When you press Enter in the first command prompt window and you exit the FsTool application, the file is actually deleted by the NTFS file system driver.
The next step is to use a POSIX deletion for getting rid of the file. You can do this by specifying
the /pdel command-line argument to the FsTool application. In the first command prompt window, restart FsTool with the /touch command-line argument (the original file has been already
marked for deletion, and you can’t delete it again). Before pressing Enter, switch to the second
window and execute the following command:
D:\>FsTool /pdel Test.txt
NTFS / ReFS Tool v0.1
Copyright (C) 2018 Andrea Allievi (AaLl86)
Deleting "Test.txt" file (Posix semantics)... Success.
Press any key to exit...
642
CHAPTER 11
Caching and file systems
D:\>dir Test.txt
Volume in drive D is DATA
Volume Serial Number is 62C1-9EB3
Directory of D:\
File Not Found
In this case the Test.txt file has been completely removed from the file system’s namespace
but is still valid. If you press Enter in the first command prompt window, FsTool is still able to write
data to the file. This is because the file has been internally moved into the \ Extend\ Deleted
hidden system directory.
Defragmentation
Even though NTFS makes efforts to keep files contiguous when allocating blocks to extend a file, a volume’s files can still become fragmented over time, especially if the file is extended multiple times or when
there is limited free space. A file is fragmented if its data occupies discontiguous clusters. For example,
Figure 11-26 shows a fragmented file consisting of five fragments. However, like most file systems (including versions of FAT on Windows), NTFS makes no special efforts to keep files contiguous (this is handled
by the built-in defragmenter), other than to reserve a region of disk space known as the master file table
(MFT) zone for the MFT. (NTFS lets other files allocate from the MFT zone when volume free space runs
low.) Keeping an area free for the MFT can help it stay contiguous, but it, too, can become fragmented.
(See the section “Master file table” later in this chapter for more information on MFTs.)
Fragmented file
Contiguous file
FIGURE 11-26 Fragmented and contiguous files.
To facilitate the development of third-party disk defragmentation tools, Windows includes a defragmentation API that such tools can use to move file data so that files occupy contiguous clusters.
The API consists of file system controls that let applications obtain a map of a volume’s free and in-use
clusters (FSCTL_GET_VOLUME_BITMAP), obtain a map of a file’s cluster usage (FSCTL_GET_RETRIEVAL
_POINTERS), and move a file (FSCTL_MOVE_FILE).
CHAPTER 11
Caching and file systems
643
Windows includes a built-in defragmentation tool that is accessible by using the Optimize Drives
utility (%SystemRoot%\System32\Dfrgui.exe), shown in Figure 11-27, as well as a command-line interface, %SystemRoot%\System32\Defrag.exe, that you can run interactively or schedule, but that does
not produce detailed reports or offer control—such as excluding files or directories—over the defragmentation process.
FIGURE 11-27 The Optimize Drives tool.
The only limitation imposed by the defragmentation implementation in NTFS is that paging
files and NTFS log files can’t be defragmented. The Optimize Drives tool is the evolution of the Disk
Defragmenter, which was available in Windows 7. The tool has been updated to support tiered volumes, SMR disks, and SSD disks. The optimization engine is implemented in the Optimize Drive service
(Defragsvc.dll), which exposes the IDefragEngine COM interface used by both the graphical tool and
the command-line interface.
For SSD disks, the tool also implements the retrim operation. To understand the retrim operation,
a quick introduction of the architecture of a solid-state drive is needed. SSD disks store data in flash
memory cells that are grouped into pages of 4 to 16 KB, grouped together into blocks of typically 128
to 512 pages. Flash memory cells can only be directly written to when they’re empty. If they contain
data, the contents must be erased before a write operation. An SSD write operation can be done on
a single page but, due to hardware limitations, erase commands always affect entire blocks; consequently, writing data to empty pages on an SSD is very fast but slows down considerably once previously written pages need to be overwritten. (In this case, first the content of the entire block is stored in
644
CHAPTER 11
Caching and file systems
cache, and then the entire block is erased from the SSD. The overwritten page is written to the cached
block, and finally the entire updated block is written to the flash medium.) To overcome this problem,
the NTFS File System Driver tries to send a TRIM command to the SSD controller every time it deletes
the disk’s clusters (which could partially or entirely belong to a file). In response to the TRIM command,
the SSD, if possible, starts to asynchronously erase entire blocks. Noteworthy is that the SSD controller
can’t do anything in case the deleted area corresponds only to some pages of the block.
The retrim operation analyzes the SSD disk and starts to send a TRIM command to every cluster in
the free space (in chunks of 1-MB size). There are different motivations behind this:
■
■
TRIM commands are not always emitted. (The file system is not very strict on trims.)
The NTFS File System emits TRIM commands on pages, but not on SSD blocks. The Disk
Optimizer, with the retrim operation, searches fragmented blocks. For those blocks, it first
moves valid data back to some temporary blocks, defragmenting the original ones and inserting even pages that belongs to other fragmented blocks; finally, it emits TRIM commands on
the original cleaned blocks.
Note The way in which the Disk Optimizer emits TRIM commands on free space is somewhat tricky: Disk Optimizer allocates an empty sparse file and searches for a chunk (the size
of which varies from 128 KB to 1 GB) of free space. It then calls the file system through the
FSCTL_MOVE_FILE control code and moves data from the sparse file (which has a size of 1
GB but does not actually contain any valid data) into the empty space. The underlying file
system actually erases the content of the one or more SSD blocks (sparse files with no valid
data yield back chunks of zeroed data when read). This is the implementation of the TRIM
command that the SSD firmware does.
For Tiered and SMR disks, the Optimize Drives tool supports two supplementary operations: Slabify
(also known as Slab Consolidation) and Tier Optimization. Big files stored on tiered volumes can be
composed of different Extents residing in different tiers. The Slab consolidation operation not only
defragments the extent table (a phase called Consolidation) of a file, but it also moves the file content
in congruent slabs (a slab is a unit of allocation of a thinly provisioned disk; see the “Storage Spaces”
section later in this chapter for more information). The final goal of Slab Consolidation is to allow files
to use a smaller number of slabs. Tier Optimization moves frequently accessed files (including files that
have been explicitly pinned) from the capacity tier to the performance tier and, vice versa, moves less
frequently accessed files from the performance tier to the capacity tier. To do so, the optimization engine consults the tiering engine, which provides file extents that should be moved to the capacity tier
and those that should be moved to the performance tier, based on the Heat map for every file accessed
by the user.
Note Tiered disks and the tiering engine are covered in detail in the following sections of
the current chapter.
CHAPTER 11
Caching and file systems
645
EXPERIMENT: Retrim an SSD volume
You can execute a Retrim on a fast SSD or NVMe volume by using the defrag.exe /L command,
as in the following example:
D:\>defrag /L c:
Microsoft Drive Optimizer
Copyright (c) Microsoft Corp.
Invoking retrim on (C:)...
The operation completed successfully.
Post Defragmentation Report:
Volume Information:
Volume size
Free space
= 475.87 GB
= 343.80 GB
Retrim:
Total space trimmed
= 341.05 GB
In the example, the volume size was 475.87 GB, with 343.80 GB of free space. Only 341 GB
have been erased and trimmed. Obviously, if you execute the command on volumes backed by
a classical HDD, you will get back an error. (The operation requested is not supported by the
hardware backing the volume.)
Dynamic partitioning
The NTFS driver allows users to dynamically resize any partition, including the system partition, either
shrinking or expanding it (if enough space is available). Expanding a partition is easy if enough space
exists on the disk and the expansion is performed through the FSCTL_EXPAND_VOLUME file system
control code. Shrinking a partition is a more complicated process because it requires moving any file
system data that is currently in the area to be thrown away to the region that will still remain after the
shrinking process (a mechanism similar to defragmentation). Shrinking is implemented by two components: the shrinking engine and the file system driver.
The shrinking engine is implemented in user mode. It communicates with NTFS to determine the
maximum number of reclaimable bytes—that is, how much data can be moved from the region that
will be resized into the region that will remain. The shrinking engine uses the standard defragmentation mechanism shown earlier, which doesn’t support relocating page file fragments that are in use or
any other files that have been marked as unmovable with the FSCTL_MARK_HANDLE file system control code (like the hibernation file). The master file table backup ( MftMirr), the NTFS metadata transaction log ( LogFile), and the volume label file ( Volume) cannot be moved, which limits the minimum
size of the shrunk volume and causes wasted space.
646
CHAPTER 11
Caching and file systems
The file system driver shrinking code is responsible for ensuring that the volume remains in a consistent state throughout the shrinking process. To do so, it exposes an interface that uses three requests
that describe the current operation, which are sent through the FSCTL_SHRINK_VOLUME control code:
■
■
■
The ShrinkPrepare request, which must be issued before any other operation. This request
takes the desired size of the new volume in sectors and is used so that the file system can block
further allocations outside the new volume boundary. The ShrinkPrepare request doesn’t verify
whether the volume can actually be shrunk by the specified amount, but it does ensure that the
amount is numerically valid and that there aren’t any other shrinking operations ongoing. Note
that after a prepare operation, the file handle to the volume becomes associated with the shrink
request. If the file handle is closed, the operation is assumed to be aborted.
The ShrinkCommit request, which the shrinking engine issues after a ShrinkPrepare request. In
this state, the file system attempts the removal of the requested number of clusters in the most
recent prepare request. (If multiple prepare requests have been sent with different sizes, the last
one is the determining one.) The ShrinkCommit request assumes that the shrinking engine has
completed and will fail if any allocated blocks remain in the area to be shrunk.
The ShrinkAbort request, which can be issued by the shrinking engine or caused by events such
as the closure of the file handle to the volume. This request undoes the ShrinkCommit operation
by returning the partition to its original size and allows new allocations outside the shrunk region
to occur again. However, defragmentation changes made by the shrinking engine remain.
If a system is rebooted during a shrinking operation, NTFS restores the file system to a consistent
state via its metadata recovery mechanism, explained later in the chapter. Because the actual shrink
operation isn’t executed until all other operations have been completed, the volume retains its original
size and only defragmentation operations that had already been flushed out to disk persist.
Finally, shrinking a volume has several effects on the volume shadow copy mechanism. Recall that the
copy-on-write mechanism allows VSS to simply retain parts of the file that were actually modified while
still linking to the original file data. For deleted files, this file data will not be associated with visible files
but appears as free space instead—free space that will likely be located in the area that is about to be
shrunk. The shrinking engine therefore communicates with VSS to engage it in the shrinking process. In
summary, the VSS mechanism’s job is to copy deleted file data into its differencing area and to increase
the differencing area as required to accommodate additional data. This detail is important because it
poses another constraint on the size to which even volumes with ample free space can shrink.
NTFS support for tiered volumes
Tiered volumes are composed of different types of storage devices and underlying media. Tiered volumes are usually created on the top of a single physical or virtual disk. Storage Spaces provides virtual
disks that are composed of multiple physical disks, which can be of different types (and have different
performance): fast NVMe disks, SSD, and Rotating Hard-Disk. A virtual disk of this type is called a tiered
disk. (Storage Spaces uses the name Storage Tiers.) On the other hand, tiered volumes could be created
on the top of physical SMR disks, which have a conventional “random-access” fast zone and a “strictly
sequential” capacity area. All tiered volumes have the common characteristic that they are composed
CHAPTER 11
Caching and file systems
647
by a “performance” tier, which supports fast random I/O, and a “capacity” tier, which may or may not
support random I/O, is slower, and has a large capacity.
Note SMR disks, tiered volumes, and Storage Spaces will be discussed in more detail later in
this chapter.
The NTFS File System driver supports tiered volumes in multiple ways:
■
■
■
The volume is split in two zones, which correspond to the tiered disk areas (capacity and
performance).
The new $DSC attribute (of type LOGGED_UTILITY_STREAM) specifies which tier the file
should be stored in. NTFS exposes a new “pinning” interface, which allows a file to be locked in a
particular tier (from here derives the term “pinning”) and prevents the file from being moved by
the tiering engine.
The Storage Tiers Management service has a central role in supporting tiered volumes. The
NTFS file system driver records ETW “heat” events every time a file stream is read or written.
The tiering engine consumes these events, accumulates them (in 1-MB chunks), and periodically
records them in a JET database (once every hour). Every four hours, the tiering engine processes
the Heat database and through a complex “heat aging” algorithm decides which file is considered recent (hot) and which is considered old (cold). The tiering engine moves the files between
the performance and the capacity tiers based on the calculated Heat data.
Furthermore, the NTFS allocator has been modified to allocate file clusters based on the tier area
that has been specified in the $DSC attribute. The NTFS Allocator uses a specific algorithm to decide
from which tier to allocate the volume’s clusters. The algorithm operates by performing checks in the
following order:
1.
If the file is the Volume USN Journal, always allocate from the Capacity tier.
2.
MFT entries (File Records) and system metadata files are always allocated from the
Performance tier.
3.
If the file has been previously explicitly “pinned” (meaning that the file has the $DSC attribute),
allocate from the specified storage tier.
4.
If the system runs a client edition of Windows, always prefer the Performance tier; otherwise,
allocate from the Capacity tier.
5.
If there is no space in the Performance tier, allocate from the Capacity tier.
An application can specify the desired storage tier for a file by using the NtSetInformationFile API
with the FileDesiredStorageClassInformation information class. This operation is called file pinning, and,
if executed on a handle of a new created file, the central allocator will allocate the new file content in
the specified tier. Otherwise, if the file already exists and is located on the wrong tier, the tiering engine
will move the file to the desired tier the next time it runs. (This operation is called Tier optimization and
can be initiated by the Tiering Engine scheduled task or the SchedulerDefrag task.)
648
CHAPTER 11
Caching and file systems
Note It’s important to note here that the support for tiered volumes in NTFS, described here,
is completely different from the support provided by the ReFS file system driver.
EXPERIMENT: Witnessing file pinning in tiered volumes
As we have described in the previous section, the NTFS allocator uses a specific algorithm to
decide which tier to allocate from. In this experiment, you copy a big file into a tiered volume
and understand what the implications of the File Pinning operation are. After the copy finishes,
open an administrative PowerShell window by right-clicking on the Start menu icon and selecting Windows PowerShell (Admin) and use the Get-FileStorageTier command to get the tier
information for the file:
PS E:\> Get-FileStorageTier -FilePath 'E:\Big_Image.iso' | FL FileSize,
DesiredStorageTierClass, FileSizeOnPerformanceTierClass, FileSizeOnCapacityTierClass,
PlacementStatus, State
FileSize
DesiredStorageTierClass
FileSizeOnPerformanceTierClass
FileSizeOnCapacityTierClass
PlacementStatus
State
:
:
:
:
:
:
4556566528
Unknown
0
4556566528
Unknown
Unknown
The example shows that the Big_Image.iso file has been allocated from the Capacity Tier. (The
example has been executed on a Windows Server system.) To confirm this, just copy the file from
the tiered disk to a fast SSD volume. You should see a slow transfer speed (usually between 160
and 250 MB/s depending on the rotating disk speed):
CHAPTER 11
Caching and file systems
649
You can now execute the “pin” request through the Set-FileStorageTier command, like in the
following example:
PS E:\> Get-StorageTier -MediaType SSD | FL FriendlyName, Size, FootprintOnPool, UniqueId
FriendlyName
Size
FootprintOnPool
UniqueId
:
:
:
:
SSD
128849018880
128849018880
{448abab8-f00b-42d6-b345-c8da68869020}
PS E:\> Set-FileStorageTier -FilePath 'E:\Big_Image.iso' -DesiredStorageTierFriendlyName
'SSD'
PS E:\> Get-FileStorageTier -FilePath 'E:\Big_Image.iso' | FL FileSize,
DesiredStorageTierClass, FileSizeOnPerformanceTierClass, FileSizeOnCapacityTierClass,
PlacementStatus, State
FileSize
DesiredStorageTierClass
FileSizeOnPerformanceTierClass
FileSizeOnCapacityTierClass
PlacementStatus
State
:
:
:
:
:
:
4556566528
Performance
0
4556566528
Not on tier
Pending
The example above shows that the file has been correctly pinned on the Performance
tier, but its content is still stored in the Capacity tier. When the Tiering Engine scheduled task
runs, it moves the file extents from the Capacity to the Performance tier. You can force a Tier
Optimization by running the Drive optimizer through the defrag.exe /g built-in tool:
PS E:> defrag /g /h e:
Microsoft Drive Optimizer
Copyright (c) Microsoft Corp.
Invoking tier optimization on Test (E:)...
Pre-Optimization Report:
Volume Information:
Volume size
Free space
Total fragmented space
Largest free space size
=
=
=
=
2.22 TB
1.64 TB
36%
1.56 TB
Note: File fragments larger than 64MB are not included in the fragmentation statistics.
The operation completed successfully.
Post Defragmentation Report:
Volume Information:
Volume size
Free space
Storage Tier Optimization Report:
650
CHAPTER 11
Caching and file systems
= 2.22 TB
= 1.64 TB
% I/Os Serviced from Perf Tier
100%
95%
Perf Tier Size Required
28.51 GB *
22.86 GB
20%
15%
10%
5%
2.44 GB
1.58 GB
873.80 MB
361.28 MB
...
* Current size of the Performance tier: 474.98 GB
Percent of total I/Os serviced from the Performance tier: 99%
Size of files pinned to the Performance tier: 4.21 GB
Percent of total I/Os: 1%
Size of files pinned to the Capacity tier: 0 bytes
Percent of total I/Os: 0%
The Drive Optimizer has confirmed the “pinning” of the file. You can check again the “pinning”
status by executing the Get-FileStorageTier command and by copying the file again to an SSD
volume. This time the transfer rate should be much higher, because the file content is entirely
located in the Performance tier.
PS E:\> Get-FileStorageTier -FilePath 'E:\Big_Image.iso' | FL FileSize, DesiredStorageTierClass,
FileSizeOnPerformanceTierClass, FileSizeOnCapacityTierClass, PlacementStatus, State
FileSize
DesiredStorageTierClass
FileSizeOnPerformanceTierClass
FileSizeOnCapacityTierClass
PlacementStatus
State
:
:
:
:
:
:
4556566528
Performance
0
4556566528
Completely on tier
OK
You could repeat the experiment in a client edition of Windows 10, by pinning the file in the
Capacity tier (client editions of Windows 10 allocate file’s clusters from the Performance tier by
default). The same “pinning” functionality has been implemented into the FsTool application
available in this book’s downloadable resources, which can be used to copy a file directly into a
preferred tier.
CHAPTER 11
Caching and file systems
651
T S file system driver
As described in Chapter 6 in Part I, in the framework of the Windows I/O system, NTFS and other file
systems are loadable device drivers that run in kernel mode. They are invoked indirectly by applications that use Windows or other I/O APIs. As Figure 11-28 shows, the Windows environment subsystems
call Windows system services, which in turn locate the appropriate loaded drivers and call them. (For a
description of system service dispatching, see the section “System service dispatching” in Chapter 8.)
Environment
subsystem
or DLL
User mode
Kernel mode
Windows system services
Object
Security
manager reference
monitor
…
Windows
executive
Advanced Memory
manager
local
procedure
call
facility
I/O manager
NTFS driver
Volume
manager
Disk driver
Kernel
FIGURE 11-28 Components of the Windows I/O system.
The layered drivers pass I/O requests to one another by calling the Windows executive’s I/O manager. Relying on the I/O manager as an intermediary allows each driver to maintain independence so
that it can be loaded or unloaded without affecting other drivers. In addition, the NTFS driver interacts
with the three other Windows executive components, shown in the left side of Figure 11-29, which are
closely related to file systems.
The log file service (LFS) is the part of NTFS that provides services for maintaining a log of disk
writes. The log file that LFS writes is used to recover an NTFS-formatted volume in the case of a system
failure. (See the section “Log file service” later in this chapter.)
652
CHAPTER 11
Caching and file systems
Log file
service
Flush the
log file
Log the
transaction
Read/write the file
NTFS driver
Volume
manager
Write the
cache
Cache
manager
I/O manager
Disk driver
Read/write a
mirrored or
striped volume
Read/write
the disk
Load data
from disk
into
memory
Access the mapped
file or flush the cache
Memory
manager
FIGURE 11-29 NTFS and related components.
As we have already described, the cache manager is the component of the Windows executive that
provides systemwide caching services for NTFS and other file system drivers, including network file system drivers (servers and redirectors). All file systems implemented for Windows access cached files by
mapping them into system address space and then accessing the virtual memory. The cache manager
provides a specialized file system interface to the Windows memory manager for this purpose. When
a program tries to access a part of a file that isn’t loaded into the cache (a cache miss), the memory
manager calls NTFS to access the disk driver and obtain the file contents from disk. The cache manager
optimizes disk I/O by using its lazy writer threads to call the memory manager to flush cache contents
to disk as a background activity (asynchronous disk writing).
NTFS, like other file systems, participates in the Windows object model by implementing files as
objects. This implementation allows files to be shared and protected by the object manager, the component of Windows that manages all executive-level objects. (The object manager is described in the
section “Object manager” in Chapter 8.)
An application creates and accesses files just as it does other Windows objects: by means of object
handles. By the time an I/O request reaches NTFS, the Windows object manager and security system
have already verified that the calling process has the authority to access the file object in the way it is
attempting to. The security system has compared the caller’s access token to the entries in the access
control list for the file object. (See Chapter 7 in Part 1 for more information about access control lists.)
The I/O manager has also transformed the file handle into a pointer to a file object. NTFS uses the
information in the file object to access the file on disk.
Figure 11-30 shows the data structures that link a file handle to the file system’s on-disk structure.
CHAPTER 11
Caching and file systems
653
Process
Object
manager
data
structures
Handle
table
File object
File object
…
NTFS data
structures
(used to manage
the on-disk structure)
Stream
control
blocks
File
control
block
Data
attribute
Named
stream
Master file
table
NTFS
database
(on disk)
…
FIGURE 11-30 NTFS data structures.
NTFS follows several pointers to get from the file object to the location of the file on disk. As
Figure 11-30 shows, a file object, which represents a single call to the open-file system service, points to
a stream control block (SCB) for the file attribute that the caller is trying to read or write. In Figure 11-30,
a process has opened both the unnamed data attribute and a named stream (alternate data attribute)
for the file. The SCBs represent individual file attributes and contain information about how to find
specific attributes within a file. All the SCBs for a file point to a common data structure called a file control block (FCB). The FCB contains a pointer (actually, an index into the MFT, as explained in the section
“File record numbers” later in this chapter) to the file’s record in the disk-based master file table (MFT),
which is described in detail in the following section.
NTFS on-disk structure
This section describes the on-disk structure of an NTFS volume, including how disk space is divided and
organized into clusters, how files are organized into directories, how the actual file data and attribute
information is stored on disk, and finally, how NTFS data compression works.
654
CHAPTER 11
Caching and file systems
Volumes
The structure of NTFS begins with a volume. A volume corresponds to a logical partition on a disk, and
it’s created when you format a disk or part of a disk for NTFS. You can also create a RAID virtual disk
that spans multiple physical disks by using Storage Spaces, which is accessible through the Manage
Storage Spaces control panel snap-in, or by using Storage Spaces commands available from the Windows
PowerShell (like the New-StoragePool command, used to create a new storage pool. A comprehensive
list of PowerShell commands for Storage Spaces is available at the following link: https://docs.microsoft
.com/en-us/powershell/module/storagespaces/ )
A disk can have one volume or several. NTFS handles each volume independently of the others.
Three sample disk configurations for a 2-TB hard disk are illustrated in Figure 11-31.
C:
(1 TB)
C:
(2 TB)
NTFS
Volume
D:
(1 TB)
NTFS
Volume 1
ReFS
Volume 2
C:
(1 TB)
D:
(1 TB)
ReFS
Volume
exFAT
Volume
FIGURE 11-31 Sample disk configurations.
A volume consists of a series of files plus any additional unallocated space remaining on the disk
partition. In all FAT file systems, a volume also contains areas specially formatted for use by the file
system. An NTFS or ReFS volume, however, stores all file system data, such as bitmaps and directories,
and even the system bootstrap, as ordinary files.
Note The on-disk format of NTFS volumes on Windows 10 and Windows Server 2019 is version 3.1, the same as it has been since Windows XP and Windows Server 2003. The version
number of a volume is stored in its Volume metadata file.
Clusters
The cluster size on an NTFS volume, or the cluster factor, is established when a user formats the volume
with either the format command or the Disk Management MMC snap-in. The default cluster factor
varies with the size of the volume, but it is an integral number of physical sectors, always a power of 2
(1 sector, 2 sectors, 4 sectors, 8 sectors, and so on). The cluster factor is expressed as the number of
bytes in the cluster, such as 512 bytes, 1 KB, 2 KB, and so on.
CHAPTER 11
Caching and file systems
655
Internally, NTFS refers only to clusters. (However, NTFS forms low-level volume I/O operations such
that clusters are sector-aligned and have a length that is a multiple of the sector size.) NTFS uses the
cluster as its unit of allocation to maintain its independence from physical sector sizes. This independence allows NTFS to efficiently support very large disks by using a larger cluster factor or to support
newer disks that have a sector size other than 512 bytes. On a larger volume, use of a larger cluster factor can reduce fragmentation and speed allocation, at the cost of wasted disk space. (If the cluster size
is 64 KB, and a file is only 16 KB, then 48 KB are wasted.) Both the format command available from the
command prompt and the Format menu option under the All Tasks option on the Action menu in the
Disk Management MMC snap-in choose a default cluster factor based on the volume size, but you can
override this size.
NTFS refers to physical locations on a disk by means of logical cluster numbers (LCNs). LCNs are
simply the numbering of all clusters from the beginning of the volume to the end. To convert an LCN
to a physical disk address, NTFS multiplies the LCN by the cluster factor to get the physical byte offset
on the volume, as the disk driver interface requires. NTFS refers to the data within a file by means of
virtual cluster numbers (VCNs). VCNs number the clusters belonging to a particular file from 0 through
m. VCNs aren’t necessarily physically contiguous, however; they can be mapped to any number of LCNs
on the volume.
Master file table
In NTFS, all data stored on a volume is contained in files, including the data structures used to locate
and retrieve files, the bootstrap data, and the bitmap that records the allocation state of the entire volume (the NTFS metadata). Storing everything in files allows the file system to easily locate and maintain
the data, and each separate file can be protected by a security descriptor. In addition, if a particular
part of the disk goes bad, NTFS can relocate the metadata files to prevent the disk from becoming
inaccessible.
The MFT is the heart of the NTFS volume structure. The MFT is implemented as an array of file records. The size of each file record can be 1 KB or 4 KB, as defined at volume-format time, and depends
on the type of the underlying physical medium: new physical disks that have 4 KB native sectors size
and tiered disks generally use 4 KB file records, while older disks that have 512 bytes sectors size use 1
KB file records. The size of each MFT entry does not depend on the clusters size and can be overridden
at volume-format time through the Format /l command. (The structure of a file record is described in
the “File records” section later in this chapter.) Logically, the MFT contains one record for each file on
the volume, including a record for the MFT itself. In addition to the MFT, each NTFS volume includes
a set of metadata files containing the information that is used to implement the file system structure.
Each of these NTFS metadata files has a name that begins with a dollar sign ( ) and is hidden. For
example, the file name of the MFT is MFT. The rest of the files on an NTFS volume are normal user files
and directories, as shown in Figure 11-32.
Usually, each MFT record corresponds to a different file. If a file has a large number of attributes or
becomes highly fragmented, however, more than one record might be needed for a single file. In such
cases, the first MFT record, which stores the locations of the others, is called the base file record.
656
CHAPTER 11
Caching and file systems
0
$MFT - MFT
1
$MFTMirr - MFT mirror
2
$LogFile - Log file
3
$Volume - Volume file
4
$AttrDef - Attribute definition table
5
\ - Root directory
6
$BitMap - Volume cluster allocation file
7
$Boot - Boot sector
8
$BadClus - Bad-cluster file
9
$Secure - Security settings file
10
$UpCase - Uppercase character mapping
11
$Extend - Extended metadata directory
12
Unused
23
Unused
24
$Extend\$Quota - Quota information
25
$Extend\$ObjId - Distributed link tracking information
26
$Extend\$Reparse - Back references to reparse points
27
$Extend\$RmMetadata - RM metadata directory
28
$Extend\$RmMetadata\$Repair - RM repair information
29
$Extend\$Deleted - POSIX deleted files
30
$Extend\$RmMetadata\$TxfLog - TxF log directory
31
$Extend\$RmMetadata\$Txf - TxF metadata directory
32
$Extend\$RmMetadata\$TxfLog\$Tops - TOPS file
33
$Extend\$RmMetadata\$TxfLog\$TxfLog.blf - TxF BLF
34
$TxfLogContainer00000000000000000001
35
$TxfLogContainer00000000000000000002
Reserved for NTFS
metadata files
FIGURE 11-32 File records for NTFS metadata files in the MFT.
When it first accesses a volume, NTFS must mount it—that is, read metadata from the disk and
construct internal data structures so that it can process application file system accesses. To mount the
volume, NTFS looks in the volume boot record (VBR) (located at LCN 0), which contains a data structure
called the boot parameter block (BPB), to find the physical disk address of the MFT. The MFT’s file record
is the first entry in the table; the second file record points to a file located in the middle of the disk called
the MFT mirror (file name MFTMirr) that contains a copy of the first four rows of the MFT. This partial
copy of the MFT is used to locate metadata files if part of the MFT file can’t be read for some reason.
Once NTFS finds the file record for the MFT, it obtains the VCN-to-LCN mapping information in the
file record’s data attribute and stores it into memory. Each run (runs are explained later in this chapter
in the section “Resident and nonresident attributes”) has a VCN-to-LCN mapping and a run length
because that’s all the information necessary to locate the LCN for any VCN. This mapping information
CHAPTER 11
Caching and file systems
657
tells NTFS where the runs containing the MFT are located on the disk. NTFS then processes the MFT records for several more metadata files and opens the files. Next, NTFS performs its file system recovery
operation (described in the section “Recovery” later in this chapter), and finally, it opens its remaining
metadata files. The volume is now ready for user access.
Note For the sake of clarity, the text and diagrams in this chapter depict a run as including
a VCN, an LCN, and a run length. NTFS actually compresses this information on disk into an
LCN/next-VCN pair. Given a starting VCN, NTFS can determine the length of a run by subtracting the starting VCN from the next VCN.
As the system runs, NTFS writes to another important metadata file, the log file (file name LogFile).
NTFS uses the log file to record all operations that affect the NTFS volume structure, including file creation or any commands, such as copy, that alter the directory structure. The log file is used to recover an
NTFS volume after a system failure and is also described in the “Recovery” section.
Another entry in the MFT is reserved for the root directory (also known as \; for example, C:\). Its file
record contains an index of the files and directories stored in the root of the NTFS directory structure.
When NTFS is first asked to open a file, it begins its search for the file in the root directory’s file record.
After opening a file, NTFS stores the file’s MFT record number so that it can directly access the file’s
MFT record when it reads and writes the file later.
NTFS records the allocation state of the volume in the bitmap file (file name BitMap). The data
attribute for the bitmap file contains a bitmap, each of whose bits represents a cluster on the volume,
identifying whether the cluster is free or has been allocated to a file.
The security file (file name Secure) stores the volume-wide security descriptor database. NTFS files
and directories have individually settable security descriptors, but to conserve space, NTFS stores the
settings in a common file, which allows files and directories that have the same security settings to
reference the same security descriptor. In most environments, entire directory trees have the same
security settings, so this optimization provides a significant saving of disk space.
Another system file, the boot file (file name Boot), stores the Windows bootstrap code if the volume
is a system volume. On nonsystem volumes, there is code that displays an error message on the screen
if an attempt is made to boot from that volume. For the system to boot, the bootstrap code must be
located at a specific disk address so that the Boot Manager can find it. During formatting, the format
command defines this area as a file by creating a file record for it. All files are in the MFT, and all clusters
are either free or allocated to a file—there are no hidden files or clusters in NTFS, although some files
(metadata) are not visible to users. The boot file as well as NTFS metadata files can be individually
protected by means of the security descriptors that are applied to all Windows objects. Using this “everything on the disk is a file” model also means that the bootstrap can be modified by normal file I/O,
although the boot file is protected from editing.
NTFS also maintains a bad-cluster file (file name BadClus) for recording any bad spots on the disk
volume and a file known as the volume file (file name Volume), which contains the volume name, the
658
CHAPTER 11
Caching and file systems
version of NTFS for which the volume is formatted, and a number of flag bits that indicate the state and
health of the volume, such as a bit that indicates that the volume is corrupt and must be repaired by
the Chkdsk utility. (The Chkdsk utility is covered in more detail later in the chapter.) The uppercase file
(file name UpCase) includes a translation table between lowercase and uppercase characters. NTFS
maintains a file containing an attribute definition table (file name AttrDef) that defines the attribute
types supported on the volume and indicates whether they can be indexed, recovered during a system
recovery operation, and so on.
Note Figure 11-32 shows the Master File Table of a NTFS volume and indicates the specific
entries in which the metadata files are located. It is worth mentioning that file records at position less than 16 are guaranteed to be fixed. Metadata files located at entries greater than
16 are subject to the order in which NTFS creates them. Indeed, the format tool doesn t create any metadata file above position 16; this is the duty of the NTFS file system driver while
mounting the volume for the first time (after the formatting has been completed). The order
of the metadata files generated by the file system driver is not guaranteed.
NTFS stores several metadata files in the extensions (directory name Extend) metadata directory, including the ob ect identifier file (file name ObjId), the quota file (file name Quota), the change
journal file (file name UsnJrnl), the reparse point file (file name Reparse), the Posix delete support
directory ( Deleted), and the default resource manager directory (directory name RmMetadata). These
files store information related to extended features of NTFS. The object identifier file stores file object
IDs, the quota file stores quota limit and behavior information on volumes that have quotas enabled,
the change journal file records file and directory changes, and the reparse point file stores information
about which files and directories on the volume include reparse point data.
The Posix Delete directory ( Deleted) contains files, which are invisible to the user, that have been
deleted using the new Posix semantic. Files deleted using the Posix semantic will be moved in this
directory when the application that has originally requested the file deletion closes the file handle.
Other applications that may still have a valid reference to the file continue to run while the file’s name is
deleted from the namespace. Detailed information about the Posix deletion has been provided in the
previous section.
The default resource manager directory contains directories related to transactional NTFS (TxF)
support, including the transaction log directory (directory name TxfLog), the transaction isolation
directory (directory name Txf), and the transaction repair directory (file name Repair). The transaction log directory contains the TxF base log file (file name TxfLog.blf) and any number of log container
files, depending on the size of the transaction log, but it always contains at least two: one for the Kernel
Transaction Manager (KTM) log stream (file name TxfLogContainer00000000000000000001), and
one for the TxF log stream (file name TxfLogContainer00000000000000000002). The transaction log
directory also contains the TxF old page stream (file name Tops), which we’ll describe later.
CHAPTER 11
Caching and file systems
659
EXPERIMENT: Viewing NTFS information
You can use the built-in Fsutil.exe command-line program to view information about an NTFS
volume, including the placement and size of the MFT and MFT zone:
d:\>fsutil fsinfo ntfsinfo d:
NTFS Volume Serial Number :
NTFS Version
:
LFS Version
:
Number Sectors :
Total Clusters :
Free Clusters :
Total Reserved :
Bytes Per Sector :
Bytes Per Physical Sector :
Bytes Per Cluster :
Bytes Per FileRecord Segment
:
Clusters Per FileRecord Segment :
Mft Valid Data Length :
Mft Start Lcn :
Mft2 Start Lcn :
Mft Zone Start :
Mft Zone End
:
Max Device Trim Extent Count :
Max Device Trim Byte Count :
Max Volume Trim Extent Count :
Max Volume Trim Byte Count :
Resource Manager Identifier :
0x48323940323933f2
3.1
2.0
0x000000011c5f6fff
0x00000000238bedff
0x000000001a6e5925
0x00000000000011cd
512
4096
4096
4096
1
0x0000000646500000
0x00000000000c0000
0x0000000000000002
0x00000000069f76e0
0x00000000069f7700
4294967295
0x10000000
62
0x10000000
81E83020-E6FB-11E8-B862-D89EF33A38A7
In this example, the D: volume uses 4 KB file records (MFT entries), on a 4 KB native sector size
disk (which emulates old 512-byte sectors) and uses 4 KB clusters.
File record numbers
A file on an NTFS volume is identified by a 64-bit value called a file record number, which consists of a
file number and a sequence number. The file number corresponds to the position of the file’s file record
in the MFT minus 1 (or to the position of the base file record minus 1 if the file has more than one file
record). The sequence number, which is incremented each time an MFT file record position is reused,
enables NTFS to perform internal consistency checks. A file record number is illustrated in Figure 11-33.
63
47
Sequence
number
0
File number
FIGURE 11-33 File record number.
660
CHAPTER 11
Caching and file systems
File records
Instead of viewing a file as just a repository for textual or binary data, NTFS stores files as a collection
of attribute/value pairs, one of which is the data it contains (called the unnamed data attribute). Other
attributes that compose a file include the file name, time stamp information, and possibly additional
named data attributes. Figure 11-34 illustrates an MFT record for a small file.
Master file table
…
Standard
information
File name
Data
FIGURE 11-34 MFT record for a small file.
Each file attribute is stored as a separate stream of bytes within a file. Strictly speaking, NTFS doesn’t
read and write files; it reads and writes attribute streams. NTFS supplies these attribute operations: create, delete, read (byte range), and write (byte range). The read and write services normally operate on
the file’s unnamed data attribute. However, a caller can specify a different data attribute by using the
named data stream syntax.
Table 11-6 lists the attributes for files on an NTFS volume. (Not all attributes are present for every
file.) Each attribute in the NTFS file system can be unnamed or can have a name. An example of a
named attribute is the LOGGED_UTILITY_STREAM, which is used for various purposes by different
NTFS components. Table 11-7 lists the possible LOGGED_UTILITY_STREAM attribute’s names and their
respective purposes.
CHAPTER 11
Caching and file systems
661
TABLE 11-6 Attributes for NTFS files
Attribute
Attribute Type Name
Resident?
Description
Volume information
VOLUME_INFORMATION,
VOLUME_NAME
Always,
Always
These attributes are present only in the Volume
metadata file. They store volume version and label
information.
Standard information
STANDARD_INFORMATION
Always
File attributes such as read-only, archive, and so
on; time stamps, including when the file was created or last modified.
File name
FILE_NAME
Maybe
The file’s name in Unicode 1.0 characters. A file
can have multiple file name attributes, as it does
when a hard link to a file exists or when a file with
a long name has an automatically generated short
name for access by MS-DOS and 16-bit Windows
applications.
Security descriptor
SECURITY_DESCRIPTOR
Maybe
This attribute is present for backward compatibility with previous versions of NTFS and is rarely
used in the current version of NTFS (3.1). NTFS
stores almost all security descriptors in the Secure
metadata file, sharing descriptors among files and
directories that have the same settings. Previous
versions of NTFS stored private security descriptor
information with each file and directory. Some files
still include a SECURITY_DESCRIPTOR attribute,
such as Boot.
Data
DATA
Maybe
The contents of the file. In NTFS, a file has one
default unnamed data attribute and can have
additional named data attributes—that is, a file
can have multiple data streams. A directory has
no default data attribute but can have optional
named data attributes.
Named data streams can be used even for particular system purposes. For example, the Storage
Reserve Area Table (SRAT) stream ( SRAT) is used
by the Storage Service for creating Space reservations on a volume. This attribute is applied only on
the Bitmap metadata file. Storage Reserves are
described later in this chapter.
662
Index root, index allocation
INDEX_ROOT,
INDEX_ALLOCATION,
Always,
Never
Three attributes used to implement B-tree data
structures used by directories, security, quota, and
other metadata files.
Attribute list
ATTRIBUTE_LIST
Maybe
A list of the attributes that make up the file and the
file record number of the MFT entry where each
attribute is located. This attribute is present when
a file requires more than one MFT file record.
Index Bitmap
BITMAP
Maybe
This attribute is used for different purposes:
for nonresident directories (where an INDEX_
ALLOCATION always exists), the bitmap records
which 4 KB-sized index blocks are already in use
by the B-tree, and which are free for future use
as B-tree grows; In the MFT there is an unnamed
“ Bitmap” attribute that tracks which MFT segments are in use, and which are free for future
use by new files or by existing files that require
more space.
CHAPTER 11
Caching and file systems
Attribute
Attribute Type Name
Resident?
Description
Object ID
OBJECT_ID
Always
A 16-byte identifier (GUID) for a file or directory.
The link-tracking service assigns object IDs to shell
shortcut and OLE link source files. NTFS provides
APIs so that files and directories can be opened
with their object ID rather than their file name.
Reparse information
REPARSE_POINT
Maybe
This attribute stores a file’s reparse point data.
NTFS junctions and mount points include this attribute.
Extended attributes
EA, EA_INFORMATION
Maybe,
Always
Extended attributes are name/value pairs and
aren’t normally used but are provided for backward compatibility with OS/2 applications.
Logged utility stream
LOGGED_UTILITY_STREAM
Maybe
This attribute type can be used for various purposes by different NTFS components. See Table 11-7
for more details.
TABLE 11-7
LOGGED_UTILITY_STREAM attribute
Attribute
Attribute Type Name
Resident?
Description
Encrypted File
Stream
EFS
Maybe
EFS stores data in this attribute that’s used to
manage a file’s encryption, such as the encrypted
version of the key needed to decrypt the file and a
list of users who are authorized to access the file.
Online encryption
backup
EfsBackup
Maybe
The attribute is used by the EFS Online encryption to store chunks of the original encrypted
data stream.
Transactional
NTFSData
TXF_DATA
Maybe
When a file or directory becomes part of a transaction, TxF also stores transaction data in the
TXF_DATA attribute, such as the file’s unique
transaction ID.
Desired Storage
Class
DSC
Resident
The desired storage class is used for “pinning” a
file to a preferred storage tier. See the “NTFS support for tiered volumes” section for more details.
Table 11-6 shows attribute names; however, attributes actually correspond to numeric type codes,
which NTFS uses to order the attributes within a file record. The file attributes in an MFT record are
ordered by these type codes (numerically in ascending order), with some attribute types appearing
more than once—if a file has multiple data attributes, for example, or multiple file names. All possible
attribute types (and their names) are listed in the AttrDef metadata file.
Each attribute in a file record is identified with its attribute type code and has a value and an optional name. An attribute’s value is the byte stream composing the attribute. For example, the value of
the FILE_NAME attribute is the file’s name; the value of the DATA attribute is whatever bytes the user
stored in the file.
Most attributes never have names, although the index-related attributes and the DATA attribute
often do. Names distinguish between multiple attributes of the same type that a file can include. For
example, a file that has a named data stream has two DATA attributes: an unnamed DATA attribute
storing the default unnamed data stream, and a named DATA attribute having the name of the alternate stream and storing the named stream’s data.
CHAPTER 11
Caching and file systems
663
File names
Both NTFS and FAT allow each file name in a path to be as many as 255 characters long. File names can
contain Unicode characters as well as multiple periods and embedded spaces. However, the FAT file
system supplied with MS-DOS is limited to 8 (non-Unicode) characters for its file names, followed by
a period and a 3-character extension. Figure 11-35 provides a visual representation of the different file
namespaces Windows supports and shows how they intersect.
Windows Subsystem for Linux (WSL) requires the biggest namespace of all the application execution environments that Windows supports, and therefore the NTFS namespace is equivalent to the
WSL namespace. WSL can create names that aren’t visible to Windows and MS-DOS applications,
including names with trailing periods and trailing spaces. Ordinarily, creating a file using the large
POSIX namespace isn’t a problem because you would do that only if you intended WSL applications
to use that file.
Examples
WSL
Windows
subsystem
MS-DOS –Windows
clients
"TrailingDots..."
"SameNameDifferentCase"
"samenamedifferentcase"
"TrailingSpaces "
"LongFileName"
"UnicodeName.Φ∆ΠΛ"
"File.Name.With.Dots"
"File.Name2.With.Dots"
"Name With Embedded Spaces"
".BeginningDot"
"EIGHTCHR.123"
"CASEBLND.TYP"
FIGURE 11-35 Windows file namespaces.
The relationship between 32-bit Windows applications and MS-DOS and 16-bit Windows applications is a much closer one, however. The Windows area in Figure 11-35 represents file names that the
Windows subsystem can create on an NTFS volume but that MS-DOS and 16-bit Windows applications
can’t see. This group includes file names longer than the 8.3 format of MS-DOS names, those containing Unicode (international) characters, those with multiple period characters or a beginning period,
and those with embedded spaces. For compatibility reasons, when a file is created with such a name,
NTFS automatically generates an alternate, MS-DOS-style file name for the file. Windows displays these
short names when you use the /x option with the dir command.
The MS-DOS file names are fully functional aliases for the NTFS files and are stored in the same
directory as the long file names. The MFT record for a file with an autogenerated MS-DOS file name is
shown in Figure 11-36.
664
CHAPTER 11
Caching and file systems
Standard
information
NTFS
file name
MS-DOS
file name
Data
New file name
attribute
FIGURE 11-36 MFT file record with an MS-DOS file name attribute.
The NTFS name and the generated MS-DOS name are stored in the same file record and therefore
refer to the same file. The MS-DOS name can be used to open, read from, write to, or copy the file. If
a user renames the file using either the long file name or the short file name, the new name replaces
both the existing names. If the new name isn’t a valid MS-DOS name, NTFS generates another MS-DOS
name for the file. (Note that NTFS only generates MS-DOS-style file names for the first file name.)
Note Hard links are implemented in a similar way. When a hard link to a file is created, NTFS
adds another file name attribute to the file’s MFT file record, and adds an entry in the Index
Allocation attribute of the directory in which the new link resides. The two situations differ in
one regard, however. When a user deletes a file that has multiple names (hard links), the file
record and the file remain in place. The file and its record are deleted only when the last file
name (hard link) is deleted. If a file has both an NTFS name and an autogenerated MS-DOS
name, however, a user can delete the file using either name.
Here’s the algorithm NTFS uses to generate an MS-DOS name from a long file name. The algorithm is actually implemented in the kernel function RtlGenerate8dot3Name and can change in future
Windows releases. The latter function is also used by other drivers, such as CDFS, FAT, and third-party
file systems:
1.
Remove from the long name any characters that are illegal in MS-DOS names, including spaces
and Unicode characters. Remove preceding and trailing periods. Remove all other embedded
periods, except the last one.
2.
Truncate the string before the period (if present) to six characters (it may already be six or fewer
because this algorithm is applied when any character that is illegal in MS-DOS is present in the
name). If it is two or fewer characters, generate and concatenate a four-character hex checksum
string. Append the string n (where n is a number, starting with 1, that is used to distinguish
different files that truncate to the same name). Truncate the string after the period (if present)
to three characters.
3.
Put the result in uppercase letters. MS-DOS is case-insensitive, and this step guarantees that
NTFS won’t generate a new name that differs from the old name only in case.
4.
If the generated name duplicates an existing name in the directory, increment the n string. If n
is greater than 4, and a checksum was not concatenated already, truncate the string before the
period to two characters and generate and concatenate a four-character hex checksum string.
CHAPTER 11
Caching and file systems
665
Table 11-8 shows the long Windows file names from Figure 11-35 and their NTFS-generated MS-DOS
versions. The current algorithm and the examples in Figure 11-35 should give you an idea of what NTFSgenerated MS-DOS-style file names look like.
Note Since Windows 8.1, by default all the NTFS nonbootable volumes have short
name generation disabled. You can disable short name generation even in older version of Windows by setting HKLM\SYSTEM\CurrentControlSet\Control\FileSystem\
NtfsDisable8dot3NameCreation in the registry to a DWORD value of 1 and restarting the
machine. This could potentially break compatibility with older applications, though.
TABLE 11-8 NTFS-generated file names
Windows Long Name
NTFS-Generated Short Name
LongFileName
LONGFI 1
UnicodeName.FDPL
UNICOD 1
File.Name.With.Dots
FILENA 1.DOT
File.Name2.With.Dots
FILENA 2.DOT
File.Name3.With.Dots
FILENA 3.DOT
File.Name4.With.Dots
FILENA 4.DOT
File.Name5.With.Dots
FIF596 1.DOT
Name With Embedded Spaces
NAMEWI 1
.BeginningDot
BEGINN 1
25 .two characters
255440 1.TWO
©
6E2D 1
Tunneling
NTFS uses the concept of tunneling to allow compatibility with older programs that depend on the file
system to cache certain file metadata for a period of time even after the file is gone, such as when it
has been deleted or renamed. With tunneling, any new file created with the same name as the original
file, and within a certain period of time, will keep some of the same metadata. The idea is to replicate
behavior expected by MS-DOS programs when using the safe save programming method, in which
modified data is copied to a temporary file, the original file is deleted, and then the temporary file is
renamed to the original name. The expected behavior in this case is that the renamed temporary file
should appear to be the same as the original file; otherwise, the creation time would continuously
update itself with each modification (which is how the modified time is used).
NTFS uses tunneling so that when a file name is removed from a directory, its long name and short
name, as well as its creation time, are saved into a cache. When a new file is added to a directory, the
cache is searched to see whether there is any tunneled data to restore. Because these operations apply
to directories, each directory instance has its own cache, which is deleted if the directory is removed.
666
CHAPTER 11
Caching and file systems
NTFS will use tunneling for the following series of operations if the names used result in the deletion
and re-creation of the same file name:
■
Delete + Create
■
Delete + Rename
■
Rename + Create
■
Rename + Rename
By default, NTFS keeps the tunneling cache for 15 seconds, although you can modify this timeout by creating a new value called MaximumTunnelEntryAgeInSeconds in the HKLM\SYSTEM\
CurrentControlSet\Control\FileSystem registry key. Tunneling can also be completely disabled by
creating a new value called MaximumTunnelEntries and setting it to 0; however, this will cause older
applications to break if they rely on the compatibility behavior. On NTFS volumes that have short name
generation disabled (see the previous section), tunneling is disabled by default.
You can see tunneling in action with the following simple experiment in the command prompt:
1.
Create a file called file1.
2.
Wait for more than 15 seconds (the default tunnel cache timeout).
3.
Create a file called file2.
4.
Perform a dir /TC. Note the creation times.
5.
Rename file1 to file.
6.
Rename file2 to file1.
7.
Perform a dir /TC. Note that the creation times are identical.
Resident and nonresident attributes
If a file is small, all its attributes and their values (its data, for example) fit within the file record that
describes the file. When the value of an attribute is stored in the MFT (either in the file’s main file record
or an extension record located elsewhere within the MFT), the attribute is called a resident attribute.
(In Figure 11-37, for example, all attributes are resident.) Several attributes are defined as always being
resident so that NTFS can locate nonresident attributes. The standard information and index root attributes are always resident, for example.
Each attribute begins with a standard header containing information about the attribute—information that NTFS uses to manage the attributes in a generic way. The header, which is always resident,
records whether the attribute’s value is resident or nonresident. For resident attributes, the header also
contains the offset from the header to the attribute’s value and the length of the attribute’s value, as
Figure 11-37 illustrates for the file name attribute.
When an attribute’s value is stored directly in the MFT, the time it takes NTFS to access the value
is greatly reduced. Instead of looking up a file in a table and then reading a succession of allocation
CHAPTER 11
Caching and file systems
667
units to find the file’s data (as the FAT file system does, for example), NTFS accesses the disk once and
retrieves the data immediately.
Standard
information
File name
Data
Attribute header
Attribute value
“RESIDENT”
Offset: 8h
Length: 18h
MYFILE.DAT
FIGURE 11-37 Resident attribute header and value.
The attributes for a small directory, as well as for a small file, can be resident in the MFT, as Figure 11-38
shows. For a small directory, the index root attribute contains an index (organized as a B-tree) of file
record numbers for the files (and the subdirectories) within the directory.
Standard
information
File name
Index root
Index of files
file1, file2, file3, ...
Empty
FIGURE 11-38 MFT file record for a small directory.
Of course, many files and directories can’t be squeezed into a 1 KB or 4 KB, fixed-size MFT record. If a
particular attribute’s value, such as a file’s data attribute, is too large to be contained in an MFT file record,
NTFS allocates clusters for the attribute’s value outside the MFT. A contiguous group of clusters is called
a run (or an extent). If the attribute’s value later grows (if a user appends data to the file, for example),
NTFS allocates another run for the additional data. Attributes whose values are stored in runs (rather than
within the MFT) are called nonresident attributes. The file system decides whether a particular attribute is
resident or nonresident; the location of the data is transparent to the process accessing it.
When an attribute is nonresident, as the data attribute for a large file will certainly be, its header
contains the information NTFS needs to locate the attribute’s value on the disk. Figure 11-39 shows a
nonresident data attribute stored in two runs.
Standard
information File name
Data
Data
NTFS
extended
attributes
Data
FIGURE 11-39 MFT file record for a large file with two data runs.
668
CHAPTER 11
Caching and file systems
Among the standard attributes, only those that can grow can be nonresident. For files, the attributes
that can grow are the data and the attribute list (not shown in Figure 11-39). The standard information
and file name attributes are always resident.
A large directory can also have nonresident attributes (or parts of attributes), as Figure 11-40 shows.
In this example, the MFT file record doesn’t have enough room to store the B-tree that contains the
index of files that are within this large directory. A part of the index is stored in the index root attribute,
and the rest of the index is stored in nonresident runs called index allocations. The index root, index
allocation, and bitmap attributes are shown here in a simplified form. They are described in more detail
in the next section. The standard information and file name attributes are always resident. The header
and at least part of the value of the index root attribute are also resident for directories.
Standard
information File name
Index root
Index
allocation
Bitmap
Index of files
file4 file8
Index buffers
file1 file2 file3
file5 file6
FIGURE 11-40 MFT file record for a large directory with a nonresident file name index.
When an attribute’s value can’t fit in an MFT file record and separate allocations are needed, NTFS
keeps track of the runs by means of VCN-to-LCN mapping pairs. LCNs represent the sequence of
clusters on an entire volume from 0 through n. VCNs number the clusters belonging to a particular file
from 0 through m. For example, the clusters in the runs of a nonresident data attribute are numbered
as shown in Figure 11-41.
Standard
information File name
Data
File 16
VCN
0
1
2
3
4
Data
LCN
1355
1356
1357
5
6
7
1590
1591
Data
1358
1588
1589
FIGURE 11-41 VCNs for a nonresident data attribute.
If this file had more than two runs, the numbering of the third run would start with VCN 8. As
Figure 11-42 shows, the data attribute header contains VCN-to-LCN mappings for the two runs here,
which allows NTFS to easily find the allocations on the disk.
CHAPTER 11
Caching and file systems
669
Standard
information File name
File 16
VCN
Data
Starting
VCN
0
1
2
Starting Number of
LCN
clusters
0
1355
4
4
1588
4
3
4
Data
LCN
1355
1356
1357
5
6
7
1590
1591
Data
1358
1588
1589
FIGURE 11-42 VCN-to-LCN mappings for a nonresident data attribute.
Although Figure 11-41 shows just data runs, other attributes can be stored in runs if there isn’t
enough room in the MFT file record to contain them. And if a particular file has too many attributes
to fit in the MFT record, a second MFT record is used to contain the additional attributes (or attribute
headers for nonresident attributes). In this case, an attribute called the attribute list is added. The attribute list attribute contains the name and type code of each of the file’s attributes and the file number
of the MFT record where the attribute is located. The attribute list attribute is provided for those cases
where all of a file’s attributes will not fit within the file’s file record or when a file grows so large or so
fragmented that a single MFT record can’t contain the multitude of VCN-to-LCN mappings needed to
find all its runs. Files with more than 200 runs typically require an attribute list. In summary, attribute
headers are always contained within file records in the MFT, but an attribute’s value may be located
outside the MFT in one or more extents.
Data compression and sparse files
NTFS supports compression on a per-file, per-directory, or per-volume basis using a variant of the LZ77
algorithm, known as LZNT1. (NTFS compression is performed only on user data, not file system metadata.) In Windows 8.1 and later, files can also be compressed using a newer suite of algorithms, which
include LZX (most compact) and XPRESS (including using 4, 8, or 16K block sizes, in order of speed).
This type of compression, which can be used through commands such as the compact shell command (as
well as File Provder APIs), leverages the Windows Overlay Filter (WOF) file system filter driver (Wof.sys),
which uses an NTFS alternate data stream and sparse files, and is not part of the NTFS driver per se.
WOF is outside the scope of this book, but you can read more about it here: https://devblogs.microsoft.
com/oldnewthing/20190618-00/ p 102597.
You can tell whether a volume is compressed by using the Windows GetVolumeInformation function. To
retrieve the actual compressed size of a file, use the Windows GetCompressedFileSize function. Finally,
to examine or change the compression setting for a file or directory, use the Windows DeviceIoControl
function. (See the FSCTL_GET_COMPRESSION and FSCTL_SET_COMPRESSION file system control
codes.) Keep in mind that although setting a file’s compression state compresses (or decompresses) the
file right away, setting a directory’s or volume’s compression state doesn’t cause any immediate compression or decompression. Instead, setting a directory’s or volume’s compression state sets a default
670
CHAPTER 11
Caching and file systems
compression state that will be given to all newly created files and subdirectories within that directory or
volume (although, if you were to set directory compression using the directory’s property page within
Explorer, the contents of the entire directory tree will be compressed immediately).
The following section introduces NTFS compression by examining the simple case of compressing sparse data. The subsequent sections extend the discussion to the compression of ordinary files
and sparse files.
Note NTFS compression is not supported in DAX volumes or for encrypted files.
Compressing sparse data
Sparse data is often large but contains only a small amount of nonzero data relative to its size. A sparse
matrix is one example of sparse data. As described earlier, NTFS uses VCNs, from 0 through m, to enumerate the clusters of a file. Each VCN maps to a corresponding LCN, which identifies the disk location
of the cluster. Figure 11-43 illustrates the runs (disk allocations) of a normal, noncompressed file, including its VCNs and the LCNs they map to.
VCN
0
1
2
3
4
Data
LCN
1355
1356
5
6
7
8
Data
1357
1358
1588
1589
1590
9
10
11
Data
1591
2033 2034 2035 2036
FIGURE 11-43 Runs of a noncompressed file.
This file is stored in three runs, each of which is 4 clusters long, for a total of 12 clusters. Figure 11-44
shows the MFT record for this file. As described earlier, to save space, the MFT record’s data attribute,
which contains VCN-to-LCN mappings, records only one mapping for each run, rather than one for
each cluster. Notice, however, that each VCN from 0 through 11 has a corresponding LCN associated
with it. The first entry starts at VCN 0 and covers 4 clusters, the second entry starts at VCN 4 and covers
4 clusters, and so on. This entry format is typical for a noncompressed file.
Standard
information File name
Data
Starting
VCN
0
Starting Number of
LCN
clusters
1355
4
4
1588
4
8
2033
4
FIGURE 11-44 MFT record for a noncompressed file.
When a user selects a file on an NTFS volume for compression, one NTFS compression technique is
to remove long strings of zeros from the file. If the file’s data is sparse, it typically shrinks to occupy a
CHAPTER 11
Caching and file systems
671
fraction of the disk space it would otherwise require. On subsequent writes to the file, NTFS allocates
space only for runs that contain nonzero data.
Figure 11-45 depicts the runs of a compressed file containing sparse data. Notice that certain ranges
of the file’s VCNs (16–31 and 64–127) have no disk allocations.
VCN
0
15
Data
LCN
133 134 135 136 137 138 139 140 141 142 143 144 145 146 147 148
32
47
Data
193 194 195 196 197 198 199 200 201 202 203 204 205 206 207 208
48
63
Data
96
97
98
99 100 101 102 103 104 105 106 107 108 109 110 111
128
143
Data
324 325 326 327 328 329 330 331 332 333 334 335 336 337 338 339
FIGURE 11-45 Runs of a compressed file containing sparse data.
The MFT record for this compressed file omits blocks of VCNs that contain zeros and therefore have
no physical storage allocated to them. The first data entry in Figure 11-46, for example, starts at VCN 0
and covers 16 clusters. The second entry jumps to VCN 32 and covers 16 clusters.
Standard
information File name
Data
Starting
VCN
Starting Number of
LCN
clusters
0
133
16
32
193
16
48
96
16
128
324
16
FIGURE 11-46 MFT record for a compressed file containing sparse data.
When a program reads data from a compressed file, NTFS checks the MFT record to determine
whether a VCN-to-LCN mapping covers the location being read. If the program is reading from an
unallocated “hole” in the file, it means that the data in that part of the file consists of zeros, so NTFS
returns zeros without further accessing the disk. If a program writes nonzero data to a “hole,” NTFS
quietly allocates disk space and then writes the data. This technique is very efficient for sparse file data
that contains a lot of zero data.
672
CHAPTER 11
Caching and file systems
Compressing nonsparse data
The preceding example of compressing a sparse file is somewhat contrived. It describes “compression” for a case in which whole sections of a file were filled with zeros, but the remaining data in the file
wasn’t affected by the compression. The data in most files isn’t sparse, but it can still be compressed by
the application of a compression algorithm.
In NTFS, users can specify compression for individual files or for all the files in a directory. (New
files created in a directory marked for compression are automatically compressed—existing files
must be compressed individually when programmatically enabling compression with FSCTL_SET_
COMPRESSION.) When it compresses a file, NTFS divides the file’s unprocessed data into compression
units 16 clusters long (equal to 128 KB for a 8 KB cluster, for example). Certain sequences of data in a file
might not compress much, if at all; so for each compression unit in the file, NTFS determines whether
compressing the unit will save at least 1 cluster of storage. If compressing the unit won’t free up at least
1 cluster, NTFS allocates a 16-cluster run and writes the data in that unit to disk without compressing
it. If the data in a 16-cluster unit will compress to 15 or fewer clusters, NTFS allocates only the number
of clusters needed to contain the compressed data and then writes it to disk. Figure 11-47 illustrates
the compression of a file with four runs. The unshaded areas in this figure represent the actual storage
locations that the file occupies after compression. The first, second, and fourth runs were compressed;
the third run wasn’t. Even with one noncompressed run, compressing this file saved 26 clusters of disk
space, or 41%.
VCN
0
15
Compressed data
LCN
19
20
21
22
16
31
Compressed data
23
24
25
26
27
28
29
30
32
47
Noncompressed data
97
98
99 100 101 102 103 104 105 106 107 108 109 110 111 112
48
63
Compressed data
113 114 115 116 117 118 119 120 121 122
FIGURE 11-47 Data runs of a compressed file.
Note Although the diagrams in this chapter show contiguous LCNs, a compression unit
need not be stored in physically contiguous clusters. Runs that occupy noncontiguous clusters produce slightly more complicated MFT records than the one shown in Figure 11-47.
CHAPTER 11
Caching and file systems
673
When it writes data to a compressed file, NTFS ensures that each run begins on a virtual 16-cluster
boundary. Thus the starting VCN of each run is a multiple of 16, and the runs are no longer than 16 clusters. NTFS reads and writes at least one compression unit at a time when it accesses compressed files.
When it writes compressed data, however, NTFS tries to store compression units in physically contiguous locations so that it can read them all in a single I/O operation. The 16-cluster size of the NTFS compression unit was chosen to reduce internal fragmentation: the larger the compression unit, the less the
overall disk space needed to store the data. This 16-cluster compression unit size represents a trade-off
between producing smaller compressed files and slowing read operations for programs that randomly
access files. The equivalent of 16 clusters must be decompressed for each cache miss. (A cache miss is
more likely to occur during random file access.) Figure 11-48 shows the MFT record for the compressed
file shown in Figure 11-47.
Standard
information File name
Data
Starting
VCN
Starting Number of
LCN
clusters
0
19
4
16
23
8
32
97
16
48
113
10
FIGURE 11-48 MFT record for a compressed file.
One difference between this compressed file and the earlier example of a compressed file containing sparse data is that three of the compressed runs in this file are less than 16 clusters long. Reading
this information from a file’s MFT file record enables NTFS to know whether data in the file is compressed. Any run shorter than 16 clusters contains compressed data that NTFS must decompress when
it first reads the data into the cache. A run that is exactly 16 clusters long doesn’t contain compressed
data and therefore requires no decompression.
If the data in a run has been compressed, NTFS decompresses the data into a scratch buffer and
then copies it to the caller’s buffer. NTFS also loads the decompressed data into the cache, which makes
subsequent reads from the same run as fast as any other cached read. NTFS writes any updates to the
file to the cache, leaving the lazy writer to compress and write the modified data to disk asynchronously. This strategy ensures that writing to a compressed file produces no more significant delay than
writing to a noncompressed file would.
NTFS keeps disk allocations for a compressed file contiguous whenever possible. As the LCNs indicate, the first two runs of the compressed file shown in Figure 11-47 are physically contiguous, as are
the last two. When two or more runs are contiguous, NTFS performs disk read-ahead, as it does with
the data in other files. Because the reading and decompression of contiguous file data take place asynchronously before the program requests the data, subsequent read operations obtain the data directly
from the cache, which greatly enhances read performance.
674
CHAPTER 11
Caching and file systems
Sparse files
Sparse files (the NTFS file type, as opposed to files that consist of sparse data, as described earlier) are
essentially compressed files for which NTFS doesn’t apply compression to the file’s nonsparse data.
However, NTFS manages the run data of a sparse file’s MFT record the same way it does for compressed
files that consist of sparse and nonsparse data.
The change journal file
The change journal file, \ Extend\ UsnJrnl, is a sparse file in which NTFS stores records of changes to
files and directories. Applications like the Windows File Replication Service (FRS) and the Windows
Search service make use of the journal to respond to file and directory changes as they occur.
The journal stores change entries in the J data stream and the maximum size of the journal in the Max
data stream. Entries are versioned and include the following information about a file or directory change:
■
The time of the change
■
The reason for the change (see Table 11-9)
■
The file or directory’s attributes
■
The file or directory’s name
■
The file or directory’s MFT file record number
■
The file record number of the file’s parent directory
■
The security ID
■
The update sequence number (USN) of the record
■
Additional information about the source of the change (a user, the FRS, and so on)
TABLE 11-9 Change journal change reasons
Identifier
Reason
USN_REASON_DATA_OVERWRITE
The data in the file or directory was overwritten.
USN_REASON_DATA_EXTEND
Data was added to the file or directory.
USN_REASON_DATA_TRUNCATION
The data in the file or directory was truncated.
USN_REASON_NAMED_DATA_OVERWRITE
The data in a file’s data stream was overwritten.
USN_REASON_NAMED_DATA_EXTEND
The data in a file’s data stream was extended.
USN_REASON_NAMED_DATA_TRUNCATION
The data in a file’s data stream was truncated.
USN_REASON_FILE_CREATE
A new file or directory was created.
USN_REASON_FILE_DELETE
A file or directory was deleted.
USN_REASON_EA_CHANGE
The extended attributes for a file or directory changed.
USN_REASON_SECURITY_CHANGE
The security descriptor for a file or directory was changed.
USN_REASON_RENAME_OLD_NAME
A file or directory was renamed; this is the old name.
CHAPTER 11
Caching and file systems
675
Identifier
Reason
USN_REASON_RENAME_NEW_NAME
A file or directory was renamed; this is the new name.
USN_REASON_INDEXABLE_CHANGE
The indexing state for the file or directory was changed (whether or not
the Indexing service will process this file or directory).
USN_REASON_BASIC_INFO_CHANGE
The file or directory attributes and/or the time stamps were changed.
USN_REASON_HARD_LINK_CHANGE
A hard link was added or removed from the file or directory.
USN_REASON_COMPRESSION_CHANGE
The compression state for the file or directory was changed.
USN_REASON_ENCRYPTION_CHANGE
The encryption state (EFS) was enabled or disabled for this file or directory.
USN_REASON_OBJECT_ID_CHANGE
The object ID for this file or directory was changed.
USN_REASON_REPARSE_POINT_CHANGE
The reparse point for a file or directory was changed, or a new reparse point
(such as a symbolic link) was added or deleted from a file or directory.
USN_REASON_STREAM_CHANGE
A new data stream was added to or removed from a file or renamed.
USN_REASON_TRANSACTED_CHANGE
This value is added (ORed) to the change reason to indicate that the
change was the result of a recent commit of a TxF transaction.
USN_REASON_CLOSE
The handle to a file or directory was closed, indicating that this is the
final modification made to the file in this series of operations.
USN_REASON_INTEGRITY_CHANGE
The content of a file’s extent (run) has changed, so the associated integrity stream has been updated with a new checksum. This Identifier is
generated by the ReFS file system.
USN_REASON_DESIRED_STORAGE_
CLASS_CHANGE
The event is generated by the NTFS file system driver when a stream is
moved from the capacity to the performance tier or vice versa.
EXPERIMENT: Reading the change journal
You can use the built-in %SystemRoot%\System32\Fsutil.exe tool to create, delete, or query journal information with the built-in Fsutil.exe utility, as shown here:
d:\>fsutil usn queryjournal d:
Usn Journal ID
: 0x01d48f4c3853cc72
First Usn
: 0x0000000000000000
Next Usn
: 0x0000000000000a60
Lowest Valid Usn : 0x0000000000000000
Max Usn
: 0x7fffffffffff0000
Maximum Size
: 0x0000000000a00000
Allocation Delta : 0x0000000000200000
Minimum record version supported : 2
Maximum record version supported : 4
Write range tracking: Disabled
The output indicates the maximum size of the change journal on the volume (10 MB) and its
current state. As a simple experiment to see how NTFS records changes in the journal, create a
file called Usn.txt in the current directory, rename it to UsnNew.txt, and then dump the journal
with Fsutil, as shown here:
d:\>echo Hello USN Journal! > Usn.txt
d:\>ren Usn.txt UsnNew.txt
676
CHAPTER 11
Caching and file systems
d:\>fsutil usn readjournal d:
...
Usn
File name
File name length
Reason
Time stamp
File attributes
File ID
Parent file ID
Source info
Security ID
Major version
Minor version
Record length
:
:
:
:
:
:
:
:
:
:
:
:
:
2656
Usn.txt
14
0x00000100: File create
12/8/2018 15:22:05
0x00000020: Archive
0000000000000000000c000000617912
00000000000000000018000000617ab6
0x00000000: *NONE*
0
3
0
96
Usn
File name
File name length
Reason
Time stamp
File attributes
File ID
Parent file ID
Source info
Security ID
Major version
Minor version
Record length
:
:
:
:
:
:
:
:
:
:
:
:
:
2736
Usn.txt
14
0x00000102: Data extend | File create
12/8/2018 15:22:05
0x00000020: Archive
0000000000000000000c000000617912
00000000000000000018000000617ab6
0x00000000: *NONE*
0
3
0
96
Usn
File name
File name length
Reason
Time stamp
File attributes
File ID
Parent file ID
Source info
Security ID
Major version
Minor version
Record length
:
:
:
:
:
:
:
:
:
:
:
:
:
2816
Usn.txt
14
0x80000102: Data extend | File create | Close
12/8/2018 15:22:05
0x00000020: Archive
0000000000000000000c000000617912
00000000000000000018000000617ab6
0x00000000: *NONE*
0
3
0
96
Usn
File name
File name length
Reason
Time stamp
File attributes
File ID
Parent file ID
Source info
Security ID
:
:
:
:
:
:
:
:
:
:
2896
Usn.txt
14
0x00001000: Rename: old name
12/8/2018 15:22:15
0x00000020: Archive
0000000000000000000c000000617912
00000000000000000018000000617ab6
0x00000000: *NONE*
0
CHAPTER 11
Caching and file systems
677
Major version
Minor version
Record length
: 3
: 0
: 96
Usn
File name
File name length
Reason
Time stamp
File attributes
File ID
Parent file ID
Source info
Security ID
Major version
Minor version
Record length
:
:
:
:
:
:
:
:
:
:
:
:
:
2976
UsnNew.txt
20
0x00002000: Rename: new name
12/8/2018 15:22:15
0x00000020: Archive
0000000000000000000c000000617912
00000000000000000018000000617ab6
0x00000000: *NONE*
0
3
0
96
Usn
File name
File name length
Reason
Time stamp
File attributes
File ID
Parent file ID
Source info
Security ID
Major version
Minor version
Record length
:
:
:
:
:
:
:
:
:
:
:
:
:
3056
UsnNew.txt
20
0x80002000: Rename: new name | Close
12/8/2018 15:22:15
0x00000020: Archive
0000000000000000000c000000617912
00000000000000000018000000617ab6
0x00000000: *NONE*
0
3
0
96
The entries reflect the individual modification operations involved in the operations underlying the command-line operations. If the change journal isn’t enabled on a volume (this happens
especially on non-system volumes where no applications have requested file change notification
or the USN Journal creation), you can easily create it with the following command (in the example
a 10-MB journal has been requested):
d:\ >fsutil usn createJournal d: m=10485760 a=2097152
The journal is sparse so that it never overflows; when the journal’s on-disk size exceeds the maximum defined for the file, NTFS simply begins zeroing the file data that precedes the window of change
information having a size equal to the maximum journal size, as shown in Figure 11-49. To prevent constant resizing when an application is continuously exceeding the journal’s size, NTFS shrinks the journal
only when its size is twice an application-defined value over the maximum configured size.
678
CHAPTER 11
Caching and file systems
$J alternate data stream
Change Entry
Empty
File name
Type of change
Time of change
File MFT entry number
…
Virtual size of $UsnJrnl:$J
…
Physical size of $UsnJrnl:$J
FIGURE 11-49 Change journal ( UsnJrnl) space allocation.
Indexing
In NTFS, a file directory is simply an index of file names—that is, a collection of file names (along with their
file record numbers) organized as a B-tree. To create a directory, NTFS indexes the file name attributes of
the files in the directory. The MFT record for the root directory of a volume is shown in Figure 11-50.
Standard
information
File name
LCN
Bitmap
Index of files
File 5
VCN
Index
allocation
Index root
"\"
0
1
2
file0
file1
file3
1355
1356
1357
VCN-to-LCN
mappings
file4 file10 file15
VCN
3
8
9
10
11
file11 file12 file13 file14
LCN
1358
VCN
LCN
4
5
file6
file8
1588
1589
6
2033 2034 2035 2036
7
file9
1590
1591
FIGURE 11-50 File name index for a volume’s root directory.
CHAPTER 11
Caching and file systems
679
Conceptually, an MFT entry for a directory contains in its index root attribute a sorted list of the
files in the directory. For large directories, however, the file names are actually stored in 4 KB, fixedsize index buffers (which are the nonresident values of the index allocation attribute) that contain and
organize the file names. Index buffers implement a B-tree data structure, which minimizes the number
of disk accesses needed to find a particular file, especially for large directories. The index root attribute
contains the first level of the B-tree (root subdirectories) and points to index buffers containing the
next level (more subdirectories, perhaps, or files).
Figure 11-50 shows only file names in the index root attribute and the index buffers (file6, for
example), but each entry in an index also contains the record number in the MFT where the file is
described and time stamp and file size information for the file. NTFS duplicates the time stamps and
file size information from the file’s MFT record. This technique, which is used by FAT and NTFS, requires
updated information to be written in two places. Even so, it’s a significant speed optimization for directory browsing because it enables the file system to display each file’s time stamps and size without
opening every file in the directory.
The index allocation attribute maps the VCNs of the index buffer runs to the LCNs that indicate
where the index buffers reside on the disk, and the bitmap attribute keeps track of which VCNs in the
index buffers are in use and which are free. Figure 11-50 shows one file entry per VCN (that is, per cluster), but file name entries are actually packed into each cluster. Each 4 KB index buffer will typically contain about 20 to 30 file name entries (depending on the lengths of the file names within the directory).
The B-tree data structure is a type of balanced tree that is ideal for organizing sorted data stored on
a disk because it minimizes the number of disk accesses needed to find an entry. In the MFT, a directory’s index root attribute contains several file names that act as indexes into the second level of the
B-tree. Each file name in the index root attribute has an optional pointer associated with it that points
to an index buffer. The index buffer points to containing file names with lexicographic values less than
its own. In Figure 11-50, for example, file4 is a first-level entry in the B-tree. It points to an index buffer
containing file names that are (lexicographically) less than itself—the file names file0, file1, and file3.
Note that the names file1, file3, and so on that are used in this example are not literal file names but
names intended to show the relative placement of files that are lexicographically ordered according to
the displayed sequence.
Storing the file names in B-trees provides several benefits. Directory lookups are fast because the
file names are stored in a sorted order. And when higher-level software enumerates the files in a directory, NTFS returns already-sorted names. Finally, because B-trees tend to grow wide rather than deep,
NTFS’s fast lookup times don’t degrade as directories grow.
NTFS also provides general support for indexing data besides file names, and several NTFS features—including object IDs, quota tracking, and consolidated security—use indexing to manage
internal data.
The B-tree indexes are a generic capability of NTFS and are used for organizing security descriptors,
security IDs, object IDs, disk quota records, and reparse points. Directories are referred to as file name
indexes whereas other types of indexes are known as view indexes.
680
CHAPTER 11
Caching and file systems
Object IDs
In addition to storing the object ID assigned to a file or directory in the OBJECT_ID attribute of its
MFT record, NTFS also keeps the correspondence between object IDs and their file record numbers in
the O index of the \ Extend\ ObjId metadata file. The index collates entries by object ID (which is a
GUID), making it easy for NTFS to quickly locate a file based on its ID. This feature allows applications,
using the NtCreateFile native API with the FILE_OPEN_BY_FILE_ID flag, to open a file or directory using
its object ID. Figure 11-51 demonstrates the correspondence of the ObjId metadata file and OBJECT_
ID attributes in MFT records.
$ObjId metadata file MFT entry
ID passed when an
application opens a
file using its object ID
$O index
Object ID 0
Standard
information
Filename
$O index
root
$O index
allocation
MFT
File 3
MFT entry number
FILE_OBJECTID_BUFFER
File 1
$OBJECT_ID
$OBJECT_ID
Object ID 1
MFT entry number
FILE_OBJECTID_BUFFER
File 2
$OBJECT_ID
Object ID 2
FIGURE 11-51
…
MFT entry number
FILE_OBJECTID_BUFFER
ObjId and OBJECT_ID relationships.
Quota tracking
NTFS stores quota information in the \ Extend\ Quota metadata file, which consists of the named
index root attributes O and Q. Figure 11-52 shows the organization of these indexes. Just as NTFS
assigns each security descriptor a unique internal security ID, NTFS assigns each user a unique user ID.
When an administrator defines quota information for a user, NTFS allocates a user ID that corresponds
to the user’s SID. In the O index, NTFS creates an entry that maps an SID to a user ID and sorts the
index by SID; in the Q index, NTFS creates a quota control entry. A quota control entry contains the
value of the user’s quota limits, as well as the amount of disk space the user consumes on the volume.
When an application creates a file or directory, NTFS obtains the application user’s SID and looks up
the associated user ID in the O index. NTFS records the user ID in the new file or directory’s STANDARD_
INFORMATION attribute, which counts all disk space allocated to the file or directory against that user’s
quota. Then NTFS looks up the quota entry in the Q index and determines whether the new allocation
causes the user to exceed his or her warning or limit threshold. When a new allocation causes the user to
CHAPTER 11
Caching and file systems
681
exceed a threshold, NTFS takes appropriate steps, such as logging an event to the System event log or
not letting the user create the file or directory. As a file or directory changes size, NTFS updates the quota
control entry associated with the user ID stored in the STANDARD_INFORMATION attribute. NTFS uses
the NTFS generic B-tree indexing to efficiently correlate user IDs with account SIDs and, given a user ID, to
efficiently look up a user’s quota control information.
SID taken from
application when a file
or directory is created
User ID taken from a file’s
$STANDARD_INFORMATION
attribute during a file operation
$O index
$Q index
SID 0
User ID 0
User ID 0
Quota entry for user 0
SID 1
User ID 1
User ID 1
Quota entry for user 1
SID 2
User ID 2
User ID 2
Quota entry for user 2
FIGURE 11-52
Quota indexing.
Consolidated security
NTFS has always supported security, which lets an administrator specify which users can and can’t access
individual files and directories. NTFS optimizes disk utilization for security descriptors by using a central
metadata file named Secure to store only one instance of each security descriptor on a volume.
The Secure file contains two index attributes— SDH (Security Descriptor Hash) and SII (Security
ID Index)—and a data-stream attribute named SDS (Security Descriptor Stream), as Figure 11-53
shows. NTFS assigns every unique security descriptor on a volume an internal NTFS security ID (not to
be confused with a Windows SID, which uniquely identifies computers and user accounts) and hashes
the security descriptor according to a simple hash algorithm. A hash is a potentially nonunique shorthand representation of a descriptor. Entries in the SDH index map the security descriptor hashes to
the security descriptor’s storage location within the SDS data attribute, and the SII index entries map
NTFS security IDs to the security descriptor’s location in the SDS data attribute.
When you apply a security descriptor to a file or directory, NTFS obtains a hash of the descriptor and
looks through the SDH index for a match. NTFS sorts the SDH index entries according to the hash of
their corresponding security descriptor and stores the entries in a B-tree. If NTFS finds a match for the descriptor in the SDH index, NTFS locates the offset of the entry’s security descriptor from the entry’s offset
value and reads the security descriptor from the SDS attribute. If the hashes match but the security
descriptors don’t, NTFS looks for another matching entry in the SDH index. When NTFS finds a precise
match, the file or directory to which you’re applying the security descriptor can reference the existing
security descriptor in the SDS attribute. NTFS makes the reference by reading the NTFS security identifier
682
CHAPTER 11
Caching and file systems
from the SDH entry and storing it in the file or directory’s STANDARD_INFORMATION attribute. The
NTFS STANDARD_INFORMATION attribute, which all files and directories have, stores basic information
about a file, including its attributes, time stamp information, and security identifier.
Hash of a security
descriptor when a security
setting is applied to a
file or directory
ID taken from a file’s
$STANDARD_INFORMATION
attribute during a file or
directory security check
$SDH index
$SDS data stream
$SII index
Hash 1
Security descriptor
0
NTFS security ID 0
Security descriptor
1
NTFS security ID 1
$SDS offset
Hash 2
$SDS offset
$SDS offset
$SDS offset
Hash 0
NTFS security ID 2
$SDS offset
$SDS offset
Security descriptor
2
FIGURE 11-53
Secure indexing.
If NTFS doesn’t find in the SDH index an entry that has a security descriptor that matches the descriptor you’re applying, the descriptor you’re applying is unique to the volume, and NTFS assigns the
descriptor a new internal security ID. NTFS internal security IDs are 32-bit values, whereas SIDs are typically several times larger, so representing SIDs with NTFS security IDs saves space in the STANDARD_
INFORMATION attribute. NTFS then adds the security descriptor to the end of the SDS data attribute,
and it adds to the SDH and SII indexes entries that reference the descriptor’s offset in the SDS data.
When an application attempts to open a file or directory, NTFS uses the SII index to look up the file
or directory’s security descriptor. NTFS reads the file or directory’s internal security ID from the MFT
entry’s STANDARD_INFORMATION attribute. It then uses the Secure file’s SII index to locate the ID’s
entry in the SDS data attribute. The offset into the SDS attribute lets NTFS read the security descriptor and complete the security check. NTFS stores the 32 most recently accessed security descriptors
with their SII index entries in a cache so that it accesses the Secure file only when the SII isn’t cached.
NTFS doesn’t delete entries in the Secure file, even if no file or directory on a volume references the
entry. Not deleting these entries doesn’t significantly decrease disk space because most volumes, even
those used for long periods, have relatively few unique security descriptors.
NTFS’s use of generic B-tree indexing lets files and directories that have the same security settings
efficiently share security descriptors. The SII index lets NTFS quickly look up a security descriptor in
the Secure file while performing security checks, and the SDH index lets NTFS quickly determine
whether a security descriptor being applied to a file or directory is already stored in the Secure file
and can be shared.
CHAPTER 11
Caching and file systems
683
Reparse points
As described earlier in the chapter, a reparse point is a block of up to 16 KB of application-defined
reparse data and a 32-bit reparse tag that are stored in the REPARSE_POINT attribute of a file or directory. Whenever an application creates or deletes a reparse point, NTFS updates the \ Extend\ Reparse
metadata file, in which NTFS stores entries that identify the file record numbers of files and directories
that contain reparse points. Storing the records in a central location enables NTFS to provide interfaces
for applications to enumerate all a volume’s reparse points or just specific types of reparse points, such
as mount points. The \ Extend\ Reparse file uses the generic B-tree indexing facility of NTFS by collating the file’s entries (in an index named R) by reparse point tags and file record numbers.
EXPERIMENT: Looking at different reparse points
A file or directory reparse point can contain any kind of arbitrary data. In this experiment, we use
the built-in fsutil.exe tool to analyze the reparse point content of a symbolic link and of a Modern
application’s AppExecutionAlias, similar to the experiment in Chapter 8. First you need to create a
symbolic link:
C:\>mklink test_link.txt d:\Test.txt
symbolic link created for test_link.txt <<===>> d:\Test.txt
Then you can use the fsutil reparsePoint query command to examine the reparse point content:
C:\>fsutil reparsePoint query test_link.txt
Reparse Tag Value : 0xa000000c
Tag value: Microsoft
Tag value: Name Surrogate
Tag value: Symbolic Link
Reparse Data Length: 0x00000040
Reparse Data:
0000: 16 00 1e 00 00 00 16 00
0010: 5c 00 54 00 65 00 73 00
0020: 74 00 5c 00 3f 00 3f 00
0030: 54 00 65 00 73 00 74 00
00
74
5c
2e
00
00
00
00
00
2e
64
74
00
00
00
00
64
74
3a
78
00
00
00
00
3a
78
5c
74
00
00
00
00
............d.:.
\.T.e.s.t...t.x.
t.\.?.?.\.d.:.\.
T.e.s.t...t.x.t.
As expected, the content is a simple data structure (REPARSE_DATA_BUFFER, documented in
Microsoft Docs), which contains the symbolic link target and the printed file name. You can even
delete the reparse point by using fsutil reparsePoint delete command:
C:\>more test_link.txt
This is a test file!
C:\>fsutil reparsePoint delete test_link.txt
C:\>more test_link.txt
684
CHAPTER 11
Caching and file systems
If you delete the reparse point, the file become a 0 bytes file. This is by design because the
unnamed data stream ( DATA) in the link file is empty. You can repeat the experiment with an
AppExecutionAlias of an installed Modern application (in the following example, Spotify was used):
C:\>cd C:\Users\Andrea\AppData\Local\Microsoft\WindowsApps
C:\Users\andrea\AppData\Local\Microsoft\WindowsApps>fsutil reparsePoint query Spotify.exe
Reparse Tag Value : 0x8000001b
Tag value: Microsoft
Reparse Data Length: 0x00000178
Reparse Data:
0000: 03 00 00 00 53 00 70 00
0010: 79 00 41 00 42 00 2e 00
0020: 69 00 66 00 79 00 4d 00
0030: 5f 00 7a 00 70 00 64 00
0040: 72 00 7a 00 72 00 65 00
0050: 70 00 6f 00 74 00 69 00
0060: 2e 00 53 00 70 00 6f 00
0070: 4d 00 75 00 73 00 69 00
0080: 64 00 6e 00 65 00 6b 00
0090: 65 00 61 00 30 00 21 00
00a0: 69 00 66 00 79 00 00 00
00b0: 72 00 6f 00 67 00 72 00
00c0: 69 00 6c 00 65 00 73 00
00d0: 64 00 6f 00 77 00 73 00
00e0: 5c 00 53 00 70 00 6f 00
00f0: 41 00 42 00 2e 00 53 00
0100: 66 00 79 00 4d 00 75 00
0110: 31 00 2e 00 39 00 34 00
0120: 2e 00 30 00 5f 00 78 00
0130: 7a 00 70 00 64 00 6e 00
0140: 7a 00 72 00 65 00 61 00
0150: 6f 00 74 00 69 00 66 00
0160: 72 00 61 00 74 00 6f 00
0170: 65 00 00 00 30 00 00 00
6f
53
75
6e
61
66
74
63
64
53
43
61
5c
41
74
70
73
2e
38
65
30
79
72
00
00
00
00
00
00
00
00
00
00
00
00
00
00
00
00
00
00
00
00
00
00
00
74
70
73
65
30
79
69
5f
72
70
3a
6d
57
70
69
6f
69
32
36
6b
5c
4d
2e
00
00
00
00
00
00
00
00
00
00
00
00
00
00
00
00
00
00
00
00
00
00
00
69
6f
69
6b
00
41
66
7a
7a
6f
5c
20
69
70
66
74
63
36
5f
64
53
69
65
00
00
00
00
00
00
00
00
00
00
00
00
00
00
00
00
00
00
00
00
00
00
00
66
74
63
64
53
42
79
70
72
74
50
46
6e
73
79
69
5f
32
5f
72
70
67
78
00
00
00
00
00
00
00
00
00
00
00
00
00
00
00
00
00
00
00
00
00
00
00
....S.p.o.t.i.f.
y.A.B...S.p.o.t.
i.f.y.M.u.s.i.c.
_.z.p.d.n.e.k.d.
r.z.r.e.a.0...S
p.o.t.i.f.y.A.B.
..S.p.o.t.i.f.y.
M.u.s.i.c._.z.p.
d.n.e.k.d.r.z.r.
e.a.0.!.S.p.o.t.
i.f.y...C.:.\.P.
r.o.g.r.a.m. .F.
i.l.e.s.\.W.i.n.
d.o.w.s.A.p.p.s.
\.S.p.o.t.i.f.y.
A.B...S.p.o.t.i.
f.y.M.u.s.i.c._.
1...9.4...2.6.2.
..0._.x.8.6._._.
z.p.d.n.e.k.d.r.
z.r.e.a.0.\.S.p.
o.t.i.f.y.M.i.g.
r.a.t.o.r...e.x.
e...0...
From the preceding output, we can see another kind of reparse point, the AppExecutionAlias,
used by Modern applications. More information is available in Chapter 8.
Storage reserves and NTFS reservations
Windows Update and the Windows Setup application must be able to correctly apply important security updates, even when the system volume is almost full (they need to ensure that there is enough
disk space). Windows 10 introduced Storage Reserves as a way to achieve this goal. Before we describe the Storage Reserves, it is necessary that you understand how NTFS reservations work and why
they’re needed.
When the NTFS file system mounts a volume, it calculates the volume’s in-use and free space. No
on-disk attributes exist for keeping track of these two counters; NTFS maintains and stores the Volume
bitmap on disk, which represents the state of all the clusters in the volume. The NTFS mounting code
scans the bitmap and counts the number of used clusters, which have their bit set to 1 in the bitmap,
CHAPTER 11
Caching and file systems
685
and, through a simple equation (total number of clusters of the volume minus the number of used
ones), calculates the number of free clusters. The two calculated counters are stored in the volume control block (VCB) data structure, which represents the mounted volume and exists only in memory until
the volume is dismounted.
During normal volume I/O activity, NTFS must maintain the total number of reserved clusters. This
counter needs to exist for the following reasons:
■
■
■
When writing to compressed and sparse files, the system must ensure that the entire file is
writable because an application that is operating on this kind of file could potentially store valid
uncompressed data on the entire file.
The first time a writable image-backed section is created, the file system must reserve available
space for the entire section size, even if no physical space is still allocated in the volume.
The USN Journal and TxF use the counter to ensure that there is space available for the USN log
and NTFS transactions.
NTFS maintains another counter during normal I/O activities, Total Free Available Space, which is the
final space that a user can see and use for storing new files or data. These three concepts are parts of
NTFS Reservations. The important characteristic of NTFS Reservations is that the counters are only inmemory volatile representations, which will be destroyed at volume dismounting time.
Storage Reserve is a feature based on NTFS reservations, which allow files to have an assigned
Storage Reserve area. Storage Reserve defines 15 different reservation areas (2 of which are reserved by
the OS), which are defined and stored both in memory and in the NTFS on-disk data structures.
To use the new on-disk reservations, an application defines a volume’s Storage Reserve area by
using the FSCTL_QUERY_STORAGE_RESERVE file system control code, which specifies, through a data
structure, the total amount of reserved space and an Area ID. This will update multiple counters in the
VCB (Storage Reserve areas are maintained in-memory) and insert new data in the $SRAT named data
stream of the Bitmap metadata file. The SRAT data stream contains a data structure that tracks each
Reserve area, including the number of reserved and used clusters. An application can query information about Storage Reserve areas through the FSCTL_QUERY_STORAGE_RESERVE file system control
code and can delete a Storage Reserve using the FSCTL_DELETE_STORAGE_RESERVE code.
After a Storage Reserve area is defined, the application is guaranteed that the space will no longer be used by any other components. Applications can then assign files and directories to a Storage
Reserve area using the NtSetInformationFile native API with the FileStorageReserveIdInformationEx information class. The NTFS file system driver manages the request by updating the in-memory reserved
and used clusters counters of the Reserve area, and by updating the volume’s total number of reserved
clusters that belong to NTFS reservations. It also stores and updates the on-disk STANDARD_INFO attribute of the target file. The latter maintains 4 bits to store the Storage Reserve area ID. In this way, the
system is able to quickly enumerate each file that belongs to a reserve area by just parsing MFT entries.
(NTFS implements the enumeration in the FSCTL_QUERY_FILE_LAYOUT code’s dispatch function.) A
user can enumerate the files that belong to a Storage Reserve by using the fsutil storageReserve
find yID command, specifying the volume path name and Storage Reserve ID she is interested in.
686
CHAPTER 11
Caching and file systems
Several basic file operations have new side effects due to Storage Reserves, like file creation and
renaming. Newly created files or directories will automatically inherit the storage reserve ID of their
parent; the same applies for files or directories that get renamed (moved) to a new parent. Since a
rename operation can change the Storage Reserve ID of the file or directory, this implies that the operation might fail due to lack of disk space. Moving a nonempty directory to a new parent implies that
the new Storage Reserve ID is recursively applied to all the files and subdirectories. When the reserved
space of a Storage Reserve ends, the system starts to use the volume’s free available space, so there is
no guarantee that the operation always succeeds.
EXPERIMENT: Witnessing storage reserves
Starting from the May 2019 Update of Windows 10 (19H1), you can look at the existing NTFS
reserves through the built-in fsutil.exe tool:
C:\>fsutil storagereserve query c:
Reserve ID:
1
Flags:
0x00000000
Space Guarantee: 0x0
Space Used:
0x0
(0 MB)
(0 MB)
Reserve ID:
Flags:
Space Guarantee:
Space Used:
(0 MB)
(409 MB)
2
0x00000000
0x0
0x199ed000
Windows Setup defines two NTFS reserves: a Hard reserve (ID 1), used by the Setup application to store its files, which can’t be deleted or replaced by other applications, and a Soft reserve
(ID 2), which is used to store temporary files, like system logs and Windows Update downloaded
files. In the preceding example, the Setup application has been already able to install all its files
(and no Windows Update is executing), so the Hard Reserve is empty; the Soft reserve has all its
reserved space allocated. You can enumerate all the files that belong to the reserve using the
fsutil storagereserve find yId command. (Be aware that the output is very large, so you might
consider redirecting the output to a file using the > operator.)
C:\>fsutil storagereserve findbyid c: 2
...
********* File 0x0002000000018762 *********
File reference number
: 0x0002000000018762
File attributes
: 0x00000020: Archive
File entry flags
: 0x00000000
Link (ParentID: Name)
: 0x0001000000001165: NTFS Name
Windows\System32\winevt\Logs\OAlerts.evtx
Link (ParentID: Name)
: 0x0001000000001165: DOS Name
Creation Time
: 12/9/2018 3:26:55
Last Access Time
: 12/10/2018 0:21:57
Last Write Time
: 12/10/2018 0:21:57
Change Time
: 12/10/2018 0:21:57
LastUsn
: 44,846,752
OwnerId
: 0
SecurityId
: 551
:
: OALERT~1.EVT
CHAPTER 11
Caching and file systems
687
StorageReserveId
Stream
Attributes
Flags
Size
Allocated Size
Stream
Attributes
Flags
Size
Allocated Size
Stream
Attributes
Flags
Size
Allocated Size
Stream
Attributes
Flags
Size
Allocated Size
Extents
:
:
:
:
:
:
:
:
:
:
:
:
:
:
:
:
:
:
:
:
:
:
:
2
0x010 ::$STANDARD_INFORMATION
0x00000000: *NONE*
0x0000000c: Resident | No clusters allocated
72
72
0x030 ::$FILE_NAME
0x00000000: *NONE*
0x0000000c: Resident | No clusters allocated
90
96
0x030 ::$FILE_NAME
0x00000000: *NONE*
0x0000000c: Resident | No clusters allocated
90
96
0x080 ::$DATA
0x00000000: *NONE*
0x00000000: *NONE*
69,632
69,632
1 Extents
1: VCN: 0 Clusters: 17 LCN: 3,820,235
Transaction support
By leveraging the Kernel Transaction Manager (KTM) support in the kernel, as well as the facilities provided by the Common Log File System, NTFS implements a transactional model called transactional NTFS
or TxF. TxF provides a set of user-mode APIs that applications can use for transacted operations on their
files and directories and also a file system control (FSCTL) interface for managing its resource managers.
Note Windows Vista added the support for TxF as a means to introduce atomic transactions to Windows. The NTFS driver was modified without actually changing the format of
the NTFS data structures, which is why the NTFS format version number, 3.1, is the same as it
has been since Windows XP and Windows Server 2003. TxF achieves backward compatibility
by reusing the attribute type ( LOGGED_UTILITY_STREAM) that was previously used only for
EFS support instead of adding a new one.
TxF is a powerful API, but due to its complexity and various issues that developers need to consider,
they have been adopted by a low number of applications. At the time of this writing, Microsoft is considering deprecating TxF APIs in a future version of Windows. For the sake of completeness, we present
only a general overview of the TxF architecture in this book.
The overall architecture for TxF, shown in Figure 11-54, uses several components:
688
■
Transacted APIs implemented in the Kernel32.dll library
■
A library for reading TxF logs (%SystemRoot%\System32\Txfw32.dll)
CHAPTER 11
Caching and file systems
■
A COM component for TxF logging functionality (%SystemRoot\System32\Txflog.dll)
■
The transactional NTFS library inside the NTFS driver
■
The CLFS infrastructure for reading and writing log records
Application
Transacted APIs
TxF library
CLFS library
User mode
Kernel mode
NTFS driver
CLFS driver
FIGURE 11-54 TxF architecture.
Isolation
Although transactional file operations are opt-in, just like the transactional registry (TxR) operations
described in Chapter 10, TxF has an effect on regular applications that are not transaction-aware
because it ensures that the transactional operations are isolated. For example, if an antivirus program
is scanning a file that’s currently being modified by another application via a transacted operation,
TxF must ensure that the scanner reads the pretransaction data, while applications that access the file
within the transaction work with the modified data. This model is called read-committed isolation.
Read-committed isolation involves the concept of transacted writers and transacted readers. The
former always view the most up-to-date version of a file, including all changes made by the transaction
that is currently associated with the file. At any given time, there can be only one transacted writer for
a file, which means that its write access is exclusive. Transacted readers, on the other hand, have access
only to the committed version of the file at the time they open the file. They are therefore isolated from
changes made by transacted writers. This allows for readers to have a consistent view of a file, even
when a transacted writer commits its changes. To see the updated data, the transacted reader must
open a new handle to the modified file.
Nontransacted writers, on the other hand, are prevented from opening the file by both transacted
writers and transacted readers, so they cannot make changes to the file without being part of the
transaction. Nontransacted readers act similarly to transacted readers in that they see only the file
contents that were last committed when the file handle was open. Unlike transacted readers, however,
they do not receive read-committed isolation, and as such they always receive the updated view of the
latest committed version of a transacted file without having to open a new file handle. This allows nontransaction-aware applications to behave as expected.
CHAPTER 11
Caching and file systems
689
To summarize, TxF’s read-committed isolation model has the following characteristics:
■
■
■
Changes are isolated from transacted readers.
Changes are rolled back (undone) if the associated transaction is rolled back, if the machine
crashes, or if the volume is forcibly dismounted.
Changes are flushed to disk if the associated transaction is committed.
Transactional APIs
TxF implements transacted versions of the Windows file I/O APIs, which use the suffix Transacted:
■
■
■
Create APIs CreateDirectoryTransacted, CreateFileTransacted, CreateHardLinkTransacted,
CreateSymbolicLinkTransacted
Find APIs
FindFirstFileNameTransacted, FindFirstFileTransacted, FindFirstStreamTransacted
Query APIs GetCompressedFileSizeTransacted, GetFileAttributesTransacted,
GetFullPathNameTransacted, GetLongPathNameTransacted
■
Delete APIs
■
Copy and Move/Rename APIs
■
Set APIs
DeleteFileTransacted, RemoveDirectoryTransacted
CopyFileTransacted, MoveFileTransacted
SetFileAttributesTransacted
In addition, some APIs automatically participate in transacted operations when the file handle they
are passed is part of a transaction, like one created by the CreateFileTransacted API. Table 11-10 lists
Windows APIs that have modified behavior when dealing with a transacted file handle.
TABLE 11-10 API behavior changed by TxF
690
API Name
Change
CloseHandle
Transactions aren’t committed until all applications close transacted
handles to the file.
CreateFileMapping, MapViewOfFile
Modifications to mapped views of a file part of a transaction are associated with the transaction themselves.
FindNextFile, ReadDirectoryChanges,
GetInformationByHandle, GetFileSize
If the file handle is part of a transaction, read-isolation rules are applied
to these operations.
GetVolumeInformation
Function returns FILE_SUPPORTS_TRANSACTIONS if the volume supports TxF.
ReadFile, WriteFile
Read and write operations to a transacted file handle are part of the
transaction.
SetFileInformationByHandle
Changes to the FileBasicInfo, FileRenameInfo, FileAllocationInfo,
FileEndOfFileInfo, and FileDispositionInfo classes are transacted if the file
handle is part of a transaction.
SetEndOfFile, SetFileShortName, SetFileTime
Changes are transacted if the file handle is part of a transaction.
CHAPTER 11
Caching and file systems
On-disk implementation
As shown earlier in Table 11-7, TxF uses the LOGGED_UTILITY_STREAM attribute type to store additional data for files and directories that are or have been part of a transaction. This attribute is called
TXF_DATA and contains important information that allows TxF to keep active offline data for a file part
of a transaction. The attribute is permanently stored in the MFT; that is, even after the file is no longer
part of a transaction, the stream remains, for reasons explained soon. The major components of the
attribute are shown in Figure 11-55.
File record number of RM root
Flags
TxF file ID (TxID)
LSN for NTFS metadata
LSN for user data
LSN for directory index
USN index
FIGURE 11-55
TXF_DATA attribute.
The first field shown is the file record number of the root of the resource manager responsible for
the transaction associated with this file. For the default resource manager, the file record number is 5,
which is the file record number for the root directory (\) in the MFT, as shown earlier in Figure 11-31.
TxF needs this information when it creates an FCB for the file so that it can link it to the correct resource
manager, which in turn needs to create an enlistment for the transaction when a transacted file request
is received by NTFS.
Another important piece of data stored in the TXF_DATA attribute is the TxF file ID, or TxID, and
this explains why TXF_DATA attributes are never deleted. Because NTFS writes file names to its records
when writing to the transaction log, it needs a way to uniquely identify files in the same directory
that may have had the same name. For example, if sample.txt is deleted from a directory in a transaction and later a new file with the same name is created in the same directory (and as part of the same
transaction), TxF needs a way to uniquely identify the two instances of sample.txt. This identification is
provided by a 64-bit unique number, the TxID, that TxF increments when a new file (or an instance of
a file) becomes part of a transaction. Because they can never be reused, TxIDs are permanent, so the
TXF_DATA attribute will never be removed from a file.
Last but not least, three CLFS (Common Logging File System) LSNs are stored for each file part of a
transaction. Whenever a transaction is active, such as during create, rename, or write operations, TxF
writes a log record to its CLFS log. Each record is assigned an LSN, and that LSN gets written to the
appropriate field in the TXF_DATA attribute. The first LSN is used to store the log record that identifies
the changes to NTFS metadata in relation to this file. For example, if the standard attributes of a file are
changed as part of a transacted operation, TxF must update the relevant MFT file record, and the LSN
for the log record describing the change is stored. TxF uses the second LSN when the file’s data is modified. Finally, TxF uses the third LSN when the file name index for the directory requires a change related
to a transaction the file took part in, or when a directory was part of a transaction and received a TxID.
CHAPTER 11
Caching and file systems
691
The TXF_DATA attribute also stores internal flags that describe the state information to TxF and the
index of the USN record that was applied to the file on commit. A TxF transaction can span multiple
USN records that may have been partly updated by NTFS’s recovery mechanism (described shortly), so
the index tells TxF how many more USN records must be applied after a recovery.
TxF uses a default resource manager, one for each volume, to keep track of its transactional state.
TxF, however, also supports additional resource managers called secondary resource managers. These
resource managers can be defined by application writers and have their metadata located in any
directory of the application’s choosing, defining their own transactional work units for undo, backup,
restore, and redo operations. Both the default resource manager and secondary resource managers
contain a number of metadata files and directories that describe their current state:
■
■
■
The Txf directory, located into Extend\ RmMetadata directory, which is where files are linked
when they are deleted or overwritten by transactional operations.
The Tops, or TxF Old Page Stream (TOPS) file, which contains a default data stream and an alternate data stream called T. The default stream for the TOPS file contains metadata about the
resource manager, such as its GUID, its CLFS log policy, and the LSN at which recovery should
start. The T stream contains file data that is partially overwritten by a transactional writer (as
opposed to a full overwrite, which would move the file into the Txf directory).
The TxF log files, which are CLFS log files storing transaction records. For the default resource
manager, these files are part of the TxfLog directory, but secondary resource managers can
store them anywhere. TxF uses a multiplexed base log file called TxfLog.blf. The file \ Extend
\ RmMetadata\ TxfLog\ TxfLog contains two streams: the KtmLog stream used for Kernel
Transaction Manager metadata records, and the TxfLog stream, which contains the TxF
log records.
EXPERIMENT: Querying resource manager information
You can use the built-in Fsutil.exe command-line program to query information about the
default resource manager as well as to create, start, and stop secondary resource managers and
configure their logging policies and behaviors. The following command queries information
about the default resource manager, which is identified by the root directory (\):
d:\>fsutil resource info \
Resource Manager Identifier :
81E83020-E6FB-11E8-B862-D89EF33A38A7
KTM Log Path for RM: \Device\HarddiskVolume8\$Extend\$RmMetadata\$TxfLog\$TxfLog::KtmLog
Space used by TOPS:
1 Mb
TOPS free space:
100%
RM State:
Active
Running transactions: 0
One phase commits:
0
Two phase commits:
0
System initiated rollbacks: 0
Age of oldest transaction: 00:00:00
Logging Mode:
Simple
Number of containers: 2
692
CHAPTER 11
Caching and file systems
Container size:
Total log capacity:
Total free log space:
Minimum containers:
Maximum containers:
Log growth increment:
Auto shrink:
10 Mb
20 Mb
19 Mb
2
20
2 container(s)
Not enabled
RM prefers availability over consistency.
As mentioned, the fsutil resource command has many options for configuring TxF resource
managers, including the ability to create a secondary resource manager in any directory of your
choice. For example, you can use the fsutil resource create c:\rmtest command to create a
secondary resource manager in the Rmtest directory, followed by the fsutil resource start
c:\rmtest command to initiate it. Note the presence of the Tops and TxfLogContainer files
and of the TxfLog and Txf directories in this folder.
Logging implementation
As mentioned earlier, each time a change is made to the disk because of an ongoing transaction, TxF
writes a record of the change to its log. TxF uses a variety of log record types to keep track of transactional changes, but regardless of the record type, all TxF log records have a generic header that
contains information identifying the type of the record, the action related to the record, the TxID that
the record applies to, and the GUID of the KTM transaction that the record is associated with.
A redo record specifies how to reapply a change part of a transaction that’s already been committed
to the volume if the transaction has actually never been flushed from cache to disk. An undo record, on
the other hand, specifies how to reverse a change part of a transaction that hasn’t been committed at
the time of a rollback. Some records are redo-only, meaning they don’t contain any equivalent undo
data, whereas other records contain both redo and undo information.
Through the TOPS file, TxF maintains two critical pieces of data, the base LSN and the restart LSN.
The base LSN determines the LSN of the first valid record in the log, while the restart LSN indicates
at which LSN recovery should begin when starting the resource manager. When TxF writes a restart
record, it updates these two values, indicating that changes have been made to the volume and flushed
out to disk—meaning that the file system is fully consistent up to the new restart LSN.
TxF also writes compensating log records or CLRs. These records store the actions that are being
performed during transaction rollback. They’re primarily used to store the undo-next LSN which allows
the recovery process to avoid repeated undo operations by bypassing undo records that have already
been processed, a situation that can happen if the system fails during the recovery phase and has
already performed part of the undo pass. Finally, TxF also deals with prepare records, abort records and
commit records which describe the state of the KTM transactions related to TxF.
CHAPTER 11
Caching and file systems
693
NTFS recovery support
NTFS recovery support ensures that if a power failure or a system failure occurs, no file system operations (transactions) will be left incomplete, and the structure of the disk volume will remain intact
without the need to run a disk repair utility. The NTFS Chkdsk utility is used to repair catastrophic disk
corruption caused by I/O errors (bad disk sectors, electrical anomalies, or disk failures, for example) or
software bugs. But with the NTFS recovery capabilities in place, Chkdsk is rarely needed.
As mentioned earlier (in the section “Recoverability”), NTFS uses a transaction-processing scheme to
implement recoverability. This strategy ensures a full disk recovery that is also extremely fast (on the order
of seconds) for even the largest disks. NTFS limits its recovery procedures to file system data to ensure
that at the very least the user will never lose a volume because of a corrupted file system; however, unless
an application takes specific action (such as flushing cached files to disk), NTFS’s recovery support doesn’t
guarantee user data to be fully updated if a crash occurs. This is the job of transactional NTFS (TxF).
The following sections detail the transaction-logging scheme NTFS uses to record modifications to
file system data structures and explain how NTFS recovers a volume if the system fails.
Design
NTFS implements the design of a recoverable file system. These file systems ensure volume consistency by
using logging techniques (sometimes called ournaling) originally developed for transaction processing.
If the operating system crashes, the recoverable file system restores consistency by executing a recovery
procedure that accesses information that has been stored in a log file. Because the file system has logged
its disk writes, the recovery procedure takes only seconds, regardless of the size of the volume (unlike
in the FAT file system, where the repair time is related to the volume size). The recovery procedure for a
recoverable file system is exact, guaranteeing that the volume will be restored to a consistent state.
A recoverable file system incurs some costs for the safety it provides. Every transaction that alters the
volume structure requires that one record be written to the log file for each of the transaction’s suboperations. This logging overhead is ameliorated by the file system’s batching of log records—writing
many records to the log file in a single I/O operation. In addition, the recoverable file system can employ
the optimization techniques of a lazy write file system. It can even increase the length of the intervals
between cache flushes because the file system metadata can be recovered if the system crashes before
the cache changes have been flushed to disk. This gain over the caching performance of lazy write file
systems makes up for, and often exceeds, the overhead of the recoverable file system’s logging activity.
Neither careful write nor lazy write file systems guarantee protection of user file data. If the system
crashes while an application is writing a file, the file can be lost or corrupted. Worse, the crash can corrupt a lazy write file system, destroying existing files or even rendering an entire volume inaccessible.
The NTFS recoverable file system implements several strategies that improve its reliability over that
of the traditional file systems. First, NTFS recoverability guarantees that the volume structure won’t
be corrupted, so all files will remain accessible after a system failure. Second, although NTFS doesn’t
guarantee protection of user data in the event of a system crash—some changes can be lost from the
694
CHAPTER 11
Caching and file systems
cache—applications can take advantage of the NTFS write-through and cache-flushing capabilities to
ensure that file modifications are recorded on disk at appropriate intervals.
Both cache write-through—forcing write operations to be immediately recorded on disk—and
cache ushing—forcing cache contents to be written to disk—are efficient operations. NTFS doesn’t
have to do extra disk I/O to flush modifications to several different file system data structures because
changes to the data structures are recorded—in a single write operation—in the log file; if a failure occurs and cache contents are lost, the file system modifications can be recovered from the log.
Furthermore, unlike the FAT file system, NTFS guarantees that user data will be consistent and available
immediately after a write-through operation or a cache flush, even if the system subsequently fails.
Metadata logging
NTFS provides file system recoverability by using the same logging technique used by TxF, which consists
of recording all operations that modify file system metadata to a log file. Unlike TxF, however, NTFS’s
built-in file system recovery support doesn’t make use of CLFS but uses an internal logging implementation called the log file service (which is not a background service process as described in Chapter 10).
Another difference is that while TxF is used only when callers opt in for transacted operations, NTFS records all metadata changes so that the file system can be made consistent in the face of a system failure.
Log file service
The log file service (LFS) is a series of kernel-mode routines inside the NTFS driver that NTFS uses to
access the log file. NTFS passes the LFS a pointer to an open file object, which specifies a log file to be
accessed. The LFS either initializes a new log file or calls the Windows cache manager to access the existing log file through the cache, as shown in Figure 11-56. Note that although LFS and CLFS have similar
sounding names, they’re separate logging implementations used for different purposes, although their
operation is similar in many ways.
Log the transaction
Log file
service
I/O manager
NTFS driver
Flush the
log file
Read/write/flush
the log file
…
Write the
volume updates
Cache
manager
Call the memory
manager to access
the mapped file
FIGURE 11-56 Log file service (LFS).
CHAPTER 11
Caching and file systems
695
The LFS divides the log file into two regions: a restart area and an “infinite” logging area, as shown in
Figure 11-57.
LFS restart area
Copy 1
Copy 2
Logging area
Log records
FIGURE 11-57 Log file regions.
NTFS calls the LFS to read and write the restart area. NTFS uses the restart area to store context information such as the location in the logging area at which NTFS begins to read during recovery after a
system failure. The LFS maintains a second copy of the restart data in case the first becomes corrupted
or otherwise inaccessible. The remainder of the log file is the logging area, which contains transaction
records NTFS writes to recover a volume in the event of a system failure. The LFS makes the log file appear infinite by reusing it circularly (while guaranteeing that it doesn’t overwrite information it needs).
Just like CLFS, the LFS uses LSNs to identify records written to the log file. As the LFS cycles through the
file, it increases the values of the LSNs. NTFS uses 64 bits to represent LSNs, so the number of possible
LSNs is so large as to be virtually infinite.
NTFS never reads transactions from or writes transactions to the log file directly. The LFS provides
services that NTFS calls to open the log file, write log records, read log records in forward or backward
order, flush log records up to a specified LSN, or set the beginning of the log file to a higher LSN. During
recovery, NTFS calls the LFS to perform the same actions as described in the TxF recovery section: a redo
pass for nonflushed committed changes, followed by an undo pass for noncommitted changes.
Here’s how the system guarantees that the volume can be recovered:
1.
NTFS first calls the LFS to record in the (cached) log file any transactions that will modify the
volume structure.
2.
NTFS modifies the volume (also in the cache).
3.
The cache manager prompts the LFS to flush the log file to disk. (The LFS implements the flush
by calling the cache manager back, telling it which pages of memory to flush. Refer back to the
calling sequence shown in Figure 11-56.)
4.
After the cache manager flushes the log file to disk, it flushes the volume changes (the metadata operations themselves) to disk.
These steps ensure that if the file system modifications are ultimately unsuccessful, the corresponding transactions can be retrieved from the log file and can be either redone or undone as part of the
file system recovery procedure.
696
CHAPTER 11
Caching and file systems
File system recovery begins automatically the first time the volume is used after the system is rebooted. NTFS checks whether the transactions that were recorded in the log file before the crash were
applied to the volume, and if they weren’t, it redoes them. NTFS also guarantees that transactions not
completely logged before the crash are undone so that they don’t appear on the volume.
Log record types
The NTFS recovery mechanism uses similar log record types as the TxF recovery mechanism: update records, which correspond to the redo and undo records that TxF uses, and checkpoint records, which are
similar to the restart records used by TxF. Figure 11-58 shows three update records in the log file. Each
record represents one suboperation of a transaction, creating a new file. The redo entry in each update
record tells NTFS how to reapply the suboperation to the volume, and the undo entry tells NTFS how to
roll back (undo) the suboperation.
LFS restart area
Logging area
Log file records
…
T1a
Redo: Allocate/initialize an MFT file record
Undo: Deallocate the file record
T1b
T1c
...
Redo: Set bits 3–9 in the bitmap
Undo: Clear bits 3–9 in the bitmap
Redo: Add the file name to the index
Undo: Remove the file name from the index
FIGURE 11-58 Update records in the log file.
After logging a transaction (in this example, by calling the LFS to write the three update records to the
log file), NTFS performs the suboperations on the volume itself, in the cache. When it has finished updating the cache, NTFS writes another record to the log file, recording the entire transaction as complete—a
suboperation known as committing a transaction. Once a transaction is committed, NTFS guarantees that
the entire transaction will appear on the volume, even if the operating system subsequently fails.
When recovering after a system failure, NTFS reads through the log file and redoes each committed transaction. Although NTFS completed the committed transactions from before the system failure,
it doesn’t know whether the cache manager flushed the volume modifications to disk in time. The
updates might have been lost from the cache when the system failed. Therefore, NTFS executes the
committed transactions again just to be sure that the disk is up to date.
After redoing the committed transactions during a file system recovery, NTFS locates all the transactions in the log file that weren’t committed at failure and rolls back each suboperation that had been
logged. In Figure 11-58, NTFS would first undo the T1c suboperation and then follow the backward
pointer to T1b and undo that suboperation. It would continue to follow the backward pointers, undoing
suboperations, until it reached the first suboperation in the transaction. By following the pointers, NTFS
knows how many and which update records it must undo to roll back a transaction.
CHAPTER 11
Caching and file systems
697
Redo and undo information can be expressed either physically or logically. As the lowest layer of
software maintaining the file system structure, NTFS writes update records with physical descriptions that
specify volume updates in terms of particular byte ranges on the disk that are to be changed, moved,
and so on, unlike TxF, which uses logical descriptions that express updates in terms of operations such as
“delete file A.dat.” NTFS writes update records (usually several) for each of the following transactions:
■
Creating a file
■
Deleting a file
■
Extending a file
■
Truncating a file
■
Setting file information
■
Renaming a file
■
Changing the security applied to a file
The redo and undo information in an update record must be carefully designed because although
NTFS undoes a transaction, recovers from a system failure, or even operates normally, it might try to
redo a transaction that has already been done or, conversely, to undo a transaction that never occurred
or that has already been undone. Similarly, NTFS might try to redo or undo a transaction consisting of
several update records, only some of which are complete on disk. The format of the update records
must ensure that executing redundant redo or undo operations is idempotent—that is, has a neutral effect. For example, setting a bit that is already set has no effect, but toggling a bit that has already been
toggled does. The file system must also handle intermediate volume states correctly.
In addition to update records, NTFS periodically writes a checkpoint record to the log file, as illustrated in Figure 11-59.
Logging area
LFS restart area
Log file records
NTFS restart
...
LSN
2058
LSN
2059
LSN
2060
LSN
2061
...
Checkpoint
record
FIGURE 11-59 Checkpoint record in the log file.
A checkpoint record helps NTFS determine what processing would be needed to recover a volume if
a crash were to occur immediately. Using information stored in the checkpoint record, NTFS knows, for
example, how far back in the log file it must go to begin its recovery. After writing a checkpoint record,
NTFS stores the LSN of the record in the restart area so that it can quickly find its most recently written
checkpoint record when it begins file system recovery after a crash occurs; this is similar to the restart
LSN used by TxF for the same reason.
698
CHAPTER 11
Caching and file systems
Although the LFS presents the log file to NTFS as if it were infinitely large, it isn’t. The generous size
of the log file and the frequent writing of checkpoint records (an operation that usually frees up space
in the log file) make the possibility of the log file filling up a remote one. Nevertheless, the LFS, just like
CLFS, accounts for this possibility by tracking several operational parameters:
■
■
■
The available log space
The amount of space needed to write an incoming log record and to undo the write, should
that be necessary
The amount of space needed to roll back all active (noncommitted) transactions, should that
be necessary
If the log file doesn’t contain enough available space to accommodate the total of the last two
items, the LFS returns a “log file full” error, and NTFS raises an exception. The NTFS exception handler
rolls back the current transaction and places it in a queue to be restarted later.
To free up space in the log file, NTFS must momentarily prevent further transactions on files. To
do so, NTFS blocks file creation and deletion and then requests exclusive access to all system files and
shared access to all user files. Gradually, active transactions either are completed successfully or receive
the “log file full” exception. NTFS rolls back and queues the transactions that receive the exception.
Once it has blocked transaction activity on files as just described, NTFS calls the cache manager to
flush unwritten data to disk, including unwritten log file data. After everything is safely flushed to disk,
NTFS no longer needs the data in the log file. It resets the beginning of the log file to the current position, making the log file “empty.” Then it restarts the queued transactions. Beyond the short pause in
I/O processing, the log file full error has no effect on executing programs.
This scenario is one example of how NTFS uses the log file not only for file system recovery but also for
error recovery during normal operation. You find out more about error recovery in the following section.
Recovery
NTFS automatically performs a disk recovery the first time a program accesses an NTFS volume after
the system has been booted. (If no recovery is needed, the process is trivial.) Recovery depends on two
tables NTFS maintains in memory: a transaction table, which behaves just like the one TxF maintains,
and a dirty page table which records which pages in the cache contain modifications to the file system
structure that haven’t yet been written to disk. This data must be flushed to disk during recovery.
NTFS writes a checkpoint record to the log file once every 5 seconds. Just before it does, it calls
the LFS to store a current copy of the transaction table and of the dirty page table in the log file. NTFS
then records in the checkpoint record the LSNs of the log records containing the copied tables. When
recovery begins after a system failure, NTFS calls the LFS to locate the log records containing the most
recent checkpoint record and the most recent copies of the transaction and dirty page tables. It then
copies the tables to memory.
The log file usually contains more update records following the last checkpoint record. These
update records represent volume modifications that occurred after the last checkpoint record was
CHAPTER 11
Caching and file systems
699
written. NTFS must update the transaction and dirty page tables to include these operations. After
updating the tables, NTFS uses the tables and the contents of the log file to update the volume itself.
To perform its volume recovery, NTFS scans the log file three times, loading the file into memory
during the first pass to minimize disk I/O. Each pass has a particular purpose:
1.
Analysis
2.
Redoing transactions
3.
Undoing transactions
Analysis pass
During the analysis pass, as shown in Figure 11-60, NTFS scans forward in the log file from the beginning of the last checkpoint operation to find update records and use them to update the transaction
and dirty page tables it copied to memory. Notice in the figure that the checkpoint operation stores
three records in the log file and that update records might be interspersed among these records. NTFS
therefore must start its scan at the beginning of the checkpoint operation.
Analysis pass
...
Dirty page
table
Update
record
Transaction
table
Beginning of
checkpoint operation
Checkpoint
record
Update
record
Update
record
...
End of checkpoint
operation
FIGURE 11-60 Analysis pass.
Most update records that appear in the log file after the checkpoint operation begins represent a
modification to either the transaction table or the dirty page table. If an update record is a “transaction committed” record, for example, the transaction the record represents must be removed from the
transaction table. Similarly, if the update record is a page update record that modifies a file system data
structure, the dirty page table must be updated to reflect that change.
Once the tables are up to date in memory, NTFS scans the tables to determine the LSN of the oldest
update record that logs an operation that hasn’t been carried out on disk. The transaction table contains the LSNs of the noncommitted (incomplete) transactions, and the dirty page table contains the
LSNs of records in the cache that haven’t been flushed to disk. The LSN of the oldest update record that
NTFS finds in these two tables determines where the redo pass will begin. If the last checkpoint record
is older, however, NTFS will start the redo pass there instead.
Note In the TxF recovery model, there is no distinct analysis pass. Instead, as described in
the TxF recovery section, TxF performs the equivalent work in the redo pass.
700
CHAPTER 11
Caching and file systems
Redo pass
During the redo pass, as shown in Figure 11-61, NTFS scans forward in the log file from the LSN of the
oldest update record, which it found during the analysis pass. It looks for page update records, which
contain volume modifications that were written before the system failure but that might not have been
flushed to disk. NTFS redoes these updates in the cache.
Redo pass
...
Update
record
...
Dirty page
table
Update
record
Transaction
table
Checkpoint
record
Update
record
...
Beginning of
checkpoint operation
Oldest unwritten
log record
FIGURE 11-61 Redo pass.
When NTFS reaches the end of the log file, it has updated the cache with the necessary volume modifications, and the cache manager’s lazy writer can begin writing cache contents to disk in the background.
Undo pass
After it completes the redo pass, NTFS begins its undo pass, in which it rolls back any transactions that
weren’t committed when the system failed. Figure 11-62 shows two transactions in the log file; transaction 1 was committed before the power failure, but transaction 2 wasn’t. NTFS must undo transaction 2.
Power failure
Undo pass
...
LSN
4044
LSN
4045
Transaction 1
LSN
4046
LSN
4047
LSN
4048
LSN
4049
“Transaction committed” record
Transaction 2
FIGURE 11-62 Undo pass.
Suppose that transaction 2 created a file, an operation that comprises three suboperations, each
with its own update record. The update records of a transaction are linked by backward pointers in the
log file because they aren’t usually contiguous.
The NTFS transaction table lists the LSN of the last-logged update record for each noncommitted
transaction. In this example, the transaction table identifies LSN 4049 as the last update record logged
for transaction 2. As shown from right to left in Figure 11-63, NTFS rolls back transaction 2.
CHAPTER 11
Caching and file systems
701
...
LSN
4044
LSN
4045
LSN
4046
LSN
4047
LSN
4048
LSN
4049
Redo: Set bits 3–9 in the bitmap
Undo: Clear bits 3–9 in the bitmap
Transaction 1
Transaction 2
Redo: Add the file name to the index
Undo: Remove the file name from the index
Redo: Allocate/initialize an MFT file record
Undo: Deallocate the file record
FIGURE 11-63 Undoing a transaction.
After locating LSN 4049, NTFS finds the undo information and executes it, clearing bits 3 through
9 in its allocation bitmap. NTFS then follows the backward pointer to LSN 4048, which directs it to
remove the new file name from the appropriate file name index. Finally, it follows the last backward
pointer and deallocates the MFT file record reserved for the file, as the update record with LSN 4046
specifies. Transaction 2 is now rolled back. If there are other noncommitted transactions to undo, NTFS
follows the same procedure to roll them back. Because undoing transactions affects the volume’s file
system structure, NTFS must log the undo operations in the log file. After all, the power might fail again
during the recovery, and NTFS would have to redo its undo operations
When the undo pass of the recovery is finished, the volume has been restored to a consistent state.
At this point, NTFS is prepared to flush the cache changes to disk to ensure that the volume is up to
date. Before doing so, however, it executes a callback that TxF registers for notifications of LFS flushes.
Because TxF and NTFS both use write-ahead logging, TxF must flush its log through CLFS before the
NTFS log is flushed to ensure consistency of its own metadata. (And similarly, the TOPS file must be
flushed before the CLFS-managed log files.) NTFS then writes an “empty” LFS restart area to indicate
that the volume is consistent and that no recovery need be done if the system should fail again immediately. Recovery is complete.
NTFS guarantees that recovery will return the volume to some preexisting consistent state, but not
necessarily to the state that existed just before the system crash. NTFS can’t make that guarantee because, for performance, it uses a lazy commit algorithm, which means that the log file isn’t immediately
flushed to disk each time a transaction committed record is written. Instead, numerous transaction
committed records are batched and written together, either when the cache manager calls the LFS to
flush the log file to disk or when the LFS writes a checkpoint record (once every 5 seconds) to the log
file. Another reason the recovered volume might not be completely up to date is that several parallel transactions might be active when the system crashes, and some of their transaction committed
records might make it to disk, whereas others might not. The consistent volume that recovery produces
includes all the volume updates whose transaction committed records made it to disk and none of the
updates whose transaction committed records didn’t make it to disk.
702
CHAPTER 11
Caching and file systems
NTFS uses the log file to recover a volume after the system fails, but it also takes advantage of an important freebie it gets from logging transactions. File systems necessarily contain a lot of code devoted
to recovering from file system errors that occur during the course of normal file I/O. Because NTFS logs
each transaction that modifies the volume structure, it can use the log file to recover when a file system
error occurs and thus can greatly simplify its error handling code. The log file full error described earlier
is one example of using the log file for error recovery.
Most I/O errors that a program receives aren’t file system errors and therefore can’t be resolved
entirely by NTFS. When called to create a file, for example, NTFS might begin by creating a file record in
the MFT and then enter the new file’s name in a directory index. When it tries to allocate space for the
file in its bitmap, however, it could discover that the disk is full and the create request can’t be completed. In such a case, NTFS uses the information in the log file to undo the part of the operation it has
already completed and to deallocate the data structures it reserved for the file. Then it returns a disk
full error to the caller, which in turn must respond appropriately to the error.
NTFS bad-cluster recovery
The volume manager included with Windows (VolMgr) can recover data from a bad sector on a
fault-tolerant volume, but if the hard disk doesn’t perform bad-sector remapping or runs out of spare
sectors, the volume manager can’t perform bad-sector replacement to replace the bad sector. When
the file system reads from the sector, the volume manager instead recovers the data and returns the
warning to the file system that there is only one copy of the data.
The FAT file system doesn’t respond to this volume manager warning. Moreover, neither FAT nor the
volume manager keeps track of the bad sectors, so a user must run the Chkdsk or Format utility to prevent the volume manager from repeatedly recovering data for the file system. Both Chkdsk and Format
are less than ideal for removing bad sectors from use. Chkdsk can take a long time to find and remove
bad sectors, and Format wipes all the data off the partition it’s formatting.
In the file system equivalent of a volume manager’s bad-sector replacement, NTFS dynamically replaces the cluster containing a bad sector and keeps track of the bad cluster so that it won’t be reused.
(Recall that NTFS maintains portability by addressing logical clusters rather than physical sectors.) NTFS
performs these functions when the volume manager can’t perform bad-sector replacement. When a
volume manager returns a bad-sector warning or when the hard disk driver returns a bad-sector error,
NTFS allocates a new cluster to replace the one containing the bad sector. NTFS copies the data that
the volume manager has recovered into the new cluster to reestablish data redundancy.
Figure 11-64 shows an MFT record for a user file with a bad cluster in one of its data runs as it existed
before the cluster went bad. When it receives a bad-sector error, NTFS reassigns the cluster containing
the sector to its bad-cluster file, BadClus. This prevents the bad cluster from being allocated to another file. NTFS then allocates a new cluster for the file and changes the file’s VCN-to-LCN mappings to
point to the new cluster. This bad-cluster remapping (introduced earlier in this chapter) is illustrated in
Figure 11-64. Cluster number 1357, which contains the bad sector, must be replaced by a good cluster.
CHAPTER 11
Caching and file systems
703
Standard
information File name
Data
Starting
VCN
User
file
VCN
0
1
Starting Number of
LCN
clusters
0
1355
3
3
1588
3
2
3
4
5
1588
1589
1590
Bad
LCN
1355
1356
1357
FIGURE 11-64 MFT record for a user file with a bad cluster.
Bad-sector errors are undesirable, but when they do occur, the combination of NTFS and the
volume manager provides the best possible solution. If the bad sector is on a redundant volume,
the volume manager recovers the data and replaces the sector if it can. If it can’t replace the sector,
it returns a warning to NTFS, and NTFS replaces the cluster containing the bad sector.
If the volume isn’t configured as a redundant volume, the data in the bad sector can’t be recovered.
When the volume is formatted as a FAT volume and the volume manager can’t recover the data, reading from the bad sector yields indeterminate results. If some of the file system’s control structures reside in the bad sector, an entire file or group of files (or potentially, the whole disk) can be lost. At best,
some data in the affected file (often, all the data in the file beyond the bad sector) is lost. Moreover, the
FAT file system is likely to reallocate the bad sector to the same or another file on the volume, causing
the problem to resurface.
Like the other file systems, NTFS can’t recover data from a bad sector without help from a volume
manager. However, NTFS greatly contains the damage a bad sector can cause. If NTFS discovers the
bad sector during a read operation, it remaps the cluster the sector is in, as shown in Figure 11-65. If the
volume isn’t configured as a redundant volume, NTFS returns a data read error to the calling program.
Although the data that was in that cluster is lost, the rest of the file—and the file system—remains
intact; the calling program can respond appropriately to the data loss, and the bad cluster won’t be
reused in future allocations. If NTFS discovers the bad cluster on a write operation rather than a read,
NTFS remaps the cluster before writing and thus loses no data and generates no error.
The same recovery procedures are followed if file system data is stored in a sector that goes bad.
If the bad sector is on a redundant volume, NTFS replaces the cluster dynamically, using the data
recovered by the volume manager. If the volume isn’t redundant, the data can’t be recovered, so NTFS
sets a bit in the Volume metadata file that indicates corruption on the volume. The NTFS Chkdsk utility
checks this bit when the system is next rebooted, and if the bit is set, Chkdsk executes, repairing the file
system corruption by reconstructing the NTFS metadata.
704
CHAPTER 11
Caching and file systems
Standard
information File name
$Bad alternate data stream
Starting
VCN
Badcluster
file
0
VCN
Starting Number of
LCN
clusters
1357
1
0
Bad
LCN
1357
Standard
information File name
$Data
Starting
VCN
User
file
Starting Number of
LCN
clusters
0
1355
2
2
1049
1588
31
3
1588
3
VCN
0
1
2
3
4
5
LCN
1355
1356
1049
1588
1589
1590
FIGURE 11-65 Bad-cluster remapping.
In rare instances, file system corruption can occur even on a fault-tolerant disk configuration. A
double error can destroy both file system data and the means to reconstruct it. If the system crashes
while NTFS is writing the mirror copy of an MFT file record—of a file name index or of the log file, for
example—the mirror copy of such file system data might not be fully updated. If the system were rebooted and a bad-sector error occurred on the primary disk at exactly the same location as the incomplete write on the disk mirror, NTFS would be unable to recover the correct data from the disk mirror.
NTFS implements a special scheme for detecting such corruptions in file system data. If it ever finds an
inconsistency, it sets the corruption bit in the volume file, which causes Chkdsk to reconstruct the NTFS
metadata when the system is next rebooted. Because file system corruption is rare on a fault-tolerant
disk configuration, Chkdsk is seldom needed. It is supplied as a safety precaution rather than as a firstline data recovery strategy.
The use of Chkdsk on NTFS is vastly different from its use on the FAT file system. Before writing
anything to disk, FAT sets the volume’s dirty bit and then resets the bit after the modification is complete. If any I/O operation is in progress when the system crashes, the dirty bit is left set and Chkdsk
runs when the system is rebooted. On NTFS, Chkdsk runs only when unexpected or unreadable file
system data is found, and NTFS can’t recover the data from a redundant volume or from redundant
file system structures on a single volume. (The system boot sector is duplicated — in the last sector
CHAPTER 11
Caching and file systems
705
of a volume—as are the parts of the MFT ( MftMirr) required for booting the system and running
the NTFS recovery procedure. This redundancy ensures that NTFS will always be able to boot and
recover itself.)
Table 11-11 summarizes what happens when a sector goes bad on a disk volume formatted for one of
the Windows-supported file systems according to various conditions we’ve described in this section.
TABLE 11-11 Summary of NTFS data recovery scenarios
Scenario
With a Disk That Supports Bad-Sector
Remapping and Has Spare Sectors
Fault-tolerant
volume1
1. Volume manager recovers the data.
2. Volume manager performs bad-sector
1. Volume manager recovers the data.
2. Volume manager sends the data and a
3. File system remains unaware of the error.
3. NTFS performs cluster remapping.
1. Volume manager can’t recover the data.
2. Volume manager sends a bad-sector error
1. Volume manager can’t recover the data.
2. Volume manager sends a bad-sector error
3. NTFS performs cluster remapping.
3. NTFS performs cluster remapping.
replacement.
Non-faulttolerant volume
With a Disk That Does Not Perform BadSector Remapping or Has No Spare Sectors
to the file system.
Data is lost. 2
bad-sector error to the file system.
to the file system.
Data is lost.
1 A fault-tolerant volume is one of the following: a mirror set (RAID-1) or a RAID-5 set.
2 In a write operation, no data is lost: NTFS remaps the cluster before the write.
If the volume on which the bad sector appears is a fault-tolerant volume—a mirrored (RAID-1) or
RAID-5 / RAID-6 volume—and if the hard disk is one that supports bad-sector replacement (and that
hasn’t run out of spare sectors), it doesn’t matter which file system you’re using (FAT or NTFS). The volume manager replaces the bad sector without the need for user or file system intervention.
If a bad sector is located on a hard disk that doesn’t support bad sector replacement, the file system
is responsible for replacing (remapping) the bad sector or—in the case of NTFS—the cluster in which
the bad sector resides. The FAT file system doesn’t provide sector or cluster remapping. The benefits of
NTFS cluster remapping are that bad spots in a file can be fixed without harm to the file (or harm to the
file system, as the case may be) and that the bad cluster will never be used again.
Self-healing
With today’s multiterabyte storage devices, taking a volume offline for a consistency check can result in
a service outage of many hours. Recognizing that many disk corruptions are localized to a single file or
portion of metadata, NTFS implements a self-healing feature to repair damage while a volume remains
online. When NTFS detects corruption, it prevents access to the damaged file or files and creates a
system worker thread that performs Chkdsk-like corrections to the corrupted data structures, allowing access to the repaired files when it has finished. Access to other files continues normally during this
operation, minimizing service disruption.
You can use the fsutil repair set command to view and set a volume’s repair options, which are
summarized in Table 11-12. The Fsutil utility uses the FSCTL_SET_REPAIR file system control code to set
these settings, which are saved in the VCB for the volume.
706
CHAPTER 11
Caching and file systems
TABLE 11-12 NTFS self-healing behaviors
Flag
Behavior
SET_REPAIR_ENABLED
Enable self-healing for the volume.
SET_REPAIR_WARN_ABOUT_DATA_LOSS
If the self-healing process is unable to fully recover a file, specifies whether
the user should be visually warned.
SET_REPAIR_DISABLED_AND_BUGCHECK
_ON_CORRUPTION
If the NtfsBugCheckOnCorrupt NTFS registry value was set by using fsutil
behavior set NtfsBugCheckOnCorrupt 1 and this flag is set, the system will
crash with a STOP error 0x24, indicating file system corruption. This setting
is automatically cleared during boot time to avoid repeated reboot cycles.
In all cases, including when the visual warning is disabled (the default), NTFS will log any self-healing
operation it undertook in the System event log.
Apart from periodic automatic self-healing, NTFS also supports manually initiated self-healing
cycles (this type of self-healing is called proactive) through the FSCTL_INITIATE_REPAIR and FSCTL_
WAIT_FOR_REPAIR control codes, which can be initiated with the fsutil repair initiate and fsutil
repair wait commands. This allows the user to force the repair of a specific file and to wait until repair
of that file is complete.
To check the status of the self-healing mechanism, the FSCTL_QUERY_REPAIR control code or the
fsutil repair query command can be used, as shown here:
C:\>fsutil repair query c:
Self healing state on c: is: 0x9
Values: 0x1 - Enable general repair.
0x9 - Enable repair and warn about potential data loss.
0x10 - Disable repair and bugcheck once on first corruption.
Online check-disk and fast repair
Rare cases in which disk-corruptions are not managed by the NTFS file system driver (through self-healing, Log file service, and so on) require the system to run the Windows Check Disk tool and to put the volume offline. There are a variety of unique causes for disk corruption: whether they are caused by media
errors from the hard disk or transient memory errors, corruptions can happen in file system metadata. In
large file servers, which have multiple terabytes of disk space, running a complete Check Disk can require
days. Having a volume offline for so long in these kinds of scenarios is typically not acceptable.
Before Windows 8, NTFS implemented a simpler health model, where the file system volume was
either healthy or not (through the dirty bit stored in the VOLUME_INFORMATION attribute). In that
model, the volume was taken offline for as long as necessary to fix the file system corruptions and bring
the volume back to a healthy state. Downtime was directly proportional to the number of files in the
volume. Windows 8, with the goal of reducing or avoiding the downtime caused by file system corruption, has redesigned the NTFS health model and disk check.
The new model introduces new components that cooperate to provide an online check-disk tool and
to drastically reduce the downtime in case severe file-system corruption is detected. The NTFS file system
driver is able to identify multiple types of corruption during normal system I/O. If a corruption is detected,
CHAPTER 11
Caching and file systems
707
NTFS tries to self-heal it (see the previous paragraph). If it doesn’t succeed, the NTFS file system driver
writes a new corruption record to the Verify stream of the \ Extend\ RmMetadata\ Repair file.
A corruption record is a common data structure that NTFS uses for describing metadata corruptions
and is used both in-memory and on-disk. A corruption record is represented by a fixed-size header,
which contains version information, flags, and uniquely represents the record type through a GUID, a
variable-sized description for the type of corruption that occurred, and an optional context.
After the entry has been correctly added, NTFS emits an ETW event through its own event provider
(named Microsoft-Windows-Ntfs-UBPM). This ETW event is consumed by the service control manager,
which will start the Spot Verifier service (more details about triggered-start services are available in
Chapter 10).
The Spot Verifier service (implemented in the Svsvc.dll library) verifies that the signaled corruption is
not a false positive (some corruptions are intermittent due to memory issues and may not be a result of
an actual corruption on disk). Entries in the Verify stream are removed while being verified by the Spot
Verifier. If the corruption (described by the entry) is not a false positive, the Spot Verifier triggers the
Proactive Scan Bit (P-bit) in the VOLUME_INFORMATION attribute of the volume, which will trigger
an online scan of the file system. The online scan is executed by the Proactive Scanner, which is run as a
maintenance task by the Windows task scheduler (the task is located in Microsoft\Windows\Chkdsk, as
shown in Figure 11-66) when the time is appropriate.
FIGURE 11-66 The Proactive Scan maintenance task.
708
CHAPTER 11
Caching and file systems
The Proactive scanner is implemented in the Untfs.dll library, which is imported by the Windows
Check Disk tool (Chkdsk.exe). When the Proactive Scanner runs, it takes a snapshot of the target volume
through the Volume Shadow Copy service and runs a complete Check Disk on the shadow volume.
The shadow volume is read-only; the check disk code detects this and, instead of directly fixing the
errors, uses the self-healing feature of NTFS to try to automatically fix the corruption. If it fails, it sends
a FSCTL_CORRUPTION_HANDLING code to the file system driver, which in turn creates an entry in the
Corrupt stream of the \ Extend\ RmMetadata\ Repair metadata file and sets the volume’s dirty bit.
The dirty bit has a slightly different meaning compared to previous editions of Windows. The VOLUME
_INFORMATION attribute of the NTFS root namespace still contains the dirty bit, but also contains the
P-bit, which is used to require a Proactive Scan, and the F-bit, which is used to require a full check disk
due to the severity of a particular corruption. The dirty bit is set to 1 by the file system driver if the P-bit
or the F-bit are enabled, or if the Corrupt stream contains one or more corruption records.
If the corruption is still not resolved, at this stage there are no other possibilities to fix it when the
volume is offline (this does not necessarily require an immediate volume unmounting). The Spot Fixer
is a new component that is shared between the Check Disk and the Autocheck tool. The Spot Fixer
consumes the records inserted in the Corrupt stream by the Proactive scanner. At boot time, the
Autocheck native application detects that the volume is dirty, but, instead of running a full check disk,
it fixes only the corrupted entries located in the Corrupt stream, an operation that requires only a few
seconds. Figure 11-67 shows a summary of the different repair methodology implemented in the previously described components of the NTFS file system.
FIGURE 11-67 A scheme that describes the components that cooperate to provide online check disk
and fast corruption repair for NTFS volumes.
A Proactive scan can be manually started for a volume through the chkdsk /scan command. In the same
way, the Spot Fixer can be executed by the Check Disk tool using the spotfix command-line argument.
CHAPTER 11
Caching and file systems
709
EXPERIMENT: Testing the online disk check
You can test the online checkdisk by performing a simple experiment. Assuming that you would
like to execute an online checkdisk on the D: volume, start by playing a large video stream from
the D drive. In the meantime, open an administrative command prompt window and start an
online checkdisk through the following command:
C:\>chkdsk d: /scan
The type of the file system is NTFS.
Volume label is DATA.
Stage 1: Examining basic file system structure ...
4041984 file records processed.
File verification completed.
3778 large file records processed.
0 bad file records processed.
Stage 2: Examining file name linkage ...
Progress: 3454102 of 4056090 done; Stage: 85%; Total: 51%; ETA:
0:00:43 ..
You will find that the video stream won’t be stopped and continues to play smoothly. In case
the online checkdisk finds an error that it isn’t able to correct while the volume is mounted, it will
be inserted in the Corrupt stream of the Repair system file. To fix the errors, a volume dismount
is needed, but the correction will be very fast. In that case, you could simply reboot the machine
or manually execute the Spot Fixer through the command line:
C:\>chkdsk d: /spotfix
In case you choose to execute the Spot Fixer, you will find that the video stream will be interrupted, because the volume needs to be unmounted.
Encrypted file system
Windows includes a full-volume encryption feature called Windows BitLocker Drive Encryption.
BitLocker encrypts and protects volumes from offline attacks, but once a system is booted, BitLocker’s
job is done. The Encrypting File System (EFS) protects individual files and directories from other authenticated users on a system. When choosing how to protect your data, it is not an either/or choice
between BitLocker and EFS; each provides protection from specific—and nonoverlapping—threats.
Together, BitLocker and EFS provide a “defense in depth” for the data on your system.
The paradigm used by EFS is to encrypt files and directories using symmetric encryption (a single
key that is used for encrypting and decrypting the file). The symmetric encryption key is then encrypted using asymmetric encryption (one key for encryption—often referred to as the public key—and a
different key for decryption—often referred to as the private key) for each user who is granted access
to the file. The details and theory behind these encryption methods is beyond the scope of this book;
however, a good primer is available at https://docs.microsoft.com/en-us/windows/desktop/SecCrypto/
cryptography-essentials.
710
CHAPTER 11
Caching and file systems
EFS works with the Windows Cryptography Next Generation (CNG) APIs, and thus may be configured to use any algorithm supported by (or added to) CNG. By default, EFS will use the Advanced
Encryption Standard (AES) for symmetric encryption (256-bit key) and the Rivest-Shamir-Adleman
(RSA) public key algorithm for asymmetric encryption (2,048-bit keys).
Users can encrypt files via Windows Explorer by opening a file’s Properties dialog box, clicking
Advanced, and then selecting the Encrypt Contents To Secure Data option, as shown in Figure 1168. (A file may be encrypted or compressed, but not both.) Users can also encrypt files via a commandline utility named Cipher (%SystemRoot%\System32\Cipher.exe) or programmatically using Windows
APIs such as EncryptFile and AddUsersToEncryptedFile.
Windows automatically encrypts files that reside in directories that are designated as encrypted
directories. When a file is encrypted, EFS generates a random number for the file that EFS calls the file’s
File Encryption Key (FEK). EFS uses the FEK to encrypt the file’s contents using symmetric encryption. EFS
then encrypts the FEK using the user’s asymmetric public key and stores the encrypted FEK in the EFS
alternate data stream for the file. The source of the public key may be administratively specified to come
from an assigned X.509 certificate or a smartcard or can be randomly generated (which would then be
added to the user’s certificate store, which can be viewed using the Certificate Manager (%SystemRoot%\
System32\Certmgr.msc). After EFS completes these steps, the file is secure; other users can’t decrypt the
data without the file’s decrypted FEK, and they can’t decrypt the FEK without the user private key.
FIGURE 11-68 Encrypt files by using the Advanced Attributes dialog box.
Symmetric encryption algorithms are typically very fast, which makes them suitable for encrypting
large amounts of data, such as file data. However, symmetric encryption algorithms have a weakness:
You can bypass their security if you obtain the key. If multiple users want to share one encrypted file
protected only using symmetric encryption, each user would require access to the file’s FEK. Leaving
the FEK unencrypted would obviously be a security problem, but encrypting the FEK once would require all the users to share the same FEK decryption key—another potential security problem.
Keeping the FEK secure is a difficult problem, which EFS addresses with the public key–based half of
its encryption architecture. Encrypting a file’s FEK for individual users who access the file lets multiple
users share an encrypted file. EFS can encrypt a file’s FEK with each user’s public key and can store each
user’s encrypted FEK in the file’s EFS data stream. Anyone can access a user’s public key, but no one
CHAPTER 11
Caching and file systems
711
can use a public key to decrypt the data that the public key encrypted. The only way users can decrypt
a file is with their private key, which the operating system must access. A user’s private key decrypts the
user’s encrypted copy of a file’s FEK. Public key–based algorithms are usually slow, but EFS uses these
algorithms only to encrypt FEKs. Splitting key management between a publicly available key and a
private key makes key management a little easier than symmetric encryption algorithms do and solves
the dilemma of keeping the FEK secure.
Several components work together to make EFS work, as the diagram of EFS architecture in Figure 11-69
shows. EFS support is merged into the NTFS driver. Whenever NTFS encounters an encrypted file, NTFS
executes EFS functions that it contains. The EFS functions encrypt and decrypt file data as applications
access encrypted files. Although EFS stores an FEK with a file’s data, users’ public keys encrypt the FEK.
To encrypt or decrypt file data, EFS must decrypt the file’s FEK with the aid of CNG key management
services that reside in user mode.
Windows 10
client
Downlevel
client
EFSRPC
LSA
SC logon
PIN, cert
User
Logon
EFS APIs
EFSRPC
SC logon
PIN, cert
EFSRPC
forwarding
User key store
Keys
EFS service
Kerberos
Group policy
Settings
Settings
EFS
recovery policy
EFSRPC
RPC client
FSCTLs
for
EFSRPC
File I/O (plaintext)
NTFS
Ciphertext
User secrets
Registry
LSA domain
policy store
EFS cache
CreateFile
EFS kernel
helper library
Kernel
Disk
FIGURE 11-69 EFS architecture.
The Local Security Authority Subsystem (LSASS, %SystemRoot%\System32\Lsass.exe) manages
logon sessions but also hosts the EFS service (Efssvc.dll). For example, when EFS needs to decrypt a FEK
to decrypt file data a user wants to access, NTFS sends a request to the EFS service inside LSASS.
712
CHAPTER 11
Caching and file systems
Encrypting a file for the first time
The NTFS driver calls its EFS helper functions when it encounters an encrypted file. A file’s attributes record that the file is encrypted in the same way that a file records that it’s compressed (discussed earlier
in this chapter). NTFS has specific interfaces for converting a file from nonencrypted to encrypted form,
but user-mode components primarily drive the process. As described earlier, Windows lets you encrypt
a file in two ways: by using the cipher command-line utility or by checking the Encrypt Contents To
Secure Data check box in the Advanced Attributes dialog box for a file in Windows Explorer. Both
Windows Explorer and the cipher command rely on the EncryptFile Windows API.
EFS stores only one block of information in an encrypted file, and that block contains an entry for
each user sharing the file. These entries are called key entries, and EFS stores them in the data decryption field (DDF) portion of the file’s EFS data. A collection of multiple key entries is called a key ring
because, as mentioned earlier, EFS lets multiple users share encrypted files.
Figure 11-70 shows a file’s EFS information format and key entry format. EFS stores enough information in the first part of a key entry to precisely describe a user’s public key. This data includes the user’s
security ID (SID) (note that the SID is not guaranteed to be present), the container name in which the
key is stored, the cryptographic provider name, and the asymmetric key pair certificate hash. Only the
asymmetric key pair certificate hash is used by the decryption process. The second part of the key entry
contains an encrypted version of the FEK. EFS uses the CNG to encrypt the FEK with the selected asymmetric encryption algorithm and the user’s public key.
EFS information
Header
Checksum
Number of DDF key entries
Data
decryption
field
DDF key entry 1
DDF key entry 2
Data
recovery
field
Key entry
Version
Number of DRF key entries
DRF key entry 1
User SID
(S-1-5-21-...)
Container name
(ee341-2144-55ba...)
Provider name
(Microsoft Base Cryptographic Provider 1.0)
EFS certificate hash
(cb3e4e...)
Encrypted FEK
(03fe4f3c...)
FIGURE 11-70 Format of EFS information and key entries.
EFS stores information about recovery key entries in a file’s data recovery field (DRF). The format of
DRF entries is identical to the format of DDF entries. The DRF’s purpose is to let designated accounts, or
recovery agents, decrypt a user’s file when administrative authority must have access to the user’s data.
For example, suppose a company employee forgot his or her logon password. An administrator can
reset the user’s password, but without recovery agents, no one can recover the user’s encrypted data.
CHAPTER 11
Caching and file systems
713
Recovery agents are defined with the Encrypted Data Recovery Agents security policy of the local
computer or domain. This policy is available from the Local Security Policy MMC snap-in, as shown in
Figure 11-71. When you use the Add Recovery Agent Wizard (by right-clicking Encrypting File System
and then clicking Add Data Recovery Agent), you can add recovery agents and specify which private/
public key pairs (designated by their certificates) the recovery agents use for EFS recovery. Lsasrv (Local
Security Authority service, which is covered in Chapter 7 of Part 1) interprets the recovery policy when it
initializes and when it receives notification that the recovery policy has changed. EFS creates a DRF key
entry for each recovery agent by using the cryptographic provider registered for EFS recovery.
FIGURE 11-71 Encrypted Data Recovery Agents group policy.
A user can create their own Data Recovery Agent (DRA) certificate by using the cipher /r command. The generated private certificate file can be imported by the Recovery Agent Wizard and by the
Certificates snap-in of the domain controller or the machine on which the administrator should be able
to decrypt encrypted files.
As the final step in creating EFS information for a file, Lsasrv calculates a checksum for the DDF and
DRF by using the MD5 hash facility of Base Cryptographic Provider 1.0. Lsasrv stores the checksum’s
result in the EFS information header. EFS references this checksum during decryption to ensure that the
contents of a file’s EFS information haven’t become corrupted or been tampered with.
Encrypting file data
When a user encrypts an existing file, the following process occurs:
714
1.
The EFS service opens the file for exclusive access.
2.
All data streams in the file are copied to a plaintext temporary file in the system’s
temporary directory.
3.
A FEK is randomly generated and used to encrypt the file by using AES-256.
CHAPTER 11
Caching and file systems
4.
A DDF is created to contain the FEK encrypted by using the user’s public key. EFS automatically
obtains the user’s public key from the user’s X.509 version 3 file encryption certificate.
5.
If a recovery agent has been designated through Group Policy, a DRF is created to contain the
FEK encrypted by using RSA and the recovery agent’s public key.
6.
EFS automatically obtains the recovery agent’s public key for file recovery from the recovery agent’s X.509 version 3 certificate, which is stored in the EFS recovery policy. If there are
multiple recovery agents, a copy of the FEK is encrypted by using each agent’s public key, and a
DRF is created to store each encrypted FEK.
Note The file recovery property in the certificate is an example of an enhanced
key usage (EKU) field. An EKU extension and extended property specify and limit
the valid uses of a certificate. File Recovery is one of the EKU fields defined by
Microsoft as part of the Microsoft public key infrastructure (PKI).
7.
EFS writes the encrypted data, along with the DDF and the DRF, back to the file. Because symmetric encryption does not add additional data, file size increase is minimal after encryption.
The metadata, consisting primarily of encrypted FEKs, is usually less than 1 KB. File size in bytes
before and after encryption is normally reported to be the same.
8.
The plaintext temporary file is deleted.
When a user saves a file to a folder that has been configured for encryption, the process is similar
except that no temporary file is created.
The decryption process
When an application accesses an encrypted file, decryption proceeds as follows:
1.
NTFS recognizes that the file is encrypted and sends a request to the EFS driver.
2.
The EFS driver retrieves the DDF and passes it to the EFS service.
3.
The EFS service retrieves the user’s private key from the user’s profile and uses it to decrypt the
DDF and obtain the FEK.
4.
The EFS service passes the FEK back to the EFS driver.
5.
The EFS driver uses the FEK to decrypt sections of the file as needed for the application.
Note When an application opens a file, only those sections of the file that the application is using are decrypted because EFS uses cipher block chaining. The behavior is different if the user removes the encryption attribute from the file. In this
case, the entire file is decrypted and rewritten as plaintext.
CHAPTER 11
Caching and file systems
715
6.
The EFS driver returns the decrypted data to NTFS, which then sends the data to the requesting
application.
Backing up encrypted files
An important aspect of any file encryption facility’s design is that file data is never available in unencrypted form except to applications that access the file via the encryption facility. This restriction
particularly affects backup utilities, in which archival media store files. EFS addresses this problem by
providing a facility for backup utilities so that the utilities can back up and restore files in their encrypted states. Thus, backup utilities don’t have to be able to decrypt file data, nor do they need to encrypt
file data in their backup procedures.
Backup utilities use the EFS API functions OpenEncryptedFileRaw, ReadEncryptedFileRaw, WriteEncrypted
FileRaw, and CloseEncryptedFileRaw in Windows to access a file’s encrypted contents. After a backup
utility opens a file for raw access during a backup operation, the utility calls ReadEncryptedFileRaw to
obtain the file data. All the EFS backup utilities APIs work by issuing FSCTL to the NTFS file system. For
example, the ReadEncryptedFileRaw API first reads the EFS stream by issuing a FSCTL_ENCRYPTION
_FSCTL_IO control code to the NTFS driver and then reads all of the file s streams (including the DATA
stream and optional alternate data streams); in case the stream is encrypted, the ReadEncryptedFileRaw
API uses the FSCTL_READ_RAW_ENCRYPTED control code to request the encrypted stream data to the
file system driver.
EXPERIMENT: Viewing EFS information
EFS has a handful of other API functions that applications can use to manipulate encrypted files.
For example, applications use the AddUsersToEncryptedFile API function to give additional users
access to an encrypted file and RemoveUsersFromEncryptedFile to revoke users’ access to an
encrypted file. Applications use the QueryUsersOnEncryptedFile function to obtain information
about a file’s associated DDF and DRF key fields. QueryUsersOnEncryptedFile returns the SID,
certificate hash value, and display information that each DDF and DRF key field contains. The following output is from the EFSDump utility, from Sysinternals, when an encrypted file is specified
as a command-line argument:
C:\Andrea>efsdump Test.txt
EFS Information Dumper v1.02
Copyright (C) 1999 Mark Russinovich
Systems Internals - http://www.sysinternals.com
C:\Andrea\Test.txt:
DDF Entries:
WIN-46E4EFTBP6Q\Andrea:
Andrea(Andrea@WIN-46E4EFTBP6Q)
Unknown user:
Tony(Tony@WIN-46E4EFTBP6Q)
DRF Entry:
Unknown user:
EFS Data Recovery
716
CHAPTER 11
Caching and file systems
You can see that the file Test.txt has two DDF entries for the users Andrea and Tony and one
DRF entry for the EFS Data Recovery agent, which is the only recovery agent currently registered
on the system. You can use the cipher tool to add or remove users in the DDF entries of a file. For
example, the command
cipher /adduser /user:Tony Test.txt
enables the user Tony to access the encrypted file Test.txt (adding an entry in the DDF of the file).
Copying encrypted files
When an encrypted file is copied, the system doesn’t decrypt the file and re-encrypt it at its destination; it just copies the encrypted data and the EFS alternate data stream to the specified destination.
However, if the destination does not support alternate data streams—if it is not an NTFS volume (such
as a FAT volume) or is a network share (even if the network share is an NTFS volume)—the copy cannot
proceed normally because the alternate data streams would be lost. If the copy is done with Explorer, a
dialog box informs the user that the destination volume does not support encryption and asks the user
whether the file should be copied to the destination unencrypted. If the user agrees, the file will be decrypted and copied to the specified destination. If the copy is done from a command prompt, the copy
command will fail and return the error message “The specified file could not be encrypted.”
BitLocker encryption offload
The NTFS file system driver uses services provided by the Encrypting File System (EFS) to perform
file encryption and decryption. These kernel-mode services, which communicate with the user-mode
encrypting file service (Efssvc.dll), are provided to NTFS through callbacks. When a user or application
encrypts a file for the first time, the EFS service sends a FSCTL_SET_ENCRYPTION control code to the
NTFS driver. The NTFS file system driver uses the “write” EFS callback to perform in-memory encryption of the data located in the original file. The actual encryption process is performed by splitting the
file content, which is usually processed in 2-MB blocks, in small 512-byte chunks. The EFS library uses
the BCryptEncrypt API to actually encrypt the chunk. As previously mentioned, the encryption engine
is provided by the Kernel CNG driver (Cng.sys), which supports the AES or 3DES algorithms used by
EFS (along with many more). As EFS encrypts each 512-byte chunk (which is the smallest physical size
of standard hard disk sectors), at every round it updates the IV (initialization vector, also known as salt
value, which is a 128-bit number used to provide randomization to the encryption scheme), using the
byte offset of the current block.
In Windows 10, encryption performance has increased thanks to BitLocker encryption of oad. When
BitLocker is enabled, the storage stack already includes a device created by the Full Volume Encryption
Driver (Fvevol.sys), which, if the volume is encrypted, performs real-time encryption/decryption on
physical disk sectors; otherwise, it simply passes through the I/O requests.
CHAPTER 11
Caching and file systems
717
The NTFS driver can defer the encryption of a file by using IRP Extensions. IRP Extensions are provided by the I/O manager (more details about the I/O manager are available in Chapter 6 of Part 1) and
are a way to store different types of additional information in an IRP. At file creation time, the EFS driver
probes the device stack to check whether the BitLocker control device object (CDO) is present (by using the IOCTL_FVE_GET_CDOPATH control code), and, if so, it sets a flag in the SCB, indicating that the
stream can support encryption offload.
Every time an encrypted file is read or written, or when a file is encrypted for the first time, the NTFS
driver, based on the previously set flag, determines whether it needs to encrypt/decrypt each file block.
In case encryption offload is enabled, NTFS skips the call to EFS; instead, it adds an IRP extension to the
IRP that will be sent to the related volume device for performing the physical I/O. In the IRP extension,
the NTFS file system driver stores the starting virtual byte offset of the block of the file that the storage driver is going to read or write, its size, and some flags. The NTFS driver finally emits the I/O to the
related volume device by using the IoCallDriver API.
The volume manager will parse the IRP and send it to the correct storage driver. The BitLocker driver
recognizes the IRP extension and encrypts the data that NTFS has sent down to the device stack, using
its own routines, which operate on physical sectors. (Bitlocker, as a volume filter driver, doesn’t implement the concept of files and directories.) Some storage drivers, such as the Logical Disk Manager
driver (VolmgrX.sys, which provides dynamic disk support) are filter drivers that attach to the volume
device objects. These drivers reside below the volume manager but above the BitLocker driver, and
they can provide data redundancy, striping, or storage virtualization, characteristics which are usually
implemented by splitting the original IRP into multiple secondary IRPs that will be emitted to different physical disk devices. In this case, the secondary I/Os, when intercepted by the BitLocker driver, will
result in data encrypted by using a different salt value that would corrupt the file data.
IRP extensions support the concept of IRP propagation, which automatically modifies the file virtual
byte offset stored in the IRP extension every time the original IRP is split. Normally, the EFS driver encrypts
file blocks on 512-byte boundaries, and the IRP can’t be split on an alignment less than a sector size. As a
result, BitLocker can correctly encrypt and decrypt the data, ensuring that no corruption will happen.
Many of BitLocker driver’s routines can’t tolerate memory failures. However, since IRP extension is
dynamically allocated from the nonpaged pool when the IRP is split, the allocation can fail. The I/O
manager resolves this problem with the IoAllocateIrpEx routine. This routine can be used by kernel
drivers for allocating IRPs (like the legacy IoAllocateIrp). But the new routine allocates an extra stack
location and stores any IRP extensions in it. Drivers that request an IRP extension on IRPs allocated by
the new API no longer need to allocate new memory from the nonpaged pool.
Note A storage driver can decide to split an IRP for different reasons—whether or not it
needs to send multiple I/Os to multiple physical devices. The Volume Shadow Copy Driver
(Volsnap.sys), for example, splits the I/O while it needs to read a file from a copy-onwrite volume shadow copy, if the file resides in different sections: on the live volume and
on the Shadow Copy’s differential file (which resides in the System Volume Information
hidden directory).
718
CHAPTER 11
Caching and file systems
Online encryption support
When a file stream is encrypted or decrypted, it is exclusively locked by the NTFS file system driver. This
means that no applications can access the file during the entire encryption or decryption process. For
large files, this limitation can break the file’s availability for many seconds—or even minutes. Clearly
this is not acceptable for large file-server environments.
To resolve this, recent versions of Windows 10 introduced online encryption support. Through the
right synchronization, the NTFS driver is able to perform file encryption and decryption without retaining
exclusive file access. EFS enables online encryption only if the target encryption stream is a data stream
(named or unnamed) and is nonresident. (Otherwise, a standard encryption process starts.) If both conditions are satisfied, the EFS service sends a FSCTL_SET_ENCRYPTION control code to the NTFS driver to set
a flag that enables online encryption.
Online encryption is possible thanks to the EfsBackup attribute (of type LOGGED_UTILITY_STREAM)
and to the introduction of range locks, a new feature that allows the file system driver to lock (in an
exclusive or shared mode) only only a portion of a file. When online encryption is enabled, the
NtfsEncryptDecryptOnline internal function starts the encryption and decryption process by creating
the EfsBackup attribute (and its SCB) and by acquiring a shared lock on the first 2-MB range of the file.
A shared lock means that multiple readers can still read from the file range, but other writers need to
wait until the end of the encryption or decryption operation before they can write new data.
The NTFS driver allocates a 2-MB buffer from the nonpaged pool and reserves some clusters from
the volume, which are needed to represent 2 MB of free space. (The total number of clusters depends
on the volume cluster’s size.) The online encryption function reads the original data from the physical
disk and stores it in the allocated buffer. If BitLocker encryption offload is not enabled (described in the
previous section), the buffer is encrypted using EFS services; otherwise, the BitLocker driver encrypts
the data when the buffer is written to the previously reserved clusters.
At this stage, NTFS locks the entire file for a brief amount of time: only the time needed to remove
the clusters containing the unencrypted data from the original stream’s extent table, assign them to
the EfsBackup non-resident attribute, and replace the removed range of the original stream’s extent
table with the new clusters that contain the newly encrypted data. Before releasing the exclusive lock,
the NTFS driver calculates a new high watermark value and stores it both in the original file in-memory
SCB and in the EFS payload of the EFS alternate data stream. NTFS then releases the exclusive lock. The
clusters that contain the original data are first zeroed out; then, if there are no more blocks to process,
they are eventually freed. Otherwise, the online encryption cycle restarts with the next 2-MB chunk.
The high watermark value stores the file offset that represents the boundary between encrypted
and nonencrypted data. Any concurrent write beyond the watermark can occur in its original form;
other concurrent writes before the watermark need to be encrypted before they can succeed. Writes to
the current locked range are not allowed. Figure 11-72 shows an example of an ongoing online encryption for a 16-MB file. The first two blocks (2 MB in size) already have been encrypted; the high watermark value is set to 4 MB, dividing the file between its encrypted and non-encrypted data. A range lock
is set on the 2-MB block that follows the high watermark. Applications can still read from that block,
but they can’t write any new data (in the latter case, they need to wait). The block’s data is encrypted
CHAPTER 11
Caching and file systems
719
and stored in reserved clusters. When exclusive file ownership is taken, the original block’s clusters are
remapped to the EfsBackup stream (by removing or splitting their entry in the original file’s extent
table and inserting a new entry in the EfsBackup attribute), and the new clusters are inserted in place
of the previous ones. The high watermark value is increased, the file lock is released, and the online
encryption process proceeds to the next stage starting at the 6-MB offset; the previous clusters located
in the EfsBackup stream are concurrently zeroed-out and can be reused for new stages.
Already Encrypted Data
Non-encrypted data
Non-encrypted locked data
New clusters containing encrypted data
0 MB
0 MB
2 MB
Encrypted
region
2 MB
4 MB
High watermark
4 MB
6 MB
End of the
locked range
Encrypted
region
6 MB
8 MB
10 MB
0 MB
High watermark
8 MB
Non-Encrypted
region
10 MB
2 MB
4 MB
6 MB
8 MB
Non-Encrypted
region
10 MB
12 MB
12 MB
12 MB
16 MB
16 MB
16 MB
$DATA stream
Before the
Encryption Cycle
$EfsBackup
$DATA stream
After the
Encryption Cycle
Encrypted
region
High watermark
End of the
locked range
Non-Encrypted
region
$DATA stream
Before the
Next encryption
Cycle
FIGURE 11-72 Example of an ongoing online encryption for a 16MB file.
The new implementation allows NTFS to encrypt or decrypt in place, getting rid of temporary files
(see the previous “Encrypting file data” section for more details). More importantly, it allows NTFS to
perform file encryption and decryption while other applications can still use and modify the target file
stream (the time spent with the exclusive lock hold is small and not perceptible by the application that
is attempting to use the file).
Direct Access (DAX) disks
Persistent memory is an evolution of solid-state disk technology: a new kind of nonvolatile storage
medium that has RAM-like performance characteristics (low latency and high bandwidth), resides on
the memory bus (DDR), and can be used like a standard disk device.
Direct Access Disks (DAX) is the term used by the Windows operating system to refer to such persistent memory technology (another common term used is storage class memory, abbreviated as SCM). A
nonvolatile dual in-line memory module (NVDIMM), shown in Figure 11-73, is an example of this new type
of storage. NVDIMM is a type of memory that retains its contents even when electrical power is removed.
“Dual in-line” identifies the memory as using DIMM packaging. At the time of writing, there are three
different types of NVDIMMs: NVIDIMM-F contains only flash storage; NVDIMM-N, the most common, is
720
CHAPTER 11
Caching and file systems
produced by combining flash storage and traditional DRAM chips on the same module; and NVDIMM-P
has persistent DRAM chips, which do not lose data in event of power failure.
One of the main characteristics of DAX, which is key to its fast performance, is the support of zerocopy access to persistent memory. This means that many components, like the file system driver and
memory manager, need to be updated to support DAX, which is a disruptive technology.
Windows Server 2016 was the first Windows operating system to supports DAX: the new storage
model provides compatibility with most existing applications, which can run on DAX disks without any
modification. For fastest performance, files and directories on a DAX volume need to be mapped in
memory using memory-mapped APIs, and the volume needs to be formatted in a special DAX mode.
At the time of this writing, only NTFS supports DAX volumes.
FIGURE 11-73 An NVDIMM, which has DRAM and Flash chips. An attached battery or on-board supercapacitors are
needed for maintaining the data in the DRAM chips.
The following sections describe the way in which direct access disks operate and detail the architecture of the new driver model and the modification on the main components responsible for DAX
volume support: the NTFS driver, memory manager, cache manager, and I/O manager. Additionally,
inbox and third-party file system filter drivers (including mini filters) must also be individually updated
to take full advantage of DAX.
DAX driver model
To support DAX volumes, Windows needed to introduce a brand-new storage driver model. The SCM
Bus Driver (Scmbus.sys) is a new bus driver that enumerates physical and logical persistent memory
(PM) devices on the system, which are attached to its memory bus (the enumeration is performed
thanks to the NFIT ACPI table). The bus driver, which is not considered part of the I/O path, is a primary
bus driver managed by the ACPI enumerator, which is provided by the HAL (hardware abstraction
layer) through the hardware database registry key (HKLM\SYSTEM\CurrentControlSet\Enum\ACPI).
More details about Plug Play Device enumeration are available in Chapter 6 of Part 1.
CHAPTER 11
Caching and file systems
721
Figure 11-74 shows the architecture of the SCM storage driver model. The SCM bus driver creates
two different types of device objects:
■
■
Physical device objects (PDOs) represent physical PM devices. A NVDIMM device is usually
composed of one or multiple interleaved NVDIMM-N modules. In the former case, the SCM bus
driver creates only one physical device object representing the NVDIMM unit. In the latter case,
it creates two distinct devices that represent each NVDIMM-N module. All the physical devices
are managed by the miniport driver, Nvdimm.sys, which controls a physical NVDIMM and is
responsible for monitoring its health.
Functional device objects (FDOs) represent single DAX disks, which are managed by the persistent memory driver, Pmem.sys. The driver controls any byte-addressable interleave sets and is
responsible for all I/O directed to a DAX volume. The persistent memory driver is the class driver
for each DAX disk. (It replaces Disk.sys in the classical storage stack.)
Both the SCM bus driver and the NVDIMM miniport driver expose some interfaces for communication with the PM class driver. Those interfaces are exposed through an IRP_MJ_PNP major function
by using the IRP_MN_QUERY_INTERFACE request. When the request is received, the SCM bus driver
knows that it should expose its communication interface because callers specify the {8de064ff-b63042e4-ea88-6f24c8641175} interface GUID. Similarly, the persistent memory driver requires communication interface to the NVDIMM devices through the {0079c21b-917e-405e-cea9-0732b5bbcebd} GUID.
User mode
Management
status of the
logical disk
I/O
(block and DAX)
Kernel mode
Type specific
NVDIMM drivers
Common PM
disk driver
Does I/O directly
to the NVDIMM
UAFI
Management
status of the
physical NVDIMM
ACPI.sys
nvdimm.sys
pmem.sys
nvdimm.sys
scmbus.sys
FIGURE 11-74 The SCM Storage driver model.
The new storage driver model implements a clear separation of responsibilities: The PM class driver manages logical disk functionality (open, close, read, write, memory mapping, and so on), whereas NVDIMM
drivers manage the physical device and its health. It will be easy in the future to add support for new types
of NVDIMM by just updating the Nvdimm.sys driver. (Pmem.sys doesn’t need to change.)
DAX volumes
The DAX storage driver model introduces a new kind of volume: the DAX volumes. When a user first
formats a partition through the Format tool, she can specify the /DAX argument to the command line. If
the underlying medium is a DAX disk, and it’s partitioned using the GPT scheme, before creating the basic
disk data structure needed for the NTFS file system, the tool writes the GPT_BASIC_DATA_ ATTRIBUTE_DAX
722
CHAPTER 11
Caching and file systems
flag in the target volume GPT partition entry (which corresponds to bit number 58). A good reference
for the GUID partition table is available at https://en.wikipedia.org/wiki/GUID_Partition_Table.
When the NTFS driver then mounts the volume, it recognizes the flag and sends a STORAGE_
QUERY_PROPERTY control code to the underlying storage driver. The IOCTL is recognized by the SCM
bus driver, which responds to the file system driver with another flag specifying that the underlying
disk is a DAX disk. Only the SCM bus driver can set the flag. Once the two conditions are verified, and as
long as DAX support is not disabled through the HKLM\System\CurrentControlSet\Control\FileSystem\
NtfsEnableDirectAccess registry value, NTFS enables DAX volume support.
DAX volumes are different from the standard volumes mainly because they support zero-copy access to the persistent memory. Memory-mapped files provide applications with direct access to the underlying hardware disk sectors (through a mapped view), meaning that no intermediary components
will intercept any I/O. This characteristic provides extreme performance (but as mentioned earlier, can
impact file system filter drivers, including minifilters).
When an application creates a memory-mapped section backed by a file that resides on a DAX volume, the memory manager asks the file system whether the section should be created in DAX mode,
which is true only if the volume has been formatted in DAX mode, too. When the file is later mapped
through the MapViewOfFile API, the memory manager asks the file system for the physical memory
range of a given range of the file. The file system driver translates the requested file range in one or
more volume relative extents (sector offset and length) and asks the PM disk class driver to translate
the volume extents into physical memory ranges. The memory manager, after receiving the physical
memory ranges, updates the target process page tables for the section to map directly to persistent
storage. This is a truly zero-copy access to storage: an application has direct access to the persistent
memory. No paging reads or paging writes will be generated. This is important; the cache manager is
not involved in this case. We examine the implications of this later in the chapter.
Applications can recognize DAX volumes by using the GetVolumeInformation API. If the returned
flags include FILE_DAX_VOLUME, the volume is formatted with a DAX-compatible file system (only
NTFS at the time of this writing). In the same way, an application can identify whether a file resides on
a DAX disk by using the GetVolumeInformationByHandle API.
Cached and noncached I/O in DAX volumes
Even though memory-mapped I/O for DAX volumes provide zero-copy access to the underlying storage, DAX volumes still support I/O through standard means (via classic ReadFile and WriteFile APIs).
As described at the beginning of the chapter, Windows supports two kinds of regular I/O: cached and
noncached. Both types have significant differences when issued to DAX volumes.
Cached I/O still requires interaction from the cache manager, which, while creating a shared cache
map for the file, requires the memory manager to create a section object that directly maps to the
PM hardware. NTFS is able to communicate to the cache manager that the target file is in DAX-mode
through the new CcInitializeCacheMapEx routine. The cache manager will then copy data from the user
buffer to persistent memory: cached I/O has therefore one-copy access to persistent storage. Note that
cached I/O is still coherent with other memory-mapped I/O (the cache manager uses the same section);
CHAPTER 11
Caching and file systems
723
as in the memory-mapped I/O case, there are still no paging reads or paging writes, so the lazy writer
thread and intelligent read-ahead are not enabled.
One implication of the direct-mapping is that the cache manager directly writes to the DAX disk as
soon as the NtWriteFile function completes. This means that cached I/O is essentially noncached. For
this reason, noncached I/O requests are directly converted by the file system to cached I/O such that
the cache manager still copies directly between the user’s buffer and persistent memory. This kind of
I/O is still coherent with cached and memory-mapped I/O.
NTFS continues to use standard I/O while processing updates to its metadata files. DAX mode I/O
for each file is decided at stream creation time by setting a flag in the stream control block. If a file is
a system metadata file, the attribute is never set, so the cache manager, when mapping such a file,
creates a standard non-DAX file-backed section, which will use the standard storage stack for performing paging read or write I/Os. (Ultimately, each I/O is processed by the Pmem driver just like for block
volumes, using the sector atomicity algorithm. See the “Block volumes” section for more details.) This
behavior is needed for maintaining compatibility with write-ahead logging. Metadata must not be
persisted to disk before the corresponding log is flushed. So, if a metadata file were DAX mapped, that
write-ahead logging requirement would be broken.
Effects on file system functionality
The absence of regular paging I/O and the application’s ability to directly access persistent memory
eliminate traditional hook points that the file systems and related filters use to implement various
features. Multiple functionality cannot be supported on DAX-enabled volumes, like file encryption,
compressed and sparse files, snapshots, and USN journal support.
In DAX mode, the file system no longer knows when a writable memory-mapped file is modified.
When the memory section is first created, the NTFS file system driver updates the file’s modification
and access times and marks the file as modified in the USN change journal. At the same time, it signals
a directory change notification. DAX volumes are no longer compatible with any kind of legacy filter
drivers and have a big impact on minifilters (filter manager clients). Components like BitLocker and
the volume shadow copy driver (Volsnap.sys) don’t work with DAX volumes and are removed from the
device stack. Because a minifilter no longer knows if a file has been modified, an antimalware file access
scanner, such as one described earlier, can no longer know if it should scan a file for viruses. It needs
to assume, on any handle close, that modification may have occurred. In turn, this significantly harms
performance, so minifilters must manually opt-in to support DAX volumes.
Mapping of executable images
When the Windows loader maps an executable image into memory, it uses memory-mapping services
provided by the memory manager. The loader creates a memory-mapped image section by supplying
the SEC_IMAGE flag to the NtCreateSection API. The flag specifies to the loader to map the section as
an image, applying all the necessary fixups. In DAX mode this mustn’t be allowed to happen; otherwise,
all the relocations and fixups will be applied to the original image file on the PM disk. To correctly deal
724
CHAPTER 11
Caching and file systems
with this problem, the memory manager applies the following strategies while mapping an executable
image stored in a DAX mode volume:
■
■
If there is already a control area that represents a data section for the binary file (meaning that
an application has opened the image for reading binary data), the memory manager creates an
empty memory-backed image section and copies the data from the existing data section to the
newly created image section; then it applies the necessary fixups.
If there are no data sections for the file, the memory manager creates a regular non-DAX image
section, which creates standard invalid prototype PTEs (see Chapter 5 of Part 1 for more details).
In this case, the memory manager uses the standard read and write routines of the Pmem driver
to bring data in memory when a page fault for an invalid access on an address that belongs to
the image-backed section happens.
At the time of this writing, Windows 10 does not support execution in-place, meaning that the loader is not able to directly execute an image from DAX storage. This is not a problem, though, because
DAX mode volumes have been originally designed to store data in a very performant way. Execution
in-place for DAX volumes will be supported in future releases of Windows.
EXPERIMENT: Witnessing DAX I/O with Process Monitor
You can witness DAX I/Os using Process Monitor from SysInternals and the FsTool.exe application,
which is available in this book’s downloadable resources. When an application reads or writes from
a memory-mapped file that resides on a DAX-mode volume, the system does not generate any
paging I/O, so nothing is visible to the NTFS driver or to the minifilters that are attached above or
below it. To witness the described behavior, just open Process Monitor, and, assuming that you
have two different volumes mounted as the P: and Q: drives, set the filters in a similar way as illustrated in the following figure (the Q: drive is the DAX-mode volume):
CHAPTER 11
Caching and file systems
725
For generating I/O on DAX-mode volumes, you need to simulate a DAX copy using the FsTool
application. The following example copies an ISO image located in the P: DAX block-mode
volume (even a standard volume created on the top of a regular disk is fine for the experiment)
to the DAX-mode “Q:” drive:
P:\>fstool.exe /daxcopy p:\Big_image.iso q:\test.iso
NTFS / ReFS Tool v0.1
Copyright (C) 2018 Andrea Allievi (AaLl86)
Starting DAX copy...
Source file path: p:\Big_image.iso.
Target file path: q:\test.iso.
Source Volume: p:\ - File system: NTFS - Is DAX Volume: False.
Target Volume: q:\ - File system: NTFS - Is DAX Volume: True.
Source file size: 4.34 GB
Performing file copy... Success!
Total execution time: 8 Sec.
Copy Speed: 489.67 MB/Sec
Press any key to exit...
Process Monitor has captured a trace of the DAX copy operation that confirms the
expected results:
From the trace above, you can see that on the target file (Q:\test.iso), only the
CreateFileMapping operation was intercepted: no WriteFile events are visible. While the copy
was proceeding, only paging I/O on the source file was detected by Process Monitor. These
paging I/Os were generated by the memory manager, which needed to read the data back from
the source volume as the application was generating page faults while accessing the memorymapped file.
726
CHAPTER 11
Caching and file systems
To see the differences between memory-mapped I/O and standard cached I/O, you need to
copy again the file using a standard file copy operation. To see paging I/O on the source file data,
make sure to restart your system; otherwise, the original data remains in the cache:
P:\>fstool.exe /copy p:\Big_image.iso q:\test.iso
NTFS / ReFS Tool v0.1
Copyright (C) 2018 Andrea Allievi (AaLl86)
Copying "Big_image.iso" to "test.iso" file... Success.
Total File-Copy execution time: 13 Sec - Transfer Rate: 313.71 MB/s.
Press any key to exit...
If you compare the trace acquired by Process Monitor with the previous one, you can confirm that cached I/O is a one-copy operation. The cache manager still copies chunks of memory
between the application-provided buffer and the system cache, which is mapped directly on the
DAX disk. This is confirmed by the fact that again, no paging I/O is highlighted on the target file.
As a last experiment, you can try to start a DAX copy between two files that reside on the
same DAX-mode volume or that reside on two different DAX-mode volumes:
P:\>fstool /daxcopy q:\test.iso q:\test_copy_2.iso
TFS / ReFS Tool v0.1
Copyright (C) 2018 Andrea Allievi (AaLl86)
Starting DAX copy...
Source file path: q:\test.iso.
Target file path: q:\test_copy_2.iso.
Source Volume: q:\ - File system: NTFS - Is DAX Volume: True.
Target Volume: q:\ - File system: NTFS - Is DAX Volume: True.
Great! Both the source and the destination reside on a DAX volume.
Performing a full System Speed Copy!
CHAPTER 11
Caching and file systems
727
Source file size: 4.34 GB
Performing file copy... Success!
Total execution time: 8 Sec.
Copy Speed: 501.60 MB/Sec
Press any key to exit...
The trace collected in the last experiment demonstrates that memory-mapped I/O on DAX
volumes doesn’t generate any paging I/O. No WriteFile or ReadFile events are visible on either
the source or the target file:
Block volumes
Not all the limitations brought on by DAX volumes are acceptable in certain scenarios. Windows provides backward compatibility for PM hardware through block-mode volumes, which are managed by
the entire legacy I/O stack as regular volumes used by rotating and SSD disk. Block volumes maintain
existing storage semantics: all I/O operations traverse the storage stack on the way to the PM disk class
driver. (There are no miniport drivers, though, because they’re not needed.) They’re fully compatible
with all existing applications, legacy filters, and minifilter drivers.
Persistent memory storage is able to perform I/O at byte granularity. More accurately, I/O is performed at cache line granularity, which depends on the architecture but is usually 64 bytes. However,
block mode volumes are exposed as standard volumes, which perform I/O at sector granularity (512
bytes or 4 Kbytes). If a write is in progress on a DAX volume, and suddenly the drive experiences a
power failure, the block of data (sector) contains a mix of old and new data. Applications are not prepared to handle such a scenario. In block mode, the sector atomicity is guaranteed by the PM disk class
driver, which implements the Block Translation Table (BTT) algorithm.
728
CHAPTER 11
Caching and file systems
The BTT, an algorithm developed by Intel, splits available disk space into chunks of up to 512 GB,
called arenas. For each arena, the algorithm maintains a BTT, a simple indirection/lookup that maps an
LBA to an internal block belonging to the arena. For each 32-bit entry in the map, the algorithm uses
the two most significant bits (MSB) to store the status of the block (three states: valid, zeroed, and error). Although the table maintains the status of each LBA, the BTT algorithm provides sector atomicity
by providing a og area, which contains an array of nfree blocks.
An nfree block contains all the data that the algorithm needs to provide sector atomicity. There are
256 nfree entries in the array; an nfree entry is 32 bytes in size, so the flog area occupies 8 KB. Each
nfree is used by one CPU, so the number of nfrees describes the number of concurrent atomic I/Os an
arena can process concurrently. Figure 11-75 shows the layout of a DAX disk formatted in block mode.
The data structures used for the BTT algorithm are not visible to the file system driver. The BTT algorithm eliminates possible subsector torn writes and, as described previously, is needed even on DAXformatted volumes in order to support file system metadata writes.
Arena Info Block (4K)
Arena 0
512GB
Arena 1
512GB
•
•
•
Backing Store
Data Blocks
nfree reserved blocks
BTT Map
BTT Flog (8K)
Info Block Copy (4K)
Arena
FIGURE 11-75 Layout of a DAX disk that supports sector atomicity (BTT algorithm).
Block mode volumes do not have the GPT_BASIC_DATA_ATTRIBUTE_DAX flag in their partition
entry. NTFS behaves just like with normal volumes by relying on the cache manager to perform cached
I/O, and by processing non-cached I/O through the PM disk class driver. The Pmem driver exposes read
and write functions, which performs a direct memory access (DMA) transfer by building a memory
descriptor list (MDL) for both the user buffer and device physical block address (MDLs are described in
more detail in Chapter 5 of Part 1). The BTT algorithm provides sector atomicity. Figure 11-76 shows the
I/O stack of a traditional volume, a DAX volume, and a block volume.
CHAPTER 11
Caching and file systems
729
User Mode
Traditional
PM Block Volume
DAX Volume
App
App
App
NTFS
NTFS
NTFS
Volsnap
Volsnap
Volmgr/
Partmgr
Volmgr/
Partmgr
Volmgr/
Partmgr
PM Disk
Driver
PM Disk
Driver
PM
PM
Cached I/O
Memory Mapped
Kernel Mode
Disk/
ClassPnP
StorPort
MiniPort
SSD/HDD
FIGURE 11-76 Device I/O stack comparison between traditional volumes, block mode volumes, and DAX volumes.
File system filter drivers and DAX
Legacy filter drivers and minifilters don’t work with DAX volumes. These kinds of drivers usually
augment file system functionality, often interacting with all the operations that a file system driver
manages. There are different classes of filters providing new capabilities or modifying existing functionality of the file system driver: antivirus, encryption, replication, compression, Hierarchical Storage
Management (HSM), and so on. The DAX driver model significantly modifies how DAX volumes interact
with such components.
As previously discussed in this chapter, when a file is mapped in memory, the file system in DAX
mode does not receive any read or write I/O requests, neither do all the filter drivers that reside above
or below the file system driver. This means that filter drivers that rely on data interception will not work.
To minimize possible compatibility issues, existing minifilters will not receive a notification (through the
InstanceSetup callback) when a DAX volume is mounted. New and updated minifilter drivers that still
want to operate with DAX volumes need to specify the FLTFL_REGISTRATION_SUPPORT_DAX_VOLUME
flag when they register with the filter manager through FltRegisterFilter kernel API.
Minifilters that decide to support DAX volumes have the limitation that they can’t intercept any
form of paging I/O. Data transformation filters (which provide encryption or compression) don’t
have any chance of working correctly for memory-mapped files; antimalware filters are impacted as
730
CHAPTER 11
Caching and file systems
described earlier—because they must now perform scans on every open and close, losing the ability to
determine whether or not a write truly happened. (The impact is mostly tied to the detection of a file
last update time.) Legacy filters are no longer compatible: if a driver calls the IoAttachDeviceToDevice
Stack API (or similar functions), the I/O manager simply fails the request (and logs an ETW event).
Flushing DAX mode I/Os
Traditional disks (HDD, SSD, NVme) always include a cache that improves their overall performance.
When write I/Os are emitted from the storage driver, the actual data is first transferred into the cache,
which will be written to the persistent medium later. The operating system provides correct flushing,
which guarantees that data is written to final storage, and temporal order, which guarantees that data
is written in the correct order. For normal cached I/O, an application can call the FlushFileBuffers API to
ensure that the data is provably stored on the disk (this will generate an IRP with the IRP_MJ_FLUSH_
BUFFERS major function code that the NTFS driver will implement). Noncached I/O is directly written to
disk by NTFS so ordering and flushing aren’t concerns.
With DAX-mode volumes, this is not possible anymore. After the file is mapped in memory, the
NTFS driver has no knowledge of the data that is going to be written to disk. If an application is writing
some critical data structures on a DAX volume and the power fails, the application has no guarantees
that all of the data structures will have been correctly written in the underlying medium. Furthermore,
it has no guarantees that the order in which the data was written was the requested one. This is
because PM storage is implemented as classical physical memory from the CPU’s point of view. The
processor uses the CPU caching mechanism, which uses its own caching mechanisms while reading or
writing to DAX volumes.
As a result, newer versions of Windows 10 had to introduce new flush APIs for DAX-mapped regions,
which perform the necessary work to optimally flush PM content from the CPU cache. The APIs are
available for both user-mode applications and kernel-mode drivers and are highly optimized based
on the CPU architecture (standard x64 systems use the CLFLUSH and CLWB opcodes, for example). An
application that wants I/O ordering and flushing on DAX volumes can call RtlGetNonVolatileToken on
a PM mapped region; the function yields back a nonvolatile token that can be subsequently used with
the RtlFlushNonVolatileMemory or RtlFlushNonVolatileMemoryRanges APIs. Both APIs perform the
actual flush of the data from the CPU cache to the underlying PM device.
Memory copy operations executed using standard OS functions perform, by default, temporal copy
operations, meaning that data always passes through the CPU cache, maintaining execution ordering.
Nontemporal copy operations, on the other hand, use specialized processor opcodes (again depending on the CPU architecture; x64 CPUs use the MOVNTI opcode) to bypass the CPU cache. In this case,
ordering is not maintained, but execution is faster. RtlWriteNonVolatileMemory exposes memory copy
operations to and from nonvolatile memory. By default, the API performs classical temporal copy operations, but an application can request a nontemporal copy through the WRITE_NV_MEMORY_FLAG_
NON_ TEMPORAL flag and thus execute a faster copy operation.
CHAPTER 11
Caching and file systems
731
Large and huge pages support
Reading or writing a file on a DAX-mode volume through memory-mapped sections is handled by the
memory manager in a similar way to non-DAX sections: if the MEM_LARGE_PAGES flag is specified at
map time, the memory manager detects that one or more file extents point to enough aligned, contiguous physical space (NTFS allocates the file extents), and uses large (2 MB) or huge (1 GB) pages to map the
physical DAX space. (More details on the memory manager and large pages are available in Chapter 5 of
Part 1.) Large and huge pages have various advantages compared to traditional 4-KB pages. In particular,
they boost the performance on DAX files because they require fewer lookups in the processor’s page
table structures and require fewer entries in the processor’s translation lookaside buffer (TLB). For applications with a large memory footprint that randomly access memory, the CPU can spend a lot of time
looking up TLB entries as well as reading and writing the page table hierarchy in case of TLB misses. In addition, using large/huge pages can also result in significant commit savings because only page directory
parents and page directory (for large files only, not huge files) need to be charged. Page table space (4 KB
per 2 MB of leaf VA space) charges are not needed or taken. So, for example, with a 2-TB file mapping, the
system can save 4 GB of committed memory by using large and huge pages.
The NTFS driver cooperates with the memory manager to provide support for huge and large pages
while mapping files that reside on DAX volumes:
■
■
■
By default, each DAX partition is aligned on 2-MB boundaries.
NTFS supports 2-MB clusters. A DAX volume formatted with 2-MB clusters is guaranteed to use
only large pages for every file stored in the volume.
1-GB clusters are not supported by NTFS. If a file stored on a DAX volume is bigger than 1 GB,
and if there are one or more file’s extents stored in enough contiguous physical space, the
memory manager will map the file using huge pages (huge pages use only two pages map
levels, while large pages use three levels).
As introduced in Chapter 5, for normal memory-backed sections, the memory manager uses large
and huge pages only if the extent describing the PM pages is properly aligned on the DAX volume.
(The alignment is relative to the volume’s LCN and not to the file VCN.) For large pages, this means
that the extent needs to start at at a 2-MB boundary, whereas for huge pages it needs to start at 1-GB
boundary. If a file on a DAX volume is not entirely aligned, the memory manager uses large or huge
pages only on those blocks that are aligned, while it uses standard 4-KB pages for any other blocks.
In order to facilitate and increase the usage of large pages, the NTFS file system provides the FSCTL_
SET_DAX_ALLOC_ALIGNMENT_HINT control code, which an application can use to set its preferred
alignment on new file extents. The I/O control code accepts a value that specifies the preferred alignment, a starting offset (which allows specifying where the alignment requirements begin), and some
flags. Usually an application sends the IOCTL to the file system driver after it has created a brand-new
file but before mapping it. In this way, while allocating space for the file, NTFS grabs free clusters that
fall within the bounds of the preferred alignment.
If the requested alignment is not available (due to volume high fragmentation, for example), the
IOCTL can specify the fallback behavior that the file system should apply: fail the request or revert to a
fallback alignment (which can be specified as an input parameter). The IOCTL can even be used on an
732
CHAPTER 11
Caching and file systems
already-existing file, for specifying alignment of new extents. An application can query the alignment
of all the extents belonging to a file by using the FSCTL_QUERY_FILE_REGIONS control code or by using
the fsutil dax ueryfilealignment command-line tool.
EXPERIMENT: Playing with DAX file alignment
You can witness the different kinds of DAX file alignment using the FsTool application available
in this book’s downloadable resources. For this experiment, you need to have a DAX volume
present on your machine. Open a command prompt window and perform the copy of a big file
(we suggest at least 4 GB) into the DAX volume using this tool. In the following example, two
DAX disks are mounted as the P: and Q: volumes. The Big_Image.iso file is copied into the Q: DAX
volume by using a standard copy operation, started by the FsTool application:
D:\>fstool.exe /copy p:\Big_DVD_Image.iso q:\test.iso
NTFS / ReFS Tool v0.1
Copyright (C) 2018 Andrea Allievi (AaLl86)
Copying "Big_DVD_Image.iso" to "test.iso" file... Success.
Total File-Copy execution time: 10 Sec - Transfer Rate: 495.52 MB/s.
Press any key to exit...
You can check the new test.iso file’s alignment by using the /queryalign command-line argument of the FsTool.exe application, or by using the queryFileAlignment argument with the built-in
fsutil.exe tool available in Windows:
D:\>fsutil dax queryFileAlignment q:\test.iso
File Region Alignment:
Region
0
1
2
3
4
Alignment
Other
Large
Huge
Large
Other
StartOffset
0
0x1fd000
0x3b9fd000
0xfb9fd000
0x10f7fd000
LengthInBytes
0x1fd000
0x3b800000
0xc0000000
0x13e00000
0x17e000
As you can read from the tool’s output, the first chunk of the file has been stored in 4-KB aligned
clusters. The offsets shown by the tool are not volume-relative offsets, or LCN, but file-relative
offsets, or VCN. This is an important distinction because the alignment needed for large and huge
pages mapping is relative to the volume’s page offset. As the file keeps growing, some of its clusters will be allocated from a volume offset that is 2-MB or 1-GB aligned. In this way, those portions
of the file can be mapped by the memory manager using large and huge pages. Now, as in the
previous experiment, let’s try to perform a DAX copy by specifying a target alignment hint:
P:\>fstool.exe /daxcopy p:\Big_DVD_Image.iso q:\test.iso /align:1GB
NTFS / ReFS Tool v0.1
Copyright (C) 2018 Andrea Allievi (AaLl86)
Starting DAX copy...
Source file path: p:\Big_DVD_Image.iso.
Target file path: q:\test.iso.
Source Volume: p:\ - File system: NTFS - Is DAX Volume: True.
CHAPTER 11
Caching and file systems
733
Target Volume: q:\ - File system: NTFS - Is DAX Volume: False.
Source file size: 4.34 GB
Target file alignment (1GB) correctly set.
Performing file copy... Success!
Total execution time: 6 Sec.
Copy Speed: 618.81 MB/Sec
Press any key to exit...
P:\>fsutil dax queryFileAlignment q:\test.iso
File Region Alignment:
Region
0
1
2
Alignment
Huge
Large
Other
StartOffset
0
0x100000000
0x10f800000
LengthInBytes
0x100000000
0xf800000
0x17b000
In the latter case, the file was immediately allocated on the next 1-GB aligned cluster. The first
4-GB (0x100000000 bytes) of the file content are stored in contiguous space. When the memory
manager maps that part of the file, it only needs to use four page director pointer table entries
(PDPTs), instead of using 2048 page tables. This will save physical memory space and drastically
improve the performance while the processor accesses the data located in the DAX section.
To confirm that the copy has been really executed using large pages, you can attach a kernel
debugger to the machine (even a local kernel debugger is enough) and use the /debug switch of
the FsTool application:
P:\>fstool.exe /daxcopy p:\Big_DVD_Image.iso q:\test.iso /align:1GB /debug
NTFS / ReFS Tool v0.1
Copyright (C) 2018 Andrea Allievi (AaLl86)
Starting DAX copy...
Source file path: p:\Big_DVD_Image.iso.
Target file path: q:\test.iso.
Source Volume: p:\ - File system: NTFS - Is DAX Volume: False.
Target Volume: q:\ - File system: NTFS - Is DAX Volume: True.
Source file size: 4.34 GB
Target file alignment (1GB) correctly set.
Performing file copy...
[Debug] (PID: 10412) Source
Source file mapping
Target file mapping
File offset : 0x0 -
and Target file correctly mapped.
address: 0x000001F1C0000000 (DAX mode: 1).
address: 0x000001F2C0000000 (DAX mode: 1).
Alignment: 1GB.
Press enter to start the copy...
[Debug] (PID: 10412) File chunk’s copy successfully executed.
Press enter go to the next chunk / flush the file...
734
CHAPTER 11
Caching and file systems
You can see the effective memory mapping using the debugger’s !pte extension. First, you
need to move to the proper process context by using the .process command, and then you can
analyze the mapped virtual address shown by FsTool:
8: kd> !process 0n10412 0
Searching for Process with Cid == 28ac
PROCESS ffffd28124121080
SessionId: 2 Cid: 28ac
Peb: a29717c000 ParentCid: 31bc
DirBase: 4cc491000 ObjectTable: ffff950f94060000 HandleCount:
Image: FsTool.exe
49.
8: kd> .process /i ffffd28124121080
You need to continue execution (press 'g' <enter>) for the context
to be switched. When the debugger breaks in again, you will be in
the new process context.
8: kd> g
Break instruction exception - code 80000003 (first chance)
nt!DbgBreakPointWithStatus:
fffff804`3d7e8e50 cc
3
int
8: kd> !pte 0x000001F2C0000000
VA 000001f2c0000000
PPE at FFFFB8DC6E203E58
PDE at FFFFB8DC407CB000
contains 8A000152400008E7 contains 0000000000000000
pfn 15240000 --LDA--UW-V LARGE PAGE pfn 15240000
PXE at FFFFB8DC6E371018
contains 0A0000D57CEA8867
pfn d57cea8
---DA--UWEV
PTE at FFFFB880F9600000
contains 0000000000000000
LARGE PAGE pfn 15240000
The pte debugger command confirmed that the first 1 GB of space of the DAX file is mapped
using huge pages. Indeed, neither the page directory nor the page table are present. The FsTool
application can also be used to set the alignment of already existing files. The FSCTL_SET_DAX_
ALLOC_ALIGNMENT_HINT control code does not actually move any data though; it just provides
a hint for the new allocated file extents, as the file continues to grow in the future:
D:\>fstool e:\test.iso /align:2MB /offset:0
NTFS / ReFS Tool v0.1
Copyright (C) 2018 Andrea Allievi (AaLl86)
Applying file alignment to "test.iso" (Offset 0x0)... Success.
Press any key to exit...
D:\>fsutil dax queryfileAlignment e:\test.iso
File Region Alignment:
Region
0
1
2
Alignment
Huge
Large
Other
StartOffset
0
0x100000000
0x10f800000
LengthInBytes
0x100000000
0xf800000
0x17b000
CHAPTER 11
Caching and file systems
735
Virtual PM disks and storages spaces support
Persistent memory was specifically designed for server systems and mission-critical applications, like
huge SQL databases, which need a fast response time and process thousands of queries per second.
Often, these kinds of servers run applications in virtual machines provided by HyperV. Windows Server
2019 supports a new kind of virtual hard disk: virtual PM disks. Virtual PMs are backed by a VHDPMEM
file, which, at the time of this writing, can only be created (or converted from a regular VHD file) by
using Windows PowerShell. Virtual PM disks directly map chunks of space located on a real DAX disk
installed in the host, via a VHDPMEM file, which must reside on that DAX volume.
When attached to a virtual machine, HyperV exposes a virtual PM device (VPMEM) to the guest. This
virtual PM device is described by the NVDIMM Firmware interface table (NFIT) located in the virtual
UEFI BIOS. (More details about the NVFIT table are available in the ACPI 6.2 specification.) The SCM Bus
driver reads the table and creates the regular device objects representing the virtual NVDIMM device
and the PM disk. The Pmem disk class driver manages the virtual PM disks in the same way as normal
PM disks, and creates virtual volumes on the top of them. Details about the Windows Hypervisor and
its components can be found in Chapter 9. Figure 11-77 shows the PM stack for a virtual machine that
uses a virtual PM device. The dark gray components are parts of the virtualized stack, whereas light
gray components are the same in both the guest and the host partition.
Host
Worker process
BIOS VDEV
Provides guest
NTFS (DAX)
NTFS (DAX)
PMEM Disk
PMEM Disk
ACPI
NFIT
VID
Describe
VHDPMEM
File
Guest
PMEM driver
stack
Virtual PMEM
device
NVDIMM layout
Persistent
region
Host PMEM driver stack
NVDIMM
Guest
PMEM-aware
file system
NFIT
VPMEM VDEV
Open
VHDPMEM File
Guest
NVDIMM
Persistent region
Host physical address space
FIGURE 11-77 The virtual PM architecture.
A virtual PM device exposes a contiguous address space, virtualized from the host (this means that
the host VHDPMEM files don’t not need to be contiguous). It supports both DAX and block mode,
which, as in the host case, must be decided at volume-format time, and supports large and huge pages,
which are leveraged in the same way as on the host system. Only generation 2 virtual machines support
virtual PM devices and the mapping of VHDPMEM files.
Storage Spaces Direct in Windows Server 2019 also supports DAX disks in its virtual storage pools. One
or more DAX disks can be part of an aggregated array of mixed-type disks. The PM disks in the array can
be configured to provide the capacity or performance tier of a bigger tiered virtual disk or can be configured to act as a high-performance cache. More details on Storage Spaces are available later in this chapter.
736
CHAPTER 11
Caching and file systems
EXPERIMENT: Create and mount a VHDPMEM image
As discussed in the previous paragraph, virtual PM disks can be created, converted, and assigned
to a HyperV virtual machine using PowerShell. In this experiment, you need a DAX disk and a
generation 2 virtual machine with Windows 10 October Update (RS5, or later releases) installed
(describing how to create a VM is outside the scope of this experiment). Open an administrative
Windows PowerShell prompt, move to your DAX-mode disk, and create the virtual PM disk (in
the example, the DAX disk is located in the Q: drive):
PS Q:\> New-VHD VmPmemDis.vhdpmem -Fixed -SizeBytes 256GB -PhysicalSectorSizeBytes 4096
ComputerName
Path
VhdFormat
VhdType
FileSize
Size
MinimumSize
LogicalSectorSize
PhysicalSectorSize
BlockSize
ParentPath
DiskIdentifier
FragmentationPercentage
Alignment
Attached
DiskNumber
IsPMEMCompatible
AddressAbstractionType
Number
:
:
:
:
:
:
:
:
:
:
:
:
:
:
:
:
:
:
:
37-4611k2635
Q:\VmPmemDis.vhdpmem
VHDX
Fixed
274882101248
274877906944
4096
4096
0
3AA0017F-03AF-4948-80BE-B40B4AA6BE24
0
1
False
True
None
Virtual PM disks can be of fixed size only, meaning that all the space is allocated for the virtual
disk—this is by design. The second step requires you to create the virtual PM controller and attach it to your virtual machine. Make sure that your VM is switched off, and type the following
command. You should replace “TestPmVm” with the name of your virtual machine):
PS Q:\> Add-VMPmemController -VMName "TestPmVm"
Finally, you need to attach the created virtual PM disk to the virtual machine’s PM controller:
PS Q:\> Add-VMHardDiskDrive "TestVm" PMEM -ControllerLocation 1 -Path 'Q:\VmPmemDis.vhdpmem'
You can verify the result of the operation by using the Get-VMPmemController command:
PS Q:\> Get-VMPmemController -VMName "TestPmVm"
VMName
-----TestPmVm
ControllerNumber Drives
---------------- -----0
{Persistent Memory Device on PMEM controller number 0 at location 1}
If you switch on your virtual machine, you will find that Windows detects a new virtual disk. In
the virtual machine, open the Disk Management MMC snap-in Tool (diskmgmt.msc) and initialize
the disk using GPT partitioning. Then create a simple volume, assign a drive letter to it, but don’t
format it.
CHAPTER 11
Caching and file systems
737
You need to format the virtual PM disk in DAX mode. Open an administrative command
prompt window in the virtual machine. Assuming that your virtual-pm disk drive letter is E:, you
need to use the following command:
C:\>format e: /DAX /fs:NTFS /q
The type of the file system is RAW.
The new file system is NTFS.
WARNING, ALL DATA ON NON-REMOVABLE DISK
DRIVE E: WILL BE LOST!
Proceed with Format (Y/N)? y
QuickFormatting 256.0 GB
Volume label (32 characters, ENTER for none)? DAX-In-Vm
Creating file system structures.
Format complete.
256.0 GB total disk space.
255.9 GB are available.
738
CHAPTER 11
Caching and file systems
You can then confirm that the virtual disk has been formatted in DAX mode by using the
fsutil.exe built-in tool, specifying the fsinfo volumeinfo command-line arguments:
C:\>fsutil fsinfo volumeinfo C:
Volume Name : DAX-In-Vm
Volume Serial Number : 0x1a1bdc32
Max Component Length : 255
File System Name : NTFS
Is ReadWrite
Not Thinly-Provisioned
Supports Case-sensitive filenames
Preserves Case of filenames
Supports Unicode in filenames
Preserves & Enforces ACL’s
Supports Disk Quotas
Supports Reparse Points
Returns Handle Close Result Information
Supports POSIX-style Unlink and Rename
Supports Object Identifiers
Supports Named Streams
Supports Hard Links
Supports Extended Attributes
Supports Open By FileID
Supports USN Journal
Is DAX Volume
Resilient File System (ReFS)
The release of Windows Server 2012 R2 saw the introduction of a new advanced file system, the
Resilient File System (also known as ReFS). This file system is part of a new storage architecture, called
Storage Spaces, which, among other features, allows the creation of a tiered virtual volume composed
of a solid-state drive and a classical rotational disk. (An introduction of Storage Spaces, and Tiered
Storage, is presented later in this chapter). ReFS is a “write-to-new” file system, which means that file
system metadata is never updated in place; updated metadata is written in a new place, and the old
one is marked as deleted. This property is important and is one of the features that provides data
integrity. The original goals of ReFS were the following:
1.
Self-healing, online volume check and repair (providing close to zero unavailability due to file
system corruption) and write-through support. (Write-through is discussed later in this section.)
2.
Data integrity for all user data (hardware and software).
3.
Efficient and fast file snapshots (block cloning).
4.
Support for extremely large volumes (exabyte sizes) and files.
5.
Automatic tiering of data and metadata, support for SMR (shingled magnetic recording) and
future solid-state disks.
CHAPTER 11
Caching and file systems
739
There have been different versions of ReFS. The one described in this book is referred to as ReFS v2,
which was first implemented in Windows Server 2016. Figure 11-78 shows an overview of the different
high-level implementations between NTFS and ReFS. Instead of completely rewriting the NTFS file
system, ReFS uses another approach by dividing the implementation of NTFS into two parts: one part
understands the on-disk format, and the other does not.
NTFS upper layer
API/semantics engine
Upper layer
engine inherited from NTFS
NTFS on-disk store engine
New on-disk store engine
Minstore
NTFS.SYS
ReFS.SYS
FIGURE 11-78 ReFS high-level implementation compared to NTFS.
ReFS replaces the on-disk storage engine with Minstore. Minstore is a recoverable object store library that provides a key-value table interface to its callers, implements allocate-on-write semantics for
modification to those tables, and integrates with the Windows cache manager. Essentially, Minstore is a
library that implements the core of a modern, scalable copy-on-write file system. Minstore is leveraged
by ReFS to implement files, directories, and so on. Understanding the basics of Minstore is needed to
describe ReFS, so let’s start with a description of Minstore.
Minstore architecture
Everything in Minstore is a table. A table is composed of multiple rows, which are made of a key-value
pair. Minstore tables, when stored on disk, are represented using B+ trees. When kept in volatile
memory (RAM), they are represented using hash tables. B+ trees, also known as balanced trees, have
different important properties:
740
1.
They usually have a large number of children per node.
2.
They store data pointers (a pointer to the disk file block that contains the key value) only on the
leaves—not on internal nodes.
3.
Every path from the root node to a leaf node is of the same length.
CHAPTER 11
Caching and file systems
Other file systems (like NTFS) generally use B-trees (another data structure that generalizes a binary
search-tree, not to be confused with the term “Binary tree”) to store the data pointer, along with the
key, in each node of the tree. This technique greatly reduces the number of entries that can be packed
into a node of a B-tree, thereby contributing to the increase in the number of levels in the B-tree, hence
increasing the search time of a record.
Figure 11-79 shows an example of B+ tree. In the tree shown in the figure, the root and the internal
node contain only keys, which are used for properly accessing the data located in the leaf’s nodes. Leaf
nodes are all at the same level and are generally linked together. As a consequence, there is no need to
emit lots of I/O operations for finding an element in the tree.
For example, let’s assume that Minstore needs to access the node with the key 20. The root node
contains one key used as an index. Keys with a value above or equal to 13 are stored in one of the children indexed by the right pointer; meanwhile, keys with a value less than 13 are stored in one of the left
children. When Minstore has reached the leaf, which contains the actual data, it can easily access the
data also for node with keys 16 and 25 without performing any full tree scan.
Furthermore, the leaf nodes are usually linked together using linked lists. This means that for huge
trees, Minstore can, for example, query all the files in a folder by accessing the root and the intermediate nodes only once—assuming that in the figure all the files are represented by the values stored in
the leaves. As mentioned above, Minstore generally uses a B+ tree for representing different objects
than files or directories.
13
9 11
1
4
9 10
16
11 12
13 15
16 20 25
FIGURE 11-79 A sample B+ tree. Only the leaf nodes contain data pointers. Director nodes contain only links to
children nodes.
In this book, we use the term B+ tree and B+ table for expressing the same concept. Minstore
defines different kind of tables. A table can be created, it can have rows added to it, deleted from it, or
updated inside of it. An external entity can enumerate the table or find a single row. The Minstore core
is represented by the object table. The object table is an index of the location of every root (nonembedded) B+ trees in the volume. B+ trees can be embedded within other trees; a child tree’s root is
stored within the row of a parent tree.
Each table in Minstore is defined by a composite and a schema. A composite is just a set of rules
that describe the behavior of the root node (sometimes even the children) and how to find and manipulate each node of the B+ table. Minstore supports two kinds of root nodes, managed by their
respective composites:
CHAPTER 11
Caching and file systems
741
■
■
Copy on Write (CoW): This kind of root node moves its location when the tree is modified. This
means that in case of modification, a brand-new B+ tree is written while the old one is marked
for deletion. In order to deal with these nodes, the corresponding composite needs to maintain
an object ID that will be used when the table is written.
Embedded: This kind of root node is stored in the data portion (the value of a leaf node) of an
index entry of another B+ tree. The embedded composite maintains a reference to the index
entry that stores the embedded root node.
Specifying a schema when the table is created tells Minstore what type of key is being used, how big
the root and the leaf nodes of the table should be, and how the rows in the table are laid out. ReFS uses
different schemas for files and directories. Directories are B+ table objects referenced by the object
table, which can contain three different kinds of rows (files, links, and file IDs). In ReFS, the key of each
row represents the name of the file, link, or file ID. Files are tables that contain attributes in their rows
(attribute code and value pairs).
Every operation that can be performed on a table (close, modify, write to disk, or delete) is represented by a Minstore transaction. A Minstore transaction is similar to a database transaction: a unit of
work, sometimes made up of multiple operations, that can succeed or fail only in an atomic way. The
way in which tables are written to the disk is through a process known as updating the tree. When a tree
update is requested, transactions are drained from the tree, and no transactions are allowed to start
until the update is finished.
One important concept used in ReFS is the embedded table: a B+ tree that has the root node located
in a row of another B+ tree. ReFS uses embedded tables extensively. For example, every file is a B+ tree
whose roots are embedded in the row of directories. Embedded tables also support a move operation
that changes the parent table. The size of the root node is fixed and is taken from the table’s schema.
B+ tree physical layout
In Minstore, a B+ tree is made of buckets. Buckets are the Minstore equivalent of the general B+ tree
nodes. Leaf buckets contain the data that the tree is storing; intermediate buckets are called director nodes
and are used only for direct lookups to the next level in the tree. (In Figure 11-79, each node is a bucket.)
Because director nodes are used only for directing traffic to child buckets, they need not have exact
copies of a key in a child bucket but can instead pick a value between two buckets and use that. (In
ReFS, usually the key is a compressed file name.) The data of an intermediate bucket instead contains
both the logical cluster number (LCN) and a checksum of the bucket that it’s pointing to. (The checksum allows ReFS to implement self-healing features.) The intermediate nodes of a Minstore table could
be considered as a Merkle tree, in which every leaf node is labelled with the hash of a data block, and
every nonleaf node is labelled with the cryptographic hash of the labels of its child nodes.
Every bucket is composed of an index header that describes the bucket, and a footer, which is an array
of offsets pointing to the index entries in the correct order. Between the header and the footer there are
the index entries. An index entry represents a row in the B+ table; a row is a simple data structure that
gives the location and size of both the key and data (which both reside in the same bucket). Figure 11-80
shows an example of a leaf bucket containing three rows, indexed by the offsets located in the footer. In
leaf pages, each row contains the key and the actual data (or the root node of another embedded tree).
742
CHAPTER 11
Caching and file systems
# Rows
# Free Bytes
First Row
Offset
Row 1
Row 3
Row 2
0x20
0x100
Row Offset
Array Start
0x80
FIGURE 11-80 A leaf bucket with three index entries that are ordered by the array of offsets in the footer.
Allocators
When the file system asks Minstore to allocate a bucket (the B+ table requests a bucket with a process
called pinning the bucket), the latter needs a way to keep track of the free space of the underlaying medium. The first version of Minstore used a hierarchical allocator, which meant that there were multiple
allocator objects, each of which allocated space out of its parent allocator. When the root allocator
mapped the entire space of the volume, each allocator became a B+ tree that used the lcn-count table
schema. This schema describes the row’s key as a range of LCN that the allocator has taken from its parent node, and the row’s value as an allocator region. In the original implementation, an allocator region
described the state of each chunk in the region in relation to its children nodes: free or allocated and
the owner ID of the object that owns it.
Figure 11-81 shows a simplified version of the original implementation of the hierarchical allocator.
In the picture, a large allocator has only one allocation unit set: the space represented by the bit has
been allocated for the medium allocator, which is currently empty. In this case, the medium allocator
is a child of the large allocator.
key
{0 - 0x3FFFFF}
value
{10000000000000000000000000000…}
{0 - 0x000FFF} {00000000000000000000000000000…}
{0x400000 - …}
{00000000000000000000000000000…}
FIGURE 11-81 The old hierarchical allocator.
B+ tables deeply rely on allocators to get new buckets and to find space for the copy-on-write copies of existing buckets (implementing the write-to-new strategy). The latest Minstore version replaced
the hierarchical allocator with a policy-driven allocator, with the goal of supporting a central location in the file system that would be able to support tiering. A tier is a type of the storage device—for
CHAPTER 11
Caching and file systems
743
example, an SSD, NVMe, or classical rotational disk. Tiering is discussed later in this chapter. It is basically the ability to support a disk composed of a fast random-access zone, which is usually smaller than
the slow sequential-only area.
The new policy-driven allocator is an optimized version (supporting a very large number of allocations
per second) that defines different allocation areas based on the requested tier (the type of underlying
storage device). When the file system requests space for new data, the central allocator decides which
area to allocate from by a policy-driven engine. This policy engine is tiering-aware (this means that
metadata is always written to the performance tiers and never to SMR capacity tiers, due to the randomwrite nature of the metadata), supports ReFS bands, and implements deferred allocation logic (DAL). The
deferred allocation logic relies on the fact that when the file system creates a file, it usually also allocates
the needed space for the file content. Minstore, instead of returning to the underlying file system an
LCN range, returns a token containing the space reservation that provides a guarantee against the disk
becoming full. When the file is ultimately written, the allocator assigns LCNs for the file’s content and
updates the metadata. This solves problems with SMR disks (which are covered later in this chapter) and
allows ReFS to be able to create even huge files (64 TB or more) in less than a second.
The policy-driven allocator is composed of three central allocators, implemented on-disk as global
B+ tables. When they’re loaded in memory, the allocators are represented using AVL trees, though. An
AVL tree is another kind of self-balancing binary tree that’s not covered in this book. Although each
row in the B+ table is still indexed by a range, the data part of the row could contain a bitmap or, as
an optimization, only the number of allocated clusters (in case the allocated space is contiguous). The
three allocators are used for different purposes:
■
■
■
The Medium Allocator (MAA) is the allocator for each file in the namespace, except for some B+
tables allocated from the other allocators. The Medium Allocator is a B+ table itself, so it needs
to find space for its metadata updates (which still follow the write-to-new strategy). This is the
role of the Small Allocator (SAA).
The Small Allocator (SAA) allocates space for itself, for the Medium Allocator, and for two
tables: the Integrity State table (which allows ReFS to support Integrity Streams) and the Block
Reference Counter table (which allows ReFS to support a file’s block cloning).
The Container Allocator (CAA) is used when allocating space for the container table, a fundamental table that provides cluster virtualization to ReFS and is also deeply used for container
compaction. (See the following sections for more details.) Furthermore, the Container Allocator
contains one or more entries for describing the space used by itself.
When the Format tool initially creates the basic data structures for ReFS, it creates the three allocators. The Medium Allocator initially describes all the volume’s clusters. Space for the SAA and CAA
metadata (which are B+ tables) is allocated from the MAA (this is the only time that ever happens in
the volume lifetime). An entry for describing the space used by the Medium Allocator is inserted in the
SAA. Once the allocators are created, additional entries for the SAA and CAA are no longer allocated
from the Medium Allocator (except in case ReFS finds corruption in the allocators themselves).
744
CHAPTER 11
Caching and file systems
To perform a write-to-new operation for a file, ReFS must first consult the MAA allocator to find
space for the write to go to. In a tiered configuration, it does so with awareness of the tiers. Upon successful completion, it updates the file’s stream extent table to reflect the new location of that extent
and updates the file’s metadata. The new B+ tree is then written to the disk in the free space block,
and the old table is converted as free space. If the write is tagged as a write-through, meaning that the
write must be discoverable after a crash, ReFS writes a log record for recording the write-to-new operation. (See the “ReFS write-through” section later in this chapter for further details).
Page table
When Minstore updates a bucket in the B+ tree (maybe because it needs to move a child node or even
add a row in the table), it generally needs to update the parent (or director) nodes. (More precisely,
Minstore uses different links that point to a new and an old child bucket for every node.) This is because,
as we have described earlier, every director node contains the checksum of its leaves. Furthermore, the
leaf node could have been moved or could even have been deleted. This leads to synchronization problems; for example, imagine a thread that is reading the B+ tree while a row is being deleted. Locking the
tree and writing every modification on the physical medium would be prohibitively expensive. Minstore
needs a convenient and fast way to keep track of the information about the tree. The Minstore Page Table
(unrelated to the CPU’s page table), is an in-memory hash table private to each Minstore’s root table—
usually the directory and file table—which keeps track of which bucket is dirty, freed, or deleted. This
table will never be stored on the disk. In Minstore, the terms bucket and page are used interchangeably;
a page usually resides in memory, whereas a bucket is stored on disk, but they express exactly the same
high-level concept. Trees and tables also are used interchangeably, which explains why the page table is
called as it is. The rows of a page table are composed of the LCN of the target bucket, as a Key, and a data
structure that keeps track of the page states and assists the synchronization of the B+ tree as a value.
When a page is first read or created, a new entry will be inserted into the hash table that represents
the page table. An entry into the page table can be deleted only if all the following conditions are met:
■
There are no active transactions accessing the page.
■
The page is clean and has no modifications.
■
The page is not a copy-on-write new page of a previous one.
Thanks to these rules, clean pages usually come into the page table and are deleted from it repeatedly, whereas a page that is dirty would stay in the page table until the B+ tree is updated and finally
written to disk. The process of writing the tree to stable media depends heavily upon the state in the
page table at any given time. As you can see from Figure 11-82, the page table is used by Minstore as
an in-memory cache, producing an implicit state machine that describes each state of a page.
CHAPTER 11
Caching and file systems
745
co Pag
pi e
ed h a
(o s b
n - ee
w n
rit
e)
k
COPIED
e is
tre n d
B+ n o
e
itt
wr
CLEAN
(New)
DIRTY
Page has been
modified
sk
di
neo
ac d
sp ee
ge fr
Pa
Can exit the
page table ONLY
in clean state
FREED
FIGURE 11-82 The diagram shows the states of a dirty page (bucket) in the page table. A new page is produced due
to copy-on-write of an old page or if the B+ tree is growing and needs more space for storing the bucket.
Minstore I/O
In Minstore, reads and writes to the B+ tree in the final physical medium are performed in a different
way: tree reads usually happen in portions, meaning that the read operation might only include some
leaf buckets, for example, and occurs as part of transactional access or as a preemptive prefetch action.
After a bucket is read into the cache (see the “Cache manager” section earlier in this chapter), Minstore
still can’t interpret its data because the bucket checksum needs to be verified. The expected checksum
is stored in the parent node: when the ReFS driver (which resides above Minstore) intercepts the read
data, it knows that the node still needs to be validated: the parent node is already in the cache (the tree
has been already navigated for reaching the child) and contains the checksum of the child. Minstore
has all the needed information for verifying that the bucket contains valid data. Note that there could
be pages in the page table that have been never accessed. This is because their checksum still needs
to be validated.
Minstore performs tree updates by writing the entire B+ tree as a single transaction. The tree update
process writes dirty pages of the B+ tree to the physical disk. There are multiple reasons behind a tree
update—an application explicitly flushing its changes, the system running in low memory or similar
conditions, the cache manager flushing cached data to disk, and so on. It’s worth mentioning that
Minstore usually writes the new updated trees lazily with the lazy writer thread. As seen in the previous
section, there are several triggers to kick in the lazy writer (for example, when the number of the dirty
pages reaches a certain threshold).
Minstore is unaware of the actual reason behind the tree update request. The first thing that Minstore
does is make sure that no other transactions are modifying the tree (using complex synchronization
primitives). After initial synchronization, it starts to write dirty pages and with old deleted pages. In a
746
CHAPTER 11
Caching and file systems
write-to-new implementation, a new page represents a bucket that has been modified and its content
replaced; a freed page is an old page that needs to be unlinked from the parent. If a transaction wants to
modify a leaf node, it copies (in memory) the root bucket and the leaf page; Minstore then creates the
corresponding page table entries in the page table without modifying any link.
The tree update algorithm enumerates each page in the page table. However, the page table has
no concept of which level in the B+ tree the page resides, so the algorithm checks even the B+ tree by
starting from the more external node (usually the leaf), up to the root nodes. For each page, the algorithm performs the following steps:
1.
Checks the state of the page. If it’s a freed page, it skips the page. If it’s a dirty page, it updates
its parent pointer and checksum and puts the page in an internal list of pages to write.
2.
Discards the old page.
When the algorithm reaches the root node, it updates its parent pointer and checksum directly in
the object table and finally puts also the root bucket in the list of pages to write. Minstore is now able to
write the new tree in the free space of the underlying volume, preserving the old tree in its original location. The old tree is only marked as freed but is still present in the physical medium. This is an important
characteristic that summarizes the write-to-new strategy and allows the ReFS file system (which resides
above Minstore) to support advanced online recovery features. Figure 11-83 shows an example of the tree
update process for a B+ table that contains two new leaf pages (A’ and B’). In the figure, pages located in
the page table are represented in a lighter shade, whereas the old pages are shown in a darker shade.
Object Table
Checksum(A') Checksum(B') Checksum(C')
Checksum(A') Checksum(B') Checksum(C)
A'
B'
C
WriteList
FIGURE 11-83 Minstore tree update process.
CHAPTER 11
Caching and file systems
747
Maintaining exclusive access to the tree while performing the tree update can represent a performance issue; no one else can read or write from a B+ tree that has been exclusively locked. In the latest
versions of Windows 10, B+ trees in Minstore became generational—a generation number is attached
to each B+ tree. This means that a page in the tree can be dirty with regard to a specific generation. If
a page is originally dirty for only a specific tree generation, it can be directly updated, with no need to
copy-on-write because the final tree has still not been written to disk.
In the new model, the tree update process is usually split in two phases:
■
■
Failable phase: Minstore acquires the exclusive lock on the tree, increments the tree’s generation number, calculates and allocates the needed memory for the tree update, and finally drops
the lock to shared.
Nonfailable phase: This phase is executed with a shared lock (meaning that other I/O can read
from the tree), Minstore updates the links of the director nodes and all the tree’s checksums,
and finally writes the final tree to the underlying disk. If another transaction wants to modify the
tree while it’s being written to disk, it detects that the tree’s generation number is higher, so it
copy-on-writes the tree again.
With the new schema, Minstore holds the exclusive lock only in the failable phase. This means that
tree updates can run in parallel with other Minstore transactions, significantly improving the overall
performance.
ReFS architecture
As already introduced in previous paragraphs, ReFS (the Resilient file system) is a hybrid of the NTFS
implementation and Minstore, where every file and directory is a B+ tree configured by a particular
schema. The file system volume is a flat namespace of directories. As discussed previously, NTFS is
composed of different components:
■
■
■
Core FS support: Describes the interface between the file system and other system components, like the cache manager and the I/O subsystem, and exposes the concept of file create,
open, read, write, close, and so on.
High-level FS feature support: Describes the high-level features of a modern file system,
like file compression, file links, quota tracking, reparse points, file encryption, recovery support,
and so on.
On-disk dependent components and data structures MFT and file records, clusters, index
package, resident and nonresident attributes, and so on (see the “The NT file system (NTFS)”
section earlier in this chapter for more details).
ReFS keeps the first two parts largely unchanged and replaces the rest of the on-disk dependent
components with Minstore, as shown in Figure 11-84.
748
CHAPTER 11
Caching and file systems
System Interface (IRP_MJ_XYZ…)
Interface support (object lifetime, rename, etc.)
Index package
Change journal
Quota, etc.
File record attribute package
MFT package
Format-dependent
Bitmap package
Log manager
FIGURE 11-84 ReFS architecture’s scheme.
In the “NTFS driver” section of this chapter, we introduced the entities that link a file handle to the
file system’s on-disk structure. In the ReFS file system driver, those data structures (the stream control
block, which represents the NTFS attribute that the caller is trying to read, and the file control block,
which contains a pointer to the file record in the disk’s MFT) are still valid, but have a slightly different
meaning in respect to their underlying durable storage. The changes made to these objects go through
Minstore instead of being directly translated in changes to the on-disk MFT. As shown in Figure 11-85,
in ReFS:
■
■
■
A file control block (FCB) represents a single file or directory and, as such, contains a pointer to
the Minstore B+ tree, a reference to the parent directory’s stream control block and key (the
directory name). The FCB is pointed to by the file object, through the FsContext2 field.
A stream control block (SCB) represents an opened stream of the file object. The data structure used in ReFS is a simplified version of the NTFS one. When the SCB represents directories,
though, the SCB has a link to the directory’s index, which is located in the B+ tree that represents the directory. The SCB is pointed to by the file object, through the FsContext field.
A volume control block (VCB) represents a currently mounted volume, formatted by ReFS.
When a properly formatted volume has been identified by the ReFS driver, a VCB data structure
is created, attached into the volume device object extension, and linked into a list located in a
global data structure that the ReFS file system driver allocates at its initialization time. The VCB
contains a table of all the directory FCBs that the volume has currently opened, indexed by their
reference ID.
CHAPTER 11
Caching and file systems
749
File object
File object
FCB
FCB
Embedded
B+ tree
Embedded
B+ tree
Index SCB
Data SCB
Index B+
tree
Directory
File
FIGURE 11-85 ReFS files and directories in-memory data structures.
In ReFS, every open file has a single FCB in memory that can be pointed to by different SCBs (depending on the number of streams opened). Unlike NTFS, where the FCB needs only to know the MFT
entry of the file to correctly change an attribute, the FCB in ReFS needs to point to the B+ tree that
represents the file record. Each row in the file’s B+ tree represents an attribute of the file, like the ID, full
name, extents table, and so on. The key of each row is the attribute code (an integer value).
File records are entries in the directory in which files reside. The root node of the B+ tree that represents a file is embedded into the directory entry’s value data and never appears in the object table. The
file data streams, which are represented by the extents table, are embedded B+ trees in the file record.
The extents table is indexed by range. This means that every row in the extent table has a VCN range
used as the row’s key, and the LCN of the file’s extent used as the row’s value. In ReFS, the extents table
could become very large (it is indeed a regular B+ tree). This allows ReFS to support huge files, bypassing the limitations of NTFS.
Figure 11-86 shows the object table, files, directories, and the file extent table, which in ReFS are all
represented through B+ trees and provide the file system namespace.
Object Table
Object ID
Disk
Location
Object ID
Disk
Location
Object ID
Disk
Location
Disk
Location
File Name File Record Index
File Name File Record Index
File Name File Record Index
File Name File Record Index
…
…
FIGURE 11-86 Files and directories in ReFS.
750
CHAPTER 11
…and so is this one
File Record
Caching and file systems
File Extents
10
Std Info
30
File Name
0-100
@ 5004
80
Extents Index
101-200
@ 9550
300-304
@ 1000
…
Object ID
This root is embedded in parent table’s row
Directory
Directories are Minstore B+ trees that are responsible for the single, flat namespace. A ReFS
directory can contain:
■
Files
■
Links to directories
■
Links to other files (file IDs)
Rows in the directory B+ tree are composed of a key type value pair, where the key is the entry’s
name and the value depends on the type of directory entry. With the goal of supporting queries and
other high-level semantics, Minstore also stores some internal data in invisible directory rows. These kinds
of rows have have their key starting with a Unicode zero character. Another row that is worth mentioning
is the directory’s file row. Every directory has a record, and in ReFS that file record is stored as a file row in
the self-same directory, using a well-known zero key. This has some effect on the in-memory data structures that ReFS maintains for directories. In NTFS, a directory is really a property of a file record (through
the Index Root and Index Allocation attributes); in ReFS, a directory is a file record stored in the directory
itself (called directory index record). Therefore, whenever ReFS manipulates or inspects files in a directory,
it must ensure that the directory index is open and resident in memory. To be able to update the directory, ReFS stores a pointer to the directory’s index record in the opened stream control block.
The described configuration of the ReFS B+ trees does not solve an important problem. Every time
the system wants to enumerate the files in a directory, it needs to open and parse the B+ tree of each
file. This means that a lot of I/O requests to different locations in the underlying medium are needed.
If the medium is a rotational disk, the performance would be rather bad.
To solve the issue, ReFS stores a STANDARD_INFORMATION data structure in the root node of
the file’s embedded table (instead of storing it in a row of the child file’s B+ table). The STANDARD
_INFORMATION data includes all the information needed for the enumeration of a file (like the file’s
access time, size, attributes, security descriptor ID, the update sequence number, and so on). A file’s
embedded root node is stored in a leaf bucket of the parent directory’s B+ tree. By having the data
structure located in the file’s embedded root node, when the system enumerates files in a directory,
it only needs to parse entries in the directory B+ tree without accessing any B+ tables describing individual files. The B+ tree that represents the directory is already in the page table, so the enumeration
is quite fast.
ReFS on-disk structure
This section describes the on-disk structure of a ReFS volume, similar to the previous NTFS section. The
section focuses on the differences between NTFS and ReFS and will not cover the concepts already
described in the previous section.
The Boot sector of a ReFS volume consists of a small data structure that, similar to NTFS, contains
basic volume information (serial number, cluster size, and so on), the file system identifier (the ReFS
OEM string and version), and the ReFS container size (more details are covered in the “Shingled magnetic recording (SMR) volumes” section later in the chapter). The most important data structure in the
volume is the volume super block. It contains the offset of the latest volume checkpoint records and
CHAPTER 11
Caching and file systems
751
is replicated in three different clusters. ReFS, to be able to mount a volume, reads one of the volume
checkpoints, verifies and parses it (the checkpoint record includes a checksum), and finally gets the
offset of each global table.
The volume mounting process opens the object table and gets the needed information for reading
the root directory, which contains all of the directory trees that compose the volume namespace. The
object table, together with the container table, is indeed one of the most critical data structures that is
the starting point for all volume metadata. The container table exposes the virtualization namespace,
so without it, ReFS would not able to correctly identify the final location of any cluster. Minstore optionally allows clients to store information within its object table rows. The object table row values, as
shown in Figure 11-87, have two distinct parts: a portion owned by Minstore and a portion owned by
ReFS. ReFS stores parent information as well as a high watermark for USN numbers within a directory
(see the section “Security and change journal” later in this chapter for more details).
key
ObjectId
value
Root location
Root checksum
Last written log #
Last USN #
Parent object ID
FIGURE 11-87 The object table entry composed of a ReFS part (bottom rectangle) and Minstore part (top rectangle).
Object IDs
Another problem that ReFS needs to solve regards file IDs. For various reasons—primarily for tracking
and storing metadata about files in an efficient way without tying information to the namespace—
ReFS needs to support applications that open a file through their file ID (using the OpenFileById API, for
example). NTFS accomplishes this through the Extend\ ObjId file (using the 0 index root attribute;
see the previous NTFS section for more details). In ReFS, assigning an ID to every directory is trivial;
indeed, Minstore stores the object ID of a directory in the object table. The problem arises when the
system needs to be able to assign an ID to a file; ReFS doesn’t have a central file ID repository like NTFS
does. To properly find a file ID located in a directory tree, ReFS splits the file ID space into two portions:
the directory and the file. The directory ID consumes the directory portion and is indexed into the key
of an object table’s row. The file portion is assigned out of the directory’s internal file ID space. An ID
that represents a directory usually has a zero in its file portion, but all files inside the directory share
the same directory portion. ReFS supports the concept of file IDs by adding a separate row (composed
of a FileId FileName pair) in the directory’s B+ tree, which maps the file ID to the file name within
the directory.
752
CHAPTER 11
Caching and file systems
When the system is required to open a file located in a ReFS volume using its file ID, ReFS satisfies
the request by:
1.
Opening the directory specified by the directory portion
2.
Querying the FileId row in the directory B+ tree that has the key corresponding to the
file portion
3.
Querying the directory B+ tree for the file name found in the last lookup.
Careful readers may have noted that the algorithm does not explain what happens when a file is renamed or moved. The ID of a renamed file should be the same as its previous location, even if the ID of
the new directory is different in the directory portion of the file ID. ReFS solves the problem by replacing the original file ID entry, located in the old directory B+ tree, with a new “tombstone” entry, which,
instead of specifying the target file name in its value, contains the new assigned ID of the renamed file
(with both the directory and the file portion changed). Another new File ID entry is also allocated in the
new directory B+ tree, which allows assigning the new local file ID to the renamed file. If the file is then
moved to yet another directory, the second directory has its ID entry deleted because it’s no longer
needed; one tombstone, at most, is present for any given file.
Security and change journal
The mechanics of supporting Windows object security in the file system lie mostly in the higher components that are implemented by the portions of the file system remained unchanged since NTFS. The
underlying on-disk implementation has been changed to support the same set of semantics. In ReFS,
object security descriptors are stored in the volume’s global security directory B+ table. A hash is computed for every security descriptor in the table (using a proprietary algorithm, which operates only on
self-relative security descriptors), and an ID is assigned to each.
When the system attaches a new security descriptor to a file, the ReFS driver calculates the security descriptor’s hash and checks whether it’s already present in the global security table. If the hash is
present in the table, ReFS resolves its ID and stores it in the STANDARD_INFORMATION data structure
located in the embedded root node of the file’s B+ tree. In case the hash does not already exist in the
global security table, ReFS executes a similar procedure but first adds the new security descriptor in the
global B+ tree and generates its new ID.
The rows of the global security table are of the format hash ID
security descriptor ref. count ,
where the hash and the ID are as described earlier, the security descriptor is the raw byte payload of
the security descriptor itself, and ref. count is a rough estimate of how many objects on the volume are
using the security descriptor.
As described in the previous section, NTFS implements a change journal feature, which provides applications and services with the ability to query past changes to files within a volume. ReFS implements
an NTFS-compatible change journal implemented in a slightly different way. The ReFS journal stores
change entries in the change journal file located in another volume’s global Minstore B+ tree, the
metadata directory table. ReFS opens and parses the volume’s change journal file only once the volume is mounted. The maximum size of the journal is stored in the USN_MAX attribute of the journal
CHAPTER 11
Caching and file systems
753
file. In ReFS, each file and directory contains its last USN (update sequence number) in the STANDARD_
INFORMATION data structure stored in the embedded root node of the parent directory. Through the
journal file and the USN number of each file and directory, ReFS can provide the three FSCTL used for
reading and enumerate the volume journal file:
■
■
■
FSCTL_READ_USN_JOURNAL: Reads the USN journal directly. Callers specify the journal ID
they’re reading and the number of the USN record they expect to read.
FSCTL_READ_FILE_USN_DATA: Retrieves the USN change journal information for the specified
file or directory.
FSCTL_ENUM_USN_DATA: Scans all the file records and enumerates only those that have last
updated the USN journal with a USN record whose USN is within the range specified by the
caller. ReFS can satisfy the query by scanning the object table, then scanning each directory
referred to by the object table, and returning the files in those directories that fall within the
timeline specified. This is slow because each directory needs to be opened, examined, and so
on. (Directories’ B+ trees can be spread across the disk.) The way ReFS optimizes this is that it
stores the highest USN of all files in a directory in that directory’s object table entry. This way,
ReFS can satisfy this query by visiting only directories it knows are within the range specified.
ReFS advanced features
In this section, we describe the advanced features of ReFS, which explain why the ReFS file system is a
better fit for large server systems like the ones used in the infrastructure that provides the Azure cloud.
File’s block cloning (snapshot support) and sparse VDL
Traditionally, storage systems implement snapshot and clone functionality at the volume level (see
dynamic volumes, for example). In modern datacenters, when hundreds of virtual machines run and
are stored on a unique volume, such techniques are no longer able to scale. One of the original goals of
the ReFS design was to support file-level snapshots and scalable cloning support (a VM typically maps
to one or a few files in the underlying host storage), which meant that ReFS needed to provide a fast
method to clone an entire file or even only chunks of it. Cloning a range of blocks from one file into a
range of another file allows not only file-level snapshots but also finer-grained cloning for applications
that need to shuffle blocks within one or more files. VHD diff-disk merge is one example.
ReFS exposes the new FSCTL_DUPLICATE_EXTENTS_TO_FILE to duplicate a range of blocks from
one file into another range of the same file or to a different file. Subsequent to the clone operation,
writes into cloned ranges of either file will proceed in a write-to-new fashion, preserving the cloned
block. When there is only one remaining reference, the block can be written in place. The source and
target file handle, and all the details from which the block should be cloned, which blocks to clone from
the source, and the target range are provided as parameters.
754
CHAPTER 11
Caching and file systems
As already seen in the previous section, ReFS indexes the LCNs that make up the file’s data stream
into the extent index table, an embedded B+ tree located in a row of the file record. To support block
cloning, Minstore uses a new global index B+ tree (called the block count reference table) that tracks the
reference counts of every extent of blocks that are currently cloned. The index starts out empty. The
first successful clone operation adds one or more rows to the table, indicating that the blocks now have
a reference count of two. If one of the views of those blocks were to be deleted, the rows would be
removed. This index is consulted in write operations to determine if write-to-new is required or if writein-place can proceed. It’s also consulted before marking free blocks in the allocator. When freeing
clusters that belong to a file, the reference counts of the cluster-range is decremented. If the reference
count in the table reaches zero, the space is actually marked as freed.
Figure 11-88 shows an example of file cloning. After cloning an entire file (File 1 and File 2 in the picture), both files have identical extent tables, and the Minstore block count reference table shows two
references to both volume extents.
1
2
3
4
5
6
File 1
a
1
7
8
1
file
volume
[1-4]
[5-8]
3
3
4
5
6
7
File 2
8
refcnt
[a-b]
2
[x-y]
2
file
volume
[a-b]
[1-4]
[a-b]
[x-y]
[5-8]
[x-y]
b
2
2
volextent
4
x
5
y
6
7
8
FIGURE 11-88 Cloning an ReFS file.
Minstore automatically merges rows in the block reference count table whenever possible with
the intention of reducing the size of the table. In Windows Server 2016, HyperV makes use of the
new cloning FSCTL. As a result, the duplication of a VM, and the merging of its multiple snapshots,
is extremely fast.
ReFS supports the concept of a file Valid Data Length (VDL), in a similar way to NTFS. Using the
ZeroRangeInStream file data stream, ReFS keeps track of the valid or invalid state for each allocated
file’s data block. All the new allocations requested to the file are in an invalid state; the first write to the
file makes the allocation valid. ReFS returns zeroed content to read requests from invalid file ranges.
The technique is similar to the DAL, which we explained earlier in this chapter. Applications can logically
zero a portion of file without actually writing any data using the FSCTL_SET_ZERO_DATA file system
control code (the feature is used by HyperV to create fixed-size VHDs very quickly).
CHAPTER 11
Caching and file systems
755
EXPERIMENT: Witnessing ReFS snapshot support through HyperV
In this experiment, you’re going to use HyperV for testing the volume snapshot support of ReFS.
Using the HyperV manager, you need to create a virtual machine and install any operating
system on it. At the first boot, take a checkpoint on the VM by right-clicking the virtual machine
name and selecting the Checkpoint menu item. Then, install some applications on the virtual
machine (the example below shows a Windows Server 2012 machine with Office installed) and
take another checkpoint.
756
CHAPTER 11
Caching and file systems
If you turn off the virtual machine and, using File Explorer, locate where the virtual hard disk
file resides, you will find the virtual hard disk and multiple other files that represent the differential content between the current checkpoint and the previous one.
If you open the HyperV Manager again and delete the entire checkpoint tree (by rightclicking the first root checkpoint and selecting the Delete Checkpoint Subtree menu item), you
will find that the entire merge process takes only a few seconds. This is explained by the fact that
HyperV uses the block-cloning support of ReFS, through the FSCTL_DUPLICATE_EXTENTS_TO_FILE
I/O control code, to properly merge the checkpoints’ content into the base virtual hard disk file.
As explained in the previous paragraphs, block cloning doesn’t actually move any data. If you
repeat the same experiment with a volume formatted using an exFAT or NTFS file system, you will
find that the time needed to merge the checkpoints is much larger.
ReFS write-through
One of the goals of ReFS was to provide close to zero unavailability due to file system corruption. In
the next section, we describe all of the available online repair methods that ReFS employs to recover
from disk damage. Before describing them, it’s necessary to understand how ReFS implements writethrough when it writes the transactions to the underlying medium.
The term write-through refers to any primitive modifying operation (for example, create file, extend
file, or write block) that must not complete until the system has made a reasonable guarantee that the
results of the operation will be visible after crash recovery. Write-through performance is critical for different I/O scenarios, which can be broken into two kinds of file system operations: data and metadata.
CHAPTER 11
Caching and file systems
757
When ReFS performs an update-in-place to a file without requiring any metadata mutation (like
when the system modifies the content of an already-allocated file, without extending its length), the
write-through performance has minimal overhead. Because ReFS uses allocate-on-write for metadata,
it’s expensive to give write-through guarantees for other scenarios when metadata change. For example, ensuring that a file has been renamed implies that the metadata blocks from the root of the file
system down to the block describing the file’s name must be written to a new location. The allocateon-write nature of ReFS has the property that it does not modify data in place. One implication of this
is that recovery of the system should never have to undo any operations, in contrast to NTFS.
To achieve write-through, Minstore uses write-ahead-logging (or WAL). In this scheme, shown in
Figure 11-89, the system appends records to a log that is logically infinitely long; upon recovery, the
log is read and replayed. Minstore maintains a log of logical redo transaction records for all tables
except the allocator table. Each log record describes an entire transaction, which has to be replayed at
recovery time. Each transaction record has one or more operation redo records that describe the actual
high-level operation to perform (such as insert key K / value V pair in Table X). The transaction record
allows recovery to separate transactions and is the unit of atomicity (no transactions will be partially redone). Logically, logging is owned by every ReFS transaction; a small log buffer contains the log record.
If the transaction is committed, the log buffer is appended to the in-memory volume log, which will
be written to disk later; otherwise, if the transaction aborts, the internal log buffer will be discarded.
Write-through transactions wait for confirmation from the log engine that the log has committed up
until that point, while non-write-through transactions are free to continue without confirmation.
Transaction
Transaction
Redo records
Redo records
B+ tree
Transaction records–tree log
Volume
Volume log
FIGURE 11-89 Scheme of Minstore’s write-ahead logging.
Furthermore, ReFS makes use of checkpoints to commit some views of the system to the underlying
disk, consequently rendering some of the previously written log records unnecessary. A transaction’s
redo log records no longer need to be redone once a checkpoint commits a view of the affected trees
to disk. This implies that the checkpoint will be responsible for determining the range of log records
that can be discarded by the log engine.
758
CHAPTER 11
Caching and file systems
ReFS recovery support
To properly keep the file system volume available at all times, ReFS uses different recovery strategies.
While NTFS has similar recovery support, the goal of ReFS is to get rid of any offline check disk utilities
(like the Chkdsk tool used by NTFS) that can take many hours to execute in huge disks and require the
operating system to be rebooted. There are mainly four ReFS recovery strategies:
■
■
■
■
Metadata corruption is detected via checksums and error-correcting codes. Integrity streams
validate and maintain the integrity of the file’s data using a checksum of the file’s actual content
(the checksum is stored in a row of the file’s B+ tree table), which maintains the integrity of the
file itself and not only on its file-system metadata.
ReFS intelligently repairs any data that is found to be corrupt, as long as another valid copy is
available. Other copies might be provided by ReFS itself (which keeps additional copies of its
own metadata for critical structures such as the object table) or through the volume redundancy provided by Storage Spaces (see the “Storage Spaces” section later in this chapter).
ReFS implements the salvage operation, which removes corrupted data from the file system
namespace while it’s online.
ReFS rebuilds lost metadata via best-effort techniques.
The first and second strategies are properties of the Minstore library on which ReFS depends (more
details about the integrity streams are provided later in this section). The object table and all the global
Minstore B+ tree tables contain a checksum for each link that points to the child (or director) nodes
stored in different disk blocks. When Minstore detects that a block is not what it expects, it automatically attempts repair from one of its duplicated copies (if available). If the copy is not available, Minstore
returns an error to the ReFS upper layer. ReFS responds to the error by initializing online salvage.
The term salvage refers to any fixes needed to restore as much data as possible when ReFS detects
metadata corruption in a directory B+ tree. Salvage is the evolution of the zap technique. The goal of
the zap was to bring back the volume online, even if this could lead to the loss of corrupted data. The
technique removed all the corrupted metadata from the file namespace, which then became available
after the repair.
Assume that a director node of a directory B+ tree becomes corrupted. In this case, the zap operation will fix the parent node, rewriting all the links to the child and rebalancing the tree, but the data
originally pointed by the corrupted node will be completely lost. Minstore has no idea how to recover
the entries addressed by the corrupted director node.
To solve this problem and properly restore the directory tree in the salvage process, ReFS needs
to know subdirectories’ identifiers, even when the directory table itself is not accessible (because it
has a corrupted director node, for example). Restoring part of the lost directory tree is made possible
by the introduction of a volume global table, called called the parent-child table, which provides a
directory’s information redundancy.
A key in the parent–child table represents the parent table’s ID, and the data contains a list of child
table IDs. Salvage scans this table, reads the child tables list, and re-creates a new non-corrupted B+
tree that contains all the subdirectories of the corrupted node. In addition to needing child table IDs, to
CHAPTER 11
Caching and file systems
759
completely restore the corrupted parent directory, ReFS still needs the name of the child tables, which
were originally stored in the keys of the parent B+ tree. The child table has a self-record entry with this
information (of type link to directory; see the previous section for more details). The salvage process
opens the recovered child table, reads the self-record, and reinserts the directory link into the parent
table. The strategy allows ReFS to recover all the subdirectories of a corrupted director or root node
(but still not the files). Figure 11-90 shows an example of zap and salvage operations on a corrupted
root node representing the Bar directory. With the salvage operation, ReFS is able to quickly bring the
file system back online and loses only two files in the directory.
Foo
Foo
Bar
Bar
File
Bar
A.txt
A.txt
B.txt
B.txt
Subdir1
Dir
Foo
Subdir1
A.txt
B.txt
Subdir1
Important file.doc
Important file.doc
Important file.doc
Important file.jpeg
Important file.jpeg
Important file.jpeg
FIGURE 11-90 Comparison between the zap and salvage operations.
The ReFS file system, after salvage completes, tries to rebuild missing information using various
best-effort techniques; for example, it can recover missing file IDs by reading the information from
other buckets (thanks to the collating rule that separates files’ IDs and tables). Furthermore, ReFS also
augments the Minstore object table with a little bit of extra information to expedite repair. Although
ReFS has these best-effort heuristics, it’s important to understand that ReFS primarily relies on the redundancy provided by metadata and the storage stack in order to repair corruption without data loss.
In the very rare cases in which critical metadata is corrupted, ReFS can mount the volume in readonly mode, but not for any corrupted tables. For example, in case that the container table and all of its
duplicates would all be corrupted, the volume wouldn’t be mountable in read-only mode. By skipping
over these tables, the file system can simply ignore the usage of such global tables (like the allocator,
for example), while still maintaining a chance for the user to recover her data.
Finally, ReFS also supports file integrity streams, where a checksum is used to guarantee the integrity
of a file’s data (and not only of the file system’s metadata). For integrity streams, ReFS stores the checksum
of each run that composes the file’s extent table (the checksum is stored in the data section of an extent
table’s row). The checksum allows ReFS to validate the integrity of the data before accessing it. Before
returning any data that has integrity streams enabled, ReFS will first calculate its checksum and compares
it to the checksum contained in the file metadata. If the checksums don’t match, then the data is corrupt.
The ReFS file system exposes the FSCTL_SCRUB_DATA control code, which is used by the scrubber
(also known as the data integrity scanner). The data integrity scanner is implemented in the Discan.dll
library and is exposed as a task scheduler task, which executes at system startup and every week. When
the scrubber sends the FSCTL to the ReFS driver, the latter starts an integrity check of the entire volume:
the ReFS driver checks the boot section, each global B+ tree, and file system’s metadata.
760
CHAPTER 11
Caching and file systems
Note The online Salvage operation, described in this section, is different from its offline
counterpart. The refsutil.exe tool, which is included in Windows, supports this operation.
The tool is used when the volume is so corrupted that it is not even mountable in read-only
mode (a rare condition). The offline Salvage operation navigates through all the volume
clusters, looking for what appears to be metadata pages, and uses best-effort techniques
to assemble them back together.
Leak detection
A cluster leak describes the situation in which a cluster is marked as allocated, but there are no references to it. In ReFS, cluster leaks can happen for different reasons. When a corruption is detected on
a directory, online salvage is able to isolate the corruption and rebuild the tree, eventually losing only
some files that were located in the root directory itself. A system crash before the tree update algorithm has written a Minstore transaction to disk can lead to a file name getting lost. In this case, the
file’s data is correctly written to disk, but ReFS has no metadata that point to it. The B+ tree table representing the file itself can still exist somewhere in the disk, but its embedded table is no longer linked in
any directory B+ tree.
The built-in refsutil.exe tool available in Windows supports the Leak Detection operation, which can
scan the entire volume and, using Minstore, navigate through the entire volume namespace. It then
builds a list of every B+ tree found in the namespace (every tree is identified by a well-known data
structure that contains an identification header), and, by querying the Minstore allocators, compares
the list of each identified tree with the list of trees that have been marked valid by the allocator. If it
finds a discrepancy, the leak detection tool notifies the ReFS file system driver, which will mark the clusters allocated for the found leaked tree as freed.
Another kind of leak that can happen on the volume affects the block reference counter table, such
as when a cluster’s range located in one of its rows has a higher reference counter number than the
actual files that reference it. The lower-case tool is able to count the correct number of references and
fix the problem.
To correctly identify and fix leaks, the leak detection tool must operate on an offline volume, but,
using a similar technique to NTFS’ online scan, it can operate on a read-only snapshot of the target
volume, which is provided by the Volume Shadow Copy service.
CHAPTER 11
Caching and file systems
761
EXPERIMENT: Use Refsutil to find and fix leaks on a ReFS volume
In this experiment, you use the built-in refsutil.exe tool on a ReFS volume to find and fix cluster
leaks that could happen on a ReFS volume. By default, the tool doesn’t require a volume to be
unmounted because it operates on a read-only volume snapshot. To let the tool fix the found
leaks, you can override the setting by using the /x command-line argument. Open an administrative command prompt and type the following command. (In the example, a 1 TB ReFS volume
was mounted as the E: drive. The /v switch enables the tool’s verbose output.)
C:\>refsutil leak /v e:
Creating volume snapshot on drive \\?\Volume{92aa4440-51de-4566-8c00-bc73e0671b92}...
Creating the scratch file...
Beginning volume scan... This may take a while...
Begin leak verification pass 1 (Cluster leaks)...
End leak verification pass 1. Found 0 leaked clusters on the volume.
Begin leak verification pass 2 (Reference count leaks)...
End leak verification pass 2. Found 0 leaked references on the volume.
Begin leak verification pass 3 (Compacted cluster leaks)...
End leak verification pass 3.
Begin leak verification pass 4 (Remaining cluster leaks)...
End leak verification pass 4. Fixed 0 leaks during this pass.
Finished.
Found leaked clusters: 0
Found reference leaks: 0
Total cluster fixed : 0
Shingled magnetic recording (SMR) volumes
At the time of this writing, one of the biggest problems that classical rotating hard disks are facing is
in regard to the physical limitations inherent to the recording process. To increase disk size, the drive
platter area density must always increase, while, to be able to read and write tiny units of information,
the physical size of the heads of the spinning drives continue to get increasingly smaller. In turn, this
causes the energy barrier for bit flips to decrease, which means that ambient thermal energy is more
likely to accidentally flip flip bits, reducing data integrity. Solid state drives (SSD) have spread to a lot of
consumer systems, large storage servers require more space and at a lower cost, which rotational drives
still provide. Multiple solutions have been designed to overcome the rotating hard-disk problem. The
most effective is called shingled magnetic recording (SMR), which is shown in Figure 11-91. Unlike PMR
(perpendicular magnetic recording), which uses a parallel track layout, the head used for reading the
data in SMR disks is smaller than the one used for writing. The larger writer means it can more effectively magnetize (write) the media without having to compromise readability or stability.
762
CHAPTER 11
Caching and file systems
Writer
Reader
Track N
Track N + 1
Track N + 2
Track N + 3
FIGURE 11-91 In SMR disks, the writer track is larger than the reader track.
The new configuration leads to some logical problems. It is almost impossible to write to a disk track
without partially replacing the data on the consecutive track. To solve this problem, SMR disks split the
drive into zones, which are technically called bands. There are two main kinds of zones:
■
■
Conventional (or fast) zones work like traditional PMR disks, in which random writes are allowed.
Write pointer zones are bands that have their own “write pointer” and require strictly sequential writes. (This is not exactly true, as host-aware SMR disks also support a concept of write
preferred zones, in which random writes are still supported. This kind of zone isn’t used by
ReFS though.)
Each band in an SMR disk is usually 256 MB and works as a basic unit of I/O. This means that the system can write in one band without interfering with the next band. There are three types of SMR disks:
■
■
■
Drive-managed: The drive appears to the host identical to a nonshingled drive. The host
does not need to follow any special protocol, as all handling of data and the existence of the
disk zones and sequential write constraints is managed by the device’s firmware. This type of
SMR disk is great for compatibility but has some limitations–the disk cache used to transform
random writes in sequential ones is limited, band cleaning is complex, and sequential write
detection is not trivial. These limitations hamper performance.
Host-managed: The device requires strict adherence to special I/O rules by the host. The host
is required to write sequentially as to not destroy existing data. The drive refuses to execute
commands that violate this assumption. Host-managed drives support only sequential write
zones and conventional zones, where the latter could be any media including non-SMR, drivemanaged SMR, and flash.
Host-aware: A combination of drive-managed and host-managed, the drive can manage the
shingled nature of the storage and will execute any command the host gives it, regardless of
whether it’s sequential. However, the host is aware that the drive is shingled and is able to query
the drive for getting SMR zone information. This allows the host to optimize writes for the
shingled nature while also allowing the drive to be flexible and backward-compatible. Hostaware drives support the concept of sequential write preferred zones.
At the time of this writing, ReFS is the only file system that can support host-managed SMR disks
natively. The strategy used by ReFS for supporting these kinds of drives, which can achieve very large
capacities (20 terabytes or more), is the same as the one used for tiered volumes, usually generated by
Storage Spaces (see the final section for more information about Storage Spaces).
CHAPTER 11
Caching and file systems
763
ReFS support for tiered volumes and SMR
Tiered volumes are similar to host-aware SMR disks. They’re composed of a fast, random access area
(usually provided by a SSD) and a slower sequential write area. This isn’t a requirement, though; tiered
disks can be composed by different random-access disks, even of the same speed. ReFS is able to
properly manage tiered volumes (and SMR disks) by providing a new logical indirect layer between files
and directory namespace on the top of the volume namespace. This new layer divides the volume into
logical containers, which do not overlap (so a given cluster is present in only one container at time). A
container represents an area in the volume and all containers on a volume are always of the same size,
which is defined based on the type of the underlying disk: 64 MB for standard tiered disks and 256 MB
for SMR disks. Containers are called ReFS bands because if they’re used with SMR disks, the containers’
size becomes exactly the same as the SMR bands’ size, and each container maps one-to-one to each
SMR band.
The indirection layer is configured and provided by the global container table, as shown in Figure 11-92.
The rows of this table are composed by keys that store the ID and the type of the container. Based on
the type of container (which could also be a compacted or compressed container), the row’s data is
different. For noncompacted containers (details about ReFS compaction are available in the next section), the row’s data is a data structure that contains the mapping of the cluster range addressed by the
container. This provides to ReFS a virtual LCN-to-real LCN namespace mapping.
Container table
File’s extent table
B+ tree
Bands divided
into clusters
KEY
VALUE
{ID: 194 Type: Base }
{ID: 195 Type: Base }
{ID: 196 Type: Base }
{ID: 197 Type: Base }
RLCN 0x12E400
RLCN 0x12E800
RLCN 0x12F000
RLCN 0x12EC00
Virtual LCN namespace
Real LCN namespace
FIGURE 11-92 The container table provides a virtual LCN-to-real LCN indirection layer.
The container table is important: all the data managed by ReFS and Minstore needs to pass through
the container table (with only small exceptions), so ReFS maintains multiple copies of this vital table.
To perform an I/O on a block, ReFS must first look up the location of the extent’s container to find the
764
CHAPTER 11
Caching and file systems
real location of the data. This is achieved through the extent table, which contains target virtual LCN
of the cluster range in the data section of its rows. The container ID is derived from the LCN, through a
mathematical relationship. The new level of indirection allows ReFS to move the location of containers
without consulting or modifying the file extent tables.
ReFS consumes tiers produced by Storage Spaces, hardware tiered volumes, and SMR disks. ReFS
redirects small random I/Os to a portion of the faster tiers and destages those writes in batches to the
slower tiers using sequential writes (destages happen at container granularity). Indeed, in ReFS, the
term fast tier (or ash tier) refers to the random-access zone, which might be provided by the conventional bands of an SMR disk, or by the totality of an SSD or NVMe device. The term slow tier (or HDD
tier) refers instead to the sequential write bands or to a rotating disk. ReFS uses different behaviors
based on the class of the underlying medium. Non-SMR disks have no sequential requirements, so
clusters can be allocated from anywhere on the volume; SMR disks, as discussed previously, need to
have strictly sequential requirements, so ReFS never writes random data on the slow tier.
By default, all of the metadata that ReFS uses needs to stay in the fast tier; ReFS tries to use the
fast tier even when processing general write requests. In non-SMR disks, as flash containers fill, ReFS
moves containers from flash to HDD (this means that in a continuous write workload, ReFS is continually moving containers from flash into HDD). ReFS is also able to do the opposite when needed—select
containers from the HDD and move them into flash to fill with subsequent writes. This feature is called
container rotation and is implemented in two stages. After the storage driver has copied the actual
data, ReFS modifies the container LCN mapping shown earlier. No modification in any file’s extent
table is needed.
Container rotation is implemented only for non-SMR disks. This is important, because in SMR
disks, the ReFS file system driver never automatically moves data between tiers. Applications that are
SMR disk–aware and want to write data in the SMR capacity tier can use the FSCTL_SET_REFS_FILE_
STRICTLY_SEQUENTIAL control code. If an application sends the control code on a file handle, the ReFS
driver writes all of the new data in the capacity tier of the volume.
EXPERIMENT: Witnessing SMR disk tiers
You can use the FsUtil tool, which is provided by Windows, to query the information of an SMR
disk, like the size of each tier, the usable and free space, and so on. To do so, just run the tool in
an administrative command prompt. You can launch the command prompt as administrator by
searching for cmd in the Cortana Search box and by selecting Run As Administrator after rightclicking the Command Prompt label. Input the following parameters:
fsutil volume smrInfo <VolumeDrive>
replacing the VolumeDrive part with the drive letter of your SMR disk.
CHAPTER 11
Caching and file systems
765
Furthermore, you can start a garbage collection (see the next paragraph for details about this
feature) through the following command:
fsutil volume smrGc <VolumeDrive> Action=startfullspeed
The garbage collection can even be stopped or paused through the relative Action parameter. You can start a more precise garbage collection by specifying the IoGranularity parameter,
which specifies the granularity of the garbage collection I/O, and using the start action instead
of startfullspeed.
Container compaction
Container rotation has performance problems, especially when storing small files that don’t usually
fit into an entire band. Furthermore, in SMR disks, container rotation is never executed, as we explained earlier. Recall that each SMR band has an associated write pointer (hardware implemented),
which identifies the location for sequential writing. If the system were to write before or after the write
pointer in a non-sequential way, it would corrupt data located in other clusters (the SMR firmware must
therefore refuse such a write).
ReFS supports two types of containers: base containers, which map a virtual cluster’s range directly
to physical space, and compacted containers, which map a virtual container to many different base
containers. To correctly map the correspondence between the space mapped by a compacted container and the base containers that compose it, ReFS implements an allocation bitmap, which is stored in
the rows of the global container index table (another table, in which every row describes a single compacted container). The bitmap has a bit set to 1 if the relative cluster is allocated; otherwise, it’s set to 0.
Figure 11-93 shows an example of a base container (C32) that maps a range of virtual LCNs (0x8000
to 0x8400) to real volume’s LCNs (0xB800 to 0xBC00, identified by R46). As previously discussed, the
container ID of a given virtual LCN range is derived from the starting virtual cluster number; all the
766
CHAPTER 11
Caching and file systems
containers are virtually contiguous. In this way, ReFS never needs to look up a container ID for a given
container range. Container C32 of Figure 11-93 only has 560 clusters (0x230) contiguously allocated
(out of its 1,024). Only the free space at the end of the base container can be used by ReFS. Or, for
non-SMR disks, in case a big chunk of space located in the middle of the base container is freed, it
can be reused too. Even for non-SMR disks, the important requirement here is that the space must
be contiguous.
If the container becomes fragmented (because some small file extents are eventually freed), ReFS
can convert the base container into a compacted container. This operation allows ReFS to reuse the
container’s free space, without reallocating any row in the extent table of the files that are using the
clusters described by the container itself.
Cluster size: 64KB
Container size: 64MB (0x400 clusters)
Volume size: 1TB (0x1000000 clusters)
0
64MB
128MB
192MB
210MB
Base Container C32
0x8000
C32
0x8400
Container table entry:
Key –> (ID: 32, Type: Base)
R46
0xB800
0xBC00
Value –> Allocated size: 0x230 clusters
Real LCNs: [0xB800 - 0xBC00]
EXTENT TABLE
VCN RANGE
[0 - 0x400]
[0x400 - 0x800]
[0x800 - 0xA00]
[0xA00 - 0xC00]
[0xC00 - 0xD20]
LCN
0x18400
0x32000
0x61E00
0x11200
0x8110
CONTAINER ID
97
200
391
68
32
FIGURE 11-93 An example of a base container addressed by a 210 MB file. Container C32 uses only 35 MB of its
64 MB space.
ReFS provides a way to defragment containers that are fragmented. During normal system I/O
activity, there are a lot of small files or chunks of data that need to be updated or created. As a result,
containers located in the slow tier can hold small chunks of freed clusters and can become quickly
fragmented. Container compaction is the name of the feature that generates new empty bands in the
slow tier, allowing containers to be properly defragmented. Container compaction is executed only in
the capacity tier of a tiered volume and has been designed with two different goals:
CHAPTER 11
Caching and file systems
767
■
■
Compaction is the garbage collector for SMR-disks: In SMR, ReFS can only write data in the
capacity zone in a sequential manner. Small data can’t be singularly updated in a container located in the slow tier. The data doesn’t reside at the location pointed by the SMR write pointer,
so any I/O of this kind can potentially corrupt other data that belongs to the band. In that case,
the data is copied in a new band. Non-SMR disks don’t have this problem; ReFS updates data
residing in the small tier directly.
In non-SMR tiered volumes, compaction is the generator for container rotation: The
generated free containers can be used as targets for forward rotation when data is moved from
the fast tier to the slow tier.
ReFS, at volume-format time, allocates some base containers from the capacity tier just for compaction; which are called compacted reserved containers. Compaction works by initially searching for
fragmented containers in the slow tier. ReFS reads the fragmented container in system memory and
defragments it. The defragmented data is then stored in a compacted reserved container, located in
the capacity tier, as described above. The original container, which is addressed by the file extent table,
becomes compacted. The range that describes it becomes virtual (compaction adds another indirection layer), pointing to virtual LCNs described by another base container (the reserved container). At
the end of the compaction, the original physical container is marked as freed and is reused for different
purposes. It also can become a new compacted reserved container. Because containers located in the
slow tier usually become highly fragmented in a relatively small time, compaction can generate a lot of
empty bands in the slow tier.
The clusters allocated by a compacted container can be stored in different base containers. To properly manage such clusters in a compacted container, which can be stored in different base containers,
ReFS uses another extra layer of indirection, which is provided by the global container index table and
by a different layout of the compacted container. Figure 11-94 shows the same container as Figure
11-93, which has been compacted because it was fragmented (272 of its 560 clusters have been freed).
In the container table, the row that describes a compacted container stores the mapping between the
cluster range described by the compacted container, and the virtual clusters described by the base
containers. Compacted containers support a maximum of four different ranges (called legs). The four
legs create the second indirection layer and allow ReFS to perform the container defragmentation in an
efficient way. The allocation bitmap of the compacted container provides the second indirection layer,
too. By checking the position of the allocated clusters (which correspond to a 1 in the bitmap), ReFS is
able to correctly map each fragmented cluster of a compacted container.
In the example in Figure 11-94, the first bit set to 1 is at position 17, which is 0x11 in hexadecimal. In
the example, one bit corresponds to 16 clusters; in the actual implementation, though, one bit corresponds to one cluster only. This means that the first cluster allocated at offset 0x110 in the compacted
container C32 is stored at the virtual cluster 0x1F2E0 in the base container C124. The free space available after the cluster at offset 0x230 in the compacted container C32, is mapped into base container
C56. The physical container R46 has been remapped by ReFS and has become an empty compacted
reserved container, mapped by the base container C180.
768
CHAPTER 11
Caching and file systems
Compacted Container C32
0x8000
C32
0x8400
C32 Container table entry:
Key –> (ID: 32, Type: Compacted)
C124
0x1F000
R201
0x32400
0x1F400 C180
0x2D000
0x32800 R46
0xB800
0x1C400
C56
0x1C800
0x2D400
0x2C00
R11
0x3000
Value –> 2 Legs
1. Virtual LCNs: [0x1F2E0 - 0x1F400]
2. Virtual LCNs: [0x1C400 - 0x1C6F0]
0xBC00
C124 Container table entry:
C56 Container table entry:
C32 Container Index table entry:
Key –> (ID: 124, Type: Base)
Key –> (ID: 56, Type: Base)
Key –> (ID: 32, Type: Compacted)
Value –> Allocated size: 0x400 clusters
Real LCNs: [0x32400 - 0x32800]
Value –> Allocated size: 0x2F0 clusters Value –> Index Allocation Bitmap (1 bit = 16 clusters)
0000000000000000 0111111111111000 00000…
Real LCNs: [0x2C00 - 0x3000]
FIGURE 11-94 Container C32 has been compacted in base container C124 and C56.
In SMR disks, the process that starts the compaction is called garbage collection. For SMR disks, an
application can decide to manually start, stop, or pause the garbage collection at any time through the
FSCTL_SET_REFS_SMR_VOLUME_GC_PARAMETERS file system control code.
In contrast to NTFS, on non-SMR disks, the ReFS volume analysis engine can automatically start the
container compaction process. ReFS keeps track of the free space of both the slow and fast tier and the
available writable free space of the slow tier. If the difference between the free space and the available
space exceeds a threshold, the volume analysis engine kicks off and starts the compaction process.
Furthermore, if the underlying storage is provided by Storage Spaces, the container compaction runs
periodically and is executed by a dedicated thread.
Compression and ghosting
ReFS does not support native file system compression, but, on tiered volumes, the file system is able to
save more free containers on the slow tier thanks to container compression. Every time ReFS performs
container compaction, it reads in memory the original data located in the fragmented base container.
At this stage, if compression is enabled, ReFS compresses the data and finally writes it in a compressed
compacted container. ReFS supports four different compression algorithms: LZNT1, LZX, XPRESS, and
XPRESS_HUFF.
Many hierarchical storage management (HMR) software solutions support the concept of a ghosted
file. This state can be obtained for many different reasons. For example, when the HSM migrates the
user file (or some chunks of it) to a cloud service, and the user later modifies the copy located in the
cloud through a different device, the HSM filter driver needs to keep track of which part of the file
changed and needs to set the ghosted state on each modified file’s range. Usually HMRs keep track
of the ghosted state through their filter drivers. In ReFS, this isn’t needed because the ReFS file system
exposes a new I/O control code, FSCTL_GHOST_FILE_EXTENTS. Filter drivers can send the IOCTL to the
ReFS driver to set part of the file as ghosted. Furthermore, they can query the file’s ranges that are in
the ghosted state through another I/O control code: FSCTL_QUERY_GHOSTED_FILE_EXTENTS.
CHAPTER 11
Caching and file systems
769
ReFS implements ghosted files by storing the new state information directly in the file’s extent
table, which is implemented through an embedded table in the file record, as explained in the previous section. A filter driver can set the ghosted state for every range of the file (which must be clusteraligned). When the ReFS driver intercepts a read request for an extent that is ghosted, it returns a
STATUS_GHOSTED error code to the caller, which a filter driver can then intercept and redirect the read
to the proper place (the cloud in the previous example).
Storage Spaces
Storage Spaces is the technology that replaces dynamic disks and provides virtualization of physical storage hardware. It has been initially designed for large storage servers but is available even in client editions
of Windows 10. Storage Spaces also allows the user to create virtual disks composed of different underlying physical mediums. These mediums can have different performance characteristics.
At the time of this writing, Storage Spaces is able to work with four types of storage devices:
Nonvolatile memory express (NVMe), flash disks, persistent memory (PM), SATA and SAS solid state
drives (SSD), and classical rotating hard-disks (HDD). NVMe is considered the faster, and HDD is the
slowest. Storage spaces was designed with four goals:
■
■
■
■
Performance: Spaces implements support for a built-in server-side cache to maximize storage
performance and support for tiered disks and RAID 0 configuration.
Reliability: Other than span volumes (RAID 0), spaces supports Mirror (RAID 1 and 10) and
Parity (RAID 5, 6, 50, 60) configurations when data is distributed through different physical disks
or different nodes of the cluster.
Flexibility: Storage spaces allows the system to create virtual disks that can be automatically
moved between a cluster’s nodes and that can be automatically shrunk or extended based on
real space consumption.
Availability: Storage spaces volumes have built-in fault tolerance. This means that if a drive, or
even an entire server that is part of the cluster, fails, spaces can redirect the I/O traffic to other
working nodes without any user intervention (and in a way). Storage spaces don’t have a single
point of failure.
Storage Spaces Direct is the evolution of the Storage Spaces technology. Storage Spaces Direct is
designed for large datacenters, where multiple servers, which contain different slow and fast disks, are
used together to create a pool. The previous technology didn’t support clusters of servers that weren’t
attached to JBOD disk arrays; therefore, the term direct was added to the name. All servers are connected through a fast Ethernet connection (10GBe or 40GBe, for example). Presenting remote disks
as local to the system is made possible by two drivers—the cluster miniport driver (Clusport.sys) and
the cluster block filter driver (Clusbflt.sys)—which are outside the scope of this chapter. All the storage
physical units (local and remote disks) are added to a storage pool, which is the main unit of management, aggregation, and isolation, from where virtual disks can be created.
The entire storage cluster is mapped internally by Spaces using an XML file called BluePrint. The file
is automatically generated by the Spaces GUI and describes the entire cluster using a tree of different
770
CHAPTER 11
Caching and file systems
storage entities: Racks, Chassis, Machines, JBODs (Just a Bunch of Disks), and Disks. These entities compose each layer of the entire cluster. A server (machine) can be connected to different JBODs or have
different disks directly attached to it. In this case, a JBOD is abstracted and represented only by one
entity. In the same way, multiple machines might be located on a single chassis, which could be part
of a server rack. Finally, the cluster could be made up of multiple server racks. By using the Blueprint
representation, Spaces is able to work with all the cluster disks and redirect I/O traffic to the correct
replacement in case a fault on a disk, JBOD, or machine occurs. Spaces Direct can tolerate a maximum
of two contemporary faults.
Spaces internal architecture
One of the biggest differences between Spaces and dynamic disks is that Spaces creates virtual disk
objects, which are presented to the system as actual disk device objects by the Spaces storage driver
(Spaceport.sys). Dynamic disks operate at a higher level: virtual volume objects are exposed to the
system (meaning that user mode applications can still access the original disks). The volume manager
is the component responsible for creating the single volume composed of multiple dynamic volumes.
The Storage Spaces driver is a filter driver (a full filter driver rather than a minifilter) that lies between
the partition manager (Partmgr.sys) and the disk class driver.
Storage Spaces architecture is shown in Figure 11-95 and is composed mainly of two parts: a
platform-independent library, which implements the Spaces core, and an environment part, which
is platform-dependent and links the Spaces core to the current environment. The Environment layer
provides to Storage Spaces the basic core functionalities that are implemented in different ways based
on the platform on which they run (because storage spaces can be used as bootable entities, the
Windows boot loader and boot manager need to know how to parse storage spaces, hence the need
for both a UEFI and Windows implementation). The core basic functionality includes memory management routines (alloc, free, lock, unlock and so on), device I/O routines (Control, Pnp, Read, and Write),
and synchronization methods. These functions are generally wrappers to specific system routines. For
example, the read service, on Windows platforms, is implemented by creating an IRP of type IRP_MJ_
READ and by sending it to the correct disk driver, while, on UEFI environments, it s implemented by
using the BLOCK_IO_PROTOCOL.
Storage Spaces
Core Library
Memory management
Device I/O
Synchronization
Storage
Spaces
Environment
part
Core
Store
Metadata
I/O
Spaceport.sys
FIGURE 11-95 Storage Spaces architecture.
CHAPTER 11
Caching and file systems
771
Other than the boot and Windows kernel implementation, storage spaces must also be available
during crash dumps, which is provided by the Spacedump.sys crash dump filter driver. Storage Spaces is
even available as a user-mode library (Backspace.dll), which is compatible with legacy Windows operating systems that need to operate with virtual disks created by Spaces (especially the VHD file), and even
as a UEFI DXE driver (HyperSpace.efi), which can be executed by the UEFI BIOS, in cases where even the
EFI System Partition itself is present on a storage space entity. Some new Surface devices are sold with a
large solid-state disk that is actually composed of two or more fast NVMe disks.
Spaces Core is implemented as a static library, which is platform-independent and is imported by
all of the different environment layers. Is it composed of four layers: Core, Store, Metadata, and IO.
The Core is the highest layer and implements all the services that Spaces provides. Store is the component that reads and writes records that belong to the cluster database (created from the BluePrint
file). Metadata interprets the binary records read by the Store and exposes the entire cluster database
through different objects: Pool Drive Space Extent Column Tier and Metadata. The IO component,
which is the lowest layer, can emit I/Os to the correct device in the cluster in the proper sequential way,
thanks to data parsed by higher layers.
Services provided by Spaces
Storage Spaces supports different disk type configurations. With Spaces, the user can create virtual
disks composed entirely of fast disks (SSD, NVMe, and PM), slow disks, or even composed of all four
supported disk types (hybrid configuration). In case of hybrid deployments, where a mix of different
classes of devices are used, Spaces supports two features that allow the cluster to be fast and efficient:
■
■
Server cache: Storage Spaces is able to hide a fast drive from the cluster and use it as a cache for
the slower drives. Spaces supports PM disks to be used as a cache for NVMe or SSD disks, NVMe
disks to be used as cache for SSD disks, and SSD disks to be used as cache for classical rotating
HDD disks. Unlike tiered disks, the cache is invisible to the file system that resides on the top of
the virtual volume. This means that the cache has no idea whether a file has been accessed more
recently than another file. Spaces implements a fast cache for the virtual disk by using a log that
keeps track of hot and cold blocks. Hot blocks represent parts of files (files’ extents) that are often
accessed by the system, whereas cold blocks represent part of files that are barely accessed. The
log implements the cache as a queue, in which the hot blocks are always at the head, and cold
blocks are at the tail. In this way, cold blocks can be deleted from the cache if it’s full and can be
maintained only on the slower storage; hot blocks usually stay in the cache for a longer time.
Tiering: Spaces can create tiered disks, which are managed by ReFS and NTFS. Whereas ReFS supports SMR disks, NTFS only supports tiered disks provided by Spaces. The file system keeps track of
the hot and cold blocks and rotates the bands based on the file’s usage (see the “ReFS support
for tiered volumes and SMR” section earlier in this chapter). Spaces provides to the file system
driver support for pinning, a feature that can pin a file to the fast tier and lock it in the tier until
it will be unpinned. In this case, no band rotation is ever executed. Windows uses the pinning
feature to store the new files on the fast tier while performing an OS upgrade.
As already discussed previously, one of the main goals of Storage Spaces is flexibility. Spaces
supports the creation of virtual disks that are extensible and consume only allocated space in the
772
CHAPTER 11
Caching and file systems
underlying cluster’s devices; this kind of virtual disk is called thin provisioned. Unlike fixed provisioned
disks, where all of the space is allocated to the underlying storage cluster, thin provisioned disks allocate only the space that is actually used. In this way, it’s possible to create virtual disks that are much
larger than the underlying storage cluster. When available space gets low, a system administrator can
dynamically add disks to the cluster. Storage Spaces automatically includes the new physical disks to
the pool and redistributes the allocated blocks between the new disks.
Storage Spaces supports thin provisioned disks through slabs. A slab is a unit of allocation, which is
similar to the ReFS container concept, but applied to a lower-level stack: the slab is an allocation unit of
a virtual disk and not a file system concept. By default, each slab is 256 MB in size, but it can be bigger
in case the underlying storage cluster allows it (i.e., if the cluster has a lot of available space.) Spaces
core keeps track of each slab in the virtual disk and can dynamically allocate or free slabs by using its
own allocator. It’s worth noting that each slab is a point of reliability: in mirrored and parity configurations, the data stored in a slab is automatically replicated through the entire cluster.
When a thin provisioned disk is created, a size still needs to be specified. The virtual disk size will be
used by the file system with the goal of correctly formatting the new volume and creating the needed
metadata. When the volume is ready, Spaces allocates slabs only when new data is actually written to
the disk—a method called allocate-on-write. Note that the provisioning type is not visible to the file
system that resides on top of the volume, so the file system has no idea whether the underlying disk is
thin or fixed provisioned.
Spaces gets rid of any single point of failure by making usage of mirroring and pairing. In big storage clusters composed of multiple disks, RAID 6 is usually employed as the parity solution. RAID 6 allows the failure of a maximum of two underlying devices and supports seamless reconstruction of data
without any user intervention. Unfortunately, when the cluster encounters a single (or double) point of
failure, the time needed to reconstruct the array (mean time to repair or MTTR) is high and often causes
serious performance penalties.
Spaces solves the problem by using a local reconstruction code (LCR) algorithm, which reduces the
number of reads needed to reconstruct a big disk array, at the cost of one additional parity unit. As
shown in Figure 11-96, the LRC algorithm does so by dividing the disk array in different rows and by
adding a parity unit for each row. If a disk fails, only the other disks of the row needs to be read. As a
result, reconstruction of a failed array is much faster and more efficient.
D
0
D
1
D
2
D
3
D
4
D
5
P
0
RAID 6
P
1
D
0
D
2
D
4
P
0
D
1
D
3
D
5
P
1
P
2
LRC
FIGURE 11-96 RAID 6 and LRC parity.
Figure 11-96 shows a comparison between the typical RAID 6 parity implementation and the LRC
implementation on a cluster composed of eight drives. In the RAID 6 configuration, if one (or two)
disk(s) fail(s), to properly reconstruct the missing information, the other six disks need to be read; in
LRC, only the disks that belong to the same row of the failing disk need to be read.
CHAPTER 11
Caching and file systems
773
EXPERIMENT: Creating tiered volumes
Storage Spaces is supported natively by both server and client editions of Windows 10. You can
create tiered disks using the graphical user interface, or you can also use Windows PowerShell.
In this experiment, you will create a virtual tiered disk, and you will need a workstation that,
other than the Windows boot disk, also has an empty SSD and an empty classical rotating disk
(HDD). For testing purposes, you can emulate a similar configuration by using HyperV. In that
case, one virtual disk file should reside on an SSD, whereas the other should reside on a classical
rotating disk.
First, you need to open an administrative Windows PowerShell by right-clicking the Start
menu icon and selecting Windows PowerShell (Admin). Verify that the system has already identified the type of the installed disks:
PS C:\> Get-PhysicalDisk | FT DeviceId, FriendlyName, UniqueID, Size, MediaType, CanPool
DeviceId
-------2
0
1
FriendlyName
-----------Samsung SSD 960 EVO 1TB
Micron 1100 SATA 512GB
TOSHIBA DT01ACA200
UniqueID
Size MediaType CanPool
----------- --------- ------eui.0025385C61B074F7 1000204886016 SSD
False
500A071516EBA521
512110190592 SSD
True
500003F9E5D69494
2000398934016 HDD
True
In the preceding example, the system has already identified two SSDs and one classical
rotating hard disk. You should verify that your empty disks have the CanPool value set to True.
Otherwise, it means that the disk contains valid partitions that need to be deleted. If you’re testing a virtualized environment, often the system is not able to correctly identify the media type of
the underlying disk.
PS C:\> Get-PhysicalDisk | FT DeviceId, FriendlyName, UniqueID, Size, MediaType, CanPool
DeviceId
-------2
1
0
FriendlyName
UniqueID
Size MediaType
CanPool
---------------------- --------------Msft Virtual Disk 600224802F4EE1E6B94595687DDE774B 137438953472 Unspecified
True
Msft Virtual Disk 60022480170766A9A808A30797285D77 1099511627776 Unspecified
True
Msft Virtual Disk 6002248048976A586FE149B00A43FC73 274877906944 Unspecified
False
In this case, you should manually specify the type of disk by using the command
Set-PhysicalDisk -UniqueId (Get-PhysicalDisk)[<IDX>].UniqueID -MediaType <Type>,
where IDX is the row number in the previous output and MediaType is SSD or HDD, depending
on the disk type. For example:
PS C:\> Set-PhysicalDisk -UniqueId (Get-PhysicalDisk)[0].UniqueID -MediaType SSD
PS C:\> Set-PhysicalDisk -UniqueId (Get-PhysicalDisk)[1].UniqueID -MediaType HDD
PS C:\> Get-PhysicalDisk | FT DeviceId, FriendlyName, UniqueID, Size, MediaType, CanPool
DeviceId
-------2
1
0
774
FriendlyName
UniqueID
Size MediaType
CanPool
---------------------- --------------Msft Virtual Disk 600224802F4EE1E6B94595687DDE774B 137438953472 SSD
True
Msft Virtual Disk 60022480170766A9A808A30797285D77 1099511627776 HDD
True
Msft Virtual Disk 6002248048976A586FE149B00A43FC73 274877906944 Unspecified
False
CHAPTER 11
Caching and file systems
At this stage you need to create the Storage pool, which is going to contain all the physical
disks that are going to compose the new virtual disk. You will then create the storage tiers. In this
example, we named the Storage Pool as DefaultPool:
PS C:\> New-StoragePool -StorageSubSystemId (Get-StorageSubSystem).UniqueId -FriendlyName
DeafultPool -PhysicalDisks (Get-PhysicalDisk -CanPool $true)
FriendlyName OperationalStatus HealthStatus IsPrimordial IsReadOnly
------------ ----------------- ------------ ------------ ---------Pool
OK
Healthy
1.12 TB
False
Size AllocatedSize
---- ------------512 MB
PS C:\> Get-StoragePool DefaultPool | New-StorageTier -FriendlyName SSD -MediaType SSD
...
PS C:\> Get-StoragePool DefaultPool | New-StorageTier -FriendlyName HDD -MediaType HDD
...
Finally, we can create the virtual tiered volume by assigning it a name and specifying the
correct size of each tier. In this example, we create a tiered volume named TieredVirtualDisk
composed of a 120-GB performance tier and a 1,000-GB capacity tier:
PS C:\> $SSD = Get-StorageTier -FriendlyName SSD
PS C:\> $HDD = Get-StorageTier -FriendlyName HDD
PS C:\> Get-StoragePool Pool | New-VirtualDisk -FriendlyName "TieredVirtualDisk"
-ResiliencySettingName "Simple" -StorageTiers $SSD, $HDD -StorageTierSizes 128GB, 1000GB
...
PS C:\> Get-VirtualDisk | FT FriendlyName, OperationalStatus, HealthStatus, Size,
FootprintOnPool
FriendlyName
Size FootprintOnPool
OperationalStatus HealthStatus
---------------------------- --------------- --------------TieredVirtualDisk OK
Healthy
1203664584704
1202590842880
After the virtual disk is created, you need to create the partitions and format the new volume
through standard means (such as by using the Disk Management snap-in or the Format tool).
After you complete volume formatting, you can verify whether the resulting volume is really a
tiered volume by using the fsutil.exe tool:
PS E:\> fsutil tiering regionList e:
Total Number of Regions for this volume: 2
Total Number of Regions returned by this operation: 2
Region # 0:
Tier ID: {448ABAB8-F00B-42D6-B345-C8DA68869020}
Name: TieredVirtualDisk-SSD
Offset: 0x0000000000000000
Length: 0x0000001dff000000
Region # 1:
Tier ID: {16A7BB83-CE3E-4996-8FF3-BEE98B68EBE4}
Name: TieredVirtualDisk-HDD
Offset: 0x0000001dff000000
Length: 0x000000f9ffe00000
CHAPTER 11
Caching and file systems
775
Conclusion
Windows supports a wide variety of file system formats accessible to both the local system and remote
clients. The file system filter driver architecture provides a clean way to extend and augment file system
access, and both NTFS and ReFS provide a reliable, secure, scalable file system format for local file
system storage. Although ReFS is a relatively new file system, and implements some advanced features
designed for big server environments, NTFS was also updated with support for new device types and
new features (like the POSIX delete, online checkdisk, and encryption).
The cache manager provides a high-speed, intelligent mechanism for reducing disk I/O and increasing overall system throughput. By caching on the basis of virtual blocks, the cache manager can perform
intelligent read-ahead, including on remote, networked file systems. By relying on the global memory
manager’s mapped file primitive to access file data, the cache manager can provide a special fast I/O
mechanism to reduce the CPU time required for read and write operations, while also leaving all matters
related to physical memory management to the Windows memory manager, thus reducing code duplication and increasing efficiency.
Through DAX and PM disk support, storage spaces and storage spaces direct, tiered volumes, and
SMR disk compatibility, Windows continues to be at the forefront of next-generation storage architectures designed for high availability, reliability, performance, and cloud-level scale.
In the next chapter, we look at startup and shutdown in Windows.
776
CHAPTER 11
Caching and file systems
CHAPTER 12
Startup and shutdown
I
n this chapter, we describe the steps required to boot Windows and the options that can affect system
startup. Understanding the details of the boot process will help you diagnose problems that can
arise during a boot. We discuss the details of the new UEFI firmware, and the improvements brought
by it compared to the old historical BIOS. We present the role of the Boot Manager, Windows Loader,
NT kernel, and all the components involved in standard boots and in the new Secure Launch process,
which detects any kind of attack on the boot sequence. Then we explain the kinds of things that can
go wrong during the boot process and how to resolve them. Finally, we explain what occurs during an
orderly system shutdown.
Boot process
In describing the Windows boot process, we start with the installation of Windows and proceed through
the execution of boot support files. Device drivers are a crucial part of the boot process, so we explain
how they control the point in the boot process at which they load and initialize. Then we describe how the
executive subsystems initialize and how the kernel launches the user-mode portion of Windows by starting the Session Manager process (Smss.exe), which starts the initial two sessions (session 0 and session 1).
Along the way, we highlight the points at which various on-screen messages appear to help you correlate
the internal process with what you see when you watch Windows boot.
The early phases of the boot process differ significantly on systems with an Extensible Firmware
Interface (EFI) versus the old systems with a BIOS (basic input/output system). EFI is a newer standard
that does away with much of the legacy 16-bit code that BIOS systems use and allows the loading of
preboot programs and drivers to support the operating system loading phase. EFI 2.0, which is known
as Unified EFI, or UEFI, is used by the vast majority of machine manufacturers. The next sections describe the portion of the boot process specific to UEFI-based machines.
To support these different firmware implementations, Windows provides a boot architecture that
abstracts many of the differences away from users and developers to provide a consistent environment
and experience regardless of the type of firmware used on the installed system.
The UEFI boot
The Windows boot process doesn’t begin when you power on your computer or press the reset button. It begins when you install Windows on your computer. At some point during the execution of the
Windows Setup program, the system’s primary hard disk is prepared in a way that both the Windows
777
Boot Manager and the UEFI firmware can understand. Before we get into what the Windows Boot
Manager code does, let’s have a quick look at the UEFI platform interface.
The UEFI is a set of software that provides the first basic programmatic interface to the platform.
With the term platform, we refer to the motherboard, chipset, central processing unit (CPU), and other
components that compose the machine “engine.” As Figure 12-1 shows, the UEFI specifications provide
four basic services that run in most of the available CPU architectures (x86, ARM, and so on). We use the
x86-64 architecture for this quick introduction:
■
■
■
■
Power on When the platform is powered on, the UEFI Security Phase handles the platform
restart event, verifies the Pre EFI Initialization modules’ code, and switches the processor from
16-bit real mode to 32-bit flat mode (still no paging support).
Platform initialization The Pre EFI Initialization (PEI) phase initializes the CPU, the UEFI core’s
code, and the chipset and finally passes the control to the Driver Execution Environment (DXE)
phase. The DXE phase is the first code that runs entirely in full 64-bit mode. Indeed, the last PEI
module, called DXE IPL, switches the execution mode to 64-bit long mode. This phase searches
inside the firmware volume (stored in the system SPI flash chip) and executes each peripheral’s
startup drivers (called DXE drivers). Secure Boot, an important security feature that we talk about
later in this chapter in the “Secure Boot” section, is implemented as a UEFI DXE driver.
OS boot After the UEFI DXE phase ends, execution control is handed to the Boot Device
Selection (BDS) phase. This phase is responsible for implementing the UEFI Boot Loader. The
UEFI BDS phase locates and executes the Windows UEFI Boot Manager that the Setup program
has installed.
Shutdown The UEFI firmware implements some runtime services (available even to the OS)
that help in powering off the platform. Windows doesn’t normally make use of these functions
(relying instead on the ACPI interfaces).
verify
Pre
Verifier
UEFI
Interface
Processor
Init
Chipset
Init
Board
Init
Device,
Device,
Device,
Bus,oror
Device,
Bus,
Device,
Bus,
Service
Bus,
oror
Service
Bus,
or
Service
Driver
Service
Driver
Service
Driver
Driver
Driver
EFI Driver
Dispatcher
Transient OS
Environment
Transient OS
Boot Loader
Power on
Pre EFI
Initialization
(PEI)
Driver Execution
Environment
(DXE)
Boot Dev
Select
(BDS)
[ . . Platform initialization . . ]
FIGURE 12-1 The UEFI framework.
778
CHAPTER 12
OS-Present
App
Boot
Manager
Intrinsic
Services
Security
(SEC)
OS-Absent
App
Startup and shutdown
Final OS Boot
Loader
Final OS
Environment
?
Transient
System Load
(TSL)
Run Time
(RT)
After
Life
(AL)
[ . . . . OS boot . . . . ]
Shutdown
Describing the entire UEFI framework is beyond the scope of this book. After the UEFI BDS phase ends,
the firmware still owns the platform, making available the following services to the OS boot loader:
■
■
■
Boot services Provide basic functionality to the boot loader and other EFI applications, such
as basic memory management, synchronization, textual and graphical console I/O, and disk and
file I/O. Boot services implement some routines able to enumerate and query the installed “protocols” (EFI interfaces). These kinds of services are available only while the firmware owns the
platform and are discarded from memory after the boot loader has called the ExitBootServices
EFI runtime API.
Runtime services Provide date and time services, capsule update (firmware upgrading), and
methods able to access NVRAM data (such as UEFI variables). These services are still accessible
while the operating system is fully running.
Platform configuration data
the UEFI framework.
System ACPI and SMBIOS tables are always accessible through
The UEFI Boot Manager can read and write from computer hard disks and understands basic file
systems like FAT, FAT32, and El Torito (for booting from a CD-ROM). The specifications require that the
boot hard disk be partitioned through the GPT (GUID partition table) scheme, which uses GUIDs to
identify different partitions and their roles in the system. The GPT scheme overcomes all the limitations
of the old MBR scheme and allows a maximum of 128 partitions, using a 64-bit LBA addressing mode
(resulting in a huge partition size support). Each partition is identified using a unique 128-bit GUID
value. Another GUID is used to identify the partition type. While UEFI defines only three partition types,
each OS vendor defines its own partition’s GUID types. The UEFI standard requires at least one EFI system partition, formatted with a FAT32 file system.
The Windows Setup application initializes the disk and usually creates at least four partitions:
■
■
■
■
The EFI system partition, where it copies the Windows Boot Manager (Bootmgrfw.efi), the
memory test application (Memtest.efi), the system lockdown policies (for Device Guardenabled systems, Winsipolicy.p7b), and the boot resource file (Bootres.dll).
A recovery partition, where it stores the files needed to boot the Windows Recovery environment in case of startup problems (boot.sdi and Winre.wim). This partition is formatted using the
NTFS file system.
A Windows reserved partition, which the Setup tool uses as a fast, recoverable scratch area for
storing temporary data. Furthermore, some system tools use the Reserved partition for remapping
damaged sectors in the boot volume. (The reserved partition does not contain any file system.)
A boot partition—which is the partition on which Windows is installed and is not typically the
same as the system partition—where the boot files are located. This partition is formatted using
NTFS, the only supported file system that Windows can boot from when installed on a fixed disk.
The Windows Setup program, after placing the Windows files on the boot partition, copies the boot
manager in the EFI system partition and hides the boot partition content for the rest of the system. The
UEFI specification defines some global variables that can reside in NVRAM (the system’s nonvolatile
RAM) and are accessible even in the runtime phase when the OS has gained full control of the platform
CHAPTER 12
Startup and shutdown
779
(some other UEFI variables can even reside in the system RAM). The Windows Setup program configures the UEFI platform for booting the Windows Boot Manager through the settings of some UEFI
variables (Boot000X one, where X is a unique number, depending on the boot load-option number,
and BootOrder). When the system reboots after setup ends, the UEFI Boot Manager is automatically
able to execute the Windows Boot Manager code.
Table 12-1 summarizes the files involved in the UEFI boot process. Figure 12-2 shows an example of a
hard disk layout, which follows the GPT partition scheme. (Files located in the Windows boot partition
are stored in the \Windows\System32 directory.)
TABLE 12-1 UEFI boot process components
780
Component
Responsibilities
bootmgfw.efi
Reads the Boot Configuration Database (BCD), if required, pres- EFI system partition
ents boot menu, and allows execution of preboot programs
such as the Memory Test application (Memtest.efi).
Winload.efi
Loads Ntoskrnl.exe and its dependencies (SiPolicy.p7b,
hvloader.dll, hvix64.exe, Hal.dll, Kdcom.dll, Ci.dll, Clfs.sys,
Pshed.dll) and bootstart device drivers.
Windows boot partition
Winresume.efi
If resuming after a hibernation state, resumes from the hibernation file (Hiberfil.sys) instead of typical Windows loading.
Windows boot partition
Memtest.efi
If selected from the Boot Immersive Menu (or from the Boot
Manager), starts up and provides a graphical interface for scanning memory and detecting damaged RAM.
EFI system partition
Hvloader.dll
If detected by the boot manager and properly enabled, this
module is the hypervisor launcher (hvloader.efi in the previous
Windows version).
Windows boot partition
Hvix64.exe (or hvax64.exe)
The Windows Hypervisor (Hyper-V). Depending on the processor architecture, this file could have different names. It’s the
basic component for Virtualization Based Security (VBS).
Windows boot partition
Ntoskrnl.exe
Initializes executive subsystems and boot and system-start
device drivers, prepares the system for running native applications, and runs Smss.exe.
Windows boot partition
Securekernel.exe
The Windows Secure Kernel. Provides the kernel mode services
for the secure VTL 1 World, and some basic communication
facility with the normal world (see Chapter 9, “Virtualization
Technologies”).
Windows boot partition
Hal.dll
Kernel-mode DLL that interfaces Ntoskrnl and drivers to the
hardware. It also acts as a driver for the motherboard, supporting soldered components that are not otherwise managed by
another driver.
Windows boot partition
Smss.exe
Initial instance starts a copy of itself to initialize each session.
The session 0 instance loads the Windows subsystem driver
(Win32k.sys) and starts the Windows subsystem process
(Csrss.exe) and Windows initialization process (Wininit.exe). All
other per-session instances start a Csrss and Winlogon process.
Windows boot partition
Wininit.exe
Windows boot partition
Starts the service control manager (SCM), the Local Security
Authority process (LSASS), and the local session manager
(LSM). Initializes the rest of the registry and performs usermode
initialization tasks.
Winlogon.exe
Coordinates log-on and user security; launches Bootim and
LogonUI.
CHAPTER 12
Startup and shutdown
Location
Windows boot partition
Component
Responsibilities
Location
Logonui.exe
Presents interactive log on dialog screen.
Windows boot partition
Bootim.exe
Presents the graphical interactive boot menu.
Windows boot partition
Services.exe
Loads and initializes auto-start device drivers and Windows
services.
Windows boot partition
TcbLaunch.exe
Orchestrates the Secure Launch of the operating system in a
system that supports the new Intel TXT technology.
Windows boot partition
TcbLoader.dll
Contains the Windows Loader code that runs in the context of
the Secure Launch.
Windows boot partition
Primary
GPT
UEFI Windows Reserved
system Recovery partition
partition petition
Windows Boot
Partition
Backup GPT
Protective
MBR
GPT Protective partition
LBA 0
LBA z
FIGURE 12-2 Sample UEFI hard disk layout.
Another of Setup’s roles is to prepare the BCD, which on UEFI systems is stored in the \EFI\Microsoft
\Boot\BCD file on the root directory of the system volume. This file contains options for starting
the version of Windows that Setup installs and any preexisting Windows installations. If the BCD
already exists, the Setup program simply adds new entries relevant to the new installation. For more
information on the BCD, see Chapter 10, “Management, diagnostics, and tracing.”
All the UEFI specifications, which include the PEI and BDS phase, secure boot, and many other
concepts, are available at https://uefi.org/specifications.
The BIOS boot process
Due to space issues, we don’t cover the old BIOS boot process in this edition of the book. The complete
description of the BIOS preboot and boot process is in Part 2 of the previous edition of the book.
Secure Boot
As described in Chapter 7 of Part 1, Windows was designed to protect against malware. All the old BIOS
systems were vulnerable to Advanced Persistent Threats (APT) that were using a bootkit to achieve
stealth and code execution. The bootkit is a particular type of malicious software that runs before
the Windows Boot Manager and allows the main infection module to run without being detected by
CHAPTER 12
Startup and shutdown
781
antivirus solutions. Initial parts of the BIOS bootkit normally reside in the Master Boot Record (MBR)
or Volume Boot Record (VBR) sector of the system hard disk. In this way, the old BIOS systems, when
switched on, execute the bootkit code instead of the main OS code. The OS original boot code is
encrypted and stored in other areas of the hard disk and is usually executed in a later stage by the malicious code. This type of bootkit was even able to modify the OS code in memory during any Windows
boot phase.
As demonstrated by security researchers, the first releases of the UEFI specification were still vulnerable to this problem because the firmware, bootloader, and other components were not verified.
So, an attacker that has access to the machine could tamper with these components and replace the
bootloader with a malicious one. Indeed, any EFI application (executable files that follow the portable
executable or terse executable file format) correctly registered in the relative boot variable could have
been used for booting the system. Furthermore, even the DXE drivers were not correctly verified, allowing the injection of a malicious EFI driver in the SPI flash. Windows couldn’t correctly identify the
alteration of the boot process.
This problem led the UEFI consortium to design and develop the secure boot technology. Secure
Boot is a feature of UEFI that ensures that each component loaded during the boot process is digitally
signed and validated. Secure Boot makes sure that the PC boots using only software that is trusted
by the PC manufacturer or the user. In Secure Boot, the firmware is responsible for the verification of
all the components (DXE drivers, UEFI boot managers, loaders, and so on) before they are loaded. If a
component doesn’t pass the validation, an error message is shown to the user and the boot process
is aborted.
The verification is performed through the use of public key algorithms (like RSA) for digital signing, against a database of accepted and refused certificates (or hashes) present in the UEFI firmware. In
these kind of algorithms, two different keys are employed:
■
■
A public key is used to decrypt an encrypted digest (a digest is a hash of the executable file
binary data). This key is stored in the digital signature of the file.
The private key is used to encrypt the hash of the binary executable file and is stored in a secure
and secret location. The digital signing of an executable file consists of three phases:
1.
Calculate the digest of the file content using a strong hashing algorithm, like SHA256. A
strong “hashing” should produce a message digest that is a unique (and relatively small)
representation of the complete initial data (a bit like a sophisticated checksum). Hashing
algorithms are a one-way encryption—that is, it’s impossible to derive the whole file from
the digest.
2.
Encrypt the calculated digest with the private portion of the key.
3.
Store the encrypted digest, the public portion of the key, and the name of the hashing
algorithm in the digital signature of the file.
In this way, when the system wants to verify and validate the integrity of the file, it recalculates the file
hash and compares it against the digest, which has been decrypted from the digital signature. Nobody except the owner of the private key can modify or alter the encrypted digest stored into the digital signature.
782
CHAPTER 12
Startup and shutdown
This simplified model can be extended to create a chain of certificates, each one trusted by the firmware. Indeed, if a public key located in a specific certificate is unknown by the firmware, but the certificate is signed another time by a trusted entity (an intermediate or root certificate), the firmware could
assume that even the inner public key must be considered trusted. This mechanism is shown in Figure
12-3 and is called the chain of trust. It relies on the fact that a digital certificate (used for code signing)
can be signed using the public key of another trusted higher-level certificate (a root or intermediate
certificate). The model is simplified here because a complete description of all the details is outside the
scope of this book.
End-entity Certificate
Owner’s name
Owner’s public key
reference
Issuer’s (CA’s)
name
Intermediate Certificate
Issuer’s signature
sign
Owner’s (CA’s) name
Owner’s public key
reference
Issuer’s (root CA’s)
name
Issuer’s signature
Root CA’s name
sign
Root CA’s public key
self-sign
Root CA’s signature
Root Certificate
FIGURE 12-3 A simplified representation of the chain of trust.
The allowed/revoked UEFI certificates and hashes have to establish some hierarchy of trust by using
the entities shown in Figure 12-4, which are stored in UEFI variables:
■
■
Platform key (PK) The platform key represents the root of trust and is used to protect the
key exchange key (KEK) database. The platform vendor puts the public portion of the PK into
UEFI firmware during manufacturing. Its private portion stays with the vendor.
Key exchange key (KEK) The key exchange key database contains trusted certificates that
are allowed to modify the allowed signature database (DB), disallowed signature database
(DBX), or timestamp signature database (DBT). The KEK database usually contains certificates of
the operating system vendor (OSV) and is secured by the PK.
Hashes and signatures used to verify bootloaders and other pre-boot components are stored in
three different databases. The allowed signature database (DB) contains hashes of specific binaries
or certificates (or their hashes) that were used to generate code-signing certificates that have signed
bootloader and other preboot components (following the chain of trust model). The disallowed signature database (DBX) contains the hashes of specific binaries or certificates (or their hashes) that were
CHAPTER 12
Startup and shutdown
783
compromised and/or revoked. The timestamp signature database (DBT) contains timestamping certificates used when signing bootloader images. All three databases are locked from editing by the KEK.
PK–Platform key
KEK–Key exchange key
database
DBT–timestamping
database
DBX–revoked
signatures database
DB–allowed signatures
database
FIGURE 12-4 The certificate the chain of trust used in the UEFI Secure Boot.
To properly seal Secure Boot keys, the firmware should not allow their update unless the entity
attempting the update can prove (with a digital signature on a specified payload, called the authentication descriptor) that they possess the private part of the key used to create the variable. This mechanism is implemented in UEFI through the Authenticated Variables. At the time of this writing, the UEFI
specifications allow only two types of signing keys: X509 and RSA2048. An Authenticated Variable may
be cleared by writing an empty update, which must still contain a valid authentication descriptor. When
an Authenticated Variable is first created, it stores both the public portion of the key that created it and
the initial value for the time (or a monotonic count) and will accept only subsequent updates signed
with that key and which have the same update type. For example, the KEK variable is created using the
PK and can be updated only by an authentication descriptor signed with the PK.
Note The way in which the UEFI firmware uses the Authenticated Variables in Secure Boot
environments could lead to some confusion. Indeed, only the PK, KEK, and signatures databases are stored using Authenticated Variables. The other UEFI boot variables, which store
boot configuration data, are still regular runtime variables. This means that in a Secure Boot
environment, a user is still able to update or change the boot configuration (modifying even
the boot order) without any problem. This is not an issue, because the secure verification
is always made on every kind of boot application (regardless of its source or order). Secure
Boot is not designed to prevent the modification of the system boot configuration.
784
CHAPTER 12
Startup and shutdown
The Windows Boot Manager
As discussed previously, the UEFI firmware reads and executes the Windows Boot Manager (Bootmgfw.efi).
The EFI firmware transfers control to Bootmgr in long mode with paging enabled, and the memory
space defined by the UEFI memory map is mapped one to one. So, unlike wBIOS systems, there’s no
need to switch execution context. The Windows Boot Manager is indeed the first application that’s
invoked when starting or resuming the Windows OS from a completely off power state or from hibernation (S4 power state). The Windows Boot Manager has been completely redesigned starting from
Windows Vista, with the following goals:
■
■
■
Support the boot of different operating systems that employ complex and various boot
technologies.
Separate the OS-specific startup code in its own boot application (named Windows Loader)
and the Resume application (Winresume).
Isolate and provide common boot services to the boot applications. This is the role of the
boot libraries.
Even though the final goal of the Windows Boot Manager seems obvious, its entire architecture is
complex. From now on, we use the term boot application to refer to any OS loader, such as the Windows
Loader and other loaders. Bootmgr has multiple roles, such as the following:
■
■
Initializes the boot logger and the basic system services needed for the boot application
(which will be discussed later in this section)
Initializes security features like Secure Boot and Measured Boot, loads their system policies,
and verifies its own integrity
■
Locates, opens, and reads the Boot Configuration Data store
■
Creates a “boot list” and shows a basic boot menu (if the boot menu policy is set to Legacy)
■
■
Manages the TPM and the unlock of BitLocker-encrypted drives (showing the BitLocker unlock
screen and providing a recovery method in case of problems getting the decryption key)
Launches a specific boot application and manages the recovery sequence in case the boot has
failed (Windows Recovery Environment)
One of the first things performed is the configuration of the boot logging facility and initialization of
the boot libraries. Boot applications include a standard set of libraries that are initialized at the start of
the Boot Manager. Once the standard boot libraries are initialized, then their core services are available
to all boot applications. These services include a basic memory manager (that supports address translation, and page and heap allocation), firmware parameters (like the boot device and the boot manager
entry in the BCD), an event notification system (for Measured Boot), time, boot logger, crypto modules,
the Trusted Platform Module (TPM), network, display driver, and I/O system (and a basic PE Loader). The
reader can imagine the boot libraries as a special kind of basic hardware abstraction layer (HAL) for the
Boot Manager and boot applications. In the early stages of library initialization, the System Integrity
boot library component is initialized. The goal of the System Integrity service is to provide a platform
for reporting and recording security-relevant system events, such as loading of new code, attaching a
CHAPTER 12
Startup and shutdown
785
debugger, and so on. This is achieved using functionality provided by the TPM and is used especially for
Measured Boot. We describe this feature later in the chapter in the “Measured Boot” section.
To properly execute, the Boot Manager initialization function (BmMain) needs a data structure
called Application Parameters that, as the name implies, describes its startup parameters (like the
Boot Device, BCD object GUID, and so on). To compile this data structure, the Boot Manager uses the
EFI firmware services with the goal of obtaining the complete relative path of its own executable and
getting the startup load options stored in the active EFI boot variable (BOOT000X). The EFI specifications dictate that an EFI boot variable must contain a short description of the boot entry, the complete
device and file path of the Boot Manager, and some optional data. Windows uses the optional data to
store the GUID of the BCD object that describes itself.
Note The optional data could include any other boot options, which the Boot Manager will
parse at later stages. This allows the configuration of the Boot Manager from UEFI variables
without using the Windows Registry at all.
EXPERIMENT: Playing with the UEFI boot variables
You can use the UefiTool utility (found in this book’s downloadable resources) to dump all the
UEFI boot variables of your system. To do so, just run the tool in an administrative command
prompt and specify the /enum command-line parameter. (You can launch the command
prompt as administrator by searching cmd in the Cortana search box and selecting Run As
Administrator after right-clicking Command Prompt.) A regular system uses a lot of UEFI variables. The tool supports filtering all the variables by name and GUID. You can even export all the
variable names and data in a text file using the /out parameter.
Start by dumping all the UEFI variables in a text file:
C:\Tools>UefiTool.exe /enum /out Uefi_Variables.txt
UEFI Dump Tool v0.1
Copyright 2018 by Andrea Allievi (AaLl86)
Firmware type: UEFI
Bitlocker enabled for System Volume: NO
Successfully written “Uefi_Variables.txt” file.
You can get the list of UEFI boot variables by using the following filter:
C:\Tools>UefiTool.exe /enum Boot
UEFI Dump Tool v0.1
Copyright 2018 by Andrea Allievi (AaLl86)
Firmware type: UEFI
Bitlocker enabled for System Volume: NO
786
CHAPTER 12
Startup and shutdown
EFI Variable “BootCurrent”
Guid
: {8BE4DF61-93CA-11D2-AA0D-00E098032B8C}
Attributes: 0x06 ( BS RT )
Data size : 2 bytes
Data:
00 00
|
EFI Variable “Boot0002”
Guid
: {8BE4DF61-93CA-11D2-AA0D-00E098032B8C}
Attributes: 0x07 ( NV BS RT )
Data size : 78 bytes
Data:
01 00 00 00 2C 00 55 00 53 00 42 00 20 00 53 00 |
, U S B
S
74 00 6F 00 72 00 61 00 67 00 65 00 00 00 04 07 | t o r a g e
14 00 67 D5 81 A8 B0 6C EE 4E 84 35 2E 72 D3 3E | g ü¿ l Nä5.r >
45 B5 04 06 14 00 71 00 67 50 8F 47 E7 4B AD 13 | E q gPÅG K¡
87 54 F3 79 C6 2F 7F FF 04 00 55 53 42 00
| çT≤y /
USB
EFI Variable “Boot0000”
Guid
: {8BE4DF61-93CA-11D2-AA0D-00E098032B8C}
Attributes: 0x07 ( NV BS RT )
Data size : 300 bytes
Data:
01 00 00 00 74 00 57 00 69 00 6E 00 64 00 6F 00 |
t W I n d o
77 00 73 00 20 00 42 00 6F 00 6F 00 74 00 20 00 | w s
B o o t
4D 00 61 00 6E 00 61 00 67 00 65 00 72 00 00 00 | M a n a g e r
04 01 2A 00 02 00 00 00 00 A0 0F 00 00 00 00 00 | * á
00 98 0F 00 00 00 00 00 84 C4 AF 4D 52 3B 80 44 | ÿ
ä »MR;ÇD
98 DF 2C A4 93 AB 30 B0 02 02 04 04 46 00 5C 00 | ÿ ,ñô½0 F \
45 00 46 00 49 00 5C 00 4D 00 69 00 63 00 72 00 | E F I \ M i c r
6F 00 73 00 6F 00 66 00 74 00 5C 00 42 00 6F 00 | o s o f t \ B o
6F 00 74 00 5C 00 62 00 6F 00 6F 00 74 00 6D 00 | o t \ b o o t m
67 00 66 00 77 00 2E 00 65 00 66 00 69 00 00 00 | g f w . e f i
7F FF 04 00 57 49 4E 44 4F 57 53 00 01 00 00 00 |
WINDOWS
88 00 00 00 78 00 00 00 42 00 43 00 44 00 4F 00 | ê
x
B C D O
42 00 4A 00 45 00 43 00 54 00 3D 00 7B 00 39 00 | B J E C T = { 9
64 00 65 00 61 00 38 00 36 00 32 00 63 00 2D 00 | d e a 8 6 2 c 35 00 63 00 64 00 64 00 2D 00 34 00 65 00 37 00 | 5 c d d - 4 e 7
30 00 2D 00 61 00 63 00 63 00 31 00 2D 00 66 00 | 0 - a c c 1 - f
33 00 32 00 62 00 33 00 34 00 34 00 64 00 34 00 | 3 2 b 3 4 4 d 4
37 00 39 00 35 00 7D 00 00 00 6F 00 01 00 00 00 | 7 9 5 }
o
10 00 00 00 04 00 00 00 7F FF 04 00
|
EFI Variable "BootOrder"
Guid
: {8BE4DF61-93CA-11D2-AA0D-00E098032B8C}
Attributes: 0x07 ( NV BS RT )
Data size : 8 bytes
Data:
02 00 00 00 01 00 03 00
|
<Full output cut for space reasons>
CHAPTER 12
Startup and shutdown
787
The tool can even interpret the content of each boot variable. You can launch it using the
/enumboot parameter:
C:\Tools>UefiTool.exe /enumboot
UEFI Dump Tool v0.1
Copyright 2018 by Andrea Allievi (AaLl86)
Firmware type: UEFI
Bitlocker enabled for System Volume: NO
System Boot Configuration
Number of the Boot entries: 4
Current active entry: 0
Order: 2, 0, 1, 3
Boot Entry #2
Type: Active
Description: USB Storage
Boot Entry #0
Type: Active
Description: Windows Boot Manager
Path: Harddisk0\Partition2 [LBA: 0xFA000]\\EFI\Microsoft\Boot\bootmgfw.efi
OS Boot Options: BCDOBJECT={9dea862c-5cdd-4e70-acc1-f32b344d4795}
Boot Entry #1
Type: Active
Description: Internal Storage
Boot Entry #3
Type: Active
Description: PXE Network
When the tool is able to parse the boot path, it prints the relative Path line (the same applies
for the Winload OS load options). The UEFI specifications define different interpretations for
the path field of a boot entry, which are dependent on the hardware interface. You can change
your system boot order by simply setting the value of the BootOrder variable, or by using the
/setbootorder command-line parameter. Keep in mind that this could invalidate the BitLocker
Volume master key. (We explain this concept later in this chapter in the “Measured Boot” section):
C:\Tools>UefiTool.exe /setvar bootorder {8BE4DF61-93CA-11D2-AA0D-00E098032B8C}
0300020000000100
UEFI Dump Tool v0.1
Copyright 2018 by Andrea Allievi (AaLl86)
Firmware type: UEFI
Bitlocker enabled for System Volume: YES
Warning, The "bootorder" firmware variable already exist.
Overwriting it could potentially invalidate the system Bitlocker Volume Master Key.
Make sure that you have made a copy of the System volume Recovery Key.
Are you really sure that you would like to continue and overwrite its content? [Y/N] y
The "bootorder" firmware variable has been successfully written.
788
CHAPTER 12
Startup and shutdown
After the Application Parameters data structure has been built and all the boot paths retrieved
(\EFI\Microsoft\Boot is the main working directory), the Boot Manager opens and parses the Boot
Configuration Data file. This file internally is a registry hive that contains all the boot application descriptors and is usually mapped in an HKLM\BCD00000000 virtual key after the system has completely
started. The Boot Manager uses the boot library to open and read the BCD file. The library uses EFI services to read and write physical sectors from the hard disk and, at the time of this writing, implements
a light version of various file systems, such as NTFS, FAT, ExFAT, UDFS, El Torito, and virtual file systems
that support Network Boot I/O, VMBus I/O (for Hyper-V virtual machines), and WIM images I/O. The
Boot Configuration Data hive is parsed, the BCD object that describes the Boot Manager is located
(through its GUID), and all the entries that represent boot arguments are added to the startup section
of the Application Parameters data structure. Entries in the BCD can include optional arguments that
Bootmgr, Winload, and other components involved in the boot process interpret. Table 12-2 contains
a list of these options and their effects for Bootmgr, Table 12-3 shows a list of BCD options available to
all boot applications, and Table 12-4 shows BCD options for the Windows boot loader. Table 12-5 shows
BCD options that control the execution of the Windows Hypervisor.
TABLE 12-2 BCD options for the Windows Boot Manager (Bootmgr)
Readable name
Values
BCD Element Code1
Meaning
bcdfilepath
Path
BCD_FILEPATH
Points to the BCD (usually \Boot\BCD) file on
the disk.
displaybootmenu
Boolean
DISPLAY_BOOT_MENU
Determines whether the Boot Manager
shows the boot menu or picks the default
entry automatically.
noerrordisplay
Boolean
NO_ERROR_DISPLAY
Silences the output of errors encountered by
the Boot Manager.
resume
Boolean
ATTEMPT_RESUME
Specifies whether resuming from hibernation should be attempted. This option is
automatically set when Windows hibernates.
timeout
Seconds
TIMEOUT
Number of seconds that the Boot Manager
should wait before choosing the default entry.
resumeobject
GUID
RESUME_OBJECT
Identifier for which boot application
should be used to resume the system after
hibernation.
displayorder
List
DISPLAY_ORDER
Definition of the Boot Manager’s display
order list.
toolsdisplayorder
List
TOOLS_DISPLAY_ORDER
Definition of the Boot Manager’s tool display
order list.
bootsequence
List
BOOT_SEQUENCE
Definition of the one-time boot sequence.
default
GUID
DEFAULT_OBJECT
The default boot entry to launch.
customactions
List
CUSTOM_ACTIONS_LIST
Definition of custom actions to take when
a specific keyboard sequence has been
entered.
processcustomactionsfirst
Boolean
PROCESS_CUSTOM
_ACTIONS_FIRST
Specifies whether the Boot Manager
should run custom actions prior to the
boot sequence.
bcddevice
GUID
BCD_DEVICE
Device ID of where the BCD store is located.
CHAPTER 12
Startup and shutdown
789
Readable name
Values
BCD Element Code1
Meaning
hiberboot
Boolean
HIBERBOOT
Indicates whether this boot was a hybrid boot.
fverecoveryurl
String
FVE_RECOVERY_URL
Specifies the BitLocker recovery URL string.
fverecoverymessage
String
FVE_RECOVERY
_MESSAGE
Specifies the BitLocker recovery message
string.
flightedbootmgr
Boolean
BOOT_FLIGHT
_BOOTMGR
Specifies whether execution should proceed
through a flighted Bootmgr.
1 All the Windows Boot Manager BCD element codes start with BCDE_BOOTMGR_TYPE, but that has been omitted due to limited space.
TABLE 12-3 BCD library options for boot applications (valid for all object types)
Readable Name
Values
BCD Element Code2
Meaning
advancedoptions
Boolean
DISPLAY_ADVANCED
_OPTIONS
If false, executes the default behavior of
launching the auto-recovery command
boot entry when the boot fails; otherwise,
displays the boot error and offers the user
the advanced boot option menu associated
with the boot entry. This is equivalent to
pressing F8.
avoidlowmemory
Integer
AVOID_LOW_PHYSICAL
_MEMORY
Forces physical addresses below the specified value to be avoided by the boot loader
as much as possible. Sometimes required
on legacy devices (such as ISA) where only
memory below 16 MB is usable or visible.
badmemoryaccess
Boolean
ALLOW_BAD_MEMORY
_ACCESS
Forces usage of memory pages in the Bad
Page List (see Part 1, Chapter 5, “Memory
management,” for more information on the
page lists).
badmemorylist
Array of page frame
numbers (PFNs)
BAD_MEMORY_LIST
Specifies a list of physical pages on the
system that are known to be bad because
of faulty RAM.
baudrate
Baud rate in bps
DEBUGGER_BAUDRATE
Specifies an override for the default baud
rate (19200) at which a remote kernel debugger host will connect through a serial port.
bootdebug
Boolean
DEBUGGER_ENABLED
Enables remote boot debugging for the
boot loader. With this option enabled, you
can use Kd.exe or Windbg.exe to connect to
the boot loader.
bootems
Boolean
EMS_ENABLED
Causes Windows to enable Emergency
Management Services (EMS) for boot applications, which reports boot information and
accepts system management commands
through a serial port.
busparams
String
DEBUGGER_BUS
_PARAMETERS
If a physical PCI debugging device is used
to provide kernel debugging, specifies the
PCI bus, function, and device number (or the
ACPI DBG table index) for the device.
channel
Channel between 0
and 62
DEBUGGER_1394
_CHANNEL
Used in conjunction with <debugtype> 1394
to specify the IEEE 1394 channel through
which kernel debugging communications
will flow.
790
CHAPTER 12
Startup and shutdown
Readable Name
Values
BCD Element Code2
Meaning
configaccesspolicy
Default,
DisallowMmConfig
CONFIG_ACCESS
_POLICY
Configures whether the system uses
memory-mapped I/O to access the PCI
manufacturer’s configuration space or falls
back to using the HAL’s I/O port access routines. Can sometimes be helpful in solving
platform device problems.
debugaddress
Hardware address
DEBUGGER_PORT
_ADDRESS
Specifies the hardware address of the serial
(COM) port used for debugging.
debugport
COM port number
DEBUGGER_PORT
_NUMBER
Specifies an override for the default serial
port (usually COM2 on systems with at least
two serial ports) to which a remote kernel
debugger host is connected.
debugstart
Active, AutoEnable,
Disable
DEBUGGER_START
_POLICY
Specifies settings for the debugger when kernel debugging is enabled. AutoEnable enables
the debugger when a breakpoint or kernel
exception, including kernel crashes, occurs.
debugtype
Serial, 1394, USB, or Net
DEBUGGER_TYPE
Specifies whether kernel debugging will be
communicated through a serial, FireWire (IEEE
1394), USB, or Ethernet port. (The default is
serial.)
hostip
Ip address
DEBUGGER_NET
_HOST_IP
Specifies the target IP address to connect
to when the kernel debugger is enabled
through Ethernet.
port
Integer
DEBUGGER_NET_PORT
Specifies the target port number to connect
to when the kernel debugger is enabled
through Ethernet.
key
String
DEBUGGER_NET_KEY
Specifies the encryption key used for encrypting debugger packets while using the
kernel Debugger through Ethernet.
emsbaudrate
Baud rate in bps
EMS_BAUDRATE
Specifies the baud rate to use for EMS.
emsport
COM port number
EMS_PORT_NUMBER
Specifies the serial (COM) port to use for EMS.
extendedinput
Boolean
CONSOLE_EXTENDED
_INPUT
Enables boot applications to leverage BIOS
support for extended console input.
keyringaddress
Physical address
FVE_KEYRING_ADDRESS
Specifies the physical address where the
BitLocker key ring is located.
firstmegabytepolicy
UseNone, UseAll,
UsePrivate
FIRST_MEGABYTE
_POLICY
Specifies how the low 1 MB of physical memory
is consumed by the HAL to mitigate corruptions by the BIOS during power transitions.
fontpath
String
FONT_PATH
Specifies the path of the OEM font that
should be used by the boot application.
graphicsmodedisabled
Boolean
GRAPHICS_MODE
_DISABLED
Disables graphics mode for boot applications.
graphicsresolution
Resolution
GRAPHICS_RESOLUTION
Sets the graphics resolution for boot
applications.
initialconsoleinput
Boolean
INITIAL_CONSOLE
_INPUT
Specifies an initial character that the system
inserts into the PC/ AT keyboard input buffer.
integrityservices
Default, Disable, Enable
SI_POLICY
Enables or disables code integrity services, which are used by Kernel Mode Code
Signing. Default is Enabled.
CHAPTER 12
Startup and shutdown
791
Readable Name
Values
BCD Element Code2
Meaning
locale
Localization string
PREFERRED_LOCALE
Sets the locale for the boot application (such
as EN-US).
noumex
Boolean
DEBUGGER_IGNORE_
Disables user-mode exceptions when kernel
USERMODE_EXCEPTIONS debugging is enabled. If you experience
system hangs (freezes) when booting in debugging mode, try enabling this option.
recoveryenabled
Boolean
AUTO_RECOVERY
_ENABLED
Enables the recovery sequence, if any. Used
by fresh installations of Windows to present the Windows PE-based Startup And
Recovery interface.
recoverysequence
List
RECOVERY_SEQUENCE
Defines the recovery sequence (described
earlier).
relocatephysical
Physical address
RELOCATE_PHYSICAL
_MEMORY
Relocates an automatically selected NUMA
node’s physical memory to the specified
physical address.
targetname
String
DEBUGGER_USB
_TARGETNAME
Defines the target name for the USB debugger when used with USB2 or USB3 debugging (debugtype is set to USB).
testsigning
Boolean
ALLOW_PRERELEASE
_SIGNATURES
Enables test-signing mode, which allows
driver developers to load locally signed
64-bit drivers. This option results in a watermarked desktop.
truncatememory
Address in bytes
TRUNCATE_PHYSICAL
_MEMORY
Disregards physical memory above the
specified physical address.
2 All the BCD elements codes for Boot Applications start with BCDE_LIBRARY_TYPE, but that has been omitted due to limited space.
TABLE 12-4 BCD options for the Windows OS Loader (Winload)
BCD Element
Values
BCD Element Code3
Meaning
bootlog
Boolean
LOG_INITIALIZATION
Causes Windows to write a log of the boot to
the file %SystemRoot%\Ntbtlog.txt.
bootstatuspolicy
DisplayAllFailures,
ignoreAllFailures,
IgnoreShutdownFailures,
IgnoreBootFailures
BOOT_STATUS_POLICY
Overrides the system’s default behavior of
offering the user a troubleshooting boot
menu if the system didn’t complete the previous boot or shutdown.
bootux
Disabled, Basic, Standard
BOOTUX_POLICY
Defines the boot graphics user experience
that the user will see. Disabled means that
no graphics will be seen during boot time
(only a black screen), while Basic will display
only a progress bar during load. Standard
displays the usual Windows logo animation
during boot.
bootmenupolicy
Legacy
Standard
BOOT_MENU_POLICY
Specify the type of boot menu to show in
case of multiple boot entries (see “The boot
menu” section later in this chapter).
clustermodeaddressing
Number of processors
CLUSTERMODE
_ADDRESSING
Defines the maximum number of processors
to include in a single Advanced Programmable
Interrupt Controller (APIC) cluster.
configflags
Flags
PROCESSOR_
Specifies processor-specific configuration
CONFIGURATION_FLAGS flags.
792
CHAPTER 12
Startup and shutdown
BCD Element
Values
BCD Element Code3
Meaning
dbgtransport
Transport image name
DBG_TRANSPORT_PATH
Overrides using one of the default kernel
debugging transports (Kdcom.dll, Kd1394,
Kdusb.dll) and instead uses the given file,
permitting specialized debugging transports
to be used that are not typically supported
by Windows.
debug
Boolean
KERNEL_DEBUGGER
_ENABLED
Enables kernel-mode debugging.
detecthal
Boolean
DETECT_KERNEL_AND
_HAL
Enables the dynamic detection of the HAL.
driverloadfailurepolicy
Fatal, UseErrorControl
DRIVER_LOAD_FAILURE
_POLICY
Describes the loader behavior to use when
a boot driver has failed to load. Fatal will
prevent booting, whereas UseErrorControl
causes the system to honor a driver’s default
error behavior, specified in its service key.
ems
Boolean
KERNEL_EMS_ENABLED
Instructs the kernel to use EMS as well. (If
only bootems is used, only the boot loader
will use EMS.)
evstore
String
EVSTORE
Stores the location of a boot preloaded hive.
groupaware
Boolean
FORCE_GROUP
_AWARENESS
Forces the system to use groups other than
zero when associating the group seed to new
processes. Used only on 64-bit Windows.
groupsize
Integer
GROUP_SIZE
Forces the maximum number of logical
processors that can be part of a group (maximum of 64). Can be used to force groups to
be created on a system that would normally
not require them to exist. Must be a power
of 2 and is used only on 64-bit Windows.
hal
HAL image name
HAL_PATH
Overrides the default file name for the HAL
image (Hal.dll). This option can be useful
when booting a combination of a checked
HAL and checked kernel (requires specifying
the kernel element as well).
halbreakpoint
Boolean
DEBUGGER_HAL
_BREAKPOINT
Causes the HAL to stop at a breakpoint early in
HAL initialization. The first thing the Windows
kernel does when it initializes is to initialize
the HAL, so this breakpoint is the earliest one
possible (unless boot debugging is used). If the
switch is used without the /DEBUG switch, the
system will present a blue screen with a STOP
code of 0x00000078 (PHASE0_ EXCEPTION).
novesa
Boolean
BCDE_OSLOADER_TYPE
_DISABLE_VESA_BIOS
Disables the usage of VESA display modes.
optionsedit
Boolean
OPTIONS_EDIT_ONE
_TIME
Enables the options editor in the Boot
Manager. With this option, Boot Manager
allows the user to interactively set on-demand
command-line options and switches for the
current boot. This is equivalent to pressing F10.
osdevice
GUID
OS_DEVICE
Specifies the device on which the operating
system is installed.
CHAPTER 12
Startup and shutdown
793
BCD Element
Values
BCD Element Code3
Meaning
pae
Default, ForceEnable,
ForceDisable
PAE_POLICY
Default allows the boot loader to determine
whether the system supports PAE and loads
the PAE kernel. ForceEnable forces this behavior, while ForceDisable forces the loader
to load the non-PAE version of the Windows
kernel, even if the system is detected as
supporting x86 PAEs and has more than 4
GB of physical memory. However, non-PAE
x86 kernels are not supported anymore in
Windows 10.
pciexpress
Default, ForceDisable
PCI_EXPRESS_POLICY
Can be used to disable support for PCI
Express buses and devices.
perfmem
Size in MB
PERFORMANCE_DATA
_MEMORY
Size of the buffer to allocate for performance data logging. This option acts similarly to the removememory element, since
it prevents Windows from seeing the size
specified as available memory.
quietboot
Boolean
DISABLE_BOOT_DISPLAY
Instructs Windows not to initialize the VGA
video driver responsible for presenting bitmapped graphics during the boot process.
The driver is used to display boot progress
information, so disabling it disables the ability of Windows to show this information.
ramdiskimagelength
Length in bytes
RAMDISK_IMAGE
_LENGTH
Size of the ramdisk specified.
ramdiskimageoffset
Offset in bytes
RAMDISK_IMAGE
_OFFSET
If the ramdisk contains other data (such as
a header) before the virtual file system, instructs the boot loader where to start reading the ramdisk file from.
ramdisksdipath
Image file name
RAMDISK_SDI_PATH
Specifies the name of the SDI ramdisk to load.
ramdisktftpblocksize
Block size
RAMDISK_TFTP_BLOCK
_SIZE
If loading a WIM ramdisk from a network
Trivial FTP (TFTP) server, specifies the block
size to use.
ramdisktftpclientport
Port number
RAMDISK_TFTP_CLIENT
_PORT
If loading a WIM ramdisk from a network
TFTP server, specifies the port.
ramdisktftpwindowsize
Window size
RAMDISK_TFTP_
WINDOW_SIZE
If loading a WIM ramdisk from a network
TFTP server, specifies the window size to use.
removememory
Size in bytes
REMOVE_MEMORY
Specifies an amount of memory Windows
won’t use.
restrictapiccluster
Cluster number
RESTRICT_APIC_CLUSTER Defines the largest APIC cluster number to
be used by the system.
resumeobject
Object GUID
ASSOCIATED_RESUME
_OBJECT
Describes which application to use for
resuming from hibernation, typically
Winresume.exe.
safeboot
Minimal, Network,
DsRepair
SAFEBOOT
Specifies options for a safe-mode boot.
Minimal corresponds to safe mode without
networking, Network to safe mode with
networking, and DsRepair to safe mode with
Directory Services Restore mode. (See the
“Safe mode” section later in this chapter.)
794
CHAPTER 12
Startup and shutdown
BCD Element
Values
BCD Element Code3
Meaning
safebootalternateshell
Boolean
SAFEBOOT_ALTERNATE
_SHELL
Tells Windows to use the program specified
by the HKLM\SYSTEM\CurrentControlSet\
Control\SafeBoot\AlternateShell value as the
graphical shell rather than the default, which
is Windows Explorer. This option is referred
to as safe mode with command prompt in
the alternate boot menu.
sos
Boolean
SOS
Causes Windows to list the device drivers
marked to load at boot time and then to
display the system version number (including the build number), amount of physical
memory, and number of processors.
systemroot
String
SYSTEM_ROOT
Specifies the path, relative to osdevice, in
which the operating system is installed.
targetname
Name
KERNEL_DEBUGGER
_USB_TARGETNAME
For USB debugging, assigns a name to the
machine that is being debugged.
tpmbootentropy
Default, ForceDisable,
ForceEnable
TPM_BOOT_ENTROPY
_POLICY
Forces a specific TPM Boot Entropy policy to
be selected by the boot loader and passed
on to the kernel. TPM Boot Entropy, when
used, seeds the kernel’s random number
generator (RNG) with data obtained from
the TPM (if present).
usefirmwarepcisettings
Boolean
USE_FIRMWARE_PCI
_SETTINGS
Stops Windows from dynamically assigning
IO/IRQ resources to PCI devices and leaves
the devices configured by the BIOS. See
Microsoft Knowledge Base article 148501 for
more information.
uselegacyapicmode
Boolean
USE_LEGACY_APIC
_MODE
Forces usage of basic APIC functionality
even though the chipset reports extended
APIC functionality as present. Used in cases
of hardware errata and/or incompatibility.
usephysicaldestination
Boolean
USE_PHYSICAL_
DESTINATION,
Forces the use of the APIC in physical destination mode.
useplatformclock
Boolean
USE_PLATFORM_CLOCK
Forces usage of the platforms’s clock source
as the system’s performance counter.
vga
Boolean
USE_VGA_DRIVER
Forces Windows to use the VGA display
driver instead of the third-party high-performance driver.
winpe
Boolean
WINPE
Used by Windows PE, this option causes the
configuration manager to load the registry
SYSTEM hive as a volatile hive such that
changes made to it in memory are not saved
back to the hive image.
x2apicpolicy
Disabled, Enabled,
Default
X2APIC_POLICY
Specifies whether extended APIC functionality should be used if the chipset supports it. Disabled is equivalent to setting
uselegacyapicmode, whereas Enabled forces
ACPI functionality on even if errata are detected. Default uses the chipset’s reported
capabilities (unless errata are present).
xsavepolicy
Integer
XSAVEPOLICY
Forces the given XSAVE policy to be loaded
from the XSAVE Policy Resource Driver
(Hwpolicy.sys).
CHAPTER 12
Startup and shutdown
795
BCD Element
Values
BCD Element Code3
Meaning
xsaveaddfeature0-7
Integer
XSAVEADDFEATURE0-7
Used while testing support for XSAVE on
modern Intel processors; allows for faking
that certain processor features are present when, in fact, they are not. This helps
increase the size of the CONTEXT structure
and confirms that applications work correctly with extended features that might appear
in the future. No actual extra functionality
will be present, however.
xsaveremovefeature
Integer
XSAVEREMOVEFEATURE
Forces the entered XSAVE feature not to
be reported to the kernel, even though the
processor supports it.
xsaveprocessorsmask
Integer
XSAVEPROCESSORSMASK Bitmask of which processors the XSAVE
policy should apply to.
xsavedisable
Boolean
XSAVEDISABLE
Turns off support for the XSAVE functionality
even though the processor supports it.
3 All the BCD elements codes for the Windows OS Loader start with BCDE_OSLOADER_TYPE, but this has been omitted due to limited space.
TABLE 12-5 BCD options for the Windows Hypervisor loader (hvloader)
BCD Element
Values
BCD Element Code4
Meaning
hypervisorlaunchtype
Off
Auto
HYPERVISOR_LAUNCH
_TYPE
Enables loading of the hypervisor on a
Hyper-V system or forces it to be disabled.
hypervisordebug
Boolean
HYPERVISOR_
DEBUGGER_ENABLED
Enables or disables the Hypervisor
Debugger.
hypervisordebugtype
Serial
1394
None
Net
HYPERVISOR_
DEBUGGER_TYPE
Specifies the Hypervisor Debugger type
(through a serial port or through an IEEE1394 or network interface).
hypervisoriommupolicy
Default
Enable
Disable
HYPERVISOR_IOMMU
_POLICY
Enables or disables the hypervisor DMA
Guard, a feature that blocks direct memory
access (DMA) for all hot-pluggable PCI ports
until a user logs in to Windows.
hypervisormsrfilterpolicy Disable
Enable
HYPERVISOR_MSR
_FILTER_POLICY
Controls whether the root partition is allowed to access restricted MSRs (model
specific registers).
hypervisormmionxpolicy
Disable
Enable
HYPERVISOR_MMIO
_NX_POLICY
Enables or disables the No-Execute (NX)
protection for UEFI runtime service code and
data memory regions.
hypervisorenforcedcodeintegrity
Disable
Enable
Strict
HYPERVISOR
_ENFORCED_CODE
_INTEGRITY
Enables or disables the Hypervisor Enforced
Code Integrity (HVCI), a feature that prevents the root partition kernel from allocating unsigned executable memory pages.
hypervisorschedulertype
Classic
Core
Root
HYPERVISOR
_SCHEDULER_TYPE
Specifies the hypervisor’s partitions scheduler type.
hypervisordisableslat
Boolean
HYPERVISOR_SLAT_DISA
BLED
Forces the hypervisor to ignore the presence of the second layer address translation
(SLAT) feature if supported by the processor.
hypervisornumproc
Integer
HYPERVISOR_NUM
_PROC
Specifies the maximum number of logical
processors available to the hypervisor.
796
CHAPTER 12
Startup and shutdown
BCD Element
Values
BCD Element Code4
Meaning
hypervisorrootprocpernode
Integer
HYPERVISOR_ROOT
_PROC_PER_NODE
Specifies the total number of root virtual
processors per node.
hypervisorrootproc
Integer
HYPERVISOR_ROOT
_PROC
Specifies the maximum number of virtual
processors in the root partition.
hypervisorbaudrate
Baud rate in bps
HYPERVISOR_
DEBUGGER_BAUDRATE
If using serial hypervisor debugging, specifies the baud rate to use.
hypervisorchannel
Channel number from
0 to 62
HYPERVISOR
_DEBUGGER_1394
_CHANNEL
If using FireWire (IEEE 1394) hypervisor debugging, specifies the channel number to use.
hypervisordebugport
COM port number
HYPERVISOR_
DEBUGGER_PORT_
NUMBER
If using serial hypervisor debugging, specifies the COM port to use.
hypervisoruselargevtlb
Boolean
HYPERVISOR_USE_
LARGE_VTLB
Enables the hypervisor to use a larger number of virtual TLB entries.
hypervisorhostip
IP address (binary format)
HYPERVISOR_
DEBUGGER_NET_HOST_
IP
Specifies the IP address of the target machine (the debugger) used in hypervisor
network debugging.
hypervisorhostport
Integer
HYPERVISOR_
DEBUGGER_NET_HOST_
PORT
Specifies the network port used in hypervisor
network debugging.
hypervisorusekey
String
HYPERVISOR_
DEBUGGER_NET_KEY
Specifies the encryption key used for encrypting the debug packets sent through
the wire.
hypervisorbusparams
String
HYPERVISOR_
Specifies the bus, device, and function numDEBUGGER_BUSPARAMS bers of the network adapter used for hypervisor debugging.
hypervisordhcp
Boolean
HYPERVISOR_
DEBUGGER_NET_DHCP
Specifies whether the Hypervisor Debugger
should use DHCP for getting the network
interface IP address.
4 All the BCD elements codes for the Windows Hypervisor Loader start with BCDE_OSLOADER_TYPE, but this has been omitted due to limited space.
All the entries in the BCD store play a key role in the startup sequence. Inside each boot entry (a boot
entry is a BCD object), there are listed all the boot options, which are stored into the hive as registry
subkeys (as shown in Figure 12-5). These options are called BCD elements. The Windows Boot Manager
is able to add or remove any boot option, either in the physical hive or only in memory. This is important
because, as we describe later in the section “The boot menu,” not all the BCD options need to reside in the
physical hive.
If the Boot Configuration Data hive is corrupt, or if some error has occurred while parsing its boot
entries, the Boot Manager retries the operation using the Recovery BCD hive. The Recovery BCD hive is
normally stored in \EFI\Microsoft\Recovery\BCD. The system could be configured for direct use of this
store, skipping the normal one, via the recoverybcd parameter (stored in the UEFI boot variable) or via
the Bootstat.log file.
CHAPTER 12
Startup and shutdown
797
FIGURE 12-5 An example screenshot of the Windows Boot Manager’s BCD objects and their associated boot
options (BCD elements).
The system is ready to load the Secure Boot policies, show the boot menu (if needed), and launch
the boot application. The list of boot certificates that the firmware can or cannot trust is located in the
db and dbx UEFI authenticated variables. The code integrity boot library reads and parses the UEFI
variables, but these control only whether a particular boot manager module can be loaded. Once the
Windows Boot Manager is launched, it enables you to further customize or extend the UEFI-supplied
Secure Boot configuration with a Microsoft-provided certificates list. The Secure Boot policy file (stored
in \EFI\Microsoft\Boot\SecureBootPolicy.p7b), the platform manifest polices files (.pm files), and the
supplemental policies (.pol files) are parsed and merged with the policies stored in the UEFI variables.
Because the kernel code integrity engine ultimately takes over, the additional policies contain OSspecific information and certificates. In this way, a secure edition of Windows (like the S version) could
verify multiple certificates without consuming precious UEFI resources. This creates the root of trust because the files that specify new customized certificates lists are signed by a digital certificate contained
in the UEFI allowed signatures database.
If not disabled by boot options (nointegritycheck or testsigning) or by a Secure Boot policy, the Boot
Manager performs a self-verification of its own integrity: it opens its own file from the hard disk and
validates its digital signature. If Secure Boot is on, the signing chain is validated against the Secure Boot
signing policies.
The Boot Manager initializes the Boot Debugger and checks whether it needs to display an OEM
bitmap (through the BGRT system ACPI table). If so, it clears the screen and shows the logo. If Windows
has enabled the BCD setting to inform Bootmgr of a hibernation resume (or of a hybrid boot), this
shortcuts the boot process by launching the Windows Resume Application, Winresume.efi, which will
read the contents of the hibernation file into memory and transfer control to code in the kernel that
798
CHAPTER 12
Startup and shutdown
resumes a hibernated system. That code is responsible for restarting drivers that were active when the
system was shut down. Hiberfil.sys is valid only if the last computer shutdown was a hibernation or a
hybrid boot. This is because the hibernation file is invalidated after a resume to avoid multiple resumes
from the same point. The Windows Resume Application BCD object is linked to the Boot Manager
descriptor through a specific BCD element (called resumeobject, which is described in the “Hibernation
and Fast Startup” section later in this chapter).
Bootmgr detects whether OEM custom boot actions are registered through the relative BCD element, and, if so, processes them. At the time of this writing, the only custom boot action supported is
the launch of an OEM boot sequence. In this way the OEM vendors can register a customized recovery
sequence invoked through a particular key pressed by the user at startup.
The boot menu
In Windows 8 and later, in the standard boot configurations, the classical (legacy) boot menu is
never shown because a new technology, modern boot, has been introduced. Modern boot provides
Windows with a rich graphical boot experience while maintaining the ability to dive more deeply into
boot-related settings. In this configuration, the final user is able to select the OS that they want to execute, even with touch-enabled systems that don’t have a proper keyboard and mouse. The new boot
menu is drawn on top of the Win32 subsystem; we describe its architecture later in this chapter in the
”Smss, Csrss, and Wininit” section.
The bootmenupolicy boot option controls whether the Boot Loader should use the old or new
technology to show the boot menu. If there are no OEM boot sequences, Bootmgr enumerates the
system boot entry GUIDs that are linked into the displayorder boot option of the Boot Manager. (If this
value is empty, Bootmgr relies on the default entry.) For each GUID found, Bootmgr opens the relative
BCD object and queries the type of boot application, its startup device, and the readable description.
All three attributes must exist; otherwise, the Boot entry is considered invalid and will be skipped. If
Bootmgr doesn’t find a valid boot application, it shows an error message to the user and the entire
Boot process is aborted. The boot menu display algorithm begins here. One of the key functions,
BmpProcessBootEntry, is used to decide whether to show the Legacy Boot menu:
■
■
If the boot menu policy of the default boot application (and not of the Bootmgr entry) is explicitly set to the Modern type, the algorithm exits immediately and launches the default entry
through the BmpLaunchBootEntry function. Noteworthy is that in this case no user keys are
checked, so it is not possible to force the boot process to stop. If the system has multiple boot
entries, a special BCD option5 is added to the in-memory boot option list of the default boot
application. In this way, in the later stages of the System Startup, Winlogon can recognize the
option and show the Modern menu.
Otherwise, if the boot policy for the default boot application is legacy (or is not set at all) and
there is only an entry, BmpProcessBootEntry checks whether the user has pressed the F8 or F10
key. These are described in the bootmgr.xsl resource file as the Advanced Options and Boot
5
The multi-boot “special option” has no name. Its element code is BCDE_LIBRARY_TYPE_MULTI_BOOT_SYSTEM
(that corresponds to 0x16000071 in hexadecimal value).
CHAPTER 12
Startup and shutdown
799
Options keys. If Bootmgr detects that one of the keys is pressed at startup time, it adds the relative BCD element to the in-memory boot options list of the default boot application (the BCD
element is not written to the disk). The two boot options are processed later in the Windows
Loader. Finally, BmpProcessBootEntry checks whether the system is forced to display the boot
menu even in case of only one entry (through the relative “displaybootmenu” BCD option).
■
In case of multiple boot entries, the timeout value (stored as a BCD option) is checked and, if it
is set to 0, the default application is immediately launched; otherwise, the Legacy Boot menu is
shown with the BmDisplayBootMenu function.
While displaying the Legacy Boot menu, Bootmgr enumerates the installed boot tools that are listed
in the toolsdisplayorder boot option of the Boot Manager.
Launching a boot application
The last goal of the Windows Boot Manager is to correctly launch a boot application, even if it resides
on a BitLocker-encrypted drive, and manage the recovery sequence in case something goes wrong.
BmpLaunchBootEntry receives a GUID and the boot options list of the application that needs to be executed. One of the first things that the function does is check whether the specified entry is a Windows
Recovery (WinRE) entry (through a BCD element). These kinds of boot applications are used when dealing with the recovery sequence. If the entry is a WinRE type, the system needs to determine the boot
application that WinRE is trying to recover. In this case, the startup device of the boot application that
needs to be recovered is identified and then later unlocked (in case it is encrypted).
The BmTransferExecution routine uses the services provided by the boot library to open the device
of the boot application, identify whether the device is encrypted, and, if so, decrypt it and read the
target OS loader file. If the target device is encrypted, the Windows Boot Manager tries first to get
the master key from the TPM. In this case, the TPM unseals the master key only if certain conditions
are satisfied (see the next paragraph for more details). In this way, if some startup configuration has
changed (like the enablement of Secure Boot, for example), the TPM won’t be able to release the key.
If the key extraction from the TPM has failed, the Windows Boot Manager displays a screen similar to
the one shown in Figure 12-6, asking the user to enter an unlock key (even if the boot menu policy is
set to Modern, because at this stage the system has no way to launch the Modern Boot user interface).
At the time of this writing, Bootmgr supports four different unlock methods: PIN, passphrase, external
media, and recovery key. If the user is unable to provide a key, the startup process is interrupted and
the Windows recovery sequence starts.
The firmware is used to read and verify the target OS loader. The verification is done through the
Code Integrity library, which applies the secure boot policies (both the systems and all the customized
ones) on the file’s digital signature. Before actually passing the execution to the target boot application,
the Windows Boot Manager needs to notify the registered components (ETW and Measured Boot in
particular) that the boot application is starting. Furthermore, it needs to make sure that the TPM can’t
be used to unseal anything else.
800
CHAPTER 12
Startup and shutdown
FIGURE 12-6 The BitLocker recovery procedure, which has been raised because something in the boot configuration has changed.
Finally, the code execution is transferred to the Windows Loader through l
r
ppl
n.
This routine returns only in case of certain errors. As before, the Boot Manager manages the latter situation by launching the Windows Recovery Se uence.
Measured Boot
In late 2006, Intel introduced the Trusted Execution Technology (TXT), which ensures that an authentic
operating system is started in a trusted environment and not modified or altered by an external agent
(like malware). The TXT uses a TPM and cryptographic techni ues to provide measurements of software and platform (UEFI) components. Windows 8.1 and later support a new feature called Measured
Boot, which measures each component, from firmware up through the boot start drivers, stores those
measurements in the TPM of the machine, and then makes available a log that can be tested remotely
to verify the boot state of the client. This technology would not exist without the TPM. The term measure en refers to a process of calculating a cryptographic hash of a particular entity, like code, data
structures, configuration, or anything that can be loaded in memory. The measurements are used for
various purposes. Measured Boot provides antimalware software with a trusted (resistant to spoofing
and tampering) log of all boot components that started before Windows. The antimalware software
uses the log to determine whether components that ran before it are trustworthy or are infected with
malware. The software on the local machine sends the log to a remote server for evaluation. Working
with the TPM and non-Microsoft software, Measured Boot allows a trusted server on the network to
verify the integrity of the Windows startup process.
CHAPTER 12
Startup and shutdown
801
The main rules of the TPM are the following
■
Provide a secure nonvolatile storage for protecting secrets
■
Provide platform configuration registers (PCRs) for storing measurements
■
Provide hardware cryptographic engines and a true random number generator
The TPM stores the Measured Boot measurements in PCRs. Each PCR provides a storage area that
allows an unlimited number of measurements in a fixed amount of space. This feature is provided by a
property of cryptographic hashes. The Windows Boot Manager (or the Windows Loader in later stages)
never writes directly into a PCR register it extends the PCR content. The extend operation takes
the current value of the PCR, appends the new measured value, and calculates a cryptographic hash
(S A-1 or S A-256 usually) of the combined value. The hash result is the new PCR value. The extend
method assures the order-dependency of the measurements. One of the properties of the cryptographic hashes is that they are order-dependent. This means that hashing two values A and B produces
two different results from hashing B and A. Because PCRs are extended (not written), even if malicious
software is able to extend a PCR, the only effect is that the PCR would carry an invalid measurement.
Another property of the cryptographic hashes is that it’s impossible to create a block of data that produces a given hash. Thus, it’s impossible to extend a PCR to get a given result, except by measuring the
same objects in exactly the same order.
At the early stages of the boot process, the System Integrity module of the boot library registers
different callback functions. Each callback will be called later at different points in the startup sequence
with the goal of managing measured-boot events, like Test Signing enabling, Boot Debugger enabling,
PE Image loading, boot application starting, hashing, launching, exiting, and BitLocker unlocking. Each
callback decides which kind of data to hash and to extend into the TPM PCR registers. For instance,
every time the Boot Manager or the Windows Loader starts an external executable image, it generates
three measured boot events that correspond to different phases of the Image loading
r n ,
ppl
n s e , and ppl
n un e . In this case, the measured entities, which are sent to the
PCR registers (11 and 12) of the TPM, are the following hash of the image, hash of the digital signature
of the image, image base, and size.
All the measurements will be employed later in Windows when the system is completely started, for
a procedure called es
n. Because of the uniqueness property of cryptographic hashes, you can
use PCR values and their logs to identify exactly what version of software is executing, as well as its environment. At this stage, Windows uses the TPM to provide a TPM uote, where the TPM signs the PCR
values to assure that values are not maliciously or inadvertently modified in transit. This guarantees
the authenticity of the measurements. The quoted measurements are sent to an attestation authority, which is a trusted third-party entity that is able to authenticate the PCR values and translate those
values by comparing them with a database of known good values. Describing all the models used for
attestation is outside the scope of this book. The final goal is that the remote server confirms whether
the client is a trusted entity or could be altered by some malicious component.
Earlier we explained how the Boot Manager is able to automatically unlock the BitLocker-encrypted
startup volume. In this case, the system takes advantage of another important service provided by the
TPM secure nonvolatile storage. The TPM nonvolatile random access memory (NVRAM) is persistent
802
CHAPTER 12
Startup and shutdown
across power cycles and has more security features than system memory. While allocating TPM
NVRAM, the system should specify the following
■
■
■
Read access rights Specify which TPM privilege level, called locality, can read the data. More
importantly, specify whether any PCRs must contain specific values in order to read the data.
Write access rights
The same as above but for write access.
Attributes/permissions Provide optional authorizations values for reading or writing (like a
password) and temporal or persistent locks (that is, the memory can be locked for write access).
The first time the user encrypts the boot volume, BitLocker encrypts its volume master key (VMK)
with another random symmetric key and then seals that key using the extended TPM PCR values
(in particular, PCR 7 and 11, which measure the BIOS and the Windows Boot se uence) as the sealing
condition. e l n is the act of having the TPM encrypt a block of data so that it can be decrypted only
by the same TPM that has encrypted it, only if the specified PCRs have the correct values. In subse uent
boots, if the unsealing is re uested by a compromised boot se uence or by a different BIOS configuration, TPM refuses the re uest to unseal and reveal the VMK encryption key.
EXPERIMENT: Invalidate TPM measurements
In this experiment, you explore a uick way to invalidate the TPM measurements by invalidating the BIOS configuration. Before measuring the startup se uence, drivers, and data, Measured
Boot starts with a static measurement of the BIOS configuration (stored in PCR1). The measured
BIOS configuration data strictly depends on the hardware manufacturer and sometimes even
includes the UEFI boot order list. Before starting the experiment, verify that your system includes
a valid TPM. Type tpm.msc in the Start menu search box and execute the snap-in. The Trusted
Platform Module (TPM) Management console should appear. Verify that a TPM is present and
enabled in your system by checking that the Status box is set to The TPM Is Ready For Use.
CHAPTER 12
Startup and shutdown
803
Start the BitLocker encryption of the system volume. If your system volume is already encrypted, you can skip this step. ou must be sure to save the recovery key, though. ( ou can
check the recovery key by selecting Back Up our Recovery Key, which is located in the Bitlocker
drive encryption applet of the Control Panel.) Open File Explorer by clicking its taskbar icon, and
navigate to This PC. Right-click the system volume (the volume that contains all the Windows
files, usually C ) and select Turn On BitLocker. After the initial verifications are made, select Let
Bitlocker Automatically Unlock My Drive when prompted on the Choose ow to Unlock our
Drive at Startup page. In this way, the VMK will be sealed by the TPM using the boot measurements as the unsealing key. Be careful to save or print the recovery key you’ll need it in the next
stage. Otherwise, you won’t be able to access your files anymore. Leave the default value for all
the other options.
After the encryption is complete, switch off your computer and start it by entering the UEFI
BIOS configuration. (This procedure is different for each PC manufacturer check the hardware
user manual for directions for entering the UEFI BIOS settings.) In the BIOS configuration pages,
simply change the boot order and then restart your computer. (You can change the startup
boot order by using the UefiTool utility, which is in the downloadable files of the book.) If your
hardware manufacturer includes the boot order in the TPM measurements, you should get the
BitLocker recovery message before Windows boots. Otherwise, to invalidate the TPM measurements, simply insert the Windows Setup DVD or flash drive before switching on the workstation.
If the boot order is correctly configured, the Windows Setup bootstrap code starts, which prints
804
CHAPTER 12
Startup and shutdown
the Press Any Key For Boot From CD Or DVD message. If you don’t press any key, the system proceeds to boot the next Boot entry. In this case, the startup sequence has changed, and the TPM
measurements are different. As a result, the TPM won’t be able to unseal the VMK.
ou can invalidate the TPM measurements (and produce the same effects) if you have Secure
Boot enabled and you try to disable it. This experiment demonstrates that Measured Boot is tied
to the BIOS configuration.
Trusted execution
Although Measured Boot provides a way for a remote entity to confirm the integrity of the boot
process, it does not resolve an important issue Boot Manager still trusts the machine’s firmware code
and uses its services to effectively communicate with the TPM and start the entire platform. At the
time of this writing, attacks against the UEFI core firmware have been demonstrated multiple times.
The Trusted Execution Technology (TXT) has been improved to support another important feature,
called Secure Launch. Secure Launch (also known as Trusted Boot in the Intel nomenclature) provides
secure authenticated code modules (ACM), which are signed by the CPU manufacturer and executed
CHAPTER 12
Startup and shutdown
805
by the chipset (and not by the firmware). Secure Launch provides the support of dynamic measurements made to PCRs that can be reset without resetting the platform. In this scenario, the OS provides
a special Trusted Boot (TBOOT) module used to initialize the platform for secure mode operation and
initiate the Secure Launch process.
An u en
e
e
ule (ACM) is a piece of code provided by the chipset manufacturer. The
ACM is signed by the manufacturer, and its code runs in one of the highest privilege levels within a special secure memory that is internal to the processor. ACMs are invoked using a special
instruction. There are two types of ACMs BIOS and SINIT. While BIOS ACM measures the BIOS and performs
some BIOS security functions, the SINIT ACM is used to perform the measurement and launch of the
Operating System TCB (TBOOT) module. Both BIOS and SINIT ACM are usually contained inside the
System BIOS image (this is not a strict requirement), but they can be updated and replaced by the OS if
needed (refer to the “Secure Launch” section later in this chapter for more details).
The ACM is the core root of trusted measurements. As such, it operates at the highest security level
and must be protected against all types of attacks. The processor microcode copies the ACM module in
the secure memory and performs different checks before allowing the execution. The processor verifies
that the ACM has been designed to work with the target chipset. Furthermore, it verifies the ACM integrity, version, and digital signature, which is matched against the public key hardcoded in the chipset
fuses. The
instruction doesn’t execute the ACM if one of the previous checks fails.
Another key feature of Secure Launch is the support of Dynamic Root of Trust Measurement (DRTM)
by the TPM. As introduced in the previous section, Measured Boot, 16 different TPM PCR registers (0
through 15) provide storage for boot measurements. The Boot Manager could extend these PCRs, but
it’s not possible to clear their contents until the next platform reset (or power up). This explains why
these kinds of measurements are called static measurements. Dynamic measurements are measurements made to PCRs that can be reset without resetting the platform. There are six dynamic PCRs
(actually there are eight, but two are reserved and not usable by the OS) used by Secure Launch and
the trusted operating system.
In a typical TXT Boot se uence, the boot processor, after having validated the ACM integrity, executes the ACM startup code, which measures critical BIOS components, exits ACM secure mode, and
jumps to the UEFI BIOS startup code. The BIOS then measures all of its remaining code, configures the
platform, and verifies the measurements, executing the
instruction. This TXT instruction loads
the BIOS ACM module, which performs the security checks and locks the BIOS configuration. At this
stage the UEFI BIOS could measure each option ROM code (for each device) and the Initial Program
Load (IPL). The platform has been brought to a state where it’s ready to boot the operating system
(specifically through the IPL code).
The TXT Boot se uence is part of the Static Root of Trust Measurement (SRTM) because the trusted
BIOS code (and the Boot Manager) has been already verified, and it’s in a good known state that will
never change until the next platform reset. Typically, for a TXT-enabled OS, a special TCB (TBOOT)
module is used instead of the first kernel module being loaded. The purpose of the TBOOT module is to
initialize the platform for secure mode operation and initiate the Secure Launch. The Windows TBOOT
806
CHAPTER 12
Startup and shutdown
module is named TcbLaunch.exe. Before starting the Secure Launch, the TBOOT module must be verified by the SINIT ACM module. So, there should be some components that execute the
instructions and start the DRTM. In the Windows Secure Launch model, this component is the boot library.
Before the system can enter the secure mode, it must put the platform in a known state. (In this
state, all the processors, except the bootstrap one, are in a special idle state, so no other code could
ever be executed.) The boot library executes the
instruction, specifying the
operation.
This causes the processor to do the following
1.
Validate the SINIT ACM module and load it into the processor’s secure memory.
2.
Start the DRTM by clearing all the relative dynamic PCRs and then measuring the SINIT ACM.
3.
Execute the SINIT ACM code, which measures the trusted OS code and executes the Launch
Control Policy. The policy determines whether the current measurements (which reside in some
dynamic PCR registers) allow the OS to be considered trusted.
When one of these checks fails, the machine is considered to be under attack, and the ACM issues
a TXT reset, which prevents any kind of software from being executed until the platform has been
hard reset. Otherwise, the ACM enables the Secure Launch by exiting the ACM mode and jumping
to the trusted OS entry point (which, in Windows is the
n function of the TcbLaunch.exe module). The trusted OS then takes control. It can extend and reset the dynamic PCRs for every measurement that it needs (or by using another mechanism that assures the chain of trust).
Describing the entire Secure Launch architecture is outside the scope of this book. Please refer to
the Intel manuals for the TXT specifications. Refer to the Secure Launch section, later in this chapter,
for a description of how Trusted Execution is implemented in Windows. Figure 12-7 shows all the components involved in the Intel TXT technology.
VT-x and TXT support
VT-x and TXT support
(VMX+SMX)
CPU
CPU
TXT and
VT-d support in IOH
AC modules
and platform
initialization
TPM support
SINIT AC Module
BIOS AC Module
BIOS
IOH/PCH
TPM
v1.2
Tools
TPM by third party
(TCG* compliant)
Third-party
software:
MLE, hosted
OS, apps, etc.
FIGURE 12-7 Intel TXT (Trusted Execution Technology) components.
CHAPTER 12
Startup and shutdown
807
The Windows OS Loader
The Windows OS Loader (Winload) is the boot application launched by the Boot Manager with the goal
of loading and correctly executing the Windows kernel. This process includes multiple primary tasks
■
■
■
■
■
Create the execution environment of the kernel. This involves initializing, and using, the kernel’s
page tables and developing a memory map. The EFI OS Loader also sets up and initializes the
kernel’s stacks, shared user page, GDT, IDT, TSS, and segment selectors.
Load into memory all modules that need to be executed or accessed before the disk stack is
initialized. These include the kernel and the AL because they handle the early initialization of
basic services once control is handed off from the OS Loader. Boot-critical drivers and the registry system hive are also loaded into memory.
Determine whether yper-V and the Secure Kernel (VSM) should be executed, and, if so, correctly load and start them.
Draw the first background animation using the new high-resolution boot graphics library
(BGFX, which replaces the old Bootvid.dll driver).
Orchestrate the Secure Launch boot se uence in systems that support Intel TXT. (For a complete description of Measured Boot, Secure Launch, and Intel TXT, see the respective sections
earlier in this chapter). This task was originally implemented in the hypervisor loader, but it has
moved starting from Windows 10 October Update (RS5).
The Windows loader has been improved and modified multiple times during each Windows release.
Osl
n is the main loader function (called by the Boot Manager) that (re)initializes the boot library
and calls the internal Oslp
n. The boot library, at the time of this writing, supports two different
execution contexts
■
■
Firmware context means that the paging is disabled. Actually, it’s not disabled but it’s provided by
the firmware that performs the one-to-one mapping of physical addresses, and only firmware services are used for memory management. Windows uses this execution context in the Boot Manager.
Application context means that the paging is enabled and provided by the OS. This is the context used by the Windows Loader.
The Boot Manager, just before transferring the execution to the OS loader, creates and initializes the
four-level x64 page table hierarchy that will be used by the Windows kernel, creating only the self-map
and the identity mapping entries. Osl
n switches to the Application execution context, just before
starting. The Osl rep re r e routine captures the boot/shutdown status of the last boot, reading
from the bootstat.dat file located in the system root directory.
When the last boot has failed more than twice, it returns to the Boot Manager for starting the
Recovery environment. Otherwise, it reads in the S STEM registry hive, Windows System32 Config
System, so that it can determine which device drivers need to be loaded to accomplish the boot. (A hive
is a file that contains a registry subtree. More details about the registry were provided in Chapter 10.)
Then it initializes the BGFX display library (drawing the first background image) and shows the
Advanced Options menu if needed (refer to the section The boot menu earlier in this chapter). One
808
CHAPTER 12
Startup and shutdown
of the most important data structures needed for the NT kernel boot, the Loader Block, is allocated
and filled with basic information, like the system hive base address and size, a random entropy value
(queried from the TPM if possible), and so on.
Osl n l e
er l
contains code that ueries the system’s ACPI BIOS to retrieve basic device
and configuration information (including event time and date information stored in the system’s
CMOS). This information is gathered into internal data structures that will be stored under the
KLM ARDWARE DESCRIPTION registry key later in the boot. This is mostly a legacy key that exists
only for compatibility reasons. Today, it’s the Plug and Play manager database that stores the true
information on hardware.
Next, Winload begins loading the files from the boot volume needed to start the kernel initialization. The boot volume is the volume that corresponds to the partition on which the system directory
(usually Windows) of the installation being booted is located. Winload follows these steps
1.
Determines whether the hypervisor or the Secure Kernel needs to be loaded (through the
yper s rl un ype BCD option and the VSM policy) if so, it starts phase 0 of the hypervisor
setup. Phase 0 pre-loads the V loader module ( vloader.dll) into RAM memory and executes
its HvlLoadHypervisor initialization routine. The latter loads and maps the hypervisor image
( vix64.exe, vax64.exe, or vaa64.exe, depending on the architecture) and all its dependencies in memory.
2.
Enumerates all the firmware-enumerable disks and attaches the list in the Loader Parameter
Block. Furthermore, loads the Synthetic Initial Machine Configuration hive (Imc.hiv) if specified
by the configuration data and attaches it to the loader block.
3.
Initializes the kernel Code Integrity module (CI.dll) and builds the CI Loader block. The Code
Integrity module will be then shared between the NT kernel and Secure Kernel.
4.
Processes any pending firmware updates. (Windows 10 supports firmware updates distributed
through Windows Update.)
5.
Loads the appropriate kernel and AL images (Ntoskrnl.exe and al.dll by default). If Winload
fails to load either of these files, it prints an error message. Before properly loading the two
modules’ dependencies, Winload validates their contents against their digital certificates and
loads the API Set Schema system file. In this way, it can process the API Set imports.
6.
Initializes the debugger, loading the correct debugger transport.
7.
Loads the CPU microcode update module (Mcupdate.dll), if applicable.
8.
Oslp
ll
ules finally loads the modules on which the NT kernel and AL depend, ELAM
drivers, core extensions, TPM drivers, and all the remaining boot drivers (respecting the load
order the file system drivers are loaded first). Boot device drivers are drivers necessary to
boot the system. The configuration of these drivers is stored in the S STEM registry hive. Every
device driver has a registry subkey under KLM S STEM CurrentControlSet Services. For
example, Services has a subkey named rdyboost for the ReadyBoost driver, which you can see in
Figure 12-8 (for a detailed description of the Services registry entries, see the section Services
in Chapter 10). All the boot drivers have a start value of
OO
(0).
CHAPTER 12
Startup and shutdown
809
9.
At this stage, to properly allocate physical memory, Winload is still using services provided
by the EFI Firmware (the ll
e
es boot service routine). The virtual address translation is
instead managed by the boot library, running in the Application execution context.
FIGURE 12-8 ReadyBoost driver service settings.
10. Reads in the NLS (National Language System) files used for internationalization. By default,
these are l intl.nls, C 1252.nls, and C 437.nls.
11. If the evaluated policies re uire the startup of the VSM, executes phase 0 of the Secure Kernel
setup, which resolves the locations of the VSM Loader support routines (exported by the
vloader.dll module), and loads the Secure Kernel module (Securekernel.exe) and all of its
dependencies.
12. For the S edition of Windows, determines the minimum user-mode configurable code integrity
signing level for the Windows applications.
13. Calls the Osl r
p ernel e up
se routine, which performs the memory steps required for
kernel transition, like allocating a GDT, IDT, and TSS mapping the AL virtual address space
and allocating the kernel stacks, shared user page, and USB legacy handoff. Winload uses the
UEFI GetMemoryMap facility to obtain a complete system physical memory map and maps
each physical page that belongs to EFI Runtime Code/Data into virtual memory space. The
complete physical map will be passed to the OS kernel.
14. Executes phase 1 of VSM setup, copying all the needed ACPI tables from VTL0 to VTL1 memory.
(This step also builds the VTL1 page tables.)
15. The virtual memory translation module is completely functional, so Winload calls the
ExitBootServices UEFI function to get rid of the firmware boot services and remaps all
the remaining Runtime UEFI services into the created virtual address space, using the
e ru l
ress p UEFI runtime function.
16. If needed, launches the hypervisor and the Secure Kernel (exactly in this order). If successful,
the execution control returns to Winload in the context of the yper-V Root Partition. (Refer to
Chapter 9, Virtualization technologies, for details about yper-V.)
17. Transfers the execution to the kernel through the Osl r
810
CHAPTER 12
Startup and shutdown
r ns er
ernel routine.
Booting from iSCSI
Internet SCSI (iSCSI) devices are a kind of network-attached storage in that remote physical disks are
connected to an iSCSI ost Bus Adapter ( BA) or through Ethernet. These devices, however, are different from traditional network-attached storage (NAS) because they provide block-level access to disks,
unlike the logical-based access over a network file system that NAS employs. Therefore, an iSCSIconnected disk appears as any other disk drive, both to the boot loader and to the OS, as long as the
Microsoft iSCSI Initiator is used to provide access over an Ethernet connection. By using iSCSI-enabled
disks instead of local storage, companies can save on space, power consumption, and cooling.
Although Windows has traditionally supported booting only from locally connected disks or
network booting through PXE, modern versions of Windows are also capable of natively booting
from iSCSI devices through a mechanism called iSCSI Boot. As shown in Figure 12-9, the boot loader
(Winload.efi) detects whether the system supports iSCSI boot devices reading the iSCSI Boot Firmware
Table (iBFT) that must be present in physical memory (typically exposed through ACPI). Thanks to the
iBFT table, Winload knows the location, path, and authentication information for the remote disk. If the
table is present, Winload opens and loads the network interface driver provided by the manufacturer,
which is marked with the
O
OO O
(0x1) boot flag.
Additionally, Windows Setup also has the capability of reading this table to determine bootable
iSCSI devices and allow direct installation on such a device, such that no imaging is re uired. In combination with the Microsoft iSCSI Initiator, this is all that’s required for Windows to boot from iSCSI.
Pre-boot
Windows
iSCSI initiator
EFI
UNDI
iBF
Table
Boot
parameter
driver
NIC
TCPIP
NDIS
NDIS miniport
NIC
Vendor
Microsoft iSCSI
Microsoft Windows
FIGURE 12-9 iSCSI boot architecture.
The hypervisor loader
The hypervisor loader is the boot module (its file name is vloader.dll) used to properly load and start
the yper-V hypervisor and the Secure Kernel. For a complete description of yper-V and the Secure
Kernal, refer to Chapter 9. The hypervisor loader module is deeply integrated in the Windows Loader
and has two main goals
■
■
Detect the hardware platform load and start the proper version of the Windows ypervisor
( vix64.exe for Intel Systems, vax64.exe for AMD systems and vaa64.exe for ARM64 systems).
Parse the Virtual Secure Mode (VSM) policy load and start the Secure Kernel.
CHAPTER 12
Startup and shutdown
811
In Windows 8, this module was an external executable loaded by Winload on demand. At that time
the only duty of the hypervisor loader was to load and start yper-V. With the introduction of the VSM
and Trusted Boot, the architecture has been redesigned for a better integration of each component.
As previously mentioned, the hypervisor setup has two different phases. The first phase begins in
Winload, just after the initialization of the NT Loader Block. The vLoader detects the target platform
through some CPUID instructions, copies the UEFI physical memory map, and discovers the IOAPICs
and IOMMUs. Then vLoader loads the correct hypervisor image (and all the dependencies, like the
Debugger transport) in memory and checks whether the hypervisor version information matches the
one expected. (This explains why the vLoader couldn’t start a different version of yper-V.) vLoader
at this stage allocates the hypervisor loader block, an important data structure used for passing system
parameters between vLoader and the hypervisor itself (similar to the Windows loader block). The
most important step of phase 1 is the construction of the hypervisor page tables hierarchy. The justborn page tables include only the mapping of the hypervisor image (and its dependencies) and the
system physical pages below the first megabyte. The latter are identity-mapped and are used by the
startup transitional code (this concept is explained later in this section).
The second phase is initiated in the final stages of Winload the UEFI firmware boot services have
been discarded, so the vLoader code copies the physical address ranges of the UEFI Runtime Services
into the hypervisor loader block captures the processor state disables the interrupts, the debugger,
and paging and calls lp r ns er
yper s r
r ns n p e to transfer the code execution to
the below 1 MB physical page. The code located here (the transitional code) can switch the page tables,
re-enable paging, and move to the hypervisor code (which actually creates the two different address
spaces). After the hypervisor starts, it uses the saved processor context to properly yield back the code
execution to Winload in the context of a new virtual machine, called root partition (more details available in Chapter 9).
The launch of the virtual secure mode is divided in three different phases because some steps are
re uired to be done after the hypervisor has started.
812
1.
The first phase is very similar to the first phase in the hypervisor setup. Data is copied from the
Windows loader block to the just-allocated VSM loader block the master key, IDK key, and
Crashdump key are generated and the SecureKernel.exe module is loaded into memory.
2.
The second phase is initiated by Winload in the late stages of OslPrepareTarget, where the
hypervisor has been already initialized but not launched. Similar to the second phase of the
hypervisor setup, the UEFI runtime services physical address ranges are copied into the VSM
loader block, along with ACPI tables, code integrity data, the complete system physical memory map, and the hypercall code page. Finally, the second phase constructs the protected page
tables hierarchy used for the protected VTL1 memory space (using the Oslp s u l
e
les
function) and builds the needed GDT.
3.
The third phase is the final launch phase. The hypervisor has already been launched. The
third phase performs the final checks. (Checks such as whether an IOMMU is present, and
CHAPTER 12
Startup and shutdown
whether the root partition has VSM privileges. The IOMMU is very important for VSM. Refer
to Chapter 9 for more information.) This phase also sets the encrypted hypervisor crash dump
area, copies the VSM encryption keys, and transfers execution to the Secure Kernel entry
point (
ys e
r up). The Secure Kernel entry point code runs in VTL 0. VTL 1 is started by
the Secure Kernel code in later stages through the
ll n le r
n l hypercall. (Read
Chapter 9 for more details.)
VSM startup policy
At startup time, the Windows loader needs to determine whether it has to launch the Virtual Secure
Mode (VSM). To defeat all the malware attempts to disable this new layer of protection, the system
uses a specific policy to seal the VSM startup settings. In the default configurations, at the first boot
(after the Windows Setup application has finished to copy the Windows files), the Windows Loader uses
the Osl e s
l y routine to read and seal the VSM configuration, which is stored in the VSM root
registry key
urren
nr l e
nr l e e u r .
VSM can be enabled by different sources
■
■
■
Device Guard Scenarios Each scenario is stored as a subkey in the VSM root key. The n le
DWORD registry value controls whether a scenario is enabled. If one or more scenarios are active, the VSM is enabled.
lo al Settings
Stored in the n
le r u l
n
se
e ur y registry value.
ode ntegrity policies Stored in the code integrity policy file (Policy.p7b).
Also, by default, VSM is automatically enabled when the hypervisor is enabled (except if the
yper
ru l
n se e ur yOp Ou registry value exists).
Every VSM activation source specifies a locking policy. If the locking mode is enabled, the Windows
loader builds a Secure Boot variable, called s l y, and stores in it the VSM activation mode and the
platform configuration. Part of the VSM platform configuration is dynamically generated based on the
detected system hardware, whereas another part is read from the equ re l
r e ur y e ures
registry value stored in the VSM root key. The Secure Boot variable is read at every subse uent boot the
configuration stored in the variable always replaces the configuration located in the Windows registry.
In this way, even if malware can modify the Windows Registry to disable VSM, Windows will simply
ignore the change and keep the user environment secure. Malware won’t be able to modify the VSM
Secure Boot variable because, per Secure Boot specification, only a new variable signed by a trusted
digital signature can modify or delete the original one. Microsoft provides a special signed tool that
could disable the VSM protection. The tool is a special EFI boot application, which sets another signed
Secure Boot variable called s l y s le . This variable is recognized at startup time by the
Windows Loader. If it exists, Winload deletes the s l y secure variable and modifies the registry to
disable VSM (modifying both the global settings and each Scenario activation).
CHAPTER 12
Startup and shutdown
813
EXPERIMENT: Understanding the VSM policy
In this experiment, you examine how the Secure Kernel startup is resistant to external tampering. First, enable Virtualization Based Security (VBS) in a compatible edition of Windows (usually
the Pro and Business editions work well). On these SKUs, you can uickly verify whether VBS is
enabled using Task Manager if VBS is enabled, you should see a process named Secure System on
the Details tab. Even if it’s already enabled, check that the UEFI lock is enabled. Type Edit Group
policy (or gpedit msc) in the Start menu search box, and start the Local Policy Group Editor snapin. Navigate to Computer Configuration, Administrative Templates, System, Device Guard, and
double-click Turn On Virtualization Based Security. Make sure that the policy is set to Enabled
and that the options are set as in the following figure
814
CHAPTER 12
Startup and shutdown
Make sure that Secure Boot is enabled (you can use the System Information utility or your
system BIOS configuration tool to confirm the Secure Boot activation), and restart the system.
The Enabled With UEFI Lock option provides antitampering even in an Administrator context.
After your system is restarted, disable VBS through the same Group policy editor (make sure that
all the settings are disabled) and by deleting all the registry keys and values located in KE
LOCAL MAC INE S STEM CurrentControlSet Control DeviceGuard (setting them to 0 produces
the same effect). Use the registry editor to properly delete all the values
Disable the hypervisor by running
e /set {current} hypervisorlaunchtype off from
an elevated command prompt. Then restart your computer again. After the system is restarted,
even if VBS and hypervisor are expected to be turned off, you should see that the Secure System
and LsaIso process are still present in the Task Manager. This is because the UEFI secure variable
s l y still contains the original policy, so a malicious program or a user could not easily disdisable the additional layer of protection. To properly confirm this, open the system event viewer by
typing eventvwr and navigate to Windows Logs, System. If you scroll between the events, you
should see the event that describes the VBS activation type (the event has Kernel-Boot source).
CHAPTER 12
Startup and shutdown
815
s l y is a Boot Services–authenticated UEFI variable, so this means it’s not visible af
af-ter the OS switches to Runtime mode. The UefiTool utility, used in the previous experiment, is
not able to show these kinds of variables. To properly examine the
p l y variable content,
restart your computer again, disable Secure Boot, and use the Efi Shell. The Efi Shell (found
in this book’s downloadable resources, or downloadable from ps //
u
/ n
re/
e
/ ree/
/ ell n
/ efi ell/
) must be copied into a FAT32 USB stick in a file
named bootx64.efi and located into the efi boot path. At this point, you will be able to boot
from the USB stick, which will launch the Efi Shell. Run the following command
dmpstore VbsPolicy -guid 77FA9ABD-0359-4D32-BD60-28F4E78F784B
(
is the GUID of the Secure Boot private namespace.)
The Secure Launch
If Trusted Execution is enabled (through a specific feature value in the VSM policy) and the system
is compatible, Winload enables a new boot path that’s a bit different compared to the normal one.
This new boot path is called Secure Launch. Secure Launch implements the Intel Trusted Boot (TXT)
technology (or SKINIT in AMD64 machines). Trusted Boot is implemented in two components boot
library and the TcbLaunch.exe file. The Boot library, at initialization time, detects that Trusted Boot is
enabled and registers a boot callback that intercepts different events Boot application starting, hash
calculation, and Boot application ending. The Windows loader, in the early stages, executes to the three
stages of Secure Launch Setup (from now on we call the Secure Launch setup the TCB setup) instead of
loading the hypervisor.
As previously discussed, the final goal of Secure Launch is to start a secure boot se uence, where
the CPU is the only root of trust. To do so, the system needs to get rid of all the firmware dependencies.
816
CHAPTER 12
Startup and shutdown
Windows achieves this by creating a RAM disk formatted with the FAT file system, which includes
Winload, the hypervisor, the VSM module, and all the boot OS components needed to start the system.
The windows loader (Winload) reads TcbLaunch.exe from the system boot disk into memory, using
the l
ppl
n routine. The latter triggers the three events that the TCB boot callback
manages. The callback first prepares the Measured Launch Environment (MLE) for launch, checking the
ACM modules, ACPI table, and mapping the re uired TXT regions then it replaces the boot application
entry point with a special TXT MLE routine.
The Windows Loader, in the latest stages of the Osl e u e r ns n routine, doesn’t start the hypervisor launch se uence. Instead, it transfers the execution to the TCB launch se uence, which is uite
simple. The TCB boot application is started with the same l
r
ppl
n routine described
in the previous paragraph. The modified boot application entry point calls the TXT MLE launch routine,
which executes the GETSEC(SENTER) TXT instruction. This instruction measures the TcbLaunch.exe
executable in memory (TBOOT module) and if the measurement succeeds, the MLE launch routine
transfers the code execution to the real boot application entry point (
n).
n function is the first code executed in the Secure Launch environment. The implementation is simple reinitialize the Boot Library, register an event to receive virtualization launch/resume
notification, and call
n ry from the Tcbloader.dll module located in the secure RAM disk. The
Tcbloader.dll module is a mini version of the trusted Windows loader. Its goal is to load, verify, and
start the hypervisor set up the ypercall page and launch the Secure Kernel. The Secure Launch at
this stage ends because the hypervisor and Secure Kernel take care of the verification of the NT kernel
and other modules, providing the chain of trust. Execution then returns to the Windows loader, which
moves to the Windows kernel through the standard Osl r r ns er
ernel routine.
Figure 12-10 shows a scheme of Secure Launch and all its involved components. The user can enable
the Secure Launch by using the Local Group policy editor (by tweaking the Turn On Virtualization Based
Security setting, which is under Computer Configuration, Administrative Templates, System, Device Guard).
Bootmgr
Winload
Allocates Ramdisk
Reads TcbLaunch
Preload HvLoader, debugger
transports and hypervisor
PHASE 0
Secure Kernel
Verifies Winload
and Nt Kernel
Nt Kernel
Hypervisor
LAUNCH
Preload Secure Kernel
Winload
Continue standard
system initialization
(load Nt Kernel, Boot
drivers, …)
Prepare the MLE
Load SINIT ACM
PHASE 1
GETSEC(SENTER)
SINIT ACM measures TcbLaunch
TcbLaunch
Verifies
hypervisor and
Secure Kernel
FIGURE 12-10 The Secure Launch scheme. Note that the hypervisor and Secure Kernel start from the RAM disk.
CHAPTER 12
Startup and shutdown
817
Note The ACM modules of Trusted Boot are provided by Intel and are chipset-dependent.
Most of the TXT interface is memory mapped in physical memory. This means that the v
Loader can access even the SINIT region, verify the SINIT ACM version, and update it if needed. Windows achieves this by using a special compressed WIM file (called Tcbres.wim) that
contains all the known SINIT ACM modules for each chipset. If needed, the MLE preparation
phase opens the compressed file, extracts the right binary module, and replaces the contents
of the original SINIT firmware in the TXT region. When the Secure Launch procedure is invoked, the CPU loads the SINIT ACM into secure memory, verifies the integrity of the digital
signature, and compares the hash of its public key with the one hardcoded into the chipset.
Secure Launch on AMD platforms
Although Secure Launch is supported on Intel machines thanks to TXT, the Windows 10 Spring 2020
update also supports SKINIT, which is a similar technology designed by AMD for the verifiable startup
of trusted software, starting with an initially untrusted operating mode.
SKINIT has the same goal as Intel TXT and is used for the Secure Launch boot flow. It’s different
from the latter, though The base of SKINIT is a small type of software called secure loader (SL), which in
Windows is implemented in the amdsl.bin binary included in the resource section of the Amddrtm.dll
library provided by AMD. The SKINIT instruction reinitializes the processor to establish a secure execution environment and starts the execution of the SL in a way that can’t be tampered with. The secure
loader lives in the Secure Loader Block, a 64-Kbyte structure that is transferred to the TPM by the
SKINIT instruction. The TPM measures the integrity of the SL and transfers execution to its entry point.
The SL validates the system state, extends measurements into the PCR, and transfers the execution
to the AMD MLE launch routine, which is located in a separate binary included in the TcbLaunch.exe
module. The MLE routine initializes the IDT and GDT and builds the page table for switching the processor to long mode. (The MLE in AMD machines are executed in 32-bit protected mode, with a goal
of keeping the code in the TCB as small as possible.) It finally jumps back in the TcbLaunch, which, as for
Intel systems, reinitializes the Boot Library, registers an event to receive virtualization launch/resume notification, and calls
n ry from the tcbloader.dll module. From now on, the boot flow is identical
to the Secure Launch implementation for the Intel systems.
Initializing the kernel and executive subsystems
When Winload calls Ntoskrnl, it passes a data structure called the Loader Parameter block. The Loader
Parameter block contains the system and boot partition paths, a pointer to the memory tables Winload
generated to describe the system physical memory, a physical hardware tree that is later used to build
the volatile ARDWARE registry hive, an in-memory copy of the S STEM registry hive, and a pointer to
the list of boot drivers Winload loaded. It also includes various other information related to the boot
processing performed until this point.
818
CHAPTER 12
Startup and shutdown
EXPERIMENT: Loader Parameter block
While booting, the kernel keeps a pointer to the Loader Parameter block in the e
er l
variable. The kernel discards the parameter block after the first boot phase, so the only way to
see the contents of the structure is to attach a kernel debugger before booting and break at the
initial kernel debugger breakpoint. If you’re able to do so, you can use the dt command to dump
the block, as shown
kd> dt poi(nt!KeLoaderBlock) nt!LOADER_PARAMETER_BLOCK
+0x000 OsMajorVersion
: 0xa
+0x004 OsMinorVersion
: 0
+0x008 Size
: 0x160
+0x00c OsLoaderSecurityVersion : 1
+0x010 LoadOrderListHead : _LIST_ENTRY [ 0xfffff800`2278a230 - 0xfffff800`2288c150 ]
+0x020 MemoryDescriptorListHead : _LIST_ENTRY [ 0xfffff800`22949000 - 0xfffff800`22949de8 ]
+0x030 BootDriverListHead : _LIST_ENTRY [ 0xfffff800`22840f50 - 0xfffff800`2283f3e0 ]
+0x040 EarlyLaunchListHead : _LIST_ENTRY [ 0xfffff800`228427f0 - 0xfffff800`228427f0 ]
+0x050 CoreDriverListHead : _LIST_ENTRY [ 0xfffff800`228429a0 - 0xfffff800`228405a0 ]
+0x060 CoreExtensionsDriverListHead : _LIST_ENTRY [ 0xfffff800`2283ff20 - 0xfffff800`22843090 ]
+0x070 TpmCoreDriverListHead : _LIST_ENTRY [ 0xfffff800`22831ad0 - 0xfffff800`22831ad0 ]
+0x080 KernelStack
: 0xfffff800`25f5e000
+0x088 Prcb
: 0xfffff800`22acf180
+0x090 Process
: 0xfffff800`23c819c0
+0x098 Thread
: 0xfffff800`23c843c0
+0x0a0 KernelStackSize : 0x6000
+0x0a4 RegistryLength
: 0xb80000
+0x0a8 RegistryBase
: 0xfffff800`22b49000 Void
+0x0b0 ConfigurationRoot : 0xfffff800`22783090 _CONFIGURATION_COMPONENT_DATA
+0x0b8 ArcBootDeviceName : 0xfffff800`22785290 "multi(0)disk(0)rdisk(0)partition(4)"
+0x0c0 ArcHalDeviceName : 0xfffff800`22785190 "multi(0)disk(0)rdisk(0)partition(2)"
+0x0c8 NtBootPathName
: 0xfffff800`22785250 "\WINDOWS\"
+0x0d0 NtHalPathName
: 0xfffff800`22782bd0 "\"
+0x0d8 LoadOptions
: 0xfffff800`22772c80 "KERNEL=NTKRNLMP.EXE NOEXECUTE=OPTIN
HYPERVISORLAUNCHTYPE=AUTO DEBUG ENCRYPTION_KEY=**** DEBUGPORT=NET
HOST_IP=192.168.18.48 HOST_PORT=50000 NOVGA"
+0x0e0 NlsData
: 0xfffff800`2277a450 _NLS_DATA_BLOCK
+0x0e8 ArcDiskInformation : 0xfffff800`22785e30 _ARC_DISK_INFORMATION
+0x0f0 Extension
: 0xfffff800`2275cf90 _LOADER_PARAMETER_EXTENSION
+0x0f8 u
: <unnamed-tag>
+0x108 FirmwareInformation : _FIRMWARE_INFORMATION_LOADER_BLOCK
+0x148 OsBootstatPathName : (null)
+0x150 ArcOSDataDeviceName : (null)
+0x158 ArcWindowsSysPartName : (null)
Additionally, you can use the !loadermemorylist command on the
field to dump the physical memory ranges
kd> !loadermemorylist 0xfffff800`22949000
Base
Length
Type
0000000001 0000000005 (26) HALCachedMemory
0000000006 000000009a ( 5) FirmwareTemporary
...
e
ry es r p r s
e
( 20 Kb )
( 616 Kb )
CHAPTER 12
Startup and shutdown
819
0000001304 0000000001
0000001305 0000000081
0000001386 000000001c
...
0000001800 0000000b80
0000002380 00000009fe
0000002d7e 0000000282
0000003000 0000000391
0000003391 0000000068
00000033f9 0000000257
0000003650 00000008d2
000007ffc9 0000000026
000007ffef 0000000004
000007fff3 000000000c
000007ffff 0000000001
NumberOfDescriptors: 90
Summary
Memory Type
Free
LoadedProgram
FirmwareTemporary
FirmwarePermanent
OsloaderHeap
SystemCode
BootDriver
RegistryData
MemoryData
NlsData
HALCachedMemory
FirmwareCode
FirmwareData
FirmwareReserved
Total
( 7) OsloaderHeap
( 5) FirmwareTemporary
(20) MemoryData
( 4 Kb )
( 516 Kb )
( 112 Kb )
(19)
( 9)
( 2)
( 9)
(11)
( 2)
( 5)
(31)
(32)
( 6)
( 5)
(
(
(
(
(
(
(
(
(
(
(
RegistryData
SystemCode
Free
SystemCode
BootDriver
Free
FirmwareTemporary
FirmwareData
FirmwareReserved
FirmwarePermanent
FirmwareTemporary
Pages
000007a89c
0000000370
0000001fd4
000000030e
0000000275
0000001019
000000115a
0000000b88
0000000098
0000000023
0000000005
0000000008
0000000075
0000000044
==========
000007FFDF
(
(
(
(
(
(
(
(
(
(
(
(
(
(
501916)
880)
8148)
782)
629)
4121)
4442)
2952)
152)
35)
5)
8)
117)
68)
==========
(
524255) =
(
(
(
(
(
(
(
(
(
(
(
(
(
(
11 Mb 512 Kb )
9 Mb 1016 Kb )
2 Mb 520 Kb )
3 Mb 580 Kb )
416 Kb )
2 Mb 348 Kb )
8 Mb 840 Kb )
152 Kb )
16 Kb )
48 Kb )
4 Kb )
1 Gb 936 Mb 624 Kb )
3 Mb 448 Kb )
31 Mb 848 Kb )
3 Mb 56 Kb )
2 Mb 468 Kb )
16 Mb 100 Kb )
17 Mb 360 Kb )
11 Mb 544 Kb )
608 Kb )
140 Kb )
20 Kb )
32 Kb )
468 Kb )
272 Kb )
( ~2047 Mb )
The Loader Parameter extension can show useful information about the system hardware,
CPU features, and boot type
kd> dt poi(nt!KeLoaderBlock) nt!LOADER_PARAMETER_BLOCK Extension
+0x0f0 Extension : 0xfffff800`2275cf90 _LOADER_PARAMETER_EXTENSION
kd> dt 0xfffff800`2275cf90 _LOADER_PARAMETER_EXTENSION
nt!_LOADER_PARAMETER_EXTENSION
+0x000 Size
: 0xc48
+0x004 Profile
: _PROFILE_PARAMETER_BLOCK
+0x018 EmInfFileImage
: 0xfffff800`25f2d000 Void
...
+0x068 AcpiTable
: (null)
+0x070 AcpiTableSize
: 0
+0x074 LastBootSucceeded : 0y1
+0x074 LastBootShutdown : 0y1
+0x074 IoPortAccessSupported : 0y1
+0x074 BootDebuggerActive : 0y0
+0x074 StrongCodeGuarantees : 0y0
+0x074 HardStrongCodeGuarantees : 0y0
+0x074 SidSharingDisabled : 0y0
820
CHAPTER 12
Startup and shutdown
+0x074
+0x074
+0x074
+0x074
+0x074
+0x074
+0x074
+0x074
...
+0x900
+0x900
+0x900
+0x900
+0x908
+0x908
+0x908
+0x908
TpmInitialized
: 0y0
VsmConfigured
: 0y0
IumEnabled
: 0y0
IsSmbboot
: 0y0
BootLogEnabled
: 0y0
FeatureSettings : 0y0000000 (0)
FeatureSimulations : 0y000000 (0)
MicrocodeSelfHosting : 0y0
BootFlags
: 0
DbgMenuOsSelection : 0y0
DbgHiberBoot
: 0y1
DbgSoftRestart
: 0y0
InternalBootFlags : 2
DbgUtcBootTime
: 0y0
DbgRtcBootTime
: 0y1
DbgNoLegacyServices : 0y0
Ntoskrnl then begins phase 0, the first of its two-phase initialization process (phase 1 is the second).
Most executive subsystems have an initialization function that takes a parameter that identifies which
phase is executing.
During phase 0, interrupts are disabled. The purpose of this phase is to build the rudimentary
structures re uired to allow the services needed in phase 1 to be invoked. Ntoskrnl’s startup function,
ys e
r up, is called in each system processor context (more details later in this chapter
in the Kernel initialization phase 1 section). It initializes the processor boot structures and sets up a
Global Descriptor Table (GDT) and Interrupt Descriptor Table (IDT). If called from the boot processor,
the startup routine initializes the Control Flow Guard (CFG) check functions and cooperates with the
memory manager to initialize KASLR. The KASLR initialization should be done in the early stages of
the system startup in this way, the kernel can assign random VA ranges for the various virtual memory
regions (such as the PFN database and system PTE regions more details about KASLR are available
in the Image randomization section of Chapter 5, Part 1).
ys e
r up also initializes the kernel
debugger, the XSAVE processor area, and, where needed, KVA Shadow. It then calls n l e ernel.
If n l e ernel is running on the boot CPU, it performs systemwide kernel initialization, such as
initializing internal lists and other data structures that all CPUs share. It builds and compacts the System
Service Descriptor table (SSDT) and calculates the random values for the internal
l ys and
e er values, which are used for kernel pointers encoding. It also checks whether virtualization
has been started if it has, it maps the ypercall page and starts the processor’s enlightenments (more
details about the hypervisor enlightenments are available in Chapter 9).
n l e ernel, if executed by compatible processors, has the important role of initializing and
enabling the Control Enforcement Technology (CET). This hardware feature is relatively new, and basically implements a hardware shadow stack, used to detect and prevent ROP attacks. The technology
is used for protecting both user-mode applications as well as kernel-mode drivers (only when VSM
is available). n l e ernel initializes the Idle process and thread and calls p n l e e u e.
n l e ernel and p n l e e u e are normally executed on each system processor. When
CHAPTER 12
Startup and shutdown
821
executed by the boot processor, p n l e e u e relies on the function responsible for orchestrating phase 0, n
r ess r, while subsequent processors call only n O er r ess rs.
Note Return-oriented programming (ROP) is an exploitation techni ue in which an attacker
gains control of the call stack of a program with the goal of hijacking its control flow and
executes carefully chosen machine instruction sequences, called “gadgets,” that are already
present in the machine’s memory. Chained together, multiple gadgets allow an attacker to
perform arbitrary operations on a machine.
n
r ess r starts by validating the boot loader. If the boot loader version used to launch
Windows doesn’t correspond to the right Windows kernel, the function crashes the system with a
O
O
bugcheck code (0x100). Otherwise, it initializes the pool look-aside pointers for the initial CPU and checks for and honors the BCD urn e ry boot option, where it discards
the amount of physical memory the value specifies. It then performs enough initialization of the NLS
files that were loaded by Winload (described earlier) to allow Unicode to ANSI and OEM translation
to work. Next, it continues by initializing Windows ardware Error Architecture (W EA) and calling
the AL function l n ys e , which gives the AL a chance to gain system control before Windows
performs significant further initialization. l n ys e is responsible for initializing and starting various components of the AL, like ACPI tables, debugger descriptors, DMA, firmware, I/O MMU, System
Timers, CPU topology, performance counters, and the PCI bus. One important duty of l n ys e is
to prepare each CPU interrupt controller to receive interrupts and to configure the interval clock timer
interrupt, which is used for CPU time accounting. (See the section Quantum in Chapter 4, Threads,
in Part 1 for more on CPU time accounting.)
When l n ys e exits, n
r ess r proceeds by computing the reciprocal for clock timer
expiration. Reciprocals are used for optimizing divisions on most modern processors. They can perform
multiplications faster, and because Windows must divide the current 64-bit time value in order to find
out which timers need to expire, this static calculation reduces interrupt latency when the clock interval
fires. n
r ess r uses a helper routine,
n ys e , to fetch registry values from the control
vector of the S STEM hive. This data structure contains more than 150 kernel-tuning options that are
part of the KLM S STEM CurrentControlSet Control registry key, including information such as the
licensing data and version information for the installation. All the settings are preloaded and stored
in global variables. n
r ess r then continues by setting up the system root path and searching into the kernel image to find the crash message strings it displays on blue screens, caching their
location to avoid looking them up during a crash, which could be dangerous and unreliable. Next,
n
r ess r initializes the timer subsystem and the shared user data page.
n
r ess r is now ready to call the phase 0 initialization routines for the executive, Driver
Verifier, and the memory manager. These components perform the following initialization tasks
1.
822
The executive initializes various internal locks, resources, lists, and variables and validates that
the product suite type in the registry is valid, discouraging casual modification of the registry to
upgrade to an SKU of Windows that was not actually purchased. This is only one of the many
such checks in the kernel.
CHAPTER 12
Startup and shutdown
2.
Driver Verifier, if enabled, initializes various settings and behaviors based on the current state of
the system (such as whether safe mode is enabled) and verification options. It also picks which
drivers to target for tests that target randomly chosen drivers.
3.
The memory manager constructs the page tables, PFN database, and internal data structures
that are necessary to provide basic memory services. It also enforces the limit of the maximum
supported amount of physical memory and builds and reserves an area for the system file
cache. It then creates memory areas for the paged and nonpaged pools (described in Chapter
5 in Part 1). Other executive subsystems, the kernel, and device drivers use these two memory
pools for allocating their data structures. It finally creates the UltraSpace, a 16 TB region that
provides support for fast and inexpensive page mapping that doesn’t re uire TLB flushing.
Next, n
r ess r enables the hypervisor CPU dynamic partitioning (if enabled and correctly
licensed), and calls l n l e s to set up the old BIOS emulation code part of the AL. This code is
used to allow access (or to emulate access) to 16-bit real mode interrupts and memory, which are used
mainly by Bootvid (this driver has been replaced by BGFX but still exists for compatibility reasons).
At this point, n
r ess r enumerates the boot-start drivers that were loaded by Winload
and calls
e y
ls to inform the kernel debugger (if attached) to load symbols for
each of these drivers. If the host debugger has configured the break on symbol load option, this will
be the earliest point for a kernel debugger to gain control of the system. n
r ess r now calls
l
se n l e, which performs the remaining VL initialization that hasn’t been possible to complete in previous phases. When the function returns, it calls e less n to initialize the serial console if
the machine was configured for Emergency Management Services (EMS).
Next, n
r ess r builds the versioning information that will be used later in the boot process,
such as the build number, service pack version, and beta version status. Then it copies the NLS tables
that Winload previously loaded into the paged pool, reinitializes them, and creates the kernel stack
trace database if the global flags specify creating one. (For more information on the global flags, see
Chapter 6, I/O system, in Part 1.)
Finally, n
r ess r calls the object manager, security reference monitor, process manager,
user-mode debugging framework, and Plug and Play manager. These components perform the following initialization steps
1.
During the object manager initialization, the objects that are necessary to construct the object
manager namespace are defined so that other subsystems can insert objects into it. The system
process and the global kernel handle tables are created so that resource tracking can begin.
The value used to encrypt the object header is calculated, and the Directory and SymbolicLink
object types are created.
2.
The security reference monitor initializes security global variables (like the system SIDs and
Privilege LUIDs) and the in-memory database, and it creates the token type object. It then creates and prepares the first local system account token for assignment to the initial process. (See
Chapter 7 in Part 1 for a description of the local system account.)
3.
The process manager performs most of its initialization in phase 0, defining the process, thread,
job, and partition object types and setting up lists to track active processes and threads. The
CHAPTER 12
Startup and shutdown
823
systemwide process mitigation options are initialized and merged with the options specified
in the KLM S STEM CurrentControlSet Control Session Manager Kernel MitigationOptions
registry value. The process manager then creates the executive system partition object, which
is called MemoryPartition0. The name is a little misleading because the object is actually an
executive partition object, a new Windows object type that encapsulates a memory partition
and a cache manager partition (for supporting the new application containers).
4.
The process manager also creates a process object for the initial process and names it idle. As
its last step, the process manager creates the System protected process and a system thread to
execute the routine
se n l
n. This thread doesn’t start running right away because
interrupts are still disabled. The System process is created as protected to get protection from
user mode attacks, because its virtual address space is used to map sensitive data used by the
system and by the Code Integrity driver. Furthermore, kernel handles are maintained in the system
process’s handle table.
5.
The user-mode debugging framework creates the definition of the debug object type that is
used for attaching a debugger to a process and receiving debugger events. For more information on user-mode debugging, see Chapter 8, System mechanisms.
6.
The Plug and Play manager’s phase 0 initialization then takes place, which involves initializing
an executive resource used to synchronize access to bus resources.
When control returns to n l e ernel, the last step is to allocate the DPC stack for the current
processor, raise the IRQL to dispatch level, and enable the interrupts. Then control proceeds to the Idle
loop, which causes the system thread created in step 4 to begin executing phase 1. (Secondary processors wait to begin their initialization until step 11 of phase 1, which is described in the following list.)
Kernel initialization phase 1
As soon as the Idle thread has a chance to execute, phase 1 of kernel initialization begins. Phase 1
consists of the following steps
824
1.
se n l
n s r , as the name implies, discards the code that is part of the INIT section of the kernel image in order to preserve memory.
2.
The initialization thread sets its priority to 31, the highest possible, to prevent preemption.
3.
The BCD option that specifies the maximum number of virtual processors (hypervisorrootproc)
is evaluated.
4.
The NUMA/group topology relationships are created, in which the system tries to come up with
the most optimized mapping between logical processors and processor groups, taking into
account NUMA localities and distances, unless overridden by the relevant BCD settings.
5.
l n ys e performs phase 1 of its initialization. It prepares the system to accept interrupts
from external peripherals.
6.
The system clock interrupt is initialized, and the system clock tick generation is enabled.
CHAPTER 12
Startup and shutdown
7.
The old boot video driver (bootvid) is initialized. It’s used only for printing debug messages and
messages generated by native applications launched by SMSS, such as the NT chkdsk.
8.
The kernel builds various strings and version information, which are displayed on the boot
screen through Bootvid if the sos boot option was enabled. This includes the full version information, number of processors supported, and amount of memory supported.
9.
The power manager’s initialization is called.
10. The system time is initialized (by calling
l uery e l
e l
) and then stored as the time
the system booted.
11. On a multiprocessor system, the remaining processors are initialized by e
r ll r ess rs
and HalAllProcessorsStarted. The number of processors that will be initialized and supported
depends on a combination of the actual physical count, the licensing information for the
installed SKU of Windows, boot options such as nu pr and bootproc, and whether dynamic
partitioning is enabled (server systems only). After all the available processors have initialized,
the affinity of the system process is updated to include all processors.
12. The object manager initializes the global system silo, the per-processor nonpaged lookaside
lists and descriptors, and base auditing (if enabled by the system control vector). It then creates the namespace root directory ( ), KernelObjects directory, ObjectTypes directory, and
the DOS device name mapping directory ( Global ), with the Global and GLOBALROOT links
created in it. The object manager then creates the silo device map that will control the DOS
device name mapping and attach it to the system process. It creates the old DosDevices symbolic link (maintained for compatibility reasons) that points to the Windows subsystem device
name mapping directory. The object manager finally inserts each registered object type in the
ObjectTypes directory object.
13. The executive is called to create the executive object types, including semaphore, mutex, event,
timer, keyed event, push lock, and thread pool worker.
14. The I/O manager is called to create the I/O manager object types, including device, driver, con-
troller, adapter, I/O completion, wait completion, and file objects.
15. The kernel initializes the system watchdogs. There are two main types of watchdog the DPC
watchdog, which checks that a DPC routine will not execute more than a specified amount of
time, and the CPU Keep Alive watchdog, which verifies that each CPU is always responsive. The
watchdogs aren’t initialized if the system is executed by a hypervisor.
16. The kernel initializes each CPU processor control block (KPRCB) data structure, calculates the
Numa cost array, and finally calculates the System Tick and Quantum duration.
17. The kernel debugger library finalizes the initialization of debugging settings and parameters,
regardless of whether the debugger has not been triggered prior to this point.
18. The transaction manager also creates its object types, such as the enlistment, resource man-
ager, and transaction manager types.
19. The user-mode debugging library (Dbgk) data structures are initialized for the global system silo.
CHAPTER 12
Startup and shutdown
825
20. If driver verifier is enabled and, depending on verification options, pool verification is enabled,
object handle tracing is started for the system process.
21. The security reference monitor creates the Security directory in the object manager namespace,
protecting it with a security descriptor in which only the SYSTEM account has full access, and
initializes auditing data structures if auditing is enabled. Furthermore, the security reference
monitor initializes the kernel-mode SDDL library and creates the event that will be signaled
after the LSA has initialized ( Security LSA AUT ENTICATION INITIALI ED).
Finally, the Security Reference Monitor initializes the Kernel Code Integrity component (Ci.dll)
for the first time by calling the internal n l e routine, which initializes all the Code Integrity
Callbacks and saves the list of boot drivers for further auditing and verification.
22. The process manager creates a system handle for the executive system partition. The handle
will never be dereferenced, so as a result the system partition cannot be destroyed. The Process
Manager then initializes the support for kernel optional extension (more details are in step 26).
It registers host callouts for various OS services, like the Background Activity Moderator (BAM),
Desktop Activity Moderator (DAM), Multimedia Class Scheduler Service (MMCSS), Kernel
ardware Tracing, and Windows Defender System Guard.
Finally, if VSM is enabled, it creates the first minimal process, the IUM System Process, and
assigns it the name Secure System.
23. The SystemRoot symbolic link is created.
24. The memory manager is called to perform phase 1 of its initialization. This phase creates the
Section object type, initializes all its associated data structures (like the control area), and
creates the Device PhysicalMemory section object. It then initializes the kernel Control Flow
Guard support and creates the pagefile-backed sections that will be used to describe the user
mode CFG bitmap(s). (Read more about Control Flow Guard in Chapter 7, Part 1.) The memory
manager initializes the Memory Enclave support (for SGX compatible systems), the hot-patch
support, the page-combining data structures, and the system memory events. Finally, it spawns
three memory manager system worker threads (Balance Set Manager, Process Swapper, and
ero Page Thread, which are explained in Chapter 5 of Part 1) and creates a section object used
to map the API Set schema memory buffer in the system space (which has been previously allocated by the Windows Loader). The just-created system threads have the chance to execute
later, at the end of phase 1.
25. NLS tables are mapped into system space so that they can be mapped easily by user-mode
processes.
26. The cache manager initializes the file system cache data structures and creates its worker threads.
27. The configuration manager creates the Registry key object in the object manager namespace
and opens the in-memory S STEM hive as a proper hive file. It then copies the initial hardware
tree data passed by Winload into the volatile ARDWARE hive.
28. The system initializes Kernel Optional Extensions. This functionality has been introduced in
Windows 8.1 with the goal of exporting private system components and Windows loader data
826
CHAPTER 12
Startup and shutdown
(like memory caching re uirements, UEFI runtime services pointers, UEFI memory map, SMBIOS
data, secure boot policies, and Code Integrity data) to different kernel components (like the
Secure Kernel) without using the standard PE (portable executable) exports.
29. The errata manager initializes and scans the registry for errata information, as well as the
INF (driver installation file, described in Chapter 6 of Part 1) database containing errata for
various drivers.
30. The manufacturing-related settings are processed. The manufacturing mode is a special
operating system mode that can be used for manufacturing-related tasks, such as components and support testing. This feature is used especially in mobile systems and is provided by
the UEFI subsystem. If the firmware indicates to the OS (through a specific UEFI protocol) that
this special mode is enabled, Windows reads and writes all the needed information from the
KLM System CurrentControlSet Control ManufacturingMode registry key.
31. Superfetch and the prefetcher are initialized.
32. The Kernel Virtual Store Manager is initialized. The component is part of memory compression.
33. The VM Component is initialized. This component is a kernel optional extension used to com-
municate with the hypervisor.
34. The current time zone information is initialized and set.
35. Global file system driver data structures are initialized.
36. The NT Rtl compression engine is initialized.
37. The support for the hypervisor debugger, if needed, is set up, so that the rest of the system
does not use its own device.
38. Phase 1 of debugger-transport-specific information is performed by calling the
e u
er n
l e routine in the registered transport, such as Kdcom.dll.
39. The advanced local procedure call (ALPC) subsystem initializes the ALPC port type and ALPC
waitable port type objects. The older LPC objects are set as aliases.
40. If the system was booted with boot logging (with the BCD
l option), the boot log file
is initialized. If the system was booted in safe mode, it finds out if an alternate shell must be
launched (as in the case of a safe mode with command prompt boot).
41. The executive is called to execute its second initialization phase, where it configures part of the
Windows licensing functionality in the kernel, such as validating the registry settings that hold
license data. Also, if persistent data from boot applications is present (such as memory diagnostic results or resume from hibernation information), the relevant log files and information are
written to disk or to the registry.
42. The MiniNT/WinPE registry keys are created if this is such a boot, and the NLS object directory
is created in the namespace, which will be used later to host the section objects for the various
memory-mapped NLS files.
CHAPTER 12
Startup and shutdown
827
43. The Windows kernel Code Integrity policies (like the list of trusted signers and certificate
hashes) and debugging options are initialized, and all the related settings are copied from
the Loader Block to the kernel CI module (Ci.dll).
44. The power manager is called to initialize again. This time it sets up support for power requests,
the power watchdogs, the ALPC channel for brightness notifications, and profile callback support.
45. The I/O manager initialization now takes place. This stage is a complex phase of system startup
that accounts for most of the boot time.
The I/O manager first initializes various internal structures and creates the driver and device object types as well as its root directories Driver, FileSystem, FileSystem Filters, and
UMDFCommunicationPorts (for the UMDF driver framework). It then initializes the Kernel
Shim Engine, and calls the Plug and Play manager, power manager, and AL to begin the
various stages of dynamic device enumeration and initialization. (We covered all the details
of this complex and specific process in Chapter 6 of Part 1.) Then the Windows Management
Instrumentation (WMI) subsystem is initialized, which provides WMI support for device drivers.
(See the section “Windows Management Instrumentation” in Chapter 10 for more information.)
This also initializes Event Tracing for Windows (ETW) and writes all the boot persistent data
ETW events, if any.
The I/O manager starts the platform-specific error driver and initializes the global table of
hardware error sources. These two are vital components of the Windows ardware Error
infrastructure. Then it performs the first Secure Kernel call, asking the Secure Kernel to perform the last stage of its initialization in VTL 1. Also, the encrypted secure dump driver is
initialized, reading part of its configuration from the Windows Registry ( KLM System
CurrentControlSet\Control\CrashControl).
All the boot-start drivers are enumerated and ordered while respecting their dependencies and
load-ordering. (Details on the processing of the driver load control information on the registry
are also covered in Chapter 6 of Part 1.) All the linked kernel mode DLLs are initialized with the
built-in RAW file system driver.
At this stage, the I/O manager maps Ntdll.dll, Vertdll.dll, and the WOW64 version of Ntdll into
the system address space. Finally, all the boot-start drivers are called to perform their driverspecific initialization, and then the system-start device drivers are started. The Windows subsystem device names are created as symbolic links in the object manager’s namespace.
46. The configuration manager registers and starts its Windows registry’s ETW Trace Logging
Provider. This allows the tracing of the entire configuration manager.
47. The transaction manager sets up the Windows software trace preprocessor (WPP) and registers
its ETW Provider.
48. Now that boot-start and system-start drivers are loaded, the errata manager loads the INF
database with the driver errata and begins parsing it, which includes applying registry PCI
configuration workarounds.
49. If the computer is booting in safe mode, this fact is recorded in the registry.
828
CHAPTER 12
Startup and shutdown
50. Unless explicitly disabled in the registry, paging of kernel-mode code (in Ntoskrnl and drivers)
is enabled.
51. The power manager is called to finalize its initialization.
52. The kernel clock timer support is initialized.
53. Before the INIT section of Ntoskrnl will be discarded, the rest of the licensing information for
the system is copied into a private system section, including the current policy settings that are
stored in the registry. The system expiration time is then set.
54. The process manager is called to set up rate limiting for jobs and the system process creation
time. It initializes the static environment for protected processes, and looks up various systemdefined entry points in the user-mode system libraries previously mapped by the I/O manager
(usually Ntdll.dll, Ntdll32.dll, and Vertdll.dll).
55. The security reference monitor is called to create the Command Server thread that commu-
nicates with LSASS. This phase creates the Reference Monitor command port, used by LSA to
send commands to the SRM. (See the section Security system components in Chapter 7 in Part
1 for more on how security is enforced in Windows.)
56. If the VSM is enabled, the encrypted VSM keys are saved to disk. The system user-mode librar-
ies are mapped into the Secure System Process. In this way, the Secure Kernel receives all the
needed information about the VTL 0’s system DLLs.
57. The Session Manager (Smss) process (introduced in Chapter 2, System architecture, in Part 1)
is started. Smss is responsible for creating the user-mode environment that provides the visible
interface to Windows its initialization steps are covered in the next section.
58. The bootvid driver is enabled to allow the NT check disk tool to display the output strings.
59. The TPM boot entropy values are ueried. These values can be ueried only once per boot, and
normally, the TPM system driver should have ueried them by now, but if this driver has not
been running for some reason (perhaps the user disabled it), the un ueried values would still
be available. Therefore, the kernel also manually ueries them to avoid this situation in normal
scenarios, the kernel’s own query should fail.
60. All the memory used by the loader parameter block and all its references (like the initialization
code of Ntoskrnl and all boot drivers, which reside in the INIT sections) are now freed.
As a final step before considering the executive and kernel initialization complete, the phase 1
initialization thread sets the critical break on termination flag to the new Smss process. In this way, if
the Smss process exits or gets terminated for some reason, the kernel intercepts this, breaks into the
attached debugger (if any), and crashes the system with a
O
stop code.
If the five-second wait times out (that is, if five seconds elapse), the Session Manager is assumed to
have started successfully, and the phase 1 initialization thread exits. Thus, the boot processor executes
one of the memory manager’s system threads created in step 22 or returns to the Idle loop.
CHAPTER 12
Startup and shutdown
829
Smss, Csrss, and Wininit
Smss is like any other user-mode process except for two differences. First, Windows considers Smss
a trusted part of the operating system. Second, Smss is a n
e application. Because it’s a trusted
operating system component, Smss runs as a protected process light (PPL PPLs are covered in Part 1,
Chapter 3, Processes and jobs ) and can perform actions few other processes can perform, such as
creating security tokens. Because it’s a native application, Smss doesn’t use Windows APIs it uses
only core executive APIs known collectively as the Windows native API (which are normally exposed by
Ntdll). Smss doesn’t use the Win32 APIs, because the Windows subsystem isn’t executing when Smss
launches. In fact, one of Smss’s first tasks is to start the Windows subsystem.
Smss initialization has been already covered in the Session Manager section of Chapter 2 of Part 1.
For all the initialization details, please refer to that chapter. When the master Smss creates the children
Smss processes, it passes two section objects’ handles as parameters. The two section objects represent
the shared buffers used for exchanging data between multiple Smss and Csrss instances (one is used to
communicate between the parent and the child Smss processes, and the other is used to communicate
with the client subsystem process). The master Smss spawns the child using the l re e ser r ess
routine, specifying a flag to instruct the Process Manager to create a new session. In this case, the
PspAllocateProcess kernel function calls the memory manager to create the new session address space.
The executable name that the child Smss launches at the end of its initialization is stored in the
shared section, and, as stated in Chapter 2, is usually Wininit.exe for session 0 and Winlogon.exe for any
interactive sessions. An important concept to remember is that before the new session 0 Smss launches
Wininit, it connects to the Master Smss (through the SmApiPort ALPC port) and loads and initializes all
the subsystems.
The session manager ac uires the Load Driver privilege and asks the kernel to load and map the
Win32k driver into the new Session address space (using the
e ys e n r
n native API). It
then launches the client-server subsystem process (Csrss.exe), specifying in the command line the following information the root Windows Object directory name ( Windows), the shared section objects’
handles, the subsystem name (Windows), and the subsystem’s DLLs
■
Basesrv.dll
■
Sxssrv.dll
■
Winsrv.dll
The server side of the subsystem process
The side-by-side subsystem support extension module
The multiuser subsystem support module
The client–server subsystem process performs some initialization It enables some process mitigation
options, removes unneeded privileges from its token, starts its own ETW provider, and initializes a linked
list of
O
data structures to trace all the Win32 processes that will be started in the system. It
then parses its command line, grabs the shared sections’ handles, and creates two ALPC ports
■
830
CSR API command port ( Sessions ID Windows ApiPort) This ALPC Port will be used by
every Win32 process to communicate with the Csrss subsystem. (Kernelbase.dll connects to it in
its initialization routine.)
CHAPTER 12
Startup and shutdown
■
Su system Session anager A
ort ( Sessions ID Windows SbApiPort)
used by the session manager to send commands to Csrss.
This port is
Csrss creates the two threads used to dispatch the commands received by the ALPC ports. Finally,
it connects to the Session Manager, through another ALPC port ( SmApiPort), which was previously
created in the Smss initialization process (step 6 of the initialization procedure described in Chapter 2).
In the connection process, the Csrss process sends the name of the just-created Session Manager API
port. From now on, new interactive sessions can be started. So, the main Csrss thread finally exits.
After spawning the subsystem process, the child Smss launches the initial process (Wininit or
Winlogon) and then exits. Only the master instance of Smss remains active. The main thread in Smss
waits forever on the process handle of Csrss, whereas the other ALPC threads wait for messages to
create new sessions or subsystems. If either Wininit or Csrss terminate unexpectedly, the kernel crashes
the system because these processes are marked as critical. If Winlogon terminates unexpectedly, the
session associated with it is logged off.
Pending file rename operations
The fact that executable images and DLLs are memory-mapped when they’re used makes it impossible to update core system files after Windows has finished booting (unless hotpatching technology is used, but that’s only for Microsoft patches to the operating system). The
e le Windows
API has an option to specify that a file move be delayed until the next boot. Service packs and
hotfixes that must update in-use memory-mapped files install replacement files onto a system in
temporary locations and use the
e le API to have them replace otherwise in-use files. When
used with that option,
e le simply records commands in the en n le en eOper
ns
and en n le en eOper
ns keys under KLM S STEM CurrentControlSet Control Session
Manager. These registry values are of type
, where each operation is specified in pairs of
file names The first file name is the source location, and the second is the target location. Delete
operations use an empty string as their target path. ou can use the Pendmoves utility from
Windows Sysinternals ( ps // s
r s
/en us/sys n ern ls/) to view registered delayed
rename and delete commands.
Wininit performs its startup steps, as described in the “Windows initialization process” section of
Chapter 2 in Part 1, such as creating the initial window station and desktop objects. It also sets up the
user environment, starts the Shutdown RPC server and WSI interface (see the Shutdown section later
in this chapter for further details), and creates the service control manager (SCM) process (Services.exe),
which loads all services and device drivers marked for auto-start. The local session manager (Lsm.dll)
service, which runs in a shared Svchost process, is launched at this time. Wininit next checks whether
there has been a previous system crash, and, if so, it carves the crash dump and starts the Windows
Error Reporting process (werfault.exe) for further processing. It finally starts the Local Security
Authentication Subsystem Service ( SystemRoot System32 Lsass.exe) and, if Credential Guard is
enabled, the Isolated LSA Trustlet (Lsaiso.exe) and waits forever for a system shutdown re uest.
CHAPTER 12
Startup and shutdown
831
On session 1 and beyond, Winlogon runs instead. While Wininit creates the noninteractive session 0
windows station, Winlogon creates the default interactive-session Windows station, called WinSta0,
and two desktops the Winlogon secure desktop and the default user desktop. Winlogon then ueries
the system boot information using the
uery ys e n r
n API (only on the first interactive
logon session). If the boot configuration includes the volatile Os Selection menu flag, it starts the GDI
system (spawning a UMDF host process, fontdrvhost.exe) and launches the modern boot menu application (Bootim.exe). The volatile Os Selection menu flag is set in early boot stages by the Bootmgr only
if a multiboot environment was previously detected (for more details see the section The boot menu
earlier in this chapter).
Bootim is the GUI application that draws the modern boot menu. The new modern boot uses the
Win32 subsystem (graphics driver and GDI calls) with the goal of supporting high resolutions for
displaying boot choices and advanced options. Even touchscreens are supported, so the user can select
which operating system to launch using a simple touch. Winlogon spawns the new Bootim process
and waits for its termination. When the user makes a selection, Bootim exits. Winlogon checks the exit
code thus it’s able to detect whether the user has selected an OS or a boot tool or has simply requested a system shutdown. If the user has selected an OS different from the current one, Bootim adds
the
sequen e one-shot BCD option in the main system boot store (see the section The Windows
Boot Manager earlier in this chapter for more details about the BCD store). The new boot se uence is
recognized (and the BCD option deleted) by the Windows Boot Manager after Winlogon has restarted
the machine using NtShutdownSystem API. Winlogon marks the previous boot entry as good before
restarting the system.
EXPERIMENT: Playing with the modern boot menu
The modern boot menu application, spawned by Winlogon after Csrss is started, is really a classical Win32 GUI application. This experiment demonstrates it. In this case, it’s better if you start
with a properly configured multiboot system otherwise, you won’t be able to see the multiple
entries in the Modern boot menu.
Open a non-elevated console window (by typing cmd in the Start menu search box) and go
to the Windows System32 path of the boot volume by typing cd /d C:\Windows\System32
(where C is the letter of your boot volume). Then type Bootim.exe and press Enter. A screen
similar to the modern boot menu should appear, showing only the Turn Off Your Computer option. This is because the Bootim process has been started under the standard non-administrative
token (the one generated for User Account Control). Indeed, the process isn’t able to access the
system boot configuration data. Press Ctrl Alt Del to start the Task Manager and terminate the
BootIm process, or simply select Turn Off Your Computer. The actual shutdown process is started by the caller process (which is Winlogon in the original boot sequence) and not by BootIm.
832
CHAPTER 12
Startup and shutdown
Now you should run the Command Prompt window with an administrative token by rightclicking its taskbar icon or the Command Prompt item in the Windows search box and selecting
Run As Administrator. In the new administrative prompt, start the BootIm executable. This time
you will see the real modern boot menu, compiled with all the boot options and tools, similar to
the one shown in the following picture
In all other cases, Winlogon waits for the initialization of the LSASS process and LSM service. It
then spawns a new instance of the DWM process (Desktop Windows Manager, a component used to
draw the modern graphical interface) and loads the registered credential providers for the system (by
default, the Microsoft credential provider supports password-based, pin-based, and biometrics-based
logons) into a child process called LogonUI ( SystemRoot System32 Logonui.exe), which is responsible for displaying the logon interface. (For more details on the startup sequence for Wininit, Winlogon,
and LSASS, see the section “Winlogon initialization” in Chapter 7 in Part 1.)
After launching the LogonUI process, Winlogon starts its internal finite-state machine. This is used
to manage all the possible states generated by the different logon types, like the standard interactive
logon, terminal server, fast user switch, and hiberboot. In standard interactive logon types, Winlogon
shows a welcome screen and waits for an interactive logon notification from the credential provider
(configuring the SAS se uence if needed). When the user has inserted their credential (that can be a
password, PIN, or biometric information), Winlogon creates a logon session LUID, and validates the
logon using the authentication packages registered in Lsass (a process for which you can find more
CHAPTER 12
Startup and shutdown
833
information in the section User logon steps in Chapter 7 in Part 1). Even if the authentication won’t
succeed, Winlogon at this stage marks the current boot as good. If the authentication succeeded,
Winlogon verifies the se uential logon scenario in case of client SKUs, in which only one session each
time could be generated, and, if this is not the case and another session is active, asks the user how to
proceed. It then loads the registry hive from the profile of the user logging on, mapping it to KCU. It
adds the re uired ACLs to the new session’s Windows Station and Desktop and creates the user’s environment variables that are stored in KCU Environment.
Winlogon next waits the Sihost process and starts the shell by launching the executable or executables
specified in KLM SOFTWARE Microsoft Windows NT CurrentVersion WinLogon Userinit (with multiple
executables separated by commas) that by default points at Windows System32 Userinit.exe. The new
Userinit process will live in Winsta0 Default desktop. Userinit.exe performs the following steps
1.
Creates the per-session volatile Explorer Session key KCU Software Microsoft Windows
CurrentVersion\Explorer\SessionInfo\.
2.
Processes the user scripts specified in KCU Software Policies Microsoft Windows System
Scripts and the machine logon scripts in KLM SOFTWARE Policies Microsoft Windows
System Scripts. (Because machine scripts run after user scripts, they can override user settings.)
3.
Launches the comma-separated shell or shells specified in KCU Software Microsoft Windows
NT CurrentVersion Winlogon Shell. If that value doesn’t exist, Userinit.exe launches the shell or
shells specified in KLM SOFTWARE Microsoft Windows NT CurrentVersion Winlogon Shell,
which is by default Explorer.exe.
4.
If Group Policy specifies a user profile uota, starts
enforce the quota for the current user.
SystemRoot
System32 Pro uota.exe to
Winlogon then notifies registered network providers that a user has logged on, starting the mpnotify.exe process. The Microsoft network provider, Multiple Provider Router ( SystemRoot System32
Mpr.dll), restores the user’s persistent drive letter and printer mappings stored in KCU Network and
KCU Printers, respectively. Figure 12-11 shows the process tree as seen in Process Monitor after a
logon (using its boot logging capability). Note the Smss processes that are dimmed (meaning that they
have since exited). These refer to the spawned copies that initialize each session.
834
CHAPTER 12
Startup and shutdown
FIGURE 12-11 Process tree during logon.
ReadyBoot
Windows uses the standard logical boot-time prefetcher (described in Chapter 5 of Part 1) if the system
has less than 400 MB of free memory, but if the system has 400 MB or more of free RAM, it uses an inRAM cache to optimize the boot process. The size of the cache depends on the total RAM available, but
it’s large enough to create a reasonable cache and yet allow the system the memory it needs to boot
smoothly. ReadyBoot is implemented in two distinct binaries the ReadyBoost driver (Rdyboost.sys) and
the Sysmain service (Sysmain.dll, which also implements SuperFetch).
The cache is implemented by the Store Manager in the same device driver that implements
ReadyBoost caching (Rdyboost.sys), but the cache’s population is guided by the boot plan previously
stored in the registry. Although the boot cache could be compressed like the ReadyBoost cache, another difference between ReadyBoost and ReadyBoot cache management is that while in ReadyBoot
mode, the cache is not encrypted. The ReadyBoost service deletes the cache 50 seconds after the
service starts, or if other memory demands warrant it.
CHAPTER 12
Startup and shutdown
835
When the system boots, at phase 1 of the NT kernel initialization, the ReadyBoost driver, which is
a volume filter driver, intercepts the boot volume creation and decides whether to enable the cache.
The cache is enabled only if the target volume is registered in the KLM System CurrentControlSet
Services rdyboost Parameters ReadyBootVolumeUni ueId registry value. This value contains the ID of
the boot volume. If ReadyBoot is enabled, the ReadyBoost driver starts to log all the volume boot I/Os
(through ETW), and, if a previous boot plan is registered in the BootPlan registry binary value, it spawns
a system thread that will populate the entire cache using asynchronous volume reads. When a new
Windows OS is installed, at the first system boot these two registry values do not exist, so neither the
cache nor the log trace are enabled.
In this situation the Sysmain service, which is started later in the boot process by the SCM, determines whether the cache needs to be enabled, checking the system configuration and the running
Windows SKU. There are situations in which ReadyBoot is completely disabled, such as when the boot
disk is a solid state drive. If the check yields a positive result, Sysmain enables ReadyBoot by writing the
boot volume ID on the relative registry value ( e y
lu e n que ) and by enabling the WMI
ReadyBoot Autologger in the KLM S STEM CurrentControlSet Control WMI AutoLogger Readyboot
registry key. At the next system boot, the ReadyBoost driver logs all the Volume I/Os but without populating the cache (still no boot plan exists).
After every successive boot, the Sysmain service uses idle CPU time to calculate a boot-time caching
plan for the next boot. It analyzes the recorded ETW I/O events and identifies which files were accessed and
where they’re located on disk. It then stores the processed traces in SystemRoot Prefetch Readyboot as
.fx files and calculates the new caching boot plan using the trace files of the five previous boots. The Sysmain
service stores the new generated plan under the registry value, as shown in Figure 12-12. The ReadyBoost
boot driver reads the boot plan and populates the cache, minimizing the overall boot startup time.
FIGURE 12-12 ReadyBoot configuration and statistics.
836
CHAPTER 12
Startup and shutdown
Images that start automatically
In addition to the Userinit and Shell registry values in Winlogon’s key, there are many other registry locations and directories that default system components check and process for automatic process startup during the boot and logon processes. The Msconfig utility ( SystemRoot System32 Msconfig.exe)
displays the images configured by several of the locations. The Autoruns tool, which you can download
from Sysinternals and is shown in Figure 12-13, examines more locations than Msconfig and displays
more information about the images configured to automatically run. By default, Autoruns shows only
the locations that are configured to automatically execute at least one image, but selecting the Include
Empty Locations entry on the Options menu causes Autoruns to show all the locations it inspects.
The Options menu also has selections to direct Autoruns to hide Microsoft entries, but you should
always combine this option with eri y mage Signatures otherwise, you risk hiding malicious programs that include false information about their company name information.
FIGURE 12-13 The Autoruns tool available from Sysinternals.
Shutdown
The system shutdown process involves different components. Wininit, after having performed all its
initialization, waits for a system shutdown.
If someone is logged on and a process initiates a shutdown by calling the Windows
n
s
function, a message is sent to that session’s Csrss instructing it to perform the shutdown. Csrss in turn
impersonates the caller and sends an RPC message to Winlogon, telling it to perform a system shutdown. Winlogon checks whether the system is in the middle of a hybrid boot transition (for further
details about hybrid boot, see the ybernation and Fast Startup section later in this chapter), then
impersonates the currently logged-on user (who might or might not have the same security context as
CHAPTER 12
Startup and shutdown
837
the user who initiated the system shutdown), asks LogonUI to fade out the screen (configurable
through the registry value KLM Software Microsoft Windows NCurrentVersion Winlogon
FadePeriodConfiguration), and calls
n
s with special internal flags. Again, this call causes a
message to be sent to the Csrss process inside that session, requesting a system shutdown.
This time, Csrss sees that the request is from Winlogon and loops through all the processes in the
logon session of the interactive user (again, not the user who re uested a shutdown) in reverse order
of their s u
n le el. A process can specify a shutdown level, which indicates to the system when it
wants to exit with respect to other processes, by calling e r ess u
n r e ers. Valid shutdown levels are in the range 0 through 1023, and the default level is 640. Explorer, for example, sets
its shutdown level to 2, and Task Manager specifies 1. For each active process that owns a top-level
window, Csrss sends the
O message to each thread in the process that has
a Windows message loop. If the thread returns TRUE, the system shutdown can proceed. Csrss then
sends the
O Windows message to the thread to request it to exit. Csrss waits the number of seconds defined in KCU Control Panel Desktop ungAppTimeout for the thread to exit. (The
default is 5000 milliseconds.)
If the thread doesn’t exit before the timeout, Csrss fades out the screen and displays the hungprogram screen shown in Figure 12-14. ( ou can disable this screen by creating the registry value KCU
Control Panel Desktop AutoEndTasks and setting it to 1.) This screen indicates which programs are
currently running and, if available, their current state. Windows indicates which program isn’t shutting down in a timely manner and gives the user a choice of either killing the process or aborting the
shutdown. (There is no timeout on this screen, which means that a shutdown re uest could wait forever
at this point.) Additionally, third-party applications can add their own specific information regarding
state for example, a virtualization product could display the number of actively running virtual machines (using the u
n l
e s n re e API).
FIGURE 12-14
838
ung-program screen.
CHAPTER 12
Startup and shutdown
EXPERIMENT: Witnessing the HungAppTimeout
ou can see the use of the ungAppTimeout registry value by running Notepad, entering text
into its editor, and then logging off. After the amount of time specified by the ungAppTimeout
registry value has expired, Csrss.exe presents a prompt that asks you whether you want to end
the Notepad process, which has not exited because it’s waiting for you to tell it whether to save
the entered text to a file. If you select Cancel, Csrss.exe aborts the shutdown.
As a second experiment, if you try shutting down again (with Notepad’s query dialog box still
open), Notepad displays its own message box to inform you that shutdown cannot cleanly proceed.
owever, this dialog box is merely an informational message to help users Csrss.exe will still consider that Notepad is hung and display the user interface to terminate unresponsive processes.
If the thread does exit before the timeout, Csrss continues sending the
O /
O message pairs to the other threads in the process that own windows. Once all the
threads that own windows in the process have exited, Csrss terminates the process and goes on to the
next process in the interactive session.
If Csrss finds a console application, it invokes the console control handler by sending the
O O
event. (Only service processes receive the
O
event on
shutdown.) If the handler returns
, Csrss kills the process. If the handler returns
or doesn’t
respond by the number of seconds defined by KCU Control Panel Desktop WaitToKillTimeout (the
default is 5,000 milliseconds), Csrss displays the hung-program screen shown in Figure 12-14.
Next, the Winlogon state machine calls
that are part of the interactive user’s session.
n
s
to have Csrss terminate any COM processes
At this point, all the processes in the interactive user’s session have been terminated. Wininit next
calls
n
s , which this time executes within the system process context. This causes Wininit
to send a message to the Csrss part of session 0, where the services live. Csrss then looks at all the processes belonging to the system context and performs and sends the
O /
O messages to GUI threads (as before). Instead of sending
O O
,
however, it sends
O
to console applications that have registered control
handlers. Note that the SCM is a console program that registers a control handler. When it receives the
shutdown re uest, it in turn sends the service shutdown control message to all services that registered
CHAPTER 12
Startup and shutdown
839
for shutdown notification. For more details on service shutdown (such as the shutdown timeout Csrss
uses for the SCM), see the Services section in Chapter 10.
Although Csrss performs the same timeouts as when it was terminating the user processes, it
doesn’t display any dialog boxes and doesn’t kill any processes. (The registry values for the system process timeouts are taken from the default user profile.) These timeouts simply allow system processes
a chance to clean up and exit before the system shuts down. Therefore, many system processes are in
fact still running when the system shuts down, such as Smss, Wininit, Services, and LSASS.
Once Csrss has finished its pass notifying system processes that the system is shutting down,
Wininit wakes up, waits 60 seconds for all sessions to be destroyed, and then, if needed, invokes System
Restore (at this stage no user process is active in the system, so the restore application can process all
the needed files that may have been in use before). Wininit finishes the shutdown process by shutting
down LogonUi and calling the executive subsystem function
u
n ys e . This function calls the
function
e ys e
er
e to orchestrate the shutdown of drivers and the rest of the executive
subsystems (Plug and Play manager, power manager, executive, I/O manager, configuration manager,
and memory manager).
For example,
e ys e
er
e calls the I/O manager to send shutdown I/O packets to all
device drivers that have re uested shutdown notification. This action gives device drivers a chance to
perform any special processing their device might re uire before Windows exits. The stacks of worker
threads are swapped in, the configuration manager flushes any modified registry data to disk, and the
memory manager writes all modified pages containing file data back to their respective files. If the
option to clear the paging file at shutdown is enabled, the memory manager clears the paging file at
this time. The I/O manager is called a second time to inform the file system drivers that the system is
shutting down. System shutdown ends in the power manager. The action the power manager takes
depends on whether the user specified a shutdown, a reboot, or a power down.
Modern apps all rely on the Windows Shutdown Interface (WSI) to properly shut down the system. The WSI API still uses RPC to communicate between processes and supports the grace period.
The grace period is a mechanism by which the user is informed of an incoming shutdown, before the
shutdown actually begins. This mechanism is used even in case the system needs to install updates.
Advapi32 uses WSI to communicate with Wininit. Wininit ueues a timer, which fires at the end of the
grace period and calls Winlogon to initialize the shutdown request. Winlogon calls
n
s , and
the rest of the procedure is identical to the previous one. All the UWP applications (and even the new
Start menu) use the ShutdownUX module to switch off the system. ShutdownUX manages the power
transitions for UWP applications and is linked against Advapi32.dll.
Hibernation and Fast Startup
To improve the system startup time, Windows 8 introduced a new feature called Fast Startup (also
known as hybrid boot). In previous Windows editions, if the hardware supported the S4 system powerstate (see Chapter 6 of Part 1 for further details about the power manager), Windows allowed the user
to put the system in ibernation mode. To properly understand Fast Startup, a complete description of
the ibernation process is needed.
840
CHAPTER 12
Startup and shutdown
When a user or an application calls e uspen
e API, a worker item is sent to the power manager. The worker item contains all the information needed by the kernel to initialize the power state
transition. The power manager informs the prefetcher of the outstanding hibernation request and
waits for all its pending I/Os to complete. It then calls the
e ys e
er
e kernel API.
e ys e
er
e is the key function that orchestrates the entire hibernation process. The
routine checks that the caller token includes the Shutdown privilege, synchronizes with the Plug and
Play manager, Registry, and power manager (in this way there is no risk that any other transactions
could interfere in the meantime), and cycles against all the loaded drivers, sending an
O
Irp to each of them. In this way the power manager informs each driver that a power operation
is started, so the driver’s devices must not start any more I/O operations or take any other action that
would prevent the successful completion of the hibernation process. If one of the re uests fails (perhaps a driver is in the middle of an important I/O), the procedure is aborted.
The power manager uses an internal routine that modifies the system boot configuration data (BCD)
to enable the Windows Resume boot application, which, as the name implies, attempts to resume the
system after the hibernation. (For further details, see the section “The Windows Boot Manager” earlier
in this chapter). The power manager
■
■
■
Opens the BCD object used to boot the system and reads the associated Windows Resume
application GUID (stored in a special unnamed BCD element that has the value 0x23000003).
Searches the Resume object in the BCD store, opens it, and checks its description. Writes the
device and path BCD elements, linking them to the Windows System32 winresume.efi file located in the boot disk, and propagates the boot settings from the main system BCD object (like
the boot debugger options). Finally, it adds the hibernation file path and device descriptor into
filep
and file e e BCD elements.
Updates the root Boot Manager BCD object writes the resumeobject BCD element with the
GUID of the discovered Windows Resume boot application, sets the resume element to 1, and, in
case the hibernation is used for Fast Startup, sets the hiberboot element to 1.
Next, the power manager flushes the BCD data to disk, calculates all the physical memory ranges
that need to be written into the hibernation file (a complex operation not described here), and sends a
new power IRP to each driver (
O
function). This time the drivers must put their device to sleep and don’t have the chance to fail the re uest and stop the hibernation process. The system
is now ready to hibernate, so the power manager starts a “sleeper” thread that has the sole purpose of
powering the machine down. It then waits for an event that will be signaled only when the resume is
completed (and the system is restarted by the user).
The sleeper thread halts all the CPUs (through DPC routines) except its own, captures the system
time, disables interrupts, and saves the CPU state. It finally invokes the power state handler routine
(implemented in the AL), which executes the ACPI machine code needed to put the entire system to
sleep and calls the routine that actually writes all the physical memory pages to disk. The sleeper thread
uses the crash dump storage driver to emit the needed low-level disk I/Os for writing the data in the
hibernation file.
CHAPTER 12
Startup and shutdown
841
The Windows Boot Manager, in its earlier boot stages, recognizes the resume BCD element (stored
in the Boot Manager BCD descriptor), opens the Windows Resume boot application BCD object, and
reads the saved hibernation data. Finally, it transfers the execution to the Windows Resume boot application (Winresume.efi).
n, the entry point routine of Winresume, reinitializes the boot library
and performs different checks on the hibernation file
■
Verifies that the file has been written by the same executing processor architecture
■
Checks whether a valid page file exists and has the correct size
■
■
Checks whether the firmware has reported some hardware configuration changes (through the
FADT and FACS ACPI tables)
Checks the hibernation file integrity
If one of these checks fails, Winresume ends the execution and returns control to the Boot Manager,
which discards the hibernation file and restarts a standard cold boot. On the other hand, if all the previous checks pass, Winresume reads the hibernation file (using the UEFI boot library) and restores all the
saved physical pages contents. Next, it rebuilds the needed page tables and memory data structures,
copies the needed information to the OS context, and finally transfers the execution to the Windows kernel, restoring the original CPU context. The Windows kernel code restarts from the same power manager
sleeper thread that originally hibernated the system. The power manager reenables interrupts and thaws
all the other system CPUs. It then updates the system time, reading it from the CMOS, rebases all the
system timers (and watchdogs), and sends another
O
Irp to each system driver, asking
them to restart their devices. It finally restarts the prefetcher and sends it the boot loader log for further
processing. The system is now fully functional the system power state is S0 (fully on).
Fast Startup is a technology that’s implemented using hibernation. When an application passes
the
O
flag to the
n
s API or when a user clicks the Shutdown
start menu button, if the system supports the S4 (hibernation) power state and has a hibernation file
enabled, it starts a hybrid shutdown. After Csrss has switched off all the interactive session processes,
session 0 services, and COM servers (see the Shutdown section for all the details about the actual
shutdown process), Winlogon detects that the shutdown request has the Hybrid flag set, and, instead
of waking up the shutdown code of Winint, it goes into a different route. The new Winlogon state
uses the
er n r
n system API to switch off the monitor it next informs LogonUI about the
outstanding hybrid shutdown, and finally calls the
n l e
er
n API, asking for a system
hibernation. The procedure from now on is the same as the system hibernation.
842
CHAPTER 12
Startup and shutdown
EXPERIMENT: Understanding hybrid shutdown
ou can see the effects of a hybrid shutdown by manually mounting the BCD store after the system
has been switched off, using an external OS. First, make sure that your system has Fast Startup
enabled. To do this, type Control Panel in the Start menu search box, select System and Security,
Security
and then select Power Options. After clicking Choose What The Power Button does, located in
the upper-left side of the Power Options window, the following screen should appear
As shown in the figure, make sure that the Turn On Fast Startup option is selected.
Otherwise, your system will perform a standard shutdown. You can shut down your workstation
using the power button located in the left side of the Start menu. Before the computer shuts
down, you should insert a DVD or USB flash drive that contains the external OS (a copy of a live
Linux should work well). For this experiment, you can’t use the Windows Setup Program (or any
WinRE based environments) because the setup procedure clears all the hibernation data before
mounting the system volume.
CHAPTER 12
Startup and shutdown
843
When you switch on the workstation, perform the boot from an external DVD or USB drive.
This procedure varies between different PC manufacturers and usually re uires accessing the
BIOS interface. For instructions on accessing the BIOS and performing the boot from an external
drive, check your workstation’s user manual. (For example, in the Surface Pro and Surface Book
laptops, usually it’s sufficient to press and hold the Volume Up button before pushing and releasing the Power button for entering the BIOS configuration.) When the new OS is ready, mount
the main UEFI system partition with a partitioning tool (depending on the OS type). We don’t
describe this procedure. After the system partition has been correctly mounted, copy the system
Boot Configuration Data file, located in EFI Microsoft Boot BCD, to an external drive (or in the
same USB flash drive used for booting). Then you can restart your PC and wait for Windows to
resume from hibernation.
O
After your PC restarts, run the Registry Editor and open the root
registry key. Then from the File menu, select Load Hive. Browse for your saved BCD file, select
Open, and assign the BCD key name for the new loaded hive. Now you should identify the main
Boot Manager BCD object. In all Windows systems, this root BCD object has the 9DEA862C5CDD-4E70-ACC1-F32B344D4795 GUID. Open the relative key and its le en s subkey. If the
system has been correctly switched off with a hybrid shutdown, you should see the resume and
hiberboot BCD elements (the corresponding keys names are 26000005 and 26000025 see Table
12-2 for further details) with their le en registry value set to 1.
To properly locate the BCD element that corresponds to your Windows Installation, use the
displayorder element (key named 24000001), which lists all the installed OS boot entries. In
the le en registry value, there is a list of all the GUIDs of the BCD objects that describe the
installed operating systems loaders. Check the BCD object that describes the Windows Resume
application, reading the GUID value of the resumeobject BCD element (which corresponds to the
23000006 key). The BCD object with this GUID includes the hibernation file path into the filepath
element, which corresponds to the key named 22000002.
844
CHAPTER 12
Startup and shutdown
Windows Recovery Environment (WinRE)
The Windows Recovery Environment provides an assortment of tools and automated repair technologies to fix the most common startup problems. It includes six main tools
■
■
■
■
■
■
System Restore Allows restoring to a previous restore point in cases in which you can’t boot
the Windows installation to do so, even in safe mode.
System mage Recover Called Complete PC Restore or Automated System Recovery (ASR) in
previous versions of Windows, this restores a Windows installation from a complete backup, not
just from a system restore point, which might not contain all damaged files and lost data.
Startup Repair An automated tool that detects the most common Windows startup problems and automatically attempts to repair them.
PC Reset A tool that removes all the applications and drivers that don’t belong to the standard Windows installation, restores all the settings to their default, and brings back Windows to
its original state after the installation. The user can choose to maintain all personal data files or
remove everything. In the latter case, Windows will be automatically reinstalled from scratch.
Command Prompt For cases where troubleshooting or repair re uires manual intervention
(such as copying files from another drive or manipulating the BCD), you can use the command
prompt to have a full Windows shell that can launch almost any Windows program (as long as
the re uired dependencies can be satisfied) unlike the Recovery Console on earlier versions of
Windows, which only supported a limited set of specialized commands.
Windows emory iagnostic Tool Performs memory diagnostic tests that check for signs
of faulty RAM. Faulty RAM can be the reason for random kernel and application crashes and
erratic system behavior.
When you boot a system from the Windows DVD or boot disks, Windows Setup gives you the choice
of installing Windows or repairing an existing installation. If you choose to repair an installation, the
system displays a screen similar to the modern boot menu (shown in Figure 12-15), which provides different choices.
The user can select to boot from another device, use a different OS (if correctly registered in the
system BCD store), or choose a recovery tool. All the described recovery tools (except for the Memory
Diagnostic Tool) are located in the Troubleshoot section.
The Windows setup application also installs WinRE to a recovery partition on a clean system installation. ou can access WinRE by keeping the Shift key pressed when rebooting the computer through the
relative shutdown button located in the Start menu. If the system uses the Legacy Boot menu, WinRE
can be started using the F8 key to access advanced boot options during Bootmgr execution. If you see
the Repair our Computer option, your machine has a local hard disk copy. Additionally, if your system
failed to boot as the result of damaged files or for any other reason that Winload can understand, it instructs Bootmgr to automatically start WinRE at the next reboot cycle. Instead of the dialog box shown
in Figure 12-15, the recovery environment automatically launches the Startup Repair tool, shown in
Figure 12-16.
CHAPTER 12
Startup and shutdown
845
FIGURE 12-15 The Windows Recovery Environment startup screen.
FIGURE 12-16 The Startup Recovery tool.
At the end of the scan and repair cycle, the tool automatically attempts to fix any damage found,
including replacing system files from the installation media. If the Startup Repair tool cannot automatically fix the damage, you get a chance to try other methods, and the System Recovery Options dialog
box is displayed again.
The Windows Memory Diagnostics Tool can be launched from a working system or from a
Command Prompt opened in WinRE using the mdsched.exe executable. The tool asks the user if they
want to reboot the computer to run the test. If the system uses the Legacy Boot menu, the Memory
Diagnostics Tool can be executed using the Tab key to navigate to the Tools section.
846
CHAPTER 12
Startup and shutdown
Safe mode
Perhaps the most common reason Windows systems become unbootable is that a device driver crashes
the machine during the boot se uence. Because software or hardware configurations can change over
time, latent bugs can surface in drivers at any time. Windows offers a way for an administrator to attack
the problem booting in s e
e. Safe mode is a boot configuration that consists of the minimal set
of device drivers and services. By relying on only the drivers and services that are necessary for booting, Windows avoids loading third-party and other nonessential drivers that might crash.
There are different ways to enter safe mode
■
Boot the system in WinRE and select Startup Settings in the Advanced options (see
Figure 12-17).
FIGURE 12-17 The Startup Settings screen, in which the user can select three different kinds of safe mode.
■
■
In multi-boot environments, select hange e aults r hoose ther ptions in the modern
boot menu and go to the Troubleshoot section to select the Startup Settings button as in the
previous case.
If your system uses the Legacy Boot menu, press the F8 key to enter the Advanced Boot
Options menu.
CHAPTER 12
Startup and shutdown
847
ou typically choose from three safe-mode variations Safe mode, Safe mode with networking, and
Safe mode with command prompt. Standard safe mode includes the minimum number of device drivers and services necessary to boot successfully. Networking-enabled safe mode adds network drivers and
services to the drivers and services that standard safe mode includes. Finally, safe mode with command
prompt is identical to standard safe mode except that Windows runs the Command Prompt application
(Cmd.exe) instead of Windows Explorer as the shell when the system enables GUI mode.
Windows includes a fourth safe mode Directory Services Restore mode which is different from
the standard and networking-enabled safe modes. ou use Directory Services Restore mode to boot
the system into a mode where the Active Directory service of a domain controller is offline and unopened. This allows you to perform repair operations on the database or restore it from backup media.
All drivers and services, with the exception of the Active Directory service, load during a Directory
Services Restore mode boot. In cases when you can’t log on to a system because of Active Directory
database corruption, this mode enables you to repair the corruption.
Driver loading in safe mode
ow does Windows know which device drivers and services are part of standard and networkingenabled safe mode The answer lies in the KLM S STEM CurrentControlSet Control SafeBoot registry key. This key contains the Minimal and Network subkeys. Each subkey contains more subkeys that
specify the names of device drivers or services or of groups of drivers. For example, the s
spl y sys
subkey identifies the Basic display device driver that the startup configuration includes. The Basic
display driver provides basic graphics services for any PC-compatible display adapter. The system uses
this driver as the safe-mode display driver in lieu of a driver that might take advantage of an adapter’s
advanced hardware features but that might also prevent the system from booting. Each subkey under
the SafeBoot key has a default value that describes what the subkey identifies the s
spl y sys
subkey’s default value is Driver.
The Boot file system subkey has as its default value Driver Group. When developers design a device
driver’s installation script (.inf file), they can specify that the device driver belongs to a driver group. The
driver groups that a system defines are listed in the List value of the KLM S STEM CurrentControlSet
Control ServiceGroupOrder key. A developer specifies a driver as a member of a group to indicate to
Windows at what point during the boot process the driver should start. The er e r upOr er key’s
primary purpose is to define the order in which driver groups load some driver types must load either
before or after other driver types. The Group value beneath a driver’s configuration registry key associates the driver with a group.
Driver and service configuration keys reside beneath KLM S STEM CurrentControlSet Services.
If you look under this key, you’ll find the s
spl y key for the basic display device driver, which you
can see in the registry is a member of the Video group. Any file system drivers that Windows re uires
for access to the Windows system drive are automatically loaded as if part of the Boot file system
group. Other file system drivers are part of the File System group, which the standard and networkingenabled safe-mode configurations also include.
When you boot into a safe-mode configuration, the boot loader (Winload) passes an associated switch
to the kernel (Ntoskrnl.exe) as a command-line parameter, along with any switches you’ve specified in the
848
CHAPTER 12
Startup and shutdown
BCD for the installation you’re booting. If you boot into any safe mode, Winload sets the safeboot BCD option with a value describing the type of safe mode you select. For standard safe mode, Winload sets n mal, and for networking-enabled safe mode, it adds ne
r . Winload adds n
l and sets l ern es ell
for safe mode with command prompt and dsrepair for Directory Services Restore mode.
Note An exception exists regarding the drivers that safe mode excludes from a boot.
Winload, rather than the kernel, loads any drivers with a Start value of 0 in their registry key,
which specifies loading the drivers at boot time. Winload doesn’t check the SafeBoot registry
key because it assumes that any driver with a Start value of 0 is re uired for the system to
boot successfully. Because Winload doesn’t check the SafeBoot registry key to identify which
drivers to load, Winload loads all boot-start drivers (and later Ntoskrnl starts them).
The Windows kernel scans the boot parameters in search of the safe-mode switches at the end of
phase 1 of the boot process (
se n l
n s r , see the Kernel initialization phase 1 section
earlier in this chapter), and sets the internal variable n
e
e to a value that reflects the switches
it finds. During the n
e
function, the kernel writes the n
e
e value to the registry
value KLM S STEM CurrentControlSet Control SafeBoot Option OptionValue so that user-mode
components, such as the SCM, can determine what boot mode the system is in. In addition, if the system
is booting in safe mode with command prompt, the kernel sets the KLM S STEM CurrentControlSet
Control SafeBoot Option UseAlternateShell value to 1. The kernel records the parameters that Winload
passes to it in the value KLM S STEM CurrentControlSet Control SystemStartOptions.
When the I/O manager kernel subsystem loads device drivers that KLM S STEM CurrentControlSet
Services specifies, the I/O manager executes the function p
r er. When the Plug and Play manager detects a new device and wants to dynamically load the device driver for the detected device, the Plug
and Play manager executes the function p ll r er
e e. Both these functions call the function
p e
r er
before they load the driver in uestion. p e
r er
checks the value
of n
e
e and determines whether the driver should load. For example, if the system boots in
standard safe mode, p e
r er
looks for the driver’s group, if the driver has one, under the
n
l subkey. If p e
r er
finds the driver’s group listed, p e
r er
indicates
to its caller that the driver can load. Otherwise, p e
r er
looks for the driver’s name under
the n
l subkey. If the driver’s name is listed as a subkey, the driver can load. If p e
r er
can’t find the driver group or driver name subkeys, the driver will not be loaded. If the system boots in
networking-enabled safe mode, p e
r er
performs the searches on the e
r subkey.
If the system doesn’t boot in safe mode, p e
r er
lets all drivers load.
Safe-mode-aware user programs
When the SCM user-mode component (which Services.exe implements) initializes during the
boot process, the SCM checks the value of KLM S STEM CurrentControlSet Control SafeBoot
Option OptionValue to determine whether the system is performing a safe-mode boot. If so, the SCM
mirrors the actions of p e
r er
. Although the SCM processes the services listed under
KLM S STEM CurrentControlSet Services, it loads only services that the appropriate safe-mode
CHAPTER 12
Startup and shutdown
849
subkey specifies by name. ou can find more information on the SCM initialization process in the section Services in Chapter 10.
Userinit, the component that initializes a user’s environment when the user logs on ( SystemRoot
System32 Userinit.exe), is another user-mode component that needs to know whether the system is
booting in safe mode. It checks the value of KLM S STEM CurrentControlSet Control SafeBoot
Option UseAlternateShell. If this value is set, Userinit runs the program specified as the user’s shell in
the value KLM S STEM CurrentControlSet Control SafeBoot AlternateShell rather than executing
Explorer.exe. Windows writes the program name Cmd.exe to the l ern e ell value during installation, making the Windows command prompt the default shell for safe mode with command prompt.
Even though the command prompt is the shell, you can type Explorer.exe at the command prompt to
start Windows Explorer, and you can run any other GUI program from the command prompt as well.
ow does an application determine whether the system is booting in safe mode By calling the
Windows e ys e
er s
OO function. Batch scripts that need to perform certain
operations when the system boots in safe mode look for the
OO O O environment variable
because the system defines this environment variable only when booting in safe mode.
Boot status file
Windows uses a
s us file ( SystemRoot Bootstat.dat) to record the fact that it has progressed
through various stages of the system life cycle, including boot and shutdown. This allows the Boot
Manager, Windows loader, and Startup Repair tool to detect abnormal shutdown or a failure to shut
down cleanly and offer the user recovery and diagnostic boot options, like the Windows Recovery
environment. This binary file contains information through which the system reports the success of the
following phases of the system life cycle
■
Boot
■
Shutdown and hybrid shutdown
■
Resume from hibernate or suspend
The boot status file also indicates whether a problem was detected the last time the user attempted
to boot the operating system and the recovery options shown, indicating that the user has been made
aware of the problem and taken action. Runtime Library APIs (Rtl) in Ntdll.dll contain the private interfaces that Windows uses to read from and write to the file. Like the BCD, it cannot be edited by users.
Conclusion
In this chapter, we examined the detailed steps involved in starting and shutting down Windows (both
normally and in error cases). A lot of new security technologies have been designed and implemented
with the goal of keeping the system safe even in its earlier startup stages and rendering it immune
from a variety of external attacks. We examined the overall structure of Windows and the core system
mechanisms that get the system going, keep it running, and eventually shut it down, even in a fast way.
850
CHAPTER 12
Startup and shutdown
APPENDIX
Contents of Windows Internals,
Seventh Edition, Part 1
Introduction . . . . . . . . . . . . . . . . . . . . . . . . . . . . . . . . . . . . . . . . . . . . . . . . . . . . . . . . . . xi
Chapter 1
Concepts and tools
1
Windows operating system versions . . . . . . . . . . . . . . . . . . . . . . . . . . . . . . . . . . . . 1
Windows 10 and future Windows versions . . . . . . . . . . . . . . . . . . . . . . . . 3
Windows 10 and OneCore . . . . . . . . . . . . . . . . . . . . . . . . . . . . . . . . . . . . . . . . 3
Foundation concepts and terms . . . . . . . . . . . . . . . . . . . . . . . . . . . . . . . . . . . . . . . . 4
Windows API . . . . . . . . . . . . . . . . . . . . . . . . . . . . . . . . . . . . . . . . . . . . . . . . . . . . 4
Services, functions, and routines . . . . . . . . . . . . . . . . . . . . . . . . . . . . . . . . . 7
Processes . . . . . . . . . . . . . . . . . . . . . . . . . . . . . . . . . . . . . . . . . . . . . . . . . . . . . . . 8
Threads . . . . . . . . . . . . . . . . . . . . . . . . . . . . . . . . . . . . . . . . . . . . . . . . . . . . . . . . 18
Jobs . . . . . . . . . . . . . . . . . . . . . . . . . . . . . . . . . . . . . . . . . . . . . . . . . . . . . . . . . . . 20
Virtual memory . . . . . . . . . . . . . . . . . . . . . . . . . . . . . . . . . . . . . . . . . . . . . . . . 21
Kernel mode vs. user mode . . . . . . . . . . . . . . . . . . . . . . . . . . . . . . . . . . . . . 23
Hypervisor . . . . . . . . . . . . . . . . . . . . . . . . . . . . . . . . . . . . . . . . . . . . . . . . . . . . . 27
Firmware . . . . . . . . . . . . . . . . . . . . . . . . . . . . . . . . . . . . . . . . . . . . . . . . . . . . . . . 29
Terminal Services and multiple sessions . . . . . . . . . . . . . . . . . . . . . . . . . . 29
Objects and handles . . . . . . . . . . . . . . . . . . . . . . . . . . . . . . . . . . . . . . . . . . . . 30
Security . . . . . . . . . . . . . . . . . . . . . . . . . . . . . . . . . . . . . . . . . . . . . . . . . . . . . . . . 31
Registry . . . . . . . . . . . . . . . . . . . . . . . . . . . . . . . . . . . . . . . . . . . . . . . . . . . . . . . . 32
Unicode . . . . . . . . . . . . . . . . . . . . . . . . . . . . . . . . . . . . . . . . . . . . . . . . . . . . . . . . 33
Digging into Windows internals . . . . . . . . . . . . . . . . . . . . . . . . . . . . . . . . . . . . . . . 35
Performance Monitor and Resource Monitor . . . . . . . . . . . . . . . . . . . . . 36
Kernel debugging . . . . . . . . . . . . . . . . . . . . . . . . . . . . . . . . . . . . . . . . . . . . . . 38
Windows Software Development Kit. . . . . . . . . . . . . . . . . . . . . . . . . . . . . 43
Windows Driver Kit . . . . . . . . . . . . . . . . . . . . . . . . . . . . . . . . . . . . . . . . . . . . . 43
Sysinternals tools . . . . . . . . . . . . . . . . . . . . . . . . . . . . . . . . . . . . . . . . . . . . . . .44
Conclusion . . . . . . . . . . . . . . . . . . . . . . . . . . . . . . . . . . . . . . . . . . . . . . . . . . . . . . . . . . .44
851
Chapter 2
System architecture
45
Requirements and design goals . . . . . . . . . . . . . . . . . . . . . . . . . . . . . . . . . . . . . . . 45
Operating system model . . . . . . . . . . . . . . . . . . . . . . . . . . . . . . . . . . . . . . . . . . . . . .46
Architecture overview . . . . . . . . . . . . . . . . . . . . . . . . . . . . . . . . . . . . . . . . . . . . . . . . 47
Portability . . . . . . . . . . . . . . . . . . . . . . . . . . . . . . . . . . . . . . . . . . . . . . . . . . . . . . 50
Symmetric multiprocessing . . . . . . . . . . . . . . . . . . . . . . . . . . . . . . . . . . . . . 51
Scalability . . . . . . . . . . . . . . . . . . . . . . . . . . . . . . . . . . . . . . . . . . . . . . . . . . . . . . 53
Differences between client and server versions . . . . . . . . . . . . . . . . . . . 54
Checked build . . . . . . . . . . . . . . . . . . . . . . . . . . . . . . . . . . . . . . . . . . . . . . . . . . 57
Virtualization-based security architecture overview . . . . . . . . . . . . . . . . . . . . 59
Key system components . . . . . . . . . . . . . . . . . . . . . . . . . . . . . . . . . . . . . . . . . . . . . . 61
Environment subsystems and subsystem DLLs. . . . . . . . . . . . . . . . . . . . 62
Other subsystems . . . . . . . . . . . . . . . . . . . . . . . . . . . . . . . . . . . . . . . . . . . . . . 68
Executive. . . . . . . . . . . . . . . . . . . . . . . . . . . . . . . . . . . . . . . . . . . . . . . . . . . . . . . 72
Kernel. . . . . . . . . . . . . . . . . . . . . . . . . . . . . . . . . . . . . . . . . . . . . . . . . . . . . . . . . . 75
Hardware abstraction layer. . . . . . . . . . . . . . . . . . . . . . . . . . . . . . . . . . . . . . 79
Device drivers . . . . . . . . . . . . . . . . . . . . . . . . . . . . . . . . . . . . . . . . . . . . . . . . . . 82
System processes . . . . . . . . . . . . . . . . . . . . . . . . . . . . . . . . . . . . . . . . . . . . . . . 88
Conclusion . . . . . . . . . . . . . . . . . . . . . . . . . . . . . . . . . . . . . . . . . . . . . . . . . . . . . . . . . . . 99
Chapter 3
Processes and jobs
101
Creating a process . . . . . . . . . . . . . . . . . . . . . . . . . . . . . . . . . . . . . . . . . . . . . . . . . . . .101
CreateProcess* functions arguments. . . . . . . . . . . . . . . . . . . . . . . . . . . . 102
Creating Windows modern processes . . . . . . . . . . . . . . . . . . . . . . . . . . . 103
Creating other kinds of processes. . . . . . . . . . . . . . . . . . . . . . . . . . . . . . . 104
Process internals. . . . . . . . . . . . . . . . . . . . . . . . . . . . . . . . . . . . . . . . . . . . . . . . . . . . . 105
Protected processes . . . . . . . . . . . . . . . . . . . . . . . . . . . . . . . . . . . . . . . . . . . . . . . . . 113
Protected Process Light (PPL). . . . . . . . . . . . . . . . . . . . . . . . . . . . . . . . . . . 115
Third-party PPL support . . . . . . . . . . . . . . . . . . . . . . . . . . . . . . . . . . . . . . . 119
Minimal and Pico processes . . . . . . . . . . . . . . . . . . . . . . . . . . . . . . . . . . . . . . . . . . 120
Minimal processes . . . . . . . . . . . . . . . . . . . . . . . . . . . . . . . . . . . . . . . . . . . . . 120
Pico processes . . . . . . . . . . . . . . . . . . . . . . . . . . . . . . . . . . . . . . . . . . . . . . . . . 121
Trustlets (secure processes). . . . . . . . . . . . . . . . . . . . . . . . . . . . . . . . . . . . . . . . . . . 123
Trustlet structure . . . . . . . . . . . . . . . . . . . . . . . . . . . . . . . . . . . . . . . . . . . . . . 123
852
Contents of Windows Internals, Part 1, 7th Edition
Trustlet policy metadata . . . . . . . . . . . . . . . . . . . . . . . . . . . . . . . . . . . . . . . 124
Trustlet attributes. . . . . . . . . . . . . . . . . . . . . . . . . . . . . . . . . . . . . . . . . . . . . . 125
System built-in Trustlets . . . . . . . . . . . . . . . . . . . . . . . . . . . . . . . . . . . . . . . . 125
Trustlet identity . . . . . . . . . . . . . . . . . . . . . . . . . . . . . . . . . . . . . . . . . . . . . . . 126
Isolated user-mode services . . . . . . . . . . . . . . . . . . . . . . . . . . . . . . . . . . . . 127
Trustlet-accessible system calls . . . . . . . . . . . . . . . . . . . . . . . . . . . . . . . . . 128
Flow of CreateProcess . . . . . . . . . . . . . . . . . . . . . . . . . . . . . . . . . . . . . . . . . . . . . . . 129
Stage 1 Converting and validating parameters and flags . . . . . . . . . 131
Stage 2: Opening the image to be executed . . . . . . . . . . . . . . . . . . . . . 135
Stage 3: Creating the Windows executive process object . . . . . . . . . 138
Stage 4: Creating the initial thread and its stack and context . . . . . 144
Stage 5 Performing Windows subsystem–specific initialization . . 146
Stage 6: Starting execution of the initial thread . . . . . . . . . . . . . . . . . . 148
Stage 7: Performing process initialization in the context
of the new process. . . . . . . . . . . . . . . . . . . . . . . . . . . . . . . . . . . . . . . . . . . 148
Terminating a process . . . . . . . . . . . . . . . . . . . . . . . . . . . . . . . . . . . . . . . . . . . . . . . 154
Image loader . . . . . . . . . . . . . . . . . . . . . . . . . . . . . . . . . . . . . . . . . . . . . . . . . . . . . . . . 155
Early process initialization . . . . . . . . . . . . . . . . . . . . . . . . . . . . . . . . . . . . . . 157
DLL name resolution and redirection . . . . . . . . . . . . . . . . . . . . . . . . . . . 160
Loaded module database . . . . . . . . . . . . . . . . . . . . . . . . . . . . . . . . . . . . . . 164
Import parsing . . . . . . . . . . . . . . . . . . . . . . . . . . . . . . . . . . . . . . . . . . . . . . . . 168
Post-import process initialization . . . . . . . . . . . . . . . . . . . . . . . . . . . . . . . 170
SwitchBack . . . . . . . . . . . . . . . . . . . . . . . . . . . . . . . . . . . . . . . . . . . . . . . . . . . . 171
API Sets . . . . . . . . . . . . . . . . . . . . . . . . . . . . . . . . . . . . . . . . . . . . . . . . . . . . . . . 173
Jobs . . . . . . . . . . . . . . . . . . . . . . . . . . . . . . . . . . . . . . . . . . . . . . . . . . . . . . . . . . . . . . . . 176
Job limits . . . . . . . . . . . . . . . . . . . . . . . . . . . . . . . . . . . . . . . . . . . . . . . . . . . . . . 177
Working with a job . . . . . . . . . . . . . . . . . . . . . . . . . . . . . . . . . . . . . . . . . . . . 178
Nested jobs . . . . . . . . . . . . . . . . . . . . . . . . . . . . . . . . . . . . . . . . . . . . . . . . . . . 179
Windows containers (server silos) . . . . . . . . . . . . . . . . . . . . . . . . . . . . . . . 183
Conclusion . . . . . . . . . . . . . . . . . . . . . . . . . . . . . . . . . . . . . . . . . . . . . . . . . . . . . . . . . . 191
Chapter 4
Threads
193
Creating threads. . . . . . . . . . . . . . . . . . . . . . . . . . . . . . . . . . . . . . . . . . . . . . . . . . . . . 193
Thread internals . . . . . . . . . . . . . . . . . . . . . . . . . . . . . . . . . . . . . . . . . . . . . . . . . . . . . 194
Contents of Windows Internals, Part 1, 7th Edition
853
Data structures . . . . . . . . . . . . . . . . . . . . . . . . . . . . . . . . . . . . . . . . . . . . . . . . 194
Birth of a thread . . . . . . . . . . . . . . . . . . . . . . . . . . . . . . . . . . . . . . . . . . . . . . .206
Examining thread activity . . . . . . . . . . . . . . . . . . . . . . . . . . . . . . . . . . . . . . . . . . . .207
Limitations on protected process threads . . . . . . . . . . . . . . . . . . . . . . . 212
Thread scheduling . . . . . . . . . . . . . . . . . . . . . . . . . . . . . . . . . . . . . . . . . . . . . . . . . . . 214
Overview of Windows scheduling . . . . . . . . . . . . . . . . . . . . . . . . . . . . . . 214
Priority levels . . . . . . . . . . . . . . . . . . . . . . . . . . . . . . . . . . . . . . . . . . . . . . . . . . 215
Thread states . . . . . . . . . . . . . . . . . . . . . . . . . . . . . . . . . . . . . . . . . . . . . . . . . .223
Dispatcher database . . . . . . . . . . . . . . . . . . . . . . . . . . . . . . . . . . . . . . . . . . .228
Quantum . . . . . . . . . . . . . . . . . . . . . . . . . . . . . . . . . . . . . . . . . . . . . . . . . . . . . 231
Priority boosts . . . . . . . . . . . . . . . . . . . . . . . . . . . . . . . . . . . . . . . . . . . . . . . . .238
Context switching . . . . . . . . . . . . . . . . . . . . . . . . . . . . . . . . . . . . . . . . . . . . .255
Scheduling scenarios . . . . . . . . . . . . . . . . . . . . . . . . . . . . . . . . . . . . . . . . . .256
Idle threads . . . . . . . . . . . . . . . . . . . . . . . . . . . . . . . . . . . . . . . . . . . . . . . . . . .260
Thread suspension . . . . . . . . . . . . . . . . . . . . . . . . . . . . . . . . . . . . . . . . . . . . .264
(Deep) freeze . . . . . . . . . . . . . . . . . . . . . . . . . . . . . . . . . . . . . . . . . . . . . . . . . .264
Thread selection . . . . . . . . . . . . . . . . . . . . . . . . . . . . . . . . . . . . . . . . . . . . . . .266
Multiprocessor systems . . . . . . . . . . . . . . . . . . . . . . . . . . . . . . . . . . . . . . . .268
Thread selection on multiprocessor systems . . . . . . . . . . . . . . . . . . . .283
Processor selection . . . . . . . . . . . . . . . . . . . . . . . . . . . . . . . . . . . . . . . . . . . .284
Heterogeneous scheduling (big.LITTLE). . . . . . . . . . . . . . . . . . . . . . . . .286
Group-based scheduling . . . . . . . . . . . . . . . . . . . . . . . . . . . . . . . . . . . . . . . . . . . . .287
Dynamic fair share scheduling . . . . . . . . . . . . . . . . . . . . . . . . . . . . . . . . . .289
CPU rate limits. . . . . . . . . . . . . . . . . . . . . . . . . . . . . . . . . . . . . . . . . . . . . . . . .292
Dynamic processor addition and replacement . . . . . . . . . . . . . . . . . .295
Worker factories (thread pools). . . . . . . . . . . . . . . . . . . . . . . . . . . . . . . . . . . . . . .297
Worker factory creation . . . . . . . . . . . . . . . . . . . . . . . . . . . . . . . . . . . . . . . .298
Conclusion . . . . . . . . . . . . . . . . . . . . . . . . . . . . . . . . . . . . . . . . . . . . . . . . . . . . . . . . . .300
Chapter 5
Memory management
301
Introduction to the memory manager . . . . . . . . . . . . . . . . . . . . . . . . . . . . . . . . 301
Memory manager components . . . . . . . . . . . . . . . . . . . . . . . . . . . . . . . .302
Large and small pages . . . . . . . . . . . . . . . . . . . . . . . . . . . . . . . . . . . . . . . . .303
Examining memory usage . . . . . . . . . . . . . . . . . . . . . . . . . . . . . . . . . . . . .305
854
Contents of Windows Internals, Part 1, 7th Edition
Internal synchronization . . . . . . . . . . . . . . . . . . . . . . . . . . . . . . . . . . . . . . .308
Services provided by the memory manager . . . . . . . . . . . . . . . . . . . . . . . . . . .309
Page states and memory allocations . . . . . . . . . . . . . . . . . . . . . . . . . . . . 310
Commit charge and commit limit . . . . . . . . . . . . . . . . . . . . . . . . . . . . . . . 313
Locking memory . . . . . . . . . . . . . . . . . . . . . . . . . . . . . . . . . . . . . . . . . . . . . . 314
Allocation granularity . . . . . . . . . . . . . . . . . . . . . . . . . . . . . . . . . . . . . . . . . . 314
Shared memory and mapped files . . . . . . . . . . . . . . . . . . . . . . . . . . . . . . 315
Protecting memory . . . . . . . . . . . . . . . . . . . . . . . . . . . . . . . . . . . . . . . . . . . . 317
Data Execution Prevention . . . . . . . . . . . . . . . . . . . . . . . . . . . . . . . . . . . . . 319
Copy-on-write . . . . . . . . . . . . . . . . . . . . . . . . . . . . . . . . . . . . . . . . . . . . . . . . 321
Address Windowing Extensions . . . . . . . . . . . . . . . . . . . . . . . . . . . . . . . .323
Kernel-mode heaps (system memory pools) . . . . . . . . . . . . . . . . . . . . . . . . . .324
Pool sizes . . . . . . . . . . . . . . . . . . . . . . . . . . . . . . . . . . . . . . . . . . . . . . . . . . . . .325
Monitoring pool usage . . . . . . . . . . . . . . . . . . . . . . . . . . . . . . . . . . . . . . . .327
Look-aside lists . . . . . . . . . . . . . . . . . . . . . . . . . . . . . . . . . . . . . . . . . . . . . . . . 331
Heap manager . . . . . . . . . . . . . . . . . . . . . . . . . . . . . . . . . . . . . . . . . . . . . . . . . . . . . .332
Process heaps . . . . . . . . . . . . . . . . . . . . . . . . . . . . . . . . . . . . . . . . . . . . . . . . .333
Heap types . . . . . . . . . . . . . . . . . . . . . . . . . . . . . . . . . . . . . . . . . . . . . . . . . . . .334
The NT heap . . . . . . . . . . . . . . . . . . . . . . . . . . . . . . . . . . . . . . . . . . . . . . . . . .334
Heap synchronization. . . . . . . . . . . . . . . . . . . . . . . . . . . . . . . . . . . . . . . . . .334
The low-fragmentation heap . . . . . . . . . . . . . . . . . . . . . . . . . . . . . . . . . . .335
The segment heap . . . . . . . . . . . . . . . . . . . . . . . . . . . . . . . . . . . . . . . . . . . . .336
Heap security features . . . . . . . . . . . . . . . . . . . . . . . . . . . . . . . . . . . . . . . . . 341
Heap debugging features . . . . . . . . . . . . . . . . . . . . . . . . . . . . . . . . . . . . . .342
Pageheap . . . . . . . . . . . . . . . . . . . . . . . . . . . . . . . . . . . . . . . . . . . . . . . . . . . . .343
Fault-tolerant heap . . . . . . . . . . . . . . . . . . . . . . . . . . . . . . . . . . . . . . . . . . . .347
Virtual address space layouts . . . . . . . . . . . . . . . . . . . . . . . . . . . . . . . . . . . . . . . . .348
x86 address space layouts . . . . . . . . . . . . . . . . . . . . . . . . . . . . . . . . . . . . . .349
x86 system address space layout . . . . . . . . . . . . . . . . . . . . . . . . . . . . . . .352
x86 session space . . . . . . . . . . . . . . . . . . . . . . . . . . . . . . . . . . . . . . . . . . . . . .353
System page table entries . . . . . . . . . . . . . . . . . . . . . . . . . . . . . . . . . . . . . .355
ARM address space layout . . . . . . . . . . . . . . . . . . . . . . . . . . . . . . . . . . . . .356
64-bit address space layout . . . . . . . . . . . . . . . . . . . . . . . . . . . . . . . . . . . .357
x64 virtual addressing limitations . . . . . . . . . . . . . . . . . . . . . . . . . . . . . . .359
Dynamic system virtual address space management. . . . . . . . . . . . .359
Contents of Windows Internals, Part 1, 7th Edition
855
System virtual address space quotas . . . . . . . . . . . . . . . . . . . . . . . . . . . .364
User address space layout . . . . . . . . . . . . . . . . . . . . . . . . . . . . . . . . . . . . . .365
Address translation . . . . . . . . . . . . . . . . . . . . . . . . . . . . . . . . . . . . . . . . . . . . . . . . . . 371
x86 virtual address translation . . . . . . . . . . . . . . . . . . . . . . . . . . . . . . . . . . 371
Translation look-aside buffer . . . . . . . . . . . . . . . . . . . . . . . . . . . . . . . . . . .377
x64 virtual address translation . . . . . . . . . . . . . . . . . . . . . . . . . . . . . . . . . .380
ARM virtual address translation . . . . . . . . . . . . . . . . . . . . . . . . . . . . . . . . 381
Page fault handling . . . . . . . . . . . . . . . . . . . . . . . . . . . . . . . . . . . . . . . . . . . . . . . . . .383
Invalid PTEs . . . . . . . . . . . . . . . . . . . . . . . . . . . . . . . . . . . . . . . . . . . . . . . . . . .384
Prototype PTEs . . . . . . . . . . . . . . . . . . . . . . . . . . . . . . . . . . . . . . . . . . . . . . . .385
In-paging I/O . . . . . . . . . . . . . . . . . . . . . . . . . . . . . . . . . . . . . . . . . . . . . . . . .386
Collided page faults . . . . . . . . . . . . . . . . . . . . . . . . . . . . . . . . . . . . . . . . . . .387
Clustered page faults . . . . . . . . . . . . . . . . . . . . . . . . . . . . . . . . . . . . . . . . . .387
Page files . . . . . . . . . . . . . . . . . . . . . . . . . . . . . . . . . . . . . . . . . . . . . . . . . . . . . .389
Commit charge and the system commit limit . . . . . . . . . . . . . . . . . . . .394
Commit charge and page file size. . . . . . . . . . . . . . . . . . . . . . . . . . . . . . .397
Stacks . . . . . . . . . . . . . . . . . . . . . . . . . . . . . . . . . . . . . . . . . . . . . . . . . . . . . . . . . . . . . . .398
User stacks . . . . . . . . . . . . . . . . . . . . . . . . . . . . . . . . . . . . . . . . . . . . . . . . . . . .399
Kernel stacks . . . . . . . . . . . . . . . . . . . . . . . . . . . . . . . . . . . . . . . . . . . . . . . . . 400
DPC stack . . . . . . . . . . . . . . . . . . . . . . . . . . . . . . . . . . . . . . . . . . . . . . . . . . . . . 401
Virtual address descriptors . . . . . . . . . . . . . . . . . . . . . . . . . . . . . . . . . . . . . . . . . . . 401
Process VADs . . . . . . . . . . . . . . . . . . . . . . . . . . . . . . . . . . . . . . . . . . . . . . . . . .402
Rotate VADs . . . . . . . . . . . . . . . . . . . . . . . . . . . . . . . . . . . . . . . . . . . . . . . . . . .403
NUMA . . . . . . . . . . . . . . . . . . . . . . . . . . . . . . . . . . . . . . . . . . . . . . . . . . . . . . . . . . . . . 404
Section objects . . . . . . . . . . . . . . . . . . . . . . . . . . . . . . . . . . . . . . . . . . . . . . . . . . . . . .405
Working sets . . . . . . . . . . . . . . . . . . . . . . . . . . . . . . . . . . . . . . . . . . . . . . . . . . . . . . . . 412
Demand paging . . . . . . . . . . . . . . . . . . . . . . . . . . . . . . . . . . . . . . . . . . . . . . . 413
Logical prefetcher and ReadyBoot . . . . . . . . . . . . . . . . . . . . . . . . . . . . . . 413
Placement policy . . . . . . . . . . . . . . . . . . . . . . . . . . . . . . . . . . . . . . . . . . . . . . 416
Working set management . . . . . . . . . . . . . . . . . . . . . . . . . . . . . . . . . . . . . 417
Balance set manager and swapper . . . . . . . . . . . . . . . . . . . . . . . . . . . . . . 421
System working sets . . . . . . . . . . . . . . . . . . . . . . . . . . . . . . . . . . . . . . . . . . .422
Memory notification events . . . . . . . . . . . . . . . . . . . . . . . . . . . . . . . . . . . .423
856
Contents of Windows Internals, Part 1, 7th Edition
Page frame number database . . . . . . . . . . . . . . . . . . . . . . . . . . . . . . . . . . . . . . . .425
Page list dynamics . . . . . . . . . . . . . . . . . . . . . . . . . . . . . . . . . . . . . . . . . . . . .428
Page priority . . . . . . . . . . . . . . . . . . . . . . . . . . . . . . . . . . . . . . . . . . . . . . . . . .436
Modified page writer and mapped page writer . . . . . . . . . . . . . . . . . .438
PFN data structures . . . . . . . . . . . . . . . . . . . . . . . . . . . . . . . . . . . . . . . . . . . 440
Page file reservation . . . . . . . . . . . . . . . . . . . . . . . . . . . . . . . . . . . . . . . . . . 443
Physical memory limits . . . . . . . . . . . . . . . . . . . . . . . . . . . . . . . . . . . . . . . . . . . . . 446
Windows client memory limits . . . . . . . . . . . . . . . . . . . . . . . . . . . . . . . . .447
Memory compression . . . . . . . . . . . . . . . . . . . . . . . . . . . . . . . . . . . . . . . . . . . . . . 449
Compression illustration . . . . . . . . . . . . . . . . . . . . . . . . . . . . . . . . . . . . . . .450
Compression architecture . . . . . . . . . . . . . . . . . . . . . . . . . . . . . . . . . . . . . .453
Memory partitions . . . . . . . . . . . . . . . . . . . . . . . . . . . . . . . . . . . . . . . . . . . . . . . . . .456
Memory combining . . . . . . . . . . . . . . . . . . . . . . . . . . . . . . . . . . . . . . . . . . . . . . . . .459
The search phase . . . . . . . . . . . . . . . . . . . . . . . . . . . . . . . . . . . . . . . . . . . . . .460
The classification phase . . . . . . . . . . . . . . . . . . . . . . . . . . . . . . . . . . . . . . . . 461
The page combining phase . . . . . . . . . . . . . . . . . . . . . . . . . . . . . . . . . . . .462
From private to shared PTE . . . . . . . . . . . . . . . . . . . . . . . . . . . . . . . . . . . . .462
Combined pages release . . . . . . . . . . . . . . . . . . . . . . . . . . . . . . . . . . . . . . 464
Memory enclaves. . . . . . . . . . . . . . . . . . . . . . . . . . . . . . . . . . . . . . . . . . . . . . . . . . . .467
Programmatic interface . . . . . . . . . . . . . . . . . . . . . . . . . . . . . . . . . . . . . . . .468
Memory enclave initializations . . . . . . . . . . . . . . . . . . . . . . . . . . . . . . . . .469
Enclave construction . . . . . . . . . . . . . . . . . . . . . . . . . . . . . . . . . . . . . . . . . . .469
Loading data into an enclave . . . . . . . . . . . . . . . . . . . . . . . . . . . . . . . . . . . 471
Initializing an enclave . . . . . . . . . . . . . . . . . . . . . . . . . . . . . . . . . . . . . . . . . .472
Proactive memory management (SuperFetch) . . . . . . . . . . . . . . . . . . . . . . . .472
Components . . . . . . . . . . . . . . . . . . . . . . . . . . . . . . . . . . . . . . . . . . . . . . . . . .473
Tracing and logging . . . . . . . . . . . . . . . . . . . . . . . . . . . . . . . . . . . . . . . . . . . 474
Scenarios. . . . . . . . . . . . . . . . . . . . . . . . . . . . . . . . . . . . . . . . . . . . . . . . . . . . . .475
Page priority and rebalancing . . . . . . . . . . . . . . . . . . . . . . . . . . . . . . . . . . 476
Robust performance . . . . . . . . . . . . . . . . . . . . . . . . . . . . . . . . . . . . . . . . . . .478
ReadyBoost . . . . . . . . . . . . . . . . . . . . . . . . . . . . . . . . . . . . . . . . . . . . . . . . . . .479
ReadyDrive . . . . . . . . . . . . . . . . . . . . . . . . . . . . . . . . . . . . . . . . . . . . . . . . . . . .480
Process reflection . . . . . . . . . . . . . . . . . . . . . . . . . . . . . . . . . . . . . . . . . . . . . .480
Conclusion . . . . . . . . . . . . . . . . . . . . . . . . . . . . . . . . . . . . . . . . . . . . . . . . . . . . . . . . . .482
Contents of Windows Internals, Part 1, 7th Edition
857
Chapter 6
I/O system
483
I/O system components. . . . . . . . . . . . . . . . . . . . . . . . . . . . . . . . . . . . . . . . . . . . . .483
The I/O manager . . . . . . . . . . . . . . . . . . . . . . . . . . . . . . . . . . . . . . . . . . . . . .485
Typical I/O processing . . . . . . . . . . . . . . . . . . . . . . . . . . . . . . . . . . . . . . . . .486
Interrupt Request Levels and Deferred Procedure Calls . . . . . . . . . . . . . . . .488
Interrupt Request Levels . . . . . . . . . . . . . . . . . . . . . . . . . . . . . . . . . . . . . . .488
Deferred Procedure Calls . . . . . . . . . . . . . . . . . . . . . . . . . . . . . . . . . . . . . .490
Device drivers . . . . . . . . . . . . . . . . . . . . . . . . . . . . . . . . . . . . . . . . . . . . . . . . . . . . . . .492
Types of device drivers . . . . . . . . . . . . . . . . . . . . . . . . . . . . . . . . . . . . . . . . .492
Structure of a driver . . . . . . . . . . . . . . . . . . . . . . . . . . . . . . . . . . . . . . . . . . .498
Driver objects and device objects . . . . . . . . . . . . . . . . . . . . . . . . . . . . . . .500
Opening devices. . . . . . . . . . . . . . . . . . . . . . . . . . . . . . . . . . . . . . . . . . . . . . .507
I/O processing. . . . . . . . . . . . . . . . . . . . . . . . . . . . . . . . . . . . . . . . . . . . . . . . . . . . . . . 510
Types of I/O . . . . . . . . . . . . . . . . . . . . . . . . . . . . . . . . . . . . . . . . . . . . . . . . . . . 511
I/O request packets . . . . . . . . . . . . . . . . . . . . . . . . . . . . . . . . . . . . . . . . . . . . 513
I/O request to a single-layered hardware-based driver. . . . . . . . . . .525
I/O requests to layered drivers . . . . . . . . . . . . . . . . . . . . . . . . . . . . . . . . .533
Thread-agnostic I/O . . . . . . . . . . . . . . . . . . . . . . . . . . . . . . . . . . . . . . . . . . .536
I/O cancellation . . . . . . . . . . . . . . . . . . . . . . . . . . . . . . . . . . . . . . . . . . . . . . .537
I/O completion ports . . . . . . . . . . . . . . . . . . . . . . . . . . . . . . . . . . . . . . . . . . 541
I/O prioritization . . . . . . . . . . . . . . . . . . . . . . . . . . . . . . . . . . . . . . . . . . . . . .546
Container notifications . . . . . . . . . . . . . . . . . . . . . . . . . . . . . . . . . . . . . . . . .552
Driver Verifier . . . . . . . . . . . . . . . . . . . . . . . . . . . . . . . . . . . . . . . . . . . . . . . . . . . . . . .552
I/O-related verification options. . . . . . . . . . . . . . . . . . . . . . . . . . . . . . . . .554
Memory-related verification options . . . . . . . . . . . . . . . . . . . . . . . . . . .555
The Plug and Play manager . . . . . . . . . . . . . . . . . . . . . . . . . . . . . . . . . . . . . . . . . .559
Level of Plug and Play support . . . . . . . . . . . . . . . . . . . . . . . . . . . . . . . . .560
Device enumeration . . . . . . . . . . . . . . . . . . . . . . . . . . . . . . . . . . . . . . . . . . . 561
Device stacks . . . . . . . . . . . . . . . . . . . . . . . . . . . . . . . . . . . . . . . . . . . . . . . . . .563
Driver support for Plug and Play . . . . . . . . . . . . . . . . . . . . . . . . . . . . . . . .569
Plug-and-play driver installation . . . . . . . . . . . . . . . . . . . . . . . . . . . . . . . 571
General driver loading and installation . . . . . . . . . . . . . . . . . . . . . . . . . . . . . . .575
Driver loading . . . . . . . . . . . . . . . . . . . . . . . . . . . . . . . . . . . . . . . . . . . . . . . . .575
Driver installation. . . . . . . . . . . . . . . . . . . . . . . . . . . . . . . . . . . . . . . . . . . . . .577
858
Contents of Windows Internals, Part 1, 7th Edition
The Windows Driver Foundation . . . . . . . . . . . . . . . . . . . . . . . . . . . . . . . . . . . . .578
Kernel-Mode Driver Framework . . . . . . . . . . . . . . . . . . . . . . . . . . . . . . . .579
User-Mode Driver Framework . . . . . . . . . . . . . . . . . . . . . . . . . . . . . . . . . .587
The power manager . . . . . . . . . . . . . . . . . . . . . . . . . . . . . . . . . . . . . . . . . . . . . . . . .590
Connected Standby and Modern Standby . . . . . . . . . . . . . . . . . . . . . .594
Power manager operation . . . . . . . . . . . . . . . . . . . . . . . . . . . . . . . . . . . . .595
Driver power operation . . . . . . . . . . . . . . . . . . . . . . . . . . . . . . . . . . . . . . . .596
Driver and application control of device power . . . . . . . . . . . . . . . . . .599
Power management framework . . . . . . . . . . . . . . . . . . . . . . . . . . . . . . . .600
Power availability requests . . . . . . . . . . . . . . . . . . . . . . . . . . . . . . . . . . . . .602
Conclusion . . . . . . . . . . . . . . . . . . . . . . . . . . . . . . . . . . . . . . . . . . . . . . . . . . . . . . . . . .603
Chapter 7
Security
605
Security ratings . . . . . . . . . . . . . . . . . . . . . . . . . . . . . . . . . . . . . . . . . . . . . . . . . . . . . .605
Trusted Computer System Evaluation Criteria . . . . . . . . . . . . . . . . . . .605
The Common Criteria . . . . . . . . . . . . . . . . . . . . . . . . . . . . . . . . . . . . . . . . . .607
Security system components . . . . . . . . . . . . . . . . . . . . . . . . . . . . . . . . . . . . . . . . .608
Virtualization-based security . . . . . . . . . . . . . . . . . . . . . . . . . . . . . . . . . . . . . . . . . 611
Credential Guard . . . . . . . . . . . . . . . . . . . . . . . . . . . . . . . . . . . . . . . . . . . . . . 612
Device Guard . . . . . . . . . . . . . . . . . . . . . . . . . . . . . . . . . . . . . . . . . . . . . . . . . . 617
Protecting objects . . . . . . . . . . . . . . . . . . . . . . . . . . . . . . . . . . . . . . . . . . . . . . . . . . . 619
Access checks . . . . . . . . . . . . . . . . . . . . . . . . . . . . . . . . . . . . . . . . . . . . . . . . . 621
Security identifiers . . . . . . . . . . . . . . . . . . . . . . . . . . . . . . . . . . . . . . . . . . . . .625
Virtual service accounts . . . . . . . . . . . . . . . . . . . . . . . . . . . . . . . . . . . . . . . .646
Security descriptors and access control . . . . . . . . . . . . . . . . . . . . . . . . .650
Dynamic Access Control . . . . . . . . . . . . . . . . . . . . . . . . . . . . . . . . . . . . . . .666
The AuthZ API . . . . . . . . . . . . . . . . . . . . . . . . . . . . . . . . . . . . . . . . . . . . . . . . . . . . . . .666
Conditional ACEs . . . . . . . . . . . . . . . . . . . . . . . . . . . . . . . . . . . . . . . . . . . . . .667
Account rights and privileges . . . . . . . . . . . . . . . . . . . . . . . . . . . . . . . . . . . . . . . .668
Account rights . . . . . . . . . . . . . . . . . . . . . . . . . . . . . . . . . . . . . . . . . . . . . . . . .669
Privileges . . . . . . . . . . . . . . . . . . . . . . . . . . . . . . . . . . . . . . . . . . . . . . . . . . . . .670
Super privileges . . . . . . . . . . . . . . . . . . . . . . . . . . . . . . . . . . . . . . . . . . . . . . .675
Access tokens of processes and threads . . . . . . . . . . . . . . . . . . . . . . . . . . . . . . .677
Contents of Windows Internals, Part 1, 7th Edition
859
Security auditing . . . . . . . . . . . . . . . . . . . . . . . . . . . . . . . . . . . . . . . . . . . . . . . . . . . .677
Object access auditing . . . . . . . . . . . . . . . . . . . . . . . . . . . . . . . . . . . . . . . . .679
Global audit policy . . . . . . . . . . . . . . . . . . . . . . . . . . . . . . . . . . . . . . . . . . . .682
Advanced Audit Policy settings . . . . . . . . . . . . . . . . . . . . . . . . . . . . . . . . .683
AppContainers . . . . . . . . . . . . . . . . . . . . . . . . . . . . . . . . . . . . . . . . . . . . . . . . . . . . . .684
Overview of UWP apps . . . . . . . . . . . . . . . . . . . . . . . . . . . . . . . . . . . . . . . .685
The AppContainer . . . . . . . . . . . . . . . . . . . . . . . . . . . . . . . . . . . . . . . . . . . . .687
Logon . . . . . . . . . . . . . . . . . . . . . . . . . . . . . . . . . . . . . . . . . . . . . . . . . . . . . . . . . . . . . . 710
Winlogon initialization . . . . . . . . . . . . . . . . . . . . . . . . . . . . . . . . . . . . . . . . . 711
User logon steps . . . . . . . . . . . . . . . . . . . . . . . . . . . . . . . . . . . . . . . . . . . . . . . 713
Assured authentication . . . . . . . . . . . . . . . . . . . . . . . . . . . . . . . . . . . . . . . . 718
Windows Biometric Framework . . . . . . . . . . . . . . . . . . . . . . . . . . . . . . . . 719
Windows Hello . . . . . . . . . . . . . . . . . . . . . . . . . . . . . . . . . . . . . . . . . . . . . . . . 721
User Account Control and virtualization . . . . . . . . . . . . . . . . . . . . . . . . . . . . . .722
File system and registry virtualization . . . . . . . . . . . . . . . . . . . . . . . . . . .722
Elevation . . . . . . . . . . . . . . . . . . . . . . . . . . . . . . . . . . . . . . . . . . . . . . . . . . . . . .729
Exploit mitigations. . . . . . . . . . . . . . . . . . . . . . . . . . . . . . . . . . . . . . . . . . . . . . . . . . .735
Process-mitigation policies . . . . . . . . . . . . . . . . . . . . . . . . . . . . . . . . . . . . .735
Control Flow Integrity. . . . . . . . . . . . . . . . . . . . . . . . . . . . . . . . . . . . . . . . . .740
Security assertions . . . . . . . . . . . . . . . . . . . . . . . . . . . . . . . . . . . . . . . . . . . . .752
Application Identification . . . . . . . . . . . . . . . . . . . . . . . . . . . . . . . . . . . . . . . . . . . .756
AppLocker . . . . . . . . . . . . . . . . . . . . . . . . . . . . . . . . . . . . . . . . . . . . . . . . . . . . . . . . . . 757
Software Restriction Policies . . . . . . . . . . . . . . . . . . . . . . . . . . . . . . . . . . . . . . . . .762
Kernel Patch Protection . . . . . . . . . . . . . . . . . . . . . . . . . . . . . . . . . . . . . . . . . . . . . .764
PatchGuard . . . . . . . . . . . . . . . . . . . . . . . . . . . . . . . . . . . . . . . . . . . . . . . . . . . . . . . . . 765
HyperGuard . . . . . . . . . . . . . . . . . . . . . . . . . . . . . . . . . . . . . . . . . . . . . . . . . . . . . . . . .768
Conclusion . . . . . . . . . . . . . . . . . . . . . . . . . . . . . . . . . . . . . . . . . . . . . . . . . . . . . . . . . .770
Index
860
Contents of Windows Internals, Part 1, 7th Edition
771
Index
SYMBOLS
\ (root directory), 692
NUMBERS
32-bit handle table entry, 147
64-bit IDT, viewing, 34–35
A
AAM (Application Activation Manager), 244
ACL (access control list), displaying, 153–154
ACM (authenticated code module), 805–806
!acpiirqarb command, 49
ActivationObject object, 129
ActivityReference object, 129
address-based pushlocks, 201
address-based waits, 202–203
ADK (Windows Assessment and
Deployment Kit), 421
administrative command prompt, opening,
253, 261
AeDebug and AeDebugProtected root keys,
WER (Windows Error Reporting), 540
AES (Advanced Encryption Standard), 711
allocators, ReFS (Resilient File System), 743–745
ALPC (Advanced Local Procedure Call), 209
!alpc command, 224
ALPC message types, 211
ALPC ports, 129, 212–214
ALPC worker thread, 118
APC level, 40, 43, 62, 63, 65
!apciirqarb command, 48
APCs (asynchronous procedure calls), 61–66
APIC, and PIC (Programmable Interrupt
Controller), 37–38
APIC (Advanced Programmable Interrupt
Controller), 35–36
!apic command, 37
APIC Timer, 67
APIs, 690
\AppContainer NamedObjects directory, 160
AppContainers, 243–244
AppExecution aliases, 263–264
apps, activating through command line,
261–262. See also packaged applications
APT (Advanced Persistent Threats), 781
!arbiter command, 48
architectural system service dispatching, 92–95
\ArcName directory, 160
ARM32 simulation on ARM 64 platforms, 115
assembly code, 2
associative cache, 13
atomic execution, 207
attributes, resident and nonresident, 667–670
auto-expand pushlocks, 201
Autoruns tool, 837
autostart services startup, 451–457
AWE (Address Windowing Extension), 201
B
B+ Tree physical layout, ReFS (Resilient File
System), 742–743
background tasks and Broker Infrastructure,
256–258
861
Background Broker Infrastructure
kernel initialization phase 1, 824–829
Measured Boot, 801–805
ReadyBoot, 835–836
safe mode, 847–850
Secure Boot, 781–784
Secure Launch, 816–818
shutdown, 837–840
Background Broker Infrastructure, 244, 256–258
backing up encrypted files, 716–717
bad-cluster recovery, NTFS recovery support,
703–706. See also clusters
bad-cluster remapping, NTFS, 633
base named objects, looking at, 163–164.
See also objects
\BaseNamedObjects directory, 160
BCD (Boot Configuration Database), 392,
398–399
BCD library for boot operations, 790–792
BCD options
Windows hypervisor loader (Hvloader),
796–797
Windows OS Loader, 792–796
bcdedit command, 398–399
BI (Background Broker Infrastructure), 244,
256–258
BI (Broker Infrastructure), 238
BindFlt (Windows Bind minifilter driver), 248
BitLocker
encryption offload, 717–718
recovery procedure, 801
turning on, 804
block volumes, DAX (Direct Access Disks),
728–730
BNO (Base Named Object) Isolation, 167
BOOLEAN status, 208
boot application, launching, 800–801
Boot Manager
BCD objects, 798
overview, 785–799
and trusted execution, 805
boot menu, 799–800
boot process. See also Modern boot menu
BIOS, 781
driver loading in safe mode, 848–849
hibernation and Fast Startup, 840–844
hypervisor loader, 811–813
images start automatically, 837
kernel and executive subsystems, 818–824
862
Index
Smss, Csrss, Wininit, 830–835
trusted execution, 805–807
UEFI, 777–781
VSM (Virtual Secure Mode) startup policy,
813–816
Windows OS Loader, 808–810
WinRE (Windows Recovery
Environment), 845
boot status file, 850
Bootim.exe command, 832
booting from iSCSI, 811
BPB (boot parameter block), 657
BTB (Branch Target Buffer), 11
bugcheck, 40
C
C-states and timers, 76
cache
copying to and from, 584
forcing to write through to disk, 595
cache coherency, 568–569
cache data structures, 576–582
cache manager
in action, 591–594
centralized system cache, 567
disk I/O accounting, 600–601
features, 566–567
lazy writer, 622
mapping views of files, 573
memory manager, 567
memory partitions support, 571–572
NTFS MFT working set enhancements, 571
read-ahead thread, 622–623
recoverable file system support, 570
commands
stream-based caching, 569
virtual block caching, 569
write-back cache with lazy write, 589
cache size, 574–576
cache virtual memory management, 572–573
cache-aware pushlocks, 200–201
caches and storage memory, 10
caching
with DMA (direct memory access) interfaces, 584–585
with mapping and pinning interfaces, 584
caching and file systems
disks, 565
partitions, 565
sectors, 565
volumes, 565–566
\Callback directory, 160
cd command, 144, 832
CDFS legacy format, 602
CEA (Common Event Aggregator), 238
Centennial applications, 246–249, 261
CFG (Control Flow Integrity), 343
Chain of Trust, 783–784
change journal file, NTFS on-disk structure,
675–679
change logging, NTFS, 637–638
check-disk and fast repair, NTFS recovery
support, 707–710
checkpoint records, NTFS recovery support, 698
!chksvctbl command, 103
CHPE (Compile Hybrid Executable) bitmap,
115–118
CIM (Common Information Model), WMI
(Windows Management Instrumentation),
488–495
CLFS (common logging file system), 403–404
Clipboard User Service, 472
clock time, 57
cloning ReFS files, 755
Close method, 141
clusters. See also bad-cluster recovery
defined, 566
NTFS on-disk structure, 655–656
cmd command, 253, 261, 275, 289, 312, 526, 832
COM-hosted task, 479, 484–486
command line, activating apps through,
261–262
Command Prompt, 833, 845
commands
!acpiirqarb, 49
!alpc, 224
!apciirqarb, 48
!apic, 37
!arbiter, 48
bcdedit, 398–399
Bootim.exe, 832
cd, 144, 832
!chksvctbl, 103
cmd, 253, 261, 275, 289, 312, 526, 832
db, 102
defrag.exe, 646
!devhandles, 151
!devnode, 49
!devobj, 48
dg, 7–8
dps, 102–103
dt, 7–8
dtrace, 527
.dumpdebug, 547
dx, 7, 35, 46, 137, 150, 190
.enumtag, 547
eventvwr, 288, 449
!exqueue, 83
fsutil resource, 693
fsutil storagereserve findById, 687
g, 124, 241
Get-FileStorageTier, 649
Get-VMPmemController, 737
!handle, 149
!idt, 34, 38, 46
!ioapic, 38
!irql, 41
Index
863
commands
commands (continued)
k, 485
link.exe/dump/loadconfig, 379
!locks, 198
msinfo32, 312, 344
notepad.exe, 405
!object, 137–138, 151, 223
perfmon, 505, 519
!pic, 37
!process, 190
!qlocks, 176
!reg openkeys, 417
regedit.exe, 468, 484, 542
Runas, 397
Set-PhysicalDisk, 774
taskschd.msc, 479, 484
!thread, 75, 190
.tss, 8
Wbemtest, 491
wnfdump, 237
committing a transaction, 697
Composition object, 129
compressing
nonsparse data, 673–674
sparse data, 671–672
compression and ghosting, ReFS (Resilient File
System), 769–770
compression and sparse files, NTFS, 637
condition variables, 205–206
connection ports, dumping, 223–224
container compaction, ReFS (Resilient File
System), 766–769
container isolation, support for, 626
contiguous file, 643
copying
to and from cache, 584
encrypted files, 717
CoreMessaging object, 130
corruption record, NTFS recovery support, 708
CoverageSampler object, 129
864
Index
CPL (Code Privilege Level), 6
CPU branch predictor, 11–12
CPU cache(s), 9–10, 12–13
crash dump files, WER (Windows Error
Reporting), 543–548
crash dump generation, WER (Windows Error
Reporting), 548–551
crash report generation, WER (Windows Error
Reporting), 538–542
crashes, consequences of, 421
critical sections, 203–204
CS (Code Segment)), 31
Csrss, 830–835, 838–840
D
data compression and sparse files, NTFS, 670–671
data redundancy and fault tolerance, 629–630
data streams, NTFS, 631–632
data structures, 184–189
DAX (Direct Access Disks). See also disks
block volumes, 728–730
cached and noncached I/O in volume,
723–724
driver model, 721–722
file system filter driver, 730–731
large and huge pages support, 732–735
mapping executable images, 724–728
overview, 720–721
virtual PMs and storage spaces support,
736–739
volumes, 722–724
DAX file alignment, 733–735
DAX mode I/Os, flushing, 731
db command, 102
/debug switch, FsTool, 734
debugger
breakpoints, 87–88
objects, 241–242
!pte extension, 735
!trueref command, 148
enclave configuration, dumping
debugging. See also user-mode debugging
object handles, 158
trustlets, 374–375
WoW64 in ARM64 environments, 122–124
decryption process, 715–716
defrag.exe command, 646
defragmentation, NTFS, 643–645
Delete method, 141
Dependency Mini Repository, 255
Desktop object, 129
!devhandles command, 151
\Device directory, 161
device shims, 564
!devnode command, 49
!devobj command, 48
dg command, 4, 7–8
Directory object, 129
disk I/Os, counting, 601
disks, defined, 565. See also DAX (Direct
Access Disks)
dispatcher routine, 121
DLLs
Hvloader.dll, 811
IUM (Isolated User Mode), 371–372
Ntevt.dll, 497
for Wow64, 104–105
DMA (Direct Memory Access), 50, 584–585
DMTF, WMI (Windows Management
Instrumentation), 486, 489
DPC (dispatch or deferred procedure call) interrupts, 54–61, 71. See also software interrupts
DPC Watchdog, 59
dps (dump pointer symbol) command, 102–103
drive-letter name resolution, 620
\Driver directory, 161
driver loading in safe mode, 848–849
driver objects, 451
driver shims, 560–563
\DriverStore(s) directory, 161
dt command, 7, 47
DTrace (dynamic tracing)
ETW provider, 533–534
FBT (Function Boundary Tracing) provider,
531–533
initialization, 529–530
internal architecture, 528–534
overview, 525–527
PID (Process) provider, 531–533
symbol server, 535
syscall provider, 530
type library, 534–535
dtrace command, 527
.dump command, LiveKd, 545
dump files, 546–548
Dump method, 141
.dumpdebug command, 547
Duplicate object service, 136
DVRT (Dynamic Value Relocation Table),
23–24, 26
dx command, 7, 35, 46, 137, 150, 190
Dxgk* objects, 129
dynamic memory, tracing, 532–533
dynamic partitioning, NTFS, 646–647
E
EFI (Extensible Firmware Interface), 777
EFS (Encrypting File System)
architecture, 712
BitLocker encryption offload, 717–718
decryption process, 715–716
described, 640
first-time usage, 713–715
information and key entries, 713
online support, 719–720
overview, 710–712
recovery agents, 714
EFS information, viewing, 716
EIP program counter, 8
enclave configuration, dumping, 379–381
Index
865
encrypted files
encrypted files
backing up, 716–717
copying, 717
encrypting file data, 714–715
encryption NTFS, 640
encryption support, online, 719–720
EnergyTracker object, 130
enhanced timers, 78–81. See also timers
/enum command-line parameter, 786
.enumtag command, 547
Error Reporting. See WER (Windows Error
Reporting)
ETL file, decoding, 514–515
ETW (Event Tracing for Windows). See also tracing dynamic memory
architecture, 500
consuming events, 512–515
events decoding, 513–515
Global logger and autologgers, 521
and high-frequency timers, 68–70
initialization, 501–502
listing processes activity, 510
logger thread, 511–512
overview, 499–500
providers, 506–509
providing events, 509–510
security, 522–525
security registry key, 503
sessions, 502–506
system loggers, 516–521
ETW provider, DTrace (dynamic tracing), 533–534
ETW providers, enumerating, 508
ETW sessions
default security descriptor, 523–524
enumerating, 504–506
ETW_GUID_ENTRY data structure, 507
ETW_REG_ENTRY, 507
EtwConsumer object, 129
EtwRegistration object, 129
Event Log provider DLL, 497
866
Index
Event object, 128
Event Viewer tool, 288
eventvwr command, 288, 449
ExAllocatePool function, 26
exception dispatching, 85–91
executive mutexes, 196–197
executive objects, 126–130
executive resources, 197–199
exFAT, 606
explicit file I/O, 619–622
export thunk, 117
!exqueue command, 83
F
F5 key, 124, 397
fast I/O, 585–586. See also I/O system
fast mutexes, 196–197
fast repair and check-disk, NTFS recovery support, 707–710
Fast Startup and hibernation, 840–844
FAT12, FAT16, FAT32, 603–606
FAT64, 606
Fault Reporting process, WER (Windows Error
Reporting), 540
fault tolerance and data redundancy, NTFS,
629–630
FCB (File Control Block), 571
FCB Headers, 201
feature settings and values, 22–23
FEK (File Encryption Key), 711
file data, encrypting, 714–715
file names, NTFS on-disk structure, 664–666
file namespaces, 664
File object, 128
file record numbers, NTFS on-disk structure, 660
file records, NTFS on-disk structure, 661–663
file system drivers, 583
file system formats, 566
file system interfaces, 582–585
File System Virtualization, 248
HKEY_PERFORMANCE_TEXT
file systems
CDFS, 602
data-scan sections, 624–625
drivers architecture, 608
exFAT, 606
explicit file I/O, 619–622
FAT12, FAT16, FAT32, 603–606
filter drivers, 626
filter drivers and minifilters, 623–626
filtering named pipes and mailslots, 625
FSDs (file system drivers), 608–617
mapped page writers, 622
memory manager, 622
NTFS file system, 606–607
operations, 618
Process Monitor, 627–628
ReFS (Resilient File System), 608
remote FSDs, 610–617
reparse point behavior, 626
UDF (Universal Disk Format), 603
\FileSystem directory, 161
fill buffers, 17
Filter Manager, 626
FilterCommunicationPort object, 130
FilterConnectionPort object, 130
Flags, 132
flushing mapped files, 595–596
Foreshadow (L1TF) attack, 16
fragmented file, 643
FSCTL (file system control) interface, 688
FSDs (file system drivers), 608–617
FsTool, /debug switch, 734
fsutil resource command, 693
fsutil storagereserve findById command, 687
G
g command, 124, 241
gadgets, 15
GDI/User objects, 126–127. See also
user-mode debugging
GDT (Global Descriptor Table), 2–5
Get-FileStorageTier command, 649
Get-VMPmemController command, 737
Gflags.exe, 554–557
GIT (Generic Interrupt Timer), 67
\GLOBAL?? directory, 161
global flags, 554–557
global namespace, 167
GPA (guest physical address), 17
GPIO (General Purpose Input Output), 51
GSIV (global system interrupt vector), 32, 51
guarded mutexes, 196–197
GUI thread, 96
H
HAM (Host Activity Manager), 244, 249–251
!handle command, 149
Handle count, 132
handle lists, single instancing, 165
handle tables, 146, 149–150
handles
creating maximum number of, 147
viewing, 144–145
hard links, NTFS, 634
hardware indirect branch controls, 21–23
hardware interrupt processing, 32–35
hardware side-channel vulnerabilities, 9–17
hibernation and Fast Startup, 840–844
high-IRQL synchronization, 172–177
hive handles, 410
hives. See also registry
loading, 421
loading and unloading, 408
reorganization, 414–415
HKEY_CLASSES_ROOT, 397–398
HKEY_CURRENT_CONFIG, 400
HKEY_CURRENT_USER subkeys, 395
HKEY_LOCAL_MACHINE, 398–400
HKEY_PERFORMANCE_DATA, 401
HKEY_PERFORMANCE_TEXT, 401
Index
867
HKEY_USERS
HKEY_USERS, 396
HKLM\SYSTEM\CurrentControlSet\Control\
SafeBoot registry key, 848
HPET (High Performance Event Timer), 67
hung program screen, 838
HungAppTimeout, 839
HVCI (Hypervisor Enforced Code Integrity), 358
hybrid code address range table, dumping,
117–118
hybrid shutdown, 843–844
hypercalls and hypervisor TLFS (Top Level
Functional Specification), 299–300
Hyper-V schedulers. See also Windows
hypervisor
classic, 289–290
core, 291–294
overview, 287–289
root scheduler, 294–298
SMT system, 292
hypervisor debugger, connecting, 275–277
hypervisor loader boot module, 811–813
I
IBPB (Indirect Branch Predictor Barrier), 22, 25
IBRS (Indirect Branch Restricted Speculation),
21–22, 25
IDT (interrupt dispatch table), 32–35
!idt command, 34, 38, 46
images starting automatically, 837
Import Optimization and Retpoline, 23–26
indexing facility, NTFS, 633, 679–680
Info mask, 132
Inheritance object service, 136
integrated scheduler, 294
interlocked operations, 172
interrupt control flow, 45
interrupt dispatching
hardware interrupt processing, 32–35
overview, 32
programmable interrupt controller
architecture, 35–38
868
Index
software IRQLs (interrupt request levels),
38–50
interrupt gate, 32
interrupt internals, examining, 46–50
interrupt objects, 43–50
interrupt steering, 52
interrupt vectors, 42
interrupts
affinity and priority, 52–53
latency, 50
masking, 39
I/O system, components of, 652. See also
Fast I/O
IOAPIC (I/O Advanced Programmable Interrupt
Controller), 32, 36
!ioapic command, 38
IoCompletion object, 128
IoCompletionReserve object, 128
Ionescu, Alex, 28
IRPs (I/O request packets), 567, 583, 585, 619,
621–624, 627, 718
IRQ affinity policies, 53
IRQ priorities, 53
IRQL (interrupt request levels), 347–348.
See also software IRQLs (interrupt request
levels)
!irql command, 41
IRTimer object, 128
iSCSI, booting from, 811
isolation, NTFS on-disk structure, 689–690
ISR (interrupt service routine), 31
IST (Interrupt Stack Table), 7–9
IUM (Isolated User Mode)
overview, 371–372
SDF (Secure Driver Framework), 376
secure companions, 376
secure devices, 376–378
SGRA (System Guard Runtime attestation),
386–390
trustlets creation, 372–375
VBS-based enclaves, 378–386
local procedure call
J
jitted blocks, 115, 117
jitting and execution, 121–122
Job object, 128
K
k command, 485
Kali Linus, 247
KeBugCheckEx system function, 32
KEK (Key Exchange Key), 783
kernel. See also Secure Kernel
dispatcher objects, 179–181
objects, 126
spinlocks, 174
synchronization mechanisms, 179
kernel addresses, mapping, 20
kernel debugger
!handle extension, 125
!locks command, 198
searching for open files with, 151–152
viewing handle table with, 149–150
kernel logger, tracing TCP/IP activity with,
519–520
Kernel Patch Protection, 24
kernel reports, WER (Windows Error
Reporting), 551
kernel shims
database, 559–560
device shims, 564
driver shims, 560–563
engine initialization, 557–559
shim database, 559–560
witnessing, 561–563
kernel-based system call dispatching, 97
kernel-mode debugging events, 240
\KernelObjects directory, 161
Key object, 129
keyed events, 194–196
KeyedEvent object, 128
KilsrThunk, 33
KINTERRUPT object, 44, 46
\KnownDlls directory, 161
\KnownDlls32 directory, 161
KPCR (Kernel Processor Control Region), 4
KPRCB fields, timer processing, 72
KPTI (Kernel Page Table Isolation ), 18
KTM (Kernel Transaction Manager), 157, 688
KVA Shadow, 18–21
L
L1TF (Foreshadow) attack, 16
LAPIC (Local Advanced Programmable
Interrupt Controllers), 32
lazy jitter, 119
lazy segment loading, 6
lazy writing
disabling, 595
and write-back caching, 589–595
LBA (logical block address), 589
LCNs (logical cluster numbers), 656–658
leak detections, ReFS (Resilient File System),
761–762
leases, 614–615, 617
LFENCE, 23
LFS (log file service), 652, 695–697
line-based versus message signaled-based
interrupts, 50–66
link tracking, NTFS, 639
link.exe tool, 117, 379
link.exe/dump/loadconfig command, 379
LiveKd, .dump command, 545
load ports, 17
loader issues, troubleshooting, 556–557
Loader Parameter block, 819–821
local namespace, 167
local procedure call
ALPC direct event attribute, 222
ALPC port ownership, 220
asynchronous operation, 214–215
attributes, 216–217
blobs, handles, and resources, 217–218
Index
869
local procedure call
local procedure call (continued)
connection model, 210–212
debugging and tracing, 222–224
handle passing, 218–219
message model, 212–214
overview, 209–210
performance, 220–221
power management, 221
security, 219–220
views, regions, and sections, 215–216
Lock, 132
!locks command, kernel debugger, 198
log record types, NTFS recovery support,
697–699
$LOGGED_UTILITY_STREAM attribute, 663
logging implementation, NTFS on-disk structure, 693
Low-IRQL synchronization. See also
synchronization
address-based waits, 202–203
condition variables, 205–206
critical sections, 203–204
data structures, 184–194
executive resources, 197–202
kernel dispatcher objects, 179–181
keyed events, 194–196
mutexes, 196–197
object-less waiting (thread alerts), 183–184
overview, 177–179
run once initialization, 207–208
signalling objects, 181–183
(SRW) Slim Reader/Writer locks, 206–207
user-mode resources, 205
LRC parity and RAID 6, 773
LSASS (Local Security Authority Subsystem
Service) process, 453, 465
LSN (logical sequence number), 570
M
mailslots and named pipes, filtering, 625
Make permanent/temporary object service, 136
870
Index
mapped files, flushing, 595–596
mapping and pinning interfaces, caching
with, 584
masking interrupts, 39
MBEC (Mode Base Execution Controls), 93
MDL (Memory Descriptor List), 220
MDS (Microarchitectural Data Sampling), 17
Measured Boot, 801–805
media mixer, creating, 165
Meltdown attack, 14, 18
memory, sharing, 171
memory hierarchy, 10
memory manager
modified and mapped page writer, 622
overview, 567
page fault handler, 622–623
memory partitions support, 571–572
metadata
defined, 566, 570
metadata logging, NTFS recovery support, 695
MFT (Master File Table)
NTFS metadata files in, 657
NTFS on-disk structure, 656–660
record for small file, 661
MFT file records, 668–669
MFT records, compressed file, 674
Microsoft Incremental linker ((link.exe)), 117
minifilter driver, Process Monitor, 627–628
Minstore architecture, ReFS (Resilient File
System), 740–742
Minstore I/O, ReFS (Resilient File System),
746–748
Minstore write-ahead logging, 758
Modern Application Model, 249, 251, 262
modern boot menu, 832–833. See also boot
process
MOF (Managed Object Format), WMI
(Windows Management Instrumentation),
488–495
MPS (Multiprocessor Specification), 35
Msconfig utility, 837
NTFS recovery support
MSI (message signaled interrupts), 50–66
msinfo32 command, 312, 344
MSRs (model specific registers), 92
Mutex object, 128
mutexes, fast and guarded, 196–197
mutual exclusion, 170
N
named pipes and mailslots, filtering, 625
namespace instancing, viewing, 169
\NLS directory, 161
nonarchitectural system service dispatching,
96–97
nonsparse data, compressing, 673–674
notepad.exe command, 405
notifications. See WNF (Windows Notification
Facility)
NT kernel, 18–19, 22
Ntdll version list, 106
Ntevt.dll, 497
NTFS bad-cluster recovery, 703–706
NTFS file system
advanced features, 630
change logging, 637–638
compression and sparse files, 637
data redundancy, 629–630
data streams, 631–632
data structures, 654
defragmentation, 643–646
driver, 652–654
dynamic bad-cluster remapping, 633
dynamic partitioning, 646–647
encryption, 640
fault tolerance, 629–630
hard links, 634
high-end requirements, 628
indexing facility, 633
link tracking, 639
metadata files in MFT, 657
overview, 606–607
per-user volume quotas, 638–639
POSIX deletion, 641–643
recoverability, 629
recoverable file system support, 570
and related components, 653
security, 629
support for tiered volumes, 647–651
symbolic links and junctions, 634–636
Unicode-based names, 633
NTFS files, attributes for, 662–663
NTFS information, viewing, 660
NTFS MFT working set enhancements, 571
NTFS on-disk structure
attributes, 667–670
change journal file, 675–679
clusters, 655–656
consolidated security, 682–683
data compression and sparse files, 670–674
on-disk implementation, 691–693
file names, 664–666
file record numbers, 660
file records, 661–663
indexing, 679–680
isolation, 689–690
logging implementation, 693
master file table, 656–660
object IDs, 681
overview, 654
quota tracking, 681–682
reparse points, 684–685
sparse files, 675
Storage Reserves and reservations, 685–688
transaction support, 688–689
transactional APIs, 690
tunneling, 666–667
volumes, 655
NTFS recovery support
analysis pass, 700
bad clusters, 703–706
check-disk and fast repair, 707–710
design, 694–695
LFS (log file service), 695–697
Index
871
NTFS recovery support
NTFS recovery support (continued)
log record types, 697–699
metadata logging, 695
recovery, 699–700
redo pass, 701
self-healing, 706–707
undo pass, 701–703
NTFS reservations and Storage Reserves,
685–688
Ntoskrnl and Winload, 818
NVMe (Non-volatile Memory disk), 565
O
!object command, 137–138, 151, 223
Object Create Info, 132
object handles, 146, 158
object IDs, NTFS on-disk structure, 681
Object Manager
executive objects, 127–130
overview, 125–127
resource accounting, 159
symbolic links, 166–170
Object type index, 132
object-less waiting (thread alerts), 183–184
objects. See also base named objects; private
objects; reserve objects
directories, 160–165
filtering, 170
flags, 134–135
handles and process handle table, 143–152
headers and bodies, 131–136
methods, 140–143
names, 159–160
reserves, 152–153
retention, 155–158
security, 153–155
services, 136
signalling, 181–183
structure, 131
temporary and permanent, 155
types, 126, 136–140
872
Index
\ObjectTypes directory, 161
ODBC (Open Database Connectivity),
WMI (Windows Management
Instrumentation), 488
Okay to close method, 141
on-disk implementation, NTFS on-disk
structure, 691–693
open files, searching for, 151–152
open handles, viewing, 144–145
Open method, 141
Openfiles/query command, 126
oplocks and FSDs, 611–612, 616
Optimize Drives tool, 644–645
OS/2 operating system, 130
out-of-order execution, 10–11
P
packaged applications. See also apps
activation, 259–264
BI (Background Broker Infrastructure),
256–258
bundles, 265
Centennial, 246–249
Dependency Mini Repository, 255
Host Activity Manager, 249–251
overview, 243–245
registration, 265–266
scheme of lifecycle, 250
setup and startup, 258
State Repository, 251–254
UWP, 245–246
page table, ReFS (Resilient File System),
745–746
PAN (Privileged Access Neven), 57
Parse method, 141
Partition object, 130
partitions
caching and file systems, 565
defined, 565
Pc Reset, 845
PCIDs (Process-Context Identifiers), 20
ReFS (Resilient File System)
PEB (process environment block), 104
per-file cache data structures, 579–582
perfmon command, 505, 519
per-user volume quotas, NTFS, 638–639
PFN database, physical memory removed
from, 286
PIC (Programmable Interrupt Controller), 35–38
!pic command, 37
pinning and mapping interfaces, caching
with, 584
pinning the bucket, ReFS (Resilient File
System), 743
PIT (Programmable Interrupt Timer), 66–67
PM (persistent memory), 736
Pointer count field, 132
pop thunk, 117
POSIX deletion, NTFS, 641–643
PowerRequest object, 129
private objects, looking at, 163–164.
See also objects
Proactive Scan maintenance task, 708–709
!process command, 190
Process Explorer, 58, 89–91, 144–145, 147,
153–154, 165 169
Process Monitor, 591–594, 627–628, 725–728
Process object, 128, 137
processor execution model, 2–9
processor selection, 73–75
processor traps, 33
Profile object, 130
PSM (Process State Manager), 244
!pte extension of debugger, 735
PTEs (Page table entries), 16, 20
push thunk, 117
pushlocks, 200–202
Q
!qlocks command, 176
Query name method, 141
Query object service, 136
Query security object service, 136
queued spinlocks, 175–176
quota tracking, NTFS on-disk structure,
681–682
R
RAID 6 and LRC parity, 773
RAM (Random Access Memory), 9–11
RawInputManager object, 130
RDCL (Rogue Data Cache load), 14
Read (R) access, 615
read-ahead and write-behind
cache manager disk I/O accounting,
600–601
disabling lazy writing, 595
dynamic memory, 599–600
enhancements, 588–589
flushing mapped files, 595–596
forcing cache to write through disk, 595
intelligent read-ahead, 587–588
low-priority lazy writes, 598–599
overview, 586–587
system threads, 597–598
write throttling, 596–597
write-back caching and lazy writing,
589–594
reader/writer spinlocks, 176–177
ReadyBoost driver service settings, 810
ReadyBoot, 835–836
Reconciler, 419–420
recoverability, NTFS, 629
recoverable file system support, 570
recovery, NTFS recovery support, 699–700.
See also WinRE (Windows Recovery
Environment)
redo pass, NTFS recovery support, 701
ReFS (Resilient File System)
allocators, 743–745
architecture’s scheme, 749
B+ tree physical layout, 742–743
compression and ghosting, 769–770
container compaction, 766–769
Index
873
ReFS (Resilient File System)
ReFS (Resilient File System) (continued)
data integrity scanner, 760
on-disk structure, 751–752
file integrity streams, 760
files and directories, 750
file’s block cloning and spare VDL, 754–757
leak detections, 761–762
Minstore architecture, 740–742
Minstore I/O, 746–748
object IDs, 752–753
overview, 608, 739–740, 748–751
page table, 745–746
pinning the bucket, 743
recovery support, 759–761
security and change journal, 753–754
SMR (shingled magnetic recording) volumes, 762–766
snapshot support through HyperV, 756–757
tiered volumes, 764–766
write-through, 757–758
zap and salvage operations, 760
ReFS files, cloning, 755
!reg openkeys command, 417
regedit.exe command, 468, 484, 542
registered file systems, 613–614
registry. See also hives
application hives, 402–403
cell data types, 411–412
cell maps, 413–414
CLFS (common logging file system), 403–404
data types, 393–394
differencing hives, 424–425
filtering, 422
hive structure, 411–413
hives, 406–408
HKEY_CLASSES_ROOT, 397–398
HKEY_CURRENT_CONFIG, 400
HKEY_CURRENT_USER subkeys, 395
HKEY_LOCAL_MACHINE, 398–400
HKEY_PERFORMANCE_DATA, 401
HKEY_PERFORMANCE_TEXT, 401
874
Index
HKEY_USERS, 396
HKLM\SYSTEM\CurrentControlSet\Control\
SafeBoot key, 848
incremental logging, 419–421
key control blocks, 417–418
logical structure, 394–401
modifying, 392–393
monitoring activity, 404
namespace and operation, 415–418
namespace redirection, 423
optimizations, 425–426
Process Monitor, 405–406
profile loading and unloading, 397
Reconciler, 419–420
remote BCD editing, 398–399
reorganization, 414–415
root keys, 394–395
ServiceGroupOrder key, 452
stable storage, 418–421
startup and process, 408–414
symbolic links, 410
TxR (Transactional Registry), 403–404
usage, 392–393
User Profiles, 396
viewing and changing, 391–392
virtualization, 422–425
RegistryTransaction object, 129
reparse points, 626, 684–685
reserve objects, 152–153. See also objects
resident and nonresident attributes, 667–670
resource manager information, querying,
692–693
Resource Monitor, 145
Restricted User Mode, 93
Retpoline and Import optimization, 23–26
RH (Read-Handle) access, 615
RISC (Reduced Instruction Set Computing), 113
root directory (\), 692
\RPC Control directory, 161
RSA (Rivest-Shamir-Adleman) public key
algorithm, 711
side-channel attacks
RTC (Real Time Clock), 66–67
run once initialization, 207–208
Runas command, 397
runtime drivers, 24
RW (Read-Write) access, 615
RWH (Read-Write-Handle) access, 615
S
safe mode, 847–850
SCM (Service Control Manager)
network drive letters, 450
overview, 446–449
and Windows services, 426–428
SCM Storage driver model, 722
SCP (service control program), 426–427
SDB (shim database), 559–560
SDF (Secure Driver Framework), 376
searching for open files, 151–152
SEB (System Events Broker), 226, 238
second-chance notification, 88
Section object, 128
sectors
caching and file systems, 565
and clusters on disk, 566
defined, 565
secure boot, 781–784
Secure Kernel. See also kernel
APs (application processors) startup,
362–363
control over hypercalls, 349
hot patching, 368–371
HVCI (Hypervisor Enforced Code
Integrity), 358
memory allocation, 367–368
memory manager, 363–368
NAR data structure, 365
overview, 345
page identity/secure PFN database,
366–367
secure intercepts, 348–349
secure IRQLs, 347–348
secure threads and scheduling, 356–358
Syscall selector number, 354
trustlet for normal call, 354
UEFI runtime virtualization, 358–360
virtual interrupts, 345–348
VSM startup, 360–363
VSM system calls, 349–355
Secure Launch, 816–818
security consolidation, NTFS on-disk structure,
682–683
Security descriptor field, 132
\Security directory, 161
Security method, 141
security reference monitor, 153
segmentation, 2–6
self-healing, NTFS recovery support, 706–707
Semaphore object, 128
service control programs, 450–451
service database, organization of, 447
service descriptor tables, 100–104
ServiceGroupOrder registry key, 452
services logging, enabling, 448–449
session namespace, 167–169
Session object, 130
\Sessions directory, 161
Set security object service, 136
/setbootorder command-line parameter, 788
Set-PhysicalDisk command, 774
SGRA (System Guard Runtime attestation),
386–390
SGX, 16
shadow page tables, 18–20
shim database, 559–560
shutdown process, 837–840
SID (security identifier), 162
side-channel attacks
L1TF (Foreshadow), 16
MDS (Microarchitectural Data Sampling), 17
Meltdown, 14
Spectre, 14–16
SSB (speculative store bypass), 16
Index
875
Side-channel mitigations in Windows
Side-channel mitigations in Windows
hardware indirect branch controls, 21–23
KVA Shadow, 18–21
Retpoline and import optimization, 23–26
STIPB pairing, 26–30
Signal an object and wait for another service, 136
Sihost process, 834
\Silo directory, 161
SKINIT and Secure Launch, 816, 818
SkTool, 28–29
SLAT (Second Level Address Translation) table, 17
SMAP (Supervisor Mode Access Protection),
57, 93
SMB protocol, 614–615
SMP (symmetric multiprocessing), 171
SMR (shingled magnetic recording) volumes,
762–763
SMR disks tiers, 765–766
Smss user-mode process, 830–835
SMT system, 292
software interrupts. See also DPC (dispatch or
deferred procedure call) interrupts
APCs (asynchronous procedure calls), 61–66
DPC (dispatch or deferred procedure call),
54–61
overview, 54
software IRQLs (interrupt request levels), 38–
50. See also IRQL (interrupt request levels)
Spaces. See Storage Spaces
sparse data, compressing, 671–672
sparse files
and data compression, 670–671
NTFS on-disk structure, 675
Spectre attack, 14–16
SpecuCheck tool, 28–29
SpeculationControl PowerShell script, 28
spinlocks, 172–177
Spot Verifier service, NTFS recovery support, 708
spurious traps, 31
SQLite databases, 252
SRW (Slim Read Writer) Locks, 178, 195, 205–207
876
Index
SSB (speculative store bypass), 16
SSBD (Speculative Store Bypass Disable), 22
SSD (solid-state disk), 565, 644–645
SSD volume, retrimming, 646
Startup Recovery tool, 846
Startup Repair, 845
State Repository, 251–252
state repository, witnessing, 253–254
STIBP (Single Thread Indirect Branch
Predictors), 22, 25–30
Storage Reserves and NTFS reservations,
685–688
Storage Spaces
internal architecture, 771–772
overview, 770–771
services, 772–775
store buffers, 17
stream-based caching, 569
structured exception handling, 85
Svchost service splitting, 467–468
symbolic links, 166
symbolic links and junctions, NTFS, 634–637
SymbolicLink object, 129
symmetric encryption, 711
synchronization. See also Low-IRQL
synchronization
High-IRQL, 172–177
keyed events, 194–196
overview, 170–171
syscall instruction, 92
system call numbers, mapping to functions and
arguments, 102–103
system call security, 99–100
system call table compaction, 101–102
system calls and exception dispatching, 122
system crashes, consequences of, 421
System Image Recover, 845
SYSTEM process, 19–20
System Restore, 845
system service activity, viewing, 104
system service dispatch table, 96
trap dispatching
system service dispatcher, locating, 94–95
system service dispatching, 98
system service handling
architectural system service dispatching,
92–95
overview, 91
system side-channel mitigation status,
querying, 28–30
system threads, 597–598
system timers, listing, 74–75. See also timers
system worker threads, 81–85
T
take state segments, 6–9
Task Manager, starting, 832
Task Scheduler
boot task master key, 478
COM interfaces, 486
initialization, 477–481
overview, 476–477
Triggers and Actions, 478
and UBPM (Unified Background Process
Manager), 481–486
XML descriptor, 479–481
task scheduling and UBPM, 475–476
taskschd.msc command, 479, 484
TBOOT module, 806
TCP/IP activity, tracing with kernel logger,
519–520
TEB (Thread Environment Block), 4–5, 104
Terminal object, 130
TerminalEventQueue object, 130
thread alerts (object-less waiting), 183–184
!thread command, 75, 190
thread-local register effect, 4. See also
Windows threads
thunk kernel routines, 33
tiered volumes. See also volumes
creating maximum number of, 774–775
support for, 647–651
Time Broker, 256
timer coalescing, 76–77
timer expiration, 70–72
timer granularity, 67–70
timer lists, 71
Timer object, 128
timer processing, 66
timer queuing behaviors, 73
timer serialization, 73
timer tick distribution, 75–76
timer types
and intervals, 66–67
and node collection indices, 79
timers. See also enhanced timers; system timers
high frequency, 68–70
high resolution, 80
TLB flushing algorithm, 18, 20–21, 272
TmEn object, 129
TmRm object, 129
TmTm object, 129
TmTx object, 129
Token object, 128
TPM (Trusted Platform Module), 785, 800–801
TPM measurements, invalidating, 803–805
TpWorkerFactory object, 129
TR (Task Register), 6, 32
Trace Flags field, 132
tracing dynamic memory, 532–533. See also
DTrace (dynamic tracing); ETW (Event
Tracing for Windows)
transaction support, NTFS on-disk structure,
688–689
transactional APIs, NTFS on-disk structure, 690
transactions
committing, 697
undoing, 702
transition stack, 18
trap dispatching
exception dispatching, 85–91
interrupt dispatching, 32–50
line-based interrupts, 50–66
message signaled-based interrupts, 50–66
Index
877
trap dispatching
trap dispatching (continued)
overview, 30–32
system service handling, 91–104
system worker threads, 81–85
timer processing, 66–81
TRIM commands, 645
troubleshooting Windows loader issues,
556–557
!trueref debugger command, 148
trusted execution, 805–807
trustlets
creation, 372–375
debugging, 374–375
secure devices, 376–378
Secure Kernel and, 345
secure system calls, 354
VBS-based enclaves, 378
in VTL 1, 371
Windows hypervisor on ARM64, 314–315
TSS (Task State Segment), 6–9
.tss command, 8
tunneling, NTFS on-disk structure, 666–667
TxF APIs, 688–690
$TXF_DATA attribute, 691–692
TXT (Trusted Execution Technology), 801,
805–807, 816
type initializer fields, 139–140
type objects, 131, 136–140
U
UBPM (Unified Background Process Manager),
481–486
UDF (Universal Disk Format), 603
UEFI boot, 777–781
UEFI runtime virtualization, 358–363
UMDF (User-Mode Driver Framework), 209
\UMDFCommunicationPorts directory, 161
undo pass, NTFS recovery support, 701–703
unexpected traps, 31
Unicode-based names, NTFS, 633
user application crashes, 537–542
878
Index
User page tables, 18
UserApcReserve object, 130
user-issued system call dispatching, 98
user-mode debugging. See also debugging;
GDI/User objects
kernel support, 239–240
native support, 240–242
Windows subsystem support, 242–243
user-mode resources, 205
UWP (Universal Windows Platform)
and application hives, 402
application model, 244
bundles, 265
and SEB (System Event Broker), 238
services to apps, 243
UWP applications, 245–246, 259–260
V
VACBs (virtual address control blocks), 572,
576–578, 581–582
VBO (virtual byte offset), 589
VBR (volume boot record), 657
VBS (virtualization-based security)
detecting, 344
overview, 340
VSM (Virtual Secure Mode), 340–344
VTLs (virtual trust levels), 340–342
VCNs (virtual cluster numbers), 656–658,
669–672
VHDPMEM image, creating and mounting,
737–739
virtual block caching, 569
virtual PMs architecture, 736
virtualization stack
deferred commit, 339
EPF (enlightened page fault), 339
explained, 269
hardware support, 329–335
hardware-accelerated devices, 332–335
memory access hints, 338
memory-zeroing enlightenments, 338
Windows hypervisor
overview, 315
paravirtualized devices, 331
ring buffer, 327–329
VA-backed virtual machines, 336–340
VDEVs (virtual devices), 326–327
VID driver and memory manager, 317
VID.sys (Virtual Infrastructure Driver), 317
virtual IDE controller, 330
VM (virtual machine), 318–322
VM manager service and worker processes,
315–316
VM Worker process, 318–322, 330
VMBus, 323–329
VMMEM process, 339–340
Vmms.exe (virtual machine manager service), 315–316
VM (View Manager), 244
VMENTER event, 268
VMEXIT event, 268, 330–331
\VmSharedMemory directory, 161
VMXROOT mode, 268
volumes. See also tiered volumes
caching and file systems, 565–566
defined, 565–566
NTFS on-disk structure, 655
setting repair options, 706
VSM (Virtual Secure Mode)
overview, 340–344
startup policy, 813–816
system calls, 349–355
VTLs (virtual trust levels), 340–342
W
wait block states, 186
wait data structures, 189
Wait for a single object service, 136
Wait for multiple objects service, 136
wait queues, 190–194
WaitCompletionPacket object, 130
wall time, 57
Wbemtest command, 491
Wcifs (Windows Container Isolation minifilter
driver), 248
Wcnfs (Windows Container Name
Virtualization minifilter driver), 248
WDK (Windows Driver Kit), 392
WER (Windows Error Reporting)
ALPC (advanced local procedure call), 209
AeDebug and AeDebugProtected root
keys, 540
crash dump files, 543–548
crash dump generation, 548–551
crash report generation, 538–542
dialog box, 541
Fault Reporting process, 540
implementation, 536
kernel reports, 551
kernel-mode (system) crashes, 543–551
overview, 535–537
process hang detection, 551–553
registry settings, 539–540
snapshot creation, 538
user application crashes, 537–542
user interface, 542
Windows 10 Creators Update (RS2), 571
Windows API, executive objects, 128–130
Windows Bind minifilter driver, (BindFit) 248
Windows Boot Manager, 785–799
BCD objects, 798
\Windows directory, 161
Windows hypervisor. See also Hyper-V
schedulers
address space isolation, 282–285
AM (Address Manager), 275, 277
architectural stack, 268
on ARM64, 313–314
boot virtual processor, 277–279
child partitions, 269–270, 323
dynamic memory, 285–287
emulation of VT-x virtualization extensions,
309–310
enlightenments, 272
Index
879
Windows hypervisor
Windows hypervisor (continued)
execution vulnerabilities, 282
Hyperclear mitigation, 283
intercepts, 300–301
memory manager, 279–287
nested address translation, 310–313
nested virtualization, 307–313
overview, 267–268
partitions, processes, threads, 269–273
partitions physical address space, 281–282
PFN database, 286
platform API and EXO partitions, 304–305
private address spaces/memory zones, 284
process data structure, 271
processes and threads, 271
root partition, 270, 277–279
SLAT table, 281–282
startup, 274–279
SynIC (synthetic interrupt controller),
301–304
thread data structure, 271
VAL (VMX virtualization abstraction layer),
274, 279
VID driver, 272
virtual processor, 278
VM (Virtualization Manager), 278
VM_VP data structure, 278
VTLs (virtual trust levels), 281
Windows hypervisor loader (Hvloader), BCD
options, 796–797
Windows loader issues, troubleshooting,
556–557
Windows Memory Diagnostic Tool, 845
Windows OS Loader, 792–796, 808–810
Windows PowerShell, 774
Windows services
accounts, 433–446
applications, 426–433
autostart startup, 451–457
boot and last known good, 460–462
characteristics, 429–433
880
Index
Clipboard User Service, 472
control programs, 450–451
delayed autostart, 457–458
failures, 462–463
groupings, 466
interactive services/session 0 isolation,
444–446
local service account, 436
local system account, 434–435
network service account, 435
packaged services, 473
process, 428
protected services, 474–475
Recovery options, 463
running services, 436
running with least privilege, 437–439
SCM (Service Control Manager), 426, 446–450
SCP (service control program), 426
Service and Driver Registry parameters,
429–432
service isolation, 439–443
Service SIDs, 440–441
shared processes, 465–468
shutdown, 464–465
startup errors, 459–460
Svchost service splitting, 467–468
tags, 468–469
triggered-start, 457–459
user services, 469–473
virtual service account, 443–444
window stations, 445
Windows threads, viewing user start address
for, 89–91. See also thread-local register
effect
WindowStation object, 129
Wininit, 831–835
Winload, 792–796, 808–810
Winlogon, 831–834, 838
WinObjEx64 tool, 125
WinRE (Windows Recovery Environment),
845–846. See also recovery
XTA cache
WMI (Windows Management Instrumentation)
architecture, 487–488
CIM (Common Information Model),
488–495
class association, 493–494
Control Properties, 498
DMTF, 486, 489
implementation, 496–497
Managed Object Format Language,
489–495
MOF (Managed Object Format), 488–495
namespace, 493
ODBC (Open Database Connectivity), 488
overview, 486–487
providers, 488–489, 497
scripts to manage systems, 495
security, 498
System Control commands, 497
WmiGuid object, 130
WmiPrvSE creation, viewing, 496
WNF (Windows Notification Facility)
event aggregation, 237–238
features, 224–225
publishing and subscription model, 236–237
state names and storage, 233–237
users, 226–232
WNF state names, dumping, 237
wnfdump command, 237
WnfDump utility, 226, 237
WoW64 (Windows-on-Windows)
ARM, 113–114
ARM32 simulation on ARM 64 platforms, 115
core, 106–109
debugging in ARM64, 122–124
exception dispatching, 113
file system redirection, 109–110
memory models, 114
overview, 104–106
registry redirection, 110–111
system calls, 112
user-mode core, 108–109
X86 simulation on AMD64 platforms, 759–751
X86 simulation on ARM64 platforms, 115–125
write throttling, 596–597
write-back caching and lazy writing, 589–595
write-behind and read-ahead. See read-ahead
and write-behind
WSL (Windows Subsystem for Linux), 64, 128
X
x64 systems, 2–4
viewing GDT on, 4–5
viewing TSS and IST on, 8–9
x86 simulation in ARM64 platforms, 115–124
x86 systems, 3, 35, 94–95, 101–102
exceptions and interrupt numbers, 86
Retpoline code sequence, 23
viewing GDT on, 5
viewing TSSs on, 7–8
XML descriptor, Task Scheduler, 479–481
XPERF tool, 504
XTA cache, 118–120
Index
881