/


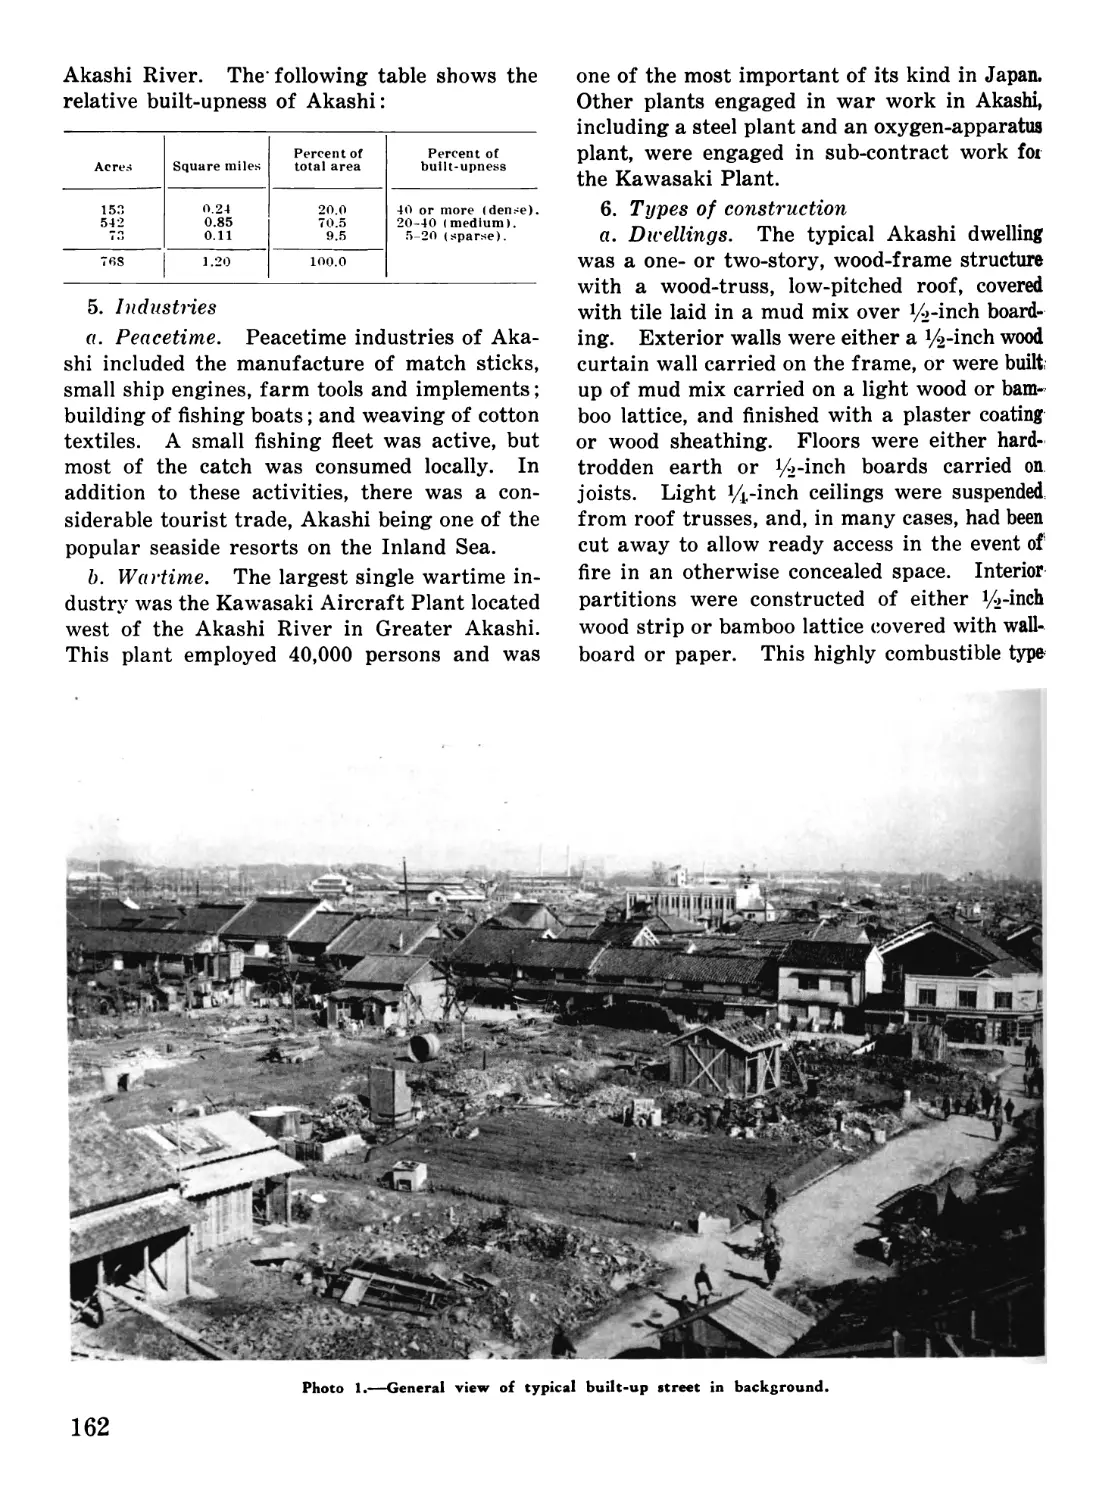


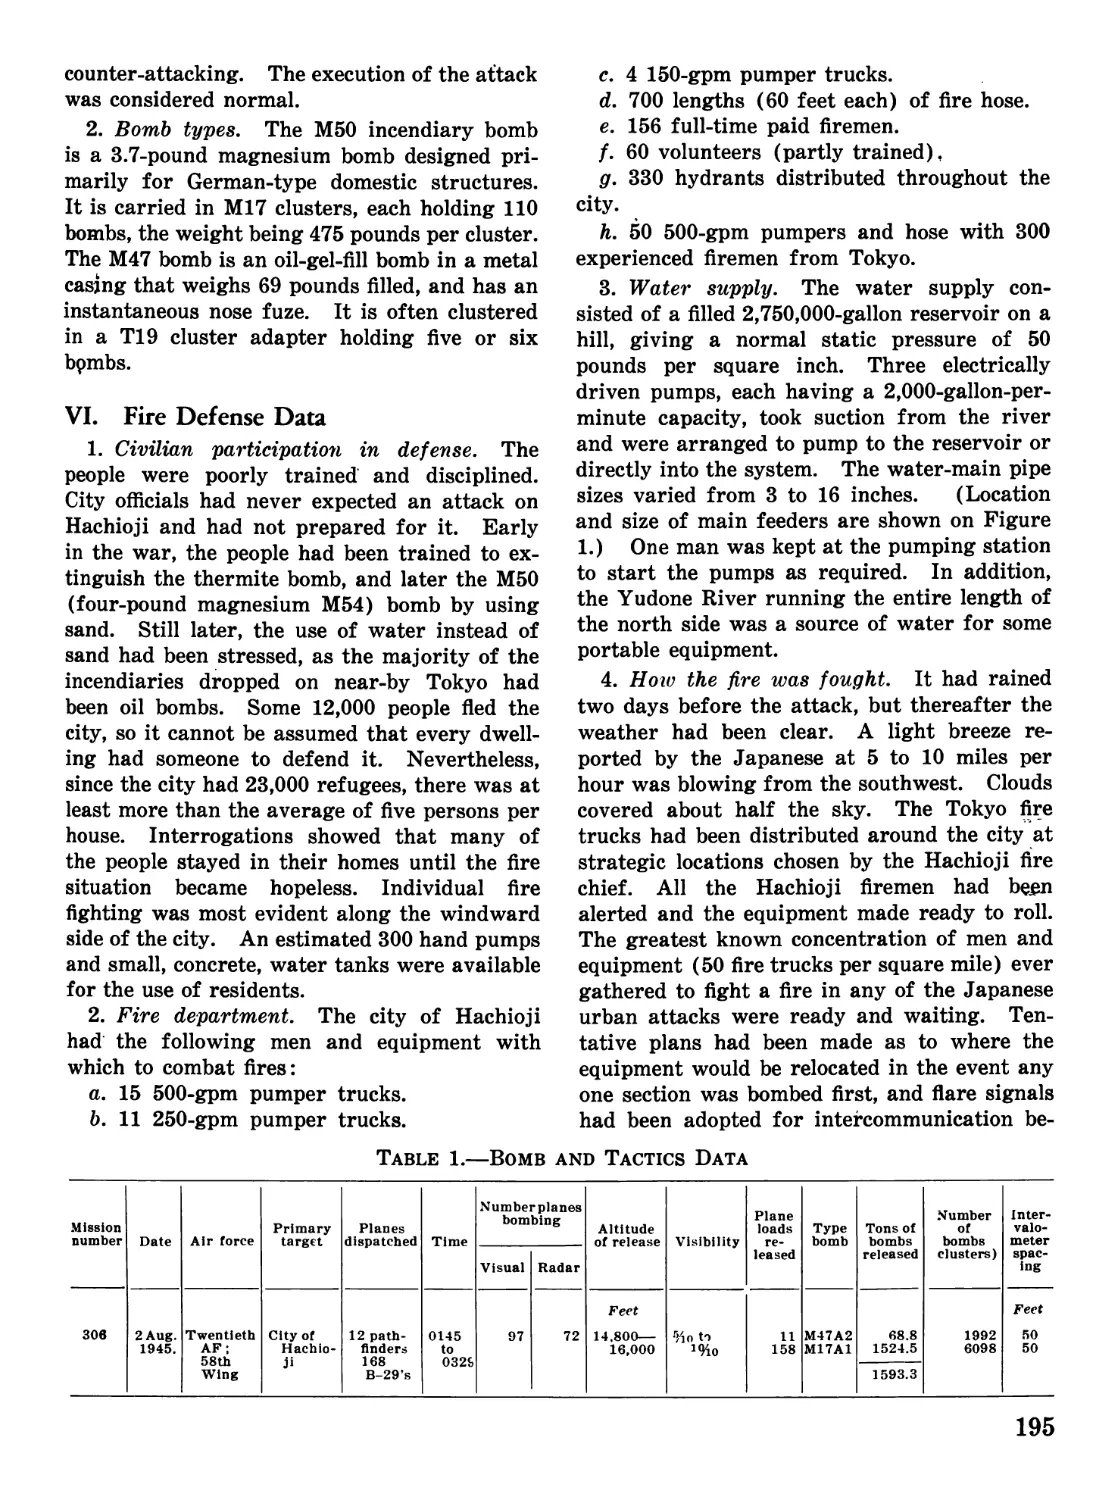


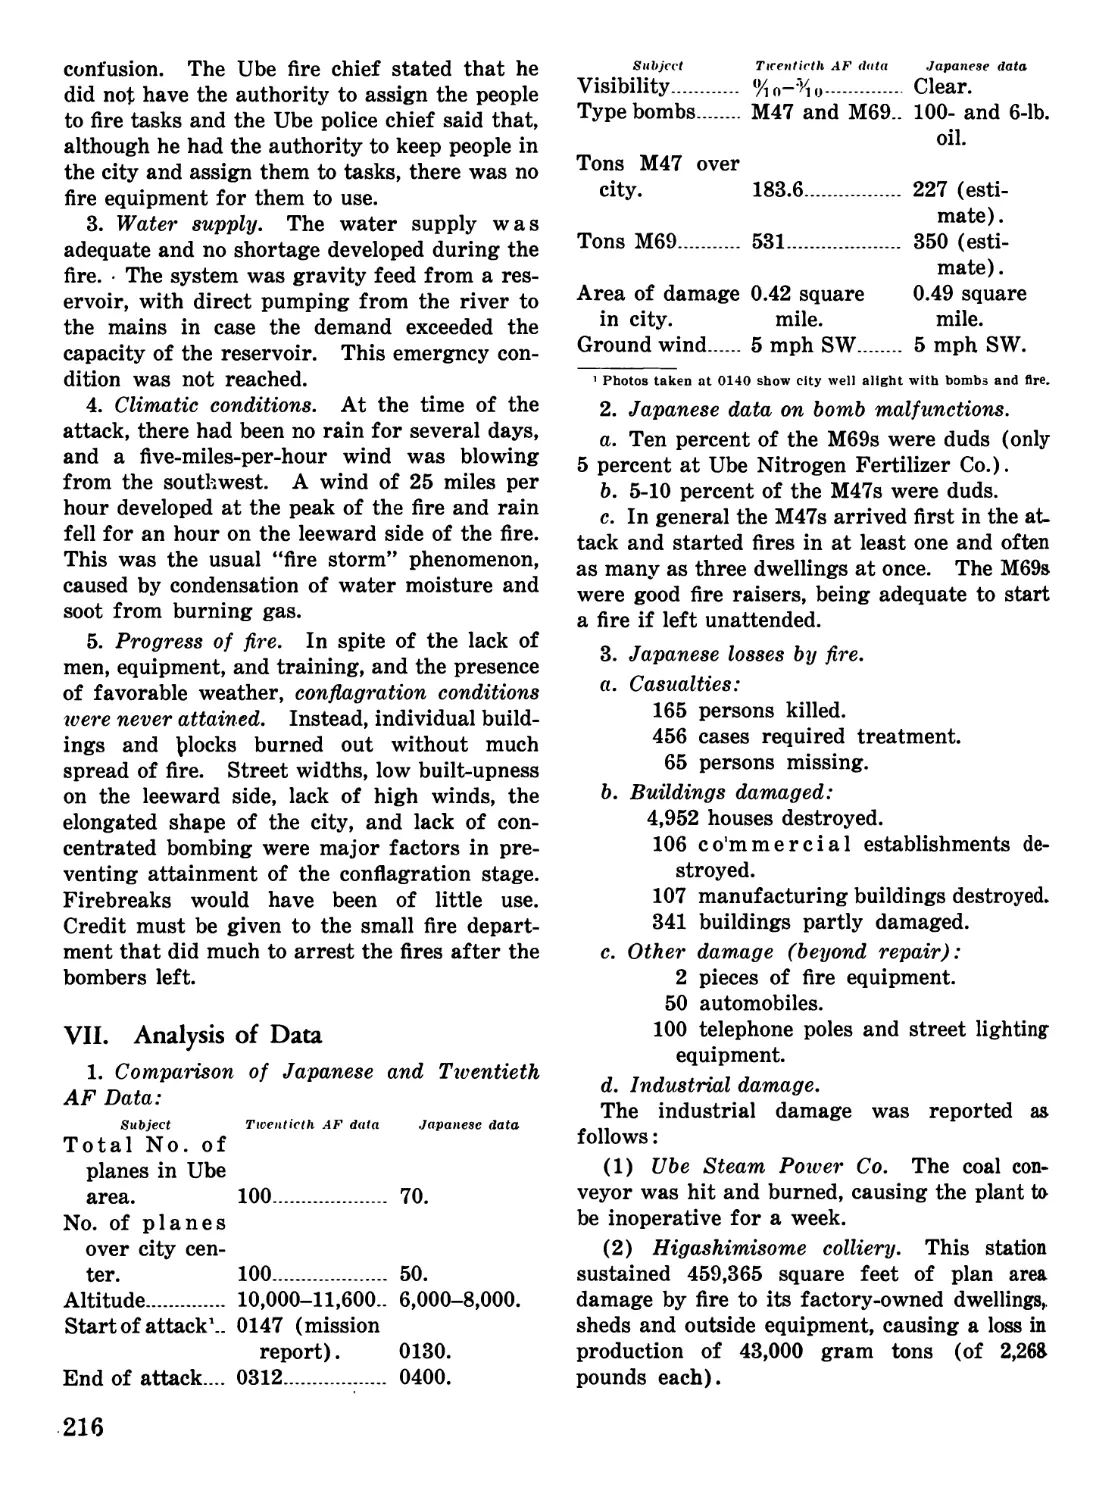


Теги: military affairs military operations
Год: 1947
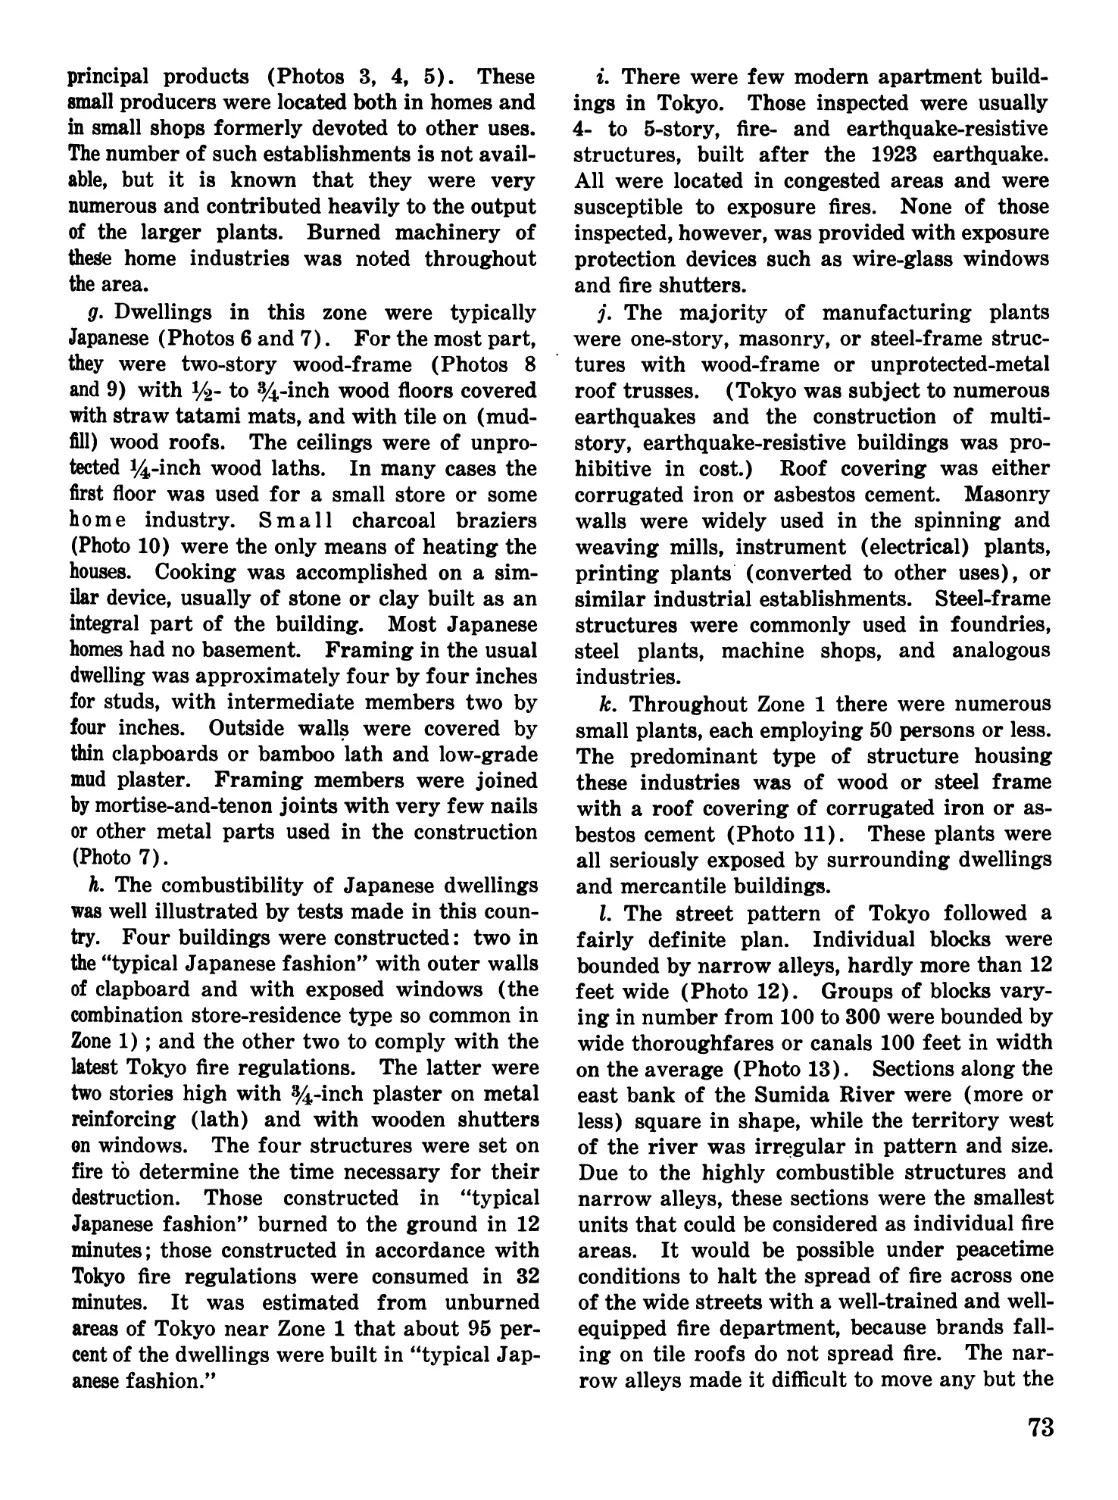
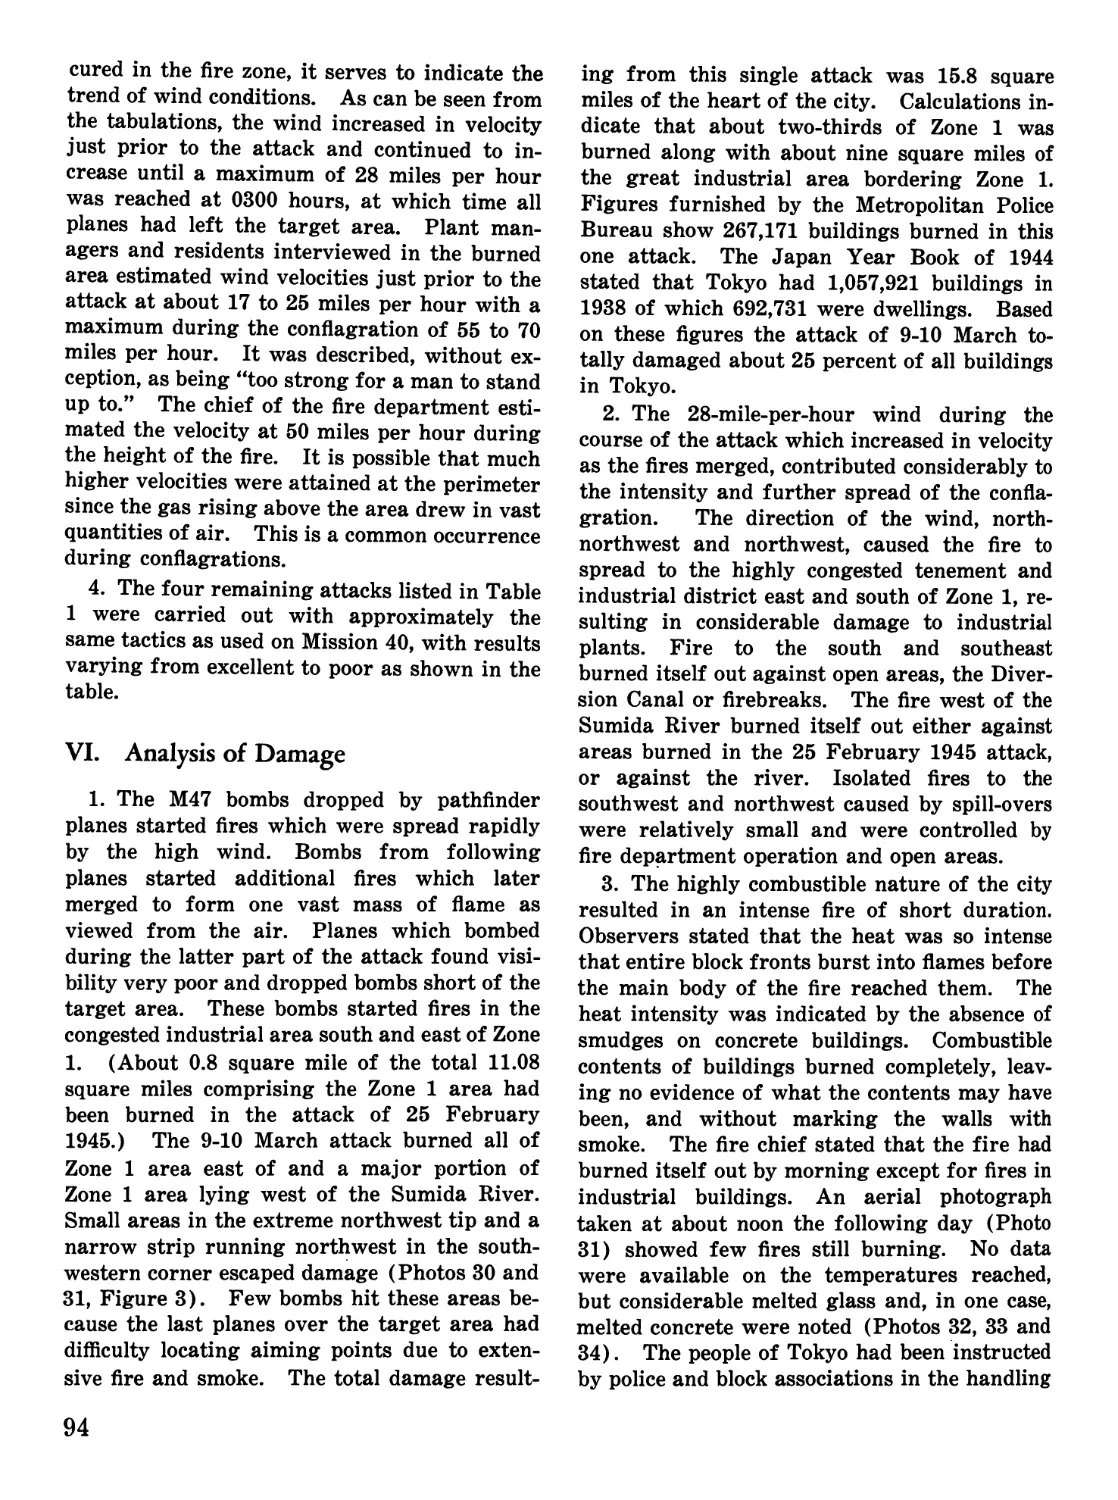
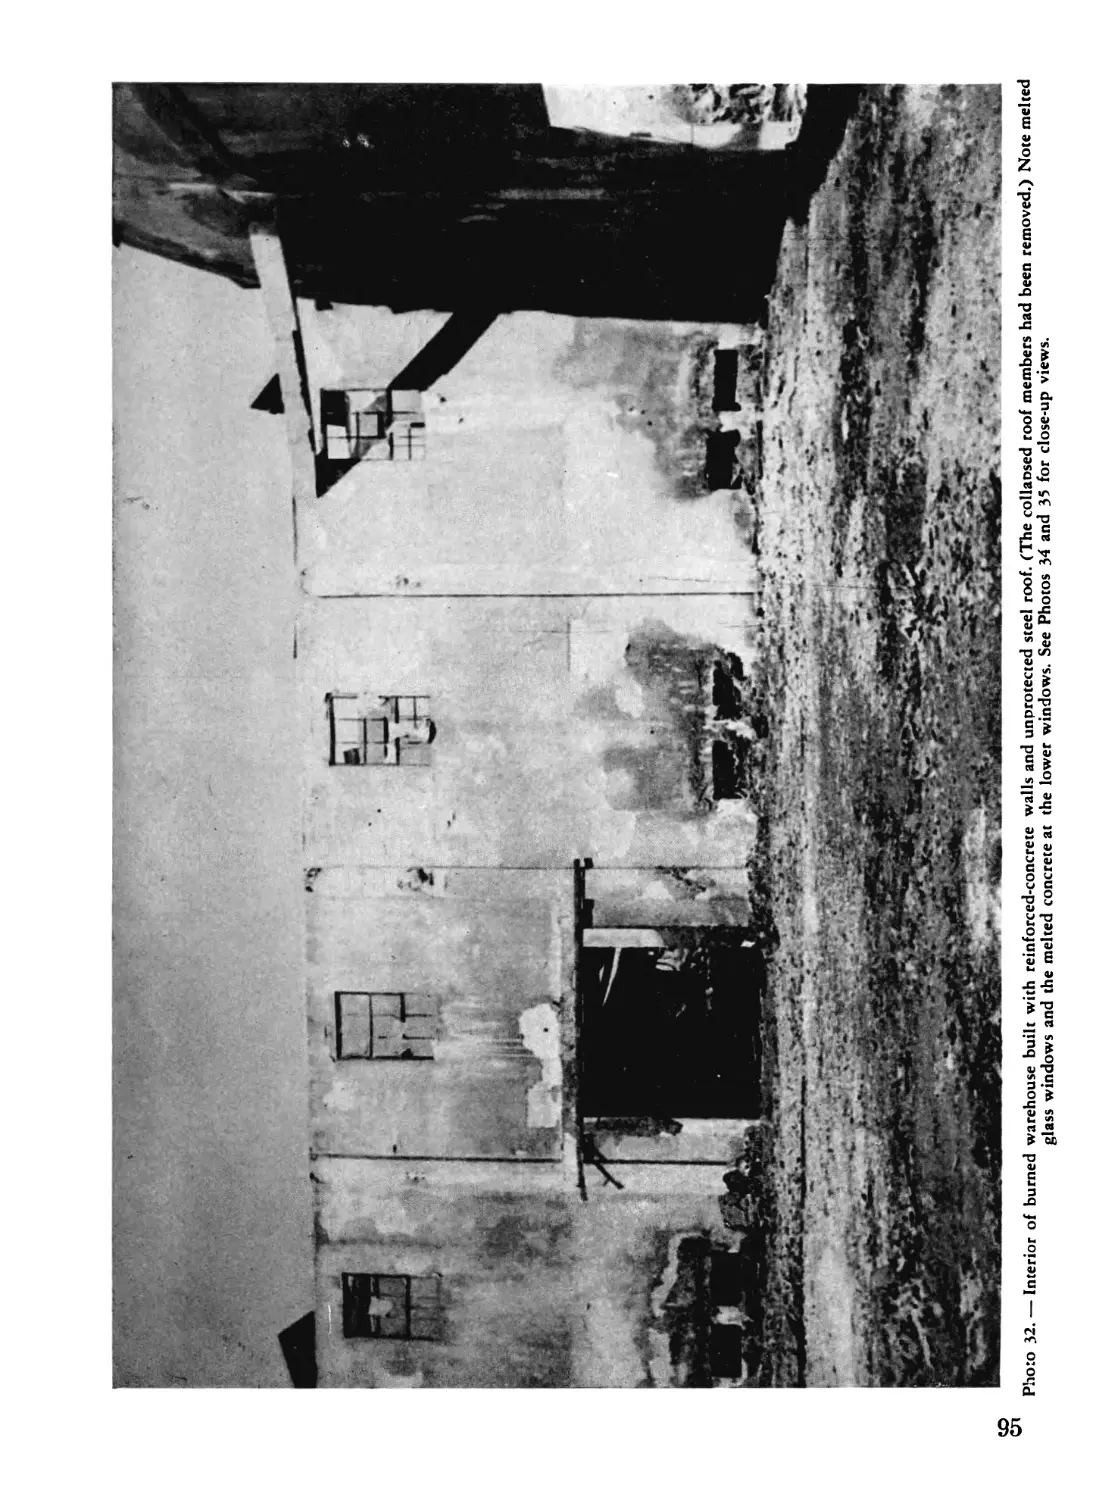
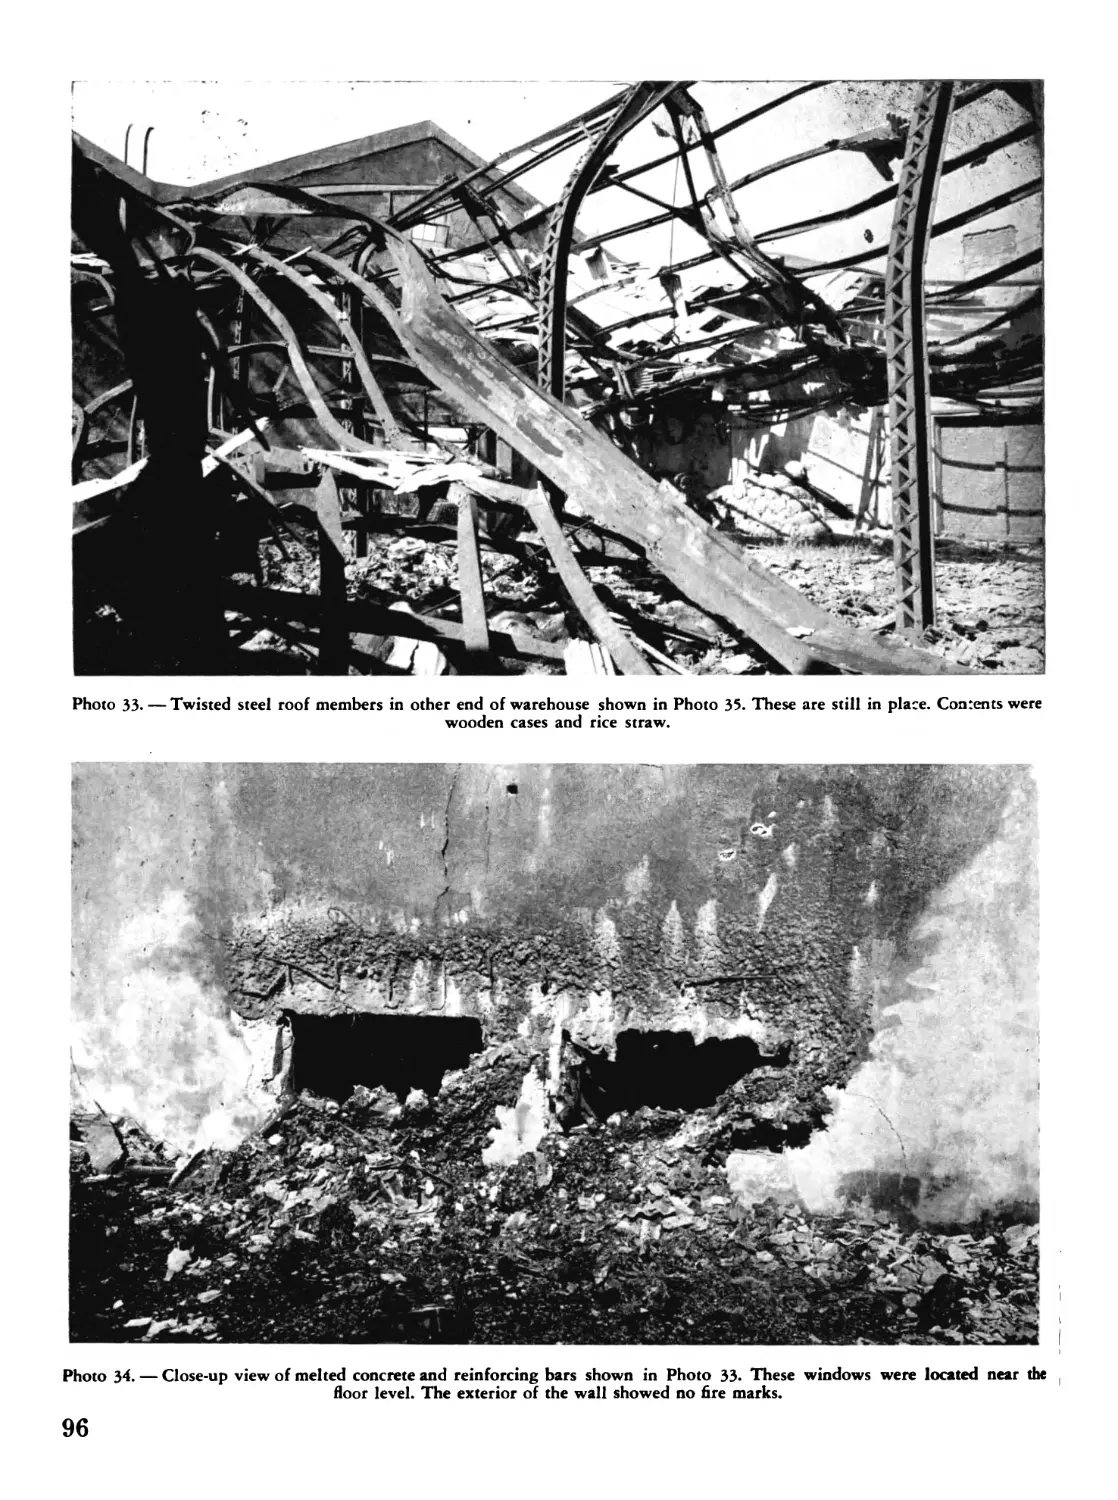
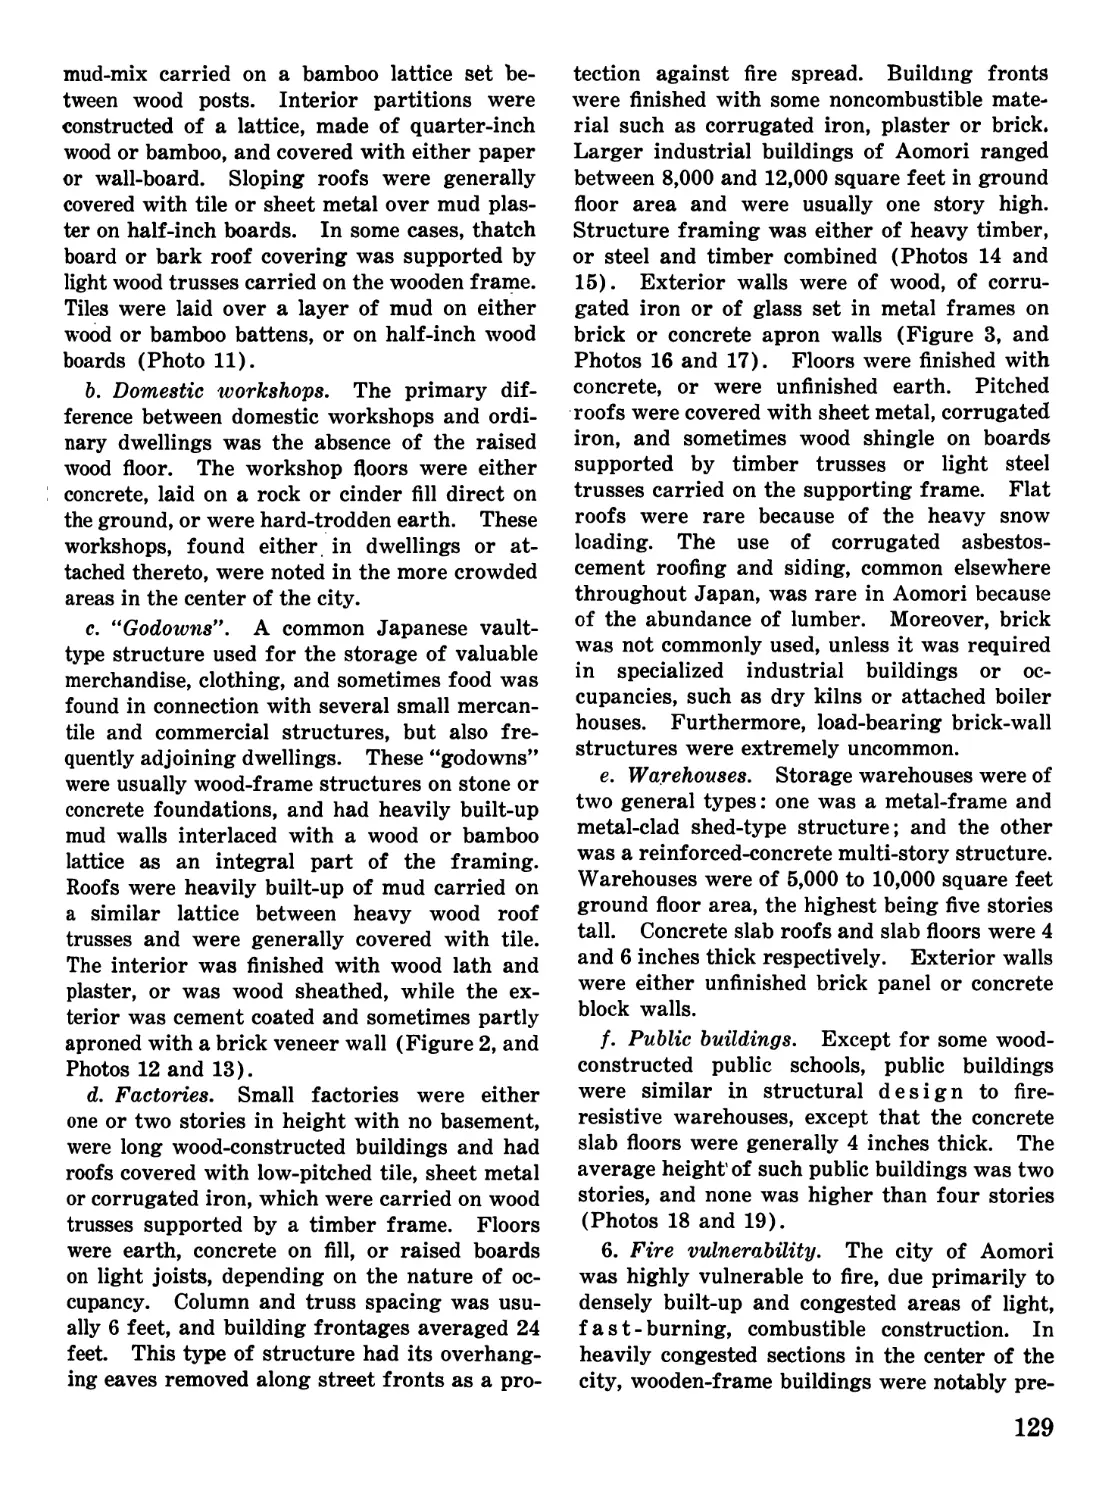
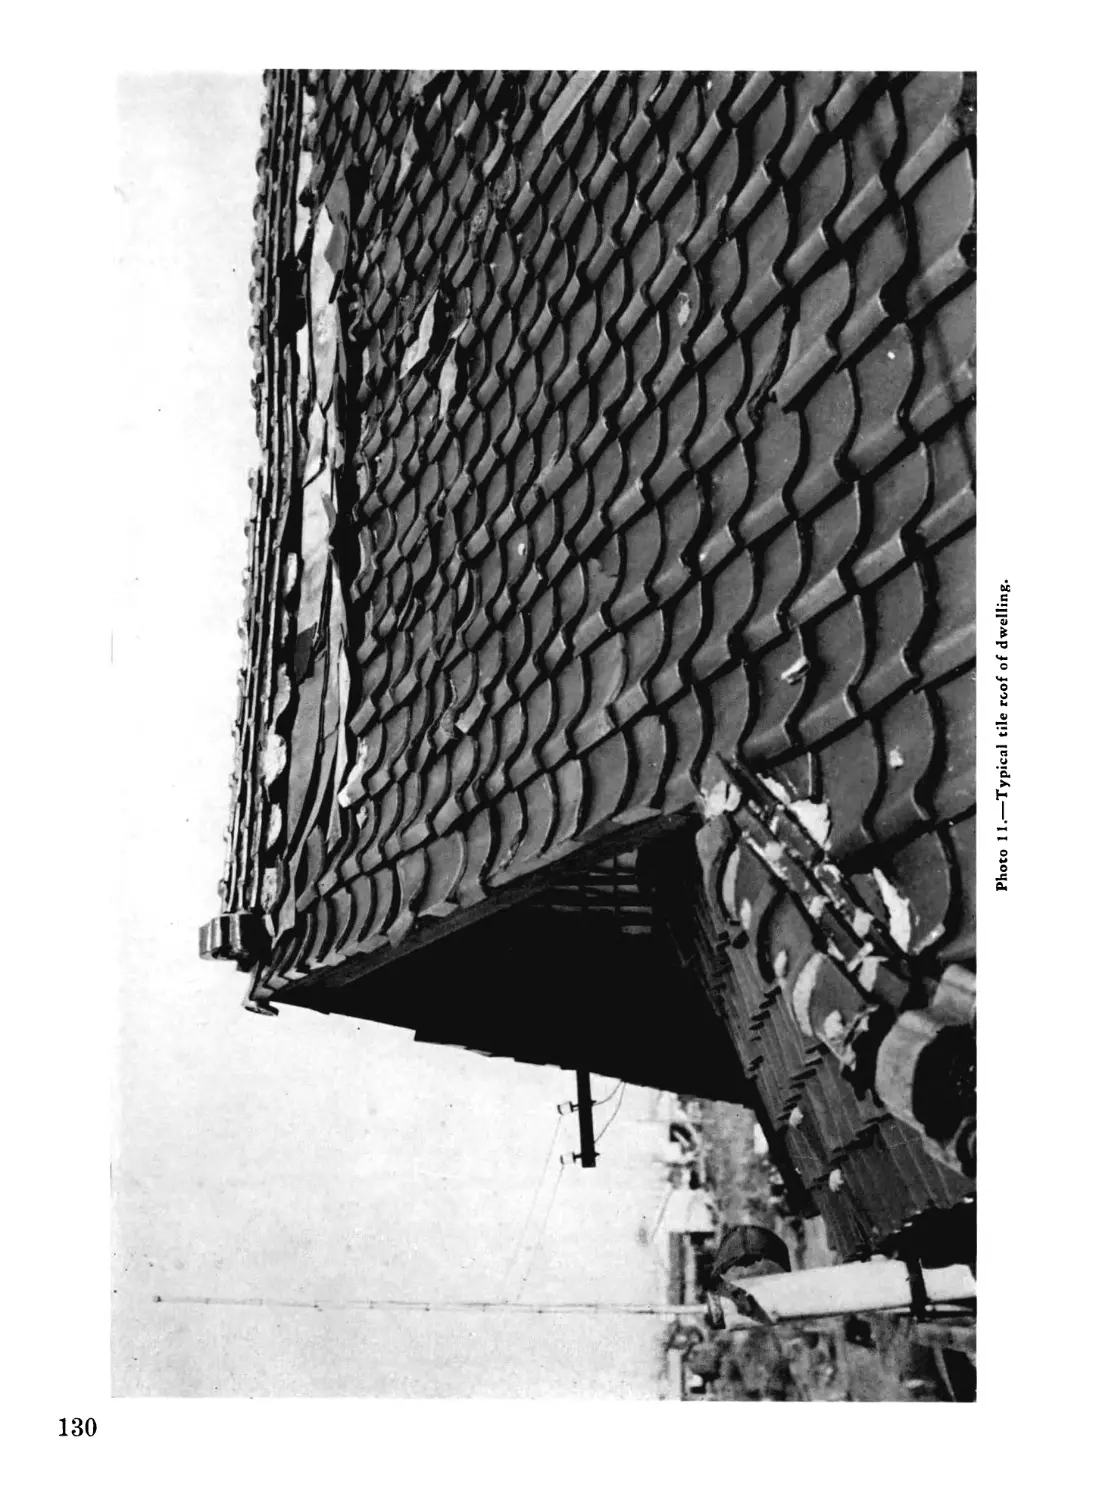
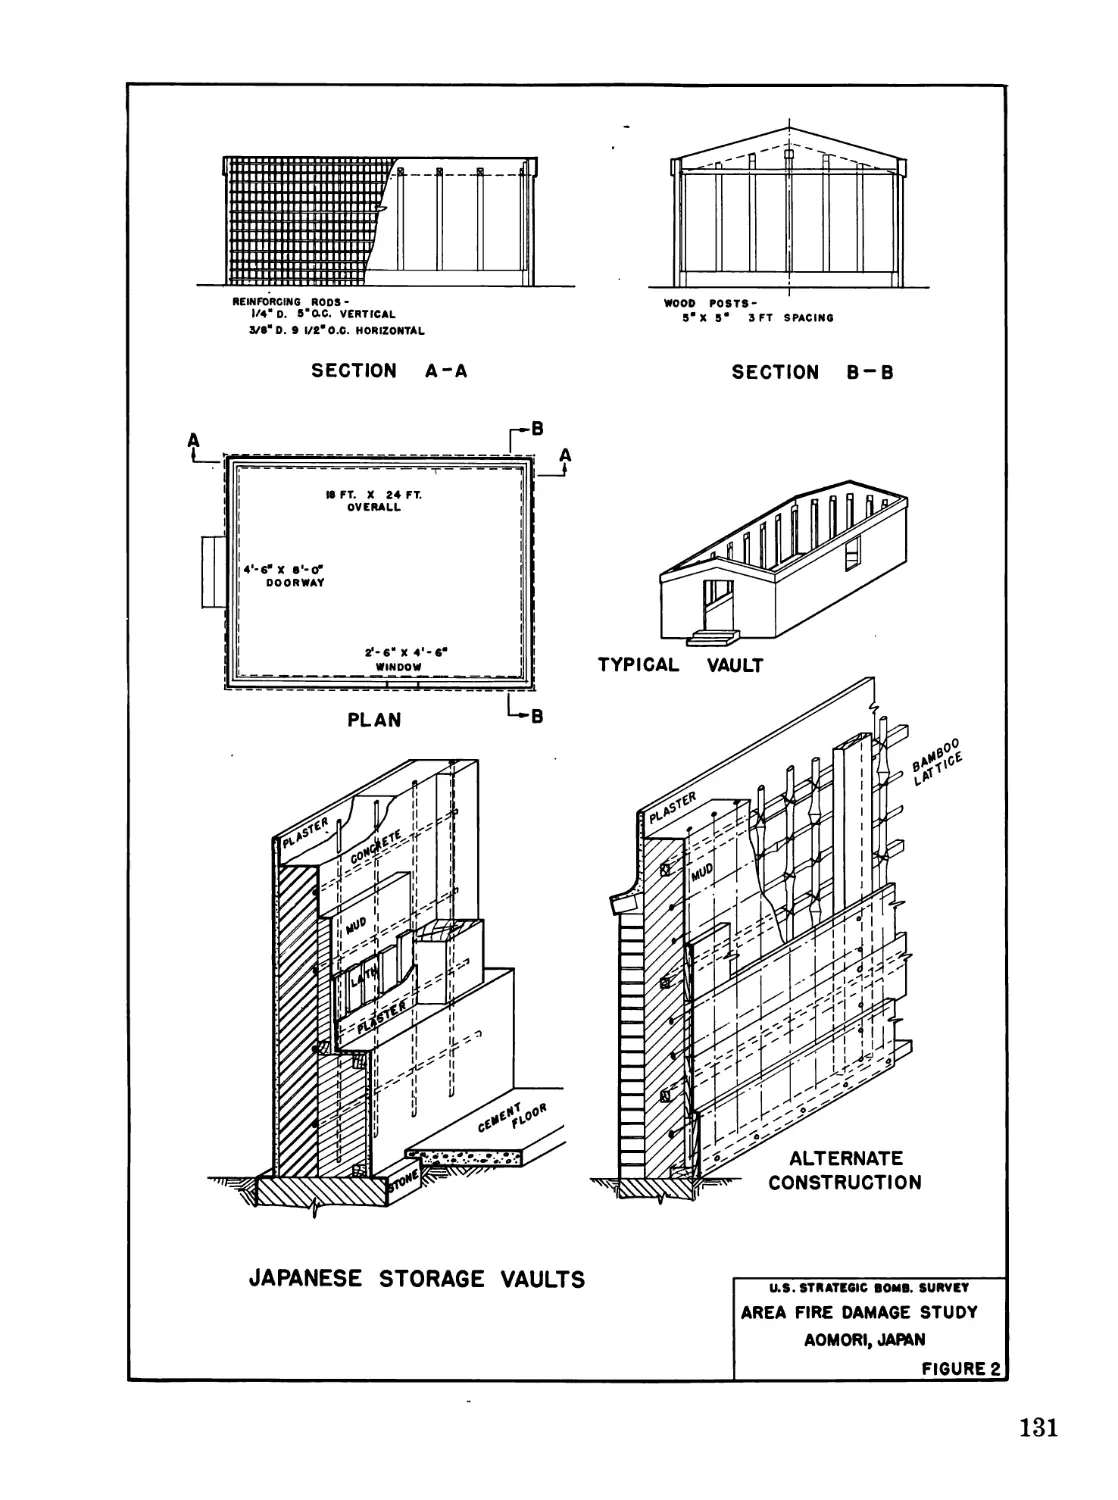
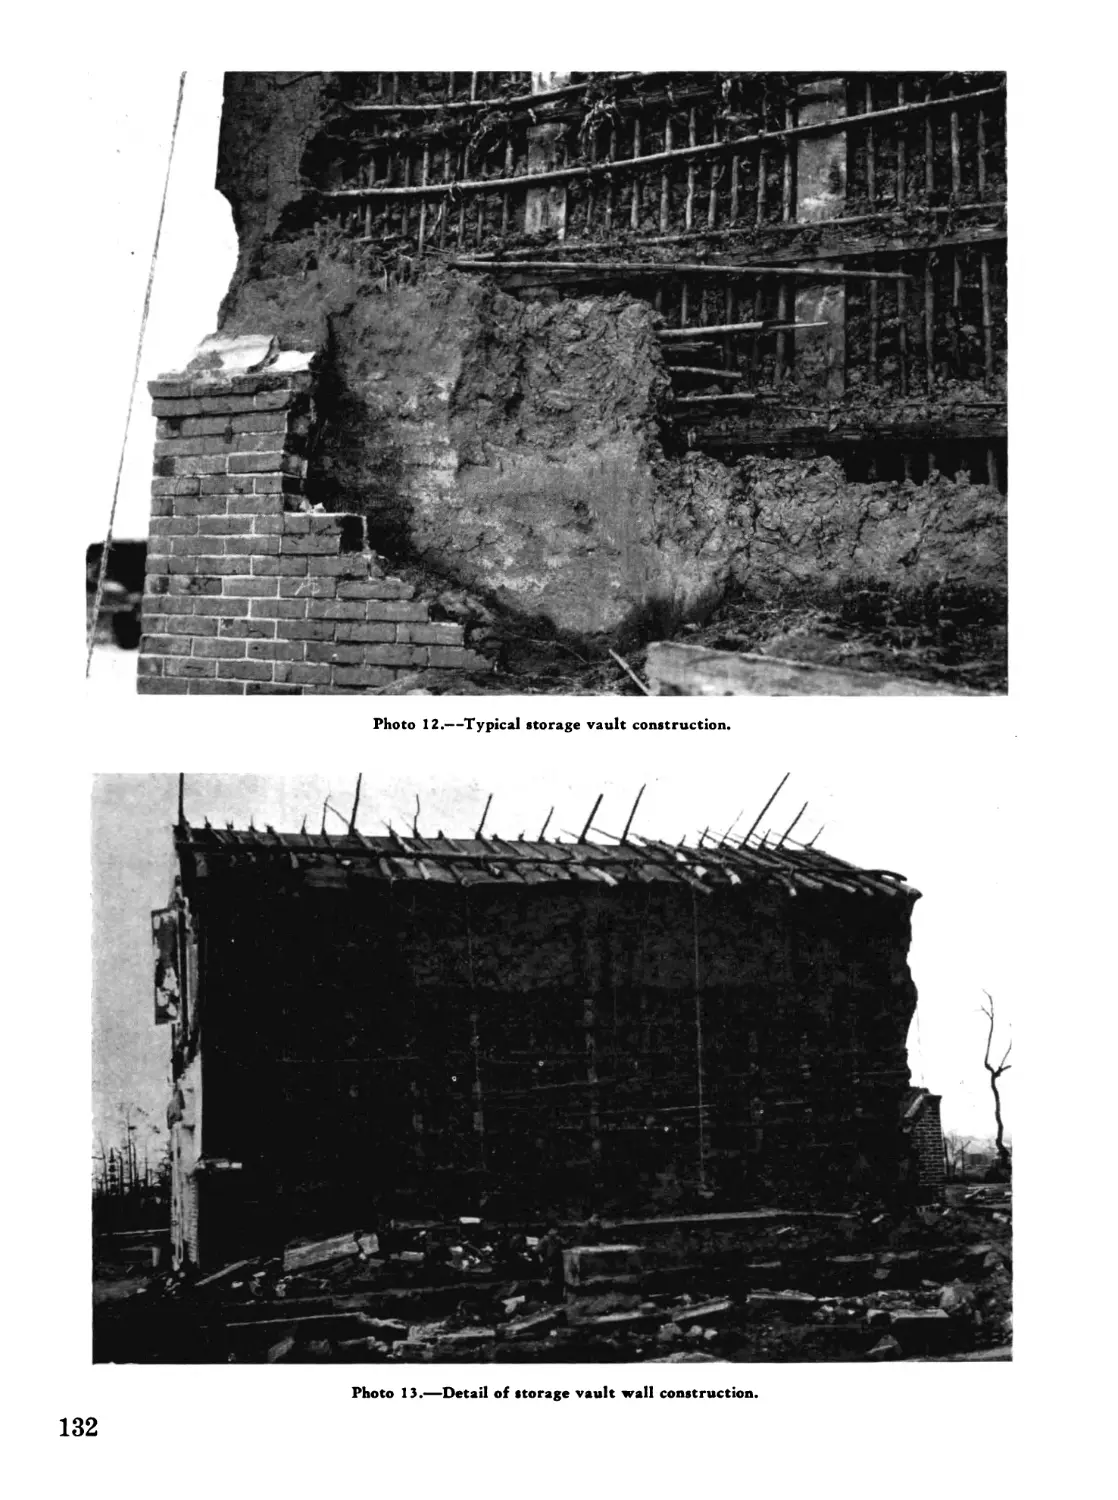
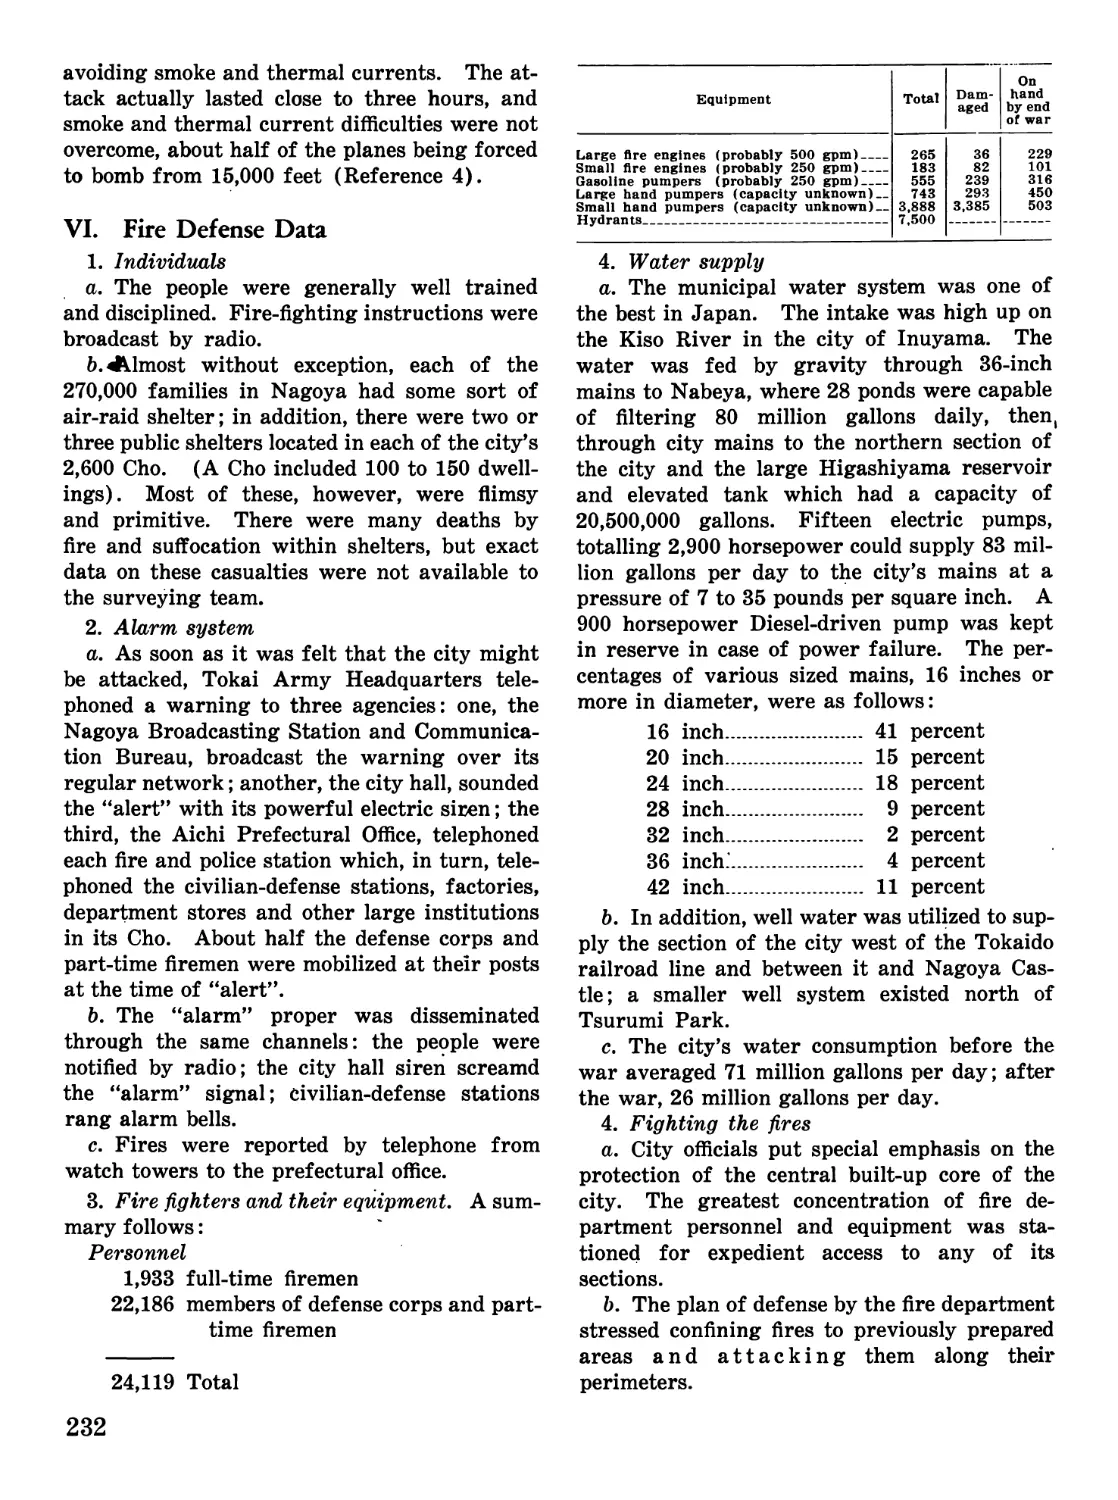
Текст
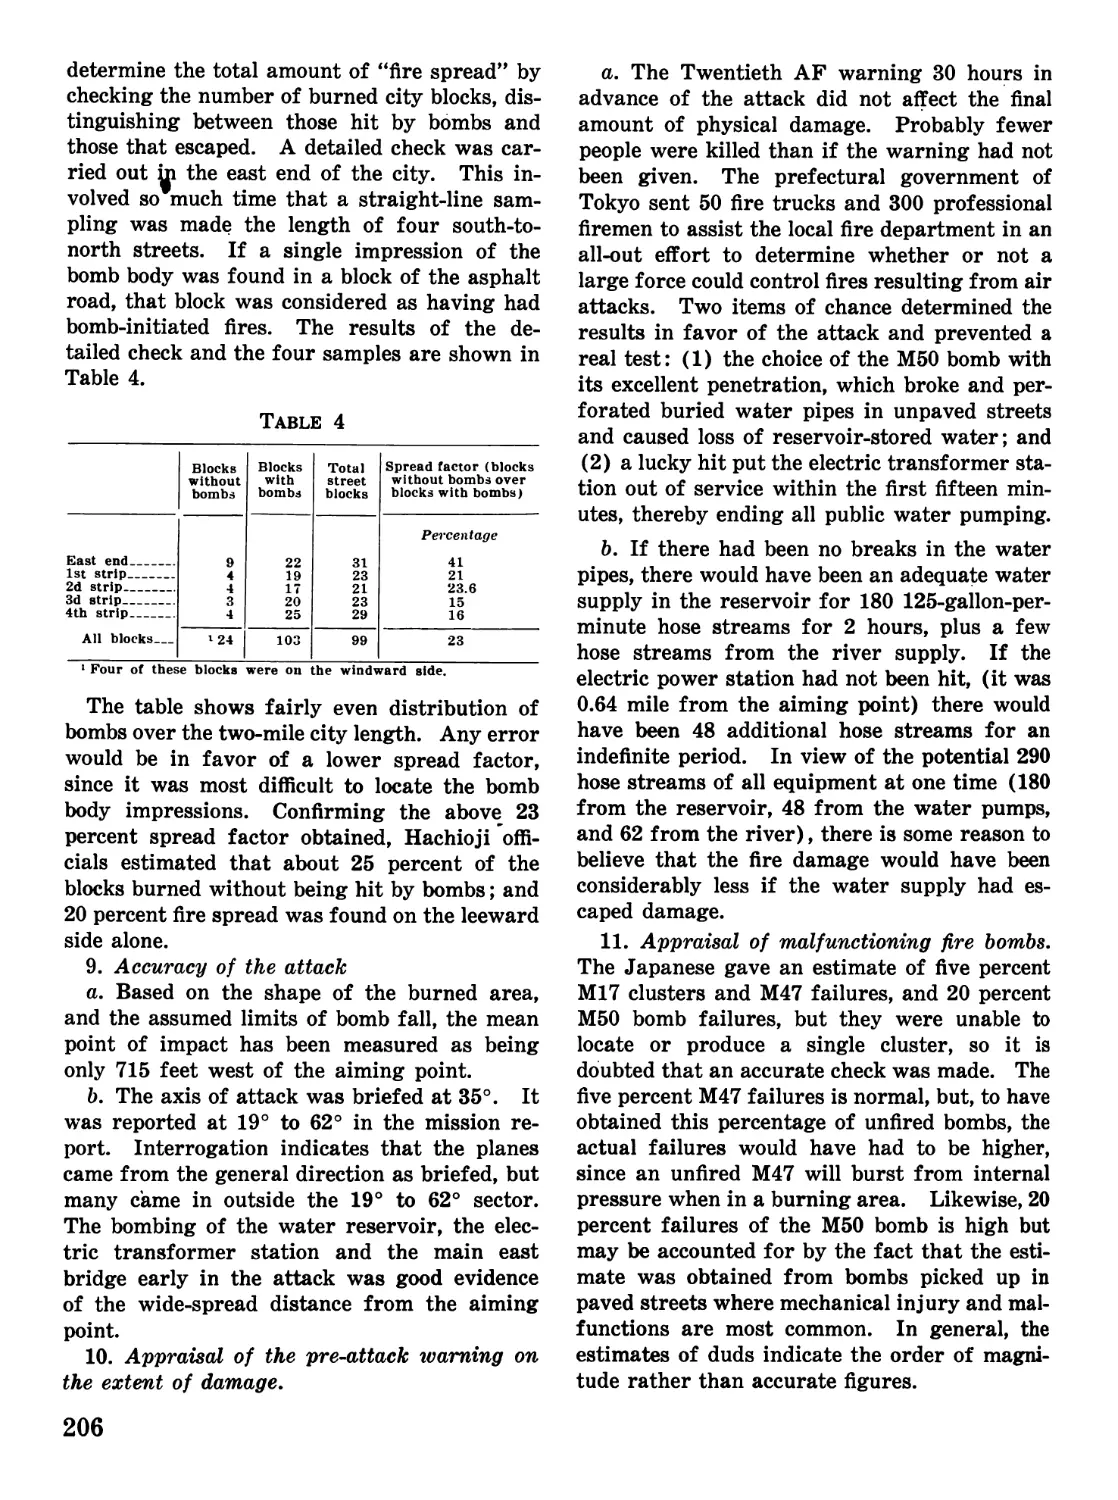
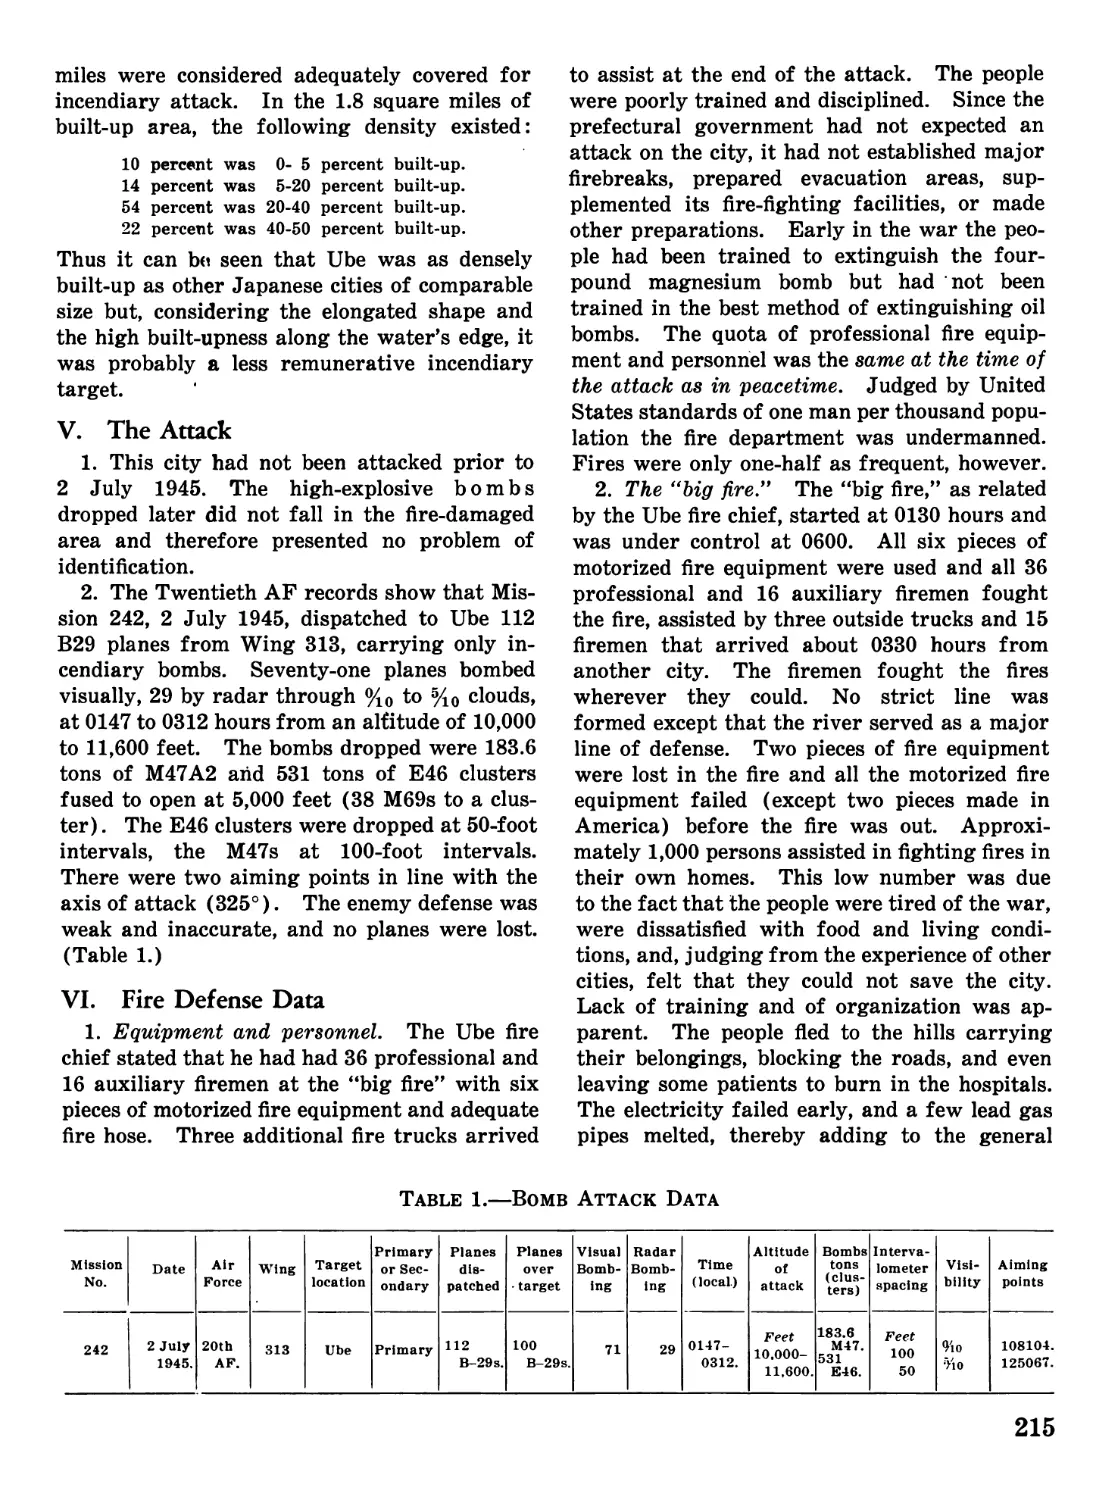
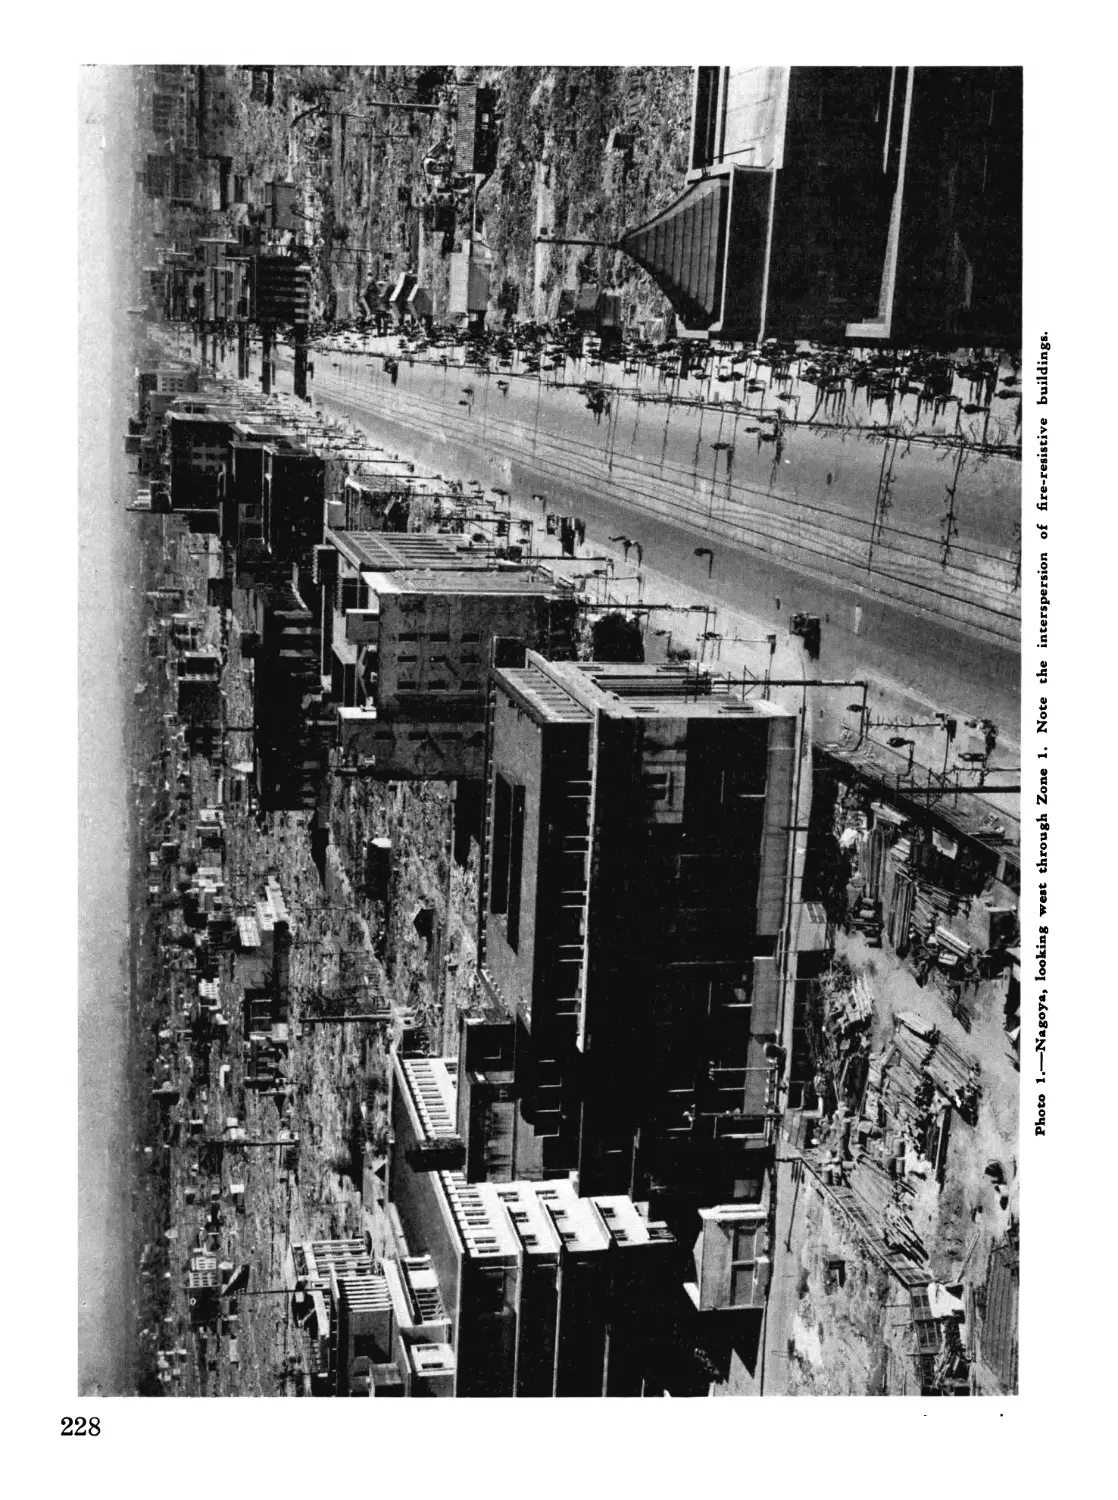
THE UNITED STATES
STRATEGIC BOMBING SURVEY
Effects of Incendiary Bomb
Attacks on Japan
A REPORT ON EIGHT CITIES
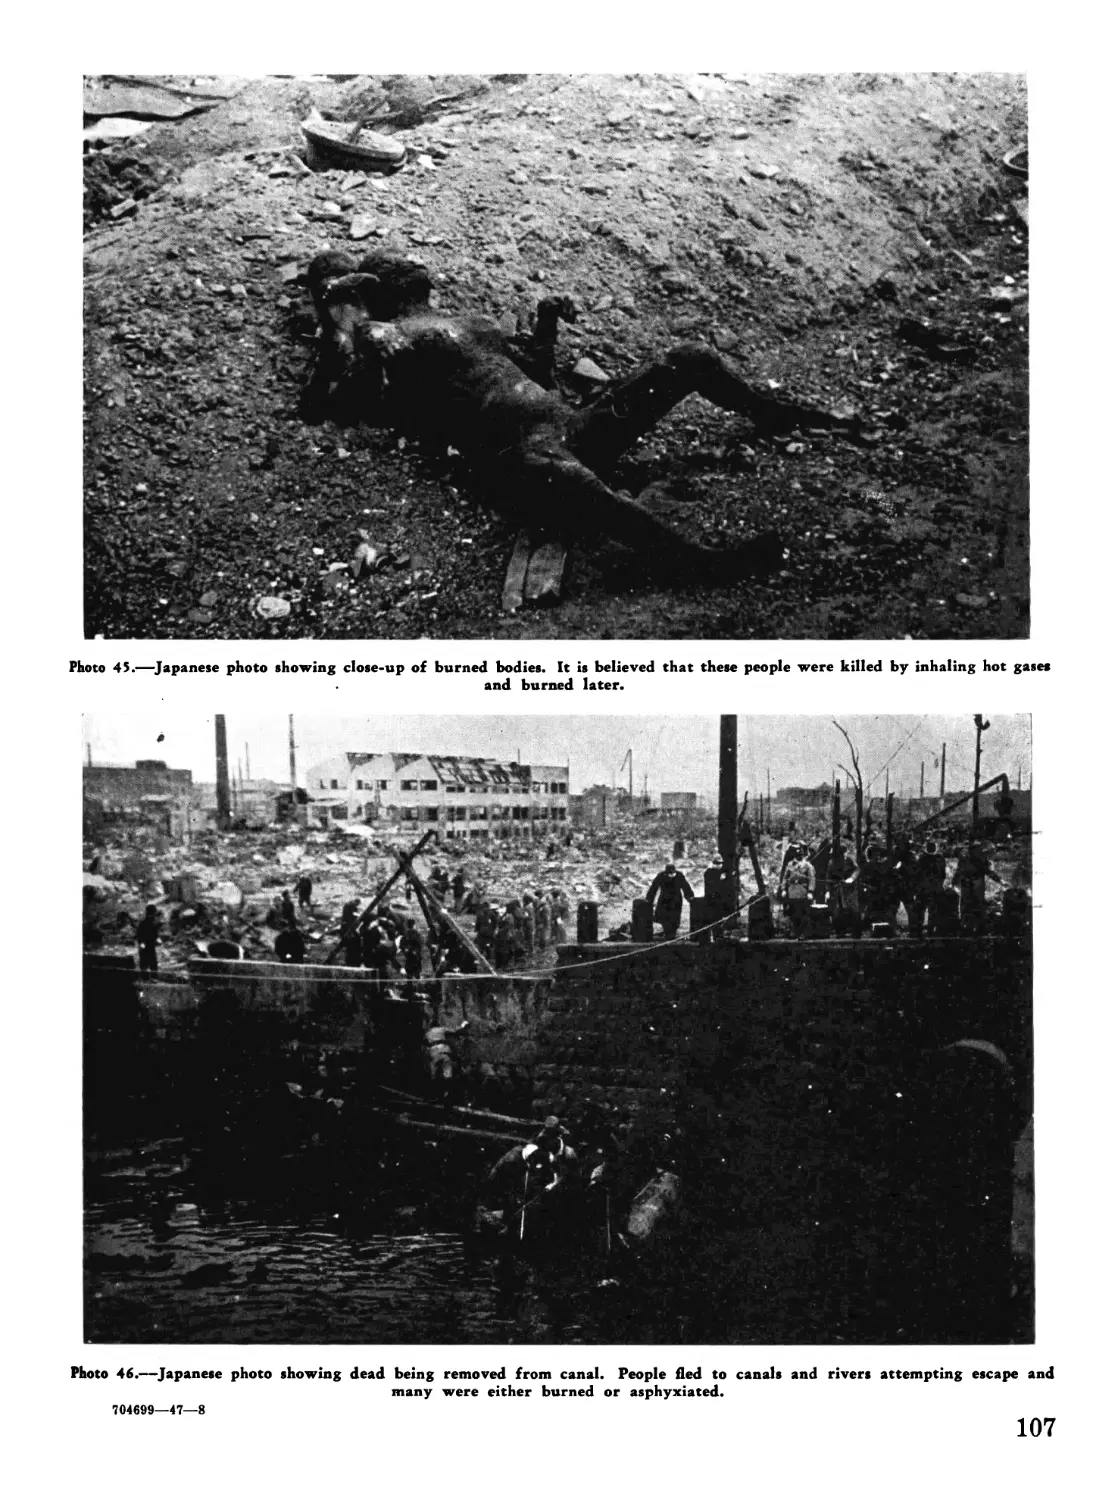
Physical Damage Division
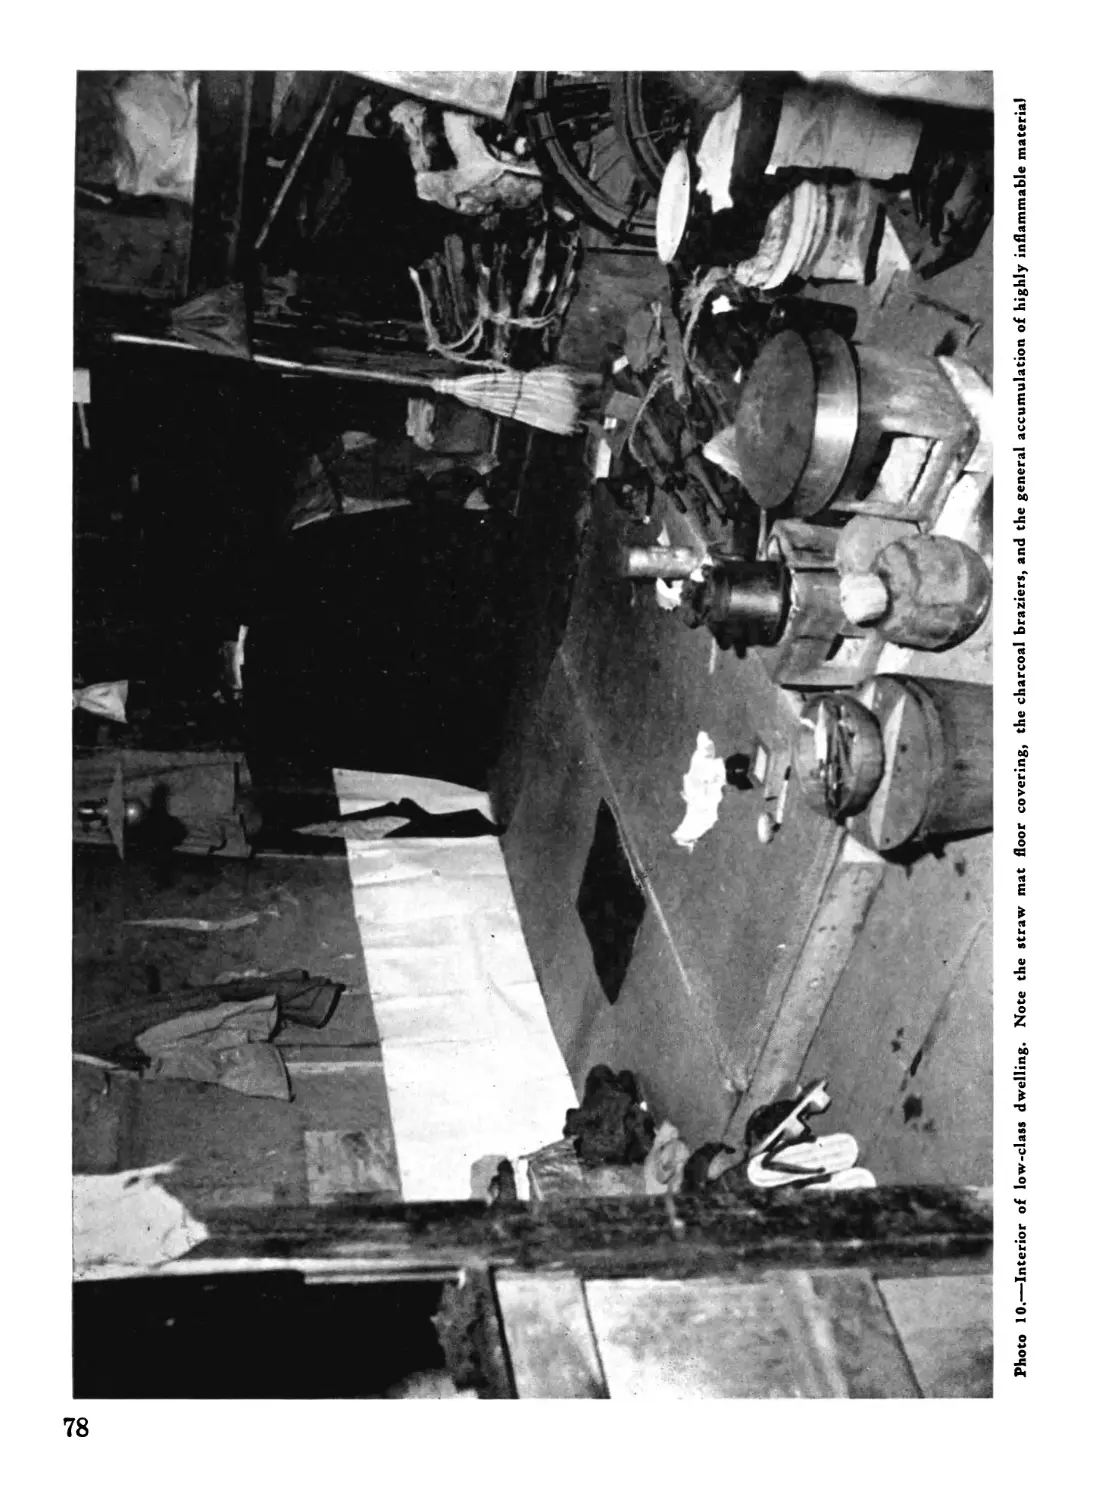
April 1947
THE UNITED STATES
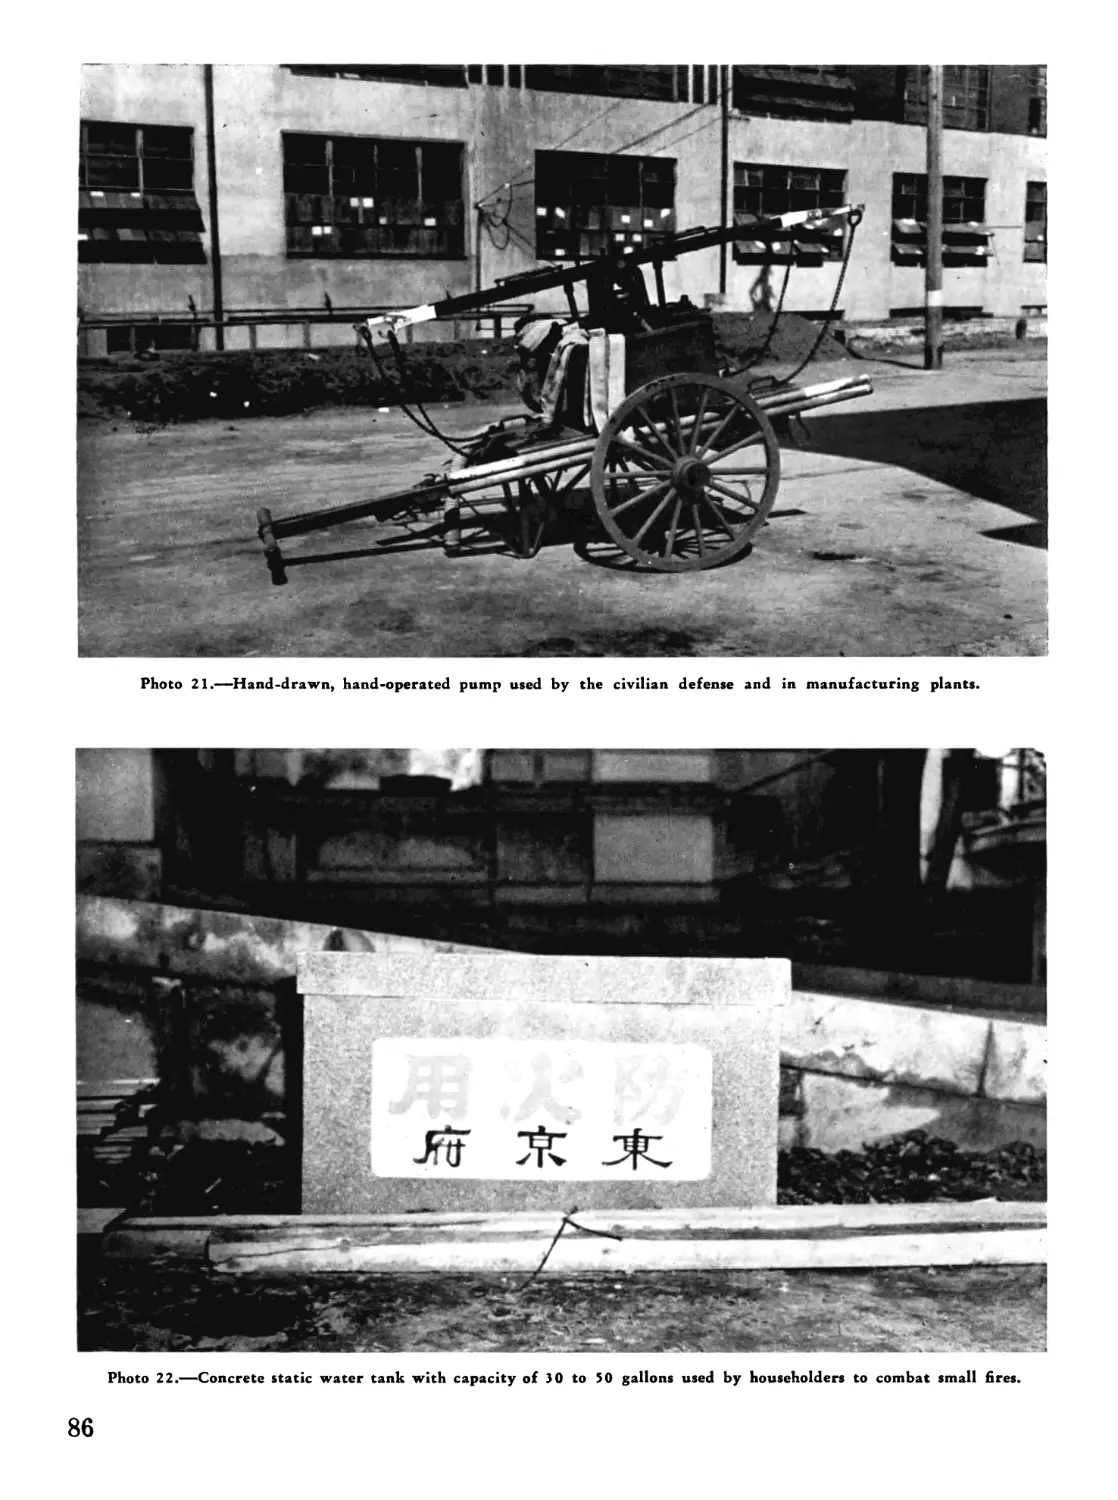
STRATEGIC BOMBING SURVEY
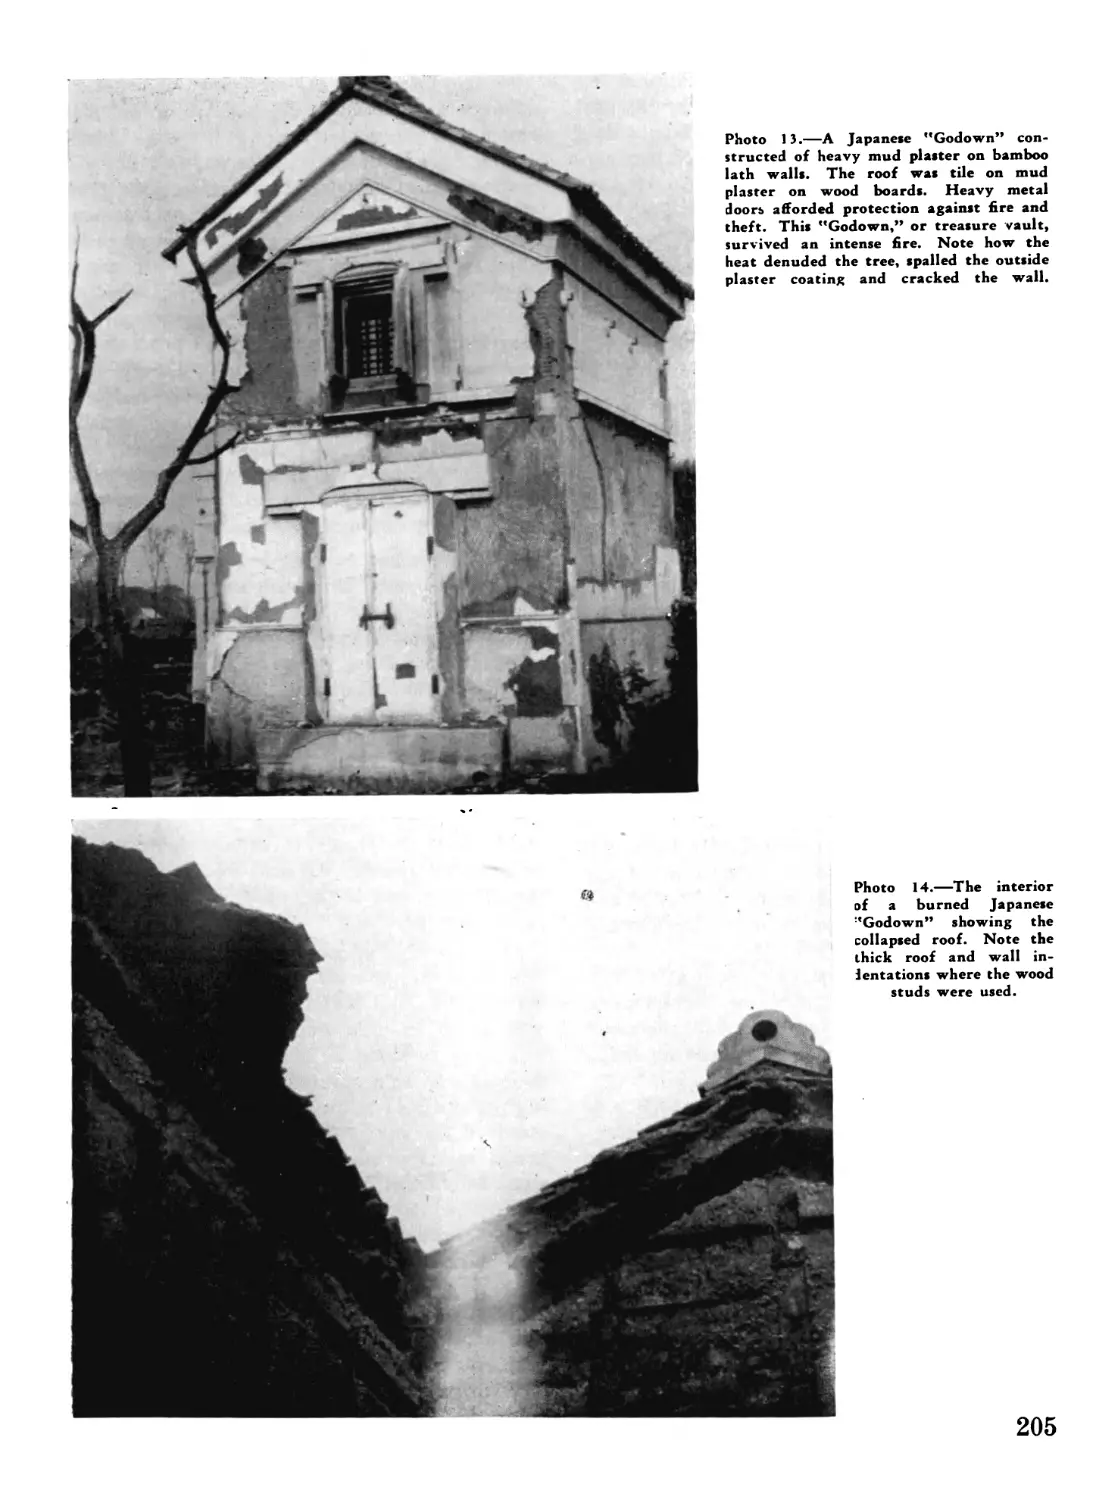
Effects of incendiary Bomb
Attacks on Japan
A REPORT ON EIGHT CITIES
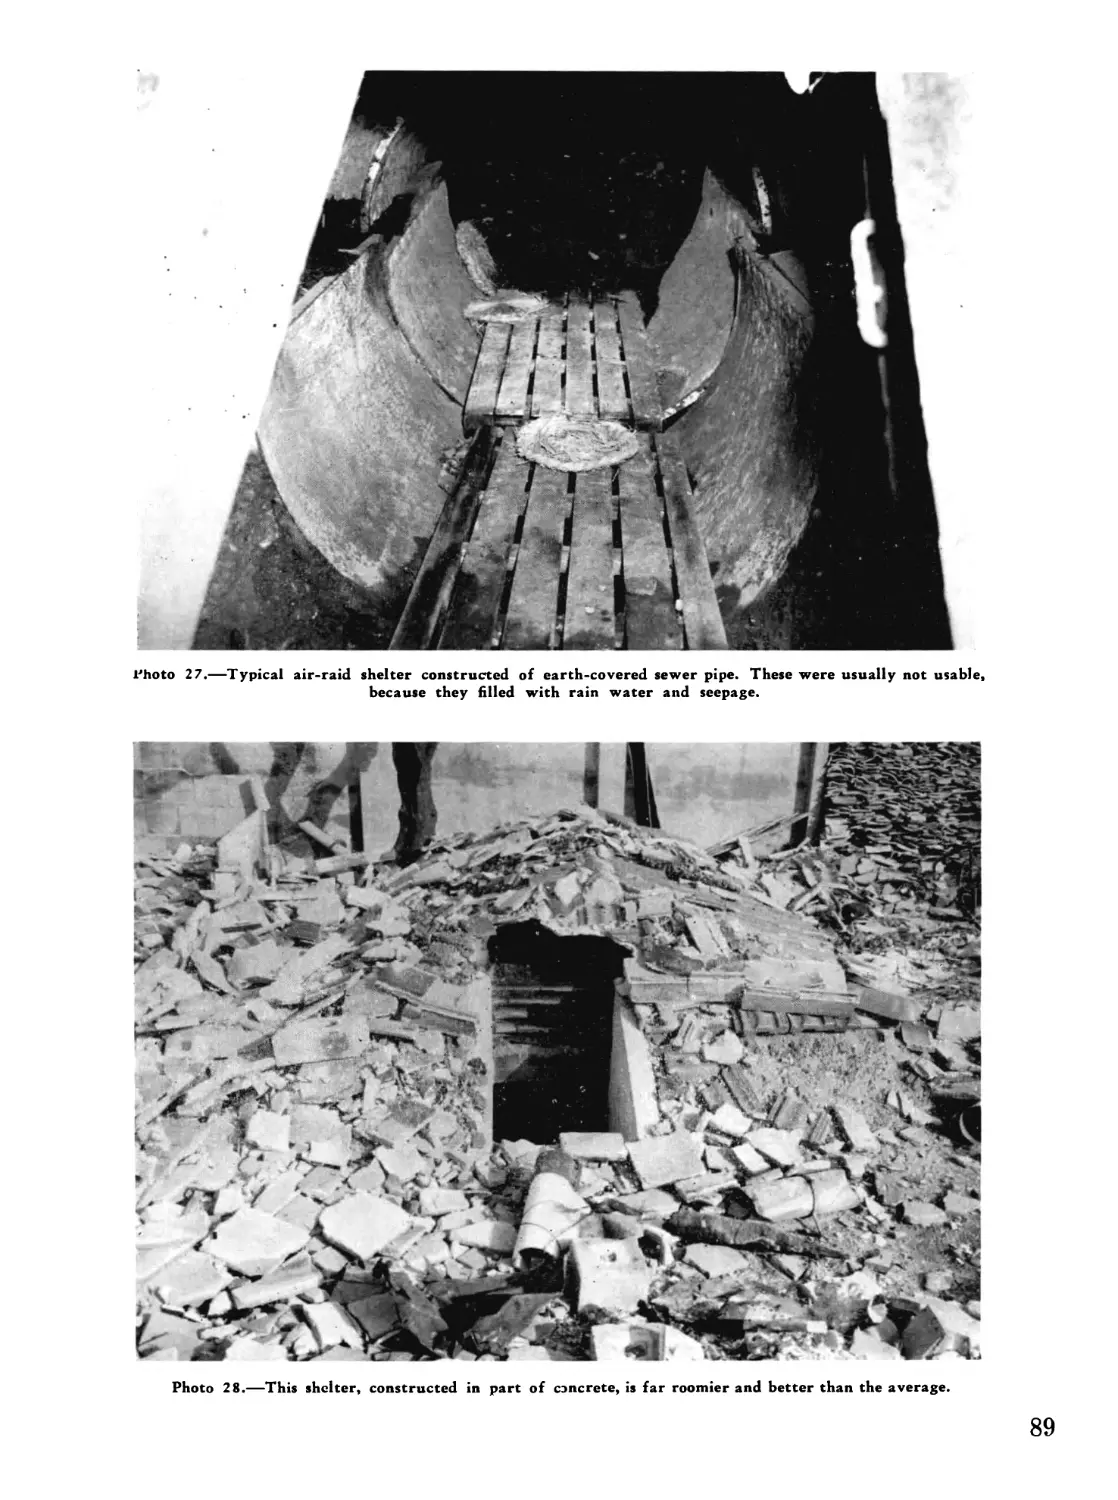
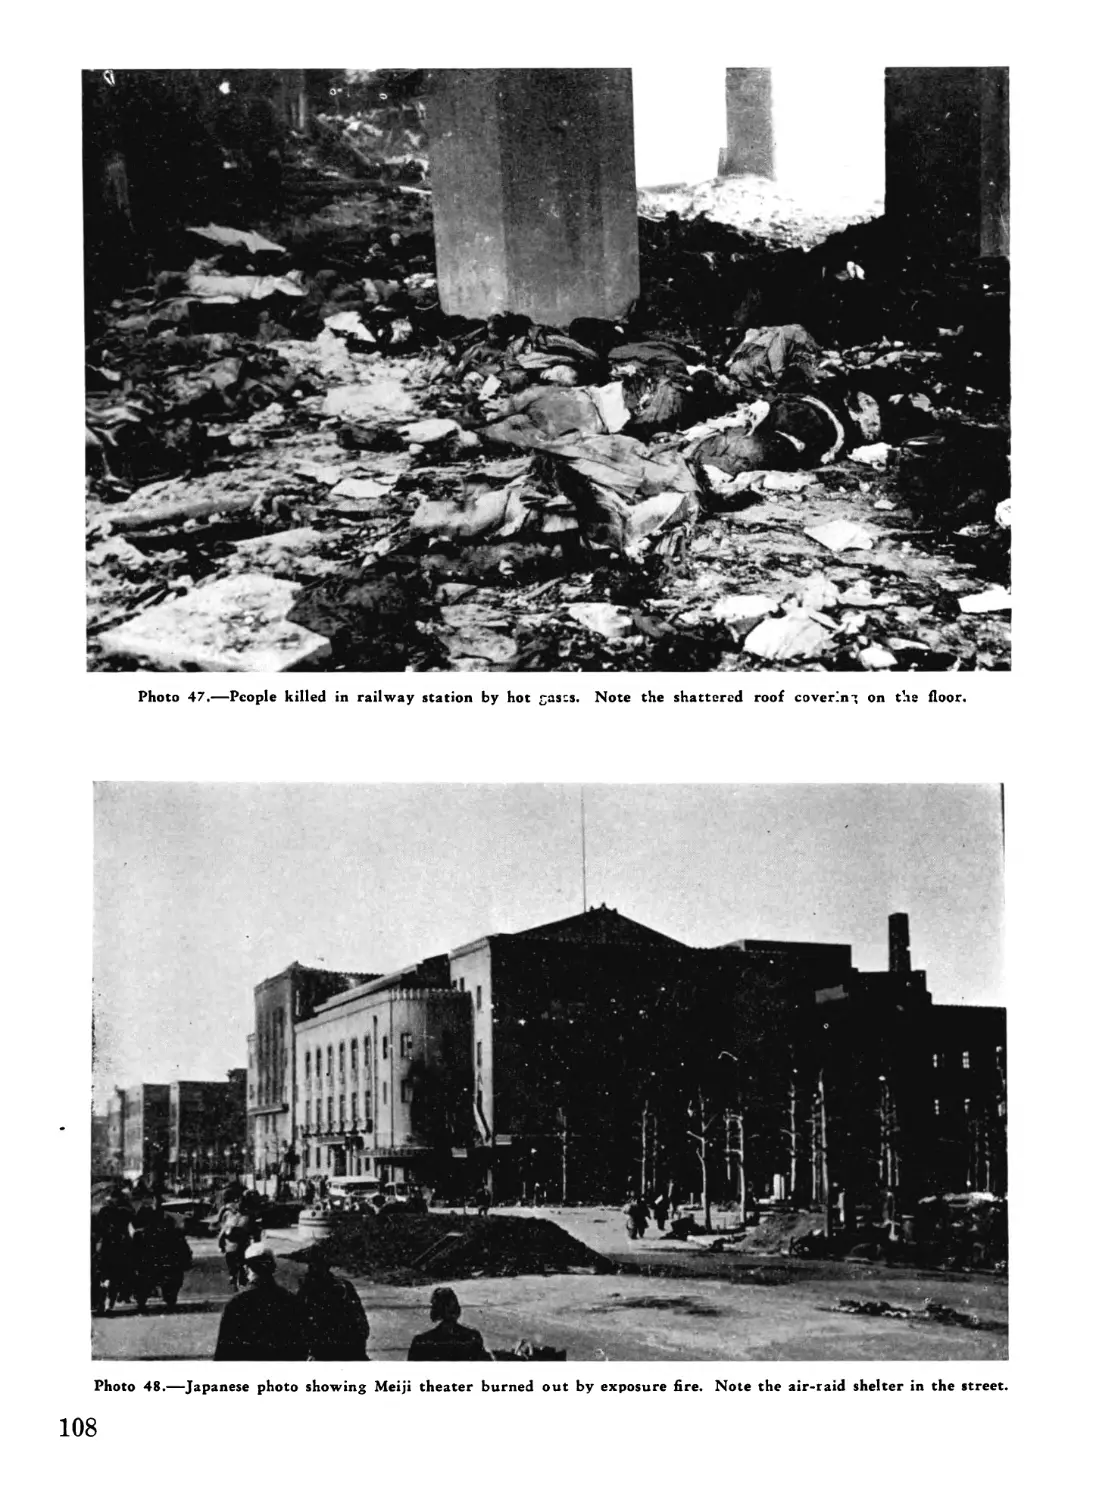
Physical Damage Division
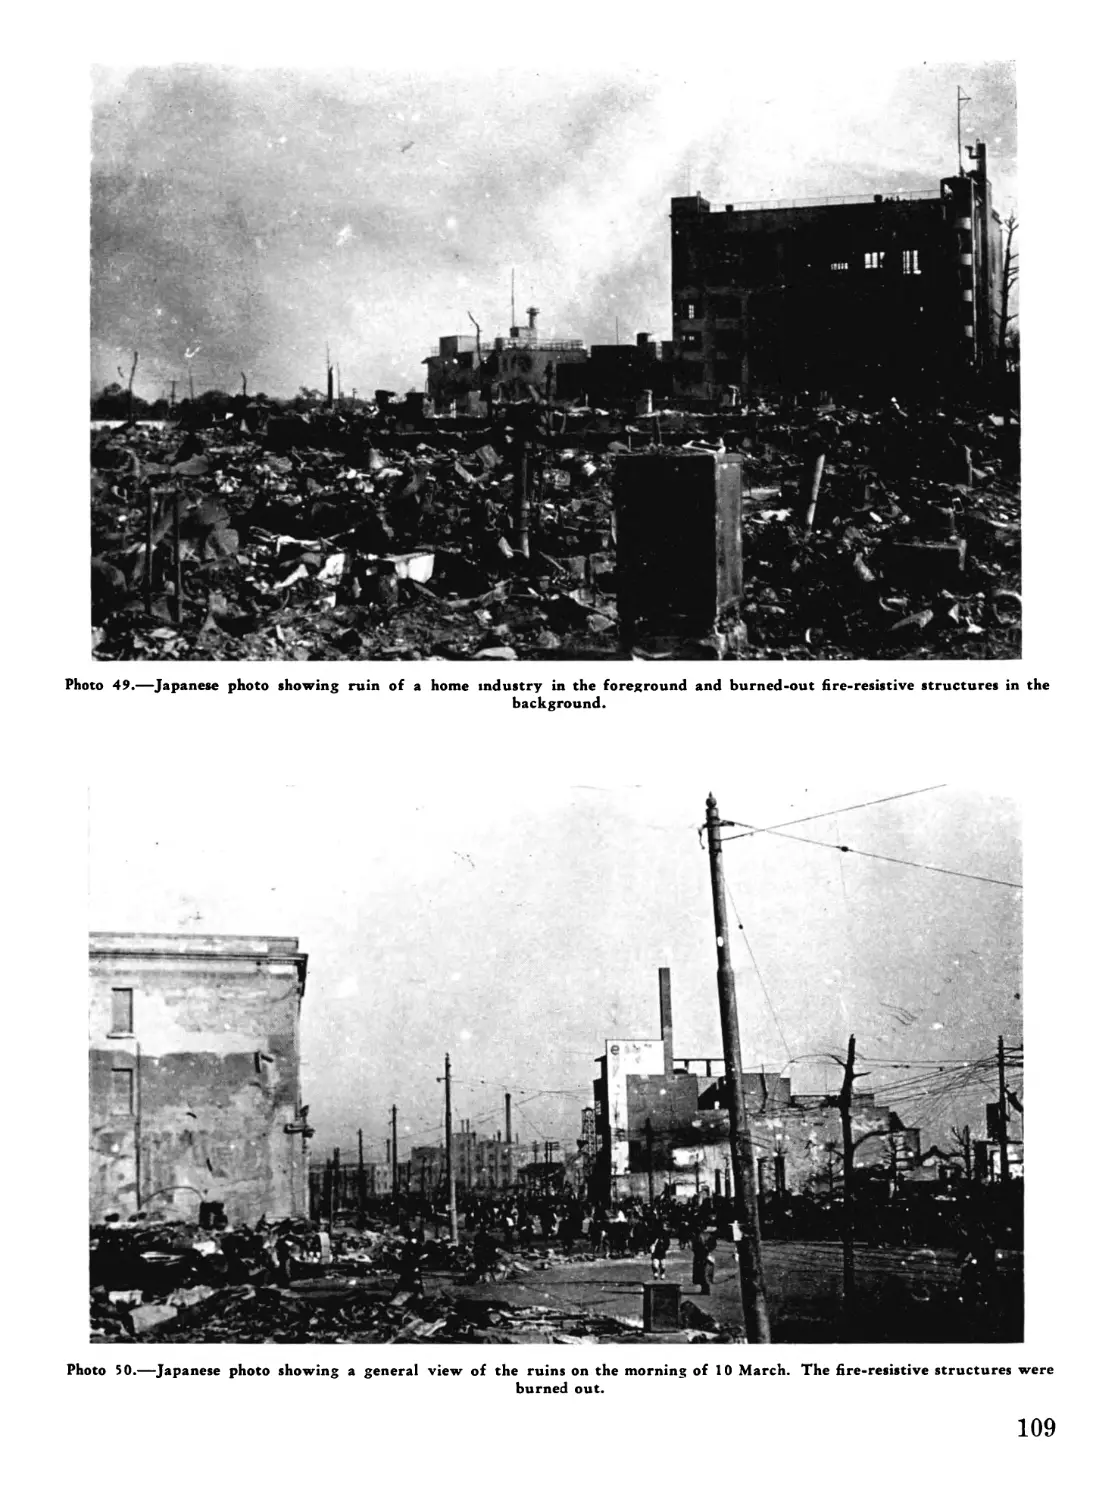
Dates of Survey:
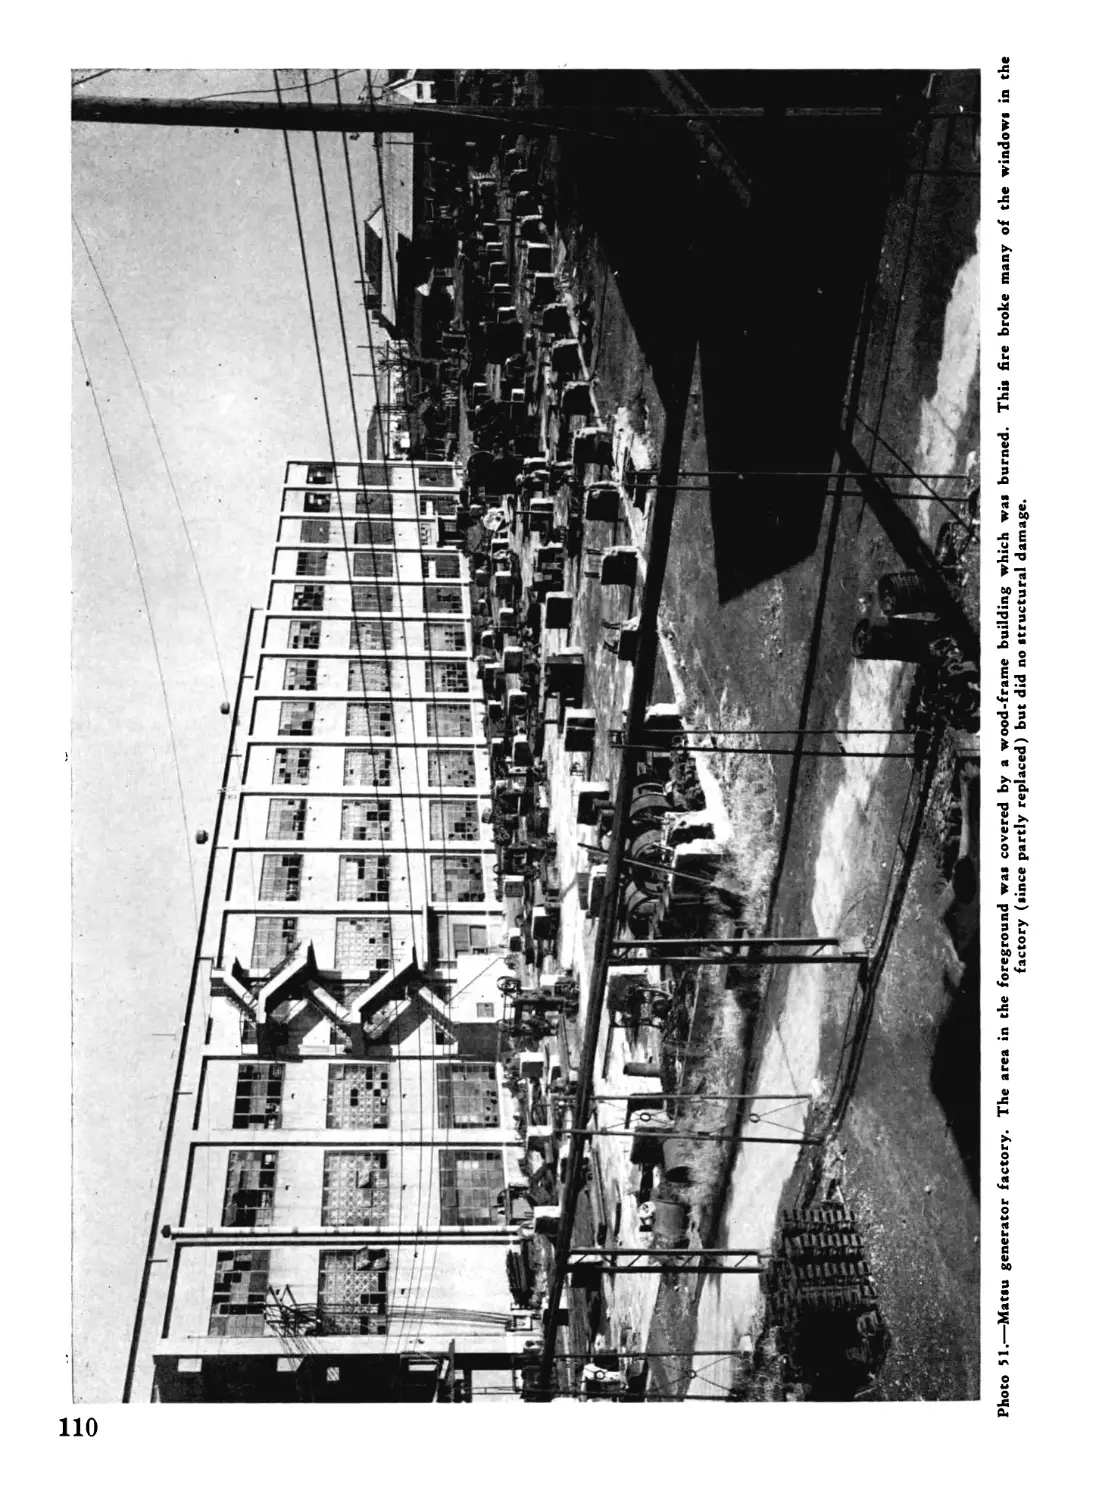
3 October 1945 — 1 December 1945
Date of Publication:
April 1947
RESTRICTED
This report was written primarily for the use of the United States
Strategic Bombing Survey in the preparation of further reports of a more
comprehensive nature. Any conclusions or opinions expressed in this
report must be considered as limited to the specific material covered and
as subject to further interpretation in the light of further studies con-
ducted by the Survey.
ii
FOREWORD
The United States Strategic Bombing Survey
was established by the Secretary of War on 3
November 1944, pursuant to a directive from
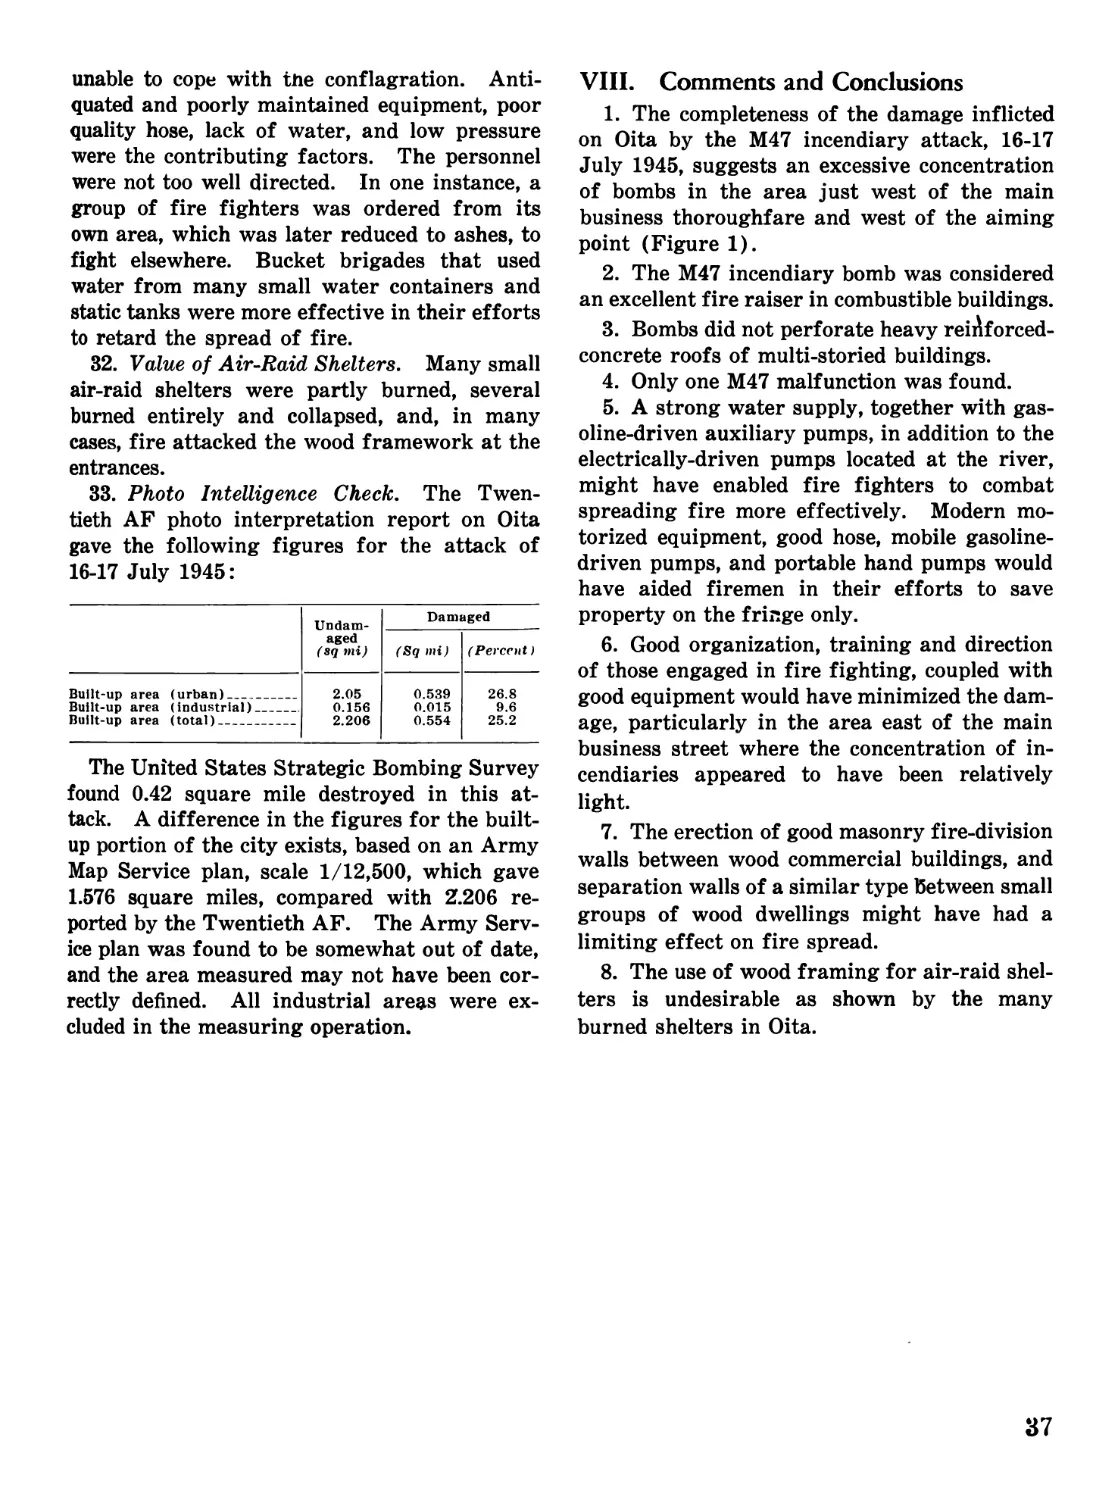
the late President Roosevelt. Its mission was
to conduct an impartial and expert study of the
effects of our aerial attack on Germany, to be
used in connection with air attacks on Japan
and to establish a basis for evaluating the im-
portance and potentialities of air power as an
instrument of military strategy for planning
the future development of the United States
armed forces and for determining future eco-
nomic policies with respect to the national de-
fense. A summary report and some 200 sup-
porting reports containing the findings of the
Survey in Germany have been published.
On 15 August 1945, President Truman re-
quested that the Survey conduct a similar study
of the effects of all types of air attack in the
war against Japan, submitting reports in dupli-
cate to the Secretary of War and to the Secre-
tary of the Navy. The officers of the Survey
during its Japanese phase were:
Franklin D’Olier, Chairman.
Paul H. Nitze, Henry C. Alexander, Vice
Chairmen.
Harry L. Bowman,
J. Kenneth Galbraith,
Rensis Likert,
Frank A. McNamee, Jr.,
Fred Searls, Jr.,
Monroe E. Spaght,
Dr. Lewis R. Thompson,
Theodore P. Wright, Directors.
Walter Wilds, Secretary.
The Survey’s complement provided for 300
civilians, 350 officers, and 500 enlisted men.
The military segment of the organization was
drawn from the Army to the extent of 60 per-
cent, and from the Navy to the extent of 40
percent. Both the Army and the Navy gave
the Survey all possible assistance in furnishing
men, supplies, transport, and information. The
Survey operated from headquarters established
in Tokyo early in September 1945, with head-
quarters in Nagoya, Osaka, Hiroshima, and
Nagasaki, and with mobile teams operating in
other parts of Japan, the islands of the Pacific,
and the Asiatic mainland.
It was possible to reconstruct much of war-
time Japanese military planning and execution,
engagement by engagement, and campaign by
campaign, and to secure reasonably accurate
statistics on Japan’s economy and war produc-
tion, plant by plant, and industry by industry.
In addition, studies were conducted on Japan’s
over-all strategic plans and the background of
her entry into the war, the internal discussions
and negotiations leading to her acceptance of
unconditional surrender, the course of health
and morale among the civilian population, the
effectiveness of the Japanese civilian defense
organization, and the effects of the atomic
bombs. Separate reports will be issued cover-
ing each phase of the study.
The Survey interrogated more than 700 Japa-
nese military, government, and industrial offi-
cials. It also recovered and translated many
documents which not only have been useful to
the Survey, but also will furnish data valuable
for other studies. Arrangements have been
made to turn over the Survey’s files to the Cen-
tral Intelligence Group, through which they
will be available for further examination and
distribution.
iii
TABLE OF CONTENTS
Section I. Introduction...........................—............
IL Reference Tables...................................
III. Individual Reports. .............................
Part 1. Effects of Incendiary Bomb Attack on Imabari, Japan
Part 2. Effects of Incendiary Bomb Attack on Oita, Japan..
Part 3. Effects of Incendiary Bomb Attacks on Tokyo, Japan..
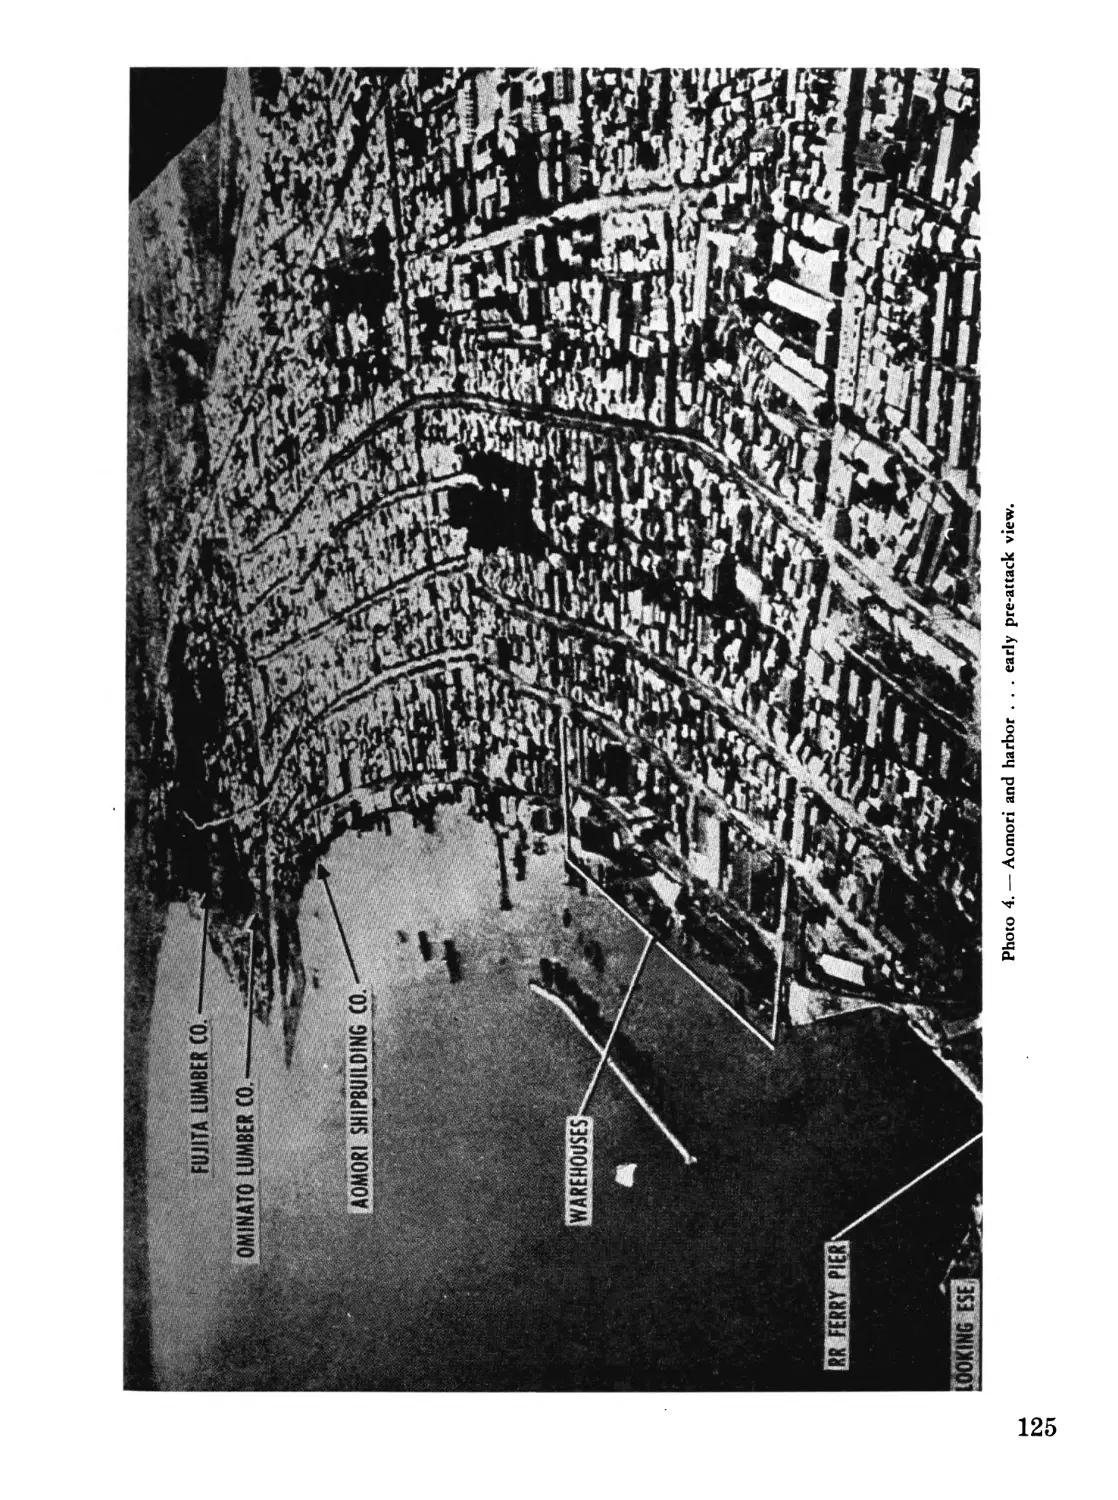
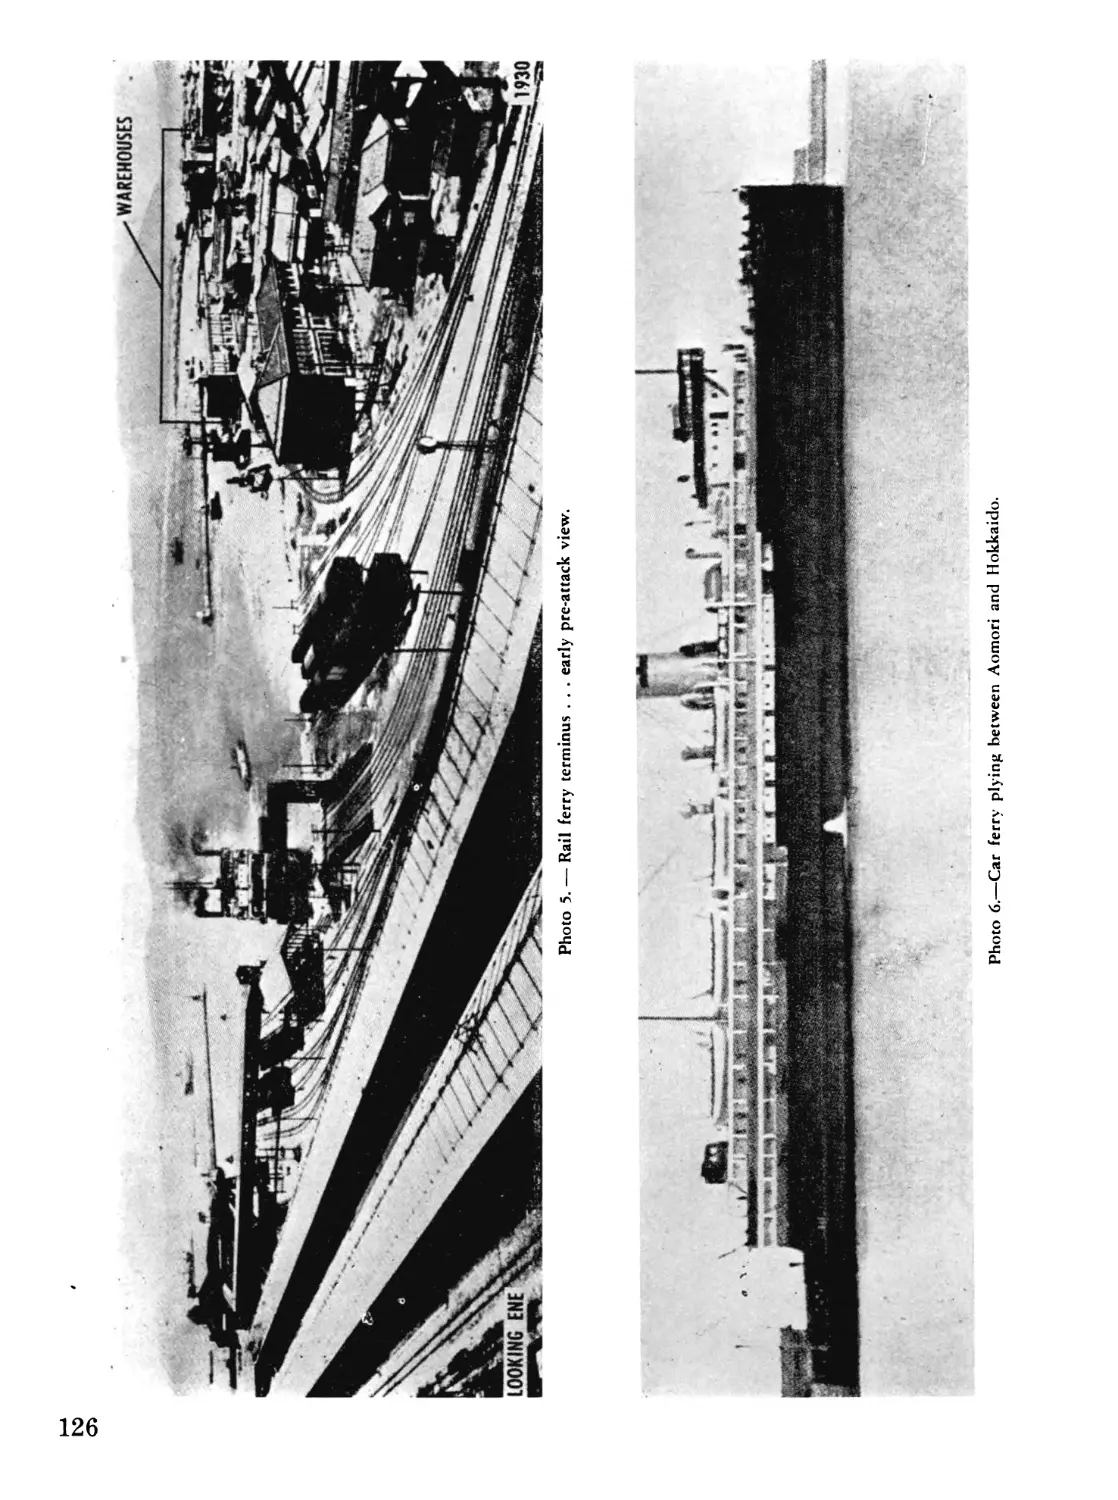
Part 4. Effects of Incendiary Bomb Attack on Aomori, Japan..
Part 5-. Effects of Incendiary Bomb Attack on Akashi, Japan..
Part 6. Effects of Incendiary Bomb Attack on Hachioji, Japan
Part 7. Effects of Incendiary Bomb Attack on Ube, Japan...
Part 8. Effects of Incendiary Bomb Attacks on Nagoya, Japan
1
5
7
7
24
65
119
159
190
211
224
Note.—A table of contents for each Part will be found in the forepart thereof.
VI
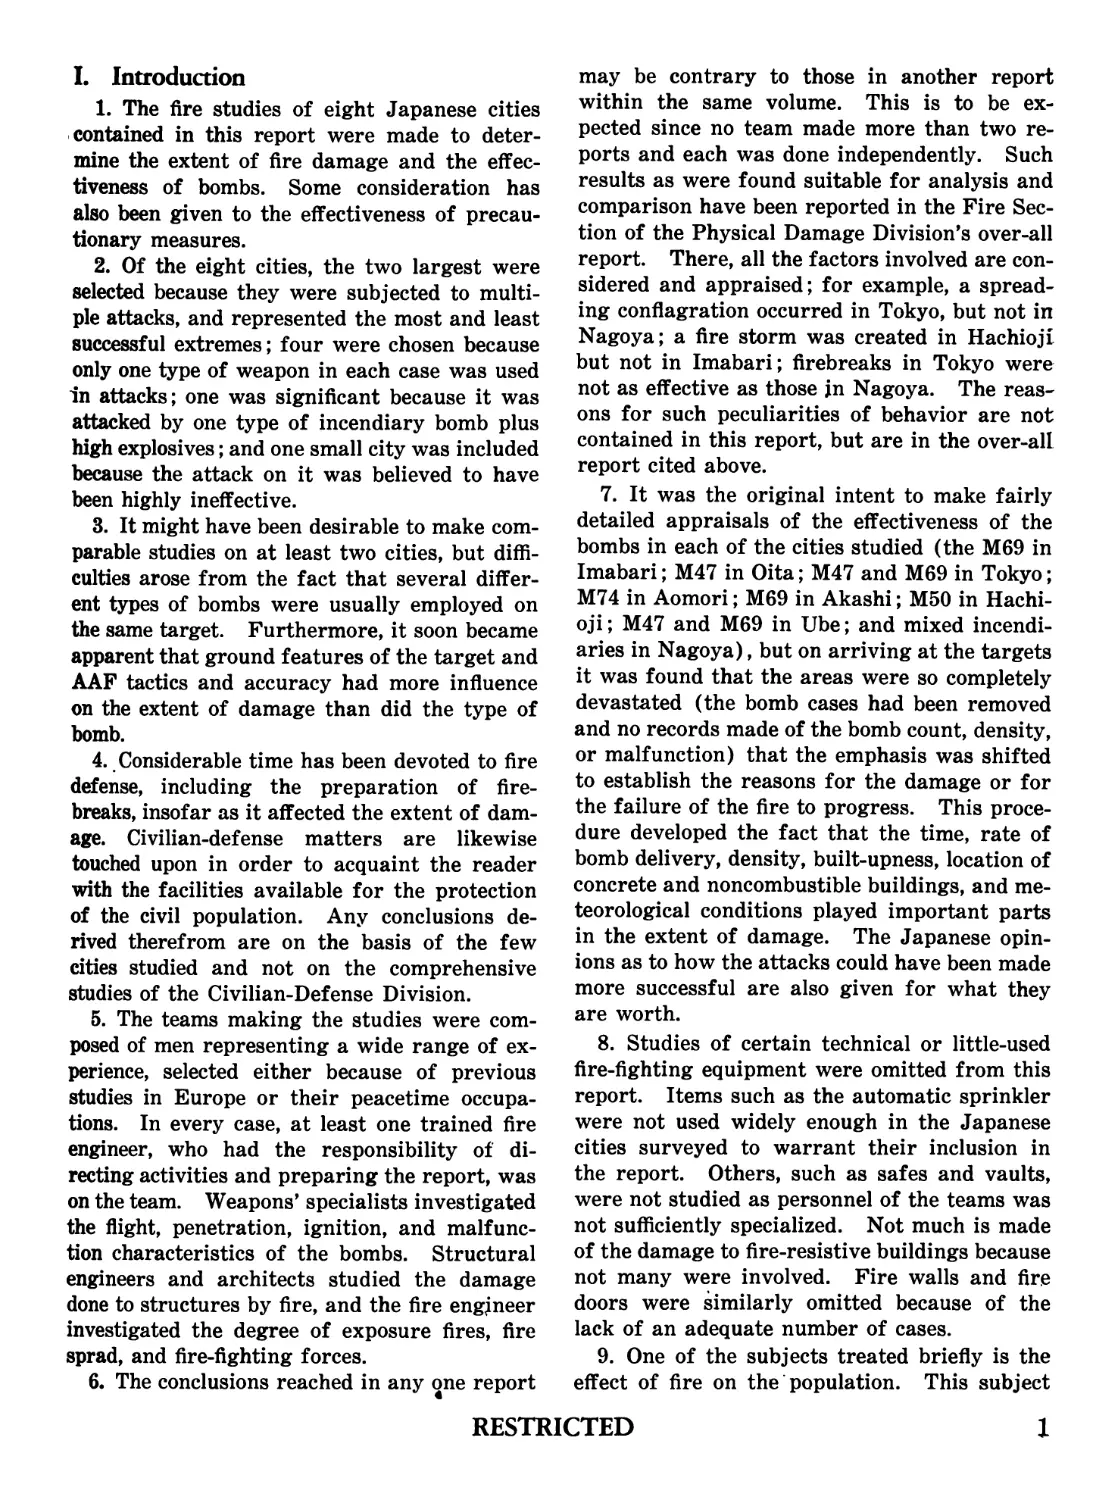
I. Introduction
1. The fire studies of eight Japanese cities
contained in this report were made to deter-
mine the extent of fire damage and the effec-
tiveness of bombs. Some consideration has
also been given to the effectiveness of precau-
tionary measures.
2. Of the eight cities, the two largest were
selected because they were subjected to multi-
ple attacks, and represented the most and least
successful extremes; four were chosen because
only one type of weapon in each case was used
in attacks; one was significant because it was
attacked by one type of incendiary bomb plus
high explosives; and one small city was included
because the attack on it was believed to have
been highly ineffective.
3. It might have been desirable to make com-
parable studies on at least two cities, but diffi-
culties arose from the fact that several differ-
ent types of bombs were usually employed on
the same target. Furthermore, it soon became
apparent that ground features of the target and
AAF tactics and accuracy had more influence
on the extent of damage than did the type of
bomb.
4. Considerable time has been devoted to fire
defense, including the preparation of fire-
breaks, insofar as it affected the extent of dam-
age. Civilian-defense matters are likewise
touched upon in order to acquaint the reader
with the facilities available for the protection
of the civil population. Any conclusions de-
rived therefrom are on the basis of the few
cities studied and not on the comprehensive
studies of the Civilian-Defense Division.
5. The teams making the studies were com-
posed of men representing a wide range of ex-
perience, selected either because of previous
studies in Europe or their peacetime occupa-
tions. In every case, at least one trained fire
engineer, who had the responsibility of di-
recting activities and preparing the report, was
on the team. Weapons’ specialists investigated
the flight, penetration, ignition, and malfunc-
tion characteristics of the bombs. Structural
engineers and architects studied the damage
done to structures by fire, and the fire engineer
investigated the degree of exposure fires, fire
sprad, and fire-fighting forces.
6. The conclusions reached in any one report
may be contrary to those in another report
within the same volume. This is to be ex-
pected since no team made more than two re-
ports and each was done independently. Such
results as were found suitable for analysis and
comparison have been reported in the Fire Sec-
tion of the Physical Damage Division’s over-all
report. There, all the factors involved are con-
sidered and appraised; for example, a spread-
ing conflagration occurred in Tokyo, but not in
Nagoya; a fire storm was created in Hachioji
but not in Imabari; firebreaks in Tokyo were
not as effective as those in Nagoya. The reas-
ons for such peculiarities of behavior are not
contained in this report, but are in the over-all
report cited above.
7. It was the original intent to make fairly
detailed appraisals of the effectiveness of the
bombs in each of the cities studied (the M69 in
Imabari; M47 in Oita; M47 and M69 in Tokyo;
M74 in Aomori; M69 in Akashi; M50 in Hachi-
oji; M47 and M69 in Ube; and mixed incendi-
aries in Nagoya), but on arriving at the targets
it was found that the areas were so completely
devastated (the bomb cases had been removed
and no records made of the bomb count, density,
or malfunction) that the emphasis was shifted
to establish the reasons for the damage or for
the failure of the fire to progress. This proce-
dure developed the fact that the time, rate of
bomb delivery, density, built-upness, location of
concrete and noncombustible buildings, and me-
teorological conditions played important parts
in the extent of damage. The Japanese opin-
ions as to how the attacks could have been made
more successful are also given for what they
are worth.
8. Studies of certain technical or little-used
fire-fighting equipment were omitted from this
report. Items such as the automatic sprinkler
were not used widely enough in the Japanese
cities surveyed to warrant their inclusion in
the report. Others, such as safes and vaults,
were not studied as personnel of the teams was
not sufficiently specialized. Not much is made
of the damage to fire-resistive buildings because
not many were involved. Fire walls and fire
doors were similarly omitted because of the
lack of an adequate number of cases.
9. One of the subjects treated briefly is the
effect of fire on the population. This subject
RESTRICTED
1
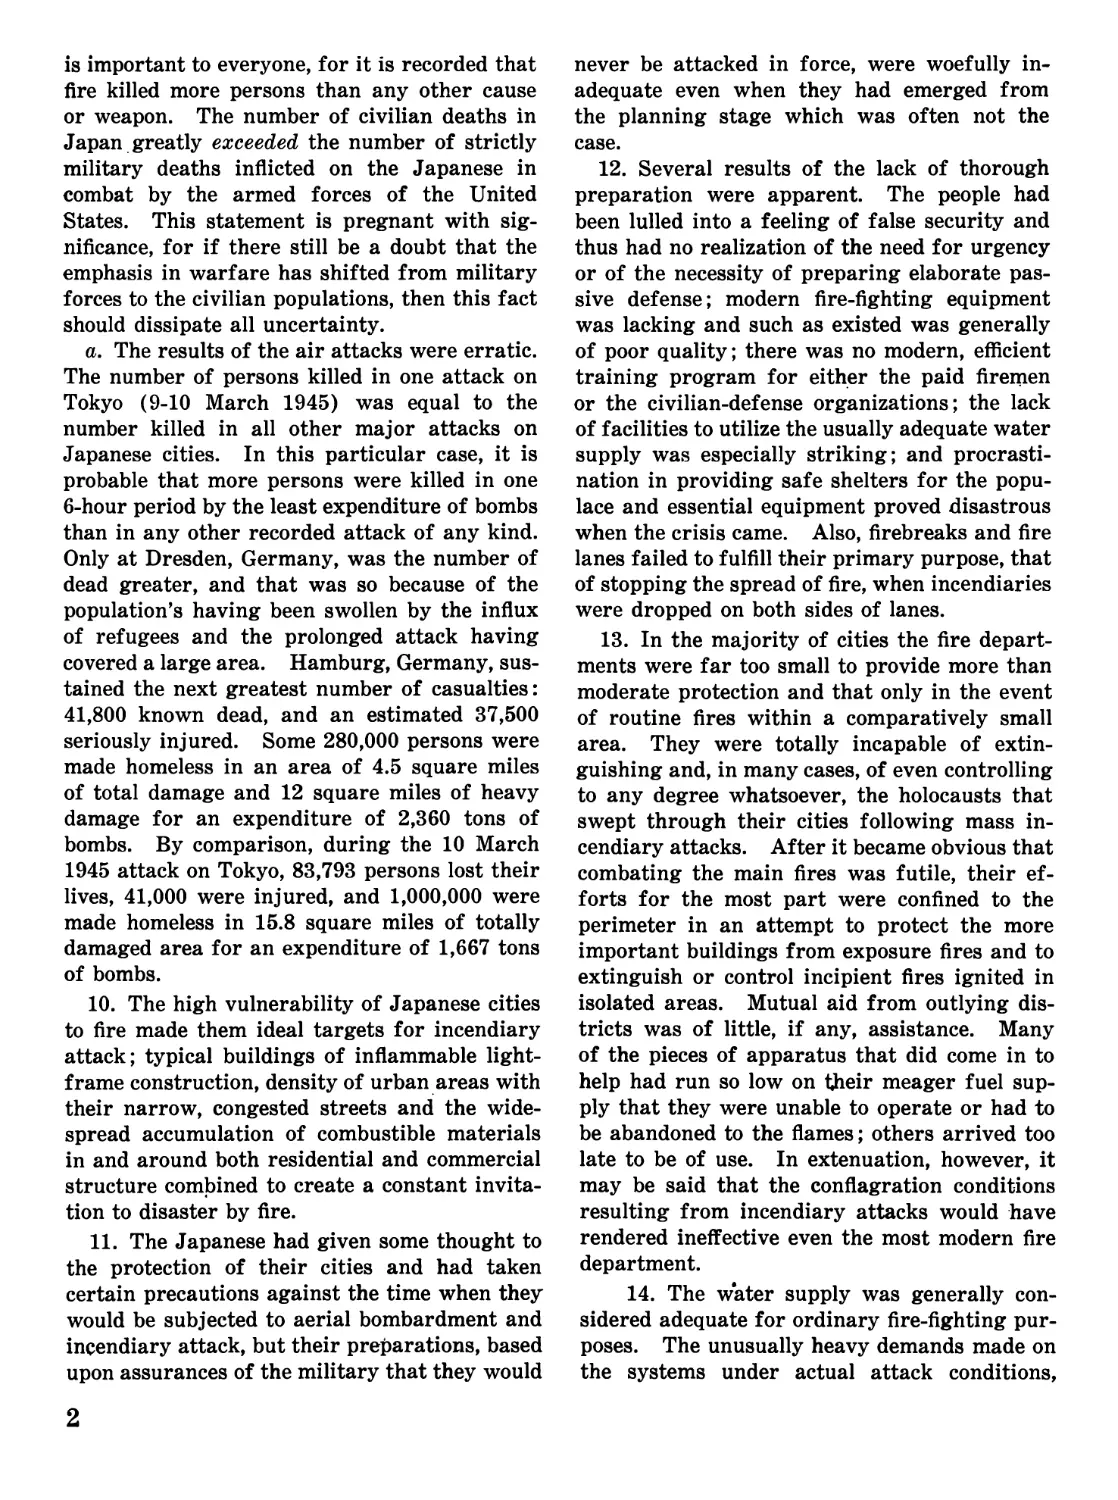
is important to everyone, for it is recorded that
fire killed more persons than any other cause
or weapon. The number of civilian deaths in
Japan greatly exceeded the number of strictly
military deaths inflicted on the Japanese in
combat by the armed forces of the United
States. This statement is pregnant with sig-
nificance, for if there still be a doubt that the
emphasis in warfare has shifted from military
forces to the civilian populations, then this fact
should dissipate all uncertainty.
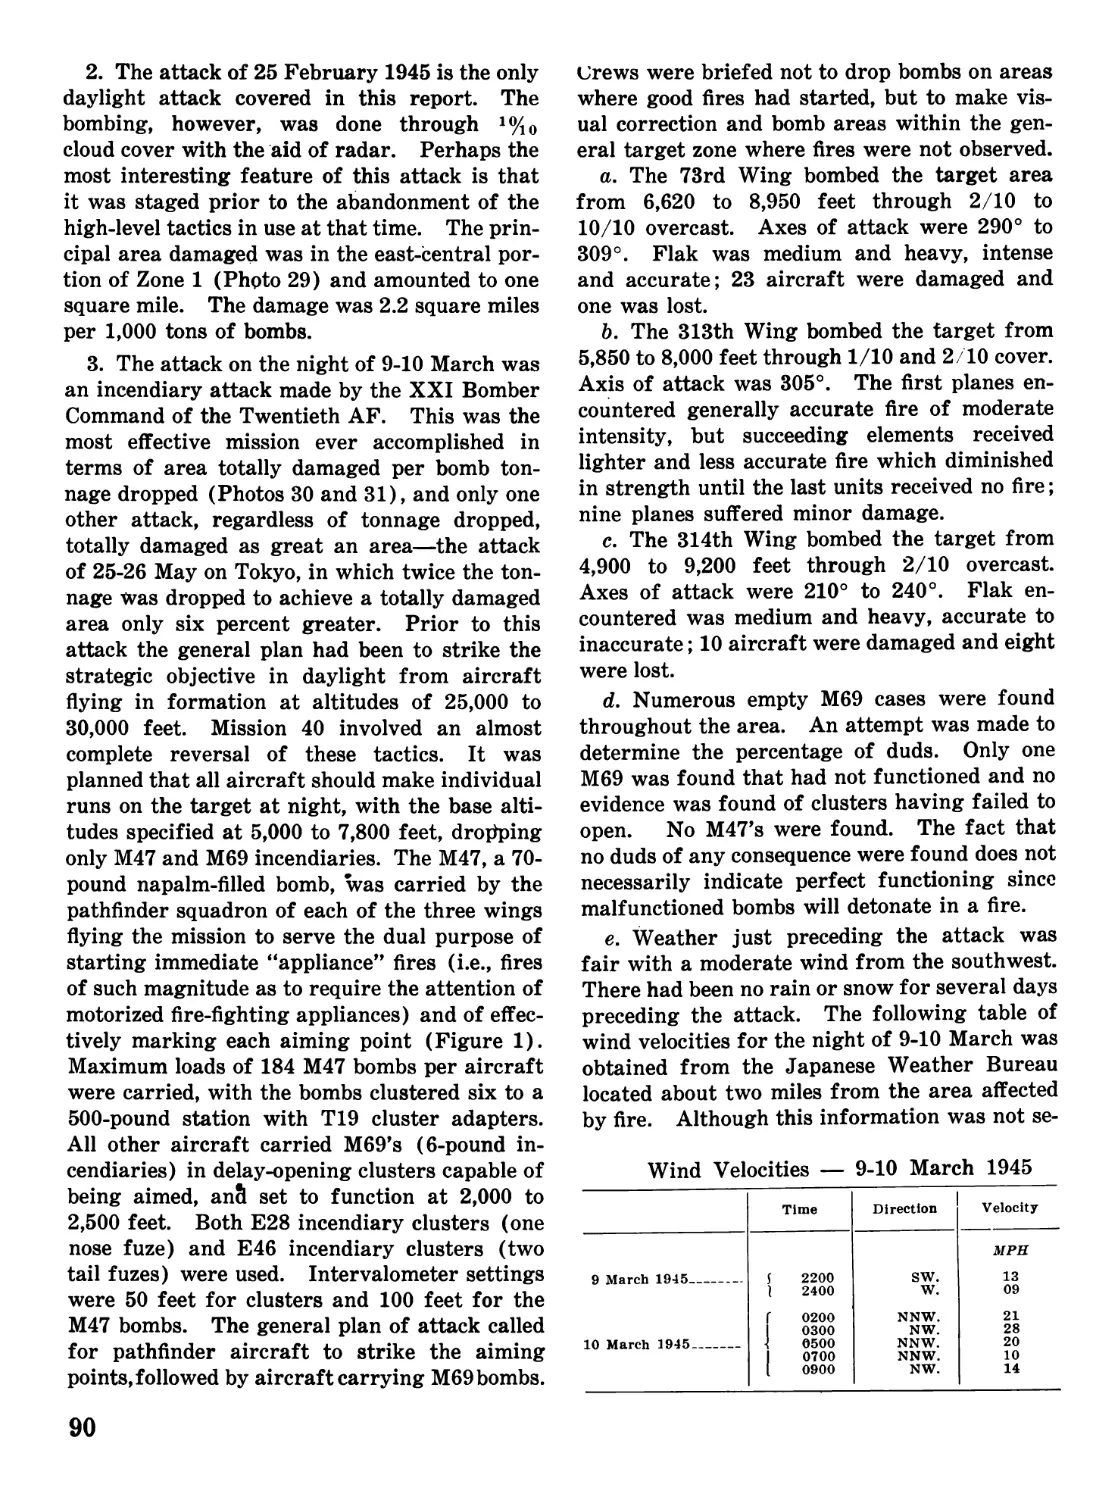
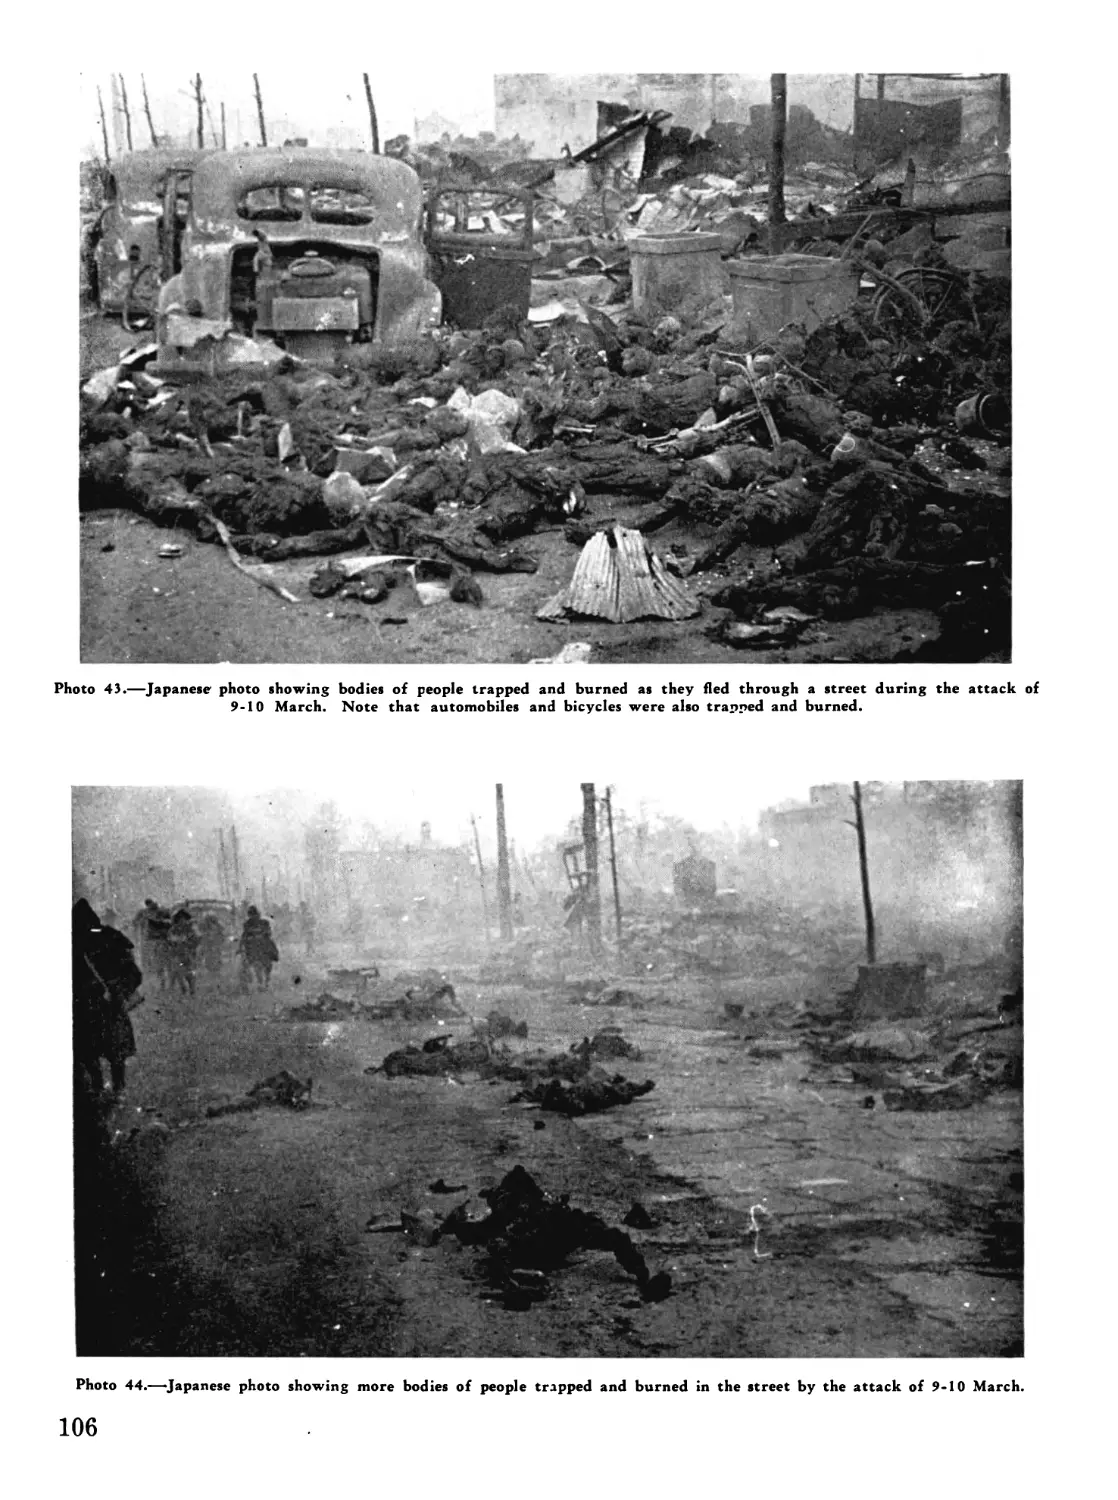
a. The results of the air attacks were erratic.
The number of persons killed in one attack on
Tokyo (9-10 March 1945) was equal to the
number killed in all other major attacks on
Japanese cities. In this particular case, it is
probable that more persons were killed in one
6-hour period by the least expenditure of bombs
than in any other recorded attack of any kind.
Only at Dresden, Germany, was the number of
dead greater, and that was so because of the
population’s having been swollen by the influx
of refugees and the prolonged attack having
covered a large area. Hamburg, Germany, sus-
tained the next greatest number of casualties:
41,800 known dead, and an estimated 37,500
seriously injured. Some 280,000 persons were
made homeless in an area of 4.5 square miles
of total damage and 12 square miles of heavy
damage for an expenditure of 2,360 tons of
bombs. By comparison, during the 10 March
1945 attack on Tokyo, 83,793 persons lost their
lives, 41,000 were injured, and 1,000,000 were
made homeless in 15.8 square miles of totally
damaged area for an expenditure of 1,667 tons
of bombs.
10. The high vulnerability of Japanese cities
to fire made them ideal targets for incendiary
attack; typical buildings of inflammable light-
frame construction, density of urban areas with
their narrow, congested streets and the wide-
spread accumulation of combustible materials
in and around both residential and commercial
structure combined to create a constant invita-
tion to disaster by fire.
11. The Japanese had given some thought to
the protection of their cities and had taken
certain precautions against the time when they
would be subjected to aerial bombardment and
incendiary attack, but their preparations, based
upon assurances of the military that they would
2
never be attacked in force, were woefully in-
adequate even when they had emerged from
the planning stage which was often not the
case.
12. Several results of the lack of thorough
preparation were apparent. The people had
been lulled into a feeling of false security and
thus had no realization of the need for urgency
or of the necessity of preparing elaborate pas-
sive defense; modern fire-fighting equipment
was lacking and such as existed was generally
of poor quality; there was no modern, efficient
training program for either the paid firemen
or the civilian-defense organizations; the lack
of facilities to utilize the usually adequate water
supply was especially striking; and procrasti-
nation in providing safe shelters for the popu-
lace and essential equipment proved disastrous
when the crisis came. Also, firebreaks and fire
lanes failed to fulfill their primary purpose, that
of stopping the spread of fire, when incendiaries
were dropped on both sides of lanes.
13. In the majority of cities the fire depart-
ments were far too small to provide more than
moderate protection and that only in the event
of routine fires within a comparatively small
area. They were totally incapable of extin-
guishing and, in many cases, of even controlling
to any degree whatsoever, the holocausts that
swept through their cities following mass in-
cendiary attacks. After it became obvious that
combating the main fires was futile, their ef-
forts for the most part were confined to the
perimeter in an attempt to protect the more
important buildings from exposure fires and to
extinguish or control incipient fires ignited in
isolated areas. Mutual aid from outlying dis-
tricts was of little, if any, assistance. Many
of the pieces of apparatus that did come in to
help had run so low on their meager fuel sup-
ply that they were unable to operate or had to
be abandoned to the flames; others arrived too
late to be of use. In extenuation, however, it
may be said that the conflagration conditions
resulting from incendiary attacks would have
rendered ineffective even the most modern fire
department.
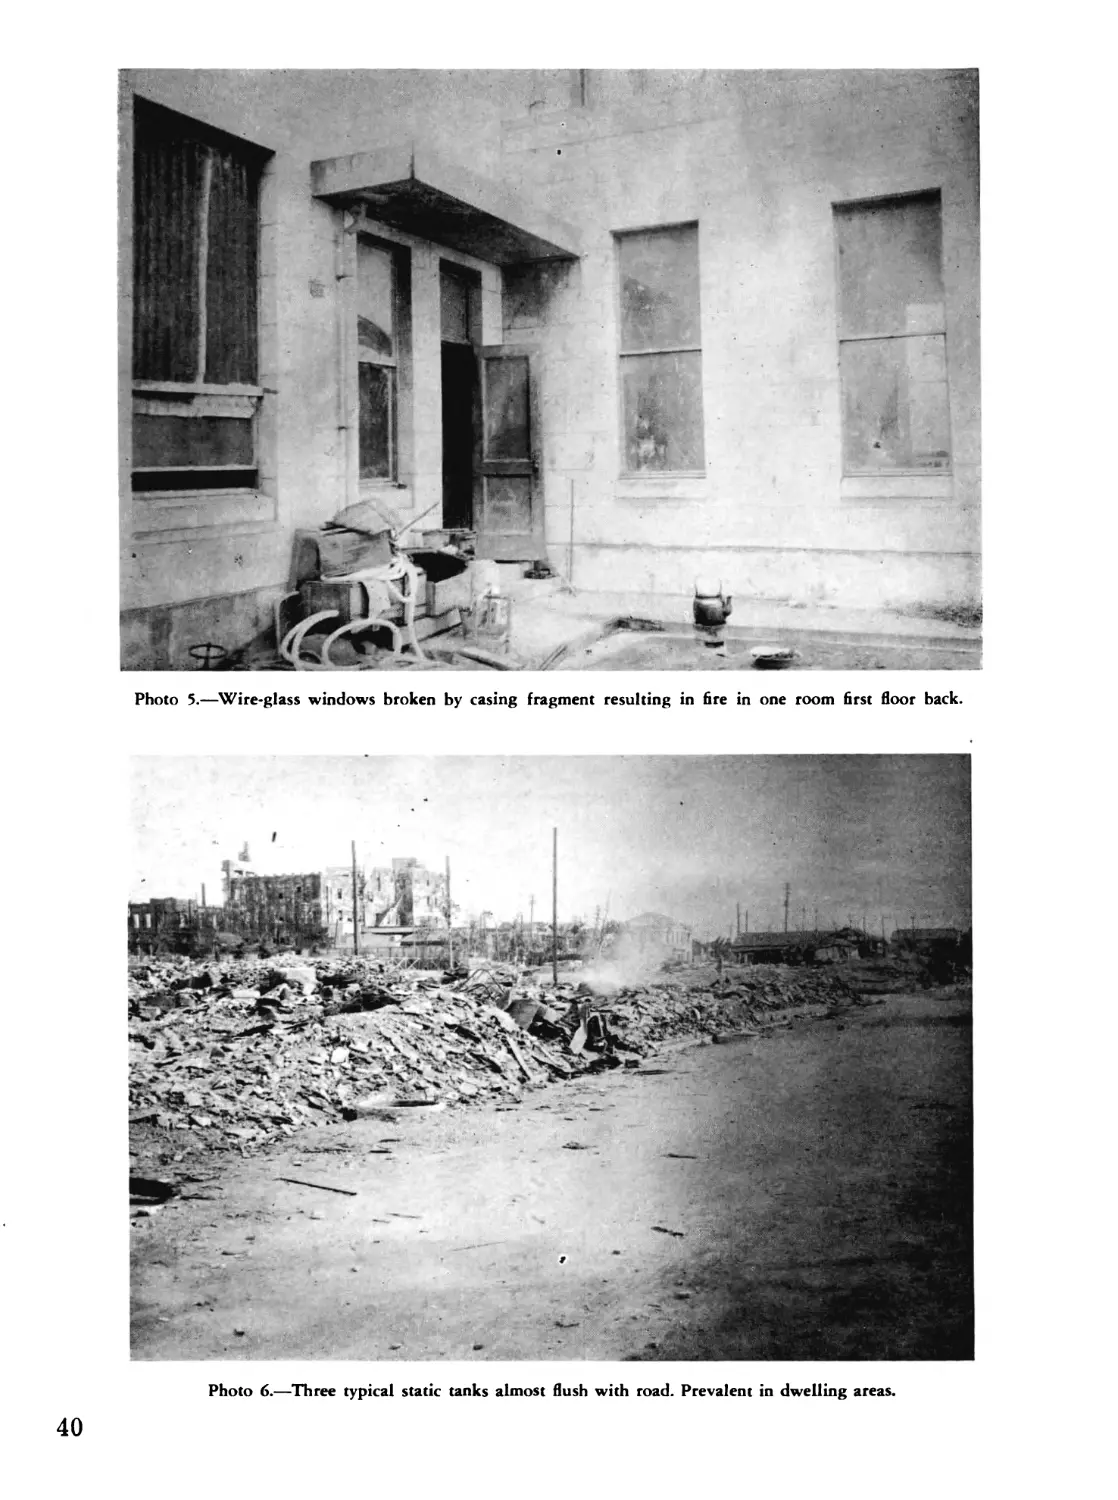
14. The water supply was generally con-
sidered adequate for ordinary fire-fighting pur-
poses. The unusually heavy demands made on
the systems under actual attack conditions,
however, together with the loss of pressure re-
sulting from broken mains and melted pipes,
quickly exhausted normal supplies and weak-
ened the resistance of the fire-fighting elements.
Where there was an unlimited water supply,
complete utilization was not made of it, or, as
Was often the case, lack of suitable pumping
equipment precluded its use. In one case
studied where a sufficient water supply would
have been available, the entire system was de-
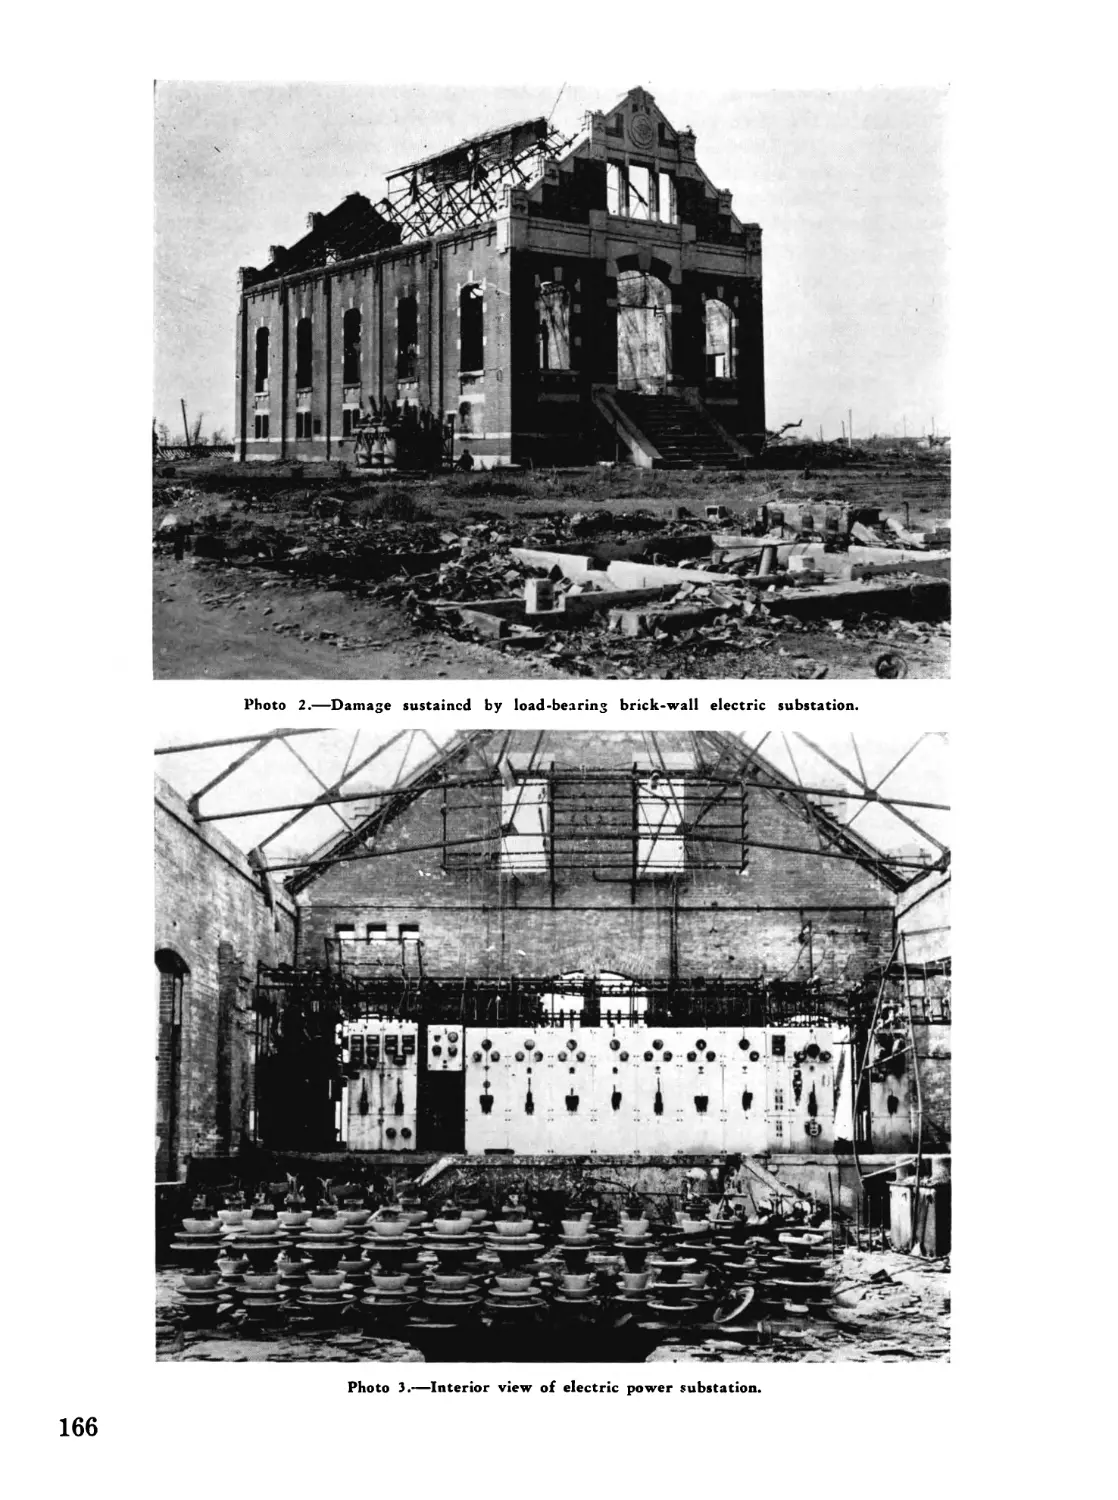
-pendent on electric power. A bomb strike on
the power plant early in the attack crippled the
pumping equipment and left the city with only
static water supplies for fire-fighting purposes.
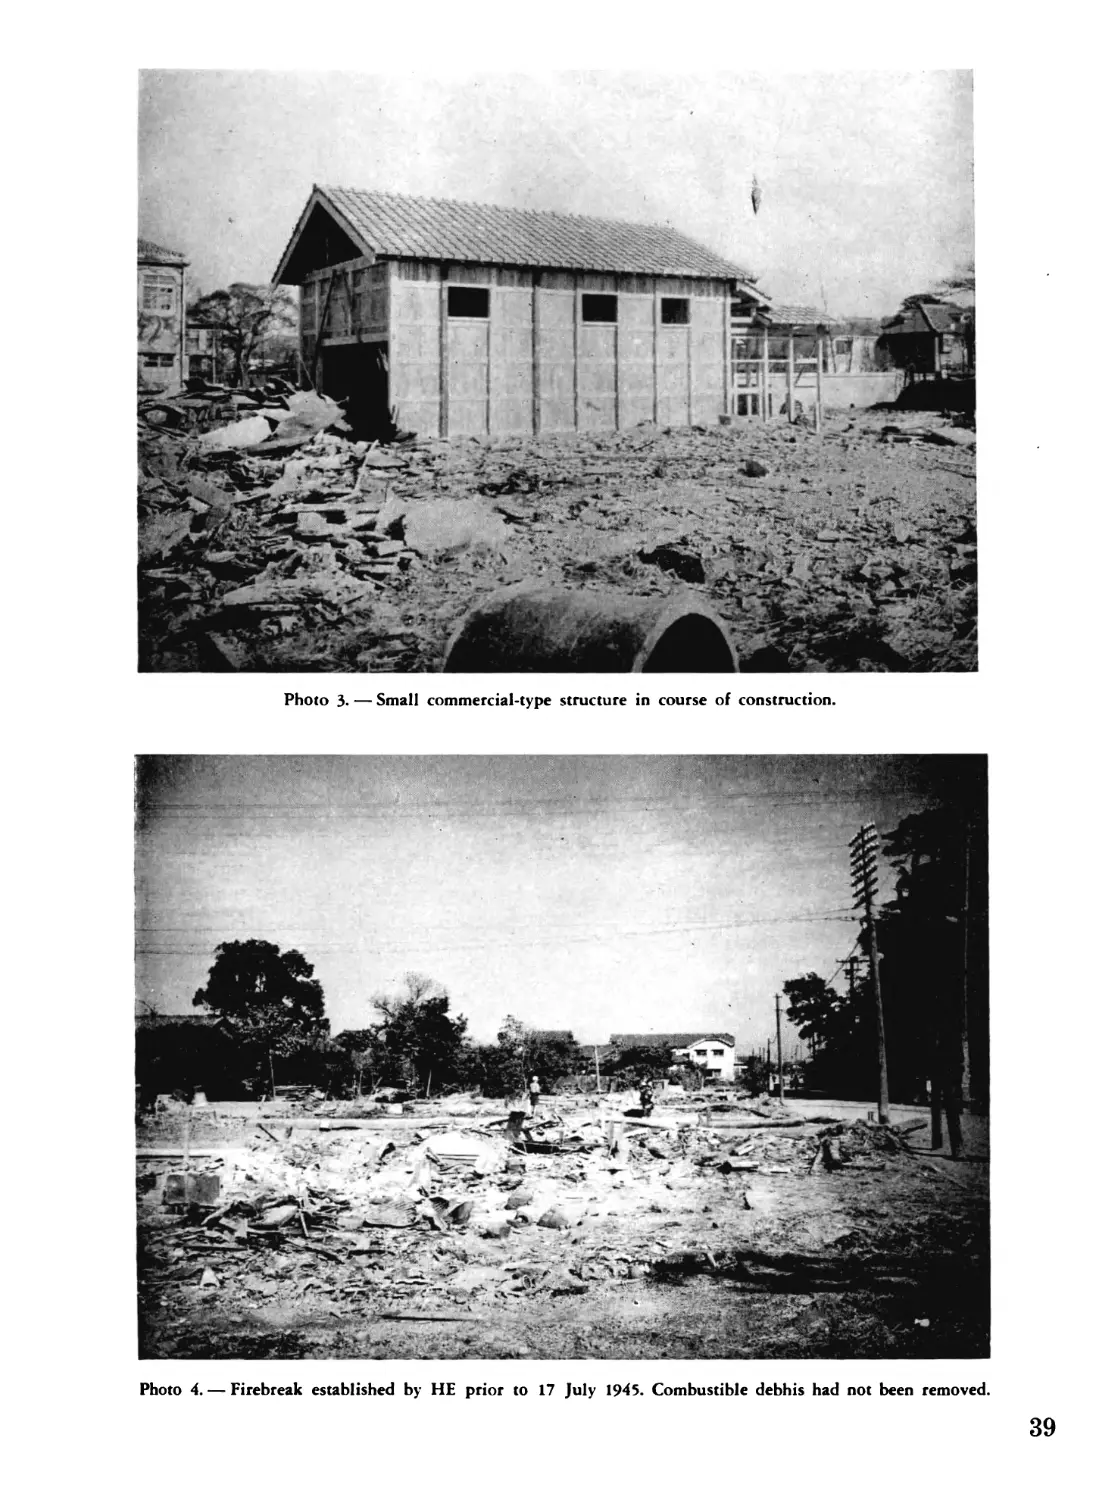
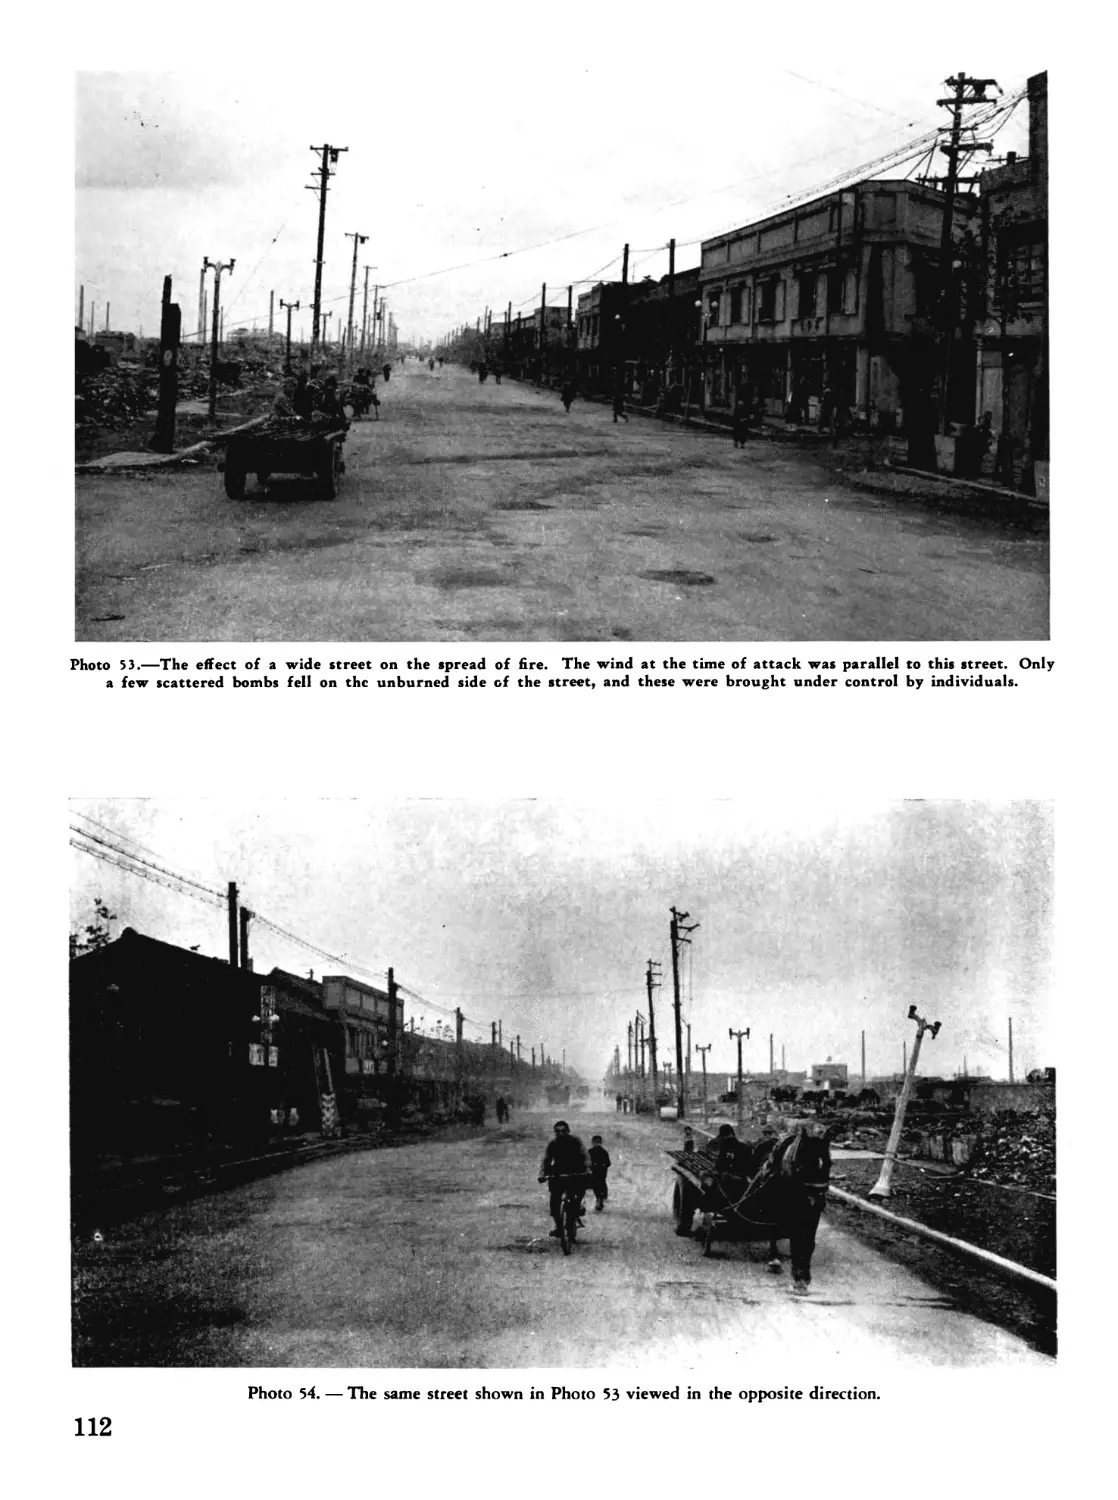
15. The firebreak program, which was late
in starting, was never completed to the degree
planned. In the larger cities, buildings were
demolished to create fire lanes 80 to 300 feet
wide through congested areas, and wooden
structures were removed from areas adjacent
•to fsome of the more important buildings to re-
duce fire hazard. Few such precautions, how-
ever, were taken in the smaller cities. In gen-
eral, the man-made firebreaks had almost no
effect on stopping the spread of fire since in-
cendiary bomb loads were dropped over wide
areas and ignited numerous fires on both sides
of the lanes. In a few instances where bombs
dropped on only one side of the firebreak, or
the firebreak was located on the periphery of
the conflagration area, the fire spread stopped
at the break. These breaks or lanes did, how-
ever, serve as avenues of escape for persons
who might otherwise have been trapped in
burning areas, and occasionally these open
spaces permitted access of fire apparatus to
burning areas for limited operations, such as
fighting isolated fires. In several cities fortu-
nate enough to have large natural firebreaks
(rivers, canals, parks and railroad yards) some
degree of success in controlling fires was
achieved by permitting them to burn in the
direction of the breaks and concentrating fire-
fighting efforts along the perimeter on the op-
posite side.
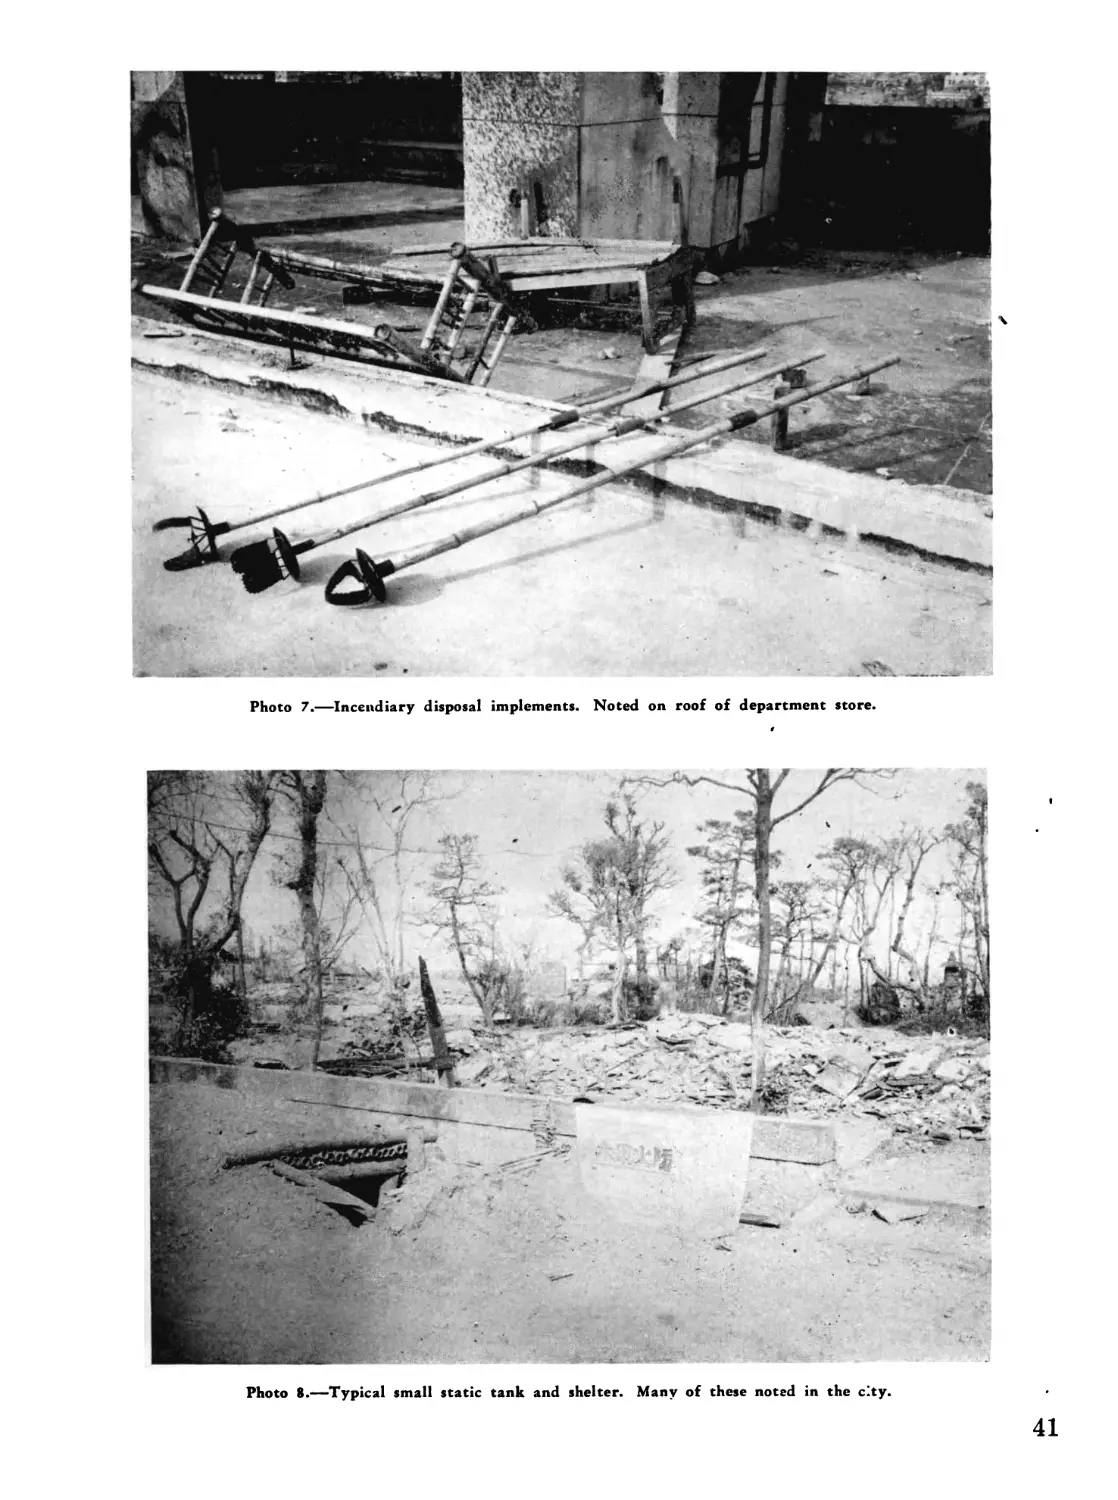
16. Air-raid shelters were insufficient in
number and the majority was hopelessly inade-
quate for protection, being little more than shal-
low trenches with earth coverings supported by
wood frames. Some of the better-constructed
tunnel-type shelters, located outside congested
city areas or in parks, offered from fair to
excellent protection against high-explosive
bombs, but within areas affected by large fires
practically all types of shelters failed to serve
their purpose, as occupants died from suffoca-
tion or the effects of intense heat even when
not exposed to fire itself.
17. The weapons used in the incendiary at-
tacks described in this report were the M47,
100-pound, oil-gel bomb; the M69, 6-pound,
• gelled-gasoline bomb; the M47, 10-pound, mag-
nesium-gasolirie and white phosphorus bomb;
and the M50, 4-pound magnesium bomb.
These bombs were especially effective in the
densely built-up areas of cities where the flimsy
construction and abundance of combustible ma-
terial facilitated the spread and merging of
numerous fires into huge conflagrations of ter-
rifying and destructive magnitude. Virtually
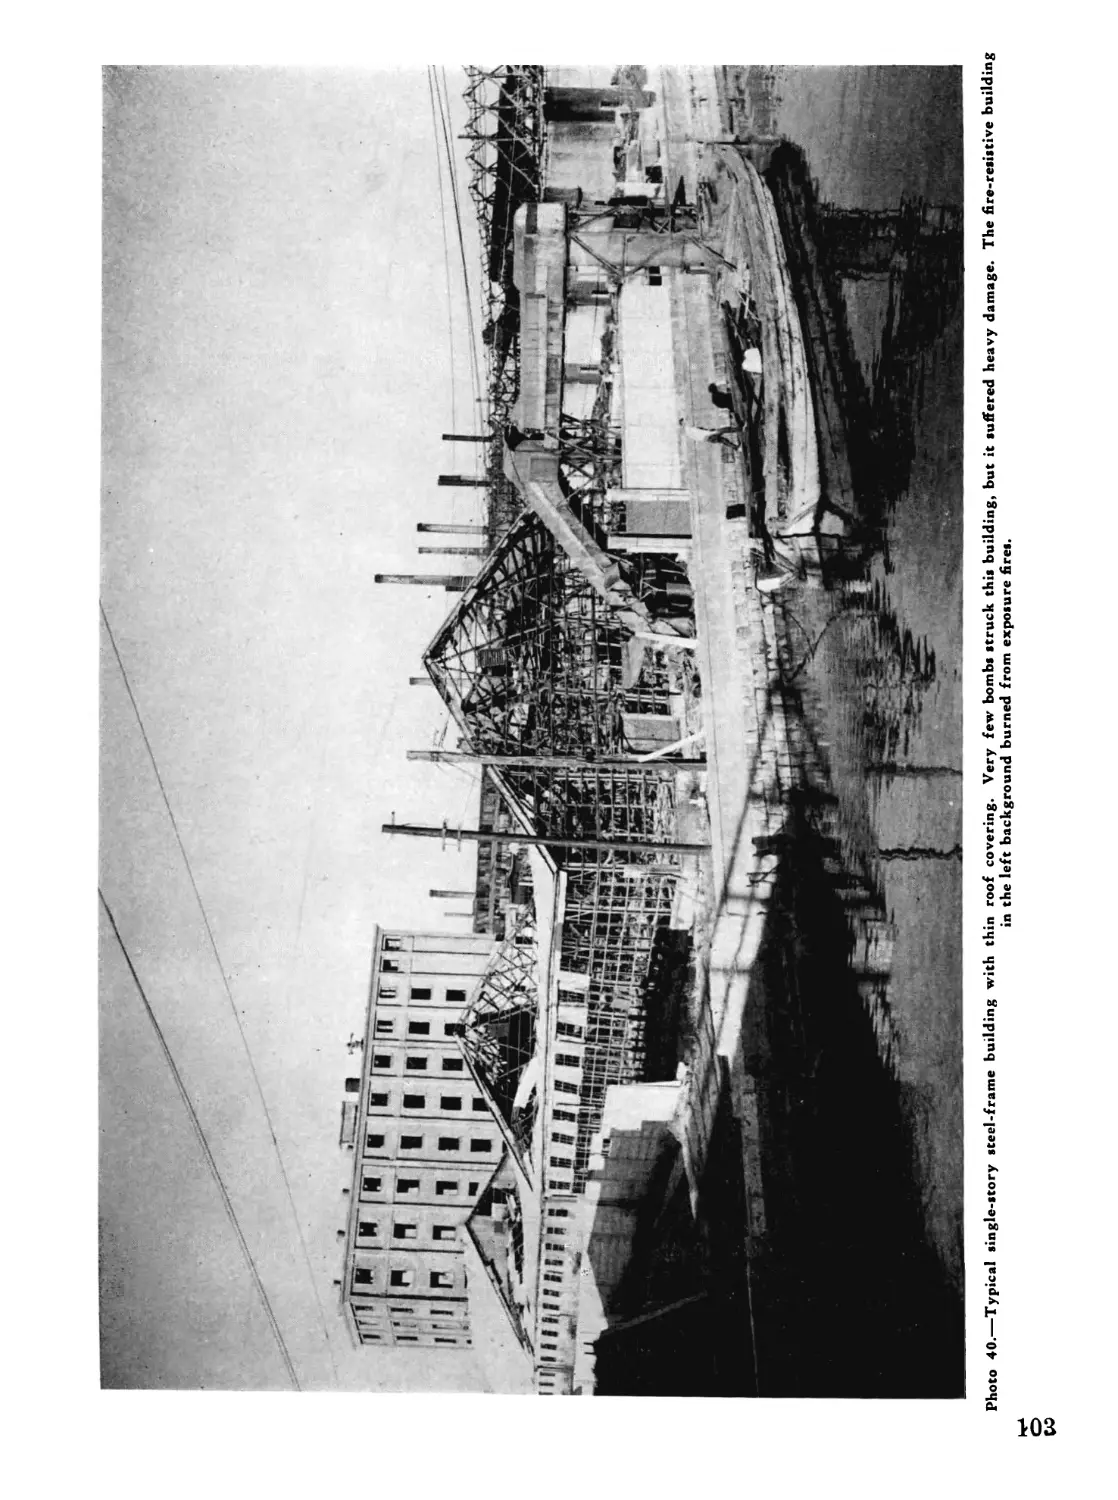
all combustible structures in the fire areas were
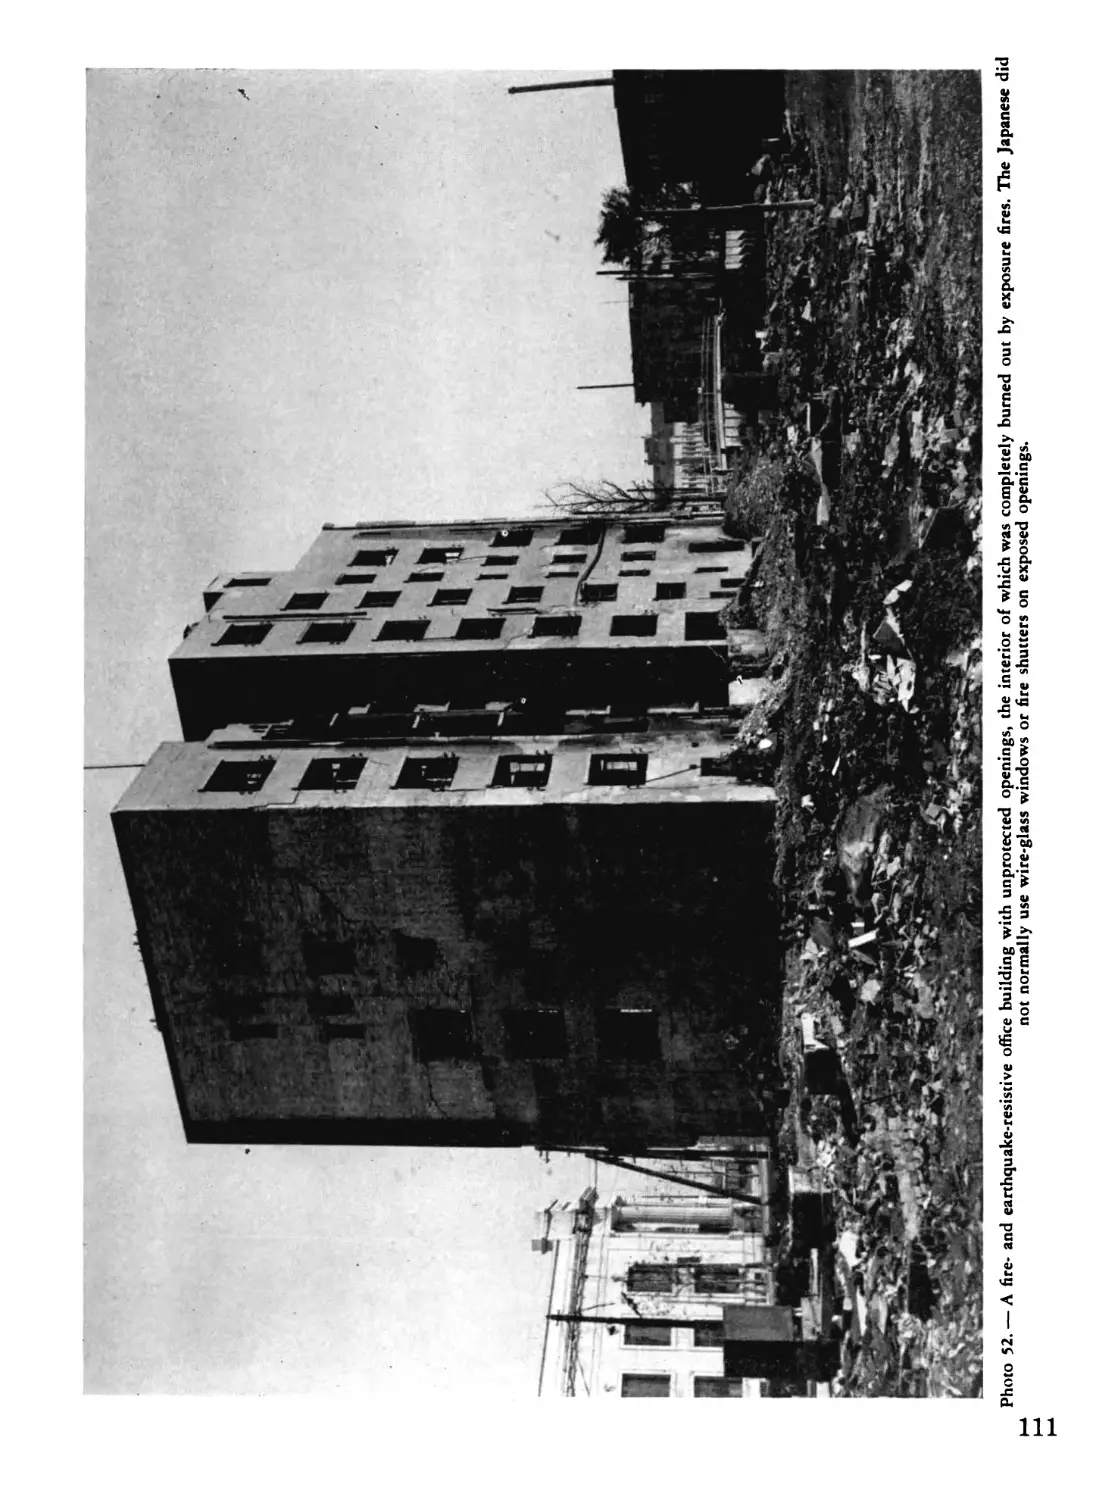
consumed. Buildings of noncombustible con-
struction suffered damage in direct ratio to the
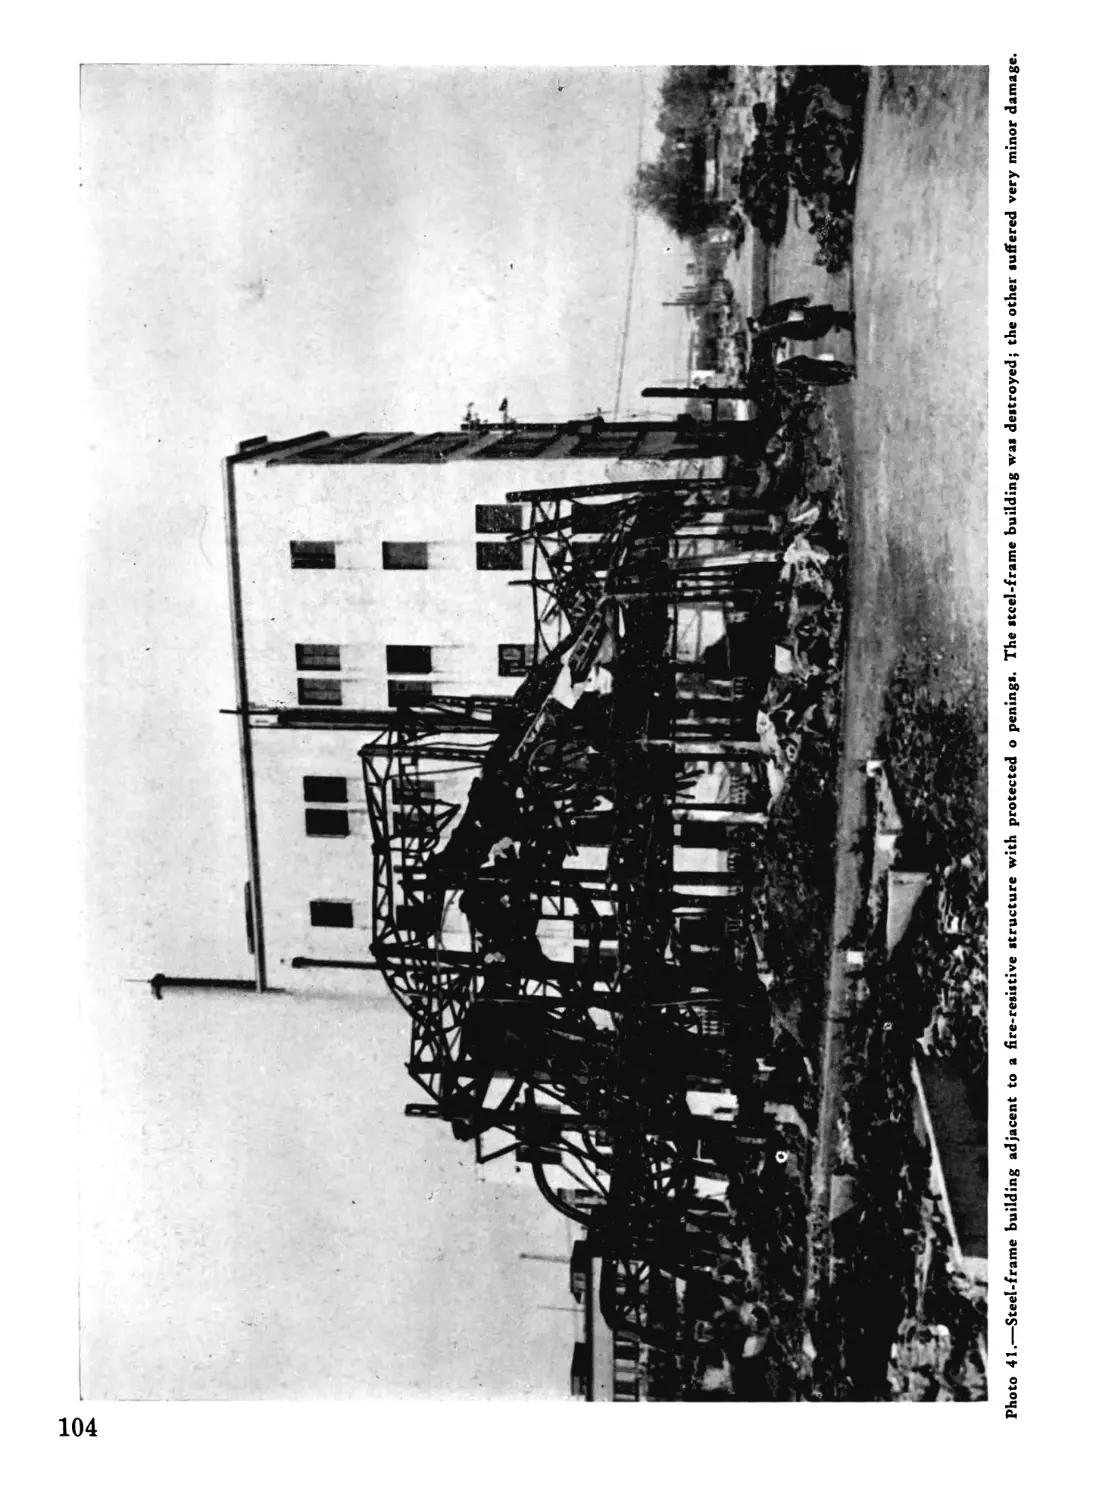
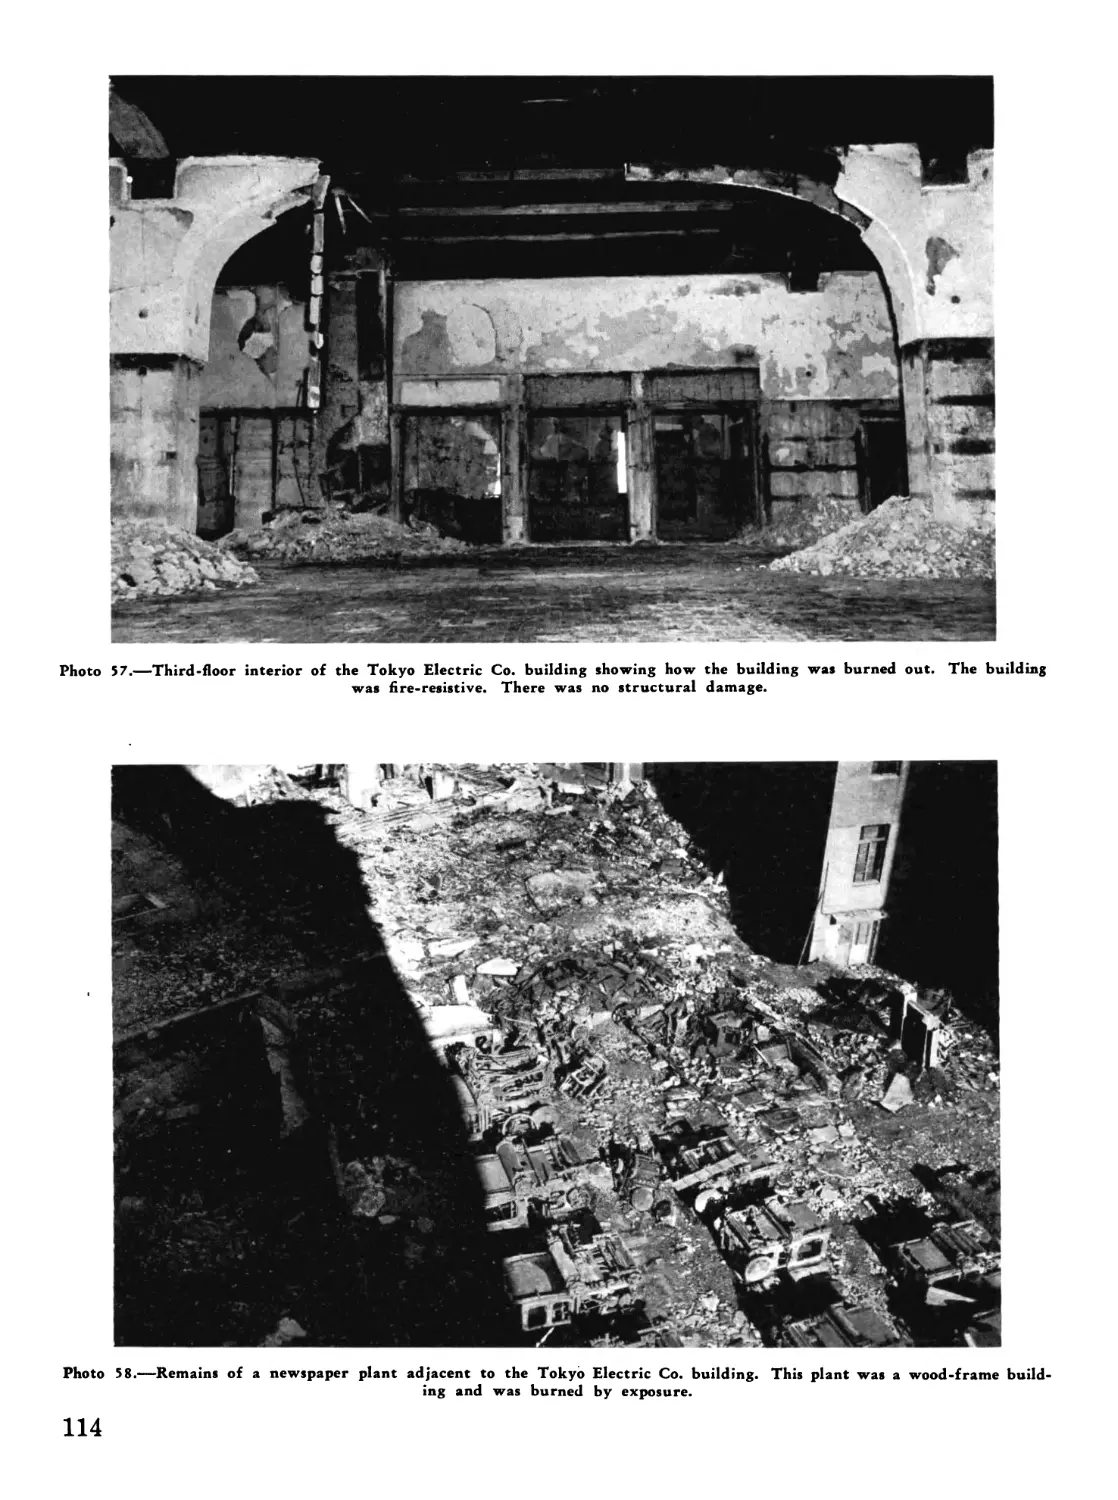
combustibility of their contents. Many fire-
resistive buildings were gutted or were dam-
aged to varying degrees by exposure fires. In
several instances important factory installa-
tions and government buildings were saved
from total damage at the expense of less vital
buildings by the concentration of fire-fighting
equipment and personnel.
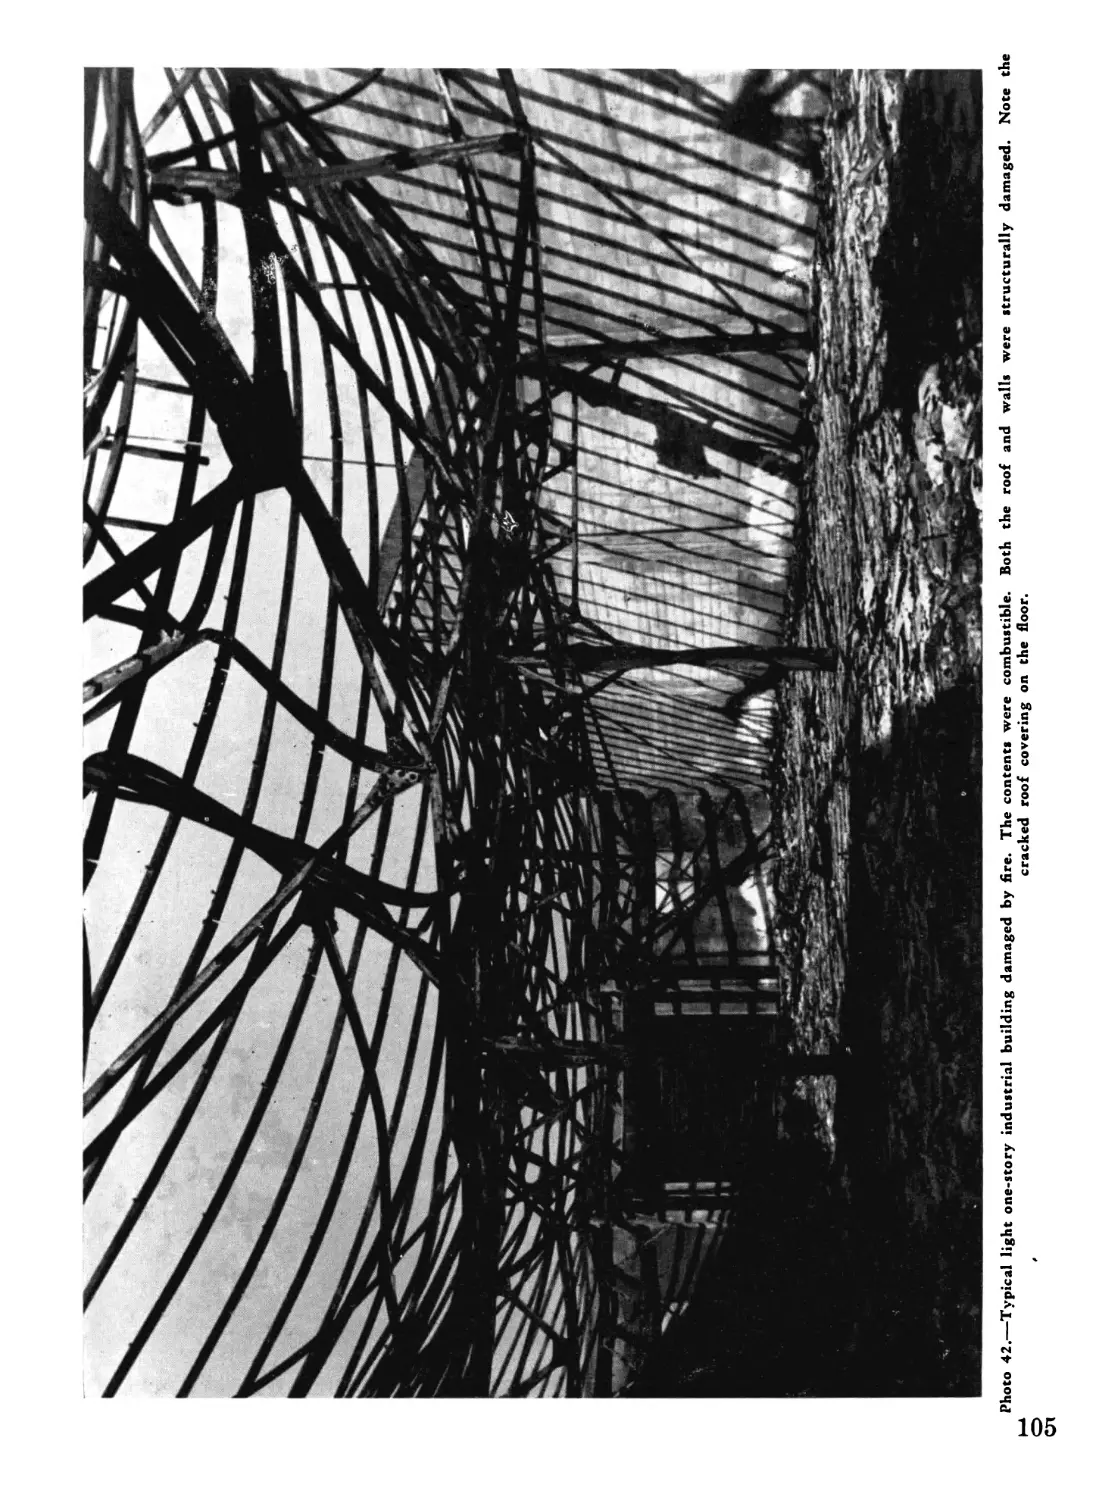
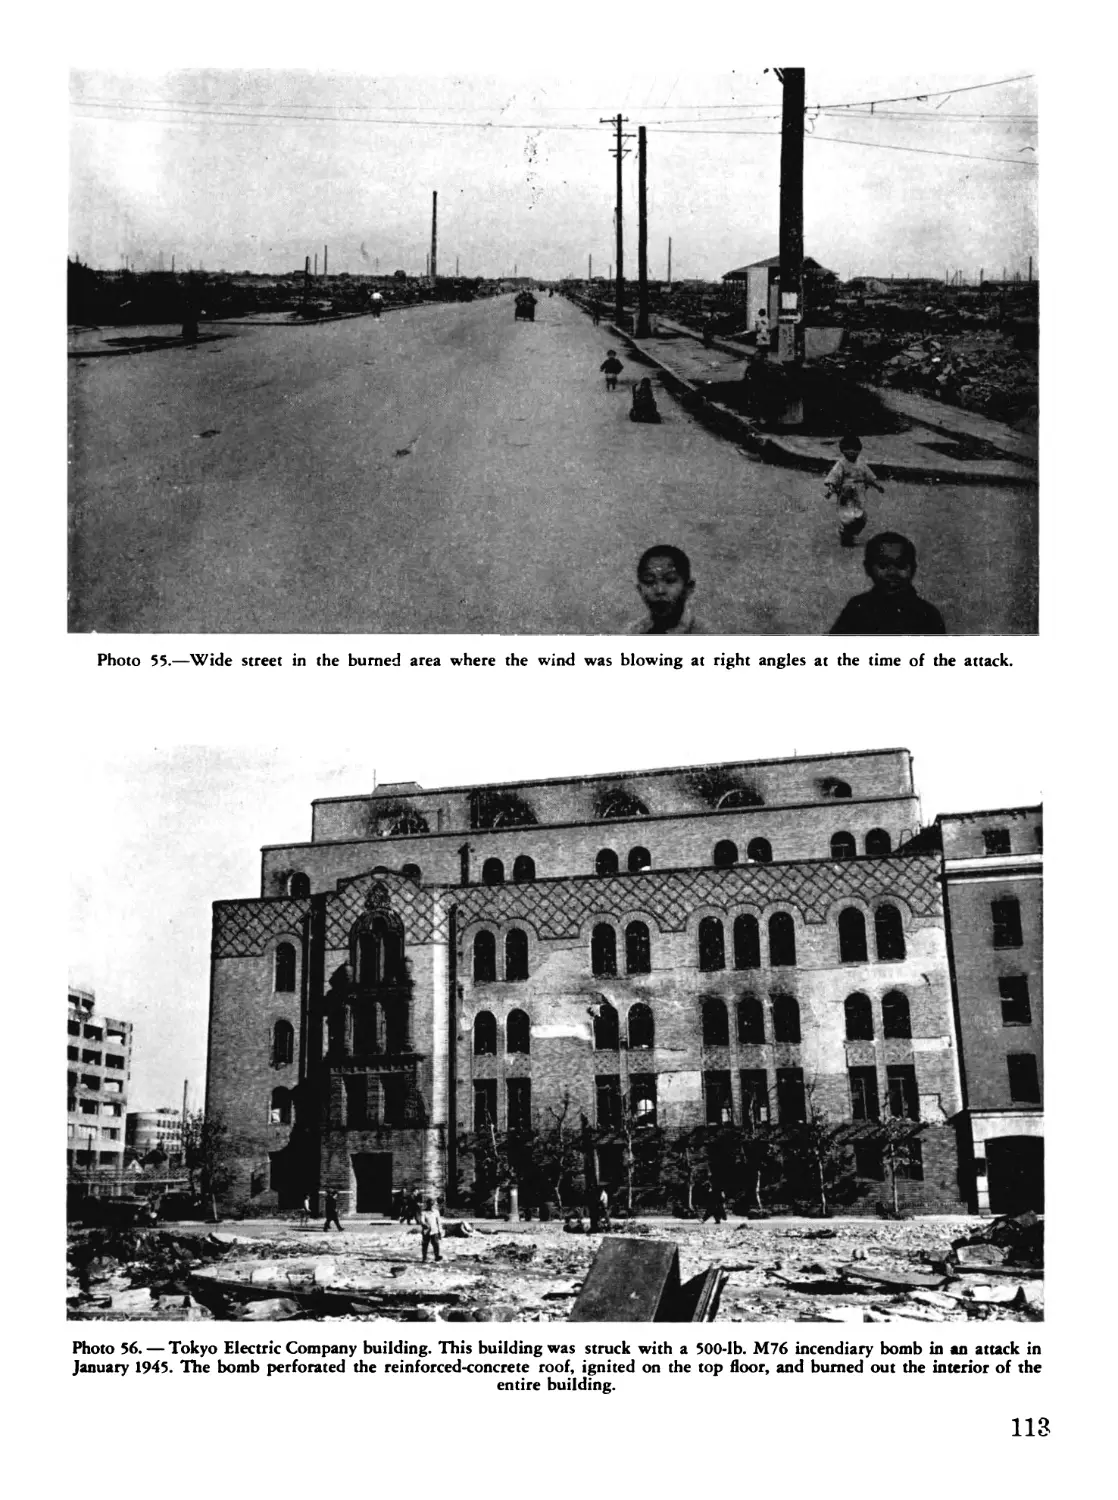
18. The incendiary bombs were generally ef-
fective against industrial plants having thin
roofs and moderately combustible contents.
They did not perforate heavy reinforced-con-
crete roofs. The M50 incendiary had too much
penetration for the average light-frame con-
struction typical of Japanese dwellings; its high
penetration, however, achieved unusual, if un-
expected, success by breaking buried water
mains in unpaved streets, thereby reducing the
supply of water available for fire fighting.
19. The incendiary attacks on Japanese cities
were highly effective in causing widespread
damage. In several instances, it was consid-
ered that the bomb load was excessive for the
target area, and that a smaller bomb load would
have achieved the same proportion of damage.
Variable factors, however, such as weather
conditions, active opposition, and the obscuring
of target by smoke, enter into this matter. It
was likewise found at some of the targets that
3
the density within the bomb-fall area was not
uniform; many bombs fell into areas already
ignited or into sparsely built-up districts; and,
on one target at least, it was considered that
greater damage would have been caused had
the fall of the bomb load been compressed into
a shorter period of time. The effectiveness of
the incendiary weapons lay to a large extent in
the larger number dropped and the wide area
covered, which nullified the protection of fire-
breaks and created an insuperable task for fire-
fighting and civilian-defense organizations.
20. It was found that when subsequent in-
cendiary attacks were made on the two largest
cities the resulting damage by fire was gen-
erally lower in proportion to the tonnage of
bombs dropped or, conversely, a greater bomb
load was required to cause an equal amount of
damage. This fact was accounted for by a
part of the bomb load’s falling on burned-out
areas or those partly burned; by the probability
that there was a lower concentration of com-
bustible material to facilitate rapid fire spread;
and by the fact that many of the larger burned
areas served as firebreaks. It is believed that
a series of attacks on a given target becomes
more effective if the attacks are closely spaced
within a period of not more than several days,
which prevents repair of protective facilities
and recuperation of defense agencies.
21. Production in cities hit by large-scale
incendiary attacks was drastically reduced.
This effect was brought about, first, because
many plants were heavily or totally damaged
by fires, either as a result of direct bomb strikes
or by fire spread. Second, normal plant opera-
tions were curtailed by (1) plant employees
being rendered homeless by fires; (2) damage
to facilities supplying the plants, such as water,
electricity, gas and transportation; (3) damage
to the plants’ own facilities; (4) loss of innu-
merable home workshops which supplied parts
to the plants; (5) loss of raw materials; (6)
damage to finished parts and (7) deaths and
injuries among employees. In many cases, the
production loss was greater than the percent-
age of damage sustained by a plant would seem
to warrant.
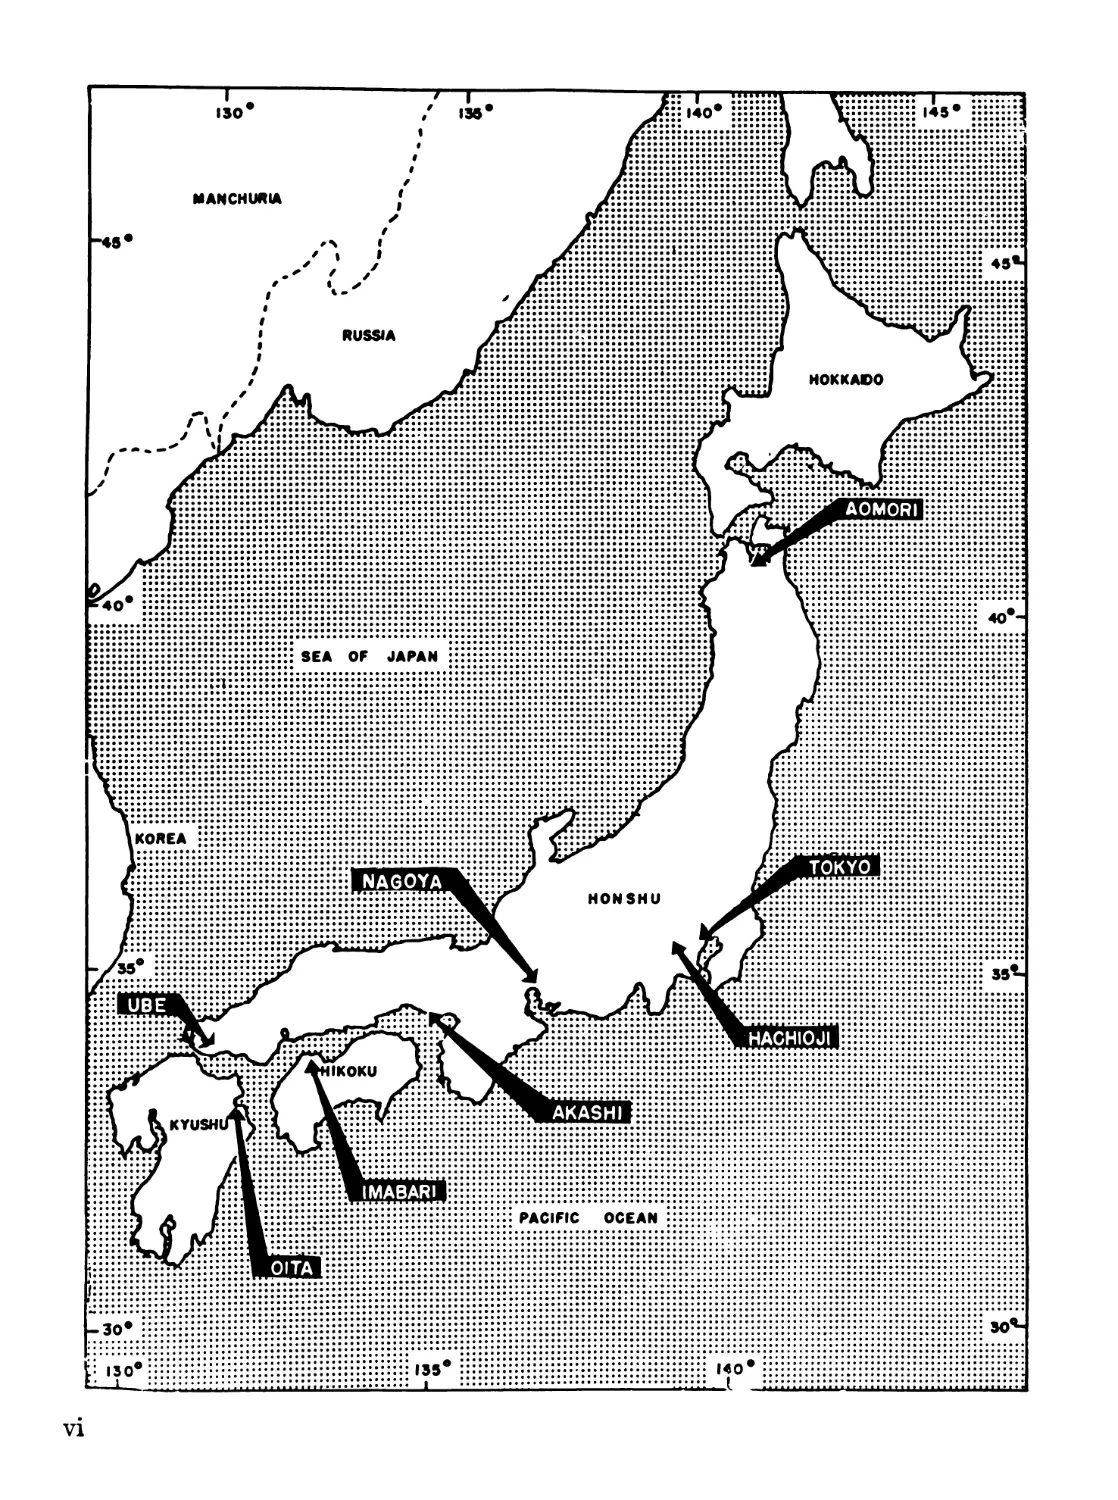
22. This report covers damage by fire in the
following target cities: Imabari, Oita, Tokyo,
Aomori, Akashi, Hachioji, Ube and Nagoya.
The fire stories on Hiroshima and Nagasaki will
be found in Physical Damage Division Reports
69 and 70, respectively.
4
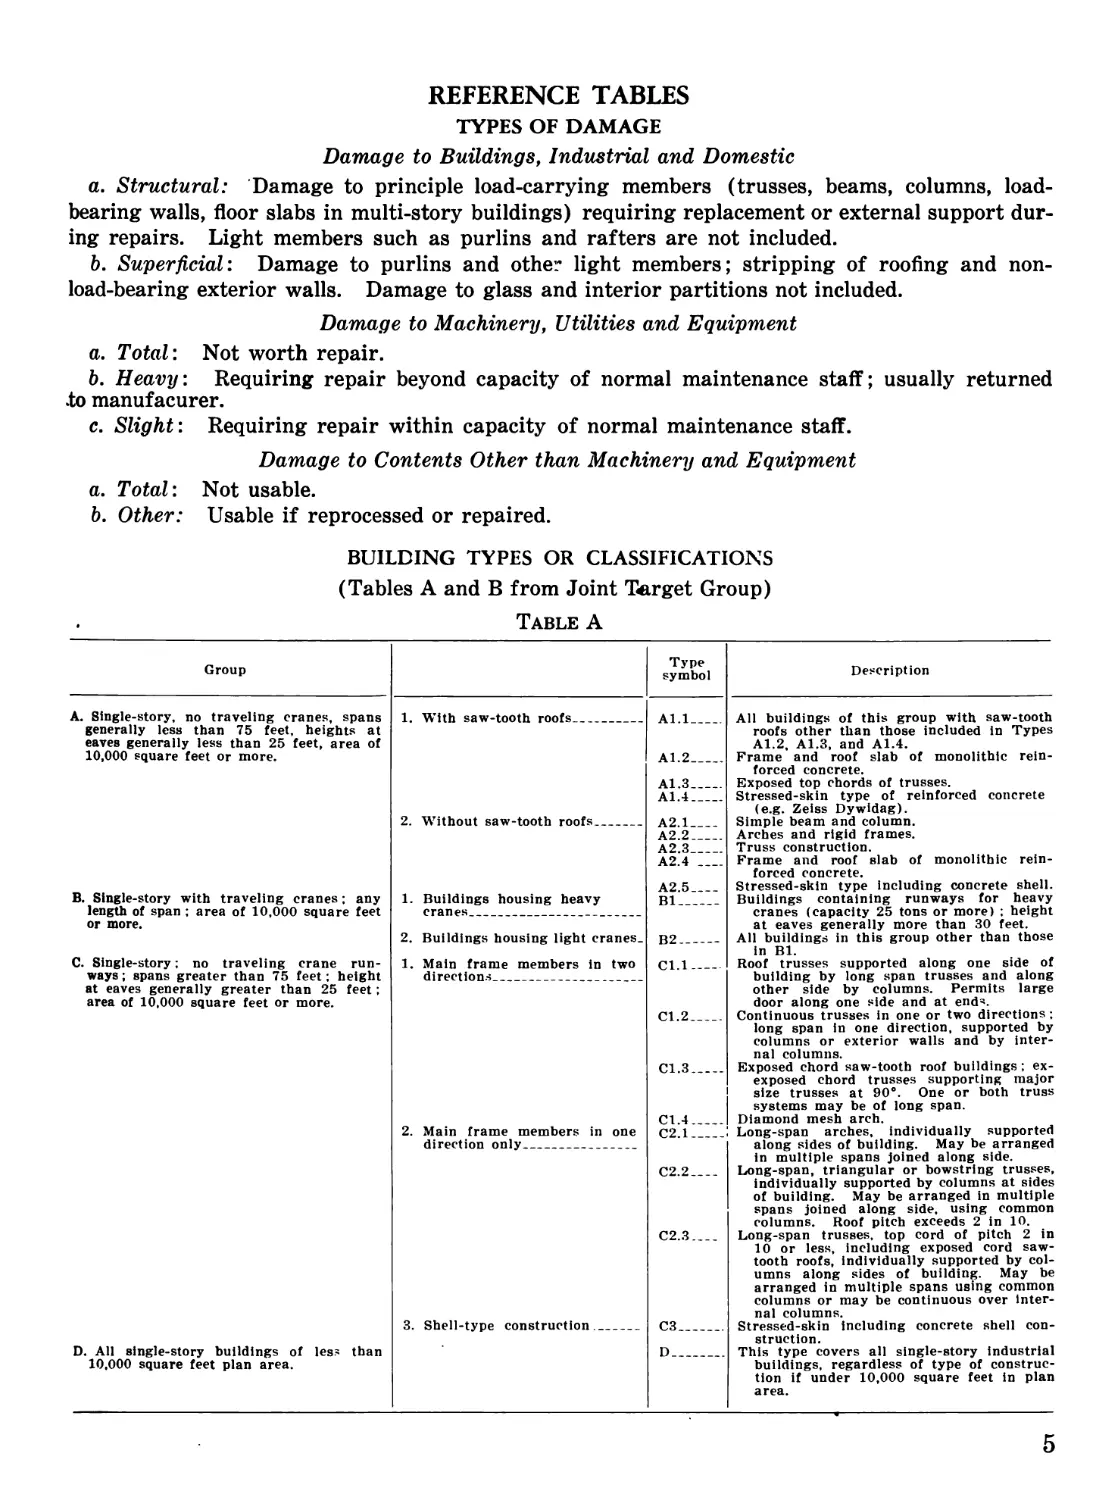
REFERENCE TABLES
TYPES OF DAMAGE
Damage to Buildings, Industrial and Domestic
a. Structural: Damage to principle load-carrying members (trusses, beams, columns, load-
bearing walls, floor slabs in multi-story buildings) requiring replacement or external support dur-
ing repairs. Light members such as purlins and rafters are not included.
b. Superficial: Damage to purlins and other light members; stripping of roofing and non-
load-bearing exterior walls. Damage to glass and interior partitions not included.
Damage to Machinery, Utilities and Equipment
a. Total: Not worth repair.
b. Heavy: Requiring repair beyond capacity of normal maintenance staff; usually returned
.to manufacurer.
c. Slight: Requiring repair within capacity of normal maintenance staff.
Damage to Contents Other than Machinery and Equipment
a. Total: Not usable.
b. Other: Usable if reprocessed or repaired.
BUILDING TYPES OR CLASSIFICATIONS
(Tables A and В from Joint Target Group)
Table A
Group Type symbol Description
A. Single-story, no traveling cranes, spans generally less than 75 feet, heights at eaves generally less than 25 feet, area of 10,000 square feet or more. B. Single-story with traveling cranes; any length of span ; area of 10,000 square feet or more. C. Single-story; no traveling crane run- ways ; spans greater than 75 feet; height at eaves generally greater than 25 feet; area of 10,000 square feet or more. D. All single-story buildings of les? than 10,000 square feet plan area. 1. With saw-tooth roofs 2. Without saw-tooth roofs Al.l Al.2 A1.3 Al.4 A2.1 A2.2 A2.3 A2.4 A2.5 Bl B2 Cl.l Cl.2 C1.3 C1.4 C2.1 C2.2 C2.3 C3 D All buildings of this group with saw-tooth roofs other than those included in Types Al.2. A1.3, and A1.4. Frame and roof slab of monolithic rein- forced concrete. Exposed top chords of trusses. Stressed-skin type of reinforced concrete (e.g. Zeiss Dywidag). Simple beam and column. Arches and rigid frames. Truss construction. Frame and roof slab of monolithic rein- forced concrete. Stressed-skin type including concrete shell. Buildings containing runways for heavy cranes (capacity 25 tons or more) ; height at eaves generally more than 30 feet. All buildings in this group other than those in Bl. Roof trusses supported along one side of building by long span trusses and along other side by columns. Permits large door along one side and at end?. Continuous trusses in one or two directions ; long span in one direction, supported by columns or exterior walls and by inter- nal columns. Exposed chord saw-tooth roof buildings ; ex- exposed chord trusses supporting major | size trusses at 90°. One or both truss systems may be of long span. I Diamond mesh arch. ; Long-span arches, individually supported along sides of building. May be arranged in multiple spans joined along side. Long-span, triangular or bowstring trusses, individually supported by columns at sides of building. May be arranged in multiple spans joined along side, using common columns. Roof pitch exceeds 2 in 10. Long-span trusses, top cord of pitch 2 in 10 or less, including exposed cord saw- tooth roofs, individually supported by col- umns along sides of building. May be arranged in multiple spans using common columns or may be continuous over inter- nal columns. Stressed-skin including concrete shell con- struction. This type covers all single-story industrial buildings, regardless of type of construc- tion if under 10,000 square feet in plan area.
1. Buildings housing heavy cranes 2. Buildings housing light cranes. 1. Main frame members in two directions
2. Main frame members in one direction only 3. Shell-type construction
5
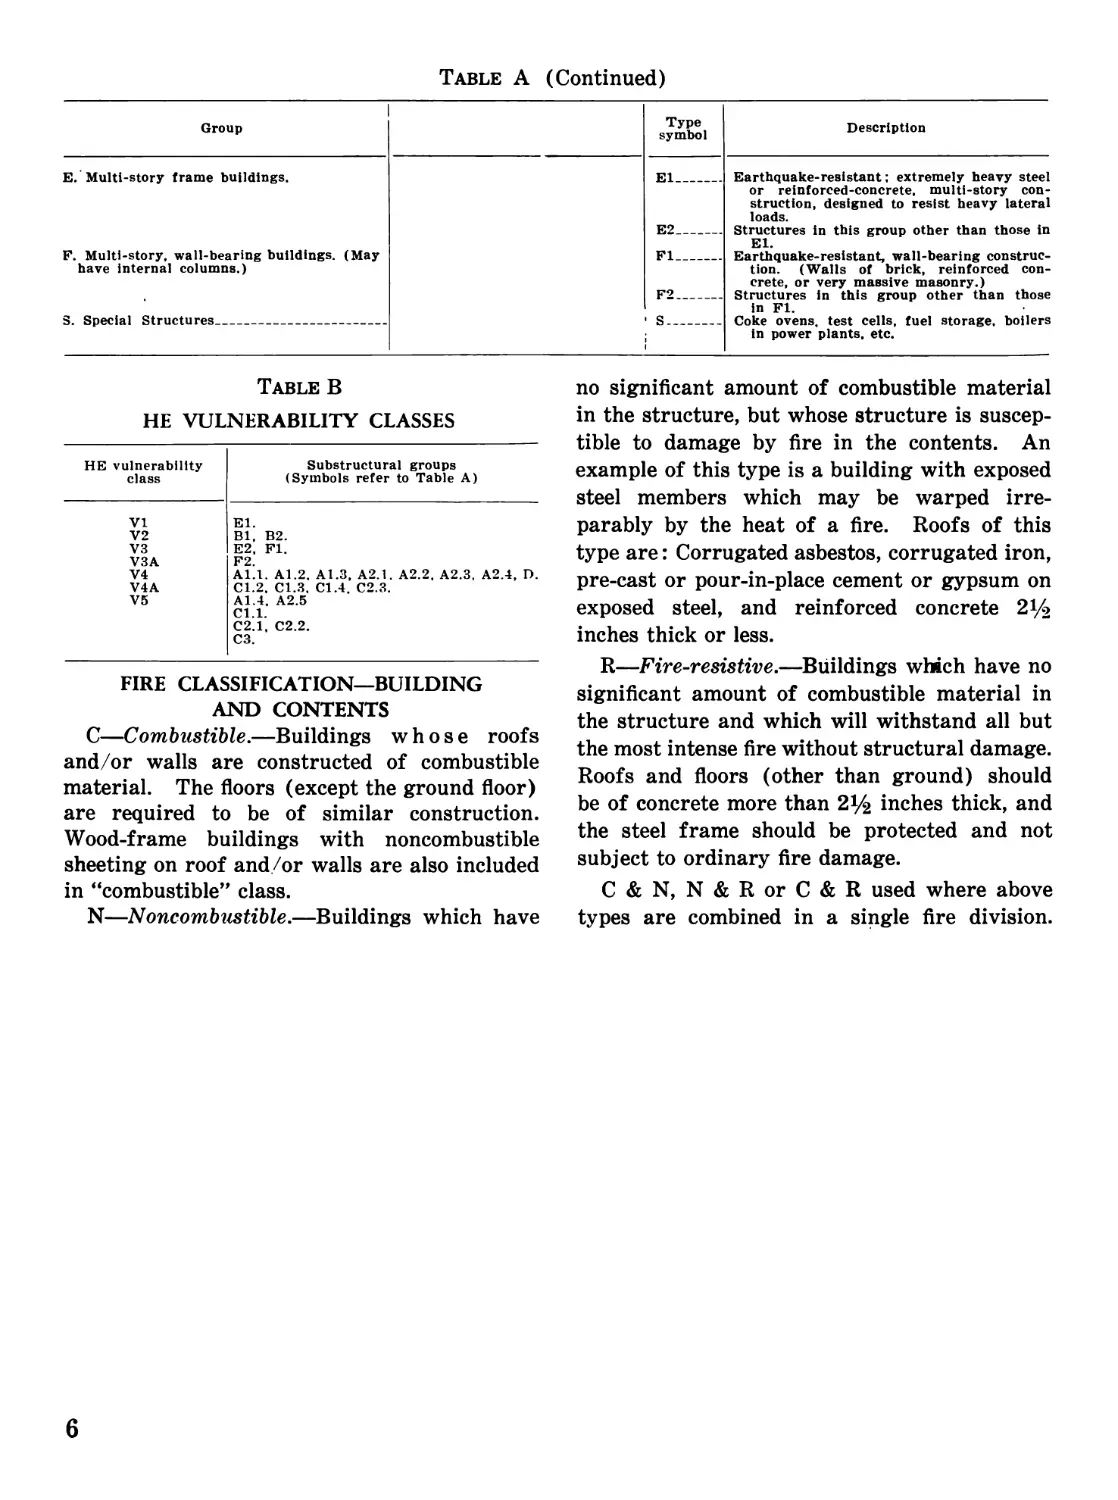
Table A (Continued)
Group Type symbol Description
E. Multi-story frame buildings. El E2 Earthquake-resistant; extremely heavy steel or reinforced-concrete, multi-story con- struction, designed to resist heavy lateral loads. Structures in this group other than those in El.
F. Multi-story, wall-bearing buildings. (May have internal columns.) Fl F2 Earthquake-resistant, wall-bearing construc- tion. (Walls of brick, reinforced con- crete, or very massive masonry.) Structures in this group other than those in Fl.
S. Special Structures • S Coke ovens, test cells, fuel storage, boilers in power plants, etc.
Table В
HE VULNERABILITY CLASSES
HE vulnerability
class
VI
V2
V3
V3A
V4
V4A
V5
Substructural groups
(Symbols refer to Table A)
El.
Bl, B2.
E2, Fl.
F2.
Al.I. Al.2. A1.3, A2.1. A2.2, A2.3, A2.4, D.
Cl.2, C1.3. C1.4. C2.3.
Al.4, A2.5
Cl.l.
C2.1, C2.2.
C3.
FIRE CLASSIFICATION—BUILDING
AND CONTENTS
C—Combustible.—Buildings whose roofs
and/or walls are constructed of combustible
material. The floors (except the ground floor)
are required to be of similar construction.
Wood-frame buildings with noncombustible
sheeting on roof and/or walls are also included
in “combustible” class.
N—Noncombustible.—Buildings which have
no significant amount of combustible material
in the structure, but whose structure is suscep-
tible to damage by fire in the contents. An
example of this type is a building with exposed
steel members which may be warped irre-
parably by the heat of a fire. Roofs of this
type are: Corrugated asbestos, corrugated iron,
pre-cast or pour-in-place cement or gypsum on
exposed steel, and reinforced concrete 2^
inches thick or less.
R—Fire-resistive.—Buildings which have no
significant amount of combustible material in
the structure and which will withstand all but
the most intense fire without structural damage.
Roofs and floors (other than ground) should
be of concrete more than 2Ц inches thick, and
the steel frame should be protected and not
subject to ordinary fire damage.
C&N, N&RorC&R used where above
types are combined in a single fire division.
6
SECTION III
Part 1
EFFECTS OF INCENDIARY BOMB ATTACK ON IMABARI, JAPAN
7
TABLE OF CONTENTS
Page
I. Object of Study.............................. 9
II. Summary ....................................... 9
III. General Information................................ 9
IV. The Target................................. —....... 10
V. The Attacks................................ 11
VI. Fire Attack Data.............................. 12
VII. Analysis of Damage............................. 13
VIII. Recommendations and Conclusions................... 14
Photos 1-15, inclusive
Figure 1
Table 1
8
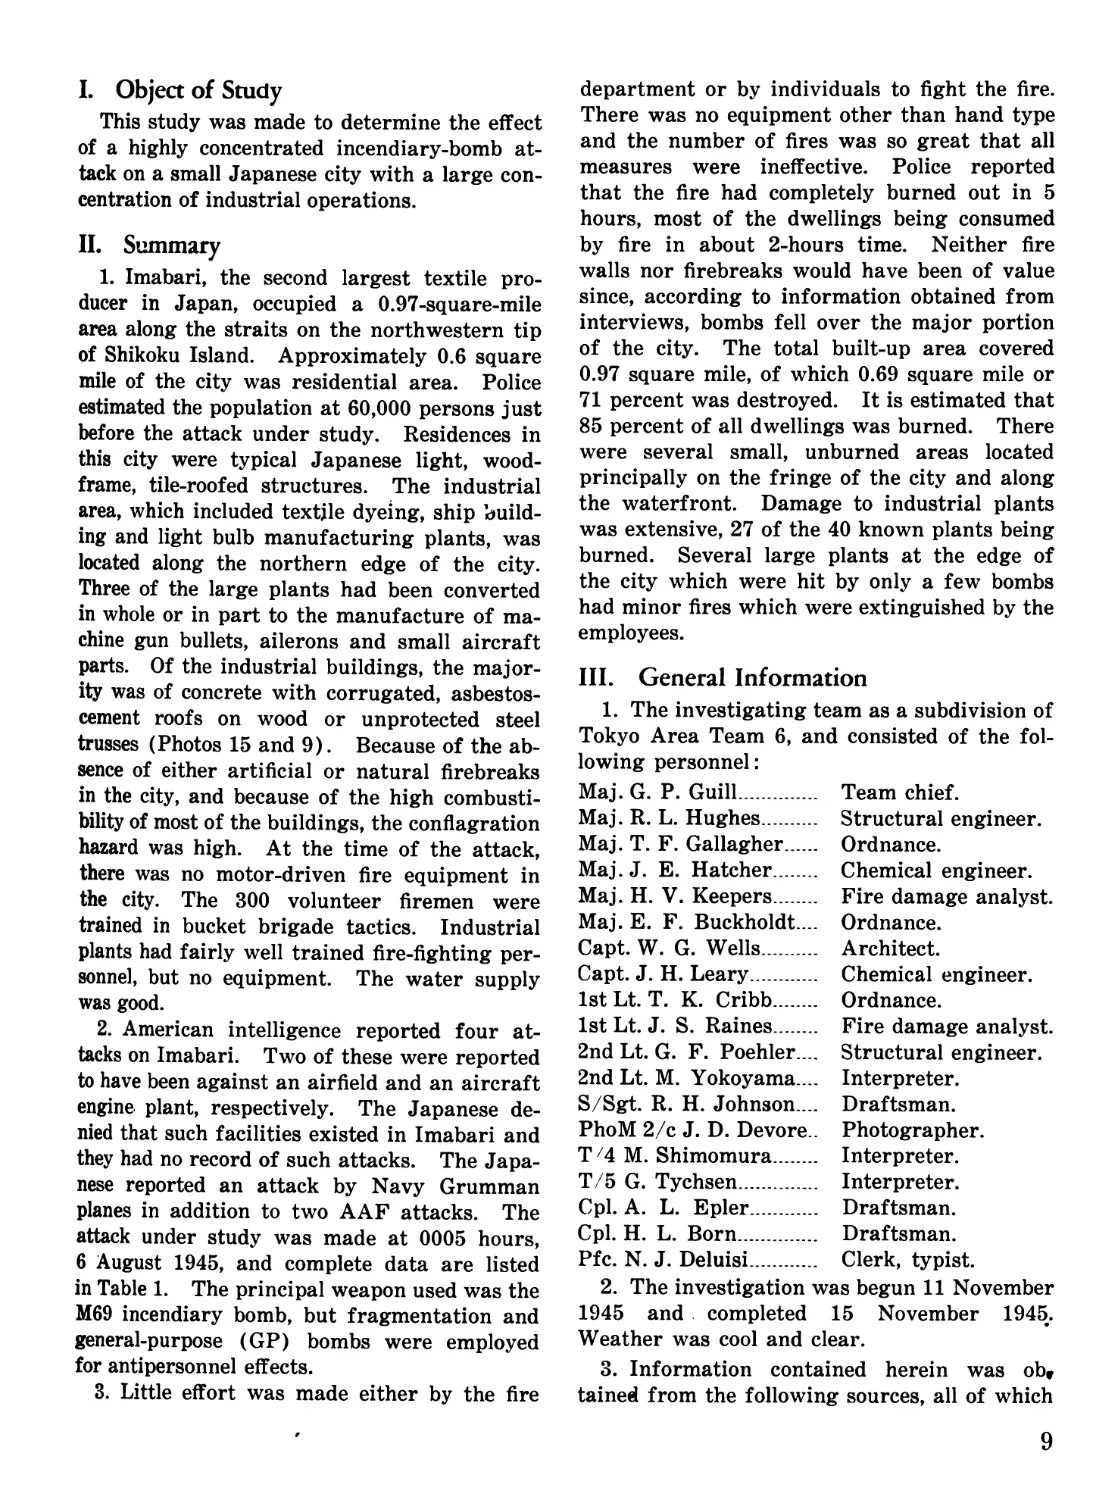
I. Object of Study
This study was made to determine the effect
of a highly concentrated incendiary-bomb at-
tack on a small Japanese city with a large con-
centration of industrial operations.
II. Summary
1. Imabari, the second largest textile pro-
ducer in Japan, occupied a 0.97-square-mile
area along the straits on the northwestern tip
of Shikoku Island. Approximately 0.6 square
mile of the city was residential area. Police
estimated the population at 60,000 persons just
before the attack under study. Residences in
this city were typical Japanese light, wood-
frame, tile-roofed structures. The industrial
area, which included textile dyeing, ship build-
ing and light bulb manufacturing plants, was
located along the northern edge of the city.
Three of the large plants had been converted
in whole or in part to the manufacture of ma-
chine gun bullets, ailerons and small aircraft
parts. Of the industrial buildings, the major-
ity was of concrete with corrugated, asbestos-
cement roofs on wood or unprotected steel
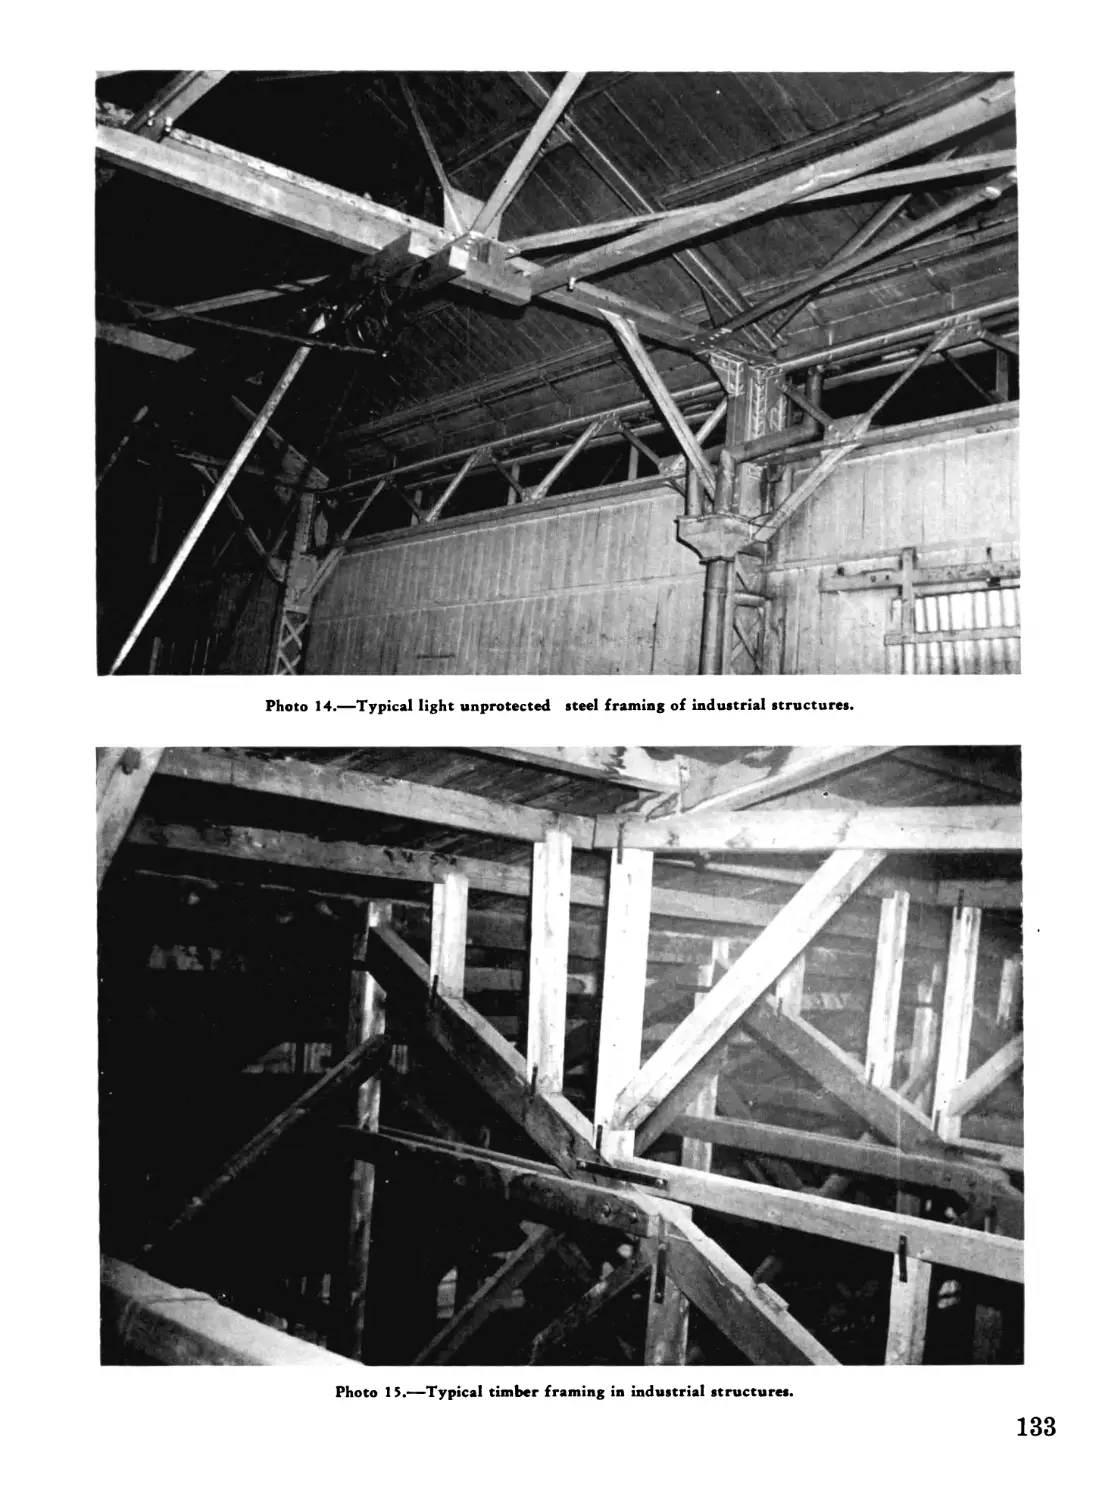
trusses (Photos 15 and 9). Because of the ab-
sence of either artificial or natural firebreaks
in the city, and because of the high combusti-
bility of most of the buildings, the conflagration
hazard was high. At the time of the attack,
there was no motor-driven fire equipment in
the city. The 300 volunteer firemen were
trained in bucket brigade tactics. Industrial
plants had fairly well trained fire-fighting per-
sonnel, but no equipment. The water supply
was good.
2. American intelligence reported four at-
tacks on Imabari. Two of these were reported
to have been against an airfield and an aircraft
engine plant, respectively. The Japanese de-
nied that such facilities existed in Imabari and
they had no record of such attacks. The Japa-
nese reported an attack by Navy Grumman
planes in addition to two AAF attacks. The
attack under study was made at 0005 hours,
6 August 1945, and complete data are listed
in Table 1. The principal weapon used was the
M69 incendiary bomb, but fragmentation and
general-purpose (GP) bombs were employed
for antipersonnel effects.
3. Little effort was made either by the fire
department or by individuals to fight the fire.
There was no equipment other than hand type
and the number of fires was so great that all
measures were ineffective. Police reported
that the fire had completely burned out in 5
hours, most of the dwellings being consumed
by fire in about 2-hours time. Neither fire
walls nor firebreaks would have been of value
since, according to information obtained from
interviews, bombs fell over the major portion
of the city. The total built-up area covered
0.97 square mile, of which 0.69 square mile or
71 percent was destroyed. It is estimated that
85 percent of all dwellings was burned. There
were several small, unburned areas located
principally on the fringe of the city and along
the waterfront. Damage to industrial plants
was extensive, 27 of the 40 known plants being
burned. Several large plants at the edge of
the city which were hit by only a few bombs
had minor fires which were extinguished by the
employees.
III. General Information
1. The investigating team as a subdivision of
Tokyo Area Team 6, and consisted of the fol-
lowing personnel:
Maj. G. P. Guill......
Maj. R. L. Hughes.....
Maj. T. F. Gallagher..
Maj. J. E. Hatcher....
Maj. H. V. Keepers....
Maj. E. F. Buckholdt....
Capt. W. G. Wells.....
Capt. J. H. Leary.....
1st Lt. T. K. Cribb...
1st Lt. J. S. Raines..
2nd Lt. G. F. Poehler....
2nd Lt. M. Yokoyama....
S/Sgt. R. H. Johnson....
PhoM 2/c J. D. Devore..
T z4 M. Shimomura.....
T/5 G. Tychsen........
Cpl. A. L. Epler......
Cpl. H. L. Born.......
Team chief.
Structural engineer.
Ordnance.
Chemical engineer.
Fire damage analyst.
Ordnance.
Architect.
Chemical engineer.
Ordnance.
Fire damage analyst.
Structural engineer.
Interpreter.
Draftsman.
Photographer.
Interpreter.
Interpreter.
Draftsman.
Draftsman.
Clerk, typist.
Pfc. N. J. Deluisi.....
2. The investigation was begun 11 November
1945 and completed 15 November 1945.
Weather was cool and clear.
3. Information contained herein was ob,
tained from the following sources, all of which
9
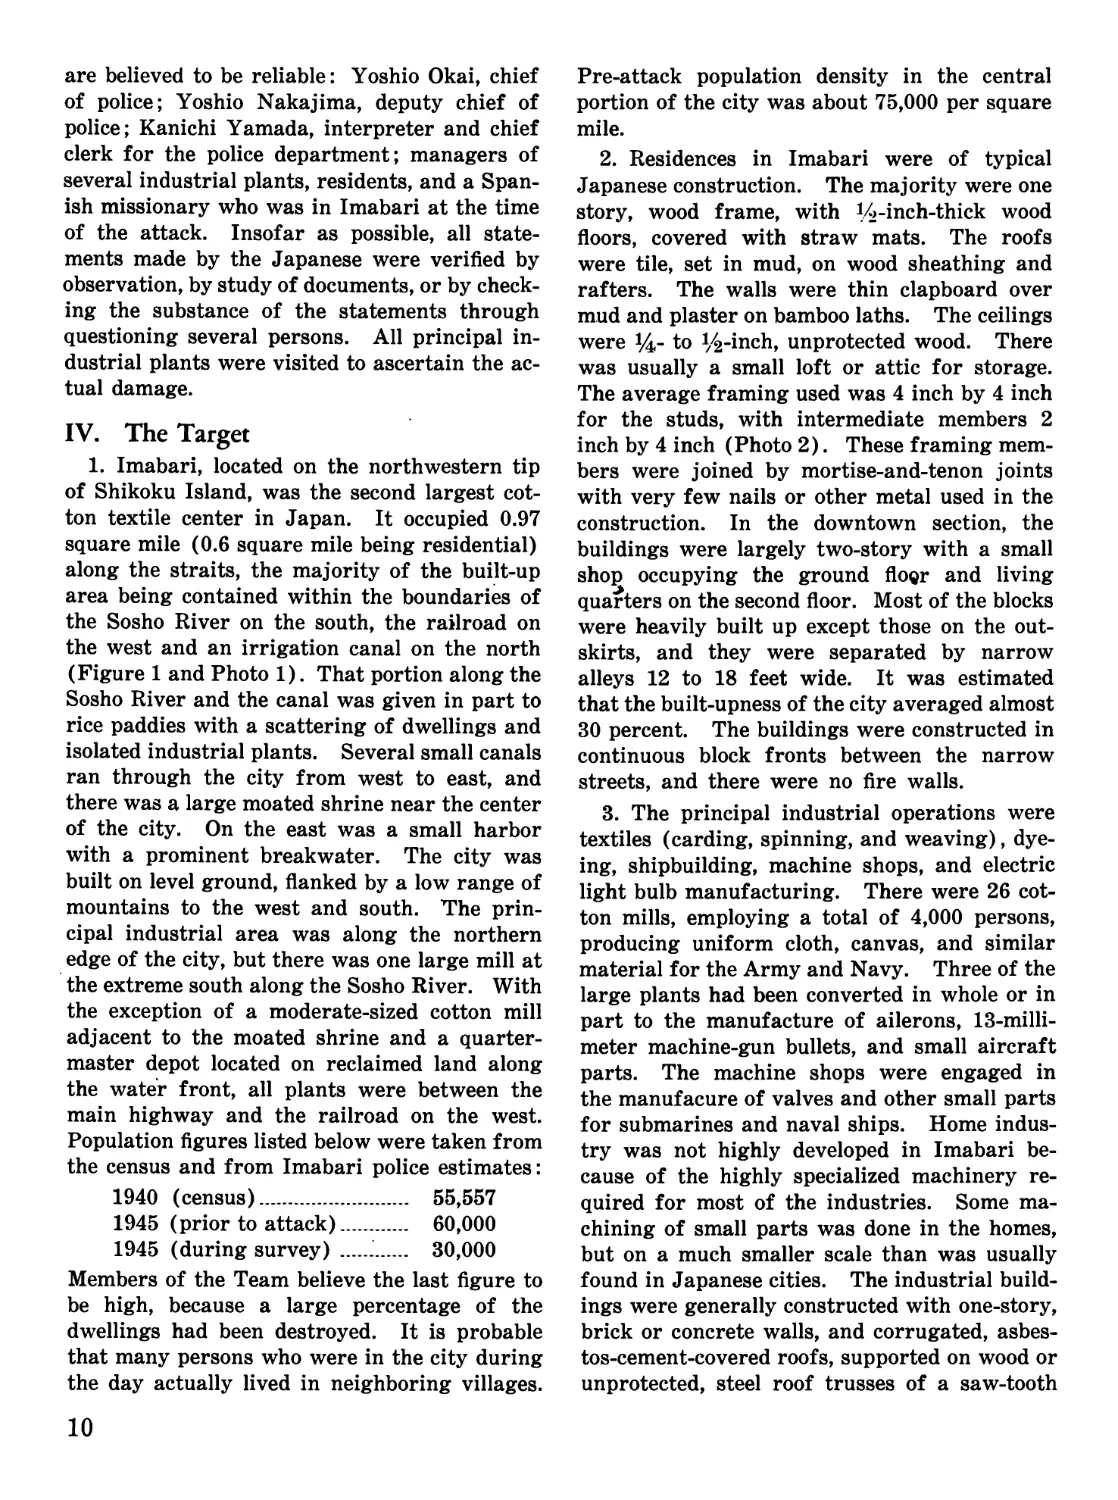
are believed to be reliable: Yoshio Okai, chief
of police; Yoshio Nakajima, deputy chief of
police; Kanichi Yamada, interpreter and chief
clerk for the police department; managers of
several industrial plants, residents, and a Span-
ish missionary who was in Imabari at the time
of the attack. Insofar as possible, all state-
ments made by the Japanese were verified by
observation, by study of documents, or by check-
ing the substance of the statements through
questioning several persons. All principal in-
dustrial plants were visited to ascertain the ac-
tual damage.
IV. The Target
1. Imabari, located on the northwestern tip
of Shikoku Island, was the second largest cot-
ton textile center in Japan. It occupied 0.97
square mile (0.6 square mile being residential)
along the straits, the majority of the built-up
area being contained within the boundaries of
the Sosho River on the south, the railroad on
the west and an irrigation canal on the north
(Figure 1 and Photo 1). That portion along the
Sosho River and the canal was given in part to
rice paddies with a scattering of dwellings and
isolated industrial plants. Several small canals
ran through the city from west to east, and
there was a large moated shrine near the center
of the city. On the east was a small harbor
with a prominent breakwater. The city was
built on level ground, flanked by a low range of
mountains to the west and south. The prin-
cipal industrial area was along the northern
edge of the city, but there was one large mill at
the extreme south along the Sosho River. With
the exception of a moderate-sized cotton mill
adjacent to the moated shrine and a quarter-
master depot located on reclaimed land along
the water front, all plants were between the
main highway and the railroad on the west.
Population figures listed below were taken from
the census and from Imabari police estimates:
1940 (census)................ 55,557
1945 (prior to attack)...... 60,000
1945 (during survey) ........ 30,000
Members of the Team believe the last figure to
be high, because a large percentage of the
dwellings had been destroyed. It is probable
that many persons who were in the city during
the day actually lived in neighboring villages.
10
Pre-attack population density in the central
portion of the city was about 75,000 per square
mile.
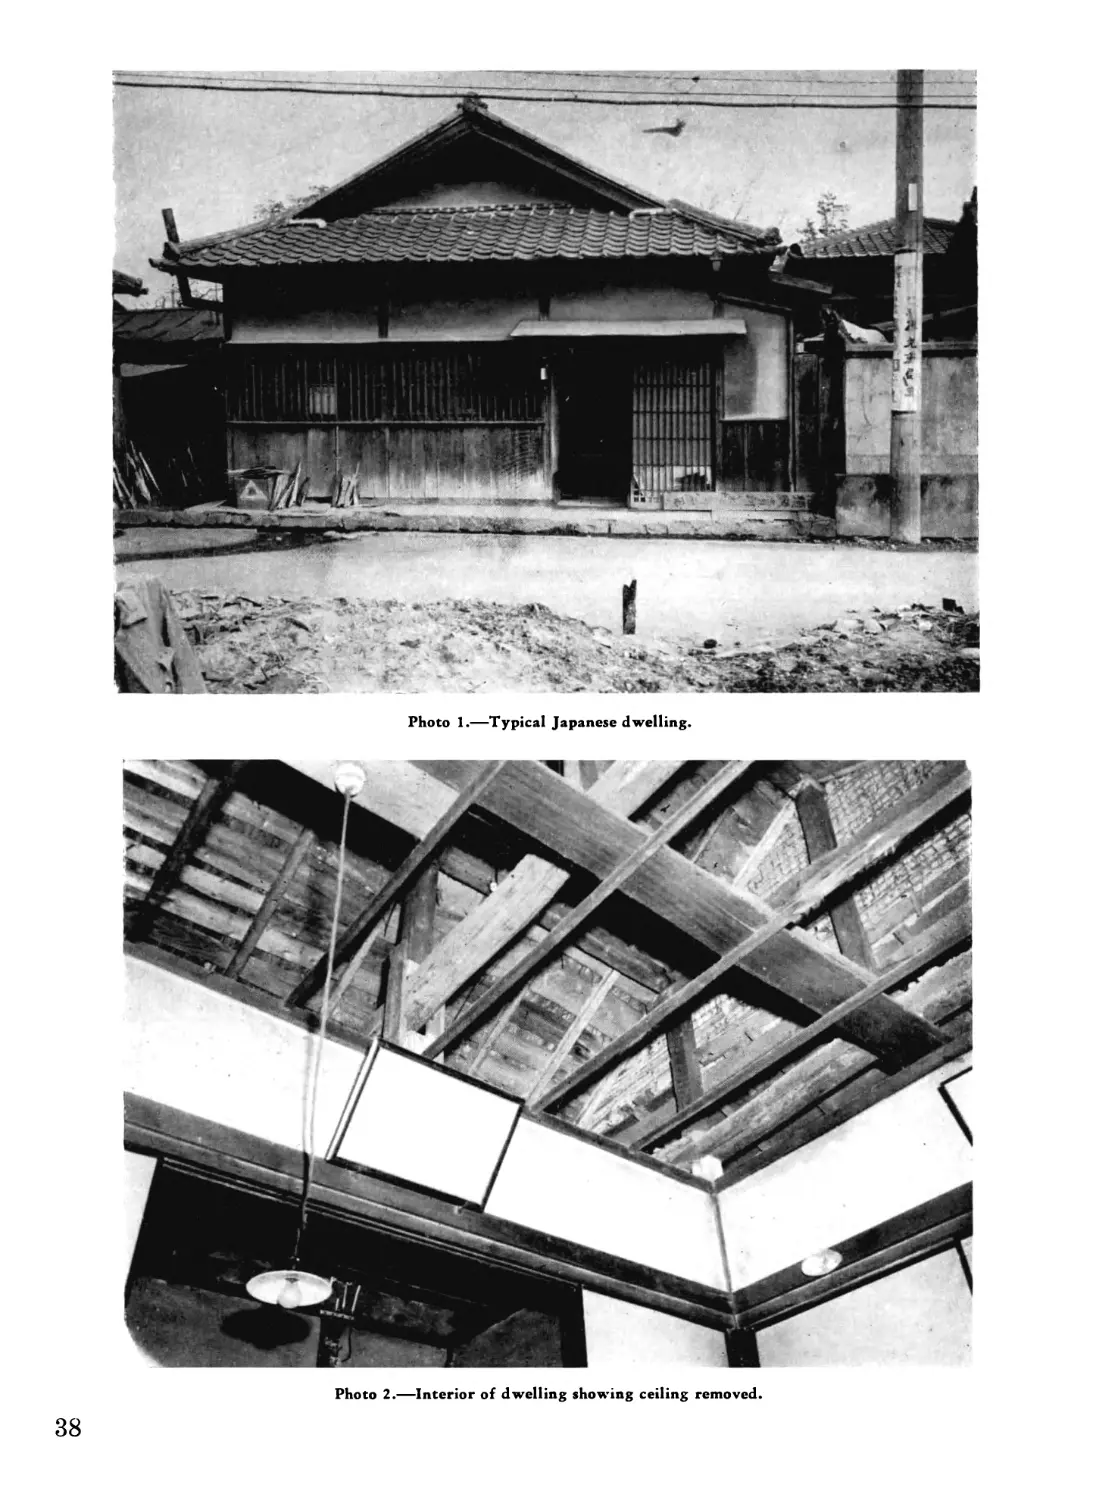
2. Residences in Imabari were of typical
Japanese construction. The majority were one
story, wood frame, with ^-inch-thick wood
floors, covered with straw mats. The roofs
were tile, set in mud, on wood sheathing and
rafters. The walls were thin clapboard over
mud and plaster on bamboo laths. The ceilings
were 1Д- to %-inch, unprotected wood. There
was usually a small loft or attic for storage.
The average framing used was 4 inch by 4 inch
for the studs, with intermediate members 2
inch by 4 inch (Photo 2). These framing mem-
bers were joined by mortise-and-tenon joints
with very few nails or other metal used in the
construction. In the downtown section, the
buildings were largely two-story with a small
shop occupying the ground floqr and living
quarters on the second floor. Most of the blocks
were heavily built up except those on the out-
skirts, and they were separated by narrow
alleys 12 to 18 feet wide. It was estimated
that the built-upness of the city averaged almost
30 percent. The buildings were constructed in
continuous block fronts between the narrow
streets, and there were no fire walls.
3. The principal industrial operations were
textiles (carding, spinning, and weaving), dye-
ing, shipbuilding, machine shops, and electric
light bulb manufacturing. There were 26 cot-
ton mills, employing a total of 4,000 persons,
producing uniform cloth, canvas, and similar
material for the Army and Navy. Three of the
large plants had been converted in whole or in
part to the manufacture of ailerons, 13-milli-
meter machine-gun bullets, and small aircraft
parts. The machine shops were engaged in
the manufacure of valves and other small parts
for submarines and naval ships. Home indus-
try was not highly developed in Imabari be-
cause of the highly specialized machinery re-
quired for most of the industries. Some ma-
chining of small parts was done in the homes,
but on a much smaller scale than was usually
found in Japanese cities. The industrial build-
ings were generally constructed with one-story,
brick or concrete walls, and corrugated, asbes-
tos-cement-covered roofs, supported on wood or
unprotected, steel roof trusses of a saw-tooth
design (Photos 15 and 9). Floors were of
wood or concrete. It was the general practice
to surround the plants with a 10-foot brick or
pre-cast concrete fence which separated the
plant from near-by dwellings.
4. The conflagration hazard in the built-up
area was severe. Block after block was sub-
ject to destruction because of the high built-
upness (about 30 percent), because of the solid
block fronts and inflammable construction, and
because of the complete absence of either man-
made or natural* firebreaks. One main street
through the center of the city, under favorable
conditions, might have acted as a barrier, but
since bombs straddled the street (determined
through interview and finding of empty bomb
casings) its existence did not prevent the
spread of fire. The other streets in the city
were actually narrow alleyways, 12 to 18 feet in
width.
5. Fire department personnel consisted of
four or five professional firemen and about 300
volunteers. The professionals included the fire
chief and his assistants who trained and di-
rected the volunteers in the rudiments of fire
fighting, particularly in the action to be taken
in case of air attack. This training included
methods of escape from burning areas, aircraft
identification, first aid, household fire fighting
and use of the limited equipment available.
The individual householder was given some
training in the extinguishing of incendiary
bombs and spot fires, and this training was in-
tensified after the great fire attacks on Tokyo
and other major cities. The industrial plants
had individual fire brigades, but their equip-
ment was limited to such items as stirrup
pumps, buckets, sand boxes, and first-aid appli-
ances. It was apparent from discussion with
plant managers that special emphasis was
placed on fire fighting, particularly in plants
with a large amount of combustible construc-
tion.
6. Treated water for fire and domestic pur-
poses was supplied from an irrigation canal
through a 14-inch line to a 475,000-gallon, ele-
vated reservoir, 148 feet above the city. This
provided a static water pressure of 64 pounds
per square inch. Supply to the city was
through a single 18-inch line with a by-passed
regulator valve. The distribution system con-
sisted of 3-inch to 10-inch metal pipes. The
fire hydrants were one-way, flush type except
for seven which were a standard one-way type.
There were two centrifugal pumps of unknown
size, driven by 55-horsepower, electric motors.
It was estimated that each of these pumps
would deliver about 750 gallons per minute. A
75-horsepower Diesel engine was provided for
emergency in case of failure of electric power.
At the time of the attack, the elevated reservoir
was practically full, and the pumps operated
throughout the period. The water supply sys-
tem was small, judged by United States stand-
ards, but was not unusual for a Japanese city.
It was considered by the Japanese to be ade-
quate to cope with normal fires.
7. The Imabari warning system consisted of
a single siren located at the moarted shrine near
the center of the city. It was used for both
fire and air-raid warnings. The few public
shelters, shallow excavations in the sidewalk
with about a foot of earth over wood covers,
offered little protection from bombs and were
often rendered unusable because of water seep-
age. Some of the industrial plants had fairly
well constructed, earth-covered shelters along
the perimeter of the plant grounds.
V. The Attacks
1. American intelligence indicates an attack
by the Twentieth AF on 7 May 1945, in which
36 1,000-pound bombs and 56 2,000-pound
bombs were dropped by 11 B-29 airplanes.
The urban area was the target. No further
American intelligence on this attack is availa-
ble. Japanese officials estimate that eight
B-29s made this attack. Observation of strikes
and discussions with police indicated that in-
stantaneous fuzes were used with the smaller
bombs and variable long-delay fuzes (maximum
126 hours) with the 2,000-pound bombs. The
Japanese made no attempt to remove the de-
layed action bombs, but evacuated the area and
allowed the bombs to explode. The bomb track
indicated that the direction of the attack was
from SSW. No evaluation of the damage
caused by this attack could be made, since the
target was burned later. Japanese police state
that in this attack the only motor-driven fire
truck in the city was damaged beyond repair,
704699—47—2
11
and this was verified by inspection of the ve-
hicle.
2. Two additional attacks by the Twentieth
AF are listed by the Machine Record Unit’s
consolidated record of air attacks in the Pa-
cific Theater. The first of these, 25 April 1945,
was directed against the Imabari airfield and
was executed by 15 aircraft, carrying 66 tons
of high-explosive bombs. The target of the
second attack, 15 May 1945, was an aircraft
engine factory, and the attack was carried out
by one airplane, carrying three tons of high-
explosive bombs. Japanese officials denied,
however, that such installations existed in Ima-
bari and stated that they had no record of either
attack. *
3. Japanese police reported a heavy strafing
attack by a large number of Grumman carrier-
based planes on 18 March 1945. A 2,000-ton
transport was sunk and a 1,000-ton cargo ship
burned.
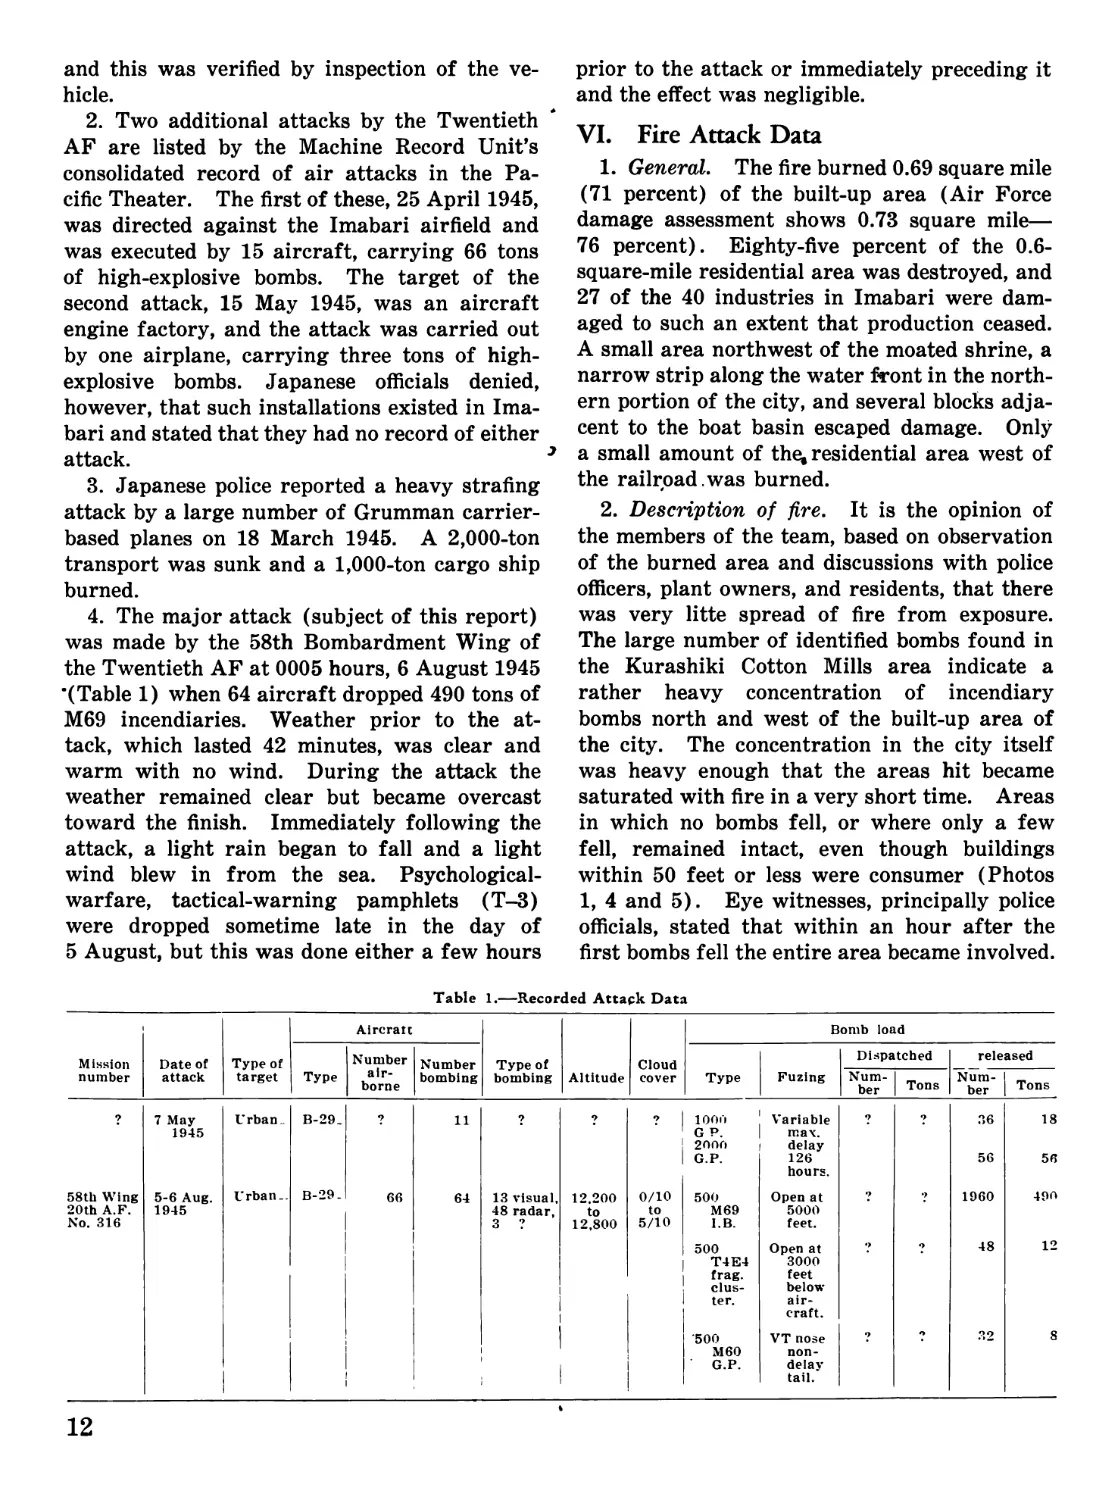
4. The major attack (subject of this report)
was made by the 58th Bombardment Wing of
the Twentieth AF at 0005 hours, 6 August 1945
'(Table 1) when 64 aircraft dropped 490 tons of
M69 incendiaries. Weather prior to the at-
tack, which lasted 42 minutes, was clear and
warm with no wind. During the attack the
weather remained clear but became overcast
toward the finish. Immediately following the
attack, a light rain began to fall and a light
wind blew in from the sea. Psychological-
warfare, tactical-warning pamphlets (T-3)
were dropped sometime late in the day of
5 August, but this was done either a few hours
prior to the attack or immediately preceding it
and the effect was negligible.
VI. Fire Attack Data
1. General. The fire burned 0.69 square mile
(71 percent) of the built-up area (Air Force
damage assessment shows 0.73 square mile—
76 percent). Eighty-five percent of the 0.6-
square-mile residential area was destroyed, and
27 of the 40 industries in Imabari were dam-
aged to such an extent that production ceased.
A small area northwest of the moated shrine, a
narrow strip along the water front in the north-
ern portion of the city, and several blocks adja-
cent to the boat basin escaped damage. Only
a small amount of the, residential area west of
the railroad.was burned.
2. Description of fire. It is the opinion of
the members of the team, based on observation
of the burned area and discussions with police
officers, plant owners, and residents, that there
was very litte spread of fire from exposure.
The large number of identified bombs found in
the Kurashiki Cotton Mills area indicate a
rather heavy concentration of incendiary
bombs north and west of the built-up area of
the city. The concentration in the city itself
was heavy enough that the areas hit became
saturated with fire in a very short time. Areas
in which no bombs fell, or where only a few
fell, remained intact, even though buildings
within 50 feet or less were consumer (Photos
1, 4 and 5). Eye witnesses, principally police
officials, stated that within an hour after the
first bombs fell the entire area became involved.
Table 1.—Recorded Attack Data
Mission number Date of attack Type of target Aircratc Type of bombing Altitude Cloud cover Bomb load
Type Number air- borne Number bombing Type Fuzing Dispatched released
Num- ber | Tons Num- ber Tons
? 7 May 1945 U rban _ B-29. ? 11 ? 9 1 looo G P. 2OOO G.P. Variable max. f delay 126 hours. 9 ? 36 56 18 56
58th Wing 20th A.F. No. 316 5-6 Aug. 1945 Urban.. B-29. 1 66 64 13 visual, 48 radar, 3 ? 12.200 to 12,800 0/10 to 5/10 500 M69 I.B. Open at 5000 feet. ? 9 1960 490
1 1 I 1 1 1 1 i 500 T4E4 frag, clus- ter. Open at 3000 feet below air- craft. •> 48 12
1 '500 M60 G.P. VT nose non- delay tail. 9 32 8
12
That the flimsy construction caused the build-
ings to burn readily and with great intensity,
for a short time was indicated by the increase
in wind velocity from zero to 30 miles per hour.
Melted glass and warped and twisted steel gave
evidence of a quick, hot fire. Police reported
that, except for isolated spots, the entire area
was consumed in five hours and most of the
residential buildings were completely burned in
a much shorter time. No “fire storm” condi-
tion occurred.
3. Casualties. An air-raid alarm was
sounded at 2020 hours, 5 August 1945, and most
of the people fled to the hills, because they had
little faith in the inadequate air-raid shelters
provided for them. After waiting several hours
during which nothing happened, they returned
to town. The attack at 0005 hours, 6 August
1945, came without warning because of failure
of the warning system; and many persons were
trapped and burned. According to police rec-
ords, 484 persons were killed, and 150 were
injured sufficiently to require hospitalization;
430 were burned to death and 54 were killed by
fragments; most of the injuries were in the
nature of burns.
4. Fire defense. Little or no effort was
made to combat the fire. The fire-defense or-
ganization included 300 volunteer firemen and
a detachment of the city police. Since the only
fire truck had been destroyed in a previous at-
tack, the majority of the men was organized
into bucket brigades. Even if the fire truck
had been in operation, it would have had no
effect on the results of the attack, since fires
were started in hundreds of places in the city
at about the same time. The fire was so wide-
spread that the 70 men who reported for duty
directed most of their efforts to saving personal
belongings or to escaping the area.
VII. Analysis of Damage
1. The M69 incendiary bomb was extremely
effective against this target in the concentra-
tion obtained. The load carried would have
provided a concentration of 500 tons per square
mile, if all the bombs had struck within the
city. It is estimated, however, that the bombs
were dispersed over an area roughly twice this
size. In the Kurashiki Cotton Mills area, on
the northwestern edge of the city, the concen-
tration was estimated at 200 tons per square
mile. But dispersion of bombs is as important
as density, and there must be a sufficient num-
ber to cause a conflagration over an area large
enough to discourage fire fighting. Where sin-
gle bombs fell on isolated buildings, the resi-
dents were able to extinguish the fire before it
gained headway. The only unexploded M69
bombs found by the team were 20 of some 1,500
which were estimated by the Japanese to have
dropped on the Kurashiki Cotton Mills. These
bombs had been placed in a concrete water tank
by plant personnel. If there were malfunc-
tioned incendiaries in the city, most of them
were probably burned in the fire.
2. Twenty-pound fragmentation bombs and
500-pound general-purpose bombs with air-
burst fuzes were used in this attack for anti-
personnel effect and to discourage fire fighting.
It was not possible to appraise the damage
caused by these bombs because evidence there-
of had been subsequently obliterated by the
fire. Questioning of residents and police indi-
cated that these bombs were treated lightly or
ignored by the people in their efforts to extin-
guish fires or save personal belongings, possibly
because they were apparently unaware that
these types of bombs were being used. The
police said that many of them fell outside the
city in the direction of the hills, and most of
the casualties occurred when the escaping peo-
ple ran into this area of burst. They caused
no damage to underground utilities, probably
because none of the bombs had delay fuzing and
consequently did not penetrate the ground. It
is believed that this was a result of the air-burst
fuze which should have caused the bombs to
function at a height of 10 to 40 feet above the
ground. Since no 500-pound bomb craters nor
unexploded bombs were found, it is assumed
that there were probably no malfunctions of
this fuze. It is further believed that neither
the fragmentation nor the general-purpose
bomb contributed to the effectiveness of the
attack.
3. Approximately 85 percent of the residen-
tial area was destroyed by this attack, leaving
about 47,000 persons homeless. This displace-
ment of workers had little effect on production
in the remaining undamaged plants because the
13
people were able to live in the numerous near-
by villages and commute to Imabari.
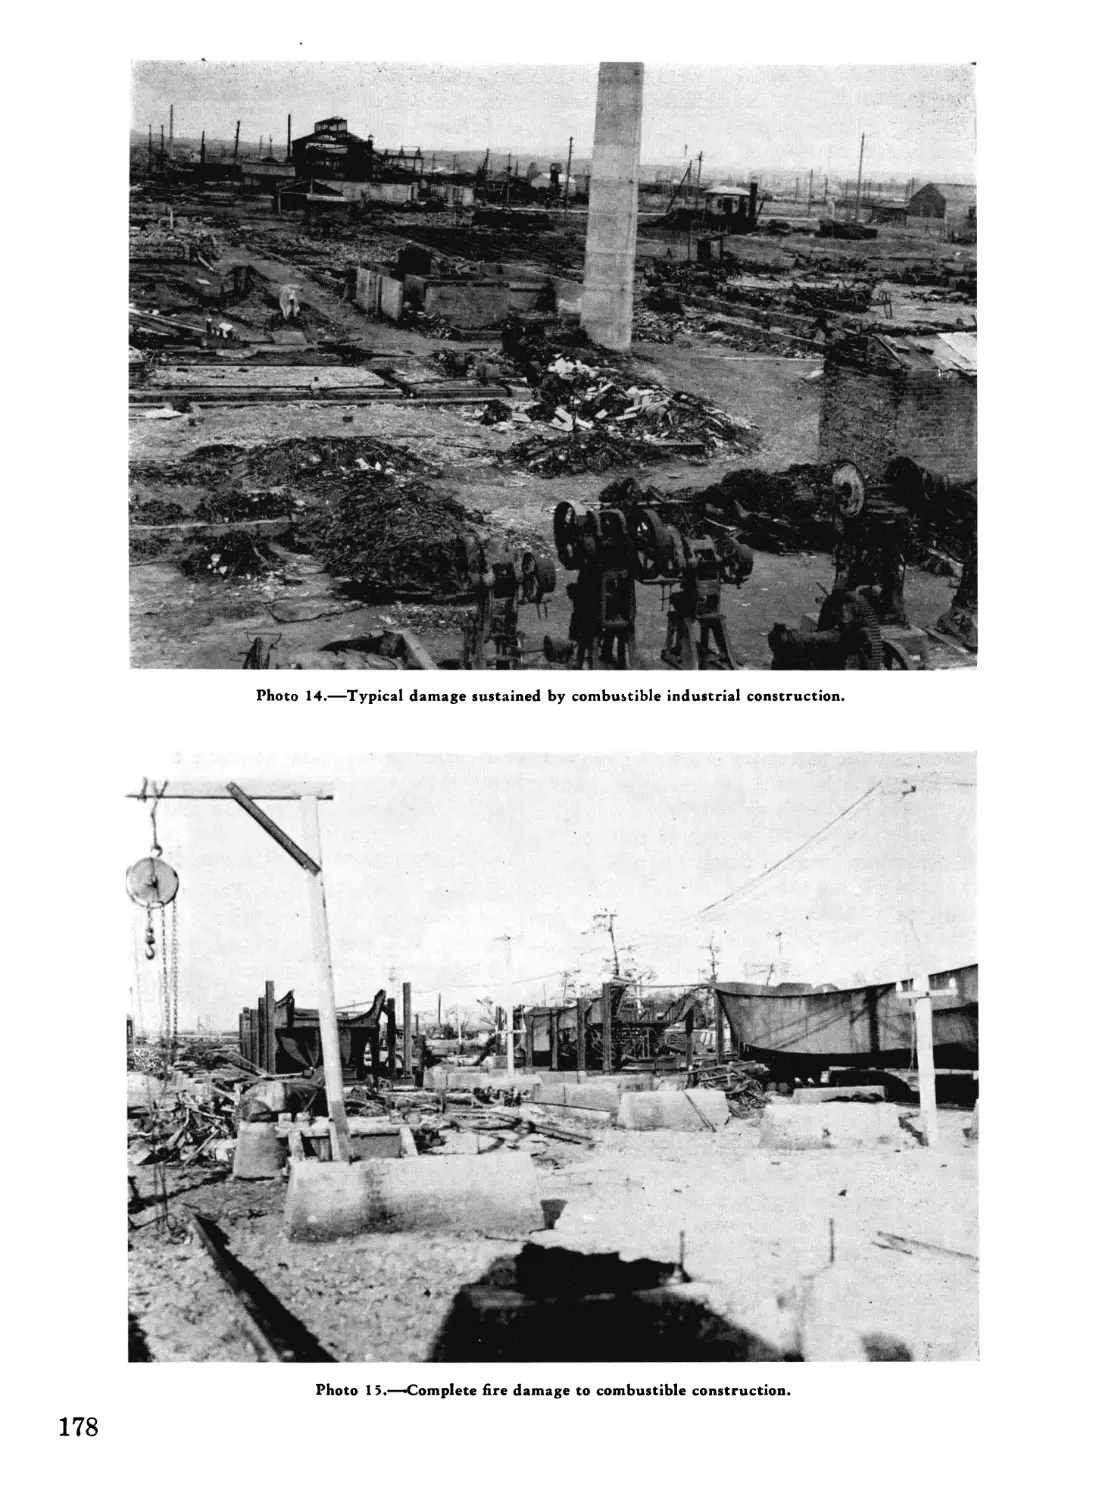
4. Of the 40 plants in the area, 27 were dam-
aged to such an extent that production ceased.
A typical plant (Photo 15) was a combustible
building containing a moderate amount of com-
bustible material. The M69 incendiary easily
penetrated the roofs which were of corrugated
asbestos cement on unprotected steel or wood
trusses, and, where the concentration of bombs
was sufficient to defeat the efforts of the fire
fighters, the factory invariably suffered heavy
damage. Combustible roofs were burned and
asbestos-cement roofs were shattered by the
heat, so that weather further damaged machin-
ery in the buildings, most of it beyond repair
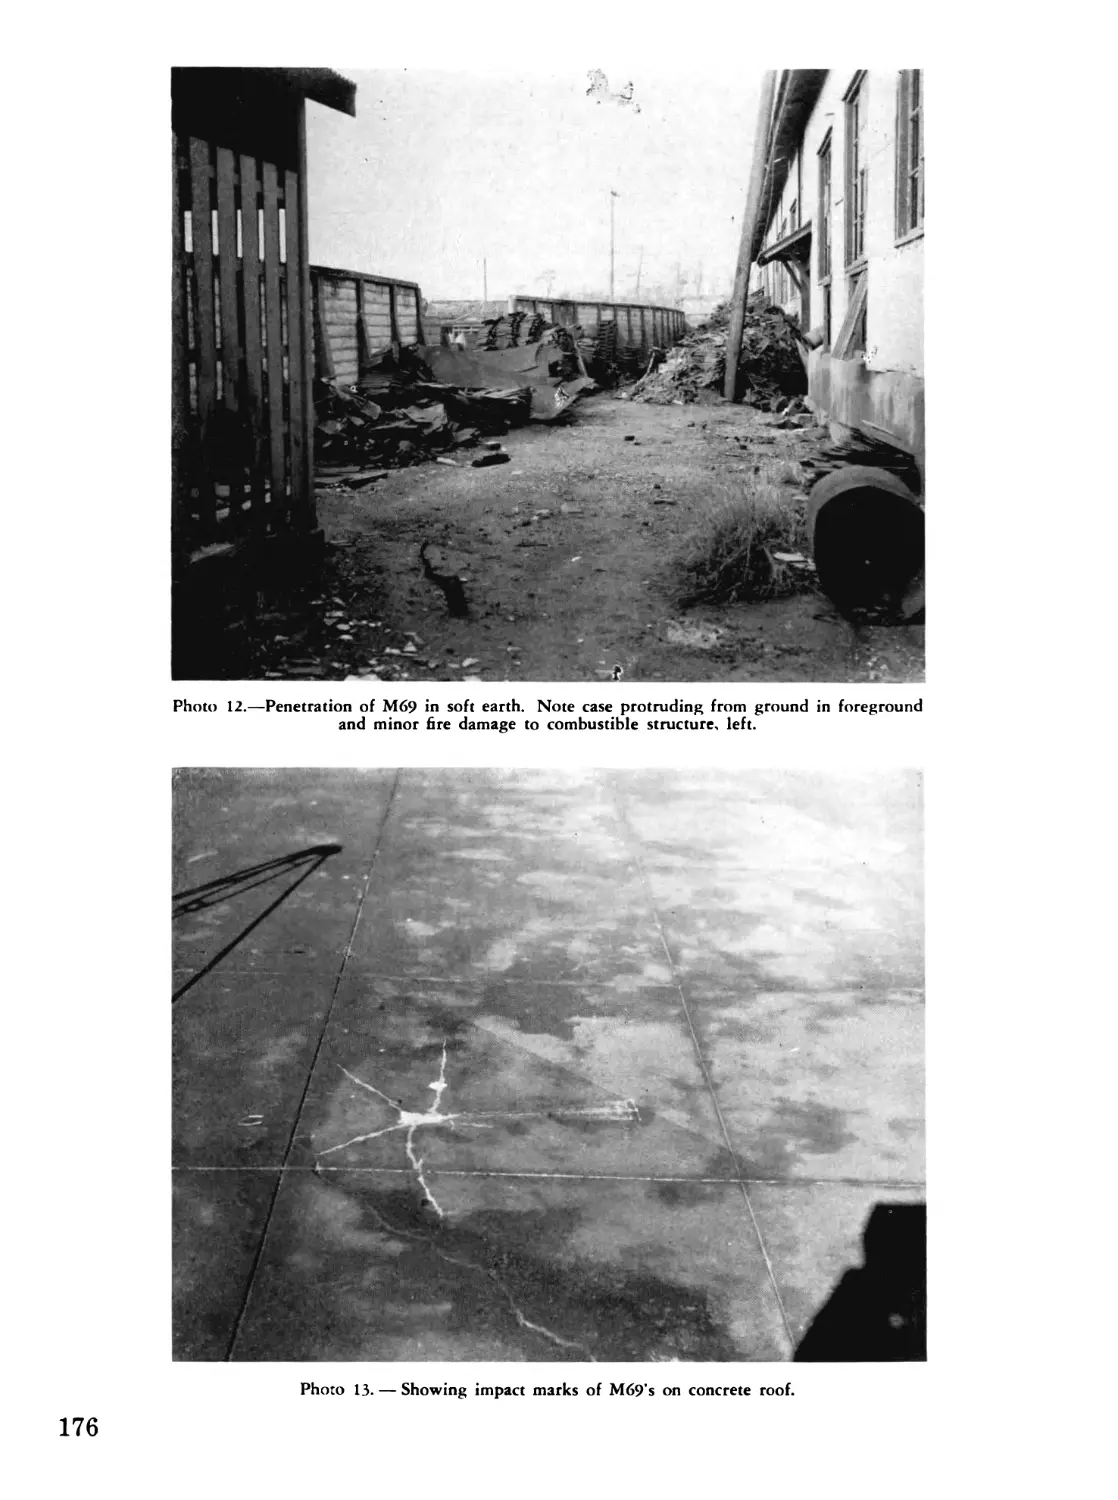
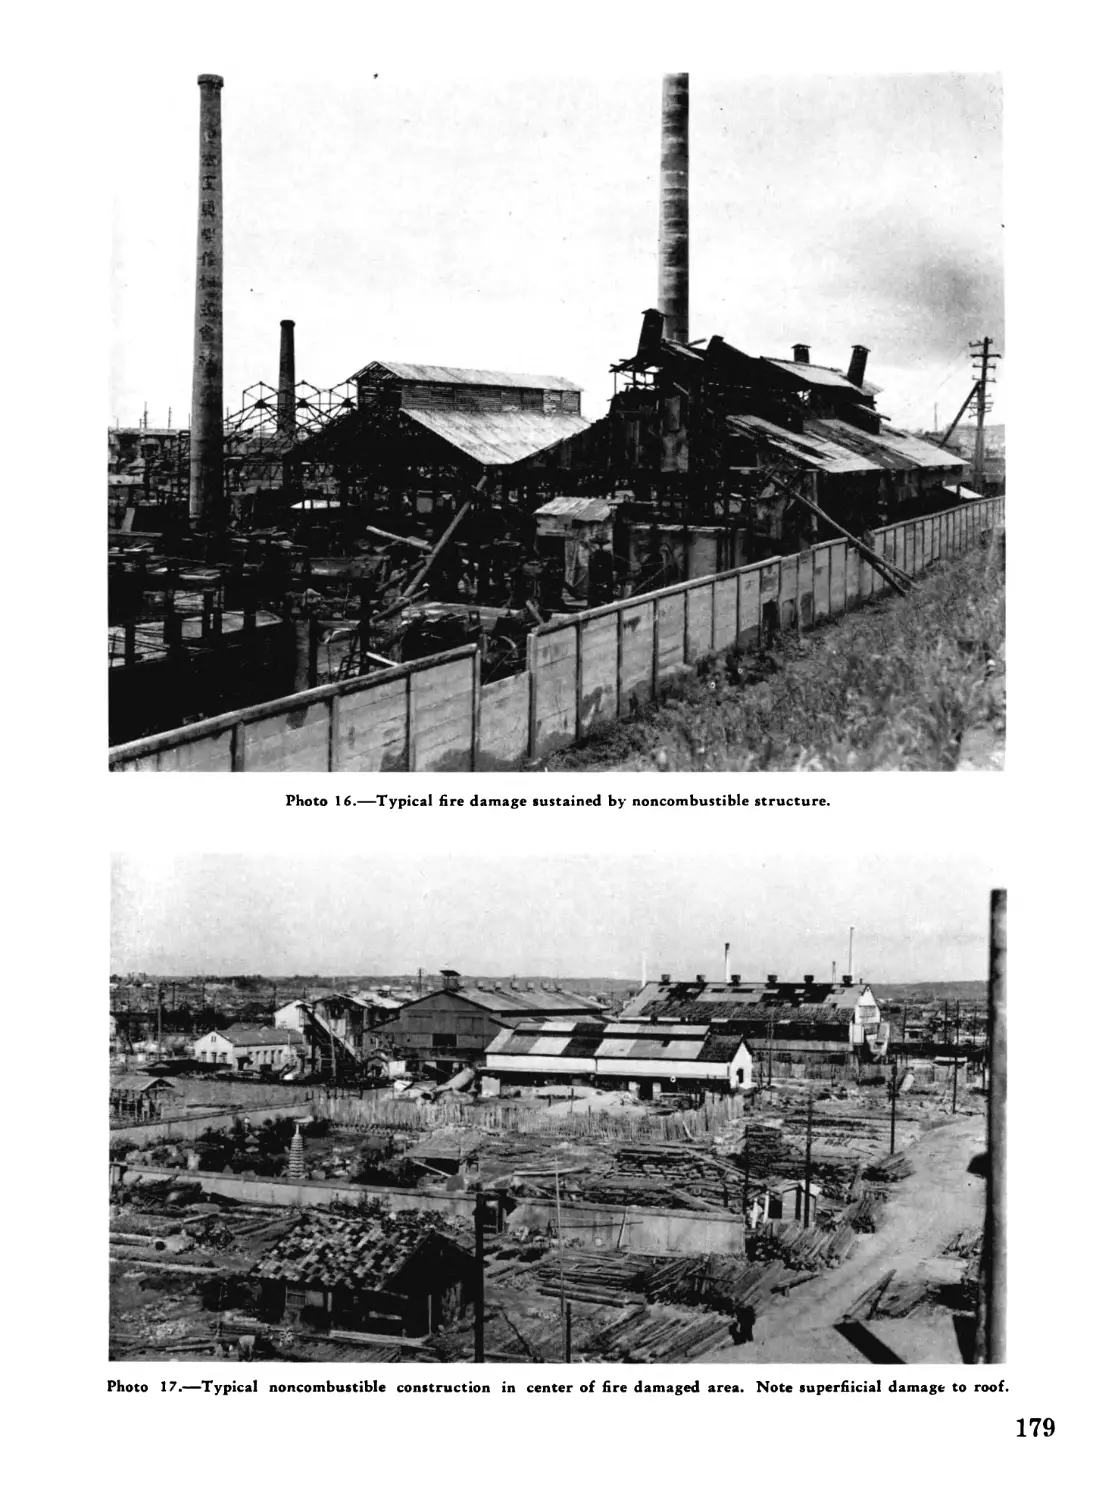
(Photos 9,11, and 12). There were many non-
combustible-type buildings used to house small
iron foundries, machine shops, and cotton mills.
Where there was only a small amount of com-
combustible material in these plants, there was
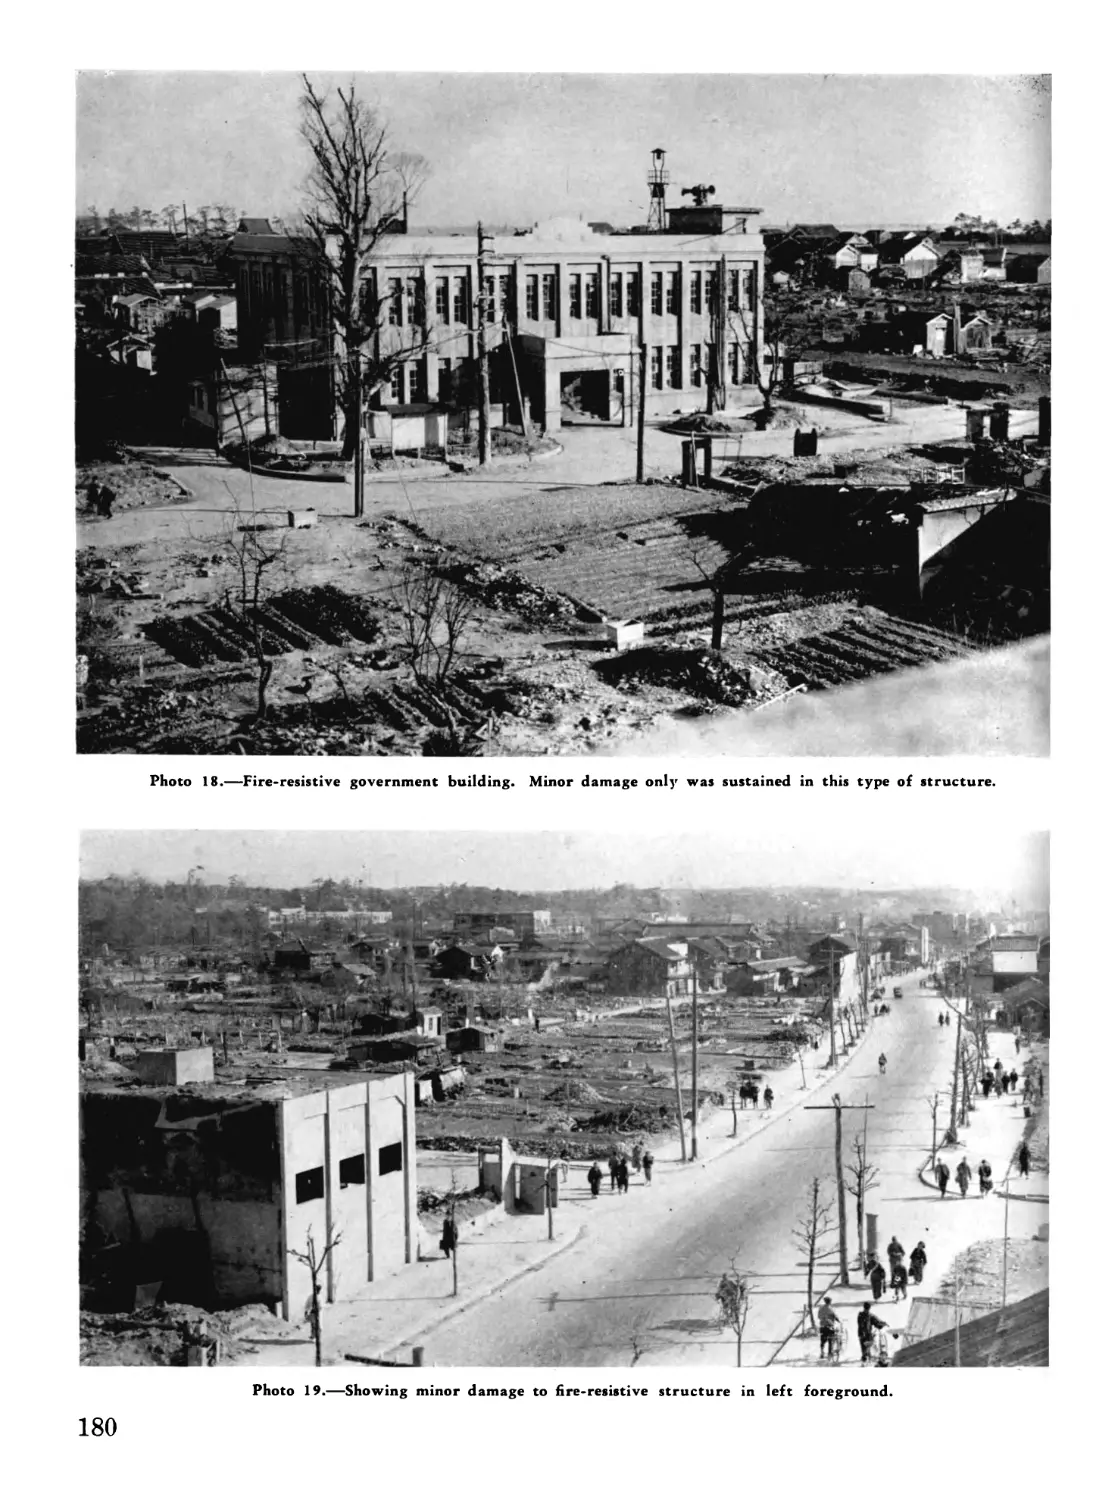
little structural damage (Photos 8 and 9). The
only fire-resistive building in the burned area
of Imabari was the post office. This building
was subjected to exposure fires but was not
structurally damaged, although the contents
were burned. Some of the factories were sur-
rounded by high, solid-brick walls with an in-
tervening space of about 5 to 15 feet. These
walls were sufficient in several cases to prevent
combustible plant buildings from being ignited
by exposure fires, probably by directing the
flames upward, since there was little wind.
5. In the Kurashiki Cotton Mills, Ltd., a
large textile plant partially converted to the
manufacture of 13-millimeter machine-gun bul-
lets, a standard American sprinkler system was
in service in about half the building area. The
buildings in this plant were one story high, and
had masonry walls and wood or unprotected
steel roof trusses covered with corrugated as-
bestos cement. The fire areas were segregated
by good metal-clad, automatic fire doors which
functioned properly. According to the Japa-
nese about 1,500 bombs struck the plant area
(700 by 900 feet) setting fire to the buildings
and contents. This provided a concentration
of about 0.32 ton per acre or 200 tons per
square mile. Employees attempted to combat
the fires, but soon gave up and fled to safety.
The sprinkler system operated, but the drain
14
on the water supply was so severe because of
the large number of open heads that the system
became useless. Tokyo Cotion Mills, Ltd., a
large, textile mill located at the mouth of the
river bordering the city on the south, had been
converted to the manufacture of ailerons. A
few bombs fell on the frame hospital at the
north side of the plant and destroyed it. The
hospital was not close enough to the other build-
ings to cause an exposure fire and no other part
of the plant was damaged. The Ube Cotton
Mills, Ltd., and another plant of the Tokyo Cot-
ton Mills were located in the central section
of the city, but so few bombs struck the plants
that the fires were easily extinguished by the
fire fighters and little damage was done. This
indicates that the bomb concentration near the
aiming point was too low.
6. There were no man-made firebreaks in the
city and the streets were so narrow that they
were of little or no value for that purpose.
In general, the fire burned itself out against
open areas, but in some sections it burned itself
out in the center of blocks at narrow alleyways.
This circumstance may be explained by the al-
most complete lack of wind necessary to spread
the fire and by the fact that the wind which
started during the attack was caused by the
updraft of the fire and was in the direction of
the center of the area.
VIII. Recommendations and Conclusions
1. The bomb load carried against this target
was excessive considering the area of the tar-
get, and the accuracy of the attack. One-half
the load carried, or 250 tons, would probably
have been adequate, if the accuracy of the at-
tack had been sufficiently good within the city
area.
2. The bomb density on the target was not
uniform and better results would have been
obtained if such had not been the case.
3. The M69 incendiary was effective against
the typical Japanese residences of Imabari and
was also effective against the industrial plants
with roofs light enough for it to penetrate,
whether they were combustible or noncombus-
tible, provided that the noncombustible build-
ings had a moderately combustible occupancy,
and provided further that fires were started in
enough places in the plant to discourage the
plant fire fighters.
4. Japanese firemen in Imabari were neither
well disciplined nor sufficiently trained, and
the equipment was totally inadequate, in both
quality and number, to deal with the eventuali-
ties of an air attack with incendiaries. The
water system compared favorably with that of
other Japanese cities. The earth-covered, air-
raid shelters were useless.
5. The city was extremely vulnerable to in-
cendiary attack because of the high built-upness
and combustibility of the buildings and the
absence of fire breaks.
15
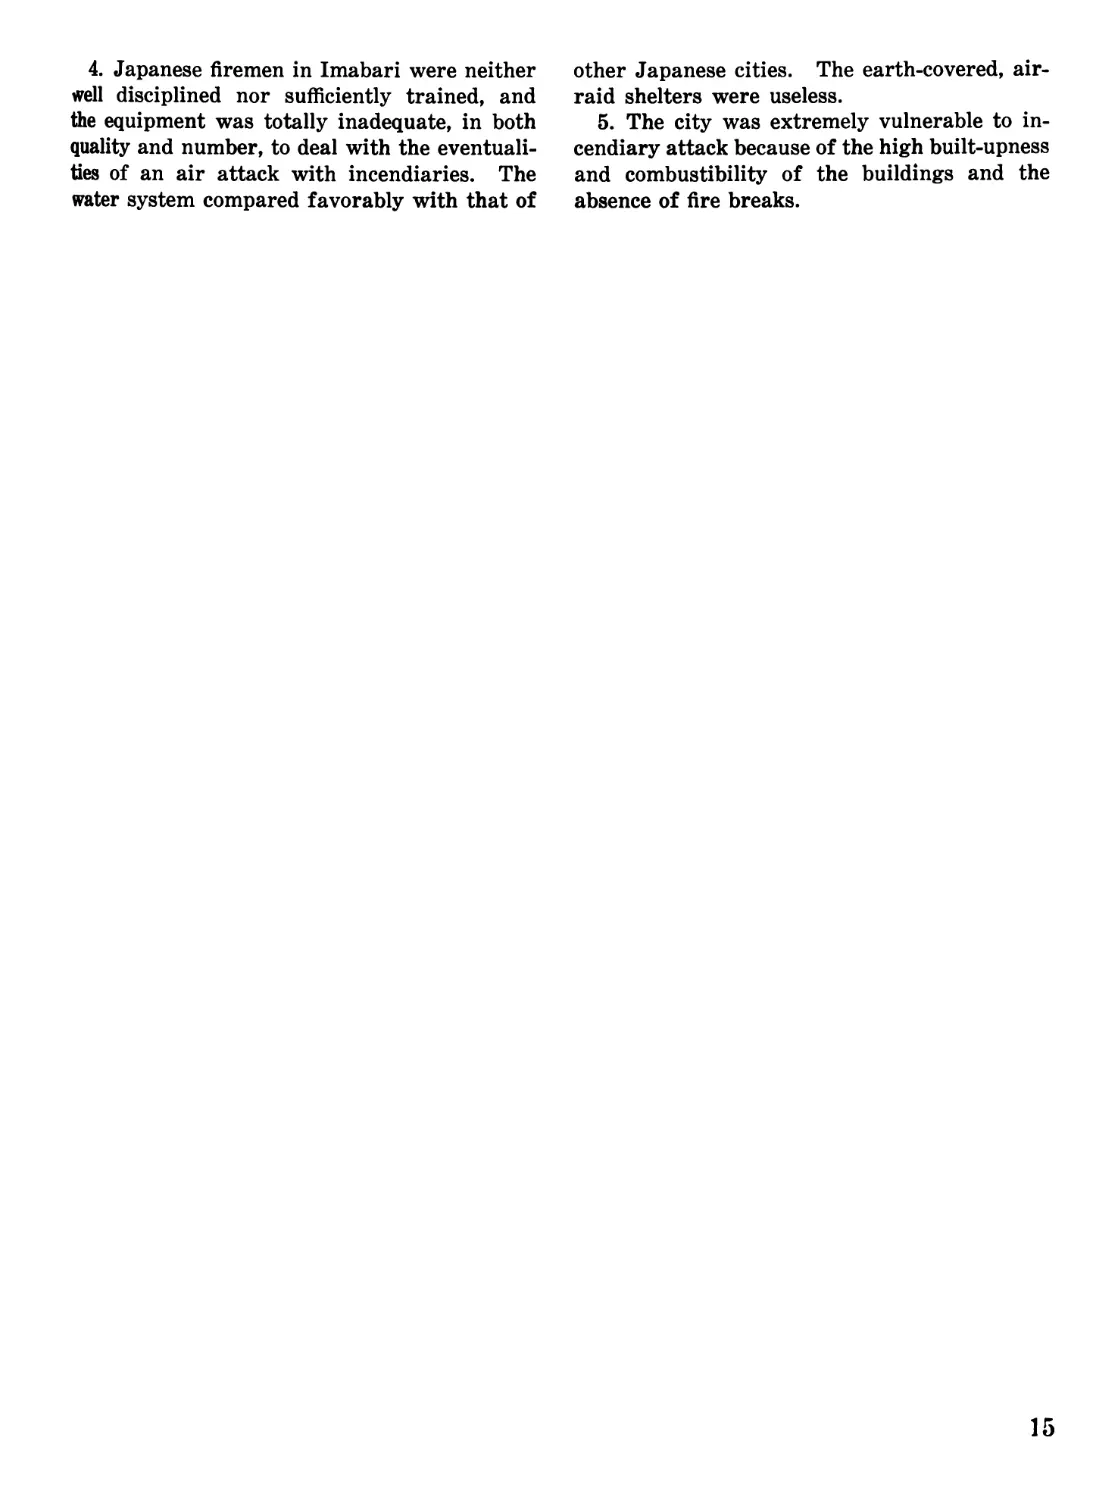
Photo 1.—Post-strike aerial view of Imabari. The light gray area is damaged by fire; the portion in the lower left comer
across the river from the city is undamaged.
16
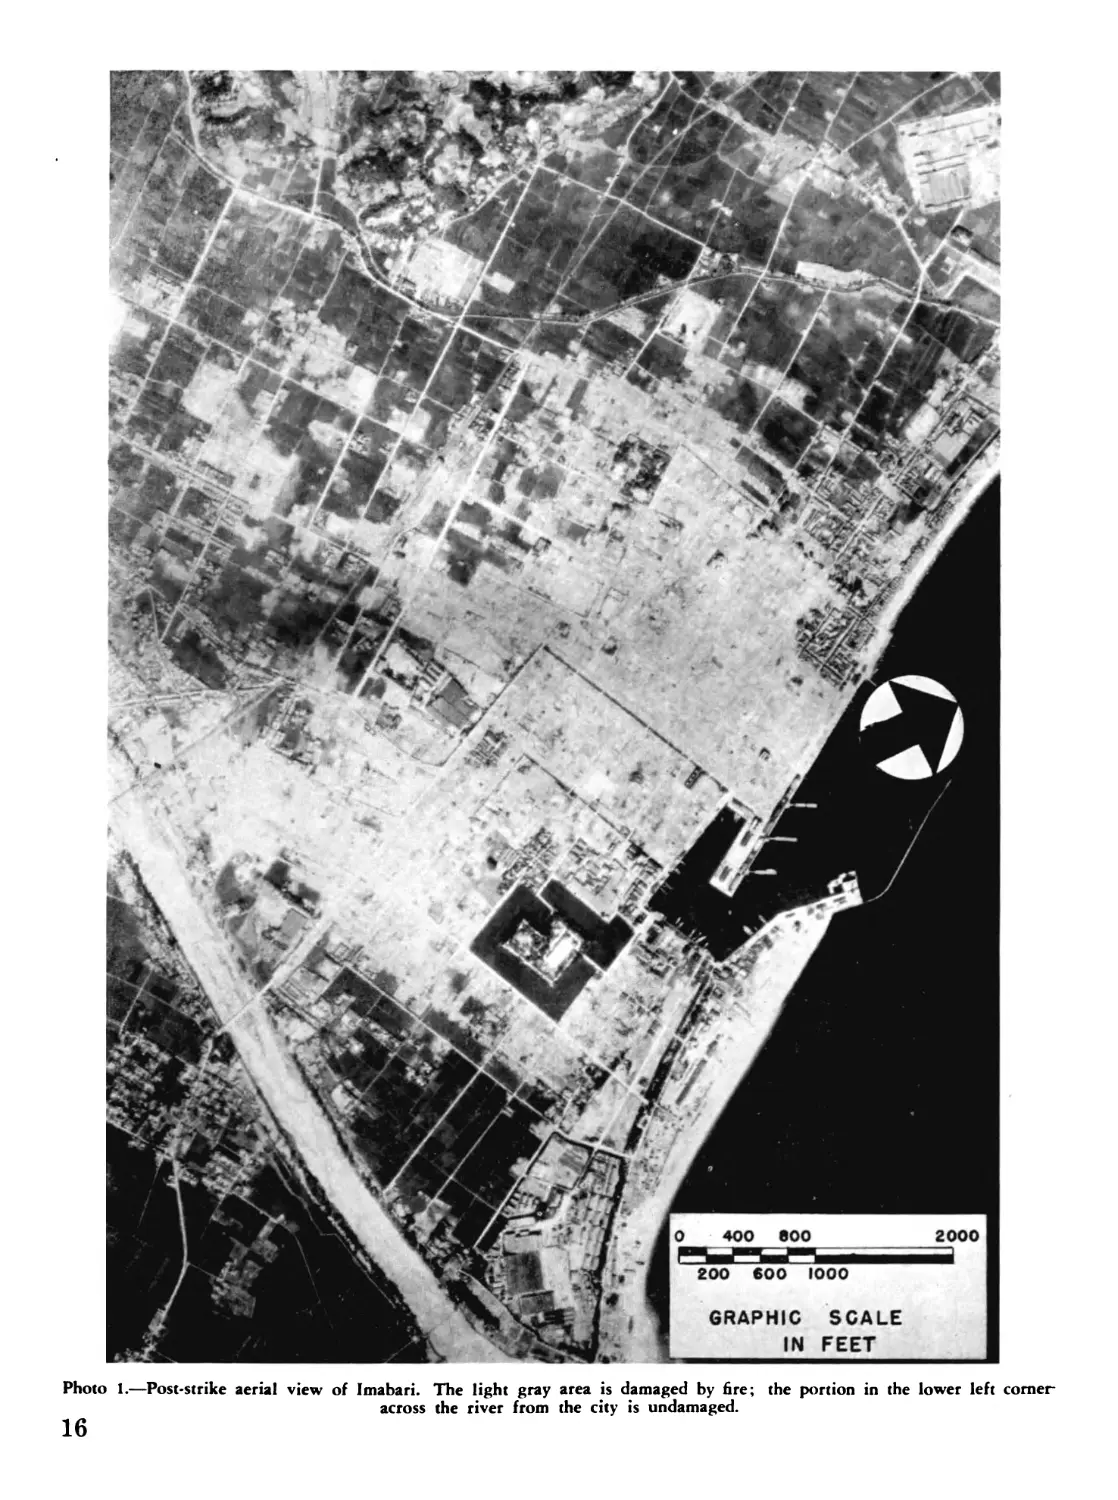
Photo 2. — Partly completed Japanese house showing a typical example of framing. Note the mortise-and-tenon joints.
Photo 3.—General view looking north from the moated shrine. The undamaged plant in the foreground was the ABE Cotton
Mill, Ltd.
17
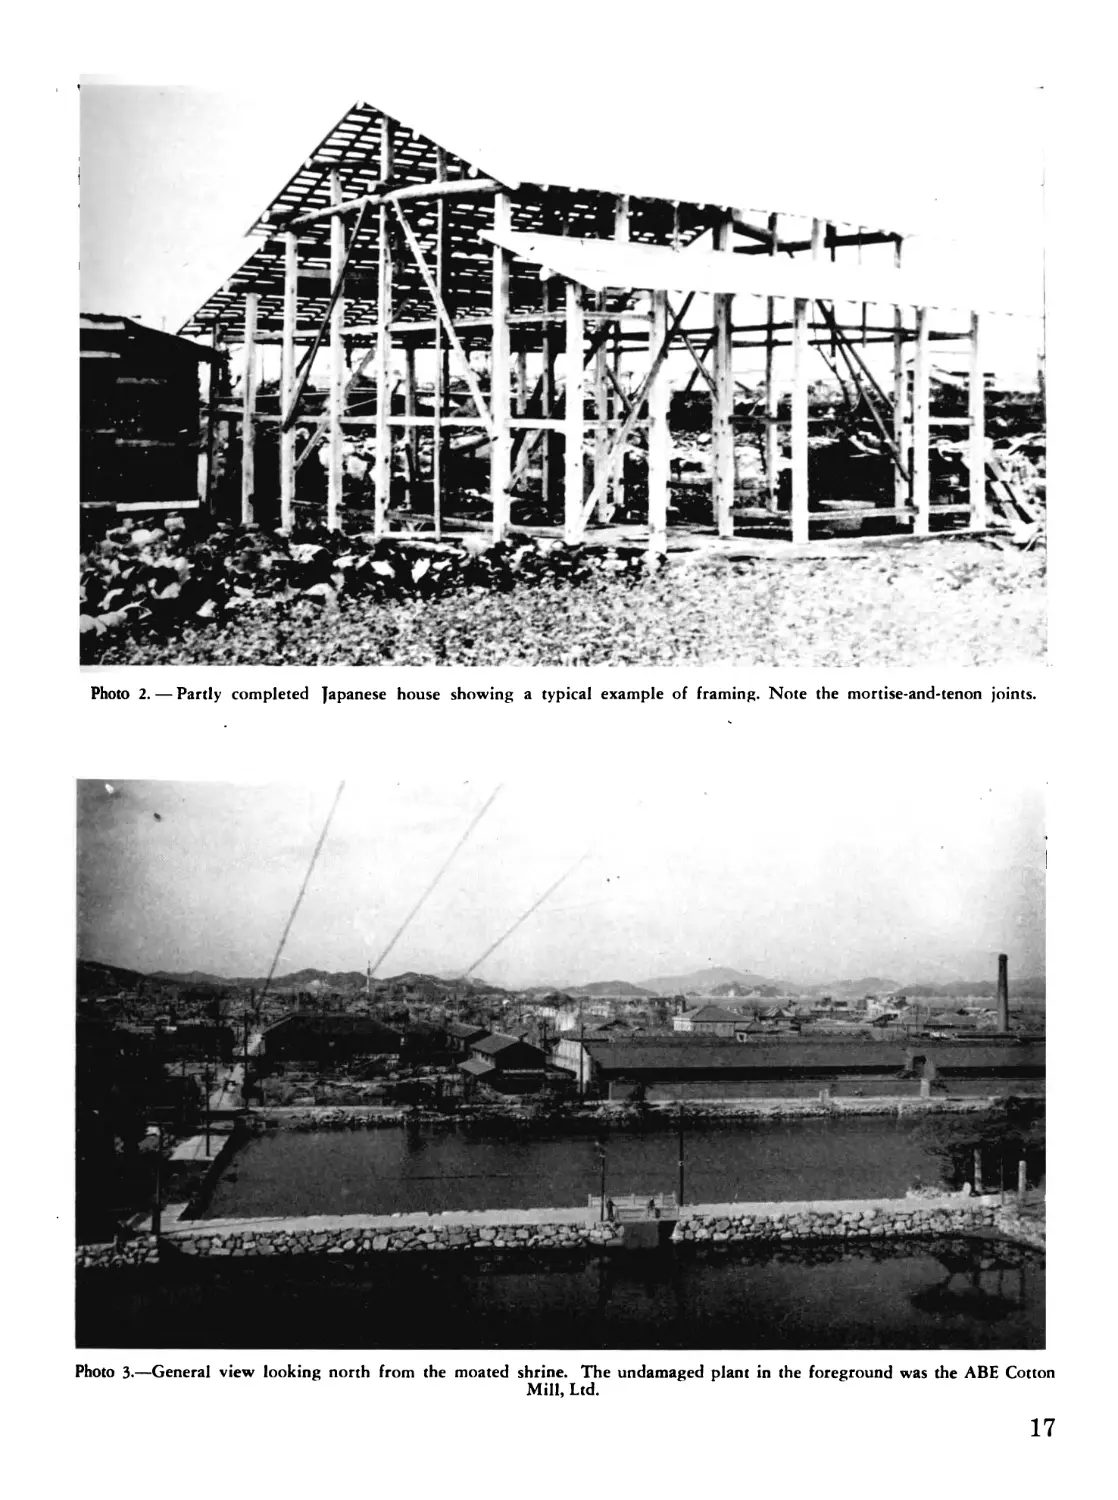
Photo 4.—General view looking NNW from the moated shrine. Note the undamaged dwellings in the foreground. No bombs
fell in this section.
Photo 5.—General view looking west from the moated shrine. Observe the burned dwellings on the left and the intact area
on the right.
18
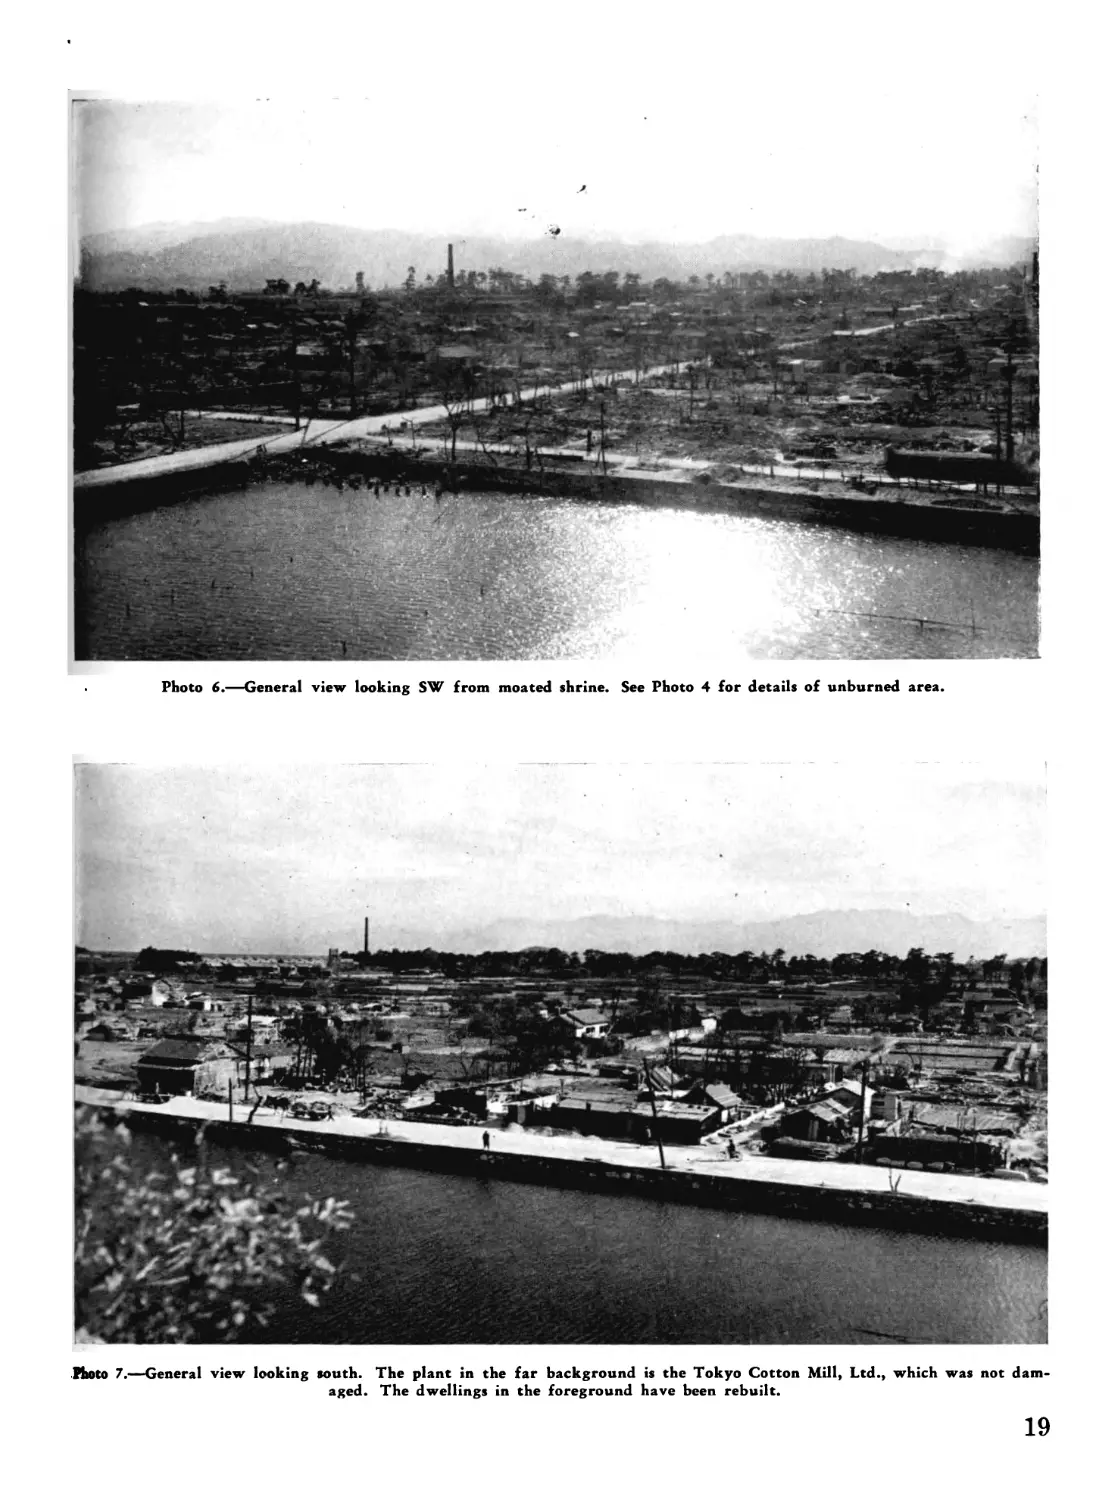
Photo 6.—General view looking SW from moated shrine. See Photo 4 for details of unburned area.
Photo 7.—General view looking south. The plant in the far background is the Tokyo Cotton Mill, Ltd., which was not dam-
aged. The dwellings in the foreground have been rebuilt.
19
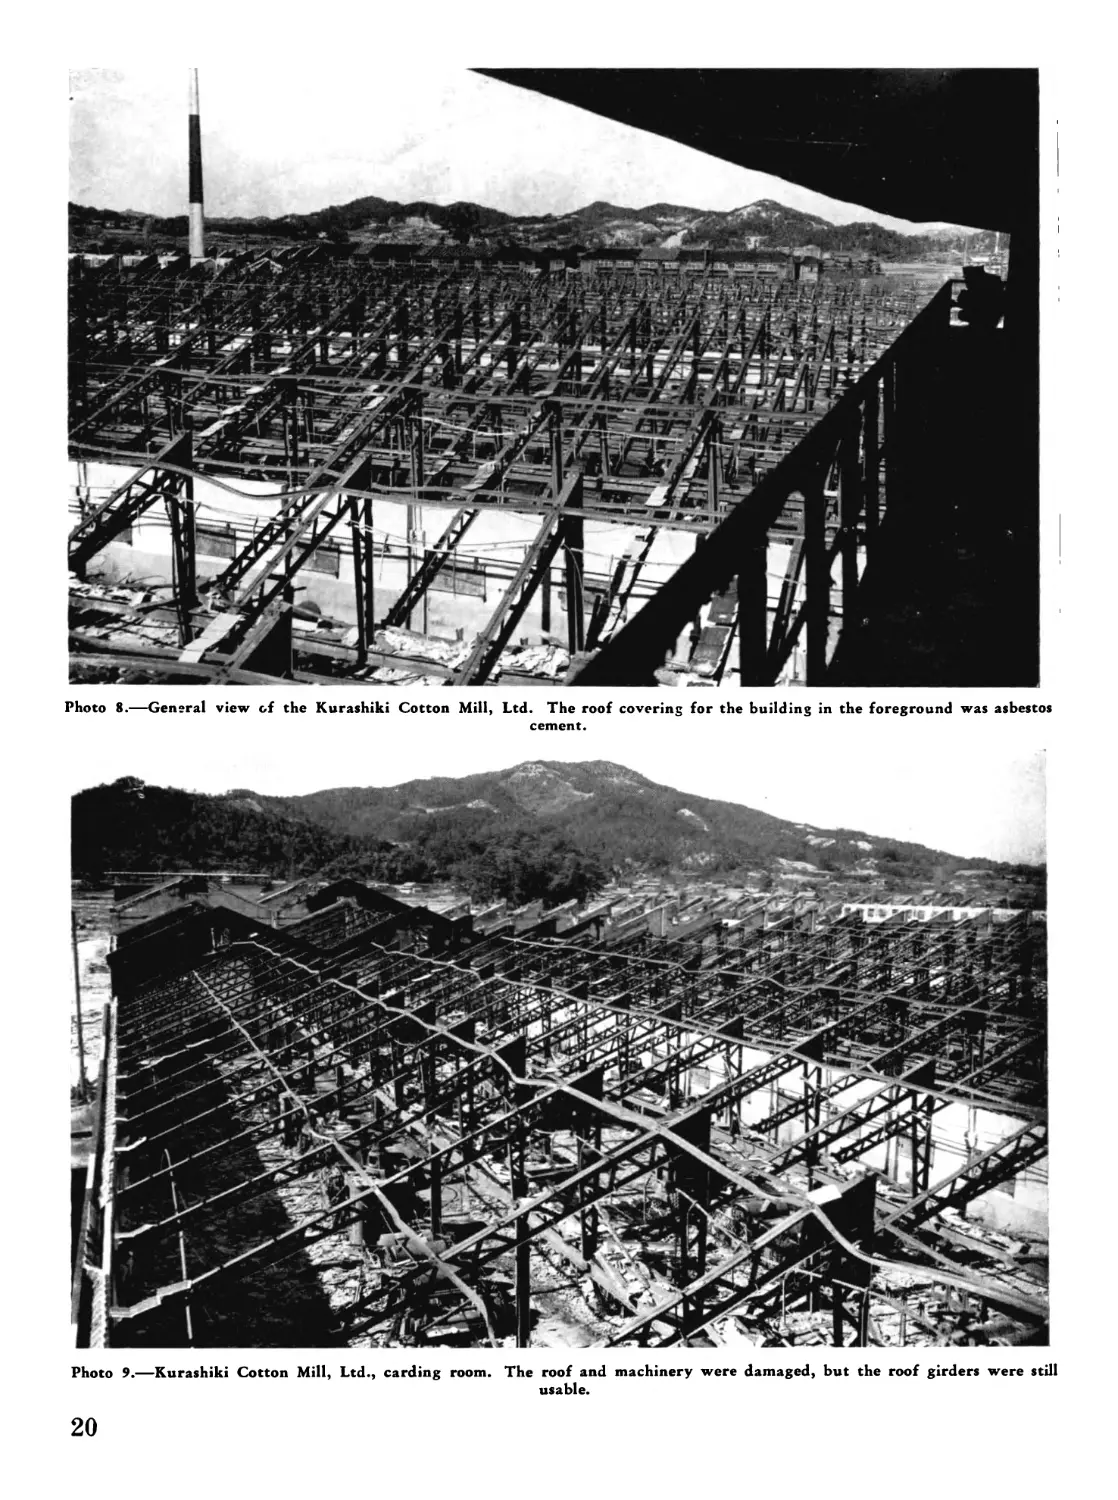
Photo 8.—General view of the Kurashiki Cotton Mill, Ltd. The roof covering for the building in the foreground was asbestos
cement.
Photo 9.—Kurashiki Cotton Mill, Ltd., carding room. The roof and machinery were damaged, but the roof girders were still
usable.
20
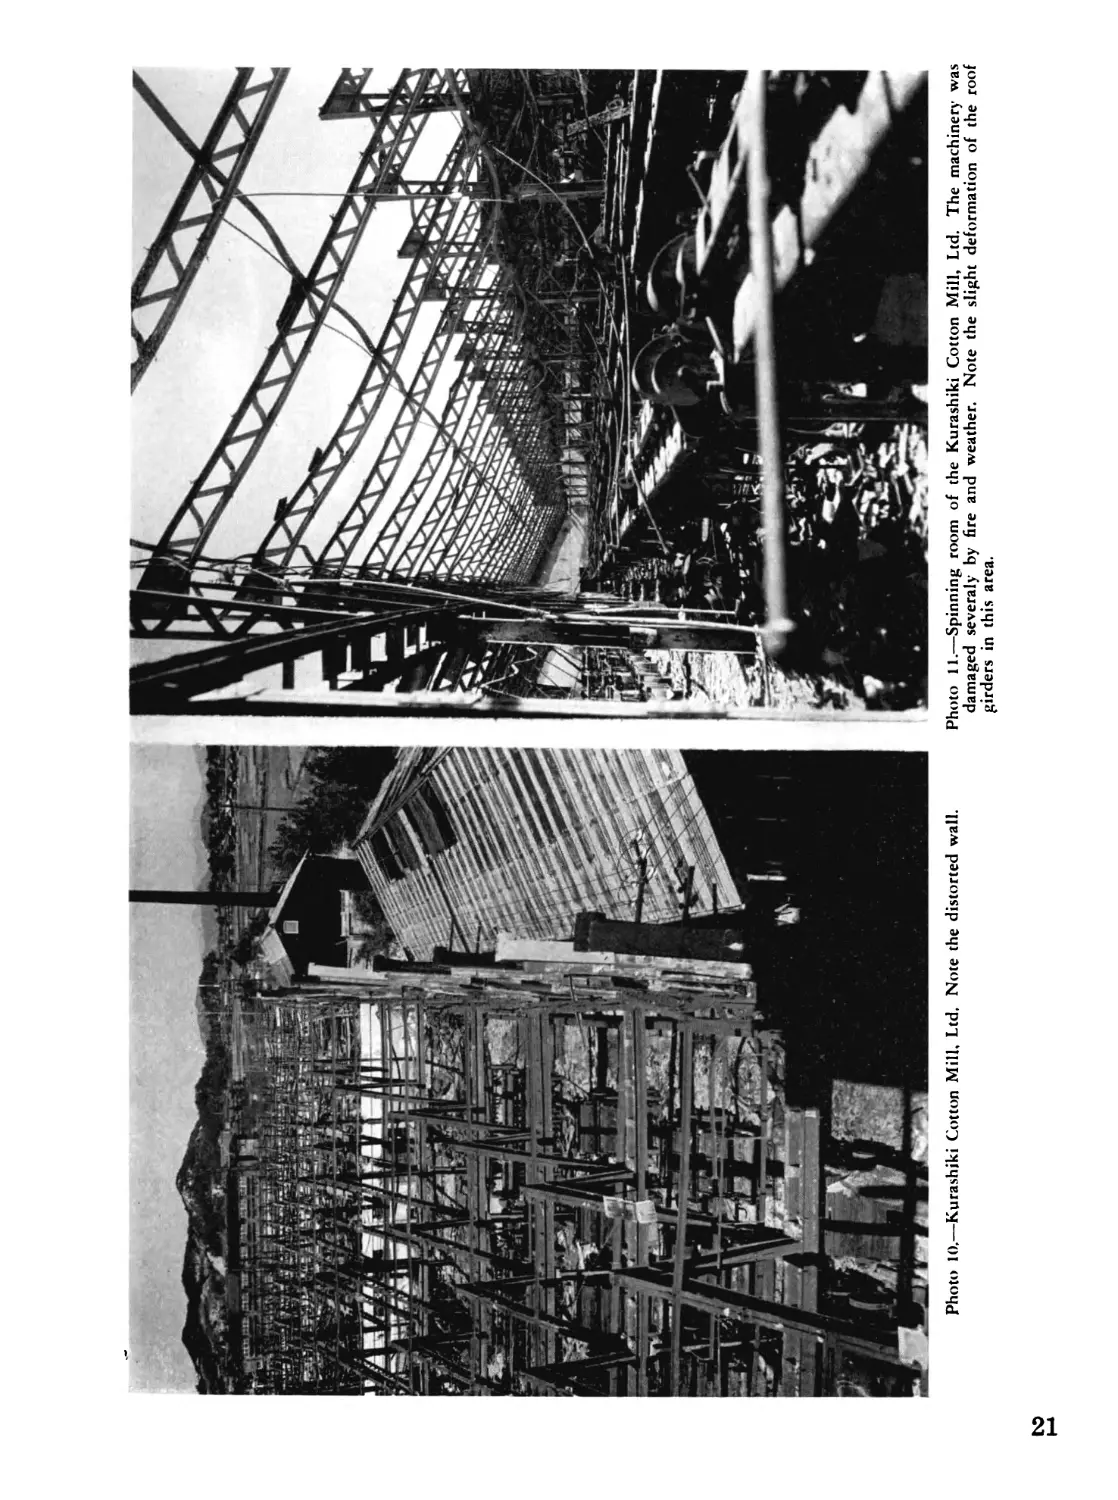
Photo 10,—Kurashiki Cotton Mill, Ltd, Note the distorted wall.
Photo 11.—Spinning room of the Kurashiki Cotton Mill, Ltd. The machinery was
damaged several у by fire and weather. Note the slight deformation of the roof
girders in this area.
Photo 12.—Kurashiki Cotton Mill, Ltd., area used in making 13*mm. machine gun bullets. The roof was asbestos cement
laid on wood saw-tooth roof trusses, supported by wooden columns. The machinery was severely damaged by fire and weather.
Photo 13.—Kurashiki Cotton Mill, Ltd., mill-type construction similar to that used in the building shown in Photo 12.
22
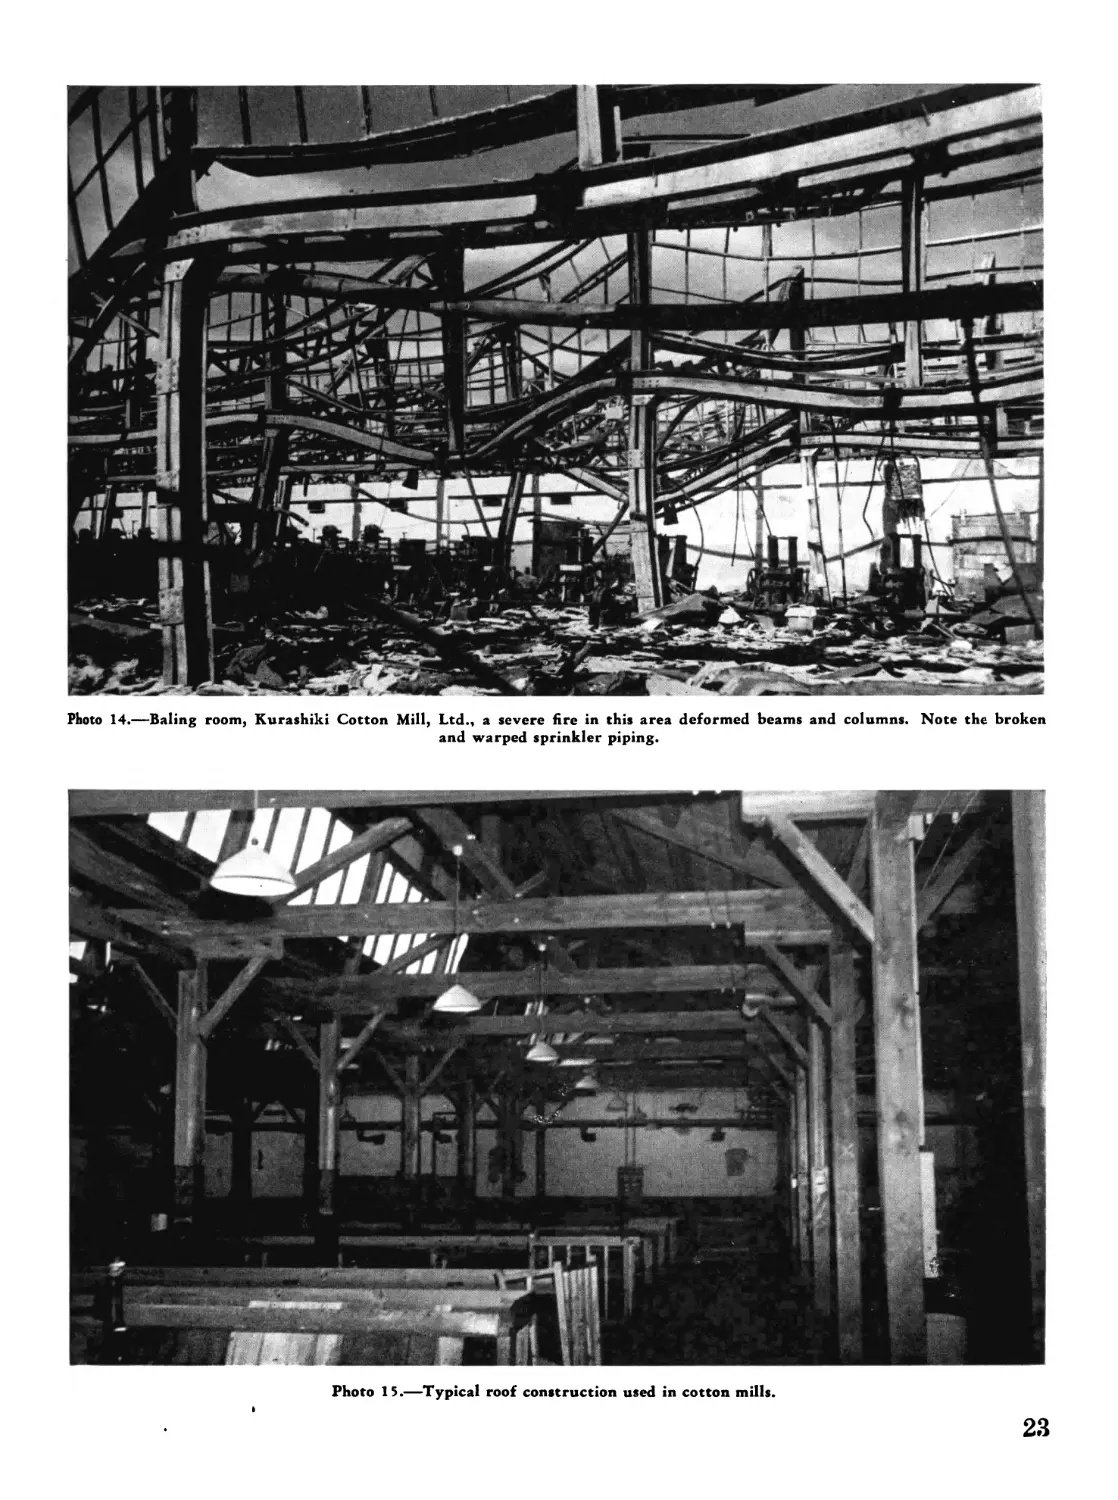
Photo 14.—Baling room, Kurashiki Cotton Mill, Ltd., a severe fire in this area deformed beams and columns. Note the broken
and warped sprinkler piping.
Photo 15.—Typical roof construction used in cotton mills.
23
Part 2
EFFECTS OF INCENDIARY BOMB ATTACK ON OITA, JAPAN
24
TABLE OF CONTENTS
Patjf*
I. Object cf Study..................................... 26
II. Summary............................................... 26
III. General Information................................... 26
IV. The Target............................................ 27
V. The Attacks........................................... 29
VI. The Fire.......................................... 30
VII. Analysis of Damage.................................... 31
VIII. Comments and Conclusions.............................. 37
Photographs 1-70, inclusive
Tables 1-5, inclusive
Figures 1 and 2
25
I. Object of Study
1. The city of Oita, Kyushu, Japan, was se-
lected for a study of the effectiveness of an M47
incendiary-bomb attack.
II. Summary
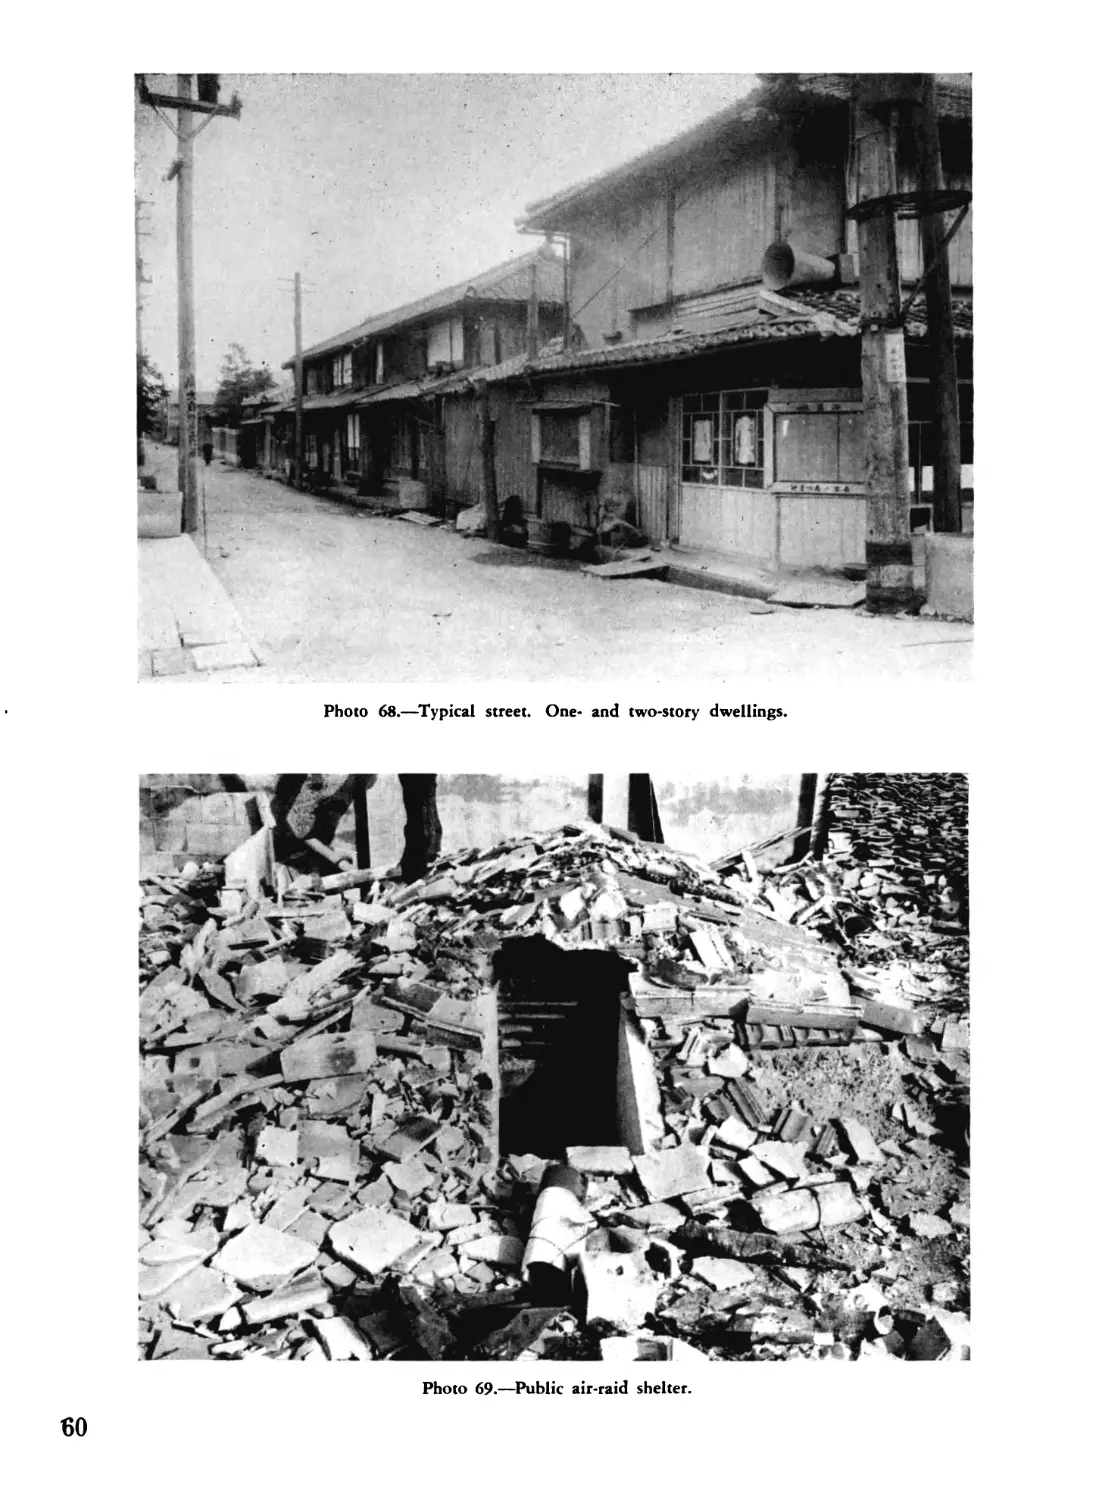
1. The greater part of the center of the city
was heavily built up with typical Japanese one-
and two-story wooden structures. A few mod-
ern buildings were of reinforced concrete and
a considerable number was imitation American
and European type with lath and plaster and
imitation stone finish, giving them a solid, im-
posing appearance. Practically every dwell-
ing had electric lighting, but only one percent
of the gas consumed in the city was used by
householders.
2. Although specific targets in Oita were
bombed with high explosives prior to the M47
attack of 16-17 July 1945, and a few M69 bombs
were dropped on 10 August 1945, this report
deals primarily with the attack of 16-17 July, in
which only M47 incendiary bombs were used.
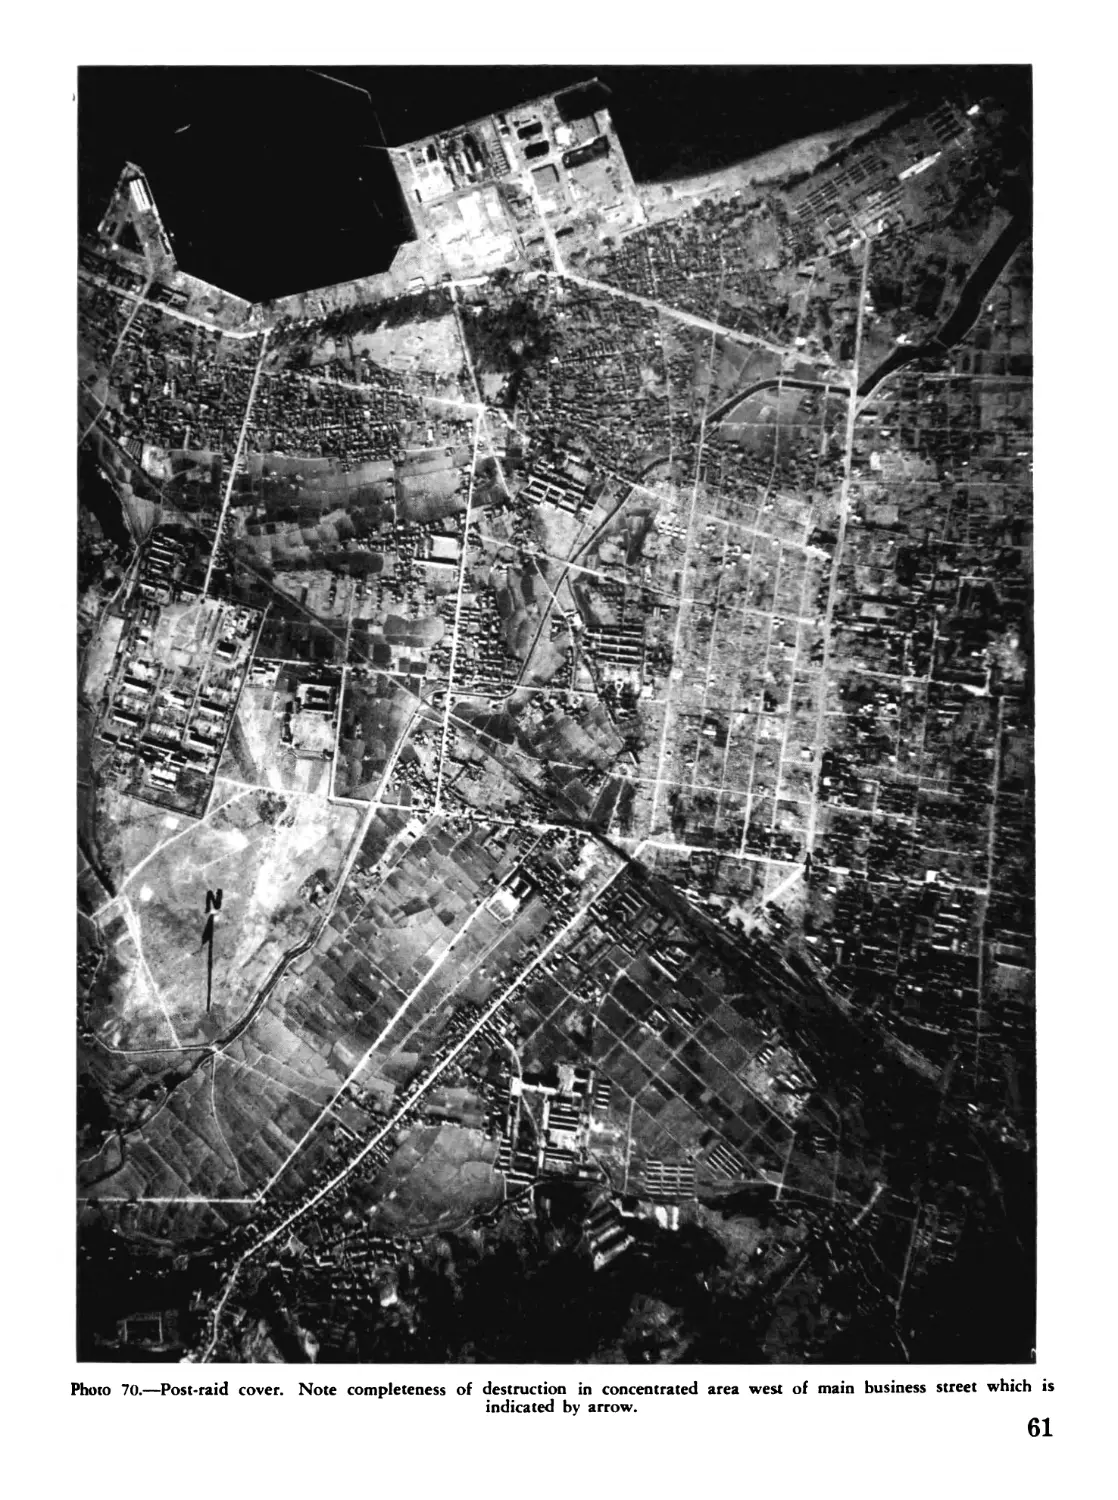
3. The densely built-up area was 0.308 square
miles, the sparsely built-up area 1.268 square
miles, totalling 1.576 square miles. The total
area of the city was 21.7 square miles, of which
7.21 percent was built up. The area destroyed
by fire was 0.42 square mile, representing 20.6
percent of the built-up area.
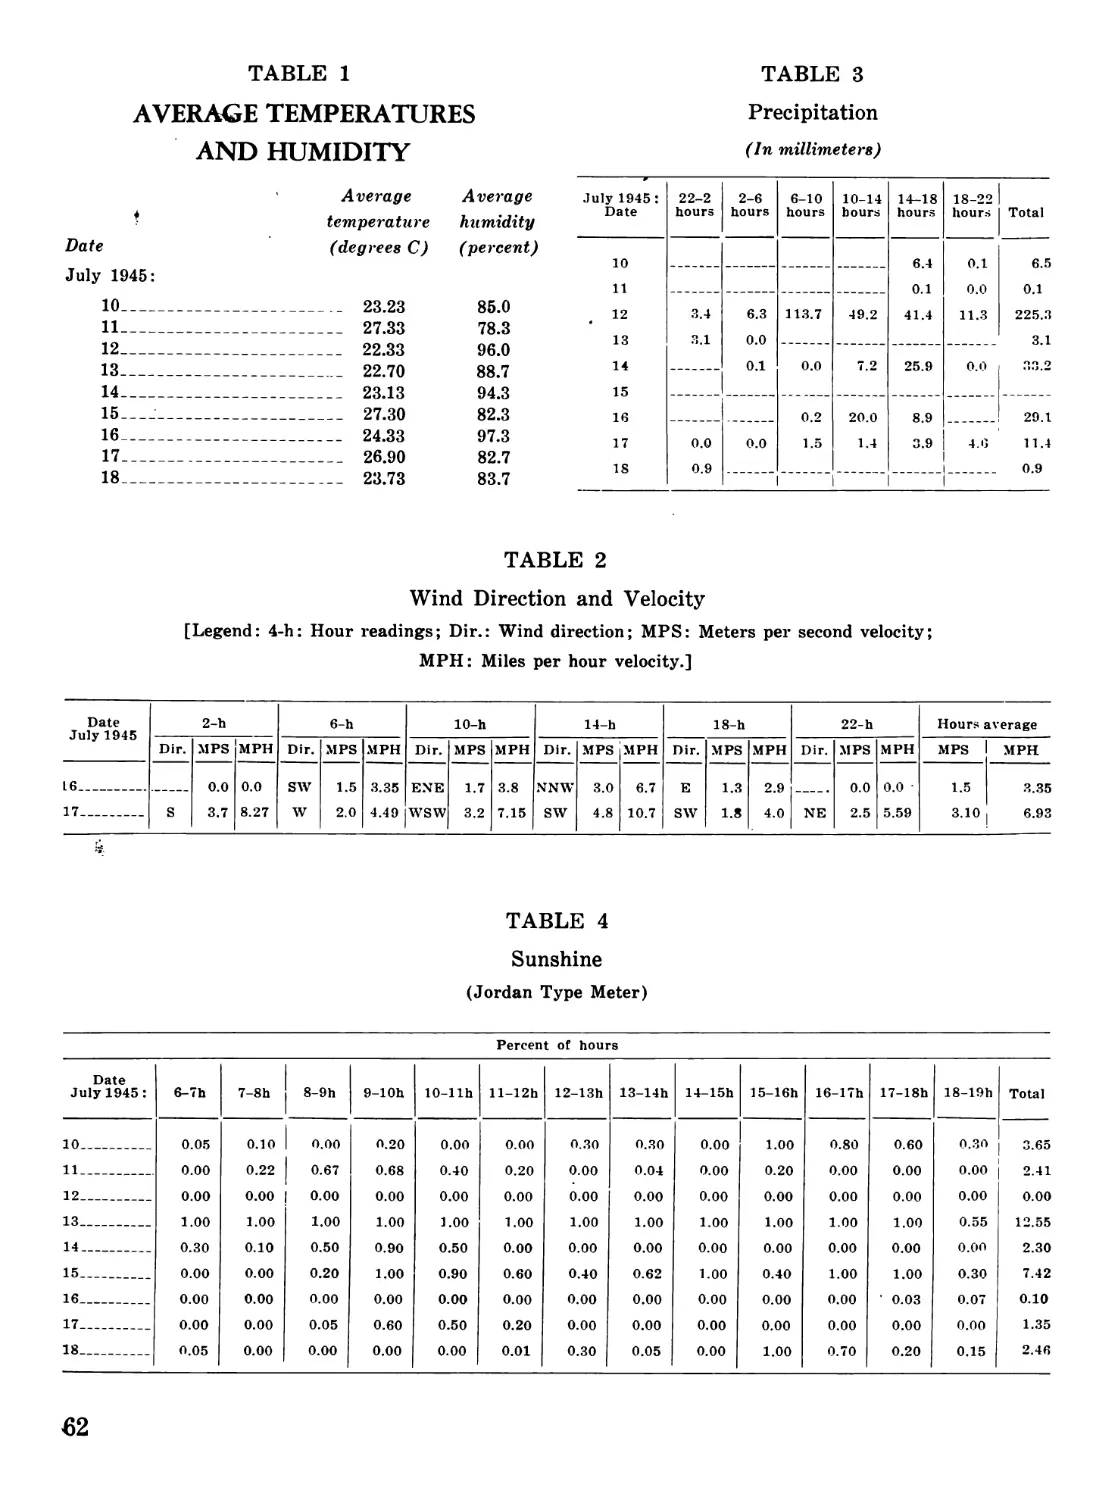
4. For a week prior to the attack there had
been considerable rainfall and high humidity.
An incendiary attack had been anticipated for
some days and, as a result, many women and
children were evacuated to the neighboring hills
or communities, which accounted somewhat for
the low loss of life and few serious injuries.
5. The official Japanese report indicated that
the attack began at 0010 and ended at 0135
hours, 17 July 1945. The city was attacked by
the 73d Wing of the Twentieth AF. The aim-
ing point was about 1,000 feet west of the
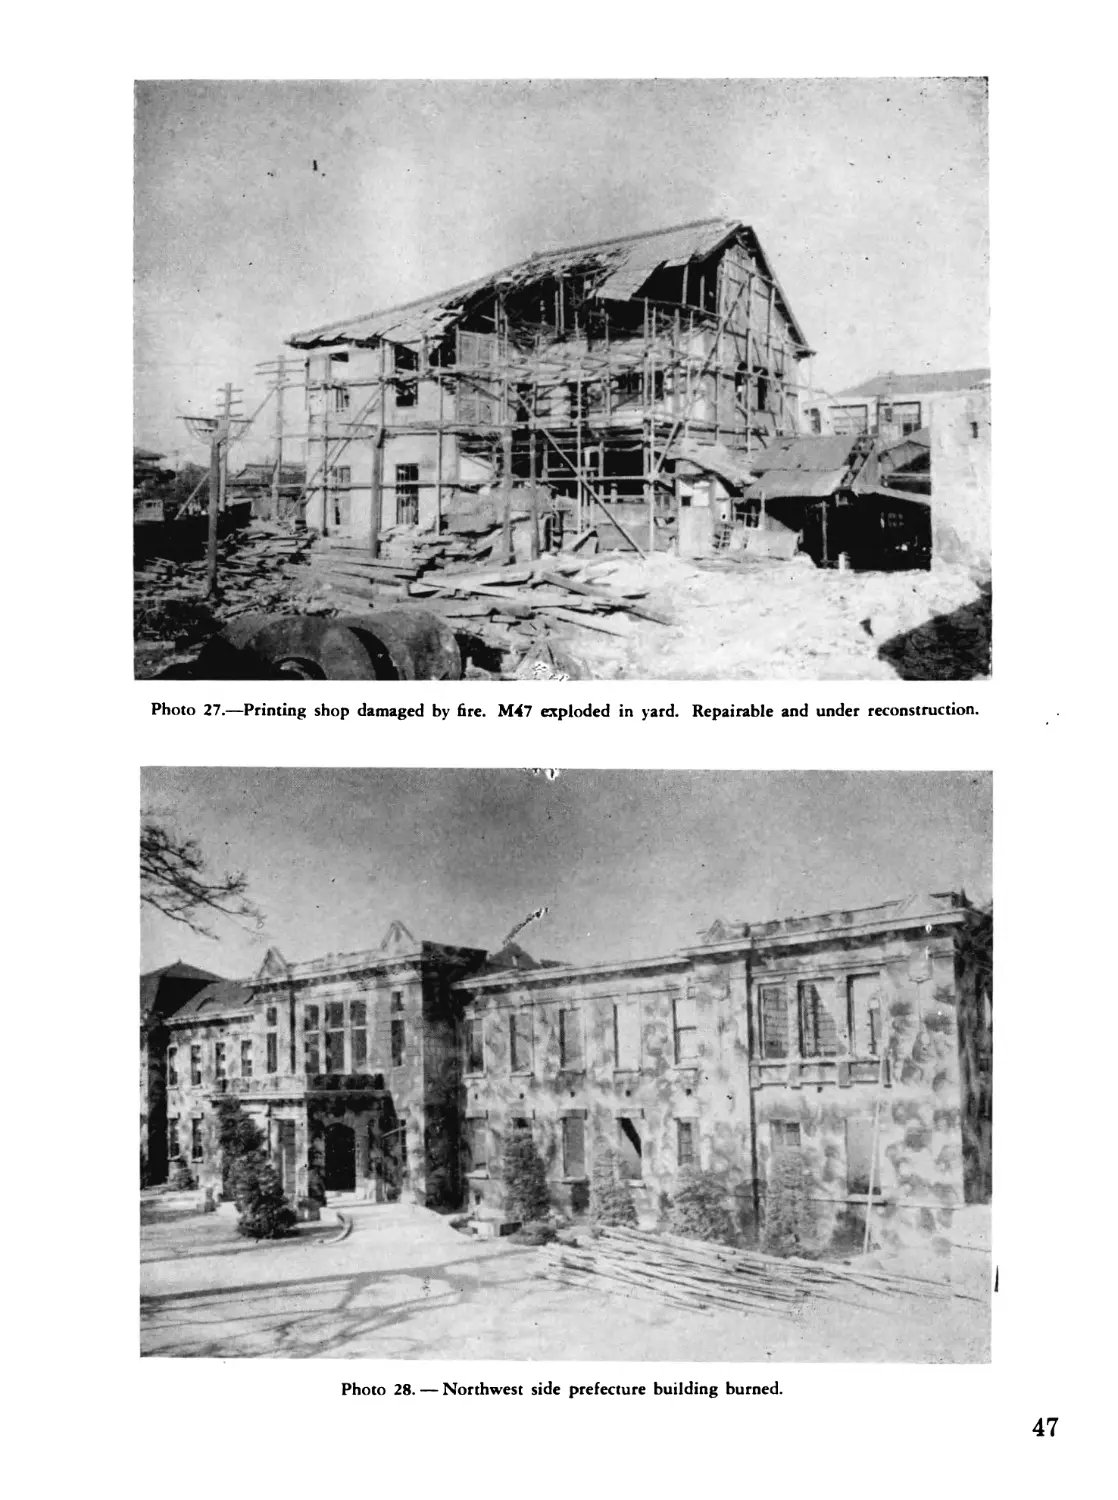
prefecture building.
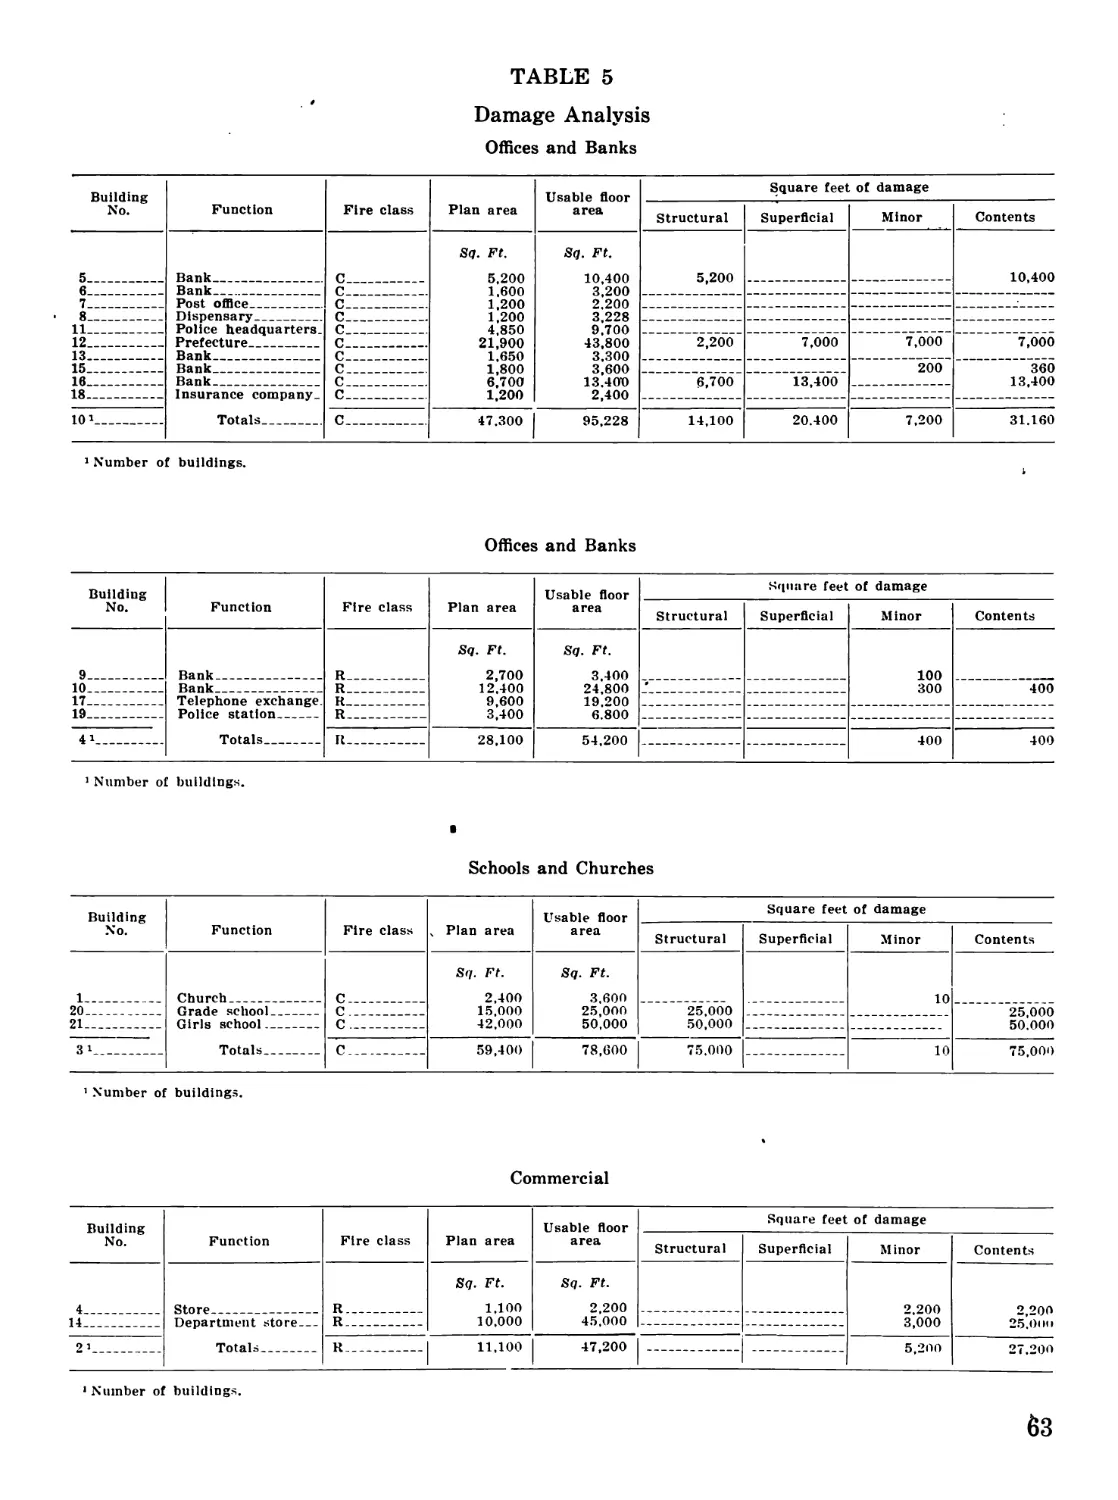
6. A maximum of 790 tons of M47 100-pound
incendiaries was dropped on the target. There
appeared to be an over concentration in the
area west of the main thoroughfare. The
bombs did not perforate the roofs of heavy,
reinforced-concrete buildings, and burned with-
out damage to those structures.
7. There was one reservoir of small capacity,
26
fed from a river. Failure of electricity pre-
cluded use of the pumps, and, in a short time
after the start of the attack, the reservoir was
three-quarters emptied. Many service pipes in
dwellings and commercial buildings melted or
were broken, thereby causing an excessive loss
of water. Numerous small water containers
and a few large static tanks were distributed
throughout the city.
8. The fire department and volunteer asso-
ciation fire fighters were unable to cope with
the conflagration. Their equipment was anti-
quated, hose was in poor condition, and direc-
tion was inadequate. Bucket brigades were of
considerable value in retarding fire spread, and,
if more water had been available, would have
undoubtedly saved many more buildings.
9. According to the Japanese Air-Defense
Diary, some 2,011 buildings burned, 110 build-
ings were partly burned, and 8,695 persons
were made homeless.
10. The city’s electrical system was put out
of commission because of direct hits on the sub-
station. Poles and wire burned. Even at the
time of the survey, some parts of Oita were still
without electricity.
III. General Information
1. The following members of P. D. D. Team
2 made the Oita survey:
Maj. C. Ralph Fletcher, officer-in-charge,
Capt. Ving I. Smith, photo interpreter,
Capt. Gerald O. Waeterling, fire engineer,
Lt. Paul M. Speake, U. S. N. R., engineer,
Sgt. A. Hiroshima, interpreter,
Pho M 1/c C. Hovey, photographer.
Capt. F. G. S. Mitchel, RAF, air-raid shelter
specialist, accompanied the team to Oita.
2. Information relating to damage to build-
ings and contents was obtained by field survey.
An Army Map Service plan, scale 1/12,500, was
used at the time of the survey to check densely
and sparsely built-up areas. A Japanese map
was obtained on which the damaged areas had
been recorded. Both were carefully checked by
inspection, and were considered accurate after
minor corrections had been made.
3. Many damaged areas had been cleared
prior to this survey, and a scrap metal drive,
started eai*ly in August, included removal of
bomb casings from all sites. All malfunction-
ing bombs had been disposed of. No positive
information could be obtained from the Jap-
anese relative to the approximate number of
bombs dropped or duds found.
4. Following is a list of persons interviewed
by team members:
Name and position Information obtained on
Mr. Fuku, Chief, Fire Pre-
caution---------------Fire department equip-
ment. Fire breaks. Con-
trol of fire. Air-raid shel-
ters.
Mr. Yufu, Chief, Air De-
fense-----------------Air-raid precautionary
measures.
Mr. Kurahata, Chief, Pub-
lic Works-------------Building codes.
Mr. T. Masuno, Engineer
and Interpreter_______General data.
Mr. U. Tomogo, Manager
Kyushu Electric Supply
Co--------------------Electric light and power.
IV. The Target
1. Area. Oita, located on the south shore
of the Beppu Wan delta plain in northeast
Kyushu, was the largest Kyushu city on the
Inland Sea. Its site was flat. The densely
built-up area (20 percent or more built up)
measured 0.308 square mile; the sparsely built-
up area (5 to 20 per cent built up), 1.268 square
miles; the total built-up area (5 percent or more
built up), 1.576 square miles. The total area
of the city was 21.7 square miles, of which 7.21
percent was built up. The area destroyed by
fire was 0.42 square mile, representing 26.6
percent of the built-up area.
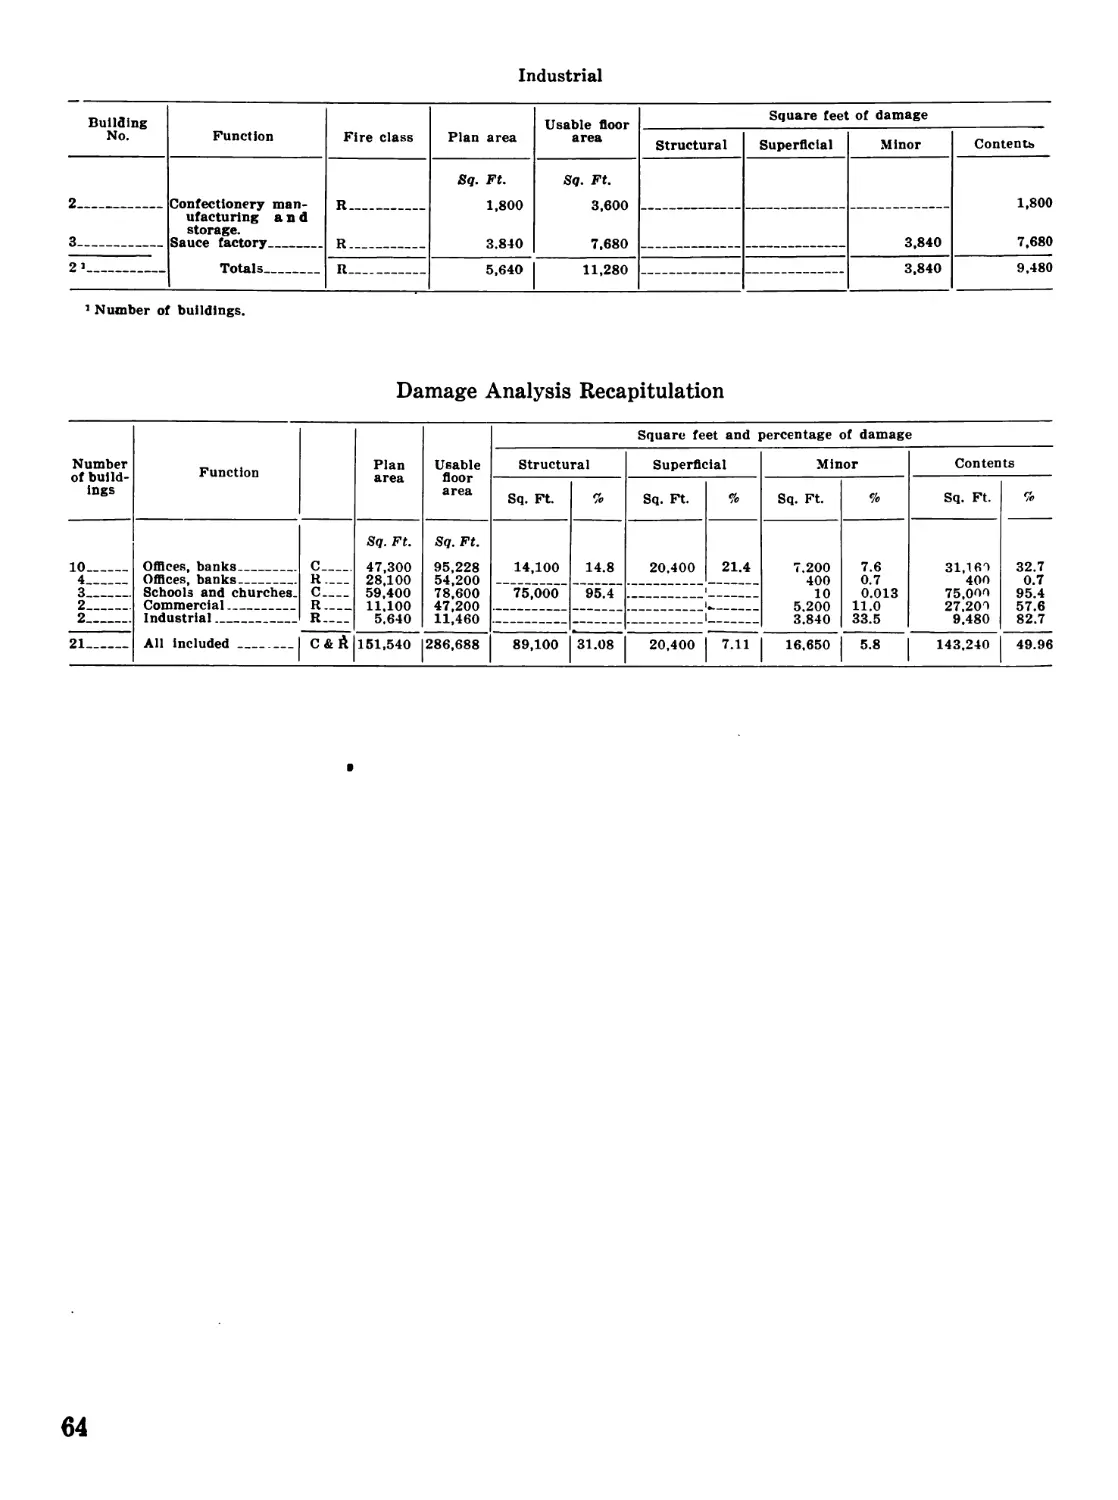
2. Importance. The city was a prefectual
capital and a district regimental headquarters.
There was a large number of schools and banks.
It had no major industry, although textile and
sauce factories, together with a vital naval air
depot for three Kyushu airfields (Oita, Saeln,
Usa), were noted. Rail yards within the area
represented an important hub for the Idary
line, the East Coast Nippon Main line, the
Kyudai line to Kuraine, and the Hobi line to
Kumamoto. Oita also had the only important
railway repair facilities on the east coast of
Kyushu. The town appeared to have been
thriving and well organized.
3. Commercial district. The main commer-
cial district ran roughly north and south, to-
ward the only railroad station and the freight
704699—47—3
yards, along a main street which divided the
city approximately in two.
4. Building construction. The central part
of the city was heavily built up with wood
dwellings, about 50 percent of which were one
story and the remainder one and one-half and
two stories in height. The typical Japanese
dwelling has four small rooms. Framework
was about four by four inches and two by two
inches, over which was placed bamboo lath
covered with about two inches of mud. Exterior
sides were covered with thin boards, often
treated with coal tar or oil, rubbed dry. In-
teriors were generally of smooth finished wood,
with paper or cloth insets in sliding doors.
Flooring was covered with two-inch, woven,
straw matting (Tatami). Ceilings were 14-inch
boards. Roofs were pitched with tiles laid on
mud on wood sheathing supported on heavy
wood beams, many of which were hand hewn.
Footings were of concrete, brick, or stone.
Comparatively few dwellings had been built
after 1938.
5. Heating and cooking appliances. Heating
of individual rooms was accomplished by a large
brazier, usually glazed porcelain, partly filled
with sand and old ashes. Charcoal fires were
used, and, occasionally, a small metal plate on
six-inch legs was placed over the charcoal to
heat water for tea. The kitchen was generally
the smallest room. Two types of stoves were
used: one, a wood- or coal-fired, metal, “pot”-
type appliance, set on the wood flood; the other,
a brick-set, open-hearth type, either round or
square. Electricity was used in practically
every house, but only one percent of the avail-
able gas was used for domestic purposes.
6. Congestion of buildings. Buildings were
detached or contiguous, and some were designed
to house two and three families. The absence
of masonry fire-division walls was particularly
noticeable, and the only considerable separation
between buildings was due to the streets, the
widths of which were: maximum 30 feet, aver-
age 18 feet, minimum 12 feet. The blocks of
the residential, as well as the commercial areas,
were roughly rectangular, with all thorough-
fares running north-south or east-west.
7. Small stores. Small stores lined both
sides of the main street, and, in .addition, were
scattered in various districts throughout the
27
city. They were generally of wood construc-
tion and differed little from the dwellings.
Living quarters were often located in the rear
or above the grade floor. Masonry fire-division
walls were not provided. The contents were
usually arranged in a haphazard manner, and,
in addition to regular stock, the usual accumu-
lation of paper, boxes, straw, and other com-
bustible material was present.
8. Large stores and office buildings. Larger
stores and some of the office buildings were de-
signed to resemble European and American
types. They were constructed of wood fram-
ing and lath and plaster, and had an imitation
stone finish which gave them a solid and im-
posing appearance.
9. Other buildings. Schools, courthouses
and industrial buildings were usually of wood-
frame construction and of moderate size.
Banks, a department store and a few office
buildings were of reinforced-concrete or load-
bearing brick-wall construction.
10. Building and population statistics. Pre-
fectural records showed Oita to have 12,638
dwellings, 26 schools, 2,500 commercial and 15
industrial buildings. The population was
61,345, of whom 2,585 were engaged in indus-
try, 8,000 in commerce, 5,027 in agriculture,
and 1,290 in various governmental capacities.
11. Electricity was furnished to the city by
the Kyushu Electric Supply Co., Ltd., a pri-
vately owned company. Power was supplied
by overhead lines from eight hydro stations.
Oita had one power station and one substation.
The average power generated was 37,136 kw„
and the maximum 54,000 kw. Stand-by power
was available from the Nippon Power Co., Ona-
gohata Switch House (maximum 44,000 kw.),
the Nippon Power Co., Nobbrio Switch House
(maximum 15,000 kw.), or the Kyushu Electric
Co., Ltd., Unashima Switch House (10,000 kw.).
All power was carried through the city by over-
head lines on wood poles. High tension lines
coming into the city were carried on steel poles.
12. Gas was supplied by the Beppu Gas Co.
There were two gas holders, one of 6,000-cubic-
feet (170 cubic-meters) and one of 70,630-
cubic-feet (2,000 cubic-meters) capacity. Sev-
enty percent of the gas was supplied to
industrial and military consumers; 29 percent
28
to commercial consumers; and 1 percent to
domestic consumers. It was the practice of
the company to shut off gas at the source at the
time of air-raid alerts.
13. Water was supplied to the city from one
reinforced-concrete reservoir of 525,000-gallon
capacity. Three electrically driven pumps,
each of 75 horsepower, were located at the
river, and had a total pumping capacity of
45,000 gallons of water per hour delivered to
the reservoir. After water passed through
filtration beds, it was fed to the city by gravity.
The sizes of the cast-iron pipes ranged from
18 inches to ЗЦ inches. The average static
pressure in the central portion of the city was
50 pounds per square inch. There were neither
booster pumps nor a reserve supply.
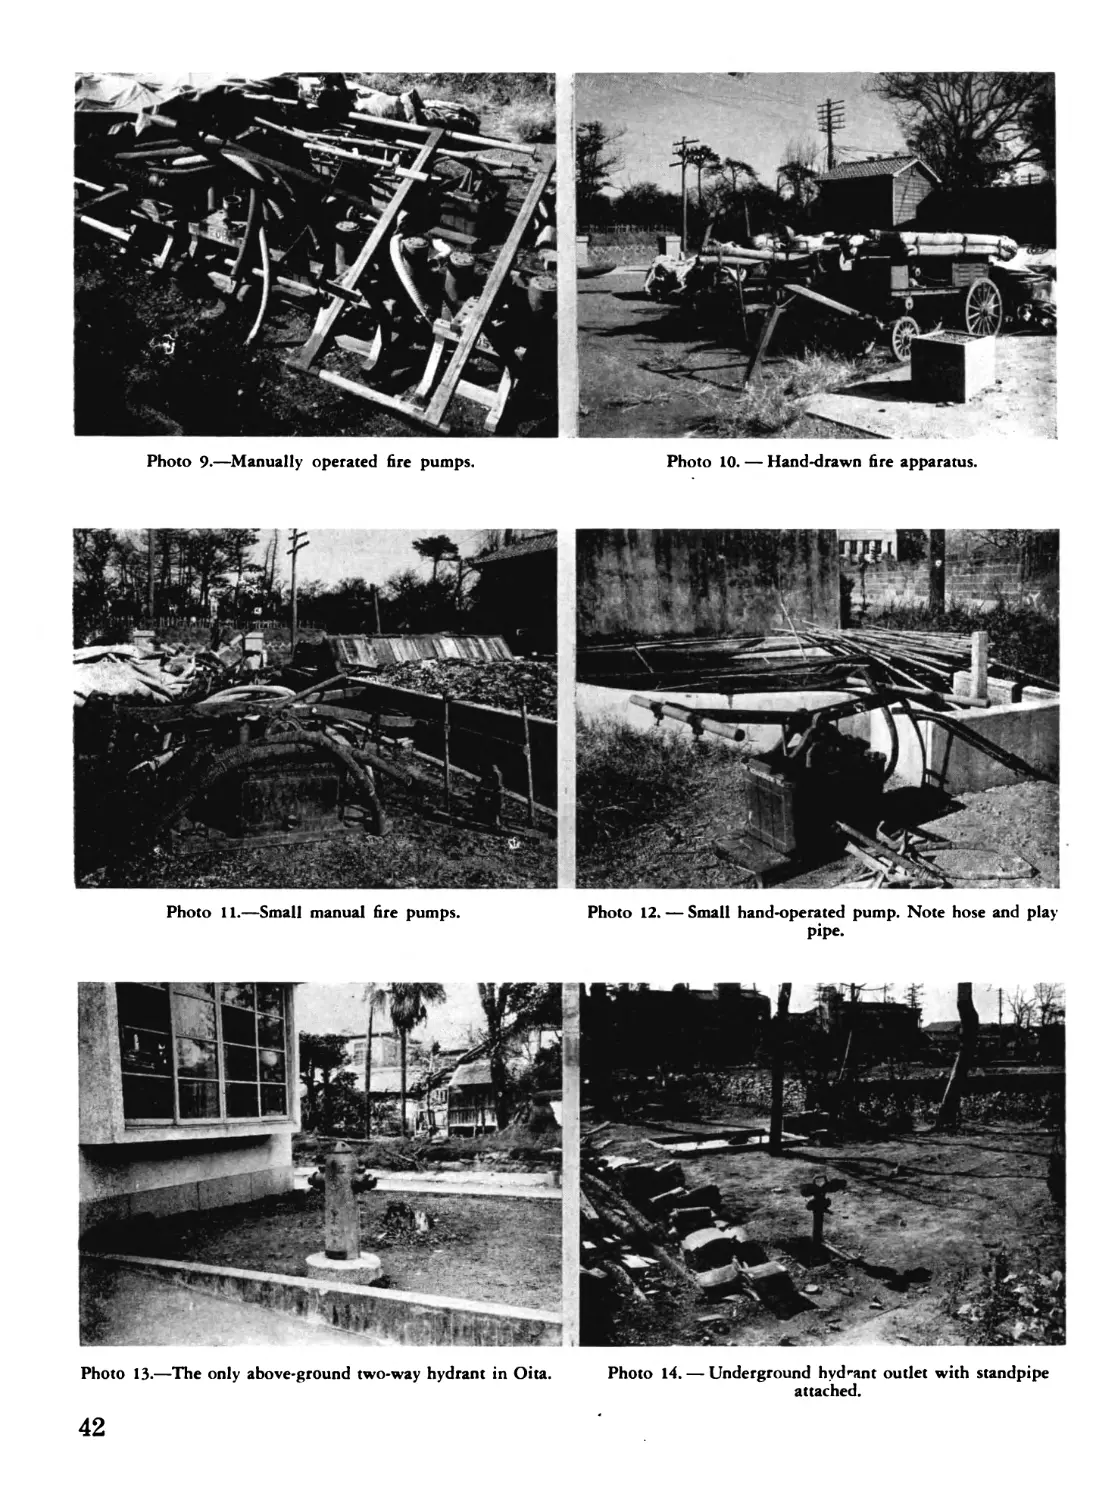
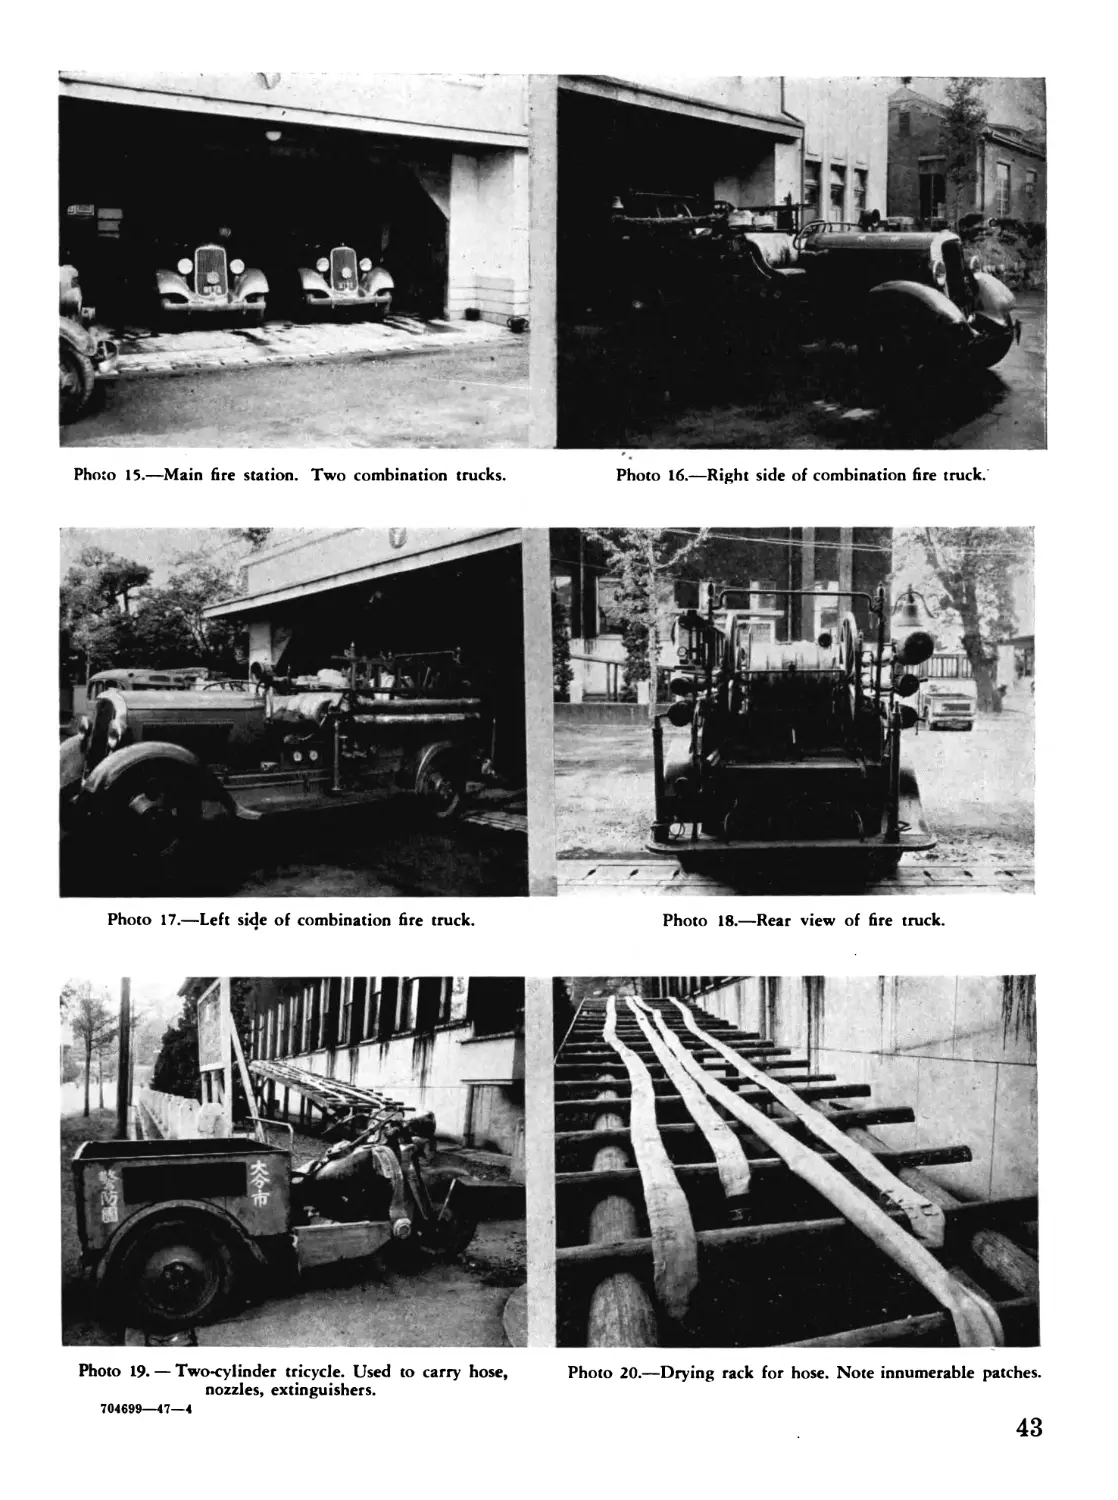
14. Hydrants. Fire hydrant outlets were
underground. There was only one two-way,
above-ground hydrant in Oita, and it was lo-
cated near the fire station. A plan showing the
reservoir and the layout of the water and
hydrant system is shown in Figure 2.
15. Public fire department. The fire depart-
ment in Oita, called the Organization Against
Fire Attack, functioned as a partly paid and
partly volunteer organization. It was an emer-
gency war substitute for the peace-time fire
department. Following is a list of the per-
sonnel and equipment:
Members______________________________________ 1,234
Fire stations____________________________________ 9
Motorized combination engines (350 gpm) 8
Hand-drawn, gasoline-driven pumps
(200-250 gpm)_________________________________ 9
Hand-operated pumps----------------------------- 13
Sirens and bells________________________________ 37
Gas masks______________________________________ 385
Fire extinguishers (U. S. type)______________ None
Feet of 2-inch hose on each pumper______ 200 to 400
Feet of 2^-inch hose on each pumper----- 200 to 400
The. combination pumpers were 1926, 1930,
1934, 1938 and 1940 models, respectively, and
included Dutch Brussea, Nissan, Ford, and
Chevrolet makes. The fire-fighting equipment,
judged by American standards, was antiquated,
and lacked the high standard of maintenance
characteristic of fire departments in the United
States. Fire hose was patched in many places,
and was totally unsatisfactory for effective fire-
fighting use.
16. Volunteer organizations. The volunteei
associations were controlled by the chief of the
police department of the city of Oita, and to-
gether they functioned as a civilian-defense
group. From the standpoint of fire fighting,
the auxiliary police and fire units (Keibodan)
were the most important of these volunteer as-
sociations. Approximately 40 percent of the
personnel of these units was detailed in the fire-
fighting arm and served as an auxiliary to the
regular fire department. There were 10 prin-
cipal districts, 109 block associations, and 911
neighborhood defense squads comprising a total
of 4,886 members. The prefectural office gave
instructions to the leaders of the block associa-
tions weekly, and they in turn were charged
with the responsibility of instructing the people
living within the neighborhood groups on how
to combat fires started by various types of in-
cendiary bombs. Each householder was pro-
vided with a booklet that explained the types of
incendiaries and gave general air-raid precau-
tion instructions.
17. The following equipment was maintained
by the volunteer associations, and distributed
in the 10 districts:
Gasoline-driven, hand-drawn pumps__________________ 8
Hand-operated, hand-drawn pumps___________________ 22
Stirrup pumps____________________________________ 104
Hose carts, hand-drawn____________________________ 17
Usable hose, 2-inch, 60-foot lengths_____________ 518
Lengths of suction hose__________________________ 372
18. Static water. Great reliance was placed
upon the concrete static-water tanks located
throughout the city, which were below ground
and varied in capacity from 1,500 to 5,000 gal-
lons. Small concrete tanks with capacities of
from 50 to 100 gallons were common in all
areas, as were many 28-gallon concrete tanks.
It was the responsibility of the neighborhood
association members and householders to keep
the tanks filled.
19. Air-raid shelters. Three underground,
concrete shelters were provided, 2 in the central
part of the city, with a combined capacity of
250, and 1 private shelter with a capacity of
300 persons. A fourth cave-type shelter with
sides and roof of split boards was provided for
factory employees on the site of the Fujito
Works. Twenty buildings were also utilized as
emergency shelters. Some of these buildings
were fire resistive; others were of brick load-
bearing, dozo, or wood-frame construction. Ac-
cording to the Japanese, they could accommo-
date 25,800 persons. Many small shelters were
located in the residential areas throughout the
city. These were principally of the trench
type, braced with boards and bamboo, and had
an overhead earth covering, 18 to 20 inches in
thickness. The wood framework at the en-
trances was unprotected and exposed to the
action of incendiaries. The capacity of each
of these small shelters averaged eight persons.
20. Incendiary fire precautions. The Jap-
anese government had ordered the removal of
ceilings to provide an open space in which to
combat roof fires, and the order was carried
out. Gates in walls around property were
opened upon the sounding of an alert. Instruc-
tions had been issued regarding the evacuation
of the aged, infirm and children to the hills
when danger of an air raid was imminent.
Complete black-out was effected upon sounding
of air-raid alerts.
21. Firebreaks. The prefecture had prepared
a plan to create firebreaks, but virtually no
progress had been made prior to 16 July 1945.
A few natural breaks existed, such as ceme-
teries, freight yards, shrines, and broad streets.
Firebreaks had also been created by the demo-
lition of buildings in previous high-explosive
bomb attacks, but debris had not been removed.
V. The Attacks
1. Minor attacks. Oita was subjected to
several specific target bomb attacks in March,
April and May, 1945. The Fifth AF attacked
the city on 10 August 1945 in a small incendiary
attack which involved the use of M69 bombs
and 50-gallon fuel tanks. The Japanese Air-
Defense Diary reported that bombs fell be-
tween 1109 and 1113 hours. About 100 houses
were destroyed, eight persons were killed, and
the damage totalled 340,000 square feet. Most
of the bombs fell in areas already burned, and
no information could be obtained regarding the
effectiveness of the a0-gallon fuel tanks.
2. Main Attack. The Twentieth AF records
show that on Mission 272, on 16-17 July 1945,
129 B-29 planes from the 73d Wing were air-
borne to bomb Oita as the primary target.
Eleven of these acted as pathfinders. The tar-
29
get was found by planes which dropped 790.4
tons of M47 incendiary bombs over the city.
The following data are a condensation from the
records of the Twentieth AF:
fighting equipment was held in readiness, and
the personnel was at its posts.
3. Start of fire. Planes began dropping
bombs on the city at 0010, 17 July, according
Mission No. Date Air force Pri- mary target Aiming point Planes dis- patched Planes bomb- ing Sighting Time (local time) Altitude Feet Visibil- bility Bomb type Tons No re- leased Axis of attack Interval- ometer spacing
Radar Visual
272 16-17 July 1945 73d Wing 20th AF. Oita 058071 (Just southwest of castle.) 129 124 122 2 1512Z 1632Z 10,000 to 11,450. 8/10 to 10/10. M47 790.4 22,922 210е- 250 е. 75 ft.
3. Antiaircraft defenses. Oita was defended
by 19 heavy antiaircraft guns and 54 medium
antiaircraft weapons. Although only one
searchlight was identified, the estimated num-
ber was from two to six. Because of the poor
searchlight defense, only inaccurate flak was
expected. The planned altitude of 10,000 to
10,800 feet was believed sufficient to render the
medium weapons ineffective, and the route was
planned to avoid other flak areas. Enemy flak
was encountered by approximately 25 percent
of the planes, and was reported to be meager,
inaccurate, heavy, and medium.
VI. The Fire
1. Weather. It seemed desirable to study
the official records of the Japanese Meteoro-
logical Station at Oita from which Tables 1-4
are extracts. It will be noted that:
a. There had been rainfall in Oita each day
from 10 July to 17 July, except 15 July. On
the 16th, precipitation had been 1.15 inches,
and on the 17th, 0.45 inches.
b. The average temperature on 16 July was
75.79° F., and on 17 July, 80.42° F.
c. On 16 July, at 2200, the wind velocity was
nil and at 0200, 17 July, the official bureau
record indicated a south wind with a velocity
of 4.8 miles per hour. At 0600, the wind shifted
to the west with a velocity of 2.6 miles per hour.
d. On the 16th, there was only 0.1 hour of
sunshine, and on the 17th there was sunshine
for 1.35 hours.
2. Alert. The air-defense commander or-
dered an alert for all civilian-defense groups
at 2350, 16 July. Information had been re-
ceived by him that a large formation of planes
was headed for the city. At the same time, he
ordered all householders to make preparations
for fire fighting, and a few minutes later or-
dered the populace to take shelter. All fire-
to the official Japanese Air-Defense Diary. The
prefecture office asserted that wood structures
located in the highly built-up area just west of
the main thoroughfare took fire immediately.
Japanese who were interrogated stated that
many bombs fell in that area. There were
many direct hits and near misses which caused
primary fires. The section of the city located
east of the main thoroughfare was more sparse-
ly built up, but fires were started there from
direct hits and near misses at more widely
separated points.
4. Progress of fire. The Japanese reported
that the planes departed at 0135. By that time,
a large number of wooden structures were afire.
The high degree of built-upness, the conges-
tion, the combustible nature of the buildings
and the lack of firebreaks caused the then well-
established fire to spread. The narrow streets
offered no protection to buildings unaffected by
direct incendiary action. One Japanese stated
that a bomb started a fire on one side of an
18-foot street which destroyed several houses.
It then jumped across to the opposite side of
the street where no bomb had fallen and burned
out completely a two-story house, despite the
efforts of inhabitants to save it. Flying em-
bers contributed to the spread of fire at the
eastern fringes of the city.
5. Control of fire. The chief of Air Defense
stated that fires were not brought under control
until 0700 hours, 17 July. In isolated sections
of the city, fires continued to smolder until
18 July.
6. Action of fire fighters. The fire depart-
ment and the volunteer organizations concen-
trated their activities on the prevention of the
spread of fire by utilizing their motorized
equipment and hand-drawn motor-driven
pumps until the water supply failed. Many
men formed bucket brigades and drenched the
30
outside of buildings with water until the static
tanks became empty.
7. Action of people. As the Are grew more
intense, the people were forced to leave many
of the small shelters located adjacent to their
homes. In many cases, the wood framework
at the entrances to these shelters started to
burn. Some darning buildings collapsed over
the shelters. The heat was intense, and the
smoke suffocating. Many persons ran through
the debris-choked streets to And refuge in shel-
ters outside the burning area, only to move on
again as the conAagration progressed. There
was considerable disorder and panic among the
people, and efforts of the police and the civilian-
defense personnel to maintain any semblance
of order were fruitless. A few home-owners
remained in the Are area, and, as soon as the
planes had departed, saved their homes by pull-
ing down Aaming sheds and burning parts of
adjacent houses. Some of the people who Aed
to unburned areas assisted in preventing the
further spread of Are by co-operating with the
Are-Aghting organization.
VIL Analysis of Damage
1. Areas and nature of damage. The extent
of the damage has been indicated on a plan of
the city (Figure 1). Inspection of all the dam-
aged areas disclosed that the part of the city
west of the main business street had been hit
harder than the east side, as it was almost com-
pletely burned. Practically every wood build-
ing was 100 percent damaged. Only the con-
crete or stone footings remained, and consider-
able spalling was noted from intense heat.
The few buildings that remained in the devas-
tated area were saved by their occupants.
2. Causes of damage. Study of the damaged
areas and interrogation indicated that there
was an appreciable percentage of primary fires
caused by direct incendiary bomb hits and
near misses, and the remainder resulted from
Are spread. The few natural Arebreaks af-
forded by cemeteries, shrines, roads and struc-
tures demolished in previous high-explosive
attacks were not effective to any extent in re-
tarding the progress of the fire.
3. Damage to built-up areas. The densely
built-up area (that is, 20 percent or more built
up) was 0.318 square mile, the sparsely built-
up area (that is, 5 to 20 percent built up) was
1.27 square miles, making a total built-up area
of 1.58 square miles. The area of destruction
by Are was 0.42 square mile. The total area
of damage was 26.6 percent of the total built-up
area. The Municipal Handbook of Japan gave
the over-all area (corporation limits) of Oita
as 21.7 square miles, so that, accepting this fig-
ure as accurate, the city was 7.21 percent built
up. The Twentieth AF target area covered 1.4
square miles.
4. Damage by building classification. In the
burned-out area there were 21 principal build-
ings or groups of buildings. These have been
numbered consecutively, located on Figure 1,
and described (together with their damage) in
the following paragraphs. Of 15 banks, insti-
tutions and public buildings, six combustible
and two fire-resistive buildings sustained no
damage. Two fire-resistive commercial build-
ings were partly damaged, and two reinforced-
concrete industrial buildings sustained serious
internal damage from fire. Table 5 summar-
izes the damage by classes of buildings.
5. Building 1. Fire: Class C; Photo 45.
a. Occupancy. Presbyterian Church.
b. Construction. This building was cross-
shaped in plan, 66 by 48 feet over-all, with a
plan area of 2,400 square feet; the total floor
area was 3,600 square feet. A one-story audi-
torium occupied the main (south) leg of the
cross, with the pastor’s study and classrooms in
the remainder, which was two story, but of the
same height to the eaves—about 20 feet. It
was wood frame throughout; the roof was sur-
faced with asbestos shingles; the exterior walls
were covered with stucco; the Anished Aoors
were of wood; and the interior wall was sur-
faced with plaster and wood.
c. Damage. The building lost most of its
window glass from blast in high-explosive at-
tacks prior to July. Japanese pulled down
burning parts of buildings 10 feet north, and
wet down the church walls with buckets of
water. The only damage sustained by the
building was due to a small eaves fire on the
north side, which was extinguished by the
bucket brigade.
6. Building 2. Fire: Class R; Photo 46.
a. Occupancy. First floor: confectionery
31
manufacture and storage; second floor: living
quarters.
b. Construction. Irregular but generally
rectangular in plan, this building was 80 by 25
feet over-all; its plan area was 1,800 square
feet. The total floor area was 3,600 square
feet. There were two stories, and the roof
height was 22 feet. It was a reinforced-con-
crete structure, light, and non-earthquake re-
sistant, with 8- by 8-inch columns carrying the
beam-and-slab second floor. The first floor con-
tained no combustible trim or finish materials;
the second floor was subdivided by wood-frame
partitions and trimmed with wood.
c. Damage. On the second floor all interior
partitions and wood trim were burned out, but
reconstruction was already in process so that
the exact determination of the extent of dam-
age was impossible. The interior finish coat
(about Ц inch thick) on the concrete walls gen-
erally had fallen off. The first floor showed no
sign of internal fire. The building was struc-
turally undamaged. Fire destroyed wooden
buildings on three sides of this structure, and
spread to this building through unprotected
openings in the rear.
7. Building 3. Fire: Class R; Photo 47.
a. Occupancy. Soya sauce factory.
b. Construction. This was a rectangular,
two-story building which was 80 by 48 feet in
plan and 26^ feet high. Its plan area was
3,840 square feet, and its total floor area, 7,680
square feet. It had a reinforced-concrete
frame with 12- by 12-inch columns. The sec-
ond floor and roof slabs were divided into bays,
16 by 16 feet. Secondary beams 12 by 13
inches in section and 8 feet o.c. (i.e., on centers)
framed into main beams 12 by 20 inches, 16 feet
o.c. Beams were slightly haunched at junc-
tions with columns. There were nine-inch
brick-panel walls on the exterior, plastered
both sides to resemble concrete, and no interior
partitions. Windows were unglazed, barred
with vertical, square, 21/-;- by 2 Ц-inch concrete
bars 8 inches o.c., and closed by solid wooden
shutters on the outside. There had been four
skylights or monitors, five by 30 feet in plan,
16 feet on centers.
c. Damage. All window shutters were
burned. Skylights were destroyed or removed,
32
and there was evidence (smoked walls, peeled
interior plaster) of contents fire. However,
no structural damage resulted from fire. At
one point, a severe impact on the roof had ap-
parently caused spalling which exposed the re-
inforcing steel of the underside of the roof slab
and one roof beam, but structural failure did
not follow. There was no roof perforation,
except such as may have occurred through the
skylights. Fire was caused either by a direct
hit through the skylight or by spread from ad-
jacent buildings.
8. Building 4. Fire: Class R; Photo 48.
a. Occupancy. Mercantile shop.
b. Construction. A rectangular two-story
building, 22 by 50 feet with a plan area of
1,100 square feet and a total floor area of 2,200
square feet, was 25 feet high to the roof, and
had a one-story wing at the rear, 8 by 40 feet.
It had reinforced-concrete frame, roof, walls,
and floors; columns were 15 by 15 inches,
beams were 13 by 21 inches by 22 feet
(haunched), 12 feet 6 inches o.c. Walls were
7 inches thick plus finish coats exterior and
interior, floor and roof slabs were 5 inches
thick. There were no partitions. Openings
were in all walls, except the west. Shop front
work, sash and frames, stairs, and interior trim
were of wood, and there was wood-finish floor-
ing (laid in mastic) on the first floor only.
c. Damage. All woodwork and building con-
tents were consumed by fire; walls and ceilings
were damaged by extensive loss of the finish
coat; fine cracks appeared in the cement finish
of the second floor. There was no structural
damage. Fire was caused by direct exposure
to fire from adjoining wooden buildings, prob-
ably through large window openings on the
second floor.
9. ‘ Building 5. Fire: Class C; Photos 49-51.
a. Occupancy. Bank.
b. Construction. This was an important
two-story commercial building, L-shaped in
plan, 82 by 82 feet over-all, with a plan area of
5,200 square feet, and a total floor area of
10,400 square feet. It was 32 feet high to the
eaves and had 17-inch, load-bearing, brick ex-
terior walls and heavy timber interior columns,
roof trusses and second floor framing. A small
part of the first floor was wood frame, the
remainder was concrete on earth fill. The
building had wood partitions, probably plas-
tered; steel sash; and slate roofing over wood
sheathing, rafters, and purlins. In the internal
angle of the building there was a two-story vault
which had 23-inch brick walls, a concrete slab
overhead, steel vault doors, wood shelving and
second floor. A separate record room (out-
building) in the rear was one story high, 19 by
22 feet in plan, and had 12-inch brick walls and
a wood-frame tile roof.
c. Damage. The vault-type doors were badly
warped by fire but the vault interior and con-
tents were undamaged. The remainder of the
main building was completely burned out, leav-
ing only the exterior walls which were struc-
turally undamaged. The roof and interior of
the separate record room were completely
burned, only the exterior walls remaining. Di-
rect hits in this building caused the fire.
10. Building 6. Fire: Class C; Photo 52.
a. Occupancy. Nippon Savings Bank Co.,
Ltd.
b. Construction. This small two-story com-
mercial building, 35 by 45 feet, had a plan area
of 1,600 square feet, a total floor area of 3,200
square feet, and was 25 feet high to eaves. It
had load-bearing brick walls, a slate roof on
wood trusses, and wood interior framing and
floors.
c. Damage. The building was undamaged.
A 12-foot brick fire wall erected about 10 feet
north of the building prevented spread from
burning wood structures. There was no fire
on the side south of this structure.
11. Building 7. Fire: Class C; Photo 53.
a. Occupancy. Oita Post Office (postal sec-
tion) .
b. Construction. This was actually two sep-
arate buildings, north and south. The north
building was rectangular, 25 by 20 feet, had a
plan area of 500 square feet, and a total floor
area of 1,000 square feet. It was two stories
high, had an eaves height of 22 feet and was all
of wood construction. The first floor was con-
crete on earth. Roofing was tile covered, and
walls were stucco finished outside, plastered in-
side. The south building was rectangular, 33
by 22 feet in plan and had a floor area of 700
square feet. It was one story high, had an
eaves height of 14 feet, and was of the same
construction as the north building.
c. Damage. Both buildings were undam-
aged. There was no fire in the vicinity on the
north side of the north building. Wood struc-
tures burned south of the south building, but
the fire department prevented spread to the
building.
12. Building 8. Fire: Class C; Photo 54.
a. Occupancy. Uchida Dispensary.
b. Construction. This commercial building
had a main part, 32 by 24 feet, which was 3
stories high, and a rear wing, 22 by 21 feet,
which was 2 stories high. The plan area was
1,200 square feet, the total floor area was 3,228
square feet, and the approximate height to the
eaves was 30 feet. The building was entirely
of wood construction, with walls stuccoed out-
side and plastered inside. The roofing was of
tile. Foundations and the first floor were of
concrete.
c. Damage. The building was undamaged.
The photograph shows debris of a small burned
wood structure on the right but the fire depart-
ment prevented spread to this building. There
was no other fire within 50 feet of this struc-
ture.
13. Building 9. Fire: Class R; Photo 55.
a. Occupancy. Bank.
b. Construction. This was a two-story
building, 28 feet high to the roof, rather irreg-
ular in plan but 88 by 44 feet in over-all dimen-
sions, with 2,700 square feet in plan area, and
3,400 square feet of total floor area. Framing,
floors, walls, and roof were of reinforced con-
crete; interior partitions of 4-inch hollow tile
or brick, plastered. Interior trim was of wood.
All openings on the west and south sides were
protected by metal fire shutters or doors.
c. Damage. The rear door on the first floor
was warped by fire from the adjacent building
and wood trim in that vestibule was slightly
burned. The fire did not spread farther into
the building as building employees and volun-
teers extinguished the fire promptly. The
building was undamaged structurally.
14. Building 10. Fire: Class R; Photo 56.
a. Occupancy. Hypothec Bank of Japan,
Ltd., Oita Branch.
b. Construction. Irregular in plan, with
over-all dimensions of 180 by 100 feet, this two-
story building of 12,400 square feet plan area,
total floor area of 24,80U square leer, was mod-
ern and was fire and earthquake resistant. Its
greatest height to the roof was 36 feet. Frame,
walls, floors, and roof were of reinforced con-
crete; exterior walls were faced with stone;
the interior partitions were of 4-inch masonry
units and plastered; the interior trim was
wood. Roofing was partly tar and gravel,
partly cement coating over built-up water-
proofing.
c. Damage. Although several incendiary
bombs struck the roof, they did not perforate
it and caused only superficial damage to the
roof fill and surfacing. One bomb that ex-
ploded on the ground at the rear of the building
broke two wire-glass windows and started a
fire in the contents and wood trim of two ad-
joining rooms on the first floor. The fire was
extinguished without serious damage and the
building was structurally undamaged.
15. Building 11. Fire: Class C; Photo 57.
a. Occupancy. Oita Occupation Group
Headquarters (former occupancy unknown).
b. Construction. This building was L-shaped
in plan, 70 by 94 feet over-all, 4,850 square
feet in plan area, and had a total floor area of
9,700 square feet. It was 2-storied, 26 feet
high to the eaves, and had 2 small one-story
additions at the rear. Load-bearing brick
walls, 17-inch exterior and 13-inch interior,
supported the wood-frame floors and wood-
trussed roof, the latter being surfaced with
slate. Walls were stuccoed outside, plastered
inside, and interior trim, doors, and the like
were of wood.
c. Damage. The building was undamaged.
The nearest fire was in a small wood building
located 35 feet south which burned but volun-
teer fire fighters, aided by a 30-foot street
which intervened, brought the fire under con-
trol.
16. Building 12. Fire: Class C; Photo 58.
a. Occupancy. Oita prefectural offices.
b. Construction. This two-story and part-
basement public building (33 feet high to the
eaves) was rectangular, 190 by 150 feet, and
Contained two light courts. The net plan area
was 21,400 square feet, and the total floor area
was 43,800 square feet. All of the walls were
of brick, and load bearing; the exterior and fire
. walls’were 17 inches thick, the other interior
E«4
walls 13 inches thick. Exterior walls were
faced with granite up to the first-floor window
sills, above which they were stuccoed, and had
granite trim. Corridor floors were of rein-
forced concrete, others were of wood framing
and finish. Roofing was clay tile over wood
sheathing and framing. The basement extended
under part of the building only.
c. Damage. Severe internal fire in the
southeast part of the building completely de-
stroyed 30 percent of the roof, 22 percent of the
second floor, and 15 percent of the first floor,
with additional damage to windows and inte-
rior finish in adjacent spaces. There was no
basement under this part of the building. All
walls remained standing without structural
damage. A fire wall with protected openings
stopped the fire in one direction, and an inte-
rior wall without openings stopped it in the
others. This fire was caused by direct hits in
the damaged parts of the building.
17. Building 13. Fire: Class C; Photo 59.
a. Occupancy. Bank.
b. Construction. This building, 55 by 30
feet, with a plan area of 1,650 square feet, and
a total floor area of 3,300 square feet, was a
rectangular 2-story structure about 20 feet high
to the eaves. It was framed throughout in
wood, but was finished on the outside in an
excellently executed imitation-stone stucco on
wood lath. The roof was tile on wood trusses.
c. Damage. There was no fire in the imme-
diate neighborhood of this building, which was
undamaged from that source. Bomb frag-
ments from a previous high-explosive attack
did slight damage—perforation of windows,
roof, and ceiling, and one hole in the east wall.
18. Building 14. Fire: Class R; Photo 60.
a. Occupancy. Department store, first two
floors temporarily occupied by the telegraph
section of the Oita Post Office.
b. Construction. Basically rectangular in
plan, with an offset on one side, this building
was 120 by 90 feet over-all and contained 10,000
square feet of plan area, and 45,000 square feet
of floor area. It had four, full stories and a
part fifth story which opened on a roof garden
formerly containing two or. three; small native-
style pavilions or other garden structures.
Except for these wooden pavilions, it was a
thoroughly modern, fire-resistive and earth-
quake-resistant structure of reinforced-concrete
frame, walls, floors and roof. The few inte-
rior partitions were plastered and appeared to
be of four-inch masonry units.
c. Damage. Fire on the roof, caused by a
direct hit, entirely consumed the garden struc-
tures and spread through wide openings into
the fifth story, burning out the contents and
wood trim. The third and fourth stories suf-
fered smoke and water damage to walls, ceilings
and contents. A few window lights were miss-
ing. Otherwise the building was undamaged.
19. Building 15. Fire: Class C; Photo 61.
a. Occupancy. Formerly refectory of the .
Oita Godo Bank; now converted to banking of-
fices (Building 16).
b. Construction. Actually 3 buildings: (a)
a T-shaped structure 65 by 65 feet over-all,
partly 2-story, 1,800 square feet in plan area,
3,600 square feet in floor area, and partly a
1-story section of 1,300 square feet floor and
plan area, 20 feet high to the main eaves; (b)
a rectangular 2-story structure 40 by 22 feet,
900 square feet plan area, and 1,800 square
feet total floor area, 18 feet high; and (c) a
rectangular 2-story record room about 20 by
50 feet, with 1,000 square feet of plan area and
2,000 square feet of total floor area, 18 feet
high. All 3 were similar in construction, with
13-inch brick exterior walls (load-bearing),
stuccoed outside and plastered inside. Roofing
was tile on wood trusses, and internal framing
and finish were of wood.
c. Damage. Roof and windows suffered
about five percent minor damage from fire,
which also very slightly damaged the interior
finish. The fire was extinguished without
other damage to the building. About 10 per-
cent damage occurred to contents. The fire
was caused when burning embers and heat from
the adjoining building ignited the roof and win-
dow frames. The fire was extinguished by the
fire department.
20. Building 16. Fire: Class C; Photos 62,
64 and 65<
a.- Occupancy. Oita Godo Bank, head office.
b.' Construction. L-shaped in plan, the
building fronted on two streets. This impor-
tant two-story bank building was 30 feet high
to the eaves and 86 by 119 feet over-all. It had
6,700 square feet of plan area, 13,400 square
feet of total floor area. Load-bearing brick
walls (24- and 29-inch exterior, 18-inch inte-
rior) supported interior wood floor framing,
except that in the main banking room there
were five non-fireproofed columns built up of
riveted steel angles carrying steel girders which
in turn supported part of the second floor
framing. 'Roofing was of slate and copper
over all-wood construction. A small part of
the first floor was of cement topping over
brick arches: the remainder was wood-frame
on brick piers. The interior finish was of
wood and plaster.
c. Damage. Except for the brickwork which
was undamaged structurally, the building was
entirely destroyed by fire; all wood-work was
consumed, steel work was distorted, and plaster
was burned off the brickwork. The fire was
caused by an unknown number of direct hits on
the building.
21. Building 17. Fire: Class R; Photo 66.
a. Occupancy. Telephone company offices
and exchange.
b. Construction. This building was rectan-
gular, 114 by 104 feet, with a central light
court, and covered a net plan area of 9,600
square feet, with a total floor area of 19,200
square feet. It was two stories, or about 30
feet high. The building was of thoroughly
modern fire- and earthquake-resistive construc-
tion throughout, with reinforced-concrete
frame, walls, floors and roof.
c. Damage. There was no fire within 100
feet of this building and it was undamaged.
22. Building 18. Fire: Class C; Photo 67.
a. Occupancy. Dai Ichi Mutual Life Insur-
ance Co., Oita Branch.
b. Construction. This was a small rectan-
gular office building 40 by 30 feet, with a plan
area of 1,200 square feet, and a total floor area
of 2,400 square feet. It was two stories high,
and was 28 feet to the eaves. It was wood-
frame throughout, on concrete foundations.
The first floor was concrete. Exterior walls
were stuccoed, and interior finish was of plas-
ter with wood trim and doors. The roof was
tile covered, on wood boards supported on
wood trusses.
c. Damage. The building was undamaged,
35
although fire destroyed a small wood structure
located about 20 feet away as shown on the pho-
tograph. Volunteers used buckets of water to
prevent fire spread.
23. Building 19. Fire: Class R; Photo 63.
a. Occupancy. Oita police station.
b. Construction. This was a 2-story build-
ing, generally rectangular, 80 by 46 feet over-
all, of 3,400 square feet net plan area, and
6,800 square feet total floor area. The build-
ing was 32 feet high to the roof. It had rein-
forced-concrete frame, walls, floors, and roof.
Partitions were plastered masonry units.
c. Damage. There was no fire within 100
feet of this building and it was undamaged.
24. Building 20. Fire: Class C.
a. Occupancy. Grade school.
b. Construction. A group of one- and two-
story buildings, of all-wood construction, lo-
cated in the southwesterly part of the city.
High explosives had badly damaged all of
these buildings except the three which are the
only ones considered in this report because of
their having been damaged by fire. They had
a plan area of 15,000 square feet and a total
floor area of about 25,000 square feet.
c. Damage. The three buildings and their
contents were completely destroyed by fire,
only the concrete footings remaining. The fire
was caused by direct hits on the buildings.
25. Building 21. Fire: Class C.
a. Occupancy. Girls’ school.
b. Construction. This was a group of 10
main buildings, located near the center of the
city, east of the main business street. All of
the buildings were of wood construction, prin-
cipally one-story high. The plan area was
42,000 square feet, and the total floor area was
50,000 square feet. The roofs were tile on
wood.
c. Damage. All of the buildings and their
contents were completely destroyed by fire, only
the concrete footings remaining. The fire was
caused by direct hits on some of the buildings
and fire spread to the others.
26. Damage to the electrical system. The
city’s electrical system was completely dis-
rupted by the action of incendiary bombs, and
by direct Hits on the substation. Some of the
overhead trolley contact lines were damaged.
Street cars did not run until about 1800 hours,
36
17 July. Light poles were burned, also service
lines. Transformers burned out. The distri-
bution equipment was damaged to the amount
of 195,253 yen. Damage to high and low ten-
sion lines, poles, transformers and their bases,
switches, service wire, meters, and all asso-
ciated electrical equipment amounted to 278,000
yen. In all, 150 poles, 22.5 miles (36 km.) of
wire, 90 transformers (900 kva. each) and 17
pull switches were destroyed by fire and debris.
These figures and the data relating to the elec-
trical equipment damage were obtained from
the manager of the Kyushu Electric Supply Co.
At the time this survey was conducted, some
areas were still without light.
27. Damage to gas supply. The gas mains
were not damaged as the result of the attack,
nor were the gas holders. Inasmuch as most
of the dwellings and small stores were not piped
for gas, the damage to service lines leading into
buildings was small. Gas was shut off at the
source at the time of the alert.
28. Damage to water system. There was no
damage to the water mains. However, many
of the lead-in pipes to consumers’ buildings
melted or were broken. It was estimated by
the Japanese that a 65 percent leakage of water
resulted from these breaks in the house service
connections. This condition contributed ma-
terially to the rapidity with which the reservoir
was emptied.
29. Effectiveness of water supply. The pub-
lic water supply failed. The Chief of Air De-
fense stated that at 0300 hours, 17 July, three-
quarters of the water in the reservoir had been
used. The electric substation was hit by in-
cendiaries and the pumps at the river, which
were electrically driven, were rendered inopera-
tive. The water supply was shut off at the
source between 0300 and 0400, 17 July, as the
reservoir was low, pressure was fading, and
the Japanese claimed there was danger of draw-
ing air into the water mains.
30. Effectiveness of hydrants. Recessed hy-
drants created a problem for the fire fighters.
Many of the hydrant covers had been covered
with debris, and could not readily be located.
Others were under piles of burning material,
and were rendered inaccessible.
31. Effectiveness of fire fighters. The fire
department and volunteer organization were
unable to cope with the conflagration. Anti-
quated and poorly maintained equipment, poor
quality hose, lack of water, and low pressure
were the contributing factors. The personnel
were not too well directed. In one instance, a
group of fire fighters was ordered from its
own area, which was later reduced to ashes, to
fight elsewhere. Bucket brigades that used
water from many small water containers and
static tanks were more effective in their efforts
to retard the spread of fire.
32. Value of Air-Raid Shelters. Many small
air-raid shelters were partly burned, several
burned entirely and collapsed, and, in many
cases, fire attacked the wood framework at the
entrances.
33. Photo Intelligence Check. The Twen-
tieth AF photo interpretation report on Oita
gave the following figures for the attack of
16-17 July 1945:
Undam- aged (sq mi) Damaged
(Sq mi) (Percent)
Built-up area (urban) 2.05 0.539 26.8
Built-up area (industrial) 0.156 0.015 9.6
Built-up area (total) 2.206 0.554 25.2
The United States Strategic Bombing Survey
found 0.42 square mile destroyed in this at-
tack. A difference in the figures for the built-
up portion of the city exists, based on an Army
Map Service plan, scale 1/12,500, which gave
1.576 square miles, compared with 2.206 re-
ported by the Twentieth AF. The Army Serv-
ice plan was found to be somewhat out of date,
and the area measured may not have been cor-
rectly defined. All industrial areas were ex-
cluded in the measuring operation.
VIII. Comments and Conclusions
1. The completeness of the damage inflicted
on Oita by the M47 incendiary attack, 16-17
July 1945, suggests an excessive concentration
of bombs in the area just west of the main
business thoroughfare and west of the aiming
point (Figure 1).
2. The M47 incendiary bomb was considered
an excellent fire raiser in combustible buildings.
3. Bombs did not perforate heavy reiAforced-
concrete roofs of multi-storied buildings.
4. Only one M47 malfunction was found.
5. A strong water supply, together with gas-
oline-driven auxiliary pumps, in addition to the
electrically-driven pumps located at the river,
might have enabled fire fighters to combat
spreading fire more effectively. Modern mo-
torized equipment, good hose, mobile gasoline-
driven pumps, and portable hand pumps would
have aided firemen in their efforts to save
property on the fringe only.
6. Good organization, training and direction
of those engaged in fire fighting, coupled with
good equipment would have minimized the dam-
age, particularly in the area east of the main
business street where the concentration of in-
cendiaries appeared to have been relatively
light.
7. The erection of good masonry fire-division
walls between wood commercial buildings, and
separation walls of a similar type Between small
groups of wood dwellings might have had a
limiting effect on fire spread.
8. The use of wood framing for air-raid shel-
ters is undesirable as shown by the many
burned shelters in Oita.
37
Photo 1.—Typical Japanese dwelling.
Photo 2.—Interior of dwelling showing ceiling removed.
38
Photo 3. — Small commercial-type structure in course of construction.
Photo 4. — Firebreak established by HE prior to 17 July 1945. Combustible debhis had not been removed.
39
Photo 5.—Wire-glass windows broken by casing fragment resulting in fire in one room first floor back.
Photo 6.—Three typical static tanks almost flush with road. Prevalent in dwelling areas.
40
Photo 7.—Incendiary disposal implements. Noted on roof of department store.
Photo 8.—Typical small static tank and shelter. Many of these noted in the city.
41
Photo 10. — Hand-drawn fire apparatus.
Photo 9.—Manually operated fire pumps.
Photo 11.—Small manual fire pumps.
Photo 12. — Small hand-operated pump. Note hose and play
pipe.
Photo 13.—The only above-ground two-way hydrant in Oita. Photo 14. — Underground hydrant outlet with standpipe
attached.
42
Photo 15.—Main fire station. Two combination trucks.
Photo 16.—Right side of combination fire truck.
Photo 17.—Left side of combination fire truck. Photo 18.—Rear view of fire truck.
Photo 20.—Drying rack for hose. Note innumerable patches.
Photo 19. — Two-cylinder tricycle. Used to carry hose,
nozzles, extinguishers.
704699—47—4
43
Photo 21.—M47 fragment scraps and cne complete casing.
Photo 22.—Perforation of tile roof by M47—Soy bean sauce factory.
44
Photo 23. — Burned-out area right. Buildings on left separated by 20-foot streets, unburned.
Photo 24.—Concrete and mud wall around prison, which stopped fire spread.
45
Photo 25.— General view north of courthouse, all buildings except dozo record vault destroyed.
Photo 26.—Timber radio shop and dwelling saved by bucket brigade.
46
Photo 27.—Printing shop damaged by fire. M47 exploded in yard. Repairable and under reconstruction.
Photo 28. — Northwest side prefecture building burned.
47
Photo 29.—Combustible store completely destroyed, located in center of city.
Photo 30. — All buildings destroyed both sides of five-foot-high masonry wall.
48
Photo 31.—School building burned. Buttresses standing.
Photo 32.—Spalling of stone footing due to intense heat.
49
Photo 3 3.—General destruction. Looking west from Building 10.
Photo 34.—General destruction. Looking southeast from Building 10.
50
Photo 3 5.—Destroyed area east from Building 14.
Photo 36.—Destroyed area southeast from Building 14.
51
Photo 37. — Destruction south from Building 14.
Photo 38. — Destruction southwest from Building 14.
52
Photo 39.—Destroyed area west from Building 14.
Photo 40.—Destroyed area northwest from Building 14.
53
Photo 41.—Destroyed area north from Building 14.
Photo 42.—Destroyed area northeast from Building 14.
54
Photo 43.—General view of burned business district.
Photo 44.—Complete destruction of combustible business building. Note collapsed steel elevator shaft and tower.
55
Photo 45.—Building 1. Presbyterian Church.
Photo 46.—Building 2. Confectionary manufacturing and
dwelling.
Photo 47.—Building 3. Soya sauce factory. Contents fire.
Photo 48.—Building 4. Mercantile shop. Contents fire.
Photo 49.—Building 5>. Bank. Burned out.
Photo 50.—Building 5. Bank. Northwest view.
56
Photo 51.—Building 5. Interior destroyed. Vault at right.
Photo 52.—Building 6. Nippon Bank. Undamaged.
Photo 5 3.—Building 7. Post Office. Undamaged.
Photo 54.—Building 8. Dispensary. Undamaged.
Photo 5 5.—Building 9. Bank. Minor damage.
Photo 56.—Building 10. Bank. M47 did not perforate roof.
57
Photo 58.—Building 12. Prefecture. Partly burned.
Photo 57.—Building 11. Probable police station. Undamaged.
Photo 59.—Building 13. Bank. Undamaged from IB
action.
Photo 60.—Building 14. Department store. Partly damaged
by fire.
Photo 61.—Building 15. Bank. Minor fire damage.
Photo 62.—Building 16. Bank. Interior burned. .
58
од
Photo 63.—Building 19. Oita police station. Undamaged.
Photo 64.—Building 16. Complete destruction of interior. Photo 65.—Building 16. Interior of main banking room.
Photo 66.—Building 17. Telephone Exchange. Undamaged. Photo 67.—Building 18. Insurance Company. Undamaged.
704699—47—5
59
Photo 68.—Typical street. One- and two-story dwellings.
Photo 69.—Public air-raid shelter.
60
Photo 70.—Post-raid cover. Note completeness of destruction in concentrated area west of main business street which is
indicated by arrow.
61
TABLE 1
AVERAGE TEMPERATURES
AND HUMIDITY
Average Average
t temperature humidity
Date (degrees C) (percent)
July 1945:
10________________________________ 23.23 85.0
11 27.33 78.3
12 22.33 96.0
13 22.70 88.7
14 23.13 94.3
15 27.30 82.3
16 24.33 97.3
17 26.90 82.7
18 23.73 83.7
TABLE 3
Precipitation
(In millimeters)
July 1945: 22-2 2-6 6-10 10-14 14-18 18-22
Date hours hours hours hours hours hours Total
10 — 6.4 0.1 6.5
11 — 0.1 0.0 0.1
12 3.4 6.3 113.7 49.2 41.4 11.3 225.3
13 3.1 0.0 3.1
14 15 — 0.1 0.0 7.2 25.9 0.0 33.2
16 0.2 20.0 8.9 — 29.1
17 0.0 0.0 1.5 1.4 3.9 4.6 j 11.4
IS 0.9 1 1 1 1 1 0.9
TABLE 2
Wind Direction and Velocity
[Legend: 4-h: Hour readings; Dir.: Wind direction; MPS: Meters per second velocity;
MPH: Miles per hour velocity.]
Date July 1945 2-h 6-h 10-h 14-h 18-h 22-h Hours average
Dir. MPS MPH Dir. MPS MPH Dir. MPS MPH Dir. MPS MPH Dir. MPS MPH Dir. MPS MPH MPS 1 MPH
16 — 0.0 0.0 SW 1.5 3.35 ENE 1.7 3.8 NNW 3.0 6.7 E 1.3 2.9 0.0 o.o • 1.5 3.35
17 S 3.7 8.27 W 2.0 4.49 WSW 3.2 7.15 SW 4.8 10.7 SW 1.8 4.0 NE 2.5 5.59 3.10 । 6.93
TABLE 4
Sunshine
(Jordan Type Meter)
Percent of hours
Date July 1945: 6-7h 7-8h | 8-9h 9-10h 10-llh ll-12h 12-13h 13-14h 14-15h 15-16h 16-17h 17-18h 18-19h Total
10 0.05 0.10 1 0.00 0.20 0.00 0.00 0.30 0.30 0.00 1.00 0.80 0.60 0.30 | 3.65
11 0.00 0.22 0.67 0.68 0.40 0.20 0.00 0.04 0.00 0.20 0.00 0.00 0.00 | 2.41
12 0.00 0.00 0.00 0.00 0.00 0.00 0.00 0.00 0.00 0.00 0.00 0.00 0.00 0.00
13 1.00 1.00 1.00 1.00 1.00 1.00 1.00 1.00 1.00 1.00 1.00 1.00 0.55 12.55
14 0.30 0.10 0.50 0.90 0.50 0.00 0.00 0.00 0.00 0.00 0.00 0.00 o.oo 2.30
15 0.00 0.00 0.20 1.00 0.90 0.60 0.40 0.62 1.00 0.40 1.00 1.00 0.30 7.42
16 0.00 0.00 0.00 0.00 0.00 0.00 0.00 0.00 0.00 0.00 0.00 ' 0.03 0.07 0.10
17 0.00 0.00 0.05 0.60 0.50 0.20 0.00 0.00 0.00 0.00 0.00 0.00 0.00 1.35
18 0.05 0.00 0.00 0.00 0.00 0.01 0.30 0.05 0.00 1.00 0.70 0.20 0.15 2.46
62
TABLE 5
Damage Analysis
Offices and Banks
Building No. Function Fire class Plan area Usable floor area Square feet of damage
Structural Superficial Minor Contents
Sq. Ft. Sq. Ft.
5 Bank C 5,200 10,400 5,200 _ _ _ _ .. 10,400
6 Bank C 1,600 3,200
7 Post office C 1,200 2,200
8 Dispensary C 1,200 3,228
11 Police headquarters. C 4,850 9,700 2,200 7,000 7,000 7,000
12 Prefecture C 21,900 43,800
13 Bank C 1,650 3,300 200 360
15 Bank C 1,800 3,600 6,700 13,400
16 Bank C 6,700 13.400 13,400
18 Insurance company. C 1,200 2,400 —
101 Totals C 47.300 | 95,228 14,100 20.400 7,200 31.160
1 Number of buildings.
Offices and Banks
Building No. Function Fire class Plan area Usable floor area Square feet of damage
Structural Superficial Minor Contents
9 Bank R Sq. Ft. 2,700 12,400 9,600 3,400 Sq. Ft. 3,400 24,800 19,200 6.800 100 300
10 Bank R * 400
17 Telephone exchange. Police station R
19 R
Totals
41 R 28,100 54,200 400 400
1 Number of buildings.
Schools and Churches
Building No. Function Fire class 4 Plan area Usable floor area Square feet of damage
Structural Superficial Minor Contents
1 20 Church C Sq. Ft. 2,400 15,000 42,000 Sq. Ft. 3.600 25,000 50,000 10
Grade school C 25,000 50,000 25,000 50.000
21 Girls school Totals C —
3i C 59,400 78,600 75.000 — 10 75,000
1 Number of buildings.
Commercial
Building No. Function Fire class Plan area Usable floor area Square feet of damage
Structural Superficial Minor Contents
4 14 Store Department store Totals 1 1 1 1 1 1 1 1 1 1 1 1 1 1 1 1 1 1 1 1 Sq. Ft. 1,100 10,000 Sq. Ft. 2,200 45,000 — 2,200 3,000 2,200 25.0ОЧ
2 i n 1 11,100 | 47,200 1 — 5.2П0 27,200
1 Number of buildings.
63
Industrial
Building No. Function Fire class Plan area Usable floor area Square feet of damage
Structural Superficial Minor Contents
2 3 Confectionery man- ufacturing and storage. Sauce factory Totals R R Sq. Ft. 1,800 3.840 Sq. Ft. 3,600 7,680 — 3,840 1,800 7,680
21 R 5,640 11,280 — — 3,840 9,480
1 Number of buildings.
Damage Analysis Recapitulation
Number of build- ings Function Plan area Usable floor area Square feet and percentage of damage
Structural Superficial Minor Contents
Sq. Ft. % Sq. Ft. % Sq. Ft. % Sq. Ft. %
। । i । । । । i । । । । । । i । । i । i । i i । i । । । । । Offices, banks Offices, banks Schools and churches, Commercial Industrial All included C R.___ C____ R R Sq. Ft. 47,300 28,100 59,400 11,100 5,640 Sq. Ft. 95,228 54,200 78,600 47,200 11,460 14,100 75,000 14.8 95.4 20,400 1 21.4 1 7.200 400 10 5.200 3.840 7.6 0.7 0.013 11.0 33.5 31,160 400 75,000 27,200 9.480 32.7 0.7 95.4 57.6 82.7
21 C&ft 151,540 | 286,688 89,100 31.08 20,400 | 16,650 1 58 1 143.240 49.96
64
Parts
EFFECTS OF INCENDIARY BOMB ATTACKS ON TOKYO, JAPAN
6Б
TABLE OF CONTENTS
Page
I. Object of Study................................ 67
II. Summary....................................... 67
III. General Information................................. 67
IV. The Target........................................ 68
V. Attack Data................................... 87
VI. Analysis of Damage..................................... 94
VII. Conclusions......................................... 116
Photographs 1-58, inclusive
Figures 1-3, inclusive
Table 1
66
I. Object of Study
The primary purpose of this study was to
determine why the incendiary bomb attack of
9-10 March 1945 by the Twentieth AF on the
densely populated Incendiary Zone 1 of Tokyo
was so highly successful. The purpose was
further to appraise the fire damage to indus-
trial establishments caused by direct hits and
by exposure fires. In addition, the other major
attacks on Tokyo are listed to give a more com-
plete picture of the effort directed against the
city and the damage accomplished.
II. Summary
1. Tokyo, included in the world’s third
largest metropolitan area, had a population of
more than 7,000,000 in 1944. It was the seat
of the national government and the leading city
of Japan in manufacturing, commerce, com-
munication, transportation, and amusements.
The metropolitan area of Tokyo covered more
than 800 square miles; the city proper, more
than 200 square miles; and the highly built-up
portion of the city, about 100 square miles.
2. Tokyo Incendiary Zone 1 was the most
highly built-up portion of the city and its 11.08
square miles had an average built-upness of
more than 40 percent. (Built-upness is a
measure of the portion of an area covered by
buildings.) Its population density ranged
from 90,000 to more than 135,000 persons a
square mile and averaged 103,000.
3. More than 95 percent of the buildings in
Zone 1 were wooden and of typical Japanese
construction. Most of these buildings had tile
roofs, but some had corrugated sheet-metal
roofs. They were normally built in solid block
fronts separated by narrow alleys 10 to 15 feet
wide. Wide streets separated these into sec-
tions of 50 to 100 blocks. The total length of
firebreaks in this zone was 78 miles.
4. Home industry was highly concentrated in
Zone 1 which was also surrounded on three
sides by factory areas. Most of the people
living in the zone worked either in the home
industries or in the surrounding factories.
' 5. When it became evident that the city
would be subjected to air attacks the Japanese
prepared firebreaks 120 to 300 feet wide
through the densely built-up areas by razing
buildings. Thousands of structures were de-
molished for this purpose before the end of the
war. Fire equipment was increased to a total
of 1,117 pieces, of which 716 were motor-driven
pumpers with capacities of 350 to 500 gallons
per minute. In addition, numerous pieces of
hand-operated equipment were distributed
throughout the city, and an effort was made to
instruct the people in their use. The normal
fire department strength of 2,000 was increased
to 8,100. Practically all firemen were required
to go through a school of instruction. By
Japanese standards they were considered well
trained, but by American standards they were
still in the recruit stage.
6. The source of water was ample for the
city, but the scant distribution system was in-
adequate from a fire-protection standpoint.
More than half of all pipes were three or four
inches in diameter. Pressures were generally
low, varying from zero to 25 pounds per square
inch. Sixty percent of all hydrants were one-
way flush type on 4-inch or smaller mains. A
few static tanks of 20,000- to 40,000-gallon
capacity had been built, but they were not in
sufficient number to be effective.
7. Six attacks are considered in this report.
The most important of these was the night
attack of 9-10 March 1945, both because this
attack marked the departure from high-altitude
daylight bombing in formation to individual
low-level night bombing, and because the effi-
ciency of this attack was greater than any made
before or since. In this attack 9.48 square
miles of the target were burned for each 1,000
tons of bombs dropped (or 1 square mile per
105 tons). A total of 1J.8 square miles of the
city was totally or heavily damaged in this at-
tack; 56 square miles were totally or heavily
damaged in all attacks. One other attack, that
of 25-26 May 1945, damaged a greater area,
16.8 square miles, but the bomb tonnage
dropped was twice as great.
8. The number of persons made homeless by
all attacks on Tokyo totaled 2,861,857 (1,008,000
by the attack of 9-10 March). All attacks
killed 95,972 persons (8o,793 in the attack of
9-10 March).
III. General Information
1. The portion of Tokyo Area Team 6 which
67
conducted this investigation following personnel: consisted of the
Maj. G. P. Guill Team chief.
Maj. T. F. Gallagher Ordnance.
Maj. H. V. Keepers Fire damage
analyst.
1st Lt. J. S. Raines Fire damage
analyst.
PhoM 2/c J. D. Devore.... Photographer.
T/4 M. Shimomura Interpreter.
Cpl. H. L. Born Draftsman.
2. The,study was conducted during the
periods 27 October-1 November and 20 Novem-
ber-28 November 1945. The weather during
the latter period was cold and rainy, making it
difficult to obtain good photographs.
3. Information for this report was obtained
from the chief of the Tokyo Are department,
various plant managers, police, firemen, resi-
dents, and other divisions of the Survey. In-
formation from Japanese sources was usually
verified by examination or by questioning sev-
eral individuals on the same subject, although
there seemed to be no reason why false infor-
mation should be given deliberately by the
Japanese. Cooperation by all concerned was
excellent. The photo cover for the attack of
23-24 May was too poor to be used in making a
good damage estimate. The figure for the dam-
age in that attack used in this report was
obtained by measuring the damage plotted on
a map by the Japanese immediately following
the attack. Excellent photo cover was avail-
able for the combination of this attack and the
attack of 25-26 May, and the damage from the
latter attack was taken as the difference be-
tween the combination from photo cover and
the former from Japanese sources.
IV. The Target
1. Tokyo was part of a vast metropolitan
area located along the north shore of Tokyo
Bay and situated in the southeast corner of the
Kanto plain. This metropolitan area which
included Tokyo, Yokohama, Kawasaki, and
numerous small suburban villages was the third
largest in the world before the air attacks be-
gan. The city of Tokyo proper was the largest
city in Japan, its population of 7,238,569 (1944
census) having been as great as the five next
largest cities of Japan combined. Tokyo was
the seat of the national government, the home
of the emperor and the imperial court and the
center of power and authority. It was at once
the greatest industrial, communications, trans-
portation, commercial, and amusement center
of Japan. It was also considered to be pre-
eminent in respect to universities, museums,
hospitals, department stores, office buildings,
and theaters.
2. The Metropolitan District of Tokyo
formed an irregular oval extending some 28
miles from north to south and 57 miles from
east to west, totaling 828 square miles. The 35
wards of the city proper covered only one-
fourth of the Metropolitan District (213 square
miles), but contained more than 90 percent of
its population. Of the city proper an area of
103.45 square miles was highly built up, and
for this reason it was considered by the United
States Air Forces as the Tokyo target area.
This area consisted of:
Square
miles
Incendiary Zone 1_____________________________ 11.08
Incendiary Zone 2_____________________________ 57.04
Target Area 90.17-3600_________________________ 8.52
Target Area 90.17-3601________________________ 14.85
Target Area 90.17-3602_________________________ 6.70
Target Area 90.17-3603_________________________ 5.26
Total____________________________________103.45
Figure 1 shows the location of Incendiary
Zone 1.
3. The largest and best buildings in Tokyo
were located east of the imperial palace (Photo
1) in the financial and shopping districts
(Marunouchi and the Ginza). There were
many multi-story, earthquake-and-fire-resistive
buildings, but these were interspersed with
flimsy wood structures. The better residential
areas extended from the palace grounds well
into the northwestern and southwestern sec-
tions of the city. Although most of the streets
in these sections were narrow, the built-upness
was not so great as in other sections of the city,
and the houses were often surrounded with
walled gardens. The principal open spaces
were parks totaling some seven square miles.
4. Since the primary object of this report is
concerned with Mission 40, the 9-10 March at-
tack, a somewhat detailed description of Incen-
diary Zone 1 follows. The facts presented
68
Photo 1.—Looking toward the shopping and financial districts of Tokyo. This section contained the modem fire-resistive structures of the city. Note the bareness of
the burned-out section in the foreground on which typical Japanese structures formerly stood. Also note the burned vehicles caught in the street.
would have applied in general to the rest of
Tokyo.
a. The target area chosen for Mission 40 was
Incendiary Zone 1, a highly congested, rec-
tangular-shaped area approximately three miles
east-west by four miles north-south (Figure 1).
The conspicuous imperial palace grounds lay at
the southwest corner, and the western boundary
extended northward to Ueno Park, another
prominent open space about two miles north of
the palace. The boundary then curved to the
east and north along the Joban railroad to the
Sumida River, thence southeast to a north-south
line, the eastern boundary, which was halfway
between the Sumida River and the Diversion
Canal. The southern boundary extended from
this line due west across the Y-mouth of the
Sumida River to the palace grounds. The
western boundary of Zone 1 bordered on
Tokyo’s business center, extending north and
south along the east side of the imperial palace
grounds. Included in this area was the Ginza
(shopping area) with its numerous shops and
fine department stores. The Marounouchi Sec-
tion, near the palace, contained government
buildings, banking houses, newspaper plants,
and insurance company buildings. The north
boundary adjoined Tokyo’s great arsenal area
and railroad marshalling yards. The eastern
boundary, extending through the center of the
island made by the Sumida River and the Diver,
sion Canal, bordered on a large industrial area
of steel mills, instrument plants, foundries,
spinning mills, and numerous miscellaneous in-
dustrial plants on the canals in this area. The
southern boundary bordered on an area of
heavy industry, including shipyards along
Tokyo Bay. The near-by industrial area drew
heavily on the population of Zone 1 for labor.
b. Zone 1 included one of the most densely
populated areas in the world—Asakusa Ku with
a population of more than 135,000 persons per
square mile. The remainder of the zone had a
population density of 80,000-135,000 persons
per square mile except for a small portion in
the southeast corner where the population was
somewhat less (Figure 2). Average population
density was 103,000. The total number of per-
sons living within the area was estimated at
1,100,000 or about 15 percent of Tokyo’s popu-
lation. Most of the persons made their living
70
from the industries in and surrounding this
area.
c. There was probably no other residential
area in the world of a comparable size which
equaled the built-upness of Zone 1, which aver-
aged 40 to 50 percent. This means that the
roof area of the zone was 40 to 50 percent of
the total area, including streets, small parks
and rivers, and all other areas within its boun-
daries (Photo 2). When it is considered that
the average American residential area is only
about 10 percent built up, it can be seen that
Zone 1 was highly congested.
d. After the earthquake and fire of 1923,
Tokyo was largely rebuilt, but many temporary
wooden barracks were erected to meet the
emergency. In Zone 1 a large number of these
barracks had degenerated into permanent slum
areas instead of being replaced as had been
originally planned. ,;
e. There were six important targets within
Zone 1, the most important of which was the
Hattori Co., peacetime manufacturers of Sei-
kosha watches, and wartime manufacturers of
fuzes for artillery shells. The remaining tar-
gets were railroad yards, stations, and market
areas. The heavy industrial area was just east
of the eastern boundary of Zone 1 and included
some 35 important targets. Shipyards, steel
mills, and cable plants were along the southern
boundary of Zone 1. Principal strategic prod-
ucts were fuzes, steel and special alloys, copper
wire and cable, bakelite, electric motors and
allied products, textiles, guns, railroad rolling
stock, and numerous small parts for aircraft
and automobiles. The importance of this area
to the total output of strategic war products
was indicated by the special efforts made to
protect the plants from possible incendiary
attacks. They were surrounded by 100-foot
firebreaks, and special efforts were made to
train fire brigades. In some instances the
Tokyo fire department maintained a fire station
on the premises.
f. This target area of Tokyo was ideal for
home industry which was prevalent in all large
Japanese cities. The feeder factories were near
the workers’ homes, which solved the problem
of transportation of raw materials to the home
and finished products back to the factory.
Small machined parts and foodstuffs were the
71
Photo 2.—Japanese photograph of a typical section of Tokyo in Zone 1 showing the construction and congestion of buildings.
The street in the foreground was one of the widest. The house across the street was damaged by an HE bomb.
Photo 3. — Interior view of a home industry food plant. Note exposed wiring. This plant was much less cluttered up with
loose inflammable items than were the majority.
72
principal products (Photos 3, 4, 5). These
small producers were located both in homes and
in small shops formerly devoted to other uses.
The number of such establishments is not avail-
able, but it is known that they were very
numerous and contributed heavily to the output
of the larger plants. Burned machinery of
these home industries was noted throughout
the area.
g. Dwellings in this zone were typically
Japanese (Photos 6 and 7). For the most part,
they were two-story wood-frame (Photos 8
and 9) with Ц- to %,-inch wood floors covered
with straw tatami mats, and with tile on (mud-
fill) wood roofs. The ceilings were of unpro-
tected 14-inch wood laths. In many cases the
first floor was used for a small store or some
home industry. Small charcoal braziers
(Photo 10) were the only means of heating the
houses. Cooking was accomplished on a sim-
ilar device, usually of stone or clay built as an
integral part of the building. Most Japanese
homes had no basement. Framing in the usual
dwelling was approximately four by four inches
for studs, with intermediate members two by
four inches. Outside walls were covered by
thin clapboards or bamboo lath and low-grade
mud plaster. Framing members were joined
by mortise-and-tenon joints with very few nails
or other metal parts used in the construction
(Photo 7).
Л. The combustibility of Japanese dwellings
was well illustrated by tests made in this coun-
try. Four buildings were constructed: two in
the “typical Japanese fashion” with outer walls
of clapboard and with exposed windows (the
combination store-residence type so common in
Zone 1); and the other two to comply with the
latest Tokyo Are regulations. The latter were
two stories high with %-inch plaster on metal
reinforcing (lath) and with wooden shutters
on windows. The four structures were set on
fire to determine the time necessary for their
destruction. Those constructed in “typical
Japanese fashion” burned to the ground in 12
minutes; those constructed in accordance with
Tokyo Are regulations were consumed in 32
minutes. It was estimated from unburned
areas of Tokyo near Zone 1 that about 95 per-
cent of the dwellings were built in “typical Jap-
anese fashion.”
i. There were few modern apartment build-
ings in Tokyo. Those inspected were usually
4- to 5-story, Are- and earthquake-resistive
structures, built after the 1923 earthquake.
All were located in congested areas and were
susceptible to exposure Ares. None of those
inspected, however, was provided with exposure
protection devices such as wire-glass windows
and Are shutters.
j. The majority of manufacturing plants
were one-story, masonry, or steel-frame struc-
tures with wood-frame or unprotected-metal
roof trusses. (Tokyo was subject to numerous
earthquakes and the construction of multi-
story, earthquake-resistive buildings was pro-
hibitive in cost.) Roof covering was either
corrugated iron or asbestos cement. Masonry
walls were widely used in the spinning and
weaving mills, instrument (electrical) plants,
printing plants (converted to other uses), or
similar industrial establishments. Steel-frame
structures were commonly used in foundries,
steel plants, machine shops, and analogous
industries.
k. Throughout Zone 1 there were numerous
small plants, each employing 50 persons or less.
The predominant type of structure housing
these industries was of wood or steel frame
with a roof covering of corrugated iron or as-
bestos cement (Photo 11). These plants were
all seriously exposed by surrounding dwellings
and mercantile buildings.
I. The street pattern of Tokyo followed a
fairly definite plan. Individual blocks were
bounded by narrow alleys, hardly more than 12
feet wide (Photo 12). Groups of blocks vary-
ing in number from 100 to 300 were bounded by
wide thoroughfares or canals 100 feet in width
on the average (Photo 13). Sections along the
east bank of the Sumida River were (more or
less) square in shape, while the territory west
of the river was irregular in pattern and size.
Due to the highly combustible structures and
narrow alleys, these sections were the smallest
units that could be considered as individual Are
areas. It would be possible under peacetime
conditions to halt the spread of Are across one
of the wide streets with a well-trained and well-
equipped Are department, because brands fall-
ing on tile roofs do not spread Are. The nar-
row alleys made it difficult to move any but the
73
Photo 4.—Typical Japanese home industry machine shop showing crowded conditions and combustibility.
Photo 5.—Typical Japanese home industry machine shop showing roof construction and crowded pulley arrangement.
74
Photo 6. — Typical Japanese homes with thin clapboard sides and tile roofs. The garden in the foreground was planted inside
the foundations of a house wrecked to form a firebreak.
Photo 7.—Typical Japanese house under construction. Note joining of members with mortise-and*tenon joints. Very little
metal was used in the construction. Small building at left had bamboo lath walls which were to be covered with mud and
plaster.
704699—47—6
75
Photo 8.—Typical combination dwelling and shop buildings in solid block front without intervening fire walls. Observe the small static water tanks at the far end.
Photo 9.—Interior of block showing rear of buildings in Photo 8. Note the flimsy construction and narrow alley.
Photo 10.—Interior of low-class dwelling. Note the straw mat floor covering, the charcoal braziers, and the general accumulation of highly inflammable material
smallest pieces of fire equipment within the in-
dividual sections. Thus the conflagration haz-
ard from a large area incendiary bomb attack
was serious. In view of the above, it is ap-
parent that the starting of numerous fires on
both sides of firebreaks and wide streets would
be more than the local householders could com-
bat and would be too numerous for the fire
department personnel to handle. This together
with the highly combustible, flimsy, quick-burn-
ing construction would defeat the efforts of the
best of fire departments.
m. The purpose of firebreaks is to confine
fires within certain limits and provide avenues
of escape for the people. These firebreaks may
be blocks of fire-resistive structures forming a
solid wall at right angles to the source of the
fire, or open spaces of land, canals, rivers, or
widened streets made by removing buildings.
Tokyo, like other Japanese cities, had many
transportation canals. Where they were 100
feet or more in width, these canals made excel-
lent firebreaks. Several wide canals were lo-
cated west of the Sumida River and east of the
imperial palace. The Sumida River was the
most effective firebreak in Zone 1. It divided
the Zone almost in half from northeast to south-
west. In April 1944 the Japanese Government
realized that the Home Islands might be subject
to heavy air attacks and took steps to lessen the
danger of fire spread by creating man-made
firebreaks. From this time until the end of the
war thousands of buildings were removed or
demolished for this purpose (Photo 14). From
east to west the breaks were 120 to 300 feet
wide, since the prevailing winds were north-
south except in summer months. A notable ex-
ception was a 300-foot break running north to
south near the eastern boundary of Zone 1.
With the natural barriers of canals and rivers,
these firebreaks with the assistance of an ade-
quate fire department would have kept a peace-
time fire confined to the area of origin. The
incendiary bomb attacks, however, nullified
their effectiveness by starting fires on both
sides of them. Statistics on fire breaks in Zone
1 are given below:
n. Fire departments in Japan were admin-
istered from the ministerial level though the
police bureau of the Minister of Home Affairs.
In Tokyo the fire chief was appointed directly
Firebreaks
150 feet wide or more 65-150 feet wide Total
Total length (miles) 26.3 51.7 78.0
Subjected to fire (miles) 20.6 37.3 57.9
Percentage subjected to fire 78.3 72.1 74.2
Fire stopped (miles) 3.6 2.3 5.9
Percentage stopped 17.4 6.1 10.1
Note—Fires were considered “stopped” where incendiary dam-
age existed directly on one side of a firebreak only. This is,
therefore, a minimum assessment of efficiency, because fires on
both sides were often caused by bombs falling on both sides and
not by fire spread.
by the Minister of Home Affairs with the sanc-
tion of the emperor. In this manner the fire
department came under the direct control of the
police department with the result that many in-
experienced men from the police department
were given positions in the fire department.
The actual operating heads of the various units
of the fire department were usually well edu-
cated men of long experience.
(1) Personnel was generally well selected
with emphasis on personal fitness, but wartime
drain on fire department personnel made it nec-
essary to relax these restrictions. When it
became apparent that Allied forces were ap-
proaching closer to the Home Islands an inten-
sive campaign to increase the size of the
department was made. The normal strength
of the Tokyo fire department, about 2,000, was
increased to 8,100, including 2,700 active junior
firemen. The ultimate goal of 12,500 was
never reached, and at the time of the survey,
the actual strength was 6,610 men.
(2) The work periods were definitely set out
in regulations, but, during the closing days of
the war, the man-power shortage and the nu-
merous air-raid warnings allowed few firemen
to spend more than an hour or two a day away
from the stations. During the war the recruit
training period was reduced to 30 days and
included the same routine as the regular school
but with less time devoted to practice. All
drills were under the direction of instructors
especially selected for their ability. The train-
ing period compared favorably to the time de-
voted to that purpose in the United States, but
the subjects covered were elementary from a
fire-protection standpoint. The severe short-
age of fire-fighting equipment made it necessary
to use dummy or immobilized equipment for
79
Photo II.—One of the large home industry machine shops. Its corrugated-asbestos roof covering was cracked off by the
heat, and the siding was warped, but the frame was intact. The machinery was ruined. Broken tile in the foreground was
all that remain?d of dwellings.
Photo 12.—Narrow alley in block interior. An air-raid shelter can be seen in the center of the picture, static water tanks in
the foreground.
80
Photo 13.—This street was the widest in Zone 1 and served to divide the small blocks made by alleys into larger sections.
Observe the fire tower on the left side.
Photo 14. — Japanese photograph showing a firebreak being constructed. These houses were wrecked by demolition.
81
training purposes. The normal company was
seven men and it was the usual practice to de-
clare a company out of service if less than this
number was present. This was a decided dis-
advantage during air attacks when it was a
common occurrence for companies to lose one or
more men during the course of an attack.
(3) Tokyo was divided into 35 Ku (wards),
each of which had a main Are station and one to
eleven branch stations (Photos 15 and 16).
There was a total of 42 main stations and 190
branch stations in metropolitan Tokyo. The
main stations housed two pumpers each and the
branch stations one. These were pieces of mo-
tor-driven equipment actually manned. There
was a total of 1,117 pieces of apparatus, of
which 716 were standard motor-driven pump-
ers (Photo 17). The remaining equipment in-
cluded 11 small, 500-gallon-per-minute fire
boats, one undamaged ladder truck of the four
originally provided (Photo 18), and hand-
drawn units with 120-gallon-per-minute, motor-
operated fire pumps (Photo 19). Most of the
pumpers were of Japanese make with a two-
stage centrifugal pump of 350- to 500-gallon-
per-minute capacity, mounted on a commercial
chassis (Photo 17). There were some pumpers
of American make, but most of these were un-
serviceable due to lack of parts. Equipment on
the pumpers included, in addition to a meager
amount of minor equipment, two hose reels
with 1,330 feet of 2i/_>-inch single-jacket linen
hose (Photo 20). All trucks of Japanese make
were underpowered for the purpose for which
they were used. They were not considered the
equal of the equipment used in the average
small American town. In normal operations
the pumper answering the alarm went to the
source of water supply nearest the fire, which
might be a hydrant or a static tank. The hose
reel was removed from the truck and a line of
hose laid to the fire. The hose reel was re-
turned to the truck and another line laid. In
the meantime the truck was connected to the
source of water supply. Open nozzles were
used in Japan. Small stream appliances were
used, reliance being placed on hand lines with
%- to 1-inch tips. A minimum of four trucks
responded to alarms, with the ladder truck re-
sponding only to special calls. Numerous small
hand-operated pumps, manned by junior fire-
men or householders of the block associations
who had been trained in the rudiments of fire
fighting, were scattered throughout the city
(Photo 21). Each dwelling was also provided
with a small concrete static water tank, always
kept full (Photo 22), which was to be used by
the individual in combatting incipient fires
started by incendiary bombs.
o. Tokyo drew its water supply from lakes
and streams in the near-by mountains and from
wells. The average yearly rainfall in the
Tokyo area was 64 inches and the streams were
all permanent, so the water sources were ample.
Ninety-five percent of the water was pumped by
electrically-powered equipment. The reservoir
capacity was approximately 80,000,000 gallons
and the total daily pumping capacity was
284,000,000 gallons. The reservoir capacity
servicing Zone 1 was about 8,000,000 gallons.
(1) The distribution system consisted of
water mains up to 70 inches in diameter with
cross feeders of 20 to 48 inches. The grid,
however, was weak since it was made up prin-
cipally of 3- and 4-inch pipes with about 60 per-
cent of all pipes 4 inches or less in diameter.
Diameter of pipe having hydrants (not risers) Percentage Number of fire hydrants, public and private
Inches
3 6.4 2.158
4 56.8 19,100
6 19.8 6,670
8 8.1 2,716
10 4.8 1,630
12 3.2 1,078
14 0.9 304
Total 100.0 33.656
The quantity available through such a grid
system is considered inadequate for a small
town; for the congested areas of Tokyo, it was
hardly adequate for domestic purposes. Pres-
sure in many districts rarely exceeded eight
pounds per square inch, and the maximum
pressure noted was about 25 pounds per square
inch. It was reported that pressures were so
low that householders sometimes permitted
house connections to remain open to secure
enough water for domestic purposes. There
were 33,656 fire hydrants on the distribution
system, of which 60 percent was on mains four
inches or smaller in size. In heavy industrial
and business districts two-way, post-type hy-
82
Photo 15.—A main, or ward, fire ftation with watch tower.
Photo 16.—A branch fire ftation burned in one of the attacks.
Photo 17. — Standard Japanese motor-driven 500-gallon-per-minute pumper.
Photo 18. — One of the
four aerial ladder trucks
in Japan.
84
Photo 19.—Hand-drawn 120-gallon-per-minute pumper distributed throughout the city and at important manufacturing plants.
Photo 20.—Japanese-made fire truck of 300- to 500-gallon-per-minute capacity. Hose reels were removed upon arrival at
scene of fire.
85
Photo 21.—Hand-drawn, hand-operated pump used by the civilian defense and in manufacturing plants.
Photo 22.—Concrete static water tank with capacity of 30 to 50 gallons used by householders to combat small fires.
86
drants were used (Photos 23 and 24), but the
great majority was one-way flush hydrants
(Photo 25). Post hydrants were not equipped
with pumper connections, draft being through
21^-inch hoses or from static tanks or canals.
(2) Emergency static water tanks, located
throughout the city for use in case of failure of
the water systems, varied in size from 20,000
to 40,000 gallons (Photo 26). Shallow wells
and canals were available but no definite plan
had been made for their use as indicated by the
lack of platforms which would be necessary to
permit fire trucks to obtain a satisfactory water
supply from them. The majority of house con-
nections were of lead and, during the 9-19
March attack, 70 percent of those in Zone 1
melted, resulting in a great drain on the water
system. In the confusion caused by the attack
no attempt was made to isolate these areas by
sectional control valves.
p. A fairly well planned air-raid warning
system was in effect, which was arranged
and operated by the Japanese Eastern Army
headquarters in Tokyo. Radar installations
on outlying island posts and at strategic main-
land coastal points, Navy picket boats equipped
with radar and radio, supplemented by civilian
defense and military observation posts, supplied
the Army headquarters with information re-
garding impending attacks. At the discretion
of Army headquarters telephone warnings were
sent to the Metropolitan Police board and im-
portant munitions plants. The decision as to
what signals should be sounded and at what
time rested with the commander of the Army
operations room, from which all municipal
sirens in Tokyo could be operated. It was cus-
tomary to withhold giving the air-raid “alert”
until 30 minutes before the expected attack, and
the “alarm” indicating the imminence of at-
tack was to be given 15 minutes prior to the ex-
pected arrival of enemy planes. It is considered
that the Tokyo air-raid warning system func-
tioned efficiently, and although considerable
damage was suffered by the siren system during
raids, alternate methods of control which had
been provided permitted the system to furnish
satisfactory service.
q. Shelters for the general public were
meager or lacking entirely (Photos 12, 27 and
28). Many of those in Zone 1 were built in the
sidewalks and consisted of little more than
shallow trenches with bamboo or light wood
roofs covered with a few inches of earth.
These shelters were so close to buildings that
they were worthless and were not used to any
great extent.
r. The fire susceptibility of Zone 1 was prob-
ably greater than that of any other similar
area in the world. Fire susceptibility is a
loose indication of the probability of an area
burning to a specified extent or degree. All
the factors discussed under “The Target” had
an influence on the measure of the fire suscepti-
bility. To give a better understanding of how
some of these factors were concerned a few of
them will be considered below:
(1) Assuming that an incendiary has been
placed on a target, the entire target is more
likely to burn, i.e., its fire susceptibility is
greater, if any set of conditions exists which
will tend to utilize the heat given off by the
portion of the target which is burning to ignite
portions not directly affected by the incendiary.
The high built-upness of Zone 1 increased its
fire vulnerability, since the buildings were close
together or adjoining and the heat given off by
those already burning ignited some of those not
directly hit by bombs.
(2) A high wind was blowing during the
attack, and this also temporarily increased the
fire susceptibility to a very great extent, be-
cause it blew the heat and flame from the build-
ings already burning against those not hit by
bombs, instead of allowing the heat to arise al-
most vertically as would have normally been
the case.
(3) The vulnerability of the zone was also
increased by lack of adequate water pressure
for fire fighting, insufficient firebreaks, the high
combustibility of the buildings and their con-
tents, and the lack of initiative on the part of
the fire department.
V. Attack Data
1. Six major attacks on the city are consid-
ered in this report. These attacks are listed in
Table 1. They do not include all attacks on the
city, but only the major attacks and attacks
which are interesting from both the tactical
point of view and from the standpoint of dam-
age done.
87
Photo 23.—Standard post-type fire hydrant. Note the valved
outlets and the absence of the usual operation stem.
Photo 24.—Older post-type fire hydrant. None of this type
had steamer connections.
Photo 2 5.—One-way flush-type fire hydrant. Photo 26.—Static water tank for emergency use. These tanks
varied in size from 20,000 to 40,000 gallons.
88
Photo 27.—Typical air-raid shelter constructed of earth-covered sewer pipe. These were usually not usable,
because they filled with rain water and seepage.
Photo 2 8.—This shelter, constructed in part of concrete, is far roomier and better than the average.
89
2. The attack of 25 February 1945 is the only
daylight attack covered in this report. The
bombing, however, was done through
cloud cover with the aid of radar. Perhaps the
most interesting feature of this attack is that
it was staged prior to the abandonment of the
high-level tactics in use at that time. The prin-
cipal area damaged was in the east-central por-
tion of Zone 1 (Photo 29) and amounted to one
square mile. The damage was 2.2 square miles
per 1,000 tons of bombs.
3. The attack on the night of 9-10 March was
an incendiary attack made by the XXI Bomber
Command of the Twentieth AF. This was the
most effective mission ever accomplished in
terms of area totally damaged per bomb ton-
nage dropped (Photos 30 and 31), and only one
other attack, regardless of tonnage dropped,
totally damaged as great an area—the attack
of 25-26 May on Tokyo, in which twice the ton-
nage was dropped to achieve a totally damaged
area only six percent greater. Prior to this
attack the general plan had been to strike the
strategic objective in daylight from aircraft
flying in formation at altitudes of 25,000 to
30,000 feet. Mission 40 involved an almost
complete reversal of these tactics. It was
planned that all aircraft should make individual
runs on the target at night, with the base alti-
tudes specified at 5,000 to 7,800 feet, dro]fping
only M47 and M69 incendiaries. The M47, a 70-
pound napalm-filled bomb, was carried by the
pathfinder squadron of each of the three wings
flying the mission to serve the dual purpose of
starting immediate “appliance” fires (i.e., fires
of such magnitude as to require the attention of
motorized fire-fighting appliances) and of effec-
tively marking each aiming point (Figure 1).
Maximum loads of 184 M47 bombs per aircraft
were carried, with the bombs clustered six to a
500-pound station with T19 cluster adapters.
All other aircraft carried M69’s (6-pound in-
cendiaries) in delay-opening clusters capable of
being aimed, anS set to function at 2,000 to
2,500 feet. Both E28 incendiary clusters (one
nose fuze) and E46 incendiary clusters (two
tail fuzes) were used. Intervalometer settings
were 50 feet for clusters and 100 feet for the
M47 bombs. The general plan of attack called
for pathfinder aircraft to strike the aiming
points, followed by aircraft carrying M69 bombs.
Crews were briefed not to drop bombs on areas
where good fires had started, but to make vis-
ual correction and bomb areas within the gen-
eral target zone where fires were not observed.
a. The 73rd Wing bombed the target area
from 6,620 to 8,950 feet through 2/10 to
10/10 overcast. Axes of attack were 290° to
309°. Flak was medium and heavy, intense
and accurate; 23 aircraft were damaged and
one was lost.
b. The 313th Wing bombed the target from
5,850 to 8,000 feet through 1/10 and 2/10 cover.
Axis of attack was 305°. The first planes en-
countered generally accurate fire of moderate
intensity, but succeeding elements received
lighter and less accurate fire which diminished
in strength until the last units received no fire;
nine planes suffered minor damage.
c. The 314th Wing bombed the target from
4,900 to 9,200 feet through 2/10 overcast.
Axes of attack were 210° to 240°. Flak en-
countered was medium and heavy, accurate to
inaccurate; 10 aircraft were damaged and eight
were lost.
d. Numerous empty M69 cases were found
throughout the area. An attempt was made to
determine the percentage of duds. Only one
M69 was found that had not functioned and no
evidence was found of clusters having failed to
open. No M47’s were found. The fact that
no duds of any consequence were found does not
necessarily indicate perfect functioning since
malfunctioned bombs will detonate in a fire.
e. Weather just preceding the attack was
fair with a moderate wind from the southwest.
There had been no rain or snow for several days
preceding the attack. The following table of
wind velocities for the night of 9-10 March was
obtained from the Japanese Weather Bureau
located about two miles from the area affected
by fire. Although this information was not se-
Wind Velocities — 9-10 March 1945
Time Direction Velocity
MPH
9 March 1945 J 2200 SW. 13
1 2400 W. 09
f 0200 NNW. 21
0300 NW. 28
10 March 1945 1 0500 NNW. 20
0700 NNW. 10
( 0900 NW. 14
90
Photo 29.—Aerial photo taken between the attacks of 2 5 February and 9-10 March. There was snow at the time of the
2 5 February attack and the burned out areas show up as black.
704699—47—7
91
Photo 30.—Aerial photo taken 11 March showing damage from the attack of 9-10 March. In this photo the snow has melted
and the burned areas show as light gray.
92
CD
CO
Photo 31.—Oblique photo taken 10 March showing most of the damaged area and some of the fires still burning from the attack of 9*10 March.
cured in the fire zone, it serves to indicate the
trend of wind conditions. As can be seen from
the tabulations, the wind increased in velocity
just prior to the attack and continued to in-
crease until a maximum of 28 miles per hour
was reached at 0300 hours, at which time all
planes had left the target area. Plant man-
agers and residents interviewed in the burned
area estimated wind velocities just prior to the
attack at about 17 to 25 miles per hour with a
maximum during the conflagration of 55 to 70
miles per hour. It was described, without ex-
ception, as being “too strong for a man to stand
up to.” The chief of the fire department esti-
mated the velocity at 50 miles per hour during
the height of the fire. It is possible that much
higher velocities were attained at the perimeter
since the gas rising above the area drew in vast
quantities of air. This is a common occurrence
during conflagrations.
4. The four remaining attacks listed in Table
1 were carried out with approximately the
same tactics as used on Mission 40, with results
varying from excellent to poor as shown in the
table.
VI. Analysis of Damage
1. The M47 bombs dropped by pathfinder
planes started fires which were spread rapidly
by the high wind. Bombs from following
planes started additional fires which later
merged to form one vast mass of flame as
viewed from the air. Planes which bombed
during the latter part of the attack found visi-
bility very poor and dropped bombs short of the
target area. These bombs started fires in the
congested industrial area south and east of Zone
1. (About 0.8 square mile of the total 11.08
square miles comprising the Zone 1 area had
been burned in the attack of 25 February
1945.) The 9-10 March attack burned all of
Zone 1 area east of and a major portion of
Zone 1 area lying west of the Sumida River.
Small areas in the extreme northwest tip and a
narrow strip running northwest in the south-
western corner escaped damage (Photos 30 and
31, Figure 3). Few bombs hit these areas be-
cause the last planes over the target area had
difficulty locating aiming points due to exten-
sive fire and smoke. The total damage result-
94
ing from this single attack was 15.8 square
miles of the heart of the city. Calculations in-
dicate that about two-thirds of Zone 1 was
burned along with about nine square miles of
the great industrial area bordering Zone 1.
Figures furnished by the Metropolitan Police
Bureau show 267,171 buildings burned in this
one attack. The Japan Year Book of 1944
stated that Tokyo had 1,057,921 buildings in
1938 of which 692,731 were dwellings. Based
on these figures the attack of 9-10 March to-
tally damaged about 25 percent of all buildings
in Tokyo.
2. The 28-mile-per-hour wind during the
course of the attack which increased in velocity
as the fires merged, contributed considerably to
the intensity and further spread of the confla-
gration. The direction of the wind, north-
northwest and northwest, caused the fire to
spread to the highly congested tenement and
industrial district east and south of Zone 1, re-
sulting in considerable damage to industrial
plants. Fire to the south and southeast
burned itself out against open areas, the Diver-
sion Canal or firebreaks. The fire west of the
Sumida River burned itself out either against
areas burned in the 25 February 1945 attack,
or against the river. Isolated fires to the
southwest and northwest caused by spill-overs
were relatively small and were controlled by
fire department operation and open areas.
3. The highly combustible nature of the city
resulted in an intense fire of short duration.
Observers stated that the heat was so intense
that entire block fronts burst into flames before
the main body of the fire reached them. The
heat intensity was indicated by the absence of
smudges on concrete buildings. Combustible
contents of buildings burned completely, leav-
ing no evidence of what the contents may have
been, and without marking the walls with
smoke. The fire chief stated that the fire had
burned itself out by morning except for fires in
industrial buildings. An aerial photograph
taken at about noon the following day (Photo
31) showed few fires still burning. No data
were available on the temperatures reached,
but considerable melted glass and, in one case,
melted concrete were noted (Photos 32, 33 and
34). The people of Tokyo had been instructed
by police and block associations in the handling
Photo 32. — Interior of burned warehouse built with reinforced-concrete walls and unprotected steel roof. ("The collaosed roof members had been removed.) Note melted
glass windows and the melted concrete at the lower windows. See Photos 34 and 35 for close-up views.
Photo 33. — Twisted steel roof members in other end of warehouse shown in Photo 35. These are still in place. Contents were
wooden cases and rice straw.
Photo 34. — Close-up view of melted concrete and reinforcing bars shown in Photo 33. These windows were located near the
floor level. The exterior of the wall showed no fire marks.
96
of bombs and the extinguishing of incipient
fires. The military authorities, however, had
advised that all attacks would be made at high
altitude and that the attackers would be suffi-
ciently dispersed to offset the possibility of any
great area fires. This attack was made at a
low altitude by a much larger number of planes
than had been expected, taking both the mili-
tary and the general public by complete sur-
prise. At the beginning of the attack, the
people attempted to extinguish the fires started
by the first planes, but, as the attack continued,
they realized that such action was hopeless and
confined their efforts to saving personal belong-
ings and to escaping. Plant employees at-
tempted to combat fires started in industrial
buildings and, by virtue of better training and
equipment, they were able to confine the fires
in some cases. When bomb concentrations
were heavy and combustible contents were pres-
ent, however, their best efforts were futile.
The inhabitants, in general, fled to parks,
canals, and rivers, or left the area entirely if
possible. Fire lanes were used as corridors
and, as such, were the means of saving many
lives.
4. The Tokyo fire department organization
was not prepared to combat fires of any magni-
tude, for too much dependence was placed on
the individual stations to respond to a fire with-
out notification from the central headquarters.
This was satisfactory for ordinary fires, since
by this method it was possible to extinguish
quickly incipient fires in highly combustible
areas. The general plan for air-raid protection
included the use of apparatus outside the area
under attack to attempt to confine the fire and
prevent it from spreading. This was more or
less standard fire department practice in any
conflagration but its proper execution depended
on many factors, such as ample equipment and
men, adequate water supply, and favorable
weather conditions. The conditions during the
attack could hardly have been more favorable
for a conflagration, or more unfavorable from
a fire-protection standpoint. Tokyo fire de-
partment equipment and personnel were in-
adequate, as was the water supply. These
shortcomings, coupled with a high wind and
highly congested, combustible buildings, re-
sulted in the many small fires growing into a
conflagration in a matter of minutes. The chief
of the fire department stated that the situation
was completely out of control 30 minutes after
the first bomb dropped and efforts to combat
the fire were futile. Attempts were made to
hold isolated fires in check. A total of 186 fire
trucks was destroyed in all attacks on Tokyo,
95 of which were lost in this attack. This fig-
ure does not include small hand trucks of the
type used by civilian-defense organizations.
Most of the damaged fire trucks were dis-
patched from outside the fire zone to combat
the fire and were subsequently trapped and
burned. Five of the 15 large fire stations were
completely gutted. One station was noted
where firemen were killed and equipment
burned in the station. This equipment was
still in its original position even though the
attack occurred 8 months prior to the in-
vestigation.
5. The highly combustible residential struc-
tures burned quickly. An inspection revealed
that not a single dwelling remained in the
burned area. All combustible material was
completely consumed. No charred remains of
combustible structural members of residences
were found. The area was simply a mass of
shattered tile, concrete static water tanks, and
twisted steel (Photos 35 and 36.)
6. Industrial plants of fire-resistive construc-
tion were few in the fire-damaged area. Three
plants were inspected in which some of the
structures were of this type. In only one was
there any evidence of bombs entering the build-
ing and starting fires. The manager of this
plant claimed that the bombs falling at an angle
entered through the windows, which is unusual
for a bomb of the M69 type. No building was
sufficiently near, however, to cause damage
from exposure fires and it is therefore assumed
that this statement was correct. The entire
structure, a reinforced-concrete warehouse 25
feet in height, was structurally damaged
(Photos 37, 38, 39). The other two plants suf-
fered damage from exposure fires. One, a
cable plant, was completely gutted, while the
other, a fuze plant, suffered slight damage to
the building and total damage to the contents.
Noncombustible structures predominated in the
industrial plants studied which were, for
the most part, machine shops, steel works,
97
с©
00
Photo 3 5,—The foreground of this picture shows a typical burned area. Japanese homes formerly stood on this site, but all that remained was shattered tile and some twisted
metal roof covering. The station in the background burned and the steel roof supports were warped beyond use.
Photo 36.—Shattered tile from the roof», the building foundations and small static tanks are about all that remain after the burning of typical Japanese buildings which
stood here before the attack of 9- 10 March. The fire-resistive building in the background burned from an exposure fire.
о
о
Photo 37.—General view of damaged concrete warehouse with unprotected steel roof trusses. Japanese stated that the bombs entered through the windows.
Photo 38.—Interior of the warehouse in Photo 37 showing sag of roof supports and collapse of roof. Roof was 5-inch concrete.
Photo 39.—View from one end of the warehouse shown in Photo 37 showing the collapsed roof and a collapsed wall.
101
foundries, and textile mills. Bombs readily
penetrated the corrugated-asbestos-cement or
corrugated-iron roofs. When sufficient com-
bustible contents were present, the structure
was almost always totally damaged, and all
that remained was a mass of sagging steel
members and shattered roof covering. This
condition of total damage also existed in many
instances where buildings were adjacent to
near-by dwellings, as were the numerous small
shops scattered throughout the area (Photos 40,
41, and 42).
8. No over-all figures for production loss
were available since not all plants in the area
were visited. However, an estimate of the loss
of production to the damaged area resulting
from the 9-10 March attack was made by the
local managers of 10 of the larger plants.
Building and equipment damage in these 10
plants ranged from five to 100 percent and loss
in production was estimated at 50 percent. It
is believed that 50 percent is somewhat low
since home industries which accounted for much
of the production capacity of the area and which
were totally damaged were not included. The
population of Tokyo dropped from 5,063,495
as of 1 January 1945 to 2,310,734 on 1 August
1945. It appears from these figures that the
attack of 9-10 March 1945 resulted in a large
exodus of persons from the Tokyo area thereby
causing an acute man-power shortage for in-
dustrial operation. This is borne out by state-
ments of plant managers that production in
plants was seriously curtailed or stopped com-
pletely. The manager of the Fukagawa works,
Mitsubishi Steel company, stated that his plant
did not operate after 9 March, although the
property was not damaged in the attack.
9. Any figures on loss of life in a conflagra-
tion of this magnitude are necessarily estima-
tions. Japanese figures, obtained from the
Metropolitan Police bureau, are believed to be
the most accurate available. All attacks on
Tokyo caused 93,056 deaths and 72,840 injuries.
The attack of 10 March resulted in 83,793
deaths, or 90 percent of the deaths caused by all
air attacks on Tokyo, and 40,918 injuries. The
number of homeless from all attacks was
2,891,000, of whom 1,008,000 were made home-
less by this one attack. A total of 201 firemen
were killed in all air attacks on Tokyo. Of
102
that total 85 were killed and 40 missing in the
9-10 March attack. Total casualties to auxilT
iary firemen in the attack were in excess of 500.
No figure was available for total casualties to
this group in all attacks. The great loss of life
is attributed to the rapid spread of fire, its great
intensity, and the large area covered. Persons
attempting to flee from the attacked area were
burned in the streets by the intense heat
(Photos 43, 44,45, and 46), although some were
able to escape through the fire lanes. Many
fled to the canals and were literally scalded to
death or died from the effects of hot gases
(Photo 46).
10. The following plants, damaged in the at-
tack of 9-10 March, were investigated:
a. Target 3, Hitachi Engineering Works,
Ltd., Kameido Plant. This plant manufactured
naval accessories such as air coolers, compres-
sors, and ventilating systems. There was no
damage to any of the main buildings, but 240
M69 bombs fell in the vacant yard south of the
plant buildings and totally damaged several
small auxiliary buildings of wood-frame con-
struction. None of these bombs was a dud.
The plant was not damaged by exposure fire—
either radiation or flying brands. The area
surrounding the property offered almost com-
plete protection from exposure fires by means
of a 150-foot, man-made firebreak, a canal, and
a railroad embankment. The property sur-
rounding this area was a mixture of poorer-
class factories and workers’ homes, all of which
were totally damaged. The bombs which
dropped in this area came from the last of the
bombers at about 0115 hours. The first warn-
ing the plant had was the beginning of the
attack on the city, but this gave them consider-
able time to prepare their defenses. The em-
ployees had been well trained in fire fighting
and it was evident that they had functioned
better than most, although they were aided by
having more time to make preparations and by
the firebreaks and the bomb pattern.
b. Target 6, Mitsubishi Steel Works, Fukaga-
wa Plant. The products of this plant were steel
bars and cylinders used by other concerns in
the vicinity for manufacturing various items
for the ship-building industry. This plant was
not damaged except for an isolated frame ware-
house which was completely burned as a result
SOI
Photo 40.—Typical single-story steel-frame building with thin roof covering. Very few bombs struck this building, but it suffered heavy damage. The fire-resistive building
in the left background burned from exposure fires.
Photo 41.—Steel-frame building adjacent to a fire-resistive structure with protected о penings. The steel-frame building was destroyed; the other suffered very minor damage.
Photo 42.—Typical light one-story industrial building damaged by fire. The contents were combustible. Both the roof and walls were structurally damaged. Note the
cracked roof covering on the floor.
О *
СП
Photo 43.—Japanese photo showing bodies of people trapped and burned as they fled through a street during the attack of
9-10 March. Note that automobiles and bicycles were also trapped and burned.
Photo 44.—Japanese photo showing more bodies of people trapped and burned in the street by the attack of 9-10 March.
106
Photo 45.—Japanese photo showing close-up of burned bodies. It is believed that these people were killed by inhaling hot gases
and burned later.
Photo 46.—Japanese photo showing dead being removed from canal. People fled to canals and rivers attempting escape and
many were either burned or asphyxiated.
704699—47—8
107
Photo 47.—People killed in railway station by hot gases. Note the shattered roof covering on the floor.
Photo 48.—Japanese photo showing Meiji theater burned out by exposure fire. Note the air-raid shelter in the street.
108
Photo 49.—Japanese photo showing ruin of a home industry in the foreground and burned-out fire-resistive structures in the
background.
Photo 50.—Japanese photo showing a general view of the ruins on the morning of 10 March. The fire-resistive structures were
burned out.
109
о
Photo 51.—Matsu generator factory. The area in the foreground was covered by a wood-frame building which was burned. This fire broke many of the windows in the
factory (since partly replaced) but did no structural damage.
Photo 52. — A fire- and earthquake-resistive office building with unprotected openings, the interior of which was completely burned out by exposure fires. The Japanese did
not normally use wire-glass windows or fire shutters on exposed openings.
Photo 53.—The effect of a wide street on the spread of fire. The wind at the time of attack was parallel to this street. Only
a few scattered bombs fell on the unburned side of the street, and these were brought under control by individuals.
Photo 54. — The same street shown in Photo 53 viewed in the opposite direction.
112
Photo 55.—Wide street in the burned area where the wind was blowing at right angles at the time of the attack.
Photo 56. — Tokyo Electric Company building. This building was struck with a 500-lb. M76 incendiary bomb in an attack in
January 1945. The bomb perforated the reinforced-concrete roof, ignited on the top floor, and burned out the interior of the
entire building.
113
Photo 57.—Third-floor interior of the Tokyo Electric Co. building showing how the building was burned out. The building
was fire-resistive. There was no structural damage.
Photo 58.—Remains of a newspaper plant adjacent to the Tokyo Electric Co. building. This plant was a wood-frame build-
ing and was burned by exposure.
114
of fire caused by one bomb. About 400 bombs
were scattered over an adjoining open area and
over a small neighboring spinning mill which
was about 60 percent damaged. The steel plant
ceased production after the attack because of a
shortage of help brought on by the displacement
of laborers.
c. Target 5, Fujikura Electric Cable Works.
This company employed about 4,000 persons
prior to the attack, but had not operated since.
It manufactured electric cable and wire of all
types and sizes. A small number of M69s fell
among some small shops and warehouses across
a narrow canal from the buildings of the main
plant. The plant manager said that most of
these bombs were extinguished. Only one of
the buildings in this area was totally damaged.
The canal was so narrow, however, that a
strong wind blew flames from this building
across the canal, and the main plant buildings
were ignited by exposure. These main build-
ings were of reinforced concrete with either
wood-truss roofs covered with corrugated-
asbestos cement or steel-truss roofs covered
with corrugated sheet iron. All the roofs were
stripped, but the steel trusses were still intact
with little deformation and could have been
re-covered. In almost every instance walls and
roofs of corrugated-asbestos cement shattered
and collapsed from the heat. It was estimated
that 80 percent of this plant was totally dam-
aged. All the machines were heavily damaged
except for a few in the winding building.
d. Target 4, Shibaura Electrical Works.
(Shows on G-2 reports as Japan Sugar Co.)
This plant produced tungsten for lamp and
vacuum-tube filaments and molybdenum and
tantalum concentrates. It also made synthetic
rubber for gaskets, packing, and hose. The
main portion of the plant was not damaged, but
a warehouse and a laboratory collapsed as a
result of fire. Both of these buildings had
reinforced-concrete walls and reinforced-
concrete roofs on unprotected steel trusses.
The sagging of the trusses released the roofs
and collapsed the walls (Photos 37, 38, and
39). The source of heat in these buildings was
not completely explained. The manager said
that the two structures were used largely for
the storage of ore, but it is known that they also
contained pitch and calcium carbide. The
manager stated that the bombs entered through
the windows. The roof was a 6-inch concrete
slab and had no skylight, so M69s should not
have been able to perforate it, and there were
no other structures near enough to cause an
exposure fire. Plant damage was estimated at
20 percent.
e. Target 2, Hattori Co. (Seikosha Watch
Mfg. Co.). This company manufactured time
fuzes for artillery shells including 20-, 25-, 40-,
57-, and 77-mm. shells. About 4,000 people
were employed. Ten M69 bombs struck the
plant, and were all extinguished by plant per-
sonnel. The main plant building, however, was
ignited by an exposure fire across a 75-foot open
space (a street and cleared area). The heat
here was great enough to melt wire-glass win-
dows and to enter the plant proper. All the
plant buildings were fire resistive throughout,
the construction being reinforced concrete with
wire-glass windows. After the fire entered, it
burned through the buildings and heavily dam-
aged most of the machinery. The buildings
were only superficially damaged. The manage-
ment estimated the damage at 35 percent.
Operation continued on a reduced scale until
14 August 1945.
/. Target 1, Oana Manufacturing Co. (Nip-
pon Electric Works). This plant produced
small motor-generator sets of 1, 3, 6, 8, and 25
KW for the Navy. It employed 2,200 persons.
Between 200 and 300 M69 bombs fell on the
plant area and ignited the wooden buildings.
This put the plant fire-fighting equipment,
which was housed in one of them, out of com-
mission and also started fires in the adjacent
fire-resistive structures through exposure.
About 40 percent damage was suffered by build-
ings and contents. The fire-resistive buildings
were only superficially damaged, but the ma-
chinery was heavily damaged. Production was
reduced to an output of about 20 percent of
normal.
VIL Conclusions
1. The high efficiency of the attack of
9-10 March was due to:
a. The great combustibility of the buildings
in the target area.
b. The high built-upness of the target area,
i.e., more than 40 percent.
115
c. The ideal weather conditions, i.e., a high
wind, clear, dry.
d. The large size of the target area and of
the city surrounding it, making it almost im-
possible to drop bombs where they would do
no damage.
e. The wise choice and efficient performance
of the tactics involved—four aiming points,
briefing to drop bombs individually in areas of
target where fires were not already burning;
low level for greater accuracy; and an all-
incendiary bomb load.
f. The ineffectiveness of the fire-fighting
forces and equipment.
2. Fire-resistive buildings in burning areas
were often ignited by exposure fires, sometimes
over an open area as great as 75 feet.
3. Fire-resistive buildings when subjected to
contents fires, generally suffered only internal
damage.
4. Many home industries were destroyed in
attacks on residential areas.
5. Loss in production at undamaged fac-
tories was heavy because of the displacement
of workers.
116
Ш
1871 I 1 8345 2081 994 348 143 1191 1 922 56.3 4.73 57 percent total load M69’s.
I-» 00 w В © co © © w 00 Mission number
bO Sa © 2 w 15-16 April 13-14 April 9-10 March 25 Feb. Date
© СЛ to © © © w ьэ to -o to Planes over target
NE. Я NE. NW. NW. и И Approximate true heading
NW. 2 NW. NW. SW. NW. Approximate surface wind from—
0) © co 4* Number of aiming points
7.9 22.0 7.8 15.1 8.0 10.1 ©00 ' 4.9 ! 9.2 23.5 । 31.0 Altitude (1,000 feet)
100 P 50 M 100 P 50 M 100 P 50 M 100 P 50 M 100 P 50 M СЛ Intervalometer (feet) p = Pathfinder ; M = Main force
1320 2820 co 4- 1820 1539 to Total tons (M69) Bombs used
0) 00 3 320 frC frO to to 00 1 1 1 1 1 1 1 Total tons (M47)
co СЛ © 1 1 1 1 1 1 1 1 1 1 1 1 1 1 1 1 1 1 1 1 1 1 1 1 1 1 1 Total tons (M50)
348 । । । । । । । 1 1 1 1 1 1 1 1 1 1 1 1 1 1 1 1 1 1 1 1 1 1 1 1 1 1 1 1 Total tons (M76)
। । i i i । । h-» cn 00 to 1 1 1 1 1 1 1 to Total tons (HE)
3251 3646 © 2124 1667 СЛ 4- Total tons dropped
5000 5000 2500 2500 2000 2500 5000 Clusters to open at (feet)
СЛ СЛ © to © 4- Time over targets (minutes)
16.8 cn bo © © 11.4 15.8 © Damage (square miles)
5.17 1.45 7.80 5.37 © oo 2.20 Damage per 1000 Tons Bombs (square miles)
Night attack, 3/10 overcast, 3/4 radar bombing, smoke fairly bad, flak and fighter opposition very in- tense, 41 percent M69’s. Night attack, 9/10 overcast, almost all radar bombing, initial point not identified in many cases, smoke especially bad, blinding search- lights, flak and fighter opposition intense, 77 percent M69’s. Night attack, clear, all radar bomb- ing, thermals bad on breakaway but visibility good, some planes ar- rived too early, flak and fighter opposition intense, searchlights blinding, 56 percent M69’s. Night attack, 5/10 overcast, 2/3 radar bombing, excessive smoke and turbulence, fighter opposition moderate, flak intense, 86 percent M69’s, 164 M69’s and 77 M47’s dropped safe. Night attack, 3/10 overcast, half visual-half radar bombing, smoke and thermals, fighter opposition weak, flak intense, 92 percent M69’s. Day attack, complete overcast, al) radar bombing, no fighter oppo- sition, flak meager, 91 percent M69’s. Remarks
Table I.—Summary of Attacks.
Part 4
EFFECTS OF INCENDIARY BOMB ATTACK ON AOMORI, JAPAN
119
TABLE OF CONTENTS
Page
I. Object of Study......................... 121
II. Summary........................................ 121
III. General Information....................... r..— 121
IV. The Target................................... 121
V. Weapon Data ................................ 137
VI. Attack Data..................................... 137
VII. Defense Against Air Attack..................... 138
VIII. The Fire.................................... 142
IX. Damage.......................................... 143
X. Recuperability................................ 146
XI. Conclusion and Recommendations................. 146
Appendices A, B, and C
Photographs 1-33, inclusive
Figures 1-5, inclusive
120
Aomori Fire Damage Study
I. Object of Study
This study was made primarily for the pur-
pose of evaluating-the weapon'effectiveness of
the M74 incendiary bomb, and of surveying the
Иге damage accomplished by the attack made
by the Twentieth AF on Aomori, Japan, on
28-29 July 1945.
II. Summary
1. The area of the city was computed to be
960 acres, of which 753 acres (or 78.4 percent)
was built up. The greater part of this popu-
lated area consisted of combustible frame
dwellings (one and two stories in height), small
commercial establishments and a few small fac-
tories. Interspersed through this area were
several medium-sized factories and, along the
waterfront (Mutsu Wan), a few modern multi-
storied structures of reinforced concrete.
There was also a number of well constructed
wooden municipal buildings in the city.
2. The dispatched load of the Twentieth AF
Mission 298 against the city of Aomori was
583.5 tons of M74 incendiary bombs. The load
reported dropped on the target area was 546.5
tons.
3. This attack is of particular interest, inas-
much as it was the first time that the M74
10-pound incendiary bomb was used exclusively.
This bomb was developed from the M69 and is
described in detail in the body of this report.
The principal differences between the two are
that the M74 uses an all-ways fuze and a
telescopic tail. White phosphorous was also
added to insure ignition of the charge and to
produce smoke in order to create antipersonnel
effect and confusion.
4. Eighty-eight percent of the built-up area
was destroyed as a result of this attack. Rail
and ship ferry transportation and the general
economy of the city were seriously crippled.
Twenty-five ships in the harbor were burned
beyond repair and two were partly burned.
Railroad facilities were affected to the extent
that 43 freight cars and 18 passenger cars were
burned beyond repair; and 15 warehouses and
10 miscellaneous railroad buildings were com-
pletely consumed by fire. In addition, 19 fire
department vehicles were so damaged by fire
that they became unsalvageable; and 12 others
were damaged, but less seriously.
5. There were 1,016 casualties, including 728
killed, 40 seriously wounded, 240 slightly
wounded, and eight missing. Dwelling units to
the number of 11,330 were literally consumed
by the flames, thereby rendering 17,843 fam-
ilies homeless.
III. General Information
1. The team assigned this study was desig-
nated as Physical Damage Division Team 9
and consisted of the following personnel:
Capt. Robert H. Merz........... Team chief-
fire engi-
neer
Capt. Elmer R. Hjortsberg...... Fire engi-
neer
Lt. (jg) Maurice H. Hellner.... Interpreter
Lt. (jg) Gaspare B. Tamburello.. Interpreter
PhoM 3/c William P. Mattern.... Photograph-
er
Sgt. John J. Cherry............ Clerk
S 1/c Robert M. McClintock... Draftsman
S 1 zc Wesley A. Feige........... Draftsman
2. Able assistance was rendered the team by
Lt. Col. Paul D. Stoddard, AC of S, G-2, of the
81st Division and officers under his command
and also by Lt. Col. W. F. Atkins, the military
governor, and his staff.
3. The information obtained in conjunction
with the survey, other than by the physical in-
spection of the area, was secured from records
and from interrogation of Japanese officials and
civilians. The information from the Japanese
was considered to be reliable.
4. No difficulty was experienced in obtaining
the cooperation of the people interviewed, but,
in a number of cases, records requested were
unobtainable because of having been destroyed
by the fire.
IV. The Target
1. Geographical. Aomori is located in the
northern part of the island of Honshu in the
southern curve of Aomori Wan, an indentation
of Mutsu Wan which is one of Japan’s largest
and best protected bays. The immediate har-
bor for the city is called Aomori Ko. The two
121
bays are almost landlocked by two large penin-
sulas, running generally north of Aomori, sep-
arated at their tips by Tairadate Kaikyo straits,
only five miles wide, forming the outlet into
Taugair Kaikyo. The Komogome River runs
northwest toward the city and is joined by the
Ara River, the two forming the Tsutsumi River
which borders the eastern edge of the main
built-up area of the city. The area south of
the city is mountainous (Figure 1, Photo 1).
2. Built-upness or building ground occupancy.
Built-upness or building ground occupancy is
defined as the fraction of plan area that has
buildings. Sparsely built-up sections are areas
upon which the built-upness ranges from 5 per-
cent to 20 percent, while densely built-up areas
range from 20 percent to 40 percent and higher.
This city covers an area of 1.5 square miles of
which 0.76 square mile (50.5 percent of the
total area) is densely built up, and 0.42 square
miles (28.0 percent of the total area) is sparsely
built up. The remaining portion of the city
(21.5 percent of the total) consists of open park
and shrine areas.
3. Population. The normal population of
Aomori was approximately 100,000. The city
was, therefore, relatively compact with an over-
all population density of 67,000 persons per
square mile.
4. Industries.
a. There is no general industrial development
in the city of Aomori, comparable to that which
is found a short distance south in central Japan.
The primary industry of Aomori consists of
small lumber mills and yards, fisheries, fish
canneries, and food storage warehouses. Sec-
ondary industries include small factories em-
ploying five to 10 persons, and numerous
unimportant “home workshops”.
b. The city serves principally as a major
choke point in the transportation corridor be-
tween central Honshu and the island of Hok-
kaido. Being the northern terminus of two
railroads from industrial Honshu and the south-
ern terminus of a railroad-car ferry shuttle from
Hokkaido, Aomori provides a major strategic
link between that island and the heart of Japan.
In addition, there are moderately developed
harbor facilities along the waterfront which
provide lightering and berthing for small sea-
going vessels. A small quay area behind a
122
breakwater is used in conjunction with limited
mechanical facilities for unloading coal (Photos
4, 5, and 6).
c. The general war status of Japan brought
no appreciable change in the industry of
Aomori, principally because of the fact that,
industrially, prewar Aomori had been poorly
developed. The lumber mills and yards con-
tinued operation in the early war years at only
slightly increased rates of production, with the
bulk of the finished lumber being shipped south
by rail for use in large industrial centers. Two
small lumber-working plants were engaged in
the manufacture of wooden plane and glider
parts, the largest single item being a wood seat
Net production of the item was negligible in so
far as it contributed to the war effort. The
Asiatic Can Co. (Photos 7 and 8) manufactured
a cargo-plane landing-gear retriever piston and
a wing-flap actuator piston. These were the
only factories in Aomori which produced mate-
rial for the war effort.
d. The greatest change effected in Aomori as
a result of the war was the growth of the city’s
strategic importance as a transportation choke
point, brought about by the restriction of sea-
borne coastal commodity traffic. Prior to the
war, the total rail-borne through-tonnage be-
tween Hokkaido and central Japan had been
greatly exceeded by seaborne traffic. The shift
of the latter to rail routes, and the subsequent
increased importance of storage and rail mar-
shalling yard facilities in Aomori were by far
the most important of all local industrial
changes occasioned by the exigencies of war.
e. In addition to its vital role in railroad
traffic, Aomori was of importance from a gov-
ernmental standpoint, being the capital of
Aomori Prefecture, of which the most impor-
tant cities were Aomori itself, Hachinohe, and
Hirosaki.
5. Construction
a. Dwellings. The typical Aomori dwelling
was a one- or two-story frame structure with
low-pitched, tile-covered roof (Photo 9). A
raised floor of half-inch boards on light joists,
a quarter-inch unfinished wood ceiling and the
roof were supported by a light wood frame
(Photo 10). Exterior walls were either of
wood or wallboard, fastened directly to the
main supporting structural frame, or were-a
to
со
Photo 1.—Panoramic view, central portion of city.
Photo 2. — Typical congested urban district street scene.
Photo 3.—General view showing street layout.
124
Photo 4. — Aomori and harbor . . . early pre-attack view.
Photo 5. — Rail ferry terminus . . . early pre-attack view.
Photo 6.—Car ferry plying between Aomori and Hokkaido.
Photo 7.—Asiatic Can Co., typical industrial structure.
Photo 8.—Asiatic Can Co. Note partial fire wall of concrete between sections.
127
Photo 9.—Typical dwelling construction.
Photo 10. — Roof framing of dwelling. Note interior finish and partly removed suspended wood ceiling.
128
mud-mix carried on a bamboo lattice set be-
tween wood posts. Interior partitions were
constructed of a lattice, made of quarter-inch
wood or bamboo, and covered with either paper
or wall-board. Sloping roofs were generally
covered with tile or sheet metal over mud plas-
ter on half-inch boards. In some cases, thatch
board or bark roof covering was supported by
light wood trusses carried on the wooden frame.
Tiles were laid over a layer of mud on either
wood or bamboo battens, or on half-inch wood
boards (Photo 11).
b. Domestic workshops. The primary dif-
ference between domestic workshops and ordi-
nary dwellings was the absence of the raised
wood floor. The workshop floors were either
concrete, laid on a rock or cinder fill direct on
the ground, or were hard-trodden earth. These
workshops, found either in dwellings or at-
tached thereto, were noted in the more crowded
areas in the center of the city.
c. “Godowns”. A common Japanese vault-
type structure used for the storage of valuable
merchandise, clothing, and sometimes food was
found in connection with several small mercan-
tile and commercial structures, but also fre-
quently adjoining dwellings. These “godowns”
were usually wood-frame structures on stone or
concrete foundations, and had heavily built-up
mud walls interlaced with a wood or bamboo
lattice as an integral part of the framing.
Roofs were heavily built-up of mud carried on
a similar lattice between heavy wood roof
trusses and were generally covered with tile.
The interior was finished with wood lath and
plaster, or was wood sheathed, while the ex-
terior was cement coated and sometimes partly
aproned with a brick veneer wall (Figure 2, and
Photos 12 and 13).
d. Factories. Small factories were either
one or two stories in height with no basement,
were long wood-constructed buildings and had
roofs covered with low-pitched tile, sheet metal
or corrugated iron, which were carried on wood
trusses supported by a timber frame. Floors
were earth, concrete on fill, or raised boards
on light joists, depending on the nature of oc-
cupancy. Column and truss spacing was usu-
ally 6 feet, and building frontages averaged 24
feet. This type of structure had its overhang-
ing eaves removed along street fronts as a pro-
tection against fire spread. Building fronts
were finished with some noncombustible mate-
rial such as corrugated iron, plaster or brick.
Larger industrial buildings of Aomori ranged
between 8,000 and 12,000 square feet in ground
floor area and were usually one story high.
Structure framing was either of heavy timber,
or steel and timber combined (Photos 14 and
15). Exterior walls were of wood, of corru-
gated iron or of glass set in metal frames on
brick or concrete apron walls (Figure 3, and
Photos 16 and 17). Floors were finished with
concrete, or were unfinished earth. Pitched
roofs were covered with sheet metal, corrugated
iron, and sometimes wood shingle on boards
supported by timber trusses or light steel
trusses carried on the supporting frame. Flat
roofs were rare because of the heavy snow
loading. The use of corrugated asbestos-
cement roofing and siding, common elsewhere
throughout Japan, was rare in Aomori because
of the abundance of lumber. Moreover, brick
was not commonly used, unless it was required
in specialized industrial buildings or oc-
cupancies, such as dry kilns or attached boiler
houses. Furthermore, load-bearing brick-wall
structures were extremely uncommon.
e. Warehouses. Storage warehouses were of
two general types: one was a metal-frame and
metal-clad shed-type structure; and the other
was a reinforced-concrete multi-story structure.
Warehouses were of 5,000 to 10,000 square feet
ground floor area, the highest being five stories
tall. Concrete slab roofs and slab floors were 4
and 6 inches thick respectively. Exterior walls
were either unfinished brick panel or concrete
block walls.
f. Public buildings. Except for some wood-
constructed public schools, public buildings
were similar in structural design to fire-
resistive warehouses, except that the concrete
slab floors were generally 4 inches thick. The
average height' of such public buildings was two
stories, and none was higher than four stories
(Photos 18 and 19).
6. Fire vulnerability. The city of Aomori
was highly vulnerable to fire, due primarily to
densely built-up and congested areas of light,
fast-burning, combustible construction. In
heavily congested sections in the center of the
city, wooden-frame buildings were notably pre-
129
00
о
Photo 11.—Typical tile roof of dwelling.
REINFORCING RODS -
1/4" D. 5"0.C. VERTICAL
3/8* D. 9 1/2* O.C. HORIZONTAL
5* X 3* 3 FT SPACING
SECTION A-A
SECTION B-B
JAPANESE STORAGE VAULTS
US. STRATEGIC BOMB. SURVEY
AREA FIRE DAMAGE STUDY
AOMORI, JAR&N
FIGURE 2
131
Photo 12.—Typical storage vault construction.
Photo 13.—Detail of storage vault wall construction.
132
Photo 14.—Typical light unprotected steel framing of industrial structures.
Photo 15.—Typical timber framing in industrial structures.
133
co
LEGEND
COMPANY
10 40 10 FtCT
WALLS
I ONE-INCH WOOD SIDING WITH
FOUR FOOT HIGH BRICK APRON
2 ONE-INCH WOOD CLAD WITH
CORRUGATED IRON
3 ONE-INCH WOOD SIDING
4 CORRUGATED IRON
FLOORS
cl CONCRETE FLOOR
WlWOOD FLOOR
ROOFS
8 SHINGLE ROOF
MC SHEET METAL ROOF OVER
z ONE-INCH WOOD SHEATHING
WOOD FRAME
RESIDENCE
COMPLETELY
URNEO
ASIATIC CAN
IO O IO >0
BOMB. SURVEY
U.S. STRATEGIC
AREA FIRE
DAMAGE --------
AOMORI, JAPAN
' FIGURE 3
STUDY
Photo 16. — Corrugated-iron, glass in metal frame exterior wall. Note non-combustible apron wall.
Photo 17. — Mixed construction of exterior wall. Note part fire wall of concrete with parapet.
135
Photo 18. — Aomori customhouse. Typical fire-resistive public building.
Photo 19. — Reinforced-concrete bank building. Note cistern right foreground.
136
dominant. These buildings were contiguous
along street fronts, and their back-yard areas
were well covered with wooden sheds and dwell-
ing attachments. City blocks were separated
by streets, the widest about 36 feet, measured
building front to building front. Most of the
typical streets, however, were narrow and in
the range from 18 to 24 feet. Although in-
dividual, wooden-frame structures were in
themselves extremely susceptible to incendiary-
bomb action and subsequent fire damage be-
cause of their light, combustible construction,
the entire target area was made further sus-
ceptible to the effects of mass incendiary attack
by the high degree of congestion and building
ground occupancy.
V. Weapon Data
1. Description of bomb. The weapon used
against Aomori was the recently developed M74
incendiary bomb. This bomb commonly known
as the 10-pound M74 weighs 8.4 pounds. It is
2.87 inches in diameter and 19.15 inches long.
The incendiary charge is 2.8 pounds of PT-1
mixture consisting of a thickened magnesium-
gasoline paste. The main ejection charge con-
sists of 0.11 ounce of magnesium powder and
0.07 ounce of black powder. In addition, there
is a small chemical container, located imme-
diately behind the nose fuze cup, which is filled
with white phosphorous to insure ignition of
the charge and to produce smoke to cause anti-
personnel effects and confusion. The bomb,
like the M69, has a hexagonal, sheet-steel, leak-
proof case with a nose cup housing the fuze. It
has a telescopic tail which is extended into the
air stream under spring pressure when the
bomb is released from the cluster. An all-ways
action fuze screws into the nose of the bomb,
consisting essentially of a steel head, an arming-
pin retainer, a steel striker pin, and safety pin,
a zinc-alloy die-cast striker, sleeve, a fuze cas-
ing, an arming pin M26 percussion primer, a
cavity in case filled with one gram of black
powder and a zinc booster cup filled with three
grams of propellant powder.
2. Method of carrying. The bombs are car-
ried in the E48 cluster, with the M23 cluster
adapter, in 525-pound clusters, capable of being
aimed. When a cluster is released, the arming
wires are withdrawn and the two fuzes arm.
Upon the expiration of the time setting (the
clusters used on Aomori were set to open at
5,000 feet above ground), the short-delay clus-
ter fuze operates to set off the boosters and
primacord which is channeled to the fin-
retaining cup. The cone is blown off by the
primacord detonation, thereby releasing the
buckle and retaining straps, and the cluster
opens. Upon failure of the short-delay fuze to
function, the long-delay fuze operates two sec-
onds later by detonating the primacord extend-
ing the length of the cluster, thus shearing the
steel straps and releasing the bombs.
3. Method of functioning. When the bomb
strikes, the M142 fuze striker ignites the primer
which sets off the booster and main ejection
charge. This action activates the auxiliary
ejection-ignition charge; expanding gases rup-
ture the ejection dome at the scored section
which breaks and forces the white phosphorous-
filled cup and tail assembly out of the bomb
casing (Figure 4) ; and the magnesium and
white phosphorous thereupon ignite the ejected
filling. This entire action takes place within
a space of eight feet from the bomb’s point of
impact. The bomb was designed so that it
would pierce the roofs of the flimsily con-
structed Japanese dwellings, and explode below
the ceiling in such a way that most of the gel
would be deposited on the underside of the ceil-
ing where it would be difficult to reach in order
to extinguish the ensuing fire. Thirty-eight
thousand BTU’s of heat are liberated by this
bomb, including the heat produced by burning
of the white phosphorous.
VI. Attack Data
1. Mission 298, the object of which was to
accomplish an over-all incendiary attack on the
city of Aomori, was assigned to the 58th Wing
of the XXI Bomber Command, Twentieth AF.
The two groups of the Wing which were to
accomplish this mission were staged at Iwo
Jima so that a greater weight of munitions
could be carried to the target.
2. The weight of airborne bombs was 583.5
tons of which 546.5 tons were released over
Aomori. The intervalometer setting was 50
feet. It is estimated that 2,082 E48 clusters
containing a total of 79,116 10-pound M74 in-
cendiary bombs were dropped on the target.
137
3. The primary target (Aomori) was bombed
by 61 B29’s between 2301 and 0012 hours, local
time, 28-29 July 1945, from 10,000 to 16,000
feet. The axis of attack varied between 77°
and 110 \ Weather was reported as 5 10-10/10
undercast which cleared up over the target as
the attack progressed because of the heat of
the fires (Table 1).
4. Defensive action of the enemy. Mission
Report 298 states that seven aircraft reported
heavy-caliber flak over the target, which was
meager and inaccurate, and consequently in-
effective, and there was no flak upon with-
drawal. One ineffective searchlight was also
reported. Red and white bursts coming from
three small surface craft in the harbor were
reported by the crew of one plane.
VII. Defense Against Air Attack
1. Civilian.
a. Fire department. As was standard
throughout Japan, the Aomori fire department
was under the direction of the chief of police
of the Prefecture. Personnel of the depart-
ment consisted of 1,000 men, 150 of whom were
full-time firemen, and the remainder served as
volunteers assigned to that task by the govern-
ment as an extra war duty. Prior to the attack
there were three large and four small fire
stations. The fire apparatus, without excep-
tion, was in poor condition and obviously poorly
maintained (Photos 20 and 21), and, judging
from the results of a demonstration staged for
the survey team, it was apparent that the effi-
ciency of the fire department as a well trained
and disciplined unit was far below American
or European standards.
b. Water Supply. The Aomori waterworks
was municipally owned and served approxi-
mately 80 percent of the population. The sys-
tem was of the gravity type with its intake on
the Yokouchi River at a point eight miles south
of the city in the Oza district. The dam was
approximately 150 feet above the mean eleva-
tion of the center of the city, resulting in a
static pressure of about 65 pounds per square
inch. A 24-inch steel pipe carried the water
from the dam to the purification plant, and a
20-inch steel pipe carried it from there to the
city. The principal arterial mains in the city
were 12-inch steel pipes. There were 13,981
private service connections to the distribution
system which consisted principally of four-,
six-, and eight-inch mains.
c. Hydrants. There were no above-ground
hydrants in Aomori, but as is customary in
some Asiatic and European cities, the connec-
tions for the portable hydrants were located in
the streets below the surface of the roadway
(Photos 22 and 23). The portable hydrant or
standpipe hooked on to the underground outlet
which was normally kept shut by means of a
ball valve, two inches in diameter (Photo 22).
After the hydrant had been securely attached
to the outlet, a valve stem, operated by a hand
wheel forced the ball downward off its seat,
thus permitting the water to rise and flow out
of either one or both of the 21/->-inch outlets
which were individually controlled by hand-
operated valves (Photo 23).
d. Civilian defense organization. In accord-
ance with the traditional “face-saving” policy,
the Japanese official report (Appendix A) in-
dicates that the civilian-defense units per-
formed heroically and well. Interrogation of
a number of city officials and ordinary citizens
revealed, however, that there was very little
planned civilian defense such as the United
States or Europe had. In so far as the facilities
were concerned, the block associations had to
provide above-ground cisterns, hand-drawn
pumping equipment and hose carts (Photo 24),
Table 1.—Attack Data Chart
Primary target Air Force 1 Date of attack A/C dis- patched A/C over target Bombs, airborne tons Tons bombs dropped on pri- mary target Altitude of re- lease Intervalo- meter setting Time over target (local time) Axis of attack Wind 1 Visibility Methodot aiming
Aomori, Japan 20th 28-29 Jul 45. 65 B29’s 61 1 583.5 546.5 Feet 10.000 to 16,000 50 ft. 2301 to 0012 to 110° Calm 5 10 to 1O/10 37 Visual 24 Radar
138
Photo 20.—Temporary "fire station.**
Photo 21.—Aomori fire department company.
704699—47—10
139
Photo 22.—Subsurface fire hydrant outlet.
Photo 23.—Portable fire hydrant tn position and in operation.
140
Photo 24. — Hand-drawn hose cart.
141
As far as could be learned, this equipment was
of little value in fighting fires caused by in-
cendiary attacks.
e. Air-Raid Shelters. With few exceptions
air-raid shelters were poorly constructed of
timber and earth (Photo 25) and were ineffec-
tive against incendiary attack.
2. Military
a. Antiaircraft battery location. An anti-
aircraft battery was located directly west of
Aomori on a site adjacent to the ferry slips.
At the time of the survey, this area was visited
and all that was found was the remains of the
gun positions and observation posts. The site
did not impress one as being either well located
or properly laid out, the gun positions being
close together and not concealed from air
observation.
3. Psychological. On 27 July 1945, the day
before the attack, leaflets were dropped on
Aomori warning the people that an air attack
against their city was imminent. The people
were required to turn over all such leaflets to
the prefectural police without delay, and, ap-
parently, a violation of this order was an ex-
tremely serious offense, so that compliance
therewith was almost 100 percent. The leaf-
lets, however, were evidently read and given
serious consideration, because a large number
of the population, particularly women, children
and old people, took what possessions they could
carry and sought refuge in the woods.
VIII. The Fire
1. General. The incendiary-bomb attack
over Aomori lasted for a period of 1 hour and
11 minutes. At its onset, various defense or-
ganizations attempted to fight the scattered
incipient-stage fires, but, with the increasing
magnitude of the attack and the subsequent
spread of the areas involved in fire, this initial
fire-fighting effort was soon abandoned, so that,
after the first 20 minutes, there was no further
organized attempt to combat the spread of
flames or to extinguish fires, except on the part
of a few groups of persons in the suburbs. The
efforts of all defense agencies were then di-
rected toward evacuation of the populace from
the city. Meanwhile, the initial-stage fires
had merged into a fire of conflagration propor-
tions, and the entire area burned intensely for
142
a period of four hours, and smoldered for three
days thereafter. Subsequent defense efforts
were directed toward extinguishing isolated
smoldering fires, restoring lighting and com-
munications, clearing roadways and identifying
the dead.
2. Fire department. During the initial stage
of the attack, fire department apparatus were
dispatched to predetermined areas within the
city where firemen, with the aid of civilian-
defense organizations and reserve fire organiza-
tions, fought incipient-stage fires, until forced
to withdraw from the area because of increas-
ing personal danger and lack of water. In
many instances, fire apparatus were abandoned
in burning areas, and, in some cases, the with-
drawal of equipment was impossible due to the
impassability of roads because of fire-softened
asphalt paving.
3. Development of fire. At the start of the
attack, a great number of dispersed individual
incipient fires was started throughout the city.
Although the city was divided into natural fire
divisions by a canal, a river, railway marshal-
ling yards, and three artificial firebreaks, the
bomb-fall pattern was such that fires started
almost simultaneously throughout each fire
division. With the increased magnitude of the
attack, individual fires in each fire division
merged into one big conflagration without re-
gard to natural or artificial firebreaks. There
was no indication of the development of a “fire
storm,” although a column of smoke was ob-
served to have risen to the height of 20,000 feet
over the city. The period of intense fire was
estimated at four hours, following which the
fire subsided rapidly, and, by early morning,
the area was sufficiently cooled to allow rescue
workers and clean-up details to enter. Except
for some isolated fires, the greater part of the
area lay a smoldering ruin.
4. Communications. Communication net-
works among operating defense agencies in the
burning area and between those agencies and
their respective headquarters were interrupted)
shortly after the initial attack, and soon there-
after became inoperative for the rest of the
attack period. Twenty-four hours later, only
the more important government buildings
which remained standing were provided with
emergency telephones. Information was re-
layed to the homeless people by means of cruis-
ing radio cars and posters on bulletin boards.
5. Power. Although neither of the two pow-
er substations was involved in the fire, the
distribution network was extensively damaged
in many places. Lighting was restored two
days following the attack on a very limited
scale, with temporary lines running to the few
remaining government buildings.
6. Evacuation. Evacuation of the populace
was directed by the prefectural police according
to a prearranged plan. A greater part of the
population had already moved to the hills out-
side the city as a consequence of the leaflet
warning dropped the day before, but, on the
day of the attack, some had returned to the
city to pick up food rations. There is, how-
ever, no estimate of how many persons had
evacuated the city prior to the attack, nor of
how many had returned that day. Interviews
revealed that the police experienced difficulty
in evacuating the aged, but were able to use
artificial firebreaks to good advantage as ave-
nues of escape.
7. Deaths in shelters. The Japanese re-
ported finding a number of unburned bodies in
air-raid shelters, death having been caused by
either asphyxiation or the inhalation of hot
gases and consequent searing of the lungs.
IX. Damage
1. General. It was estimated that 88 per-
cent of the city of Aomori was destroyed as a
result of the attack of 28-29 July 1945. The
following table shows the areas of the city and
its suburbs destroyed with reference to built-
upness (Photo 26) :
Area Damage Table
Built-upness Area subject to damage (acres) Area damaged (acres) Percent of area damaged
City of Aomori 753 668 88
Densely built 488 464 95
Sparsely built 265 204 77
Suburban Aomori 303 20 6.5
Densely built 2 2 100
Sparsely built 301 18 6
Total Aomori 1056 688 65
Densely built 490 466 95
Sparsely built 566 222 39
a. Damage to major industries in the area
based upon Japanese figures is tabulated as
follows:
Industrial losses
Industry Totally destroyed (in burned area) Undamaged (outside burned area)
Lumber mills Lumber companies Warehouses (general) Shipbuilding yards Canneries 3 mills. 2 plants. 19 buildings. 1 site. 1 factory. 102 boats (38 sunk, balance damaged beyond repair). 61 cars. 25 ships. 6 mills. 3 plants. 5 buildings. 2 sites. 2 factories.
Fishing 1 3 boats.
Transportation, rail rolling stock Water 2 Unknown. Unknown.
1 Does not include transport and cargo ships.
2 Does not include fishing vessels.
b. The following figures are based on the
Japanese record of casualties incurred as a
result of the attack:
Casualties:
Persons
Total casualties____________________________ 1,016
Killed _______________________________________ 728
Seriously wounded_____________________________ 40
Injured_______________________________________ 240
Missing_________________________________________ 8
c. Losses of the fire department, based on
Japanese figures, are tabulated as follows:
Fire department losses
Totally destroyed Seriously damaged (beyond repair)
Fire stations Fire department apparatus 3 buildings. 19 vehicles. 4 buildings. 12 vehicles.
d. Japanese figures note in addition that
11,330 dwellings were destroyed, rendering
17,843 families homeless.
2. Analysis of damage
a. Bomb density. The probable average
bomb density in the central portion of the tar-
get has been estimated as 272 tons per square
mile. This estimate is based on the reported
delivered bomb load on the target area and as-
sumes that 90 percent of the bombs fell within
a limit as shown in Figure 1 as “Probable Limit
of Bomb Fall.” This limit of bomb fall is an
oval which encloses all areas of damage within
the target area and is based on ground observa-
tions at the target site. If it is assumed that a
normal (Gaussian) distribution of bombs was
achieved along any diameter on this oval, then
143
144
Photo 26.—General view of fire damage area.
it is calculated that 46 percent of the total re-
ported delivered bomb load arrived within a
central portion of the target area measured as
25 percent of the total area of oval. This cal-
culation results in a probable bomb density of
251 tons in 0.92 square mile of area, or 272 tons
per square mile.
b. Appraisal of bomb density. The twen-
tieth AF has reported an average CPE (cir-
cular probable error) of 4,000 feet radius for
night radar bombing with good target identifi-
cation. This CPE determination was based on
aerial photograph interpretation of several
target areas, and is defined as a circular area
of measured radius in which 50 percent of the
bombs dropped are expected to arrive. The es-
timated maximum bomb density of 272 tons per
square mile corresponds favorably to a CPE of
3,400 feet, which is not at great variance with
bombing experience.
c. Damage characteristics. The central por-
tion of the target area was well burned out, as
shown in the damage table. Of the area that
was heavily built up, 95 percent was completely
consumed. The thoroughness of fire damage
was likewise noticeable in the sparsely built-up
areas of the city, particularly in the suburbs.
Combustible structures within the perimeter
were completely destroyed in the burned area,
or were intact, if outside the perimeter of the
consumed area. There were no cases noted of
partly burned combustible structures. Non-
combustible structures sustained structural
damage in direct ratio to the combustibility of
their contents. Fire damage to these struc-
tures ranged from light superficial damage to
complete structural damage, and, in all cases ob-
served, this damage was caused by burning of
contents. Noncombustible structures sustained
only light superficial damage due to exposure
fires, when the contents of such structures was
likewise noncombustible. Fire-resistive struc-
tures sustained only minor damage from con-
tents fires (started as a result of exposure fires
transmitted through unprotected openings) or
from exposure fires. The typical Japanese
treasure-house type of construction stood up
well in the fire. Any damage resulting there-
from was generally limited to structural roof
damage, while the walls remained intact.
d. Efficiency of the attack. An estimated
1.3 acres were damaged for each ton of bombs
reported delivered on the target. Relative ap-
praisal of attack efficiency based on this meas-
ure of damage area per ton of bombs dropped
is beyond the scope of this report. This figure
must be compared with other damage figures on
a damage area per ton basis.
e. Accuracy of the attack. The aiming point
in the target area is synonomous with the Mean
Point of Impact, shown on Figure 1. The cen-
ter point of the probable limit of bomb fall dif-
fers by only 2,300 feet distance from the Mean
Point of Impact. The attack was reasonably
accurate, therefore, considering the conditions
—such as altitude and night radar with fair-to-
good target identification—under which it was
carried out.
f. Effectiveness of the Bomb. The M74 is
considered a highly effective bomb, based on the
results achieved against this particular target.
Although the success of the attack is evaluated
by the bombing accuracy, the concentration of
bombs within the target area, and the vulner-
ability of the target to fire, it remains a func-
tion of the individual bomb to start an incip-
ient-stage fire when striking. According to
Japanese accounts of the performance of the
bomb in this respect, and in view of the extent
of fire damage, the M74 was successful in rais-
ing the necessary individual incipient-stage
fires in numbers great enough to overwhelm
fire-fighting counter-measures.
g. Fire spread:
(1) A study of the perimeter of the fire-dam-
age area reveals that the fire stopped at 61 per-
cent of the total perimeter because there was
nothing left to burn, while at the remainder of
the perimeter, 39 percent, the fire stopped in
sparsely built-up areas because of varying ex-
panses of clear space. Only in the case of one
city block, and for a distance of 200 feet, did the
fire stop at a 24-foot street in a densely built-up
section of the city.
(2) The wind was not a factor in fire spread
as it did not exceed seven miles per hour for the
period of the attack and for the following six
hours.
(3) There was no test of the effectiveness of
the firebreaks in stopping fires. Because of
the wide bomb-fall pattern over the target area,
fires involved both sides of natural firebreaks,
145
such as river, canals and railroad tracks, and
specially constructed firebreaks in the form of
widened streets.
h. Bomb penetration. Scant information
was gathered regarding bomb penetration ow-
ing to the fact that the military had picked up
bomb cases, disposed of malfunctions, and
otherwise obliterated evidence. Some cases of
bomb penetration in soft earth were observed
of the order of 8 inches. No cases of bomb
perforation were observed in 4-inch concrete
roofs.
i. Air bursts. A number of Japanese were
interrogated to determine the extent of air
bursts. It was learned that there was a consid-
erable number of bursts, most of which oc-
curred at about 5,000 feet elevation.
X. Recuperability
At the time of the survey (4-11 November
1945) there was much building activity and
there was every indication that it would con-
tinue. Planned construction of permanent-
type, frame-dwelling units was being accom-
plished with unusual rapidity due, for the most
part, to the fact that Aomori has easy access to
lumber, and because the lumber mill industry
was not seriously affected by the attack. Then,
too, there was a large number of experienced,
industrious workers available.
XI. Conclusions and Recommendations
1. This attack showed that the recently de-
veloped M74 incendiary bomb was an effective
weapon when used against a combustible target
such as Aomori. The results were excellent in
that this bomb was apparently adequate in de-
sign and function, and the density of bombs was
sufficient.
2. The results indicated that the M74 was
unsatisfactory against concrete roofs in that
none was perforated.
3. Air burst of bombs was observed by sev-
eral witnesses.
4. Firebreaks were found ineffective because
of the wide dispersion of the attack over the
city. Firebreaks and the natural breaks such
as the canal, the river, and the railroad tracks
afforded the people, however, avenues of escape
that undoubtedly reduced the number of pos-
sible casualties.
5. It had rained during part of the attack,
and humidity had been high prior thereto.
These climatic conditions apparently had little
effect on the intensity of the fire.
6. This attack provided further evidence of
the ineffectiveness of fire fighting in a heavy at-
tack, because of the large number of fires that
started nearly simultaneously and the rapidity
with which they burned completely over-
whelmed the local fire department.
7. The people of Aomori had received little
or no instructions concerning the basic air-
raid precautions. Feeble attempts were made
by constructing earth shelters and provid-
ing above-ground cisterns and hand-operated
pumps. It was evident that prior to receiving
notice of the pending air attack through the
leaflets dropped by the United States Air Force,
the people believed that their city would not
be attacked. Unexpected attacks against such
cities are valuable particularly insofar as they
affect the morale of the people.
8. Earth and timber air-raid shelters were
found inadequate in this incendiary attack.
Many people who sought refuge in them be-
came casualties through asphyxiation.
9. The densely built-up sections of the target
area burned out more completely than the
sparsely built-up sections, as shown in the Dam-
age Table. The amount of damage sustained
in the densely built-up area (466 acres) was
2.15 times the amount in sparsely built-up areas
(222 acres), yet the sparsely built-up area sub-
ject to damage was 15 percent larger than the
densely built-up area.
146
APPENDICES
Page
A. Translation of Prefecture Police Report of Raid------------ 148
B. Description of Kawamura Match Factory Fire.................. 152
C. Other Attacks on Aomori Area............................. 154
147
Appendix A
(Translator’s Note. This is a report of the B29 at-
tack on 28 July 1945 as published by the Prefecture
Police Department. Copies were distributed to defense
units in the area. It includes the results and methods
of attack, counter measures by various departments to
combat the fire, and a study of their results.)
B29 Attack
The following is a report gathered from docu-
ments and telephone information.
1. Air-raid defense learning
Date Time Area Type
July:
28 2115 Aomori Prefecture Air-raid alert.
28 2210 do Air-raid warning.
29 0022 do Raid-over.
29 0033 dn All-clear.
28 2215 Ominato Air-raid alert.
28 2301 dn Air-raid warning.
28 2317 dn Raid-over.
29 0020 dn All-clear.
28 2215 Hokkaido, Eastern Air-raid warning.
Sea Frontier
29 0020 do All-clear.
28 2215 Tsugaru Sea Air-raid warning.
Frontier
29 0020 do All-clear.
28 2130 Hokkaido, Southwest Air-raid alert.
Sea Frontier
28 2350 dn Air-raid warning.
29 0035 dn Raid-over.
29 0045 _do All-clear.
2. Types and number of planes: about 70
B29s.
3. Altitude of Flight: 4,000 to 6,000 meters.
4. Enemy planes bomb run. On 28 July at
about 2223 hours, B29s arrived on the target
entering the prefecture by way of the Sugaru
and Omagne areas, having come north from
Ojika Peninsula and Akita Prefecture. Start-
ing at 2330 hours, a formation of three to five
planes attack for two hours dropping incen-
diaries, small can-shaped type bombs and foun-
tain-pen type bombs. The planes levelled off at
the southeast leaving by way of Iwate Prefec-
ture toward the open sea.
5. Bombs
50,000 jelly, phosphorous and electron, large
and small incendiary bombs.
1,000 small “can” bombs.
A few fountain-pen type bombs and star
shells.
6. Weather report:
Time Wind direction Wind velocity Weather Atmospheric temperature (cent.) Humidity
Meters sec. Percent
2100 NNW 1.0 19.1 92
2200—. Calm 0.0 Rain 19.1 93
2300—. Calm 0.5 19.0 94
2400— NNW. 1.8 18.9 95
0100 N 3.3 18.5 96
0200 N 2.2 18.4 97
0300 N 1.2 18.2 97
0400 _ N 1.0 Misty 18.3 98
0500-. Calm .0 Misty 18.5 99
7. Bombed areas. Aomori (City), Aomori
Suguras, Gosho, Gawara, Kozukuri Nanare,
and a section under the jurisdiction of the
police department.
8. Damage
a. See table (recapitulation of damage and
losses).
b. Casualties suffered by the principal air-
raid defense units:
Dead: Police officials, 5 (whereabouts of 21
unknown; firemen, 1; civilian-defense corps
personnel, 4; air-defense observation unit, 6.
Wounded: Police officials, 14 (4 of these se-
riously) ; firemen, 2 (seriously); civilian-de-
fense corps personnel, 7.
c. Important buildings destroyed by fire.
Aomori Prefectural Office, Aomori Area Law
Court and Prosecutor’s Office, Aomori Public
Office, Aomori Police House, Aomori Water Po-
lice Department, Aomori Post Office and local
offices, Sendai Railway Bureau, Aomori Control
Department, Revenue Office, Normal School,
Aomori Middle School, Aomori High School for
Women, Aomori City High School for Women,
Aomori Hospital used by the Aomori Medical
School and nine other government-owned
schools.
d. Important factories. Aomori Shipbuild-
ing and Iron Works, Aomori Iron Works (half
burned), Tohoku (Northeast) Plywood Com-
pany, Inc., Office, Towada Miso and Shoyu
Sauce Co., Inc.
9. Operation of important air-raid defense
units
a. Police department. This department, in
addition to planning the preliminary fire-fight-
ing methods, supervised evacuees, dug up the
dead, and identified bodies. They also super-
148
vised the civilian-defense radio and information
sections and prepared propaganda. They gath-
ered and transmitted intelligence reports to the
prefecture officials. Six policemen died and 14
were injured during the attack. The police de-
partment received high praise from the people
because of the heroic manner in which it per-
formed its duties.
b. Civilian-defense corps. At the time of the
alarm, there were 350 members of the civilian-
defense corps available for duty. They were
assisted by 410 members of the Army-Navy De-
fense Unit. During the early stages of the at-
tack, although they valiantly attempted to fight
the fire, the attack continued and fire spread
with the result that they could no longer cope
with it. Five died and eight were injured.
The members of this corps received high praise
because of the unselfish manner in which they
carried out their tasks.
c. Air-defense observation unit. The head-
quarters of the Air-Defense Observation unit
was in the center of the city, and, even though
they were besieged and hindered by the fire at-
tack, Adjutant Shioya and his subordinates con-
sisting of 26 (all of the Women’s Corps) main-
tained communications until the very end, and,
finally, when the communications were broken
off, the Adjutant had his staff carry the com-
munication equipment in their hands. As soon
as they retired to the duty room, the fierce fire
raged about them to the extent that they could
not move and became panicky. In spite of the
fine judgment of the Adjutant, six did not leave
the dangerous place. He took charge, but fi-
nally died at his post.
d. Military personnel. At dawn on 29 July
the Tohoku 93 Unit quartered in Aomori re-
ceived orders from the Army Headquarters to
engage in controlling the remaining fire.
After the conflagration, there were 1,000 men
from the Tohoku 80 Unit who engaged in clean-
ing up and opening the roads, restoring com-
munications, and policing the area.
10. Plans of Action
a. Policemen and civilian defense. Imme-
diately after the attack, the policemen and fire-
men received their orders from all of the police
departments of Hirosaki, Owani, Itayagi, Gosho
Gawara, Namioka, Kuroishi, Kominato, Nobei-
chi, Kanita, Sambongi, Shichinohe, Kizukuri,
and Kanagi.
b. Communication liaison. Communications
with police department and the central and re-
lating army units.
Tsugaru area—Shinkimura (about 2.44 miles
from Aomori).
Nambu area—Nonai Mura (about 4.88 miles
from Aomori). Mr. Chiba, with the aid of 11
men, organized 2 units of 6 men to a section,
with 2 of them remaining behind, and was able
to contact the Home Ministry, Tohoku Gover-
nor General, and Hirosaki General Headquar-
ters by crawling on the ground to get to the
railroad telephone.
c. Investigating damage done in the prefec-
ture. The above-mentioned personnel, by using
the railroad telephone, were able to communi-
cate to all police stations and report the
damage.
d. Gathering evacuees. As the fire damage
increased, evacuees were assembled in the fol-
lowing places according to previous plans:
Tokuuchi Mura—4,143 persons; Shinkimura
—500 persons; Ona Mura—6,050 persons;
Arakawa Mura—6,151 persons; Takada Mura
—2,200 persons; Kokouchi Mura—6,500 per-
sons ; Tsutsui Mura—3,200 persons; Hamadate
Mura—6,717 persons; Harabetsu Mura—3,201
persons; Nonai Mura—740 persons; Okuuchi
Mura—200 persons. Total 39,602. Some
67,280 persons remained in Aomori.
e. Medical aid measures. Places of refuge
were established in Kami Hospital, Aomori
Shinkoren Hospital, Public Hall, Zodo Primary
School, Aomori Technical School, and Aomori
Medical College. Relief sections were also es-
tablished in Nonai, Gosho Kawa Hara, and
Hirosaki. The Hirosaki Army Hospital, Aom-
ori Army Hospital, Ominato Guard District,
Ominato Naval Barracks, and Iwa Headquar-
ters Unit Relief Section also gave aid and ad-
ministered relief.
f. Opening of roads. Policemen, civilian-
defense corps personnel and coal workers units
were mobilized to open the roads from Aomori
to Shin Machi, Omachi, Tsutsumi Machi, Ko-
kudo Tatemono Sokatsu, and the main roads in
the public house area. The Tokoku 93 Unit
also assisted by clearing away fallen communi-
cation lines.
149
g. Restoring communication lines. Imme-
diately after the attack, all communication lines
were out, but, with the aid of communication
officials and communication bureau personnel,
the communication bureau and police telephone
lines were restored five minutes after the fires
were put out.
h. Disposal of dead bodies. With the aid of
the special guard unit and one section of the
civilian-defense unit, a mortuary unit was
formed which disposed of bodies in the follow-
ing manner:
When the bodies were discovered, sheets of
metal were put over them and they were then
placed at the side of the roads. Tags were at-
tached which listed sex and place where body
was found. They were then taken and as-
sembled at the Sannai Cemetery.
i. Ominato Coast Guard District. At about
0500 hours, 29 July, this organization dis-
patched two ships to aid in relief work. Five
hours later two more ships were dispatched
loaded with food and clothing.
j. Governmental agencies. At 1000 hours on
31 July, various governmental agencies, includ-
ing the Army, met in Aomori and discussed
plans concerning their future action.
k. Transportation
(1) Railroad transportation. As a result of
the attack, 13 box cars, 17 passenger cars, and
some trackage were damaged. Although this
had a temporary adverse effect, rail transporta-
tion was soon restored to normal.
(2) Automobile transportation. Trucks and
busses were dispersed as soon as the attack be-
gan. Seven trucks, 7 busses, and approximately
15 percent of all other vehicles were either com-
pletely burned or rendered unserviceable. In
accordance with previously made plans, service-
able automobiles were pooled and used by the
Aomori Transportation Headquarters for the
following purposes:
(a) Transportation of dead bodies.
(b) Transportation of emergency rations,
clothing, and other necessary items.
(c) Transportation of relief workers.
(d) Transportation of communication re-
pair equipment.
(e) Transportation of intelligence reports.
(3) Sea transportation. Because of the lack
of electrical power, ships could not be unloaded
until 31 July. Coal, however, was immediately
unloaded by using 10 percent of the workers of
the Nippon Tsun Branch Office, 357 Korean
laborers and 420 soldiers.
1. Electric power. The restoration of elec-
tric lighting was given first consideration be-
cause of its effect on morale. Power was re-
stored by 1900 hours on 29 July in the principal
offices, such as the Aomori Railroad Station,
Aomori Radio Station, and Tohoku 93 Unit
Headquarters, through the efforts of the
Aomori branch of the Tohoku Power Distribut-
ing Corporation. By 31 July, practically all
the important buildings in Aomori and its
suburbs had electricity.
m. Morale. In order to raise the morale of
the people, propaganda posters were printed
and distributed urging the people to keep their
spirits up.
n. Building inspection. An inspection was
made of all buildings still standing to determine
whether or not they could be used.
o. Public toilets. In order to maintain
proper hygiene standards, 100 public toilets
were established.
p. Outside aid. Immediately after the at-
tack, the radio volunteer units of Hirosaki and
Hachinoche did the following:
(1) Posted propaganda posters in 50 locali-
ties. These dealt with the bolstering of morale
of the average citizen.
(2) The Volunteer Mobile Radio unit trans-
mitted the methods of receiving and distribut-
ing food, of getting aid to Aomori, and of evac-
uating the victims from the various assembly
points. It also transmitted information con-
cerning the location of relief stations. In addi-
tion, it attempted to counteract false rumors.
(3) It transmitted the orders of the prefec-
tural governors as well as those of the Aomori
police chief to the two Nippon Daily news-
papers and to all police stations.
(4) On 30 July, assistance was obtained
from the Sambongi Machi Volunteer Radio unit
which organized a mobile radio receiving unit
and also a public address system for dissemi-
nating propaganda.
(5) This unit constructed and distributed
bulletin boards throughout the city for the
posting of official notices. Seven suggestion
boxes were also distributed, in order to encour-
150
age the people to give their ideas of the man-
ner in which relief should be effected.
q. Koreans. It was reported that 271 Ko-
reans were assembled and evacuated. One was
listed as missing. However, for the present,
this is not an important matter.
r. Food Distribution
(1) Immediately following the attack. The
victims were supplied with rice balls from the
neighboring suburbs. Each person was sup-
plied free with 1 “Go” which was supposed to
last 3 days.
(2) Food distribution centers. Ten food
distribution stations were established in
Aomori. After 1 August, rice, miso sauce,
shoyu sauce, vegetables, meat, and milk distri-
bution was effected with a minimum of effort,
and there were no serious problems to be
considered.
(3) Manufactured straw goods. According
to previous arrangement, there were supposed
to be 9,000 straw mats, 24,000 pounds of rope
for shelters and temporary huts and 15,000
straw bags to be used for unloading coal. By
31 July, 25,000 straw mats, and 2,000 straw
bags had been obtained.
Battle Lessons
(Translator’s Note. This is a list of the lessons that
the Japanese have learned as the result of the attack.
It will be noticed that in practically all cases recom-
mendations are made for future action.)
1. Evacuation of personnel. The evacuation
of personnel following this attack was success-
fully carried out. However, in view of the pos-
sibility of further attacks, the evacuation of
young, old, sick, and pregnant should be en-
couraged. As the result of the carrier attacks
of 14-15 July, the evacuation in this attack was
improved, and, even though this was a partic-
ularly heavy attack, the casualties were com-
paratively light, in spite of the fact that 90 per-
cent of the city was completely burned. In
view of the fact that many old people who had
not been evacuated were casualties, the evacua-
tion of this class of personnel should be em-
phasized.
2. Evacuation from buildings. Because of
the existence of streets which were widened to
50 meters to serve as firebreaks, the evacua-
tion from buildings in Aomori was carried out
rather successfully, in as much as these wide
streets acted as excellent avenues of escape.
(Translator’s Note. The writer of this document goes
on to say that, if the spread of fire is to be prevented,
the streets should be widened to a minimum of 100
meters and wherever possible should run along
streams.)
3. Home fire fighting. There were many
casualties because people made the mistake of
fighting the fire and thereby lost the valuable
time needed to flee from the area.
4. “Godoivns.” Immediately after the out-
break of the fire, the doors of the vaults (Go-
downs) which were hot were opened and con-
sequently the fire ignited the contents of these
buildings. Water should always be placed in-
side these storehouses and after the fire around
them has been extinguished the doors and win-
dows should be opened. However, this was
done in Kome, Machi, Kitaga, and Kohachi, and
fires broke out.
(Translator’s Note. Apparently in these cases the
contents of the vaults were smoldering due to fires being
started therein by radiation. Upon the admission of
oxygen, ignition resulted.)
5. Motor vehicles. One of the important
lessons learned from this attack was that
trucks, busses, fire apparatus, and other motor
vehicles should be dispersed outside of the city
or at least outside of the area that is burning,
and should be so located that they will not be
subjected to exposure fires. During this at-
tack, in accordance with the plan of action, the
fire trucks were dispersed within the city and
their effect was practically nil because of the
intensity of the attack.
6. Shelters:
(Translator’s Note. In this phase of their report,
the Japanese very obviously contradict themselves, par-
ticularly in so far as the use of shelters is concerned.
It is felt, however, that the inclusion of this part of
their report will prove interesting, and it is transcribed
herewith as literally as practicable.)
a. Underground shelters. It is recom-
mended that 6 inches of earth be placed over
materials stored in shelters located under
houses. In all cases where this had been done,
the materials, particularly food, were found to
be safe. (This recommendation is particularly
applicable in as much as this type of shelter
was common throughout the city.)
b. Recommended type of shelter. It is rec-
ommended that air-raid shelters be constructed
with their roofs at least three feet above the
151
ground, covered with earth and provided with
two entrances, each of which should have a
curtain made of incombustible material. In
addition, a barricade should be constructed so
that if there be a fire near by or a near miss the
shelter will be protected. This type of shelter
was used at the Yokouchi Chemical Factory in
Osaka Machi in Aomori. This plant received
hits and fires broke out, but the shelters which
were within six feet of the burning buildings
were not affected. In one case, two incendiary
bombs hit near the entrance of a shelter of this
type in which there were four persons, and, al-
though a fire burned right outside, the occu-
pants were not harmed.
c. Use of shelters. It is dangerous to escape
to a shelter at the time of an air attack. Dur-
ing this attack, those who escaped to incom-
pleted shelters lost valuable time and in the end
burned to death. The majority of deaths in
this attack was among those who escaped to
shelters. Also, since shelters were constructed
near dwellings, there were cases where people
died because the fire spread into the shelter.
In Tobago Machi there was a number of shel-
ters that had been flooded, and the water in
them was used advantageously by the people to
douse themselves, thus preventing their cloth-
ing from catching fire.
7. Evacuation by water. Those persons who
were able to escape to the shore of the bay were
saved because the Aomori Water Police Depart-
ment had its floats and small boats ready to
receive them. Also, the fact that there was no
off-shore wind blowing at the time added to the
safety of escape by water.
8. General comments
a. Since the police department had informed
the people at the time of the attack regarding
the roads to be taken in evacuating the city, the
losses were comparatively light.
b. During an attack, some sort of head pro-
tection is necessary. When evacuating, carry
buckets full of water. If the eyes and throat
hurt because of the hot wind and smoke, soak a
towel and apply it to the mouth, eyes, and nose.
In this manner, the evacuation will be com-
pleted easily; moreover from time to time cover
the clothes to prevent their catching fire.
Appendix В
Kawamura Match Factory Fire Report,
Aomori, Japan
On the night of 6 November 1945, fire which
started in an over-heated, fire-resistive, dry-
room destroyed the property of the Kawamura
Match Factory (Figure 5). The fire burned
for a period of 50 minutes and completely
destroyed the combustible portions of the
structure.
The Kawamura Match Factory manufac-
tured wooden match sticks. The manufactur-
ing process involved a simple procedure of cut-
ting match sticks to proper size, packaging
and wrapping the sticks in rice-straw for ship-
ment elsewhere for impregnation. There was
no impregnation process involved at this
location.
Heavy de-barked logs, cut to 12-inch lengths,
were soaked in hot water in a wood-shavings-
fired metal-clad wood vat. The log “chunks”
were then “skinned-off” in an electric-power
rotary shaver, cut to desired size in an electric
power shear, dried in a brick-enclosed hot-air
dry room and dressed off in an electric-driven
tumbler. After a hand-sorting process, the
sticks were packaged and tied and then bundled
in rice-straw wrappings and shipped for
impregnation.
The factory was a typical one- and two-story
wood-frame structure with no basement. Out-
side walls were frame and frame metal-clad.
Floors of sections occupied as dwelling quarters
were raised wood boarding carried on light
Japanese recapitulation of damage and losses
Aomori
Bombs dropped Personnel losses Building losses Ships Structures Railroad Fire de- partment
Dead Seriously wounded Slightly wounded Where- abouts unknown Fam- ilies Number of houses All burned Half burned Build- ings Ware- houses Freight cars Passen- ger cars Vehicles
50,000 728 40 240 8 17,843 11,330 25 2 10 15 43 18 19
152
wood joists. There were no wood floors in the
manufacturing sections, only trodden earth.
Ceilings were finished only in dwelling quarters
where they were of light suspended boarding.
A light roof framing of wood trusses carried a
sheet-metal-clad planked roof. A small brick-
enclosed dry-room was roofed with 4-inch con-
crete slab over which was built a light-wood
frame attachment. This fire-resistive enclo-
sure communicated with the combustible man-
ufacturing areas through unprotected openings.
Thirty-five percent of the factory area was of
light-wood frame construction and was occu-
pied as dwelling quarters. This construction
was contiguous with the mixed-constructed
manufacturing area of about 32 percent, the
superior constructed fire-resistive area being 6
percent. The remaining 33 percent of the area
was used for open storage of raw materials and
finished products.
On the night of 6 November 1945 at 2100
hours, a fire broke out in the frame attachment
over the fire-resistive dry room. An unat-
tended brick-set low-pressure steam boiler in
the dry room ignited loose rice straw in this
same area. This incipient fire spread to sim-
ilar contents in the frame attachment over the
roof through unused and unprotected pipe holes
in the concrete roof.
The factory site was a half-mile from the
nearest fire station. Fire department appar-
atus arrived in response to an alarm within ten
153
minutes after the fire was noticed. During this
period of time fire-fighting efforts were of a
first-aid nature with only passers-by par-
ticipating. Upon arrival of the fire depart-
ment, the fire had spread to the extent that the
entire factory site was involved. The main
effort of the fire department was, therefore,
directed toward limiting the extent of this
spread.
Within 50 minutes of the time the fire was
noticed, and within 40 minutes after the fire
department arrived, the fire was extinguished.
In this short span of time, 6,000 square feet of
ground floor area of the factory had burned out,
the fire had spread across 45 feet of clear space
and had burned out 1,450 square feet ground
floor area of a dwelling which was exposed
across a 30-foot-wide street, and had lightly
damaged two other exposed buildings.
This factory was highly vulnerable to fire
because of combustible construction and oc-
cupancy, and certain characteristics of the fire
ruin indicate that it was extremely fast-burn-
ing (Photos 27, 28, and 29). It will be noted in
the photographs that the lighter wood mate-
rials are completely consumed, while some light
structural wood members can be seen still
standing, and only partly burned or heavily
charred.
Appendix C
Other Air Attacks on Aomori Area
In addition to the incendiary attack described
in this report, there was a number of high-
explosive attacks made on the Aomori area.
On 14-15 July 1945, there was a number of
repeat attacks made on both the city and the
shipping in the harbor. In addition to drop-
ping high-explosive bombs, the planes also
strafed the streets. On the fourteenth, as a
result of an attack on shipping in the harbor,
a ferry boat was sunk with the loss of 102
persons. In addition, 10 persons were serious-
ly injured and 5 were slightly injured. On the
fifteenth, 2 were killed and 3 injured as the
result of strafing.
On 10 August, according to the Japanese,'
four carrier-based planes delivered a low-level
attack on the city, and dropped a number of
high-explosive bombs which did little physical
damage, because the bombs dropped on the area
that had been burned out by the incendiary
attack described in the main body of this re-
port. Five persons were killed, however, and
15 were injured, 10 seriously.
On 10 August, a low-level high-explosive at-
tack was made on the Rising Sun Oil Company
bulk plant (also known as Sekiyu Haikyu Tosei
K.K.—Petroleum Distribution Control Com-
pany) . This plant, which was a Shell Oil Com-
pany installation, was put completely out of
operation as a result of the attack. It is in-
teresting to note that a direct hit ruptured a
storage tank and the resulting fire spread to a
wooden area across the road from the plant.
The following “before and after” photographs
best illustrate the damage accomplished (Photos
30, 31, 32, and 33).
154
Photo 27.—Kawamura match factory fire damage. Brick enclosure houses dry room and boiler.
Photo 28.—Kawamura match factory fire damage. Brick enclosure houses dry room and boiler.
704699—47—11
155
СП
Ci
Photo 29.—Fire dama^d to machinery and equipment. Note sheet steel from roof and walls.
Photo 30. — Noni storage plant, Rising Sun Oil Co. Pre-raid view.
Photo 31.—Noni Oil Storage Plant.
157
Photo 32.—Result of direct
hit on fuel oil storage tank of Rising Sun Oil Co., bulk station, Noni.
Photo 33.—Damage to tank resulting from HE near miss. Rising Sun Oil Co., Noni.
158
Part 5
EFFECTS OF INCENDIARY BOMB ATTACK ON AKASHI, JAPAN
159
TABLE OF CONTENTS
Page
I. Object cf Study... .......................... 161
IL Summary...................... '..................... 161
III. General Information........................... 161
IV. The Target ..................................... 161
V. Attack Data..................................... 163
VI. Defense Against Air Attack.......................... 164
VII. The Fire......................................... 164
VIII. Damage............................................... 165
IX. Analysis of Damage............................... 172
X. Recuperability................................ 177
XI. Conclusions and Comments......................... 177
Appendices A and В
Photos 1-25, inclusive
Figures 1 and 2
160
Fire Damage Study, Akashi, Japan
I. Object of Study
1. The object of study was to determine the
effectiveness of the M69 bomb and the extent
of fire damage in a single air attack against a
Japanese city.
IL Summary
1. Akashi is a small industrial city situated
on the Inland Sea about 14 miles west of Kobe.
Its population was about 50,000 normally, but
had almost doubled following the China In-
cident, due principally to the establishment of
the Kawasaki Aircraft Plant and the expansion
of existing industrial plants converted to war
work, mainly as subcontractors to the Ka-
wasaki plant.
2. More than 90 percent of the city was 20
percent or more built up. The southern part
of Akashi was the most heavily built up and
was comprised chiefly of one- and two-story
frame dwellings and dwelling-shop combina-
tions with an intermixture of modern, well-
constructed office buildings. The main indus-
trial section was located along the western edge
of the city. The city of Akashi provided a
target of approximately 768 acres of built-up
area.
3. The dispatched load of this mission was
reported as 1045.2 tons of the M69 incendiary
bomb and the reported delivered bomb load on
the target was 975 tons.
4. An estimated 47 percent of the total built-
up area of the city was destroyed or damaged
as a result of this attack. Of the total built-up
area subjected to attack, which included the
.city of Akashi and its suburbs (1,130 acres), it
is estimated that 680 acres, or 60 percent, was
destroyed or damaged by the attack.
5. As a result of this attack, 576 casualties
were sustained, including 355 dead, 57 injured,
133 slightly injured, and 31 missing. A total
of 9,075 dwelling structures was destroyed or
damaged as were seven government buildings,
three schools, 10 larger factories, and four
warehouses.
III. General Information
Team personnel and time of survey. The
Team chief and
fire engineer.
Fire engineer.
Interpreter.
Clerk-driver.
Draftsman.
Photographer.
following personnel constituted Team 12 which
conducted the fire damage study of Akashi dur-
ing the period 16 November to 25 November
1945:
Capt. Robert H. Merz........
Capt. Elmer R. Hjortsberg....
Lieut. (jg) Maurice Hellner..
Sgt. John Cherry............
S 1 /с Robert McClintock____
PhoM 3/c William Mattern..
IV. The Target
1. Geographical. Akashi is an irregularly
shaped city lying along the coast of the Inland
Sea approximately 14 miles west of Kobe. It
lies within Hyogo Prefecture and is on the main
line of the Sanyo Railroad which runs between
Kobe and Shimonoseki (Figure 1). The metro-
politan section of the city occupies a built-up
area of 1.2 square miles. In 1940, the west
boundary of Akashi was relocated, as shown on
the map, in order to include the property of the
Kawasaki Aircraft Plant. The area within the
new boundaries is known as Greater Akashi.
The city is divided into a north section and a
south section by a 50-foot-wide highway run-
ning through it. On the west, the Akashi River
separates the main section of the city from the
industrial section and Greater Akashi.
2. Population. In 1940, the population of
Akashi was 48,000. This figure, however, rose
to 84,000 because of the inclusion of more area
within the city and the establishment of the
Kawasaki Aircraft Plant, many employees of
which were recruited from areas outside of
Akashi.
3. Street plan. With the exception of the
main street which runs through the center of
the city, and a few other arterial streets, the
streets are narrow, and in many cases, extreme-
ly irregular.
4. Built-upness. The south section of the
city, the most congested area, was comprised
mainly of one- and two-story frame dwellings
with an intermixture of modern, well-con-
structed public and business buildings (Photo
1). The principal industrial section was in the
western part of the city in the vicinity of the
161
Akashi River. The'following table shows the
relative built-upness of Akashi:
Acres Square miles Percent of total area Percent of built-upness
153 0.24 20.0 40 or more (dense).
542 0.85 70.5 20-40 (medium).
0.11 9.5 5-20 (sparse).
768 1.20 100.0
5. Industries
a. Peacetime. Peacetime industries of Aka-
shi included the manufacture of match sticks,
small ship engines, farm tools and implements;
building of fishing boats; and weaving of cotton
textiles. A small fishing fleet was active, but
most of the catch was consumed locally. In
addition to these activities, there was a con-
siderable tourist trade, Akashi being one of the
popular seaside resorts on the Inland Sea.
b. Wartime. The largest single wartime in-
dustry was the Kawasaki Aircraft Plant located
west of the Akashi River in Greater Akashi.
This plant employed 40,000 persons and was
one of the most important of its kind in Japan.
Other plants engaged in war work in Akashi,
including a steel plant and an oxygen-apparatus
plant, were engaged in sub-contract work for
the Kawasaki Plant.
6. Types of construction
a. Dwellings. The typical Akashi dwelling
was a one- or two-story, wood-frame structure
with a wood-truss, low-pitched roof, covered
with tile laid in a mud mix over i/j-inch board-
ing. Exterior walls were either a V^-inch wood
curtain wall carried on the frame, or were built
up of mud mix carried on a light wood or bam-
boo lattice, and finished with a plaster coating
or wood sheathing. Floors were either hard-
trodden earth or ^j-inch boards carried on
joists. Light Vi-inch ceilings were suspended,
from roof trusses, and, in many cases, had been
cut away to allow ready access in the event of
fire in an otherwise concealed space. Interior
partitions were constructed of either lA-inch
wood strip or bamboo lattice covered with wall-
board or paper. This highly combustible type
Photo 1.—General view of typical built-up street in background.
162
of construction, averaging 500 square feet of
floor area, prevailed throughout Akashi.
b. Home workshops. Small home workshops
were often found in connection with dwellings,
occupying the same structure or small, wood,
lean-to additions contiguous to the dwelling.
The principal difference in construction was the
absence of the raised wood floor. Numerous
small commercial and mercantile occupancies
were found in similar structures.
c. Industrial buildings. The larger indus-
trial buildings of Akashi ranged in size from
10,000 square feet to 50,000 square feet of
ground floor space, and usually had one or two
stories. The structural frame was either heavy
timber or a combination of timber and steel
with a correspondingly constructed truss roof.
Exterior walls were of wood, corrugated iron,
or sometimes of corrugated asbestos cement;
this same material was also used for roof cov-
ering. Floors were either concrete on fill laid
on ground or hard-trodden earth. The use of
brick was rare and ordinary load-bearing brick-
wall structures were most uncommon. Al-
though there was little or no attempt at special
construction to house specialized industrial
processes, the use of brick was sometimes noted
in connection with drying occupancies and
boiler houses. Although the general industry
of Akashi was varied, the industrial construc-
tion was preponderantly combustible with a few
noncombustible structures. There were no
cases of fire-resistive industrial construction.
d. Public buildings. There was no general
type of construction noted among public build-
ings. Some, such as the railroad station and
outlying public schools, were combustible, while
other structures, particularly the administra-
tive buildings, were fire resistive. A few of the
administration buildings were of modern rein-
forced-concrete design, generally two stories in
height with reinforced-concrete slab roofs and
floors.
8. Vulnerability. The city of Akashi was ex-
tremely vulnerable to damage by an incendiary
attack for the following reasons:
a. Approximately 95 percent of the buildings
in the city were combustible.
b. The combustible buildings, with few ex-
ceptions, were contiguous and were in congested
areas.
c. Streets were generally narrow and irreg-
ular and provided poor avenues of approach for
fire apparatus.
d. Public fire protection was poor, due mainly
to the lack of dependability of the public water
system.
e. Natural and man-made firebreaks were
few in number.
V. Attack Data
1. General. The night attack on Akashi was
included as Mission 252 in Field Order 96,
Headquarters XI Bomber Command, Twentieth
AF, dated 6 July 1945, which directed five at-
tacks on Honshu. The force that attacked
Akashi consisted of 4 groups of the 73rd Wing
made up of 124 B-29s, including 12 pathfinder
planes.
2. Load data. The planes were loaded with
E46 clusters fuzed to open 2,500 feet above the
target with an intervalometer setting of 50 feet.
Each cluster carried 38 M69 incendiary bombs
and weighed 425 pounds. The M69 incendiary
bomb weighs 6 pounds and has a hexagonal
case, 19.5 inches long and 2.8 inches in diame-
ter. It is filled with 2.8 pounds of gelled gaso-
line and has an incendiary fill weight ratio of
46 percent. It is provided with 4 gauze tail
streamers, 47 inches long, to stabilize the bomb
in flight and to reduce the terminal velocity.
3. Attack data tables
a. Flight data
Mission number Date of attack Primary target Planes Time over target
252 6-7 July 1945. Akashi, Honshu. 124 B-29’s 0015 to 0127 (local time).
Altitude Weather Wind Cloud cover
6900 to 8200 ft. Light rain. 23 m.p.h. 8000 ft. ; 5 - 10 on ground. 4/10 to 8/10.
b. Bomb data
Clusters loaded on airborne aircraft Released on target Cluster opening altitude Interval- ometer setting
Number Tons Number Tons feet Feet
5,226 1,045.2 4,875 975.0 2,500 50
Note.—In addition, 11 M46 photoflash bombs were dropped to
facilitate night photography.
163
4. Other attacks (Appendix B)
a. Prior to the incendiary attack of 6-7 July
1945, Akashi had received four attacks which
were directed against the large Kawasaki Air-
craft plant west of the city (Greater Akashi),
only high-explosive bombs being used. These
attacks were made on 19 January, 9 June,
22 June, and 26 June, all in 1945.
b. Consequently, a number of the areas hit
by the incendiary bombs had been hit previous-
ly by high explosives, particularly in the vicin-
ity of the river and the area occupied by the
Kawasaki plant. A physical damage survey of
this plant appears in a separate report.
c. In a number of cases, particularly at the
aircraft plant, high explosives caused fires and
it was therefore difficult to distinguish between
fire damage induced by high explosives and
that caused by incendiaries, except where in-
dividuals were found who could recall the
details.
d. A map of Akashi on which the fire chief
has shown the extent of damage caused by the
two types of bomb attacks is filed in the U. S.
Strategic Bombing Survey G-2 Library as:
Akashi Reference No. 1, Physical Damage Di-
vision Reference Notes.
VI. Defense Against Air Attack
1. Civilian
a. Fire department. Prior to the attack, the
personnel of the Akashi fire department con-
sisted of 200 full-time firemen and 1,000 volun-
teers. The latter were not volunteers in the
true sense of the word, but comprised those who
were assigned fire-fighting duties by the aux-
iliary police and fire units as their required
contribution to the war effort. At the time of
the survey, however, the personnel of the reg-
ular department had dwindled’ to 130 full-time
firemen and an indeterminate number of volun-
teers. Before the attack, the department had
30 pieces of motorized fire apparatus, half of
which were in Akashi proper and the remainder
distributed among the neighboring rural com-
munities which were under the protection of
the Akashi fire department. In addition, Aka-
shi had a mutual assistance agreement with
Kobe, in accordance with which Kobe was to
send 30 pieces of apparatus to Akashi in the
event of an air attack.
b. Water supply. The water supply was ob-
tained from three wells, each approximately
400 feet deep. The water was pumped from
these wells through the treatment plant and
into a 200,000-gallon-capacity reservoir from
which it flowed by gravity through a single
12-inch supply main to the city, a distance of
approximately I1/-» miles. The principal ar-
terial mains were 10 inches in diameter and
fed 8-, 6-, and 4-inch distribution mains. The
waterworks was inspected during the survey
and it was found that, although the pumping
station and treatment plant had not been af-
fected by the attack, they were in very poor
condition principally because of inadequate
maintenance and inefficient operating methods.
The most outstanding deficiency at the pumping
station, however, was the lack of a stand-by
source of power to operate the pumps in the
event of the failure of electric power which
came from Osaka through a substation located
in Akashi.
c. Hydrants. The fire hydrant connections
in Akashi were of the sub-surface type. The
hydrant riser which was carried on the fire
engine had no valve stem and a separate key
had to be carried in order to open and close the
valve. Consequently, the hooking-up of the
hydrant was a slow process. The number of
hydrants was not obtained because of the lack
of adequate water department records. It was
observed, however, that two hydrants along the
main street in the center of the city were ap-
proximately 1,200 feet apart.
VII. The Fire
1. General. The incendiary attack over
Akashi lasted for a period of one hour and
twelve minutes. During the initial stage of
the attack, various defense units and the pop-
ulace in general attempted to fight individual
incipient-stage fires. With the increasing mag-
nitude of the attack, however, their effort was
seriously diminished, and, for the rest of the
attack, fire-fighting efforts were confined to
isolated burning areas where positions could be
taken without jeopardy of personal safety.
The general success in fire fighting was meager,
however, because the bombs started many in-
dividual fires which merged into ine great fire.
164
2. Weather
a. According to the Japanese, it had rained
intermittently during the week prior to the at-
tack. On the night of 6-7 July, a light rain fell
both immediately before and during the attack
accompanied by a 7-10-mile-per-hour wind, gen-
erally from the north-northwest.
b. Air Force weather observation made dur-
ing the attack indicated 4-%0 low clouds, tops
7,000 feet and %0 middle clouds in thin broken
layers between 7,000 and 20,000 feet. Winds
at 8,000 feet were 305° at 20 knots.
3. Fire department. Upon receiving the air-
raid “alert,” fire engines were dispatched to
previously determined locations within the
city. Nine of the 15 engines in Akashi were at
the fire headquarters building when the attack
was made and were destroyed together with
the building and garage. Fifteen pieces of ap-
paratus stationed outside of Akashi remained
where they were rather than leave their dis-
tricts without protection. The remaining six
engines were hampered in their attempts to
reach the worst fires because of their inability
to maneuver along the narrow, debris-covered
streets and, therefore, had to limit their work
to fighting fires along the wide streets in which
they could move. Apparatus arrived from
Kobe too late to be of any effective assistance.
The main electric substation was seriously dam-
aged by fire early in the attack (Photos 2 and
3) and that disrupted the electric power supply,
putting the water pumps out of service and
limiting the water supply to that contained in
the 200,000-gallon reservoir. As a result,
many water pumps were without water, the
water pressure dropped, and the efforts of the
firemen, including the 150 from Kobe, were
directed mainly to rescue work.
4. Police and military. The prefecture po-
lice, assisted by local military units, directed a
general evacuation of people from the city dur-
ing the hour preceding the attack and imme-
diately following receipt of the Osaka District
air-raid “alert.” The fire-fighting efforts of
these forces during the attack were negligible.
Following the attack, these agencies directed a
general clean-up of the area, disposal of the
dead, and relief measures.
5. Communications. As a direct result of
loss of electric power and of general damage to
communication lines, communications were
seriously disrupted. Repairs to the network,
following the attack, were limited to the more
important using agencies.
6. Evacuation. An orderly evacuation was
started one hour prior to the actual attack at
the time the Osaka “alert” was received. Peo-
ple, carrying limited personal effects, were
moved either to the open park area to the north
of the city, or to the waterfront areas along
the south of the city. It was estimated that
about one-third of the population, primarily
older adults and children, moved to the park
area. Many persons, however, remained close
to home and fought fires to the best of their
ability.
7. Civilian morale
a. In general, the morale of the civilian popu-
lation of Akashi during and after the incen-
diary attack of 7 July was fairly high and there
was no panic among the townspeople.
b. Although no leaflets were dropped to warn
the inhabitants of an impending raid, the peo-
ple were not altogether surprised as the city
had already been bombed -four times, the latest
being exactly two weeks before. Consequently,
they were apparently prepared to fend for
themselves. As the fires spread and developed,
and the streets became so littered with debris
that the fire engines were unable to get through,
people came out of their shelters and courage-
ously fought the fires with the only means avail-
able—buckets of water, poles, and beaters.
What they lacked in fire-fighting training and
equipment, they made up in some small measure
by their determination, so that a number of
houses which might otherwise have burned
were saved.
VIII. Damage (Photos 4 and 5)
1. Area damage table
Built-upness Area subject to damage Area damaged Percent- age damaged
Acres Square miles Acres Square miles
City of Akashi 768 1.20 361 0.56 47.0
Dense, 40% plus 153 0.24 137 0.21 89.5
Medium, 20% to 40%. 542 0.85 164 0.26 30.3
Sparse, 5% to 20% 73 0.11 60 0.09 82.2
Suburban Akashi 365 0.57 319 0.49 87.4
Dense, 40% plus 130 0.20 124 0.19 95.4
Medium, 20% to 40%_ 100 0.16 71 0.11 71.0
Sparse, 5% to 20% 135 0.21 124 0.19 91.8
Total Akashi 1,133 1.77 680 1.05 60.0
Dense, 40% plus 283 0.44 261 0.40 92.2
Medium, 20% to 40% 642 1.01 235 0.37 36.6
Sparse, 5% to 20% 208 0.32 184 0.28 88.5
165
Photo 2.—Damage sustained by load-bearing brick-wall electric substation.
Photo 3.—Interior view of electric power substation.
166
Photo 4.—General view of fire damage, looking south from center of city.
167
Photo 5.—General view of damaged city, looking northeast. (Stack in foreground felled in previous attack.)
2. Casualties, The following tabulation is
based on the Japanese record of casualties
resulting from the attack:
Dead__________________________________________ 355
Seriously injured_____________________________ 57
Slightly injured______________________________ 133
Missing________________________________________ 31
Total_______________________________________ 576
3. Buildings and industry. The following
table is based on Japanese records regarding
losses due to the attack:
Damage to buildings
Totally damaged
Dwellings____________________ _ ______ 9,075
Government buildings_________ _ ______ 7
Schools______________________ ____l___ 3
Factories______________________________ 10
Warehouses______________________________ 4
Damaged
Electric power stations______ ____________ 1
Gas works_________________________________ 1
4. Special study of an isolated burned area.
Fire damage in Akashi was characterized by
well defined isolated burned areas, in both
densely and sparsely built-up sections, as shown
in the damage map of the city (Figure 1). One
of these damaged sections located on the east-
ern edge of the city along the water front was
studied in detail. An enlarged drawing of this
area shows various positions where photos were
taken of this fire-area perimeter (Figure 2).
a. The burned area and immediate vicinity
were estimated as 40 percent built up. Re-
maining structures were noted to be primarily
combustible dwellings, one and two stories in
height, with two-story structures predomi-
nating. Interspersed were several small com-
bustible mercantile and commercial-type struc-
tures. There were no factory structures in this
area. Principal streets were from 24 to 30 feet
wide and a great number of lesser streets aver-
aged 15 feet in width. Building fronts bor-
dered closely on street lines, and, except for
varying heights in building roof lines, the build-
ings were contiguous on both sides of streets.
Back yards had numerous sheds forming a
nearly continuous built-up pattern within the
blocks. Fire hydrants and numerous water
tanks were in this area. No estimate of bomb
density could be made by a physical inspection,
the evidence in the form of bomb casings long
since having been removed by the local military
units. It was established by interviews be-
lieved reliable, that no incendiary bombs fell in
the immediate undamaged surrounding area,
and an inspection showed that there was
neither damage nor newly repaired structures
in it.
b. Fire started as a result of incendiary
bombs within the burned area. In the general
confusion accompanying the attack and in spite
of a light rainfall, the fire developed gradually
with the aid of a light north-northwest wind.
Residents in the immediate vicinity stated that
the fire burned itself out on the leeward (shore
line) side to the south. Many persons, how-
ever, who had collected along the water front
seeking refuge from the attack helped to control
the fire, particularly along the east and west
limits of the damaged area. The results of this
fire fighting were apparent in many instances.
c. The following photographs show locations
where fire stopped either as a result of fire
fighting or as a result of a street serving as a
fire break. Other factors may have had some
influence upon the success of the fire fighters:
first, the bomb density was not high, a light
wind was blowing, a light rain was falling and
many people were available to make a concen-
trated effort; second, the burning area was well
separated from other fires, and did not burn
with sufficient intensity to prevent approach by
fire fighters, so that no particular personal
hazard was involved.
d. Photo 6, taken within the burned area,
shows the north edge of the fire limit. The
buildings standing in the mid-ground were
either being constructed or were undamaged.
The limit of the fire can easily be seen by noting
the rubble on the ground. In this position in
the damaged area the wind was blowing toward
the camera. The buildings shown are typical
Japanese, frame-constructed mercantiles and
dwellings facing a street. It is believed that
the open street and the wind blowing toward
the fire prevented spread at this point.
e. Photo 7 shows the limit of fire spread as
it occurred at a street corner of a built-up resi-
dential block. The structure on the extreme
right edge is new. The dwelling in the left
center shows that part of the second-story, exte-
rior siding has been removed. This was wood
sheathed in the same manner as the front wall.
It was torn off in order to stop the fire at this
169
PHOTO LOCATION PLAN
DAMAGED AREA
[TMF
STRATEGIC BOMB. SURVEY
D^E ^DY
AKASHI, JAPAN
FIGURE 2
170
Photo 6.—Section of fire perimeter looking north and upwind.
Photo 7.—Fire perimeter section, showing limit of fire damage.
704699—47—12
171
spot. The left wall adjoining was also dam-
aged by fire. Metal siding now replaces the
original wood. The fire was not particularly
intense at this point, so that people could ap-
proach the burning area. Two wooden electric
power poles show some fire charring, which
indicates a mild fire intensity.
/. Photo 8 shows some repair work on the
side walls of two dwellings. The limit of the
fire can be observed along the street at the left,
right, and center. One dwelling unit on the far
side of the street had been so badly damaged by
fire that it had been torn down. Fire charring
is also evident in the photo on structural tim-
bers and on the wooden pole at the corner of the
building in the center of the picture. Part of
the tile-covered canopy burned by the exposure
fire has been replaced.
g. Photo 9 shows the location where some 20
persons endeavored to check the spread of fire.
The rear portion of the two-story, mercantile
structure was torn down with the aid of long
pike poles, and the fire which had attacked that
building was extinguished. Re-ignition was
prevented by further efforts. The defacement
of the mud-and-wood treasure house wall at the
right of the picture was caused by the mild in-
tensity of the exposing fire.
h. Photo 10 shows the western edge of the
fire-damaged area. Dwellings on the right
were burned, while the dwellings on the left,
with evidence of light repair work, occupy the
undamaged half of the same block. Much of
the damage has been cleaned up as is evidenced
by the piles of salvage roofing tile in the fore-
ground. The fire was fought from the ground
and the interior of the standing dwellings.
i. Photo 11 shows the remaining, interior,
combustible side wall of a factory. Residents
stated that the radiant heat was sufficient to
ignite the facing wall of the dwelling across the
street shown in the middle of the picture. This
facing wall was wood sheathed, as is the build-
ing at the extreme right. The exposed portions
show where the sheathing was torn off during
the fire. As this area is in the down-wind por-
tion of the damaged area, bordering on the
water front shown in the background, it is note-
worthy that part of the combustible factory in
the foreground remains undamaged. The fire
at this point was fought by some 50 persons.
172
It was from here that the first inroads were
made along the western edge of the fire area by
civilian fire fighters.
5. Comment. The foregoing examples of
fire fighting demonstrated that success was
achieved under the conditions which prevailed.
Fire fighters availed themselves of relatively
safe areas in which to operate, thereby reduc-
ing the personal-risk factor. The maximum
fire-fighting effort was directed toward stopping
the continued spread of the fire, lateral to the
direction of wind. No effort was made to fight
fires on the down-wind side of the area. Al-
though the fire was intense and fast burning,
damage was not particularly severe because
only a small area was involved. As a result,
fire fighters were able to approach the area and
attack fire spread by tearing down burning
structures.
IX. Analysis of Damage
1. Bomb density. The probable average
bomb density in the central portion of the
target has been estimated as 265 tons per
square mile. This estimate is based on the re-
ported delivered bomb load on the target area
and assumes that 90 percent of the bombs fell
within a limit as shown in Figure 1 under
“Probable Limit of Bomb Fall.” This limit of
bomb fall is an oval which encloses all areas of
damage within the target area and is based on
ground observation at the target site. If it is
assumed that a normal (Gaussian) distribution
of bombs was achieved along any diameter of
this oval, then it is calculated that 46 percent of
the total reported delivered bomb load arrived
within a central portion of the target area
measured as 25 percent of the total area of the
oval. This calculation results in a probable av-
erage bomb density of 448Ц tons in 1.69 square
miles of area or 265 tons per square mile.
2. Appraisal of bomb density. A bomb den-
sity of 265 tons per square mile corresponds fa-
vorably to a Circular Probable Error of 4,000
feet. A CPE (circular probable error) is a
circular area of measured radius in which 50
percent of the bombs dropped are expected to
arrive. A CPE of 4,000 feet has been reported
by the Twentieth AF for night radar bombing
with good target identification, based on photo
interpretation of several target areas.
Photo 8.—Section of fire perimeter, showing partial burn-out between structures remaining intact.
173
Photo 9.—Fire perimeter section showing partial fire damage to remaining buildings.
174
3. Accuracy of attack. The planned Mean
Point of Impact shown in Figure 1 is 5,600 feet
from the center of the area in which the esti-
mated maximum bomb density was achieved.
The distance of 5,600 feet is too great to war-
rant evaluating the attack accuracy as good.
4. Effectiveness of attack. The amount of
damage achieved by this attack is calculated as
the total tons of bombs delivered (975 tons) or
0.70 acre of damage per ton of bombs reported
delivered on the target. As a measure of at-
tack effectiveness, this amount of damage sus-
tained by the target does not appear to be com-
mensurate with the calculated bomb density of
265 tons per square mile.
5. Bomb penetration. Bomb penetrations in
soft earth (Photo 12) reached a maximum of
10 inches, and on asphalt-surfaced roads inden-
tations were noted as having a maximum depth
of 5 inches. In one instance, the indentations
of 32 bomb strikes on a 4-inch, reinforced-
concrete roof were counted. None had pene-
trated and the markings were merely disfigura-
tions of the concrete surface (Photo 13). The
few cases of penetration observed can not be
treated statistically. The military had oblit-
erated evidence in most cases by picking up
bomb cases and otherwise disposing of malfunc-
tioning bombs.
6. Effectiveness of bomb. Although over-all
efficiency of an attack depends upon the bomb
density delivered, and effectiveness is judged by
the amount of damage sustained within the
target area, nevertheless the effectiveness of an
individual incendiary bomb is evaluated by its
ability to ignite fires. According to eyewit-
nesses who were interviewed, the M69 per-
formed this function efficiently and was there-
fore considered an effective weapon for its type
when used against Japanese dwellings in
Akashi.
7. Damage characteristics. Combustible
structures sustained the heaviest amount of
damage; noncombustible structures received
varying degrees of damage, depending pri-
marily on the combustibility of contents; and
fire-resistive structures sustained only minor
damage. Combustible structures within the
175
Photo 12.—Penetration of M69 in soft earth. Note case protruding from ground in foreground
and minor fire damage to combustible structure, left.
Photo 13. — Showing impact marks of M69’s on concrete roof.
176
perimeter of fire-damaged areas were generally
totally destroyed, only a few buildings being
partly burned (Photos 14 and 15). The degree
of damage sustained by noncombustible struc-
tures was in direct ratio to the combustibility of
their contents. This damage ranged from mi-
nor, through superficial, to total structural
damage as the combustibility of contents in-
creased (Photos 16 and 17). Fire-resistive
structures sustained minor damage only (in-
ternal fire damage to floors, ceilings, and trim),
due to external exposure fires being transmitted
through unprotected openings (Photos 18 and
19).
8. Fire spread
a. A study of the perimeters of all damaged
areas show that fires stopped for 38 percent of
the total perimeter because of varying distances
of clear space in built-up areas, while, for the
remaining 62 percent of the perimeter, the fire
stopped because there was nothing left to burn.
Fire stopped in densely built-up areas for a
total of 10 percent of the perimeter; in medium
built-up areas for a total of 12 percent of the
perimeter; and in sparsely built-up areas for a
total of 16 percent of the perimeter.
b. A study of the perimeter of the fire dam-
age area along the leeward side as compared
with the windward side shows that fires stopped
on the leeward side for 76 percent of the total
leeward perimeter because there was nothing
left to burn, while for the same reason the fire
stopped on the windward side for only 37 per-
cent of the total windward perimeter.
c. The steady 5- to 10-mile-an-hour wind,
blowing constantly during the fire was con-
sidered to have affected fire spread materially in
two ways: first, the fire-fighting effort was
successful in part due to the constancy of the
direction of this low velocity wind, since the
path of probable fire spread was easily pre-
dicted and fire-fighting efforts were, therefore,
directed only toward combating the lateral
spread of fire from this predicted path; and sec-
ond, the effect of wind is noticeable in Figure 1,
where the water front area of the eastern por-
tion of the target is completely burned out, and,
yet, up-wind and inland from this area, the
burned-out areas extend into heavily built-up
sections of the city along the axis of the direc-
tion of the wind. These isolated burned-out
areas have not joined laterally across the direc-
tion of the wind.
d. There was no true test of either natural or
man-made fire breaks in stopping fires. Fires
involved all portions of respective fire divisions
in the central part of the target area because
the wide-spread, bomb-fall pattern rendered
fire breaks ineffective. In some cases fire fight-
ers took advantage of natural fire breaks such
as streets, and fire spread was successfully
stopped along streets as narrow as 15 to 30 feet.
X. Recuperability
1. At the time of the survey, the city was in
about the same condition as it was immediately
following the attack, with the exception of some
scattered reconstruction jobs in which both new
and used building materials were being used
(Photo 4). Very little reconstruction work
had been done on the larger public and indus-
trial buildings (Photos 22 and 23).
2. Although the interurban electric railway
was in service on a reduced schedule because of
the lack of equipment, the storage yard and
damaged equipment were still in the same con-
dition at the time of the survey that they had
been after the attack (Photos 24 and 25).
Some work, however, had been started on clear-
ing the yard and salvaging equipment.
XI. Conclusions and Comments
1. Fires ignited by incendiaries in small iso-
lated areas can be successfully controlled when
relatively safe areas are available for operation
and maneuver of fire fighters.
2. Fire fighters can predict the direction of
possible fire spread when constant-direction,
low-velocity winds prevail during burning pe-
riods. Fire fighters are able to control the
spread of fire in isolated burning areas along
sides parallel to the direction of wind.
3. An estimated average bomb density of 265
tons per square mile on this target is ample, but
suggests that a greater amount of damage per
ton of bombs than calculated 0.70 acre of dam-
age per ton should have been achieved.
4. The relatively high percentage of damage
(92 percent) sustained in the sparsely built-up
part of suburban Akashi (principally indus-
trial) when compared with the relatively low
percentage of total damage (47 percent)
177
Photo 14.—Typical damage sustained by combustible industrial construction.
Photo 15.—«Complete fire damage to combustible construction.
178
Photo 16.—Typical fire damage sustained by noncombustible structure.
Photo 17.—Typical noncombustible construction in center of fire damaged area. Note superficial damage to roof.
179
Photo 18.—Fire-resistive government building. Minor damage only was sustained in this type of structure.
Photo 19.—Showing minor damage to fire-resistive structure in left foreground.
180
Photo 20.—Fire damage to load-bearing brick-wall structure. Note fire walls and parapets with
unprotected opening.
Photo 21.—Showing action of fire wall in load-bearing brick-wall structure. Fire confined to
sections in foreground.
181
Photo 22.—Showing extent of structural fire damage to brick-wall load-bearing public building.
Photo 23.—Showing typical fire damage of brick-wall load-bearing industrial construction.
182
Photo 24.—Fire-damaged interurban railway storage yards.
Photo 2 5.—Interurban railway car seriously damaged by fire.
183
achieved within the city suggests that the
achieved mean point of impact was appreciably
off from the planned mean point of impact. As
a consequence, the achieved accuracy of the at-
tack does not compare favorably with planned
accuracy.
5. The lack of water in public systems was
the principal reason for the failure of the fire
department successfully to cope with the fire.
Probably the most fortunate bomb strike was
that on the electric power substation which de-
stroyed that installation and crippled the only
source of power to the city. As a consequence,
the waterworks was put out of service because
of its complete dependence on electrically oper-
ated pumps.
6. Wind direction definitely influences the
spread of fire as was shown by the fact that
only 24 percent of the leeward side of the fire
area perimeter bordered on unburned built-up
areas, while 63 percent of the windward side of
the perimeter bordered on unburned built-up
areas.
7. The degree of built-upness definitely in-
fluenced the spread of fire. Of the total fire
area perimeter only 10 percent was in un-
burned, densely built-up areas, 12 percent in
unburned, medium built-up areas and 16 per-
cent in unburned, sparsely built-up areas. The
remaining 62 percent of the perimeter bor-
dered on open areas of clear space 100 feet or
greater, or on water front areas.
8. Combustible structures, in general, burned
completely; noncombustible structures sus-
tained damage due to fire in direct ratio to
the contents’ combustibility; and fire-resistive
structures sustained only minor damage due
primarily to exposure fires transmitted through
unprotected openings.
9. No true test of man-made fire breaks was
noted, inasmuch as the bomb pattern was such
that individual incipient-stage fires started in
all fire divisions regardless of separations cre-
ated by firebreaks.
10. Firebreaks were of service in some cases
when used by fire fighters to stop spread of
isolated fires.
184
APPENDICES
Page
A. Translation of Japanese Report of Attack__________________ 186
B. Translation of Japanese Damage Chart______________________ 189
185
Appendix A
(Translator’s Note: The following is a translation of
a report obtained from the Prefecture Police in
Akashi.)
Military Defense Secret No. 435, 7 July 1945
Military Guard Secret No. 120
Governor of Hyogo Prefecture (Chief of
Police)
(Prefectural Police and Fire Chiefs)
The Situation in Regard to Air-Raid Damage
The following is a report on the damage sus-
tained in the air attack on this prefecture on 7
July.
A. Enemy Air-Raid Situation. The 60 en-
emy B-29’s which entered the jurisdiction of
this prefecture at about 0010 hours on the sev-
enth, coming in by way of Kii Suido, Awaji, and
Harima Nada, passed over the Akashi area
from about 0015 to 0125 hours, flying both
singly and in forty waves of five or six planes
in each wave. The planes dropped a mixture
of incendiary and HE bombs on the Akashi
area from an altitude of 3,000 meters. After
dropping their bombs, the planes passed over
Harima Nada, Kii Suido, and Tokushim Ken,
and finally escaped over the sea to the south.
Name of place Time of air- raid warning Time of air- raid alarm Raid over All- clear
Hyogo Ken Eastern Area of Inland Sea 7 July. 1937 2303 2300 0143 0121 0152 0144
B. Weather conditions:
1. Wind direction, NNE.
2. Wind velocity, 3.5 meters (7 mph).
3. Weather, rain.
4. Cloud height, clouds dense, poor visibility.
C. Type and number of bombs dropped:
1 About 80,000 oil incendiary bombs (large
and small types mixed).
2. A few HE bombs.
D. Damage inflicted:
1. Imperial Household Department, none.
2. Shrines, prefecture shrines
a. Iwaya Shrine
b. Donsei Temple
c. Kaikoin Temple
3. General damage:
a. Casualties:
(1) Dead............... 115
(2) Missing.............. 31
(3) Seriously wounded... 19
(4) Slightly wounded.... 69
(5) Refugees............ 37,967
b. It is expected that all of the above figures
will increase.
(Translator’s Note: Reference to damage chart, Ap-
pendix “B,” prepared about three days later, will indi-
cate the justification of this assumption.)
c. Damage to Buildings:
(1) Houses,
Totally burned.......... 9,110
Half burned............... 104
4. Government and public buildings:
Akashi Labor Mobilization Department, to-
tally burned.
Akemi Area Office, totally burned.
Akashi Telephone Bureau, totally burned.
Akashi Post Office, totally burned.
Sanwa Bank, Akashi Branch, totally burned.
Prefecture Agriculture Experimental Sta-
tion, totally burned.
City Clinic, totally burned.
Public schools (Daikan, Hayashi, Oji) three
(3) schools, totally burned.
5. Factories and institutions:
Kawasaki Aircraft Company, Akashi Air-
frame Factory, totally burned except for
six buildings. However, the dispersal of
the machinery and equipment had been 95
percent completed.
Kawasaki Aircraft Company, Akashi Ord-
nance Works, 5 of the 10 buildings were
totally burned. However, the dispersal of
the machinery and equipment had been 50
percent completed.
Kawasaki Vehicle and Boat Factory, 18 out
of the 18 buildings were totally burned.
Japan Tool Company, Factory No. 123, 9 out
of 10 buildings were totally burned. How-
ever, six machines were saved by dispersal
to other plants.
Kinoshita Iron Foundry, Main Factory, one
part was totally burned.
Takashimaya, Ida factory, eight out of eight
buildings were totally burned.
Kishiro factory, totally burned.
Akashi Engine Factory, one out of one build-
ing was totally burned.
Nichiryo Steel Works, three out of four build-
ings were totally burned.
Japan Warehouse, Warehouse No. 1, four out
of five buildings were totally burned. Ma-
186
terials in the buildings (dried cocoons,
5,555 tons; army medical supplies; raw
rubber; army clothing) 85 percent burned.
Osaka Gas Co., Akashi Plant, six out of six
buildings totally burned.
Sanyo Electric Railroad Co., Akashi Vehicle
Factory, totally burned.
6. Transportation facilities:
Government Railroad Lines, Akashi Station,
thirty articles of small freight burned.
West Akashi Station, six buildings were to-
tally burned and one building was half
burned. Two passenger cars and two
freight cars were totally burned. Be-
tween Akashi and West Akashi Station,
277 railroad ties were burned. Wires
were cut and down at two places. Be-
cause of this, street car and train service
was interrupted for 1 hour. However,
street car service to the east of Akashi was
resumed at 1200 hours the same day and
service in western Akashi and to the west
was resumed at 1400 hours. The trains
were also able to run by 1400 hours.
(Translator’s Note: Power to operate the railway
was obtained from Osaka through the railway’s own
substations which were not damaged.)
Sanyo Electric Railroad, The Akashi Car
Factory, Akashi Operations Office, and the
Akashi Switch Station were completely
burned. Twenty-one passenger cars, 10
freight cars, and 1,337 railroad ties were
also burned.
Extent of service:
Nishi Maiko to Hayashizaki, disrupted.
Hyogo to Nishi Maiko, in operation.
Hayashizaki to Himeji, in operation.
It is expected that all lines will be reopened
on the ninth.
7. Communication facilities:
Akashi Telephone Bureau, completely
burned, and telephone poles and wires were
cut and destroyed. Recovery will take
some time.
8. Gas, water works, electricity:
a. Gas: Because the Akashi Branch of the
Osaka Gas Co. was completely burned, it is
impossible to supply gas to the entire area
and the time of recovery is uncertain.
b. Water works: The pumping station and
the main pipe lines were not damaged.
However, only 90 percent of the total water
supply can be expected due to the damage
to the water systems in the various houses.
At present, it is impossible to pump the
water to the reservoirs because of the
stoppage of electricity. The damage done
to the water systems of the various houses
has caused leaks and, therefore, reduced
the water pressure. The restoration of
the water supply and equipment of the
houses is uncertain. With the restoration
of electric power, however, the water sup-
ply system will be restored.
c. Electricity: The Akashi Power Station of
the Kansai Electric Co. and the Akashi
Power Control Station were completely
burned. Power lines at various places
within the city were cut. A quick recov-
ery is not anticipated.
E. Relief:
1. Medical relief. Adequate aid was ex-
tended to the nine relief stations which were
burned and to the victims of the attack. Be-
cause the relief stations at both the Akashi and
Hitomaru public schools were in good condi-
tion, they were able to take in th₽ light
and heavy casualties. Gradually help arrived.
The relief units of the Himeji Army Hospital
Relief Squad and of Tansu, Mayor of Kobe,
totalled 90 men and carried out treatment of the
injured.
2. Food rations and other aid. Camps for
the air-raid victims were established at the
Girls’ Normal school, the Tamatsu No. 1 and
No. 2 schools, and the Akashi Fujie and Toba
public schools. Five thousand breakfasts were
distributed and the distribution of the noon and
evening meals was as follows:
Meals
a. Mikage Police Station........... 5,000
b. Kakogawa Police Station 10,000
c. Nishiwaki Police Station........ 20,000
d. Takasago Police Station......... 30,000
e. Hayashi Police Station.......... 10,000
f. Suma Police Station............. 10,000
g. Miki Police Station........... 10,000
704699—47—13
h. One thousand portions of dried bread
were distributed from the Akashi Police
Station.
i. A total of 96,000 meals was given out.
Furthermore, not only was bedding supplied
by the Municipal Office, but two truckloads of
bedding were received from Kobe. It is ex-
187
pected that Akashi will receive the utmost in
help. Moreover, the Chief of Police of Iwaya
is giving an adequate amount of food and help
to the victims who took refuge in small boats
along the coastal area of Awaji and Iwaya.
F. The situation in regard to public order.
As has been customary in various cities re-
cently, a portion of the people fled when the
warning was issued, but the majority of the
people remained and courageously fought the
fires. In the early stages remarkable results
were achieved everywhere against the many
waves of incendiary attacks, but, during succes-
sive attacks, the scarcity of water increased.
This, together with the fact that those fighting
the fire became fatigued, made things very diffi-
cult. The fact that the damage stated above
occurred, though unavoidable, is regrettable.
The most important problem today in regard
to aiding the sufferers is the housing problem.
Simple houses are being constructed in the
northern part of Akashi by utilizing old lumber.
The measures called for by the chief of police
were speedily carried out directly after the at-
tack, qnd were supplemented by strenuous ef-
forts of relief agencies. In spite of the fact
that 70 percent of the entire population suffered
from burns, public peace in general has been
maintained and at present there is no reason to
be especially concerned on this score.
The construction of all types of important
factories in the suburbs necessitated the con-
struction of dwellings due to the influx of la-
borers. Adequate steps to help these sufferers
not only bear an important relation to produc-
tion, but their influence also extends to public
peace. This fact is fully appreciated and ev-
erything possible is being done.
G. Miscellaneous items:
1. Activities of the police and fire officials:
a. Police. One policeman who was in charge
of a certain area in the vicinity of the
Nishishin Machi Branch Police Station
courageously carried out air-raid defense
duties. Not only did he work with an air-
raid defense group and handle buckets of
water himself, but he also encouraged the
victims who happened to be there too. By
soliciting their cooperation he was finally
able to put out a fire. Just before the
warehouse of the food managing commis-
sion at Nishishin Machi, Go Chome,
burned, the police chief, who was the de-
fense commander of a small area, shouted
to the people near by, “Everybody must
help carry the sacks of rice out of the
warehouse because those who do not help
will not receive any food rations.” At the
same time, he quickly rushed into the
warehouse. The people in the vicinity,
who had, up until that time, stood idly by
as mere spectators, followed him and co-
operated in carrying out the rice sacks.
In this manner, all of the 50 sacks which
were in the warehouse were saved from
burning.
b. Firemen. As soon as the warning was is-
sued, the fire engines were dispersed to
their stations according to a fixed plan.
Then, when fire occurred, the fire-engine
crews carried out their duties well in the
face of successive waves of attacks and,
without moving from their position, suc-
ceeded in generally extinguishing even the
large fires. Moreover, during these opera-
tions, one fireman was seriously wounded.
2. The influence of the attack on production.
As has been stated before, the dispersal of the
machinery and equipment belonging to the
Akashi Plant of the Kawasaki Aircraft Co., the
Akashi Ordnance Plant of the Kawasaki Air-
craft Co., the Akashi Plant of the Kawanishi
Engine Works, and other important factories
which were damaged had been generally com-
pleted. Because of this, the damage done to
them was not very great. However, the fact
that the Akashi Power Substation of the Kansai
Electric Co., and the Akashi Gas Producer of
the Osaka Gas Co. which was in the process of
recovery after being bombed in the raid of
22 June were totally burned, seriously hin-
dered the flow of supplies to the Kawanishi En-
gine Works and the Nishi Okubo Plant of the
Kobe Steel Co. which are located in the suburbs
of Akashi. Also, the universal damage to the
medium and small subsidiary plants, which was
closely interrelated with the injuries to the
workers, had a great influence on production.
188
APPENDIX В
Report on Damage Received From Bombing, Akashi City
Population before the air attacks 84,010
Number of houses before the air attacks____________________ 17,973
Date Attack Dead Seriously injured Slightly injured Number of houses totally damaged Number of houses partly damaged Number of houses slightly damaged
19 January 1 300 69 118 135 258 482
9 June 2 642 248 345 1 226 2,158
22 June 3 25 22 32 ’175 373 232
26 June 4 142 66 141 357 1,093
7 July i 5 355 57 133 9,075 104 —
Total — 1,464 462 769 10,968 3,986 714
Number of houses in poor condition______________________________________________________________________________________________ 1,000
Number of persons who live in houses which are in poor condition 4,500
Number of persons who remain In houses which are in poor condition_________________________________________________________ 3,000
Number of houses at present (including those which are partly destroyed)_______________________________________________________ 7,005
Population at present (it is estimated that about 25,000 persons have moved outside the city)__________________________________ 81,401
Number of houses remaining______________________________________________________________________________________________________ 6,005
Number of persons remaining____________________________________________________________________________________________________ 56,401
i This chart does not include 31 persons listed as missing as the result of this attack.
Editor’s Notes: (1) This table is a translation of the Japanese summary. (2) The first four attacks listed on the above chart were
HE attacks directed against the Kawasaki Aircraft Plant. See Physical Damage Report 72.
189
Part 6
EFFECTS OF INCENDIARY BOMB ATTACK ON HACHIOJI, JAPAN
Dates of Survey: 23 November— 1 December 1945
190
TABLE OF CONTENTS
Page
I. Object of Study................................... 192
II. Summary........................................ 192
III. General Information.............................. 192
IV. The Target........................................ 193
V. The Attack........................................ 194
VI. Fire Defense Data................................. 195
VII. Fire Damage and Casualties....................... 196
VIII. Analysis of Data................................. 197
IX. Conclusions....................................... 207
X. Appendices (Figures 1-3, inclusive)............... 207
Photographs 1-14, inclusive
191
I. Object of Study
1. The primary objective of this study was to
ascertain the effectiveness of M50 (4-pound
magnesium) incendiary bombs in setting fires
to Japanese domestic structures and pene-
trating heavy concrete roofs. The M50 bomb
was developed primarily for German-type
dwellings and industrial plants where good
penetration was required, and, except in a Navy
attack on Naha City, Okinawa, had never be-
fore been used on a Japanese city subjected to
only one attack.
2. The secondary objective was to determine
the degree to which air-raid precautions and
extent of damage were affected by the practice
of warning the inhabitants in advance of an
impending air attack.
II. Summary
1. Hachioji was located along a flat river
plain 23 miles west of Tokyo. It had a normal
population of 45,000 which had increased to
68,000 with Tokyo refugees. The city was oval
in shape, covering two square miles, of which
1.4 square miles was well built up. Its only
prominent land marks were Mt. Fujiyama and
the Yudone River, both of which were used for
visual location checks by the pilots. The city
was fairly modern, having electric railways,
a few wide Streets, and modern utilities, but
only four small, modern, reinforced-concrete
buildings.
2. Industrially, economically, militarily, and
commercially the city was unimportant, except
for being a railroad junction and a refugee cen-
ter for Tokyo. The city was highly combustible
and vulnerable yet had made no major prepara-
tions for its defense. An unusual condition
was injected into the picture by the presence of
fifty additional fire trucks dispatched eight
hours before the attack from Tokyo because of
the Twentieth AF pre-attack warning.
3. A total of 1,593 tons of incendiaries (95
percent M17 clusters) was dropped on Hachioji
as a primary target on the night of 1/2 August
1945. One hundred and sixty-eight B-29s
bombed both by radar and visually from an
altitude of 14,000 to 16,000 feet. It is esti-
mated that 200 to 300 tons per square mile fell
on the burned city area and the remainder
within a 3-mile radius of the city. There were
192
neither previous nor later attacks on the city.
4. The fire damage involved 15,334 buildings
in the city and its suburbs and included every
industrial and public building, except two
banks, one school, and the telephone exchange.
Three hundred and five persons were killed and
792 were injured. The area of damage was
0.95 of a square mile in the city, or 68 percent
of the built-up portion, and 0.2 of a square mile
in the suburbs. The remaining unburned build-
ings were mainly on the south edge, or wind-
ward side, where no bombs fell.
5. The fire defense was strong, consisting of
the largest known number of firemen and pieces
of equipment per square mile ever gathered to
fight a conflagration started by air attack, but
training of the people had been poorly carried
out and there had been no organized practice.
The results of the attack might have been much
different, if the water supply system had been
undamaged, since the fire reached conflagration
proportions only after the water supply failed.
6. An attempt was made to establish the
chance of fire spread on the windward and lee-
ward sides at various exposure distances. The
results showed a total of 25 percent fire spread
which varied with the direction of the wind.
The probability of fire spread was found to be
about 20 percent on the leeward side and five
percent on the windward side with a light
breeze blowing (5 to 10 miles per hour). The
chance of fire spread across an open space
varied from about 70 percent at 25 feet to 40
percent at 75 feet on the windward side, com-
pared to 90 percent and 50 percent for the same
distances on the leeward side.
7. The penetration of the M50 bomb was
checked by measuring the depths of 34 hits on
four concrete roofs. The deepest was 5 inches,
the average 1.5 inches; none perforated any of
the four roofs (minimum thickness six inches).
8. The Mean Point of Impact was found to
be only 715 feet from the aiming point, and the
estimated Circular Probable Error was between
4,000 and 5,000 feet.
III. General Information
1. This survey was conducted by Maj. F. J.
Sanborn, fire and incendiary-bomb specialist,
with the assistance of Cpl. Tyshine and Mr. M.
Hall, language interpreter, from 22 November
through 1 December 1945. The target had
been hit only once, less than three months
before the survey, and was in excellent condi-
tion for study. The Hachioji police, firemen,
mayor, school superintendent, water-works su-
perintendent and others were interrogated and
all were helpful and appeared sincere. The fire
chief assisted several times in the study, being
intrigued by the development of the “fire spread
factor” and “exposure distances.” Time did
not permit complete studies of damage to all
types of structures or equipment, but some ob-
servations were made concerning them.
2. A fire damage map (Figure 1) of the city
was prepared, showing the perimeter of the
damage. Another map (Figure 2) of scattered,
suburban, burned areas was prepared by the
Hachioji Police Department and spot checked
by the survey team. The locations on Figure 2
are approximately correct but the size and
shape of the burned areas were not checked.
The exact location of the point of fall of many
bombs inside the burned area was determined
by hunting through the paved streets for evi-
dence of bombs scars.
3. Pre- and post-attack photographs were of
too poor quality to permit any appraisal of the
accuracy of photo interpretation.
IV. The Target
1. General. The city of Hachioji was located
along a flat river plain, 23 miles west of the
imperial palace at Tokyo and only five miles
from Tachikawa. It was the first city west of
Tokyo en route to Mt. Fuji. Its normal popula-
tion was 45,000, but, owing to the numerous
fire attacks on Tokyo, the city’s population had
been gradually increased to 68,000 by Tokyo
refugees. The city was not modern by Tokyo
standards as it had no large reinforced-concrete
buildings, but it did have many wooden com-
mercial shops with modern fronts and trim.
The city covered more than two square miles
of which 1.4 square miles was 20 percent or
more built up.
2. Industry. Industrially, Hachioji was not
important in the Japanese economic system. It
was a railway junction for lines entering Tokyo
from the north and for a branch line to Nagoya.
The main manufacturing was silk weaving,
some of which was being processed for military
use. None of the textile plants had been con-
verted to wartime products. Unknown to
United States Intelligence at the time, one of
the largest underground factories in Japan was
being completed in the hills of Hachioji for the
assembly of airplanes. Most of the workmen,
however, were to come from outside Hachioji.
3. Military. At the timfe of the attack, this
city was of little military importance. It
housed no troops, had no warehouses, was not
a shipping center, had no airfield and had only
six antiaircraft guns. It was probably chosen
for attack because of its proximity to Tokyo and
its value for housing Tokyo refugees.
4. Structures
a. General. The non-industrial buildings,
mainly one- and two-story dwellings, arranged
in compact rows with eaves nearly touching,
were much like those of other cities of its size.
There were no barrack-type dwellings because
of the absence of large corporations. Shrines
were frequently found in local beauty spots, and
gardens and cemeteries were spotted through-
out the city. The main street and two parallel
streets were apparently mercantile for all
three were studded with burned and unburned
“godowns” (vaults), safes, and damaged mer-
chandise. Small home shops, in which was
performed wood and iron work by hand or light
machinery, were also common.
b. Domestic and home shops. The residen-
tial area that surrounded the commercial core
was composed of typical Japanese one- and two-
story dwellings without basements. They had
wooden foundations set 1Ц feet above ground,
i/i>-inch wood floors covered with tatami mats,
Vt-inch wood ceilings, tile on wood (mud fill)
roofs and mud on bamboo lath walls.- The two-
story structures had open stairways, and inner
partitions formed by either thin plaster or
wood sliding doors. Dwellings were dis-
tinguished in size by the number of 3- by 6-foot
mats in a room. Families averaged five mem-
bers and houses averaged 500 square feet in
plan area. Heating was entirely by braziers.
Shops in the home were fairly common, being
used for making wooden baskets, tubs, and
shoes; for tailoring and various kinds of re-
pairing; and for producing other articles that
can be made by hand from wood or metal.
c. Commercial structures. As far as could
193
be ascertained, all the commercial structures
were wood frame. Many of the better ones
had glazed tile, stucco, or imitation stone fronts.
A few structures had sheet iron over wood side
walls to reduce the fire exposure. “Dozo” con-
structed vaults, known as “godowns,” were
unusually common. Usually, the “godown”
roof was of frame construction covered with
extra-thick mud. The walls were also built of
mud. Iron doors and window shutters pro-
tected wall openings. In general, the small
mercantile stores compared in interior com-
bustibility with United States variety stores
that deal in fabric novelties and household
furnishings.
d. Manufacturing structures. Every manu-
facturing building had wood-frame construc-
tion. Even though asbestos and sheet-iron
sheathing were frequently used, the framing
was wood. As a result, every industrial plant
in the city suffered fire damage.
5. Utilities. The city had its own water sys-
tem, an electric rail line across the city with two
stations, adequate electric power, a small gas-
manufacturing plant, telephones, and a sewage
system. The electric power came in from a
single outside source to a central transformer
and switch station. Wood poles were used to
support power and telephone lines.
6. Vulnerability of the city
a. Built-upness. Because of the lack of good
quality pre-attack photographs, it was impos-
sible accurately to determine the built-upness
of Hachioji. Judging, however, from photo-
graphs and an inspection of the burned area,
the city was closely built up with no large
parks, rivers or similar open areas in the cen-
tral section. The Twentieth AF considered 1.4
square miles adequately built up (20 percent or
more) for an all-incendiary attack. On the
average, the center of a typical Japanese city
contains about 10,000 families per square mile,
but in Hachioji, 12,000 families were dehoused
per square mile. It is, therefore, estimated
that at least V2 square mile was 40 percent built
up; another Ц square mile, 30 percent, and a
third 1/2 square mile, 20 percent.
b. Combustibility. Nearly every building
was of combustible construction, providing
practically a continuous source of combustible
194
material without interruption by fire-resistive
structures. Man-made firebreaks had not been
constructed, since city officials considered their
city too small to be chosen for attack. The only
physical hindrance to the spread of fire was the
natural width of streets and, as in other Japa-
nese cities, there were but few wide streets in
the city. The fire vulnerability must have been
at least equal to that of other cities of its size.
7. Pre-attack warning and preparations.
Thirty hours prior to the attack, the Twentieth
AF radio announced the names of 12 Japanese
cities, one of which was Hachioji, that were to
be bombed. Fifteen hours before the attack,
warning leaflets were dropped two miles from
the city. The radio continued to announce the
Twentieth AF warning hourly. City officials
reacted quickly by telling the citizens that all
able-bodied men should say in the city, but that
women and children could go to the near-by
hills. City officials estimate that some 12,000
people left that day. About the time the B-29
planes left their airstrips, the city of Tokyo
sent 50 of its largest pumper-type fire trucks
and 300 professional firemen to assist the local
fire department, if necessary. By 5 o’clock that
afternoon all the equipment had arrived and
had been stationed at strategic locations.
V. The Attack
1. The city had never been bombed prior to
2 August 1945. The Twentieth AF records
show that on Mission 306, on 1-2 August 1945,
180 B-29s of the 58th Wing were dispatched to
bomb Hachioji as the primary target. Twelve
planes carried 75.9 tons of M47 incendiaries
(including one M47 white phosphorus), and 168
planes carried 1,643.5 tons of M17 clusters.
Eleven planes dropped 68.8 tons of M47s and
158 planes dropped 1,524.5 tons of M17 clusters
over the city. Ninety-seven planes bombed
visually and 72 bombed by radar between 0145
and 0329 hours through %o to i0/10 clouds at
an altitude of 14,800 to 16,000 feet. The axis
of attack was between 19° and 62°, this being
chosen perpendicular to the long axis of the city
to take advantage of the azimuth errors. The
aiming point was selected in the center of the
city, northwest of the railroad yard. Enemy
interference was slight, only six enemy planes
counter-attacking. The execution of the attack
was considered normal.
2. Bomb types. The M50 incendiary bomb
is a 3.7-pound magnesium bomb designed pri-
marily for German-type domestic structures.
It is carried in M17 clusters, each holding 110
bombs, the weight being 475 pounds per cluster.
The M47 bomb is an oil-gel-fill bomb in a metal
casing that weighs 69 pounds filled, and has an
instantaneous nose fuze. It is often clustered
in a T19 cluster adapter holding five or six
bpmbs.
VI. Fire Defense Data
1. Civilian participation in defense. The
people were poorly trained and disciplined.
City officials had never expected an attack on
Hachioji and had not prepared for it. Early
in the war, the people had been trained to ex-
tinguish the thermite bomb, and later the M50
(four-pound magnesium M54) bomb by using
sand. Still later, the use of water instead of
sand had been stressed, as the majority of the
incendiaries dropped on near-by Tokyo had
been oil bombs. Some 12,000 people fled the
city, so it cannot be assumed that every dwell-
ing had someone to defend it. Nevertheless,
since the city had 23,000 refugees, there was at
least more than the average of five persons per
house. Interrogations showed that many of
the people stayed in their homes until the fire
situation became hopeless. Individual fire
fighting was most evident along the windward
side of the city. An estimated 300 hand pumps
and small, concrete, water tanks were available
for the use of residents.
2. Fire department. The city of Hachioji
had the following men and equipment with
which to combat fires:
a. 15 500-gpm pumper trucks.
b. 11 250-gpm pumper trucks.
c. 4 150-gpm pumper trucks.
d. 700 lengths (60 feet each) of fire hose.
e. 156 full-time paid firemen.
f. 60 volunteers (partly trained),
g. 330 hydrants distributed throughout the
city.
h. 50 500-gpm pumpers and hose with 300
experienced firemen from Tokyo.
3. Water supply. The water supply con-
sisted of a filled 2,750,000-gallon reservoir on a
hill, giving a normal static pressure of 50
pounds per square inch. Three electrically
driven pumps, each having a 2,000-gallon-per-
minute capacity, took suction from the river
and were arranged to pump to the reservoir or
directly into the system. The water-main pipe
sizes varied from 3 to 16 inches. (Location
and size of main feeders are shown on Figure
1.) One man was kept at the pumping station
to start the pumps as required. In addition,
the Yudone River running the entire length of
the north side was a source of water for some
portable equipment.
4. How the fire was fought. It had rained
two days before the attack, but thereafter the
weather had been clear. A light breeze re-
ported by the Japanese at 5 to 10 miles per
hour was blowing from the southwest. Clouds
covered about half the sky. The Tokyo fire
trucks had been distributed around the city at
strategic locations chosen by the Hachioji fire
chief. All the Hachioji firemen had been
alerted and the equipment made ready to roll.
The greatest known concentration of men and
equipment (50 fire trucks per square mile) ever
gathered to fight a fire in any of the Japanese
urban attacks were ready and waiting. Ten-
tative plans had been made as to where the
equipment would be relocated in the event any
one section was bombed first, and flare signals
had been adopted for intercommunication be-
Table 1.—Bomb and Tactics Data
Mission number Date Air force Primary target Planes dispatched Time Numberplanes bombing Altitude of release Visibility Plane loads re- leased Type bomb Tons of bombs released Number of bombs clusters) Inter- valo- meter spac- ing
Visual Radar
306 2 Aug. 1945. Twentieth AF; 58th Wing City of Hachio- ji 12 path- finders 168 B-29’s 0145 to 032S 97 72 Feet 14.800— 16,000 r/io to l%0 11 158 M47A2 M17A1 68.8 1524.5 1992 6098 Feet 50 50
1593.3
195
tween fire companies. All in all, the stage had
been set to wage a well organized fight.
a. The first planes arrived a little after 0130
hours and the first bombs fell in line with the
35° axis of attack, short and to the right of the
aiming point. Later bombs fell on the south
half and northeast quarter of the city. Fires
quickly sprang up where the bombs fell. Many
of the fire trucks started to pump water out of
the system. Within the first 15 minutes, a
cluster1 of bombs hit the electric switch station
knocking out all electric power. The public
water pumps failed, so that the only supply for
the underground system was the 2,700,000-
gallon, gravity-feed reservoir. Water pressure
dropped to five pounds per square inch. The
reservoir was drained in 1^ hours. About an
hour after the first fires, nearly all the fire
equipment was concentrated along the east-west
main street, attempting to keep the fires from
crossing. A stand here might have been suc-
cessful except for two factors, (1) the public
water systems failed entirely and (2) bombs
were falling in the northeast quarter. Trucks
were then dispatched to the northeast section
and a new line was formed at the center north-
south street. The northwest section was still
without fire as no bombs had fallen there. As
the last of the water in the underground system
was used, most of the fire equipment was with-
drawn across the bridges to the north side of
the river, but some 15 fire trucks were able to
drive onto the sand beach on the south bank
and draw water. The river was so low that no
more trucks could get to the narrow beach
pools. Relaying of the water was not at-
tempted. A number of the trucks caught fire,
hose was burned, and one truck had its motor
knocked out by a direct hit by an M50 bomb.
A few of the trucks that had been stationed on
the south edge of the city stayed there to protect
public buildings, but none assisted in fighting
dwelling fires, as they dared not move their
equipment away from the buildings to which
they had been assigned. Thus, the fire raged,
spreading across all the main streets and con-
suming 0.95 square mile of the city proper. No
assistance was sent to the suburban areas.
b. One of the most unusual features was the
rupturing of cast-iron water pipes by direct hits
of M50 incendiary bombs after they had pene-
trated four feet of soft earth in unpaved streets.
This contributed to the early failure of the pub-
lic water supply.
c. During the attack the wind continued to
blow from the southwest. It increased in in-
tensity during the attacks to 25 miles per hour
but held the same direction. Only a few people
reported a high wind of “fire storm” intensity.
Nobody reported rain during the fire.
VII. Fire Damage and Casualties
1. Buildings destroyed: Number
Hachioji..................... 14,327
20 locations in eight suburbs.... 1,007
Total......................... 15,334
Important damaged buildings are listed be-
low and are located on Figure 1 by number.
Building
number
1.
2.
3.
4.
5.
6.
7.
8.
9.
10.
11.
12.
13.
14.
15.
16.
17.
18.
19.
22.
23.
24.
25.
26.
Name of important buildings burned
Railway management office.
Mitsubishi Bank.
Yasuda Bank.
Post Office.
Private trolley company station.
Seven grammar schools.
Garage bus line station.
Hachioji Technical School.
Shno Jukogya Co. (silk plant with 200 em-
ployees).
Small loading plant for primers.
Government railroad station.
Hospital at Tawasogo (100 beds).
Local tax office.
Local government (city hall) Tokyo Prefec-
ture.
Local government (town hall).
Tama Girls Technical High School.
Military police office.
National Mobile Labor office.
Two juvenile reformatories.
Kew bus stall.
Military preparatory school (at Yokoyama).
Nihon Tokushu Noyaku (insecticide manu-
facturing) .
Electric transformer station.
Health Insurance office.
Imperial Forestry Department.
Courthouse.
Town Hall of Asakawa and its fire
station.
Telephone exchange at Yokoyama.
Three local news agencies.
Hospital at Mijita (70 beds).
Hospital at Nagmacho (40 beds).
Hospital for railway employees (40 beds).
Four theaters.
Two mercantile association buildings.
196
2. Casualties and fire department losses:
Public:
Killed______________________________________ 305
Seriously injured___________________________ 192
Slightly injured____________________________ 599
Fire department:
Firemen killed________________________________ 6
Firemen injured______________________________ 29
3. Fire-fighting equipment:
Fire stations destroyed_______________________ 4
500-gpm pumpers destroyed_________________ 13
250-gpm pumpers destroyed__________________ 5
4. Cause of fire damage. The fire chief of
Hachioji gave the following reasons in order
of importance why the fire could not have been
held in check:
a. City too densely built up.
b. All buildings were combustible.
c. Lack of water in the street system and
lack of prepared locations at the water’s edge.
d. Lack of adequate direction to the firemen
and of coordination between the Tokyo and
Hachioji fire equipment.
e. Lack of man-made or other adequate fire
breaks.
f. Failure of civilians to stay and fight fires
as bombs fell.
VIII. Analysis of Data
1. Comparison of Japanese and Twentieth
AF data:
Subject Twentieth AF data Japanese data
Total number
planes in vicin-
ity over Hachi-
oji----------169_________________150.
Total number
planes over the
city_____________________________ 100-150.
Altitude_______ 14,800 to 16,000 ft- 15,000 feet.
Time----------- 0145-0329 local time. 0130-0330.
Visibility_____-Ио to 1(Ую clouds__Cloudy.
Type bombs_____Magnesium and oil___Magnesium
and oil.
Tons of M 4 7
bombs on Hach-
ioji ________ 68.8_______________50.
Tons of M17 clus-
ters on Hachio-
ji___________ 1582.3_____________ 1,000.
Area of damage
in Hachioji__1.2 square miles____0.95 square
mile.
Area of damage
in suburb 0_____________________0.2 square mile
Estimated ground
wind_________Light SW____________5-10 mph SW.
2. Japanese bomb data on malfunctions (es-
timate):
a. Five percent of the M47s were duds.
b. Twenty percent of the M50 bombs were
duds. (Most of these were found in paved
streets.)
c. Five percent of the M17 clusters failed to
open. (An appraisal of this estimate is made
in paragraph 11, herewith.)
3. Japanese comments on the attack and en-
suing fire:
a. The attack was too long. It would have
been more effective if compressed to 1 hour.
(Note, however, that continuing the attack
after the first hour did cause further damage
in the northwest section.)
b. The attack was far too heavy—too many
bombs fell on areas already afire.
c. The fire reached conflagration stage only
after the water failed, then advanced north to
the river. This area was already partly ignited
by bombs.
d. The area of “fire spread” (area in which
no bombs fell) composed 25 percent of the total
burned area.
e. The fire department believed that it could
have controlled the fire, at least in the north-
west section, if water had been available in the
street system.
f. A “fire storm” of short duration developed.
(Only a few persons noted it, and its occurrence
is questioned.)
g. The wind increased from 5-10 to 25 miles
per hour at the peak of the fire. The light
natural wind was never completely offset by the
fire wind.
h. A night attack is more destructive than a
day attack because of the encumbrances of
darkness.
i. High explosives would not have deterred
the firemen nor increased the damage com-
mensurate with their weight.
j. The antipersonnel feature of the incen-
diary bomb was effective in discouraging
prompt handling of the bombs.
4. Extinguishment of the fire. An attempt
was made to determine what stopped the fires.
By observation and interrogation, practically
every point along the fire fringe could be
checked with reference to one of two causes.
197
These were: (1) professional or civilian fire
fighting; and (2) open spaces of varying dis-
tances. It was found that most of the profes-
sional fire fighting had been done in the north
half of the city near a river bridge, and that
most of the civilian fire fighting had been done
on the south side where the wind blew the
smoke and heat away from the fire fighters.
The combined effect of civilian fire fighting and
natural wind is illustrated on Figure 1 by the
irregular fire perimeter and the twenty isolated
fires on the windward (south) side; whereas
the fire perimeter on the leeward side is much
more regular, except at one location where pro-
fessional fire fighting was effective, and there
were no isolated fires. Although it was not
possible to check every incident, the profes-
sional and civilian fire fighting probably did not
stop fire spread along more than 20 percent of
the perimeter. Thus, open space was the
greatest contributing factor in stopping the
fires from spreading.
a. The relative effect of open spaces of vary-
ing widths on fire spread (exposure distances)
was determined by estimating the distance up
to 55 feet between the burned and the nearest
unburned building to the nearest five feet, and
to the nearest 10 feet from 55 to 100 feet,
around the entire perimeter. Small isolated
fires outside the main body of fire were ex-
cluded from this study. So few cases of ex-
posure between 100 and 200 feet occurred that
all distances beyond 100 feet were classified as
“No Exposure.” It was possible to make a
fairly equal separation of the exposure dis-
tance figures into those on the windward and
the leeward sides, respectively, by considering
the main east-west street as a natural dividing
line. Figure 1 shows the exposure distances
as they were determined around the fire fringe
(“no” means no exposure); Table 2 gives the
various totals of the segments of the perimeter
within increments of 10 feet on both the wind-
ward and leeward sides.
b. If it is assumed that streets of the same
width occurred in equal number on each side of
the main east-west street; that the effect of
fire fighting was approximately equal on each
side; and that fires stopped at a certain ex-
posure distance only after they had had an
opportunity of stopping at a lesser distance,
then a good check can be made (1) on the direc-
tion of the fire spread; (2) the effect of a 5-10-
mile-per-hour wind in causing fire spread; and
(3) the effect of distance in preventing fire
spread against a light breeze. In Table 2, col-
umns 2 and 6 give the actual distance of each
increment exposed. Columns 3 and 7 give their
relative percentage to the total perimeter for
each side. Columns 4 and 8 give the accumulated
percentage for the exposure distance, or the
probability of non-fire spread. Columns 5 and
9 give the probability of fire spread at each of
the increment distances. Figure 3 shows these
same results graphically. Here it is readily
seen that: (1) the direction of fire spread was
predominantly to the leeward; (2) the amount
of fire spread averaged about 20 percent more
on the leeward than on the windward side; and
(3) the probability of fire spread varied with
the distance and direction of the wind. For
example, at Hachioji, the probability of fire
spread across a 50-foot open space to a com-
bustible building was found to be 67 percent
Table 2
[See Figure 3 for plotted graph of these figures]
Exposure distance in feet (1) Windward side Leeward side
Perimeter distance in feet (2) Percent of total windward perimeter (3) Accumulated percent of total windward perimeter (1) Percent probability of fire spread (5) Perimeter distance in feet (6) Percent of total windward perimeter (7) Accumulated percent of total windward perimeter (8) Percent probability of fire sprout (9)
5-15 1,430 6.7 6.7 93.3 0 0 0 100.0
16-25 3.080 14.3 21.0 79.0 940 6.5 6.5 93.5
26-35 3,350 15.6 36.6 63.4 1,810 12.5 19.0 81.0
36-45 1,380 6.4 43.0 57.0 940 6.5 25.5 74.5
46-55 2,200 10.3 53.3 46.7 825 5.7 31.2 68.8
56-75 275 1.3 54.6 45.4 1,320 9.1 40.3 59.7
76-100 1,155 5.4 60.0 40.0 1,870 13.0 55.3 44.7
100 plus 8,570 40.0 100.0 0.0 8,100 56.0 100.0 .0
198
with, and 48 percent against, a light breeze.
c. Typical examples of fire fighting on the
windward side, where the direction of the wind
must have been of assistance, are shown in the
photographs following. Photo 1 shows the re-
mains of a burned building 10 feet from an
unburned combustible building, where use of
water buckets by two men prevented fire
spread. Photo 2 shows a corrugated-iron,
wood-frame shed 15 feet from a burned factory.
Buckets of water were used by neighbors.
Photo 3 shows a combustible dwelling with the
remains of a burned factory 20 feet distant in
the foreground and a burned dwelling 10 feet
q^ay at the rear. A boy and his father saved
their house with buckets of water dashed on
the side of the building to cool it off. Photo 4
shows a combustible dwelling 20 feet from a
burned factory. The side boards and fence
took fire but were extinguished by a man and
his wife. Photo 5 shows the scorched school-
house that would have burned had it not been
for the fire apparatus stationed here for its sole
protection. The foundation of a burned school
building remains in the foreground. Photo 6
shows two rolling, steel fire doors that saved the
adjoining structure. Active fire fighting by the
fire department is evident on the unburned por-
tion. Photo 7 shows a concrete, wing-type,
parapeted fire wall between two combustible
structures. The fire department was active
here also. Photo 8 shows the remains of a
burned building adjoining a fire-resistive struc-
ture. The wire-glass windows and a steel fire
door (door not shown) prevented fire entering
the fire-resistive building. People inside
watched but did not fight the fire.
5. Incendiary bomb penetration
a. Penetration in concrete roofs. Hachioji
was not a good city to check the penetrating
properties of the fire bombs, for there were only
a few reinforced-concrete buildings in the city
and not one was hit by M47 bombs. Four con-
crete roofs were hit by M50 bombs. One school
building (260 by 40 feet) with a nine-inch con-
crete roof received five bomb hits. The eight-
inch concrete roof of the Telephone Exchange
building (125 by 40 feet) received 21 hits. The
eight-inch concrete roof of the Hachioji Credit
Association building (25 by 40 feet) received
six hits, and the Mitsubishi Bank building (25
by 40 feet) six-inch concrete roof received two
hits. No bombs perforated any of the roofs.
The depths of penetration are recorded in
Table 3.
Table 3
Hachioji
School Telephone Mitsubishi
building exchange association bank
Number M50 bomb
hits_____________
Thickness roof___
Penetration depth,.
5
9 inches
"1 bomb 4
inches.
2 bombs 3
inches.
1 bomb 1
inch.
1 bomb У2
inch.
21
8 inches
1 bomb 5
inches.
4 bombs 3
inches.
2 bombs 2
inches.
6 bombs 1
inch.
8 bombs
4» inch.
6
8 inches
1 bomb 4
inches.
3 bombs 3
inches.
1 bomb 2
inches.
1 bomb 0
inch.
2 .
6 inches.
2 bombs 1
inch.
Photo 9 shows some of the 21 hits and photo
10 shows the deepest penetration of five inches
on the telephone exchange building.
b. Penetration in combustible roofs. An at-
tempt was made to determine the degree of
penetration by the M50 in roofs of combustible
buildings. The results proved statistically un-
reliable, so only impressions are given here as
gathered from the Japanese people:
(1) In general, the M50 bomb had excessive
penetration, often burying itself in the ground
after perforating the roof, ceiling, tatami mat,
and i^-inch wood floor. In this position the
bomb burned, sometimes either setting fire to
combustible trash or the underside of the
floor—a most difficult place to extinguish a fire.
(2) In 2-story structures, the bomb seldom
perforated to the earth through two floors, the
ceiling and the roof. It usually landed on its
side on the tatami mat of the first floor, having
been diverted from a straight fall by the mat
above. These bombs were the most effective in
starting fires.
(3) Nonperpendicular falling M50s often
crashed through the roofs and ceiling but failed
to ignite. (All-ways fuzes would have made
these bombs function.)
c. Perforation of water mains. Unusual
perforation was exhibited when the M50s pene-
trated four feet of soft soil and. pierced cast-
iron pipe or broke the pipe. The city water
works engineer found one 16-inch-diameter,
cast-iron pipe pierced through both sides, an-
other eight-inch-diameter pipe pierced through
199
Photo 1.—Remains of a burned building exposing an unburned building 10 feet away. Water
buckets were the only fire equipment used.
Photo 2. — An unburned shed 15 feiet from a burned factory building. A few buckets of water saved the shed
and other near-by buildings.
200
Photo 3.—An unburned dwelling 10 feet from a burned factory and 20 feet from burned
dwellings. Water buckets were used to fight the fire.
Photo 4.—A hand pump was used to extinguish a fire which started on the dwelling 20 feet from a burned factory.
201
Photo 5.—Burned siding of a schoolhouse. The foundation
of the burned building is in the foreground.
Photo 6.—Rolling steel fire doors prevented fire spread to
the adjoining building.
Photo 7. — A wing-type parapeted fire wall between Photo 8. — Wire-glass windows that prevented fire from
two combustible buildings. Saved one building. and adjoining structure from entering.
202
Photo 9.—Marks of the M50 bomb on the heavy concrete
roof of the Telephone Exchange Building.
Photo 10. — The 5-inch penetration made by one M50
bomb in the concrete roof.
Photo 11. — Shows a 16-in.-diameter cast-iron water pipe
pierced thorugh both sides by an M50 incendiary bomb.
704699—47—14
Photo 12. — Shows a 16-in.-diameter cast-iron water pipe
pierced through one side by an M50 incendiary bomb.
203
one side (Photos 11 and 12). One eight-inch
one six-inch, and 13 four-inch-diameter cast-
iron pipes were also broken by M50 bombs in
unpaved street.
d. Perforation of “godown” roofs. The
bombs perforated the mud roofs of “godowns.”
These roofs were usually tile on mud fill on
i^-inch wood sheathing over 8 to 12 inches of
mudflplaster and bamboo laths. Photo 13 shows
an unburned “godown” and photo 14 shows one
burned with the roof caved in. It was definite-
ly established that a single M50 bomb per-
forated the roof and ignited the contents.
6. Ignition by fire bombs
a. Ignition by M47 bombs. The M47 (70-
pound oil) bombs arrived first and started a
few fires along the south side of the city.
There is little doubt that they started fires rap-
idly with a direct hit and often set fire to as
many as three dwellings. As Hachioji was
predominantly highly built up, the M47 had an
average chance of 30 percent (average of 30
percent roof area) of starting a single fire by
a direct hit, or 70 percent (open space) chance
of starting up to three fires by gel from near-
misses splattering on sides of buildings. The
large amount of fire equipment and the waiting
men held the early fires in check. The quickly
started fires may have been of some advantage
to the visual-bombing planes which arrived
later.
b. Ignition by M50 bombs. The use of the
M50 bombs came as a big surprise to the people.
Many of them had fought fires in Tokyo and
were familiar with oil bombs, but had consid-
ered the M50 obsolete. Their statement was
that the bombs fell with considerable force and
many exploded while burning. (Ten to 20 per-
cent had explosive noses.) The bomb was easy
to handle during the first three minutes, but
was most difficult to get at when it penetrated
beneath the dwelling. Bombs that fell outside
the dwelling in the soft earth shot up burning
pieces of magnesium to a height of 10 feet.
Moist soil especially made the bombs appear
like Roman candles. Often these chunks of fire
ignited combustible material near by. There
is little doubt that these bombs started fires
with considerable frequency in places where
they were difficult to extinguish. The large
amount of combustible material under, around
204
and in Japanese houses made this bomb a
much more effective fire raiser than had been
anticipated from previous tests on a bare
structure.
7. Efficiency of the attack. Figure 2 shows
the location of all the burned suburban areas.
Twenty such locations are listed and they indi-
cate rather wide distribution of the bomb fall.
Several of these suburbs were spot checked for
bomb density. One case showed evidence of a
single plane load, whereas three others showed
evidence of more than a single plane load stick.
An oval ring that encloses 19 of the 20 suburban
incidents and which is estimated as the prob-
able limit within which 95 percent of the bombs
fell has been drawn on Figure 2. It is possible
that the shape of the oval area should be more
nearly circular, but the hills beyond the flat
sides of the oval contained no buildings and
thus furnished no evidence. This oval has
axes of 37,500 and 19,000 feet which are nearly
the proportions of the damaged city itself
(10,000 by 5,000 feet). Single-plane bombing
with short bomb sticks usually produces a
normal distribution about the mean point of
impact. If it is assumed that a normal Gaus-
sian distribution was obtained—there is good
evidence of this by the uniform distribution of
isolated burned areas about the main burned
area—then about 22 percent of the total re-
ported bomb load dropped, fell on the city.
This gives an average density of approximately
200 tons per square mile. On the other hand,
if the Twentieth AF estimated that 50 percent
of the bomb fall within a radius of 4,000 to
5,000 feet was obtained by radar bombing with
good identification, an average density of 445
to 285 tons per square mile fell on the city.
Still a third estimate can be made from the 34
bomb hits on the 17,000 square feet of roof area
of the four concrete buildings located in the
center of the city (described under “Penetra-
tion” in section VIII-5). This indicates a
bomb density of 123 tons per square mile.
Since these 3 estimates appear to be in reason-
ably good agreement, it is estimated that an
average density of 200 to 300 tons fell on the
city, burning out .95 square mile, and the re-
maining weight fell on a 21-square-mile area,
burning out 0.2 square mile of property.
8. Fire spread. An attempt was made to
Photo 13.—A Japanese "Godown” con-
structed of heavy mud plaster on bamboo
lath walls. The roof was tile on mud
plaster on wood boards. Heavy metal
doors afforded protection against fire and
theft. This "Godown,” or treasure vault,
survived an intense fire. Note how the
heat denuded the tree, spalled the outside
plaster coating and cracked the wall.
Photo 14.—The interior
of a burned Japanese
"Godown” showing the
collapsed roof. Note the
thick roof and wall in-
dentations where the wood
studs were used.
205
determine the total amount of “fire spread” by
checking the number of burned city blocks, dis-
tinguishing between those hit by bombs and
those that escaped. A detailed check was car-
ried out m the east end of the city. This in-
volved so much time that a straight-line sam-
pling was made the length of four south-to-
north streets. If a single impression of the
bomb body was found in a block of the asphalt
road, that block was considered as having had
bomb-initiated fires. The results of the de-
tailed check and the four samples are shown in
Table 4.
Table 4
Blocks
without
bombs
Blocks
with
bombs
Total
street
blocks
Spread factor (blocks
without bombs over
blocks with bombs)
East end_________
1st strip________
2d strip---------
3d strip---------
4th strip________
All blocks____
3
4
1 24
22
19
17
20
25
103
31
23
21
23
29
99
Percentage
41
21
23.6
15
16
23
9
Four of these blocks were on the windward side.
The table shows fairly even distribution of
bombs over the two-mile city length. Any error
would be in favor of a lower spread factor,
since it was most difficult to locate the bomb
body impressions. Confirming the above 23
percent spread factor obtained, Hachioji offi-
cials estimated that about 25 percent of the
blocks burned without being hit by bombs; and
20 percent fire spread was found on the leeward
side alone.
9. Accuracy of the attack
a. Based on the shape of the burned area,
and the assumed limits of bomb fall, the mean
point of impact has been measured as being
only 715 feet west of the aiming point.
b. The axis of attack was briefed at 35°. It
was reported at 19° to 62° in the mission re-
port. Interrogation indicates that the planes
came from the general direction as briefed, but
many came in outside the 19° to 62° sector.
The bombing of the water reservoir, the elec-
tric transformer station and the main east
bridge early in the attack was good evidence
of the wide-spread distance from the aiming
point.
10. Appraisal of the pre-attack warning on
the extent of damage.
a. The Twentieth AF warning 30 hours in
advance of the attack did not affect the final
amount of physical damage. Probably fewer
people were killed than if the warning had not
been given. The prefectural government of
Tokyo sent 50 fire trucks and 300 professional
firemen to assist the local fire department in an
all-out effort to determine whether or not a
large force could control fires resulting from air
attacks. Two items of chance determined the
results in favor of the attack and prevented a
real test: (1) the choice of the M50 bomb with
its excellent penetration, which broke and per-
forated buried water pipes in unpaved streets
and caused loss of reservoir-stored water; and
(2) a lucky hit put the electric transformer sta-
tion out of service within the first fifteen min-
utes, thereby ending all public water pumping.
b. If there had been no breaks in the water
pipes, there would have been an adequate water
supply in the reservoir for 180 125-gallon-per-
minute hose streams for 2 hours, plus a few
hose streams from the river supply. If the
electric power station had not been hit, (it was
0.64 mile from the aiming point) there would
have been 48 additional hose streams for an
indefinite period. In view of the potential 290
hose streams of all equipment at one time (180
from the reservoir, 48 from the water pumps,
and 62 from the river), there is some reason to
believe that the fire damage would have been
considerably less if the water supply had es-
caped damage.
11. Appraisal of malfunctioning fire bombs.
The Japanese gave an estimate of five percent
M17 clusters and M47 failures, and 20 percent
M50 bomb failures, but they were unable to
locate or produce a single cluster, so it is
doubted that an accurate check was made. The
five percent M47 failures is normal, but, to have
obtained this percentage of unfired bombs, the
actual failures would have had to be higher,
since an unfired M47 will burst from internal
pressure when in a burning area. Likewise, 20
percent failures of the M50 bomb is high but
may be accounted for by the fact that the esti-
mate was obtained from bombs picked up in
paved streets where mechanical injury and mal-
functions are most common. In general, the
estimates of duds indicate the order of magni-
tude rather than accurate figures.
206
IX. Conclusions
1. Vulnerability.
a. Hachioji was highly built up, and, in gen-
eral, inadequately prepared for an air attack.
b. The Japanese dwelling was highly vul-
nerable to fire; even a poor incendiary bomb
could be effective in starting fires in Japanese
buildings.
c. Little use was made of noncombustible
building material to retard the spread of fire.
d. This attack provided the only case in at-
tacks on Japanese cities where a high ratio of
firemen and equipment stood ready for the at-
tack. In spite of this preparation, the weight
of the bombs and loss of the water supply over-
whelmed the defense.
2. Conflagrations.
a. More than 25 percent built-upness with
combustible structures is a prime requisite for
conflagrations.
b. Preliminary organization of fire reserves
is highly desirable.
c. The failure of water supply is one of the
most critical items to guard against in fighting
a conflagration.
d. Many small controllable fires do not make
a conflagration. It is only when the fires be-
come uncontrollable that the conflagration
starts.
e. A fire wind of 25 miles per hour expe-
rienced during the fire did not greatly affect the
direction of the natural wind.
3. The psychological warfare tactics of warn-
ing the enemy in advance did not alter the
final extent of fire damage. It might have
seriously lessened the results except for a for-
tunate choice of bombs and a lucky hit.
4. The Japanese estimated percentage of 20
percent M50, five percent M17 clusters and five
percent M47 “duds” was unreliable.
5. The choice of the M50 bomb, the time,
altitudё and aiming point were well planned.
The tonnage of bombs dispatched was more
than double that usually considered necessary
by the Air Force for a target of this size. It
was probably double that required to obtain the
same amount of damage.
6. Accuracy of the attack.
a. The estimated mean point of impact was
715 feet from the aiming point.
b. An estimated 50 percent of the load or 800
tons of bombs fell well within the 5,000-foot
radius of the aiming point.
c. There was a wide difference in the briefed
axis of attack, the executed direction, and the
range reported in Mission Report 306.
d. An estimated average density of 200 to
300 tons per square mile fell on the central
burned portion of the city.
7. Spread (i.e., fire beyond the area of bomb
fall) accounted for the fires in one-fourth of the
blocks in the city; four-fifths of these were on
the leeward side, one-fifth on the windward.
The chance of fire spread across an open space
varied from about 70 percent at 25 feet to 40
percent at 75 feet on the windward side, com-
pared to 90 percent and 50 percent for the same
distances on the leeward side.
8. M50 bomb penetration.
a. Heavy concrete roofs (six inches or thick-
er) prevented perforation.
b. In general, the M50 has too much penetra-
tion for Japanese domestic structures; however,
a few of the bombs that did perforate the floors
started fires that were the most difficult to
extinguish.
c. The heavy mud “dozo” roofs of “godowns”
were pierced by M50 bombs.
d. The high penetration of the M50 made an
unusual contribution to the success of the at-
tack by breaking buried water mains in un-
paved streets.
9. The M50 was not an especially good fire
raiser, and was fairly easy to handle. It was
successful because of the antipersonnel feature,
the close spacing and the combined effectiveness
of large numbers.
X. Appendices
1. Figure 1. City map of Hachioji showing
burned area, location of main water pipes, aim-
ing point, planned and limit of CPE, main
buildings, and distance between burned and
unburned buildings around the perimeter.
2. Figure 2. City map of Hachioji and lo-
cation of damage in suburbs with the probable
limit of 95 percent bomb fall indicated.
3. Figure 3. A graph of Table 2 showing
the relationship between the probability of fire
spread and exposure distance.
207
209
LEGEND
DAMAGED
i.
2.
3.
4.
5.
6.
7.
8.
9.
10.
YAMAIRI, KAWAGUCHI - MURA
NIBUGATA, MOTO HACHIOJI-MURA
SHIMO- ICHIBUGATA,HACHIOJI-MURA
KAMI-ICHIBUGATA, HACHIOJI-MURA
MOTO-HACHIOJI,NO.I SECTION.HACHIOJI-MURA
MOTO - HACHIOJI,NO. 2 SECTION, HACHIOJI - MURA
YOKOKAWA, HACHIOJI-MURA
FUNEDA, YOKOYAMA - MURA
SHIMO - NAGABUSA, YOKOYAMA-MURA
SANDA, YOKOYAMA - MURA
II. MILITARY PREPARATORY SCHOOL,YOKOYAMA-MURA SUBURBS
12. KAMI-KUNUGIDA, ASAKAWA OF
13. KATAKURA.YUI-MURA HACHIOJI
14. TAMA-JUVENILE REFORMATORY, YUI-MURA JAPAN
15. UCHIKOSHI, YUI-MURA
16. KITANO,YUI-MURA SCALE
IT. 0WADA-MACHI, HACHIOJI CITY
18. ISHIKAWA-MACHI,HACHIOJI CITY
19. INUME,KAWAGUCHI-MURA
20. HINO, HINO-MACHI
FIRE DAMAGED AREA
RESTRICTED
U S STRATEGIC BOMBING SURVEY
HACHIOJI, FIRE
HACHIOJI, JAPAN
FIGURE 2
Figure 3- SHOWING THE RELATIONSHIP BETWEEN FIRE SPREAD
WITH AND AGAINST A LIGHT BREEZE AND THE
PROBABILITY OF FIRE SPREAD ACROSS OPEN SPACES
TO INVOLVE OTHER COMBUSTIBLE BUILDINGS.
210
Part 7
EFFECTS OF INCENDIARY BOMB ATTACK ON UBE, JAPAN
704699—47—15
211
TABLE OF CONTENTS
Page
I. Object of Study.............................. 213
IL Summary............................................ 213
III. General Information................................ 213
IV. The Target.......................................... 214
V. The Attack......................................... 215
VI. Fire Defense Data................................... 215
VII. Analysis of Data............................... 216
VIII. Photographic Interpretation Evaluation............. 218
IX. Recommendations and Conclusions.................... 219
X. Appendices....................................... 220
Figure 1
Night Photos 1 and 2
Mosaic
212
I. Object of Study
1. The primary objective of this study was
to uncover pertinent facts regarding the effec-
tiveness of the M47 and M69 fire bombs dropped
on the city of Ube, Japan, on 2 July 1945. This
city was of special interest to the Army Air
Forces and the United States Strategic Bomb-
ing Survey, in that it showed less damage per
ton of fire bombs than the average of the 66
Japanese cities attacked. As all operational
conditions of the attack were normal, and the
types of fire bombs were those most commonly
used, the facts herein presented can be of value
in comparison with those accumulated in
studies of other Japanese cities.
2. The secondary objective was to evaluate
the accuracy of the Central Interpretation Unit,
XXI Bomber Command, Damage Assessment
Report 118, prepared from strike and post-
strike photographs.
II. Summary
1. A fire and weapons study was conducted
od Ube, Japan, to determine the extent of fire
damage,'the effectiveness of incendiary weapons
used, and the accuracy of photo interpretation.
Ube is located on the Inland Sea at the south-
west tip of Honshu Island near Shimonoseki.
The city was relatively small, had a population
of 100,000, and occupied approximately two
square miles of built-up area. Its long narrow
shape, curving along the ocean front, made it
more difficult to hit than an ordinary target.
2. A total of 714 tons of M47 and M69 bombs
was dropped from the 100 B-29 planes at
10,000 to 11,000 feet on the night of 1-2 July
1945. It is estimated that some 500 tons of
incendiary bombs fell in the target area, of
which 150 tons landed in the center of the city
and burned 0.49 square mile. Other attacks on
the city were high-explosive attacks, and thus
presented no problem of separating damage.
3. The center of the city was badly damaged;
5,000 dwellings, more than a hundred commer-
cial buildings, and another hundred light-
manufacturing buildings burned. Casualties
were 230 killed or missing and 456 treatment
cases. Not a single reinforced-concrete or
noncombustible structure was involved in the
fire area. Although only one-half square mile
burned, it represented half of the most inflam-
mable target area. Large industrial buildings
were located mainly on the fringe of the urban
area and suffered only slight damage.
4. Fire defense was weak. The fire depart-
ment had not been augmented during the war,
nor had special training been given to civilians.
People fled the city during the attack, leaving a
small fire department and some 1,000 persons
to fight the fire. In spite of this weak defense,
conflagration conditions were not reached. The
“Spread Factor” was estimated at 20 percent.
5. An attempt was made to establish the den-
sity of bombs on the city center. It is believed
that 100 to 200 tons landed on the bumed-out
part, averaging 300 tons per square mile. The
accuracy of the attack was likewise assessed.
The Centers of Impact were 1,500 and 3,500
feet from the two aiming points.
6. Photo interpretation of the total damage
underestimated the actual damage by 2.2 per-
cent of the total area of the city. Photo intel-
ligence was found to be reliable.
III. General Information
1. On 6 November 1945, Maj. F. J. Sanborn,
fire and weapons engineer, Lt. H. C. Montgom-
ery, Jr., USNR, photo interpreter, and Lt. John
Holtom, USNR, language interpreter, working
as members of Physical Damage Division Field
Team No. 1, interrogated public officials and
manufacturers in gathering information to ex-
plain the rather low fire damage resulting from
the 2 July 1945 attack. The study consisted of
interviews and an inspection of the physical
damage, plus an analysis of aerial photographs.
2. No attempt was made to verify, by a de-
tailed study of the records or damaged build-
ings, the information obtained. The Japanese
city officials seemed sincere and willing to
cooperate, and there appeared to be no reason
to suspect that the information given was not
as accurate as would be obtained by further
checking.
3. A fire-damage map of the city was fur-
nished by the fire chief. A check of its accuracy
showed that the fire-fringe line was correct for
each block, but that it did not attempt to show
the exact outline for each building within the
213
block. The map is, therefore, suitable for
measuring the total area of damage but not
suitable for making an exposure-distance fringe
study (i.e., the distance of the burned from the
unburned buildings).
4. It should likewise be noted that estimates
of items such as planes, altitude, number of
bombs, time and percentage of duds are all in
round figures, whereas the numbers of dead,
casualties, homes destroyed, personnel and fire
equipment are given in exact figures indicating
their degree of reliability. It is the opinion of
the Survey Team that the figures given are
reasonably accurate.
IV. The Target
1. The city of Ube was located on the coast
near the southwestern tip of Honshu, 25 miles
east of the narrow Shimonoseki Straits between
Honshu and Kyushu. It had a population of
100,000 and an over-all area of 15 square miles.
The greater part of the densely populated area
was compressed along the waterfront with an
east-west axis of two miles and a north-south
axis of one-half mile. The Mashime river di-
vided the town into two nearly equal sections.
2. Although the city was old, the dwellings
had kept pace with the times, changing grad-
ually in design with the years. The majority
of the homes were flimsy one- and two-story
structures, similar to those found elsewhere in
Japan. Some of the factory-owned homes near
the industrial plants were of the row type, but
only a few of these and no modern concrete
structures were involved in the fire. The pre-
dominant occupations (i.e., mining and fishing)
did not influence the type of home. Likewise
the arrangement of buildings was similar to
that in other Japanese cities: houses faced the
streets and had little or no space between them.
Backyard gardens, little alleys, heavy over-
hanging eaves, shops, dwellings, and shrines
were all a part of the city.
3. Ube was industrially important for sub-
marine coal mines, synthetic oil plants, the
largest magnesium plant in Japan, the third
largest nitrogen fixation plant, and other chem-
ical plants, but, as practically none of these was
involved in the 2 July 1945 attack, they are not
covered specifically in this report.
4. The military importance of the city was
214
established by its industrial importance. As
all of the large industrial plants were located
along the water front, bordering only on the
fringe of the residential area, it was unlikely
that the industrial plants would be involved by
exposure fires which would result from an in-
cendiary bomb attack on the city. Therefore,
the most that could be gained was the dehousing
of workmen and destruction of the commercial-
residential area together with its small work-
shops. This goal was achieved by the attack.
5. The burned commercial-residential area
comprised the central and oldest part of the
city. The new concrete city hall and municipal
buildings were not involved. In fact, not a
single reinforced-concrete structure was af-
fected in the entire attack. The dwellings,
without basements, having wooden foundations
U/2 feet above the ground, ^-inch wood floors
covered with rice straw mats (tatami), 14.-inch
wood ceilings, tile on wood (mud fill) roofs,
and mud plaster on bamboo lath walls were
typical of those on Honshu. Two-story struc-
tures had open stairways; inner partition walls
had either thin plaster or wood sliding doors.
Homes were known in size by the number of
three- by six-foot mats which could be placed
in the sleeping room. Families averaged five
members and dwellings averaged approxi-
mately 500 square feet of floor area.
6. The Japanese-prepared damage count
showed one commercial and one industrial
building for each 50 dwellings. Manufactur-
ing shops in homes were fairly common. Often
the front of the house was used for making
small wooden items (e.g., baskets, tubs, shoes);
for repairing bicycles; for tailoring; or for the
sale of household articles.
7. Charcoal braziers provided heat for cook-
ing and home heating. Central heating sys-
tems were found only in large commercial or
industrial buildings.
8. Public utilities and services were generally
good. Electricity was common, gas was avail-
able, underground water mains were well dis-
tributed, there were a few telephones, and the
streets were well paved. These utilities are not
covered further in this report as they were not
materially affected.
9. The total built-up portion of the city in-
cluded 1.8 square miles of which 1.1 square
miles were considered adequately covered for
incendiary attack. In the 1.8 square miles of
built-up area, the following density existed:
10 percent was 0- 5 percent built-up.
14 percent was 5-20 percent built-up.
54 percent was 20-40 percent built-up.
22 percent was 40-50 percent built-up.
Thus it can be seen that Ube was as densely
built-up as other Japanese cities of comparable
size but, considering the elongated shape and
the high built-upness along the water’s edge, it
was probably a less remunerative incendiary
target.
V. The Attack
1. This city had not been attacked prior to
2 July 1945. The high-explosive bombs
dropped later did not fall in the fire-damaged
area and therefore presented no problem of
identification.
2. The Twentieth AF records show that Mis-
sion 242, 2 July 1945, dispatched to Ube 112
B29 planes from Wing 313, carrying only in-
cendiary bombs. Seventy-one planes bombed
visually, 29 by radar through %0 to % о clouds,
at 0147 to 0312 hours from an altitude of 10,000
to 11,600 feet. The bombs dropped were 183.6
tons of M47A2 arid 531 tons of E46 clusters
fused to open at 5,000 feet (38 M69s to a clus-
ter) . The E46 clusters were dropped at 50-foot
intervals, the M47s at 100-foot intervals.
There were two aiming points in line with the
axis of attack (325°). The enemy defense was
weak and inaccurate, and no planes were lost.
(Table 1.)
VI. Fire Defense Data
1. Equipment and personnel. The Ube fire
chief stated that he had had 36 professional and
16 auxiliary firemen at the “big fire” with six
pieces of motorized fire equipment and adequate
fire hose. Three additional fire trucks arrived
to assist at the end of the attack. The people
were poorly trained and disciplined. Since the
prefectural government had not expected an
attack on the city, it had not established major
firebreaks, prepared evacuation areas, sup-
plemented its fire-fighting facilities, or made
other preparations. Early in the war the peo-
ple had been trained to extinguish the four-
pound magnesium bomb but had not been
trained in the best method of extinguishing oil
bombs. The quota of professional fire equip-
ment and personnel was the same at the time of
the attack as in peacetime. Judged by United
States standards of one man per thousand popu-
lation the fire department was undermanned.
Fires were only one-half as frequent, however.
2. The “big fire.” The “big fire,” as related
by the Ube fire chief, started at 0130 hours and
was under control at 0600. All six pieces of
motorized fire equipment were used and all 36
professional and 16 auxiliary firemen fought
the fire, assisted by three outside trucks and 15
firemen that arrived about 0330 hours from
another city. The firemen fought the fires
wherever they could. No strict line was
formed except that the river served as a major
line of defense. Two pieces of fire equipment
were lost in the fire and all the motorized fire
equipment failed (except two pieces made in
America) before the fire was out. Approxi-
mately 1,000 persons assisted in fighting fires in
their own homes. This low number was due
to the fact that the people were tired of the war,
were dissatisfied with food and living condi-
tions, and, judging from the experience of other
cities, felt that they could not save the city.
Lack of training and of organization was ap-
parent. The people fled to the hills carrying
their belongings, blocking the roads, and even
leaving some patients to burn in the hospitals.
The electricity failed early, and a few lead gas
pipes melted, thereby adding to the general
Table 1.—Bomb Attack Data
Mission No. Date Air Force Wing Target location Primary or Sec- ondary Planes dis- patched Planes over • target Visual Bomb- ing Radar Bomb- ing Time (local.) Altitude of attack Bombs tons (clus- ters) Interva- lometer spacing Visi- bility Aiming points
242 2 July 1945. 20th AF. 313 Ube Primary 112 B-29s. 100 B-29s. 71 29 0147- 0312. Feet 10.000- 11,600. 183.6 M47. 531 E46. Feet 100 50 9io •Ую 108104. 125067.
215
confusion. The Ube fire chief stated that he
did not have the authority to assign the people
to fire tasks and the Ube police chief said that,
although he had the authority to keep people in
the city and assign them to tasks, there was no
fire equipment for them to use.
3. Water supply. The water supply was
adequate and no shortage developed during the
fire. • The system was gravity feed from a res-
ervoir, with direct pumping from the river to
the mains in case the demand exceeded the
capacity of the reservoir. This emergncy con-
dition was not reached.
4. Climatic conditions. At the time of the
attack, there had been no rain for several days,
and a five-miles-per-hour wind was blowing
from the southwest. A wind of 25 miles per
hour developed at the peak of the fire and rain
fell for an hour on the leeward side of the fire.
This was the usual “fire storm” phenomenon,
caused by condensation of water moisture and
soot from burning gas.
5. Progress of fire. In spite of the lack of
men, equipment, and training, and the presence
of favorable weather, conflagration conditions
were never attained. Instead, individual build-
ings and flocks burned out without much
spread of fire. Street widths, low built-upness
on the leeward side, lack of high winds, the
elongated shape of the city, and lack of con-
centrated bombing were major factors in pre-
venting attainment of the conflagration stage.
Firebreaks would have been of little use.
Credit must be given to the small fire depart-
ment that did much to arrest the fires after the
bombers left.
VII. Analysis of Data
1. Comparison of Japanese and Twentieth
AF Data:
Subject Twentieth AF data Japanese data
Total No. of
planes in Ube
area. 100......... 70.
No. of planes
over city cen-
ter. 100......... 50.
Altitude........ 10,000-11,600.. 6,000-8,000.
Start of attack1 2 3.. 0147 (mission
report). 0130.
End of attack— 0312............. 0400.
Subject Twentieth AF data Japanese data
Visibility Г10-И0-- Clear.
Type bombs M47 and M69- 100- and 6-lb.
Tons M47 over city. 183.6 oil. 227 (esti-
Tons M69 531 mate) . 350 (esti-
Area of damage 0.42 square mate) . 0.49 square
in city. mile. mile.
Ground wind 5 mph SW 5 mph SW.
1 Photos taken at 0140 show city well alight with bombs and Are.
2. Japanese data on bomb malfunctions.
a. Ten percent of the M69s were duds (only
5 percent at Ube Nitrogen Fertilizer Co.).
b. 5-10 percent of the M47s were duds.
c. In general the M47s arrived first in the at-
tack and started fires in at least one and often
as many as three dwellings at once. The M69s
were good fire raisers, being adequate to start
a fire if left unattended.
3. Japanese losses by fire.
a. Casualties:
165 persons killed.
456 cases required treatment.
65 persons missing.
b. Buildings damaged:
4,952 houses destroyed.
106 co'mmercial establishments de-
stroyed.
107 manufacturing buildings destroyed.
341 buildings partly damaged.
c. Other damage (beyond repair):
2 pieces of fire equipment.
50 automobiles.
100 telephone poles and street lighting
equipment.
d. Industrial damage.
The industrial damage was reported as
follows:
(1) Ube Steam Power Co. The coal con-
veyor was hit and burned, causing the plant to
be inoperative for a week.
(2) Higashimisome colliery. This station
sustained 459,365 square feet of plan area
damage by fire to its factory-owned dwellings,,
sheds and outside equipment, causing a loss in
production of 43,000 gram tons (of 2,268
pounds each).
216
(3) Ube Nitrogen Fertilizer Co. Fire dam-
aged the conveyor, fertilizer storage, paraffin
producing plant, oil, and straw bag storage
buildings. Plant officials estimated the produc-
tion loss would have been 50 percent, had it not
been for the fact that the plant was running
only at 10 percent capacity at the time because
of a coal shortage. (400 M69s and 40 M47s
were found on the premises, 22 M69s were
duds.)
4. Japanese opinions of the attack
a. The raid was of too long duration without
compression of the attack. Many fires could be
attacked as individual fires before spreading to
other buildings.
b. The fires never reached conflagration
stages because of the low wind, natural ar-
rangements of the wide streets, fire-fighting
activities, and elongated shape of the city.
c. The fire spread involved only 10 percent
more area than the area in which the bombs
fell.
d. The fire department believed it could have
controlled the fires to one-half the damage, if
the civilians had remained in the city. Like-
wise, the loss could have been further reduced
if additional fire equipment had been available
for civilians and the fire department.
e. The rain of the “fire storm” that devel-
oped one hour after the attack did not reduce
the fire damage.
/. The direction of the wind was pronounced
throughout the fire, blowing from the densely
to the sparsely populated area. (This undoubt-
edly accounts for the small amount of fire
spread.)
g. A night attack was more effective than a
day attack would have been because of the en-
cumbrances of darkness.
h. High-explosive bombs would not have
added greatly to the damage, unless under-
ground services had been damaged. (All above-
ground buildings were destroyed in the fire
area.)
i. Reinforced-concrete buildings within the
burned area would not have assisted in stopping
the spread of fire, or have given shelter to the
fire department, unless located on the windward
side.
5. Survey estimates and compilations.
a. The night photographs taken shortly after
the start of the attack show that the bombs
were dropped over a two-square-mile area. The
fact that only 20 percent of the property front-
ing the ocean was damaged indicated that great
care was exercised to keep the bombs over land.
The Japanese estimate of the number of planes,
and the corresponding excellent estimate of the
plane loads indicate that approximately 70
plane loads were dropped over the two square
miles of the city. Thus the following estimates
are given:
(1) Maximum number planes over target area__ 100
(2) Minimum number planes over target area__ 50
(3) Probable number planes over target area__ 70
(4) Probable number tons on target area____500
(5) Average tons per square mile___________250
(6) Probable tons in the 0.42-square-mile burned
area_______________________________________ 150
b. Two aiming points were assigned for off-
set bombing—both being in line with the axis
of attack (shown as points “A” and “B” on
Figure 1). The wind was blowing from the
southwest as determined by interrogation and
night photographs, thus keeping both points
free of smoke at all times. The earliest night
photographs show fires burning some 3,000 feet
from aiming point “A”. Photographs taken 9
minutes later show fires burning within 1,000
feet of aiming point “B”. Still later photo-
graphs show fires burning fiercely from the
river to 5,000 feet southeast of point “B”. Sev-
eral buildings are identified as shown on the
transparencies and ground map. Photos taken
1 hour later show the same points still burning
plus other near-by buildings. The accuracy of
the attack is listed as follows:
Aiming point Aiming point
“A” “B”
Nearest main fire to aiming point____
Nearest individual fire to aiming
point________________________________
Nearest industrial fire to aiming
point________________________________
Center of impact to aiming point_____
Distance between aiming points_______
Burned distance between aiming
points_______________________________
Feet
2,000
900
Feet
400
100
900 350
3,500 1,500
Feet
8,000
6,000
c. The effect of built-upness is shown by com-
paring the various built-up portions within the
burned area. Thus it is seen from the follow-
ing that 82 percent of the burned portion was
more than 30 percent built up.
217
Percent built-upness Percent of
in burned area burned, area
0-20 4
20-30 16
30-40 26
40-50 56
d. The 10 percent “Spread Factor” (the
burned area without bombs over the burned
area with bombs) estimated by the Ube fire
chief appears low and was probably influenced
by his fire-fighting position on the windward
side. Considering that the fire burned to the
sparsely built-up area on the leeward side, the
fire spread must have been at least 20 to 30 per-
cent on that side. Again, judging from the less
well defined lines on the two sides parallel to the
wind, the fire spread must have been at least
equal to that on the windward side. An over-
all estimate of 20 percent fire spread is offered
as a more probable figure.
e. The statement that conflagration condi-
tions were never attained was based on the
small amount of fire spread on three sides.
Strangely enough, however, a “fire storm” of
short duration occurred about one hour after
the start of the attack, indicating intensive
fires. The estimated density of 250 tons per
square mile obtained is the only reason that can
account for the apparent contradiction of non-
fire spread and non-conflagration versus the
completeness of the burned area.
VIII. Photographic Interpretation Evaluation 1. Comparison of Statistics of Damage Table 2
Actual Reported
Area square mile Percent area 1 Area square mile Percent area
Area of city Portion of city destroyed 1.8 0.46 25.5 1.8 0.42 23
Area of built-up urban zone. Portion of urban zone destroyed 1.09 0.42 38.5 1.09 0.39 35.7
Area of built-up industrial zone Portion of industrial zone destroyed 0.71 0.04 5.6 0.71 0.03 4.2
Area destroyed outside of city 0.03 None
1 Percentage based on reported areas for comparison.
218
The above tabulation indicates a 2.2 percent
error in under-reporting the total area of the
city destroyed (0.04 square mile of unreported
damage in the 1.8 square-mile city area.) This
represents a 14.3 percent unreported error of
damage based on the 0.49 square mile of actual
damage. Considering the fact that the area
had been a target of opportunity previously,
when small scattered areas within the target
had been destroyed, that the quality of photog-
raphy was fair to poor, and that the report was
prepared by a field unit, the small error seems
easily explainable. In several cases the extent
of damage was more accurately plotted from
photography than by the Japanese fire depart-
ment survey. An error of 0.01 square mile was
made in reporting the destroyed portion of the
industrial zone. While this area of damage is
insignificant in relation to the area of the in-
dustrial portion of the target, the economic ef-
fects were of some importance. The 0.03
square mile of unreported destruction which
fell outside the built-up urban and industrial
areas was confined to isolated, closely built-up
areas of institution or housing character. The
12 main locations missed by the interpreters
are shown on the map, Figure 1, as Numbers 1
to 12. The general statements and statistical
data included in this report give an accurate
impression of both extent and distribution of
damage resulting from the attack.
2. Comparison of industrial damage.
a. A later supplement to Report 102 (Twen-
tieth AF Damage Assessment Report) gives a
more detailed analysis of damage to industrial
targets within the Ube area. Of 23 targets, no
visible damage was reported on 16, minor dam-
age was reported on four, and 50 to 100 percent
damage on three.
b. The ground check indicated additional
damage to industrial targets but not to a degree
that would materially affect strategic planning.
A comparative study of the 23 targets reported
shows no damage to 13, minor damage to six,
nine percent damage to one, and 80 to 100 per-
cent damage to three.
c. The Ube Steam Power Plant No. 2, which
sustained only minor damage, was totally in-
capacitated for one week because of the nature
of damage. One incendiary bomb landed on a
hard-to-replace conveyor belt. This damage
could not have been detected from aerial pho-
tography; no visible damage was reported.
d. The Ube Nitrogen Fertilizer Co. was re-
ported to have received no damage. Actually
nine percent of the floor area was destroyed,
including the entire paraffin plant and a straw
bag plant for packaging the fertilizer. The
company reports 90 percent production loss re-
sulting from the nine percent physical damage.
e. The Ube Spinning and Weaving Co. was
reported to have been 50 percent destroyed.
Actually the damage was underestimated by
approximately 30 percent and the company was
totally incapacitated.
/. Other industries were found to be sub-
stantially as reported.
3. Value of night photographs. Night pho-
tographs (21BC5M242-156V7-2-0141 & 0147
& 0246) were taken during the attack. They
are of special interest because of their impor-
tance in photographic damage interpretation
and in the study of attack accuracy. The pho-
tographs were enlarged to the same scale as the
Mosaic in Figure 2 so that direct overlay com-
parison can be made. The comparison shows
the following:
a. If the night photographs had been used
by the photographic damage interpreter, the
Points of Damage 1, 3, 9, 10, 11, 12 listed on
Figure 1 would not have been missed.
b. Night Photograph 1 is of particular value
to a weapon effectiveness study because it shows
the direction of wind and the clearly defined
street pattern at Point 14. It also clearly de-
fines the location of the river at Point 13, the
L-shaped building at Point 3 and the burning
buildings at Points 9 and 10. Since these
photographs were taken at the start of the at-
tack, they can be used to assess the accuracy of
the pathfinder planes.
c. Night Photograph 2 clearly shows many
bombs and brisk fires at Point 1 which were
missed by the photographic damage interpreter.
It shows also a cluster of bombs and fire going
in the burned-out area of Point 15. Since fire
fighting was active in this area, this additional
group of bomb strikes provides the only logical
answer as to why the fire burned south to the
wide street, whereas adjoining areas were un-
burned on the south. Night Photograph 2 was
taken one hour following Night Photograph 1
and indicates the extent of fire growth. At
Point 10, only four buildings are shown burn-
ing in transparency whereas the later Night
Photograph 2 shows six buildings afire. Like-
wise, the three well defined buildings at Point
16 later involved another building. Fires are
less distinct in the last photograph indicating
merging of fires or roofs that have collapsed.
IX. Recommendations and Conclusions
1. The selection of two aiming points, type
and weight of incendiary bombs, time and alti-
tude of attack were well chosen.
2. The execution of the attack was not so
good in that the compressing of the attack into
a maximum time of one hour was not achieved.
Missing one aiming point by 2,000 feet reduced
the anticipated level of damage.
3. The idea that industrial buildings would
be seriously damaged by the urban attack was
not well founded. No spread of fire to the large
industrials resulted from the urban fires.
4. Conflagrations are a product of a rather
complicated set of conditions* not all of which
need to be present at the same time, but some
of the more important must be in evidence.
The order of relative importance, established
by the survey team and the Ube fire chief, is as
follows:
a. Wind exceeding 20 miles per hour.
b. Built-upness of more than 25 percent of
combustible structures.
c. Combustible structures.
d. Compressed bombing.
e. Favorable weather prior to bombing.
/. Lack of professional fire fighting.
g. Lack of home fire fighters.
h. Lack of man-made firebreaks.
5. The supposed low return for this attack of
0.560 square mile per 1,000 tons of bombs was
actually found to be 0.687 square mile per 1,000
tons. If the calculated probable density of 250
tons per square mile is used as a basis, then the
219
rate of efficiency was 4.0 square miles per 1,000
tons.
6. The actual amount of damage as inter-
preted from aerial photographs was under-
estimated by 14 percent of the city area. In-
dustrial and other damage outside the city ac-
counted for this. The photo intelligence inter-
pretation was generally reliable. Night photo-
graphs could have been of value in locating
other damaged areas and in assessing the
accuracy of attack.
X. Appendices
1. Fire damage map of Ube (Figure 1).
2. Photo-mosaic of Ube following the attack
(Figure 2).
3. Night Photograph 1 taken during the at-
tack showing identified buildings burning.
4. Night Photograph 2 taken 1 hour later
showing results of some fire spread.
220
Night Photo 1 of fires started early in the attack. It shows ground identified buildings, street patterns, direction of wind,
location of the shore and river, and extent of fires early in the attack.
222
Night Photo 2 of fires burning one hour after the attack. It shows the spread of fire that has taken place since Photo
1, the location of new bomb falls, and location of fires that have burned out.
223
Part 8
EFFECTS OF INCENDIARY BOMB ATTACKS ON NAGOYA, JAPAN
224
TABLE OF CONTENTS
Page
I. Object of Study...................................... 226
II. Summary.............................................. 226
III. General Information................................. 226
IV. The Target........................................... 226
V. The Attacks........................................ 231
VI. Fire Defense Data.................................... 232
VII. Fire Damage and Casualties........................... 234
VIII. Comments and Conclusions............................. 234
IX. References......................................... 234
Photos 1-3, inclusive
Figures 1-5, inclusive
225
I. Object of Study
This report attempts to examine ground con-
ditions influencing the effectiveness of four
large incendiary attacks on the city of Nagoya,
to suggest methods for tactical improvement,
and to evaluate the various measures used in
fighting incendiary fires.
II. Summary
1. Strategically important Nagoya, Japan’s
third largest city, was located where the great
Nobi Plain meets the head of Ise Bay. Rough-
ly oval in shape, the built-up portion of the city
covered about 40 square miles.
2. Industrially, economically!, militarily, and
commercially the city was of high target
priority.
3. Although the dwellings were all combus-
tible, only a central core of the city was highly
vulnerable to incendiary attack. The fire de-
partment, water system, morale, and general
preparations for defense against air attack
were excellent.
4. In four major attacks, about 9,780 tons of
incendiaries were dropped, resulting in about 12
square miles of damage, approximately 4,000
persons killed and 450,000 made homeless.
5. The excellent fire defense coupled with
weather and attack factors prevented maxi-
mum fire spread in each of the four attacks.
III. General Information
1. This survey was prepared from informa-
tion obtained by Major C. F. Castle, fire special-
ist, during his investigation of industrial
targets in and near the city of Nagoya. The
data were obtained from the Municipal Sta-
tistics Section and Weather Bureau, Bureau of
General Affairs. The cooperation of city offi-
cials was excellent, but time did not permit
complete confirmation of the data submitted.
In general, however, the information on extent
of water supply, weather and fire department is
considered reliable.
2. Fire damage maps (Figures 2 through 5)
were prepared from a master map obtained
from the Japanese. A careful check by photo
interpretation proved this damage information
to be essentially accurate.
226
IV. The Target
1. General. The city of Nagoya is located at
the eastern extremity of the head of Ise Bay
and at the southern end of Nobi Plain, one of
the most productive agricultural regions in
Japan. The plain extends southwestward to-
ward the cities of Kuwana and Yokkaichi and
is fringed by mountains that parallel the coast.
Included in this extensive delta flat are the
large estuaries of the Shonai, which wraps it-
self around the west and north limits of
Nagoya, and the Ibi and Kiso Rivers. The
city’s normal population of 1,160,000 in Decem-
ber 1944 was reduced to 592,765 by May 1945
(National Registration Census), because of
migrations to suburban areas, national con-
scription, and casualties from air attacks. The
city was modern by Japanese standards, having
mushroomed out in the previous ten years, and
included scattered steel and reinforced-concrete
buildings; this same growth, however, resulted
in flimsy residential areas typical of older
Japanese cities. The built-up section of the
city covered about 40 square miles, of which
about 30 were residential.
2. Industrial. Nagoya was one of the most
important industrial centers in Japan. Ideally-
located, it was a focal point for both land and
water transportation and was served by four
trunk railroads. The industrial system was
highly modernized and included facilities for
producing aircraft, machine tools, ordnance,
special steel alloys, electrical equipment, instru-
ments, and chemicals. Most of the prime tar-
gets were located in the city proper. Of
particular importance was the concentration of
aircraft and aircraft engine plants, the largest
in any Japanese city; the main factories of
Mitsubishi, Aichi, and other large concerns
were located here. Next in importance were the
large Okuma Iron Works and Mitsubishi Elec-
tric Manufacturing Co., the greatest machine
tool producers in Japan; Nagoya Arsenal and
its subsidiaries; and a multitude of small fac-
tories dispersed throughout the city. Major
power plants—links in the Central Honshu
Power Complex—were located along the har-
bor. It is estimated that about 6.5 square miles
of the city were industrial areas and about 2
square miles were areas of mixed residential
and small-scale manufacturing activity.
3. Military. The area was one of the most
heavily defended in Japan, the bulk of its pro-
tection being provided by a concentration of
heavy antiaircraft weapons on most approaches
that earned it the title of “Flak Alley”.
Nearly all of the actual military objectives (air
fields, barrack areas, and the like) were located
outside the city limits, but the city had great
military value as a general arsenal and dis-
tribution center.
4. Structures. The northern section of the
city presented a curious mixture of predomi-
nantly wood-frame structures, interspersed
with buildings of fire-resistive nature (Photos
1 and 2). The southern section included less
congested residential areas broken up by parks,
canals, river mouths, large industrial areas, and
undeveloped land. Residential areas were gen-
erally composed of typical one- and two-story
dwellings without basements. Commercial
structures fell into two categories: those lo-
cated in the core of the city to the south of
Nagoya Castle, predominantly of three or four
stories, a few up to nine stories, and usually of
modern fire-resistive construction; and those
scattered throughout the rest of the city, mostly
of two stories and wood frame. Industrial
structures varied from flimsy, combustible
home shops to modern, fire-resistive plant de-
velopments in the south.
5. Utilities. The city had a modern water
system, two major and three minor power
plants, and extensive telephone and sewerage
systems. Power was fed in from substations lo-
cated on the periphery of the densely built-up
central area.
6. Built-upness. Areas of built-upness were
measured as follows:
(Areas in square miles)
Ground area Roof area Percent built-up
Residential1 4.98 1.96 39.4
Residential 2 12 78 3.97 31.1
Residential 3 12.65 2.20 17*4
Manufacturing 6.49 2.64 40.7
Mixed R. and Mfg 1.97 0.60 30.4
Transportation 0.22 0.02 9 0
Storage 0.64 0.27 42.2
Totals 39.73 11.66 29.3
Residential1—Densely built-up (40 percent or more).
Residential 2—Moderately built-up (20 to 40 percent).
Residential3—Sparsely built-up (5 to 20 percent).
704699—47—16
7. Vulnerability of the city
a. The most highly built-up portion of
Nagoya, designated as Zone 1 (Figure 1), was a
triangular shaped central core bounded on the
east and southeast by the Chuo Railroad line.
The Tokaido main line formed the western and
southwestern portion of the area. Large prom-
inent Nagoya Castle was at the northern edge
and between it and the Tokaido railroad line
was a densely built-up northern extension to
the area. The zone was roughly three miles
long on each side.
b. Zone 2, composed principally of medium
built-upness, extended about two miles out from
the perimeter of Zone 1 except in the region Ц
mile to each side of the Naka Canal.
c. It was estimated that population density
in Zone 1 was as high as 70,000 per square mile.
Dwelling areas were very congested with sec-
tions of 150 to 200 acres bounded by streets 30
to 50 feet wide. Passageways were narrow
and alleys were seldom more than 12 feet in
width. The physical characteristics of the area
prevented quick access to small, isolated fires.
d. The fire breaks in and on the borders of
residential areas, more than 90 percent of which
fell in Zone 1, were measured as follows:
Linear miles
Type Width In area Along bor- der Total Per square mile
House removal Natural (streets, canals, etc Natural (streets, canals, etc Industrial areas 150 feet or more 150 feet or more 65 feet to 150 feet 1.0 6.9 6.1 2.3 3.9 6.3 12.8 1.2 4.9 13.2 18.9 3.5 0.98 2.65 3.80 0.70
Total 16.3 | 24.2 40.5 8.13
e. The city developed out from its central
core with a minimum of municipal planning
and its extremely rapid growth resulted in
fairly large concentrations of workers’ homes
(highly combustible) in Zone 2. The street
pattern became quite erratic but followed a
roughly rectangular alignment, broken up by
a number of canals (Photos 2 and 3) and rivers
that flowed through the city and by several
newly developed, modern thoroughfares. These
factors, together with the heterogeneous na-
ture of the entire southern area, rendered Zone
227
Photo 1.-----Nagoya, looking west through Zone 1. Note the interspersion of fire-resistive buildings.
229
Photo 2.— Nagoya, looking west through Zone 1. Note possible fire-breaking action of canal (foreground) and N-S street (one square distant).
230
Photo 3. — Nagoya, area arjacent to that in Photo 2, looking northwest. The canal was either jumped by fire or straddled by bombs.
2 considerably less vulnerable to fire than
Zone 1.
V. The Attacks
1. Specific. Qi the nine Nagoya attacks
listed by the Twentieth AF, five had negligible
effect on urban areas because either they used
high-explosive bombs on specific industrial tar-
gets, or else the size of the force attacking the
urban area was small and the bombing inac-
curate. The four remaining major attacks are
tabulated below:
41 44
174 176 Totals
Date---------------
Planes over target.
Number aiming
points_____________
Altitude (1,000
feet)______________
Intervalometer
(feet):
Pathfinders___
Main force____
Total tons dropped.
Total tons HE______
Total tons M69_____
Total tons M47_____
Total tons M50_____
Total tons M76_____
Clusters open
(1,000 feet)____
Time over target
(minutes)_______
11/3
280
18/3
290
13/5 16/5
472 457
1,499
6.8-7.3
100
100
1,793
0
1,689
104
0
0
2.0-2.5
178
3 4 4
4.0-7.5 12.0-20.5 6.6-18.3
100 25 50
50
1,863
19
274
959
116
495
25
2,515
0
2,515
0
0
0
50
3,609
0
75
127
3,407
0
9,780
19
4,553
1,190
3,523
495
2.0-3.0 5.0 3.0
164 80 173
2. General. The four missions were about
equally subjected to flak and fighter opposition
and experienced few operational failures.
a. Mission 41 was a night attack planned
from information obtained from the preceding
(Mission 40) Tokyo attack. Intervalometers,
however, were set for a greater spread to re-
sult, so it was thought, in more damage. The
planes came over Nagoya from the south on
an up-wind run; aiming points were staggered
and far enough apart to lessen the possibilities
of their being obscured by smoke. This pre-
caution was only partly effective: the Tactical
Mission Report (Reference 1) states that about
one-third of the force “. . . found the aiming
points smoke covered and used radar bombing
methods ...” and that “one Wing hit its aiming
point, . . . the other two Wings were short.”
A comparison of aiming points with extent of
fire damage, moreover, confirmed the fact that
a large part of the force bombed short of the
target area. This probably resulted in many
bombs falling either too far to leeward to obtain
maximum fire spread, or else into areas of less
built-upness.
b. Mission 44 was a night attack planned
from information obtained from the preceding
(Mission 43) Kobe attack. Emphasis was
placed on compressibility of force, i.e., sending
as many planes over the target in as short a
time as possible. Fifty-foot intervalometer
settings were used. Every third aircraft car-
ried two 500-pound GP bombs as antipersonnel
weapons. As in Mission 41, the attack was up
wind from the south and aiming points were
chosen so that smoke from the bombing of one
Wing would not obscure the aiming points of
the others. Again, the Mission Report (Ref-
erence 2) states that “... as a result of smoke,
the majority of the bombing was accomplished
exclusively by radar.” An examination of
aiming points and plotted damage indicated
that one of the three Wings bombed short of
its aiming point west of Nagoya Castle, so that
its bombs fell in a Residential 2 area instead of
a Residential i area. Difficulty over the target
resulted from blinding searchlights, dummy
fires, and radar interference.
c. Mission 174 was a special day attack.
Smoke was again the main problem. A down-
wind run from the west was planned and “the
aiming points were so arranged that those to
the east were to be bombed first and those to
the west.. . last...” so that “. . . those bomb-
ing last would not have their visibility re-
stricted by smoke from fires started by earlier
formations” (Reference 3). Surface winds,
however, were not exactly as predicted and
more of a cross wind from the north was en-
countered so that, once again, “.. . the greatest
difficulty . . . arose from the smoke over the
target area for the later formations. Its pres-
ence necessitated the use of offset reference
points in several cases, but this type of bomb-
ing was handicapped by the limited field of
vision of the bombsight and the wide area cov-
ered by the smoke.” (Reference 3). Most of
the bombs fell in areas of medium built-upness
(as indicated on Figure 4).
d. Mission 176 was a night attack similar to
missions 41 and 44 except that the M50 bomb
was chosen as a more effective weapon against
the dock areas and industrial targets in the
south of the city. A down-wind run from the
west was chosen and special attention given to
reducing the time of attack to one hour and to
231
avoiding smoke and thermal currents. The at-
tack actually lasted close to three hours, and
smoke and thermal current difficulties were not
overcome, about half of the planes being forced
to bomb from 15,000 feet (Reference 4).
VI. Fire Defense Data
1. Individuals
a. The people were generally well trained
and disciplined. Fire-fighting instructions were
broadcast by radio.
b. Almost without exception, each of the
270,000 families in Nagoya had some sort of
air-raid shelter; in addition, there were two or
three public shelters located in each of the city’s
2,600 Cho. (A Cho included 100 to 150 dwell-
ings). Most of these, however, were flimsy
and primitive. There were many deaths by
fire and suffocation within shelters, but exact
data on these casualties were not available to
the surveying team.
2. Alarm system
a. As soon as it was felt that the city might
be attacked, Tokai Army Headquarters tele-
phoned a warning to three agencies: one, the
Nagoya Broadcasting Station and Communica-
tion Bureau, broadcast the warning over its
regular network; another, the city hall, sounded
the “alert” with its powerful electric siren; the
third, the Aichi Prefectural Office, telephoned
each fire and police station which, in turn, tele-
phoned the civilian-defense stations, factories,
department stores and other large institutions
in its Cho. About half the defense corps and
part-time firemen were mobilized at their posts
at the time of “alert”.
b. The “alarm” proper was disseminated
through the same channels: the people were
notified by radio; the city hall siren screamd
the “alarm” signal; civilian-defense stations
rang alarm bells.
c. Fires were reported by telephone from
watch towers to the prefectural office.
3. Fire fighters and their equipment. A sum-
mary follows:
Personnel
1,933 full-time firemen
22,186 members of defense corps and part-
time firemen
24,119 Total
Equipment
Total
Dam-
aged
On
hand
by end
of war
Large fire engines (probably 500 gpm)----
Smail fire engines (probably 250 gpm)----
Gasoline pumpers (probably 250 gpm)------
Large hand pumpers (capacity unknown)__
Small hand pumpers (capacity unknown) —
Hydrants_________________________________
3.888
7,500
265
183
555
743
36 229
82 101
239 316
293 450
3,385 503
4. Water supply
a. The municipal water system was one of
the best in Japan. The intake was high up on
the Kiso River in the city of Inuyama. The
water was fed by gravity through 36-inch
mains to Nabeya, where 28 ponds were capable
of filtering 80 million gallons daily, then!
through city mains to the northern section of
the city and the large Higashiyama reservoir
and elevated tank which had a capacity of
20,500,000 gallons. Fifteen electric pumps,
totalling 2,900 horsepower could supply 83 mil-
lion gallons per day to the city’s mains at a
pressure of 7 to 35 pounds per square inch. A
900 horsepower Diesel-driven pump was kept
in reserve in case of power failure. The per-
centages of various sized mains, 16 inches or
more in diameter, were as follows:
16 inch.... 41 percent
20 inch 15 percent
24 inch 18 percent
28 inch 9 percent
32 inch— 2 percent
36 inch.' 4 percent
42 inch 11 percent
b. In addition, well water was utilized to sup-
ply the section of the city west of the Tokaido
railroad line and between it and Nagoya Cas-
tle; a smaller well system existed north of
Tsurumi Park.
c. The city’s water consumption before the
war averaged 71 million gallons per day; after
the war, 26 million gallons per day.
4. Fighting the fires
a. City officials put special emphasis on the
protection of the central built-up core of the
city. The greatest concentration of fire de-
partment personnel and equipment was sta-
tioned for expedient access to any of its
sections.
b. The plan of defense by the fire department
stressed confining fires to previously prepared
areas and attacking them along their
perimeters.
232
c. The direction and velocity of the wind
were taken into consideration. The winds dur-
ing the four attacks under discussion were not
conducive to spreading conflagration. Their
velocities and directions during attacks are
summarized below (note location of weather
station on Figure 1).
Mission 41 44 174 176
Average velocity (mph) 7.6 6.9 5.1 5.3
Maximum velocity 14.7 8.1 7.4 10.8
Direction N N NNW NNE
It was decided by the fire department to dis-
patch light equipment and hand pumpers to the
windward edges of fires and to concentrate
heavier equipment and the bulk of available
man power to leeward.
d. In practice, the fire-fighting plan proved
successful. The fires were fought until they
were finally controlled or until they were driven
against natural or man-made obstacles. Streets
were usually clear of debris, so that equipment
had direct access to fires. Fire fighters suc-
ceeded in not getting trapped in the center of a
fire. Control was obtained in windward sec-
tions by orthodox dousing with water. The
leeward portions generally burned themselves
out against parks, railroad beds, man-made fire-
breaks, wide roads, canals, resistive structures
and, especially in the second attack, previously
burned out sections. Firebreaks (Section IV,
6, d) retained about 53 percent of the fires to
which they were subjected; a detailed tabula-
tion follows:
Efficiency of firebreaks in residential areas
(Distances in linear miles)
Width length Subjected to fire Percent total Fire stopped 1 Percent stopped
150 feet or over 18.1 9.2 50.8 6.9 75.0
65 feet to 150 feet 18.9 11.2 59.2 3.9 34.8
Total 37.0 20.4 55.1 10.8 52.9
1 Fires were considered “stopped” where incendiary damage
existed directly on one side of the firebreak only. This is, there-
fore. an assessment of minimum efficiency because fires on both
sides were often caused by bombs falling on both sides and not by
fire spread.
It is interesting to note that the wider fire-
breaks were more than twice as effective as the
narrower ones.
e. The water system remained in good work-
ing order and the emergency pump never had
to be used. The remote location of distribution
and pumping stations near the outskirts of the
city kept them from being hit. Arterial mains
suffered more than 60 breaks as a result of high
explosives, and smaller distribution mains were
severed in more than 800 places, so that sec-
tions of the city were sometimes without suffi-
cient water pressure.
f. The fires resulting from the first attack
were difficult to control principally in Residen-
tial i areas where fires merged together forming
larger conflagrations. Scattered incidents were
numerous (394 separate fire areas were posi-
tively identified) and, although the fire depart-
ment had to deploy its equipment, all of the
small blazes in Residential 2 areas were quickly
brought under control (Figure 2).
g. The second attack, which emphasized
“compression”, was the most concentrated of
the four. Only 129 separate fire areas were
positively identified. Large fires were started
in Residential i areas but these were brought
under control partly because bombs were
dropped too short a distance to the windward
of previous damage for maximum fire spread,
and the burned-out area from the attack of the
week before acted as an efficient firebreak (Fig-
ure 3).
h. The third attack concentrated on the Resi-
dential areas north of Nagoya Castle (Figure
4). One hundred and thirty-one separate
blazes were identified. The only large conflag-
ration was started in the northern extension to
Zone 1, west of Nagoya Castle; this burned
itself out against a 200-foot, man-made fire-
break in the south. The wind averaged 5.1
miles per hour, the lowest for any of the at-
tacks. The fire department’s equipment was in
good condition as it had not engaged in large-
scale operations for two months and repairs
had been made.
i. The last attack concentrated on the sparse-
ly built-up southern section and the bulk of the
damage occurred in industrial targets and in
the clusters of workers’ houses (Figure 5). One
hundred and thirty-eight separate incidents
were identified. The segregation of fires was
accomplished fairly easily, although larger
areas were isolated for this purpose.
j. The Japanese reported that a period of
water pipe inspection and repair, during which
233
all water was shut off and mains were under
repair in many places, followed each attack.
It seems plausible, in the case of Nagoya, that
attacks following each other by one or two days
would have accomplished more damage, even if
the bomb loads of each were substantially light-
er than those usually employed.
k. The Japanese also indicated that attacks
following each other closely tended to catch per-
sonnel exhausted and equipment in poor
condition.
VII. Fire Damage and Casualties
a. One hundred and thirteen thousand four
hundred and sixty buildings of all types were
completely destroyed, and 4,646 were damaged
by fire. Damage to built-up areas follows:
1. Material Damage
Square miles damaged (all types) Square miles dam- aged per 1000 tons of bombs dropped on target
Mission 41 2.05 1.14
Mission 44 2.95 1.58
Mission 174 3 15 1.25
Mission 176 3.82 1.06
Total 11.97 (All) 1.25
b. Breakdown of damage by areas of built-
upness
Built-upness
Average percent
built-up
Square miles
damaged
Residential 1__________
Residential 2__________
Residential 3__________
Manufacturing__________
Mixed__________________
Transportation_________
Storage----------------
39.4
31.1
17.4
40.7
30.4
9.0
42.2
3.76
3.75
1.30
2.06
1.96
0.02
0.12
Total_____________
11.97
2. Personnel Losses
All attacks Missions 41,44. 174,176
Dead 7,724 3.866
Severely Injured 4,378 1.843
Slightly injured 6,155 4,311
Total casualties 18.257 10,020
Homeless 522,951 452,701
VIII. Comments and Conclusions
1. Only the central residential section of
Nagoya was highly vulnerable to incendiary
attack.
2. The city, with an excellent fire depart-
ment, relatively good water system, disciplined
civilian population, many fire-resistive build-
ings, a multitude of parks, wide streets, canals,
and other firebreaks, was better prepared for
incendiary attacks than most other Japanese
cities.
3. Low wind velocity appears to have been
a principal factor in the lack of fire spread.
4. Obscuring smoke from fires started by
earlier formations caused some later formations
to bomb short of their aiming points. Some-
times, consequently (as in the case of Mission
41), many bombs fell too far to leeward to pro-
duce maximum fire spread; sometimes (as in
the case of Mission 174) bombs fell in a less
densely built-up area.
5. The selection of aiming points in relation
to previously burned-out areas and the direction
of the wind was found to be important. At-
tacks directed to windward sections should be
as far away from previous damage as the
choice of combustible areas allows; attacks di-
rected to leeward sections should be as close to
previous damage as bombing accuracy renders
feasible.
6. Better results would probably have been
obtained, if key installations of the water sys-
tem had been damaged prior to or during the
incendiary attacks.
7. It is probable that attacks closely follow-
ing each other could do more damage than those
effected at sporadic intervals, because the peo-
ple would be given no time to recuperate and
fire defenses would be in poor condition.
8. Fighting a fire along its perimeter is
more effective in keeping it under control than
spending the same effort on fires within the
perimeter.
IX. References
1. Tactical Mission Report, Mission No. 41,
11-12 March 1945, Headquarters, XXI Bomber
Command.
2. Tactical Mission Report, Mission No. 44,
19-20 March 1945, Headquarters, XXI Bomber
Command.
3. Tactical Mission Report, Mission No. 174,
14 May 1945, Headquarters, XXI Bomber
Command.
4. Tactical Mission Report, Mission No. 176,
16-17 May 1945, Headquarters, XXI Bomber
Command.
234
UNITED STATES STRATEGIC BOMBING SURVEY
LIST OF REPORTS
The following is a bibliography of reports resulting
from the Survey’s studies of the European and Pacific
wars. Those reports marked with an asterisk (♦) may
be purchased from the Superintendent of Documents at
the Government Printing Office, Washington, D. C.
European War
OFFICE OF THE CHAIRMAN
♦ 1 The United States Strategic Bombing Survey:
Summary Report (European War)
* 2 The United States Strategic Bombing Survey:
Over-all’Report (European War)
* 3 The Effects of Strategic Bombing on the German
War Economy
AIRCRAFT DIVISION
(By Division and Branch)
* 4 Aircraft Division Industry Report
5 Inspection Visits to Various Targets (Special
Report)
Airframes Branch
6 Junkers Aircraft and Aero Engine Works,
Dessau, Germany
7 Erla Maschinenwerke GmbH, Heiterblick,
German
8 A T G Maschinenbau, GmbH, Leipzig
(Mockau), Germany
9 Gothaer Waggonfabrik, A G, Gotha, Germany
10 Focke Wulf Aircraft Plant, Bremen, Germany
'Over-all Report
11 Messerschmitt A G, Part A
Augsburg, Germany Part В
Appendices I, II, III
12 Dornier Works, Friedrichshafen & Munich,
Germany
13 Gerhard Fieseler Werke GmbH, Kassel,
Germany
14 Wiener Neustaedter Flugzeugwerke, Wiener
Neustadt, Austria
Aero Engines Branch
15 Bussing NAG Flugmotorenwerke GmbH,
Brunswick, Germany
16 Mittel-Deutsche Motorenwerke GmbH, Taucha,
Germany
17 Bavarian Motor Works, Inc, Eisenach & Dur-
rerhof, Germany
18 Bayerische Motorenwerke A G (BMW) Munich,
Germany
19 Henschel Flugmotorenwerke, Kassel, Germany
Light Metal Branch
20 Light Metals Industry (Part I, Aluminum
of Germany j Part II, Magnesium
21 Vereinigte Deutsche Metallwerke, Hildesheim,
Germany
22 Metallgussgesellschaft G mb H, Leipzig,
Germany
23 Aluminiumwerk GmbH, Plant No. 2, Bitterfeld,
Germany
24 Gebrueder Giulini GmbH, Ludwigshafen,
Germany
25 Luftschiffbau, Zeppelin GmbH, Friedrichshafen
on Bodensee, Germany
26 Wieland Werke A G, Ulm, Germany
27 Rudolph Rautenbach Leichmetallgiessereien,
Solingen, Germany
28 Lippewerke Vereinigte Aluminiumwerke A G,
Lunen, Germany
29 Vereinigte Deutsche Metallwerke, Heddernheim,
Germany
30 Duerener Metallwerke A G, Duren Wittenau-
Berlin & Waren, Germany
AREA STUDIES DIVISION
*31 Area Studies Division Report
32 A Detailed Study of the Effects of Area Bomb-
ing on Hamburg
33 A Detailed Study of the Effects of Area Bombing
on Wuppertal
34 A Detailed Study of the Effects of Area Bomb-
ing on Dusseldorf
35 A Detailed Study of the Effects of Area Bomb-
ing on Solingen
36 A Detailed Study of the Effects of Area Bomb-
ing on Remscheid
37 A Detailed Study of the Effects of Area Bomb-
ing on Darmstadt
38 A Detailed Study of the Effects of Area Bomb-
ing on Lubeck
39 A Brief Study of the Effects of Area Bomb-
ing on Berlin, Augsburg, Bochum, Leipzig,
Hagen, Dortmund, Oberhausen, Schweinfurt,
and Bremen
CIVILIAN DEFENSE DIVISION
*40 Civilian Defense Division—Final Report
235
41 Cologne Field Report
42 Bonn Field Report
43 Hanover Field Report
44 Hamburg Field Report—Vol I, Text; Vol П,
Exhibits
45 Bad Oldesloe Field Report
46 Augsburg Field Report
47 Reception Areas in Bavaria, Germany
EQUIPMENT DIVISION
Electrical Branch
*48 German Electrical Equipment Industry Report
49 Brown Boveri et Cie, Mannheim Kafertal,
Germany
Optical and Precision Instrument Branch
*50 Optical and Precision Instrument Industry
Report
Abrasives Branch
*51 The German Abrasive Industry
52 Mayer and Schmidt, Offenbach on Main, Germany
Anti-Friction Branch
* 53 The German Anti-Friction Bearings Industry
Machine Tools Branch
* 54 Machine Tools & Machinery as Capital Equipment
* 55 Machine Tool Industry in Germany •
56 Herman Kolb Co., Cologne, Germany
57 Collet and Engelhard, Offenbach, Germany
58 Naxos Union, Frankfort on Main, Germany
MILITARY ANALYSIS DIVISION
59 The Defeat of the German Air Force
60 V-Weapons (Crossbow) Campaign
61 Air Force Rate of Operation
62 Weather Factors in Combat Bombardment Op-
erations in the European Theatre
63 Bombing Accuracy, USAAF Heavy and Medium
Bombers in the ETO
64 Description of RAF Bombing
64a The Impact of the Allied Air Effort on German
Logistics
MORALE DIVISION
* 64b The Effects of Strategic Bombing on German
Morale (Vol I and Vol П)
Medical Branch
* 65 The Effect of Bombing on Health and Medical
Care in Germany
MUNITIONS DIVISION
Heavy Industry Branch
* 66 The Coking Industry Report on Germany
67 Coking Plant Report No. 1, Sections А, В, C, & D
68 Gutehoffnungshuette, Oberhausen, Germany
69 Friedrich-Alfred Huette, Rheinhausen, Germany
70 Neunkirchen Eisenwerke A G, Neunkirchen,
Germany
71 Reichswerke Hermann Goering A G, Hallendorf,
Germany
72 August Thyssen Huette A G, Hamborn, Germany
73 Friedrich Krupp A G, Borbeck Plant, Essen,
Germany
74 Dortmund Hoerder Huettenverein, A G, Dort-
mund, Germany
75 Hoesch A G, Dortmund, Germany
76 Bochumer Verein fuer Gusstahlfabrikation A G,
Bochum, Germany
Motor Vehicles and Tanks Branch
*77 German Motor Vehicles Industry Report
*78 Tank Industry Report
79 Daimler Benz A G, Unterturkheim, Germany
80 Denault Motor Vehicles Plant, Billancourt, Paris
81 Adam Opel, Russelsheim, Germany
82 Daimler Benz-Gaggenau Works, Gaggenau, Ger-
many
83 Maschinenfabrik Augsburg-Nurnberg, Nurn-
berg, Germany
84 Auto Union A G, Chemnitz and Zwickau, Ger-
many
85 Henschel & Sohn, Kassel, Germany
86 Maybach Motor Works, Friedrichshafen, Ger-
many
87 Voigtlander, Maschinenfabrik A G, Plauen,
Germany
88 Volkswagenwerke, Fallersleben, Germany
89 Bussing NAG, Brunswick, Germany
90 Muehlenbau Industrie A G (Miag) Brunswick,
Germany
91 Friedrich Krupp Grusonwerke, Madgeburg, Ger-
many
Submarine Branch
92 German Submarine Industry Report
93 Maschinenfabrik Augsburg-Nurnberg A G, Augs-
burg, Germany
94 Blohm and Voss Shipyards, Hamburg, Germany
95 Deutschewerke A G, Kiel, Germany
96 Deutsche Schiff und Maschinenbau, Bremen,
Germany
97 Friedrich Krupp Germaniawerft, Kiel, Germany
98 Howaldtswerke A G, Hamburg, Germany
99 Submarine Assembly Shelter, Farge, Germany
100 Bremer Vulkan, Vegesack, Germany
Ordnance Branch
*101 Ordnance Industry Report
102 Friedrich Krupp Grusonwerke A G, Madgeburg,
Germany
103 Bochumer Verein fuer Gusstahlfabrikation A G,
Bochum, Germany
104 Henschel & Sohn, Kassel, Germany
105 Rheinmetall-Borsig, Dusseldorf, Germany
106 Hermann Goering Werke, Braunschweig, Hallen-
dorf, Germany
107 Hannoverische Maschinenbau, Hanover, Germany
108 Gusstahlfabrik Friedrich Krupp, Essen, Germany
OIL DIVISION
*109 Oil Division, Final Report
*110 Oil Division, Final Report, Appendix
*111 Powder, Explosives, Special Rockets and Jet Pro-
pellants, War Gases and Smoke Acid (Ministe-
rial Report #1)
236
112 Underground and Dispersal Plants in Greater
Germany
113 The German Oil Industry, Ministerial Report
Team 78
114 Ministerial Report on Chemicals
Oil Branch
115 Ammoniakwerke Merseburg GmbH, Leuna, Ger-
many—2 Appendices
116 Braunkohle Benzin A G, Zeitz and Bohlen, Ger-
many
Wintershall A G, Luetzkendorf, Germany
117 Ludwigshafen-Oppau Works of I G Farbenindus-
trie A G, Ludwigshafen, Germany
118 Ruhroel Hydrogenation Plant, Bottrop-Boy, Ger-
many, Vol. I, Vol. II
119 Rhenania Ossag Mineraloelwerke A G, Harburg
Refinery, Hamburg, Germany
120 Rhenania Ossag Mineraloelwerke A G, Grasbrook
Refinery, Hamburg, Germany
121 Rhenania Ossag Mineraloelwerke A G, Wilhelms-
burg Refinery, Hamburg, Germany
122 Gewerkschaft Victor, Castrop-Rauxel, Germany,
Vol. I & Vol. II
123 Europaeische Tanklager und Transport A G,
Hamburg, Germany
124 Ebano Asphalt Werke A G, Harburg Refinery,
Hamburg, Germany
125 Meerbeck Rheinpreussen Synthetic Oil Plant—
Vol. I & Vol. II
Rubber Branch
126 Deutsche Dunlop Gummi Co., Hanau on Main,
Germany
127 Continental Gummiwerke, Hanover, Germany
128 Huels Synthetic Rubber Plant
129 Ministerial Report on German Rubber Industry
Propellants Branch
130 Elektrochemischewerke, Munich, Germany
131 Schoenebeck Explosive Plant, Lignose Sprengstoff
Werke GmbH, Bad Salzemen, Germany
132 Plants of Dynamit A G, Vormal, Alfred Nobel &
Co, Troisdorf, Clausthal, Drummel and Dune-
berg, Germany
133 Deutsche Sprengchemie GmbH, Krailburg, Ger-
many
OVER ALL ECONOMIC EFFECTS DIVISION
134
134a
Over-all Economic Effects Division Report
Gross National Product_______"
Kriegseilberichte__________
Herman Goering Works_______
Food and Agriculture_______ _______
Industrial Sales Output and Productivity
Special papers
which together
comprise the
above report
PHYSICAL DAMAGE DIVISION
134b Physical Damage Division Report (ETO)
135 Villacoublay Airdrome, Paris, France
136 Railroad Repair Yards, Malines, Belgium
137 Railroad Repair Yards, Louvain, Belgium
138 Railroad Repair Yards, Hasselt, Belgium
139 Railroad Repair Yards, Namur, Belgium
140 Submarine Pens, Brest, France
141 Powder Plant, Angoulene, France
142 Powder Plant, Bergerac, France
143 Coking Plants, Montigny & Liege, Belgium
144 Fort St. Blaise Verdun Group, Metz, France
145 Gnome et Rhone, Limoges, France
146 Michelin Tire Factory, Clermont-Ferrand, France
147 Gnome et Rhone Aero Engine Factory, Le Mans,
France
148 Kugelfischer Bearing Ball Plant, Ebelsbach, Ger-
many
149 Louis Breguet Aircraft Plant, Toulouse, France
150 S. N. C. A. S. E. Aircraft Plant, Toulouse, France
151 A. I. A. Aircraft Plant, Toulouse, France
152 V Weapons in London
153 City Area of Krefeld
154 Public Air Raid Shelters in Germany
155 Goldenberg Thermal Electric Power Station,
Knapsack, Germany
156 Brauweiler Transformer & Switching Station,.
Brauweiler, Germany
157 Storage Depot, Nahbollenbach, Germany
158 Railway and Road Bridge, Bad Munster, Germany
159 Railway Bridge, Eller, Germany
160 Gustloff-Werke Weimar, Weimar, Germany
161 Henschell & Sohn GmbH, Kassel, Germany
162 Area Survey at Pirmasens, Germany
163 Hanomag, Hanover, Germany
164 MAN Werke Augsburg, Augsburg, Germany
165 Friedrich Krupp A G, Essen, Germany
166 Erla Maschinenwerke, GmbH, Heiterblick, Ger-
many
167 A T G Maschinenbau GmbH, Mockau, Germany
168 Erla Maschinenwerke GmbH, Mockau, Germany
169 Bayerische Motorenwerke, Durrerhof, Germany
170 Mittel-Deutsche Motorenwerke GmbH, Taucha,
Germany
171 Submarine Pens Deutsche-Werft, Hamburg, Ger-
many
172 Multi-Storied Structures, Hamburg, Germany
173 Continental Gummiwerke, Hanover, Germany
174 Kassel Marshalling Yards, Kassel, Germany
175 Ammoniawerke, Merseburg-Leuna, Germany
176 Brown Boveri et Cie, Mannheim, Kafertal, Ger-
many
177 Adam Opel A G, Russelsheim, Germany
178 Daimler-Benz A G, Unterturkheim, Germany
179 Valentin Submarine Assembly, Farge, Germany
180 Volkswaggonwerke, Fallersleben, Germany
181 Railway Viaduct at Bielefeld, Germany
182 Ship Yards Howaldtswerke, Hamburg, Germany
183 Blohm and Voss Shipyards, Hamburg, Germany
184 Daimler-Benz A G, Mannheim, Germany
185 Synthetic Oil Plant, Meerbeck-Hamburg, Germany
186 Gewerkschaft Victor, Castrop-Rauxel, Germany
187 Klockner Humboldt Deutz, Ulm, Germany
188 Ruhroel Hydrogenation Plant, Bottrop-Boy, Ger-
many
189 Neukirchen Eisenwerke A G, Neukirchen, Ger-
many
190 Railway Viaduct at Altenbecken, Germany
191 Railway Viaduct at Arnsburg, Germany
192 Deurag-Nerag Refineries, Misburg, Germany
237
193 Fire Raids on German Cities
194 I G Farbenindustrie, Ludwigshafen, Germany,
Vol I and Vol 1Г
195 Roundhouse in Marshalling Yard, Ulm, Germany
196 I G Farbenindustrie, Leverkusen, Germany
197 Chemische-Werke, Huels, Germany
198 Gremberg Marshalling Yard, Gremberg, Germany
199 Locomotive Shops and Bridges at Hamm, Ger-
many
TRANSPORTATION DIVISION
♦200 The Effects of Strategic Bombing on German
Transportation
201 Rail Operations Over the Brenner Pass
202 Effects of Bombing on Railroad Installations in
Regensburg, Nurnberg and Munich Divisions
203 German Locomotive Industry During the War
204 German Military Railroad Traffic
UTILITIES DIVISION
♦205 German Electric Utilities Industry Report
206 1 to 10 in Vol I “Utilities Division Plant Reports”
207 11 to 20 in Vol II “Utilities Division Plant
Reports”
208 21 Rheinische-Westfalische Elektrizitaetswerk
A G
Pacific War
OFFICE OF THE CHAIRMAN
* 1 Summary Report (Pacific War)
♦ 2 Japan’s Struggle to End The War
* 3 The Effects of Atomic Bombs on Hiroshima and
Nagasaki
CIVILIAN STUDIES
Civilian Defense Division
4 Field Report Covering Air Raid Protection and
Allied Subjects, Tokyo, Japan
5 Field Report Covering Air Raid Protection and
Allied Subjects, Nagasaki, Japan.
♦6 Field Report Covering Air Raid Protection and
Allied Subjects, Kyoto, Japan
7 Field Report Covering Air Raid Protection and
Allied Subjects, Kobe, Japan
8 Field Report Covering Air Raid Protection and
Allied Subjects, Osaka, Japan
9 Field Report Covering Air Raid Protection and
Allied Subjects, Hiroshima, Japan—No. 1
♦ 10 Summary Report Covering Air Raid Protection
and Allied Subjects in Japan
♦ 11 Final Report Covering Air Raid Protection and
Allied Subjects in Japan
Medical Division
♦ 12 The Effects of Bombing on Health and Medical
Services in Japan
♦ 13 The Effects of Atomic Bombs on Health and
Medical Services in Hiroshima and Nagasaki
Morale Division
* 14 The Effects of Strategic Bombing on Japanese
Morale
ECONOMIC STUDIES
Aircraft Division
♦ 15 The Japanese Aircraft Industry
♦ 16 Mitsubishi Heavy Industries, Ltd.
Corporation Report No. I
(Mitsubishi Jukogyo KK)
(Airframes & Engines)
♦ 17 Nakajima Aircraft Company, Ltd.
Corporation Report No. II
(Nakajima Hikoki KK)
(Airframes & Engines)
♦ 18 Kawanishi Aircraft Company
Corporation Report No. Ill
(Kawanishi Kokuki Kabushiki Kaisha)
(Airframes)
♦ 19 Kawasaki Aircraft Industries Company, Inc.
Corporation Report No. IV
(Kawasaki Kokuki Kogyo Kabushiki
Kaisha)
(Airframes & Engines)
* 20 Aichi Aircraft Company
Corporation Report No. V %
(Aichi Kokuki KK)
(Airframes & Engines)
♦ 21 Sumitomo Metal Industries, Propeller Division
Corporation Report No. VI
(Sumitomo Kinzoku Kogyo KK, Puropera
Seizosho)
(Propellers)
* 22 Hitachi Aircraft Company
Corporation Report No. VII
(Hitachi Kokuki KK)
(Airframes & Engines)
♦ 23 Japan International Air Industries, Ltd.
Corporation Report No. VIII
(Nippon Kokusai Koku Kogyo KK)
(Airframes)
* 24 Japan Musical Instrument Manufacturing Com-
♦25
♦26
*27
♦28
♦29
pany
Corporation Report No. IX
(Nippon Gakki Seizo KK)
(Propellers)
Tachikawa Aircraft Company
Corporation Report No. X
(Tachikawa Hikoki KK)
(Airframes)
Fuji Airplane Company
Corporation Report No. XI
(Fuji Hikoki KK)
(Airframes)
Showa Airplane Company
Corporation Report No. XII
(Showa Hikoki Kogyo KK)
(Airframes)
Ishikawajima Aircraft Industries Company, Ltd.
Corporation Report No. XIII
(Ishikawajima Koku Kogyo Kabushiki
Kaisha)
(Engines)
Nippon Airplane Company
Corporation Report No. XIV
(Nippon Hikoki KK)
(Airframes)
238
* 30 Kyushu Airplane Company
Corporation Report No, XV
(Kyushu Hikoki KK)
(Airframes)
* 31 Shoda Engineering Company
Corporation Report No, XVI
(Shoda Seisakujo)
(Components)
* 32 Mitaka Aircraft Industries
Corporation Report No, XVII
(Mitaka Koku Kogyo Kabushiki Kaisha)
(Components)
* 33 Nissan Automobile Company
Corporation Report No. XVIII
(Nissan Jidosha KK)
(Engines)
* 34 Army Air Arsenal & Navy Air Depots
Corporation Report No. XIX
(Airframes & Engines)
* 35 Underground Production of Japanese Aircraft
Report No, XX
Basic Materials Division
* 36 Coal and Metals in Japan’s War Economy
Capital Goods, Equipment and Construction Division
* 37 The Japanese Construction Industry
* 38 Japanese Electrical Equipment
* 39 The Japanese Machine Building Industry
Electric Power Division
* 40 The Electric Power Industry of Japan
* 41 The Electric Power Industry of Japan (Plant Re-
ports)
Manpower, Food and Civilian Supplies Division
* 42 The Japanese Wartime Standard of Living and
Utilization of Manpower
Military Supplies Division
* 43 Japanese War Production Industries
* 44 Japanese Naval Ordnance
45 Japanese Army Ordnance
* 46 Japanese Naval Shipbuilding
* 47 Japanese Motor Vehicle Industry
* 48 Japanese Merchant Shipbuilding
Oil and Chemical Division
49 Chemicals in Japan’s War
50 Chemicals in Japan’s War—Appendix
51 Oil in Japan’s War
52 Oil in Japan’s War—Appendix
Over-all Economic Effects Division
♦ 53 The Effects of Strategic Bombing on Japan’s War
Economy (Including Appendix A: U. S. Eco-
nomic Intelligence on Japan—Analysis and Com-
parison; Appendix B: Gross National Product
on Japan and Its Components; Appendix C: Sta-
tistical Sources).
Transportation Division
♦ 54 The War Against Japanese Transportation,
1941-1945
Urban Areas Division
♦ 55 Effects of Air Attack on Japanese Urban Econ-
omy (Summary Report)
* 56 Effects of Air Attack on Urban Complex Tokyo-
Kawasaki-Y okohama
* 57 Effects of Air Attack on the City of Nagoya
* 58 Effects of Air Attack on Osaka-Kobe-Kyoto
59 Effects of Air Attack on the City of Nagasaki
60 Effects of Air Attack on the City of Hiroshima
MILITARY STUDIES
Military Analysis Division
61 Air Forces Allied with the United States in the
War Against Japan
62 Japanese Air Power
63 Japanese Air Weapons and Tactics
64 The Effect of Air Action on Japanese Ground
Army Logistics
65 Employment of Forces Under the Southwest
Pacific Command
66 The Strategic Air Operations of Very Heavy
Bombardment in the War Against Japan
(Twentieth Air Force)
67 Air Operations in China, Burma, India—World
War II
68 The Air Transport Command in the War
Against Japan
69 The Thirteenth Air Force in the War Against
Japan
70 The Seventh and Eleventh Air Forces in the War
Against Japan
71 The Fifth Air Force in the War Against Japan
Naval Analysis Division
* 72 The Interrogations of Japanese Officials (Vols. I
and II)
* 73 Campaigns of the Pacific War
* 74 The Reduction of Wake Island
* 75 The Allied Campaign Against Rabaul.
76 The American Campaign Against Wotje, Maloe-
lap, Mille, and Jaluit (Vols. I, II and Ш)
♦77 The Reduction of Truk
78 The Offensive Mine Laying Campaign Against
Japan
79 Report of Ships Bombardment Survey Party—
Foreword, Introduction, Conclusions, and Gen-
eral Summary
80 Report of Ships Bombardment Survey Party (En-
closure A), Kamaishi Area
81 Report of Ships Bombardment Survey Party (En-
closure B), Hamamatsu Area
82 Report of Ships Bombardment Survey Party (En-
closure C), Hitachi Area
83 Report of Ships Bombardment Survey Party (En-
closure D), Hakodate Area
84 Report of Ships Bombardment Survey Party (En-
closure E), Muroran Area
85 Report of Ships Bombardment Survey Party (En-
closure F), Shimizu Area
86 Report of Ships Bombardment Survey Party (En-
closures G and H), Shionomi-Saki and Nojima-
Saki Areas
239
87
88
89
90
91
92
93
94
95
96
97
Report of Ships Bombardment Survey Party (En-
closure I), Comments and Data on Effectiveness
of Ammunition
Report of Ships Bombardment Survey Party (En-
closure J), Comments and Data on Accuracy of
Firing
Reports of Ships Bombardment Survey Party
(Enclosure K), Effects of Surface Bombard-
ments on Japanese War Potential
Physical Damage Division
Effect of the Incendiary Bomb Attacks on Japan
(a Report on Eight Cities)
The Effects of the Ten Thousand Pound Bomb on
Japanese Targets (a Report on Nine Incidents)
Effects of the Atomic Bomb on Hiroshima, Japan
Effects of the Atomic Bomb on Nagasaki, Japan
Effects of the Four Thousand Pound Bomb on
Japanese Targets (a Report on Five Incidents)
Effects of Two Thousand, One Thousand, and
Five Hundred Pound Bombs on Japanese Tar-
gets (a Report on Eight Incidents)
A Report on Physical Damage in Japan (Sum-
mary Report)
G-2 Division
Japanese Military and Naval Intelligence
98 Evaluation of Photographic Intelligence in the
Japanese Homeland, Part Г, Comprehensive
Report
99 Evaluation of Photographic Intelligence in the
Japanese Homeland, Part II, Airfields
100 Evaluation of Photographic Intelligence in the
Japanese Homeland, Part III, Computed Bomb
Plotting
101 Evaluation of Photographic Intelligence in the
Japanese Homeland, Part IV, Urban Area
Analysis
102 Evaluation of Photographic Intelligence in the
Japanese Homeland, Part V, Camouflage
103 Evaluation of Photographic Intelligence in the
Japanese Homeland, Part VI, Shipping
104 Evaluation of Photographic Intelligence in the
Japanese I^omeland, Part VII, Electronics
105 Evaluation of Photographic Intelligence in the
Japanese Homeland, Part VIII, Beach Intel-
ligence
*106 Evaluation of Photographic Intelligence in the
Japanese Homeland, Part IX, Artillery
*107 Evaluation of Photographic Intelligence in the
Japanese Homeland, Part X, Roads and Rail-
roads
108 Evaluation of Photographic Intelligence in the
Japanese Homeland, Part XI, Industrial
Analysis
fr UNITED STATES GOVERNMENT PRINTING OFFICE: 1947-704699
240