/


Текст
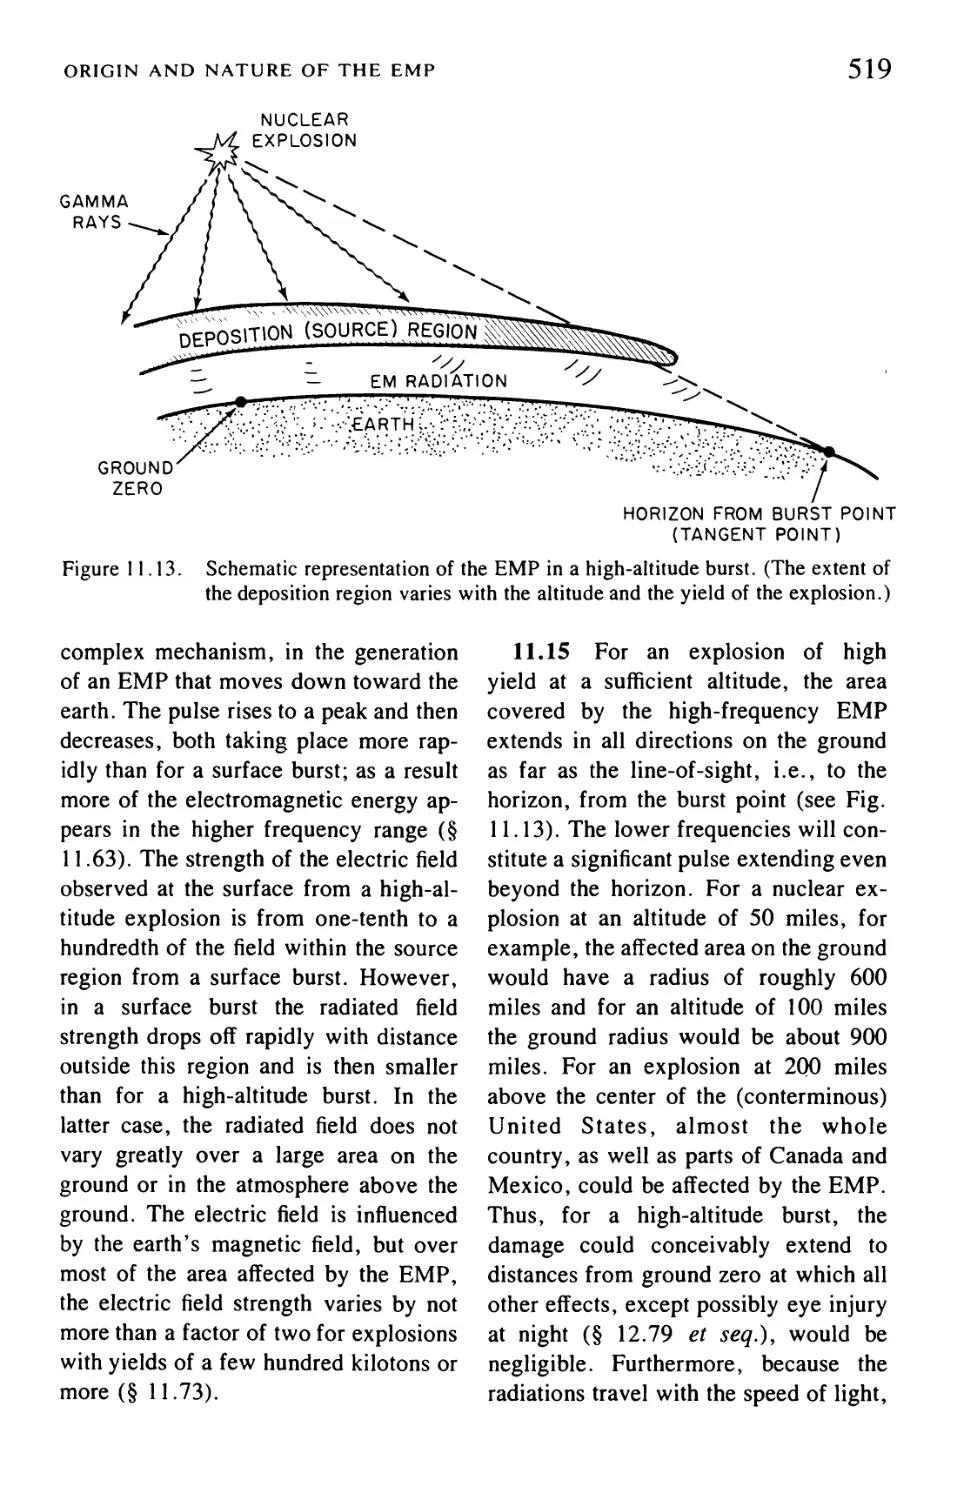
The
Effects
of
Nuclear
Weapons
Compiled and edited by
Samuel Glasstone and Philip J. Dolan
Third Edition
Prepared and published by the
United States Department of Defense
and the
United States Department of Energy
1977
PREFACE
When “The Effects of Atomic Weapons” was published in 1950, the explosive
energy yields of the fission bombs available at that time were equivalent to some
thousands of tons (i.e., kilotons) of TNT. With the development of thermonuclear
(fusion) weapons, having energy yields in the range of millions of tons (i.e.,
megatons) of TNT, a new presentation, entitled “The Effects of Nuclear Weap-
ons,” was issued in 1957. A completely revised edition was published in 1962 and
this was reprinted with a few changes early in 1964.
Since the last version of “The Effects of Nuclear Weapons” was prepared, much
new information has become available concerning nuclear weapons effects. This
has come in part from the series of atmospheric tests, including several at very high
altitudes, conducted in the Pacific Ocean area in 1962. In addition, laboratory
studies, theoretical calculations, and computer simulations have provided a better
understanding of the various effects. Within the limits imposed by security re-
quirements, the new information has been incorporated in the present edition. In
particular, attention may be called to a new chapter on the electromagnetic pulse.
We should emphasize, as has been done in the earlier editions, that numerical
values given in this book are not—and cannot be—exact. They must inevitably
include a substantial margin of error. Apart from the difficulties in making
measurements of weapons effects, the results are often dependent upon circum-
stances which could not be predicted in the event of a nuclear attack. Furthermore,
two weapons of different design may have the same explosive energy yield, but the
effects could be markedly different. Where such possibilities exist, attention is
called in the text to the limitations of the data presented; these limitations should not
be overlooked.
The material is arranged in a manner that should permit the general reader to
obtain a good understanding of the various topics without having to cope with the
more technical details. Most chapters are thus in two parts: the first part is written at
a fairly low technical level whereas the second treats some of the more technical and
mathematical aspects. The presentation allows the reader to omit any or all of the
latter sections without loss of continuity.
The choice of units for expressing numerical data presented us with a dilemma.
The exclusive use of international (SI) or metric units would have placed a burden
on many readers not familiar with these units, whereas the inclusion of both SI and
common units would have complicated many figures, especially those with
logarithmic scales. As a compromise, we have retained the older units and added an
explanation of the SI system and a table of appropriate conversion factors.
Preface
Many organizations and individuals contributed in one way or another to this
revision of “The Effects of Nuclear Weapons,” and their cooperation is gratefully
acknowledged. In particular, we wish to express our appreciation of the help given
us by L. J. Deal and W. W. Schroebel of the Energy Research and Development
Administration and by Cmdr. H. L. Hoppe of the Department of Defense.
Samuel Glasstone
Philip J. Dolan
ACKNOWLEDGEMENTS
Preparation of this revision of “The Effects of Nuclear Weapons” was made
possible by the assistance and cooperation of members of the organizations listed
below.
Department of Defense
Headquarters, Defense Nuclear Agency
Defense Civil Preparedness Agency
Armed Forces Radiobiology Research Institute
U.S. Army Aberdeen Research and Development Center, Ballistic Research Lab-
oratories
U.S. Army Engineer Waterways Experiment Station
Naval Surface Weapons Center
Department of Defense Contractors
Stanford Research Institute
General Electric, TEMPO
Mission Research Corporation
Department of Commerce
National Oceanic and Atmospheric Administration
Atomic Energy Commission/
Energy Research and Development Administration
Headquarters Divisions and the laboratories:
Brookhaven National Laboratory
Health and Safety Laboratory
Lawrence Livermore Laboratory
Los Alamos Scientific Laboratory
Lovelace Biomedical and Environmental Research Laboratories
Oak Ridge National Laboratory
Sandia Laboratories
CONTENTS
Page
Chapter I—General Principles of Nuclear Explosions ........................... 1
Characteristics of Nuclear Explosions....................................... 1
Scientific Basis of Nuclear Explosions .................................... 12
Chapter II—Descriptions of Nuclear Explosions ............................... 26
Introduction .............................................................. 26
Description of Air and Surface Bursts...................................... 27
Description of High-Altitude Bursts........................................ 45
Description of Underwater Bursts .......................................... 48
Description of Underground Bursts ......................................... 58
Scientific Aspects of Nuclear Explosion Phenomena.......................... 63
Chapter III—Air Blast Phenomena in Air and Surface Bursts ................... 80
Characteristics of the Blast Wave in Air . . . . •......................... 80
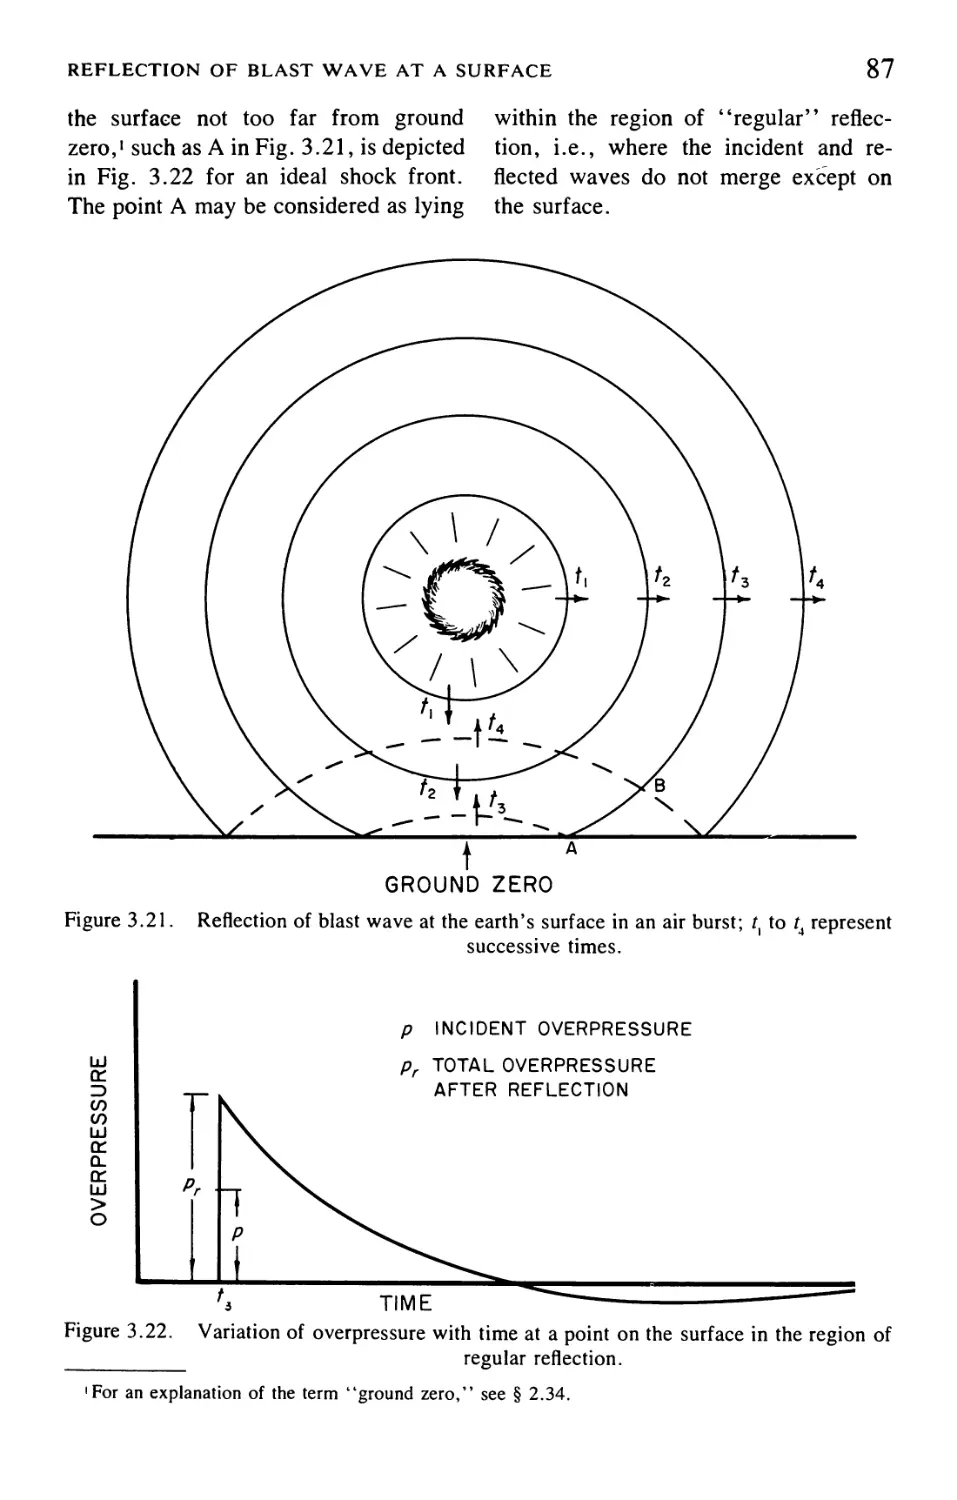
Reflection of Blast Wave at a Surface...................................... 86
Modification of Air Blast Phenomena........................................ 92
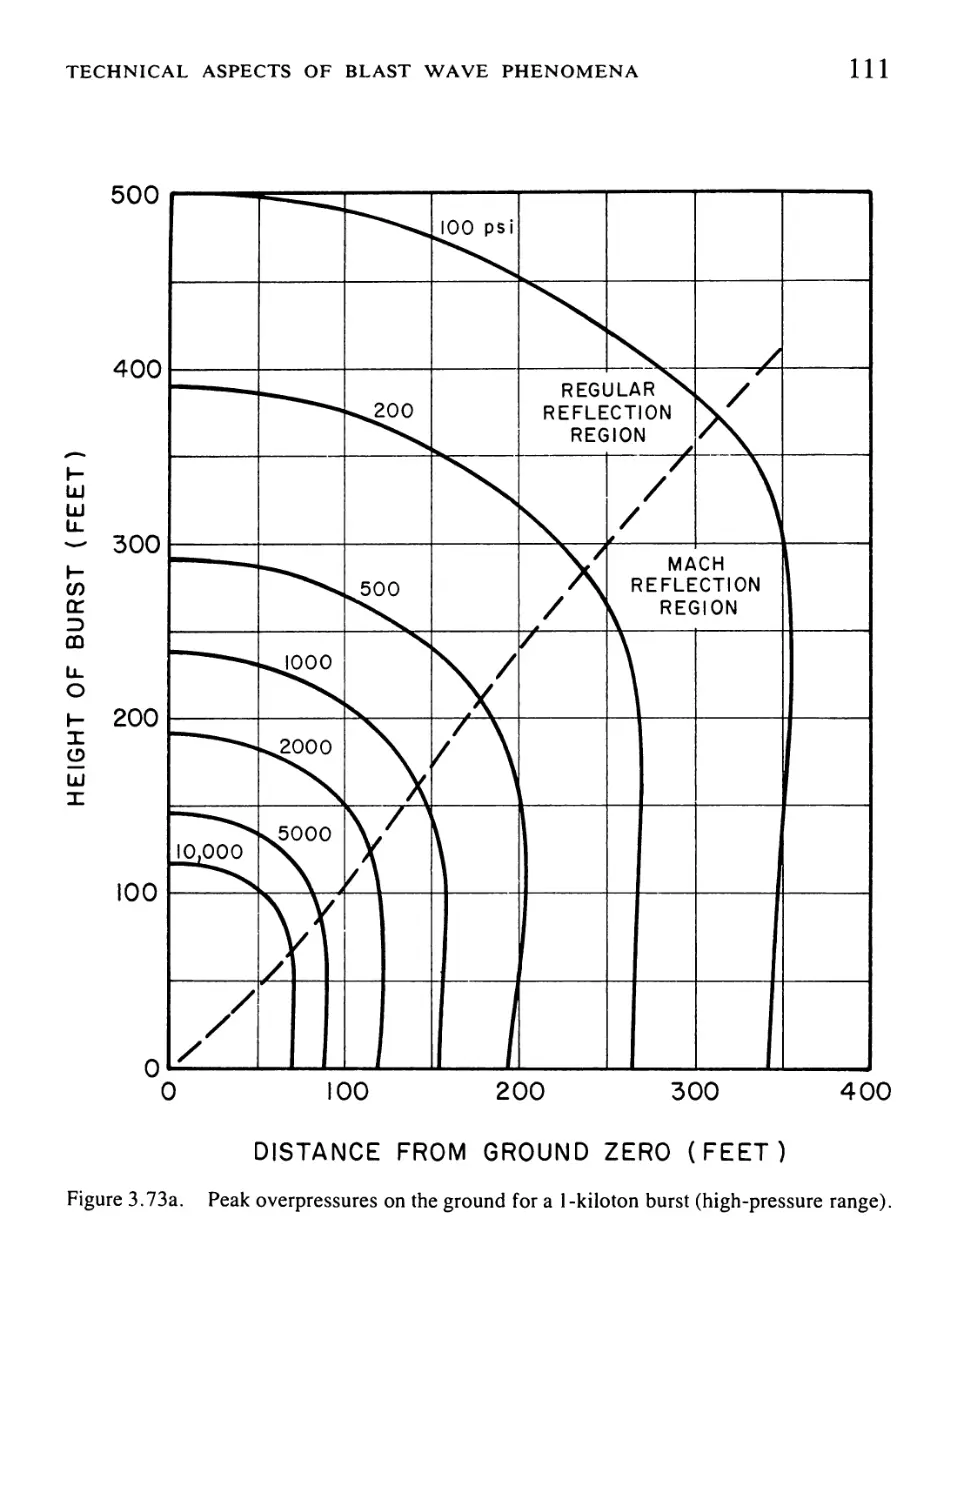
Technical Aspects of Blast Wave Phenomena.................................. 96
Chapter IV—Air Blast Loading................................................ 127
Interaction of Blast Wave with Structures ................................ 127
Interaction of Objects with Air Blast .................................... 132
Chapter V—Structural Damage from Air Blast ................................. 154
Introduction ............................................................. 154
Factors Affecting Response................................................ 156
Commercial and Administrative Structures.................................. 158
Industrial Structures..................................................... 165
Residential Structures.................................................... 175
Transportation............................................................ 189
Utilities................................................................. 195
Miscellaneous Targets .................................................... 206
Analysis of Damage from Air Blast......................................... 212
Chapter VI—Shock Effects of Surface and Subsurface Bursts ................... 231
Characteristics of Surface and Shallow Underground Bursts ................. 231
Deep Underground Bursts................................................... 238
Damage to Structures....................................................... 241
Characteristics of Underwater Bursts ...................................... 244
Technical Aspects of Surface and Underground Bursts .................. 253
Technical Aspects of Deep Underground Bursts ......................... 260
Loading on Buried Structures.......................................... 263
Damage from Ground Shock ............................................. 265
Technical Aspects of Underwater Bursts................................ 268
Chapter VII—Thermal Radiation and Its Effects .......................... 276
Radiation from the Fireball........................................... 276
Thermal Radiation Effects............................................. 282
Incendiary Effects.................................................... 296
Incendiary Effects in Japan .......................................... 300
Technical Aspects of Thermal Radiation................................ 305
Radiant Exposure-Distance Relationships............................... 316
Chapter VIII—Initial Nuclear Radiation ................................. 324
Nature of Nuclear Radiations.......................................... 324
Gamma Rays............................................................ 326
Neutrons ............................................................. 340
Transient-Radiation Effects on Electronics (TREE)..................... 349
Technical Aspects of Initial Nuclear Radiation ....................... 353
Chapter IX—Residual Nuclear Radiation and Fallout ...................... 387
Sources of Residual Radiation ........................................ 387
Radioactive Contamination from Nuclear Explosions .................... 409
Fallout Distribution in Land Surface Bursts .......................... 414
Fallout Predictions for Land Surface Bursts........................... 422
Attenuation of Residual Nuclear Radiation............................. 439
Delayed Fallout....................................................... 442
Technical Aspects of Residual Nuclear Radiation....................... 450
Chapter X—Radio and Radar Effects....................................... 461
Introduction ......................................................... 461
Atmospheric Ionization Phenomena..................................... 462
Ionization Produced by Nuclear Explosions ........................... 466
Effects on Radio and Radar Signals................................... 479
Technical Aspects of Radio and Radar Effects ........................ 489
Chapter XI—The Electromagnetic Pulse and its Effects.................... 514
Origin and Nature of the EMP......................................... 514
EMP Damage and Protection............................................ 523
Theory of the EMP.................................................... 532
Chapter XII—Biological Effects ......................................... 541
Introduction ........................................................ 541
Blast Injuries....................................................... 548
Burn Injuries........................................................ 560
Nuclear Radiation Injury............................................. 575
Characteristics of Acute Whole-Body Radiation Injury .................. 583
Combined Injuries...................................................... 588
Late Effects of Ionizing Radiation..................................... 589
Effects of Early Fallout .............................................. 594
Long-Term Hazard from Delayed Fallout ................................. 604
Genetic Effects of Nuclear Radiation .................................. 609
Pathology of Acute Radiation Injury ................................... 614
Blast-Related Effects.................................................. 618
Effects on Farm Animals and Plants..................................... 618
Glossary................................................................. 629
Guide to SI Units ....................................................... 642
Index.................................................................... 644
CHAPTER I
GENERAL PRINCIPLES OF
NUCLEAR EXPLOSIONS
CHARACTERISTICS OF NUCLEAR EXPLOSIONS
INTRODUCTION
1.01 An explosion, in general, re-
sults from the very rapid release of a
large amount of energy within a limited
space. This is true for a conventional
“high explosive,” such as TNT, as well
as for a nuclear (or atomic) explosion,1
although the energy is produced in quite
different ways (§ 1.11). The sudden
liberation of energy causes a consider-
able increase of temperature and pres-
sure, so that all the materials present are
converted into hot, compressed gases.
Since these gases are at very high tem-
peratures and pressures, they expand
rapidly and thus initiate a pressure
wave, called a “shock wave,” in the
surrounding medium—air, water, or
earth. The characteristic of a shock
wave is that there is (ideally) a sudden
increase of pressure at the front, with a
gradual decrease behind it, as shown in
Fig. 1.01. A shock wave in air is gen-
erally referred to as a “blast wave”
because it resembles and is accompan-
ied by a very strong wind. In water or in
the ground, however, the term “shock”
is used, because the effect is like that of
a sudden impact.
1.02 Nuclear weapons are similar to
those of more conventional types insofar
as their destructive action is due mainly
to blast or shock. On the other hand,
there are several basic differences be-
tween nuclear and high-explosive
weapons. In the first place, nuclear ex-
plosions can be many thousands (or
millions) of times more powerful than
the largest conventional detonations.
Second, for the release of a given
amount of energy, the mass of a nuclear
explosive would be much less than that
of a conventional high explosive. Con-
sequently, in the former case, there is a
much smaller amount of material avail-
able in the weapon itself that is con-
verted into the hot, compressed gases
mentioned above. This results in some-
what different mechanisms for the ini-
tiation of the blast wave. Third, the
temperatures reached in a nuclear ex-
plosion are very much higher than in a
'The terms “nuclear” and atomic” may be used interchangeably so far as weapons, explosions, and
energy are concerned, but “nuclear” is preferred for the reason given in § 1.11.
1
2
GENERAL PRINCIPLES OF NUCLEAR EXPLOSIONS
DISTANCE
Figure 1.01. Variation of pressure (in excess of ambient) with distance in an ideal shock
wave.
conventional explosion, and a fairly
large proportion of the energy in a nu-
clear explosion is emitted in the form of
light and heat, generally referred to as
“thermal radiation.” This is capable of
causing skin burns and of starting fires at
considerable distances. Fourth, the nu-
clear explosion is accompanied by
highly-penetrating and harmful invisible
rays, called the “initial nuclear radia-
tion.” Finally the substances remaining
after a nuclear explosion are radioac-
tive, emitting similar radiations over an
extended period of time. This is known
as the “residual nuclear radiation” or
“residual radioactivity” (Fig. 1.02).
1.03 It is because of these funda-
mental differences between a nuclear
and a conventional explosion, including
the tremendously greater power of the
former, that the effects of nuclear
weapons require special consideration.
In this connection, a knowledge and
understanding of the mechanical and the
various radiation phenomena associated
with a nuclear explosion are of vital
importance.
1.04 The purpose of this book is to
describe the different forms in which the
energy of a nuclear explosion are re-
leased, to explain how they are propa-
gated, and to show how they may affect
people (and other living organisms) and
materials. Where numerical values are
given for specific observed effects, it
should be kept in mind that there are
inevitable uncertainties associated with
the data, for at least two reasons. In the
first place, there are inherent difficulties
in making exact measurements of
weapons effects. The results are often
dependent on circumstances which are
difficult, if not impossible, to control,
even in a test and certainly cannot be
predicted in the event of an attack. Fur-
thermore, two weapons producing the
CHARACTERISTICS OF NUCLEAR EXPLOSIONS
3
same amount of explosive energy may
have different quantitative effects be-
cause of differences in composition and
design.
1.05 It is hoped, nevertheless, that
the information contained in this vol-
ume, which is the best available, may be
of assistance to those responsible for
defense planning and in making prepa-
rations to deal with the emergencies that
may arise from nuclear warfare. In ad-
dition, architects and engineers may be
able to utilize the data in the design of
structures having increased resistance to
damage by blast, shock, and fire, and
which provide shielding against nuclear
radiations.
ATOMIC STRUCTURE AND ISOTOPES
1.06 All substances are made up
from one or more of about 90 different
kinds of simple materials known as
“elements.” Among the common ele-
ments are the gases hydrogen, oxygen,
and nitrogen; the solid nonmetals car-
bon, sulfur, and phosphorus; and
various metals, such as iron, copper,
and zinc. A less familiar element, which
has attained prominence in recent years
because of its use as a source of nuclear
energy, is uranium, normally a solid
metal.
1.07 The smallest part of any ele-
ment that can exist, while still retaining
the characteristics of the element, is
called an “atom” of that element. Thus,
there are atoms of hydrogen, of iron, of
uranium, and so on, for all the elements.
The hydrogen atom is the lightest of all
atoms, whereas the atoms of uranium
are the heaviest of those found on earth.
Heavier atoms, such as those of pluto-
nium, also important for the release of
nuclear energy, have been made artifi-
cially (§ 1.14). Frequently, two or more
atoms of the same or of different ele-
ments join together to form a “mole-
cule.”
1.08 Every atom consists of a rela-
tively heavy central region or “nu-
cleus,” surrounded by a number of very
light particles known as “electrons.”
Further, the atomic nucleus is itself
4
GENERAL PRINCIPLES OF NUCLEAR EXPLOSIONS
made up of a definite number of fun-
damental particles, referred to as “pro-
tons” and “neutrons.” These two par-
ticles have almost the same mass, but
they differ in the respect that the proton
carries a unit charge of positive elec-
tricity whereas the neutron, as its name
implies, is uncharged electrically, i.e.,
it is neutral. Because of the protons
present in the nucleus, the latter has a
positive electrical charge, but in the
normal atom this is exactly balanced by
the negative charge carried by the elec-
trons surrounding the nucleus.
1.09 The essential difference be-
tween atoms of different elements lies in
the number of protons (or positive
charges) in the nucleus; this is called the
“atomic number” of the element. Hy-
drogen atoms, for example, contain
only one proton, helium atoms have two
protons, uranium atoms have 92 pro-
tons, and plutonium atoms 94 protons.
Although all the nuclei of a given ele-
ment contain the same number of pro-
tons, they may have different numbers
of neutrons. The resulting atomic spe-
cies, which have identical atomic
numbers but which differ in their
masses, are called “isotopes” of the
particular element. All but about 20 of
the elements occur in nature in two or
more isotopic forms, and many other
isotopes, which are unstable, i.e., ra-
dioactive, have been obtained in various
ways.
1.10 Each isotope of a given ele-
ment is identified by its “mass
number,” which is the sum of the
numbers of protons and neutrons in the
nucleus. For example, the element ura-
nium, as found in nature, consists
mainly of two isotopes with mass
numbers of 235 and 238; they are con-
sequently referred to as uranium-235
and uranium-238, respectively. The nu-
clei of both isotopes contain 92 pro-
tons—as do the nuclei of all uranium
isotopes—but the former have in addi-
tion 143 neutrons and the latter 146
neutrons. The general term “nuclide” is
used to describe any atomic species dis-
tinguished by the composition of its nu-
cleus, i.e., by the number of protons
and the number of neutrons. Isotopes of
a given element are nuclides having the
same number of protons but different
numbers of neutrons in their nuclei.
1.11 In a conventional explosion,
the energy released arises from chemical
reactions; these involve a rearrangement
among the atoms, e.g., of hydrogen,
carbon, oxygen, and nitrogen, present
in the chemical high-explosive material.
In a nuclear explosion, on the other
hand, the energy is produced as a result
of the formation of different atomic nu-
clei by the redistribution of the protons
and neutrons within the interacting nu-
clei. What is sometimes referred to as
atomic energy is thus actually nuclear
energy, since it results from particular
nuclear interactions. It is for the same
reason, too, that atomic weapons are
preferably called “nuclear weapons.”
The forces between the protons and
neutrons within atomic nuclei are tre-
mendously greater than those between
the atoms; consequently, nuclear energy
is of a much higher order of magnitude
than conventional (or chemical) energy
when equal masses are considered.
1.12 Many nuclear processes are
known, but not all are accompanied by
the release of energy. There is a definite
equivalence between mass and energy,
and when a decrease of mass occurs in a
nuclear reaction there is an accompany-
CHARACTERISTICS OF NUCLEAR EXPLOSIONS
5
ing release of a certain amount of energy
related to the decrease in mass. These
mass changes are really a reflection of
the difference in the internal forces in
the various nuclei. It is a basic law of
nature that the conversion of any system
in which the constituents are held to-
gether by weaker forces into one in
which the forces are stronger must be
accompanied by the release of energy,
and a corresponding decrease in mass.
1.13 In addition to the necessity for
the nuclear process to be one in which
there is a net decrease in mass, the
release of nuclear energy in amounts
sufficient to cause an explosion requires
that the reaction should be able to re-
produce itself once it has been started.
Two kinds of nuclear interactions can
satisfy the conditions for the production
of large amounts of energy in a short
time. They are known as “fission”
(splitting) and “fusion” (joining to-
gether). The former process takes place
with some of the heaviest (high atomic
number) nuclei; whereas the latter, at
the other extreme, involves some of the
lightest (low atomic number) nuclei.
1.14 The materials used to produce
nuclear explosions by fission are certain
isotopes of the elements uranium and
plutonium. As noted above, uranium in
nature consists mainly of two isotopes,
namely, uranium-235 (about 0.7 per-
cent), and uranium-238 (about 99.3
percent). The less abundant of these
isotopes, i.e., uranium-235, is the read-
ily fissionable species that is commonly
used in nuclear weapons. Another iso-
tope, uranium-233, does not occur nat-
urally, but it is also readily fissionable
and it can be made artificially starting
with thorium-232. Since only insignifi-
cant amounts of the element plutonium
are found in nature, the fissionable iso-
tope used in nuclear weapons, pluto-
nium-239, is made artificially from ura-
nium-238.
1.15 When a free (or unattached)
neutron enters the nucleus of a fission-
able atom, it can cause the nucleus to
split into two smaller parts. This is the
fission process, which is accompanied
by the release of a large amount of
energy. The smaller (or lighter) nuclei
which result are called the “fission
products.” The complete fission of 1
pound of uranium or plutonium releases
as much explosive energy as does the
explosion of about 8,000 (short) tons of
TNT.
1.16 In nuclear fusion, a pair of
light nuclei unite (or fuse) together to
form a nucleus of a heavier atom. An
example is the fusion of the hydrogen
isotope known as deuterium or “heavy
hydrogen.” Under suitable conditions,
two deuterium nuclei may combine to
form the nucleus of a heavier element,
helium, with the release of energy.
Other fusion reactions are described in
§ 1.69.
1.17 Nuclear fusion reactions can
be brought about by means of very high
temperatures, and they are thus referred
to as “thermonuclear processes.” The
actual quantity of energy liberated, for
a given mass of material, depends on
the particular isotope (or isotopes) in-
volved in the nuclear fusion reaction. As
an example, the fusion of all the nuclei
present in 1 pound of the hydrogen iso-
tope deuterium would release roughly
the same amount of energy as the ex-
plosion of 26,000 tons of TNT.
1.18 In certain fusion processes,
between nuclei of the hydrogen iso-
topes, neutrons of high energy are lib-
6
GENERAL PRINCIPLES OF NUCLEAR EXPLOSIONS
erated (see § 1.72). These can cause
fission in the most abundant isotope
(uranium-238) in ordinary uranium as
well as in uranium-235 and plutonium-
239. Consequently, association of the
appropriate fusion reactions with natural
uranium can result in an extensive utili-
zation of the latter for the release of
energy. A device in which fission and
fusion (thermonuclear) reactions are
combined can therefore produce an ex-
plosion of great power. Such weapons
might typically release about equal
amounts of explosive energy from fis-
sion and from fusion.
1.19 A distinction has sometimes
been made between atomic weapons, in
which the energy arises from fission, on
the one hand, and hydrogen (or thermo-
nuclear) weapons, involving fusion, on
the other hand. In each case, however,
the explosive energy results from nu-
clear reactions, so that they are both
correctly described as nuclear weapons.
In this book, therefore, the general
terms “nuclear bomb” and “nuclear
weapon” will be used, irrespective of
the type of nuclear reaction producing
the energy of the explosion.
ENERGY YIELD OF A NUCLEAR
EXPLOSION
1.20 The “yield” of a nuclear
weapon is a measure of the amount of
explosive energy it can produce. It is the
usual practice to state the yield in terms
of the quantity of TNT that would gen-
erate the same amount of energy when it
explodes. Thus, a 1-kiloton nuclear
weapon is one which produces the same
amount of energy in an explosion as
does 1 kiloton (or 1,000 tons) of TNT.
Similarly, a 1-megaton weapon would
have the energy equivalent of 1 million
tons (or 1,000 kilotons) of TNT. T4he
earliest nuclear bombs, such as were
dropped over Japan in 1945 and used in
the tests at Bikini in 1946, released very
roughly the same quantity of energy as
20,000 tons (or 20 kilotons) of TNT
(see, however, § 2.24). Since that time,
much more powerful weapons, with en-
ergy yields in the megaton range, have
been developed.
1.21 From the statement in § 1.15
that the fission of 1 pound of uranium or
plutonium will release the same amount
of explosive energy as about 8,000 tons
of TNT, it is evident that in a 20-kiloton
nuclear weapon 2.5 pounds of material
undergo fission. However, the actual
weight of uranium or plutonium in such
a weapon is greater than this amount. In
other words, in a fission weapon, only
part of the nuclear material suffers fis-
sion. The efficiency is thus said to be
less than 100 percent. The material that
has not undergone fission remains in the
weapon residues after the explosion.
DISTRIBUTION OF ENERGY IN
NUCLEAR EXPLOSIONS
1.22 It has been mentioned that one
important difference between nuclear
and conventional (or chemical) explo-
sions is the appearance of an appreciable
proportion of the energy as thermal ra-
diation in the former case. The basic
reason for this difference is that, weight
for weight, the energy produced by a
nuclear explosive is millions of times as
great as that produced by a chemical
explosive. Consequently, the tempera-
tures reached in the former case are very
much higher than in the latter, namely,
tens Of millions of degrees in a nuclear
CHARACTERISTICS OF NUCLEAR EXPLOSIONS
7
explosion compared with a few thou-
sands in a conventional explosion. As a
result of this great difference in temper-
ature, the distribution of the explosion
energy is quite different in the two
cases.
1.23 Broadly speaking, the energy
may be divided into three categories:
kinetic (or external) energy, i.e., energy
of motion of electrons, atoms, and mol-
ecules as a whole; internal energy of
these particles; and thermal radiation
energy. The proportion of thermal radi-
ation energy increases rapidly with in-
creasing temperature. At the moderate
temperatures attained in a chemical ex-
plosion, the amount of thermal radiation
is comparatively small, and so essen-
tially all the energy released at the time
of the explosion appears as kinetic and
internal energy. This is almost entirely
converted into blast and shock, in the
manner described in § 1.01. Because of
the very much higher temperatures in a
nuclear explosion, however, a consid-
erable proportion of the energy is re-
leased as thermal radiation. The manner
in which this takes place is described
later (§ 1.77 et seq.\
1.24 The fraction of the explosion
energy received at a distance from the
burst point in each of the forms depicted
in Fig. 1.02 depends on the nature and
yield of the weapon and particularly on
the environment of the explosion. For a
nuclear detonation in the atmosphere
below an altitude of about 100,000 feet,
from 35 to 45 percent of the explosion
energy is received as thermal energy in
the visible and infrared portions of the
spectrum (see Fig. 1.74). In addition,
below an altitude of about 40,000 feet,
about 50 percent of the explosive energy
is used in the production of air shock. At
somewhat higher alfjtudes, where there
is less air with which the energy of the
exploding nuclear weapon can interact,
the proportion of energy converted into
shock is decreased whereas that emitted
as thermal radiation is correspondingly
increased (§ 1.36).
1.25 The exact distribution of en-
ergy between air shock and thermal ra-
diation is related in a complex manner to
the explosive energy yield, the burst
altitude, and, to some extent, to the
weapon design, as will be seen in this
and later chapters. However, an ap-
proximate rule of thumb for a fission
weapon exploded in the air at an altitude
of less than about 40,000 feet is that 35
percent of the explosion energy is in the
form of thermal radiation and 50 percent
produces air shock. Thus, for a burst at
moderately low altitudes, the air shock
energy from a fission weapon will be
about half of that from a conventional
high explosive with the same total en-
ergy release; in the latter, essentially qll
of the explosive energy is in the form of
air blast. This means that if a 20-kiloton
fission weapon, for example, is ex-
ploded in the air below 40,000 feet or
so, the energy used in the production of
blast would be roughly equivalent to
that from 10 kilotons of TNT.
1.26 Regardless of the height of
burst, approximately 85 percent of the
explosive energy of a nuclear fission
weapon produces air blast (and shock),
thermal radiation, and heat. The re-
maining 15 percent of the energy is
released as various nuclear radiations.
Of this, 5 percent constitutes the initial
nuclear radiation, defined as that pro-
duced within a minute or so of the
explosion (§ 2.42). The final 10 percent
of the total fission energy represents that
8
GENERAL PRINCIPLES OF NUCLEAR EXPLOSIONS
of the residual (or delayed) nuclear ra-
diation which is emitted over a period of
time. This is largely due to the radioac-
tivity of the fission products present in
the weapon residues (or debris) after the
explosion. In a thermonuclear device, in
which only about half of the total energy
arises from fission (§ 1.18), the residual
nuclear radiation carries only 5 percent
of the energy released in the explosion.
It should be noted that there are no
nuclear radiations from a conventional
explosion since the nuclei are unaffected
in the chemical reactions which take
place.
1.27 Because about 10 percent of
the total fission energy is released in the
form of residual nuclear radiation some
time after the detonation, this is not
included when the energy yield of a
nuclear explosion is stated, e.g., in
terms of the TNT equivalent as in
§ 1.20. Hence, in a pure fission weapon
the explosion energy is about 90 percent
of the total fission energy, and in a
thermonuclear device it is, on the aver-
age, about 95 percent of the total energy
of the fission and fusion reactions. This
common convention will be adhered to
in subsequent chapters. For example,
when the yield of a nuclear weapon is
quoted or used in equations, figures,
etc., it will represent that portion of the
energy delivered within a minute or so,
and will exclude the contribution of the
residual nuclear radiation.
1.28 The initial nuclear radiation
consists mainly of “gamma rays,”
which are electromagnetic radiations of
high energy (see § 1.73) originating in
atomic nuclei, and neutrons. These ra-
diations, especially gamma rays, can
travel great distances through air and
can penetrate considerable thicknesses
of material. Although they can neither
be seen nor felt by human beings, ex-
cept at very high intensities which cause
a tingling sensation, gamma rays and
neutrons can produce harmful effects
even at a distance from their source.
Consequently, the initial nuclear radia-
tion is an important aspect of nuclear
explosions.
1.29 The delayed nuclear radiation
arises mainly from the fission products
which, in the course of their radioactive
decay, emit gamma rays and another
type of nuclear radiation called “beta
particles.” The latter are electrons, i.e.,
particles carrying a negative electric
charge, moving with high speed; they
are formed by a change (neutron —>
proton + electron) within the nuclei of
the radioactive atoms. Beta particles,
which are also invisible, are much less
penetrating than gamma rays, but like
the latter they represent a potential haz-
ard.
1.30 The spontaneous emission of
beta particles and gamma rays from ra-
dioactive substances, i.e., a radioactive
nuclide (or radionuclide), such as the
fission products, is a gradual process. It
takes place over a period of time, at a
rate depending upon the nature of the
material and upon the amount present.
Because of the continuous decay, the
quantity of the radionuclide and the rate
of emission of radiation decrease stead-
ily. This means that the residual nuclear
radiation, due mainly to the fission
products, is most intense soon after the
explosion but diminishes in the course
of time.
CHARACTERISTICS OF NUCLEAR EXPLOSIONS
9
TYPES OF NUCLEAR EXPLOSIONS
1.31 The immediate phenomena
associated with a nuclear explosion, as
well as the effects of shock and blast and
of thermal and nuclear radiations, vary
with the location of the point of burst in
relation to the surface of the earth. For
descriptive purposes five types of burst
are distinguished, although many varia-
tions and intermediate situations can
arise in practice. The main types, which
will be defined below, are (1) air burst,
(2) high-altitude burst, (3) underwater
burst, (4) underground burst, and (5)
surface burst.
1.32 Provided the nuclear explosion
takes place at an altitude where there is
still an appreciable atmosphere, e.g.,
below about 100,000 feet, the weapon
residues almost immediately incorporate
material from the surrounding medium
and form an intensely hot and luminous
mass, roughly spherical in shape, called
the “fireball.” An “air burst” is de-
fined as one in which the weapon is
exploded in the air at an altitude below
100,000 feet, but at such a height that
the fireball (at roughly maximum bril-
liance in its later stages) does not touch
the surface of the earth. For example, in
the explosion of a 1-megaton weapon
the fireball may grow until it is nearly
5,700 feet (1.1 mile) across at maxi-
mum brilliance. This means that, in this
particular case, the explosion must
occur at least 2,850 feet above the
earth’s surface if it is to be called an air
burst.
1.33 The quantitative aspects of an
air burst will be dependent upon its
energy yield, but the general phenom-
ena are much the same in all cases.
Nearly all of the shock energy that
leaves the fireball appears as air blast,
although some is generally also trans-
mitted into the ground. The thermal ra-
diation will travel long distances
through the air and may be of sufficient
intensity to cause moderately severe
burns of exposed skin as far away as 12
miles from a 1-megaton explosion, on a
fairly clear day. For air bursts of higher
energy yields, the corresponding dis-
tances will, of course, be greater. The
thermal radiation is largely stopped by
ordinary opaque materials; hence,
buildings and clothing can provide pro-
tection.
1.34 The initial nuclear radiation
from an air burst will also penetrate a
long way in air, although the intensity
falls off fairly rapidly at increasing dis-
tances from the explosion. The interac-
tions with matter that result in the ab-
sorption of energy from gamma rays and
from neutrons are quite different, as will
be seen in Chapter VIII. Different ma-
terials are thus required for the most
efficient removal of these radiations; but
concrete, especially if it incorporates a
heavy element, such as iron or barium,
represents a reasonable practical com-
promise for reducing the intensities of
both gamma rays and neutrons. A
thickness of about 4 feet of ordinary
concrete would probably provide ade-
quate protection from the effects of the
initial nuclear radiation for people at a
distance of about 1 mile from an air
burst of a 1-megaton nuclear weapon.
However, at this distance the blast effect
would be so great that only specially
designed blast-resistant structures would
survive.
1.35 In the event of a moderately
high (or high) air burst, the fission
products remaining after the nuclear ex-
10
GENERAL PRINCIPLES OF NUCLEAR EXPLOSIONS
plosion will be dispersed in the atmos-
phere. The residual nuclear radiation
arising from these products will be of
minor immediate consequence on the
ground. On the other hand, if the burst
occurs nearer the earth’s surface, the
fission products may fuse with particles
of earth, part of which will soon fall to
the ground at points close to the explo-
sion. This dirt and other debris will be
contaminated with radioactive material
and will, consequently, represent a pos-
sible danger to living things.
1.36 A “high-altitude burst” is de-
fined as one in which the explosion takes
place at an altitude in excess of 100,000
feet. Above this level, the air density is
so low that the interaction of the weapon
energy with the surroundings is mark-
edly different from that at lower alti-
tudes and, moreover, varies with the
altitude. The absence of relatively dense
air causes the fireball characteristics in a
high-altitude explosion to differ from
those of an air burst. For example, the
fraction of the energy converted into
blast and shock is less and decreases
with increasing altitude. Two factors
affect the thermal energy radiated at
high altitude. First, since a shock wave
does not form so readily in the less
dense air, the fireball is able to radiate
thermal energy that would, at lower al-
titudes, have been used in the produc-
tion of air blast. Second, the less dense
air allows energy from the exploding
weapon to travel much farther than at
lower altitudes. Some of this energy
simply warms the air at a distance from
the fireball and it does not contribute to
the energy that can be radiated within a
short time (§ 1.79). In general, the first
of these factors is effective between
100,000 and 140,000 feet, and a larger
proportion of the explosion energy is
released in the form of thermal radiation
than at lower altitudes. For explosions
above about 140,000 feet, the second
factor becomes the more important, and
the fraction of the energy that appears as
thermal radiation at the time of the ex-
plosion becomes smaller.
1.37 The fraction of the explosion
energy emitted from a weapon as nu-
clear radiations is independent of the
height of burst. However, the partition
of that energy between gamma rays and
neutrons received at a distance will vary
since a significant fraction of the gamma
rays result from interactions of neutrons
with nitrogen atoms in the air at low
altitudes. Furthermore, the attenuation
of the initial nuclear radiation with in-
creasing distance from the explosion is
determined by the total amount of air
through which the radiation travels.
This means that, for a given explosion
energy yield, more initial nuclear radia-
tion will be received at the same slant
range on the earth’s surface from a
high-altitude detonation than from a
moderately high air burst. In both cases
the residual radiation from the fission
products and other weapon residues will
not be significant on the ground
(§ 1.35).
1.38 Both the initial and the resid-
ual nuclear radiations from high-altitude
bursts will interact with the constituents
of the atmosphere to expel electrons
from the atoms and molecules. Since the
electron carries a negative electrical
charge, the residual part of the atom (or
molecule) is positively charged, i.e., it
is a positive ion. This process is referred
to as “ionization,” and the separated
electrons and positive ions are called
“ion pairs.” The existence of large
CHARACTERISTICS OF NUCLEAR EXPLOSIONS
11
numbers of electrons and ions at high
altitudes may have seriously degrading
effects on the propagation of radio and
radar signals (see Chapter X). The free
electrons resulting from gamma-ray
ionization of the air in a high-altitude
explosion may also interact with the
earth’s magnetic field to generate strong
electromagnetic fields capable of caus-
ing damage to unprotected electrical or
electronic equipment located in an ex-
tensive area below the burst. The phe-
nomenon known as the “electromagne-
tic pulse’’ (or EMP) is described in
Chapter XI. The EMP can also be pro-
duced in surface and low air bursts, but
a much smaller area around the detona-
tion point is affected.
1.39 If a nuclear explosion occurs
under such conditions that its center is
beneath the ground or under the surface
of water, the situation is described as an
“underground burst” or an “under-
water burst,” respectively. Since some
of the effects of these two types of
explosions are similar, they will be
considered here together as subsurface
bursts. In a subsurface burst, most of the
shock energy of the explosion appears
as underground or underwater shock,
but a certain proportion, which is less
the greater the depth of the burst,
escapes and produces air blast. Much of
the thermal radiation and of the initial
nuclear radiation will be absorbed
within a short distance of the explosion.
The energy of the absorbed radiations
will merely contribute to the heating of
the ground or body of water. Depending
upon the depth of the explosion, some
of the thermal and nuclear radiations
will escape, but the intensities will gen-
erally be less than for an air burst.
However, the residual nuclear radiation,
i.e., the radiation emitted after the first
minute, now becomes of considerable
significance, since large quantities of
earth or water in the vicinity of the
explosion will be contaminated with ra-
dioactive fission products.
1.40 A “surface burst” is regarded
as one which occurs either at or slightly
above the actual surface of the land or
water. Provided the distance above the
surface is not great, the phenomena are
essentially the same as for a burst oc-
curring on the surface. As the height of
burst increases up to a point where the
fireball (at maximum brilliance in its
later stages) no longer touches the land
or water, there is a transition zone in
which the behavior is intermediate be-
tween that of a true surface burst and of
an air burst. In surface bursts, the air
blast and ground (or water) shock are
produced in varying proportions de-
pending on the energy of the explosion
and the height of burst.
1.41 Although the five types of
burst have been considered as being
fairly distinct, there is actually no clear
line of demarcation between them. It
will be apparent that, as the height of the
explosion is decreased, a high-altitude
burst will become an air burst, and an
air burst will become a surface burst.
Similarly, a surface burst merges into a
subsurface explosion at a shallow depth,
when part of the fireball actually breaks
through the surface of the land or water.
It is nevertheless a matter of conven-
ience, as will be seen in later chapters,
to divide nuclear explosions into the five
general types defined above.
12
GENERAL PRINCIPLES OF NUCLEAR EXPLOSIONS
SCIENTIFIC BASIS OF NUCLEAR EXPLOSIONS2
FISSION ENERGY
1.42 The significant point about the
fission of a uranium (or plutonium) nu-
cleus by means of a neutron, in addition
to the release of a large quantity of
energy, is that the process is accompan-
ied by the instantaneous emission of two
or more neutrons; thus,
Neutron +
uranium-235
(or uranium-233)
(or plutonium-239) .
fission fragments +
2 or 3 neutrons + energy.
The neutrons liberated in this manner
are able to induce fission of additional
uranium (or plutonium) nuclei, each
such process resulting in the emission of
more neutrons which can produce fur-
ther fission, and so on. Thus, in prin-
ciple, a single neutron could start off a
chain of nuclear fissions, the number of
nuclei suffering fission, and the energy
liberated, increasing at a tremendous
rate, as will be seen shortly.
1.43 There are many different ways
in which the nuclei of a given fission-
able species can split up into two fission
fragments (initial fission products), but
the total amount of energy liberated per
fission does not vary greatly. A satis-
factory average value of this energy is
200 million electron volts. The million
electron volt (or 1 MeV) unit has been
found convenient for expressing the en-
ergy released in nuclear reactions; it is
equivalent to 1.6 x 10~6ergorl.6 x
IO-13 joule. The manner in which this
energy is distributed among the fission
fragments and the various radiations as-
sociated with fission is shown in Table
1.43.
Table 1.43
DISTRIBUTION OF FISSION ENERGY
MeV
Kinetic energy of fission fragments 165 ± 5
Instantaneous gamma-ray energy 7 ± 1
Kinetic energy of fission neutrons 5 ± 0.5
Beta particles from fission products 7 ± 1
Gamma rays from fission products 6 ± 1
Neutrinos from fission products 10
Total energy per fission 200 ± 6
1.44 The results in the table may be
taken as being approximately applicable
to either uranium-233, uranium-235, or
plutonium-239. These are the only three
known substances, which are reason-
ably stable so that they can be stored
without appreciable decay, that are cap-
able of undergoing fission by neutrons
of all energies. Hence, they are the only
materials that can by used to sustain a
fission chain. Uranium-238, the most
abundant isotope in natural uranium
(§ 1.14), and thorium-232 will suffer
fission by neutrons of high energy only,
but not by those of lower energy. For
this reason these substances cannot sus-
tain a chain reaction. However, when
fission does occur in these elements, the
energy distribution is quite similar to
that shown in the table.
1.45 Only part of the fission energy
'The remaining (more technical) sections of this chapter may be omitted without loss of continuity.
SCIENTIFIC BASIS OF NUCLEAR EXPLOSIONS
13
is immediately available in a nuclear
explosion; this includes the kinetic en-
ergy of the fission fragments, most of
the energy of the instantaneous gamma
rays, which is converted into other
forms of energy within the exploding
weapon, and also most of the neutron
kinetic energy, but only a small fraction
of the decay energy of the fission prod-
ucts. There is some compensation from
energy released in reactions in which
neutrons are captured by the weapon
debris, and so it is usually accepted that
about 180 MeV of energy are immedi-
ately available per fission. There are
6.02 x 10²³ nuclei in 235 grams of
uranium-235 (or 239 grams of pluto-
nium-239), and by making use of fa-
miliar conversion factors (cf. § 1.43)
the results quoted in Table 1.45 may be
obtained for the energy (and other)
equivalents of 1 kiloton of TNT. The
calculations are based on an accepted,
although somewhat arbitrary, figure of
1012 calories as the energy released in
the explosion of this amount of TNT.3
Table 1.45
EQUIVALENTS OF 1 KILOTON OF TNT
Complete fission of 0.057 kg (57 grams or
2 ounces) fissionable material
Fission of 1.45 x IO23 nuclei
1012 calories
2.6 x 1025 million electron volts
4.18 x 10¹⁹ ergs (4.18 x 10¹² joules)
1.16 x 10³ * * 6 * * kilowatt-hours
3.97 x 10⁹ British thermal units
CRITICAL MASS FOR A FISSION
CHAIN
1.46 Although two to three neu-
trons are produced in the fission reaction
for every nucleus that undergoes fission,
not all of these neutrons are available for
causing further fissions. Some of the
fission neutrons are lost by escape,
whereas others are lost in various non-
fission reactions. In order to sustain a
fission chain reaction, with continuous
release of energy, at least one fission
neutron must be available to cause fur-
ther fission for each neutron previously
absorbed in fission. If the conditions are
such that the neutrons are lost at a faster
rate than they are formed by fission, the
chain reaction would not be self-sus-
taining. Some energy would be pro-
duced, but the amount would not be
large enough, and the rate of liberation
would not be sufficiently fast, to cause
an effective explosion. It is necessary,
therefore, in order to achieve a nuclear
explosion, to establish conditions under
which the loss of neutrons is minimized.
In this connection, it is especially im-
portant to consider the neutrons which
escape from the substance undergoing
fission.
1.47 The escape of neutrons occurs
at the exterior of the uranium (or pluto-
nium) material. The rate of loss by
escape will thus be determined by the
surface area. On the other hand, the
fission process, which results in the for-
mation of more neutrons, takes place
3The majority of the experimental and theoretical values of the explosive energy released by TNT
range from 900 to 1,100 calories per gram. At one time, there was some uncertainty as to whether the
term “kiloton” of TNT referred to a short kiloton (2 x 10⁶ pounds), a metric kiloton (2.205 x 10⁶
pounds), or a long kiloton (2.24 x 10⁶ pounds). In order to avoid ambiguity, it was agreed that the term
“kiloton” would refer to the release of 1012 calories of explosive energy. This is equivalent to 1 short
kiloton of TNT if the energy release is 1,102 calories per gram or to 1 long kiloton if the energy is 984
calories per gram of TNT.
14
GENERAL PRINCIPLES OF NUCLEAR EXPLOSIONS
throughout the whole of the material and
its rate is, therefore, dependent upon the
mass. By increasing the mass of the
fissionable material, at constant density,
the ratio of the surface area to the mass
is decreased; consequently, the loss of
neutrons by escape relative to their for-
mation by fission is decreased. The
same result can also be achieved by
having a constant mass but compressing
it to a smaller volume (higher density),
so that the surface area is decreased.
1.48 The situation may be under-
stood by reference to Fig. 1.48 showing
two spherical masses, one larger than
the other, of fissionable material of the
same density. Fission is initiated by a
neutron represented by a dot within a
small circle. It is supposed that in each
act of fission three neutrons are emitted;
in other words, one neutron is captured
and three are expelled. The removal of a
neutron from the system is indicated by
the head of an arrow. Thus, an arrow-
head within the sphere means that fis-
sion has occurred and extra neutrons are
produced, whereas an arrowhead out-
side the sphere implies the loss of a
neutron. It is evident from Fig. 1.48 that
a much greater fraction of the neutrons
is lost from the smaller than from the
larger mass.
1.49 If the quantity of a fissionable
isotope of uranium (or plutonium) is
such that the ratio of the surface area to
the mass is large, the proportion of
neutrons lost by escape will be so great
that the propagation of a nuclear fission
chain, and hence the production of an
explosion, will not be possible. Such a
quantity of material is said to be “sub-
critical.” But as the mass of the piece of
uranium (or plutonium) is increased (or
the volume is decreased by compres-
Figurc 1.48. Effect of increased mass of fissionable material in reducing the proportion of
neutrons lost by escape.
SCIENTIFIC BASIS OF NUCLEAR EXPLOSIONS
15
sion) and the relative loss of neutrons is
thereby decreased, a point is reached at
which the chain reaction can become
self-sustaining. This is referred to as the
“critical mass” of the fissionable mate-
rial under the existing conditions.
1.50 For a nuclear explosion to take
place, the weapon must thus contain a
sufficient amount of a fissionable ura-
nium (or plutonium) isotope for the
critical mass to be exceeded. Actually,
the critical mass depends, among other
things, on the shape of the material, its
composition and density (or compres-
sion), and the presence of impurities
which can remove neutrons in nonfis-
sion reactions. By surrounding the fis-
sionable material with a suitable neutron
“reflector,” the loss of neutrons by
escape can be reduced, and the critical
mass can thus be decreased. Moreover,
elements of high density, which make
good reflectors for neutrons of high en-
ergy, provide inertia, thereby delaying
expansion of the exploding material.
The action of the reflector is then like
the familiar tamping in blasting opera-
tions. As a consequence of its neutron
reflecting and inertial properties, the
“tamper” permits the fissionable mate-
rial in a nuclear weapon to be used more
efficiently.
ATTAINMENT OF CRITICAL MASS IN
A WEAPON
1.51 Because of the presence of
stray neutrons in the atmosphere or the
possibility of their being generated in
various ways, a quantity of a suitable
isotope of uranium (or plutonium) ex-
ceeding the critical mass would be likely
to melt or possibly explode. It is neces-
sary, therefore, that before detonation, a
nuclear weapon should contain no piece
of fissionable material that is as large as
the critical mass for the given condi-
tions. In order to produce an explosion,
the material must then be made “super-
critical,” i.e., larger than the critical
mass, in a time so short as to preclude a
subexplosive change in the configura-
tion, such as by melting.
1.52 Two general methods have
been described for bringing about a nu-
clear explosion, that is to say, for
quickly converting a subcritical system
into a supercritical one. In the first
method, two or more pieces of fission-
able material, each less than a critical
mass, are brought together very rapidly
in order to form one piece that exceeds
the critical mass (Fig. 1.52). This may
be achieved in some kind of gun-barrel
device, in which an explosive propellant
SUBCRITICAL SUBCRITICAL
(BEFORE FIRING)
( IMMEDIATELY AFTER FIRING)
THEN EXPLODES
Figure 1.52. Principle of a gun-assembly nuclear device.
16
GENERAL PRINCIPLES OF NUCLEAR EXPLOSIONS
is used to blow one subcritical piece of
fissionable material from the breech end
of the gun into another subcritical piece
firmly held in the muzzle end.
1.53 The second method makes use
of the fact that when a subcritical quan-
tity of an appropriate isotope of uranium
(or plutonium) is strongly compressed,
it can become critical or supercritical as
indicated above. The compression may
be achieved by means of a spherical
arrangement of specially fabricated
shapes (lenses) of ordinary high explo-
sive. In a hole in the center of this
system is placed a subcritical sphere of
fissionable material. When the high-
explosive lens system is set off, by
means of a detonator on the outside of
each lens, an inwardly-directed spheri-
cal “implosion” wave is produced. A
similar wave can be realized without
lenses by detonating a large number of
points distributed over a spherical sur-
face. When the implosion wave reaches
the sphere of uranium (or plutonium), it
causes the latter to be compressed and
become supercritical (Fig. 1.53). The
introduction of neutrons from a suitable
source can then initiate a chain reaction
leading to an explosion.
TIME SCALE OF A FISSION
EXPLOSION
1.54 An interesting insight into the
rate at which the energy is released in a
fission explosion can be obtained by
treating the fission chain as a series of
“generations.” Suppose that a certain
number of neutrons are present initially
and that these are captured by fission-
able nuclei; then, in the fission process
other neutrons are released. These neu-
trons, are, in turn, captured by fission-
able nuclei and produce more neutrons,
and so on. Each stage of the fission
chain is regarded as a generation, and
the “generation time” is the average
time interval between successive gener-
ations. The time required for the actual
fission of a nucleus is extremely short
and most of the neutrons are emitted
promptly. Consequently, the generation
time is essentially equal to the average
time elapsing between the release of a
neutron and its subsequent capture by a
(BEFORE FIRING)
(IMMEDIATELY AFTER FIRING)
THEN EXPLODES
Figure 1.53. Principle of an implosion-type nuclear device.
SCIENTIFIC BASIS OF NUCLEAR EXPLOSIONS
17
fissionable nucleus. This time depends,
among other things, on the energy (or
speed) of the neutron, and if most of the
neutrons are of fairly high energy,
usually referred to as “fast neutrons,”
the generation time is about a one-hun-
dred-millionth part (IO-8) of a second,
i.e., 0.01 microsecond.4
1.55 It was mentioned earlier that
not all the fission neutrons are available
for maintaining the fission chain because
some are lost by escape and by removal
in nonfission reactions. Suppose that
when a nucleus captures a neutron and
suffers fission /neutrons are released; let
/ be the average number of neutrons
lost, in one way or another, for each
fission. There will thus be f— I neutrons
available to carry on the fission chain. If
there are N neutrons present at any in-
stant, then as a result of their capture by
fissionable nuclei N(f — I) neutrons will
be produced at the end of one genera-
tion; hence, the increase in the number
of neutrons per generation is N(f— I) —
Nor N(J- / - 1). For convenience, the
quantity f- I- 1, that is, the increase in
neutrons per fission, will be represented
by x. If #is the generation time, then the
rate at which the number of neutrons
increases is given by
Rate of neutron increase
dN/dt = Nx/g.
The solution of this equation is
N = NQext/x,
where No is the number of neutrons
present initially and Nis the number at a
time t later. The fraction t/g is the
number of generations which have
elapsed during the time t, and if this is
represented by n, it follows that
N=NQexn. (1.55.1)
1.56 If the value of x is known,
equation (1.55.1) can be used to cal-
culate either the neutron population after
any prescribed number of generations in
the fission chain, or, alternatively, the
generations required to attain a particu-
lar number of neutrons. For uranium-
235, / is about 2.5, / may be taken to be
roughly 0.5, so that x, which is equal to
/ - I — 1, is close to unity; hence,
equation (1.55.1) may be written as
N~ N0e"or N010^3. (1.56.1)
1.57 According to the data in Table
1.45, it would need 1.45 x 10²² fis-
sions, and hence the same number of
neutrons, to produce 0.1 kiloton equiv-
alent of energy. If the fission chain is
initiated by one neutron, so that NQ is 1,
it follows from equation (1.56.1) that it
would take approximately 51 genera-
tions to produce the necessary number
of neutrons. Similarly, to release 100
kilotons of energy would require 1.45 x
IO25 neutrons and this number would be
attained in about 58 generations. It is
seen, therefore, that 99.9 percent of the
energy of a 100-kiloton fission explo-
sion is released during the last 7 gener-
ations, that is, in a period of roughly
0.07 microsecond. Clearly, most of the
fission energy is released in an ex-
tremely short time period. The same
conclusion is reached for any value of
the fission explosion energy.
1.58 In 50 generations or so, i.e.,
roughly half microsecond, after the ini-
4 A microsecond is a one-millionth part of a second, i.e., 10-6 second; a hundredth of a microsecond,
i e , IO4 second, is often called a “shake.” The generation time in fission by fast neutrons is thus
roughly 1 shake
18
GENERAL PRINCIPLES OF NUCLEAR EXPLOSIONS
tiation of the fission chain, so much
energy will have been released—about
1011 calories—that extremely high tem-
peratures will be attained. Conse-
quently, in spite of the restraining effect
of the tamper (§ 1.50) and the weapon
casing, the mass of fissionable material
will begin to expand rapidly. The time
at which this expansion commences is
called the “explosion time.” Since the
expansion permits neutrons to escape
more readily, the mass becomes subcri-
tical and the self-sustaining chain reac-
tion soon ends. An appreciable propor-
tion of the fissionable material remains
unchanged and some fissions will con-
tinue as a result of neutron capture, but
the amount of energy released at this
stage is relatively small.
1.59 To summarize the foregoing
discussion, it may be stated that because
the fission process is accompanied by
the instantaneous liberation of neutrons,
it is possible, in principle to produce a
self-sustaining chain reaction accom-
panied by the rapid release of large
amounts of energy. As a result, a few
pounds of fissionable material can be
made to liberate, within a very small
fraction of a second, as much energy as
the explosion of many thousands of tons
of TNT. This is the basic principle of
nuclear fission weapons.
FISSION PRODUCTS
1.60 Many different, initial fission
product nuclei, i.e., fission fragments,
are formed when uranium or plutonium
nuclei capture neutrons and suffer fis-
sion. There are 40 or so different ways
in which the nuclei can split up when
fission occurs; hence about 80 different
fragments are produced. The nature and
proportions of the fission fragment nu-
clei vary to some extent, depending on
the particular substance undergoing fis-
sion and on the energy of the neutrons
causing fission. For example, when
uranium-238 undergoes fission as a re-
sult of the capture of neutrons of very
high energy released in certain fusion
reactions (§ 1.72), the products are
somewhat different, especially in their
relative amounts, from those formed
from uranium-235 by ordinary fission
neutrons.
1.61 Regardless of their origin,
most, if not all, of the approximately 80
fission fragments are the nuclei of ra-
dioactive forms (radioisotopes) of well-
known, lighter elements. The radioac-
tivity is usually manifested by the
emission of negatively charged beta
particles (§ 1.29). This is frequently,
although not always, accompanied by
gamma radiation, which serves to carry
off excess energy. In a few special
cases, gamma radiation only is emitted.
1.62 As a result of the expulsion of
a beta particle, the nucleus of a radio-
active substance is changed into that of
another element, sometimes called the
“decay product.” In the case of the
fission fragments, the decay products
are generally also radioactive, and these
in turn may decay with the emission of
beta particles and gamma rays. On the
average there are about four stages of
radioactivity for each fission fragment
before a stable (nonradioactive) nucleus
is formed. Because of the large number
of different ways in which fission can
occur and the several stages of decay
involved, the fission product mixture
SCIENTIFIC BASIS OF NUCLEAR EXPLOSIONS
19
becomes very complex.5 More than 300
different isotopes of 36 light elements,
from zinc to terbium, have been iden-
tified among the fission products.
1.63 The rate of radioactive
change, i.e., the rate of emission of beta
particles and gamma radiation, is
usually expressed by means of the
“half-life” of the radionuclide (§ 1.30)
involved. This is defined as the time
required for the radioactivity of a given
quantity of a particular nuclide to de-
crease (or decay) to half of its original
value. Each individual radionuclide has
a definite half-life which is independent
of its state or its amount. The half-lives
of the fission products have been found
to range from a small fraction of a
second to something like a million
years.
1.64 Although every radionuclide
present among the fission products is
known to have a definite half-life, the
mixture formed after a nuclear explo-
sion is so complex that it is not possible
to represent the decay as a whole in
terms of a half-life. Nevertheless, it has
been found that the decrease in the total
radiation intensity from the fission
products can be calculated approxi-
mately by means of a fairly simple for-
mula. This will be given and discussed
in Chapter IX, but the general nature of
the decay rate of fission products, based
on this formula, will be apparent from
Fig. 1.64. The residual radioactivity
from the fission products at 1 hour after
a nuclear detonation is taken as 100 and
the subsequent decrease with time is
indicated by the curve. It is seen that at
7 hours after the explosion, the fission
product activity will have decreased to
about one-tenth (10 percent) of its
amount at 1 hour. Within approximately
2 days, the activity will have decreased
to 1 percent of the 1-hour value.
1.65 In addition to the beta-particle
and gamma-ray activity due to the fis-
sion products, there is another kind of
residual radioactivity that should be
mentioned. This is the activity of the
fissionable material, part of which, as
noted in § 1.58, remains after the ex-
plosion. The fissionable uranium and
plutonium isotopes are radioactive, and
their activity consists in the emission of
what are called “alpha particles.”
These are a form of nuclear radiation,
since they are expelled from atomic nu-
clei; but they differ from the beta par-
ticles arising from the fission products in
being much heavier and carrying a pos-
itive electrical charge. Alpha particles
are, in fact, identical with the nuclei of
helium atoms.
1.66 Because of their greater mass
and charge, alpha particles are much
less penetrating than beta particles or
gamma rays of the same energy. Thus,
very few alpha particles from radioac-
tive sources can travel more than 1 to 3
inches in air before being stopped. It is
doubtful that these particles can get
through the unbroken skin, and they
certainly cannot penetrate clothing.
Consequently, the uranium (or pluto-
nium) present in the weapon residues
does not constitute a hazard if the latter
are outside the body. However, if plu-
tonium enters the body by ingestion,
through skin abrasions, or particularly
through inhalation, the effects may be
serious.
sThe general term “fission products’’ is used to describe this complex mixture.
20
GENERAL PRINCIPLES OF NUCLEAR EXPLOSIONS
Figure 1.64. Rate of Decay of fission products after a nuclear explosion (activity is taken as
100 at 1 hour after the detonation).
FUSION (THERMONUCLEAR)
REACTIONS
1.67 Energy production in the sun
and stars is undoubtedly due to fusion
reactions involving the nuclei of various
light (low atomic weight) atoms. From
experiments made in laboratories with
charged-particle accelerators, it was
concluded that the fusion of isotopes of
hydrogen was possible. This element is
known to exist in three isotopic forms,
in which the nuclei have mass numbers
(§ 1.10) of 1, 2, and 3, respectively.
These are generally referred to as hy-
drogen ('H), deuterium (2H or D), and
tritium (3H or T). All the nuclei carry a
single positive charge, i.e., they all
contain one proton, but they differ in the
number of neutrons. The lightest (’H)
nuclei (or protons) contain no neutrons;
deuterium (D) nuclei contain one neu-
tron, and tritium (T) nuclei contain two
neutrons.
1.68 Several different fusion reac-
tions have been observed between the
nuclei of the three hydrogen isotopes,
involving either two similar or two dif-
ferent nuclei. In order to make these
reactions occur to an appreciable extent,
the nuclei must have high energies. One
way in which this energy can be sup-
SCIENTIFIC BASIS OF NUCLEAR EXPLOSIONS
21
plied is to raise the temperature to very
high levels. In these circumstances the
fusion processes are referred to as
“thermonuclear reactions,” as men-
tioned in § 1.17.
1.69 Four thermonuclear fusion re-
actions appear to be of interest for the
production of energy because they are
expected to occur sufficiently rapidly at
realizable temperatures; these are:
D + D = 3He + n + 3.2 MeV
D + D = T + *H + 4.0 MeV
T + D = 4He + n + 17.6 MeV
T + T = 4He + 2n + 11.3 MeV,
where He is the symbol for helium and n
(mass = 1) represents a neutron. The
energy liberated in each case is given in
million electron volt (MeV) units. The
first two of these reactions occur with
almost equal probability at the tempera-
tures associated with nuclear explosions
(several tens of million degrees Kelvin),
whereas the third reaction has a much
higher probability and the fourth a much
lower probability. Thus, a valid com-
parison of the energy released in fusion
reactions with that produced in fission
can be made by noting that, as a result
of the first three reactions given above,
five deuterium nuclei, with a total mass
of 10 units, will liberate 24.8 MeV upon
fusion. On the other hand, in the fission
process, e.g., of uranium-235, a mass
of 235 units will produce a total of about
200 MeV of energy (§ 1.43). Weight
for weight, therefore, the fusion of deu-
terium nuclei would produce nearly
three times as much energy as the fis-
sion of uranium or plutonium.
1.70 Another reaction of thermonu-
clear weapons interest, with tritium as a
product, is
6Li + n-+ 4He + 3T +,4.8 MeV,
where 6Li represents the lithium-6 iso-
tope, which makes up about 7.4 percent
of natural lithium. Other reactions can
occur with lithium-6 or the more abun-
dant isotope lithium-7 and various par-
ticles produced in the weapon. How-
ever, the reaction shown above is of
most interest for two reasons: (1) it has a
high probability of occurrence and (2) if
the lithium is placed in the weapon in
the form of the compound lithium deu-
teride (LiD), the tritium formed in the
reaction has a high probability of in-
teracting with the deuterium. Large
amounts of energy are thus released by
the third reaction in § 1.69, and addi-
tional neutrons are produced to react
with lithium-6.
1.71 In order to make the nuclear
fusion reactions take place at the re-
quired rate, temperatures of the order of
several tens of million degrees are nec-
essary. The only practical way in which
such temperatures can be obtained on
earth is by means of a fission explosion.
Consequently, by combining a quantity
of deuterium or lithium deuteride (or a
mixture of deuterium and tritium) with a
fission device, it should be possible to
initiate one or more of the thermonu-
clear fusion reactions given above. If
these reactions, accompanied by energy
evolution, can be propagated rapidly
through a volume of the hydrogen iso-
tope (or isotopes) a thermonuclear ex-
plosion may be realized.
1.72 It will be observed that in three
of the fusion reactions given in § 1.69,
neutrons are produced. Because of their
small mass, these neutrons carry off
most of the reaction energy; conse-
quently, they have sufficient energy to
22
GENERAL PRINCIPLES OF NUCLEAR EXPLOSIONS
cause fission of uranium-238 nuclei. As
stated earlier, this process requires neu-
trons of high energy. It is possible,
therefore, to make use of the thermonu-
clear neutrons by surrounding the fusion
weapon with a blanket of ordinary ura-
nium. The high-energy neutrons are
then captured by uranium-238 nuclei;
the latter undergo fission, thereby con-
tributing to the overall energy yield of
the explosion, and also to the residual
nuclear radiation arising from the fission
products. On the average, the energy
released in the explosion of a thermo-
nuclear weapon originates in roughly
equal amounts from fission and fusion
processes, although there may be varia-
tions in individual cases. In “boosted”
fission weapons, thermonuclear neu-
trons serve to enhance the fission proc-
ess; energy released in the thermonu-
clear reaction is then a small fraction of
the total energy yield.
THERMAL RADIATION
1.73 The observed phenomena as-
sociated with a nuclear explosion and
the effects on people and materials are
largely determined by the thermal radi-
ation and its interaction with the sur-
roundings. It is desirable, therefore, to
consider the nature of these radiations
somewhat further. Thermal radiations
belong in the broad category of what are
known as “electromagnetic radia-
tions. '' These are a kind of wave motion
resulting from oscillating electric
charges and their associated magnetic
fields. Ordinary visible light is the most
familiar kind of electromagnetic radia-
tion, and all such radiations travel
through the air (or, more exactly, a
vacuum) at the same velocity, namely.
the velocity of light, 186,000 miles per
second. Electromagnetic radiations
range from the very short wavelength
(or very high frequency) gamma rays
(§ 1.28) and X rays, through the invisi-
ble ultraviolet to the visible region, and
then to the infrared and radar and radio
waves of relatively long wavelength
(and low frequency).
1.74 The approximate wavelength
and frequency regions occupied by the
different kinds of electromagnetic radi-
ations are indicated in Fig. 1.74. The
wavelength \ in centimeters and the
frequency v in hertz, i.e., in waves (or
cycles) per second, are related by =
c, where c is the velocity of light, 3.00
x 1010 cm per second. According to
Planck’s theory, the energy of the cor-
responding “quantum” (or unit) of en-
ergy, carried by the “photon,” i.e., the
postulated particle (or atom) of radia-
tion, is given by
E (ergs) = hv
he
T
1 99 x IO-16
, (1.74.1)
л(ст)
where h is a universal constant equal to
6.62 x IO-27 erg-second. The energy
quantum values for the various electro-
magnetic radiations are included in Fig.
1.74; the results are expressed either in
MeV, i.e., million electron volt, in
keV, i.e., kilo (or thousand) electron
volt, or in eV, i.e., electron volt, units.
These are obtained from equation
(1.74.1) by writing it in the form
1 94 x 10-ю
E (MeV) = 1 (1.74.2)
A(cm)
It is seen that the energy of the radia-
tions decreases from left to right in the
WAVELENGTHS (CENTIMETERS)
10-“ io-9 io-7 io-5 io-3 10-' 10 103 10s 107
i 1 Г " v 1 1 Г 1 1 "1
—X-RAYS I L
ULTRA- s ! INFRA- MICRO- UHF VHF HF LF
GAMMA RAYS VIOLET I G RED WAVE FM (SHORT (LONG
В H RADIO WAVE) WAVE)
L T , RADIO RADIO
E RADAR
Г" 3 x IO2' i 3 x IO19 1 3 x 10° 1 3 x 10'5 1 3 x 10¹³ l 3 x 10" 1 3 x 10⁹ 1 3 x 10⁷ 1 3 x 10⁵ 1 3 x 10³
FREQUENCY (HERTZ)
I i 1 i 1 1 1 l 1 1
12.4 124 1.24 12.4 0.124 1.24 1.24 1.24 1.24 1.24
MeV keV keV eV eV IO"3 eV 10-5 eV 10-7 eV IO’9 eV 10-" eV
PHOTON ENERGY
Figure 1.74. Wavelengths, frequencies, and photon energies of electromagnetic radiations.
SCIENTIFIC BASIS OF NUCLEAR EXPLOSIONS
24
GENERAL PRINCIPLES OF NUCLEAR EXPLOSIONS
figure, i.e., as the wavelength increases
and the frequency decreases.
1.75 The (thermal) radiation energy
density for matter in temperature equi-
librium is given by
E (radiation)=7.6 x 10_I5T4 ergs/cm3,
where T is the temperature in degrees
Kelvin. At the temperature of a con-
ventional chemical explosion, e.g.,
5,000°K, the radiation energy density is
then less than 1 erg/cm3, compared with
roughly 108 ergs/cm3 for the material
energy, i.e., kinetic energy and internal
(electronic, vibrational, and rotational)
energy. Hence, as indicated in § 1.23,
the radiation energy is a very small
proportion of the total energy. In a nu-
clear explosion, on the other hand,
where temperatures of several tens of
million degrees are reached, the radia-
tion energy density will be of the order
of IO16 ergs/cm3, whereas the material
energy is in the range of 1014 to 1015
ergs/cm3. It has been estimated that in a
nuclear explosion some 80 percent of
the total energy may be present initially
as thermal radiation energy.
1.76 Not only does the radiation
energy density increase with tempera-
ture but the rate of its emission as ther-
mal radiation increases correspond-
ingly. For materials at temperatures of a
few thousand degrees Kelvin, the en-
ergy is radiated slowly, with the greatest
part in the ultraviolet, visible, and in-
frared regions of the electromagnetic
spectrum (Fig. 1.74). At the tempera-
tures of a nuclear explosion, however,
not only is the radiation energy emitted
very rapidly, but most of this energy is
in the spectral region with wavelengths
shorter than the ultraviolet.
1.77 When a nuclear weapon ex-
plodes, temperature equilibrium is rap-
idly established in the residual material.
Within about one microsecond after the
explosion, some 70 to 80 percent of the
explosion energy, as defined in § 1.27,
is emitted as primary thermal radiation,
most of which consists of soft X rays.6
Almost all of the rest of the energy is in
the form of kinetic energy of the weapon
debris at this time. The interaction of the
primary thermal radiation and the debris
particles with the surroundings will vary
with the altitude of burst and will deter-
mine the ultimate partition of energy
between the thermal radiation received
at a distance and shock.
1.78 When a nuclear detonation
occurs in the air, where the atmospheric
pressure (and density) is near to sea-
level conditions, the soft X rays in the
primary thermal radiation are com-
pletely absorbed within a distance of a
few feet. Some of the radiations are
degraded to lower energies, e.g., into
the ultraviolet region, but most of the
energy of the primary thermal radiation
serves to heat the air immediately sur-
rounding the nuclear burst. It is in this
manner that the fireball is formed. Part
of the energy is then reradiated at a
lower temperature from the fireball and
the remainder is converted into shock
(or blast) energy (see Chapter II). This
explains why only about 35 to 45 per-
cent of the fission energy from an air
burst is received as thermal radiation
energy at a distance, although the pri-
mary thermal radiation may constitute
GX rays are frequently distinguished as “hard” or “soft.” The latter have longer wavelengths and
lower energies, and they are more easily absorbed than hard X rays. They are, nevertheless, radiations of
high energy compared with ultraviolet or visible light.
SCIENTIFIC BASIS OF NUCLEAR EXPLOSIONS
25
as much as 70 to 80 percent of the total.
Furthermore, because the secondary
thermal radiation is emitted at a lower
temperature, it lies mainly in the region
of the spectrum with longer wavelengths
(lower photon energies), i.e., ultravio-
let, visible, and infrared7 (see Chapter
VII).
1.79 In the event of a burst at high
altitudes, where the air density is low,
the soft X rays travel long distances
before they are degraded and absorbed.
At this stage, the available energy is
spread throughout such a large volume
(and mass) that most of the atoms and
molecules in the air cannot get very hot.
Although the total energy emitted as
thermal radiation in a high-altitude ex-
plosion is greater than for an air burst
closer to sea level, about half is rera-
diated so slowly by the heated air that it
has no great significance as a cause of
damage. The remainder, however, is
radiated very much more rapidly, i.e.,
in a shorter time interval, than is the
case at lower altitudes. A shock wave is
generated from a high-altitude burst, but
at distances of normal practical interest
it produces a smaller pressure increase
than from an air burst of the same yield.
These matters are treated more fully in
Chapter II.
BIBLIOGRAPHY
Brode, H. L., “Review of Nuclear Weapons
Effects,’’ Annual Review of Nuclear Science,
18, 153 (1968).
Crocker, G. R., “Fission Product Decay
Chains: Schematics with Branching Fractions,
Half-Lives, and Literature References,’’ U.S.
Naval Radiological Defense Laboratory, June
1967, USNRDL-TR-67-111.
Dolan, P. J., “Calculated Abundances and Ac-
tivities of the Products of High Energy Neutron
Fission of Uranium-238,” Defense Atomic
Support Agency, May 1959, DASA 525.
Glasstone, S., “Sourcebook on Atomic En-
ergy,’’ D. Van Nostrand Co., Inc., Third Edi-
tion, 1967.
Hoisington, D. B., “Nucleonics Fundamen-
tals,’’ McGraw-Hill Book Co., Inc., 1959,
Chapter 14.
Laurence, W. L., “Men and Atoms,’’ Simon
and Schuster, Inc., 1959.
Seldon, R. W., “An Introduction to Fission
Explosions,’’ University of California,
Lawrence Radiation Laboratory, Livermore,
July 1969, UCID-15554.
Smyth, H. DeW., “Atomic Energy for Military
Purposes,’’ Princeton University Press, 1945.
Weaver, L. E., P. O. Strom, and P. A. Kil-
leen, “Estimated Total Chain and Indepen-
dent Fission Yields for Several Neutron-In-
duced Fission Processes,’’ U.S. Naval
Radiological Defense Laboratory, March 1963,
USNRDL-TR-633.
"It is sometimes referred to as the “prompt thermal radiation’’ because only that which is received
within a few seconds of the explosion is significant as a hazard.
CHAPTER II
DESCRIPTIONS OF NUCLEAR EXPLOSIONS
INTRODUCTION
2.0 1 A number of characteristic
phenomena, some of which are visible
whereas others are not directly apparent,
are associated with nuclear explosions.
Certain aspects of these phenomena will
depend on the type of burst, i.e., air,
high-altitude, surface, or subsurface, as
indicated in Chapter I. This dependence
arises from direct and secondary in-
teractions of the output of the exploding
weapon with its environment, and leads
to variations in the distribution of the
energy released, particularly among
blast, shock, and thermal radiation. In
addition, the design of the weapon can
also affect the energy distribution. Fi-
nally, meteorological conditions, such
as temperature, humidity, wind, precip-
itation, and atmospheric pressure, and
even the nature of the terrain over which
the explosion occurs, may influence
some of the observed effects. Neverthe-
less, the gross phenomena associated
with a particular type of nuclear explo-
sion, namely, high-altitude, air, sur-
face, underwater, or underground, re-
main unchanged. It is such phenomena
that are described in this chapter.
26
2.0 2 The descriptions of explosions
at very high altitudes as well as those in
the air nearer to the ground refer mainly
to nuclear devices with energies in the
vicinity of 1-megaton TNT equivalent.
For underwater bursts, the information
is based on the detonations of a few
weapons with roughly 20 to 30 kilotons
of TNT energy in shallow and modera-
tely deep, and deep water. Indications
will be given of the results to be ex-
pected for explosions of other yields. As
a general rule, however, the basic phe-
nomena for a burst in a particular envi-
ronment are not greatly dependent upon
the energy of the explosion. In the fol-
lowing discussion it will be supposed,
first, that a typical air burst takes place
at such a height that the fireball, even at
its maximum, is well above the surface
of the earth. The modifications, as well
as the special effects, resulting from a
surface burst and for one at very high
altitude will be included. In addition,
some of the characteristic phenomena
associated with underwater and under-
ground nuclear explosions will be de-
scribed.
DESCRIPTION OF AIR AND SURFACE BURSTS
27
DESCRIPTION OF AIR AND SURFACE BURSTS
THE FIREBALL
2.03 As already seen, the fission of
uranium (or plutonium) or the fusion of
the isotopes of hydrogen in a nuclear
weapon leads to the liberation of a large
amount of energy in a very small period
of time within a limited quantity of
matter. As a result, the fission products,
bomb casing, and other weapon parts
are raised to extremely high tempera-
tures, similar to those in the center of
the sun. The maximum temperature at-
tained by the fission weapon residues is
several tens of million degrees, which
may be compared with a maximum of
5,000°C (or 9,000°F) in a conventional
high-explosive weapon. Because of the
great heat produced by the nuclear ex-
plosion, all the materials are converted
into the gaseous form. Since the gases,
at the instant of explosion, are restricted
to the region occupied by the original
constituents in the weapon, tremendous
pressures will be produced. These pres-
sures are probably over a million times
the atmospheric pressure, i.e., of the
order of many millions of pounds per
square inch.
2.04 Within less than a millionth of
a second of the detonation of the
weapon, the extremely hot weapon res-
idues radiate large amounts of energy,
mainly as invisible X rays, which are
absorbed within a few feet in the sur-
rounding (sea-level) atmosphere (§
1.78). This leads to the formation of an
extremely hot and highly luminous (in-
candescent) spherical mass of air and
gaseous weapon residues which is the
fireball referred to in § 1.32; a typical
fireball accompanying an air burst is
shown in Fig. 2.04. The surface bright-
ness decreases with time, but after about
a millisecond,1 the fireball from a 1-
megaton nuclear weapon would appear
to an observer 50 miles away to be many
times more brilliant than the sun at
noon. In several of the nuclear tests
made in the atmosphere at low altitudes
at the Nevada Test Site, in all of which
the energy yields were less than 100
kilotons, the glare in the sky, in the
early hours of the dawn, was visible 400
(or more) miles away. This was not the
result of direct (line-of-sight) transmis-
sion, but rather of scattering and dif-
fraction, i.e., bending, of the light rays
by particles of dust and possibly by
moisture in the atmosphere. However,
high-altitude bursts in the megaton
range have been seen directly as far as
700 miles away.
2.05 The surface temperatures of
the fireball, upon which the brightness
(or luminance) depends, do not vary
greatly with the total energy yield of the
weapon. Consequently, the observed
brightness of the fireball in an air burst is
roughly the same, regardless of the
amount of energy released in the explo-
sion. Immediately after its formation,
the fireball begins to grow in size, en-
gulfing the surrounding air. This growth
is accompanied by a decrease in tem-
perature because of the accompanying
increase in mass. At the same time, the
fireball rises, like a hot-air baloon.
Within seven-tenths of a millisecond
’A millisecond is a one-thousandth part of a second.
28
DESCRIPTIONS OF NUCLEAR EXPLOSIONS
Figure 2.04. Fireball from an air burst in the megaton energy range, photographed from an
altitude of 12,000 feet at a distance of about 50 miles. The fireball is partially
surrounded by the condensation cloud (see § 2.48).
from the detonation, the fireball from a
1-megaton weapon is about 440 feet
across, and this increases to a maximum
value of about 5,700 feet in 10 seconds.
It is then rising at a rate of 250 to 350
feet per second. After a minute, the
fireball has cooled to such an extent that
it no longer emits visible radiation. It
has then risen roughly 4.5 miles from
the point of burst.
THE RADIOACTIVE CLOUD
2.06 While the fireball is still lumi-
nous, the temperature, in the interior at
least, is so high that all the weapon
materials are in the form of vapor. This
includes the radioactive fission prod-
ucts, uranium (or plutonium) that has
escaped fission, and the weapon casing
(and other) materials. As the fireball
increases in size and cools, the vapors
condense to form a cloud containing
solid particles of the weapon debris, as
well as many small drops of water
derived from the air sucked into the
rising fireball.
2.07 Quite early in the ascent of the
fireball, cooling of the outside by radia-
tion and the drag of the air through
which it rises frequently bring about a
change in shape. The roughly spherical
form becomes a toroid (or doughnut),
although this shape and its associated
motion are often soon hidden by the
radioactive cloud and debris. As it
ascends, the toroid undergoes a violent,
internal circulatory motion as shown in
Fig. 2.07a. The formation of the toroid
is usually observed in the lower part of
the visible cloud, as may be seen in the
lighter, i.e., more luminous, portion of
DESCRIPTION OF AIR AND SURFACE BURSTS
29
Fig. 2.07b. The circulation entrains
more air through the bottom of the
toroid, thereby cooling the cloud and
dissipating the energy contained in the
fireball. As a result, the toroidal motion
slows and may stop completely as the
cloud rises toward its maximum height.
2.08 The color of the radioactive
cloud is initially red or reddish brown,
due to the presence of various colored
compounds (nitrous acid and oxides of
nitrogen) at the surface of the fireball.
These result from chemical interaction
of nitrogen, oxygen, and water vapor in
the air at the existing high temperatures
and under the influence of the nuclear
radiations. As the fireball cools and
condensation occurs, the color of the
cloud changes to white, mainly due to
the water droplets as in an ordinary
cloud.
2.0 9 Depending on the height of
burst of the nuclear weapon and the
nature of the terrain below, a strong
updraft with inflowing winds, called
“afterwinds,” is produced in the im-
mediate vicinity. These afterwinds can
cause varying amounts of dirt and debris
to be sucked up from the earth’s surface
into the radioactive cloud (Fig. 2.07b).
2.10 In an air burst with a moderate
(or small) amount of dirt and debris
UPDRAFT THROUGH
CENTER OF TOROID
Figure 2.07a. Cutaway showing artist’s conception of toroidal circulation within the
radioactive cloud from a nuclear explosion.
30
DESCRIPTIONS OF NUCLEAR EXPLOSIONS
Figure 2.07b. Low air burst showing toroidal fireball and dirt cloud.
DESCRIPTION OF AIR AND SURFACE BURSTS
31
drawn up into the cloud, only a rela-
tively small proportion of the dirt par-
ticles become contaminated with ra-
dioactivity. This is because the particles
do not mix intimately with the weapon
residues in the cloud at the time when
the fission products are still vaporized
and about to condense. For a burst near
the land surface, however, large quanti-
ties of dirt and other debris are drawn
into the cloud at early times. Good
mixing then occurs during the initial
phases of cloud formation and growth.
Consequently, when the vaporized fis-
sion products condense they do so on
the foreign matter, thus forming highly
radioactive particles (§ 2.23).
2.11 At first the rising mass of
weapon residues carries the particles
upward, but after a time they begin to
fall slowly under the influence of grav-
ity, at rates dependent upon their size.
Consequently, a lengthening (and wi-
dening) column of cloud (or smoke) is
produced. This cloud consists chiefly of
very small particles of radioactive fis-
sion products and weapon residues,
water droplets, and larger particles of
dirt and debris carried up by the after-
winds.
2.12 The speed with which the top
of the radioactive cloud continues to
ascend depends on the meteorological
conditions as well as on the energy yield
of the weapon. An approximate indica-
tion of the rate of rise of the cloud from
a 1-megaton explosion is given by the
results in Table 2.12 and the curve in
Fig. 2.12. Thus, in general, the cloud
will have attained a height of 3 miles in
30 seconds and 5 miles in about a min-
Table 2.12
RATE OF RISE OF RADIOACTIVE CLOUD
FROM A 1-MEGATON AIR BURST
Height (miles) Time (minutes) Rate of Rise (miles per hour)
2 0.3 330
4 0.7 270
6 1.1 220
10 2.5 140
12 3.8 27
ute. The average rate of rise during the
first minute or so is nearly 300 miles per
hour (440 feet per second). These values
should be regarded as rough averages
only, and large deviations may be ex-
pected in different circumstances (see
also Figs. 10.158a, b, c).
2.13 The eventual height reached
by the radioactive cloud depends upon
the heat energy of the weapon, and upon
the atmospheric conditions, e.g., mois-
ture content and stability. The greater
the amount of heat generated the greater
will be the upward thrust due to buoy-
ancy and so the greater will be the
distance the cloud ascends. The max-
imum height attained by the radioactive
cloud is strongly influenced by the tro-
popause, i.e., the boundary between the
troposphere below and the stratosphere
above, assuming that the cloud attains
the height of the troposphere.2
2.14 When the cloud reaches the
tropopause, there is a tendency for it to
spread out laterally, i.e., sideways. But
if sufficient energy remains in the radio-
active cloud at this height, a portion of it
will penetrate the tropopause and ascend
into the more stable air of the strato-
sphere.
2The tropopause is the boundary between the troposphere and the relatively stable air of the
stratosphere. It varies with season and latitude, ranging from 25,000 feet near the poles to about 55,000
feet in equatorial regions (§ 9.128).
32
DESCRIPTIONS OF NUCLEAR EXPLOSIONS
TIME AFTER EXPLOSION (MINUTES)
Figure 2.12. Height of cloud top above burst height at various times after a 1-megaton
explosion for a moderately low air burst.
2.15 The cloud attains its maximum
height after about 10 minutes and is then
said to be “stabilized.” It continues to
grow laterally, however, to produce the
characteristic mushroom shape (Fig.
2.15). The cloud may continue to be
visible for about an hour or more before
being dispersed by the winds into the
surrounding atmosphere where it
merges with natural clouds in the sky.
2.16 The dimensions of the stabi-
lized cloud formed in a nuclear explo-
sion depend on the meteorological con-
ditions, which vary with time and place.
Approximate average values of cloud
height and radius (at about 10 minutes
after the explosion), attained in land
surface or low air bursts, for conditions
most likely to be encountered in the
continental United States, are given in
Fig. 2.16 as a function of the energy
yield of the explosion. The flattening of
the height curve in the range of about
20- to 100-kilotons TNT equivalent is
due to the effect of the tropopause in
slowing down the cloud rise. For yields
below about 15 kilotons the heights in-
dicated are distances above the burst
point but for higher yields the values are
above sea level. For land surface bursts,
the maximum cloud height is somewhat
less than given by Fig. 2.16 because of
the mass of dirt and debris carried aloft
by the explosion.
2.17 For yields below about 20 ki-
lotons, the radius of the stem of the
mushroom cloud is about half the cloud
radius. With increasing yield, however,
the ratio of these dimensions decreases,
and for yields in the megaton range the
stem may be only one-fifth to one-tenth
as wide as the cloud. For clouds which
do not penetrate the tropopause the base
of the mushroom head is, very roughly,
DESCRIPTION OF AIR AND SURFACE BURSTS
33
Figure 2.15. The mushroom cloud formed in a nuclear explosion in the megaton energy
range, photographed from an altitude of 12,000 feet at a distance of about 50
miles.
at about one-half the altitude of the top.
For higher yields, the broad base will
probably be in the vicinity of the tropo-
pause. There is a change in cloud shape
in going from the kiloton to the megaton
range. A typical cloud from a 10-kiloton
air burst would reach a height of 19,000
feet with the base at about 10,000 feet;
the horizontal extent would also be
roughly 10,000 feet. For an explosion in
the megaton range, however, the hori-
zontal dimensions are greater than the
total height (cf. Fig. 2.16).
CHARACTERISTICS OF A SURFACE
BURST
2.18 Since many of the phenomena
and effects of a nuclear explosion oc-
curring on or near the earth’s surface are
similar to those associated with an air
burst, it is convenient before proceeding
further to refer to some of the special
characteristics of a surface burst. In
such a burst, the fireball in its rapid
initial growth, abuts (or touches) the
surface of the earth (Fig. 2.18a). Be-
34
DESCRIPTIONS OF NUCLEAR EXPLOSIONS
Figure 2.16. Approximate values of stabilized cloud height and radius as a function of
explosion yield for land surface or low air bursts.
CLOUD HEIGHT OR RADIUS (STATUTE MILES)
Figure 2.18a. Fireball formed by a nuclear explosion in the megaton energy range near the
earth’s surface. The maximum diameter of the fireball was 3% miles.
DESCRIPTION OF AIR AND SURFACE BURSTS
35
Figure 2.18b. Formation of dirt cloud in surface burst.
cause of the intense heat, some of the
rock, soil, and other material in the area
is vaporized and taken into the fireball.
Additional material is melted, either
completely or on its surface, and the
strong afterwinds cause large amounts
of dirt, dust, and other particles to be
sucked up as the fireball rises (Fig.
2.18b).
2.19 An important difference be-
tween a surface burst and an air burst is,
consequently, that in the surface burst
the radioactive cloud is much more
heavily loaded with debris. This con-
sists of particles ranging in size from the
very small ones produced by condensa-
tion as the fireball cools to the much
larger debris particles which have been
raised by the afterwinds. The exact
composition of the cloud will, of
course, depend on the nature of the
surface materials and the extent of their
contact with the fireball.
2.20 For a surface burst associated
with a moderate amount of debris, such
as has been the case in several test
explosions in which the weapons were
detonated near the ground, the rate of
36
DESCRIPTIONS OF NUCLEAR EXPLOSIONS
rise of the cloud is much the same as
given earlier for an air burst (Table
2.12). The radioactive cloud reaches a
height of several miles before spreading
out abruptly into a mushroom shape.
2.21 When the fireball touches the
earth’s surface, a crater is formed as a
result of the vaporization of dirt and
other material and the removal of soil,
etc., by the blast wave and winds ac-
companying the explosion. The size of
the crater will vary with the height
above the surface at which the weapon
is exploded and with the character of the
soil, as well as with the energy of the
explosion. It is believed that for a 1-
megaton weapon there would be no ap-
preciable crater formation unless deto-
nation occurs at an altitude of 450 feet
or less.
2.22 If a nuclear weapon is ex-
ploded near a water surface, large
amounts of water are vaporized and
carried up into the radioactive cloud.
When the cloud reaches high altitudes
the vapor condenses to form water
droplets, similar to those in an ordinary
atmospheric cloud.
THE FALLOUT
2.23 In a surface burst, large quan-
tities of earth or water enter the fireball
at an early stage and are fused or va-
porized. When sufficient cooling has
occurred, the fission products and other
radioactive residues become incor-
porated with the earth particles as a
result of the condensation of vaporized
fission products into fused particles of
earth, etc. A small proportion of the
solid particles formed upon further
cooling are contaminated fairly uni-
formly throughout with the radioactive
fission products and other weapon resi-
dues,3 but as a general rule the contam-
ination is found mainly in a thin shell
near the surface of the particles (§ 9.50).
In water droplets, the small fission
product particles occur at discrete points
within the drops. As the violent distur-
bance due to the explosion subsides, the
contaminated particles and droplets
gradually descend to earth. This phe-
nomenon is referred to as “fallout,”
and the same name is applied to the
particles themselves when they reach
the ground. It is the fallout, with its
associated radioactivity which decays
over a long period of time, that is the
main source of the residual nuclear ra-
diation referred to in the preceding
chapter.
2.24 The extent and nature of the
fallout can range between wide ex-
tremes. The actual situation is deter-
mined by a combination of circum-
stances associated with the energy yield
and design of the weapon, the height of
the explosion, the nature of the surface
beneath the point of burst, and the me-
teorological conditions. In an air burst,
for example, occurring at an appreciable
distance above the earth’s surface, so
that no large amounts of surface materi-
als are sucked into the cloud, the con-
taminated particles become widely dis-
persed. The magnitude of the hazard
from fallout will then be far less than if
the explosion were a surface burst. Thus
at Hiroshima (height of burst 1670 feet,
yield about 12.5 kilotons) and Nagasaki
'These residues include radioactive species formed at the time of the explosion by neutron capture in
various materials (§ 9.31).
DESCRIPTION OF AIR AND SURFACE BURSTS
37
(height of burst 1640 feet, yield about
22 kilotons) injuries due to fallout were
completely absent.
2.25 On the other hand, a nuclear
explosion occurring at or near the
earth’s surface can result in severe con-
tamination by the radioactive fallout.
From the 15-megaton thermonuclear
device tested at Bikini Atoll on March
1, 1954— the BRAVO shot of Opera-
tion CASTLE—the fallout caused sub-
stantial contamination over an area of
more than 7,000 square miles. The
contaminated region was roughly cigar-
shaped and extended more than 20 stat-
ute miles upwind and over 350 miles
downwind. The width in the cross wind
direction was variable, the maximum
being over 60 miles (§ 9.104).
2.26 The meteorological conditions
which determine the shape, extent, and
location of the fallout pattern from a
nuclear explosion are the height of the
tropopause, atmospheric winds, and the
occurrence of precipitation. For a given
explosion energy yield, type of burst,
and tropopause height, the fallout pat-
tern is affected mainly by the directions
and speeds of the winds over the fallout
area, from the earth’s surface to the top
of the stabilized cloud, which may be as
high as 100,000 feet. Furthermore,
variations in the winds, from the time of
burst until the particles reach the
ground, perhaps several hours later, af-
fect the fallout pattern following a nu-
clear explosion (see Chapter IX).
2.27 It should be understood that
fallout is a gradual phenomenon ex-
tending over a period of time. In the
BRAVO explosion, for example, about
10 hours elapsed before the contami-
nated particles began to fall at the ex-
tremities of the 7,000 square mile area.
By that time, the radioactive cloud had
thinned out to such an extent that it was
no longer visible. This brings up the
important fact that fallout can occur
even when the cloud cannot be seen.
Nevertheless, the area of contamination
which presents the most serious hazard
generally results from the fallout of vis-
ible particles. The sizes of these par-
ticles range from that of fine sand, i.e.,
approximately 100 micrometers4 in di-
ameter, or smaller, in the more distant
portions of the fallout area, to pieces
about the size of a marble, i.e., roughly
1 cm (0.4 inch) in diameter, and even
larger close to the burst point.
2.28 Particles in this size range ar-
rive on the ground within one day after
the explosion, and will not have traveled
too far, e.g., up to a few hundred miles,
from the region of the shot, depending
on the wind. Thus, the fallout pattern
from particles of visible size is estab-
lished within about 24 hours after the
burst. This is referred to as “early”
fallout, also sometimes called “local”
or “close-in” fallout. In addition, there
is the deposition of very small particles
which descend very slowly over large
areas of the earth’s surface. This is the
“delayed” (or “worldwide”) fallout, to
which residues from nuclear explosions
of various types—air, high-altitude,
surface, and shallow subsurface—may
contribute (see Chapter IX).
2.29 Although the test of March 1,
1954 produced the most extensive early
fallout yet recorded, it should be pointed
4A micrometer (also called a micron) is a one-millionth part of a meter, i.e., IO"6 meter, or about
0.00004 (or 4 x 10"5) inch.
38
DESCRIPTIONS OF NUCLEAR EXPLOSIONS
out that the phenomenon was not nec-
essarily characteristic of (nor restricted
to) thermonuclear explosions. It is very
probable that if the same device had
been detonated at an appreciable dis-
tance above the coral island, so that the
large fireball did not touch the surface of
the ground, the early fallout would have
been of insignificant proportions.
2.30 The general term “scaveng-
ing” is used to describe various proc-
esses resulting in the removal of ra-
dioactivity from the cloud and its
deposition on the earth. One of these
processes arises from the entrainment in
the cloud of quantities of dirt and debris
sucked up in a surface (or near-surface)
nuclear burst. The condensation of the
fission-product and other radioactive
vapors on the particles and their sub-
sequent relatively rapid fall to earth
leads to a certain degree of scavenging.
2.31 Another scavenging process,
which can occur at any time in the
history of the radioactive cloud, is that
due to rain falling through the weapon
debris and carrying contaminated par-
ticles down with it. This is one mecha-
nism for the production of “hot spots,”
i.e., areas on the ground of much higher
activity than the surroundings, in both
early and delayed fallout patterns. Since
rains (other than thundershowers) gen-
erally originate from atmospheric clouds
whose tops are between about 10,000
and 30,000 feet altitude, it is only below
this region that scavenging by rain is
likely to take place. Another effect that
rain may have if it occurs either during
or after the deposition of the fallout is to
wash radioactive debris over the surface
of the ground. This may result in
cleansing some areas and reducing their
activity while causing hot spots in other
(lower) areas.
THE BLAST WAVE
2.32 At a fraction of a second after
a nuclear explosion, a high-pressure
wave develops and moves outward from
the fireball (Fig. 2.32). This is the shock
wave or blast wave, mentioned in § 1.01
and to be considered subsequently in
more detail, which is the cause of much
destruction accompanying an air burst.
The front of the blast wave, i.e., the
shock front, travels rapidly away from
the fireball, behaving like a moving wall
of highly compressed air. After the
lapse of 10 seconds, when the fireball of
a 1-megaton nuclear weapon has at-
tained its maximum size (5,700 feet
across), the shock front is some 3 miles
farther ahead. At 50 seconds after the
explosion, when the fireball is no longer
visible, the blast wave has traveled
about 12 miles. It is then moving at
about 1,150 feet per second, which is
slightly faster than the speed of sound at
sea level.
2.33 When the blast wave strikes
the surface of the earth, it is reflected
back, similar to a sound wave producing
an echo. This reflected blast wave, like
the original (or direct) wave, is also
capable of causing material damage. At
a certain region on the surface, the po-
sition of which depends chiefly on the
height of the burst and фе energy of the
explosion, the direct and reflected wave
fronts merge. This merging phenome-
non is called the “Mach effect.” The
“overpressure,” i.e., the pressure in
excess of the normal atmospheric value,
at the front of the Mach wave is gener-
ally about twice as great as that at the
direct blast wave front.
2.34 For an air burst of a 1-megaton
nuclear weapon at an altitude of 6,500
feet, the Mach effect will begin approx-
DESCRIPTION OF AIR AND SURFACE BURSTS
39
Figure 2.32. The faintly luminous shock front seen just ahead of the fireball soon after
breakaway (see § 2.120).
imately 4.5 seconds after the explosion,
in a rough circle at a radius of 1.3 miles
from ground zero.5 The overpressure on
the ground at the blast wave front at this
time is about 20 pounds per square inch,
so that the total air pressure is more than
double the normal atmospheric pres-
sure.6
2.35 At first the height of the Mach
front is small, but as the blast wave front
continues to move outward, the height
increases steadily. At the same time,
however, the overpressure, like that in
the original (or direct) wave, decreases
correspondingly because of the continu-
ous loss of energy and the ever-increas-
ing area of the advancing front. After
the lapse of about 40 seconds, when the
Mach front from a 1-megaton nuclear
weapon is 10 miles from ground zero,
the overpressure will have decreased to
roughly 1 pound per square inch.
2.36 The distance from ground zero
at which the Mach effect commences
varies with the height of burst. Thus, as
seen in Fig. 2.32, in the low-altitude
(100 feet) detonation at the TRINITY
(Alamogordo) test, the Mach front was
apparent when the direct shock front had
advanced a short distance from the fire-
ball. At the other extreme, in a very
high air burst there might be no detect-
able Mach effect. (The TRINITY test,
conducted on July 16, 1945 near Ala-
mogordo, New Mexico, was the first
test of a nuclear (implosion) weapon;
the yield was estimated to be about 19
kilotons.)
5The term “ground zero’’ refers to the point on the earth’s surface immediately below (or above) the
point of detonation. For a burst over (or under) water, the corresponding point is generally called
“surface zero.’’ The term “surface zero’’ or “surface ground zero’’ is also commonly used for ground
surface and underground explosions. In some publications, ground (or surface) zero is called the
“hypocenter’’ of the explosion.
6 The normal atmospheric pressure at sea level is 14.7 pounds per square inch.
40
DESCRIPTIONS OF NUCLEAR EXPLOSIONS
2.37 Strong transient winds are as-
sociated with the passage of the shock
(and Mach) front. These blast winds (§
3.07) are very much stronger than the
ground wind (or afterwind) due to the
updraft caused by the rising fireball (§
2.09) which occurs at a later time. The
blast winds may have peak velocities of
several hundred miles an hour fairly
near to ground zero; even at more than 6
miles from the explosion of a 1-megaton
nuclear weapon, the peak velocity will
be greater than 70 miles per hour. It is
evident that such strong winds can con-
tribute greatly to the blast damage re-
sulting from the explosion of a nuclear
weapon.
THERMAL RADIATION FROM AN AIR
BURST
2.38 Immediately after the explo-
sion, the weapon residues emit the pri-
mary thermal radiation (§ 1.77). Be-
cause of the very high temperature,
much of this is in the form of X rays
which are absorbed within a layer of a
few feet of air; the energy is then re-
emitted from the fireball as (secondary)
thermal radiation of longer wavelength,
consisting of ultraviolet, visible, and
infrared rays. Because of certain phe-
nomena occurring in the fireball (see §
2.106 et seq\ the surface temperature
undergoes a curious change. The tem-
perature of the interior falls steadily, but
the apparent surface temperature of the
fireball decreases more rapidly for a
small fraction of a second. Then, the
apparent surface temperature increases
again for a somewhat longer time, after
which it falls continuously (see Fig.
2.123). In other words, there are effec-
tively two surface-temperature pulses;
the first is of very short duration,
whereas the second lasts for a much
longer time. The behavior is quite gen-
eral for air (and surface) bursts, al-
though the duration times of the pulses
increase with the energy yield of the
explosion.
2.39 Corresponding to the two sur-
face-temperature pulses, there are two
pulses of emission of thermal radiation
from the fireball (Fig. 2.39). In the first
pulse, which lasts about a tenth of a
second for a 1-megaton explosion, the
surface temperatures are mostly very
high. As a result, much of the radiation
emitted by the fireball during this pulse
is in the ultraviolet region. Although
ultraviolet radiation can cause skin
burns, in most circumstances following
an ordinary air burst the first pulse of
thermal radiation is not a significant
hazard in this respect, for several rea-
sons. In the first place, only about 1
percent of the thermal radiation appears
in the initial pulse because of its short
duration. Second, the ultraviolet rays
are readily attenuated by the intervening
air, so that the dose delivered at a dis-
tance from the explosion may be com-
paratively small. Furthermore, it ap-
pears that the ultraviolet radiation from
the first pulse could cause significant
effects on the human skin only within
ranges at which other thermal radiation
effects are much more serious. It should
be mentioned, however, that although
the first radiation pulse may be disre-
garded as a source of skin burns, it is
capable of producing permanent or
temporary effects on the eyes, especially
of individuals who happen to be looking
in the direction of the explosion.
2.40 In contrast to the first pulse,
the second radiation pulse may last for
DESCRIPTION OF AIR AND SURFACE BURSTS
41
TIME AFTER EXPLOSION
(RELATIVE SCALE)
Figure 2.39. Emission of thermal radiation in two pulses in an air burst.
several seconds, e.g., about 10 seconds
for a 1-megaton explosion; it carries
about 99 percent of the total thermal
radiation energy. Since the temperatures
are lower than in the first pulse, most of
the rays reaching the earth consist of
visible and infrared (invisible) light. It is
this radiation which is the main cause of
skin burns of various degrees suffered
by exposed individuals up to 12 miles or
more, and of eye effects at even greater
distances, from the explosion of a 1-
megaton weapon. For weapons of
higher energy, the effective damage
range is greater, as will be explained in
Chapter VII. The radiation from the
second pulse can also cause fires to start
under suitable conditions.
INITIAL NUCLEAR RADIATION FROM
AN AIR BURST
2.41 As stated in Chapter I, the ex-
plosion of a nuclear weapon is asso-
ciated with the emission of various nu-
clear radiations, consisting of neutrons,
gamma rays, and alpha and beta par-
ticles. Essentially all the neutrons and
part of the gamma rays are emitted in
the actual fission process. These are re-
ferred to as the “prompt nuclear radia-
tions” because they are produced si-
multaneously with the nuclear
explosion. Some of the neutrons liber-
ated in fission are immediately captured
and others undergo “scattering colli-
sions” with various nuclei present in the
42
DESCRIPTIONS OF NUCLEAR EXPLOSIONS
weapon. These processes are frequently
accompanied by the instantaneous
emission of gamma rays. In addition,
many of the escaping neutrons undergo
similar interactions with atomic nuclei
of the air, thus forming an extended
source of gamma rays around the burst
point. The remainder of the gamma rays
and the beta particles are liberated over
a period of time as the fission products
undergo radioactive decay. The alpha
particles are expelled, in an analogous
manner, as a result of the decay of the
uranium (or plutonium) which has
escaped fission in the weapon.
2.42 The initial nuclear radiation is
generally defined as that emitted from
both the fireball and the radioactive
cloud within the first minute after the
explosion. It includes neutrons and
gamma rays given off almost instantan-
eously, as well as the gamma rays
emitted by the fission products and other
radioactive species in the rising cloud. It
should be noted that the alpha and beta
particles present in the initial radiation
have not been considered. This is be-
cause they are so easily absorbed that
they will not reach more than a few
yards, at most, from the radioactive
cloud.
2.43 The somewhat arbitrary time
period of 1 minute for the duration of
the initial nuclear radiations was origi-
nally based upon the following consid-
erations. As a consequence of attenua-
tion by the air, the effective range of the
fission gamma rays and of those from
the fission products from a 20-kiloton
explosion is very roughly 2 miles. In
other words, gamma rays originating
from such a source at an altitude of over
2 miles can be ignored, as far as their
effect at the earth’s surface is con-
cerned. Thus, when the radioactive
cloud has reached a height of 2 miles,
the effects of the initial nuclear radia-
tions are no longer significant. Since it
takes roughly a minute for the cloud to
rise this distance, the initial nuclear ra-
diation was defined as that emitted in the
first minute after the explosion.
2.44 The foregoing arguments are
based on the characteristics of a 20-
kiloton nuclear weapon. For a detona-
tion of higher energy, the maximum
distance over which the gamma rays are
effective will be larger than given
above. However, at the same time, there
is an increase in the rate at which the
cloud rises. Similarly for a weapon of
lower energy, the effective distance is
less, but so also is the rate of ascent of
the cloud. The period over which the
initial nuclear radiation extends may
consequently be taken to be approxi-
mately the same, namely, 1 minute,
irrespective of the energy release of the
explosion.
2.45 Neutrons are the only signifi-
cant nuclear radiations produced di-
rectly in the thermonuclear reactions
mentioned in § 1.69. Alpha particles
(helium nuclei) are also formed, but
they do not travel very far from the
explosion. Some of the neutrons will
escape but others will be captured by the
various nuclei present in the exploding
weapon. Those neutrons absorbed by
fissionable species may lead to the lib-
eration of more neutrons as well as to
the emission of gamma rays. In addi-
tion, the capture of neutrons in nonfis-
sion reactions is usually accompanied
by gamma rays. It is seen, therefore,
that the initial radiations from an explo-
sion in which both fission and fusion
(thermonuclear) processes occur consist
DESCRIPTION OF AIR AND SURFACE BURSTS
43
essentially of neutrons and gamma rays.
The relative proportions of these two
radiations may be somewhat different
than for a weapon in which all the en-
ergy release is due to fission, but for
present purposes the difference may be
disregarded.
THE ELECTROMAGNETIC PULSE
2.46 If a detonation occurs at or
near the earth’s surface, the EMP phe-
nomenon referred to in § 1.38 produces
intense electric and magnetic fields
which may extend to distances up to
several miles, depending on the weapon
yield. The close-in region near the burst
point is highly ionized and large electric
currents flow in the air and the ground,
producing a pulse of electromagnetic
radiation. Beyond this close-in region
the electromagnetic field strength, as
measured on (or near) the ground, drops
sharply and then more slowly with in-
creasing distance from the explosion.
The intense fields may damage unpro-
tected electrical and electronic equip-
ment at distances exceeding those at
which significant air blast damage may
occur, especially for weapons of low
yield (see Chapter XI).
OTHER NUCLEAR EXPLOSION
PHENOMENA
2.47 There are a number of inter-
esting phenomena associated with a nu-
clear air burst that are worth mentioning
although they have no connection with
the destructive or other harmful effects
of the explosion. Soon after the detona-
tion, a violet-colored glow may be ob-
served, particularly at night or in dim
daylight, at some distance from the
fireball. This glow may persist for an
appreciable length of time, being dis-
tinctly visible near the head of the ra-
dioactive cloud. It is believed to be the
ultimate result of a complex series of
processes initiated by the action of the
various radiations on the nitrogen and
oxygen of the air.
2.48 Another early phenomenon
following a nuclear explosion in certain
circumstances is the formation of a
“condensation cloud.” This is some-
times called the Wilson cloud (or
cloud-chamber effect) because it is the
result of conditions analogous to those
utilized by scientists in the Wilson cloud
chamber. It will be seen in Chapter III
that the passage of a high-pressure
shock front in air is followed by a rare-
faction (or suction) wave. During the
compression (or blast) phase, the tem-
perature of the air rises and during the
decompression (or suction) phase it
falls. For moderately low blast pres-
sures, the temperature can drop below
its original, preshock value, so that if
the air contains a fair amount of water
vapor, condensation accompanied by
cloud formation will occur.
2.49 The condensation cloud which
was observed in the ABLE Test at Bi-
kini in 1946 is shown in Fig. 2.49.
Since the device was detonated just
above the surface of the lagoon, the air
was nearly saturated with water vapor
and the conditions were suitable for the
production of a Wilson cloud. It can be
seen from the photograph that the cloud
formed some way ahead of the fireball.
The reason is that the shock front must
travel a considerable distance before the
blast pressure has fallen sufficiently for a
low temperature to be attained in the
subsequent decompression phase. At the
44
DESCRIPTIONS OF NUCLEAR EXPLOSIONS
Figure 2.49. Condensation cloud formed in an air burst over water.
Figure 2.50. Late stage of the condensation cloud in an air burst over water.
DESCRIPTION OF HIGH-ALTITUDE BURSTS
45
time the temperature has dropped to that
required for condensation to occur, the
blast wave front has moved still farther
away, as is apparent in Fig. 2.49, where
the disk-like formation on the surface of
the water indicates the passage of the
shock wave.
2.50 The relatively high humidity
of the air makes the conditions for the
formation of the condensation cloud
most favorable in nuclear explosions
occurring over (or under) water, as in
the Bikini tests in 1946. The cloud
commenced to form 1 to 2 seconds after
the detonation, and it had dispersed
completely within another second or so,
as the air warmed up and the water
droplets evaporated. The original
dome-like cloud first changed to a ring
shape, as seen in Fig. 2.50, and then
disappeared.
2.51 Since the Wilson condensation
cloud forms after the fireball has emitted
most of its thermal radiation, it has little
influence on this radiation. It is true that
fairly thick clouds, especially smoke
clouds, can attenuate the thermal radia-
tion reaching the earth from the fireball.
However, apart from being formed at
too late a stage, the condensation cloud
is too tenuous to have any appreciable
effect in this connection.
DESCRIPTION OF HIGH
INTRODUCTION
2.52 Nuclear devices were ex-
ploded at high altitudes during the sum-
mer of 1958 as part of the HARDTACK
test series in the Pacific Ocean and the
ARGUS operation in the South Atlantic
Ocean. Additional high-altitude nuclear
tests were conducted during the FISH-
BOWL test series in 1962. In the
HARDTACK series, two high-altitude
bursts, with energy yields in the mega-
ton range, were set off in the vicinity of
Johnston Island, 700 miles southwest of
Hawaii. The first device, named TEAK,
was detonated on August 1, 1958
(Greenwich Civil Time) at an altitude of
252,000 feet, i.e., nearly 48 miles. The
second, called ORANGE, was exploded
at an altitude of 141,000 feet, i.e.,
nearly 27 miles, on August 12, 1958
(GCT). During the FISHBOWL series,
a megaton and three submegaton de-
vices were detonated at high altitudes in
ALTITUDE BURSTS
the vicinity of Johnston Island. The
STARFISH PRIME device, with a yield
of 1.4 megatons, was exploded at an
altitude of about 248 miles on July 9,
1962 (GCT). The three submegaton de-
vices, CHECKMATE, BLUEGILL
TRIPLE PRIME, and KINGFISH, were
detonated at altitudes of tens of miles on
October 20, 1962, October 26, 1962,
and November 1, 1962 (GCT), respec-
tively.
2.53 The ARGUS operation was
not intended as a test of nuclear weap-
ons or their destructive effects. It was an
experiment designed to provide infor-
mation on the trapping of electrically
charged particles in the earth’s magnetic
field (§ 2.145). The operation consisted
of three high-altitude nuclear detona-
tions, each having a yield from 1 to 2
kilotons TNT equivalent. The burst al-
titudes were from about 125 to 300
miles.
46
DESCRIPTIONS OF NUCLEAR EXPLOSIONS
HIGH-ALTITUDE BURST PHENOMENA
2.54 If a burst occurs in the altitude
regime of roughly 10 to 50 miles, the
explosion energy radiated as X rays will
be deposited in the burst region, al-
though over a much larger volume of air
than at lower altitudes. In this manner,
the ORANGE shot created a large fire-
ball almost spherical in shape. In gen-
eral, the fireball behavior was in agree-
ment with the expected interactions of
the various radiations and kinetic energy
of the expanding weapon debris with the
ambient air (§ 2.130 et seq.).
2.55 The mechanism of fireball for-
mation changes appreciably at still
higher burst altitude, since the X rays
are able to penetrate to greater distances
in the low-density air. Starting at an
explosion altitude of about 50 miles, the
interaction of the weapon debris energy
with the atmosphere becomes the domi-
nant mechanism for producing a fire-
ball. Because the debris is highly ion-
ized (§ 1.38), the earth’s magnetic field,
i.e., the geomagnetic field, will influ-
ence the location and distribution of the
late-time fireball from bursts above
about 50 miles altitude.
2.56 The TEAK explosion was ac-
companied by a sharp and bright flash of
light which was visible above the hori-
zon from Hawaii, over 700 miles away.
Because of the long range of the X rays
in the low-density atmosphere in the
immediate vicinity of the burst, the
fireball grew very rapidly in size. In 0.3
second, its diameter was already 11
miles and it increased to 18 miles in 3.5
seconds. The fireball also ascended with
great rapidity, the initial rate of rise
being about a mile per second. Sur-
rounding the fireball was a very large
red luminous spherical wave, arising
apparently from electronically excited
oxygen atoms produced by a shock
wave passing through the low-density
air (Fig. 2.56).
2.57 At about a minute or so after
the detonation, the TEAK fireball had
risen to a height of over 90 miles, and it
was then directly (line-of-sight) visible
from Hawaii. The rate of rise of the
fireball was estimated to be some 3,300
feet per second and it was expanding
horizontally at a rate of about 1,000 feet
per second. The large red luminous
sphere was observed for a few minutes;
at roughly 6 minutes after the explosion
it was nearly 600 miles in diameter.
2.58 The formation and growth of
the fireball changes even more drasti-
cally as the explosion altitude increases
above 65 miles. Because X rays can
penetrate the low-density atmosphere to
great distances before being absorbed,
there is no local fireball. Below about
190 miles (depending on weapon yield),
the energy initially appearing as the
rapid outward motion of debris particles
will still be deposited relatively locally,
resulting in a highly heated and ionized
region. The geomagnetic field plays an
increasingly important role in control-
ling debris motion as the detonation al-
titude increases. Above about 200
miles, where the air density is very low,
the geomagnetic field is the dominant
factor in slowing the expansion of the
ionized debris across the field lines.
Upward and downward motion along
the field lines, however, is not greatly
affected (§ 10.64). When the debris is
stopped by the atmosphere, at about 75
miles altitude, it may heat and ionize the
air sufficiently to cause a visible region
which will subsequently rise and ex-
DESCRIPTION OF HIGH-ALTITUDE BURSTS
47
Figure 2.56. Fireball and red luminous spherical wave formed after the TEAK high-altitude
shot. (The photograph was taken from Hawaii, 780 miles from the explosion.)
pand. Such a phenomenon was observed
following the STARFISH PRIME
event.
2.59 A special feature of explosions
at altitudes between about 20 and 50
miles is the extreme brightness of the
fireball. It is visible at distances of sev-
eral hundred miles and is capable of
producing injury to the eyes over large
areas (§ 12.79 et seq.).
2.60 Additional important effects
that result from high-altitude bursts are
the widespread ionization and other dis-
turbances of the portion of the upper
atmosphere known as the ionosphere.
These disturbances affect the propaga-
tion of radio and radar waves, some-
times over extended areas (see Chapter
X). Following the TEAK event, propa-
gation of high-frequency (HF) radio
communications (Table 10.91) was de-
graded over a region of several thousand
miles in diameter for a period lasting
from shortly after midnight until
sunrise. Some very-high-frequency
(VHF) communications circuits in the
Pacific area were unable to function for
about 30 seconds after the STARFISH
PRIME event.
2.61 Detonations above about 19
miles can produce EMP effects (§ 2.46)
on the ground over large areas, increas-
ing with the yield of the explosion and
the height of burst. For fairly large
yields and burst heights, the EMP fields
may be significant at nearly all points
within the line of sight, i.e., to the
horizon, from the burst point. Although
these fields are weaker than those in the
close-in region surrounding a surface
burst, they are of sufficient magnitude to
damage some unprotected electrical and
48
DESCRIPTIONS OF NUCLEAR EXPLOSIONS
electronic equipment. The mechanism
of formation and the effects of the EMP
are treated in Chapter XL
2.62 An interesting visible effect of
high-altitude nuclear explosions is the
creation of an “artificial aurora.”
Within a second or two after burst time
of the TEAK shot a brilliant aurora
appeared from the bottom of the fireball
and purple streamers were seen to
spread toward the north. Less than a
second later, an aurora was observed at
Apia, in the Samoan Islands, more than
2,000 miles from the point of burst,
although at no time was the fireball in
direct view. The formation of the aurora
is attributed to the motion along the
lines of the earth’s magnetic field of beta
particles (electrons), emitted by the ra-
dioactive fission fragments. Because of
the natural cloud cover over Johnston
Island at the time of burst, direct obser-
vation of the ORANGE fireball was not
possible from the ground. However,
such observations were made from air-
craft flying above the low clouds. The
auroras were less marked than from the
TEAK shot, but an aurora lasting 17
minutes was again seen from Apia.
Similar auroral effects were observed
after the other high-altitude explosions
mentioned in § 2.52.
DESCRIPTION OF UNDERWATER BURSTS
SHALLOW UNDERWATER
EXPLOSION PHENOMENA
2.63 Certain characteristic phe-
nomena are associated with an under-
water nuclear explosion, but the details
vary with the energy yield of the
weapon, the distance below the surface
at which the detonation occurs, and the
depth and area of the body of water. The
description given here is based mainly
on the observations made at the BAKER
test at Bikini in July 1946. In this test, a
nuclear weapon of approximately 20-
kilotons yield was detonated well below
the surface of the lagoon which was
about 200 feet deep. These conditions
may be regarded as corresponding to a
shallow underwater explosion.
2.64 In an underwater nuclear det-
onation, a fireball is formed, but it is
smaller than for an air burst. At the
BAKER test the water in the vicinity of
the explosion was illuminated by the
fireball. The distortion caused by the
water waves on the surface of the lagoon
prevented a clear view of the fireball,
and the general effect was similar to that
of light seen through a ground-glass
screen. The luminosity persisted for a
few thousandths of a second, but it dis-
appeared as soon as the bubble of hot,
high-pressure gases (or vapors) and
steam constituting the fireball reached
the water surface. At this time, the gases
were expelled and cooled, so that the
fireball was no longer visible.
2.65 In the course of its rapid ex-
pansion, the hot gas bubble, while still
underwater, initiates a shock wave. In-
tersection of the shock wave with the
surface produces an effect which,
viewed from above, appears to be a
rapidly expanding ring of darkened
water. This is often called the “slick”
because of its resemblance to an oil
DESCRIPTION OF UNDERWATER BURSTS
49
slick. Following closely behind the dark
region is a white circular patch called
the “crack,” probably caused by re-
flection of the water shock wave at the
surface.
2.66 Immediately after the appear-
ance of the crack, and prior to the for-
mation of the Wilson cloud (§ 2.48), a
mound or column of broken water and
spray, called the “spray dome,” is
thrown up over the point of burst (Fig.
2.66). This dome is caused by the ve-
locity imparted to the water near the
surface by the reflection of the shock
wave and to the subsequent breakup of
the surface layer into drops of spray.
The initial upward velocity of the water
is proportional to the pressure of the
direct shock wave, and so it is greatest
directly above the detonation point.
Consequently, the water in the center
rises more rapidly (and for a longer
time) than water farther away. As a
result, the sides of the spray dome be-
come steeper as the water rises. The
upward motion is terminated by the
downward pull of gravity and the resis-
tance of the air. The total time of rise
and the maximum height depend upon
the energy of the explosion, and upon its
depth below the water surface. Addi-
tional slick, crack, and spray-dome
phenomena may result if the shock wave
reflected from the water bottom and
compression waves produced by the gas
Figure 2.66. The “spray dome” formed over the point of burst in a shallow underwater
explosion.
50
DESCRIPTIONS OF NUCLEAR EXPLOSIONS
bubble (§ 2.86 et seq.) reach the surface
with sufficient intensity.
2.67 If the depth of burst is not too
great, the bubble remains essentially in-
tact until it rises to the surface of the
water. At this point the steam, fission
gases, and debris are expelled into the
atmosphere. Part of the shock wave
passes through the surface into the air,
and because of the high humidity the
conditions are suitable for the formation
of a condensation cloud (Fig. 2.67a). As
the pressure of the bubble is released,
water rushes into the cavity, and the
resultant complex phenomena cause the
water to be thrown up as a hollow cyl-
inder or chimney of spray called the
“column” or “plume.” The radioac-
tive contents of the bubble are vented
through this hollow column and may
form a cauliflower-shaped cloud at the
top (Fig. 2.67b.)
2.68 In the shallow underwater
(BAKER) burst at Bikini, the spray
dome began to form at about 4 milli-
seconds after the explosion. Its initial
rate of rise was roughly 2,500 feet per
second, but this was rapidly diminished
by air resistance and gravity. A few
milliseconds later, the hot gas bubble
reached the surface of the lagoon and
the column began to form, quickly
overtaking the spray dome. The max-
imum height attained by the hollow
column, through which the gases
vented, could not be estimated exactly
Figure 2.67a. The condensation cloud formed after a shallow underwater explosion. (The
“crack” due to the shock wave can be seen on the water surface.)
DESCRIPTION OF UNDERWATER BURSTS
51
Figure 2.67b. Formation of the hollow column in a shallow underwater explosion; the top
is surrounded by a late stage of the condensation cloud.
Figure 2.68. The radioactive cloud and first stages of the base surge following a shallow
underwater burst. Water is beginning to fall back from the column into the
lagoon.
52
DESCRIPTIONS OF NUCLEAR EXPLOSIONS
because the upper part was surrounded
by the radioactive cloud (Fig. 2.68).
The column was probably some 6,000
feet high and the maximum diameter
was about 2,000 feet. The walls were
probably 300 feet thick, and approxi-
mately a million tons of water were
raised in the column.
2.69 The cauliflower-shaped cloud,
which concealed part of the upper por-
tion of the column, contained some of
the fission products and other weapon
residues, as well as a large quantity of
water in small droplet form. In addition,
there is evidence that material sucked up
from the bottom of the lagoon was also
present, for a calcareous (or chalky)
sediment, which must have dropped
from this cloud, was found on the decks
of ships some distance from the burst.
The cloud was roughly 6,000 feet across
and ultimately rose to a height of nearly
10,000 feet before being dispersed. This
is considerably less than the height at-
tained by the radioactive cloud in an air
burst.
2.70 The disturbance created by the
underwater burst caused a series of
waves to move outward from the center
of the explosion across the surface of
Bikini lagoon. At 11 seconds after the
detonation, the first wave had a max-
imum height of 94 feet and was about
1,000 feet from surface zero. This
moved outward at high speed and was
followed by a series of other waves. At
22,000 feet from surface zero, the ninth
wave in the series was the highest with a
height of 6 feet.
2.71 It has been observed that cer-
tain underwater and water surface bursts
have caused unexpectedly serious
Figure 2.73. The development of the base surge following a shallow underwater explosion.
DESCRIPTION OF UNDERWATER BURSTS
53
flooding of nearby beach areas, the
depth of inundation being sometimes
twice as high as the approaching water
wave. The extent of inundation is re-
lated in a complex manner to a number
of factors which include the energy
yield of the explosion, the depth of
burst, the depth of the water, the com-
position and contour of the bottom, and
the angle the approaching wave makes
with the shoreline.
THE VISIBLE BASE SURGE
2.72 As the column (or plume) of
water and spray fell back into the lagoon
in the BAKER test, there developed a
gigantic wave (or cloud) of mist com-
pletely surrounding the column at its
base (Fig. 2.68). This doughnut-shaped
cloud, moving rapidly outward from the
column, is called the “base surge.” It is
essentially a dense cloud of small water
droplets, much like the spray at the base
of Niagara Falls (or other high water-
falls), but having the property of flow-
ing almost as if it were a homogeneous
fluid.
2.73 The base surge at Bikini com-
menced to form at 10 or 12 seconds after
the detonation. The surge cloud, bil-
lowing upward, rapidly attained a height
of 900 feet, and moved outward at an
initial rate of more than a mile a minute.
Within 4 minutes the outer radius of the
cloud, growing rapidly at first and then
more slowly, was nearly ЗУ2 miles
across and its height had then increased
to 1,800 feet. At this stage, the base
surge gradually rose from the surface of
the water and began to merge with the
radioactive cloud and other clouds in the
sky (Fig. 2.73).
2.74 After about 5 minutes, the
base surge had the appearance of a mass
of stratocumulus clouds which eventu-
ally reached a thickness of several
thousand feet (Fig. 2.74). A moderate to
heavy rainfall, moving with the wind
and lasting for nearly an hour, devel-
oped from the cloud mass. In its early
stages the rain was augmented by the
small water droplets still descending
from the radioactive cloud.
2.75 In the few instances in which
base surge formation has been observed
over water, the visible configuration has
been quite irregular. Nevertheless, to a
good approximation, the base surge can
be represented as a hollow cylinder with
the inner diameter about two-thirds of
the outer diameter. The heights of the
visible base surge clouds have generally
ranged between 1,000 and 2,000 feet.
2.76 The necessary conditions for
the formation of a base surge have not
been definitely established, although it
is reasonably certain that no base surge
would accompany bursts at great
depths. The underwater test shots upon
which the present analysis is based have
all created both a visible and an invisible
(§ 2.77) base surge. The only marked
difference between the phenomena at
the various tests is that at Bikini
BAKER there was an airborne cloud,
evidently composed of fission debris and
steam. The other shots, which were at
somewhat greater depths, produced no
such cloud. The whole of the plume fell
back into the surface of the water where
the low-lying base surge cloud was
formed.
THE RADIOACTIVE BASE SURGE
2.77 From the weapons effects
standpoint, the importance of the base
54
DESCRIPTIONS OF NUCLEAR EXPLOSIONS
Figure 2.74. Final stage in the development of the base surge.
surge lies in the fact that it is likely to be
highly radioactive because of the fission
(and other) residues present either at its
inception, or dropped into it from the
radioactive cloud. Because of its ra-
dioactivity, it may represent a hazard for
a distance of several miles, especially in
the downwind direction. The fission
debris is suspended in the form of very
small particles that occupy the same
volume as the visible base surge at early
times, that is, within the first 3 or 4
minutes. However, when the small
water droplets which make the base
surge visible evaporate and disappear,
the radioactive particles and gases re-
main in the air and continue to move
outwards as an invisible radioactive
base surge. There may well be some
fallout or rainout on to the surface of the
water (or ship or shore station) from the
radioactive base surge, but in many
cases it is expected to pass over without
depositing any debris. Thus, according
to circumstances, there may or may not
be radioactive contamination on the
surfaces of objects in the vicinity of a
shallow underwater nuclear burst.
2.78 The radioactive base surge
continues to expand in the same manner
as would have been expected had it
remained visible. It drifts downwind ei-
ther as an invisible, doughnut-shaped
cloud or as several such possibly con-
centric clouds that approximate a low-
lying disc with no hole in the center.
The latter shape is more probable for
deeper bursts. The length of time this
DESCRIPTION OF UNDERWATER BURSTS
55
base surge remains radioactive will de-
pend on the energy yield of the explo-
sion, the burst depth, and the nearness
of the sea bottom to the point of burst.
In addition, weather conditions will
control depletion of debris due to rain-
out and diffusion by atmospheric winds.
As a general rule, it is expected that
there will be a considerable hazard from
the radioactive base surge within the
first 5 to 10 minutes after an underwater
explosion and a decreasing hazard for
half an hour or more.
2.79 The proportion of the residual
nuclear radiation that remains in the
water or that is trapped by the falling
plume and returns immediately to the
surface is determined by the location of
the burst and the depth of the water, and
perhaps also by the nature of the bottom
material. Although as much as 90 per-
cent of the fission product and other
radioactivity could be left behind in the
water, the base surge, both visible and
invisible, could still be extremely ra-
dioactive in its early stages.
THERMAL AND NUCLEAR
RADIATIONS IN UNDERWATER
BURST
2.80 Essentially all the thermal ra-
diation emitted by the fireball while it is
still submerged is absorbed by the sur-
rounding water. When the hot steam and
gases reach the surface and expand, the
cooling is so rapid that the temperature
drops almost immediately to a point
where there is no further appreciable
emission of thermal radiation. It fol-
lows, therefore, that in an underwater
nuclear explosion the thermal radiation
can be ignored, as far as its effects on
people and as a source of fire are con-
cerned.
2.81 It is probable, too, that most of
the neutrons and gamma rays liberated
within a short time of the initiation of
the explosion will also be absorbed by
the water. But, when the fireball reaches
the surface and vents, the gamma rays
(and beta particles) from the fission
products will represent a form of initial
nuclear radiation. In addition, the radi-
ation from the radioactive residues
present in the column, cloud, and base
surge, all three of which are formed
within a few seconds of the burst, will
contribute to the initial effects.
2.82 However, the water fallout (or
rainout) from the cloud and the base
surge are also responsible for the resid-
ual nuclear radiation, as described
above. For an underwater burst, it is
thus less meaningful to make a sharp
distinction between initial and residual
radiations, such as is done in the case of
an air burst. The initial nuclear radia-
tions merge continuously into those
which are produced over a period of
time following the nuclear explosion.
DEEP UNDERWATER EXPLOSION
PHENOMENA
2.83 Because the effects of a deep
underwater nuclear explosion are
largely of military interest, the phe-
nomena will be described in general
terms and in less detail than for a shal-
low underwater burst. The following
discussion is based largely on observa-
tions made at the * WAHOO shot in
1958, when a nuclear weapon was de-
tonated at a depth of 500 feet in deep
water. The generation of large-scale
56
DESCRIPTIONS OF NUCLEAR EXPLOSIONS
water waves in deep underwater bursts
will be considered in Chapter VI.
2.84 The spray dome formed by the
WAHOO explosion rose to a height of
900 feet above the surface of the water
(Fig. 2.84a). Shortly after the maximum
height was attained, the hot gas and
steam bubble burst through the dome,
throwing out a plume with jets in all
directions; the highest jets reached an
elevation of 1,700 feet (Fig. 2.84b).
There was no airborne radioactive
cloud, such as was observed in the
shallow underwater BAKER shot. The
collapse of the plume created a visible
base surge extending out to a distance of
over 271 miles downwind and reaching a
maximum height of about 1,000 feet
(Fig. 2.84c). This base surge traveled
outward at an initial speed of nearly 75
miles per hour, but decreased within 10
seconds to less than 20 miles per hour.
2.85 There was little evidence of
the fireball in the WAHOO shot, be-
cause of the depth of the burst, and only
a small amount of thermal radiation
escaped. The initial nuclear radiation
was similar to that from a shallow un-
derwater burst, but there was no linger-
ing airborne radioactive cloud from
which fallout could occur. The radioac-
tivity was associated with the base surge
while it was visible and also after the
water droplets had evaporated. The in-
visible, radioactive base surge contin-
ued to expand while moving in the
downwind direction. However, very lit-
tle radioactivity was found on the sur-
face of the water.
2.86 The hot gas bubble formed by
a deep underwater nuclear explosion
rises through the water and continues to
expand at a decreasing rate until a max-
imum size is reached. If it is not too near
the surface or the bottom at this time,
the bubble remains nearly spherical. As
a result of the outward momentum of the
water surrounding the bubble, the latter
actually overexpands; that is to say,
when it attains its maximum size its
contents are at a pressure well below the
ambient water pressure. The higher
pressure outside the bubble then causes
it to contract, resulting in an increase of
the pressure within the bubble and con-
densation of some of the steam. Since
the hydrostatic (water) pressure is larger
at the bottom of the bubble than at the
top, the bubble does not remain spheri-
cal during the contraction phase. The
bottom moves upward faster than the
top (which may even remain stationary)
and reaches the top to form a toroidal
bubble as viewed from above. This
causes turbulence and mixing of the
bubble contents with the surrounding
water.
2.87 The momentum of the water
set in motion by contraction of the bub-
ble causes it to overcontract, and its
internal pressure once more becomes
higher than the ambient water pressure.
A second compression (shock) wave in
the water commences after the bubble
reaches its minimum volume. This
compression wave has a lower peak
overpressure but a longer duration than
the initial shock wave in the water. A
second cycle of bubble expansion and
contraction then begins.
2.88 If the detonation occurs far
enough below the surface, as in the
WIGWAM test in 1955 at a depth of
about 2,000 feet, the bubble continues
to pulsate and rise, although after three
complete cycles enough steam will have
condensed to make additional pulsations
DESCRIPTION OF UNDERWATER BURSTS
57
Figure 2.84a. Spray dome observed 5.3 seconds after explosion in deep water.
Figure 2.84b. Plume observed 11.7 seconds after explosion in deep water.
Figure 2.84c. Formation of base surge at 45 seconds after explosion in deep water.
58
DESCRIPTIONS OF NUCLEAR EXPLOSIONS
unlikely. During the pulsation and up-
ward motion of the bubble, the water
surrounding the bubble acquires consid-
erable upward momentum and eventu-
ally breaks through the surface with a
high velocity, e.g., 200 miles per hour
in the WIGWAM event, thereby creat-
ing a large plume. If water surface
breakthrough occurs while the bubble
pressure is below ambient, a phenome-
non called “blowin” occurs. The plume
is then likely to resemble a vertical col-
umn which may break up into jets that
disintegrate into spray as they travel
through the air.
2.89 The activity levels of the ra-
dioactive base surge will be affected by
the phase of the bubble when it breaks
through the water surface. Hence, these
levels may be expected to vary widely,
and although the initial radiation inten-
sities may be very high, their duration is
expected to be short.
DESCRIPTION OF UNDERGROUND BURSTS
SHALLOW UNDERGROUND
EXPLOSION PHENOMENA
2.90 For the present purpose, a
shallow underground explosion may be
regarded as one which produces a sub-
stantial crater resulting from the
throwout of earth and rock. There is an
optimum depth of burst, dependent on
the energy yield of the detonation and
the nature of the rock medium, which
gives a crater of maximum size. The
mechanism of the formation of such
throwout (or excavation) craters will be
considered here. For shallower depths
of burst, the behavior approaches that of
a surface burst (§§ 2.18, 6.03 et seq.),
whereas for explosions at greater depths
the phenomena tend toward those of a
deep underground detonation (§ 2.101
et seq.).
2.91 When a nuclear weapon is ex-
ploded under the ground, a sphere of
extremely hot, high-pressure gases, in-
cluding vaporized weapon residues and
rock, is formed. This is the equivalent
of the fireball in an air or surface burst.
The rapid expansion of the gas bubble
initiates a ground shock wave which
travels in all directions away from the
burst point. When the upwardly directed
shock (compression) wave reaches the
earth’s surface, it is reflected back as a
rarefaction (or tension) wave. If the
tension exceeds the tensile strength of
the surface material, the upper layers of
the ground will spall, i.e., split off into
more-or-less horizontal layers. Then, as
a result of the momentum imparted by
the incident shock wave, these layers
move upward at a speed which may be
about 150 (or more) feet per second.
2.92 When it is reflected back from
the surface, the rarefaction wave travels
into the ground toward the expanding
gas sphere (or cavity) produced by the
explosion. If the detonation is not at too
great a depth, this wave may reach the
top of the cavity while it is still growing.
The resistance of the ground to the up-
ward growth of the cavity is thus de-
creased and the cavity expands rapidly
in the upward direction. The expanding
DESCRIPTION OF UNDERGROUND BURSTS
59
gases and vapors can thus supply addi-
tional energy to the spalled layers, so
that their upward motion is sustained for
a time or even increased. This effect is
referred to as “gas acceleration.”
2.93 The ground surface moving
upward first assumes the shape of a
dome. As the dome continues to in-
crease in height, cracks form through
which the cavity gases vent to the at-
mosphere. The mound then disinte-
grates completely and the rock frag-
ments are thrown upward and outward
(Fig. 2.93). Subsequently, much of the
ejected material collapses and falls
back, partly into the newly formed
crater and partly onto the surrounding
“lip.” The material that falls back im-
mediately into the crater is called the
“fallback,” whereas that descending
on the lip is called the “ejecta.” The
size of the remaining (or “apparent”)
crater depends on the energy yield of the
detonation and on the nature of the ex-
cavated medium. In general, for equiv-
alent conditions, the volume of the
crater is roughly proportional to the
yield of the explosion.
2.94 The relative extents to which
spalling and gas acceleration contribute
to the formation of a throwout crater
depend to large extent on the moisture
content of the rock medium. In rock
containing a moderately large propor-
tion of water, the cavity pressure is
greatly increased by the presence of
water vapor. Gas acceleration then plays
an important role in crater formation. In
dry rock, however, the contribution of
gas acceleration to the upward motion of
the ground is generally small and may
be unobservable.
2.95 As in an underwater burst, part
of the energy released by the weapon in
Figure 2.93. Shallow underground burst.
60
DESCRIPTIONS OF NUCLEAR EXPLOSIONS
a shallow underground explosion ap-
pears as an air blast wave. The fraction
of the energy imparted to the air in the
form of blast depends primarily on the
depth of burst for the given total energy
yield. The greater the depth of burst, the
smaller, in general, will be the propor-
tion of shock energy that escapes into
the air. For a sufficiently deep explo-
sion, there is, of course, no blast wave.
BASE SURGE AND MAIN CLOUD
2.96 When the fallback from a
shallow underground detonation de-
scends to the ground, it entrains air and
fine dust particles which are carried
downward. The dust-laden air upon
reaching the ground moves outward as a
result of its momentum and density,
thereby producing a base surge, similar
to that observed in shallow underwater
explosions. The base surge of dirt par-
ticles moves outward from the center of
the explosion and is subsequently car-
ried downwind. Eventually the particles
settle out and produce radioactive con-
tamination over a large area, the extent
of which depends upon the depth of
burst, the nature of the soil, and the
atmospheric conditions, as well as upon
the energy yield of the explosion. A dry
sandy terrain would be particularly con-
ducive to base surge formation in an
underground burst.
2.97 Throwout crater formation is
apparently always accompanied by a
base surge. If gas acceleration occurs,
however, a cloud consisting of particles
of various sizes and the hot gases
escaping from the explosion cavity gen-
erally also forms and rises to a height of
thousands of feet. This is usually re-
ferred to as the “main cloud,” to dis-
tinguish it from the base surge cloud.
The latter surrounds the base of the main
cloud and spreads out initially to a
greater distance. The main cloud and
base surge formed in the SEDAN test
(100 kilotons yield, depth of burial 635
feet in alluvium containing 7 percent of
water) are shown in the photograph in
Fig. 2.97, taken six minutes after the
explosion.
Figure 2.97. Main cloud and base surge 6 minutes after the SEDAN underground burst.
DESCRIPTION OF UNDERGROUND BURSTS
61
2.98 Both the base surge and the
main cloud are contaminated with ra-
dioactivity, and the particles present
contribute to the fallout. The larger
pieces are the first to reach the earth and
so they are deposited near the location
of the burst. But the smaller particles
remain suspended in the air some time
and may be carried great distances by
the wind before they eventually settle
out.
THERMAL AND NUCLEAR
RADIATIONS IN UNDERGROUND
BURSTS
2.99 The situations as regards ther-
mal and nuclear radiations from an un-
derground burst are quite similar to
those described above in connection
with an underwater explosion. As a
general rule, the thermal radiation is
almost completely absorbed by the
ground material, so that it does not rep-
resent a significant hazard. Most of the
neutrons and early gamma rays are also
removed, although the capture of the
neutrons may cause a considerable
amount of induced radioactivity in
various materials present in the soil (§
9.35). This will constitute a small part
of the residual nuclear radiation, of im-
portance only in the close vicinity of the
point of burst. The remainder of the
residual radiation will be due to the
contaminated base surge and fallout.
2.100 For the reasons given in §
2.82 for an underwater burst, the initial
and residual radiations from an under-
ground burst tend to merge into one
another. The distinction which is made
in the case of air and surface bursts is
consequently less significant in a sub-
surface explosion.
DEEP UNDERGROUND EXPLOSION
PHENOMENA
2.101 A deep underground explo-
sion is one occurring at such a depth that
the effects are essentially fully con-
tained. The surface above the detonation
point may be disturbed, e.g., by the
formation of a shallow subsidence crater
or a mound, and ground tremors may be
detected at a distance. There is no sig-
nificant venting of the weapon residues
to the atmosphere, although some of the
noncondensable gases present may seep
out gradually through the surface. The
United States has conducted many deep
underground tests, especially since
September 1961. Almost all of the ex-
plosion energy has been contained in the
ground, and, except in the few cases of
accidental venting or seepage of a small
fraction of the residues, the radioactivity
from these explosions has also been
confined. The phenomena of deep un-
derground detonations can be described
best in terms of four phases having
markedly different time scales.
2.102 First, the explosion energy is
released in less than one-millionth part
of a second, i.e., less than one micro-
second (§ 1.54 footnote). As a result,
the pressure in the hot gas bubble
formed will rise to several million at-
mospheres and the temperature will
reach about a million degrees within a
few microseconds. In the second (hy-
drodynamic) stage, which generally is
of a few tenths of a second duration, the
high pressure of the hot gases initiates a
strong shock wave which breaks away
and expands in all directions with a
velocity equal to or greater than the
speed of sound in the rock medium.
During the hydrodynamic phase, the hot
gases continue to expand, although
62
DESCRIPTIONS OF NUCLEAR EXPLOSIONS
more slowly than initially, and form a
cavity of substantial size. At the end of
this phase the cavity will have attained
its maximum diameter and its walls will
be lined with molten rock. The shock
wave will have reached a distance of
some hundreds of feet ahead of the cav-
ity and it will have crushed or fractured
much of the rock in the region it has
traversed. The shock wave will continue
to expand and decrease in strength
eventually becoming the “head” (or
leading) wave of a train of seismic
waves (§ 6.19). During the third stage,
the cavity will cool and the molten rock
material will collect and solidify at the
bottom of the cavity.
2.103 Finally, the gas pressure in
the cavity decreases to the point when it
can no longer support the overburden.
Then, in a matter of seconds to hours,
the roof falls in and this is followed by
progressive collapse of the overlying
rocks. A tall cylinder, commonly re-
ferred to as a “chimney,” filled with
broken rock or rubble is thus formed
(Fig. 2.103). If the top of the chimney
does not reach the ground surface, an
empty space, roughly equivalent to the
cavity volume, will remain at the top of
the chimney. However, if the collapse
of the chimney material should reach the
surface, the ground will sink into to the
empty space thereby forming a subsi-
dence crater (see Fig. 6.06f). The col-
lapse of the roof and the formation of
the chimney represented the fourth (and
last) phase of the underground explo-
sion.
2.104 The effects of the RAINIER
event of Operation Plumbbob in 1957
will provide an example of the extent to
which the surrounding medium may be
affected by a deep underground detona-
tion. RAINIER was a 1.7-kiloton nu-
clear device detonated in a chamber 6 x
6x7 feet in size, at a depth of 790 feet
below the surface in a compacted vol-
canic-ash medium referred to geologic-
ally as “tuff.” During the hydrodyna-
mic stage the chamber expanded to form
a spherical cavity 62 feet in radius,
which was lined with molten rock about
4 inches thick. The shock from the ex-
plosion crushed the surrounding me-
dium to a radius of 130 feet and frac-
tured it to 180 feet. Seismic signals were
detected out to distances of several
hundred miles and a weak signal was
recorded in Alaska. The chimney ex-
tended upward for about 400 feet from
the burst point. Further information on
cavity and chimney dimensions is given
in Chapter VI.
2.105 Deep underground nuclear
detonations, especially those of high
yield, are followed by a number of
minor seismic tremors called “after-
shocks,” the term that is used to de-
scribe the secondary tremors that gener-
Figure 2.103. The rubble chimney formed
after collapse of the cavity
in a deep underground nu-
clear detonation.
SCIENTIFIC ASPECTS OF NUCLEAR EXPLOSION PHENOMENA
63
ally occur after the main shock of a large
earthquake. In tests made in Nevada and
on Amchitka Island in the Aleutians, the
aftershocks have not constituted a
danger to people or to structures off the
test sites. No correlation has been found
between underground nuclear detona-
tions and the occurrence of natural
earthquakes in the vicinity (§ 6.24 et
seq.).
SCIENTIFIC ASPECTS OF NUCLEAR EXPLOSION
PHENOMENA7
INTRODUCTION
2.106 The events which follow the
very large and extremely rapid energy
release in a nuclear explosion are mainly
the consequences of the interaction of
the kinetic energy of the fission frag-
ments and the thermal radiations with
the medium surrounding the explosion.
The exact nature of these interactions,
and hence the directly observable and
indirect effects they produce, that is to
say, the nuclear explosion phenomena,
are dependent on such properties of the
medium as its temperature, pressure,
density, and composition. It is the vari-
ations in these factors in the environ-
ment of the nuclear detonation that ac-
count for the different types of response
associated with air, high-altitude, sur-
face, and subsurface bursts, as de-
scribed earlier in this chapter.
2.107 Immediately after the explo-
sion time, the temperature of the
weapon material is several tens of mil-
lion degrees and the pressures are es-
timated to be many million atmos-
pheres. As a result of numerous inelastic
collisions, part of the kinetic energy of
the fission fragments is converted into
internal and radiation energy. Some of
the electrons are removed entirely from
the atoms, thus causing ionization,
whereas others are raised to higher en-
ergy (or excited) states while still re-
maining attached to the nuclei. Within
an extremely short time, perhaps a hun-
dredth of a microsecond or so, the
weapon residues consist essentially of
completely and partially stripped (ion-
ized) atoms, many of the latter being in
excited states, together with the corre-
sponding free electrons. The system
then immediately emits electromagnetic
(thermal) radiation, the nature of which
is determined by the temperature. Since
this is of the order of several times 107
degrees, most of the energy emitted
within a microsecond or so is in the soft
X-ray region (§ 1.77, see also § 7.75).
2.108 The primary thermal radia-
tion leaving the exploding weapon is
absorbed by the atoms and molecules of
the surrounding medium. The medium
is thus heated and the resulting fireball
re-radiates part of its energy as the sec-
ondary thermal radiation of longer wave-
lengths (§ 2.38). The remainder of the
energy contributes to the shock wave
formed in the surrounding medium. Ul-
^The remaining (more technical) sections of this chapter may be omitted without loss of continuity.
64
DESCRIPTIONS OF NUCLEAR EXPLOSIONS
timately, essentially all the thermal ra-
diation (and shock wave energy) is ab-
sorbed and appears as heat, although it
may be spread over a large volume. In a
dense medium such as earth or water,
the degradation and absorption occur
within a short distance from the explo-
sion, but in air both the shock wave and
the thermal radiation may travel consid-
erable distances. The actual behavior
depends on the air density, as will be
seen later.
2.109 It is apparent that the kinetic
energy of the fission fragments, consti-
tuting some 85 percent of the total en-
ergy released, will distribute itself be-
tween thermal radiation, on the one
hand, and shock and blast, on the other
hand, in proportions determined largely
by the nature of the ambient medium.
The higher the density of the latter, the
greater the extent of the coupling be-
tween it and the energy from the ex-
ploding nuclear weapon. Consequently,
when a burst takes place in a medium of
high density, e.g., water or earth, a
larger percentage of the kinetic energy
of the fission fragments is converted into
shock and blast energy than is the case
in a less dense medium, e.g., air. At
very high altitudes, on the other hand,
where the air pressure is extremely low,
there is no true fireball and the kinetic
energy of the fission fragments is dissi-
pated over a very large volume. In any
event, the form and amount in which the
thermal radiation is received at a dis-
tance from the explosion will depend on
the nature of the intervening medium.
DEVELOPMENT OF THE FIREBALL IN
AN AIR BURST
2.110 As seen above, most of the
initial (or primary) thermal radiation
from a nuclear explosion is in the soft
X-ray region of the spectrum. If the
burst occurs in the lower part of the
atmosphere where the air density is ap-
preciable, the X rays are absorbed in the
immediate vicinity of the burst, and they
heat the air to high temperatures. This
sphere of hot air is sometimes referred
to as the “X-ray fireball.” The volume
of air involved, resultant air tempera-
tures, and ensuing behavior of this fire-
ball are all determined by the burst con-
ditions. At moderate and low altitudes
(below about 100,000 feet), the X rays
are aborbed within some yards of the
burst point, and the relatively small
volume of air involved is heated to a
very high temperature.
2.111 The energies (or wave-
lengths) of the X rays, as determined by
the temperature of the weapon debris,
cover a wide range (§ 7.73 etseq.), and
a small proportion of the photons
(§ 1.74) have energies considerably in
excess of the average. These high-en-
ergy photons are not easily absorbed and
so they move ahead of the fireball front.
As a result of interaction with the at-
mospheric molecules, the X rays so alter
the chemistry and radiation absorption
properties of the air that, in the air burst
at low and moderate altitudes, a veil of
opaque air is generated that obscures the
early growth of the fireball. Several mi-
croseconds elapse before the fireball
front emerges from the opaque X-ray
veil.
2.112 The X-ray fireball grows in
size as a result of the transfer of radia-
tion from the very hot interior where the
explosion has occurred to the cooler
exterior. During this “radiative
growth” phase, most of the energy
transfer in the hot gas takes place in the
SCIENTIFIC ASPECTS OF NUCLEAR EXPLOSION PHENOMENA
65
following manner. First, an atom, mo-
lecule, ion, or electron absorbs a photon
of radiation and is thereby converted
into an excited state. The atom or other
particle remains in this state for a short
time and then emits a photon, usually of
lower energy. The residual energy is
retained by the particle either as kinetic
energy or as internal energy. The emit-
ted photon moves off in a random di-
rection with the velocity of light, and it
may then be absorbed once again to
form another excited particle. The latter
will then re-emit a photon, and so on.
The radiation energy is thus transmitted
from one point to another within the
gas; at the same time, the average pho-
ton energy (and radiation frequency)
decreases. The energy lost by the pho-
tons serves largely to heat the gas
through which the photons travel.
2.113 If the mean free path of the
radiation, i.e., the average distance a
photon travels between interactions, is
large in comparison with the dimensions
of the gaseous volume, the transfer of
energy from the hot interior to the cooler
exterior of the fireball will occur more
rapidly than if the mean free path is
short. This is because, in their outward
motion through the gas, the photons
with short mean free paths will be ab-
sorbed and re-emitted several times. At
each re-emission the photon moves
away in a random direction, and so the
effective rate of transfer of energy in the
outward direction will be less than for a
photon of long mean free path which
undergoes little or no absorption and
re-emission in the hot gas.
2.114 In the radiative growth
phase, the photon mean free paths in the
hot fireball are of the order of (or longer
than) the fireball diameter because at the
very high temperatures the photons are
not readily absorbed. As a result, the
energy distribution and temperature are
fairly uniform throughout the volume of
hot gas. The fireball at this stage is
consequently referred to as the “iso-
thermal sphere.” The name is some-
thing of a misnomer, since temperature
gradients do exist, particularly near the
advancing radiation front.
2.115 As the fireball cools, the
transfer of energy by radiation and ra-
diative growth become less rapid be-
cause of the decreasing mean free path
of the photons. When the average tem-
perature of the isothermal sphere has
dropped to about 300,000°C, the ex-
pansion velocity will have decreased to
a value comparable to the local acoustic
(sound) velocity. At this point, a shock
wave develops at the fireball front and
the subsequent growth of the fireball is
dominated by the shock and associated
hydrodynamic expansion. The phenom-
enon of shock formation is sometimes
called “hydrodynamic separation.” For
a 20-kiloton burst it occurs at about a
tenth of a millisecond after the explo-
sion when the fireball radius is roughly
40 feet.
2.116 At very early times, begin-
ning in less than a microsecond, an
“inner” shock wave forms driven by
the expanding bomb debris. This shock
expands outward within the isothermal
sphere at a velocity exceeding the local
acoustic velocity. The inner shock
overtakes and merges with the outer
shock at the fireball front shortly after
hydrodynamic separation. The relative
importance of the debris shock wave
depends on the ratio of the yield to the
mass of the exploding device and on the
altitude of the explosion (§ 2.136). The
66
DESCRIPTIONS OF NUCLEAR EXPLOSIONS
debris shock front is a strong source of
ultraviolet radiation, and for weapons of
small yield-to-mass ratio it may replace
the X-ray fireball as the dominant en-
ergy source for the radiative growth.
2.117 As the (combined) shock
front from a normal air burst moves
ahead of the isothermal sphere it causes
a tremendous compression of the am-
bient air and the temperature is thereby
increased to an extent sufficient to
render the air incandescent. The lumi-
nous shell thus formed constitutes the
advancing visible fireball during this
“hydrodynamic phase” of fireball
growth. The fireball now consists of two
concentric regions. The inner (hotter)
region is the isothermal sphere of uni-
form temperature, and it is surrounded
by a layer of luminous, shock-heated air
at a somewhat lower, but still high,
temperature. Because hot (over
8,000°C) air is effectively opaque to
visible radiation, the isothermal sphere
is not visible through the outer shocked
air.
2.118 Some of the phenomena de-
scribed above are represented schemat-
ically in Fig. 2.118; qualitative temper-
ature profiles are shown at the left and
pressure profiles at the right of a series
of photographs of the fireball at various
intervals after the detonation of a 20-
kiloton weapon. In the first picture, at
0.1 millisecond, the temperature is
shown to be uniform within the fireball
and to drop abruptly at the exterior, so
that the condition is that of the isother-
mal sphere. Subsequently, as the shock
front begins to move ahead of the isoth-
ermal sphere, the temperature is no
longer uniform, as indicated by the
more gradual fall near the outside of the
fireball. Eventually, two separate tem-
perature regions form. The outer region
absorbs the radiation from the isother-
mal sphere in the center and so the latter
cannot be seen. The photographs,
therefore, show only the exterior surface
of the fireball.
2.119 From the shapes of the curves
at the right of Fig. 2.118 the nature of
the pressure changes in the fireball can
be understood. In the isothermal stage
the pressure is uniform throughout and
drops sharply at the outside, but after a
short time, when the shock front has
separated from the isothermal sphere,
the pressure near the surface is greater
than in the interior of the fireball. Within
less than 1 millisecond the steep-fronted
shock wave has traveled some distance
ahead of the isothermal region. The rise
of the pressure in the fireball to a peak,
which is characteristic of a shock wave,
followed by a sharp drop at the external
surface, implies that the latter is identi-
cal with the shock front. It will be
noted, incidentally, from the photo-
graphs, that the surface of the fireball,
which has hitherto been somewhat un-
even, has now become sharply defined.
2.120 For some time the fireball
continues to grow in size at a rate de-
termined by the propagation of the
shock front in the surrounding air. Dur-
ing this period the temperature of the
shocked air decreases steadily so that it
becomes less opaque. Eventually, it is
transparent enough to permit the much
hotter and still incandescent interior of
the fireball, i.e., the isothermal sphere,
to be seen through the faintly visible
shock front (see Fig. 2.32). The onset of
this condition at about 15 milliseconds
(0.015 second) after the detonation of a
20-kiloton weapon, for example, is re-
ferred to as the “breakaway.”
SCIENTIFIC ASPECTS OF NUCLEAR EXPLOSION PHENOMENA
67
TEMPERATURE
Figure 2.118. Variation of temperature and pressure in the fireball. (Times and dimensions
apply to a 20-kiloton air burst.)
2.121 Following the breakaway,
the visible fireball continues to increase
in size at a slower rate than before, the
maximum dimensions being attained
after about a second or so. The manner
in which the radius increases with time,
in the period from roughly 0.1 millisec-
ond to 1 second after the detonation of a
20-kiloton nuclear weapon, is shown in
Figure 2.121. Attention should be called
68
DESCRIPTIONS OF NUCLEAR EXPLOSIONS
Figure 2.121. Variation of radius of luminous fireball with time in a 20-kiloton air burst.
to the fact that both scales are logarith-
mic, so that the lower portion of the
curve (at the left) does not represent a
constant rate of growth, but rather one
that falls off with time. Nevertheless,
the marked decrease in the rate at which
the fireball grows after breakaway is
apparent from the subsequent flattening
of the curve.
TEMPERATURE OF THE FIREBALL
2.122 As indicated earlier, the inte-
rior temperature of the fireball decreases
steadily, but the apparent surface tem-
perature, which influences the emission
of thermal radiation, decreases to a
minimum and then increases to a max-
imum before the final steady decline.
This behavior is related to the fact that at
high temperatures air both absorbs and
emits thermal radiation very readily, but
as the temperature falls below a few
thousand degrees, the ability to absorb
and radiate decreases.
2.123 From about the time the fire-
ball temperature has fallen to
300,000°C, when the shock front begins
to move ahead of the isothermal sphere,
until close to the time of the first tem-
perature minimum (§ 2.38), the expan-
sion of the fireball is governed by the
laws of hydrodynamics. It is then pos-
sible to calculate the temperature of the
shocked air from the measured shock
velocity, i.e., the rate of growth of the
fireball. The variation of the temperature
of the shock front with time, obtained in
this manner, is shown by the full line
from 10~4 to 10~2 second in Fig. 2.123,
for a 20-kiloton explosion. But photo-
graphic and spectroscopic observations
of the surface brightness of the advanc-
ing shock front, made from a distance,
SCIENTIFIC ASPECTS OF NUCLEAR EXPLOSION PHENOMENA
69
Figure 2.123. Variation of apparent fireball surface temperature with time in a 20-kiloton
air burst.
indicate the much lower temperatures
represented by the broken curve in the
figure. The reason for this discrepancy is
that both the nuclear and thermal radia-
tions emitted in the earliest stages of the
detonation interact in depth with the
gases of the atmosphere ahead of the
shock front to produce ozone, nitrogen
dioxide, nitrous acid, etc. These sub-
stances are strong absorbers of radiation
coming from the fireball, so that the
brightness observed some distance away
corresponds to a temperature consider-
ably lower than that of the shock front.
2.124 Provided the temperature of
the air at the shock front is sufficiently
high, the isothermal sphere is invisible
(§ 2.117). The rate at which the shock
front emits (and absorbs) radiation is
determined by its temperature and ra-
dius. The temperature at this time is
considerably lower than that of the
isothermal sphere but the radius is
larger. However, as the temperature of
70
DESCRIPTIONS OF NUCLEAR EXPLOSIONS
the shocked air approaches 3,000°C
(5,400°F) it absorbs (and radiates) less
readily. Thus the shock front becomes
increasingly transparent to the radiation
from the isothermal sphere and there is a
gradual unmasking of the still hot iso-
thermal sphere, representing breakaway
(§ 2.120).
2.125 As a result of this unmasking
of the isothermal sphere, the apparent
surface temperature (or brightness) of
the fireball increases (Fig. 2.123), after
passing through the temperature mini-
mum of about 3,000°C attributed to the
shock front. This minimum, represent-
ing the end of the first thermal pulse,
occurs at about 11 milliseconds (0.011
second) after the explosion time for a
20-kiloton weapon. Subsequently, as
the brightness continues to increase
from the minimum, radiation from the
fireball is emitted directly from the hot
interior (or isothermal sphere), largely
unimpeded by the cooled air in the
shock wave ahead of it; energy is then
radiated more rapidly than before. The
apparent surface temperature increases
to a maximum of about 7,700°C
(14,000°F), and this is followed by a
steady decrease over a period of seconds
as the fireball cools by the emission of
radiation and mixing with air. It is dur-
ing the second pulse that the major part
of the thermal radiation is emitted in an
air burst (§ 2.38 et seq.). In such a
burst, the rate of emission of radiation is
greatest when the surface temperature is
at the maximum.
2.126 The curves in Figs. 2.121
and 2.123 apply to a 20-kiloton nuclear
burst, but similar results are obtained for
explosions of other energy yields. The
minimum temperature of the radiating
surface and the subsequent temperature
maximum are essentially independent of
the yield of the explosion. But the times
at which these temperatures occur for an
air burst increase approximately as the
0.4 power of the yield (Chapter VII).
The time of breakaway is generally very
soon after the thermal minimum is at-
tained.
SIZE OF THE FIREBALL
2.127 The size of the fireball in-
creases with the energy yield of the
explosion. Because of the complex in-
teraction of hydrodynamic and radiation
factors, the radius of the fireball at the
thermal minimum is not very different
for air and surface bursts of the same
yield. The relationship between the
average radius and the yield is then
given approximately by
R (at thermal minimum) ~ 90 W0-4,
where R is the fireball radius in feet and
W is the explosion yield in kilotons
TNT equivalent. The breakaway phe-
nomenon, on the other hand, is deter-
mined almost entirely by hydrodynamic
considerations, so that a distinction
should be made between air and surface
bursts. For an air burst the radius of the
fireball is given by
R (at breakaway) for
air burst « 110 W04, (2.127.1)
For a contact surface burst, i.e., in
which the exploding weapon is actually
on the surface,8 blast wave energy is
“For most purposes, a contact surface burst may be defined as one for which the burst point is not more
than 5 W"' feet above or below the surface.
SCIENTIFIC ASPECTS OF NUCLEAR EXPLOSION PHENOMENA
71
reflected back from the surface into the
fireball (§ 3.34) and W in equation
(2.127.1) should probably be replaced
by 2W, where W is the actual yield.
Hence, for a contact surface burst,
R (at breakaway) for contact surface
burst « 145 W°*. (2.127.2)
For surface bursts in the transition range
between air bursts and contact bursts,
the radius of the fireball at breakaway is
somewhere between the values given by
equations (2.127.1) and (2.127.2). The
size of the fireball is not well defined in
its later stages, but as a rough approx-
imation the maximum radius may be
taken to be about twice that at the time
of breakaway (cf. Fig. 2.121).
2.128 Related to the fireball size is
the question of the height of burst at
which early (or local) fallout ceases to
be a serious problem. As a guide, it may
be stated that this is very roughly related
to the weapon yield by
H (maximum for local
fallout) 180 Wo4, (2.128.1)
where H feet is the maximum value of
the height of burst for which there will
be appreciable local fallout. This ex-
pression is plotted in Fig. 2.128. For an
explosion of 1,000 kilotons, i.e., 1 me-
gaton yield, it can be found from Fig.
2.128 or equation (2.128.1) that signif-
icant local fallout is probable for heights
of burst less than about 2,900 feet. It
should be emphasized that the heights of
burst estimated in this manner are ap-
proximations only, with probable errors
of ±30 percent. Furthermore, it must
not be assumed that if the burst height
exceeds the value given by equation
(2.128.1) there will definitely be no
local fallout. The amount, if any, may
be expected, however, to be small
enough to be tolerable under emergency
conditions.
2.129 Other aspects of fireball size
are determined by the conditions under
which the fireball rises. If the fireball is
small compared with an atmospheric
scale height, which is about 4.3 miles at
altitudes of interest (§ 10.123), the late
fireball rise is caused by buoyant forces
similar to those acting on a bubble rising
in shallow water. This is called
“buoyant” rise. The fireball is then es-
sentially in pressure equilibrium with
the surrounding air as it rises. If the
initial fireball radius is comparable to or
greater than a scale height, the atmos-
pheric pressure on the bottom of the
fireball is much larger than the pressure
on the top. This causes a very rapid
acceleration of the fireball, referred to as
“ballistic” rise. The rise velocity be-
comes so great compared to the expan-
sion rate that the fireball ascends almost
like a solid projectile. “Overshoot”
then occurs, in which a parcel of dense
air is carried to high altitudes where the
ambient air has a lower density. The
dense “bubble” will subsequently ex-
pand, thereby decreasing its density,
and will fall back until it is in a region of
comparable density.
HIGH-ALTITUDE BURSTS
2.130 For nuclear detonations at
heights up to about 100,000 feet (19
miles), the distribution of explosion en-
ergy between thermal radiation and blast
varies only to a small extent with yield
and detonation altitude (§ 1.24). But at
burst altitudes above 100,000 feet, the
distribution begins to change more no-
ticeably with increasing height of burst
72
DESCRIPTIONS OF NUCLEAR EXPLOSIONS
EXPLOSION YIELD (KILOTONS)
Figure 2.128. Approximate maximum height of burst for appreciable local fallout.
SCIENTIFIC ASPECTS OF NUCLEAR EXPLOSION PHENOMENA
73
(see Chapter VII). It is for this reason
that the level of 100,000 feet has been
chosen for distinguishing between air
bursts and high-altitude bursts. There is,
of course, no sharp change in behavior
at this elevation, and so the definition of
a high-altitude burst as being at a height
above 100,000 feet is somewhat arbi-
trary. There is a progressive decline in
the blast energy with increasing height
of burst above 100,000 feet, but the
proportion of the explosion energy re-
ceived as effective thermal radiation on
the ground at first increases only slightly
with altitude. Subsequently, as the burst
altitude increases, the effective thermal
radiation received on the ground de-
creases and becomes less than at an
equal distance from an air burst of the
same total yield (§ 7.102).
2.131 For nuclear explosions at al-
titudes between 100,000 and about
270,000 feet (51 miles) the fireball phe-
nomena are affected by the low density
of the air. The probability of interaction
of the primary thermal radiation, i.e.,
the thermal X rays, with atoms and
molecules in the air is markedly de-
creased, so that the photons have long
mean free paths and travel greater dis-
tances, on the average, before they are
absorbed or degraded into heat and into
radiations of longer wavelength (smaller
photon energy). The volume of the at-
mosphere in which the energy of the
radiation is deposited, over a period of a
millisecond or so, may extend for sev-
eral miles, the dimensions increasing
with the burst altitude. The interaction
of the air molecules with the prompt
gamma rays, neutrons, and high-energy
component of the X rays produces a
strong flash of fluorescence radiation
(§2.140), but there is less tendency for
the X-ray veil to form than in an air
burst (§ 2.111).
2.132 Because the primary thermal
radiation energy in a high-altitude burst
is deposited in a much larger volume of
air, the energy per unit volume available
for the development of the shock front is
less than in an air burst. The outer shock
wave (§ 2.116) is slow to form and
radiative expansion predominates in the
growth of the fireball. The air at the
shock front does not become hot enough
to be opaque at times sufficiently early
to mask the radiation front and the fire-
ball radiates most of its energy very
rapidly. There is no apparent tempera-
ture minimum as is the case for an air
burst. Thus, with increasing height, a
series of changes take place in the ther-
mal- pulse phenomena; the surface tem-
perature minimum becomes less pro-
nounced and eventually disappears, so
that the thermal radiation is emitted in a
single pulse of fairly short duration. In
the absence of the obscuring opaque
shock front, the fireball surface is visible
throughout the period of radiative
growth and the temperature is higher
than for a low-altitude fireball. Both of
these effects contribute to the increase in
the thermal radiation emission.
2.133 A qualitative comparison of
the rate of arrival of thermal radiation
energy at a distance from the burst point
as a function of time for a megaton-
range explosion at high altitude and in a
sea-level atmosphere is shown in Fig.
2.133. In a low (or moderately low) air
burst, the thermal radiation is emitted in
two pulses, but in a'high-altitude burst
there is only a single pulse in which
most of the radiation is emitted in a
relatively short time. Furthermore, the
thermal pulse from a high-altitude ex-
74
DESCRIPTIONS OF NUCLEAR EXPLOSIONS
Figure 2.133. Qualitative comparison of
rates of arrival of thermal
radiation at a given distance
from high-altitude and sea-
level bursts.
plosion is richer in ultraviolet radiation
than is the main (second) pulse from an
air burst. The reason is that formation of
ozone, oxides of nitrogen, and nitrous
acid (§ 2.123), which absorb strongly in
this spectral region, is decreased.
2.134 For burst altitudes above
about 270,000 feet, there is virtually no
absorption of the X rays emitted in up-
ward directions. The downward directed
X rays are mostly absorbed in a layer of
air, called the “X-ray pancake,” which
becomes incandescent as a result of en-
ergy deposition. The so-called pancake
is more like the frustum of a cone,
pointing upward, with a thickness of
roughly 30,000 feet (or more) and a
mean altitude of around 270,000 feet;
the radius at this altitude is approxi-
mately equal to the height of burst
minus 270,000 feet. The height and di-
mensions of the pancake are determined
largely by the emission temperature for
the primary X rays, which depends on
the weapon yield and design, but the
values given here are regarded as being
reasonable averages. Because of the
very large volume and mass of air in the
X-ray pancake, the temperatures
reached in the layer are much lower than
those in the fireballs from bursts in the
normal atmosphere. Various excited
atoms and ions are formed and the radi-
ations of lower energy (longer wave-
length) re-emitted by these species rep-
resent the thermal radiation observed at
a distance.
2.135 For heights of burst up to
about 270,000 feet, the early fireball is
approximately spherical, although at the
higher altitudes it begins to elongate
vertically. The weapon debris and the
incandescent air heated by the X rays
roughly coincide. Above 270,000 feet,
however, the debris tends to be separate
from the X-ray pancake. The debris can
rise to great altitudes, depending on the
explosion yield and the burst height; its
behavior and ionization effects are de-
scribed in detail in Chapter X. The in-
candescent (X-ray pancake) region, on
the other hand, remains at an essentially
constant altitude regardless of the height
of burst. From this region the thermal
radiation is emitted as a single pulse
containing a substantially smaller pro-
portion of the total explosion energy but
of somewhat longer duration than for
detonations below roughly 270,000 feet
(see § 7.89 et seq.).
2.136 Although the energy density
in the atmosphere as the result of a
high-altitude burst is small compared
with that from an air burst of the same
yield, a shock wave is ultimately pro-
duced by the weapon debris (§ 2.116),
at least for bursts up to about 400,000
feet (75 miles) altitude. For example,
disturbance of the ionosphere in the vi-
cinity of Hawaii after the TEAK shot (at
252,000 feet altitude) indicated that a
SCIENTIFIC ASPECTS OF NUCLEAR EXPLOSION PHENOMENA
75
shock wave was being propagated at
that time at an average speed of about
4,200 feet per second. The formation of
the large red, luminous sphere, several
hundred miles in diameter, surrounding
the fireball, has been attributed to the
electronic excitation of oxygen atoms by
the energy of the shock wave. Soon
after excitation, the excess energy was
emitted as visible radiation toward the
red end of the spectrum (6,300 and
6,364 A).
2.137 For bursts above about
400,000 feet, the earth’s magnetic field
plays an increasingly important role in
controlling weapon debris motion, and
it becomes the dominant factor for ex-
plosions above 200 miles or so (Chapter
X). At these altitudes, the shock waves
are probably magnetohydrodynamic
(rather than purely hydrodynamic) in
character. The amount of primary ther-
mal radiation produced by these shock
waves is quite small.
AIR FLUORESCENCE PHENOMENA
2.138 Various transient fluorescent
effects, that is, the emission of visible
and ultraviolet radiations for very short
periods of time, accompany nuclear ex-
plosions in the atmosphere and at high
altitudes. These effects arise from elec-
tronic excitation (and ionization) of
atoms and molecules in the air resulting
from interactions with high-energy X
rays from the fireball, or with gamma
rays, neutrons, beta particles, or other
charged particles of sufficient energy.
The excess energy of the excited atoms,
molecules, and ions is then rapidly
emitted as fluorescence radiation.
2.139 In a conventional air burst,
i.e., at an altitude below about 100,000
feet, the first brief fluorescence that can
be detected, within a microsecond or so
of the explosion time, is called the
“Teller light.’’ The excited particles are
produced initially by the prompt (or in-
stantaneous) gamma rays that accom-
pany the fission process and in the later
stages by the interaction of fast neutrons
with nuclei in the air (§ 8.53).
2.140 For bursts above 100,000
feet, the gamma rays and neutrons tend
to be absorbed, with an emission of
fluorescence, in a region at an altitude of
about 15 miles (80,000 feet), since at
higher altitudes the mean free paths in
the low-density air are too long for ap-
preciable local absorption (§ 10.29).
The fluorescence is emitted over a rela-
tively long period of time because of
time-of-flight delays resulting from the
distances traveled by the photons and
neutrons before they are absorbed. An
appreciable fraction of the high-energy
X rays escaping from the explosion re-
gion are deposited outside the fireball
and also produce fluorescence. The rel-
ative importance of the X-ray fluores-
cence increases with the altitude of the
burst point.
2.141 High-energy beta particles
associated with bursts at sufficiently
high altitudes can also cause air fluo-
rescence. For explosions above about 40
miles, the beta particles emitted by the
weapon residues in the downward di-
rection are absorbed in the air roughly at
this altitude, their outward spread being
restricted by the geomagnetic field lines
(§ 10.63 et seq.). A region of air fluo-
rescence, called a “beta patch,’’ may
then be formed. If the burst is at a
sufficiently high altitude, the weapon
debris ions can themselves produce flu-
orescence. A fraction of these ions can
76
DESCRIPTIONS OF NUCLEAR EXPLOSIONS
be channeled by the geomagnetic field to
an altitude of about 70 miles where they
are stopped by the atmosphere (§ 10.29)
and cause the air to fluoresce. Under
suitable conditions, as will be explained
below, fluorescence due to beta particles
and debris ions can also appear in the
atmosphere in the opposite hemisphere
of earth to the one in which the nuclear
explosion occurred.
AURORAL PHENOMENA
2.142 The auroral phenomena as-
sociated with high-altitude explosions
(§ 2.62) are caused by the beta particles
emitted by the radioactive weapon resi-
dues and, to a varying extent, by the
debris ions. Interaction of these charged
particles with the atmosphere produces
excited molecules, atoms, and ions
which emit their excess energy in the
form of visible radiations characteristic
of natural auroras. In this respect, there
is a resemblance to the production of the
air fluorescence described above. How-
ever, auroras are produced by charged
particles of lower energy and they per-
sist for a much longer time, namely,
several minutes compared with fractions
of a second for air fluorescence. Fur-
thermore, the radiations have somewhat
different wavelength characteristics
since they are emitted, as a general rule,
by a different distribution of excited
species.
2.143 The geomagnetic field exerts
forces on charged particles, i.e., beta
particles (electrons) and debris ions, so
that these particles are constrained to
travel in helical (spiral) paths along the
field lines. Since the earth behaves like a
magnetic dipole, and has north and
south poles, the field lines reach the
earth at two points, called “conjugate
points,” one north of the magnetic
equator and the other south of it. Hence,
the charged particles spiraling about the
geomagnetic field lines will enter the
atmosphere in corresponding conjugate
regions. It is in these regions that the
auroras may be expected to form (Fig.
2.143).
2.144 For the high-altitude tests
conducted in 1958 and 1962 in the vi-
cinity of Johnston Island (§ 2.52), the
charged particles entered the atmos-
phere in the northern hemisphere be-
500 MILES
BETA PARTICLES
SPIRALING
ALONG MAGNETIC
LINES OF FORCE
MAGNETIC
EQUATOR
BETA IONIZATION
AND AURORA
CONJUGATE AREA
BURST
300
200
100
DEBRIS AFTER
AA FEW MINUTES
GAMMA RAY
IONIZATION BETA
IONIZATION
AND
AURORA
Figure 2.143. Phenomena associated with high-altitude explosions.
SCIENTIFIC ASPECTS OF NUCLEAR EXPLOSION PHENOMENA
77
tween Johnston Island and the main
Hawaiian Islands, whereas the conju-
gate region in the southern hemisphere
region was in the vicinity of the Sa-
moan, Fiji, and Tonga Islands. It is in
these areas that auroras were actually
observed, in addition to those in the
areas of the nuclear explosions.
2.145 Because the beta particles
have high velocities, the beta auroras in
the remote (southern) hemisphere ap-
peared within a fraction of a second of
those in the hemisphere where the bursts
had occurred. The debris ions, however,
travel more slowly and so the debris
aurora in the remote hemisphere, if it is
formed, appears at a somewhat later
time. The beta auroras are generally
most intense at an altitude of 30 to 60
miles, whereas the intensity of the
debris auroras is greatest in the 60 to
125 miles range. Remote conjugate beta
auroras can occur if the detonation is
above 25 miles, whereas debris auroras
appear only if the detonation altitude is
in excess of some 200 miles.
THE ARGUS EFFECT
2.146 For bursts at sufficiently high
altitudes, the debris ions, moving along
the earth’s magnetic field lines, are
mostly brought to rest at altitudes of
about 70 miles near the conjugate
points. There they continue to decay and
so act as a stationary source of beta
particles which spiral about the geo-
magnetic lines of force. When the par-
ticles enter a region where the strength
of the earth’s magnetic field increases
significantly, as it does in the vicinity of
the conjugate points, some of the beta
particles are turned back (or reflected).
Consequently, they may travel back and
forth, from one conjugate region to the
other, a number of times before they are
eventually captured in the atmosphere.
(More will be said in Chapter X about
the interactions of the geomagnetic field
with the charged particles and radiations
produced by a nuclear explosion.)
2.147 In addition to the motion of
the charged particles along the field
lines, there is a tendency for them to
move across the lines wherever the
magnetic field strength is not uniform.
This results in an eastward (longitu-
dinal) drift around the earth superim-
posed on the back-and-forth spiral mo-
tion between regions near the conjugate
points. Within a few hours after a high-
altitude nuclear detonation, the beta
particles form a shell completely around
the earth. In the ARGUS experiment
(§ 2.53), in which the bursts occurred at
altitudes of 125 to 300 miles, well-
defined shells of about 60 miles thick-
ness, with measurable electron densi-
ties, were established and remained for
several days. This has become known as
the “ARGUS effect.’’ Similar phenom-
ena were observed after the STARFISH
PRIME (§ 2.52) and other high-altitude
nuclear explosions.
EFFECT ON THE OZONE LAYER
2.148 Ozone (O3) is formed in the
upper atmosphere, mainly in the strato-
sphere (see Fig. 9.126) in the altitude
range of approximately 50,000 to
100,000 feet (roughly 10 to 20 miles),
by the action of solar radiation on mo-
lecular oxygen (O2). The accumulation
of ozone is limited by its decomposi-
tion, partly by the absorption of solar
ultraviolet radiation in the wavelength
range from about 2,100 to 3,000 A and
78
DESCRIPTIONS OF NUCLEAR EXPLOSIONS
partly by chemical reaction with traces
of nitrogen oxides (and other chemical
species) present in the atmosphere. The
chemical decomposition occurs by way
of a complex series of chain reactions
whereby small quantities of nitrogen
oxides can cause considerable break-
down of the ozone. The equilibrium (or
steady-state) concentration of ozone at
any time represents a balance between
the rates of formation and decomposi-
tion; hence, it is significantly dependent
on the amount of nitrogen oxides pres-
ent. Solar radiation is, of course, an-
other determining factor; the normal
concentration of ozone varies, conse-
quently, with the latitude, season of the
year, time of day, the stage in the solar
(sunspot) cycle, and perhaps with other
factors not yet defined.
2.149 Although the equilibrium
amount in the atmosphere is small,
rarely exceeding 10 parts by weight per
million parts of air, ozone has an im-
portant bearing on life on earth. If it
were not for the absorption of much of
the solar ultraviolet radiation by the
ozone, life as currently known could not
exist except possibly in the ocean. A
significant reduction in the ozone con-
centration, e.g., as a result of an in-
crease in the amount of nitrogen oxides,
would be expected to cause an increased
incidence of skin cancer and to have
adverse effects on plant and animal life.
2.150 As seen in §§ 2.08 and
2.123, nuclear explosions are accom-
panied by the formation of oxides of
nitrogen. An air burst, for example, is
estimated to produce about 1032 mole-
cules of nitrogen oxides per megaton
TNT equivalent. For nuclear explosions
of intermediate and moderately high
yield in the air or near the surface, the
cloud reaches into the altitude range of
50,000 to 100,000 feet (Fig. 2.16);
hence, the nitrogen oxides from such
explosions would be expected to en-
hance mechanisms which tend to de-
crease the ozone concentration. Routine
monitoring of the atmosphere during
and following periods of major nuclear
testing have shown no significant
change in the ozone concentration in the
sense of marked, long-lasting perturba-
tions. However, the large natural varia-
tions in the ozone layer and uncertain-
ties in the measurements do not allow an
unambiguous conclusion to be reached.
Theoretical calculations indicate that
extensive use of nuclear weapons in
warfare could cause a substantial de-
crease in the atmospheric ozone con-
centration, accompanied by an increase
in adverse biological effects due to ul-
traviolet radiation. The ozone layer
should eventually recover, but this
might take up to 25 years.
BIBLIOGRAPHY
Bauer, E., and F. R. Gilmore, “The Effect of
Atmospheric Nuclear Explosions on Total
Ozone,” Institute for Defense Analyses, Jan-
uary 1975, Paper P-1076, IDA Log. No. HQ
74-16726.
*Bethe, H. A., et al., “Blast Wave,” Univer-
sity of California, Los Alamos Scientific Labo-
ratory, March, 1958, LA-2000.
Boquist, W. P., and J. W. Snyder, “Conju-
gate Auroral Measurements from the 1962 U.S.
High Altitude Nuclear Test Series,” in “Aurora
and Airglow,” В. M. McCormac, Ed., Rein-
hold Publishing Corp., 1967.
Brickwedde, F. G., “Temperature in Atomic
Explosions,” in “Temperature, Its Measure-
ment and Control in Science and Industry.”
SCIENTIFIC ASPECTS OF NUCLEAR EXPLOSION PHENOMENA 79
Reinhold Publishing Corp., 1955, Vol. II,
p. 395.
Brode, H. L., “Review of Nuclear Weapons
Effects,” Ann Rev. Nuclear Science, 18, 153
(1968).
Christofilos, N. C., “The Argus Experi-
ment,” J. Geophys. Res., 64, 869 (1959).
Foley, N. M., and M. A. Ruderman, “Stra-
tospheric Nitric Oxide Production from Past
Nuclear Explosions and Its Relevance to Pro-
jected SST Pollution,” Institute for Defense
Analyses, August 1972, Paper P-894, IDA
Log. No. HQ 72-14452.
Gilmore, F. R., “The Production of Nitrogen
Oxides by Low Altitude Nuclear Explosions,”
Institute for Defense Analyses, July 1974,
Paper P-986, IDA Log. No. HQ 73-15738.
Glasstone, S., “Public Safety and Under-
ground Nuclear Detonations,” U.S. Atomic
Energy Commission, June 1971, TID-25708.
Hess, W. N., Ed., “Collected Papers on the
Artificial Radiation Belt from the July 9, 1962
Nuclear Detonation,” J. Geophys. Res., 68,
605 et seq. (1963).
♦Hoerlin, H., “United States High-Altitude
Test Experiences,” University of California,
Los Alamos Scientific Laboratory, October
1976, LA-6405.
♦Johnson, G. W., and С. E. Violet, “Phe-
nomenology of Contained Nuclear Explo-
sions,” University of California, Lawrence
Radiation Laboratory, Livermore, December
1958, UCRL 5124 Rev. 1.
♦Johnson, G. W., et al., “Underground Nu-
clear Detonations,” University of California,
Lawrence Radiation Laboratory, Livermore,
July 1959, UCRL 5626.
Matsushita, S., “On Artificial Geomagnetic
and Ionospheric Storms Associated with High
Altitude Explosions,” J. Geophys. Res., 64,
1149 (1959).
Nelson, D. B., “EMP Impact on U.S. De-
fense,” Survive, 2, No. 6, 2 (1969).
♦“Proceedings of the Third Plowshare Sympo-
sium, Engineering with Nuclear Explosives,”
April 1966, University of California, Lawrence
Radiation Laboratory, Livermore, TID-695.
“Proceedings of the Symposium on Engineering
with Nuclear Explosives,” Las Vegas, Nevada,
January 1970, American Nuclear Society and
U.S. Atomic Energy Commission, CONF-
700101, Vols. 1 and 2.
“Proceedings for the Symposium on Public
Health Aspects of Peaceful Uses of Nuclear
Explosives,” Las Vegas, Nevada, April 1969,
Southwestern Radiological Health Laboratory,
SWRHL-82.
“Proceedings of the Special Session on Nuclear
Excavation,” Nuclear Applications and Tech-
nology, 7, 188 et seq. (1969).
Snay, H. G., and R. C. Tipton, “Charts for the
Parameters of Migrating Explosion Bubbles,”
U.S. Naval Ordnance Laboratory, 1962,
NOLTR 62-184.
Steiger, W. R., and S. Matsushita, “Photo-
graphs of the High Altitude Nuclear Explosion
TEAK,” J. Geophys. Res., 65, 545 (I960).
Strange, J. N., and L. Miller, “Blast Phe-
nomena from Explosions and an Air-Water In-
terface,” U.S. Army Engineer Waterways Ex-
periment Station, 1966, Report 1, Misc. Paper
1-814.
Teller, E., et al., “The Constructive Uses of
Nuclear Explosives,” McGraw-Hill Book
Company, 1968.
Van Dorn, W. G., B. Le МЁнлитЁ, and
L. Hwang, “Handbook of Explosion-Gen-
erated Water Waves, Vol. I—State of the Art,”
Tetra Tech, Inc., Pasadena, California, October
1968, Report No. TC-130.
♦These documents may be purchased from the National Technical Information Center, U.S.
Department of Commerce, Springfield, Virginia, 22161.
CHAPTER III
AIR BLAST PHENOMENA IN AIR AND SURFACE
BURSTS
CHARACTERISTICS OF THE BLAST WAVE IN AIR
DEVELOPMENT OF THE BLAST
WAVE
3.01 Most of the material damage
caused by a nuclear explosion at the
surface or at a low or moderate altitude
in the air is due—directly or indi-
rectly—to the shock (or blast) wave
which accompanies the explosion.
Many structures will suffer some dam-
age from air blast when the overpressure
in the blast wave, i.e., the excess over
the atmospheric pressure (14.7 pounds
per square inch at standard sea level
conditions), is about one-half pound per
square inch or more. The distance to
which this overpressure level will ex-
tend depends primarily on the energy
yield (§ 1.20) of the explosion, and on
the height of the burst. It is conse-
quently desirable to consider in some
detail the phenomena associated with
the passage of a blast wave through the
air.
3.02 A difference in the air pressure
acting on separate surfaces of a structure
produces a force on the structure. In
considering the destructive effect of a
blast wave, one of its important charac-
teristics is the overpressure. The varia-
80
tion in the overpressure with time and
distance will be described in succeeding
sections. The maximum value, i.e., at
the blast wave (or shock) front, is called
the “peak overpressure.” Other
characteristics of the blast wave, such as
dynamic pressure, duration, and time of
arrival will also be discussed.
3.03 As stated in Chapter II, the
expansion of the intensely hot gases at
extremely high pressures in the fireball
causes a shock wave to form, moving
outward at high velocity. The main
characteristic of this wave is that the
pressure rises very sharply at the mov-
ing front and falls off toward the interior
region of the explosion. In the very
early stages, for example, the variation
of the pressure with distance from the
center of the fireball, at a given instant,
is somewhat as illustrated in Fig. 3.03
for an ideal (instantaneously rising)
shock front. It is seen that, prior to
breakaway (§ 2.120), pressures at the
shock front are two or three times as
large as the already very high pressures
in the interior of the fireball.
3.04 As the blast wave travels in the
air away from its source, the overpres-
sure at the front steadily decreases, and
CHARACTERISTICS OF THE BLAST WAVE IN AIR
81
the pressure behind the front falls off in
a regular manner. After a short time,
when the shock front has traveled a
certain distance from the fireball, the
pressure behind the front drops below
that of the surrounding atmosphere and
a so-called “negative phase” of the
blast wave forms. This development is
seen in Fig. 3.04, which shows the
overpressures at six successive times,
indicated by the numbers 1, 2, 3, 4, 5,
and 6. In the curves marked through t5
Figure 3.03. Variation of overpressure with distance in the fireball.
DISTANCE FROM EXPLOSION
Figure 3.04. Variation of overpressure in air with distance at successive times.
82
AIR BLAST PHENOMENA IN AIR AND SURFACE BURSTS
the pressure in the blast wave has not
fallen below atmospheric, but in the
curve marked r6 it is seen that at some
distance behind the shock front the
overpressure has a negative value. In
this region the air pressure is below that
of the original (or ambient) atmosphere,
so that an “underpressure” rather than
an overpressure exists.
3.05 During the negative (rarefac-
tion or suction) phase, a partial vacuum
is produced and the air is sucked in,
instead of being pushed away from the
explosion as it is when the overpressure
is positive. At the end of the negative
phase, which is somewhat longer than
the positive phase, the pressure has es-
sentially returned to ambient. The peak
(or maximum) values of the underpres-
sure are usually small compared with
the peak positive overpressures; the
former are generally not more than
about 4 pounds per square inch below
the ambient pressure whereas the posi-
tive overpressure may be much larger.
With increasing distance from the ex-
plosion, both peak values decrease, the
positive more rapidly than the negative,
and they approach equality when the
peak pressures have decayed to a very
low level.
THE DYNAMIC PRESSURE
3.06 The destructive effects of the
blast wave are frequently related to val-
ues of the peak overpressure, but there
is another important quantity called the
“dynamic pressure.” For a great variety
of building types, the degree of blast
damage depends largely on the drag
force associated with the strong winds
accompanying the passage of the blast
wave. The drag force is influenced by
certain characteristics—primarily the
shape and size—of the structure, but
this force also depends on the peak
value of the dynamic pressure and its
duration at a given location.
3.07 The dynamic pressure is pro-
portional to the square of the wind ve-
locity and to the density of the air be-
hind the shock front. Both of these
quantities may be related to the over-
pressure under ideal conditions at the
wave front by certain equations, which
will be given later (see § 3.55). For very
Table 3.07
PEAK OVERPRESSURE AND DYNAMIC PRESSURE AND MAXIMUM WIND VELOCITY
IN AIR AT SEA LEVEL CALCULATED FOR AN IDEAL SHOCK FRONT
Peak overpres-
sure (pounds per
square inch)
Peak dynamic
pressure (pounds
per square inch)
Maximum wind
velocity (miles
per hour)
200 330 2,078
150 222 1,777
100 123 1,415
72 74 1,168
50 41 934
30 17 669
20 8.1 502
10 2.2 294
5 0.6 163
2 0.1 70
CHARACTERISTICS OF THE BLAST WAVE IN AIR
83
strong shocks the peak dynamic pres-
sure is larger than the peak overpres-
sure, but below 70 pounds per square
inch overpressure at sea level the dy-
namic pressure is the smaller. Like the
peak shock overpressure, the peak dy-
namic pressure generally decreases with
increasing distance from the explosion
center, although at a different rate.
Some peak dynamic pressures and
maximum blast wind velocities corre-
sponding to various peak overpressures,
as calculated for an ideal shock front in
air at sea level (§ 3.53 et seq.) are given
in Table 3.07. The results are based on
1,116 feet per second (761 miles per
hour) as the velocity of sound in air (see
Table 3.66).
3.08 The winds referred to above,
which determine the dynamic pressure
in the shock wave, are a direct conse-
quence of the air blast. More will be
said about these winds shortly. There
are also other winds associated with
nuclear explosions. These include the
afterwinds mentioned in § 2.09, and the
firestorms which will be described in
Chapter VII.
CHANGES IN THE BLAST WAVE
WITH TIME
3.09 From the practical standpoint,
it is of interest to examine the changes
of overpressure and dynamic pressure
with time at a fixed location (or obser-
vation point). For a short interval after
the detonation, there will be no change
in the ambient pressure because it takes
some time for the blast wave to travel
from the point of the explosion to the
given location. This time interval (or
arrival time) depends upon the energy
yield of the explosion and the slant
range. For example, at a distance of 1
mile from a 20-kiloton explosion in the
air the arrival time would be about 3
seconds, whereas at 2 miles it would be
about 7.5 seconds. The corresponding
times for a 1-megaton burst would be
roughly 1.4 and 4.5 seconds, respec-
tively.
3.10 It is evident that the blast wave
from an explosion of higher yield will
arrive at a given point sooner than one
for a lower yield. The higher the over-
pressure at the shock front, the greater is
the velocity of the shock wave (see
Figure. 3.55). Initially, this velocity
may be quite high, several times the
speed of sound in air (about 1,100 feet
per second at sea level). As the blast
wave progresses outward, the pressure
at the front decreases and the velocity
falls off accordingly. At long ranges,
when the overpressure has decreased to
less than about 1 pound per square inch,
the velocity of the blast wave ap-
proaches the ambient speed of sound.
3.11 When the (ideal) shock front
arrives at the observation point, the
overpressure will increase sharply from
zero to its maximum (or peak) value.
Subsequently the overpressure de-
creases, as indicated by the upper curve
in Fig. 3.11. The overpressure drops to
zero in a short time, and this marks the
end of the positive (or compression)
phase of the overpressure at the given
location. The duration of the overpres-
sure positive phase increases with the
energy yield and the distance from the
explosion. For a 20-kiloton air burst, for
example, this phase lasts roughly 1 sec-
ond to 1.4 seconds at slant ranges of 1 to
2 miles; for a 1-megaton explosion, the
respective durations would be approxi-
mately 1.4 to 2.3 seconds.
84
AIR BLAST PHENOMENA IN AIR AND SURFACE BURSTS
Figure 3.11. Variation of overpressure and dynamic pressure with time at a fixed location.
3.12 Provided the observation point
is at a sufficient distance from the ex-
plosion, the overpressure will continue
to decrease after it falls to zero so that it
becomes negative. During this negative
(or suction) phase, the pressure in the
shock wave is less than the ambient
atmospheric pressure. However, as seen
in § 3.05, the underpressure is never
very large. After decreasing gradually to
a minimum value, the pressure starts to
increase until it becomes equal to the
normal atmospheric pressure, and the
overpressure is zero again. The negative
phase of the blast wave is usually longer
than the positive phase and it may last
for several seconds. When this phase is
ended, the blast wave will have passed
the given observation point.
3.13 Changes in the wind and in the
associated dynamic pressure accompany
the changes with time of the overpres-
sure. With the arrival of the shock front
at a given location, a strong wind com-
mences, blowing away from the explo-
sion point. This blast wind is often re-
ferred to as a “transient wind” because
its velocity decreases rapidly with time.
The maximum velocity of the transient
wind can be quite high, as indicated by
CHARACTERISTICS OF THE BLAST WAVE IN AIR
85
the values corresponding to various
peak overpressures given in Table 3.07.
The wind velocity decreases as the
overpressure decreases, but it continues
to blow for a time after the end of the
positive overpressure phase (see Fig.
3.11). The reason is that the momentum
of the air in motion behind the shock
front keeps the wind blowing in the
same direction even after the overpres-
sure has dropped to zero and has started
to become negative.
3.14 Since the dynamic pressure is
related to the square of the wind veloc-
ity, the changes in the dynamic pressure
with time will correspond to the changes
in the wind just described. The dynamic
pressure increases suddenly when the
(ideal) shock front arrives at the obser-
vation point. Then it decreases, but
drops to zero some time later than the
overpressure, as shown by the lower
curve in Fig. 3.11. The dynamic pres-
sure positive phase is thus longer than
the overpressure positive phase. The
ratio of the dynamic pressure and over-
pressure positive phase durations de-
pends on the pressure levels involved.
When the peak pressures are high, the
positive phase of the dynamic pressure
may be more than twice as long as for
the overpressure. At low peak pres-
sures, on the other hand, the difference
is only a few percent.
3.15 As a general rule, the peak
overpressure and the peak dynamic
pressure behind the shock front are quite
different (see Table 3.07). Furthermore,
the dynamic pressure takes somewhat
longer than the overpressure to drop to
zero during the positive phase. Conse-
quently, it is evident that the overpres-
sure and dynamic pressure at a given
location change at different rates with
time. This matter will be discussed more
fully later in this chapter (§ 3.57 et
seq.).
3.16 By the time the wind ceases
blowing away from the explosion, the
overpressure is definitely negative (see
Fig. 3.11); that is to say, the pressure in
the blast wave is less than the ambient
atmospheric pressure. Hence, air is
drawn in from outside and, as a result,
the wind starts to blow in the opposite
direction, i.e., toward the explosion,
but with a relatively small velocity. A
short time after the overpressure min-
imum is passed, the wind again reverses
direction and blows, once more, away
from the explosion point. The feeble
wind apparently results from expansion
of the air due to an increase of tempera-
ture that occur at this stage.
3.17 The changes in the dynamic
pressure corresponding to the foregoing
wind changes after the end of the dy-
namic pressure positive phase are indi-
cated in Fig. 3.11. The dynamic pres-
sure finally decreases to zero when the
ambient atmospheric pressure is res-
tored and the blast wave has passed the
observation point.
3.18 It should be noted that the dy-
namic pressure remains positive (or
zero) even when the overpressure is
negative. Since the overpressure is the
difference between the actual blast wave
pressure and the ambient atmospheric
pressure, a negative overpressure
merely implies that the actual pressure is
less than the atmospheric pressure. The
dynamic pressure, on the other hand, is
an actual pressure without reference to
any other pressure. It is a measure of the
kinetic energy, i.e., energy of motion,
of a certain volume of air behind the
shock front (§ 3.55). The dynamic
86
AIR BLAST PHENOMENA IN AIR AND SURFACE BURSTS
pressure is consequently positive if the
air is moving or zero if it is not; the
direction in which the pressure acts de-
pends on the direction of motion, i.e.,
the wind direction (see Fig. 3.11).
3.19 Nearly all the direct damage
caused by both overpressure and dy-
namic pressure occurs during the posi-
tive overpressure phase of the blast
wave. Although the dynamic pressure
persists for a longer time, its magnitude
during this additional time is usually so
low that the destructive effects are not
very significant. The damage referred to
here is that caused directly by the blast
wave. This will be largely terminated by
the end of the overpressure positive
phase, but the indirect destructive ef-
fects, e.g., due to fire (see Chapter VII),
may continue long after the blast wave
has passed.
3.20 There may be some direct
damage to structures during the negative
phase of the overpressure; for example,
large windows which are poorly held
against outward motion, brick veneer,
and plaster walls may be dislodged by
trapped air at normal pressure. But the
maximum underpressure (and corre-
sponding dynamic pressure) is generally
quite small in comparison with the peak
pressures at the shock front; hence,
there is usually much less direct damage
in the negative than in the positive
overpressure phase of the blast wave.
REFLECTION OF BLAST WAVE AT A SURFACE
INCIDENT AND REFLECTED WAVES
3.21 When the incident blast wave
from an explosion in air strikes a more
dense medium such as the earth’s sur-
face, e.g., either land or water, it is
reflected. The formation of the reflected
wave in these circumstances is repre-
sented in Fig. 3.21. This figure shows
four stages in the outward motion of the
spherical blast wave originating from an
air burst. In the first stage the wave front
has not reached the ground; the second
stage is somewhat later in time, and in
the third stage, which is still later, a
reflected wave, indicated by the dashed
line, has been produced.
3.22 When such reflection occurs,
an individual or object precisely at the
surface will experience a single pressure
increase, since the reflected wave is
formed instantaneously. Consequently,
the overpressure at the surface is gener-
ally considered to be entirely a reflected
pressure. For a smooth (or ideal) sur-
face, the total reflected overpressure in
the region near ground zero will be more
than twice the value of the peak over-
pressure of the incident blast wave. The
exact value of the peak reflected pres-
sure will depend on the strength of the
incident wave (§ 3.56) and the angle at
which it strikes the surface (§ 3.78).
The nature of the surface also has an
important effect (§ 3.47), but for the
present the surface is assumed to be
smooth so that it acts as an ideal reflec-
tor. The variation in overpressure with
time, as observed at a point actually on
REFLECTION OF BLAST WAVE AT A SURFACE
87
the surface not too far from ground
zero,1 such as A in Fig. 3.21, is depicted
in Fig. 3.22 for an ideal shock front.
The point A may be considered as lying
within the region of “regular” reflec-
tion, i.e., where the incident and re-
flected waves do not merge except on
the surface.
Figure 3.21. Reflection of blast wave at the earth’s surface in an air burst; to represent
successive times.
Figure 3.22. Variation of overpressure with time at a point on the surface in the region of
regular reflection.
'For an explanation of the term “ground zero,’’ see § 2.34.
88
AIR BLAST PHENOMENA IN AIR AND SURFACE BURSTS
3.23 At any location somewhat
above the surface in this region, two
separate shocks will be felt, the first
being due to the incident blast wave and
the second to the reflected wave, which
arrives a short time later (Fig. 3.23).
This situation can be illustrated by con-
sidering the point В in Fig. 3.21, also in
the regular reflection region. When the
incident wave front reaches this point, at
time tv the reflected wave is still some
distance away. There will, conse-
quently, be a short interval before the
reflected wave reaches the point above
the surface at time t.. Between L and f,
the reflected wave has spread out to
some extent, so that its peak overpres-
sure will be less than the value obtained
at surface level. In determining the ef-
fects of air blast on structures in the
regular reflection region, it may be nec-
essary to consider the magnitude and
also the directions of motion of both the
incident and reflected waves. After pas-
sage of the reflected wave, the transient
wind direction near the surface becomes
essentially horizontal.
3.24 The following discussion con-
cerning the delay between the arrival of
the incident and reflected wave fronts at
a point above the surface, such as В in
Fig. 3.21, is based on the tacit assump-
tion that the two waves travel with ap-
proximately equal velocities. This as-
sumption is reasonably justified in the
early stages, when the wave front is not
far from ground zero. However, it will
be evident that the reflected wave
always travels through air that has been
heated and compressed by the passage
of the incident wave. As a result, the
reflected wave front moves faster than
the incident wave and, under certain
conditions, eventually overtakes it so
that the two wave fronts merge to pro-
duce a single front. This process of
wave interaction is called “Mach” or
“irregular” reflection. The region in
which the two waves have merged is
therefore called the Mach (or irregular)
region in contrast to the regular region
where they have not merged.
3.25 The merging of the incident
and reflected waves is indicated sche-
matically in Fig. 3.25, which shows a
portion of the profile of the blast wave
close to the surface. The situation at a
point fairly close to ground zero, such as
A in Fig. 3.21, is represented in Fig.
3.25a. At a later stage, farther from
Figure 3.23. Variation of overpressure with time at a point above the surface in the region
of regular reflection.
REFLECTION OF BLAST WAVE AT A SURFACE
89
ground zero, as in Fig. 3.25b, the
steeper front of the reflected wave shows
that it is traveling faster than, and is
overtaking, the incident wave. At the
stage represented by Fig. 3.25c, the
reflected wave near the ground has
overtaken and merged with the incident
wave to form a single front called the
“Mach stem.” The point at which the
incident wave, reflected wave, and
Mach fronts meet is referred to as the
“triple point.”2 The configuration of
the three shock fronts has been called
the “Mach Y.”
3.26 As the reflected wave con-
tinues to overtake the incident wave, the
triple point rises and the height of the
Mach stem increases (Fig. 3.26). Any
object located either at or above the
ground, within the Mach region and
below the triple point path, will experi-
ence a single shock. The behavior of
this merged (or Mach) wave is the same
as that previously described for blast
Figure 3.25. Merging of incident and reflected waves and formation of Mach Y configura-
tion of shock fronts.
Figure 3.26. Outward motion of the blast wave near the surface in the Mach region.
2 At any instant the so-called “triple point’’ is not really a point, but a horizontal circle with its center
on the vertical line through the burst point; it appears as a point on a sectional (or profile) drawing, such
as Fig. 3.25c.
90
AIR BLAST PHENOMENA IN AIR AND SURFACE BURSTS
waves in general. The overpressure at a
particular location will fall off with time
and the positive (compression) phase
will be followed by a negative (suction)
phase in the usual manner.
3.27 At points in the air above the
triple point path, such as at an aircraft or
at the top of a high building, two pres-
sure increases will be felt. The first will
be due to the incident blast wave and the
second, a short time later, to the re-
flected wave. When a weapon is deton-
ated at the surface, i.e., in a contact
surface burst (§ 2.127 footnote), only a
single merged wave develops. Conse-
quently, only one pressure increase will
be observed either on or above the
ground.
3.28 As far as the destructive action
of the air blast is concerned, there are at
least two important aspects of the re-
flection process to which attention
should be drawn. First, only a single
pressure increase is experienced in the
Mach region below the triple point as
compared to the separate incident and
reflected waves in the region of regular
reflection. Second, since the Mach stem
is nearly vertical, the accompanying
blast wave is traveling in a horizontal
direction at the surface, and the transient
winds are approximately parallel to the
ground (Fig. 3.25). Thus, in the Mach
region, the blast forces on aboveground
structures and other objects are directed
nearly horizontally, so that vertical sur-
faces are loaded more intensely than
horizontal surfaces.
3.29 The distance from ground zero
at which the Mach stem begins to form
depends primarily upon the yield of the
detonation and the height of the burst
above the ground. Provided the height
of burst is not too great, the Mach stem
forms at increasing distances from
ground zero as the height of burst in-
creases for a given yield, and also as the
yield decreases at a specified height of
burst. For moderate heights of burst,
Mach merging of direct and reflected
waves occurs at a distance from ground
zero approximately equal to the burst
height. As the height of burst is in-
creased, the distance from ground zero
at which the Mach effect commences
exceeds the burst height by larger and
larger amounts.
HEIGHT OF BURST AND BLAST
DAMAGE
3.30 The height of burst and energy
yield of the nuclear explosion are im-
portant factors in determining the extent
of damage at the surface. These two
quantities generally define the variation
of pressure with distance from ground
zero and other associated blast wave
characteristics, such as the distance
from ground zero at which the Mach
stem begins to form. As the height of
burst for an explosion of given energy
yield is decreased, or as the energy yield
for a given height of burst increases, the
consequences are as follows: (1) Mach
reflection commences nearer to ground
zero, and (2) the overpressure at the
surface near ground zero becomes
larger. An actual contact surface burst
leads to the highest possible overpres-
sures near ground zero. In addition,
cratering and ground shock phenomena
are observed, as will be described in
Chapter VI.
3.31 Because of the relation be-
tween height of burst and energy of the
explosion, the air blast phenomena to be
expected on the ground from a weapon
of large yield detonated at a height of a
few thousand feet will approach those of
REFLECTION OF BLAST WAVE AT A SURFACE
91
a near surface burst. On the other hand,
explosions of weapons of smaller en-
ergy yields at these same or even lower
levels will have the characteristics of air
bursts. A typical example of the latter
situation is found in the nuclear explo-
sion which occurred over Nagasaki,
Japan, in World War II when a weapon
having a yield of approximately 22 ki-
lotons of TNT equivalent was detonated
at a height of about 1,640 feet. By
means of certain rules, called “scaling
laws,” which are described in the tech-
nical section of this chapter (§ 3.60 et
seq.), it is found that to produce similar
blast phenomena at ground distances
proportional to the heights of burst, for a
1-kiloton weapon the height of burst
would have to be roughly 585 feet and
for a 1-megaton explosion about 5,850
feet. In these three cases, the Mach stem
formation would occur at distances from
ground zero that are not very different
from the respective heights of burst.
3.32 It should be noted that there is
no single optimum height of burst, with
regard to blast effects, for any specified
explosion yield because the chosen burst
height will be determined by the nature
of the target. As a rule, strong (or hard)
targets will require the equivalent of a
low air burst or a surface burst. For
weaker targets, which are destroyed or
damaged at relatively low overpressures
or dynamic pressures, the height of
burst may be raised to increase the
damage areas, since the required pres-
sures will extend to a larger range than
for a low air or surface burst.
3.33 The variation of blast charac-
teristics with distance from ground zero
for air bursts occurring at different
heights are most conveniently repre-
sented by what are called “height of
burst” curves. Such curves have been
prepared for various blast wave proper-
ties, e.g., peak overpressure, peak dy-
namic pressure, time of arrival, and
positive phase duration, and will be
presented and discussed later (§ 3.69 et
seq.). Values of these (and other) prop-
erties can be determined from the
curves, by application of appropriate
scaling factors, for any explosion yield
and height of burst.
CONTACT SURFACE BURST
3.34 The general air blast phenom-
ena resulting from a contact surface
burst are somewhat different from those
for an air burst as described above. In a
surface explosion the incident and re-
flected shock waves merge instantly, as
seen in § 3.27, and there is no region of
regular reflection. All objects and struc-
tures on the surface, even close to
ground zero, are thus subjected to air
blast similar to that in the Mach region
below the triple point for an air burst.
For an ideal (absolutely rigid) reflecting
surface the shock wave characteristics,
i.e., overpressure, dynamic pressure,
etc., at the shock front would corre-
spond to that for a “free air” burst, i.e.,
in the absence of a surface, with twice
the energy yield. Behind the front, the
various pressures would decay in the
same manner as for an air burst. Be-
cause of the immediate merging of the
incident and reflected air blast waves,
there is a single shock front which is
hemispherical in form, as shown at suc-
cessive times, through t4, in Figure
3.34. Near the surface, the wave front is
essentially vertical and the transient
winds behind the front will blow in a
horizontal direction.
92
AIR BLAST PHENOMENA IN AIR AND SURFACE BURSTS
t
SURFACE GROUND ZERO
Figure 3.34. Blast wave from a contact surface burst; incident and reflected waves
coincide.
MODIFICATION OF AIR BLAST PHENOMENA
TERRAIN EFFECTS
3.35 Large hilly land masses tend to
increase air blast effects in some areas
and to decrease them in others. The
change in peak overpressure appears to
depend on the slope angle and on the
actual value of the pressure. The in-
crease (or “spike”) in peak overpres-
sure which occurs at the base of a hill is
attributable to the reflection of the blast
wave by the front slope. This spike
tends to broaden or lengthen with time
as the wave travels up the hill. How-
ever, a reduction in peak overpressure
occurs as the blast wave moves over the
crest and down the back slope. The
pressure at the wave front does not rise
instantaneously, as in an ideal shock
wave (see Fig. 3.11), but somewhat
more gradually, although the behavior
soon becomes normal as the blast wave
proceeds down the hill. In general, the
variation in peak overpressure at any
point on a hill from that expected if the
hill were not present depends on the
dimensions of the hill with respect to the
energy yield and location of the explo-
sion. Since the time interval in which
the pressure increase or decrease occurs
is short compared to the length of the
positive phase, the effects of terrain on
the blast wave are not expected to be
significant for a large variety of struc-
tural types.
3.36 It is important to emphasize,
in particular, that shielding from blast
effects behind the brow of a large hill is
not dependent upon line-of-sight con-
siderations. In other words, the fact that
the point of the explosion cannot be seen
from behind the hill by no means im-
plies that the blast effects will not be
felt. It will be shown in Chapter IV that
blast waves can easily bend (or diffract)
around apparent obstructions.
MODIFICATION OF AIR BLAST PHENOMENA
93
3.37 Although prominent terrain
features may shield a particular target
from thermal radiation, and perhaps also
to some extent from the initial nuclear
radiation, little reduction in blast dam-
age to structures may be expected, ex-
cept in very special circumstances.
Nevertheless, considerable protection
from debris and other missiles (§ 3.50)
and drag forces may be achieved for
such movable objects as heavy con-
struction equipment by placing them
below the surface of the ground in open
excavations or deep trenches or behind
steep earth mounds.
3.38 The departure from idealized
or flat terrain presented by a city com-
plex may be considered as an aspect df
topography. It is to be expected that the
presence of many buildings close to-
gether will cause local changes in the
blast wave, especially in the dynamic
pressure. Some shielding may result
from intervening objects and structures;
however, in other areas multiple reflec-
tions between buildings and the chan-
neling caused by streets may increase
the overpressure and dynamic pressure.
METEOROLOGICAL CONDITIONS
3.39 The presence of large amounts
of moisture in the atmosphere may af-
fect the properties of a blast wave in the
low overpressure region. But the proba-
bility of encountering significant con-
centrations of atmospheric liquid water
that would influence damage is consid-
ered to be small. Meteorological condi-
tions, however, can sometimes either
enlarge or contract the area over which
light structural damage would normally
be expected. For example, window
breakage and noise have been experi-
enced hundreds of miles from the burst
point. Such phenomena, which have
been observed with large TNT detona-
tions as well as with nuclear explosions,
are caused by the bending back to the
earth of the blast wave by the atmos-
phere.
3.40 Four general conditions which
can lead to this effect are known. The
first is a temperature “inversion” near
the earth’s surface. Normally, the air
temperature in the lower atmosphere
(troposphere) decreases with increasing
altitude in the daytime. In some cases,
however, the temperature near the sur-
face increases instead of decreasing with
altitude; this is called a temperature in-
version. It can arise either from night-
time cooling of the ground surface by
the radiation of heat or from a mass of
warm air moving over a relatively cold
surface. The result of an inversion is
that the overpressure on the ground at a
distance from the explosion may be
higher than would otherwise be ex-
pected. Conversely, when unstable
conditions prevail, and the temperature
near the earth’s surface decreases rap-
idly with altitude, as in the afternoon or
in tropical climates, the blast wave is
bent away from the ground. The over-
pressure then decays with distance faster
than expected.
3.41 The second situation exists
when there are high-speed winds aloft.
If the normal decrease in the tempera-
ture of the air with increasing altitude is
combined with an upper wind whose
speed exceeds 3 miles per hour for each
1,000 feet of altitude, the blast wave
will be refracted (or bent) back to the
ground. This usually occurs with jet-
stream winds, where maximum veloci-
ties are found between 25,000- and
94
AIR BLAST PHENOMENA IN AIR AND SURFACE BURSTS
50,ООО-feet altitudes. These conditions
may cause several “rays” to converge
into a sharp focus at one location on the
ground, and the concentration of blast
energy there will greatly exceed the
value that would otherwise occur at that
distance. The first (or direct striking)
focus from a jet stream duct may be at
20 to 50 miles from the explosion. Since
the blast energy is reflected from the
ground and is again bent back by the
atmosphere, the focus may be repeated
at regularly spaced distances. In an ex-
plosion of a 20-kiloton weapon in the air
at the Nevada Test Site, this effect
caused windows to break 75 to 100
miles away.
3.42 Bending of blast waves in the
downwind direction can also be pro-
duced by a layer of relatively warm air
at a height of 20 to 30 miles in the lower
mesosphere (see Fig. 9.126). In these
levels winds blow from the west in
winter and from east in summer, en-
hancing blast pressures and noise at
downwind distances from 70 to 150
miles (first direct strike). Reflections
from the ground, and subsequent re-
fractions by the lower mesosphere,
cause the usual repeat focus pattern.
Focusing of this type has resulted in the
breakage of windows on the second
ground strike at 285 miles downwind
from a 17-kiloton nuclear air burst.
Large explosions have been distinctly
heard at even greater distances.3
3.43 The fourth condition is
brought about by the very high temper-
atures in the thermosphere, the region of
the atmosphere above an altitude of
about 60 miles (Fig. 9.126). Blast
waves are ducted in the thermosphere so
that they reach the ground at distances
beyond 100 miles from the burst, gen-
erally in the opposite direction from the
principal mesospheric signals, i.e., in
the upwind direction. Most of the blast
wave energy is absorbed in the low-
density air at high altitudes, and no
structural damage has been reported
from thermospheric ducting. However,
sharp pops and crackles have been heard
when the waves from large explosions
reach the ground.
EFFECT OF ALTITUDE
3.44 The relations between over-
pressure, distance, and time that de-
scribe the propagation of a blast wave in
air depend upon the ambient atmos-
pheric conditions, and these vary with
the altitude. In reviewing the effects of
elevation on blast phenomena, two
cases will be considered; one in which
the point of burst and the target are
essentially at the same altitude, but not
necessarily at sea level, and the second,
when the burst and target are at different
altitudes.
3.45 For an air burst, the peak
overpressure at a given distance from
the explosion will depend on the am-
bient atmospheric pressure and this will
vary with the burst altitude. There are a
number of simple correction factors,
which will be given later (§ 3.65 et
seq.), that can be used to allow for
differences in the ambient conditions,
but for the present it will be sufficient to
state the general conclusions. With in-
creasing altitude of both target and burst
point, the overpressure at a given dis-
tance from an explosion of specified
'The situations described here and in § 3.43 could also be considered as temperature inversions.
MODIFICATION OF AIR BLAST PHENOMENA
95
yield will generally decrease. Corre-
spondingly, an increase may usually be
expected in both the arrival time of the
shock front and in the duration of the
positive phase of the blast wave. For
elevations of less than 5,000 feet or so
above sea level, the changes are small,
and since most surface targets are at
lower altitudes, it is rarely necessary to
make the corrections.
3.46 The effect when the burst and
target are at different elevations, such as
for a high air burst, is somewhat more
complex. Since the blast wave is in-
fluenced by changes in air temperature
and pressure in the atmosphere through
which it travels, some variations in the
pressure-distance relationship at the
surface might be expected. Within the
range of significant damaging overpres-
sures, these differences are small for
weapons of low energy yield. For
weapons of high yield, where the blast
wave travels over appreciably longer
distances, local variations, such as tem-
perature inversions and refraction, may
be expected. Consequently, a detailed
knowledge of the atmosphere on a par-
ticular day would be necessary in order
to make precise calculations. For plan-
ning purposes, however, when the tar-
get is at an appreciable elevation above
sea level the ambient conditions at the
target altitude are used to evaluate the
correction factors referred to above.
SURFACE EFFECTS
3.47 For a given height of burst and
explosion energy yield, some variation
in blast wave characteristics may be
expected over different surfaces. These
variations are determined primarily by
the type and extent of the surface over
which the blast wave passes. In consid-
ering the effects of the surface, a dis-
tinction is made between ideal (or nearly
ideal) and nonideal surface conditions.
An “ideal” surface is defined as a per-
fectly flat surface that reflects all (and
absorbs none) of the energy, both ther-
mal (heat) and blast, that strikes it. No
area of the earth’s surface is ideal in this
sense, but some surfaces behave almost
like ideal surfaces and they are classi-
fied as “nearly ideal.” For an ideal (or
nearly ideal) surface the properties of
the blast wave are essentially free of
mechanical and thermal effects. If the
surface is such that these effects are
significant, it is said to be “nonideal.”
3.48 The terrain phenomena de-
scribed in § 3.35 et seq. are examples of
mechanical factors that can change the
characteristics of the blast wave. In
general, the nature of the reflecting sur-
face can affect the peak overpressure
and the formation and growth of the
Mach stem. Absorption of some of the
blast energy in the ground, which will
be considered in § 3.51, is to be re-
garded as another type of mechanical
effect on the blast wave due to a non-
ideal surface.
3.49 Many surfaces, especially
when the explosion can raise a cloud of
dust, are nonideal because they absorb
substantial amounts of heat energy. In
these circumstances, the properties of
the blast wave may be modified by the
formation of an auxiliary wave, called a
“precursor,” that precedes the main in-
cident wave. The characteristics of the
blast wave will then be quite different
from those that would be observed on an
ideal (or nearly ideal) surface. Precursor
phenomena, which are complex, are
discussed more fully in § 3.79. et seq.
AIR BLAST PHENOMENA IN AIR AND SURFACE BURSTS
96
3.50 Somewhat related to the con-
dition of the surface are the effects of
objects and material picked up by the
blast wave. Damage may be caused by
missies such as rocks, boulders, and
pebbles, as well as by smaller particles
such as sand and dust. This particulate
matter carried along by the blast wave
does not necessarily affect the overpres-
sures at the shock front. In dusty areas,
however, the blast wave may pick up
enough dust to increase the dynamic
pressure over the values corresponding
to the overpressure in an ideal blast
wave. There may also be an increase in
the velocity of air particles in the wave
due to precursor action. Consequently,
the effect on structures which are dam-
aged mainly by dynamic pressure will
be correspondingly increased, espe-
cially in regions where the precursor is
strong.
GROUND SHOCK FROM AIR BLAST
3.51 Another aspect of the blast
wave problem is the possible effect of an
air burst on underground structures as a
result of the transfer of some of the blast
wave energy into the ground. A minor
oscillation of the surface is experienced
and a ground shock is produced. The
strength of this shock at any point is
determined by the overpressure in the
blast wave immediately above it. For
large overpressures with long positive-
phase duration, the shock will penetrate
some distance into the ground, but blast
waves which are weaker and of shorter
duration are attenuated more rapidly.
The major principal stress in the soil
will be nearly vertical and about equal in
magnitude to the air blast overpressure.
These matters will be treated in more
detail in Chapter VI.
3.52 For a high air burst, the blast
overpressures are expected to be rela-
tively small at ground level; the effects
of ground shock induced by air blast
will then be negligible. But if the over-
pressure at the surface is large, there
may be damage to buried structures.
However, even if the structure is strong
enough to withstand the effect of the
ground shock, the sharp jolt resulting
from the impact of the shock wave can
cause injury to occupants and damage to
loose equipment. In areas where the air
blast pressure is high, certain public
utilities, such as sewer pipes and drains
made of relatively rigid materials and
located at shallow depths, may be dam-
aged by earth movement, but relatively
flexible metal pipe will not normally be
affected. For a surface burst in which
cratering occurs, the situation is quite
different, as will be seen in Chapter VI.
TECHNICAL ASPECTS OF BLAST WAVE PHENOMENA4
PROPERTIES OF THE IDEAL BLAST
WAVE
3.53 The characteristics of the blast
wave have been discussed in a qualita-
tive manner in the earlier parts of this
chapter, and the remaining sections will
be devoted mainly to a consideration of
some of the quantitative aspects of blast
wave phenomena in air. The basic rela-
tionships among the properties of a blast
wave having a sharp front at which there
‘The remaining sections of this chapter may be omitted without loss of continuity.
TECHNICAL ASPECTS OF BLAST WAVE PHENOMENA
97
is a sudden pressure discontinuity, i.e.,
a true (or ideal) shock front, are derived
from the Rankine-Hugoniot conditions
based on the conservation of mass, en-
ergy, and momentum at the shock front.
These conditions, together with the
equation of state for air, permit the
derivation of the required relations in-
volving the shock velocity, the particle
(or wind) velocity, the overpressure, the
dynamic pressure, and the density of the
air behind the ideal shock front.
3.54 The blast wave properties in
the region of regular reflection are
somewhat complex and depend on the
angle of incidence of the wave with the
ground and the overpressure. For a
contact surface burst, when there is but
a single hemispherical (merged) wave,
as stated in § 3.34, and in the Mach
region below the triple point path for an
air burst, the various blast wave charac-
teristics at the shock front are uniquely
related by the Rankine-Hugoniot equa-
tions. It is for these conditions, in which
there is a single shock front, that the
following results are applicable.
3.55 The shock velocity, 17, is ex-
pressed by
U =c (i + 2L±± . Л,/2,
\ 27 PJ
where cQ is the ambient speed of sound
(ahead of the shock front), p is the peak
overpressure (behind the shock front),
PQ is the ambient pressure (ahead of the
shock), and у is the ratio of the specific
heats of the medium, i.e., air. If у is
taken as 1.4, which is the value at
moderate temperatures, the equation for
the shock velocity becomes
(6d \ 1/2
The particle velocity (or peak wind ve-
locity behind the shock front), u, is
given by
= -$£-( 1 +
ypo \
у 4- 1 p \-i/2
"p0)
so that for air
U = -Sp_____________Ed_______
7P0 ’.(I + 6p/7P0)'« •
The density, p, of the air behind the
shock front is related to the ambient
density, p0, by
P = 2yPQ + (T + 1)/?
Po 2yP0 + (y - l)p
= 7 + 6p/PQ
7 + p/PQ ‘
The dynamic pressure, q, is defined by
q = У2 рм2,
so that it is actually the kinetic energy
per unit volume of air immediately be-
hind the shock front; this quantity has
the same dimensions as pressure. Intro-
duction of the Rankine-Hugoniot equa-
tions for p and и given above leads to
the relation
£
q 2yP0 + (7 - Dp
= T 7p/+ p (3-551)
between the peak dynamic pressure in
air and the peak overpressure and am-
bient pressure. The variations of shock
velocity, particle (or peak wind) veloc-
ity, and peak dynamic pressure with the
peak overpressure at sea level, as
derived from the foregoing equations,
are shown graphically in Fig. 3.55.
98
AIR BLAST PHENOMENA IN AIR AND SURFACE BURSTS
PEAK REFLECTED PRESSURE FOR NORMAL INCIDENCE (PSI)
PEAK DYNAMIC PRESSURE (PSI)
PEAK OVERPRESSURE (PSI)
Figure 3.55. Relation of ideal blast wave characteristics at the shock front to peak
overpressure.
TECHNICAL ASPECTS OF BLAST WAVE PHENOMENA
99
3.56 When the blast wave strikes a
flat surface, such as that of a structure,
at normal incidence, i.e., head on, the
instantaneous (peak) value of the re-
flected overpressure, pr, is given by
pr = 2p + (y 4- V>q. (3.56.1)
Upon using equation (3.55.1) for air,
this becomes
pr = . (3.56.2)
It can be seen from equation (3.56.2)
that the value of pr approaches 8p for
very large values of the incident over-
pressure and dynamic pressure (strong
shocks), and tends toward 2p for small
overpressures and small dynamic pres-
sures (weak shocks). It is evident from
equation (3.56.1) that the increase in the
reflected overpressure above the ex-
pected value of twice the incident value,
i.e., 2p, is due to the dynamic (or wind)
pressure. The reflected overpressure
arises from the change of momentum
when the moving air changes direction
as a result of striking the surface. A
curve showing the variation of the in-
stantaneous (peak) reflected pressure,
with the peak incident overpressure, for
normal incidence on a flat surface, is
included in Fig. 3.55.
3.57 The equations in § 3.55 give
the peak values of the various blast
parameters at the shock front. The vari-
ation of the overpressure at a given point
with time after its arrival at that point
has been obtained by numerical integra-
tion of the equations of motion and the
results are represented in Fig. 3.57. In
these curves the “normalized” over-
pressure, defined by p(t)lp, where p(f) is
the overpressure at time t after the ar-
rival of the shock front and p is the peak
overpressure, is given as a function of
the “normalized” time, t/P, where t+,
is the duration of the overpressure posi-
tive phase. The parameter indicated on
each curve is the peak overpressure to
which that curve refers. It is seen,
therefore, that the variation of the nor-
malized (and actual) overpressure with
time depends on the peak overpressure.
Values of F for various burst conditions
are given in Fig. 3.76.
3.58 Similarly, the variation of the
normalized dynamic pressure, q(f)/q,
with the normalized time, //r, where F
' я’ я
is the duration of the dynamic pressure
positive phase, depends on the peak
value of the dynamic pressure. This is
shown by the curves in Fig. 3.58 for
several indicated values of the peak dy-
namic pressure; values of P required for
use with this figure will be found in Fig.
3.76. It should be noted that, since the
duration of the dynamic pressure posi-
tive phase is somewhat longer than that
for the overpressure, i.e., P is longer
than Г, Figs. 3.57 and 3.58 do not have
a common time base.
3.59 Another important blast dam-
age parameter is the “impulse,” which
takes into account the duration of the
positive phase and the variation of the
overpressure during that time. Impulse
(per unit area) may be defined as the
total area under the curve for the varia-
tion of overpressure with time. The
positive phase overpressure impulse
(per unit area), Z+, may then be repre-
sented mathematically by
л = p p(f)dt,
J 0
where p(f) is obtained from Fig. 3.57 for
any overpressure between 3 and 3,000
100
AIR BLAST PHENOMENA IN AIR AND SURFACE BURSTS
NORMALIZED TIME, ///£
Fig. 3.57. Rate of decay of overpressure with time for several values of the peak
overpressure.
psi. The positive phase dynamic im-
pulse is defined by a similar expression
in which q(f) and Г replace p(f) and Г,
respectively.
SCALING LAWS
3.60 In order to calculate the
characteristic properties of the blast
wave from an explosion of any given
energy if those for another energy are
known, appropriate scaling laws are ap-
plied. With the aid of such laws it is
possible to express the data for a large
range of energies in a simple form. One
way of doing this, which will be illus-
trated below, is to draw curves showing
how the various properties of the blast
wave at the surface change with in-
creasing distance from the detonation in
the case of a 1-kiloton nuclear explo-
sion. Then, with the aid of the scaling
laws, the values for an explosion of any
specified energy can be readily deter-
mined for a particular height of burst.
3.61 Theoretically, a given pressure
will occur at a distance from an explo-
sion that is proportional to the cube root
TECHNICAL ASPECTS OF BLAST WAVE PHENOMENA
101
NORMALIZED TIME, t/tq
Fig. 3.58. Rate of decay of dynamic pressure with time for several values of the dynamic
pressure.
of the energy yield. Full-scale tests have
shown this relationship between dis-
tance and energy yield to hold for yields
up to (and including) the megaton
range. Thus, cube root scaling may be
applied with confidence over a wide
range of explosion energies. According
to this law, if is the distance (or slant
range) from a reference explosion of
kilotons at which a certain overpressure
or dynamic pressure is attained, then for
any explosion of W kilotons energy
these same pressures will occur at a
distance D given by
D / w\113
% = • (3.61.1)
As stated above, the reference explosion
is conveniently chosen as having an en-
ergy yield of 1 kiloton, so that W\ = 1.
It follows, therefore, from equation
(3.61.1) that
D = X (3.61.2)
where D} refers to the slant range from a
1-kiloton explosion. Consequently, if
the distance D is specified, then the
value of the explosion energy, W, re-
102
AIR BLAST PHENOMENA IN AIR AND SURFACE BURSTS
quired to produce a certain effect, e.g.,
a given peak overpressure, can be cal-
culated. Alternatively, if the energy, W,
is specified, the appropriate range, £>,
can be evaluated from equation
(3.61.2).
3.62 When comparing air bursts
having different energy yields, it is
convenient to introduce a scaled height
of burst, defined as
Scaled height of burst =
Actual height of burst
For explosions of different energies
having the same scaled height of burst,
the cube root scaling law may be applied
to distances from ground zero, as well
as to distances from the explosion.
Thus, if is the distance from ground
zero at which a particular overpressure
or dynamic pressure occurs for a 1-
kiloton explosion, then for an explosion
of Wkilotons energy the same pressures
will be observed at a distance d deter-
mined by the relationship
d = J, x W73. (3.62.1)
This expression can be used for calcu-
lations of the type referred to in the
preceding paragraph, except that the
distances involved are from ground zero
instead of from the explosion (slant
ranges).5
3.63 Cube root scaling can also be
applied to arrival time of the shock
front, positive phase duration, and pos-
itive phase impulse, with the under-
standing that the distances concerned
are themselves scaled according to the
cube root law. The relationships (for
bursts with the same scaled height) may
be expressed in the form
t
't
and
I
I,
иА 1/3
where t} represents arrival time or posi-
tive phase duration and is the positive
phase impulse for a reference explosion
of energy W, and t and I refer to any
explosion of energy W; as before, dt
and d are distances from ground zero. If
Wj is taken as 1 kiloton, then the
various quantities are related as follows:
t = t} x W173 at a distance d = dx x W173
and
Z=ZJxW173 at a distance d=d]xW113.
Examples of the use of the equations
developed above will be given later.
ALTITUDE CORRECTIONS
3.64 The data presented (§ 3.55 et
seq.) for the characteristic properties of
a blast wave are strictly applicable to a
homogeneous (or uniform) atmosphere
at sea level. At altitudes below about
5,000 feet, the temperatures and pres-
sures in the atmosphere do not change
very much from the sea-level values.
Consequently, up to this altitude, it is a
reasonably good approximation to treat
the atmosphere as being homogeneous
with sea-level properties. The equations
given above may thus be used without
'The symbol d is used for the distance from ground zero, whereas Drefers to the slant range, i.e., the
distance from the actual burst.
TECHNICAL ASPECTS OF BLAST WAVE PHENOMENA
103
correction if the burst and target are both
at altitudes up to 5,000 feet. If it is
required to determine the air blast pa-
rameters at altitudes where the ambient
conditions are appreciably different
from those at sea level, appropriate cor-
rection factors must be applied.
3.65 The general relationships
which take into account the fact that the
absolute temperature T and ambient
pressure P are not the same as TQ and PQ
respectively, in the reference (1-kiloton)
explosion in a sea-level atmosphere, are
as follows. For the overpressure
p = p^, (3.65.1)
Л)
where p is the overpressure at altitude
and p} is that at sea level. The corrected
value of the distance from ground zero
for the new overpressure level is then
given by
(P \
I • (3.65.2)
A similar expression is applicable to the
slant range, D. The arrival time of pos-
itive phase duration at this new distance
1/2
(3.65.3)
The factor (TQ/7)I/2 appears in this ex-
pression because the speed of sound is
proportional to the square root of the
absolute temperature. For impulse at al-
titude, the appropriate relationship is
T \ 1/2
“f J
(3.65.4)
/ p \ i/3 I T
t = tw^ 4 4
’ \P J \t
I=
\ 0 /
The foregoing equations are applicable
when the target and burst point are at
roughly the same altitude. If the altitude
difference is less than a few thousand
feet, the temperature and pressure at a
mean altitude may be used. But if the
altitude difference is considerable, a
good approximation is to apply the cor-
rection at the target altitude (§ 3.46).
For bursts above about 40,000 feet, an
allowance must be made for changes in
the explosion energy partition (§ 3.67.)
3.66 In order to facilitate calcula-
tions based on the equations in the pre-
ceding paragraph, the following factors
have been defined and tabulated (Table
3.66):
S
p
so that
P = PxSp (3.66.1)
D = W^Sd and
d = d}W^Sd. (3.66.2)
t = ^lV'/з^ (3.66.3)
I = (3.66.4)
The reference values PQ and TQ are for a
standard sea-level atmosphere. The at-
mospheric pressure PQ is 14.7 pounds
per square inch and the temperature is
59°F or 15°C, so that TQ is 519° Rankine
or 288° Kelvin. In a strictly homogen-
eous atmosphere the altitude scaling
factors S , Sd, and S( would all be unity
and equations (3.66.1), etc., would re-
duce to those in § 3.65. Below an alti-
tude of about 5,000 feet the scaling
factors do not differ greatly from unity
and the approximation of a homogen-
eous (sea-level) atmosphere is not
seriously in error, as mentioned above.
104
AIR BLAST PHENOMENA IN AIR AND SURFACE BURSTS
Table 3.66
AVERAGE ATMOSPHERIC DATA FOR MID-LATITUDES
Altitude (feet) Temperature (degrees Kelvin) Pressure (psi) Altitude Scaling Factors Speed of Sound (ft/sec)
S p 5, S,
0 288 14.70 1.00 1.00 1.00 1,116
1,000 286 14.17 0.96 1.01 1.02 1,113
2,000 284 13.66 0.93 1.03 1.03 1,109
3,000 282 13.17 0.90 1.04 1.05 1,105
4,000 280 12.69 0.86 1.05 1.07 1,101
5,000 278 12.23 0.83 1.06 1.08 1,097
10,000 268 10.11 0.69 1.13 1.17 1,077
15,000 258 8.30 0.56 1.21 1.28 1,057
20,000 249 6.76 0.46 1.30 1.39 1,037
25,000 239 5.46 0.37 1.39 1.53 1,016
30,000 229 4.37 0.30 1.50 1.68 995
35,000 219 3.47 0.24 1.62 1.86 973
40,000 217 2.73 0.19 1.75 2.02 968
45,000 217 2.15 0.15 1.90 2.19 968
50,000 217 1.69 0.12 2.06 2.37 968
55,000 217 1.33 0.091 2.23 2.57 968
60,000 217 1.05 0.071 2.41 2.78 968
65,000 217 0.83 0.056 2.61 3.01 968
70,000 218 0.65 0.044 2.83 3.25 971
75,000 219 0.51 0.035 3.06 3.50 974
80,000 221 0.41 0.028 3.31 3.78 978
85,000 222 0.32 0.022 3.57 4.07 981
90,000 224 0.25 0.017 3.86 4.38 984
95,000 225 0.20 0.014 4.17 4.71 988
100,000 227 0.16 0.011 4.50 5.07 991
110,000 232 0.10 0.0070 5.23 5.82 1,003
120,000 241 0.067 0.0045 6.04 6.61 1,021
130,000 249 0.044 0.0030 6.95 7.47 1,038
140,000 258 0.029 0.0020 7.95 8.41 1,056
150,000 266 0.020 0.0013 9.06 9.43 1,073
3.67 The correction factors in
§3.66 are applicable for burst altitudes
up to about 40,000 feet (about 7.6
miles). Nearly all of the energy from
nuclear explosions below this altitude is
absorbed by air molecules near the
burst. Deviations from the scaling laws
described in the preceding paragraphs
are caused principally by differences in
the partitioning of the energy compo-
nents when the burst occurs above
40,000 feet. At such altitudes, part of
the energy that would have contributed
to the blast wave at lower altitudes is
emitted as thermal radiation.
3.68 To allow for the smaller frac-
tion of the yield that appears as blast
energy at higher altitudes, the actual
TECHNICAL ASPECTS OF BLAST WAVE PHENOMENA
105
yield is multiplied by a “blast efficiency
factor’’ to obtain an effective blast
yield. There is no simple way to for-
mulate the blast efficiency factor as a
function of altitude since, at high alti-
tudes, overpressure varies with distance
in such a manner that the effective blast
yield is different at different distances. It
is possible, however, to specify upper
and lower limits on the blast efficiency
factor, as shown in Table 3.68 for sev-
eral altitudes. By using this factor, to-
gether with the ambient pressure P and
the absolute temperature T at the obser-
vation point (or target) in the equations
in § 3.65 (or § 3.66), an estimate can be
made of the upper and lower limits of
the blast parameters. An example of
such an estimate will be given later.
Table 3.68
BLAST EFFICIENCY FACTORS FOR
HIGH-ALTITUDE BURSTS
Burst Altitude Blast Efficiency Factor
(feet) Upper Limit Lower Limit
40,000 1.0 0.9
60,000 1.0 0.8
90,000 0.9 0.6
120,000 0.7 0.4
150,000 0.4 0.2
STANDARD CURVES AND
CALCULATIONS OF BLAST WAVE
PROPERTIES
3.69 In order to estimate the dam-
age which might be expected to occur at
a particular range from a given explo-
sion, it is necessary to define the
characteristics of the blast wave as they
vary with time and distance. Conse-
quently, standard “height of burst’’
curves of the various air blast wave
properties are given here to supplement
the general discussion already pre-
sented. These curves show the variation
of peak overpressure, peak dynamic
pressure, arrival time, and positive
phase duration with distance from
ground zero for various heights of burst
over a nearly ideal surface. Similar
curves may also be constructed for other
blast wave parameters, but the ones
presented here are 'generally considered
to be the most useful. They apply to
urban targets as well as to a wide variety
of other approximately ideal situations.
3.70 From the curves given below
the values of the blast wave properties
can be determined for a free air burst or
as observed at the surface for an air
burst at a particular height or for a
contact surface burst (zero height). The
peak overpressures, dynamic pressures,
and positive phase duration times ob-
tained in this manner are the basic data
to be used in determining the blast
loading and response of a target to a
nuclear explosion under specified con-
ditions. The procedures for evaluating
the blast damage to be expected are
discussed in Chapters IV and V.
3.71 The standard curves give the
blast wave properties for a 1-kiloton
TNT equivalent explosion in a sea-level
atmosphere. By means of these curves
and the scaling laws already presented,
the corresponding properties can be cal-
culated for an explosion of W-kilotons
energy yield. Examples of the use of the
curves are given on the pages facing the
figures. It should be borne in mind that
the data have been computed for nearly
ideal conditions and that significant de-
viations may occur in practice.
3.72 The variation of peak over-
pressure with distance from a 1-kiloton
TNT equivalent free air burst, i.e., a
106
AIR BLAST PHENOMENA IN AIR AND SURFACE BURSTS
burst in a homogeneous atmosphere
where no boundaries or surfaces are
present, for a standard sea-level atmos-
phere is shown in Fig. 3.72. This curve,
together with the scaling laws and alti-
tude corrections described above, may
be used to predict incident overpressures
from air bursts for those cases in which
the blast wave arrives at the target
without having been reflected from any
surface. Other blast wave characteristics
may be obtained from the Rankine-
Hugoniot equations (§ 3.55 et seq.).
3.73 The curves in Fig. 3.73a
(high-pressure range), Fig. 3.73b (in-
termediate-pressure range), and Fig.
3.73c (low-pressure range) show the
variation with distance from ground
zero of the peak overpressure at points
near the ground surface for a 1-kiloton
air burst as a function of the height of
burst. The corresponding data for other
explosion energy yields may be ob-
tained by use of the scaling laws. The
curves are applicable to a standard sea-
level atmosphere and to nearly ideal
surface conditions. Deviations from
these conditions will affect the results,
as explained in previous sections (cf.
§3.35 et seq., also § 3.79 et seq.). It is
seen from the figures, especially for
overpressures of 30 pounds per square
inch or less, that the curves show a
pronounced “knee.” Consequently, for
any specified overpressure, there is a
burst height that will result in a max-
imum surface distance from ground zero
to which that overpressure extends. This
is called the “optimum” height of burst
for the given overpressure.
3.74 The variation of peak over-
pressure with distance from ground zero
for an air burst at any given height can
be readily derived from the curves in
Figs. 3.73a, b, and c. A horizontal line
is drawn at the desired height of burst
and then the ground distances for spe-
cific values of the peak overpressure can
be read off. These curves differ from the
one in Fig. 3.72 for a free air burst
because they include the effect of re-
flection of the blast wave at the earth’s
surface. A curve for peak overpressure
versus distance from ground zero for a
contact surface burst can be obtained by
taking the height of burst in Figs. 3.73a,
b, and c to be zero.
3.75 The curves in Fig. 3.75 indi-
cate the variation of the peak dynamic
pressure along the surface with distance
from ground zero and height of burst for
a 1-kiloton air burst in a standard sea-
level atmosphere for nearly ideal surface
conditions. Since height-of-burst charts
indicate conditions after the blast wave
has been reflected from the surface, the
curves do not represent the dynamic
pressure of the incident wave. At
ground zero the wind in the incident
blast wave is stopped by the ground
surface, and all of the incident dynamic
pressure is transformed to static over-
pressure. Thus, the height-of-burst
curves show that the dynamic pressure
is zero at ground zero. At other loca-
tions, reflection of the incident blast
wave produces winds that at the surface
must blow parallel to the surface. The
dynamic pressures associated with these
winds produce horizontal forces. It is
this horizontal component of the dy-
namic pressure that is given in Fig.
3.75.
3.76 The dependence of the posi-
tive phase duration of the overpressure
and of the dynamic pressure on the dis-
tance from ground zero and on the
height of burst is shown by the curves in
TECHNICAL ASPECTS OF BLAST WAVE PHENOMENA
107
Fig. 3.76; the values for the dynamic
pressure duration are in parentheses. As
in the other cases, the results apply to a
1-kiloton explosion in a standard sea-
level atmosphere for a nearly ideal sur-
face. It will be noted, as mentioned
earlier, that for a given detonation and
location, the duration of the positive
phase of the dynamic pressure is longer
than that of the overpressure.
3.77 The curves in Figs. 3.77a and
b give the time of arrival of the shock
front on the ground at various distances
from ground zero as a function of the
height of burst for a 1-kiloton explosion
under the usual conditions of a sea-level
atmosphere and nearly ideal surface.
3.78 The peak overpressures in
Figs. 3.74a, b, and c, which allow for
reflection at the ground surface, are
considered to be the side-on overpres-
sures (§ 4.06 footnote) to be used in
determining target loading and re-
sponse. However, further reflection is
possible at the front face of a structure
when it is struck by the blast wave. The
magnitude of the reflected pressure pr(a)
depends on the side-on pressure p and
the angle, a, between blast wave front
and the struck surface (Fig. 3.78a). The
values of the ratio pr(a)/p as a function
of angle of incidence for various indi-
cated side-on pressures are given in Fig.
3.78b. It is seen that for normal inci-
dence, i.e., when a = 0°, the ratio
pr(a)/p is approximately 2 at low over-
pressures and increases with the over-
pressure (§ 3.56). The curves in Fig.
3.78b are particularly applicable in the
Mach region where an essentially verti-
cal shock front moving radially strikes a
reflecting surface such as the front wall
of a structure (see Fig. 4.07).
(Text continued on page 124.)
108
AIR BLAST PHENOMENA IN AIR AND SURFACE BURSTS
The curve in Fig. 3.72 shows the
variation of peak overpressure with dis-
tance for a 1 KT free air burst in a
standard sea-level atmosphere.
Scaling. For targets below 5,000
feet and for burst altitudes below 40,000
feet, the range to which a given peak
overpressure extends for yields other
than 1 KT scales as the cube root of the
yield, i.e.,
D = x Wi'3,
where, for a given peak overpressure,
is the distance (slant range) from the
explosion for 1 KT, and D is the dis-
tance from the explosion for W KT.
(For higher target or burst altitudes, see
§ 3.64 et seq.)
Example
Given: A 2 MT burst at an altitude
of 100,000 feet.
Find: The highest value of peak
overpressure that reasonably may be
expected to be incident on a target (an
aircraft or missile) at an altitude of
60,000 feet.
Solution: The blast efficiency factor
is based on the burst altitude, but the
altitude scaling factors are based on tar-
get altitude (§ 3.64). The highest value
of peak overpressure will occur with the
upper limit of the blast efficiency factor.
From Table 3.68, this upper limit for a
burst at an altitude of 100,000 feet is
somewhat less than 0.9. Hence, the ef-
fective yield is approximately
0.91V = 0.9 x 2
= 1.8 MT = 1,800 KT.
The shortest distance from burst point
to target, i.e., where the overpressure
would be largest, is
D = 100,000 - 60,000 = 40,000 feet.
From equation (3.66.2), the corre-
sponding distance from a 1 KT burst for
sea-level conditions is
D. = — ,-L.
' W» s
d
From Table 3.66, Sd at the target
altitude of 60,000 feet is 2.41; hence;
_ 40,000 1
1 (l,800)1/3 * 2.41
= 1,360 feet.
From Fig. 3.72, the peak overpres-
sure at a distance of 1,360 feet from a 1
KT free air burst at sea-level conditions
is 4.2 psi. The corresponding over-
pressure at an altitude of 60,000 feet is
obtained from equation (3.66.1) and
Table 3.66; thus
p = p}Sp = 4.2 x 0.071
= 0.30 psi.
Answer
TECHNICAL ASPECTS OF BLAST WAVE PHENOMENA
109
PEAK OVERPRESSURE (PSI)
Figure 3.72. Peak overpressure from a 1-kiloton free air burst for sea-level ambient
conditions.
но
AIR BLAST PHENOMENA IN AIR AND SURFACE BURSTS
The curves in Fig. 3.73a show peak
overpressures on the ground in the
high-pressure range as a function of
distance from ground zero and height of
burst for a 1 KT burst in a standard
sea-level atmosphere. The broken line
separates the regular reflection region
from the Mach region and indicates
where the triple point is formed (§ 3.24
et seq.). The data are considered appro-
priate to nearly ideal surface conditions.
(For terrain, surface, and meteorologi-
cal effects, see §§ 3.35-3.43, §§ 3.47-
3.49, and § 3.79 et seq.)
Scaling. The height of burst and
distance from ground zero to which a
given overpressure extends scale as the
cube root of the yield, i.e.,
— = — =
J, Й,
where, for a given peak overpressure, dx
and hx are distance from ground zero
and height of burst for 1 KT, and d and
h are the corresponding distance and
height of burst for W KT. For a height
of burst of 5,000 feet or less, a homo-
geneous sea-level atmosphere may be
assumed.
Example
Given'. An 80 KT detonation at a
height of 860 feet.
Find: The distance from ground
zero to which 1,000 psi overpressure
extends.
Solution: The corresponding height
of burst for 1 KT, i.e., the scaled
height, is
, _ h _ 860 p *
1 ” Wi'3 ” (80)1'3 “ 200feeL
d = d, W™ =
110 x (80)l/3 = 475 feet.
Answer.
From Fig. 3.73a, an overpressure of
1,000 psi extends 110 feet from ground
zero for a 200-foot burst height for a 1
KT weapon. The corresponding dis-
tance for 80 KT is
d = dx =
110 x (80)’^ = 475 feet.
Answer.
The procedure described above is appli-
cable to similar problems for the curves
in Figs. 3.73b and c.
TECHNICAL ASPECTS OF BLAST WAVE PHENOMENA
111
HEIGHT OF BURST (FEET)
DISTANCE FROM GROUND ZERO (FEET)
Figure 3.73a. Peak overpressures on the ground for a 1-kiloton burst (high-pressure range).
112
AIR BLAST PHENOMENA IN AIR AND SURFACE BURSTS
The curves in Fig. 3.73b show peak
overpressures on the ground in the in-
termediate-pressure range as a function
of distance from ground zero and height
of burst for a 1 KT burst in a standard
sea-level atmosphere. The broken line
separates the regular reflection region
from the Mach region and indicates
where the triple point is formed (§ 3.24
et seq.). The data are considered appro-
priate for nearly ideal surface condi-
tions. (For terrain, surface, and meteor-
ological effects, see (§ 3.35-3.43,
§ 3.47-3.49, and § 3.79 et seq.).
Scaling. The height of burst and the
distance from ground zero to which a
given peak overpressure extends scale
as the cube root of the yield, i.e.,
A = A = ц/,/3,
where, for a given peak overpressure,
and /?! are distance from ground zero
and height of burst for 1 KT, and d and
h are the corresponding distance and
height of burst for W KT. For a height
of burst of 5,000 feet or less, a homo-
geneous sea-level atmosphere may be
assumed.
Example
Given: A 100 KT detonation at a
height of 2,320 feet.
Find: The peak overpressure at
1,860 feet from ground zero.
Solution: The corresponding height
of burst for 1 KT is
Ц/!/3
2,320
(100)i/3
= 500 feet.
and the ground distance is
d . d
। iyi/3
1,860
(100)1/3
= 400 feet.
From Fig. 3.73b, at a ground distance of
400 feet and a burst height of 500 feet,
the peak overpressure is 50 psi. Answer.
The procedure described above is appli-
cable to similar problems for the curves
in Figs. 3.73a and c.
HEIGHT OF BURST (FEET)
Figure 3.73b. Peak overpressures on the ground for a 1-kiloton burst (intermediate-pressure range).
TECHNICAL ASPECTS OF BLAST WAVE PHENOMENA
114
AIR BLAST PHENOMENA IN AIR AND SURFACE BURSTS
The curves in Fig. 3.73c show peak
overpressures on the ground in the low-
pressure range as a function of distance
from ground zero and height of burst for
a 1 KT burst in a standard sea-level
atmosphere. The broken line separates
the regular reflection region from the
Mach region and indicates where the
triple point is formed (§ 3.24 et seq.).
The data are considered appropriate for
nearly ideal surface conditions. (For
terrain, surface, and meteorological ef-
fects, see §§ 3.35-3.43, §§ 3.47-3.49,
and § 3.79 et seq.)
Scaling. The height of burst and the
distance from ground zero to which a
given peak overpressure extends scale
as the cube root of the yield, i.e.,
AL = — =
d, h,
where, for a given peak overpressure,
and hl are the distance from ground zero
and height of burst for 1 KT, and d and
h are the corresponding distance and
height of burst for W KT. For a height
of burst of 5,000 feet or less, a homo-
geneous sea-level atmosphere may be
assumed.
Example
Given: A 125 KT detonation.
Find: The maximum distance from
ground zero to which 4 psi extends, and
the height of burst at which 4 psi ex-
tends to this distance.
Solution: From Fig. 3.73c, the
maximum ground distance to which 4
psi extends for a 1 KT weapon is 2,600
feet. This occurs for a burst height of
approximately 1,100 feet. Hence, for a
125 KT detonation, the required burst
height is
h = /2, = 1,100 x (125)i/3
= 5,500 feet.
This is sufficiently close to 5,000 feet
for a homogeneous atmosphere to be
assumed. The distance from ground
zero is then
d = d{Wlf3 = 2,600 x (125)"3
= 13,000 feet. Answer.
The procedure described above is appli-
cable to similar problems for the curves
in Figs. 3.73a and b.
HEIGHT OF BURST (FEET)
Figure 3.73c. Peak overpressures on the ground for 1-kiloton burst (low-pressure range).
TECHNICAL ASPECTS OF BLAST WAVE PHENOMENA
116
AIR BLAST PHENOMENA IN AIR AND SURFACE BURSTS
The curves in Fig. 3.75 show the
horizontal component of peak dynamic
pressure on the ground as a function of
distance from ground zero and height of
burst for a 1 KT burst in a standard
sea-level atmosphere. The data are con-
sidered appropriate for nearly ideal sur-
face conditions. (For terrain, surface,
and meteorological effects, see §§
3.35-3.43, §§ 3.47-3.49, and § 3.79 et
seq.)
Scaling. The height of burst and
distance from ground zero to which a
given peak dynamic pressure value ex-
tends scale as the cube root of the yield,
i.e.,
jL = JL = ц/1/з
d, A,
where, for a given peak dynamic pres-
sure, h{ and d} are the height of burst
and distance from ground zero for 1 KT,
and h and d are the corresponding height
of burst and distance for W KT. For a
height of burst of 5,000 feet or less, a
homogeneous sea-level atmosphere may
be assumed.
Example
Given: A 160 KT burst at a height
of 3,000 feet.
Find: The horizontal component of
peak dynamic pressure on the surface at
6,000 feet from ground zero.
Solution: The corresponding height
of burst for 1 KT is
. h 3,000 ,
(MP - 550
The corresponding distance for 1 KT
is
, d 6,000 i 1f .
= (W” " ‘“oteer
From Fig. 3.75, at a distance of 1,110
feet from ground zero and a burst height
of 550 feet, the horizontal component of
the peak dynamic pressure is approxi-
mately 3 psi. Answer.
Calculations similar to those de-
scribed in connection with Figs. 3.74a
and c may be made for the horizontal
component of the peak dynamic pres-
sure (instead of the peak overpressure)
by using Fig. 3.75.
HEIGHT OF BURST (FEET)
Figure 3.75. Horizontal component of peak dynamic pressure for 1-kiloton burst.
TECHNICAL ASPECTS OF BLAST WAVE PHENOMENA
118
AIR BLAST PHENOMENA IN AIR AND SURFACE BURSTS
The curves in Fig. 3.76 show the
duration on the ground of the positive
phase of the overpressure and of the
dynamic pressure (in parentheses) as a
function of distance from ground zero
and height of burst for a 1 KT burst in a
standard sea-level atmosphere. The
curves are considered appropriate for
nearly ideal surface conditions.
Scaling. The required relationships
are
J, /ij
where d}, h{, and tl are the distance from
ground zero, the height of burst, and
duration, respectively, for 1 KT; and d,
h, and t are the corresponding distance,
height of burst, and duration for WKT.
For a height of burst of 5,000 feet or
less, a homogeneous sea-level atmos-
phere may be assumed.
Example
Given: A 160 KT explosion at a
height of 3,000 feet.
Find: The positive phase duration
on the ground of (a) the overpressure,
(Z?) the dynamic pressure at 4,000 feet
from ground zero.
Solution: The corresponding height
of burst for 1 KT is
, _ h 3,000 ( *
1 W'K (160)'« ee ’
and the corresponding distance from
ground zero is
, _ d 4,000 _ _.nr f
1 W™ (16O)|« ee
(a) From Fig. 3.76, the positive phase
duration of the overpressure for a 1 KT
at 740 feet from ground zero and a burst
height of 550 feet is 0.18 second. The
corresponding duration of the overpres-
sure positive phase for 160 KT is,
therefore,
t = tlW^ = 0.18 x (160)"3
= 1.0 second. Answer.
(Z?) From Fig. 3.76, the positive phase
duration of the dynamic pressure for 1
KT at 740 feet from ground zero and a
burst height of 550 feet is 0.34 second.
The corresponding duration of the dy-
namic pressure positive phase for 160
KT is, therefore,
t = = 0.34 x (160)1/3
= 1.8 second. Answer.
HEIGHT OF BURST (FEET)
Figure 3.76. Positive phase duration on the ground of overpressure and dynamic pressure
(in parentheses) for 1-kiloton burst.
TECHNICAL ASPECTS OF BLAST WAVE PHENOMENA
40
120
AIR BLAST PHENOMENA IN AIR AND SURFACE BURSTS
The curves in Figs. 3.77a and b give
the time of arrival in seconds of the blast
wave on the ground as a function of
distance from ground zero and height of
burst for a 1 KT burst in a standard
sea-level atmosphere. The curves are
considered appropriate for nearly ideal
surface conditions.
Scaling. The required relationships
are
— = JL = _L = ц/1/з
where dr hv and are the distance from
ground zero, height of burst, and time of
arrival, respectively, for 1 KT; and d, h,
and t are the corresponding distance,
height of burst, and time for W KT. For
a height of burst of 5,000 feet or less, a
homogeneous sea-level atmosphere may
be assumed.
Example
Given: A 1 MT explosion at a
height of 5,000 feet.
Find: The time of arrival of the
blast wave at a distance of 10 miles from
ground zero.
Solution: The corresponding burst
height for 1 KT is
= _Л_
1
5,000
(l,000)1/3
= 500 feet.
The corresponding distance from
ground zero for 1 KT is
D _ 5,280x10
W"3 (l,000)1/3
= 5,280 feet
From Fig. 3.77b, at a height of burst of
500 feet and a distance of 5,280 feet
from ground zero, the arrival time is 4.0
seconds for 1 KT. The corresponding
arrival time for 1 MT is
t = = 4.0 x (1,000)1/3
= 40 seconds. Answer.
TECHNICAL ASPECTS OF BLAST WAVE PHENOMENA
121
Figure 3.77a. Arrival times on the ground of blast wave for 1-kiloton burst (early times).
HEIGHT OF BURST (FEET)
DISTANCE FROM GROUND ZERO (FEET)
Figure 3.77b. Arrival times on the ground of blast wave for 1-kiloton burst (late times).
122
AIR BLAST PHENOMENA IN AIR AND SURFACE BURSTS
The reflected overpressure ratio pr{a}lp
is plotted in Fig. 3.78b as a function of
the angle of incidence of the blast wave
front for various values of the peak
(side-on) overpressure. The curves
apply to a wave front striking a reflect-
ing surface, such as a wall of a struc-
ture.
pr(a} = reflected blast wave overpres-
sure for any given angle of in-
cidence (psi).
p = initial peak incident overpres-
sure (psi).
a = angle between the blast wave
front and the reflecting surface
(degrees).
Example
Given: A shock wave of 50 psi ini-
tial peak overpressure striking a surface
at an angle of 35°.
Find: The reflected shock wave
overpressure.
Solution: From Fig. 3.78b, the re-
flected overpressure ratio, pr{Jp, for 50
psi and an angle of incidence of 35° is
3.6; hence,
Л<35’) = 3'6P = 36 X 50
= 180 psi. Answer.
REFLECTING SURFACE
Figure 3.78a. Angle of incidence (a) of
blast wave front with re-
flecting surface.
TECHNICAL ASPECTS OF BLAST WAVE PHENOMENA
ANGLE OF INCIDENCE, a
Figure 3.78b. Reflected overpressure ratio as a function of angle of incidence for various
side-on overpressures.
124
AIR BLAST PHENOMENA IN AIR AND SURFACE BURSTS
(Text continued from page 107.)
THE PRECURSOR
3.79 The foregoing results have re-
ferred to blast wave conditions near the
surfaces that are ideal or nearly ideal
(§ 3.47), so that the Rankine-Hugoniot
equations are applicable. When the sur-
face is nonideal, there may be mechani-
cal or thermal effects (or both) on the
blast wave. Some of the phenomena
associated with mechanical effects were
mentioned in § 3.48. As a consequence
of thermal nonideal behavior, the over-
pressure and dynamic pressure patterns
can be distorted. Severe thermal effects
are associated with the formation of a
precursor (§ 3.49) which produces sig-
nificant changes in the parameters of the
blast wave.
3.80 When a nuclear weapon is de-
tonated over a thermally nonideal (heat-
absorbing) surface, radiation from the
fireball produces a hot layer of air, re-
ferred to as a “thermal layer,” near the
surface. This layer, which often in-
cludes smoke, dust, and other particu-
late matter, forms before the arrival of
the blast wave from an air burst. It is
thus referred to as the preshock thermal
layer. Interaction of the blast wave with
the hot air layer may affect the reflection
process to a considerable extent. For
appropriate combinations of explosion
energy yield, burst height, and heat-ab-
sorbing surfaces, an auxiliary (or sec-
ondary) blast wave, the precursor, will
form and will move ahead of the main
incident wave for some distance. It is
called precursor because it precedes the
main blast wave.
3.81 After the precursor forms, the
main shock front usually no longer ex-
tends to the ground; if it does, the lower
portion is so weakened and distorted
that it is not easily recognized. Between
the ground and the bottom edge of the
main shock wave is a gap, probably not
sharply defined, through which the en-
ergy that feeds the precursor may flow.
Ahead of the main shock front, the blast
energy in the precursor is free not only
to follow the rapidly moving shock front
in the thermal layer, but also to propa-
gate upward into the undisturbed air
ahead of the main shock front. This
diverging flow pattern within the pre-
cursor tends to weaken it, while the
energy which is continually fed into the
precursor from the main blast wave
tends to strengthen the precursor shock
front. The foregoing description of what
happens within a precursor explains
some of the characteristics shown in
Fig. 3.81. Only that portion of the pre-
cursor shock front that is in the preshock
thermal layer travels faster than the
main shock front; the energy diverging
upward, out of this layer, causes the
upper portion to lose some of its forward
speed. The interaction of the precursor
and the main shock front indicates that
the main shock is continually overtaking
this upward-traveling energy. Dust,
which may billow to heights of more
than 100 feet, shows the upward flow of
air in the precursor.
3.82 Considerable modification of
the usual blast wave characteristics may
occur within the precursor region. The
overpressure wave form shows a
rounded leading edge and a slow rise to
its peak amplitude. In highly disturbed
waveforms, the pressure jump at the
leading edge may be completely absent.
(An example of a measured overpres-
sure waveform in the precursor region is
TECHNICAL ASPECTS OF BLAST WAVE PHENOMENA
125
EARLY DEVELOPMENT
Figure 3.81. Precursor characteristics.
LATE DEVELOPMENT
given in Fig. 4.67a.) Dynamic pressure
waveforms often have high-frequency
oscillations that indicate severe turbu-
lence. Peak amplitudes of the precursor
waveforms show that the overpressure
has a lower peak value and the dynamic
pressure a higher peak value than over a
surface that did not permit a precursor to
form. The higher peak value of the dy-
namic pressure is primarily attributable
to the increased density of the moving
medium as a result of the dust loading in
the air. Furthermore, the normal Ran-
kine-Hugoniot relations at the shock
front no longer apply.
3.83 Examples of surfaces which
are considered thermally nearly ideal
(unlikely to produce significant precur-
sor effects) and thermally nonideal (ex-
pected to produce a precursor for suit-
able combinations of burst height and
ground distance) are given in Table
3.83. Under many conditions, e.g., for
scaled heights of burst in excess of 800
feet or at large ground distances (where
the peak overpressure is less than about
6 psi), precursors are not expected to
occur regardless of yield and type of
surface. Thermal effects on the blast
wave are also expected to be small for
contact surface bursts; consequently, it
is believed that in many situations,
especially in urban areas, nearly ideal
blast wave conditions would prevail.
3.84 For this reason, the curves for
various air blast parameters presented
earlier, which apply to nearly ideal sur-
face conditions, are considered to be
Table 3.83
EXAMPLES OF
THERMALLY NEARLY IDEAL AND
THERMALLY NONIDEAL SURFACES
Thermally Thermally Nonideal
Nearly Ideal (precursor may occur for
(precursor unlikely) low air bursts)
Water Desert sand
Ground covered by Coral
white smoke Asphalt
Heat-reflecting Surface with thick low
concrete vegetation
Ice Surface covered by dark
Packed snow smoke
Moist soil with Most agricultural areas
sparse vegetation Dry soil with sparse
Commercial and indus- vegetation
trial areas
126
AIR BLAST PHENOMENA IN AIR AND SURFACE BURSTS
most representative for general use. It
should be noted, however, that blast
phenomena and damage observed in the
precursor region for low air bursts at the
Nevada Test Site may have resulted
from nonideal behavior of the surface.
Under such conditions, the overpressure
waveform may be irregular and may
show a slow rise to a peak value some-
what less than that expected for nearly
ideal conditions (§ 3.82). Conse-
quently, the peak value of reflected
pressure on the front face of an object
struck by the blast wave may not exceed
the peak value of the incident pressure
by more than a factor of two instead of
the much higher theoretical factor for an
ideal shock front as given by equation
(3.56.2).
3.85 Similarly, the dynamic pres-
sure waveform will probably be irregu-
lar (§ 3.82), but the peak value may be
several times that computed from the
peak overpressure by the Rankine-
Hugoniot relations. Damage to and dis-
placement of targets which are affected
by dynamic pressure may thus be con-
siderably greater in the nonideal precur-
sor region for a given value of peak
overpressure than under nearly ideal
conditions.
BIBLIOGRAPHY
*Banister, J. R., and L. J. Vortman, “Ef-
fects of a Precursor Shock Wave on Blast
Loading of a Structure,’’ Sandia Corporation,
Albuquerque, New Mexico, October 1960,
WT-1472.
*Bethe, H. A., et al., “Blast Wave,’’ Univer-
sity of California, Los Alamos Scientific Labo-
ratory, March 1958, LA-2000.
Brinkley, S. R., Jr., and J. G. Kirkwood,
“Theory of the Propagation of Shock Waves,’’
Phys. Rev., 71, 606 (1947); 72, 1109 (1947).
Brode, H. L., “Numerical Solution of Spherical
Blast Waves,’’ J. Appl. Phys. 26, 766 (1955).
Brode, H. L., “Review of Nuclear Weapons
Effects,’’ Ann. Rev. Nuclear Science, 18, 153
(1968).
Brode, H. L., “Height of Burst Effects at High
Overpressures,’’ Rand Corporation, Santa
Monica, California, July 1970, RM-6301-
DASA, DASA 2506.
Courant, R., and К. O. Friedrichs, “Super-
sonic Flow and Shock Waves,’’ Interscience
Publishers, Inc., 1948.
Goldstine, H. H., and J. Von Neumann,
“Blast Wave Calculations,’’ Comm, on Pure
and Appl. Math. 8, 327 (1955).
Letho, D. L. and R. A. Larson, “Long Range
Propagation of Spherical Shockwaves from Ex-
plosions in Air,” U.S. Naval Ordnance Labo-
ratory, July 1969, NOLTR 69-88.
Liepmann, H. W., and A. E. Puckett,
“Aerodynamics of a Compressible Fluid,”
John Wiley and Sons, Inc., 1947.
Penney, W. G., D. E. J. Samuels, and G. C.
Scorgie, “The Nuclear Explosive Yields at
Hiroshima and Nagasaki,” Phil. Trans. Roy.
Soc., A 266, 357 (1970).
Reed, J. W., “Airblast from Plowshare Proj-
ects,” in Proceedings for the Symposium on
Public Health Aspects of Peaceful Uses of Nu-
clear Explosives, Southwestern Radiological
Health Laboratory, April 1969, SWRHL-82, p.
309.
Taylor, G. I., “The Formation of a Blast Wave
by a Very Intense Explosion,” Proc. Row
Soc., A 201, 159, 175 (1950).
*U.S. Standard Atmosphere, U.S. Government
Printing Office, Washington, D.C., 1962, Sup-
plements, 1966.
*Thesc documents may be purchased from the National Technical Information Service, U.S.
Department of Commerce, Arlington, Virginia 22161.
CHAPTER IV
AIR BLAST LOADING
INTERACTION OF BLAST WAVE WITH STRUCTURES
INTRODUCTION
4.01 The phenomena associated
with the blast wave in air from a nuclear
explosion have been treated in the pre-
ceding chapter. The behavior of an ob-
ject or structure exposed to such a wave
may be considered under two main
headings. The first, called the “load-
ing,” i.e., the forces which result from
the action of the blast pressure, is the
subject of this chapter. The second, the
“response” or distortion of the structure
due to the particular loading, is treated
in the next chapter.
4.02 For an air burst, the direction
of propagation of the incident blast
wave will be toward the ground at
ground zero. In the regular reflection
region, where the direction of propaga-
tion of the blast wave is not parallel to
the horizontal axis of the structure, the
forces exerted upon structures will also
have a considerable downward compo-
nent (prior to passage of the reflected
wave) due to the reflected pressure
buildup on the horizontal surfaces.
Consequently, in addition to the hori-
zontal loading, as in the Mach region
(§ 3.24 et seq.), there will also be ini-
tially an appreciable downward force.
This tends to cause crushing toward the
ground, e.g., dished-in roofs, in addi-
tion to distortion due to translational
motion.
4.03 The discussion of air blast
loading for aboveground structures in
the Mach region in the sections that
follow emphasizes the situation where
the reflecting surface is nearly ideal
(§ 3.47) and the blast wave behaves
normally, in accordance with theoretical
considerations. A brief description of
blast wave loading in the precursor re-
gion (§ 3.79 et seq.) is also given. For
convenience, the treatment will be
somewhat arbitrarily divided into two
parts: one deals with “diffraction load-
ing,” which is determined mainly by
the peak overpressure in the blast wave,
and the other with “drag loading,” in
which the dynamic pressure is the sig-
nificant property. It is important to re-
member, however, that all structures are
subjected simultaneously to both types
of loading, since the overpressure and
dynamic pressure cannot be separated,
although for certain structures one may
be more important than the other.
4.04 Details of the interaction of a
blast wave with any structure are quite
127
128
AIR BLAST LOADING
complicated, particularly if the geome-
try of the structure is complex. How-
ever, it is frequently possible to consider
equivalent simplified geometries, and
blast loadings of several such geome-
tries are discussed later in this chapter.
DIFFRACTION LOADING
4.05 When the front of an air blast
wave strikes the face of a structure,
reflection occurs. As a result the over-
pressure builds up rapidly to at least
twice (and generally several times) that
in the incident wave front. The actual
pressure attained is determined by
various factors, such as the peak over-
pressure of the incident blast wave and
the angle between the direction of mo-
tion of the wave and the face of the
structure (§ 3.78). The pressure in-
crease is due to the conversion of the
kinetic energy of the air behind the
shock front into internal energy as the
rapidly moving air behind the shock
front is decelerated at the face of the
structure. The reflected shock front
propagates back into the air in all direc-
tions. The high pressure region expands
outward towards the surrounding re-
gions of lower pressure.
4.06 As the wave front moves for-
ward, the reflected overpressure on the
face of the structure drops rapidly to that
produced by the blast wave without re-
flection,1 plus an added drag force due
to the wind (dynamic) pressure. At the
same time, the air pressure wave bends
or “diffracts” around the structure, so
that the structure is eventually engulfed
by the blast, and approximately the
same pressure is exerted on the sides
and the roof. The front face, however, is
still subjected to wind pressure, al-
though the back face is shielded from it.
4.07 The developments described
above are illustrated in a simplified form
in Figs. 4.07a, b, c, d, e;2 this shows, in
plan, successive stages of a structure
without openings which is being struck
by an air blast wave moving in a hori-
zontal direction. In Fig. 4.07a the wave
front is seen approaching the structure
with the direction of motion perpendic-
ular to the face of the structure exposed
to the blast. In Fig. 4.07b the wave has
just reached the front face, producing a
high reflected overpressure. In Fig.
4.07c the blast wave has proceeded
about halfway along the structure and in
Fig. 4.07d the wave front has just
passed the rear of the structure. The
pressure on the front face has dropped to
some extent while the pressure is build-
ing up on the back face as the blast wave
diffracts around the structure. Finally,
when the wave front has passed com-
pletely, as in Fig. 4.07e, approximately
equal air pressures are exerted on the
sides and top of the structure. A pres-
sure difference between front and back
faces’, due to the wind forces, will per-
sist, however, during the whole positive
phase of the blast wave. If the structure
is oriented at an angle to the blast wave,
the pressure would immediately be ex-
erted on two faces, instead of one, but
the general characteristics of the blast
loading would be similar to that just
described (Figs. 4.07f, g, h, and i).
4.08 The pressure differential be-
tween the front and back faces will have
‘This is often referred to as the “side-on overpressure,” since it is the same as that experienced by the
side of the structure, where there is no appreciable reflection.
-A more detailed treatment is given later in this chapter.
INTERACTION OF BLAST WAVE WITH STRUCTURES
129
Figure 4.07. Stages in the diffraction of a blast wave by a structure without openings (plan
view).
its maximum value when the blast wave
has not yet completely surrounded the
structure, as in Figs. 4.07b, c, and d or
g and h. Such a pressure differential will
produce a lateral (or translational) force
tending to cause the structure to deflect
and thus move bodily, usually in the
same direction as the blast wave. This
force is known as the “diffraction load-
ing” because it operates while the blast
wave is being diffracted around the
structure. The extent and nature of the
response will depend upon the size,
shape, and weight of the structure and
how firmly it is attached to the ground.
Other characteristics of the structure are
also important in determining the re-
sponse, as will be seen later.
4.09 When the blast wave has en-
gulfed the structure (Fig. 4.07e or
4.07i), the pressure differential is small,
and the loading is due almost entirely to
the drag pressure3 exerted on the front
face. The actual pressures on all faces of
the structure are in excess of the ambient
atmospheric pressure and will remain
so, although decreasing steadily, until
the positive phase of the blast wave has
ended. Hence, the diffraction loading on
a structure without openings is eventu-
ally replaced by an inwardly directed
pressure, i.e., a compression or squeez-
ing action, combined with the dynamic
pressure of the blast wave. In a structure
with no openings, the loading will cease
only when the overpressure drops to
zero.
4.10 The damage caused during the
'The drag pressure is the product of the dynamic pressure and the drag coefficient (§ 4.29).
130
AIR BLAST LOADING
diffraction stage will be determined by
the magnitude of the loading and by its
duration. The loading is related to the
peak overpressure in the blast wave and
this is consequently an important factor.
If the structure under consideration has
no openings, as has been assumed so
far, the duration of the diffraction load-
ing will be very roughly the time re-
quired for the wave front to move from
the front to the back of the building,
although wind loading will continue for
a longer period. The size of the structure
will thus affect the diffraction loading.
For a structure 75 feet long, the diffrac-
tion loading will operate for a period of
about one-tenth of a second, but the
squeezing and the wind loading will
persist for a longer time (§ 4.13). For
thin structures, e.g., telegraph or utility
poles and smokestacks, the diffraction
period is so short that the corresponding
loading is negligible.
4.11 If the building exposed to the
blast wave has openings, or if it has
windows, panels, light siding, or doors
which fail in a very short space of time,
there will be a rapid equalization of
pressure between the inside and outside
of the structure. This will tend to reduce
the pressure differential while diffrac-
tion is occurring. The diffraction load-
ing on the structure as a whole will thus
be decreased, although the loading on
interior walls and partitions will be
greater than for an essentially closed
structure, i.e., one with few openings.
Furthermore, if the building has many
openings, the squeezing (crushing) ac-
tion, due to the pressure being higher
outside than inside after the diffraction
stage, will not occur.
DRAG (DYNAMIC PRESSURE)
LOADING
4.12 During the whole of the over-
pressure positive phase (and for a short
time thereafter) a structure will be sub-
jected to the dynamic pressure (or drag)
loading caused by the transient winds
behind the blast wave front. Under
nonideal (precursor) conditions, a dy-
namic pressure loading of varying
strength may exist prior to the maximum
overpressure (diffraction) loading. Like
the diffraction loading, the drag loading,
especially in the Mach region, is equiv-
alent to a lateral (or translational) force
acting upon the structure or object ex-
posed to the blast.
4.13 Except at high blast overpres-
sures, the dynamic pressures at the face
of a structure are much less than the
peak overpressures due to the blast wave
and its reflection (Table 3.07). How-
ever, the drag loading on a structure
persists for a longer period of time,
compared to the diffraction loading. For
example, the duration of the positive
phase of the dynamic pressure on the
ground at a slant range of 1 mile from a
1-megaton nuclear explosion in the air is
almost 3 seconds. On the other hand,
the diffraction loading is effective only
for a small fraction of a second, even for
a large structure, as seen above.
4.14 It is the effect of the duration
of the drag loading on structures which
constitutes an important difference be-
tween nuclear and high-explosive deto-
nations. For the same peak overpressure
in the blast wave, a nuclear weapon will
prove to be more destructive than a
conventional one, especially for build-
ings which respond to drag loading.
INTERACTION OF BLAST WAVE WITH STRUCTURES
131
This is because the blast wave is of
much shorter duration for a high-explo-
sive weapon, e.g., a few hundredths of
a second. As a consequence of the
longer duration of the positive phase of
the blast wave from weapons of high
energy yield, such devices cause more
damage to drag-sensitive structures
(§ 4.18) than might be expected from
the peak overpressures alone.
STRUCTURAL CHARACTERISTICS
AND AIR BLAST LOADING
4.15 In analyzing the response to
blast loading, as will be done more fully
in Chapter V, it is convenient to con-
sider structures in two categories, i.e.,
diffraction-type structures and drag-type
structures. As these names imply, in a
nuclear explosion the former would be
affected mainly by diffraction loading
and the latter by drag loading. It should
be emphasized, however, that the dis-
tinction is made in order to simplify the
treatment of real situations which are, in
fact, very complex. Although it is true
that some structures will respond mainly
to diffraction forces and others mainly to
drag forces, actually all buildings will
respond to both types of loading. The
relative importance of each type of
loading in causing damage will depend
upon the type of structure as well as on
the characteristics of the blast wave.
These facts should be borne in mind in
connection with the ensuing discussion.
4.16 Large buildings having a
moderately small window and door area
and fairly strong exterior walls respond
mainly to diffraction loading. This is
because it takes an appreciable time for
the blast wave to engulf the building,
and the pressure differential between
front and rear exists during the whole of
this period. Examples of structures
which respond mainly to diffraction
loading are multistory, reinforced-con-
crete buildings with small window area,
large wall-bearing structures such a<
apartment houses, and wood-frame
buildings such as dwelling houses.
4.17 Because, even with large
structures, the diffraction loading will
generally be operative for a fraction of a
second only, the duration of the blast
wave positive phase, which is usually
much longer, will not be significant. In
other words, the length of the blast wave
positive phase will not materially affect
the net translational loading (or the re-
sulting damage) during the diffraction
stage. A diffraction-type structure is,
therefore, primarily sensitive to the peak
overpressure in the blast wave to which
it is exposed. Actually it is the asso-
ciated reflected overpressure on the
structure that largely determines the
diffraction loading, and this may be
several times the incident blast over-
pressure (§ 3.78).
4.18 When the pressures on dif-
ferent areas of a structure (or structural
element) are quickly equalized, either
because of its small size, the charac-
teristics of the structure (or element), or
the rapid formation of numerous open-
ings by action of the blast, the diffrac-
tion forces operate for a very short time.
The response of the structure is then
mainly due to the dynamic pressure (or
drag force) of the blast wind. Typical
drag-type structures are smokestacks,
telephone poles, radio and television
transmitter towers, electric transmission
towers, and truss bridges. In all these
cases the diffraction of the blast wave
around the structure or its component
132
AIR BLAST LOADING
elements requires such a very short time
that the diffraction processes are neglig-
ible, but the drag loading may be con-
siderable.
4.19 The drag loading on a struc-
ture is determined not only by the dy-
namic pressure, but also by the shape of
the structure (or structural element). The
shape factor (or drag coefficient) is less
for rounded or streamlined objects than
for irregular or sharp-edged structures or
elements. For example, for a unit of
projected area, the loading on a tele-
phone pole or a smokestack will be less
than on an I-beam. Furthermore, the
drag coefficient can be either positive or
negative, according to circumstances
(§ 4.29).
4.20 Steel (or reinforced-concrete)
frame buildings with light walls made of
asbestos cement, aluminum, or corru-
gated steel, quickly become drag-sensi-
tive because of the failure of the walls at
low overpressures. This failure, accom-
panied by pressure equalization, occurs
very soon after the blast wave strikes the
structure, so that the frame is subject to
a relatively small diffraction loading.
The distortion, or other damage, sub-
sequently experienced by the frame, as
well as by narrow elements of the
structure, e.g., columns, beams, and
trusses, is then caused by the drag
forces.
4.21 For structures which are fun-
damentally of the drag type, or which
rapidly become so because of loss of
siding, the response of the structure or
of its components is determined by both
the drag loading and its duration. Thus,
the damage is dependent on the duration
of the positive phase of the blast wave as
well as on the peak dynamic pressure.
Consequently, for a given peak dynamic
pressure, an explosion of high energy
yield will cause more damage to a
drag-type structure than will one of
lower yield because of the longer dura-
tion of the positive phase in the former
case (see § 5.48 et seq.).
INTERACTION OF OBJECTS WITH AIR BLAST4
DEVELOPMENT OF BLAST LOADING
4.22 The usual procedure for pre-
dicting blast damage is by an analysis,
supported by such laboratory and full-
scale observations as may be available.
The analysis is done in two stages: first
the air blast loading on the particular
structure is determined; and second, an
evaluation is made of the response of the
structure to this loading. The first stage
of the analysis for a number of idealized
targets of simple shape is discussed in
the following sections. The second stage
is treated in Chapter V.
4.23 The blast loading on an object
is a function of both the incident blast
wave characteristics, i.e., the peak
overpressure, dynamic pressure, decay,
and duration, as described in Chapter
III, and the size, shape, orientation, and
response of the object. The interaction
of the incident blast wave with an object
is a complicated process, for which a
theory, supported primarily by experi-
mental data from shock tubes and wind
4The remaining (more technical) sections of this chapter may be omitted without loss of continuity.
INTERACTION OF OBJECTS WITH AIR BLAST
133
tunnels, has been developed. To reduce
the complex problem of blast loading to
reasonable terms, it will be assumed, for
the present purpose, that (1) the over-
pressures of interest are less than 50
pounds per square inch (dynamic pres-
sures less than about 40 pounds per
square inch), and (3) the object being
loaded is in the region of Mach reflec-
tion.
4.24 To obtain a general idea of the
blast loading process, a simple object,
namely, a cube with one side facing
toward the explosion, will be selected as
an example. It will be postulated, fur-
ther, that the cube is rigidly attached to
the ground surface and remains motion-
less when subjected to the loading. The
blast wave (or shock) front is taken to be
of such size compared to the cube that it
can be considered to be a plane wave
striking the cube. The pressures referred
to below are the average pressures on a
particular face. Since the object is in the
region of Mach reflection, the blast front
is perpendicular to the surface of the
ground. The front of the cube, i.e., the
side facing toward the explosion, is
normal to the direction of propagation of
the blast wave (Fig. 4.24).
4.25 When the blast wave strikes
the front of the cube, reflection occurs
producing reflected pressures which
Figure 4.24. Blast wave approaching cube
rigidly attached to ground.
may be from two to eight times as great
as the incident overpressure (§ 3.56).
The blast wave then bends (or diffracts)
around the cube exerting pressures on
the sides and top of the object, and
finally on its back face. The object is
thus engulfed in the high pressure of the
blast wave and this decays with time,
eventually returning to ambient condi-
tions. Because the reflected pressure on
the front face is greater than the pressure
in the blast wave above and to the sides,
the reflected pressure cannot be main-
tained and it soon decays to a “stagna-
tion pressure,” which is the sum of the
incident overpressure and the dynamic
(drag) pressure. The decay time is
roughly that required for a rarefaction
wave to sweep from the edges of the
front face to the center of this face and
back to the edges.
4.26 The pressures on the sides and
top of the cube build up to the incident
overpressure when the blast front arrives
at the points in question. This is fol-
lowed by a short period of low pressure
caused by a vortex formed at the front
edge during the diffraction process and
which travels along or near the surface
behind the wave front (Fig. 4.26). After
the vortex has passed, the pressure re-
turns essentially to that in the incident
blast wave which decays with time. The
air flow causes some reduction in the
loading to the sides and top, because, as
will be seen in § 4.43, the drag pressure
here has a negative value.
4.27 When the blast wave reaches
the rear of the cube, it diffracts around
the edges, and travels down the back
surface (Fig. 4.27). The pressure takes a
certain time (“rise time”) to reach a
more-or-less steady state value equal to
the algebraic sum of the overpressure
134
AIR BLAST LOADING
Figure 4.26. Blast wave moving over
sides and top of cube.
BLAST WAVE FRONT
Figure 4.27. Blast wave moving down
rear of cube.
and the drag pressure, the latter having a
negative value in this case also (§ 4.44).
The finite rise time results from a weak-
ening of the blast wave front as it dif-
fracts around the back edges, accom-
panied by a temporary vortex action,
and the time of transit of the blast wave
from the edges to the center of the back
face.
4.28 When the overpressure at the
rear of the cube attains the value of the
overpressure in the blast wave, the dif-
fraction process may be considered to
have terminated. Subsequently, essen-
tially steady state conditions may be
assumed to exist until the pressures have
returned to the ambient value prevailing
prior to the arrival of the blast wave.
4.29 The total loading on any given
face of the cube is equal to the algebraic
sum of the respective overpressure, p(f),
and the drag pressure. The latter is re-
lated to the dynamic pressure, q(t), by
the expression
Drag pressure =
where Cd is the drag coefficient. The
value of Cd depends on the orientation of
the particular face to the blast wave
front and may be positive or negative.
The drag pressures (or loading) may
thus be correspondingly positive or
negative. The quantities p(f) and q(f)
represent the overpressure and dynamic
pressure, respectively, at any time, f,
after the arrival of the wave front
(§ 3.57 et seq.).
4.30 The foregoing discussion has
referred to the loading on the various
surfaces in a general manner. For a
particular point on a surface, the loading
depends also on the distance from the
point to the edges and a more detailed
treatment is necessary. It should be
noted that only the gross characteristics
of the development of the loading have
been described here. There are, in actual
fact, several cycles of reflected and
rarefaction waves traveling across the
surfaces before damping out, but these
fluctuations are considered to be of
minor significance as far as damage to
the structure is concerned.
EFFECT OF SIZE ON LOADING
DEVELOPMENT
4.31 The loading on each surface
may not be as important as the net
horizontal loading on the entire object.
Hence, it is necessary to study the net
loading, i.e., the loading on the front
face minus that on the back face of the
cube. The net horizontal loading during
the diffraction process is high because
INTERACTION OF OBJECTS WITH AIR BLAST
135
the pressure on the front face is initially
the reflected pressure and no loading has
reached the rear face.
4.32 When the diffraction process is
completed, the overpressure loadings on
the front and back faces are essentially
equal. The net horizontal loading is then
relatively small. At this time the net
loading consists primarily of the dif-
ference between front and back loadings
resulting from the dynamic pressure
loading. Because the time required for
the completion of the diffraction process
depends on the size of the object, rather
than on the positive phase duration of
the incident blast wave, the diffraction
loading impulse per unit area (§ 3.59) is
greater for long objects than for short
ones.
4.33 The magnitude of the dynamic
pressure (or drag) loading, on the other
hand, is affected by the shape of the
object and the duration of the dynamic
pressure. It is the latter, and not the size
of the object, which determines the ap-
plication time (and impulse per unit
area) of the drag loading.
4.34 It may be concluded, there-
fore, that, for large objects struck by
blast waves of short duration, the net
horizontal loading during the diffraction
process is more important than the dy-
namic pressure loading. As the object
becomes smaller, or as the dynamic
pressure duration becomes longer, e.g.,
with weapons of larger yield, the drag
loading becomes increasingly impor-
tant. For classification purposes, objects
are often described as “diffraction tar-
gets” or “drag targets,” as mentioned
earlier, to indicate the loading mainly
responsible for damage. Actually, all
objects are damaged by the total load-
ing, which is a combination of over-
pressure and dynamic pressure loadings,
rather than by any one component of the
blast loading.
EFFECT OF SHAPE ON LOADING
DEVELOPMENT
4.35 The description given above
for the interaction of a blast wave with a
cube may be generalized to apply to the
loading on a structure of any other
shape. The reflection coefficient, i.e.,
the ratio of the (instantaneous) reflected
overpressure to the incident overpres-
sure at the blast front, depends on the
angle at which the blast wave strikes the
structure. For a curved structure, e.g., a
sphere or a cylinder (or part of a sphere
or cylinder), the reflection varies from
point to point on the front surface. The
time of decay from reflected to stagna-
tion pressure then depends on the size of
the structure and the location of the
point in question on the front surface.
4.36 The drag coefficient, i.e., the
ratio of the drag pressure to the dynamic
pressure (§ 4.29), varies with the shape
of the structure. In many cases an
overall (or average) drag coefficient is
given, so that the net force on the sur-
face can be determined. In other in-
stances, local coefficients are necessary
to evaluate the pressures at various
points on the surfaces. The time of
buildup (or rise time) of the average
pressure on the back surface depends on
the size and also, to some extent, on the
shape of the structure.
4.37 Some structures have frangible
portions that are easily blown out by the
initial impact of the blast wave, thus
altering the shape of the object and the
subsequent loading. When windows are
blown out of an ordinary building, the
136
AIR BLAST LOADING
blast wave enters and tends to equalize
the interior and exterior pressures. In
fact, a structure may be designed to
have certain parts frangible to lessen
damage to all other portions of the
structure. Thus, the response of certain
elements in such cases influences the
blast loading on the structure as a
whole. In general, the movement of a
structural element is not considered to
influence the blast loading on that ele-
ment itself. However, an exception to
this rule arises in the case of an aircraft
in flight when struck by a blast wave.
BLAST LOADING-TIME CURVES
4.38 The procedures whereby
curves showing the air blast loading as a
function of time may be derived are
given below. The methods presented are
for the following five relatively simple
shapes: (1) closed box-like structure; (2)
partially open box-like structure; (3)
open frame structure; (4) cylindrical
structure; and (5) semicircular arched
structure. These methods can be altered
somewhat for objects having similar
characteristics. For very irregularly
shaped structures, however, the proce-
dures described may provide no more
than a rough estimate of the blast load-
ing to be expected.
4.39 As a general rule, the loading
analysis of a diffraction-type structure is
extended only until the positive phase
overpressure falls to zero at the surface
under consideration. Although the dy-
namic pressure persists after this time,
the value is so small that the drag force
can be neglected. However, for drag-
type structures, the analysis is continued
until the dynamic pressure is zero. Dur-
ing the negative overpressure phase,
both overpressure and dynamic pressure
are too small to have any significant
effect on structures (§ 3.11 et seq.).
4.40 The blast wave characteristics
which need to be known for the loading
analysis and their symbols are sum-
marized in Table 4.40. The locations in
Chapter III where the data may be ob-
tained, at a specified distance from
ground zero for an explosion of given
energy yield and height of burst, are
also indicated.
4.41 A closed box-like structure
may be represented simply by a paralle-
lepiped, as in Fig. 4.41, having a length
L, height H, and breadth B. Structures
Table 4.40
BLAST WAVE CHARACTERISTICS FOR DETERMINATION OF LOADING
Property Symbol Source
Peak overpressure P Figs. 3.73a, b, and c
Time variation of overpressure p(t) Fig. 3.57
Peak dynamic pressure Q Fig. 3.75
Time variation of dynamic pressure q(0 Fig. 3.58
Reflected overpressure Duration of positive phase of Pr Fig. 3.78b
overpressure Duration of positive phase of t* Fig. 3.76
dynamic pressure r Fig. 3.76
Blast front (shock) velocity U Fig. 3.55
INTERACTION OF OBJECTS WITH AIR BLAST
137
Figure 4.41. Representation of closed box-like structure.
with a flat roof and walls of approxi-
mately the same blast resistance as the
frame will fall into this category. The
walls have either no openings (doors
and windows), or a small number of
such openings up to about 5 percent of
the total area. The pressures on the in-
terior of the structure then remain near
the ambient value existing before the
arrival of the blast wave, while the out-
side is subjected to blast loading. To
simplify the treatment, it will be sup-
posed that one side of the structure faces
toward the explosion and is perpendicu-
lar to the direction of propagation of the
blast wave. This side is called the front
face. The loading diagrams are com-
puted below for (a) the front face, (Z?)
the side and top, and (c) the back face.
By combining the data for (a) and (c),
the net horizontal loading is obtained in
(d).
4.42 (a) Average Loading on
Front Face.—The first step is to deter-
mine the reflected pressure, pr\ this
gives the pressure at the time t = 0,
when the blast wave front strikes the
front face (Fig. 4.42). Next, the time, ts,
is calculated at which the stagnation
pressure, ps, is first attained. It has been
found from laboratory studies that, for
peak overpressures being considered (50
pounds per square inch or less), fvcan be
represented, to a good approximation,
by
where 5 is equal to Hot BI2, whichever
is less, and U is the blast front (shock)
velocity. The drag coefficient for the
front face is unity, so that the drag
pressure is here equal to the dynamic
pressure. The stagnation pressure is thus
л =
138
AIR BLAST LOADING
where p(tx) and q(tx) are the overpres-
sure and dynamic pressure at the time tx.
The average pressure subsequently
decays with time, so that,
Pressure at time t = p(t) + q(f),
where t is any time between tx and t+.
The pressure-time curve for the front
face can thus be determined, as in Fig.
4.42.
4.43 (b) Average Loading on Sides
and Top.—Although loading com-
mences immediately after the blast wave
strikes the front face, i.e., at t = 0, the
sides and top are not fully loaded until
the wave has traveled the distance L,
i.e., at times t = UU. The average
pressure, pa, at this time is considered to
be the overpressure plus the drag load-
ing at the distance U2 from the front of
the structure, so that
L \ „ L
P° ~ P\ 2U ) + Cd4 \ 2U
The drag coefficient on the sides and top
of the structure is approximately -0.4
for the blast pressure range under con-
sideration (§ 4.23). The loading in-
creases from zero at t = 0 to the value pa
at the time UU, as shown in Fig. 4.43.
Subsequently, the average pressure at
any time t is given by
Pressure at time t = p[t— ^ )
4- C.q it — ——— |
d4 у 2U b
Figure 4.42. Average front face loading of closed box-like structure.
INTERACTION OF OBJECTS WITH AIR BLAST
139
Ш
tr
Z)
co
co
Ш
tr
o.
TIME
Figure 4.43. Average side and top loading of closed box-like structure.
where t lies between JJU and Г +
p
U2U, as seen in Fig. 4.43. The over-
pressure and dynamic pressure, respec-
tively, are the values at the time t —
U2U. Hence, the overpressure on the
sides and top becomes zero at time £ +
U2U.
4.44 (c) Average Loading on Back
Face.—The shock front arrives at the
back face at time LZU, but it requires an
additional time, 45777, for the average
pressure to build up to the value pb (Fig.
4.44), where pb is given approximately
by
( L+4S \ ~ / L+4S \
Рь = P u~ J + ("T-)
Here, as before, S is equal to H or B/2
whichever is the smaller. The drag co-
efficient on the back face is about —0.3
for the postulated blast pressure range.
The average pressure at any time t after
the attainment of pb is represented by
Pressure at time t =
'('-£) + C-’(' ’ £) ’
where t lies between (L + 45)/(7 and
Г + L/U, as seen in Fig. 4.44.
4.45 (d) Net Horizontal Load-
ing.—The net loading is equal to the
front loading minus the back loading.
This subtraction is best performed
graphically, as shown in Fig. 4.45. The
left-hand diagram gives the individual
front and back loading curves, as
derived from Figs. 4.42 and 4.44, re-
spectively. The difference indicated by
the shaded region is then transferred to
140
AIR BLAST LOADING
PRESSURE
Figure 4.45. Net horizontal loading of closed box-like structure.
INTERACTION OF OBJECTS WITH AIR BLAST
141
the right-hand diagram to give the net
pressure. The net loading is necessary
for determining the frame response,
whereas the wall actions are governed
primarily by the loadings on the indi-
vidual faces.
PARTIALLY OPEN BOX-LIKE
STRUCTURES
4.46 A partially open box-like
structure is one in which the front and
back walls have about 30 percent of
openings or window area and no interior
partitions to influence the passage of the
blast wave. As in the previous case, the
loading is derived for (a) the front face,
(7?,) the sides and roof, (79 the back face,
and*(7p the net horizontal loading. Be-
cause the blast wave can now enter the
ipside of the structure, the loading-time
curves must be considered for both the
exterior and interior of the structure.
4.47 (a) Average Loading on Front
Face.—The outside loading is com-
puted in the same manner as that used
for a closed structure, except that S is
replaced by S'. The quantity S' is the
average distance (for the entire front
face) from the center of a wall section to
an open edge of the wall. It represents
the average distance which rarefaction
waves must travel on the front face to
reduce the reflected pressures to the
stagnation pressure.
4.48 The pressure on the inside of
the front face starts rising at zero time,
because the blast wave immediately
enters through the openings, but it takes
a time 2L/U to reach the blast wave
overpressure value. Subsequently, the
inside pressure at any time t is given by
p(t). The dynamic pressures are as-
sumed to be negligible on the interior of
the structure. The variations of the in-
Figure 4.48. Average front face loading of partially open box-like structure.
142
AIR BLAST LOADING
Figure 4.49 Average side and top loading of partially open box-like structure.
side and the outside pressures with time
are as represented in Fig. 4.48.
4.49 (b) Average Loading on Sides
and Top.— The outside pressures are
obtained as for a closed structure (§
4.43), but the inside pressures, as for
the front face, require a time 2L/U to
attain the overpressure in the blast
wave. Here also, the dynamic pressures
on the interior are neglected, and side
wall openings are ignored because their
effect on the loading is uncertain. The
loading curves are depicted in Fig. 4.49.
4.50 (c) Average Loading on Back
Face.—The outside pressures are the
same as for a closed structure, with the
exception that 5 is replaced by S', as
described above. The inside pressure,
reflected from the inside of the back
face, reaches the same value as the blast
overpressure at a time L/U and then
decays as p(t - L/U)-, as before, the
dynamic pressure is regarded as being
negligible (Fig. 4.50).
4.51 (d) Net Horizontal Load-
ing.—The net horizontal loading is
equal to the net front loading, i.e., out-
side minus inside, minus the net back
face loading.
OPEN FRAME STRUCTURE
4.52 A structure in which small
separate elements are exposed to a blast
wave, e.g., a truss bridge, may be re-
garded as an open frame structure.
Steel-frame office buildings with a ma-
jority of the wall area of glass, and
industrial buildings with asbestos, light
steel, or aluminum panels quickly be-
come open frame structures after the
initial impact of the blast wave.
4.53 It is difficult to determine the
magnitude of the loading that the frang-
INTERACTION OF OBJECTS WITH AIR BLAST
143
Figure 4.50. Average back face loading of partially open box-like structure.
ible wall material transmits to the frame
before failing. For glass, the load trans-
mitted is assumed to be negligible if the
loading is sufficient to fracture the glass.
For asbestos, transite, corrugated steel,
or aluminum paneling, an approximate
value of the load transmitted to the
frame is an impulse of 0.04 pound-sec-
ond per square inch. Depending on the
span lengths and panel strength, the
panels are not likely to fail when the
peak overpressure is less than about 2
pounds per square inch. In this event,
the full blast load is transmitted to the
frame.
4.54 Another difficulty in the treat-
ment of open frame structures arises in
the computations of the overpressure
loading on each individual member
during the diffraction process. Because
this process occurs at different times for
various members and is affected by
shielding of one member by adjacent
members, the problem must be simpli-
fied. A recommended simplification is to
treat the loading as an impulse, the
value of which is obtained in the fol-
lowing manner. The overpressure load-
ing impulse is determined for an average
member treated as a closed structure and
this is multiplied by the number of
members. The resulting impulse is con-
sidered as being delivered at the time the
shock front first strikes the structure, or
it can be separated into two impulses for
front and back faces where the majority
of the elements are located, as shown
below in Fig. 4.56.
4.55 The major portion of the load-
ing on an open frame structure consists
of the drag loading. For an individual
member in the open, the drag coefficient
for I-beams, channels, angles, and for
members with rectangular cross section
144
AIR BLAST LOADING
TIME
Figure 4.56. Net horizontal loading of an open frame structure.
is approximately 1.5. However, because
in a frame the various members shield
one another to some extent from the full
blast loading, the average drag coeffi-
cient when the whole frame is consid-
ered is reduced to 1.0. The force F, i.e.,
pressure multiplied by area, on an indi-
vidual member is thus given by
F (member) = Cjq(t)Ap
where Cd is 1.5 and At is the member
area projected perpendicular to the di-
rection of blast propagation. For the
loading on the frame, however, the
force is
F (frame) = C/?(r)2A.,
where C. is 1.0 and SA. is the sum of
a i
the projected areas of all the members.
The result may thus be written in the
form
F (frame) = <?(r)A,
where A = ^Ar
4.56 The loading (force) versus
time for a frame of length L, having
major areas in the planes of the front and
rear faces, is shown in Fig. 4.56. The
symbols Afw and Abw represent the areas
of the front and back faces, respec-
tively, which transmit loads before fail-
ure, and Ifm and Ibm are the overpressure
loading impulses on front and back
members, respectively. Although drag
loading commences immediately after
the blast wave strikes the front face,
i.e., at t = 0, the back face is not fully
loaded until the wave has traveled the
distance L, i.e., at time t = L/U. The
INTERACTION OF OBJECTS WITH AIR BLAST
145
average drag loading, qa, on the entire
structure at this time is considered to be
that which would occur at the distance
L/2 from the front of the structure, so
that
( L \
Яа - c<fl ( 2U ) ’
and the average force on the frame, Fa
(frame), is
Fo (frame) = q ( j A>
where Cd is 1.0, as above. After this
time, the average drag force on the
frame at any time t is given by
Fa (frame) at time t=q^t -
where t lies between L/U and Г +
я
U2U, as seen in Fig. 4.56.
CYLINDRICAL STRUCTURE
4.57 The following treatment is ap-
plicable to structures with a circular
cross section, such as telephone poles
and smokestacks, for which the diame-
ters are small compared to the lengths.
The discussion presented here provides
methods for determining average pres-
sures on projected areas of cylindrical
structures with the direction of propa-
gation of the blast perpendicular to the
axis of the cylinder. A more detailed
method for determining the pressure-
time curves for points on cylinders is
provided in the discussion of the loading
on arched structures in § 4.62 et seq.
The general situation for a blast wave
approaching a cylindrical structure is
represented in section in Fig. 4.57.
4.58 (a) Average Loading on Front
Surface.—When an ideal blast wave
impinges on a flat surface of a structure,
the pressure rises instantaneously to the
reflected value and then it soon drops to
the stagnation pressure (§ 4.25). On the
curved surface of a cylinder the interac-
tion of the blast wave with the front face
is much more complex in detail. How-
ever, in terms of the average pressure,
the load appears as a force that increases
with time from zero when the blast front
arrives to a maximum when the blast
wave has propagated one radius. This
occurs at a time D/2U, where D is the
diameter of the cylinder. For the blast
BLAST
WAVE
FRONT
Figure 4.57. Representation of a cylindrical structure.
146
AIR BLAST LOADING
Ш
or
(Г
CL
TIME
Figure 4.58. Average pressure variation on the front face of a cylinder.
pressure range being considered, the
maximum average pressure reaches a
value of about 2p as depicted in Fig.
4.58. The load on the front surface then
decays in an approximately linear man-
ner to the value it would have at about
time t = 2D/U. Subsequently, the aver-
age pressure decreases as shown. The
drag coefficient for the front surface of
the cylinder is 0.8.
4.59 (b) Average Loading on the
Sides.—Loading of the sides com-
mences immediately after the blast wave
strikes the front surface but, as with the
closed box discussed in § 4.41 et seq.,
the sides are not fully loaded until the
wave has traveled the distance D, i.e.,
at time t = D/U. The average pressure
on the sides at this time is indicated b>
pvl, given approximately by
Complex vortex formation then causes
the average pressure to drop to a min-
imum, ps2, at the time t — 3D/2U, the
value of pQ is about half the maximum
overpressure at this time, i.e.,
1 / 3D \
Рл 2 P ( 2U j ’
The average pressure on the side then
rises until time 9D/2 U and subsequently
decays as shown in Fig. 4.59. The drag
coefficient for the side face is 0.9.
4.60 (c) Average Loading on Back
Surface.—The blast wave begins to af-
fect the back surface of the cylinder at
time D/2U and the average pressure
gradually builds up to pbi (Fig. 4.60) at
a time of about 4D/U. The value of pbl is
given by
/ d\
Psl p ( и )
1 / 4D
рм 2P\ U
INTERACTION OF OBJECTS WITH AIR BLAST
147
PRESSURE
Figure 4.59. Average pressure variation on the side face of a cylinder.
The average pressure continues to rise
until it reaches a maximum, pb2, at a
time of about 20DZU, where
n _ ( 2QD\ , 20D\
Pta ц u J + и )
The average pressure at any time t after
the maximum is represented by
T. ( D \
Pressure at time t = p I t - • ~ I
+ ~ ~Yu )
where t lies between 20DZU and r* +
p
D/2U. The drag coefficient for the back
surface is -0.2.
4.61 The preceding discussion has
been concerned with average values of
the loads on the various surfaces of a
cylinder, whereas the actual pressures
vary continuously from point to point.
Consequently, the net horizontal load-
ing cannot be determined accurately by
the simple process of subtracting the
back loading from the front loading. A
rough approximation of the net load
may be obtained by procedures similar
to those described for a closed box-like
structure (§ 4.45), but a better approx-
imation is given by the method referred
to in § 4.65 et seq.
ARCHED STRUCTURES
4.62 The following treatment is ap-
plicable to arched structures, such as
ground huts, and, as a rough approx-
imation, to dome shaped or spherical
structures. The discussion presented
here is for a semicylindrical structure
with the direction of propagation of the
blast perpendicular to the axis of the
cylinder. The results can be applied to a
cylindrical structure, such as discussed
above, since it consists of two such
semicylinders with identical loadings on
148
AIR BLAST LOADING
TIME
Figure 4.60. Average pressure variation on the back face of a cylinder.
each half. Whereas the preceding treat-
ment referred to the average loads on the
various faces of the cylinder (§ 4.57 et
seq.), the present discussion describes
the loads at each point. The general
situation is depicted in Fig. 4.62; H is
the height of the arch (or the radius of
the cylinder) and z represents any point
on the surface. The angle between the
horizontal (or springing line) and the
line joining z to the center of curvature
of the semicircle is indicated by a; and
X, equal to H(1 — cos a), is the hori-
zontal distance, in the direction of
propagation of the blast wave, between
the bottom of the arch and the arbitrary
point z.
4.63 When an ideal blast wave im-
pinges on a curved surface, vortex for-
mation occurs just after reflection, so
that there may be a temporary sharp
pressure drop before the stagnation
pressure is reached. A generalized re-
presentation of the variation of the
pressure with time at any point, z, is
shown in Fig. 4.63. The blast wave
Figure 4.62. Representation of a typical semicircular arched structure.
INTERACTION OF OBJECTS WITH AIR BLAST
149
Figure 4.63. Typical pressure variation at a point on an arched structure subjected to a blast
wave.
front strikes the base of the arch at time t
= 0 and the time of arrival at the point z,
regardless of whether it is on the front or
back half, is X/U. The overpressure
then rises sharply, in the time interval
to the reflected value, pv so that is the
rise time. Vortex formation causes the
pressure to drop to pv and this is fol-
lowed by an increase to p3, the stagna-
tion pressure; subsequently, the pres-
sure, which is equal to p(f) + Cdq(t),
where Cd is the appropriate drag coeffi-
cient, decays in the normal manner.
4.64 The dependence of the pres-
sures p, and p2 and the drag coefficient
Cd on the angle a is represented in Fig.
4.64; the pressure values are expressed
as the ratios to pr, where pr is the ideal
reflected pressure for a flat surface.
When a is zero, i.e., at the base of the
arch, p} is identical with pr, but for
larger angles it is less. The rise time t
and the time intervals t2 and r, corre-
sponding to vortex formation and at-
tainment of the stagnation pressure, re-
spectively, after the blast wave reaches
the base of the arch, are also given in
Fig. 4.64, in terms of the time unit H/U.
The rise time is seen to be zero for the
front half of the arch, i.e., for a be-
tween 0° and 90°, but it is finite and
increases with a on the back half, i.e.,
for a a between 90° and 180°. The times
t2 and are independent of the angle a.
4.65 Since the procedures described
above give the loads normal to the sur-
face at any arbitrary point z, the net
horizontal loading is not determined by
the simple process of subtracting the
back loading from that on the front. To
obtain the net horizontal loading, it is
necessary to sum the horizontal compo-
150
AIR BLAST LOADING
TIME (UNITS OF H/U)
ANGLE a (DEGREES)
Figure 4.64. Variation of pressure ratios, drag coefficient, and time intervals for an arched
structure.
Figure 4.66. Approximate equivalent net horizontal force loading on semicylindrical
structure.
INTERACTION OF OBJECTS WITH AIR BLAST
151
nents of the loads over the two areas and
then subtract them. In practice, an ap-
proximation may be used to obtain the
required result in such cases where the
net horizontal loading is considered to
be important. It may be pointed out that,
in certain instances, especially for large
structures, it is the local loading, rather
than the net loading, which is the sig-
nificant criterion of damage.
4.66 In the approximate procedure
for determining the net loading, the
overpressure loading during the diffrac-
tion stage is considered to be equivalent
to an initial impulse equal to pA(2H/U),
where A is the projected area normal to
the direction of the blast propagation. It
will be noted that 2 H/U is the time taken
for the blast front to traverse the struc-
ture. The net drag coefficient for a single
cylinder is about 0.4 in the blast pres-
sure range of interest (§ 4.23). Hence,
in addition to the initial impulse, the
remainder of the net horizontal loading
may be represented by the force 0.4
q(f)A, as seen in Fig. 4.66, which ap-
plies to a single structure. When a frame
is made up of a number of circular
elements, the methods used are similar
to those for an open frame structure (§
4.55) with Cd equal to 0.2.
NONIDEAL BLAST WAVE LOADING
4.67 The preceding discussions
have dealt with loading caused by blast
waves reflected from nearly ideal
ground surfaces (§ 3.47). In practice,
however, the wave form will not always
be ideal. In particular, if a precursor
wave is formed (§ 3.79 et seq.), the
loadings may depart radically from
Figure 4.67a. Nonideal incident air blast (shock) wave.
152
AIR BLAST LOADING
Figure 4.67b, c, d. Loading pattern on the front, top, and back, respectively, on a
rectangular block from nonideal blast wave.
INTERACTION OF OBJECTS WITH AIR BLAST
153
those described above. Although it is
beyond the scope of the present treat-
ment to provide a detailed discussion of
nonideal loading, one qualitative exam-
ple is given here. Figure 4.67a shows a
nonideal incident air blast (shock) wave
and Figs. 4.67b, c, and d give the load-
ing patterns on the front, top, and back,
respectively, of a rectangular block as
observed at a nuclear weapon test.
Comparison of Figs. 4.67b, c, and d
with the corresponding Figs. 4.42,
4.43, and 4.44 indicates the departures
from ideal loadings that may be en-
countered in certain circumstances. The
net loading on this structure was sig-
nificantly less than it would have been
under ideal conditions, but this would
not necessarily always be the case.
BIBLIOGRAPHY
♦American Society of Civil Engineers,
“Design of Structures to Resist Nuclear Weap-
ons Effects,’’ ASCE Manual of Engineering
Practice No. 42, 1961.
♦Armour Research Foundation, “A Sim-
ple Method of Evaluating Blast Effects on
Buildings,’’ Armour Research Foundation,
Chicago, Illinois, 1954.
♦Banister, J. R., and L. J. Vortman, “Effect
of a Precursor Shock Wave on Blast Loading of
a Structure,’’ Sandia Corporation, Albuquer-
que, New Mexico, October 1960, WT-1472.
Jacobsen, L. S. and R. S. Ayre, “Engineering
Vibrations,’’ McGraw-Hill Book Co., Inc.,
New York, 1958.
Kaplan, K. and C. Wiehle, “Air Blast Load-
ing in the High Shock Strength Region,’’ URS
Corporation, Burlingame, California, 1965,
URS 633-3 (DASA 1460-1), Part II.
♦Mitchell, J. H., “Nuclear Explosion Effects
on Structures and Protective Construction—A
Selected Bibliography,’’ U.S. Atomic Energy
Commission, April 1961, TID-3092.
Pickering, E. E., and J. L. Bockholt,
“Probabilistic Air Blast Failure Criteria for
Urban Structures,’’’ Stanford Research’Institute,
Menlo Park, California, November 1971.
Willoughby, А. B., et al., “A Study of Load-
ing, Structural Response, and Debris Charac-
teristics of Wall Panels,’’ URS Research Co.,
Burlingame, California, July 1969.
Wilton, C., et al., “Final Report Summary,
Structural Response and Loading of Wall
Panels,’’ URS Research Co., Burlingame, Cal-
ifornia, July 1971.
♦These documents may be purchased from the National Technical Information Service, U.S.
Department of Commerce, Springfield, Virginia 22161.
CHAPTER V
STRUCTURAL DAMAGE FROM AIR BLAST
INTRODUCTION
GENERAL OBSERVATIONS
5.01 The two preceding chapters
have dealt with general principles of air
blast and the loads on structures pro-
duced by the action of the air blast
wave. In the present chapter, the actual
damage to buildings of various types,
bridges, utilities, and vehicles caused by
nuclear explosions will be considered.
In addition, criteria of damage to
various targets will be discussed and
quantitative relationships will be given
between the damage and the distances
over which such damage may be ex-
pected from nuclear weapons of dif-
ferent yields.
5.02 Direct damage to structures
attributable to air blast can take various
forms. For example, the blast may de-
flect structural steel frames, collapse
roofs, dish-in walls, shatter panels, and
break windows. In general, the damage
results from some type of displacement
(or distortion) and the manner in which
such displacement can arise as the result
of a nuclear explosion will be examined.
5.03 Attention may be called to an
important difference between the blast
effects of a nuclear weapon and those
due to a conventional high-explosive
154
bomb. In the former case, the combina-
tion of high peak overpressure, high
wind (or dynamic) pressure, and longer
duration of the positive (compression)
phase of the blast wave results in “mass
distortion” of buildings, similar to that
produced by earthquakes and hurri-
canes. An ordinary explosion will
usually damage only part of a large
structure, but the blast from a nuclear
weapon can surround and destroy whole
buildings in addition to causing loca-
lized structural damage.
5.04 An examination of the areas in
Japan affected by nuclear explosions (§
2.24) shows that small masonry build-
ings were engulfed by the oncoming
pressure wave and collapsed com-
pletely. Light structures and residences
were totally demolished by blast and
subsequently destroyed by fire. Indus-
trial buildings of steel construction were
denuded of roofing and siding, and only
twisted frames remained. Nearly every-
thing at close range, except structures
and smokestacks of strong reinforced
concrete, was destroyed. Some build-
ings leaned away from ground zero as
though struck by a wind of stupendous
proportions. Telephone poles were
INTRODUCTION
155
snapped off at ground level, as in a
hurricane, carrying the wires down with
them. Large gas holders were ruptured
and collapsed by the crushing action of
the blast wave.
5.05 Many buildings, which at a
distance appeared to be sound, were
found on close inspection to be damaged
and gutted by fire. This was frequently
an indirect result of blast action. In
some instances the thermal radiation
may have been responsible for the ini-
tiation of fires, but in many other cases
fires were started by overturned stoves
and furnaces and by the rupture of gas
lines. The loss of water pressure by the
breaking of pipes, mainly due to the
collapse of buildings, and other circum-
stances arising from the explosions,
contributed greatly to the additional de-
struction by fire (Chapter VII).
5.06 A highly important conse-
quence of the tremendous power of the
nuclear explosions was the formation of
enormous numbers of flying missiles
consisting of bricks (and other ma-
sonry), glass, pieces of wood and metal,
etc. These caused considerable amounts
of secondary damage to structures and
utilities, and numerous casualties even
in the lightly damaged areas. In addi-
tion, the large quantities of debris re-
sulted in the blockage of streets, thus
making rescue and fire-fighting opera-
tions extremely difficult (Fig. 5.06).
5.07 Many structures in Japan were
designed to be earthquake resistant,
which probably made them stronger
than most of their counterparts in the
United States. On the other hand, some
construction was undoubtedly lighter
than in this country. However, contrary
to popular belief concerning the flimsy
character of Japanese residences, it was
the considered opinion of a group of
architects and engineers, who surveyed
the nuclear bomb damage, that the re-
sistance to blast of American residences
Figure 5.06. Debris after the nuclear explosion at Hiroshima.
156
STRUCTURAL DAMAGE FROM AIR BLAST
in general would not be markedly dif-
ferent from that of the houses in Hiro-
shima and Nagasaki. This has been
borne out by the observations on exper-
imental structures exposed to air blast at
nuclear weapons tests in Nevada.
FACTORS AFFECTING RESPONSE
STRENGTH AND MASS
5.08 There are numerous factors
associated with the characteristics of a
structure which influence the response to
the blast wave accompanying a nuclear
explosion. Those considered below in-
clude various aspects of the strength and
mass of the structure, general structural
design, and ductility (§ 5.14) of the
component materials and members.
5.0 9 The basic criterion for deter-
mining the response of a structure to
blast is its strength. As used in this
connection, “strength” is a general
term, for it is a property influenced by
many factors some of which are obvious
and others are not. The most obvious
indication of strength is, of course,
massiveness of construction, but this is
modified greatly by other factors not
immediately visible to the eye, e.g.,
resilience and ductility of the frame, the
strength of the beam and column con-
nections, the redundancy of supports,
and the amount of diagonal bracing in
the structure. Some of these factors will
be examined subsequently. If the build-
ing does not have the same strength
along both axes, then orientation with
respect to the burst should also be con-
sidered.
5.10 The strongest structures are
heavily framed steel and reinforced-
concrete buildings, particularly those
designed to be earthquake resistant,
whereas the weakest are probably cer-
tain shed-type industrial structures hav-
ing light frames and long beam spans.
Some kinds of lightly built and open
frame construction also fall into the lat-
ter category, but well-constructed frame
houses have greater strength than these
sheds.
5.11 The resistance to blast of
structures having load-bearing, masonry
walls (brick or concrete block), without
reinforcement, is not very good. This is
due to the lack of resilience and to the
moderate strength of the connections
which are put under stress when the
blast load is applied laterally to the
building. The use of steel reinforcement
with structures of this type greatly in-
creases their strength.
STRUCTURAL DESIGN
5.12 Except for those regions in
which fairly strong earthquake shocks
may be expected, most structures in the
United States are designed to withstand
only the lateral (sideways) loadings
produced by moderately strong winds.
For design purposes, such loading is
assumed to be static (or stationary) in
character because natural winds build up
relatively slowly and remain fairly
steady. The blast from a nuclear explo-
sion, however, causes a lateral dynamic
(rather than static) loading; the load is
applied extremely rapidly and it lasts for
a second or more with continuously de-
creasing strength. The inertia, as mea-
sured by the mass of the structure or
FACTORS AFFECTING RESPONSE
157
member, is an important factor in de-
termining response to a dynamic lateral
load, although it is not significant for
static loading.
5.13 Of existing structures, those
intended to be earthquake resistant and
capable of withstanding a lateral load
equal to about 10 percent of the weight,
will probably be damaged least by blast.
Such structures, often stiffened by dia-
phragm walls and having continuity of
joints to provide additional rigidity, may
be expected to withstand appreciable
lateral forces without serious damage.
DUCTILITY
5.14 The term ductility refers to the
ability of a material or structure to ab-
sorb energy inelastically without failure;
in other words, the greater the ductility,
the greater the resistance to failure.
Materials which are brittle have poor
ductility and fail suddenly after passing
their elastic (yield) loading.
5.15 There are two main aspects of
ductility to be considered. When a force
(or load) is applied to a material so as to
deform it, as is the case in a nuclear
explosion, for example, the initial de-
formation is said to be “elastic.” Pro-
vided it is still in the elastic range, the
material will recover its original form
when the loading is removed. However,
if the “stress” (or internal force) pro-
duced by the load is sufficiently great,
the material passes into the “plastic”
range. In this state the material does not
recover completely after removal of the
load; that is to say, some deformation is
permanent, but there is no failure. Only
when the stress reaches the “ultimate
strength” does failure occur.
5.16 Ideally, a structure which is to
suffer little damage from blast should
have as much ductility as possible. Un-
fortunately, structural materials are
generally not able to absorb much en-
ergy in the elastic range, although many
common materials can take up large
amounts of energy in the plastic range
before they fail. One of the problems in
blast-resistant design, therefore, is to
decide how much permanent (plastic)
deformation can be accepted before a
particular structure is rendered useless.
This will, of course, vary with the na-
ture and purpose of the structure. Al-
though deformation to the point of col-
lapse is definitely undesirable, some
lesser deformation may not seriously
interfere with the continued use of the
structure.
5.17 It is evident that ductility is a
desirable property of structural materials
required to resist blast. Structural steel
and steel reinforcement have this prop-
erty to a considerable extent. They are
able to absorb large amounts of energy,
e.g., from a blast wave, without failure
and thus reduce the chances of collapse
of the structure in which they are used.
Structural steel has the further advan-
tage of a higher yield point (or elastic
limit) under dynamic than under static
loading; the increase is quite large for
some steels.
5.18 Although concrete alone is not
ductile, when steel and concrete are
used together properly, as in rein-
forced-concrete structures, the ductile
behavior of the steel will usually pre-
dominate. The structure will then have
considerable ductility and, conse-
quently, the ability to absorb energy.
Without reinforcement, masonry walls
are completely lacking in ductility and
readily suffer brittle failure, as stated
above.
158
STRUCTURAL DAMAGE FROM AIR BLAST
COMMERCIAL AND ADMINISTRATIVE STRUCTURES
INTRODUCTION
5.19 In this and several subsequent
sections, the actual damage to various
types of structures caused by the air
blast from nuclear explosions will be
described. First, commercial, adminis-
trative, and similar buildings will be
considered. These buildings are of sub-
stantial construction and include banks,
offices, hospitals, hotels, and large
apartment houses. Essentially all the
empirical information concerning the
effects of air blast on such multistory
structures has been obtained from ob-
servations made at Hiroshima and Na-
gasaki. The descriptions given below
are for three general types, namely,
reinforced-concrete frame buildings,
steel-frame buildings, and buildings
with load-bearing walls. As is to be
expected from the preceding discussion,
buildings of the first two types are more
blast resistant than those of the third
type; however, even light to moderate
damage (see Table 5.139a) to frame-
supported buildings can result in ca-
sualties to people in these buildings.
MULTISTORY,
REINFORCED-CONCRETE FRAME
BUILDINGS
5.20 There were many multistory,
reinforced-concrete frame buildings of
several types in Hiroshima and a smaller
number in Nagasaki. They varied in
resistance to blast according to design
and construction, but they generally
suffered remarkedly little damage exter-
nally. Close to ground zero, however,
there was considerable destruction of
the interior and contents due to the entry
of blast through doors and window
openings and to subsequent fires. An
exceptionally strong structure of earth-
quake-resistant (aseismic) design,, lo-
cated some 640 feet from ground zero in
Hiroshima, is seen in Fig. 5.20a. Al-
though the exterior walls were hardly
damaged, the roof was depressed and
the interior was destroyed. More typical
of reinforced-concrete frame construc-
tion in the United States was the build-
ing shown in Fig. 5.20b at about the
same distance from ground zero. This
suffered more severely than the one of
aseismic design.
5.21 A factor contributing to the
blast resistance of many reinforced-
concrete buildings in Japan was the
construction code established after the
severe earthquake of 1923. The height
of new buildings was limited to 100 feet
and they were designed to withstand a
lateral force equal to 10 percent of the
vertical load. In addition, the recog-
nized principles of stiffening by dia-
phragms and improved framing to pro-
vide continuity were specified. The
more important buildings were well de-
signed and constructed according to the
code. However, some were built with-
out regard to the earthquake-resistant
requirements and these were less able to
withstand the blast wave from the nu-
clear explosion.
5.22 Close to ground zero the ver-
tical component of the blast was more
significant and so greater damage to the
roof resulted from the downward force
(Fig. 5.22a) than appeared farther away.
Depending upon its strength, the roof
COMMERCIAL AND ADMINISTRATIVE STRUCTURES
159
Figure 5.20a. Upper photo: Reinforced-concrete, aseimic structure; window fire shutters
were blown in by blast and the interior gutted by fire (0.12 mile from ground
zero at Hiroshima). Lower photo: Burned out interior of similar structure.
160
STRUCTURAL DAMAGE FROM AIR BLAST
Figure 5.20b. Three-story, reinforced-concrete frame building; walls were 13-inch thick
brick panel with large window openings (0.13 mile from ground zero at
Hiroshima).
was pushed down and left sagging or it
failed completely. The remainder of the
structure was less damaged than similar
buildings farther from the explosion be-
cause of the smaller horizontal (lateral)
forces. At greater distances, from
ground zero, especially in the region of
Mach reflection, the consequences of
horizontal loading were apparent (Fig.
5.22b).
5.23 In addition to the failure of
roof slabs and the lateral displacement
of walls, numerous other blast effects
were observed. These included bending
and fracture of beams, failure of col-
umns, crushing of exterior wall panels,
and failure of floor slabs (Fig. 5.23).
Heavy damage to false ceilings, plaster,
and partitions occurred as far out as
9,000 feet (1.7 miles) from ground zero,
and glass windows were generally bro-
ken out to a distance of 3% miles and in
a few instances out to 8 miles.
5.24 The various effects just de-
scribed have referred especially to rein-
forced-concrete structures. This is be-
cause the buildings as a whole did not
collapse, so that other consequences of
the blast loading could be observed. It
should be pointed out, however, that
damage of a similar nature also occurred
in structures of the other types described
below.
MULTISTORY, STEEL-FRAME
BUILDINGS
5.25 There was apparently only one
steel-frame structure having more than
two stories in the Japanese cities ex-
posed to nuclear explosions. This was a
five-story structure in Nagasaki at a dis-
tance of 4,500 feet (0.85 mile) from
COMMERCIAL AND ADMINISTRATIVE STRUCTURES
161
Figure 5.22a. Depressed roof of reinforced-concrete building (0.10 mile from ground zero
at Hiroshima).
Figure 5.22b. Effects of horizontal loading on wall facing explosion (0.4 mile from ground
zero at Nagasaki).
162
STRUCTURAL DAMAGE FROM AIR BLAST
Figure 5.23. Reinforced-concrete building showing collapsed roof and floor slabs (0.10
mile from ground zero at Nagasaki).
ground zero (Fig. 5.25). The only part
of the building that was not regarded as
being of heavy construction was the
roof, which was of 4-inch thick rein-
forced concrete supported by unusually
light steel trusses. The downward fail-
ure of the roof, which was dished 3 feet,
was the only important structural dam-
age suffered.
5.26 Reinforced-concrete frame
buildings at the same distance from the
explosion were also undamaged, and so
there is insufficient evidence to permit
any conclusions to be drawn as to the
relative resistance of the two types of
construction. An example of damage to
a two-story, steel-frame structure is
shown in Fig. 5.26. The heavy walls of
the structure transmitted their loads to
the steel frame, the columns of which
collapsed. Weakening of unprotected
steel by fire could have contributed sig-
nificantly to the damage to steel-frame
structures (§ 5.31).
BUILDING WITH LOAD-BEARING
WALLS
5.27 Small structures with light
load-bearing walls offered little resis-
tance to the nuclear blast and, in gen-
eral, collapsed completely. Large
buildings of the same type, but with
cross walls and of somewhat heavier
COMMERCIAL AND ADMINISTRATIVE STRUCTURES
163
Figure 5.25. At left and back of center is a multistory, steel-frame building (0.85 mile from
gound zero at Nagasaki).
164
STRUCTURAL DAMAGE FROM AIR BLAST
Figure 5.26. Two-story, steel-frame building with 7-inch reinforced-concrete wall panels
(0.40 mile from ground zero at Hiroshima). The first story columns buckled
away from ground zero dropping the second story to the ground.
construction, were more resistant but
failed at distances up to 6,300 feet (1.2
miles) from ground zero. Cracks were
observed at the junctions of cross walls
and sidewalls when the building re-
mained standing. It is apparent that
structures with load-bearing walls pos-
sess few of the characteristics that
would make them resistant to collapse
when subjected to large lateral loads.
INDUSTRIAL STRUCTURES
165
INDUSTRIAL STRUCTURES
JAPANESE EXPERIENCE
5.28 In Nagasaki there were many
buildings of the familiar type used for
industrial purposes, consisting of a steel
frame with roof and siding of corrugated
sheet metal or of asbestos cement. In
some cases, there were rails for gantry
cranes, but the cranes were usually of
low capacity. In general, construction of
industrial-type buildings was compara-
ble to that in the United States.
5.29 Severe damage of these struc-
tures occurred up to a distance of about
6,000 feet (1.14 miles) from ground
zero. Moderately close to ground zero,
the buildings were pushed over bodily,
and at greater distances they were gen-
erally left leaning away from the source
of the blast (Fig. 5.29). The columns
being long and slender offered little re-
sistance to the lateral loading. Some-
times columns failed due to a lateral
force causing flexure, combined with a
simultaneous small increase in the
downward load coming from the impact
of the blast on the roof. This caused
buckling and, in some instances, com-
plete collapse. Roof trusses were buck-
led by compression resulting from lat-
eral blast loading on the side of the
building facing the explosion.
5.30 A difference was noted in the
effect on the frame depending upon
whether a frangible material, like as-
bestos cement, or a material of high
tensile strength, such as corrugated
sheet-iron, was used for roof and siding.
Asbestos cement broke up more readily
permitting more rapid equalization of
pressure and, consequently, less struc-
tural damage to the frame.
5.31 Fire caused heavy damage to
unprotected steel members, so that it
was impossible to tell exactly what the
Figure 5.29. Single-story, light steel-frame building (0.80 mile from ground zero at
Hiroshima); partially damaged by blast and further collapsed by subsequent
fire.
166
STRUCTURAL DAMAGE FROM AIR BLAST
blast effect had been. In general, steel
frames were badly distorted and would
have been of little use, even if siding
and roofing material had been available
for repairs.
5.32 In some industrial buildings
wood trusses were used to support the
roof. These were more vulnerable to
blast because of poor framing and con-
nections, and were readily burned out
by fire. Concrete columns were em-
ployed in some cases with steel roof
trusses; such columns appeared to be
more resistant to buckling than steel,
possibly because the strength of con-
crete is decreased to a lesser extent by
fire than is that of steel.
5.33 Damage to machine tools was
caused by debris, resulting from the
collapse of roof and siding, by fire in
wood-frame structures, and by disloca-
tion and overturning as a result of dam-
age to the building. In many instances
the machine tools were belt-driven, so
that the distortion of the building pulled
the machine tool off its base, damaging
or overturning it.
5.34 Smokestacks, especially those
of reinforced concrete, proved to have
considerable blast resistance (Fig.
5.34a). Because of their shape, they are
subjected essentially to drag loading
only and, if sufficiently strong, their
long period of vibration makes them less
sensitive to blast than many other struc-
tures. An example of extreme damage to
a reinforced-concrete stack is shown in
Fig. 5.34b. Steel smokestacks per-
formed reasonably well, but being
lighter in weight and subject to crushing
were not comparable to reinforced con-
crete. On the whole, well-constructed
masonry stacks withstood the blast
somewhat better than did those made of
steel.
NEVADA TESTS
5.35 A considerable amount of in-
formation on the blast response of
structures of several different kinds was
obtained in the studies made at the Ne-
vada Test Site in 1953 and in 1955. The
nuclear device employed in the test of
March 17, 1953, was detonated at the
top of a ЗОО-foot tower; the energy yield
was about 16 kilotons. In the test of
May 5, 1955, the explosion took place
on a 500-foot tower and the yield was
close to 29 kilotons. In each case, air
pressure measurements made possible a
correlation, where it was justified, be-
tween the blast damage and the peak
overpressure.
5.36 Three types of metal buildings
of standard construction, such as are
used for various commercial and indus-
trial purposes, were exposed at peak
overpressures of 3.1 and 1.3 pounds per
square inch. The main objectives of the
tests, made in 1955, were to determine
the blast pressures at which such struc-
tures would survive, in the sense that
they could still be used after moderate
repairs, and to provide information upon
which could be based improvements in
design to resist blast.
STEEL FRAME WITH ALUMINUM
PANELS
5.37 The first industrial type build-
ing had a conventional rigid steel frame,
which is familiar to structural engineers,
with aluminum-sheet panels for roofing
and siding (Fig. 5.37a). At a blast
overpressure of 3.1 pounds per square
inch this building was severely dam-
aged. The welded and bolted steel frame
INDUSTRIAL STRUCTURES
167
Figure 5.34a. Destroyed industrial area showing smokestacks still standing (0.51 mile from
ground zero at Nagasaki).
remained standing, but was badly dis-
torted and pulled away from the con-
crete footings. On the side facing the
explosion the deflection was about 1
foot at the eaves (Fig. 5.37b).
5.38 At a peak overpressure of 1.3
pounds per square inch the main steel
frame suffered only slight distortion.
The aluminum roofing and siding were
not blown off, although the panels were
disengaged from the bolt fasteners on
the front face of the steel columns and
girts (horizontal connecting members).
Wall and roof panels facing the explo-
sion were dished inward. The center
girts were torn loose from their attach-
ments to the columns in the front of the
building. The aluminum panels on the
side walls were dished inward slightly,
but on the rear wall and rear slope of the
roof, the sheeting was almost undis-
turbed.
5.39 As presently designed, struc-
tures of this type may be regarded as
being repairable, provided they are not
exposed to blast pressures exceeding 1
pound per square inch. Increased blast
resistance would probably result from
improvement in the design of girts and
purlins (horizontal members supporting
rafters), in particular. Better fastening
between sill and wall footing and in-
creased resistance to transverse loading
would also be beneficial.
168
STRUCTURAL DAMAGE FROM AIR BLAST
Figure 5.34b. A circular, 60 feet high, reinforced-concrete stack (0.34 mile from ground
zero at Hiroshima). The failure caused by the blast wave occurred 15 feet
above the base.
INDUSTRIAL STRUCTURES
169
Figure 5.37a. Rigid steel-frame building before a nuclear explosion, Nevada Test Site.
Figure 5.37b. Rigid steel-frame building
SELF-FRAMING WITH STEEL PANELS
5.40 A frameless structure with
self-supporting walls and roof of light,
channel-shaped, interlocking, steel
panels (16 inches wide) represented the
second standard type of industrial
building (Fig. 5.40a). The one subjected
to 3.1 pounds per square inch peak
overpressure (and a dynamic pressure of
after a nuclear explosion (3.1 psi peak
overpressure).
0.2 pound per square inch) was com-
pletely demolished (Fig. 5.40b). One or
two segments of wall were blown as far
as 50 feet away, but, in general, the bent
and twisted segments of the building
remained approximately in their original
locations. Most of the wall sections
were still attached to their foundation
bolts on the side and rear walls of the
170
STRUCTURAL DAMAGE FROM AIR BLAST
Figure 5.40a. Exterior of self-framing steel panel building before a nuclear explosion,
Nevada Test Site.
Figure 5.40b. Self-framing steel panel building after a nuclear explosion (3.1 psi peak
overpressure).
INDUSTRIAL STRUCTURES
171
building. The roof had collapsed com-
pletely and was resting on the ma-
chinery in the interior.
5.41 Although damage at 1.3
pounds per square inch peak overpres-
sure was much less, it was still consid-
erable in parts of the structure. The front
wall panels were buckled inward from 1
to 2 feet at the center, but the rear wall
and rear slope of the roof were undam-
aged. In general, the roof structure re-
mained intact, except for some deflec-
tion near the center.
5.42 It appears that the steel panel
type of structure is repairable if exposed
to overpressures of not more than about
% to 1 pound per square inch. The
buildings are simple to construct but
they do not hold together well under
blast. Blast-resistant improvements
would seem to be difficult to incorporate
while maintaining the essential simplic-
ity of design.
SELF-FRAMING WITH CORRUGATED
STEEL PANELS
5.43 The third type of industrial
building was a completely frameless
structure made of strong, deeply-corru-
gated 43-inch wide panels of 16-gauge
steel sheet. The panels were held to-
gether with large bolt fasteners at the
sides and at the eaves and roof ridge.
The wall panels were bolted to the con-
crete foundation. The entire structure
was self-supporting, without frames,
girts, or purlins (Fig. 5.43).
Figure 5.43. Self-framing corrugated steel panel building before a nuclear explosion,
Nevada Test Site.
172
STRUCTURAL DAMAGE FROM AIR BLAST
Figure 5.44. Self-framing corrugated steel panel building after a nuclear explosion (3.1 psi
peak overpressure).
5.44 At a peak overpressure of 3.1
and a dynamic pressure of 0.2 pound per
square inch a structure of this type was
badly damaged, but all the pieces re-
mained bolted together, so that the
structure still provided good protection
from the elements for its contents. The
front slope of the roof was crushed
downward, from 1 to 2 feet, at midsec-
tion, and the ridge line suffered moder-
ate deflection. The rear slope of the roof
appeared to be essentially undamaged
(Fig. 5.44).
5.45 The front and side walls were
buckled inward several inches, and the
door in the front was broken off. All the
windows were damaged to some extent,
although a few panes in the rear re-
mained in place.
5.46 Another building of this type,
exposed to 1.3 pounds per square inch
peak overpressure, experienced little
structural damage. The roof along the
ridge line showed indications of down-
ward deflections of only 1 or 2 inches,
and there was no apparent buckling of
roof or wall panels. Most of the win-
dows were broken, cracked, or chipped.
Replacement of the glass where neces-
sary and some minor repairs would have
rendered the building completely ser-
viceable.
5.47 The corrugated steel, frame-
less structure proved to be the most
blast-resistant of those tested. It is be-
lieved that, provided the overpressure
did not exceed about 3 pounds per
square inch, relatively minor repairs
would make possible continued use of
the building. Improvement in the design
of doors and windows, so as to reduce
the missile hazard from broken glass,
would be advantageous.
POSITIVE PHASE DURATION TESTS
5.48 Tests were carried out at Ne-
vada in 1955 and at Eniwetok Atoll in
the Pacific in 1956 to investigate the
effect of the duration of the positive
overpressure phase of a blast wave on
damage. Typical drag-type structures
were exposed, at approximately the
same overpressure, to nuclear detona-
INDUSTRIAL STRUCTURES
173
Figure 5.48a. Steel-frame building with siding and roof of frangible material.
Figure 5.48b. Steel-frame building with concrete siding and window openings of 30
percent of the wall area.
STRUCTURAL DAMAGE FROM AIR BLAST
174
tions in the kiloton and megaton ranges.
Two representative types of small in-
dustrial buildings were chosen for these
tests. One had a steel frame covered
with siding and roofing of a frangible
material and was considered to be a
drag-type structure (Fig. 5.48a). The
other had the same steel frame and
roofing, but it had concrete siding with a
window opening of about 30 percent of
the wall area; this was regarded as a
semidrag structure (Fig. 5.48b).
5.49 In the Nevada tests, with kilo-
ton yield weapons, the first structure
was subjected to a peak overpressure of
about 6.5 and a dynamic pressure of 1.1
pounds per square inch; the positive
phase duration of the blast wave was 0.9
second. A permanent horizontal deflec-
tion of about 15 inches occurred at the
top of the columns. The column anchor
bolts failed, and yielding was found
between the lower chord (horizontal
member of the roof truss) and column
connections. The girts on the windward
side were severely damaged and all of
the siding was completely blown off
(Fig. 5.49).
5.50 The second building, with the
stronger siding, was exppsed in Nevada
to a peak overpressure loading of about
3.5 and a dynamic pressure of 0.3
pounds per square inch, with a positive
phase duration of 1 second. Damage to
this structure was small (Fig. 5.50).
Although almost the whole of the fran-
gible roof was blown off, the only other
damage observed was a small yielding
at some connections and column bases.
5.51 Structures of the same type
were subjected to similar pressures in
the blast wave from a megaton range
Figure 5.49. Structure in Figure 5.48a after exposure to 6.5 psi peak overpressure and 1.1
psi dynamic pressure; positive phase duration 0.9 second.
RESIDENTIAL STRUCTURES
175
Figure 5.50. Structure in Figure 5.48b after exposure to 3.5 psi peak overpressure and 0.3
psi dynamic pressure; positive phase duration 1 second.
explosion at Eniwetok; namely, a peak
overpressure of 6.1 and a dynamic
pressure of 0.6 pounds per square inch
for the drag-type building, and 5 and 0.5
pounds per square inch, respectively,
for the semidrag structure. However,
the positive phase now lasted several
seconds as compared with about 1 sec-
ond in the Nevada tests. Both structures
suffered complete collapse (Figs. 5.51a
and b). Distortion and breakup occurred
throughout, particularly of columns and
connections. It was concluded, there-
fore, that damage to drag-sensitive
structures can be enhanced, for a given
peak overpressure value, if the duration
of the positive phase of the blast wave is
increased (cf. § 4.13).
RESIDENTIAL STRUCTURES
JAPANESE EXPERIENCE
5.52 There were many wood-
framed residential structures with adobe
walls in the Japanese cities which were
subjected to nuclear attack, but such a
large proportion were destroyed by fire
that very little detailed information con-
cerning blast damage was obtained. It
appeared that, although the quality of
the workmanship in framing was usually
high, little attention was paid to good
engineering principles. On the whole,
therefore, the construction was not well
adapted to resist wracking action (dis-
tortion). For example, mortise and
tenon joints were weak points in the
176
STRUCTURAL DAMAGE FROM AIR BLAST
Figure 5.51a. Structure similar to Figure 5.48a after exposure to 6.1 psi peak overpressure
and 0.6 psi dynamic pressure; positive phase duration several seconds.
Figure 5.51b. Structure similar to Figure 5.48b after exposure to 5 psi peak overpressure
and 0.5 psi dynamic pressure; positive phase duration several seconds.
RESIDENTIAL STRUCTURES
177
Figure 5.52. Upper photo; Wood-frame building; 1.0 mile from ground zero at Hiroshima.
Lower photo: Frame of residence under construction, showing small tenons.
structure and connections were in gen- (cut into) more than was necessary or
eral poor. Timbers were often dapped slices put in improper locations, result-
178
STRUCTURAL DAMAGE FROM AIR BLAST
ing in an overall weakening (Fig. 5.52).
5.53 In Nagasaki, dwellings col-
lapsed at distances up to 7,500 feet (1.4
miles) from ground zero, where the
peak overpressure was estimated to be
about 3 pounds per square inch, and
there was severe structural damage up to
8,500 feet (1.6 miles). Roofs, wall
panels, and partitions were damaged out
to 9,000 feet (1.7 miles), where the
overpressure was approximately 2
pounds per square inch, but the build-
ings would probably have been habit-
able with moderate repairs.
NEVADA TESTS
5.54 The main objectives of the
tests made in Nevada in 1953 and 1955
(§ 5.35) on residential structures were as
follows: (1) to determine the elements
most susceptible to blast damage and
consequently to devise methods for
strengthening structures of various
types; (2) to provide information con-
cerning the amount of damage to resi-
dences that might be expected as a result
of a nuclear explosion and to what ex-
tent these structures would be subse-
quently rendered habitable without
major repairs; and (3) to determine how
persons remaining in their houses during
a nuclear attack might be protected from
the effects of blast and radiations. Only
the first two of these aspects of the tests
will be considered here, since the pres-
ent chapter deals primarily with blast
effects.
TWO-STORY, WOOD-FRAME HOUSE:
1953 TEST
5.55 In the 1953 test, two essen-
tially identical houses, of a type com-
mon in the United States, were placed at
different locations. They were of typical
wood-frame construction, with two
stories, basement, and brick chimney
(Fig. 5.55). The interiors were plastered
but not painted. Since the tests were
intended for studying the effects of
blast, precautions were taken to prevent
the houses from burning. The exteriors
were consequently painted white (ex-
cept for the shutters), to reflect the ther-
mal radiation. For the same purpose, the
windows facing the explosion were
equipped with metal Venetian blinds
having an aluminum finish. In addition,
the houses were roofed with light-gray
shingles; these were of asbestos cement
for the house nearer to the explosion
where the chances of fire were greater,
whereas asphalt shingles were used for
the other house. There were no utilities
of any kind.
5.56 One of the two houses was
located in the region of Mach reflection
where the peak incident overpressure
was close to 5 pounds per square inch. It
was expected, from the effects in Japan,
that this house would be almost com-
pletely destroyed—as indeed it was—
but the chief purpose was to see what
protection might be obtained by persons
in the basement.
5.57 Some indication of the blast
damage suffered by this dwelling can be
obtained from Fig. 5.57. It is apparent
that the house was ruined beyond repair.
The first story was completely demol-
ished and the second story, which was
very badly damaged, dropped down on
the first floor debris. The roof was blown
off in several sections which landed at
both front and back of the house. The
gable end walls were blown apart and
outward, and the brick chimney was
broken into several pieces.
RESIDENTIAL STRUCTURES
179
Figure 5.55. Wood-frame house before a nuclear explosion, Nevada Test Site.
Figure 5.57. Wood-frame house after a nuclear explosion (5 psi peak overpressure).
180
STRUCTURAL DAMAGE FROM AIR BLAST
Figure 5.59. Wood-frame house after a nuclear explosion (1.7 psi peak overpressure).
5.58 The basement walls suffered
some damage above grade, mostly in
the rear, i.e., away from the explosion.
The front basement wall was pushed in
slightly, but was not cracked except at
the ends. The joists supporting the first
floor were forced downward probably
because of the air pressure differential
between the first floor and the largely
enclosed basement, and the supporting
pipe columns were inclined to the rear.
However, only in limited areas did a
complete breakthrough from first floor to
basement occur. The rest of the base-
ment was comparatively clear and the
shelters located there were unaffected.
5.59 The second house, exposed to
an incident peak overpressure of 1.7
pounds per square inch, was badly
damaged both internally and externally,
but it remained standing (Fig. 5.59).
People in the main and upper floors
would have suffered injuries ranging
from minor cuts from glass fragments to
possible fatal injuries from flying debris
or as a result of translational displace-
ment of the body as a whole. Some
damage would also result to the fur-
nishings and other contents of the
house. Although complete restoration
would have been very costly, it is be-
lieved that, with the window and door
openings covered, and shoring in the
basement, the house would have been
habitable under emergency conditions.
5.60 The most obvious damage was
suffered by doors and windows, includ-
ing sash and frames. The front door was
broken into pieces and the kitchen and
basement entrance doors were torn off
their hinges. Damage to interior doors
varied; those which were open before
RESIDENTIAL STRUCTURES
181
Figure 5.64. Strengthened wood-frame house after a nuclear explosion (4 psi peak
overpressure).
the explosion suffered least. Window
glass throughout the house was broken
into fragments, and the force on the
sash, especially in the front of the
house, dislodged the frames.
5.61 Principal damage to the first-
floor system consisted of broken joists.
The second-story system suffered rela-
tively little in structural respects, al-
though windows were broken and plas-
ter cracked. Damage to the roof
consisted mainly of broken rafters (2 x
6 inches with 16-inch spacing).
5.62 The basement showed no signs
of damage except to the windows, and
the entry door and frame. The shelters in
the basement were intact.
TWO-STORY, WOOD-FRAME HOUSE:
1955 TEST
5.63 Based upon the results de-
scribed above, certain improvements in
design were incorporated in two similar
wood-frame houses used in the 1955
test. The following changes, which in-
creased the estimated cost of the houses
some 10 percent above that for normal
construction, were made: (1) improved
connection between exterior walls and
foundations; (2) reinforced-concrete
shear walls to replace the pipe columns
in the basement; (3) increase in size and
strengthening of connections of first-
floor joists; (4) substitution of plywood
for lath and plaster; (5) increase in size
of rafters (to 2 x 8 inches) and wall
studs; and (6) stronger nailing of win-
dow frames in wall openings.
5.64 Even with these improve-
ments, it was expected that almost
complete destruction would occur at 5
pounds per square inch peak overpres-
sure, and so one of the houses was
located where the overpressure at the
Mach front would be 4 pounds per
square inch. Partly because of the in-
creased strength and partly because of
the lower air blast pressure the house did
not collapse (Fig. 5.64). But the super-
structure was so badly damaged that it
could not have been occupied without
expensive repair which would not have
been economically advisable.
182
STRUCTURAL DAMAGE FROM AIR BLAST
Figure 5.65. Strengthened wood-frame house after a nuclear explosion (2.6 psi peak
overpressure).
5.65 The other strengthened two-
story frame house was in a location
where the incident peak overpressure
was about 2.6 pounds per square inch;
this was appreciably greater than the
lower overpressure of the 1953 test.
Relatively heavy damage was experi-
enced, but the condition of the house
was such that it could be made available
for emergency shelter by shoring and
not too expensive repairs (Fig. 5.65).
Although there were differences in de-
tail, the overall damage was much the
same degree as that suffered by the cor-
responding house without the improved
features at an overpressure of 1.7
pounds per square inch.
TWO-STORY, BRICK-WALL-BEARING
HOUSE: 1955 TEST
5.66 For comparison with the tests
on the two-story, wood-frame structures
made in Nevada in 1953, two brick-
wall-bearing houses of conventional
construction, similar in size and layout,
were exposed to 5 and 1.7 pounds per
square inch peak overpressure, respec-
tively, in the 1955 tests (Fig. 5.66). The
exterior walls were of brick veneer and
cinder block and the foundation walls of
cinder block; the floors, partitions, and
roof were wood-framed.
5.67 At an incident peak overpres-
sure of 5 pounds per square inch, the
brick-wall house was damaged beyond
RESIDENTIAL STRUCTURES
183
Figure 5.67. Unreinforced brick house after a nuclear explosion (5 psi peak overpressure).
184
STRUCTURAL DAMAGE FROM AIR BLAST
repair (Fig. 5.67). The side and back
walls failed outward. The front wall
failed initially inward, but its subse-
quent behavior was obscured by dust.
The final location of the debris from the
front wall is therefore uncertain, but
very little fell on the floor framing. The
roof was demolished and blown off, the
rear part landing 50 feet behind the
house. The first floor had partially col-
lapsed into the basement as a result of
fracturing of the floor joists at the center
of the spans and the load of the second
floor which fell upon it. The chimney
was broken into several large sections.
5.68 Farther from the explosion,
where the peak overpressure was 1.7
pounds per square inch, the corre-
sponding structure was damaged to a
considerable extent. Nevertheless, its
condition was such that it could be made
available for habitation by shoring and
some fairly inexpensive repairs (Fig.
5.68).
ONE-STORY, WOOD-FRAME
(RAMBLER TYPE) HOUSE: 1955 TEST
5.69 A pair of the so-called
“rambler” type, single-story, wood-
frame houses were erected at the Ne-
vada Test Site on concrete slabs poured
in place at grade. They were of conven-
tional design except that each contained
a shelter, above ground, consisting of
the bathroom walls, floor, and ceiling of
reinforced concrete with blast door and
shutter (Fig. 5.69).
Figure 5.68. Unreinforced brick house after a nuclear explosion (1.7 psi peak overpres-
sure).
RESIDENTIAL STRUCTURES
185
Figure 5.69. Rambler-type house before a nuclear explosion, Nevada Test Site. (Note blast
door over bathroom window at right.)
5.70 When exposed to an incident
peak overpressure of about 5 pounds per
square inch, one of these houses was
demolished beyond repair. However,
the bathroom shelter was not damaged
at all. Although the latch bolt on the
blast shutter failed, leaving the shutter
unfastened, the window was still intact.
The roof was blown off and the rafters
were split and broken. The side walls at
gable ends were blown outward, and fell
to the ground. A portion of the front
wall remained standing, although it was
leaning away from the direction of the
explosion (Fig. 5.70).
5.71 The other house of the same
type, subjected to a peak overpressure
of 1.7 pounds per square inch, did not
suffer too badly and it could easily have
been made habitable. Windows were
broken, doors blown off their hinges,
and plaster-board walls and ceilings
were badly damaged. The main struc-
tural damage was a broken midspan
rafter beam and distortion of the frame.
In addition, the porch roof was lifted 6
inches off its supports.
ONE-STORY, PRECAST CONCRETE
HOUSE: 1955 TEST
5.72 Another residential type of
construction tested in Nevada in 1955
was a single-story house made of pre-
cast, lightweight (expanded shale ag-
gregate) concrete wall and partition
panels, joined by welded matching steel
lugs. Similar roof panels were anchored
to the walls by special countersunk and
grouted connections. The walls were
supported on concrete piers and a con-
crete floor slab, poured in place on a
tamped fill after the walls were erected.
The floor was anchored securely to the
walls by means of perimeter reinforcing
rods held by hook bolts screwed into
186
STRUCTURAL DAMAGE FROM AIR BLAST
Figure 5.70. Rambler-type house after a nuclear explosion (5 psi peak overpressure).
Figure 5.72. Reinforced precast concrete house before a nuclear explosion, Nevada Test
Site.
inserts in the wall panels. The overall
design was such as to comply with the
California code for earthquake-resistant
construction (Fig. 5.72).
5.73 This house stood up well, even
at a peak overpressure of 5 pounds per
square inch. By replacement of demol-
ished or badly damaged doors and win-
dows, it could have been made available
for occupancy (Fig. 5.73).
5.74 There was some indication
that the roof slabs at the front of the
house were lifted slightly from their
supports, but this was not sufficient to
break any connections. Some of the
walls were cracked slightly and others
showed indications of minor movement.
In certain areas the concrete around the
slab connections was spalled, so that the
connectors were exposed. The steel
RESIDENTIAL STRUCTURES
187
Reinforced precast concrete house after a nuclear explosion (5 psi peak
overpressure). The LP-gas tank, sheltered by the house, is essentially
undamaged.
Figure 5.73.
window-sash was somewhat distorted,
but it remained in place.
5.75 At a peak overpressure of 1.7
pounds per square inch, the precast
concrete-slab house suffered relatively
minor damage. Glass was broken ex-
tensively, and doors were blown off
their hinges and demolished, as in other
houses exposed to the same air pressure.
But, apart from this and distortion of the
steel window-sash, the only important
damage was spalling of the concrete at
the lug connections, i.e., where the sash
projected into the concrete.
ONE-STORY, REINFORCED-MASONRY
HOUSE: 1955 TEST
5.76 The last type of house sub-
jected to test in 1955 was also of earth-
quake-resistant design. The floor was a
concrete slab, poured in place at grade.
The walls and partitions were built of
lightweight (expanded shale aggregate)
8-inch masonry blocks, reinforced with
vertical steel rods anchored into the
floor slab. The walls were also rein-
forced with horizontal steel rods at two
levels, and openings were spanned by
reinforced lintel courses. The roof was
made of precast, lightweight concrete
slabs, similar to those used in the pre-
cast concrete houses described above
(Fig. 5.76).
5.77 At a peak overpressure of
about 5 pounds per square inch, win-
dows were destroyed and doors blown
in the demolished. The steel window-
sash was distorted, but nearly all re-
mained in place. The house suffered
only minor structural damage and could
have been made habitable at relatively
small cost (Fig. 5.77).
5.78 There was some evidence that
the roof slabs had been moved, but not
sufficiently to break any connections.
The masonry wall under the large win-
dow (see Fig. 5.77) was pushed in about
4 inches on the concrete floor slab; this
appeared to be due to the omission of
dowels between the walls and the floor
beneath window openings. Some cracks
developed in the wall above the same
window, probably as a result of im-
proper installation of the reinforced lin-
tel course and the substitution of a pipe
188
STRUCTURAL DAMAGE FROM AIR BLAST
Figure 5.76. Reinforced masonry-block house before a nuclear explosion, Nevada Test
Site.
Figure 5.77. Reinforced masonry-block house after a nuclear explosion (5 psi peak
overpressure).
column in the center span of the win-
dow.
5.79 A house of the same type ex-
posed to the blast at a peak overpressure
of 1.7 pounds per square inch suffered
little more than the usual destruction of
doors and windows. The steel window-
sash remained in place but was dis-
torted, and some spalling of the concrete
around lug connections was noted. Oh
the whole, the damage to the house was
of a minor character and it could readily
have been repaired.
TRANSPORTATION
189
TRAILER-COACH MOBILE HOMES:
1955 TEST
5.80 Sixteen trailer-coaches of
various makes, intended for use as mo-
bile homes, were subjected to blast in
the 1955 test in Nevada. Nine were
located where the peak blast overpres-
sure was 1.7 pounds per square inch,
and the other seven where the peak
overpressure was about 1 pound per
square inch. They were parked at
various angles with respect to the direc-
tion of travel of the blast wave.
5.81 At the higher overpressure two
of the mobile homes were tipped over
by the explosion. One of these was
originally broadside to the blast,
whereas the second, at an angle of about
45°, was of much lighter weight. All the
others at both locations remained stand-
ing. On the whole, the damage sus-
tained was not of a serious character.
5.82 From the exterior, many of the
mobile homes showed some dents in
walls or roof, and a certain amount of
distortion. There were, however, rela-
tively few ruptures. Most windows were
broken, but there was little or no glass in
the interior, especially in those coaches
having screens fitted on the inside.
Where there were no screens or Venetian
blinds, and particularly where there
were large picture windows, glass was
found inside.
5.83 The interiors of the mobile
homes were usually in a state of disorder
due to ruptured panels, broken and upset
furniture, and cupboards, cabinets, and
wardrobes which had been torn loose
and damaged. Stoves, refrigerators, and
heaters were not displaced, and the
floors were apparently unharmed. The
plumbing was, in general, still operable
after the explosion. Consequently, by
rearranging the displaced furniture, re-
pairing cabinets, improvising window
coverings, and cleaning up the debris,
all trailer-coaches could have been made
habitable for emergency use.
5.84 At the 1 pound,per square inch
overpressure location some windows
were broken, but no major damage was
sustained. The principal repairs required
to make the mobile homes available for
occupancy would be window replace-
ment or improvised window covering.
TRANSPORTATION
LIGHT LAND TRANSPORTATION
EQUIPMENT
5.85 In Japan, trolley-car equip-
ment was heavily damaged by both blast
and fire, although the poles were fre-
quently left standing. Buses and auto-
mobiles generally were rendered inop-
erable by blast and fire as well as by
damage caused by flying debris. How-
ever, the damage decreased rapidly with
distance. An American made automo-
bile was badly damaged and burned at
3,000 feet (0.57 mile) from ground
zero, but a similar vehicle at 6,000 feet
(1.14 miles) suffered only minor dam-
age.
5.86 Automobiles and buses have
been exposed to several of the nuclear
test explosions in Nevada, where the
conditions, especially as regards dam-
190
STRUCTURAL DAMAGE FROM AIR BLAST
Figure 5.87a. Damage to automobile originally located behind wood-frame house (5 psi
peak overpressure); the front of this car can be seen in Figure 5.57. Although
badly damaged, the car could still be driven after the explosion.
Figure 5.87b. Typical public bus damaged by a nuclear explosion, Nevada Test Site; this
bus, like the one in the left background, was overturned, coming to rest as
shown after a displacement of 50 feet.
TRANSPORTATION
191
age by fire and missiles, were somewhat
different from those in Japan. In the
descriptions that follow, distance is re-
lated to peak overpressure. In most
cases, however, it was not primarily
overpressure, but drag forces, which
produced the damage. In addition, al-
lowance must be made for the effect of
the blast wave precursor (§ 3.79 et
seq.). Hence, the damage radii cannot
be determined from overpressure alone.
5.87 Some illustrations of the ef-
fects of a nuclear explosion on mo-
torized vehicles are shown in Figs.
5.87a and b. At a peak overpressure of 5
pounds per square inch motor vehicles
were badly battered, with their tops and
sides pushed in, windows broken, and
hoods blown open. But the engines were
still operable and the vehicles could be
driven away after the explosion. Even at
higher blast pressures, when the overall
damage was greater, the motors ap-
peared to be intact.
5.88 During the 1955 tests in Ne-
vada, studies were made to determine
the extent to which various emergency
vehicles and their equipment would be
available for use immediately following
a nuclear attack. The vehicles included a
rescue truck, gas and electric utility
service or repair trucks, telephone ser-
vice trucks, and fire pumpers and ladder
trucks. One vehicle was exposed to a
peak overpressure of about 30 pounds
per square inch, two at 5 pounds per
square inch, two at 1.7 pounds per
square inch, and six at about 1 pound
per square inch. It should be empha-
sized, however, that, for vehicles in
general, overpressure is not usually the
sole or even the primary damage mech-
anism.
5.89 The rescue truck at the 30
pounds per square inch location was
completely destroyed, and only one
wheel and part of the axle were found
after the blast. At 5 pounds per square
inch peak overpressure a truck, with an
earth-boring machine bolted to the bed,
was broadside to the blast. This truck
was overturned and somewhat dam-
aged, but still operable (Fig. 5.89). The
earth-boring machine was knocked
loose and was on its side leaking gaso-
line and water. At the same location,
shown to the left of the overturned truck
in Fig. 5.89, was a heavy-duty electric
utility truck, facing head-on to the blast.
It had the windshield shattered, both
doors and cab dished in, the hood partly
blown off, and one tool-compartment
door dished. There was, however, no
damage to tools or equipment and the
truck was driven away without any re-
pairs being required.
5.90 At the 1.7 pounds per square
inch location, a light-duty electric utility
truck and a fire department 75-foot
aerial ladder truck sustained minor ex-
terior damage, such as broken windows
and dished-in panels. There was no
damage to equipment in either case, and
both vehicles would have been available
for immediate use after an attack. Two
telephone trucks, two gas utility trucks,
a fire department pumper, and a Jeep
firetruck, exposed to a peak overpres-
sure of 1 pound per square inch, were
largely unharmed.
5.91 It may be concluded that vehi-
cles designed for disaster and emer-
gency operation are substantially con-
structed, so that they can withstand a
peak overpressure of about 5 pounds per
square inch and the associated dynamic
pressure and still be capable of opera-
tion. Tools and equipment are protected
192
STRUCTURAL DAMAGE FROM AIR BLAST
Figure 5.89. Truck broadside to the blast wave (5 psi peak overpressure) overturned;
electric utility truck in background head-on to blast was damaged but
remained standing.
from the blast by the design of the truck
body or when housed in compartments
with strong doors.
RAILROAD EQUIPMENT
5.92 Railroad equipment suffered
blast damage in Japan and also in tests
in Nevada. Like motor vehicles, these
targets are primarily drag sensitive and
damage cannot be directly related to
overpressure. At a peak overpressure of
2 pounds per square inch from a kilo-
ton-range weapon, an empty wooden
boxcar may be expected to receive rela-
tively minor damage. At 4 pounds per
square inch overpressure, the damage to
a loaded wooden boxcar would be more
severe (Fig. 5.92a). At a peak over-
pressure of 6 pounds per square inch the
body of an empty wooden boxcar,
weighing about 20 tons, was lifted off
the trucks, i.e., the wheels, axles, etc.,
carrying the body, and landed about 6
feet away. The trucks themselves were
pulled off the rails, apparently by the
brake rods connecting them to the car
body. A similar boxcar, at the same
location, loaded with 30 tons of sand-
bags remained upright (Fig. 5.92b). Al-
though the sides were badly damaged
and the roof demolished, the car was
capable of being moved on its own
wheels. At 7.5 pounds per square inch
peak overpressure, a loaded boxcar of
the same type was overturned, and at 9
pounds per square inch it was com-
pletely demolished.
5.93 A Diesel locomotive weighing
46 tons was exposed to a peak over-
TRANSPORTATION
193
Figure 5.92a. Loaded wooden boxcar after a nuclear explosion (4 psi peak overpressure).
Figure 5.92b. Loaded wooden boxcar after a nuclear explosion (6 psi peak overpressure).
pressure of 6 pounds per square inch
while the engine was running. It con-
tinued to operate normally after the
blast, in spite of damage to windows
and compartment doors and panels.
There was no damage to the railroad
track at this point.
194
STRUCTURAL DAMAGE FROM AIR BLAST
AIRCRAFT
5.94 Aircraft are damaged by blast
effects at levels of peak overpressure as
low as 1 to 2 pounds per square inch.
Complete destruction or damage beyond
economical repair may be expected at
peak overpressures of 4 to 10 pounds
per square inch. Within this range, the
peak overpressure appears to be the
main criterion of damage. However,
tests indicate that, at a given overpres-
sure, damage to an aircraft oriented with
the nose toward the burst will be less
than damage to one with the tail or a
side directed toward the explosion.
5.95 Damage to an aircraft exposed
with its left side to the blast at a peak
overpressure of 3.6 pounds per square
inch is shown in Fig. 5.95a. The fu-
selage of this aircraft failed completely
just aft of the wing. The skin of the
fuselage, stabilizers, and engine cowl-
ing was severely buckled. Figure 5.95b
shows damage to an aircraft oriented
with its tail toward the burst and ex-
posed to 2.4 pounds per square inch
peak overpressure. Skin was dished in
on the vertical stabilizer, horizontal sta-
bilizers, wing surface above the flaps,
and outboard wing sections. Vertical
stabilizer bulkheads and the fuselage
frame near the cockpit were buckled.
SHIPPING
5.96 Damage to ships from an air or
surface burst is due primarily to the air
blast, since little pressure is transmitted
through the water. At closer ranges, air
blast can cause hull rupture resulting in
flooding and sinking. Such rupture ap-
pears likely to begin near the waterline
on the side facing the burst. Since the
main hull generally is stronger than the
superstructure, structures and equip-
ment exposed above the waterline may
be damaged at ranges well beyond that
at which hull rupture might occur.
Masts, spars, radar antennas, stacks,
electrical equipment, and other light
objects are especially sensitive to air
blast. Damage to masts and stacks is
apparent in Fig. 5.96; the ship was ap-
proximately 0.47 mile from surface zero
at the ABLE test (about 20-kiloton air
burst) at Bikini in 1946. Air blast may
also roll and possibly capsize the ship;
this effect would be most pronounced
for the air blast wave from a large
weapon striking the ship broadside.
5.97 Blast pressures penetrating
through openings of ventilation systems
and stack-uptake systems can cause
damage to interior equipment and com-
partments, and also to boilers. Damage
to the latter may result in immobiliza-
tion of the ship. The distortion of
weather bulkheads may render useless
interior equipment mounted on or near
them. Similarly, the suddenly applied
blast loading induces rapid motion of
the structures which may cause shock
damage to interior equipment. Equip-
ment in the superstructure is most su-
sceptible to this type of damage, al-
though shock motions may be felt
throughout the ship.
UTILITIES
195
Figure 5.95a. Aircraft after side exposed to a nuclear explosion (3.6 psi peak overpressure).
Figure 5.95b. Aircraft after tail exposed to a nuclear explosion (2.4 psi peak overpressure).
UTILITIES
ELECTRICAL DISTRIBUTION
SYSTEMS
5.98 Because of the extensive dam-
age caused by the nuclear explosions to
the cities in Japan, the electrical distri-
bution systems suffered severely. Utility
poles were destroyed by blast or fire,
and overhead lines were heavily dam-
aged at distances up to 9,000 feet (1.7
miles) from ground zero (Fig. 5.98).
196
STRUCTURAL DAMAGE FROM AIR BLAST
Figure 5.96. The U.S.S. Crittenden .after ABLE test; damage resulting was generally
serious (0.47 mile from surface zero).
Underground electrical circuits were,
however, little affected. Switchgear and
transformers were not damaged so much
directly by blast as by secondary effects,
such as collapse of the structure in
which they were located or by debris.
Motors and generators were damaged by
fire.
5.99 A fairly extensive study of the
effects of a nuclear explosion on electric
utilities was made in the Nevada tests in
1955. Among the purposes of these tests
UTILITIES
197
Figure 5.98. Damage to utility pole (0.80 mile from ground zero at Hiroshima).
were the following: (1) to determine the
blast pressure at which standard electri-
cal equipment might be expected to
suffer little or no damage; (2) to study
the extent and character of the damage
that might be sustained in a nuclear
198
STRUCTURAL DAMAGE FROM AIR BLAST
attack; and (3) to determine the nature
of the repairs that would be needed to
restore electrical service in those areas
where homes and factories would sur-
vive sufficiently to permit their use after
some repair. With these objectives in
mind, two identical power systems were
erected; one to be subjected to a peak
overpressure of about 5 and a dynamic
pressure of 0.6 pounds per square inch
and the other to 1.7 and 0.1 pounds per
square inch, respectively. It will be re-
called that, at the lower overpressure,
typical American residences would not
be damaged beyond the possibility of
further use.
5.100 Each power system consisted
of a high-voltage (69-kV) transmission
line on steel towers connected to a con-
ventional, outdoor transformer substa-
tion. From this proceeded typical over-
head distribution lines on 15 wood
poles; the latter were each 45 feet long
and were set 6 feet in the ground. Ser-
vice drops from the overhead lines sup-
plied electricity to equipment placed in
some of the houses used in the tests
described earlier. These installations
were typical of those serving an urban
community. In addition, the 69-kV
transmission line, the 69-kV switch rack
with oil circuit-breakers, and power
transformer represented equipment of
the kind that might supply electricity to
large industrial plants.
5.101 At a peak overpressure of 5
and a dynamic pressure of 0.6 pounds
per square inch the power system suf-
fered to some extent, but it was not
seriously harmed. The type of damage
appeared, on the whole, to be similar to
that caused by severe wind storms. In
addition to the direct effect of blast,
some destruction was due to missiles.
5.102 The only damage suffered by
the high-voltage transmission line was
the collapse of the suspension tower,
bringing down the distribution line with
it (Fig. 5.102a). It may be noted that the
dead-end tower, which was much
stronger and heavier, and another sus-
pension tower of somewhat stronger
design were only slightly affected (Fig.
5.102b). In some parts of the United
States, the suspension towers are of
similar heavy construction. Structures
of this type are sensitive to drag forces
which are related to dynamic pressure
and positive phase duration, so that the
overpressure is not the important crite-
rion of damage.
5.103 The transformer substation
survived the blast with relatively minor
damage to the essential components.
The metal cubicle, which housed the
meters, batteries, and relays, suffered
badly, but this substation and its con-
tents were not essential to the emer-
gency operation of the power system.
The 4-kV regulators had been shifted on
the concrete pad, resulting in separation
of the electrical connections to the bus.
The glass cells of the batteries were
broken and most of the plates were
beyond repair. But relays, meters, and
other instruments were undamaged, ex-
cept for broken glass. The substation as
a whole was in sufficiently sound con-
dition to permit operation on a nonau-
tomatic (manual) basis. By replacing the
batteries, automatic operation could
have been restored.
5.104 Of the 15 wood poles used to
carry the lines from the substation to the
houses, four were blown down com-
pletely and broken, and two others were
extensively damaged. The collapse of
the poles was attributed partly to the
UTILITIES
199
Figure 5.102a. Collapsed suspension tower (5 psi peak overpressure, 0.6 psi dynamic
pressure from 30-kiloton explosion), Nevada Test Site.
Figure 5.102b. Dead-end tower, suspension tower, and transformers (5 psi peak overpres-
sure, 0.6 psi dynamic pressure from 30-kiloton explosion), Nevada Test
Site. The trucks at the left of the photograph are those in Figure 5.89.
weight and resistance of the aerial cable
(Fig. 5.104). Other damage was be-
lieved to be caused by missiles.
5.105 Several distributor trans-
formers had fallen from the poles and
secondary wires and service drops were
down (Fig. 5.105). Nevertheless the
transformers, pot heads, arresters, cut-
outs, primary conductors of both alumi-
num and copper, and the aerial cables
200
STRUCTURAL DAMAGE FROM AIR BLAST
Figure 5.104. Collapse of utility poles on line (5 psi peak overpressure, 0.6 psi dynamic
pressure from 30-kiloton explosion), Nevada Test Site.
were unharmed. Although the pole line
would have required some rebuilding,
the general damage was such that it
could have been repaired within a day or
so with materials normally carried in
stock by electric utility companies.
GAS, WATER, AND SEWERAGE
SYSTEMS
5.106 The public utility system in
Nagasaki was similar to that of a some-
what smaller town in the United States,
except that open sewers were used. The
most significant damage was suffered by
the water supply system, so that it be-
came almost impossible to extinguish
fires. Except for a special case, de-
scribed below, loss of water pressure
resulted from breakage of pipes inside
and at entrances to buildings or on
structures, rather than from the disrup-
tion of underground mains (Figs. 5.106a
and b). The exceptional case was one in
which the 12-inch cast iron water pipes
were 3 feet below grade in a filled-in
area. A number of depressions, up to 1
foot in depth, were produced in the fill,
and these caused failure of the under-
ground pipes, presumably due to un-
equal displacements.
5.107 There was no appreciable
damage to reservoirs and water-treat-
ment plants in Japan. As is generally the
case, these were located outside the
cities, and so were at too great a dis-
tance from the explosions to be dam-
aged in any way.
UTILITIES
201
Figure 5.105. Transformer fallen from collapsed utility pole (5 psi peak overpressure),
Nevada Test Site.
5.108 Gas holders suffered heavily
from blast up to 6,000 feet (1.1 miles)
from ground zero and the escaping gas
was ignited, but there was no explosion.
Underground gas mains appear to have
been little affected by the blast.
NATURAL AND MANUFACTURED
GAS INSTALLATIONS
5.109 One of the objectives of the
tests made in Nevada in 1955 was to
determine the extent to which natural
and manufactured gas utility installa-
tions might be disrupted by a nuclear
explosion. The test was intended, in
particular, to provide information con-
cerning the effect of blast on critical
underground units of a typical gas dis-
tribution system.
202
STRUCTURAL DAMAGE FROM AIR BLAST
Figure 5.106a. Four-inch gate valve in water main broken by debris from brick wall (0.23
mile from ground zero at Hiroshima).
Figure 5.106b. Broken portion of 16-inch water main carried on bridge (0.23 mile from
ground zero at Hiroshima).
5.110 The installations tested were
of two kinds, each in duplicate. The first
represented a typical underground gas-
transmission and distribution main of
6-inch steel and cast iron pipe, at a
depth of 3 feet, with its associated ser-
UTILITIES
203
vice pipes and attachments. Valve pits
of either brick or concrete blocks con-
tained 6-inch valves with piping and
protective casings. A street regulator-
vault held a 6-inch, low-pressure, pilot-
loaded regulator, attached to steel pip-
ing projecting through the walls. One of
these underground systems was installed
where the blast overpressure was about
30 pounds per square inch and the other
at 5 pounds per square inch. No domes-
tic or ordinary industrial structures at the
surface would have survived the higher
of these pressures.
5.111 The second type of installa-
tion consisted of typical service lines of
steel, copper, and plastic materials con-
nected to 20-foot lengths of 6-inch steel
main. Each service pipe rose out of the
ground at the side of a house, and was
joined to a pressure regulator and meter.
The pipe then entered the wall of the
house about 2 feet above floor level. The
copper and plastic services terminated
inside the wall, so that they would be
subject to strain if the house moved on
its foundation. The steel service line
similarly terminated inside the wall, but
it was also attached outside to piping
that ran around the back of the house at
ground level to connect to the house
piping. This latter connection was made
with flexible seamless bronze tubing,
passing through a sleeve in the wall of
the building. Typical domestic gas ap-
pliances, some attached to the interior
piping, were located in several houses.
Duplicate installations were located at
peak overpressures of 5 and 1.7 pounds
per square inch, respectively.
5.112 Neither of the underground
installations was greatly affected by the
blast. At the 30 pounds per square inch
peak overpressure location a Р/2-inch
pipe pressure-test riser was bent to the
ground, and the valve handle, stem, and
bonnet had blown off. At the same place
two 4-inch ventilating pipes of the street
regulator-vaults were sheared off just
below ground level. A few minor leaks
developed in jute and lead caulked cast
iron bell and spigot joints because of
ground motion, presumably due to
ground shock induced by air blast. Oth-
erwise the blast effects were negligible.
5.113 At the peak overpressure of
1.7 pounds per square inch, where the
houses did not suffer severe damage,
(§ 5.59), the service piping both inside
and outside the houses was unharmed,
as also were pressure regulators and
meters. In the two-story, brick house at
5 pounds per square inch peak over-
pressure, which was demolished beyond
repair (§ 5.57), the piping in the base-
ment was displaced and bent as a result
of the collapse of the first floor. The
meter also became detached from the
fittings and fell to the ground, but the
meter itself and the regulator were un-
damaged and still operable. All other
service piping and equipment were es-
sentially intact.
5.114 Domestic gas appliances,
such as refrigerators, ranges, room
heaters, clothes dryers, and water heat-
ers suffered to a moderate extent only.
There was some displacement of the
appliances and connections which was
related to the damage suffered by the
house. However, even in the collapsed
two-story, brick house (§ 5.67), the
upset refrigerator and range were prob-
ably still usable, although largely buried
in debris. The general conclusion is,
therefore, that domestic gas (and also
electric) appliances would be operable
204
STRUCTURAL DAMAGE FROM AIR BLAST
in all houses that did not suffer major
structural damage.
LIQUID PETROLEUM (LP) GAS
INSTALLATIONS
5.115 Various LP-gas installations
have been exposed to air blast from
nuclear tests in Nevada to determine the
effects of typical gas containers and
supply systems such as are found at
suburban and farm homes and at
storage, industrial, and utility plants. In
addition, it was of interest to see what
reliance might be placed upon LP-gas as
an emergency fuel after a nuclear attack.
5.116 Two kinds of typical home
(or small commercial) LP-gas installa-
tions were tested: (1) a system consist-
ing of two replaceable ICC-approved
cylinders each of 100-pound capacity;
and (2) a 500-gallon bulk storage type
system filled from a tank truck. Some of
these installations were in the open and
others were attached, in the usual man-
ner, by means of either copper tubing or
steel pipe service line, to the houses
exposed to peak overpressures of 5 and
1.7 pounds per square inch. Others were
located where the peak overpressures
were about 25 and 10 pounds per square
inch. In these cases, piping from the gas
containers passed through a concrete
wall simulating the wall of a house.
5.117 In addition to the foregoing,
a complete bulk storage plant was
erected at a point where the peak over-
pressure was 5 pounds per square inch.
This consisted of an 18,000-gallon tank
(containing 15,400 gallons of propane),
pump compressor, cylinder-filling
building, cylinder dock, and all neces-
sary valves, fittings, hose, accessories,
and interconnecting piping.
5.118 The dual-cylinder installa-
tion, exposed to 25 pounds per square
inch peak overpressure, suffered most;
the regulators were torn loose from their
mountings and the cylinders displaced.
One cylinder came to rest about 2,000
feet from its original position; it was
badly dented, but was still usable. At
both 25 and 10 pounds per square inch
peak overpressure the components, al-
though often separated, could generally
be salvaged and used again. The cylin-
der installations at 5 pounds per square
inch peak overpressure were mostly
damaged by missiles and falling debris
from the houses to which they were
attached. The component parts, except
for the copper tubing, suffered little and
were usable. At 1.7 pounds per square
inch, there was neither damage to nor
dislocation of LP-gas cylinders. Of
those tested, only one cylinder devel-
oped a leak, and this was a small punc-
ture resulting from impact with a sharp
object.
5.119 The 500-gallon bulk gas
tanks also proved very durable and ex-
perienced little damage. The tank clo-
sest to the explosion was bounced end-
over-end for a distance of some 700
feet; nevertheless, it suffered only su-
perficially and its strength and servicea-
bility were not impaired. The filler valve
was damaged, but the internal check
valve prevented escape of the contents.
The tank exposed at 10 pounds per
square inch peak overpressure was
moved about 5 feet, but it sustained
little or no damage. All the other tanks,
at 5 or 1.7 pounds per square inch,
including those at houses piped for ser-
vice, were unmoved and undamaged
(Fig. 5.73).
5.120 The equipment of the
UTILITIES
205
Figure 5.120. Upper photo: LP-gas bulk storage and filling plant before a nuclear explo-
sion. Lower photo: The plant after the explosion (5 psi peak overpressure).
18,000-gallon bulk storage and filling
plant received only superficial damage
from the blast at 5 pounds per square
inch peak overpressure. The cylinder-
filling building was completely demol-
ished; the scale used for weighing the
cylinders was wrecked, and a filling line
was broken at the point where it entered
the building (Fig. 5.120). The major
operating services of the plant would,
however, not be affected because the
transfer facilities were outside and un-
damaged. All valves and nearly all pip-
ing in the plant were intact and there
was no leakage of gas. The plant could
have been readily put back into opera-
tion if power, from electricity or a gas-
oline engine, were restored. If not, liq-
uid propane in the storage tank could
have been made available by taking ad-
vantage of gravity flow in conjunction
with the inherent pressure of the gas in
the tank.
5.121 The general conclusion to be
drawn from the tests is that standard
LP-gas equipment is very rugged, ex-
cept for copper tubing connections.
Disruption of the service as a result of a
206
STRUCTURAL DAMAGE FROM AIR BLAST
nuclear attack would probably be local-
ized and perhaps negligible, so that LP-
gas might prove to be a very useful
emergency fuel. Where LP-gas is used
mainly for domestic purposes, it appears
that the gas supply would not be af-
fected under such conditions that the
house remains habitable.
MISCELLANEOUS TARGETS
COMMUNICATIONS EQUIPMENT
5.122 The importance of having
communications equipment in operating
condition after a nuclear attack is evi-
dent and so a variety of such equipment
has been tested in Nevada. Among the
items exposed to air blast were mobile
radio-communication systems and units,
a standard broadcasting transmitter, an-
tenna towers, home radio and television
receivers, telephone equipment (includ-
ing a small telephone exchange), public
address sound systems, and sirens.
Some of these were located where the
peak overpressure was 5 pounds per
square inch, and in most cases there
were duplicates at 1.7 pounds per square
inch. The damage at the latter location
was of such a minor character that it
need not be considered here.
5.123 At the higher overpressure
region, where typical houses were dam-
aged beyond repair, the communica-
tions equipment proved to be very re-
sistant to blast. This equipment is drag
sensitive and so the peak overpressure
does not determine the extent of dam-
age. Standard broadcast and television
receivers, and mobile radio base stations
were found to be in working condition,
even though they were covered with
debris and had, in some cases, been
damaged by missiles, or by being
thrown or dropped several feet. No
vacuum or picture tubes were broken.
The only mobile radio station to be
seriously affected was one in an auto-
mobile which was completely crushed
by a falling chimney.
5.124 A guyed 150-foot antenna
tower was unharmed, but an unguyed
120-foot tower, of lighter construction,
close by, broke off at a height of about
40 feet and fell to the ground (Fig.
5.124): This represented the only
serious damage to any of the equipment
tested.
5.125 The base station antennas,
which were on the towers, appeared to
withstand blast reasonably well, al-
though those attached to the unguyed
tower, referred to above, suffered when
the tower collapsed. As would have
been expected from their lighter con-
struction, television antennas for home
receivers were more easily damaged.
Several were bent both by the blast and
the collapse of the houses upon which
they were mounted. Since the houses
were generally damaged beyond repair
at a peak overpressure of 5 pounds per
square inch, the failure of the television
antennas is not of great significance.
5.126 Some items, such as power
lines and telephone service equipment,
were frequently attached to utility-line
poles. When the poles failed, as they did
in some cases (§ 5.104), the communi-
MISCELLANEOUS TARGETS
207
Figure 5.124. Unguyed lightweight 120-foot antenna tower (5 psi peak overpressure, 0.6
psi dynamic pressure from 30-kiloton explosion), Nevada Test Site.
cations systems suffered accordingly.
Although the equipment operated satis-
factorily after repairs were made to the
wire line, it appears that the power sup-
ply represents a weak link in the com-
munications chain.
BRIDGES
5.127 There were a number of dif-
ferent kinds of bridges exposed to the
nuclear explosions in Hiroshima and
Nagasaki. Those of wood were burned
in most cases, but steel-girder bridges
suffered relatively little destruction
(Figs. 5.127a and b). One bridge, only
270 feet from ground zero, i.e., about
2,100 feet from the burst point, which
was of a girder type with a reinforced-
concrete deck, showed no sign of any
structural damage. It had, apparently,
been deflected downward by the blast
force and had rebounded, causing only a
slight net displacement. Other bridges,
208
STRUCTURAL DAMAGE FROM AIR BLAST
Figure 5.127a. Bridge with deck of reinforced concrete on steel-plate girders; outer girder
had concrete facing (270 feet from ground zero at Hiroshima). The railing
was blown down but the deck received little damage so that traffic
continued.
at greater distances from ground zero,
suffered more lateral shifting. A rein-
forced-concrete deck was lifted from the
supporting steel girder of one bridge,
apparently as a result of reflection of the
blast wave from the surface of the water
below.
HEAVY-DUTY MACHINE TOOLS
5.128 The vulnerability of heavy-
duty machine tools and their compo-
nents to air blast from a nuclear explo-
sion was studied at the Nevada Test Site
to supplement the information from Na-
gasaki (§ 5.33). A number of machine
tools were anchored on a reinforced-
concrete slab in such a manner as to
duplicate good industrial practice. Two
engine lathes (weighing approximately
7,000 and 12,000 pounds, respec-
tively), and two horizontal milling ma-
chines (7,000 and 10,000 pounds, re-
spectively) were exposed to a peak
overpressure of 10 pounds per square
inch. A concrete-block wall, 8 inches
thick and 64 inches high, was con-
structed immediately in front of the ma-
chines, i.e., between the machines and
ground zero (Fig. 5.128). The purpose
of this wall was to simulate the exterior
wall of the average industrial plant and
to provide debris and missiles.
MISCELLANEOUS TARGETS
209
Figure 5.127b.
A steel-plate girder, double-track railway bridge (0.16 mile from ground
zero at Nagasaki). The plate girders were moved about 3 feet by the blast;
the railroad track was bent out of shape and trolley cars were demolished,
but the poles were left standing.
5.129 Of the four machines, the
three lighter ones were moved from
their foundations and damaged quite
badly (Fig. 5.129a). The fourth, weigh-
ing 12,000 pounds, which was consid-
ered as the only one to be actually of the
heavy-duty type, survived (Fig.
5.129b). From the observations it was
concluded that a properly anchored ma-
chine tool of the true heavy-duty type
would be able to withstand peak over-
pressures of 10 pounds per square inch
or more without substantial damage.
5.130 In addition to the direct ef-
fects of blast, considerable destruction
was caused by debris and missiles,
much of which resulted from the ex-
pected complete demolition of the con-
crete-block wall. Delicate mechanisms
and appendages, which are usually on
the exterior and unprotected, suffered
especially severely. Gears and gear
cases were damaged, hand valves and
control levers were broken off, and
drive belts were broken. It appears,
however, that most of the missile dam-
age could be easily repaired if replace-
ment parts were available, since major
dismantling would not be required.
5.131 Behind the two-story brick
house in the peak overpressure region of
5 pounds per square inch (§ 5.67), a
210
STRUCTURAL DAMAGE FROM AIR BLAST
Figure 5.128. Machine tools behind masonry wall before a nuclear explosion, Nevada Test
Site.
200-ton capacity hydraulic press weigh-
ing some 49,000 pounds was erected.
The location was chosen as being the
best to simulate actual factory condi-
tions. This unusually tall (19 feet high)
and slim piece of equipment showed
little evidence of blast damage, even
though the brick house was demolished.
It was probable that the house provided
some shielding from the blast wave.
Moreover, at the existing blast pressure,
missiles did not have high velocities.
Such minor damage as was suffered by
the machine was probably due to debris
falling from the house.
5.132 At the 3-pounds per square
inch peak overpressure location, there
were two light, industrial buildings of
standard type. In each of these was
placed a vertical milling machine
weighing about 3,000 pounds, a 50-
gallon capacity, stainless-steel, pressure
vessel weighing roughly 4,100 pounds,
and a steel steam oven approximately
21/» feet wide, 5 feet high, and 9 feet
long. Both buildings suffered ex-
tensively from blast, but the equipment
experienced little or no operational
damage. In one case, the collapsing
structure fell on and broke off an ex-
posed part of the milling machine.
5.133 The damage sustained by
machine tools in the Nevada tests was
probably less than that suffered in Japan
at the same blast pressures (§ 5.33).
Certain destructive factors, present in
the latter case, were absent in the tests.
First, the conditions were such that there
was no damage by fire; and, second,
there was no exposure to the elements
after the explosion. In addition, the total
amount of debris and missiles produced
in the tests was probably less than in the
industrial buildings in Japan.
MISCELLANEOUS TARGETS
211
Figure 5.129a. Machine tools after a nuclear explosion (10 psi peak overpressure).
Figure 5.129b. Heavy-duty lathe after a nuclear explosion (10 psi peak overpressure).
212
STRUCTURAL DAMAGE FROM AIR BLAST
ANALYSIS OF DAMAGE FROM AIR BLAST
INTRODUCTION
5.134 The remainder of this chapter
is concerned with descriptions of air-
blast damage criteria for various types
of targets and with the development of
damage-distance relationships for pre-
dicting the distances at which damage
may be expected from nuclear explo-
sions of different energy yields. The
nature of any target complex, such as a
city, is such, however, that exact pre-
dictions are not possible. Nevertheless,
by application of proper judgment to the
available information, results of practi-
cal value can be obtained. The conclu-
sions given here are considered to be
applicable to average situations that
might be encountered in an actual target
complex.
5.135 Damage to structures and
objects is generally classified in three
categories: severe, moderate, and light.
In several of the cases discussed below,
the specific nature of each type of dam-
age is described, but the following
broad definitions are a useful guide.
Severe Damage
A degree of damage that precludes
further use of the structure or ob-
ject for its intended purpose with-
out essentially complete recon-
struction. For a structure or
building, collapse is generally im-
plied.
Moderate Damage
A degree of damage to principal
members that precludes effective
use of the structure or object for its
intended purpose unless major re-
pairs are made.
Light Damage
A degree of damage to buildings
resulting in broken windows, slight
damage to roofing and siding,
blowing down of light interior par-
titions, and slight cracking of cur-
tain walls in buildings. Minor re-
pairs are sufficient to permit use of
the structure or object for its in-
tended purpose.
5.136 For a number of types of tar-
gets, the distances out to which different
degrees of damage may be expected
from nuclear explosions of various
yields have been represented by dia-
grams, such as Figs. 5.140 and 5.146.
These are based on observations made
in Japan and at various nuclear tests, on
experiments conducted in shock tubes in
laboratories and with high-explosives in
field tests, and on theoretical analyses of
the loading and response of structures
(see Chapter IV). As a result of these
studies, it is possible to make reason-
ably accurate predictions of the response
of interior as well as exterior wall panels
and complete structures to the air-blast
wave. These predictions, however,
must take into account constructional
details of each individual structure.
Moreover, observations made during
laboratory tests have indicated a large
scatter in failure loadings as a result of
statistical variations among wall and
material properties. The data in Figs.
5.140 and 5.146 are intended, however,
ANALYSIS OF DAMAGE FROM AIR BLAST
213
to provide only gross estimates for the
categories of structures given in Tables
5.139a and b. The response of a partic-
ular structure may thus deviate from that
shown for its class in the figures.
5.137 For structures that are dam-
aged primarily by diffraction loading
(§ 4.03), the peak overpressure is the
important factor in determining the re-
sponse to blast. In some instances,
where detailed analyses have not been
performed, peak overpressures are
given for various kinds of damage. Ap-
proximate damage-distance relation-
ships can then be derived by using peak
overpressure-distance curves and scal-
ing laws from Chapter III. For equal
scaled heights of burst, as defined in
§ 3.62, the range for a specified damage
to a diffraction-sensitive structure in-
creases in proportion to the cube root,
and the damage area in proportion to the
two-thirds power, of the energy of the
explosion. This means, for example,
that a thousand-fold increase in the en-
ergy will increase the range for a par-
ticular kind of diffraction-type damage
by a factor of roughly ten; the area over
which the damage occurs will be in-
creased by a factor of about a hundred,
for a given scaled burst height.
5.138 Where the response depends
mainly on drag (or wind) loading, the
peak overpressure is no longer a useful
criterion of damage. The response of a
drag-sensitive structure is determined by
the length of the blast wave positive
phase as well as by the peak dynamic
pressure (§ 4.12 et seq.). The greater
the energy of the weapon, the farther
will be the distance from the explosion
at which the peak dynamic pressure has
a specific value and the longer will be
the duration of the positive phase. Since
there is increased drag damage with in-
creased duration at a given pressure, the
same damage will extend to lower dy-
namic pressure levels. Structures which
are sensitive to drag loading will there-
fore be damaged over a range that is
larger than is given by the cube root rule
for diffraction-type structures. In other
words, as the result of a thousand-fold
increase in the energy of the explosion,
the range for a specified damage to a
drag-sensitive structure will be in-
creased by a factor of more than ten, and
the area by more than a hundred.
ABOVE-GROUND BUILDINGS
AND BRIDGES
5.139 The detailed nature of the
damage in the severe, moderate, and
light categories to above-ground struc-
tures of various types are given in
Tables 5.139a and b. For convenience,
the information is divided into two
groups. Table 5.139a is concerned with
structures of the type that are primarily
affected by the blast wave during the
diffraction phase, whereas the structures
in Table 5.139b are drag sensitive.
5.140 The ranges for severe and
moderate damage to the structures in
Tables 5.139a and b are presented in
Fig. 5.140, based on actual observations
and theoretical analysis. The numbers (1
to 21) in the figure identify the target
types as given in the first column of the
tables. The data refer to air bursts with
the height of burst chosen so as to max-
imize the radius of damage for the par-
ticular target being considered and is not
necessarily the same for different tar-
gets. For a surface burst, the respective
ranges are to be multiplied by three-
fourths. An example illustrating the use
of the diagram is given.
(Text continued on page 220.)
214
STRUCTURAL DAMAGE FROM AIR BLAST
Table 5.139a
DAMAGE CRITERIA FOR STRUCTURES PRIMARILY AFFECTED BY DIFFRACTION
LOADING
Description of Damage
Structural Type Description of Structure Severe Moderate Light
1 Multistory reinforced concrete building with reinforced con- crete walls, blast re- sistant design for 30 psi Mach region pressure from 1 MT, no windows. Walls shattered, se- vere frame distor- tion, incipient col- lapse. Walls breached or on the point of being so, frame distorted, entrance- ways damaged, doors blown in or jammed, extensive spalling of con- crete. Some cracking of concrete walls and frame.
2 Multistory reinforced concrete building with concrete walls, small window area, three to eight stories. Walls shattered, se- vere frame distor- tion, incipient col- lapse. Exterior walls se- verely cracked. In- terior partitions se- verely cracked or blown down. Struc- tural frame perma- nently distorted, extensive spalling of concrete. Windows and doors blown in, interior partitions cracked.
3 Multistory wall-bear- ing building, brick apartment house type, up to three stories. Collapse of bearing walls, resulting in total collapse of structure. Exterior walls se- verely cracked, in- terior partitions se- verely cracked or blown down. Windows and doors blown in, interior partitions cracked.
4 Multistory wall-bear- ing building, monu- mental type, up to four stories. Collapse of bearing walls, resulting in collapse of struc- ture supported by these walls. Some bearing walls may be shielded by in- tervening walls so that part of the structure may re- ceive only moder- ate damage. Exterior walls fac- ing blast severely cracked, interior partitions severely cracked with dam- age toward far end of building possibly less intense. Windows and doors blown in, interior partitions cracked.
5 Wood frame build- ing, house type, one or two stories. Frame shattered re- sulting in almost complete collapse. Wall framing cracked. Roof se- verely damaged, in- terior partitions Windows and doors blown in, interior partitions cracked.
blown down.
ANALYSIS OF DAMAGE FROM AIR BLAST
215
Table 5.139b
DAMAGE CRITERIA FOR STRUCTURES PRIMARILY AFFECTED BY DRAG LOADING
Description of Damage
Structural Type Description of Structure Severe Moderate Light
6 Light steel frame in- dustrial building, sin- gle story, with up to 5-ton crane capacity; low strength walls which fail quickly. Severe distortion or collapse of frame. Minor to major dis- tortion of frame; cranes, if any, not operable until re- pairs made. Windows and doors blown in, light sid- ing ripped off.
7 Heavy steel-frame in- dustrial building, sin- gle story, with 25 to 50-ton crane capac- ity; lightweight, low strength walls which fail quickly. Severe distortion or collapse of frame. Some distortion to frame; cranes not operable until re- pairs made. Windows and doors blown im light sid- ing ripped off.
8 Heavy steel frame in- dustrial building, sin- gle story, with 60 to 100-ton crane capac- ity; lightweight low strength walls which fail quickly. Severe distortion or collapse of frame. Some distortion or frame; cranes not operable until re- pairs made. Windows and doors blown in, light sid- ing ripped off.
9 Multistory steel- frame office-type building, 3 to 10 stories. Lightweight low strength walls which fail quickly, earthquake resistant construction. Severe frame dis- tortion, incipient collapse. Frame distorted moderately, interior partitions blown down. Windows arid doors blown in, light sid- ing ripped off, inte- rior partitions cracked.
10 Multistory steel- frame office-type building, 3 to 10 stories. Lightweight low strength walls which fail quickly, non-earthquake resis- tant construction. Severe frame dis- tortion, incipient collapse. Frame distorted moderately, interior partitions blown down. Windows and doors blown in, light sid- ing ripped off, inte- rior partitions cracked.
216
STRUCTURAL DAMAGE FROM AIR BLAST
Table 5.139b (continued)
Structural Type Description of Structure Description of Damage
Severe Moderate Light
11 Multistory reinforced concrete frame of- fice-type building, 3 to 10 stories; light- weight low strength walls which fail quickly, earthquake resistant construction. Severe frame dis- tortion, incipient collapse. Frame distorted moderately, interior partitions blown down, some spall- ing of concrete. Windows and doors blown in, light sid- ing ripped off, inte- rior partitions cracked.
12 Multistory reinforced concrete frame office type building, 3 to 10 stories; lightweight low strength walls which fail quickly, non-earthquake re- sistant construction. Severe frame dis- tortion, incipient collapse. Frame distorted moderately, interior partitions blown down, some spall- ing of concrete. Windows and doors blown in, light sid- ing ripped off, inte- rior partitions cracked.
13 Highway truss bridges, 4-lane, spans 200 to 400 ft; railroad truss bridges, double track ballast floor, spans 200 to 400 ft. Total failure of lat- eral bracing or an- chorage, collapse of bridge. Substantial distor- tion of lateral brac- ing or slippage on supports, signifi- cant reduction in capacity of bridge. Capacity of bridge not significantly re- duced, slight distor- tion of some bridge components.
14 Highway truss bridges, 2-lane, spans 200 to 400 ft; railroad truss bridges, single track ballast or double track open floors, spans 200 to 400 ft; railroad truss bridges, single track open floor, span 400 ft. (Ditto) (Ditto) (Ditto)
15 Railroad truss bridges, single track open floor, span 200 ft. (Ditto) (Ditto) (Ditto)
16 Highway girder bridges, 4-lane through, span 75 ft. (Ditto) (Ditto) (Ditto)
ANALYSIS OF DAMAGE FROM AIR BLAST
217
Table 5.139b (concluded)
Structural Type Description of — Structure Description of Damage
Severe Moderate Light
17 Highway girder bridges, 2-lane deck, 2-lane through, 4- lane deck, span 75 ft; railroad girder bridges, double-track deck, open or ballast floor, span 75 ft; railroad girder bridges, single or double track through, ballast floors, span 75 ft. (Ditto) (Ditto) (Ditto)
18 Railroad girder bridges, single track deck, open or ballast floors, span 75 ft; railroad girder bridges, single or double track through, open floors, span 75 ft. (Ditto) (Ditto) (Ditto)
19 Highway girder bridges, 2-lane through, 4-lane deck or through, span 200 ft; railroad girder bridges, double track deck or through, bal- last floor, span 200 ft. (Ditto) (Ditto) (Ditto)
20 Highway girder bridges, 2-lane deck, span 200 ft; railroad girder bridges, single track deck or through, ballast floors, span 200 ft; railroad girder bridges, double track deck or through, open floors, span 200 ft. (Ditto) (Ditto) (Ditto)
21 Railroad girder bridges, single track deck or through, open floors, span 200 ft. (Ditto) (Ditto) (Ditto)
218
STRUCTURAL DAMAGE FROM AIR BLAST
The various above-ground structures
in Fig. 5.140 are identified (Items 1
through 21) and the different types of
damage are described in Tables 5.139a
and b. The “fan” from each point indi-
cates the range of yields for which the
diagram may be used. For a surface
burst multiply the damage distances ob-
tained from the diagram by three-
fourths. The results are estimated to be
accurate within ±20 percent for the
average target conditions specified in
§ 5.141.
Example
Given: Wood-frame building (Type
5). A 1 MT weapon is burst (a) at
optimum height, (b) at the surface.
Find: The distances from ground
zero to which severe and moderate
damage extend.
Solution: (a) From the point 5 (at
the right) draw a straight line to 1 MT
(1000 KT) on the severe damage scale
and another to 1 MT (1000 KT) on the
moderate damage scale. The intersec-
tions of these lines with the distance
scale give the required solutions for the
optimum burst height; thus,
Distance for severe damage =
29,000 feet. Answer.
Distance for moderate damage =
33,000 feet. Answer.
(b) For a surface burst the respective
distances are three-fourths those ob-
tained above; hence,
Distance for severe damage =
22,000 feet. Answer.
Distance for moderate damage =
25,000 feet. Answer.
(The values have been rounded off to
two significant figures, since greater
precision is not warranted.)
YIELD: MODERATE DAMAGE (KT)
Figure 5.140. Damage-distance relationships for above ground structures.
ANALYSIS OF DAMAGE FROM AIR BLAST 219
220
STRUCTURAL DAMAGE FROM AIR BLAST
5.141 The data in Fig. 5.140 are for
certain average target conditions. These
are that (1) the target is at sea level (no
correction is necessary if the target alti-
tude is less than 5,000 feet); (2) the
terrain is fairly flat (rugged terrain
would provide some local shielding and
protection in certain areas and local en-
hancement of damage in others); and (3)
the structures have average characteris-
tics (that is, they are of average size and
strength and that orientation of the target
with respect to the burst is no problem,
i.e., that the ratio of loading to resis-
tance is relatively the same in all direc-
tions from the target).
5.142 The “fan” from each point
in the figure designating a target type
delineates the range of yields over
which theoretical analyses have been
made. For yields falling within this
range, the diagram is estimated to be
accurate within ± 20 percent for the
average conditions discussed above.
The significance of results obtained by
applying the diagram to conditions that
depart appreciably from the average or
to yields outside the limits of the fans
must be left to the judgment of the
analyst.
5.143 Figure 5.140 gives the dis-
tances from ground zero for severe and
moderate damage. Light damage to all
targets except blast-resistant structures
and bridges can be expected at the range
at which the overpressure is 1 pound per
square inch. For the blast-resistant
structure (Type 1) described in Table
5.139a, a peak overpressure of 10
pounds per square inch should be used
to estimate the distance for light dam-
age. Light damage to bridges can be
expected at the range at which 0.6
pound per square inch dynamic pressure
occurs.
5.144 The foregoing results do not
take into consideration the possibility of
fire. Generally speaking, the direct ef-
fects of thermal radiation on the struc-
tures and other targets under considera-
tion are inconsequential. However,
thermal radiation may initiate fires, and
in structures with severe or moderate
damage fires may start because of
disrupted gas and electric utilities. In
some cases, as in Hiroshima (§ 7.71),
the individual fires may develop into a
mass fire which may exist throughout a
city, even beyond the range of signifi-
cant blast damage. The spread of such a
fire depends to a great extent on local
weather and other conditions and is
therefore difficult to predict. This limi-
tation must be kept in mind when Fig.
5.140 is used to estimate the damage to
a particular city or target area.
STRUCTURAL ELEMENTS
5.145 For certain structural ele-
ments, with short periods of vibration
(up to about 0.05 second) and small
plastic deformation at failure, the con-
ditions for failure can be expressed as a
peak overpressure without considering
the duration of the blast wave. The fail-
ure conditions for elements of this type
are given in Table 5.145. Some of these
elements fail in a brittle fashion, and
thus there is only a small difference
between the pressures that cause no
damage and those that produce complete
failure. Other elements may fail in a
moderately ductile manner, but still
with little difference between the pres-
sures for light damage and complete
failure. The pressures are side-on blast
overpressures for panels that face
ANALYSIS OF DAMAGE FROM AIR BLAST
221
Table 5.145
CONDITIONS OF FAILURE OF OVERPRESSURE-SENSITIVE ELEMENTS
Approximate
side-on
peak
overpressure
Structural element Failure (psi)
Glass windows, large and small Shattering usually, occa- sional frame failure. 0.5- 1.0
Corrugated asbestos siding. Shattering. 1.0- 2.0
Corrugated steel or aluminum paneling. Connection failure fol- lowed by buckling. 1.0- 2.0
Brick wall panel, 8 in. or 12 in. thick (not reinforced). Shearing and flexure failures. 3.0-10.0
Wood siding panels, stand- ard house construction. Usually failure occurs at the main connections allowing a whole panel to be blown in. 1.0- 2.0
Concrete or cinder-block wall panels, 8 in. or 12 in. thick (not reinforced). Shattering of the wall. 1.5- 5.5
ground zero. For panels that are oriented
so that there are no reflected pressures
thereon, the side-on pressures must be
doubled. The fraction of the area of a
panel wall that contains windows will
influence the overpressure required to
damage the panel. Such damage is a
function of the net load, which may be
reduced considerably if the windows fail
early. This allows the pressure to be-
come equalized on the two sides of the
wall before panel failure occurs.
DRAG-SENSITIVE TARGETS
5.146 A diagram of damage-dis-
tance relationships for various targets
which are largely affected by drag forces
is given in Fig. 5.146. The conditions
under which it is applicable and the
limits of accuracy are similar to those in
§ 5.141 and § 5.142, respectively; the
possibility of fire mentioned in § 5.144
must also be kept in mind. The targets
(Items 1 to 13) in the figure are enu-
merated on the page facing Fig. 5.146
and the different types of damage are
described in the following paragraphs.
Transportation Equipment
5.147 The damage criteria for
various types of land transportation
equipment, including civilian motor-
driven vehicles and earth-moving
equipment, and railroad rolling stock
are given in Table 5.147a. The various
types of damage to merchant shipping
from air blast are described in Table
5.147b.
(Text continued on page 225.)
222
STRUCTURAL DAMAGE FROM AIR BLAST
The drag-sensitive targets in Fig.
5.146 are identified as follows:
1. Truck mounted engineering equip-
ment (unprotected).
2. Earth moving engineering equip-
ment (unprotected).
3. Transportation vehicles.
4. Unloaded railroad cars.
5. Loaded boxcars, flatcars, full tank
cars, and gondola cars (side-on
orientation).
6. Locomotives (side-on orientation).
7. Telephone lines (radial).
8. Telephone lines (transverse).
9. Unimproved coniferous forest
stand.
10. Average deciduous forest stand.
11. Loaded boxcars, flatcars, full tank
cars, and gondola cars (end-on ori-
entation).
12. Locomotives (end-on orientation).
13. Merchant shipping.
Subscript “m” refers to moderate
damage and subscript “s” refers to se-
vere damage.
For a surface burst multiply the dis-
tance by three-fourths for Items 1
through 8 and by one-half for Items 9
and 10. For Items 11 through 13, the
distances are the same for a surface
burst as for the optimum burst height.
Estimated accuracy ± 20 percent for
average targets.
Example
Given: A transportation type vehi-
cle (Item 3). A 10 KT weapon is burst at
(a) the optimum height, (b) at the sur-
face.
Find: The distances from ground
zero to which severe and moderate
damage extend.
Solution: (a) Draw straight lines
from the points 3s and 3m, at the right, to
10 KT on the yield scale at the left. The
intersections of these lines with the dis-
tance scale give the solutions for severe
and moderate damage, respectively, for
the optimum burst height; thus,
Distance for severe damage =
1,400 feet. Answer.
Distance for moderate damage =
1,600 feet. Answer.
(b) For a surface burst the distances in
this case are three-fourths those ob-
tained above; thus,
Distance for severe damage =
1,000 feet. Answer.
Distance for moderate damage =
1,200 feet. Answer.
YIELD (KT)
Figure 5.146. Damage-distance relationships for drag-sensitive targets.
ANALYSIS OF DAMAGE FROM AIR BLAST 223
224
STRUCTURAL DAMAGE FROM AIR BLAST
Table 5.147a
DAMAGE CRITERIA FOR LAND TRANSPORTATION EQUIPMENT
Description of equipment Damage Nature of damage
Motor equipment (cars and trucks).
Railroad rolling stock (box, flat, tank, and
gondola cars).
Railroad locomotives (Diesel or steam).
Construction equipment (bulldozers and
graders).
Severe Gross distortion of frame, large displace-
ments, outside appurtenances (doors
and hoods) torn off, need rebuilding
before use.
Moderate Turned over and displaced, badly dented,
frames sprung, need major repairs.
Light Glass broken, dents in body, possibly
turned over, immediately usable.
Severe Car blown from track and badly smashed,
extensive distortion, some parts usable.
Moderate Doors demolished, body damaged, frame
distorted, could possibly roll to repair
shop.
Light Some door and body damage, car can con-
tinue in use.
Severe Overturned, parts blown off, sprung and
twisted, major overhaul required.
Moderate Probably overturned, can be towed to re-
pair shop after being righted, need major
repairs.
Light Glass breakage and minor damage to parts,
immediately usable.
Severe Extensive distortion of frame and crushing
of sheet metal, extensive damage to cat-
erpillar tracks and wheels.
Moderate Some frame distortion, overturning, track
and wheel damage.
Light Slight damage to cabs and housing, glass
breakage.
Table 5.147b
DAMAGE CRITERIA FOR SHIPPING FROM AIR BLAST
Damage type Nature of damage
Severe The ship is either sunk, capsized, or damaged to the extent of requiring rebuilding.
Moderate The ship is immobilized and requires extensive repairs, especially to shock-sensitive
components or their foundations, e.g., propulsive machinery, boilers, and interior
equipment.
Light The ship may still be able to operate, although there will be damage to electronic,
electrical, and mechanical equipment.
ANALYSIS OF DAMAGE FROM AIR BLAST
225
Communication and Power Lines
5.148 Damage to telephone, tele-
graph, and utility power lines is gener-
ally either severe or light. Such damage
depends on whether the poles support-
ing the lines are damaged or not. If the
poles are blown down, damage to the
lines will be severe and extensive re-
pairs will be required. On the other
hand, if the poles remain standing, the
lines will suffer only light damage and
will need little repair. In general, lines
extending radially from ground zero are
less susceptible to damage than are
those running at right angles to this
direction.
Forests
5.149 The detailed characteristics
of the damage to forest stands resulting
from a nuclear explosion will depend on
a variety of conditions, e.g., deciduous
or coniferous trees, degree of foliation
of the trees, natural or planted stands,
and favorable or unfavorable growing
conditions. A general classification of
forest damage, applicable in most cases,
is given in Table 5.149. Trees are pri-
marily sensitive to the drag forces from
a blast wave and so it is of interest that
the damage in an explosion is similar to
that resulting from a strong, steady
wind; the velocities of such winds that
would produce comparable damage are
included in the table.
5.150 The damage-distance results
derived from Fig. 5.146 apply in par-
ticular to unimproved coniferous forests
which have developed under unfavor-
able growing conditions and to most
deciduous forests in the temperate zone
when foliation is present. Improved co-
niferous forests, with trees of uniform
height and a smaller average tree density
per acre, are more resistant to blast than
are unimproved forests which have
grown under unfavorable conditions. A
forest of defoliated deciduous trees is
also somewhat more blast resistant than
is implied by the data in Fig. 5.146.
Table 5.149
DAMAGE CRITERIA FOR FORESTS
Damage type
Nature of damage
Equivalent
steady
wind velocity
(miles per hour)
Severe Up to 90 percent of trees blown down; remainder denuded of branches 130-140
Moderate and leaves. (Area impassable to vehicles and very difficult on foot.) About 30 percent of trees blown down; remainder have some 90-100
Light branches and leaves blown off. (Area passable to vehicles only after extensive clearing.) Only applies to deciduous forest stands. Very few trees blown down; 60-80
some leaves and branches blown off. (Area passable to vehicles.)
STRUCTURAL DAMAGE FROM AIR BLAST
226
PARKED AIRCRAFT
5.151 Aircraft are relatively vul-
nerable to air blast effects associated
with nuclear detonations. The forces
developed by peak overpressures of 1 to
2 pounds per square inch are sufficient to
dish in panels and buckle stiffeners and
stringers. At higher overpressures, the
drag forces due to wind (dynamic)
pressure tend to rotate, translate, over-
turn, or lift a parked aircraft, so that
damage may then result from collision
with other aircraft, structures, or the
ground. Aircraft are also very suscept-
ible to damage from flying debris carried
by the blast wave.
5.152 Several factors influence the
degree of damage that may be expected
for an aircraft of a given type at a
specified range from a nuclear detona-
tion. Aircraft that are parked with the
nose pointed toward the burst will suffer
less damage than those with the tail or
either side directed toward the oncom-
ing blast wave (§ 5.94). Shielding of
one aircraft by another or by structures
or terrain features may reduce damage,
especially that caused by flying debris.
Standard tiedown of aircraft, as used
when high winds are expected, will also
minimize the extent of damage at ranges
where destruction might otherwise
occur.
5.153 The various damage catego-
ries for parked transport airplanes, light
liaison airplanes, and helicopters are
outlined in Table 5.153 together with
the approximate peak overpressures at
which the damage may be expected to
occur. The aircraft are considered to be
parked in the open at random orientation
with respect to the point of burst. The
Table 5.153
DAMAGE CRITERIA FOR PARKED AIRCRAFT
Damage type Nature of damage Overpressure (psi)
Severe Major (or depot level) mainte- Transport airplanes 3
nance required to restore air- Light liaison craft 2
craft to operational status. Helicopters 3
Moderate Field maintenance required to Transport airplanes 2
restore aircraft to opera- Light liaison craft 1
tional status. Helicopters 1.5
Light Flight of the aircraft not pre- Transport airplanes 1.0
vented, although performance Light liaison craft 0.75
may be restricted. Helicopters 1.0
ANALYSIS OF DAMAGE FROM AIR BLAST
227
data in the table are based on tests in
which aircraft were exposed to detona-
tions with yields in the kiloton range.
For megaton yields, the longer duration
of the positive phase of the blast wave
may result in some increase in damage
over that estimated from small-yield
explosions at the same overpressure
level. This increase is likely to be sig-
nificant at pressures producing severe
damage, but will probably be less im-
portant for moderate and light damage
conditions.
5.154 Aircraft with exposed ignit-
able materials may, under certain con-
ditions, be damaged by thermal radia-
tion at distances beyond those at which
equivalent damage would result from
blast effects. The vulnerability to ther-
mal radiation may be decreased by pro-
tecting ignitable materials from expo-
sure to direct radiation or by painting
them with protective (light colored)
coatings which reflect, rather than ab-
sorb, most of the thermal radiation (see
Chapter VII).
POL STORAGE TANKS
5.155 The chief cause of failure of
POL (petroleum, oil, lubricant) storage
tanks exposed to the blast wave appears
to be the lifting of the tank from its
foundation. This results in plastic de-
formation and yielding of the joint be-
tween the side and bottom so that leak-
age can occur. Severe damage is
regarded as that damage which is asso-
ciated with loss of the contents of the
tank by leakage. Furthermore, the leak-
age can lead to secondary effects, such
as the development of fires. If failure by
lifting does not occur, it is expected that
there will be little, if any, loss of liquid
from the tank as a consequence of
sloshing. There is apparently no clear-
cut overall structural collapse which in-
itially limits the usefulness of the tank.
Peak overpressures required for severe
damage to POL tanks of diameter D
may be obtained from Figs. 5.155a and
b. Figure 5.155a is applicable to nuclear
explosions with energy yields from 1 to
500 kilotons and Fig. 5.155b to yields
over 500 kilotons. For yields less than 1
kiloton, the peak overpressure for se-
vere damage may be taken to be 1 pound
per square inch.
LIGHTWEIGHT, EARTH COVERED
AND BURIED STRUCTURES
5.156 Air blast is the controlling
factor for damage to lightweight earth
covered structures and shallow buried
underground structures. The earth cover
provides surface structures with sub-
stantial protection against air blast and
also some protection against flying
debris. The depth of earth cover above
the structure would usually be deter-
mined by the degree of protection from
nuclear radiation required at the design
overpressure or dynamic pressure (see
Chapter VIII).
5.157 The usual method of provid-
ing earth cover for surface or “cut-and-
cover” semiburied structures is to build
an earth mound over the portion of the
structure that is above the normal
ground level. If the slope of the earth
cover is chosen properly, the blast re-
flection factor is reduced and the aero-
dynamic shape of the structure is im-
proved. This results in a considerable
reduction in the applied translational
forces. An additional benefit of the earth
cover is the stiffening or resistance to
HEIGHT/DIAMETER RATIO
Figure 5.155a. Peak overpressures for severe blast damage to floating- or conical-roof tanks
of diameter D for explosions from 1 to 500 kilotons.
HEIGHT/DIAMETER RATIO
Figure 5.155b. Peak overpressures for severe blast damage to floating- or conical-roof tanks
of diameter D from explosions of 500 kilotons or more.
ANALYSIS OF DAMAGE FROM AIR BLAST
229
deformation that the earth provides to
flexible structures by the buttressing ac-
tion of the soil.
5.158 For lightweight, shallow
buried underground structures the top of
the earth cover is at least flush with the
original grade but the depth of cover is
not more than 6 percent of the span.
Such structures are not sufficiently deep
for the ratio of the depth of burial to the
span to be large enough to obtain the
benefits described in § 5.161. The soil
provides little attenuation of the air blast
pressure applied to the top surface of a
shallow buried underground structure.
Observations made at full-scale nuclear
tests indicate that there is apparently no
increase in pressure on the structure as a
result of ground shock reflection at the
interface between the earth and the top
of the structure.
5.159 The lateral blast pressures
exerted on the vertical faces of a shallow
buried structure have been found to be
as low as 15 percent of the blast pressure
on the roof in dry, well-compacted, silty
soils. For most soils, however, this lat-
eral blast pressure is likely to be some-
what higher and may approach 100 per-
cent of the roof blast pressure in porous
saturated soil. The pressures on the bot-
tom of a buried structure, in which the
bottom slab is a structural unit integral
with the walls, may range from 75 to
100 percent of the pressure exerted on
the roof.
5.160 The damage that might be
suffered by a shallow buried structure
Table 5.160
DAMAGE CRITERIA FOR SHALLOW BURIED STRUCTURES
Type of structure Damage type Peak over- pressure (psi) Nature of damage
Light, corrugated steel Severe 45- 60 Collapse
arch, surface structure (10-gage corrugated steel with a span of 20-25 ft), central angle of 180°; 5 ft of earth cover at the Moderate 50- 50 Large deformations of end walls and arch, also major entrance door damage.
crown.* Light 30- 40 Damage to ventilation and entrance door.
Buried concrete arch Severe 220-280 Collapse.
8-in. thick with a 16 ft span and central angle of 180°; 4 ft of earth cover at the Moderate 100-220 Large deformations with considerable cracking and spalling.
crown. Light 120-160 Cracking of panels, possible entrance door damage.
*For arched structures reinforced with ribs, the collapse pressure is higher depending on the number of
ribs.
230
STRUCTURAL DAMAGE FROM AIR BLAST
will depend on a number of variables,
including the structural characteristics,
the nature of the soil, the depth of
burial, and the downward pressure, i.e.,
the peak overpressure and direction of
the blast wave. In Table 5.160 are given
the limiting values of the peak over-
pressure required to cause various de-
grees of damage to two types of shallow
buried structures. The range of pres-
sures is intended to allow for differences
in structural design, soil conditions,
shape of earth mound, and orientation
with respect to the blast wave.
5.161 Underground structures,
buried at such a depth that the ratio of
the burial depth to the span approaches
(or exceeds) a value of 3.0, will obtain
some benefit from the attenuation with
depth of the pressure induced by air
blast, and from the arching of the load
from more deformable areas to less de-
formable ones. Limited experience at
nuclear tests suggests that the arching
action of the soil effectively reduces the
loading on flexible structures.
BIBLIOGRAPHY
Jacobsen, L. S. and R. S. Ayre, “Engineering
Vibrations,’’ McGraw-Hill Book Co., Inc.,
1958.
♦Johnston, B. G., “Damage to Commercial
and Industrial Buildings Exposed to Nuclear
Effects,’’ Federal Civil Defense Administra-
tion, February 1956, WT-1189.
♦Mitchell, J. H., “Nuclear Explosion Effects
on Structures and Protective Construction—A
Selected Bibliography,’’ U.S. Atomic Energy
Commission, April 1961, TID-3092.
Newmark, N. M., “An Engineering Approach
to Blast Resistant Design,” Trans. Amer. Soc.
of Civil Engineers, 121, 45 (1956).
Norris, С. H., et al., “Structural Design for
Dynamic Loads,” McGraw-Hill Book Co.,
Inc., 1959.
Pickering, E. E., and J. L. Bockholt, “Pro-
babilistic Air Blast Failure Criteria for Urban
Structures,” Stanford Research Institute,
Menlo Park, California, November 1971.
*Randall, P. A., “Damage to Conventional
and Special Types of Residences Exposed to
Nuclear Effects,” OCDM, FHA, and HHFA,
March 1961, WT-1194.
Rodgers, G. L., “Dynamics of Framed Struc-
tures,” John Wiley and Sons, Inc., 1959.
♦Shaw, E. R. and F. P. McNea, “Exposure of
Mobile Homes and Emergency Vehicles to Nu-
clear Explosions,” Federal Civil Defense Ad-
ministration, July 1957, WT-1181.
♦Sparks, L. N., “Nuclear Effects on Machine
Tools,” U.S. Atomic Energy Commission,
December 1956, WT-1184.
♦Taylor, В. C., “Blast Effects of Atomic
Weapons Upon Curtain Walls and Partitions of
Masonry and Other Materials,” Federal Civil
Defense Administration, August 1956, WT-
741.
♦Tucker, P. W. and G. R. Webster, “Effects
of a Nuclear Explosion on Typical Liquefied
Petroleum Gas (LP-Gas) Installations and Fa-
cilities,” Liquefied Petroleum Gas Association,
December 1956, WT-1175.
Tung, T. P. and N. M. Newmark, “A Review
of Numerical Integration Methods for Dynamic
Response of Structures,” University of Illinois
Structural Research Series No. 69, 1954.
♦Williamson, R. H., “Effects of a Nuclear
Explosion on Commercial Communications
Equipment,” Federal Civil Defense Adminis-
tration, May 1955, ITR-1193.
Willoughby, A. B., et al., “A Study of Load-
ing, Structural Response, and Debris Charac-
teristics of Wall Panels,” URS Research Co.,
Burlingame, California, July 1969.
Wilton, C., et al., “Final Report Summary,
Structural Response and Loading of Wall
Panels,” URS Research Co., Burlingame, Cal-
ifornia, July 1971.
♦These publications may be purchased from the National Technical Information Service, U.S
Department of Commerce, Springfield, Virginia, 22161.
CHAPTER VI
SHOCK EFFECTS OF SURFACE AND SUBSURFACE
BURSTS
CHARACTERISTICS OF SURFACE AND SHALLOW UNDERGROUND
BURSTS
INTRODUCTION
6.01 Surface and shallow under-
ground bursts are defined as those in
which either the fireball or the hot,
high-pressure gases generated by the
explosion intersect or break through the
earth’s surface. In explosions of this
type, part of the energy released is spent
in producing a surface crater, whereas
much of the remainder appears as air
blast and ground shock. The greater the
depth of the burst point below the sur-
face, the smaller is the energy expended
as air blast. The dimensions of the crater
increase at first with increasing depth of
burial of the weapon, pass through a
maximum, and then decrease virtually
to zero at still greater depths.
AIR BLAST
6.02 In a contact surface burst
(§ 2.127 footnote) the incident and re-
flected air blast waves coincide imme-
diately, forming a hemispherical shock
front as shown in Fig. 3.34. The
characteristics of the blast wave accom-
panying a reference (1 kiloton) explo-
sion, as functions of the distance from
ground (surface) zero (§ 2.34 footnote),
can then be obtained from the curves
given at the end of Chapter III. The cube
root scaling law described there can be
used to calculate the blast wave proper-
ties from a contact surface burst of any
specified energy yield. When the burst
occurs below the surface, the air blast
arises partly from the ground shock
transmitted through the surface into the
air and partly from the release of the
high-pressure gases produced in the ex-
plosion. At shallow burst depths the
latter effect predominates but with in-
creasing depth of burial it contributes
less and less to the air blast. Further-
more, as the depth of burst is increased,
the higher overpressures closer to sur-
face zero fall off more rapidly than do
the lower overpressures at greater dis-
tances. More information concerning
the air blast from shallow underground
explosions and the effect of yield and
burst depth on the spatial distribution of
the overpressure is given in § 6.80 et
seq.
231
SHOCK EFFECTS OF SURFACE AND SUBSURFACE BURSTS
232
CRATER FORMATION
6.03 The mechanism of crater for-
mation depends on the height or depth
of the burst. For an explosion well
above the surface but in which the fire-
ball intersects the ground (§ 6.08), a
depression crater is formed as a result of
the vaporization of considerable quanti-
ties of earth material. This material is
sucked upward by ascending air currents
resulting from the rising fireball and it
eventually appears as fallout (Chapter
IX). For bursts at or near (above or
below) the surface, air blast plays a part
in crater formation, in addition to va-
porization. Surface material is then re-
moved by being pushed, thrown, and
scoured out. Some of this material falls
back into the crater and most of the
remainder is deposited around the edges
to form the lip of the crater or is scat-
tered as loose ejecta beyond the crater.
6.04 When the burst is at such a
depth that surface vaporization and
scouring by air blast are not significant,
several other processes may contribute
to the formation of a “throwout” crater.
One is the crushing and fracture of the
ground material by the expanding com-
pressional (shock) wave. Another im-
portant mechanism is spalling, i.e., the
separation of earth layers at the surface
(§ 2.91). The spalled layers will fly up-
ward and be deposited as ejecta beyond
the crater or on the lip, or, for moder-
ately deep burials, they will fall back
into the crater itself. If the hot, high-
pressure gases formed by the explosion
are not vented during the crushing and
spalling phases, the expanding gases
may force the confining earth upward;
thus gas acceleration can contribute to
crater formation, as described in § 2.92.
6.05 Finally, deeply buried explo-
sions may lead to a subsidence crater, to
a raised mound above the detonation
point, or to no permanent displacement
of the surface at all. If the collapse of
the chimney containing broken and
crushed material should reach the sur-
face, a subsidence crater may be formed
(§2.103). In strong earth material, such
as hard rock, the chimney top may not
reach the surface; surface displacement
may then be only temporary. If bulking
of the broken rock occurs, a surface
mound may be formed above the chim-
ney (Fig. 6.05).
6.06 The variations in the character
of the crater as a result of the changes in
the predominant mechanism of crater
formation as the depth of burst (DOB)
increases are illustrated in Figs. 6.06a
through f. The depression crater in Fig.
6.06a is formed mainly by vaporization,
with most of the removed material being
carried away. In a contact (or near sur-
face) burst, represented in Fig. 6.06b,
scouring, etc., by an air blast also con-
tributes to crater formation and some of
the material removed falls back into and
around the crater. At greater depths
(Fig. 6.06c), spallation and gas acceler-
ation become increasingly important
and the dimensions of the crater in-
crease. The crater reaches its largest size
when gas acceleration is the predomin-
ant mechanism of formation, but even
then a large quantity of material falls
back (Fig. 6.06d). Finally, Figs. 6.Обе
and f show examples of bulking and
subsidence, respectively, for deeper un-
derground explosions.
6.07 Two more-or-less distinct
zones in the earth surrounding the crater
may be distinguished (see Fig. 6.70).
First is the “rupture zone” in which
stresses develop innumerable radial
CHARACTERISTICS OF SURFACE AND SHALLOW UNDERGROUND BURSTS 233
Figure 6.05. SULKY event; mound created by the bulking of rock material in a 0.087-
kiloton nuclear detonation at a depth of 90 feet.
cracks of various sizes. Beyond the
rupture zone is the “plastic zone” in
which the stress level has declined to
such an extent that there is no visible
rupture, although the soil is permanently
deformed and compressed to a higher
density. Plastic deformation and distor-
tion of soil around the edges of the
crater contribute to the production of the
crater lip. The thicknesses of the rupture
and plastic zones depend on the nature
of the soil, as well as upon the energy
yield of the explosion and location of
the burst point. If the earth below the
burst consists of rock, then there will be
a rupture zone but little or no plastic
zone.
CRATER DIMENSIONS
6.08 For an explosion above the
earth’s surface, appreciable formation
of a vaporization (depression) crater will
commence when the height of burst is
less than about a tenth of the maximum
fireball radius (§ 2.127). With decreas-
ing distance from the surface, the di-
mensions of the crater vary in a complex
manner, especially as the ground is ap-
proached, because of the change in the
mechanism of crater formation. In gen-
eral, however, the depth of the depres-
sion increases rapidly with decreasing
burst height and the ratio of the depth to
radius also increases. The dimensions of
the crater increase with the explosion
0. NEAR SURFACE BURST
b. SURFACE BURST
c. SHALLOW DOB
Figure 6.06.
e. DEEPLY BURIED
f. SUBSIDENCE CRATER
Relative crater sizes and shapes resulting from various burst depths; Ra and Da
are the apparent radius and depth, respectively, of the crater (see Figure 6.70).
234 SHOCK EFFECTS OF SURFACE AND SUBSURFACE BURSTS
CHARACTERISTICS OF SURFACE AND SHALLOW UNDERGROUND BURSTS 235
Figure 6.10. SEDAN event; crater formed by a 100-kiloton explosion in alluvial soil at the
optimum depth of burst (635 feet) for cratering. The crater radius is 611 feet,
the depth 323 feet, and the volume 179 million cubic feet.
yield but the actual values depend on the
soil characteristics.
6.09 For contact surface bursts, ap-
proximate values of the crater dimen-
sions can be given. For a 1-kiloton nu-
clear explosion at the surface, the
apparent radius of the crater in dry soil
or dry soft rock is estimated to be about
60 feet. The radius at the crest of the lip
will be 15 feet or so greater. The appar-
ent depth of the crater is expected to be
about 30 feet. In hard rock, consisting
of granite or sandstone, the dimensions
will be somewhat less. The radius will
be appreciably greater in soil saturated
with water, and so also will be the initial
depth, to which structural damage is
related. The final depth, however, will
be shallower because of “hydraulic
fill,” i.e., slumping back of wet mate-
rial and the seepage of water carrying
loose soil. All crater dimensions result-
ing from a surface burst of yield W
kilotons are related approximately to
those given above for a yield of 1 -kilo-
ton by the factor IV0-3. For example, for
a 100-kiloton explosion on the surface
of dry soil, the radius of the crater may
be expected to be roughly 60 x (100)03
= 240 feet, and the depth about 30 x
(100)0 3 = 120 feet. Further information
on crater dimensions will be found in
§ 6.72 et seq.
6.10 As the depth of burial is in-
creased, the radius and depth of the
crater also increase until maxima are
reached; deeper burial then results in
progressively smaller craters. These
maximum values of radius and depth for
a given yield are termed “optimum”
(Fig. 6.06d) and depths of burial for
optimum crater radius and for optimum
crater depth are roughly equal. A pho-
tograph of a crater formed at the op-
timum burst depth is shown in Fig.
6.10. For a 1-kiloton weapon, the
236
SHOCK EFFECTS OF SURFACE AND SUBSURFACE BURSTS
deepest crater possible, namely, 100
feet, is produced when the burst point is
120 feet below the surface; the radius of
the crater at that depth will also be near
its optimum, namely about 160 feet.
Optimum values, like all crater dimen-
sions, are approximately proportional to
W03. Curves showing the variations of
crater radius and depth with depth of
burial in various media appear later in
this chapter (§ 6.70 et seq.).
6.11 If the soil is saturated and the
high water table is maintained after the
detonation, the crater dimensions will
change with time. Slumping of the
crater sides will continue until a stable
condition exists for the material. It can
be expected that the sides of very large
craters will ultimately slump until their
slopes decrease to 10 to 15 degrees. As
a result, the craters will become shal-
lower and broader. In weak saturated
soil with a very high water table,
slumping occurs immediately. If the soil
is stronger and the water table not too
high, there is a time lag in the slumping
which may be a matter of hours in sands
and months in clay soils. Examination
of craters in coral from high-yield bursts
at the Eniwetok Proving Grounds has
shown that the inward rush of water
carries material which would normally
constitute the crater lip into the bottom
of the crater.
GROUND SHOCK
6.12 A nuclear explosion on or near
the surface produces a ground shock in
two primary ways, each of which sets
the earth in motion; they are (1) by
direct coupling of explosive energy to
the ground in the neighborhood of the
crater, and (2) by pressure of the air
blast wave as it runs over the earth’s
surface. A random type disturbance is
often superimposed on the ground mo-
tion resulting from these shocks
(§ 6.82) but only the latter will be con-
sidered here. Each kind of ground shock
(or pressure) is transmitted through the
earth downward and outward. The
direct ground shock contributes to the
formation of the crater and the fracture
and plastic zones immediately around it.
The air blast pressure, called “airslap,”
is the source of most of the stress on
underground structures beyond the
crater area when the burst point is not
too deep.
6.13 Although shock waves trans-
mitted through the earth may be greatly
complicated and distorted by the pres-
ence of geological inhomogeneities,
certain regularities tend to be found.
Airslap, for example, almost always re-
sults in a single movement downward
followed by a slower, partial relaxation
upward; in some soils residual perma-
nent compression after airslap is mea-
surable and significant. The amount of
earth motion depends on the air blast
overpressure, the positive phase dura-
tion, and the character of the soil. Close
to the surface, airslap motion is initially
abrupt, similar to the rise of pressure in
the air shock, but it becomes more
gradual with increasing depth.
6.14 In those regions where the air
blast wave front is ahead of the direct
ground shock front at the surface, the
situation is described as being “super-
seismic;” that is to say, the air blast
wave is traveling at a speed greater than
the speed of sound (or seismic velocity)
in the earth. The ground motion near the
surface is vertically downward, but it
becomes increasingly outward, i.e., ra-
CHARACTERISTICS OF SURFACE AND SHALLOW UNDERGROUND BURSTS 237
dial, from the burst point at greater
depths below the surface.
6.15 On the other hand, when the
air blast front lags behind the shock
front transmitted directly through the
ground, the ground wave is said to
“outrun” the air blast. The airslap then
causes the ground surface at locations
ahead of it to undergo a characteristic
outrunning motion, generally consisting
of two or three cycles of a damped, i.e.,
decreasing, undulation with the first
motion usually upward. Since the air
blast overpressure decreases with in-
creasing distance from surface zero, so
also does the outrunning motion. If the
air blast wave reaches the observation
point while the outrunning surface mo-
tion is still underway, the airslap motion
will be superimposed on the undula-
tions.
6.16 At locations close to the burst,
the air blast usually travels faster than
the direct ground shock. The superseis-
mic condition then prevails and the first
ground motion is determined essentially
by the airslap. At greater distances, the
air blast weakens and its velocity de-
creases significantly, but the ground
shock velocity, which is approximately
the same as the sesimic velocity, does
not decrease very much. Hence, the
ground shock front moves ahead and
outrunning becomes the dominant factor
in ground motion. At still greater dis-
tances from surface zero, the effect of
airslap disappears or it is so weak that it
merges with the direct ground shock
without causing any outrunning motion.
The phenomena described above are
strongly influenced by the seismic velo-
cities in the ground down to consider-
able depths.
6.17 The strength of the shock
wave in the ground decreases with in-
creasing distance from the explosion,
and at large distances it becomes similar
to an acoustic (or seismic) wave. In this
region the effects of underground shock
produced by a nuclear explosion are
somewhat similar to those of an earth-
quake of low intensity. However, the
evidence to date indicates that under-
ground explosions do not cause earth-
quakes, except for minor aftershocks
within a few miles of the burst point
(§ 6.20 et seq.).
6.18 The effect of ground shock
pressure on an underground structure is
somewhat different in character from
that of air blast on a structure above the
ground. In the latter case, as explained
in Chapter IV, the structure experiences
something like a sudden blow, followed
by drag due to the blast wind. This type
of behavior is not associated with un-
derground shock. Because of the simi-
larity in density of the medium through
which a ground shock wave travels and
that of the underground structure, the
response of the ground and the structure
are closely related. In other words, the
movement (acceleration, velocity, and
displacement) of the underground struc-
ture by the shock wave is largely deter-
mined by the motion and containing
action of the ground itself. This fact has
an important influence on the structural
damage associated with both surface
and underground explosions. Damage
criteria are outlined in § 6.28 et seq. and
are discussed more fully in § 6.90 et
seq.
238
SHOCK EFFECTS OF SURFACE AND SUBSURFACE BURSTS
DEEP UNDERGROUND BURSTS ’
GROUND SHOCK
6.19 In a fully-contained deep un-
derground explosion there would be lit-
tle or no air blast. Much of the energy is
expended in forming the cavity around
the burst point and in melting the rock
(§ 2.102), and the remainder appears in
the form of a ground shock wave. As
this shock wave moves outward it first
produces a zone of crushed and com-
pressed rock, somewhat similar to the
rupture zone associated with crater for-
mation (Fig. 6.70). Farther out, where
the shock wave is weaker, the ground
may become permanently distorted in
the plastic (deformation) zone. Finally,
at considerable distances from the burst
point, the weak shock wave (carrying
less than 5 percent of the explosion
energy) becomes the leading wave of a
series of seismic waves. A seismic wave
produces a temporary (elastic) displace-
ment or disturbance of the ground; re-
covery of the original position, follow-
ing the displacement, is generally
achieved after a series of vibrations and
undulations, up and down, to and fro,
and side to side, such as are typical of
earthquake motion.
AFTERSHOCKS AND FAULT
DISPLACEMENTS
6.20 Many of the aftershocks asso-
ciated with a deep underground explo-
sion appear to be directly related to the
postdetonation phenomena of cavity
collapse and chimney growth (§ 2.103).
Some aftershocks, however, originate a
few miles beyond the region involved in
the development of the chimney. These
aftershocks are generally considered to
result from small movements along pre-
existing fault planes2 and to represent
the release of natural strain (deforma-
tion) energy. For explosions of high
energy yields aftershocks may continue,
although at a reduced rate, for many
days after the chimney has formed.
6.21 The 1.1-megaton BENHAM
test was conducted at a depth of 4,600
feet in tuff (§ 2.104) at the Nevada Test
Site on December 19, 1968. During the
period of six weeks following the deto-
nation, some 10,000 weak aftershocks
were detected, nearly all within 8 miles
of the explosion point. Of these, 640
aftershocks were chosen for detailed
study and their locations are shown by
the small crosses in Fig. 6.21. The thin
lines indicate positions of known faults
and the thick lines show approximately
where fault displacements were ob-
served at the surface. It is apparent that
a large number of the aftershocks oc-
curred along a north-south line, which is
the general direction of the known
faults. Many of these aftershocks pre-
sumably occurred along hidden faults or
other geological discontinuities parallel
to the faults.
'The phenomena and effects of deep (fully contained) underground explosions arc of primary interest
for nuclear weapons tests. For a more detailed nontechnical discussion see “Public Safety and
Underground Nuclear Detonations/* U.S. Atomic Energy Commission. June 1971, T1D-25708.
-A geological “fault" is a fracture in the ground at which adjacent rock surfaces are displaced with
respect to each other. The presence of a fault can sometimes be detected by a fault line on the surface, but
hidden faults cannot be observed in this way.
DEEP UNDERGROUND BURSTS
239
37°15'
37° 10'
116°35'
116°25'
Figure 6.21. Locations of 640 aftershocks and fault displacements from the BENHAM
1.1-megaton test.
6.22 As may be seen from Fig.
6.21, most of the ground displacements
in the vicinity of the BENHAM explo-
sion occurred along or near pre-existing
fault lines. The maximum vertical dis-
placement was 1.5 feet, at locations 1.5
and 2.5 miles north of the burst point.
Larger displacements have occurred in
some instances, but vertical displace-
ments of the surface along or near fault
lines have been mostly less than a foot.
These displacements, although not con-
tinuous, may extend for a distance of
several miles. For the same (or similar)
conditions, the linear extent of dis-
placement is roughly proportional to the
yield of the explosion.
6.23 A rough rule of thumb has
been developed from observations at the
Nevada Test Site. According to this
rule, displacement along a fault line
may occur only if the distance (in feet)
from surface zero is less than about
1000 times the cube root of the energy
expressed in kilotons of TNT equiva-
lent. Thus, for a 1-megaton (1000-kilo-
ton) detonation, displacement would be
expected only if the fault lines were
within a distance of roughly 1000 x
(1000) = 1000 x 10 = 10,000 feet
240
SHOCK EFFECTS OF SURFACE AND SUBSURFACE BURSTS
(about 2 miles). In other words, fault
lines that are nowhere closer than 2
miles from a 1-megaton deeply buried
explosion would not be significantly af-
fected. However, if any part of the fault
line is within 2 miles of the detonation
site, the actual displacement may be
observed along that fault line at a greater
distance.
UNDERGROUND EXPLOSIONS AND
EARTHQUAKES
6.24 Fear has been expressed that
deep underground nuclear explosions of
high energy might stimulate natural
earthquakes, but there is no evidence
that such is the case. The “hypocenter”
or “focus” of an atershock or an earth-
quake is the point below the surface
where motion, e.g., slippage at a fault,
responsible for the observed disturbance
originated. The focal depths, i.e., the
depths of the hypocenters below the
earth’s surface, of the aftershocks that
follow deep underground tests in Ne-
vada have ranged from zero to roughly 4
miles, with most depths being between
0.6 and 3 miles. Natural earthquakes in
the same area, however, have consider-
ably greater focal depths. Hence, it
seems unlikely that a nuclear explosion
would stimulate a natural earthquake.
6.25 A statistical study has been
made of the occurrence of earthquakes
in a circular region of 535 miles radius
around the Nevada Test Site to deter-
mine the possible effects of underground
explosions. During a period of 104
hours preceding September 15, 1961,
when an extensive series of under-
ground tests was initiated at the Nevada
Test Site, 620 earthquakes were re-
corded. After December 19, 1968, the
date of the high-yield BENHAM event,
by which time 235 underground tests
had been conducted, 616 earthquakes
were observed in a 104-hour period.
There thus appears to be no indication
that underground tests have resulted in
any significant change in the occurrence
of earthquakes in the Nevada area.
6.26 Two high-yield underground
nuclear explosions on Amchitka Island,
in the Aleutian Island chain, are of spe-
cial interest because the island is located
in one of the earth’s most seismically
active regions. The MILROW device,
with a yield of about 1 megaton TNT
equivalent, was detonated on October 2,
1969 at a depth of 4,000 feet. The
explosion was followed by a few hun-
dred small, separate aftershocks which
were apparently related to deterioration
of the explosion cavity. This aftershock
activity decreased at first but later in-
creased sharply and then terminated
within a few minutes of a larger, com-
plex multiple event at 37 hours after the
burst. The simultaneous formation of a
surface subsidence indicated that com-
plete collapse of the cavity occurred at
this time. Subsequently, 12 small after-
shocks of a different type, ten of which
were detected within 41 days of the
explosion, were observed during a
period of 13 months. Two of these
events were close to the explosion re-
gion and most of the others originated at
or near the Rifle Range Fault, some 2 or
3 miles away. They were attributed to
underground structural adjustments fol-
lowing the explosion.
6.27 A more stringent test was pro-
vided by the CANNIKIN event on No-
vember 6, 1971 when a nuclear weapon
with a yield described as being “less
than 5 megatons” was exploded at a
DAMAGE TO STRUCTURES
241
depth of 5,875 feet below the surface of
Amchitka Island. The number of initial,
small aftershocks arising from cavity
deterioration was larger than after the
MILROW test, but otherwise the phe-
nomena were similar. Cavity collapse,
immediately preceded by considerable
activity, occurred 38 hours after the ex-
plosion. During the next 23 days, 21
earth tremors were detected and one
more occurred more than 2 months
later, but there were no others during the
next year. Of these disturbances, five
DAMAGE TO
were not clearly related to the explosion
cavity or to known faults. The hypo-
centers, as well as those of the tremors
following MILROW, were all less than
4.5 miles deep, compared with depths
exceeding 12 miles for essentially all
natural earthquakes in the area. Fur-
thermore, there was no evidence of any
increase in the frequency of such earth-
quakes in the sensitive Aleutian Islands
region following the MILROW and
CANNIKIN events.
STRUCTURES
SURFACE AND SHALLOW
UNDERGROUND BURSTS
6.28 For a nuclear burst at a mod-
erate height above the ground the crater
or depression formed will not be very
deep, although it may cover a large
area. Shallow buried and semiburied
structures near ground zero will be
damaged by this depression of the earth.
For deep underground structures,
ground shock may be the primary factor
causing damage, but its effects are prin-
cipally important to people and equip-
ment within the structures. As far as
structures above ground are concerned,
the range of damage will depend upon
the characteristics of the blast wave in
air, just as for an air burst (see Chapter
V). The area affected by air blast will
greatly exceed that in which damage is
caused by both direct and induced shock
waves in the ground. In the event of a
contact or near-surface burst, the situa-
tion is similar to that in a shallow un-
derground burst, as described below.
6.29 The damage criteria associated
with shallow underground (and contact
surface) bursts, especially in connection
with buried structures, are difficult to
define. A simple and practical approach
is to consider three regions around sur-
face zero. The first region is that of the
true crater, which is larger than the
apparent (or observable) crater (§ 6.70).
Within this region there is practically
complete destruction. The depth at
which underground structures directly
beneath the crater will remain unda-
maged cannot be clearly defined. This
depth is dependent upon the attenuation
of pressure and ground motion in the
material.
6.30 The second region, which in-
cludes the rupture and plastic deforma-
tion zones, extends roughly out as far as
the major displacement of the ground.
In some materials the radius of this
region may be about two and one-half
times the radius of the (apparent) crater.
Damage to underground structures is
caused by a combination of direct
ground shock and shock induced in the
242
SHOCK EFFECTS OF SURFACE AND SUBSURFACE BURSTS
ground by air blast. Damage to doors,
air intakes, and other exposed elements
may be expected from direct air blast.
The actual mechanism of damage from
these causes depends upon several
more-or-Iess independent factors, such
as size, shape, and flexibility of the
structure, its orientation with respect to
the explosion, and the soil characteris-
tics (§ 6.90 et seq.).
6.31 Along with underground
structures, mention may be made of
buried utility pipes and tunnels and
subways. Long pipes are damaged pri-
marily as a result of differential motion
at the joints and at points where the lines
enter a building. Failure is especially
likely to occur if the utility connections
are made of brittle material and are
rigidly attached to the structure. Al-
though tunnels and subways would
probably be destroyed within the crater
region and would suffer some damage in
the plastic zone, it appears that these
structures, particularly when bored
through solid rock and lined to minimize
spalling, are very resistant to under-
ground shock.
6.32 In the third region, beyond the
plastic zone, the effects of ground shock
are relatively unimportant and then air
blast loading becomes the significant
criterion of structural damage. Strong or
deeply buried underground structures
will not be greatly affected, but damage
to moderately light, shallow buried
structures and some utility pipes will be
determined, to a great extent, by the
downward pressure, on the ground, i.e.,
by the peak overpressure of the air blast
accompanying the surface or subsurface
burst. Structures which are partly above
and partly below ground will, of course,
also be affected by the direct air blast.
DEEP UNDERGROUND BURSTS
6.33 The ground shock wave from a
deep (or moderately deep) underground
nuclear explosion weakens into a train
of seismic waves which can cause ap-
preciable ground motion at considerable
distances from surface zero. The re-
sponse of aboveground structures of
various types to this motion can be pre-
dicted with a considerable degree of
certainty. The procedures for making
these predictions will not be described
here (see § 6.90 et seq. ), but some of
the general conclusions are of interest.
6.34 It is natural for buildings,
bridges, and other structures to vibrate
or oscillate to some extent. Apart from
earthquakes and underground detona-
tions, these vibrations can result from
high winds, from sonic booms, and
even from vehicles on a nearby street or
subway. Every structure and indeed
every element (or component) of a
structure has many natural periods of
vibration. For the majority of common
structures, the most important of these
periods is usually the longest one. This
is generally a second or two for a tall
building (10 to 20 stories) and a fraction
of a second for a short one. Unless the
structure has previously suffered signif-
icant damage, the natural periods of
vibration do not change very much re-
gardless of the source of the disturbance
that starts the vibration.
6.35 The ground motion caused by
a distant underground explosion (or an
earthquake) contains vibrations of many
different periods (or frequencies) and
widely varying amplitudes. The waves
of shorter periods (higher frequencies)
tend to be absorbed by the ground more
readily than those of longer periods
(lower frequencies). Consequently, the
DAMAGE TO STRUCTURES
243
greater the distance from the explosion,
the larger is the fraction of seismic en-
ergy in ground vibrations with longer
periods.
6.36 As a result of the effect called
“resonance,” a structure tends to re-
spond, e.g., vibrate, most readily to
ground motion when the period of the
latter is equal or close to one of the
natural periods of vibration, especially
the principal (longest) period, of the
structure. Because the ground motion
from an underground burst (or an earth-
quake) is so complex, at least one of the
natural periods of the structure will be
near to a period in the ground motion.
All structures may thus be expected to
respond to some extent to the ground
motion from a distant underground ex-
plosion. If the response is more than the
structure is designed to accept, some
damage may occur.
6.37 With increasing distance from
an explosion of specified yield, the
seismic energy decreases, but a larger
fraction of the available energy is pres-
ent in the ground vibrations with longer
periods. Furthermore, as already seen,
tall buildings have longer vibration
periods than shorter ones. As a result of
these factors, the response of any struc-
ture decreases with increasing distance
from an underground explosion, but the
decrease is relatively less for the longer
vibration periods, i.e., for tall build-
ings, than for the shorter periods, i.e.,
short buildings.
6.38 As might be expected, the re-
sponse of any structure at a given dis-
tance from the burst point increases with
the explosion energy yield. However,
the increase is greater for longer than
shorter vibration periods. Consequently,
with increasing energy yield, the re-
sponse of a tall building will increase
more than that of a short building at the
same distance from the explosion.
6.39 The foregoing generalizations,
based on Nevada Test Site experience,
imply that at greater distances from un-
derground explosions of high energy
yield there should be a tendency for a
larger proportion of the seismic energy
to appear in ground motion of longer
periods. As a consequence, the re-
sponses of high-rise buildings, e.g.,
nine or more stories, with their longer
vibration periods, are of special interest
at greater distances from underground
nuclear explosions of high yield. At
shorter distances, where more seismic
energy is available, both tall and short
buildings could exhibit a significant re-
sponse.
6.40 Tall buildings in Las Vegas,
Nevada, more than 100 miles from the
area where high-yield nuclear tests were
conducted, have been known to sway in
response to the ground motion produced
by underground explosions, just as they
do during mild earthquakes or strong
winds. No damage, which could be
definitely attributed to such explosions,
however, was recorded in these struc-
tures prior to the HANDLEY event,
with a yield somewhat greater than 1
megaton, on March 26, 1970. There
was no structural damage in Las Vegas
on this occasion, but nonstructural
damage was reported as disturbance of
ornamental blocks on one building and a
cracked window in another, which
could be readily repaired. There are no
tall structures closer to the Nevada Test
Site than those in Las Vegas, but low-
rise buildings nearer to the test area have
experienced minor nonstructural dam-
age, as was to be expected.
244
SHOCK EFFECTS OF SURFACE AND SUBSURFACE BURSTS
CHARACTERISTICS OF UNDERWATER BURSTS
SHOCK WAVE IN WATER
6.41 The rapid expansion of the hot
gas bubble formed by a nuclear explo-
sion under water (§ 2.86) results in a
shock wave being sent out through the
water in all directions. The shock wave
is similar in general form to the blast
wave in air, although it differs in detail.
Just as in air, there is a sharp rise in
overpressure at the shock front. In
water, however, the peak overpressure
does not fall off as rapidly with distance
as it does in air. Hence, the peak values
in water are much higher than at the
same distance from an equal explosion
in air. For example, the peak overpres-
sure at 3,000 feet from a 100-kiloton
burst in deep water is about 2,700
pounds per square inch, compared with
a few pounds per square inch for an air
burst. On the other hand, the duration of
the shock wave in water is shorter than
in air. In water it is of the order of a few
hundredths of a second, compared with
something like a second or so in air.
6.42 The velocity of sound in water
under normal conditions is nearly a mile
per second, almost five times as great as
in air. When the peak pressure is high,
the velocity of the shock wave is greater
than the normal velocity of sound. The
shock front velocity becomes less at
lower overpressures and ultimately ap-
proaches that of sound, just as it does in
air.
6.43 When the shock wave in water
strikes a rigid, submerged surface, such
as the hull of a ship or a firm sea bottom,
positive (compression) reflection occurs
as in air (§ 3.78). However, when the
water shock wave reaches the upper
(air) surface, an entirely different re-
flection phenomenon occurs. At this
surface the shock wave meets a much
less rigid medium, namely the air. As a
result a reflected wave is sent back into
the water, but this is a rarefaction or
tension, i.e., negative pressure, wave.
At a point below the surface the combi-
nation of the negative reflected wave
with the direct positive wave produces a
decrease in the water shock pressure.
This is referred to as the “surface cut-
off.”
6.44 The idealized variation at a
given location (or target) of the shock
overpressure with time after the explo-
sion at a point under water, in the ab-
sence of bottom reflections (§ 6.49), is
shown in Fig. 6.44. The representation
applies to what is called the “acoustic
approximation” in which the initial
shock wave and the negative reflected
wave are assumed to travel at the same
speed. After the lapse of a short inter-
val, which is the time required for the
shock wave to travel from the explosion
to the given target, the overpressure
rises suddenly due to the arrival of the
shock front. Then, for a period of time,
the pressure decreases steadily, as in air.
Soon thereafter, the arrival of the re-
flected negative wave from the air-water
surface causes the pressure to drop
sharply, possibly below the normal (hy-
drostatic) pressure of the water. This
negative pressure phase is of short du-
ration.
6.45 The time interval between the
arrival of the direct shock wave at a
particular target in the water and that of
the cutoff, signaling the arrival of the
CHARACTERISTICS OF UNDERWATER BURSTS
245
Figure 6.44. Idealized (acoustic approximation) variation of water pressure with time in an
underwater explosion at a point near the air surface in the absence of bottom
reflections.
reflected negative wave, depends on the
shock velocity and on the depth of burst,
the depth of the target, and the distance
from the burst point to the target. These
three distances determine the lengths of
the paths traveled by the direct (posi-
tive) and reflected (negative) shock
waves in reaching the underwater target.
If the latter is close to the surface, e.g.,
a shallow ship bottom, then the time
elapsing between the arrival of the two
shock fronts will be small and the cutoff
will occur soon after the arrival of the
shock front. A surface ship may then
suffer less damage than a deeper sub-
merged target at the same distance from
the explosion.
6.46 The idealized wave shape in
Fig. 6.44 for the acoustic approximation
is modified in practice, as illustrated in
Fig. 6.46. When the shock intensity is
strong, the reflection tends to overtake
the shock wave because the shock wave
sets in motion the water through which
the following reflection (rarefaction)
wave travels. Within a region near the
air-water surface—the anomalous re-
gion—the initial shock wave may be
strongly attenuated by overtaking rare-
factions, as shown at point A. At deeper
levels (points В, C, D) differences in the
paths traveled by primary and reflected
waves may be too great to allow signif-
icant overtaking. Nevertheless, passage
of the reflected wave through the dis-
turbed water results in a less sharp sur-
face cutoff than for the ideal acoustic
approximation.
6.47 In deep water, when bottom
(and other positive) reflections are not
significant, the initial shock wave and
the negative surface reflection are the
most generally important features of the
pressure disturbance arising from an
underwater detonation. There are, how-
ever, several other effects which may be
246
SHOCK EFFECTS OF SURFACE AND SUBSURFACE BURSTS
PRESSURE PRESSURE
ACOUSTIC
OBSERVED
POINT A
TIME
POINT C
ACOUSTIC
OBSERVED
POINT В
OBSERVED
PULSE WITHOUT
/SURFACE REFLECTION
POINT D
U'^SURFACE REFLECTION
IN ACOUSTIC THEORY
NO CAVITATION
Figure 6.46. Typical pressure pulses affected by air-water surface reflection in the absence
of bottom reflections.
significant in some circumstances.
6.48 One group of such effects is
associated with inhomogeneities of
density, temperature, and salinity. Be-
cause shock wave speed depends on
these nonuniform properties of the me-
dium, underwater shock waves are often
refracted, i.e., changed in direction, as
well as reflected. This means that in
some cases shock energy will be turned
away from certain regions and will ar-
rive at a target attenuated in strength. In
other cases energy may be channeled or
even focused into one part of the me-
dium to produce a stronger than ex-
pected shock wave at some point remote
from the detonation. Thus, in many
areas the expected reduction of shock
pressure by surface cutoff may be re-
placed by enhancement due to focusing.
6.49 Certain effects connected with
the bottom may be important, particu-
CHARACTERISTICS OF UNDERWATER BURSTS
larly in shallow water. One of these is
the bottom reflection of the primary
shock wave. Unlike the reflection from
the air, the bottom reflection is a com-
pression wave and increases the pres-
sure in regions it traverses. The pressure
on the target now includes a positive
reflected pressure in addition to the ini-
tial shock pressure and the negative
(air-surface) reflected pressure. The
characteristics of the overall pressure
pulse, and hence the effect on an under-
water target, will be dependent on the
magnitudes and signs of the various
pressures and the times of arrival at the
target of the two reflected pressures.
These quantities are determined by the
three distances mentioned in § 6.45 and
the water depth, as well as by the ex-
plosion yield and the nature of the bot-
tom material.
6.50 When the bottom is rock or
other hard material and the burst point is
not too far above it, the bottom may
contribute two compression waves; the
first a simple reflection of the primary
water shock, considered above, and the
second a reradiation of energy transmit-
ted a distance through the bottom mate-
rial. The latter wave may become
prominent if it can run ahead of the
primary shock and then radiate energy
back into the water. In this case the first
motion observed at a remote station will
be due to this bottom-induced wave.
6.51 In deep underwater nuclear
explosions, the associated gas bubble
may undergo two or three cycles of
expansion and contraction before it col-
lapses (§ 2.86 et seq.). Each cycle leads
to distinct compression and rarefaction
waves, called bubble pulses, which
move outward through the water ini-
tially from the burst point and subse-
247
quently from the rising gas bubble.
6.52 Secondary underwater pres-
sure pulses may be a consequence of the
action of the reflected (negative) wave at
the air-water surface. This wave mov-
ing downward can cause the temporary
upward separation of water masses in a
manner analogous to spalling in an un-
derground burst (§ 2.91). When these
water masses are brought together again
by the action of gravity, the impact may
set in motion a train of waves. The
separation of water masses in this way is
called spalling if the separated water
flies into the air to produce a spray dome
(§ 2.66) or “cavitation” if an under-
water void (or cavity) forms.
AIR BLAST FROM UNDERWATER
EXPLOSIONS
6.53 Although the particular mech-
anism will depend on yield and depth of
burst, one or more air blast waves will
generally follow an underwater nuclear
detonation. In the first place, some en-
ergy of the primary shock wave in the
water is transmitted across the water-air
interface. This air shock remains at-
tached to the water shock as it spreads
out from the brust point. Second, if the
scaled depth of burst, i.e., the actual
depth of burst in feet divided by the
cube root of the weapon yield W in
kilotons, is less than about 35 feet/kilo-
tons1/3, the bubble vents directly into the
atmosphere during its first expansion
phase, thereby causing an air shock.
Third, although deeper bursts will not
vent, the spall or spray dome pushing
rapidly upward into the air can cause an
air shock. Beyond a scaled depth of
approximately 150 feet/kilotons1/3,
however, the spray dome rises too
248
SHOCK EFFECTS OF SURFACE AND SUBSURFACE BURSTS
slowly to cause an appreciable air
shock. The second and third mecha-
nisms produce air blast waves that lag
far behind the primary water shock, but
they can be identified underwater by
airslap compression, similar to the airs-
lap effect of explosions at or near the
ground surface (§ 6.12). Thus, an un-
derwater target will always receive the
primary water shock before the airslap,
if any. Regardless of the generating
mechanism, however, attenuation of air
blast pressure with depth of burst below
the water surface is rapid and follows a
pattern similar to that shown in Fig.
6.81 for underground explosions.
SURFACE WAVES FROM
UNDERWATER EXPLOSIONS
6.54 Underwater explosions gener-
ate relatively slow, outward-moving
surface waves, which have certain rec-
ognizable characteristics. These waves,
originating in the oscillations of the gas
bubble as it breaks the surface, eventu-
ally form a train spreading in widening
circles of steadily diminishing intensity
around surface zero. The first surface
wave near the burst is generally too
steep to be sustained; consequently, it
breaks into turbulent motion, consum-
ing a large part of the original energy
that would otherwise be available to the
surface wave. Subsequently the train
travels over deep water almost without
further energy loss. The energy in this
surface motion has been estimated to be
between 2 and 5 percent of the weapon
yield.
6.55 Certain characteristics of sur-
face waves become more pronounced
when the detonation occurs in shallow
water rather than in deep water. Obser-
vation of the waves in the BAKER test
(approximately 20-kilotons yield) at Bi-
kini (§ 2.70) indicated that the first wave
behaved differently from the succeeding
ones; it was apparently a long, solitary
wave, generated directly by the explo-
sion, receiving its initial energy from
the high-velocity outward motion of the
water accompanying the expansion of
the gas bubble. The subsequent waves
were probably formed by the venting of
the gas bubble and refilling of the void
created in the water. A photograph of
the surface train approaching the beach
from the Bikini BAKER test is repro-
duced in Fig. 6.55. Later tests have
shown that the initial, solitary wave is
characteristic of explosions in shallow
water. Detonations in deep water gen-
erate a train of waves in which the
number of crests and troughs increases
as the train propagates outward from the
center of the explosion.
6.56 Near the BAKER explosion
the first crest was somewhat higher than
the succeeding ones, both above the
undisturbed water level and in total
height above the following trough. At
greater distances from the burst point
the highest wave was usually one of
those in the succeeding train. The max-
imum height in this train appeared to
pass backward to later and later waves
as the distance from the center in-
creased. This recession of the maximum
wave height has also been observed in
explosions in deep water.
6.57 The maximum heights and ar-
rival times (not always of the first
wave), at various distances from surface
zero, of the water waves accompanying
a 20-kiloton shallow underwater explo-
sion are given in Table 6.57. These
results are based on observations made
CHARACTERISTICS OF UNDERWATER BURSTS
249
Figure 6.55. Waves from the BAKER underwater explosion reaching the beach at Bikini,
11 miles from surface zero.
Table 6.57
MAXIMUM HEIGHTS (CREST TO TROUGH) AND ARRIVAL TIMES OF WATER
WAVES AT BIKINI BAKER TEST
Distance (yards) 330 660 1,330 2,000 2,700 3,300 4,000
Wave height (feet) 94 47 24 16 13 11 9
Time (seconds) 11 23 48 74 101 127 154
at the Bikini BAKER test. A more gen-
eralized treatment of wave heights,
which can be adapted to underwater
explosions of any specified energy, is
given in § 6.119 et seq.
6.58 For the conditions that existed
in the BAKER test, water wave damage
is possible to ships that are moderately
near to surface zero. There was evi-
dence for such damage to the carrier
U.S.S. Saratoga, anchored in Bikini la-
goon almost broadside on to the explo-
sion with its stern 400 yards from sur-
face zero. The “island” structure was
250
SHOCK EFFECTS OF SURFACE AND SUBSURFACE BURSTS
Figure 6.58. The aircraft carrier U.S.S. Saratoga after the BAKER explosion.
not affected by the air blast, but later the
central part of the structure was ob-
served to be folded down on the deck of
the carrier (Fig. 6.58). Shortly after ris-
ing on the first wave crest, when the
stern was over 43 feet above its previous
position, the Saratoga fell into the suc-
ceeding trough. It appears probable that
the vessel was then struck by the second
wave crest which caused the damage to
the island structure.
6.59 Water waves generated by an
underwater detonation can cause dam-
age in harbors or near the shoreline,
both by the force of the waves and by
inundation. The waves will increase in
height as they move into shallower
water, and inundation, similar to that
observed with tidal waves, can occur to
an extent depending on the beach slope
and wave height and steepness (§2.71).
UNDERWATER CRATERING
6.60 For a nuclear explosion in (or
even just above) a body of water, a
significant crater forms in the bottom
material if the gaseous bubble or a cav-
ity in the water (§ 6.52) formed by the
explosion makes contact with the bot-
tom. Such an underwater crater is simi-
lar to a crater on land formed by an
explosion near the ground surface since
both are characterized by a dish-shaped
depression, wider than it is deep, and
surrounded by a lip raised above the
undisturbed surface (see Fig. 6.70). For
most underwater craters, however, the
CHARACTERISTICS OF UNDERWATER BURSTS
251
observed ratio of crater radius to depth
is larger and the lip height is smaller
than for craters from comparable bursts
in similar materials on land. These dif-
ferences are caused by water displaced
by the explosion washing back over the
crater. This flow increases the crater
radius by as much as 10 percent and
decreases the depth by up to 30 percent.
An exception to this general rule occurs
when the water layer is so shallow that
the lip formed by the initial cratering
extends above the surface of the water.
Such craters, termed “unwashed
craters,” approach surface craters in
appearance, with higher lips and smaller
radius-to-depth ratios than washed
craters.
6.61 The Bikini BAKER explosion
resulted in a measurable increase in
depth of the bottom of the lagoon over
an area roughly 2,000 feet across. The
greatest apparent change in depth was
32 feet, but this represented the removal
of an elevated region rather than an
excavation in a previously flat surface.
Before the test, samples of sediment
collected from the bottom of the lagoon
consisted of coarse-grained algal debris
mixed with less than 10 percent of sand
and mud. Samples taken after the ex-
plosion were, however, quite different.
Instead of algal debris, layers of mud,
up to 10 feet thick, were found on the
bottom near the burst point.
UNDERWATER SHOCK DAMAGE:
GENERAL CHARACTERISTICS
6.62 The impact of a shock wave on
a ship or structure, such as a breakwater
or dam, is comparable to a sudden blow.
Shocks of this kind have been experi-
enced in connection with underwater
detonations of TNT and other chemical
explosives. However, because of the
smaller yields, the shock damage from
such explosions is localized, whereas
the shock wave from a high-yield nu-
clear explosion can engulf an entire ship
and cause damage over a large area.
6.63 The effects of an underwater
nuclear burst on a ship may be expected
to be of two general types. First, there
will be the direct effect of the shock on
the vessel’s hull; and second, the indi-
rect effects resulting from components
within the ship being set in motion by
the shock. An underwater shock acting
on the hull of a ship tends to cause
distortion of the hull below the water
line and rupture of the shell plating, thus
producing leaks as well as severely
stressing the ship’s framing. The under-
water shock also leads to a rapid move-
ment in both horizontal and vertical di-
rections. This motion causes damage by
shock to components and equipment
within the ship.
6.64 Main feed lines, main steam
lines, shafting, and boiler brickwork
within the ship are especially sensitive
to shock. Because of the effects of iner-
tia, the supporting members or founda-
tions of heavy components, such as en-
gines and boilers, are likely to collapse
or become distorted. Lighter or inade-
quately fastened articles will be thown
about with great violence, causing
damage to themselves, to bulkheads,
and to other equipment. Electronic, fire
control, and guided missile equipment is
likely to be rendered inoperative, at
least temporarily, by shock effects.
However, equipment which has been
properly designed to be shock resistant
will suffer less seriously (cf. § 6.112 et
seq.). In general, it appears that the
252
SHOCK EFFECTS OF SURFACE AND SUBSURFACE BURSTS
damage to shipboard equipment is de-
pendent on the peak velocity imparted to
the particular article by the shock wave.
6.65 The damage to the hull of a
ship is related to the energy per unit area
of the shock wave, evaluated up to a
time corresponding to the surface cutoff
time at a characteristic depth. Damage
to the gate structure of canal locks and
drydock caissons is dependent mainly
on the peak pressure of the underwater
shock wave. Within the range of very
high pressures at the shock front, such
structures may be expected to sustain
appreciable damage. On the other hand,
damage to large, massive subsurface
structures, such as harbor installations,
is more nearly dependent upon the
shock wave impulse. The impulse is
dependent upon the duration of the
shock wave as well as its pressure
(§ 3.59).
UNDERWATER SHOCK: BIKINI
EXPERIENCE
6.66 In the shallow, underwater
BAKER test, some 70 ships of various
types were anchored around the point of
burst. From the observations made after
the shot, certain general conclusions
were drawn, and these will be outlined
here. It should be noted, however, that
the nature and extent of the damage
sustained by a surface vessel from un-
derwater shock will depend upon the
depth of the burst, yield, depth of water,
range, the ship type, whether it is
operating or riding at anchor, and its
orientation with respect to the explo-
sion.
6.67 In a shallow underwater burst,
boilers and main propulsive machinery
suffer heavy damage due to motion
caused by the water shock at close-in
locations. As the range is increased,
auxiliary machinery associated with
propulsion of the ship does not suffer as
severely, but light interior equipment,
especially electronic equipment, is af-
fected to ranges considerably beyond
the limit of hull damage. In vessels
underway, machinery will probably
suffer somewhat more damage than
those at anchor.
6.68 Although the major portion of
the shock energy from a shallow under-
water explosion is propagated through
the water, a considerable amount is
transmitted through the surface as a
shock (or blast) wave in air. Air blast
undoubtedly caused some damage to the
superstructures of the ships at the Bikini
BAKER test, but this was insignificant
in comparison to the damage done by
the underwater shock. Air blast could
also cause some damage to ships by
capsizing them. The main effect of the
air blast wave, however, would proba-
bly be to targets on land, if the explo-
sion occurred not too far from shore.
The damage criteria are then the same as
for a surface burst over land, at the
appropriate overpressures and dynamic
pressures.
6.69 As the depth of burst in-
creases, the proportion of the explosion
energy going into air blast diminishes,
in a manner similar to that in a burst
beneath the earth’s surface. Conse-
quently, the range for a given overpres-
sure decreases, with the close-in higher
pressures decreasing more rapidly than
lower pressures at longer ranges.
TECHNICAL ASPECTS OF SURFACE AND UNDERGROUND BURSTS
253
TECHNICAL ASPECTS OF SURFACE AND UNDERGROUND BURSTS3
CRATER DIMENSIONS
6.70 In addition to the rupture and
plastic zones (§ 6.07), two other fea-
tures of a crater may be defined; these
are the “apparent crater” and the “true
crater.” The apparent crater, which has
a radius Ra and a depth Da, as shown in
Fig. 6.70, is the depression or hole left
in the ground after the explosion. The
true crater, on the other hand, extends
beyond the apparent crater to the dis-
tance at which definite shear has oc-
curred. The volume of the (apparent)
crater, assumed to be roughly parabo-
loid, is given approximately by
Volume of crater ~ — тг R2D .
2 a a
6.71 Values of other crater parame-
ters indicated in Fig. 6.70 can be es-
timated with respect to the apparent
crater radius and the apparent crater
depth by the following relations. The
radius to the crater lip crest, R ., is
R , = 1.25 R .
al a
The height of the lip crest, Dal, is
D . = 1.25 D .
al a
The height of the apparent lip above the
original ground surface, Hal, is
H ~ 0.25 D .
al a
Thus, if R and D are known, the
’ a a ’
quantities given above (and others de-
fined in § 6.74 et seq.) can be estimated.
6.72 Crater dimensions depend
upon the depth of burst (or burial), the
explosion energy yield, and the charac-
teristics of the soil. The apparent crater
radius and depth, as functions of the
depth of burst, are given in Figs. 6.72a
and b for a 1-kiloton explosion in four
media. For bursts just above the surface,
the heights of burst are treated as nega-
tive depths of burst. Because of the
rapid change in crater dimensions as the
depth of bursts passes through zero, the
values for a contact surface burst are
shown explicitly on the figures. The best
empirical fit to crater data indicates
that, for a given scaled depth of burst,
i.e., actual depth divided by W03, both
the radius and depth vary approximately
as W03, where Wis the weapon yield.
The procedure for calculating the di-
mensions of the apparent crater for any
specified depth of burst and yield by
means of these scaling rules is illus-
trated in the example facing Fig. 6.72a.
The maxima in the curves indicate the
so-called optimum depths of burst. It is
evident that a change in the moisture
content of a soil or rock medium can
have a significant influence on the size
of a crater; a higher moisture content
increases the crater size by increasing
the plasticity of a soil medium, weak-
ening a rock medium, and providing a
better coupling of the explosive energy
to both soil and rock media.
(Text continued on page 255.)
'The remaining sections of this chapter may be omitted without loss of continuity.
254
SHOCK EFFECTS OF SURFACE AND SUBSURFACE BURSTS
Re
Figure 6.70.
Cross section of a crater
from a subsurface nuclear detonation.
The curves in Figs. 6.72a and b give
the approximate apparent crater radius
and depth, respectively, as a function of
depth of burst (DOB) in wet hard rock,
dry hard rock, wet soil or wet soft rock,
and dry soil or dry hard rock. Heights of
burst (up to 20 feet) are treated as nega-
tive depths of burst.
Scaling. To determine the apparent
crater radius and depth for a W KT
yield, the actual burst depth is first di-
vided by 3 to obtain the scaled depth.
The radius and depth of a crater for 1
KT at this depth are obtained from Figs.
6.72a and b, respectively, The results
are then multiplied by 3 to obtain the
required dimensions.
Example
Given: A 20 KT explosion at a depth
of 270 feet in dry hard rock.
Find: Apparent crater radius and
depth.
Solution: The scaled burst depth is
DOB/Wo3 = 270/2003
= 270/2.46 = 110 feet.
From Fig. 6.72a the apparent crater ra-
dius for a 1 KT explosion at this depth in
dry hard rock is 150 feet (curve 4) and
from Fig. 6.72b the corresponding
crater depth is 87 feet (curve 4). Hence,
the apparent crater radius and depth for
a 20 KT burst at a depth of 270 feet in
dry hard rock are given approximately
as follows:
Crater radius (Ra) — 150 x 20°3 =
150 x 2 .'(16 = 368 feet.
Crater dejSth (D2) ~ 87 x 20°3 =
87 x 2.46 = 214 feet. Answer.
(With Ra and Da known, other crater
(and lip) dimensions can be obtained
from the approximate relations in §§
6.71, 6.74, and 6.75.)
TECHNICAL ASPECTS OF SURFACE AND UNDERGROUND BURSTS
255
Figure 6.72a. Apparent crater radius as a function of depth of burst for a 1-kiloton
explosion in (or above) various media.
CRATER EJECTA
6.73 Crater ejecta consist of soil or
rock debris that is thrown beyond the
boundaries of the apparent crater. To-
gether with the fallback, which lies be-
tween the true and apparent crater
boundaries, ejecta comprise all material
completely disassociated from the
parent medium by the explosion. The
ejecta field is divided into two zones: (1)
the crater lip including the continuous
ejecta surrounding the apparent crater
(Fig. 6.70), and (2) the discontinuous
ejecta, comprising the discrete missiles
that fall beyond the limit of the contin-
uous ejecta.
6.74 The amount and extent of the
continuous ejecta in the crater lip are
256
SHOCK EFFECTS OF SURFACE AND SUBSURFACE BURSTS
APPARENT CRATER DEPTH (FEET)
DEPTH OF BURST (FEET)
Figure 6.72b. Apparent crater depth as a function of depth of burst for a 1 -kiloton explosion
in (or above) various media.
determined primarily by the explosion
yield and the location of the burst point,
although the characteristics of the me-
dium have some effect. The radial limit
of the continuous ejecta, which is the
outer edge of the lip, will usually vary
from two to three times the apparent
crater radius. In most cases, a satisfac-
tory approximation to the radius of the
continuous ejecta, Re (Fig. 6.70), is
R « 2.15 R .
e a
6.75 The depth of the ejecta de-
creases rapidly in an exponential man-
ner as the distance from surface zero
increases. In general, about 80 to 90
percent of the entire ejecta volume is
deposited within the area of the contin-
uous ejecta. Analysis of data for craters
formed by nuclear bursts in soil indi-
cates that ejecta mass represents ap-
proximately 55 percent of the apparent
crater mass (the remainder being found
in fallback, compaction, and the dust
cloud which is blown away). For an
explosion of given yield, the ejecta mass
increases significantly with the depth of
burst until the optimum depth is
reached. Ejecta thickness can be esti-
mated for soil in terms of the apparent
radius and diameter; thus:
/R V86
te ~ 0.9 Da (-^-) , for R> I 8 Ra,
' ' (6.75.1)
where t is the ejecta thickness and R is
the distance from surface zero to the
point of interest. In equation (6.75.1), it
is assumed that the ejecta mass density
is approximately equal to the original
in-situ density of the medium, which
TECHNICAL ASPECTS OF SURFACE AND UNDERGROUND BURSTS
257
could be considered valid for a soil
medium. However, the bulking inherent
in disturbed rock media would result in
ejecta thicknesses about 30 percent
greater than predicted by equation
(6.75.1).
GEOLOGIC FACTORS
6.76 In addition to the nature and
water content of the soil, certain other
geologic factors may influence crater
size and shape. Terrain slopes of about
5° or more will affect the geometry of a
crater formed by either surface or buried
explosions, with the influence of the
slope being more evident as burst depth
increases. The surface slope will cause
much of the debris ejected by the ex-
plosion to fall on the downslope side of
the crater, often resulting in rockslides
below the crater area. In addition, the
upslope rupture zone may collapse into
the crater, resulting in an asymmetric
crater shape.
6.77 In rock, the dip of bedding
planes will influence energy propaga-
tion, causing the maximum crater depth
to be offset in the down-dip direction.
Little overall effect is noted in regard to
crater radius, but differences in ejecta
angles cause the maximum lip height
and ejecta radius to occur in the down-
dip direction.
6.78 A subsurface groundwater
table in a soil medium will begin to
influence the size and shape of the crater
when the water table is above the deto-
nation point. Its effect is to flatten and
widen the crater. The influence of a
bedrock layer below a soil medium is
similar to that of a water table, although
somewhat less pronounced. For explo-
sions at or near the surface, the bedrock
layer has little effect on the crater ra-
dius, but may decrease the final depth
considerably.
6.79 For relatively low-yield ex-
plosions at or very near the surface, the
bedding or jointing planes in rock can
alter significantly the shape of the crater
and the direction of the ejection. The
crater shape will tend to follow the di-
rection of the predominant joints; the
crater radius will increase in the direc-
tion parallel to the joints and decrease
normal to the joints.
AIR BLAST PRESSURE
6.80 Several different mechanisms
may operate to transfer part of the en-
ergy released in an underground explo-
sion into the air and thereby produce air
blast. For explosions at moderate
depths, such that the fireball does not
break through the surface, the predom-
inant mechanisms may be described as
follows. A shock wave propagated
through the ground arrives at the surface
and imparts an upward velocity to the
air (air particles) at the air-ground in-
terface, thus initiating an air pulse. At
the same time, there may be spalling
and upward motion of the surface
layers, as explained in § 2.91. Mean-
while, the underground explosion gases
expand, pushing the earth upward so
that the spall merges into a dome at
surface zero. The piston-like action of
the spall and the rising dome increase
the duration of the initial air pulse. The
air blast sustained in this manner ap-
pears on pressure-time records as a sin-
gle pulse, termed the air-transmitted,
ground-shock-induced pulse. Somewhat
later, the explosion gases puncture the
dome and escape, creating a second air
258
SHOCK EFFECTS OF SURFACE AND SUBSURFACE BURSTS
Figure 6.80. Air blast overpressure from underground explosions of moderate depth. With
increasing burst depth, the relative contribution of gas venting decreases and
the time between the pulses increases.
pulse called the gas-venting-induced
pulse (Fig. 6.80).
6.81 With increasing depth of
burst, the relative contribution of gas
venting decreases and the time between
the two pulses increases. Although the
mechanisms that generate the air pulses
change with depth in a complex manner,
a procedure has been developed for
predicting peak overpressures in the air
near the surface as a function of distance
from surface zero over a reasonable
range of burial depths; the results are
shown in Fig. 6.81. The value of x may
be obtained from the following rela-
tions:
x pX./126
x = d
X = x/W'« and Хя = d!W"\
V d
where x = ground distance in feet, d =
depth of the explosion in feet, W =
explosion yield in kilotons, and p =
specific gravity of the ground medium.
The curve in Fig. 6.81 may be used with
the relations given above for scaled
depths of burst, Xd, less than 252
feet/KTI/3. Typical values of specific
gravities are 1.6 for alluvium, 1.9 for
tuff, and 2.7 for granite.
GROUND MOTION
6.82 Earth shock motion at or near
the surface accompanying a shallow or
moderately deep underground burst may
be regarded as consisting of systemic
and random effects. The systemic ef-
fects are those associated with air blast
and the shock wave transmitted directly
TECHNICAL ASPECTS OF SURFACE AND UNDERGROUND BURSTS
259
PEAK OVERPRESSURE (PSI)
Figure 6.81. Peak overpressure of air blast from an underground explosion as a function of
adjusted scaled ground distance from a buried 1-kiloton explosion.
260
SHOCK EFFECTS OF SURFACE AND SUBSURFACE BURSTS
through the ground from the detonation
(§6.12 etseq.). Random effects include
high-frequency shock waves in the
ground, surface wave effects, reflec-
tions, refractions, etc. They depend on
such factors as the explosion yield, dis-
tance from surface zero, depth of the
observation point, and, in particular, the
local geologic conditions. The follow-
ing discussion will be concerned mainly
with the systemic effects.
6.83 In the superseismic situation,
the downward acceleration of the
ground due to the air blast is large com-
pared with the subsequent upward ac-
celeration caused by the direct ground
shock. The record of ground accelera-
tion (or velocity) versus time obtained
on a gage mounted near the surface is
similar in shape to the air overpressure-
time pulse, at least in the early stages.
When the direct ground shock wave
outruns the air blast, there is a slower
increase in the acceleration and the di-
rection may be upward rather than
downward. The acceleration-time pulse
may then last for a longer time than the
duration of the positive air overpressure
pulse. The overall motion record is
characterized by a considerable degree
of oscillation. When precursors (§§
3.49, 3.79) are present, the records may
exhibit components of higher frequency
and a more random type of oscillation.
6.84 By using data obtained during
various nuclear tests, expressions have
been derived from which peak ground
acceleration, velocity, and displacement
(transient and permanent), both at the
surface and down to moderate depths, in
the superseismic condition can be esti-
mated from the peak air overpressure as
evaluated in § 6.81. No simple method
is presently available for calculating the
effects of outrunning ground motion. As
far as the effects of the direct shock
wave are concerned, the expected re-
sults are inferred mainly from data ob-
tained at deep underground tests in
which the air blast is negligible. The
response of structures to seismic (or
elastic) waves generated at a distance
from the burst point by the ground shock
wave is considered in § 6.90 et seq.
TECHNICAL ASPECTS OF DEEP UNDERGROUND BURSTS
CAVITY AND CHIMNEY DIMENSIONS
6.85 The dimensions of the gas
cavity and the chimney formed in a deep
underground explosion depend on the
energy yield, on the nature of the me-
dium in which the explosion occurs, on
that in which the chimney develops, and
to some extent on the depth of burial.
Because of the variability of the condi-
tions, it is not possible to state a rela-
tionship among the factors involved.
The purpose of the following treatment
is only to give some, rough indications of
cavity and chimney dimensions and it
should not be taken as providing defini-
tive information.
6.86 As a rough approximation, the
volume of the cavity in a given medium
and fixed depth of burial may be taken to
be proportional to the explosion energy.
Hence, if the cavity is assumed to be
spherical, its radius should be propor-
TECHNICAL ASPECTS OF DEEP UNDERGROUND BURSTS
261
tional to Wl/3, where W is the energy
yield. Measurements indicate that this
relationship is very roughly true, so that
/^/IV|/3, where Rc is the cavity radius, is
approximately constant for a given me-
dium and burst depth. For moderately
deep, contained explosions the effect of
burst depth is small and the following
values have been found for Rc/W'f3 in
two types of media:
Dense silicate rocks
(e.g., granite)........35 feet/KT,/3
Dense carbonate rocks
(e.g., dolomite, limestone)
............................25 feet/KTl/3
These expressions are applicable ap-
proximately for burst depths below
about 2,000 feet.
6.87 At greater burst depths, the
pressure of the overburden, which must
be overcome in forming the gas cavity,
has some effect on the cavity radius. On
the basis of adiabatic compression of the
overburden material, the cavity radius
would be expected to be inversely pro-
portional to (p/z)0 25, where p is the den-
sity and h is the height of the overbur-
den. Limited observations, however,
indicate that the exponent may differ
significantly from 0.25. It appears,
therefore, that a number of factors,
which are not well understood, affect
the relationship between the cavity ra-
dius and the overburden pressure at
depths exceeding 2,000 feet.
6.88 If the roof of the gas cavity
collapses upon cooling, as it generally
(but not always) does, the dimensions of
the chimney are highly dependent upon
the characteristics of the medium in
which it is formed. As a general rule,
the radius of the chimney is from 10 to
20 percent greater than that of the cav-
ity. Furthermore, the height of the
chimney may be from about four to six
times the cavity radius. The higher fac-
tor appears to apply to completely
bulked granite and the lower to dolo-
mite, shale, and incompletely bulked
granite.
6.89 From the foregoing rough
data, it appears that for an underground
explosion in which the top of the chim-
ney does not reach the earth’s surface
the scaled depth of burial, i.e., J/Wl/3,
must be greater than about 300
feet/KT,/3. If the top of the chimney is
fairly close to the surface, however,
some of the radioactive gases formed in
the nuclear detonation could seep
through the ground into the atmosphere.
In conducting underground tests, the
escape of these gases must be pre-
vented. The scaled depth of burial is
consequently not less than 400
feet/KTl/3. For explosions of low yield,
when the actual depth of burial would be
relatively small, and in media with a
substantial water content, the scaled
depths of burial are increased even more
in order to achieve containment of ra-
dioactive gases.
STRUCTURAL RESPONSE TO
GROUND MOTION
6.90 A semiempirical method for
studying (and predicting) the response
of structures to ground motion caused
by the seismic wave from an under-
ground explosion makes use of the “re-
sponse spectrum.’’ A linear oscillator
with a single mode of vibration, which
may be thought of as a simple idealized
structure, is considered. It is assumed to
be subjected to the entire history of the
ground motion as actually recorded on a
seismic instrument at a given location.
262
SHOCK EFFECTS OF SURFACE AND SUBSURFACE BURSTS
By utilizing the laws of mechanics, the
peak response of the idealized structure
to the ground motion can then be cal-
culated. For an elastic oscillator, this
response depends only on the natural
vibration period (or frequency) of the
oscillator and the damping ratio. A par-
ticular damping ratio is selected, e.g.,
0.05, and the peak structural response is
calculated for one specified vibration
period by means of the procedure just
described. The calculation is repeated
for a range of vibration periods, gener-
ally from about 0.05 to 10 seconds. The
results are plotted on a special logarith-
mic paper to give the response spectrum
corresponding to the specified damping
ratio and observed ground motion. Be-
cause the peak accleration, velocity, and
displacement are related mathematic-
ally, a single curve gives the variation of
these quantities with the vibration
period of the idealized structure.
6.91 From the response spectrum at
a given location it is possible to deter-
mine the relative amounts of ground
motion energy, from an explosion of
specified yield, that would cause vibra-
tion of structures with different natural
vibration periods. The general conclu-
sions stated in § 6.37 et seq., concern-
ing the response of structures to the
seismic motion accompanying under-
ground nuclear explosions, were
reached from a study of response spectra
derived from many ground motion re-
cords obtained at various locations in
the vicinity of the Nevada Test Site.
6.92 The response spectrum is cal-
culated from the actual ground motion,
which depends primarily on the yield of
the explosion, the depth of burst, and
the distance from the burst point. In
addition, however, the nature of the
medium through which the seismic
wave is propagated and of the ground
upon which the structure stands have an
important influence. Because of the
large amount of information accumu-
lated in underground explosions at the
Nevada Test Site, reasonably good pre-
dictions can be made of the ground
motions and hence of the response
spectra in the general area of the site.
For underground explosions in other
areas, the results from Nevada are used
as the basis for preliminary calculations
of response spectra. Modifications are
then made for differences in geology.
6.93 If the characteristics of a
structure are known, an engineer expe-
rienced in such matters can predict from
the response spectrum whether the
structure will be damaged or not by a
specified underground nuclear explosion
at a given distance. In making these
predictions, it must be recalled that a
response spectrum applies to a range of
linear, elastic oscillators, each with a
single vibration period and an assumed
damping ratio. Such and oscillator may
be identified approximately with a sim-
ple, idealized structure having the same
respective vibration period and damping
ratio. In real-life situations, however,
buildings do not behave as ideal struc-
tures with a single vibration period and,
moreover, the damping ratios vary, al-
though 0.05 is a reasonable average
value. Consequently, in making damage
estimates, allowances must be made for
several variables, including structural
details, different vibration periods, and
the type, age, and condition of the
structure.
LOADING ON BURIED STRUCTURES
263
LOADING ON BURIED STRUCTURES
GENERAL CONSIDERATIONS
6.94 Of the ground motions result-
ing from a nuclear burst at or near the
surface (§ 6.12 et. seq.) two types (air-
slap and outrunning) are traceable to the
pressure of the airblast wave on the
ground surface. Only in the immediate
neighborhood of the crater will directly
coupled ground motion be a significant
damage mechanism. For example, a 1-
kiloton explosion on the surface leaves a
crater approximately 49 to 82 feet radius
(Fig. 6.72a). Yet the free-field peak air
blast overpressure, i.e., the overpres-
sure in the absence of structures, at a
distance of two crater radii from surface
zero is several thousand pounds per
square inch (Fig. 3.73a) and remains
above 100 pounds per square inch up to
a distance of five or six crater radii.
Outrunning ground motion generally
occurs so far from surface zero that it is
relatively small. Therefore, unless a
structure is extremely deeply buried,
i.e., its distance from the surface is
similar to its distance from surface zero,
the major threat to it is most likely to
arise from airslap. For shallow-buried
structures, the air blast overpressure
may consequently be taken as the effec-
tive load. For deeply-buried structures,
attenuation of the shock must be con-
sidered.
6.95 For the purposes of making
loading estimates for buried structures,
the medium may be described as soil or
rock. In soil, the structure must resist
most of the load, whereas in rock, the
medium itself may carry a large part of
the load.
ARCHING EFFECT
6.96 If the deformability of a buried
structure is the same as that of the sur-
rounding displaced soil, the loads pro-
duced on the structure by the air blast
from a nuclear detonation will be deter-
mined by the free-field pressures in-
duced in the soil by the blast wave. If
the deformability of the structure is
greater or less than that of the soil, the
pressures on the structure will be less or
greater, respectively, than those in the
soil.
6.97 Results of tests have indicated
that there is no significant buildup of
pressure due to reflection at the interface
between the soil and a buried structure.
It may be assumed, therefore, that
structures are at least as deformable as
soils and that the free-field pressure,
regardless of its direction, can be taken
as an upper limit of the pressure acting
on the structure. If the structure is much
more deformable than the surrounding
soil, the pressure on the buried structure
will be considerably lower than the
free-field pressure at the given depth. In
this case, as the free-field pressure is
exerted initially, the structure deflects
away from the soil and a situation is
created in which the “arching effect”
within the soil serves to transmit part of
the blast-induced pressure around the
structure rather than through it. Arch-
ing, properly speaking, belongs to the
loading process, but it may also be
treated as a factor that enhances the
resistance of the structure.
6.98 In soil, the load carrying abil-
ity of the medium is a form of arching.
264
SHOCK EFFECTS OF SURFACE AND SUBSURFACE BURSTS
The degree of arching is determined by
(1) the structural shape and (2) the ratio
of the roof span to depth of burial.
Shells, such as arches and domes, de-
velop significant arching resistance in
soils; rectangular structures generally do
so to a lesser extent.
6.99 The weight of the overburden
on a buried structure represents a force
that must be overcome. Hence, the
structural strength remaining to oppose
the shock decreases as the depth of
burial is increased. This effect of in-
creasing overburden on a structure is
countered to some extent by the oppo-
site effect of arching.
LOADING ON BURIED
RECTANGULAR STRUCTURES
6.100 The treatment of the air-
blast-induced loads on shallow-buried
rectangular (or box-type) structures re-
sulting from surface or shallow under-
ground bursts is similar to the treatment
of loads on buried structures from air
bursts. Thus, the procedures described
in § 5.156 et seq. are applicable, except
that the overpressure at the surface
should be obtained by the method de-
scribed in §6.81. For a column-sup-
ported slab, capitals between the col-
umns and the slab may greatly increase
the structural resistance.
LOADING ON BURIED ARCHES AND
DOMES
6.101 On buried arches and domes
the actual loading is considerably more
complex because of the constantly
changing attitude of the surface of the
structure with respect to a horizontal
plane and also because, at very shallow
depths, the initial nonuniformity of load
cannot be neglected. As a blast wave
passes over a buried arch or dome, the
side closest to the explosion is loaded
earlier than the farther side and, con-
sequently, an unsymmetrical flexural (or
bending) mode of response is excited.
Furthermore, after the structure is com-
pletely engulfed by the blast wave, the
radial (inwardly directed) loading will
be very nearly symmetrical, although
not uniform. The pressure at the crown,
corresponding to the free-field vertical
pressure close to the ground surface, is
then the maximum. Beyond the crown,
the radial pressure decreases in intensity
to a minimum at the springing line
where, if the arch or dome has a 180°
central angle, the pressure will corre-
spond to the free-field lateral (sideways)
pressure at the depth of the footings.
This symmetrical nonuniform loading
tends to excite a symmetrical flexural
mode of response. In addition to these
two flexural modes, the structures will
also respond in a direct compression
mode.
6.102 For the flexural modes to be
significant, deformations corresponding
to these modes must be possible. For
such deformations to occur, the passive
resistance of the surrounding soil must
be overcome and a wedge of the soil
must be displaced by the deforming
structure. Thus, the passive resistance
of the soil will tend to limit these defor-
mations and prevent the flexural modes
from being significant. Although the
flexural modes may be important with
shallow buried structures, they decrease
in importance very rapidly with depth
since the passive resistance of the soil
increases quite rapidly at the same time.
6.103 In the foregoing discussion it
DAMAGE FROM GROUND SHOCK
265
is assumed that the footings do not move
with respect to the soil adjacent to them.
If the footings do penetrate into the
underlying material, the radial pressures
on the arch or dome may be reduced
slightly.
DAMAGE FROM GROUND SHOCK
UNDERGROUND STRUCTURES
6.104 The damage to an under-
ground structure itself, as distinct from
the effects of ground shock on its con-
tents (§ 6.112), can be readily defined in
terms of inelastic deformation or col-
lapse. For fully buried arches and
domes, severe damage corresponds to
collapse either by elastic or, more fre-
quently, inelastic buckling. If very near
the ground surface, the deformations
may be primarily flexural. Light damage
has little or no meaning unless it refers
to partial impairment of operational ca-
pability of personnel and equipment.
Moderate structural damage for concrete
structures can be defined as deformation
accompanied by significant spalling.
Such deformation would correspond to
stress levels in the concrete slightly
above the yield point, i.e., a ductility
factor of about 1.3. This presumes that
failure is by inelastic deformation rather
than by elastic buckling, as would be the
case in a properly designed blast-resis-
tant structure. If failure is by elastic
buckling, moderate damage cannot be
realized.
6.105 For steel arches and domes,
moderate structural damage can also be
defined in terms of a reduced ductility
factor, although the nature of such
damage for steel structures is not as
clearly evident as in the spalling of
concrete. For underground, blast-resis-
tant, box-type structures, the several
degrees of damage to arches and domes
are also applicable, but the mechanism
of deformation may be different. In a
box structure, primary response may be
in flexure of the walls, roof, or base
slabs or in direct stress or buckling of
the walls or columns. However, severe
damage is still characterized by exces-
sive deformation or collapse through
any of these mechanisms; moderate
damage corresponds to deformations of
any of the elements associated with
spalling of concrete and small perma-
nent deflections; and light damage is
virtually meaningless except in terms of
shock effects on personnel and equip-
ment.
6.106 For very low yield weapons,
it is difficult to produce significant dam-
age to a buried structure unless it is
within the rupture zone around the crater
(Fig. 6.70). With the exception of a
number of special structural types, e.g.,
pipelines and small highly resistant
reinforced-concrete fortifications, soil
pressures produced by air blast pres-
sures on the ground surface constitute
the primary source of damage to buried
structures.
6.107 It is expected that under-
ground structures whose span closely
matches one-half the wave length of the
shock will “roll with the blow.” This
expectation has been borne out by actual
266
SHOCK EFFECTS OF SURFACE AND SUBSURFACE BURSTS
experience. The movement of the struc-
ture is intimately connected with the
movement of the soil as the shock wave
passes. In other words, if the particle
acceleration in the soil has certain peak
horizontal and vertical components,
then the small underground structure
may be expected to have almost the
same peak acceleration components.
6.108 Shock damage to under-
ground structures is most frequently
calculated with computer codes. Graphs
and tables suitable for hand calculations
have been developed, but such calcula-
tions are time consuming, and the re-
sults are approximations at best. There
is evidence that the degrees of damage
from shallow (and moderately shallow)
explosions can be related to the apparent
crater radius. Some examples of this
relationship are given in Table 6.108 for
moderately deep underground struc-
tures, defined as structures for which the
ratio of the depth of cover at the crown
to the span is somewhat greater than
unity. Crater radii, and hence the dam-
age distances, will vary with soil type
(§ 6.72). Deeply buried structures, with
a ratio of depth of cover to span much
greater than unity, would suffer less
damage.
6.109 Although tunnels and sub-
ways would be destroyed within the
crater region and would suffer damage
outside this area, these structures, espe-
cially when bored through solid rock
and lined to minimize spalling, are very
resistant to ground shock. The rock,
being an elastic medium, will transmit
the pressure (compression) wave very
well, and when this wave strikes the
wall of the tunnel, a tension (negative
pressure) wave is reflected from the
rock-air interface.5 Even in a soil me-
dium, tunnels and subways could sur-
vive; flexible structures would resist
damage by taking advantage of the tre-
mendous passive earth pressure. How-
ever, construction in soil should be
above the water table, if possible.
6.110 Under certain circumstances,
failure of the rock at the tunnel wall will
result in spalling when the reflected ten-
sile stress exceeds the tensile strength of
the rock. The thickness of spalling is
dependent upon the magnitude, dura-
tion, and shape of the pressure wave,
upon the size and shape of the tunnel,
and upon the physical properties of the
rock.
6.111 A structure may extend
above the grade level but be protected
by earth piled or mounded around-it
(Fig. 6.111). The idealized surface is
the surface of constant slope which is
equivalent to the actual (curved) sur-
face. If the slope of the idealized surface
is less than 14°, the structure may be
treated as buried, and the foregoing dis-
cussion of buried arches and domes is
applicable. If the slope is more than 14°,
or if the structure is located well beyond
the plastic zone, the overall damage is
determined by air blast, and is in ac-
cordance with the discussion in
Chapters IV and V.
VULNERABILITY OF EQUIPMENT
6.112 Although a structure may
suffer little or no damage from ground
motion, its contents, e.g., machinery or
other equipment, may be rendered in-
sThe formation of a negative pressure wave upon reflection of a compression wave at the surface of a
less dense medium (air) is discussed more fully in the treatment of shock waves in water (§ 6.43 et seq.).
DAMAGE FROM GROUND SHOCK
267
Table 6.108
DAMAGE CRITERIA FOR MODERATELY DEEP UNDERGROUND STRUCTURES
Structural Type Damage Type Distance from Surface Zero Nature of Damage
Relatively small, heavy, well-designed, under- Severe 1 ’Л apparent crater radii Collapse.
ground structures. Light 2’Z> apparent crater radii Slight cracking, severance of brittle external connections.
Relatively long, Severe 1 'Л apparent Deformation and
flexible structures, e.g., buried pipe- crater radii rupture.
lines, tanks, etc. Moderate 2 apparent crater radii Slight deformation and rupture.
Light 21/» to 3 apparent crater radii Failure of connections.
operative by the shock. Such equipment
may be made less vulnerable by suitable
shock mounting. Shock mounts (or
shock isolators) are commonly made of
an elastic material like rubber or they
may consist of springs. The material
absorbs much of the energy delivered
very rapidly by the shock and releases it
more slowly, thereby protecting the
mounted equipment.
6.113 By shaking, vibrating, or
dropping pieces of equipment, engi-
neers can often estimate the vulnerabil-
ity of that equipment to all kinds of
motion. The results are commonly ex-
pressed as the natural vibration fre-
quency at which the equipment is most
vulnerable and the maximum accelera-
tion tolerable at that frequency for 50
percent probability of severe damage.
Some examples of the values of these
parameters for four classes of equip-
ment, without and with shock mount-
ing, are quoted in Table 6.113. It is seen
that the shock mounting serves to de-
crease the most sensitive natural fre-
SURFACE
IDEALIZED
SURFACE
Figure 6.111. Configuration of mounded arch.
268
SHOCK EFFECTS OF SURFACE AND SUBSURFACE BURSTS
Table 6.113
FREQUENCY AND VULNERABILITY ACCELERATION OF TYPICAL EQUIPMENT
ITEMS
Typical Value of
Class Item Shock Mounted Natural frequency (cps) Vulnerability acceleration (g)
A Heavy machinery—motors, generators, transformers, etc. (>4000 lb). No Yes 10 3 20 40
В Medium and light machine- ry—pumps, condensers, air conditioning, fans, small motors (<1000 lb). No Yes 20 5 40 80
C Communication equipment, relays, rotating magnetic drum units of electronic equipment, etc. No Yes 25 6 7 60
D Storage batteries, piping and duct work. No Yes 20 5 70 150
quency, i.e., increase the period, and to
increase the acceleration for 50 percent
probability of severe damage at that
frequency.
6.114 Whether or not a specified
piece of equipment is likely to be dam-
aged by a particular ground motion can
be estimated from the data in Table
6.113 in conjunction with the response
spectrum (§ 6.90) for that ground mo-
tion. If the peak acceleration on the
response spectrum corresponding to the
equipment frequency is less than the
vulnerability acceleration, then the
equipment will probably be undamaged
by the particular ground motion. On the
other hand, if the response spectrum
indicates that the equipment may be
damaged, shock mounting should be
added or improved.
TECHNICAL ASPECTS OF UNDERWATER BURSTS
SHOCK WAVE PROPERTIES
6.115 By combining a theoretical
treatment with measurements made in
connection with detonations of high-
explosive charges under water, some
characteristic properties of the under-
water shock wave from a nuclear ex-
plosion have been calculated. The peak
pressure of the shock wave in water for
various energy yields is shown in Fig.
6.115 as a function of slant range, R, for
pressures less than 3,000 pounds per
square inch and (in the top right corner)
as a function of the scaled slant range,
TECHNICAL ASPECTS OF UNDERWATER BURSTS
R/W]/\ for higher pressures. The data
refer to “isovelocity” water, i.e., water
in which there are no reflections or re-
fractions.
6.116 The decrease of the water
pressure with time can be obtained from
Figs. 6.116a and b. The former gives
the time constant, 0, in terms of the
slant range for various yields, and the
latter shows the variation of p{t)lp,
where /Х0 is the pressure at time rafter
the arrival of the shock front at the
observation point and p is the peak
pressure at that point, with the reduced
time Г/0. The time constant is the time at
which the shock pressure has decayed to
Me, i.e., about 37 percent, of its peak
value. (The use of a time constant de-
fined in this manner must not be taken to
imply that the pressure decreases ex-
ponentially; it does not do so except at
early times.) The longer the time con-
stant, the more slowly does the water
shock pressure decay; it is apparent,
therefore, from Fig. 6.116a that the du-
ration of the shock wave increases with
the energy yield and the distance from
the explosion point. The data in Figs.
6.116a and b may be used to construct a
curve showing the decrease with time of
the pressure at a specified slant range
from an underwater explosion of given
yield. The area under the curve gives the
pressure impulse of the water shock
wave, analogous to the air overpressure
impulse defined in § 3.59.
6.117 In shallow water and in cer-
tain circumstances in deep water, the
primary underwater shock pulse will be
modified by surface and bottom effects
(§ 6.41 et seq.). Water is much less
compressible than air, and positive re-
flection phenomena (§ 6.49) are less
well understood than reflections of air
269
shocks from the ground and other sur-
faces. Bottom reflections in water are
frequently more nearly acoustic than air
blast reflections. Consequently, under
appropriate conditions, the influence of
the bottom can be treated ideally by
replacing the bottom surface with an
image explosion of the same yield as the
actual explosion located a distance
below the bottom equal to the distance
of the actual explosion above it.
6.118 In practice, the character of
the bottom, e.g., mud, loose or packed
sand, or hard rock, has a marked effect
on the magnitude of the reflected pres-
sure. The distances traveled by the pri-
mary shock and reflected waves to the
target also influence the pressures.
When the explosion and the target are
both near the bottom, the reflected pres-
sure received at the target may be
greater than, equal to, or less than the
primary pressure. When the burst point
and the target are both remote from the
bottom, the reflected pressure is gener-
ally much smaller because of the greater
travel distance. In each case, of course,
the negative pressure reflected from the
air-water interface must not be over-
looked. The times of arrival of the re-
flected pressures, after the primary
shock, may be estimated from the re-
spective travel distances by assuming
that the pulses travel with the speed of
sound in the water.
(Text continued on page 272.)
270
SHOCK EFFECTS OF SURFACE AND SUBSURFACE BURSTS
The curves in Figs. 6.115 and 6.116a
and b give the parameters for the pri-
mary shock wave from an underwater
explosion in deep isovelocity water.
Figure 6.115 shows the peak pressure p
as a function of slant range R for various
yields, where the peak pressure is lower
than 3,000 psi, and as a function of
scaled slant range (R/Wi/3) for peak
pressures above 3,000 psi. Values of the
time constant 0 as a function of slant
range for various yields are given in Fig.
6.116a, and Fig. 6.116b shows the re-
duced (or normalized) pressure
where p{t) is the shock pressure at time
r, as a function of the reduced time r/0.
Scaling. For yields other than those
shown in the figures, use linear inter-
polation between appropriate curves.
Example
Given: A 50 KT burst in deep
water.
Find: (a) The peak shock pressure p
and (b) the pressure p(t) at 0.1 second
after arrival of the shock wave at a
distance of 4,000 yards from the burst
point.
Solution: (a) From Fig. 6.115, the
peak shock pressure p at a slant range of
4,000 yards from a 50 KT burst in deep
water is found to be approximately 470
psi. Answer.
(b) From Fig. 6.116a, the time con-
stant 0 is 50 millisec, i.e., 0.050 sec.
Hence r/0 = 0.1/0.050 = 2. From Fig.
6.116b, the value of p(r)/pfor r/0 = 2 is
about 0.15; hence
p(t) ~ 470 x 0.15 = 70 psi. Answer.
TECHNICAL ASPECTS OF UNDERWATER BURSTS
271
SCALED SLANT RANGE,
R/W 1,3 (FT/KT 1,3 )
Figure 6.115. Shock wave peak pressure in deep isovelocity water as a function of slant
range.
SLANT RANGE (THOUSANDS OF YARDS)
Figure 6.116a. Shock wave time constant in deep isovelocity water as a function of slant
range.
272
SHOCK EFFECTS OF SURFACE AND SUBSURFACE BURSTS
Figure 6.116b. Pressure-time relationship for water shock waves from nuclear explosion in
deep isovelocity water; p is the peak pressure and p(f) is the value at time t
after arrival of the shock front.
SURFACE WAVES
6.119 When observed at a point re-
mote from surface zero, the idealized
surface displacement associated with the
train of waves referred to in § 6.54 is
shown in Fig. 6.119. In deep water, the
wave intensity is represented by the
peak-to-peak height H of the wave en-
velope. The manner in which this height
diminishes with distance (or radius) R
from surface zero can be expressed to an
accuracy of about 35 percent by the
relationship
H ~ 40,500
Ц/0.54
R ’
(6.119.1)
with both Hand R in feet, and the yield
W in kilotons TNT equivalent. This
expression holds provided the depth, dw
feet, of the water in which the surface
waves are produced is in the range 850
W0 25 > dw > 256 W0 25, where the
lower limit is the maximum diameter of
the gas bubble (§ 2.86). The relation is
valid for any depth of burst within the
water. Other parameters characterizing
surface waves are the length L and
period T of the peak wave. Extrapola-
tion of deep water chemical explosions
indicate these quantities are given ap-
proximately by
L « 1010 feet
T ~ 14.1 W0144 seconds
where W is in kilotons.
TECHNICAL ASPECTS OF UNDERWATER BURSTS
273
Figure 6.119. An explosion-generated wave train as observed at a given distance from
surface zero.
6.120 The length is a critical factor
in determining the changes taking place
in a wave train running into shoal water
(§ 6.59). If water depth becomes less
than approximately L/3, successive
waves in the train bunch up while wave
speed increases. The period T remains
the same. Of equal or greater impor-
tance is the fact that, after an initial
small decrease, the height H increases
as the water through which the wave is
running becomes more shoal. The in-
crease in height of a wave relative to its
length (steepening) continues as the
wave shoals until it becomes unstable
and breaks, unless the bottom slope is so
shallow that bottom friction dissipates
the wave before it breaks.
6.121 A burst in shallow water,
such as Bikini BAKER, delivers less
energy to the water than a burst of the
same yield in deep water; consequently
the constant of proportionality in equa-
tion (6.119.1) becomes less as water
depth decreases. An approximate rela-
tionship between wave height H and
distance R from surface zero for a shal-
low burst (dw < 100 25) is
U/0 25
H ~ 150 d^-
WR
with H and R in feet.
DAMAGE TO HYDRAULIC
STRUCTURES
6.122 As is the case with air blast,
it is to be expected that the damage to an
underwater structure resulting from
water shock will depend upon the di-
mensions of the structure and certain
characteristic times. The particular
times which appear to be significant are,
on the one hand, the time constant of the
shock wave (§ 6.116) and, on the other
hand, the natural (or elastic) respone
time and the diffraction time of the
structure, i.e., the time required for the
shock wave to be propagated distances
of the order of magnitude of the dimen-
sions of the structure. In the event that
the underwater structure is near the sur-
face, the cutoff time (§ 6.43) would be
significant in certain cases.
6.123 If the time constant of the
pressure wave and the cutoff time are
large compared to the times which are
characteristic of the structure, that is to
say, if the water shock wave is one of
relatively long duration, the effect of the
shock is similar to that of a steady (or
static) pressure applied suddenly. In
these circumstances, the peak pressure
is the appropriate criterion of damage.
Such would be the case for small, rigid
274
SHOCK EFFECTS OF SURFACE AND SUBSURFACE BURSTS
underwater structures, since they can be
expected to have short characteristic
times.
6.124 For large, rigid underwater
structures, where the duration of the
shock wave is short in comparison with
the characteristic times of the structure,
the impulse of the shock wave will be
significant in determining the damage. It
should be remembered, in this connec-
tion, that the magnitude of the impulse
and damage will be greatly decreased if
the negative reflected wave from the
air-water surface reaches the target and
causes cutoff soon after the arrival of the
primary shock wave.
6.125 If the large underwater struc-
ture can accept a substantial amount of
permanent (plastic) deformation as a re-
sult of impact with the shock front, it
appears that the damage depends essen-
tially on the energy of the shock wave.
If the structure is near the surface, the
cutoff effect will decrease the amount of
shock energy available for causing
damage.
BIBLIOGRAPHY
Barash, R. M., and J. A. Goertner, “Re-
fraction of Underwater Explosion Shock
Waves: Pressure Histories Measured at Caustics
in a Flooded Quarry,” U.S. Naval Ordnance
Laboratory, April 1967, NOLTR-67-9.
Carlson, R. H., and W. A. Roberts, “Project
SEDAN, Mass Distribution and Throwout
Studies,” The Boeing Company, Seattle,
Washington, August 1963, PNE-217E.
Circeo, L. J., and M. D. Nordyke, “Nuclear
Cratering Experience at the Pacific Proving
Grounds,” University of California, Lawrence
Radiation Laboratory, November 1964,
UCRL-12172.
Cole, R. H., “Underwater Explosions,” Dover
Publications, Inc., 1965. (Reprint of 1948 edi-
tion, Princeton University Press.)
Davis, L. K., “MINE SHAFT Series, Events
MINE UNDER and MINE ORE, Subtask,
N121, Crater Investigations,” U.S. Army En-
gineer Waterways Experiment Station, March
1970, Technical Report N-70-8.
Engdahl, E. R., “Seismic Effects of the
MILROW and CANNIKIN Nuclear Explo-
sions,” Bull. Seismol. Soc. America, 62, 1411
(1972).
Fitchett, D. J., “MIDDLE COURSE I Crater-
ing Series,” U.S. Army Engineer Nuclear Cra-
tering Group, June 1971, Technical Report 35.
Frandsen, A. D., “Project CABRIOLET, En-
gineering Properties Investigations of the CA-
BRIOLET Crater,” U.S. Army Engineer Nu-
clear Cratering Group, March 1970, PNE-957.
*Glasstone, S., “Public Safety and Under-
ground Nuclear Detonations,” U.S. Atomic
Energy Commission, June 1971, TID-25708.
Healy, J. H., and P. A. Marshall, “Nuclear
Explosions and Distant Earthquakes: A Search
for Correlations,” Science, 169, 176 (1970).
Кот, C. A., “Hydra Program: Theoretical Study
of Bubble Behavior in Underwater Explo-
sions,” U.S. Naval Radiological Defense Lab-
oratory, April 1964, USNRDL-TR-747.
Malme, C. L, J. R. Carbonell, and 1. Dyer,
“Mechanisms in the Generation of Airblast by
Underwater Explosions,” U.S. Naval Ord-
nance Laboratory, September 1966, Bolt,
Beranek and Newman Report No. 1434,
NOLTR-66-88.
Newmark, N. M., and W. J. Hall, “Prelimi-
nary Design Methods for Underground Protec-
tive Structures,” University of Illinois, June
1962, AFSWC-TDR-62-6.
Newmark, N. M., “Notes on Shock Isolation
Concepts,” Vibration and Civil Engineering
Proceedings of Symposium of British National
Section International Association for Earth-
quake Engineering, p. 71, Butterworths, Lon-
don, 1966.
Phillips, D. E., and T. B. Heathcote, “Un-
derwater Explosion Tests of Two Steam Pro-
ducing Explosives, I. Small Charge Tests,”
U.S. Naval Ordnance Laboratory, May 1966,
NOLTR-66-79.
♦“Proceedings of the Second Plowshare Sympo-
sium,” Part I, Phenomenology of Underground
Nuclear Explosions,” University of California,
Lawrence Radiation Laboratory, Livermore,
May 1959, UCRL-5677.
♦“Proceedings of the Third Plowshare Sympo-
sium, Engineering with Nuclear Explosives,”
April 1964, University of California, Lawrence
Radiation Laboratory, Livermore, TID-7695.
♦“Proceedings of the Symposium on Engineering
with Nuclear Explosives,” Las Vegas, Nevada,
January 1970, American Nuclear Society and
U.S. Atomic Energy Commission. CONF-
700101, Vols, 1 and 2.
TECHNICAI ASPECTS OF UNDERWATER BURSTS
275
*Rodean, H. C., “Nuclear Explosion Seismo-
logy,” AEC Critical Review Series, U.S.
Atomic Energy Commission, September 1971,
TID-25572.
Rooke, A. D., Jr., and L. K. Davis, “FERRIS
WHEEL Series, FLAT TOP Event, Crater
Measurements,” U.S. Army Engineer Water-
ways Experiment Station, August 1966, POR-
3008.
Snay, H. G., “Hydrodynamic Concepts, Se-
lected Topics for Underwater Nuclear Explo-
sions,” U.S. Naval Ordnance Laboratory,
September 1966, NOLTR-65-52.
Special Papers on Underground Nuclear Explo-
sions at the Nevada Test Site, Bull. Seismol.
Soc. America, 59, 2167 et seq. (1969).
Special Papers on the CANNIKIN Nuclear Ex-
plosion, Bull. Seismol. Soc. America, 62, 1365
et seq. (1972).
Van Dorn, W. G., B. Le Мёнаытё, and
L. Hwang, “Handbook of Explosion-Gen-
erated Water Waves Vol. I—State of the Art,”
Tetra Tech, Inc., Pasadena, California, October
1968, Report No. TC-130.
Van Dorn, W. G., and W. S. Montgomery,
“Water Waves from 10,000-lb High-Explosive
Charges,” Final Report Operation HYDRA
II—A, Scripps Institution of Oceanography, La
Jolla, California, June 1963, S1063-20.
Veletsos, A. S., and N. M. Newmark, “Ef-
fect of Inelastic Behavior on the Response of
Simple Systems to Earthquake Motions,” Uni-
versity of Illinois, I960, III. U.SRS 219.
Veletsos, A. S., and N. M. Newmark, “Re-
sponse Spectra Approach to Behavior of Shock
Isolation Systems,” Vol. 2, Newmark, Hansen
and Associates, Urbana, Illinois, June 1963.
Vortman, L. J., “Craters from Surface Explo-
sions and Scaling Laws,” J. Geophys. Res.,
73, 4621 (1968).
*These documents may be purchased from the National Technical Information Service, Department of
Commerce, Springfield, Virginia 22161
CHAPTER VII
THERMAL RADIATION AND ITS EFFECTS
RADIATION FROM THE FIREBALL
GENERAL CHARACTERISTICS OF
THERMAL RADIATION
7.01 One of the important dif-
ferences between a nuclear and a con-
ventional high-explosive weapon is the
large proportion of the energy of a nu-
clear explosion which is released in the
form of thermal (or heat) radiation. Be-
cause of the enormous amount of energy
liberated per unit mass in a nuclear
weapon, very high temperatures are at-
tained. These are estimated to be several
tens of million degrees, compared with
a few thousand degrees in the case of a
conventional explosion. As a conse-
quence of these high temperatures,
about 70 to 80 percent of the total en-
ergy (excluding the energy of the resid-
ual radiation) is released in the form of
electromagnetic radiation of short
wavelength. Initially, the (primary)
thermal radiations are mainly in the soft
X-ray region of the spectrum but, for
nuclear explosions below about 50
miles, the X rays are absorbed in air in
the general vicinity of the burst, thereby
heating it to high temperatures. Most of
the remaining 20 to 30 percent of the
276
energy is initially in the form of kinetic
energy of the weapon debris. This ki-
netic energy is also absorbed by the air
at a slightly later time (§ 2.109) and
serves to further heat the air. The heated
air, which constitutes the fireball, in turn
radiates in a spectral region roughly
similar to that of sunlight near the
earth’s surface. It is the radiation (ultra-
violet, visible, and infrared) from the
fireball, traveling with the velocity of
light, which constitutes the thermal ra-
diation at distances from the explosion.
The time elapsing, therefore, between
the emission of this (secondary) thermal
radiation from the fireball and its arrival
at a target miles away, is quite insignif-
icant.
7.02 It is desirable to state specific-
ally what is meant by the term “thermal
radiation’’ as it is used in the present
chapter. Actually, all the energy re-
leased by a nuclear detonation, includ-
ing the residual radiation from the
weapon debris, is ultimately degraded to
thermal energy, i.e., heat. But only part
of it is regarded as constituting the ther-
mal radiation of interest which can
cause fire damage and personal injury at
RADIATION FROM THE FIREBALL
277
or near the earth’s surface. Some of the
thermal radiations emitted by the fire-
ball in the very early stages, particularly
in the ultraviolet region, are selectively
absorbed by various atomic and molec-
ular species in the heated air, which
slowly re-emits this energy in a de-
graded, i.e., longer wavelength, form.
The delay in reaching the target, and the
slower rate at which they are delivered,
lowers the damaging effectiveness of
these radiations. Consequently they are
not considered as a part of the thermal
radiation for present purposes. It is
convenient, therefore, to define the ef-
fective (or prompt) thermal radiation as
that emitted from the heated air of the
fireball within the first minute (or less)
following the explosion.
7.03 For an air burst at altitudes
below about 100,000 feet (roughly 19
miles), the thermal radiation is emitted
from the fireball in two pulses, as de-
scribed in Chapter II. The first, which is
quite short, carries roughly 1 percent of
the total radiant energy (§ 2.39); the
second pulse is the more significant and
is of longer duration. The total length of
the effective thermal pulse increases
with the energy yield of the explosion.
Thus the duration of the effective pulse
from a 1-kiloton air burst is about 0.4
second, whereas from a 10-megaton
explosion it is more than 20 seconds.
With increasing altitude the character of
the thermal radiation pulse changes
(§2.130 et seq.). At altitudes above
about 100,000 feet, there is only a sin-
gle thermal pulse and its effective dura-
tion, which depends on the height of
burst and the energy yield of the explo-
sion, is of the order of a second or less
for weapons in the megaton range. For
explosions above about 270,000 feet (51
miles), the pulse length is somewhat
longer.
7.04 In an ordinary air burst, i.e., at
altitudes up to some 100,000 feet,
roughly 35 to 45 percent of the total
energy yield of the explosion is emitted
as effective thermal radiation. The ac-
tual fraction of the energy that appears
as such radiation depends on the height
of burst and the total yield, as well as on
the weapon characteristics; estimates of
this fraction for various yields and burst
altitudes will be given later (Table
7.88). For simplicity, however, it is
often assumed that 35 percent of the
total energy yield of an air burst is
emitted as thermal radiation energy.
This means that for every 1 kiloton TNT
equivalent of energy release, about 0.35
kiloton, i.e., 3.5 x 10” calories or
about 410,000 kilowatt-hours, is in the
form of thermal radiation. The propor-
tion of this energy that reaches the sur-
face depends on the distance from the
burst point and on the state of the at-
mosphere.
7.05 A nuclear air burst can cause
considerable blast damage; however,
thermal radiation can result in serious
additional damage by igniting combust-
ible materials, e.g., finely divided or
thin fuels such as dried leaves and
newspapers. Thus, fires may be started
in buildings and forests and may spread
rapidly to considerable distances. In ad-
dition, thermal radiation is capable of
causing skin burns and eye injuries to
exposed persons at distances at which
thin fuels are not ignited. Thermal radi-
ation can, in fact, be an important cause
of injuries to people from both direct
exposure and as the result of fires, even
at greater distances than other weapons
effects.
THERMAL RADIATION AND ITS EFFECTS
278
ATTENUATION OF THERMAL
RADIATION
7.06 The extent of injury or damage
caused by thermal radiation or the
chance of igniting combustible material
depends to a large extent upon the
amount of thermal radiation energy re-
ceived by a unit area of skin, fabric, or
other exposed material within a short
interval of time. The thermal energy
falling upon a given area from a spe-
cified explosion will be less the farther
from the explosion, for two reasons: (1)
the spread of the radiation over an ever
increasing area as it travels away from
the fireball, and (2) attenuation of the
radiation in its passage through the air.
These factors will be considered in turn.
7.07 If the radiation is distributed
evenly in all directions, then at a dis-
tance D from the explosion the same
amount of energy will fall upon each
unit area of the surface of a sphere of
radius D. The total area of this sphere is
4ttD2, and if E is the thermal radiation
energy produced in the explosion, the
energy received per unit area at a dis-
tance D would be E74ttD2, provided
there were no attenuation by the atmos-
phere. Obviously, this quantity varies
inversely as the square of the distance
from the explosion. At 2 miles, from a
given explosion, for example, the ther-
mal energy received per unit area would
be one-fourth of that received at half the
distance, i.e., at 1 mile, from the same
explosion.
7.08 In order to estimate the
amount of thermal energy actually
reaching the unit area, allowance must
also be made for the attenuation of the
radiation by the atmosphere. This atten-
uation is due to two main causes,
namely, absorption and scattering.
Atoms and molecules present in the air
are capable of absorbing, and thus re-
moving, certain portions of the thermal
radiation. The absorption is most effec-
tive for the shorter wavelength (or ul-
traviolet) rays. In this connection, ox-
ygen molecules, as well as ozone,
nitrogen dioxide, and nitrous acid
formed from the gases m the atmosphere
(§ 2.123), play an important part.
7.09 Because of absorption, the
thermal radiation, particularly that in the
ultraviolet region, decreases markedly
with increasing distance from the ex-
plosion. Some of the absorbed radiation
is subsequently reradiated, but the
emission occurs with equal probability
in all directions, so that the quantity
proceeding in the direction of a given
target is substantially reduced. Conse-
quently, at those distances where per-
sons exposed to thermal radiation could
survive the blast and initial nuclear ra-
diation effects, the proportion of ultra-
violet radiation is quite small. However,
the ultraviolet is more effective in caus-
ing biological injury than visible and
infrared rays, so that even the small
amount present could, under some con-
ditions, be important.
7.10 Attenuation as a result of scat-
tering, i.e., by the random diversion of
rays from their original paths, occurs
with radiations of all wavelengths.
Scattering can be caused by molecules,
such as oxygen and nitrogen, present in
the air. This is, however, not as impor-
tant as scattering resulting from the re-
flection and diffraction (or bending) of
light rays by particles, e.g., of dust,
smoke, or fog, in the atmosphere. The
diversion of the radiation as a result of
scattering interactions leads to a some-
RADIATION FROM THE FIREBALL
279
what diffuse, rather than a direct, trans-
mission of the thermal radiation.
EFFECT OF ATMOSPHERIC
CONDITIONS
7.11 The decrease in energy of
thermal radiation due to scattering by
particles in the air depends upon the
atmospheric conditions, such as the
concentration and size of the particles,
and also upon the wavelength of the
radiation. This means that radiations of
different wavelengths, namely, ultravi-
olet, visible, and infrared, will suffer
energy attenuation to different extents.
For most practical purposes, however, it
is more convenient and reasonably sat-
isfactory, although less precise, to pos-
tulate a mean attenuation averaged over
all the wavelengths present in the ther-
mal radiation.
7.12 The extent to which the at-
mosphere attenuates thermal energy and
limits visibility depends largely on the
scattering of radiation. Therefore, the
state of the atmosphere as far as scatter-
ing is concerned can be represented by
what is known as the daylight “visibil-
ity range’’ or, in brief, as the “visibil-
ity.” This is defined as the horizontal
distance at which a large dark object on
the horizon has just enough contrast
with the surrounding sky to be discern-
ible in daylight. The international code
for correlating the visibility with the
condition of the atmosphere is given in
Table 7.12.
7.13 At first thought, it would be
expected that the decrease of thermal
radiation energy with increasing dis-
tance from the explosion would be
greater when the visibility is low than
when it is high. But, for the reason
given below, it has been found that, at
distances less than about half the visi-
bility, the degree of attenuation of the
thermal radiation is relatively insensi-
tive to atmospheric conditions if at least
moderately clear (10 miles or more)
visibility prevails. At greater distances,
however, a larger proportion of the ra-
diant energy is indeed lost as the at-
mospheric visibility decreases. As a
rough approximation, the amount of
thermal energy received at a given dis-
tance from a nuclear explosion may be
assumed to be independent of the visi-
bility. This leads to overestimates at
distances greater than about half the
Table 7.12
VISIBILITY AND CONDITION OF THE ATMOSPHERE
Visibility
Atmospheric
Condition
Kilometers
Miles
Exceptionally clear 280 170
Very clear 50 31
Clear 20 12
Light haze 10 6
Haze 4 2.5
Thin fog 2 1.2
Light to thick fog 1 or less 0.6 or less
280
THERMAL RADIATION AND ITS EFFECTS
visibility range, but from the standpoint
of protection from thermal radiation
such estimates would be preferable to
those which err in being too low.
7.14 The thermal radiation received
at a given distance from a nuclear ex-
plosion is made up of both directly
transmitted (unscattered) and scattered
radiations. If the air is clear, and there
are very few suspended particles, the
extent of scattering is small, and the
radiation received is essentially only
that which has been transmitted from the
exploding weapon without scattering. If
the air contains a moderately large
number of particles, the amount of ra-
diation transmitted directly will be less
than in a clear atmosphere. But this
decrease is largely compensated by an
increase in the scattered radiation
reaching the object (or area) under con-
sideration. Multiple scattering, i.e.,
subsequent scattering of already scat-
tered radiation, which is very probable
when the concentration of particles is
high, will result in the arrival of radia-
tion at the target from many directions.
An appreciable amount of thermal radi-
ation will thus reach the given area in-
directly, in addition to that transmitted
directly. It is because of the partial
compensation due to multiple scattering
that the total amount of energy from a
nuclear explosion falling upon unit area
at a given distance may not be too
greatly dependent upon the visibility
range, within certain limits.
7.15 Under atmospheric conditions
of rain, fog, or dense industrial haze,
absorption due to the increase in water
vapor and carbon dioxide content of the
air will play a predominant role in the
attenuation of thermal radiation. The
loss in the directly transmitted radiation,
from scattering and absorption, cannot
then be compensated by multiple scat-
tering. Hence, less radiant energy is
received at a specified distance from the
explosion than for clear visibility con-
ditions.
EFFECT OF SMOKE, FOG, AND
CLOUDS
7.16 In the event of an air burst
occurring above a layer of dense cloud,
smoke, or fog, an appreciable portion of
the thermal radiation will be scattered
upward from the top of the layer. This
scattered radiation may be regarded as
lost, as far as a point on the ground is
concerned. In addition, most of the ra-
diation which penetrates the layer will
be scattered, and very little will reach
the given point by direct transmission.
These two effects will result in a sub-
stantial decrease in the amount of ther-
mal energy reaching a ground target
covered by fog or smoke, from a nuclear
explosion above the layer.
7.17 It is important to understand
that the decrease in thermal radiation by
fog and smoke will be realized only if
the burst point is above or, to a lesser
extent, within the fog (or similar) layer.
If the explosion should occur in mod-
erately clear air beneath a layer of cloud
or fog, some of the radiation which
would normally proceed outward into
space will be scattered back to earth. As
a result, there may be some cases in
which the thermal energy received will
actually be greater than for the same
atmospheric transmission conditions
without a cloud or fog cover. (A layer of
snow on the ground will have much the
same effect as a cloud layer above the
burst (§ § 7.43, 7.100)).
RADIATION FROM THE FIREBALL
281
EFFECT OF SHIELDING
7.18 Unless it is scattered, thermal
radiation from a nuclear explosion, like
ordinary light, travels in straight lines
from the fireball. Any solid, opaque
material, e.g., a wall, a hill, or a tree,
between a given object and the fireball
will act as a shield and provide protec-
tion from thermal radiation. Some in-
stances of such shielding, many of
which were observed after the nuclear
explosions in Japan, will be described
later. Transparent materials, on the
other hand, such as glass or plastics,
allow thermal radiation to pass through
only slightly attenuated.
7.19 A shield which merely inter-
venes between a given target and the
fireball but does not surround the target,
may not be entirely effective under hazy
atmospheric conditions. A large pro-
portion of the thermal radiation re-
ceived, especially at considerable dis-
tances from the,explosion, has
undergone multiple scattering and will
arrive from all directions, not merely
that from the point of burst. This situa-
tion should be borne in mind in connec-
tion with the problem of thermal radia-
tion shielding.
TYPE OF BURST
7.20 The foregoing discussion has
referred in particular to thermal radia-
tion from a nuclear air burst. For other
types of burst the general effects are the
same, although they differ in degree.
For a surface burst, in which the fireball
actually touches the earth or water, the
proportion of the explosion energy ap-
pearing at a distance as thermal radia-
tion will be less than for an air burst.
Some energy is utilized in melting or
evaporating surface material, but this is
relatively small (about 1 or 2 percent)
and has a minor effect on the thermal
radiation emitted. As far as the energy
received at a distance from the explo-
sion is concerned, other factors are more
significant. First, there will be a certain
amount of shielding due to terrain ir-
regularities and, second, some absorp-
tion of the radiation will occur in the
low layer of dust or water vapor pro-
duced near the burst point in the early
stages of the explosion. In addition,
most of the thermal radiation reaching a
given target on the ground will have
traveled through the air near the earth’s
surface. In this part of the atmosphere
there is considerable absorption by
molecules of water vapor and of carbon
dioxide and the extent of scattering by
various particles is greater than at higher
altitudes. Consequently, in a surface
burst, the amount of thermal energy
reaching a target at a specified distance
from the explosion may be from half to
three-fourths of that from an air burst of
the same total energy yield. However,
when viewed from above, e.g., from an
aircraft, surface explosions exhibit the
same thermal characteristics as air
bursts.
7.21 In subsurface bursts, either in
the earth or under water, nearly all the
thermal radiation is absorbed, provided
there is no appreciable penetration of the
surface by the fireball. The thermal en-
ergy is then used up in heating and
melting the soil or vaporizing the water,
as the case may be. Normal thermal
radiation effects, such as accompany an
air burst, are thus absent.
7.22 When nuclear explosions
occur at high altitudes, i.e., somewhat
above 100,000 feet, the primary thermal
282
THERMAL RADIATION AND ITS EFFECTS
X rays from the extremely hot weapon
residues are absorbed in a large volume
(and mass) of air because of the low
density, as explained in § 2.131 et seq.
Consequently, the fireball temperatures
are lower than for an air burst at lower
altitude (§ 7.81), with the result that,
although about half of the absorbed en-
ergy is emitted as thermal radiation in
less than a second, the remainder of the
thermal energy is radiated so slowly that
it can be ignored as a significant effect.
THERMAL RADIATION EFFECTS
ABSORPTION OF THERMAL
RADIATION
7.23 The amount of thermal energy
falling upon a unit area exposed to a
nuclear explosion depends upon the
total energy yield, the height of burst,
the distance from the explosion, and, to
some extent, the atmospheric condi-
tions. The thermal radiation leaving the
fireball covers a wide range of wave-
lengths, from the short ultraviolet,
through the visible, to the infrared re-
gion. Much of the ultraviolet radiation is
absorbed or scattered in its passage
through the atmosphere with the result
that at a target near the earth’s surface
less ultraviolet radiation is received than
might be expected from the temperature
of the fireball.1
7.24 When thermal radiation falls
upon any material or object, part may be
reflected, part will be absorbed, and the
remainder, if any, will pass through and
ultimately fall upon other materials. It is
the radiation absorbed by a particular
material that produces heat and so de-
termines the damage suffered by that
material. The extent or fraction of the
incident radiation that is absorbed de-
pends upon the nature and color of the
material or object. Highly reflecting and
transparent substances do not absorb
much of the thermal radiation and so
they are relatively resistant to its effects.
A thin material will often transmit a
large proportion of the radiation falling
upon it and thus escape serious damage.
A black fabric will absorb a much larger
proportion of the incident thermal radi-
ation than will the same fabric when
white in color. The former will thus be
more affected than the latter. A light-
colored material will then not char as
readily as a dark piece of the same
material.
7.25 Essentially all of the thermal
radiation absorbed serves to raise the
temperature of the absorbing material
and it is the high temperature attained
which causes injury or damage, or even
ignition of combustible materials. An
important point about the thermal radia-
tion from a nuclear explosion is not only
that the amount of energy is consider-
1 It is known, from theoretical studies and experimental measurements, that the wavelength corre-
sponding to the maximum energy density of radiation from an ideal (or “black body”) radiator, to which
the nuclear fireball is a good approximation, decreases with increasing temperature of the radiation. At
temperatures above 7,5OO°K (13,000°F), this maximum lies in the ultraviolet and X-ray regions of the
spectrum (§ 7.78).
THERMAL RADIATION EFFECTS
283
able, but also that it is emitted in a very
short time. This means that the intensity
of the radiation, i.e., the rate at which it
is incident upon a particular surface, is
very high. Because of this high inten-
sity, the heat accompanying the absorp-
tion of the thermal radiation is produced
with great rapidity.
7.26 Since only a small proportion
of the heat is dissipated by conduction in
the short time during which the radiation
falls upon the material—except perhaps
in good heat conductors such as
metals—the absorbed energy is largely
confined to a shallow depth of the ma-
terial. Consequently, very high temper-
atures are attained at the surface. It has
been estimated, for example, that in the
nuclear explosions in Japan (§ 2.24),
solid materials on the ground immedi-
ately below the burst probably attained
surface temperatures of 3,000 to
4,000°C (5,400 to 7,200°F). It is true
that the temperatures fell off rapidly
with increasing distance from the ex-
plosion, but there is some evidence that
they reached l,800°C (3,270°F) at
3,200 feet (0.61 mile) away (§ 7.47).
7.27 The most important physical
effects of the high temperatures result-
ing from the absorption of thermal radi-
ation are burning of the skin, and
scorching, charring, and possibly igni-
tion of combustible organic substances,
e.g., wood, fabrics, and paper (Fig.
7.TJ). Thin or porous materials, such as
lightweight fabrics, newspaper, dried
grass and leaves, and dry rotted wood,
may flame when exposed to thermal
radiation. On the other hand, thick or-
Figure 7.27. Thermal radiation from a nuclear explosion ignited the upholstery and caused
fire to spread in an automobile, Nevada Test Site.
284
THERMAL RADIATION AND ITS EFFECTS
Figure 7.28a. Thermal effects on wood-frame house 1 second after explosion (about 25
cal/cm2).
Figure 7.28b. Thermal effects on wood-frame house about % second later.
THERMAL RADIATION EFFECTS
285
ganic materials, for example, wood
(more than Vi inch thick), plastics, and
heavy fabrics, char but do not burn.
Dense smoke, and even jets of flame,
may be emitted, but the material does
not sustain ignition. If the material is
light colored and blackens readily by
charring in the initial stages of exposure
to thermal radiation, it will absorb the
subsequent thermal radiation more
readily. However, smoke formed in the
early stages will partially shield the un-
derlying material from subsequent radi-
ation.
7.28 This behavior is illustrated in
the photographs taken of one of the
wood-frame houses exposed in the 1953
Nevada tests. As mentioned in § 5.55,
the houses were given a white exterior
finish in order to reflect the thermal
radiation and minimize the chances of
fire. Virtually at the instant of the burst,
the house front became covered with a
thick black smoke, as shown in Fig.
7.28a. There was, however, no sign of
flame. Very shortly thereafter, but be-
fore the arrival of the blast wave, i.e.,
within less than 2 seconds from the
explosion, the smoke ceased, as is ap-
parent from Fig. 7.28b. Ignition of the
wood did not occur.
7.29 The ignition of materials by
thermal radiation depends upon a
number of factors, the two most impor-
tant, apart from the nature of the mate-
rial itself, being the thickness and the
moisture content. A thin piece of a
given material, for example, will ignite
more easily than a thick one, and a dry
sample will be more readily damaged
than one that is damp.
7.30 An important consideration in
connection with charring and ignition of
various materials and with the produc-
tion of skin burns by thermal radiation is
the rate at which the thermal energy is
delivered. For a given total amount of
thermal energy received by each unit
area of exposed material, the damage
will be greater if the energy is delivered
rapidly than if it were delivered slowly.
This means that, in order to produce the
same thermal effect in a given material,
the total amount of thermal energy (per
unit area) received must be larger for a
nuclear explosion of high yield than for
one of the lower yield, because a given
amount of energy is delivered over a
longer period of time, i.e., more slowly,
in the former case.
7.31 There is evidence that for
thermal radiation pulses of very short
duration, such as might arise from air
bursts of low-yield weapons or from
explosions of large yield at high alti-
tudes, this trend is reversed. In other
words, a given amount of energy may
be less effective if delivered in a very
short pulse, e.g., a fraction of second,
than in one of moderate duration, e.g.,
one or two seconds. In some experi-
ments in which certain materials were
exposed to short pulses of thermal radi-
ation, it was observed that the surfaces
were rapidly degraded and vaporized. It
appeared as if the surface had been
“exploded” off the material, leaving
the remainder with very little sign of
286
THERMAL RADIATION AND ITS EFFECTS
damage. The thermal energy incident
upon the material was apparently dissi-
pated in the kinetic energy of the “ex-
ploding” surface molecules before the
radiation could penetrate into the depth
of the material.
THERMAL RADIATION EFFECTS ON
SKIN AND EYES
7.32 One of the serious conse-
quences of the thermal radiation from a
nuclear explosion is the production of
“flash burns” resulting from the ab-
sorption of radiant energy by the skin of
exposed individuals. In addition, be-
cause of the focusing action of the lens
of the eye, thermal radiation can cause
permanent damage to the eyes of per-
sons who happen to be looking directly
at the burst; however, such direct view-
ing will be fortuitous and rare. What is
expected to be a more frequent occur-
rence, and therefore much more impor-
tant to defensive action, is the tempo-
rary loss of visual acuity (flash blindness
or dazzle) resulting from the extreme
brightness, particularly at night when
the eyes have been adapted to the dark.
This may be experienced no matter what
the direction in which the individual is
facing. The various effects of thermal
radiation on human beings will be con-
sidered more fully in Chapter XII.
THERMAL RADIATION DAMAGE TO
FABRICS, WOOD, AND PLASTICS
7.33 Mention has already been
made of the damage caused to fabrics by
the high surface temperatures accompa-
nying the absorption of thermal radia-
tion. Natural fibers, e.g., cotton and
wool, and some synthetic materials,
e.g., rayon, will scorch, char, and per-
haps burn; nylon, on the other hand,
melts when heated to a sufficient extent.
The heat energy required to produce a
particular change in a fabric depends on
a variety of circumstances. The follow-
ing generalizations, however, appear to
hold in most instances.
7.34 Dark-colored fabrics absorb
the radiation, and hence suffer damage
more readily than do the same fabrics if
light in color. Even in this connection
there are variations according to the
method of dyeing and the particular
fiber involved. Wool is more resistant to
radiant energy than cotton or rayon, and
these are less easily affected than nylon.
Orlon appears to be appreciably more
resistant than nylon. Fabrics of light
weight (for a given area) need less ther-
mal energy to cause specific damage
than do those of heavy weight. The
energy required, for the same exposure
time, is roughly proportional to the fab-
ric weight per unit area. Fabric with a
moderate moisture content behaves like
dry fabric, but if the amount of moisture
is fairly high, more thermal energy will
be needed to produce damage.
7.35 Although extensive studies
have been made of the effects of thermal
radiation on a large number of individ-
ual fabrics, it is difficult to summarize
the results because of the many vari-
ables that have a significant influence.
Some attempt is nevertheless made in
Table 7.35 to give an indication of the
magnitude of the exposures required to
ignite (or otherwise damage) various
fabric materials by the absorption of
thermal radiation. The values are ex-
pressed in terms of gram-calories of
thermal energy incident upon a 1 square
centimeter area of material, i.e.,
THERMAL RADIATION EFFECTS
287
Table 7.35
APPROXIMATE RADIANT EXPOSURES FOR IGNITION OF FABRICS FOR LOW AIR
Material BURSTS Radiant Exposure* ** (cal/cm2)
Weight (oz/yd2) Color Effect on Material 35 kiloton
1.4 s megatons 20 megatons
CLOTHING FABRICS
Cotton 8 White Ignites 32 48 85
Khaki Tears on flexing 17 27 34
Khaki Ignites 20 30 39
Olive Tears on flexing 9 14 21
Olive Ignites 14 19 21
Dark blue Tears on flexing 11 14 17
Dark blue Ignites 14 19 21
Cotton corduroy 8 Brown Ignites 11 16 22
Cotton denim, new 10 Blue Ignites 12 27 44
Cotton shirting 3 Khaki Ignites 14 21 28
Cotton-nylon mixture 5 Olive Tears on flexing 8 15 17
Olive Ignites 12 53
Wool 8 White Tears on flexing 14 25 38
Khaki Tears on flexing 14 24 34
Olive Tears on flexing 9 13 19
Dark blue Tears on flexing 8 12 18
20 Dark blue Tears on flexing 14 20 26
Rainwear (double neo- 9 Olive Begins to melt 5 9 13
prene-coated nylon twill) Olive Tears on flexing 8 14 22
DRAPERY FABRICS
Rayon gabardine 6 Black Ignites 9 20 26
Rayon-acetate drapery 5 Wine Ignites 9 22 28
Rayon gabardine 7 Gold Ignites ** 24t 28t
Rayon twill lining 3 Black Ignites 7 17 25
Rayon twill lining 3 Beige Ignites 13 20 28
Acetate-shantung 3 Black Ignites lot 22t 35t
Cotton heavy draperies 13 Dark
colors Ignites 15 18 34
TENT FABRICS
Canvas (cotton) 12 White Ignites 13 28 51
Canvas 12 Olive
drab Ignites 12 18 28
OTHER FABRICS
Cotton chenille bedspread Light blue Ignites ** lit 15t
Cotton Venetian blind
tape, dirty White Ignites 10 18 22
Cotton Venetian blind tape Cotton muslin window White Ignites 13T 27t 31t
shade 8 Green Ignites 7 13 19
*Radiant exposures for the indicated responses (except where marked t) are estimated to be valid to
±25% under standard laboratory conditions. Under typical field conditions the values are estimated to be
valid within ±50% with a greater likelihood of higher rather than lower values. For materials marked f,
ignition levels are estimated to be valid within ±50% under laboratory conditions and within ±100%
under field conditions.
**Data not available or appropriate scaling not known.
288
THERMAL RADIATION AND ITS EFFECTS
cal/cm2, generally referred to as the
“radiant exposure.” Results are pre-
sented for low air bursts with arbitrary
energy yields of 35 kilotons, 1.4 mega-
tons, and 20 megatons. It will be noted
that, for the reasons given in § 7.30, the
radiant exposure required to produce a
particular effect increases with the yield.
7.36 Since the shape and duration
of the thermal pulse depend on the ac-
tual burst altitude, as well as on the
yield, the radiant exposures given in
Table 7.35 for “low air bursts” are
somewhat approximate. In general,
however, the radiant exposures in the
three columns would apply to nuclear
explosions below 100,000 feet altitude
for which the times to the second max-
imum in the fireball temperature are 0.2,
1.0, and 3.2 seconds, respectively
(§ 7.85).
7.37 Wood is charred by exposure
to thermal radiation, the depth of the
char being closely proportional to the
radiant exposure. For sufficiently large
amounts of energy per unit area, wood
in some massive forms may exhibit
transient flaming but persistent ignition
is improbable under the conditions of a
nuclear explosion. However, the transi-
tory flame may ignite adjacent combus-
tible material which is not directly ex-
posed to the radiation. In a more-or-less
finely divided form, such as sawdust,
shavings, or excelsior, or in a decayed,
spongy (punk) state, wood can be ig-
nited fairly readily by the thermal radi-
ation from a nuclear explosion, as will
be seen below.
7.38 Roughly speaking, something
like 10 to 15 calories per square centi-
meter of thermal energy are required to
produce visible charring of unpainted
and unstained pine, douglas fir, red-
wood, and maple. Dark staining in-
creases the tendency of the wood to
char, but light-colored paints and hard
varnishes provide protection.2
7.39 Glass is highly resistant to
heat, but as it is very brittle it is some-
times replaced by transparent or trans-
lucent plastic materials or combined
with layers of plastic, as in automobile
windshields, to make it shatterproof.
These plastics are organic compounds
and so are subject to decomposition by
heat. Nevertheless, many plastic mate-
rials, such as Bakelite, cellulose acetate,
Lucite, Plexiglas, polyethylene, and
Teflon, have been found to withstand
thermal radiation remarkably well. At
least 60 to 70 cal/cm2 of thermal energy
are required to produce surface melting
or darkening.
RADIANT EXPOSURES FOR IGNITION
OF VARIOUS MATERIALS
7.40 Studies have been made in
laboratories and at nuclear tests of the
radiant exposures required for the igni-
tion of various common household
items and other materials of interest.
The results for low air bursts with three
arbitrary yields are presented in Table
7.40; the conditions and limitations
noted in § 7.36 also hold here. The
radiant exposures given would be appli-
cable to explosions at altitudes below
100,000 feet.
:The thermal radiation energy incident on the front of the house referred to in § 7.28 was about 25
cal/cm-.
THERMAL RADIATION EFFECTS
289
Table 7.40
APPROXIMATE RADIANT EXPOSURES FOR IGNITION OF VARIOUS MATERIALS
FOR LOW AIR BURSTS
Radiant Exposure*
(cal/cm2)
Weight Effect 35 1.4 20
Material (oz/yd2) Color on Material kilotons megatons megatons
HOUSEHOLD TINDER MATERIALS
Newspaper, shredded 2 Ignites 4 6 11
Newspaper, dark picture area 2 Ignites 5 7 12
Newspaper, printed text area 2 Ignites 6 8 15
Crepe paper 1 Green Ignites 6 9 16
Kraft paper 3 Tan Ignites 10 13 20
Bristol board, 3 ply Kraft paper carton, used 10 Dark Ignites 16 20 40
(flat side) 16 Brown Ignites 16 20 40
New bond typing paper 2 White Ignites 24f 30t 50t
Cotton rags Black Ignites 10 15 20
Rayon rags Black Ignites 9 14 21
Cotton string scrubbing mop (used) Cotton string scrubbing mop Gray Ignites iot 15t 21t
(weathered) Cream Ignites iot 19t 26t
Paper book matches, blue head exposed Excelsior, ponderosa pine 2 Ib/ft'Light Ignites lit 14t 20t
yellow Ignites ** 23t 23t
OUTDOOR TINDER MATERIALS* ** ***
Dry rotted wood punk (fir) Ignites 4t 6t 8t
Deciduous leaves (beech) Ignites 4 6 8
Fine grass (cheat) Ignites 5 8 10
Coarse grass (sedge) Ignites 6 9 11
Pine needles, brown (ponderosa) CONSTRUCTION MATERIALS Ignites 10 16 21
Roll roofing, mineral surface Ignites ** >34 >116
Roll roofing, smooth surface Ignites ** 30 77
Plywood, douglas fir Flaming during exposure 9 16 20
Rubber, pale latex Ignites 50 80 110
Rubber, black OTHER MATERIALS Ignites 10 20 25
Aluminum aircraft skin (0.020 in.
thick) coated with 0.002 in. of standard white aircraft paint Blisters 15 30 40
Cotton canvas sandbags, dry filled Failure 10 18 32
Coral sand Explodes (popcorning) 15 27 47
Siliceous sand Explodes (popcorning) 11 19 35
*Radiant exposures for the indicated responses (except where marked t) are estimated to be valid to
±25% under standard laboratory conditions. Under typical field conditions, the values are estimated to
be valid within ±50% with a greater likelihood of higher rather than lower values. For materials marked
t, ignition levels are estimated to be valid within ±50% under laboratory conditions and within ± 100%
under field conditions.
**Data not available or appropriate scaling not known.
***Radiant exposures for ignition of these substances are highly dependent on the moisture content.
290
THERMAL RADIATION AND ITS EFFECTS
RADIANT EXPOSURE AND SLANT
RANGE
7.41 In order to utilize the data in
Tables 7.35 and 7.40 to determine how
far from the burst point, for an explo-
sion of given energy yield, ignition of a
particular material would be observed, it
is required to know how the thermal
energy varies with distance. For a spe-
cific explosion yield, the variation of
radiation exposure with distance from
the point of burst depends upon a
number of factors, including the height
of burst and the condition (or clarity) of
the atmosphere. As seen earlier, the
proportion of the total yield that appears
as thermal energy and the character and
duration of the thermal pulse vary with
the height of burst. Furthermore, the
height of burst and the atmospheric vis-
ibility determine the fraction of the
thermal energy that can penetrate the
atmosphere.
7.42 The variation of radiant expo-
sure on the ground with slant range from
the explosion for a particular set of
conditions can be conveniently repre-
sented in the form of Fig. 7.42. These
curves were calculated for burst heights
of 200 W04 feet, where W is the explo-
sion yield in kilotons (see § 7.99), but
they provide reasonably good predic-
tions of radiant exposures from air
bursts at altitudes up to about 15,000
feet, for a visibility of 12 miles. This
visibility represents the conditions for
typical urban areas on a clear day. For
air bursts at altitudes above 15,000 feet,
Fig. 7.42 is not satisfactory and the
procedures described in § 7.93 et seq.
should be used. For bursts at low alti-
tudes, e.g., less than 180 W04 feet,
which are essentially surface bursts (cf.
§ 2.128), radiant exposures should be
calculated by using the procedures in
§ 7.101 et seq.
7.43 The application of Fig. 7.42
may be illustrated by estimating the
range over which ignition may occur in
newspaper as a result of exposure to a
1000-kiloton (1-megaton) air burst
under the conditions specified above.
According to Table 7.40, the radiant
exposure for the ignition of newspaper
is about 8 cal/cm2 in a 1-megaton ex-
plosion. Fig. 7.42 is entered at the point
on the yield scale corresponding to 1
megaton (103 kilotons); the perpendicu-
lar line is then followed until it inter-
sects the curve marked 8 cal/cm2 of
radiant exposure. The intersection is
seen to correspond to a slant range of
about 7 miles from the explosion. This
is the range at which the thermal radia-
tion from a 1-megaton air burst (below
15,000 feet altitude) could cause igni-
tion in newspaper when the visibility is
12 miles. Under hazy conditions, such
as often exist in large cities, the visibil-
ity would be less and the ignition range
might be smaller. Similarly, a layer of
dense cloud or smoke between the target
and the burst point will decrease the
distance over which a specified ignition
may occur. However, if the explosion
were to take place between a cloud layer
and the target or if the ground surface is
highly reflective, as when covered with
snow, the distance would be greater
than indicated by Fig. 7.42.
THERMAL EFFECTS ON MATERIALS
IN JAPAN'
7.44 Apart from the actual ignition
of combustible materials resulting in
'The effects of thermal radiations on people in Japan are described in Chapter XII.
SLANT RANGE (MILES)
Figure 7.42. Slant ranges for specified radiant exposures on the ground as ajunction of
energy yield of air bursts at altitudes up to 15,000 feet for a 12-mile visibility.
THERMAL RADIATION EFFECTS
292
THERMAL RADIATION AND ITS EFFECTS
Figure 7.44a. Flash burns on upholstery of chairs exposed to bomb flash at window (1 mile
from ground zero at Hiroshima, 8 to 9 cal/cm2).
fires being started, which will be re-
ferred to later, a number of other phe-
nomena observed in Japan testified to
the intense heat due to the absorption of
thermal radiation. Fabrics (Fig. 7.44a),
utility poles (Fig. 7.44b), trees, and
wooden posts, up to a radius of 11,000
feet (2.1 miles) from ground zero to
Nagasaki (estimated 3.4 cal/cm2 radiant
exposure) and 9,000 feet (1.7 miles) at
Hiroshima (estimated 3 cal/cm2), if not
destroyed in the general conflagration,
were charred and blackened, but only on
the side facing the point of burst. Where
there was protection by buildings,
walls, hills, and other objects there was
no evidence of thermal radiation effects.
An interesting case of shadowing of this
kind was recorded at Nagasaki. The tops
and upper parts of a row of wooden
posts were heavily charred, but the
charred area was sharply limited by the
shadow of a wall. The wall was, how-
ever, completely demolished by the
blast wave which arrived after the ther-
mal radiation. This radiation travels
with the speed of light, whereas the
blast wave advances much more slowly
(§ 3.09).
7.45 From observations of the
shadows left by intervening objects
where they shielded otherwise exposed
surfaces (Figs. 7.45a and b), the direc-
tion of the center of the explosion was
located with considerable accuracy.
Furthermore, by examining the shadow
effects at various places around the ex-
plosion, a good indication was obtained
of the height of burst. Occasionally, a
distinct penumbra was found, and from
THERMAL RADIATION EFFECTS
293
Figure 7.44b. Flash burns on wooden poles (1.17 miles from ground zero at Nagasaki, 5 to
6 cal/cm2). The uncharred portions were protected from thermal radiation by
a fence.
294
THERMAL RADIATION AND ITS EFFECTS
Figure 7.45a. Flash marks produced by thermal radiation on asphalt of bridge in Hiro-
shima. Where the railings served as a protection from the radiation, there
were no marks; the length and direction of the “shadows” indicate the point
of the bomb explosion.
this it was possible to calculate the di-
ameter of the fireball at the time the
thermal radiation intensity was at a
maximum.
7.46 One of the striking effects of
the thermal radiation was the roughen-
ing of the surface of polished granite
where there was direct exposure. This
roughening was attributed to the un-
equal expansion of the constituent crys-
tals of the stone, and it is estimated that
a temperature of at least 600°C
(l,100°F) was necessary to produce the
observed effects. From the depth of the
roughening and ultimate flaking of the
granite surface, the depth to which this
temperature was attained could be de-
termined. These observations were used
to calculate the maximum ground tem-
peratures at the time of the explosion.
THERMAL RADIATION EFFECTS
295
Figure 7.45b. Paint on gas holder scorched by the thermal radiation, except where
protected by the valve (1.33 miles from ground zero at Hiroshima).
As mentioned in § 7.26, they were ex-
tremely high, especially near ground
zero.
7.47 Another thermal effect, which
proved to be valuable in subsequent
studies, was the bubbling or blistering
of the dark green (almost black) tile with
a porous surface widely used for roofing
in Japan (Fig. 7.47). The phenomenon
was reported as far as 3,200 feet (0.61
mile) from ground zero at Hiroshima,
where the radiant exposure was esti-
mated to have been 45 cal/cm2. The size
of the bubbles and their extent increased
with proximity to ground zero, and also
with the directness with which the tile
itself faced the explosion. In a labora-
tory test, using undamaged tile of the
same kind, it was found that similar
blistering could be obtained by heating
to l,800°C (3,270°F) for a period of 4
seconds, although the effect extended
deeper into the tile than it did in Japan.
From this result, it was concluded that
in the nuclear explosion the tile attained
a surface temperature of more than
l,800°C for a period of less than 4
seconds.
7.48 The difference in behavior of
light and dark fabrics exposed to ther-
mal radiation in Japan is also of consid-
erable interest. Light-colored fabrics ei-
ther reflect or transmit most of the
thermal radiation and absorb very little.
Consequently, they will not reach such a
high temperature and will suffer less
296
THERMAL RADIATION AND ITS EFFECTS
damage than dark fabrics which absorb
a large proportion of the radiation. In
one case, a shirt with alternate narrow
light and dark gray stripes had the dark
stripes burned out by a radiant exposure
of about 7 cal/cm2, whereas the light-
colored stripes were undamaged (Fig.
7.48). Similarly, a piece of paper which
had received approximately 5 cal/cm2
had the characters, written in black ink,
burned out, but the rest of the paper was
not greatly affected.
INCENDIARY EFFECTS
ORIGIN OF FIRES
7.49 There are two general ways in
which fires can originate in a nuclear
explosion. First, as a direct result of the
absorption of thermal radiation, thin
kindling fuels can be ignited. And sec-
ond, as an indirect effect of the destruc-
tion caused by the blast wave, fires can
be started by upset stoves, water heat-
ers, and furnaces, electrical short cir-
cuits, and broken gas lines. No matter
how the fire originates, its subsequent
spread will be determined by the amount
and distribution of combustible materi-
als in the vicinity.
7.50 In urban areas kindling fuels
which can be ignited by direct exposure
to thermal radiation are located both
indoors and out of doors. Interior igni-
Figure 7.47. Blistered surface of roof tile; left portion of the tile was shielded by an
overlapping one (0.37 mile from ground zero at Hiroshima).
INCENDIARY EFFECTS
297
Figure 7.48. The light-colored portions of the material are intact, but some of the
dark-colored stripes have been destroyed by the heat from the thermal
radiation.
tion points could receive thermal radia-
tion through a window or other opening.
The thermal exposure at any interior
point would be roughly proportional to
the fraction of the fireball that would be
visible at that point through the opening.
If the thermal radiation should pass
through a glass window, the amount
entering a room would be about 80 per-
cent of that falling on the exterior of the
glass. The reduction is mainly due to
reflection of the radiation, and so it is
essentially independent of the thickness
of the glass. A combination of a glass
window and a screen will reduce the
transmitted radiation energy to roughly
40 to 50 percent of the incident energy.
In addition, the thermal radiation will be
attenuated by window coverings, such
as shades, curtains, and drapes. Of
course, if the window coverings are
made of combustible materials, they
will constitute internal ignition points,
as also will upholstered furniture, bed-
ding, carpets, papers, and fabrics. Ex-
terior ignition points are paper, trash,
awnings, dry grass, leaves, and dry
shrubs. Interior ignitions are more likely
to grow into self-sustaining fires than are
exterior ignitions. Large amounts of
kindling are required to maintain an ig-
nition for a sufficient time to ignite a
sound wooden structure, and the neces-
sary fuel arrangements are much more
common indoors than outdoors.
7.51 In order for an ignition to de-
velop within a room, one or two sub-
stantial combustible furnishings, such as
298
THERMAL RADIATION AND ITS EFFECTS
an overstuffed chair or couch, a bed, or
a wooden table, must be ignited and
burn vigorously. Fires that become large
enough to spread generally burn be-
tween 10 and 20 minutes before room
“flashover." Flashover occurs when
flames from a localized fire suddenly
spread to fill the room. After room
flashover, the fire becomes intense
enough to penetrate interior partitions
and to spread to other rooms. The blaze
from a single fire in an average resi-
dence may be expected to reach peak
intensity in about an hour.
7.52 In a typical urban area the
density of interior ignition points is
usually much greater than that of exte-
rior points. Furthermore, as stated
above, the probability of ignitions
spreading to more substantial fuels is
greater for interior than for exterior ig-
nition points. Nevertheless, fires started
outdoors can also result in significant
damage. Ignitions of dead weeds or tall
dry grass or brush may develop into
fires sufficiently intense to ignite houses.
The fuel contained in a pile of trash is
often sufficient to ignite a structure with
loose, weathered siding. Structures with
very badly weathered and decayed sid-
ing or shingles may ignite directly from
the incident thermal radiation.
7.53 Since most of the thermal ra-
diation reaches a target before the blast
wave, the subsequent arrival of the latter
may affect the development of fires ini-
tiated by the thermal radiation. In par-
ticular, there is a possibility that such
fires may be extinguished by the blast
wind. Studies of the effects in Japan and
at various nuclear and high-explosive
tests have given contradictory results
and they leave the matter unresolved.
Laboratory experiments that simulate
blast loading of urban interiors show
that the blast wave typically does extin-
guish flames but often leaves the mate-
rial smoldering so that active flaming is
revived at a later time. It is not certain,
however, to what extent this behavior
would apply to actual urban targets
subjected to a nuclear explosion. Al-
though some fires may be extinguished
by the blast, many others will undoubt-
edly persist.
SPREAD OF FIRES
7.54 The spread of fires in a city,
including the development of “mass
fires," depends upon various condi-
tions, e.g., weather, terrain, closeness
and combustibility of buildings, and the
amount of combustible material in a
given area. The interaction of blast and
fire, as described above, and the extent
of blast damage are also important fac-
tors in determining fire spread. Some
conclusions concerning the develop-
ment and growth of fires from a large
number of ignition points were drawn
from the experiences of World War II
incendiary raids and the two nuclear
bomb attacks on Japan, but these expe-
riences were not completely docu-
mented. More useful data have been
obtained from full-scale and model tests
conducted in recent years.
7.55 The spread of fire between
buildings can result from the ignition of
combustible materials heated by fires in
adjacent buildings, ignition of heated
combustible materials by contact with
flames, sparks, embers, or brands, and
the ignition of unheated combustible
materials by contact with flames or
burning brands. Spread by heating, due
either to convection, i.e., to the flow of
INCENDIARY EFFECTS
299
hot gases, or to absorption of radiation,
is a short-range effect, whereas spread
by firebrands may be either short or long
range. Hence, an important criterion of
the probability of fire spread is the dis-
tance between buildings. The lower the
building density, the less will be the
probability that fire will spread from one
structure to another. In an urban area,
especially one fairly close to the explo-
sion point, where substantial blast dam-
age has occurred, the situation would be
changed substantially. A deep, almost
continuous layer of debris would cover
the ground, thereby providing a medium
for the ready spread of fires.
7.56 Combustible building surfaces
exposed to a thermal radiation intensity
of as low as 0.4 cal/cm2 per second for
extended periods of time will ultimately
burst into flame. The radiating portions
of a burning building emit about 4
cal/cm2 per second. Consequently, radi-
ation from a burning building may cause
ignition of an adjacent building. Such
ignition by radiation is probable for
most structures if the dimensions of the
burning structure are as large as, or
larger than, the distance to the unburned
structure. The convective plume of hot
gases from a burning building would
come into contact with another building
which is farther away than the range for
radiation fire spread only under condi-
tions of extremely high wind. There-
fore, fire spread by convective heat
transfer is not expected to be a signifi-
cant factor under normal terrain and
weather conditions.
7.57 Fires can be spread between
buildings by burning brands which are
borne aloft by the hot gases and carried
downwind for considerable distances.
The fires can thus spread to distances
greater than those at which radiative and
convective heating can have a signifi-
cant effect. Long-range fire spread by
brands could greatly extend the area of
destruction by urban fires resulting from
nuclear explosions; there is no single
method for predicting the spread but
computer models are being developed
for this purpose.
MASS FIRES
7.58 Under some conditions the
many individual fires created by a nu-
clear explosion can coalesce into mass
fires. The types of mass fires of particu-
lar interest, because of their great po-
tential for destruction, are “fire storms”
and conflagrations. In a fire storm many
fires merge to form a single convective
column of hot gases rising from the
burning area and strong, fire-induced,
radial (inwardly directed) winds are as-
sociated with the convective column.
Thus the fire front is essentially station-
ary and the outward spread of fire is
prevented by the in-rushing wind; how-
ever, virtually everything combustible
within the fire storm area is eventually
destroyed. Apart from a description of
the observed phenomena, there is as yet
no generally accepted definition of a fire
storm. Furthermore, the conditions,
e.g., weather, ignition-point density,
fuel density, etc., under which a fire
storm may be expected are not known.
Nevertheless, based on World War II
experience with mass fires resulting
from air raids on Germany and Japan,
the minimum requirements for a fire
storm to develop are considered by
some authorities to be the following: (1)
at least 8 pounds of combustibles per
square foot of fire area, (2) at least half
300
THERMAL RADIATION AND ITS EFFECTS
of the structures in the area on fire
simultaneously, (3) a wind of less than 8
miles per hour at the time, and (4) a
minimum burning area of about half a
square mile. High-rise buildings do not
lend themselves to formation of fire
storms because of the vertical dispersion
of the combustible material and the baf-
fle effects of the structures.
7.59 Conflagrations, as distinct
from fire storms, have moving fire fronts
which can be driven by the ambient
wind. The fire can spread as long as
there is sufficient fuel. Conflagrations
can develop from a single ignition,
whereas fire storms have been observed
only where a large number of fires are
burning simultaneously over a relatively
large area.
7.60 Another aspect of fire spread is
the development of mass fires in a forest
following primary ignition of dried
leaves, grass, and rotten wood by the
thermal radiation. Some of the factors
which will influence the growth of such
fires are the average density and mois-
ture content of the trees, the ratio of
open to tree-covered areas, topography,
season of the year, and meteorological
conditions. Low atmospheric humidity,
strong winds, and steep terrain favor the
development of forest fires. In general, a
deciduous forest, particularly when in
leaf, may be expected to burn less rap-
idly and with less intensity than a forest
of coniferous trees. Green leaves and
the trunks of trees would act as shields
against thermal radiation, so that the
number of points at which ignition
occurs in a forest may well be less than
would appear at first sight.
INCENDIARY EFFECTS IN JAPAN
THE NUCLEAR BOMB AS AN
INCENDIARY WEAPON
7.61 The incendiary effects of a
nuclear explosion do not present any
especially characteristic features. In
principle, the same overall result, as
regards destruction by fire and blast,
might be achieved by the use of con-
ventional incendiary and high-explosive
bombs. It has been estimated, for ex-
ample, that the fire damage to buildings
and other structures suffered at Hiro-
shima could have been produced by
about 1,000 tons of incendiary bombs
distributed over the city. It can be seen,
however, that since this damage was
caused by a single nuclear bomb of only
about 12.5 kilotons energy yield, nu-
clear weapons are capable of causing
tremendous destruction by fire, as well
as by blast.
7.62 Evidence was obtained from
the nuclear explosions over Japan that
the damage by fire is much more de-
pendent upon local terrain and meteoro-
logical conditions than are blast effects.
At both Hiroshima and Nagasaki the
distances from ground zero at which
particular types of blast damage were
experienced were much the same. But
the ranges of incendiary effects were
quite different. In Hiroshima, for exam-
ple, the total area severely damaged by
fire, about 4.4 square miles, was
INCENDIARY EFFECTS IN JAPAN
301
roughly four times as great as in Naga-
saki. One contributory cause was the
irregular layout of Nagasaki as com-
pared with Hiroshima; also greater de-
struction could probably have been
achieved by a change in the burst point.
Nevertheless, an important factor was
the difference in terrain, with its asso-
ciated building density. Hiroshima was
relatively flat and highly built up,
whereas Nagasaki had hilly portions
near ground zero that were bare of
structures.
ORIGIN AND SPREAD OF FIRES IN
JAPAN
7.63 Definite evidence was ob-
tained from Japanese observers that the
thermal radiation caused thin, dark cot-
ton cloth, such as the blackout curtains
that were in common use during the
war, thin paper, and dry, rotted wood to
catch fire at distances up to 3,500 feet
(0.66 mile) from ground zero. It was
reported that a cedar bark roof farther
out was seen to burst into flame, ap-
parently spontaneously, but this was not
definitely confirmed. Abnormal en-
hanced amounts of radiation, due to
reflection, scattering, and focusing ef-
fects, might have caused fires to origi-
nate at isolated points (Fig. 7.63).
7.64 From the evidence of charred
wood found at both Hiroshima and Na-
gasaki, it was originally concluded that
such wood had actually been ignited by
thermal radiation and that the flames
were subsequently extinguished by the
blast. But it now seems more probable
that, apart from some exceptional in-
stances, there was no actual ignition of
the wood. The absorption of the thermal
radiation caused charring in sound wood
but the temperatures were generally not
high enough for ignition to occur
(§ 7.28). Rotted and checked (cracked)
wood and excelsior, however, have
been observed to burn completely, and
the flame was not greatly affected by the
blast wave.
7.65 It is not known to what extent
thermal radiation contributed to the ini-
tiation of fires in the nuclear bombings
in Japan. It is possible, that, up to a mile
or so from ground zero, some fires may
have originated from secondary causes,
such as upsetting of stoves, electrical
shortcircuits, broken gas lines, and so
on, which were a direct effect of the
blast wave. A number of fires in indus-
trial plants were initiated by furnaces
and boilers being overturned, and by the
collapse of buildings on them.
7.66 Once the fires had started,
there were several factors, directly re-
lated to the destruction caused by the
nuclear explosion, that influenced their
spreading. By breaking windows and
blowing in or damaging fire shutters
(Fig. 7.66), by stripping wall and roof
sheathing, and collapsing walls and
roofs, the blast made many buildings
more vulnerable to fire. Noncombustible
(fire-resistive) structures were often left
in a condition favorable to the internal
spread of fires by damage at stairways,
elevators, and in firewall openings as
well as by the rupture and collapse of
floors and partitions (see Fig. 5.23).
7.67 On the other hand, when
combustible frame buildings were
blown down, they did not burn as rap-
idly as they would have done had they
remained standing. Moreover, the non-
combustible debris produced by the
blast frequently covered and prevented
the burning of combustible material.
302
THERMAL RADIATION AND ITS EFFECTS
Figure 7.63. The top of a wood pole was reported as being ignited by the thermal radiation
(1.25 miles from ground zero at Hiroshima, 5 to 6 cal/cm2). Note the unburned
surroundings; the nearest burned building was 360 feet away.
INCENDIARY EFFECTS IN JAPAN
303
Figure 7.66. Fire shutters in building blown in or damaged by the blast; shutter at center
probably blown outward by blast passing through building (0.57 mile from
ground zero at Hiroshima).
There is some doubt, therefore, whether
on the whole the effect of the blast was
to facilitate or to hinder the development
of fires at Hiroshima and Nagasaki.
7.68 Although there were fire-
breaks, both natural, e.g., rivers and
open spaces, and artificial, e.g., roads
and cleared areas, in the Japanese cities,
they were not very effective in prevent-
ing the fires from spreading. The reason
was that fires often started simultan-
eously on both sides of the firebreaks, so
that they could not serve their intended
purpose. In addition, combustible ma-
terials were frequently strewn by the
blast across the firebreaks and open
spaces, such as yards and street areas,
so that they could not prevent the spread
of fires. Nevertheless, there were a few
instances where firebreaks assisted in
preventing the burnout of some fire-re-
sistive buildings.
7.69 One of the important aspects
of the nuclear attacks on Japan was that,
in the large area that suffered simulta-
neous blast damage, the fire departments
were completely overwhelmed. It is true
that the fire-fighting services and equip-
ment were poor by American standards,
but it is doubtful if much could have
been achieved, under the circumstances,
by more efficient fire departments. At
Hiroshima, for example, 70 percent of
the firefighting equipment was crushed
in the collapse of fire houses, and 80
percent of the personnel were unable to
304
THERMAL RADIATION AND ITS EFFECTS
respond. Even if men and machines had
survived the blast, many fires would
have been inaccessible because of the
streets being blocked with debris. For
this reason, and also because of the fear
of being trapped, a fire company from
an area which had escaped destruction
was unable to approach closer than
6,600 feet (1.25 miles) from ground
zero at Nagasaki.
7.70 Another contributory factor to
the destruction by fire was the failure of
the water supply in both Hiroshima and
Nagasaki. The pumping stations were
not largely affected, but serious damage
was sustained by distribution pipes and
mains, with a resulting leakage and drop
in available water pressure. Most of the
lines above ground were broken by col-
lapsing buildings and by heat from the
fires which melted the pipes. Some
buried water mains were fractured and
others were broken due to the collapse
or distortion of bridges upon which they
were supported (§ 5.106).
7.71 About 20 minutes after the
detonation of the nuclear bomb at Hiro-
shima, a mass fire developed showing
many characteristics usually associated
with fire storms. A wind blew toward
the burning area of the city from all
directions, reaching a maximum veloc-
ity of 30 to 40 miles per hour about 2 to
3 hours after the explosion, decreasing
to light or moderate and variable in
direction about 6 hours after. The wind
was accompanied by intermittent rain,
light over the center of the city and
heavier about 3,500 to 5,000 feet (0.67
to 0.95 mile) to the north and west. Rain
in these circumstances was apparently
due to the condensation of moisture on
particles from the fire when they reached
a cooler area. The strong inward draft at
ground level was a decisive factor in
limiting the spread of fire beyond the
initial ignited area. It accounts for the
fact that the radius of the burned-out
area was so uniform in Hiroshima and
was not much greater than the range in
which fires started soon after the explo-
sion. However, virtually everything
combustible within this region was de-
stroyed.
7.72 No definite fire storm occurred
at Nagasaki, although the velocity of the
southwest wind blowing between the
hills increased to 35 miles an hour when
the conflagration had become well es-
tablished, perhaps about 2 hours after
the explosion. This wind tended to carry
the fire up the valley in a direction where
there was nothing to burn. Some 7 hours
later, the wind had shifted to the east
and its velocity had dropped to 10 to 15
miles per hour. These winds undoubt-
edly restricted the spread of fire in the
respective directions from which they
were blowing. The small number of
dwellings exposed in the long narrow
valley running through Nagasaki proba-
bly did not furnish sufficient fuel for the
development of a fire storm as compared
to the many buildings on the flat terrain
at Hiroshima.
TECHNICAL ASPECTS OF THERMAL RADIATION
305
TECHNICAL ASPECTS OF THERMAL RADIATION4
DISTRIBUTION AND ABSORPTION OF
ENERGY FROM THE FIREBALL
7.73 Spectroscopic studies made in
the course of weapons tests have shown
that the fireball does not behave exactly
like a black body, i.e., as a perfect
radiator. Generally, the proportion of
radiations of longer wavelength (greater
than 5,500 A) corresponds to higher
black body temperatures than does the
shorter wave emission. The assumption
of black body behavior for the fireball,
however, serves as a reasonable ap-
proximation in interpreting the thermal
radiation emission characteristics. For a
black body, the distribution of radiant
energy over the spectrum can be related
to the surface temperature by Planck’s
radiation equation. If EKdK denotes the
energy density, i.e., energy per unit
volume, in the wavelength interval
X to X + dX, then,
_ Sir/n? 1
л V- ’ hc/XkT , ’
e -1
(7.73.1)
where c is the velocity of light, h is
Planck’s quantum of action, к is Boltz-
mann’s constant, i.e., the gas constant
per molecule, and T is the absolute
temperature. It will be noted that hc/\ is
the energy of the photon of wavelength
X (§ 1.74).
7.74 From the Plank equation it is
possible to calculate the rate of energy
emission (or radiant power) of a black
body for a given wavelength, i.e., Jx, as
a function of wavelength for any spe-
cified temperature, since Jx is related to
Exby
JK = ^EK, (7.74.1)
where JK is in units of energy (ergs) per
unit area (cm2) per unit time (sec) per
unit wavelength (A). The results of such
calculations for temperatures ranging
from 100 million (108) degrees to
2,000°K are shown in Fig. 7.74. It is
seen that the total radiant power, which
is given by the area under each curve,
decreases greatly as the temperature is
decreased.
7.75 An important aspect of Fig.
7.74 is the change in location of the
curves with temperature; in other
words, the spectrum of the radiant en-
ergy varies with the temperature. At
high temperatures, radiations of short
wavelength predominate, but at low
temperatures those of long wavelength
make the major contribution. For ex-
ample, in the exploding weapon, before
the formation of the fireball, the tem-
perature is several tens of million de-
grees Kelvin. Most of the (primary)
thermal radiation is then in the wave-
length range from about 0.1 to 100 A,
i.e., 120 to 0.12 kilo-electron volts
(keV) energy, corresponding roughly to
the soft X-ray region (Fig. 1.74). This is
the basis of the statement made earlier
that the primary thermal radiation from
’The remaining sections of this chapter may be omitted without loss of continuity.
306
THERMAL RADIATION AND ITS EFFECTS
RADIANT POWER (ERGS/CM2-SEC-A)
WAVE LENGTH (ANGSTROMS)
Figure 7.74. Radiant power of a black body as a function of wavelength at various
temperatures.
TECHNICAL ASPECTS OF THERMAL RADIATION
307
a nuclear explosion consists largely of X
rays. These radiations are absorbed by
the surrounding air to form the fireball
from which the effective thermal radia-
tion of present interest is emitted in the
ultraviolet, visible, and infrared regions
of the spectrum. The dimensions of the
fireball in which the thermal X rays are
absorbed depends on the ambient air
density, as will be seen shortly.
7.76 It will be recalled that the
thermal radiation received at the earth’s
surface differs to some extent from that
leaving the fireball. The reason is that
the radiations of shorter wavelength,
i.e., in the ultraviolet, are more readily
absorbed than the others by the atmos-
phere between the burst point and the
earth’s surface. The thermal radiation
received at a distance from a nuclear
explosion is fairly characteristic of a
black body at a temperature of about
6,000 to 7,000°K, although somewhat
depleted in the ultraviolet and other
shorter wavelengths. Even if the deto-
nation occurs at very high altitudes, the
thermal radiation from the low-density
fireball must pass through the denser
atmosphere before reaching the ground.
The effective thermal radiation received
on the earth’s surface in this case is,
therefore, also composed of the longer
wavelengths.
7.77 An expression for the wave-
length (XJ corresponding to the max-
imum in the radiant power as a function
of the black body temperature can be
obtained by differentiating equation
(7.74.1) with respect to wavelength and
equating the result to zero. It is then
found that Ч
Ч = V ’ (7-77.1)
where Cis a constant, equal to 2.90 x
107 angstroms-degrees K. This expres-
sion is known as Wien’s displacement
law.
7.78 The temperature at which the
maximum in the radiant power distribu-
tion from a black body should just fall
into the visible spectrum, i.e., wave-
length 3,850 A, is found from equation
(7.77.1) to be about 7,500°K. This
happens to be very close to the max-
imum surface temperature of the fireball
after the minimum, i.e., during the sec-
ond radiation pulse (Fig. 2.39). Since
the apparent surface temperature gener-
ally does not exceed 8,000°K and the
average is considerably less, it is evi-
dent that the thermal energy emitted in
the second pulse should consist mainly
of visible and infrared rays, with a
smaller proportion in the ultraviolet re-
gion of the spectrum. This has been
found to be the case in actual tests, even
though the fireball deviates appreciably
from black body behavior at this stage.
7.79 The mean free path (§ 2.113)
in cold air, at sea-level density, of X-ray
photons with energies from about 0.5 to
15 keV is given by the approximate
relationship
£3
Mean free path « — cm, (7.79.1)
where E is the photon energy in keV. In
order to make some order-of-magnitude
calculations of the distances in which
thermal X rays from a nuclear explosion
are absorbed in air, a convenient round-
number temperature of 107 degrees
Kelvin will be used for simplicity. From
equation (7.77.1), the wavelength at
which the rate of emission of radiation
308
THERMAL RADIATION AND ITS EFFECTS
from a black body at this temperature is
a maximum is found to be 2.9 A. Ac-
cording to equation (1.74.2) this corre-
sponds to a photon energy of 4.3 keV,
and from equation (7.79.1) the mean
free path of these photons in normal air
is about 15 cm. In traversing a distance
of one mean free path the energy of the
radiations decreases by a factor of e,
i.e., approximately 2.7; hence 90 per-
cent of the energy will be deposited
within a radius of 2.3 mean free paths. It
is seen, therefore, that 4.3-keV radia-
tion will be largely absorbed in a dis-
tance of about 35 cm, i.e., a little over 1
foot, in a sea-level atmosphere.
7.80 The primary thermal radia-
tions from a nuclear explosion cover a
wide range of wavelengths, as is evident
from Fig. 7.74. But to obtain a rough
indication of the initial size of the fire-
ball, the wavelength (or energy) at
which the radiant power from a black
body is a maximum may be taken as
typical. It follows, therefore, from the
results given above that the thermal X
rays from a nuclear explosion will be
almost completely absorbed by about a
foot of air at normal density. The ox-
ygen and nitrogen in the air in the vi-
cinity of the explosion are considerably
ionized, and the ions do not absorb as
effectively as do neutral molecules.
Nevertheless, in a nuclear explosion in
the atmosphere where the air density
does not differ greatly from the sea-level
value, most of the X rays, which con-
stitute the primary thermal radiation,
will be absorbed within a few feet of the
explosion. It is in this manner that the
initial fireball is formed in an air burst.
7.81 With increasing altitude, the
air density decreases roughly by a factor
of ten for every 10 miles (see § 10.124);
hence at 155,000 feet (approximately 30
miles), for example, the density is about
10of the sea-level value. The mean
free path of the photon varies inversely
as the density, so that for nuclear ex-
plosions at an altitude of about 30 miles,
the region of the air heated by X rays,
which is equivalent to the fireball, ex-
tends over a radius of some thousands of
feet. In spite of the lower density, the
mass of heated air in this large volume is
much greater than in the fireball asso-
ciated with a nuclear explosion at lower
altitudes, and so the temperature at-
tained by the air is lower.
THERMAL POWER AND ENERGY
FROM THE FIREBALL
7.82 According to the Stefan-
Boltzmann law, the total amount of en-
ergy (of all wavelengths), J, radiated per
square centimeter per second by a black
body in all directions in one hemisphere
is related to the absolute temperature, T,
by the equation
J=(i7\ (7.82.1)
where cr is the Stefan-Boltzmann con-
stant. The value of J can also be ob-
tained by integration of equation
(7.74.1) over all wavelengths from zero
to infinity. It is then found that
o’ = 2'ттЧ4/15/Рс2
= 5.67 x 10~5 erg cm-2 sec-1 deg-4
= 1.36 x 10⁻¹² cal cm-2 sec-1
deg-4.
With o’ known, the total radiant energy
intensity from the fireball behaving as a
black body can be readily calculated for
any required temperature.
7.83 In accordance with the defini-
tion of 7, given above, it follows that the
TECHNICAL ASPECTS OF THERMAL RADIATION
309
total rate of emission of radiant energy
from the fireball can be obtained upon
multiplying the expression in equation
(7.82.1) by the area. If R is the radius of
the fireball, its area is 4irP2, so that the
total rate of thermal energy emission (or
total radiant power) is o-T4 x 4irP2.
Representing this quantity by the sym-
bol P, it follows that
P = 41ГО-Т4/?2
= 1.71 x 10 " T4R2 cal/sec,
where Tis in degrees Kelvin and R is in
centimeters. Alternatively, if the radius,
R, is expressed in feet, then
P = 1.59 x 10 « T4R2 cal/sec.
(7.83.1)
7.84 Complex interactions of hy-
drodynamic and radiation factors govern
the variation of the apparent size and
temperature of the fireball with time.
Nevertheless, the fireball thermal power
can be calculated as a function of time
based upon theoretical considerations
modified by experimental measure-
ments. The results are conveniently ex-
pressed as the scaled power, i.e., P/Pmax,
versus the scaled time, i.e., f/fmax; Pis
the thermal power at any time rafter the
explosion, and the Pmax is the maximum
value of the thermal power at the time,
Zmax, of the second temperature maxi-
mum (§2.125). The resulting (left
scale) curve, shown in Fig. 7.84, is then
of general applicability irrespective of
the yield of the explosion. Changes in
yield and altitude can affect the shape of
the power pulse; however, the values in
Fig. 7.84 are reasonably accurate for
most air bursts below 100,000 feet. The
zero of the scaled time axis is the time of
the first maximum, but for all practical
purposes this may be taken as the ex-
plosion time.
THERMAL ENERGY FROM AN AIR
BURST
7.85 In order to make the power-
time curve specific for any particular
explosion energy yield, it is necessary to
know the appropriate values of Pmax and
/max. Theoretically, these quantities
should depend on the air density, but
experimental evidence indicates that the
dependence is small for air bursts at
altitudes below 15,000 feet; in this alti-
tude range, P and t are related
approximately to the yield, W kilotons,
in the following manner:
P ~ 3.18 56 kilotons/sec
max
t ~ 0.0417 W1’44 sec.
max
For heights of burst above 15,000 feet
the data are sparse. Theoretical calcula-
tions indicate that the corresponding re-
lationships are as follows:
3 56 И/0 59
P = r z/ч/ -.л T kilotons/sec.
max [p(^)/p0]045
rmax = 0.038 44[p(/z)/p0]°36 sec.
In these expressions p(/i) is the ambient
air density at the burst altitude and p0 is
the normal ambient air density at sea
level (taken to be 1.225 x 10~3
gram/cm3). Values of p(/?)/p0 are given
in Table 7.85 for several altitudes. Use
of the preceding equations results in a
discontinuity at 15,000 feet. For heights
of burst at or near that altitude, values
should be calculated by both sets of
equations, and the appropriate result
should be used depending on whether
offensive or defensive conservatism is
(Text continued on page 312.)
310
THERMAL RADIATION AND ITS EFFECTS
The curves in Fig. 7.84 show the
variation with the scaled time, t/t , of
the scaled fireball power, PZP (left
ordinate) and of the percent of the total
thermal energy emitted, E/E{ox (right
ordinate), in the thermal pulse of an air
burst.
Scaling. In order to apply the data
in Fig. 7.84 to an explosion of any
yield, W kilotons, the following ex-
pressions are used for bursts below
15,000 feet:
P . « 3.18 W0 56 kilotons/sec.
Example
Given: A 500 KT burst at 5,000 feet
altitude
Find: (a) The rate of emission of
thermal energy, (b) the total amount of
thermal energy emitted, at 1 second
after the explosion.
Solution: Since the explosion is
below 15,000 feet,
t = 0.0417 x (500)044 = 0.64
max v z
sec, and the normalized time at 1 sec
after the explosion is
t ~ 0.0417 W044 sec.
max
For bursts above 15,000 feet, the fol-
lowing expressions are used:
3.56 W'159
[p(/>)/p„l045
kilotons/sec.
Pmax
= 0.038 44[р(Л)/р0]°36 sec.
In all cases E = fW.
In these expressions /max is the time
after the explosion for the temperature
maximum in the second thermal pulse,
Pnax is the maximum rate (at rmax) of
emission of thermal energy from the
fireball, Eoi is the total thermal energy
emitted by the fireball, f is the thermal
partition (Table 7.88), and p(/i)/p0 is
ratio of the ambient air density at burst
altitude to that at sea level (Table 7.85).
(a) From Fig. 7.84, the value of P/Pmax
at this scaled time is 0.59, and since
Pmax = 3.18 x (500)°56 = 103 kilo-
tons/sec,
it follows that
P = 0.59 x 103 = 60.8 kilotons/sec
= 60.8 x 10¹² cal/sec. Answer.
(b) For a yield of 500 KT and a burst
altitude of 5,000 feet, f(=E{JW) is
found from Table 7.88 to be about 0.35;
hence,
E = 500 x 0.35 = 175 kilotons,
tot
At the scaled time of 1.56, the value of
E!E{qx from Fig. 7.84 is 40 percent, i.e.,
0.40, so that
E = 0.40 x 175 = 70 kilotons
= 70 x 10l2cal. Answer.
Reliability: For bursts below
15,000 feet, the data in Table 7.88 to-
gether with the curves in Fig. 7.84 are
accurate to within about ± 25 percent.
For bursts between 15,000 and 100,000
feet, the accuracy is probably within ±
50 percent. Explosions above 100,000
feet are described in § 7.89 et seq.
NORMALIZED POWER (Р/Ртак'>
NORMALIZED TIME (///max)
Figure 7.84. Scaled (or normalized) fireball power and fraction of thermal energy emitted
versus scaled (or normalized) time in the thermal pulse of an air burst below
100,000 feet.
312
THERMAL RADIATION AND ITS EFFECTS
Table 7.85
ATMOSPHERIC DENSITY RATIOS
Altitude (feet) Density Ratio, Р(Л)/р„ Altitude (feet) Density Ratio, p(Wp„
15,000 0.63 60,000 0.095
20,000 0.53 65,000 0.075
25,000 0.45 70,000 0.059
30,000 0.37 75,000 0.046
35,000 0.31 80,000 0.036
40,000 0.24 85,000 0.028
45,000 0.19 90,000 0.022
50,000 0.15 95,000 0.017
55,000 0.12 100,000 0.014
desired. For a contact surface burst
(§ 2.127 footnote) the fireball develops
in a manner approaching that for an air
burst of twice the yield, because the
blast wave energy is reflected back from
the surface into the fireball (§ 3.34).
Hence, /max may be expected to be larger
than for an air burst of the same actual
yield.
7.86 The thermal power curve in
Fig. 7.84 (left scale) presents some fea-
tures of special interest. As is to be
expected, the thermal power (or rate of
emission of radiant energy) of the fire-
ball rises to a maximum, just as does the
temperature in the second radiation
pulse. However, since the thermal
power is roughly proportional to T4, it
increases and decreases much more
rapidly than does the temperature. This
accounts for the sharp rise to the max-
imum in the PIP curve, followed by a
somewhat less sharp drop which tapers
off as the fireball approaches its final
stages. The amount of thermal energy,
E, emitted by the fireball in an air burst
up to any specified time can be obtained
from the area under the curve of P/Piax
versus r/rmax up to that time. The results,
expressed as E/Eiot (percent) versus
r/rmax, are shown by the second curve
(right scale) in Fig. 7.84, where E is
the total thermal energy emitted by the
fireball. It is seen that at a time equal to
10 rmax about 80 percent of the thermal
energy will have been emitted; hence
this time may be taken as a rough mea-
sure of the effective duration of the
thermal pulse for an air burst. Since fmax
increases with the explosion energy
yield, so also does the pulse length.
7.87 The fact that the thermal pulse
length increases with the weapon yield
has a bearing on the possibility of peo-
ple taking evasive action against thermal
radiation. Evasive action is expected to
have greater relative effectiveness for
explosions of higher than lower yield
because of the longer thermal pulse du-
ration. The situation is indicated in an-
other way in Fig. 7.87, which shows the
thermal energy emission as a function of
actual time, rather than of t/tm^ for four
different explosion energy yields. The
data were derived from the correspond-
ing curve in Fig. 7.84 by using the
TECHNICAL ASPECTS OF THERMAL RADIATION
313
appropriate calculated value of /max for
each yield. At the lower energy yields
the thermal radiation is emitted in such a
short time that no evasive action is pos-
sible. At the higher yields, however,
exposure to much of the thermal radia-
tion could be avoided if evasive action
were taken within a fraction of a second
of the explosion time. It must be re-
membered, of course, that even during
this short period a very considerable
amount of thermal energy will have
been emitted from an explosion of high
yield.
7.88 The fraction of the explosion
energy yield in the form of thermal
radiation, i.e., EJW, is called the
‘‘thermal partition" and is represented
by the symbol f. Estimated values of f
are given in Table 7.88 for air bursts
with yields in the range from 1 kiloton
to 10 megatons at altitudes up to
100,000 feet (19 miles). The data for
heights of burst up to 15,000 feet were
obtained primarily from experimental
results. For higher bursts altitudes, the
values were obtained by calculations,
various aspects of which were checked
with experimental results. They are
considered to be fairly reliable for yields
between 1 kiloton and 1 megaton at
altitudes up to 50,000 feet (9.5 miles).
Outside this range of yields and alti-
tudes, the data in Table 7.88 may be
used with less confidence. Values of f
for burst altitudes above 100,000 feet
are given in § 7.90 (see also § 7.104).
Table 7.88
THERMAL PARTITION FOR VARIOUS EXPLOSION YIELDS AT DIFFERENT
ALTITUDES
Thermal Partition, f
Height of Total Yield (kilotons)
Burst -------------------------------------------
(kilofeet) 1 10 100 1,000 10.000
Up to 15 0.35 0.35 0.35 0.35 0.35
20 0.35 0.36 0.39 0.41 0.43
30 0.35 0.36 0.39 0.41 0.43
40 0.35 0.36 0.38 0.40 0.42
50 0.35 0.36 0.38 0.40 0.42
60 0.35 0 37 0.38 0.40 0.42
70 0.36 0.37 0.39 0.40 0.42
SO 0.37 0 38 0.39 0.41 0.43
90 0.38 0.39 0.40 0.41 0.43
100 0.40 0.40 0.41 0.42 0.45
314
THERMAL RADIATION AND ITS EFFECTS
THERMAL ENERGY EMITTED (PERCENT)
Figure 7.87. Percentage of thermal energy emitted as a function of time for air bursts of
various yields.
THERMAL RADIATION IN
HIGH-ALTITUDE EXPLOSIONS
7.89 The results described above
are applicable to detonations at altitudes
below about 100,000 feet (19 miles)
where the density of the air is still ap-
preciable. At higher altitudes, the fire-
ball phenomena change, as described in
Chapter II, and so also do the thermal
pulse characteristics, such as shape and
length, and the thermal partition. With
increasing altitude, there is a tendency
for the relative duration of the first
pulse, i.e., up to the first temperature
minimum (§§ 2.39, 2.125), to increase
and for the minimum to be less marked.
Up to an altitude of about 100,000 feet,
these changes are small and so also are
those in the second thermal pulse. The
normalized plot (Fig. 7.84) is thus a
satisfactory representation in this alti-
tude range. However, between 100,000
and 130,000 feet (25 miles), the pulse
shape changes drastically. The first
minimum observed at lower altitudes
disappears and essentially all the ther-
mal radiation is emitted as a single pulse
(§ 2.132). The thermal emission rises to
a maximum in an extremely short time
TECHNICM ASPECTS OF THERMAI RADIATION
315
and then declines steadily, at first rap-
idly and later more slowly. For an ex-
plosion in the megaton range at an alti-
tude of 250,000 feet (about 47 miles),
the duration of the thermal pulse is less
than a second compared with a few
seconds for a similar burst below
100,000 feet (cf. Fig. 7.87). Scaling of
the pulse length with respect to the ex-
plosion yield at high altitudes is very
complex and depends on a variety of
factors. However, the duration of the
thermal pulse is probably not strongly
dependent on the total yield. At altitudes
above roughly 270,000 feet (51 miles),
the pulse length increases because of the
larger mass and lower temperature of
the radiating region (§ 7.91).
7.90 At high altitudes shock waves
form much less readily in the thinner air
and consequently the fireball is able to
radiate thermal energy that would, at
lower altitudes, have been transformed
to hydrodynamic energy of the blast
wave. Furthermore, the thinner air
allows the primary thermal radiation (X
rays) from the explosion to travel much
farther than at lower levels. Some of this
radiation travels so far from the source
that it makes no contribution to the en-
ergy in the fireball. Between about
100,000 and 160,000 feet (30 miles),
the first factor is dominant and the pro-
portion of energy in the blast wave de-
creases; consequently, the thermal en-
ergy increases. In this altitude range the
thermal partition, /, is about 0.6, com-
pared with 0.40 to 0.45 at 100,000 feet
(Table 7.88). Above 160,000 feet,
however, the second factor, i.e., escape
of thermal X rays, becomes increasingly
important; the thermal partition de-
creases to about 0.25 at 200,000 feet (38
miles) and remains at this value up to
roughly 260,000 feet (49 miles). At still
higher altitudes there is a change in the
fireball behavior (§ 2.135) and the ther-
mal partition decreases very rapidly
with increasing altitude of the explo-
sion.
7.91 At heights of burst above
about 270,000 feet, only the primary X
rays traveling downward are absorbed
and the energy deposition leads to the
formation of the incandescent X-ray
pancake described in Chapter II. This
heated region then reradiates its energy
at longer wavelengths over a period of
several seconds. The altitude and di-
mensions of the pancake depend to
some extent on the explosion yield but,
as stated in § 2.134, reasonable average
values are 30,000 feet for the thickness,
270,000 feet for the mean altitude, and
the height of burst minus 270,000 feet
for the radius at this altitude. The alti-
tude and thickness of the reradiating
region are essentially independent of the
height of burst above 270,000 feet, but
the mean radius increases with the burst
height. The shape of the region thus
approaches a thick disk (or frustum)
centered at about 270,000 feet altitude.
7.92 Not more than one-fourth of
the X-ray energy from the explosion is
absorbed in the low-density air of the
reradiating region, and only a small
fraction, which decreases with increas-
ing height of burst, is reradiated as sec-
ondary radiation. Consequently, only a
few percent of the weapon energy is
emitted as thermal radiation capable of
causing damage at the earth’s surface.
In fact, for bursts at altitudes exceeding
some 330,000 feet (63 miles), the ther-
mal radiation from a nuclear explosion
even in the megaton range is essentially
ineffective so far as skin burns, ignition,
316
THERMAL RADIATION AND ITS EFFECTS
etc., are concerned. However, the
early-time debris, which separates from
the X-ray pancake (§ 2.135), is at a
fairly high temperature and it emits a
very short pulse of thermal energy that
can cause eye injury to individuals
looking directly at the explosion
(§ 12.79 et seq.).
RADIANT EXPOSURE-DISTANCE RELATIONSHIPS
AIR BURSTS
7.93 The following procedure is
used to calculate the dependence of the
radiant exposure of a target (§ 7.35)
upon its distance from an air burst of
specified yield. As seen earlier in this
chapter, such information, which is
given in Fig. 7.42, combined with the
data in Tables 7.35 and 7.40, permits
estimates to be made of the probable
ranges for various thermal radiation ef-
fects.
7.94 If there is no atmospheric at-
tenuation, then at a distance D from the
explosion the thermal radiation energy,
Eio[ may be regarded as being spread
uniformly over the surface of a sphere of
area 41TD2. If the radiating fireball is
treated as a point source, the energy
received per unit area of the sphere
would be E|o|/4irZ>. If attenuation were
due only to absorption in a uniform
atmosphere, e.g., for an air burst, this
quantity would be multiplied by the
factor e~*D, where к is an absorption
coefficient averaged over the whole
spectrum of wavelengths. Hence in
these circumstances, using the symbol
Qto represent the radiant exposure, i.e.,
the energy received per unit area normal
to the direction of propagation, at a
distance D from the explosion, it fol-
lows that
p
Q = ——ин— e~*D. (7.94.1)
v 41TD2
7.95 When scattering of the radia-
tion occurs, in addition to absorption,
the coefficient к changes with distance
and other variables. The simple expo-
nential attenuation factor in equation
(7.94.1) is then no longer adequate. A
more useful (empirical) formulation is
P т
° - . <7-95-0
where the transmittance, t, i.e., the
fraction of the radiation (direct and
scattered) which is transmitted, is a
complex function of the visibility (scat-
tering), absorption, and distance.5
7.96 Since F|o| = fW, equation
(7.95.1) for the radiant exposure from
an air burst of yield Wean be expressed
as
Q = (7.96.1)
v 4ir D2 ’
' Scattered radiation does not cause permanent damage to the retina of the eye. Hence, to determine the
effective radiant exposure in this connection equation (7.94.1) should be used; к is about 0.03 km-' for a
visibility of 80 km (50 miles), 0.1 km-' for 40 km (25 miles) and 0.2 km-' for 20 km (12.4 miles).
Scattered radiation can, however, contribute to flashblindness, resulting from the dazzling effect of bright
light (§ 12.83).
RADIANT EXPOSURE-DISTANCE RELATIONSHIPS
317
By utilizing the fact that 1 kiloton of
TNT is equivalent to 1012 calories,
equation (7.96.1) for an air burst be-
comes
Q (cal/cm2) = ’ (7.96.2)
4irD2
where D is in centimeters and W is in
kilotons. If the distance, E>, from the
explosion to the target, i.e., the slant
range, is expressed in kilofeet or miles,
equation (7.96.2) reduces approxi-
mately to
D in kilofeet: Q (cal/cm2) ~ ---
(7.96.3)
3.07/Wt
D in miles: Q (cal/cm2) ~ ----•
(7.96.4)
7.97 In nuclear weapons tests, it is
possible to measure Qand W, and since
the distance D from the explosion is
known the magnitude of the product /т
can be determined from the equations in
§ 7.96. Hence, to obtain / and т indi-
vidually, one of these two quantities
must be determined independently of
the other. The method used is to obtain /
for different conditions from calcula-
tions checked by observations, as stated
in § 7.88. The values of т are then
derived from measurements of /т made
at a large number of weapons tests.
7.98 The transmittance т for any
given atmospheric condition depends on
the solid angle over which scattered ra-
diation can reach a particular exposed
object. For the present purpose it will be
assumed that the target is such, e.g., an
appreciable flat area, that scattered radi-
ation is received from all directions
above, in addition to the direct thermal
radiation from the source. Transmit-
tance data for these conditions are pre-
sented in Fig. 7.98 in terms of burst
altitude and distance of a surface target
from ground zero for a cloudless at-
mosphere with a visibility of 12 miles.
Since actual visibilities in cities are
often less, the values in Fig. 7.98 are
conservative.
7.99 The transmittance values in
Fig. 7.98 were used, in conjunction
with equation (7.96.4) and the thermal
partitions from Table 7.88, to obtain the
data from which the curves in Fig. 7.42
were constructed. If H is the height of
burst and d is the distance from ground
zero of a given point on the surface, the
corresponding slant range for use in
equation (7.96.4) is D = (d2 + H2)l/2. A
height of burst of 200 IV04 feet, with W
in kilotons, was used for the calcula-
tions, but the results in Fig. 7.42 are
reasonably accurate for air bursts at any
altitude up to some 15,000 feet.
7.100 Under unusual conditions
and especially for cities at high-altitude
locations, the visibility might be greater
than at sea level and the transmittance
would be larger than the values given in
Fig. 7.98. The curves show that most
attenuation of radiation occurs within a
few thousand feet of the surface; thus,
the much clearer air at higher altitudes
has less effect. For bursts above about
150,000 feet (28 miles), the transmit-
tance changes slowly with the altitude.
Experimental data indicate that multi-
plying the transmittance by 1.5 corrects
approximately for the effect of reflection
from a cloud layer over the burst. The
same correction may be made for a
snow-covered ground surface. If the
burst and target are both between a
HEIGHT OF BURST (KILOFEET)
DISTANCE FROM GROUND ZERO (KILOFEET)
Figure 7.98. Transmittance, t, to a target on the ground on a typical clear day (visibility =
12 miles).
CM
00
HERMAL RADIATION AND ITS EFFECTS
RADIANT EXPOSURE-DISTANCE RELATIONSHIPS
319
cloud layer and a snow covered surface,
the correction is 1.5 x 1.5 = 2.25.
SURFACE BURSTS
7.101 For a surface burst, the radi-
ant exposures along the earth’s surface
will be less than for equal distances
from an air burst of the same total yield.
This difference arises partly, as indi-
cated in § 7.20, from the decreased
transmittance of the intervening low air
layer due to dust and water vapor pro-
duced by the explosion. Furthermore,
the normal atmosphere close to the
earth’s surface transmits less than at
higher altitudes. In order to utilize the
equations in § 7.96 to determine radiant
exposure for surface bursts, the concept
of an ‘‘effective thermal partition” is
used, together with the normal trans-
mittance, such as given in Fig. 7.98, for
the existing atmospheric conditions.
Based upon experimental data, contact
surface bursts can be represented fairly
well by an effective thermal partition of
0.18. Values of the thermal partition for
other surface bursts are shown in Table
7.101; they have been derived by as-
signing a thermal partition of 0.18 to a
contact surface burst and interpolating
between that value and the air burst
thermal partition values in Table 7.88.
VERY-HIGH-ALTITUDE BURSTS
7.102 In the calculation of the ther-
mal radiation exposure at the surface of
the earth from very-high-altitude nu-
clear explosions, two altitude regions
must be considered because of the
change in the fireball behavior that
occurs at altitudes in the vicinity of
about 270,000 feet (§ 7.91). At burst
heights from roughly 160,000 to
200,000 feet (30 to 38 miles), the ther-
Table 7.101
EFFECTIVE THERMAL PARTITION FOR SURFACE BURSTS
Thermal Partition
Height of Total Yield (kilotons)
Burst ---------------------------------------------
(feet) 1 10 100 1,000 10,000
20 0 19 * * * *
40 0.21 0.19 * * *
70 0.23 0.21 0.19 * *
100 0 26 0.22 0.20 * *
200 0.35 0.25 0.21 0.19 *
400 ** 0.33 0.25 0 21 0.19
700 * * ** 0.28 Q.24 0.21
1.000 ** ** 0.34 0.26 0.22
2.000 ** ** ** 0.34 0.26
4.000 ** ** ** ** 0.33
7,000 ** ** ** 0.35
*These may be treated as contact surface bursts, with f = 0.18.
14 Air bursts, for values of f see Table 7.88.
320
THERMAL RADIATION AND ITS EFFECTS
mal energy capable of causing damage
at the surface of the earth drops sharply
from about 60 percent to about 25 per-
cent, i.e., from / = 0.60 to f= 0.25. As
the height of burst is increased above
200,000 feet, the thermal partition re-
mains about 0.25 up to a height of burst
of approximately 260,000 feet (49
miles). Since a nearly spherical fireball
forms within this latter altitude region,
equation (7.93.3) becomes
21 4 Wt
Q (cal/cm2) = 21 у I , (7.102.1)
where D is the slant range in kilofeet,
and W is the yield in kilotons. A linear
interpolation of the variation of thermal
partition with burst altitude may be per-
formed for bursts between 160,000 feet
and 200,000 feet; however, in view of
the uncertainties in high-altitude burst
phenomenology, it may be desirable to
use the high (0.60) or the low (0.25)
value throughout this burst altitude re-
gion, depending on the degree of con-
servatism desired.
7.103 At burst altitudes of roughly
270,000 feet and above, the thermal
radiation is emitted from the thick X-ray
pancake at a mean altitude of about
270,000 feet, essentially independent of
the actual height of burst (§ 7.91). In
order to use the equations in § 7.96 to
calculate radiant exposures at various
distances from the burst, the approxi-
mation is made of replacing the disklike
radiating region by an equivalent source
point defined in the following manner. If
the distance d from ground zero to the
target position where Q is to be calcu-
lated is less than the height of burst, H,
the source may be regarded as being
located at the closest point on a circle
with the median radius at an altitude of
270,000 feet; this is indicated by the
point S in Fig. 7.103. Hence, for the
target point X, the appropriate slant
range is given approximately by
D (kilofeet) «
{(270? + [’A (W- 270) - dp}1'2,
(7.103.1)
with d and H in kilofeet. This expres-
sion holds even when d is greater than
V2(H - 270); although the quantity in
the square brackets is then negative, the
square is positive. The slant range, Do,
for ground zero is obtained by setting d
in equation (7.103.1) equal to zero;
thus,
Do (kilofeet)—[(270)2 + V2(H - 270)2]"2
If the distance d is greater than the
height of burst, the equivalent point
source may be taken to be approxi-
mately at the center of the radiating disk
at 270,00 feet altitude; then
D (kilofeet) « [(270)2 + d^f\
7.104 For the heights of burst under
consideration, it is assumed that the
fraction 0.8 of the total yield is emitted
as X-ray energy and that 0.25 of this
energy is absorbed in the radiating disk
region. Hence, 0.8 x 0.25 = 0.2 of
the total yield is absorbed. For calculat-
ing the radiant exposure, the total yield
W in the equations in § 7.96 is conse-
quently replaced by 0.2 W. Further-
more, the equivalent of the thermal par-
tition is called the ‘‘thermal
efficiency," e, defined as the effective
fraction of the absorbed energy that is
RADIANT EXPOSURE-DISTANCE RELATIONSHIPS
321
BURST POINT
Figure 7.103. Equivalent point souree at
median radius when height
of burst exceeds distance of
the target, X, from ground
zero.
reradiated. Hence equation (7.96.3), for
example, becomes
/ 17.1 8 Wt
(cal/cm2) = -------—------- ,
where D in kilofeet is determined in
accordance with the conditions de-
scribed in the preceding paragraph. The
values of 8 given in Fig. 7.104 as a
function of height of burst and yield
were obtained by theoretical calcula-
tions.6 The transmittance may be esti-
mated from Fig. 7.98 but no serious
error would be involved by setting it
equal to unity for the large burst heights
involved.
7.105 With the information given
above, it is possible to utilize the equa-
tions in § 7.96 to calculate the approx-
imate radiant exposure, Q, for points on
the earth’s surface at a given distance,
J, from ground zero, for a prescribed
height of burst, H, for explosions of
essentially all burst altitudes. If d and H
are specified, the appropriate slant range
can be determined. Tables 7.88 and
7.101 and Fig. 7.104 are used to obtain
the required thermal partition or thermal
efficiency, and the transmittance can be
estimated from Fig. 7.98 for the known
d and H. Suppose, however, it is re-
quired to reverse the calculations and to
find the slant range to a surface target (or
the corresponding distance from ground
zero for a specified height of burst) at
which a particular value of Q will be
attained. The situation is then much
more difficult because т can be esti-
mated only when the slant range or
distance from ground zero is known.
One approach would be to prepare fig-
ures like Fig. 7.42 for several heights of
burst and to interpolate among them for
any other burst height. Another possi-
bility is to make use of an interation
procedure by guessing a value of t,
e.g., т = 1, to determine a first ap-
proximation to D. With this value of D
and the known height of burst, an im-
proved estimate of т can be obtained
from Fig. 7.98. This is then utilized to
derive a better approximation to D, and
so on until convergence is attained.
'The calculations are actually for the fraction of the absorbed X-ray energy reradiated within 10
seconds; for estimating effects on the ground, the subsequent reradiation can be neglected
EXPLOSION YIELD (KILOTONS)
Figure 7.104. Fraction of absorbed X-ray energy reradiated from high-altitude bursts.
322 THERMAL RADIATION AND ITS EFFECTS
RADIANT EXPOSURE-DISTANCE RELATIONSHIPS
323
BIBLIOGRAPHY
* Bethe, H. A., et aL, “Blast Wave," Univer-
sity of California, Los Alamos Scientific Labo-
ratory, March 1958, LA-2000.
Brode, H. L., “Review of Nuclear Weapons
Effects,’’ Ann. Rev. Nuclear Sci., 18,
153(1968).
Chandler, С. C., et al., “Prediction of Fire
Spread Following Nuclear Explosions," Pacific
Southwest Forest and Range Experiment Sta-
tion, Berkeley, California, 1963, U.S. Forest
Service Paper PSW-5.
Gibbons, M. G., “Transmissivity of the Atmos-
phere for Thermal Radiation from Nuclear
Weapons," U.S. Naval Radiological Labora-
tory, August 1966, USNRDL-TR-1060.
Goodale, T., “Effects of Air Blast on Urban
Fires," URS Research Co., Burlingame, Cali-
fornia, December 1970, OCD Work Unit
25341.
* *Guess, A. W., and R. M. Chapman, “Re-
flection of Point Source Radiation from a Lam-
bert Plane onto a Plane Receiver," Air Force
Cambridge Research Center, TR-57-253, Li-
brary of Congress, Washington, D.C., 1957.
* *Hardy, J. D., “Studies on Thermal Radia-
tion," Cornell University Medical College, PB
154-803, Library of Congress, Washington,
DC., 1952.
*Laughlin, К. P., “Thermal Ignition and Re-
sponse of Materials," Office of Civrl Defense
and Mobilization, 1957, WT-1198.
Martin, S. B., “The Role of Fire in Nuclear
Warfare: An Interpretative Review of the Cur-
rent Technology for Evaluating the Incendiary
Consequences of the Strategic and Tactical
Uses of Nuclear Weapons," URS Research
Co., San Mateo, California, August 1974,
DNA 2692F.
Middleton, W. E., “Vision Through the At-
mosphere," University of Toronto Press, 1958.
Passell, T. O., and R. I. Miller, “Radiative
Transfer from Nuclear Detonations Above
50-Km Altitude," Fire Research Abstracts and
Reviews, 6, 99 (1964), National Academy of
Sciences—National Research Council.
*Randall, P. A., “Damage to Conventional
and Special Types of Residences Exposed to
Nuclear Effects," Office of Civil Defense and
Mobilization, March 1961, WT-1194.
*Vishkanta, R., “Heat Transfer in Thermal
Radiation Absorbing and Scattering Material,"
Argonne National Laboratory, May I960, ANL
6170.
Wiersma, S. J., and S. B. Martin, “Evalua-
tion of the Nuclear Fire Threat to Urban
Areas," Stanford Research Institute, Menlo
Park, California, September 1973, SRI PYU-
XI50
*These documents may be purchased from the National Technical Information Service, Department of
Commerce, Springfield, Virginia, 22161.
**These documents may be obtained from the Library of Congress, Washington, D.C. 20402.
CHAPTER VIII
INITIAL NUCLEAR RADIATION
NATURE OF NUCLEAR RADIATIONS
NEUTRONS AND GAMMA RAYS
8.01 As stated in Chapter I, one of
the special features of a nuclear explo-
sion is the emission of nuclear radia-
tions. These radiations, which are quite
different from the thermal radiation dis-
cussed in the preceding chapter, consist
of gamma rays, neutrons, beta particles,
and a small proportion of alpha parti-
cles. Most of the neutrons and part of
the gamma rays are emitted in the fis-
sion and fusion reactions, i.e., simul-
taneously with the explosion. The re-
mainder of the gamma rays are
produced in various secondary nuclear
processes, including decay of the fission
products. The beta particles are also
emitted as the fission products decay.
Some of the alpha particles result from
the normal radioactive decay of the ura-
nium or plutonium which has escaped
fission in the weapon, and others (he-
lium nuclei) are formed in fusion reac-
tions (§ 1.69).
8.02 Because of the nature of the
phenomena associated with a nuclear
explosion, either in the air or near the
surface, it is convenient, for practical
purposes, to consider the nuclear radia-
tions as being divided into two catego-
324
ries, namely, initial and residual
(§ 1.02). The line of demarcation is
somewhat arbitrary, but it may be taken
as about 1 minute after the explosion,
for the reasons given in § 2.43. The
initial nuclear radiation, with which the
present chapter will be concerned, con-
sequently refers to the radiation emitted
within 1 minute of the detonation. For
underground or underwater explosions,
it is less meaningful to separate the
initial from the residual nuclear radia-
tion (§ 2.82, 2.100), although the dis-
tinction may be made if desired.
8.03 The ranges of alpha and beta
particles are comparatively short and
they cannot reach the surface of the
earth from an air burst. Even when the
fireball touches the ground, the alpha
and beta particles are not very impor-
tant. The initial nuclear radiation may
thus be regarded as consisting only of
the gamma rays and neutrons produced
during a period of 1 minute after the
nuclear explosion. Both of these nuclear
radiations, although different in charac-
ter, can travel considerable distances
through the air. Further, both gamma
rays and neutrons can produce harmful
effects in living organisms (see Chapter
XII). It is the highly injurious nature of
NATURE OF NUCLEAR RADIATIONS
325
these nuclear radiations, combined with
their long range, that makes them such a
significant aspect of nuclear explosions.
The energy of the initial gamma rays
and neutrons is only about 3 percent of
the total explosion energy, compared
with some 35 to 45 percent appearing as
thermal radiation in an air burst, but the
nuclear radiations can cause a consider-
able proportion of the casualties. Nu-
clear radiation can also damage certain
electronic equipment, as will be seen
later in this chapter.
8.04 Most of the gamma rays ac-
companing the actual fission process are
absorbed by the weapon materials and
are thereby converted into other forms
of energy. Thus, only a small proportion
(about 1 percent) of this gamma radia-
tion succeeds in penetrating any dis-
tance from the exploding weapon, but
there are several other sources of
gamma radiation that contribute to the
initial nuclear radiation. Similarly,
many of the neutrons produced in fis-
sion and fusion reactions (§ 1.69) are
reduced in energy and captured by the
weapon residues or by the air through
which they travel. Nevertheless, a suf-
ficient number of high-energy neutrons
escape from the explosion region to
represent a significant hazard at consid-
erable distances away.
COMPARISON OF NUCLEAR WEAPON
RADIATIONS
8.05 Although shielding from ther-
mal radiation at distances not too close
to the point of the explosion of a nuclear
weapon is a fairly simple matter, this is
not true for gamma rays and neutrons.
For example, at a distance of 1 mile
from a 1-megaton explosion, the initial
nuclear radiation would probably prove
fatal to a large proportion of exposed
human beings even if surrounded by 24
inches of concrete; however, a much
lighter shield would provide complete
protection from thermal radiation at the
same location. The problems of shield-
ing from thermal and nuclear radiations
are thus quite distinct.
8.06 The effective injury ranges of
these two kinds of nuclear weapon radi-
ations may also differ widely. For ex-
plosions of moderate and large energy
yields, thermal radiation can have
harmful consequences at appreciably
greater distances than can the initial nu-
clear radiation. Beyond about 1 *4 miles,
the initial nuclear radiation from a 20-
kiloton air burst, for instance, would not
cause observable injury even without
protective shielding. However, expo-
sure to thermal radiation at this distance
could produce serious skin burns. On
the other hand, when the energy of the
nuclear explosion is relatively small,
e.g., a few kilotons, the initial nuclear
radiation has the greater effective range.
8.07 In the discussion of the
characteristics of the initial nuclear ra-
diation, it is desirable to consider the
neutrons and the gamma rays sepa-
rately. Although their ultimate effects
on living organisms are much the same,
the two kinds of nuclear radiations differ
in many respects. The subject of gamma
rays will be considered in the section
which follows, and neutrons will be
discussed in § 8.49 et seq.
326
INITIAL NUCLEAR RADIATION
GAMMA RAYS
SOURCES OF GAMMA RAYS
8.08 In addition to the gamma rays
that actually accompany the fission
process, contributions to the initial nu-
clear radiations are made by gamma
rays from other sources. Of the neutrons
produced in fission, some serve to sus-
tain the fission chain reaction, others
escape, and a large number are inevit-
ably captured by nonfissionable nuclei.
Similar interactions occur for the neu-
trons produced by fusion. As a result of
neutron capture, the nucleus is con-
verted into a new species known as a
“compound nucleus,” which is in a
high-energy (or excited) state. The ex-
cess energy may then be emitted, almost
instantaneously, as gamma radiations.
These are called “capture gamma
rays,” because they are the result of the
capture of a neutron by a nucleus. The
process is correspondingly referred to as
“radiative capture.”
8.09 The interaction of weapon
neutrons with certain atomic nuclei pro-
vides another source of gamma rays.
When a “fast” neutron, i.e., one hav-
ing a large amount of kinetic energy,
collides with such a nucleus, the neutron
ma> transfer some of its energy to the
nucleus, leaving the latter in an excited
(high-energy) state. The excited nucleus
can then return to its normal energy (or
ground) state by the emission of the
excess energy as gamma rays. This type
of interaction of a fast neutron with a
nucleus is called “inelastic scattering”
and the accompanying radiations are re-
ferred to as “inelastic scattering gamma
rays.”1 The fast neutrons produced
during the fission and fusion reactions
can undergo inelastic scattering reac-
tions with atomic nuclei in the air as
well as with nuclei of weapon materials.
8.10 During the fission process,
certain of the fission products and
weapon products are formed as
isomers.2 Some of the isomers decay
initially by emitting a gamma ray. This
is generally followed by emission of a
beta particle that may or may not be
accompanied by additional gamma rays.
The initial gamma rays emitted by such
isomers may be considered an indepen-
dent source of gamma rays. Those
gamma rays that may be emitted sub-
sequently are generally considered to be
part of the fission product decay.
8.11 Neutrons produced during the
fission and fusion processes can undergo
radiative capture reactions with nuclei
of nitrogen in the surrounding atmos-
phere as well as with nuclei of various
materials present in the weapon. These
reactions are accompanied by (secon-
dary) gamma rays which form part of
the initial nuclear radiation. The in-
teraction with nitrogen nuclei is of par-
ticular importance, since some of the
l‘he (erm “scattering'* (cf. § 7 10) is used because, after interacting with the nucleus, the neutron of
lower energy generally moves off in a direction different from (hat in which the original neutron was
traveling before the collision
In an isomer of a particular nuclear species the nuclei are in a high-energy (or excited) state with an
appreciable half-life. The isomers of interest here arc those that decay rapidly, with a half-life of about
one thousandth of a second or less, by the emission of the excess (or excitation) energy as gamma
radiation
GAMMA RAYS
327
gamma rays thereby produced have very
high energies and are, consequently,
much less readily attenuated than the
other components of the initial gamma
radiation.
8.12 The gamma rays produced
during fission and as a result of neutron
interactions with weapon materials form
a pulse of extremely short duration,
much less than a microsecond (§ 1.54
footnote). For this reason, the radiations
from these sources are known as the
‘prompt’’ or “instantaneous” gamma
rays.
8.13 The fission fragments and
many of their decay products are radio-
activc species, i.e., radionuclides
(§ 1.30), which emit gamma radiations
(sec Chapter I). The half-lives of these
radioactive species range from a fraction
of a second to many years. Neverthe-
less, since the decay of the fission frag-
ments commences at the instant of fis-
sion and since, in fact, their rate of
decay is greatest at the beginning, there
will be an appreciable liberation of
gamma radiation from these radionu-
clides during the first minute after the
explosion. In other words, the gamma
rays emitted by the fission products
make a significant contribution to the
initial nuclear radiation. However, since
the radioactive decay process is a con-
tinuing (or gradual) one, spread over a
period of time which is long compared
to that in which the instantaneous radia-
tion is produced, the resulting gamma
radiations, together with part of the
gamma radiations that arise from initial
isomeric decays and interactions of
neutrons with nuclei of the air, are re-
ferred to as “delayed” gamma rays.
8.14 The calculated time depen-
dence of the gamma-ray output of a
hypothetical nuclear weapon is shown in
Fig. 8.14. The energy rate is expressed
in terms of million electron volts
(§ 1.43) per second per kiloton of ex-
plosion energy. The gamma rays that
result from neutron capture in nitrogen
occur at late times relative to some of
the other sources because the probability
of capture is much greater for low-en-
ergy neutrons, i.e., those that have lost
energy by multiple scattering reactions.
The dashed lines in Fig. 8.14 show the
gamma-ray source as it would exist in a
vacuum, e.g., from an explosion above
the normal atmosphere. The gamma
rays that result from inelastic scattering
of neutrons by nuclei of air atoms and
capture in nitrogen would be absent
from such an explosion.
8.15 The instantaneous gamma rays
and the portion of the delayed gamma
rays included in the initial radiation are
produced in nearly equal amounts, but
they are by no means equal fractions of
the initial nuclear radiation escaping
from the exploding weapon. The in-
stantaneous gamma rays are produced
almost entirely before the weapon has
completely blown apart. They are,
therefore, strongly absorbed by the
dense weapon materials, and only a
small proportion actually emerges The
delayed gamma rays, on the other hand,
are mostly emitted at a later stage in the
explosion, after the weapon materials
have vaporized and expanded to form a
tenuous gas. These radiations thus suf-
fer little or no absorption before emerg-
ing into the air. The net result is that, at
a distance from an air (or surface) burst,
the delayed gamma rays, together with
those produced by the radiative capture
of neutrons by the nitrogen in the at-
mosphere, contribute about a hundred
328
INITIAL NUCLEAR RADIATION
ENERGY RATE (MEV/SEC/KT)
TIME (SEC)
Figure 8.14. Calculated time dependence of the gamma-ray energy output per kiloton
energy yield from a hypothetical nuclear explosion. The dashed line refers to
an explosion at very high altitude.
GAMMA RAYS
329
times more energy than the prompt
gamma rays to the total nuclear radia-
tion received during the first minute
after detonation (§ 8.47).
8.16 There is another possible
source of gamma rays which may be
mentioned. If a nuclear explosion
occurs near the earth’s surface, the
emitted neutrons can cause what is
called “induced radioactivity” in the
materials present in the ground (or
water). This may be accompanied by the
emission of gamma rays which will
commence at the time of the explosion
and will continue thereafter. However,
except near ground zero, where the in-
tensity of gamma rays from other
sources is very high in any event, the
contribution of induced radioactivity to
the initial gamma radiation is small.
Consequently, the radioactivity induced
in the earth’s surface by neutrons will be
treated in the next chapter as an aspect
of the residual nuclear radiation (§ 9.31
et. seq.).
RADIATION DOSE AND DOSE RATE
8.17 Gamma rays are electromag-
netic radiations analogous to X rays,
but, generally of shorter wave length or
higher photon energy (§ 1.74). A mea-
surement unit that is used specifically
for gamma rays (and X rays) is called
the “roentgen.” It is based on the abil-
ity of these radiations to cause ioniza-
tion and produce ion pairs, i.e., sepa-
rated electrons and positive ions, in their
passage through matter, as described in
§ 1.38. In simple terms, a roentgen is
the quantity of gamma radiation (or X
rays) that will give rise to the formation
of 2.08 x 10⁹ ion pairs per cubic centi-
meter of dry air at S.T.P., i.e., at
standard temperature (0°C) and pressure
(1 atmosphere). This is equivalent to the
release of about 88 ergs of energy when
1 gram of dry air under S.T.P. condi-
tions is exposed to 1 roentgen of gamma
radiation.3
8.18 The roentgen is a measure of
exposure to gamma rays (or X rays).
The effect on a biological system, such
as the whole body or a particular organ,
or on a material, e.g., in electronic
equipment, however, is related to the
amount of energy absorbed as a result of
exposure to radiation. The unit of en-
ergy absorption, which applies to all
kinds of nuclear radiations, including
alpha and beta particles and neutrons as
well as gamma rays, is the “rad.” The
rad represents the deposition of 100 ergs
of radiation energy per gram of the ab-
sorbing material. In stating the quantity
(or dose) of a particular radiation in
rads, the absorbing material must be
specified since the extent of energy de-
position depends on the nature of the
material. In tissue at or near the surface
of the body, the gamma (or X-ray) ex-
posure of 1 roentgen results in an ab-
sorption of approximately 1 rad,4 but
this rough equivalence does not neces-
sarily apply to other materials. Further-
more, the relationship does not hold for
’According to the official definition. I roentgen produces electrons (in ion pairs) with a total charge of
2 5X x 10 4 coulomb in 1 kilogram of dry air
4 The rough equivalence between a gamma (or X-ray) exposure of I roentgen and the absorption in
body tissue of 1 rad holds for photons of intermediate energies (0 3 to 3 MeV) For photon energies
outside the range from 0 3 to 3 MeV, the exposure in roentgens is no longer simply related to the
absorption in rads
330
INITIAL NUCLEAR RADIATION
absorption in tissue in the interior of the
body. However, in describing the bio-
logical effects of nuclear radiations in
this book, the energy absorption (in
rads) refers to that in tissue at (or close
to) the body surface nearest to the ex-
plosion (§ 12.108).
8.19 There are two basic types of
nuclear radiation measurement both of
which are important for biological ef-
fects and damage to materials. One is
the total “exposure” in roentgens of
gamma rays or the total absorbed
“dose” in rads of any radiation accu-
mulated over a period of time. The other
is the “exposure rate” or the “dose
rate", respectively; the rate is the ex-
posure or the absorbed dose received
per unit time. Exposure rates may be
expressed in roentgens per hour or, for
lower rates, in milliroentgens per hour,
where 1 milliroentgen is one thousandth
part of a roentgen. Absorbed dose rates
can be given correspondingly in rads per
hour or millirads per hour. In connec-
tion with damage to electronic equip-
ment, the exposure rates are generally
stated in roentgens per second and the
absorbed dose rates in rads per second.
MEASUREMENT OF GAMMA
RADIATION
8.20 Thermal radiation from a nu-
clear explosion can be felt (as heat), and
the portion in the visible region of the
spectrum can be seen as light. The
human senses, however, do not respond
to nuclear radiations except at very high
intensities (or dose rates), when itching
and tingling of the skin are experienced.
Special instrumental methods, based on
the interaction of these radiations with
matter, have therefore been developed
for the detection and measurement of
various nuclear radiations. Some of the
instruments described below respond to
neutrons (to a certain extent) as well as
to gamma rays. For gamma-ray mea-
surement, the instrument would have to
be shielded from neutrons. The basic
operating principles of the instruments
are described below and their use for
determining either doses or dose rates is
indicated in §§ 8.29, 8.30.
8.21 Normally a gas will not con-
duct electricity to any appreciable ex-
tent, but as a result of the formation of
ion pairs, by the passage of nuclear (or
ionizing) radiations, e.g., alpha parti-
cles, beta particles or gamma rays, the
gas becomes a reasonably good con-
ductor. Several types of ionization in-
struments, e.g., the Geiger counter and
the pocket chamber (or dosimeter), for
the measurement of gamma (and other)
radiations, are based on the formation of
electrically charged ion pairs in a gas
and its consequent ability to conduct
electricity.
8.22 Semiconductor (solid-state)
detectors depend on ionization in a solid
rather than in a gas. These detectors
consist of three regions: one is the n (for
negative) region, so called because it
has an excess of electrons available for
conducting electricity, the second is the
p (for positive) region which has a defi-
ciency of such electrons, and the third is
neutral. In the detector, the neutral re-
gion is located between the n and p
regions. A voltage from a battery is
applied across the detector to balance
the normal difference of potential be-
tween the outer regions and there is no
net flow of current. When exposed to
nuclear radiation, ionization occurs in
the neutral region and there is a pulse of
GAMMA RAYS
331
current proportional to the radiation in-
tensity. Semiconductor detectors for
operation at normal temperature are
made of silicon which is either pure
(neutral region) or contains regulated
amounts of impurities, e.g., arsenic or
antimony (n region) or boron or alumi-
num (p region).
8.23 Another type of interaction of
nuclear radiations with matter, cither
solid, liquid, or gas, called “excita-
tion,” is also used in radiation mea-
surement. Instead of the electron being
removed completely from an atom, as it
is in ionization, it acquires an additional
amount of energy. As a result, the atom
is converted into a high-energy (or ex-
cited) electronic state. When an atom
(or molecule) becomes electronically
excited, it will generally give off the
excess (or excitation) energy within
about one-millionth of a second. Certain
materials, usually in the solid or liquid
state, are able to lose their electronic
excitation energy in the form of visible
flashes of light or scintillations. In scin-
tillation detectors, the scintillations are
counted by means of a photomultiplier
tube and associated electronic devices.
8.24 In radio-photoluminescent do-
simeters, irradiation produces stable
fluorescence centers which can be sti-
mulated by subsequent ultraviolet illu-
mination to emit visible light. For ex-
ample, after exposure to gamma (or X)
rays, a silver metaphosphate glass rod or
plate system emits a phosphorescent
glow when subjected to ultraviolet light;
the glow can be measured by means of a
photoelectric detector. In thermolumin-
escent dosimeters metastable centers are
produced by radiation, and these centers
can be induced to emit light by heating
the material. A thermoluminescent sub-
stance commonly used in radiation do-
simeters is lithium fluoride containing a
small quantity of manganese. The total
light emission from radio-photolumine-
scent and thermoluminescent dosimeters
is a measure of the absorbed dose in the
sensitive material.
8.25 In most materials, the energy
of the absorbed radiation ultimately ap-
pears in the form of heat. Thus, the heat
generated by the passage of radiation is
a measure of the absorbed dose. This
fact is utilized in a special calorimeter
dosimeter consisting of a thin sample of
absorbing material. The energy depo-
sited by the radiation can then be deter-
mined from the measured temperature
rise and the known heat capacity of this
material.
8.26 Indirect effects of nuclear ra-
diations, notably chemical changes,
have also been used for measurement
purposes. One example is the blacken-
ing (or fogging) of photographic film
which appears after it is developed. Film
badges for the measurement of nuclear
radiations generally contain two or three
pieces of film, similar to those used by
dentists for taking X rays. They are
wrapped in paper (or other thin material)
which is opaque to light but is readily
penetrated by gamma rays. The films are
developed and the degree of fogging
observed is a measure of the gamma-ray
exposure.
8.27 Other optical density dosi-
meters depend on the production by ra-
diation of stable color centers which
absorb light at a certain wavelength. An
example is a device that measures radi-
ation by a change in the transmission of
light through a cobalt-glass chip. A lead
borate glass containing bismuth has also
been developed for the measurement of
332
INITIAL NUCLEAR RADIATION
high levels of radiation, specifically for
use in mixed gamma-neutron environ-
ments. Other materials that are utilized
in instruments for the measurement of
radiation by color changes include dyed
plastics, such as blue cellophane and
“cinemoid” film, i.e., a celluloid-like
film containing a red dye.
8.28 In practice, measuring instru-
ments do not determine the exposure in
roentgens or the absorbed dose in rads
directly. One or other of several ob-
servable effects, such as current pulses
produced by ionization, scintillations,
changes in optical response, or temper-
ature rise, serves as the basis for the
actual determination. The instruments
can indicate the exposure in roentgens
or the dose in rads after being calibrated
with a standard gamma-ray source,
usually a known quantity of a radioac-
tive material that emits a gamma ray of
the appropriate energy at a known rate.
8.29 Some instruments can record
both the total radiation dose (or expo-
sure) and the dose (or exposure) rate,
but most radiation measuring devices
are designed to indicate either the total
or the rate. Total radiation doses (or
exposures) are measured by personnel
dosimeters worn by individuals who
may be exposed to unusual amounts of
nuclear radiation in the course of their
work. Examples of such instruments are
pocket ion chambers, optical density
devices (especially film badges), and
photoluminescent, thermoluminescent,
and color-change dosimeters. Calori-
meters also measure total radition doses.
The charge collection time in semicon-
ductor detectors is so short that these
instruments lend themselves to the
measurement of gamma-ray dose rates
in pulses of very short duration as well
as of the total dose.
8.30 Dose (or exposure) rates are
usually determined by what are called
“survey meters.” They may be ion
chambers, Geiger-Mueller tubes, or
scintillation detectors, together with as-
sociated electronic counting circuitry. In
general, these survey meters are port-
able and battery powered. The dose-rate
measurement may be converted into the
total radiation dose by multiplying the
properly averaged dose rate by the total
time of exposure.
GAMMA-RAY DOSE DEPENDENCE ON
YIELD AND DISTANCE
8.31 The biological effects of
various gamma-radiation doses will be
considered more fully in Chapter XII.
However, in order to provide some in-
dication of the significance of the
numbers given below, it may be stated
that a single absorbed dose of gamma
rays of less than 25 rads (in body tissue)
will produce no detectable clinical ef-
fects in humans. Larger doses have in-
creasingly more serious consequences
and whole-body doses of 1,000 rads
would probably prove fatal in nearly all
cases, although death would not occur
until a few days later.
8.32 As is to be expected, the
gamma-ray dose at a particular location,
resulting from a nuclear explosion, is
less the farther that location is from the
point of burst. The relationship of the
radiation dose to the distance is depen-
dent upon two factors, analogous to
those which apply to thermal radiation.
There is, first, the general decrease due
to the spread of the radiation over larger
and larger areas as it travels away from
GAMMA RAYS
333
Figure 8.33a.
Slant ranges for specified gamma-ray doses for targets near the ground as a
function of energy yield of air-burst fission weapons, based on 0.9 sea-level
air density. (Reliability factor from 0.5 to 2 for most fission weapons.)
the explosion center. As with thermal
radiation (§ 7.07), the dose received is
inversely proportional to the square of
the distance from the burst point, so that
it is said to be governed by the “inverse
square” law. Second, there is an atten-
uation factor to allow for the decrease in
intensity due to absorption and scatter-
ing of gamma rays by the intervening
atmosphere.
8.33 The gamma-radiation doses at
known distances from explosions of
different energy yields have been mea-
sured at a number of nuclear weapons
tests. Extensive computer calculations
have also been performed of the trans-
port of gamma rays through the air.
These calculations have been correlated
with measurements of the gamma-ray
transport from known sources and with
observations made at nuclear explo-
sions. The results obtained for air bursts
are summarized in the form of two
graphs: the first (Fig. 8.33a) shows the
relation between yield and slant range
for various absorbed gamma-ray doses
(in tissue near the body surface, see
§ 8.18) for fission weapons; the second
(Fig. 8.33b) gives similar information
for thermonuclear weapons with 50
334
INITIAL NUCLEAR RADIATION
Figure 8.33b. Slant ranges for specified gamma-ray doses for targets near the ground as a
function of energy yield of air-burst thermonuclear weapons with 50 percent
fission yield, based on 0.9 sea-level air density. (Reliability factor from 0.25
to 1.5 for most thermonuclear weapons.)
percent of their yield from fiss-
ion(§ 1.72). The data are based on an
average density of the air in the trans-
mission path between the burst point
and the target of 0.9 of the normal
sca-level density.5 Because of variations
in weapon design and for other reasons
(§ 8.127), the gamma-ray doses calcu-
lated from Figs. 8.33a and b are not
exact for all situations that may arise.
Figure 8.33a is considered to be reliable
within a factor of 0.5 to 2 for most
fission weapons, whereas the reliability
factor for Fig. 8.33b is. from 0.25 to 1.5
for most thermonuclear weapons. Inter-
polation may be used for doses other
than those shown on the figures.
8.34 The use of the gamma-ray
dose curves may be illustrated by deter-
mining the absorbed dose received at a
distance of 2,000 yards from a 50-kilo-
ton low air burst of a fission weapon.
'The density referred to here (and subsequently) is that of the air before it is disturbed by the explosion
(cf.§ 8.36)
GAMMA RAYS
335
From Fig. 8.33a, the dose for the case
specified is seen to be somewhat less
than 300 rads. A reasonable interpolated
value would appear to be about 250
rads.
8.35 The data in Figs. 8.33a and b
are dependent upon the density of the air
between the center of the explosion and
the point on the ground at which the
radiation is received. This is so because
the air absorbs some of the gamma ra-
diation in the course of its transmission;
the dense air near the surface absorbs
more than the less dense air at higher
altitudes. If the actual average density is
higher or lower than 0.9 of the normal
sea-level value for which the curves
were drawn, the gamma-ray dose will
be decreased or increased, respectively.
8.36 It will be noted, especially in
Fig. 8.33b, that for a specified dose, the
slant range increases more rapidly in the
higher explosion yield range, i.e., the
slope of the curves becomes steeper.
The cause is the sustained low air den-
sity following the passage of the posi-
tive phase of the shock wave (§ 3.04),
particularly for explosions of high en-
ergy yield. The emission of gamma rays
by the fission products is delayed
(§ 8.13) and so these radiations do not
reach distant points until the shock wave
has passed and the air density has de-
creased. There is consequently less at-
tenuation of the fission product gamma
rays by the air than at lower energy
yields. This effect is known as the “hy-
drodynamic enhancement” of the
gamma-ray dose.
8.37 The foregoing figures were
calculated for heights of burst of
200 W°4 feet and the conclusions are
reasonably applicable provided the
height of burst exceeds about 300 feet,
even though the fireball may touch the
earth’s surface. For a contact surface
burst (§ 2.127 footnote) the dose for a
specified explosion yield and range may
be obtained upon multiplication of the
corresponding dose in Fig. 8.33a or b by
a factor which depends to some extent
on both yield and range. The factors in
Table 8.37 for some specific yields are
averages which provide a fair approx-
imation for distances of interest. The
factors for intermediate yields may be
obtained by interpolation. Interpolation
between unity and the tabulated factor
may also be used to obtain the appro-
priate factors for bursts between about
300 feet and the actual surface.
Table 8.37
CORRECTION FACTORS FOR CONTACT SURFACE BURSTS
Fig. 8.33a Fig. 8.33b
Yield Factor Yield Factor
to 50 KT % 100 KT I
100 KT 1 300 KT 1 '/4
700 KT 1 */2
2 MT 2
5 to 20 MT 3
336
INITIAL NUCLEAR RADIATION
SHIELDING AGAINST GAMMA RAYS
8.38 Gamma rays are absorbed (or
attenuated) to some extent in the course
of their passage through any material.
As a rough rule, the decrease in the
radiation intensity is dependent upon the
mass (per unit area) of material that
intervenes between the source of the
rays and the point of observation. This
means that it would require a greater
thickness of a substance of low density,
e.g., water, than one of high density,
e.g., iron, to attenuate the radiations by
a specified amount. Strictly speaking, it
is not possible to absorb gamma rays
completely. Nevertheless, if a sufficient
thickness of matter is interposed be-
tween the radiation source, such as an
exploding nuclear weapon, and an indi-
vidual, the dose received can be reduced
to negligible proportions.
8.39 The simplest case of gamma-
ray attenuation is that of a narrow beam
of monoenergetic radiation, i.e., radia-
tion having a single energy, passing
through a relatively thin layer of shield-
ing material. In these special (and hy-
pothetical) circumstances, theoretical
considerations lead to the concept of a
“tenth-value” thickness as a measure of
the effectiveness of the material in at-
tenuating gamma rays of a given energy
(cf. § 8.95 et seq.). A tenth-value
thickness is defined as the thickness of
the specified material which reduces the
radiation dose (or dose rate) to one tenth
of that falling upon it; in other words,
one tenth-value thickness of the material
would decrease the radiation by a factor
of ten. Thus, if a person were in a
location where the tissue dose is 500
rads, e.g., of initial gamma radiation,
with no shielding, the introduction of
the appropriate tenth-value thickness of
any substance would decrease the dose
to (approximately) 50 rads. The addition
of a second tenth-value thickness would
result in another decrease by a factor of
ten, so that the dose received would be
(approximately) 5 rads. Each succeed-
ing tenth-value thickness would bring
about a further reduction by a factor of
ten. Thus, one tenth-value thickness
decreases the radiation dose by a factor
of (approximately) 10; two tenth-value
thicknesses by a factor of 10 x 10, i.e.,
100; three tenth-value thicknesses by a
factor of 10 x 10 x 10, i.e., 1,000; and
so on.6
8.40 In shielding against gamma
radiations from a nuclear explosion the
conditions leading to the tenth-value
thickness concept do not exist. In the
first place, the gamma-ray energies
cover a wide range, the radiations are
spread over a large area, and thick
shields are necessary in regions of in-
terest. Evaluation of the effectiveness of
a given shield material is then a complex
problem, but calculations have been
made with the aid of electronic com-
puters. It has been found that, beyond
the first few inches of a shielding mate-
rial, the radiation attenuation can be
expressed with fair accuracy in many
cases in terms of an effective tenth-value
thickness. This useful result apparently
arises from the fortuitous cancellation of
factors which have opposing effects on
the simple situation considered in
§ 8.39. In the first few inches of the
"The “half-value thickness" is sometimes used; it is defined as the thickness of a given material which
reduces the dose of impinging radiation to (approximately) one half. Two such thicknesses decrease the
dose to one fourth; three thicknesses to one eighth, etc.
GAMMA RAYS
337
shield the attenuation is generally
greater than indicated by the effective
tenth-value thickness and so use of the
latter would be conservative.
8.41 The effective tenth-value
thicknesses of some materials of interest
in radiation shielding are given in Table
8.41,7 for broad beams of gamma rays
emitted by the fission products in the
first minute after the detonation and for
those (secondary gamma rays) accom-
panying the capture of neutrons by ni-
trogen in the air (§ 8.11). These partic-
ular radiations were chosen because
they are representative of the main con-
stituents of the initial gamma rays. The
thickness of any material required to
decrease the nitrogen capture (secon-
dary) gamma rays to one-tenth is about
50 percent greater than for the fission
product gamma rays; this is because the
former have a considerably higher en-
ergy.
8.42 The second column for each
type of gamma radiation, designated D
x T (Ib/sq ft), gives the product of the
density, £>, of the material (in Ib/cu ft)
and the tenth-value thickness, T (in
feet). It will be noted that D x T is
roughly constant for a given gamma
radiation. This is the basis of the state-
ment in § 8.38 that gamma-ray attenua-
tion is determined approximately by the
mass (per unit area) of the shielding
material. If the tenth-value thickness for
a particular material is not known, but
the density is, a fair estimate can be
made by assuming D x T to be 130
Ib/sq ft for fission product gamma rays
and 200 Ib/sq ft for nitrogen capture
gamma rays. To determine the effecti-
veness of a given shield as a protection
against the initial radiation from a nu-
clear explosion, it is recommended that
the higher of these values be employed.
The result will indicate a smaller degree
Table 8.41
APPROXIMATE EFFECTIVE TENTH-VALUE THICKNESSES FOR FISSION PRODUCT
AND NITROGEN CAPTURE GAMMA RAYS
Material Density (Ib/cu ft) Fission Product Nitrogen Capture
Tenth- Value Thickness (inches) D x T (Ib/sq ft) Tenth- Value Thickness (inches) D x T (Ib/sq ft)
Steel (Iron) 490 3.3 135 4.3 176
Concrete 146 1 1 134 16 194
Earth 100 16 133 24 200
Water 62.4 24 125 39 201
Wood 40 38 127 63 210
The tenth-value thicknesses are for gamma rays that arc incident perpendicularly on the slab of
material If the rays make an angle 0 with the perpendicular, the tenth-value thickness is obtained
approximately by multiplying the values in the table by cosine 9, provided 9 is less than 45°
338
INITIAL NUCLEAR RADIATION
of protection than can actually be ob-
tained. but it is better to be conservative
in this respect than to overestimate the
effectiveness of the shield.
8.43 A more accurate estimate of
the protection that can be provided by a
particular shield between the source of
(he radiation and the target, e.g.. a per-
son. can be made by taking a number of
factors into consideration. These in-
clude the energy distribution of the
gamma radiation falling on the shield,
the angle of incidence of the radiation,
and the geometry (or form) of the
shielding material. Such considerations
make it necessary to use computer
methods to calculate the shielding pro-
vided by even simple structures. Esti-
mates of the effectiveness of some
common shelters in shielding from ini-
tial gamma radiation (and neutrons) are
given in Table 8.72. (Data for these
same structures for residual (fallout)
gamma rays will be found in Table
9.120.)
8.44 In a vacuum, gamma rays
travel in straight lines with the speed of
light. However, in its passage through
the atmosphere, gamma radiation, like
thermal radiation, is scattered, espe-
cially by the oxygen and nitrogen in the
air. Consequently, gamma rays will
reach a particular target on the ground
from many directions. Most of the dose
received will come from the direction of
the explosion, but a considerable
amount of radiation will arrive from
other directions. The gamma radiation
reaching a target as a result of scattering
in the air is called “skyshine.”
8.45 The fact that gamma rays can
reach a target from directions other than
that of the burst point has an important
bearing on the problem of shielding. A
person taking shelter behind a single
wall, an embankment, or a hill will be
shielded, to some extent, from the direct
gamma rays, but will still be exposed to
the scattered radiation (or skyshine), as
shown by the broken lines in Fig. 8.45a.
Adequate protection from gamma rays
can be secured only if the shelter is one
which surrounds the individual, so that
he can be shielded from all directions
(Fig. 8.45b). In this case, both direct
and scattered radiations can be atten-
uated. The variation in the amounts of
radiation received at a target from dif-
ferent directions is called the “angular
distribution. It has been found that the
angular distribution of the initial gamma
radiation is relatively insensitive to the
type of weapon and to the distance of
the target from the explosion point.
RATE OF DELIVERY OF INITIAL
GAMMA RAYS
8.46 Radiation dose calculations
based on Figs. 8.33a and b involve the
assumption that the exposure lasts for
the whole minute which was somewhat
arbitrarily set as the period in which the
initial nuclear radiation is emitted. It is
important to know, however, something
about the rate at which the radiation is
delivered from the exploding weapon. If
this information is available, it is possi-
ble to obtain some idea of the dose that
would be received if part of the radiation
could be avoided, e.g., by taking shelter
within a second or two of observing the
luminous flash of the explosion.
8.47 The rate at which gamma-ray
energy is released from a weapon is
shown in Fig. 8.14. But the rate at
which this energy is received at a distant
target depends upon a number of fac-
339
GAMMA RAYS
source
. ₽ R 45b. Target
Figure b -+JU
Ь Mtered gamma radian-
shielded from mattered g
340
INITIAL NUCLEAR RADIATION
tors; the most significant are the energy
yield of the explosion and the distance
from the burst point. These two quanti-
ties affect the relative importance of the
several components of the initial gamma
radiation. The larger the yield and the
greater the distance, the greater will be
the hydrodynamic enhancement of the
fission product gamma rays (§ 8.36). As
this enhancement is increased, the rela-
tive importance of the fission product
gamma rays is increased. Thus, for
larger yields and greater distances, the
fission product gamma rays, which are
important at late times relative to the
other components of the initial gamma
radiation, provide a larger percentage of
the total dose. The percentage of the
total dose received up to various times
for two different cases is shown in Fig.
8.47 . One curve refers to a distance of
1,000 yards from a 20-kiloton air burst
and the other to 2,500 yards from a
5-megaton explosion. It is seen that in
the former case about 65 percent and in
the latter case about 5 percent of the
total initial gamma radiation dose is re-
ceived during the first second after the
detonation.
8.48 If some shelter could be ob-
tained, e.g., by falling prone behind a
substantial object, within a second of
seeing the explosion flash, in certain
circumstances it might make the dif-
ference between life and death. The
curves in Fig. 8.47 show that avoidance
of part of the initial gamma-ray dose
would be more practicable for explo-
sions of higher energy yields.
NEUTRONS
SOURCES OF NEUTRONS
8.49 Although neutrons are nuclear
particles of appreciable mass, whereas
gamma rays are electromagnetic waves
(§ 8.17), their harmful effects on the
body and their ability to damage certain
materials are similar in character. Like
gamma rays, only very large doses of
neutrons may possibly be detected by
the human senses. Neutrons can pene-
trate a considerable distance through the
air and constitute a hazard that is greater
than might be expected from the small
fraction (about 1 percent) of the explo-
sion energy which they carry.
8.50 Essentially all the neutrons
accompanying a nuclear explosion are
released either in the fission or fusion
process (§§ 1.42, 1.69). All of the neu-
trons from the latter source and over 99
percent of the fission neutrons are pro-
duced almost immediately, within less
than a millionth of a second of the
initiation of the explosion. These are
referred to as the “prompt” neutrons. In
addition, somewhat less than 1 percent
of the fission neutrons, called the “de-
layed” neutrons, are emitted subse-
quently. The majority of these delayed
neutrons are released within the first
minute, and so constitute part of the
initial nuclear radiation. At distances
greater than about 2,000 yards from a
multimegaton explosion, the dose from
delayed neutrons can exceed that from
NEUTRONS
341
TIME (SECONDS)
Figure 8.47 Percentage of initial gamma-radiation dose received as a function of time for
20-kiloton and 5-megaton air bursts.
prompt neutrons, because the delayed
neutrons are subject to hydrodynamic
enhancement (§ 8.36) whereas the
prompt neutrons are not. Both doses
are, however, much less than the
gamma-ray dose for high-yield weap-
ons. Neutrons are also produced by the
action of high-energy gamma rays on
the weapon materials, but their contri-
bution is minor.
8.51 Despite their almost instanta-
neous release, the prompt fission neu-
trons are slightly delayed in escaping
from the environment of the exploding
weapon. This delay arises from the nu-
merous scattering collisions suffered by
the neutrons with the nuclei present in
the weapon residues. As a result, the
neutrons traverse a complex zigzag path
before they finally emerge. However,
they move so fast that the delay in the
escape of the prompt neutrons is much
less than a one-thousandth part of a
second. At distances from the burst
where they represent a hazard, nearly all
of the neutrons are received within a
second of the explosion, that is, before
the arrival of the fission product gamma
rays. The evasive action described in
§ 8.48 for gamma rays thus has little
effect on the neutron dose received.
8.52 The neutrons produced in the
fission process have a range of energies,
but they are virtually all in the region of
high energy. Such high-energy neutrons
are the fast neutrons referred to in
§ 8.09, their energy being kinetic in
nature, i.e., energy of motion. In the
course of scattering collisions with
atomic nuclei, there is an exchange of
energy between the fast neutrons and the
nuclei. Within the weapon itself, where
heavy nuclei, e.g., of uranium, are
present, some of the neutrons lose en-
ergy as a result of inelastic scattering,
the energy removed being emitted in the
342
INITIAL NUCLEAR RADIATION
form of gamma radiation (§ 8.09). In
other collisions, especially with light
nuclei, there is a simple transfer of ki-
netic energy from the fast neutron to the
struck nucleus; these are “elastic colli-
sions" and are not accompanied by
gamma radiation. Because of the variety
of collisions which occur with different
nuclei, the neutrons leaving the region
of the explosion have speeds (or ener-
gies) covering a wide range, from fast
through intermediate to slow. The neu-
trons of lowest energy (or speed) are
often called “thermal" neutrons be-
cause they are approximately in thermal
(or temperature) equilibrium with their
surroundings.
8.53 As a consequence of the
various interactions described above,
the neutrons that emerge from the region
of the explosion have a very different
energy distribution, i.e., “neutron en-
ergy spectrum," than when they were
formed in the fission and fusion reac-
tions. Furthermore, the energy spectrum
may change as the neutrons travel
through the air. For example, the neu-
trons leaving the weapon environment
undergo scattering collisions with nuclei
of nitrogen, oxygen, and other elements
in the atmosphere. These collisions are
less frequent than within the weapon
because of the lower density and smaller
concentration of nuclei. Nevertheless,
the results of the collisions are impor-
tant. In the first place, the fractional
decrease in neutron energy per elastic
scattering collision is, on the average,
greatest for light nuclei. The nuclei of
oxygen and nitrogen are relatively light,
so that the neutrons are appreciably
slowed down by clastic scattering colli-
sions in the air. Some of the collisions
with nitrogen result in inelastic scatter-
ing which removes energy from the
neutrons and is a substantial source of
gamma radiation (§ 8.09, Fig. 8.14).
Inelastic scattering of high-energy neu-
trons by oxygen also results in energy
removal and provides a less important
source of gamma radiation (§ 8.107).
8.54 In some collisions, particu-
larly with nitrogen nuclei, the neutrons
can be captured (§ 8.11), so that they
are completely removed. The probabil-
ity of capture is greatest with the slow
(low-energy) neutrons. Consequently,
in their passage through the air, from the
weapon to a location on the ground, for
example, there are many interactions
involving the neutrons. There is a ten-
dency for the fast (high-energy) neu-
trons to lose some of their energy and to
be slowed down. At the same time, the
slower neutrons have a greater chance of
being captured and eliminated, as such,
from the nuclear radiation, although the
capture usually leads to the emission of
gamma rays.
8.55 It is important in connection
with the measurement of nuclear
weapon neutrons and the study of their
biological effects to know something of
the neutron energy spectrum and its
variation with distance from the explo-
sion. From measurements made during
nuclear tests in the field, measurements
with laboratory calibrated sources, and
extensive computer calculations, it ap-
pears that the neutron energy spectrum
for fission weapons remains essentially
the same for a given weapon over the
range of distances that are of biological
interest. This condition is referred to as
an "equilibrium spectrum."
8.56 The occurrence of an equilib-
rium spectrum is related to a combina-
tion of circumstances which arise during
NEUTRONS
343
passage of the neutrons through the air;
the loss of the slower neutrons by cap-
ture, e.g., by nitrogen nuclei, is com-
pensated by the slowing down of fast
neutrons. Consequently, the proportion
(or fraction) of neutrons present in any
particular energy range appears to be
essentially constant at all distances of
interest. The total number of neutrons
received per unit area, however, at a
given location is less the farther that
point is from the explosion, because, in
addition to being spread over a large
area (cf. § 8.32), some of the neutrons
are removed by capture.
8.57 The thermonuclear reaction
between deuterium and tritium results in
the liberation of neutrons with energies
of 14.1 MeV. This energy is consider-
ably greater than that of essentially all
the fission neutrons and is also much
greater than the energy of the neutrons
produced by the other thermonuclear
reactions (§ 1.69). These neutrons of
very high energy undergo reactions
within the exploding weapon similar to
those described in § 8.52. Consequently
some of the high-energy neutrons are
emitted from the region of the explosion
with energies lower than 14.1 MeV.
Nevertheless, sufficient quantities of
energetic neutrons emerge from a ther-
monuclear weapon to cause a peak in
the neutron spectrum at energies in the
range of 12 to 14 MeV. This peak is in
contrast to the continuous decrease in
the number of neutrons with increasing
neutron energy observed for fission
weapons. The existence of the high-en-
ergy peak in the neutron energy spec-
trum from thermonuclear weapons pre-
vents the occurrence of an equilibrium
spectrum until the neutrons have trav-
eled long distances in air (§8:117 et
seq.).
MEASUREMENT OF NEUTRON FLUX
8.58 Neutrons, being electrically
neutral particles, do not produce ioniza-
tion or excitation directly in their pas-
sage through matter. They can, how-
ever, cause these effects indirectly as a
result of their interaction with certain
light nuclei. When a fast neutron col-
lides with the nucleus of a hydrogen
atom, for example, the neutron may
transfer a large part of its energy to that
nucleus. As a result, the hydrogen nu-
cleus is freed from its associated elec-
tron and moves off as a high-energy
proton. Such a proton is capable of
producing a considerable number of ion
pairs in its passage through a gas or it
can cause electronic excitation. Thus,
the interaction of a fast neutron with
hydrogen (or with any substance con-
taining hydrogen) can cause ionization
or excitation to occur indirectly.8 The
interaction of neutrons with hydrogen
thus makes it possible to use both ion-
ization and scintillation counters as
neutron detectors. For example, if a
hydrogenous material is impregated
with a substance that is capable of pro-
ducing scintillations, protons released
by neutrons interacting with hydrogen
atoms cause the excitation of the scin-
tillation material.
8.59 Neutrons in the slow and
moderate speed ranges can produce
ionization and excitation indirectly in
*The ionization and excitation resulting from the interaction of fast neutrons with hydrogen in tissue is
considered to be the main cause of biological injury by neutrons.
344
INITIAL NUCLEAR RADIATION
other ways. When such neutrons are
captured by the lighter isotope of boron
(boron-10), two electrically charged
particles—a helium nucleus (alpha par-
ticle) and a lithium nucleus—of high
energy are formed. Neutrons also can be
captured in the lighter isotope of lithium
(lithium-6) to produce a tritium nucleus
and an alpha particle (§ 1.70), or the
neutrons can be captured by nitrogen
nuclei and high-energy particles are
emitted (§ 8.110). In each of these re-
actions, the resulting charged particles
can produce ion pairs or excitation. In-
direct ionization by neutrons can also
result from the fission of plutonium or
uranium isotopes. The fission fragments
are electrically charged particles (ions)
of high energy which leave considerable
ionization in their paths.
8.60 All of the foregoing indirect
ionization or excitation processes can be
used to detect and measure neutron in-
tensities. The quantity determined, ei-
ther directly or indirectly, is called the
“neutron flux”; it is the product of the
neutron density, i.e., the number per
unit volume, and the average velocity.
The instruments employed for the mea-
surement of neutron flux, such as boron
counters and fission chambers, are
somewhat similar, in general principle,
to the dose rate (survey) meters com-
monly used for gamma radiations
(§ 8.30). “Tissue equivalent”
chambers have been developed in which
the ionization produced indirectly by
neutrons is related to the energy which
would be taken up from these neutrons
by animal tissue. Thus, the absorbed
dose in rads (tissue) can be determined
in this manner.
8.61 In addition to the procedures
described above, “foil activation”
methods have been extensively used in
the detection and measurement of neu-
trons in various energy ranges. These
methods are based upon the fact that
certain elements become radioactive as
a result of the capture of neutrons
(§ 8.16). Under appropriate conditions,
the extent of the radioactivity, as mea-
sured by the rate of emission of radia-
tion (beta or gamma or both), is related
to the “integrated flux,” or “fluence,”
of incident neutrons, i.e., the product of
the flux and time, expressed as neutrons
per square centimeter (neutrons/cm2).
Hence, by the use of appropriate con-
version factors, neutron fluence can be
calculated.9 In practice the elements are
used in the form of thin sheet or foil, so
that they produce a minimum distur-
bance of the neutron field. The tech-
nique is referred to as “activation de-
tection” and the materials employed are
known as “activation detectors.” An
activation detector which has an appre-
ciable probability of reaction only when
the energy of the neutron exceeds a
particular (threshold) value is called a
“threshold detector.” The procedure is
then described as the “threshold detec-
tor technique” and is used to determine
the number of neutrons with energies in
excess of the threshold value.
8.62 The “fission foil” method, as
its name implies, makes use of fission
reactions. A thin layer of a fissionable
material, such as an isotope of uranium
•’The neutron fluence (at a given energy) is, in a sense, a measure of the neutron exposure (at that
energy). The absorbed dose can be derived from the fluence by allowing for the energy deposited by the
neutrons in a specified material.
NEUTRONS
345
or plutonium, is exposed to neutrons.
The fission products formed are highly
radioactive, emitting beta particles and
gamma rays. By measuring the radioac-
tivity produced in this manner, the
amount of fission and, hence, the neu-
tron fluence to which the fissionable
material was exposed can be deter-
mined.
NEUTRON DOSE DEPENDENCE ON
YIELD AND DISTANCE
8.63 A basic difficulty in expressing
the relation between the neutron dose,
yield, and the distance from a nuclear
explosion is the fact that the results vary
significantly with changes in the
characteristics of the weapon. The ma-
terials, for example, have a considerable
influence on the extent of neutron cap-
ture and, consequently, on the number
and energy distribution of the fission
neutrons that succeed in escaping into
the air. Further, the thermonuclear re-
action between deuterium and tritium is
accompanied by the liberation of neu-
trons of high energy (§ 8.57). Hence, it
is to be expected that, for an explosion
in which part of the energy yield arises
from thermonuclear (fusion) processes,
there will be a larger proportion of
high-energy (fast) neutrons than from a
purely fission explosion.
8.64 In view of these considera-
tions, it is evident that the actual number
of neutrons emitted per kiloton of ex-
plosion energy yield, as well as their
energy distribution, may differ not only
for weapons of different types, i.e., fis-
sion and fusion, but also for weapons of
the same kind. Hence, any curve which
purports to indicate the variation of
neutron dose with yield and distance
cannot be correct for all situations that
might arise. It is with this limitation in
mind that the curves in Figs. 8.64a and
b are presented; the former is for fission
weapons and the latter for thermonu-
clear weapons with 50 percent of their
yield from fission. The estimated reli-
ability factors are the same as given in
§8.33 for Figs 8.33a and b, respec-
tively. The curves give absorbed neu-
tron doses in tissue close to the surface
of the body received near the ground for
low air bursts. The data are based on an
average air density in the transmission
path of 0.9 of the normal sea-level den-
sity. If the actual average air density is
higher or lower than this, the neutron
dose will be decreased or increased,
respectively.
8.65 When comparing or combin-
ing neutron doses with those from
gamma rays (Figs. 8.33a and b), it
should be noted that the biological ef-
fects of a certain number of rads of
neutrons are often greater than for the
same number of rads of gamma rays
absorbed in a given tissue (§ 12.97). As
for gamma rays, the neutron dose de-
creases with distance from the explosion
as a result of the inverse square law and
attenuation by absorption and scattering
in the atmosphere. However, since the
prompt neutrons are emitted during a
short time (§ 8.51), and since those of
major biological significance travel
much faster than the blast wave, there is
no hydrodynamic enhancement of the
(prompt) neutrons dose as there is for
fission product gamma rays. This is one
reason why the gamma-ray dose in-
creases more rapidly with the energy
yield than does the neutron dose. The
data in Figs. 8.64a and b may be re-
garded as applying to air bursts. For
346
INITIAL NUCLEAR RADIATION
EXPLOSION YIELD (KT)
Figure 8.64a. Slant ranges for specified neutron doses for targets near the ground as a
function of energy yield of air-burst fission weapons, based on 0.9 sea-level
air density. (Reliability factor from 0.5 to 2 for most fission weapons.)
contact surface bursts, the prompt neu-
tron dose may be taken as one-half the
value for a corresponding air burst. For
heights of burst below 300 feet, the dose
may be estimated by interpolation be-
tween the values for an air burst and a
contact surface burst.
SHIELDING AGAINST NEUTRONS
8.66 Neutron shielding is a dif-
ferent, and more difficult, problem than
shielding against gamma rays. As far as
the latter are concerned, it is merely a
matter of interposing a sufficient mass of
material between the source of gamma
radiations and the recipient. Heavy
metals, such as iron and lead, make
good gamma-ray shields because of
their high density. These elements
alone, however, are not quite as satis-
factory for neutron shielding. An iron
shield will attenuate weapon neutrons to
some extent, but it is less effective than
some of the types described below.
8.67 The attenuation of neutrons
from a nuclear explosion involves sev-
eral different phenomena. First, the very
fast neutrons must be slowed down into
the moderately fast range; this requires a
suitable (inelastic) scattering material,
such as one containing barium or iron.
Then, the moderately fast neutrons have
to be decelerated (by elastic scattering)
into the slow range by means of an
element of low atomic weight (or mass
NEUTRONS
347
EXPLOSION YIELD (KT)
Figure 8.64b. Slant ranges for specified neutron doses for targets near the ground as a
function of energy yield of air-burst thermonuclear weapons based on 0.9
sea-level air density. (Reliability factor 0.25 to 1.5 for most thermonuclear
weapons.)
number). Water is very satisfactory in
this respect, since its two constituent
elements, i.e., hydrogen and oxygen,
both have low atomic weights. The slow
(thermal) neutrons must then be ab-
sorbed. This is not a difficult matter,
since the hydrogen in water will serve
the purpose. However, neutron inelastic
scattering reactions and most neutron
capture reactions are accompanied by
the emission of gamma rays (§§ 8.53,
8.54). Consequently, sufficient gamma-
attenuating material must be included to
minimize the escape of the gamma rays
from the shield.
8.68 In general, concrete or damp
earth would represent a fair compromise
for neutron, as well as for gamma-ray
shielding. Although these materials do
not normally contain elements of high
atomic weight, they do have a fairly
large proportion of hydrogen to slow
down and capture neutrons, as well as
calcium, silicon, and oxygen to absorb
the gamma radiations. A thickness of 12
inches of concrete, for example, will
348
INITIAL NUCLEAR RADIATION
decrease the neutron fluence from a
thermonuclear weapon by a factor of
about 10, and 24 inches by a factor of
roughly 100. The high energy initial
gamma radiation would be decreased to
a somewhat lesser extent (see Table
8.41), but, in sufficient thickness, con-
crete could be used to provide shielding
against both neutrons and gamma rays
from a nuclear explosion. Damp earth
may be expected to act in a similar
manner, although about 50 percent
greater thickness would be required.
8.69 An increase in the absorption
of the nuclear radiations can be achieved
by using a modified (“heavy”) concrete
made by adding a considerable propor-
tion of an iron (oxide) ore, e.g., limon-
ite, to the mix and incorporating small
pieces of iron, such as steel punchings.
Alternatively, the mineral barytes,
which is a compound of barium, may be
included in the concrete. The presence
of a heavy element improves both the
neutron and gamma-ray shielding prop-
erties of a given thickness (or volume)
of the material. Attenuation of the neu-
tron fluence from a thermonuclear
weapon by a factor of 10 requires about
7 inches of this heavy concrete.
8.70 The presence of boron or a
boron compound in neutron shields has
certain advantages. The lighter (boron-
10) isotope of the element captures slow
neutrons very readily (§ 8.59), the
process being accompanied by the
emission of gamma rays of moderate
energy (0.48 MeV) that are not difficult
to attenuate. Thus, the mineral cole-
manite, which contains a large propor-
tion of boron, can be incorporated into
concrete in order to improve its ability
to absorb neutrons.
8.71 It was pointed out in § 8.45
that, because of the scattering experi-
enced by gamma rays, an adequate
shield must provide protection from all
directions. Somewhat the same situation
applies to neutrons. As seen earlier,
neutrons undergo extensive scattering in
the air, so that, by the time they reach
the ground, even at a moderate distance
from the explosion, their directions of
motion are almost randomly distributed.
Partial protection from injury by neu-
trons may be obtained by means of an
object or structure that provides shield-
ing only from the direction of the ex-
plosion, although better protection, as in
the case of gamma rays, would be given
by a shelter which shields in all direc-
tions.
8.72 In addition to the complexities
introduced by the arrival of neutrons at a
target from many directions, the distri-
bution in energy from each direction
makes it impractical to calculate the
shielding effectiveness of even simple
structures without resort to complex
computer codes. Estimates of the
shielding afforded by various structures
are given in Table 8.72 in terms of a
“dose transmission factor”; this is de-
fined as the ratio of the dose received
behind the shield to the dose at the same
location in the absence of shielding.
Some of the transmission factors were
obtained by measurements at weapons
tests or are extrapolations from such
measurements. Others were obtained by
relatively detailed calculations, whereas
still others are mere estimates. Ranges
of values are given for the dose trans-
mission factors for two reasons: uncer-
tainties in the estimates themselves and
variations in the degree of shielding that
may be obtained at different locations
within a structure.
TRANSIENT-RADIATION EFFECTS ON ELECTRONICS (TREE)
349
Table 8.72
DOSE TRANSMISSION FACTORS FOR VARIOUS STRUCTURES
Structure
Initial
Gamma Rays
Neutrons
Three feet underground
Frame House
Basement
Multistory building
(apartment type):
Upper stories
Lower stories
Concrete blockhouse shelter:
9-in. walls
12-in. walls
24-in. walls
Shelter, partly
above grade:
With 2 ft earth cover
With 3 ft earth cover
0.002-0.01
0.3-0.8
0.1-0.8
0.002-0.004
0.8-1.0
0.I-0.6
0.8-0.9 0.3-0.6 0.9-1.0 0.3-0.8
0.1-0.2 0.3-0.5
0.05-0.1 0.2-0.4
0.007-0.02 0.1-0.2
0.03-0.07 0.02-0.08
0.007-0.02 0.01-0.05
TRANSIENT-RADIATION EFFECTS ON ELECTRONICS (TREE)
GENERAL CHARACTERISTICS OF
TREE
8.73 The initial nuclear radiation,
specifically gamma rays and neutrons,
can affect materials, such as those used
in electronics systems, e.g., radio and
radar sets, gyroscopes, inertial guidance
devices, computers, etc. The response
of such systems to radiation from a
nuclear explosion depends on the nature
of the radiation absorbed and also on the
specific component and often on the
operating state of the system. The actual
effects are determined by the charac-
teristics of the circuits contained in the
electronics package, the exact compo-
nents present in the circuits, and the
specific construction techniques and
materials used in making the compo-
nents.
8.74 The name commonly applied
to the class of effects under considera-
tion is ‘"transient-radiation effects on
electronics,” commonly abbreviated to
the acronym TREE. In general, TREE
means those effects occurring in an
electronics system as a result of expo-
sure to the transient initial radiation
from a nuclear weapon explosion. The
adjective “transient” applies to the ra-
diation since it persists for a short time,
i.e., less than 1 minute. The response,
however, is not necessarily transient. In
order to study the effects of nuclear
radiations on electronics systems and
components, the transient radiation
from a weapon is simulated in the labo-
ratory by means of controlled sources of
both steady-state and transient radia-
tions.
350
INITIAL NUCLEAR RADIATION
8.75 The term “electronics” as
used in TREE may refer to any or all of
the following: individual electronic
component parts, component parts as-
sembled into a circuit, and circuits
combined to form a complete system.
TREE studies may also include electro-
mechanical components connected to
the electronics, e.g., gyros, inertial in-
struments, etc. Purely mechanical or
structural components are excluded
since they are much less sensitive to
radiation than are components or sys-
tems that depend on electrical currents
(or voltages) for their operation.
8.76 Radiation effects on elec-
tronics may be temporary or more-or-
less permanent. Even though the effects
on a particular component, e.g., a tran-
sistor, may be temporary, these effects
may result in permanent damage to
some other part of a circuit. The com-
ponent responses of short duration are
usually the result of ionization caused
by gamma radiation and are dependent
upon the dose rate, e.g., in rads per
second, rather than the dose. The more
permanent effects are generally—but
not always—due to the displacement of
atoms in a crystal lattice by high-energy
(fast) neutrons. In such cases the extent
of damage is determined by the neutron
fluence, expressed in neutrons/cm2
(§ 8.61). When a permanent effect is
produced in an electronic component by
gamma radiation, the important quantity
usually is the dose in rads. A brief
description of the responses of some
components of electronics systems are
given below; the mechanisms of the
interactions with nuclear radiations are
explained later (§ 8.133 et seq.).
OBSERVED EFFECTS ON
ELECTRONICS COMPONENTS
Solid-State Devices
8.77 Solid-state devices, such as
diodes, transistors, and integrated cir-
cuits, are widely used in electronics
systems. They consist of semiconductor
materials that are quite sensitive to nu-
clear radiations. Temporary effects are
the production of spurious current
pulses caused by gamma rays absorbed
in the solid. This phenomenon is turned
to advantage in the semiconductor de-
tectors of nuclear radiation (§ 8.22).
The strength of the current pulse is pro-
portional to the dose rate of the radiation
and is much larger in a transistor than in
a diode because the primary current re-
sulting from ionization produces an am-
plified secondary current in the transis-
tor.
8.78 Some of the changes caused
by atomic displacements in a semicon-
ductor disappear or “anneal” (§ 8.142)
in a short time but others remain. Per-
manent changes in the physical proper-
ties of materials affect the operating
characteristics of the diode or transistor.
The latter are usually more sensitive to
radiation and so the discussion here will
be restricted to transistors. In most
cases, degradation in the current ampli-
fication (or gain) of transistors is the
critical factor in determining the useful-
ness of electronic systems containing
solid-state components.
8.79 There is a wide variation in the
response of transistors to radiation, even
among electronic devices designed to
perform similar functions. The decrease
in gain may become unacceptable at
TRANSIENT-RADIATION EFFECTS ON ELECTRONICS (TREE)
351
fast-neutron fluences as small as 10й or
as large as 1015 (or more) neutrons/cm2.
(Fast-neutron fluences referred to in this
section are fission neutrons with ener-
gies exceeding 10 keV, i.e., 0.01
MeV).10 The structure of the device has
an important influence on the radiation
resistance of a transistor. As a general
rule, a thin base, as in high-frequency
devices, and a small junction area favor
radiation resistance. For example, dif-
fuse-junction transistors are signifi-
cantly more resistant than alloy-junction
devices because of the smaller junction
area. Junction and especially thin-film
field-effect transistors can be made that
are quite resistant to radiation. Certain
types of the latter have remained opera-
tional after exposure to a fast-neutron
fluence of 1015 neutrons/cm2.
8.80 Damage in MOS (metal-oxide
semiconductor) field-effect transistors is
caused primarily by gamma radiation
rather than by neutrons; hence, the ef-
fects are reported in terms of the dose in
rads (silicon). The most sensitive pa-
rameter to radiation in these devices is
the threshold voltage, i.e., the value of
the gate voltage for which current just
starts to flow between the drain and the
source. In general, gradual degradation,
i.e., a shift of about 0.5 volt in the
threshold voltage, begins at about 104
rads (silicon) and proceeds rapidly at
higher doses. The sensitivity of MOS
transistors to radiation is, however, de-
pendent on the impurities in the gate
oxide. With improvements in the tech-
nique for producing the oxide, the de-
vices are expected to survive doses of
IO6 rads (silicon).
Vacuum Tubes and Thyratrons
8.81 The principal transient effect
in vacuum tubes arises from the
(Compton) electrons ejected by gamma
rays (§ 8.89) from the structural parts of
the tube into the evacuated region.
These electrons are too energetic to be
significantly influenced by the electric
fields in the tube. However, their impact
on the interior surfaces of the tube pro-
duces low-energy secondary electrons
that can be affected by the existing
electric fields, and as a result the
operating characteristics of the tube can
be altered temporarily. The grid is par-
ticularly sensitive to this phenomenon;
if it suffers a net loss of electrons, its
voltage will become more positive and
there is a transient increase in the plate
current. Large fluences of thermal neu-
trons, e.g., IO16 neutrons/cm2, can cause
permanent damage to vacuum tubes as a
consequence of mechanical failure of
the glass envelope. But at distances
from a nuclear explosion at which such
fluences might be experienced, blast and
fire damage would be dominant.
8.82 Gas-filled tubes (thyratrons)
exposed to gamma radiation exhibit a
transient, spurious firing due to partial
ionization of the gas, usually xenon.
Additional ionization is caused by colli-
sions between ions and neutral mole-
cules in the gas. As with vacuum tubes,
large fluences of thermal neutrons can
cause thyratrons to become useless as a
result of breakage of the glass envelope
or failure of glass-to-metal seals.
"'For the dependence of neutron fluences at various energies on the energy yield and distance from a
nuclear explosion, see Figs. 8.117a and b.
352
INITIAL NUCLEAR RADIATION
Capacitors, Resistors, and Batteries
8.83 Nuclear radiation affects the
electrical properties of capacitors to
some extent. Changes in the capacitance
value, dissipation factor, and leakage
resistance have been observed as a con-
sequence of exposure. The effects are
generally not considered to be severe for
fast-neutron fluences less than 1OIS neu-
trons/cm2. During a high-intensity pulse
of nuclear radiation, the most pro-
nounced effect in a capacitor is a tran-
sient change in the conductivity of the
dielectric (insulating) material with a
corresponding increase in the leakage
currents through the capacitor.
8.84 Radiation effects in resistors
are generally small compared with those
in semiconductors and capacitors and
are usually negligible. However, in cir-
cuits requiring high-precision carbon
resistors transient effects may be signif-
icant at gamma-ray dose rates of 107
rads (carbon)/sec11 * and at fast-neutron
fluences of 1014 neutrons/cm2. The tran-
sient effects are generally attributed to
gamma rays that interact with materials
to produce electrons; however, ener-
getic neutrons can also cause significant
ionization by recoiling nuclei. The tran-
sient effects on resistors include (1) a
change in the effective resistance due to
leakage in the insulating material and
the surrounding medium, and (2) in-
duced current that is the result of the
difference between the emission and
absorption of secondary electrons by the
resistor materials. The permanent ef-
fects are generally due to the displace-
ment of atoms by neutrons, thereby
causing a change in the resistivity of the
material.
8.85 Batteries are affected much
less by radiation than other components.
The effects of radiation on nickel-cad-
mium batteries appear to be insignifi-
cant at gamma-ray dose rates up to 107
rads (air)/sec. No radiation damage was
apparent in a number of batteries and
standard cells that were subjected to IO13
fast neutrons/cm2. Mercury batteries can
withstand fast neutron fluences up to
IO16 neutrons/cm2.
Cables and Wiring
8.86 It has been recognized for
some time that intense pulses of radia-
tion produce significant perturbation in
electrical cables and wiring, including
coaxial and triaxial signal cables. Even
with no voltage applied to a cable, a
signal is observed when the cable is
exposed to a radiation pulse. The cur-
rent associated with this signal is de-
fined as a replacement current, since it is
a current in an external circuit that is
apparently necessary to replace elec-
trons or other charged particles that are
knocked out of their usual positions by
the radiation. In addition there is a sig-
nal, attributed to what is called the con-
duction current, which varies with the
voltage applied to the cable. It is
ascribed to the conductivity induced in
the insultating dielectric by the radia-
tion. However, the conductivity current
may also include substantial contribu-
tions from changes in the dielectric ma-
11 In this and other cases, the damage is determined by the dose rate (rather than the dose) of gamma
radiation.
TECHNICAL ASPECTS OF INITIAL NUCLEAR RADIATION
teriaL These can usually be identified by
their gradual disappearance (saturation)
after repeated exposures and by their
reappearance after additional exposures
in which there is a considerable change
in the applied voltage, e.g., it is re-
moved or reversed.
8.87 Nuclear radiation can have
both temporary and permanent effects
on the insulating material of cables. If
ionization occurs in the material, the
free electrons produced contribute to its
conductivity. Hence, insulators are ex-
pected to have a temporary enhancement
of conductivity in an ionizing radiation
environment. Conduction in the insula-
tor is frequently characterized by two
components: (1) for very short radiation
pulses, a prompt component whose
magnitude is a function of only the in-
stantaneous exposure rate, and (2) fre-
quently at the end of the short radiation
exposure, a delayed component having
approximately exponential decay, i.e.,
rapid at first and then more and more
slowly.
8.88 Permanent damage effects in
cables and wiring are apparent as
353
changes in the electrical properties of
the insulating materials. When such
damage becomes appreciable, e.g.,
when the resistance is reduced severely,
electrical characteristics may be af-
fected. The extent of the damage to
insulating materials increases with the
neutron fluence (or gamma-ray dose),
humidity, and irradiation temperature.
Certain types of insulation are quite su-
sceptible to permanent damage. For ex-
ample, silicon rubber is severely
cracked and powdered by a fluence of
2 x 10,s fast neutrons/cm2. The ap-
proximate gamma-radiation damage
thresholds for three common types of
cable insulation are: polyethylene,
1 x 10⁷ rads (carbon); Teflon TFE,
1 x 10* rads (carbon); and Teflon FEB,
2 x 10⁶ rads (carbon). On the other
hand, some irradiated polyolefins are
capable of withstanding up to 5 x 10⁹
rads (carbon). A considerable degree of
recovery has been observed with respect
to insulation resistance; this implies the
possibility of adequate electrical servi-
ceability after moderate physical dam-
age.
TECHNICAL ASPECTS OF INITIAL NUCLEAR RADIATION12
INTERACTION OF GAMMA RAYS
WITH MATTER
8.89 There are three important
types of interaction of gamma rays with
matter, as a result of which the photons
(§ 1.74) are scattered or absorbed. The i:
first of the these is called the “Compton
effect.” In this interaction, the gamma-
ray (primary) photon collides with an
electron and some of the energy of the
photon is transferred to the electron.
Another (secondary) photon, with less
energy, then moves off in a new direc-
i:Thc remaining sections of this chapter may be omitted without loss of continuity.
354
INITIAL NUCLEAR RADIATION
lion at an angle to the direction of mo-
tion of the primary photon. Conse-
quently, Compton interaction results in
a change of direction (or scattering) of
the gamma-ray photon and a degrada-
tion in its energy. The electron which,
after colliding with the primary photon,
recoils in such a manner as to conserve
energy and momentum is called a
Compton (recoil) electron.
8.90 The total extent of Compton
scattering per atom of the material with
which the radiation interacts is propor-
tional to the number of electrons in the
atom, i.e., to the atomic number
(§ 1.09). It is, consequently, greater per
atom for an element of high atomic
number than for one of low atomic
number. The Compton scattering de-
creases with increasing energy of the
gamma radiation for all materials, irre-
spective of the atomic number.
8.91 The second type of interaction
of gamma rays and matter is by the
“photoelectric effect.” A photon, with
energy somewhat greater than the bind-
ing energy of an electron in an atom,
transfers all its energy to the electron
which is consequently ejected from the
atom. Since the photon involved in the
photoelectric effect loses all of its en-
ergy, it ceases to exist. In this respect, it
differs from the Compton effect, in
which a photon still remains after the
interaction, although with decreased
energy. The magnitude of the photo-
electric effect per atom, like that of the
Compton effect, increases with the
atomic number of the material through
which the gamma rays pass, and de-
creases with increasing energy of the
photon.
8.92 Gamma radiation can interact
with matter in a third manner, called
“pair production.” When a gamma-ray
photon with energy in excess of 1.02
MeV passes near the nucleus of an
atom, the photon may be converted into
matter with the formation of a pair of
particles, namely, a positive and a neg-
ative electron. As with the photoelectric
effect, pair production results in the
disappearance of the gamma-ray photon
concerned. However, the positive elec-
tron soon interacts with a negative elec-
tron with the formation of two photons
of lower energy than the original one.
The occurrence of pair production per
atom, as with the other interactions,
increases with the atomic number of the
material, but it also increases with the
energy of the photon in excess of 1.02
MeV.
8.93 In reviewing the three types of
interaction described above, it is seen
that, in all cases, the magnitude per
atom increases with increasing atomic
number (or atomic weight) of the mate-
rial through which the gamma rays pass.
Each effect, too, is accompanied by ei-
ther the complete removal of photons or
a decrease in their energy. The net result
is some attenuation of the gamma-ray
intensity or dose rate. Since there is an
approximate parallelism between atomic
weight and density, the number of
atoms per unit volume does not vary
greatly from one substance to another.
Hence, a given volume (or thickness) of
a material containing elements of high
atomic weight (“heavy elements”) will
be more effective as a gamma-ray shield
than the same volume (or thickness) of
one consisting only of elements of low
atomic weight (“light elements”). An
illustration of this difference in behavior
will be given below.
8.94 Another important point is that
TECHNICAL ASPECTS OF INITIAL NUCLEAR RADIATION
355
the probabilities of the Compton and
photoelectric effects (per atom) both
decrease with increasing energy of the
gamma-ray photon. However, pair pro-
duction, which starts at 1.02 MeV, in-
creases with the energy beyond this
value. Combination of the various at-
tenuating effects, two of which decrease
whereas one increases with increasing
photon energy, means that, at some en-
ergy in excess of 1.02 MeV, the ab-
sorption of gamma radiation by a par-
ticular material should be a minimum.
That such minima do exist will be seen
shortly.
GAMMA-RAY ATTENUATION
COEFFICIENTS
8.95 When a narrow (or collimated)
beam of gamma rays passes through a
material, photons are removed as a re-
sult of the Compton scattering interac-
tion as well as by the photoelectric and
pair-production interactions. In other
words, the scattered photons are re-
garded as being lost from the beam,
although only part of their energy will
have been deposited in the material. If
such a collimated beam of gamma rays
of a specific energy, having an initial
intensity (or flux) of IQ photons per
square centimeter per second, traverses
a thickness of x of a given material, the
intensity, /, of the rays which emerge
without having undergone any interac-
tions can be represented by the equation
I = /ое-их, (8.95.1)11 * 13
where |л is called the “linear attenuation
coefficient.” The distance x is usually
expressed in centimeters, so that the
corresponding units for |л are reciprocal
centimeters (cm4). It can be seen from
the equation (8.95.1) that, for a given
thickness x of material, the intensity I
of the emerging gamma rays will be less
the larger is the value of pi. In other
words, the linear attenuation coefficient
is a measure of the shielding ability of a
definite thickness, e.g., 1 cm, 1 foot, or
other thickness, or any material for a
collimated beam of monoenergetic
gamma rays.
8.96 The value of pi, under any
given conditions, can be obtained with
the aid of equation (8.95.1) by deter-
mining the gamma-ray intensity before
(/0) and after (/) passage through a
known thickness, x, of material. Some
of the data obtained in this manner, for
monoenergetic gamma rays with ener-
gies ranging from 0.5 MeV to 10 MeV,
are recorded in Table 8.96. The values
given for concrete apply to the common
form with a density of 2.3 grams per
cubic centimeter (144 pounds per cubic
foot). For special heavy concretes, con-
taining iron, iron oxide, or barytes, the
coefficients are increased roughly in
proportion to the density.
11 In this equation, the intensity is the number of (uncollided) photons per square centimeter per
second A similar equation, with the “linear energy absorption coefficient” replacing the linear
attenuation coefficient, is applicable when the intensity is expressed in terms of the total energy of the
photons per square centimeter per second.
356
INITIAL NUCLEAR RADIATION
Table 8.96
LINEAR ATTENUATION COEFFICIENTS FOR GAMMA RAYS
Linear Attenuation Coefficient (|x) in cm*1
Gamma-ray Energy
(MeV) Air Water Concrete Iron Lead
0.5 1.11 x IO"4 0.097 0.22 0.66 1.64
1.0 0.81 x 10⁻⁴ 0.071 0.15 0.47 0.80
2.0 0.57 x IO-4 0.049 0.11 0.33 0.52
3.0 0.46 x 10⁻⁴ 0.040 0.088 0.28 0.47
4.0 0.41 x 10⁻⁴ 0.034 0.078 0.26 0.48
5.0 0.35 x 10⁻⁴ 0.030 0.071 0.25 0.52
10 0.26 x 10⁻⁴ 0.022 0.060 0.23 0.55
8.97 By suitable measurements and
theoretical calculations, it is possible to
determine the separate contributions of
the Compton effect (|лс), of the photo-
electric effect (|x ), and of pair produc-
tion (|лрр) to the total linear attenuation
coefficient as functions of the gamma-
ray energy. The results for lead, a typi-
cal heavy element (high atomic number)
with a large attenuation coefficient, are
given in Fig. 8.97a and those for air, a
mixture of light elements (low atomic
number) with a small attenuation coef-
ficient, in Fig. 8.97b. Except at ex-
tremely low energies, the photoelectric
effect in air is negligible, and hence is
not shown in the figure. At the lower
gamma-ray energies, the linear attenua-
tion coefficients in both lead and air
decrease with increasing energy because
of the decrease in the Compton and
photoelectric effects. At energies in ex-
cess of 1.02 MeV, pair production
begins to make an increasingly signifi-
cant contribution. Therefore, at suffi-
ciently high energies the attenuation co-
efficient begins to increase after passing
through a minimum. This is apparent in
Fig. 8.97a, as well as in the last column
of Table 8.96, for lead. For elements of
lower atomic weight, the increase does
not set in until very high gamma-ray
energies are attained, e.g., about 17
MeV for concrete and 50 MeV for
water.
8.98 The fact that the attenuation
coefficient decreases as the gamma-ray
energy increases, and may pass through
a minimum, has an important bearing on
the problem of shielding. For example,
a shield intended to attenuate gamma
rays of 1 MeV energy will be much less
effective for radiations of 10 MeV en-
ergy because of the lower value of the
TECHNICAL ASPECTS OF INITIAL NUCLEAR RADIATION
357
ATTENUATION COEFFICIENT (м х Ю4 cm'1) c ATTENUATION COEFFICIENT ( M cm
- 1 1 1 1 1
- -
- - p TOTAL -
~T— MPP 1
0 2 4 6 8 10
GAMMA RADIATION ENERGY (MEV)
8.97a. Linear attenuation coefficient of lead as function of gamma-ray energy.
1 i 1 1
- \ -
г-p TOTAL -
1 1 MPP-^ —
0 2 4 6 8 10
GAMMA RADIATION ENERGY (MEV)
Figure 8.97b. Linear attenuation coefficient of air as function of gamma-ray energy.
358
INITIAL NUCLEAR RADIATION
attentuation coefficient, irrespective of
the material of which the shield is com-
posed.
8.99 An examination of Table 8.96
shows that, for any particular energy
value, the linear attenuation coefficients
increase from left to right, that is, with
increasing density of the material. Thus,
a given thickness of a denser substance
will attenuate the gamma radiation more
than the same thickness of a less dense
material. This is in agreement with the
qualitative concept that a small thick-
ness of a substance of high density will
make as effective a gamma-ray shield as
a greater thickness of one of lower den-
sity (§ 8.38 et seq.).
MASS ATTENUATION COEFFICIENT
8.100 As a very rough approxima-
tion, it has been found that the linear
attenuation coefficient for gamma rays
of a particular energy is proportional to
the density of the absorbing (shield)
material. That is to say, the linear at-
tenuation coefficient divided by the
density, giving what is called the “mass
attenuation coefficient,” is approxi-
mately the same for all substances for a
specified gamma-ray energy. This is
especially true for elements of low and
medium atomic weight, up to that of
iron (about 56), where the Compton
effect makes the major contribution to
the attenuation coefficient for energies
up to a few million electron volts (cf.
Fig. 8.97b). For the initial gamma rays
of higher energy, the effective mass at-
tenuation coefficient (§ 8.104) is close
to 0.023 for water, wood, concrete, and
earth, with the densities expressed in
grams per cubic centimeter. The value
for iron is about 0.027 in the same units
(g/cm2).
8.101 If the symbol p is used for the
density of the shield material, then
equation (8.95.1) can be rewritten in the
form
///0 = = e-(n/p)(px), (8.101.1)
where ///0 is the transmission factor of
the shield of thickness лет, and |x/p is,
by definition, the mass attenuation co-
efficient. Taking |x/p to be 0.023 g/cm2
for initial gamma rays, it follows from
equation (8.101.1) that
Transmission factor ~
e-0 023pr 10-0 0!P< (8.101.2)
In the absence of better information, this
expression may be used to provide a
rough idea of the dose transmission fac-
tor, as defined in § 8.72, of a thickness
of x centimeters of any material (of
known density) of low or moderate
atomic weight.
8.102 The simple tenth-value
thickness concept described in § 8.39 is
based on equation (8.95.1). For such a
thickness the transmission factor is 0.1
and if the thickness is represented by
x0 p it follows that
0.1 = е-нчи
or
x,, = 2— cm. (8.102.1)
° 1 |Л
If |л/р is taken to be 0.023 g/cm2 for the
initial gamma radiation of higher energy
then, as a “rule-of-thumb” approxima-
tion,
Л° । (cm) p(g/cm3)
TECHNICAL ASPECTS OF INITIAL NUCLEAR RADIATION
359
or the equivalent
203
T(ft) ~ zwfer (8102-2)
where, as in § 8.42, Tis the tenth-value
thickness in feet and D is the density of
the material in lb/ft\ It follows, there-
fore, that for the less-dense materials,
for which |л/р is close to 0.023 g/cm2,
the product D x T should be equal to
about 200 lb/ft2 for gamma rays of
higher energy. This is in agreement with
the values in the last column of Table
8.41 for nitrogen capture (secondary)
gamma rays. The D x T for iron (or
steel) is smaller than for the other mate-
rials because |x/p is larger, namely about
0.027 g/cm2, for the gamma rays of
higher energy.
THICK SHIELDS: BUILDUP FACTOR
8.103 Equation (8.95.1) is strictly
applicable only to cases in which the
photons scattered in Compton interac-
tions may be regarded as having been
removed from the gamma-ray beam.
This situation holds reasonably well for
narrow beams or for shields of moderate
thickness, but it fails for broad beams or
thick shields. In the latter circum-
stances, the photon may be scattered
several times before emerging from the
shield. For broad radiation beams and
thick shields, such as are of interest in
shielding from nuclear explosions, the
value of /, the intensity (or dose) of the
emerging radiation, is larger than that
given by equation (8.95.1). Allowance
for the multiple scattering of the radia-
tion is made by including a “buildup
factor,” represented by B(x), the value
of which depends upon the thickness x
of the shield, the nature of the material.
and the energy of the impinging radia-
tion; thus, equation (8.95.1) is now
written as
I =
Values of the buildup factor for a variety
of conditions have been calculated for a
number of elements from a theoretical
consideration of the scattering of pho-
tons by electrons. The fact that these
values are frequently in the range from
10 to 100 shows that serious errors
could arise if equation (8.95.1) is used
to determine the attenuation of gamma
rays by thick shields.
8.104 It will be apparent, therefore,
that equation (8.95.1) and others
derived from it, such as equations
(8.101.2) and (8.102.1), as well as the
simple tenth-value thickness concept,
will apply only to monoenergetic radia-
tions and thin shields, for which the
buildup factor is unity. By taking the
mass attenuation coefficient to be 0.023
for less dense materials (or 0.027 for
iron), as given above, an approximate
(empirical) allowance has been made for
both the polyenergetic nature of the
gamma radiations from a nuclear explo-
sion and the buildup factors due to mul-
tiple scattering of the photons. The re-
sults are, at best, applicable only to
shields with simple (slab) geometries.
Furthermore, practical radiation shields
must absorb neutrons as well as gamma
rays, and the gamma radiation produced
in the shield by inelastic scattering and
radiative capture of the neutrons may
produce a greater intensity inside the
shield than the incident gamma radia-
tion. Consequently, any problem in-
volving gamma radiation shielding,
especially in the presence of neutrons, is
complex, even for relatively simple
360
INITIAL NUCLEAR RADIATION
structures; appropriate computer codes
are thus necessary to obtain approxima-
tions of the attenuation. In the absence
of better information, however, the ef-
fective tenth-value thicknesses, as given
in Table 8.41 or derived from equation
(8.102.2), can be used to provide a
rough indication of gamma-ray shield-
ing.
THE INITIAL GAMMA-RAY
SPECTRUM
8.105 The major proportion of the
initial gamma radiation received at a
distance from a nuclear explosion arises
from the interaction of neutrons with
nuclei, especially nitrogen, in the at-
mosphere and from the fission products
during the first minute after the burst.
Gamma rays from inelastic scattering
and neutron capture by nitrogen have
effective energies ranging up to 7.5
MeV (or more) and those from the fis-
sion products are mainly in the 1 to 2
MeV range. After passage through a
distance in air, some of the photons will
have been removed by photoelectric and
pair-production effects and others will
have had their energies decreased as a
result of successive Compton scatter-
ings. There will consequently be a
change in the gamma-ray energy distri-
bution, i.e., in the spectrum.
8.106 Information concerning the
gamma-ray spectrum of the initial radi-
ation is important because the suscepti-
bility of living organisms and of various
electronics components, the attenuation
properties of air and shielding materials,
and the response of radiation detectors
are dependent upon it. Although the
interactions of both neutrons and
gamma rays with the atmosphere, which
determine the gamma-ray spectrum, are
complex, it is possible to calculate the
spectrum at various distances from a
nuclear explosion. Computations of this
kind have been used to estimate
gamma-ray doses, as will be seen later
(§ 8.125 et seq.). As an example, Fig.
8.106 shows the spectrum of the initial
gamma radiation received at a distance
of 2,000 yards from the explosion of a
fission weapon with an energy yield of
20 kilotons. At this range, some 70
percent of the gamma-ray photons have
energies less than 0.75 MeV. It should
be remembered, however, that the pho-
tons of high energy are the most haz-
ardous and also are the most difficult to
attenuate.
INTERACTIONS OF NEUTRONS WITH
MATTER
8.107 The modes of interaction of
neutrons with matter are quite different
from those experienced by gamma-ray
photons. Unlike photons, neutrons are
little affected by electrons, but they do
interact in various ways with the nuclei
of atoms present in all forms of matter.
These neutron-nucleus interactions are
of two main types, namely, scattering
and absorption. As already seen, scat-
tering reactions can be either inelastic (§
8.09) or elastic (§ 8.52). In inelastic
scattering part of the kinetic energy of
the neutron is converted into internal (or
excitation) energy of the struck nucleus;
this energy is then emitted as gamma
radiation. For inelastic scattering to
occur, the neutron must initially have
sufficient energy to raise the nucleus to
an excited state. The magnitude of this
energy depends on the nature of the
nucleus and varies greatly from one el-
TECHNICAL ASPECTS OF INITIAL NUCLEAR RADIATION
361
Figure 8.106. Spectrum of initial gamma radiation 2,000 yards from a 20-kiloton explo-
sion.
ement to another. However, a rough
general rule is that for many, but not all,
heavy or moderately heavy nuclei, e.g.,
iron and uranium, inelastic scattering
may occur for neutrons with energies
ranging from a few tenths MeV to as
low as a few tens of keV. For lighter
nuclei, inelastic scattering is possible
only when the neutrons have higher en-
ergies. Significant inelastic scattering
occurs only for neutron energies above
about 1.6 MeV for nitrogen and about 6
MeV for oxygen. Neutrons with ener-
gies below the appropriate threshold
values for the nuclei present in the me-
dium cannot undergo inelastic scatter-
ing.
8.108 When elastic scattering
occurs, the interaction of the neutron
with a nucleus is equivalent to a colli-
sion between two billiard balls; kinetic
energy is conserved and is merely
transferred from one particle to the
other. None of the neutron energy is
transformed into excitation energy of
the nucleus and there is no accompany-
ing gamma radiation. In contrast with
inelastic scattering, elastic scattering
can take place with neutrons of all en-
ergies and any nucleus. For a given
angle of impact, the fraction of the ki-
netic energy of the neutron that is trans-
ferred to the nucleus in a collision is
dependent only on the mass of the latter.
The smaller the mass of the nucleus the
greater is the fraction of the neutron
energy it can remove. Theoretically, the
whole of the kinetic energy of a neutron
362
INITIAL NUCLEAR RADIATION
could be transferred to a hydrogen nu-
cleus (proton) in a single head-on colli-
sion. In fact, hydrogen, the lightest ele-
ment, offers the best means for rapidly
degrading fast neutrons with energies
less than about 0.5 MeV. It is for this
reason that hydrogen, e.g., as water, is
an important constituent of neutron
shields (§ 8.67). For neutrons of higher
energy than 0.5 MeV, it is better to take
advantage of inelastic scattering to slow
down the neutrons. The heavy element
in the special concretes described in §
8.69 serves this purpose.
8.109 The second fundamental type
of interaction of neutrons with matter
involves complete removal of the neu-
tron by capture. Radiative capture (§
8.08) is the most common kind of cap-
ture reaction; it occurs to some extent,
at least, with nearly all nuclei. The
probability of capture is greater for slow
neutrons than for those of high energy.
Most light nuclei, e.g., carbon and ox-
ygen, have little tendency to undergo
the radiative capture reaction with neu-
trons. With nitrogen, however, the ten-
dency is significant (§ 8.11), but not
great. For other nuclei, especially some
of medium or high mass, e.g., cad-
mium, the radiative capture reaction
occurs very readily. In certain cases, the
reaction product is radioactive (§ 8.61);
this is of importance in some aspects of
weapons effects, as will be seen in
Chapter IX.
8.110 Another type of reaction is
that in which the incident neutron enters
the target nucleus and the compound
nucleus so formed has enough excitation
energy to permit the expulsion of an-
other (charged) particle, e.g., a proton,
deuteron, or alpha particle. The residual
nucleus is often in an excited state and
emits the excess energy as a gamma-ray
photon. This type of reaction usually
occurs with light nuclei and fast neu-
trons, although there are a few in-
stances, e.g., lithium-6 and boron-10,
where it also takes place with slow neu-
trons. Nitrogen interacts with fast neu-
trons in at least two ways in which
charged particles are emitted (§§ 9.34,
9.44); one leads to the formation of
radioactive carbon-14 (plus a proton)
and the other to tritium, the radioactive
isotope of hydrogen (plus stable car-
bon-12).
8.111 Fission, is of course, also a
form of interaction between neutrons
and matter. But since it is restricted to a
small number of nuclear species and has
been considered in detail in Chapter I, it
will not be discussed further here.
8.112 The rate of interaction of
neutrons with nuclei can be described
quantitatively in terms of the concept of
nuclear “cross sections.” The cross
section may be regarded as the effective
target area of a particular type of nu-
cleus for a specific reaction and is a
measure of the probability that this re-
action will occur between a neutron, of
given energy, and that nucleus. Thus,
each nuclear species has a specific scat-
tering cross section, a capture cross
section, and so on, for a given neutron
energy; the total cross section for that
energy is the sum of the specific cross
sections for the individual interactions.
Both specific and total cross sections
vary with the energy of the neutron,
often in a very complex manner.
8.113 The nuclear cross sections for
neutron-nucleus interactions are analo-
gous to the linear attenuation coeffi-
cients (for gamma rays) divided by the
number of nuclei in unit volume of the
TECHNICAL ASPECTS OF INITIAL NUCLEAR RADIATION
363
medium. In fact, an expression similar
to equation (8.95.1) can be employed to
describe the attenuation of a narrow
beam of monoenergetic neutrons in their
passage through matter. However, be-
cause the neutrons in the initial nuclear
radiation are far from monoenergetic
and the cross sections are so highly
dependent on the neutron energy, the
equivalent of equation (8.95.1) must not
be used to calculate neutron attenuation
for shielding purposes. Shielding calcu-
lations can be made by utilizing cross
sections, the neutron energy distribution
in space and direction, and other data,
but the calculations require the use of
computer codes. Such calculations are
too complicated to be described here.
THE NEUTRON ENERGY SPECTRUM
8.114 The energies of the neutrons
received at some distance from a nuclear
explosion cover a very wide range, from
several millions down to a fraction of an
electron volt. The determination of the
complete energy spectrum (§ 8.53), ei-
ther by experiment or by calculation, is
very difficult. However, it is possible to
divide the spectrum into a finite number
of energy groups and to calculate the
neutron flux in each energy group at
various distances from the explosion
point. These calculations can then be
checked by measuring the variation of
flux with distance from known neutron
sources that are representative of each
energy group.
8.115 Prior to the cessation of at-
mospheric testing of nuclear weapons,
neither the extremely large and fast
computers nor the sophisticated mea-
surement instruments that are now
available were in existence. Recourse
was, therefore, made to measurements
of neutron flux within a few specified
energy ranges; from the results a general
idea of the spectrum was obtained.
Measurements of this kind were made
by the use of threshold detectors of
activated foil or fission foil type (§§
8.61, 8.62).
8.116 Neutrons are liberated during
the fission and fusion processes, but the
neutrons of interest here are those that
escape from the exploding weapon.
Both the total number of neutrons and
their spectrum are altered during transit
through the weapon materials. Output
spectra that might be considered illus-
trative of fission and thermonuclear
weapons are shown in Figs. 8.116a and
b, respectively. As mentioned pre-
viously, the neutron source can be de-
fined properly only by considering the
actual design of a specific weapon.
Hence, the spectra in these figures are
presented only as examples and should
not be taken to be generally applicable.
8.117 Passage of the neutrons
through the air, from the exploding
weapon to a distant point, is accompan-
ied by interactions with nuclei that result
in attenuation and energy changes.
Hence, the neutron spectrum at a dis-
tance may differ from the output spec-
trum of the weapon. Extensive results of
computer calculations of neutron
fluences at (or near) the earth’s surface
are now available and these have been
used to plot the curves in Figs. 8.117a
and b, for fission and thermonuclear
weapons, respectively. The figures
show the neutron fluences per kiloton of
energy release for a number of energy
groups as a function of slant range. The
uppermost curve in each case gives the
total fluence (per kiloton) of neutrons
364
INITIAL NUCLEAR RADIATION
0.1 0.2 0.5
2 5 10 20
ENERGY INTERVAL (MEV)
Figure 8.116a. Neutron spectrum for a fission weapon per kiloton total energy yield.
with energies greater than 0.0033 MeV,
i.e., 3.3 keV.
8.118 It is apparent from Fig.
8.117a that for a fission weapon the
curves for the different energy groups all
have roughly the same slope. This
means that the fluence in each energy
group decreases with increasing dis-
tance from the explosion, but the pro-
portions in the various groups do not
change very much; that is to say, the
neutron spectrum does not vary signifi-
TECHNICAL ASPECTS OF INITIAL NUCLEAR RADIATION
365
SPECTRUM (NEUTRONS/КТ)
ENERGY INTERVAL (MEV)
Figure 8.116b. Neutron spectrum for a thermonuclear weapon per kiloton total energy
yield.
cantly with distance. Furthermore, al-
though it is not immediately apparent
from Fig. 8.117a, the spectrum is al-
most the same as the source spectrum in
Fig. 8.116a. This accounts for the equi-
librium neutron spectrum from a fission
explosion mentioned in § 8.55. The
spectrum does change at much lower
FLUENCE (NEUTRONS/CM*/KT)
SLANT RANGE (YARDS)
Figure 8.1 17a. Neutron fluence per kiloton energy yield incident on a target located on or
near the earth's surface from the fission spectrum shown in Fig. 8. l-16a.
TECHNICAL ASPECTS OF INITIAL NUCLEAR RADIATION
367
FLUENCE (NEUTRONS/CMZ/KT)
SLANT RANGE (YARDS)
Figure 8.117b. Neutron fluence per kiloton energy yield incident on a target located on or
near the earth's surface from the thermonuclear spectrum shown in Fig.
8.116b.
368
INITIAL NUCLEAR RADIATION
neutron energies, but this is not impor-
tant.
8.119 Examination of Fig. 8.117b
for thermonuclear weapons reveals a
different behavior. Curves 5 through 9,
i.e., for neutron energies from О.ООЗЗ to
6.36 MeV, are almost parallel, so that in
this range the spectrum does not change
much with distance. But at higher ener-
gies, especially from 8.18 to 15 MeV,
the slopes of the curves are quite dif-
ferent. Of the neutrons in groups 1, 2,
and 3, those in group 1, which have the
highest energies, predominate at a slant
range of 400 yards, but they are present
in the smallest proportion at 1,600
yards. During their passage through the
air, the fastest neutrons are degraded in
energy and their relative abundance is
decreased whereas the proportions of
the somewhat less energic neutrons is
increased. The neutron spectrum thus
changes with distance, especially in the
high-energy range. The peak that exists
at 12 to 14 MeV of the source spectrum
in Fig. 8.116b becomes lower and the
valley between about 6 and 12 MeV
disappears with increasing slant range.
At very long ranges, when the high-en-
ergy neutrons have lost much of their
energy, an equilibrium spectrum would
be approached.
8.120 Figs. 8.117a and b provide
estimates of neutron fluences and spec-
tra from low air bursts for targets on or
near the surface of the ground. As a
result of reflections and absorption by
the ground, an air-ground interface can
increase or decrease the neutron
fluences by as much as a factor of ten
compared to fluences at corresponding
distances in an infinite air medium. For
source-target separation distances less
than about a relaxation length,14 local-
ized reflection from the ground gener-
ally tends to increase the intensity of
high-energy neutrons; however, at such
short distances, the initial nuclear radi-
ation is of interest only for very low
yields, since for higher yields other
weapon effects will normally be domi-
nant (cf. § 8.06). At longer distances,
the high-energy neutron intensity may
be reduced by a factor of five or more
compared to infinite air when both the
source and the target are at or near the
ground surface, e.g. a surface or near-
surface burst. These effects have been
included in the calculations from which
the figures given above were derived.
INITIAL RADIATION DOSE IN TISSUE
8.121 Simplified, but reasonably
accurate, methods have been developed
to predict the initial radiation dose to
persons located on or near the surface of
the earth. These methods are described
separately for neutrons, secondary
gamma rays from radiative capture and
inelastic scattering in the atmosphere (§
8.11), and fission product gamma rays.
The contribution of the primary gamma
rays from fission to the radiation dose at
a distance is small enough to neglect (§
8.04). In all cases, the data are based on
the assumption that the average density
of the air in the transmission path, be-
tween the burst point and the target, is
0.9 of the normal sea-level density.
14 A relaxation length may be taken as the distance in which the radiation intensity in a specified
material is decreased by a factor of e, where e is the base of the natural logarithms (about 2.718). The
relaxation length in a given material depends on the neutron energy and on whether the direct fluence
only or the total (direct plus scattered) fluence is being considered.
TECHNICAL ASPECTS OF INITIAL NUCLEAR RADIATION
369
Initial Neutron Absorbed Dose
8.122 With spectra such as those
shown in Figs. 8.116a and b to serve as
sources, a neutron transport computer
code may be used to calculate the neu-
tron dose resulting from a nuclear ex-
plosion in a specified geometry, i.e.,
burst height, target height, and air den-
sity. The latter is taken to be the average
density of the air between the burst and
the target before disturbance of the air
by the blast wave, since the neutrons of
interest depart from the region of the
explosion before formation of the blast
wave and are deposited at the target
prior to its arrival.
8.123 Results of such calculations,
which have been corroborated by test
data, are given in Figs. 8.123a and b,
for fission and thermonuclear weapons,
respectively. In each case the absorbed
neutron dose (in tissue) received by a
target on or near the surface of the earth
is shown as a function of slant range per
kiloton energy yield for explosions at a
height of about 300 feet or more. For
convenience of representation, the
curves are shown in two parts; the left
ordinate scale is for shorter ranges and
the right is for longer distances. For
fission weapons, there are two curves in
each part; they do not necessarily rep-
resent the extremes in neutron dose that
might result from different weapon de-
signs, but the dose from most fission
weapons should fall between the two
curves. It is suggested that the upper
curve of each pair in Fig. 8.123a be
used to obtain a conservative estimate of
the neutron dose from fission weapons
for defensive purposes and that the
lower curve be used for a conservative
estimate for offensive purposes.
8.124 In order to determine the
neutron dose received from an air burst
of Wkilotons energy yield, the dose for
the given distance as obtained from Fig.
8.123a or b is multiplied by W. For a
contact surface burst, the values from
Figs. 8.123a and b should be multiplied
by 0.5. For explosions above the surface
but below about 300 feet, an approx-
imate value of the neutron dose may be
obtained by linear interpolation between
the values for a contact surface burst and
one at 300 feet or above. The "de-
fense’ ’ curve of Fig. 8.123a was used to
generate the data for Fig. 8.64a, and the
curve in Fig. 8.123b was used for Fig.
8.64b.
(Text continued on page 373 )
370
INITIAL NUCLEAR RADIATION
The curves in Figs. 8.123a and b
show the neutron dose in tissue per
kiloton yield as a function of slant range
from a burst at a height of 300 feet or
more for fission weapons and thermo-
nuclear weapons, respectively.
Scaling. In order to apply the data in
Figs. 8.123a and b to an explosion of
any energy, W kilotons, multiply the
value for the given distance as obtained
from Fig. 8.123a or b by W. For a
contact surface burst, multiply the dose
obtained from Fig. 8.123a or b by 0.5.
For bursts between the surface and
about 300 feet, an approximate value of
the neutron dose may be obtained by
linear interpolation between a surface
burst and one at 300 feet or above.
Example
Given: A 10 KT fission weapon is
exploded at a height of 300 feet.
Find: The neutron dose at a slant
range of 1,500 yards that is conservative
from the defensive standpoint.
Solution: Since the height of burst is
300 feet, no height correction is neces-
sary. From the upper (“defense”) curve
in Fig. 8.123a, the neutron dose per
kiloton yield at a slant range of 1,500
yards from an explosion is 16 rads. The
corresponding dose, Dr, from a 10 KT
explosion is
D = 10 x 16 = 160 rads. Answer
n
TECHNICAL ASPECTS OF INITIAL NUCLEAR RADIATION
371
NEUTRON DOSE (RADS (TISSUE)ZKT)
Figure 8.123a. Initial neutron dose per kiloton total yield as a function of slant range from
fission weapon air bursts, based on 0.9 normal sea-level air density.
372
INITIAL NUCLEAR RADIATION
NEUTRON DOSE (RADS (TISSUE)ZKT)
SLANT RANGE FROM EXPLOSION (YARDS)
Figure 8.123b. Initial neutron dose per kiloton total yield as a function of slant range from
thermonuclear weapon air bursts, based on 0.9 normal sea-level airdensity.
TECHNICAL ASPECTS OF INITIAL NUCLEAR RADIATION
373
Secondary Gamma-Ray Absorbed Dose
8.125 The secondary (or air-secon-
dary) gamma rays, i.e., the gamma rays
produced by various interactions of
neutrons with atmospheric nuclei, must
be considered separately from the fis-
sion product gamma rays to provide a
generalized prediction scheme since the
relative importance of the two depends
on several factors, including the total
yield, the fraction of the total yield
derived from fission, the height of burst,
and the slant range from the explosion to
the target. Since measurements at at-
mospheric tests have provided only the
total gamma radiation dose as a function
of distance from the source, computer
calculations have been used to obtain
the doses from the two individual
gamma-ray sources. The results of the
calculations of air-secondary gamma-
ray doses (and the total doses) predicted
by the calculations have been compared
with measurements performed at nu-
clear weapon tests. For bursts in the
lower atmosphere, the gamma rays from
isomeric decay provide such a small
fraction of the total gamma-ray energy
that they can be neglected in the cal-
culation of total dose in tissue.15
8.126 By using neutron spectra,
such as those shown in Figs. 8.116a and
b, the secondary gamma-ray source can
be calculated. The latter is then utilized
to compute the secondary gamma-ray
dose resulting from a nuclear explosion
in a specified geometry. As is the case
for neutrons, the air density is taken to
be the average density of the air between
the burst and the target before distur-
bance of the air by the blast wave, since
the secondary gamma rays reach a dis-
tant target before the blast wave has
traveled very far (see Fig. 8.14).
8.127 Some of the results of calcu-
lations of secondary absorbed gamma-
ray doses (in tissue), obtained in the
manner indicated above, are shown in
Figs. 8.127a and b, which correspond to
the neutron dose curves in Figs. 8.123a
and b, respectively. The conditions of
applicability of the figures, such as air
burst or contact surface burst, target
location, offensive or defensive use,
etc., are the same as given in §§ 8.123,
8.124. In order to be consistent, if either
the “offense” or “defense” curve in
Fig. 8.123a is used to obtain the neutron
dose for a given situation, the corre-
sponding curve in Fig. 8.127a should be
used for the secondary gamma-ray dose.
Fission Product Gamma-Ray Absorbed
Dose
8.128 In order to estimate the
gamma-ray dose from fission products,
the radiation transport computer code
must be supplemented with a code that
describes the evolution and rise of the
radioactive cloud containing the fission
products. Since the fission product radi-
ation is emitted over a sufficiently long
period of time, the hydrodynamic effect
(§ 8.36) of the blast wave on the aver-
age air density between the source and
the target must be considered. The hy-
drodynamic enhancement becomes
more important at high energy yields
and also at greater ranges because of the
larger volume of low-density air behind
the shock front.
ish should be noted that the ordinates in Fig. 8.14 are the energy emission rates; the total energy
would then be obtained by integration over the effective emission time. This time is very much shorter for
isomeric decay gamma rays than for fission products.
374
INITIAL NUCLEAR RADIATION
The curves in Figs. 8.127a and b
show the secondary gamma-ray dose in
tissue per kiloton yield as a function of
slant range from a burst at a height of
300 feet or more for fission weapons and
thermonuclear weapons, respectively.
Scaling. In order to apply the data in
Figs. 8.127a and b to an explosion of
any energy, W kilotons, multiply the
value for the given distance as obtained
from Fig. 8.127a or b by W. In the case
of a contact surface burst, multiply the
dose obtained from Fig. 8.127a or b by
0.5. For bursts between the surface and
about 300 feet, an approximate value of
the secondary gamma-ray dose may be
obtained by linear interpolation.
Example
Given: A 20 KT fission weapon is
exploded on the surface.
Find: The secondary gamma-ray dose
at a slant range of 1,000 yards that is
conservative from the offensive stand-
point.
Solution: Since this is a contact sur-
face burst, a correction factor of 0.5
must be applied to the value obtained
from Fig. 8.127a. From the lower
(“offense”) curve in Fig. 8.127a, the
secondary gamma-ray dose per kiloton
yield at a slant range of 1,000 yards
from an explosion at or above 300 feet is
30 rads. The corresponding dose,
from a surface burst 20 KT explosion is
D = 20 x 0.5 x 30
= 300 rads. Answer
TECHNICAL ASPECTS OF INITIAL NUCLEAR RADIATION
375
SECONDARY GAMMA-RAY DOSE (RADS (TISSUE)ZKT)
Figure 8.127a. Air-secondary gamma-ray component of the initial nuclear radiation dose
per kiloton yield as a function of slant range from fission weapon air bursts,
based on 0.9 normal sea-level air density.
376
INITIAL NUCLEAR RADIATION
Figure 8.127b. Air-secondary gamma-ray component of the initial nuclear radiation dose
per kiloton yield as a function of slant range from thermonuclear weapon air
bursts, based on 0.9 normal sea-level air density.
8.129 With minimal hydrodynamic
enhancement, as is the case for very
low-yield weapons, the fission product
gamma rays and the secondary gamma
rays contribute approximately equal
doses at slant ranges up to about 3,000
yards. However, the average energy of
the former gamma rays is considerably
less than that of the latter, and the an-
gular distribution of the fission product
gamma rays is diffused by the rise of the
cloud. Each of these factors tends to
reduce the dose from fission product
gamma rays relative to that from secon-
dary gamma rays with increasing dis-
tance from low-yield explosions. For
explosions of higher yield, however,
hydrodynamic enhancement may cause
the fission product gamma-ray dose to
exceed the secondary gamma-ray dose,
particularly at longer ranges.
8.130 The calculated fission prod-
uct gamma-ray dose in tissue per kiloton
of fission energy yield received by a
TECHNICAL ASPECTS OF INITIAL NUCLEAR RADIATION
377
target on or near the surface of the earth
as a function of slant range from a
nuclear explosion is shown in Fig.
8.130a. In order to determine the fission
product gamma-ray dose received in the
initial radiation from an air burst of a
fission weapon of W kilotons energy
yield, the value for the given distance as
obtained from Fig. 8.130a is multiplied
by the “effective” yield, determined
from Fig. 8.130b. The use of the effec-
tive yield instead of the actual yield
provides the necessary corrections for
the differences in cloud rise velocity and
the hydrodynamic enhancement, each of
which is a function of total energy yield.
8.131 For thermonuclear weapons,
the dose for a given distance as obtained
from Fig. 8.130a must be multiplied by
the fraction of the total yield that results
from fission, e.g., 0.5 for a weapon with
50 percent fission yield, prior to multi-
plying by the effective yield as obtained
from Fig. 8.130b. It should be noted
that Fig. 8.130b is always entered with
the total energy yield of the weapon to
obtain the effective yield, since the
cloud rise velocity and the hydrodyn-
amic enhancement depend on the total
energy release. Interpolation may be
employed to obtain the effective yield
for slant ranges that are not shown. The
curves in Fig. 8.130b were calculated
for a scaled height of burst of 200 IV0 4
feet, where W is the total weapon en-
ergy yield in kilotons. For a given slant
range the curve is terminated at the yield
at which the height of burst is equal to
that slant range.
8.132 The data for the effective
yields in Fig. 8.132 are similar to those
in Fig. 8.130b but are applicable to
contact surface bursts. There is no sim-
ple method to interpolate or extrapolate
these curves for fission-product gamma
rays to other heights of burst; however,
Fig. 8.130b may be taken to be reason-
ably accurate for most low air bursts,
and Fig. 8.132 may be applied to near-
surface as well as to contact surface
bursts. The results presented in Fig.
8.33a are based on the upper curves in
Fig. 8.127a (for secondary gamma rays)
and the curves in Figs. 8.130a and b.
The results in Fig. 8.33b are based cor-
respondingly on the curves in Fig.
8.127b and those in Figs. 8.130a and b.
(Text continued on page 383.)
378
INITIAL NUCLEAR RADIATION
The curves in Fig. 8.130a show the
initial radiation, fission product
gamma-ray dose per kiloton fission yield
as a function of slant range from a
nuclear explosion.
Scaling. In order to apply the data in
Fig. 8.130a to a fission explosion of any
energy, W kilotons, multiply the value
for the given distance as obtained from
Fig. 8.130a by the effective yield, VVff
kilotons, from Fig. 8.130b for a low air
burst or from Fig. 8.132 for a surface
burst. For a thermonuclear weapon, the
value obtained from Fig. 8.130a should
be multiplied by the fraction of the yield
that results from fission as well as by
VV)r for the total yield.
Example I
Given: A 20 KT fission weapon is
exploded on the surface.
Find: The fission product gamma-ray
dose at a slant range of 1,000 yards.
Solution: From Fig. 8.130a, the ini-
tial radiation, fission product gamma-
ray dose per kiloton yield at a slant
range of 1,000 yards is 75 rads. From
Fig. 8.132, the effective yield at a slant
range of 1,000 yards from a 20 KT
explosion on the surface is 45 KT. The
fission product gamma-ray dose for the
desired conditions is therefore
D = 75 x 45 = 3,375 rads. Answer
y(
(This is more than ten times the secon-
dary gamma-ray dose determined pre-
viously for the same conditions, but the
relative values will change with varia-
tions in total and fission yields and
height of burst.)
Example 2
Given: A 1 MT thermonuclear
weapon with 50 percent of its energy
yield derived from fission is exploded at
a height of 3,200 feet.
Find: The total initial nuclear radia-
tion dose at a slant range of 4,000 yards.
Solution: The total initial nuclear ra-
diation dose is the sum of the initial
neutron dose, the secondary gamma-ray
dose, and the fission product gamma-ray
dose. From Fig. 8.123b, the neutron
dose per kiloton yield, is 1.2 x IO"4 rad
at a slant range of 4,000 yards from a
low air burst. The corresponding dose
from a 1 MT explosion is
D = 1.2 x 10⁻⁴ x Юз = 0.12 rad.
n
From Fig. 8.127b, the secondary
gamma-ray dose per kiloton yield is 1.8
x 10~3 rad at a slant range of 4,000
yards from a low air burst. The corre-
sponding dose from a 1 MT explosion is
D =1.8 X10⁻³ x Юз = 1.8 rads.
7'
From Fig. 8.130a, the fission product
gamma-ray dose per kiloton fission yield
at a slant range of 4,000 yards from the
explosion is 3.2 x 10~4 rad. The height
of burst, 3,200 feet, is sufficiently close
to the scaled height of 200 W04, i.e.,
3,170 feet, that Fig. 8.130b should pro-
vide an accurate value of the effective
yield. From Fig. 8.130b, the effective
yield at a slant range of 4,000 yards
from a low air burst 1 MT explosion is 4
x 104 KT (or 40 MT). Since only 50
percent of the total yield is derived from
fission, a correction factor of 0.5 must
be applied. The fission product gamma-
ray dose is
TECHNICAL ASPECTS OF INITIAL NUCLEAR RADIATION
379
FISSION PRODUCT GAMMA-RAY DOSE (RADS (TISSUE)/KT)
SLANT RANGE FROM EXPLOSION (YARDS)
Figure 8.130a. Fission product gamma-ray component of the initial nuclear radiation dose
per kiloton fission yield as a function of slant range from, a nuclear
explosion, based on 0.9 normal sea-level air density.
380
INITIAL NUCLEAR RADIATION
D = 0.5 x 3.2 x io-4 x 4 x 104
yf
= 6.4 rads.
The total initial nuclear radiation dose is
D = D + D 4- D ,
ti 7? yf
= 0.12 + 1.8 4- 6.4
= 8.3 rads. Answer
In adding the doses, it should be re-
called that 1 rad of neutrons may not be
biologically equivalent to 1 rad of
gamma rays (§ 8.64).
TECHNICAL ASPECTS OF INITIAL NUCLEAR RADIATION 381
ACTUAL EXPLOSION YIELD (KILOTONS)
Figure 8.130b. Effective yield as a function of actual yield for the fission product
gamma-ray dose from a low air burst, based on 0.9 normal sea-level air
density.
382
INITIAL NUCLEAR RADIATION
EFFECTIVE YIELD (KILOTONS)
ACTUAL EXPLOSION YIELD (KILOTONS)
Figure 8.132. Effective yield as a function of actual yield for the fission product gamma-ray
dose from a contact surface burst, based on 0.9 normal sea-level air density.
TECHNICAL ASPECTS OF INITIAL NUCLEAR RADIATION
383
MECHANISMS IN TREE: IONIZATION
8.133 Two basic interactions of nu-
clear radiation with matter are important
in connection with the transient-radia-
tion effects on electronics (TREE); they
are ionization and atomic displacement
(§ 8.76). The charged particles, i.e.,
electrons and ions, produced by ioniza-
tion eventually combine but the accom-
panying changes in materials may be
more or less permanent. Some aspects
of TREE depend on the relative dura-
tions of the radiation pulse and the re-
covery time. If the pulse duration is the
longer, the effect is observed promptly.
The magnitude of the effect is usually a
function of the density of charged par-
ticles created by ionization and this is
determined by the rate of energy ab-
sorption, i.e., by the dose rate. On the
other hand, if the pulse length is short
relative to the recovery time, the effect
will be delayed. The amount of damage
is then usually a function of the total
energy absorbed, i.e., the dose. Thus,
both absorbed dose and dose rate must
be considered in assessing the effects of
nuclear radiation on electronics; in
many cases, the dose rate is the deter-
mining factor. The persistence of the
effect is related, in general, to the re-
covery time.
8.134 The chief manifestations of
ionization include (1) charge transfers,
(2) bulk conductivity increase, (3) ex-
cess minority-carrier generation, (4)
charge trapping, and (5) chemical
change. These effects will be examined
in turn in the following paragraphs.
8.135 Charge transfer results from
the escape of some electrons produced
by ionization from the surface of the
ionized material. If the net flow of these
electrons is from the ionized material to
an adjacent material, the former will
acquire a positive charge and the latter a
negative charge. Consequently, a dif-
ference of potential will exist between
the two materials. The most obvious
effect of this potential difference is a
flow of current through an electrical cir-
cuit connecting the two materials, and
this current will produce electric and
magnetic fields. If there is matter in the
space between the two materials, the
charge transfer may cause ionization
and hence conduction if there are local
electric fields. Finally, if the charge ei-
ther originates or embeds itself in an
insulator, a long-lived local space
charge may result. The effects of charge
transfer may thus be temporary or
semipermanent.
8.136 The free charge carriers pro-
duced during ionization respond to an
applied electric field by causing a net
drift current; there is consequently a
transient increase in conductivity. This
effect is particularly important for capa-
citors, since the ability to retain or re-
store electrical charge is dependent on
the low conductivity of the dielectric. In
an ionizing environment the increase in
tfie bulk conductivity results in a de-
crease of the stored charge in a capaci-
tor.
8.137 In semiconductor devices,
such as transistors and diodes, there are
both positive (holes) and negative
(electron) charge carriers, either of
which may be in the minority. The ef-
fect of ionization in producing addi-
tional minority carriers is of prime con-
cern in many semiconductors and is
usually the most important manifesta-
tion of ionization in TREE. Some of the
characteristics of semiconductor devices
depends upon the instantaneous con-
384
INITIAL NUCLEAR RADIATION
centration of minority carriers in various
regions of the device. Since ionizing
radiation creates large (and equal)
numbers of positive and negative charge
carriers, there is a large relative increase
in the concentration of minority carriers.
The electrical operation of the device
may thus be seriously affected. The
current pulse observed in a semicon-
ductor detector (§ 8.22) when exposed
to radiation is an example of the effect
of excess minority carriers, although in
this case it is turned to advantage.
8.138 When free charge carriers are
created in insulating materials and are
trapped at impurity sites, sometimes
present in such materials, many may not
undergo recombination with the oppo-
sitely charged carriers, which may be
trapped elsewhere. In these cases, the
properties of the material may be altered
semipermanently, even though there is
no net charge in the material. This ion-
ization effect is known as charge trap-
ping. Trapped charge can change the
optical properties of some substances,
e.g., F (color) centers in alkali halides
and coloration of glasses. The trapped
carriers may be released thermally, ei-
ther at the temperature of irradiation or
by increasing the temperature. In either
case, the resultant creation of free carri-
ers is manifested by an increase in con-
ductivity and sometimes by the emission
of light (§ 8.24).
8.139 As a result of the recombina-
tion of electrical charges, sufficient en-
ergy may be released to disrupt chemi-
cal bonds. The material may thus suffer
a chemical change which persists long
after the charged particles have disap-
peared. This chemical change may be
accompanied by permanent changes in
the electrical and other properties of the
material. However, the radiation dose
required to produce a significant chemi-
cal effect is larger than would normally
be encountered at a distance from a
nuclear explosion where the equipment
would survive blast and fire damage.
MECHANISMS IN TREE: ATOMIC
DISPLACEMENT
8.140 Another potential damage
mechanism of nuclear radiation in elec-
tronic systems involves the movement
of electrically neutral atoms. Such dis-
placement of atoms from their usual
sites in a crystal lattice produces lattice
defects. A common type of defect arises
from the displacement of an atom from a
normal lattice position to an “intersti-
tial” position between two occupied
normal positions. The displaced atom
leaves behind an unoccupied normal
lattice position (or “vacancy”), possi-
bly some distance away. At least part of
the damage to a crystalline material
caused in this manner is permanent.
Since many electronic devices contain
crystalline semiconductor materials,
usually silicon or germanium, displace-
ment damage is of special concern for
TREE.
8.141 Fast neutrons, in particular,
are very effective in causing atomic dis-
placement. The total number of defects
(temporary and permanent) generated
by a neutron depends on its energy.
Thus, a 14-MeV neutron (from a ther-
monuclear weapon) produces about 2.5
times as many defects as a 1-MeV neu-
tron (roughly the average energy from a
fission weapon). For neutrons of a given
energy (or energy spectrum) the number
of defects is determined by the neutron
fluence, and the changes in the proper-
TECHNICAL ASPECTS OF INITIAL NUCLEAR RADIATION
385
ties of a semiconductor material are di-
rectly related to the total number of
defects. Thus, the neutron fluence is an
important consideration in assessing
damage to a semiconductor caused by
atomic displacement.
8.142 Some of the defects produced
by the displacement process are perma-
nent but others are temporary. The tem-
porary defects are annihilated by re-
combination of the vacancy-interstitial
pairs, i.e., by the movement of an in-
terstitial atom into a vacancy, by com-
bination with pre-existing lattice de-
fects, or they may eventually escape
from a free surface of the material The
gradual disappearance of some defects
is called “annealing” and the rate of
annealing can be increased by raising
the temperature. The degree of dis-
placement damage in a crystalline
semiconductor increases rapidly with
time, reaches a peak, and then decreases
as annealing becomes increasingly ef-
fective. The annealing process may lead
to either an improvement or further
degradation of the irradiated material,
because in some cases thermally stable
defects may result. These defects may
be more or less effective than the unst-
able ones in changing a particular prop-
erty.
8.143 Annealing processes fall
roughly into two time frames. Rapid (or
short-term) annealing occurs in hun-
dredths of a second, whereas long-term
annealing continues for times of the
order of tens of seconds. At ambient
temperature, annealing of temporary
damage will be essentially complete
within about half an hour. The ratio of
the damage observed at early times
(number of defects present) to the dam-
age remaining after a long time is called
the “annealing factor”; it depends on
the observation time as well as on the
temperature and the electrical condition
of the material. The maximum number
of defects created at early times follow-
ing a fast-neutron burst is frequently
important to the performance of elec-
tronics systems. The maximum anneal-
ing factor of a component indicates the
peak damage that must be tolerated
above the permanent damage if that
component is to continue to function.
8.144 The lattice damage caused by
atomic displacement degrades the elec-
trical characteristics of semiconductors
by increasing the number of centers for
trapping, scattering, and recombination
of charge carriers. The increase in trap-
ping centers results in removal of charge
carriers and thereby decreases the cur-
rent flow. The additional scattering
centers reduce the capability of the
charge carriers to move through the
semiconductor material. Finally, the
additional recombination centers de-
crease the time during which the minor-
ity charge carriers are available for
electrical conduction. The last effect,
i.e., the reduced lifetime of the minority
carriers, is the most important factor in
determining the performance of a semi-
conductor device in an environment of
radiation that can cause atomic dis-
placement. The minority carrier lifetime
is very roughly inversely proportional to
the neutron fluence at large values of the
fluence that are likely to cause damage
to semiconductors. At sufficiently large
fluences, the lifetime becomes too short
for the semiconductor device to function
properly.
386
INITIAL NUCLEAR RADIATION
BIBLIOGRAPHY
Abboi i. L S . ’“Shielding Against Initial Radi-
ations from Nuclear Explosions," Oak Ridge
National Laboratory. July 1973, ORNL-
RS1C-36
♦Auxier, J. A., et al., “Nuclear Weapons Free-
Field Environment Recommended for Initial
Radiation Shielding Calculations," Oak Ridge
National Laboratory, February 1972, ORNL-
TM-3396
“ Basic Radiation Protection Criteria," NCRP
Report No 39. National Council on Radiation
Protection. Washington, D.C., 1971.
ErHERlNGton, H. (Ed ), “Nuclear Engineering
Handbook," McGraw-Hill Book Co . Inc..
1958.
French, R. L., ““A First-Last Collision Model of
the Air/Ground Interface Effects on Fast-Neu-
tron Distributions." Nuclear Sci. and Eng., 19,
151 (1964).
French, R. L., and L. G. Mooney, “Initial
Radiation Exposure from Nuclear Weapons,"
Radiation Research Associates, Fort Worth,
Texas, July 1972, RRA-T7201
♦Fritzsche. A. E., N. E. Lorimier, and Z G.
Burson, “Measured Low-Altitude Neutron
and Gamma Dose Distributions Due to a 14-
MeV Neutron Source," E. G., and G.. Inc.,
Las Vegas, Nevada, 1969, EGG 1183-1449.
♦Fritzsche, A. E., N. E. Lorimier, and Z. G.
Burson, “Measured High-Altitude Neutron
and Gamma Dose Distributions Due to a 14-
MeV Neutron Source," E. G., and G., Inc.,
Las Vegas, Nevada, 1969, EGG 1183-1438.
Gwyn. C. W., D. L. Scharfetter, and J. L.
Wirth. “The Analysis of Radiation Effects in
Semiconductor Junction Devices," Sandia
Corporation, Albuquerque, New Mexico, July
1967, SC-R-67-1 158.
Jones, T. D., and F. F. Haywood, “‘Trans-
mission of Photons Through Common Shield-
ing Media," Oak Ridge National Laboratory,
October 1974, ORNL-TM-4728.
♦Keith, J. R., and F. H. Shelton, “‘Neutron
Transport in Non-Uniform Air by Monte Carlo
Calculations, Volume I," Kaman Nuclear, Co-
lorado Springs, Colorado, January 1969,
DASA 2236-1, KN-774-69-1.
♦Kukhtevich, V. L, et al., "Protection from
Penetrating Radiation of Nuclear Explosions,"
English translation. Joint Publications Research
Service, U.S. Department of Commerce, July
1971, JPRS 53498.
Larin, F., "Radiation Effects in Semiconductor
Devices," John Wiley and Sons, Inc.. 1968.
Marshall, J D., and M. B. Wells, “The
Effects of Cut-Off Energy on Monte Carlo Cal-
culated Gamma-Ray Dose Rates in Air," Ra-
diation Research Associates, Fort Worth,
Texas, 1966, RRA-M67.
Mooney, L. G., “Calculations of Weapon Ra-
diation Doses in Single-Compartment Above-
Ground Concrete Structures," Radiation Re-
search Associates, Fort Worth, Texas,
November 1969, RRA-M93.
National Bureau of Standards, "Measurement of
Absorbed Dose of Neutrons and Mixtures of
Neutrons and Gamma Rays," NCRP Report
No. 25, U.S. Government Printing Office,
1961, National Bureau of Standards Handbook
75.
“Protection Against Neutron Radiation," NCRP
Report No. 38, National Council on Radiation
Protection, Washington, D. C., 1971.
“Radiation Damage and Defects in Semiconduc-
tors," Conference Series, No. 16, July 1972.
The Institute of Physics (London), 1973.
“Recommended Techniques for the Measurement
of Selected Nuclear Radiation Effects on Elec-
tronic Components," IBM Electronics Systems
Center, Owego, New York, August 1967,
DASA 627, Vol. II.
♦Schaefer, N. M. (Editor), “Reactor Shielding
for Nuclear Engineers," U.S. AEC Report
TID-25951, 1973.
♦Straker, E. A., "Time-Dependent Neutron
and Secondary Gamma-Ray Transport in an
Air-Over-Ground Geometry, Volume II. Tabu-
lated Data,” Oak Ridge National Laboratory,
September 1968, ORNL 4289.
♦Straker, E. A., “Status of Neutron Transport
in the Atmosphere,” Oak Ridge National Lab-
oratory, July 1970, ORNL-TM-3065.
Vook, F. L. (Editor), “Radiation Effects in
Semiconductors,” Proceedings of the Santa Fe
Conference on Radiation Effects in Semicon-
ductors, Plenum Press, 1968.
♦These publications may be purchased from the National Technical Information Service, Department
of Commerce, Springfield, Virginia, 22161.
CHAPTER IX
RESIDUAL NUCLEAR RADIATION AND FALLOUT
SOURCES OF RESIDUAL RADIATION
INTRODUCTION
9.01 The residual nuclear radiation
is defined as that which is emitted later
than I minute from the instant of the
explosion (§ 8.02). The sources and
characteristics of this radiation will vary
in accordance with the relative extents
to which fission and fusion reactions
contribute to the energy of the weapon.
The residual radiation from a fission
weapon detonated in the air arises
mainly from the weapon debris, that is,
from the fission products and, to a lesser
extent, from the uranium and plutonium
which have escaped fission. In addition,
the debris will usually contain some
radioactive isotopes formed by neutron
reactions, other than fission, in the
weapon materials. Another source of
residual radiation, especially for surface
and subsurface bursts, is the radioact-
ivity induced by the interaction of neu-
trons with various elements present in
the earth, sea, air, or other substances in
the explosion environment. The debris
from a predominantly fusion weapon,
on the other hand, will not contain the
quantities of fission products associated
with a fission weapon of the same en-
ergy yield. However, large numbers of
high-energy neutrons are produced (§
1.72), so that the residual radiation from
fusion weapons will arise mainly from
neutron reactions in the weapon and its
surroundings, if the fission yield is suf-
ficiently low.
9.02 The primary hazard of the re-
sidual radiation results from the creation
of fallout particles (§ 2.18 et seq.)
which incorporate the radioactive
weapon residues and the induced activ-
ity in the soil, water, and other materials
in the vicinity of the explosion. These
particles may be dispersed over large
areas by the wind and their effects may
be felt at distances well beyond the
range of the other effects of a nuclear
explosion (§ 9.113). A secondary haz-
ard may arise from neutron induced ac-
tivity on the earth’s surface in the im-
mediate neighborhood of the burst point
(§ 8.16). Both the absolute and relative
contributions of the fission product and
induced radioactivity will depend on the
total and fission yields of the weapon,
the height of burst, the nature of the
surface at the burst point, and the time
after the explosion.
9.03 As mentioned in § 2.28, it is
convenient to consider the fallout in two
parts, namely, early and delayed. Early
387
388
RESIDUAL NUCLEAR RADIATION AND FALLOUT
(or local) fallout is defined as that which
reaches the ground during the first 24
hours following a nuclear explosion.
The early fallout from surface, subsur-
face, or low air bursts can produce ra-
dioactive contamination over large areas
and can represent an immediate biolog-
ical hazard. Delayed (or long range)
fallout, which is that reaching the
ground after the first day, consists of
very fine, invisible particles which settle
in low concentrations over a consider-
able portion of the earth’s surface. The
radiation from the fission products and
other substances is greatly reduced as a
result of radioactive decay during the
relatively long time the delayed fallout
remains suspended in the atmosphere.
Consequently, the radiations from most
of the delayed fallout pose no immediate
danger to health, although there may be
a long-term hazard. The biological ef-
fects on people, plants, and animals of
the radiations from early and late fallout
are described in Chapter XII.
9.04 In the case of an air burst,
particularly when the fireball is well
above the earth’s surface, a fairly sharp
distinction can be made between the
initial nuclear radiation, considered in
the preceding chapter, and the residual
radiation. The reason is that, by the end
of a minute, essentially all of the
weapon residues, in the form of very
small particles, will have risen to such a
height that the nuclear radiations no
longer reach the ground in significant
amounts. Subsequently, the fine parti-
cles are widely dispersed in the atmos-
phere and descend to earth very slowly.
9.05 With surface and, especially,
subsurface explosions, or low air bursts
in weather involving precipitation (§
9.67) the demarcation between initial
and residual nuclear radiations is not as
definite. Some of the radiations from the
weapon residues will be within range of
the earth’s surface at all times, so that
the initial and residual categories merge
continuously into one another (§§ 2.82,
2.100). For very deep underground and
underwater bursts the initial gamma rays
and neutrons produced in the fission or
fusion process may be ignored since
they are absorbed by the surrounding
medium. The residual radiations, from
fission products and from radioactive
species produced by neutron interaction,
are then the only kind of nuclear radia-
tions that need be considered. In a sur-
face burst, however, both initial and
residual nuclear radiations must be
taken into account.
EARLY FALLOUT
9.06 The radiological characteris-
tics of the early fallout from a nuclear
weapon are those of the fission products
and any induced activity produced. The
relative importance of these two sources
of residual radiation depends upon the
percentage of the total yield that is due
to fission, and other factors mentioned
in § 9.02. There are, however, two
additional factors, namely, fractionation
and salting, which may affect the activ-
ity of the early fallout; these will be
described below.
9.07 As the fireball cools, the fis-
sion products and other vapors are
gradually condensed on such soil and
other particles as are sucked up from
below while the fireball rises in the air.
For detonations over land, where the
particles consist mainly of soil minerals,
the fission product vapors condense onto
both solid and molten soil particles and
SOURCES OF RESIDUAL RADIATION
389
also onto other particles that may be
present. In addition, the vapors of the
fission products may condense with
vapors of other substances to form
mixed solid particles of small size. In
the course of these processes, the com-
position of the fission products will
change, apart from the direct effects of
radioactive decay. This change in com-
position is called “fractionation.” The
occurrence of fractionation is shown,
for example, by the fact that in a land
surface burst the larger particles, which
fall out of the fireball at early times and
are found near ground zero, have dif-
ferent radiological properties from the
smaller particles that leave the radioac-
tive cloud at later times and reach the
ground some distance downwind.
9.08 The details of the fractionation
process are not completely understood,
but models have been developed that
represent the phenomena reasonably sa-
tisfactorily. Fractionation can occur, for
example, when there is a change in
physical state of the fission products. As
a result of radioactive decay, the gases
krypton and xenon form rubidium and
cesium, respectively, which subse-
quently condense onto solid particles.
Consequently, the first particles to fall
out, near ground zero, will be depleted
not only in krypton and xenon, but also
in their various decay (or daughter)
products. On the other hand, small par-
ticles that have remained in the cloud for
some time will have rubidium and ce-
sium, and their daughters, strontium and
barium, condensed upon them. Hence,
the more distant fallout will be relatively
richer in those elements in which the
close fallout is depleted.
9.09 An additional phenomenon
which contributes to the fractionation
process is the separation of the fission
product elements in the ascending fire-
ball and cloud as they condense at dif-
ferent times, corresponding to their dif-
ferent condensation temperatures. Thus
the refractory elements can condense at
early times in the nuclear cloud, when
the temperature is quite high, onto the
relatively larger particles which are
more abundant at these times. Con-
versely, volatile elements, with low
condensation temperatures, cannot con-
dense until later, when the cloud has
cooled and when the larger particle sizes
will be depleted. Refractory elements
are expected to be relatively more
abundant in the close-in early fallout,
representing the larger particles, and to
be relatively depleted in the more distant
portion of the early fallout deposited by
smaller particles. The reverse will be
true for the more volatile elements. The
particle size distribution in the nuclear
cloud varies with the surface material
and hence the latter will have an effect
on fractionation.
9.10 For explosions of large energy
yield at or near the surface of the sea,
where the condensed particles consist of
sea-water salts and water, fractionation
is observed to a lesser degree than for a
land surface burst. The reason is that the
cloud must cool to 100°C (212°F) or less
before the evaporated water condenses.
The long cooling time and the presence
of very small water droplets permit re-
moval from the radioactive cloud of the
daughters of the gaseous krypton and
xenon along with the other fission prod-
ucts. In this event, there is little or no
variation in composition of the. radioac-
tive fallout (or rainout) with distance
from the explosion.
9.11 The composition of the fallout
390
RESIDUAL NUCLEAR RADIATION AND FALLOUT
can also be changed by “salting” the
weapon to be detonated. This consists in
the inclusion of significant quantities of
certain elements, possibly enriched in
specific isotopes, for the purpose of
producing induced radioactivity. There
are several reasons why a weapon might
be salted. For example, salting has been
used in some weapons tests to provide
radioactive tracers for various purposes,
such as the study of the paths and rela-
tive compositions of the early and de-
layed stages of fallout.
ACTIVITY AND DECAY OF EARLY
FALLOUT
9.12 The fission products constitute
a very complex mixture of more than
300 differnt forms (isotopes) of 36 ele-
ments (§ 1.62). Most of these isotopes
are radioactive, decaying by the emis-
sion of beta particles, frequently ac-
companied by gamma radiation. About
3 x IO23 fission product atoms, weigh-
ing roughly 2 ounces, are formed per
kiloton (or 125 pounds per megaton) of
fission energy yield. The total radioac-
tivity of the fission products initially is
extremely large but it falls off at a fairly
rapid rate as the result of radioactive
decay.
9.13 At 1 minute after a nuclear
explosion, when the residual nuclear
radiation has been postulated as begin-
ning, the radioactivity of the fission
products from a 1-kiloton fission yield
explosion is of the order of 102' disinte-
grations per second, i.e., almost 3 x
10’° curies (§ 9.141). The level of ac-
tivity even from an explosion of low
yield is enormously greater than any-
thing that had been encountered prior to
the detonation of nuclear weapons. By
the end of a day, the rate of beta-particle
emission will have decreased by a factor
of about 2,000 from its 1-minute value,
and there will have been an even larger
decrease in the gamma-ray energy
emission rate. Nevertheless, the ra-
dioactivity of the fission products will
still be very considerable.
9.14 It has been calculated (§
9.159) that if fallout particles were
spread uniformly over a smooth infinite
plane surface, with the radioactivity
equal to that of all the fission products
from 1-kiloton fission energy yield for
each square mile, the radiation dose rate
at a height of 3 feet above the plane
would be approximately 2,900 rads (in
tissue)1 per hour at 1 hour after the
explosion.2 In actual practice, a uniform
distribution would be improbable, since
a larger proportion of the fission prod-
ucts would be deposited near ground
zero than at farther distances. Hence,
the dose rate will greatly exceed the
average at points near the explosion
center, whereas at more remote loca-
tions it will usually be less. Moreover,
the phenomenon of fractionation will
cause a depletion of certain fission
product isotopes in the local fallout; this
will tend to lower the theoretically cal-
culated dose rate. Finally, the actual
'The actual value depends on (he nature of the fissionable material and other weapon variables, but the
number quoted here is a reasonable average (§ 9.159).
-Fallout radiation measurements (and calculations) have commonly been made in terms of gamma-ray
exposures (or rates) in roentgens. For consistency with other chapters, however, all data in this chapter
are given as the equivalent doses (or rates) in rads absorbed in tissue near (he surface of the body (cf. §
8.18) The qualification “in tissue" will be omitted subsequently since it applies throughout (he chapter
SOURCES OF RESIDUAL RADIATION
391
surface of the earth is not a smooth
plane. As will be discussed subse-
quently (§ 9.95), the surface roughness
will cause a further decrease in the dose
rate calculated for an infinite smooth
plane. In spite of these reductions, ex-
tremely high dose rates have been ob-
served within the first few hours fol-
lowing surface bursts.
9.15 The early fallout consists of
particles that are contaminated mainly,
but not entirely, with fission products.
An indication of the manner in which
the dose rate from a fixed quantity of the
actual mixture decreases with time may
be obtained from the following approx-
imate rule: for every sevenfold increase
in time after the explosion, the dose rate
decreases by a factor of ten. For exam-
ple, if the radiation dose rate at 1 hour
after the explosion is taken as a refer-
ence point, then at 7 hours after the
explosion the dose rate will have de-
creased to one-tenth; at 7x7=49 hours
(or roughly 2 days) it will be one-hun-
dredth; and at 7x7x7 = 343 hours (or
roughly 2 weeks) the dose rate will be
one-thousandth of that at 1 hour after the
burst. Another aspect of the rule is that
at the end of 1 week (7 days), the
radiation dose rate will be about one-
tenth of the value after 1 day. This rule
is accurate to within about 25 percent up
to 2 weeks or so and is applicable to
within a factor of two up to roughly 6
months after the nuclear detonation.
Subsequently, the dose rate decreases at
a much more rapid rate than predicted
by this rule. The complications intro-
duced by fractionation and the presence
of induced activities make the approx-
imate rule useful only for illustration
and some planning purposes. Any
change in the quantity of fallout, arising
from the continuing descent or the re-
moval of particles or from multiple det-
onations, would affect the dose rate.
Hence, in any real fallout situation, it
would be necessary to perform actual
measurements repeated at suitable in-
tervals to establish the level and the rate
of decay of the radioactivity.
9.16 The decrease of dose rate from
a given amount of the early fallout,
consisting of fission products and some
other weapon residues (§ 9.32), is indi-
cated by the continuous curves in Figs.
9.16a and b, which were calculated in
the manner described in § 9.146. In
these figures the ratio of the approximate
radiation dose rate (in rads per hour) at
any time after the explosion to a conve-
nient reference value, called the “unit-
time reference dose rate,” is plotted
against time in hours.3 The use of the
reference dose rate simplifies the repre-
sentation of the results and the calcula-
tions based on them, as will be shown
below. The following treatment refers
only to external radiation exposures
from gamma-ray sources outside the
body. The possibility should be borne in
mind, however, that some fallout could
enter the body, by inhalation and inges-
tion, and so give rise to internal radia-
tion exposures (§ 12.163 et seq.). The
major hazard in this respect is probably
radioactive iodine, which can readily
enter the body by way of milk from
cows that have eaten forage contami-
'The significance of the dashed lines, marked will be described in § 9.146 et seq.. where the
physical meaning of the unit-time reference dose rate will be explained. For the present, the dashed lines
may be ignored
392
RESIDUAL NUCLEAR RADIATION AND FALLOUT
tr
X
CO
о
<
cr
Ld
<
cr
Ld
CO
О
О
Dependence of dose rate from early fallout upon time after explosion.
Figure 9.16a.
nated with fallout. Because the internal
doses are highly dependent upon the
circumstances, they are not predictable.
9.17 Suppose, for example, that at
a given location, the fallout commences
at 5 hours after the explosion, and that at
15 hours, when the fallout has ceased to
descend, the observed (external) dose
rate is 4.0 rads per hour (rads/hr). From
the curve in Fig. 9.16a (or the data in
Table 9.19), it is seen that at 15 hours
after the explosion, the ratio of the ac-
tual dose rate to the reference value is
0.040; hence, the reference dose rate
must be 4.0/0.040=100 rads/hr. By
means of this reference value and the
SOURCES OF RESIDUAL RADIATION
393
Figure 9.16b. Dependence of dose rate from early fallout upon time after explosion.
decay curves in Figs. 9.16a and b, it is
possible to estimate the actual dose rate
at the place under consideration at any
time after fallout is complete. Thus, if
the value is required at 24 hours after the
explosion, Fig. 9.16a is entered at the
point representing 24 hours on the hori-
zontal axis. Upon moving upward ver-
tically until the plotted (continuous) line
is reached, it is seen that the required
dose rate is 0.023 multiplied by the
unit-time reference dose rate, i.e.,
0.023 x 100-2.3 rads/hr.
9.18 If the dose rate at any time is
394
RESIDUAL NUCLEAR RADIATION AND FALLOUT
Table 9.19
RELATIVE THEORETICAL DOSE RATES FROM EARLY FALLOUT AT VARIOUS
TIMES AFTER A NUCLEAR EXPLOSION
Relative Relative
Time (hours) dose rate Time (hours) dose rate
1 1.000 36 15
IVS 610 48 10
2 400 72 6.2
3 230 100 4.0
5 130 200 1.7
6 100 400 0.69
10 63 600 0.40
15 40 800 0.31
24 23 1,000 0.24
known, by actual measurement, the
value at any other time can be esti-
mated. All that is necessary is to com-
pare the ratios (to the unit-time refer-
ence dose rate) for the two given times
as obtained from Fig. 9.16a or Fig.
9.16b. For example, suppose the dose
rate at 3 hours after the explosion is
found to be 50 rads/hr; what would be
the value at 18 hours? The respective
ratios, as given by the curve in Fig.
9.16a, are 0.23 and 0.033, with respect
to the unit-time reference dose rate.
Hence, the dose rate at 18 hours after
the explosion is 50x0.033/0.23 = 7.2
rads/hr.
9.19 The results in Figs. 9.16a and
b may be represented in an alternative
form, as in Table 9.19, which is more
convenient, although somewhat less
complete. The dose rate, in any suitable
units, is taken as 1,000 at 1 hour after a
nuclear explosion; the expected dose
rate in the same units at a number of
subsequent times, for the same quantity
of early fallout, are then as given in the
table. If the actual dose rate at 1 hour (or
any other time) after the explosion is
known, the value at any specified time,
up to 1,000 hours, can be obtained by
simple proportion.4
9.20 It should be noted that Figs.
9.16a and b and Table 9.19 are used for
calculations of dose rates. In order to
determine the total or accumulated radi-
ation dose received during a given
period it is necessary to multiply the
average dose rate by the exposure time.
However, since the dose rate is steadily
decreasing during the exposure, appro-
priate allowance for this must be made.
The results of the calculations based on
Fig. 9.16a are expressed by the curve in
Fig. 9.20. It gives the total dose re-
ceived from early fallout, between 1
minute and any other specified time after
the explosion, in terms of the unit-time
reference dose rate.
9.21 To illustrate the application of
Fig. 9.20, suppose that an individual
becomes exposed to a certain quantity of
gamma radiation from early fallout 2
4Devices, similar to a slide rule, are available for making rapid calculations of the decay of fallout
dose rates and related matters.
Figure 9.20. Curve for calculating accumulated total dose from early fallout at various
times after explosion.
SOURCES OF RESIDUAL RADIATION 395
396
RESIDUAL NUCLEAR RADIATION AND FALLOUT
hours after a nuclear explosion and the
dose rate, measured at that time, is
found to be 1.5 rads/hr. What will be the
total dose accumulated during the sub-
sequent 12 hours, i.e., by 14 hours after
the explosion? The first step is to deter-
mine the unit-time reference dose rate.
From Fig. 9.16a it is seen that
Dose rate at 2 hours after explosion
Unit-time reference dose rate
and, since the dose rate at 2 hours is
known to be 1.5 rads/hr, the reference
value is 1.5/0.40=3.8 rads/hr. Next,
from Fig. 9.20, it is found that for 2
hours and 14 hours, respectively, after
the explosion,
Accumulated dose at 2 hours after explosion _ $ %
Unit-time reference dose rate
and
Accumulated dose at 14 hours after explosion _
Unit-time reference dose rate
Hence, by subtraction
Accumulated dose between 2 and 14 hours after explosion
Unit-time reference dose rate
The unit-time reference dose rate is 3.8
rads/hr, and so the accumulated dose
received in the 12 hours, between 2 and
14 hours after the explosion, is
3.8x1.3=4.9 rads.
9.22 The percentage of the accu-
mulated “infinity dose” or “infinite
time dose” that would be received from
a given quantity of early fallout, com-
puted from 1 minute to various times
after a nuclear explosion, is shown in
Table 9.22. The calculated infinite time
dose is essentially equal to the dose that
would be accumulated as a result of
exposure to a fixed quantity of fallout
for many years. These data can be used
to determine the proportion of the infi-
nite time dose received during any spe-
cified period following the complete de-
position of the early fallout. Of course,
if the deposition of fallout is incomplete
or part is removed, Table 9.22 would
not be applicable.
9.23 If an individual is exposed to a
certain amount of early fallout during
the interval from 2 hours to 14 hours
after the explosion, the percentage of
the infinite time dose received may be
obtained by subtracting the respective
values in (or estimated from) Table
9.22, i.e., 76 (for 14 hours) minus 62
(for 2 hours), giving 14 percent, i.e.,
0.14, of the infinite time dose. The ac-
tual value of the infinite time dose com-
puted from 1 minute after detonation, is
9.3 times the unit-time reference dose
rate (in rads/hr), as indicated by in
Fig. 9.20. Hence, if the reference value
is 3.8 rads per hour as in the above
example, the accumulated dose received
between 2 hours and 14 hours after the
burst is 0.14x9.3x3.8=4.9 rads, as
before.
SOURCES OF RESIDUAL RADIATION
397
Tabl e 9.22
PERCENTAGES OF INFINITE TIME RESIDUAL RADIATION DOSE RECEIVED FROM 1
MINUTE UP TO VARIOUS TIMES AFTER EXPLOSION
Percent of
Time (hours) infinite time dose
1 55
2 62
4 68
6 71
12 75
24 80
48 83
Percent of
Time (hours) infinite time dose
72 86
100 88
200 90
500 93
1,000 95
2,000 97
10,000 99
9.24 With the aid of Figs. 9.16a
and b and Fig. 9.20 (or the equivalent
Tables 9.19 and 9.22) many different
types of calculations relating to radia-
tion dose rates and total doses received
from early fallout can be made. The
procedures can be simplified, however,
by means of special charts, as will be
shown below. The results, like those
already given, are applicable to a par-
ticular quantity of fallout. If there is any
change in the situation, either by further
contamination or by decontamination,
the conclusions will not be valid.
9.25 If the radiation dose rate from
early fallout is known at a given loca-
tion, the nomograph in Fig. 9.25 may be
used to determine the dose rate at any
other time at the same location, assum-
ing there has been no change in the
fallout other than natural radioactive
decay. The same nomograph can be
utilized, alternatively, to determine the
time after the explosion at which the
dose rate will have attained a specified
value. The nomograph is based on the
straight line marked “/-’-2” jn Figs.
9.16a and b which is seen to deviate
only slightly from the continuous decay
curve for times less than 6 months or so.
It is thus possible to obtain from Fig.
9.25 approximate dose rates, which are
within 25 percent of the continuous
curve values of Figs. 9.16a and b for the
first 200 days after the nuclear detona-
tion.
(Text continued on page 404.)
398
RESIDUAL NUCLEAR RADIATION AND FALLOUT
The nomograph in Fig. 9.25 gives an
approximate relationship between the
dose rate at any time after the explosion
and the unit-time reference value. If the
dose rate at any time is known, that at
any other time can be derived from the
figure. Alternatively, the time after the
explosion at which a specific dose rate is
attained can be determined approxi-
mately.
For the conditions of applicability of
Fig. 9.25, see § 9.30.
Example
Given: The radiation dose rate due tp
fallout at a certain location is 8 rads per
hour at 6 hours after a nuclear explo-
sion.
Find: (a) The dose rate at 24 hours
after the burst, (b) The time after the
explosion at which the dose rate is 1
rad/hr.
Solution: By means of a ruler (or
straight edge) join the point representing
8 rads/hr on the left scale to the time 6
hours on the right scale. The straight
line intersects the middle scale at 69
rads/hr; this is the unit-time reference
value of the dose rate.
(a) Using the straight edge, connect
this reference point (69 rads/hr) with
that representing 24 hours after the ex-
plosion on the right scale and extend the
line to read the corresponding dose rate
on the left scale, i.e., 1.5 rads/hr. An-
swer
(b) Extend the straight line joining the
dose rate of 1 rad/hr on the left scale to
the reference value of 69 rads/hr bn the
middle scale out to the right scale. This
is intersected at 34 hours after the ex-
plosion. Answer
SOURCES OF RESIDUAL RADIATION
399
1,000 - 700 - 7 1,000 - 700
400 “ -400
200 - -200
UNIT-TIME REFERENCE
100 - DOSE RATE (RADS/HR) 7100
70 “ r 10,000 -70
r 7,000
: 4,000
40- -40
- 2,000
r 1,000
го- 7 700 -20
DOSE RATE - 400 TIME
(RADS/HR) - 200 ( HR )
Ю - 710
г 100 '
7- - 70 -7
- 40
4- :20 -4
: 10
r 7
2- - 4 -2
- 2
17 - 1 71
- 0.7 :
0.7- - 0.4 ; -0.7
- 0.2
0.4- 7 0.1 -0.4
г 0.07
- 0.04
0.2- -0.2
; 0.02
- 0.01
0.1_ -0.1
Figure 9.25. Nomograph for calculating approximate dose rates from early fallout.
400
RESIDUAL NUCLEAR RADIATION AND FALLOUT
From Fig. 9.26 the total accumulated
radiation dose received from early fall-
out during any specified stay in a con-
taminated area can be estimated if the
dose rate at some definite time after the
explosion is known. Alternatively, the
time can be calculated for commencing
an operation requiring a specified stay
and a prescribed total radiation dose.
For conditions of applicability of Fig.
9.26, see § 9.30.
Example
Given: The dose rate at 4 hours after a
nuclear explosion is 6 rads/hr.
Find: (a) The total accumulated dose
received during a period of 2 hours
commencing at 6 hours after the explo-
sion. (/?) The time after the explosion
when an operation requiring a stay of 5
hours can be started if the total dose is to
be 4 rads.
Solution: The first step is to determine
the unit-time reference dose rate (/?,).
From Fig. 9.25, a straight line connect-
ing 6 rads/hr on the left scale with 4
hours on the right scale intersects the
middle scale at 32 rads/hr; this is the
value of Rr
fa) Enter Fig. 9.26 at 6 hours after the
explosion (horizontal scale) and move
up to the curve representing a time of
stay of 2 hours. The corresponding
reading on the vertical scale, which
gives the multiplying factor to convert
/?, to the required total dose, is seen to
be 0.19. Hence, the accumulated dose is
0.19x32=6.1 rads. Answer
(b) Since the accumulated dose is
given as 4 rads and is 32 rads/hr, the
multiplying factor is 4/32=0.125. En-
tering Fig. 9.26 at this point on the
vertical scale and moving across until
the (interpolated) curve for 5 hours stay
is reached, the corresponding reading on
the horizontal scale, giving the time
after the explosion, is seen to be
21 hours. Answer
UNIT-TIME DOSE RATE MULTIPLYING FACTOR
ENTRY TIME (DAYS AFTER EXPLOSION)
Figure 9.26. Curves for calculating accumulated radiation dose from early fallout based on
unit-time reference dose rate.
SOURCES OF RESIDUAL RADIATION
402
RESIDUAL NUCLEAR RADIATION AND FALLOUT
From the chart in Fig. 9.27, the total
accumulated radiation dose received
from early fallout during any specified
stay in a contaminated area can be es-
timated if the dose rate at the time of
entry into the area is known. Alterna-
tively, the time of stay may be evaluated
if the total dose is prescribed.
For conditions of applicability of Fig.
9.27, see § 9.30.
Example
Given: Upon entering a contaminated
area at 12 hours after a nuclear explo-
sion the dose rate is 5 rads/hr.
Find: (a) The total accumulated radi-
ation dose received for a stay of 2 hours.
(b) The time of stay for a total accumu-
lated dose of 20 rads.
Solution: (a) Start at the point on Fig.
9.27 representing 12 hours after the ex-
plosion on the horizontal scale and
move up to the curve representing a time
of stay of 2 hours. The multiplying
factor for the dose rate at the time of
entry, as read from the vertical scale, is
seen to be 1.9. Hence, the total accu-
mulated dose received is
1.9x5=9.5 rads. Answer.
(b) The total accumulated dose is 20
rads and the dose rate at the time of
entry is 5 rads/hr; hence, the multiply-
ing factor is 20/5 = 4.0. Enter Fig.
9.27 at the point corresponding to 4.0
on the vertical scale and move horizon-
tally to meet a vertical line which starts
from the point representing 12 hours
after the explosion on the horizontal
scale. The two lines are found to inter-
sect at a point indicating a time of stay
of about 47г hours. Answer.
ENTRY-TIME DOSE RATE MULTIPLYING FACTOR
ENTRY TIME (DAYS AFTER EXPLOSION)
ENTRY TIME (HOURS AFTER EXPLOSION)
Figure 9.27. Curves for calculating accumulated radiation dose from early fallout based on
dose rate at time of entry.
SOURCES OF RESIDUAL RADIATION 403
404
RESIDUAL NUCLEAR RADIATION AND FALLOUT
9.26 To determine the total accu-
mulated radiation dose received during a
specified time of stay in an area con-
taminated with early fallout, if the dose
rate in that area at any given time is
known, use is made of Fig. 9.26 in
conjunction with Fig. 9.25. The chart
may also be employed to evaluate the
time when a particular operation may be
commenced in a contaminated area in
order not to exceed a specified accumu-
lated radiation dose.
9.27 Another type of calculation of
radiation dose in a contaminated area
(from a fixed quantity of fallout) is
based on a knowledge of the dose rate at
the time when exposure commenced in
that area. The procedure described in
the examples facing Fig. 9.26, which
also requires the use of Fig. 9.25, may
then be applied to determine either the
total dose received in a specified time of
stay or the time required to accumulate a
given dose of radiation. The calculation
may, however, be simplified by means
of Fig. 9.27 which avoids the necessity
for evaluating the unit-time reference
dose rate, provided the dose rate at the
time of entry (or fallout arrival time) in
the contaminated area is known.
9.28 If the whole of the early fallout
reached a given area within a short time,
Fig. 9.27 could be used to determine
how the total accumulated radiation
dose received by inhabitants of that area
would increase with time, assuming no
protection. For example, suppose the
early fallout arrived at 6 hours after the
explosion and the dose rate at that time
was R rads per hour; the total dose
received would be 9 R rads in 1 day, 12
R rads in 2 days, and 16 R rads in 5
days.
9.29 It is evident that the first day or
so after the explosion is the most haz-
ardous as far as the exposure to residual
nuclear radiation from the early fallout
is concerned. Although the particular
values given above apply to the case
specified, i.e., complete early fallout
arrival 6 hours after the explosion, the
general conclusions to be drawn are true
in all cases. The radiation doses that
would be received during the first day or
two are considerably greater than on
subsequent days. Consequently, it is in
the early stages following the explosion
that protection from fallout is most im-
portant.
9.30 It is essential to understand
that the tables and figures given above,
and the calculations of radiation dose
rates and doses in which they are used,
are based on the assumption that an
individual is exposed to a certain quan-
tity of early fallout and remains exposed
continuously (without protection) to this
same quantity for a period of time. In an
actual fallout situation, however, these
conditions probably would not exist.
For one thing, any shelter which atten-
uates the radiation will reduce the ex-
posure dose rate (and dose) as given by
the calculations. Furthermore, the ac-
tion of wind and weather will generally
tend to disperse the fallout particles in
some areas and concentrate them in
others. As a result, there may be a
change in the quantity of early fallout at
a given location during the time of ex-
posure; the radiation dose rate (and
dose) would then change correspond-
ingly. The same would be true, of
course, if there were additional fallout
from another nuclear explosion.
SOURCES OF RESIDUAL RADIATION
405
NEUTRON-INDUCED ACTIVITY
9.31 The neutrons liberated in the
fission process, but which are not in-
volved in the propagation of the fission
chain, are ultimately captured by the
weapon residues through which they
must pass before they can escape, by
nitrogen (especially) and oxygen in the
atmosphere, and by various materials
present on the earth's surface (§ 8.16).
As a result of capturing neutrons many
substances become radioactive. They,
consequently, emit beta particles, fre-
quently accompanied by gamma radia-
tion, over an extended period of time
following the explosion. Such neutron-
induced activity, therefore, is part of the
residual nuclear radiation.
9.32 The activity induced in the
weapon materials is highly variable,
since it is greatly dependent upon the
design and structural characteristics of
the weapon. Any radioactive isotopes
produced by neutron capture in the resi-
dues will remain associated with the
fission products. The curves and tables
given above have been adjusted to in-
clude the contribution of such isotopes,
e.g., uranium-237 and -239 and nep-
tunium-239 and -240. In the period from
20 hours to 2 weeks after the burst,
depending to some extent upon the
weapon materials, these isotopes can
contribute up to 40 percent of the total
activity of the weapon debris. At other
times, their activity is negligible in
comparison with that of the fission
products.
9.33 When neutrons interact with
oxygen and nitrogen nuclei present in
the atmosphere, the resulting radioacti-
vity is of little or no sigificance, as far as
the early residual radiation is concerned.
Oxygen-16, for example, reacts to a
slight extent with fast neutrons, but the
product, an isotope of nitrogen, has a
half-life of only 7 seconds. It will thus
undergo almost complete decay within a
minute or two.
9.34 The product of neutron in-
teraction with nitrogen-14 is carbon-14
(§ 8.110), which is radioactive; it emits
beta particles of low energy but no
gamma rays. Carbon-14 has a long
half-life (5,730 years), so that it decays
and emits beta particles relatively
slowly. In the form of carbon dioxide it
is readily incorporated by all forms of
plant life and thus finds its way into the
human body. The carbon in all living
organisms contains a certain proportion
of carbon-14 resulting from the capture
by atmospheric nitrogen of neutrons
from naturally occurring cosmic rays
and from weapons tests. The total res-
ervoir of carbon-14 in nature, including
oceans, atmosphere, and biosphere (liv-
ing organisms), is normally from 50 to
80 tons; of this amount, about 1 ton is in
the atmosphere and 0.2 ton in the bios-
phere. It is estimated that before Sep-
tember 1961 weapons testing had pro-
duced an additional 0.65 (short) ton of
carbon-14 and about half had dissolved
in the oceans. As a result of the large
number of atmospheric nuclear tests,
many of high yield, conducted during
1961 and 1962, the excess of carbon-14
in the atmosphere rose to about 1.6
(short) tons in the spring of 1963. By
mid-1969, this excess had fallen to
about 0.74 ton. In the course of time,
more and more of the carbon-14 will
enter the oceans and, provided there is
no great addition as a result of weapons
tests, the level in the atmosphere should
continue to decrease. If the rate of de-
406
RESIDUAL NUCLEAR RADIATION AND FALLOUT
crease of excess carbon-14 in the at-
mosphere observed between 1963 and
1969 were to continue, the level should
fall to less than 1 percent above normal
in 40 to 80 years.
9.35 An important contribution to
the residual nuclear radiation can arise
from the activity induced by neutron
capture in certain elements in the earth
and in sea water. The extent of this
radioactivity is highly variable. The el-
ement which probably deserves most
attention, as far as environmental neu-
tron-induced activity is concerned, is
sodium. Although this is present only to
a small extent in average soils, the
amount of radioactive sodium-24
formed by neutron capture can be quite
appreciable. This isotope has a half-life
of 15 hours and emits both beta par-
ticles, and more important, gamma rays
of relatively high energy.5
9.36 Another source of induced ac-
tivity is manganese which, being an
element that is essential for plant
growth, is found in most soils, even
though in small proportions. As a result
of neutron capture, the radioisotope
manganese-56, with a half-life of 2.6
hours, is formed. Upon decay it gives
off several gamma rays of high energy,
in addition to beta particles. Because its
half-life is less than that of sodium-24,
the manganese-56 loses its activity more
rapidly. But, within the first few hours
after an explosion, the manganese in
soil may constitute a serious hazard,
greater than that of sodium.
9.37 A major constituent of soil is
silicon, and neutron capture leads to the
formation of radioactive silicon-31.
This isotope, with a half-life of 2.6
hours, gives off beta particles, but
gamma rays are emitted in not more
than about 0.07 percent of the disinte-
grations. It will be seen later that only
in certain circumstances do beta parti-
cles themselves constitute a serious ra-
diation hazard. Aluminum, another
common constituent of soil, can form
the radioisotope aluminum-28, with a
half-life of only 2.3 minutes. Although
isotopes such as this, with short half-
lives, contribute greatly to the high ini-
tial activity, very little remains within
an hour after the nuclear explosion.
9.38 When neutrons are captured
by the hydrogen nuclei in water (H2O),
the product is the nonradioactive
(stable) isotope, deuterium, so that there
is no resulting activity. As seen in §
9.33, the activity induced in the oxygen
in water can be ignored because of the
very short half-life of the product.
However, substances dissolved in the
water, especially the salt (sodium chlo-
ride) in sea water, can be sources of
considerable induced activity. The so-
dium produces sodium-24, as already
mentioned, and the chlorine yields
chlorine-38 which emits both beta par-
ticles and high-energy gamma rays.
However, the half-life of chlorine-38 is
only 37 minutes, so that within 4 to 5
hours its activity will have decayed to
about 1 percent of its initial value.
9.39 Apart from the interaction of
neutrons with elements present in soil
and water, the neutrons from a nuclear
explosion may be captured by other nu-
4n each act of decay of sodium-24, there are produced two gamma-ray photons, with energies of 1.4
and 2.8 MeV, respectively. The mean energy per photon from fission products at I hour after formation
is about I MeV.
SOURCES OF RESIDUAL RADIATION
407
clei, such as those contained in struc-
tural and other materials. Among the
metals, the chief sources of induced
radioactivity are probably zinc, copper,
and manganese, the latter being a con-
stituent of many steels, and, to a lesser
extent, iron. Wood and clothing are un-
likely to develop appreciable activity as
a result of neutron capture, but glass
could become radioactive because of the
large proportions of sodium and silicon.
Foodstuffs can acquire induced activity,
mainly as a result of neutron capture by
sodium. However, at such distances
from a nuclear explosion and under such
conditions that this activity would be
significant, the food would probably not
be fit for consumption for other reasons,
e.g., blast and fire damage. Some ele-
ments, e.g., boron, absorb neutrons
without becoming radioactive, and their
presence will decrease the induced ac-
tivity.
URANIUM AND PLUTONIUM
9.40 The uranium and plutonium
which may have escaped fission in the
nuclear weapon represent a further pos-
sible source of residual nuclear radia-
tion. The common isotopes of these el-
ements emit alpha particles and also
some gamma rays of low energy. How-
ever, because of their very long half-
lives, the activity is very small com-
pared with that of the fission products.
9.41 The alpha particles from ura-
nium and plutonium, or from radioac-
tive sources in general, are completely
absorbed in an inch or two of air (§
1.66). This, together with the fact that
the particles cannot penetrate ordinary
clothing, indicates that uranium and
plutonium deposited on the earth do not
represent a serious external hazard.
Even if they actually come in contact
with the body, the alpha particles emit-
ted are unable to penetrate the unbroken
skin.
9.42 Although there is negligible
danger from uranium and plutonium
outside the body, it is possible for dan-
gerous amounts of these elements to
enter the body through the lungs, the
digestive system, or breaks in the skin.
Plutonium, for example, tends to con-
centrate in bone and lungs, where the
prolonged action of the alpha particles
can cause serious harm (Chapter XII).
9.43 At one time it was suggested
that the explosion of a sufficiently large
number of nuclear weapons might result
in such an extensive distribution of the
plutonium as to represent a worldwide
hazard. It is now realized that the fission
products—the radioisotope strontium-
90 in particular—are a more serious
hazard than plutonium is likely to be.
Further, any steps taken to minimize the
danger from fission products, which are
much easier to detect, will automatically
reduce the hazard from the plutonium.
TRITIUM
9.44 The interaction of fast neu-
trons in cosmic rays with nitrogen nuclei
in the air leads to the formation of some
tritium in the normal atmosphere; this
radioactive isotope of hydrogen has a
half-life of about 12.3 years. Small
amounts of tritium are formed in fission
but larger quantities result from the ex-
plosion of thermonuclear weapons. The
fusion of deuterium and tritium pro-
ceeds much more rapidly than the other
thermonuclear reactions (§ 1.69) so that
most of the tritium present (or formed in
408
RESIDUAL NUCLEAR RADIATION AND FALLOUT
the D-D and Li-n reactions) is con-
sumed in the explosion. Nevertheless,
some residual quantity will remain. Tri-
tium is also produced by the interaction
of nitrogen nuclei in the air with high-
energy neutrons released in the fusion
reactions. Most of the tritium remaining
after a nuclear explosion, as well as that
produced by cosmic rays, is rapidly
converted into tritiated water, НТО; this
is chemically similar to ordinary water
(H2O) and differs from it only in the
respect that an atom of the radioactive
isotope tritium (T) replaces one atom of
ordinary hydrogen (H). If the tritiated
water should become associated with
natural water, it will move with the
latter.
9.45 The total amount of tritium on
earth, mostly in the form of tritiated
water, attained a maximum in 1963,
after atmospheric testing by the United
States and the U.S.S.R. had ceased.
The amount was then about 16 to 18
times the natural value, but this has been
decreasing as a result of radioactive
decay. By the end of the century, there
will have been a decrease by a factor of
eight or so from the maximum, provided
there are no more than a few nuclear
explosions in the atmosphere. A portion
of the tritium produced remains in the
lower atmosphere, i.e., the troposphere,
whereas the remainder ascends into the
stratosphere (see Fig. 9.126). The tri-
tiated water in the troposphere is re-
moved by precipitation and at times, in
1958 and 1963, following extensive nu-
clear weapons test series, the tritiated
water in rainfall briefly reached values
about 100 times the natural concentra-
tion. Tritium in the stratosphere is re-
moved slowly, so that substantial
amounts are still present in this region of
the atmosphere. As a general rule, the
tritium (and other weapons debris) must
descend into the troposphere before
scavenging by rain or snow can be ef-
fective (§ 9.135).
9.46 When tritium decays it emits a
beta particle of very low energy but no
gamma rays. Consequently, it does not
represent a significant external radiation
hazard. In principle, however, it could
be an internal hazard. Natural water is
relatively mobile in the biosphere and
any tritiated water present will be rap-
idly dispersed and become available for
ingestion by man through both food and
drink. But the hazard is greatly reduced
by the dilution of the tritiated water with
the large amounts of ordinary water in
the environment. On the whole, the in-
ternal radiation dose from tritium is rel-
atively unimportant when compared
with the external (or internal) dose from
fission products (§ 12.199).
CLEAN AND DIRTY WEAPONS
9.47 The terms “clean” and
“dirty” are often used to describe the
amount of radioactivity produced by a
fusion weapon (or hydrogen bomb) rel-
ative to that from what might be de-
scribed as a “normal” weapon. The
latter may be defined as one in which no
special effort has been made either to
increase or to decrease the amount of
radioactivity produced for the given ex-
plosion yield. A “clean” weapon would
then be one which is designed to yield
significantly less radioactivity than an
equivalent normal weapon. Inevitably,
however, any fusion weapon will pro-
duce some radioactive species. Even if a
pure fusion weapon, with no fission,
should be developed, its explosion in air
RADIOACTIVE CONTAMINATION FROM NUCLEAR EXPLOSION
409
would still result in the formation of
carbon-14, tritium, and possibly other
neutron-induced activities. If special
steps were taken in the design of a
fusion device, e.g., by salting (§ 9.11),
so that upon detonation it generated
more radioactivity than a similar normal
weapon, it would be described as
“dirty.” By its very nature, a fission
weapon must be regarded as being dirty.
RADIOACTIVE CONTAMINATION FROM NUCLEAR EXPLOSION
AIR BURSTS
9.48 An air burst, by definition, is
one taking place at such a height above
the earth that no appreciable quantities
of surface materials are taken up into the
fireball. The radioactive residues of the
weapon then condense into very small
particles with diameters in the range of
0.01 to 20 micrometers (see § 2.27
footnote). The nuclear cloud carries
these particles to high altitudes, deter-
mined by the weapon yield and the at-
mospheric conditions. Many of the par-
ticles are so small that they fall
extremely slowly under the influence of
gravity, but they can diffuse downward
and be deposited by atmospheric turbu-
lence. The deposition takes place over
such long periods of time that the par-
ticles will have become widely distrib-
uted and their concentration thereby re-
duced. At the same time, the
radioactivity will have decreased as a
result of natural decay. Consequently,
in the absence of precipitation, i.e., rain
or snow (§ 9.67), the deposition of early
fallout from an air burst will generally
not be significant.
9.49 An air burst, however, may
produce some induced radioactive con-
tamination in the general vicinity of
ground zero as a result of neutron cap-
ture by elements in the soil. The extent
of the contamination will depend on the
characteristices of the weapon, e.g., fu-
sion and fission energy yields, the height
of burst, and the composition of the
surface material. The residual radioac-
tivity which would arise in this manner
will thus be highly variable, but it is
probable that where the induced activity
is substantial, all buildings except
strong underground structures would be
destroyed by blast and fire.
LAND SURFACE AND SUBSURFACE
BURSTS
9.50 As the height of burst de-
creases, earth, dust, and other debris
from the earth’s surface are taken up
into the fireball; an increasing propor-
tion of the fission (and other radioactive)
products of the nuclear explosion then
condense onto particles of appreciable
size. These contaminated particles range
in diameter from less than 1 micron to
several millimeters; the larger ones
begin to fall back to earth even before
the radioactive cloud has attained its
maximum height, whereas the very
smallest ones may remain suspended in
the atmosphere for long periods. In
these circumstances there will be an
early fallout, with the larger particles
reaching the ground within 24 hours.
Photographs of typical fallout particles
410
RESIDUAL NUCLEAR RADIATION AND FALLOUT
are shown in Figs. 9.50a through d. The
distribution of the radioactivity of the
particles is indicated by the autoradio-
graphs, i.e., self-photographs produced
by the radiations. As a general rule, the
contamination is confined to the surface
of the particle, but in some cases the
distribution is uniform throughout, in-
dicating that the particle was molten
when it incorporated the radioactive
material.
9.51 The extent of the contamina-
tion of the earth’s surface due to the
residual nuclear radiation following a
land surface or subsurface burst depends
primarily on the location of the burst
point. There is a gradual transition in
behavior from a high air burst, at one
extreme, where all the radioactive resi-
dues are injected into the atmosphere, to
a deep subsurface burst, at the other
extreme, where the radioactive materi-
als remain below the surface. In neither
case will there be any significant local
fallout. Between these two extremes are
surface and near-surface bursts which
will be accompanied by extensive con-
tamination due to early fallout. A shal-
low subsurface burst, in which part of
the fireball emerges from the ground, is
essentially similar to a surface burst.
The distribution of the early fallout from
surface and related explosions is deter-
mined by the total and fission yields,
and the depth or height of burst, the
nature of the soil, and the wind and
weather conditions. These matters will
be discussed in some detail later in this
chapter.
9.52 For a subsurface burst that is
not too deep, but deep enough to pre-
vent emergence of the fireball, a con-
siderable amount of dirt is thrown up as
a column in the air and there is also
crater formation. Much of the radioac-
tive material will remain in the crater
area, partly because it does not escape
and partly because the larger pieces of
contaminated rock, soil, and debris
thrown up into the air will descend in
the vicinity of the explosion (Chapter
VI). The finer particles produced di-
rectly or in the form of a base surge
(§ 2.96) will remain suspended in the
air and will descend as fallout at some
distance from ground zero.
WATER SURFACE AND
UNDERWATER BURSTS
9.53 The particles entering the at-
mosphere from a sea water surface or
shallow subsurface burst consist mainly
of sea salts and water drops. When dry,
the particles are generally smaller and
lighter than the fallout particles from a
land burst. As a consequence of this
difference, sea water bursts produce less
close-in fallout than do similar land
surface bursts. In particular, water sur-
face and shallow underwater bursts are
often not associated with a region of
intense residual radioactivity near sur-
face zero. Possible exceptions, when
such a region does occur, are water
surface bursts in extremely humid at-
mospheres or in shallow water. If the
humidity is high, the hygroscopic, i.e.,
water-absorbing, nature of the sea salt
particles may cause a cloud seeding ef-
fect leading to a local rainout of ra-
dioactivity.
9.54 The early residual radioacti-
vity from a water burst can arise from
two sources: (1) the base surge if
formed (§ 2.72 et seq.) and (2) the
radioactive material, including induced
radioactivity, remaining in the water.
RADIOACTIVE CONTAMINATION FROM NUCLEAR EXPLOSION
411
Figure 9.50a.
A typical fallout particle from a tower shot in Nevada. The particle has a dull,
metallic luster and shows numerous adhering small particles.
Figure 9.50b. A fallout particle from a tower shot in Nevada. The particle is spherical with
a brilliant, glossy surface.
412
RESIDUAL NUCLEAR RADIATION AND FALLOUT
Figure 9.50c. Photograph (left) and autoradiograph (right) of a thin section of a spherical
particle from a ground-surface shot at Eniwetok. The radioactivity is un-
iformly distributed throughout the particle.
Figure 9.50d. Photograph (left) and autoradiograph (right) of a thin section of an irregular
particle from a ground-surface shot at Bikini. The radioactivity is concen-
trated on the surface of the particle.
RADIOACTIVE CONTAMINATION FROM NUCLEAR EXPLOSION
413
The base surge is influenced strongly by
the wind, moving as an entity at the
existing wind speed and direction. Ini-
tially, the base surge is highly radioac-
tive, but as it expands and becomes
diluted the concentration of fission
products, etc., decreases. This disper-
sion, coupled with radioactive decay,
results in comparatively low dose rates
from the base surge by about 30 minutes
after the burst (§ 2.77 et seq.).
9.55 The radioactivity in the water
is initially present in a disk-like “pool,”
usually not more than 300 feet deep,
near the ocean surface which is moved
by the local currents. The pool gradually
expands into a roughly annular form,
but it reverts to an irregular disk shape at
later times. Eventually, downward mix-
ing and horizontal turbulent diffusion
result in a rapid dilution of the radioac-
tivity, thus reducing the hazard with
time.
9.56 In the Bikini BAKER test
(§ 2.63), the contaminated fallout (or
rainout) consisted of both solid particles
and a slurry of sea salt crystals in drops
of water. This contamination was diffi-
cult to dislodge and had there been per-
sonnel on board the ships used in the
test, they would have been subjected to
considerable doses of radiation if the
fallout were not removed immediately.6
Since the BAKER shot was fired in
shallow water, the bottom material may
have helped in the scavenging of the
radioactive cloud, thus adding to the
contamination. It is expected that for
shallow bursts in very deep water the
fallout from the cloud will be less than
observed at the test in Bikini lagoon.
9.57 An indication of the rate of
spread of the active material and the
decrease in the dose rate following a
shallow underwater burst is provided by
the data in Table 9.57, obtained after the
Bikini BAKER test. Although the dose
rate in the water was still fairly high
after 4 hours, there would be consider-
able attenuation in the interior of a ship,
so that during the time required to cross
the contaminated area the total dose re-
ceived would be small. Within 2 or 3
days after the BAKER test the radioac-
tivity had spread over an area of about
50 square miles, but the radiation dose
rate in the water was so low that the
region could be traversed in safety.
Table 9.57
DIMENSIONS AND DOSE RATE IN CONTAMINATED WATER AFTER THE
20-KILOTON UNDERWATER EXPLOSION AT BIKINI
Time after explosion (hours) Contaminated area (square miles) Mean diameter (miles) Maximum dose rate (rads/hr)
4 16.6 4.6 3.1
38 18.4 4.8 0.42
62 48.6 7.9 0.21
86 61.8 8.9 0.042
100 70 6 9.5 0.025
130 107 11.7 0.008
200 160 14.3 0.0004
6The technique of washdown of ships, by continuous flow of water over exposed surfaces to remove
fallout as it settles, was developed as a result of the Bikini BAKER observations.
414
RESIDUAL NUCLEAR RADIATION AND FALLOUT
9.58 The residual radiation dose
rates and doses from the base surge and
pool resulting from an underwater nu-
clear explosion vary significantly with
weapon yield and burst depth, proximity
of the ocean bottom to the point of
detonation, wind velocity, and current
velocity. Consequently, the residual ra-
diation distribution associated with an
underwater burst is complex, and there
is no simplified prediction system suit-
able for general application, such as has
been developed for land surface bursts
(§ 9.79 et seq.).
FALLOUT DISTRIBUTION IN LAND SURFACE BURSTS
DISTRIBUTION OF CONTAMINATION
9.59 More is known about the fall-
out from land surface and near-surface
bursts than for other types of explo-
sions. Consequently, the remainder of
this chapter will be concerned mainly
with the radioactive contamination re-
sulting from bursts at or near the ground
surface. The proportion of the total ra-
dioactivity of the weapon residues that
is present in the early fallout, sometimes
called the “early fallout fraction,”
varies from one test explosion to an-
other. For land surface bursts the early
fallout fraction, which depends on the
nature of the surface material, has been
estimated to range from 40 to 70 per
cent. Values somewhat higher than this
are expected for shallow underground
bursts. For water surface bursts, how-
ever, the fraction is generally lower, in
the neighborhood of 20 to 30 percent,
for the reason given in § 9.53. Some
variability is expected in the fallout
fraction for a given type of burst due to
variations in environmental and meteor-
ological conditions. Nevertheless, it
will be assumed here that 60 percent of
the total radioactivity from a land sur-
face burst weapon will be in the early
fallout. The remainder will contribute to
the delayed fallout, most of which un-
dergoes substantial radioactive decay
and, hence, decreases in activity before
it eventually reaches the ground many
hundreds or thousands of miles away
(§ 9.121 et seq.).
9.60 The distribution on the ground
of the activity from the early fallout,
i.e., the “fallout pattern,” even for sim-
ilar nuclear yields, also shows great
variability. In addition to the effect of
wind, such factors as the dimensions of
the radioactive cloud, the distribution of
radioactivity within the mushroom
head, and the range of particle sizes
contribute to the uncertainty in attempts
to predict the fallout pattern.
9.61 The spatial distribution of ra-
dioactivity within the cloud is not
known accurately, but some of the gross
features have been derived from obser-
vations and theoretical considerations. It
is generally accepted that, of the total
activity that is lofted, the mushroom
head from a contact land-surface burst
initially contains about 90 percent with
the remainder residing in the stem. The
proportion of activity in the stem may be
even less for a water surface burst and
almost zero for an air burst. However, it
appears that some radioactive particles
from the mushroom head fall or are
FALLOUT DISTRIBUTION IN LAND SURFACE BURST
415
transported by subsiding air currents to
lower altitudes even before the cloud
reaches its maximum height. In addition
to the radioactivity in the mushroom
head and the stem, a considerable
quantity of radioactivity from a surface
burst is contained in the fallback in the
crater and in the ejecta scattered in all
directions around ground zero (Chapter
VI). There is some evidence that, for
explosions in the megaton range, the
highest concentration of radioactivity
initially lies in the lower third of the
head of the mushroom cloud. It is prob-
able, too, that in detonations of lower
yield, a layer of relatively high activity
exists somewhere in the cloud. The lo-
cation of the peak concentration appears
to vary with different detonations, per-
haps as a function of atmospheric con-
ditions.
9.62 Because particles of different
sizes descend at different rates and carry
different amounts of radioactive con-
tamination, the fallout pattern will de-
pend markedly on the size distribution
of the particles in the cloud after con-
densation has occurred. In general,
larger particles fall more rapidly and
carry more activity, so that a high pro-
portion of such particles will lead to
greater contamination near ground zero,
and less at greater distances, than would
be the case if small particles predomin-
ated.
9.63 The particle size distribution
in the radioactive cloud may well de-
pend on the nature of the material which
becomes engulfed by the fireball. A
surface burst in a city, for example,
could result in a particle size distribution
and consequent fallout pattern which
would differ from those produced under
test conditions either in Nevada or in the
Pacific. However, in the absence of any
definite evidence to the contrary, it is
generally assumed that the fallout pat-
tern for a surface burst in a large city
will not differ greatly from those asso-
ciated with surface and tower shots in
the Nevada desert. This may not be the
same as the patterns observed at tests in
Pacific Ocean atolls.
AREA OF CONTAMINATION
9.64 The largest particles fall to the
ground from the radioactive cloud and
stem shortly after the explosion and
hence are found within a short distance
of surface zero. Smaller particles, on the
other hand, will require many hours to
fall to earth. During this period they
may be carried hundreds of miles from
the burst point by the prevailing winds.
The very smallest particles have no ap-
preciable rate of fall and so they may
circle the earth many times before
reaching the ground, generally in pre-
cipitation with rain or snow.
9.65 The fact that smaller particles
from the radioactive cloud may reach
the ground at considerable distances
from the explosion means that fallout
from a surface burst can produce serious
contamination far beyond the range of
other effects, such as blast, shock, ther-
mal radiation, and initial nuclear radia-
tion. It is true that the longer the cloud
particles remain suspended in the air,
the lower will be their activity when
they reach the ground. However, the
total quantity of contaminated material
produced by the surface burst of a me-
gaton weapon with a high fission yield is
so large that fallout may continue to
arrive in hazardous concentrations up to
416
RESIDUAL NUCLEAR RADIATION AND FALLOUT
perhaps 24 hours after the burst. Radio-
active contamination from a single det-
onation may thus affect vast areas and so
fallout must be regarded as one of the
major effects of nuclear weapons.
9.66 An important factor determin-
ing the area covered by appreciable
fallout, as well as its distribution within
that area, is the wind pattern from the
ground up to the top of the radioactive
cloud. The direction and speed of the
wind at the cloud level will influence the
motion and extent of the cloud itself. In
addition, the winds at lower altitudes,
which may change both in time and
space, will cause the fallout particles to
drift one way or another while they
descend to earth. The situation may be
further complicated by the effect of rain
(see below) and of irregularities in the
terrain. These, as well as nonuniform
distribution of activity in the cloud and
fluctuations in the wind speed and di-
rection, will contribute to the develop-
ment of “hot spots” of much higher
activity than in the immediate sur-
roundings.
DEPOSITION OF RADIOACTIVE
DEBRIS BY PRECIPITATION
9.67 If the airborne debris from a
nuclear explosion should encounter a
region where precipitation is occurring,
a large portion of the radioactive par-
ticles may be brought to earth with the
rain or snow. The distribution of the
fallout on the ground will then probably
be more irregular than in the absence of
precipitation, with heavy showers pro-
ducing local hot spots within the con-
taminated area. Although an air burst
does not normally produce any early
fallout, precipitation in or above the
nuclear cloud could, however, cause
significant contamination on the ground
as a result of scavenging of the radioac-
tive debris by rain or snow. Precipita-
tion can also affect the fallout from a
surface or subsurface burst, mainly by
changing the distribution of the local
contamination that would occur in any
event. Fallout from the cloud stem in a
surface burst of high yield should not be
greatly influenced by precipitation,
since the particles in the stem will fall to
earth in a relatively short time regardless
of whether there is precipitation or not.
9.68 A number of circumstances
affect the extent of precipitation sca-
venging of the stabilized nuclear cloud.
The first requirement is, of course, that
the nuclear cloud should be within or
below the rain cloud. If the nuclear
cloud is above the rain cloud, there will
be no scavenging. The altitudes of the
top of rain (or snow) clouds range from
about 10,000 to 30,000 feet, with
lighter precipitation generally being as-
sociated with the lower altitudes. The
bottom of the rain cloud, from which the
precipitation emerges, is commonly at
an altitude of about 2,000 feet. Precipi-
tation from thunderstorms, however,
may originate as high as 60,000 feet.
For low air or surface bursts, the height
and depth of the nuclear cloud may be
obtained from Fig. 9.96 and these data
may be used to estimate the fraction of
this cloud that might be intercepted by
precipitation. For explosion yields up to
about 10 kilotons essentially all of the
nuclear cloud, and for yields up to 100
kilotons at least part of the cloud could
be subject to scavenging. For yields in
FALLOUT DISTRIBUTION IN LAND SURFACE BURST
417
excess of about 100 kilotons, precipita-
tion scavenging should be insignificant.
But if the nuclear cloud should en-
counter a thunderstorm region, it is
possible that all of the cloud from ex-
plosions with yields up to several hun-
dred kilotons and a portion from yields
in the megaton range may be affected by
precipitation.
9.69 If the horizontal diameter of
the rain cloud is less than that of the
nuclear cloud, only that portion of the
latter that is below (or within) the rain
cloud will be subject to scavenging. If
the rain cloud is the larger, then the
whole of the nuclear cloud will be
available for precipitation scavenging.
The length of time during which the
nuclear cloud is accessible for scaveng-
ing will depend on the relative direc-
tions and speed of travel of the nuclear
and rain clouds.
9.70 The time, relative to the burst
time, at which the nuclear cloud en-
counters a region of precipitation is ex-
pected to have an important influence on
the ground contamination resulting from
scavenging. If the burst occurs during
heavy precipitation or if heavy precipi-
tation begins at the burst location during
the period of cloud stabilization, a
smaller area on the ground will be con-
taminated but the dose rate will be
higher than if the nuclear cloud encoun-
tered the rain cloud at a later time. Even
for such early encounters, the dose rates
near ground zero will be lower than after
a surface burst with or without precipi-
tation. If the rainfall is light, the sca-
venging will be less efficient, and the
ground distribution pattern will be elon-
gated if the nuclear cloud drifts with the
wind but remains in the precipitation
system.
9.71 If the nuclear cloud should
enter a precipitation region at some time
after the burst, the surface contamina-
tion caused by scavenging will be de-
creased. In the first place, while the
cloud is drifting, the radioactive nu-
clides (§ 1.30) decay continuously.
Thus, the longer the elapsed time before
the nuclear cloud encounters precipita-
tion, the smaller will be the total amount
of radioactive material present. Further-
more, the nuclear cloud, especially from
a low-altitude burst, tends to increase in
size horizontally with time, due to wind
shear and eddy diffusion, without dras-
tic change in the vertical dimensions,
unless precipitation scavenging should
occur. This increase in horizontal di-
mensions will decrease the concentra-
tion of radioactive particles available for
scavenging. Finally, the particles that
are scavenged will not be deposited on
the ground immediately but will fall
with the precipitation (typically 800 to
1,200 feet per minute for rain and 200
feet per minute for snow). Since the
particles are scavenged over a period of
time and over a range of altitudes, hori-
zontal movement during their fall will
tend to decrease the concentration of
radioactivity (and dose rate) on the
ground. The horizontal movement dur-
ing scavenging and deposition will re-
sult in elongated surface fallout pat-
terns, the exact shape depending on the
wind shear.
9.72 After the radioactive particles
have been brought to the ground by
scavenging, they may or may not stay in
place. There is a possibility that water
runoff will create hot spots in some
areas while decreasing the activity in
others. Some of the radioactive material
may be dissolved out by the rain and
418
RESIDUAL NUCLEAR RADIATION AND FALLOUT
will soak into the ground. Attenuation
of the radiations by the soil may then
reduce the dose rates above the ground
surface.
9.73 Much of what has been stated
concerning the possible effects of rain
on fallout from both surface and air
bursts is based largely on theoretical
considerations. Nuclear test operations
have been conducted in such a manner
as to avoid the danger of rainout. The
few recorded cases of rainout which
have occurred have involved very low
levels of radioactivity and the possibility
of severe contamination under suitable
conditions has not been verified. Never-
theless, there is little doubt that precipi-
tation scavenging can affect the fallout
distribution on the ground from both air
and surface bursts with yields in the
appropriate range. Because of the many
variables in precipitation scavenging,
the extent and level of surface contami-
nation to be expected are uncertain.
Some estimates have been made, how-
ever, of the amounts of rainfall neces-
sary to remove given percentages of the
radioactive particles from a nuclear
cloud. These estimates are based partly
on field experiments with suspended
particles and partly on mathematical
models for use with a computer; the
results are thus dependent on the details
of the model, e.g., particle size distri-
bution.
9.74 Two types of precipitation
scavenging have been treated in this
manner: “rainout” (or “snowout”),
when the nuclear cloud is within the rain
(or snow) cloud, and “washout” when
the nuclear cloud is below the rain (or
snow) cloud. The rainfall rate appears to
have little effect on rainout but washout
is affected to a marked extent. The data
in Tables 9.74a and b give rough es-
timates of the amounts of rainfall, ex-
pressed as the duration, required for the
removal of specified percentages of the
nuclear cloud particles by rainout and
washout; the terms light, moderate, and
heavy in Table 9.74b refer to 0.05,
0.20, and 0.47 inch of rain per hour,
respectively, as measured at the surface.
Thus, it appears that washout is a less
effective scavenging mechanism than
rainout. The tabulated values are based
on the assumption that the nuclear and
rain clouds remain in the same relative
positions, with the rain cloud at least as
large as the nuclear cloud (§ 9.69). It
should be noted that the times in Tables
9.74a and b are those required for the
radioactive debris to be removed by the
rain; additional time will elapse before
the radioactivity is deposited on the
ground. The deposition time will de-
pend on the altitude at which the debris
is scavenged and the rate of fall of the
rain.
FALLOUT DISTRIBUTION IN LAND SURFACE BURST
419
Table 9.74a
ESTIMATED RAINFALL DURATION FOR RAINOUT
Percent of Cloud Scavenged Duration of Rainfall (hours)
25 50 75 0.07 0.16 0.32
90 0.53
99 1.1
Table 9.74b
ESTIMATED RAINFALL DURATION FOR WASHOUT
Duration of Rainfall
Percent of Cloud Scavenged (hours)
Light Moderate Heavy
25 8 1.6 0.8
50 19 3.8 1.9
75 38 7.7 3.6
90 64 13 6.4
99 128 26 13
FALLOUT PATTERNS
9.75 Information concerning fallout
distribution has been obtained from ob-
servations made during nuclear weapons
tests at the Nevada Test Site and the
Eniwetok Proving Grounds.7 However,
there are many difficulties in the analysis
and interpretation of the results, and in
their use to predict the situation that
might arise from a land surface burst
over a large city. This is particularly the
case for the megaton-range detonations
at the Eniwetok Proving Grounds. Since
the fallout descended over vast areas of
the Pacific Ocean, the contamination
pattern of a large area had to be inferred
from a relatively few radiation dose
measurements (§9.105). Furthermore,
the presence of sea water affected the
results, as will be seen below.
9.76 Nuclear tests in the atmos-
phere in Nevada have been confined to
weapons having yields below 100 kilo-
tons and most of the detonations were
from the tops of steel towers 100 to 700
7The Eniwetok Proving Grounds, called the Pacific Proving Ground before 1955, included test sites on
Bikini and Eniwetok Atolls and on Johnston and Christmas Islands in the Pacific Ocean.
420
RESIDUAL NUCLEAR RADIATION AND FALLOUT
feet high or from balloons at levels of
400 to 1,500 feet. None of these could
be described as a true surface burst and,
in any event, in the tower shots there is
evidence that the fallout was affected by
the tower. There have been a few sur-
face bursts, but the energy yields were
about 1 kiloton or less, so that they
provided relatively little useful infor-
mation concerning the effects to be ex-
pected from weapons of higher energy.
Tests of fusion weapons with yields up
to 15 megatons TNT equivalent have
been made at the Pacific Ocean test
sites. A very few were detonated on
atoll islands, but most of the shots in the
Bikini and Eniwetok Atolls in 1958
were fired on barges in the lagoons or on
coral reefs. In all cases, however, con-
siderable quantities of sea water were
drawn into the radioactive cloud, so that
the fallout was probably quite different
from what would have been associated
with a true land surface burst.
9.77 The irregular nature of the
fallout distribution from two tests in
Nevada is shown by the patterns in Figs.
9.77a and b; the contour lines are drawn
through points having the indicated dose
rates at 12 hours after the detonation
time. Figure 9.77a refers to the
BOLTZMANN shot (12 kilotons, 500-
foot tower) of May 28, 1957 and Fig.
9.77b to the TURK shot (43 kilotons,
500-foot tower) of March 7, 1955. Be-
cause of the difference in wind condi-
tions, the fallout patterns are quite dif-
ferent. Furthermore, attention should be
drawn to the hot spot, some 60 miles
NNW of the northern boundary of the
Nevada Test Site, that was observed in
connection with the BOLTZMANN
test. This area was found to be seven
times more radioactive than its immedi-
ate surroundings. The location was di-
rectly downwind of a mountain range
and rain was reported in the general
vicinity at the time the fallout occurred.
Either or both of these factors may have
been responsible for the increased ra-
dioactivity.
9.78 Measurement of fallout activ-
ity from megaton-yield weapons in the
Pacific Ocean area has indicated the
presence of marked irregularities in the
overall pattern. Some of these may have
been due to the difficulties involved in
collecting and processing the limited
data. Nevertheless, there is evidence to
indicate that a hot spot some distance
(50 to 75 miles) downwind of the burst
point may be typical of the detonations
at the Eniwetok Proving Grounds and,
in fact, some fallout prediction methods
have been designed to reproduce this
feature. The occurrence of these hot
spots may have been a consequence of
the particular wind structure (§ 9.66).
The times for most explosions at the
Eniwetok Proving Grounds coincided
with complex wind structures from the
altitude of the stabilized cloud to the
surface. The large directional changes in
the wind served to contain the fallout
more locally than if the wind were
blowing in one direction.
FALLOUT DISTRIBUTION IN LAND SURFACE BURST
421
Figure 9.77a. Early fallout dose-rate contours from the BOLTZMANN shot at the Nevada
Test Site.
Figure 9.77b. Early fallout dose-rate contours from the TURK shot at Nevada Test Site.
422
RESIDUAL NUCLEAR RADIATION AND FALLOUT
FALLOUT PREDICTIONS FOR LAND SURFACE BURSTS
PREDICTION OF FALLOUT PATTERNS
9.79 Several methods, of varying
degree of complexity, have been devel-
oped for predicting dose rates and inte-
grated (total) doses resulting from fall-
out at various distances from ground (or
surface) zero. These methods fall into
four general categories; they are, in de-
creasing order of complexity, and hence
detail, the mathematical fallout model,
the analog method, the danger sector
forecast, and the idealized fallout pat-
tern. Each of these techniques requires,
of course, a knowledge of the total and
fission yields of the explosion, the burst
height, and the wind structure to the top
of the radioactive cloud in the vicinity of
the burst. The more complex procedures
require a forecast of the winds and
weather in the locality over a period of
several hours to a few days after the
explosion. In making these forecasts,
the considerable seasonable variations
in wind patterns must be kept in mind.
9.80 In the fallout model method,
an attempt is made to describe fallout
mathematically and, with various inher-
ent assumptions, to predict the dose-rate
distribution contours resulting from a
particular situation. The most reliable
procedures are very complex and re-
quire use of a large digital computer in
their application to a variety of circum-
stances. They are, consequently, em-
ployed primarily in theoretical studies of
the fallout process, in making planning
estimates, and in the preparation of
templates for use with analog prediction
methods. Apart from a few instances,
less detailed mathematical models,
which do not require digital computers,
have been used to predict fallout dis-
tribution patterns during nuclear tests.
9.81 The analog technique, which
is essentially a comparison process, uti-
lizes a pattern chosen from a catalog of
fallout contour patterns covering a wide
range of yields and wind conditions.
The choice is determined by the simi-
larity between the yield and wind in the
given situation and those in the catalog
pattern. The catalog can consist of ac-
tual fallout patterns and others interpo-
lated and extrapolated from these, or of
patterns obtained by calculation from a
mathematical fallout model.
9.82 The danger sector forecast re-
quires a minimum of detailed informa-
tion in order to give a qualitative picture
of the general fallout area and an idea of
the arrival times. Although it provides a
rough indication of the relative degree
of hazard, there is little or no informa-
tion concerning the actual dose rates to
be expected at various locations. The
method yields a prediction quickly and
simply and is probably as accurate as the
explosion yield and meteorological in-
formation will justify in an operational
(field) situation. The fourth prediction
method, based on the use of idealized
fallout distribution patterns, is described
in some detail below. Such idealized
patterns are derived from a detailed
mathematical model, as described in
§ 9.80, based on average or most prob-
able conditions.
FALLOUT PREDICTIONS FOR LAND SURFACE BURSTS
423
IDEALIZED FALLOUT PATTERNS
9.83 Idealized fallout contour pat-
terns have been developed which repre-
sent the average fallout field for a given
yield and wind condition. No attempt is
made to indicate irregularities which
will undoubtedly occur in a real fallout
pattern, because the conditions deter-
mining such irregularities are highly
variable and uncertain. Nevertheless, in
spite of their limitations, idealized pat-
terns are useful for planning purposes,
for example in estimating the overall
effect of fallout from a large-scale nu-
clear attack. Although they will un-
doubtedly underestimate the fallout in
some locations and overestimate it in
others, the evaluation of the gross fall-
out problem over the whole area af-
fected should not be greatly in error.
9.84 For a detailed fallout distribu-
tion prediction, the winds from the sur-
face to all levels in the radioactive cloud
must be considered. However, for the
idealized patterns, the actual complex
wind system is replaced by an approxi-
mately equivalent “effective wind.”
Various methods have been used to de-
fine the effective wind, i.e., speed and
direction, for the generation of idealized
patterns. The effective wind that is ap-
propriate for use with the idealized pat-
terns described below should be ob-
tained by first determining the average
wind from the ground to the base and to
the top of the stabilized cloud (§ 2.15).
The effective wind is then the mean of
these two average winds.
9.85 By assuming little or no wind
shear, that is, essentially no change in
wind direction at different altitudes, the
idealized fallout contour patterns have a
regular cigar-like shape, as will be seen
shortly. But if the wind direction
changes with altitude, the fallout will
spread over a wider angle, as in Fig.
9.77a, and the activity, i.e., the radia-
tion dose rate, at a given distance from
ground (or surface) zero will be de-
creased because the same amout of ra-
dioactive contamination will cover a
larger area. Lower wind speeds will
make the pattern shorter in the down-
wind direction because the particles will
not travel so far before descending to
earth; the activity at some distance from
the burst point will be lower and the
high dose rates immediately downwind
of ground zero will be increased. If the
wind speed is higher, the contaminated
area will be greater, and the radioac-
tivity will be higher at large distances
from surface zero and lower immedi-
ately downwind of ground zero.
DEVELOPMENT OF FALLOUT
PATTERN
9.86 Before showing an idealized
fallout distribution pattern it is impor-
tant to understand how such a pattern
develops over a large area during a
period of several hours following a sur-
face burst. The situation will be illus-
trated by the diagrams in Figs. 9.86a
and b, which apply to a 2-megaton ex-
plosion with 50 percent fission yield.
The effective wind speed was taken as
15 miles per hour. Fig. 9.86a shows a
number of contour lines for certain (ar-
bitrary) round-number values of the
dose rate, as would be observed on the
ground, at 1, 6, and 18 hours, respec-
tively, after the explosion. A series of
total (or accumulated) dose contour
lines for the same times are given in Fig.
9.86b. It will be understood, of course,
424
RESIDUAL NUCLEAR RADIATION AND FALLOUT
that the various dose rates and doses
change gradually from one contour line
to the next. Similarly, the last contour
line shown does not represent the limit
of the contamination, since the dose rate
(and dose) will continue to fall off over a
greater distance.
9.87 Consider, first, a location
about 20 miles directly downwind from
ground zero. At 1 hour after the deto-
nation, the observed dose rate is seen to
be roughly 3 rads/hr but it will rise
rapidly and will reach a value over 500
rads/hr sometime between 1 and 2
hours. The dose rate will then decrease
to about 200 rads/hr at 6 hours; at 18
hours it is down to roughly 50 rads/hr.
The increase in dose rate after 1 hour
means that at the specified location the
fallout was not complete at that time.
The subsequent decrease after about 2
hours is then due to the natural decay of
the fission products. Turning to Fig.
9.86b, it is seen that the total radiation
dose received at the given location by 1
hour after the explosion is small, be-
cause the fallout has only just started to
arrive. By 6 hours, the total dose has
reached more than 1,000 rads and by 18
hours a total dose of some 2,000 rads
will have been accumulated. Subse-
quently, the total dose will continue to
increase, toward the infinite time value,
but at a slow rate (see Table 9.22).
9.88 Next, consider a point 100
miles downwind from ground zero. At 1
hour after the explosion the dose rate, as
indicated in Fig. 9.86a, is zero, since
the fallout will not have reached the
specified location. At 6 hours, the dose
rate is about 1 rad per hour and at 18
hours about 5 rads per hour. The fallout
commences at somewhat more than 6
hours after the detonation and it is es-
sentially complete at 9 hours, although
this cannot be determined directly from
the contours given. The total accumu-
lated dose, from Fig. 9.86b, is seen to
be zero at 1 hour after the explosion,
less than 1 rad at 6 hours, and about 80
rads at 18 hours. The total (infinite time)
dose will not be as great as at locations
closer to ground zero, because the
quantity of fission products reaching the
ground decreases at increasing distances
from the explosion.
9.89 In general, therefore, at any
given location at a distance from a sur-
face burst, some time will elapse be-
tween the explosion and the arrival of
the fallout. This time will depend on the
distance from ground zero and the ef-
fective wind velocity. When the fallout
first arrives, the dose rate is small, but it
increases as more and more fallout de-
scends. After the fallout is complete, the
radioactive decay of the fission products
will cause the dose rate to decrease.
Until the fallout commences, the accu-
mulated dose will, of course, be small,
but after its arrival the total accumulated
radiation dose will increase contin-
uously, at first rapidly and then some-
what more slowly, over a long period of
time, extending for many months and
even years.
9.90 The curves in Figs. 9.90a and
b illustrate this behavior qualitatively;
they show the variation with time of the
dose rate and the accumulated dose from
fallout at points near and far, respec-
tively, in the downwind direction from a
FALLOUT PREDICTIONS FOR LAND SURFACE BURSTS
425
280 r
240 -
200 -
160 -
120 -
80 -
40 -
0 -
20 -
Figure 9.86a.
DISTANCE FROM GROUND ZERO (MILES)
3 RADS/HR |0
-30
'100
s300
1000
I RAD/HR |6
I—i___i_l__I
20 0 20
TIME OF ARRIVAL (HOURS)
20 0 20
DISTANCE FROM GROUND ZERO (MILES)
I HOUR 6 HOURS 18 HOURS
Dose-rate contours from early fallout at 1,6, and 18 hours after a surface
burst with a total yield of 2 megatons and 1 megaton fission yield (15 mph
effective wind speed).
426
RESIDUAL NUCLEAR RADIATION AND FALLOUT
DISTANCE FROM GROUND ZERO (MILES)
Q
Z
I
Q.
S
Ю
10 RADS
18
16
TIME OF ARRIVAL (HOURS)
DISTANCE FROM GROUND ZERO (MILES)
I HOUR 6 HOURS 18 HOURS
Figure 9.86b. Total-dose contours from early fallout at 1, 6, and 18 hours after a surface
burst with a total yield of 2 megatons and 1-megaton fission yield (15 mph
effective wind speed).
FALLOUT PREDICTIONS FOR LAND SURFACE BURSTS
427
surface burst. Both the dose rate and the
dose are zero until the fallout particles
reach the given locations. At these times
the dose rate commences to increase,
reaches a maximum, and subsequently
decreases, rapidly at first as the radio-
isotopes of short half-life decay, and
then more slowly. The total accumu-
lated dose increases continuously from
the time of arrival of the fallout toward
the limiting (infinite time) value.
9.91 Since the mushroom cloud
grows rapidly in radius and reaches its
stabilized altitude before the winds can
act on it significantly, the time of arrival
of the fallout at a particular location is
measured by the distance from the por-
tion of the cloud nearest to that location
and the speed of the effective wind. The
time of arrival is equal to the distance
from ground zero to the point of interest
minus the radius of the cloud, divided
by the effective wind speed. For the
present purpose the radius of the stabi-
lized cloud as a function of yield may be
obtained from Fig. 2.16. The radius is
affected to some extent by the properties
of the atmosphere, in particular by the
height of the tropopause. The curve in
Fig. 2.16 represents a reasonable aver-
age for mid-latitudes. The radius of the
stabilized cloud is only important in
calculating the time of arrival for loca-
tions relatively close to ground zero and
for large-yield weapons. If the cloud
radius is small in comparison with the
distance from ground zero to the point
of interest, e.g., for low yields or large
distances, the cloud radius may be neg-
lected in calculating fallout arrival
times.
UNIT-TIME REFERENCE DOSE RATE
9.92 The representation of dose rate
and accumulated dose curves, of the
form of Figs. 9.86a and b, for all times
following a nuclear detonation would
obviously be a highly complicated mat-
ter. Fortunately, the situation can be
simplified by utilizing an idealized fall-
out pattern in terms of the unit-time
reference dose rate, mentioned in § 9.16
et seq. By means of the curves given
earlier in the chapter (Figs. 9.16a and b
and Fig. 9.20) it is then possible to
estimate dose rates and total doses from
fallout at any given time for a specified
distance downwind from the burst point.
The calculations are valid only if all the
early fallout has descended at that time.
9.93 The general form of the idea-
lized unit-time reference dose-rate con-
tours for land surface bursts is shown in
Fig. 9.93. The dimensions that define
the various contours are indicated for
the 1-rad per hour contour. In a real
situation all contour lines would be
closed in the upwind direction as shown
for the 1-rad per hour contour. The
scaling relationships, for calculating the
downwind distance, the maximum
width, the ground-zero width of the
idealized unit-time dose-rate contours,
for contact surface bursts (§ 2.127 foot-
note) of W kilotons yield are sum-
marized in Table 9.93. The effective
wind is 15 miles per hour in each case
with wind shear of 15°. The upwind
distance depends on the cloud radius; it
is estimated to be approximately one-
half the ground-zero width, i.e., the
upwind contours may be represented
roughly by semicircles centered at
ground zero. The contour scaling rela-
tionships are dependent upon the nature
of the surface; the values in Table 9.93
are applicable to most surface materials
in the continental United States (cf.
§ 9.63).
428
RESIDUAL NUCLEAR RADIATION AND FALLOUT
TIME
(LINEAR SCALE)
a
Qualitative representation of dose rate and accumulated dose from fallout as a
function of time after explosion at a point not far downwind from ground
zero.
Figure 9.90a.
Figure 9.90b. Qualitative representation of dose rate and accumulated dose from fallout as
a function of time after explosion at a point far downwind from ground zero.
9.94 Idealized contour shapes and
sizes are a function of the total yield of
the weapon, whereas the dose-rate con-
tour values are determined by the fission
yield. Thus, in order to obtain idealized
fallout patterns for a weapon that does
not derive all of its yield from fission,
the dose-rate values of the contour lines
for a weapon of the same total yield
should be multiplied by the ratio of the
fission yield to the total yield. For ex-
ample, for a weapon having a total yield
of W kilotons with 50 percent of the
energy derived from fission, the contour
dimensions are first determined from
Table 9.93 for a yield of W kilotons.
The unit-time reference dose rates are
then multiplied by 0.5. Except for iso-
lated points in the immediate vicinity of
ground zero, observations indicate that
unit-time reference dose rates greater
than about 5,000 rads/hr are unlikely. In
any event, the locations of such high
reference values will be within the areas
of complete devastation from other ef-
fects.
9.95 The idealized reference dose
rates obtained by the methods described
above apply to doses that would be
received in the open over a completely
smooth surface. Such surfaces provide a
convenient reference for calculations,
but they do not occur to any great extent
in nature. Even the surface roughness in
relatively level terrain will make the
actual values smaller than the idealized
values. A reduction (or terrain shield-
ing) factor of about 0.7 is appropriate
under such circumstances. A reduction
factor of 0.5 to 0.6 would be more
suitable for rough, hilly terrain. Any
shelter would decrease the dose received
from early fallout (§ 9.120).
h--------------------------DOWNWIND DISTANCE FOR I RAD/HR-------------------------------H
Figure 9.93. Illustration of idealized unit-time dose-rate pattern for early fallout from a
surface burst. (The contour dimensions are indicated for a dose rate of 1
rad/hr.)
FALLOUT PREDICTIONS FOR LAND SURFACE BURSTS 429
430
RESIDUAL NUCLEAR RADIATION AND FALLOUT
Table 9.93
SCALING RELATIONSHIPS FOR UNIT-TIME REFERENCE DOSE-RATE CONTOUR?
FOR A CONTACT SURFACE BURST WITH A YIELD OF W KILOTONS AND A 15 MPH
WIND
Reference dose rate (rads/hr) Downwind distance Maximum width Ground zero width
(statute miles) (statute miles) (statute miles)
3,000 0.95 Ц/0 45 0.0076 WO 86 0.026 W°58
1,000 1.8 Ц/0 45 0.036 WO 76 0.060 W°57
300 4.5 W0 45 0.13 W° 66 0.20 WO 4«
100 8.9 WO 45 0.38 Wo 60 0.39 Wo 42
30 16 W0 45 0.76 W0 56 0.53 W0 4!
10 24 W0 45 1.4 WO 5' 0.68 WO 4»
3 30 W0 45 2.2 W0 50 0.89 W0 41
1 40 WO 45 3.3 W« 4S 1.5 W04I
SCALING FOR EFFECTIVE WIND
9.96 The effective wind speed and
direction vary with the heights of the top
and bottom of the stabilized cloud
(§ 9.84). For a weapon of given yield,
these heights will depend upon many
factors, including the density and rela-
tive humidity of the atmosphere and the
altitude of the tropopause. Nevertheless,
within the accuracy of the idealized
unit-time reference dose-rate contours,
approximate values of the cloud heights
may be used. The curves in Fig. 9.96
are based on the same model as was
used in deriving the dose-rate contours
and scaling relationships in § 9.93.
They may be taken to be representative
of the average altitudes to which nuclear
clouds from surface (or low air) bursts
of various yields might be expected to
rise in the mid-latitudes, e.g., over the
United States.
9.97 If there is no directional shear,
then doubling the effective wind speed
would cause the particles of a given size
that originate at a particular location
within the cloud to reach the ground at
twice the distance from ground zero, so
that they are spread over roughly twice
the area. However, particles of many
different sizes will arrive at any given
point on the ground as a result of the
different travel times from different
points of origin in the large nuclear
cloud. Consequently, simple scaling re-
lationships for wind speed are not pos-
sible. Examination of test data and the
results of calculations with computer
codes suggest the following approxi-
mate scaling procedure: for effective
wind speeds of v miles per hour, the
downwind distances derived from Table
9.93 are multiplied by the factor F,
where
p = | -и r ~ 1 ?
60
for effective wind speeds greater than 15
miles per hour, and
p = । + v ~J.5
30
FALLOUT PREDICTIONS FOR LAND SURFACE BURSTS
431
Figure 9.96. Altitudes of the stabilized cloud top and cloud bottom as a function of total
energy yield for surface or low air bursts.
for wind speeds less than 15 miles per
hour. These relations hold reasonably
well for simple wind structures, i.e., for
winds with very little directional shear,
and for effective wind speeds between
about 8 and 45 miles per hour. As de-
fined in § 9.84, effective winds with
speeds greater than 45 miles per hour
are not common, and speeds less than 8
miles per hour generally result from
large changes in directional wind shear
with increasing altitude. The fallout
patterns would then be too complex to
be represented by idealized dose-rate
contours.
9.98 As the downwind distance for
a given unit-time reference dose-rate
contour increases with increasing wind
speed, the maximum width of that con-
tour will decrease somewhat. Con-
versely, a decrease in downwind dis-
tance of a given contour with decreasing
wind speed will be accompanied by an
increase in maximum width of that con-
tour. For an increase in wind speed,
within the limits of the simple wind
structures and wind speeds for which the
idealized contours apply, the changes in
maximum width of a given contour will
be small, and wind scaling may be ig-
432
RESIDUAL NUCLEAR RADIATION AND FALLOUT
nored. This may also be done for the
upwind distances and hence for the
ground-zero widths. An increase in the
wind speed will tend to decrease upwind
distances by causing the particles to drift
toward ground zero as they fall. At the
lower 1-hour reference dose rates, e.g.,
100 rads/hr or less, the upwind distances
will in fact decrease with increasing
wind speed. However, the larger par-
ticles, which are mainly responsible for
the close-in high dose rates, descend
very quickly and the high dose-rate
contours will not be greatly affected by
the wind speed. Consequently, since
simple wind scaling is not possible and
the upwind distances are relatively
short, a conservative approach is to as-
sume that wind speed has no effect on
upwind distances (and ground-zero
widths).
FALLOUT EXAMPLE
Given: A 10-megaton surface burst,
50-percent fission yield, with an effec-
tive wind speed of 30 miles per hour.
Find: The idealized unit-time refer-
ence dose rate, the fallout arrival time,
and the dose accumulated by an exposed
person during the first week following
fallout arrival at points 100, 200, and
300 miles directly downwind from
ground zero.
Solution: Preliminary estimates,
based on Table 9.93, indicate that the
idealized unit-time reference dose rates
are in the range of 300 to 3,000 rads/hr.
For a total yield of 10 MT, i.e., W =
104 KT, and an effective wind of 30 mph
(F = 1.25 from § 9.97), the following
downwind distances are obtained from
Table 9.93.
Dose rate 3,000 1,000 300 rads/hr
Distance 75 142 355 miles.
Interpolation indicates that the unit-time
reference dose rates are 1,800 rads/hr at
100 miles, 620 rads/hr at 200 miles, and
360 rads/hr at 300 miles. (The best
method of interpolation is to plot the
known points on logarithmic paper and
to read the desired values from a smooth
curve connecting the points.) The cor-
responding idealized reference dose
rates for 50 percent fission yield would
then be 900, 310, and 180 rads/hr at
100, 200, and 300 miles, respectively.
Answer.
From Fig. 2.16, the cloud radius for a
10 MT explosion is about 21 miles; this
should be subtracted from the distances
from ground zero in order to determine
the fallout arrival (or entry) times. For a
30-mph wind, these are (100—21 )/30 =
2.6 hours at 100 miles, (200-21)/30 = 6
hours at 200 miles, and (300-21)/30 =
9.3 hours at 300 miles. Answer
Within the accuracy of the idealized
unit-time dose-rate contours, the entry
times for Fig. 9.26 may be rounded off
FALLOUT PREDICTIONS FOR LAND SURFACE BURSTS
433
to 3, 6, and 10 hours, respectively. The
multiplying factors for an exposure 1
week after arrival of the fallout are then
found to be about 2.3 at 100 miles, 1.6
at 200 miles, and 1.4 at 300 miles. The
approximate total accumulated doses at
the required distances would then be as
follows:
Distance (miles) Dose (rads)
100 900x2.3 - 2,070
200 310x1.6 = 496
300 180x1.4 = 252
Answer
These doses would be reduced by the
appropriate surface roughness (or terrain
shielding) factor (§ 9.95).
LIMITATIONS OF IDEALIZED
CONTOURS
9.99 Both the idealized 15-mile per
hour pattern dimensions and the wind
scaling procedure tend to maximize the
downwind extent of the dose-rate con-
tours since they involve the postulate
that there is little wind shear. This is not
an unreasonable assumption for the
continental United States, since the
wind shear is generally small at altitudes
of interest from the standpoint of fall-
out. If there is a greater wind shear,
e.g., 20° or more between the top and
bottom of the mushroom head, the fall-
out pattern would be wider and shorter
than that based on Table 9.93. The ac-
tual unit-time reference dose rate at a
specified downwind distance from
ground zero for a given effective wind
speed would then be smaller than pre-
dicted. The crosswind values at certain
distances would, however, be in-
creased. In some cases of extreme shear
the pattern will extend from ground zero
in two or more directions. In these
cases, it is impossible to define a down-
wind direction, and idealized contours
are of little value in describing the shape
of the pattern (cf. Fig. 9.77b).
9.100 In order to emphasize the
limitations of the idealized fallout pat-
terns, Figs. 9.100a and b are presented
here. The former shows the idealized
unit-time reference dose-rate contours
for a 10-megaton, 50-percent fission
surface burst and an effective wind
speed of 30 miles per hour. In Fig.
9.100b an attempt is made to indicate
what the actual situation might be like as
a result of variations in local meteoro-
logical and surface conditions. Near
ground zero the wind is from the south-
west but the mean wind gradually
changes to a westerly and then a north-
westerly direction over a distance of a
few hundred miles. These changes in
the mean wind are reflected in Fig.
9.100b, but, since the idealized pattern
is based on a single effective wind, the
changes in the mean wind do not affect
Fig. 9.100a. The total contamination of
the area is about the same in both cases,
but the details of the distribution, e.g.,
the occurrence of hot spots, which are
shown shaded in Fig. 9.100b, is quite
434
RESIDUAL NUCLEAR RADIATION AND FALLOUT
Figure 9.100a. Idealized unit-time reference dose-rate contours for a 10-megaton, 50-per-
cent fission, surface burst (30 mph effective wind speed).
Figure 9.100b. Corresponding actual dose-rate contours (hypothetical).
FALLOUT PREDICTIONS FOR LAND SURFACE BURSTS
435
different. The pattern in Fig. 9.100b is
hypothetical and not based on actual
observations; its purpose is to call at-
tention to the defects of the idealized
fallout pattern. But since the factors
causing deviations from the ideal vary
from place to place and even from day
to day, it is impossible to know them in
advance. Consequently, the best that
can be done here is to give an idealized
pattern and show how it may be used to
provide an overall picture of the con-
tamination while, at the same time, in-
dicating that in an actual situation there
may be marked differences in the details
of the distribution.
FACTORS AFFECTING FALLOUT
PATTERNS
9.101 It must be emphasized that
the procedures described above for de-
veloping idealized fallout patterns are
intended only for overall planning.
There are several factors which will af-
fect the details of the distribution of the
early fallout and also the rate of de-
crease of the radioactivity. Near ground
zero, activity induced by neutrons in the
soil may be significant, apart from that
due to the fallout. However, the extent
of the induced activity is very variable
and difficult to estimate (§ 9.49). The
existence of unpredictable hot spots will
also affect the local radiation intensity.
Furthermore, precipitation scavenging
will have an important effect on the
fallout pattern (§ 9.67 et seq.). The data
presented in the preceding paragraphs
are applicable to very smooth surfaces
of large size. As mentioned in § 9.95,
even ground roughness in what would
normally be considered flat countryside
might reduce the dose rates to about 70
percent of those predicted for a smooth
surface. In a city, buildings, trees, etc.,
will reduce the average intensity still
further.
9.102 The rate of decay of the early
fallout radioactivity, and hence the total
dose accumulated over a period of time,
will be affected by weathering. Wind
may transfer the fallout from one loca-
tion to another, thus causing local vari-
ations. Rain, after the fallout has de-
scended, may wash the particles into the
soil and this will tend to decrease the
dose rate observed above the ground.
The extent of the decrease will, of
course, depend on the climatic and sur-
face conditions. In temperate regions in
the absence of rain, the weathering ef-
fect will probably be small during the
first month after the explosion, but over
a period of years the fallout dose rate
would decrease to about half that which
would otherwise be expected.
9.103 In attempting to predict the
time that must elapse, after a nuclear
explosion, for the radiation dose rate to
decrease to a level that will permit re-
entry of a city or the resumption of
agricultural operations, use may be
made of the (continuous) decay curves
in Figs. 9.16a and b or of equivalent
data. It is inadvisable, however, to de-
pend entirely on these estimates because
of the uncertainties mentioned above.
Moreover, even if the decay curve could
be relied upon completely, which is by
no means certain, the actual composi-
tion of the fallout is known to vary with
distance from ground zero (§ 9.08) and
the decay rate will vary accordingly. At
3 months after a nuclear explosion, the
dose rate will have fallen to about 0.01
percent, i.e., one ten-thousandth part,
of its value at 1 hour, so that almost any
436
RESIDUAL NUCLEAR RADIATION AND FALLOUT
contaminated area will be safe enough
to enter for the purposes of taking a
measurement with a dose-rate meter,
provided there has been no additional
contamination in the interim.
THE HIGH-YIELD EXPLOSION OF
MARCH 1, 1954
9.104 The foregoing discussion of
the distribution of the early fallout may
be supplemented by a description of the
observations made of the contamination
of the Marshall Islands area following
the high-yield test explosion (BRAVO)
at Bikini Atoll on March 1, 1954. The
total yield of this explosion was ap-
proximately 15-megatons TNT equiva-
lent. The device was detonated about 7
feet above the surface of a coral reef and
the resulting fallout, consisting of ra-
dioactive particles ranging from about
one-thousandth to one-fiftieth of an inch
in diameter, contaminated an elongated
area extending over 330 (statute) miles
downwind and varying in width up to
over 60 miles. In addition, there was a
severely contaminated region upwind
extending some 20 miles from the point
of detonation. A total area of over 7,000
square miles was contaminated to such
an extent that avoidance of death or
radiation injury would have depended
upon evacuation of the area or taking
protective measures.
9.105 The available data, for the
estimated total doses accumulated at
various locations by 96 hours after the
BRAVO explosion, are shown by the
points in Fig. 9.105. Through these
points there have been drawn a series of
contour lines which appear to be in
moderately good agreement with the
data. However, other patterns are pos-
sible; one, for example, ascribes the
large radiation doses on the northern
islands of Rongelap Atoll to a hot spot
and brings the 3,000-rad contour line in
much closer to Bikini Atoll. Because of
the absence of observations from large
areas of ocean, the choice of the fallout
pattern, such as the one in Fig. 9.105, is
largely a matter of guesswork. Never-
theless, one fact is certain: there was
appreciable radioactive contamination at
distances downwind of 300 miles or
more from the explosion.
9.106 The doses to which the con-
tours in Fig. 9.105 refer were calculated
from instrument records. They represent
the maximum possible exposures that
would be received only by individuals
who remained in the open, with no pro-
tection against the radiation, for the
whole time. Any kind of shelter, e.g.,
within a building, or evacuation of the
area would have reduced the dose re-
ceived. On the other hand, persons re-
maining in the area for a period longer
than 96 hours after the explosion would
have received larger doses of the resid-
ual radiation.
9.107 A radiation dose of 700 rads
over a period of 96 hours would proba-
bly prove fatal in the great majority of
cases. It would appear, therefore, that
following the test explosion of March 1,
1954, there was sufficient radioactivity
from the fallout in a downwind belt
about 170 miles long and up to 35 miles
wide to have seriously threatened the
lives of nearly all persons who remained
in the area for at least 96 hours follow-
ing the detonation without taking pro-
tective measures of any kind. At dis-
tances of 300 miles or more downwind,
the number of deaths due to short-term
radiation effects would have been negli-
EFFECTIVE ARRIVAL TIME (HOURS)
О
r
6 7
1----------Г
8 9 IO II 12 13 14 15 16 17 18 19 20
1-------1------1------1-----1----1-----1----1----1—•I----1----1--•
300 320 340
BIKAR 06|
ATOLL
UTIRIK
ATOLL
fr - —»
DISTANCE FROM GROUND ZERO (MILES)
Figure 9.105. Estimated total (accumulated) dose contours in rads at 96 hours after the
BRAVO test explosion.
438
RESIDUAL NUCLEAR RADIATION AND FALLOUT
gible, although there would probably
have been many cases of sickness re-
sulting in temporary incapacity.
9.108 The period of 96 hours after
the explosion, for which Fig. 9.105
gives the accumulated radiation doses,
was chosen somewhat arbitrarily. It
should be understood, however, as has
been frequently stated earlier in this
chapter, that the radiations from the
fallout will continue to be emitted for a
long time, although at a gradually de-
creasing rate. The persistence of the
external gamma radiation may be illus-
trated in connection with the BRAVO
test by considering the situation at two
different locations in Rongelap Atoll.
Fallout began about 4 to 6 hours after
the explosion and continued for several
hours at both places.
9.109 The northwestern tip of the
atoll, 100 miles from the point of deto-
nation, received 3,300 rads during the
first 96 hours after the fallout started.
This was the heaviest fallout recorded at
the same distance from the explosion
and may possibly have represented a hot
spot, as mentioned above. About 25
miles south, and 115 miles from ground
zero, the dose over the same period was
only 220 rads. The inhabitants of Ron-
gelap Atoll were in this area, and were
exposed to radiation dosages up to 175
rads before they were evacuated some
44 hours after the fallout began
(§§12.124, 12.156). The maximum
theoretical exposures in these two areas
of the atoll for various time intervals
after the explosion, calculated from the
decay curves given earlier in this
chapter, are recorded in Table 9.109.
9.110 It must be emphasized that
the calculated values in Table 9.109
represent the maximum doses at the
given locations, since they are based on
the assumption that exposed persons re-
main out-of-doors for 24 hours each day
and that no measures are taken to re-
move radioactive contamination. Fur-
thermore, no allowance is made for
weathering or the possible dispersal of
the particles by winds. For example, the
dose rates measured on parts of the
Marshall Islands on the 25th day fol-
lowing the explosion were found to be
about 40 percent of the expected values.
Rains were known to have occurred
during the second week, and these were
probably responsible for the major de-
crease in the contamination.
Table 9.109
CALCULATED RADIATION DOSES AT TWO LOCATIONS IN RONGELAP ATOLL
FROM FALLOUT FOLLOWING THE MARCH 1, 1954 TEST AT BIKINI
Exposure period after the explosion
First 96 hours ..................
96 hours to 1 week ..............
1 week to 1 month ..............
1 month to 1 year...............
Total to 1 year
year to infinity . .
Accumulated dose in this period
(rads)
Inhabited Uninhabited
location location
220 3,300
35 530
75 1,080
75 1,100
405 6,010
About 8 About 115
ATTENUATION OF RESIDUAL NUCLEAR RADIATION
439
9.111 In concluding this section, it
may be noted that the 96-hour dose
contours shown in Fig. 9.105, repre-
senting the fallout pattern in the vicinity
of Bikini Atoll after the high-yield ex-
plosion of March 1, 1954, as well as the
idealized unit-time reference dose-rate
contours from Table 9.93, can be re-
garded as more-or-less typical, so that
they may be used for planning purposes.
Nevertheless, it should be realized that
they cannot be taken as an absolute
guide. The particular situation which
developed in the Marshall Islands was
the result of a combination of circum-
stances involving the energy yield of the
explosion, the very low burst height
(§9.104), the nature of the surface
below the point of burst, the wind sys-
tem over a large area and to a great
height, and other meteorological condi-
tions. A change in any one of these
factors could have affected considerably
the details of the fallout pattern.
9.112 In other words, it should be
understood that the fallout situation de-
scribed above is one that can happen,
but is not necessarily one that will hap-
pen, following the surface burst of a
high fission-yield weapon. The general
direction in which the fallout will move
can be estimated fairly well if the wind
pattern is known. But the total and fis-
sion yields of the explosion and the
height of burst, in the event of a nuclear
attack, are unpredictable. Conse-
quently, it is impossible to determine in
advance how far the seriously contami-
nated area will extend, although the
time at which the fallout will commence
at any point could be calculated if the
effective wind speed and direction were
known.
9.113 In spite of the uncertainties
concerning the exact fallout pattern,
there are highly important conclusions
to be drawn from the results described
above. One is that the residual nuclear
radiation from a surface burst can, under
some conditions, represent a serious
hazard at great distances from the ex-
plosion, well beyond the range of blast,
shock, thermal radiation, and the initial
nuclear radiation. Another is that plans
can be made to minimize the hazard, but
such plans must be flexible, so that they
can be adapted to the particular situation
which develops after the attack.
ATTENUATION OF RESIDUAL NUCLEAR RADIATION
ALPHA AND BETA PARTICLES
9.114 In their passage through mat-
ter, alpha particles produce considerable
direct ionization and thereby rapidly
lose their energy. After traveling a cer-
tain distance, called the “range,” an
alpha particles ceases to exist as such.8
The range of an alpha particle depends
upon its initial energy, but even those
from plutonium, which have a modera-
tely high energy, have an average range
of only just over U/2 inches in air. In
more dense media, such as water or
body tissue, the range is less, being
about one-thousandth part of the range
K An alpha particle is identical with a nucleus of the element helium (§ 1.65). When it has lost most of
its (kinetic) energy, it captures two electrons and becomes a harmless (neutral) helium atom.
440
RESIDUAL NUCLEAR RADIATION AND FALLOUT
in air. Consequently, alpha particles
from radioactive sources cannot pene-
trate even the outer layer of the unbro-
ken skin (epidermis). It is seen, there-
fore, that as far as alpha particles arising
from sources outside the body are con-
cerned, attenuation is no problem.
9.115 Beta particles, like alpha
particles, are able to cause direct ion-
ization in their passage through matter.
But the beta particles dissipate their en-
ergy less rapidly and so have a greater
range in air and in other materials.
Many of the beta particles emitted by
the fission products traverse a total dis-
tance of 10 feet (or more) in the air
before they are absorbed. However, be-
cause the particles are continually de-
flected by electrons and nuclei of the
medium, they follow a tortuous path,
and so their effective (or net) range is
somewhat less.
9.116 The range of a beta particle is
shorter in more dense media, and the
average net distance a particle of given
energy can travel in water, wood, or
body tissue is roughly one-thousandth of
that in air. Persons in the interior of a
house would thus be protected from beta
radiation arising from fission products
on the outside. It appears that even
moderate clothing provides substantial
attenuation of beta radiation, the exact
amount varying, for example, with the
weight and number of layers. Only beta
radiation from material ingested or in
contact with the body poses a hazard.
GAMMA RADIATION
9.117 The residual gamma radia-
tions present a different situation. These
gamma rays, like those which form part
of the initial nuclear radiation, can pen-
etrate considerable distances through air
and into the body. Shielding will be
required in most fallout situations to
reduce the radiation dose to an accept-
able level. Incidentally, any method
used to decrease the gamma radiation
will also result in a much greater atten-
uation of both alpha and beta particles.
9.118 The absorption (or attenua-
tion) by shielding materials of 4he re-
sidual gamma radiation from fission
products and from radioisotopes pro-
duced by neutron capture, e.g., in so-
dium, manganese, and in the weapon
residues, is based upon exactly the same
principles as were described in Chapter
VIII in connection with the initial
gamma radiation. Except for the earliest
stages of decay, however, the gamma
rays from fallout have much less en-
ergy, on the average, than do those
emitted in the first minute after a nuclear
explosion. This means that the residual
gamma rays are more easily attenuated;
in other words, compared with the ini-
tial gamma radiation, a smaller thick-
ness of a given material will produce the
same degree of attenuation.
9.119 Calculation of the attenuation
of the gamma radiation from fallout is
different and in some ways more com-
plicated than for the initial radiations.
The latter come from the explosion
point, but the residual radiations arise
from fallout particles that are widely
distributed on the ground, on roofs,
trees, etc. The complication stems from
the fact that the effectiveness of a given
thickness of material is influenced by the
fallout distribution (or geometry) and
hence depends on the degree of con-
tamination and its location relative to
the position where protection is desired.
Estimates of the attenuation of residual
ATTENUATION OF RESIDUAL NUCLEAR RADIATION
441
radiation in various structures have been
made, based partly on calculations and
partly on measurements with simulated
fallout.
9.120 Some of the results of these
estimates are given in Table 9.120 in
terms of a dose-transmission factor
(§ 8.72). Ranges of values are given in
view of the uncertainties in the estimates
themselves and the variations in the de-
gree of shielding that may be obtained at
different locations within a structure.
(Shielding data for the same structures
for initial nuclear radiation are given in
Table 8.72.) All of the structures are
assumed to be isolated, so that possible
effects of adjacent buildings have been
neglected. For vehicles, such as auto-
mobiles, buses, trucks, etc., the trans-
mission factor is about 0.5 to 0.7.
Rough estimates can thus be made of the
shielding from fallout radiation that
might be expected in various situations.
Depending upon his location, a person
in the open in a built-up city area would
receive from about 20 to 70 percent of
the dose that would be delivered by the
same quantity of fallout in the absence
of the buildings. An individual standing
against a building in the middle of a
block would receive a much smaller
dose than one standing at the intersec-
tion of two streets. In contaminated ag-
ricultural areas, the gamma-ray dose
above the surface can be reduced by
turning over the soil so as to bury the
fallout particles.
Table 9.120
FALLOUT GAMMA-RAY DOSE TRANSMISSION FACTORS FOR VARIOUS
STRUCTURES
Dose transmission
Structure factor
Three feet underground
Frame house
Basement
Multistory building
(apartment type):
Upper stories
Lower stories
Concrete blockhouse
shelter:
9-in. walls
12-in. walls
24-in. walls
Shelter, partly
above grade:
With 2 ft earth cover
With 3 ft earth cover
0.0002
0.3-0.6
0.05-0.1
0.01
0.1
0.007-0.09
0.001-0.03
0.0001-0.002
0.005-0.02
0.001-0.005
442
RESIDUAL NUCLEAR RADIATION AND FALLOUT
DELAYED FALLOUT
INTRODUCTION
9.121 There is, of course, no sharp
change at 24 hours after a nuclear ex-
plosion when, according to the arbitrary
definition (§ 9.03), the early fallout
ends and the delayed fallout com-
mences. Nevertheless, there is an im-
portant difference between the two types
of fallout. The principal early fallout
hazard is from exposure to gamma rays
from sources outside the body, although
there is also a possibility of some inter-
nal exposure (§9.16). A secondary
hazard would arise from beta particles
emitted by fallout in contact with the
skin. The delayed fallout, on the other
hand, is almost exclusively a potential
internal hazard that would be due to the
ingestion of iodine, strontium, and ce-
sium isotopes present in food, especially
milk. Both early and delayed fallout can
have long-term genetic effects, but they
are probably of less significance than
other expected consequences. These and
related biological aspects of fallout are
discussed in Chapter XII.
9.122 Essentially all of the residues
from an air burst contribute to the de-
layed fallout, for in an explosion of this
type there is very little early (or local)
fallout. For land surface bursts, about
40 percent of the radioactivity of the
weapons residues remains in the atmos-
phere after the early fallout and for
water surface bursts the proportion has
been estimated to be roughly 70 percent
(§ 9.59). The time required for the
debris particles to descend to earth and
the distance they will have traveled
during this time depend on the size of
the particles and the altitude to which
they have ascended in the nuclear cloud.
The very fine particles, e.g., those with
radii of a few micrometers or less, fall
extremely slowly. Consequently, they
may remain suspended in the atmos-
phere for a considerable time and may
be carried over great distances by the
wind. Ultimately, however, the parti-
cles are brought to the ground, primarily
by precipitation scavenging (§ 9.67 et
seq.), and the resulting delayed fallout
will be spread over large areas of the
earth’s surface.
9.123 Much (if not all) of the debris
from low air and surface bursts with
yields less than about 100 kilotons does
not rise above 30,000 feet or so (Fig.
9.96) and it soon becomes accessible to
removal by precipitation. Should this
occur within the first few weeks after the
explosion, as it often will, the fallout
will still contain appreciable amounts of
radioisotopes with fairly short half-
lives, as well as those with long half-
lives. The main potential hazard then
arises from the ingestion of iodine-131,
which has a half-life of 8 days; like all
isotopes of iodine, when it enters the
body this isotope tends to become con-
centrated in the thyroid gland (§ 12.169
et seq.). Iodine-131 has been detected in
rainfall and in milk from cows which
have eaten contaminated forage at dis-
tances several thousand miles from but
in the same hemisphere as the burst
point. With increasing yield, a smaller
proportion of the weapon debris remains
in the atmosphere below 30,000 to
40,000 feet, from which it can be re-
moved fairly rapidly; but this may be
sufficient to produce significant deposi-
tion of iodine-131 on the ground, espe-
DELAYED FALLOUT
443
cially if the total fission yield is large.
9.124 For explosions of moderately
high and high yields, most of the radio-
active residues enter the stratosphere
from which removal occurs slowly. The
small particles in the stratosphere are
effectively held in storage for a few
months up to a few years, as will be
seen shortly (§ 9.135 et seq.). During
this time, the radioisotopes of short and
moderate half-life will have decayed al-
most complely. Radioactive species
with intermediate half-lives, from about
a month to a year, have been detected on
the ground within a few months after a
nuclear test series. But the major bio-
logical hazard of the delayed fallout is
from the long-lived isotopes strontium-
90 (half-life 27.7 years) and cesium-137
(half-life 30.0 years) which might enter
the body in food over a period of years.
Strontium-90 can accumulate in the
bone from which it is removed slowly
by radioactive decay and by natural
elimination processes; it can thus repre-
sent a prolonged internal hazard
(§ 12.188 et seq.). Not only do these
isotopes of strontium and cesium decay
slowly, they constitute relatively large
fractions of the fission products; thus,
for every 1,000 atoms undergoing fis-
sion there are eventually formed from
30 to 40 atoms of strontium-90 and from
50 to 60 of cesium-137. Moreover, both
of these isotopes have gaseous precur-
sors (or ancestors), so that as a result of
fractionation (§ 9.08) their proportions
in the delayed fallout will tend to be
greater, at least for surface bursts, than
in the fission products as a whole.
9.125 The ultimate distribution of
the delayed fallout over the earth’s sur-
face is not affected by the particular
wind conditions at the time of the deto-
nation nearly as much as that of the
early fallout. What is more important is
the manner in which the contaminated
particles enter the upper atmosphere. In
order to understand the situation, it is
necessary to review some of the charac-
teristic features of the atmosphere.
STRUCTURE OF THE ATMOSPHERE
9.126 One of the most significant
aspects of the atmosphere is the varia-
tion in temperature at different altitudes
and its dependence on latitude and time.
In ascending into the lower atmosphere
from the surface of the earth, the tem-
perature of the air falls steadily, in gen-
eral, toward a minimum value. This
region of falling temperature is called
the “troposphere” and its top, where
the temperature ceases to decrease, is
known as the “tropopause.” Above the
troposphere is the “stratosphere,”
where the temperature remains more or
less constant with increasing altitude in
the temperate and polar zones. Although
all the atmosphere immediately over the
tropopause is commonly referred to as
the stratosphere, there are areas in
which the structure varies (Fig. 9.126).
In the equatorial regions, the tempera-
ture in the stratosphere increases with
height. This inversion also occurs at the
higher altitudes in the temperate and
polar regions. In the “mesosphere” the
temperature falls off again with increas-
ing height. At still higher altitudes is the
“thermosphere” where the temperature
rises rapidly with height.
9.127 Most of the visible phenom-
ena associated with weather occur in the
troposphere. The high moisture content,
the relatively high temperature at the
earth’s surface, and the convective
444
RESIDUAL NUCLEAR RADIATION AND FALLOUT
Figure 9.126. Structure of the atmosphere during July and August.
movement (or instability) of the air
arising from temperature differences
promote the formation of clouds and
rainfall. In the temperate latitudes, at
about 45° in the summer and 30° in the
winter, where the cold polar air meets
the warm air of the tropics, there are
formed meandering, wavelike bands of
storm fronts called “polar fronts” (Fig.
9.126) . In these regions, the average
rainfall is high.
9.128 The tropopause, that is the
top of the troposphere, is lower in the
polar and temperate zones than in the
tropics; its height in the former regions
varies from 25,000 to 45,000 feet, de-
pending on latitude, time of year, and
particular conditions of the day. In gen-
DELAYED FALLOUT
eral, the altitude is lowest in the polar
regions. The tropopause may disappear
entirely at times in the polar winter
night. In the tropics, the tropopause
usually occurs near 55,000 feet at all
seasons. It is more sharply defined than
in the temperate and polar regions be-
cause m the tropics the temperature in-
creases with height above the tropo-
pause instead of remaining constant.
There is a marked gap or discontinuity
in the tropopause in each temperate
zone, as may be seen in Fig. 9.126, that
constitutes a region of unusual turbu-
lence. Each gap moves north and south
seasonally, following the sun, and is
usually located near a polar front. It is
believed that considerable interchange
of air between the stratosphere and tro-
posphere takes place at the gaps. A jet
stream, forming a river of air moving
with high speed and circulating about
the earth, is located at the tropical edge
of the polar tropopause in each hemi-
sphere .
9.129 Because of its temperature
structure, there is very little convective
motion in the stratosphere, and the air is
exceptionally stable. This is especially
noticeable in the tropics where thever-
tical movement of the radioactive cloud
from a nuclear explosion has sometimes
been less than 2 miles in three trips
around the globe, i.e., approximately
70,000 miles. This stability continues
up to the mesosphere were marked tur-
bulence is again noted. The polar
stratosphere is less stable than that in the
tropics, particularly during the polar
winter night when the stratospheric
temperature structure changes to such an
extent that the inversion may disappear.
When this occurs there may be consid-
445
erable convective mixing of the air to
great heights.
ATMOSPHERIC PATHS OF DELAYED
FALLOUT: TROPOSPHERIC
FALLOUT
9.130 The fallout pattern of the
very small particles in the radioactive
cloud Avhich remain-suspended in The
atmosphere depends upon whether they
were initially stabilized in'the-' tropos-
phere or in the stratosphere. The dis-
tribution of the radioactive material be-
tween the troposphere and the
stratosphere is determined by many fac-
tors, including the total energy yield of
the explosion, the height of burst, The
environment of the detonation, and the
height of the tropopause.' Additional
complications arise from scavenging by
dirt and precipitation and from fraction-
ation in surface bursts.” Scavenging will
tend to decrease the proportion of ra-
dioactive debris remaining in the cloud
while increasing that in the early fallout,
whereas fractionation will result in a
relative increase in the amounts of
strontium-90 and cesium-137 that re-
main suspended. Consequently, it is not
yet possible to predict the quantitative
distribution between troposphere and
stratosphere, although certain qualita-
tive conclusions can be'drawn?
9.131 In general, a larger propor-
tion of the weapon debris wilt go into
the stratosphere in an air burst than in a
surface burst under the same conditions;
for one thing, there is essentially no
local or early fallout in the former case
and, for another, surface material1 taken
up into the cloud Tends to depress The
height attained in the latter case.' In the
temperate and polar regions,тпоге of the
radioactive debris enters the Strato-
446
RESIDUAL NUCLEAR RADIATION AND FALLOUT
sphere from an air burst than for an
equivalent burst in the tropics. The rea-
son is that the tropopause is lower and
the stratosphere is less stable in the
nontropic regions. For low-yield explo-
sions, most of the radioactive material
remains in the troposphere, with little
entering the stratosphere. But since the
altitude to which the cloud rises in-
creases with the explosion energy yield,
the proportion of debris passing into the
stratosphere will increase correspond-
ingly.
9.132 The small particles remaining
in the troposphere descend to earth
gradually over a period of time up to
several months; this constitutes the
“tropospheric fallout.’’ The most im-
portant mechanism for causing this fall-
out appears to be the scavenging effect
of rain and snow. The fine particles may
be incorporated into the water droplets
(or snow crystals) as they are formed
and are thus brought down in the pre-
cipitation. Except for unusually dry or
wet regions, the amount of delayed
fallout deposited in adjacent areas is
closely related to the amount of precipi-
tation in those areas during the fallout
period. Dry fallout has been recorded,
but it probably represents a minor pro-
portion of the tropospheric fallout in
most instances.
9.133 The rate of removal of mate-
rial from the troposphere at any time is
roughly proportional to the amount still
present at that time; consequently, the
“half-residence time” concept is use-
ful. It is defined as the period of time
required at a given location for the re-
moval of half the suspended material. If
the cloud particles originally reached the
upper part of the troposphere, the half-
residence time for tropospheric fallout is
about 30 days. During the course of its
residence in the atmosphere, the tropos-
pheric debris is carried around the earth,
by generally westerly winds, in perhaps
a month’s time. The bulk of the fallout
on the average is then confined to a
relatively narrow belt that spreads to a
width of about 30° of latitude.
9.134 Since uniform winds and
rainfall are not very probable, the tro-
pospheric fallout patterns, like those of
the early fallout, will vary and probably
will be quite irregular. In view of the
strong dependence of tropospheric fall-
out distribution on the weather, and in
particular on precipitation, it is not
practical to provide an idealized repre-
sentation of the possible distribution.
STRATOSPHERIC FALLOUT
9.135 The radioactive debris that
enters the stratosphere descends much
more slowly than does the tropospheric
fallout. This is mainly due to the fact
that vertical motions in the stratosphere
are slow, as stated above, and little
moisture is available to scavenge the
particles. It appears that almost the only
way for the removal of the radioactivity
from the stratosphere is for the air
masses carrying the particles to move
first into the troposphere, where the
particles can be brought down by pre-
cipitation. There are at least three ways
in which this transfer of air from the
stratosphere to the troposphere can
occur, they are (1) direct downward
movement across the tropopause, (2)
upward movement of the tropopause or
its reformation at a higher altitude, and
(3) turbulent, large-scale meandering
horizontal circulation through the tro-
popause gaps. The relative importance
DELAYED FALLOUT
447
of these mechanisms depends upon the
altitude, latitude, and time of year at
which the injection into the stratosphere
takes place. The first method may be
important during the arctic winter and
the second in the lower polar strato-
sphere in the early spring. The third
mechanism is particularly applicable to
material in the lower stratosphere near
the gaps. Very little debris crosses the
tropopause in equatorial regions.
9.136 The relatively complicated
structure of the stratosphere and the
varied modes by which contaminated
particles may leave it, make it impossi-
ble to assign a single half-residence time
for all stratospheric debris. However,
semiempirical models have been devel-
oped that permit the calculation of stra-
tospheric inventories, concentrations in
air near the surface, and deposition of
debris injected into the stratosphere,
mesosphere, or higher levels. The
model used here has successfully pre-
dicted the fallout from several specific
injections of radioisotopes from atmos-
pheric nuclear tests conducted since
1961. It also predicted the fate of the
substantial amount of plutonium-238
released in the burnup of the SNAP-9A
generator in a satellite launch-vehicle
failure in 1964.
9.137 The model divides the strato-
sphere of each of earth’s (north and
south) hemispheres into two compart-
ments: the region above 70,000 feet and
that below 70,000 feet. For an injection
of radioactive debris at an initial altitude
above 70,000 feet, rapid transfer be-
tween the hemispheres is assumed to
take place, based on what is known of
air circulation in the upper atmosphere.
The debris will begin to arrive below
70,000 feet during the winter or spring
season in each hemisphere after a delay
of about one year from the time of
injection. If the injection occurs in the
stratosphere below 70,000 feet, the
major influx of debris into the tropos-
phere will begin during the first winter
or spring season following the injection.
At this lower altitude in the strato-
sphere, transfer between the hemi-
spheres takes place at a much slower
rate. Most of the radioactive debris
tends initially to become a narrow band
girdling the globe more or less at the
latitude of injection, since the winds in
the stratosphere below 70,000 feet are
predominantly unidirectional, i.e., ei-
ther easterly or westerly, depending on
the place and the time. The band soon
spreads out as a result of diffusion and in
the winter and spring there is a poleward
and downward transfer of the debris.
9.138 In the lower stratosphere,
below 70,000 feet, the half-residence
time for transfer between hemispheres is
roughly 60 months, whereas the half-
residence time for transfer to the tro-
posphere is about 10 months. Since the
half-residence time in the troposphere is
only a month (§ 9.133), it is apparent
that weapon residues entering the lower
stratosphere in a particular hemisphere
will tend to fall out in that hemisphere.
Most nuclear tests have been conducted
in the Northern Hemisphere and most of
the debris injected into the stratosphere
did not reach altitudes above 70,000
feet. Consequently, the amount of de-
layed fallout on the ground in this
hemisphere is considerably greater than
in the Southern Hemisphere. On the
other hand, in the upper stratosphere,
above 70,000 feet, the transfer between
hemispheres is much more rapid than in
the lower region and entry into the tro-
RESIDUAL NUCLEAR RADIATION AND FALLOUT
448
posphere is delayed. Hence, in the few
injections that have occurred above
70,000 feet there has been a more even
distribution of the fallout between the
hemispheres.
9.139 Regardless of where it is in-
jected, the major portion of the stratos-
pheric fallout will reach the earth in the
temperate latitudes. This is mainly due
to high-rainfall regions near the polar
fronts (§9.127). Since the half-resi-
dence time in the troposphere is so
short, air coming down through the tro-
popause gap or on its poleward side and
moving toward the equator will be de-
pleted of its contaminated particles by
scavenging before it can reach the trop-
ics. Consequently, stratospheric fallout
in the equatorial zone is low in spite of
the heavy rainfall.
DELAYED FALLOUT FROM NUCLEAR
WEAPONS TESTS
9.140 For making estimates of de-
layed fallout, it is the general practice to
determine the amount of strontium-90,
for several reasons. It has a long half-
life compared with the residence time in
the stratosphere, so that it does not
decay to any great extent prior to its
deposition on the earth; it is produced in
relatively large quantities in fission, and
it is fairly easy to identify and measure
by standard radiochemical techniques.
Furthermore, the concentration of
strontium-90 is of special interest be-
cause it provides a measure of the haz-
ard from delayed fallout.
9.141 The activity of strontium-90,
as of radioactive materials in general, is
conveniently expressed in terms of a
unit called the “curie.” It is defined as
the activity (or quantity) of any radio-
active substance undergoing 3.7 x 10¹⁰
disintegrations per second. (This partic-
ular rate was chosen because it is close
to the rate of disintegration of 1 gram of
radium.) Where large amounts of active
material are involved, the “megacurie”
unit is employed; this is equal to 1
million curies and corresponds to disin-
tegrations at the rate of 3.7 x IO’6 per
second. A megacurie of strontium-90 is
that quantity of this isotope which emits
3.7 x IO16 beta particles per second.9
9.142 Since 1954, a number of
sampling networks have been estab-
lished in various parts of the world to
determine the amounts of radioactive
contamination in tropospheric and stra-
tospheric air and in rainwater and soil,
arising from weapons tests. The results
obtained have shed a great deal of light
on the possible mechanisms of the de-
layed fallout. The information so ob-
tained, coupled with biological studies
to determine the concentrations of cer-
tain radioisotopes in the diet and in
human beings and animals, has permit-
ted an evaluation to be made of the
possible worldwide hazard (see Chapter
XII).
9.143 The plots in Figs. 9.143a and
b show the variations over a period of
years of the megacuries of strontium-90
present in the total stratospheric inven-
tory, i.e., the activity still remaining in
the stratosphere at various times, and
the ground inventory, i.e., the activity
deposited on the ground. The extensive
atmospheric nuclear test programs con-
ducted by the U.S. and the U.S.S.R.
during 1961 and 1962 are reflected by
One megaton of fission yield produces about 0.11 megacurie of strontium-90.
DELAYED FALLOUT
449
Figure 9.143a. Stratospheric burden (or inventory) of strontium-90.
YEAR
Figure 9.143b. Surface burden (or inventory) of strontium-90.
RESIDUAL NUCLEAR RADIATION AND FALLOUT
450
the large peak in the stratospheric in-
ventory (Fig. 9.143a) which reached a
maximum toward the end of 1962. The
sharp increase in the ground inventory
(Fig. 9.143b), which began in 1962 and
continued through 1965, reflects the de-
position of the strontium-90 during
those years.
9.144 The maximum amounts of
strontium-90 on the earth’s surface will
be attained when the rate of natural
radioactive decay just begins to exceed
the rate at which the isotope reaches the
ground in delayed fallout. The atmos-
pheric tests conducted by France and
China during the late 1960’s and early
1970’s have not caused a significant
increase in the surface inventory, and if
atmospheric testing were discontinued,
the surface inventory should decrease
steadily.
9.145 After strontium-90, the next
most important radioisotope from the
biological standpoint in the worldwide
fallout is cesium-137. Fission products
contain, after a short time, roughly 1.5
times as many cesium-137 atoms as
strontium-90 atoms (§ 9.124). Since
there is essentially no fractionation rel-
ative to one another of these two iso-
topes and they have half-lives which are
not very different, the activity of ce-
sium-137 on the ground can be deter-
mined, to a good approximation, by
multiplying the values for strontium-90,
e.g., Fig. 9.143b, by 1.5.
TECHNICAL ASPECTS OF RESIDUAL NUCLEAR RADIATION10
RATE OF DECAY OF FALLOUT
ACTIVITY
9.146 The continuous curves in
Figs. 9.16a and b, which represent the
decrease in dose rate due to gamma
radiation from radioactive fallout, have
been obtained by summing the contri-
butions of the more than 300 isotopes in
the fission products and of the activity
induced by neutrons in the weapons
materials for various times after fission.
The effects of fractionation, resulting
from the partial loss of gaseous krypton
and xenon (and their daughter elements)
and from other circumstances, have also
been taken into account (§ 9.08). The
dose rates calculated in this manner vary
with the nature of the weapon, but the
values plotted in Figs. 9.16a and b are
reasonable averages for situations in
which the fallout activity arises mainly
from fission products. It is seen that the
decrease in the dose rate with time can-
not be represented by a simple equation
which is valid at all times, but it can be
approximated by the dashed straight
lines labeled -2”, for times between
30 minutes to about 5,000 hours (200
days) after the explosion, to within 25
percent. For times longer than 200 days,
the fallout decays more rapidly than
indicated by the Г"12 line, so that the
continuous curve may be used to esti-
mate dose rates from fallout at these
times.
l0The remaining sections of this chapter may be omitted without loss of continuity.
TECHNICAL ASPECTS OF RESIDUAL NUCLEAR RADIATION
451
9.147 During the interval in which
the approximation is applicable, the
decay of fallout activity at a given loca-
tion may be represented by the simple
expression
Rt~ (9.147.1)
where Rt is the gamma radiation dose
rate at time t after the explosion and
is the dose rate at unit time; this is the
unit-time reference dose rate which has
been used earlier, e.g., in Figs. 9.16a
and b, and Figs. 9.20 and 9.25. The
actual value of 1?! will depend on the
units in which the time is expressed,
e.g., minutes, hours, days, etc. In this
chapter, time is generally expressed in
hours, so that the unit time for the ref-
erence dose rate R} is 1 hour.”
9.148 It should be clearly under-
stood that equation (9.147.1) is appli-
cable provided there is no change in the
quantity of fallout during the time inter-
val under consideration. It cannot be
used, therefore, at such times that the
fallout is still descending, but only after
it is essentially complete at the particu-
lar location. If fallout material is re-
moved in any way, e.g., by weathering
or by washing away during the time t, or
if additional material is brought to the
given point by wind or by another nu-
clear detonation, equation (9.147.1)
could not be employed to determine the
rate of decay of the fallout activity.
9.149 By rearranging equation
(9.147.1) and taking logarithms, it fol-
lows that
log^ = - 1.2 log z, (9.149.1)
К
so that a logarithmic plot of R[/Rl
against t should give a straight line with
a slope of —1.2. When t = 1, i.e., 1
hour after the explosion, R( = or
Rl/Rl = 1; this is the basic reference
point through which the straight line of
slope —1.2 is drawn in Figs. 9.16a and
b.
9.150 The total accumulated dose
received from a given quantity of fallout
can be determined from Fig. 9.20 using
the method described in § 9.21. The
curve in Fig. 9.20 was obtained by nu-
merical integration over time of the ac-
tual dose-rate (continuous) curve in
Figs. 9.16a and b. However, for times
between 0.5 hour (30 minutes) and
5,000 hours (200 days) after the explo-
sion, an approximate analytical expres-
sion for the dose received during a given
time interval can be obtained by direct
integration of equation (9.147.1); thus if
D is the total dose accumulated between
the times t and t., then
a о
D~ t-ч dt
A
= 5Я, (/о-0 2-Гл-0 2).
(9.150.1)
Hence if the unit-time reference dose
rate R' is known or is determined, e.g.,
from Fig. 9.25 and the measured dose
rate at any known time after the explo-
sion, the total (or accumulated) dose for
any required period can be calculated,
provided the fallout activity decays in
accordance with the Г12 relationship
during this period.
"Physically the unit-time reference dose rate is the dose rate that would be received from the given
(constant) amount of fallout at unit time, e.g., 1 hour after the explosion, although this quantity might
actually be in transit at that time and would not have reached the location under consideration.
452
RESIDUAL NUCLEAR RADIATION AND FALLOUT
9.151 Measurements made on ac-
tual fallout from weapons tests indicate
that, although the Г’2 decay represents
a reasonable average, there have been
instances where exponents in the range
of -0.9 to -2.0, rather than —1.2, are
required to represent the rate of decay.
In fact, different exponents are some-
times needed for different times after the
same explosion. These anomalies ap-
parently arise from the particular cir-
cumstances of the explosion and are
very difficult to predict, except possibly
when a large quantity of neutron-in-
duced activity is known to have been
produced. Furthermore, fallout from
two or more explosions occurring at
different times will completely change
the observed decay rate. In general, too,
over a long period of time after the
burst, weathering will tend to alter the
dose rates in an unpredictable manner.
Consequently, in an actual situation
following a nuclear detonation, esti-
mates based on either the Г12 decay rule
or even on the continuous curves in
Figs. 9.16a and b must be used with
caution and should be verified by actual
measurements as frequently as possible.
9.152 Within the limits of applica-
bility of the r12 decay relationship,
equation (9.150.1) can be used to es-
timate the time which an individual can
stay in a location contaminated by fis-
sion products without accumulating
more than a specified dose of radiation.
In this case, the accumulated dose is
specified; ta is the known time of entry
into the contaminated area and th is the
required time at (or before) which the
exposed individual must leave. In order
to solve this problem with the aid of
equation (9.150.1), it is necessary to
know the unit-time reference dose rate
Rr This can be obtained from equation
(9.149.1), if the dose rate, R(, is mea-
sured at any time, t, after the explosion,
e.g., at the time of entry. The results
can be expressed graphically as in Figs.
9.26 and 9.27.
9.153 In principle, equation
(9.150.1) could be used to estimate the
total accumulated dose received from
fallout in a contaminated area, provided
the whole of the fallout arrives in a very
short time. Actually, the contaminated
particles may descend for several hours,
and without knowing the rate at which
the fallout particles reach the ground, it
is not possible to make a useful calcula-
tion. When the fallout has ceased, how-
ever, equations (9.149.1) and (9.150.1)
may be employed to make rough esti-
mates of accumulated radiation doses
over moderate periods of time, up to
about 200 days after the explosion, pro-
vided one measurement of the dose rate
is available.
RADIATION DOSE RATES OVER
CONTAMINATED SURFACES
9.154 It was seen in § 9.141 that
the curie and megacurie are useful units
for expressing the activity of radioactive
material, and they will now be em-
ployed in connection with the contami-
nation of areas. Because, as far as the
external radiation dose is concerned, the
gamma rays are more significant biolo-
gically than the beta particles, the early
fallout activity may be stated in
gamma-megacuries, as a measure of the
rate of emission of gamma-ray photons,
where 1 gamma-megacurie represents
the production of 3.7 x IO16 photons per
second.
9.155 If an area is uniformly con-
TECHNICAL ASPECTS OF RESIDUAL NUCLEAR RADIATION
453
taminated with any radioactive material
of known activity (in gamma-mega-
curies) at a given time, it is possible to
calculate the gamma-radiation dose rate
at various heights above the surface,
provided the average energy of the
gamma-ray photons is known. The re-
sults of such calculations, assuming a
contamination density of 1 gamma-
megacurie per square mile, for gamma
rays having various energies, are repre-
sented in Fig. 9.155. If the actual con-
tamination density differs from 1 mega-
curie per square mile, the ordinates in
the figure would be multiplied in pro-
portion.
9.156 The calculations upon which
Fig. 9.155 is based take into account the
effects of buildup in air (§ 8.103). Fur-
thermore, it is assumed that the surface
over which the contamination is distrib-
uted is perfectly smooth and infinite in
extent. For actual terrain, which is mo-
derately rough and may have a variety
of radiation shielding, the dose rate at a
specific height above the ground would
be less than for an infinite, smooth
plane. The actual reduction factor will,
of course, depend on the terrain features
and the extent of the contaminated area.
A terrain shielding factor of 0.7 is com-
monly applied to the dose rates obtained
from Fig. 9.155 to obtain approximate
average values for a moderately rough
terrain (§ 9.95).
9.157 The dose rate at greater
heights above the ground, such as might
be observed in an aircraft, can be es-
timated with the aid of Fig. 9.157. The
curve gives approximate values of the
attenuation factor for early fallout radi-
ation as a function of altitude. It applies
in particular to a uniformly contami-
nated area that is large compared to the
altitude of the aircraft. If the dose rate
near, i.e., 3 fee| above, the ground is
known, then the value at any specified
altitude can be obtained upon dividing
by the attentuation factor for that alti-
tude. On the other hand, if the dose rate
is measured at a known altitude, mul-
tiplication by the attenuation factor
gives the dose rate at about 3 feet above
the ground at that time.
9.158 A possible use of the curve in
Fig. 9.157 is to determine the dose rate
near the ground and contamination den-
sity from data obtained by means of an
aerial survey. For example, suppose a
radiation measuring instrument sus-
pended from an aircraft at a height of
1,000 feet showed a radiation dose of
0.24 rad/hr and that, from the known
time after the explosion, the average
energy'of the gamma-ray photons was
estimated to be 0.8 MeV. The attenua-
tion factor for an altitude of 1,000 feet is
approximately 27 and so the dose rate at
3 feet above ground at the time of the
observation is roughly
0.24 x 27 = 6.5 rads/hr. It is seen
from Fig. 9.155 that for a contamination
density of 1 megacurie per square mile
and a photon energy of 0.8 MeV, the
dose rate 3 feet above the ground would
be about 5.9 rads/hr. Hence, in the
present case, the contamination density
of the ground is approximately
6.5/5.9 = 1.1 gamma-megacurie per
square mile.
9.159 The gamma-ray activity from
the fission products will vary depending
upon the nature of the fissionable mate-
rial; however, it has been calculated that
a reasonable average would be about
530 gamma-megacuries per kiloton fis-
sion yield at 1 hour after the explosion.
The average photon energy also depends
454
RESIDUAL NUCLEAR RADIATION AND FALLOUT
Figure 9.155. Dose rates above an ideal plane from gamma rays of various energies for a
contamination density of 1 gamma-megacurie per square mile.
on the fissionable material, but at 1 hour
after the explosion an average energy of
about 0.7 MeV is a reasonable approx-
imation. Thus, if all the (unfractionated)
fission products from 1-kiloton fission
yield were spread uniformly over a
smooth plane 1 square mile in area, the
radiation dose received at a point 3 feet
above the plane can be estimated from
Fig. 9.155 as 5.3 x 530 i.e., approxi-
mately 2,800 rads/hr. Activity induced
by neutron capture in the weapon mate-
rials may add about 100 rads/hr to this
figure, making a total of 2,900 rads/hr at
1 hour after the explosion.12
9.160 If all of the radioactivity in
the weapon debris were deposited uni-
formly over a smooth surface of area 1
square mile, the 1 hour dose rate above
this area would thus be about 2,900
rads/hr per kiloton of fission yield. If the
same residues were spread uniformly
over a smooth surface of A square miles
in area, the 1-hour dose rate would be
2,900/A rads/hr; consequently, the
product of the 1-hour dose rate and the
area in square miles would be equal to
2,900 in units of (rads/hr) (miles)2/kt
fission. If all the residues from 1-kiloton
fission yield were deposited on a smooth
l2The best values reported in the technical literature range from roughly 2,700 to 3,100 rads/hr for
different fissionable materials and neutron energy spectra. The dose rate given here is considered to be a
good average.
TECHNICAL ASPECTS OF RESIDUAL NUCLEAR RADIATION
455
ATTENUATION FACTOR
Figure 9.157. Altitude attenuation factor for early fallout radiation dose rate relative to the
dose rate 3 feet above the ground.
456
RESIDUAL NUCLEAR RADIATION AND FALLOUT
surface in varying concentrations typical
of an early fallout pattern, instead of
uniformly, the product of the dose rate
at 1 hour and the area would be replaced
by the “area integral” of the 1-hour
dose rate defined by
Area Integral = I
J A
where R} is the 1-hour dose rate over an
element of area dA and A square miles
is the total area covered by the residues.
Hence, regardless of the concentration
pattern, the area integral of the 1-hour
dose rate over a smooth surface would
always be 2,900 (rads/hr) (miles)2/kt
fission, assuming that the fallout had
been completely deposited at that time.
9.161 Measurements after several
nuclear tests have given a wide range of
values, but a reasonable average is
about 1,000 (rads/hr) (miles)2/kt fission.
These measurements were made with
radiation monitoring instruments at
various times after the explosions. This
value differs from the 2,900 (rads/hr)
(miles)2/kt fission given above for two
main reasons: first, only part of the
radioactivity of the weapon residues ap-
pears in the early fallout, and second,
corrections must be applied to the mea-
sured value for instrument response and
terrain shielding. Typical ionization-
chamber monitoring instruments that
were used in the surveys, calibrated in
the usual manner, will read about 25
percent too low as a result of a nonlinear
response to gamma rays of various en-
ergies, directional response, and shield-
ing provided by the operator. This cor-
rection increases the “observed” area
integral from 1,000 to about 1,300
(rads/hr) (miles)2/kt fission. If the terrain
shielding factor is taken to be 0.7
(§ 9.156), the 1-hour dose rate area in-
tegral that would be measured over an
ideal smooth plane, with no shielding,
would be 1,300/0.7, i.e., approximately
1,900 (rads/hr) (miles)2/kt fission.
9.162 The ratio of 1,900 rads/hr to
the theoretical 2,900 (rads/hr)
(miles)2/kt fission indicates that about 60
percent of the total gamma-ray activity
of the weapon residues is deposited in
the early fallout from a land surface
burst (§ 9.59). This value must be rec-
ognized as an estimate because the data
upon which it is based are both limited
and variable. For example, it depends to
some extent on the nature of the surface
material. Furthermore, as the burst
height increases, the fraction of the
weapon debris deposited as local fallout
will decrease until the fireball no longer
intersects the earth’s surface.
RATE OF PARTICLE FALL
9.163 The time at which particles of
a given size and density will arrive at the
ground from specified heights in the
nuclear cloud may be calculated from
aerodynamic equations of motion. The
effects of vertical air motions are gener-
ally ignored since they cannot be pre-
dicted, especially as they are believed to
be generally small for particles which
fall within 24 hours. However, field test
data sometimes indicate times of arrival
which are quite different from those
predicted by the theoretical calculations;
hence, it is probable that vertical wind
components and other factors may
sometimes significantly influence the
particle fall. One such factor is precipi-
tation (§ 9.67 et seq.), but this will be
disregarded here.
TECHNICAL ASPECTS OF RESIDUAL NUCLEAR RADIATION
457
9.164 Some typical results of time
of fall calculations are shown in Fig.
9.164. The curves give the times re-
quired for particles of different sizes to
fall to earth from various initial alti-
tudes. The density of the fallout material
is taken to be 2.5 g/cm3, which is
roughly that of dry sand; the falling
particles are assumed to be spherical,
their radii being given in micrometers
(p,m). Actual fallout particles are some-
times quite irregular and angular in
shape, although a large percentage tend
to be fairly smooth and globular since
they result from the solidification of
fused spherical droplets of earth and of
weapon debris (see Figs. 9.50a through
d). Even if the particles are irregular,
they can be assigned an effective radius
and then treated as spheres for calculat-
ing times of fall.
9.165 The percentages given in Fig.
9.164 represent estimates of the propor-
tions of the total activity deposited by
particles with sizes lying between pairs
of lines. Thus, particles with radii larger
than 200 p,m carry 1 percent of the
activity; those between 150 and 200 p,m
carry 3 percent, and so on; at the other
extreme, particles less than 20 рлп in
radius carry 12 percent of the activity.
This distribution of activity is known as
“log-normal” because it obeys the nor-
mal (Gaussian) distribution law with the
logarithm of the particle radius as the
variable. It may not be strictly valid in
any given case, since the activity dis-
tribution varies with the type of burst,
the nature of the terrain at ground zero,
etc. Nevertheless, it is characteristic of
the activity distributions assumed for the
theoretical analysis of fallout.
9.166 The method for estimating
the arrival time of the fallout at a
downwind location was described in
§ 9.91. Suppose that the time of arrival
is 20 hours at a downwind distance of
300 miles from the explosion. If the
nuclear cloud stabilizes at 60,000 feet,
then it follows from Fig. 9.164 that, at
this time, all particles with radii less
than about 30 p will still be present, and
that they carry roughly 28 percent of the
total activity deposited in the early fall-
out. It is evident that, in spite of the
decay which will have occurred in tran-
sit, fallout of appreciable activity may
be expected 300 miles downwind at
about 20 hours after the detonation.
458
INITIAL ALTITUDE (THOUSANDS OF FEET)
TIME (HOURS)
Figure 9.164. Times of fall of particles of different sizes from various altitudes and
percentages of total activity carried.
TECHNICAL ASPECTS OF RESIDUAL NUCLEAR RADIATION
459
BIBLIOGRAPHY
Bunney, L. R., and D. Sam, “Gamma-Ray
Spectra of Fractionated Fission Products,”
Naval Ordnance Laboratory, June 1971,
NOLTR 71-103.
Burson, Z. G., “Fallout Radiation Protection
Provided by Transportation Vehicles,” EG &
G, Inc., Las Vegas, Nevada, October 1972,
EGG-1183-1566.
Crawford, T. V., “Precipitation Scavenging
and 2BPUFF,” University of California,
Lawrence Livermore Laboratory, December
1971, UOPKA 71-14.
Crocker, G. R., “Fission Product Decay
Chains: Schematics with Branching Fractions,
Half-Lives, and Literature References,” U.S.
Naval Radiological Defense Laboratory, June
1967, USNRDL-TR-67-111.
Crocker, G. R., and T. Turner, “Calculated
Activities, Exposure Rates, and Gamma Spec-
tra for Unfractionated Fission Products,” U.S.
Naval Radiological Defense Laboratory, De-
cember 1965, USNRDL-TR-1009.
Crocker, G. R., and M. A. Connors,
“Gamma-Emission Data for the Calculation of
Exposure Rates from Nuclear Debris, Volume
I, Fission Products,” U.S. Naval Radiological
Defense Laboratory, June 1965, USNRDL-
TR-876
Crocker, G. R., J. D. O’Connor, and E. C.
Freiling, “Physical and Radiochemical
Properties and Fallout Particles,” U.S. Naval
Radiological Defense Laboratory, June 1965,
USNRDL-TR-899.
“Department of Defense Land Fallout Prediction
System,” Defense Atomic Support Agency,
Washington, D.C.; U.S. Army Nuclear De-
fense Laboratory; U.S. Naval Radiological De-
fense Laboratory; Technical Operations Re-
search, Burlington, Massachusetts, 1966,
DASA 1800-1 through 1800-VII.
Dolan, P. J., “Gamma Spectra of Uranium-235
Fission Products at Various Times After Fis-
sion,” Armed Forces Special Weapons Project,
Washington, D C., March 1959, AFSWP 524.
Dolan, P. J., “Calculation of Abundances and
Activities of the Products of High-Energy Neu-
tron Fission of Uranium-238,” Defense Atomic
Support Agency, Washington, D.C., May
1959, DASA 525
Dolan, P. J., “Gamma Spectra of Uranium-238
Fission Products at Various Times After Fis-
sion,” Defense Atomic Support Agency,
Washington, D.C., May 1959, DASA 526.
*Englemann, R. J., and W. G. N. Slinn,
Coordinators, “Precipitation Scavenging
(1970),” AEC Symposium Series No. 22, U.S.
Atomic Energy Commission, December 1970.
Feely, H. W., et al., “Final Report on Project
Stardust, Volumes I through III,” Isotopes, A
Teledyne Company, Westwood, New Jersey,
October 1967, DASA 2166-1 through 2166-3.
Ferber, G. J., “Distribution of Radioactivity
with Height in Nuclear Clouds,” Proceedings
of the Second Conference sponsored by the
Fallout Studies Branch, U.S. Atomic Energy
Commission, November 1965.
Freiling, E. C., and N. E. Ballou, “Nature of
Nuclear Debris in Sea Water,” Nature, 195,
1283 (1962).
Knox, J. В., T. V. Crawford, and W. K.
Crandall, “Potential Exposures from Low-
Yield Free Air Bursts,” University of Califor-
nia, Lawrence Livermore Laboratory, De-
cember 1971, UCRL-51164.
*Krey, P. W., and B. Krajewski, “HASL
Model of Atmospheric Transport,” Health and
Safety Laboratory, U.S. Atomic Energy Com-
mission, New York, N.Y., September 1969,
HASL-215.
Krey, P. W., and B. Krajewski, “Comparison
of Atmospheric Transport Model Calculations
with Observations of Radioactive Debris,” J.
Geophys. Res., 75, 2901 (1970).
*Krey, P. W., M. Schonberg, and L. Toon-
kel, “Updating Stratospheric Inventories to
April 1974,” Fallout Program Quarterly Sum-
mary Report, Health and Safety Laboratory,
U.S. Energy Research and Development Ad-
ministration, New York, N.Y., July 1975,
HASL-294.
Lee, H., P. W. Wong, and S. L. Brown,
“SEER II: A New Damage Assessment Fallout
Model,” Stanford Research Institute, Menlo
Park, California, May 1972, DNA 3OO8F.
Martin, J. R., and J. J. Koranda, “The Im-
portance of Tritium in the Civil Defense Con-
text,” University of California, Lawrence Li-
vermore Laboratory, March 1971,
UCRL-73085.
National Academy of Sciences, Advisory Com-
mittee on Civil Defense, Subcommittee on
Fallout, “Response to DCPA Questions on
Fallout,” Defense Civil Preparedness Agency,
Research Report No. 19, May 1973.
Peterson, “An Empirical Model for Estimating
World-Wide Deposition from Atmospheric Nu-
clear Detonations,” Health Physics, 18, 357
(1970).
460 RESIDUAL NUCLEAR RADIATION AND FALLOUT
*Slinn, W. G. N., “Aerosol Particle Size De-
pendence of the Rainout Rate,’’ Battelle Pacific
Northwest Laboratories, AEC Research and
Development Report, June 1971, BNWL-1551
Vol. II, Part 1.
Stewart, G. L., and R. K. Farnsworth,
“United States Rainout and Hydrologic Impli-
cation,’’ Water Resources Research, 4, 273
(1968).
*“Sr-90 and Sr-89 in Monthly Deposition at
World Land Sites,’’ Fallout Program Quarterly
Summary Report, Appendix A, Health and
Safety Laboratory, U.S. Atomic Energy Com-
mission, New York, N.Y., April 1973,
HASL-273 Appendix.
Volchok, H. L., “Strontium-90 Deposition in
New York City,” Science, 156, 1487 (1967).
*Volchok, H. L., “Worldwide Deposition of
^Sr Through 1974,” Fallout Program Quarterly
Summary Report, Health and Safety Labora-
tory, U.S. Energy Research and Development
Administration, New York, N.Y., October
1975, HASL-297.
♦These publications may be purchased from the National Technical Information Service, Department of
Commerce, Springfield, Virginia 22161.
CHAPTER X
RADIO AND RADAR EFFECTS
INTRODUCTION
RADIO BLACKOUT
10.01 The transmission of electro-
magnetic waves with wavelengths of 1
millimeter or more, which are used for
radio communications and for radar, is
often dependent upon the electrical
properties, i.e., the ionization (§ 8.17),
of the atmosphere. The radiations from
the fireball of a nuclear explosion and
from the radioactive debris can produce
marked changes in the atmospheric ion-
ization. The explosion can, therefore,
disturb the propagation of the electro-
magnetic waves mentioned above.
Apart from the energy yield of the ex-
plosion, the effects are dependent on the
altitudes of the burst and of the debris
and on the wavelength (or frequency) of
the electromagnetic waves. In certain
circumstances, e.g., short-wave (high-
frequency) communications after the
explosion of a nuclear weapon at an
altitude above about 40 miles, the elec-
tromagnetic signals may be completely
disrupted, i.e., “blacked out," for sev-
eral hours.
10.02 In this chapter, the normal
ionization of the atmosphere will be
described and this will be followed by a
discussion of the disturbances produced
by nuclear bursts at various altitudes.
Consideration will then be given to the
effects of these disturbances on the
propagation of electromagnetic waves in
different frequency ranges. Apart from
the effects that can be ascribed directly
to changes in ionization, radio com-
munications and radar signals can be
degraded in other ways, e.g., by noise,
distortion, changes in direction, etc.
These disturbances, which cannot be
treated in a quantitative manner, will be
discussed briefly.
ELECTROMAGNETIC PULSE
10.03 Another consequence of a
nuclear explosion that may cause tem-
porary interference with radio and radar
signals is an electrical (or electromag-
netic) pulse of short duration emitted
from the region of the burst. The most
serious potential effects of this pulse are
damage to electrical and electronic
equipment, rather than to the propaga-
tion of electromagnetic waves. Hence,
the electromagnetic pulse will be con-
sidered separately in Chapter XI.
461
462
RADIO AND RADAR EFFECTS
ATMOSPHERIC IONIZATION PHENOMENA
EFFECT OF IONIZATION ON
ELECTROMAGNETIC WAVES
10.04 Ionization, that is, the for-
mation of ion pairs consisting of sepa-
rated electrons and positive ions, can be
produced, either directly or indirectly,
by the gamma rays and neutrons of the
prompt nuclear radiation, by the beta
particles and gamma rays of the residual
nuclear radiation, by the X rays and the
ultraviolet light present in the primary
thermal radiation, and by positive ions
in the weapon debris. Hence, after a
nuclear explosion, the density of elec-
trons in the atmosphere in the vicinity is
greatly increased. These electrons can
affect electromagnetic (radip and radar)
signals in at least two ways. First, under
suitable conditions, they can remove
energy from the wave and thus attenuate
the signal; second, a wave front travel-
ing from one region into another in
which the electron density is different
will be refracted, i.e., its direction of
propagation will be changed. It is evi-
dent, therefore, that the ionized regions
of the atmosphere created by a nuclear
explosion can influence the behavior of
communications or radar signals whose
transmission paths encounter these re-
gions.
10.05 When an electromagnetic
wave’ interacts with free electrons,
some of the energy of the wave is
transferred to the electrons as energy of
vibration. If the electrons do not lose
this energy as the result of collisions
with other particles (atoms, molecules,
or ions) in the air, they will reradiate
electromagnetic energy of the same fre-
quency, but with a slight time delay.
Thus, the energy is restored to the wave
without loss, but with a change in phase
(§ 10.82 et seq.). If, however, the air
density is appreciable, e.g., more than
about one ten-thousandth (IO-4) of the
sea-level value, as it is below about 40
miles altitude, collisions of electrons
with neutral particles will take place at a
significant rate. Even above 40 miles,
collisions between electrons and ions
are significant if the electron density is
abnormally high. In such collisions,
most of the excess (coherent) energy of
the electron is transformed into kinetic
energy of random motion and cannot be
reradiated. The result is that energy is
absorbed from the wave and the elec-
tromagnetic signal is attenuated.
10.06 Other conditions being the
same, more energy is absorbed from an
electromagnetic wave by an ionized gas
as the wavelength of the signal is in-
creased, i.e., as its frequency decreases.
This may be regarded as being due to
the longer time interval, as the fre-
quency is decreased, between success-
ive alternations (or reversals) of the
oscillating electromagnetic field
(§ 1.73). When the accelerating influ-
ence of the wave is applied for a longer
time, a given electron will attain a
higher vibrational velocity during each
cycle of the wave, and will dissipate a
greater amount of energy upon colli-
sion.
‘As used in this chapter, the term “electromagnetic wave” refers to radiations of wavelength of 1
millimeter or more, such as are used in radio and radar, and not to the entire spectrum described in § 1.74
et seq.
ATMOSPHERIC IONIZATION PHENOMENA
463
10.07 Positive and negative ions
can also absorb energy from an elec-
tromagnetic wave. Because of their
larger mass, however, the ions attain
much lower velocities than electrons
and so they are less effective in absorb-
ing energy. Thus, the effects of ions
may ordinarily be neglected. However,
for some situations in the denser (low-
altitude) portion of the atmosphere,
where ions can persist for an appreciable
time, or for frequencies low enough for
the ions to have time to acquire signifi-
cant velocity before reversal of the
electromagnetic field, the effect of ions
may be important.
10.08 A radio or radar wave travel-
ing upward from the ground begins to be
bent (refracted) when an increase of
electron density is encountered. In-
creased electron density causes the wave
path to bend away from the region of
higher electron density toward the re-
gion of lower density (§ 10.85). As the
electromagnetic wave penetrates farther
into a region where the electron density
increases toward a peak value, more and
more bending occurs. For certain com-
binations of the angle of incidence
(angle between propagation direction
and the vertical), the electron density,
and the frequency, the wave may actu-
Figure 10.08. Reflection of a radio (or
radar) wave by successive
refractions in an ionized
region of the atmosphere.
ally be refracted back toward the earth
(Fig. 10.08). This process is commonly
referred to as “reflection,” although it
is not the same as true reflection, in
which there would be no penetration of
the ionized layer of air. True (or spe-
cular) reflection, as from a mirror, does
occur to some extent especially with
electromagnetic waves of the lowest
radio frequencies.
IONIZATION IN THE NORMAL
ATMOSPHERE
10.09 In order to understand the ef-
fects of free electrons on radio and radar
systems, it is necessary to review briefly
the ionization in the normal, undis-
turbed atmosphere. Below an altitude of
about 30 miles, there is little ionization,
but above this level there is a region
called the “ionosphere,” in which the
density of free electrons (and ions) is
appreciable (see Fig. 9.126). The ion-
osphere consists of three, more-or-less
distinct, layers, called the D-, E-, and
F-regions. Multiple layers, which
sometimes occur in the E- and F-
regions, may be disregarded for the
ELECTRON DENSITY (ELECTRONS/CM3 )
Figure 10.09. Typical electron densities in
D-, E-, and F-regions of the
ionosphere.
464
RADIO AND RADAR EFFECTS
present purpose. Typical variations of
electron density with altitude and with
time of day are illustrated in Fig. 10.09.
The approximate altitudes of the three
main regions of the ionosphere are given
in Table 10.09.
Table 10.09
APPROXIMATE ALTITUDES OF
REGIONS IN THE IONOSPHERE
Approximate Altitude
Region (miles)
D 30-55
E 55-95
F Above 95
10.10 Although the D-, E-, and F-
regions always exist in the daytime and
the E- and F-regions at night, the details
of the dependence of the electron den-
sity on altitude, especially in the F-
region, vary with the season, with the
geographic latitude, with the solar (sun-
spot) activity, and with other factors.
The curves in Fig. 10.09 are applicable
to summer, at middle latitudes, around
the time of maximum sunspot activity.
The effects of the variable factors men-
tioned above are fairly well known, so
that the corresponding changes in the
electron density-altitude curve can be
predicted reasonably accurately.
10.11 In addition to these system-
atic variations in the electron density,
there are temporary changes arising
from special circumstances, such as
solar flares and magnetic storms. Solar
flares can cause a ten-fold increase in the
electron density in the D-region, but that
in the F-region generally increases by no
more than a factor of two. Magnetic
storms, on the other hand, produce most
of their effect in the F-region. In some
latitudes, the maximum electron density
in the ionosphere during a magnetic
storm may decrease to some 6 to 10
percent of its normal value.
10.12 Apart from these major
changes in electron density, the causes
of which are known, there are other
variations that are not well understood.
Sometimes an irregular and rapidly
varying increase in the electron density
is observed in the E-region. Apparently
one or more layers of high electron
density are formed and they extend over
distances of several hundred miles. This
is referred to as the “sporadic-E” phe-
nomenon. A somewhat similar effect,
called “spread-F,” in which there are
rapid changes of electron density in
space and time, occurs in the F-region.
The areas affected by spread-F are gen-
erally much smaller than those asso-
ciated with sporadic-E.
CHARACTERISTICS OF THE
IONOSPHERE
10.13 The composition of the at-
mosphere, especially at the higher alti-
tudes, varies with the time of <iay and
with the degree of solar activity; how-
ever, a general description that is appli-
cable to daytime conditions and mean
sunspot activity is sufficient for the
present purpose. Near the earth’s sur-
face, the principal constituents of the
atmosphere are molecular nitrogen (N2)
and molecular oxygen (O2). These dia-
tomic gases continue to be the dominant
ones up to an altitude of approximately
75 miles. At about 55 miles, ultraviolet
radiation from the sun begins to disso-
ciate the oxygen molecules into two
atoms of oxygen (O). The extent of
ATMOSPHERIC IONIZATION PHENOMENA
465
dissociation increases with altitude, so
that above 120 miles or so, oxygen
atoms are the dominant species in the
low-pressure atmosphere. This condi-
tion persists up to an altitude of some
600 miles. Ozone (O3) and nitric oxide
(NO) are formed in the lower atmos-
phere by the action of solar radiations on
the oxygen and nitrogen. Although the
amounts of ozone and nitric oxide are
quite small, they are important because
each absorbs radiation and enters into
chemical reactions in a characteristic
manner.
10.14 The electrons (and positive
ions) in the normal ionosphere are pro-
duced by the interactions of solar radia-
tions of short wavelength with the
various molecular and atomic species
present in the atmosphere. In the D-
region, the ions are almost exclusively
NO+, and these ions are also the most
important in the E-region; in the latter
region, however, there are, in addition,
about one-third as many 0+ ions.
Atomic oxygen ions, O+, begin to ap-
pear in the upper parts of the E-region,
and their proportion increases with alti-
tude. In the F-region, the proportion of
NO+ and O+ ions decreases, whereas
that of O+ increases steadily. Above an
altitude of about 120 miles (up to 600
miles), O+ ions are dominant.
10.15 The actual electron density at
any altitude depends on the rate of for-
mation of electrons as a result of ion-
ization and their rate of removal, either
by recombination with positive ions or
by attachment to neutral particles (mol-
ecules or atoms). Recombination tends
to be the more important removal proc-
ess at high altitudes (low atmospheric
pressure), whereas attachment to neutral
particles predominates at lower alti-
tudes, where molecular nitrogen and
oxygen are the main components of the
atmosphere.
10.16 At altitudes below about 30
miles, i.e., below the D-region, where
the air is relatively dense, the probabil-
ity of interaction between free electrons
and neutral molecules is large. The few
electrons that are produced by short-
wavelength solar radiation that pene-
trates so low into the atmosphere are
thus rapidly removed by attachment.
The density of free electrons in the at-
mosphere below about 30 miles is con-
sequently so small that it can be neg-
lected.
10.17 In the altitude range from
roughly 30 to 55 miles (D-region of the
ionosphere), the density of neutral par-
ticles is relatively low, between about
10~3 and 10~5 of the sea-level density.
Because of this low density, the rate of
attachment is not large and electrons
remain free for several minutes. The
average lifetime varies with location and
the time of the year, but it is long
enough for the radiation from the sun to
♦maintain a peak density between about
102 and 103 electrons per cubic centi-
meter (electrons/cm3) in the daytime. At
night, when electrons are no longer
being generated by solar radiations, the
free electrons in the D-region disappear.
Although the density of neutral particles
is small enough to permit the electrons
(in the daytime) to have an appreciable
average life, it is nevertheless suffi-
ciently large for collisions to cause con-
siderable attenuation of electromagnetic
waves, in the manner described in
§ 10.05.
10.18 In the E-region of the ionos-
phere (55 to 95 miles altitude), the air
density is quite low, about 10~5 to 10~8
466
RADIO AND RADAR EFFECTS
of the sea-level value, and the average
lifetime of electrons is even longer than
in the D-region. The daytime electron
density is about 103 to 105 elec-
trons/cm3, but most of the ionization, as
in the D-region, disappears at night.
However, because of the very low den-
sity of neutral particles, the frequency of
collisions between them and electrons is
so small that there is relatively little
attenuation of electromagnetic signals in
the E-region. If sporadic-E conditions
exist, radio signals are reflected
(§ 10.08) in an erratic manner.
10.19 The F-region extends upward
from an altitude of about 95 miles. Here
the neutral-particle density is so low that
free electrons have extremely long life-
times. At about 190 miles, the peak
electron density in the daytime is ap-
proximately 106 electrons/cm3, decreas-
ing to about 105 electrons/cm3 at night.
During the day there are various layers
of ionization in the F-region, which tend
to merge and lose their identity at night.
The altitude of peak ionization may also
shift at night. Other factors causing
changes in the F-region were referred to
earlier (§ 10.12). Attenuation of elec-
tromagnetic signals in the F-region is
small, despite the high electron density,
because of the very low electron-neu-
tral collision frequency; however, re-
flection effects (§ 10.08) make the re-
gion important.
10.20 Normally, the low electron
densities in the D-region are sufficient to
reflect back to earth only those electro-
magnetic waves with frequencies below
about 1 million hertz, j.e., 1 megahertz
(§ 1.74), provided the angle of inci-
dence is small. At larger angles, the
limiting frequency for reflection by the
normal D-region is increasingly less
than 1 megahertz. Waves of higher fre-
quency pass through the D-region, with
some refraction (bending) and attenua-
tion, and penetrate into the E-region or
into the F-region if the frequencies are
high enough. Reflection may then occur
in the E- or F-region, where the electron
densities are higher than in the D-
region. For a given angle of incidence,
the electron density required for reflec-
tion increases with the frequency of the
electromagnetic wave. The smaller the
angle of incidence, i.e., the more nearly
vertical the direction of propagation, the
higher the frequency that will be re-
flected by a given electron density.
IONIZATION PRODUCED BY NUCLEAR EXPLOSIONS
INTRODUCTION
10.21 Up to three-fourths of the
energy yield of a nuclear explosion may
be expended in ionizing the atmosphere.
The resulting changes are characteristic
of the given weapon and of the burst and
debris altitudes. The ionization effects
caused by the nuclear and thermal radi-
ations from a low-altitude nuclear ex-
plosion are much more intense within a
limited volume of space, i.e., in and
near the fireball, than the changes pro-
duced naturally, e.g., by solar flares.
Nuclear explosions at high altitudes may
affect a considerable portion of the ion-
osphere in ways somewhat similar to
IONIZATION PRODUCED BY NUCLEAR EXPLOSIONS
467
changes in solar activity; however, the
mechanisms and details of the interac-
tions with the atmosphere are quite dif-
ferent. Because of the complexities of
these interactions, descriptions of “typ-
ical” changes to be expected from a
nuclear explosion are often not applica-
ble or even very meaningful. A careful
analysis of each situation, with the con-
ditions stated fairly explicitly, is usually
necessary.
10.22 Atmospheric ionization and
disturbances to the propagation of elec-
tromagnetic signals caused by a nuclear
explosion can be described in terms of
four spatial regions: (1) the hot fireball,
(2) the atmosphere surrounding the fire-
ball, (3) the D-region, and (4) the high-
altitude region which includes the nor-
mal E- and F-regions of the ionosphere.
10.23 Fireballs from explosions at
low altitude are relatively small
(roughly, a 1-megaton explosion at sea
level produces a fireball of about 0.6
mile diameter at 1 second). The air
inside the fireball is at a temperature of
many thousands of degrees. Electron
density and collision frequency are
high, and the absorption of electromag-
netic waves is so large that the fireball is
considered to be opaque. At intermedi-
ate burst altitudes (up to about 50 or 60
miles), the early fireball is larger in size,
but it is still defined as a hot, ionized
mass of air which is opaque to radio and
radar signals for many seconds With
increasing altitude the characteristics of
the region of energy absorption change.
At burst altitudes above about 190
miles, the atmosphere is very thin and
the energy from the nuclear explosion
can spread over very large distances.
10.24 When the burst point is
below the D-region, the atmosphere
around the fireball is ionized in varying
degrees by the initial thermal and nu-
clear radiations and by the delayed
gamma rays and beta particles from the
radioactive debris. The chemistry of the
atmosphere may be modified signifi-
cantly, thus making predictions of elec-
tron persistence difficult (and greatly
complicating the problem of analyzing
multiple-burst situations). For near-sur-
face explosions, the density of the air
prevents radiation from escaping very
far from the fireball, and the ionization
is both localized and short-lived due to
very rapid attachment of free electrons
to neutral particles. As the detonation
altitude is increased the radiation can
escape to greater distances, and the
electron density will reach values at
which electromagnetic signal propaga-
tion can be affected.
10.25 When prompt or delayed ra-
diation from the explosion can reach the
D-region, the electron density of that
region is enhanced. Most of the wide-
spread and persistent absorption of
electromagnetic waves then takes place
in and near the D-region of the normal
ionosphere. For electromagnetic waves
in the radio and radar frequency ranges,
circumstances are such that the maxi-
mum attenuation usually occurs within a
layer 10 miles deep centered at an alti-
tude of about 40 miles (§ 10.128).
Hence, most of the subsequent discus-
sion pertaining to D-region ionization
will be in terms of the free electron
density at an altitude of 40 miles.
10.26 In the E- and F-regions of the
ionosphere, the frequency of electron-
neutral particle collisions is low, and
refraction rather than absorption is gen-
erally the predominant effect. When the
burst or debris altitude is high enough
468
RADIO AND RADAR EFFECTS
for prompt or delayed radiation to reach
the E- and F-regions, the electron den-
sity of those regions may be increased.
On the other hand, nuclear explosions
sometimes cause a decrease of electron
density in the E- and F-regions, largely
due to traveling hydrodynamic and hy-
dromagnetic disturbances2 and to
changes in air chemistry (§ 10.71 et
seq.).
10.27 Increased ionization in the
D-region may occur not only in the
vicinity of the nuclear explosion, but
also at its magnetic conjugate in the
earth’s opposite hemisphere (§ 2.143).
Charged particles, especially beta par-
ticles (electrons), resulting from the ex-
plosion will spiral along the earth’s
magnetic field lines. Upon reaching the
conjugate region, the beta particles will
cause ionization similar to that produced
near the burst point.
ENERGY DEPOSITION
10.28 A detailed analysis of energy
deposition, the starting point for exa-
mining the effects of nuclear explosions
on the propagation of radio and radar
signals, is very complicated. The fun-
damental principles, however, are well
known and relatively simple. Consider
ionizing radiation entering the earth’s
atmosphere from a nuclear explosion at
high altitude or, as it normally does,
from the sun. As it travels downward,
the radiation at first encounters air of
such low density that very few interac-
tions occur with atmospheric atoms and
molecules. Hence, very little ionization
is produced. As the air density increases
with decreasing altitude, interactions of
the atoms and molecules with the radia-
tion take place at rapidly increasing
rates and energy is removed from the
radiation.
10.29 The concept of “stopping al-
titude” provides a useful approximate
model for treating the interaction of
ionizing radiation and the atmosphere in
which the density changes with altitude.
The stopping altitude for a given type of
radiation is the level in the atmosphere
to which that radiation coming from
above will penetrate before losing so
much of its energy that it produces little
further ionization. The radiation is then
said to have been “stopped.” Most of
the energy will actually be deposited
within a few miles of the stopping alti-
tude. Only a small proportion of the
energy is absorbed at the higher alti-
tudes where the air has a lower density
and is relatively transparent to the radi-
ation, and little energy remains to be
given up at lower altitudes. Different
types of radiation deposit their energy in
the atmosphere in different ways and
thus have different stopping altitudes.
Table 10.29 shows approximate stop-
ping altitudes for various ionizing out-
puts from a typical nuclear explosion.
The altitude quoted for debris ions refers
to ionization that results from the ran-
dom (thermal) motion of these ions. The
debris mass can, however, be carried to
greater heights by the rising fireball and
cause ionization by the emission of de-
layed radiations.
10.30 For detonations below 15
miles altitude, the minimum stopping
altitude in Table 10.29, the air is essen-
- A hydrodynamic disturbance of the atmosphere is a direct result of the shock wave. The air is ionized
and so its motion is affected by the earth's magnetic field. The combination of hydrodynamic and
magnetic effects leads to hydromagnetic (or magnetohydrodynamic) disturbances.
IONIZATION PRODUCED BY NUCLEAR EXPLOSIONS 469
Table 10.29
APPROXIMATE STOPPING ALTITUDES FOR PRINCIPAL WEAPON OUTPUTS
CAUSING IONIZATION
Weapon Output
Prompt radiation
X rays
Neutrons and gamma rays
Debris ions
Delayed radiation
Gamma rays
Beta particles
tially opaque to all ionizing radiations.
The radiation will penetrate only a fairly
short distance into the atmosphere be-
fore most of its energy is absorbed in
causing ionization (or is transformed
into other kinds of energy). As the alti-
tude of the explosion increases to 15
miles and above, the radiation can
escape to increasingly greater distances.
Once the stopping altitude for a given
ionizing radiation is reached, the at-
mosphere above the burst is relatively
transparent to that radiation, which can
then travel upward and outward to great
distances.
10.31 Below the stopping altitude,
in a region of uniform density, the no-
minal penetration distance of ionizing
radiation of a particular kind and energy
is inversely proportional to the air den-
sity. (The penetration distance is often
expressed in terms of the mean free
path, as described in § 2.113.) For a
particular radiation of a single energy
traveling through an undisturbed region
of constant density, the penetration dis-
tance (or mean free path) can be cal-
culated relatively easily. For a radiation
spectrum covering a range of energies
and for complex paths along which the
air density changes, the computations
Stopping Altitude
(miles)
35 to 55
15
70
15
35
are more laborious. For a disturbed at-
mosphere, calculations of the penetra-
tion distance are difficult and not very
reliable.
LOCATION OF RESULTANT
IONIZATION
10.32 The region of maximum en-
ergy deposition is the location where
ion-pair production is the greatest, but it
is not always the location of the max-
imum density of free electrons. At alti-
tudes below about 30 miles, i.e., at
relatively high air densities, removal
processes are so rapid that the average
lifetime of a free electron is a fraction of
a second. An extremely high ion-pair
production rate is then required to sus-
tain even a few free electrons per cubic
centimeter. But in the D-region (starting
at about 30 miles altitude) Removal
processes are not so rapid and higher
electron densities are possible. For the
delayed gamma rays, for example, the
stopping altitude, i.e., the region of
maximum energy deposition and ion-
pair production rate, is 15 miles; how-
ever, the resultant electron density tends
to a maximum at a higher altitude in the
D-region.
470
RADIO AND RADAR EFFECTS
10.33 To understand the ionization
resulting from nuclear explosions, it is
helpful to examine four detonation alti-
tude regimes separately; they are: (1)
below 10 miles, (2) between 10 and 40
miles, (3) between 40 and 65 miles, and
(4) above 65 miles. Different mecha-
nisms associated with various burst
heights will be considered, but it should
be understood that these altitude re-
gimes are somewhat arbitrary and are
chosen for convenience in bringing out
the changes in behavior that occur with
burst height. Actually, there are no lines
of demarcation between the various al-
titude ranges; the changes are continu-
ous, and one type of mechanism gradu-
ally supersedes another and becomes
dominant. The four spatial regions
where there may be significant effects
(§ 10.22) also shift in importance as the
altitudes of the detonation and of the
radioactive debris change.
DETONATIONS BeLoW 10 MILES
ALTITUDE
10.34 For nuclear explosions at al-
titudes below 10 miles (and somewhat
higher), most of the energy is deposited
in the atmosphere in the immediate vi-
cinity of the detonation, resulting in the
formation of the fireball and the air blast
wave, as described in Chapter II. The
electron density within the fireball, ini-
tially at least equal to the particle den-
sity (about 10,9/cm3), will remain above
about 108 electrons/cm3 for times up to 3
and 4 minutes, depending on the nature
of the weapon. For about 10 seconds the
fireball temperature will be high enough
(above 2,500° Kelvin) to cause signifi-
cant ionization of the air by the thermal
radiation (§ 10.04). After this period,
beta radiation from the radioactive
debris within the fireball may sustain the
ionization level for up to 3 or 4 minutes.
Thus, the fireball region will be suffi-
ciently ionized to absorb electromagne-
tic signals for a period of at least 10
seconds and possible for as long as 3 or
4 minutes; however, the spatial extent
of the ionization will be small.
10.35 The fireball will be spherical
in shape initially. After a few seconds,
as the hot fireball rises upward
buoyantly (§2.129), it will take the
form of a torus. The torus, having lost
its luminous qualities, will coalesce into
a flattened cloud shape. The transition
from a fireball or torus to a debris cloud
is indefinite, but at late enough times—
after a few minutes—the fireball as such
will cease to exist, and only a cloud of
radioactive debris will remain. This
cloud will reach a final stabilization al-
titude in about 5 minutes. It will then be
spread by whatever winds prevail at that
altitude range. Typically, the average
spreading velocity is about 35 feet per
second.
10.36 The atmosphere surrounding
the fireball will be ionized by prompt
neutrons and by prompt gamma radia-
tion, but the free electrons thus formed
will persist less than a second. The air
will also be ionized by the delayed ra-
diation emitted continuously from the
radioactive debris within the fireball.
Close to the fireball, the continuous
emission from the adjacent gamma-ray
source will result in a high electron
density in spite of the fairly rapid remo-
val of electrons by attachment of air
particles at the low altitudes under con-
sideration. Thus, for detonations below
10 miles, there will be a region sur-
rounding the fireball which will absorb
IONIZATION PRODUCED BY NUCLEAR EXPLOSIONS
471
electromagnetic waves appreciably for
tens of seconds. This effect will be neg-
ligible for most radiofrequency systems,
but it may be significant for radars with
highly directional beams that pass fairly
near (in addition to those passing
through) the fireball.
10.37 In the atmosphere around the
region referred to above, the electron
density will be much lower because the
gamma rays are somewhat attentuated
by the air, and the electrons that are
formed are removed rapidly by attach-
ment. Hence, the number of free elec-
trons is not expected to be as large,
neither will they be as widely distrib-
uted, as in the region around the fireball
for bursts at higher altitudes (§ 10.43 et
seq.). Refraction of radar signals
(§ 10.118) and clutter (§ 10.120) may
then be more significant than absorp-
tion. These effects are also important if
the signals pass through or near the stem
or cloud of a burst that is sufficiently low
for debris from the surface to be carried
aloft.
10.38 The D-region is not affected
to any great extent by prompt radiation
from nuclear explosions below 10
miles, since the burst is below the stop-
ping altitude for X rays, neutrons, and
gamma rays (Table 10.29). Ionization in
the D-region may be increased, how-
ever, by delayed radiation, if the radio-
active debris is carried upward by the
rising fireball above 15 miles, the stop-
ping altitude for gamma radiation.
There may be additional ionization due
to beta particles if the debris rises as
high as 35 miles, but this is expected
only for weapons of large yield (see Fig.
10.158c).
10.39 Ionization in the E- and F-
regions is not changed significantly by
radiation from a nuclear explosion
below 10 miles, except possibly by the
rising debris from a high-yield burst (cf.
§ 10.41). However, perturbations in the
refractive properties of the F-region
have been noted following explosions in
this altitude regime. Traveling distur-
bances (§ 10.26) that move outward in
the E- and lower F-regions appear to
result from the initial blast wave.
DETONATIONS AT 10 TO 40 MILES
ALTITUDE
10.40 If the explosion occurs in the
altitude regime of roughly 10 to 40
miles, thermal energy radiated as X rays
will be deposited in the vicinity of the
burst, as at lower altitudes, with sub-
sequent reradiation to form the familiar
fireball. Ionization by debris ions or by
beta particles within the fireball may
sustain the electron density after the
temperature has fallen to the 2,500°
Kelvin required for significant thermal
ionization by air. The fireball region will
be ionized to high levels—more than 107
electrons per cubic centimeter—for a
period of at least 30 seconds and possi-
bly for longer than 3 minutes. The spa-
tial extent of the ionization will be larger
than for detonations at the lower altitude
considered previously.
10.41 The fireball will be spherical
in shape initially, with the transition
from sphere to torus occurring later than
for bursts at lower altitudes. Further-
more, the debris, most of which is car-
ried upward by the hot, rising fireball,
may reach considerably greater heights.
Multimegaton weapons detonated near
the upper limit of the 10 to 40 miles
altitude regime will begin to exhibit the
effects of an initial ballistic impulse,
472
RADIO AND RADAR EFFECTS
caused by pressure gradients across the
large vertical diameter of the fireball
(§ 2.129). As the fireball and debris rise
into thinner air, they continue to ex-
pand. The ballistically rising fireball can
reach altitudes far above the detonation
point. Because of the rapid upward mo-
tion of the fireball and the decrease in
atmospheric density with altitude, the
density of the fireball may be greater
than that of the surrounding atmosphere.
Overshoot then occurs, and after reach-
ing maximum altitude, the fireball de-
scends until it encounters air of density
comparable to its own.
10.42 When the cloud of debris
stabilizes in altitude, its horizontal
spread will be influenced by diffusion
and by the prevailing winds. A spread-
ing velocity of 165 feet per second is a
reasonable estimate for debris at alti-
tudes between about 50 and 125 miles;
the spread is, however, more complex
than is implied by such an assumption of
a uniform expansion.
10.43 For bursts in the 10 to 40
miles altitude regime, the X rays are
largely confined within the fireball,
especially at the lower altitudes. Even
though the prompt gamma rays carry
only a small proportion of the explosion
energy (§ 10.138), they will cause ion-
ization in the surrounding air for a very
short time. However, the main source of
prompt ionization in the surrounding air
(and also in the D-region for detonations
above 15 miles) appears to be the fast
neutrons. There are three important in-
teraction processes of such neutrons
with atomic nuclei in the atmosphere
which can lead to ionization; they are
absorption, inelastic scattering, and
elastic scattering (see Chapter VIII).
The amount of absorption is small for
fast neutrons and the inelastic scattering
gamma rays are spread over a large
volume, so that the resulting electron
density is low. Most of the neutron-in-
duced (prompt) ionization arises from
elastic scattering of the neutrons. The
nuclei that recoil from the scattering
process have sufficient energy to pro-
duce ionization by interaction with at-
mospheric atoms and molecules.
10.44 The persistent ionization in
the air is caused mainly, however, by
delayed gamma radiation. Most of the
beta particles from the radioactive
debris are absorbed within the fireball,
but the gamma rays can travel great
distances when the debris is above their
stopping altitude (15 miles). The size of
the ionized region surrounding the fire-
ball can then be quite large. Calculation
of the electron densities is fairly com-
plicated since it depends on the attenua-
tion of the gamma rays by the atmos-
phere and the electron loss mechanisms
which change with altitude.
10.45 Ionization in the D-region
from delayed gamma rays and beta par-
ticles will be much more important for
detonations in the 10 to 40 miles altitude
regime than for those below 10 miles. If
the debris attains an altitude above 15
miles, the delayed gamma rays can
reach the D-region and produce ioniza-
tion there. When the debris is below 35
miles, the stopping altitude for beta
particles, the energy of these particles is
deposited close to or within the debris
cloud. The ionization is thus restricted
to this region.
10.46 For the beta particles to cause
ionization in the D-region, the debris
must be above 35 miles. Because of
their electric charge, the spread of the
beta particles is largely prevented by the
IONIZATION PRODUCED BY NUCLEAR EXPLOSIONS
473
BETA PARTICLES
GAMMA
RAYS
GEOMAGNETIC
FIELD LINES
BETA-PARTICLE
AND GAMMA-RAY
IONIZATION
DEBRIS
EARTH
GAMMA-RAY
IONIZATION
Figure 10.47. Location of beta and gamma ionization regions when the debris from an
explosion in the northern hemisphere is above 40 miles altitude.
BETA PARTICLES
BETA- PARTICLE
IONIZATION
GEOMAGNETIC
•• EQUATOR.-./
earth’s magnetic (geomagnetic) field.
The area over which the beta particles
produce ionization in the D-region is
thus essentially the same as the area of
the debris when its initial expansion has
ceased.
10.47 If the debris rises above 40
miles, the beta particles will travel back
and forth along the geomagnetic field
lines. They will then cause ionization in
the local D-region and also in the mag-
netic conjugate region in the opposite
hemisphere of the earth (Fig. 10.47). If
the radioactive debris is uniformly dis-
tributed over a horizontal plane, the
electron density in the D-region due to
the beta particles will be about the same
in both hemispheres. In practice, at-
mospheric winds and turbulence and
geomagnetic anomalies cause the distri-
bution of the debris to be nonuniform,
but a uniform distribution is generally
assumed for estimating electron densi-
ties resulting from nuclear explosions.
10.48 Unlike the beta particles, the
gamma rays are not affected by the
geomagnetic field and they can therefore
spread in all directions. If the debris
rises above 40 miles, the delayed
gammas can produce ionization over a
large area in the D-region. The ioniza-
tion is not restricted by the tube of
magnetic field lines containing the
debris, as is that from the beta particles.
The D-region ionization caused by the
delayed gamma rays is thus more ex-
tensive in area although usually less
intense than that due to the beta par-
ticles.
10.49 Since the beta particles are
largely prevented from spreading by the
geomagnetic field, the ionization they
produce (in the D-region) is not greatly
affected by the altitude to which the
radioactive debris rises, provided it is
above 40 miles. For the accompanying
gamma radiation, however, the inten-
sity, and hence the associated ioniza-
tion, decreases the higher the altitude of
the debris above the D-region. The areal
474
RADIO AND RADAR EFFECTS
extent increases at the same time.
Gamma-ray ionization in the magnetic
conjugate region will be much smaller
and will arise from such debris ions as
have traveled along the geomagnetic
field lines and reached the vicinity of the
D-region in the other terrestrial hemi-
sphere (§§ 2.141, 10.64).
10.50 There are two other sources
of ionization in the conjugate region,
namely, Compton electrons and neu-
trons. Gamma rays lose part of their
energy in the atmosphere by Compton
scattering (§ 8.89). If the Compton
electrons are formed above about 40
miles, they will either deposit their en-
ergy (and cause ionization) locally in the
D-region or be guided by the geomag-
netic field to the conjugate region. Since
delayed gamma rays are spread over a
fairly large volume when the radioactive
debris is above about 15 miles, Comp-
ton electrons can produce widespread
ionization. The space affected is larger
than that in which beta particles cause
ionization in both conjugate regions.
Although the ionization from Compton
electrons in the magnetic conjugate re-
gion is not large, the effects on the
propagation of electromagnetic waves,
especially those of lower frequencies,
can be important.
10.51 Many of the neutrons pro-
duced in a nuclear explosion above 15
miles will travel upward, escaping to
high altitudes. Since neutrons are not
affected by the geomagnetic field, they
spread over a large region. A free neu-
tron disintegrates spontaneously, with a
half-life of about 12 minutes, into a
proton and an electron (beta particle).
The latter will be trapped by the geo-
magnetic field lines and will produce
ionization in the D-region after follow-
ing a field line into the atmosphere,
either in the vicinity of the explosion or
at the magnetic conjugate. The ioniza-
tion levels produced by neutrons in this
manner are low, but they have been
detected at distances of several thousand
miles from the burst point. From the
times at which the effects were ob-
served, they could hhve been caused
only by neutrons.
10.52 Thermal X rays begin to
escape from the fireball for detonations
in the upper portion of the 10 to 40 miles
altitude regime and can cause appreci-
able ionization in the E-region above the
burst point. Ionization in the E- and
F-regions will be perturbed by traveling
disturbances to a greater extent from
detonations in this altitude regime than
from explosions of similar yield below
10 miles. A high-yield detonation near
40 miles altitude may produce a region
of severe electron density depletion
(§ 10.71 et seq.). Fireballs rising above
65 miles and beta particles escaping
from fission debris above 40 miles also
increase the electron density in the E-
and F-regions.
DETONATIONS AT 40 TO 65 MILES
ALTITUDE
10.53 X rays ionize a region of
considerable extent around a detonation
in the 40 to 65 miles regime. The
mechanism of fireball formation
changes appreciably in this range
(§ 2.130 et seq.), since at 65 miles the
X-ray stopping altitude has been ex-
ceeded, and the radiations can spread
very widely. Starting at about 50 miles
altitude, the interaction of the expanding
weapon debris with the atmosphere be-
comes the dominant mechanism pro-
IONIZATION PRODUCED BY NUCLEAR EXPLOSIONS
475
ducing a fireball. Above about 50 miles,
the geomagnetic field will influence the
location and distribution of the late time
fireball, as will be seen shortly. The 40
to 65 miles altitude regime is also a
transitional one for deionization mecha-
nisms in the fireball, and for the dy-
namic motion of the rising fireball.
10.54 Above about 40 miles, the
temperature of the fireball is no longer
the governing factor in ionization. The
electron density changes only in ac-
cordance with the increase in volume of
the fireball, thus causing a wider dis-
tribution of the free electrons in space.
Recombination of electrons with posi-
tive atomic ions, produced by the high
temperatures in the fireball, is the main
removal process. This is, however,
much slower than the recombination
with molecular ions which predominates
in the normal D- and E-regions. Elec-
tron densities greater than 108 elec-
trons/cm3 can then persist for tens of
seconds, resulting in significant attenu-
ation and refraction of electromagnetic
waves. The persistence depends on how
rapidly the fireball volume increases and
on the detailed chemistry of the fireball
gases.
10.55 For explosions of high and
moderately high yields at altitudes near
the upper limit of the regime under
consideration, the fireball may rise to
heights of hundreds of miles (see Figs.
10.158b and c). At these heights, the
fireball and debris regions will be af-
fected by the geomagnetic field lines
(§ 10.63 et seq.). For smaller yields, the
fireball generally rises buoyantly and
smoothly to a nominal stabilization alti-
tude, with no overshoot (Fig. 10.158a).
A spreading velocity of 165 feet per
second is frequently used to make rough
estimates of debris motion for stabiliza-
tion altitudes between 50 and 125 miles.
If more than a rough estimate is re-
quired, upper-altitude wind information
must be used to calculate the spreading
velocity.
10.56 The region identified for
lower altitude bursts as that around the
fireball now merges into the D-, and E-,
and F-regions. Hence, it will not be
discussed separately here or in the next
section which is concerned with deto-
nations above 65 miles altitude.
10.57 The D-region is more widely
influenced by prompt radiation from
detonations above 40 miles than from
detonations below that altitude, since
both X rays and neutrons have longer
penetration distances at the higher alti-
tudes. For detonations above 40 miles,
X rays produce essentially all the
prompt ionization in the D-region. As
indicated in § 10.43, fast neutrons are
apparently the main source of prompt
ionization in this region for detonations
at somewhat lower altitudes.
10.58 Continuing ionization of the
D-region by delayed gamma rays and
beta particles is of major importance
when the burst altitude is between 40
and 65 miles. The situation is similar to
that described in § 10.47 for the case in
which the debris rises to a height of
more than 40 miles. The beta-particle
ionization is restricted to areas, in the
D-regions of both hemispheres of the
earth, which are each roughly equal to
the area of the debris. The delayed
gamma rays spread in all directions,
however, and the ionization in the D-
region near the burst point is conse-
quently more extensive in area but is
less intense than that due to the beta
particles. The upward motion of the
4Л6
RADIO AND RADAR EFFECTS
debris can allow the gamma rays to
irradiate areas of the D-region several
hundred miles in radius. It is apparent
that the electron densities resulting from
such widespread irradiation will gener-
ally be low.
10.59 Compton electrons from de-
layed gamma rays and beta particles
formed by the spontaneous disintegra-
tion of neutrons can cause widespread,
although relatively weak, ionization in
the D-region near the burst point and
also at its magnetic conjugate. The gen-
eral effects are similar to those described
in §§ 10.50 and 10.51 for nuclear deto-
nations at lower altitude.
10.60 Detonations above 40 miles,
and particularly those above 50 or 55
miles, will irradiate the E-region ex-
tensively with X rays. Consequently,
there will be prompt ionization, with the
usual fairly long E-region recovery
time, in addition to that caused by the
continuing radiations from the radioac-
tive debris. Ionization effects in the E-
region, similar to sporadic-E (§ 10.12),
have been noted following detonations
above 40 miles.
10.61 Strong F-region distur-
bances, involving an initial increase
followed by a decrease in electron den-
sity, were observed over an area of more
than a thousand miles in radius for many
hours after the TEAK megaton-range
burst at about 48 miles altitude (§ 2.52).
The proposed explanation for these dis-
turbances is given in § 10.71 et seq.
There also appeared to be an effect sim-
ilar to spread-F (§ 10.12) which ended
at sunrise, and some tilting of the nor-
mal ionospheric stratification which al-
tered the path of reflected radio signals.
Similar but less severe effects were
noted after subsequent high-altitude ex-
plosions.
DETONATIONS ABOVE 65 MILES
10.62 The mechanisms of fireball
formation and growth continue to
change as the detonation altitude in-
creases above 65 miles. At these alti-
tudes, X rays travel great distances in
the very low-density atmosphere and do
not produce a normal fireball. Below
about 190 miles, depending on the
weapon yield, the energy initially ap-
pearing as the high outward velocity of
debris particles will still be deposited
within a fairly short distance. This re-
sults in the formation of a heated and
ionized region. The apparent size of this
so-called “fireball” region may depend
on the manner in which it is viewed.
The optical (or radiating) fireball may
not coincide with the radar fireball, i.e.,
the region affecting radar signals, and
the fireball boundary may not be well
defined. Because of the large dimen-
sions, times of the order of a few sec-
onds may be required before the initial
motion of the debris is reduced signifi-
cantly.
10.63 The geomagnetic field plays
an increasingly important role in con-
trolling debris motion as the detonation
altitude increases. Above about 300
miles, where the density of the atmos-
phere is very low, the geomagnetic field
is the dominant factor slowing the out-
ward expansion of the weapon debris.
This debris is initially highly ionized
and is consequently a good electrical
conductor. As it expands, it pushes the
geomagnetic field out ahead of it, and
the magnetic pressure caused by the
deformation of the field can slow down
IONIZATION PRODUCED BY NUCLEAR EXPLOSIONS
477
and stop the debris expansion. The
debris may expand hundreds of miles
radially before being stopped by the
magnetic pressure. The problem of the
expansion of ionized debris against a
magnetic field is quite complex. Insta-
bilities in the interface between the ex-
panding debris and the geomagnetic
field can cause jetting of debris across
field lines, and some debris can escape
to great distances.
10.64 Debris initially directed
downward will be stopped by the denser
air below the burst point at an altitude of
about 70 miles, whereas upward-di-
rected debris travels for long distances.
If, in being stopped by the atmosphere,
the downward-directed debris heats and
ionizes the air, that heated region will
subsequently rise and expand. Some
upward-directed, ionized debris will
follow geomagnetic field lines and will
reach the conjugate region in the other
hemisphere of the earth.
10.65 The geomagnetic field will
also play an important role in determin-
ing the continued growth and location of
the ionized region once it has formed.
Expansion along the field lines can con-
tinue after expansion across the field has
stopped. Arcs (or tubes) of charged
particles, mainly beta particles, may be
formed, extending from one hemisphere
to the other. Ionization will then occur
in the upper atmosphere in each con-
jugate region. This may happen even for
detonations below 65 miles if the fire-
ball is still highly ionized after it reaches
altitudes of a few hundred miles.
10.66 Within the fireball, the rap-
idly moving debris ions cause ionization
of the air; each such ion can ionize
many air molecules and atoms before
losing its kinetic energy. Because of the
reduced air density above 65 miles, the
initial ionization within the fireball is
less than for detonations at lower alti-
tudes. However, if expansion is largely
along the geomagnetic field lines, de-
crease in electron density due to volume
expansion may be relatively slow. Di-
mensions across the geomagnetic field
are typically a few hundred miles after a
few minutes.
10.67 As stated in § 10.54, electron
recombination with positive atomic ions
will proceed slowly, and electron den-
sities in the fireball high enough to pro-
duce attenuation of radar signals may
last up to a few minutes. Electron den-
sities sufficient to affect electromagnetic
signals of lower frequency may persist
much longer. The formation, location,
and extent of the ionized regions are
dependent both on weapon characteris-
tics and atmospheric composition and
are difficult to predict.
10.68 Apart from the ionization
within the fireball region due to the
kinetic energy of the debris ions, the
radioactive debris causes ionization (in
the D-region), after the initial expansion
has ceased. This ionization results from
the emission of beta particles and de-
layed gamma rays. Hence, the location
of the debris after the initial expansion is
important.
10.69 Neutrons and X rays travel-
ing downward from a burst above about
65 miles altitude will irradiate large
areas of the D-region. Some widespread
ionization of low intensity will also be
caused by the decay of neutrons in the
earth’s magnetic field, as described in
§ 10.51.
10.70 The debris that is initially di-
rected upward or jets across the field
lines will be in a position to release beta
478
RADIO AND RADAR EFFECTS
particles in locations and directions
suitable for trapping in the earth's mag-
netic field. These particles, traveling
back and forth along the field lines and
drifting eastward in longitude around
the earth, will spread within a few hours
to form a shell of high-energy beta par-
ticles, i.e., electrons, completely
around the earth (§ 2.147).
INDIRECT EFFECTS OF
HIGH-ALTITUDE EXPLOSIONS
10.71 The electron density in the E-
and F-regions of the ionosphere may be
changed by effects associated with a
nuclear explosion other than direct ion-
ization. The most important of these
effects are hydrodynamic (shock) and
hydromagnetic disturbances (see
§ 10.26 footnote) and changes in air
chemistry. As the shock wave from the
detonation propagates through the at-
mosphere, the air in a given region ex-
periences first a compression phase and
then a suction phase (§ 3.04). During
the compression phase, the density of
the air, and hence of the electrons pres-
ent, increases because of the decrease in
volume. However, the combined effect
of heating by compression and of ex-
pansion of the air during the suction
phase may be a decrease in the electron
density below the normal value.
10.72 The TEAK high-altitude shot
produced a shock wave which propa-
gated for several hundred miles from the
burst point. As the shock passed a par-
ticular location, the electron densities in
the E- and F-regions first increased and
then decreased well below normal until
local sunrise (§ 10.61). Changes in the
chemistry of the atmosphere may have
been partly responsible for the decrease
in electron density.
10.73 As the shock wave slows
down, it eventually becomes an acoustic
(or sound) wave, often called a gravity
acoustic wave because it is propagated
in a medium (the atmosphere) whose
density variation is determined by grav-
ity. Acoustic waves travel thousands of
miles from the burst point and can cause
perturbations in the E- and F-regions at
great distances. These perturbations are
evidently hydromagnetic in nature,
since the electron densities, which are
difficult to calculate, are apparently de-
pendent on the direction of propagation
of the acoustic waves relative to the
local geomagnetic field lines.
10.74 As well as causing ioniza-
tion, X rays from a nuclear explosion,
like gamma rays, can produce excited
states (§ 8.23) of atoms and molecules
of the air in the E- and F-regions. These
excited neutral particles can undergo
chemical reactions which affect electron
densities. If the detonation altitude is
above about 200 miles, the resulting
changes can be widespread and may last
for several hours. The moderate de-
crease in electron density in the F-
region, observed out to more than 600
miles from the burst point after the
STARFISH PRIME event (1.4 mega-
tons at 250 miles altitude), has been
attributed to changes in air chemistry
caused by X rays.
EFFECTS ON RADIO AND RADAR SIGNALS
479
EFFECTS ON RADIO AND RADAR SIGNALS
SIGNAL DEGRADATION
10.75 Nuclear explosions can de-
grade, i.e., attenuate, distort, or inter-
fere with, signals from radar, commun-
ication, navigation, and other systems
employing electromagnetic waves pro-
pagated through the atmosphere. In
general, systems that depend on the
normal ionosphere for propagation by
reflection or scattering, as will be de-
scribed in due course, can be affected
over large areas for periods ranging
from minutes to hours following a single
burst at high altitude. Electromagnetic
waves that pass through the ionosphere,
but do not rely on it for propagation,
e.g., satellite communication and some
radar systems, can also be affected, but
usually only over localized regions and
for periods of seconds to minutes. Sys-
tems which use waves that propagate
below the ionosphere, along lines-of-
sight between ground stations or be-
tween ground stations and aircraft, will
not, in general, experience signal deg-
radation.
10.76 The signal strength required
for acceptable systems performance is
usually given in terms of a signal-to-
noise ratio. The term “noise” refers to
random signals that may originate
within the receiver itself or may arise
from external sources, usually thunder-
storms and other electrical disturbances
in the atmosphere. Nuclear explosions
can also generate noise. When the sig-
nal-to-noise ratio falls below a mini-
mum acceptable level, system degrada-
tion occurs in the form of increased
error rate, e.g., symbol or word errors
for communications systems and false
or missed targets for radars. As the
result of a nuclear explosion, the sig-
nal-to-noise ratio may be decreased by
attenuation of the signal strength or by
increase in noise (or by both).
10.77 Detailed analysis of system
performance requires consideration of
many factors. These include the follow-
ing: the geographic and geomagnetic
locations of the burst point and of the
propagation paths; time variations of the
electromagnetic transmission properties
along these paths, i.e., propagation
channel characteristics; the effect of
these characteristics on the desired sig-
nal, on noise generated within the re-
ceiver, and on undesired signals reach-
ing the receiver; the signal processing
used; the system mission; and criteria of
system performance.
SIGNAL ATTENUATION
10.78 Absorption of energy from
the electromagnetic waves is the major
source of signal attenuation following
the detonation of a nuclear weapon. In
general, the absorption produced by a
certain electron density is related inver-
sely to the square of the wave frequency
(§ 10.130); hence, absorption is more
important for low- than for high-
frequency systems that use the ionos-
phere for long-range transmission. The
extent of absorption depends strongly on
the location of the transmission path
relative to the burst point and to the time
after the burst. Shortly after the explo-
sion, absorption may be so intense that
there is a blackout and communication
is impossible. This will be followed by a
480
RADIO AND RADAR EFFECTS
period of reduced system performance
before fairly normal conditions are res-
tored. The duration of the blackout,
particularly for systems operating below
about 30 megahertz, is generally long in
comparison with that of reduced per-
formance. Absorption may also affect
received noise levels if the noise reaches
the receiver via the ionosphere.
10.79 When the electron densities
are decreased by the effects of a nuclear
explosion, signal attenuation, especially
in the frequency range between 3 and 30
megahertz, can result from loss of re-
flection (due to refraction) from the E-
and F-region. Signals which would nor-
mally reach the receiver by reflection
from the ionosphere may then be only
weakly refracted so that they continue
into space.
NOISE
10.80 Two noise sources from a
nuclear detonation are thermal radiation
from the fireball and synchrotron radia-
tion from beta particles traveling along
the geomagnetic field lines. The fireball
may remain at temperatures above
1,000° Kelvin for a few hundred sec-
onds and may produce considerable
noise if the antenna is pointed at the
fireball. Thermal noise generally will be
significant only for systems with low
(internal) receiver noise. The actual
noise received will depend on the prop-
erties of the fireball, e.g., whether or not
it is absorbing at the frequency of inter-
est, the amount of attenuation outside
the fireball, and the directivity of the
receiving antenna.
10.81 Beta particles spiraling along
the geomagnetic field lines radiate elec-
tromagnetic energy in the form of what
is known as “synchrotron radiation.”
This covers a range of frequencies, but
is much more intense at low than at high
frequencies. Synchrotron radiation
picked up by an antenna will produce
noise in the receiver. However, the
noise level is relatively weak and is not
significant except for very sensitive,
low-frequency systems with the antenna
beam at right angles to the geomagnetic
field lines.
PHASE EFFECTS
10.82 In free space, the phase ve-
locity of an electromagnetic wave, i.e.,
the rate of propagation of a plane of
constant phase, is equal to the velocity
of light in a vacuum. In an ionized
medium, however, the phase velocity
exceeds the velocity of light by an
amount which depends on the frequency
of the wave and the electron density of
the medium. If an electromagnetic sig-
nal traverses a region that has become
ionized by a nuclear detonation, it will
consequently suffer phase changes. A
communication system that uses phase
information will thus be affected. Fur-
thermore, because the phase velocity
varies with the wave frequency, a signal
consisting of waves of several frequen-
cies, as is commonly the case, will be
distorted because the phase relationships
between the waves will be changed.
10.83 If the propagation path passes
through regions of varying electron
densities, that is to say, if the electron
densities encountered by the signal vary
with time, a frequency shift (Doppler
shift) occurs. For wide-band communi-
cations systems there may then be in-
terference between adjacent channels.
EFFECTS ON RADIO AND RADAR SIGNALS
481
As a result, the effective (or useful)
bandwidth would be decreased.
10.84 Although the phase velocity
of electromagnetic waves is greater in
an ionized medium than in free space,
the group velocity, i.e., the velocity
with which the signal energy is trans-
mitted, is less than the velocity of light.
The group velocity is also dependent on
the wave frequency and the electron
density of the medium. A signal passing
through an ionized region thus suffers
frequency-dependent time delays as
compared with propagation through free
space. This will cause various errors in
radar systems, as will be seen in
§ 10.119.
REFRACTION AND SCATTERING
EFFECTS
10.85 The phase change of an elec-
tromagnetic wave in an ionized medium
is related to the refractive index of the
wave in this medium (§ 10.125). The
index of refraction in free space is unity,
but in an ionized region it is less than
unity by an amount that increases with
the electron density, for waves of a
given frequency. As a result, the direc-
tion of propagation of an electromagne-
tic wave is changed in passing from free
space, i.e., the nonionized (or very
weakly ionized) atmosphere, into a re-
gion of significant ionization. This is the
basis of the refraction (or bending) of
electromagnetic waves by an ionized
medium described in § 10.08. The wave
is always bent away from the region of
lower refractive index (higher electron
density) toward that of higher refractive
index (lower electron density).
10.86 If an electromagnetic wave is
propagated through a region of increas-
ing electron density, i.e., of decreasing
refractive index, the continued refrac-
tion may cause the wave to return to the
region of low electron density from
which it originally came. The wave is
then said to be reflected. By increasing
the electron density in the ionosphere, a
nuclear detonation will change the re-
flection altitude of electromagnetic
waves coming from the earth. Thus,
systems that rely on reflection from the
ionosphere for long-range communica-
tions can be adversely affected by the
detonation. Even if reflected signals are
not normally used, unwanted reflected
signals may cause interference with the
desired direct signals.
10.87 When an electromagnetic
wave encounters patches (or blobs) of
irregular ionization, successive refrac-
tions may lead to more-or-less random
changes in the direction of propagation.
This is referred to as “scattering.” The
term “forward scattering” is used when
the propagation after scattering is in the
same general direction as before scat-
tering. If the electromagnetic wave is
scattered toward the location from
which it came, the effect is described as
“backscattering.”
10.88 Reflection and scattering of
electromagnetic waves from ionized re-
gions produced by a nuclear explosion
can result in abnormal propagation paths
between transmitter and receiver of a
radio system. Multipath interference,
which occurs when a desired signal
reaches the receiver after traversing two
or more separate paths, produces fading
and signal distortion. Interfering sig-
nals, due to anomalous propagation
from other radio transmitters, can in-
crease noise levels to such an extent that
the desired signal might be masked. In
482
radar systems, changes in the propaga-
tion direction due to refraction can cause
angular errors. Moreover, if a radar
signal is scattered back to the receiver, it
can mask desired target returns or, de-
pending on the characteristics of the
scattering medium, it may generate a
false target (§ 10.120 et seq.).
RADIO COMMUNICATIONS SYSTEMS
10.89 The general category of radio
systems of interest includes those in
which electromagnetic waves are re-
flected or scattered from the troposphere
(§ 9.126) or the ionosphere. Such sys-
tems are used primarily for long-dis-
tance communications; however, other
uses, e.g., over-the-horizon radars, also
fall in this category.
10.90 Detailed analysis of com-
munications systems, even for the nor-
mal atmosphere, is difficult and depends
largely on the use of empirical data.
Measurements made during nuclear
tests have shown that both degradation
and enhancement of signals can occur.
The limited information available,
however, has been obtained in tests for
RADIO AND RADAR EFFECTS
weapon yields and detonation altitudes
which were not necessarily those that
would maximize the effects on com-
munications systems.
10.91 It is convenient to discuss
radio system effects in accordance with
the conventional division of the radio-
frequency spectrum into decades of fre-
quency ranges. These ranges, with as-
sociated frequencies and wavelengths,
are given in Table 10.91. Radar sys-
tems, which normally employ the fre-
quency range of VHF or higher, are
treated separately in § 10.114 et seq.
VERY-LOW-FREQUENCY RANGE (3 to
30 kHz)
10.92 The frequencies in the VLF
band are low enough for fewer than 100
free electrons/cm3 to cause reflection of
the signal (§ 10.20). The bottom of the
ionosphere thus effectively acts as a
sharp boundary which is not penetrated,
and the electromagnetic radiation is
confined between the earth and the ion-
osphere by repeated reflections. The re-
sulting “sky wave,” as it is called, may
be regarded as traveling along a duct (or
Table 10.91
RADIOFREQUENCY SPECTRUM
Name of Range
Frequency Range* Wavelength Range
Very Low Frequency VLF 3-30 kHz ЮМО6 cm
Low Frequency LF 30-300 kHz lOMO5 cm
Medium Frequency MF 300-3,000 kHz Ю5-1О4 cm
High Frequency HF 3-30 MHz 104-103 cm
Very High Frequency VHF 30-300 MHz 103-102 cm
Ultra High Frequency UHF 300-3,000 MHz 102-10 cm
Super High Frequency SHF 3-30 GHz 10- 1 cm
Extremely High Frequency EHF 30-300 GHz 10- 1 mm
*The abbreviation kHz, MHz, and GHz refer to kilohertz (103 cycles/sec), megahertz (106 cycles/ sec),
and gigahertz (109 cycles/sec), respectively.
EFFECTS ON RADIO AND RADAR SIGNALS
483
guide) whose boundaries are the earth
and that level in the atmosphere at
which the electron density is about 100
electrons per cubic centimeter. There is
also a “ground wave” whereby the sig-
nal is transmitted along the surface of
the earth and tends to follow its curva-
ture. Global VLF broadcast communi-
cations and maritime and aerial naviga-
tion systems use the long propagation
distances that are possible because
ground wave attenuation is relatively
low and the sky wave is reflected at the
bottom of the ionosphere with little ab-
sorption.
10.93 The major effect of nuclear
detonations is to cause ionization i.e.,
an increase in electron density, which
may lower the ionospheric reflection al-
titude. Theoretical analyses and experi-
mental data indicate that the major con-
sequences are phase anomalies and
changes in signal strength and in the
noise from distant thunderstorms. These
effects are expected to persist longer in
the daytime than at night because of the
slower decay of the electron density,
assuming the same weapon yield and
burst altitude.
10.94 Phase changes may be large
and rapid, e.g., 1,000 degrees or so
within a millisecond, and they are fol-
lowed by a slow recovery of a few
degrees per second. Such phase changes
may be significant for navigation, syn-
chronous communications, and phase
modulation systems. VLF systems
operating over short, medium, or long
distances can be affected by the phase
changes that result from the ionization
produced by a nuclear explosion.
10.95 On paths of medium length,
where both ground and sky waves are
received, the change in phase of the sky
wave may result in mutual interference
of the two signals. There will then be a
reduction in the strength of the pro-
cessed signal. Over relatively short
transmission paths, when only the
ground wave is normally used, the
change in reflection altitude may cause
the sky wave to be received. This may
enhance or interfere with the ground
wave, according to circumstances. For
long-distance VLF communications,
when only the sky wave is important, a
nuclear explosion can cause large phase
changes even at a distance. Thus, after
the TEAK and ORANGE high-altitude
shots (§ 2.52), the 18.6-kilohertz signal
transmitted from the Naval Radio Sta-
tion at Seattle, Washington, to Cam-
bridge, Massachusetts, suffered an
abrupt phase shift. The entire path was
at least 3,000 miles from the burst
points.
10.96 Distant thunderstorms pro-
duce some atmospheric noise in the
VLF band, the noise level depending on
the ionospheric reflection height.
Hence, a change in this height can affect
the signal-to-noise ratio. The system
degradation or improvement following a
nuclear detonation will depend on the
relative geographic locations of the sig-
nal source, the noise source, the ioniza-
tion produced, and the propagation
path. Reduction of the signal-to-noise
ratio appears to be significant primarily
for long transmission paths with ionos-
pheric reflection. A single high-altitude
explosion or multiple explosions which
produce ionization affecting appreciable
portions of a propagation path will result
in maximum degradation.
484
RADIO AND RADAR EFFECTS
LOW-FREQUENCY RANGE (30 TO 300
kHz)
10.97 As the electromagnetic wave
frequency is increased above 30 kilo-
hertz, the normal ionosphere behaves
much less as a sharp boundary. The
wave penetrates several miles before
being reflected back toward the earth.
The altitude to which the wave pene-
trates and the attenuation normally ex-
perienced depend strongly on the mag-
nitude and the rate of vertical change,
i.e., the gradient, of electron density at
the bottom of the ionosphere. Reflection
extends the useful range of propagation,
particularly at night when ionization in
the lower D-region is normally absent.
Attenuation of the sky wave increases in
the daytime, especially for the higher
frequencies because of their greater
penetration. Although ground waves are
commonly used for LF transmissions,
sky waves often provide acceptable sig-
nals a few thousand miles from the
transmitting station.
10.98 Ionization from nuclear ex-
plosions will generally not degrade the
performance of LF systems which nor-
mally depend only on the ground wave
unless the change in reflection altitude
causes the sky wave to be received. As
with VLF, this may enhance or interfere
with the ground wave according to the
circumstances; however, reception of
the sky wave is less likely for LF than
for VLF. Systems which rely on sky-
wave propagation may experience at-
tenuation lasting from a few minutes to
several hours. For a given yield and
burst height, the duration of the distur-
bance may be expected to be greatest in
the daytime. The most severe attenua-
tion appears to occur for long paths,
when ionization produced by the deto-
nation affects appreciable portions of the
propagation path. Furthermore, large
phase shifts can occur.
MEDIUM-FREQUENCY RANGE
(300kHz TO 3 MHz)
10.99 Normal propagation in the
MF band is characterized by large at-
tenuation of sky waves in the daytime,
limiting communication at such times to
ground waves. Increase of ionization in
the D-region from high-altitude nuclear
explosions will cause further attenuation
of MF sky waves, and propagation may
be limited to the ground wave during
both day and night. In regions near the
burst (or its magnetic conjugate) the sky
wave may be blacked out for hours.
Since atmospheric noise propagated by
the ionosphere is a principal source of
interference, absorption in the D-region
may improve ground-wave reception for
some paths. However, the limiting sig-
nal-to-noise ratio is determined pri-
marily by local thunderstorm activity.
Reduction of noise from distant thun-
derstorms will thus not improve mar-
ginal reception.
HIGH-FREQUENCY RANGE (3 TO 30
MHz)
10.100 The HF band is used ex-
tensively for long-range communica-
tions; the frequencies are high enough to
permit transmission of information at a
rapid rate and yet are sufficiently low to
be reflected by the ionosphere. The sig-
nals are propagated from the transmitter
to a receiver by successive reflections
from the E- or F-region and the surface
of the earth. Electromagnetic waves
EFFECTS ON RADIO AND RADAR SIGNALS
485
with frequencies toward the lower end
of the HF range are normally reflected
from the E-region of the ionosphere
after suffering some attenuation by ab-
sorption in the D-region. Reflection at
the upper end of the range requires
higher electron densities and occurs
from the F-region (§ 10.135).
10.101 If a nuclear explosion in-
creases the electron density in the D-
region above its usual maximum value
of about 103 electrons/cm3, signal atten-
uation by absorption will be increased.
Furthermore, the increase in electron
density may lower the reflection altitude
and thus change the propagation path of
the signal. Communications (and other)
systems using the HF range can thus be
seriously degraded. Disturbances re-
sulting from an increase in the D-region
electron density will persist longer in the
daytime than at night, but decreases in
the E- and F-regions may reverse the
situation (§ 10.105).
10.102 Both prompt and delayed
radiations from a nuclear burst can pro-
duce sufficient ionization to cause
blackout of HF signals, lasting from a
few seconds to several hours. The re-
covery time depends, among other
things, on the weapon yield and the
detonation altitude. The period during
which the system is degraded is greater
for lower than for higher frequencies,
because a higher electron density is re-
quired in the latter case, and it increases
with the number of times the propaga-
tion path traverses the region of en-
hanced ionization.
10.103 The effect of prompt radia-
tion is greatest for high-altitude explo-
sions. Thus, a megaton burst at a height
of 200 miles in the daytime would be
expected to disrupt HF systems out to a
distance of about 1,500 miles from the
burst point. Recovery would require
from a few hundred to a few thousand
seconds, depending on the explosion
yield, the signal frequency, and the
number of traversals of the D-region
made by the electromagnetic wave in its
successive reflections from transmitter
to receiver.
10.104 The signal degradation due
to delayed radiations also varies with the
explosion yield and altitude. For weap-
ons detonated at low altitudes, in which
the radioactive residues do not rise
above 15 miles, the effects on HF sys-
tems will generally be small, except for
propagation paths close to the burst
point. If the debris reaches an altitude
above 15 miles but below about 35 to 40
miles, the D-region above the debris
will be ionized by delayed gamma rays
and possibly by beta particles (§ 10.46).
Should the debris rise above 40 miles,
the beta particles will cause ionization
both in the burst region and in the mag-
netic conjugate region. In the low-alti-
tude detonation of weapons of large
yield, the debris may rise above 15
miles and significant attenuation of HF
signals can occur for propagation paths
within several hundred miles of the
burst point. For high-altitude detonation
of such weapons, blackout may persist
for many hours over regions thousands
of miles in diameter. Even kiloton-yield
detonations at very high altitudes may
cause daytime blackout of HF systems
over considerable areas for periods of
minutes to tens of minutes.
10.105 Nuclear explosions may
also affect HF communications by a
decrease in the electron density in the E-
and F-regions which changes their re-
flection characteristics. Following the
486
RADIO AND RADAR EFFECTS
TEAK shot (in the D-region), the max-
imum usable frequency for long-dis-
tance communication was reduced over
an area some thousands of miles in ra-
dius for a period lasting from shortly
after midnight until sunrise (cf.
§ 10.72). Such severe changes in the
reflection properties of the ionosphere
were not noted, however, during the
FISHBOWL high-altitude test series
(§ 2.52). Nevertheless, electron deple-
tion in the E- and F-regions is expected
to be a significant degradation factor
following large-yield detonations above
about 65 miles during the nighttime.
Restoration of the normal electron den-
sity following a daytime explosion of
the same type should occur more rap-
idly.
10.106 For three events at the
highest altitudes in the FISHBOWL
series, a number of new propagation
modes were noted; in some cases the
use of exceptionally high frequencies,
well into the VHF range, became possi-
ble. When such modes were in exis-
tence, in addition to the normal modes,
considerable multipath propagation was
experienced. The usefulness of the new
modes depends markedly on the relative
geometry of the transmitter and re-
ceiver, and on the reflection mechanism.
10.107 It is important to mention
that, although HF communications can
be degraded seriously by a nuclear ex-
plosion at high altitude, radio systems
operating in this band may still be able
to perform substantial portions of their
mission in some circumstances. It is by
no means certain, for example, that HF
systems will be blacked out completely
if the transmission path is at some dis-
tance from the burst point.
VERY-HIGH-FREQUENCY RANGE (30
TO 300 MHz)
10.108 Signals in the VHF range
penetrate the normal ionosphere and
escape from the earth. Consequently,
this frequency range is primarily used
for line-of-sight communications over
short distances, e.g., commercial tele-
vision channels and FM radio, but
long-range communication is possible
by making use of the small amount of
transmitted energy that is scattered back
to earth in a forward direction by
patches of unusually intense ionization.
Forward propagation ionospheric scatter
(FPIS) systems are inefficient, since
only a minute fraction of the energy of
the transmitter reaches the receiver, but
they make additional portions of the
electromagnetic spectrum available for
fairly reliable communication between
ground stations at distances up to 1,500
miles apart.
10.109 Normally, VHF signals
scatter from ionization irregularities
caused by meteor trails or by turbulence
in the upper part of the D-region. Since
scattering from meteor trails occurs at
altitudes of about 60 miles or more, the
propagation path must traverse the re-
gion of maximum absorption (around 40
miles altitude) caused by delayed
gamma and beta radiations from a nu-
clear burst. Meteor-scatter circuits nor-
mally operate with fairly small signal
margins, and so absorption effects can
be important.
10.110 Signals in FPIS systems
scattered from irregularities in electron
density caused by turbulence may be
enhanced by the increased ionization
from a nuclear explosion. However,
absorption will reduce the signal return
EFFECTS ON RADIO AND RADAR SIGNALS
487
from normal scatter heights to negligible
magnitudes for only a short period of
time. New propagation modes, pro-
duced by reflection from increased ion-
ization in the F-region or by fireball
ionization, can cause a multipath condi-
tion which will reduce the effective cir-
cuit bandwidth. Following the KING-
FISH event (submegaton yield in the
E-region), the Midway-to-Kauai ionos-
pheric-scatter circuit in the Pacific was
required to operate on a reduced band-
width for 21 minutes. Pacific FPIS sys-
tems also experienced about 30 seconds
of blackout following the STARFISH
PRIME test (§ 10.74).
10.111 Line-of-sight propagation
traversing the D-region, e.g., satellite
communications, can be degraded by
absorption due to an increase in electron
density arising from delayed radiation.
The degradation may last for tens of
minutes over regions of hundreds of
miles in radius. Attenuation and signal
distortion caused by fireball regions
above about 60 miles may also affect
communication systems operating in the
VHF band.
ULTRA-HIGH FREQUENCY RANGE
(300 MHz TO 3 GHz)
10.112 In the UHF band (and the
upper part of the VHF band), forward
scattering by neutral molecules and
small particles in the troposphere (below
aboiit 12 miles) is used to extend prop-
agation beyond the line of sight. Weap-
ons detonated above the troposphere are
not expected to affect tropospheric
propagation paths. Bursts at lower alti-
tude may cause degradation for a few
seconds if the fireball rises through the
propagation path. Significant multipath
propagation due to increased ionos-
pheric ionization appears unlikely.
10.113 Line-of-sight propagation
through the ionosphere, such as is used
by UHF satellite links, can be degraded
if the propagation path passes through or
near the fireball. Ionization by delayed
radiation, especially beta particles, can
produce absorption lasting a few min-
utes over regions of from tens of miles
to a few hundred miles in radius. If the
ground-to-satellite propagation path
moves rapidly, the degradation period
will depend primarily on the relative
geometry of the path and the disturbed
region. Wide-band satellite signals can
be degraded by signal distortion.
RADAR SYSTEM EFFECTS (VHF AND
ABOVE)
10.114 Radar systems are similar to
radio communications systems in the
respect that a transmitter and receiver of
electromagnetic waves are used. How-
ever, in radar the receiver is located near
the transmitter and may use the same
antenna, which typically is highly
directional. The transmitted signal,
consisting of a series of pulses, is in part
reflected back to the receiver, like an
echo, by objects in the path of the
pulsed beam. From the direction of the
antenna, the travel time of the signal,
and its speed of propagation, informa-
tion can be obtained concerning the lo-
cation and movement of the source of
the echo. Frequencies normally em-
ployed in this connection are in the VHF
range and above. There is little effect of
ionization on signals of these frequen-
cies provided both the radar and the
target are below the ionosphere.
10.115 If the signal must pass
488
RADIO AND RADAR EFFECTS
through the ionosphere, however, the
interference from nuclear detonations
becomes important. Radar signals tra-
versing the ionosphere will, like radio
signals, be subject to attenuation. Al-
though any additional attenuation is un-
dersirable, the amount which can be
tolerated varies widely with the type of
radar and the purpose of the system. In
search radars, for example, where it is
desired to detect each target at the
greatest possible range, i.e., just as soon
as the target return becomes observable
against the background noise, even the
smallest additional signal loss results
directly in shortening of the range at
which a given target can be detected. A
tracking or guidance radar in a weapon
system, on the other hand, usually takes
over its target, well inside its maximum
detection range, from another (search)
radar which has already detected and
tracked the object. In this case the signal
can be attenuated to a much greater
degree before the radar loses its ability
to acquire or track.
10.116 A large amount of attenua-
tion by absorption occurs when the
propagation path traverses a fireball.
The attenuation is determined by the
properties of the fireball and these are
strongly dependent on altitude. In gen-
eral, it can be said that fireballs will be
opaque to radar signals operating at fre-
quencies of 10 gigahertz (104 mega-
hertz) and below, for periods of tens of
seconds to a few minutes.
10.117 The ionized atmosphere
surrounding the fireball will absorb
radar frequencies below a few giga-
hertz, i.e., a few thousand megahertz,
when the fireball is above about 10
miles. A smaller region adjacent to the
fireball will have the same effect for
detonations at lower altitudes (§ 10.36).
The degree and areal extent of the ab-
sorption can be calculated with reason-
able reliability but lengthy computations
are required.
10.118 Although absorption is gen-
erally the main source of degradation of
radar systems, there are a number of
other mechanisms which may be im-
portant in some cases. For example, the
signal path may be bent by refraction
when the electromagnetic wave tra-
verses a medium in which the electron
density changes along the path length.
As a result, directional errors can occur.
This effect may be significant if the
signal passes close to the fireball, but
outside the region in which absorption
predominates, where the electron gra-
dients are large, or if the signal traverses
the E-region where the electron density
is high and the rate of collision with
other particles is low (§ 10.137).
10.119 The velocity of propagation
of the radar signal that is detected is
equal to the group velocity of the elec-
tromagnetic wave described in § 10.84;
this determines the travel time of the
signal from the transmitter to the target
and back. Changes in the group velocity
as a result of propagation through an
ionized medium will change the signal
travel time and will introduce an error in
estimating the range of the target. Since
the change in the group velocity varies
with the wave frequency, radar systems
using wide bandwidths will have dif-
ferent travel times over the range of
frequencies present in the signal. The
return signals will then arrive at dif-
ferent times, leading to what is called
“dispersion.” The phenomenon is
characteristic of transmission through a
TECHNICAL ASPECTS OF RADIO AND RADAR EFFECTS
489
highly ionized medium and causes sub-
stantial range errors.
10.120 The fireball and the charged
particles in the tube enclosed by the
geomagnetic field lines (§ 10.65) may
reflect or scatter radar waves, thus pro-
ducing spurious signals which may be
confused with target return signals. This
effect, known as “clutter,” may occur
by reflection from rapidly changing gra-
dients of electron density or as back-
scatter from irregular patches of ioniza-
tion or from particulate matter thrown
into the air when a fireball touches the
surface. Clutter returns may be so in-
tense as to affect radars in the same way
that terrain features sometimes cause
difficulties by reflecting energy back to
the receiver thereby masking weak tar-
gets.
10.121 If part of the energy of the
radar pulses returning from a target ex-
periences forward scattering through
small angles, the signals reaching the
receiver will fluctuate both in phase and
amplitude. The resulting effect is re-
ferred to as “scintillation.” The phase
fluctuations are equivalent to fluctua-
tions in the angle of arrival of the sig-
nals, so that the apparent position of the
target will appear to move somewhat
randomly. The amplitude fluctuations
make target identification difficult for
the signal processing system.
SUMMARY OF NUCLEAR
DETONATION EFFECTS
10.122 The general effects of nu-
clear detonations on the various radio-
frequency ranges used in radio and radar
systems are summarized in Table
10.122.
TECHNICAL ASPECTS OF RADIO AND RADAR EFFECTS3
DENSITY OF THE ATMOSPHERE AND
ALTITUDE
10.123 The decrease in density of
the atmosphere with increasing altitude
can be represented approximately by the
equation
p (h) ~ pQe~h/Hp g cm-3, (10.123.1)
where p (A) and p0 are the densities, in
g/cm3 at height h and at sea level, re-
spectively, and Hp is called the scale
height; h and Я must be expressed in
the same units of length, e.g., miles.
Because both temperature and composi-
tion of the air change with altitude, the
scale height is not actually a constant.
However, below about 60 miles, use of
a constant density scale height of 4.3
miles in equation (10.123.1) gives a
fairly good representation of the change
in atmospheric density with altitude. For
higher altitudes the density scale height
increases, i.e., the density varies more
slowly with altitude, but since altitudes
below 60 miles are of primary interest
for the present purpose, the simple ex-
ponential relationships with constant
scale height will be employed.
’The remaining sections of this chapter may be omitted without loss of continuity.
о
о
EFFECTS OF NUCLEAR DETONATIONS ON RADIO AND RADAR SYSTEMS
Table 10.122
Frequency Band Degradation Mechanism Spatial Extent and Duration of Effects* Comments
VLF Phase changes, amplitude changes Hundreds to thousands of miles; minutes to hours Ground wave not affected, lowering of sky wave reflection height causes rapid phase change with slow recovery. Significant amplitude degradation of sky wave modes possible
LF Absorption of sky waves, defocusing Hundreds to thousands of miles; minutes to hours Ground wave not affected, effects sensitive to relative geometry of burst and propagation path
MF Absorption of sky waves, defocusing Hundreds to thousands of miles; minutes to hours Ground wave not affected
HF Absorption of sky waves, loss of support for F-region reflection, multipath interference Hundreds to thousands of miles, burst region and conjugate; minutes to hours Daytime absorption larger than nighttime, F-region disturbances may result in new modes, multipath interference
VHF Absorption, multipath interference, or false targets resulting from resolved multipath radar signals Few miles to hundreds of miles; minutes to tens of minutes Fireball and D-region absorption, FPIS circuits may experience attenuation or multipath interference
UHF Absorption Few miles to tens of miles; seconds to few minutes Only important for line-of-sight propagation through highly ionized regions
*The magnitudes of spatial extent and duration are sensitive functions of detonation altitude and weapon yield.
RADIO AND RADAR EFFECTS
TECHNICAL ASPECTS OF RADIO AND RADAR EFFECTS
491
10.124 By setting H in equation
(10.123.1) equal to 4.3 miles, the result
is
p(A)« p0<r"43 (10.124.1)
and this expression, with h in miles, will
be used later. If the base of the exponent
is changed from e to 10, where
e ~ 10’2 3, then
p (Л) « ро1О~л/4 3 * 2 3 « p010-^°.
It follows, therefore, that in the altitude
range of interest, the density of the at-
mosphere decreases approximately by a
factor of 10 for every 10 miles increase
in altitude. Thus, at an altitude of 40
miles the air density is about IO-4 and at
60 miles roughly 10~6 of the sea-level
density.
ATTENUATION AND REFRACTION OF
ELECTROMAGNETIC WAVES
10.125 The propagation of electro-
magnetic waves of a given frequency
through a medium can be described in
terms of a “complex” index of refrac-
tion, consisting of a real part and an
imaginary part. The real part is a phase
factor which determines the phase shift
and ordinary index of refraction, i.e.,
the ratio of the phase velocity of the
electromagnetic waves in a vacuum to
that in the given medium. The imagi-
nary part, on the other hand, is related to
the attenuation of the waves by absorp-
tion in the medium. From the equations
of motion of electromagnetic waves, it
is possible to derive expressions for the
index of refraction and for the attenua-
tion in an ionized medium. Appropriate
forms of these expressions are given and
discussed below, with special reference
to the effects of nuclear explosions on
the ionization of the atmosphere.
10.126 Attenuation of electromag-
netic (and other) signals is commonly
stated in terms of decibels; thus,
p
Attenuation in decibels = 10 log
1 out
where Pin is the signal power (or
strength) before attenuation and Pout is
that after attenuation. An attenuation of
10 decibels implies that the signal
strength has been reduced to IO-1, 20
decibels to 10-2, 30 decibels to 10-3,
and so on, of the original strength. A
decrease of 20 to 40 decibels, depending
on the original signal power and the
noise level, will generally result in
serious degradation of communications.
As a rough guide, it may be taken that
an attenuation of 30 decibels will reduce
substantially the effectiveness of a radio
or radar system.
10.127 From the theory of the
propagation of electromagnetic waves
through an ionized medium, it is found
that the signal attenuation, a, in decibels
per mile of travel path, is given by
a = 7.4 x 10⁴ ——
co2 4- v2
decibels per mile, (10.127.1)
where N is the electron density, i.e.,
number of electrons per cubic centime-
ter, v is the number of collisions per
second which an electron makes with
ions, molecules, or atoms, and co is the
(angular) frequency of the wave (in ra-
dians per second). It follows from
equation (10.127.1) that if the collision
frequency v is small then, for a given
wave frequency, a will be small because
of the v in the numerator. On the other
492
RADIO AND RADAR EFFECTS
hand, if v is very large, a will again be
small because of the v2 in the denomi-
nator. Thus, the attenuation passes
through a maximum for a particular
value of the electron collision fre-
quency.
10.128 Since the collision fre-
quency is proportional to the density of
the air, it will decrease exponentially
with altitude. It is to be expected,
therefore, that the values of v for which
attenuation of signals is important
would occur only within a relatively
narrow altitude region. Theoretical
studies show that the attenuation of
radio and radar signals caused by nu-
clear explosions occurs mainly within a
10-mile range centered about an altitude
of 40 miles. Hence, by confining atten-
tion to the situation in the neighborhood
of a 40 mile altitude, it is possible to
avoid complexities and yet present a
reasonably accurate picture of the ef-
fects of the burst on electromagnetic
signals.
10.129 There are two exceptions to
the foregoing generalizations: (1) atten-
uation within or close to the fireball or
debris regions, and (2) nighttime atten-
uation by ionization resulting from
prompt radiation. In the former case, the
altitude of the region of maximum at-
tenuation is governed by the altitude and
size of the fireball or debris region. In
the second case, the altitude of peak
attenuation is about 55 miles, but since
the electron density due to delayed ra-
diation is dominant at night after only a
few seconds, the prompt ionization can
be ignored. The present treatment will,
therefore, be mainly concerned with the
10-mile range of the atmosphere cen-
tered at an altitude of 40 miles.
10.130 For electromagnetic wave
frequencies greater than about 10 me-
gahertz, v2 at an altitude of 40 miles
may be neglected in comparison with co2
in the denominater of equation
(10.127.1); this equation then reduces
to
Nv
a « 7.4xlO4 —e— decibels per mile,
co2
(10.130.1)
so that the attenuation (in decibels) is
approximately proportional to the elec-
tron collision frequency. At 40 miles
altitude, the latter is roughly 2 x 10⁷
per second. Upon inserting this value
for v in equation (10.130.1) and con-
verting the wave frequency from radians
per second to megahertz, the result is
IO’2
N
~r-
decibels per mik,
a ~ 4 x
where f is the wave frequency in mega-
hertz, i.e., 10-6o)/2tt. If the signal beam
has an angle of incidence i, referred to
the vertical, and the ionized region is 10
miles thick, the total attenuation, A, is
0.4
TV
7*
sec i decibels, (10.130.2)
for frequencies greater than about 10
megahertz.
10.131 The collision frequency
used above is for electron collisions
with neutral particles, since these pre-
dominate at 40 miles altitude. For elec-
tron densities greater than about 109
electrons/cm3, collisions of electrons
with ions can be important, particularly
within a fireball at or above 60 miles
altitude, where the neutral particle den-
sity is low and electron-neutral collision
frequencies are small. But for attenua-
TECHNICAL ASPECTS OF RADIO AND RADAR EFFECTS
493
tion of electromagnetic signals in the
D-region at some distance from the
fireball, equation (10.130.2) is applica-
ble.
10.132 For operational HF circuits,
the value of sec i is about 5 under
normal conditions. It follows then from
equation (10.130.2) that, for a fre-
quency of 10 megahertz, a 10-mile thick
layer with an electron density of about
1.5 x 10³ electrons/cm3 at 40 miles al-
titude will produce 30 decibels of signal
attenuation. For a frequency of 30 me-
gahertz, the same attenuation will result
from an electron density of about
1.4 x 10⁴ electrons/cm3. These electron
densities may be taken as indicative of
the values required to degrade HF sys-
tems. Since radars usually operate at
frequencies greater than 30 megahertz
and sec i generally will be less than 5,
densities exceeding 105 electrons/cm3
are necessary to cause serious attenua-
tion when the signals pass through the
D-region of the ionosphere.
10.133 Consideration will now be
given to the phase aspects of the propa-
gation of electromagnetic waves
through an ionized medium. Provided
the electron collision frequency, v, is
small in comparison with the wave fre-
quency, co, as has been assumed above,
the ordinary (real) index of refraction,
и, is given by
/ . 4ttN e2\,/2
n = I 1 — --------c— I
I wco2 у
(10“12N e2 \ 1/2
1 _ , (10.133.1)
it mf2 I
where e is the charge (4.8 x 10"10
electrostatic unit) and m is the mass
(9.1 x 10~28 gram) of the electron, and
f is the wave frequency in megahertz?
Upon inserting the numerical values for
e and m, it is found that
n
0.8 7V \ i/2
104/ J
Since electron densities are not known
very accurately, this result may be ap-
proximated to
(10.133.2)
10.134 If an electromagnetic wave
crosses a plane interface where the
index of refraction changes sharply from
1 to и, a beam will be bent by an amount
given by the familiar Snell’s law, i.e.,
sin i
—— = 77 >
sin r
where i is the angle of incidence and r
the angle of refraction. If the index of
refraction is such that n = sin z, then
sin r = 1, i.e., r = 90°, and critical
reflection occurs; the refraction is so
large that the signal is unable to pene-
trate the medium. The condition for
critical reflection by an ionized medium
is obtained by setting n in equation
(10.133.2) equal to sin z; the result ob-
tained is
f ~ 10"2y/Ne sec z
(for critical reflection). (10.134.1)
For reflection of an electromagnetic sig-
nal encountering a given ionized me-
dium, with electron density TV, the fre-
quency must be less than that expressed
by equation (10.134.1). Alternatively,
for reflection of a signal of specified
494
RADIO AND RADAR EFFECTS
frequency /, the electron density of the
ionized medium must be greater than
that given by this equation.4
10.135 As in § 10.132, sec i may
be taken to be about 5 for an operational
HF system. Hence, for a signal of 5
megahertz, at the lower end of the band,
to be reflected, the electron density must
exceed 104 electrons/cm3. For a fre-
quency of 30 megahertz, the minimum
density for reflection is 3.6 x IO5 elec-
trons/cm3. These densities are normally
attained in the E- and F-regions of the
ionosphere, respectively. A change in
the electron density arising from the
effects of a nuclear explosion can alter
the altitude at which an electromagnetic
wave is reflected and can consequently
affect communications systems, as seen
earlier in this chapter.
10.136 Equation (10.134.1) is ap-
plicable only when a nonionized me-
dium is separated from an ionized one
by a sharp boundary at which the change
in refractive index, from 1 to n, occurs
over a distance small in comparison to a
wavelength at the propagating fre-
quency. This condition does not exist
either in the normal ionosphere or after
it has been disturbed by a nuclear deto-
nation. The refractive index does not
change sharply and there is a gradual
bending of the transmitted wave. In
such situations, both the electron den-
sity and its gradient determine the phase
(refraction) effects.
10.137 When the quantity Nc/f2 is
sufficiently large, electromagnetic
waves can be both attenuated and re-
fracted by the ionized medium. The ef-
fect that predominates depends on the
ratio of the electron density gradient to
the electron collision frequency. If this
ratio is large, then the wave will be
refracted, but if it is small the main
effect will be attenuation. In most cir-
cumstances associated with a nuclear
explosion, attenuation around 40 miles
altitude predominates. At altitudes
above about 60 miles, however, where
the collision frequency is small and the
electron density gradient moderately
large, refraction may be important.
Also, near the fireball but outside the
absorbing region, refraction of electro-
magnetic waves up to high frequencies,
such as radar signals, is possible
(§ 10.37). Although the collision fre-
quency is large, the high electron den-
sity gradient is here the dominant factor.
Within the fireball itself, however,
electromagnetic waves are always
strongly absorbed.
ELECTRON PRODUCTION BY
PROMPT RADIATIONS
10.138 Consider a nuclear explo-
sion of W kilotons yield and let к be the
fraction of the yield radiated at a partic-
ular energy, i.e., as monochromatic ra-
diation. For a point source of such radi-
ation, assuming negligible scattering
and no reradiation, the energy deposited
(or absorbed) per unit volume of air, ED,
4Thc quantity 1O?\/N. megahertz or, more exactly, (4тг/УД/т)4 radians per second, is called the
“critical frequency" or “plasma frequency" of an ionized medium, i.e., a plasma. It is the frequency for
which the index of refraction of the given medium is zero. It is also the lowest frequency of an
electromagnetic wave that can penetrate into (he medium, and (hen only for normal incidence, i.e., for
; — n
TECHNICAL ASPECTS OF RADIO AND RADAR EFFECTS
495
at an “observation” point at a slant
distance D from the explosion is
„ kW -p-M
E = ------- ой e m
(10.138.1)
where p is the air density at the obser-
vation altitude, |лт is the mass (energy)
absorption coefficient in air of the given
radiation,5 and M is the penetration
mass, i.e., the mass of air per unit area
between the radiation source and the
observation point. This equation may be
used for all forms of prompt radiation,
using the appropriate value of к given in
Table 10.138. The fraction of the en-
ergy radiated as prompt gamma rays is
small and its contribution to the electron
density is generally less than the for
other radiations. If the energy deposited
in the air is reradiated or if the source
photons or neutrons are scattered and
follow a random path before depositing
all their energy, equation (10.138.1)
must be modified (§ 10.142).
Table 10.138
FRACTION OF EXPLOSION ENERGY
AS PROMPT RADIATIONS
pairs, i.e., 3 x 10⁴ electrons, are pro-
duced for each million electron volts of
energy absorbed in air (about 34 elec-
tron volts are required to produce an ion
pair). Consequently, about 8 x 1029
electrons are produced for each kiloton
of energy deposited in the air. Hence,
the number of free electrons per unit
volume, N, is obtained from equation
(10.138.1), with W in kilotons, as
N = 2.4 x lOis
e
kW — |л M ,
— e cm-5 , (Ю.139.1)
with p in grams per cubic centimeter, |лт
in square centimeters per gram, M in
grams per square centimeter, and D in
miles.
10.140 An expression for Mmay be
obtained in the following manner. Let
HQ (Fig. 10.140) be the altitude of the
explosion point and Я that of the obser-
vation point which is at a distance D
from the burst. Then if D' represents
any position between the explosion and
the observation point, and h is the cor-
responding altitude, the value of M in
appropriate units is given by
Radiation к
X rays 0.7
Gamma rays 0.003
Neutrons 0.01
p(D')dD'
D
H - Ho
p(h)dh ,
10.139 According to Table 1.45, 1
kiloton TNT equivalent of energy is
equal to 2.6 x 1025 million electron
volts. Furthermore, about 3 x 10⁴ ions
where, in deriving the second form, the
curvature of the earth has been neg-
lected. If p(/i) is now represented by
sThe mass absorption coefficient is similar to the mass attenuation coefficient defined in § 8.100,
except that it involves the energy absorption coefficient, referred to in the footnote to equation (8.95.1).
496
RADIO AND RADAR EFFECTS
equation (10.124.1), it is found that
M = 6.8 x 10⁵ D
Г7 Г70
Po
-H/4.3 - -Я/4.3 1
e ° e I g cm~2
(10.140.1)
where £>, H, and Ho are in miles and p0
in grams per cubic centimeter; the factor
6.8 x 10⁵, which is the density scale
height in centimeters (slightly less than
4.3 miles), is introduced to obtain
required units (g/cm2) for M.
the
Figure 10.140. Quantities used in defining
the penetration mass (M).
10.141 In general, the energy ra-
diated from a nuclear explosion as
gamma rays and X rays is not mono-
chromatic but covers a range of photon
energies. Hence, integration over the
energy spectrum is necessary. For the
range in which most of the gamma-ray
energy is radiated, the mass absorption
coefficient of air, can be considered
to be constant. But this is not the case
for X-ray photons (of lower energy) for
which the mass absorption coefficient is
approximately inversely proportional to
the cube of the energy. Furthermore, the
situation is complicated as a result of
energy changes that occur when the
photons are scattered. For neutrons, the
highest electron densities arise from
elastic scattering (§ 10.43) and the ne-
cessity for summing over multiple scat-
tering angles makes the calculations
difficult, especially in an (inhomogen-
eous) atmosphere of changing density.
10.142 Allowance for the effects of
scattering and of the energy spectrum of
the radiation can be made approximately
by modifying equation (10.139.1) to
take the form
kW
Ne « 2.4 x 101* pF(M) cm-’ ,
(10.142.1)
where F (M) is an effective mass ab-
sorption coefficient which is a function
of the penetration mass, M. Values of
F (A4)/k, where к is a normalization
factor that permits F (M) for various
radiations to be plotted on a single dia-
gram, are given in Fig. 10.142. The
values of к used are shown in the insert.
10.143 The electron densities pro-
duced by the total prompt radiation
(neutrons and X rays) are obtained by
summing the contributions of the indi-
vidual radiations as given by the appro-
priate forms of equation (10.142.1). In
this manner, the curves in Fig. 10.143
for electron densities at a height of 40
miles as a function of horizontal dis-
tance6 were derived for a 1-megaton
6 The term “horizontal distance,” as used here and later, refers to the distance parallel to the earth's
surface.
TECHNICAL ASPECTS OF RADIO AND RADAR EFFECTS
497
О
PENETRATION MASS, M (GRAMS/CM )
Figure 10.142. Values of F (M) for various radiation sources.
explosion at various altitudes. Since the
electron density is proportional to the
energy yield, W9 of the weapon, the
results for other yields can be readily
obtained from Fig. 10.143. In comput-
ing M for this figure, the effects of a
curved earth and a variable density scale
height were included. The calculations
show that below about 40 miles, ion-
ization due to neutrons predominates,
but for nuclear detonations at higher
altitudes the X rays produce essentially
all the additional electrons from prompt
ionization in the D-region.
10.144 It is seen from Fig. 10.143
that at low burst altitudes, up to about
20 miles, the ionization from prompt
radiation is relatively small except at
short distances. At higher burst alti-
tudes, not only does the electron density
(at 40 miles altitude) for a given hori-
zontal distance increase, but the range
for a given electron density, especially
above 105 electrons/cm3, increases
markedly. These densities are sufficient
to cause blackout of HF systems that use
the sky wave for long-distance propa-
gation. However, it will be seen
(§ 10.152) that the blackout would be of
relatively short duration.
498
RADIO AND RADAR EFFECTS
The curves in Fig. 10.143 show the
initial electron densities at 40 miles al-
titude produced by the prompt radiation
from a 1-megaton explosion as a func-
tion of distance, for various burst alti-
tudes.
Scaling. For any specified combi-
nation of burst height and distance, the
initial electron density at 40 miles alti-
tude is directly proportional to the yield
in megatons, i.e.,
N(W) = WNe (1 MT),
where N (1 MT) is the value of the
initial electron density at 40 miles alti-
tude and the desired distance from a 1
MT explosion at the desired altitude,
and N(W) is the corresponding initial
electron density for W MT.
Example:
Given: A 500 KT detonation at an
altitude of (a) 20 miles, (b) 60 miles.
Find: In each case, the horizontal
distance at an altitude of 40 miles at
which the initial electron density from
prompt radiations is 105 electrons/cm3 or
more.
Solution: The corresponding elec-
tron density for 1 MT is
N(W) 105
N (1 MT) = — = —
1V11J w 0 5
= 2 x 10⁵ electrons/cm3 .
From Fig. 10.143, the prompt radia-
tion from a 1 MT explosion will produce
initial electron densities of 2 x 10⁵
electrons per cubic centimeter at an al-
titude of 40 miles
(a) to a horizontal range of about
190 miles, if burst is at an altitude of 20
miles. Answer.
(b) to a horizontal range of about
550 miles, if burst is at an altitude of 60
miles. Answer.
ELECTRON DENSITY (ELECTRONS/CM
HORIZONTAL DISTANCE (MILES)
Figure 10.143. Initial electron density at 40-miles altitude produced by prompt radiation
from a 1-megaton explosion, as a function of distance (miles), for various
burst altitudes.
TECHNICAL ASPECTS OF RADIO AND RADAR EFFECTS 499
500
RADIO AND RADAR EFFECTS
RATE OF DISAPPEARANCE OF FREE
ELECTRONS PRODUCED BY PROMPT
RADIATION
10.145 Free electrons are removed
either by attachment to neutral particles
(usually molecular oxygen in the D-
region) or by recombination with posi-
tive ions. The electron loss by recom-
bination is proportional to the number
densities of electrons, Ne, and of posi-
tive ions, N+, so that
= -a,NN (10.145.1)
dt d + e
where ad is the recombination coeffi-
cient. Below an altitude of about 60
miles, ad is approximately 2 x 10⁻⁷ cm3
sec-’.
10.146 Electron loss by attachment
to molecular oxygen is proportional to
the square of the atmospheric density
and the number density of electrons;
thus,
= -[3p2N , (10.146.1)
where £ is an attachment coefficient
approximately equal to 4 x 10’3 cm6g-2
sec-1. The quantity [Bp2 is often called
the attachment rate coefficient, K\ it
decreases from 6 x 10⁷ sec-1 at sea
level to about 2 x 10⁻³ sec-’ at 55 miles
altitude.
10.147 After electrons are attached
to molecules to form negative ions, they
may become detached by solar radiation
or by collisional processes. The rate of
free electron production by detachment
is proportional to the number density of
negative ions, N_, and the detachment
source strength, i.e.,
= SN , (10.147.1)
dt
where S, the .detachment rate coeffi-
cient, is related to the detachment
source strength. In the daytime, S is
approximately 0.4 sec-1 above about 35
miles altitude. Below about 35 miles the
value of S is uncertain but apparently it
is lower by several orders of magnitude.
At night, detachment is negligible at
altitudes less than about 50 miles.
10.148 Negative ions formed by at-
tachment of electrons to molecular ox-
ygen can also react with positive ions to
form neutral molecules. Since the nega-
tive and positive ion densities affect the
electron density, the ion loss by recom-
bination must be considered. The rate of
positive ion loss by recombination with
negative ions is proportional to the
number densities of both ions; thus,
= a N N , (10.148.1)
dt i - +
where otp usually known as the mutual
neutralization coefficient, is equal to
about 3 x 10⁻⁸ cm3 sec-1 above 30
miles. Below 30 miles, a( is approxi-
mately proportional to the atmospheric
density and is 4 x 10⁻⁶ cm3 sec-1 at sea
level.
ELECTRON DENSITIES FROM
PROMPT RADIATIONS
10.149 The differential equations
describing the time history of electron
and ion densities do not have a closed-
form solution. However, a number of
approximations are available, and nu-
merical solutions have been obtained
with the aid of computers for particular
cases. An approximate solution, which
gives reasonable results for many con-
ditions, is the so-called “equal-alpha"
TECHNICAL ASPECTS OF RADIO AND RADAR EFFECTS
501
approximation. When ad is taken equal
to ap the electron density, Ne(f), as a
function of time following a pulse of
prompt radiation, can be represented by
N(0)
1 4- aN(0)r
N (0 =
S 4- (K + S)t
, (10.149.1)
d 4- A
where N(0) is the initial electron den-
sity, given by equation (10.142.1), a is
an effective recombination coefficient,
and t is the time after the burst.
10.150 Approximate values of a,
S, and К in centimeter-gram-second
units are given in Table 10.150 for an
altitude of 40 miles in the daytime and
55 miles at night. These are the alti-
tudes, for day and night, respectively, at
which maximum attenuation of electro-
magnetic signals is to be expected
(§ 10.129). Upon inserting the appro-
priate values into equation (10.149.1),
the time history of electron density at
the altitude of maximum attenuation is
found to be
Ne(f) at 40 miles ~ -y •
N(0) . /Я r 4
-------e --y— cnr3 (daytime)
1 4- 10-7N(0)r 7
(10.150.1)
for times more than a few seconds after
the burst in the daytime, and
Ne(r) at 55 miles «
N (0) ... , .
----------жг - - cm~3 * S, (nighttime)
1 + 2 x 10⁻⁷N(0)r 6
(10.150.2)
for nighttime conditions.
10.151 Calculations of the decay of
electron densities from ionization pro-
duced by prompt radiations from a nu-
clear detonation have been made with a
computer using numerical solutions that
do not involve the equal-alpha approx-
imation. The results for daytime condi-
tions at a height of 40 miles are shown
in Fig. 10.151; they are reasonably
consistent with equation (10.150.1)
provided the electron density is appre-
ciably larger than the normal value in
the ionosphere. Natural ionization
sources must be considered when the
electron density resulting from prompt
radiation has decayed to values compa-
rable to those normally existing at an
altitude of 40 miles.
10.152 There are two aspects of
Fig. 10.151 that are of special interest.
First, it is seen that when the initial
electron density, N(0), is greater than
107 electrons/cm3, the electron density,
N(0, at any time more than about 1
Table 10.150
APPROXIMATE VALUES OF a, 5, and К IN CGS UNITS
Coefficient
40 Miles
(daytime)
55 Miles
(nighttime)
a io-? 2 x 10⁻⁷
S 0.4 2 x 10 =
К 0.8 2 x 10-'
502
RADIO AND RADAR EFFECTS
The curves in Fig. 10.151 show the
electron density from prompt radiation
at 40 miles altitude in the daytime as a
function of time after burst, for various
values of the initial electron density.
These curves together with those in Fig.
10.143 can be used to estimate the
electron density at 40 miles altitude in
the daytime for various combinations of
explosion yields and burst altitudes.
Example:
Given: A 1 MT explosion in the
daytime at an altitude of 30 miles.
Find: The one-way attenuation of a
100-MHz radar system that would result
from D-region ionization at 30 seconds
after the burst; the radar beam makes an
angle of 80 degrees (sec i ~ 6) with the
vertical and intersects the 40 mile alti-
tude layer at a horizontal distance of 125
miles from the burst.
Solution: From Fig. 10.143, the
initial electron density at a horizontal
distance of 125 miles from a 1 MT
explosion at an altitude of 30 miles is
about 5 x 10⁶ electrons/cm3. From Fig.
10.151, this initial value will have de-
cayed to about 105 electrons/cm3 by 30
seconds after the burst. By use of equa-
tion (10.130.2), the attenuation is
дг 105
A ~ 0.4 sec i = 0.4 x 6
= 24 decibels. Answer.
Note: The attenuation determined
above is due only to prompt radiation.
The effect of delayed radiation should
also be investigated to estimate the
overall effect on the system (§ 10.154 et
seq.).
TECHNICAL ASPECTS OF RADIO AND RADAR EFFECTS
503
ELECTRON DENSITY (ELECTRONS/CM0)
TIME AFTER BURST (SECONDS)
Figure 10.151. Decay of ionization from prompt radiation at 40 miles altitude in the
daytime.
504
RADIO AND RADAR EFFECTS
second after the burst (in daytime) is
independent of the initial value. This
condition is referred to as a “saturated
atmosphere.” It is to be expected from
equation (10.150.1), since when N(0)
is more than 107 * and t is at least a few
seconds, the quantity 10~7N(0)r in the
denominator of the equation is greater
than unity. Hence, the latter can be
neglected and equation (10.150.1) re-
duces to
N (0 ~ — cnr ' ,
f 3 x 10~7r
so that the electron density at time t is
independent of the initial value.
10.153 The other matter of interest
is that, regardless of the initial value,
the electron density in the daytime will
have decreased to 103 electrons/cm3
within an hour (or so). This fact is
apparent from Fig. 10.151 or it can be
derived from equation (10.150.1). It
follows, therefore, that significant deg-
radation of HF or radar systems as the
result of ionization by prompt radiation
will not persist for more than an hour or
so in the daytime. At night, decay is
faster, as is apparent from equation
(10.150.2), and effects on electromag-
netic waves of the prompt radiations can
usually be neglected. As will be seen
later, the effects of the delayed radiation
may persist for longer times.
RATE OF ELECTRON PRODUCTION
BY DELAYED RADIATIONS
10.154 The rate of energy emission
as delayed (beta and gamma) radiation
from the radioactive residues of a nu-
clear explosion, consisting mainly of
fission products but including activity
induced by neutrons in the weapon ma-
terial (§ 9.32), is represented by
It = Z, (1 4- O’’2, (10.154.1)
where I( is the rate of energy emission at
t seconds after the detonation and Z, is
the value after 1 second.7 The total beta
and gamma energy emitted is obtained
(approximately) by integrating between
zero time and infinity; thus,
Total energy
= Z,(l 4- f)~i2dt = 5Z, .
Jo
The fraction of the delayed radiation
energy emited per second at time t is
then
/,(1 + 0~12 = 0 2 (] + f)_l 2
3 7,
10.155 About 7 percent of the fis-
sion explosion energy is radiated as de-
layed beta particles and gamma rays,
with approximately half carried by each
kind of radiation. Hence, for an explo-
sion of WF kilotons fission yield,
roughly 0.007 (1 4- r)-'2 W,,kilotons of
energy per second are radiated by beta
particles and the same amount by
gamma rays.
10.156 The rate of production of
ion pairs (and hence of electrons) by
delayed gamma rays can be estimated
from an expression similar to that used
to determine the electron density arising
from the prompt radiation. Thus, if kW
in equation (10.142.1) is replaced by
0.007 (1 4- r)-1 -2Wf, the result, assum-
7For times that are long in comparison with I second, equation (10.154.1) reduces to the same form as
equation (9.147.1).
TECHNICAL ASPECTS OF RADIO AND RADAR EFFECTS
505
ing a point source for the gamma rays
(cf. § 10.138), is
qy(f) = 1.7 x 10¹⁶
W
D2(T+ r)7"2 P(#)F<M) cm-3 sec-1 ,
(10.156.1)
where qy(t) cnWsec'1 is the electron
production rate at time t seconds after
the nuclear detonation, as observed at a
slant distance D miles at an altitude of H
miles (see Fig. 10.140). The function
F(M) can be obtained from Fig. 10.142
with Mdefined by an equation similar to
equation (10.140.1), except that the
detonation altitude HQ is replaced by the
debris altitude HD.
10.157 The radial motion of the
beta particles is largely prevented by the
geomagnetic field lines. The area of the
D-region at an altitude of 40 miles
where the beta ionization occurs is then
approximately the same as the area of
the debris (Fig. 10.47). If the latter rises
above 40 miles, roughly half of the
energy is deposited in the local D-region
and half at the magnetic conjugate. The
total area over which the beta-particle
energy is deposited is thus twice the
debris area. If the debris is assumed to
be uniformly distributed over an area A,
which may be taken to be тг/?2, where R
is the debris radius, the electron pro-
duction rate from ionization due to beta
particles in each D-region is then
’»<'> -2J X '°” 2Л(1 + .sin Ф
p (J-T)F(M) cm-3 sec"1 ,
(10.157.1)
where cp is the local magnetic dip angle
and A is in square miles. The change in
the numerical factor (by 4тг) arises from
the replacement of the area 4тг£>2 in
equation (10.156.1) by 2A in equation
(10.157.1) and sin <pis required because
of the motion of the beta particles along
the field lines. The function F (M) is
evaluated from Fig. 10.142 for
1 f
M = —— p (fi) dh
sin (p J H
6.8 x 10⁵pn
sin (p
/ -HI43 2
I e —eD l& cm~2 ,
(10.157.2)
where HD is the debris altitude in miles;
in this expression the curvature of the
earth is neglected.
10.158 In order to use equations
(10.156.1) and (10.157.1) it is neces-
sary to know the altitude, HD, and ra-
dius, R, of the weapon debris. Deter-
mination of these quantities requires an
understanding of the processes taking
place as the debris cloud rises and
spreads horizontally. The actual proc-
esses are very complex, but a simple
model which parallels the gross features
of the debris motion has been devel-
oped. The debris height and radius, as
they change with time, for various burst
altitudes as obtained from this model are
shown in Figs. 10.158a, b, and c, for
energy yields of 10 and 100 kilotons and
I megaton, respectively. For interpola-
tion between these yields, Wl/3 scaling
may be used, at least for the first few
minutes after the explosion. The ex-
treme left-hand end of each curve indi-
cates the altitude of the explosion and
the initial size of the fireball. It should
be noted that when using Figs. 10.158a,
b, and c that W is the total energy yield
506
RADIO AND RADAR EFFECTS
RADIUS (MILES)
Figure 10.158a. Fireball/debris altitude and horizontal radius for 10-kiloton explosions at
various altitudes.
of the explosion. For thermonuclear
weapons, the fission yield WF in equa-
tions (10.156.1) and (10.157.1) is gen-
erally taken to be half of the total yield.
ELECTRON DENSITIES FROM
DELAYED RADIATIONS
10.159 The actual electron density,
Ne(f), arising from the delayed radia-
tions at a particular location and time
can be calculated by assuming that,
soon after the detonation, a transient
steady state exists at any instant. The
value of Ne(t) is then obtained by
equating q^(t) or qx(t) at any time Г to the
rate of loss of electrons by various re-
combination and attachment processes.
The curves in Figs. 10.159a and b, for
delayed beta particles and gamma rays,
respectively, were obtained in this gen-
eral manner for an altitude of 40 miles,
where maximum attenuation of electro-
magnetic signals due to ionization from
delayed radiations occurs both during
day and night. In computing the curves,
an accurate treatment for the energy
spectra of the radiations was used to
evaluate the rate of formation of elec-
trons; removal rates were calculated
along the lines indicated in § 10.145 et
seq., with detailed consideration of all
important loss mechanisms. The values
shown in Fig. 10.159a were computed
for a magnetic dip angle of 60°; how-
ever, they provide reasonable estimates
for dip angles between about 45° and
75°, i.e., for mid-latitudes.
(Text continued on page 5 / / )
TECHNICAL ASPECTS OF RADIO AND RADAR EFFECTS
507
RADIUS (MILES)
Figure 10.158b. Fireball/debris altitude and horizontal radius for 100-kiloton explosions at
various altitudes.
RADIUS (MILES)
Figure 10.158c. Fireball/debris altitude and horizontal radius for 1-megaton explosions at
various altitudes.
508
RADIO AND RADAR EFFECTS
The curves in Figs. 10.159a and b
show the electron densities at 40 miles
altitude due to beta particles (for debris
above 40 miles) and delayed gamma
rays (for debris above 15 miles), re-
spectively. Only the attenuation result-
ing from the highest electron density,
which may arise from prompt radiations
(Figs. 10.143 and 10.151), delayed
gamma radiation, or beta particles, need
be considered. The densities, and hence
the attenuations, cannot be addded di-
rectly. Figures 10.158a through c may
be used to estimate the position and size
of the debris for use with Figs. 10.159a
and b. The curves of Fig. 10.159a (for
beta particles) are for a magnetic dip
angle of 60°, but they provide reason-
able estimates for dip angles between
about 45° and 75°. The possible effect of
the earth’s curvature on Fig. 10.159b
(gamma rays) is obtained from Fig.
10.162.
Example:
Given: A 1 MT explosion during the
night at an altitude of 25 miles and a
location in the northern hemisphere
where the magnetic dip angle is 60°.
Find: The electron density in the D-
region at a horizontal distance of 250
miles north of the burst point (a) 5
minutes after the explosion, and (b) 2
hours after the explosion.
Solution: Since it is nighttime, any
prompt ionization will have died away
by the times of interest and can be
neglected (§ 10.153).
(a) Interpolation of Fig. 10.158c
suggests that by 5 minutes the debris
will have reached an altitude (Hd) of
about 60 miles, with a horizontal radius
of about 30 miles. Since the beta par-
ticles follow the geomagnetic field lines,
the ionization they cause at an altitude
of 40 miles (Я) will be centered about a
point that is displaced a distance d hori-
zontally from the center of the debris,
where d is given (approximately) by
d ~ (Hd — Я) tan (p =
(60 - 40) tan 60° = 35 miles.
The radial extent of the ionized region
will be approximately equal to the
debris radius (30 miles). Thus, at 5
minutes after the explosion beta ioniza-
tion will not affect a point that is located
at a horizontal distance of 250 miles
from the burst. Hence, at this time only
the ionization caused by delayed gamma
rays need be considered.
The distance D from the debris to the
point of interest is about 250 miles and
the time is 300 seconds. Since the total
yield is 1 MT, the fission yield, Wp
may be taken to be 500 kilotons; hence,
WF _ 500
Z?2(l + O’2 (250p (301)*.2
8 x 10⁻⁶ .
The debris altitude (60 miles) and the
horizontal distance (250 miles) are such
that the conditions are in Region 1 of
Fig. 10.162, so that Fig. 10.159b is
applicable. The electron density due to
TECHNICAL ASPECTS OF RADIO AND RADAR EFFECTS
509
A (I +/)L2
Figure 10.159a. Electron density at 40-mile altitude due to beta particles (for debris above
40 miles).
io®
2
IO7
- 1 1 1 1 1 1 1 1 1 1 1
- -
- DAYx^ /NIGHT -
- -
- -
1 l_ 1 1 1 1—2 1 1 1 L_ 1 1 1 L 1 1 1
о 10е
CL
q 5
Ш
-J
Ш 2
> ios
(Л 5
2
Ш
° 2
g '°4
О 5
Ш
Ш 2
10s
5
2
Ю2
10 9 2 5 10 8 2 5 I0"7 2 5 IO"6 2 5 IO"S 2 5 Ю"4 2 5 io"3 2 5 IO"2 2 5 10"’ 2 5 I 2 4
Wf
P2(l + /)'-2
Figure 10.159b. Electron density at 40-mile altitude due to delayed gamma rays (for debris
above 15 miles).
510
RADIO AND RADAR EFFECTS
delayed gamma rays is then found to be
103 electrons/cm3. Answer.
(b) At 2 hours after the explosion, the
debris will still be at an altitude of about
60 miles, but interpolation of Fig.
10.158c suggests that it will have spread
to a radius of about 250 miles. Since the
center of the beta ionization will be
displaced about 35 miles farther north,
the point of interest will be contained
within the beta ionized region.8 At that
time, i.e., t = 7200 sec,
_ 500
A(1 + 0» 2 tt(250)2 (7201)< 2
~ 6 x 10⁻⁸ .
The electron density due to beta parti-
cles is found from Fig. 10.159a to be
about 2 x 10³ electrons/cm3. The elec-
tron density from the delayed gamma
rays was estimated above to be 103
electrons/cm3 at 5 minutes after the ex-
plosion, and so it will be much less at 2
hours. Hence, the ionization due to the
gamma rays can be neglected. Answer.
«It is assumed that the debris expands uniformly about a stationary center once it has ceased to rise.
Motion of the debris caused by atmospheric winds introduces many uncertainties in the prediction of
ionization at times more than a few minutes after the burst.
TECHNICAL ASPECTS OF RADIO AND RADAR EFFECTS
511
10.160 The curves in Fig. 10.159a
for the electron density resulting from
ionization by delayed beta particles are
based on the assumption that the debris
has risen above 40 miles. The particle
energy is then equally distributed be-
tween the local D-region and the one at
the magnetic conjugate. The electron
densities given in the figure are those to
be expected at the 40-mile altitude in
each region. If the debris is below 35
miles, the delayed beta particles cause
essentially no ionization in the D-region
(§ 10.45); at altitudes of 35 through 40
miles, the ionization in this region is
intense, but the electron densities are
difficult to calculate. Because beta par-
ticles follow the geomagnetic field lines,
the ionization they produce at any alti-
tude is not affected by the earth’s cur-
vature. Gamma rays, on the other hand,
travel in straight lines and may be so
affected (§ 10.162).
10.161 The stopping altitude for the
delayed gamma rays is about 15 miles;
hence, the results in Fig. 10.159b are
applicable only if the debris rises above
this altitude. The principal source of
error in the figure is that the gamma rays
are assumed to originate from a point
source at the center of the debris cloud.
Since the atmospheric absorption of
gamma rays is negligible above the
stopping altitude, the straight-line path
from the debris to the point of interest in
the D-region (40 miles altitude) can lie
in any direction, provided it does not
pass through the stopping altitude.
10.162 As a consequence of the
curvature of the earth, the path of the
gamma rays, for sufficiently large dis-
tances, may intersect the stopping alti-
tude, even when the debris rises above
15 miles. If this occurs, the energy of
the gamma rays will be largely ab-
sorbed. For the conditions in Region 1
of Fig. 10.162, the straight line from the
debris (center) to the observation point
at 40 miles altitude does not intersect the
stopping altitude for gamma rays, and
the electron densities in Fig. 10.159b
are applicable. But in Region 2, most of
the rays will intersect a volume of air
below the stopping altitude before
reaching the point of interest. As a result
of the gamma-ray absorption, the elec-
tron densities will be substantially
below those given in Fig. 10.159b. In
the intermediate (unshaded) region of
Fig. 10.162, part but not all of the
gamma rays will encounter the stopping
altitude and the electron densities will
be somewhat lower than in Fig.
10.159b. When using this figure to de-
termine the expected effects of a nuclear
explosion on a radar system, for exam-
ple, a conservative approach would be
to assume that the unshaded portion in
Fig. 10.162 is part of Region 1 for the
user’s radar, but that it is part of Region
2 for the opponent’s radar.
10.163 As for prompt radiations (§
10.149 etseq.), an approximate solution
to the problem of calculating electron
densities arising from the delayed radi-
ations, which is consistent with Figs.
10.159a and b, can be obtained by using
the equal alpha approximation to deter-
mine the loss rate at any instant. The
result can be written in the form
N(0 = Vq(0 ,
f Va
____S + y/aq(f)
____ —— - cm ~3
5+^4- \/a?(0
(10.163.1)
where qf^f) is either the value for beta
particles from equation (10.157.1), or
512
RADIO AND RADAR EFFECTS
HORIZONTAL DISTANCE (MILES)
Figure 10.162. Effect of earth’s curvature on delayed gamma-ray ionization at 40 miles
altitude.
for gamma rays from equation
(10.156.1); the coefficients a, S, and К
have the same significance as before. By
using the appropriate values of these
coefficients for different altitudes, it has
been found that the electron densities
peak around an altitude of 40 miles for
both daytime and nighttime conditions
for slant distances more than 30 miles
from the burst point. This is also the
altitude for the maximum attenuation of
electromagnetic signals by the ioniza-
tion from delayed radiations (§ 10.159).
For smaller distances from the burst
point, the electron density peaks near
the altitude of the debris region.
10.164 For electron production
rates less than 106 electrons cnr3 sec"1,
equation (10.163.1), with the values of
a, S, and К given in Table 10.150 for
an altitude of 40 miles in the daytime,
reduces to
Ne (f) at 40 miles
~ 103 cnr3 (daytime).
At night, the values of a, 5, and К at an
altitude of 40 miles are 3 x 10⁻⁸, 0, and
0.8, respectively, and then
Ne(t) at 40 miles
~ q(t) cm-3 (nighttime),
TECHNICAL ASPECTS OF RADIO AND RADAR EFFECTS
513
for production rates less than about 106
electrons cnr3 sec-1. For production
rates of about 107 (or more) electrons
cnr3 sec"1, the electron density at 40
miles is given approximately by
Ne(f) at 40 miles
~ 3 x 10³ y/q(t) cm-3 ,
for both daytime and nighttime. This
result is consistent with Figs. 10.159a
and b, in which the curves for day and
night coincide when the circumstances
are such as to lead to high electron
densities. The conditions of applicabil-
ity of these figures, as described in
§ 10.160 et seq., also apply to the ex-
pressions given above.
BIBLIOGRAPHY
Christofilos, N. C., “The Argus Experi-
ment,” J. Geophys. Res. 64, 869 (1959).
Crain, С. M., “Decay of Ionization Impulses in
the D and E Regions of the Ionosphere,” J.
Geophys. Res., 68, 2167 (1963).
Crain, С. M., “Ionization Loss Rates Below 90
km,” J. Geophys. Res. 65, 1117 (1960).
Crain, С. M., and P. Tamarkin, “A Note on
the Cause of Sudden Ionization Anomalies in
Regions Remote from High-Altitude Nuclear
Bursts,” J. Geophys. Res., 66, 35 (1961).
Cummack, С. H., and G. A. M. King, “Dis-
turbances in the Ionospheric F-Region Follow-
ing a Johnston Island Nuclear Explosion,” New
Zealand J Geol. and Geophys., 2, 634 (1959).
Davis, K., “Ionospheric Radio Propagation,”
National Bureau of Standards, Monograph 80,
April 1965.
Hoeri in, H , “United States High-Altitude Test
Experiences,” University of California, Los
Alamos Scientific Laboratory,” October 1976,
LA—6405.
Journal of Geophysical Research, Special Issue
on the Artificial Radiation Belt, 68, 605 et seq.
(1963).
Knapp, W. S., С. F. Meyer, and P. G. Fisher,
“Introduction to the Effects of Nuclear Explo-
sions on Radio and Radar Propagation,” Gen-
eral Electric Co., TEMPO, December 1967,
DASA-1940.
Latter, R., and R. E. LeLevier, “Detection of
Ionization Effects from Nuclear Explosions in
Space,” J. Geophys. Res., 68, 1643 (1963).
New Zealand Journal of Geology and Geophysics,
Special Nuclear Explosions Issue, 5, 918 etseq.
(1962).
Proceedings of the IEEE, Special Issue on Nuclear
Test Detection, 53, 1813 et seq. (1965).
Samson, C. A., “Radio Noise Anomalies in
August 1958,” J. Geophys. Res., 68, 2719
(1963).
Skolnik, M. L, “Introduction to Radar Sys-
tems,” McGraw-Hill Book Company, 1962.
Steiger, W. R., and S. Matsushita, “Photo-
graphs of the High-Altitude Nuclear Explosion
TEAK,” J. Geophys. Res., 65, 545 (1960).
CHAPTER XI
THE ELECTROMAGNETIC PULSE AND ITS
EFFECTS
ORIGIN AND NATURE OF THE EMP
INTRODUCTION
11.01 Explosions of conventional
high explosives can produce electro-
magnetic signals and so the generation
of an electromagnetic pulse (EMP) from
a nuclear detonation was expected.
However, the extent and potentially
serious nature of EMP effects were not
realized for several years. Attention
slowly began to focus on EMP as a
probable cause of malfunction of elec-
tronic equipment during atmospheric
nuclear tests in the early 1950’s. In-
duced currents and voltages caused un-
expected equipment failures and subse-
quent analysis disclosed the role of EMP
in such failures. Finally, around 1960
the possible vulnerability of various ci-
vilian and military electrical and elec-
tronic systems to EMP was recognized.
At about the same time it became ap-
parent that the EMP could be used in the
long-range detection of nuclear detona-
tions.
11.02 For the foregoing reasons,
theoretical and experimental efforts
have been made to study the EMP and
its effects. A limited amount of data had
been gathered when aboveground test-
514
ing was halted in 1962. Subsequently,
reliance has been placed on under-
ground testing, analysis of existing at-
mospheric test data, nonnuclear simula-
tion, and theoretical calculations.
Extended efforts have been made to im-
prove theoretical models and to develop
associated computer codes for predic-
tive studies. In addition, simulators
have been developed which are capable
of producing representative pulses for
system coupling and response studies.
11.03 Nuclear explosions of all
types — from underground to high alti-
tudes — are accompanied by an EMP,
although the intensity and duration of
the pulse and the area over which it is
effective vary considerably with the lo-
cation of the burst point. The strongest
electric fields are produced near the
burst by explosions at or near the earth’s
surface, but for those at high altitudes
the fields at the earth’s surface are strong
enough to be of concern for electrical
and electronic equipment over a very
much larger area.
11.04 The nuclear EMP is a time-
varying electromagnetic radiation which
increases very rapidly to a peak and then
ORIGIN AND NATURE OF THE EMP
515
decays somewhat more slowly. The ra-
diation has a very broad spectrum of
frequencies, ranging from very low to
several hundred megahertz but mainly
in the radiofrequency (long wavelength)
region (Fig. 1.74). Furthermore, the
wave amplitude (or strength) of the ra-
diation varies widely over this fre-
quency range. Because the EMP is a
very complex phenomenon dependent
upon the conditions of the burst, the
descriptions given in this chapter are
largely qualitative and sometimes over-
simplified. They should, however, pro-
vide a general indication of the origin
and possible effects of the EMP.
DEVELOPMENT OF AN ELECTRIC
FIELD
11.05 The instantaneous (or
prompt) gamma rays emitted in the nu-
clear reactions and those produced by
neutron interactions with weapon resi-
dues or the surrounding medium (Fig.
8.14) are basically responsible for the
processes that give rise to EMP from
bursts in the lower atmosphere. The
gamma rays interact with air molecules
and atoms, mainly by the Compton ef-
fect (§ 8.89), and produce an ionized
region surrounding the burst point (§
8.17). In EMP studies this is called the
“deposition region.” The negatively
charged electrons move outward faster
than the much heavier positively
charged ions and as a result there is
initially a separation of charges. The
region nearer to the burst point has a net
positive charge whereas that farther
away has a net negative charge. This
separation of charges produces an elec-
tric field which can attain its maximum
value in about 10~8 second, i.e., one
hundredth part of a microsecond (§ 1.54
footnote).
11.06 If the explosion occurred in a
perfectly homogeneous (constant den-
sity) atmosphere and the gamma rays
were emitted uniformly in all directions,
the electric field would be radial and
spherically symmetric, i.e., it would
have the same strength in all directions
outward from the center (Fig. 11.06a).
There would then be no electromagnetic
energy radiated from the ionized depos-
ition region. In practice, however, such
an ideal situation does not exist; there is
inevitably some condition, such as dif-
ferences in air density at different levels,
proximity of the earth’s surface, the
nonuniform configuration of the ex-
ploding weapon (including auxiliary
equipment, the case, or the carrying
vehicle), or even variations in the water
vapor content of the air, that will inter-
fere with the symmetry of the ionized,
region. If the burst occurs at or near the
earth’s surface, the departure from
spherical symmetry will clearly be con-
siderable. In all these circumstances,
there is a net vertical electron current
generated within the ionized deposition
region (Fig. 11.06b). The time-varying
current results in the emission of a short
pulse of electromagnetic radiation
which is strongest in directions perpen-
dicular to the current; this is the EMP.
In a high-altitude explosion, the EMP
arises in a somewhat different manner,
as will be seen shortly.
NATURE OF THE EMP
11.07 After reaching its maximum
in an extremely short time, the electric
field strength falls off and becomes quite
small in a few tens of microseconds. In
516
THE ELECTROMAGNETIC PULSE AND ITS EFFECTS
RADIAL
ELECTRIC
(SOURCE)
REGION
Figure 11.06a. Only a symmetric radial electron field is produced if the ionized deposition
region is spherically symmetric; there is no net electron current.
NET
Figure 11.06b. Disturbance of symmetry results in a net electron current; a pulse of
electromagnetic radiation is emitted which is strongest in directions per-
pendicular to the net current.
spite of the short duration of the pulse, it
carries a considerable amount of energy,
especially if the exploding weapon has a
yield in the megaton range. As it travels
away from the burst point at the speed of
light, as do all electromagnetic waves
(§ 1.73), the radiation can be collected
by metallic and other conductors at a
distance, just as radio waves are picked
up by antennas. The energy of the radi-
ation can then be converted into strong
electric currents and high voltages.
Electrical and electronic equipment
connected to (or associated with) the
collector may thus suffer severe dam-
age. The consequences could be serious
for any system that relies on such
equipment, e.g., commercial electric
power generation and distribution sys-
tems, telecommunications, i.e., radio,
radar, television, telephone, and tele-
graph systems, and electronic com-
puters.
11.08 In a crude sense, the EMP
radiations are somewhat similar to the
familiar radio waves, although there are
some important differences. Radio
transmitters are designed to produce
ORIGIN AND NATURE OF THE EMP
517
electromagnetic waves of a particular
frequency (or wavelength), but the
waves in the EMP have a wide range of
frequencies and amplitudes. Further-
more, the strength of the electric fields
associated with the EMP can be millions
of times greater than in ordinary radio
waves. Nevertheless, in each case, the
energy of electromagnetic waves is col-
lected by a suitable antenna (or conduc-
tor) and transferred to attached or adja-
cent equipment. The energy from the
EMP is received in such a very short
time, however, that it produces a strong
electric current which could damage the
equipment. An equal amount of energy
spread over a long period of time, as in
conventional radio reception, would
have no harmful effect.
11.09 The characteristics of the
EMP depend to a great extent on the
weapon yield and height of burst. For
explosions in the atmosphere at altitudes
of a few miles, the deposition region
will have a radius of about 3 miles, but
it will increase to roughly 9 miles with
increasing height of the burst point up to
altitudes of approximately 19 miles. In
this altitude range, the difference in air
density across the vertical dimension of
the deposition region will not be large
and so the EMP effect will be moderate.
In addition to the EMP arising from air
density asymmetries, a short pulse is
emitted in a manner similar Го that de-
scribed in §11.14 for high-altitude
bursts. The electric fields produced on
the ground from air bursts between a
few miles and about 19 miles altitude
will be less than those radiated from
surface (or near-surface) and high-alti-
tude explosions. These latter two types
of nuclear explosions will be considered
briefly he're, and more will be said later
about them and about air bursts (§ 11.66
et seq.).
EMP IN SURFACE BURSTS
11.10 The mechanism of EMP for-
mation is different in explosions at (or
near) the surface and at high altitudes.
In a surface burst, those gamma rays
that travel in a generally downward di-
rection are readily absorbed in the upper
layers of the ground and there is essen-
tially no charge separation or electric
field in this direction. The gamma rays
moving outward and upward, however,
produce ionization and charge separa-
tion in the air. Consequently, there is a
net vertical electron current (Fig.
11.10). As a result, the ionized deposit-
ion (source) region is stimulated to emit
much of its energy as an electromagne-
tic pulse in the radiofrequency spec-
trum.
11.11 Since the ground is a rela-
tively good conductor of electricity, it
provides an alternative path for the
electrons to return from the outer part of
the deposition region toward the burst
point where the positively charged ions,
which have been left behind, predomi-
nate. Electric currents thus flow in the
ground and generate strong magnetic
fields in the region of the surface burst
point.
11.12 The electric field produced in
a surface burst is very strong but the
radiated field falls off with increasing
distance from the deposition region, at
first quite rapidly and then somewhat
less so. The potential hazard to electri-
cal and electronic equipment from the
EMP will thus be greatest within and
near the deposition region which may
extend over a radius around ground zero
518
THE ELECTROMAGNETIC PULSE AND ITS EFFECTS
Figure 11.10. Schematic representation of the EMP in a surface burst.
of about 2 to 5 miles, depending on the
explosion yield. In this area, structures
in which equipment is housed may suf-
fer severe damage, especially from
high-yield explosions, unless they are
blast resistant. However, the threat to
electrical and electronic systems from a
surface-burst EMP may extend as far as
the distance at which the peak over-
pressure from a 1-megaton burst is 2
pounds per square inch, i.e., 8 miles
(see Chapter III). The degree of dam-
age, if any, will depend on the suscep-
tibility of the equipment and the extent
of shielding (§ 11.33 et seq.).
EMP IN HIGH-ALTITUDE BURSTS
11.13 If the nuclear burst is at an
altitude above about 19 miles, the
gamma rays moving in an upward di-
rection will enter an atmosphere where
the air density is so low that the rays
travel great distances before being ab-
sorbed. On the other hand, the gamma
rays emitted from the explosion in a
generally downward direction will en-
counter a region where the atmospheric
density is increasing. These gamma rays
will interact with the air molecules and
atoms to form the deposition (or source)
region for the EMP (Fig. 11.13). This
roughly circular region may be up to 50
miles thick in the center, tapering
toward the edge, with a mean altitude of
about 25 to 30 miles. It extends hori-
zontally for great distances which in-
crease with the energy yield and the
height of the burst point (see Figs.
11.70a and b).
11.14 In the deposition region the
gamma rays produce Compton electrons
by interactions in the air; these electrons
are deflected by the earth’s magnetic
field and are forced to undergo a turning
motion about the field lines. This motion
causes the electrons to be subjected to a
radial acceleration which results, by a
ORIGIN AND NATURE OF THE EMP
519
Figure 11.13. Schematic representation of the EMP in a high-altitude burst. (The extent of
the deposition region varies with the altitude and the yield of the explosion.)
complex mechanism, in the generation
of an EMP that moves down toward the
earth. The pulse rises to a peak and then
decreases, both taking place more rap-
idly than for a surface burst; as a result
more of the electromagnetic energy ap-
pears in the higher frequency range (§
11.63). The strength of the electric field
observed at the surface from a high-al-
titude explosion is from one-tenth to a
hundredth of the field within the source
region from a surface burst. However,
in a surface burst the radiated field
strength drops off rapidly with distance
outside this region and is then smaller
than for a high-altitude burst. In the
latter case, the radiated field does not
vary greatly over a large area on the
ground or in the atmosphere above the
ground. The electric field is influenced
by the earth’s magnetic field, but over
most of the area affected by the EMP,
the electric field strength varies by not
more than a factor of two for explosions
with yields of a few hundred kilotons or
more (§ 11.73).
11.15 For an explosion of high
yield at a sufficient altitude, the area
covered by the high-frequency EMP
extends in all directions on the ground
as far as the line-of-sight, i.e., to the
horizon, from the burst point (see Fig.
11.13). The lower frequencies will con-
stitute a significant pulse extending even
beyond the horizon. For a nuclear ex-
plosion at an altitude of 50 miles, for
example, the affected area on the ground
would have a radius of roughly 600
miles and for an altitude of 100 miles
the ground radius would be about 900
miles. For an explosion at 200 miles
above the center of the (conterminous)
United States, almost the whole
country, as well as parts of Canada and
Mexico, could be affected by the EMP.
Thus, for a high-altitude burst, the
damage could conceivably extend to
distances from ground zero at which all
other effects, except possibly eye injury
at night (§ 12.79 et seq.), would be
negligible. Furthermore, because the
radiations travel with the speed of light,
520
THE ELECTROMAGNETIC PULSE AND ITS EFFECTS
the whole area could be affected almost
simultaneously by the EMP from a sin-
gle high-altitude nuclear explosion.
COLLECTION OF EMP ENERGY
11.16 For locations that are not
within or close to the deposition region
for a surface or air burst, both the
amount and rate of EMP energy re-
ceived per unit area on or near the
ground will be small, regardless of the
type of nuclear explosion. Hence, for
damage to occur to electrical or elec-
tronic systems, it would usually be nec-
essary for the energy to be collected
over a considerable area by means of a
suitable conductor. In certain systems,
however, sufficient energy, mainly from
the high-frequency components of the
EMP, may be collected by small me-
tallic conductors to damage very sensi-
tive components (§ 11.31). The energy
is then delivered from the collector (an-
tenna) in the form of a strong current
and voltage surge to attached equip-
ment. Actually, the equipment does not
have to be attached directly to the col-
lector; the EMP energy can be coupled
in other ways (§ 11.27). For example, it
is possible for an electric current to be
induced or for a spark to jump from the
conductor which collects the EMP en-
ergy to an adjacent conductor, not con-
nected to the collector, and thence to a
piece of equipment.
11.17 The manner in which the
electromagnetic energy is collected
from the EMP is usually complex, be-
cause much depends on the size and
shape of the collector, on its orientation
with respect to the source of the pulse,
and on the frequency spectrum of the
pulse. As a rough general rule, the
amount of energy collected increases
with the dimensions of the conductor
which serves as the collector (or an-
tenna). Typical effective collectors of
EMP energy are given in Table 11.17.
Deeply buried cables, pipes, etc., are
generally less effective than overhead
runs because the gound provides some
shielding by absorbing the high-
frequency part of the energy (see, how-
ever, § 11.68).
Table 11.17
TYPICAL COLLECTORS OF EMP ENERGY
Long runs of cable, piping, or conduit
Large antennas, antenna feed cables, guy wires, antenna support towers
Overhead power and telephone lines and support towers
Long runs of electrical wiring, conduit, etc., in buildings
Metallic structural components (girders), reinforcing bars, corrugated roof,
expanded metal lath, metallic fencing
Railroad tracks
Aluminum aircraft bodies
SUMMARY OF EMP DAMAGE AND
PROTECTION
11.18 The sensitivity of various
systems and components to the EMP has
been studied by means of simulators
which generate sharp pulses of electro-
magnetic radiation ( § 11.41 et seq.).
The results are not definitive because the
amount of EMP energy delivered to a
ORIGIN AND NATURE OF THE EMP
521
particular component would depend on
the details of the circuit in which it is
connected. Nevertheless, certain gen-
eral conclusions seem to be justifiable.
Computers and other equipment having
solid-state components are particularly
sensitive. Since computers are used ex-
tensively in industry and commerce, in-
cluding electrical distribution and com-
munications systems, the consequence
of operational failure could be very
serious. Vacuum-tube equipment (with
no solid-state components) and low-
current relays, switches, and meters,
such as are used in alarm and indicator
systems, are less susceptible. The least
susceptible electrical components are
motors, transformers, circuit breakers,
etc., designed for high-voltage applica-
tions. The threat to any component, re-
gardless of its susceptibility to opera-
tional upset (temporary impairment) or
damage, is increased if it is connected
(or coupled) to a large collector. Con-
versely, the danger is diminished if the
collector is small. Thus, although tran-
sistorized circuits are generally sensitive
to the EMP, portable (battery operated)
radios with very short “whip” or ferrite
core antennas are not readily damaged
unless they are close to a collector.
Disconnection of a piece of equipment
from the electric power main supply will
decrease the energy collected, but this is
not always feasible because it would
deny use of the equipment.
11.19 Various means are possible
for protecting or “hardening” equip-
ment against damage by the EMP. Such
protection is generally difficult for ex-
isting systems, but it can be built into
new systems. Some of the approaches to
hardening which have been proposed
are the following: metal shields to pre-
vent access of the radiation, good
grounding to divert the large currents,
surge arrestors similar to those used for
lightning protection, and proper wiring
arrangements. Finally, components that
are known to be susceptible to damage
by sharp pulses of electromagnetic en-
ergy should be eliminated. A further
discussion of these procedures is given
later in this chapter ( § 11.33 et seq.).
11.20 Except for locations close to
a surface burst, where other effects
would dominate in any event, the EMP
radiation from a nuclear explosion is
expected to be no more harmful to peo-
ple than a flash of lightning at a dis-
tance. Tests on monkeys and dogs have
shown that there are no deleterious ef-
fects from pulses administered either
singly or repetitively over a period of
several months. However, a person in
contact with an effective collector of
EMP energy, such as a long wire, pipe,
conduit, or other sizable metallic object
listed in Table 11.17, might receive a
severe shock.
SYSTEM-GENERATED EMP
11.21 In addition to the EMP aris-
ing from the interaction of gamma rays
from a nuclear explosion with the at-
mosphere (or the ground), another type
of electromagnetic pulse, called the
“system-generated EMP” (or
SGEMP), is possible. This term refers
to the electric field that can be generated
by the interaction of nuclear (or ioniz-
ing) radiations, particularly gamma rays
and X rays, with various solid materials
present in electronic systems. The ef-
fects include both forward- and back-
scatter emission of electrons and exter-
nal and internal current generation.
522
THE ELECTROMAGNETIC PULSE AND ITS EFFECTS
11.22 The system-generated EMP
is most important for electronic compo-
nents in satellites and ballistic systems,
above the deposition region, which
would be exposed directly to the nuclear
radiations from a high-altitude burst.
The system-generated EMP can also be
significant for surface and moderate-al-
titude bursts if the system is within the
deposition region but is not subject to
damage by other weapons effects. This
could possibly occur for surface systems
exposed to a burst of relatively low yield
or for airborne (aircraft) systems and
bursts of higher yield.
11.23 The system-generated EMP
phenomenon is actually very complex,
but in simple terms it may be considered
to be produced in the following manner.
The solid material in an electronic sys-
tem or even in the shielding designed to
protect the system from the external
EMP contains atoms which are heavier
than those present in the air. Conse-
quently, interaction with gamma rays
and high-energy X rays will produce
electrons by both the Compton and
photoelectric effects ( § 8.89 et seq.\
These electrons can, in turn, interact
with the solid material to release more
electrons, called secondary electrons,
by ionization. Such electrons as are
produced, directly or indirectly, close to
and on both faces of the solid material
and have a velocity component perpen-
dicular to the surface, will be emitted
from the surface of the material. As a
result, an electric field is generated near
the surface. There are other effects, but
they need not be considered here.
11.24 If the component has a cavity
(or space) in which the gas pressure is
very low, less than about 10~3 milli-
meter of mercury, very high electric
fields — about 100,000 to a million
volts per meter — can occur near the
interior walls. At higher gas pressures,
however, the electrons cause substantial
ionization of the gas, e.g., air, thereby
releasing low-energy (secondary) elec-
trons. The relatively large number of
secondary (conduction) electrons form a
current which tends to cancel the elec-
tric field, thus enabling the high-energy
electrons to move across the cavity more
easily.
11.25 The electric fields generated
near the walls by direct interactions of
ionizing radiations with the materials in
an electronic system can induce electric
currents in components, cables, ground
wires, etc. Large currents and voltages,
capable of causing damage or disrup-
tion, can be developed just as with the
external EMP. Because of the complex-
ity of the interactions that lead to the
system-generated EMP, the effects are
difficult to predict and they are usually
determined by exposure to radiation
pulses from a device designed to simu-
late the EMP radiation from a nuclear
explosion (§ 11.42).
EMP EXPERIENCE IN HIGH-ALTITUDE
TESTS
11.26 The reality of damage to
electrical and electronic equipment by
the EMP has been established in various
nuclear tests and by the use of EMP
simulators. A number of failures in ci-
vilian electrical systems were reported
to have been caused by the EMP from
the high-altitude test explosions con-
ducted in the Johnston Island area of the
Pacific Ocean in 1962. One of the best
authenticated cases was the simulta-
neous failure of 30 strings (series-con-
EMP DAMAGE AND PROTECTION
523
nected loops) of street lights at various
locations on the Hawaiian island of
Oahu, at a distance of some 800 miles
from ground zero. The failures occurred
in devices called “fuses” which are
installed across the secondaries of
transformers serving these strings; the
purpose of the fuses is to prevent dam-
age to the lighting system by sudden
current surges. Similar fuses associated
with individual street lights were not
affected. It was also reported that
“hundreds” of burglar alarms in Hon-
olulu began ringing and that many cir-
cuit breakers in power lines were
opened. These occurrences probably re-
sulted from the coupling of EMP energy
to the lines to which the equipment was
connected and not to failure of the de-
vices themselves. No serious damage
occurred since these items are among
the least susceptible to the EMP (§
11.18).
EMP DAMAGE AND PROTECTION1
COUPLING OF EMP ENERGY
11.27 There are three basic modes
of coupling of the EMP energy with a
conducting system; they are electric in-
duction, magnetic induction, and resis-
tive coupling (sometimes referred to as
direct charge deposition). In electric in-
duction a current is induced in a con-
ductor by the component of the electric
field in the direction of the conductor
length. Magnetic induction occurs in
conductors that form a closed loop; the
component of the magnetic field per-
pendicular to the plane of the loop
causes current to flow in the loop. The
form of the loop is immaterial and any
connected conductors, even the rein-
forcing bars in concrete, can constitute a
loop in this respect. Resistive coupling
can occur when a conductor is immersed
in a conducting medium, such as ion-
ized air, salt water, or the ground. If a
current is induced in the medium by one
of the coupling modes already de-
scribed, the conductor forms an alterna-
tive conducting path and shares the cur-
rent with the medium.
11.28 If the EMP wave impinges
upon the ground, a part of the energy
pulse is transmitted through the air-
ground surface whereas the remainder is
reflected. An aboveground collector,
such as an overhead power line or a
radio antenna tower, can then receive
energy from both the direct and re-
flected pulses. The net effect will de-
pend on the degree of overlap between
the two pulses. The EMP transmitted
into the ground can cause a current to
flow in an underground conductor either
by induction or by resistive coupling.
11.29 The coupling of electromag-
netic energy to a conductor is particu-
larly efficient when the maximum di-
mension is about the same size as the
wavelength of the radiation. The con-
ductor is then said to be resonant, or to
behave as an antenna, for the frequency
'This section (§§ 11.27 through 11.59) is of particular interest to electrical and electronic engineers.
524
THE ELECTROMAGNETIC PULSE AND ITS EFFECTS
corresponding to this wavelength. Since
EMP has a broad spectrum of frequen-
cies, only a portion of this spectrum will
couple most efficiently into a specific
conductor configuration. Thus, a partic-
ular collection system of interest must
be examined with regard to its overall
configuration as well as to the compo-
nent configuration. Most practical col-
lector systems, such as those listed in
Table 11.17, are complex and the de-
termination of the amount of EMP en-
ergy collected presents a very difficult
problem. Both computer methods and
experimental simulation are being used
to help provide a solution.
COMPONENT AND SYSTEM DAMAGE
11.30 Degradation of electrical and
electronic system performance as a re-
sult of exposure to the EMP may consist
of functional damage or operational
upset. Functional damage is a catastro-
phic failure that is permanent; examples
are burnout of a device or component,
such as a fuse or a transistor, and in-
ability of a component or subsystem to
execute its entire range of functions.
Operational upset is a temporary im-
pairment which may deny use of a piece
of equipment from a fraction of a second
to several hours. Change of state in
switches and in flip-flop circuits are ex-
amples of operational upset. The
amount of EMP energy required to
cause operational upset is generally a
few orders of magnitude smaller than
for functional damage.
11.31 Some electronic components
are very sensitive to functional damage
(burnout) by the EMP. The actual sen-
sitivity will often depend on the charac-
teristics of the circuit containing the
component and also on the nature of the
semiconductor materials and fabrication
details of a solid-state device. In gen-
eral, however, the components listed in
Table 11.31 are given in order of de-
creasing sensitivity to damage by a
sharp pulse of electromagnetic energy.
Tests with EMP simulators have shown
that a very short pulse of about IO"7
joule may be sufficient to damage a
microwave semiconductor diode,
roughly 5 x 10'2 joule will damage an
audio transistor, but 1 joule would be
required for vacuum tube damage. Sys-
tems using vacuum tubes only would
thus be much less sensitive to the EMP
than those employing solid-state com-
ponents. The minimum energy required
to damage a microammeter or a low-
current relay is about the same as for
audio transistors.
Table 11.31
ELECTRONIC COMPONENTS IN ORDER
OF DECREASING SENSITIVITY
Microwave semiconductor diodes
Field-effect transistors
Radiofrequency transistors
Silicon-controlled rectifiers
Audio transistors
Power rectifier semiconductor diodes
Vacuum tubes
11.32 As seen earlier, the EMP
threat to a particular system, subsystem,
or component is largely determined by
the nature of the collector (antenna). A
sensitive system associated with a poor
collector may suffer less damage than a
system of lower sensitivity attached to a
more efficient collector. Provided the
EMP energy collectors are similar in all
cases, electrical and electronic systems
may be classified in the manner shown
EMP DAMAGE AND PROTECTION
525
in Table 11.32. However, the amount of
energy collected is not always a suffi-
cient criterion for damage. For example,
an EMP surge can sometimes serve as a
trigger mechanism by producing arcing
or a change of state which, in turn,
allows the normal operating voltage to
cause damage to a piece of equipment.
Thus, analysis of sensitivity to EMP
may require consideration of operational
upset and damage mechanisms in addi-
tion to the energy collected.
PROTECTIVE MEASURES
11.33 A general approach to the
examination of a system with regard to
its EMP vulnerability might include the
Table 11.32
DEGREES OF SUSCEPTIBILITY TO THE EMP
Most Susceptible
Low-power, high-speed digital computer, either transistorized or vacuum tube (operational
upset)
Systems employing transistors or semiconductor rectifiers (either silicon or selenium):
Computers and power supplies
Semiconductor components terminating long cable runs, especially between sites
Alarm systems
Intercom system
Life-support system controls
Some telephone equipment which is partially transistorized
Transistorized receivers and transmitters
Transistorized 60 to 400 cps converters
Transistorized process control systems
Power system controls and communication links
Less Susceptible
Vacuum-tube equipment that does not include semiconductor rectifiers:
Transmitters Intercom systems
Receivers Teletype-telephone
Alarm systems Power Supplies
Equipment employing low-current switches, relays, meters:
Alarms
Life-support systems
Power system control
panels
Hazardous equipment containing:
Detonators
Squibs
Pyrotechnical devices
Other-
Long power cable runs employing dielectric insulation
Equipment associated with high-energy storage capacitors
Inductors
Panel indicators and status
boards
Process controls
Explosive mixtures
Rocket fuels
Least Susceptible
High-voltage 60 cps equipment:
Transformers, motors
Lamps (filament)
Heaters
Rotary converters
Heavy-duty relays,
circuit breakers
Air-insultated power cable runs
526
THE ELECTROMAGNETIC PULSE AND ITS EFFECTS
following steps. First, information con-
cerning the system components and de-
vices is collected. The information is
categorized into physical zones based on
susceptibility and worst-case exposure
for these items. It must be borne in mind
in this connection that energy collected
in one part of a system may be coupled
directly or indirectly (by induction) to
other parts. By using objective criteria,
problem areas are identified, analyzed,
and tested. Suitable changes are made as
necessary to correct deficiencies, and
the modified system is examined and
tested. The approach may be followed
on proposed systems or on those already
existing, but experience indicates that
the cost of retrofitting EMP protection
may often be prohibitive. Consequently,
it is desirable to consider the vulnera-
bility of the system early during the
design stage.
11.34 A few of the practices that
may be employed to harden a system
against EMP damage are described
below. The discussion is intended to
provide a general indication of the tech-
niques rather than a comprehensive
treatment of what is a highly technical
and specialized area. Some of the
methods of hardening against the EMP
threat are shielding, proper circuit
layout, satisfactory grounding, and
various protective devices. If these
measures do not appear to be adequate,
it may be advisable to design equipment
with vacuum tubes rather than solid-
state components, if this is compatible
with the intended use of the equipment.
11.35 A so-called “electromagne-
tic” shield consists of a continuous
metal, e.g., steel, soft iron, or copper,
sheet surrounding the system to be pro-
tected. Shielding of individual compo-
nents or small subsystems is generally
not practical because of the complexity
of the task. Good shielding practice may
include independent zone shields, sev-
eral thin shields rather than one thick
one, and continuous joints. The shield
should not be used as a ground or return
conductor, and sensitive equipment
should be kept away from shield
corners. Apertures in shields should be
avoided as far as possible; doors should
be covered with metal sheet so that
when closed they form a continuous part
of the whole shield, and ventilation
openings, which cannot be closed,
should be protected by special types of
screens or waveguides. In order not to
jeopardize the effectiveness of the
shielding, precautions must be taken in
connection with penetrations of the
housing by conductors, such as pipes,
conduits, and metal-sheathed cables
(§ 11.59).
11.36 Recommendations for circuit
layout include the use of common
ground points, twisted cable pairs, sys-
tem and intrasystem wiring in “tree”
format (radial spikes), avoiding loop
layouts and coupling to other circuits,
use of conduit or cope trays, and
shielded isolated transformers. The
avoidance of ground return in cable
shields is also recommended. Some
procedures carry over from communi-
cations and power engineering whereas
others do not.
11.37 From the viewpoint of EMP
protection, cable design represents an
extension of both shielding and circuit
practices. Deeply buried (more than 3
feet underground) cables, shield layer
continuity at splices, and good junction
box contacts are desirable. Ordinary
braid shielding should be avoided.
EMP DAMAGE AND PROTECTION
527
Compromises are often made in this
area in the interest of economy, but they
may prove to be unsatisfactory.
11.38 Good grounding practices
will aid in decreasing the susceptibility
of a system to damage by the EMP. A
“ground” is commonly thought of as a
part of a circuit that has a relatively low
impedance to the local earth surface. A
particular ground arrangement that sa-
tisfies this definition may, however, not
be optimum and may be worse than no
ground for EMP protection. In general,
a ground can be identified as the chassis
of an electronic circuit, the “low” side
of an antenna system, a common bus, or
a metal rod driven into the earth. The
last depends critically on local soil con-
ditions (conductivity), and it may result
in resistively coupled currents in the
ground circuit. A good starting point for
EMP protection is to provide a single
point ground for a circuit cluster,
usually at the lowest impedance element
— the biggest piece of the system that is
electrically immersed in the earth, e.g.,
the water supply system.
11.39 Various protective devices
may be used to supplement the measures
described above. These are related to
the means commonly employed to pro-
tect radio and TV transmission antennas
from lightning strokes and power lines
from current surges. Examples are ar-
resters, spark gaps, band-pass filters,
amplitude limiters, circuit breakers, and
fuses. Typically, the protective device
would be found in the “EMP room” at
the cable entrance to an underground
installation, in aircraft antenna feeds, in
telephone lines, and at power entry
panels for shielded rooms. On a smaller
scale, diodes, nonlinear resistors, Sili-
con-controlled rectifier clamps, and
other such items are built into circuit
boards or cabinet entry panels.
11.40 Few of the devices men-
tioned above are by themselves suffi-
cient as a complete solution to a specific
problem because each has some limita-
tion in speed of response, voltage rat-
ing, power dissipation capacity, or reset
time. Hence, most satisfactory protec-
tive devices are hybrids. For example, a
band-pass filter may be used preceding a
lightning arrester. The filter tends to
stretch out the rise time of the EMP,
thus providing sufficient time for the
arrester to become operative. In general,
a hybrid protection device must be de-
signed specially for each application.
TESTING
11.41 Because of the complexities
of the EMP response, sole reliance can-
not be placed on predictions based on
analysis. Testing is essential to verify
analysis of devices, components, and
complete systems early in the design
stage. Testing also is the only known
method that can be used to reveal unex-
pected effects. These may include cou-
pling or interaction modes or weak-
nesses that were overlooked during the
design. In some simple systems, non-
linear interaction effects can be analyzed
numerically, but as a general rule testing
is necessary to reveal them. As a result
of the test, many of the original ap-
proximations can be refined for future
analysis, and the data can improve the
analytic capability for more complex
problems. Testing also locates weak or
susceptible points in components or
systems early enough for economic im-
provement. After the improvements,
528
THE ELECTROMAGNETIC PULSE AND ITS EFFECTS
testing confirms that the performance is
brought up to standard. A complete
system should be tested to verify that it
has been hardened to the desired level;
subsequent periodic testing will indicate
if any degradation has resulted from
environmental or human factors.
11.42 Since the cessation of atmos-
pheric weapons tests, heavy reliance has
been placed on simulation to test the
EMP hardness of systems. The classes
of EMP tests include: (1) low-level cur-
rent mapping; (2) high-level current in-
jection; (3) high-level electromagnetic
fields. Low-level current mapping
should be used at the beginning of any
test program. With the system power
turned off, the magnitudes and signa-
tures on internal cables are determined
in a low-level field. This provides an
insight into the work that must follow.
After indicated improvements are made,
a high-level current can be injected di-
rectly into the system with the system
power on to explore for nonlinearities,
and to uncover initial indications of
system effects. If subsystems malfunc-
tion, it may be desirable to conduct
extensive subsystem tests in the labora-
tory. Finally, test in a high-level elec-
tromagnetic field is essential.
11.43 The type of excitation must
be defined in any type of test. The two
principal choices are: (1) waveform
simulations, which provide time-
domain data, and (2) continuous wave
(CW) signals, which provide fre-
quency-domain data. If the intent is to
match a system analysis in the fre-
quency domain to measured system re-
sponse, CW signals may be the more
suitable. If the test results were being
compared to known electronic thresh-
olds, it is frequently necessary to test in
the time domain. Both types of tests
should be considered for a complete
analysis.
11.44 Large-scale simulators are
required for the final test of large sys-
tems. The two principal kinds of large
simulators are metallic structures that
guide an electromagnetic wave past a
test object, and antennas that radiate an
electromagnetic field to the object. Each
type of simulator may use either pulse
generators (time domain) or CW signal
generators (frequency domain). Pulse
generators themselves can be either
high-level single shot or low-level re-
petitive.
11.45 The essential elements of a
guided-wave or transmission-line simu-
lator include a pulser, a transition sec-
tion, working volume, and a termina-
tion. An electromagnetic wave of
suitable amplitude and wave shape is
generated by the pulser. This wave is
guided by a tapered section of transmis-
sion line (the transition section) from the
small cross-sectional dimension of the
pulser output to the working volume.
The working volume, where the test
object is located, should be large
enough to provide a certain degree of
field uniformity over the object. This
condition is satisfied if the volume of the
test object is about one-third (or less)
that of the working volume, depending
on the degree of field perturbation that is
acceptable. The termination region pre-
vents the reflection of the guided wave
back into the test volume; it consists of a
transition section that guides the inci-
dent wave to a geometrically small re-
sistive load whose impedance is equal to
the characteristic impedance of the
transmission line structure.
11.46 The basic types of radiating
EMP DAMAGE AND PROTECTION
529
simulators are long wire, biconical di-
pole, or conical monopole. The long
wire is usually a long dipole oriented
parallel to the earth’s surface. It is sup-
ported above the ground by noncon-
ducting poles with high-voltage insula-
tors. The two arms of the dipole are
symmetric about the center and con-
structed from sections of lightweight
cylindrical conductor, such as irrigation
pipe. Pipe sections decrease in diameter
with increasing distance from the
center, and resistors are placed between
the pipe sections to shape the current
wave and to reduce resonances. The two
arms of the dipole are oppositely
charged, and when the voltage across
the spark gap at the dipole center
reaches the breakdown voltage, the gap
begins conducting and a wave front
propagates away from the gap.
11.47 Conical and biconical an-
tennas use pulsers, such as Marx gener-
ators or CW transmitters, instead of re-
lying on the discharge of static surface
charges. The antennas consist of light-
weight conducting surfaces or wire
grids.
11.48 Electromagnetic scale mod-
eling may sometimes be an important
alternative to full-scale testing of a sys-
tem. Because of the difficulty in intro-
ducing minute openings or poor bonds
into models, and since these often con-
trol interior fields, the usefulness of
modeling ordinarily is limited to the
measurement of external fields, volt-
ages, and currents. Once these param-
eters are known for a complex structure,
perhaps having cable runs, analysis can
often provide internal field quantities of
interest.
EMP AND ELECTRIC POWER
SYSTEMS
11.49 Some indication of the possi-
ble threat of the EMP to commercial
electric power system may be obtained
by considering the effects of lightning
strokes and switching surges. In power
systems, protection against lightning is
achieved by means of overhead
“ground” wires and lightning arresters
of various types. By providing an ef-
fective shunt, an overhead ground can
divert most of the lightning surge from
the phase conductors. Such grounding,
however, would afford only partial pro-
tection from the EMP. Furthermore, al-
though there are some similarities be-
tween the consequences of lightning and
those of the EMP, there are differences
in the nature of the current (or voltage)
pulse which make the lightning arresters
in common use largely ineffective for
the EMP.
11.50 The general manner of the
growth and decay of the current induced
by the EMP from a high-altitude burst in
an overhead transmission line is indi-
cated by the calculated curve in Fig.
11.50. The details of the curve will vary
with the conditions, but the typical fea-
tures of the current pulse are as shown: a
very rapid rise to a peak current of
several thousand amperes in a fraction
of a microsecond followed by a decay
lasting up to a millisecond for a long
transmission line. The current surge in
an overhead power line caused by a
lightning stroke increases to a maximum
more slowly and persists for a longer
time than for the EMP. As a result,
older conventional lightning arresters
are less effective for the EMP from
530
THE ELECTROMAGNETIC PULSE AND ITS EFFECTS
TIME (microseconds)
Figur e 11.50. Typical form of the current pulse induced by the EMP from a high-altitude
nuclear explosion in a long overhead power line. (The actual currents and
times will depend to some extent on the conditions.)
high-altitude explosions than for light-
ning. Modern lightning arresters, how-
ever, can provide protection against
EMP in many applications and hybrid
arresters (§ 11.40) are expected to be
even better.
11.51 In the absence of adequate
protection, the surge voltages on over-
head power lines produced by the EMP
could cause insulator flashover, particu-
larly on circuits of medium and low
voltage. (The components of high-volt-
age transmission systems should be able
to withstand the EMP surge voltages.) If
EMP DAMAGE AND PROTECTION
531
flashovers occur in the event of a high-
altitude burst many would be experi-
enced over a large area. Such simulta-
neous multiple flashovers could lead to
system instability.
11.52 Switching surges occur when
power lines are energized or de-ener-
gized. In systems of moderate and low
voltage such surges can cause breakers
in the switching circuit to operate er-
roneously, but the effect of the EMP is
uncertain because the current rise in a
switching surge is even slower than for
lightning. In extra-high-voltage (EHV)
lines, i.e., 500 kilovolts or more,
switching surges are accompanied by a
rapidly increasing radiated electromag-
netic field similar to that of the EMP.
The currents induced in control and
communications cables are sufficient to
cause damage or malfunction in asso-
ciated equipment. The information ob-
tained in connection with the develop-
ment of protective measures required for
EHV switching stations should be ap-
plicable to EMP protection.
11.53 There is a growing move-
ment in the electric power industry to
substitute semiconductor devices for
vacuum tubes in control and communi-
cations circuits. Solid-state components
are, however, particularly sensitive to
the EMP. Even a small amount of en-
ergy received from the pulse could re-
sult in erroneous operation or temporary
failure. Computers used for automatic
load control would be particularly sen-
sitive and a small amount of EMP en-
ergy, insufficient to cause permanent
damage, could result in faulty operation
or temporary failure. Special attention is
thus required in the protection of such
equipment.
EMP AND RADIO STATIONS
11.54 Unless brought in under-
ground and properly protected, power
and telephone lines could introduce
substantial amounts of energy into radio
(and TV) stations. A major collector of
this energy, however, would be the
transmitting (or receiving) antennas
since they are specially designed for the
transmission and reception of electro-
magnetic energy in the radiofrequency
region. The energy collected from the
EMP would be mainly at the frequencies
in the vicinity of the antenna design
frequency.
11.55 Antenna masts (or towers)
are frequently struck by lightning and
spark gaps are installed at the base of the
tower to protect the station equipment.
But the gaps in common use, like those
in power lines, are not very effective
against the EMP. Actually, when an
antenna is struck by lightning, the sup-
porting guy wires, rather than the spark
gaps, serve to carry most of the light-
ning current to the ground. Although the
guy wires have insulators along their
length, arcing occurs across them
thereby providing continuity for the
current. This flashover of the insulators
would not, however, provide protection
against the EMP. In fact, the guy wires
would then serve as additional collectors
of the EMP energy by induction.
11.56 In spite of protective devices,
both direct and indirect, damage to radio
stations by lightning is not rare. The
most commonly damaged component is
the capacitor in the matching network at
the base of the antenna; it generally
suffers dielectric failure. Capacitors and
inductors in the phasor circuit are also
subject to damage. It is expected that
THE ELECTROMAGNETIC PULSE AND ITS EFFECTS
532
high-voltage capacitors would be sensi-
tive to damage by the EMP. Such dam-
age could result in shorting of the an-
tenna feed line to the ground across the
capacitor, thus precluding transmission
until the capacitor is replaced. Experi-
ence with lightning suggests that there
may also be damage to coaxial trans-
mission lines from dielectric flashover.
Solid-state components, which are now
in common use in radio stations, would,
of course, be susceptible to damage by
the EMP and would need to be pro-
tected.
11.57 Radio transmitting stations
employ various means to prevent inter-
ference from their own signals. These
include shielding of audio wiring and
components with low-level signals, sin-
gle-point grounding, and the avoidance
of loops. Such practices would be useful
in decreasing the EMP threat.
EMP AND TELEPHONE SYSTEMS
11.58 Some of the equipment in
telephone systems may be susceptible to
damage from the EMP energy collected
by power supply lines and by the sub-
scriber and trunk lines that carry the
signals. Various lightning arresting de-
vices are commonly used for overhead
telephone lines, but they may provide
limited protection against the EMP un-
less suitably modified. Steps are being
taken to improve the ability of the long-
distance telephone network in the
United States to withstand the EMP as
well as the other effects of a nuclear
explosion.
11.59 In a properly “hardened”
system, coaxial cables are buried un-
derground and so also are the main and
auxiliary repeater or switching centers.
In the main (repeater and switching)
stations, the building is completely en-
closed in a metal EMP shield. Metal
flashing surrounds each metallic line,
e.g., pipe, conduit, or sheathed cable,
entering or leaving the building, and the
flashing is bonded to the line and to the
shield. Where this is not possible, pro-
tectors or filters are used to minimize the
damage potential of the EMP surge.
Inside the building, connecting cables
are kept short and are generally in
straight runs. An emergency source of
power is available to permit operation to
continue in the event of a failure (or
disconnection) of the commercial power
supply. The auxiliary (repeater) sta-
tions, which are also underground, do
not have exterior shielding but the elec-
tronic equipment is protected by steel
cases.
THEORY OF THE EMP2
DEVELOPMENT OF THE RADIAL
ELECTRIC FIELD
11.60 The energies of the prompt
gamma rays accompanying a nuclear
explosion are such that, in air, Compton
scattering is the dominant photon in-
teraction (see Fig. 8.97b). The scattered
photon frequently retains sufficient en-
JThe remainder of this chapter may be omitted without loss of continuity.
THEORY OF THE EMP
533
ergy to permit it to repeat the Compton
process. Although scattering is some-
what random, the free electrons pro-
duced (and the scattered photons) tend,
on the average, to travel in the radial
direction away from the burst point. The
net movement of the electrons consti-
tutes an electron current, referred to as
the Compton current. The prompt
gamma-ray pulse increases rapidly to a
peak value in about 10~8 second or so,
and the Compton current varies with
time in a similar manner.
11.61 When the electrons are
driven radially outward by the flux of
gamma rays, the atoms and molecules
from which they have been removed,
i.e., the positive ions, travel outward
more slowly. This results in a partial
separation of charges and a radial elec-
tric field. The lower energy (secondary)
electrons generated by collisions of the
Compton electrons are then driven back
by the field toward the positive charges.
Consequently, a reverse electron current
is produced and it increases as the field
strength increases. This is called the
“conduction current” because, for a
given field strength, its magnitude is
determined by the electrical conductiv-
ity of the ionized medium. The conduc-
tivity depends on the extent of ioniza-
tion which itself results from the
Compton effect; hence the conductivity
of the medium will increase as the
Compton current increases. Thus, as the
radial field grows in strength so also
does the conduction current. The con-
duction current flows in such a direction
as to oppose this electric field; hence at a
certain time, the field will cease to in-
crease. The electric field is then said to
be “saturated.” At points near the
burst, the radial electric field reaches
saturation sooner and is somewhat
stronger than at points farther away.
11.62 In a perfectly homogeneous
medium, with uniform emission of
gamma rays in all directions, the radial
electric field would be spherically sym-
metrical. The electric field will be con-
fined to the region of charge separation
and no energy will be radiated away. In
a short time, recombination of charges
in the ionized medium occurs and the
electric field strength in all radial direc-
tions decreases within a few microse-
conds. The energy of the gamma rays
deposited in the ionized sphere is then
degraded into thermal radiation (heat).
If the symmetry of the ionized sphere is
disturbed, however, nonradial oscilla-
tions will be initiated and energy will be
emitted as a pulse of electromagnetic
radiation much of which is in the radio-
frequency region of the spectrum.
Since, in practice, there is inevitably
some disturbance of the spherical sym-
metry in a nuclear explosion, all such
explosions are accompanied by a ra-
diated EMP, the strength of which de-
pends on the circumstances.
GENERAL CHARACTERISTICS OF THE
EMP
11.63 The radiation in the EMP
covers a wide range of frequencies with
the maximum determined by the rise
time of the Compton current. This is
typically of the order of 10~8 second and
the maximum frequency for the mecha-
nism described above is then roughly
108 cycles per second, i.e., 108 hertz or
100 megahertz. Most of the radiation
will, however, be emitted at lower fre-
quencies in the radiofrequency range.
The rise time is generally somewhat
534
THE ELECTROMAGNETIC PULSE AND ITS EFFECTS
shorter for high-altitude bursts than for
surface and medium-altitude bursts;
hence, the EMP spectrum in high-alti-
tude bursts tends toward higher fre-
quencies than in bursts of the other
types.
11.64 The prompt gamma rays
from a nuclear explosion carry, on the
average, about 0.3 percent of the ex-
plosion energy (Table 10.138) and only
a fraction of this, on the order of ap-
proximately 10~2 for a high-altitude
burst and 10-7 for a surface burst, is
radiated in the EMP. For a 1-megaton
explosion at high altitude, the total en-
ergy release is 4.2 x 10²² ergs and the
amount that is radiated as the EMP is
roughly 1018 ergs or 10й joules. Al-
though this energy is distributed over a
very large area, it is possible for a col-
lector to pick up something on the order
of 1 joule (or so) of EMP energy. The
fact that a small fraction of a joule,
received as an extremely short pulse,
could produce either permanent or tem-
porary degradation of electronic de-
vices, shows that the EMP threat is a
serious one.
11.65 Although all nuclear bursts
are probably associated with the EMP to
some degree, it is convenient to con-
sider three more-or-less distinct (or ex-
treme) types of explosions from the
EMP standpoint. These are air bursts at
medium altitudes, surface bursts, and
bursts at high altitudes. Medium-alti-
tude bursts are those below about 19
miles in which the deposition region
does not touch the earth’s surface. The
radius of the sphere ranges roughly from
3 to 9 miles, increasing with the burst
altitude. The EMP characteristics of air
bursts at lower altitudes, in which the
deposition region does touch the earth,
are intermediate between medium-alti-
tude and surface bursts. At burst alti-
tudes below about 1.2 miles, the ra-
diated pulse has the general
characteristics of that from a surface
burst.
MEDIUM-ALTITUDE AIR BURSTS
11.66 In an air burst at medium
altitude, the density of the air is some-
what greater in the downward than in
the upward direction. The difference in
density is not large, although it in-
creases with the radius of the deposition
(or source) region, i.e., with increasing
altitude. The frequency of Compton
collisions and the ionization of the air
will vary in the same manner as the air
density. As a result of the asymmetry,
an electron current is produced with a
net component in the upward direction,
since the symmetry is not affected in the
azimuthal (radial horizontal) direction.
The electron current pulse initiates
oscillations in the ionized air and energy
is emitted as a short pulse of electro-
magnetic radiation. The EMP covers a
wide range of frequencies and wave
amplitudes, but much of the energy is in
the low-frequency radio range. In addi-
tion, a high-frequency pulse of short
duration is radiated as a result of the
turning of the Compton electrons by the
earth’s magnetic field (§ 11.71).
11.67 The magnitude of the EMP
field radiated from an air burst will de-
pend upon the weapon yield, the height
of burst (which influences the asym-
metry due to the atmospheric density
gradient), and asymmetries introduced
by the weapon (including auxiliary
equipment, the case, or the carrying
vehicle). At points outside the deposit-
THEORY OF THE EMP
535
ion region, for the lower-frequency
EMP arising from differences in air
density, the radiated electric field E(t) at
any specified time t as observed at a
distance R from the burst point is given
by
о
E(f) = E^ sin
(11.67.1)
where Ro is the radius of the deposition
region, EQ(t) is the radiated field strength
at the distance /?0, i.e., at the beginning
of the radiating region, at the time t, and
0 is the angle between the vertical and a
line joining the observation point to the
burst point. It follows from equation
(11.67.1) that, as stated in § 11.06, the
EMP field strength is greatest in direc-
tions perpendicular to the (vertical)
electron current. Values of EQ (f) and RQ
are determined by computer calculations
for specific situations; E0(t) is com-
monly from a few tens to a few hundred
volts per meter and Ro is from about 3 to
9 miles (§ 11.09). The interaction of the
gamma rays with air falls off roughly
exponentially with distance; hence, the
deposition region does not have a pre-
cise boundary, but RQ is taken as the
distance that encloses a volume in which
the conductivity is 10~7 mho per meter
or greater.
SURFACE BURSTS
11.68 In a contact surface burst, the
presence of the ground introduces a
strong additional asymmetry. Compared
with air, the ground is a very good
absorber of neutrons and gamma rays
and a good conductor of electricity.
Therefore, the deposition region con-
sists approximately of a hemisphere in
the air and there is a net electron current
with a strong component in the upward
direction. Further, the conducting
ground provides an effective return path
for the electrons with the result that
current loops are formed. That is, elec-
trons travel outward from the burst in
the air, then return toward the burst
point through the higher conductivity
ground. These current loops generate
very large azimuthal magnetic fields that
run clockwise around the burst point
(looking down on the ground) in the
deposition region, especially close to
the ground (Fig. 11.10). At points very
near the burst, the air is highly ionized
and its conductivity exceeds the ground
conductivity. The tendency for the con-
duction current to shift to the ground is
therefore reduced, and the magnetic
fields in the ground and in the air are
decreased correspondingly.
11.69 Large electric and magnetic
fields are developed in the ground which
contribute to the EMP, in addition to the
fields arising from the deposition region.
As a result of the number of variables
that can affect the magnitude and shape
of the fields, it is not possible to describe
them in a simple manner. The peak
radiated fields at the boundary of the
deposition region are ten to a hundred
times stronger in a direction along the
earth than for a similar air burst. The
variation with distance of the peak ra-
diated electric field along the earth’s
surface is given by
E=^>En, (11.69.1)
R
where EQ is the peak radiated field at the
radius Ro of the deposition region and E
is the peak field at the surface distance R
from the burst point. For observation
536
THE ELECTROMAGNETIC PULSE AND ITS EFFECTS
Figure 11,70a. Deposition regions for 1-MT explosions at altitudes of 31,62, 124, and 186
miles.
DISTANCE PARALLEL TO SURFACE ( km )
Deposition regions for 10-MT explosions
Figure 11.70b.
points above the surface the peak ra-
diated field falls off rapidly with in-
creasing distance. As stated in § 11.12,
Rq is roughly 2 to 5 miles, depending on
the explosion yield; Eo may be several
kilovolts per meter.
HIGH-ALTITUDE BURSTS
11.70 The thickness and extent of
half of the deposition region for bursts
of 1 and 10 megatons yield, respec-
tively, for various heights of burst
(HOB) are shown in Figs. 11.70a and b.
The abscissas are distances in the at-
mosphere measured parallel to the
at altitudes of 31, 62, 124, 186
miles.
earth’s surface from ground zero. The
curves were computed from the esti-
mated gamma-ray emissions from the
explosions and the known absorption
coefficients of the air at various densities
(or altitudes). At small ground dis-
tances, i.e., immediately below the
burst, the deposition region is thicker
than at larger distances because the
gamma-ray intensity decreases with
distance from the burst point. Since the
gamma rays pass through air of increas-
ing density as they travel toward the
ground, most are absorbed in a layer
between altitudes of roughly 40 and 10
miles.
THEORY OF THE EMP
537
11.71 Unless they happen to be
ejected along the lines of the geomag-
netic field, the Compton electrons re-
sulting from the interaction of the
gamma-ray photons with the air mole-
cules and atoms in the deposition region
will be forced to follow curved paths
along the field lines.3 In doing so they
are subjected to a radial acceleration and
the ensemble of turning electrons,
whose density varies with time, emits
electromagnetic radiations which add
coherently. The EMP produced in this
manner from a high-altitude burst—and
also to some extent from an air burst—is
in a higher frequency range than the
EMP arising from local asymmetries in
moderate-altitude and surface bursts (§
11.63).
11.72 The curves in Figs. 11.70a
and b indicate the dimensions of the
deposition (source) region, but they do
not show the extent of coverage on (or
near) the earth’s surface. The EMP does
not radiate solely in a direction down
from the source region; it also radiates
from the edges and at angles other than
vertical beneath this region. Thus, the
effect at the earth’s surface of the
higher-frequency EMP extends to the
horizon (or tangent point on the surface
as viewed from the burst). The lower
frequencies, however, will extend even
beyond the horizon because these elec-
tromagnetic waves can follow the
earth’s curvature (cf. § 10.92). Table
11.72 gives the distances along the sur-
face from ground zero to the tangent
point for several burst heights.
11.73 The peak electric field (and
Table 11.72
GROUND DISTANCE TO TANGENT POINT
FOR VARIOUS BURST ALTITUDES
Burst Altitude (miles Tangent Distance (miles)
62 695
93 850
124 980
186 1,195
249 1,370
311 1,520
its amplitude) at the earth’s surface from
a high-altitude burst will depend upon
the explosion yield, the height of burst,
the location of the observer, and the
orientation with respect to the geomag-
netic field. As a general rule, however,
the field strength may be expected to be
tens of kilovolts per meter over most of
the area receiving the EMP radiation.
Figure 11.73 shows computed contours
for E , the maximum peak electric
field, and various fractions of Emax for
burst altitudes between roughly 60 and
320 miles, assuming a yield of a few
hundred kilotons or more. The dis-
tances, measured along the earth’s sur-
face, are shown in terms of the height of
burst. The spatial distribution of the
EMP electric field depends on the geo-
magnetic field and so varies with the
latitude; the results in the figures apply
generally for ground zero between about
30° and 60° north latitude. South of the
geomagnetic equator the directions in-
dicating magnetic north and east in the
figure would become south and west,
respectively. It is evident from Fig.
’At higher altitudes, when the atmospheric density is much less and collisions with air atoms and
molecules are less frequent, continued turning of the electrons (beta particles) about the field lines leads
to the helical motion referred to in §§ 2.143, 10.27.
538
THE ELECTROMAGNETIC PULSE AND ITS EFFECTS
GROUND DISTANCE
TO TANGENT POINT
GROUND DISTANCE
TO TANGENT POINT
Figure 11.73. Variations in peak electric fields for locations on the earth’s surface for burst
altitudes between 60 and 320 miles and for ground zero between 30° and 60°
north latitude. The data are applicable for yields of a few hundred kilotons or
more.
THEORY OF THE EMP
539
11.73 that over most of the area affected
by the EMP the electric field strength on
the ground would exceed 0.5Emax. For
yields of less than a few hundred kilo-
tons, this would not necessarily be true
because the field strength at the earth’s
tangent could be substantially less than
0.5 E .
max
11.74 The reason why Fig. 11.73
does not apply at altitudes above about
320 miles is that at such altitudes the
tangent range rapidly becomes less than
four times the height of burst. The dis-
tance scale in the figure, in terms of the
HOB, then ceases to have any meaning.
For heights of burst above 320 miles, a
set of contours similar to those in Fig.
11.73 can be plotted in terms of frac-
tions of the tangent distance.
11.75 The spatial variations of
EMP field strength arise primarily from
the orientation and dip angle of the
geomagnetic field, and geometric fac-
tors related to the distance from the
explosion to the observation point. The
area of low field strength slightly to the
north of ground zero in Fig. 11.73 is
caused by the dip in the geomagnetic
field lines with reference to the horizon-
tal direction. Theoretically, there should
be a point of zero field strength in the
center of this region where the Compton
electrons would move directly along the
field lines without turning about them,
but other mechanisms, such as oscilla-
tions within the deposition region, will
produce a weak EMP at the earth’s sur-
face. The other variations in the field
strength at larger ground ranges are due
to differences in the slant range from the
explosion.
11.76 The contours in Fig. 11.73
apply to geomagnetic dip angles of
roughly 50° to 70°. Although Emax would
probably not vary greatly with the burst
latitude, the spatial distribution of the
peak field strength would change with
the dip angle. At larger dip angles, i.e.,
at higher latitudes than about 60°, the
contours for Emax and 0.75 Emax would
tend more and more to encircle ground
zero. Over the magnetic pole (dip angle
90°), the contours would be expected
theoretically to consist of a series of
circles surrounding ground zero, with
the field having a value of zero at ground
zero. At lower dip angles, i.e., at lati-
tudes less than about 30°, the tendency
for the contours to become less circular
and to spread out, as in Fig. 11.73,
would be expected to increase.
BIBLIOGRAPHY
Block, R., et al., “EMP Seal Evaluation,”
Physics International Co., San Leandro, Cali-
fornia, January 1971.
Bridges, J. E., D. A. Miller, and A. R.
Valentino, “EMP Directory for Shelter De-
sign.” Illinois Institute of Technology Research
Institute, Chicago, Illinois, April 1968.
♦Bridges, J. E., and J. Weyer, “EMP Threat
and Countermeasures for Civil Defense Sys-
tems,” Illinois Institute of Technology Re-
search Institute, Chicago, Illinois, November
1968.
♦“Electromagnetic Pulse Problems in Civilian
Power and Communications,” Summary of a
seminar held at Oak Ridge National Laboratory,
August 1969, sponsored by the U.S. Atomic
Energy Commission and the Department of
Defense/Office of Civil Defense.
“Electromagnetic Pulse Sensor and Simulation
Notes, Volumes 1-10,” Air Force Weapons
Laboratory, April 1967 through 1972, AFWL
EMP 1-1 through 1-10.
“EMP Protection for Emergency Operating
Centers,” Department of Defense/Office of
540
THE ELECTROMAGNETIC PULSE AND ITS EFFECTS
Civil Defense, May 1971, TR-61-A.
“EMP Protective Systems,” Department of De-
fense/Office of Civil Defense, November 1971,
TR-61-B.
“EMP Protection for AM Radio Broadcast Sta-
tions,” Department of Defense/Office of Civil
Defense, May 1972, TR-61-C.
Foss, J. W., and R. W. Mayo, “Operation
Survival,” Bell Laboratories Record, January
1969, page 11.
Gilinsky, V., and G. Peebles, “The Develop-
ment of a Radio Signal from a Nuclear Explo-
sion in the Atmosphere,” J. Geophys. Res., 73,
405 (1968).
Hirsch, F. G., and A. Bruner, “Absence of
Electromagnetic Pulse Effects on Monkeys and
Dogs,” J. Occupational Medicine, 14, 380
(1972).
Karzas, W. J. and R. Latter, “Detection of
Electromagnetic Radiation from Nuclear Ex-
plosions in Space,” Phys. Rev. 137, В1369
(1965).
Lennox, C. R., “Experimental Results of Test-
ing Resistors Under Pulse Conditions,” Elec-
trical Standards Division 2412, Sandia Labora-
tory, Albuquerque, New Mexico, November
1967.
Mindel, I. N., Program Coordinator, “DNA
EMP Awareness Course Notes,” 2nd ed., Illi-
nois Institute of Technology Research Institute,
Chicago, Illinois, August 1973, DNA 2772T.
*Nelson, D. B., “Effects of Nuclear EMP on
AM Broadcast Stations in the Emergency
Broadcast System,” Oak Ridge National Labo-
ratory, July 1971, ORNL-TM-2830.
Nelson, D. B., “EMP Impact on U.S. De-
fenses,” Survive, 2, No. 6, 2 (1969).
Nelson, D. B., “A Program to Counter Effects
of Nuclear EMP in Commercial Power Sys-
tems,” Oak Ridge National Laboratory, Oc-
tober 1972, ORNL-TM-3552.
Ricketts, L. W., et al., “EMP Radiation and
Protective Techniques,” Wiley-Interscience,
1976.
*Sargis, D. A., et al., “Late Time Source for
Close-In EMP,” Science Applications, La
Jolla, California, August 1972, DNA 3064F,
SAI-72-556-L-J.
♦These documents may be purchased from the National Technical Information Service, Department of
Commerce, Springfield, Virginia 22161.
CHAPTER XII
BIOLOGICAL EFFECTS
INTRODUCTION
TYPES OF INJURIES
12.01 The three main types of
physical effects associated with a nu-
clear explosion, namely, blast and
shock, thermal radiation, and nuclear
radiation, each have the potentiality for
causing death and injury to exposed
persons. Blast injuries may be direct or
indirect; the former are caused by the
high air pressure and the latter by mis-
siles and by displacement of the body.
For a given overpressure, a nuclear de-
vice is more effective in producing
direct blast injuries than is a conven-
tional, high-explosive weapon because,
as will be seen, the human body is
sensitive to the duration of the pressure
pulse and this is relatively long in a
nuclear explosion unless the yield is
much less than 1 kiloton. On the whole,
indirect blast injuries, especially those
caused by missiles such as glass, wood,
debris, etc., are similar for nuclear and
conventional weapons. However, be-
cause of its longer duration, the blast
wave from a nuclear explosion produces
missile and displacement injuries at
much lower overpressures than does a
chemical explosion.
12.02 The frequency of burn inju-
ries due to a nuclear explosion is ex-
ceptionally high. Most of these are flash
burns caused by direct exposure to the
pulse of thermal radiation, although in-
dividuals trapped by spreading fires may
be subjected to flame burns. In addition,
persons in buildings or tunnels close to
ground zero may be burned by hot gases
and dust entering the structure even
though they are shielded adequately
from direct or scattered thermal radia-
tion. Finally, there are potential harmful
effects of the nuclear radiations on the
body. These represent a source of ca-
sualties entirely new to warfare.
12.03 A nuclear explosion in the air
or near the ground will inevitably be
accompanied by damage and destruction
of buildings, by blast, shock, and fire,
over a considerable area. Consequently,
a correspondingly larger number of per-
sonal casualties is to be expected.
However, the actual number, as well as
their distribution among the different
kinds of injuries mentioned above, will
be greatly dependent upon circum-
stances. As a general rule, for bursts of
a given type, e.g., air, surface, or sub-
surface, the range of each of the major
immediate effects—blast, thermal radi-
ation, and initial nuclear radiation—in-
541
542
BIOLOGICAL EFFECTS
creases with the explosive yield of the
weapon. But the relative importance of
the various effects does not remain the
same. The initial nuclear radiation, for
example, is much more significant in
comparison with blast and thermal radi-
ation for nuclear explosions of low en-
ergy yield than it is for those of high
yield. In other words, although the total
number of casualties will increase with
the energy of the explosion, under sim-
ilar circumstances, the percentage of
injuries due to initial nuclear radiation
may be expected to decrease whereas
the proportions of blast and thermal in-
juries will increase.
12.04 All other things, including
exposure conditions, being the same,
the number and distribution of casualties
of various kinds for a nuclear explosion
of given yield will be determined by the
type of burst. Moreover, for an air
burst, the height of burst will have an
important influence. With other factors
constant, there is an optimum height of
burst which maximizes the range on the
ground for a given overpressure in the
blast wave (§ 3.73). This optimum
height differs for each yield and for each
value of the overpressure. Similarly,
there are particular heights of burst,
usually different from that for blast
damage, which maximize the ranges for
either thermal radiation or the initial
nuclear radiation. It is evident, there-
fore, that considerable variations are
possible both in the number and in the
nature of the injuries associated with an
air burst.
12.05 The effects of a surface or of
a shallow subsurface burst will not be
greatly different from those accompany-
ing a low air burst. However, as in-
creasing amounts of contaminated earth
and debris are sucked up into the radio-
active cloud the hazard from the residual
nuclear radiation in the early fallout in-
creases. For an underground burst at a
moderate depth, the injuries from blast
and from thermal and initial nuclear
radiations would be much less than from
an air burst or even from a surface burst
of the same yield. On the other hand,
the effects of ground shock and the de-
layed nuclear radiation hazard would be
greatly increased. In the case of a deep
(completely contained) underground
burst, casualties would result only from
ground shock.
12.06 Apart from the explosion
yield and burst conditions, local en-
vironmental circumstances can be a sig-
nificant factor in the casualty potential
of a nuclear weapon. Conditions of ter-
rain and weather can influence the inju-
ries caused by blast and by thermal
radiation. Structures may have an im-
portant, although variable, effect. For
example, the shielding in ordinary
houses may markedly reduce the range
over which significant casualties from
flash burns can occur. This is particu-
larly the case for heavier structures ex-
tending below as well as above ground;
persons properly located in such build-
ings could be protected from blast and
initial nuclear radiations as well as from
thermal radiations. On the other hand,
in certain buildings the frequency of
indirect blast injuries may be greatly
increased by the presence of large
numbers of missiles.
12.07 As regards direct injuries re-
sulting from the overpressure of the air
in the blast wave, the effects of a struc-
ture are also quite variable. In some
situations it is known that the magnitude
of the peak overpressure inside a struc-
INTRODUCTION
543
ture can be appreciably less than the
free-field (open terrain) value. On the
other hand, there is a possibility that, as
a result of reflection at walls, etc., the
air overpressure in the interior of a
building may be increased twofold or
more, depending on the geometry in-
volved (see Chapter IV). There will also
be changes in wind velocity inside
structures, so that the magnitudes may
differ markedly from those existing in
the free field as the blast wave spreads
outward from the burst point. Never-
theless, provided people do not lean
against the walls or sit or lie on the
floor, there is generally a lower proba-
bility of injury from direct overpressure
effects inside a structure than at equiva-
lent distances on the outside. This re-
sults from alterations in the pattern of
the overpressure wave upon entering the
structure.
JAPANESE CASUALTIES
12.08 The only direct information
concerning human casualties resulting
from a nuclear explosion is that obtained
following the air bursts over Japan and
this will be used as the basis for much of
the discussion presented here. It should
be pointed out, however, that the Japa-
nese experience applies only to the par-
ticular heights of burst and yields of the
weapons exploded over Hiroshima and
Nagasaki (§ 2.24), and to the weather,
terrain, and other conditions existing at
the times and locations of the explo-
sions. Almost any kind of nuclear ex-
plosion in a populated area, except per-
haps one deep under the surface, would
be accompanied by a large number of
deaths and injuries in a short interval of
time, but the actual number of casualties
and their distribution between blast (and
shock), thermal, and nuclear radiation
effects could vary markedly with the
circumstances.
12.09 The data in Table 12.09 are
the best available estimates1 for civilian
casualties resulting from all effects of
the explosions over Hiroshima and Na-
gasaki. The population estimates are
only for civilians within the affected
area in each city and do not include an
unknown number of military personnel.
Three zones, representing different dis-
tances from ground zero, are consid-
ered: the first is a circular area of 0.6
mile radius about ground zero, the sec-
ond is a ring from 0.6 to 1.6 miles from
ground zero, and the third is from 1.6 to
3.1 miles from ground zero. In each
case there is given the total population
in a particular zone, the population
density, i.e., number per square mile,
and the numbers of killed and injured, in
that zone. Also included are the total
population “at risk” in the city, the
average population density, and the total
numbers of killed and injured. The
standardized casualty rates are values
calculated by proportion on the basis of
a population density of one person per
1,000 square feet (or about 28,000 per
square mile) of vulnerable area.
'Computed from data in A. W. Oughterson and S. Warren (Editors), “Medical Effects of the Atomic
Bomb in Japan,” McGraw-Hill Book Co., Inc., Chapter 4, 1956. For further information, see also
“Medical Effects of the Atomic Bomb,” Report of the Joint Commission for the Investigation of the
Effects of the Atomic Bomb in Japan, Office of the Air Surgeon NP-3041; “Medical Report on Atomic
Bomb Effects,” The Medical Section, Special Committee for the Investigation of the Effects of the
Atomic Bomb, National Research Council of Japan, 1953; and the U.S. Strategic Bombing Survey,
“The Effects of Atomic Bombs on Hiroshima and Nagasaki,” 1946.
544
BIOLOGICAL EFFECTS
Table 12.09
CASUALTIES AT HIROSHIMA AND NAGASAKI
Density
Zone Population (per square mile) Killed Injured
Hiroshima
0 to 0.6 mile 31,200 25,800 26,700 3,000
0.6 to 1.6 miles 144,800 22,700 39,600 53,000
1.6 to 3.1 miles 80,300 3,500 1,700 20,000
Totals 256,300 8,500 68,000 76,000
Standardized Casualty Rate: 261,000 (Vulnerable area 9.36 square miles).
Nagasaki
0 to 0.6 mile 30,900 25,500 27,300 1,900
0.6 to 1.6 miles 27,700 4,400 9,500 8,100
1.6 to 3.1 miles 115,200 5,100 1,300 11,000
Totals 173,800 5,800 38,000 21,000
Standardized Casualty Rate: 195,000 (Vulnerable area 7.01 square miles).
12.10 It is important to note that,
although the average population densi-
ties in Hiroshima and Nagasaki were
8,500 and 5,800 per square mile, re-
spectively, densities of over 25,000 per
square mile existed in areas close to
ground zero. For comparison, the aver-
age population density for the five
boroughs of New York City, based on
the 1970 census, is about 24,700 per
square mile and for Manhattan alone it
is 68,600 per square mile. The popula-
tion density for the latter borough during
the working day is, of course, much
higher. The ten next largest U.S. cities
have average population densities rang-
ing from 14,900 to 3,000 persons per
square mile.
12.11 The numbers in Table 12.09
serve to emphasize the high casualty
potential of nuclear weapons. There are
several reasons for this situation. In the
first place, the explosive energy yield is
very much larger than is possible with
conventional weapons, so that both the
area and degree of destruction are
greatly increased. Second, because of
the high energy yields, the duration of
the overpressure (and winds) associated
with the blast wave, for a given peak
overpressure, is so long that injuries
occur at overpressures which would not
be effective in a chemical explosion.
Third, the proportion of the explosive
energy released as thermal radiation is
very much greater for a nuclear weapon;
hence there is a considerably larger in-
cidence of flash burns. Finally, nuclear
radiation injuries, which are completely
absent from conventional explosions,
add to the casualties.
12.12 The data in the table also
show that more than 80 percent of the
population within 0.6 mile (3170 feet)
from ground zero were casualties. In
this area the blast wave energy, thermal
exposure, and initial nuclear radiation
were each sufficient to cause serious
injury or death. Beyond about 1.6
miles, however, the chances of survival
INTRODUCTION
545
were very greatly improved. Between
0.6 and 1.6 miles from ground zero a
larger proportion of the population
would probably have survived if imme-
diate medical attention had been avail-
able. Although the particular distances
mentioned apply to the yield and condi-
tions of the Japanese explosions, it is to
be expected quite generally that close to
ground zero the casualty rate will be
high, but it will drop sharply beyond a
certain distance which scales with the
energy yield of the explosion.
CAUSES OF FATALITIES
12.13 There is no exact information
available concerning the relative signi-
ficance of blast, burn, and nuclear radi-
ation injuries as a source of fatalities in
the nuclear bombings of Japan. It has
been estimated that some 50 percent of
the deaths were caused by burns of one
kind or another, but this figure is only a
rough estimate. Close to two-thirds of
those who died at Hiroshima during the
first day after the explosion were re-
ported to have been badly burned. In
addition, there were many deaths from
burns during the first week.
12.14 The high incidence of flash
burns caused by thermal radiation
among both fatalities and survivors in
Japan was undoubtedly related to the
light and scanty clothing being worn,
because of the warm summer weather
prevailing at the time of the attacks. If
there had been an appreciable cloud
cover or haze below the burst point, the
thermal radiation would have been at-
tenuated somewhat and the frequency of
flash burns would have been much less.
Had the weather been cold, fewer peo-
ple would have been outdoors and they
would have been wearing more exten-
sive clothing. Both the number of peo-
ple and individual skin areas exposed to
thermal radiation would then have been
greatly reduced and there would have
been fewer casualties from flash burns.
12.15 None of the estimates of the
causes of death bear directly on the
incidence of those blast effects which
result in early death, e.g., air (emboli)
in the arteries, lung damage, and heart
injury which tolerate very little post-in-
jury activity, various bone fractures,
severing of major blood vessels by sharp
missiles, violent impact, and others.
One of the difficulties in assessing the
importance of injuries of various types
lies in the fact that many people who
suffered fatal blast injuries were also
burned. As seen earlier, within about
half a mile of ground zero in the Japa-
nese explosions, either blast, burns, or
nuclear radiation injury alone was lethal
in numerous instances.
12.16 As a result of various cir-
cumstances, however, not everyone
within a radius of half a mile was killed
immediately. Among those who sur-
vived the first few days after the explo-
sions at Hiroshima and Nagasaki, a
number died two or more weeks later
with symptoms which were ascribed to
nuclear radiation injuries (see § 12.113
et seq.). These were believed to repre-
sent from 5 to 15 percent of the total
fatalities. A rough estimate indicates
that about 30 percent of those who died
at Hiroshima had received lethal doses
of nuclear radiation, although this was
not always the immediate cause of
death.
12.17 The death rate in Japan was
greatest among individuals who were in
the open at the time of the explosions; it
546
BIOLOGICAL EFFECTS
was less for persons in residential
(wood-frame and plaster) structures and
least of all for those in concrete build-
ings. These facts emphasize the influ-
ence of circumstances of exposure on
the casualties produced by a nuclear
weapon and indicate that shielding of
some type can be an important factor in
survival. For example, within a range of
0.6 mile from ground zero over 50 per-
cent of individuals in Japanese-type
homes probably died of nuclear radia-
tion effects, but such deaths were rare
among persons in concrete buildings
within the same range. The effective-
ness of concrete structures in providing
protection from injuries of all kinds is
apparent from the data in Table 12.17;
this gives the respective average dis-
tances from ground zero at which there
was 50-percent survival (for at least 20
days) among the occupants of a number
of buildings in Hiroshima. School per-
sonnel who were indoors had a much
higher survival probability than those
who were outdoors at the times of the
explosions.
Table 12.17
AVERAGE DISTANCES FOR
50-PERCENT SURVIVAL AFTER
20 DAYS IN HIROSHIMA
Approximate Distance (miles)
Overall 0.8
Concrete buildings 0.12
School personnel:
Indoors 0.45
Outdoors 1.3
CAUSES OF INJURIES AMONG
SURVIVORS
12.18 From surveys made of a large
number of Japanese, a fairly good idea
has been obtained of the distribution of
the three types of injuries among those
who became casualties but survived the
nuclear attacks. The results are quoted
in Table 12.18; the totals add up to more
than 100 percent, since many individu-
als suffered multiple injuries.
Table 12.1?
DISTRIBUTION OF TYPES OF INJURY
AMONG SURVIVORS
Percent of
Injury Survivors
Blast (mechanical) 70
Burns (flash and flame) 65
Nuclear radiation (initial) 30
12.19 Among survivors the propor-
tion of indirect blast (mechanical) inju-
ries due to flying missiles and motion of
other debris was smallest outdoors and
largest in certain types of industrial
buildings. Patients were treated for lac-
erations received out to 10,500 feet (2
miles) from ground zero in Hiroshima
and out to 12,500 feet (2.2 miles) in
Nagasaki. These distances correspond
roughly to those at which moderate
damage occurred to wood-frame
houses, including the shattering of win-
dow glass.
12.20 An interesting observation
made among the Japanese survivors was
the relatively low incidence of serious
mechanical injuries. For example, frac-
tures were found in only about 4 percent
of survivors. In one hospital there were
no cases of fracture of the skull or back
and only one fractured femur among
675 patients, although many such inju-
ries must have undoubtedly occurred.
This was attributed to the fact that per-
sons who suffered severe concussion or
INTRODUCTION
547
fractures were rendered helpless, par-
ticularly if leg injuries occurred, and,
along with those who were pinned be-
neath the wreckage, were trapped and
unable to seek help or escape in case fire
ensued. Such individuals, of course, did
not survive.
CASUALTIES AND STRUCTURAL
DAMAGE
12.21 For people who were in
buildings in Japan, the overall casualties
were related to the extent of structural
damage, as well as to the type of struc-
ture (§ 12.17). The data in Table 12.21
were obtained from a study of 1,600
Japanese who were in reinforced-con-
crete buildings, between 0.3 and 0.75
mile from ground zero, when the nu-
clear explosions occurred. At these dis-
tances fatalities in the open ranged from
about 90 to 100 percent, indicating,
once more, that people were safer inside
buildings, even when no special protec-
tive action was taken because of the lack
of warning. There may have been an
increase of casualties in buildings from
debris etc., but this was more than
compensated by the reduction due to
shielding against the initial nuclear ra-
diation and particularly from the thermal
pulse.
12.22 In two concrete buildings
closest to ground zero, where the mor-
tality rate was 88 percent, about half the
casualties were reported as being early
and the other half as delayed. The
former were attributed to a variety of
direct and indirect blast injuries, caused
by overpressure, structural collapse,
debris, and whole-body translation,
whereas the latter were ascribed mainly
to burns and initial nuclear radiation.
Minor to severe but nonfatal blast inju-
ries no doubt coexisted and may have
contributed to the delayed lethality in
many cases. At greater distances, as the
threat from nuclear radiation decreased
more rapidly than did that from air blast
and thermal radiation, the proportion of
individuals with minor injuries or who
were uninjured increased markedly. The
distribution of casualties of different
types in Japanese buildings was greatly
influenced by where the people hap-
pened to be at the time of the explosion.
Had they been forewarned and knowl-
edgeable about areas of relative hazard
and safety, there would probably have
Table 12.21
CASUALTIES IN REINFORCED-CONCRETE BUILDINGS IN JAPAN RELATED TO
STRUCTURAL DAMAGE
Percent of Individuals
Structural Damage Killed Outright Serious Injury (hospital- ization) Light Injury (no hospi- talization) No Injury Reported
Severe damage 88 11 — 1
Moderate damage 14 18 21 47
Light damage 8 14 27 51
548
BIOLOGICAL EFFECTS
been fewer casualties even in structures
that were badly damaged.
12.23 The shielding effect of a par-
ticular building is not only different for
blast, the thermal pulse, and nuclear
radiation, but it may also depend on the
distance from the explosion and the
height of burst. Furthermore, the loca-
tions and orientations of individuals in
the building are important in determin-
ing the extent of the shielding. Hence,
the protection offered by structures is
quite variable. This fact must be kept in
mind in considering the data in Table
12.21. Although the table indicates a
general correlation between structural
damage and the frequency of casualties,
the numbers cannot be used to estimate
casualties from the degree of structural
damage. In an actual situation, the ef-
fects would depend on many factors,
including the tvpe of structure, the yield
of the nuclear explosion, the height of
burst, the distance from the explosion
point, the locations and orientations of
people in the building, and the nature of
prior protective action.
BLAST INJURIES
DIRECT BLAST INJURIES:
BIOLOGICAL FACTORS
12.24 Blast injuries are of two main
types, namely, direct (or primary) inju-
ries associated with exposure of the
body to the environmental pressure
variations accompanying a blast wave,
and indirect injuries resulting from im-
pact of penetrating and nonpenetrating
missiles on the body or as the conse-
quences of displacement of the body as
a whole. There are also miscellaneous
blast injuries, such as burns from the
gases and debris, and irritation and pos-
sibly suffocation caused by airborne
dust. The present section will treat
direct injuries, and indirect blast effects
will be discussed later.
12.25 The general interactions of a
human body with a blast wave are
somewhat similar to that of a structure
as described in Chapter IV. Because of
the relatively small size of the body, the
diffraction process is quickly over, the
body being rapidly engulfed and sub-
jected to severe compression. This con-
tinues with decreasing intensity for the
duration of the positive phase of the
blast wave. At the same time the blast
wind exerts a drag force of considerable
magnitude which contributes to the dis-
placement hazard.
12.26 The sudden compression of
the body and the inward motion of the
thoracic and abdominal walls cause
rapid pressure oscillations to occur in
the air-containing organs. These effects,
together with the transmission of the
shock wave through the body, produce
damage mainly at the junctions of tis-
sues with air-containing organs and at
areas between tissues of different den-
sity, such as where cartilage and bone
join soft tissue. The chief consequences
are hemorrhage and occasional rupture
of abdominal and thoracic walls.
12.27 The lungs are particularly
prone to hemorrhage and edema (accu-
mulation of fluid causing swelling), and
BLAST INJURIES
549
if the injury is severe, air reaches the
veins of the lungs and hence the heart
and arterial circulation. Death can occur
in a few minutes from air embolic ob-
struction of the vessels of the heart or
the brain or from suffocation caused by
lung hemorrhage or edema. Fibrin em-
boli in the blood may also affect the
brain and other critical organs. The em-
boli, apparently associated with severe
hemorrhagic damage to the lungs, are a
consequence of the disturbance of the
blood-clotting mechanism. Damage to
the brain due to air blast overpressure
alone is improbable, but indirect dam-
age may arise from injury to the head
caused by missiles, debris, or displace-
ment of the body. Bodily activity after
blast damage to the heart and lungs is
extremely hazardous and lethality can
result quickly where recovery might
otherwise have been expected. The
direct blast effect was not specifically
recognized as a cause of fatality in
Japan, but it no doubt contributed sig-
nificantly to early mortality even though
most of the affected individuals may
also have received mortal injury from
debris, displacement, fire, or thermal
and nuclear radiations.
12.28 Primary blast casualties have
been reported after large-scale air at-
tacks with conventional high-explosive
bombs, mainly because of the provision
of medical care for those who otherwise
would have suffered the early death that
is characteristic of serious blast injury to
the lungs. However, persons who spon-
taneously survive for 24 to 48 hours in
the absence of treatment, complications,
and other injury usually recover and
show little remaining lung hemorrhage
after 7 to 10 days. In very severe inju-
ries under treatment, jpcurring lung
hemorrhage has been reported as long as
5 to 10 days after injury. In view of such
facts and overwhelming disruptive ef-
fects of the Japanese bombings on med-
ical and rescue services, it can be con-
cluded that individuals with significant
direct blast injuries did not survive.
Those with relatively minor blast inju-
ries who did survive, did so without
getting into medical channels, or if they
did require medical care it was for post-
blast complications, e.g., pneumonitis,
or for causes other than blast injury to
the lungs. For these reasons primary
blast effects, except for eardrum rup-
ture, were not commonly seen among
Japanese survivors.
12.29 Many persons who ap-
parently suffered no serious injury re-
ported temporary loss of consciousness.
This symptom can be due to the direct
action of the blast wave, resulting from
transient disturbance of the blood cir-
culation in the brain by air emboli.
However, it can also be an indirect ef-
fect arising from impact injury to the
head caused by missiles or by violent
displacement of the body by the air
pressure wave.
12.30 A number of cases of rup-
tured eardrums were reported among the
survivors in Hiroshima and Nagasaki,
but the incidence was not high even for
those who were fairly close to ground
zero. Within a circle of 0.31 mile (1,640
feet) radius about 9 percent of a group of
44 survivors in Nagasaki had ruptured
eardrums, as also did some 8 percent of
125 survivors in the ring from 0.31 to
0.62 mile from ground zero. In Hiro-
shima the incidence of ruptured ear-
drums was somewhat less. In both cities
very few cases were observed beyond
0.62 mile.
550
BIOLOGICAL EFFECTS
DIRECT BLAST INJURIES: PHYSICAL
FACTORS
12.31 Tests with animals have
demonstrated that five parameters of the
blast wave can affect the extent of the
direct injuries to the body; they are (1)
the ambient pressure, (2) the “effec-
tive” peak overpressure, (3) the rate of
pressure rise (or “rise time”) at the
blast wave front, (4) the character and
“shape” of the pressure pulse, and (5)
the duration of the positive phase of the
blast wave and the associated wind (see
Chapter III). These parameters will be
considered below as they arise.
12.32 The biologically effective
peak overpressure depends on the ori-
entation of the individual to the blast
wave. If the subject is against a reflect-
ing surface, e.g., a wall, the effective
overpressure for direct blast injury is
equal to the maximum reflected over-
pressure, which may be a few times the
incident peak overpressure. On the other
hand, in the open at a substantial dis-
tance from a reflecting surface, the ef-
fective overpressure is the sum of the
peak incident overpressure and the as-
sociated peak dynamic pressure if the
subject is perpendicular to the direction
of travel of the blast wave and to the
peak overpressure alone if the subject is
parallel to this direction. Consequently,
for a given incident overpressure, the
blast injury is expected to be greatest if
the individual is close to a wall and least
if he is at a distance from a reflecting
surface and is oriented with his body
parallel to the direction in which the
blast wave is moving.
12.33 The body, like many other
structures, responds to the difference
between the external and internal pres-
sures. As a consequence, the injury
caused by a certain peak overpressure
depends on the rate of increase of the
pressure at the blast wave front. For
wave fronts with sufficiently slow pres-
sure rise, the increase in internal pres-
sure due to inward movement of the
body wall and air flow in the lungs keeps
pace (to some extent) with the external
pressure. Consequently, quite high in-
cident overpressures are tolerable. In
contrast, if the rise time is short, as it is
in nuclear explosions under appropriate
terrain and burst conditions, the damag-
ing effect of a given overpressure is
greater. The increase in internal pres-
sure of the body takes a finite time and
the response is then to the maximum
possible pressure differential. Thus, a
sharply rising pressure pulse will be
more damaging than if the same peak
overpressure is attained more slowly. In
precursor formation (§ 3.79 et seq.), for
example, the blast pressure increases at
first slowly and then quite rapidly; the
injury potential of a given peak over-
pressure is thus decreased.
12.34 An individual inside a build-
ing but not too close to a wall would be
subject to multiple reflections of the
blast wave from the ceiling, floor, and
walls as well as to the incident wave
entering the structure. Since the re-
flected waves would reach him at dif-
ferent times, the result would be a step
loading, although the rise time for each
step might be quite short. In such cases,
where the initial blast pressure is tolera-
ble and the subsequent pressure increase
is not too great or occurs in stages (or
slowly), a certain peak overpressure is
much less hazardous than if it were
applied in a single sharp pulse. Ap-
parently the reason for the decreased
BLAST INJURIES
551
blast injury potential in these situations
is that the early stage of the pressure
pulse produces an increase in the inter-
nal body pressure, thereby reducing the
pressure differential associated with the
later portion of the pulse. In a manner of
speaking, a new and higher “ambient”
pressure is imposed on the body by the
early part of the pressure pulse and tol-
erance to the later rise in overpressure is
enhanced. A higher peak overpressure is
then required to cause a certain degree
of blast injury.
12.35 Clearly, for a given peak in-
cident overpressure, the geometry2 in
which an individual is exposed inside a
structure may have a significant effect
on his response to air blast. A location
against a wall is the most hazardous
position because the effective peak
overpressure, which is the maximum
reflected overpressure, is high and is
applied rapidly in a single step. A loca-
tion a few feet from a wall is expected to
decrease the direct blast injury, although
the hazard arising from displacement of
the body may be increased. Apart from
the effects just described, oscillating
pressures, for which no adequate bio-
medical criteria are available, often
exist inside structures due to reverberat-
ing reflections from the inside walls.
12.36 The duration of the positive
phase of the blast wave is a significant
factor for direct blast injuries. Up to a
point, the increase in the duration in-
creases the probability of injury for a
given effective peak overpressure.
Beyond this point, which may be of the
order of several tens to a few hundred
milliseconds, depending on the body
size, it is only the magnitude of the
overpressure that is important. The du-
ration of the positive phase, for a given
peak overpressure, varies with the en-
ergy yield and the height of burst
(§ 3.75 et seq.\ But for most condi-
tions, especially for energy yields in
excess of about 10 kilotons, the duration
of the positive phase of the blast wave is
so long—approaching a second or
more—that the effective peak overpres-
sure is the main factor for determining
the potential for direct injury from a
fast-rising pressure pulse.
12.37 A given peak pressure in the
blast wave from conventional high ex-
plosives is less effective than from a
nuclear explosion—except perhaps at
unusually low yields—mainly because
of the short duration of the positive
phase in the former case. From obser-
vations made with small charges of
chemical explosives, it has been esti-
mated that deaths in humans would re-
quire sharp-rising effective overpres-
sures as high as 200 to 400 (or more)
pounds per square inch when the posi-
tive phase durations are less than a mil-
lisecond or so. These pressures may be
compared with values of roughly 50 (or
less) to about 100 pounds per square
inch, with positive phase durations of
the order of a second, for nuclear ex-
plosions.
12.38 Tentative criteria, in terms of
effective peak overpressure as defined in
§ 12.32, for lung damage, lethality, and
eardrum rupture caused by a fast-rising
pressure pulse of long duration (0.1
second or more) are given in Table
12.38. The values for lung damage and
2The word “geometry” is used here as a general term to describe the location of an individual in
relation to the details of the environment that may affect the blast wave characteristics.
552
BIOLOGICAL EFFECTS
lethality are average pressures obtained
by extrapolation from animal data to
man; the variability of the results is
indicated by the numbers in parenthe-
ses. Rupture of the normal eardrum is
apparently a function of the age of the
individual as well as of the effective
blast pressure. Failures have been re-
corded at overpressures as low at 5
pounds per square inch ranging up to 40
or 50 pounds per square inch. The val-
ues in Table 12.38 of the effective peak
overpressures for eardrum rupture are
based on relatively limited data from
man and animals.
INDIRECT BLAST INJURIES
12.39 Indirect bjast injuries are as-
sociated with (1) the impact of missiles,
either penetrating or nonpenetrating
(secondary effects), and (2) the physical
displacement of the body as a whole
(tertiary effects). The wounding poten-
tial of blast debris depends upon a
number of factors; these include the
impact (or striking) velocity, the angle
at which impact occurs, and the size,
shape, density, mass, and nature of the
moving objects. Furthermore, consider-
ation must be given to the portion of the
body involved in the missile impact, and
the events which may occur at and after
the time of impact, namely, simple
contusions and lacerations, at one ex-
treme, or more serious penetrations,
fractures, and critical damage to vital
organs, at the other extreme.
12.40 The hazard from displace-
ment depends mainly upon the time and
distance over which acceleration and
deceleration of the body occur. Injury is
more likely to result during the latter
phase when the body strikes a solid
object, e.g., a wall or the ground. The
velocity which has been attained before
impact is then significant. This is deter-
mined by certain physical parameters of
the blast wave, as mentioned below, as
well as by the orientation of the body
with respect to the direction of motion
of the wave. The severity of the damage
depends on the magnitude of the impact
velocity, the properties of the impact
Table 12.38
TENTATIVE CRITERIA FOR DIRECT (PRIMARY) BLAST EFFECTS IN MAN FROM
FAST-RISING, LONG-DURATION PRESSURE PULSES
Effect
Effective Peak Pressure (psi)
Lung Damage:
Threshold
Severe
Lethality:
Threshold
50 percent
100 percent
Eardrum Rupture:
Threshold
50 percent
12 ( 8-15)
25 (20-30)
40 (30-50)
62 (50-75)
92 (75-115)
5
15-20 (more than 20 years old)
30-35 (less than 20 years old)
BLAST INJURIES
553
surface, and the particular portion of the
body that has received the decelerative
impact, e.g., head, back, extremities,
thoracic and abdominal organs, body
wall, etc.
DISPLACEMENT VELOCITIES
12.41 Because the effects of both
missiles and body displacement depend
on the velocity attained before impact, it
is convenient to consider the relation-
ships between displacement velocity
and the blast parameters for objects as
small as tiny pieces of glass and as large
as man. The significant physical factors
in all cases are the magnitude and dura-
tion of the blast overpressure and the
accompanying winds, the acceleration
coefficient of the displaced object,3
ground shock, gravity, and the distance
traveled by the object. The latter is im-
portant because, as a result of the action
of the blast wave, the velocity of the
object increases with the time and dis-
tance of travel until it attains that of the
blast wind. Subsequently, the velocity
falls because of negative winds or im-
pact with the ground or other material.
12.42 As a result of the interaction
of the various factors, large and heavy
objects gain velocity rather slowly and
attain a maximum velocity only after
most of the blast wave has passed. The
velocity is consequently determined by
the duration of the overpressure and
winds. In contrast, small and light ob-
jects reach their maximum velocity
fairly quickly, often after a small pro-
portion of the blast wave has passed
over them. The maximum velocity is
thus not too sensitive to the duration of
the overpressure and winds, but depends
largely on the effective peak overpres-
sure (cf. § 12.32). As a consequence of
this fact, it has been found possible to
relate the velocities attained by the
fragments produced by the breakage of
glass window panes to the effective
overpressure. The results for glass panes
of different thicknesses can be expressed
in a fairly simple graphical manner as
will be shown in § 12.238.
12.43 The variations of the over-
pressure and dynamic pressure with
time (§ 3.57 et seq.) at the location of
interest also have a bearing on the be-
havior of a displaced object. Data were
obtained at nuclear weapons tests under
such conditions that the blast wave was
approximately ideal in behavior. Some
of the median velocities, masses, and
spatial densities (number of fragments
per square foot) of window glass, from
houses exposed to the blast, and of nat-
ural stones are summarized in Table
12.43. For glass, the velocities refer to
those attained after 7 to 13 feet of travel;
for the stones the distances are not
known, but the velocities given in the
table may be regarded as applicable to
optimum distances of missile travel.
12.44 Studies have also been made
of the displacement of anthropomorphic
dummies weighing 165 pounds by the
blast from a nuclear explosion. A
dummy standing with its back to the
blast attained its maximum velocity,
about 21 feet per second, after a dis-
placement of 9 feet within 0.5 second
after the arrival of the blast wave. The
free-field overpressure at the test loca-
3The acceleration coefficient is the product of the projected area presented to the blast wave and the
drag coefficient (§ 4.19) divided by the mass of the object.
554
BIOLOGICAL EFFECTS
Table 12.43
VELOCITIES, MASSES, AND DENSITIES OF MISSILES
Missile Peak Overpressure (psi) Median Velocity (ft/sec) Median Mass (grams) Maximum Number per Sq Ft
Glass 1.9 108 1.45 4.3
Glass 3.8 168 0.58 159
Glass 3.9 140 0.32* 108
Glass 5.0 170 0.13 388
Stones 8.5 286 0.22 40
tion was 5.3 pounds per square inch.
The dummy traveled 13 feet before
striking the ground and then slid or
rolled another 9 feet. A prone dummy,
however, did not move under the same
conditions. The foregoing results were
obtained in a situation where the blast
wave was nearly ideal, but in another
test, at a peak overpressure of 6.6
pounds per square inch, where the blast
wave was nonideal (§ 3.79), both
standing and prone dummies suffered
considerably greater displacements.
Even in such circumstances, however,
the displacement of over 125 feet for the
prone dummy was much less than that
of about 250 feet for the standing one.
The reason for the greater displacement
of the standing dummy is that it ac-
quired a higher velocity.
12.45 In order to study the dis-
placements of moving objects, field tests
have been made by dropping animal
cadavers, including guinea pigs, rab-
bits, goats, and dogs, and stones and
concrete blocks onto a flat, hard surface
from a vehicle traveling between 10 and
60 miles per hour (14.7 to 88 feet per
second). For a given initial velocity, the
stopping distance for the animals in-
creased somewhat with the mass, and a
relationship was found to represent the
stopping distance as a function of ve-
locity applicable to the animals over a
wide range of mass (§ 12.239). One
reason for the consistency of the data is
probably that all the animals assumed a
rolling position about their long axis
regardless of the initial orientation. The
animals remained relatively low to the
ground and bounced very little. By
contrast, stones and concrete blocks
bounced many times before stopping;
the data were not sensitive to mass,
depended more on orientation, and were
more variable than the results obtained
with animals. On the whole, the stop-
ping distances of the blocks and stones
were greater for a given initial velocity.
One of the conclusions drawn from the
foregoing tests was that a person tum-
bling over a smooth surface, free from
rocks and other hard irregularities,
might survive, even if the initial veloc-
ity is quite high, if he could avoid head
injury and did not flail his limbs.
MISSILE AND DISPLACEMENT
INJURY CRITERIA
12.46 Velocity criteria for the pro-
duction of skin lacerations by penetrat-
BLAST INJURIES
555
ing missiles, e.g., glass fragments, are
not known with certainty. Some reliable
information is available, however, con-
cerning the probability of penetration of
the abdominal wall by glass. The impact
velocities, for glass fragments of dif-
ferent masses, corresponding to 1, 50,
and 99 percent penetration probability
are recorded in Table 12.46.
12.47 The estimated impact veloci-
ties of a 10-gram (0.35-ounce) glass
missile required to produce skin lacera-
tions and serious wounds are sum-
marized in Table 12.47. The threshold
value for skin lacerations is recorded as
50 feet per second and for serious
wounds it is 100 feet per second.
12.48 Little is known concerning
the relationship between mass and ve-
locity of nonpenetrating missiles that
will cause injury after impact with the
body. Studies with animals showed that
fairly high missile velocities are re-
quired to produce lung hemorrhage, rib
fractures, and early mortality, but
quantitative data for man are lacking.
No relationship has yet been developed
between mass and velocity of nonpene-
Table 12.46
PROBABILITIES OF GLASS FRAGMENTS PENETRATING ABDOMINAL WALL
Probability of Penetration
(percent)
Mass of Glass
Fragments
(grams)
1 50 99
Impact Velocity (ft/sec)
0.1 235 410 730
0.5 160 275 485
1.0 140 245 430
10.0 115 180 355
Table 12.47
TENTATIVE CRITERIA FOR INDIRECT (SECONDARY) BLAST EFFECTS FROM
PENETRATING 10-GRAM GLASS FRAGMENTS4
Effect
Impact Velocity
(ft/sec)
Skin laceration:
Threshold 50
Serious wounds:
Threshold
50 percent
Near 100 percent
100
180
300
4Figures represent impact velocities with unclothed skin. A serious wound is arbitrarily defined as a
laceration of the skin with missile penetration into the tissues to a depth of 1 cm (about 0.4 inch) or more.
556
BIOLOGICAL EFFECTS
trating missiles that will cause injury as
a result of impacts with other parts of
the body wall, particularly near the
spine, kidney, liver, spleen and pelvis.
It appears, however, that a missile with
a mass of 10 pounds striking the head at
a velocity of about 15 feet per second or
more can cause skull fracture. For such
missiles it is unlikely that a significant
number of dangerous injuries will occur
at impact velocities of less than 10 feet
per second. The impact velocities of a
10-pound missile for various effects on
the head are given in Table 12.48.
12.49 Although there may be some
hazard associated with the accelerative
phase of body displacement (translation)
by a blast wave, the deceleration, par-
ticularly if impact with a solid object is
involved, is by far the more significant.
Since a hard surface will cause a more
serious injury than a softer one, the
damage criteria given below refer to
perpendicular impact of the displaced
body with a hard, flat object. From
various data it is concluded that an im-
pact velocity of 10 feet per second is
unlikely to be associated with a signifi-
cant number of serious injuries; between
10 and 20 feet per second some fatalities
may occur if the head is involved; and
above 20 feet per second, depending on
trauma to critical organs, the probabili-
ties of serious and fatal injuries increase
rapidly with increasing displacement
velocity. Impact velocities required to
produce various indirect (tertiary) blast
effects are shown in Table 12.49. The
curves marked “translation near struc-
tures” in Fig. 12.49 may be used to
estimate ground distances at which 1
percent and 50 percent casualties would
be expected, as functions of height of
burst, for a 1-kiloton explosion.5 Based
on tests with animals, the criteria for 1
and 50 percent casualties were some-
what arbitrarily set at impact velocities
of 8 and 22 feet per second, respec-
tively. The results in Fig. 12.49 may be
extended to other burst heights and
yields by using the scaling law given in
the example facing the figure.
Table 12.48
TENTATIVE CRITERIA FOR INDIRECT BLAST EFFECTS INVOLVING
NONPENETRATING 10-POUND MISSILES
Impact Velocity
Effect (ft/sec)
Cerebral Concussion:
Mostly “safe” 10
Threshold 15
Skull Fracture:
Mostly “safe” 10
Threshold 13
Near 100 percent 23
5In (his connection, a casualty is defined as an individual so injured that he would probably be a burden
on others. Some of the casualties would prove fatal, especially in the absence of medical care.
BLAST INJURIES
557
Table 12.49
TENTATIVE CRITERIA FOR INDIRECT (TERTIARY) BLAST EFFECTS INVOLVING
IMPACT
Impact Velocity
Effect (ft/sec)
Standing Stiff-Legged Impact:
Mostly “safe”
No significant effect
Severe discomfort
Injury
Threshold
Fracture threshold (heels, feet, and legs)
< 8
8-10
10-12
13-16
Seated Impact:
Mostly “safe”
No effect < 8
Severe discomfort 8-14
Injury
Threshold 15-26
Skull Fracture:
Mostly “safe” 10
Threshold 13
50 percent 18
Near 100 percent 23
Total Body Impact:
Mostly “safe” 10
Lethality threshold 21
Lethality 50 percent 54
Lethality near 100 percent 138
12.50 Evaluation of human toler-
ance to decelerative tumbling during
translation in open terrain is more diffi-
cult than for impact against a rigid sur-
face described above. Considerably
fewer data are available for decelerative
tumbling than for body impact, and
there is virtually no human experience
for checking the validity of extrapola-
tions from observations on animal ca-
davers. Tests have been made with
goats, sheep, and dogs, but for humans
the information required to derive reli-
able hazards criteria for decelerative
tumbling are still not adequate. The ini-
tial velocities at which 1 and 50 percent
of humans are expected to become ca-
sualties as a result of decelerative tum-
bling have been tentatively estimated to
be 30 and 75 feet per second, respec-
tively. The curves in Fig. 12.49 marked
“translation over open terrain” are ap-
proximate, but they may be used to
provide a general indication of the range
within which casualties might occur
from decelerative tumbling due to air
blast from surface and air bursts.
(Text continued on page 560.)
558
BIOLOGICAL EFFECTS
The curves in Fig. 12.49 show 50
percent and 1 percent casualties result-
ing from translation near structures and
over open terrain as a function of ground
distance and height of burst for a 1 KT
explosion in a standard sea-level atmos-
phere. The results apply to randomly
oriented, prone personnel exposed to the
blast wave in the open. The curves for
translation over open terrain (decelera-
tive tumbling) are approximate
(§ 12.50).
Scaling. The required relationships
are
JEL = JL = w°.4
J, Й,
where d{ and are the distance from
ground zero and height of burst, re-
spectively, for 1 KT; and J and hare the
corresponding distance and height of
burst for W KT.
Example
Given: A 50 KT explosion at a
height of 860 feet over open terrain.
Find: The ground distance at which
translational effects would produce 50
percent casualties among prone person-
nel.
Solution: The corresponding burst
height for 1 KT is
, h 860 i on r *
h. = —— = ——— = 180 feet.
1 W0-4 (50)°4
From Fig. 12.49, at a height of burst of
180 feet, the ground distance at which
50 percent casualties among personnel
in the open will occur is roughly 660
feet. The corresponding ground distance
for 50 KT is then given approximately
as
d = d{WQA = 660 x (50)°-4
= 3,150 feet. Answer
HEIGHT OF BURST (FEET)
1000
800
600
400
200
0
200
0
400
600
800
1200
1400
1000
1600
DISTANCE FROM GROUND ZERO (FEET)
Figure 12.49. Casualties from translation near structures and over open terrain for a
Figi 1-kiloton explosion. (The curves for open terrain are more approximate than
the others.)
BLAST INJURIES 559
560
BIOLOGICAL EFFECTS
BURN INJURIES
CLASSIFICATION OF BURNS
12.51 Thermal radiation can cause
burn injuries either directly, i.e., by
absorption of the radiant energy by the
skin, or indirectly by heating or ignition
of clothing, or as a result of fires started
by the radiation. The direct burns are
often called “flash burns,” since they
are produced by the flash of thermal
radiation from the fireball. The indirect
(or secondary) burns are referred to as
“contact burns” or “flame burns”; they
are identical with skin burns that result
from touching a hot object or those that
would accompany (or be caused by) any
large fire no matter what its origin. In
addition, individuals in buildings or
tunnels close to ground zero may be
burned from hot debris, gases, and dust
(§ 12.02).
12.52 A skin burn is an injury
caused by an increase in skin tempera-
ture resulting from direct absorption of
thermal radiation, which varies with
skin color, or from the transference of
heat through clothing. The severity of
the burn depends on the amount of the
temperature increase and on the duration
of the increase. For example, a skin
temperature of 70°C (155°F) for a frac-
tion of a second will produce the same
type of burn as a temperature of 48°C
(118°F) for a few minutes. Skin burns
are generally classified as first, second,
or third degree, in order of increasing
severity of the burn. Pain associated
with skin burns occurs when the tem-
perature of certain nerve cells near the
surface is raised to 43°C (109°F) or
more. If the temperature is not suffi-
ciently high or does not persist for a
sufficient length of time, pain will cease
and no injury will occur. The amount of
pain is not directly related to the severity
of the burn injury, but it can serve a
useful purpose in warning an individual
to evade part of the thermal pulse from a
nuclear explosion.
12.53 First-degree burns, which are
the mildest, are characterized by imme-
diate pain and by ensuing redness of the
affected area. The pain continues even
after the temperature of the skin has
returned to normal. The first-degree
burn is a reversible injury; that is to say,
healing is complete with no scar forma-
tion. Sunburn is the classic example of
first-degree burn.
12.54 Second-degree burns result
from skin temperatures that are higher
and/or of longer duration than those
causing first-degree skin burns. The in-
jury is characterized by pain which per-
sists, and may be accompanied either by
no immediate visible effect or by a va-
riety of skin changes including blanch-
ing, redness, loss of elasticity, swelling,
and development of blisters. After 6 to
24 hours, a scab will form over the
injured area. The scab may be flexible
and tan or brown, if the injury is mod-
erate, or it may be thick, stiff, and dark,
if the injury is more severe. The wounds
will heal within one to two weeks unless
they are complicated by infection. Sec-
ond-degree burns do not involve the full
thickness of the skin, and the remaining
uninjured cells may be able to regener-
ate normal skin without scar formation.
12.55 If skin temperatures become
sufficiently high and/or are of long du-
BURN INJURIES
561
ration, third-degree burns will be pro-
duced. Pain is experienced at the pe-
ripheral, less injured areas only, since
the nerve endings in the centrally burned
areas are damaged to the extent that they
are unable to transmit pain impulses.
Immediately after suffering the burn, the
skin may appear either normal, scalded,
or charred, and it may lose its elasticity.
The healing of third-degree burns takes
several weeks and will always result in
scar formation unless new skin is
grafted over the burned area. The scar
results from the fact that the full thick-
ness of the skin is injured, and the skin
cells are unable to regenerate normal
tissue.
12.56 The distribution of burns into
three groups obviously has certain limi-
tations since it is not possible to draw a
sharp line of demarcation between first-
and second-degree, or between second-
and third-degree burns. Within each
class the burn may be mild, moderate,
or severe, so that upon preliminary ex-
amination it may be difficult to distin-
guish between a severe burn of the sec-
ond degree and a mild third-degree
burn. Subsequent pathology of the in-
jury, however, will usually make a dis-
tinction possible. In the following dis-
cussion, reference to a particular degree
of burn should be taken to imply a
moderate burn of that type.
12.57 The depth of the burn is not
the only factor in determining its effect
on the individual. The extent of the area
of the skin which has been affected is
also important. Thus, a first-degree burn
over the entire body may be more
serious than a third-degree burn at one
spot. The larger the area burned, the
more likely is the appearance of symp-
toms involving the whole body. Fur-
thermore, there are certain critical, local
regions, such as the hands, where al-
most any degree of burn will incapaci-
tate the individual.
12.58 Persons exposed to nuclear
explosions of low or intermediate yield
may sustain very severe burns on their
faces and hands or other exposed areas
of the body as a result of the short pulse
of directly absorbed thermal radiation.
These burns may cause severe superfi-
cial damage similar to a third-degree
burn, but the deeper layers of the skin
may be uninjured. Such burns would
heal rapidly, like mild second-degree
burns. Thermal radiation burns occur-
ring under clothing or from ignited
clothing or other tinder will be similar to
those ordinarily seen in burn injuries of
nonnuclear origin. Because of the
longer duration of the thermal pulse
from an air burst weapon in the megaton
range, flash burns on exposed skin and
burns of nonnuclear origin may also be
similar.
BURNS UNDER CLOTHING
12.59 Skin burns under clothing,
which depend on the color, thickness,
and nature of the fabric, can be pro-
duced in the following ways: by direct
transmittance through the fabric if the
latter is thin and merely acts as an at-
tenuating screen; by heating the fabric
and causing steam or volatile products
to impinge on the skin; by conduction
from the hot fabric to the skin; or the
fabric may ignite and hot vapors and
flames will cause burns where they im-
pinge on the skin. Burns beneath cloth-
ing can arise from heat transfer for some
time after the thermal pulse ends. These
burns generally involve deeper tissues
562
BIOLOGICAL EFFECTS
than the flash burns produced by the
direct thermal pulse on bare skin. Flame
burns caused by ignited clothing also
result from longer heat application, and
thus will be more like burns due to
conventional conflagrations.
12.60 First- and second-degree
burns of the uncovered skin and burns
through thin clothing occur at lower
radiant exposures (§ 7.35) than those
which ignite clothing (Table 7.36). Be-
cause of these factors, first- and sec-
ond-degree burns in exposed persons
would involve only those body areas
that face the explosion. Where the direct
thermal pulse produces third-degree
burns and clothing ignition takes place,
persons wearing thin clothing would
have such burns over parts of the body
facing the burst. Persons wearing heavy
clothing could suffer third-degree burns
over the whole body if the ignited
clothing could not be removed quickly.
This phenomenon is typically seen in
persons whose clothing catches fire by
conventional means.
INCAPACITATION FROM BURNS
12.61 Burns of certain areas of the
body, even if only of the first degree,
will frequently result in incapacitation
because of their critical location. Any
burn surrounding the eyes that causes
occluded vision, e.g., because of swell-
ing of the eyelids, will be incapacitat-
ing. Burns of the elbows, knees, hands,
and feet produce immobility or limita-
tion of motion as the result of swelling,
pain, or scab formation, and will cause
ineffectiveness in most cases. The oc-
currence of burns of the face, neck, and
hands are probable because these areas
are most likely to be unprotected. Sec-
ond- or third-degree burns in excess of
20 percent of the surface area of the
body should be considered major burns
and will require special medical care in
a hospital. If the nose and throat are
seriously involved and obstructive
edema (§ 12.27) occurs, breathing may
become impossible and tracheotomy
may be required as a life-saving mea-
sure.
12.62 Shock is a term denoting a
generalized state of serious circulatory
inadequacy. If serious, it will result in
incapacitation and unconsciousness and
if untreated may cause death. Third-de-
gree burns of 25 percent of the body and
second-degree burns of 30 percent of the
body will generally produce shock
within 30 minutes to 12 hours and re-
quire prompt medical treatment. Such
treatment is complicated and causes a
heavy drain on medical personnel and
supply resources.
RADIANT EXPOSURES FOR BURNS
ON EXPOSED SKIN
12.63 The critical radiant exposure
for a skin burn depends on the duration
of the radiation pulse and the thermal
energy spectrum; both of these quanti-
ties vary with the yield and height of
burst. Hence, although the radiant ex-
posure is known as a function of dis-
tance and yield (see Chapter VII), it is
not a simple matter to predict distances
at which burns of different types may be
expected from a given explosion. Apart
from radiant exposure, the probability
and severity of the burns will depend on
several factors. One of the most impor-
tant is the absorptive properties of the
skin for thermal radiation. In a normal
population, the fraction of the radiation
BURN INJURIES
563
energy absorbed may vary by as much
as 50 percent because of differences in
skin pigmentation.
12.64 For thermal radiation pulses
of 0.5 second duration or more, as is the
case for explosions with yields exceed-
ing 1 kiloton, the energy absorbed by
the skin, rather than the radiant expo-
sure, determines the extent of the burn
injury. The spectral absorptance of the
skin, i.e., the fraction of the incident
radiation energy (or radiant exposure)
that is absorbed, depends on the skin
pigmentation. The curves in Fig. 12.64
have been derived from thermal energy
spectra of nuclear explosions in the
lower part of the atmosphere and mea-
sured values of the absorptance of dif-
ferent skin types. By considering ex-
plosions in the lower atmosphere, the
height of burst variable is largely elimi-
nated. The results in the figure are ap-
plicable to exposed skin when no eva-
sive action is taken and there is no
protection from structures or clothing. It
is seen that the radiant exposure re-
quired to produce a given degree of burn
injury varies significantly with skin pig-
mentation. In fact, people with very
dark skins could receive burns from ap-
proximately two-thirds the incident ra-
diant energy that will cause similar
burns in very light-skinned people.
12.65 Figure 12.65 shows radiant
exposures for the various probabilities
of burn occurrence, again assuming no
evasive or protective action. The solid
lines represent the conditions under
which it is probable that 50 percent of an
average exposed population will receive
skin burns of the indicated degree. The
broken lines divide the burn probability
distributions into ranges for three de-
grees of burn severity with average pro-
babilities of 18 percent and 82 percent
assigned within the various ranges. For
example, from Fig. 12.65 it is expected
that, if a normal population is exposed
to the thermal pulse from a 1-megaton
explosion in the lower atmosphere, at
distances where the radiant exposures
are between 4.5 and 6 cal/cm2, 18 per-
cent of the population will receive sec-
ond-degree burns and the remainder
first-degree burns to the exposed (un-
protected) skin.
12.66 With the aid of the yield-
distance relationships for various radiant
exposures given in Chapter VII, the
curves in Fig. 12.65 may be used to
determine the approximate distances
from ground zero at which given burn
probabilities may be experienced. Sup-
pose that, in the example given above,
the 1-megaton weapon is detonated at a
height of 10,000 feet, which is within
the lower atmosphere. According to
Fig. 7.42, for air bursts below 20,000
feet and 12-mile visibility, the specified
radiant exposure between 4.5 and 6
cal/cm2, would be received at slant
ranges of from 9 to 10 miles. Since
these ranges are substantially greater
than the height of burst (about 2 miles),
they may be taken as the distances to
ground zero to the accuracy of Fig.
7.42. Hence, within the radii of 9 and
10 miles from ground zero, it is proba-
ble that 18 percent of an average popu-
lation subjected to the whole thermal
pulse will receive second-degree burns
and 82 percent first-degree burns to their
exposed (unprotected) skin.
12.67 As already noted, the burn
criteria given above are based on the
supposition that no evasive action is
taken. For air bursts with yields less
than about 100 kilotons, the main part of
564
BIOLOGICAL EFFECTS
Third-
Degree
Second
Degree
First -
Degree
EXPLOSION YIELD (KILOTONS)
Figure 12.64. Radiant exposure required to produce skin burns for different skin pigmen-
tations.
RADIANT EXPOSURE (CAL/CM
EXPLOSION YIELD (KILOTONS)
Figure 12.65. Skin burn probabilities for an average unshielded population taking no
evasive action as a function of explosion yield and radiant exposure.
BURN INJURIES 565
566
BIOLOGICAL EFFECTS
the thermal energy arrives too quickly
for people to react and take some pro-
tective action. Evasion of part of the
thermal energy that would be effective
in reducing burn injuries is possible,
however, for yields of 100 kilotons or
more in the lower atmosphere. The
length of the thermal pulse is then such
that the pain could initiate a reaction
which, if appropriate, might allow a
person to obtain sufficient protection to
decrease the severity of the potential
burn (§ 7.87). The ability to react in this
manner can apparently be improved by
appropriate training.
BURN INJURIES IN JAPAN
12.68 Among the survivors of the
nuclear explosions in Japan, the inci-
dence of flame burns appeared to be
very small. In fact, they constituted not
more than 5 percent of the total burn
injuries. This was the case because most
of those who suffered flame burns did
not survive, since they were caught in
burning buildings and could not escape.
The character of the flame burns was
similar to that of burns caused by other
conflagrations. The clothing usually
caught fire and then large parts of the
body suffered flame burns. By contrast,
as will be seen below, flash burns were
generally restricted to exposed skin
areas, i.e., face, arms, hands, and legs.
12.69 One of the most striking
consequences of the nuclear bombings
of Japan was the large number of ca-
sualties due to flash burns caused by the
thermal radiation. The situation was ag-
gravated by the clear atmosphere and
warm weather which prevailed at the
time (§ 12.14). It was estimated that 20
to 30 percent of the fatal casualties in
Hiroshima and Nagasaki were caused by
flash burns. In the former city alone,
about 42,000 burn cases were reported
and of those some 24,500 were recorded
as being serious. Unless protected by
heavy clothing, thermal radiation burns,
apart from other injuries, would have
been fatal to nearly all unshielded per-
sons in the open at distances up to 6,000
feet (1.1 miles) or more from ground
zero. Even as far out as 12,000 to
14,000 feet (2.3 to 2.6 miles), there
were instances of such burns which
were bad enough to require treatment.
THERMAL RADIATION BURNS IN
JAPAN
12.70 A distinctive feature of the
thermal radiation (flash) burns was their
sharp limitation to exposed areas of the
skin facing the center of the explosion.
For this reason they are sometimes
called “profile burns” (Fig. 12.70). The
phenomenon occurred because most of
the radiation received had traveled in a
straight line from the fireball and so only
regions that were directly exposed were
affected. A striking illustration of this
behavior was that of a man writing be-
fore a window. His hands were
seriously burned, but his face and neck,
which were not covered, suffered only
slight burns because the angle of entry
of the thermal radiation through the
window was such as to place them in
partial shadow.
12.71 Although flash burns were
largely confined to exposed parts of the
body, there were a few cases where such
burns occurred through one, and very
occasionally more, layers of clothing.
Instances of this kind were observed
when the radiant exposure was large
BURN INJURIES
567
Figure 12.70. Partial protection against thermal radiation produced “profile” burns (1.23
miles from ground zero in Hiroshima; the radiant exposure was estimated to
be 5.5 to 6 cal/cm2)- The cap was sufficient to protect the top of the head
against flash burn.
enough to overcome the protective ef-
fect of the particular fabric. When burns
did occur through clothing, they fre-
quently involved regions where the
clothes were in contact with the skin, at
the elbows and shoulders, for example.
Such burns may have been due to heat
transmitted from the hot fabric, rather
than to the direct effect of radiation.
Areas over which the clothing fitted
loosely, so that an air space separated it
from the skin, were generally unharmed
by the thermal radiation (Fig. 12.71).
12.72 There were many instances in
which burns occurred through black
clothing, but not through white material
worn by the same individual (Fig.
12.72 ). This was attributed to the re-
flection of thermal radiation by white or
other light-colored fabrics, whereas
materials of dark color absorbed radia-
tion, became hot, and so caused contact
burns. In some cases black outer cloth-
ing actually burst into flame and ignited
the undergarments, so that flame burns
resulted. It should be mentioned, how-
ever, that white clothing does not
always necessarily provide protection
against thermal radiation. Some materi-
als of this kind transmit enough radia-
tion to permit flash burning of the skin to
occur.
12.73 The frequency of flash burns
was, of course, greatest among persons
568
BIOLOGICAL EFFECTS
Figure 12.71. The skin under the areas of contact with clothing is burned. The protective
effect of thicker layers can be seen on the shoulders and across the back.
who were in the open. Nevertheless,
there were a surprising number of such
burns among individuals who were in-
doors. This was largely because many
windows, especially in commercial
structures, were uncurtained or were
wide open on account of the summer
weather. Hence, many persons inside
buildings were directly exposed to ther-
mal radiation. In addition to the protec-
tion afforded by clothing, particularly if
light in color, some shielding was pro-
vided by the natural promontories of the
body, e.g., the nose, supraorbital (eye
socket) ridges, and the chin.
GENERAL CHARACTERISTICS OF
FLASH BURNS
12.74 In spite of the thousands of
flash burns experienced after the nuclear
attacks on Japan, only their general fea-
tures were reported. However, this in-
formation has been supplemented by
observations made, especially on an-
esthetized pigs, both in the laboratory
and at nuclear test explosions. The skin
of white pigs has been found to respond
to thermal radiation in a manner which
is in many respects similar to, and can
be correlated with, the response of
human skin.
12.75 Severity of the flash burns in
Japan ranged from mild erythema (red-
dening) to charring of the outermost
layers of the skin. Among those who
were within about 6,000 feet (1.1 miles)
from ground zero, the burn injuries were
depigmented lesions (light in color), but
at greater distances, from 6,000 to
12,000 feet (1.1 to 2.3 miles), the initial
erythema was followed by the develop-
BURN INJURIES
569
Figure 12.72. The patient’s skin is burned in a pattern corresponding to the dark portions of
a kimono worn at the time of the explosion.
ment of a walnut coloration of the skin,
sometimes called the “mask of Hiro-
shima.”
12.76 Burns of moderate second
degree (and milder) usually healed
within four weeks, but more severe
burns frequently became infected so that
the healing process was much more
prolonged. Even under the best condi-
tions, it is difficult to prevent burns from
becoming infected, and after the nuclear
bombings of Japan the situation was
aggravated by inadequate care, poor
sanitation, and general lack of proper
facilities. Nuclear radiation injury may
have been a contributory factor in some
cases because of the decrease in resis-
tance of the body to infection.
12.77 Experimental flash burns
have been produced both in the labora-
tory and in nuclear tests which were
apparently quite similar to those re-
ported from Hiroshima and Nagasaki. In
the more severe cases of circular exper-
imental burns there was a central
charred region with a white outer ring
surrounded by an area of erythema. A
definite demarcation both in extent and
depth of the burns was noted, so that
they were unlike contact burns which
are generally variable in depth. The
surface of the flash burns became dry
570
BIOLOGICAL EFFECTS
without much edema or weeping of
serum.
12.78 Another phenomenon, which
appeared in Japan after the healing of
some of the more severe burns, was the
formation of keloids, that is, thick
overgrowths of scar tissue. It was sug-
gested, at one time, that they might have
been due to nuclear radiation, but this
view is no longer accepted. The degree
of keloid formation appears to have
been influenced by infections, which
complicated healing of the burns, and
by malnutrition. A secondary factor is
the known disposition for keloid forma-
tion to occur among the Japanese and
other dark-skinned people as a racial
characteristic. Many spectacular ke-
loids, for example, were formed after
the healing of burns produced in the
incendiary bomb attacks on Tokyo.
There is a tendency, however, for ke-
loids to disappear gradually in the
course of time.
EFFECTS OF THERMAL RADIATION
ON THE EYES
12.79 It is of interest that, among
the survivors in Hiroshima and Naga-
saki, eye injuries directly attributable to
thermal radiation appeared to be rela-
tively unimportant. There were many
instances of temporary blindness, occa-
sionally lasting up to 2 or 3 hours, but
only one case of retinal injury was re-
ported.
12.80 The eye injury known as
keratitis (an inflammation of the cornea)
occurred in some instances. The symp-
toms, including pain caused by light,
foreign-body sensation, lachrymation,
and redness, lasted for periods ranging
from a few hours to several days.
Among 1,000 cases, chosen at random,
of individuals who were in the open,
within some 6,600 feet (1.25 miles) of
ground zero at the time of the explo-
sions, only 42 gave a history of keratitis
coming on within the first day. Delayed
keratitis was reported in 14 additional
cases, with symptoms appearing at
various times up to a .month or more
after the explosion. It is possible that
nuclear radiation injury, which is asso-
ciated with delayed symptoms, as will
be seen below, may have been a factor
in these patients.
12.81 Investigators have reported
that in no case, among 1,400 examined,
was the thermal radiation exposure of
the eyes apparently sufficient to produce
permanent opacity of the cornea. This
observation is not surprising since the
cornea is transparent to the major por-
tion of the thermal energy which is re-
ceived in the visible and longer wave-
length (infrared) parts of the spectrum.
In approximately one-quarter of the
cases studied there had been facial burns
and often singeing of the eyebrows and
eyelashes. Nevertheless, some 3 years
later the corneas were found to be nor-
mal.
12.82 Several reasons have been
suggested for the scarcity of severe eye
injuries in Japan. For example, the det-
onations occurred in the morning in
broad daylight when the eye pupil
would be expected to be small. Another
possible explanation is that the recessed
position of the eyes and, in particular,
the overhanging upper lids served to
decrease the direct exposure to thermal
radiation. Furthermore, on the basis of
probability, it is likely that only a small
proportion of individuals would be fac-
ing the explosions in such a way that the
BURN INJURIES
571
fireball would actually be in their field of
vision.
12.83 Exposure of the eye to the
bright flash of a nuclear detonation can
produce two possible injuries: flash-
blindness and retinal burns. Flashblind-
ness (dazzle) is a temporary impairment
of vision caused by a bleaching of the
light-sensitive elements (rods and
cones) in the retina of the eye. It may be
produced by scattered light and does not
necessarily require the eye to be focused
on the fireball. Flashblindness will nor-
mally blank out the entire visual field of
view with a bright afterimage. The ef-
fects persist only a short time and re-
covery is complete.
12.84 During the period of flash-
blindness (several seconds to minutes)
useful vision is lost. This may preclude
effective performance of activities re-
quiring constant, precise visual func-
tion. The severity and time required for
recovery of vision are determined by the
intensity and duration of the flash, the
viewing angle from the burst, the pupil
size, brightness of the object being
viewed and its background, and the vi-
sual complexity of the object. Flash-
blindness would be more severe at night
since the pupil is larger and the objects
and background are usually dimly illu-
minated.
12.85 A retinal burn is a permanent
eye injury that occurs whenever the re-
tinal tissue is heated excessively by the
image of the fireball focused in the eye.
The underlying pigmented cells absorb
much of the light (radiation) energy and
the temperature is increased in that area.
A temperature elevation of 12 to 20°C
(22 to 36°F) in the eye produces a ther-
mal injury that involves both the pig-
mented layer and the adjacent rods and
cones, so that visual capacity is perma-
nently lost in the burned area. The nat-
ural tendency of people to look directly
at the fireball would increase the inci-
dence of retinal burns. A retinal burn
normally will not be noticed by the
individual concerned if it is off the cen-
tral axis of vision, but very small burned
areas may be noticeable if they are cen-
trally located. A person generally will
be able to compensate for a small retinal
burn by learning to scan around the
burned area.
12.86 Retinal burns can be pro-
duced at great distances from nuclear
detonations, because the probability of
their occurrence does not decrease as the
square of the distance from the detona-
tion, as is true of many other nuclear
weapons effects. Theoretically, the op-
tical process of image formation within
the eye should keep the energy per unit
area on the retina a constant, regardless
of the distance. However, meteorologi-
cal conditions and the fact that the
human eye is not a perfect lens, all
contribute toward reducing the retinal
burn hazard as the distance is increased
between the observer and the detona-
tion.
12.87 Explosions with yields of
more than about 1 megaton at heights
greater than some 25 miles may produce
retinal burns as far out as the horizon on
clear nights. If the burst height is greater
than some 50 miles, the short pulse of
thermal energy from the early-time
weapon debris, as well as that from the
X-ray pancake, can be effective in this
respect (§ 7.91). Bursts above 90 miles
572
BIOLOGICAL EFFECTS
altitude probably will not cause retinal
burns in persons on the ground, unless
the yield is greater than 10 megatons.
The eye’s blink reflexes are sufficiently
fast (roughly 0.25 second) to provide
some protection against weapons of
more than 100 kilotons yield detonated
below about 25 miles. The blink time is
too slow to provide any appreciable
protection from smaller weapons or
from bursts at higher altitudes. When
people have adequate warning of an
impending nuclear burst, evasive ac-
tion, including closing or shielding the
eyes, will prevent both flashblindness
and retinal burns.
12.88 Safe separation distances
from ground zero, i.e., distances
beyond which persons on the ground
would not receive incapacitating eye in-
juries, are shown in Figs. 12.88a and b
as a function of weapon yield for two
heights of burst (HOB). The curves in
Fig. 12.88a are for a clear day; for a
cloudy day the safe separation distances
would be reduced to about half. The
curves in Fig. 12.88b are for night con-
ditions. The distances for retinal burns
are those for which such burns will not
occur provided the eye can blink within
0.25 second. A faster blink time will not
change the values appreciably, but a
slower time would increase them. Data
for the complete absence of flashblind-
ness are not available and the distances
in Figs. 12.88a and b are those within
which a visual loss for about 10 seconds
may be expected, to a degree sufficient
to preclude the performance of a preci-
sion task under conditions of dim light,
e.g., a pilot reading instruments at
night.
12.89 The flashblindness and retinal
burn safe separation distances do not
bear a constant relationship to one an-
other as the yield changes. In circum-
stances that require determination of
complete eye safety (bearing in mind the
10-second visual loss criterion for
flashblindness), the effect that occurs at
the greater distance from the burst is the
critical one. For example, for a height of
burst of 50,000 feet at night, it is seen
from Fig. 12.88b that for yields up to
about 3 megatons, flashblindness is the
important factor in determining the dis-
tance at which there will be no incapa-
citating eye effects. For larger yields,
retinal burn becomes the limiting factor.
Where only permanent eye damage is of
interest and the temporary loss of vision
from flashblindness is of little concern,
the retinal burn curves should be used to
estimate safe distances no matter what
the explosion energy yield.
BURN INJURIES
573
EXPLOSION YIELD (KILOTONS)
SAFE SEPARATION DISTANCE (MILES)
Figure 12.88a. Flashblindness and retinal burn safe separation distances for an observer on
the ground, as a function of explosion yield, for burst heights of 10,000 feet
and 50,000 feet on a clear day.
574
BIOLOGICAL EFFECTS
EXPLOSION YIELD (KILOTONS)
SAFE SEPARATION DISTANCE (MILES)
Figure 12.88b. Flashblindness and retinal burn safe separation distances for an observer on
the ground, as a function of explosion yield, for burst heights of 10,000 feet
and 50,000 feet at night.
BURN INJURIES
575
NUCLEAR RADIATION INJURY
INTRODUCTION
12.90 The injurious effects of nu-
clear radiations from a nuclear explo-
sion represent a phenomenon which is
completely absent from conventional
explosions. For this reason, the subject
of radiation injury (or sickness) will be
described at some length. It should be
understood, however, that the extended
discussion does not necessarily imply
that nuclear radiation would be the most
important source of casualties in a nu-
clear explosion. This was certainly not
the case in Japan where the detonations
occurred at heights of approximately
1,870 feet (Hiroshima) and 1,640 feet
(Nagasaki) above the ground. Such in-
juries as were caused by nuclear radia-
tion were due to the initial radiation.
The effect of the residual radiation, in
the form of early fallout and induced
radioactivity, was negligible. However,
as was seen in Chapter IX, the situation
could be very different in the event of a
surface burst.
12.91 It has long been known that
exposure to radiations, such as X rays,
alpha and beta particles, gamma rays,
and neutrons, which are capable of pro-
ducing ionization, either directly or in-
directly (§§ 8.21, 8.58), can cause in-
jury to living organisms. After the
discovery of X rays and radioactivity,
toward the end of the nineteenth cen-
tury, it became increasingly apparent
that an element of danger was associated
with exposure to ionizing radiations.6 In
spite of the growing awareness by both
scientists and physicians of the hazards
inherent in many radiation sources,
there were some excessive exposures. In
the course of time, however, recom-
mendations for preventing overexpo-
sures were adopted and radiation inju-
ries became less frequent. Nevertheless,
occasional overexposures have occurred
among personnel operating radiographic
equipment, powerful X-ray machines in
industrial laboratories and hospitals,
cyclotrons, and experimental nuclear
reactors, or working with radioactive
materials.
12.92 The harmful effects of nu-
clear radiations appear to be caused by
the ionization (and excitation) produced
in the cells composing living tissue. As
a result of ionization, some of the con-
stituents, which are essential to the nor-
mal functioning of the cells, are altered
or destroyed. In addition, the products
formed may act as poisons. Among the
observed consequences of the action of
ionizing radiations on cells are breaking
of the chromosomes, swelling of the
nucleus and of the entire cell, increase
in viscosity of the cell fluid, increased
permeability of the cell membrane, and
destruction of cells. In addition, the
process of cell division (or “mitosis”)
is delayed by exposure to radiation.
Frequently, the cells are unable to un-
dergo mitosis, so that the normal cell
replacement occurring in the living or-
ganism is inhibited.
6 The more general expression “ionizing radiations’’ is often employed instead of nuclear radiations,
since this permits the inclusion of radiations of nonnuclear origin, e.g., X rays, having similar biological
effects.
BIOLOGICAL EFFECTS
576
RADIATION DOSE UNITS
12.93 The radiation unit known as
the roentgen was described in § 8.17.
By definition, it is applicable only to
gamma rays or X rays and not to other
types of ionizing radiation, such as
alpha and beta particles and neutrons.
Since the roentgen refers to a specific
result in air accompanying the passage
of an amount of radiation through the
air, it does not imply any effect that it
would produce in a biological system.
The roentgen is thus a measure of the
“exposure” to gamma rays and X rays.
The efect on a biological system, such
as the whole body or a particular organ,
however, depends on the amount of ra-
diation energy that has been absorbed by
the body or organ. The unit of absorbed
dose, which applies to all kinds of ion-
izing radiations, including alpha and
beta particles and neutrons, is the rad, as
defined in § 8.18.
12.94 Although all ionizing radia-
tions are capable of producing similar
biological effects, the absorbed dose
(measured in rads) which will produce a
certain effect may vary appreciably from
one type of radiation to another. This
difference in behavior is expressed by
means of the “relative biological effec-
tiveness” (or RBE) of the particular
nuclear radiation. The RBE of a given
radiation is defined as the ratio of the
absorbed dose in rads of gamma radia-
tion (of a specified energy)7 to the ab-
sorbed dose in rads of the given radia-
tion having the same biological effect.
The value of the RBE for a particular
type of nuclear radiation depends upon
several factors, including the dose rate,
the energy of the radiation, the kind and
degree of the biological damage, and the
nature of the organism or tissue under
consideration.
12.95 The “biological dose,” also
called the “RBE dose,” that provides a
direct indication of the expected effects
of any ionizing radiation on the body (or
organ), is stated in terms of the “rem,”
an abbreviation of “roentgen equivalent
(in) man.” It is equal to the absorbed
dose in rads multiplied by the RBE for
the particular radiation (or radiations)
absorbed; thus,
Dose in rems = Dose in rads x RBE.
An advantage of the rem is that it is
possible to express the total biological
effect that might result from the absorp-
tion of more than one kind of ionizing
radiation. The absorbed dose in rads of
each radiation type is multiplied by the
appropriate RBE and the results are
added. (In connection with radiological
protection in peacetime activities, the
“dose equivalent” in rems is defined as
the absorbed dose in rads multiplied by
a “quality factor,” and sometimes by
other modifying factors. The quality
factor, which depends on the nature and
energy of the absorbed radiation, re-
places the RBE.)
12.96 All radiations capable of
producing ionization (or excitation) di-
rectly or indirectly, e.g., alpha and beta
particles, X rays, gamma rays, and
neutrons, cause radiation injury of the
same general type. Although the effects
are qualitatively similar, the various ra-
diations differ in the depth to which they
penetrate the body and in the degree of
injury corresponding to a specified
’Gamma rays from cobalt-60 have been commonly specified for this purpose.
NUCLEAR RADIATION INJURY
577
amount of energy absorption. As seen
above, the latter difference is expressed
by means of the RBE.
12.97 The RBE for gamma rays is
approximately unity, by definition, al-
though it varies somewhat with the en-
ergy of the radiation. For beta particles,
the RBE is also close to unity; this
means that for a given amount of energy
absorbed in living tissue, beta particles
produce about the same extent of injury
within the body as do X rays or gamma
rays.8 The RBE for alpha particles from
radioactive sources that have been taken
into the body is in the range from 10 to
20, more specifically for the develop-
ment of bone cancers. The RBE for
neutrons varies with the energy and the
type of injury. For the neutron energy
spectrum of nuclear weapons, the RBE
for immediate (acute) radiation injury is
close to 1.0. But it is significantly larger
(4 to 10) for the occurrence of opacities
of the eye lens (cataracts), leukemia,
and genetic changes (§ 12.144 et seq.,
§ 12.201 et seq.). For these biological
effects, a certain amount of energy ab-
sorbed from exposure to neutrons is
much more damaging than the same
amount of energy (in rads) absorbed
from gamma rays.9
GENERAL CHARACTERISTICS OF
RADIATION EFFECTS
12.98 In considering the possible
effects on the body of ionizing radia-
tions from external sources, it is neces-
sary to distinguish between an “acute”
(or “one-shot”) exposure and a
“chronic” (or extended) exposure. In
an acute exposure the whole radiation
dose is received in a relatively short
interval of time. This is the case, for
example, in connection with the initial
nuclear radiation. It is not possible to
define an acute dose precisely, but it
may be somewhat arbitrarily taken to be
the dose received during a 24-hour
period. Although the delayed radiations
from early fallout persist for longer
times, the main exposure would be re-
ceived during the first day and so it is
regarded as being acute. On the other
hand, an individual entering a fallout
area after the first day or so and remain-
ing for some time would be considered
to have been subjected to a chronic
exposure.
12.99 The importance of making a
distinction between acute and chronic
exposures lies in the fact that, if the dose
rate is not too large, the body can
achieve partial recovery from many (but
perhaps not all) of the consequences of
nuclear radiations. For example, an
acute dose of 50 rems will generally
cause changes in the constituents of the
blood (§ 12.113), but the same dose
spread over a period of years (or even
less) will produce only minor effects on
the blood cells. In an extreme case, an
acute dose exceeding 600 rems would
cause serious illness and in the great
majority of instances death could occur
within a few weeks. On the other hand,
8Beta particles from sources on or near the body can also cause skin lesions, called “beta burns’’
(§ 12.155 et seq.).
’The curves in Chapter VIII that show the neutron dose in rads at a particular location relative to a
nuclear explosion calculated by considering the contributions of neutrons in various energy ranges at that
location for typical weapons spectra. Multiplication of these doses by the appropriate RBE gives the
corresponding biological dose in rems.
578
BIOLOGICAL EFFECTS
a chronic dose of the same total magni-
tude accumulated gradually over 20
years might have no observable effect.
12.100 The injury caused by a cer-
tain dose (and dose rate) of radiation
will depend upon the extent and part of
the body that is exposed. One possible
reason is that when the exposure is res-
tricted, the unexposed regions may be
able to contribute to the recovery of the
injured area. But if the whole body is
exposed, many organs are affected and
recovery is much more difficult.
12.101 Different portions of the
body show different sensitivities to ion-
izing radiations, and there are variations
in degree of sensitivity among individu-
als. In general, the most radiosensitive
cells are found in the lymphoid tissue,
bone marrow, spleen, organs of repro-
duction, and gastrointestinal tract. Of
intermediate sensitivity are the skin,
lungs, and liver, whereas muscle,
nerve, and adult bones are the least
sensitive.
EFFECTS OF ACUTE RADIATION
DOSES
12.102 Before the nuclear bomb-
ings of Hiroshima and Nagasaki rela-
tively little was known of the phenom-
ena associated with acute whole-body
exposure to ionizing radiation. In Japan,
however, a large number of individuals
received whole-body doses of radiation
ranging from insignificant quantities to
amounts which proved fatal. The effects
were often complicated by other injuries
and shock, so that the symptoms of
acute radiation injury could not always
be isolated. Because of the great
numbers of patients and the lack of
facilities after the explosions, it was
impossible to make detailed observa-
tions and keep accurate records. Never-
theless, certain important conclusions
have been drawn from Japanese experi-
ence with regard to the effects of nuclear
radiation on the human organism.
12.103 Information on this subject
has also been gathered from other
sources. These include a few laboratory
accidents involving a small number of
human beings, irradiatiori used in treat-
ing various diseases and malignancies,
and extrapolation to man of observa-
tions on animals. In addition, detailed
knowledge has been obtained from a
careful study of over 250 persons in the
Marshall Islands, who were accidentally
exposed to nuclear radiation from fall-
out following the test explosion on
March 1, 1954 (§ 9.104 et seq.). The
exposed individuals included both Mar-
shallese and a small group of American
servicemen. The whole-body radiation
doses ranged from relatively small val-
ues (14 rems), which produced no ob-
vious symptoms, to amounts (175 rems)
that caused prompt marked changes in
the blood-forming system (§ 12.124).
12.104 No single source of data di-
rectly yields the relationship between
the physical dose of ionizing radiation
and the clinical effect in man. Hence,
there is no complete agreement con-
cerning the effect associated with a spe-
cific dose or dose range. Attempts in the
past have been made to relate particular
symptoms to certain narrow ranges of
exposure; however, the data are incom-
plete and associated with many compli-
cating factors that make interpretation
difficult. For instance, the observations
in Japan were very sketchy until 2
weeks following the exposures, and the
people at that time were suffering from
NUCLEAR RADIATION INJURY
579
malnutrition and pre-existing bacterial
and parasitic infections. Consequently,
their sickness was often erroneously at-
tributed to the effects of ionizing radia-
tion when such was not necessarily the
case. The existing conditions may have
been aggravated by the radiation, but to
what extent it is impossible to estimate
in retrospect.
12.105 In attempting to relate the
acute radiation dose to the effect on
man, it should be mentioned that reli-
able information has been obtained for
doses up to 200 rems. As the dose
increases from 200 to 600 rems, the data
from exposed humans decrease rapidly
and must be supplemented more and
more by extrapolations based on animal
studies. Nevertheless, the conclusions
drawn can be accepted with a reasonable
degree of confidence. Beyond 600 rems,
however, observations on man are so
sporadic that the relationship between
dose and biological effect must be in-
ferred or conjectured almost entirely
from observations made on animals ex-
posed to ionizing radiations. Such ob-
servations have been made in recent
years at extremely high doses.
12.106 Individuals receiving acute
whole-body doses of ionizing radiation
may show certain signs and symptoms
of illness. The time interval to onset of
these symptoms, their severity, and
their duration generally depend on the
amount of radiation absorbed, although
there may be significant variations
among individuals. Within any given
dose range the effects manifested can be
divided conveniently into three time
phases: initial, latent, and final.
12.107 During the initial phase,
exposed individuals may experience
nausea, vomiting, headache, dizziness,
and a generalized feeling of illness. The
onset time decreases and the severity of
these symptoms increases with increas-
ing dose. During the latent phase ex-
posed individuals will experience few,
if any, symptoms and most likely will
be able to perform useful tasks. The
final phase is characterized by illness
that requires hospitalization of people
receiving the higher doses. In addition
to the recurrence of the symptoms noted
during the initial phase, skin hemor-
rhages, diarrhea, and loss of hair may
appear, and, at higher doses, seizures
and prostration may occur. The final
phase is consummated by recovery or
death.
12.108 With the foregoing in mind,
Table 12.108 is presented as the best
available summary of the effects of
various whole-body dose ranges of ion-
izing radiation on human beings. Re-
sults of radiobiological studies are gen-
erally reported in terms of the (vertical)
midline tissue dose in rads. This dose is
lower than the dose that would be mea-
sured by instruments (and the dose that
would be absorbed by tissue) near the
surface of the body by a factor that
depends upon the energy of the radiation
and the size of the individual. The nu-
clear radiation data presented in
Chapters VIII and IX refer to the ab-
sorbed dose in tissue at the surface of an
individual that is nearest the burst, and
thus they also correspond to the ex-
pected instrument readings. For consis-
tency, the data in Table 12.108 are the
doses (in rems) equivalent to the ab-
sorbed doses (in rads) in tissue at the
surface of the individual. For gamma
rays, these absorbed doses are essen-
tially equal to the exposures in roent-
gens (§ 8.18). For nuclear weapon ra-
Table 12.108
SUMMARY OF CLINICAL EFFECTS OF ACUTE IONIZING RADIATION DOSES
Range 0 to 100 rems Subclinical range 100 to 1,000 rems Therapeutic range Over 1,000 rems Lethal range
100 to 200 rems 200 to 600 rems 600 to 1,000 rems 1,000 to 5,000 rems Over 5,000 rems
Clinical surveillance Therapy effective Therapy promising Therapy palliative
Incidence of vomiting None 100 rems: infrequent 200 rems: common 300 rems: 100% 100% 100%
Initial Phase Onset Duration — 3 to 6 hours < 1 day ’Л to 6 hours 1 to 2 days % to ’Л hour < 2 days 5 to 30 minutes < 1 day Almost immediately**
Latent Phase Onset Duration — < 1 day < 2 weeks 1 to 2 days 1 to 4 weeks < 2 days 5 to 10 days < 1 day* 0 th 7 days* Almost immediately**
Final Phase Onset Duration — 10 to 14 days 4 weeks 1 to 4 weeks 1 to 8 weeks 5 to 10 days 1 to 4 weeks 0 to 10 days 2 to 10 days Almost immediately**
Leading organ Hematopoietic tissue Gastrointestinal tract Central nervous system
Characteristic signs None below 50 rems Moderate leukopenia Severe leukopenia; purpura; hemorrhage; infection. Epilation above 300 rems. Diarrhea; fever; disturb- ance of electrolyte balance. Convulsions; tremor; ataxia; lethargy.
Critical period post- exposure — — 1 to 6 weeks 2 to 14 days 1 to 48 hours
580 BIOLOGICAL EFFECTS
Therapy Reassurance Reassurance; hema- tologic surveillance. Blood transfusion; antibiotics. Consider bone mar- row transplantation. Maintenance of electrolyte balance. Sedatives
Prognosis Excellent Excellent Guarded Guarded Hopeless
Convalescent period Incidence of death None None Several weeks None 1 to 12 months 0 to 90% Long 90 to 100% 100%
Death occurs within — — 2 to 12 weeks 1 to 6 weeks 2 to 14 days < 1 day to 2 days
Cause of death — — Hemorrhage; infection Circulatory collapse Respiratory failure; brain edema.
*At the higher doses within this range there may be no latent phase.
**Initial phase merges into final phase, death usually occurring from a few hours to about 2 days; this chronology is possibly interrupted by a very short latent phase.
NUCLEAR RADIATION INJURY
Ui
00
582
BIOLOGICAL EFFECTS
diation, the midline tissue doses for
average size adults would be approxi-
mately 70 percent of the doses in the
table.
12.109 As shown in Table 12.108,
below 100 rems the response is almost
completely subclinical; that is to say,
there is no sickness requiring special
attention. Changes may, nevertheless,
be occurring in the blood, as will be
seen later. Between 100 and 1,000 rems
is the range in which therapy, i.e.,
proper medical treatment, will be suc-
cessful at the lower end and may be
successful at the upper end. The earliest
symptoms of radiation injury are nausea
and vomiting, which may commence
within about 15 minutes to 6 hours of
exposure, depending on the dose, ac-
companied by discomfort (malaise),
loss of appetite, and fatigue. The most
significant, although not immediately
obvious effect in the range under con-
sideration, is that on the hematopoietic
tissue, i.e., the organs concerned with
the formation of blood. An important
manifestation of the changes in the
functioning of these organs is leuko-
penia, that is, a decline in the number of
leukocytes (white blood cells). Loss of
hair (epilation) will be apparent about 2
weeks or so after receipt of a dose ex-
ceeding 300 rems.
12.110 Because of the increase in
the severity of the radiation injury and
the variability in response to treatment
in the range from 100 to 1,000 rems, it
is convenient to subdivide this range
into three subsections, as shown in
Table 12.108. For whole-body doses
from 100 to 200 rems, hospitalization is
generally not required, but above 200
rems admission to a hospital is neces-
sary so that the patient may receive such
treatment as may be indicated. Up to
600 rems, there is reasonable confi-
dence in the clinical events and appro-
priate therapy, but for doses in excess of
this amount there is considerably uncer-
tainty and variability in response.
12.111 Beyond 1,000 rems, the
prospects of recovery are so poor that
therapy may be restricted largely to pal-
liative measures. It is of medical inter-
est, however, to subdivide this lethal
range into two parts in which the
characteristic major clinical effects are
different. Although the dividing line has
been somewhat arbitrarily set at 5,000
rems in Table 12.108, human data are
so limited that this dose level might well
have any value from 2,000 to 6,000
rems. In the range from 1,000 to
(roughly) 5,000 rems, pathological
changes in the gastrointestinal tract,
which are apparent at lower doses, be-
come very marked. Above 5,000 rems,
the central nervous system also exhibits
the consequences of major injury.
12.112 The superposition of radia-
tion effects upon injuries from other
causes may be expected to result in an
increase in the number of cases of
shock. For example, the combination of
sublethal nuclear radiation exposure and
moderate thermal burns will produce
earlier and more severe shock than
would the comparable burns alone. The
healing of wounds of all kinds will be
retarded because of the susceptibility to
secondary infection accompanying radi-
ation injury and for other reasons. In
fact, infections, which could normally
be dealt with by the body, may prove
fatal in such cases.
CHARACTERISTICS OF ACUTE WHOLE-BODY RADIATION INJURY
583
CHARACTERISTICS OF ACUTE WHOLE-BODY RADIATION INJURY
DOSES OF 25 TO 100 REMS: NO
ILLNESS
12.113 Single doses in the range of
from 25 to 100 rems over the whole
body will produce some changes in the
blood (§ 12.124). These changes do not
usually occur below this range and are
not produced consistently unless the
dose is 50 rems or more. Disabling
sickness does not occur and exposed
individuals should be able to proceed
with their usual duties.
DOSES OF 100 TO 200 REMS: SLIGHT
OR NO ILLNESS
12.114 A whole-body dose in the
range of 100 to 200 rems will result in a
certain amount of illness but it will
rarely be fatal. Doses of this magnitude
were common in Hiroshima and Naga-
saki, particularly among persons who
were at some distance from the nuclear
explosion. Of the 267 individuals acci-
dentally exposed to fallout in the Mar-
shall Islands following the test explo-
sion of March 1, 1954, a group of 64
received radiation doses in this range.
The exposure of these individuals was
not strictly of the acute type, since it
extended over a period of some 45
hours. More than half the dose, how-
ever, was received within 24 hours and
the observed effects were similar to
those to be expected from an acute ex-
posure of the same amount.
12.115 The illness from radiation
doses in this range does not present a
serious problem since most patients will
suffer little more than discomfort and
fatigue and others may have no symp-
toms at all. There may be some nausea
and vomiting on the first day or so
following irradiation, but subsequently
there is a latent period, of up to 2 weeks
or more (§ 12.107). The usual symp-
toms, such as loss of appetite and ma-
laise, may reappear, but if they do, they
are mild. The changes in the character
of the blood, which accompany radia-
tion injury, become significant during
the latent period and persist for some
time. If there are no complications, due
to other injuries or infection, there will
be recovery in essentially all cases. In
general, the more severe the early stages
of the radiation sickness, the longer will
be the process of recovery. Adequate
care and the use of antibiotics, as may
be indicated clinically, can greatly ex-
pedite complete recovery of the small
proportion of more serious cases.
DOSES OF 200 TO 1,000 REMS:
SURVIVAL POSSIBLE
12.116 For doses between 200 and
1,000 rems the probability of survival is
good at the lower end of the range but
poor at the upper end. The initial symp-
toms are similar to those common in
radiation sickness, namely, nausea, vo-
miting, diarrhea, loss of appetite, and
malaise. The larger the dose, the sooner
will these symptoms develop, generally
during the initial day of the exposure.
After the first day or two the symptoms
disappear and there may be a latent
period of several days to 2 weeks during
which the patient feels relatively well,
although important changes are occur-
ring in the blood. Subsequently, there is
584
BIOLOGICAL EFFECTS
Figure 12.117. An example of epilation due to radiation exposure.
a return of symptoms, including fever,
diarrhea, and a steplike rise in tempera-
ture which may be due to accompanying
infection.
12.117 Commencing about 2 or 3
weeks after exposure, there is a ten-
dency to bleed into various organs, and
small hemorrhages under the skin (pe-
techiae) are observed. This tendency
may be marked. Particularly common
are spontaneous bleeding in the mouth
and from the lining of the intestinal
tract. There may be blood in the urine
due to bleeding in the kidney. The he-
morrhagic tendency depends mainly
upon depletion of the platelets in the
CHARACTERISTICS OF ACUTE WHOLE-BODY RADIATION INJURY
585
blood, resulting in defects in the blood-
clotting mechanism (see § 12.129).
Loss of hair, which is a prominent con-
sequence of radiation exposure, also
starts after about 2 weeks, i.e., imme-
diately following the latent period, for
doses over 300 rems (Fig. 12.117).
12.118 Susceptibility to infection of
wounds, burns, and other lesions, can
be a serious complicating factor. This
would result to a large degree from loss
of the white blood cells, and a marked
depression in the body’s immunological
process. For example, ulceration about
the lips may commence after the latent
period and spread from the mouth
through the entire gastrointestinal tract
in the terminal stage of the sickness.
The multiplication of bacteria, made
possible by the decrease in the white
cells of the blood and injury to other
immune mechanisms of the body,
allows an overwhelming infection to
develop.
12.119 Among other effects ob-
served in Japan was a tendency to
spontaneous internal bleeding toward
the end of the first week. At the same
time, swelling and inflammation of the
throat was not uncommon. The devel-
opment of severe radiation illness
among the Japanese was accompanied
by an increase in the body temperature,
which was probably due to secondary
infection. Generally there was a step-
like rise between the fifth and seventh
days, sometimes as early as the third
day following exposure, and usually
continuing until the day of death.
12.120 In addition to fever, the
more serious cases exhibited severe
emaciation and delirium, and death oc-
curred within 2 to 8 weeks. Examination
after death revealed a decrease in size of
and degenerative changes in testes and
ovaries. Ulceration of the mucous
membrane of the large intestine, which
is generally indicative of doses of 1,000
rems or more, was also noted in some
cases.
12.121 Those patients in Japan who
survived for 3 to 4 months, and did not
succumb to tuberculosis, lung diseases,
or other complications, gradually re-
covered. There was no evidence of per-
manent loss of hair, and examination of
824 survivors some 3 to 4 years later
showed that their blood composition
was not significantly different from that
of a control group in a city not subjected
to nuclear attack.
LARGE DOSE (OVER 1,000 REMS):
SURVIVAL IMPROBABLE
12.122 Very large doses of whole-
body radiation (approximately 5,000
rems or more) result in prompt changes
in the central nervous system. The
symptoms are hyperexcitability, ataxia
(lack of muscular coordination), respi-
ratory distress, and intermittent stupor.
There is almost immediate incapacita-
tion for most people, and death is cer-
tain in a few hours to a week or so after
the acute exposure. If the dose is in the
range from 1,000 to roughly 5,000
rems, it is the gastrointestinal system
which exhibits the earliest severe clini-
cal effects. There is the usual vomiting
and nausea followed, in more or less
rapid succession, by prostration, diar-
rhea, anorexia (lack of appetite and dis-
like for food), and fever. As observed
after the nuclear detonations in Japan,
the diarrhea was frequent and severe in
character, being watery at first and
tending to become bloody later; how-
586
BIOLOGICAL EFFECTS
ever, this may have been related to pre-
existing disease.
12.123 The sooner the foregoing
symptoms of radiation injury develop
the sooner is death likely to result. Al-
though there may be no pain during the
first few days, patients experience ma-
laise, accompanied by marked depres-
sion and fatigue. At the lower end of the
dose range, the early stages of the se-
vere radiation illness are followed by a
latent period of 2 or 3 days (or more),
during which the patient appears to be
free from symptoms, although profound
changes are taking place in the body,
especially in the blood-forming tissues.
This period, when it occurs, is followed
by a recurrence of the early symptoms,
often accompanied by delirium or coma,
terminating in death usually within a
few days to 2 weeks.
EFFECTS OF RADIATION ON BLOOD
CONSTITUENTS
12.124 Among the biological con-
sequences of exposure of the whole
body to an acute dose of nuclear radia-
tion, perhaps the most striking and
characteristic are the changes which
take place in the blood and blood-form-
ing organs. Normally, these changes
will be detectable only for doses greater
than 25 rems. Much information on the
hematological response of human
beings to nuclear radiation was obtained
after the nuclear explosions in Japan and
also from observations on victims of
laboratory accidents. The situation
which developed in the Marshall Islands
in March 1954, however, provided the
opportunity for a very thorough study of
the effects of small and moderately large
doses of radiation (up to 175 rems) on
the blood of human beings (§ 12.103).
The descriptions given below, which are
in general agreement with the results
observed in Japan, are based largely on
this study.
12.125 One of the most striking
hematological changes associated with
radiation injury is in the number of
white blood cells. Among these cells are
the neutrophils, formed ‘chiefly in the
bone marrow, which are concerned with
resisting bacterial invasion of the body.
During the course of certain types of
bacterial infection, the number of neu-
trophils in the blood increases rapidly to
combat the invading organisms. Loss of
ability to meet the bacterial invasion,
whether due to radiation or any other
injury, is a very grave matter, and bac-
teria which are normally held in check
by the neutrophils can then multiply
rapidly; the consequences are thus
serious. There are several types of white
blood cells with different specialized
functions, but which have in common
the general property of resisting infec-
tion or removing toxic products from the
body, or both.
12.126 After the body has received
a radiation dose in the sublethal range,
i.e., about 200 rems or less, the total
number of white blood cells may show a
transitory increase during the first 2 days
or so, and then decrease below normal
levels. Subsequently the white count
may fluctuate and possibly rise above
normal on occasions. During the sev-
enth or eighth weeks, the white cell
count becomes stabilized at low levels
and a minimum probably occurs at
about this time. An upward trend is
observed in succeeding weeks but com-
plete recovery may require several
months or more.
CHARACTERISTICS OF ACUTE WHOLE-BODY RADIATION INJURY
587
12.127 The neutrophil count paral-
lels the total white blood cell count, so
that the initial increase observed in the
latter is apparently due to increased
mobilization of neutrophils. Complete
return of the number of neutrophils to
normal does not occur for several
months.
12.128 In contrast to the behavior
of the neutrophils, the number of lym-
phocytes, produced in parts of the lym-
phatic tissues of the body, e.g., lymph
nodes and spleen, shows a sharp drop
soon after exposure to radiation. The
lymphocyte count continues to remain
considerably below normal for several
months and recovery may require many
months or even years. However, to
judge from the observations made in
Japan, the lymphocyte count of exposed
individuals 3 or 4 years after exposure
was not appreciably different from that
of unexposed persons.
12.129 A significant hematological
change also occurs in the platelets, a
constituent of the blood which plays an
important role in blood clotting. Unlike
the fluctuating total white count, the
number of platelets begins to decrease
soon after exposure and falls steadily
and reaches a minimum at the end of
about a month. The decrease in the
number of platelets is followed by par-
tial recovery, but a normal count may
not be attained for several months or
even years after exposure. It is the de-
crease in the platelet count which partly
explains the appearance of hemorrhage
and purpura in radiation injury.
12.130 The red blood cell (erythro-
cyte) count also undergoes a decrease as
a result of radiation exposure and hem-
orrhage, so that symptoms of anemia,
e.g., pallor, become apparent. But the
change in the number of erythrocytes is
much less striking than that in the white
blood cells and platelets, especially for
radiation doses in the range of 200 to
400 rems. Whereas the response in these
cells is rapid, the red cell count shows
little or no change for several days.
Subsequently, there is a decrease which
may continue for 2 or 3 weeks, followed
by a gradual increase in individuals who
survive.
12.131 As an index of severity of
radiation exposure, particularly in the
sublethal range, the total white cell or
neutrophil counts are of limited useful-
ness because of the wide fluctuations
and the fact that several weeks may
elapse before the maximum depression
is observed. The lymphocyte count is of
more value in this respect, particularly
in the low dose range, since depression
occurs within a few hours of exposure
(§ 12.224). However, a marked de-
crease in the number of lymphocytes is
observed even with low doses and there
is relatively little difference with large
doses.
12.132 The platelet count, on the
other hand, appears to exhibit a regular
pattern, with the maximum depression
being attained at approximately the
same time for various exposures in the
sublethal range. Furthermore, in this
range, the degree of depression from the
normal value is roughly proportional to
the estimated whole-body dose. It has
been suggested, therefore, that the pla-
telet count might serve as a convenient
and relatively simple direct method for
determining the severity of radiation in-
jury in the sublethal range. The main
disadvantage is that an appreciable de-
crease in the platelet count is not appar-
ent until some time after exposure.
588
BIOLOGICAL EFFECTS
COMBINED INJURIES
GENERAL CONSIDERATIONS
12.133 Thus far, blast, thermal,
and (ionizing) radiation injuries have
been considered separately, but com-
bined injuries, from two or more of
these causes, would probably be com-
mon as a result of a nuclear explosion.
Combined injuries might be received
almost simultaneously, e.g., from a
single detonation without fallout, or
separated in time by minutes to days,
e.g., from a single detonation followed
by fallout or from multiple detonations.
Injuries may consist of any combination
of blast, thermal, and radiation effects.
Furthermore, such injuries may be in-
fluenced by other conditions that might
be expected during or after a nuclear
attack, e.g., malnutrition, poor sanita-
tion, fatigue, and various other en-
vironmental factors. Current knowledge
concerning combined injuries is derived
mainly from studies of the Japanese
victims of nuclear bombs and from lab-
oratory and field tests with a variety of
animals.
12.134 The contribution of com-
bined injuries to overall mortality and
morbidity in Japan has never been de-
termined adequately, but two general
impressions have emerged: the combi-
nation of mechanical (blast) and thermal
injuries was responsible for the majority
of deaths that occurred within the first
48 hours after the attacks, and delayed
mortality was higher and complications
were more numerous among burned
people exposed to ionizing radiation
than would have been anticipated in the
absence of such radiation. In Hiroshima
and Nagasaki, among those who sur-
vived for 20 days or more, about 50
percent of the people within 1.25 miles
of ground zero received combined inju-
ries, whereas the incidence was roughly
25 percent at distances from 1.25 to 3
miles from ground zero.
12.135 It should be recognized that
the incidences of combined injuries in
the two Japanese cities apply only to the
particular curcumstances of the nuclear
explosions. The number and types of
combined injuries will depend on the
yield, height of burst, and the conditions
of exposure. Air bursts, unaccompanied
by fallout, with yields less than about 10
kilotons, would cause combinations of
mechanical, thermal, and initial-radia-
tion injuries. On the other hand, larger
yields would be expected to produce a
greater proportion of combined burn and
mechanical injuries; initial-radiation in-
juries would be less significant in the
surviving population. A nuclear explo-
sion near (above or below) the surface
would maximize radiation injuries due
to fallout and in a large proportion of the
casualties such injuries would be com-
bined with mechanical and thermal ef-
fects. People who are outdoors and un-
shielded would have a greater
probability of sustaining initial and/or
fallout (residual) radiation injury in
combination with flash burns than would
those within buildings. In the latter
case, burns would be minimized and
combinations of mechanical and radia-
tion injuries might be dominant.
12.136 No reliable criteria for inca-
pacitation are known for persons re-
ceiving combined injuries. The avail-
COMBINED INJURIES
589
able data do indicate, however, that
individuals suffering such injuries that
occur nearly simultaneously are unlikely
to become casualties within a few hours,
provided the individual injuries would
not produce casualties if administered
separately. Consequently, it is not un-
reasonable to make early casualty pre-
dictions for a single nuclear detonation
on the basis of the most significant in-
jury. If there is a substantial probability
of another injury, this could contribute
to combined injury and might result in
increased casualties at later times.
12.137 The effects of combined in-
juries may be synergistic, additive, or
antagonistic. That is to say, the overall
response may be greater than, equal to,
or less than, respectively, what would
be predicted based on the assumption
that the various injuries act indepen-
dently of one another in producing ca-
sualties. Quantitative data from labora-
tory experiments suggests that in
situations where a combined effect has
been observed, the interaction of the
various forms of injury has resulted in
enhanced early as well as delayed mor-
tality, although from the limited data
available the latter seems to be the more
common.
RADIATION AND THERMAL INJURIES
12.138 Exposure of laboratory an-
imals to external ionizing radiation
while subjected to thermal burn has
been found to cause a substantial in-
crease in mortality over that expected
from the insults received separately.
The extent of the increase depends on
the radiation dose and the severity of the
burn. Severely burned subjects exhibit
some anemia and the body is less able to
cope with this stress if the immune
mechanism and the activity of the bone
marrow are depressed by the ionizing
radiation. The enhanced mortality from
the thermal burns combined with radia-
tion exposure was not observed for
doses of 25 rems or less and it is im-
probable that the synergistic effect
would occur unless the dose is large
enough to produce at least minimal ef-
fect on the immunologic and hematolo-
gic systems. Very little information is
available on fallout (internal) radiation
in combination with thermal or any
other form of injury.
MECHANICAL AND RADIATION
INJURIES
12.139 Mechanical and radiation
injuries can be expected to be frequent,
particularly if fallout is present. Studies
indicate that there is a delay in wound
healing with doses in excess of 300
rems, and that wounds in irradiated
subjects are considerably more serious if
treatment is delayed for more than 24
hours. In addition, missile and impact
injuries that result in disruption of the
skin and damage to the soft tissues pro-
vide a portal of entry for infection, and
thus may be extremely hazardous to
irradiated people. Injuries that are asso-
ciated with significant blood loss would
be more serious in those who have re-
ceived a radiation dose large enough to
interfere with normal blood clotting
mechanisms.
12.140 One week after exposure to
an external radiation dose which would
by itself have resulted in 45 percent
590
BIOLOGICAL EFFECTS
mortality within 30 days, animals (rats)
were subjected to a blast overpressure
which would normally produce 5 per-
cent early lethality. As a result, early
lethality associated with blast-induced
hemorrhage and lung injury was in-
creased four fold and the delayed mor-
tality was almost double that expected
from the radiation alone. In these tests,
ionizing radiation and blast were clearly
synergistic in causing both early and
delayed mortality.
THERMAL AND MECHANICAL
INJURIES
12.141 Burns and mechanical inju-
ries in combination are often encoun-
tered in victims of conventional explo-
sions. Increased numbers of delayed
complications, shorter times-to-death,
and enhanced mortality rate are frequent
occurrences. However, few quantitative
data are available on this form of com-
bined injury.
LATE EFFECTS OF IONIZING RADIATION
INTRODUCTION
12.142 There are a number of con-
sequences of nuclear radiation which
may not appear for some years after
exposure. Among them, apart from
genetic effects, are the formation of
cataracts, nonspecific life shortening,
leukemia, other forms of malignant dis-
ease, and retarded development of chil-
dren in utero at the time of the exposure.
Information concerning these late ef-
fects has been obtained from continued
studies of various types, including those
in Japan made chiefly under the direc-
tion of the Atomic Bomb Casualty
Commission.10
12.143 The effects which occur
later in life, like the acute reactions
observed within a few weeks or months
after irradiation, arise from changes in
cells and tissues at the time of exposure.
If an exposed individual survives the
acute reaction, cell replacement may be
complete, but the cells may not neces-
sarily be quite normal; however, the
causes for the late effects are largely
unknown although many theories have
been proposed.
CATARACTS
12.144 The term “cataract” is
commonly used to describe any detect-
able change in the normal transparency
of the lens of the eye. Cataracts may
range from small lesions, which cause
only minor impairment of vision, to
extensive opacification that results in
total blindness. The vast majority of
natural cataracts in man are of the senile
’"The Atomic Bomb Casualty Commission (ABCC) of the U.S. National Academy of Sciences-Na-
tional Research Council was sponsored by the U.S. Atomic Energy Commission (now the Energy
Research and Development Administration) and administered in cooperation with the Japanese National
Institute of Health. One of its purposes was to study the long-term effects of human exposure to nuclear
radiation. In 1975, the ABCC was superseded by the Radiation Effects Research Foundation which is
supported equally by Japan and the United States.
LATE EFFECTS OF IONIZING RADIATION
591
type; it is rare in people under 40 years
old and its frequency increases with age.
Sufficient exposure of the eye lens to
ionizing radiations can cause cataracts
in man and in other animal species.
There is a latent period between expo-
sure of the eye and development of an
opacity ranging from a few months to
several years. The duration of the latent
period is shorter the greater the radiation
exposure. Fast neutrons, such as those
from a nuclear explosion, have been
found to be more effective than gamma
rays in producing cataracts. Studies with
small animals indicate that fast neutrons
have an RBE (§ 12.95) of about 4 to 6
for cataracts and it is commonly as-
sumed that similar values are applicable
to man.
12.145 Eye lens opacities caused by
radiation from the nuclear explosions
were first detected among the inhabi-
tants of Hiroshima and Nagasaki in
1950, about five years after the attacks.
In nearly all cases the individuals had
suffered extensive epilation of the scalp,
so that they had probably received
whole-body doses of 300 rems or more.
In 1963 and 1964 eye examinations
were made on some 2,500 survivors, of
whom an estimated 40 percent had re-
ceived radiation doses in excess of 200
rems. A significantly larger number of
cataracts were found among those who
had received the highest doses. In an-
other survey, there was a suggestion of
impairment of visual acuity among
children who were in utero at the time of
the bombings and whose mothers had
been exposed to radiation. The sample
size was too small, however, for a sta-
tistically meaningful conclusion to be
drawn.
12.146 In the great majority of Jap-
anese who developed eye opacities from
radiation, proper correcting lenses pro-
vided serviceable vision. Furthermore,
the opacities have apparently not be-
come worse with the passage of time; in
some cases, in fact, an improvement has
been observed. Only a small proportion
of the cataracts were bad enough to
cause substantial diminution of central
vision. There have been very few cases
of eye lens opacities in people who
received doses of less than 200 rems of
ionizing radiation to the eyes. This tends
to support the commonly held view that
cataract formation is a threshold phe-
nomenon; that is to say, it will not occur
unless the eye dose exceeds a more-or-
less definite minimum value. Not ev-
eryone receiving a radiation dose ex-
ceeding the threshold value will
necessarily develop cataracts, but the
probability of this occurring is expected
to increase the larger the dose to the
eyes.
LEUKEMIA
12.147 Studies of mortality rates
have shown that, at least prior to about
1950, leukemia, a form of cancer in
which there is a proliferation of white
cells in the blood, was a much more
common cause of death of radiologists
than of other physicians. This has been
attributed to chronic exposure to mod-
erate amounts of radiation over many
years. After protective measures were
improved, the incidence of leukemia
among radiologists declined markedly.
A larger than expected frequency of
leukemia has also been observed among
a group of people in the United King-
dom who had received large doses of X
гауз to the spine for the treatment of a
592
BIOLOGICAL EFFECTS
form of arthritis known as ankylosing
spondylitis. Three main types of leuke-
mia are induced by radiation, namely,
acute and chronic granulocytic and
acute lymphocytic forms; the occur-
rence of chronic lymphocytic leukemia
is not significantly increased by radia-
tion. The development of leukemia as a
result of an overexposure to radiation is
associated with a latent period varying
from one to 20 years or more. The
disease is generally fatal, no matter
what its cause.
12.148 The first evidence of an in-
creased incidence of leukemia among
the survivors of the Hiroshima and Na-
gasaki explosions appeared in 1947.
The occurrence of the disease reached a
peak in 1951 and 1952 and it has been
declining since then. By the end of
1966, the frequency of acute granulo-
cytic anemia was approaching the nor-
mal value for Japan. Children who were
exposed to radiation when they were
less than 10 years old were roughly
twice as susceptible to leukemia as older
individuals. One case of acute granulo-
cytic leukemia was discovered in 1972
among the 53 inhabitants of Rongelap
Atoll in the Marshall Islands who had
received an estimated whole-body dose
of 175 rems of gamma radiation from
fallout in 1954 (§ 12.175 et seq.). The
individual, a young man, had been a
year old at the time of exposure.
12.149 The occurrence of leuke-
mia, for a given estimated absorbed
dose (in rads), appeared to be greater in
Hiroshima than in Nagasaki. Later
studies revealed that the Hiroshima (gun
type, uranium-235) bomb emitted a
larger proportion of neutrons, relative to
gamma rays, than did the Nagasaki
(implosion type, plutonium-239) de-
vice. By attributing an RBE of about 5
for the induction of leukemia by fast
neutrons, the incidences (per rem) in the
two cities were in general agreement.
The evidence from Japan, and from
other sources, is that the probability of
the occurrence of leukemia is roughly
proportional to the whole-body dose,
and there is no indication of a threshold
value. About 90 percent of the cases of
leukemia among the survivors in Hiro-
shima and Nagasaki received doses of
more than 200 rems, but not all the
people who received such large doses
developed the disease. An approximate
estimate suggests that there were about
20 instances of leukemia per rem per
million population exposed at age 10
years or more and roughly twice this
number for younger individuals.
OTHER TYPES OF CANCER
12.150 It has been established from
the mortality statistics of radiologists
and of some of the spondyltic patients
mentioned in § 12.147, from other ex-
posures to radiation for various medical
purposes, and from experiments with
animals that large doses of radiation can
increase the frequency of various types
of cancer, in addition to leukemia. The
same effect has been observed among
the survivors of the nuclear attacks on
Japan. For example, after a latent period
of about 10 years, a significant increase
was observed in the incidence of thyroid
cancer among individuals who were
within about half a mile from ground
zero and consequently received large
doses of ionizing radiations. Delayed
thyroid abnormalities have also been
found among the inhabitants of the
LATE EFFECTS OF IONIZING RADIATION
593
Marshall Islands whose glands were
subjected to internal exposure from ra-
dioiodines in fallout, but only a small
proportion were malignant (§ 12.181).
The frequency of thyroid cancer induced
by radiation is estimated to be roughly
10 per rem per million of exposed
adults, but substantially more for chil-
dren. Provided it is detected in time,
however, thyroid cancer is rarely fatal in
children and only in about 10 percent of
adults.
12.151 A statistical study of mor-
tality data, obtained from 1950 through
1970, of a large number of people who
were in Hiroshima and Nagasaki at the
times of the nuclear explosions shows
an increased frequency of various other
types of cancer. The most important
sites appear to be the lung, the gas-
trointestinal system (other than the
stomach), and the female breast. Al-
though they are relatively rare, salivary
gland tumors have been found to be
more common among the Japanese ex-
posed to radiation than in the unexposed
population. In a group of 109,000 sur-
vivors who have been studied about
5,700 received whole-body doses of 100
rems or more. Among these, 690 were
over 50 years of age at the time of
exposure and during the period from
1960 to 1970 there were 47 deaths from
cancer, other than leukemia, whereas
about 30 would have been expected. Of
the 820 children who were under 10
years of age when exposed, there were
six such deaths, compared with 0.75
expected. Thus, although the actual in-
crease in fatal cancers was smaller
among those exposed at an early age,
the relative increase, i.e., actual/ex-
pected, was much greater than in older
persons.
LIFE SHORTENING
12.152 Laboratory studies with an-
imals have indicated that shortening of
the life span, apart from the effects of
leukemia and other forms of malignant
disease, can sometimes (but not always)
result from partial or whole-body expo-
sure to radiation. Such shortening may
be the result of a number of factors,
including decreased immunity to infec-
tion, damage to connective tissues, and
possibly premature aging. The life
shortening in a given animal, for a spe-
cific radiation dose, apparently depends
on such factors as genetic constitution
and on the age and physical condition at
the time of the exposure.
12.153 It has been reported that for
radiologists who received fairly large
chronic doses of radiation in the course
of their work, before adequate protec-
tive measures were instituted, the aver-
age age at death was about five years
less than for other physicians. Part of
the increase in death rate was due to
leukemia and other forms of cancer, but
after allowing for these and other spe-
cific effects of radiation, there were in-
dications that ionizing radiations caused
nonspecific life shortening. However,
an examination of deaths occurring from
1950 through 1970 of survivors of the
nuclear attacks on Japan suggests that,
apart from various forms of cancer,
there is little evidence that radiation ac-
celerated aging.
RETARDED DEVELOPMENT OF
CHILDREN
12.154 Among the mothers who
were pregnant at the time of the nuclear
594
BIOLOGICAL EFFECTS
explosions in Japan, and who received
sufficiently large doses to show the usual
acute radiation symptoms, there was a
marked increase over normal in the
number of stillbirths and in the deaths of
infants within a year of birth. The in-
crease in mortality was significant only
when the mothers had been exposed
during the last three months of preg-
nancy. Among the surviving children
there was a slight increase in frequency
of mental retardation and head circum-
ferences were smaller than normal.
These effects were most marked when
the radiation exposure occurred within
the first three or four months of preg-
nancy. Most of the mothers of the chil-
dren referred to above were so close to
ground zero that they must have re-
ceived more than 200 rems of ionizing
radiation. Maldevelopment of the teeth,
attributed to injury to the roots, was also
noted in many of the children. Children
who were conceived after the nuclear
attacks, even by irradiated parents, ap-
pear for the most part to be normal. The
fear expressed at one time that there
would be a sharp increase in the occur-
rence of abnormalities has not been
substantiated.
EFFECTS OF EARLY FALLOUT
EXTERNAL HAZARD: BETA BURNS
12.155 In most circumstances, the
whole-body dose from the gamma rays
emitted by the early fallout will repre-
sent the major external hazard from the
delayed nuclear radiation. The biologi-
cal effects are then similar to those from
equal acute doses of radiation (§ 12.102
et seq.). In addition, injury can arise in
two general ways from external sources
of beta particles. If the beta-particle
emitters, e.g., fission products, come
into actual contact with the skin and
remain for an appreciable time, a form
of radiation injury, sometimes referred
to as “beta burn,” will result. In addi-
tion, in an area of extensive early fall-
out, the whole surface of the body may
be exposed to beta particles coming
from many directions. It is true that
clothing will attenuate this radiation to a
considerable extent; nevertheless, the
whole body could receive a large dose
from beta particles which might be sig-
nificant.
12.156 Information concerning the
development and healing of beta burns
has been obtained from observations of
the Marshall Islanders who were ex-
posed to fallout in March 1954
(§ 12.103). Within about 5 hours of the
burst, radioactive material commenced
to fall on some of the islands. Although
the fallout was observed as a white
powder, consisting largely of particles
of lime (calcium oxide) resulting from
the decomposition of coral (calcium
carbonate) by heat, the island inhabi-
tants did not realize its significance.
Because the weather was hot and damp,
the Marshallese remained outdoors;
their bodies were moist and they wore
relatively little clothing. As a result,
appreciable amounts of fission products
fell upon the hair and skin and remained
there for a considerable time. Moreover,
since the islanders, as a rule, did not
EFFECTS OF EARLY FALLOUT
595
Figure 12.158a. Beta burn on neck 1 month after exposure.
wear shoes, their bare feet were contin-
ually subjected to contamination from
fallout on the ground.
12.157 During the first 24 to 48
hours, a number of individuals in the
more highly contaminated groups expe-
rienced itching and a burning sensation
of the skin. These symptoms were less
marked among those who were less
contaminated with early fallout. Within
a day or two all skin symptoms subsided
and disappeared, but after the lapse of
about 2 to 3 weeks, epilation and skin
lesions were apparent on the areas of the
body that had been contaminated by
fallout particles. There was apparently
no erythema, as might have been ex-
pected, but this may have been obscured
by the natural coloration of the skin.
12.158 The first evidence of skin
damage was increased pigmentation, in
the form of dark colored patches and
raised areas (macules, papules, and
raised plaques). These lesions devel-
oped on the exposed parts of the body
not protected by clothing, and occurred
usually in the following order: scalp
(with epilation), neck, shoulders, de-
pressions in the forearm, feet, limbs,
and trunk. Epilation and lesions of the
scalp, neck, and foot were most fre-
quently observed (Figs. 12.158a and b).
12.159 In addition, a bluish-brown
pigmentation of the fingernails was very
common among the Marshallese and
also among American negroes who were
in a group of servicemen stationed on
Rongerik Atoll (Fig. 9.105). The phe-
nomenon appears to be a radiation re-
sponse peculiar to the dark-skinned
races, since it was not apparent in any of
the white Americans who were exposed
at the same time. The nail pigmentation
occurred in a number of individuals who
did not have skin lesions. It is probable
that this was caused by gamma rays,
rather than by beta particles, as the same
effect has been observed in dark-skinned
596
BIOLOGICAL EFFECTS
Figure 12.158b. Beta burn on feet 1 month after exposure.
patients undergoing X-ray treatment in
clinical practice.
12.160 Most of the lesions were
superficial without blistering. Micro-
scopic examination at 3 to 6 weeks
showed that the damage was most
marked in the outer layers of the skin
(epidermis), whereas damage to the
deeper tissue was much less severe.
This is consistent with the short range of
beta particles in animal tissue. After
formation of dry scab, the lesions healed
rapidly leaving a central depigmented
area, surrounded by an irregular zone of
increased pigmentation. Normal pig-
mentation gradually spread outward in
the course of a few weeks.
12.161 Individuals who had been
more highly contaminated developed
deeper lesions, usually on the feet or
neck, accompanied by mild burning,
itching, and pain. These lesions were
wet, weeping, and ulcerated, becoming
covered by a hard, dry scab; however,
the majority healed readily with the
regular treatment generally employed
for other skin lesions not connected with
radiation. Abnormal pigmentation ef-
EFFECTS OF EARLY FALLOUT
597
Figure 12.161a. Beta burn on neck 1 year after exposure (see Fig. 12.158a).
fects persisted for some time, and in
several cases about a year elapsed be-
fore the normal (darkish) skin coloration
was restored (Figs. 12.161a and b).
12.162 Regrowth of hair, of the
usual color (in contrast to the skin pig-
mentation) and texture, began about 9
weeks after contamination by fallout
and was complete in 6 months. By the
same time, nail discoloration had grown
out in all but a few individuals. Seven
years later, there were only 10 cases
which continued to show any effects of
beta burns, and there was no evidence of
malignant changes.
INTERNAL HAZARD
12.163 Wherever fallout occurs
598
BIOLOGICAL EFFECTS
Beta burn on feet 6 months after exposure (see Fig. 12.158b).
Figure 12.161b.
there is a chance that radioactive mate-
rial will enter the body through the di-
gestive tract (due to the consumption of
food and water contaminated with fis-
sion products), through the lungs (by
breathing air containing fallout parti-
cles), or through wounds or abrasions.
Even a very small quantity of radioac-
tive material if retained in the body can
produce considerable injury. Radiation
exposure of various organs and tissues
from internal sources is continuous,
subject only to depletion of the quantity
of active material in the body as a result
of physical (radioactive decay) and bio-
logical (elimination) processes. Fur-
thermore, internal sources of alpha
emitters, e.g., plutonium, or of beta
particles, or soft (low-energy) gamma-
ray emitters, can deposit their entire
EFFECTS OF EARLY FALLOUT
599
energy within a small, possibly sensi-
tive, volume of body tissue, thus caus-
ing considerable damage. Even if the
radioisotope remains in the body for a
fairly short time and causes no observ-
able early injury, it may contribute to
damage that does not become apparent
for some time (§ 12.142 et seq.).
12.164 The situation with regard to
internal exposure is sometimes aggra-
vated by the fact that certain chemical
elements tend to concentrate in specific
organs or tissues, some of which are
highly sensitive to ionizing radiation.
The fate of a given radioactive element
which has entered the blood stream will
depend upon its chemical nature. Ra-
dioisotopes of an element which is a
normal constitutent of the body will
follow the same metabolic processes as
the naturally occurring, inactive (stable)
isotopes of the same element. This is the
case, for example, with iodine isotopes,
all of which—radioactive and stable—
tend to concentrate in the thyroid gland.
12.165 An element not usually
found in the body, except perhaps in
minute traces, will behave like one with
similar chemical properties that is nor-
mally present. Thus, among the fission
products, strontium and barium, which
are similar chemically to calcium,
would be largely deposited in the cal-
cifying tissue of bone. The radioiso-
topes of the rare earth elements, e.g.,
cerium, which constitute a considerable
proportion of the fission products, and
plutonium, which may be present to
some extent in the fallout, are also
“bone-seekers.” Since they are not
chemical analogues of calcium, how-
ever, they are deposited to a smaller
extent and in other parts of the bone than
are strontium and barium. Bone-seeking
radioisotopes are potentially hazardous
for two reasons in particular; first, the
radiations can damage the bone marrow
and thus affect the whole body by de-
creasing blood-cell formation
(§ 12.226), and second, the deposition
of alpha- or beta-particle energy in a
small volume can cause serious bone
damage, including cancer (§ 12.173).
12.166 The extent to which early
fallout contamination can enter the
bloodstream as a result of ingestion,
inhalation, or a wound is strongly in-
fluenced by the physical properties,
e.g., size distribution, density, and sur-
face area, of the particles, and by their
solubility in the body fluids. Whether
the material is subsequently deposited in
some specific tissue or not will be de-
termined by the chemical properties of
the elements present, as indicated pre-
viously. Elements which do not tend to
concentrate in a particular part of the
body are eliminated fairly rapidly by
natural processes.
12.167 The amount of radioactive
material absorbed from early fallout by
inhalation appears to be relatively small
because the nose can filter out almost all
particles over 10 micrometers (see
§2.27 footnote) in diameter, and about
95 percent of those exceeding 5 mi-
crometers. Although particles of a wide
range of sizes will be present, most of
the particles descending in the fallout
during the critical period of highest ac-
tivity, e.g., within 24 hours of the ex-
plosion, will be the larger ones (§ 9.50),
more than 10 micrometers in diameter.
Consequently, only a small proportion
of the early fallout particles present in
the air will succeed in reaching the
lungs. Furthermore, the optimum size
for deposition in the alveolar (air) cells
600
BIOLOGICAL EFFECTS
of the lungs is as small as 1 to 2 mi-
crometers.
12.168 Since many of the contami-
nated particles are relatively insoluble,
the probability is low that inhaled fis-
sion products and other weapon residues
present in the early fallout will reach the
blood stream from the lungs. After de-
position in the alveolar spaces of the
lungs, particles of low solubility in the
body fluids may be retained in these
spaces for long periods until they are
eventually dissolved or are removed by
mechanical means, e.g., by cellular or
lymphatic transport or in mucus. Par-
ticles leaving the lungs by way of the
lymphatic system tend to accumulate
principally in the tracheobronchial
lymph nodes thereby leading to an in-
tense, localized radiation dose.
12.169 Following ingestion or
clearance of the upper respiratory tract
after inhalation, the extent of absorption
of fission products and other radioactive
materials through the intestine is largely
dependent upon the solubility of the
particles. In the early fallout, the fission
products as well as uranium and pluto-
nium are chiefly present as oxides, many
of which do not dissolve to any great
extent in body fluids. The oxides of
strontium and barium, however, are
soluble, so that these elements enter the
blood stream more readily and find their
way into the bones.11 The element io-
dine is also chiefly present in a soluble
form and so it soon enters the blood and
is concentrated in the thyroid gland.
12.170 The length of time a partic-
ular nuclide remains in the body de-
pends on its radioactive half-life
(§ 1.63), which determines the rate of
removal by natural decay, and on its
“biological half-life,” i.e., the time for
the amount in the body to decrease to
half of its initial value solely as a result
of elimination by biological processes.
The combination of radioactive and bi-
ological half-lives leads to the “effec-
tive half-life” as a measure of the net
rate of loss of the radionuclide from the
body by both decay and biological
elimination. The retention pattern of a
given element in the body represents the
summation of the retentions in individ-
ual tissues. In those cases where practi-
cally all the body burden is in one tissue
(or organ), e.g., iodine in the thyroid
gland, the effective half-life is essen-
tially that for this tissue (or organ). A
major consideration in assessing the in-
ternal hazard from a given radionuclide
is the total radiation dose (in rems) de-
livered while it is in the body (or a
critical organ). The main factors in this
respect are the effective half-life, which
determines the time the nuclide is pres-
ent in the body (or organ), the total
quantity in the body (or organ), and the
nature and energy of the radiation emit-
ted. The importance of these factors in
various circumstances will become ap-
parent in due course.
12.171 The biological half-life of
the element iodine, which is essentially
that in the thyroid gland, has an average
value of about 80 days, although it ac-
tually varies from a few days in some
people to several years in others. A
number of radioactive isotopes of iodine
are present among the fission products,
but most have moderate or short radio-
Even under these conditions, only about 10 percent of the strontium or barium is actually absorbed.
EFFECTS OF EARLY FALLOUT
601
active half-lives. The effective half-
lives, which are related to the times the
various isotopes are effective in the
body (thyroid), are then determined
mainly by the radioactive half-lives,
rather than by the longer biological
half-life. The heavier isotopes, iodine-
132, -133, -134, etc., all of which have
radioactive half-lives of less than a day,
thus have short effective half-lives;
consequently, they constitute a hazard
only if delivered in sufficient amounts to
the thyroid via the blood stream. The
injury that might be caused by these
isotopes is then largely dependent on the
quantities that reach the thyroid gland
within a short time. On the other hand,
the common fission product iodine-131,
with a half-life of about 8 days, has a
longer effective half-life and can repre-
sent a hazard in smaller amounts be-
cause it remains active in the thyroid for
a longer time.
12.172 In addition to radioiodine,
the important potentially hazardous fis-
sion products, assuming sufficient
amounts get into the body, fall into two
groups. The first, and more significant,
contains strontium-89, strontium-90,
cesium-137, and barium-140, whereas
the second consists of a group of rare
earth and related elements, particularly
cerium-144 and the chemically similar
yttrium-91.
12.173 Another potentially hazard-
ous element, which may be present to
some extent in the early fallout, is plu-
tonium, in the form of the alpha-particle
emitting isotope plutonium-239. This
isotope has a long radioactive half-life
(24,000 years) as well as a long biolog-
ical half-life in the skeleton (about 100
years) and the liver (about 40 years). As
with any airborne particulate matter, a
fraction of the inhaled fallout particles
contaminated with plutonium will be
deposited in the alveolar spaces of the
lungs. If the particles are relatively in-
soluble, they can be retained in the
lungs for long periods with gradual re-
moval by mechanical means or by slow
absorption in the blood. With the more
soluble particles, residence time in the
lungs will be shorter and absorption into
the blood stream will occur more rap-
idly. Plutonium that enters the blood
stream tends to be deposited in the liver
and on certain surfaces of the bone; the
amount of plutonium present and its
activity decrease at a very slow rate
because of the long radioactive and bio-
logical half-lives. The continuous expo-
sure for many years of a limited region
of the body, e.g., lung, liver, or bone
surface, to the short-range but high-en-
ergy alpha particles from plutonium can
cause serious injury. Thus, the injection
of sufficient amounts of soluble pluto-
nium into some animals has been found
to cause bone malignancies whereas in-
halation of plutonium dioxide particles
may result in the formation of lung
tumors.
12.174 Despite the large amounts
of radioactive material which may pass
through the kidneys in the process of
elimination, these organs ordinarily are
not greatly affected by radiation. By
contrast, uranium can cause damage to
the kidneys, but as a chemical poison
rather than because of its radioactivity.
However, the quantity of uranium com-
pounds found in the fallout that must be
ingested in order to be potentially poi-
sonous are so large that it is not consid-
ered to be of primary concern compared
with other constituents of nuclear
weapon debris.
602
BIOLOGICAL EFFECTS
MARSHALLESE EXPERIENCE
12.175 Early fallout accompanying
the nuclear air bursts over Japan was
insignificant and was not monitored.
Consequently, no information was
available concerning the potentialities of
fission products and other weapon resi-
dues as internal sources of radiation.
Following the incident in the Marshall
Islands in March 1954, however, data of
great interest were obtained. Because
they were not aware of the significance
of the fallout, many of the inhabitants
ate contaminated food and drank con-
taminated water from open containers
for periods up to 2 days before they
were evacuated from the islands.
12.176 Internal deposition of fis-
sion products resulted mainly from in-
gestion rather than inhalation for, in
addition to the reasons given above, the
radioactive particles in the air settled out
fairly rapidly, but contaminated food,
water, and utensils were used all the
time. The belief that ingestion was the
chief source of internal contamination
was supported by the observations on
chickens and pigs made soon after the
explosion. The gastrointestinal tract, its
contents, and the liver were found to be
much more contaminated than lung tis-
sue.
12.177 From radiochemical analy-
sis of the urine of the Marshallese sub-
jected to the early fallout, it was possi-
ble to estimate the body burdens, i.e.,
the amounts deposited in the tissues, of
various isotopes. It was found that io-
dine-131 made the major contribution to
the activity at the beginning, but it soon
disappeared because of its relatively
short radioactive half-life (8 days).
Somewhat the same was true for
barium-140 (12.8 days half-life), but the
activity levels of the strontium isotopes
were more persistent. Not only do these
isotopes have longer radioactive half-
lives, but the biological half-life of the
element is also relatively long.
12.178 No elements other than io-
dine, strontium, barium, and the rare
earth group were found to be retained in
appreciable amounts in the body. Es-
sentially all other fission products and
weapon residue activities were rapidly
eliminated, because of either the short
effective half-lives of the radionuclides,
the sparing solubility of the oxides, or
the relatively large size of the fallout
particles.
12.179 The body burden of radio-
active material among the more highly
contaminated inhabitants of the Mar-
shall Islands was never very large and it
decreased fairly rapidly in the course of
2 or 3 months. The activity of the
strontium isotopes fell off somewhat
more slowly than that of the other ra-
dioisotopes, because of the longer ra-
dioactive half-lives and greater retention
in the bone. Nevertheless, even stron-
tium could not be regarded as a danger-
ous source of internal radiation in the
cases studied. At 6 months after the
explosion, the urine of most individuals
contained only barely detectable quanti-
ties of radioactive material.
12.180 In spite of the fact that the
Marshallese people lived approximately
2 days under conditions where maxi-
mum probability of contamination of
food and water supplies existed and that
they took few steps to protect them-
selves, the amount of internally depo-
sited radioactivity from early fallout was
small. There seems to be little doubt,
therefore, that, at least as far as short-
term effects are concerned, the radiation
EFFECTS OF EARLY FALLOUT
603
injury by early fallout due to internal
sources can be minor in comparison
with that due to the external radiation.
However, delayed effects of internal ra-
diation exposure, including one case of
leukemia (§ 12.148), became apparent
several years after the explosion.
12.181 Until 1963, no thyroid ab-
normalities had been detected among
the inhabitants of the Marshall Islands
that could be attributed to the fallout. In
that year, one was found among the
people of Rongelap Atoll, but by 1966
there were 18 cases; the total number
increased to 22 by 1969 and to 28 by
1974. Of the Rongelap people who were
exposed, 64 (plus one in utero) received
external doses of about 175 rems; 18
others (plus one in utero), who were on
the neighboring Alinginae Atoll (cf.
Fig. 9.105) at the time of the nuclear
test, received about 69 rems. The
thyroid doses from radioiodines were
much larger, especially in children
under 16 years of age. In 1974, there
were 22 individuals with thyroid lesions
among the more highly exposed group
and six among the others. In the former
group there were three malignancies and
two cases of atrophied thyroids (hy-
pothyroidism); there were no definite
malignancies in the latter group al-
though there was one doubtful case. All
other thyroid abnormalities were benign
nodules.
12.182 Most of the lesions occurred
in children who were less than 10 years
old at the time of the explosion in 1954.
Of a total of 19 such children who were
on Rongelap, 17 developed abnormali-
ties, including one malignancy and two
cases of hypothyroidism. The radiation
doses from radioiodine isotopes that had
been concentrated in the thyroids of
these children were estimated to be from
810 to 1,150 rems. In 1974, a lesion
was observed in one of the individuals
who had been exposed in utero; the
thyroid dose was uncertain but it must
have been at least 175 rems. The six
children in the less highly exposed
group who were on Alinginae received
estimated thyroid doses of 275 to 450
rems; by 1974, lesions were observed in
two cases with one doubtful malign-
ancy.
12.183 For purposes of compari-
son, studies were made on 194 people
who normally lived on Rongelap Atoll
but who were away on other islands and
were not exposed to the fallout. There
were nine thyroid abnormalities (none
malignant), including one in 61 children
who were less than 10 years old in 1954.
An examination was also made of 157
inhabitants of Utirik Atoll who had re-
ceived external doses of 14 rems from
the fallout. The 58 children less than 10
years old at the time of the explosion
received thyroid doses from radioio-
dines estimated to be 60 to 95 rems, but
by 1974 no abnormalities had been ob-
served. Six people in the older group of
99 were found to have thyroid lesions,
one of which was malignant; the esti-
mated thyroid doses were in the range of
27 to 60 rems.
604
BIOLOGICAL EFFECTS
LONG-TERM HAZARD FROM DELAYED FALLOUT12
CESIUM-137
12.184 Of the fission products
which present a potential long-term
hazard from either the atmospheric test-
ing of nuclear weapons in peacetime or
their use in warfare, the most important
are probably the radioactive isotopes
cesium-137 and strontium-90. Since
both of these isotopes are fairly abun-
dant among the fission products and
have relatively long half-lives, they will
constitute a large percentage of any de-
layed fallout. The process of fractiona-
tion will tend to increase the proportions
of strontium and cesium still further
(§ 9.08). Of course, the activity level
due to these isotopes at late times in the
early fallout pattern in the area close to a
surface or subsurface burst will be con-
siderably larger than in the delayed fall-
out from a given explosion. However,
the special interest in the delayed fallout
arises from the fact that it may occur in
significant amounts in many parts of the
globe remote from the point of the nu-
clear detonation, as explained in
Chapter IX, as well as in close by areas.
12.185 Cesium-137 has a radioac-
tive half-life of 30 years and is of par-
ticular interest in fallout that is more
than a year old because it is the principal
constituent whose radioactive decay is
accompanied by the emission of gamma
rays. The chemical and biochemical
properties of cesium resemble those of
potassium. The compounds of these el-
ements are generally more soluble than
the corresponding compounds of stron-
tium and calcium and the details of the
transfer of these two pairs of elements
from the soil to the human body are
quite different. The element cesium is
relatively rare in nature and the body
normally contains only small traces.
Because of the presence of cesium-137
in the delayed fallout, studies have been
made of the behavior of this isotope in
various biological systems and of the
levels of uptake and retention in man.
Regardless of its mode of entry—
inhalation, ingestion, or wounds—ce-
sium is soon distributed fairly uniformly
throughout the body. A preferential de-
position in muscle results in concentra-
tions that are somewhat higher than in
the body as a whole, whereas in some
other tissues, e.g., the lungs and skele-
ton, the concentrations are lower than
the body average.
12.186 From the studies referred to
above, the biological half-life of cesium
in human adults has been reported as
ranging from 50 to 200 days. Factors
contributing to this spread of values in-
clude diet, age, sex, race, and body
weight. Because of the fairly uniform
distribution of cesium, the entire body
would be irradiated by both beta par-
ticles and gamma rays emitted as the
cesium-137 decays. However, since the
biological half-life of cesium is rela-
tively short, compared with strontium,
'-Much valuable information on delayed fallout and related problems can be found in the published
Hearings before the Special Committee on Radiation of the Joint Committee on Atomic Energy,
Congress of the United States: “The Nature of Radioactive Fallout and its Effects on Man," May 27 to
June 7, 1957; “Fallout from Nuclear Weapons Tests," May 5 to 8, 1959; and “Biological and
Environmental Effects of Nuclear War," June 22 to 26. 1959 (U.S. Government Printing Office).
LONG-TERM HAZARD FROM DELAYED FALLOUT
605
and it does not tend to concentrate sig-
nificantly in any organ or tissue, the
residual cesium-137 in a given amount
of delayed fallout is much less of a
biological hazard than is the strontium-
90.
12.187 The amount of internal ex-
posure to cesium-137 is determined by
the quantity of this isotope in food. If
the major mechanism for its incorpora-
tion into the diet is through the root
systems of plants, then the dose will be
more or less proportional to the total
amount of cesium-137 accumulated on
the ground. On the other hand, if this
isotope enters the diet mainly through
material deposited directly on the leaves
of plants, the internal dose will be more
nearly proportional to the rate of descent
of delayed fallout. It has been calculated
that if the former mechanism prevails,
the internal 30-year dose to the gonads,
which is of interest in connection with
possible genetic effects (§ 12.201 et
seq.), would be much higher than if the
alternative mechanism were of major
importance. The best data presently
available on cesium-137 levels in food
suggest that, up to the present time, the
fallout rate has been the dominant fac-
tor; but in the future a larger proportion
of the cesium may get into food via the
soil, provided no considerable amounts
of cesium-137 are added to the atmos-
phere.
STRONTIUM-90
12.188 Stontium-90, because of its
relatively long radioactive half-life of
27.7 years and its appreciable yield in
the fission process, accounts for a con-
siderable fraction of the total activity of
fission products which are several years
old. Strontium is chemically similar to
calcium, an element essential to both
plant and animal life; an adult human
being, for example, contains over 2
pounds of calcium, mainly in bone.
However, the relationship between
strontium and calcium is not a simple
one as will be seen in subsequent sec-
tions and, because of its complex me-
tabolism in the body, the behavior of
strontium-90 cannot be stated in terms
of a single effective half-life (§
12.170). '3
12.189 The probability of serious
pathological change in the body of a
particular individual, due to the effects
of radioisotopes deposited internally,
depends upon the amount deposited, the
energy of the radiations emitted, and the
length of time the source remains in the
body. Strontium-90 and its daughter,
yttrium-90, emit beta particles which
can cause serious localized damage fol-
lowing their deposition and long-term
retention in the skeleton.11 * * 14 Tests with
animals indicate that the pathological
effects resulting from sufficient quanti-
ties of inhaled, ingested, or injected
11 Data from strontium-90 excretion by the Marshallese people and studies in a case of accidental
inhalation indicate that for an acute intake the major portion of the absorbed strontium-90 is excreted with
a biological half-life of 40 days during the first year. During the next 2 years, at least, a smaller fraction
is excreted with a biological half-life of 500 days. The remaining portion (less than 10 percent) is tightly
bound to bone and is excreted very slowly with a long biological half-life of about 50 years. In this latter
case, the effective half-life (§ 12.170) would be about 18 years. The situation for a chronic intake e.g.,
from delayed fallout, although not the same, would be similar.
l4The energy of the strontium-90 beta particles is 0.54 MeV. However, its daughter, yttrium-90,
which has the short half-life of only 64 hours, emits 2.27-MeV beta particles (no gamma rays); the decay
product is stable zirconium-90. Thus, both 0.54- and 2.27-MeV beta particles accompany the decay of
strontium-90. (The energies quoted are maxima; the average energy is about one-third of the maximum.)
606
BIOLOGICAL EFFECTS
strontium-90 include bone necrosis,
bone tumors, leukemia, and other he-
matologic dyscrasias (abnormalities).
12.190 Most of the strontium-90 in
the delayed fallout is ultimately brought
to earth by rain or snow, and it makes its
way into the human body primarily
(directly and indirectly) through plants.
At first thought, it might appear that the
ratio of strontium to calcium in man
would be equal to that in the soil from
which he obtains his food. Fortunately,
however, a number of processes in the
chain of biological transfer of these ele-
ments to the human body operate col-
lectively to decrease the relative quan-
tity of strontium that is stored in man by
an overall factor of two to ten. The
accumulation of strontium-90 in the
human body by way of food is affected
by the availability and proximity of
strontium to the root system of a plant,
strontium-90 uptake by the plant,
transfer from plant to animal (where
relevant), and transfer from plant or
animal to man.
12.191 Greenhouse experiments
show a slight discrimination in favor of
calcium and against strontium when
these elements are taken up by most
plants from homogeneous soils. How-
ever, several factors make it difficult to
generalize concerning the ratio of stron-
tium to calcium in the plant compared to
that in field soils. First, plants obtain
most of their minerals through their root
systems, but such systems vary from
plant to plant, some having deep roots
and others shallow roots. Most of the
strontium-90 deposited in undisturbed
soil has been found close to the surface,
so that the uptake of this nuclide may be
expected to vary with the root habit of
the plant. Second, although strontium
and calcium, because of their chemical
similarity, may be thought of as com-
peting for entry into the root system of
plants, not all of the calcium in soil is
available for assimilation. Some natural
calcium compounds in soil are insoluble
and are not available as plant food until
they have been converted into soluble
compounds. Most of the strontium-90 in
the delayed fallout, however, is in a
water-soluble form. Third, in addition,
to the strontium-90 which plants derive
from the soil, growing plants retain a
certain amount of strontium-90 from
fallout deposited directly on the surface
of the plant.
12.192 As the next link in the
chain, animals consume plants as food,
thereby introducing strontium-90 into
their bodies. Once again, the evidence
indicates that natural discrimination
factors result in a strontium-90/calcium
ratio in the edible animal products that is
less than in the animal’s feed. Very little
strontium is retained in the soft tissue,
so that the amount of strontium-90 in the
edible parts of the animal is negligible.
It is of particular interest, too, that the
strontium-90/calcium ratio in cow’s
milk is much lower than that in the
cow’s feed, and thus is an important
barrier to the consumption of stron-
tium-90 by man. This barrier does not
operate, of course, when plant food is
consumed directly by human beings.
However, it appears that about three-
fourths of the calcium, and hence a large
fraction of the strontium-90, in the
average diet in the United States is ob-
tained from milk and milk products. The
situation may be different in areas where
a greater or lesser dependence is placed
upon milk and milk products in the diet.
12.193 Not all of the strontium-90
LONG-TERM HAZARD FROM DELAYED FALLOUT
607
that enters the body in food is deposited
in the human skeleton. An appreciable
fraction of the strontium-90 is elimi-
nated, just as is most of the daily intake
of calcium. But there is always some
fresh deposition of calcium taking place
in the skeletal structure of healthy indi-
viduals, so that strontium-90 is incor-
porated at the same time. The rate of
deposition of both calcium and stron-
tium-90 is, of course, greater in growing
children than in adults. In addition to the
fact that the human metabolism dis-
criminates against strontium, it will be
noted that, in each link of the food
chain, the amount of strontium-90 re-
tained is somewhat less than in the pre-
vious link. Thus, a series of safeguards
reduces deposition of strontium in
human bone.
12.194 As there has been no expe-
rience with appreciable quantities of
strontium-90 in the human body, the
relationship between the probability of
serious biological effect and the body
burden of this isotope is not known with
certainty. Tentative conclusions have
been based on a comparison of the
effects of strontium-90 with radium on
test animals, and on the known effects
of radium on human beings. From these
comparisons it has been estimated that a
body content of 10 microcuries (1 mi-
crocurie is a one-millionth part of a
curie, as defined in § 9.141) of stron-
tium-90 in a large proportion of the
population would produce a noticeable
increase in the occurrence of bone
cancer. On this basis, it has been rec-
ommended that the maximum activity of
strontium-90 in the body of any indi-
vidual who is exposed in the course of
his occupation be taken as 2 micro-
curies. Since the average amount of
calcium in the skeleton of an adult
human is about 1 kilogram (or a little
over 2 pounds), this corresponds to a
concentration in the skeleton of 2 mi-
crocuries of strontium-90 per kilogram
of calcium. Moreover, the limit gener-
ally considered to be acceptable for any
individual member of the general popu-
lation is 0.2 microcurie of strontium-90
per kilogram of calcium. The Interna-
tional Commission on Radiological
Protection has suggested that the con-
centration of strontium-90 averaged
over the whole population should not
exceed 0.067 microcurie per kilogram
of calcium.
12.195 As a result of nuclear test
explosions in the atmosphere by various
countries, there has been an increase in
the strontium-90 content of the soil,
plants, and the bones of animals and
man. This increase is worldwide and is
not restricted to areas in the vicinity of
the test sites, although it is naturally
somewhat higher in these regions be-
cause of the more localized (early) fall-
out.15 The fine particles of the delayed
fallout descend from the stratosphere
into the troposphere over a period of
years, and are then brought down by
rain and snow. Consequently, the
amount of strontium-90 in the strato-
15 It is to be expected that areas near the explosion will be more highly contaminated in strontium-90
than are more distant regions, to an extent dependent upon such factors as the height (or depth) of burst,
the total and fission yields of the explosion, and the prevailing atmospheric conditions. Because of the
phenomenon of fractionation, the proportion of strontium-90 in the local (early) fallout will generally be
less than that in the worldwide (delayed) fallout. It is of interest to mention, too, that the strontium-90 in
early fallout appears to be in a less soluble form, and hence probably less readily accessible to plants,
than that present in the delayed fallout.
608
BIOLOGICAL EFFECTS
sphere available to fall on earth is de-
termined by the difference between the
quantity introduced by nuclear explo-
sions and that removed by precipitation
(and radioactive decay). This net
amount reached a maximum at the end
of 1962, after the cessation of nuclear
weapons testing in the atmosphere by
the United States and the U.S.S.R. (see
Fig. 9.143a). Subsequent additions of
strontium-90 from nuclear tests made by
France and mainland China have caused
temporary increases in the stratospheric
reservoir.
12.196 Calculations, based on
somewhat uncertain premises, suggest
that, in the event nuclear weapons were
to be used in warfare, debris from many
thousands of megatons of fission would
have to be added to the stratosphere
before the delayed fallout from these
weapons would lead to an average con-
centration in the human body equal to
the recommended maximum value for
occupationally exposed persons, i.e., 2
microcuries of strontium-90 per kilo-
gram of calcium.
CARBON-14 AND TRITIUM
12.197 Long-term radiation expo-
sure can arise from carbon-14 and from
tritium, the radioactive isotope of hy-
drogen; both of these substances are
normally present in nature and they are
also produced in considerable amounts
in nuclear explosions. Carbon-14 is not
strictly a component of fallout, but it is
convenient to consider it here since it is
formed by the action of fast neutrons,
e.g., from a thermonuclear weapon, on
nitrogen in the atmosphere (§ 9.34).
Carbon-14, with a half-life of 5,730
years, emits beta particles, with the low
average energy of about 0.05 MeV, and
no gamma rays. Tritium is a minor
product of fission, but much larger
amounts are released in thermonuclear
explosions (§ 9.44). The half-life of tri-
tium is 12.3 years and the beta particles
it emits have even a lower energy
(average approximately 0.006 MeV)
than those from carbon-14; there are
also no gamma rays.
12.198 As a consequence of the
testing of thermonuclear weapons,
starting in 1952, there has been a large
increase in the quantity of carbon-14 in
the atmosphere, particularly in the
stratosphere. Although this has been
decreasing since 1963, there is still a
significant burden of carbon-14 in the
stratosphere which will find its way into
the lower part of the atmosphere (tro-
posphere). Because of its long half-life,
carbon-14 decays very slowly and the
decrease in concentration in the tropos-
phere is largely due to removal of car-
bon dioxide by gradual solution in ocean
waters.
12.199 Carbon-14 does not tend to
concentrate in any particular part of the
body and is distributed almost uniformly
throughout soft tissue; hence, the whole
body is exposed to the low-energy beta
particles. The whole-body dose from
carbon-14 in nature before 1952 was
somewhat less than 1 millirem per
annum. By 1964, this dose had been
roughly doubled by the additional car-
bon-14 arising from nuclear tests in the
atmosphere. If there are no further sub-
stantial additions, the dose will decrease
gradually and approach normal in an-
other 100 years or so. Compared with
the annual radiation dose from stron-
tium-90, mainly to the skeleton, the
contribution from carbon-14 produced
by thermonuclear weapons is small.
GENETIC EFFECTS OF NUCLEAR RADIATIONS
609
12.200 Tritium, in the form of tri-
tiated water (§ 9.44), can enter the body
by the ingestion of food and water, by
inhalation of air containing tritiated
water vapor, and by absorption through
the skin. Since it is an isotope of hy-
drogen, and has the same chemical
properties, tritium soon becomes dis-
tributed throughout the body wherever
hydrogen is normally found. There is no
reason for believing that there is any
significant preferential concentration of
tritium in any organ. In spite of the large
increase in the quantity of tritium on the
earth as a result of nuclear explosions,
the annual whole-body dose was less
than 0.1 millirem even at its maximum.
Because of the low energy of the beta
particles it emits and its relatively short
half-life, tritium is much less of a long-
range radiation hazard than the radio-
isotopes already considered.
GENETIC EFFECTS OF NUCLEAR RADIATIONS
SPONTANEOUS AND INDUCED
MUTATIONS
12.201 The mechanism of heredity,
which is basically similar in all sexually
reproducing plants and animals, includ-
ing man, is somewhat as follows. The
nuclei of dividing cells contain a defi-
nite number of thread-like entities called
“chromosomes” which are visible
under the microscope. These chromo-
somes are believed to be differentiated
along their length into several thousands
(in man) of distinctive units, referred to
as “genes.” The chromosomes (and
genes) exist in every cell of the body,
but from the point of view of genetics
(or heredity), it is only those in the germ
cells, produced in the reproductive
organs (sex glands), that are important.
12.202 Human body cells normally
contain 46 chromosomes, made up of
two similar (but not identical) sets of 23
chromosomes each. In sexual reproduc-
tion, the first step is the union of an egg
cell, produced in the ovaries of the
mother, with a sperm cell, originating in
the testes of the father. Each of these
cells carries a set of 23 chromosomes,
one representing the characteristics of
the mother and the other set those of the
father. The resulting fused cell then has
the normal complement of 46 chromo-
somes. Subsequently, as the embroyo
develops, the cells reproduce them-
selves and, in general, the 46 chromo-
somes (and their constituent genes) are
duplicated without change.
12.203 In rare instances, however,
a deviation from normal behavior occurs
and instead of a chromosome duplicat-
ing itself in every respect, there is a
change in one or more of the genes. This
change, called a “mutation,” is essen-
tially permanent, for the mutant gene is
reproduced in its altered form. If this
mutation occurs in a body cell, there
may be some effect on the individual,
but the change is not passed on. But, if
the mutation occurs in a germ cell of
either parent, a new characteristic may
appear in a later generation, although
there may be no observable effect on the
individual in whom the gene mutation
occurs. The mutations which arise nat-
610
BIOLOGICAL EFFECTS
urally, without any definitely assignable
cause or human intervention, are called
‘ ‘spontaneous mutations. ’ *
12.204 The matter of immediate
interest is that the frequency with which
heritable mutations occur can be in-
creased in various ways, one being by
exposure of the sex glands (or
“gonads”), i-e., testes or ovaries, to
ionizing radiation. This effect of radia-
tion has been observed with various in-
sects and mammals, and it undoubtedly
occurs also in human beings. The gene
mutations induced by radiation (or by
various chemicals or heat) do not differ
qualitatively from those occurring
spontaneously. In practice, it is impos-
sible to determine in any particular in-
stance if the change has occurred natu-
rally or if it was a result of exposure to
radiation. It is only the frequency with
which the mutations occur that is in-
creased by ionizing radiation. One of
the concerns about radiation exposure of
a large population is that there may be a
substantial increase in the overall bur-
den of harmful mutations. There would
then be a greater than normal incidence
of defects in subsequent generations.
12.205 All genes have the property
of being either “dominant” or “reces-
sive.” If a gene is dominant, then the
appropriate characteristic affected by
that gene will appear in the offspring
even if it is produced by the gonads of
only one of the parents. On the other
hand, a particular recessive gene must
occur in the gonads of both parents if the
characteristic is to be apparent in the
next generation. A recessive gene may
consequently be latent for a number of
generations, until the occasion arises for
the union of sperm and egg cells both of
which contain this particular gene.
12.206 As a general rule, new mu-
tations, whether spontaneous or induced
by radiation, are recessive. Neverthe-
less, it appears that a mutant gene is
seldom completely recessive, and some
effect is observable in the next genera-
tion even if the particular gene is in-
herited from only one parent. Further-
more, in the great majority of cases,
mutations have deleterious effects of
some kind. A very few of the mutations
are undoubtedly beneficial, but their
consequences become apparent only in
the slow process of biological evolution.
12.207 The harmful effects of a de-
leterious mutation may be moderate,
such as increased susceptibility to dis-
ease or a decrease in life expectancy by
a few months, or they may be more
serious, such as death in the embryonic
stage. Thus, individuals bearing harm-
ful genes are handicapped relative to the
rest of the population, particularly in the
respects that they tend to have fewer
children or to die earlier. It is apparent,
therefore, that such genes will eventu-
ally be eliminated from the population.
A gene that does great harm will be
eliminated rapidly, since few (if any)
individuals carrying such genes will
survive to the age of reproduction. On
the other hand, a slightly deleterious
mutant gene may persist much longer,
and thereby do harm, although of a less
severe character, to a larger number of
individuals.
GENE MUTATIONS INDUCED BY
RADIATION
12.208 Since genetic effects of ra-
diation are not apparent in exposed in-
dividuals, information concerning mu-
tations can be obtained only from
GENETIC EFFECTS OF NUCLEAR RADIATIONS
611
observations on subsequent generations.
Data on radiation-induced mutations are
available only from laboratory studies
on experimental organisms with short
generation times. Unfortunately, these
data cannot be extrapolated to man with
any degree of certainty. The extensive
investigations of genetic effects of radi-
ation on mice appear to provide the most
relevant information from which the
possible effects on man may be esti-
mated. Radiation can cause two general
types of genetic change: gene (or point)
mutations in which the general structure
of the chromosomes remains un-
changed, and chromosome abnormali-
ties associated with gross structural
changes. The former appear to be the
more important and the subsequent dis-
cussion refers mainly to gene mutations.
12.209 From the earlier studies of
radiation-induced mutations, made with
fruitflies, it appeared that the number (or
frequency) of mutations in a given pop-
ulation, i.e., the probability of the oc-
currence of mutations, is proportional to
the total dose received by the gonads of
the parents from the beginning of their
development up to the time of concep-
tion. The mutation frequency appeared
to be independent of the rate at which
the radiation dose was received. The
implication was that the damage to the
gonads of the parents caused by radia-
tion was cumulative with no possibility
of repair or recovery. More recent ex-
periments with mice, however, have
shown that these conclusions must be
revised, at least for mammals. When
exposed to X rays or gamma rays, the
mutation frequency in these animals has
been found to be dependent on the ex-
posure (or dose) rate at which the radia-
tion is received. There are definite indi-
cations that some recovery can occur at
low exposure rates and not too large
total exposure (or doses).
12.210 For exposure rates greater
than about 90 roentgens per minute, the
incidence of radiation-induced muta-
tions in male mice appears to be pro-
portional to the total (accumulated)
gamma-ray (or X-ray) exposure to the
gonads; that is to say, the mutation
frequency per roentgen is independent
of the exposure rate.16 For exposure
rates from 90 down to 0.8 roentgens per
minute, however, the mutation fre-
quency per roentgen decreases as the
exposure rate is decreased. Finally,
below 0.8 roentgen per minute, the mu-
tation frequency per roentgen once
again becomes independent of the ex-
posure rate, but the value is only about
one-third as large as at the high expo-
sure rates (above 90 roentgens per min-
ute). In other words, a given radiation
exposure will produce roughly one-third
as many mutations at low than at high
exposure rates.
12.211 The exposure-rate effect in
female mice, for radiation exposure
rates of less than 90 roentgens per min-
ute, is even more marked than in males.
The radiation-induced mutation fre-
quency per roentgen decreases contin-
uously with the exposure rate from 90
roentgens per minute downward. At an
exposure rate of 0.009 roentgen per
minute, the total mutation frequency in
16In the experiments with gamma and X rays, measurements were made of exposures in roentgens per
minute; hence, these units are used here. The dose rates in rads (or rems) per minute to the mouse gonads
are probably essentially the same as the exposure rates. All conclusions concerning exposure-rate effects
thus apply equally to dose-rate effects.
612
BIOLOGICAL EFFECTS
female mice is indistinguishable from
the spontaneous frequency. There thus
seems to be an exposure-rate threshold
below which radiation-induced muta-
tions are absent or negligible, no matter
how large the total (accumulated) expo-
sure to the female gonads, at least up to
400 roentgens. Another important ob-
servation is that at the same high expo-
sure rate of 90 roentgens per minute, the
mutation frequency per roentgen at a
total exposure of 50 roentgens is only
one-third of that for a total exposure of
400 roentgens. The radiation-induced
mutation frequency in female mice thus
decreases both with decreasing exposure
rate and with the total exposure, in the
ranges studied.
12.212 For exposure to fission neu-
trons, no dose-rate effect has been ob-
served for genetic mutations in male
mice and only a small one in females.
For large dose rates, equivalent to acute
radiation exposures, the mutation fre-
quency per rad of fast neutrons is five or
six times as great as for gamma rays. It
would thus appear that a RBE value of 5
or 6 should be applicable for genetic
effects due to exposure to fast neutrons;
but this is not strictly correct because the
types of mutations induced in mice by
neutron irradiation differ from those
caused by X rays and gamma rays.
Since there is virtually no dose-rate ef-
fect with neutrons, but a large one for X
rays, the apparent RBE for neutrons
becomes quite large at very low dose
rates. This situation is, however, of
limited interest in connection with
weapons effects because neutron expo-
sure can result only from the initial
radiations and the dose rates are then in
the high range.
12.213 A significant observation
made with adult female mice is that a
delay of at least seven weeks between
exposure to a substantial dose of radia-
tion, either neutrons or gamma rays, and
conception causes the mutation fre-
quency in the offspring to drop almost to
zero. In males, on the other hand, a
lengthening of the interval between ex-
posure and fertilization of the female
has little effect on the mutation fre-
quency. It is to be noted that in this as
well as other respects male and female
mice exhibit different responses to radi-
ation in the occurrence of genetic muta-
tions. The reason is that in mice (and
other mammals) the mechanisms for the
development of male and female germ
cells are quite different.
12.214 Since the reproductive sys-
tems are basically the same in humans
as in lower mammals, it is probable that
the genetic effects of radiation in man
will be at least qualitatively similar to
those in mice, as described above.
Thus, a decrease in mutation frequency
per rad is expected at very low dose
rates of gamma rays in humans, espe-
cially in females, and the apparent RBE
for fast neutrons should be about 5 or 6.
GENETIC EFFECTS OF NUCLEAR
EXPLOSIONS
12.215 In a nuclear explosion, peo-
ple would be subjected to various
amounts of initial ionizing radiation,
consisting of gamma rays and neutrons,
delivered at a high dose rate, and also
possibly to the beta particles and gamma
rays from fallout received at a very
much lower dose rate. Because of inter-
breeding between exposed and unex-
posed persons, it is not possible to make
accurate predictions of the genetic con-
GENETIC EFFECTS OF NUCLEAR RADIATIONS
613
sequences. A rough estimate is that an
acute dose of about 50 rems to the
gonads of all members of the population
would result in additional mutations
equal to the number occurring spontan-
eously. But this may not allow for the
possible advantage that might arise from
delaying conception for some months
after exposure to radiation. Although, to
judge from the observations on mice,
this might not decrease the genetic ef-
fects of radiation in males, recovery in
the female members of the population
would bring about a substantial reduc-
tion in the “load” of mutations in sub-
sequent generations.
12.216 Gamma rays from radionu-
clides of short half-life in the early fall-
out on the ground or in the surroundings
will be part of the initial (acute) radia-
tion dose to the gonads. Beta particles
and gamma rays emitted from constitu-
ents of the fallout that enter the body
and remain there for some time can also
induce mutations. Genetic effects of
strontium-90 are expected to be rela-
tively minor. The element strontium
tends to concentrate in the skeleton and
because of the short range of the beta
particles from strontium-90 in the body,
they do not penetrate to the gonads.
Furthermore, the intensity of the secon-
dary X radiation (bremsstrahlung) pro-
duced by the beta particles is low. Fi-
nally, the amount of strontium-90 in soft
tissue, from which the beta particles
might reach the reproductive organs, is
small. Radioiodines in the body would
also not be important because all iso-
topes of iodine are taken up quite rap-
idly by the thyroid gland and the expo-
sure of the gonads would be
insignificant.
12.217 Cesium-137, carbon-14, and
tritium are in a different category as
internal sources because they are dis-
tributed throughout the body and so can
cause irradiation of the gonads. More-
over, the decay of cesium-137 is ac-
companied by gamma rays of fairly long
range.17 From the standpoint of the
genetic impact of a particular radio-
nuclide, the total radiation dose to the
population over many generations must
be taken into account. Hence, although
the annual radiation dose to the gonads
from carbon-14 is less than from ce-
sium-137, the overall effect of these two
substances may not be very different
because of the much longer half-life of
carbon-14. An additional effect can re-
sult from the radioactive decay of car-
bon-14 atoms in the molecules that carry
genetic information. Replacement of a
carbon atom by its decay product, ni-
trogen-14, would result in a change in
the nature of the molecule.
12.218 The suggestion has been
made that tritium may become concen-
trated in the genetic molecules and so
represent a special hazard. There is,
however, no convincing evidence that
such is the case. It appears that the
increase in mutation frequency that
might arise from the presence of tritium
in the gonads is not appreciably greater
than would be expected from the dose to
the body as a whole. Since the whole-
body dose from tritium produced in a
nuclear explosion is less than from car-
17Gamma rays accompanying the decay of cesium-137 (and of other species of moderately long
half-life) deposited on the ground as delayed fallout, i.e., as an external source, can make a significant
contribution to the genetic dose.
614
BIOLOGICAL EFFECTS
bon-14 and the effective half-life is
considerably shorter, the genetic effects
of tritium should be very much less than
those of carbon-14.
12.219 In attempting to assess the
genetic effects of internal radiation
emitters, it should be borne in mind
that, although the total radiation doses
over many generations may be large, the
dose rate is very low. In fact, it may be
so low that the effects in females, in
particular, will be negligible. Further-
more, the radiation from fallout should
be compared with the gonad exposure of
all members of the population to the
natural background radiation, i.e., apart
from that due to nuclear explosions. In
the United States, the average dose to
the gonads, from cosmic rays and from
radioactive isotopes in the body (espe-
cially potassium-40) and in the ground,
is about 90 millirems per annum. It has
been estimated that the fallout from ex-
plosions of a few hundred megatons
yield would be necessary to double the
overall mutation rate arising from back-
ground radiation. This, incidentally,
represents probably only a small frac-
tion of the total number of spontaneous
mutations.
PATHOLOGY OF ACUTE RADIATION INJURY18
CELLULAR SENSITIVITY
12.220 The discussion presented in
§12.90 et seq. has been coqcprned
chiefly with general symptoms and the
clinical effects of radiation injury. These
effects are due directly to the action of
nuclear radiation upon individual organs
and tissues. The changes in the periph-
eral blood, for example, reflect the
damage done by nuclear radiation to the
bone marrow and lymphatic tissue. The
pathologic changes in other systems and
organs caused by ionizing radiation,
which are the basis of the clinical radia-
tion syndrome, are discussed here
briefly.
12.221 Radiation damage is the re-
sult of changes induced in individual
cells. Morphologically demonstrable
changes, such as chromosome breaks,
nuclear swelling, increased cytoplasmic
viscosity, cellular permeability, and
cellular death, are manifested as altered
bodily functions when enough cells are
affected to reduce the total function of
the organ made up of these cells. In
certain instances, cells may be killed
outright with very high doses of radia-
tion (interphase death), but more com-
monly irradiated cells die when they
divide to reproduce (mitosis-linked
death). Delayed death of this kind may
occur after several cell divisions fol-
lowing irradiation, so that the effect may
not be observed until some time after
exposure. Mitosis-linked death is ap-
parently caused by chromosomal and
perhaps other nuclear abnormalities, but
with time some of these abnormalities
are repaired. Consequently, the longer
IKThe more technical discussion in § 12.220 through § 12.239 may be omitted without loss of
continuity. A general treatment of radiation effects on plants and farm animals is given in § 12.240 et
seq.
PATHOLOGY OF ACUTE RADIATION INJURY
615
the time between cell divisions, the
greater is the opportunity to recover
from radiation damage. Cells of dif-
ferent types and organs have quite dif-
ferent degrees of radiosensitivity based
mainly on the rapidity of the cell divi-
sion. Chromosomal changes can also
occur that will not result in cell death
but in hereditable abnormalities
(§ 12.208) or in cell transformations
which may lead to cancer.
12.222 Of the more common tis-
sues, the radiosensitivity decreases
roughly in the following order: lym-
phoid tissue, bone marrow, gastrointes-
tinal epithelium, germinal epithelium of
the gonads, embryonic tissues, corneal
tissue, endothelial cells of the blood
vessels, germinal epithelium of the skin,
differentiated nervous tissue, collagen
and elastic tissue, and bone and carti-
lage. The lymphocytes are remarkable
in that they are killed by relatively small
acute radiation doses (see below).
LYMPHOID TISSUE
12.223 Lymphoid tissue is com-
posed of the lymph nodes, tonsils, ade-
noids, spleen, and the submucosal is-
lands of the intestine. The lymphocytes
of the peripheral blood arise in these
various sites. Wherever these cells
occur, they are the most radiosensitive
cells of the whole body. In fact, lym-
phocytes are killed outright by radiation
doses as low as 100 rems or less.
12.224 Under the microscope, irra-
diated lymphocytes can be seen to be
undergoing pyknosis and subsequent
disintegration. As these cells die, theii
remnants are removed and the lymph
nodes atrophy. This change was com-
mon among the victims of the nuclear
bombs in Japan. After damage by radi-
ation, the lymph nodes do not produce
new lymphocytes for periods that vary
with the radiation dose. As a result of
this cessation of production, combined
with death of circulating lymphocytes,
there is a rapid fall in the number of the
latter. This easily measurable early
change in the peripheral blood has been
found to be a useful means of prognosis
following radiation exposure. A rapid,
almost complete, disappearance of lym-
phocytes implies that death is highly
probable, whereas no change within 72
hours is indicative of an inconsequential
exposure.
12.225 Atrophic lymph nodes, ton-
sils, adenoids, Peyer’s patches of the
intestine, appendices, and spleens were
common findings among the radiation
casualties in Japan.
BONE MARROW
12.226 Since all the other formed
blood cells, except the lymphocytes,
arise from radiosensitive marrow cells,
the acute radiation exposure syndrome
is accompanied by severe changes in
cellular composition of the blood.
Under normal circumstances, the ma-
ture blood cells leave the marrow and
enter the blood stream where they re-
main until destroyed by natural proc-
esses and in defense against infection.
The different kinds of cells have dif-
ferent spans of natural life. The shorter
the life of a particular cell, the more
quickly will radiation damage to the
parents of that particular cell be revealed
by a decrease in number of such cells in
the circulation. The red blood cells,
which have the longest life span (about
120 days), are the last to show a reduc-
616
BIOLOGICAL EFFECTS
tion in number even though their parent
cells, the erythroblasts, are almost as
radiosensitive as the lymphocytes.
12.227 Bone marrow exhibits strik-
ing changes soon after irradiation. There
is at once a temporary cessation of cell
division. Those cells in the process of
dividing go on and complete the proc-
ess, after which all the cells in the mar-
row mature progressively. Since they
leave the marrow as rapidly as maturity
is reached, the marrow becomes de-
pleted at once of both adult and less
mature cells. As time passes, the mar-
row, barring regeneration, becomes
progressively more atrophic until in the
final stage it consists of dilated blood-
filled sinuses, with gelatinous edema of
the spaces left empty by the loss of
marrow cells, and large macrophages
containing the debris of dead cells re-
moved from the circulation. Such ex-
treme atrophy of the marrow was com-
mon among those dying of radiation
injury in Japan up to 4 months after
exposure. In some of these delayed ra-
diation deaths, the bone marrow showed
a return of cellular reproductive activity.
HEMORRHAGE AND INFECTION
12.228 Hemorrhage is a common
phenomenon after radiation exposure
because the megakaryocytes, from
which the blood platelets necessary for
clotting are formed, are destroyed and
platelets are not replenished. If hemor-
rhage occurs in vital centers, death can
result. Often the hemorrhages are so
widespread that severe anemia and
death are the consequences.
12.229 The loss of the epithelial
coverings of tissues, together with the
loss of white blood cells and the de-
creased ability to produce antibodies,
lowers the resistance of the body to
bacterial and viral invasion. If death
does not take place in the first few days
after a large dose of radiation, bacterial
invasion of the blood stream usually
occurs and the patient dies of infection.
Often such infections are caused by
bacteria which, under normal circum-
stances, are harmless.
12.230 Very often in whole-body
irradiation the outward signs of severe
damage to the bone marrow, lymphatic
organs, and epithelial linings are gan-
grenous ulcerations of the tonsils and
pharynx. This condition (agranulocytic
anemia) is also found in cases of chem-
ical. poisoning of the bone marrow that
resemble the effect of radiation expo-
sure. Such ulcerations and the pneumo-
nia that often accompanies them are
unusual in the respect that very little
suppuration is found because of the
paucity of leucocyte cells. Although
most of the bacteria in such ulcerations
can usually be controlled by antibiotic
drugs, the viruses and fungi which also
invade such damaged tissues are not
affected by treatment, and fatal septi-
cemia is common.
REPRODUCTIVE ORGANS
12.231 Cell division in the germinal
epithelium of the testes stops at once
with lethal exposure to ionizing irradia-
tion. The first change is pyknosis or
nuclear death of the spermatogonia, the
most primitive of the male germinal
epithelium. Following this change, the
more developed cells undergo matura-
tion without further division, so that the
testicular germinal cells leave the testes
as adult sperm, and the most primitive
PATHOLOGY OF ACUTE RADIATION INJURY
617
cells disappear sequentially as they ma-
ture and die during cell division.
12.232 Changes in the ovaries
caused by radiation are less striking than
those in the testes. The primordial ova
can be found in progressive stages of
post irradiation atrophy and degenera-
tion. In some Japanese irradiation vic-
tims, the ovarian follicles failed to de-
velop normally and menstrual
irregularitiies resulted. There was an
increased incidence of miscarriages and
premature births, along with an in-
creased death rate among expectant
mothers. These changes were related to
the radiation dose, as determined by the
distance from ground zero.
12.233 Morphologic changes in the
human reproductive organs, compatible
with sterility, are thought to occur with
doses of 450 to 600 rems. Various de-
grees of temporary sterility were found
among surviving Japanese men and
women. Many supposedly sterile from
exposure to significant doses of radia-
tion have since produced children who
are normal by ordinary measurements.
LOSS OF HAIR
12.234 Epilation was common
among exposed Japanese surviving
more than 2 weeks after the explosion.
The onset of epilation from the head was
between the 13th and 14th days after
exposure in both sexes. Combing ac-
centuated this change, although copious
amounts of hair were lost spontaneously
for about 2 weeks. The distribution of
the radioepilation conformed in general
with that expected from the senile
changes of male ancestors. The hair of
the eyebrows, eyelashes, and beard
came out much less easily than from the
head. In severely exposed but surviving
cases, hair began to return within a few
months, and epilation was never per-
manent.
GASTROINTESTINAL TRACT
12.235 Some of the first gross
changes noted in radiation-exposed Jap-
anese were ulcerations of the intestinal
lining. The mucosa of the first part of
the small intestine is the most radiosen-
sitive but usually does not ulcerate
deeply. Ulcers are most commonly
found after irradiation in the lymphoid
tissues of the lower ileum and in the
caecum, where bacterial invasion is
common.
12.236 Microscopically profound
changes are found throughout the gas-
trointestinal tract. For example, the
acid-secreting cells of the stomach are
lost. Mitosis stops in the crypts of the
intestinal glands and, as a result, the
cells covering the villi of the intestine
are not replaced and the villi become
swollen, turgid, and denuded. When
bacterial invasion occurs, ulcers cov-
ered by a shaggy, fecally contaminated
exudate develop. Since the white blood
cells are simultaneously depleted and
too few in number to combat infection,
these intestinal ulcerations are often the
point of entry of bacteria that kill the
victim of heavy radiation exposure.
NERVOUS SYSTEM
12.237 Although certain nerve cells
are among the most radioresistant cells
in the adult body, the nervous tissue of
the embryo and some cells of the adult
cerebellum are relatively sensitive to
radiation. Early disorientation and coma
may be induced by brain damage at dose
levels of thousands of rems.
618
BIOLOGICAL EFFECTS
BLAST-RELATED EFFECTS
VELOCITIES OF GLASS FRAGMENTS
12.238 Glass fragments produced
by air blast are a substantial hazard and
the injuries they can cause are related to
the velocities attained (§ 12.42). Mea-
surements have been made of the frag-
ments produced from glass panes,
mounted in either steel or wood frames,
when destroyed by the blast from nu-
clear (11 to 29 kilotons) or conventional
(15 to 500 tons) explosions. The types
of glass ranged from 0.25-inch thick
plate glass, through various standard
thicknesses of single- and double-
strength glass, to thin nonstandard panes
0.064 inch thick. The results obtained
can be represented, with an accuracy of
roughly ± 10 to 15 percent, by the
straight line in Fig. 12.238. The geo-
metric mean velocity, i.e., the antilo-
garithm of the mean of the logarithms of
the velocities, represented by V50 feet
per second, is modified by an empirical
scaling factor for the thickness (finches)
of the glass panes. The effective peak
overpressure (pounds per square inch) is
equal to the peak reflected overpressure
if the glass is oriented face-on to the
blast wave and it is the same as the
incident peak overpressure if the pane is
located on the side or back of a structure
relative to the advancing shock front.
From Fig. 12.238 the geometric mean
velocity of the fragments can be deter-
mined for glass panes of any specified
thickness exposed to a given effective
peak overpressure.
DECELERATIVE TUMBLING
12.239 The results of the tests re-
ferred to in § 12.45, on the decelerative
tumbling of various animal cadavers
dropped onto a hard, flat surface at dif-
ferent velocities, are represented graph-
ically in Fig. 12.239; the possible error
is within the range of about ± 10 to 15
percent. The initial velocity V. feet per
second and the stopping distance S feet
are scaled for the mass of the animal (m
pounds). Scaled stopping times are also
shown. Thus, for a given initial velocity
and animal mass, the stopping distance
for decelerative tumbling may be
derived directly from the linear plot and
the corresponding stopping time may be
determined by interpolation. Although
the data were obtained from tests with
animals, it is thought that the results can
be applied to the decelerative tumbling
of humans provided there is no signifi-
cant bouncing.
EFFECTS ON FARM ANIMALS AND PLANTS
INTRODUCTION
12.240 In general, the three main
immediate physical effects of nuclear
explosions, i.e., blast, thermal radia-
tion, and the initial nuclear radiation,
have similar potential for causing dam-
age to animals and plants as they do to
humans. As biological systems, larger
animals are similar to man and would
experience much the same blast, bum,
SCALED GEOMETRIC MEAN VELOCITY
EFFECTIVE PEAK OVERPRESSURE (psi)
Figure 12.238. Geometric mean velocity of glass fragments (V50 feet per second) scaled
according to pane thickness (r inches) versus the effective peak overpres-
sure (pounds per square inch) of the blast wave. (Estimated accuracy -± 10
to 15 percent.)
EFFECTS ON FARM ANIMALS AND PLANTS
Os
40
SCALED INITIAL VELOCITY, Vj (I65//77) (ft/sec)
SCALED STOPPING DISTANCE, 5 (165//77 )l/3 (ft)
Figure 12.239. Initial velocity of animal (V. feet per second) scaled according to the mass
(in pounds) versus the stopping distance .for decelerative tumbling on a
hard, flat surface. Scaled stopping times are indicated on the plot. (Es-
timated accuracy ± 10 to 15 percent.)
620 BIOLOGICAL EFFECTS
EFFECTS ON FARM ANIMALS AND PLANTS
621
and radiation injuries, if exposed in the
same manner. In fact, much information
concerning the expected effects of nu-
clear weapons on man, apart from the
data from Japan, has been inferred from
studies on animals. Plants, on the other
hand, vary greatly in the characteristics
that determine injury from the immedi-
ate physical effects of nuclear explo-
sions. Consequently, for plants the
range of biological responses is greater
than for man or animals.
12.241 In nuclear warfare, an im-
portant need would be to assure an ade-
quate food supply for the survivors.,
especially during the early post-attack
period. The main concern would then
not be with the immediate effects of the
explosions, but rather with the effects of
the fallout on farm animals and crop
plants forming part of man’s food chain.
As a rule, the seriousness of these ef-
fects increases with increasing dose and
dose rate of ionizing radiations. The
total effect of a given dose is also in-
fluenced by the stage of development of
the organism and the environmental
conditions prior to, during, and after the
exposure. As with the immediate effects
of a nuclear explosion, plants show a
wide range of sensitivity to fallout radi-
ation.
12.242 Another factor to be con-
sidered is the possible consequences of
the accumulation of various radioiso-
topes in food supplies due to the residual
radioactivity in soils and water from
deposited worldwide fallout. However,
these effects are of a protracted nature
and their importance is not well under-
stood at present.
12.243 Another matter of interest in
connection with the effects of nuclear
explosions on plants and farm animals is
the possibility of serious ecological dis-
turbances. These might be caused by
large-scale fires, denuding of forests by
fallout, destructive plagues of insects
which are known to be relatively insen-
sitive to radiation, and so on. It is not
expected that such effects would be se-
vere enough to prohibit or seriously
delay recovery of food production facil-
ities after a nuclear attack.
FALLOUT RADIATION EFFECTS ON
LIVESTOCK
12.244 As with man, fallout may
cause both internal and external radia-
tion exposures to animals. The external
(whole-body) exposure would arise
mainly from gamma rays, and if the
fallout particles should remain on the
skin for some time, the animals could
suffer beta burns (§ 12.155). Internal
radiation exposure could result from
farm animals consuming contaminated
grass and thereby ingesting fallout par-
ticles. Beta radiations from these par-
ticles would then irradiate the walls of
the intestinal tract whereas the gamma
rays would contribute to the whole-body
exposure. Certain radioisotopes may be
leached from the fallout particles and
enter the blood stream; they may then be
deposited in specific parts of the body,
e.g., iodine in the thyroid and strontium
in the skeleton.
12.245 Skin injury caused by fall-
out was observed in cattle exposed at the
TRINITY test (§ 2.36) and also in an-
imals during atmospheric tests at the
Nevada Test Site. Minor to severe inju-
ries due to beta radiation have occurred,
although none of the cattle died within
150 days of exposure. The skin injuries
appeared to be similar to thermal burns
622
BIOLOGICAL EFFECTS
except that the latter are soon visible
whereas the effects of beta particles may
not be seen for three or four weeks.
12.246 The damage to the cattle at
the TRINITY site was described as the
development of zones of thickened and
hardened skin which appeared as
plaques and cutaneous horns. After 15
years, three of the exposed cows devel-
oped scale-like carcinomas of the skin in
the affected regions, but it is not entirely
clear that they were induced by radia-
tion. In areas less severely affected,
there was some loss and graying of the
hair. The location of these cattle with
respect to ground zero is not known, but
it is estimated that the whole-body
gamma radiation dose was about 150
rems, although the skin dose may have
been very much larger. There was no
evidence of radiation damage on the
lower surfaces of the body that might
have been caused by exposure from
fallout on the ground.
12.247 Information concerning the
possible effects of fallout on farm an-
imals under various conditions has been
obtained from studies with simulated
fallout sources. Three main situations of
interest, depending on the location of
the animals, are as follows:
1. In a barn: whole-body exposure
to gamma rays from fallout on the roof
and the surrounding ground.
2. In a pen or corral: whole-body
exposure to gamma rays from fallout on
the ground and exposure of the skin to
beta particles from fallout deposited on
the skin.
3. In a pasture: whole-body expo-
sure to gamma rays from fallout on the
ground, exposure of the skin to beta
particles, and exposure of the gastroin-
testinal tract from fallout on the grass.
The exposure to gamma rays is simu-
lated by means of an external cobalt-60
source. Skin irradiation is achieved by
attaching to the back of the animal a
flexible source of beta particles. Finally,
the internal exposure is simulated by
adding to the animal’s feed a material
consisting of yttrium-90 fused to 88-
175 micrometers particles of sand, giv-
ing a specific activity of 10 microcuries
per gram of sand. This product is con-
sidered to be representative of the beta
radiation from the fallout produced by a
land-surface detonation.
12.248 Observations have been
made on animals exposed to whole-
body gamma radiation alone (barn) or in
combination with skin exposure (pen or
corral) or with exposure of the skin and
the intestinal tract (pasture) at dose rates
Table 12.248
ESTIMATED LIVESTOCK LETHALITY (LD50/60) FROM FALLOUT
Total Gamma Exposure (roentgens)
Animals Barn Pen or Corral Pasture
Cattle 500 450 180
Sheep 400 350 240
Swine 640 600* 550*
Horses 670 600* 350*
Poultry 900 850* 800*
*No experimental data available; estimates are based on grazing habits, anatomy, and physiology of
the species.
EFFECTS ON FARM ANIMALS AND PLANTS
623
of the order of magnitude expected from
fallout. From the results, estimates were
made of the total gamma exposure
which would be fatal to 50 percent of a
large group of animals within 60 days
(LD5O/6o); the values are summarized in
Table 12.248. It is evident that, for
cattle and sheep, which are ruminants,
internal exposure can contribute sub-
stantially to the lethality of fallout.
12.249 The data in the table apply
to extreme conditions and are intended
only to indicate the different sensitivities
to radiation of a few animal species, the
kinds of doses that might prove fatal,
and the effects of combining different
types of exposures. The basic assump-
tion involved is that the animals remain
in a given situation while they accumu-
late an exposure of a few hundred
roentgens of radiation.19 In practice, of
course, the animals would probably be
removed as soon as possible from a
contaminated area and, in any event,
contaminated grass would soon be re-
placed by clean fodder. Swine are nor-
mally fed in a drylot and would proba-
bly not ingest enough radioactivity to
increase doses above those expected
from whole-body irradiation alone.
12.250 There are considerable vari-
ations in radiation sensitivity in a given
animal species, just as in man, but on
the whole it appears, in agreement with
the estimates in Table 12.248, that cattle
and sheep are more sensitive to radiation
than are swine. Furthermore, among
those who survive, the recovery time is
shorter in swine than in cattle and sheep.
As a general rule, young animals are
more sensitive to radiation than are
adults, but the difference appears to be
less marked for swine than for cattle. At
high exposure rates, the total exposure
required to produce a certain degree of
lethality is smaller than when the rate is
low, suggesting the possibility of partial
recovery by the animal from radiation
injury. Again, this effect is more
marked for swine than for other live-
stock.
12.251 The great majority of farm
animals receiving an exposure of less
than 400 roentgens of whole-body radi-
ation alone would be expected to sur-
vive. However, they will show symp-
toms similar to those observed in man.
The primary symptoms are those asso-
ciated with damage to the blood-form-
ing tissues; they usually include a severe
drop in the number of platelets in the
blood and gastrointestinal damage
caused by failure in blood clotting. In-
creased permeability of the capillaries
also contributes to the loss of blood
cells, plasma, and electrolytes (salts).
Most of these losses occur between 14
and 30 days after exposure, at which
time the white-cell count is low; fever
and bacterial invasion may also occur.
12.252 Cattle receiving whole-body
exposures in the range of 200 to 600
roentgens commonly experience some
loss of appetite and slight fever for
about 24 hours. They then appear nor-
mal for about 14 days (latent stage),
after which there is a marked fever in
those receiving the larger radiation ex-
posures; most of the latter will die
within a month or so. Those animals
which survive show only a mild fever.
Very few, if any, of these survivors are
19 In the tests, the gamma-ray exposures were measured in roentgens and so are expressed in this form
in the table. The actual whole-body doses in rems would probably not be greatly different.
624
BIOLOGICAL EFFECTS
expected to suffer the serious loss of
appetite and vomiting which are asso-
ciated with the gastrointestinal radiation
syndrome at higher exposures.
12.253 The effects of internal radi-
ation exposures have been studied by
adding the simulant Mentioned in
§ 12.247 to the feed of sheep. The ear-
liest symptoms were loss of appetite,
diarrhea, weight loss, and fever. The
sandy radioactive material tended to
collect in “pockets” in the rumen and
abomasum20 where the radiations
caused ulceration and accumulation of
fibrinous exudate. No gross lesions were
found in the intestines of sheep under
these conditions. Loss of appetite was
accompanied by stagnation in the rumen
which prevented the normal passage of
the animal’s food. This was followed by
severe diarrhea and weight loss. Sheep
that survived usually returned to normal
feed consumption within 60 days, but
considerably more time was required to
recover the loss of weight.
12.254 Whole-body exposure to
240 roentgens of external gamma radia-
tion, at the high exposure rate of 60
roentgens per hour, affected neither the
body weight nor the feed consumption
of sheep and cattle. If the whole-body
exposure was supplemented by a skin
dose there was some decrease in weight,
and an even greater decrease if there
was also exposure of the intestinal tract.
However, it appears that at radiation
doses below lethal values and at dose
rates expected from fallout, the effect on
livestock production would be minor at
most. As a rule, irradiated dairy cows
produce as much milk as those which
have not been exposed, but lactation
may be reduced as a result of destruction
of thyroid tissue by radioiodines from
ingested fallout. It is possible that the
concentrations of strontium-90 and of
iodine-131 may make the milk unsuit-
able for general use. Most sheep, cattle,
and swine surviving the exposure to
fallout, even those with gastrointestinal
tract injuries from ingested fallout,
could eventually be used for food under
emergency conditions. Until more data
are available, it has been recommended
that, for 15 to 60 days after exposure to
radiation levels that might cause some
mortality, only muscle meat from sur-
viving animals be used for food.
FALLOUT RADIATION EFFECTS ON
PLANTS
12.255 Plants differ from animals
(and man) with respect to radiation ex-
posure from fallout; animals can move
or be moved from the fallout field
whereas plants in the ground must re-
main in the same location during their
lifetime. Since food crops are harvested
at the end of the growing season, the
total exposure received will be greatly
dependent on the stage of development
at which the fallout occurs. Thus, a
young seedling will receive a much
larger radiation dose than will a fairly
mature plant which is almost ready for
harvesting. Furthermore, the sensitivity
of a plant to radiation is different at
different growth stages. These and other
factors make it impossible to present
any precise information concerning the
expected effects of fallout on plants.
wThe rumen is the first stomach (or pouch) of a ruminant and the abomasum is the fourth (or true)
stomach.
EFFECTS ON FARM ANIMALS AND PLANTS
625
Nevertheless, some general conclusions
can be drawn.
12.256 At sufficiently large doses,
radiation can seriously reduce the
growth and yield of a plant, particularly
if it is exposed at certain stages of de-
velopment. In addition, there may be
loss of reproductive capacity, changes
in shape and appearance, wilting, and
ultimately death. There may also be
changes in the normal plant tolerance to
environmental stresses. The sensitivities
of plants to radiation vary over a wide
range and they are influenced by many
biological, environmental, and radiolo-
gical factors. The sensitivities of dif-
ferent species may differ as much as
100-fold or more, and there may be a
50-fold range of sensitivity in a given
species at different stages of growth.
Thus, certain stages of the development
of reproductive structures, e.g., forma-
tion of flower buds, are very sensitive to
radiation, but the ripe seeds are much
more resistant.
12.257 As with animals, the re-
sponse of a plant to a given dose of
radiation depends on the dose (or expo-
sure) rate, although the effect appears to
be more marked for plants. A much
larger total dose is usually required to
produce a given degree of injury to
plants when the dose rate is low than
when it is high. At very high and very
low dose rates, however, there is no
observable evidence of a dose-rate ef-
fect.
12.258 Among the many important
environmental conditions influencing
the radiation response of plants are cli-
mate, temperature, light, soil moisture,
and competition from other plants. Ex-
cluding the effects of drought, changes
in environmental factors can result in as
much as a ten-fold change in apparent
radiosensitivity of a given plant species.
Significant exposures to radiation are
expected to delay flower initiation and
fruit ripening. Hence, plants with a
growing season that is limited by cli-
matic conditions, e.g., tomato, may
survive through the growing season but
would produce essentially no useful
yield.
12.259 Since seeds are needed to
provide the next crop, the viability of
seeds from irradiated plants is impor-
tant. Adverse characteristics are some-
times present, although the seed appears
to be normal. Too little is known about
this matter for any definite statements to
be made. Seeds already formed are
fairly resistant to radiation and seeds in
storage will probably remain essentially
unaffected. Seed potato tubers and small
onion transplants are more sensitive
than ordinary dry seeds. Exposure of
seeds to sufficiently large doses of radi-
ation is known to produce mutations,
and mutations may well appear in seeds
from exposed plants. Although most of
the mutations are deleterious, a number
of beneficial mutant forms have been
developed from irradiated seeds.
12.260 Information on the effects of
actual fallout on plants is meager. At the
Nevada Test Site, trees and shrubs have
been killed by radiation from fallout,
but the plants have been close to the
locations of cratering explosions. Sub-
stantial amounts of fallout particles were
deposited on the leaves where they re-
mained for some time because of the
small rainfall in the desert area. No such
occurrences have been observed fol-
lowing contained, buried nuclear explo-
sions. Essentially all that is known
about the effects of radiation on plants
626
BIOLOGICAL EFFECTS
has been obtained from tests in which
plants at various stages of growth and
development have been exposed to
gamma rays from an external source.
12.261 Because of the great varia-
tions in radiosensitivity even among
plants of the same species, the results
obtained with experimental plants are
applicable only under the precise condi-
tions of the experiments. However, an
important conclusion has emerged from
these studies which should provide a
general guide as to the expected effects
of gamma radiation on plants. At
equivalent growth stages and under
similar conditions, the radiosensitivity
of a plant is directly related to the size of
the chromosomes, measured as the
average volume occupied per chromo-
some in the cell nucleus. The larger the
effective chromosome volume, the more
sensitive is the plant to radiation. In
other words, under equivalent condi-
tions, a given total dose (or exposure) of
radiation will cause a larger proportion
of deaths and a greater decrease in yield
from the surviving plants, the larger the
chromosome volume. Or stated in an-
other way, the larger the chromosome
volume, the smaller the radiation dose
required to produce a given degree of
damage to the plants.
12.262 On the basis of chromosome
volume (and experimental observations
of lethality and yield) some important
food crops can be placed in an approx-
imate order of decreasing sensitivity to
radiation as follows: onions, small-grain
cereals, e.g., wheat, barley, oats, and
corn (but not rice), field peas, lettuce,
lima beans, potatoes, sugar beets, broc-
coli, and rice. It is of interest that young
seedlings of rice appear to be excep-
tionally resistant to radiation. Even for
the least resistant plant species, a total
exposure of about 1,000 roentgens (or
more) in the seedling stage is required to
kill about 50 percent of the exposed
plants, whereas for the most radioresis-
tant plant 15,000 roentgens may be re-
quired. The decrease in yield of the
surviving plants after exposure to radia-
tion follows the same order, in general,
as the increase in lethality.
12.263 Although woody plants are
not a source of food, they are of eco-
nomic importance. Evergreen trees
(gymnosperms), such as pines and re-
lated species, are quite sensitive to ra-
diation. Deciduous trees, which shed
their leaves at the end of each growing
season, are much less sensitive; the ex-
posures that will kill about half the ex-
posed trees range from 2,600 to 7,700
roentgens. However, even smaller ex-
posures would have a serious effect on
the economic value of these trees.
12.264 The results described above
refer to exposures from gamma radia-
tion. In a fallout situation, however, the
plant would be subjected to beta radia-
tion in addition. In fact, it appears that
for many crop plants, which typically
have relatively little tissue mass around
their most radiosensitive parts and
which are often in contact (or near con-
tact) with the fallout particles, the dose
from beta radiation may be greater than
from gamma rays. This would be par-
ticularly the case in the early stages of
plant growth. Beta radiation may thus
make an important contribution to the
injury of plants and may be the domi-
nant cause of damage in many situa-
tions. Apart from the view that beta and
gamma radiation have equivalent effects
for the same dose in rads, information
concerning beta-radiation injury and the
EFFECTS ON FARM ANIMALS AND PLANTS
627
possible synergism with gamma radia-
tion is very sparse.
12.265 Food crops harvested from
plants that have survived exposure to
fallout would probably be safe to eat
under emergency conditions, especially
if the exposure occurred during the later
stages of growth. Care would have to be
taken to remove by washing any fallout
particles that might be attached to leaf or
root vegetables. The major problem
would arise from the possible presence
in the edible parts of the plant of ra-
dionuclides taken up from the soil by the
roots or from particles deposited on the
leaves. Because of the complexities in-
volved, no generalizations can be made
and each situation would have to be
evaluated individually.
BIBLIOGRAPHY21
Allen, R. G., et al., “The Calculation of Ret-
inal Burn and Flashblindness Safe Separation
Distances,’’ U.S. Air Force School of Aero-
space Medicine, September 1968, SAM-TR-
68-106.
Bair, W. J., and R. C. Thompson, “Plutonium:
Biomedical Research,” Science, 183, 715
(1974).
Bell, M. C., L. B. Sasser, J. L. West, and
L. Wade, “Effects of Feeding Yttrium-90
Labelled Fallout Simulant to Sheep,” Radia-
tion Research, 43, 71 (1970).
*Benson, D. W., and A. H. Sparrow (Eds.),
“Survival of Food Crops and Livestock in the
Event of Nuclear War,” Proceedings of a
Symposium held at Brookhaven National Lab-
oratory, September 15-18, 1970, AEC Sympo-
sium Series, No. 24, U.S. Atomic Energy
Commission, 1971.
Brooks, J. W., et al, “The Influence of External
Body Radiation on Mortality from Thermal
Burns,” Annals of Surgery, 136, 533 (1952).
Brown, S. L., W. B. Lane, and J. L. Mackin,
“Beta Dosimetry for Fallout Hazard Evalua-
tion,” Stanford Research Institute, Menlo Park,
California, July 1970, EGU-8013.
*Brucer, M. “The Acute Radiation Syndrome:
Y-12 Accident,” Oak Ridge Institute of Nu-
clear Studies, April 1959, ORINS-25.
Bryant, F. J., et al., U.K. Atomic Energy
Authority Report AERE HP/R 2353 (1957);
“Strontium in Diet,” Brit. Medical Journal, 1,
1371 (1958).
*Conard, R. A., et al., “A Twenty-Year Re-
view of Medical Findings in a Marshallese
Population Accidentally Exposed to Radioac-
tive Fallout,” Brookhaven National Labora-
tory, September 1975, BNL 50424. (This report
contains references to previous studies.)
Gerstner, H. B., “Acute Radiation Syndrome
in Man,” U.S. Armed Forces Medical Journal,
9, 313 (1958).
Ishimaru, T., et al., “Leukemia in Atomic
Bomb Survivors, Hiroshima and Nagasaki,”
Radiation Research, 45, 216 (1971).
Jablon, S., et al., “Cancer in Japanese Exposed
as Children to Atomic Bombs,” The Lancet,
May 8, 1971, p. 927.
Jablon, S. and H. Kato, “Studies of the Mor-
tality of A-Bomb Survivors, 5. Radiation Dose
and Mortality, 1950-1970,” Radiation Re-
search, 50, 649 (1972).
Kato, H. “Mortality in Chidren Exposed to the
A-Bombs While In Utero, 1945-1969,” Amer.
J. Epidemiology, 93, 435 (1971).
Kulp, J. I., A. R. Schulert, and E. J.
Hodges, “Strontium-90 in Man: IV,”
Science, 132, 448 (1960).
Lane, W. B., “Fallout Simulant Development:
Leaching of Fission Products from Nevada
Fallout and Properties of Iodine-tagged Simu-
lant,” Stanford Research Institute, Menlo Park,
California, June 1970, SRI-7968. (This report
contains references to and summaries of pre-
vious studies.)
Langham, W. H. (Ed.), “Radiobiological Fac-
21 The number of publications on the biological effects of nuclear weapons is very large; additional
citations will be found in the selected references given here.
628
tors in Manned Space Flight,” Chapters 5 and
6, National Academy of Sciences-National Re-
search Council, Publication No. 1487, 1967.
Lappin, P. W., and C. F. Adams, ‘‘Analysis of
the First Thermal Pulse and Associated Eye
Effects,” Aerospace Medical Research Labora-
tories, Wright Patterson Air Force Base, Ohio,
December 1968, AM RL-TR-67-214.
Loutit, J. F., and R. S. Russell, (Eds.), ‘‘The
Entry of Fission Products into Food Chains,”
Progress in Nuclear Energy, Series VI, Vol. 3.,
Pergamon Press, Inc., 1961.
Miller, C. F., and P. D. La Riviere, ‘‘In-
troduction to Long-Term Biological Effects of
Nuclear War,” Stanford Research Institute,
Menlo Park, California, April 1966, MU-5779.
Miller, R. W., ‘‘Delayed Radiation Effects in
Atomic Bomb Survivors,” Science, 166, 569
(1969).
National Academy of Sciences-National Research
Council, “The Biological Effects of Atomic
Radiation,” 1956 and 1960; “Pathological Ef-
fects of Atomic Radiation,” Publication No.
452, 1961; “Effects of Inhaled Radioactive
Particles,” Publication No. 848, 1961; “Long-
Term Effects of Ionizing Radiations from Ex-
ternal Sources,” Publication No. 849, 1961;
“Effects of Ionizing Radiation on the Human
Hematopoietic System,” Publication No. 875,
1961; “The Effects on Populations of Exposure
to Low Levels of Ionizing Radiation,” 1972 (a
complete review with numerous references to
the biological effects of ionizing radiations);
“Long-Term Worldwide Effects of Multiple
Nuclear-Weapons Detonation,” 1975; Wash-
ington, D.C.
National Council on Radiation Protection and
Measurements, “Basic Radiation Protection
Criteria,” NCRP Report No. 39, Washington,
D.C., 1971.
Oughterson, A. W., and S. Warren, “Med-
ical Effects of the Atomic Bomb in Japan,”
National Nuclear Energy Series VIII,
McGraw-Hill Book Co., Inc., 1956.
* “Radiation Injuries and Sickness: A DDC Bib-
liography, Volume I, May 1957—July 1970,”
May 1971.
Rubin, P., and Casarett, G. W., “Clinical
Radiation Pathology,” Vols. I and II, W. B.
Saunders Company, 1968.
Russell, S. R., and A. H. Sparrow (Eds.),
“The Effects of Radioactive Fallout on Food
and Agriculture,” North Atlantic Treaty Orga-
nization Report (1971).
Sparrow, A. H., S. S. Schwemmer, and P. J.
Bottino, “The Effects of External Gamma
Radiation from Radioactive Fallout on Plants
with Special Reference to Crop Production,”
Radiation Botany, 11, 85 (1971).
United Nations General Assembly Official Re-
cords, “Report of the United Nations Scientific
Committee on the Effects of Atomic Radia-
tion,” A/5216 (1962); A/5814 (1964); A/6314
(1966); A/7613 (1969); A/8725 (1972); United
Nations, New York.
♦ White, C. S., et al., “Comparative Nuclear
Effects of Biomedical Interest,” Civil Effects
Study, U.S. Atomic Energy Commission, Jan-
uary 1961, CEX-58.8.
White, C. S., et al., “The Relation Between
Eardrum Failure and Blast-Induced Pressure
Variations,” Space Life Sciences, 2, 158
(1970).
♦ White, C. S., “The Nature of Problems In-
volved in Estimating the Immediate Casualties
From Nuclear Explosions,” Civil Effects
Study, U.S. Atomic Energy Commission, July
1971, CEX 71.1.
White, C. S., et al., “The Biodynamics of Air
Blast,” Advisory Group for Aerospace Re-
search and Development, North Atlantic Treaty
Organization, December 1971, AGARD-CP-
88-71, p. 14-1. Also published as DASA
2738T, July 1971. (A complete review with
numerous references.)
Wood., J. W. etal., “Thyroid Cancer in Atomic
Bomb Survivors, Hiroshima and Nagasaki,”
Amer. J. Epidemiology, 89, 4 (1969).
♦These publications may be purchased from the National Technical Information Service, Department
of Commerce, Springfield, Virginia, 22161.
GLOSSARY
A-Bomb: An abbreviation for atomic bomb. See
Nuclear weapon.
Absorbed Dose: The amount of energy im-
parted by nuclear (or ionizing) radiation to unit
mass of absorbing material. The unit is the rad.
See Dose, Rad.
Absorption: The irreversible conversion of the
energy of an electromagnetic wave into another
form of energy as a result of its interaction with
matter. As applied to gamma (or X) rays it is the
process (or processes) resulting in the transfer of
energy by the radiation to an absorbing material
through which it passes. In this sense, absorption
involves the photoelectric effect and pair pro-
duction, but only part of the Compton effect. See
Attenuation, Compton effect, Pair production,
Photoelectric effect.
Absorption Coefficient: A number characteriz-
ing the extent to which specified gamma (or X)
rays transfer their energy to a material through
which they pass. The linear energy absorption
coefficient is a measure of the energy transfer (or
absorption) per unit thickness of material and is
stated in units of reciprocal length (or thickness).
The mass energy absorption coefficient is equal
to the linear absorption coefficient divided by the
density of the absorbing material; it is a measure
of the energy absorption per unit mass. See
Attenuation coefficient.
Afterwinds: Wind currents set up in the vicinity
of a nuclear explosion directed toward the burst
center, resulting from the updraft accompanying
the rise of the fireball.
Air Burst: The explosion of a nuclear weapon at
such a height that the expanding fireball does not
touch the earth’s surface when the luminosity is a
maximum (in the second pulse).
Alpha particle: A particle emitted spontan-
eously from the nuclei of some radioactive ele-
ments. It is identical with a helium nucleus,
having a mass of four units and an electric charge
of two positive units. See Radioactivity.
Angstrom: A unit of length, represented by A,
equal to 10-R centimeter. It is commonly used to
express the wavelengths of electromagnetic radi-
ations in the visible, ultraviolet, and X-ray re-
gions.
Apparent Crater: See Crater.
Arching: In the case of a buried structure, it is
the tendency for the soil particles to lock together
in the form of an arch, .with the result that part of
the stress is transmitted around the structure
instead of through it.
Atom: The smallest (or ultimate) particle of an
element that still retains the characteristics of that
element. Every atom consists of a positively
charged central nucleus, which carries nearly all
the mass of the atom, surrounded by a number of
negatively charged electrons, so that the whole
system is electrically neutral. See Electron, Ele-
ment, Nucleus.
Atomic Bomb (or Weapon): A term sometimes
applied to a nuclear weapon utilizing fission
energy only. See Fission, Nuclear weapon.
Atomic Cloud: See Radioactive cloud.
Atomic Number: See Nucleus.
Atomic Weight: The relative mass of an atom
of the given element. As a basis of reference, the
atomic weight of the common isotope of carbon
(carbon-12) is taken to be exactly 12; the atomic
weight of hydrogen (the lightest element) is then
1.008. Hence, the atomic weight of any element
is approximately the mass of an atom of that
element relative to the mass of a hydrogen atom.
Attenuation: Decrease in intensity of a signal,
beam, or wave as a result of absorption and
scattering out of the path of a detector, but not
including the reduction due to geometric spread-
ing (i.e., the inverse square of distance effect).
As applied to gamma (and X) rays, attenuation
refers to the loss of photons (by the Compton,
photoelectric, and pair-production effects) in the
passage of the radiation through a material. See
Absorption, Inverse square law, Photon, Scat-
tering.
Attenuation Coefficient: A number character-
izing the extent of interaction of photons of
specified gamma (or X) rays in their passage
through a material. The linear attenuation coef-
ficient is a measure of the photon interaction per
unit thickness of material and is stated in units of
reciprocal length (or thickness). The mass atten-
uation coefficient is equal to the linear attenuation
629
630
GLOSSARY
coefficient divided by the density of the material;
it is a measure of the attenuation per unit mass.
See Absorption coefficient.
Background Radiation: Nuclear (or ionizing)
radiations arising from within the body and from
the surroundings to which individuals are always
exposed. The main sources of the natural back-
ground radiation are potassium-40 in the body,
potassium-40 and thorium, uranium, and their
decay products (including radium) present in
rocks and soil, and cosmic rays.
Base Surge: A cloud which rolls outward from
the bottom of the column produced by a subsur-
face explosion. For underwater bursts the visible
surge is, in effect, a cloud of liquid (water)
droplets with the property of flowing almost as if
it were a homogeneous fluid. After the water
evaporates, an invisible base surge of small ra-
dioactive particles may persist. For subsurface
land bursts the surge is made up of small solid
particles but it still behaves like a fluid. A soft
earth medium favors base surge formation in an
underground burst.
Bearing Wall: A wall which supports (or bears)
part of the mass of a structure such as the floor
and roof systems.
Beta Particle: A charged particle of very small
mass emitted spontaneously from the nuclei of
certain radioactive elements. Most (if not all) of
the direct fission products emit (negative) beta
particles. Physically, the beta particle is identical
with an electron moving at high velocity. See
Electron, Fission products. Radioactivity.
Beta Patch: A region of air fluorescence formed
by absorption of beta particles from the fission
products in the debris from a nuclear explosion
above about 40 miles altitude.
Biological Half-Life: The time required for the
amount of a specified element which has entered
the body (or a particular organ) to be decreased to
half of its initial value as a result of natural,
biological elimination processes. See Half-life.
Black Body: An ideal body which would absorb
all (and reflect none) of the radiation falling upon
it. The spectral energy distribution of a black
body is described by Planck's equation; the total
rate of emission of radiant energy is proportional
to the fourth power of the absolute temperature
(Stefan-Boltzmann law).
Blast Loading: The loading (or force) on an
object caused by the air blast from an explosion
striking and flowing around the object. It is a
combination of overpressure (or diffraction) and
dynamic pressure (or drag) loading. See Diffrac-
tion, Drag loading. Dynamic pressure. Over-
pressure.
Blast Scaling Laws: Formulas which permit the
calculation of the properties, e.g., overpressure,
dynamic pressure, time of arrival, duration, etc.,
of a blast wave at any distance from an explosion
of specified energy from the known variation
with distance of these properties for a reference
explosion of known energy (e.g., of 1 kiloton).
See Cube root law.
Blast Wave: A pulse of air in which the pressure
increases sharply at the front, accompanied by
winds, propagated from an explosion. See Shock
wave.
Blast Yield: That portion of the total energy of a
nuclear explosion that manifests itself as a blast
(or shock) wave.
Bomb Debris: See Weapon debris.
Boosted Fission Weapon: A weapon in which
neutrons produced by thermonuclear reactions
serve to enhance the fission process. The ther-
monuclear energy represents only a small frac-
tion of the total explosion energy. See Fission,
Thermonuclear.
Breakway: The onset of a condition in which
the shock front (in the air), moves away from the
exterior of the expanding fireball produced by the
explosion of a nuclear (or atomic) weapon. See
Fireball, Shock front.
Bremsstrahlung: Literally “braking radia-
tion.” Radiations covering a range of wave
lengths (and energies) in the X-ray region result-
ing from the electrical interaction of fast (high-
energy) electrons with atomic nuclei. Brems-
strahlung are produced by the interaction of beta
particles with matter. See X rays.
Burst: Explosion or detonation. See Air burst.
High-altitude burst, Surface burst. Underground
burst. Underwater burst.
Clean Weapon: One in which measures have
been taken to reduce the amount of residual
radioactivity relative to a “normal” weapon of
the same energy yield.
Cloud Chamber Effect: See Condensation
cloud.
Cloud Column: The visible column of weapon
debris (and possibly dust and water droplets)
extending upward from the point of burst of a
nuclear (or atomic) weapon. See Radioactive
cloud.
Cloud Phenomena: See Base surge. Cloud
column. Fallout, Fireball, Radioactive cloud.
Colum (or Plume): A hollow cylinder of water
and spray thrown up from an underwater burst of
a nuclear (or atomic) weapon, through which the
hot, high-pressure gases formed in the explosion
GLOSSARY
631
are vented to the atmosphere. A somewhat simi-
lar column of dirt is formed in an underground
explosion.
Compton Current: Electron current generated
as a result of Compton processes. See Compton
effect, Compton electron.
Compton Effect: The scattering of photons (of
gamma or X rays) by the orbital electrons of
atoms. In a collision between a (primary) photon
and an electron, some of the energy of the photon
is transferred to the electron which is generally
ejected from the atom. Another (secondary)
photon, with less energy, then moves off in a
new direction at an angle to the direction of
motion of the primary photon. See Scattering.
Compton Electron: An electron of increased
energy ejected from an atom as a result of a
Compton interaction with a photon. See Comp-
ton effect.
Condensation Cloud: A mist or fog of minute
water droplets which temporarily surrounds the
fireball following a nuclear (or atomic) detona-
tion in a comparatively humid atmosphere. The
expansion of the air in the negative phase of the
blast wave from the explosion results in a lower-
ing of the temperature, so that condensation of
water vapor present in the air occurs and a cloud
forms. The cloud is soon dispelled when the
pressure returns to normal and the air warms up
again. The phenomenon is similar to that used by
physicists in the Wilson cloud chamber and is
sometimes called the cloud chamber effect.
Contact Surface Burst: See Surface burst.
Contained Underground Burst: An under-
ground detonation at such a depth that none of
the radioactive residues escape through the sur-
face of the ground.
Contamination: The deposit of radioactive ma-
terial on the surfaces of structures, areas, objects,
or personnel, following a nuclear (or atomic)
explosion. This material generally consists of
fallout in which fission products and other
weapon debris have become incorporated with
particles of dirt, etc. Contamination can also
arise from the radioactivity induced in certain
substances by the action of neutrons from a
nuclear explosion. See Decontamination, Fall-
out, Induced radioactivity, Weapon debris.
Crack: The light-colored region which follows
closely behind the dark slick in an underwater
burst. It is probably caused by the reflection of
the water shock wave at the surface. See Slick.
Crater: The pit, depression, or cavity formed in
the surface of the earth by a surface or under-
ground explosion. Crater formation can occur by
vaporization of the surface material, by the
scouring effect of air blast, by throwout of dis-
turbed material, or by subsidence. In general, the
major mechanism changes from one to the next
with increasing depth of burst. The apparent
crater is the depression which is seen after the
burst; it is smaller than the true crater (i.e., the
cavity actually formed by the explosion), be-
cause it is covered with a layer of loose earth,
rock, etc.
Critical Mass: The minimum mass of a fission-
able material that will just maintain a fission
chain reaction under precisely specified condi-
tion, such as the nature of the material and its
purity, the nature and thickness of the tamper (or
neutron reflector), the density (or compression),
and the physical shape (or geometry). For an
explosion to occur, the system must be supercri-
tical (i.e., the mass of material must exceed the
critical mass under the existing conditions). See
Supercritical.
Cube Root Law: A scaling law applicable to
many blast phenomena. It relates the time and
distance at which a given blast effect is observed
to the cube root of the energy yield of the
explosion.
Curie: A unit of radioactivity; it is the activity
of a quantity of any radioactive species in which
3.700 x 10¹⁰ nuclear disintegrations occur per
second. The gamma curie is sometimes defined
correspondingly as the activity of material in
which this number of gamma-ray photons are
emitted per second.
Damage Criteria: Standards or measures used
in estimating specific levels of damage.
Debris: See Weapon debris.
Decay (or Radioactive Decay): The decrease in
activity of any radioactive material with the pas-
sage of time due to the spontaneous emission
from the atomic nuclei of either alpha or beta
particles, sometimes accompanied by gamma ra-
diation. See Half-life, Radioactivity.
Decay Curve: The representation by means of a
graph of the decrease of radioactivity with re-
spect to time.
Decontamination: The reduction or removal of
contaminating radioactive material from a struc-
ture, area, object, or person. Decontamination
may be accomplished by (1) treating the surface
so as to remove or decrease the contamination;
(2) letting the material stand so that the radioac-
tivity is decreased as a result of natural decay;
and (3) covering the contamination so as to
attenuate the radiation emitted. Radioactive ma-
terial removed in process (1) must be disposed of
632
GLOSSARY
by burial on land or at sea, or in other suitable
way.
Delayed Fallout: See Fallout.
Deuterium: An isotope of hydrogen of mass 2
units; it is sometimes referred to as heavy hy-
drogen. It can be used in thermonuclear fusion
reactions for the release of energy. Deuterium is
extracted from water which always contains 1
atom of deuterium to about 6,500 atoms of ordi-
nary (light) hydrogen. See Fusion, Isotope,
Thermonuclear.
Diffraction: The bending of waves around the
edges of objects. In connection with a blast wave
impinging on a structure, diffraction refers to the
passage around and envelopment of the structure
by the blast wave. Diffraction loading is the
force (or loading) on the structure during the
envelopment process.
Dome: The mound of water spray thrown up
into the air when the shock wave from an under-
water detonation of a nuclear (or atomic) weapon
reaches the surface.
Dosage: See Dose.
Dose: A (total or accumulated) quantity of ion-
izing (or nuclear) radiation. The absorbed dose
in rads represents the amount of energy absorbed
from the radiation per gram of specified absorb-
ing material. In soft body tissue the absorbed
dose in rads is essentially equal to the exposure in
roentgens. The biological dose (also called the
RBE dose) in rems is a measure of biological
effectiveness of the absorbed radiation. See Ex-
posure, Rad, RBE, Rem, Roentgen.
Dose Equivalent: In radiation protection asso-
ciated with peacetime nuclear activities, the dose
equivalent in rems is a measure of the biological
effectiveness of absorbed ionizing radiation. It is
similar to the biological dose which is used in
connection with the large radiation exposures
that might accompany a nuclear explosion. See
Dose, Rem.
Dose Rate: As a general rule, the amount of
ionizing (or nuclear) radiation which an individ-
ual or material would receive per unit of time. It
is usually expressed as rads (or rems) per hour or
in multiples or submultiples of these units, such
as millirads per hour. The dose rate is commonly
used to indicate the level of radioactivity in a
contaminated area. See Survey meter.
Dosimeter: An instrument for measuring and
registering the total accumulated dose of (or
exposure to) ionizing radiations. Instruments
worn or carried by individuals are called person-
nel dosimeters
Dosimetry: The theory and application of the
principles and techniques involved in the mea-
surement and recording of radiation doses and
dose rates. Its practical aspect is concerned with
the use of various types of radiation instruments
with which measurements are made. See Dosi-
meter, Survey meter.
Drag Loading: The force on an object or struc-
ture due to the transient winds accompanying the
passage of a blast wave. The drag pressure is the
product of the dynamic pressure and the drag
coefficient which is dependent upon the shape (or
geometry) of the structure or object. See Dy-
namic pressure.
Dynamic Pressure: The air pressure which re-
sults from the'mass air flow (or wind) behind the
shock front of a blast wave. It is equal to the
product of half the density of the air through
which the blast wave passes and the square of the
particle (or wind) velocity behind the shock front
as it impinges on the object or structure.
Early Fallout: See Fallout.
Effective Half-Life: See Half-life.
Elastic Range: The stress range in which a
material will recover its original form when the
force (or loading) is removed. Elastic deforma-
tion refers to dimensional changes occurring
within the elastic range. See Plastic range.
Elastic Zone: The zone beyond the plastic zone
in crater formation in which the ground is dis-
turbed by the explosion but returns to its original
condition.
Electromagnetic Pulse: A sharp pulse of radio-
frequency (long wavelength) electromagnetic ra-
diation produced when an explosion occurs in an
unsymmetrical environment, especially at or near
the earth’s surface or at high altitudes. The in-
tense electric and magnetic fields can damage
unprotected electrical and electronic equipment
over a large area. See Electromagnetic radiation,
High-altitude burst.
Electromagnetic Radiation: A traveling wave
motion resulting from oscillating magnetic and
electric fields. Familiar electromagnetic radia-
tions range from X rays (and gamma rays) of
short wavelength (high frequency), through the
ultraviolet, visible, and infrared legions, to radar
and radio waves of relatively long wavelength
(low frequency). All electromagnetic radiations
travel in a vacuum with the velocity of light. See
Photon.
Electron: A particle of very small mass, carry-
ing a unit negative or positive charge. Negative
electrons, surrounding the nucleus, (i.e., orbital
GLOSSARY
electrons), are present in all atoms; their number
is equal to the number of positive charges (or
protons) in the particular nucleus. The term
electron, where used alone, commonly refers to
negative electrons. A positive electron is usually
called a positron, and a negative electron is
sometimes called a negatron. See Beta particle.
Electron Volt (EV): The energy imparted to an
electron when it is moved through a potential
difference of 1 volt. It is equivalent to
1.6 x 10~12 erg.
Element: One of the distinct, basic varieties of
matter occurring in nature which, individually or
in combination, compose substances of all kinds.
Approximately ninety different elements are
known to exist in nature and several others,
including plutonium, have been obtained as a
result of nuclear reactions with these elements.
EMP: See Electromagnetic Pulse.
Energy Absorption: See Absorption.
Energy Partition: The distribution of the total
energy released by a nuclear explosion among
the various phenomena (e.g., nuclear radiation,
thermal radiation, and blast). The exact distribu-
tion is a function of time, explosion yield, and
the medium in which the explosion occurs.
Exposure: A measure expressed in roentgens of
the ionization produced by gamma (or X) rays in
air. The exposure rate is the exposure per unit
time (e.g., roentgens per hour). See Dose, Dose
rate, Roentgen.
Fallout: The process or phenomenon of the de-
scent to the earth’s surface of particles contami-
nated with radioactive material from the radio-
active cloud. The term is also applied in a
collective sense to the contaminated particulate
matter itself. The early (or local) fallout is de-
fined, somewhat arbitrarily, as those particles
which reach the earth within 24 hours after a
nuclear explosion. The delayed (or worldwide)
fallout consists of the smaller particles which
ascend into the upper troposphere and into the
stratosphere and are carried by winds to all parts
of the earth. The delayed fallout is brought to
earth, mainly by rain and snow, over extended
periods ranging from months to years.
Fireball: The luminous sphere of hot gases
which forms a few millionths of a second after a
nuclear (or atomic) explosion as the result of the
absorption by the surrounding medium of the
thermal X rays emitted by the extremely hot
(several tens of million degrees) weapon resi-
dues. The exterior of the fireball in air is initially
sharply defined by the luminous shock front and
later by the limits of the hot gases themselves
633
(radiation front). See Breakaway, Thermal X-
rays.
Fire Storm: Stationary mass fire, generally in
builtup urban areas, causing strong, inrushing
winds from all sides; the winds keep the fires
from spreading while adding fresh oxygen to
increase their intensity.
Fission: The process whereby the nucleus of a
particular heavy element splits into (generally)
two nuclei of lighter elements, with the release of
substantial amounts of energy. The most impor-
tant fissionable materials are uranium-235 and
plutonium 239; fission is caused by the absorp-
tion of neutrons.
Fission Fraction: The fraction (or percentage)
of the total yield of a nuclear weapon which is
due to fission. For thermonuclear weapons the
average value of the fission fraction is about 50
percent.
Fission Products: A general term for the com-
plex mixture of substances produced as a result
of nuclear fission. A distinction should be made
between these and the direct fission products or
fission fragments which are formed by the actual
splitting of the heavy-element nuclei. Something
like 80 different fission fragments result from
roughly 40 different modes of fission of a given
nuclear species (e.g., uranium-235 or pluto-
nium-239). The fission fragments, being radio-
active, immediately begin to decay, forming ad-
ditional (daughter) products, with the result that
the complex mixture of fission products so
formed contains over 300 different isotopes of 36
elements.
Flash Burn: A burn caused by excessive expo-
sure (of bare skin) to thermal radiation. See
Thermal radiation.
Fluence (or Integrated Flux): The product (or
integral) of particle (neutron or photon) flux and
time, expressed in units of particles per square
centimeter. The absorbed dose of radiation (in
rads) is related to the fluence. See Flux.
Flux (or Flux Density): The product of the
particle (neutron or photon) density (i.e., number
per cubic centimeter) and the particle velocity.
The flux is expressed as particles per square
centimeter per second and is related to the ab-
sorbed dose rate. It is numerically equal to the
total number of particles passing in all directions
through a sphere of 1 square centimeter cross-
sectional area per second.
Fractionation: Any one of several processes,
apart from radioactive decay, which results in
change in the composition of the radioactive
weapon debris. As a result of fractionation, the
634
GLOSSARY
delayed fallout generally contains relatively more
of strontium-90 and cesium-137, which have
gaseous precursors, than does the early fallout
from a surface burst.
Free Air Overpressure (or Free Field Over-
pressure): The unreflected pressure, in excess
of the ambient atmospheric pressure, created in
the air by the blast wave from an explosion. See
Overpressure.
Fusion: The process whereby the nuclei of light
elements, especially those of the isotopes of
hydrogen, namely, deuterium and tritium, com-
bine to form the nucleus of a heavier element
with the release of substantial amounts of energy.
See Thermonuclear.
Gamma Rays (or Radiations): Electromag-
netic radiations of high photon energy orginat-
ing in atomic nuclei and accompanying many
nuclear reactions (e.g., fission, radioactivity,
and neutron capture). Physically, gamma rays
are identical with X rays of high energy, the
only essential difference being that X rays do
not originate from atomic nuclei, but are pro-
duced in other ways (e.g., by slowing down
(fast) electrons of high energy). See Electro-
magnetic radiation, Photon, X rays.
Genetic Effect: The effect of various agents
(including nuclear radiation) in producing
changes (mutations) in the hereditary compo-
nents (genes) of the germ cells present in the
reproductive organs (gonads). A mutant gene
causes changes in the next generation which may
or may not be apparent.
Ground Zero: The point on the surface of land
vertically below or above the center of a burst of
a nuclear (or atomic) weapon; frequently abbre-
viated to GZ. For a burst over or under water the
corresponding term is surface zero (SZ). Surface
zero is also commonly used for ground surface
and underground bursts.
Gun-Type Weapon: A device in which two or
more pieces of fissionable material, each less
than a critical mass, are brought together very
rapidly so as to form a supercritical mass which
can explode as the result of a rapidly expanding
fission chain. See Critical mass. Supercritical.
Half-Life: The time required for the activity of a
given radioactive species to decrease to half of its
initial value due to radioactive decay. The half-
life is a characteristic property of each radioac-
tive species and is independent of its amount or
condition. The effective half-life of a given iso-
tope is the time in which the quantity in the body
(or an organ) will decrease to half as a result of
both radioactive decay and biological elimina-
tion. See Biological half-life.
Half-Residence Time: As applied to delayed
fallout, it is the time required for the amount of
weapon debris deposited in a particular part of
the atmosphere (e.g., stratosphere or tropos-
phere) to decrease to half of its initial value.
Half-Value Thickness: The thickness of a given
material which will absorb half the gamma radi-
ation incident upon it. This thickness depends on
the nature of the material—it is roughly inversely
proportional to its density—and also on the en-
ergy of the gamma rays.
H-Bomb: An abbreviation for hydrogen bomb.
See Hydrogen bomb.
Height of Burst: The height above the earth’s
surface at which a bomb is detonated in the air.
The optimum height of burst for a particular
target (or area) is that at which it is estimated a
weapon of a specified energy yield will produce a
certain desired effect over the maximum possible
area.
High-Altitude Burst: This is defined, some-
what arbitrarily, as a detonation at an altitude
over 100,000 feet. Above this level the distribu-
tion of the energy of the explosion between blast
and thermal radiation changes appreciably with
increasing altitude due to changes in the fireball
phenomena.
Hot Spot: Region in a contaminated area in
which the level of radioactive contamination is
somewhat greater than in neighboring regions in
the area. See Contamination.
Hydrogen Bomb (or Weapon: A term some-
times applied to nuclear weapons in which part of
the explosive energy is obtained from nuclear
fusion (or thermonuclear) reactions. See Fusion,
Nuclear weapon, Thermonuclear.
Hypocenter: A term sometimes used for ground
zero. See Ground zero.
Implosion Weapon: A device in which a quan-
tity of fissionable material, less than a critical
mass, has its volume suddenly decreased by
compression, so that it becomes supercritical and
an explosion can take place. The compression is
achieved by means of a spherical arrangement of
specially fabricated shapes of ordinary high ex-
plosive which produce an inwardly-directed im-
plosion wave, the fissionable material being at
the center of the sphere. See Critical mass.
Supercritical.
Impulse (Per Unit Area): The product of the
overpressure (or dynamic pressure) from the
blast wave of an explosion and the time during
which it acts at a given point. More specifically,
it is the integral, with respect to time of over-
pressure (or dynamic pressure), the integration
GLOSSARY
635
being between the time of arrival of the blast
wave and that at which the overpressure (or
dynamic pressure) returns to zero at the given
point.
Induced Radioactivity: Radioactivity produced
in certain materials as a result of nuclear reac-
tions, particularly the capture of neutrons, which
are accompanied by the formation of unstable
(radioactive) nuclei. In a nuclear explosion,
neutrons can induce radioactivity in the weapon
materials, as well as in the surroundings (e.g., by
interaction with nitrogen in the air and with
sodium, manganese, aluminum, and silicon in
soil and sea water).
Infrared: Electromagnetic radiations of wave-
length between the longest visible red (7,000
Angstroms or 7xl0~4 millimeter) and about 1
millimeter. See Electromagnetic radiation.
Initial Nuclear Radiation: Nuclear radiation
(essentially neutrons and gamma rays) emitted
from the fireball and the cloud column during the
first minute after a nuclear (or atomic) explosion.
The time limit of one minute is set, somewhat
arbitrarily, as that required for the source of part
of the radiations (fission products, etc., in the
radioactive cloud) to attain such a height that
only insignificant amounts of radiation reach the
earth’s surface. See Residual nuclear radiation.
Integrated Neutron Flux: See Fluence.
Intensity: The amount or energy of any radia-
tion incident upon (or flowing through) unit area,
perpendicular to the radiation beam, in unit time.
The intensity of thermal radiation is generally
expressed in calories per square centimeter per
second falling on a given surface at any specified
instant. As applied to nuclear radiation, the term
intensity is sometimes used, rather loosely, to
express the exposure (or dose) rate at a given
location.
Internal Radiation: Nuclear radiation (alpha
and beta particles and gamma radiation) resulting
from radioactive substances in the body. Impor-
tant sources are iodine-131 in the thyroid gland,
and strontium-90 and plutonium-239 in bone.
Inverse Square Law: The law which states that
when radiation (thermal or nuclear) from a point
source is emitted uniformly in all directions, the
amount received per unit area at any given dis-
tance from the source, assuming no absorption,
is inversely proportional to the square of that
distance.
Ionization: The separation of a normally elec-
trically neutral atom or molecule into electrically
charged components. The term is also employed
to describe the degree or extent to which this
separation occurs. In the sense used in this book,
ionization refers especially to the removal of an
electron (negative charge) from the atom or
molecule, either directly or indirectly, leaving a
positively charged ion. The separated electron
and ion are referred to as an ion pair. See
Ionizing radiation.
Ionizing Radiation: Electromagnetic radiation
(gamma rays or X rays) or particulate radiation
(alpha particles, beta particles, neutrons, etc.)
capable of producing ions, i.e., electrically
charged particles, directly or indirectly, in its
passage through matter. See Nuclear radiation.
Ionosphere: The region of the atmosphere, ex-
tending from roughly 40 to 250 miles altitude, in
which there is appreciable ionization. The pres-
ence of charged particles in this region pro-
foundly affects the propagation of long-wave-
length electromagnetic radiations (radio and
radar waves).
Ion Pair: See Ionization.
Isomer (or Isomeric Nuclide): See Nuclide.
Isotopes: Forms of the same element having
identical chemical properties but differing in their
atomic masses (due to different numbers of neu-
trons in their respective nuclei) and in their
nuclear properties (e.g., radioactivity, fission,
etc.). For example, hydrogen has three isotopes,
with masses of 1 (hydrogen), 2 (deuterim), and 3
(tritium) units, respectively. The first two of
these are stable (nonradioactive), but the third
(tritium) is a radioactive isotope. Both of the
common isotopes of uranium, with masses of
235 and 238 units, respectively, are radioactive,
emitting alpha particles, but their half-lives are
different. Furthermore, uranium-235 is fission-
able by neutrons of all energies, but uranium-238
will undergo fission only with neutrons of high
energy. See Nucleus.
Kilo-Electron Volt (or KEV): An amount of
energy equal to 1,000 electron volts. See Elec-
tron Volt.
Kiloton Energy: Defined strictly as 1012 calories
(or 4.2X10¹⁹ ergs). This is approximately the
amount of energy that would be released by the
explosion of 1 kiloton (1,000 tons) of TNT. See
TNT equivalent.
Linear Attenuation Coefficient: See Attenua-
tion.
Linear Energy Absorption Coefficient: See
Absorption.
Lip Height: The height above the original sur-
face to which earth is piled around the crater
formed by an explosion. See Crater.
636
GLOSSARY
Loading: The force on an object or structure or
element of a structure. The loading due to blast is
equal to the net pressure in excess of the ambient
value multiplied by the area of the loaded object,
etc. See Diffraction, Drag loading.
Mach Front: See Mach stem.
Mach Region: The region on the surface at
which the Mach stem has formed as the result of
a particular explosion in the air.
Mach Stem: The shock front formed by the
merging of the incident and reflected shock fronts
from an explosion. The term is generally used
with reference to a blast wave, propagated in the
air, reflected at the surface of the earth. The
Mach stem is nearly perpendicular to the reflect-
ing surface and presents a slightly convex (for-
ward) front. The Mach stem is also called the
Mach front. See Shock front, Shock wave.
Mass Attenuation Coefficient: See Attenua-
tion.
Mass Energy Absorption Coefficient: See Ab-
sorption.
Mass Number: See Nucleus.
Mean Free Path: The average path distance a
particle (neutron or photon) travels before un-
dergoing a specified reaction (with a nucleus or
electron) in matter.
Megacurie: One million curies. See Curie.
Megaton Energy: Defined strictly as 1015 calo-
ries (or 4.2x IO22 ergs). This is approximately the
amount of energy that would be released by the
explosion of 1,000 kilotons (1,000,000 tons) of
TNT. See TNT equivalent.
MEV (or Million Electron Volt): A unit of
energy commonly used in nuclear physics. It is
equivalent to 1.6xl0-ft erg. Approximately 200
MeV of energy are produced for every nucleus
that undergoes fission. See Electron volt.
Microcurie: A one-millionth part of a curie. See
Curie.
Micrometer: See Micron.
Micron: A one-millionth part of a meter (i.e.,
10~6 meter or IO4 centimeter); it is roughly four
one-hundred-thousandths (4x10 s) of an inch.
Microsecond: A one-millionth part of a second.
Million Electron Volt: See MeV.
Millirad: A one-thousandth part of a rad. See
Rad.
Millirem: A one-thousandth part of a rem. See
Rem.
Milliroentgen: A one-thousandth part of a
roentgen. See Roentgen.
Millisecond: A one-thousandth part of a second.
Mirror Point: A point at which a charged par-
ticle, moving (in a spiral path) along the lines of
a magnetic field, is reflected back as it enters a
stronger magnetic field region. The actual loca-
tion of the mirror point depends on the direction
and energy of motion of the charged particle and
the ratio of the magnetic field strengths. As a
result, only those particles satisfying the re-
quirements of the existing situation are reflected.
Monitoring: The procedure or operation of lo-
cating and measuring radioactive contamination
by means of survey instruments which can detect
and measure (as dose rates) ionizing radiations.
The individual performing the operation is called
a monitor.
Negative Phase: See Shock wave.
Neutron: A neutral particle (i.e., with no elec-
trical charge) of approximately unit mass, pres-
ent in ail atomic nuclei, except those of ordinary
(light) hydrogen. Neutrons are required to initiate
the fission process, and large numbers of neu-
trons are produced by both fission and fusion
reactions in nuclear (or atomic) explosions.
Neutron Flux: See Flux.
Nominal Atomic Bomb: A term, now becom-
ing obsolete, used to describe an atomic weapon
with an energy release equivalent to 20 kilotons
(i.e., 20,000 tons) of TNT. This is very approx-
imately the energy yield of the bombs exploded
over Japan and in the Bikini test of 1946.
Nuclear Cloud: See Radioactive cloud.
Nuclear Radiation: Particulate and electro-
magnetic radiation emitted from atomic nuclei in
various nuclear processes. The important nuclear
radiations, from the weapons standpoint, are
alpha and beta particles, gamma rays, and neu-
trons. All nuclear radiations are ionizing radia-
tions, but the reverse is not true; X rays, for
example, are included among ionizing radia-
tions, but they are not nuclear radiations since
they do not originate from atomic nuclei. See
Ionizing radiation, X-rays.
Nuclear (or Atomic) Tests: Test carried out to
supply information required for the design and
improvement of nuclear (or atomic) weapons and
to study the phenomena and effects associated
with nuclear (or atomic) explosions. Many of the
data presented in this book are based on mea-
surements and observations made at such tests.
Nuclear Weapon (or Bomb): A general name
GLOSSARY
637
given to any weapon in which the explosion
results from the energy released by reactions
involving atomic nuclei, either fission or fusion
or both. Thus, the A- (or atomic) bomb and the
H- (or hydrogen) bomb are both nuclear weap-
ons. It would be equally true to call them atomic
weapons, since it is the energy of atomic nuclei
that is involved in each case. However, it has
become more-or-less customary, although it is
not strictly accurate, to refer to weapons in which
all the energy results from fission as A-bombs or
atomic bombs. In order to make a distinction,
those weapons in which part, at least, of the
energy results from thermonuclear (fusion) reac-
tions of the isotopes of hydrogen have been
called H-bombs or hydrogen bombs.
Nucleus (or Atomic Nucleus): The small, cen-
tral, positively charged region of an atom which
carries essentially all the mass. Except for the
nucleus of ordinary (light) hydrogen, which is a
single proton, all atomic nuclei contain both
protons and neutrons. The number of protons
determines the total positive charge, or atomic
number, this is the same for all the atomic nuclei
of a given chemical element. The total number of
neutrons and protons, called the mass number, is
closely related to the mass (or weight) of the
atom. The nuclei of isotopes of a given element
contain the same number of protons, but different
numbers of neutrons. They thus have the same
atomic number, and so are the same element, but
they have different mass numbers (and masses).
The nuclear properties (e.g., radioactivity, fis-
sion, neutron capture, etc.) of an isotope of a
given element are determined by both the number
of neutrons and the number of protons. See
Atom, Element, Isotope, Neutron, Proton.
Nuclide: An atomic species distinguished by the
composition of its nucleus (i.e., by the number of
protons and the number of neutrons). In isomeric
nuclides the nuclei have the same composition
but are in different energy states. See Atom,
Neutron, Nucleus, Proton.
Overpressure: The transient pressure, usually
expressed in pounds per square inch, exceeding
the ambient pressure, manifested in the shock (or
blast) wave from an explosion. The variation of
the overpressure with time depends on the energy
yield of the explosion, the distance from the
point of burst, and the medium in which the
weapon is detonated. The peak overpressure is
the maximum value of the overpressure at a
given location and is generally experienced at the
instant the shock (or blast) wave reaches that
location. See Shock wave.
Pair Production: The process whereby a
gamma-ray (or X-ray) photon, with energy in
excess of 1.02 MeV in passing near the nucleus
of an atom is converted into a positive electron
and a negative electron. As a result, the photon
ceases to exist. See Photon.
Photoelectric Effect: The process whereby a
gamma-ray (or X-ray) photon, with energy
somewhat greater than that of the binding energy
of an electron in an atom, transfers all its energy
to the electron which is consequently removed
from the atom. Since it has lost all its energy, the
photon ceases to exist. See Photon.
Photon: A unit or “particle” of electromagnetic
radiation, carrying a quantum of energy which is
characteristic of the particular radiation. If v is
the frequency of the radiation in cycles per sec-
ond and X is the wavelength in centimeters, the
energy quantum of the photon in ergs is hv or
hc/X, where h is Planck’s constant, 6.62x10⁻²⁷
erg-second and c is the velocity of light
(3.00x 10¹⁰ centimeters per second). For gamma
rays, the photon energy is usually expressed in
million electron volt (MeV) units (i.e.,
1.24x 10-|0/X where X is in centimeters or
1.24x 10~2/X if X is in angstroms).
Plastic Range: The stress range in which a ma-
terial will not fail when subjected to the action of
a force, but wifi not recover completely, so that a
permanent deformation results when the force is
removed. Plastic deformation refers to dimen-
sional changes occurring within the plastic range.
See Elastic range.
Plastic Zone: The region beyond the rupture
zone associated with crater formation in which
there is no visible rupture but in which the
ground is permanently deformed and compressed
to a higher density. See Crater, Elastic Zone,
Rupture zone.
Plume: See Column.
Positive Phase: See Shock wave.
Precursor: An air pressure wave which moves
ahead of the main blast wave for some distance
as a result of a nuclear (or atomic) explosion of
appropriate yield and low burst height over a
heat-absorbing (or dusty) surface. The pressure
at the precursor front increases more gradually
than in a true (or ideal) shock wave, so that the
behavior in the precursor region is said to be
non ideal. See Blast wave, Shock front, Shock
wave.
Proton: A particle of mass (approximately)
unity carrying a unit positive charge; it is identi-
cal physically with the nucleus of the ordinary
(light) hydrogen atom. AH atomic nuclei contain
protons. See Nucleus.
Quantum: See Photon.
638
GLOSSARY
Rad: A unit of absorbed dose of radiation; it
represents the absorption of 100 ergs of nuclear
(or ionizing) radiation per gram of absorbing
material, such as body tissue.
Radiant Exposure: The total amount of thermal
radiation energy received per unit area of ex-
posed surface; it is usually expressed in calories
per square centimeter.
Radiation: See Ionizing Radiation, Nuclear ra-
diation, Thermal radiation.
Radiation Injury (or Syndrome): See Syn-
drome (Radiation).
Radioactive (or Nuclear) Cloud: An All-
inclusive term for the cloud of hot gases, smoke,
dust, and other particulate matter from the
weapon itself and from the environment, which
is carried aloft in conjunction with the rising
fireball produced by the detonation of a nuclear
(or atomic) weapon.
Radioactivity: The spontaneous emission of ra-
diation, generally alpha or beta particles, often
accompanied by gamma rays, from the nuclei of
an (unstable) isotope. As a result of this emission
the radioactive isotope is converted (or decays)
into the isotope of a different (daughter) element
which may (or may not) also be radioactive.
Ultimately, as a result of one or more stages of
radioactive decay, a stable (nonradioactive) end
product is formed. See Isotope.
Radio Blackout: The complete disruption of
radio (or radar) signals over large areas caused by
the ionization accompanying a high-altitude nu-
clear explosion, especially above about 40 miles.
Radioisotope: A radioactive isotope. See Iso-
tope, Radioactivity.
Radionuclide: A radioactive nuclide (or radio-
active atomic species). See Nuclide.
Rainout: The removal of radioactive particles
from a nuclear cloud by precipitation when this
cloud is within a rain cloud. See Washout.
RBE (or Relative Biological Effective-
ness): The ratio of the number of rads of
gamma (or X) radiation of a certain energy which
will produce a specified biological effect to the
number of rads of another radiation required to
produce the same effect is the RBE of the latter
radiation.
Reflected Pressure: The total pressure which
results instantaneously at the surface when a
sliock (or blast) wave traveling in one medium
strikes another medium (e.g., at the instant when
the front of a blast wave in air strikes the ground
or a structure). If the medium struck (e.g., the
ground or a structure) is more dense than that in
which the shock wave is traveling (e.g., air), the
reflected pressure is positive (compression). If
the reverse is true (e.g., when a shock wave in
the ground or water strikes the air surface) the
reflected pressure is negative (rarefaction or ten-
sion).
Reflection Factor: The ratio of the total (re-
flected) pressure to the incident pressure when a
shock (or blast) wave traveling in one medium
strikes another.
Rem: A unit of biological dose of radiation; the
name is derived from the initial letters of the term
“roentgen equivalent man (or mammal).’’ The
number of rems of radiation is equal to the
number of rads absorbed multiplied by the RBE
of the given radiation (for a specified effect). The
rem is also the unit of dose equivalent, which is
equal to the product of the number of rads ab-
sorbed and the “quality factor’’ of the radiation.
See Dose, Dose equivalent. Rad, RBE.
Residual Nuclear Radiation: Nuclear radia-
tion, chiefly beta particles and gamma rays,
which persists for some time following a nuclear
(or atomic) explosion. The radiation is emitted
mainly by the fission products and other bomb
residues in the fallout, and to some extent by
earth and water constitutents, and other materi-
als, in which radioactivity has been induced by
the capture of neutrons. See Fallout, Induced
radioactivity, Initial nuclear radiation.
Roentgen: A unit of exposure to gamma (or X)
radiation. It is defined precisely as the quantity of
gamma (or X) rays that will produce electrons (in
ion pairs) with a total charge of 2.58 x 10~4 cou-
lomb in 1 kilogram of dry air. An exposure of 1
roentgen results in the deposition of about 94
ergs of energy in 1 gram of soft body tissue.
Hence, an exposure of 1 roentgen is approxi-
mately equivalent to an absorbed dose of 1 rad in
soft tissue. See Dose, Rad.
Rupture Zone: The region immediately adja-
cent to the crater boundary in which the stresses
produced by the explosion have exceeded the
ultimate strength of the ground medium. It is
characterized by the appearance of numerous
radial (and other) cracks of various sizes. See
Crater, Plastic zone.
Scaling Law: A mathematical relationship
which permits the effects of a nuclear (or atomic)
explosion of given energy yield to be determined
as a function of distance from the explosion (or
from ground zero), provided the corresponding
effect is known as a function of distance for a
reference explosion (e.g., of 1-kilton energy
yield). See Blast scaling law, Cube root law.
Scattering: The diversion of radiation, includ-
GLOSSARY
639
ing radio, radar, thermal, and nuclear, from its
orginai path as a result of interactions (or colli-
sions) with atoms, molecules, or larger particles
in the atmosphere or other medium between the
source of the radiations (e.g., a nuclear explo-
sion) and a point at some distance away. As a
result of scattering, radiations (especially gamma
rays and neutrons) will be received at such a
point from many directions instead of only from
the direction of the source.
Scavenging: The selective removal of material
from the radioactive cloud from a nuclear explo-
sion by inert substances, such as earth or water,
introduced into the fireball. The term is also
applied to the process of removal of fallout
particles from the atmosphere by precipitation.
See Rainout, Snowout, Washout.
Shear (Wind): Unless the term “velocity
shear” is used, wind shear refers to differences in
direction (directional shear) of the wind at dif-
ferent altitudes.
Shear Wall: A wall (or partition) designed to
take a load in the direction of the plane of the
wall, as distinct from lateral loads perpendicular
to the wall. Shear walls may be designed to take
lateral loads as well. See Bearing wall.
Shielding: Any material or obstruction which
absorbs (or attentuates) radiation and thus tends
to protect personnel or materials from the effects
of a nuclear (or atomic) explosion. A moderately
thick layer of any opaque material will provide
satisfactory shielding from thermal radiation, but
a considerable thickness of material of high den-
sity may be needed for nuclear radiation shield-
ing. Electrically continuous housing for a facil-
ity, area, or component, attenuates impinging
electric and magnetic fields.
Shock Front (or Pressure Front): The fairly
sharp boundary between the pressure disturbance
created by an explosion (in air, water, or earth)
and the ambient atmosphere, water, or earth,
respectively. It constitutes the front of the shock
(or blast) wave. See Shock wave.
Shock Wave: A continuously propagated pres-
sure pulse (or wave) in the surrounding medium
which may be air, water, or earth, initiated by the
expansion of the hot gases produced in an ex-
plosion. A shock wave in air is generally referred
to as a blast wave, because it resembles and is
accompanied by strong, but transient, winds.
The duration of a shock (or blast) wave is distin-
guished by two phases. First there is the positive
(compression) phase during which the pressure
rises very sharply to a value that is higher than
ambient and then decreases rapidly to the am-
bient pressure The positive phase for the dy-
namic pressure is somewhat longer than for
overpressure, due to the momentum of the mov-
ing air behind the shock front. The duration of
the positive phase increases and the maximum
(peak) pressure decreases with increasing dis-
tance from an explosion of given energy yield. In
the second phase, the negative (suction, rarefac-
tion, or tension) phase, the pressure falls below
ambient and then returns to the ambient value.
The duration of the negative phase may be sev-
eral times the duration of the positive phase.
Deviations from the ambient pressure during the
negative phase are never large and they decrease
with increasing distance from the explosion. See
Dynamic pressure, Overpressure.
Skyshine: Radiation, particularly gamma rays
from a nuclear explosion, reaching a target from
many directions as a result of scattering by the
oxygen and nitrogen in the intervening atmos-
phere.
Slant Range: The distance from a given loca-
tion, usually on the earth’s surface, to the point at
which the explosion occurred.
Slick: The trace of an advancing shock wave
seen on the surface of reasonably calm water as a
circle of rapidly increasing size apparently darker
than the surrounding water. It is observed, in
particular, following an underwater explosion.
See Crack.
Snowout: The removal of radioactive particles
from a nuclear cloud by precipitation when this
cloud is within a snow cloud. See Rainout.
Spray Dome: See Dome.
Stopping Altitude: The altitude in the vicinity
of which a specified ionizing radiation coming
from above (e.g., from a high-altitude nuclear
explosion) deposits most of its energy by ab-
sorption in the atmosphere. The stopping altitude
varies with the nature of the ionizing radiation.
Stratosphere: A relatively stable layer of the
atmosphere between the tropopause and a height
of about 30 miles in which temperature changes
very little (in polar and temperate zones) or
increases (in the tropics) with increasing altitude.
In the stratosphere clouds of water never form
and there is practically no convection. See Tro-
popause, Troposphere.
Subsurface Burst: See Underground burst,
Underwater burst.
Supercritical: A term used to describe the state
of a given fission system when the quantity of
fissionable material is greater than the critical
mass under the existing conditions. A highly
supercritical system is essential for the produc-
640
GLOSSARY
tion of energy at a very rapid rate so that an
explosion may occur. See Critical mass.
Surface Burst: The explosion of a nuclear (or
atomic) weapon at the surface of the land or
water at a height above the surface less than the
radius of the fireball at maximum luminosity (in
the second thermal pulse). An explosion in which
the weapon is detonated actually on the surface
(or within 5W03 feet, where W is the explosion
yield in kilotons, above or below the surface) is
called a contact surface burst or a true surface
burst. See Air burst.
Surface Zero: See Ground zero.
Surge (or Surge Phenomena): See Base surge.
Survey Meter: A portable instrument, such as a
Geiger counter or ionization chamber, used to
detect nuclear radiation and to measure the dose
rate. See Monitoring.
Syndrome, Radiation: The complex of symp-
toms characterizing the disease known as radia-
tion injury, resulting from excessive exposure of
the whole (or a large part) of the body to ionizing
radiation. The earliest of these symptoms are
nausea, vomiting, and diarrhea, which may be
followed by loss of hair (epilation), hemorrhage,
inflammation of the mouth and throat, and gen-
eral loss of energy. In severe cases, where the
radiation exposure has been relatively large,
death may occur within 2 to 4 weeks. Those who
survive 6 weeks after the receipt of a single dose
of radiation may generally be expected to re-
cover.
Tenth-Value Thickness: The thickness of a
given material which will decrease the intensity
(or dose) of gamma radiation to one-tenth of the
amount incident upon it. Two tenth-value thick-
nesses will reduce the dose received by a factor
of lOx 10, i.e., 100, and so on. The tenth-value
thickness of a given material depends on the
gamma-ray energy, but for radiation of a partic-
ular energy it is roughly inversely proportional to
the density of the material.
Tests: See Nuclear tests.
Thermal Energy: The energy emitted from the
fireball (or other heated region) as thermal radia-
tion. The total amount of thermal energy re-
ceived per unit area at a specified distance from a
nuclear (or atomic) explosion is generally ex-
pressed in terms of calories per square centime-
ter. See Radiant exposure, Thermal radiation,
Transmittance, X-ray pancake.
Thermal Energy Yield (or Thermal
Yield): The part of the total energy yield of the
nuclear (or atomic) explosion which is received
as thermal energy usually within a minute or less.
In an air burst, the thermal partition (i.e., the
fraction of the total explosion energy emitted as
thermal radiation) ranges from about 0.35 to
0.45. The trend is toward the smaller fraction for
low yields or low burst heights and toward the
higher fraction at high yields or high bursts.
Above 100,000 feet burst height, the fraction
increases from about 0.45 to 0.6, and then de-
creases to about 0.25 at burst altitudes of
160,000 to 260,000 feet. At still greater burst
heights, the fraction decreases rapidly with in-
creasing altitude.
Thermal Radiation: Electromagnetic radiation
emitted (in two pulses from an air burst) from the
fireball as a consequence of its very high tem-
perature; it consists essentially of ultraviolet,
visible, and infrared radiations. In the early
stages (first pulse of an air burst), when the
temperature of the fireball is extremely high, the
ultraviolet radiation predominates; in the second
pulse, the temperatures are lower and most of the
thermal radiation lies in the visible and infrared
regions of the spectrum. For high-altitude bursts
(above 100,000 feet), the thermal radiation is
emitted as a single pulse, which is of short
duration below about 270,000 feet but increases
at greater burst heights.
Thermal X-Rays: The electromagnetic radia-
tion, mainly in the soft (low-energy) X-ray re-
gion, emitted by the extremely hot weapon resi-
due in virtue of its extremely high temperature; it
is also referred to as the primary thermal radia-
tion. It is the absorption of this radiation by the
ambient medium, accompanied by an increase in
temperature, which results in the formation of the
fireball (or other heated region) which then emits
thermal radiation. See Weapon residue, X-ray
pancake, X-rays.
Thermonuclear: An adjective referring to the
process (or processes) in which very high tem-
peratures are used to bring about the fusion of
light nuclei, such as those of the hydrogen iso-
topes (deuterium and tritium), with the accom-
panying liberation of energy. A thermonuclear
bomb is a weapon in which part of the explosion
energy results from thermonuclear fusion reac-
tions. The high temperatures required are ob-
tained by means of a fission explosion. See
Fusion.
TNT Equivalent: A measure of the energy re-
leased in the detonation of a nuclear (or atomic)
weapon, or in the explosion of a given quantity
of fissionable material, expressed in terms of the
mass of TNT which would release the same
amount of energy when exploded. The TNT
equivalent is usually stated in kilotons or mega-
tons. The basis of the TNT equivalence is that the
GLOSSARY
641
explosion of I (on of TNT is assumed to release
IO9 calories of energy. See Kiloton, Megaton,
Yield.
Transmittance (Atmospheric): The fraction
(or percentage) of the thermal energy received at
a given location after passage through the at-
mosphere relative to that which would have been
received at the same location if no atmosphere
were present
Triple Point: The intersection of the incident,
reflected, and merged (or Mach) shock fronts
accompanying an air burst. The height of the
triple point above the surface (i.e., the height of
the Mach stem) increases with increasing dis-
tance from a given explosion. See Mach stem.
Tritium: A radioactive isotope of hydrogen,
having a mass of 3 units; it is produced in nuclear
reactors by the action of neutrons on lithium
nuclei.
Tropopause: The imaginary boundary layer di-
viding the stratosphere from the lower part of the
atmosphere, (he troposphere. The tropopause
normally occurs at an altitude of about 25,000 to
45,000 feet in polar and temperate zones, and at
55,000 feet in the tropics. See Stratosphere,
Troposphere.
Troposphere: The region of the atmosphere,
immediately above the earth's surface and up to
the tropopause, in which the temperature falls
fairly regularly with increasing altitude, clouds
form, convection is active, and mixing is con-
tinuous and more or less complete.
True Surface Burst: See Surface Burst.
2 W Concept: The concept that the explosion of
a weapon of energy yield W on the earth’s
surface produces (as a result of reflection) blast
phenomena identical to those produced by a
weapon of twice the yield (i.e., 2W) burst in free
air (i.e., away from any reflecting surface).
Ultraviolet: Electromagnetic radiation of wave
length between the shortest visible violet (about
3,850 Angstroms) and soft X-rays (about 100
Angstroms).
Underground Burst: The explosion of a nu-
clear (or atomic) weapon with its center more
than 5 3 feet, where Wis the explosion yield in
kilotons, beneath the surface of the ground. See
also Contained underground burst.
Underwater Burst: The explosion of a nuclear
(or atomic) weapon with its center beneath the
surface of the water.
Visibility Range (or Visibility): The horizontal
distance (in kilometers or miles) at which a large
dark object can just be seen against the horizon
sky in daylight. The visibility is related to the
clarity of the atmosphere ranging from 170 miles
(280 kilometers) for an exceptionally clear at-
mosphere to 0.6 mile (1.0 kilometer) or less for
dense haze or fog. The visibility on an average
clear day is taken to be 12 miles (19 kilometers).
Washout: The removal of radioactive particles
from a nuclear cloud by precipitation when this
cloud is below a rain (or snow) cloud. See
Rainout, Snow out.
Weapon, Atomic (or Nuclear): See Nuclear
weapon.
Weapon Debris: The highly radioactive mate-
rial, consisting of fission products, various prod-
ucts of neutron capture, and uranium and pluto-
nium that have escaped fission, remaining after
the explosion.
Weapon Residue: The extremely hot, com-
pressed gaseous residues formed at the instant of
the explosion of a nuclear weapon. The temper-
ature is several tens of million degrees (Kelvin)
and the pressure is many millions of atmos-
pheres.
Wilson Cloud Chamber: See Condensation
cloud.
Worldwide Fallout: See Fallout.
X-Ray Pancake: A layer of air, about 30,000
feet thick at a mean altitude of roughly 270,000
feet, which becomes incandescent by absorption
of the thermal X rays from explosions above
270,000 feet altitude. The heated air emits ther-
mal radiation (of longer wavelengths) in a single
pulse of several seconds duration. See Thermal
radiation, Thermal X rays.
X Rays: Electromagnetic radiations of high en-
ergy having wavelengths shorter than those in the
ultraviolet region, i.e., less than 10~6 cm or 100
Angstroms. Materials at very high temperatures
(millions of degrees) emit such radiations; they
are then called thermal X rays. As generally
produced by X-ray machines, they are brems-
strahlung resulting from the interaction of elec-
trons of 1 kilo-electron volt or more energy with
a metallic target. See Bremsstrahlung, Electro-
magnetic radiation, Thermal X-rays.
Yield (or Energy Yield): The total effective
energy released in a nuclear (or atomic) explo-
sion. It is usually expressed in terms of the
equivalent tonnage of TNT required to produce
the same energy release in an explosion. The
total energy yield is manifested as nuclear radia-
tion, thermal radiation, and shock (and blast)
energy, the actual distribution being dependent
upon the medium in which the explosion occurs
(primarily) and also upon the type of weapon and
the time after detonation. See TNT equivalent.
642
GUIDE TO SI UNITS
Guide to SI Units
The International System of Units (SI) has been adopted in the publications of
several scientific and technical societies in the United States and other countries. It
is expected that in due course that these units will come into general use. The SI
units and conversion factors applicable to this book are given below. For further
information, see “The International System of Units (SI),” National Bureau of
Standards Special Publication 330, U.S. Government Printing Office, Washington,
D.C. 20402. Base Units
Quanity SI Unit Symbol
Length Mass Time Electric current Temperature* meter m kilogram kg second s ampere A kelvin К
* (Temperatures may also be expressed in °C)
Derived Units
Quantity Unit Symbol Formula
Force newton N kg-m/s2
Pressure pascal Pa N/m2
Energy, heat, etc. joule J N«m
Power watt W J/s
Frequency hertz Hz 1 (cycle)/s
Radioactivity becquerel Bq 1 (decay)/s
Absorbed dose gray Gy J/kg
Conversion Factors
To convert from: to: multiply by:
Length, Area, Volume
inch meter (m) 2.540 x 10⁻²
foot meter (m) 0.3048
yard meter (m) 0.9144
mile kilometer (km) 1.609
centimeter meter (m) 10-2
angstrom meter (m) 10-ю
square inch meter2 (m2) 6.452 x 10-<
square foot meter2 9.290 x 10⁻²
square mile kilometer2 (km2) 2.590
cubic foot meter ’ (m ’) 2.832 x 10⁻²
644
GUIDE TO SI UNITS
643
Mass
pound ounce kilogram (kg) kilogram (kg) 0.4536 2.835 x IO-2
Energy
calorie joule (J) 4.187
erg joule (J) 1.00 x IO-2
MeV joule (J) 1.602 x 10-»3
ton (TNT equivalent) joule (J) 4.2 x 10⁹
Miscellaneous
density (lb/ft3) kg/m3 1.602 X 10
pressure (psi) pascal (Pa) 6.895 x Ю3
radiant exposure (cal/cm2) J/m2 4.187 x 10⁴
speed (ft/sec) m/s 0.3048
speed (miles/hour) m/s 0.4470
dose (rads) gray (Gy) 1.00 x IO-2
dose rate (rads/hour) Gy/s 2.778 x 10⁻⁶
curie becquerel (Bq) 3.700 x lO'o
The only multiples or submultiples of SI to which appropriate prefixes may be
applied are those represented by factors of 10n or 10~n where n is divisible by 3.
Thus, kilometer (103m or 1 km), millimeter (10”3m or 1 mm), and micrometer
(10 ~6m or 1 jim). The centimeter and gram are not used in the SI system, but they
are included in the metric system proposed for adoption in the United States.
INDEX
Aftershocks, 2.105, 6.24-6.27
Afterwinds, 2.09, 2.18
Air blast, see Blast
Air burst, 1.31-1.35, 1.78, 2.03-2.17, 2.32-
2.51, see also High-altitude burst
afterwinds, 2.09, 2.18
blast wave, 2.32-2.37, see also Blast
damage, see Damage; Structures
definition, 1.31
EMP, 11.66, 11.67
energy distribution, 1.24-1.27
fireball, 2.03-2.05, 2.110-2.129
ground shock, 3.51, 3.52
injuries, see Injuries
nuclear radiation, 2.41-2.45, see also Nuclear
radiation
radioactive cloud, see Cloud
contamination, 9.48, 9.49
radio and radar effects, see Radio and radar
thermal radiation, 2.38-2.40, see also Thermal
radiation
Aircraft, damage, 5.94, 5.95, 5.151-5.154
Alpha particles (or radiation), 1.65, 2.41, 8.01,
8.03, 9.40-9.42, 9.114
attenuation, 2.42, 9.114
contamination, 9.42
hazard, 9.114, 12.97, 12.165, 12.173
RBE, 12.97
sources, 2.41, 8.01, 9.40-9.43
Animals, nuclear explosion effects, 12.240-
12.254
Arch, loading, 4.62-4.66
Arching effect, soil, 6.96-6.99
Area integral, fallout, 9.160
ARGUS effect, 2.146, 2.147
Atmosphere, density vs. altitude, 3.66, 10.123,
10.124
ionization, 10.09-10.12, see also Ionosphere
pressure vs. altitude, 3.66
properties, 3.66
scale height, 10.123
structure, 9.126-9.129
visibility, 7.12
Atom, 1.07
Atomic bomb (or weapon), 1.11, see also Nuclear
weapons
cloud, see Cloud
explosion, see Nuclear explosion
number, 1.09
structure, 1.06-1.09
644
Atomic Bomb Casualty Commission, 12.142
Attenuation, radiation, see Alpha particles; Beta
particles; Gamma rays, Neutrons; Transmission
factors
Aurora, artificial, 2.62, 2.142-2.145
Ball of fire, see Fireball
Base surge, see Surface burst; Underground burst;
Underwater burst
Beta burns, 12.155-12.162
Beta particles (or radiation), 1.29, 1.43, 1.61-
1.66, 2.42, 8.01, 9.13
attenuation, 2.42, 9.115, 9.116
and geomagnetic field, see Geomagnetic field
hazard, external, 12.155-12.162
internal, 12.163-12.172
RBE, 12.97
sources, 1.61-1.63
stopping altitude, 10.29
Beta patch, 2.141
Biological effectiveness, relative (RBE), 12.95
Biological effects of nuclear radiations, see Nu-
clear radiations
Biological half-life, 12.170
Blackout radio, see Radio and radar
Blast (and Blast wave), 1.01, 1.25, 2.32-2.37,
3.01-3.85, 6.02, 6.80, 6.81, see also Dynamic
pressure; Overpressure; Shock wave
altitude effect, 3.44-3.46, 3.64-3.68
arrival time, 3.09, 3.14, 3.63, 3.77
atmospheric effects on, 3.39-3.43
bending of, 3.42, 3.43
characteristics, 3.01-3.20
damage, see Damage
and height of burst, 3.30-3.34
development, 3.01-3.20
diffraction, 4.03, see also Loading
duration, 3.14, 3.15, 3.63, 3.76
front, 1.01, 2.32, 3.02, 3.03
and ground shock, 3.51, 3.52
impulse, 3.49
injuries, see Injuries
interaction with structures, 4.01-4.67
loading, see Loading
Mach effect, see Mach effect
and meteorological conditions, 3.39-3.43
negative phase, 3.04, 3.05
nonideal, 3.47, 4.67
positive phase, 3.05
precursor, 3.49, 3.79-3.85, 4.67
INDEX
645
pressure, see Dynamic pressure; Overpressure
properties, 3.53-3.59
height of burst curves, 3.73-3.77
Rankine-Hugoniot relations, 3.53-3.56
reflection, 3.21-3.29, 3.78, see also Mach ef-
fect
irregular, 3.24
regular, 3.22
refraction, 3.42, 3.43
scaling laws, 3.60-3.63
and structures, see Damage; Loading
surface (or terrain) effects, see Terrain effects
target response, 5.08-5.18, see also Damage
velocity, 3.55
wind, 3.07, 3.13, 3.55
Blood, radiation effects, 12.124-12.132
Boltzmann constant, 7.73
-Stefan law, 7.82
Bone seekers, 12.165
Boosted weapons, 1.72
Breakaway, fireball, 2.120, 2.121
Bridges, damage, 5.127, 5.139, 5.140
Buildings, damage, see Damage
Burns, 7.32, 12.13, 12.14, 12.22, 12.51-12.89
beta, 12.155-12.162
classification, 12.51-12.58
under clothing, 12.59-12.60
to eyes, see Eye injuries
flame, 12.51
flash, 7.32, 12.13, 12.14, 12.18, 12.51,
12.74-12.78
incapacitation from, 12.61, 12.62
in Japan, 12.13, 12.14, 12.18, 12.68-12.73
profile, 42.70
and radiant exposure, 12.63-12.69
Buses, damage, 5.87
Cancer, nuclear radiation, 12.147-12.151
Capture gamma rays, 8.08
Carbon-14, in nature, 12.198
in weapons residues, 12.197-12.199
Casualties, 12.01-12.21, see also Injuries
in buildings, 12.17
in Japan, 12.08-12.22
Cataracts, nuclear radiation, 12.144-12.146
Cattle, see Animals
Cavity, in underground burst, 2.102, 6.85-6.88
Cesium-137, in delayed fallout, 9.124, 12.184-
12.187
Chain reaction, see Fission
Chimney, in underground burst, 2.103, 6.88, 6.89
Clean weapon, see Nuclear weapons
Cloud, condensation, 2.47-2.50, 2.66
radioactive, 2.06-2.17, 2.19, 2.43, 2.68, 2.97,
9.07-9.09
dimensions, 2.16
height, 2.16, 9.96, 10.158
rate of rise, 2.12
radioactivity in, 9.61
radius, 2.16
scavenging, 9.67-9.74
stabilized, 2.15, 9.84, 9.91, 9.96
Column, in underwater burst, 2.67, 2.68
Compton effect, 8.89, 8.90, 8.95, 8.97, 8.103,
11.105
and EMP, 11.60-11.63, 11.66
Concrete, radiation shielding, 8.41, 8.68, 8.69,
8.72, 9.120
structures, damage, see Damage
Conjugate points (or regions), 2.143, 10.49,
10.64, 10.65
Condensation cloud, 2.47-2.50, 2.66
Contamination, radioactive, 9.48-9.113, 9.154—
9.162, see also Fallout; Fission products; Ra-
dioactivity, induced
in air bursts, 9.48, 9.49
decay, 1.64, 9.15-9.130, 9.146-9.153
distribution patterns, 9.75-9.113
dose calculations, 9.15-9.30
hot spots, 2.31, 9.66, 9.105
in surface and subsurface bursts, 9.50-9.52,
9.61
in underwater bursts, 9.53-9.55
Crack, in underwater burst, 2.65
Crater, 2.21, 2.90, 6.03-6.11, 6.70-6.79
dimensions, 6.08-6.11, 6.70-6.72
formation mechanism, 2.92-2.94
plastic zone, 6.07, 6.70
rupture zone, 6.07, 6.70
underwater, 6.60, 6.61
Critical mass (or size), 1.46-1.53
attainment in weapon, 1.51-1.53
Crops, see Plants
Cross section, neutron, 8.112
Curie, 9.141
Damage, 5.01-5.161, 6.104-6.114
administrative buildings, 5.19-5.27, 5.139-
5.141
aircraft, 5.94, 5.95, 5.151-5.154
arches and domes, 6.101
automobiles, 5.86-5.91, 5.146
brick structures, 5.139, 5.140
bridges, 5.127, 5.139, 5.140
buses, 5.87
chimneys, 5.34
commercial buildings, 5.19-5.27, 5.139, 5.140
communications equipment, 5.122-5.126,
5.148
concrete buildings, 5.20-5.27, 5.139, 5.140
diffraction-sensitive structures, 5.139-5.145
-distance relationships, 5.140, 5.146
domestic appliances, 5.114
drag-sensitive structures, 5.146-5.154
dwellings, see Damage, residences
electrical distribution systems, 5.98-5.105
fabrics, 7.33-7.36, 7.44-7.48
forests, 5.146, 5.149, 5.150, 7.60
frame buildings, 5.25, 5.26, 5.37-5.51,5.139,
5.140
646
INDEX
gas systems, 5.108-5.121
houses, see Damage, residences
hydraulic structures, 6.122-6.125
industrial buildings, 5.04, 5.28-5.51, 5.139,
5.140
in Japan, see Japan, nuclear explosions
machine tools, 5.128-5.133
masonry buildings, 5.76-5.79, 5.139, 5.140
mobile homes, 5.80-5.84
oil tanks, 5.155
plastics, 7.39, 7.40
railroad equipment, 5.92, 5.93, 5.146
residences, 5.04, 5.52-5.84, 5.139, 5.140,
7.28
ships, 5.96, 5.97, 5.146, 6.63-6.65
smokestacks, 5.34
storage tanks, 5.155
subways, 6.106
transportation equipment, 5.85-5.97, 5.146,
5.147
tunnels, 6.109
utilities, 5.98-5.121
vehicles, 5.86-5.91, 5.146
water systems, 5.106, 5.107
Decay, radioactive, 1.02, 1.62
fission products, 1.54 see also Fallout, decay
Decibel, 10.126
Detection ionizing radiation, see Measurement
Deuterium fusion reactions, 1.16, 1.67-1.71
Diffraction loading, see Loading
-sensitive structures, 5.139-5.145
Dirty weapons, 9.47
Dose (and dose rate), radiation, 8.17-8.19
absorbed, 8.18, 12.94
biologically effective, 12.93-12.97
exposure, 8.19, 12.93
from initial radiation, 8.33, 8.64, 8.121-8.127
from residual (fallout) radiation, 9.12-9.30
transmission factors, 8.72, 9.120
Dosimeter, 8.21, 8.24, 8.29
Drag loading, see Loading
-sensitive structures, 5.146-5.154
Ductility, materials and structures, 5.14-5.18
Dynamic pressure, 3.06-3.08, 3.13-3.20
decay rate, 3.07, 3.13, 3.58
-distance relationships, 3.75
duration, 3.76
and height of burst, 3.75
loading, see Loading, drag
Rankine-Hugoniot relations, 3.55
surface effects, 3.50, 3.82
and wind, 3.07, 3.13-3.17, 3.55
Earth, shielding, 8.41, 8.72, 9.156, 9.161
Earthquakes, and underground bursts, 6.24-6.27
Effective half-life, 12.170
Electrical and electronic equipment, EMP effects,
11.26-11.59
nuclear radiation effects, 8.73-8.88, 8.133-
8.144
Electromagnetic pulse (EMP), 1.38, 2.46, 2.61,
11.01-11.76
and animals, 11.20
characteristics, 11.04, 11.07-11.09, 11.63-
11.65
and Compton current, 11.60, 11.61
damage, 11.18-11.20, 11.26, 11.30-11.33,
11.49-11.59
electrical systems, 11.26, 11.32, 11.33,
11.49-11.53
electronic equipment, 11.30, 11.31
and electrical power systems, 11.49-11.53
energy collectors, 11.16, 11.17
coupling, 11.27-11.29
high-altitude bursts, 11.03, 11.13-11.15,
11.26, 11.70-11.76
medium-altitude bursts, 11.66, 11.67
protection, 11.19, 11.33-11.40
and radio stations, 11.54-11.57
surface bursts, 11.03, 11.10-11.12, 11.68,
11.69
system-generated, 11.21-11.25
and telephone systems, 11.58, 11.59
testing for response, 11.41-11.48
theory, 11.60-11.76
Electromagnetic radiation, 1.73-1.79, see also
Thermal radiation
Electromagnetic waves, see Radio and radar
Electron, 1.08, see also Bela, particles
Electron volt, definition, 1.42
EMP, see Electromagnetic pulse
Energy distribution in nuclear explosions, 1.22-
1.27, 7.88, 7.101, 7.102
Energy, fission, 1.43
fusion, 1.69
Energy yield, explosion, 1.20, 1.21, 1.45
Evasive action, nuclear radiation, 8.48
thermal radiation, 7.87
Explosion, atomic, see Nuclear explosion
Eye injuries, 7.32, 12.79-12.89
cataracts, 12.144
flashblindness, 12.83, 12.84, 12.87-12.89
keratitis, 12.80
retinal burns, 12.85-12.89
Fabric damage, thermal, 7.33-7.36, 7.44, 7.48
Fallout, 2.18-2.31, 2.99, 9.01-9.166
air burst, 9.48, 9.49
attenuation of radiation from, 9.114-9.120
from BRAVO explosion, 9.114-9.120
cesium-137 in delayed, 9.124, 9.145, 12.184-
12.187
contamination, 9.48-9.113
distribution, 9.75-9.113
contours, see Fallout patterns
decay, 1.64, 9.12-9.30, 9.145-9.153
half-residence time, 9.133
stratospheric, 9.130, 9.131, 9.135-9.139
tropospheric, 9.130-9.134
INDEX
647
from weapons tests, 9.140-9.141
distribution, 9.59-9.63, see also Fallout pat-
terns
dose, 9.16-9.30, 9.146-9.162
rate, area integral, 9.160
early, 2.28, 9.03, 9.06-9.30
fractionation, 9.06-9.10
hazard, to animals, 12.244-12.254
to humans, 12.155-12.200
to plants, 12.255-12.265
and height of burst, 2.128
hot spots, 2.31, 9.66, 9.105
iodine in delayed, 9.123
local, see Fallout, early
particles, rate of fall, 9.163-9.166
patterns, 9.75-9.114
idealized, 9.83-9.103
limitations, 9.99-9.103
wind effect, 9.96-9.98
plutonium in, 9.40, 12.173
protection factors, 9.120
and rainfall, 9.67-9.74
rainout, 9.74
scavenging, 2.30, 9.67-9.74
stratospheric, 9.130, 9.131, 9.135-9.139
strontium-90 in delayed, 9.124, 9.140-9.145,
12.188-12.196
surface burst, 2.23-2.31, 9.50-9.52
surface (or terrain) effect, 9.95, 9.101, 9.156,
9.161
tropospheric, 9.130-9.134
underground burst, 2.99, 9.05, 9.51, 9.52
underwater burst, 2.82, 2.85, 9.05, 9.53-9.58
uranium in, 9.40-9.43
washout, 9.74
worldwide, see Fallout, delayed
Farm animals, see Animals
Film badge, 8.26
Fireball, 1.32, 1.36, 1.40,2.03-2.05,2.18,2.36,
2.38-2.40, 2.54-2.59, 2.110-2.137, 7.73-
7.105
air burst, 2.03-2.05, 2.106-2.129, 7.83, 7.86
breakaway in, 2.120
debris uptake, 2.09, 2.18, 2.19, 9.50, 9.59
development, 2.110-2.121
dimensions, 1.32, 2.05, 2.127-2.129
high-altitude burst, 2.53-2.59, 2.132, 2.136,
7.22
ionization, 10.21-10.24, 10.40-10.44, 10.53-
10.55, 10.62
shock front development, 2.115-2.120
surface burst, 2.18, 7.20
thermal power, 7.82-7.85
thermal radiation, 2.38-2.40, 7.01-7.04, 7.75,
7.76, 7.80-7.84
underground burst, 2.91, 7.21
underwater burst, 2.64, 7.21
X-ray, 2.110-2.119
Fires, 7.49-7.70
in Japan, 7.61-7.80
mass, 7.58-7.60
origin, 7.49-7.53
spread, 7.54-7.60
Firestorm, 7.58, 7.71
Fission, 1.13, 1.14, 1.21, 1.42-1.56
chain, 1.42, 1.46-1.50, 1.54-1.59
energy, 1.15, 1.20, 1.21
distribution, 1.42-1.45
TNT equivalent, 1.45
explosion time scale, 1.54-1.59
fragments, 1.42, 1.43
generation time, 1.54
products, 1.15, 1.26, 1.29, 1.43, 1.60-1.66,
2.06, 2.10, 2.11, see also Fallout, decay
weapons, see Nuclear weapons
Flame burns, see Burns, flame
Flash blindness, 12.83, 12.84, 12.87-12.89
Flash burns, see Burns, flash
Fluorescence radiation, high-altitude burst, 2.131,
2.138-2.141
Fog, and thermal radiation, 7.16, 7.17
Food plants, see Plants
Forests, damage, 5.146, 5.149, 5.150, 7.60
Fractionation, fallout, 9.06-9.10
Fusion reactions, 1.13, 1.16-1.18, 1.67-1.72
weapons, see Thermonuclear weapons
pamma rays (or radiation), 1.28-1.30, 1.43,
1.61-1.66, 1.71, 8.01, 8.04, 8.08-8.48
attenuation, 8.38-8.42, 8.95-8.104, 9.117-
9.120
coefficients, 8.95-8.102
biological effectiveness, 12.94
buildup factor, 8.103, 8.104
capture, 8.08
delayed, 8.13
delivery rate, 8.46-8.48
dose-distance relationships, 8.31-8.37, 8.125-
8.132
evasive action, 8.48
half-value thickness, 8.39
hazard, 12.91-12.92
hydrodynamic enhancement, 8.36, 8.47
inelastic scattering, 8.09
interaction with matter, 8.17, 8.89-8.104
ionization by, 8.17, 8.21
measurement, 8.20-8.30
prompt, 8.12
RBE, 12.94
scattering, 8.44, 8.45
shielding, 8.05, 8.38-8.45, 8.72, 9.120
skyshine, 8.44
sources, 1.61-1.63, 8.08-8.16, 9.16
spectrum, nuclear explosion, 8.105
stopping altitude, 10.29
tenth-value thickness, 8.39-8.42, 8.102-8.104
648
INDEX
transmission factors, 8.72, 9.120
and weapon yield, 8.63, 8.64
Gas systems, damage, 5.108-5.121
Geiger counter, 8.21
Genetic effects, radiation, 12.208-12.219
Geomagnetic field, and auroral phenomena,
2.142-2.145
and beta particle motion, 2.143, 10.27, 10.46-
10.51
conjugate regions, 2.141, 2.143, 10.27, 10.47,
10.64
and ionization, 10.46-10.51, 10.55, 10.63-
10.66
and weapon debris, 10.55, 10.63, 10.64, 10.70
Glass, missile hazard, 12.42, 12.43, 12.238
Ground motion, in surface burst, 6.12-6.17
in underground burst, 6.33-6.40, 6.90-6.93
Ground shock, see Shock
Ground zero, 2.34
Gun-barrel assembly, 1.52
Half-life, biological, 12.170
effective, 12.170
radioactive, 1.63
Half-residence time, delayed fallout, 9.133
Half-value thickness, 8.39
Harbor damage, see Hydraulic structures
Height of burst and blast damage, 3.30-3.33
and blast wave arrival time, 3.77
and dynamic pressure, 3.75
duration, 3.76
and fallout, 2.128
optimum, 3.73
and overpressure, 3.73
duration, 3.76
scaling, 3.62
Hematological effects, radiation, 12.124-12.132
High-altitude burst, 1.24, 1.36, 1.37, 2.52-2.62,
2.130-2.150
auroral phenomena, 2.62, 2.142-2.145
beta patch, 2.141
blast, 3.68
definition, 1.36, 2.130
and EMP, see Electromagnetic pulse
energy distribution, 1.36, 2.130, 7.89-7.92
eye injuries, 12.87
fireball, 2.53-2.59, 2.131, 2.136, 7.22
FISHBOWL series, 2.52
fluorescence radiation, 2.131, 2.138-2.141
ionization, atmospheric, 10.40-10.74
and ozone layer, 2.148-2.150
phenomena, 1.36, 1.37, 2.52-2.60, 2.130-
2.150
radio and radar effects, 10.89-10.121
shock wave, 2.136
thermal radiation, 2.131-2.135, 7.89-7.92,
7.102-7.105
X-ray pancake, 2.130, 7.91, 7.103
Hiroshima, nuclear explosion, 2.24, see also
Japan
Hot spots, 2.31, 9.66, 9.105
House damage, see Damage, residences
Hydraulic fill, craters, 6.09
Hydraulic structures, damage, 6.122-6.125
Hydrodynamic enhancement, 8.36, 8.47, 8.128-
8.131
phase, fireball, 2.117
separation, 2.115
Hypocenter, explosion, 2.34
Hydrogen bomb, see Thermonuclear weapons
isotopes, 1.16, 1.17, 1.67-1.69
Ignition, materials, 7.33-7.40
Implosion, 1.53
Impulse, 3.59, 3.63, 3.65, 3.66
and structure loading, 4.54, 4.56, 4.66
Incendiary effects, see Fires
Induced radioactivity, 8.16, 9.31-9.39
Industrial buildings, damage, 5.04, 5.28-5.51,
5.139, 5.140
Initial nuclear radiation, 1.02, 1.26-1.29, 1.34,
1.37-1.39, 2.41-2.45, 8.01-8.72, 8.89-8.124,
9.04, see also Gamma rays; Neutrons
Injuries, 12.01-12.239, see also Burns; Casual-
ties; Radiation injury
blast, direct 12.24-12.38, 12.239
indirect, 12.39-12.50, 12.238
blood, see Blood
burn, 12.51-12.78, see also Burns
causes, 12.18
combined, 12.133-12.143
eardrums, 12.38
eye, See Eye injuries t
in Japan, 12.08-12.23, 12.68-12.78, 12.114-
12.132, 12.144-12.154
ionizing radiation, 12.91, see also Radiation
injury
lung damage, 12.38
from missiles, 12.41-12.48
nuclear radiation, see Burns, beta; Radiation
injury
protection by buildings, 12.17
thermal radiation, see Burns
Iodine in delayed fallout, 9.123
Ionization, 1.38, 8.17, 10.04
atmospheric, 10.09-10.20, see also Geomag-
netic field
and electromagnetic waves, 10.04-10.08,
10.125-10.137
in nuclear explosions, 10.21-10.74
below 10 miles, 10.34-10.39
10 to 40 miles, 10.40-10.52
40 to 65 miles, 10.53-10.61
above 65 miles, 10.62-10.74
Ionizing radiation, 12.91, see also Nuclear radia-
tion
INDEX
649
Ionosphere, 10.09-10.20
electron density, 10.09
delayed radiation effects, 10.154-10.164
nuclear explosion effects, see Ionization, in
nuclear explosions
prompt radiation effects, 10.138-10.153
radio and radar effects, see Radio and radar
Ion pairs, 1.38, 8.17
Iron, radiation shielding, 8.41, 8.104
Isothermal sphere, fireball, 2.114-2.120, 2.124
Isotopes, 1.09
hydrogen, 1.16, 1.17, 1.67-1.69
Japan, nuclear explosions, 2.24
casualties, 12.08-12.23
nuclear radiation injuries, 12.114-12.132,
12.144-12.154
structural damage, 5.28-5.34, 5.52, 5.53,
5.85, 5.98, 5.106-5.108, 5.127
thermal radiation, burns, 12.68-12.78
incendiary effects, 7.61-7.72
materials effects, 7.44-7.48
Keloid formation, 12.78
Keratitis, 12.80
Leukemia, nuclear radiation, 12.147-12.149
Lithium deuteride, 1.70, 1.71
Loading, blast, 4.01-4.67, 6.94-6.103
arched structures, 4.62-4.66
buried structures, 6.94-6.103
development, 4.22-4.37
shape effect, 4.35-4.37
size effect, 4.31-4.34
diffraction, 4.03, 4.05-4.11
drag, 4.12-4.14, 4.29
nonideal blast wave, 4.67
structures, 4.15-4.20, 4.41-4.67
box-like, closed, 4.41—4.45
partially open, 4.46-4.51
cylindrical, 4.57-4.16
open-frame, 4.52-4.56
Lung injuries, 12.15, 12.28, 12.38
Mach effect, 2.33-2.37, 3.24-3.31, 3.34
front (or stem), 2.33-2.37, 3.25
and height of burst, 3.29
triple point, 3.25
Machine tools damage, 5.128-5.133
Marshall Islands, inhabitants, 12.175-12.183
Masonry buildings, damage, 5.76-5.79, 5.139,
5.140
Mean free path, 2.113, 7.79
Measurement, ionizing radiation, 8.20-8.30,
8.58-8.62
Megacurie, 9.141
Mesosphere, 3.42, 9.126
Meteorological effects, blast wave, 3.39-3.43
fallout, 9.66-9.74, 9.102, see also Hot spots;
Scavenging
fires, 7.54, 7.58, 7.71, 7.72
Million electron volt (or MeV), 1.42
Mobile homes, damage, 5.80-5.84
Monitoring, ionizing radiation, see Measurement
Mutations, see Genetic effects
Nagasaki, nuclear explosion, 2.24, see also Japan
Neoplasms, nuclear radiation, 12.147-12.151
Neutron, 1.08, 1.31, 8.01, 8.04, 8.49-8.72
absorption (or attenuation), 8.66-8.72, 9.120
capture, 8.08, 8.11, 8.16, 8.54, 8.56, 9.31-
9.39
cross section, 8.112
delayed, 8.50
dose-distance relationships, 8.121-8.124
fast, 8.52
fluence, 8.61
flux, 8.60
measurement, 8.58-8.62
hydrodynamic enhancement, 8.50
induced activity, 8.16, 9.31-9.39
initial nuclear radiation, 8.01, 8.04, 8.49-8.72
interaction with matter, 8.107-8.113
ionization, 8.58, 8.59
measurement, 8.58-8.62
prompt, 8.50
RBE, 12.97
scattering, 2.41,8.09, 8.52, 8.53, 8.107, 8.108
л shielding, 8.66-8.72, 9.120
slow, 8.52
slowing down, 8.54
sources, 8.01, 8.04, 8.49-8.57
spectrum, 8.53, 8.114-8.120
equilibrium, 8.118, 8.119
thermal, 8.52
from thermonuclear (fusion) reactions, 1.69,
1.72, 8.57, 8.116, 8.117, 8.119
transmission factors, 8.72, 9.120
transmission from source, 8.52-8.56, 8.117-
8.120
Nitrogen, neutron reaction, 8.11, 8.54, 8.56,
8.110, 9.34
Nuclear explosion, blast wave, 1.01, see also
Blast; Shock
casualties, see Casualties
characteristics, 1.01-1.23
and conventional explosions, 1.01-1.03
damage, see Damage
description, air burst, 2.03-2.51, see also Air
burst
high-altitude burst, 2.52-2.62, see also
High-altitude burst
surface burst, 2.03-2.51, see also Surface
burst
underground burst, 2.90-2.105
underwater burst, 2.63-2.89
650
INDEX
fireball development, see Fireball
incendiary effects, see Fires
injuries, see Injuries; Radiation injury
ionization, see Ionization
nuclear radiation, see Nuclear radiation
pressures, 2.107
principles, 1.46-1.59
radio and radar effects, see Radio and radar
shock wave, 1.01, see also Blast; Shock
temperatures, 1.23, 2.107, 7.75
thermal radiation, see Thermal radiation
types, 1.31-1.41, 2.01, 2.02
Nuclear radiation, 1.02, 1.34-1.39, 2.41-2.45
from air burst, 1.33-1.35, 2.44, 2.45
biological effects, on animals, 12.240-12.254
on man, see Radiation injury
on plants, 12.240-12.243, 12.255-12.265
initial, see Initial nuclear radiation
injuries, see Radiation injury
prompt, 2.41
residual, see Residual nuclear radiation
from surface burst, 2.23-2.31, 8.37, 8.65,
9.50-9.52
transmission factors, 8.72, 9.120
from underground burst, 1.39, 2.99, 2.100
from underwater burst, 2.77-2.79, 2.81, 2.82,
2.89
Nuclear weapons, 1.02, 1.11, 1.19-1.21, 1.51-
1.72, see also Nuclear explosions
boosted, 1.72
clean and dirty, 9.47
criticality attainment, 1.51-1.53
fission, 1.46-1.59
fusion, 1.67-1.72, see also Thermonuclear
weapons
salted, 9.11
thermonuclear, see Thermonuclear weapons
yield, 1.20, 1.21
Nucleus, atomic, 1.08
Nuclide, 1.10
radioactive, 1.30
Oil-tank damage, 5.155
Overpressure, 2.33, 3.01-3.05, 3.21-3.34,
3.53-3.85, see also Blast; Loading; Mach ef-
fect
decay rate, 3.09, 3.57
distance relationships, 3.73
duration, 3.76
free air, 3.72
and height of burst, 3.73, 3.76
loading, see Loading, diffraction
negative, 3.05
peak, 3.02, 3.74
arrival time, 3.77
Rankine-Hugoniot relations, 3.55, 3.56
reflected, 3.56, 3.78
scaling, 3.66
surface (terrain) effects, 3.47-3.50, 3.79-3.85
Ozone layer, nuclear explosion effects, 2.148-
2.150
Pair production, gamma-ray, 8.92
Particles, rate of fall, 9.163-9.166
Pathology, radiation injury, 12.220-12.237
Photoelectric effect, gamma-ray, 8.91
Photon, 1.74, 7.79
Planck equation (or theory), 1.74, 7.73, 7.74
Plants, nuclear explosion effects, 12.240-12.243,
12.255-12.265
Plastic deformation, 5.15
Plastics, thermal damage, 7.39
Plastic zone, crater, 6.07, 6.70
Plutonium, fission, 1.14, 1.15, 1.18, 1.42, 1.44,
1.45
hazard, 12.173
in weapons residues, 9.40-9.43
Polar front, 9.127
Precursor, blast wave, 3.49, 3.79-3.85
loading, 4.67
Pressure, blast and shock, see Dynamic pressure;
Loading; Overpressure
Profile burns, 12.70
Protection, see Evasive action; Shielding
factors, initial radiation, 8.72
fallout, 9.120
Proton, 1.08
Quantum, 1.74
theory, see Planck
Rad, 8.18
Radar effects, see Radio and radar
Radiant exposure, 7.35
power, 7.74, 7.82-7.84, 7.86
Radiation injury, 12.90-12.237
acute, 12.102-12.132
blood, 12.124-12.132
cancer (neoplasms), 12.147-12.151
cataracts, 12.144-12.146
clinical phenomena, 12.108-12.123
delayed, 12.142-12.154
from fallout,
early, 12.155-12.183
delayed, 12.184-12.200
genetic, 12.208-12.219
pathology, 12.220-12.237
thyroid, 12.171, 12.181-12.183
Radiation Effects Research Foundation, 12.142
Radiation, nuclear, see Gamma rays; Neutrons;
Nuclear radiation
Radioactive capture, neutrons, 8.08
Radioactive cloud, see Cloud
Radioactive half-life, 1.63
Radioactivity, 1.02, 1.28-1.30, 1.61-1.66, see
also Fallout
induced, 8.16, 9.31-9.39
INDEX
Radioflash, see Electromagnetic pulse
Radionuclide, 1.30
Radio and radar effects, 10.01-10.164, see also
Ionization, in nuclear explosions
attenuation, signal, 10.78, 10.79
blackout, 10.01
Doppler shift, 10.83
degradation, signal, 10.75-10.77
HF (high-frequency), 10.100-10.107
hydromagnetic disturbance, 10.26
initial radiation, 10.149-10.153
LF (low-frequency), 10.97, 10.98
MF (medium-frequency), 10.82-10.84
noise, 10.80, 10.81
phase changes, 10.82-10.84, 10.94
radar systems, 10.114-10.122
radio systems, 10.89-10.113, 10.122
residual radiation, 10.154-10.164
scattering, 10.87, 10.88
summary, 10.122
UHF (ultrahigh-frequency), 10.112, 10.113
VHF (very-high-frequency), 10.92-10.111
VLF (very-low-frequency), 10.92-10.96
Railroad equipment, damage, 5.92, 5.93, 5.146
Rainout, 9.74
Rankine-Hugoniot relations, 3.53-3.56
RBE (Relative biological effectiveness), 12.94
Reflection, blast wave, see Blast wave; Mach
effect
Reinforced-concrete buildings, damage, 5.20-
5.27, 5.139, 5.140
Relative biological effectiveness (RBE), 12.94
Rem, 12.95
Residences, damage, 5.04, 5.52-5.84, 5.139,
5.140, 7.28
Residual nuclear radiation, 1.02, 1.26-1.30,
1.35, 1.39, 9.01-9.166, see also Fallout; Ra-
dioactivity, induced
Response, spectrum, 6.90
structures, 5.08-5.18, see also Damage
Retinal burns, see Eye injuries
Roentgen, 8.17
Rupture zone, crater, 6.07, 6.70
Scattering, see Compton effect; Gamma radiation;
Thermal radiation; Neutrons
Scavenging, fallout, 2.30, 9.67-9.74
Scintillation counter, 8.23
Seismic effects, 2.102, 2.105, 6.19-6.27
Semiconductor detector, 8.22
Semiconductor, EMP effects, 11.31, 11.32
radiation effects, 8.77-8.80
Shake, 1.54
Shielding, gamma rays, 8.05, 8.38-8.45, 8.72,
9.120
neutrons, 8.66-8.72
thermal radiation, 7.18, 7.19
Ships, damage, 5.96, 5.97, 5.146, 6.63-6.65
651
Shock (and Shock wave), 1.01, 1.33, 6.82-6.84,
see also Blast
front, 1.01, 3.03
in fireball, 2.155-2.120
ground, in air burst, 3.51, 3.52
damage from, 6.104-6.114
in surface burst, 6.12-6.17
in underground burst, 6.18, 6.19, see also
Seismic effects
in underwater burst, 6.14-6.52, 6.115-6.118
Skin burns, see Burns
Skyshine, gamma-ray, 8.44
Slick, in underwater burst, 2.65
Smoke, and thermal radiation, 7.16, 7.17
Soil, vaporization in surface burst, 2.18
Spray dome in underwater burst, 2.66, 2.84
Stagnation pressure, 4.25
Stefan-Boltzmann law, 7.82
Stopping altitude, 10.29
Storage tank, damage, 5.155
Stratosphere, 9.126
fallout from, 9.130, 9.131, 9.135-9.139
Stopping altitude, radiation, 10.29
Strontium-90 in delayed fallout, 9.124, 9.140-
9.145
radiation hazard, 12.188-12.196
Structural damage, see Damage
Structures, see Damage; Loading
Subsurface bursts, see Surface; Underground;
Underwater
Subways, damage, 6.106
Surface (and shallow underground) burst, 1.40,
2.18-2.31, 2.90-2.100, 6.01-6.18
air blast, 2.32-2.37, 3.34-3.74, 6.02, 6.80,
6.81
characteristics, 2.18-2.37, 2.90-2.100, 6.01-
6.18
contact, 3.34, 3.74
crater formation, 2.21, 2.90-2.94, 6.03-6.11,
6.70-6.79, see also Crater
damage in, 6.28-6.31, 6.94-6.103
EMP effect, 11.03, 11.10-11.12, 11.68, 11.69
fallout, 2.23-2.31, 9.50-9.52, see also Fallout
fireball, 2.18, 7.20
ground motion, 6.82-6.84
ground shock, 6.12-6.18
nuclear radiation, initial, 8.37, 8.65, see also
Nuclear radiation
residual, 2.23-2.31, 9.50-9.52
radioactive cloud, 2.19-2.22
contamination, 9.50-9.52
thermal radiation, 7.20, 7.42, 7.101
Surface effects on blast, see Terrain effects
Surface zero, 2.34
Survey meter, 7.30
Tamper, nuclear weapon, 1.50
Tenth-value thickness, 8.38, 8.102
652
INDEX
Terrain effects, on blast, 3.35-3.38, 3.47-3.50,
3.79-3.85
on fallout, 9.95, 9.101, 9.156, 9.161
Thermal layer, 3.80
Thermal pulses, in air burst, 2.38-2.40, 7.86,
7.87
in high-altitude burst, 2.132, 2.133, 7.89
Thermal radiation, 1.02, 1.22-1.25, 1.73-1.79,
7.01-7.105
absorption, in materials, 7.23-7.31, 7.33, 7.34
in air burst, 1.33, 2.38-2.40, 7.03-7.05,
7.85-7.100
and atmospheric conditions, 7.11-7.17, 7.98
attenuation, 7.08-7.19, 7.94, 7.98
burns, see Burns, flash
damage, 7.33-7.40
definition, 7.02
effects, 7.23-7.53
in Japan, 7.44—7.48, 7.61-7.72
energy fraction, air burst, 1.25, 7.04, 7.88
high-altitude burst, 7.22, 7.90, 7.102, 7.104
surface burst, 7.101
evasive action, 7.87
exposure-distance relationship, 7.41-7.43,
7.93-7.105
and fabrics, 7.27, 7.33-7.35
from fireball, 7.01-7.22, 7.73-7.92
in high-altitude burst, 7.22, 7.89-7.92, 7.102-
7.105
ignition exposures, 7.35, 7.40
incendiary effects, 7.49-7.72
injuries, 7.32, 12.51-12.78
materials ignition, 7.33-7.40, 7.44-7.49
and plastics, 7.39
primary, 1.77, 7.01, 7.75, see also Thermal
X-rays
prompt, 7.02
pulses, see Thermal pulses
radiant exposure, 7.35
power, 7.74, 7.82-7.84, 7.86
scattering, 7.08, 7.10-7.17, 7.19, 7.95, 7.98
shielding, 7.18, 7.19
smoke and fog effects, 7.16, 7.17
in surface burst, 7.20, 7.101
transmittance, 7.95-7.98, 7.101, 7.104, 7.105
underground burst, 2.99
underwater burst, 2.80
Thermal X-rays, 1.77-1.79, 7.01, 7.75, 7.80,
7.81, 7.90-7.92, 7.104
ionization, 10.53, 10.57, 10.60, 10.62, 10.69
Thermonuclear (fusion) reactions, 1.17-1.19,
1.67-1.72
weapons, 1.67-1.72
fallout patterns, 9.94
gamma rays, 8.33
neutrons, 8.64, 8.116, 8.117, 8.119
Thermosphere, 3.43, 9.126
Thyroid abnormalities, 12.171, 12.181-12.183
Time scale, fission explosion, 1.54—1.59
TNT equivalent, 1.20, 1.45
Trailer coach, damage, 5.80-5.84
Transient-radiation effects on electronics (TREE),
8.73-8.88, 8.133-8.144
characteristics, 8.73-8.76
effects on equipment, 8.77, 8.78
mechanism, 8.133-8.144
Transmission factors, initial nuclear radiation,
8.72
residual nuclear radiation, 9.120
Transmittance, thermal radiation, 7.95-7.98,
7.101-7.104, 7.105
Transportation equipment, damage, 5.85-5.97,
5.146, 5.147
Trinity test, 2.36, 12.245, 12.246
Triple point, 3.25, see also Mach effect
Tritium, thermonuclear (fusion) reactions, 1.67-
1.70
in residual radiation, 12.197, 12.200
Tropopause, 2.13, 9.126
Troposphere, 3.40, 9.126
fallout from, 9.130-9.134
Tunnels, damage, 6.109
Ultraviolet radiation, 1.73, 1.78, 2.38, 2.39,
7.75, 7.76
Underground burst (deep), 1.39, 2.90-2.105,
6.19-6.40, 6.85-6.93
aftershocks, 2.105, 6.20-6.27
air blast, 6.02, 6.53
base surge, 2.96-2.98
cavity, 2.102, 6.85-6.88
characteristics, 2.90-2.105
chimney, 2.103, 6.89
damage criteria, 6.104-6.114
fallout, 2.98, see also Fallout
fault displacement, 6.20-6.27
fireball, 2.91
ground motion, 6.33-6.40
loading, buried structures, 6.104-6.111
seismic effects, 6.19-6.27
shallow, see Surface burst
shock wave, 6.18, 6.19, 6.33
and structures, 6.33-6.40
Underwater burst, 1.39, 2.63-2.89, 6.41-6.69,
6.115-6.125
air blast, 6.53, 6.68, 6.69
base surge, radioactive, 2.76-2.79
visible, 2.72-2.75
characteristics, 2.63-2.79, 6.41-6.69
cloud, 2.69
column, 2.67, 2.68
contamination, water, 9.53-9.58
crack, 2.65
crater formation, 6.60, 6.61
damage, 6.62-6.64
deep, 2.81-2.89
INDEX
653
fireball, 2.64
hydraulic structures, damage, 6.122-6.124
nuclear.radiation, 2.74-2.79; 2.81, 2.82, see
also Fallout
overpressure, water, 6.41
plume, 2.67
shallow, 2.63-2.82
ships, damage, 6.58, 6.63-6.69
shock wave, 6.41-6.52, 6.62-6.69, 6.115-
6.118
reflection, 6.43, 6.44-6.52
surface cutoff, 6.43
slick, 2.65
thermal radiation, 2.80
water waves, 2.70, 2.71, 6.54-6.59, 6.119-
6.121
Unit-time reference dose rate, 9.16-9.23, 9.92-
9.95
Uranium fission, 1.14, 1.15, 1.18, 1.42, 1.44,
1.45, 1.72
hazard, 12.174
in weapons residues, 9.31, 9.40-9.42
Utilities, damage, 5.98-5.121
Vehicle, damage, 5.86-5.91, 5.146
Wall-bearing structures, 5.27, 5.139
Wall failure, 5.145
Weapons, nuclear, see Nuclear weapons
Weather effects, see Meteorological effects
Wien’s displacement law, 7.77
Wilson cloud, 2.47-2.50, 2.66
Wind, and fallout patterns, 9.96-9.98
Wind (dynamic pressure), 3.07, 3.08, 3.13, 3.14,
3.15
velocity, 3.07, 3.55
Wood, thermal radiation effects, 7.37, 7.38, 7.40,
7.44
Worldwide fallout, see Fallout, delayed
X-ray fireball, 2.1 iO
X rays, 1.73, 1.77, 1.79
absorption; 2.134, 7.80, 7.81, 7.92
degradation, 1.78, 2.38, 7.02, 7.75
ionization, atmospheric, 10.53, 10.57, 10.60,
10.62, 10.69
pancake, 2.134, 2.135, 7.91, 7.103
stopping altitude, 10.29
thermal, see Thermal X-rays
Yield, explosion, 1.20, 1.21, 1.45
U.S. GOVERNMENT PRINTING OFFICE' 1977 0—213—794
NUCLEAR BOMB EFFECTS COMPUTER
(Revised Edition, 1977)
developed by
The Lovelace Biomedical and
Environmental Research Institute, Inc.
for
The Division of Biomedical and Environmental Research
Energy Research and Development Administration
Based on data from
“The Effects of Nuclear Weapons,” Third Edition