/


Автор: Handley H. A. Tolk A.
Теги: programming languages programming computer science microprocessors reverse engineering
ISBN: 9781119698753
Год: 2021
Похожие


Текст
A Framework of Human Systems Engineering
IEEE Press
445 Hoes Lane
Piscataway, NJ 08854
IEEE Press Editorial Board
Ekram Hossain, Editor in Chief
Jón Atli Benediktsson
Xiaoou Li
Saeid Nahavandi
Sarah Spurgeon
David Alan Grier
Peter Lian
Jeffrey Reed
Ahmet Murat Tekalp
Elya B. Joffe
Andreas Molisch
Diomidis Spinellis
A Framework of Human Systems Engineering
Applications and Case Studies
Edited by
Holly A. H. Handley
Andreas Tolk
Copyright © 2021 by The Institute of Electrical and Electronics Engineers, Inc. All rights reserved.
Published by John Wiley & Sons, Inc., Hoboken, New Jersey.
Published simultaneously in Canada.
No part of this publication may be reproduced, stored in a retrieval system, or transmitted in any form or by
any means, electronic, mechanical, photocopying, recording, scanning, or otherwise, except as permitted under
Section 107 or 108 of the 1976 United States Copyright Act, without either the prior written permission of
the Publisher, or authorization through payment of the appropriate per-copy fee to the Copyright Clearance
Center, Inc., 222 Rosewood Drive, Danvers, MA 01923, (978) 750-8400, fax (978) 750-4470, or on the web at
www.copyright.com. Requests to the Publisher for permission should be addressed to the Permissions Department,
John Wiley & Sons, Inc., 111 River Street, Hoboken, NJ 07030, (201) 748-6011, fax (201) 748-6008, or online at
http://www.wiley.com/go/permissions.
Limit of Liability/Disclaimer of Warranty: While the publisher and author have used their best efforts in preparing
this book, they make no representations or warranties with respect to the accuracy or completeness of the contents
of this book and specifically disclaim any implied warranties of merchantability or fitness for a particular purpose.
No warranty may be created or extended by sales representatives or written sales materials. The advice and
strategies contained herein may not be suitable for your situation. You should consult with a professional where
appropriate. Neither the publisher nor author shall be liable for any loss of profit or any other commercial damages,
including but not limited to special, incidental, consequential, or other damages.
For general information on our other products and services or for technical support, please contact our
Customer Care Department within the United States at (800) 762-2974, outside the United States at (317) 572-3993
or fax (317) 572-4002.
Wiley also publishes its books in a variety of electronic formats. Some content that appears in print may not be
available in electronic formats. For more information about Wiley products, visit our web site at www.wiley.com.
Library of Congress Cataloging-in-Publication Data:
Names: Handley, Holly A. H., editor. | Tolk, Andreas, editor.
Title: A framework of human systems engineering : applications and case
studies / edited by Holly A. H. Handley, Andreas Tolk.
Description: Hoboken, New Jersey : Wiley-IEEE Press, [2021] | Includes
bibliographical references and index.
Identifiers: LCCN 2020038951 (print) | LCCN 2020038952 (ebook) | ISBN
9781119698753 (cloth) | ISBN 9781119698777 (adobe pdf) | ISBN
9781119698760 (epub)
Subjects: LCSH: Systems engineering. | Human engineering.
Classification: LCC TA168 .F736 2021 (print) | LCC TA168 (ebook) | DDC
620.8/2–dc23
LC record available at https://lccn.loc.gov/2020038951
LC ebook record available at https://lccn.loc.gov/2020038952
Cover Design: Wiley
Cover Images: Power robotic arm© Phanie/Alamy Stock Photo, Young woman with wearing smart glass
© Tim Robberts/Getty Images, Self driving vehicle © metamorworks/Getty Images, Abstract background
© MR.Cole_Photographer/ Getty Images
10
9
8
7
6
5
4
3 2
1
To Mark
Quarantined together for 86 days and still married.
HAHH
To my father, who taught me the love for numbers and precision,
And to my mother, who taught me the love for the human mind and inclusion.
Andreas Tolk
vii
Contents
E
ditor Biographies xv
Contributors List xvii
Foreword xxi
Preface xxiii
Section 1
1
1.1
1.2
1.3
1.4
1.5
1.6
2
2.1
2.2
2.3
2.4
2.5
2.6
3
3.1
3.2
3.3
3.3.1
3.3.2
Sociotechnical System Types
1
Introduction to the Human Systems Engineering Framework 3
Holly A. H. Handley
Introduction 3
Human-Centered Disciplines 3
Human Systems Engineering 4
Development of the HSE Framework 5
HSE Applications 7
Conclusion 9
References 9
Human Interface Considerations for Situational Awareness 11
Christian G. W. Schnedler and Michael Joy
Introduction 11
Situational Awareness: A Global Challenge 12
Putting Situational Awareness in Context: First Responders 13
Deep Dive on Human Interface Considerations 14
Putting Human Interface Considerations in Context: Safe Cities 15
Human Interface Considerations for Privacy-Aware SA 16
Reference 17
Utilizing Artificial Intelligence to Make Systems Engineering More Human
Philip S. Barry and Steve Doskey
Introduction 19
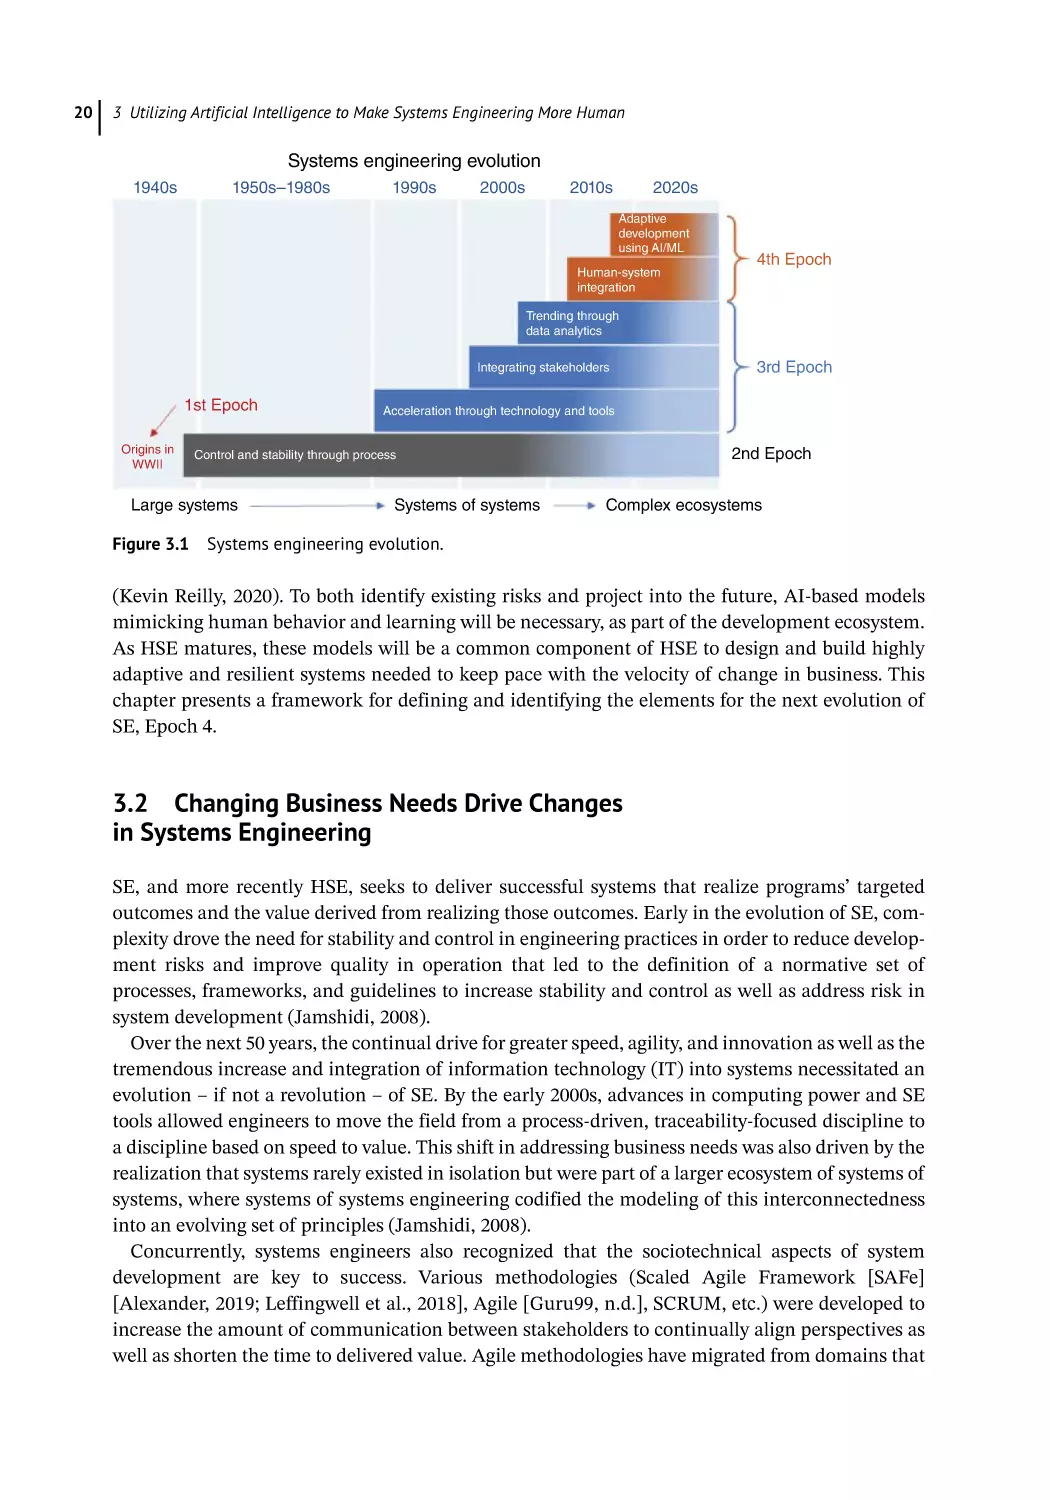
Changing Business Needs Drive Changes in Systems Engineering 20
Epoch 4: Delivering Capabilities in the Sociotechnical Ecosystem 21
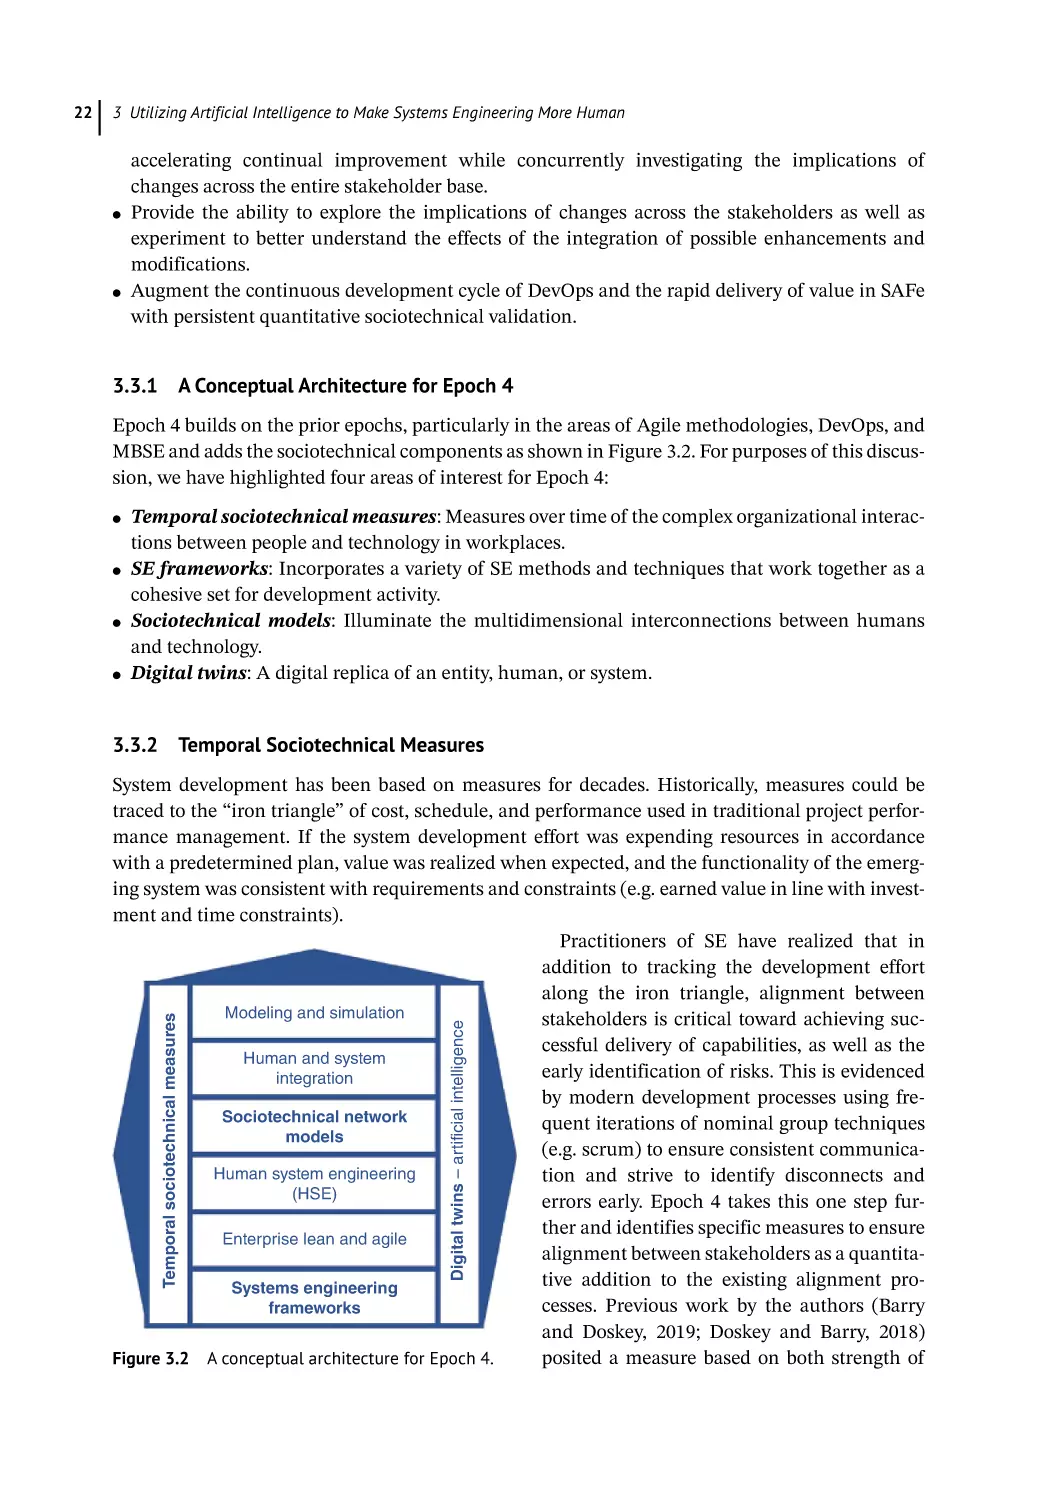
A Conceptual Architecture for Epoch 4 22
Temporal Sociotechnical Measures 22
19
viii
Contents
3.3.3
3.3.3.1
3.3.3.2
3.4
3.5
3.6
3.7
3.8
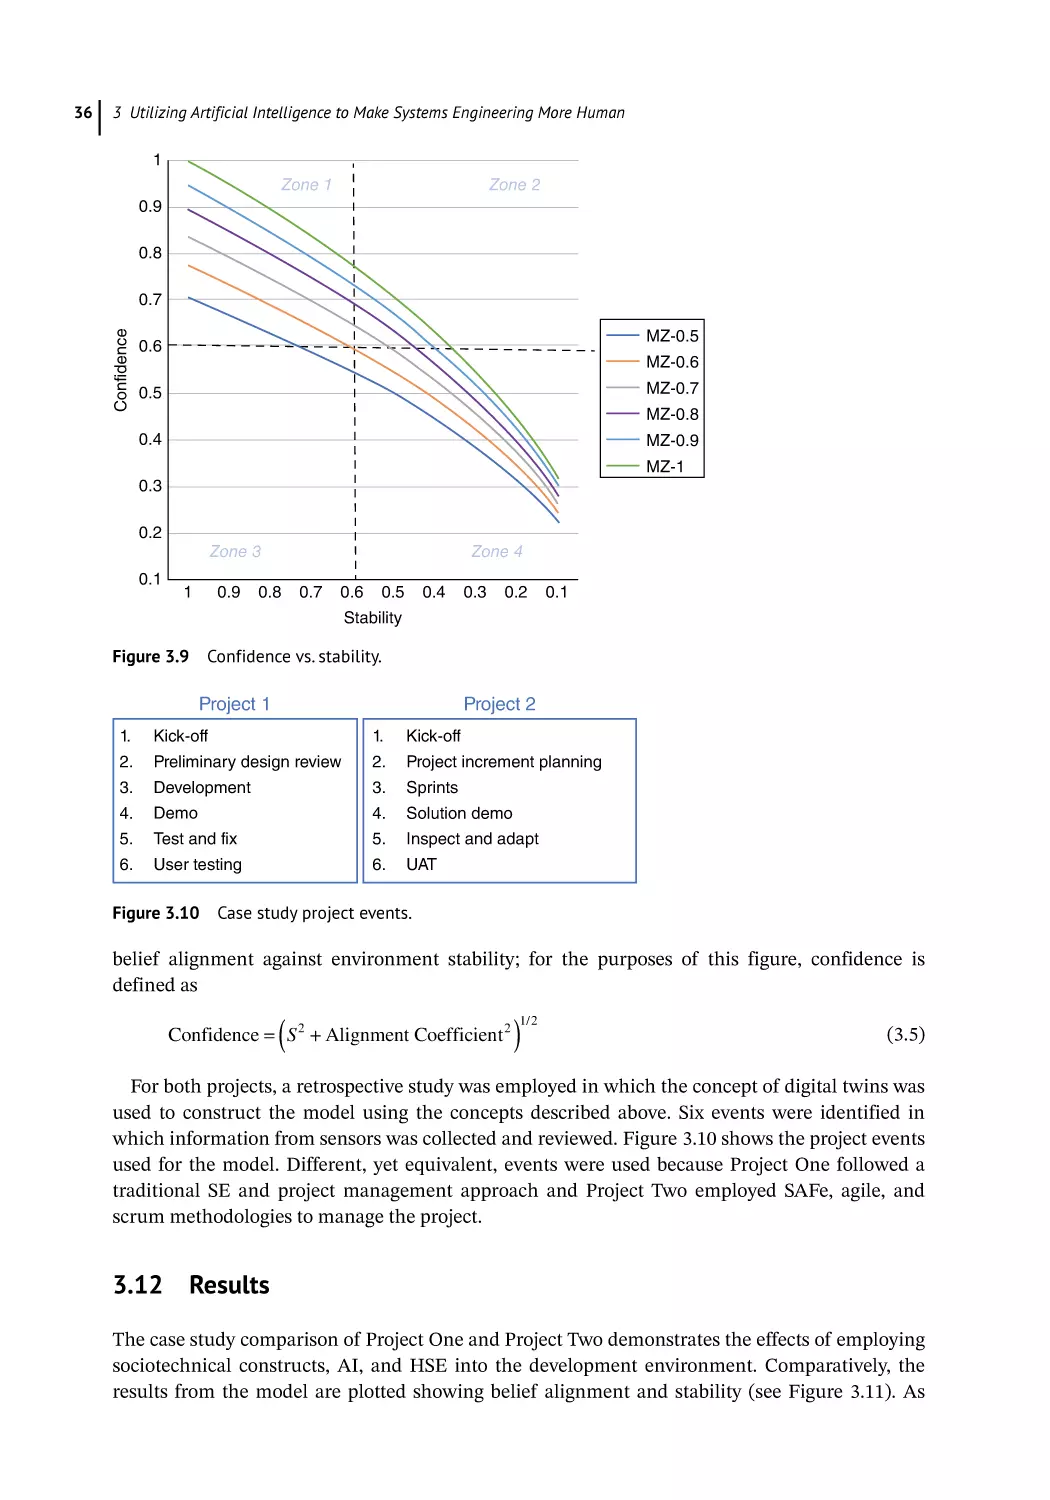
3.9
3.10
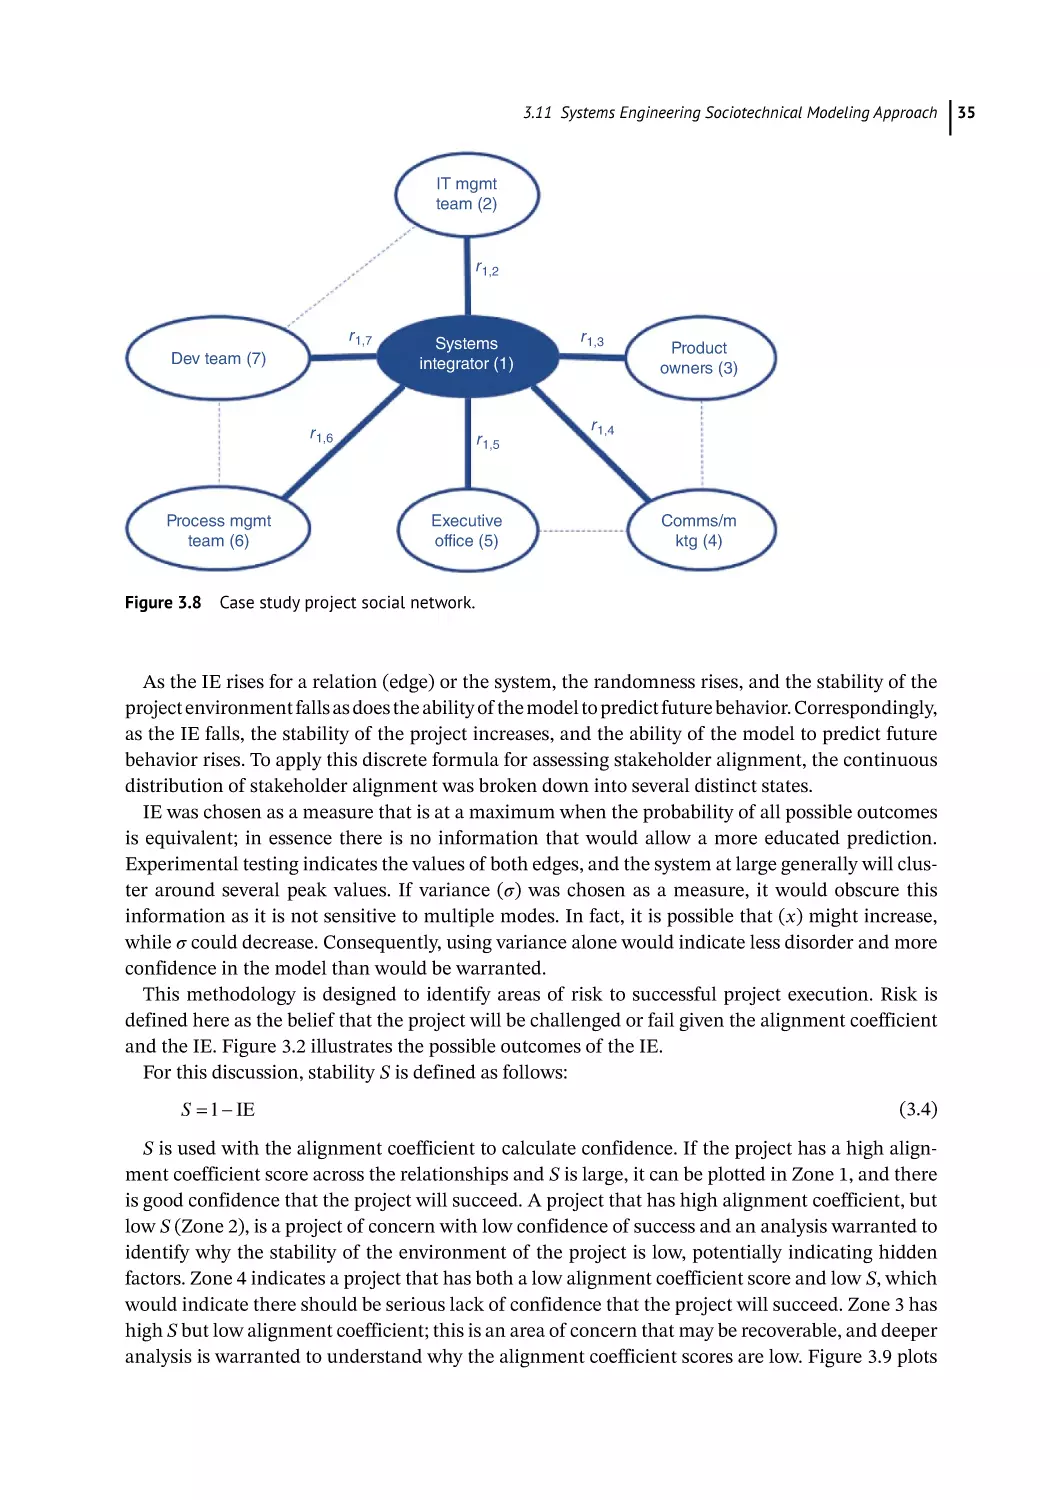
3.11
3.11.1
3.12
3.13
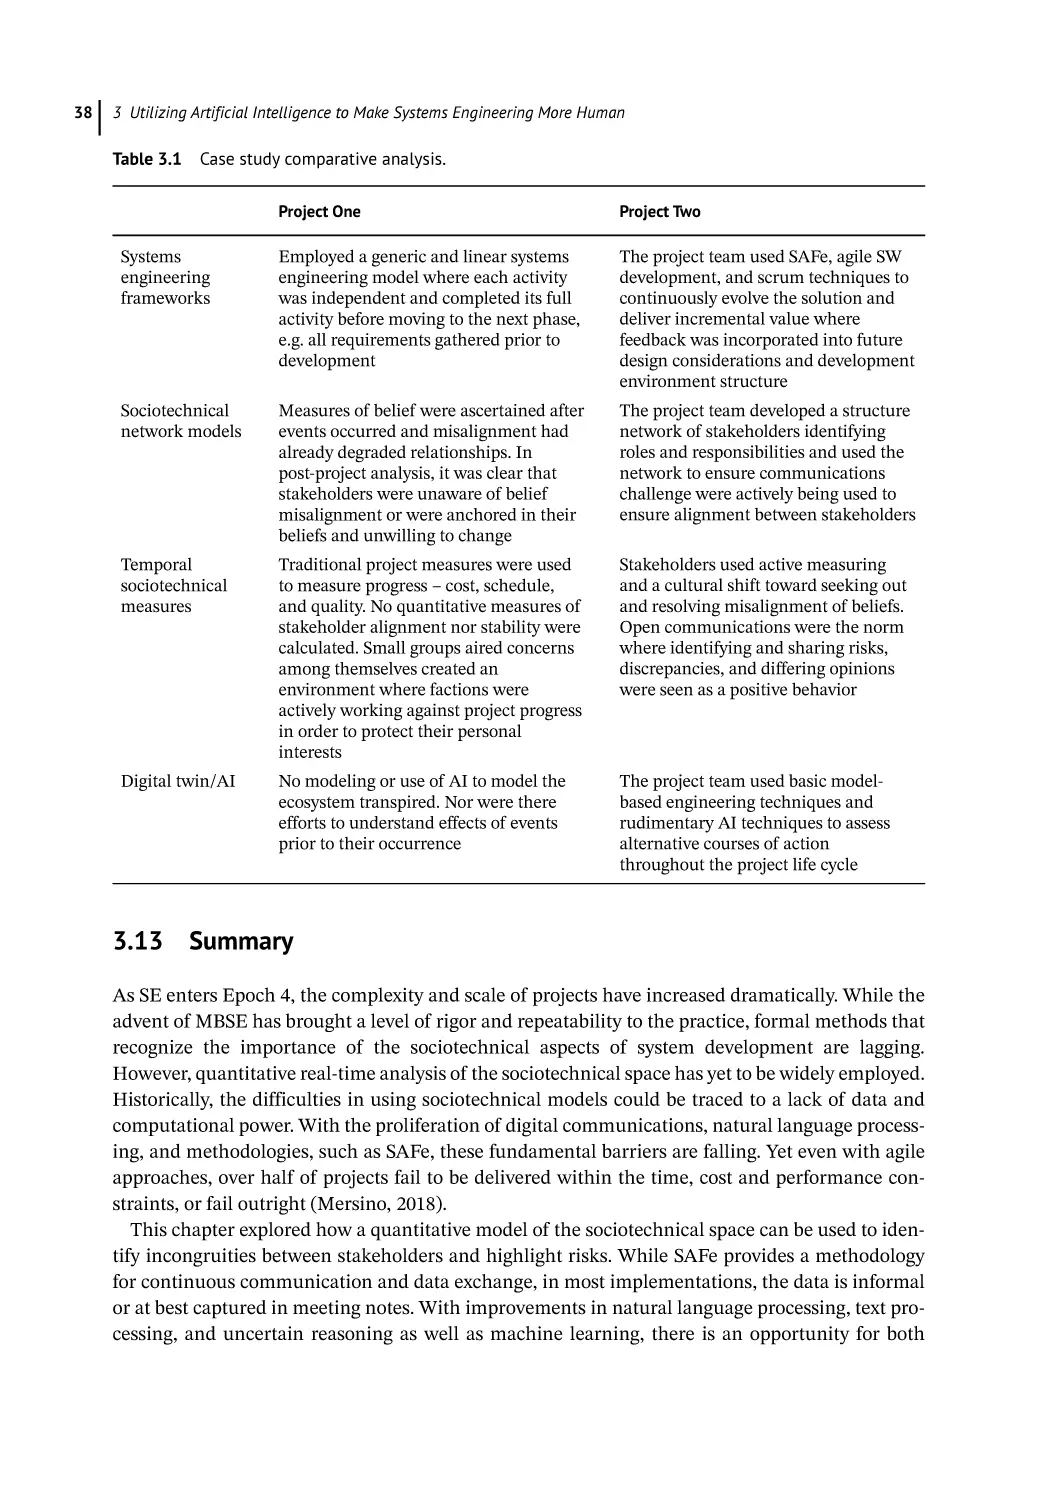
Systems Engineering Frameworks 23
Sociotechnical Network Models 23
Digital Twins 23
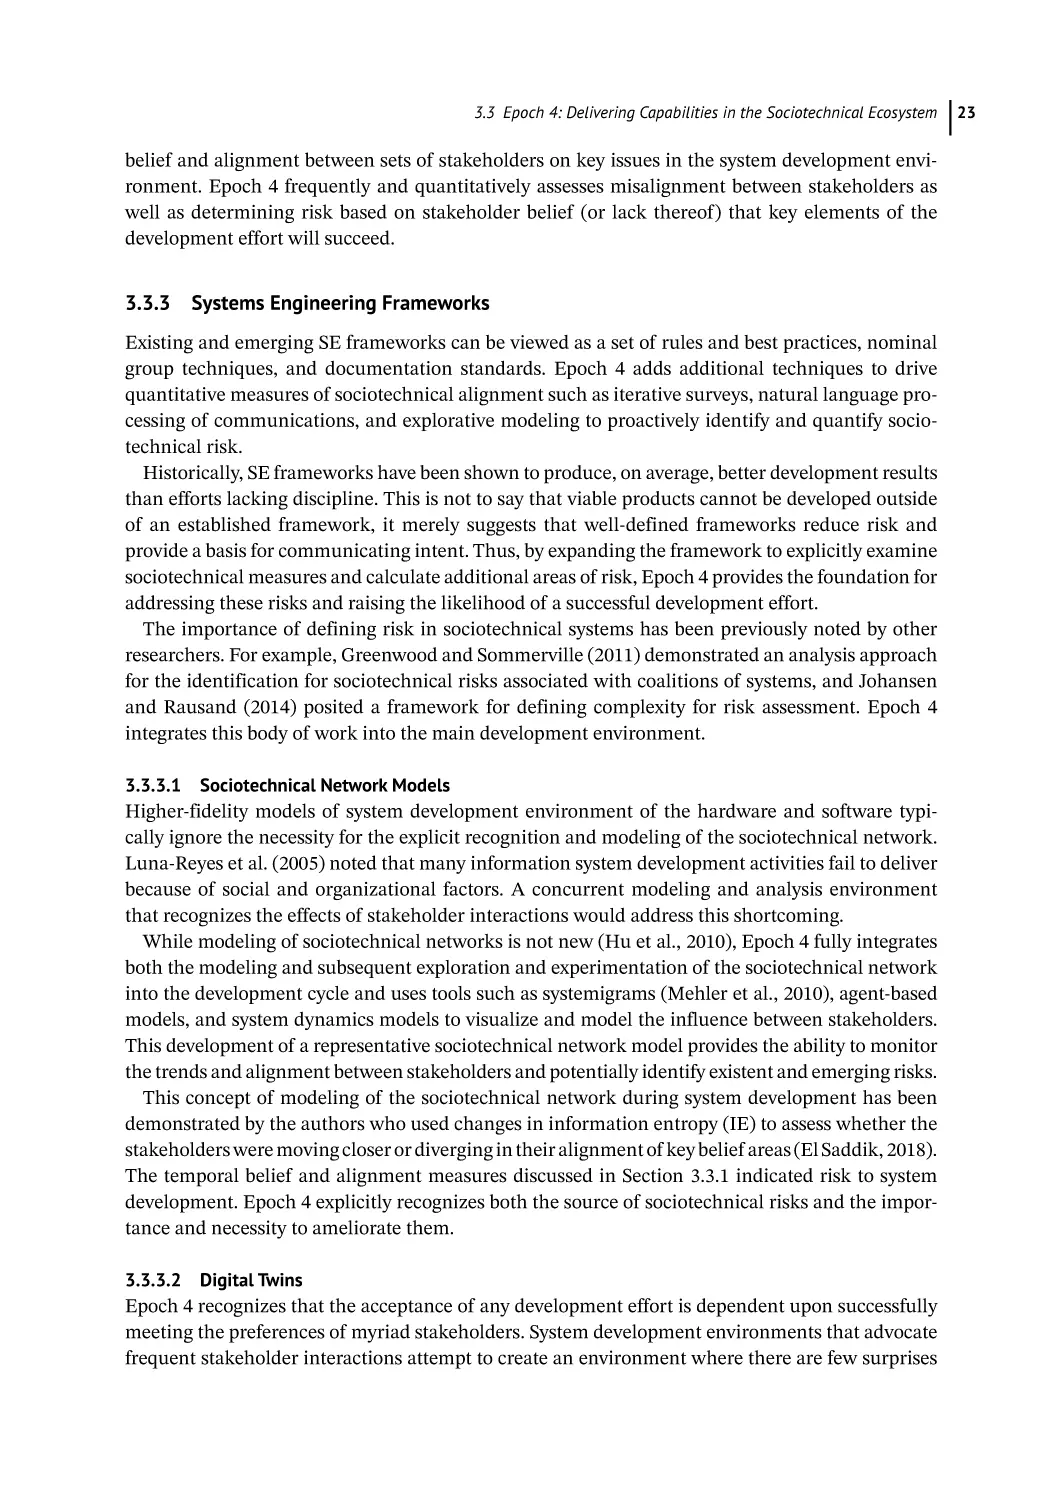
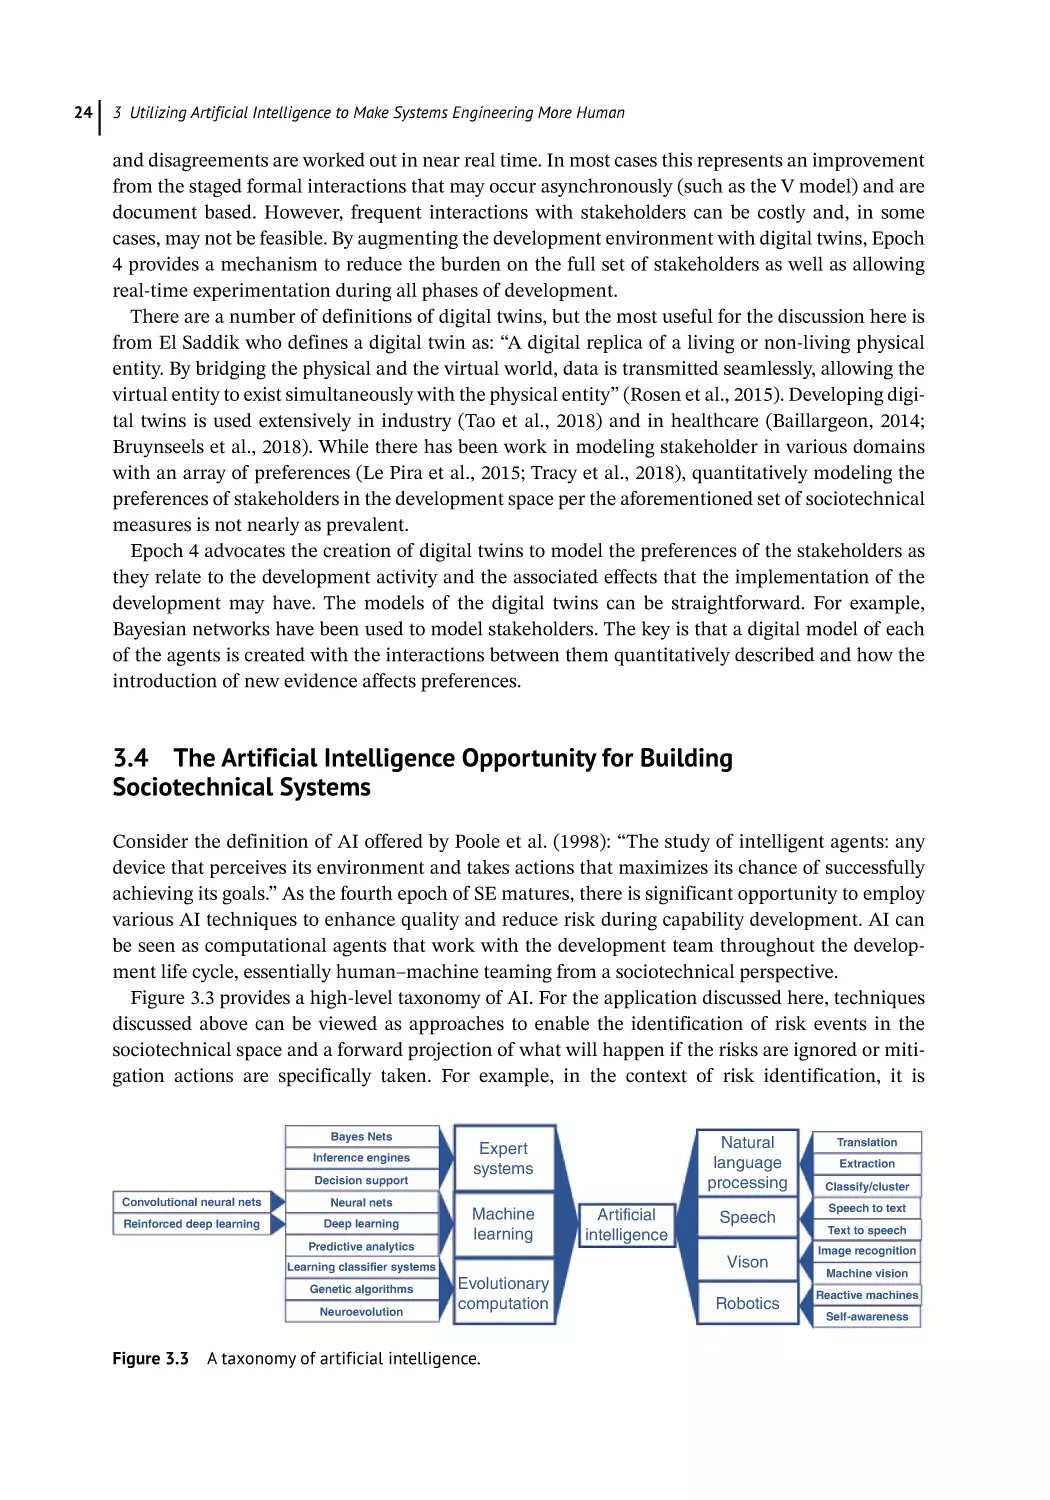
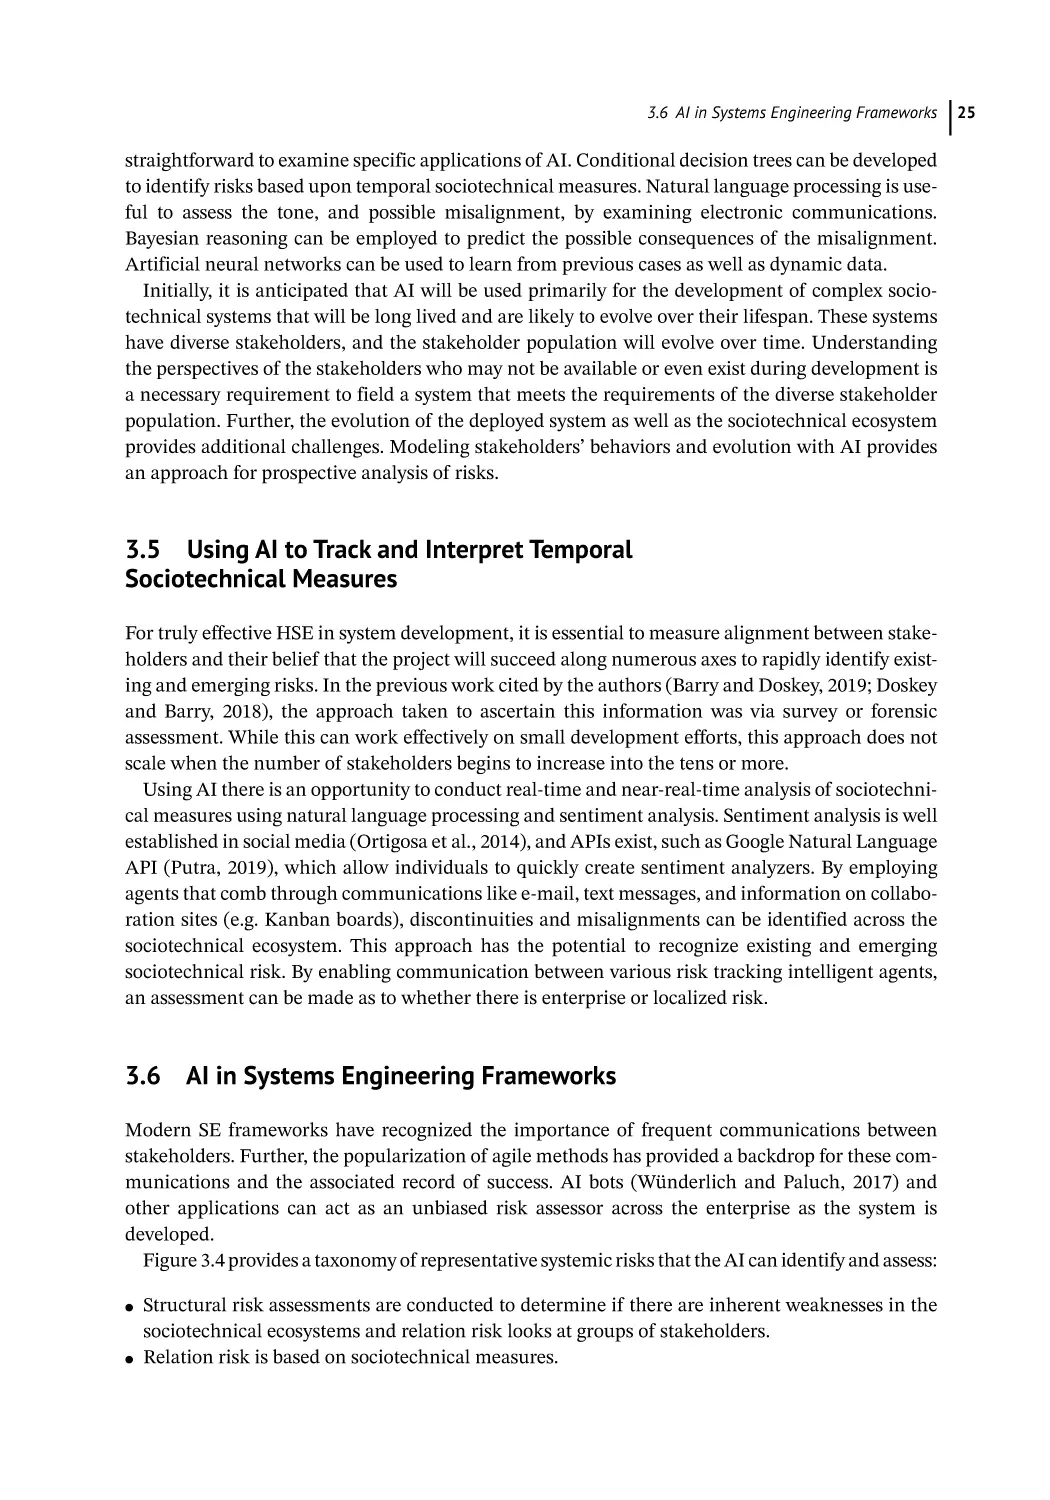
The Artificial Intelligence Opportunity for Building Sociotechnical Systems 24
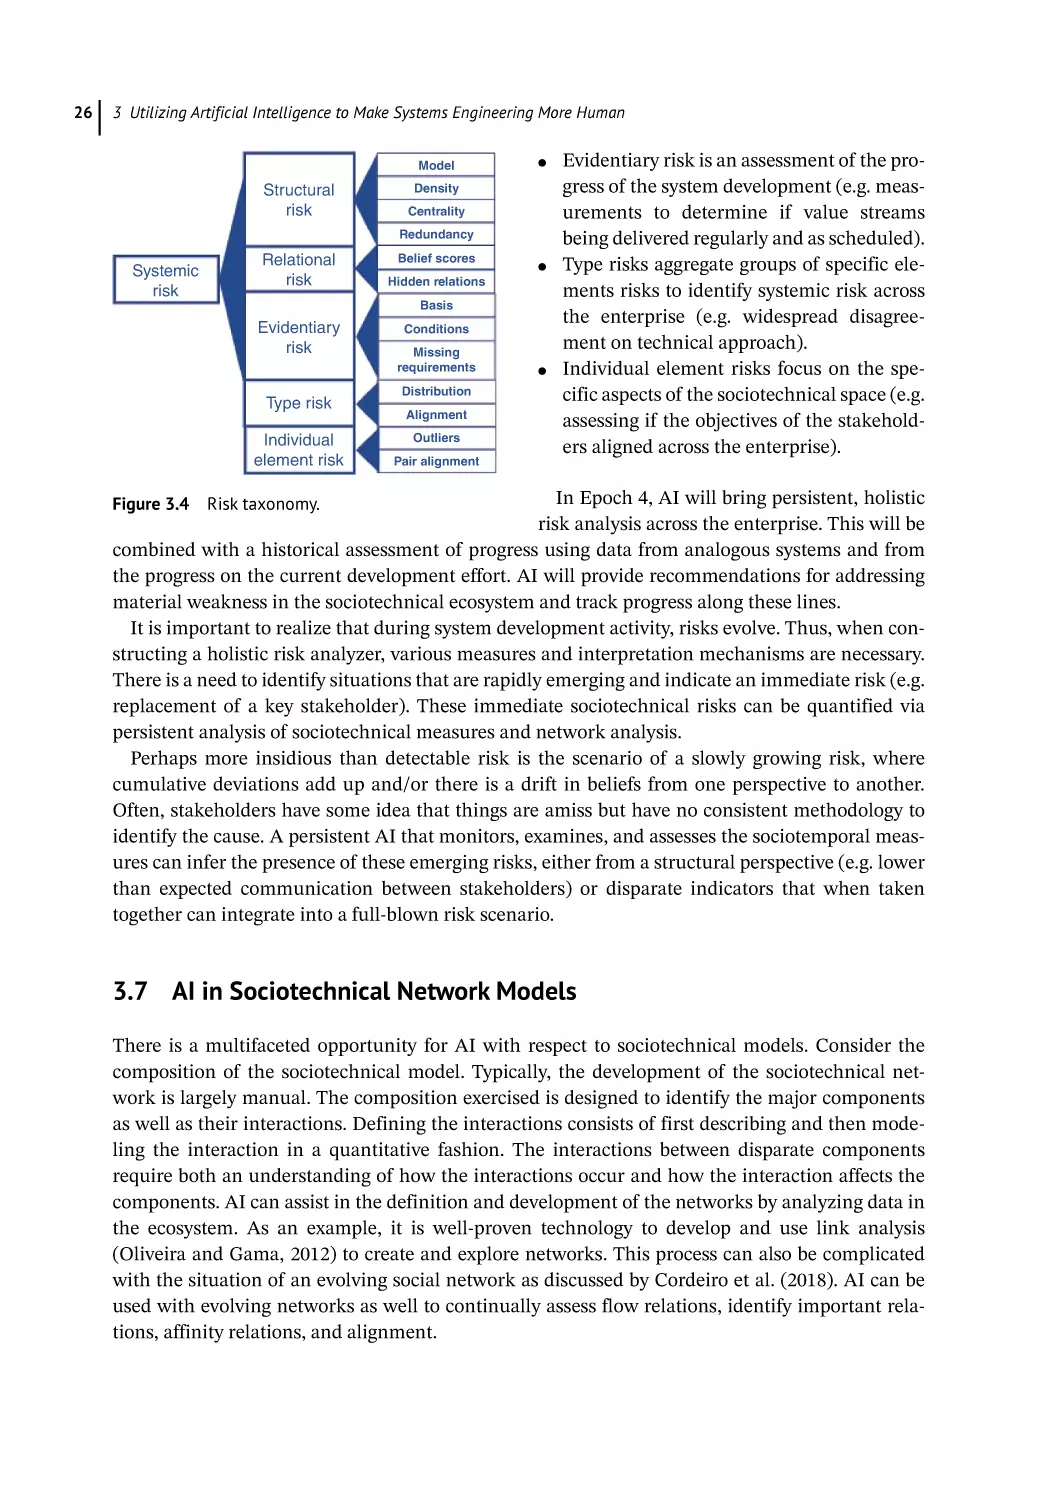
Using AI to Track and Interpret Temporal Sociotechnical Measures 25
AI in Systems Engineering Frameworks 25
AI in Sociotechnical Network Models 26
AI-Based Digital Twins 27
Discussion 27
Case Study 30
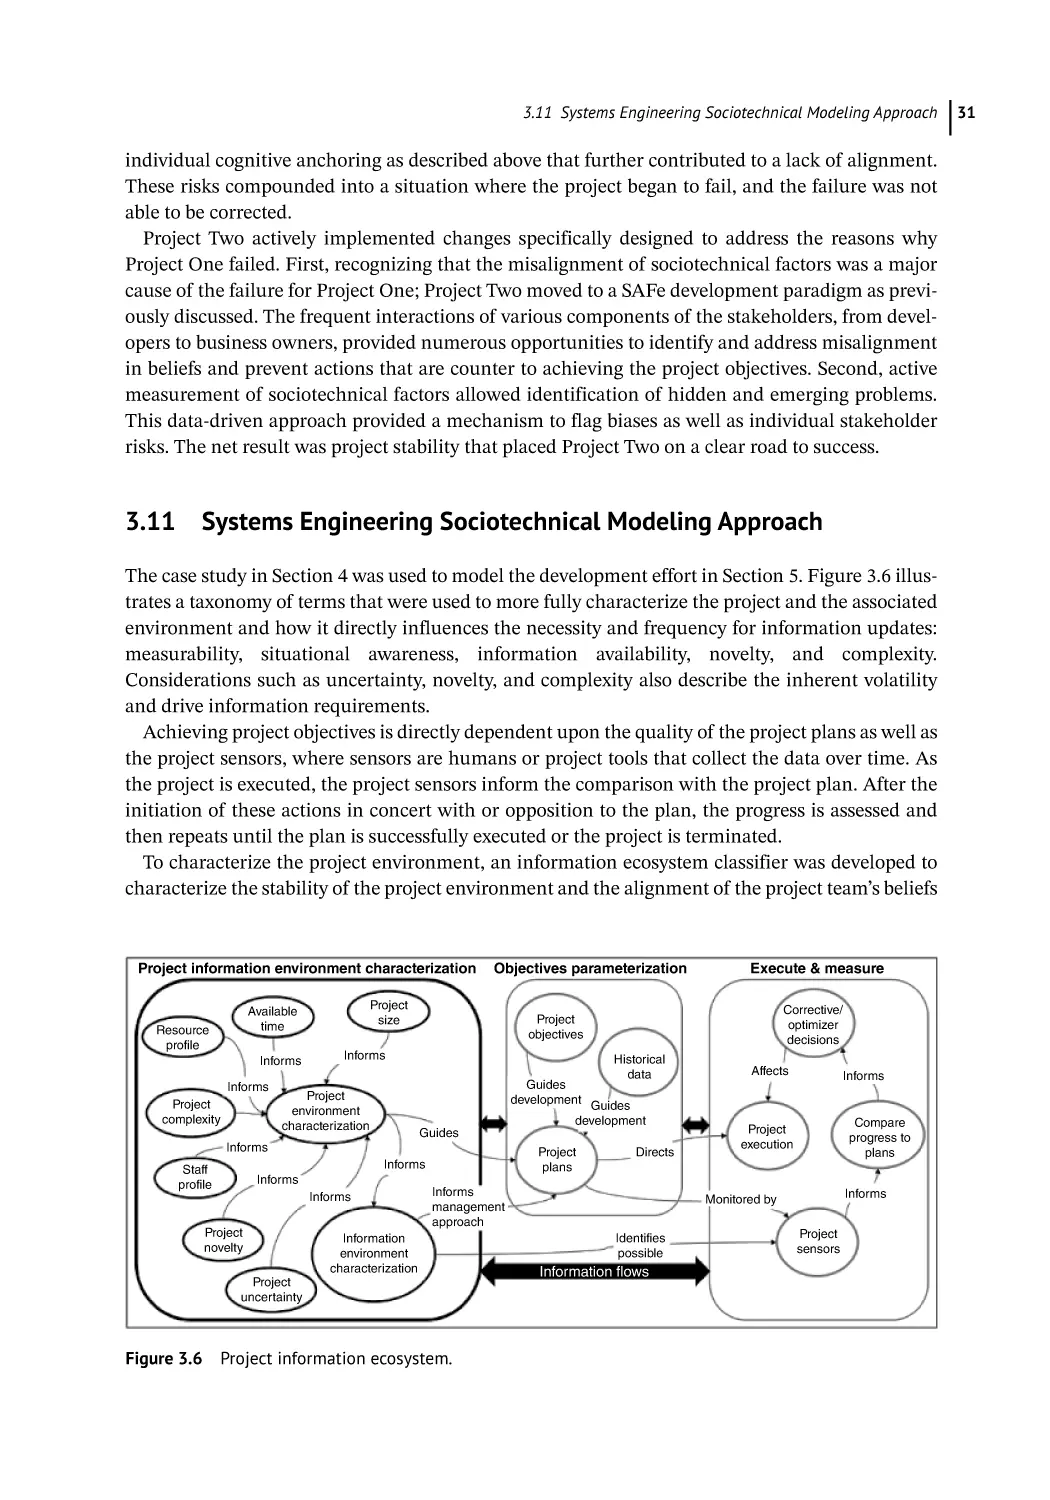
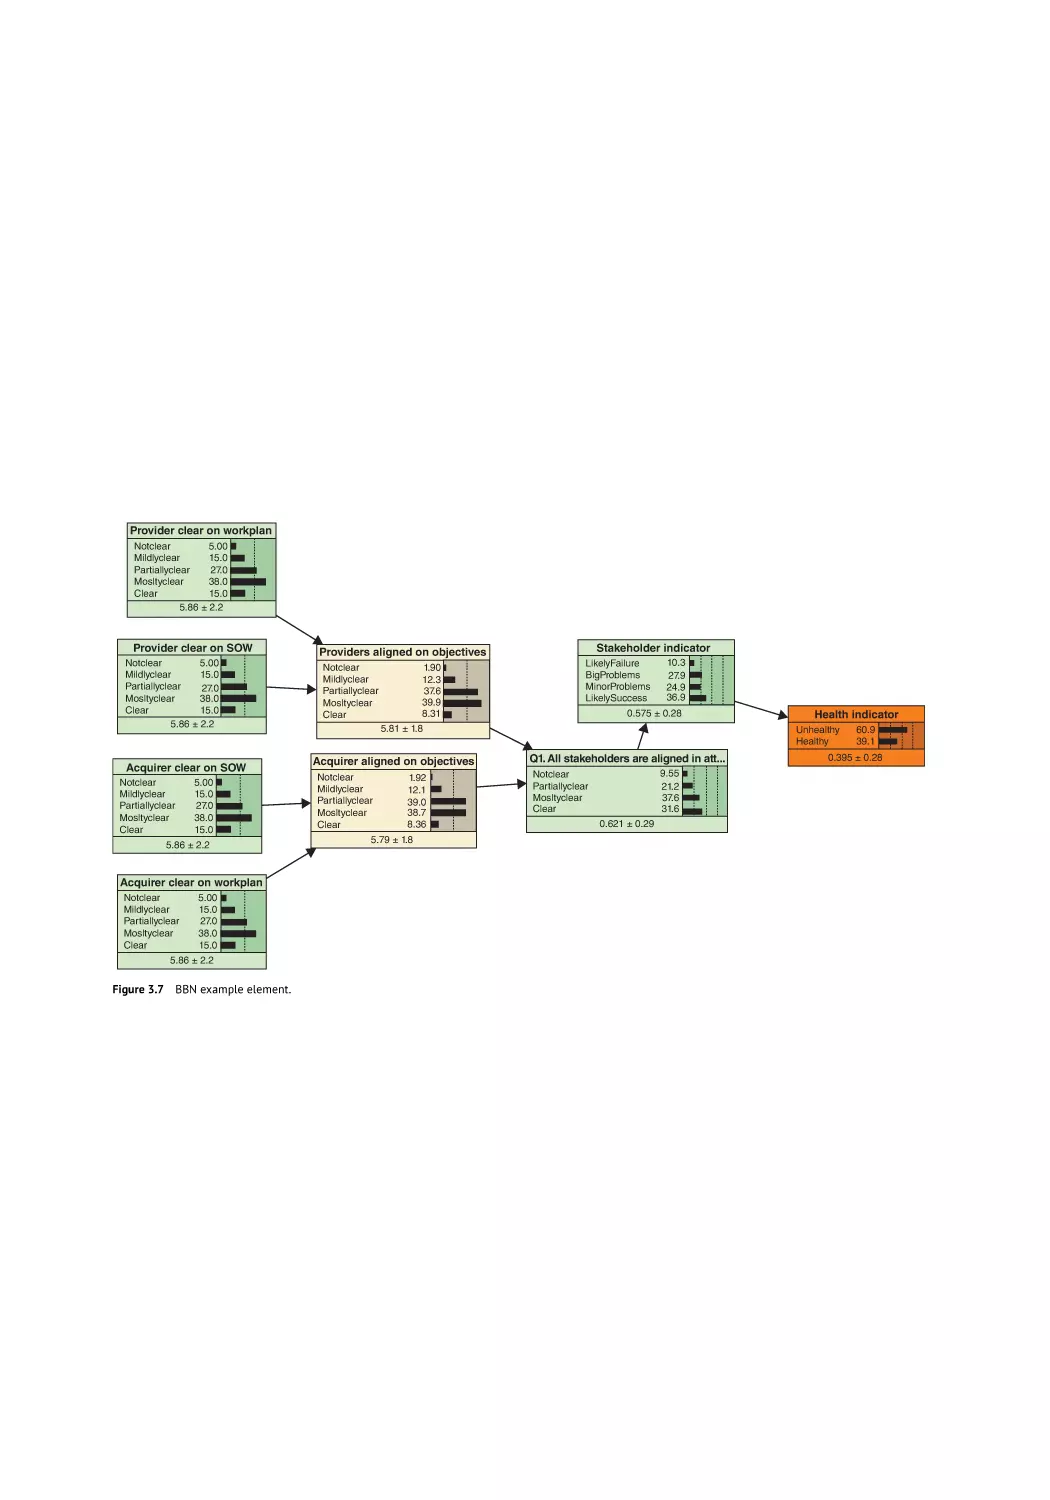
Systems Engineering Sociotechnical Modeling Approach 31
Modeling the Project 33
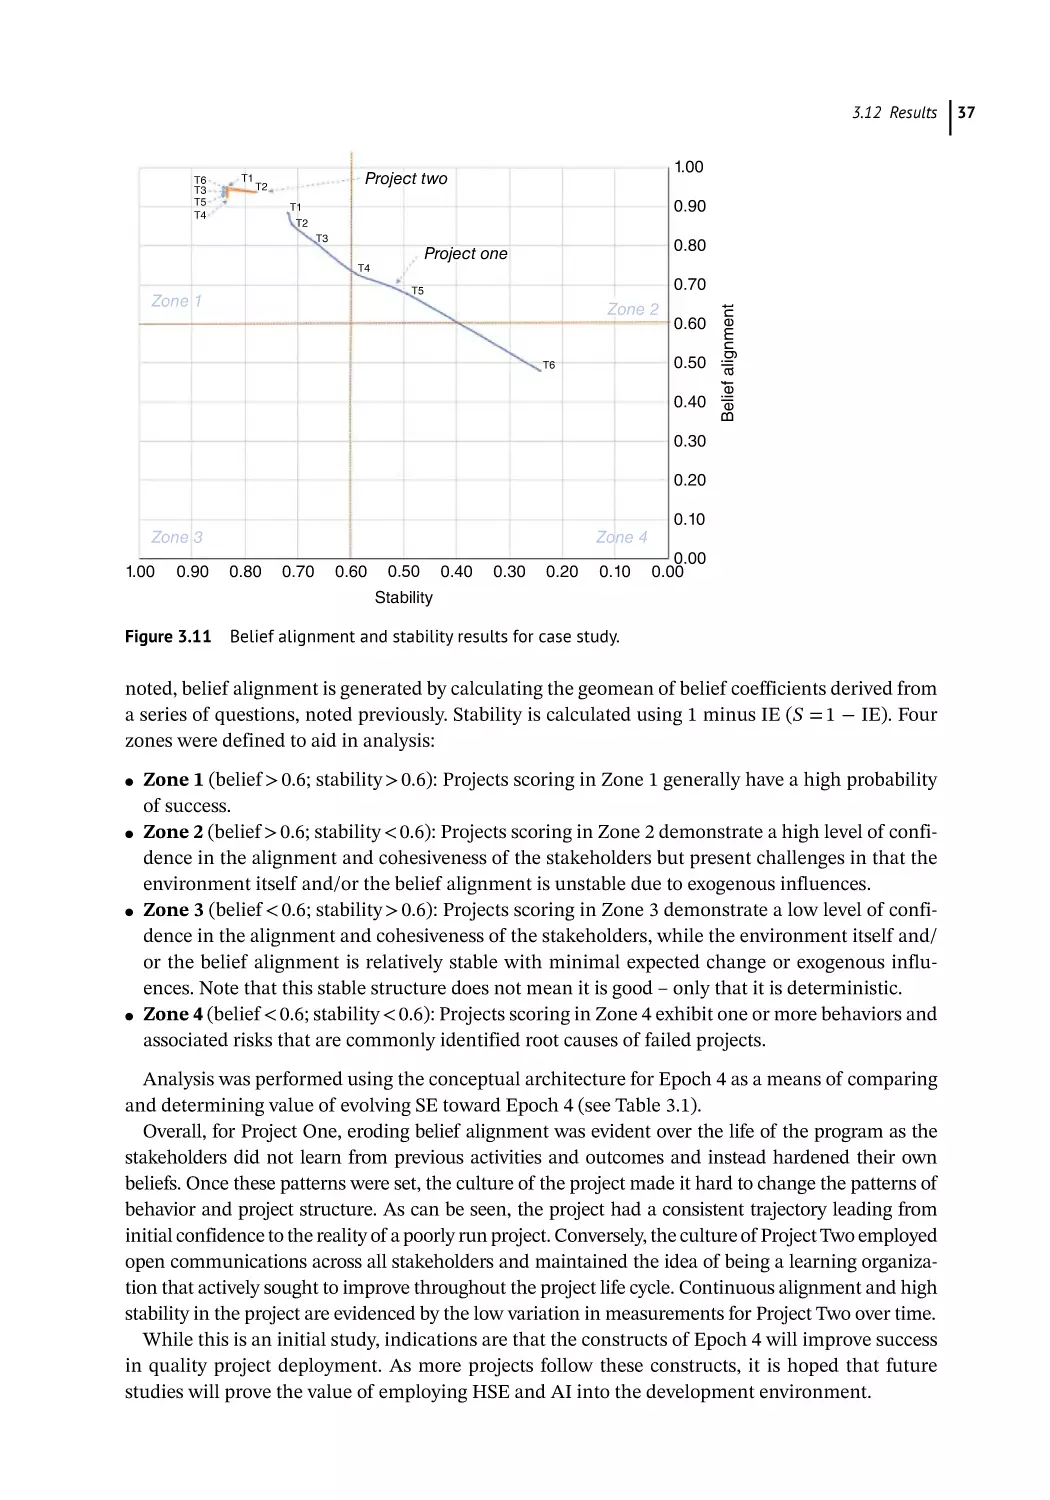
Results 36
Summary 38
References 39
4
Life Learning of Smart Autonomous Systems for Meaningful Human-Autonomy
Teaming 43
Kate J. Yaxley, Keith F. Joiner, Jean Bogais, and Hussein A. Abbass
Introduction 43
Trust in Successful Teaming 45
Meaningful Human-Autonomy Teaming 46
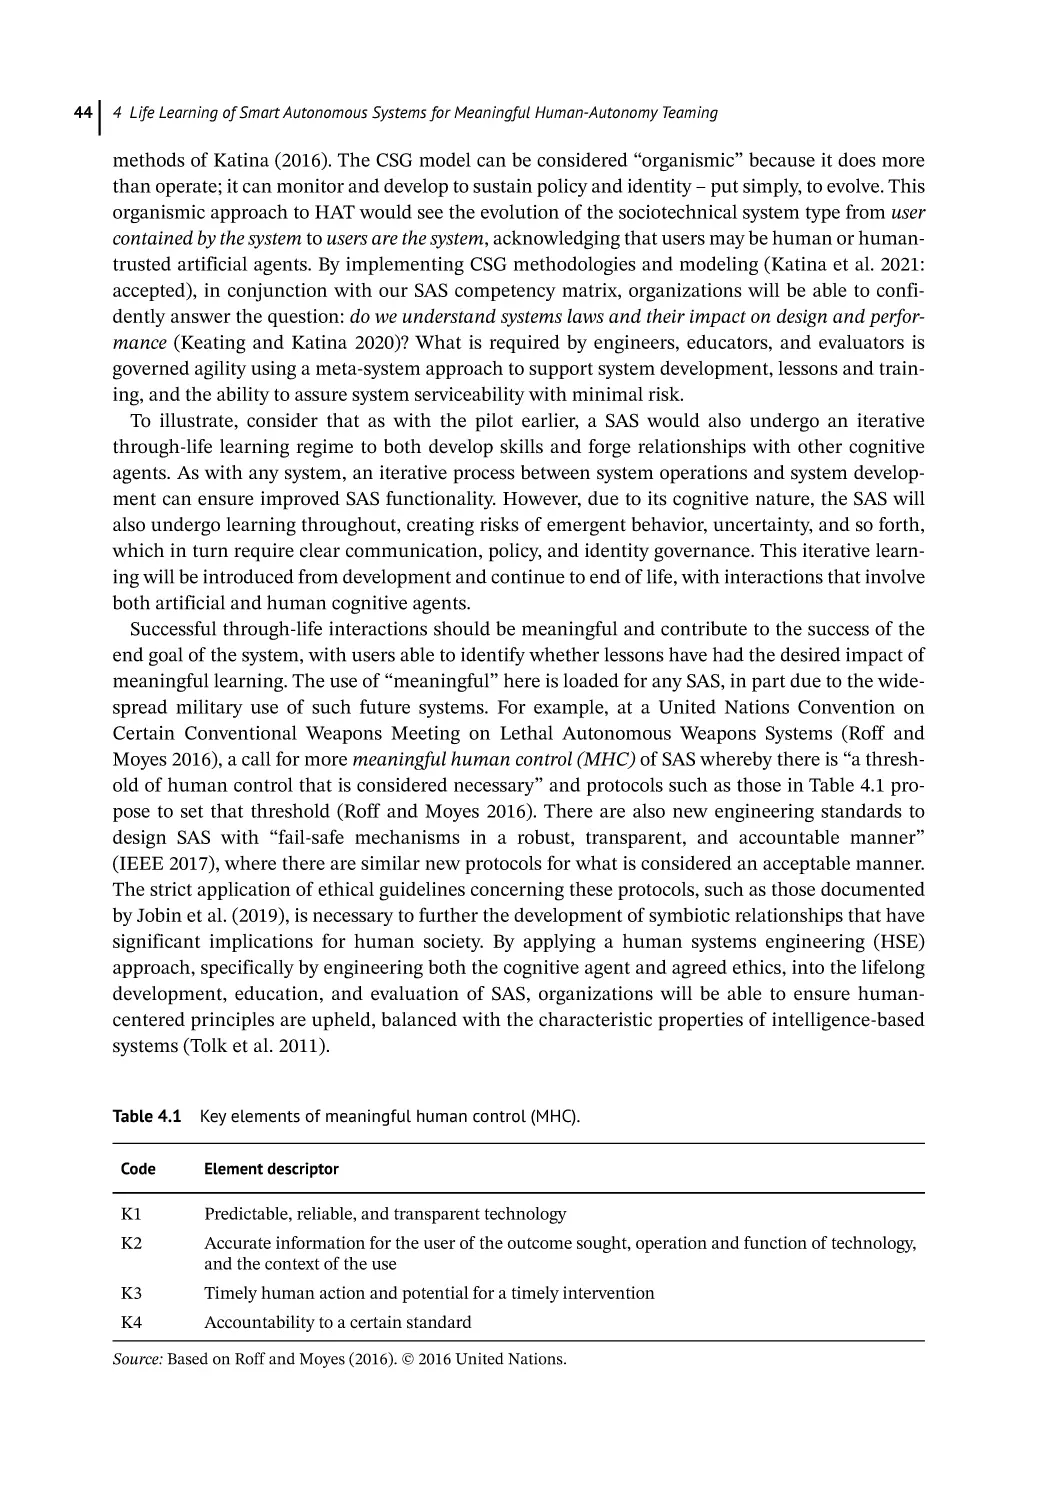
Systematic Taxonomy for Iterative Through-Life Learning of SAS 47
Ensuring Successful SAS 51
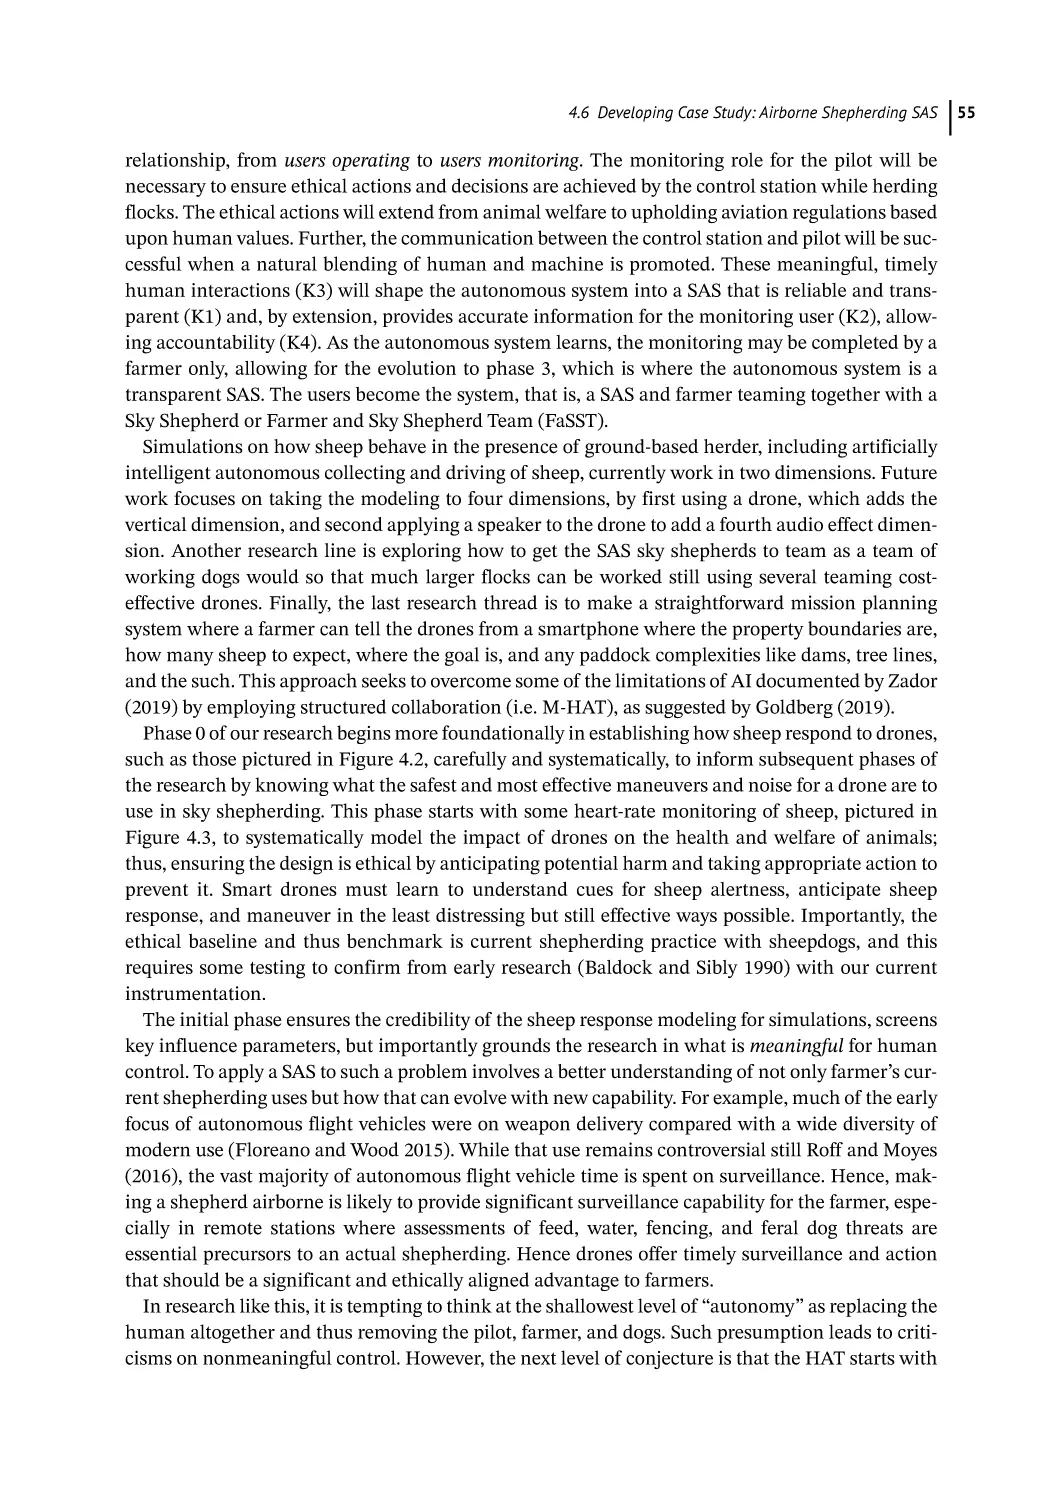
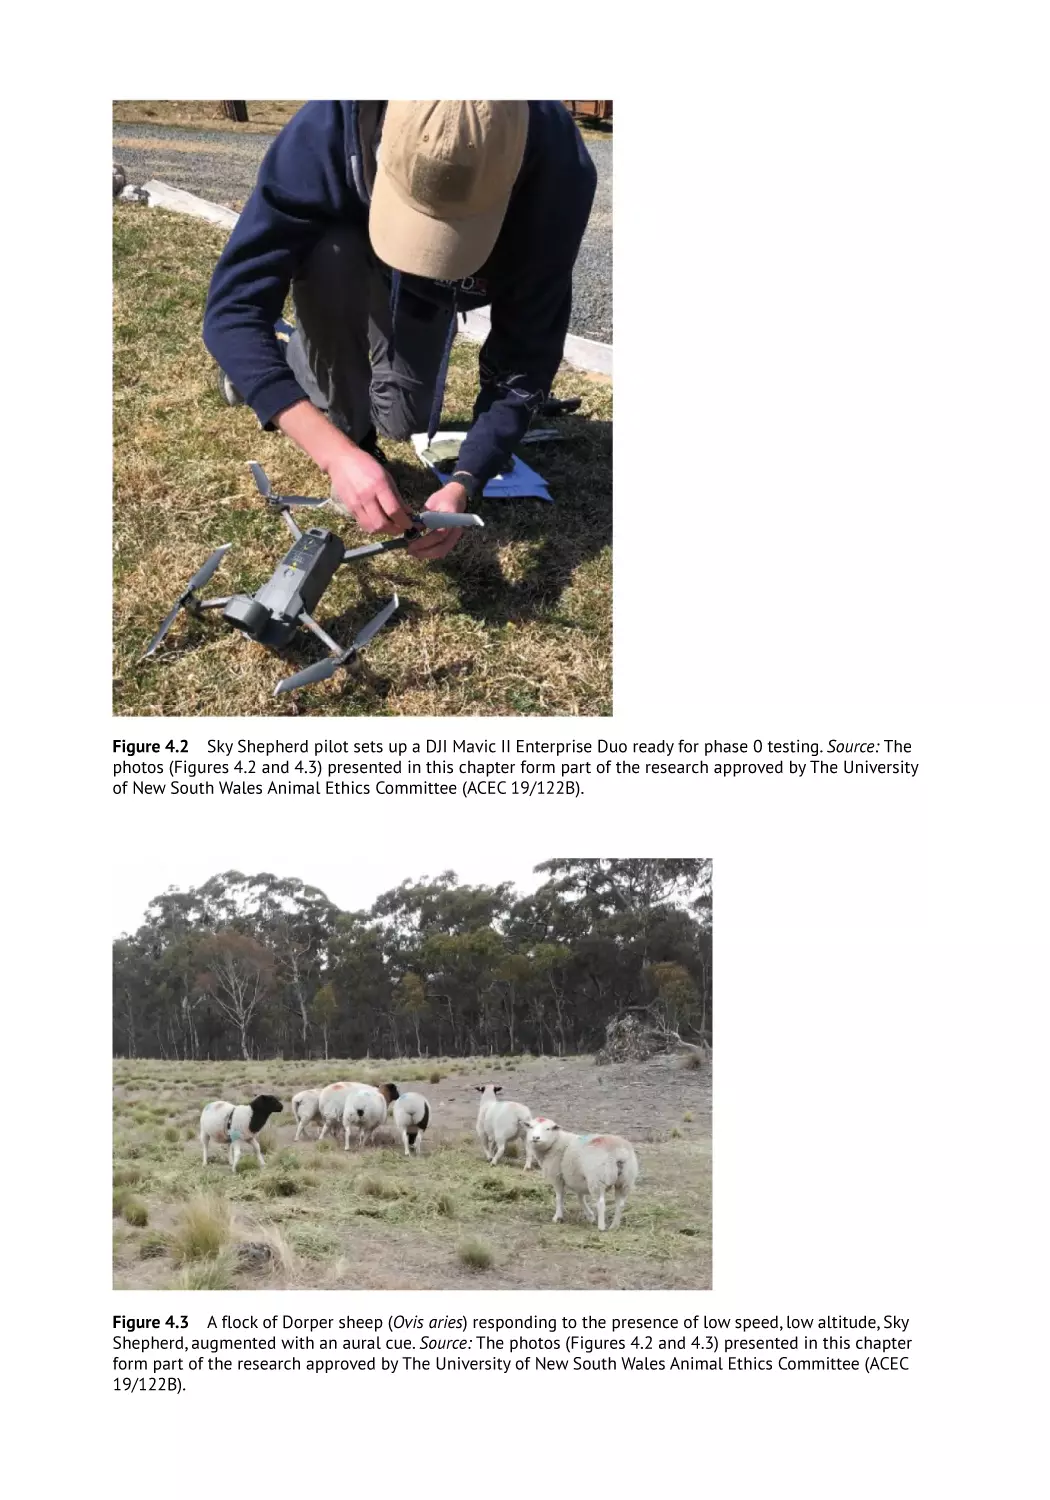
Developing Case Study: Airborne Shepherding SAS 53
Conclusion 57
Acknowledgment 58
References 58
4.1
4.2
4.3
4.4
4.5
4.6
4.7
Section 2
5
5.1
5.2
5.2.1
5.2.2
5.2.3
5.3
5.4
5.4.1
5.4.2
5.4.3
5.4.4
5.4.5
Domain Deep Dives
63
Modeling the Evolution of Organizational Systems for the Digital Transformation
of Heavy Rail 65
Grace A. L. Kennedy, William R. Scott, Farid Shirvani, and A. Peter Campbell
Introduction 65
Organizational System Evolution 66
Characteristics of Organizational Systems 66
The Organization in Flux 67
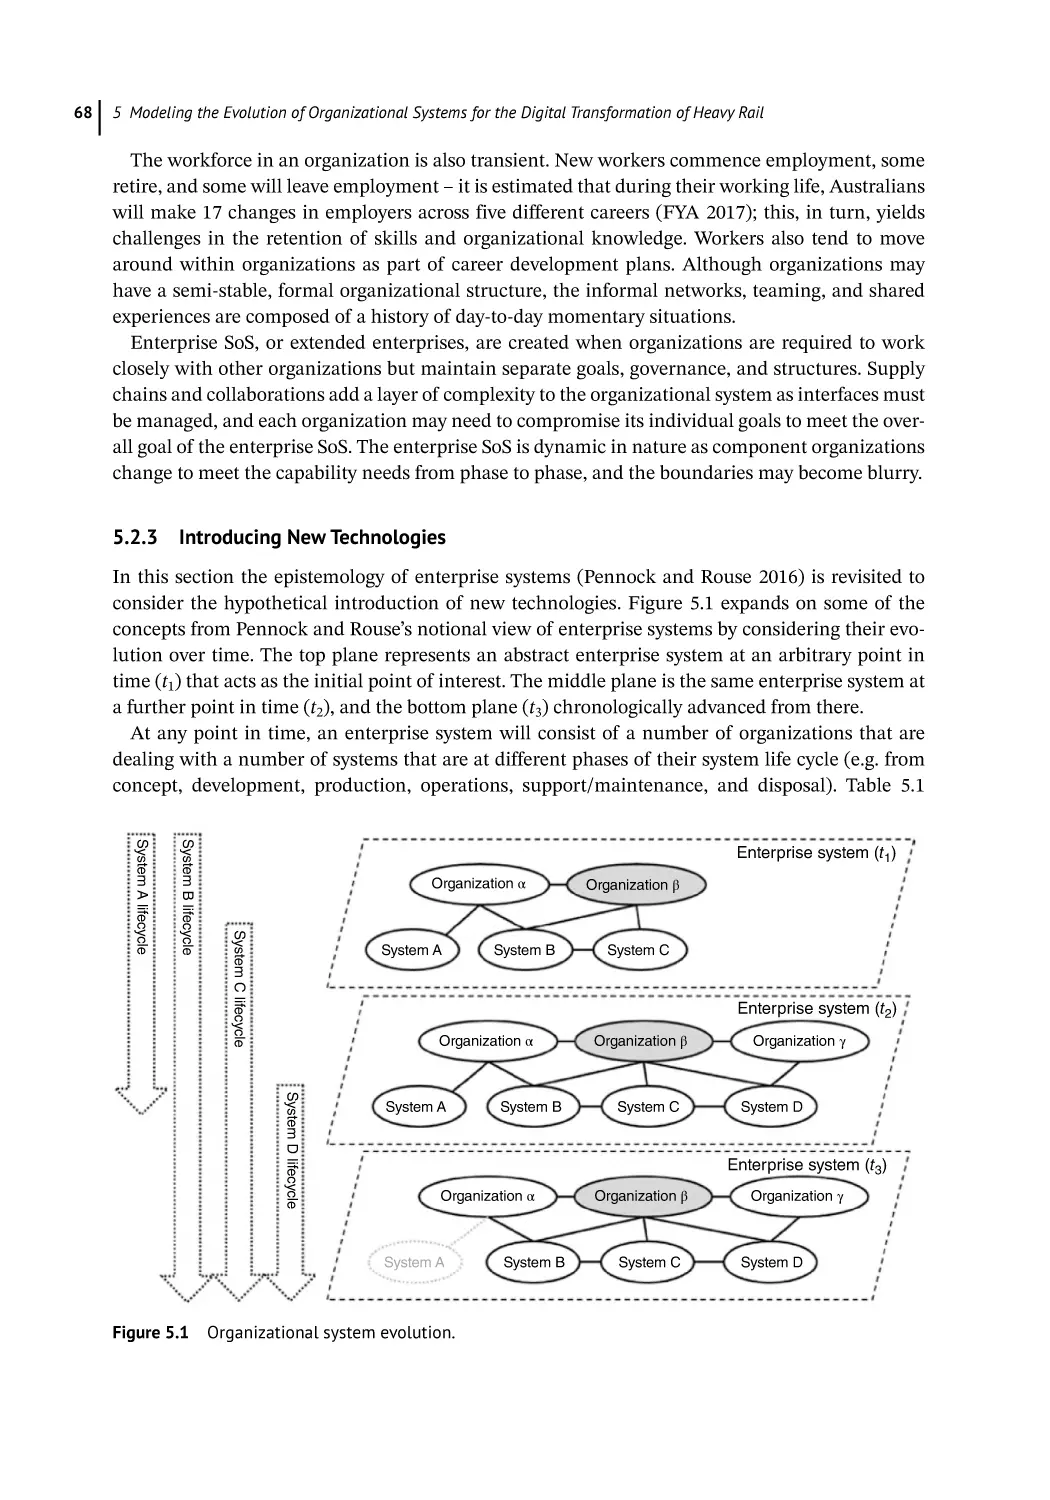
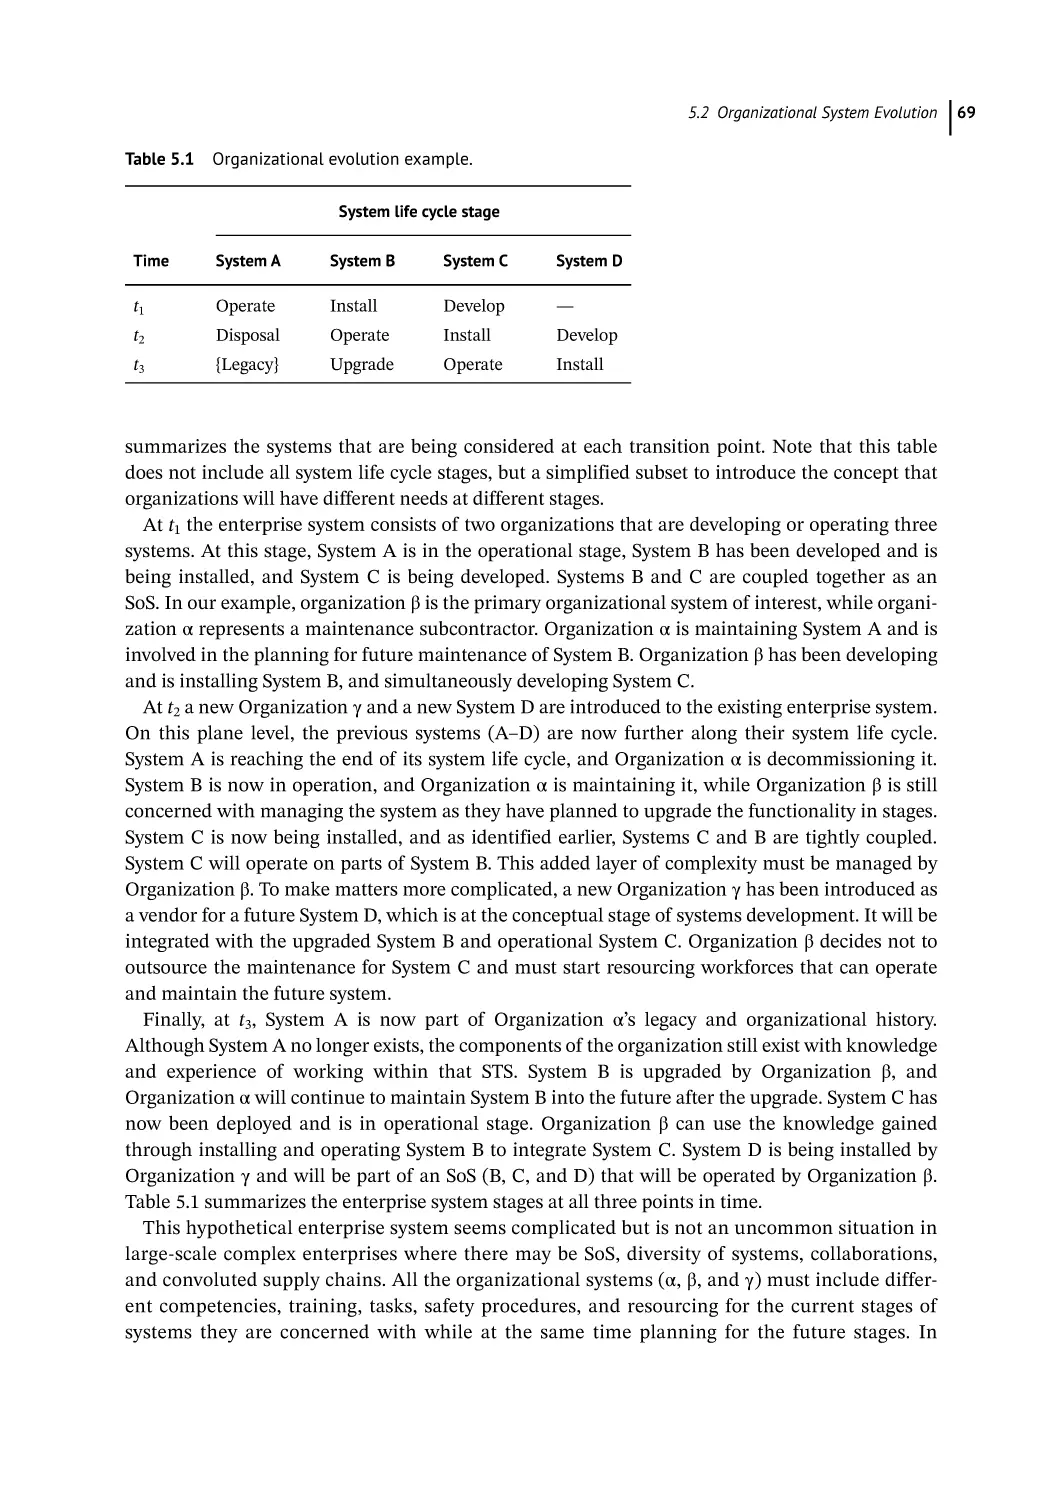
Introducing New Technologies 68
Model-Based Systems Engineering 70
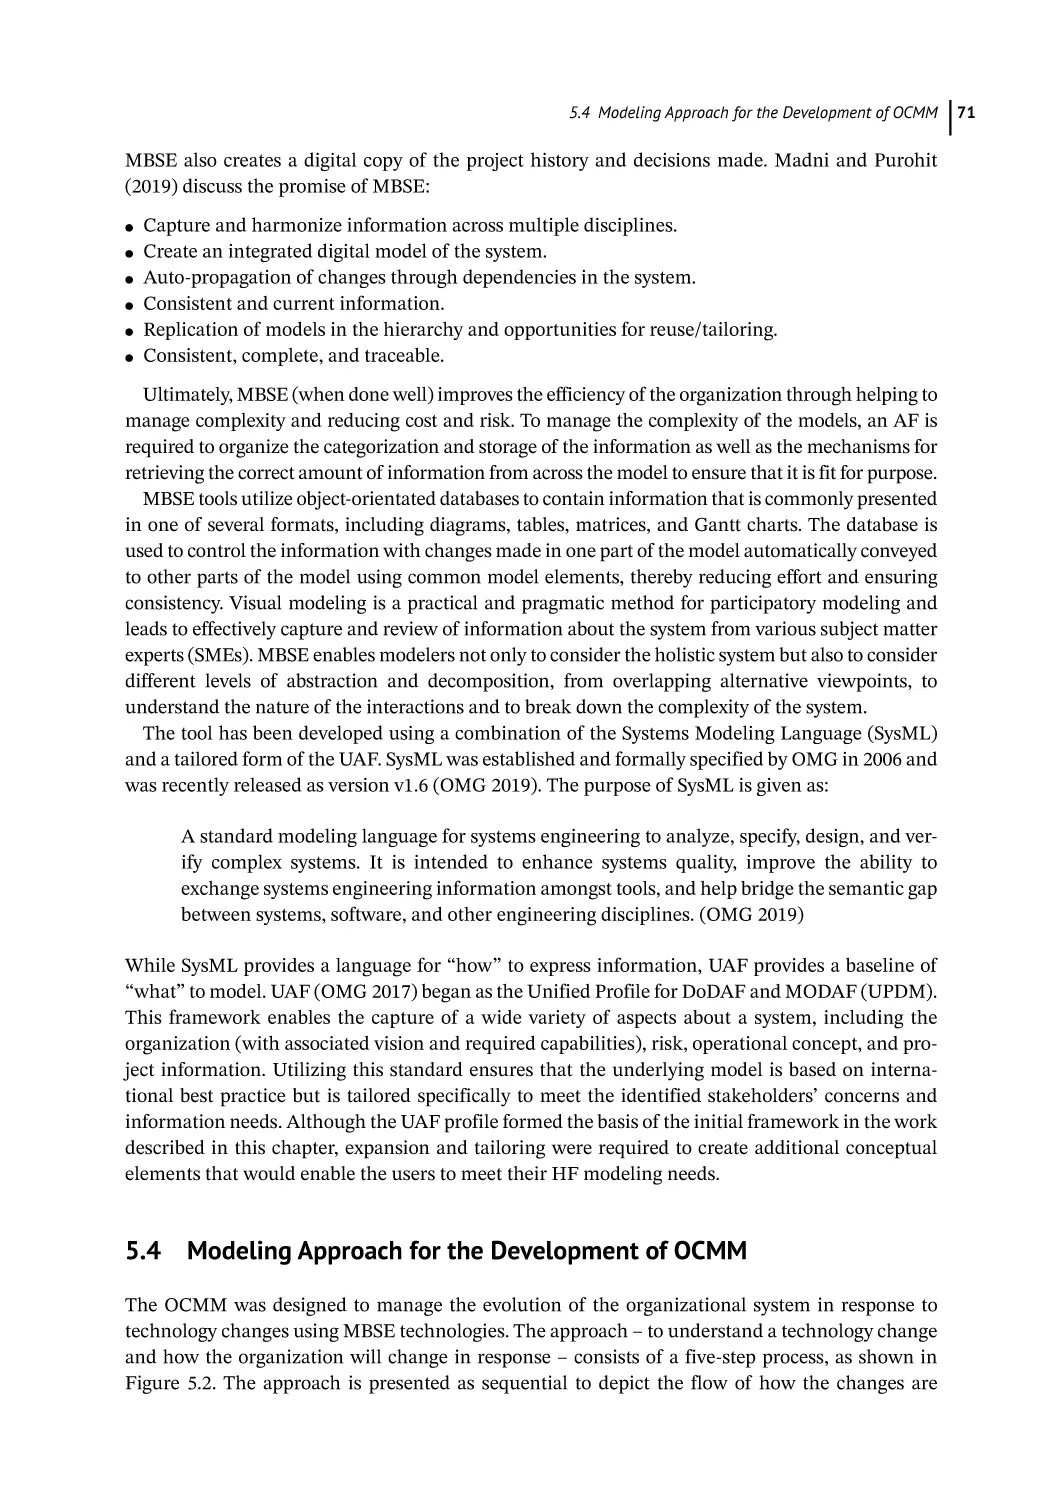
Modeling Approach for the Development of OCMM 71
Technology Specification 72
Capture System Change 73
Capture Organizational Changes 73
Manage Organization Change 73
Analyze Emergent System 73
Contents
5.5
5.5.1
5.5.2
5.6
5.6.1
5.6.2
5.6.3
5.6.4
5.6.5
5.6.5.1
5.6.5.2
5.7
5.8
I mplementation 74
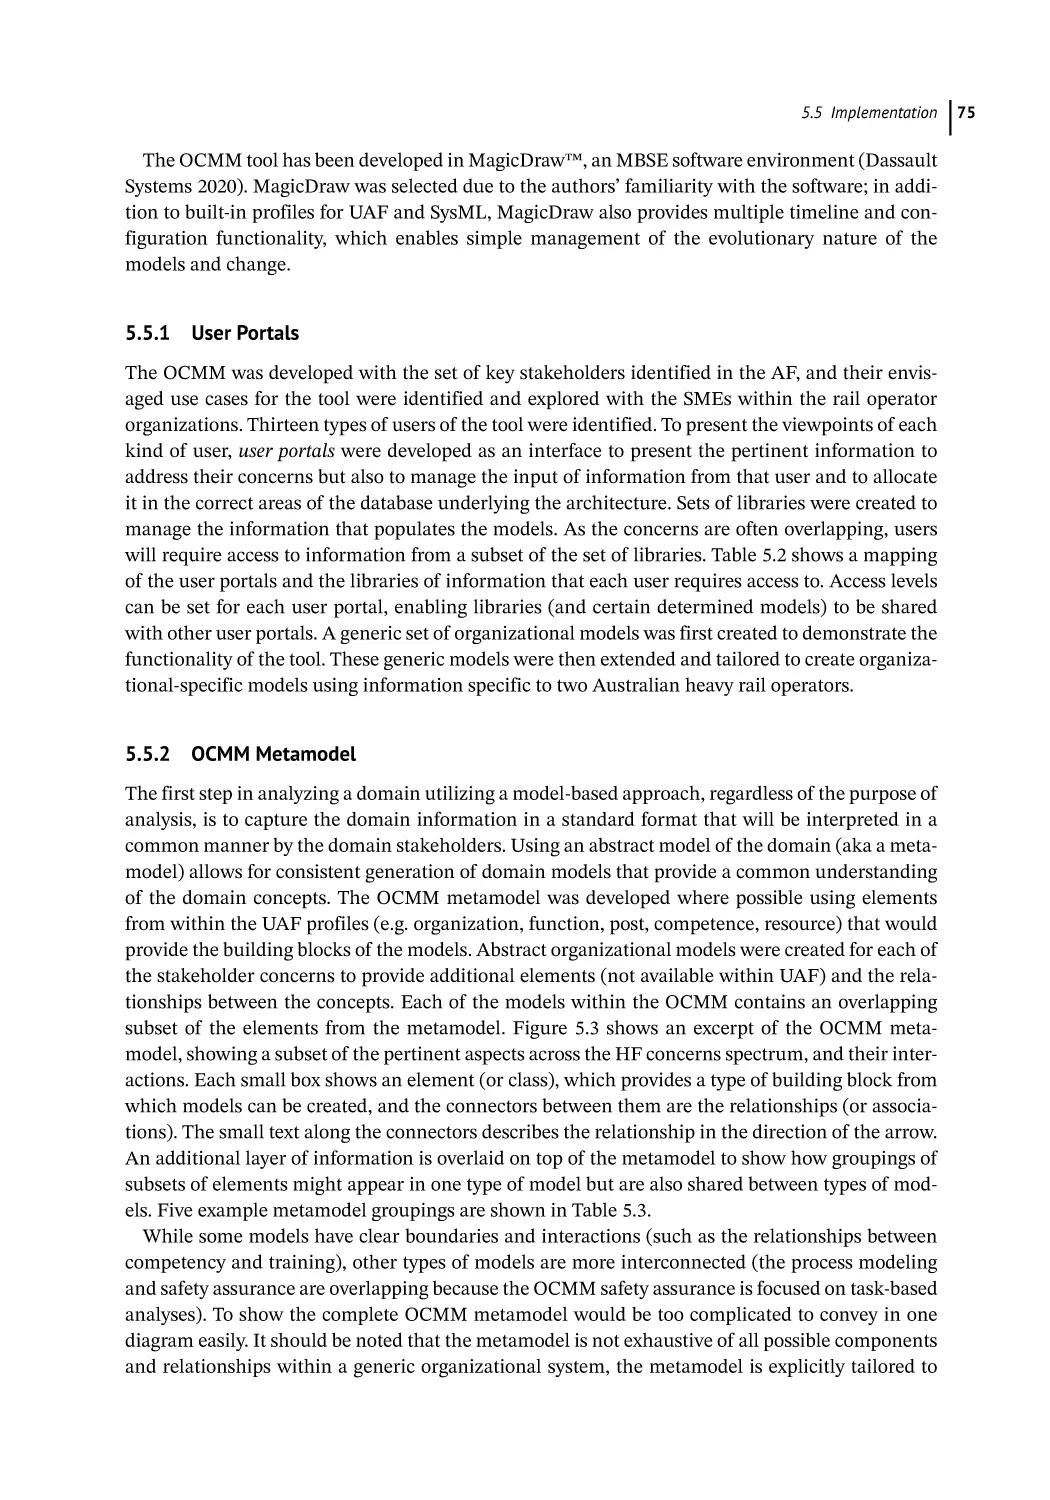
User Portals 75
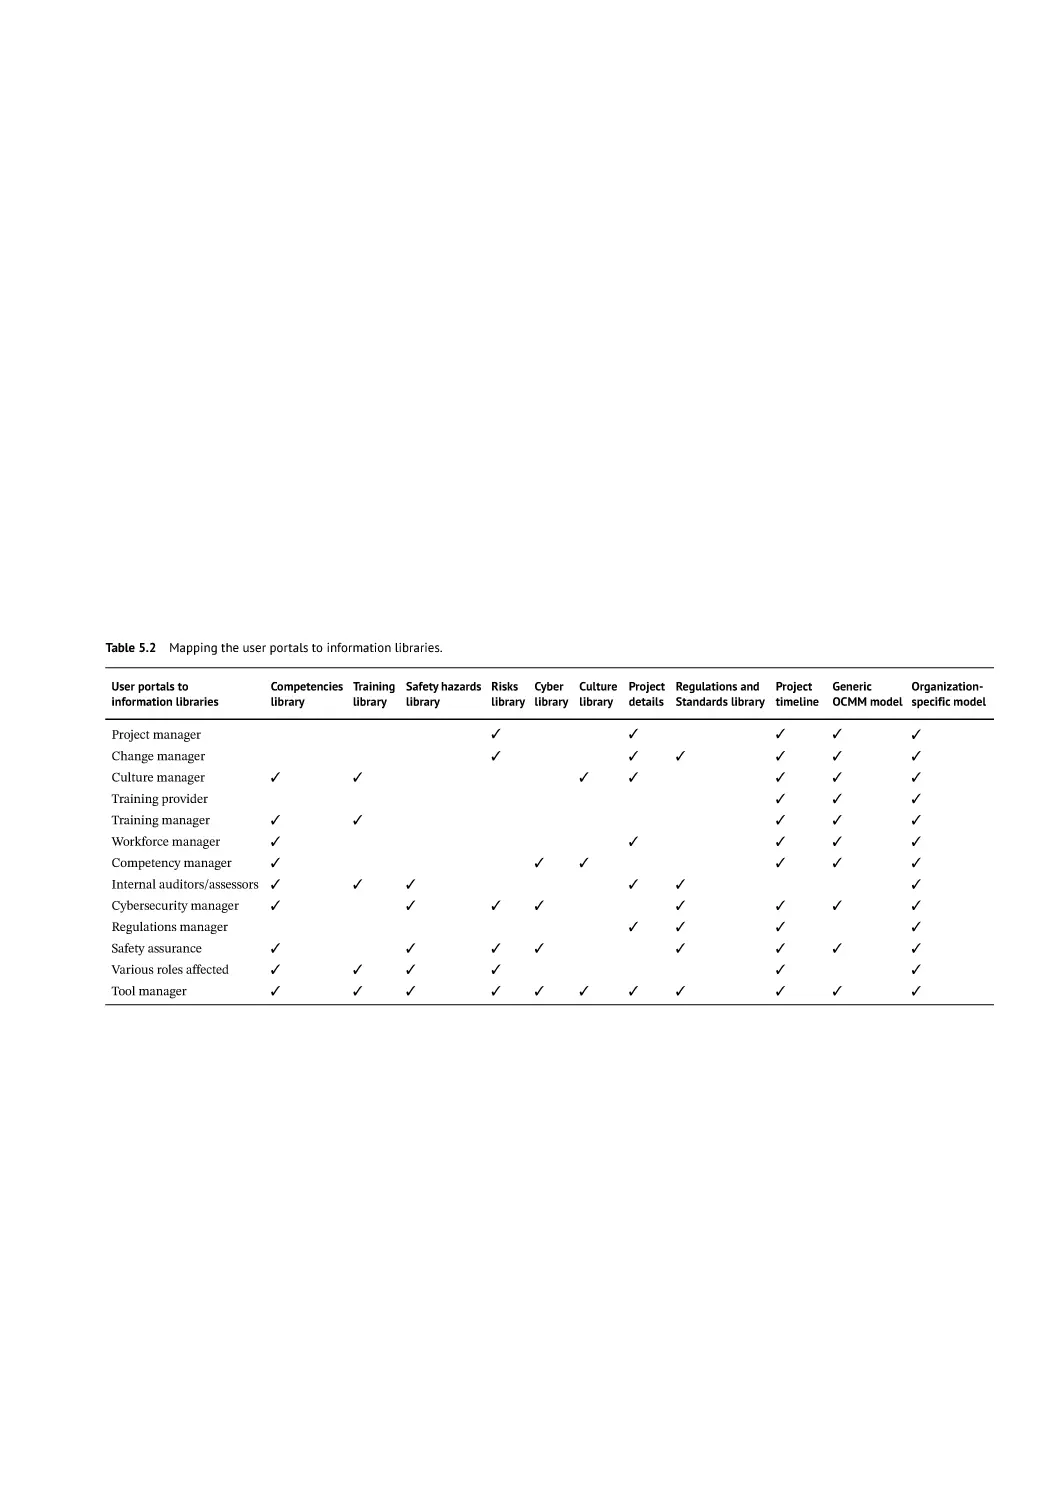
OCMM Metamodel 75
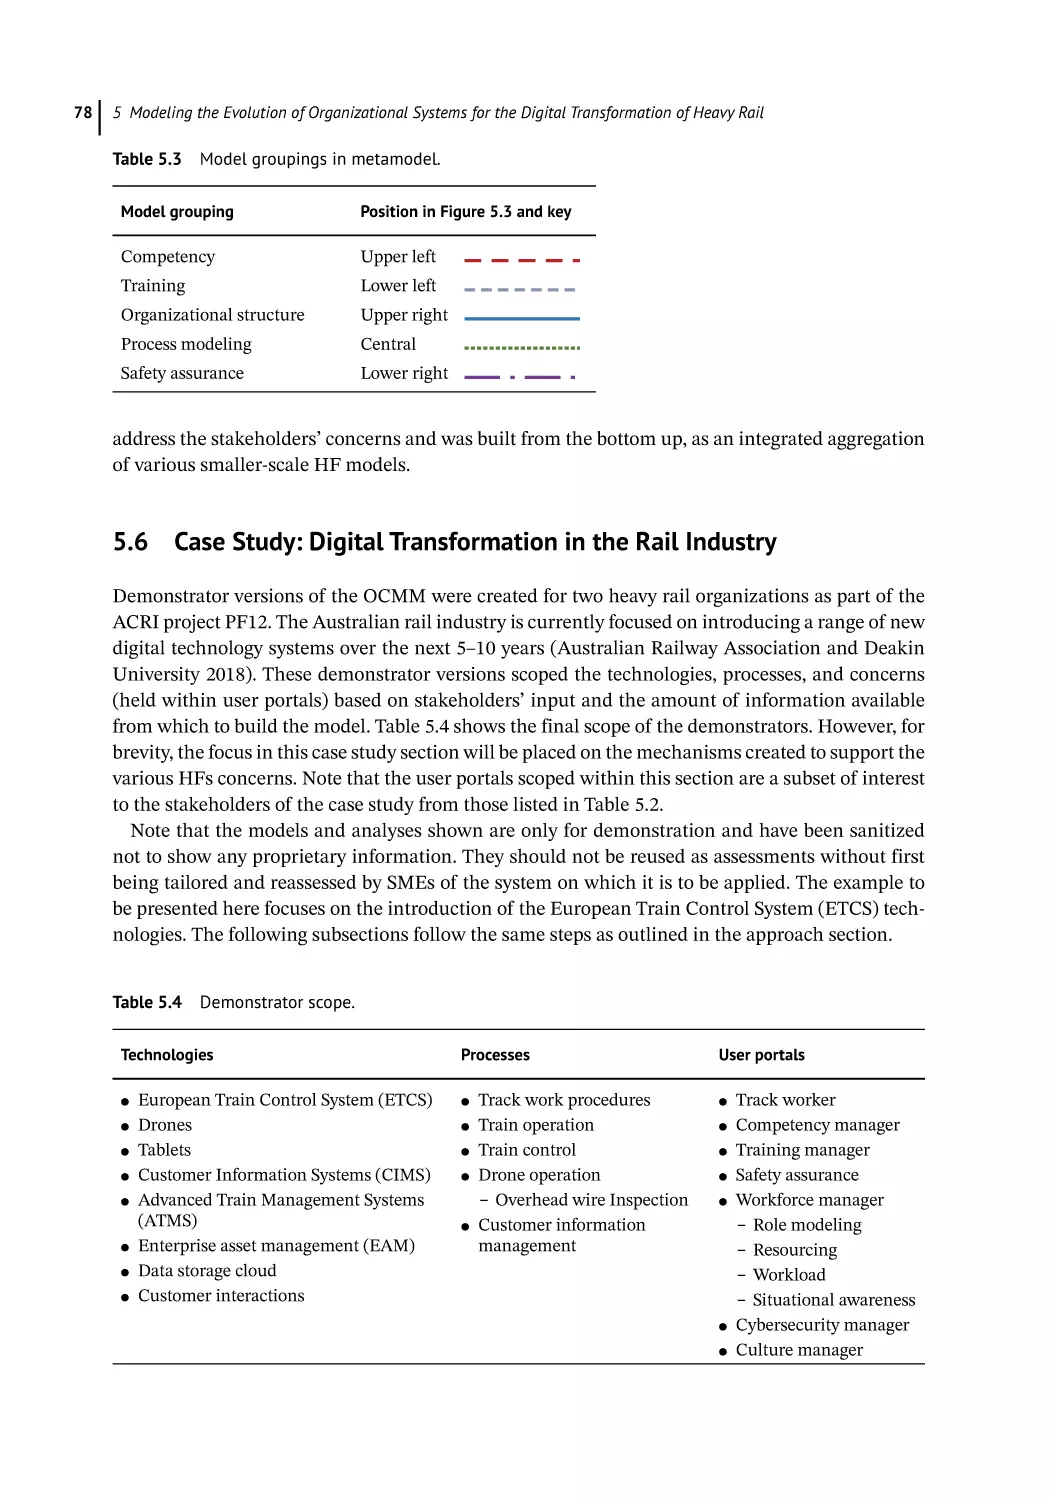
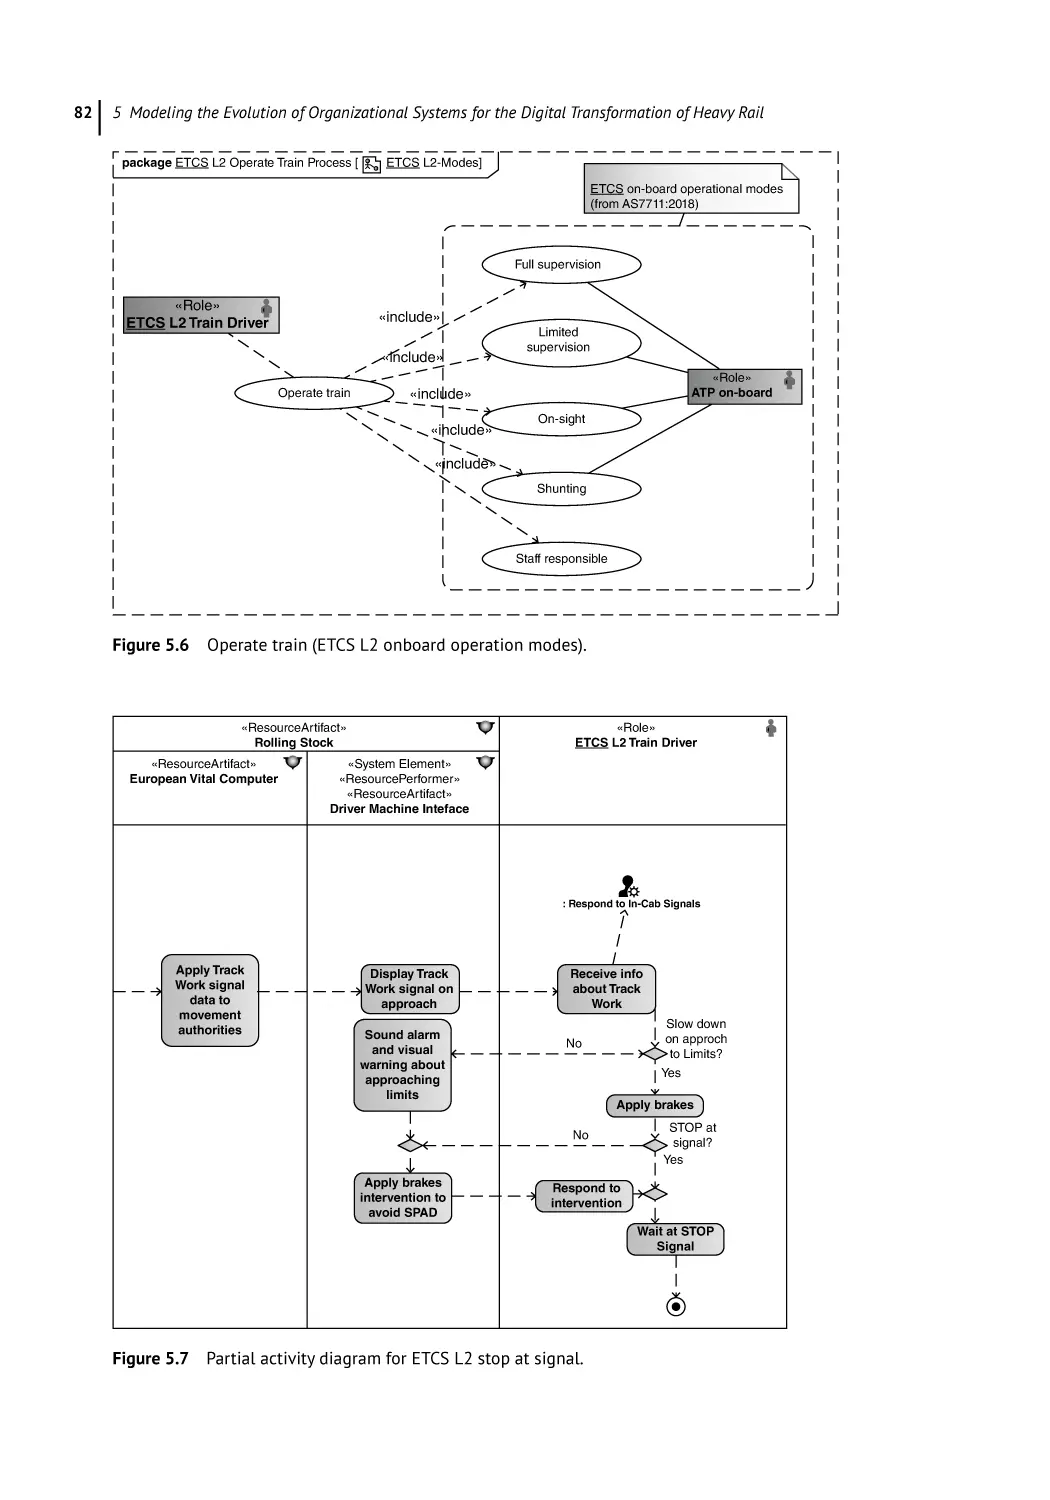
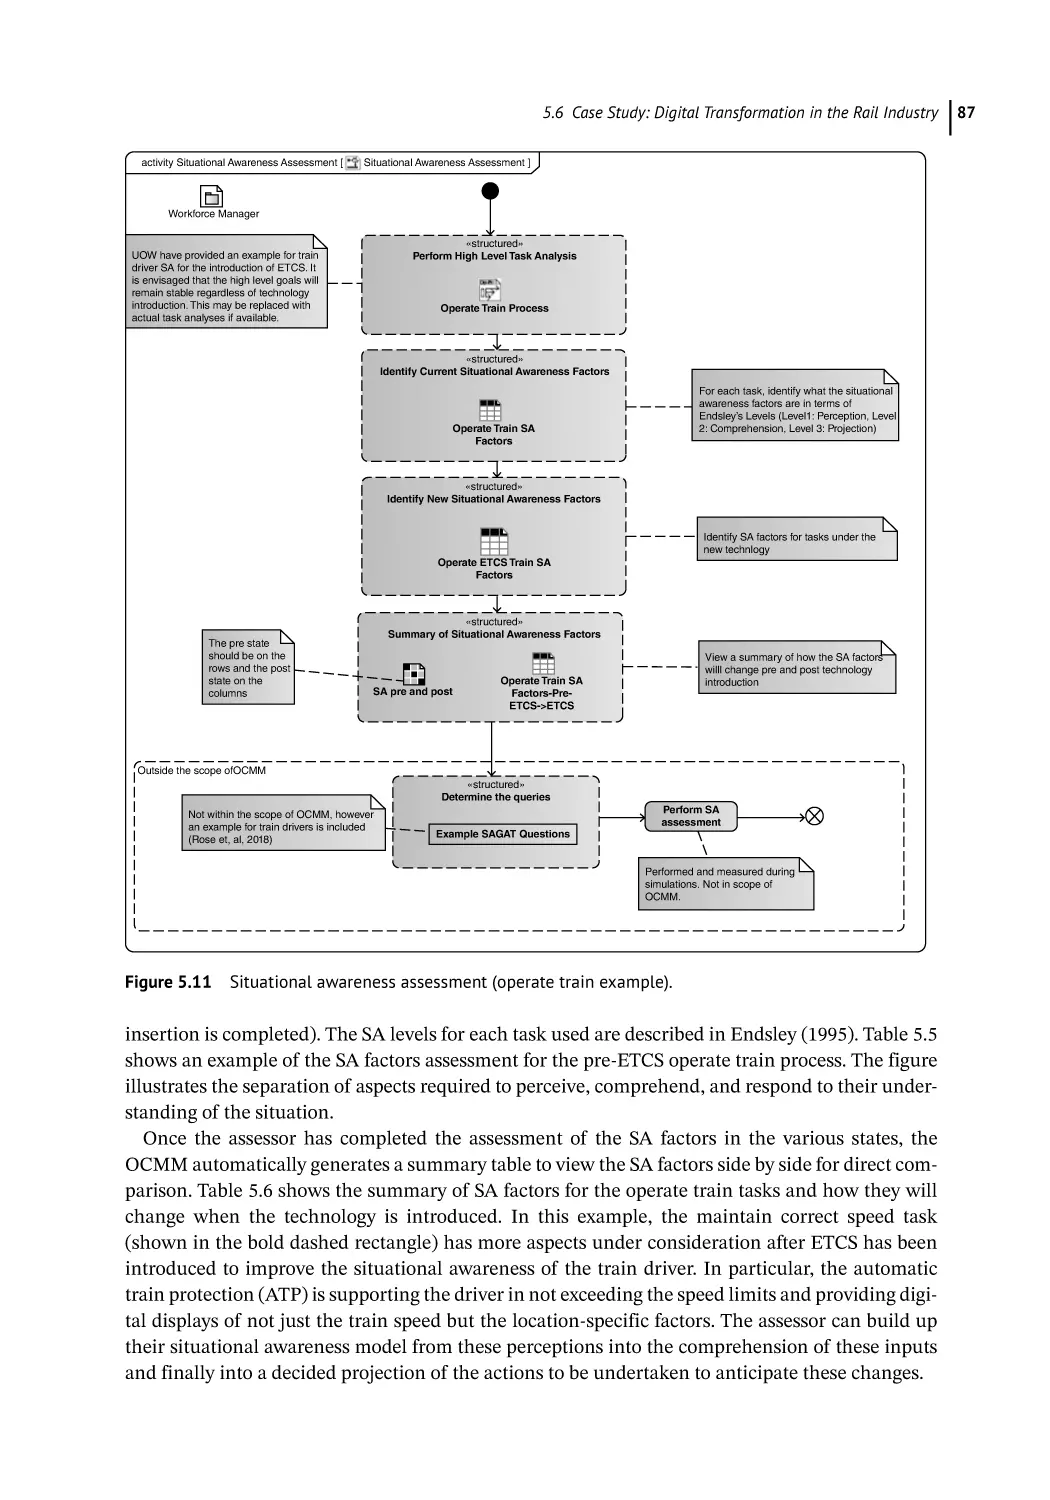
Case Study: Digital Transformation in the Rail Industry
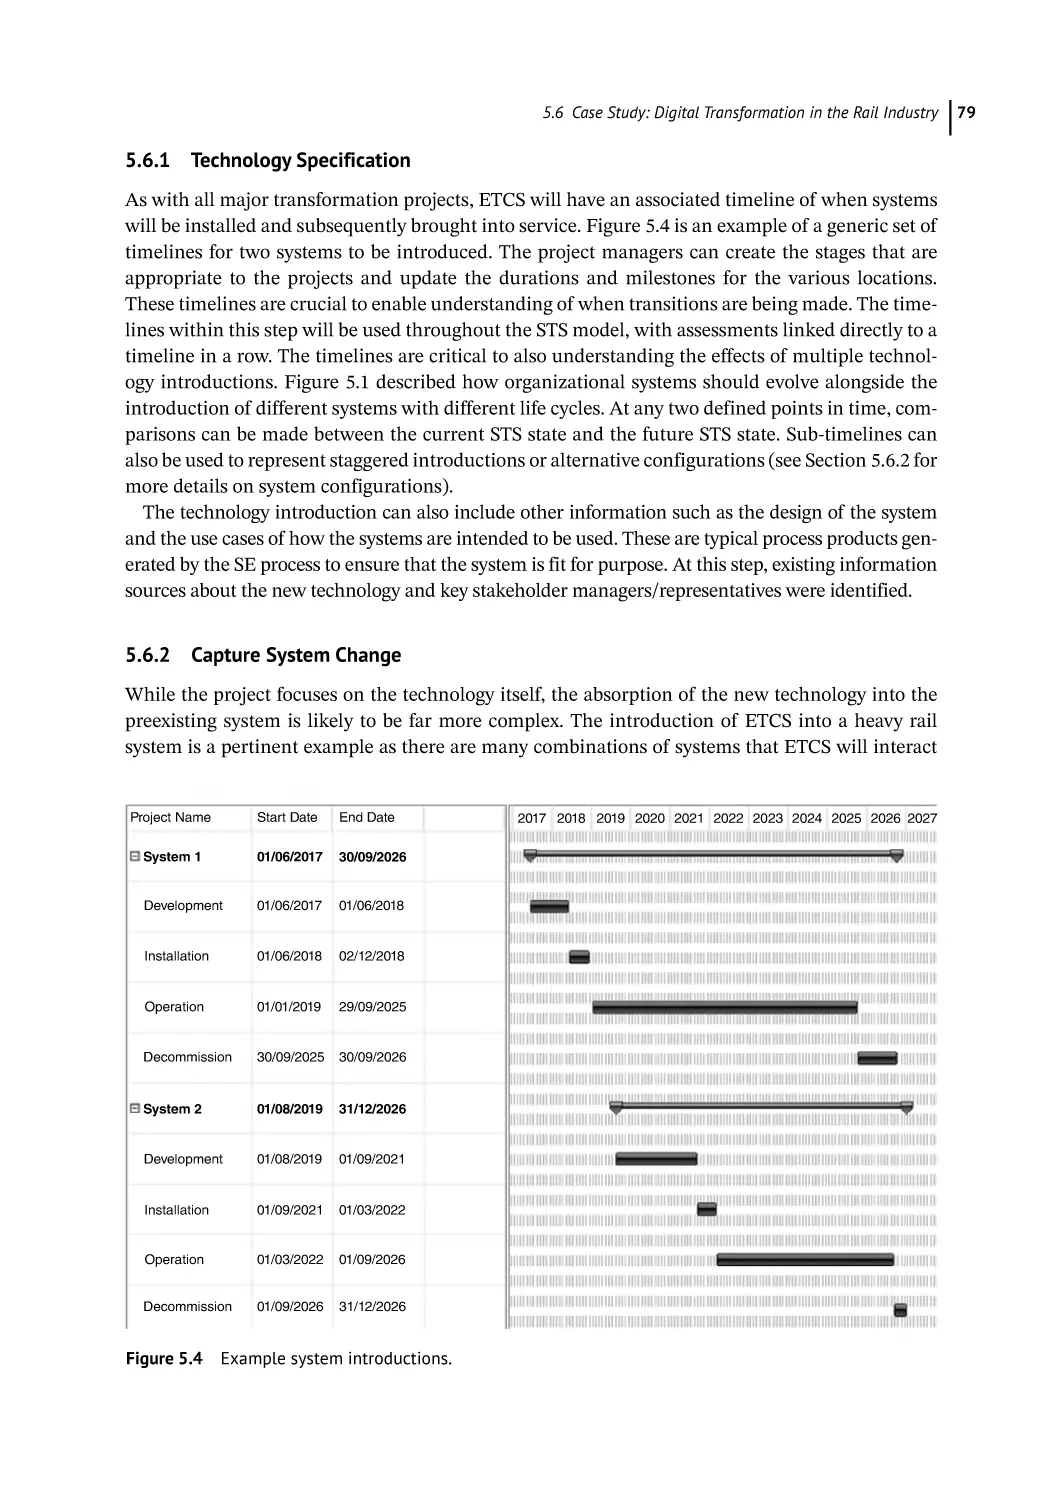
Technology Specification 79
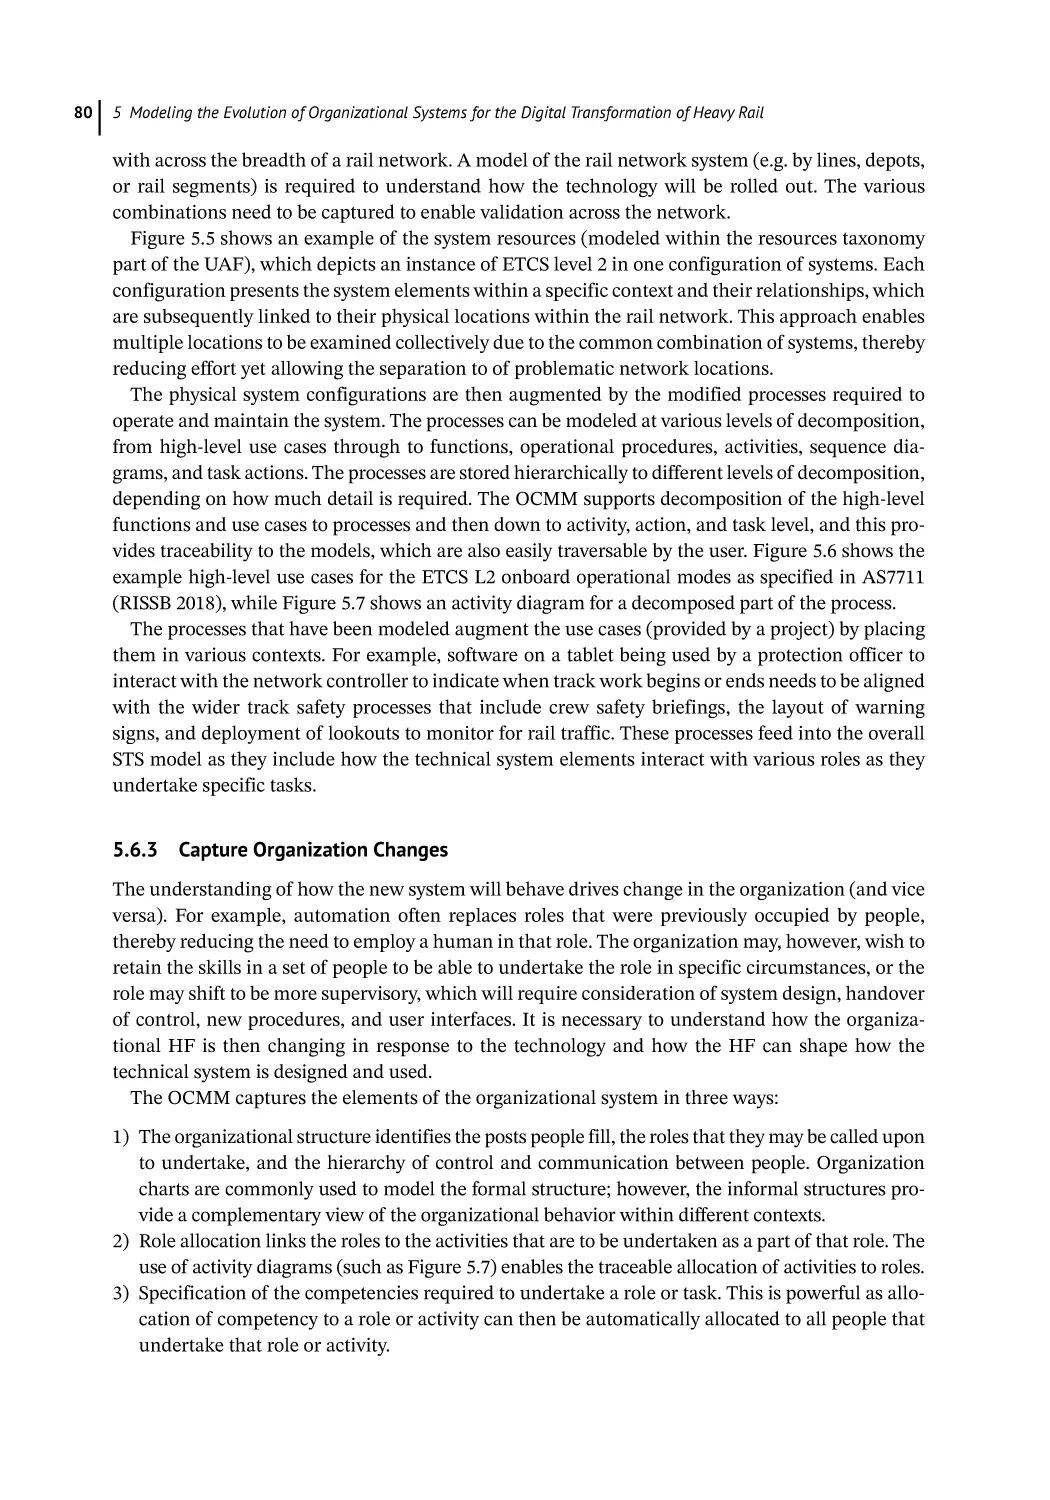
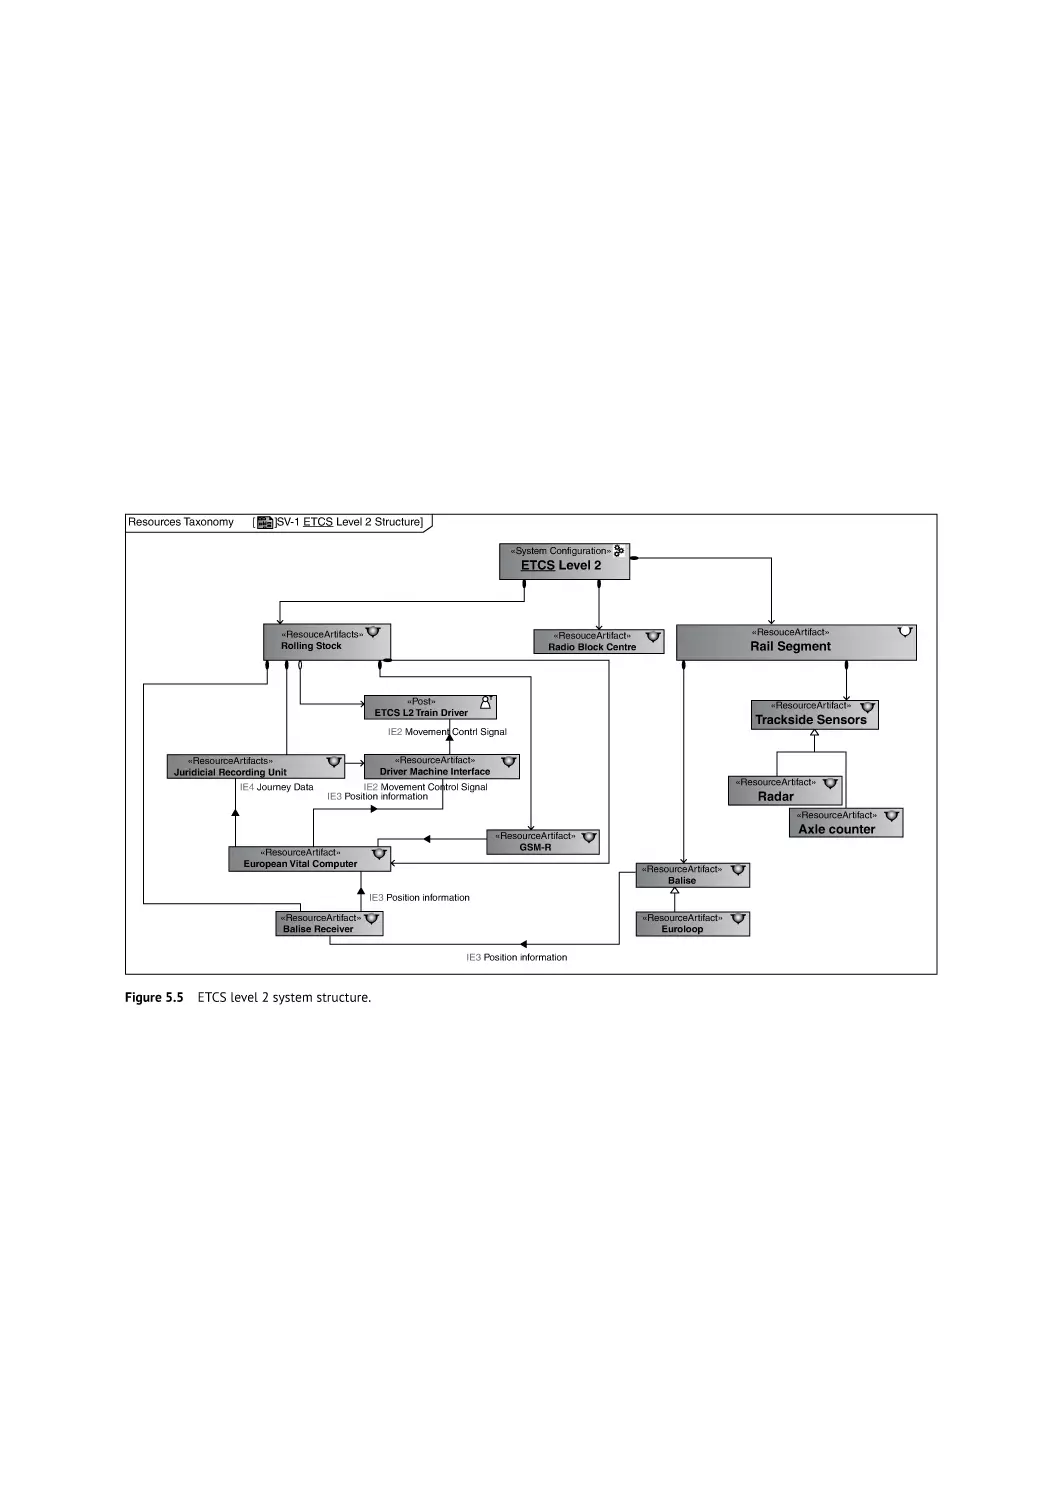
Capture System Change 79
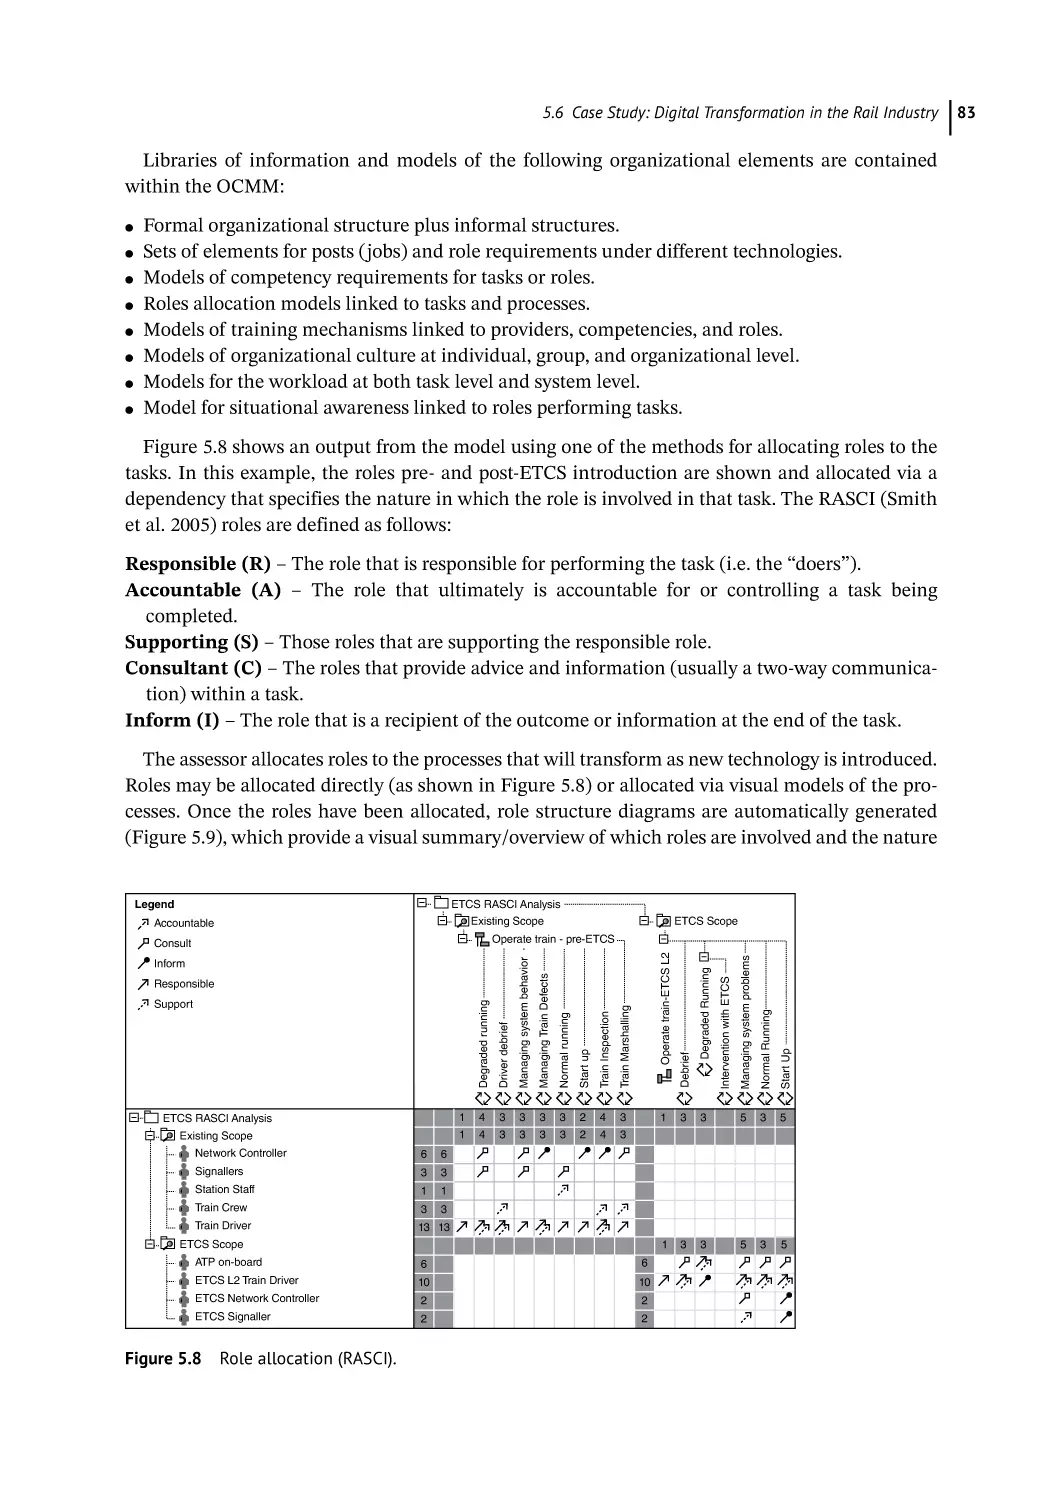
Capture Organization Changes 80
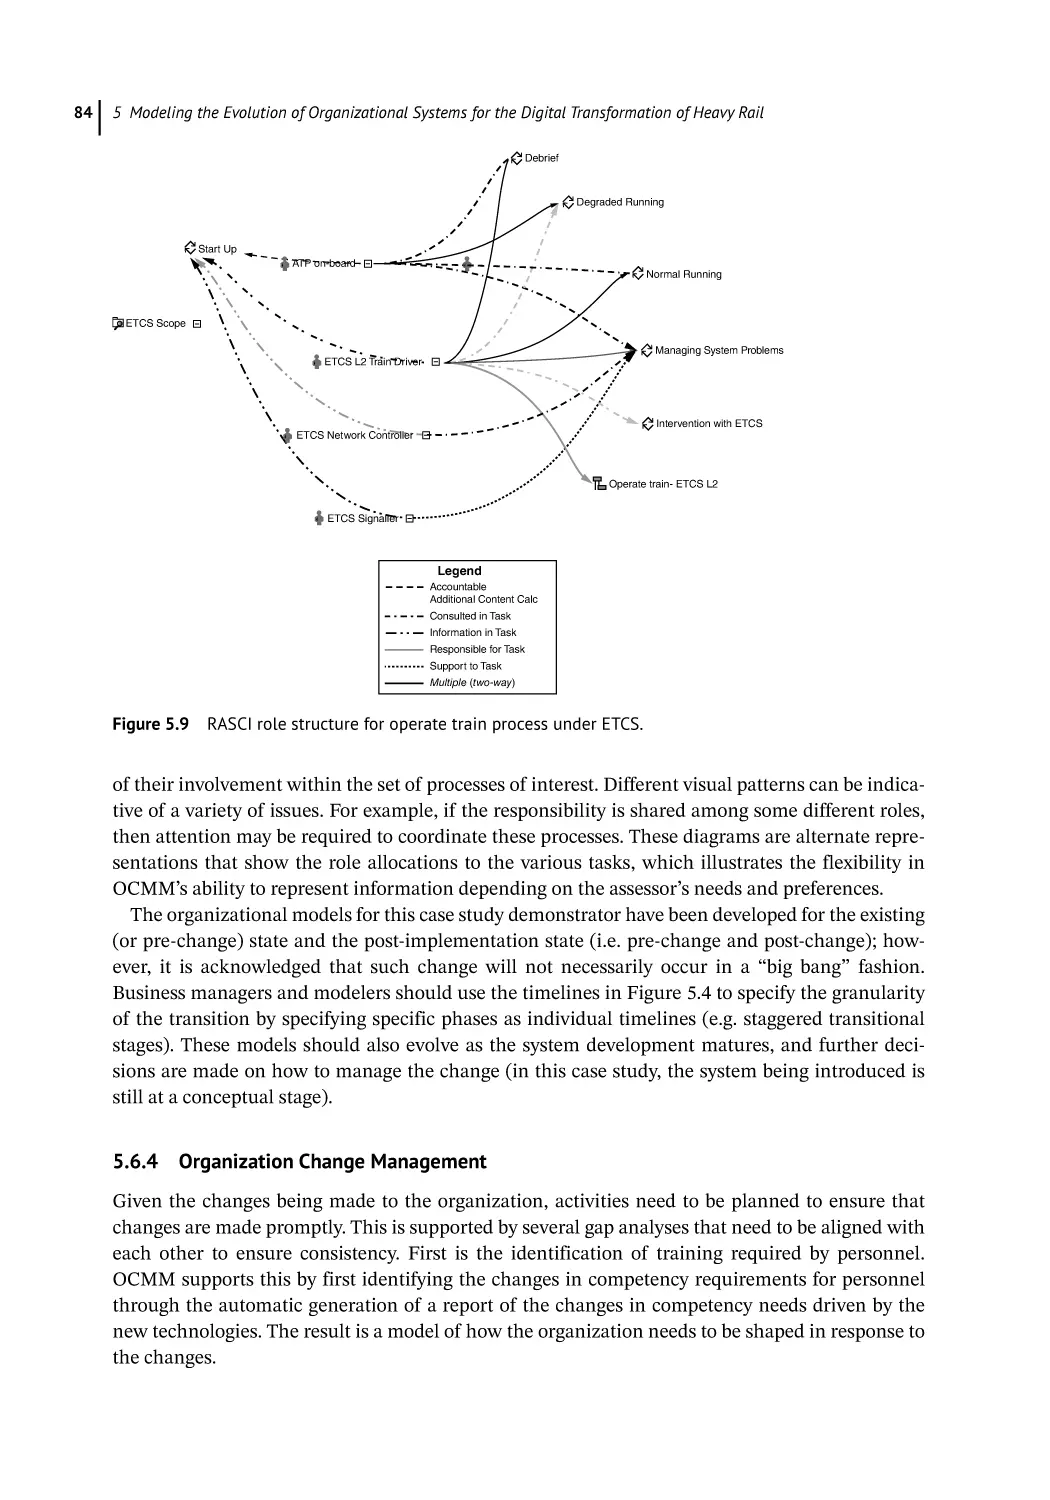
Organization Change Management 84
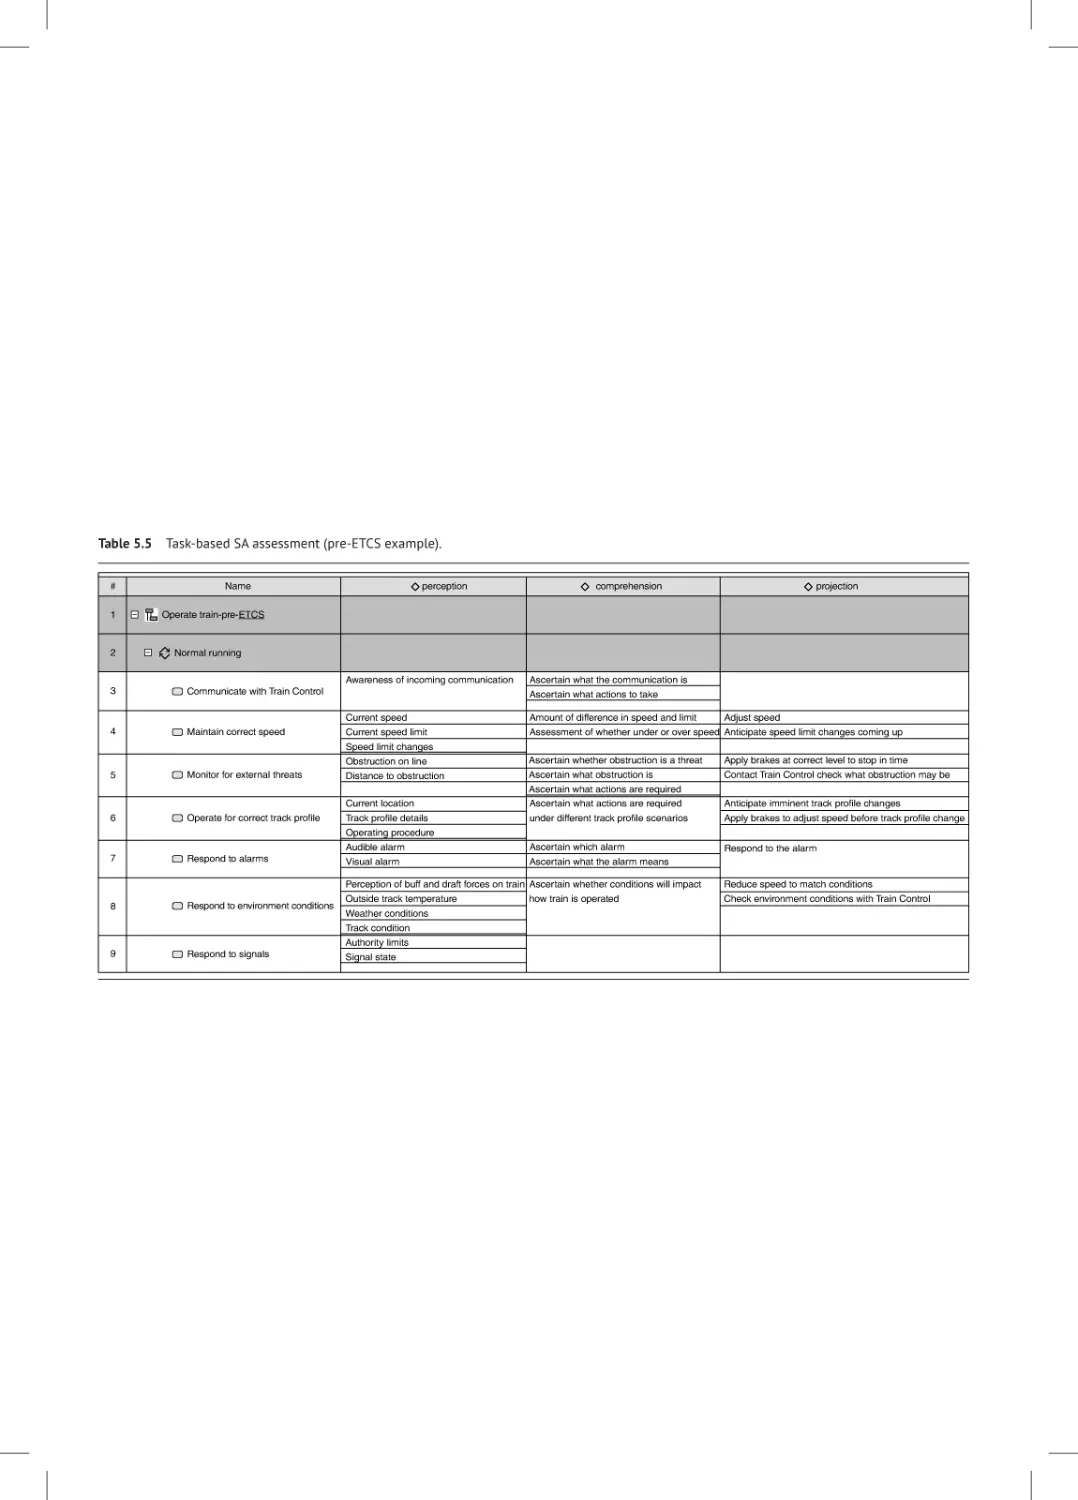
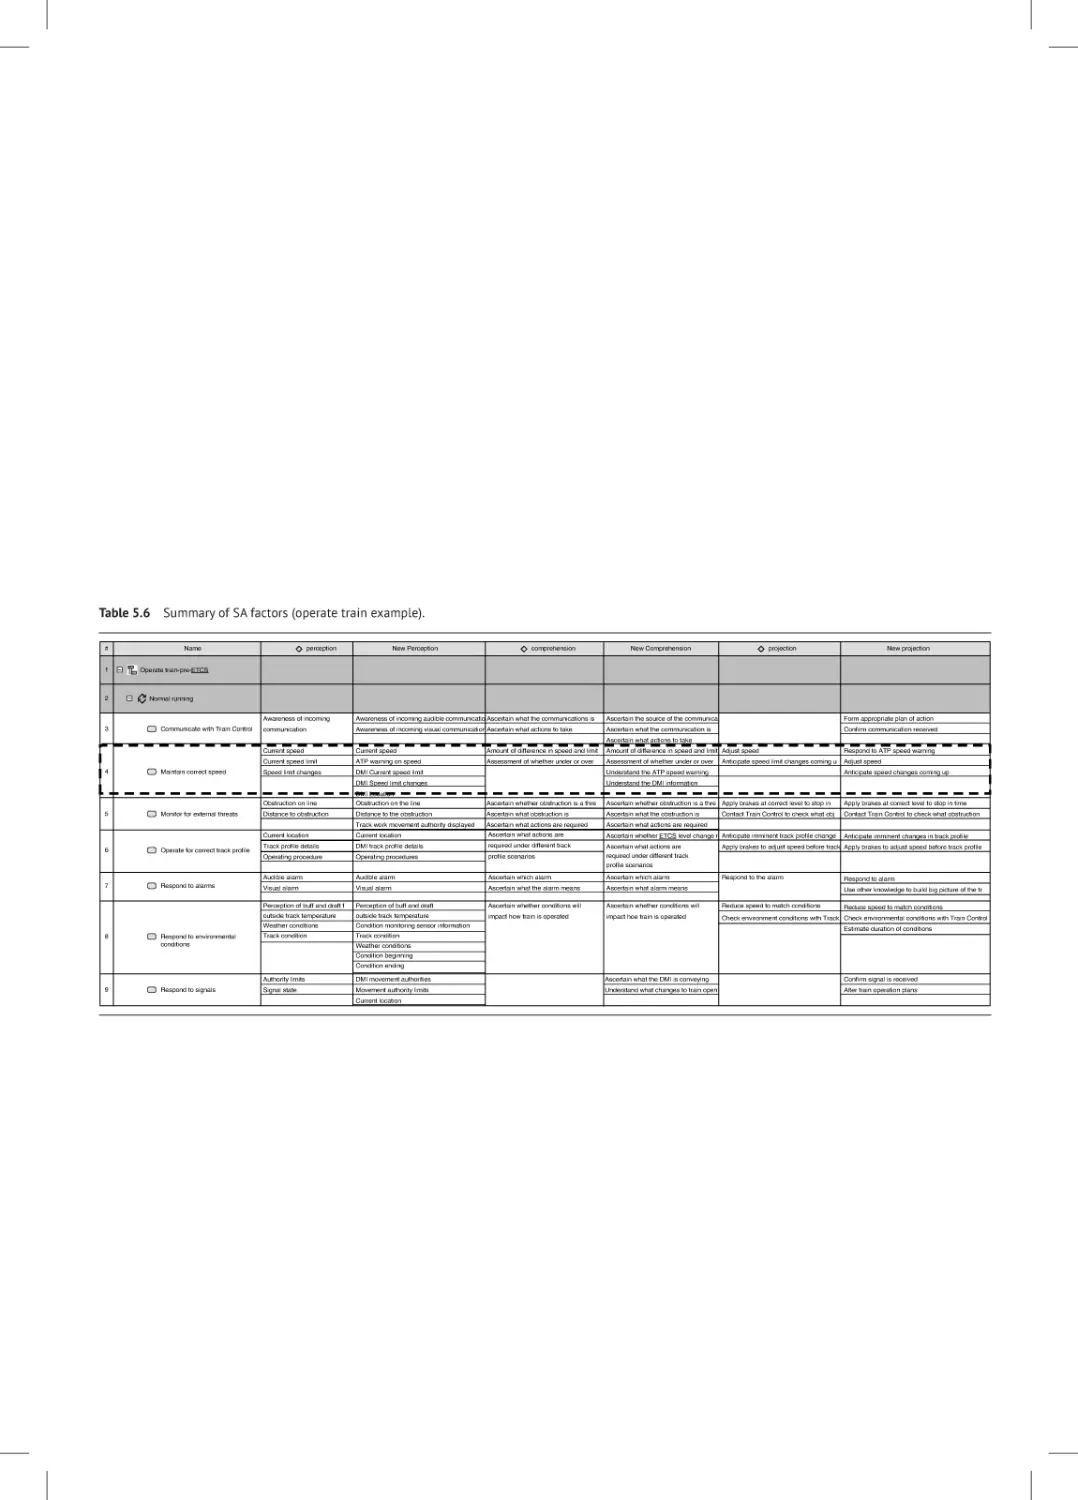
Analyze Emergent System 85
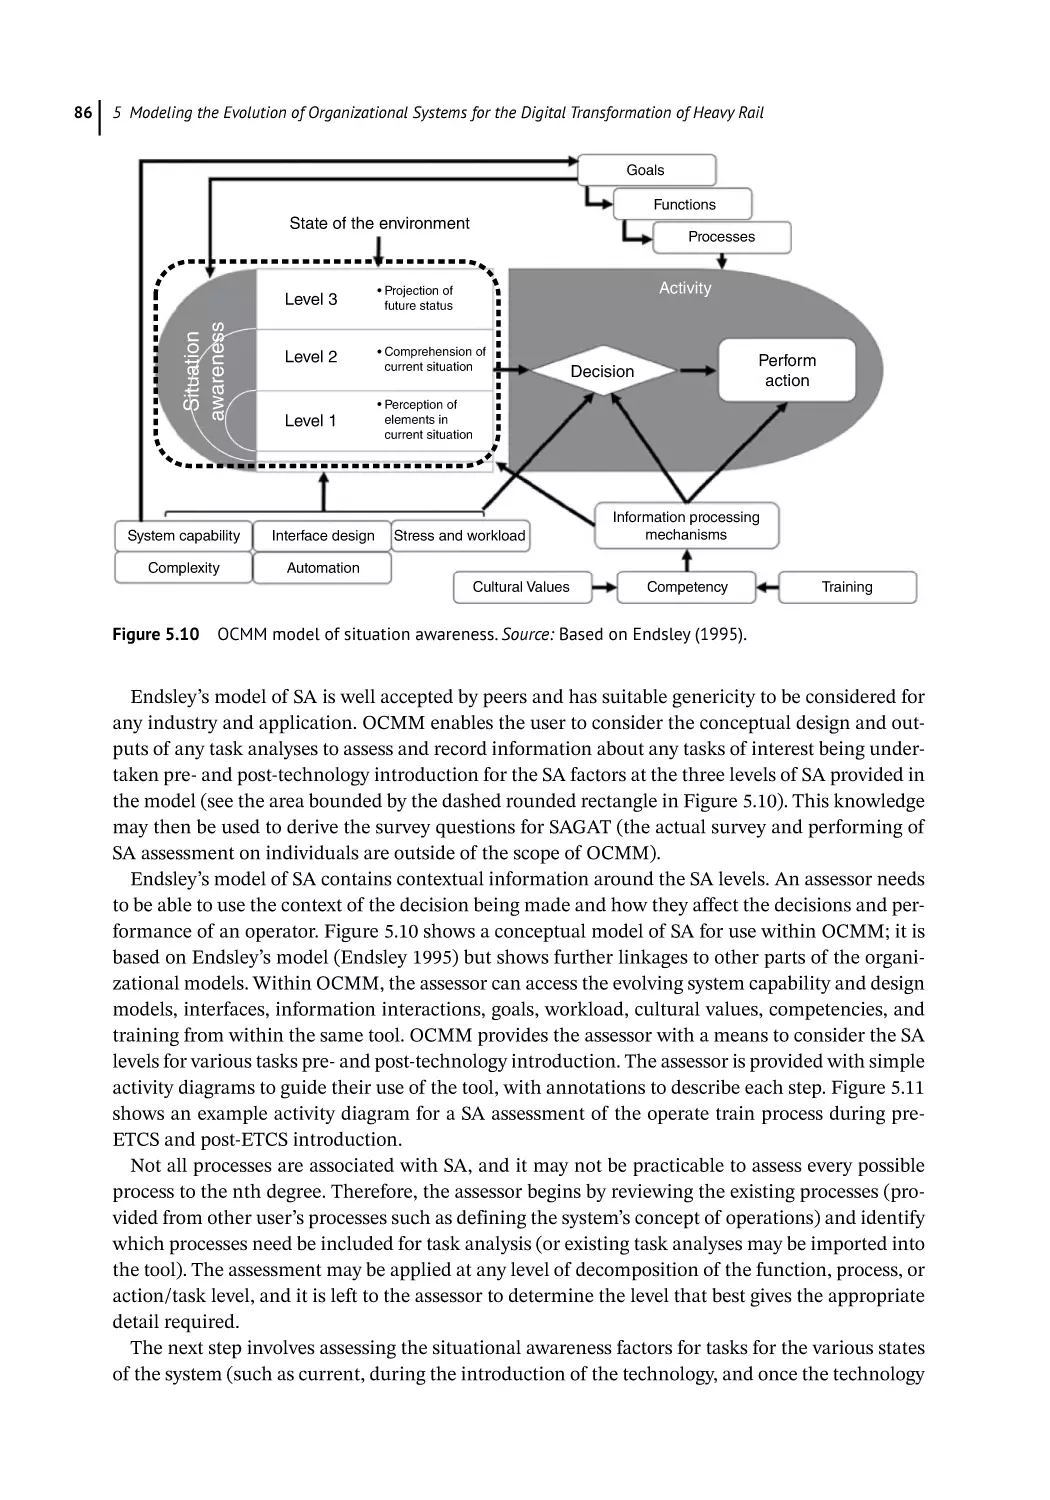
Situation Awareness 85
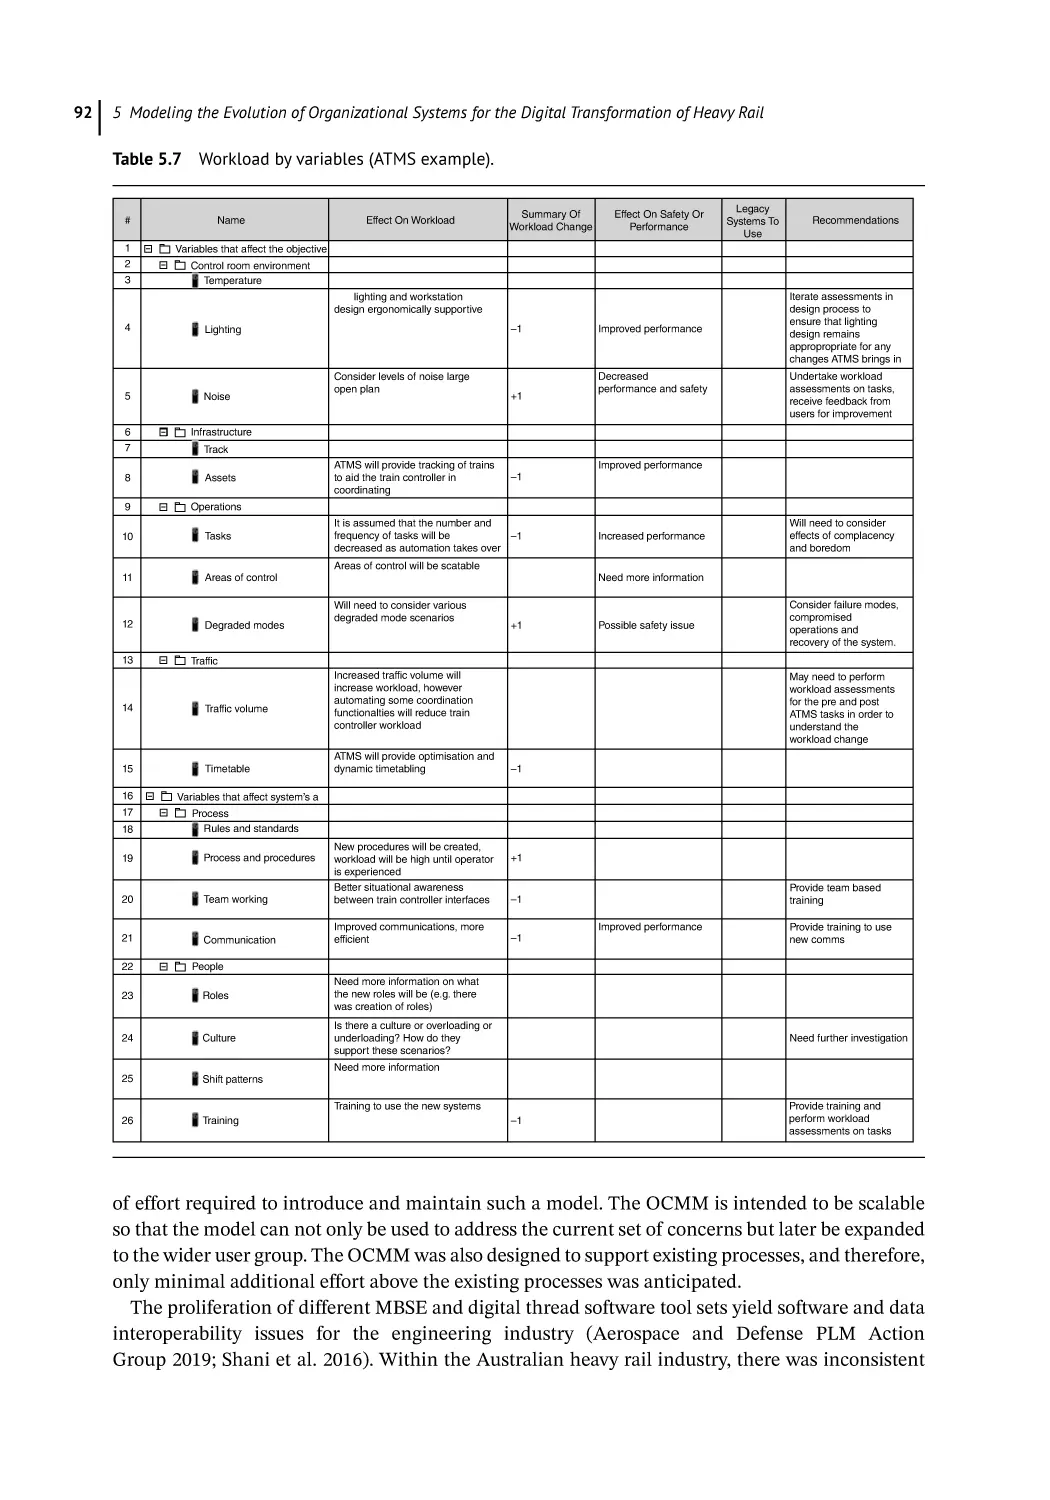
Workload Analysis 90
OCMM Reception 91
Summary and Conclusions 94
References 94
6
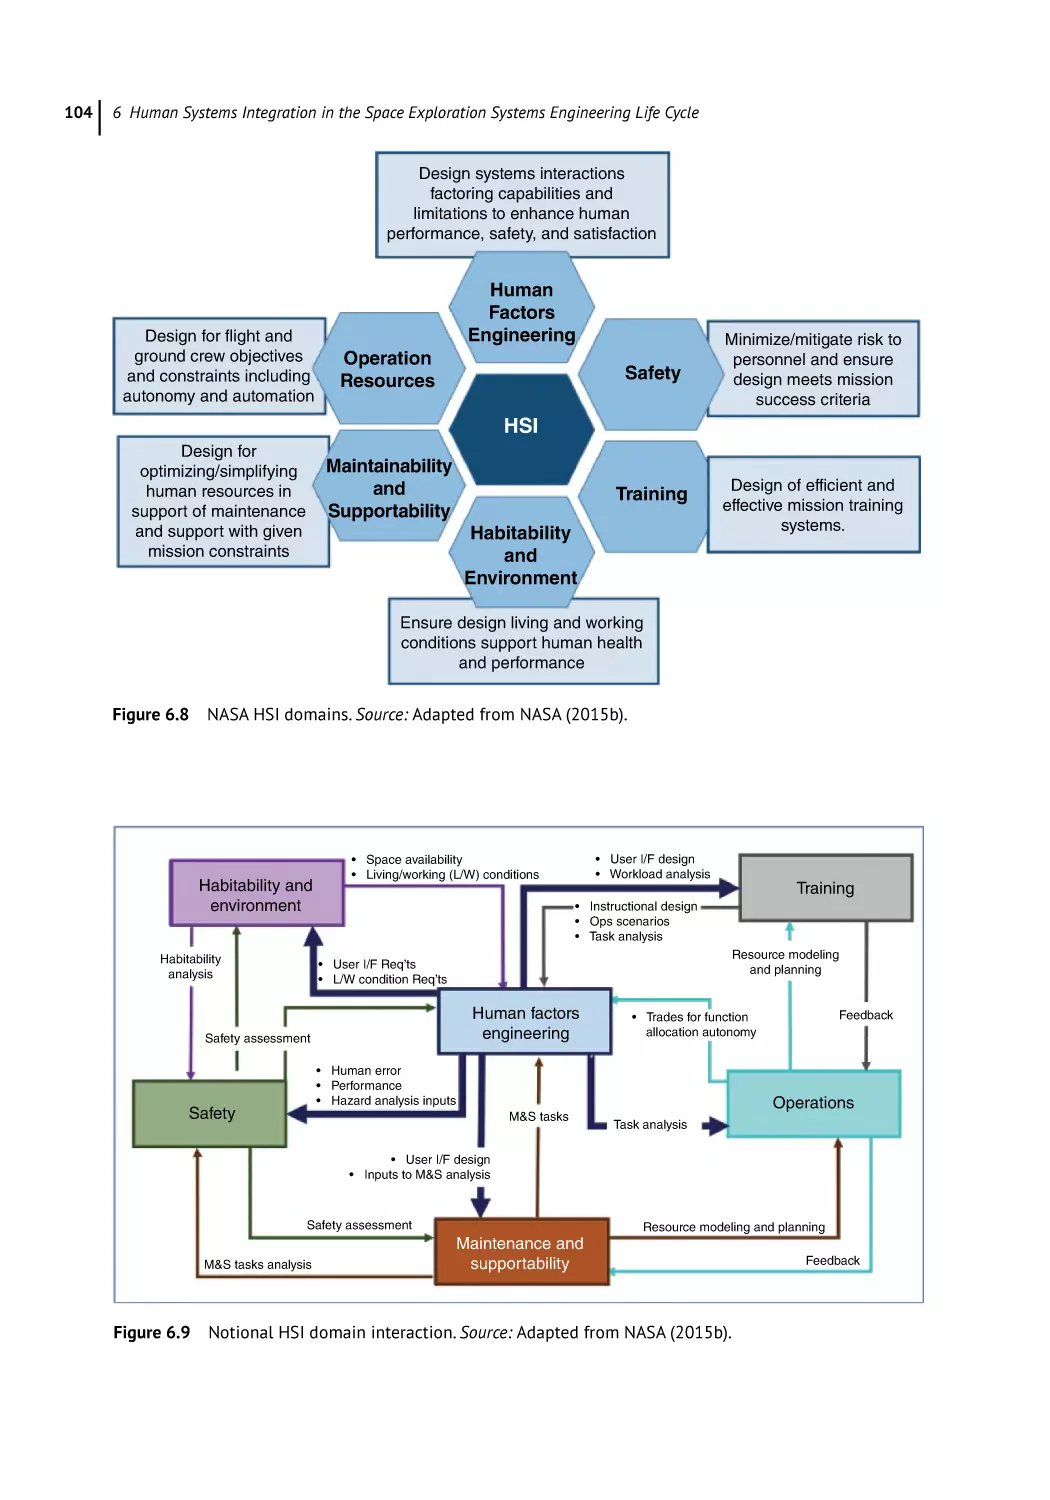
Human Systems Integration in the Space Exploration Systems
Engineering Life Cycle 97
George Salazar and Maria Natalia Russi-Vigoya
Introduction 97
Spacecraft History 98
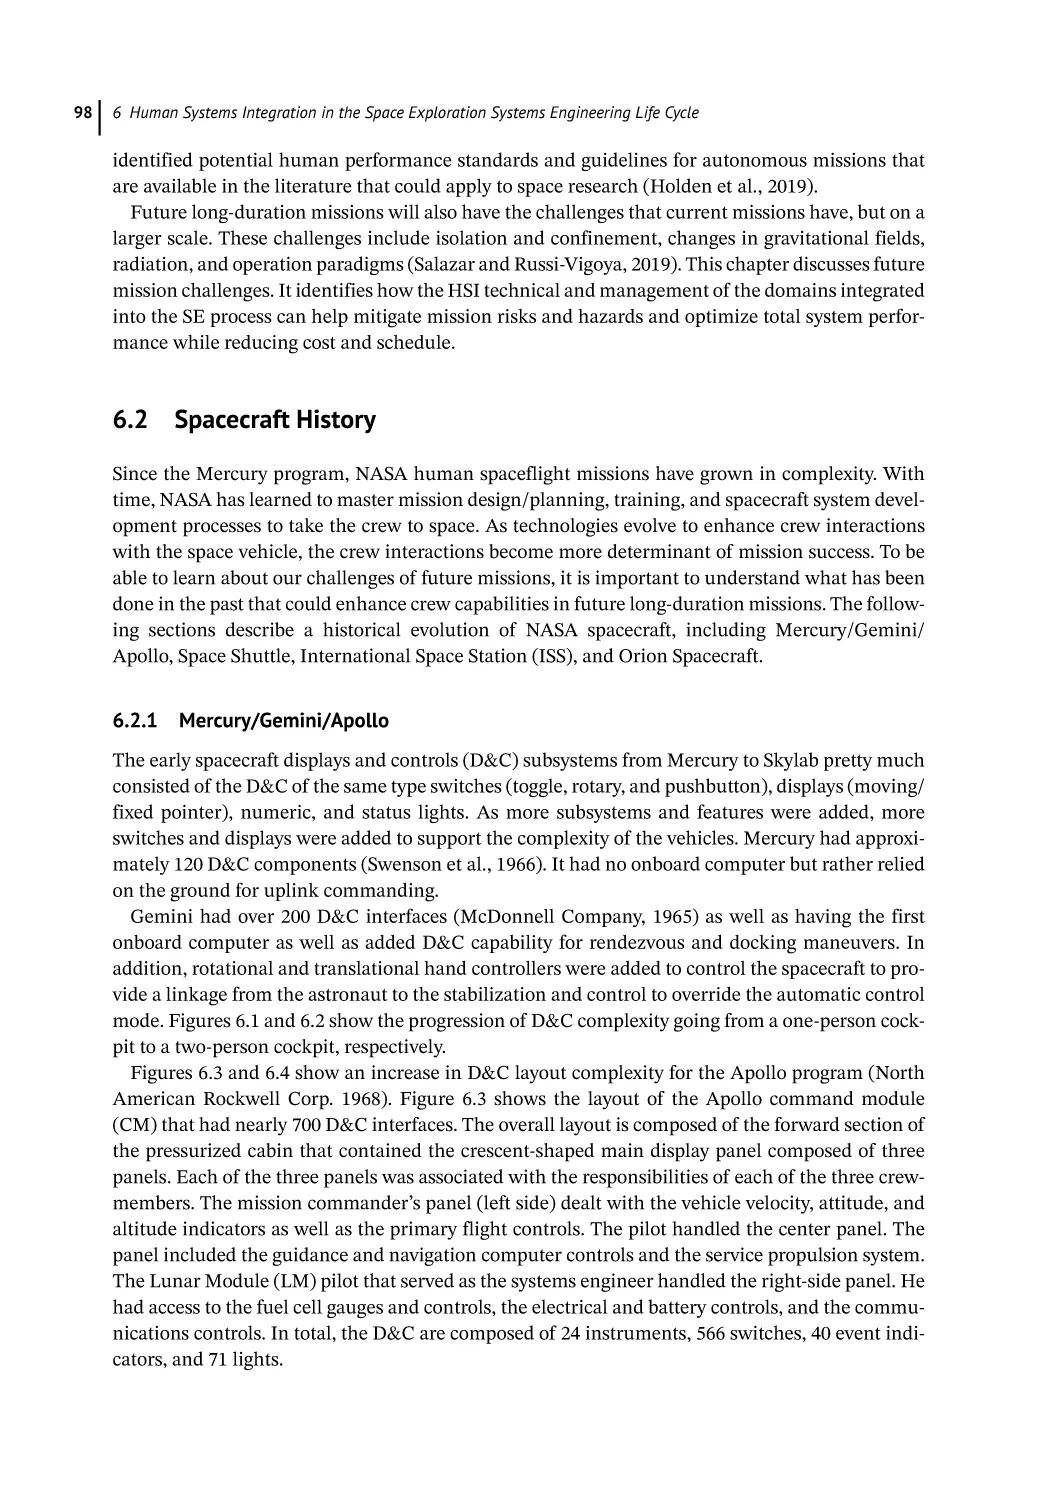
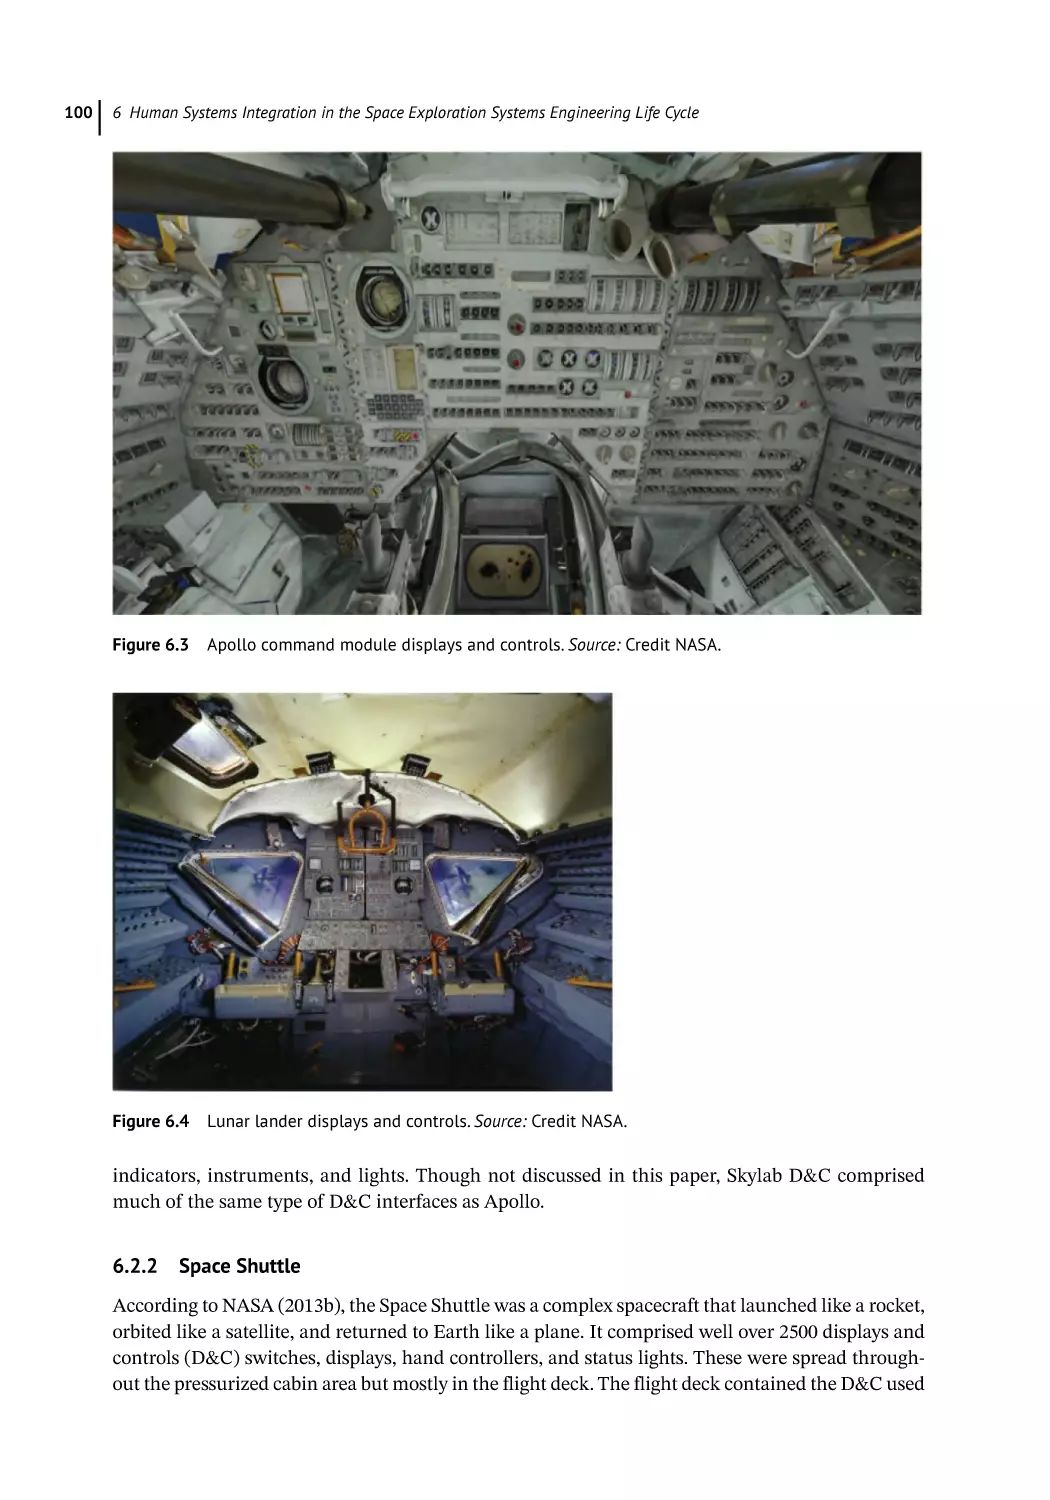
Mercury/Gemini/Apollo 98
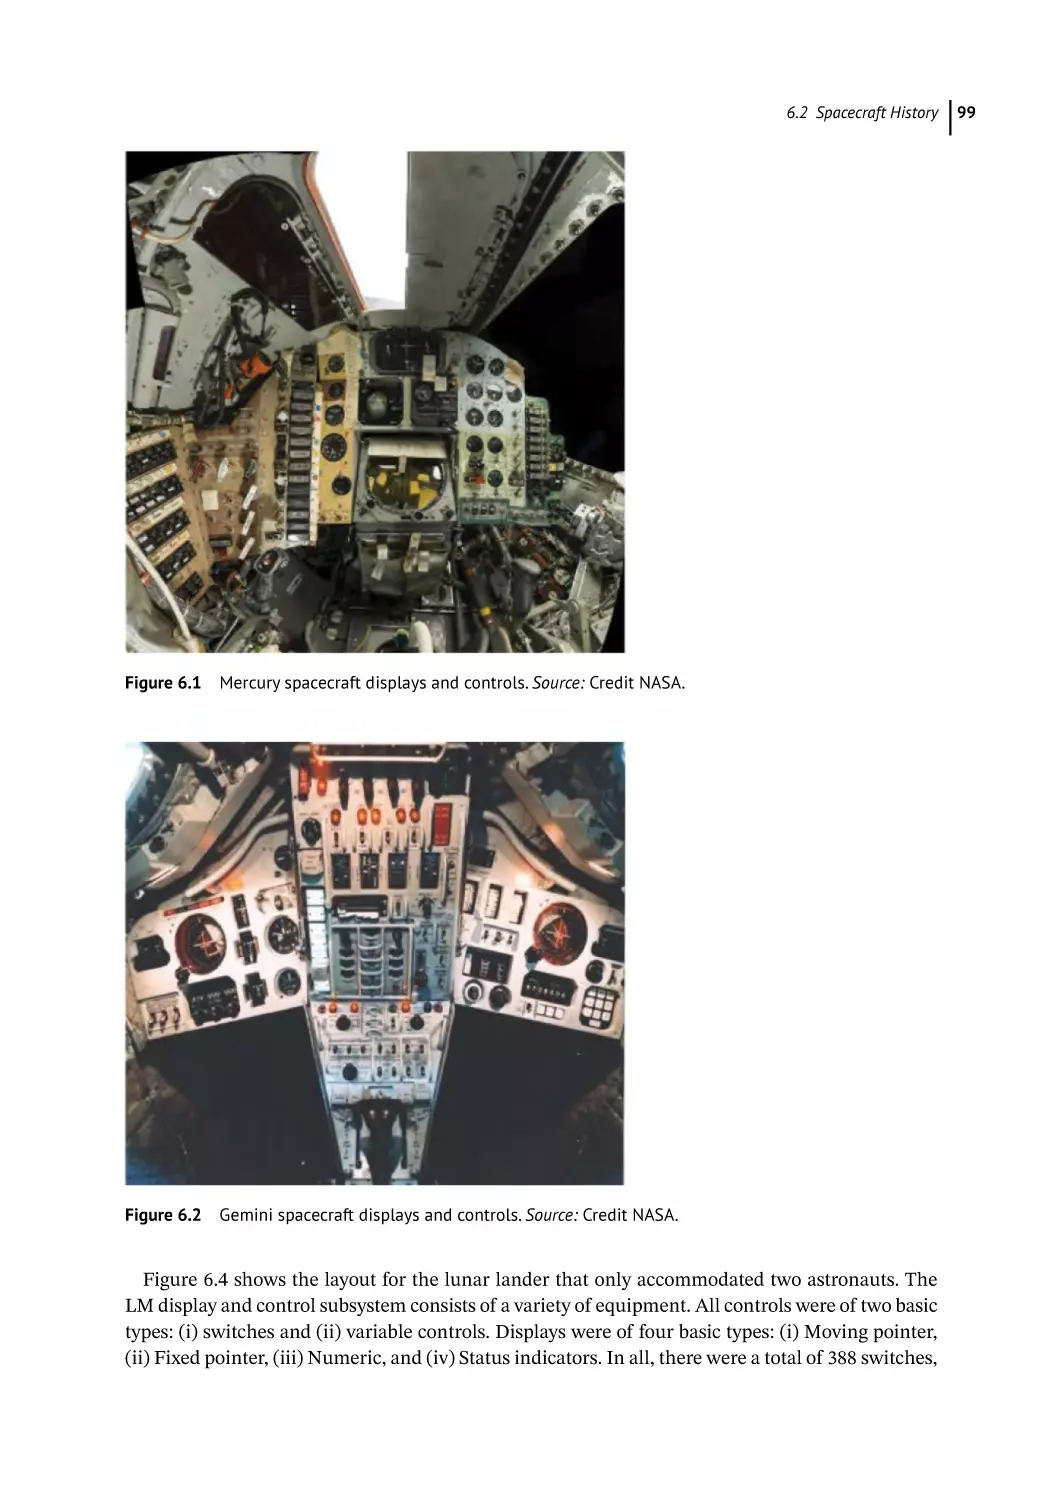
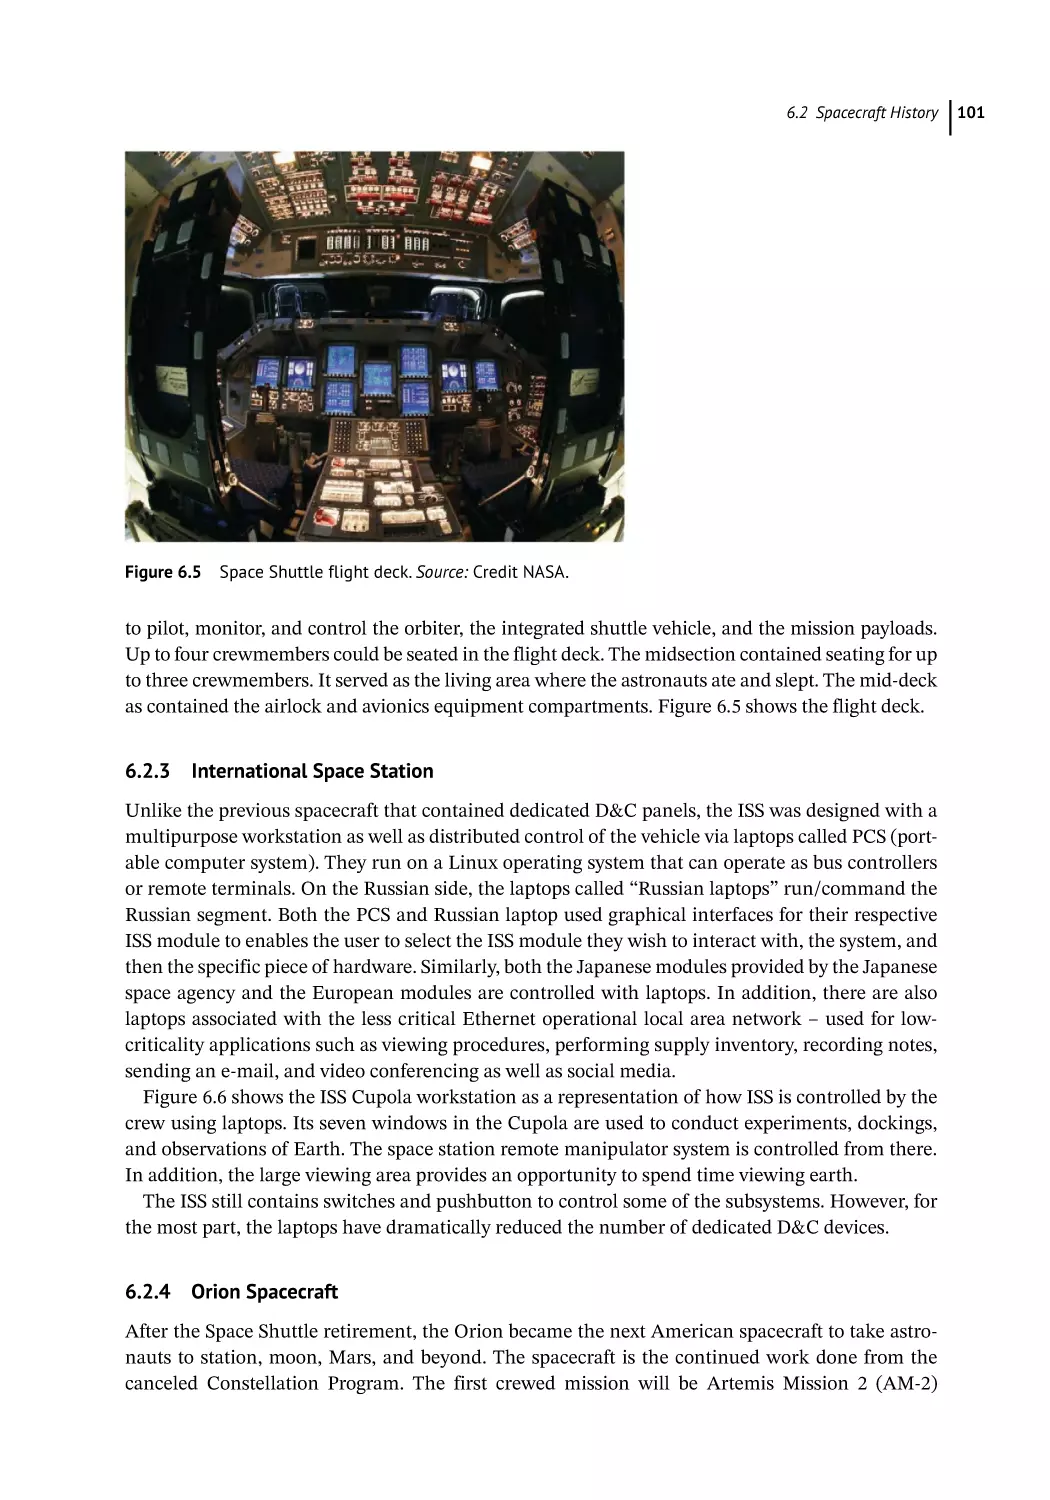
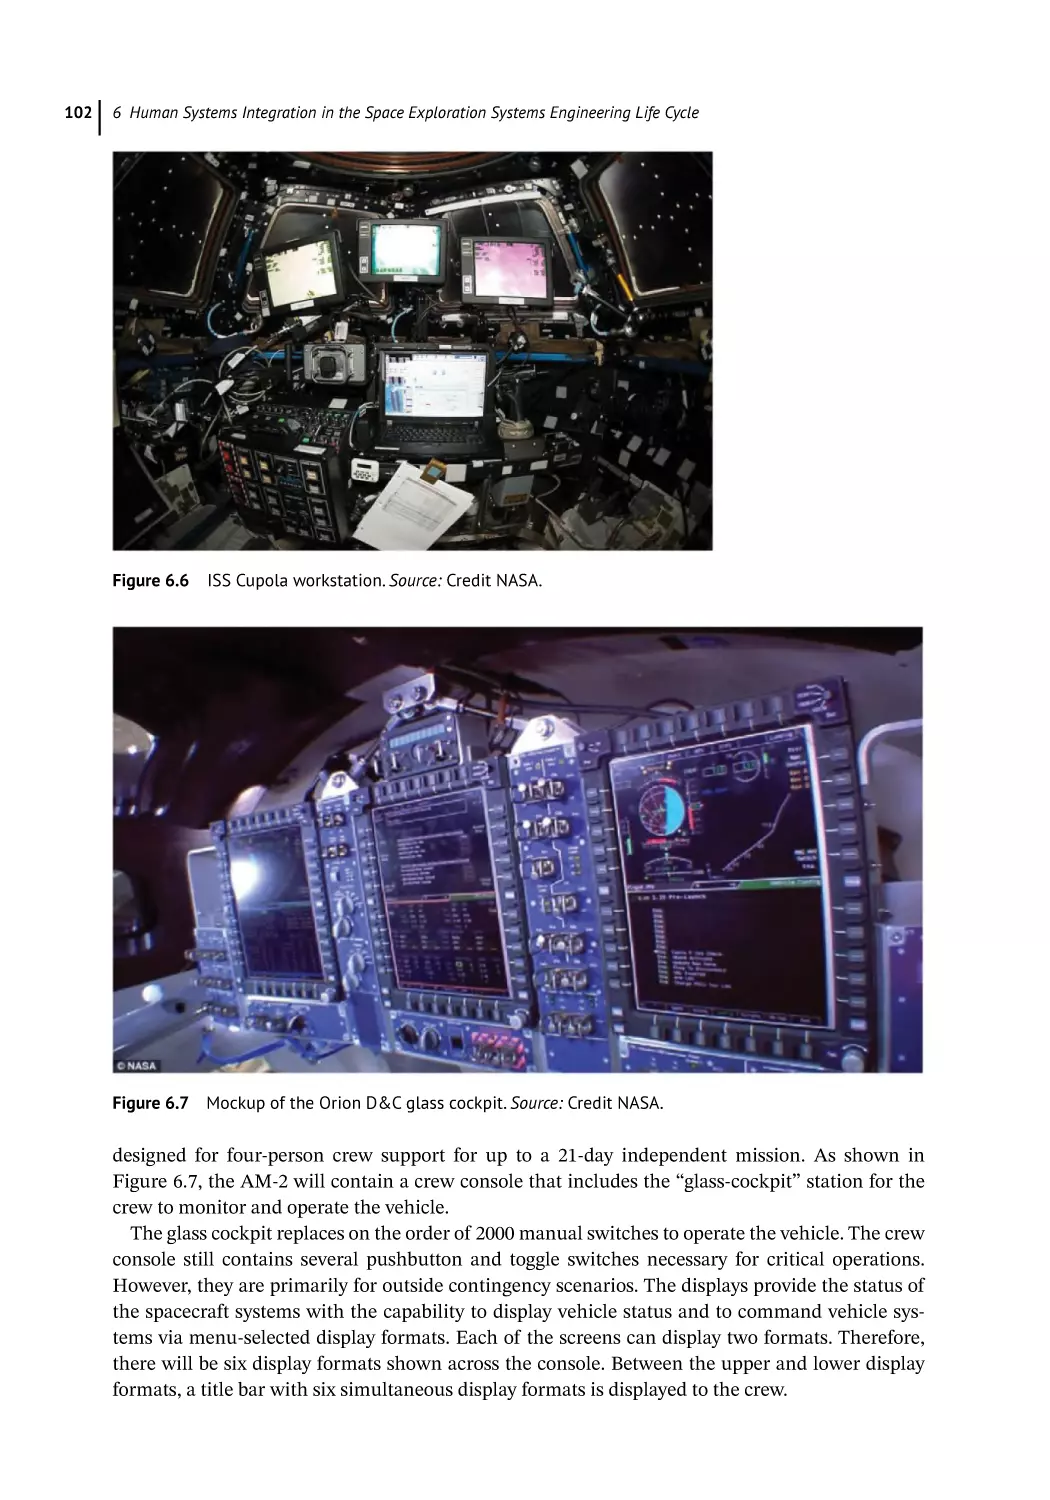
Space Shuttle 100
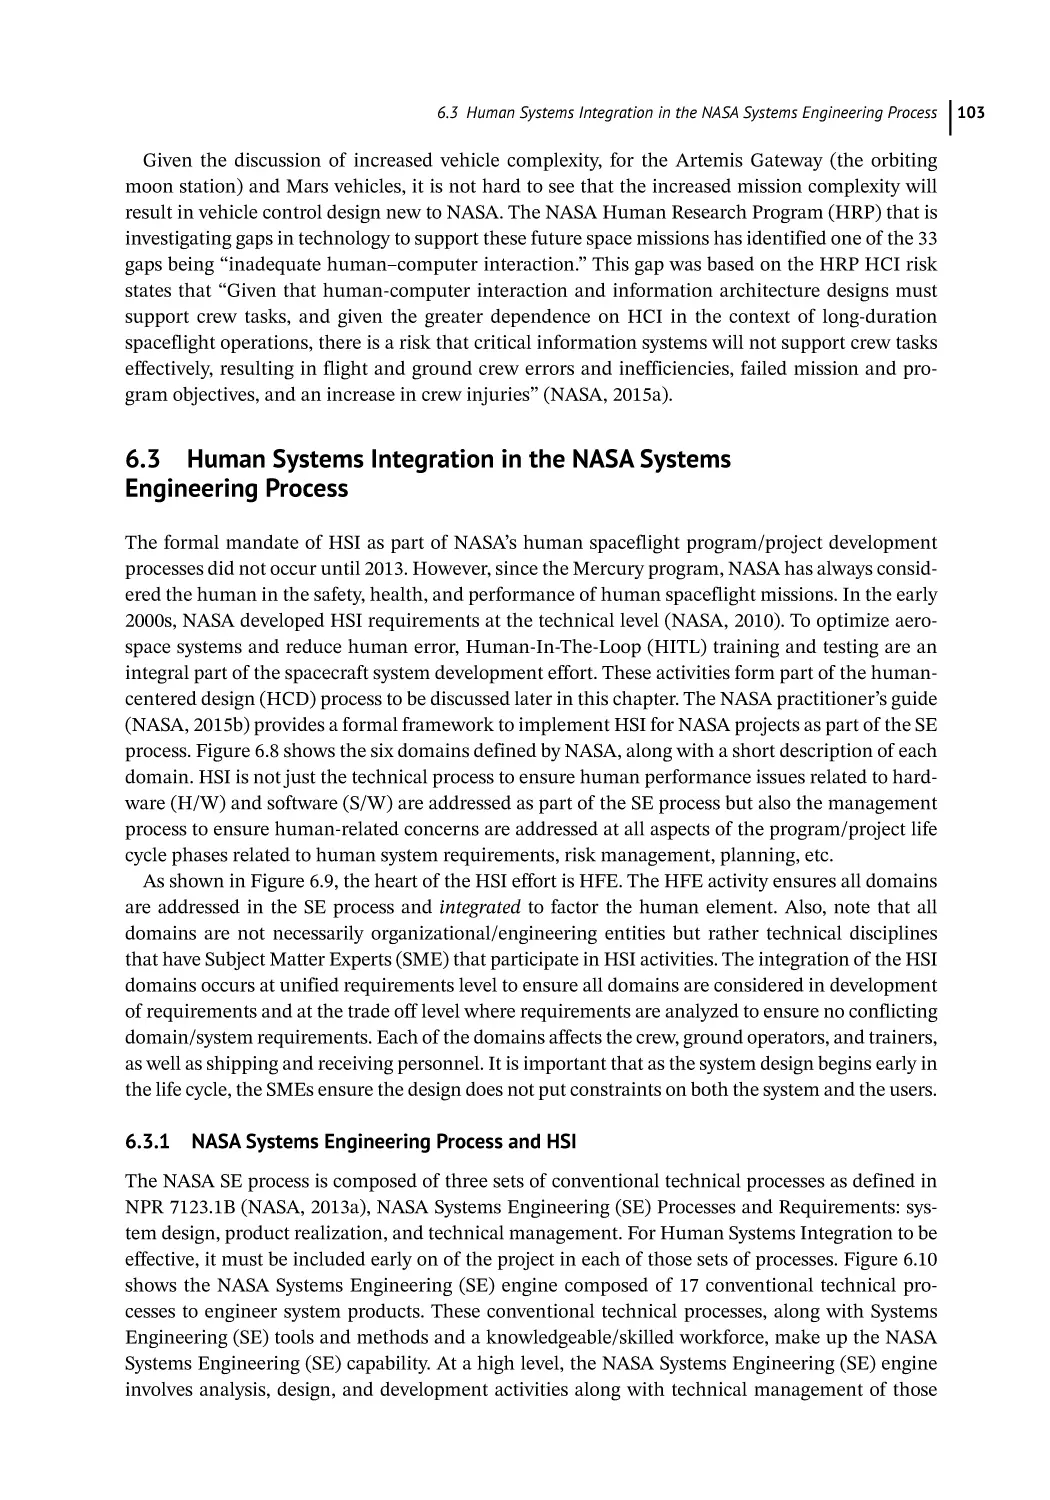
International Space Station 101
Orion Spacecraft 101
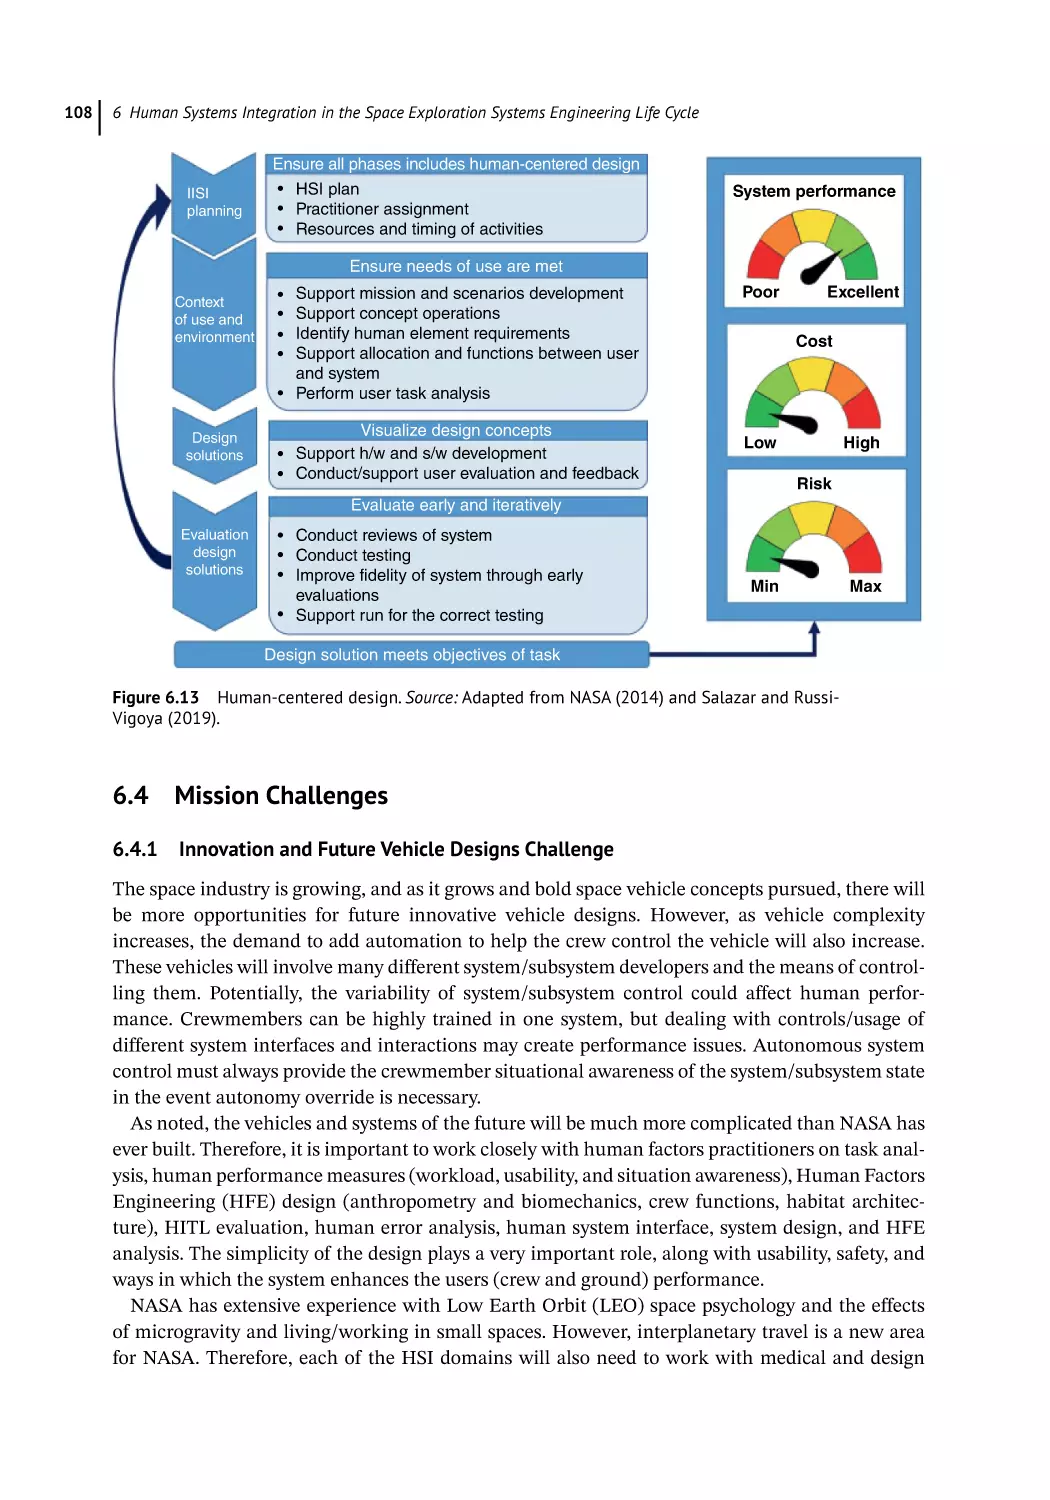
Human Systems Integration in the NASA Systems Engineering Process 103
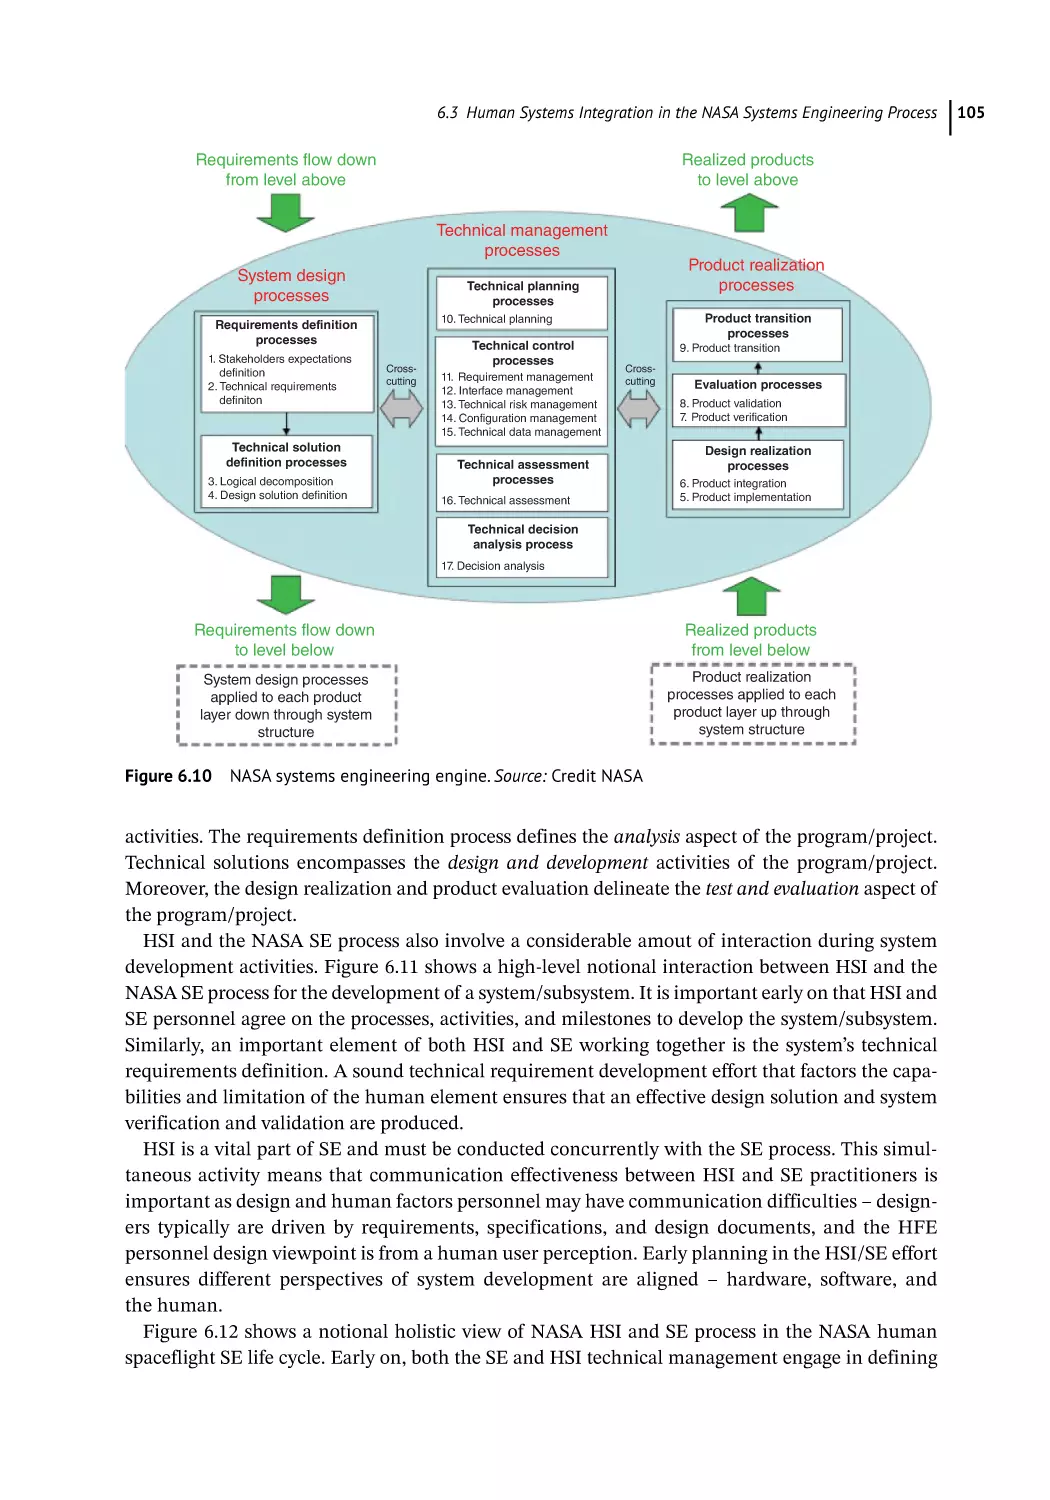
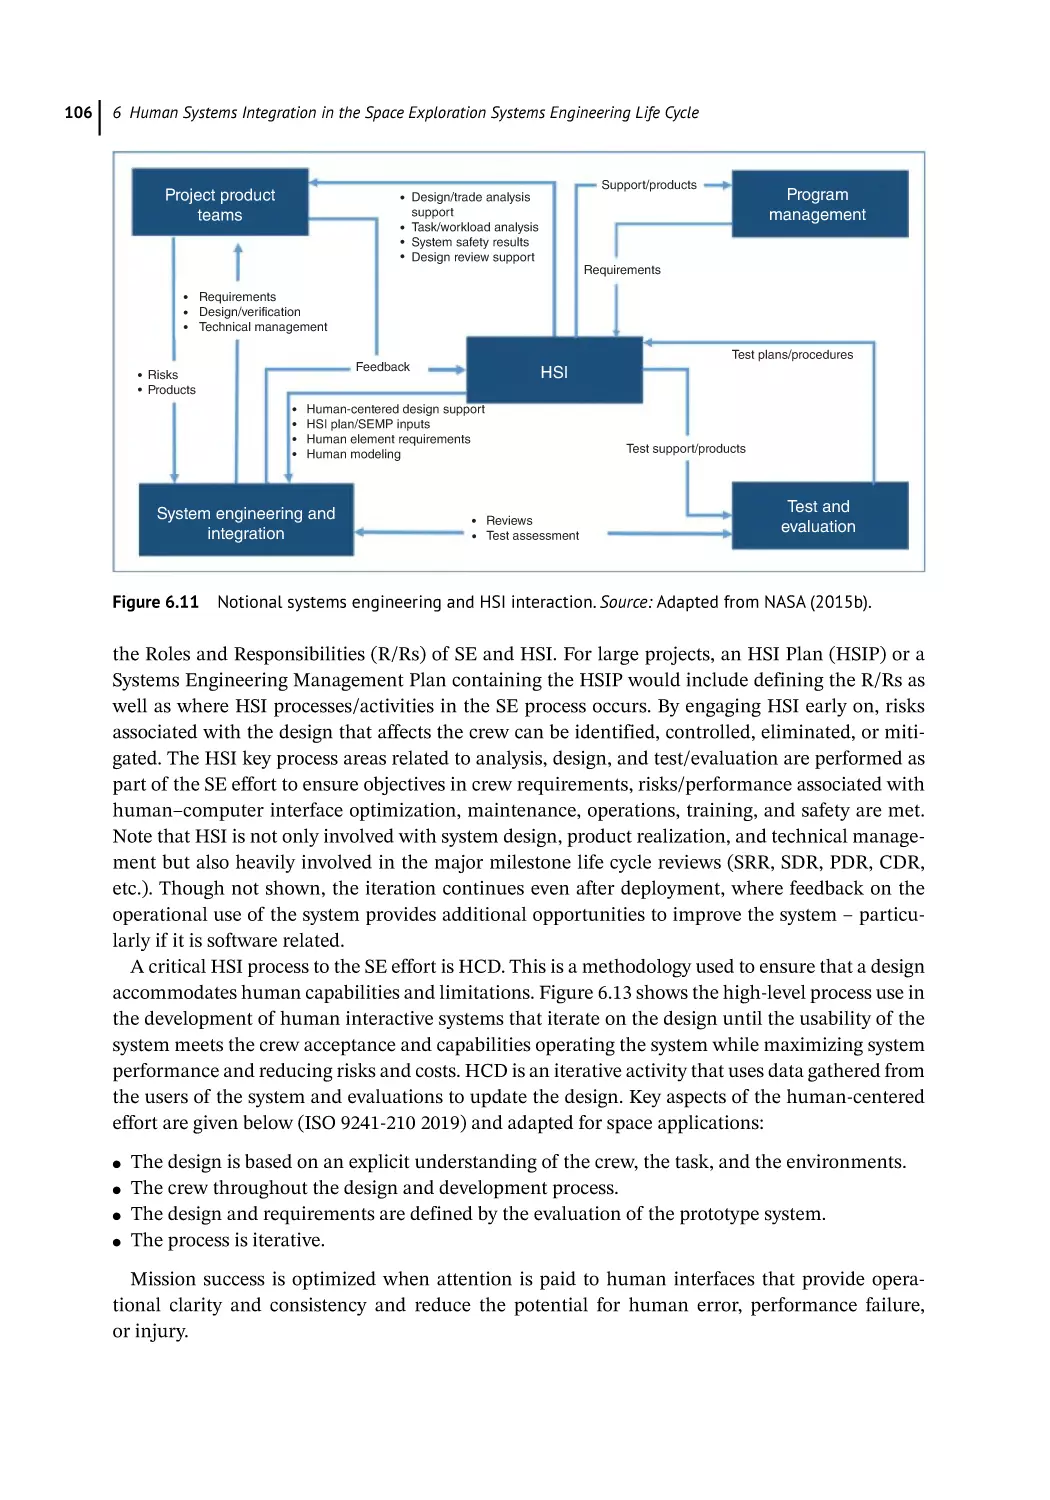
NASA Systems Engineering Process and HSI 103
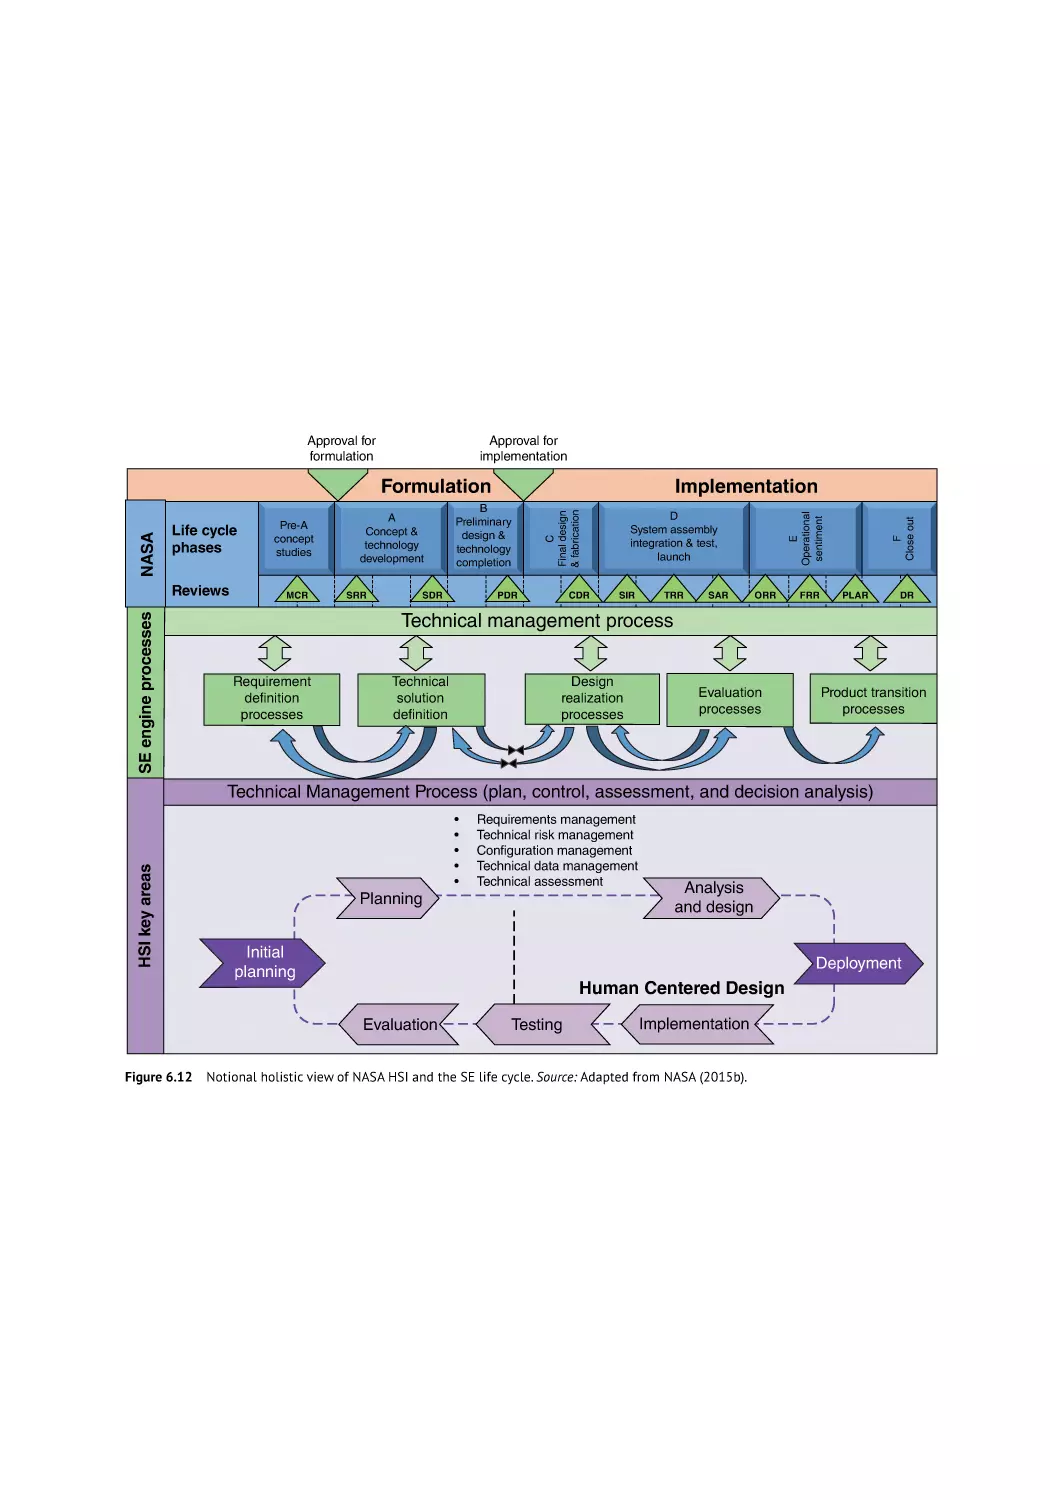
Mission Challenges 108
Innovation and Future Vehicle Designs Challenge 108
Operations Challenges 109
Maintainability and Supportability Challenges 110
Habitability and Environment Challenges 110
Safety Challenges 110
Training Challenges 111
Conclusions 111
References 112
6.1
6.2
6.2.1
6.2.2
6.2.3
6.2.4
6.3
6.3.1
6.4
6.4.1
6.4.2
6.4.3
6.4.4
6.4.5
6.4.6
6.5
7
7.1
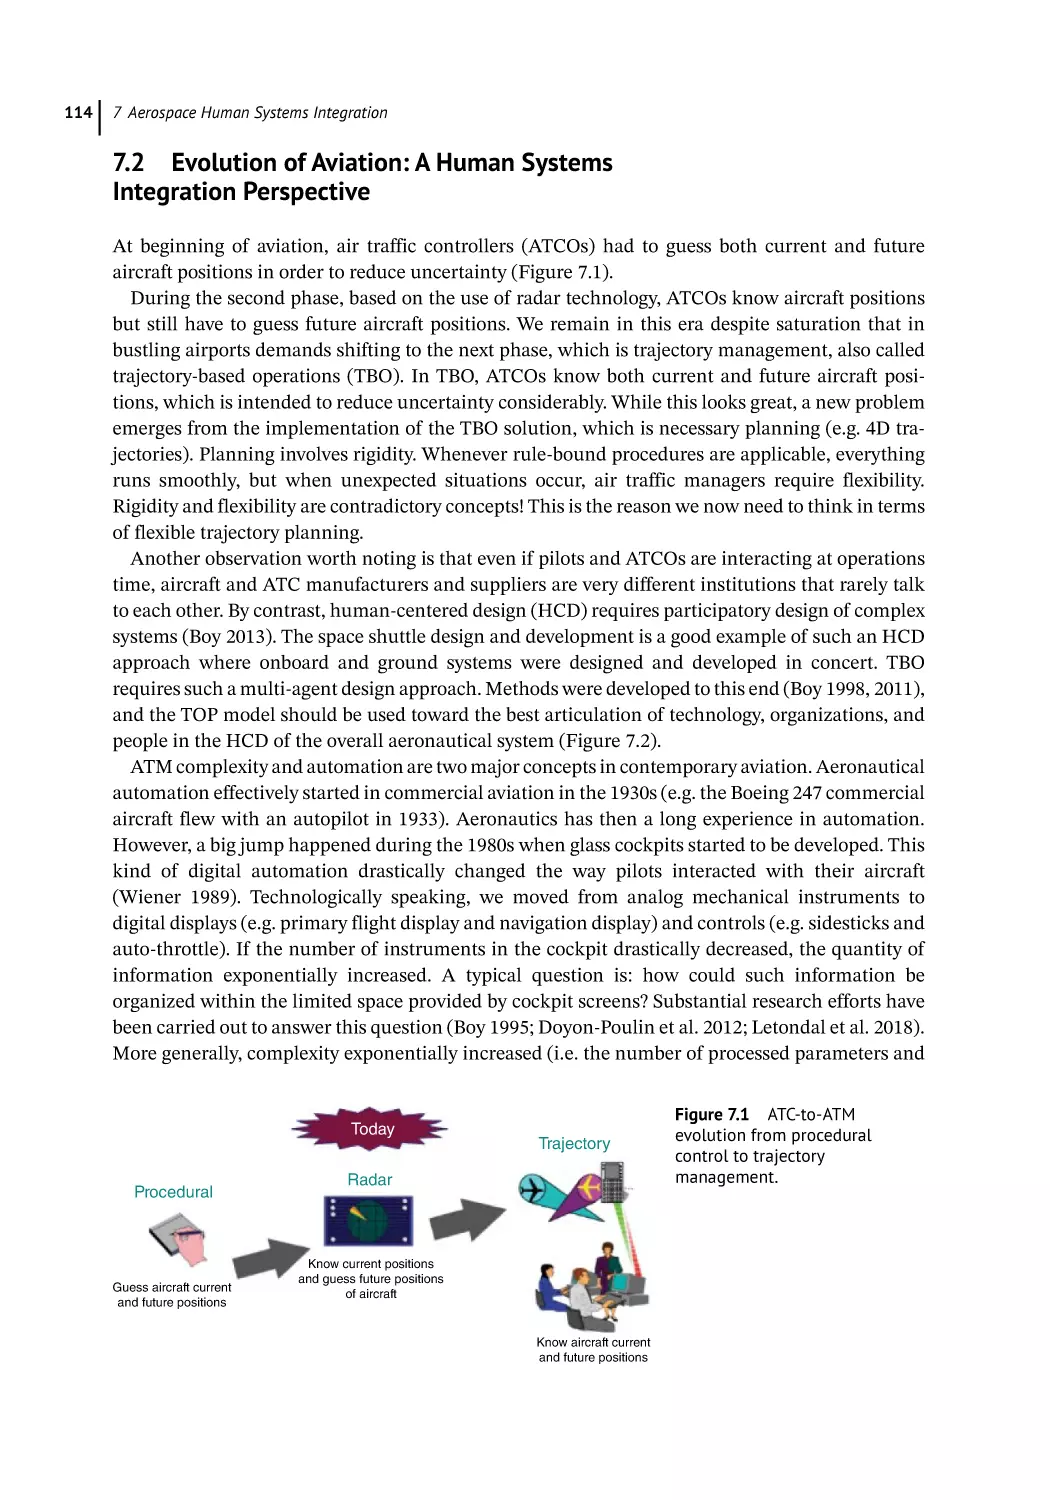
7.2
7.3
7.3.1
7.3.2
7.3.3
7.3.4
7.4
78
Aerospace Human Systems Integration: Evolution over the
Last 40 Years 113
Guy André Boy
Introduction 113
Evolution of Aviation: A Human Systems Integration Perspective 114
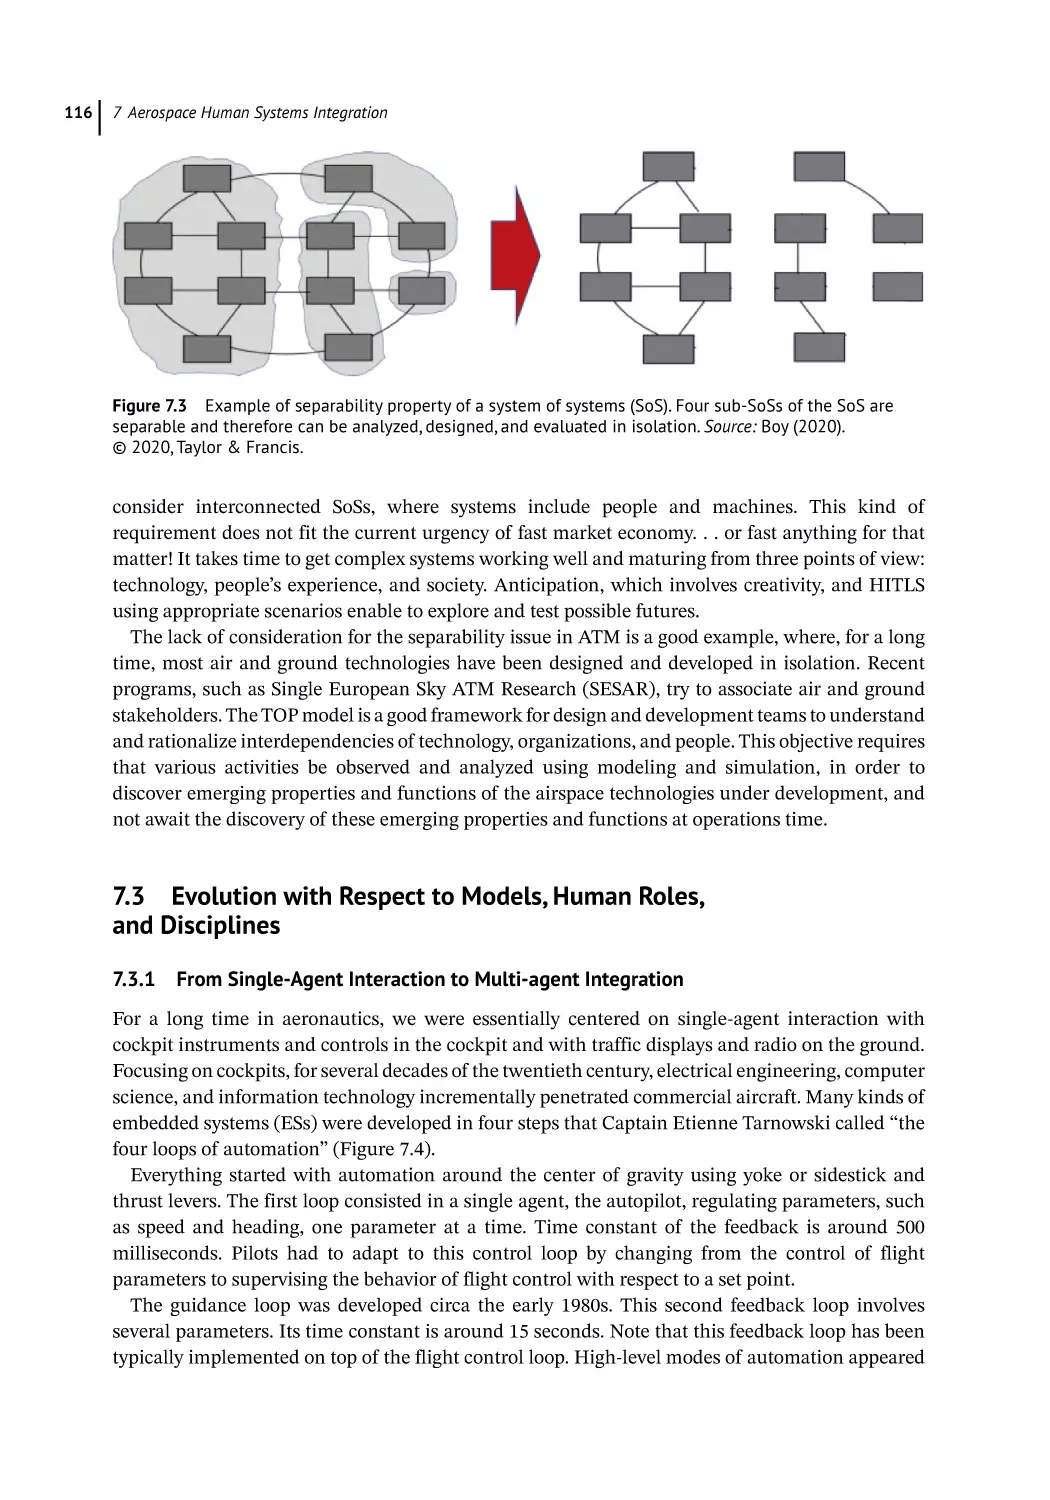
Evolution with Respect to Models, Human Roles, and Disciplines 116
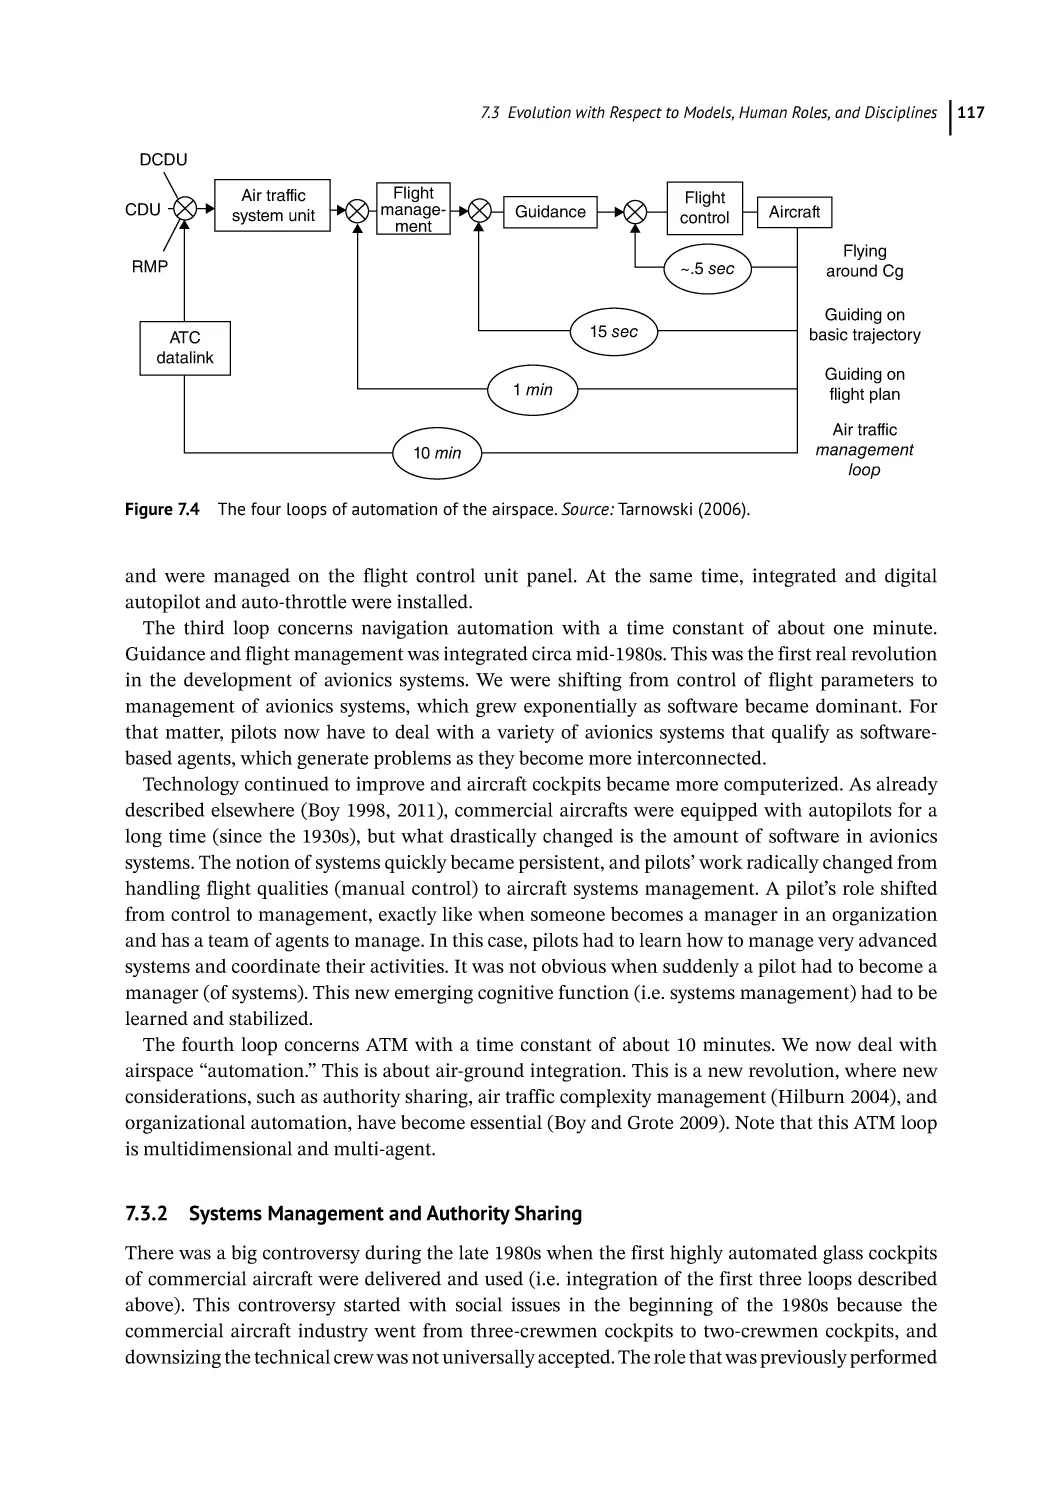
From Single-Agent Interaction to Multi-agent Integration 116
Systems Management and Authority Sharing 117
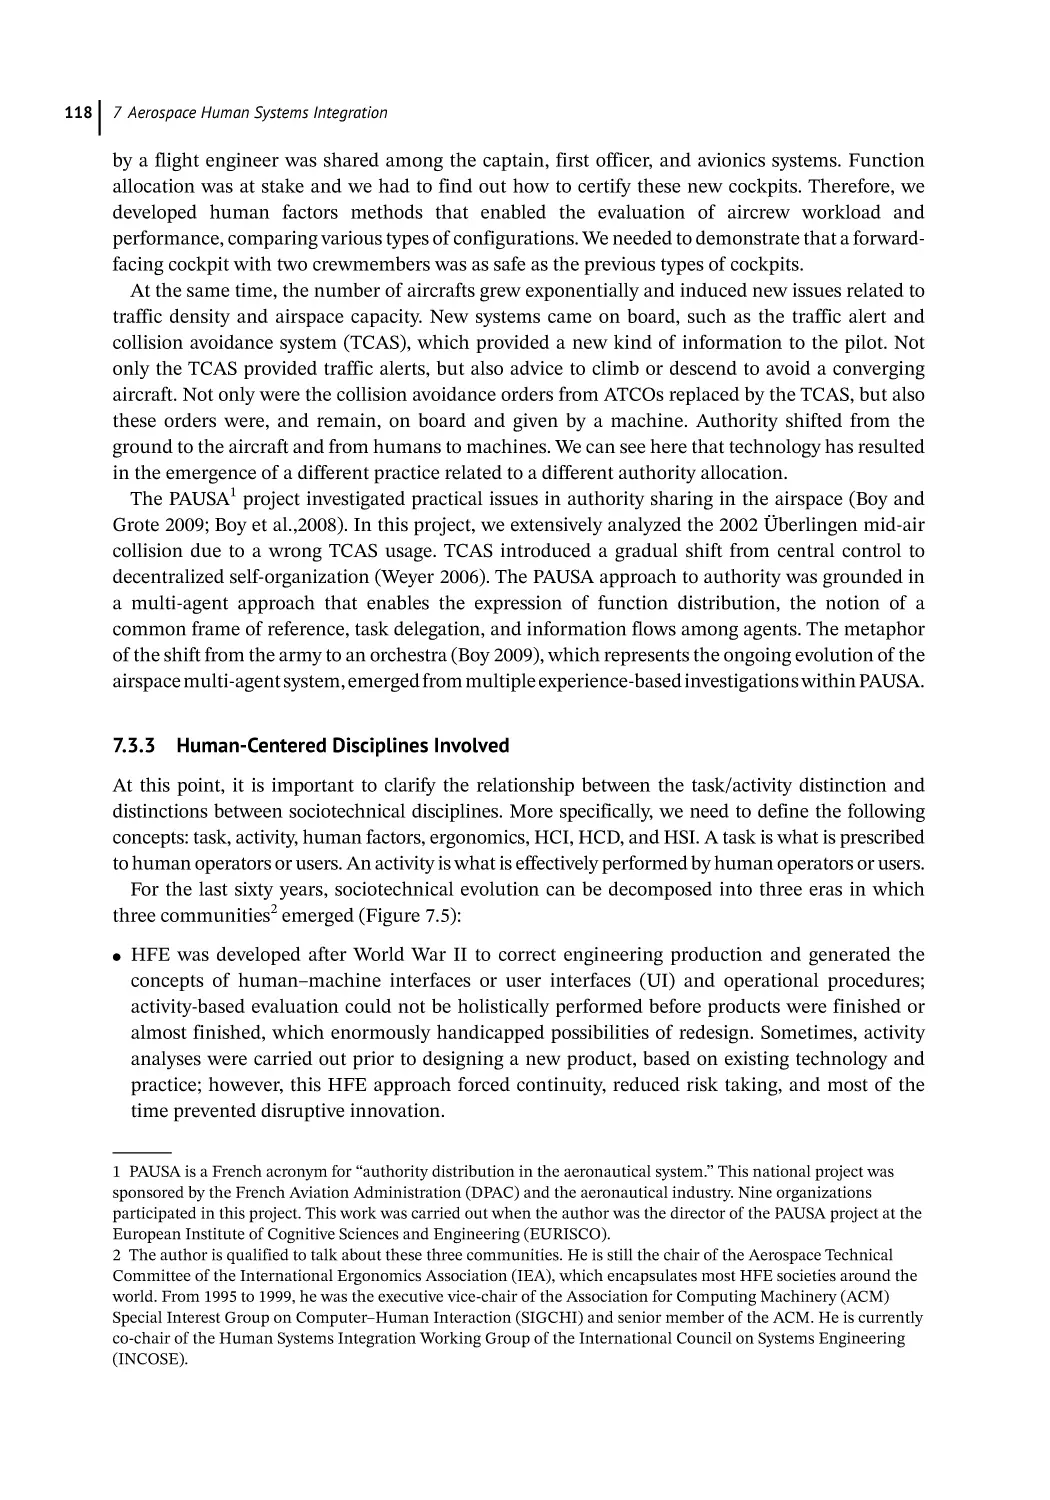
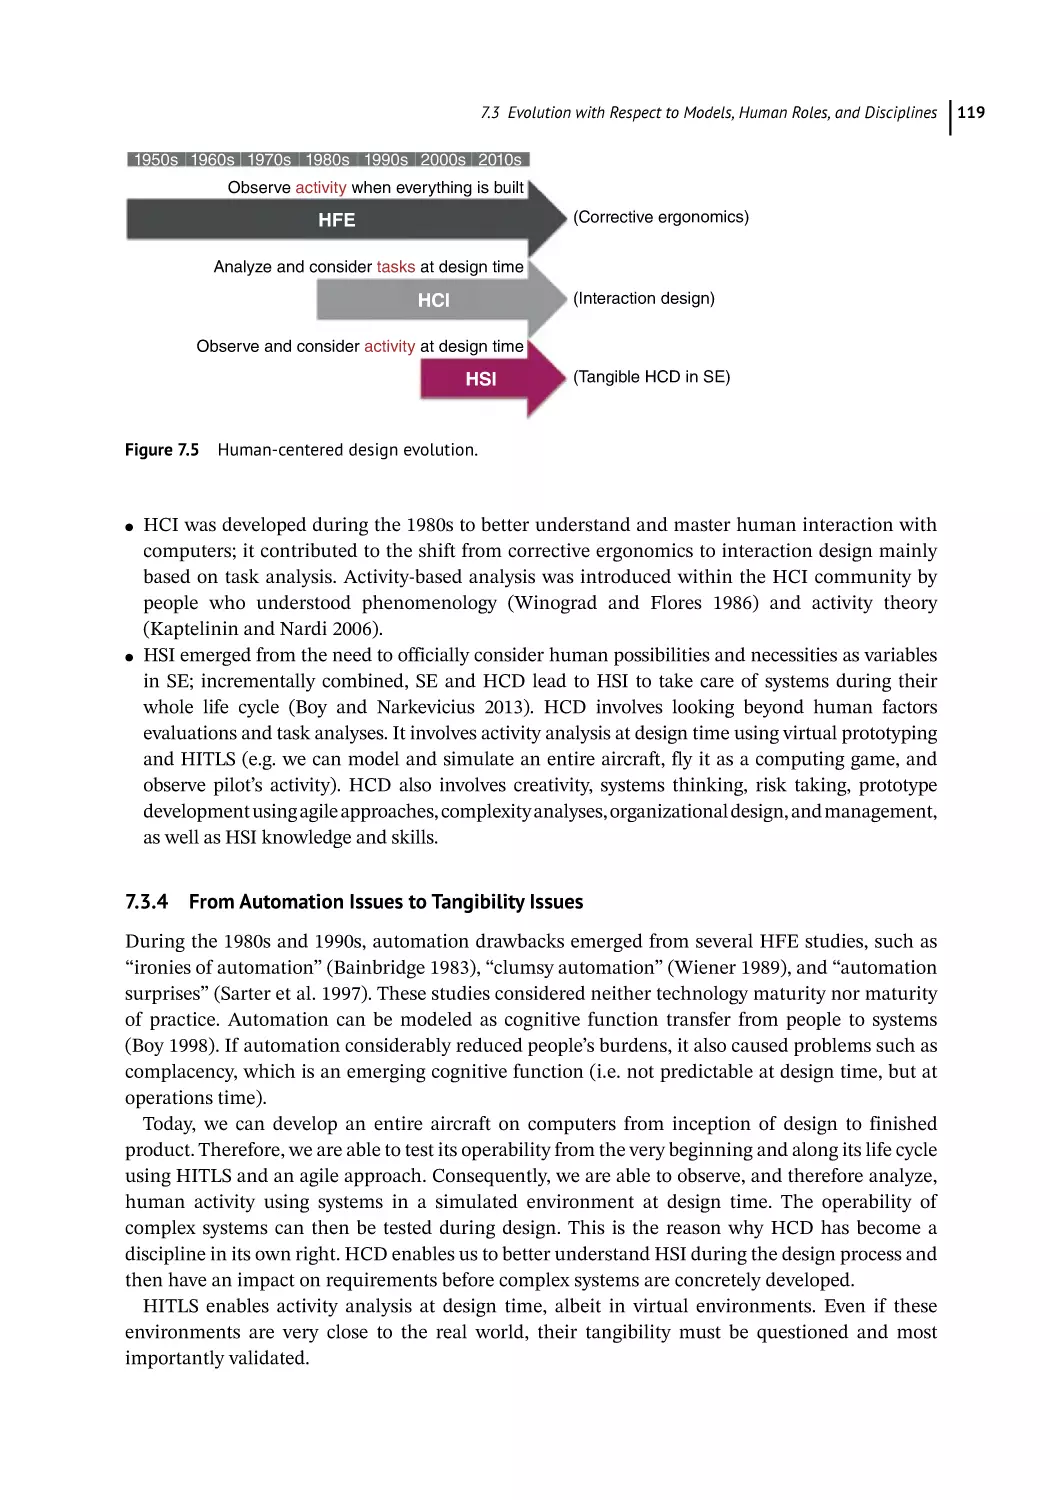
Human-Centered Disciplines Involved 118
From Automation Issues to Tangibility Issues 119
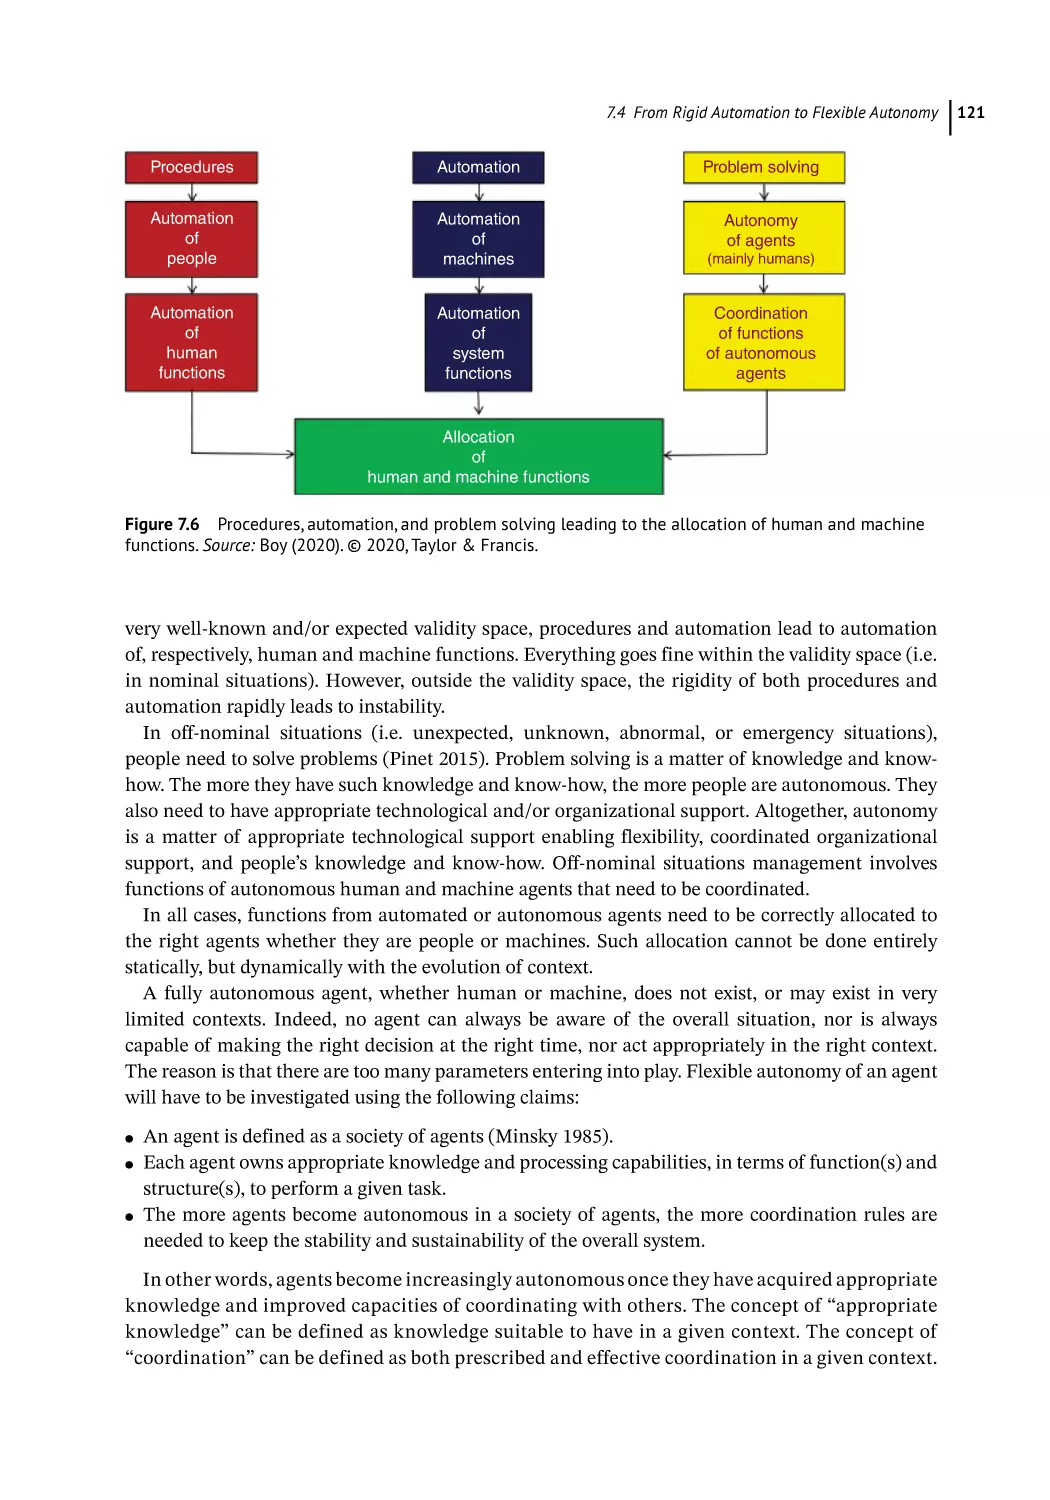
From Rigid Automation to Flexible Autonomy 120
ix
x
Contents
7.5
7.6
7.6.1
7.6.2
7.6.3
7.7
ow Software Took the Lead on Hardware 122
H
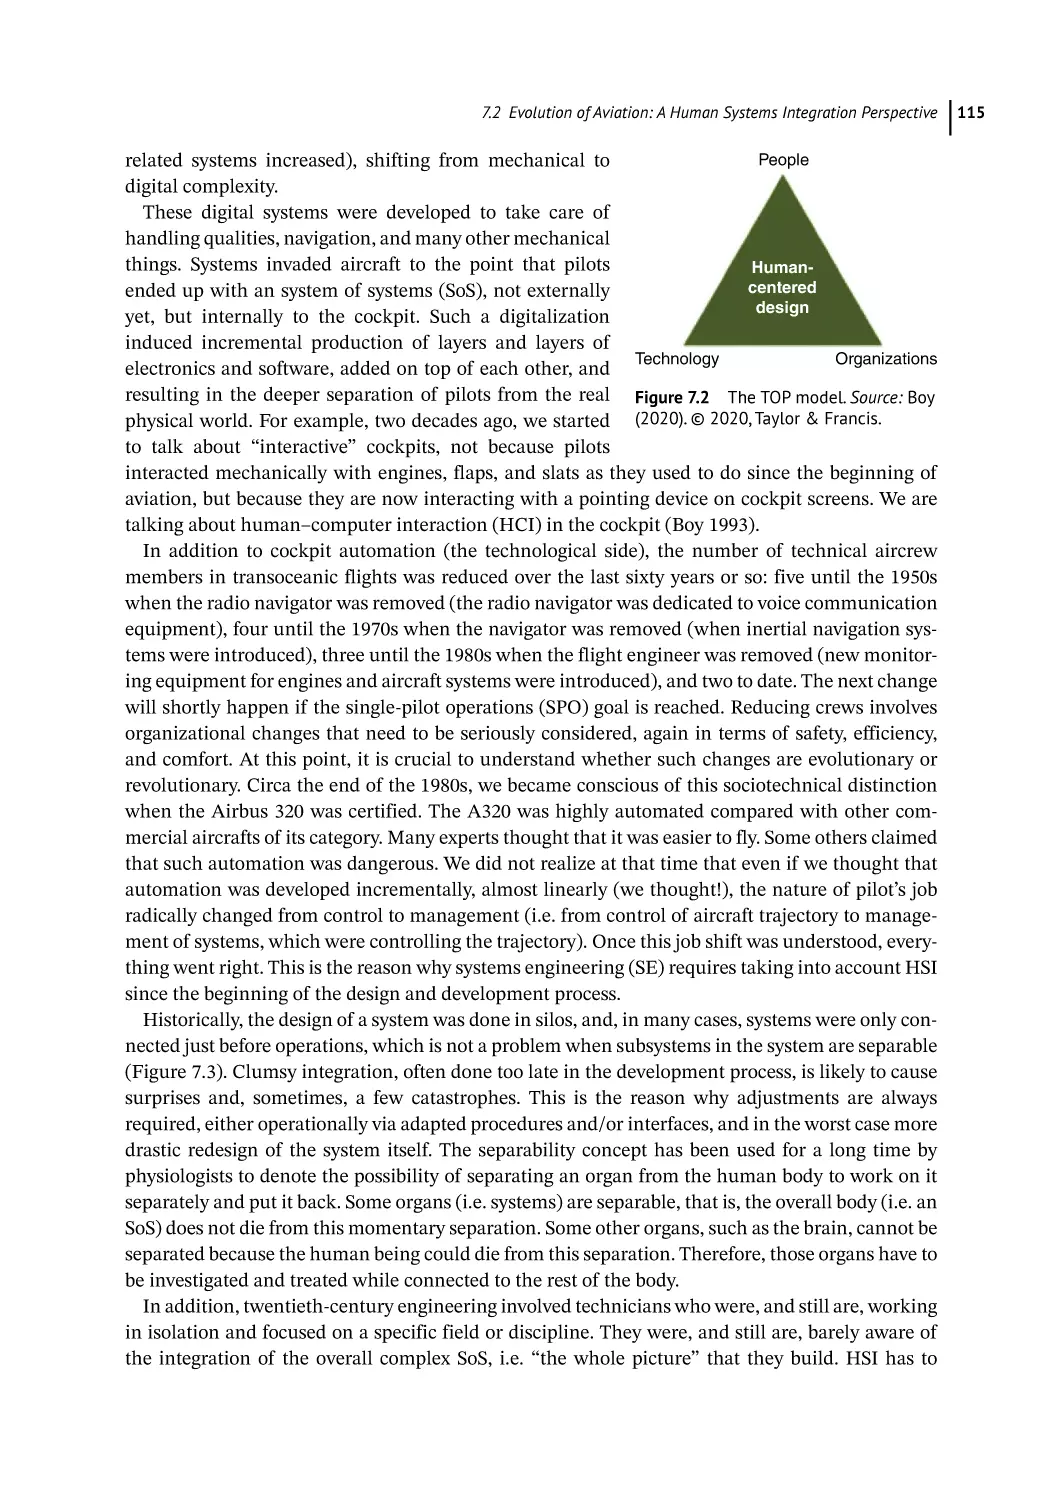
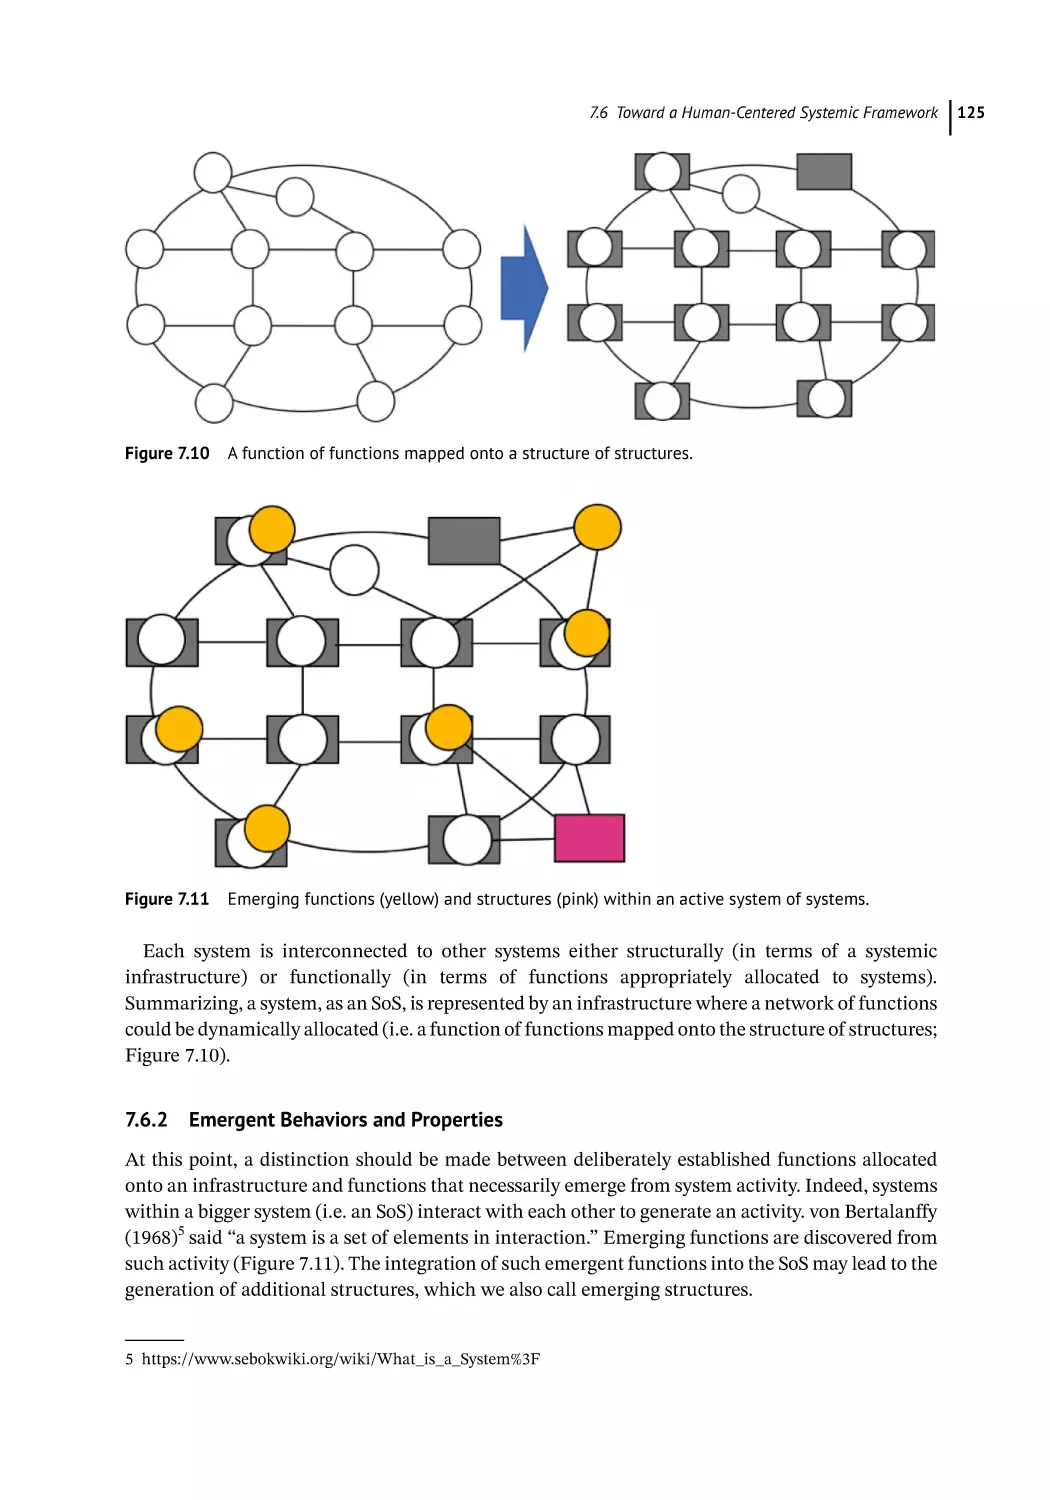
Toward a Human-Centered Systemic Framework 123
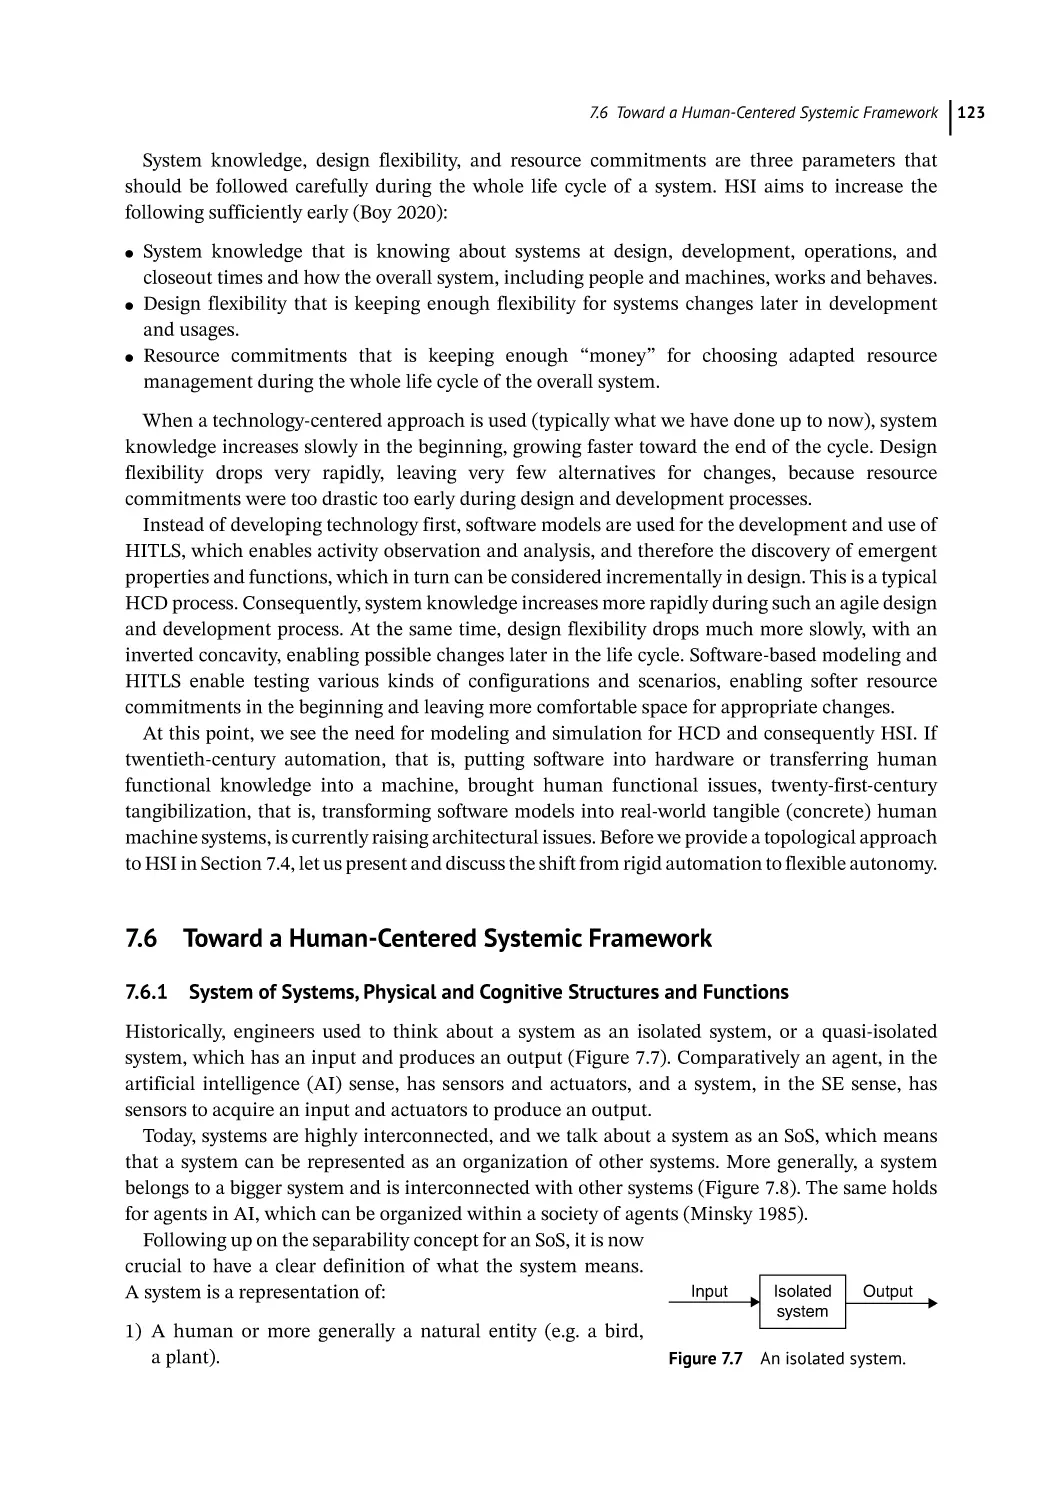
System of Systems, Physical and Cognitive Structures and Functions 123
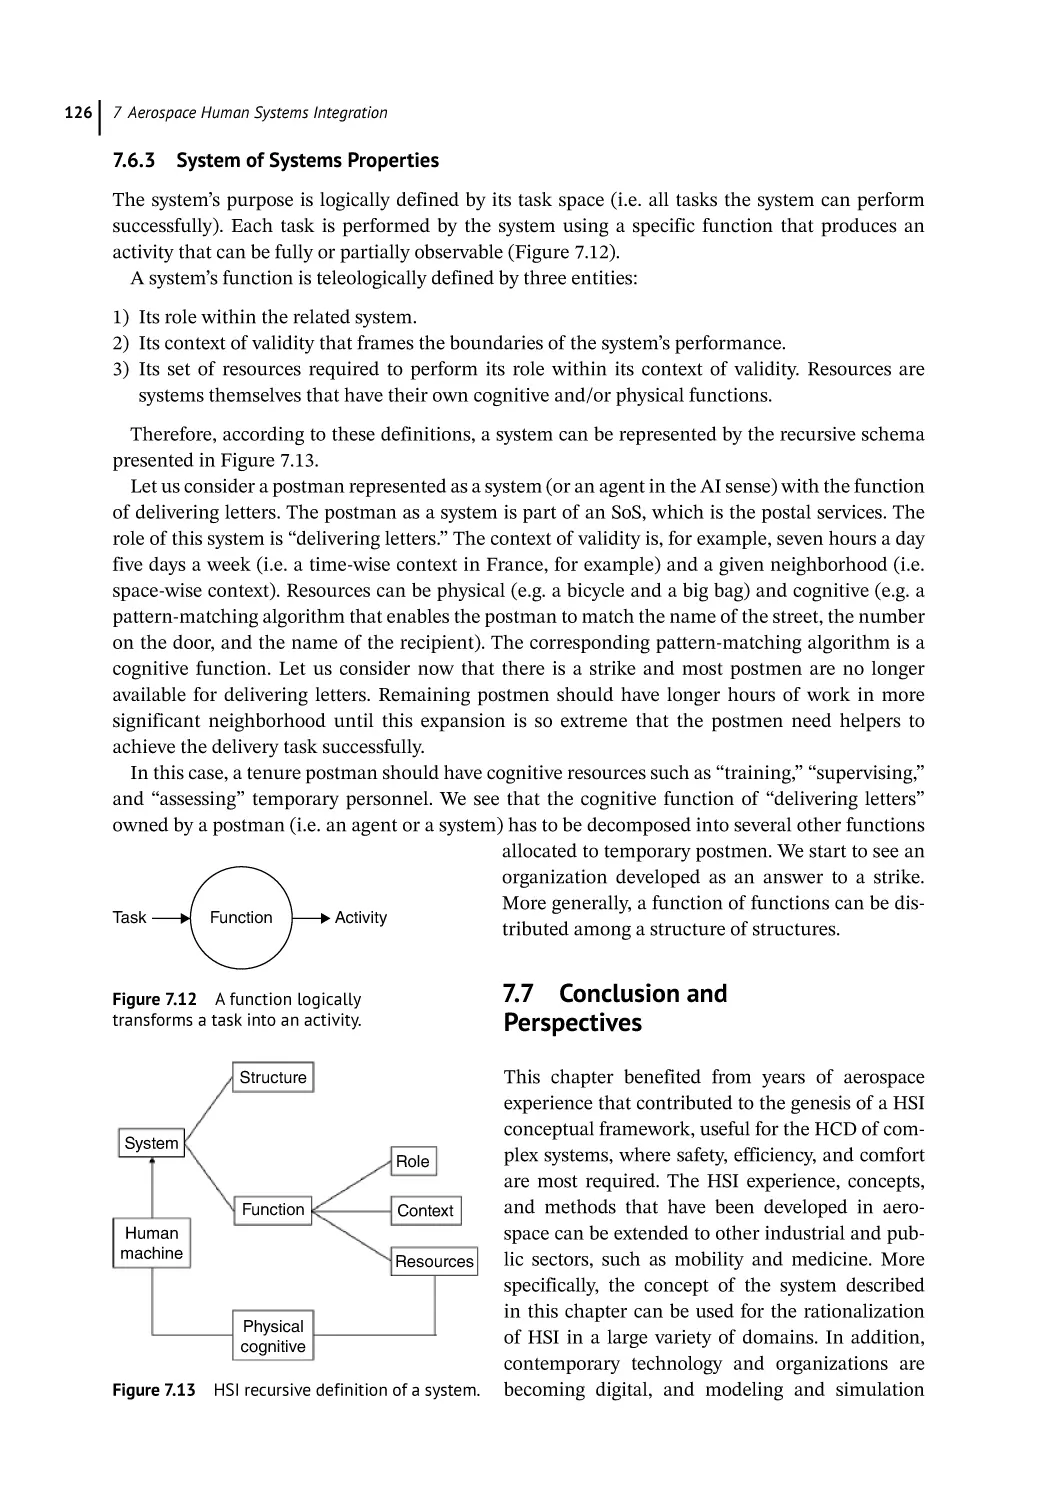
Emergent Behaviors and Properties 125
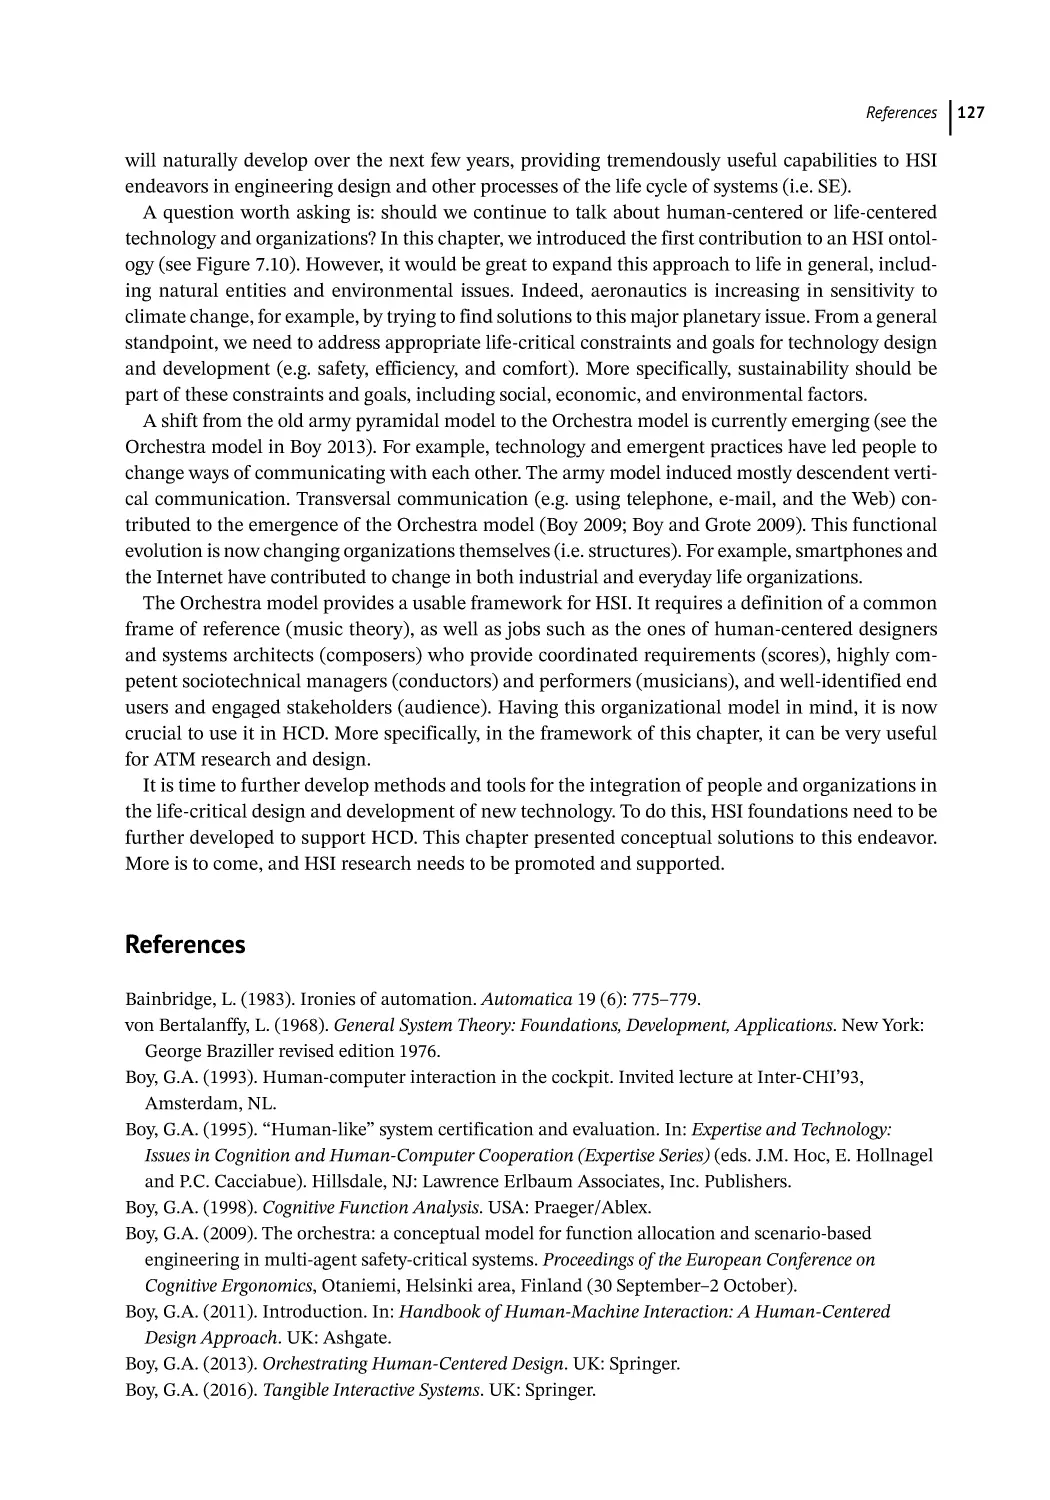
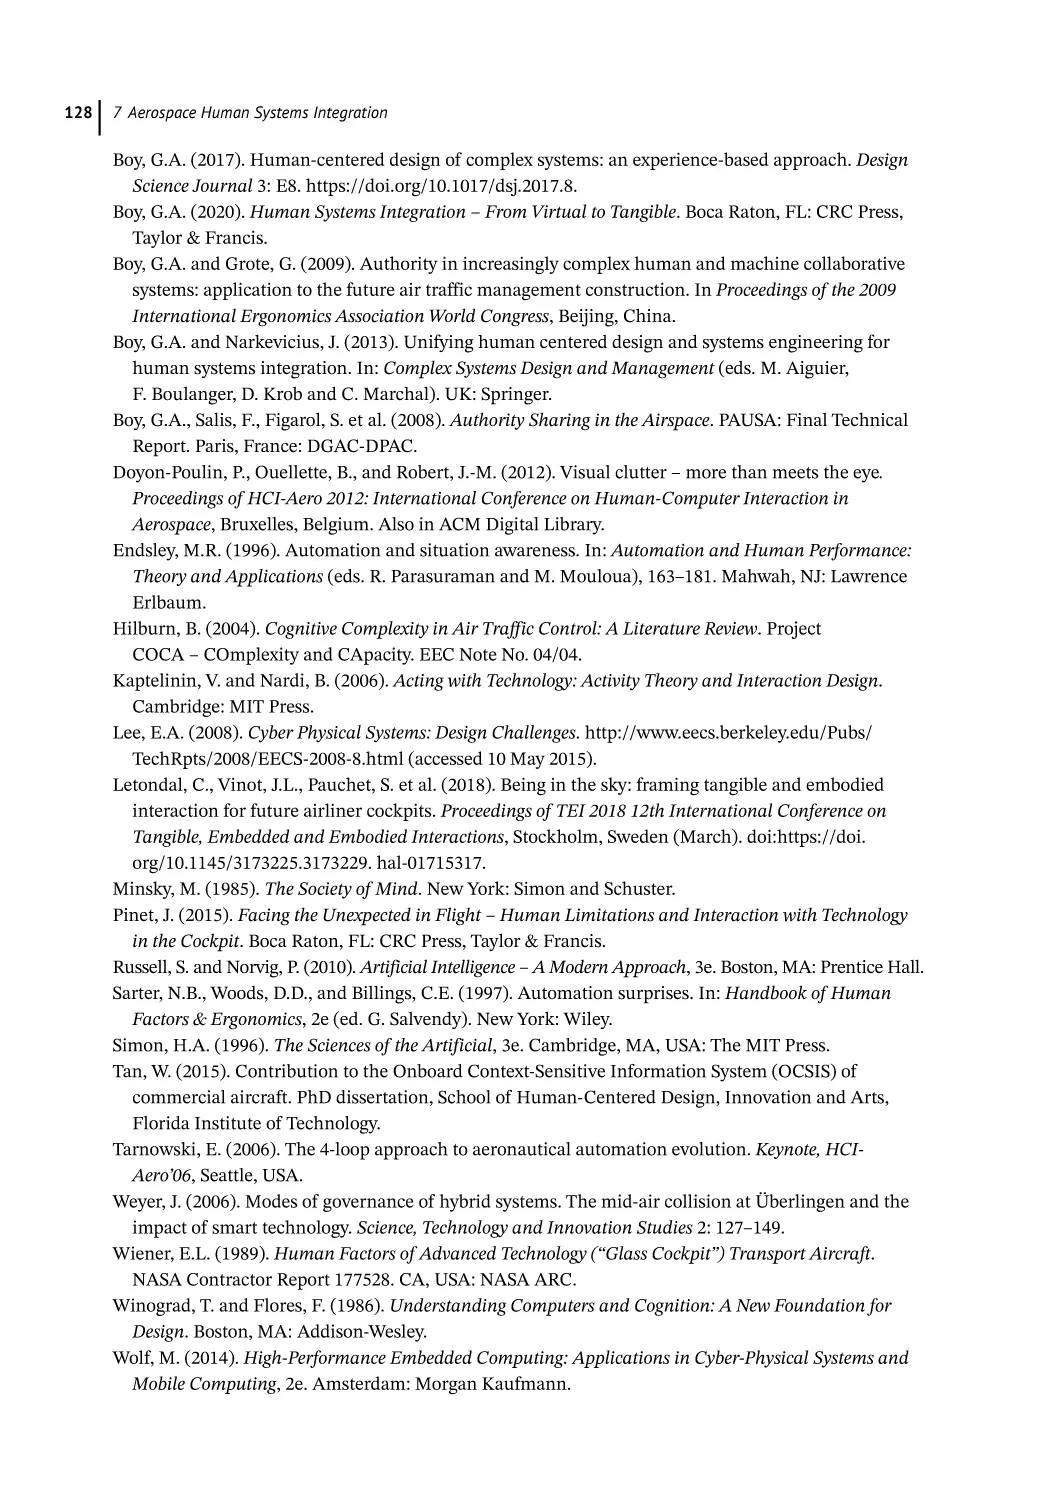
System of Systems Properties 126
Conclusion and Perspectives 126
References 127
Section 3
8
8.1
8.1.1
8.1.2
8.2
8.2.1
8.3
8.4
8.5
9
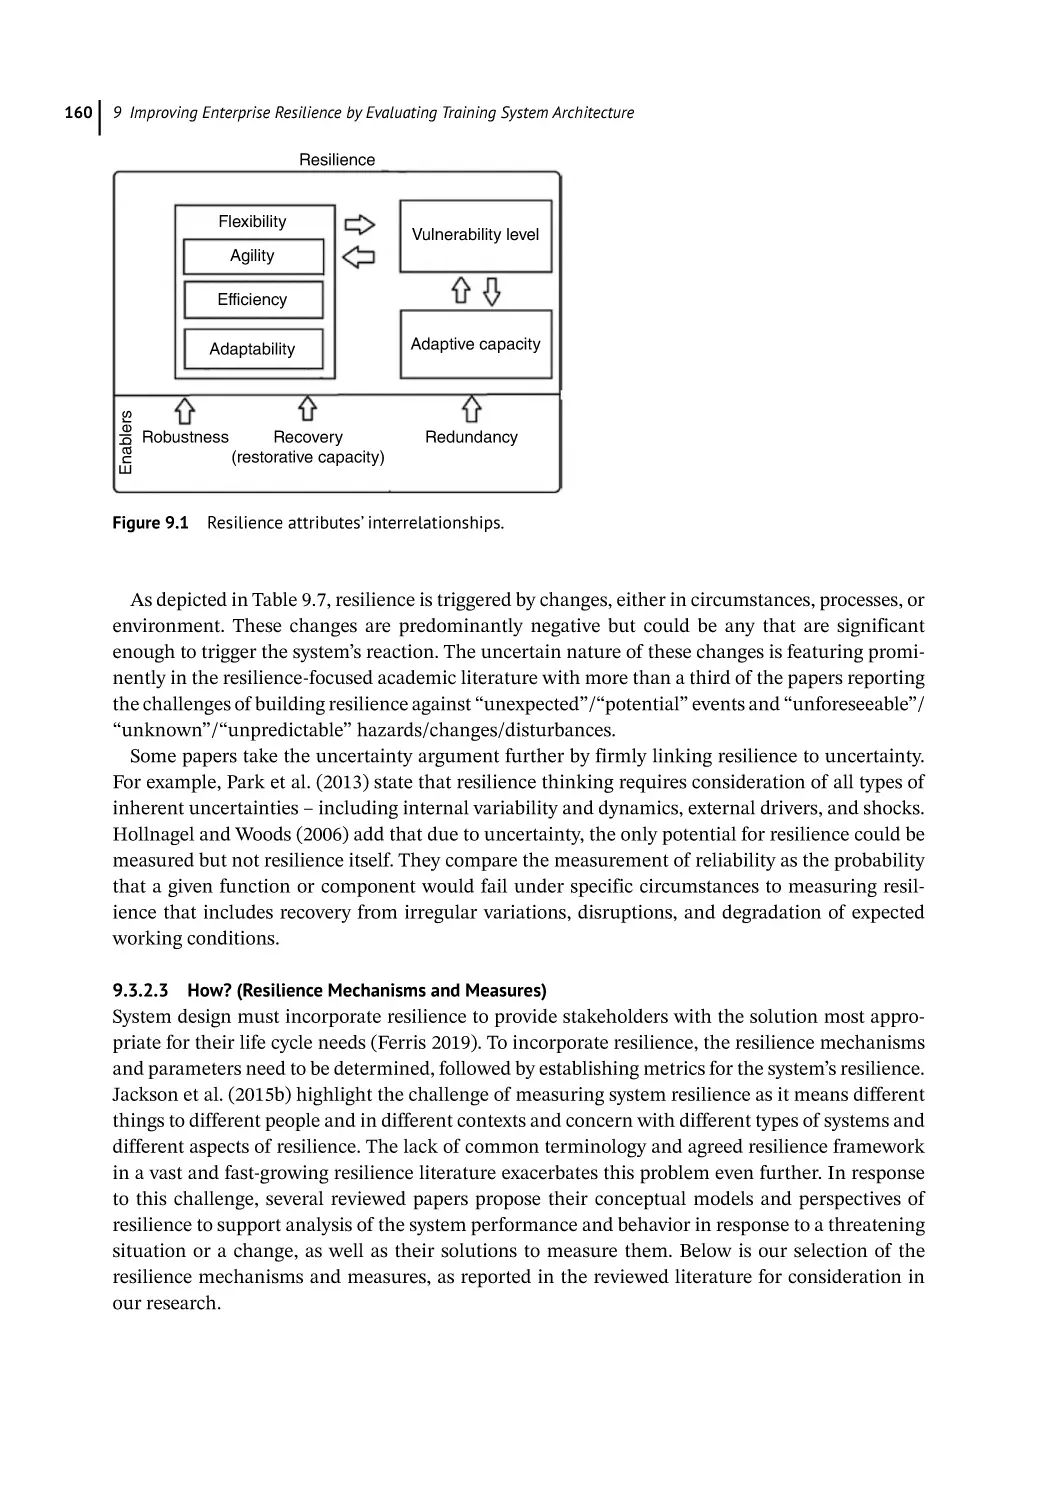
9.1
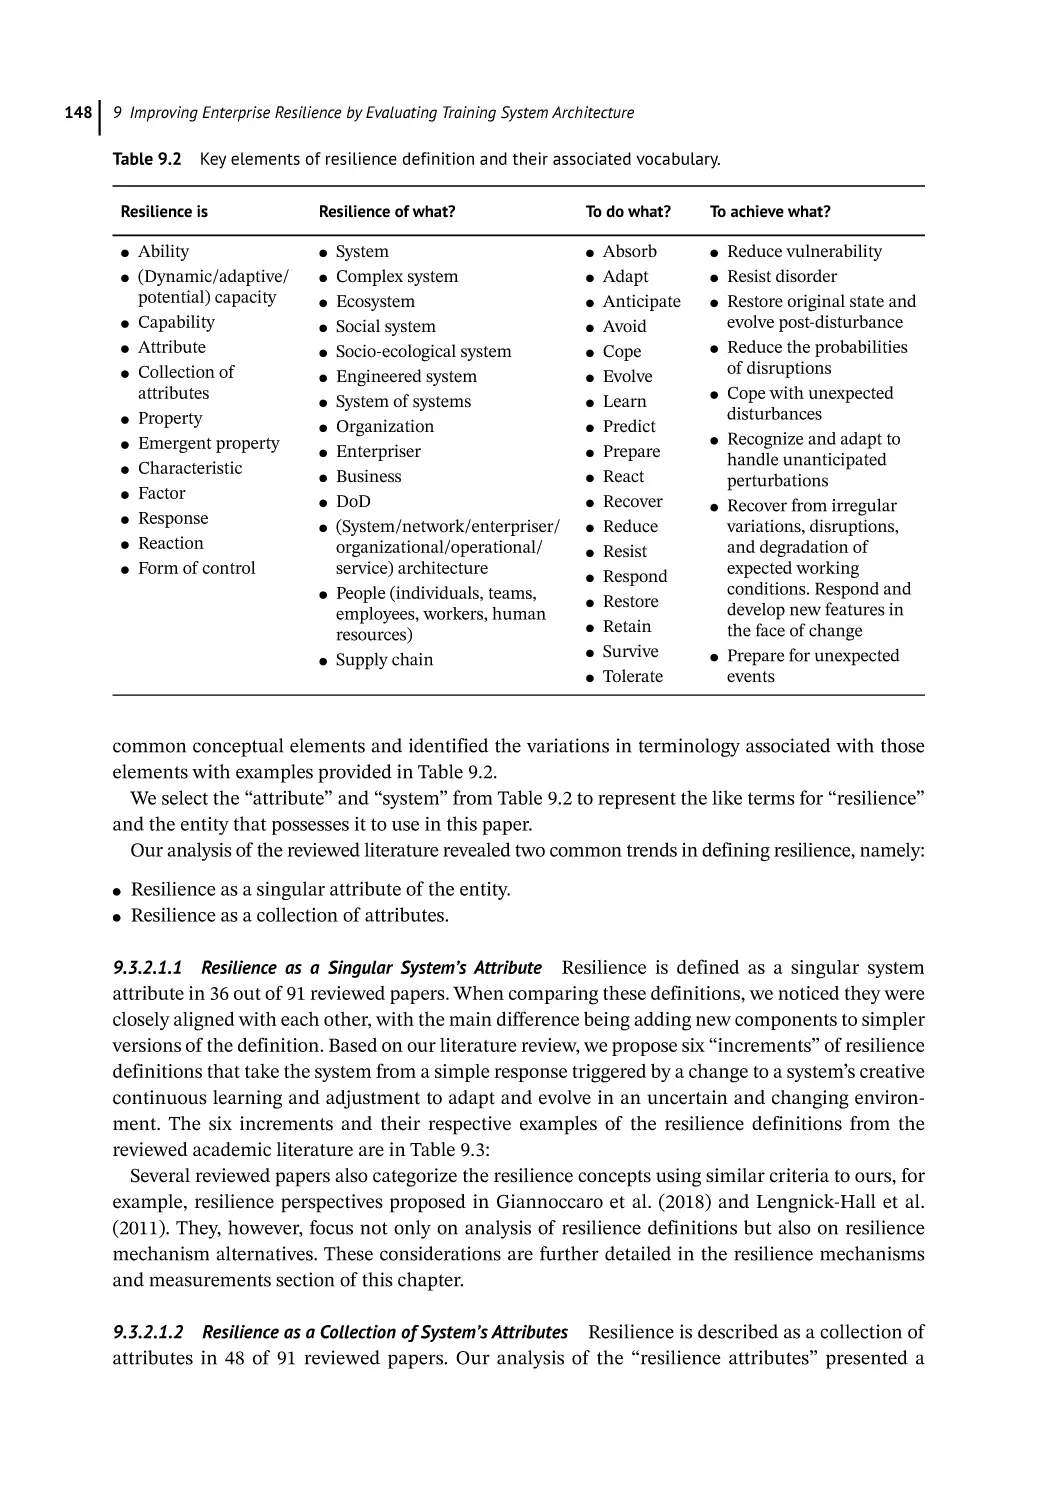
9.2
9.2.1
9.2.2
9.2.3
9.2.3.1
9.2.3.2
9.3
9.3.1
9.3.2
9.3.2.1
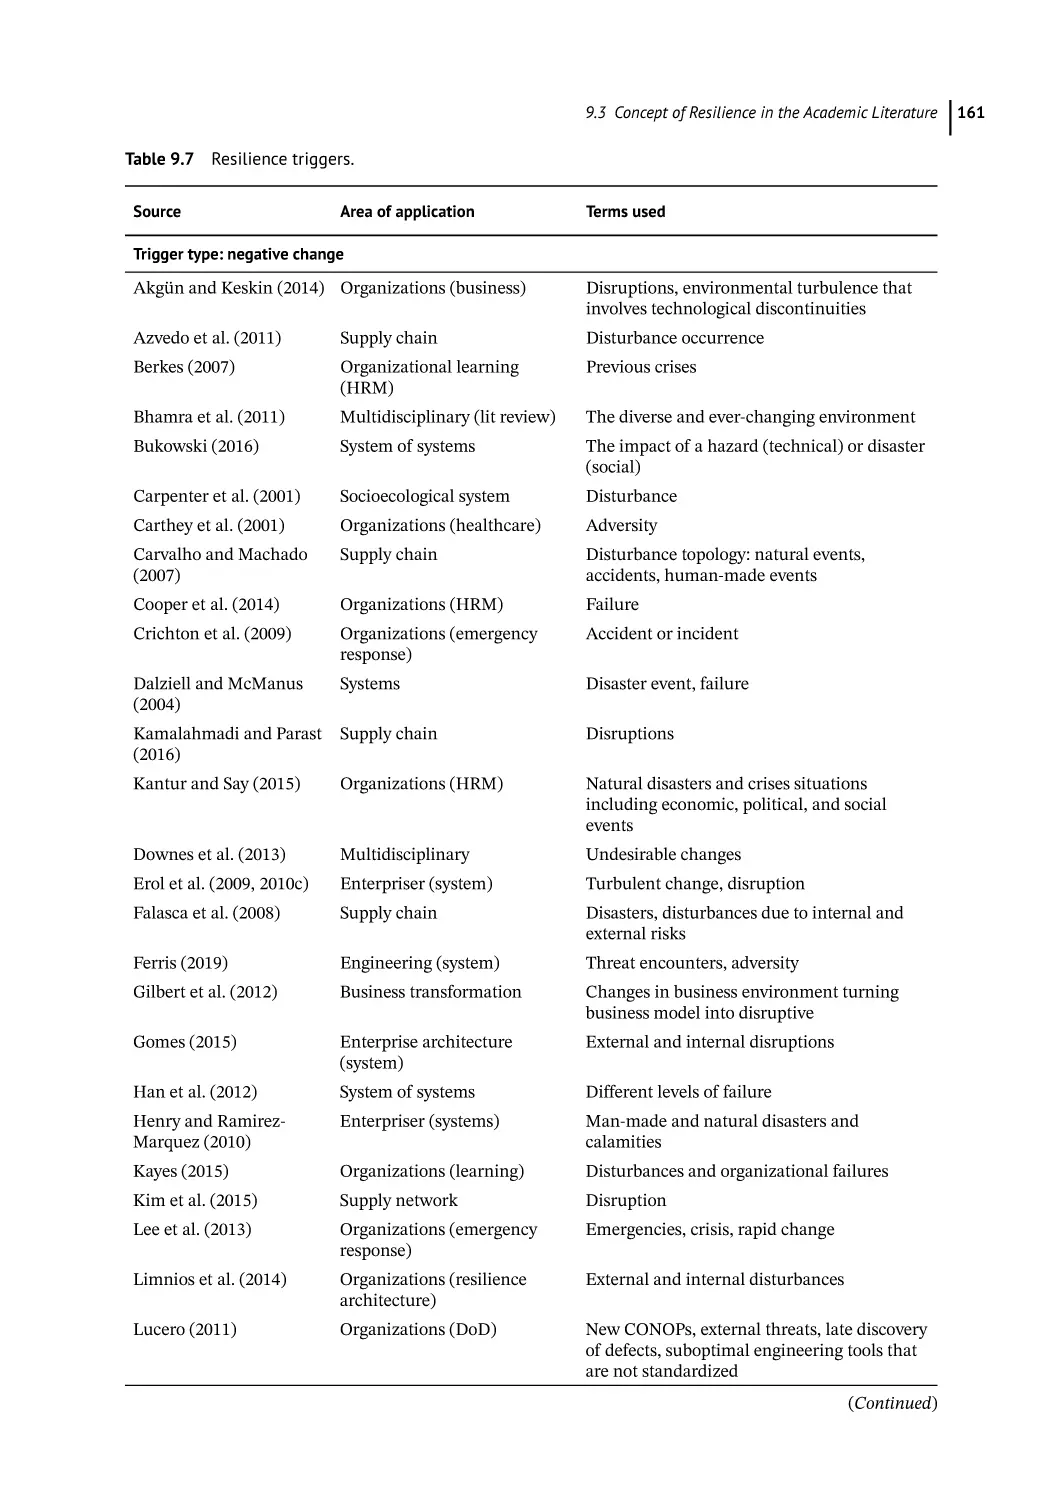
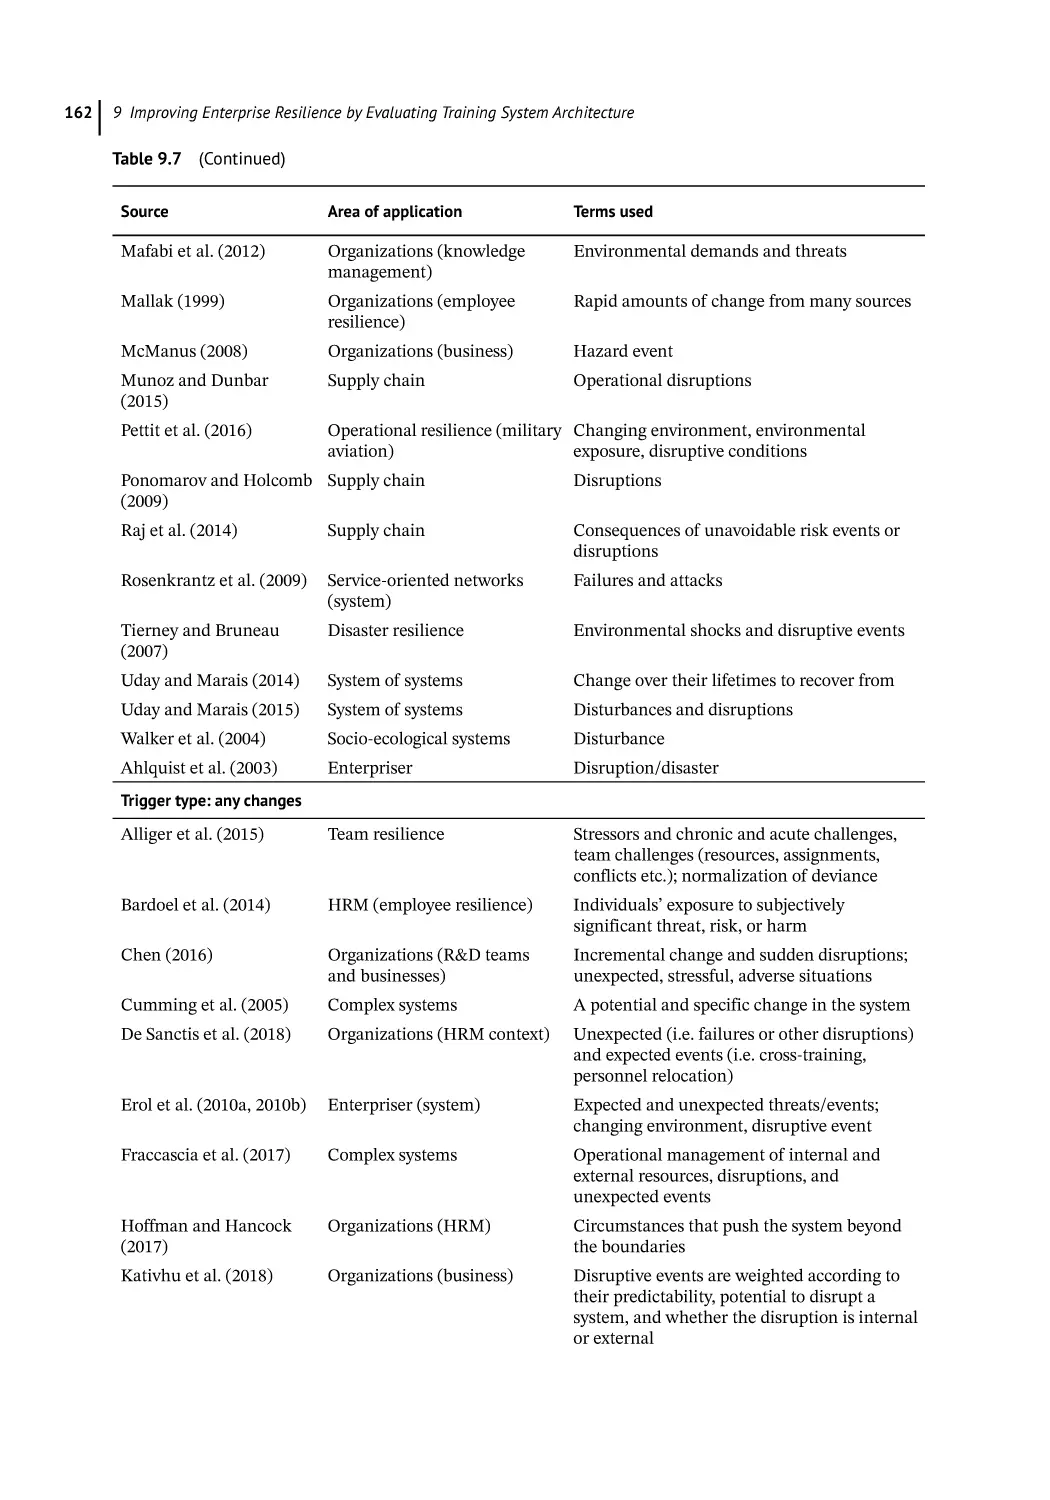
9.3.2.2
9.3.2.3
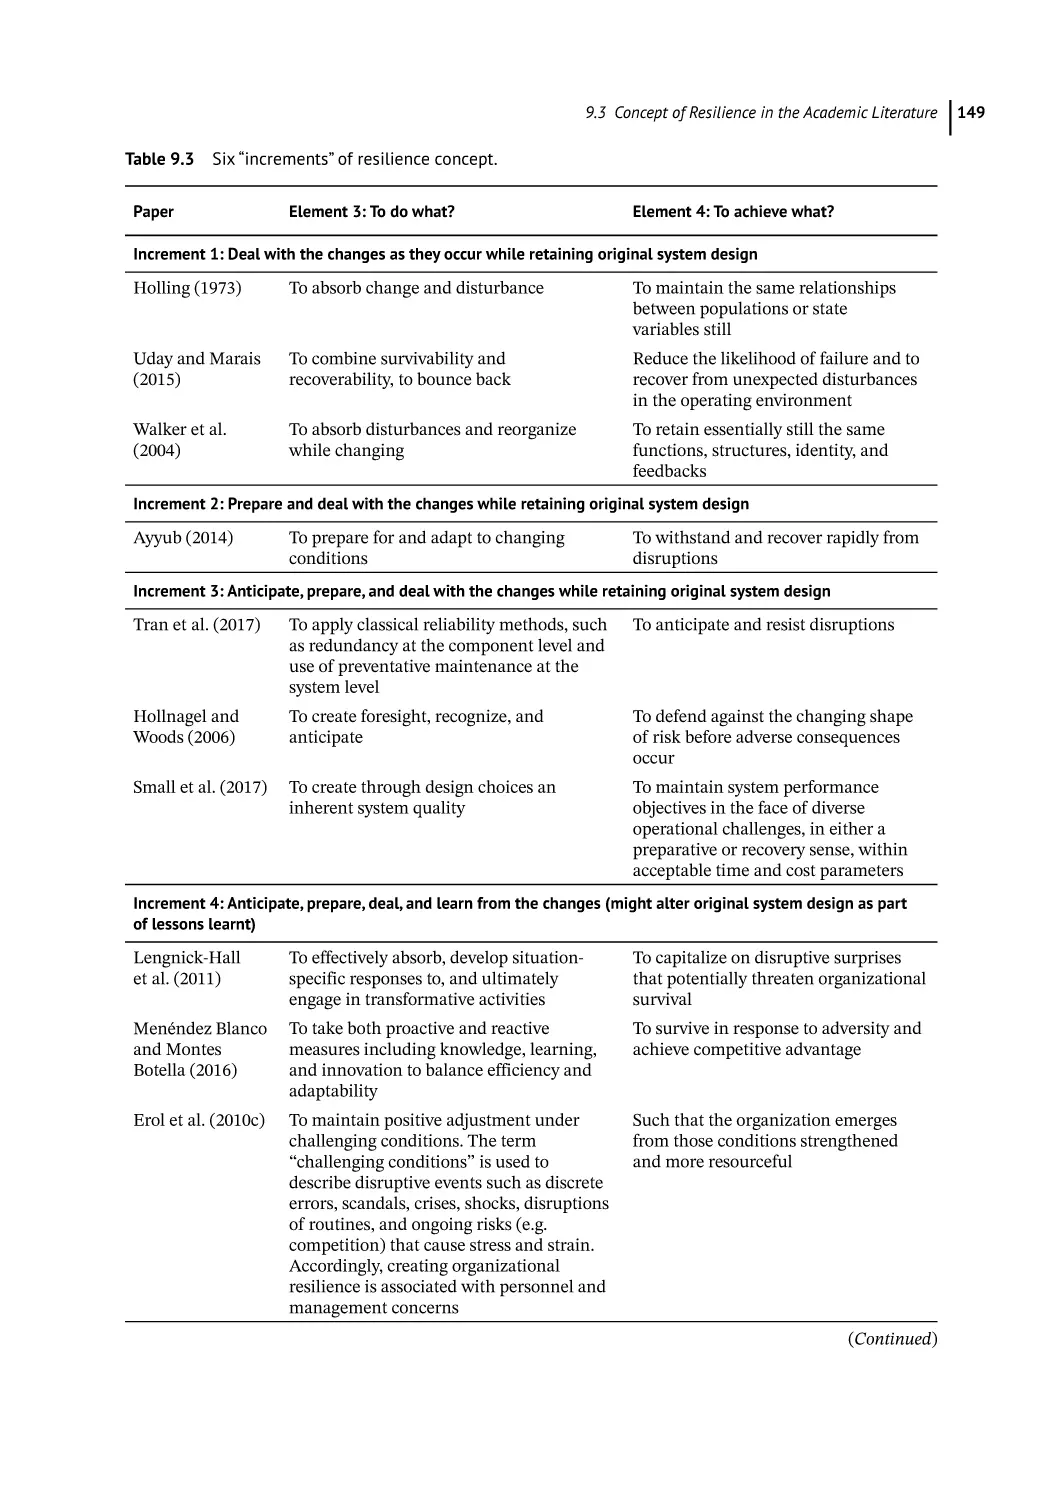
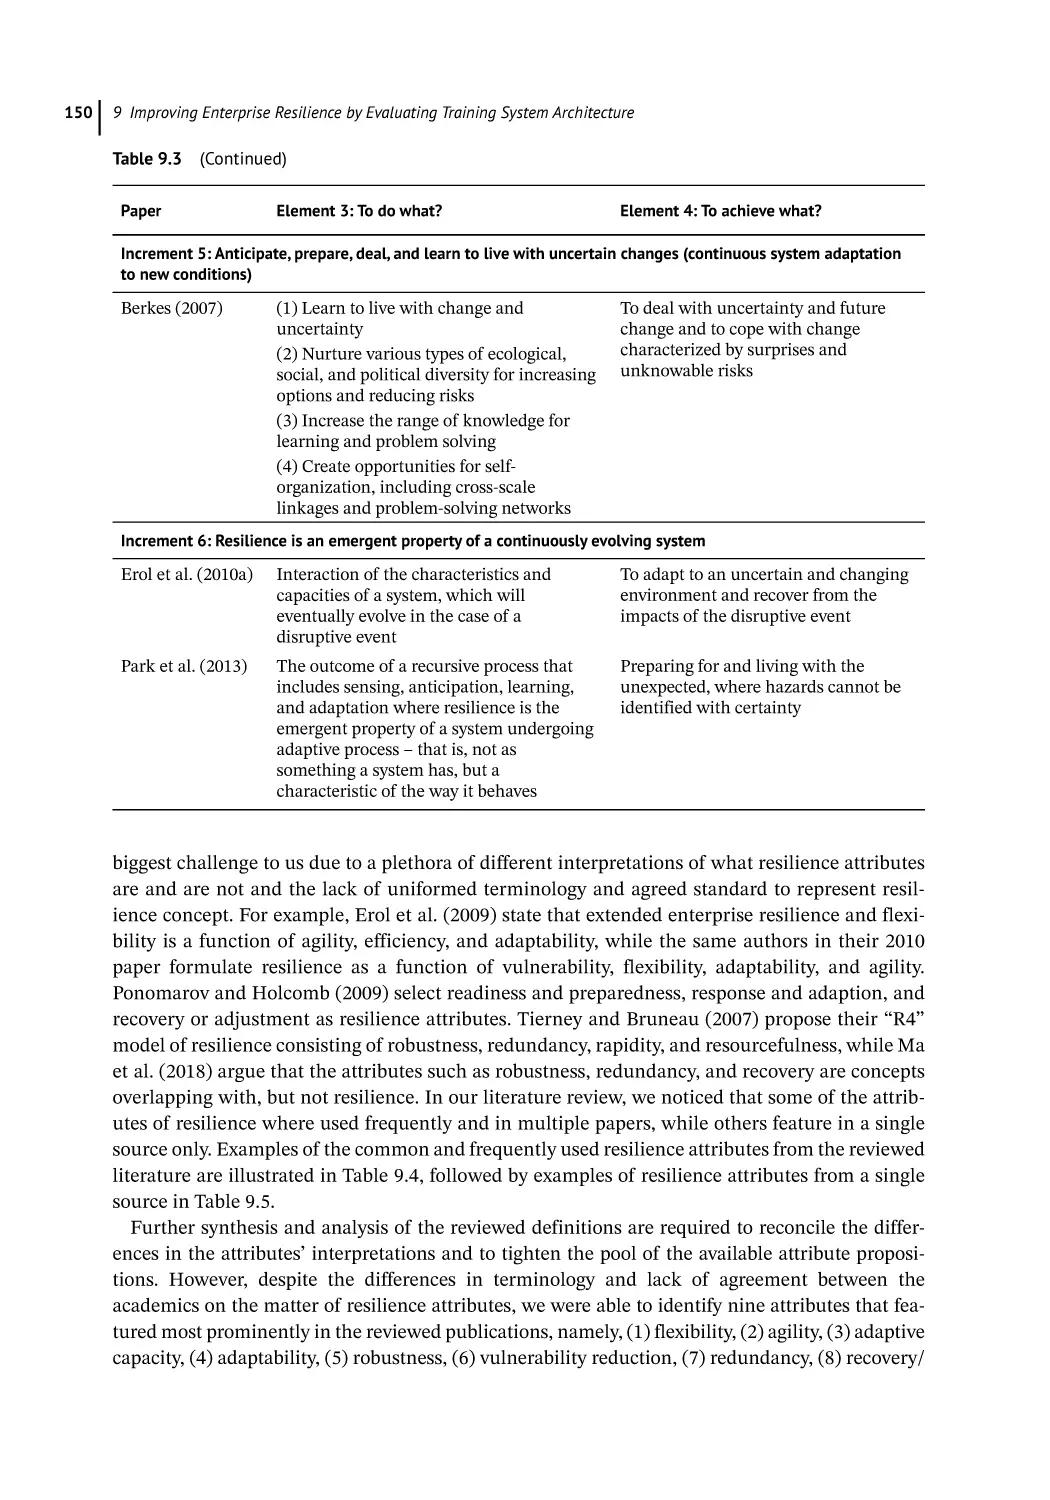
9.4
9.4.1
9.4.2
Focus on Training and Skill Sets
129
Building a Socio-cognitive Evaluation Framework to Develop Enhanced
Aviation Training Concepts for Gen Y and Gen Z Pilot Trainees 131
Alliya Anderson, Samuel F. Feng, Fabrizio Interlandi, Michael Melkonian,
Vladimir Parezanović, M. Lynn Woolsey, Claudine Habak,
and Nelson King
Introduction 131
Gamification Coupled with Cognitive Neuroscience and Data Analysis 132
Generational Differences in Learning 133
Virtual Technologies in Aviation 134
Potential Approaches for Incorporating Virtual Technologies 135
Human Systems Engineering Challenges 136
Potential Applications Beyond Aviation Training 137
Looking Forward 137
Acknowledgement 137
References 138
Improving Enterprise Resilience by Evaluating Training System Architecture:
Method Selection for Australian Defense 143
Victoria Jnitova, Mahmoud Efatmaneshnik, Keith F. Joiner, and Elizabeth Chang
Introduction 143
Defense Training System 144
DTS Conceptualization 144
DTS as an Extended Enterprise Systems 144
Example: Navy Training System 145
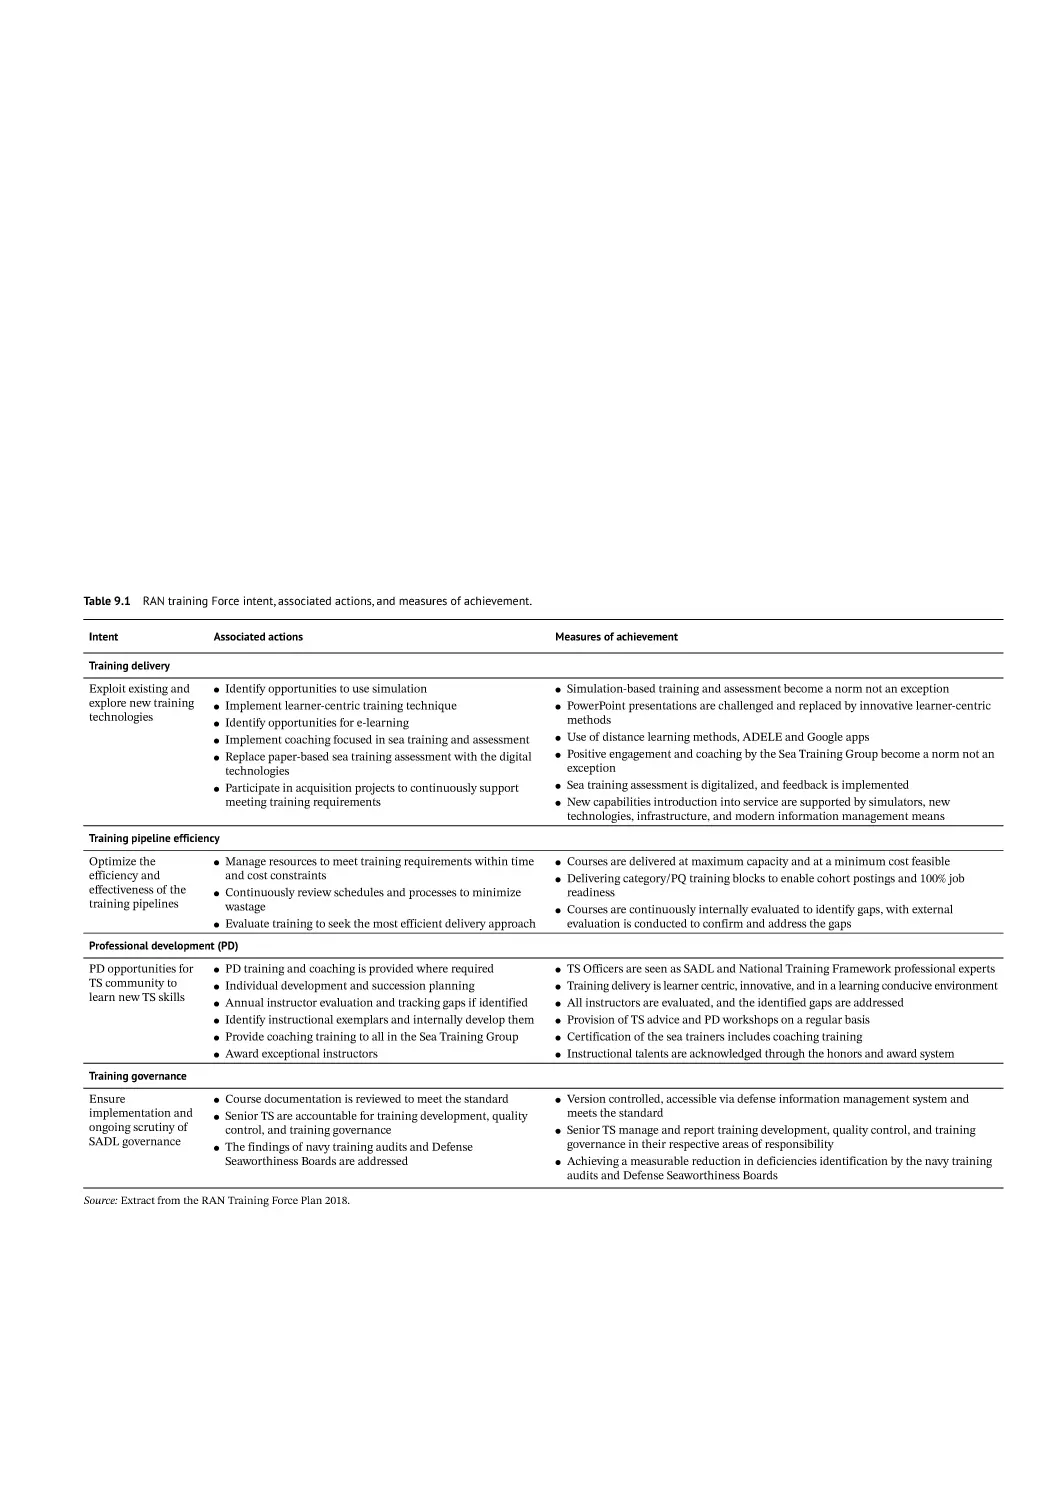
Navy Training System as a Part of DTS 145
Navy Training System as a Part of DoD 145
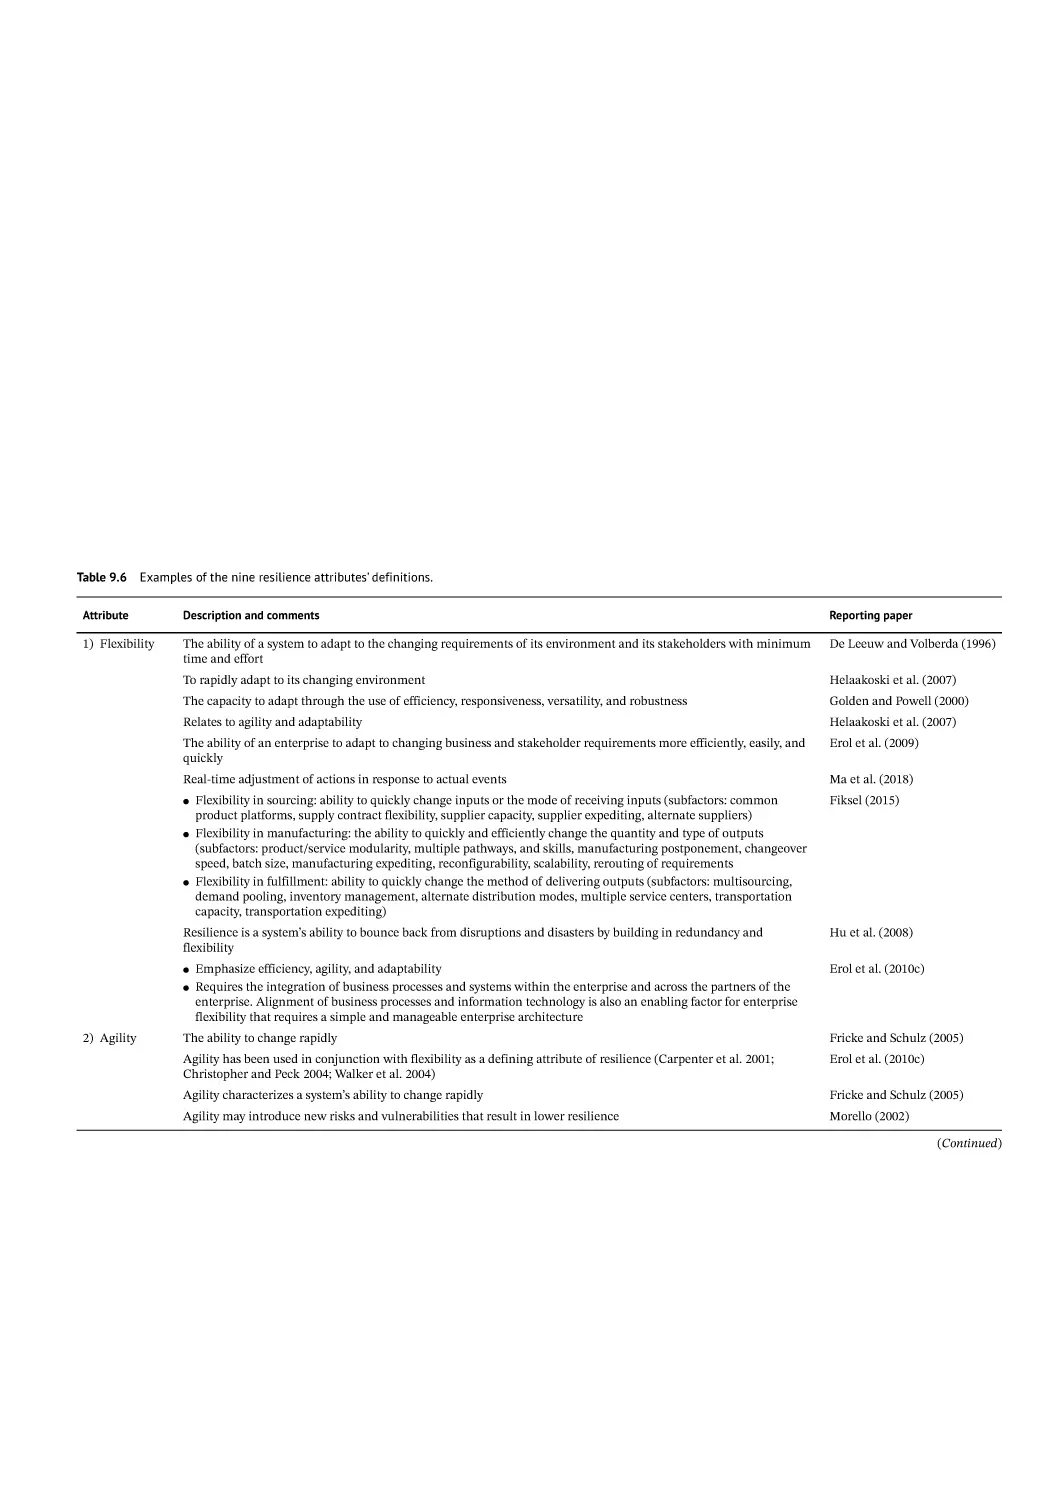
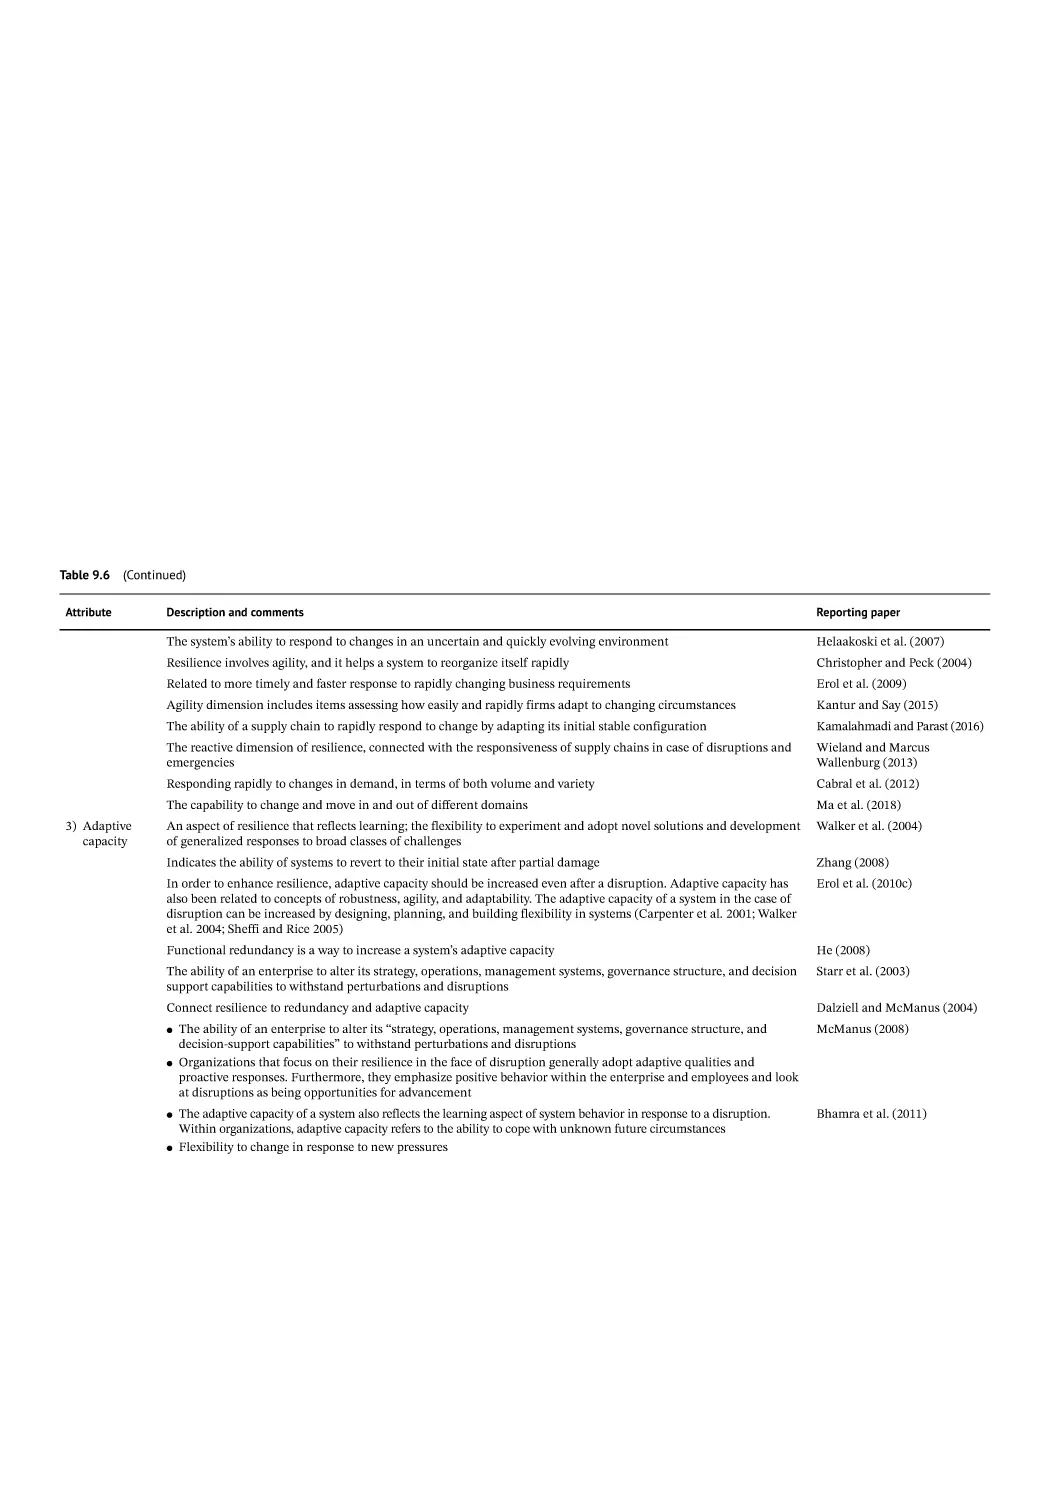
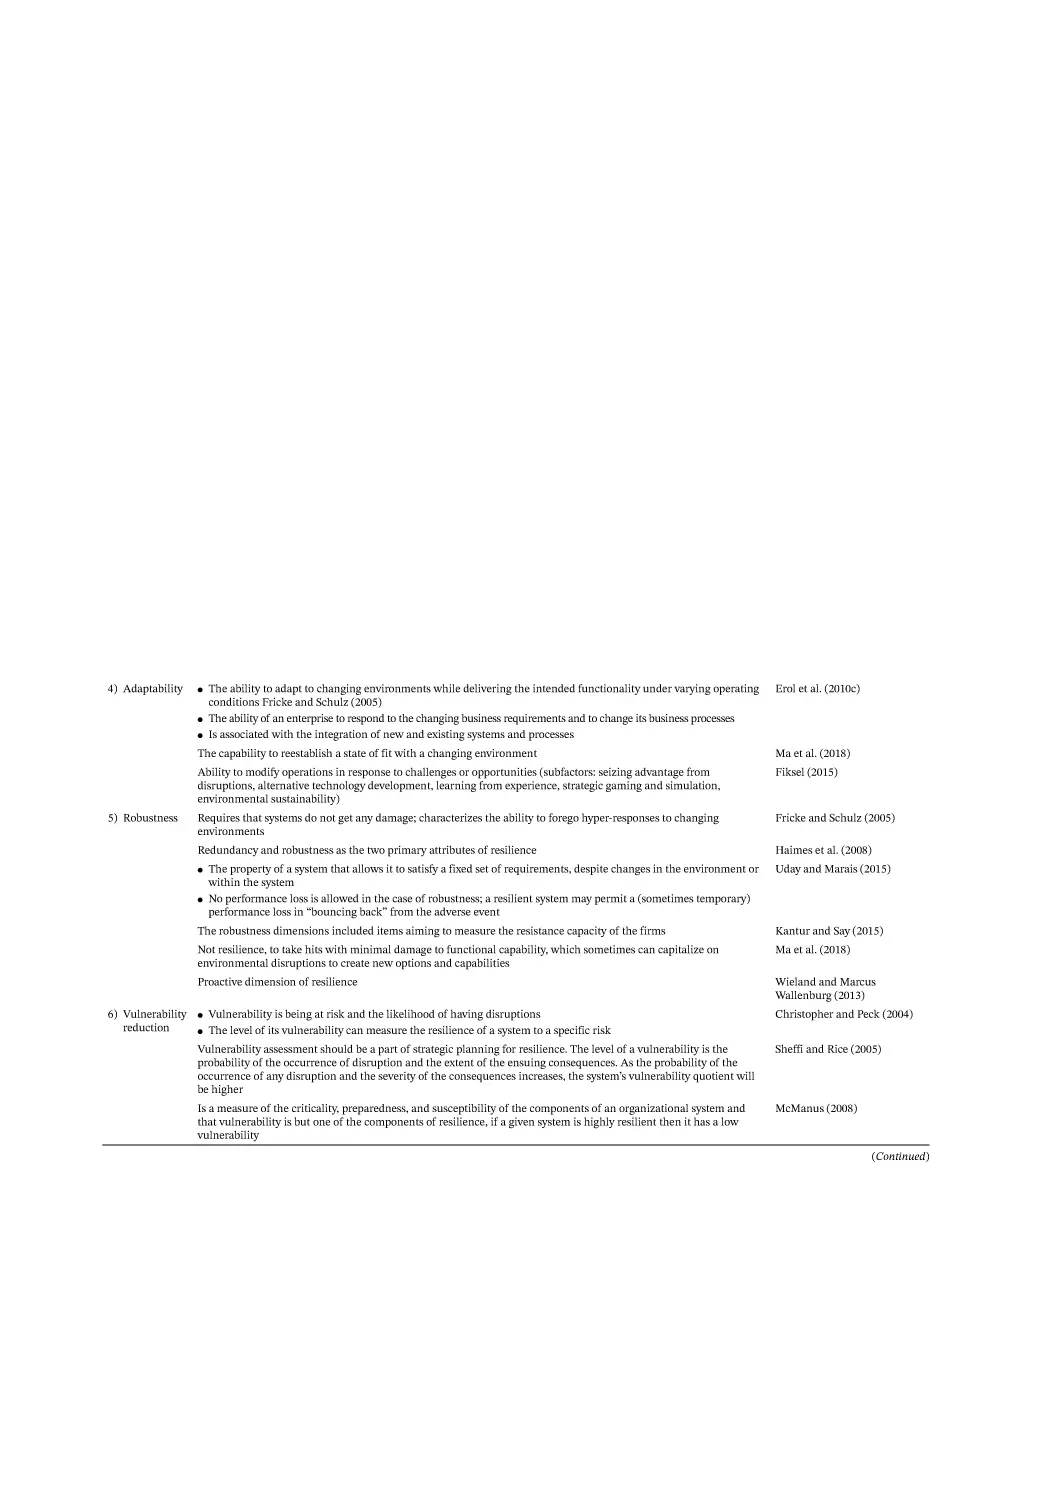
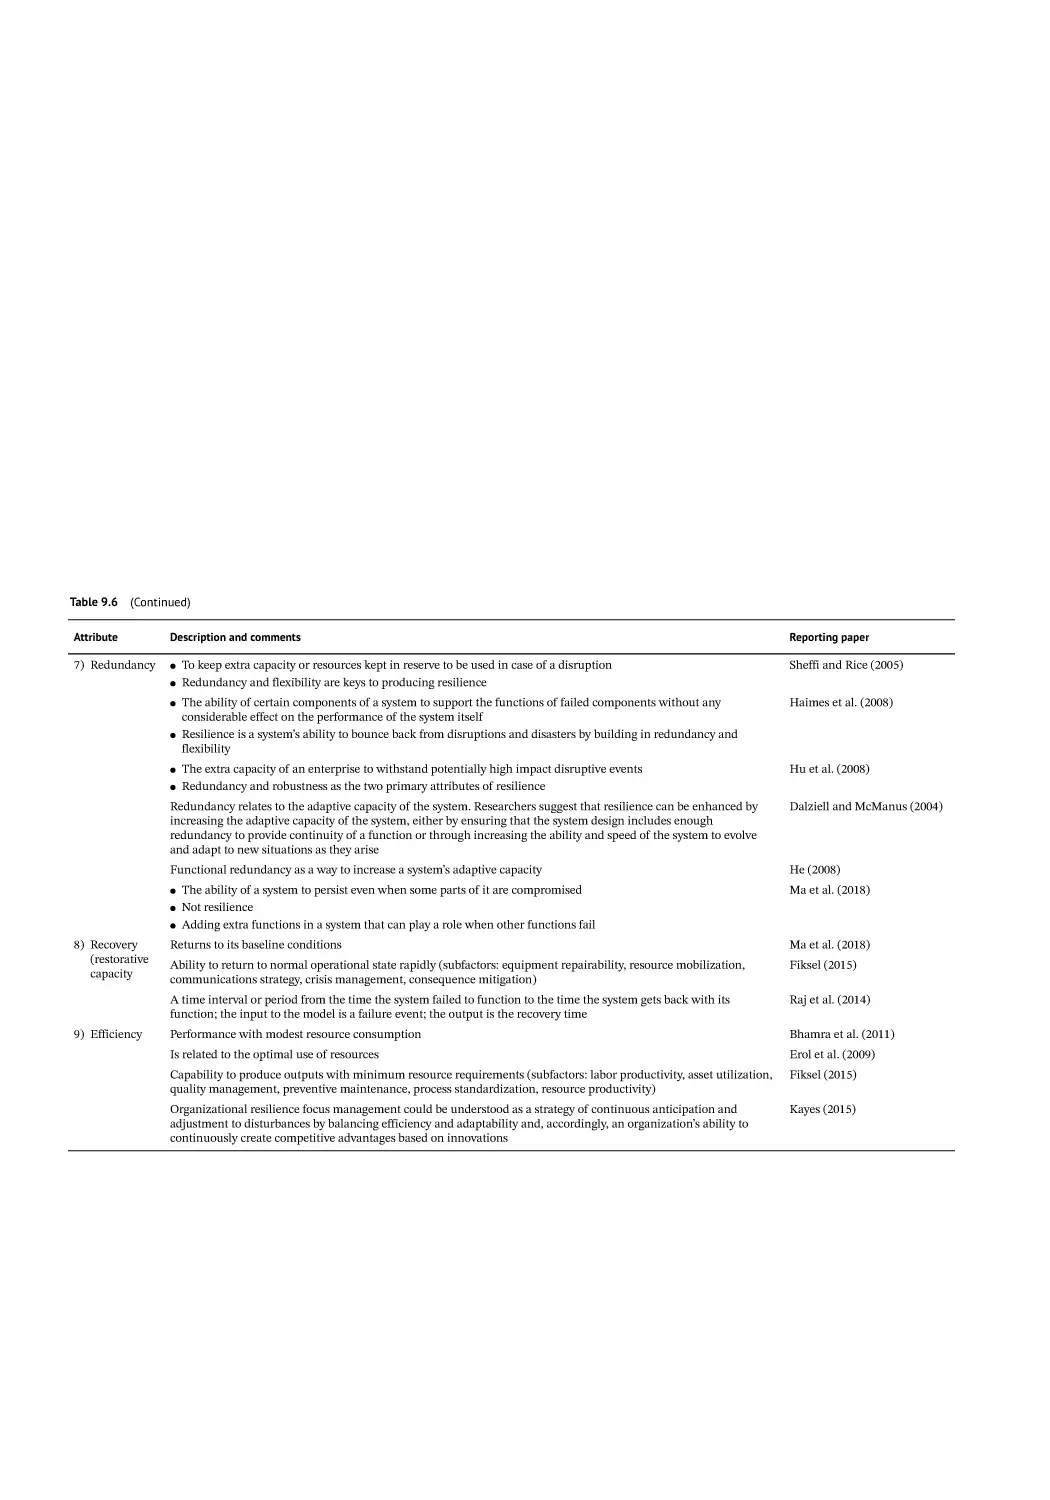
Concept of Resilience in the Academic Literature 147
Definition of Resilience: A Multidisciplinary and Historical View 147
Definition of Resilience: Key Aspects 147
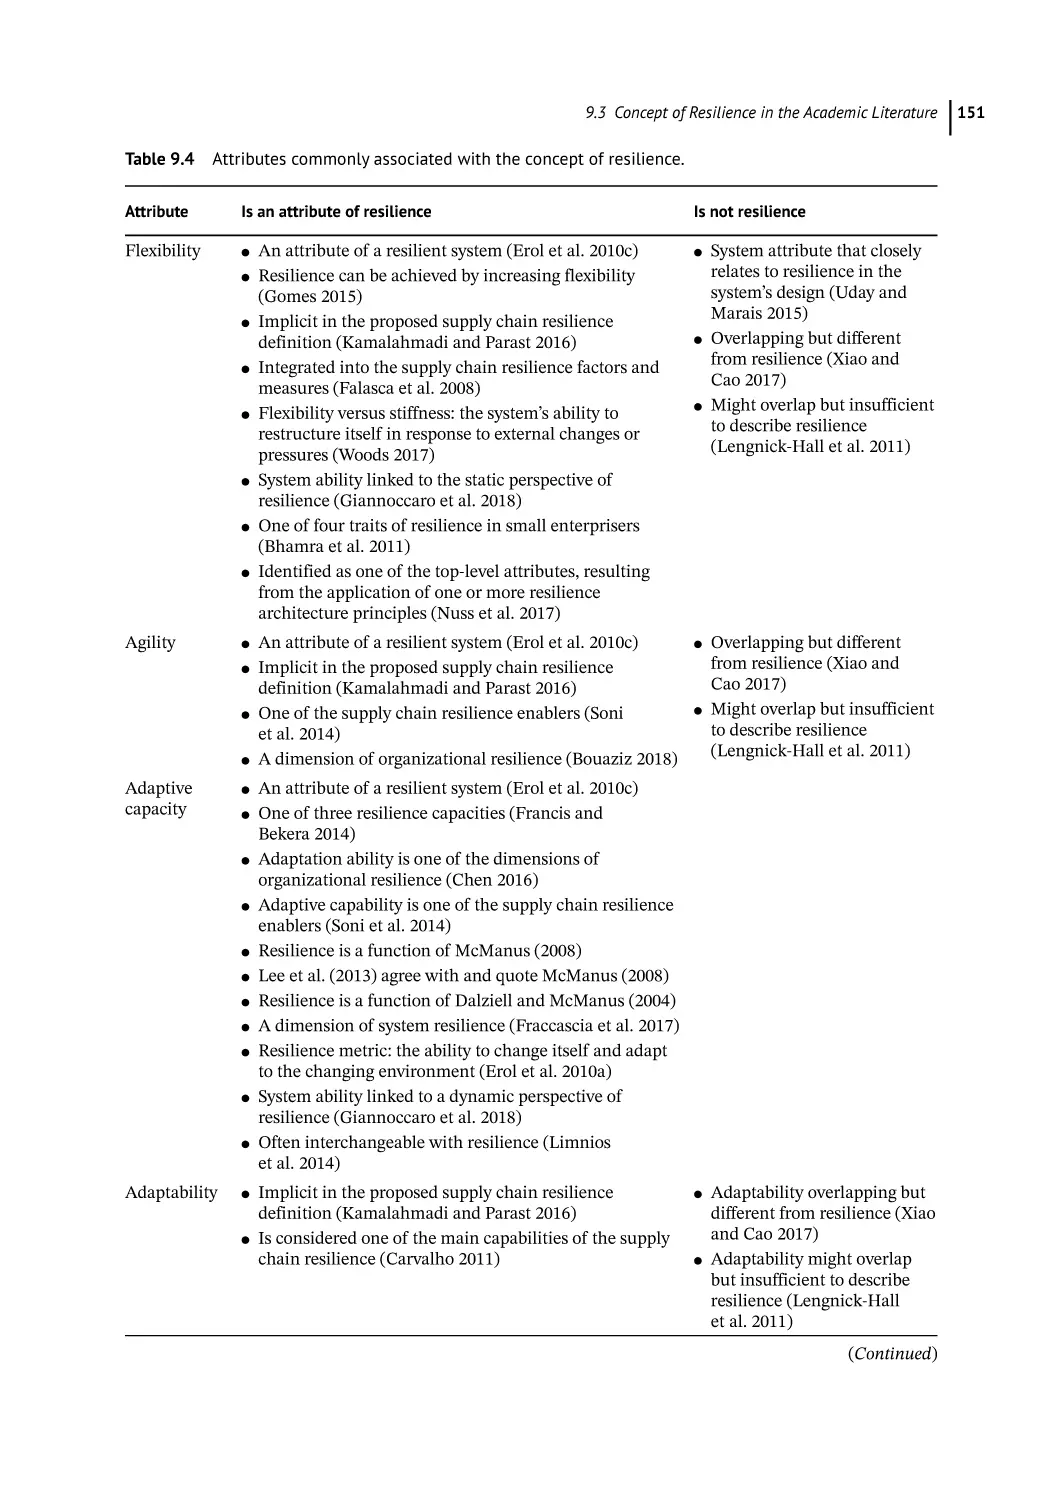
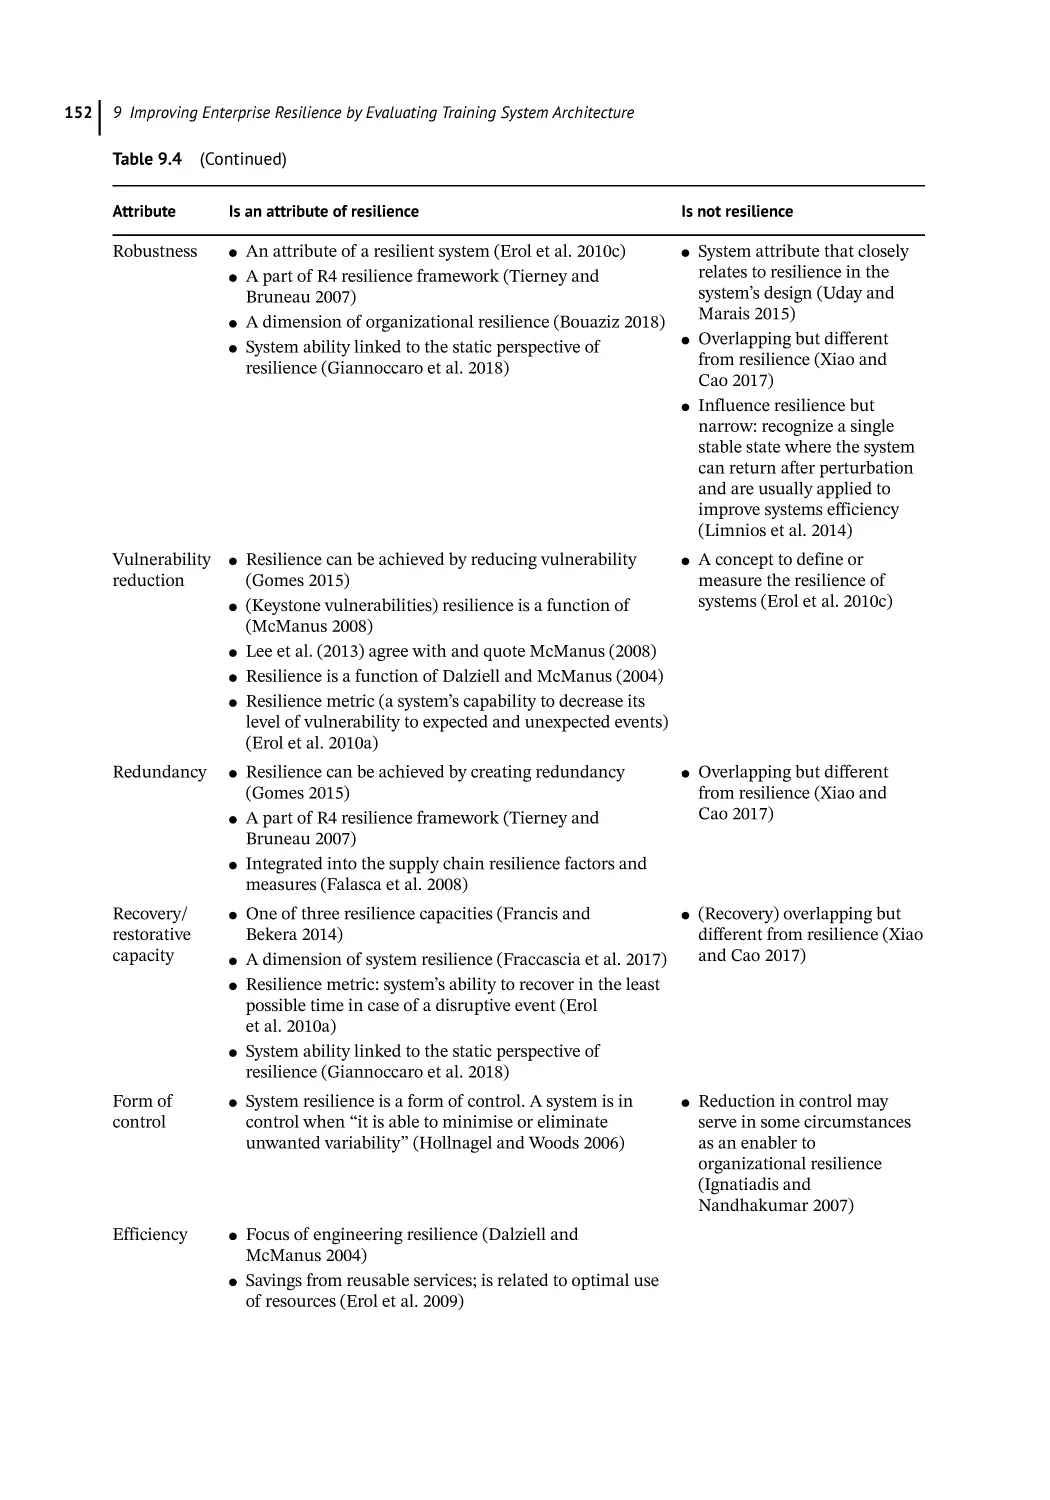
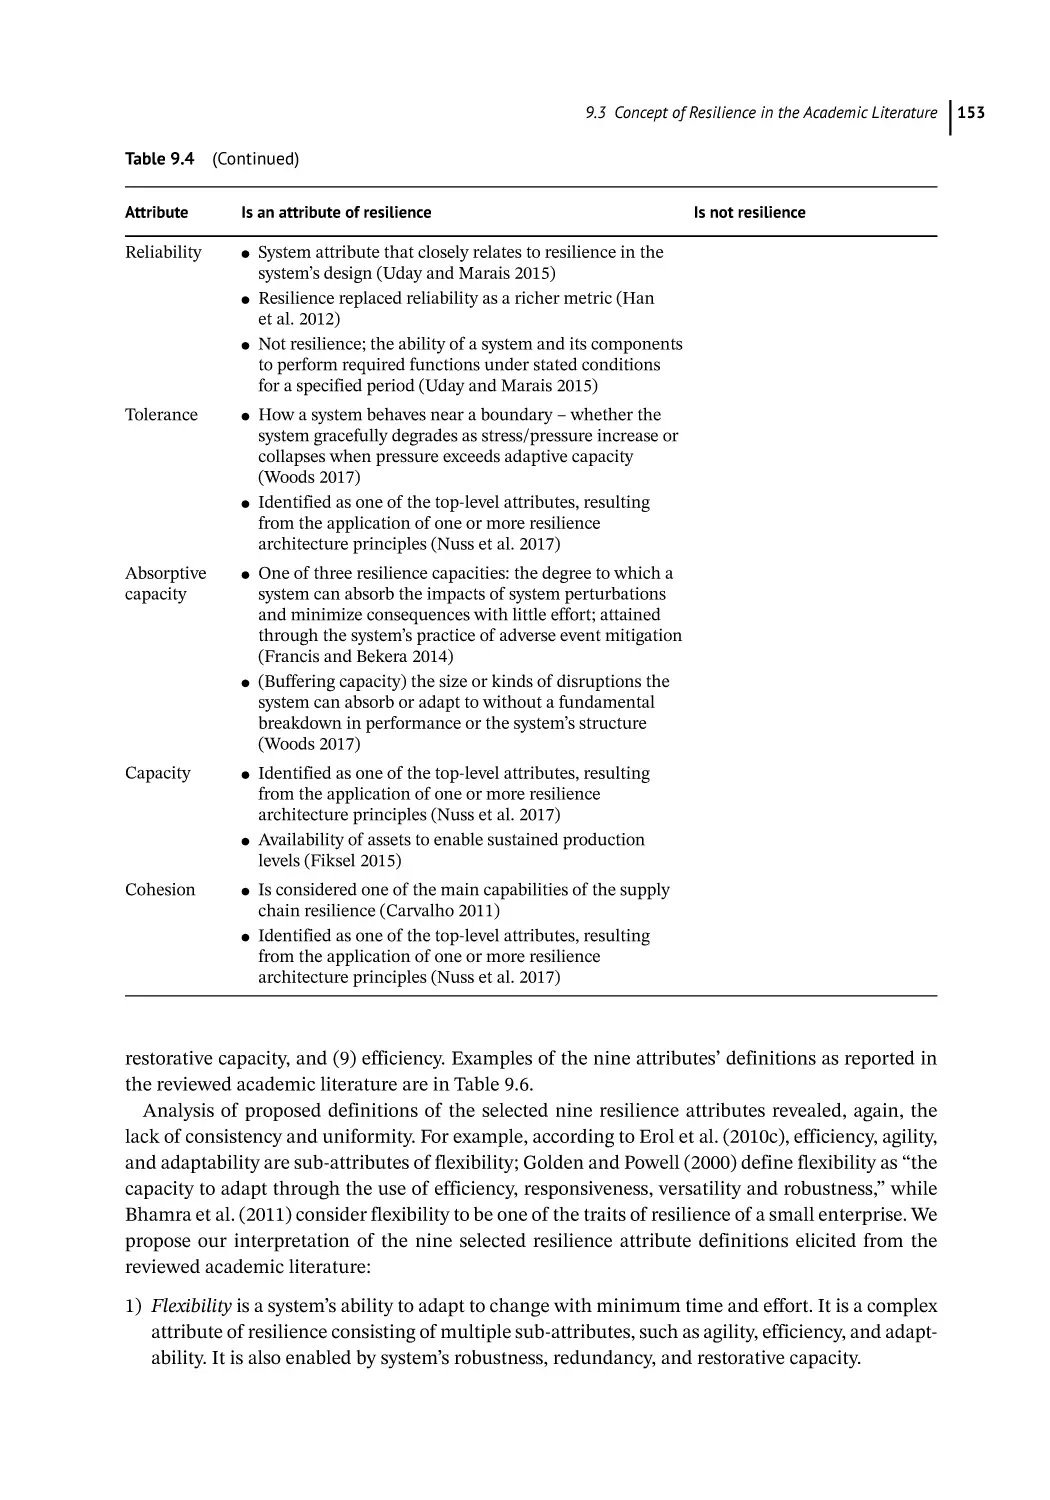
What? (Resilience Is and Is Not) 147
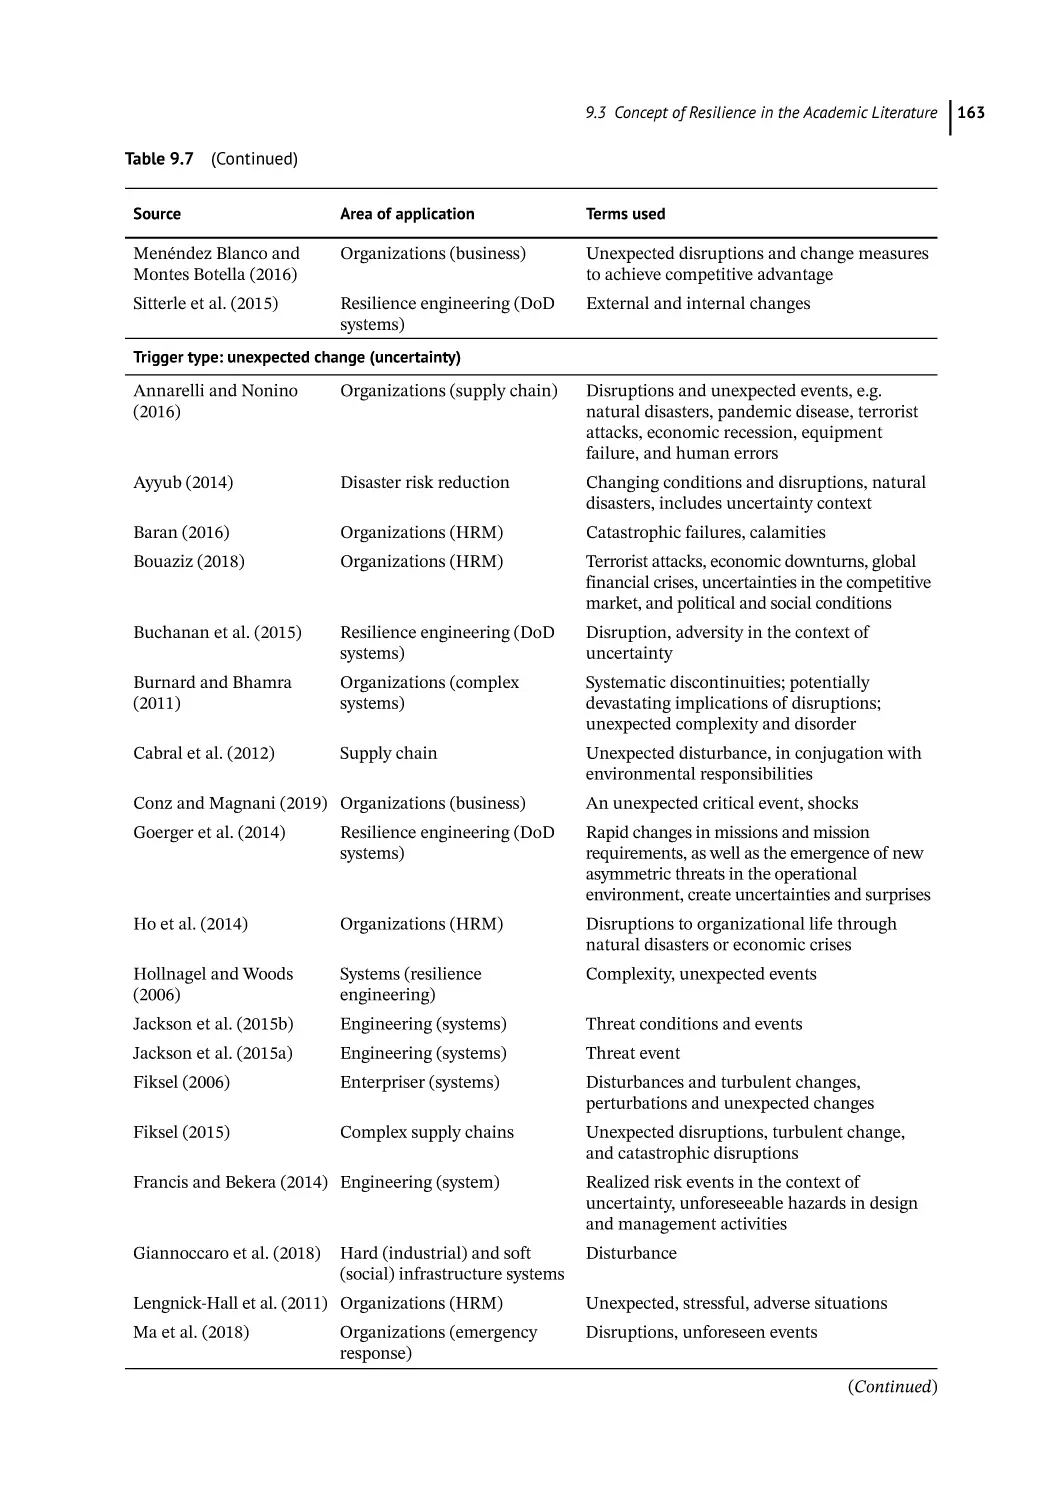
Why? (Resilience Triggers) 159
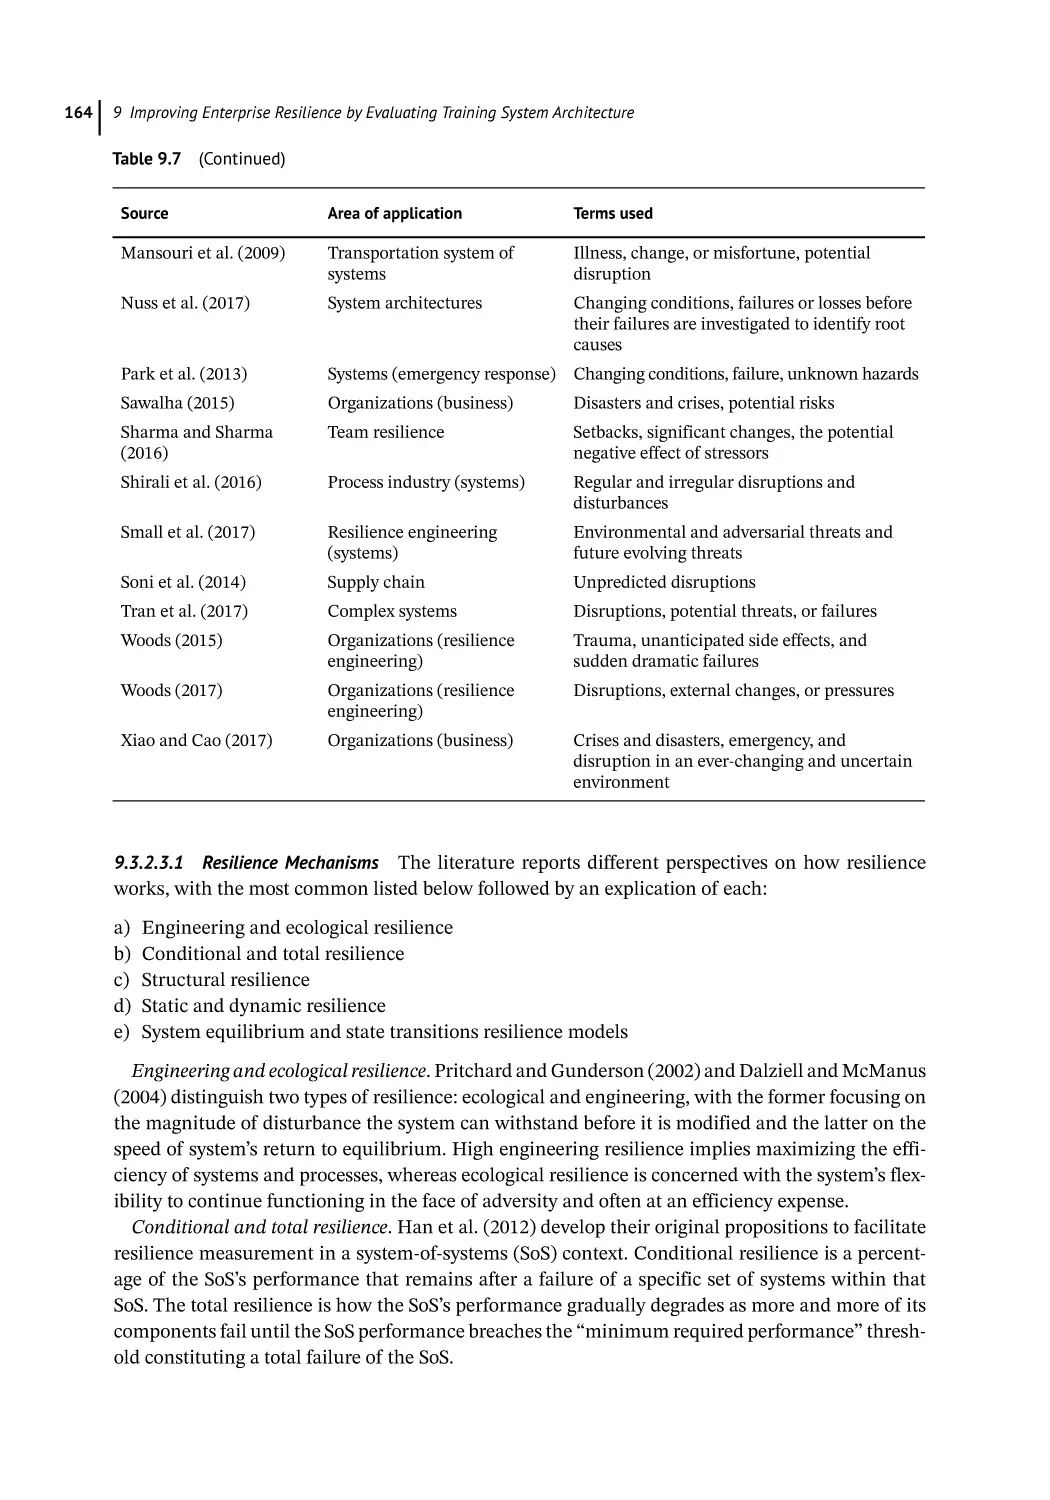
How? (Resilience Mechanisms and Measures) 160
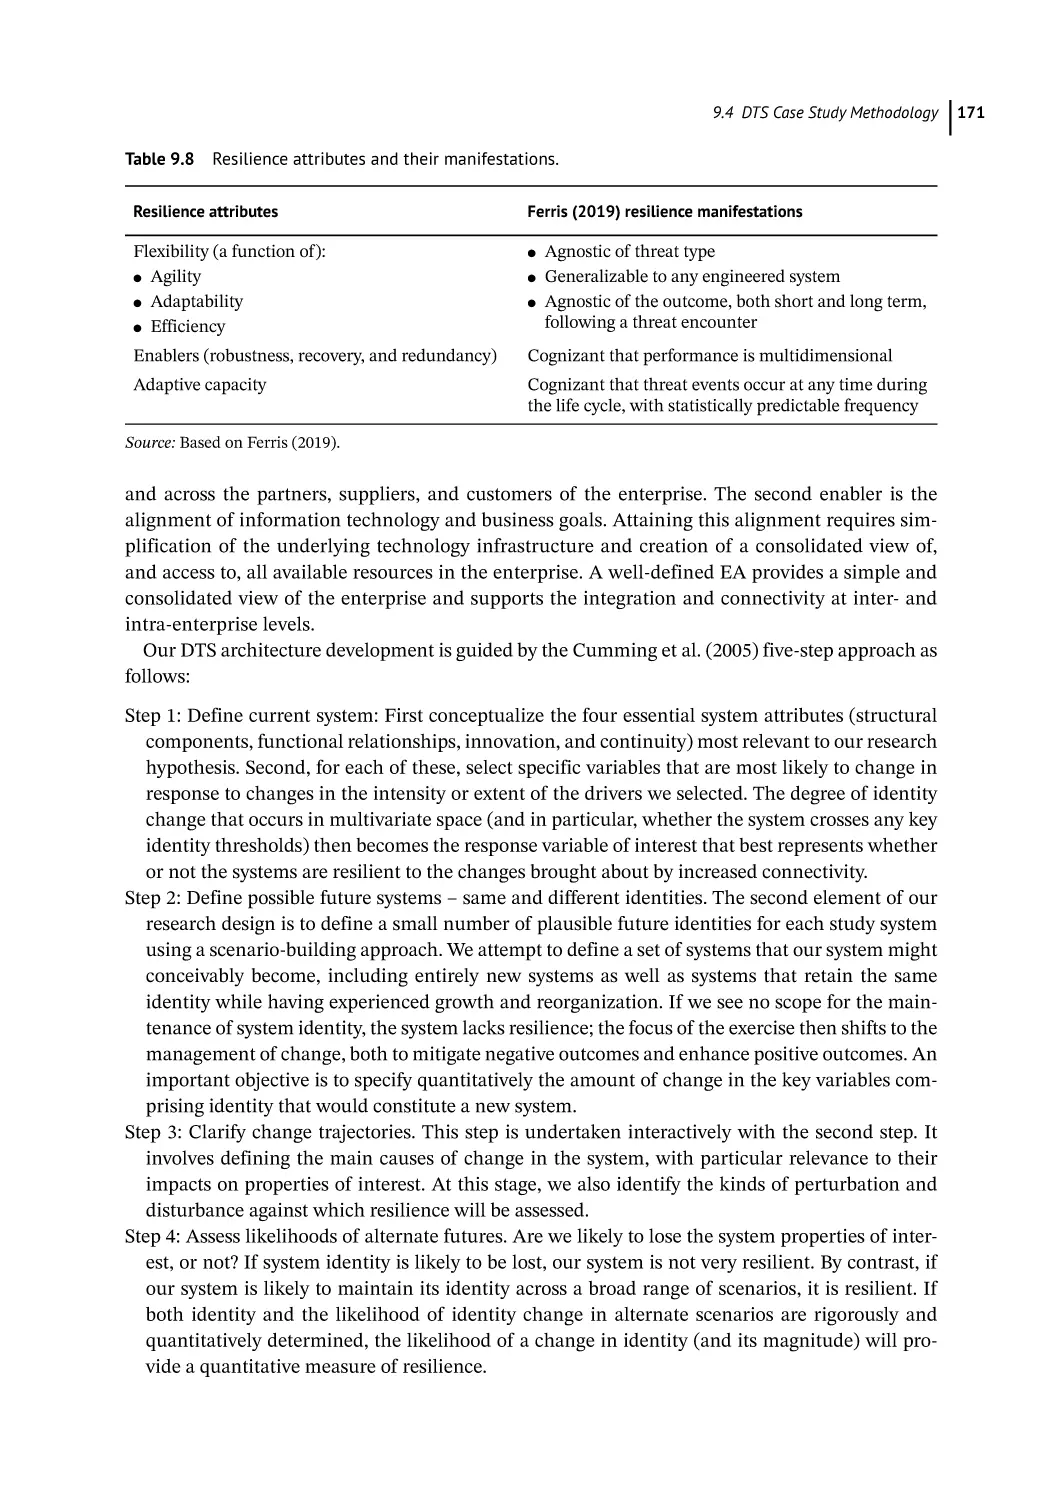
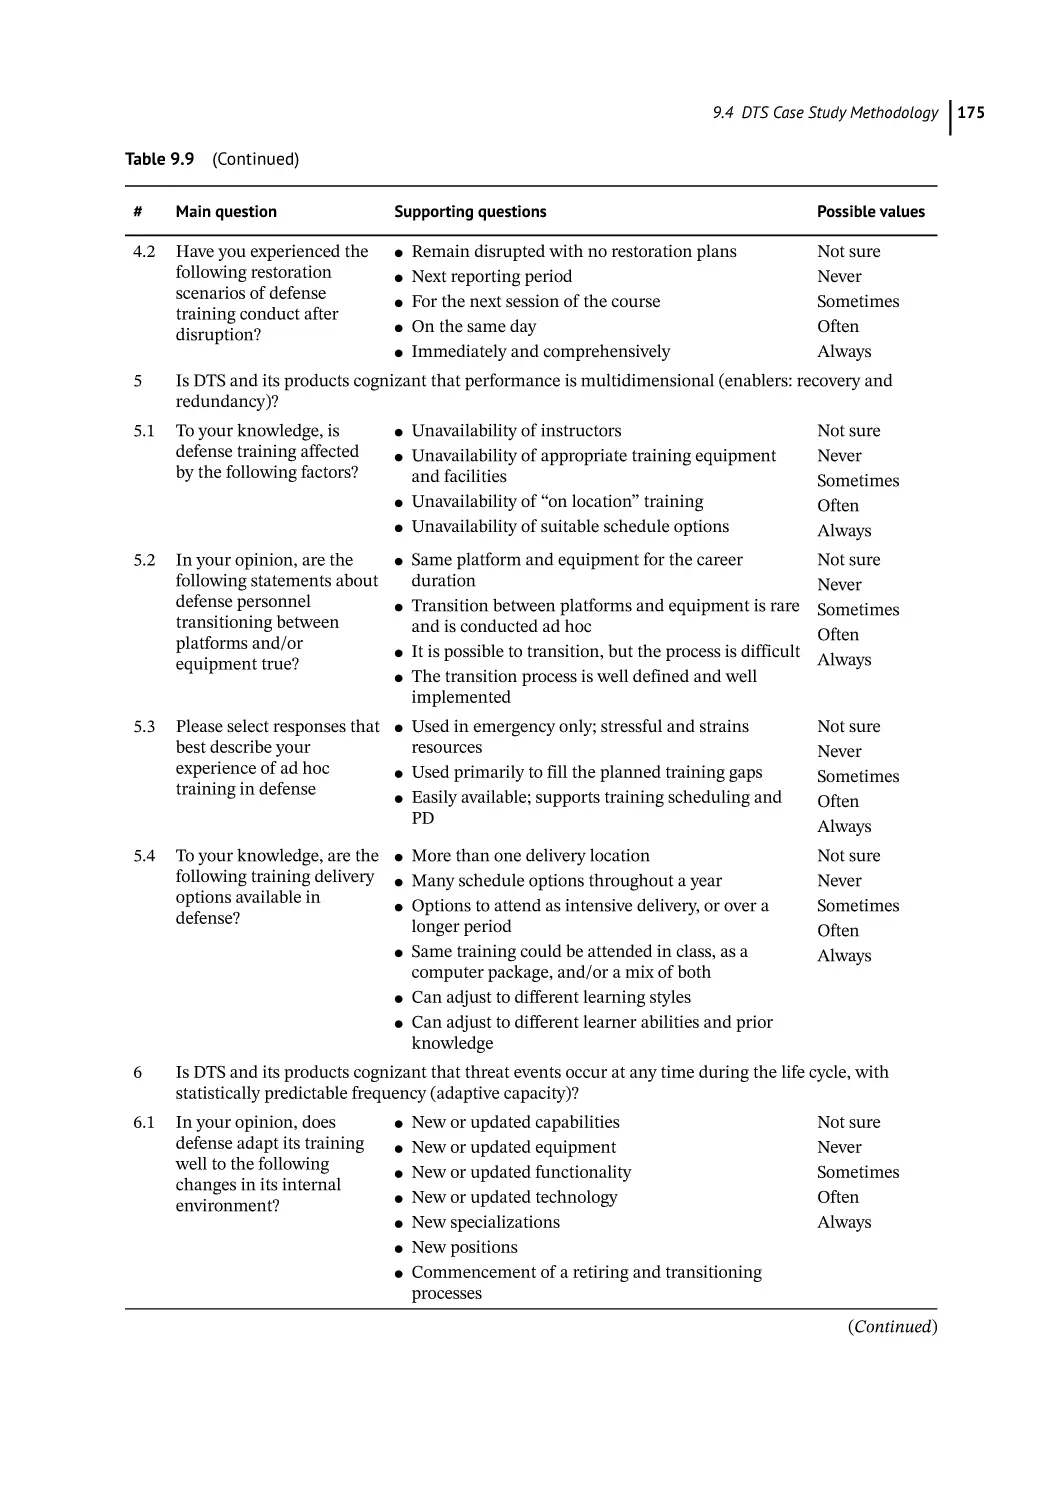
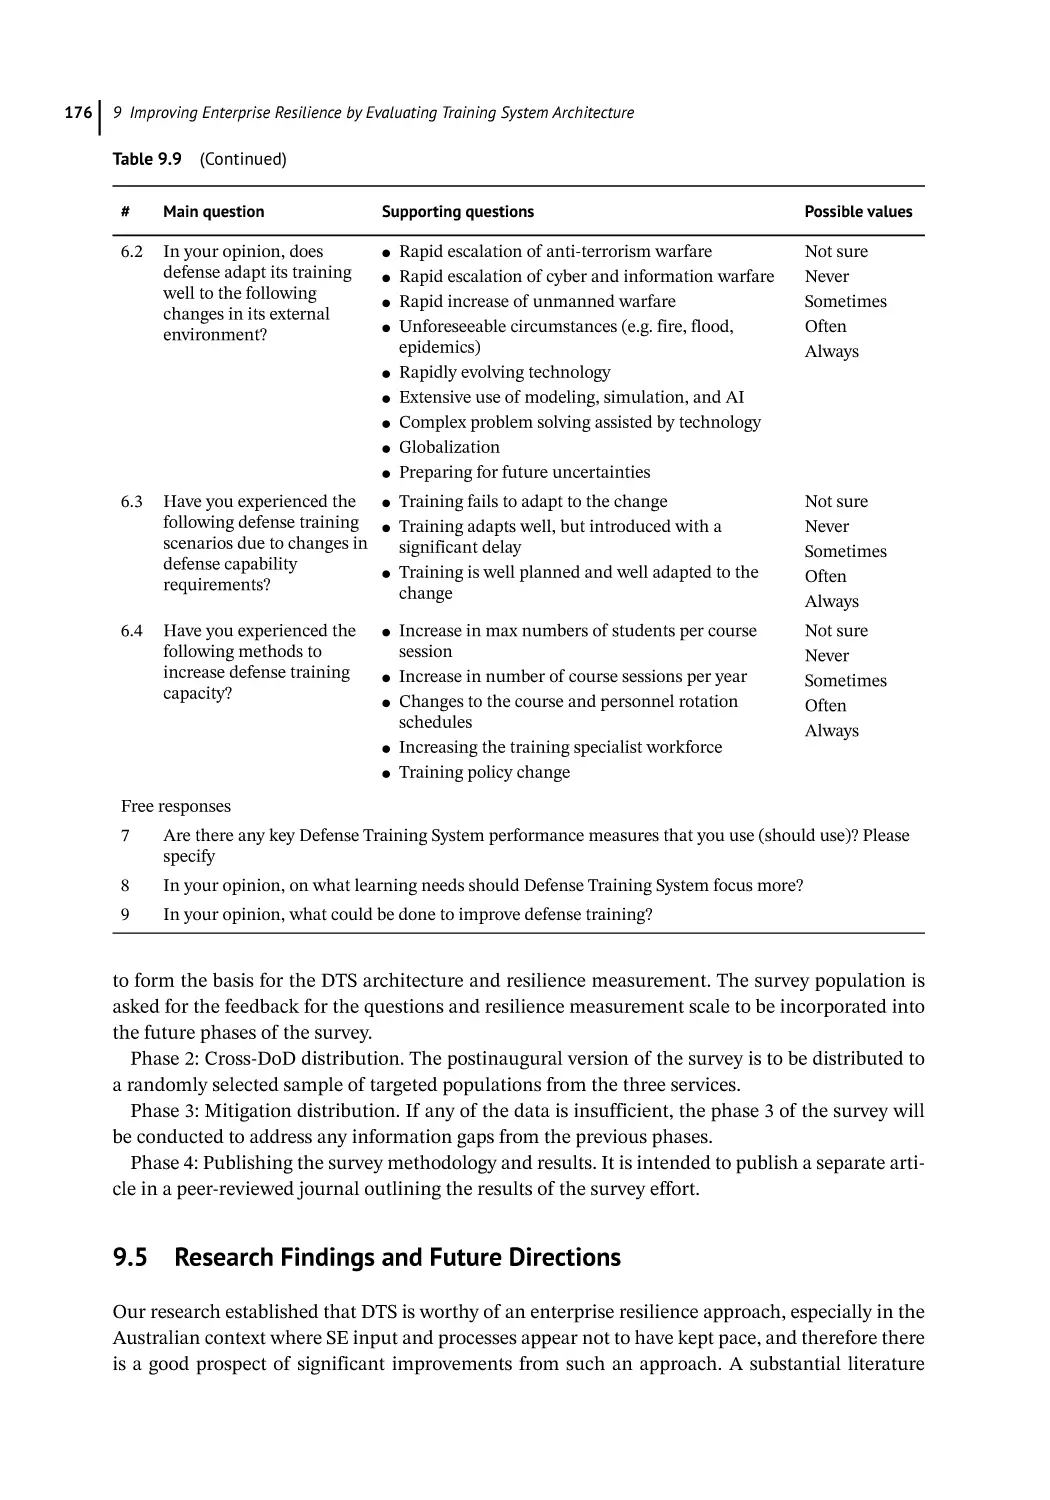
DTS Case Study Methodology 169
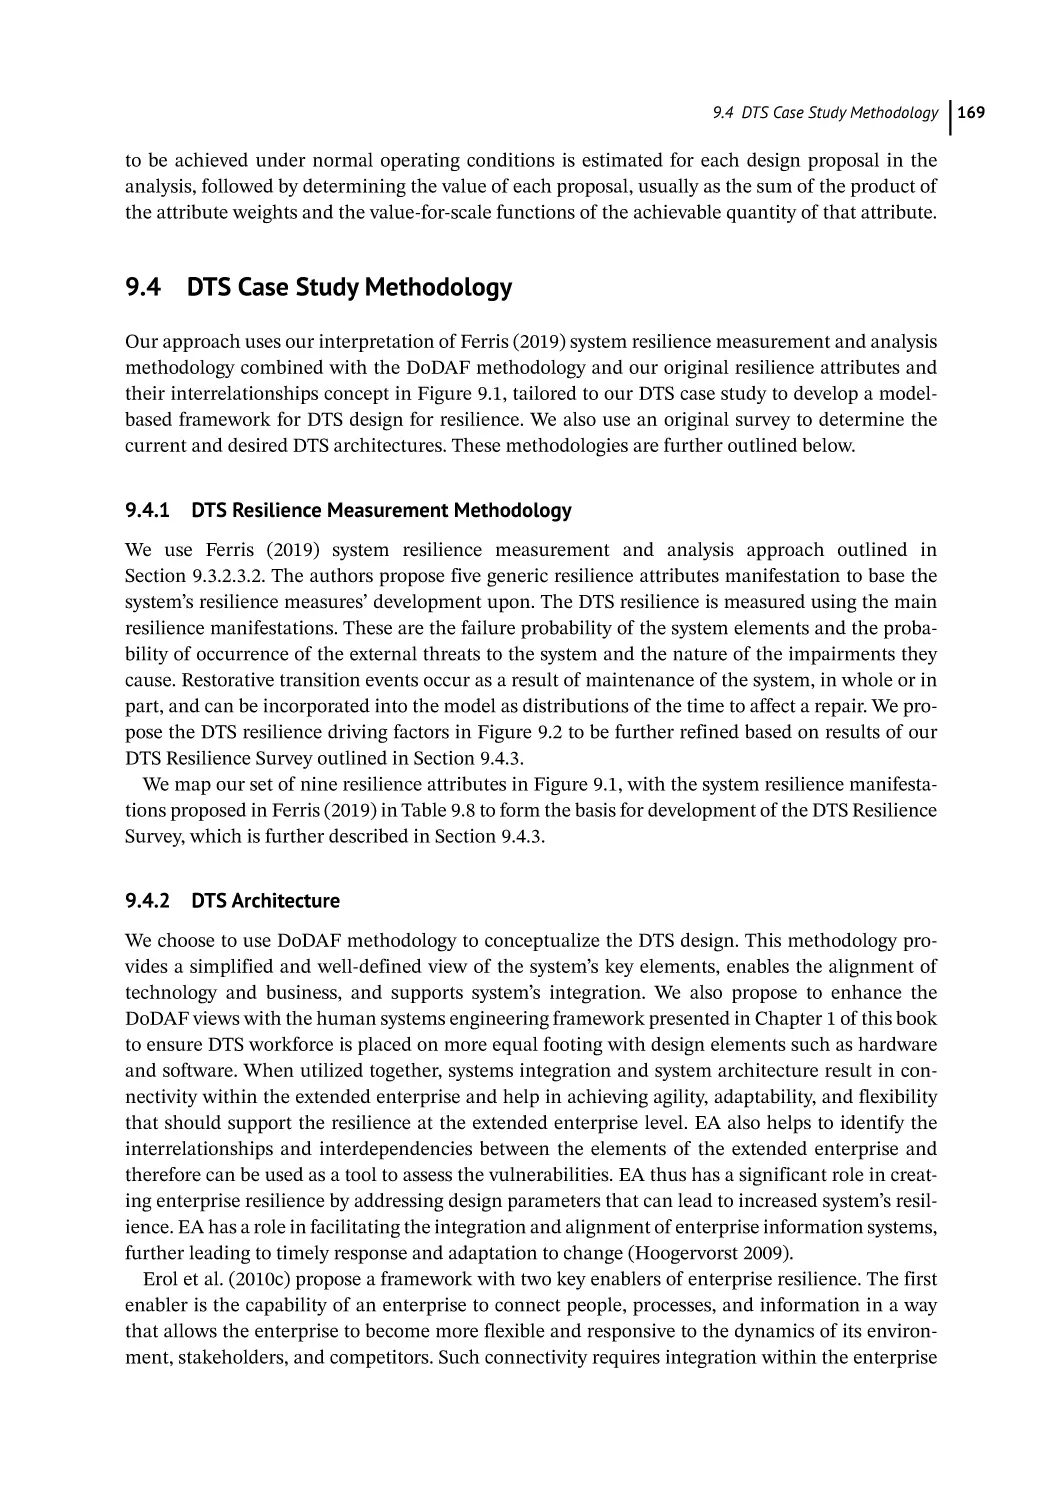
DTS Resilience Measurement Methodology 169
DTS Architecture 169
Contents
9.4.3
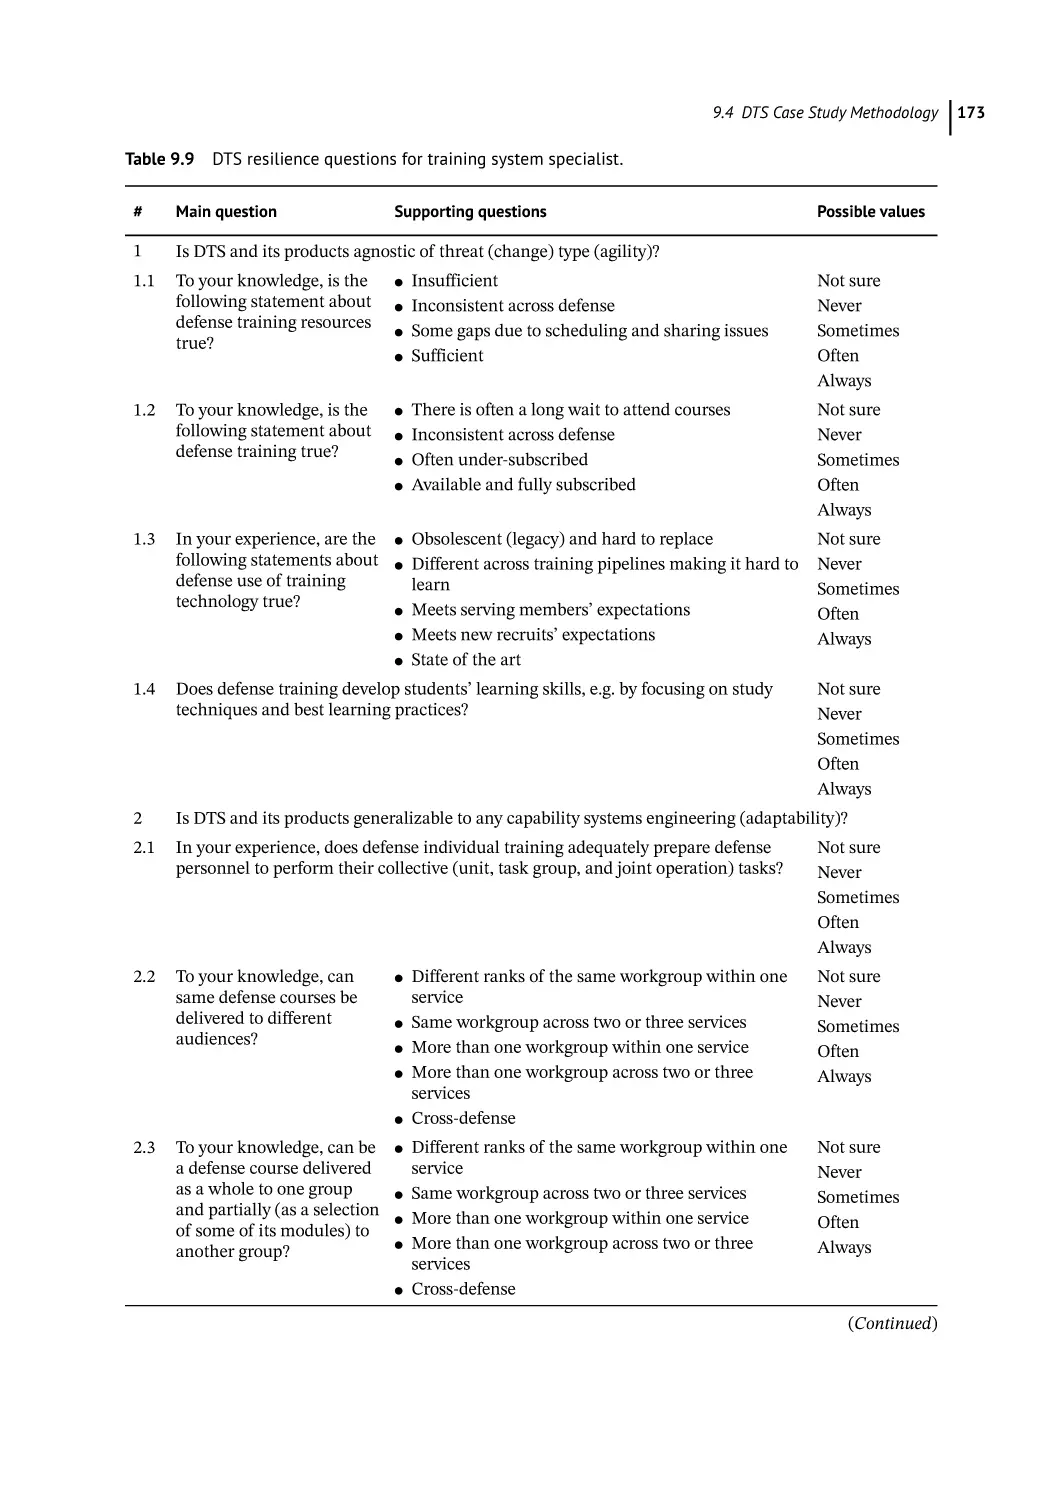
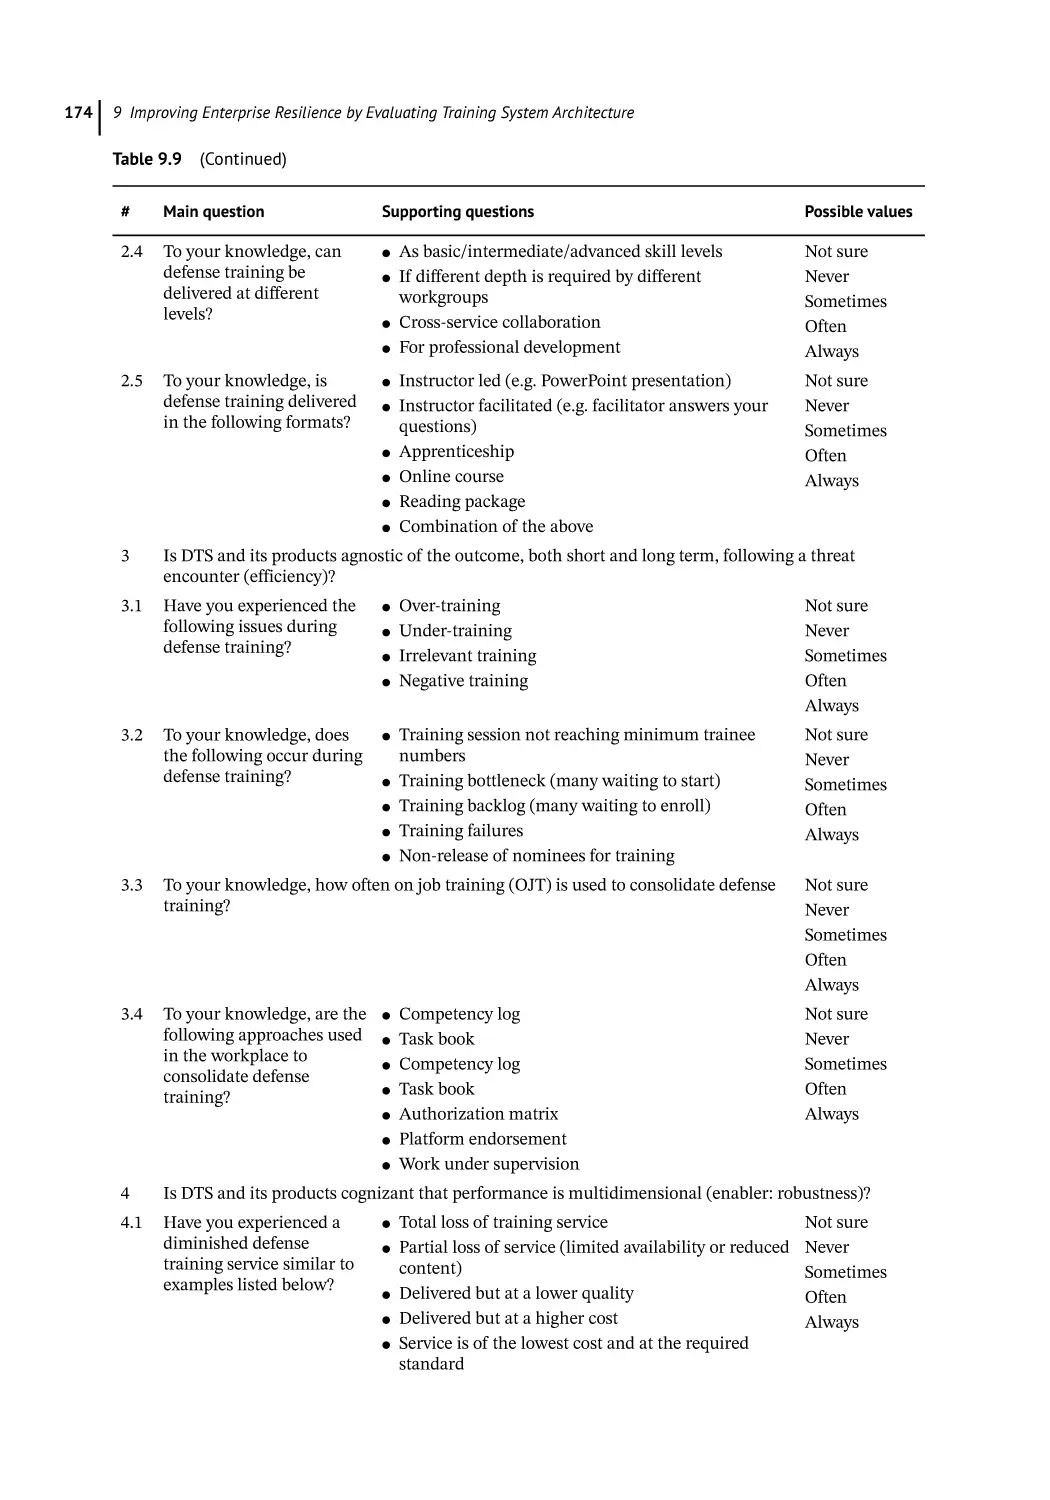
DTS Resilience Survey 172
9.4.3.1 DTS Resilience Survey Design 172
9.4.3.2 DTS Resilience Survey Conduct 172
9.5
Research Findings and Future Directions 176
References 177
10
10.1
10.2
10.2.1
10.2.2
10.3
10.3.1
10.3.2
10.3.3
10.3.4
10.3.5
10.3.6
10.3.7
10.4
Integrating New Technology into the Complex System of Air Combat Training
Sarah M. Sherwood, Kelly J. Neville, Angus L. M. T. McLean, III,
Melissa M. Walwanis, and Amy E. Bolton
Introduction 185
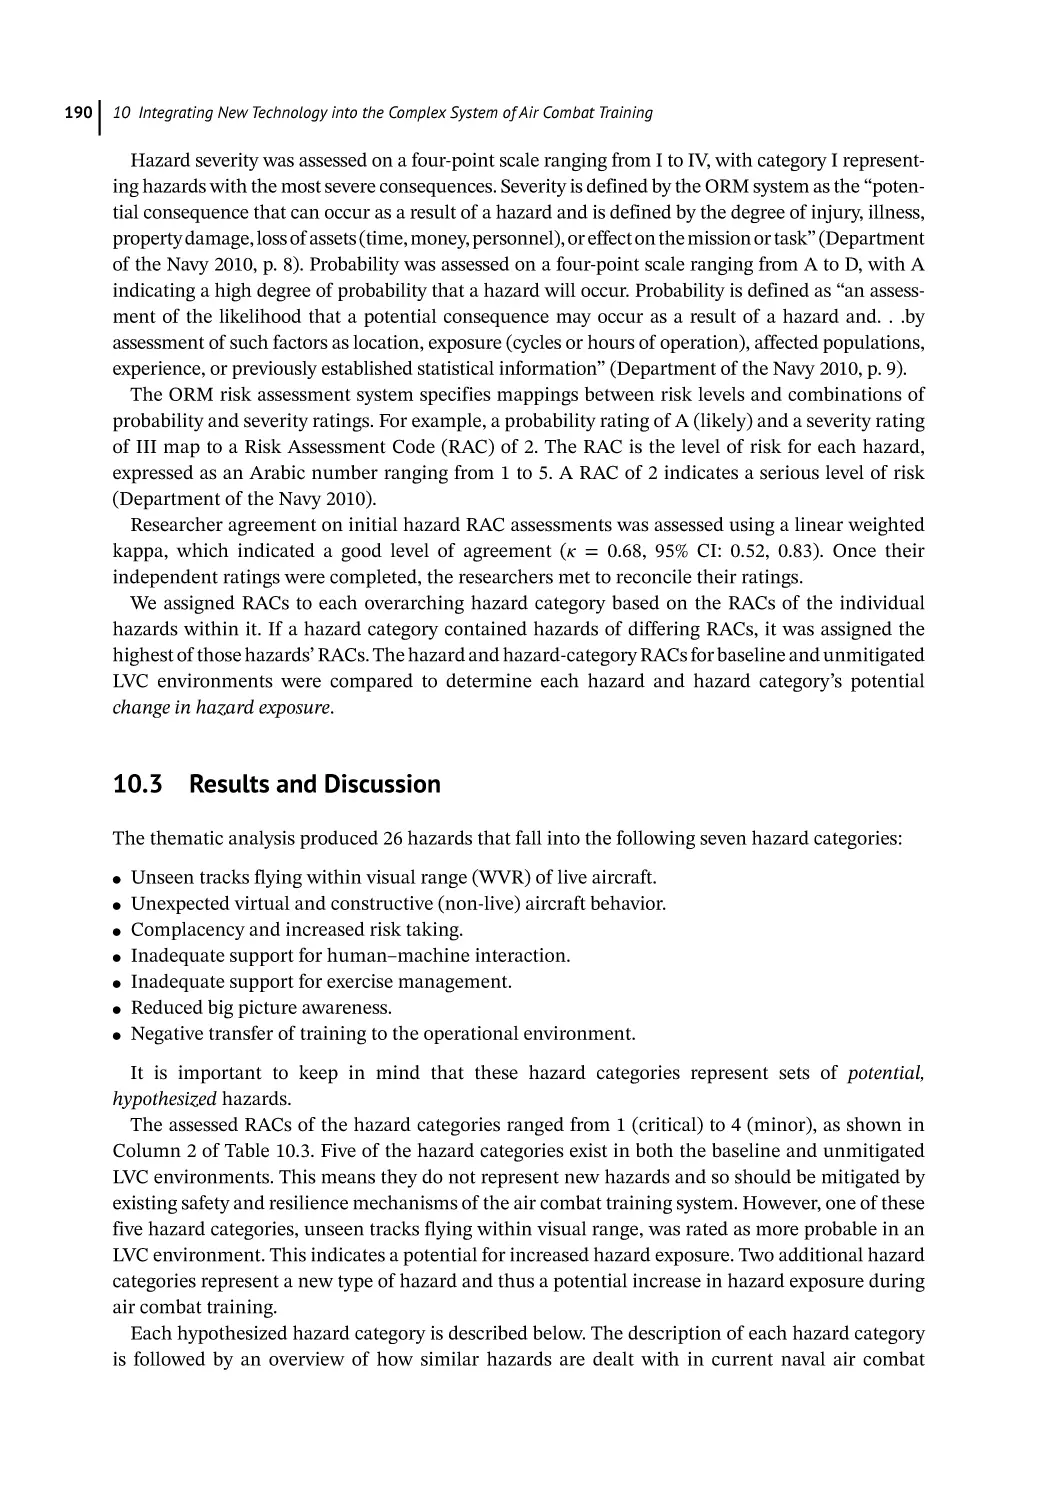
Method 187
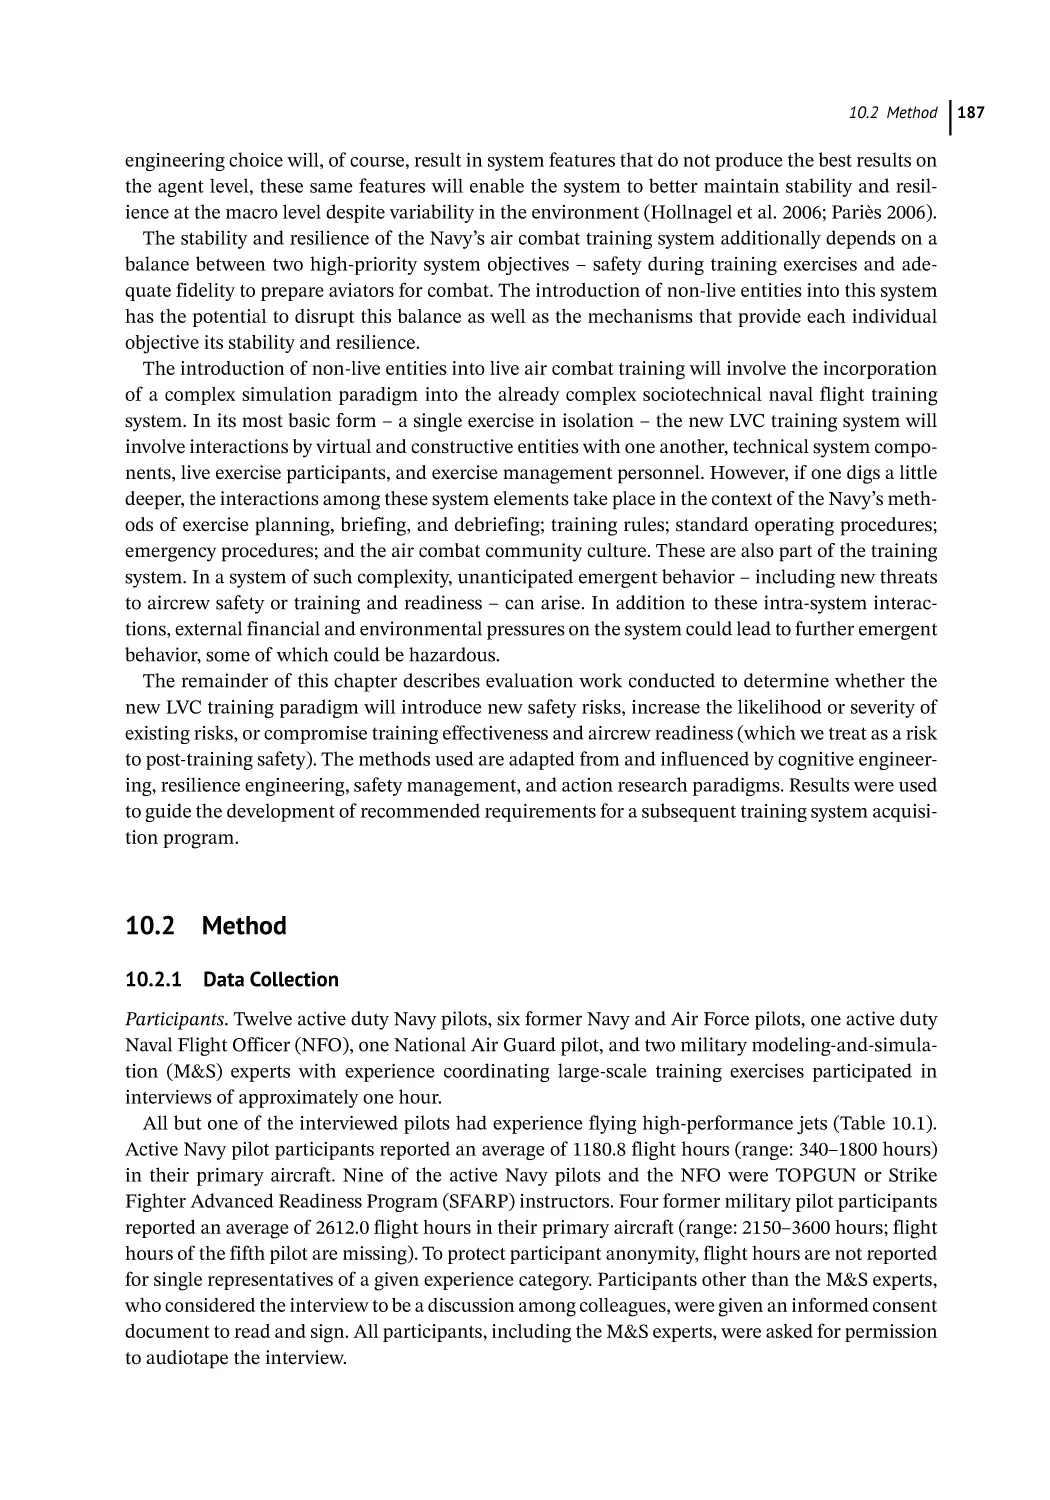
Data Collection 187
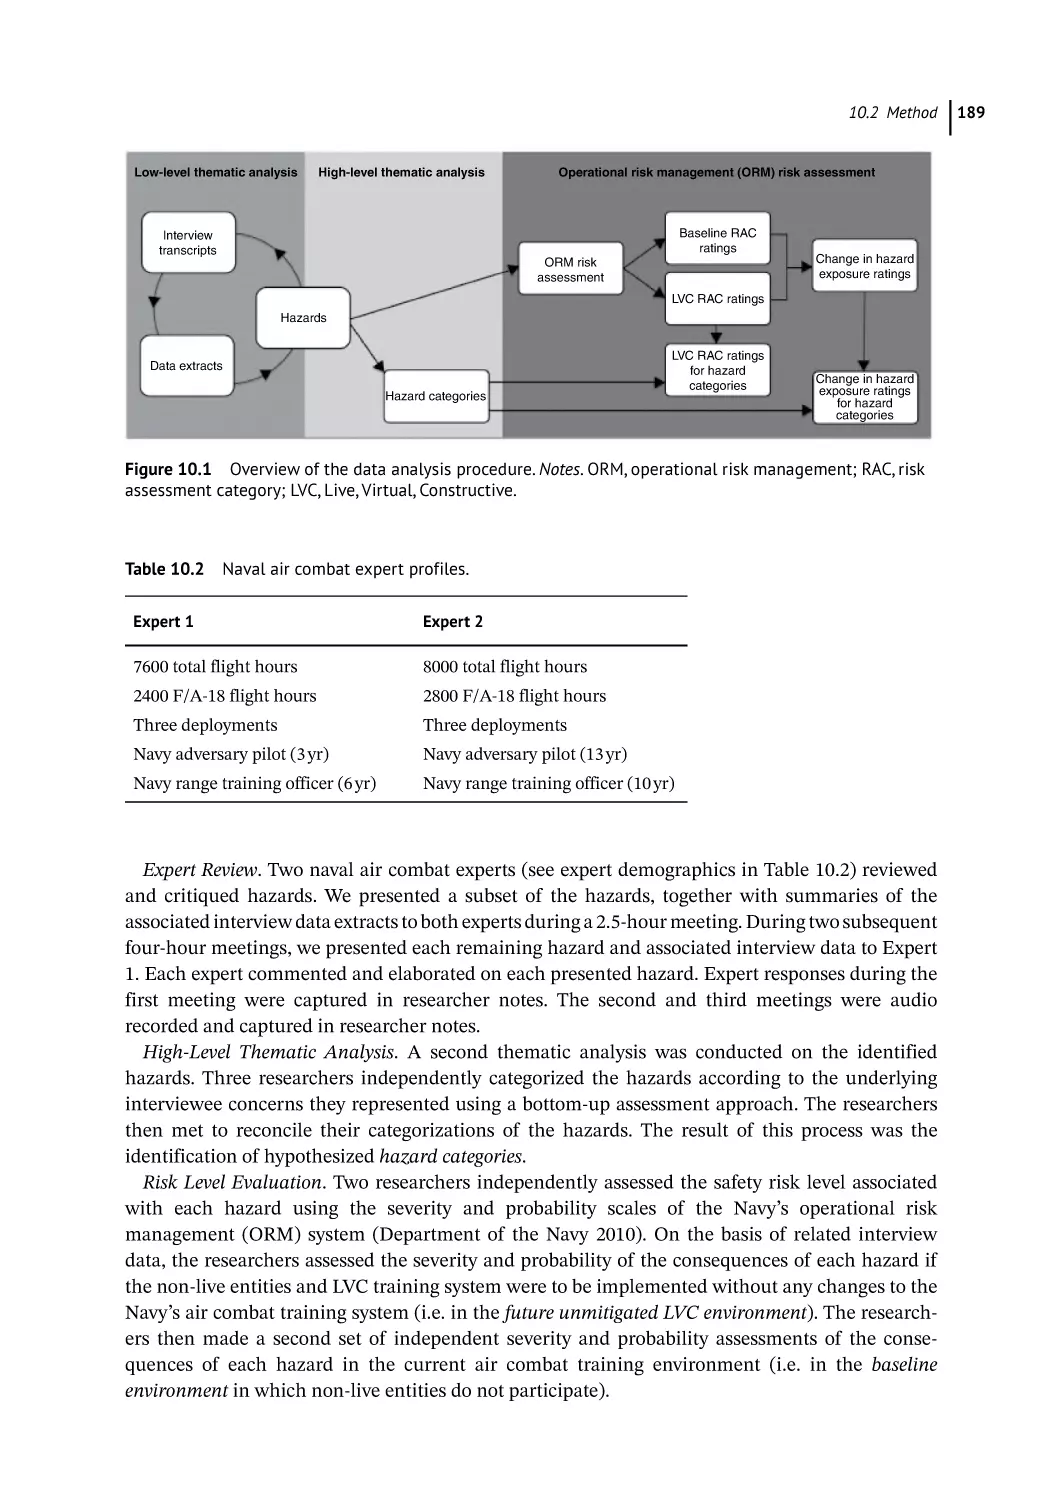
Data Analysis 188
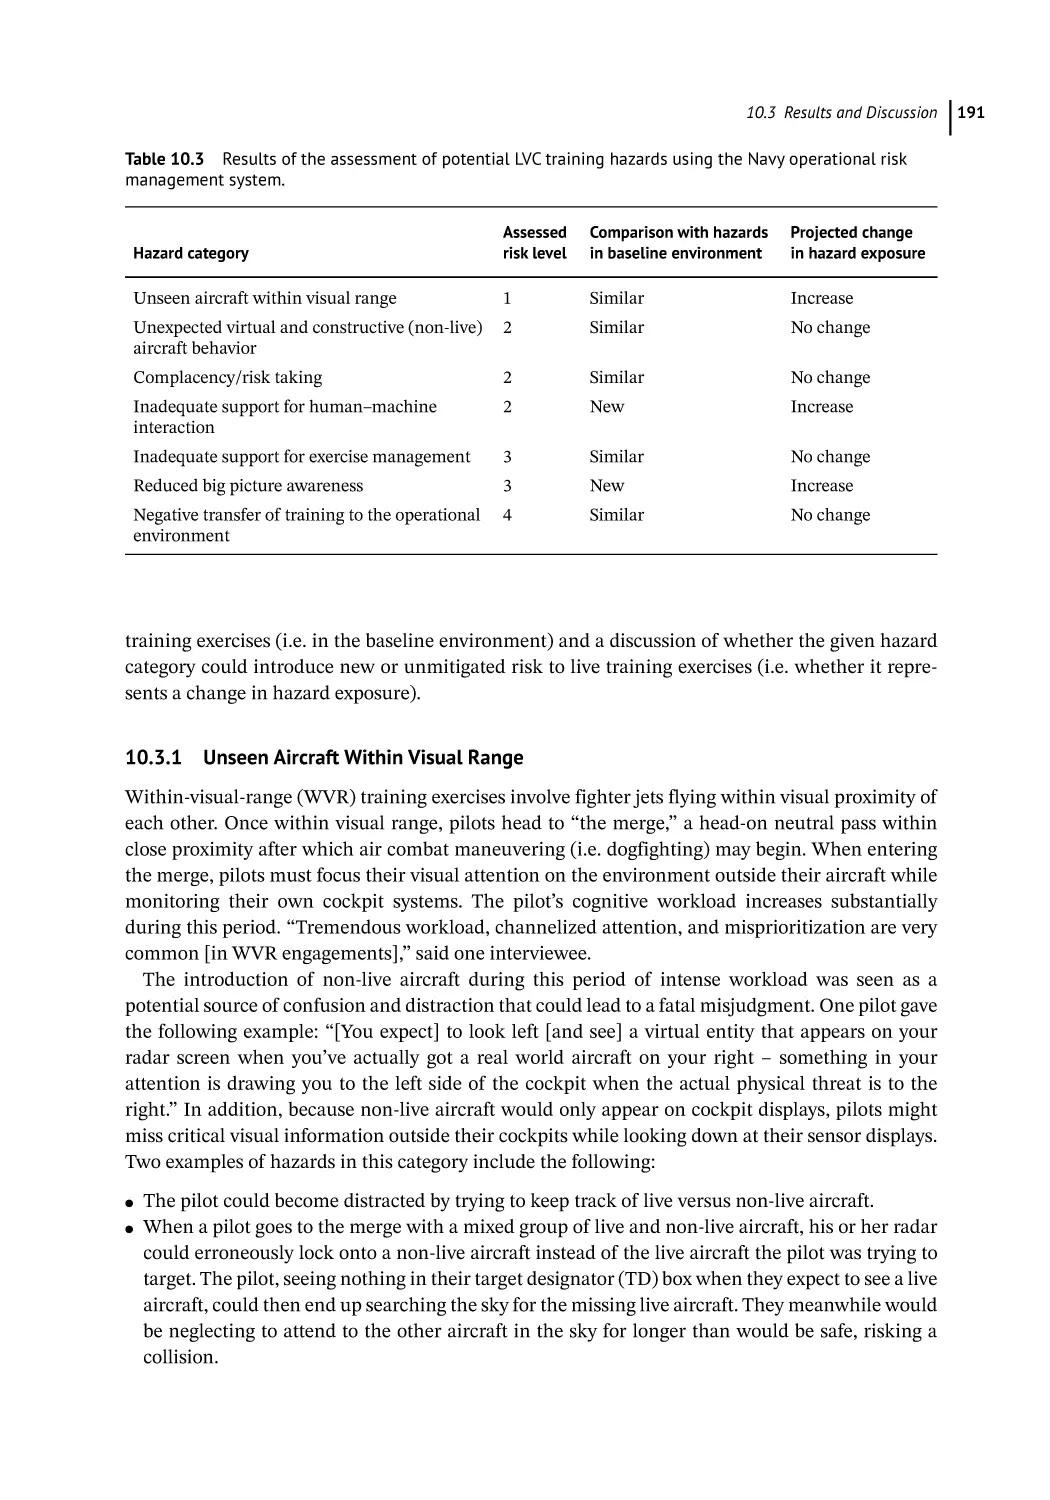
Results and Discussion 190
Unseen Aircraft Within Visual Range 191
Unexpected Virtual and Constructive Aircraft Behavior 193
Complacency and Increased Risk Taking 194
Human–Machine Interaction 195
Exercise Management 196
Big Picture Awareness 197
Negative Transfer of Training to the Operational Environment 198
Conclusion 199
Acknowledgments 202
References 202
Section 4
11
11.1
11.2
11.3
11.4
11.4.1
11.4.2
11.4.3
11.5
11.6
11.6.1
11.6.2
11.6.3
11.6.4
Considering Human Characteristics
185
205
Engineering a Trustworthy Private Blockchain for Operational Risk Management:
A Rapid Human Data Engineering Approach Based on Human Systems
Engineering 207
Marius Becherer, Michael Zipperle, Stuart Green, Florian Gottwalt, Thien Bui-Nguyen,
and Elizabeth Chang
Introduction 207
Human Systems Engineering and Human Data Engineering 207
Human-Centered System Design 208
Practical Issues Leading to Large Complex Blockchain System Development 208
Human-Centered Operational Risk Management 208
Issues Leading to Risk Management Innovation Through Blockchain 209
Issues in Engineering Trustworthy Private Blockchain 209
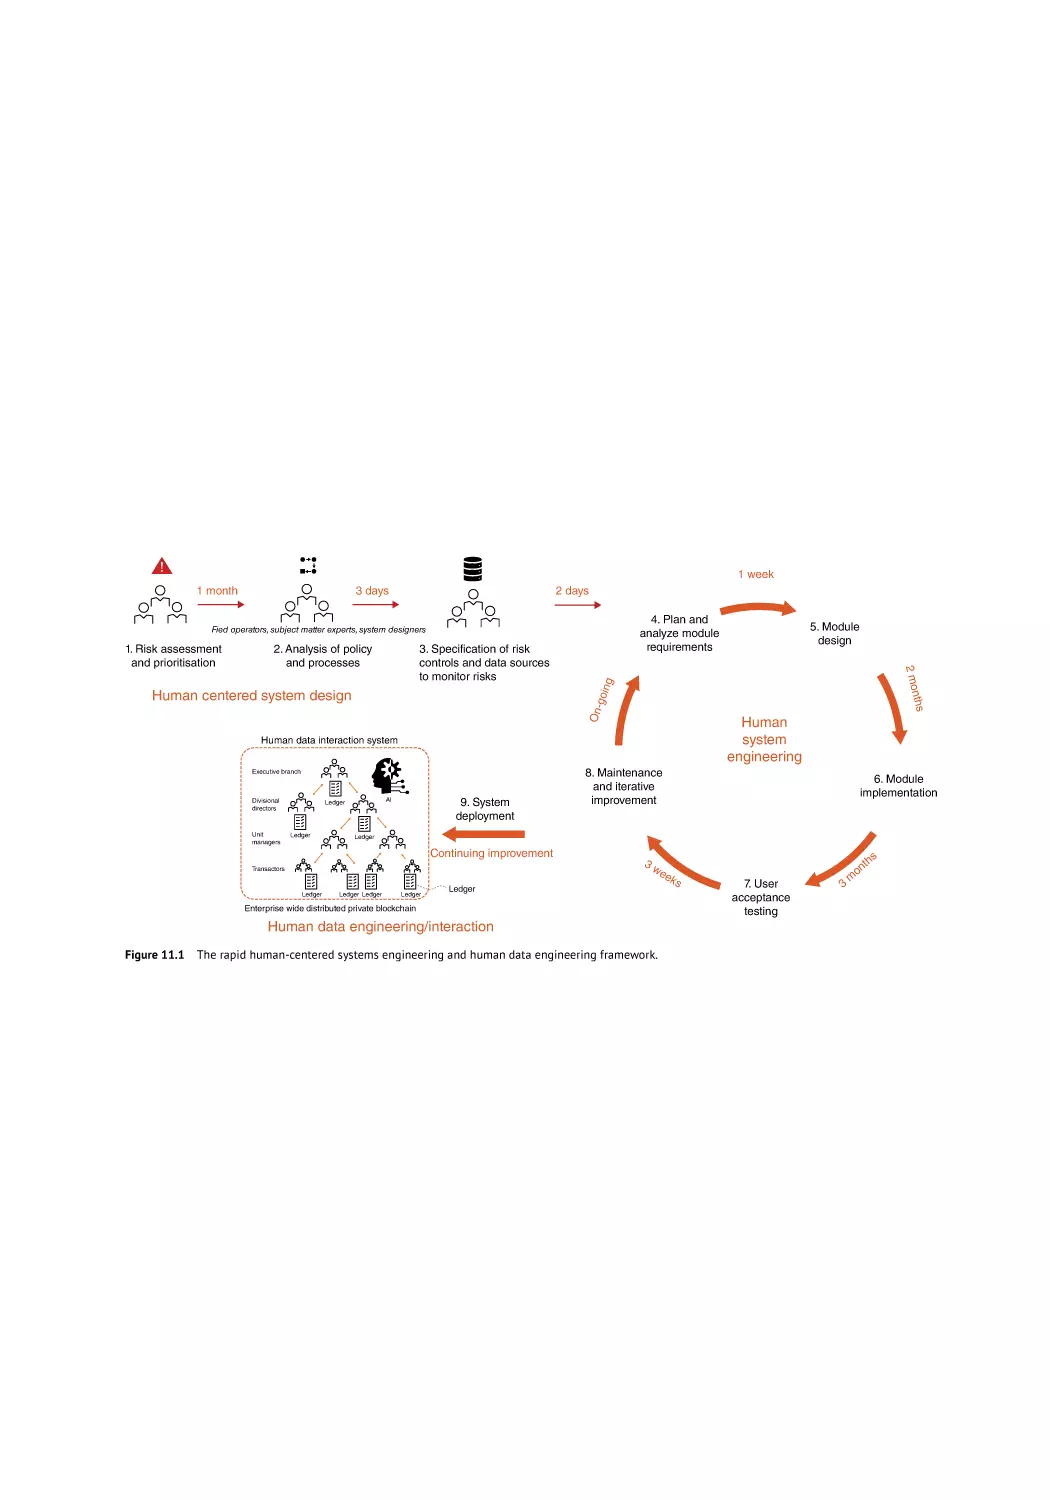
Framework for Rapid Human Systems–Human Data Engineering 210
Human Systems Engineering for Trustworthy Blockchain 210
Engineering Trustworthy Blockchain 210
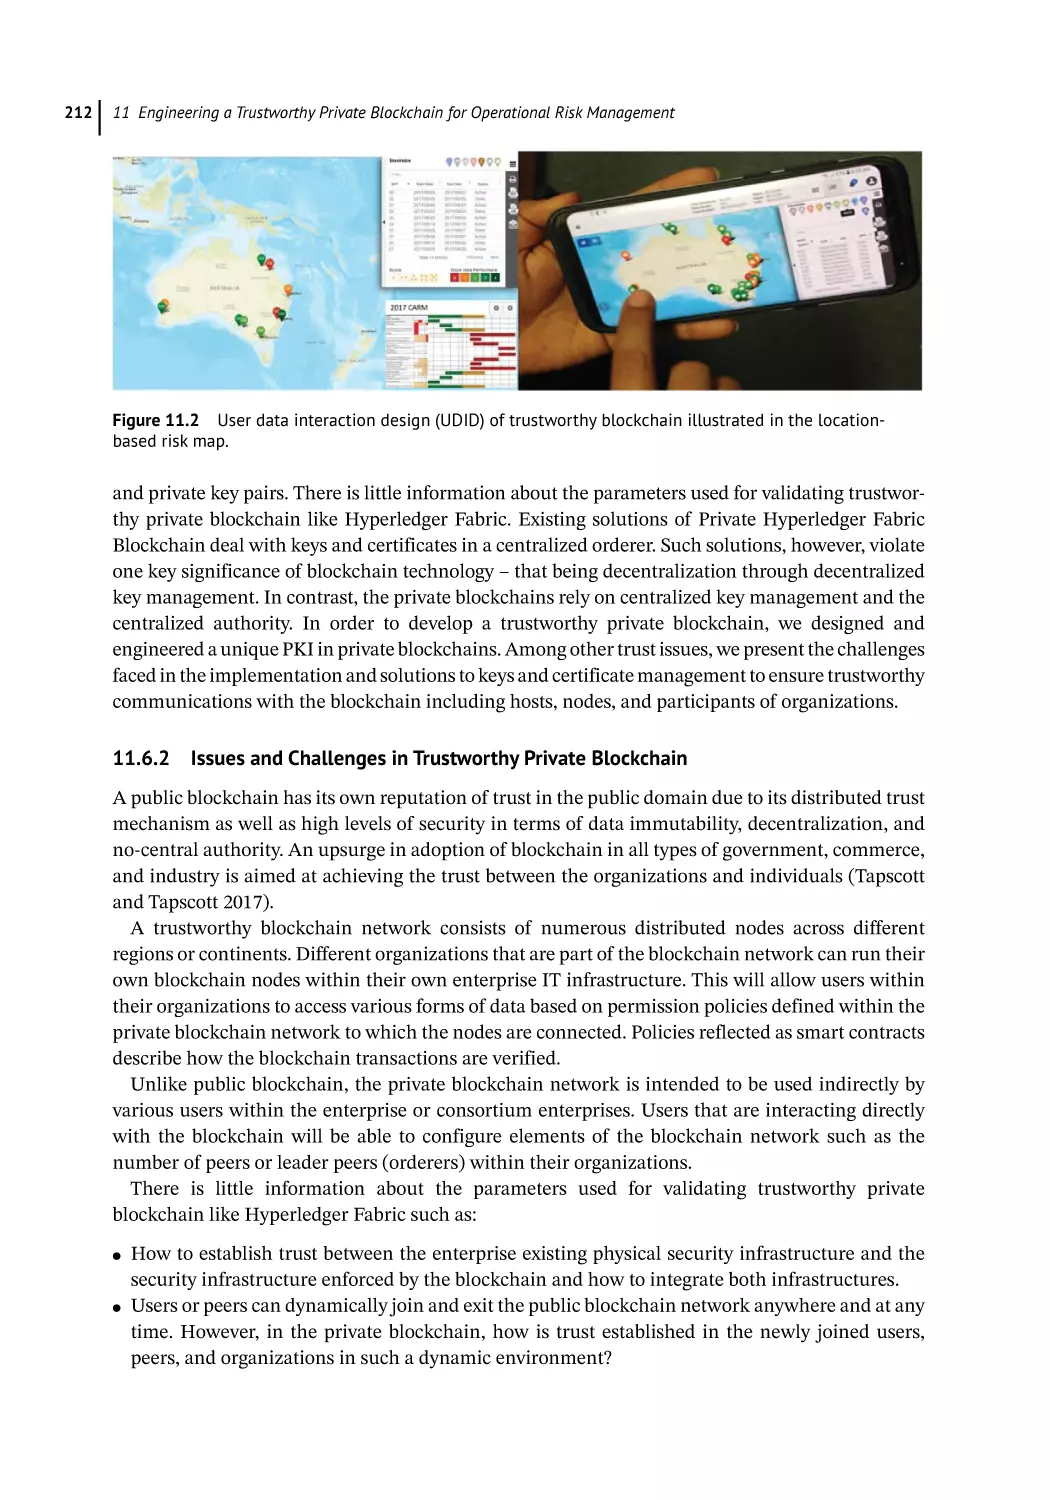
Issues and Challenges in Trustworthy Private Blockchain 212
Concepts Used in Trustworthy Private Blockchain 213
Prototype Scenario for Trusted Blockchain Network 214
xi
xii
Contents
11.6.5
11.6.6
11.6.6.1
11.6.6.2
11.6.6.3
11.6.6.4
11.7
11.8
11.8.1
11.8.2
11.8.3
11.9
Systems Engineering of the Chain of Trust 214
Design Public Key Infrastructure (PKI) for Trust 215
Design of Certificate Authority (CA) 215
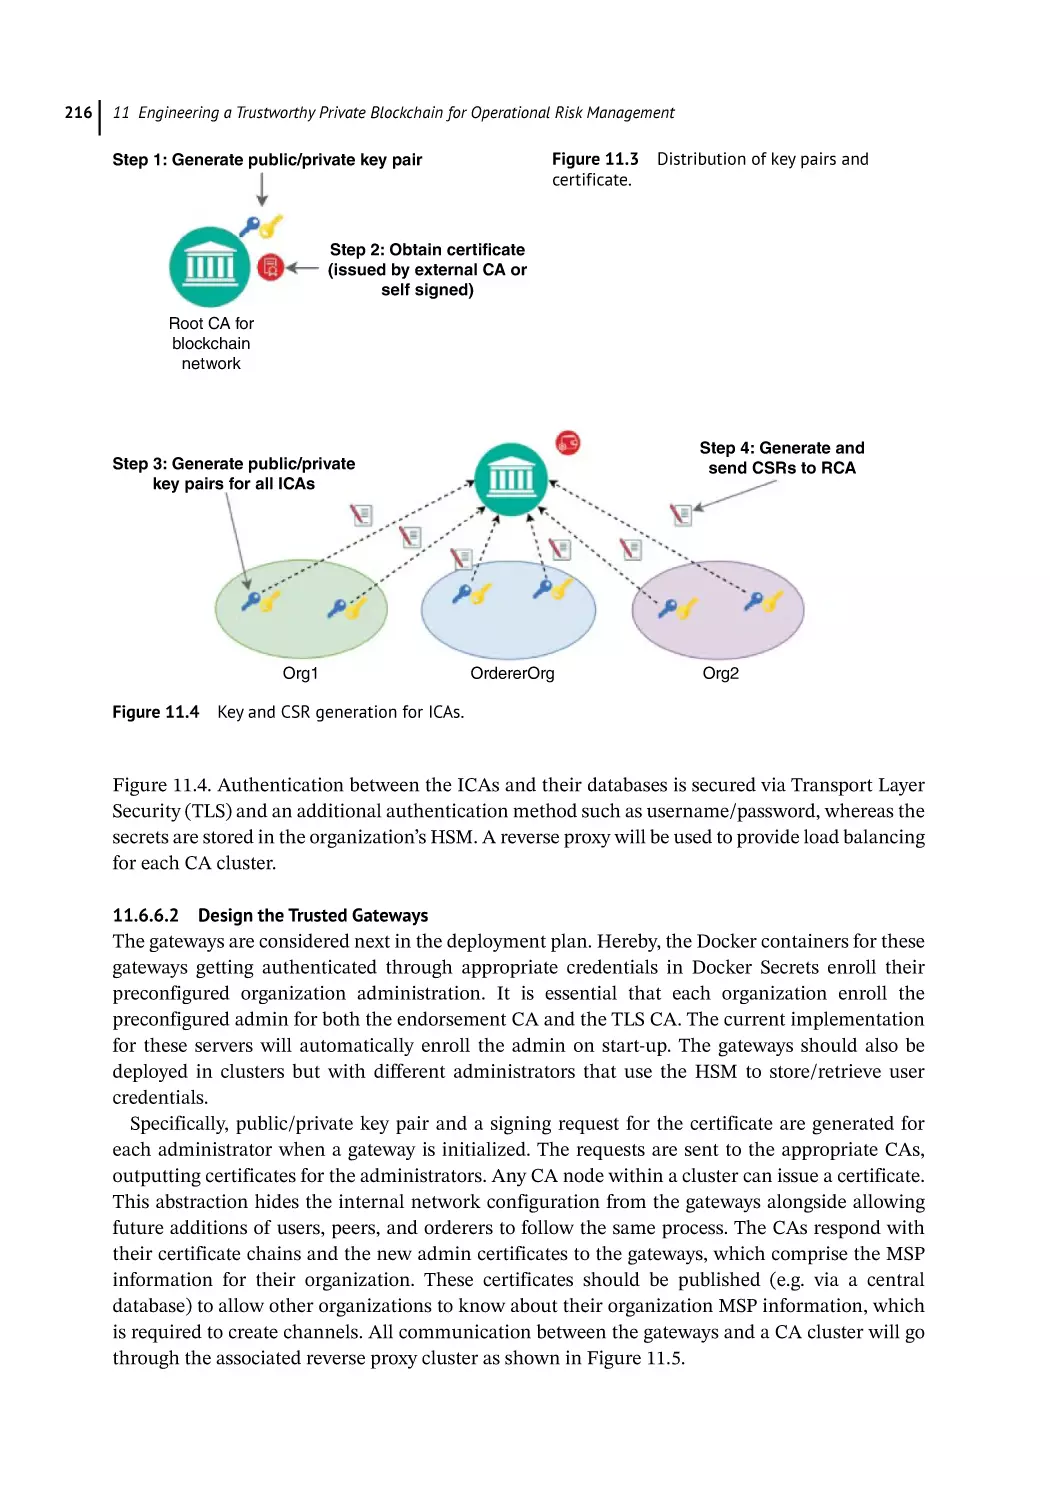
Design the Trusted Gateways 216
Involving Trusted Peers and Orderers 217
Facilitate Trust Through Channels 217
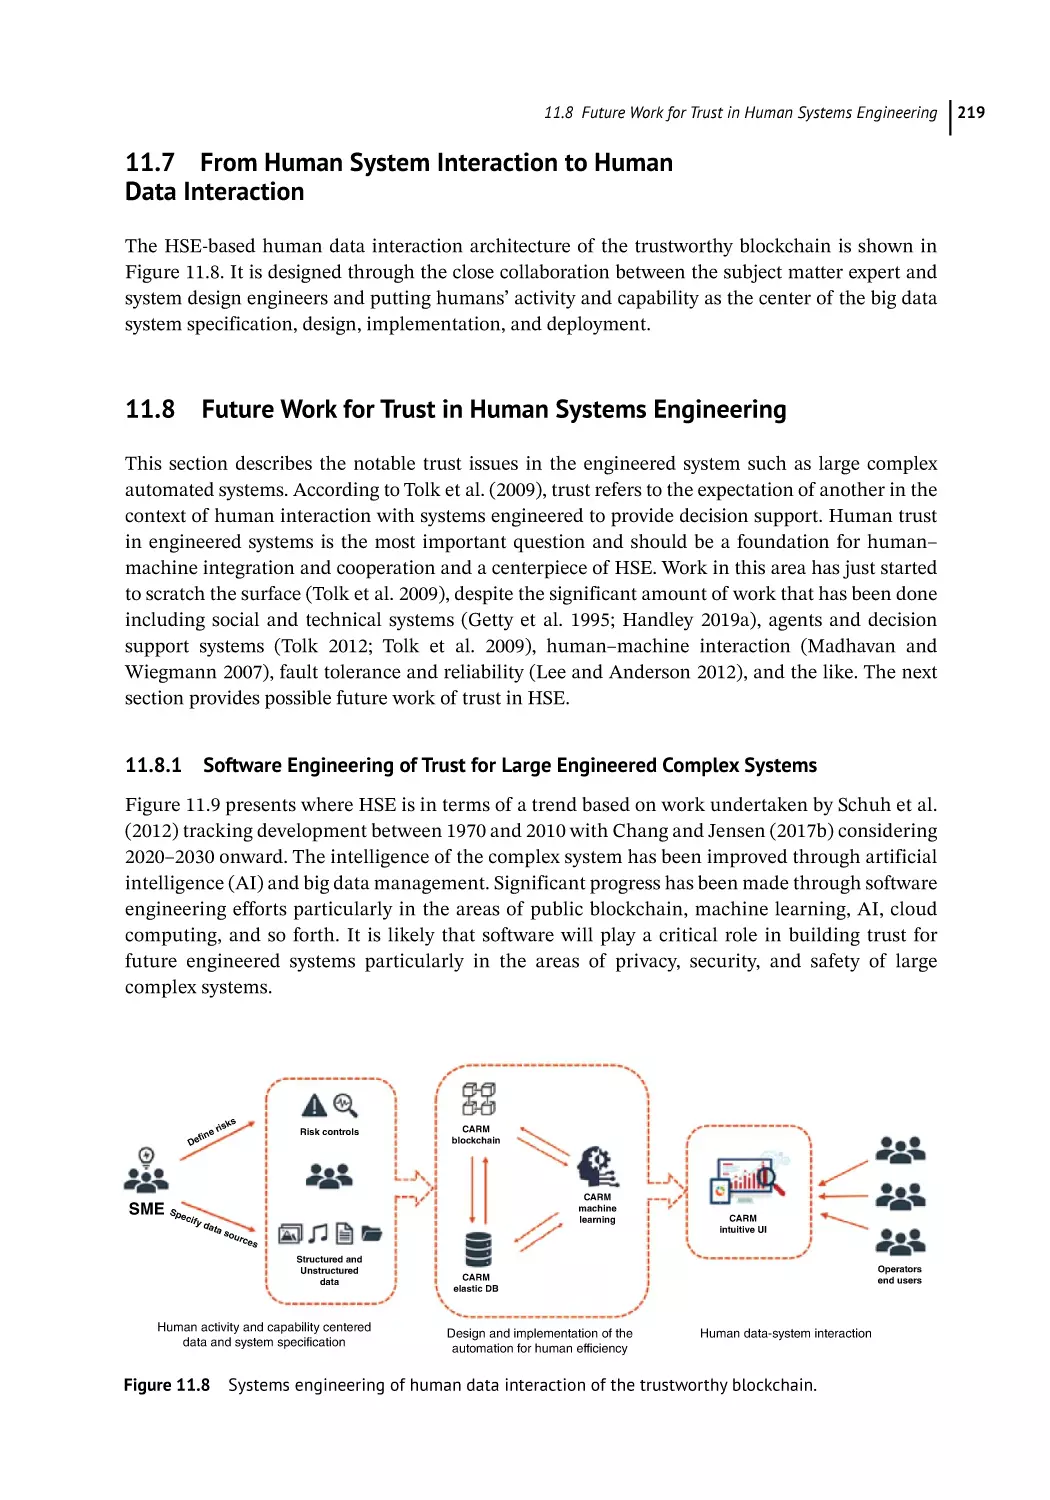
From Human System Interaction to Human Data Interaction 219
Future Work for Trust in Human Systems Engineering 219
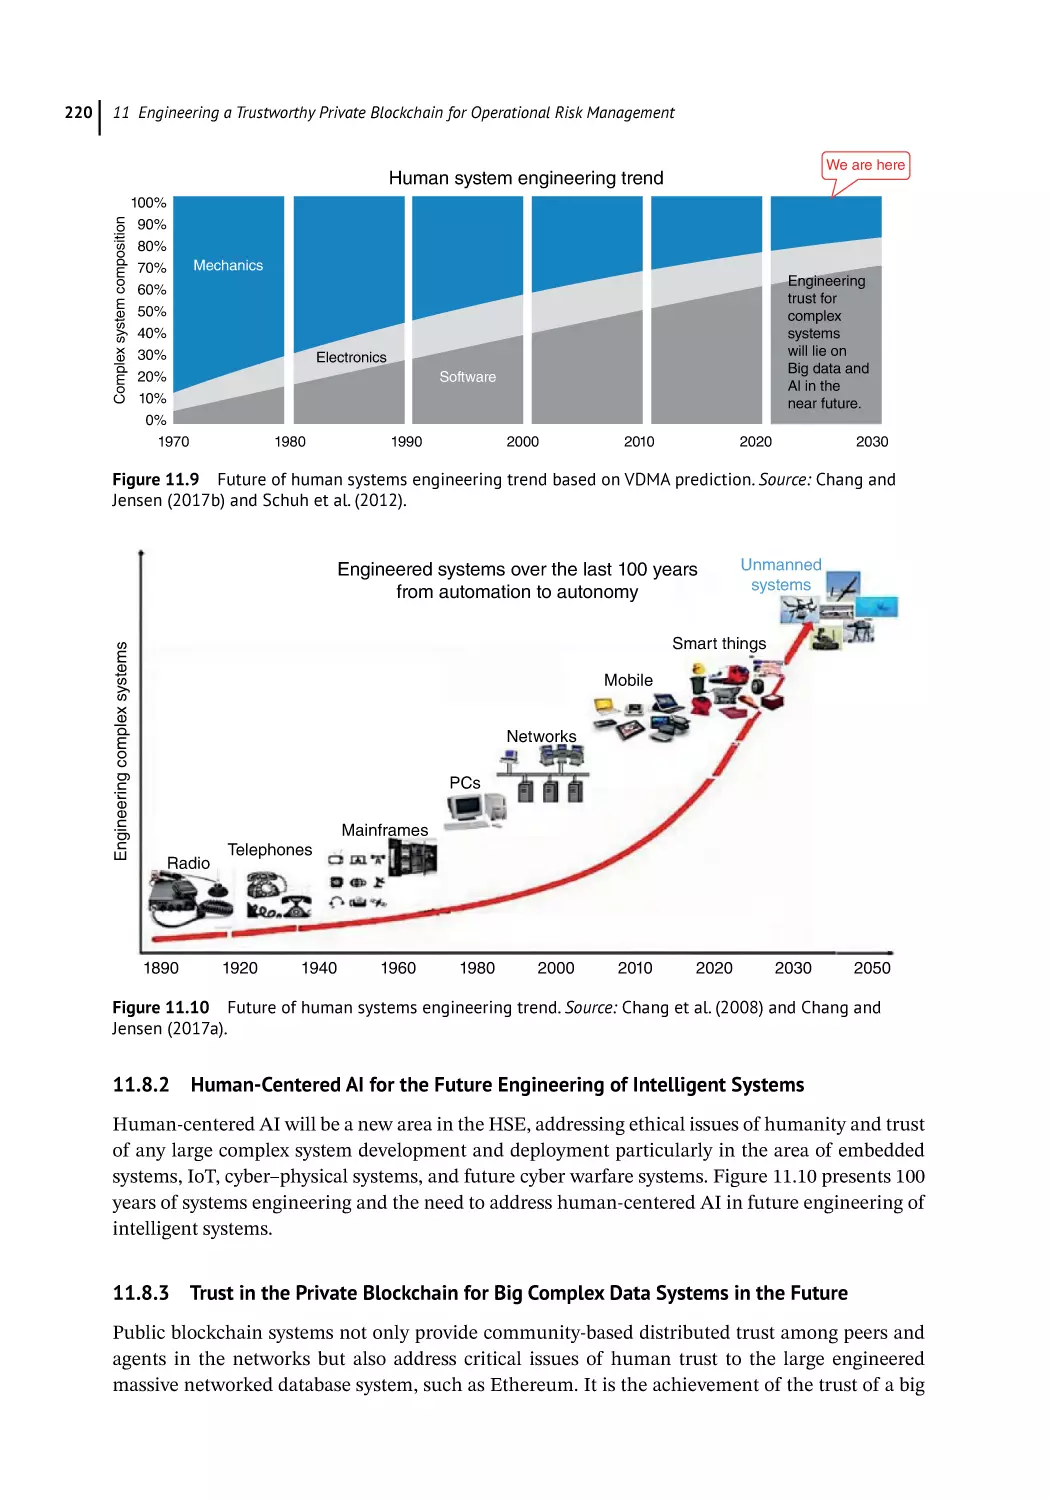
Software Engineering of Trust for Large Engineered Complex Systems 219
Human-Centered AI for the Future Engineering of Intelligent Systems 220
Trust in the Private Blockchain for Big Complex Data Systems in the Future 220
Conclusion 221
Acknowledgment 222
References 222
12
Light’s Properties and Power in Facilitating Organizational Change
Pravir Malik
Introduction 225
Implicit Properties and a Mathematical Model of Light 226
Materialization of Light 230
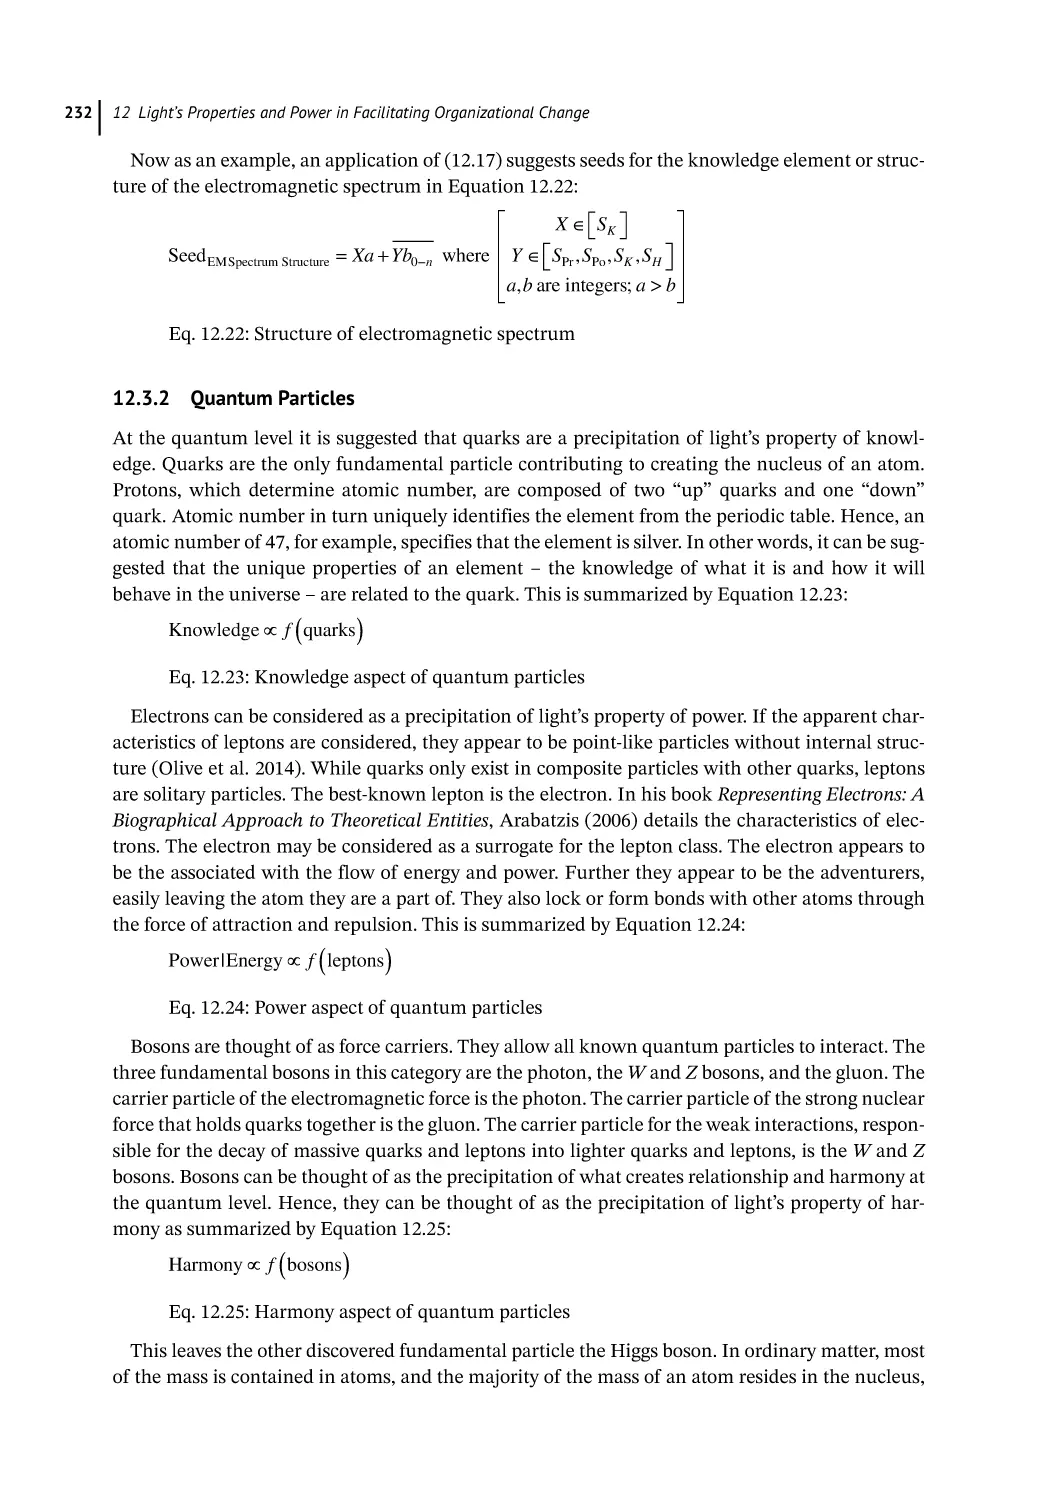
The Electromagnetic Spectrum 231
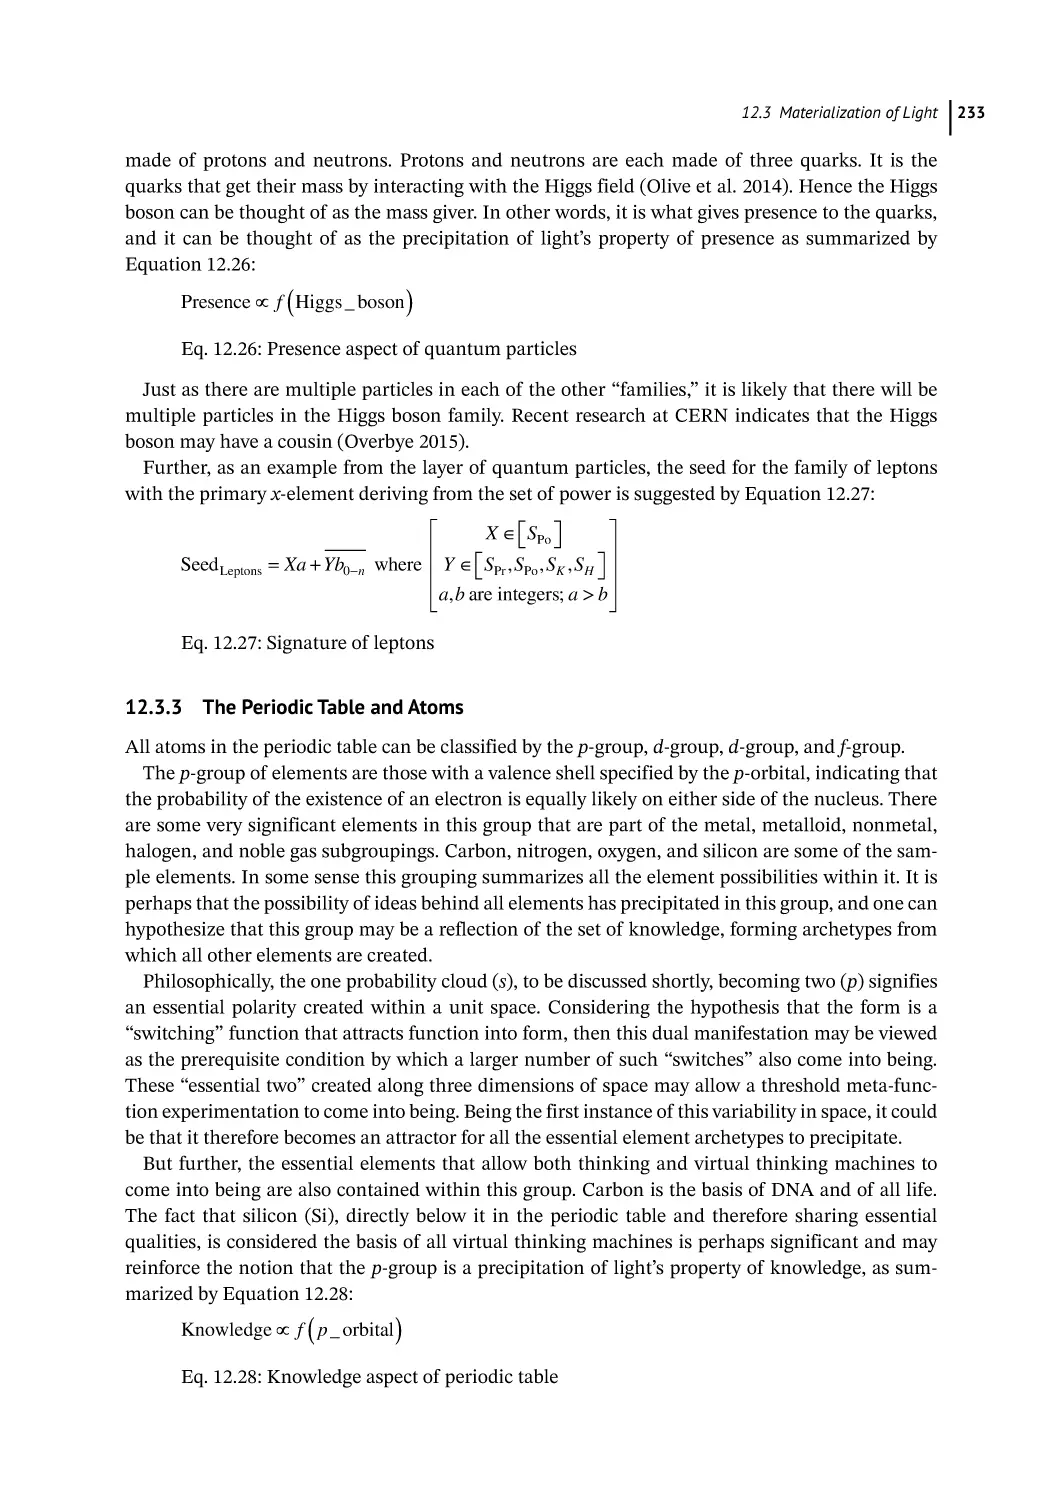
Quantum Particles 232
The Periodic Table and Atoms 233
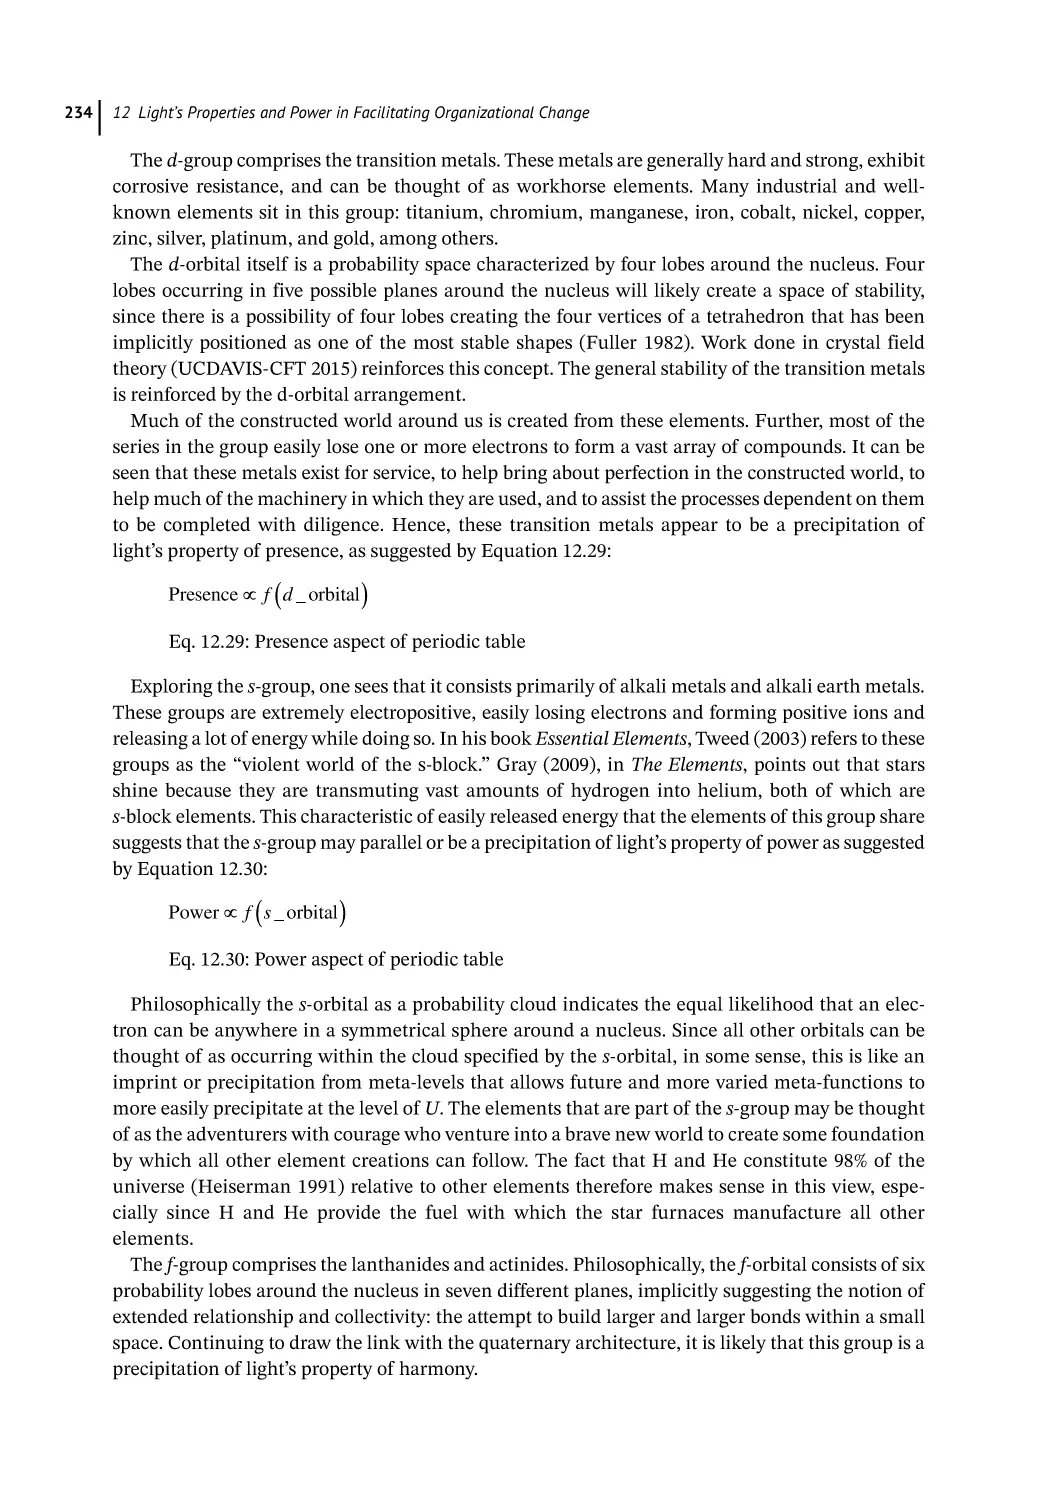
A Living Cell 235
Fundamental Capacities of Self 237
Leveraging Light to Bring About Organizational Change 239
Summary and Conclusion 243
References 243
12.1
12.2
12.3
12.3.1
12.3.2
12.3.3
12.3.4
12.3.5
12.4
12.5
Section 5
From the Field
245
Observations of Real-Time Control Room Simulation 247
Hugh David with an editor introduction by Holly A. H. Handley
13.1
Introduction 247
13.1.1 What Is a “Real-Time Control Room Simulator”? 247
13.1.2 What Is It Used For? 247
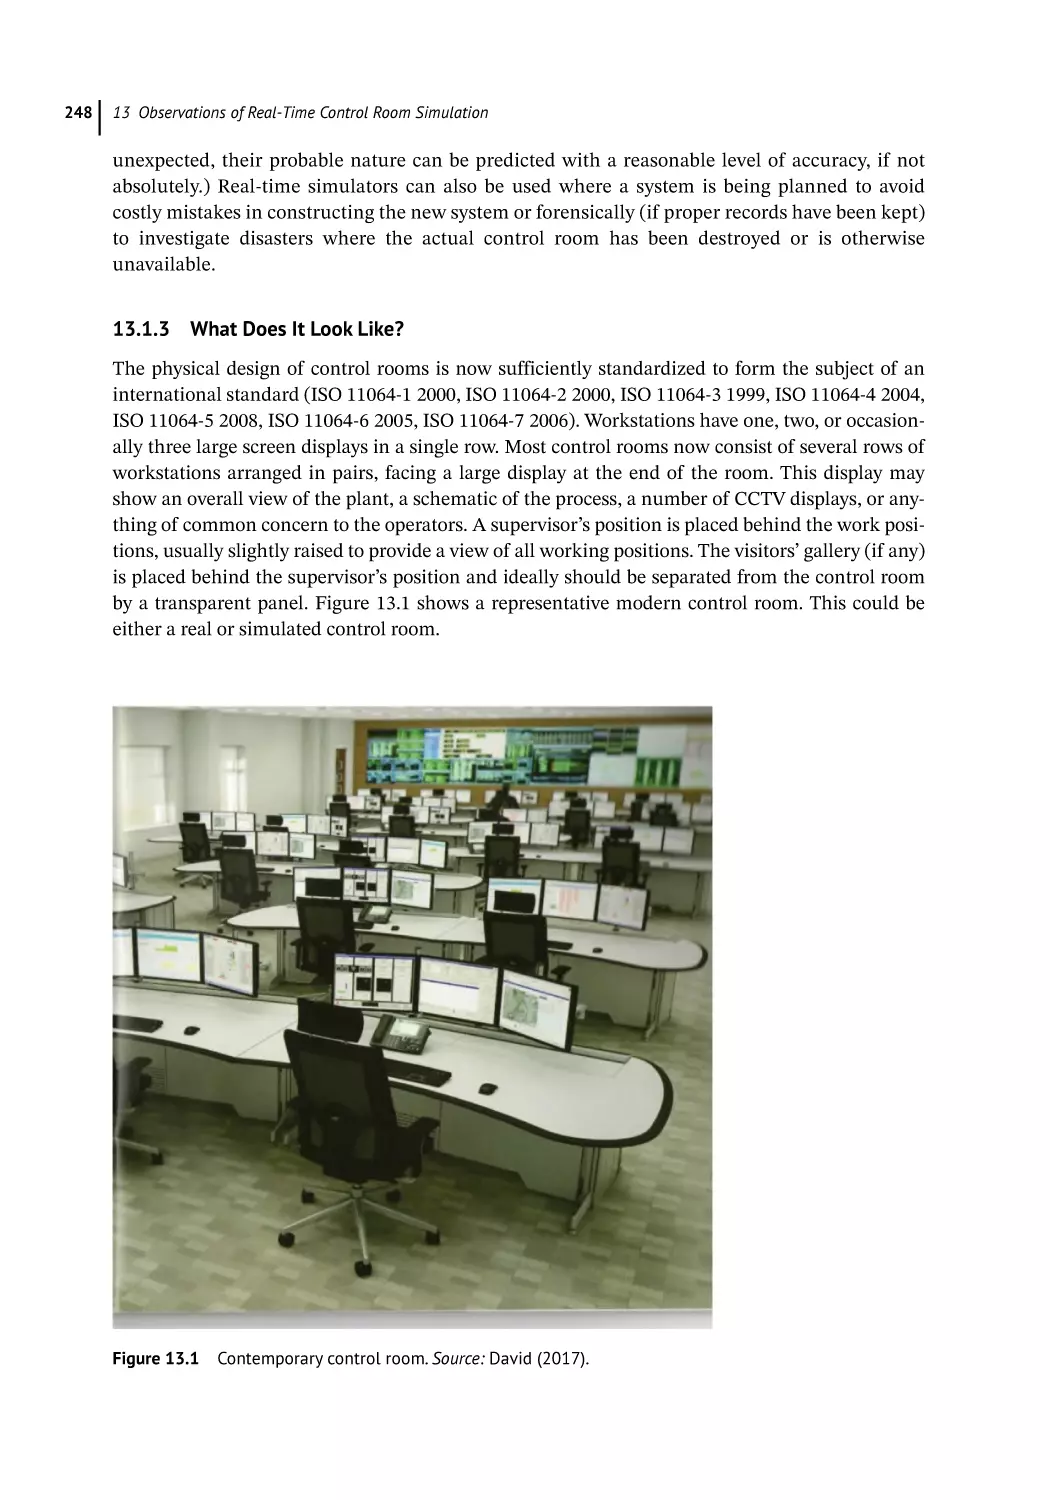
13.1.3 What Does It Look Like? 248
13.1.4 How Will They Develop? 249
13.2
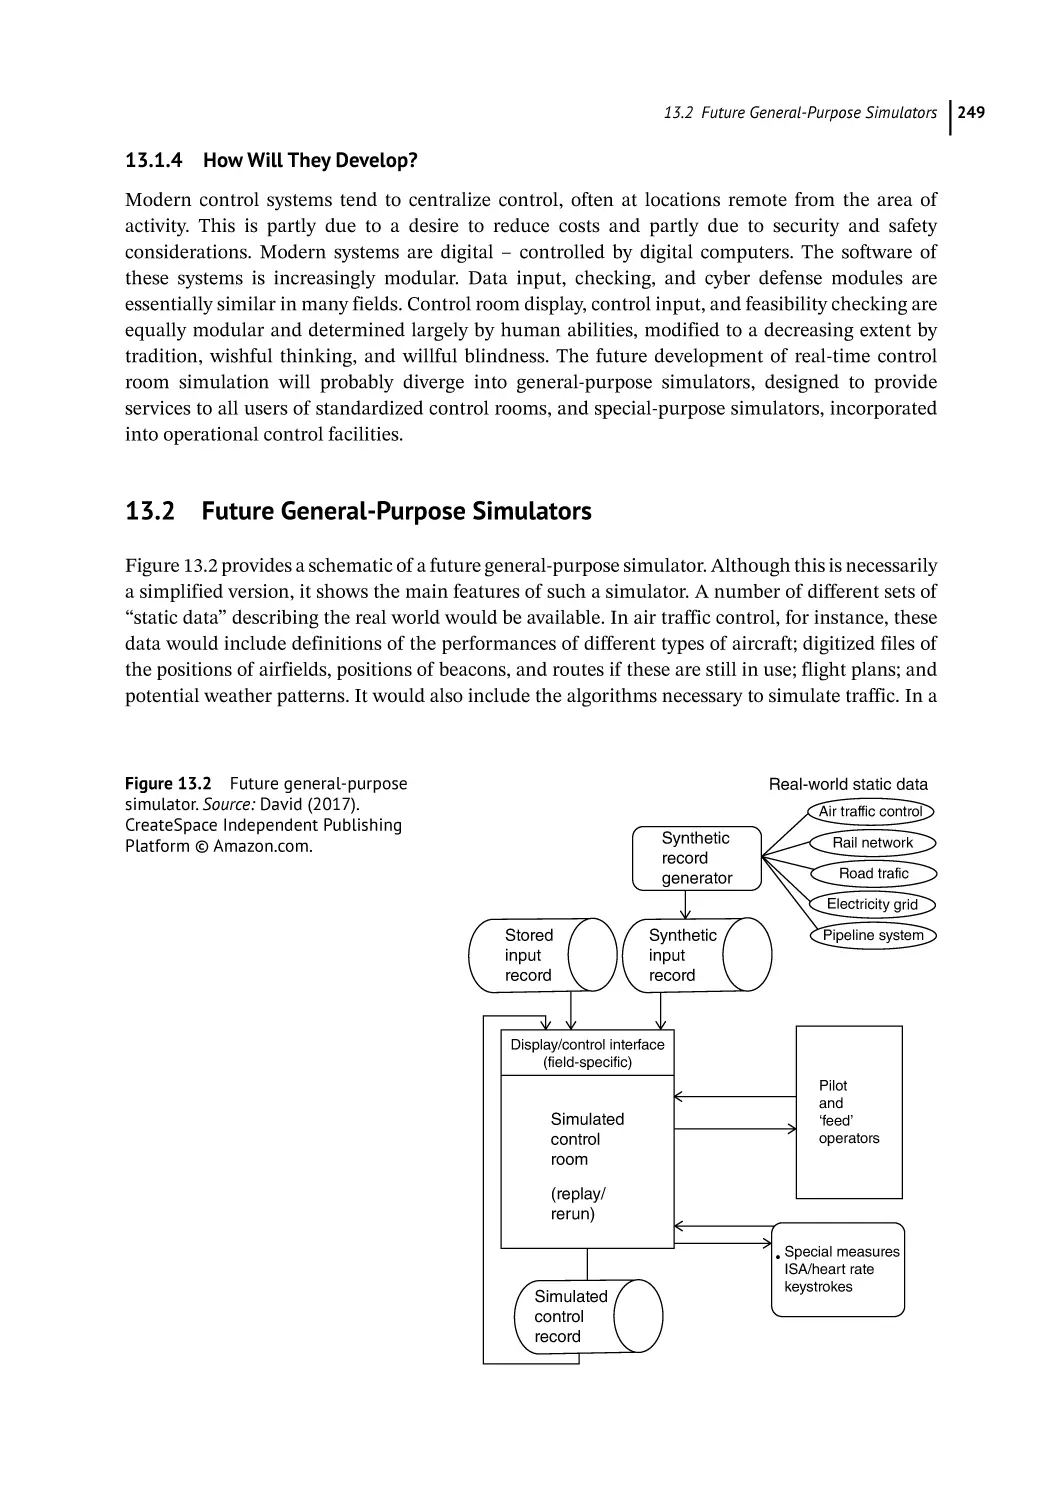
Future General-Purpose Simulators 249
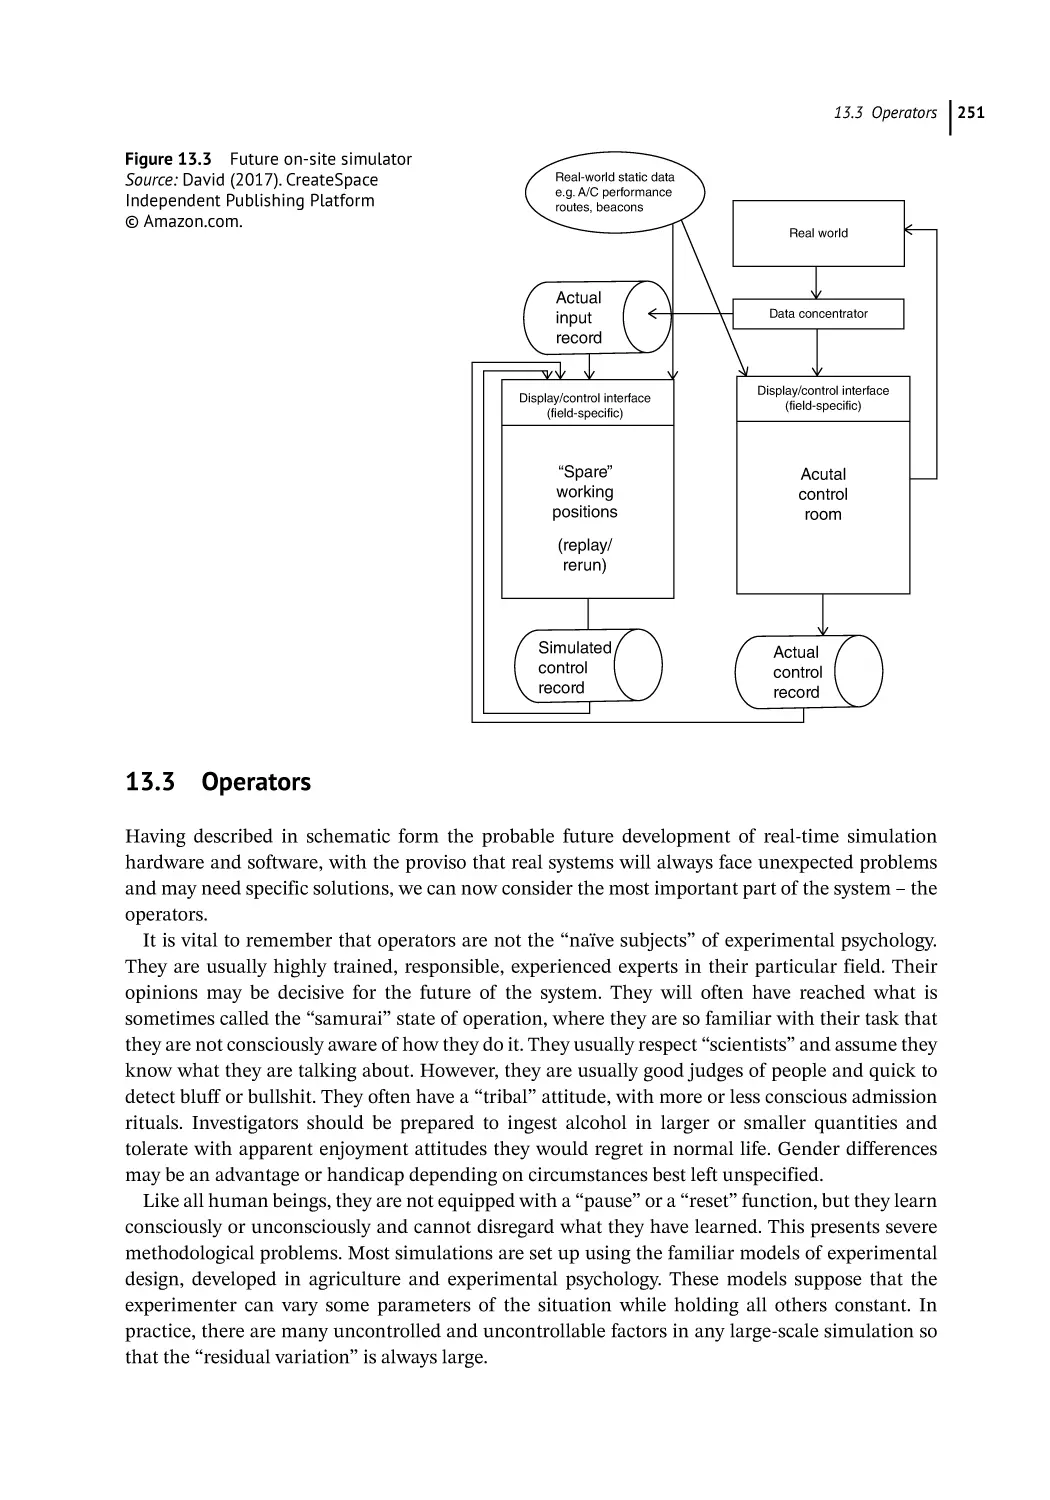
13.2.1 Future On-Site Simulators 250
13.3
Operators 251
13.4
Data 252
13.5
Measurement 252
13.5.1 Objective Measures 253
13.5.1.1 Recommended 253
13.5.1.2 Not Recommended 253
13
225
Contents
13.5.2
13.5.2.1
13.5.2.2
13.6
Subjective Measures 254
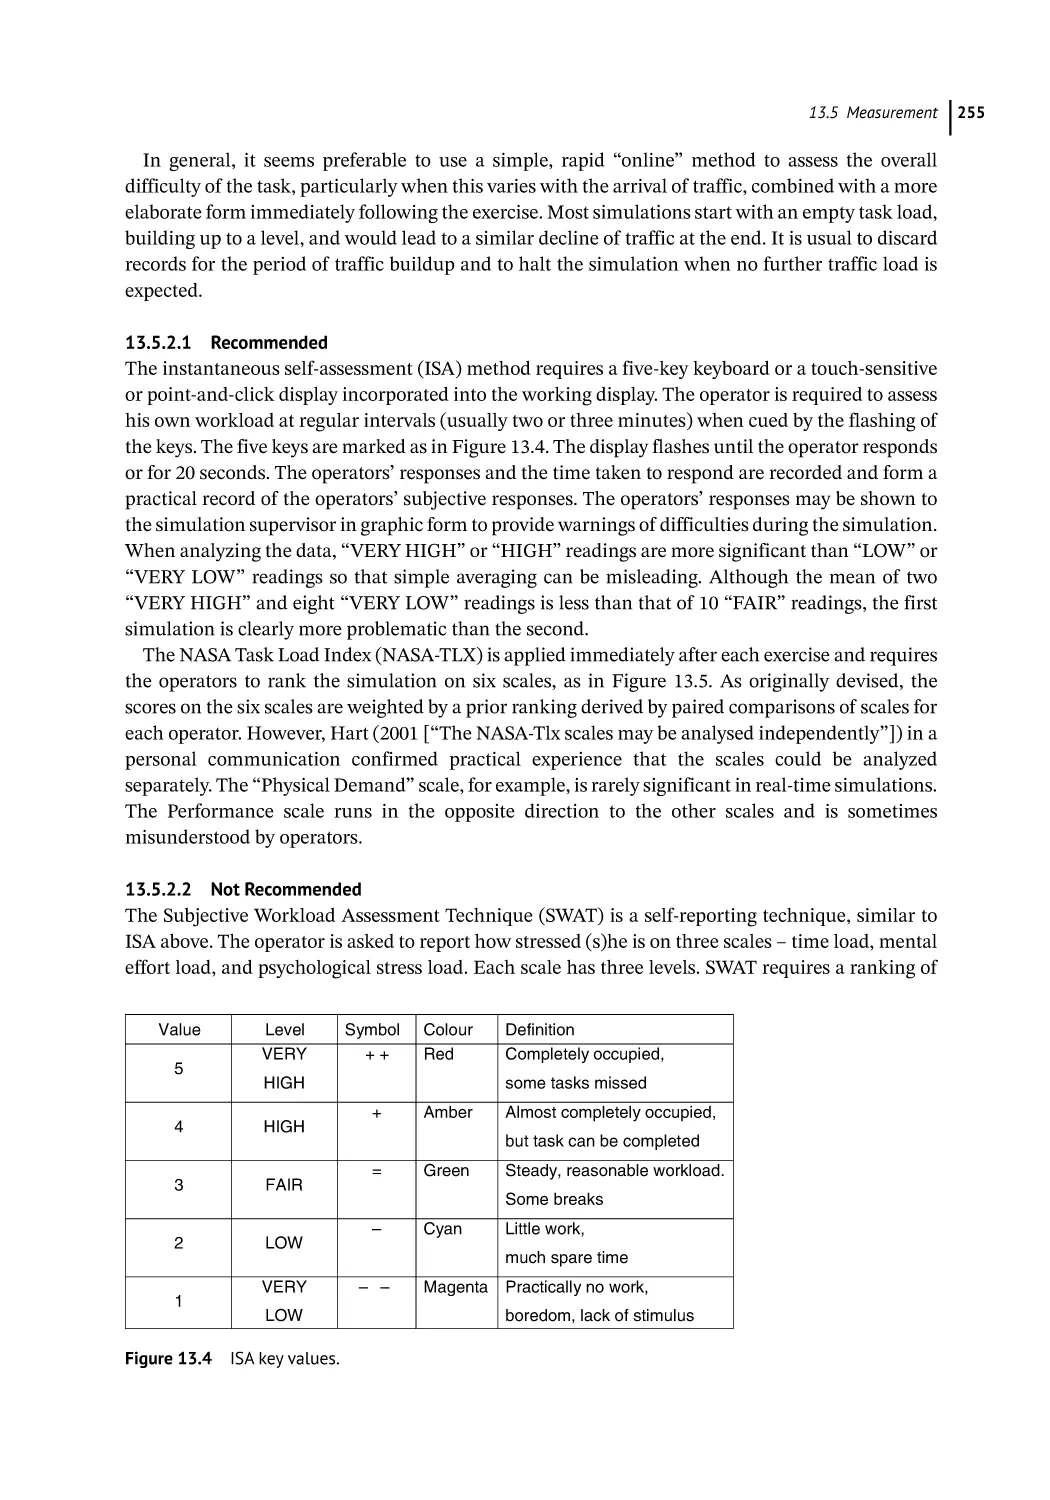
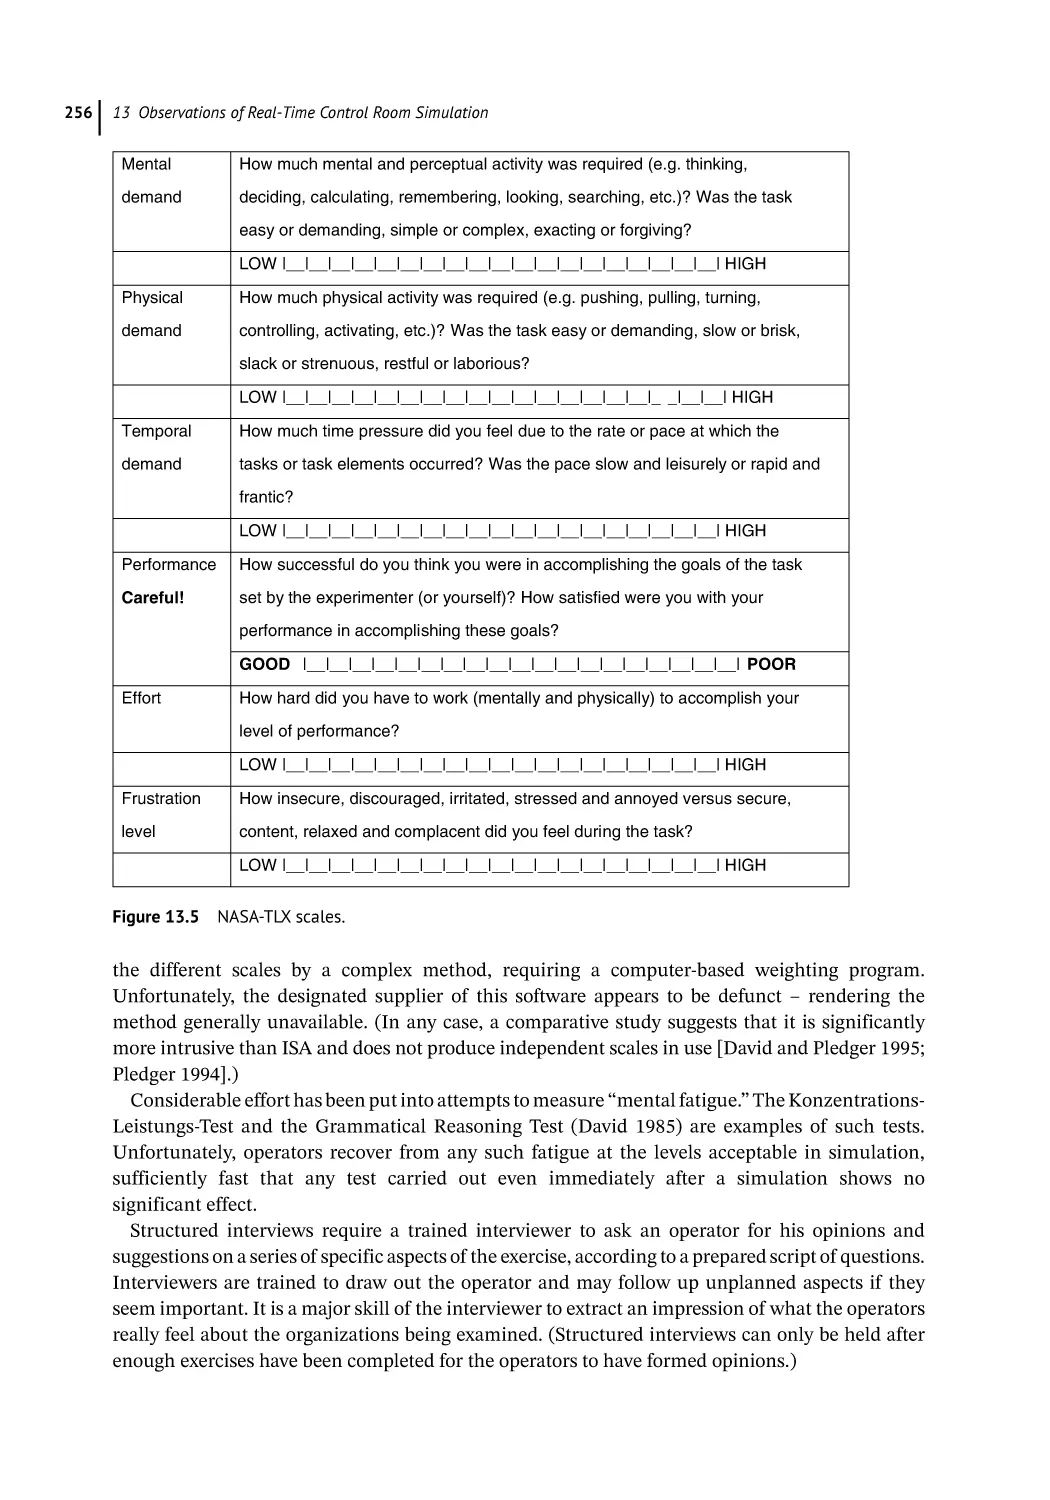
Recommended 255
Not Recommended 255
Conclusion 257
Disclaimer 257
References 257
14
A Research Agenda for Human Systems Engineering 259
Andreas Tolk
The State of Human Systems Engineering 259
Recommendations from the Chapter Contributions 260
Data and Visualization Challenges 260
Next-Generation Computing 261
Advanced Methods and Tools 262
Increased Integration of Social Components into System Artifacts 263
Uniting the Human Systems Engineering Stakeholders 263
Transdisciplinary Approach 264
Common Formalisms 265
Common Metrics 266
Summary 266
Disclaimer 267
References 267
14.1
14.2
14.2.1
14.2.2
14.2.3
14.2.4
14.3
14.3.1
14.3.2
14.3.3
14.4
Index 271
xiii
xv
E
ditor Biographies
Holly A. H. Handley is an associate professor in the Engineering Management and System
Engineering Department of Old Dominion University (ODU). Her research focuses on developing
models and methodologies to better represent the human component during the architecting and
design of sociotechnical systems. She received her PhD from George Mason University in 1999 and
is a licensed professional engineer. Her education includes a BS in Electrical Engineering from
Clarkson College (1984), a MS in Electrical Engineering from the University of California at
Berkeley (1987), and an MBA from the University of Hawaii (1995). Prior to joining ODU, Dr.
Handley worked as a design engineer for Raytheon Company (1984–1993) and as a senior engineer
for Pacific Science & Engineering Group (2002–2010). Dr. Handley is a member of the Institute of
Electrical and Electronic Engineers (IEEE) Senior Grade, the International Council on Systems
Engineering (INCOSE), and the Human Factors and Ergonomics Society. She is currently the chair
of the IEEE Systems Council Human Systems Integration Technical Committee and was recently
named an HFES Science Policy Fellow.
Andreas Tolk is a senior divisional staff member at The MITRE Corporation in Charlottesville,
VA, and adjunct full professor at Old Dominion University in Norfolk, VA. He holds a PhD and
MSc in Computer Science from the University of the Federal Armed Forces of Germany. His
research interests include computational and epistemological foundations and constraints of
model-based solutions in computational sciences and their application in support of model-based
systems engineering, including the integration of simulation methods and tools into the systems
engineering (SE) education and best practices. He published more than 250 peer-reviewed journal
articles, book chapters, and conference papers and edited 12 textbooks and compendia on SE and
modeling and simulation topics. He is a fellow of the Society for Modeling (SCS) and Simulation
and senior member of IEEE and the Association for Computing Machinery (ACM) and received
multiple awards, including professional distinguished contribution awards from SCS and ACM.
xvii
Contributors List
Hussein A. Abbass
School of Engineering and Information
Technology
University of New South Wales
Canberra, Canberra, ACT, Australia
A. Peter Campbell
SMART Infrastructure Facility
University of Wollongong
Wollongong, NSW
Australia
Alliya Anderson
Khalifa University of Science and Technology
Abu Dhabi, United Arab Emirates
Elizabeth Chang
University of New South Wales at
Australian Defence Force Academy
Canberra, ACT, Australia
Philip S. Barry
George Mason University
Fairfax, VA, USA
Marius Becherer
University of New South Wales at Australian
Defence Force Academy
Canberra, ACT, Australia
Jean Bogais
University of Sydney
Sydney, NSW, Australia
Amy E. Bolton
Office of Naval Research
Arlington, VA, USA
Guy André Boy
CentraleSupélec, Paris Saclay University
Gif-sur-Yvette, France; ESTIA Institute of
Technology, Bidart, France
Thien Bui-Nguyen
University of New South Wales at Australian
Defence Force Academy
Canberra, ACT, Australia
Hugh David
Chartered Institute of Ergonomics
and Human Factors
Birmingham, UK
Steve Doskey
The MITRE Corporation
McLean, VA, USA
Mahmoud Efatmaneshnik
Defence Systems Engineering at the
University of South Australia (UNISA)
Adelaide, SA, Australia
Samuel F. Feng
Khalifa University of Science and
Technology
Abu Dhabi, United Arab Emirates
Florian Gottwalt
University of New South Wales at
Australian Defence Force Academy
Canberra, ACT
Australia
xviii
Contributors List
Stuart Green
University of New South Wales at Australian
Defence Force Academy
Canberra, ACT, Australia
Claudine Habak
Emirates College for Advanced Education
Abu Dhabi, United Arab Emirates
Angus L. M. T. McLean
Collins Aerospace
Cedar Rapids, IA, USA
Michael Melkonian
Emirates College for Advanced Education
Abu Dhabi, United Arab Emirates
Holly A. H. Handley
Old Dominion University
Norfolk, VA, USA
Kelly J. Neville
The MITRE Corporation
Orlando, FL, USA
Fabrizio Interlandi
Etihad Aviation Training
Abu Dhabi, United Arab Emirates
Vladimir Parezanović
Khalifa University of Science and Technology
Abu Dhabi, United Arab Emirates
Victoria Jnitova
School of Engineering and Information
Technology, University of New South Wales at
Australian Defence Force Academy, Canberra,
ACT, Australia
Maria Natalia Russi-Vigoya
KBR, Houston, TX, USA
Keith F. Joiner
Capability Systems Center, School of
Engineering and Information Technology,
University of New South Wales at Australian
Defence Force Academy, Canberra, ACT,
Australia
Michael Joy
IDEMIA National Security Solutions
New York, NY, USA
Grace A. L. Kennedy
SMART Infrastructure Facility
University of Wollongong
Wollongong, NSW, Australia
George Salazar
Johnson Space Center, NASA,
Houston, TX, USA
Christian G. W. Schnedler
CISSP®, CSEP®, PMP®, and PSP®; IDEMIA
National Security Solutions, New York,
NY, USA
William R. Scott
SMART Infrastructure Facility
University of Wollongong, Wollongong
NSW, Australia
Sarah M. Sherwood
Naval Medical Research Unit Dayton
Wright-Patterson AFB, OH, USA
Nelson King
Khalifa University of Science and Technology
Abu Dhabi
United Arab Emirates
Farid Shirvani
SMART Infrastructure Facility, University
of Wollongong, Wollongong, NSW,
Australia
Pravir Malik
First Order Technologies, LLC
Berkeley, CA, USA
Andreas Tolk
The MITRE Corporation,
Charlottesville, VA, USA
Contributors List
Melissa M. Walwanis
Naval Air Warfare Center Training
Systems Division
Orlando, FL, USA
Kate J. Yaxley
School of Engineering and Information
Technology, University of New South Wales,
Canberra, Canberra, ACT, Australia
M. Lynn Woolsey
Emirates College for Advanced Education
Abu Dhabi
United Arab Emirates
Michael Zipperle
University of New South Wales at Australian
Defence Force Academy, Canberra, ACT,
Australia
xix
xxi
F
oreword
No one would question that we are today living in the age of connectivity. Global communications,
global commerce, and global pandemics epitomize current affairs.
From a system of systems perspective rarely do we ever design and employ a system in isolation.
Systems are developed and used in new and innovative ways as needs change, often working with
other systems in ways not considered when the systems themselves were conceived. Complex supply chains integral to the modern economy include connections and dependencies that go beyond
common understanding. With unknown billions of nodes in the Internet, connectivity between
systems and people is a bedrock of contemporary society.
People are connected to their workplace, retailers, and their friends and family electronically.
The majority of Americans possess “smart phones” that connect them into a growing network of
cyber–physical systems – the Internet of Things – where they are part of a complex collaborative
exchange with people and systems. People have moved beyond being “users” of systems to become
an integral part of systems of systems both in the small and large sense. People no longer simply
consume services of systems, but they and their actions are a core part of the dynamics of the
larger system of systems. Their actions can affect the systems of systems in ways often not well
understood, and changes in human behavior can have considerable ripple effects on large complex
societal capabilities.
All of this has profound implications for human systems engineering. While a premium continues to be placed on human-centered design focusing on the direct relationship between systems
and their users, human systems considerations have expanded in this age of connectivity putting
new demands on systems engineers as they factor human systems considerations into engineering
endeavors.
We as systems engineers are no longer just expected to ensure that our systems are usable by an
individual, but we are also expected to integrate users into complex distributed systems of systems
where the users are part of the systems of systems and their behavior is part of the larger system of
systems dynamics.
Systems engineers are no longer just expected to design systems, so they have value for the users
but increasingly are asked to build systems that also bring value to the system owners through
generation of data to support other aspects of the enterprise or to influence people’s economic,
political, or social behavior.
Particularly in safety critical situations, it is no longer enough for systems engineers to design
systems that enable people to operate systems to meet their immediate needs, but as these systems
are part of a larger dynamic environment, a growing need exists to provide sufficient situational
awareness to understand the impacts individual actions may have on other systems and people in
the larger systems of systems.
xxii
Forewor
Finally, as systems take on functions that had in the past been done by people, there is an
increased emphasis on developing approaches to human systems teaming, a challenge heightened
by the increased use of machine learning, where the balance between human and systems may
shift over time based on experience.
These changes make this book both timely and important. With the framework provided by
Handley in the opening chapter to the research agenda by Tolk at the close, the papers here explore
numerous dimensions of human systems engineering, providing a window on experiences today
and challenges for the future.
Judith Dahmann
MITRE Corporation Technical Fellow
INCOSE Fellow
Alexandria, Virginia
xxiii
Preface
The International Council on Systems Engineering (INCOSE) defines Systems Engineering (SE)
as an interdisciplinary approach and means to enable the realization of successful systems. SE
focuses on defining customer needs by documenting requirements and then proceeds with functional analysis, design synthesis, and system validation. Throughout this process the complete system life cycle is considered: operations, performance, test, manufacturing, cost and schedule,
training and support, and disposal.
SE promotes a team effort integrating various disciplines and specialty groups into a structured
development process that considers both the business and the technical needs of all customers
with the goal of providing a quality product that meets the users’ needs. It is therefore considered
a methodical, disciplined approach for the design, realization, technical management, operations,
and retirement of a system. In all these aspects, humans play a vital role. They define, use, maintain, and, as operators and decision makers, are part of the system. Since a system is only as strong
as its weakest component, human potentials, capabilities, constraints, and limitations are pivotal
for the successful engineering of systems.
The Human Systems Integration (HSI) Technical Committee (TC) of the IEEE Systems Council
was formed in order to increase awareness of the user during SE processes. It focuses on identifying and improving methods to integrate human concerns into the conceptualization and design of
systems. It encourages early understanding of human roles and responsibilities, along with limitations and constraints that may impact system design. This consideration of human concerns from
the system design perspective is termed human systems engineering (HSE). HSE describes the
engineering efforts conducted as part of the system design and analysis processes to evaluate the
appropriateness and feasibility of system functions and roles allocated to operators. The importance of this topic is apparent from notable design errors, i.e. the placement of the iPhone 4 antenna
resulting in poor performance when holding the phone, to design successes, for example, the Xbox
Kinect that allowed users to interact with the game system without a handheld interface.
One of the goals of the HSI TC is to improve communication between the HSI and SE communities to provide better integration of human and systems to expedite resolution of issues. The HSI
TC members promote this collaboration through conference presentations and workshops, as well
as cooperation with other societies through joint events. Our members serve as technical reviewers
and society liaisons to promote the role of human factors in engineering. This volume is a continuation of our technical committee outreach efforts.
This book was written for both systems engineers and HSI practitioners who are designing and
evaluating different types of sociotechnical systems across various domains. Many engineers have
heard of HSE but don’t understand its importance in system development. This book presents a
series of HSE applications on a range of topics, such as interface design, training requirements,
xxiv
Preface
personnel capabilities and limitations, and human task allocation. Each chapter represents a case
study of the application of HSE from different dimensions of sociotechnical systems. The examples are organized using a sociotechnical system framework to reference the applications across
multiple system types and domains. These case studies serve to illustrate the value of applying
HSE to the broader engineering community and provide real-world examples. The goal is to provide reference examples in a variety of domains and applications to educate engineers; the integration of the human user is listed as one of the enablers of SE in the Systems Engineering Body
of Knowledge (SEBoK).
As IEEE is primarily concerned with the engineering of electrical technologies, our goal is to
include the perspective of design engineers who may be removed from the end user and unaware
of potential concerns. The book chapters represent specific projects from the HSI TC members; the
result is a set of stories that show the value of HSE through the development of human interfaces,
improvement of human performance, effective use of human resources, and the design of safe and
usable systems. The examples cross traditional SE sectors and identify a diverse set of HSE practices. Our contributed book is a source of information for engineers on current HSE applications.
Holly A. H. Handley, PhD, PE and Andreas Tolk, PhD
1
Section 1
Sociotechnical System Types
3
1
Introduction to the Human Systems Engineering Framework
Holly A. H. Handley
Old Dominion University, Norfolk, VA, USA
1.1 Introduction
Many human-centered disciplines exist that focus on the integration of humans and systems.
These disciplines, such as human factors (HF), human systems integration (HSI), and human factors engineering (HFE), are often used interchangeable but have distinct meanings. This introductory chapter identifies these varied disciplines and then defines the domain of human systems
engineering (HSE). HSE implies that human has been “engineered” into the design, in contrast to
“integrating” the user into the system at later stages of design.
The use of HSE for increasing complex and varied sociotechnical systems requires a more
context-specific suite of tools and processes to address the combination of human and system components. More often a wider range of system stakeholders, including design and development
engineers, are becoming involved in, and are vested in, the success of both HSE- and HSI-related
efforts. To assist these efforts, a framework was developed based on the dimensions of sociotechnical system and domain types, with relationships to specific HSI and SE concerns. The development
of this framework and its dimensions is also described in the chapter.
Finally, the framework is used to organize a wide range of case studies across a variety of system
types and domains to provide examples of current work in the field. These case studies focus on
both the systems engineering (SE) applications and the HSE successes. Linking the cases to the
framework identifies the contextual variables, based on both sociotechnical system and domain
characteristics, and links them to specific human system concerns. Our goal with this volume is to
emphasize the role of systems engineers in the development of successful sociotechnical systems.
1.2 Human-Centered Disciplines
HF is a broad scientific and applied discipline. As a body of knowledge, HF is a collection of data
and principles about human characteristics, capabilities, and limitations. This knowledge base is
derived from empirical evidence from many fields and is used to help minimize the risk of systems
by incorporating the diversity of human characteristics (England 2017). Ergonomics is the
A Framework of Human Systems Engineering: Applications and Case Studies, First Edition.
Edited by Holly A. H. Handley and Andreas Tolk.
© 2021 The Institute of Electrical and Electronics Engineers, Inc. Published 2021 by John Wiley & Sons, Inc.
4
1 Introduction to the Human Systems Engineering Framework
scientific discipline concerned with the understanding of interactions among humans and other
elements of a system and the profession that applies theory, principles, data, and methods to design
in order to optimize human well-being and overall system performance (IEA 2018). The term
“human factors” is generally considered synonymous with the term “ergonomics.” HF engineers
or ergonomics practitioners apply the body of knowledge of HF to the design of systems to make
them compatible with the abilities and limitations of the human user.
HF has always employed a systems approach; however, in large complex systems, it was recognized that the role of the human must be considered from multiple perspectives (Smillie 2019).
HSI is the interdisciplinary technical process for integrating multiple human considerations into
SE practice (DOA 2015). Seven HSI areas of concerns have been identified – manpower, personnel,
training, HFE, health and safety, habitability, and survivability – all of which need to be addressed
in an interconnected approach. The emphasis of the HSI effort is on the trade-offs within and
across these domains in order to evaluate all options in terms of overall system performance, risk,
and personnel-related ownership cost (SAE6906 2019). HSI provides a comprehensive snapshot of
how human systems interaction has been addressed throughout the system development process
by evaluating each of these domains as the system design progresses through different stages. It
identifies what issues remain to be resolved, including their level of risk, and suggests potential
mitigations.
Human factors integration (HFI) is a systematic process for identifying, tracking, and resolving
human-related issues ensuring a balanced development of both technological and human aspects
of a system (Defence Standard 00-251 2015). HFI is the term used in the United Kingdom equivalent to HSI. Similar to HSI, HFI draws on the breadth of the HF disciplines and emphasizes the
need to facilitate HFI management activities of concern across seven similar domains: manpower, personnel, training, HFE, system safety, health hazard assessment, and social and organizational (England 2017). The methods and processes available for HFI can be broken down into
both technical activities and management activities; HFI has a well-defined process and can draw
on many methods, tools, standards, and data in order to prevent operational and development
risks (Bruseberg 2009).
1.3 Human Systems Engineering
The HSI discipline was established with the primary objective to enhance the success of the
Department of Defense (DoD) systems by placing humans on more equal footing with design elements such as hardware and software (SAE6906 2019). SE is an interdisciplinary field of engineering and engineering management that focuses on how to design and manage complex systems
over the system life cycle. While HSI is considered an enabler to SE practice, systems engineers
need to be actively engaged to continuously consider the human as part of the total system throughout the design and development stages. HSE is the application of human principles, models, and
techniques to system design with the goal of optimizing system performance by taking human
capabilities and limitations into consideration (DOD 1988). HSE approaches the human system
design from the perspective of the systems engineer and views the human component as a system
resource. Human-focused analyses that occur as part of the HSE evaluations determine the
required interactions between users and technology and are essential to insure efficient processes
and data exchange between the technology elements and the human users (Handley 2019a). In the
United Kingdom, human-centric systems engineering (HCSE) seeks better ways to address HF
within mainstream SE while building on and optimizing the coherence of existing best practice.
1.4 Development of the HSE Framewor
Similar to HSE, HCSE approaches HF from an SE viewpoint and aims to develop core SE practices
that help engineering organizations adopt the best HF processes for their needs (England 2017).
HSE applies what is known about the human to the design of systems. It focuses on the tasks
that need to be performed, the allocation of specific tasks to human roles, the interactions required
among the human operators, and the constraints imposed by human capabilities and limitations.
A key focus of HSE is on the determination of the human role strategy; this allocation determines
the implications for manning, training, and ultimately cost (ONR 1998). The human elements of
the system possess knowledge, skills, and abilities that must be accounted for in system design,
along with their physical characteristics and constraints, similar to other technical elements of the
system. The goal of HSE is to augment the system descriptions with human-centered models and
analysis; these purposeful models inform trade-off analyses between system design, program costs,
schedule, and overall performance (Handley 2019a). As part of the SE process, HSE incorporates
the human-related specifications into the system description to improve overall system performance through human performance analysis throughout the system design process.
1.4 Development of the HSE Framework
The HSE framework was developed for the SE community to provide a basis for categorizing and
understanding applications of HSE for different types of sociotechnical systems. It was developed
by cross-referencing and aligning different aspects of domains, system types, and design stages
with applicable HSE and HSI tools and methods. The goal was to categorize projects in such a way
that systems engineers and HSI practitioners could leverage tools, processes, and lessons learned
across projects (Handley 2019b).
The original framework was developed by a team of Army HSI practitioners and subject matter
experts (SMEs). The HSE framework was part of a larger project designed to mitigate human performance shortfalls and maximize system effectiveness by integrating well-defined HSE (and
where applicable HSI) processes and activities into the acquisition life cycle and to make these
analyses explicit to stakeholders to increase “buy-in” early in the design process (Taylor 2016). The
resulting ontology could be expanded as needed to provide a common framework to identify elements and relationships important to the application of HSE, including classifying different stakeholders, system types, acquisition timelines, and user needs. This would allow HSI practitioners,
systems engineers, and program managers to determine appropriate tools, methodologies, and
information. The overall goal was to provide an overall organizing structure for HSE processes and
products relevant to the SE effort that could be linked to a comprehensive repository of information and concurrent and past projects (Taylor 2016).
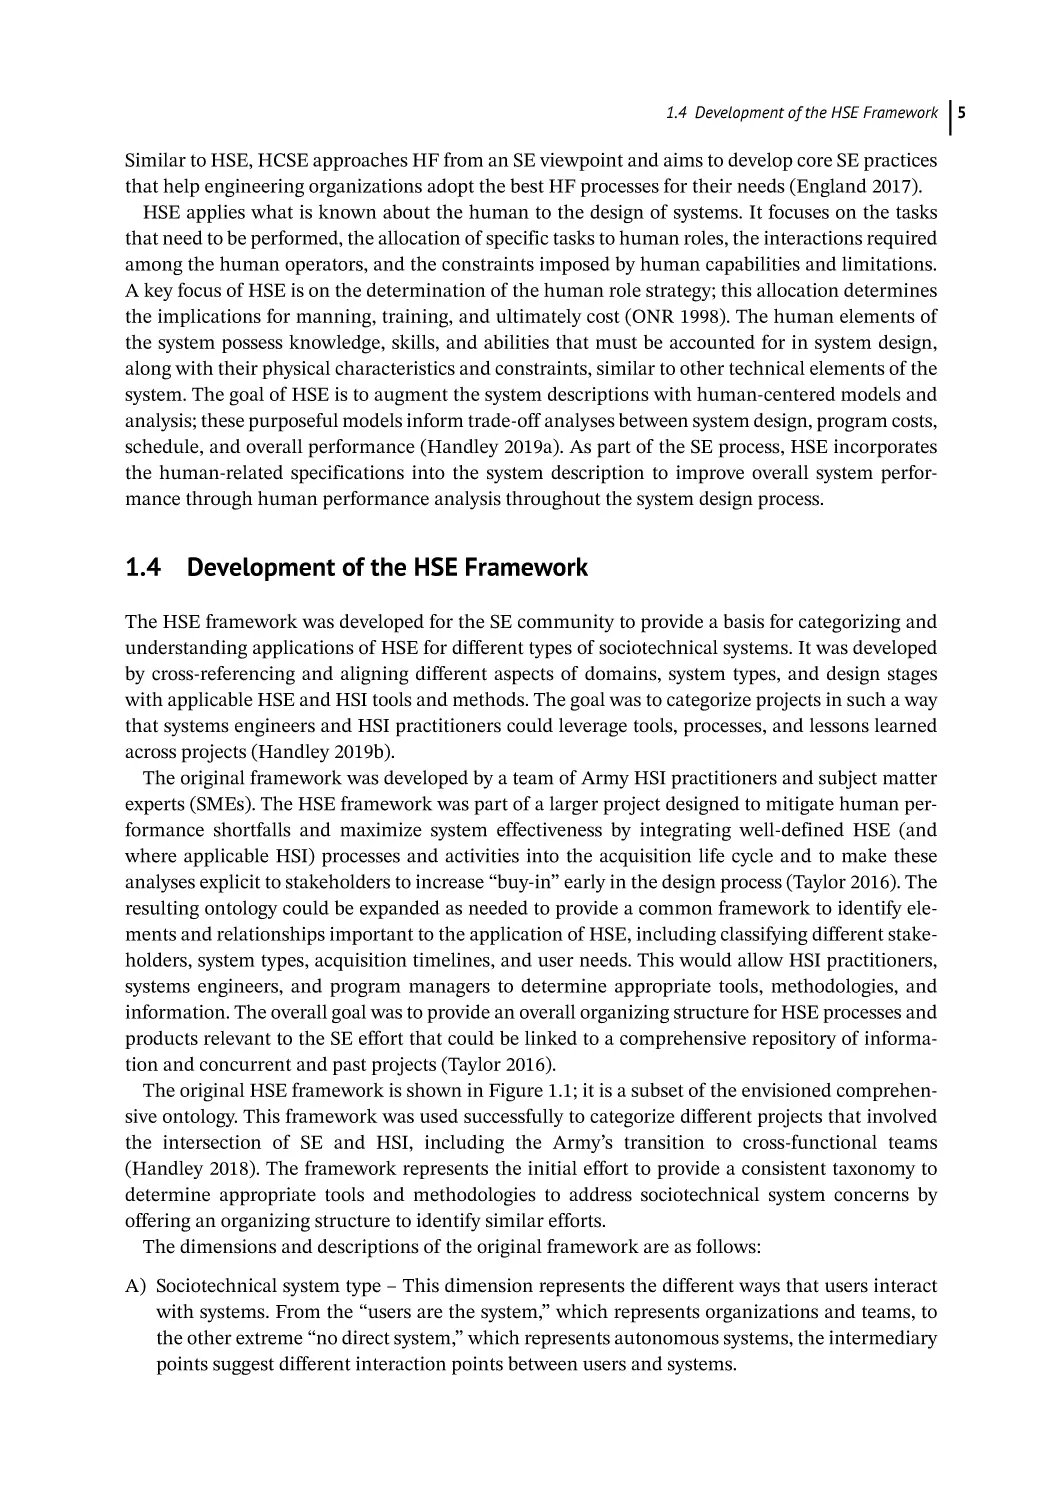
The original HSE framework is shown in Figure 1.1; it is a subset of the envisioned comprehensive ontology. This framework was used successfully to categorize different projects that involved
the intersection of SE and HSI, including the Army’s transition to cross-functional teams
(Handley 2018). The framework represents the initial effort to provide a consistent taxonomy to
determine appropriate tools and methodologies to address sociotechnical system concerns by
offering an organizing structure to identify similar efforts.
The dimensions and descriptions of the original framework are as follows:
A) Sociotechnical system type – This dimension represents the different ways that users interact
with systems. From the “users are the system,” which represents organizations and teams, to
the other extreme “no direct system,” which represents autonomous systems, the intermediary
points suggest different interaction points between users and systems.
5
6
1 Introduction to the Human Systems Engineering Framework
HSE framework
Sociotechnical
system type
Operational
domain
System design
phase
Tools and
methods
Users are
the system
Space
Concept
Design tools
User wears
the system
Healthcare
Preliminary
design
Simulation
tools
User
operates the
system
Aerospace
Detail design
Analysis
methods
User is
contained
by system
Military
Test and
evaluation
Processes
and
checklists
User remotely
controls the
system
Transportation
Deployment
Lessons
learned
There is no
direct user
Service sector
Retirement
References
Figure 1.1 HSE original framework.
B) Domains – This dimension represents the different contexts of use for systems, as different
domains can induce different considerations and restrictions. Domain-induced constraints
include environmental variables, operator state, organizational factors, and personnel characteristics. While the framework was developed specifically for military systems, it can be
extended and adapted across various domains such as space, transportation, and aerospace.
C) System design phases – The intent of the original framework was to capture the impact of
different tools and methods at different phases of system design, i.e. concept, preliminary
design, detailed design, test and evaluation, deployment, and retirement. This approach
emphasized the benefits of applying human-centered analyses early in the system
development.
D) Tools and methods – By mapping the three previous dimensions to available tools and methods, the intent of the framework was that it could be used to suggest tool sets for different
human-centered analyses depending on the system type, domain, and stage of system
development.
The framework acts as an index to identify essential information and previously validated findings. It can be used to suggest tools, methods, processes, data, standards, and expertise across similar systems and/or domains. The intent in developing the framework was that the dimensions
could be expanded or modified as needed to capture evolving elements in sociotechnical systems
and provide the metadata to classify the required HSE efforts.
1.5 HSE Application
1.5 HSE Applications
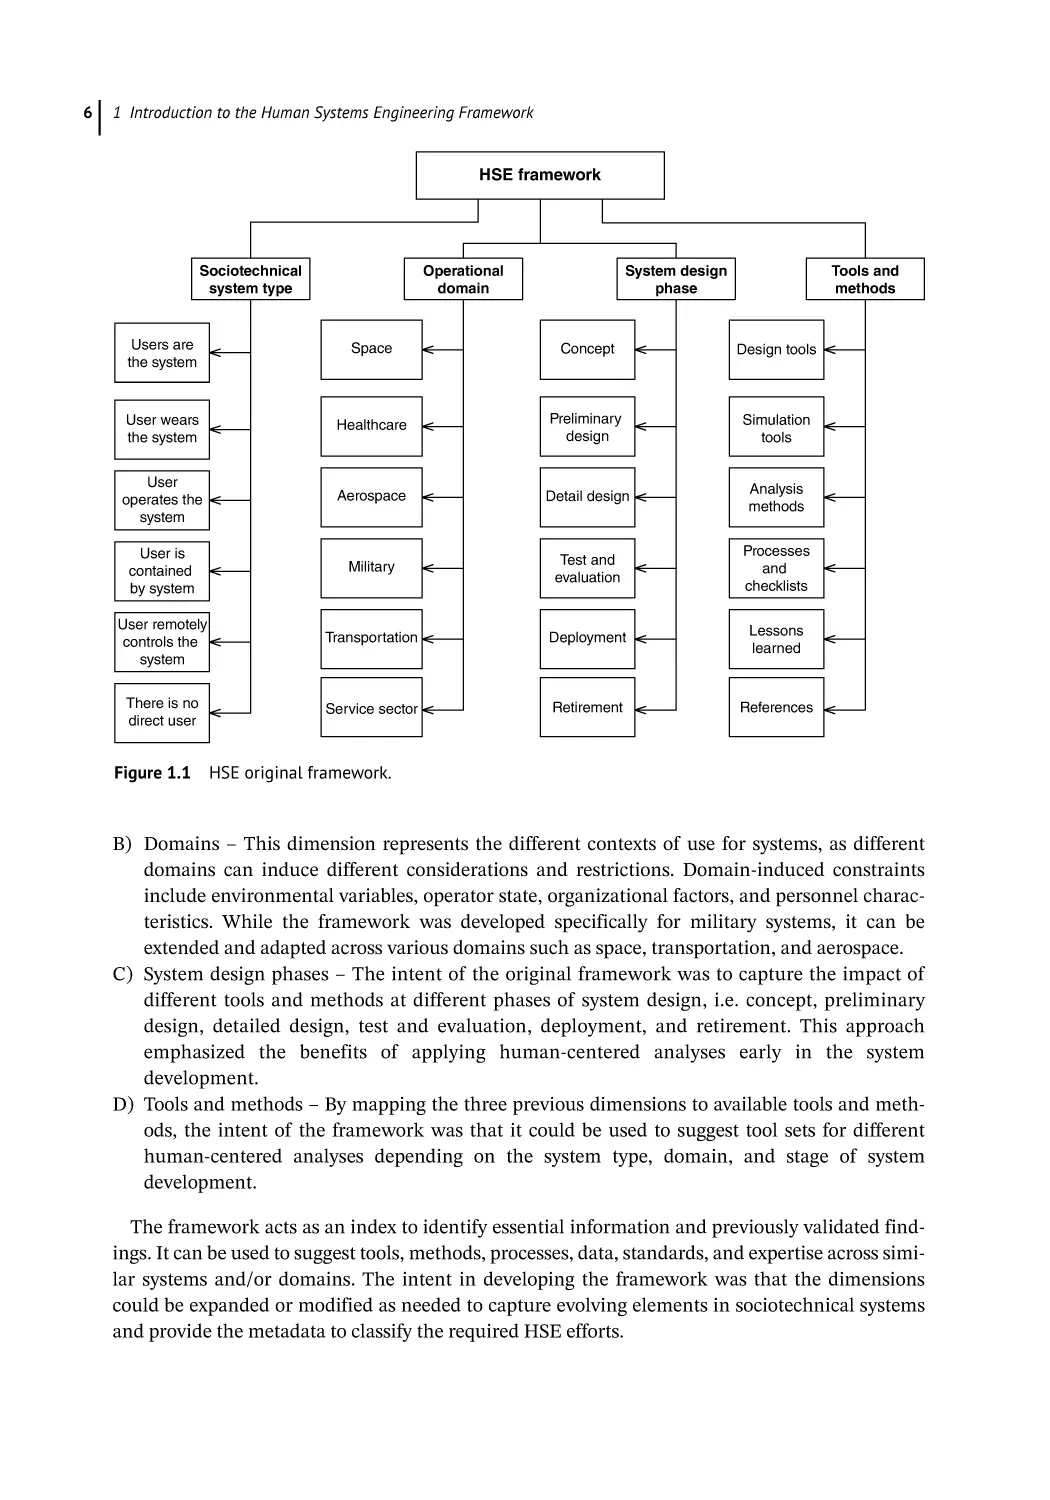
The original framework has been repurposed here to classify the case studies that compose this
volume. The original dimensions have been slightly modified to better provide an index to the
cases presented. This revised framework maintains the sociotechnical and domain dimensions;
however, the second two dimensions were modified slightly to represent both HSE and SE concerns as shown in Figure 1.2. Note that for simplicity, both the HSE and SE concerns dimensions
were limited to those that appear in the case studies. The modified framework presents a better
categorization of the cases provided and facilitates easy identification of cases that best match the
readers’ interest.
Additionally, the rendering of the framework has changed from the original tree structure to a
multi-axis plot. Each axis represents one of the framework dimensions, and the hash marks identify the subcategories. This visualization allows the cases to be “plotted” as an intersection of two
(or more) dimensions. While the original framework identified the categories for each domain, the
new rendering allows these categories to be used as a classification system, easily identifying the
key content of each case study. As the applications in this volume are quite varied, the framework
provides a logical way to organize and connect the case studies.
As shown in Figure 1.2, each chapter has been located on the framework to show its intersection
among the dimensions. The first section of the book contains applications that describe different
sociotechnical system types and their relationships with the human user. For example, Chapter 2
Domain-specific concerns
Transportation
Aerospace
Defense
CH 7
CH 4
Sociotechnical system type
No direct user
Space
CH 6
CH 3
CH 8
CH 10
Cost
Risk
Schedule
SE concerns
User is contained
by system
CH 11
User operates
system
CH 14
CH 2
User wears
system
CH 9
CH 12
Users are
system
Figure 1.2
CH 5
and
Training
skill sets
design
Interface
ics
aracterist
HSE concerns
Human ch rmance
o
rf
e
p
and
HSE framework as an index for the case studies.
7
8
1 Introduction to the Human Systems Engineering Framework
describes human considerations for domain awareness and focuses on human interface design.
The authors make a comprehensive analysis of situational awareness platforms for public safety
and stress the importance of traditional training methods coupled with cutting-edge technology.
Chapter 3 defines the sociotechnical factors shown to improve success using artificial intelligence
in a system development. With the integration of artificial intelligence into every system domain,
the authors employ a quantitative model of the sociotechnical space to identify the discrepancies
between not considering the stakeholder and high risks in complex agile projects. Chapter 4 considers both technology readiness and autotomy level to determine meaningful human control
based on trust in human-autonomy teaming. The authors use an example of herding sheep with
airborne drones to provide a validation scenario for the proposed concept and process.
The second section of the book provides a “deep dive” focus on specific domains. These chapters
provide examples of HSE impacts in specific contexts. For example, Chapter 5 looks at the
Australian heavy rail industry and the use of sociotechnical modeling. The authors describe how
integrating HF models with SE can be used to introduce new capabilities from an integrated organizational standpoint. Chapter 6 focuses on the engineering life cycle for space exploration systems
and the use of human-centered programs to mitigate risk. The authors describe how HSE can play
an important role throughout the SE phases to optimize total system performance. Chapter 7
reviews the evolution of cockpit design based on the impact of evolving technologies the aerospace
domain. The author describes how traditional human–computer interaction practices have given
way to user experience “UX” and interaction design methodologies.
The next section, section three, focuses on training and skill sets with cross-references to different domains. Chapter 8 discusses the impact of generational differences of users on the design of
training programs. The authors describe a socio-cognitive framework that combines the social
aspects, i.e. generational differences, with the cognitive aspects, such as neuropsychology, that
allows researchers to assess the effectiveness of gamified learning interventions. Chapter 9 investigates how training resiliency impacts readiness in the military domain. The authors identify basic
workforce resilience measures that can be used to guide SE efforts to migrate to new training systems. Finally, Chapter 10 describes research that evaluates the introduction of virtual and constructive technology into live air combat training systems. The authors use qualitative methods,
influenced by cognitive engineering and action research, to iteratively identify, assess, and mitigate
risks stemming from the change of training techniques.
Section four presents two chapters that focus on the intersection of the socio-component and
human characteristics. Chapter 11 presents an approach to build trustworthy blockchain applications for large complex enterprises based on HSE principles. The methodology develops a human
data integration and interaction methodology through establishing trust and security links. The
authors illustrate their approach through an operational risk management example. Chapter 12
offers a unique took at the impact of light technologies on organizational information. The author
describes the association between the implicit properties of light on the four organizational principles of presence, power, knowledge, and harmony.
Finally, section five offers some observations “from the field.” Chapter 13 provides a lighter note,
offering an unedited account of some observations and suggestions for real-time control room
future designs. Chapter 14 concludes the volume with a selection of research topics challenges
compiled into several categories. The chapter author hopes that members of the scholastic community will contribute to the improvement of this first topology of challenges as well as the framework for HSE itself.
Reference
1.6 Conclusion
While many systems engineers understand that the human operator and maintainer are part of
the system, they often lack the expertise or information needed to fully specify and incorporate
human capabilities into the system design (INCOSE 2011). Human systems engineers are actively
involved in the development of the system and ensure human-centered principles are incorporated into design decisions. HSE provides methods for integrating human considerations with and
across system elements to optimize human system performance and minimize total ownership costs.
The case studies in this volume provide insights into HSE efforts across different sociotechnical
system types across a variety of domains. Currently, most of the existing sociotechnical system case
studies are from the HSI perspective, i.e. working with users to improve the system usability and
interfaces in deployed systems. The focus of this book, however, is from the SE viewpoint, encouraging early consideration of the human in the system design. While some of the chapters will
overlap with the traditional HSI approaches, the goal of the book is to encourage systems engineers to think about the human component earlier in the system development. The chapters are
organized and indexed by the framework; the book can be read in order to follow the progression
across the framework, or Figure 1.2 can be used to identify specific chapters of interest to the
reader based on any one of the four dimensions. The goal of this book is to serve as a reference
volume for HSE.
R
eferences
Bruseberg, A. (2009). The Human View Handbook for MODAF (Pt. 2, Technical Description). Somerset,
UK: Human Factors Integration Defence Technology Centre.
DOA (2015). Soldier-Materiel Systems Human Systems Integration in the System Acquisition Process.
Department of the Army Regulation 602-2. Washington, DC: DOA.
DOD (1988). Manpower, Personnel, Training, and Safety (MPTS) in the Defense System Acquisition
Process. DoD Directive 5000.53. Washington, DC: DOD.
England, R. (2017). Human Factors for SE. INCOSE UK, Z12, Issue 1.0 (March 2017). http://
incoseonline.org.uk/Groups/Human_Centric_Systems_Engineering_WG/Main.aspx (accessed 16
March 2020).
Handley, H. (2018). CFT by System Type and HSI Domain, Deliverable to Human Systems Integration
(HSI) Tool Gap Analysis Report for Deputy Director. US Army Human Systems Integration.
Handley, H. (2019a). Human system engineering. In: The Human Viewpoint for System Architectures.
Springer.
Handley, H. (2019b). A socio-technical architecture. In: The Human Viewpoint for System Architectures.
Springer.
IEA (2018). What Is Ergonomics? International Ergonomics Association. https://iea.cc/what-isergonomics (accessed 16 March 2020).
INCOSE (2011). Systems Engineering Handbook: A Guide for System Life Cycle Processes and Activities,
3.2e (ed. H. Cecilia). San Diego, CA: INCOSE.
ONR (1998). Human Engineering Process. Technical Report, SC-21 S&T Manning Affordability
Initiative. Washington, DC: Office of Naval Research.
9
10
1 Introduction to the Human Systems Engineering Framework
SAE6906 (2019). Standard Practice for Human System Integration, SAW6906, 2019-02-08.
Smillie, R. (2019). Introduction to the human viewpoint. In: The Human Viewpoint for System
Architectures (ed. H. Handley). Springer.
Taylor, A. (2016). The Human Systems Integration Workbench. White Paper PJF-18-425. US Army
Materiel Command (AMC).
UK Defence Standardization (2015). Def Stan 00-251 Human Factors Integration for Defence Systems,
Public Comment Draft, Issue 1, Version 1.0 (September 2015).
11
2
Human Interface Considerations for Situational Awareness
Christian G. W. Schnedler1 and Michael Joy2
1
2
CISSP®, CSEP®, PMP®, and PSP®, IDEMIA National Security Solutions, New York, NY, USA
IDEMIA National Security Solutions, New York, NY, USA
2.1 Introduction
The field of situational awareness (SA) arguably embodies the most urgent demand for human
systems integration (HSI) as it encompasses the real-time application of (increasingly machineassisted) human decision making in all-too-often life and death circumstances. Birthed in the
maritime and military domains, SA concepts are now applied to fields as diverse as public safety
and first responders, facility and border security, autonomous vehicles, and digital marketing.
Common across these domains is the need to understand relevance within vast amounts of disparate data and present this information to human operators in an intuitive, timely, and conspicuous
manner. To achieve these objectives, SA systems must disambiguate the definition of “relevant” by
understanding the rules governing an operator’s potential range of actions and the specific context
of the operator receiving the information.
Emerging developments in the technology platforms of sensors, data, artificial intelligence (AI),
computer vision, and mobile devices are enabling advancements in the SA platforms that provide
real-time decision-making opportunities in both structured and unstructured space. These developments challenge the traditional ways that information has been collected, aggregated, collated,
analyzed, disseminated, and provide opportunities to empower operators and citizens to gain
greater awareness of their surroundings in order to make better informed and more meaningful
decisions. Inherent challenges with the volume, variety, velocity, and veracity of this information
demand novel approaches to HSI across multiple, concurrent operational theaters.
This chapter summarizes major considerations given to SA platforms and illustrates these
through their application to the public safety domain. The authors draw on their decades-long
experience designing and implementing SA systems in municipal and federal public safety organizations in regions as diverse as the United States, Middle East, and Africa. Due consideration is
This chapter contains the personal views of the authors based on their experience designing, implementing, and
operating a variety of mission-critical situational awareness platforms. The opinions contained herein do not reflect
the official position of the government agencies or private sector companies with which the authors served. The
reader should remember that while technology can provide significant advancements to public safety, officer safety,
and transparency, there is no substitute for systematic training and adhering to a culture of relentless improvement.
A Framework of Human Systems Engineering: Applications and Case Studies, First Edition.
Edited by Holly A. H. Handley and Andreas Tolk.
© 2021 The Institute of Electrical and Electronics Engineers, Inc. Published 2021 by John Wiley & Sons, Inc.
12
2 Human Interface Considerations for Situational Awareness
given to the growing concerns around privacy in Western nations and the apparent paradox around
the need to promote transparency within public safety organizations without empowering terrorists, criminals, and others’ intent on disrupting the lives and liberties of those engaged in democratic societies.
2.2 Situational Awareness: A Global Challenge
Situational awareness is a concept, a system, and a solution. There are well-established SA definitions and related organizations for the maritime domain, the space domain, and the Arctic. In her
seminal Designing for Situation Awareness (Endsley 2011), Dr. Mica Endsley summarizes SA as
“being aware of what is happening around you and understanding what that information means
to you now and in the future.” Elsewhere, Dr. Endsley has defined SA as “the perception of the
elements in the environment within a volume of time and space, the comprehension of their
meaning, and the projection of their status in the near future.”1 It is the internal mental model of
the dynamic environment, which when combined with more static system and procedural knowledge allows decision makers in these domains to function effectively.
In the wake of the 9/11 attacks, the New York Police Department (NYPD) led a public–private
partnership (PPP) effort to create what became the Domain Awareness System (DAS) to counter
future terrorist attempts and to improve public safety.2 This initial DAS effort by the NYPD provided a subsequent technology framework for the development of real-time SA solutions to address
a broad range of public and private use cases, from high value facility security and border management to conflict zone and environmental protection, to healthcare, to opioid crisis response, and to
the recovery of persons at risk from human traffickers. In each of these use cases, development was
led by industry in partnership with government.
The Chinese central government has led PPP development of its “Sharp Eyes” surveillance system.3 By intertwining digital commerce with public safety, China has created an unprecedented
surveillance apparatus with near limitless opportunities for machine learning and analytics to process, categorize, and contextualize information for human operators. This surveillance system
model now exported around the world as “Safe City” solutions challenges the Western notion of
privacy and human rights when employed against targeted population groups like the Muslim
Uighurs in western China.
In light of this range of applications, the definition of “situational awareness” remains somewhat ambiguous and nonpractical. For the purpose of this paper, SA refers back to the foundational definition espoused by Dr. Endsley and refers to the real-time presentation of pertinent
information to a human operator to inform subsequent action. The geographic domain is relevant
only in so much as its relevance to the human operator in question. Similarly, historic information
and trends are relevant only in as much as they apply to the real-time context of the operator.
Multiple operators may be involved in a single event, and the SA platform must consider the perspective and context of each in order to achieve its intended purpose.
1 https://www.researchgate.net/publication/285745823_A_model_of_inter_and_intra_team_situation_awareness_
Implications_for_design_training_and_measurement_New_trends_in_cooperative_activities_Understanding_
system_dynamics_in_complex_environments.
2 https://www1.nyc.gov/site/nypd/about/about-nypd/equipment-tech/technology.page.
3 https://asia.nikkei.com/Business/China-tech/China-s-sharp-eyes-offer-chance-to-take-surveillanceindustry-global.
2.3 Putting Situational Awareness in Context: First Responder
2.3 Putting Situational Awareness in Context: First Responders
Although much literature has been written on SA concepts in the aerospace, military, and maritime domains, the proliferation of Internet of Things (IoT) devices and advancements in machine
vision and AI have enabled the democratization of SA capabilities. Under the banner of “smart
cities,” municipalities have begun implementing static surveillance capabilities and outfitting first
responders with mobile and body-worn devices that act as both a sensor and a means of improving
SA. By some estimates, the market for surveillance equipment will reach $77B by 2023.4 This
explosion in sensors has led to increased public safety expectations, as well as greater scrutiny over
the actions taken by first responders.
To meet these expectations, law enforcement agencies in particular employ a variety of surveillance tools to achieve awareness of events occurring in the geographic domain under their authority. These tools include closed-circuit television (CCTV) cameras; license plate readers; and
chemical, biological, radiation, nuclear, and explosive (CBRNE) sensors. Historically compartmented information warehouses containing criminal histories, emergency calls, use of force logs,
and similar are increasingly being fused and made available for real-time search. Moreover, noncriminal information ranging from social media and other open-source datasets to credit histories
and other quasi-public records are increasingly accessible to provide context to an event. The use
of such noncriminal records to assist law enforcement is often vigorously contested and will be
addressed later in this chapter, but regardless of a particular agency’s implementation, today’s
challenge remains a big data problem. In other words, identifying the particular set of information
relevant to an event is paramount; with few exceptions, the requisite data points to improve an
officer’s SA are available.
Complicating the analysis and dissemination of pertinent information to SA are the layers of
information security policies applied to the first responder community. For example, law enforcement agencies in the United States must adhere to the Criminal Justice Information Standards
established by the Federal Bureau of Investigation.5 These standards mandate, among other
requirements, that anyone accessing law enforcement data first authenticate themselves as a qualified operator and further establish a need to know the information requested. These regulations
are often further restricted by agency-specific policies, such as preventing the disclosure of information pertaining to active cases to anyone not specifically associated with the case in question.
Such policies and regulations were generally enacted and expanded in the wake of inadvertent (or
deliberate) misuse of information over many decades. Few contemplated the ramifications on nonhuman actors, such as the potential of AI, and fewer still considered how persistent access to such
information may contribute to real-time SA platforms charged with improving the safety and effectiveness of modern-day first responders.
It is in this context that the demands on first responders to employ SA platforms for decision
support are being placed. With this comes a myriad of HSI concerns, ranging from the physical real
estate available to first responders to interact with SA platforms to the means by which this complex set of information can be presented. Underpinning all considerations is the paramount importance of officer safety and the need to understand the operator’s context in order to establish
information relevance and right to know.
4 https://www.prnewswire.com/news-releases/the-global-video-surveillance-market-is-expected-to-grow-over77-21-billion-by-2023-808999313.html.
5 https://www.fbi.gov/file-repository/cjis-security-policy-v5_6_20170605.pdf.
13
14
2 Human Interface Considerations for Situational Awareness
2.4 Deep Dive on Human Interface Considerations
With the advent of IoT sensors and significant increases in capabilities for both connectivity and
storage, big data has become the prime dependency for many new technologies and solutions,
especially SA. In public safety, and more particularly with first responders, the sheer breadth of
information available is overwhelming. Designing human system interfaces that can retrieve,
parse, and organize relevant data based on real-time activities and events, as well as present it in a
meaningful, concise, and unintrusive (yet attentive) way, is a defining challenge.
At its core, public safety focused SA is predicated on alerting to noteworthy events in real time
while increasing the knowledge and expanding the experience of responding personnel by drawing upon all pertinent historical, concurrent, and predictive information available to the agency.
With a primary focus on officer safety, users of this system only have a few minutes upon being
notified of the event to ingest the relevant data, make a determination on tactics, and adjust their
response accordingly. This is all while they are also driving, communicating with dispatch, and
coordinating with colleagues and supervisors. As such, the intelligence generated and presented
must offer substantive benefits as rapidly and concisely as possible. The immediate goal of all first
responders is to protect life, and much of the data available to police departments can support key
areas such as subject identification, threat assessment, and response tactics, all of which greatly
enhance SA and help to keep everyone safe.
Machine-assisted data retrieval, organization, and presentation not only improve the safety of all
those involved, but it supports officer decision making by informing them of supplementary details
and historical activities and actions. These characteristics are unique to every call for service, and
a better understanding of them within the context of the current interaction is invaluable. However,
the same mechanisms that collate the appropriate information must also exclude the rest.
Considering the highly mobile nature of first responders and the inherent limitations of portable
hardware in a public safety setting, it is not practical to expose all associated data, even if it could
potentially be relevant in some ancillary contexts. Conversely, ignoring that information has its
own tangible detriments, most notably, indicating an incorrect narrative to responding personnel
that causes them to make poor judgments that have lasting impacts.
Computers have a unique ability to project truth, regardless of the quality and completeness of
the underlying data. This “machine heuristic”6 easily combines with algorithmic bias, which can
corrupt the decision-making process for first responders with little apparency. As an example,
domestic violence incidents are some of the most volatile and dangerous in policing and one in
which historical context can greatly sharpen the officer’s picture of the situation. Here, the prioritization of arrest history of the involved individuals would seem prudent, since it can assist with
the identification of the primary aggressor. However, if that lessens the visibility, or excludes completely, non-arrest situations where the incident was resolved without enforcement action, it can
skew the opinion of the officer prior to the interaction. In a public safety context, there is no single
right answer. Extreme care must be given to ensure that relevant data sources are identified
through a careful review by experienced personnel, that the presentation and prioritization is tailored to the specific situation, and that the assumptions exhibited are revisited frequently as part
of a never ending cycle of improvement.
6 https://doi.org/10.1145/3290605.3300768.
2.5 Putting Human Interface Considerations in Context: Safe Citie
2.5 Putting Human Interface Considerations in Context:
Safe Cities
Public safety is a team effort. First responders do not work in a silo, but rather, they communicate
regularly with dispatch, supervisors, operation centers, and a multitude of others. Additionally,
support organizations may receive nonemergency tasks and follow-ups related to the work of those
responding personnel. While the first responder in the field, that same data being leveraged for
officer safety and rapid decision making is being reorganized and expanded to support the medium
and long-term goals of the agency. Specifically, frontline supervisors will monitor the duration and
amount of resources allocated to ensure continued coverage for this and other potential incidents;
commanders will want to immediately recognize and respond to trends; operation centers will
coordinate the response of supplemental agencies when required. All of these moving parts will
leverage the same pool of data in dramatically different ways. In addition, many of these partners
will have a broader picture of an incident, as they have the time and space to ingest more information and make more meaningful connections among the disparate sources. As such, human interfaces built around public safety data must support staff in many positions and at all levels of an
organization.
All of the dependencies on data mean that there are real and significant impacts to public safety
when that information is wrong. Historically, government has been very good about ensuring there
is documentation of incidents, actions, and outcomes; however, the quality of that documentation
varies wildly. Data can be incomplete, poorly structured, badly transcribed, or any combination
thereof. Any of these deficiencies will inherently flow down to SA and data democratization platforms, where their inaccuracies will distract and delay the efforts of public safety professionals at
best or compromise them completely at worst. Separately, with the explosion of IoT sensor platforms, such as gunfire detection, license plate recognition, video analytics, etc., the accuracy and
pertinence of real-time alerts are just as important. For example, acoustic gunfire detection draws
attention to shootings faster than any witness phone call. However, if those alerts are frequently
inaccurate, the data itself becomes meaningless. False alarms become background noise, and the
system is ignored. Worse, responding personnel become distrusting of the data, increasing the risk
to their personal safety through complacency. Sensor limitations and bad data will likely slow the
advancement of automation and enforce human independence for the foreseeable future.
While legacy data may contain inaccuracies and some sensors themselves may have a high false
positive rate, human system interfaces are increasingly becoming smarter gatekeepers. The failings of the underlying technology and information are being counterbalanced through sheer volume. Individual data points may be important within the context of a single event, but it is the
aggregation of these elements that build complex trend and pattern of life analyses. Here, individual errors are drowned out, and modern visualization solutions present this intelligence in a
human-readable and actionable format. What started as a method to present real-time information
to a user in order to address a specific incident has grown into an endless parade of data that can
be stored indefinitely.
This boundless repository of information brings with it a host of security, policy, and legal concerns. Law enforcement is increasingly becoming augmented through technology, which often
evolves faster than the necessary companion legislative changes, privacy guidelines, and security
enhancements. Beyond the straightforward need to minimize the exposure of this data outside of
its intended distribution, there must be controls within the organization as well, maintaining the
15
16
2 Human Interface Considerations for Situational Awareness
concept of “need to know.” Access itself should be routinely audited, reviewed, and revised, with
secure mechanisms for data distribution and sharing. Just as important as the technical solutions,
policy and procedures set a sturdy foundation for an organization’s data security. In addition, having a written policy that has been properly vetted, reviewed, and socialized outside of the organization will express to the general public that the security of what is inherently their data is taken
seriously. It also provides a roadmap for how to handle data breaches and inadvertent disclosures.
Notably, with such large datasets, bad actors no longer require personally identifiable information
(PII), like names or social security numbers. Rather, they can cause significant harm through
anonymized sources with techniques such as data reidentification. As such, all data can be vulnerable to targeting and must be treated with as much care as traditional PII.
2.6 Human Interface Considerations for Privacy-Aware SA
The ability for HSI systems to understand the complex data used to achieve SA, as well as the context of the human operator consuming the information, will reach its apex in the form of minimum viable data presentation. Demands for better protection of PII have evolved over the past
decade to include right to PII data ownership and demands on disclosure of PII use and storage.
These rights have been codified through legislation including the European Union’s General Data
Protection Regulation (GDPR),7 California Consumer Privacy Act (CCPA),8 and Illinois Biometric
Information Privacy Act (BIPA).9 Though most legislation currently allows for lawful government
use, the expectation is that government will adhere to the underlying principles in the performance of its duty.
To illustrate the impact such privacy-aware requirements have on SA platforms, consider the
example of electronic identification (eID) mechanisms such as the mobile driver’s license (mDL).
Visitors to secure facilities, individuals involved in routine traffic stops, and even patrons to bars
have historically been required to present a government-issued document verifying their name, date
of birth, and other PII. Such credentials often violate the principle of minimum viable data as only
portions of this information or, more precisely, derivatives of this information are needed to affect
the requisite vetting. The root question of the individual accessing the secure facility is whether he
or she is authorized to access the site, just as the bouncer is fundamentally concerned with whether
or not the individual is of legal age to enter the bar. All other PII contained on the credential is incidental to this core concern and represents an elevated risk to the SA operator – providing them the
opportunity to act on information irrelevant to the interaction – and to the information provider by
disclosing more PII than necessary to complete the transaction. To mitigate these risks, the Secure
Technology Alliance has advocated the widespread adoption of eIDs such as mDLs.10 Such solutions provide the operator the pertinent derivative information – whether or not the person is of
legal age – without disclosing the underlying PII (name, date of birth, address, etc.). Such solutions
not only have the potential to improve the efficiency of SA operations but also mitigate the risk of
excess PII disclosure.
Another manifestation of the requirement of SA platforms to incorporate privacy-aware concepts in their design and operation comes in the form of demands for greater transparency and
7 https://eur-lex.europa.eu/eli/reg/2016/679/oj.
8 https://leginfo.legislature.ca.gov/faces/billTextClient.xhtml?bill_id=201720180AB375.
9 http://www.ilga.gov/legislation/ilcs/ilcs3.asp?ActID=3004&ChapterID=57.
10 https://www.securetechalliance.org/mobile-drivers-license-initiative.
Reference
auditability. Regulators and privacy advocates are increasingly interested in the means by which
public safety organizations achieve SA, concerning themselves not only with the underlying data
employed but also with the tools used to analyze and correlate aggregate data sources. Interest in
this tooling is only increasing with the proliferation of AI as the determination of relevance and
scoring of risk shifts from human operators to machines. The debate around facial recognition
epitomizes this concern, as highlighted by Georgetown Law’s “The Perpetual Lineup” report.11
The impact such privacy-aware demands will have on SA platforms is manifold. As minimal
viable data presentation capabilities progress, the data available to SA platforms will shift from
primary source data to derivative data, and the need for contextualization and inference will
increase. To overcome these and other challenges, SA platforms will increasingly incorporate AI to
interpret information and ascertain relevance to the operator. As AI becomes increasingly pervasive, SA platforms must develop the capacity to explain nonhuman decision-making processes and
accommodate transparency and independent auditing.
The impact these changes will have on HSI concerns is equally complex. On one hand, the ability to develop and interpret derivative information will improve the efficiency of man–machine
interfaces by focusing operators on the most pertinent information available. On the other, the use
of AI and reliance on derivative datasets will increase the demand on auditors tasked with ensuring the SA platform is making reasoned decisions, without bias, and that traceability is maintained
to primary data where appropriate.
Reference
Endsley, M.R. (2011). Designing for Situation Awareness. Boca Raton, FL: CRC Press, Inc.
11 www.perpetuallineup.org.
17
19
3
Utilizing Artificial Intelligence to Make Systems
Engineering More Human*
Philip S. Barry1 and Steve Doskey2
1
2
George Mason University, Fairfax, VA, USA
The MITRE Corporation, McLean, VA, USA
3.1 Introduction
Systems engineering (SE) can be broken into several major phases since its inception during World
War II. These major phases can be binned into four epochs, where each ensuing epoch builds on
the knowledge and insights of the previous epochs as shown in Figure 3.1.
Epoch 1 began with the origins of SE being driven by the advent of large systems being developed such as the telephone system and operations research concepts employed during World War
II. Epoch 2 picked up in the mid-1940s as Bell Labs (Fagen, 1978), DoD, and universities begin to
formalize engineering development processes. While great strides were made, SE remained a
methodology to maintain control and enforce stability in large programs. Epoch 3 changed SE by
introducing technology as a force multiplier allowing industry to build ever more powerful SE
tools that extended and leveraged the traditional processes developed in Epoch 2.
SE is now entering Epoch 4 that will integrate artificial intelligence (AI) and sociotechnical integration into the development and deployment of systems and systems of systems. AI has permeated our society in such diverse areas: improving mobile phone reception, spam filters, ride-sharing
apps, autopilot systems, and fighting fraud. Epoch 4 will integrate AI, not only in the deployed
systems, but change how we engineer these systems as part of human systems engineering (HSE).
Furthermore, AI coupled with advances in sociotechnical system design will change SE tools and
methods used to develop systems.
There is increasing recognition of the importance of considering stakeholders as part of the system development ecosystem. Epoch 4 explicitly recognizes the “human” as a part of the system
and requires development environments to take into consideration human behavior and humans’
proclivity for making choices not aligned with traditional statistical optimization. As the development of system capabilities evolve, it is apparent that a static interpretation of human integration
into the system is insufficient. AI will enable real-time interpretation of continuous human integration and will be interdependent, collaborative, and cooperate between people and systems
*Approved for Public Release; Release Unlimited. Public Release Case Number 20-1208.
A Framework of Human Systems Engineering: Applications and Case Studies, First Edition.
Edited by Holly A. H. Handley and Andreas Tolk.
© 2021 The Institute of Electrical and Electronics Engineers, Inc. Published 2021 by John Wiley & Sons, Inc.
20
3 Utilizing Artificial Intelligence to Make Systems Engineering More Human
Systems engineering evolution
1940s
1950s–1980s
1990s
2000s
2010s
2020s
Adaptive
development
using AI/ML
Human-system
integration
4th Epoch
Trending through
data analytics
Integrating stakeholders
1st Epoch
Origins in
WWII
Figure 3.1
Acceleration through technology and tools
2nd Epoch
Control and stability through process
Large systems
3rd Epoch
Systems of systems
Complex ecosystems
Systems engineering evolution.
(Kevin Reilly, 2020). To both identify existing risks and project into the future, AI-based models
mimicking human behavior and learning will be necessary, as part of the development ecosystem.
As HSE matures, these models will be a common component of HSE to design and build highly
adaptive and resilient systems needed to keep pace with the velocity of change in business. This
chapter presents a framework for defining and identifying the elements for the next evolution of
SE, Epoch 4.
3.2 Changing Business Needs Drive Changes
in Systems Engineering
SE, and more recently HSE, seeks to deliver successful systems that realize programs’ targeted
outcomes and the value derived from realizing those outcomes. Early in the evolution of SE, complexity drove the need for stability and control in engineering practices in order to reduce development risks and improve quality in operation that led to the definition of a normative set of
processes, frameworks, and guidelines to increase stability and control as well as address risk in
system development (Jamshidi, 2008).
Over the next 50 years, the continual drive for greater speed, agility, and innovation as well as the
tremendous increase and integration of information technology (IT) into systems necessitated an
evolution – if not a revolution – of SE. By the early 2000s, advances in computing power and SE
tools allowed engineers to move the field from a process-driven, traceability-focused discipline to
a discipline based on speed to value. This shift in addressing business needs was also driven by the
realization that systems rarely existed in isolation but were part of a larger ecosystem of systems of
systems, where systems of systems engineering codified the modeling of this interconnectedness
into an evolving set of principles (Jamshidi, 2008).
Concurrently, systems engineers also recognized that the sociotechnical aspects of system
development are key to success. Various methodologies (Scaled Agile Framework [SAFe]
[Alexander, 2019; Leffingwell et al., 2018], Agile [Guru99, n.d.], SCRUM, etc.) were developed to
increase the amount of communication between stakeholders to continually align perspectives as
well as shorten the time to delivered value. Agile methodologies have migrated from domains that
3.3 Epoch 4: Delivering Capabilities in the Sociotechnical Ecosyste
were primarily for software development to being widely used in the broader SE development
environment. Model-based approaches and digital engineering provide for high-fidelity concept
exploration, rapid integration, and continual verification during all phases of system development
through the integration of digital engineering (Baldwin, 2019; Zimmerman and Gilbert, 2017),
model-based systems engineering (MBSE) (Ramos et al., 2012), modeling and simulation, and
DevOps constructs, where DevOps is defined as a set of practices combining development practices and IT operations with the goal of shorten the system development life cycle. This digital
foundation has expanded the development of the ecosystem (Tolk and Hughes, 2014; Tolk
et al., 2017) to integrate stakeholder perspectives, further reinforcing the value of exploration and
experimentation of the sociotechnical solution space.
There is an emerging realization that the success or failure of a system development effort is
often driven by the sociotechnical aspects of the development environment. By explicit quantitative modeling of sociotechnical factors, with a focus on delivering capabilities, stakeholder alignment and coordinated action can be engineered. Sociotechnical factors can describe the quality of
stakeholder alignment in a complex, multi-stakeholder environment. These factors assess the
degree and strength of alignment between stakeholders and are combined with traditional SE
evaluation criteria to create a complete picture of the project environment, allowing for a holistic
risk analysis, early warning of anti-pattern presence, and success determination. AI makes it
feasible to deal with the complexity and dynamic nature of adding temporal sociotechnical factors
across large numbers of stakeholders. Critical aspects of the projects often have significant,
dynamic uncertainties that challenge integrating evidence from stakeholder behaviors with traditional project management techniques. Innovative use of AI to assess the implication of new evidence can more fully identify risks and emergent trends and suggest corrective action or where
continued actions are unwarranted.
As business owners realize the benefits of HSE and AI, the fourth epoch will integrate HSE and
AI into a system development ecosystem that can effectively address the development and release
of incremental value for complex, human-technology integrated systems while promoting innovation and effectively managing risks.
3.3 Epoch 4: Delivering Capabilities
in the Sociotechnical Ecosystem
As discussed above, the serial approach to SE from phase 1 has morphed into an almost continual
delivery of value, particularly in IT. For example, the increased popularity of DevOps has provided
a basis for continual improvement in enterprise IT systems as exemplified by Netflix (Netflix
Technology Blog, 2017). DevOps is “a set of practices intended to reduce the time between committing a change to a system and the change being placed into normal production, while ensuring
high quality” (Mersino, 2018), which can be viewed as accelerating continual improvement, but
perhaps at the cost of thoroughly investigating the implications of changes across the entire stakeholder base. Epoch 4 will:
●●
●●
Provide the ability to explore the implications of changes across the stakeholders, as well as
experimentation to better understand the effects of the integration of possible enhancements
and modifications.
Augment the continuous development cycle of DevOps and the rapid delivery of value in
SAFe with persistent quantitative sociotechnical validation through AI. It can be viewed as
21
3 Utilizing Artificial Intelligence to Make Systems Engineering More Human
●●
●●
accelerating continual improvement while concurrently investigating the implications of
changes across the entire stakeholder base.
Provide the ability to explore the implications of changes across the stakeholders as well as
experiment to better understand the effects of the integration of possible enhancements and
modifications.
Augment the continuous development cycle of DevOps and the rapid delivery of value in SAFe
with persistent quantitative sociotechnical validation.
3.3.1 A Conceptual Architecture for Epoch 4
Epoch 4 builds on the prior epochs, particularly in the areas of Agile methodologies, DevOps, and
MBSE and adds the sociotechnical components as shown in Figure 3.2. For purposes of this discussion, we have highlighted four areas of interest for Epoch 4:
●●
●●
●●
●●
Temporal sociotechnical measures: Measures over time of the complex organizational interactions between people and technology in workplaces.
SE frameworks: Incorporates a variety of SE methods and techniques that work together as a
cohesive set for development activity.
Sociotechnical models: Illuminate the multidimensional interconnections between humans
and technology.
Digital twins: A digital replica of an entity, human, or system.
3.3.2 Temporal Sociotechnical Measures
Digital twins – artificial intelligence
System development has been based on measures for decades. Historically, measures could be
traced to the “iron triangle” of cost, schedule, and performance used in traditional project performance management. If the system development effort was expending resources in accordance
with a predetermined plan, value was realized when expected, and the functionality of the emerging system was consistent with requirements and constraints (e.g. earned value in line with investment and time constraints).
Practitioners of SE have realized that in
addition to tracking the development effort
along the iron triangle, alignment between
Modeling and simulation
stakeholders is critical toward achieving successful delivery of capabilities, as well as the
Human and system
early identification of risks. This is evidenced
integration
by modern development processes using freSociotechnical network
quent iterations of nominal group techniques
models
(e.g. scrum) to ensure consistent communicaHuman system engineering
tion and strive to identify disconnects and
(HSE)
errors early. Epoch 4 takes this one step further and identifies specific measures to ensure
Enterprise lean and agile
alignment between stakeholders as a quantitative addition to the existing alignment proSystems engineering
cesses. Previous work by the authors (Barry
frameworks
and Doskey, 2019; Doskey and Barry, 2018)
posited a measure based on both strength of
Figure 3.2 A conceptual architecture for Epoch 4.
Temporal sociotechnical measures
22
3.3 Epoch 4: Delivering Capabilities in the Sociotechnical Ecosyste
belief and alignment between sets of stakeholders on key issues in the system development environment. Epoch 4 frequently and quantitatively assesses misalignment between stakeholders as
well as determining risk based on stakeholder belief (or lack thereof) that key elements of the
development effort will succeed.
3.3.3
Systems Engineering Frameworks
Existing and emerging SE frameworks can be viewed as a set of rules and best practices, nominal
group techniques, and documentation standards. Epoch 4 adds additional techniques to drive
quantitative measures of sociotechnical alignment such as iterative surveys, natural language processing of communications, and explorative modeling to proactively identify and quantify sociotechnical risk.
Historically, SE frameworks have been shown to produce, on average, better development results
than efforts lacking discipline. This is not to say that viable products cannot be developed outside
of an established framework, it merely suggests that well-defined frameworks reduce risk and
provide a basis for communicating intent. Thus, by expanding the framework to explicitly examine
sociotechnical measures and calculate additional areas of risk, Epoch 4 provides the foundation for
addressing these risks and raising the likelihood of a successful development effort.
The importance of defining risk in sociotechnical systems has been previously noted by other
researchers. For example, Greenwood and Sommerville (2011) demonstrated an analysis approach
for the identification for sociotechnical risks associated with coalitions of systems, and Johansen
and Rausand (2014) posited a framework for defining complexity for risk assessment. Epoch 4
integrates this body of work into the main development environment.
3.3.3.1
Sociotechnical Network Models
Higher-fidelity models of system development environment of the hardware and software typically ignore the necessity for the explicit recognition and modeling of the sociotechnical network.
Luna-Reyes et al. (2005) noted that many information system development activities fail to deliver
because of social and organizational factors. A concurrent modeling and analysis environment
that recognizes the effects of stakeholder interactions would address this shortcoming.
While modeling of sociotechnical networks is not new (Hu et al., 2010), Epoch 4 fully integrates
both the modeling and subsequent exploration and experimentation of the sociotechnical network
into the development cycle and uses tools such as systemigrams (Mehler et al., 2010), agent-based
models, and system dynamics models to visualize and model the influence between stakeholders.
This development of a representative sociotechnical network model provides the ability to monitor
the trends and alignment between stakeholders and potentially identify existent and emerging risks.
This concept of modeling of the sociotechnical network during system development has been
demonstrated by the authors who used changes in information entropy (IE) to assess whether the
stakeholders were moving closer or diverging in their alignment of key belief areas (El Saddik, 2018).
The temporal belief and alignment measures discussed in Section 3.3.1 indicated risk to system
development. Epoch 4 explicitly recognizes both the source of sociotechnical risks and the importance and necessity to ameliorate them.
3.3.3.2
Digital Twins
Epoch 4 recognizes that the acceptance of any development effort is dependent upon successfully
meeting the preferences of myriad stakeholders. System development environments that advocate
frequent stakeholder interactions attempt to create an environment where there are few surprises
23
24
3 Utilizing Artificial Intelligence to Make Systems Engineering More Human
and disagreements are worked out in near real time. In most cases this represents an improvement
from the staged formal interactions that may occur asynchronously (such as the V model) and are
document based. However, frequent interactions with stakeholders can be costly and, in some
cases, may not be feasible. By augmenting the development environment with digital twins, Epoch
4 provides a mechanism to reduce the burden on the full set of stakeholders as well as allowing
real-time experimentation during all phases of development.
There are a number of definitions of digital twins, but the most useful for the discussion here is
from El Saddik who defines a digital twin as: “A digital replica of a living or non-living physical
entity. By bridging the physical and the virtual world, data is transmitted seamlessly, allowing the
virtual entity to exist simultaneously with the physical entity” (Rosen et al., 2015). Developing digital twins is used extensively in industry (Tao et al., 2018) and in healthcare (Baillargeon, 2014;
Bruynseels et al., 2018). While there has been work in modeling stakeholder in various domains
with an array of preferences (Le Pira et al., 2015; Tracy et al., 2018), quantitatively modeling the
preferences of stakeholders in the development space per the aforementioned set of sociotechnical
measures is not nearly as prevalent.
Epoch 4 advocates the creation of digital twins to model the preferences of the stakeholders as
they relate to the development activity and the associated effects that the implementation of the
development may have. The models of the digital twins can be straightforward. For example,
Bayesian networks have been used to model stakeholders. The key is that a digital model of each
of the agents is created with the interactions between them quantitatively described and how the
introduction of new evidence affects preferences.
3.4 The Artificial Intelligence Opportunity for Building
Sociotechnical Systems
Consider the definition of AI offered by Poole et al. (1998): “The study of intelligent agents: any
device that perceives its environment and takes actions that maximizes its chance of successfully
achieving its goals.” As the fourth epoch of SE matures, there is significant opportunity to employ
various AI techniques to enhance quality and reduce risk during capability development. AI can
be seen as computational agents that work with the development team throughout the development life cycle, essentially human–machine teaming from a sociotechnical perspective.
Figure 3.3 provides a high-level taxonomy of AI. For the application discussed here, techniques
discussed above can be viewed as approaches to enable the identification of risk events in the
sociotechnical space and a forward projection of what will happen if the risks are ignored or mitigation actions are specifically taken. For example, in the context of risk identification, it is
Bayes Nets
Inference engines
Decision support
Convolutional neural nets
Neural nets
Reinforced deep learning
Deep learning
Predictive analytics
Machine
learning
Neuroevolution
Figure 3.3
Artificial
intelligence
Speech
Vison
Learning classifier systems
Genetic algorithms
Natural
language
processing
Expert
systems
Evolutionary
computation
A taxonomy of artificial intelligence.
Robotics
Translation
Extraction
Classify/cluster
Speech to text
Text to speech
Image recognition
Machine vision
Reactive machines
Self-awareness
3.6 AI in Systems Engineering Framework
straightforward to examine specific applications of AI. Conditional decision trees can be developed
to identify risks based upon temporal sociotechnical measures. Natural language processing is useful to assess the tone, and possible misalignment, by examining electronic communications.
Bayesian reasoning can be employed to predict the possible consequences of the misalignment.
Artificial neural networks can be used to learn from previous cases as well as dynamic data.
Initially, it is anticipated that AI will be used primarily for the development of complex sociotechnical systems that will be long lived and are likely to evolve over their lifespan. These systems
have diverse stakeholders, and the stakeholder population will evolve over time. Understanding
the perspectives of the stakeholders who may not be available or even exist during development is
a necessary requirement to field a system that meets the requirements of the diverse stakeholder
population. Further, the evolution of the deployed system as well as the sociotechnical ecosystem
provides additional challenges. Modeling stakeholders’ behaviors and evolution with AI provides
an approach for prospective analysis of risks.
3.5 Using AI to Track and Interpret Temporal
Sociotechnical Measures
For truly effective HSE in system development, it is essential to measure alignment between stakeholders and their belief that the project will succeed along numerous axes to rapidly identify existing and emerging risks. In the previous work cited by the authors (Barry and Doskey, 2019; Doskey
and Barry, 2018), the approach taken to ascertain this information was via survey or forensic
assessment. While this can work effectively on small development efforts, this approach does not
scale when the number of stakeholders begins to increase into the tens or more.
Using AI there is an opportunity to conduct real-time and near-real-time analysis of sociotechnical measures using natural language processing and sentiment analysis. Sentiment analysis is well
established in social media (Ortigosa et al., 2014), and APIs exist, such as Google Natural Language
API (Putra, 2019), which allow individuals to quickly create sentiment analyzers. By employing
agents that comb through communications like e-mail, text messages, and information on collaboration sites (e.g. Kanban boards), discontinuities and misalignments can be identified across the
sociotechnical ecosystem. This approach has the potential to recognize existing and emerging
sociotechnical risk. By enabling communication between various risk tracking intelligent agents,
an assessment can be made as to whether there is enterprise or localized risk.
3.6 AI in Systems Engineering Frameworks
Modern SE frameworks have recognized the importance of frequent communications between
stakeholders. Further, the popularization of agile methods has provided a backdrop for these communications and the associated record of success. AI bots (Wünderlich and Paluch, 2017) and
other applications can act as an unbiased risk assessor across the enterprise as the system is
developed.
Figure 3.4 provides a taxonomy of representative systemic risks that the AI can identify and assess:
●●
●●
Structural risk assessments are conducted to determine if there are inherent weaknesses in the
sociotechnical ecosystems and relation risk looks at groups of stakeholders.
Relation risk is based on sociotechnical measures.
25
26
3 Utilizing Artificial Intelligence to Make Systems Engineering More Human
Model
Structural
risk
●●
Density
Centrality
Redundancy
Systemic
risk
Relational
risk
Belief scores
●●
Hidden relations
Basis
Evidentiary
risk
Type risk
Individual
element risk
Conditions
Missing
requirements
Distribution
Alignment
Outliers
Pair alignment
●●
videntiary risk is an assessment of the proE
gress of the system development (e.g. measurements to determine if value streams
being delivered regularly and as scheduled).
Type risks aggregate groups of specific elements risks to identify systemic risk across
the enterprise (e.g. widespread disagreement on technical approach).
Individual element risks focus on the specific aspects of the sociotechnical space (e.g.
assessing if the objectives of the stakeholders aligned across the enterprise).
In Epoch 4, AI will bring persistent, holistic
risk analysis across the enterprise. This will be
combined with a historical assessment of progress using data from analogous systems and from
the progress on the current development effort. AI will provide recommendations for addressing
material weakness in the sociotechnical ecosystem and track progress along these lines.
It is important to realize that during system development activity, risks evolve. Thus, when constructing a holistic risk analyzer, various measures and interpretation mechanisms are necessary.
There is a need to identify situations that are rapidly emerging and indicate an immediate risk (e.g.
replacement of a key stakeholder). These immediate sociotechnical risks can be quantified via
persistent analysis of sociotechnical measures and network analysis.
Perhaps more insidious than detectable risk is the scenario of a slowly growing risk, where
cumulative deviations add up and/or there is a drift in beliefs from one perspective to another.
Often, stakeholders have some idea that things are amiss but have no consistent methodology to
identify the cause. A persistent AI that monitors, examines, and assesses the sociotemporal measures can infer the presence of these emerging risks, either from a structural perspective (e.g. lower
than expected communication between stakeholders) or disparate indicators that when taken
together can integrate into a full-blown risk scenario.
Figure 3.4
Risk taxonomy.
3.7 AI in Sociotechnical Network Models
There is a multifaceted opportunity for AI with respect to sociotechnical models. Consider the
composition of the sociotechnical model. Typically, the development of the sociotechnical network is largely manual. The composition exercised is designed to identify the major components
as well as their interactions. Defining the interactions consists of first describing and then modeling the interaction in a quantitative fashion. The interactions between disparate components
require both an understanding of how the interactions occur and how the interaction affects the
components. AI can assist in the definition and development of the networks by analyzing data in
the ecosystem. As an example, it is well-proven technology to develop and use link analysis
(Oliveira and Gama, 2012) to create and explore networks. This process can also be complicated
with the situation of an evolving social network as discussed by Cordeiro et al. (2018). AI can be
used with evolving networks as well to continually assess flow relations, identify important relations, affinity relations, and alignment.
3.9 Discussio
Typically, an SE ecosystem is rife with unstructured and semistructured data. Typically, large
amounts of e-mail are exchanged along with texts messages. Using natural language processing
and uncertain reasoning, a base social network can be constructed that can then be adjusted as
evidence is introduced. This network can then be employed to focus the measurement of sociotechnical measures. Without such analysis, the number of possible connections in a medium-sized
network can become very large, i.e. n(n − 1)/2. Moreover, as some of the connections are likely not
significant, without a network analysis, nonrepresentative emergent effects may be inadvertently
modeled.
3.8 AI-Based Digital Twins
Perhaps the most intriguing use of AI in the development of sociotechnical systems is creating
digital twins to represent the interests and proclivities of the various stakeholders. Representative
stakeholder digital twins provide a mechanism to better understand how events in the development of the sociotechnical system will be interpreted. For example, if some stakeholders have
significant interest in a rapid delivery of specific value, the effect of delays in that delivery can be
modeled.
The mechanisms for building representative models can be simple. For example, a simple version of this would be the development of a Bayesian network that processes the introduction of
evidence of successful or unsuccessful progress with an assessment of the likelihood of successful capability delivery (Misirli and Bener, 2014). One can posit a digital mapping of the stakeholders’ preferences that can describe influence propagation across the stakeholders that will
either increase or decrease alignment and belief in the potential success of the capability
development.
Digital twins that model stakeholder beliefs provide an opportunity to do exploratory experiments to examine how to best manage risks that may result from emergent effects of influence
propagation across the sociotechnical network. There has been interesting work in this area, for
example, agent-based models have been used to model bidirectional influence propagation (Li
et al., 2016).
3.9 Discussion
Practitioners can apply the methods and tools, as described in the previous sections to create
models of the sociotechnical environments where risks are actively modeled, monitored, and
predicted; alternative courses of action can be simulated and assessed to provide practitioners
with insight on how to lower risk and maximize value delivered. Using AI-based approaches to
develop explicit models of stakeholders, how they relate and how their beliefs directly affect the
chances for successful capability development is foundational to the constructs employed in the
fourth epoch. These “proxy stakeholders” provide a powerful mechanism to conduct explorations into possible futures and allows proactive risk mitigation as the scope and scale of development efforts increases. The opportunity for the development effort to potentially get off track
due to the multitude of stakeholders and the rapid pace of development necessitates holistic
active monitoring and continual risk assessment that is infeasible for manual human-intensive
approaches.
27
28
3 Utilizing Artificial Intelligence to Make Systems Engineering More Human
To illustrate the necessity for computational aids, consider the example
N1
N2
of a system development effort with
five stakeholders. The connections
r1,3
r2,3
between the stakeholders form a network, albeit not a fully connected netN4
r3,4
work, as shown in Figure 3.5, where
stakeholders are represented as nodes
N3
in the directed graph and the interacr3,5
tions between the stakeholders are
shown as arcs. Thus, the set of stakeN5
holders N = {N1, N2, N3, N4, N5} and
the relationships between them are
Figure 3.5 Example project social network.
described as rx,y where x and y are
stakeholders X and Y.
The relationship between the stakeholders rx,y can be represented as rx,y(d, s, a) where d, s, and a
are defined as follows:
r1,2
●●
●●
●●
d represents directionality: In Figure 3.5, r1,3 is shown as stakeholder 1 influencing stakeholder
3, but not vice versa. Compare this to r3,4 where this influence is bidirectional. In long-lived capability development environments, a given relationships rx,y may not persist over time, or new
relationships may emerge. Failure to recognize the network structure between relationships can
result in unintended consequences that likely inject adverse effects into the development cycle
or operations of the ensuing system.
S indicates strength of influence: Strength of influence is defined as the degree to which the
change in one node affects another. The strength of influence can be positive, negative, or neutral. Upon a change in a stakeholder, positive influence will increase the value of the temporal
sociotechnical measures, negative influence will decrease them, and neutral influence indicates
that a change in one node will have no effect on the other. For example, in Figure 3.5, if N1 was
the leader of the organization, it is reasonable to assume that the r1,3(s) would be strongly positive. The diagram above also indicates that the leader is not significantly influenced by stakeholder N3 as arc is unidirectional; in other words, the leader is not listening. Similarly, the
discussion with respect to relationships and the strength of influence of a relationship may
change over time.
a is the alignment between stakeholders: Alignment (a) is defined as the difference between the
beliefs in both project execution and the underlying project ecosystem between stakeholders.
Large differences in beliefs may portend risk as tactical measures may be taken that are not congruent with the success metrics of the parties and larger strategic measures of success may be
out of alignment. The alignment is explicitly assessed using the temporal sociotechnical measures, such as the previously discussed belief approach. Whereas the relationship and strength of
influence form the underlying substrata for sociotechnical network, risk is directly assessed by
alignment (or lack thereof) of the belief structures of the stakeholders.
As a system development effort progresses, evidence is presented to the stakeholders that affects
their beliefs. AI models of stakeholders can be used to model how beliefs can morph and drive how
the stakeholder processes evidence and chooses actions. Understanding and modeling how misaligned belief structures can result in actions that are counter to overall goals of the development
effort is key to proactively managing emerging risks. Frameworks such as belief, desire, and
3.9 Discussio
intention (Kim et al., 2012) have been used successfully in developing high-fidelity agent-based
models and can be used here.
Accurate AI modeling of stakeholders using digital twin concepts provides a solid representation
of the stakeholders and mechanism to track the evolution of the preferences. These AI-based risk
assessors can look at atomic measures, group measures, and holistic sociotemporal measures to
assess risks as shown in Figure 3.5. Structural risk can be assessed using appropriate interpretations of the sociotechnical network, consistently looking for over-connectiveness as well as sparsity. Structural risks are identified when measures exceed the tolerance of network metrics within
a degree of error.
The canonical definition of risk can be described as a tuple represented as risk{event, likelihood,
consequence}. Using this definition, AI-based models can spot misalignment across the sociotechnical measures and have the added capability of identifying localized risk, enterprise level risks,
and emergent risks as misalignment grows over time. Further, with the introduction of evidence,
and stakeholders’ interpretation, may result in the identification of hidden risks. For example, a
significant reduction in electronic communication between certain stakeholders can be a signal if
impending misalignment and the advent of a relational risk. Relational risk occurs when a risk
assessor looks at the relationship between two stakeholders and identifies significant incongruence between the sociotemporal measures leading to a lack of alignment. Here again the application of AI can model incidental and emerging risks as the scale of a large enterprise and the rapid
pace of change make typical knowledge acquisition efforts across the stakeholders unrealistic.
AI-based models can assist in proactive decision support when coupled with SE to identify measures, establish metrics, and define acceptable deviation limits for the measure.
A large enterprise may have tens or even hundreds of relevant stakeholders, all of whom are
seeing different aspects of the development effort. As evidence is introduced to stakeholders in
these complex sociotechnical networks, it is improbable that manual, or mental, methods can
adequately track and assess the impact of the evidence. AI-based models can easily track and
learn from these events and provide the practitioner with insight on how best to lower risk and
improve value delivery.
Traditional risks in typical system development projects and their evolution are well documented
in literature (Warkentin et al., 2009), but analytical analysis of risk particularly in the sociotemporal space is largely a manual process. An AI-based risk assessor can monitor trends in the sociotechnical measures to examine if there are emerging risks from a growing misalignment between
groups of stakeholders. An AI risk assessor can develop forecasts of emerging risks that can be
modeled by deliberate introduction of possible evidence that may occur in the future. Modeling in
this fashion provides the capability to proactively assess system risk areas and take preventive steps.
In addition to localized risk identification, a holistic view of systemic risk across the sociotechnical ecosystem becomes more feasible using AI-based models. While localized gross individual misalignment may not manifest itself, a general trend toward misalignment across the enterprise can
be discovered and identified. Whereas the values for sociotemporal measures typically have been
discovered through interviews, AI offers the opportunity to make assessments based upon noninvasive approaches such as analyzing e-mails and text messages. Applications like the hedonometer
(Dodds et al., 2011) have been used for many years; it is suggested here that AI can tap into the
results of the hedonometer for both localized and global assessments of risk.
The second element in the risk tuple is the likelihood that the risk will occur. Misalignment on
the sociotechnical measures provides an indication of an impending risk event. Traditional uncertain reasoning approaches, e.g. using a Bayesian network, can be employed to determine the likelihood of the risk (Feng et al., 2008; Hui and Liu, 2004). If the misalignment is observed, there is a
29
30
3 Utilizing Artificial Intelligence to Make Systems Engineering More Human
certitude that the risk event has now become an issue, at which point the AI can be used to make
an estimate of the consequences should the issue not be resolved in a timely fashion.
With an estimate of the likelihood of the risk event, the last step is to assess the consequence(s)
if the risk event happens and becomes an issue as mentioned above. This is again an opportunity
for the AI to employ uncertain reasoning: taking a risk event and the likelihood that it will happen,
what are the anticipated consequences? The assessment can be based upon historical data or generalized rules that categorize the risk and its associated consequences and iterate multiple outcomes based on actions taken to determine enterprise-level success vice local optimization.
Generally, the consequences will manifest themselves as a negative effect along the traditional
lines for system development, impact on cost, an extension of the schedule, or a decrease in the
capability or value delivered with the system increment. This mapping to the traditional measures
of system progress facilitates the movement toward the use of AI to risk amelioration.
A conceptually straightforward approach for amelioration is to use AI to calculate the expected
value of the impact of a given risk if it comes to fruition and then compare the costs of various
amelioration activities with the expected value of the courses of action that could be taken. In
general, taking steps to reduce risks that are more expensive than the expected value of the payoff
is a poor decision. The other aspect of choosing a risk reducer is to consider the global effect that
may have an aggregate cost that is unacceptable even though the local risk calculation may indicate a local improvement. Thus, having AI make a global assessment as to the possible future state
to best calculate the expected cost is an important capability that will differentiate the fourth epoch
of SE. Essentially, AI will conduct localized sociotechnical risk assessments and heuristic risk
assessments and suggest corrective actions based upon a quantitative risk calculation and projections of the effects of the actions.
3.10 Case Study
The concepts described above were used to analyze a large governmental IT development effort.
The project was designed to modernize an antiquated system that provided benefits to hundreds of
thousands of recipients. Initially, a traditional development effort was undertaken that focused
almost solely on the technical aspects of the effort. While the technical engineering was adequate,
the project failed in large part due to sociotemporal factors and inherent structural risks. After the
project was halted, a new system develop approach was implemented. The project was put back on
track and is successfully delivered its primary capability suite. Further development of ensuing
capability is on track for successful deployment on time, at cost, and with the requisite quality. For
the remainder of this discussion, the first effort will be called Project One, and the second will be
called Project Two.
Project One started in a precarious position, but for all intents and purposes, the stakeholders
were unaware. There was significant structural risk in that lines of communication were not fully
open; the network had insufficient communication channels between the stakeholders, resulting
in discontinuities in beliefs; discontinuities in beliefs resulted in disparate actions that can act at
cross-purposes. There was significant relational risk resulting from an apparent unwillingness of
the stakeholders to change beliefs even after evidence was presented, which further contributed to
the project inability to successfully deliver on time.
To further compound the situation, Project One suffered from type risk that resulted in an inability to recognize systemic risks and trends across the enterprise. In part, there was no mechanism
in place to measure the trends, particularly in the area of sociotechnical risks. Further, there was
3.11 Systems Engineering Sociotechnical Modeling Approac
individual cognitive anchoring as described above that further contributed to a lack of alignment.
These risks compounded into a situation where the project began to fail, and the failure was not
able to be corrected.
Project Two actively implemented changes specifically designed to address the reasons why
Project One failed. First, recognizing that the misalignment of sociotechnical factors was a major
cause of the failure for Project One; Project Two moved to a SAFe development paradigm as previously discussed. The frequent interactions of various components of the stakeholders, from developers to business owners, provided numerous opportunities to identify and address misalignment
in beliefs and prevent actions that are counter to achieving the project objectives. Second, active
measurement of sociotechnical factors allowed identification of hidden and emerging problems.
This data-driven approach provided a mechanism to flag biases as well as individual stakeholder
risks. The net result was project stability that placed Project Two on a clear road to success.
3.11 Systems Engineering Sociotechnical Modeling Approach
The case study in Section 4 was used to model the development effort in Section 5. Figure 3.6 illustrates a taxonomy of terms that were used to more fully characterize the project and the associated
environment and how it directly influences the necessity and frequency for information updates:
measurability, situational awareness, information availability, novelty, and complexity.
Considerations such as uncertainty, novelty, and complexity also describe the inherent volatility
and drive information requirements.
Achieving project objectives is directly dependent upon the quality of the project plans as well as
the project sensors, where sensors are humans or project tools that collect the data over time. As
the project is executed, the project sensors inform the comparison with the project plan. After the
initiation of these actions in concert with or opposition to the plan, the progress is assessed and
then repeats until the plan is successfully executed or the project is terminated.
To characterize the project environment, an information ecosystem classifier was developed to
characterize the stability of the project environment and the alignment of the project team’s beliefs
Project information environment characterization
Project
size
Available
time
Resource
profile
Informs
Informs
Project
complexity
Objectives parameterization
Guides
Informs
Informs
Informs
Project
novelty
Project
uncertainty
Historical
data
Guides
development Guides
development
Project
plans
Informs
Staff
profile
Corrective/
optimizer
decisions
Project
objectives
Informs
Project
environment
characterization
Execute & measure
Directs
Informs
management
approach
Information
environment
characterization
Figure 3.6 Project information ecosystem.
Affects
Informs
Compare
progress to
plans
Project
execution
Informs
Monitored by
Identifies
possible
Information flows
Project
sensors
31
32
3 Utilizing Artificial Intelligence to Make Systems Engineering More Human
with what the beliefs of the organization requesting the project. Descriptive questions or phrases
were used to provide a better and more consistent means of collecting perceptions versus using
single word attributes. To fill out the classifier, each of the following 10 criteria was scored on a
0–10 Likert scale, where 0 means “fully disagree” and 10 means “fully agree.” The project team
assessed their beliefs and then provided complementary ratings for the perception of the stakeholder procuring the project. The environmental analysis was developed using a cross section of
common attributes identified in literature such as Relationships Between Leadership and Success in
Diverse Types of Project Complexities (Muller et al., 2012). The criteria were as follows:
1)
2)
3)
4)
5)
6)
All stakeholders are committed to attaining the project objectives.
Stakeholders are willing to adapt/change.
Project objectives are known and measurable.
Timely information is available from stakeholders.
Sufficient time is provided to complete the project on schedule.
Budget is sufficient for the project.
The project classifier offered a translation to quantitatively assess each aspect of the project ecosystem in terms of where information and communication will be critical to the success of the
project. Each aspect considered was assessed for both symmetry and stability/maturity. For example, the project team is wholly committed to the achieving the project outcome, but the stakeholder’s commitment is perceived as lacking, thereby creating an imbalance and likely area of risk.
Similar assessments can be done for each of the criteria used in the project classifier.
The difference and the size for each element in the classifier was used to derive a coefficient that
provided an indication of risk in achieving that element. Equation 3.1 describes the belief coefficient, a tunable coefficient derived from heuristics and project experience:
e(
Belief
1*(( f d 1)/( s g 1)))
(3.1)
where
●●
●●
●●
●●
f is the difference for a given criterion
s is the value for stability/maturity
d and g are real values used to emphasize the contribution of size over maturity or vice versa
Belief values run from 0 to 1, where lower values indicate significant risk for project success for
a given criterion
The belief coefficient equation was developed for large-scale, contract-based, custom IT projects
in which a relationship with the stakeholder is integral to the delivery of the project. In essence,
alignment with the stakeholder has been found to be equal to or greater in priority than maturity
or stability of the environment as determined by the responses to the project classifier questions.
To assess the overall information risk profile of the project, the authors computed a single value
that aggregated the belief coefficients across the project. The authors calculated the geometric
mean of the belief values as shown in Equation 3.2. The geometric mean is commonly used to find
a single value when trying to aggregate criteria with different properties:
n
i 1
xi
1
n
n
x1 x2 xn
where
●●
x’s are individual belief coefficients for each criterion in the project classifier
(3.2)
3.11 Systems Engineering Sociotechnical Modeling Approac
The intent of using the geometric mean of the belief coefficients is to provide a singular aggregate risk for a project in terms of where information and communication are critical to project
success, where belief values approaching 1 presume high alignment and ecosystem stability for a
program and values approaching 0 denote areas of concern that require attention. Additionally, as
belief coefficients approach 0, the velocity of decision making should be expected to increase to
account for the abundance of uncertainty.
As stated, the goal of this research was to identify sources of hidden risk in the programmatic
underpinnings of system development efforts. To do it, the authors used the following logic to
translate the beliefs of the stakeholders and the evidence that drives these beliefs into a Bayesian
belief network (BBN). Expert elicitation of individuals involved in the system development projects
and along with a review of published artifacts was used to develop prior probabilities, such as success and failure rates for project based on the Standish Group’s Chaos Report for 2015 (The Standish
Group, International, Inc., n.d.). Figure 3.7 is provided as an exemplar of BBN construction.
The scalar measures were then translated into a logistics distribution curve, i.e. the belief coefficients. The belief coefficients indicate areas of misalignment in beliefs between stakeholders,
where the beliefs are not objective measures of reality but instead the best understanding of the
beliefs of other stakeholders’ expectations, if direct collection of beliefs is unavailable. The belief
coefficients were categorized based on their position of the logistics distribution curve. This categorization gives practitioners an indication of the material weaknesses within the system development environment and profiles where risk may be present yet unidentified. Note that these
categorizations will vary for different types of system development project genres.
3.11.1
Modeling the Project
There are two major components of designing the social system and technical system in tandem in
order for them to work together so that the interaction of social and technical factors creates the
conditions for successful organizational performance. IE was used as a measure of environment
stability, and belief coefficients were used as a measure of alignment of sociotechnical attributes.
IE was used as a means of gauging confidence in the conditions for success in a multi-stakeholder environment. IE calculations provided a measure of project environment stability. Changes
in entropy provided a mechanism to examine the project over time and to understand the patterns
that model environments for success or failure.
The analysis began by modeling the project stakeholders and their relationships as a graph,
where edges are assumed to be bidirectional (see Figure 3.8). The edges represent the relationships
between the stakeholders, and the strength of the relationships as well as the alignment is defined
by the integration of the belief coefficients scores for the belief questions.
As can be seen, the project is composed of stakeholders that must work together to deliver the
project. For expediency, calculations were made for the edges connected to the program team/PIO.
In addition to looking at the overall enterprise modeled as a graph structure, it is important to
look at the evolution of the alignment coefficients and the overall alignment coefficient over time.
Specifically, it is desirable to determine whether the analysis can assess whether the project will
succeed based on current and past behavior. For example, random behavior between measuring
periods will probably indicate poor predictability of future states. Correspondingly, reasonably stable behavior is an indicator of future performance. Information theory provides a ready measure
of the randomness in the system with IE. IE is defined as
(x )
k 1
p xk log k p xk
where k refers to the number of distinct states the system may be in.
(3.3)
33
Provider clear on workplan
Notclear
5.00
Mildlyclear
15.0
Partiallyclear
27.0
Mosltyclear
38.0
Clear
15.0
5.86 ± 2.2
Provider clear on SOW
5.00
Notclear
15.0
Mildlyclear
Partiallyclear
27.0
38.0
Mosltyclear
15.0
Clear
5.86 ± 2.2
Acquirer clear on SOW
Notclear
Mildlyclear
Partiallyclear
Mosltyclear
Clear
5.00
15.0
27.0
38.0
15.0
5.86 ± 2.2
Acquirer clear on workplan
Notclear
Mildlyclear
Partiallyclear
Mosltyclear
Clear
5.00
15.0
27.0
38.0
15.0
5.86 ± 2.2
Figure 3.7 BBN example element.
Providers aligned on objectives
Notclear
Mildlyclear
Partiallyclear
Mosltyclear
Clear
1.90
12.3
37.6
39.9
8.31
Stakeholder indicator
LikelyFailure
BigProblems
MinorProblems
LikelySuccess
10.3
27.9
24.9
36.9
0.575 ± 0.28
5.81 ± 1.8
Acquirer aligned on objectives
Notclear
Mildlyclear
Partiallyclear
Mosltyclear
Clear
1.92
12.1
39.0
38.7
8.36
5.79 ± 1.8
Health indicator
Unhealthy
Healthy
Q1. All stakeholders are aligned in att...
9.55
21.2
37.6
31.6
Notclear
Partiallyclear
Mosltyclear
Clear
0.621 ± 0.29
60.9
39.1
0.395 ± 0.28
3.11 Systems Engineering Sociotechnical Modeling Approac
IT mgmt
team (2)
r1,2
r1,7
Dev team (7)
Systems
integrator (1)
r1,6
Process mgmt
team (6)
Figure 3.8
r1,5
Executive
office (5)
r1,3
Product
owners (3)
r1,4
Comms/m
ktg (4)
Case study project social network.
As the IE rises for a relation (edge) or the system, the randomness rises, and the stability of the
project environment falls as does the ability of the model to predict future behavior. Correspondingly,
as the IE falls, the stability of the project increases, and the ability of the model to predict future
behavior rises. To apply this discrete formula for assessing stakeholder alignment, the continuous
distribution of stakeholder alignment was broken down into several distinct states.
IE was chosen as a measure that is at a maximum when the probability of all possible outcomes
is equivalent; in essence there is no information that would allow a more educated prediction.
Experimental testing indicates the values of both edges, and the system at large generally will cluster around several peak values. If variance (𝜎) was chosen as a measure, it would obscure this
information as it is not sensitive to multiple modes. In fact, it is possible that (𝑥) might increase,
while 𝜎 could decrease. Consequently, using variance alone would indicate less disorder and more
confidence in the model than would be warranted.
This methodology is designed to identify areas of risk to successful project execution. Risk is
defined here as the belief that the project will be challenged or fail given the alignment coefficient
and the IE. Figure 3.2 illustrates the possible outcomes of the IE.
For this discussion, stability S is defined as follows:
S 1 IE
(3.4)
S is used with the alignment coefficient to calculate confidence. If the project has a high alignment coefficient score across the relationships and S is large, it can be plotted in Zone 1, and there
is good confidence that the project will succeed. A project that has high alignment coefficient, but
low S (Zone 2), is a project of concern with low confidence of success and an analysis warranted to
identify why the stability of the environment of the project is low, potentially indicating hidden
factors. Zone 4 indicates a project that has both a low alignment coefficient score and low S, which
would indicate there should be serious lack of confidence that the project will succeed. Zone 3 has
high S but low alignment coefficient; this is an area of concern that may be recoverable, and deeper
analysis is warranted to understand why the alignment coefficient scores are low. Figure 3.9 plots
35
3 Utilizing Artificial Intelligence to Make Systems Engineering More Human
1
Zone 1
Zone 2
0.9
0.8
0.7
Confidence
36
MZ-0.5
0.6
MZ-0.6
MZ-0.7
0.5
MZ-0.8
0.4
MZ-0.9
MZ-1
0.3
0.2
0.1
Zone 3
1
0.9
0.8
Zone 4
0.7
0.6
0.4
0.5
0.3
0.2
0.1
Stability
Figure 3.9
Confidence vs. stability.
Project 1
1.
Project 2
Kick-off
1.
Kick-off
2.
Preliminary design review
2.
Project increment planning
3.
Development
3.
Sprints
4.
Demo
4.
Solution demo
5.
Test and fix
5.
Inspect and adapt
6.
User testing
6.
UAT
Figure 3.10
Case study project events.
belief alignment against environment stability; for the purposes of this figure, confidence is
defined as
Confidence
S2
Alignment Coefficient 2
1/ 2
(3.5)
For both projects, a retrospective study was employed in which the concept of digital twins was
used to construct the model using the concepts described above. Six events were identified in
which information from sensors was collected and reviewed. Figure 3.10 shows the project events
used for the model. Different, yet equivalent, events were used because Project One followed a
traditional SE and project management approach and Project Two employed SAFe, agile, and
scrum methodologies to manage the project.
3.12 Results
The case study comparison of Project One and Project Two demonstrates the effects of employing
sociotechnical constructs, AI, and HSE into the development environment. Comparatively, the
results from the model are plotted showing belief alignment and stability (see Figure 3.11). As
3.12 Result
T1
1.00
Project two
T2
0.90
T1
T2
T3
0.80
Project one
T4
0.70
T5
Zone 1
Zone 2
0.60
0.50
T6
0.40
Belief alignment
T6
T3
T5
T4
0.30
0.20
Zone 3
1.00
0.90
Zone 4
0.80
0.70
0.60
0.50
0.40
0.30
0.20
0.10
0.10
0.00
0.00
Stability
Figure 3.11
Belief alignment and stability results for case study.
noted, belief alignment is generated by calculating the geomean of belief coefficients derived from
a series of questions, noted previously. Stability is calculated using 1 minus IE (S = 1 − IE). Four
zones were defined to aid in analysis:
●●
●●
●●
●●
Zone 1 (belief > 0.6; stability > 0.6): Projects scoring in Zone 1 generally have a high probability
of success.
Zone 2 (belief > 0.6; stability < 0.6): Projects scoring in Zone 2 demonstrate a high level of confidence in the alignment and cohesiveness of the stakeholders but present challenges in that the
environment itself and/or the belief alignment is unstable due to exogenous influences.
Zone 3 (belief < 0.6; stability > 0.6): Projects scoring in Zone 3 demonstrate a low level of confidence in the alignment and cohesiveness of the stakeholders, while the environment itself and/
or the belief alignment is relatively stable with minimal expected change or exogenous influences. Note that this stable structure does not mean it is good – only that it is deterministic.
Zone 4 (belief < 0.6; stability < 0.6): Projects scoring in Zone 4 exhibit one or more behaviors and
associated risks that are commonly identified root causes of failed projects.
Analysis was performed using the conceptual architecture for Epoch 4 as a means of comparing
and determining value of evolving SE toward Epoch 4 (see Table 3.1).
Overall, for Project One, eroding belief alignment was evident over the life of the program as the
stakeholders did not learn from previous activities and outcomes and instead hardened their own
beliefs. Once these patterns were set, the culture of the project made it hard to change the patterns of
behavior and project structure. As can be seen, the project had a consistent trajectory leading from
initial confidence to the reality of a poorly run project. Conversely, the culture of Project Two employed
open communications across all stakeholders and maintained the idea of being a learning organization that actively sought to improve throughout the project life cycle. Continuous alignment and high
stability in the project are evidenced by the low variation in measurements for Project Two over time.
While this is an initial study, indications are that the constructs of Epoch 4 will improve success
in quality project deployment. As more projects follow these constructs, it is hoped that future
studies will prove the value of employing HSE and AI into the development environment.
37
38
3 Utilizing Artificial Intelligence to Make Systems Engineering More Human
Table 3.1
Case study comparative analysis.
Project One
Project Two
Systems
engineering
frameworks
Employed a generic and linear systems
engineering model where each activity
was independent and completed its full
activity before moving to the next phase,
e.g. all requirements gathered prior to
development
The project team used SAFe, agile SW
development, and scrum techniques to
continuously evolve the solution and
deliver incremental value where
feedback was incorporated into future
design considerations and development
environment structure
Sociotechnical
network models
Measures of belief were ascertained after
events occurred and misalignment had
already degraded relationships. In
post-project analysis, it was clear that
stakeholders were unaware of belief
misalignment or were anchored in their
beliefs and unwilling to change
The project team developed a structure
network of stakeholders identifying
roles and responsibilities and used the
network to ensure communications
challenge were actively being used to
ensure alignment between stakeholders
Temporal
sociotechnical
measures
Traditional project measures were used
to measure progress – cost, schedule,
and quality. No quantitative measures of
stakeholder alignment nor stability were
calculated. Small groups aired concerns
among themselves created an
environment where factions were
actively working against project progress
in order to protect their personal
interests
Stakeholders used active measuring
and a cultural shift toward seeking out
and resolving misalignment of beliefs.
Open communications were the norm
where identifying and sharing risks,
discrepancies, and differing opinions
were seen as a positive behavior
Digital twin/AI
No modeling or use of AI to model the
ecosystem transpired. Nor were there
efforts to understand effects of events
prior to their occurrence
The project team used basic modelbased engineering techniques and
rudimentary AI techniques to assess
alternative courses of action
throughout the project life cycle
3.13 Summary
As SE enters Epoch 4, the complexity and scale of projects have increased dramatically. While the
advent of MBSE has brought a level of rigor and repeatability to the practice, formal methods that
recognize the importance of the sociotechnical aspects of system development are lagging.
However, quantitative real-time analysis of the sociotechnical space has yet to be widely employed.
Historically, the difficulties in using sociotechnical models could be traced to a lack of data and
computational power. With the proliferation of digital communications, natural language processing, and methodologies, such as SAFe, these fundamental barriers are falling. Yet even with agile
approaches, over half of projects fail to be delivered within the time, cost and performance constraints, or fail outright (Mersino, 2018).
This chapter explored how a quantitative model of the sociotechnical space can be used to identify incongruities between stakeholders and highlight risks. While SAFe provides a methodology
for continuous communication and data exchange, in most implementations, the data is informal
or at best captured in meeting notes. With improvements in natural language processing, text processing, and uncertain reasoning as well as machine learning, there is an opportunity for both
Reference
model stakeholder belief systems to predict their actions and train the models by analyzing the
correlation between text communications, e-mail, and other sources.
The chapter also illustrated how the conceptual architecture described in Section 3.3.1 can be
readily instantiated as a tool to identify incidental and emerging risk. Results indicated promise
that sociotechnical risks can be identified early on in the development effort and dealt with. The
case study presented illustrated the possible positive effects of employing this approach.
The quest to find more effective methodologies for system development efforts continues to be a
research challenge across numerous industries. While improving digital representation can result
in faster, more accurate system development, it still does not address the most frequent reason for
project failures, the misalignment between stakeholders’ beliefs and expectations. In addition to
the obvious challenge of mismatched expectations, misalignment can have a more insidious risk.
When belief structures are misaligned, noncomplementary actions, and even actions that are
cross-purposes, can be taken. Quantitative sociotechnical modeling and risk analysis have the
potential to significantly improve successful development by explicitly monitoring and analyzing
belief structures and making proactive predictions of emerging risks. Mature sociotechnical modeling as part of the SE capability development is the realization of the promise of Epoch 4.
The authors’ affiliation with The MITRE Corporation is provided for identification purposes
only and is not intended to convey or imply MITRE’s concurrence with, or support for, the positions, opinions, or viewpoints expressed by the author. This paper has been approved for Public
Release; Distribution Unlimited; Case Number 20-1208.
R
eferences
Alexander, M. (2019). What is SAFe? The Scaled Agile Framework explained. CIO Magazine
(30 August).
Baillargeon, K. (2014). The Living Heart Project: a robust and integrative simulator for human heart
function. European Journal of Mechanics – A/Solids 48: 38–47.
Baldwin, K. (2019). Journal of Defense Modeling and Simulation (JDMS) special issue: transforming
the engineering enterprise – applications of Digital Engineering and Modular Open Systems
Approach. The Journal of Defense Modeling and Simulation: Applications, Methodology and
Technology 16 (4): 323–324.
Barry, P. and Doskey, S. (2019). Identifying hidden risks in multi-stakeholder, dynamic system
development environments. 2019 IEEE International Systems Conference (SysCon), Orlando, FL,
USA, pp. 1–7.
Bruynseels, K., Santoni de Sio, F., and van den Hoven, J. (2018). Digital twins in health care: ethical
implications of an emerging engineering paradigm. Frontiers in Genetics 9: 31.
Cordeiro, M., Sarmento, R.P., Brazdil, P., and Gama, J. (2018). Evolving networks and social network
analysis methods and techniques. In: Social Media and Journalism – Trends, Connections,
Implications. IntechOpen https://doi.org/10.5772/intechopen.79041.
Dodds, P.S., Harris, K.D., Kloumann, I.M. et al. (2011). Temporal patterns of happiness and
information in a global social network: Hedonometrics and Twitter. PLoS One 6 (12): e26752.
https://doi.org/10.1371/journal.pone.0026752.
Doskey, S. and Barry, P. (2018). A systems engineering perspective of timing information for optimized
decision making. 2018 Annual IEEE International Systems Conference (SysCon), Vancouver, BC,
pp. 1–8.
39
40
3 Utilizing Artificial Intelligence to Make Systems Engineering More Human
El Saddik, A. (2018). Digital twins: the convergence of multimedia technologies. IEEE Multimedia 25
(2): 87–92.
Fagen, M.D. (ed.) (1978). A History of Engineering and Science in the Bell System: National Service in
War and Peace (1925–1975). Bell Telephone Laboratories.
Feng, N., Li, M., Xie, J., and Fang, D. (2008). A data-driven model for software development risk
analysis using Bayesian networks. 2008 IEEE Symposium on Advanced Management of Information
for Globalized Enterprises (AMIGE), Tianjin, pp. 1–5.
Greenwood, D. and Sommerville, I. (2011). Responsibility modeling for the sociotechnical risk analysis
of coalitions of systems. Computing Research Repository – CORR. doi: https://doi.org/10.1109/
ICSMC.2011.6083832.
Guru99 (n.d.). Agile vs. scrum: know the difference. https://www.guru99.com/agile-vs-scrum.html
(accessed 16 January 2020).
Hu, F., Mostashari, A., and Xie, J. (eds.) (2010). Socio-technical Networks: Science and Engineering
Design. CRC Press.
Hui, K.T. and Liu, D.B. (2004). A Bayesian belief network model and tool to evaluate risk and impact
in software development projects. Annual Symposium Reliability and Maintainability, 2004 – RAMS,
Los Angeles, CA, USA, pp. 297–301.
Jamshidi, M. (ed.) (2008). Systems of Systems Engineering: Principles and Applications, 1e. CRC Press.
Johansen, I.L. and Rausand, M. (2014). Defining complexity for risk assessment of sociotechnical
systems: a conceptual framework. Proceeding of the Institution of Mechanical Engineers, Part O:
Journal of Risk and Reliability 228 (3): 272–290.
Kevin Reilly, C.W. (2020). Quantum computing, climate change, and interdependent AI: academics
and execs predict how tech will revolutionize the next decade (29 January 2020). https://www.
businessinsider.com/davos-microsoft-tech-henry-blodget-panel-2020-1.
Kim, S., Xi, H., Mungle, S., and Son, Y.-J. (2012). Modeling human interactions with learning under the
extended belief – desire – intention framework using agent-based simulation. 62nd IIE Annual
Conference and Expo 2012.
Le Pira, M., Inturri, G., Ignaccolo, M. et al. (2015). Simulating opinion dynamics on stakeholders’
networks through agent-based modeling for collective transport decisions. Procedia Computer
Science 52: 884–889.
Leffingwell, D., Knaster, R., Oren, I., and Jemilo, D. (2018). SAFe® 4.5 Reference Guide: Scaled Agile
Framework® for Lean Enterprises. Scaled Agile, Incorporated.
Li, W., Bai, Q., Zhang, M. et al. (2016). Agent-based influence propagation in social networks. 2016
IEEE International Conference on Agents (ICA), pp. 51–56.
Luna-Reyes, L.F., Zhang, J., Gil-García, J.R., and Cresswell, A.M. (2005). Information systems
development as emergent socio-technical change: a practice approach. European Journal of
Information Systems 14 (1): 93–105. Special Issue: from Technical to Socio-technical Change:
Tackling the Human and Organisational Aspects of Systems Development Projects.
Mehler, J., McGee, S., and Edson, R. (2010). Leveraging systemigrams for conceptual analysis of
complex systems: application to the U.S. National Security System. 8th Conference on Systems
Engineering Research, Hoboken, NJ (17–19 March 2010).
Mersino, A. (2018). Agile project success rates are 2X higher than traditional projects (1 April [2019
update]). https://vitalitychicago.com/blog/agile-projects-are-more-successful-traditional-projects
(accessed 18 December 2019).
Misirli, T. and Bener, A.B. (2014). Bayesian networks for evidence-based decision-making in software
engineering. IEEE Transactions on Software Engineering 40 (6): 533–554.
Reference
Muller, R., Geraldi, J., and Turner, J.R. (2012). Relationships between leadership and success in
different types of project complexities. IEEE Transactions on Engineering Management 59 (1): 77–90.
Netflix Technology Blog (2017). How we build code at Netflix (19 April). https://netflixtechblog.com/
how-we-build-code-at-netflix-c5d9bd727f15 (accessed 19 December 2019).
Oliveira, M.D.B. and Gama, J. (2012). An overview of social network analysis. Wiley Interdisciplinary
Reviews: Data Mining and Knowledge Discovery 2 (2): 99–115.
Ortigosa, A., Martín, J.M., and Carro, R.M. (2014). Sentiment analysis in Facebook and its application
to e-learning. Computers in Human Behavior: 527–541.
Poole, D., Mackworth, A., and Goebel, R. (1998). Computational Intelligence: A Logical Approach.
New York: Oxford University Press.
Putra, D.W. (2019). How to make your own sentiment analyzer using Python and Google’s Natural
Language API (12 February). https://www.freecodecamp.org/news/how-to-make-your-ownsentiment-analyzer-using-python-and-googles-natural-language-api-9e91e1c493e (accessed
20 February 2020).
Ramos, A.L., Ferreira, J.V., and Barceló, J. (2012). Model-based systems engineering: an emerging
approach for modern systems. IEEE Transactions on Systems, Man, and Cybernetics – Part C:
Applications and Reviews 42 (1): 101–111.
Rosen, R., von Wichert, G., Lo, G., and Bettenhausen, K.D. (2015). About the importance of autonomy
and digital twins for the future of manufacturing. IFAC-PapersOnLine 48 (3): 567–572.
Tao, F., Cheng, J., Qi, Q. et al. (2018). Digital twin-driven product design, manufacturing and service
with big data. The International Journal of Advanced Manufacturing Technology 94 (9–12):
3563–3576.
The Standish Group, International, Inc. (n.d.). The Chaos Report 2015. https://www.standishgroup.
com/sample_research_files/CHAOSReport2015-Final.pdf (accessed 19 December).
Tolk, A. and Hughes, T.K. (2014). Systems engineering, architecture, and simulation. In: Modeling and
Simulation-Based Systems Engineering Handbook (eds. D. Gianni, A. D’Ambrogio and A. Tolk),
11–41. CRC Press.
Tolk, A., Glazner, C.G., and Pitsko, R. (2017). Simulation-based systems engineering. In: Guide to
Simulation-Based Disciplines – Advancing Our Computational Future, Simulation Foundations,
Methods and Applications, 75–102. Switzerland: Springer International Publishing AG.
Tracy, M., Cerdá, M., and Keyes, K.M. (2018). Agent-based modeling in public health: current
applications and future directions. The Annual Review of Public Health 39: 77–94.
Warkentin, M., Moore, R., Bekkering, E., and Johnston, A. (2009). Analysis of systems development
project risks: an integrative framework. Database 40: 8–27. https://doi.org/10.1145/1531817.1531821.
Wünderlich, N.V. and Paluch, S. (2017). A nice and friendly chat with a bot: user perceptions of
AI-based service agents. ICIS.
Zimmerman, P. and Gilbert, T. (2017). Digital engineering transformation across the Department of
Defense. The Journal of Defense Modeling and Simulation: Applications, Methodology and Technology
16 (4): 325–338.
41
43
4
Life Learning of Smart Autonomous Systems for Meaningful
Human-Autonomy Teaming
Kate J. Yaxley1, Keith F. Joiner2, Jean Bogais3, and Hussein A. Abbass1
1
School of Engineering and Information Technology, University of New South Wales, Canberra, Canberra, ACT, Australia
Capability Systems Center, School of Engineering and Information Technology, University of New South Wales at Australian Defence
Force Academy, Canberra, ACT, Australia
3
University of Sydney, Sydney, NSW, Australia
2
4.1 Introduction
Cyber–physical systems augment all aspects of society (Zanero 2017), with many industries
embracing the benefits available (Brennan et al. 2019a; Muller 2017). While the increase of sensors, information sharing, and computer-aided mechanization has improved industrial capabilities, it has also introduced a level of complexity that means significant analysis is required for
performance assurance before decision making (Joiner and Tutty 2018; US Government
Accountability Office 2018). Take, for example, a pilot operating an aircraft representing a classic
cyber–physical system. The aircraft is equipped with computers to enable easier mechanical operation, sensors to interpret data on the environment, under varying operating conditions robustly
and an ability to share information with other operators through networked connectivity. However,
without the cognitive ability provided by the pilot to operate the aircraft and interpret information,
that is, containing the user in the system, the cyber–physical aircraft is not useful. Together, the
pilot and cyber–physical aircraft create a cognitive cyber–physical (C2P) system that can contribute to fulfilling missions’ objectives meaningfully.
An extension of this example of C2P is the concept of a smart autonomous system (SAS), where
the cognitive agent controlling the system is artificial. Artificial intelligence (AI) already forms
part of many cyber–physical systems (Abbass et al. 2016b; Endsley 1997; Klemas and Chan 2018),
performing task-specific functions to assist a cyber–physical system’s performance. The limitation
of current AI is that while we understand how it has been programmed, with algorithms to allow
for machine learning, what is not yet understood is how a lifetime of learning impacts the
SAS. Hence, through-life SAS is likely to partner with humans who rely on them or put another
way; SAS systems need governing. The partnership between humans and SAS can be termed
human-autonomy teaming (HAT) (Lyons et al. 2018; Strybel et al. 2018), which will be subject to
all the complex systems traits of an organismic model such as those documented by Keating and
Bradley (2015) like emergence, uncertainty, interdependence, complexity, and ambiguity. Hence,
any through-life HAT should conform to complex systems governance (CSG) such as the foundational CSG model by Keating and Bradley (2015), supported where necessary by the pathological
A Framework of Human Systems Engineering: Applications and Case Studies, First Edition.
Edited by Holly A. H. Handley and Andreas Tolk.
© 2021 The Institute of Electrical and Electronics Engineers, Inc. Published 2021 by John Wiley & Sons, Inc.
44
4 Life Learning of Smart Autonomous Systems for Meaningful Human-Autonomy Teaming
methods of Katina (2016). The CSG model can be considered “organismic” because it does more
than operate; it can monitor and develop to sustain policy and identity – put simply, to evolve. This
organismic approach to HAT would see the evolution of the sociotechnical system type from user
contained by the system to users are the system, acknowledging that users may be human or humantrusted artificial agents. By implementing CSG methodologies and modeling (Katina et al. 2021:
accepted), in conjunction with our SAS competency matrix, organizations will be able to confidently answer the question: do we understand systems laws and their impact on design and performance (Keating and Katina 2020)? What is required by engineers, educators, and evaluators is
governed agility using a meta-system approach to support system development, lessons and training, and the ability to assure system serviceability with minimal risk.
To illustrate, consider that as with the pilot earlier, a SAS would also undergo an iterative
through-life learning regime to both develop skills and forge relationships with other cognitive
agents. As with any system, an iterative process between system operations and system development can ensure improved SAS functionality. However, due to its cognitive nature, the SAS will
also undergo learning throughout, creating risks of emergent behavior, uncertainty, and so forth,
which in turn require clear communication, policy, and identity governance. This iterative learning will be introduced from development and continue to end of life, with interactions that involve
both artificial and human cognitive agents.
Successful through-life interactions should be meaningful and contribute to the success of the
end goal of the system, with users able to identify whether lessons have had the desired impact of
meaningful learning. The use of “meaningful” here is loaded for any SAS, in part due to the widespread military use of such future systems. For example, at a United Nations Convention on
Certain Conventional Weapons Meeting on Lethal Autonomous Weapons Systems (Roff and
Moyes 2016), a call for more meaningful human control (MHC) of SAS whereby there is “a threshold of human control that is considered necessary” and protocols such as those in Table 4.1 propose to set that threshold (Roff and Moyes 2016). There are also new engineering standards to
design SAS with “fail-safe mechanisms in a robust, transparent, and accountable manner”
(IEEE 2017), where there are similar new protocols for what is considered an acceptable manner.
The strict application of ethical guidelines concerning these protocols, such as those documented
by Jobin et al. (2019), is necessary to further the development of symbiotic relationships that have
significant implications for human society. By applying a human systems engineering (HSE)
approach, specifically by engineering both the cognitive agent and agreed ethics, into the lifelong
development, education, and evaluation of SAS, organizations will be able to ensure humancentered principles are upheld, balanced with the characteristic properties of intelligence-based
systems (Tolk et al. 2011).
Table 4.1
Key elements of meaningful human control (MHC).
Code
Element descriptor
K1
Predictable, reliable, and transparent technology
K2
Accurate information for the user of the outcome sought, operation and function of technology,
and the context of the use
K3
Timely human action and potential for a timely intervention
K4
Accountability to a certain standard
Source: Based on Roff and Moyes (2016). © 2016 United Nations.
4.2 Trust in Successful Teamin
Finally, in organizations that employ cognitive agents to produce outcomes, such as the military,
teams are an integral part of executing missions (DeCostanza et al. 2015; Stearns 2018). For such
teams to be successful, both trust (Douglas and Strutton 2009) and good leadership (Quigley 2013)
are essential. While such trust and leadership are crucial in human teaming, the extension of these
value-laden concepts to, and with governance over, meaningful human-autonomy teaming
(M-HAT) is what concerns this research.
We start by defining trust and the role of trust in successful teaming, allowing for the formation
of M-HAT. We then present concepts of HAT to present our definition of M-HAT. We then present
a systematic taxonomy and a method to characterize the maturity, or meaningfulness, of HAT in
the development and through-life operations of SAS. Such a taxonomy is quintessential to the
many interactive meta-functions of governing complex systems (Keating and Bradley 2015) in
ways that meet the essential AI principles (Jobin et al. 2019). Following our systematic taxonomy,
we discuss concepts to ensure successful SAS. Finally, we illustrate aspects of M-HAT using our
Australian research program into smart autonomous sky shepherding.
4.2 Trust in Successful Teaming
Trust is an essential key to the performance of an organization (Berens 2007), with teams that
exhibit trust between agents, at all levels, producing positive outcomes and displaying harmonious
relationships, relishing the payoff of building trust (Reina and Reina 1999). However, what is
trust? Trust is a complex array of feelings, emotions, attitudes, and beliefs combined with elements
of control, risk, and power (Petraki and Abbass 2014), which is essential for interdependent teams
(Mayer et al. 1995). Trust requires an understanding of values as the objects of moral conscience
experienced by all individuals and communities. Values do not exist in an inaccessible metaphysical realm but exist when they function in cognitive thought and action. They are the objects of
intentions (Kelly 2011). Because trust impacts on the actions and behavior of an agent, it becomes
a needed characteristic for an agent to be considered fully autonomous (Abbass et al. 2016a). For a
team to be successful, each agent must be capable of both understanding and displaying trust – in
this case, both the humans and SAS that form a human-autonomy team.
When considering the complexity inherent in C2P, trust is a root cause for the emergence of successful teaming. First, consider two agents and the trust relationship between each other. One
agent (i.e. truster) must be willing to be vulnerable to the other (i.e. trustee), with the reward being
successful completion of the request (Abbass et al. 2016a). With this established trust, the agents,
within their group, may later form part of a team. The formation of trust must then extend beyond
two agents and to that of multiple. Here learned trust (Abbass et al. 2016a) may assist in propagating the trust beyond the two original agents, through transparency and communication, as well as
repeated reliability (Abbass et al. 2016a). Hence, trust can be carefully and deliberately built
through team-building exercises that reinforce reliability, transparency, communication, and alignment of objectives and intents, thereby allowing a trust relationship to follow. With an established
team, freely demonstrating trust, overall performance will improve (Berens 2007; Mayer et al. 1995),
allowing the trust relationship, and by proxy, the sociotechnical system evolution, to be measured.
While task completion is one metric to measure the existence of a trust relationship within a team,
additionally, Costa and Anderson (2011) recommend measuring individual agent performance
(perceived trustworthiness and propensity to trust) and collective performance (cooperative behaviors
and monitoring behaviors), which includes quality of achievement and the ability of the team to
accept commands outside of the team network. By applying such broad metrics, testers and
45
46
4 Life Learning of Smart Autonomous Systems for Meaningful Human-Autonomy Teaming
developers will be able to meet the MHC elements presented in Table 4.1. Specifically, task completion relates to K1 – predictable, reliable, and transparent technology. While task completion may
not be a complete indication of transparency, combining this with K2, accurate information for the
user of the outcome sought, with a correlation between precise information and transparent performance between cognitive agents, forms an enabler for task completion. The metric of individual
agent performance applies to both human and artificial cognitive agents. Successful agent performance requires disclosing accurate information for the outcome sought and the context of use (K2)
while also remaining accountable for actions (K4). The cognitive agent, who demonstrates trust
through transparency, will understand the importance of being accountable for tasks completed,
which may assist with the reinforcing of transparency in relationships. The level of transparency
will contribute to the development of a trust relationship, linking back to individual performance,
quality of achievement, and team cohesion. While working in a team, it is often necessary to accept
commands from agents external to the group. The timeliness in receiving and acting on this external information (K3) is a measure of both individual performance and team cohesion.
An insight into how to structure the evaluation of HAT is evident in the precepts of usability testing for human–computer interaction where there is a significant emphasis on appropriately diverse
metrics and enough iteration (Wickens et al. 2014). Perhaps the most significant extension of these
usability testing precepts necessary to cater for SAS is the increased dependency on continued
through-life testing1 governance with meaningful control being “as frequent as necessary.” Research
in the governance of cyber–physical systems that are under constant emergent and adaptive threats
has found there is a significant overhead in test infrastructure and skills from such through-life
governance (Joiner et al. 2018), which likely will be the case for M-HAT, unless the risk is mitigated
through properly designed cognitive agents specializing in lifelong testing of SAS, in adequately
prepared scenarios for meaningful behavior and decision-making assessment (Tolk et al. 2009).
4.3 Meaningful Human-Autonomy Teaming
HAT is the shared operation of systems by task-specific autonomous systems and humans. Matessa
et al. (2018) present one example of this form of HAT, where automation enhances the planning
system for emergency landing that allows operator interaction, a form of transparency, and humanautonomy communication. The task-specific autonomous system, in this case, an Autonomous
Constrained Flight Planner (ACFP), reduces human workload by selecting the optimal flight path
for various emergencies. The user operates the ACFP by influencing weightings for flight path
optimization. The ACFP provides the operator with not only the apparent optimal path but correspondingly alternative paths, therefore achieving transparency and reinforcing a degree of trust
both through justifying the recommendations and the human-autonomy communication.
While the use of the HAT by Matessa et al. (2018) is simple, it seeks to provide an exemplar foundation for M-HAT, that is, one that seeks to form a meaningful relationship. However, the ACFP
does not learn from suggestions it provides the pilot, nor whether the pilot accepts its input.
Further, there is no reward for the pilot choosing to trust the ACFP; therefore, the success of this
system becoming a team built on trust in the future is, in our opinion, considered low. Further, the
ability of such a system to evolve as a sociotechnical system is low and can therefore remain a system that is engineered for user operates system only (Chapter 1).
1 A system is defined to have a “life cycle” as per IEEE (2015). Through-life testing refers to testing during the life
cycle, from conception to retirement.
4.4 Systematic Taxonomy for Iterative Through-Life Learning of SA
As presented earlier, fostering trust between any two agents, or more, is complex, requiring an
understanding of beliefs, attitudes, and expectations (Petraki and Abbass 2014; Strybel et al. 2018),
but, together with values, must also be measurable when developing autonomous systems designed
for integration within teams. Lyons et al. (2018) identified that the initial introduction of systems
where humans are required to trust autonomous agents is comparable with teams with members
who have not worked together before. This incremental approach may work if it is accretional;
however, few developmental acquisitions of SAS are likely to be ideally incremental since the
underlying architecture and interface changes will mean significant project investment. If a major
information communication technology (ICT) project implemented M-HAT as simple addition,
that is, without consideration of the interaction between systems within a family of systems
(Clark 2008), there are substantial risks that the traits of such a complex system could undermine
trust during development and certainly before operational implementation. Introducing HAT,
without the influence of meaningful relationships throughout development, risks creating a bias
by humans preferring human-human teaming, thereby inefficiently avoiding the autonomy or of
humans deferring to the SAS and providing the type of nonmeaningful control implied by Roff and
Moyes (2016). Such relationship would result in a sociotechnical system that remains user operates
systems, instead of evolving to users are system that includes human-SAS users (Chapter 1).
Trust in automation requires the considerations of reliability, performance, error type, transparency, shared awareness, and shared intent (Abbass et al. 2016a; Lyons et al. 2018) just as it does in
human teams, commonly used in performance appraisal (Denisi and Pritchad 2006). To foster a
meaningful relationship, the development of the autonomous system should be integrated with
human teams from the creation of the project, in such a manner that both the autonomous
system(s) and the human team members must be able to each provide and accept feedback (Abbass
et al. 2016a). By ensuring transparency, team-building interactions, and human-autonomy communication, the systems, engineered through consideration of human-centered principles, will
build trust in a meaningful and measurable way. Human teams that operate in a manner promoting trust demonstrate greater collaboration and performance, with views to improve productivity
and overall team behavior (Cummings 1983; Favero et al. 2016): hypothetically human-autonomy
teams can be expected to do the same. Irrespective of the efficacy of such careful team development and maintenance, a systematic approach should promote transparency and reward accuracy
and task completion for meeting the principle of predictable, reliable, and transparent technology
outlined earlier (Jobin et al. 2019; Roff and Moyes 2016) – tenets of MHC.
4.4 Systematic Taxonomy for Iterative Through-Life
Learning of SAS
As discussed, establishing M-HAT from the beginning of a teaming system life cycle allows for the
development of meaningful relationships between the cognitive agent teams. Given the complexity of SAS, project managers, human systems engineers, researchers, and developers will need to
alter their view of testing and operational introduction of SAS to one of continual learning and
development of cognitive agents. In research presented by Klemas and Chan (2018), agencies are
seeking to promote cyber resilience by introducing machine learning, data analytics, and automated testing; however, there is no defined way to appropriately assess the competency of such
technology. Promoting the cyber resilience of ICT systems through testing has been presented
(Joiner et al. 2018), and augmenting this testing with competency measures will better communicate system readiness and security to users and managers alike.
47
48
4 Life Learning of Smart Autonomous Systems for Meaningful Human-Autonomy Teaming
Currently, the development of a system includes conducting a technology readiness assessment,
using a technology readiness level (TRL) as a metric (U.S. Department of Defense 2016b), shown
in Table 4.2.
While conducting a technology readiness assessment for SAS will remain relevant, the metric
will need to consider not only the TRL but also the ability of the SAS to learn and demonstrate
concepts. That is, what lessons are required for the SAS, not only to be technologically ready but
just like a human apprentice, cognitively prepared for the task. Consequently, we propose SAS
assessments must consider not only TRL but also the SAS cognitive competence level to produce
an overall SAS readiness level (SRL). We define SAS cognitive competence level as the ability of the
SAS to articulate its understanding of a task to another cognitive agent, as given in Table 4.3, based on
similar human concepts reviewed by Krathwohl (2002). Identifying the SAS cognitive competence
level is vital to ensure M-HAT principles of interaction, human-autonomy communication, and
transparency. Human team members will better accept a learning SAS, or through-life a relearning
SAS if it is part of the normal progression of the team’s development. Importantly, managers of
programs, simulationists, engineers, and trainers can then systematically allocate the schedule,
time, and funding to constructively develop, introduce, and refine SAS in the M-HAT construct.
For example, Ryan (2018) presents that the future workforce of militaries will include both soldiers
Table 4.2
Technology readiness level (TRL).
1
Basic principles observed and reported
Survey and review
2
Technology concept or application formulated
Analytic study
3
Analytic and experimental critical function or characteristic
proof of concept
Proof of concept
4
Component or breadboard validation in a laboratory
environment
Laboratory (lab) integration
5
Component or breadboard validation in a relevant environment
Early integration
6
System and subsystem model or prototype demonstration in a
relevant environment
Lab or simulated (sim) environment
(env) demonstration (demo)
7
System prototype demonstration in an operational environment
Demo in operational (op) env
8
Actual system is completed and qualified by test and
demonstration
Accepted
9
Actual system has been proven in successful mission operations
Operational
Source: Modifed from U.S. Department of Defense (2016b).
Table 4.3
Proposed SAS cognitive competence levels.
Level
Definition
A. Remembering
Recall gameplay, recite an instruction
B. Understanding
Explain process using own words, explain movements
C. Applying
Create new moves, create a procedure for others to follow
D. Analyzing
Troubleshoot, identify tasks for training, conduct a test
E. Evaluating
Select the most suitable player, justify a process
F. Creating
Integrate information from multiple sources to create a solution, network with others
Source: Adapted from Krathwohl (2002).
4.4 Systematic Taxonomy for Iterative Through-Life Learning of SA
and SAS. SAS will be part of the team and structure, equating to both following and leading a team
of cognitive agents. To fulfill this role, SAS must be able to not only learn but also demonstrate
concepts with others. To ensure success, organizations will need to continue to employ the iterative development of teams.
We illustrate how to assess SAS using SRL by considering AlphaGo (Silver et al. 2016, 2017).
AlphaGo learned to play a strategic game through simulated gameplay and actual gameplay with
humans. While learning, AlphaGo used information from historical gameplay, as well as reinforcement learning during simulated gameplay. AlphaGo then applied this knowledge in a game against
Fan Hui, winning five games to zero. While AlphaGo used its knowledge and demonstrated gameplay closer to human play, it was unable to communicate the methodology. To understand how
AlphaGo played, researchers analyzed gameplay in isolation and not in conjunction with AlphaGo.
Using the proposed SAS cognitive competence levels (Table 4.3), AlphaGo demonstrated Level A
and aspects of Levels B and C; however, these are insufficient as they are to classify the readiness
of the SAS adequately and therefore require further refinement. Combining the technological
readiness level (Table 4.2) and SAS cognitive competence level (Table 4.3), we propose that the
two-dimensional SRL be defined for use, as shown in Table 4.4.
In the AlphaGo example, we assign an SRL nomenclature of “7.Abc” as follows:
●●
●●
●●
Number “7” indicates that AlphaGo was demonstrated in an operational environment.
Uppercase “A” indicates AlphaGo has competency in remembering.
The lowercase letters “b” and “c” indicate AlphaGo has potential, yet need for improvement, in
understanding and applying.
As per our M-HAT definition, to ensure meaningful interactions, effective human-autonomous
communication, and transparency, SAS will need to hold a minimum of SRL “4.A.B.C.d.e.f.” SAS
with a competency of “4.A.B.C.d.e.f” will be able to operate with a human or operator, in a simulated environment, and be able to demonstrate meaningful behavior to foster trust, collaborate on
ideas, and learn through interactions with either self, human(s), or another SAS. By compiling a
SAS competency matrix, modular components making up the SAS may be tracked, allowing
Table 4.4
Proposed SAS readiness levels.
Technological Readiness
Level
Basic research
Applied research
Early acquisition
Final acquisition
1
Survey and review
2
Analytic study
3
Proof of concept
4
Lab integration
5
Early integration
6
Lab or sim env demo
7
Demo in op env
8
Accepted
9
Operational
B
C
D
E
F
Apply
Analyze
Evaluate
Create
Remember
A
Understand
SAS cognitive competency level
SAS competency matrix
49
50
4 Life Learning of Smart Autonomous Systems for Meaningful Human-Autonomy Teaming
flexible design and good project management. Further, simulationists and testers will be able to
assess M-HAT teams in terms of task completion (K1 and K2), individual agent performance (K2
and K4), and collective performance (K3). This minimum standard would also allow testers to
assess whether outcomes achieved are a result of proper function, or chance, as the system will be
able to explain what it has sought to achieve. An assessment of the autonomous agent as displaying
operational or functional morality (Sharkey 2017) is also possible, or at least “collaborative intelligence” as described by Goldberg (2019), where humans collaborate with SAS to mutually complement each other. An autonomous agent exhibiting operational morality (value based) would
show lower levels of ethical sensitivity and would be unsuitable for any safety-critical system applications beyond full human control. Such systems would remain tools to assist or augment humans,
whereby the user operates the system to support system outcomes, yet not collaborate at an intellectual level. However, an autonomous agent exhibiting functional morality (values/virtues based)
would also be ethically sensitive and could integrate with a team of cognitive agents, utilizing
MHC. SAS would be capable of collaborating with humans intellectually, and by assessing actions,
assessors will be better able to query the agent on both the outcome sought and the purpose behind
such a result. In this manner, agents will be able to articulate decisions, measurable in terms of
both competence and ability to express responsibility for actions (Laukyte 2017), evolving to a system of users, where users are both human and SAS. Responsibility for actions may align to normative outcomes, with an autonomous agent capable of making meaningful decisions when faced
with a choice of good/bad or right/wrong (B), taking these normative conditions into account (E)
and exercising a degree of control in making decisions on that basis (ABCDEF). Should the explanation be incorrect, there is likely a need to introduce further learning curriculum to ensure correct operation, human-centered principles, and function as well as to assign the agent to a team to
enable success correctly. Using the SRL in Table 4.4 to assess SAS, it is possible to instill a multilevel interdisciplinary research, development, assessment, and operation process. Such a process
introduces what Brey (2000) termed disclosive computer ethics, focusing on justice, autonomy,
democracy, and privacy and involved disciplines ranging from philosophers to computer scientists.
Robbins and Steffen (2018) also propose that completing testing of SAS in phases of simulation,
hardware-in-the-loop, and safe-level operational environments. By leveraging the results from previous phases to shape the test plan of future phases, a continuous assessment of readiness is possible. Further, Robbins and Steffen (2018) present that to adequately test the decision-making
logic, the SAS should be exposed to highly stressful situations before being placed in an operational
environment. It is not impossible to stress an agent in a simulated environment in safety-critical
domains, such as by using a flight simulator or in gameplay (gaming for soldiers). However, it is
important to caution against only assessing the decision-making logic of SAS in levels of stress as
it is likely to reduce the ability to measure the cognitive competence level of the SAS effectively. It
is important to simultaneously evaluate the errors a SAS makes and the cognitive capacity of the
SAS, which represents a SAS capacity to learn and overcome the mistakes. A system with a medium
level of errors but with no capacity to be educated could deem unviable, especially compared with
a system that initially has a higher level of errors, but a significant capacity to be educated and
reach a lower level of errors.
As such, we recommend developing SRL testing to identify the optimum performance in both
general tasks and high-stress task environments caused by congestion and contestation while
simultaneously considering the system capacity for further education and learning. By conducting
SRL evolution tests using proper and thorough methodologies, transparently reporting outcomes
during testing and evaluation, and collaborating beyond bespoke disciplines, the risk of unexplainable emergent behavior is reduced. The success of through-life development will be dependent not
4.5 Ensuring Successful SA
only on the ability of a SAS to demonstrate competence but also on the ability of the entire team to
uphold code of practices2 and transparently report outcomes to stakeholders, including society.
With the systematic technological phases of simulation, hardware-in-the-loop, and safe-level
operational environments, the testing process will need to be structured to ensure a successful
assessment of the SRL throughout. Using regular phases, underpinned with contemporary test
and evaluation (Joiner et al. 2019), will evolve the SAS to promote self-awareness, trust, and, therefore, M-HAT. The systematic progression proposed would substantially help meet the conventions
of Roff and Moyes (2016) (i.e. Table 4.1) and the new IEEE standard for SAS (IEEE 2017). The next
section of the chapter focuses on the specialist teaming expected to govern the SAS through education, assessment, and testing.
4.5 Ensuring Successful SAS
To reliably and quickly identify emergent behavior, ambiguity, or uncertainty in decision-making
logic during development and through-life of SAS, it is likely to require more than just the teamed
humans and systematic readiness testing. Early concepts of identifying emergent behavior have
been proposed using the conceptual terms sidecar or cyber sidecar (U.S. Department of
Defense 2016a, pp. 28–30; Brennan et al. 2019b). What we propose here is the alternative conceptual term watchdog AI agents (Abbass et al. 2018), as it conveys the role as being less passive, more
intelligent, and more analogous to augmenting human attention than a sidecar. Chan (2018) outlines an AI system for cybersecurity monitoring that provides oversight against threats and deals
with uncertainty and ambiguity in a manner that aids timely human decision making. Such uses
for watchdog AI are likely to be led by cybersecurity applications seeking to regain the initiative
from the prevalence of malicious threats, albeit in ways to avoid accelerating such threat sophistication (Klemas and Chan 2018).
For a watchdog AI to be valuable requires it to be developed independently of, but concurrent
with, the SAS utilized for M-HAT. Watchdog AI agents would independently monitor the SAS during testing and operational implementation to continually assess the readiness level progress
yet also mitigate risks that may be present by continuously iterating education of the SAS (Abbass
et al. 2018). Specifically, by defining and assessing risky behaviors, or directly interrogating SAS to
understand actions, education of SAS will still have bounds on the meta-cognitive level. By both
assessing and interrogating, timely intervention is more ensured (Jobin et al. 2019; Roff and
Moyes 2016). As with any system exposed to the cyber environment, monitoring performance is
key to identify whether vulnerabilities have developed or a change in interactive behavior has
resulted through a meaningful interaction shift assessment. Using watchdog AI agents potentially
alleviates complexities in assessing the nature and speed of information processing of SAS that
cannot be achieved by humans alone (Abbass et al. 2018). The oversight of the HAT SAS through
a watchdog AI and supervising human agents is itself a governing layer of HAT, belonging to the
strategic monitoring component of policy and identity in the CSG model. Emergent behavior
detected by the teaming of watchdog AI and governing humans can then trigger adjustments to
system operations and system development with the necessary information and communications
2 Many disciplines, such as research (The Australian Code for the Responsible Conduct of Research, 2018),
engineering (IEEE Code of Ethics 2020), and simulation (Tolk 2017), include a code of ethics to govern
professionals.
51
52
4 Life Learning of Smart Autonomous Systems for Meaningful Human-Autonomy Teaming
Table 4.5
Human–robot interaction roles.
Role
Responsibility
Definition
Supervisor
Testing
Monitor and control the overall situation
Operator
Training
Modify internal software of models when behavior not acceptable
Mechanic
Training
Physical intervention, including hardware changes to ensure correct behavior
Peer
M-HAT
M-HAT team members, working together to achieve the outcome
Bystander
M-HAT
An external observer who may be called upon to interact with SAS
Educatora
Testing
Responsible for assessing SRL and developing curriculum to assess
achievements and enable lifelong learning
Source: Based on Scholtz (2003).
a
The role of educator is proposed in this chapter and not in Scholtz (2003).
to regain trust and promote human-centered principles. Such governance aligns with the “timely
human action” and “accountability” to a certain standard of Roff and Moyes (2016).
Scholtz (2003) presents five roles for human–robot interactions, shown in Table 4.5 for completeness. We propose two changes to these roles for HAT. The first change is to add a SAS educator or
clarify who among the supervisor, operator, or mechanic fulfills that secondary role. The second
change is to relabel the bystander as human team members.
The human supervisor alone will be unable to adequately assess the success of SAS promptly, as
the SAS cognitive processes occur at a much faster rate (Chan 2018; Klemas and Chan 2018). Using
watchdog AI and meeting SRL milestones, it is possible to assess whether intervention is required.
Intervention from a supervisor would trigger an evaluation of the SAS to reassess the SAS readiness against a known state. This assessment should be undertaken by a SAS educator, who complements both the operator and mechanic roles presented by Scholtz (2003). Using the educator may
identify the need to modify either software or hardware components of the SAS with specific
knowledge for the SAS of goals, intentions, actions, a priori curriculum, and lifelong experiences.
Specifically, the educator would be responsible for monitoring, educating, and assessing.
Establishing a hybrid team of agents to ensure the successful integration, operation, and education
of SAS is an example of extended agency and, therefore, hybrid responsibility (Gunkel 2017),
enhanced with the critical elements of MHC.
As presented by Scholtz (2003), the different roles may assist in assessing how well the human–
robot team interacts. Concerning fostering trust between agents and successful M-HAT, this is
essential. Given the SAS readiness assessments are to determine and later monitor whether the
SAS is ready to be part of the team, there must also be a way to identify whether interactions are
meaningful. As mentioned, one aspect is the achievement of outcomes. However, this may not
determine whether the team is genuinely cohesive. Therefore, a valuable addition proposed is “situational awareness” assessments that promote meaningful interactions that are a result of perceptions from SAS and peers. Situational awareness is the processing of incoming information from
many systems, including the environment and other team members, to better enable decision
making (Endsley 2013). These proposed situational awareness assessments are akin to the teambuilding exercises mentioned earlier but adapted to account for SAS being on the team, with a
greater focus on information flows around critical decisions and with less intuition than a purely
human exercise (i.e. where the monitoring and information may be subliminal or in some other
way not explicit).
4.6 Developing Case Study: Airborne Shepherding SA
Table 4.6
Situation awareness levels.
Level
Definition
1
Perception of the elements in the environment
2
Comprehension of the current situation
3
Projection of the future status
Source: Based on Endsley (2013).
Given that situational awareness is influenced by several factors, including abilities, experience,
and training (Endsley 1995), iterative learning (SAS education and training) will be essential in
promoting M-HAT. Endsley (2013) identifies the three levels of situational awareness in Table 4.6
that, when applied to HAT, reaffirms a level of educational understanding of self, situation, and
task for the partnered SAS. Through-life education can focus on developing HAT through regular
education to improve situational awareness in different environments and adapted roles, including
adaptive threats. The team will involve varying aspects of human-autonomy interaction, catered to
the unique situation of the education environment. Crucially the governing supervisor, watchdog
AI, and SAS educator will need to be involved throughout, focused on read-across of readiness
levels to the adapted roles and threats. As such, the proposed situational awareness assessments
are an extension to the first analogy of a pilot, where the pilot must undergo reeducation for
adapted roles and threats performed in a real aircraft and for emergency circumstances in a
simulator.
Like education iterations, training iterations must also occur in phases. However, to ensure the
success, education phases must be completed first, before progressing to training. Specifically, the
agent must be able to communicate an understanding of the know-how to perform a task before
being trained. Without this understanding, the agent will not be able to meaningfully connect and
interrelate lessons experienced during training to promote their situational awareness. To classify
the level of training completed, assessing SAS against both the SRL and situational awareness level
achieved in the training phase is required. Training iterates until sufficient readiness on both levels
are delivered by the HAT. Such training is analogous to the pilots undergoing currency checks on
their certified roles both in a real aircraft and simulator. The importance is to ensure the simulation
environment is representative, realistic, and transparent (Tolk 2017).
In summary, SAS involved in M-HAT require governance that itself likely needs to be augmented
with AI (watchdog) and similar levels of education and training oversight, such as through-life
education of SAS itself, as well as high-performance human operators (i.e. pilot, surgeon, etc.).
With regular team-building competency assessments focused on situation awareness, M-HAT
teams will be better able to foster trust and other performance characteristics, such as task achievement on operations and low error rates.
4.6 Developing Case Study: Airborne Shepherding SAS
Strömbom et al. (2014) advanced research into the modeling of shepherding with the two-
dimensional modeling of sheep behavior to herding agents. According to Singh et al. (2019), the
modeling “offers a level of abstraction for Human-Swarm Interaction” or “a smart robot could act
as a shepherd to replace biological shepherds with ground or air vehicles.” The role of AI so far has
53
54
4 Life Learning of Smart Autonomous Systems for Meaningful Human-Autonomy Teaming
been to “preserve the energy of the shepherd by modulating the shepherd’s influence vector on the
sheep.” Other related research includes by Clayton and Abbass (2019) into machine-learning
reward functions “to evolve a swarm controller for an agent shepherding a boids3-based swarm”
and by Gee and Abbass (2019) on “a novel curriculum to teach an AI-empowered agent to shepherd.” However, this research remains laboratory based, at least since the original study by
Strömbom et al. (2014), needing applied research to put the SAS capability into practical use. Using
the proposed SRL, such applied research aims to take the readiness level from “2ABc” to “7ABCde”
(Table 4.4). Given geographical distances and terrain in Australia, practical research is ideally airborne, which reduces the technological readiness from the two-dimensional basis just given. An
online search of videos disclosed an alarming number of farmers in Australia, New Zealand, and
the United States exploring the use of remotely piloted drones for the herding of sheep, despite the
lack of serious research and underpinning science. The potential inefficiency of using remotely
piloted drones is of concern with these ad hoc trials, as is the ethical lens of drone pilots who are
not familiar with sheep or the subject paddocks (fields) trying to herd. There also exists a potential
of drone accidents, resulting in injury to farmers or livestock, due to farmers not familiar with
complexities in drone piloting. Applying smart autonomy research from two-dimensional shepherding to an airborne capability through to an operational demonstration is an ideal case study
for applying the SAS readiness taxonomy and proposed concepts for meaningful HAT. While this
case study will take several years to apply, using the taxonomy now to illustrate the usefulness of
the proposed method for developmental design will assist in the development and evaluation of an
exemplar M-HAT system. Figure 4.1 distinguishes the four phases leading to the autonomous use
of drones to herd a flock of sheep to a goal, such as an open gate on a paddock.
The research has so far identified four phases leading to the autonomous use of drones to herd a
flock of sheep to a goal, such as an open gate on a paddock. Phase 0 commenced with the use of a
commercial off-the-shelf drone to investigate the significant factors within the environment.
Experiments were designed to have a pilot executing communicated by a farmer. Phase 1 sees the
implementation of a research developed drone (Sky Shepherd). Both phase 0 and phase 1 have
users operating the system, with considerations for animal ethics and the investigation of how to
safely and efficiently herd flocks of sheep.
The evolution from phase 1 to phase 2 will see the introduction of an autonomous control system
for operating the Sky Shepherd, coinciding with the first evolution in the socio-technology
Users operate the
system
M-HAT 1
FaSST
Phase 0
Figure 4.1
Users operate the
system
M-HAT 1
FaSST
Phase 1
Users monitor the
system
M-HAT 1
FaSST
Users are the system
M-HAT 1
Phase 2
FaSST
Phase 3
Technology evolution for successful M-HAT in Sky Shepherd research.
3 The term boids was initially used by Reynolds (1987) to model the behavior of biologically inspired swarms.
4.6 Developing Case Study: Airborne Shepherding SA
relationship, from users operating to users monitoring. The monitoring role for the pilot will be
necessary to ensure ethical actions and decisions are achieved by the control station while herding
flocks. The ethical actions will extend from animal welfare to upholding aviation regulations based
upon human values. Further, the communication between the control station and pilot will be successful when a natural blending of human and machine is promoted. These meaningful, timely
human interactions (K3) will shape the autonomous system into a SAS that is reliable and transparent (K1) and, by extension, provides accurate information for the monitoring user (K2), allowing accountability (K4). As the autonomous system learns, the monitoring may be completed by a
farmer only, allowing for the evolution to phase 3, which is where the autonomous system is a
transparent SAS. The users become the system, that is, a SAS and farmer teaming together with a
Sky Shepherd or Farmer and Sky Shepherd Team (FaSST).
Simulations on how sheep behave in the presence of ground-based herder, including artificially
intelligent autonomous collecting and driving of sheep, currently work in two dimensions. Future
work focuses on taking the modeling to four dimensions, by first using a drone, which adds the
vertical dimension, and second applying a speaker to the drone to add a fourth audio effect dimension. Another research line is exploring how to get the SAS sky shepherds to team as a team of
working dogs would so that much larger flocks can be worked still using several teaming costeffective drones. Finally, the last research thread is to make a straightforward mission planning
system where a farmer can tell the drones from a smartphone where the property boundaries are,
how many sheep to expect, where the goal is, and any paddock complexities like dams, tree lines,
and the such. This approach seeks to overcome some of the limitations of AI documented by Zador
(2019) by employing structured collaboration (i.e. M-HAT), as suggested by Goldberg (2019).
Phase 0 of our research begins more foundationally in establishing how sheep respond to drones,
such as those pictured in Figure 4.2, carefully and systematically, to inform subsequent phases of
the research by knowing what the safest and most effective maneuvers and noise for a drone are to
use in sky shepherding. This phase starts with some heart-rate monitoring of sheep, pictured in
Figure 4.3, to systematically model the impact of drones on the health and welfare of animals;
thus, ensuring the design is ethical by anticipating potential harm and taking appropriate action to
prevent it. Smart drones must learn to understand cues for sheep alertness, anticipate sheep
response, and maneuver in the least distressing but still effective ways possible. Importantly, the
ethical baseline and thus benchmark is current shepherding practice with sheepdogs, and this
requires some testing to confirm from early research (Baldock and Sibly 1990) with our current
instrumentation.
The initial phase ensures the credibility of the sheep response modeling for simulations, screens
key influence parameters, but importantly grounds the research in what is meaningful for human
control. To apply a SAS to such a problem involves a better understanding of not only farmer’s current shepherding uses but how that can evolve with new capability. For example, much of the early
focus of autonomous flight vehicles were on weapon delivery compared with a wide diversity of
modern use (Floreano and Wood 2015). While that use remains controversial still Roff and Moyes
(2016), the vast majority of autonomous flight vehicle time is spent on surveillance. Hence, making a shepherd airborne is likely to provide significant surveillance capability for the farmer, especially in remote stations where assessments of feed, water, fencing, and feral dog threats are
essential precursors to an actual shepherding. Hence drones offer timely surveillance and action
that should be a significant and ethically aligned advantage to farmers.
In research like this, it is tempting to think at the shallowest level of “autonomy” as replacing the
human altogether and thus removing the pilot, farmer, and dogs. Such presumption leads to criticisms on nonmeaningful control. However, the next level of conjecture is that the HAT starts with
55
Figure 4.2 Sky Shepherd pilot sets up a DJI Mavic II Enterprise Duo ready for phase 0 testing. Source: The
photos (Figures 4.2 and 4.3) presented in this chapter form part of the research approved by The University
of New South Wales Animal Ethics Committee (ACEC 19/122B).
Figure 4.3 A flock of Dorper sheep (Ovis aries) responding to the presence of low speed, low altitude, Sky
Shepherd, augmented with an aural cue. Source: The photos (Figures 4.2 and 4.3) presented in this chapter
form part of the research approved by The University of New South Wales Animal Ethics Committee (ACEC
19/122B).
4.7 Conclusio
the laboratory or operational demonstration (TRL 6–7). This presumption leads to highly nonoptimal interfaces and the lack of trust described earlier. Working the HAT as soon as the concept
stages, such as an infield response collection, offers a chance to focus HSE on whether design
requirements meet farmer’s needs and to support more rigorous simulations. Such simulations, in
turn, mean farmers can be engaged on a user interface for mission planning with far less risk.
The proposed systematic approach to M-HAT readiness (Table 4.4), the CSG view, and HSE principles has helped focus the path of researchers to a team of stakeholders representing the governing influences for the envisaged complex system, including, farmers, animal welfare, pilots, drone
designers, and commercial livestock agents. The CSG model has also highlighted the importance
of information and communication. New ethical uses of drones need to be sought and also seen to
be explored since to have practical effect requires significant collective farmer and consumer
acceptance (Munoz et al. 2019). Ongoing public awareness programs will be vital to making the
autonomy trusted by all concerned (Proposed Australian Animal Welfare Standards and
Guidelines – Sheep 2013).
Furthermore, this application raises new ethical challenges, such as follows:
●●
●●
●●
What is the principal actor?
Can phenomenology characterize the actor as executor of acts?
Is unity discoverable in the tables of values, moral values, norms, and virtues such that any given
action could be characterized consistently as either right or wrong?
Finally, the concept of a watchdog AI for this system appears as a simple presumption, to be an
added complication to an already complex research task, and it may always face such concern.
However, on deeper examination, the commercial and public acceptance hinges on trust. The
likely most significant treatment for any abnormal event, whether it occurs in the laboratory development or each farmer’s first use, is early timely feedback on whether the behavior is anticipated
or emergent. How many farmers and videos of their use would it take to cause an issue with the
SAS, whereas how many times could a resident watchdog AI cause a farmer to reread the mission
planning instructions? Developing the watchdog AI from the inception of the SAS offers “learned”
governance of meaningful in this context.
4.7 Conclusion
This chapter has presented the tenets of M-HAT as being transparent, human-autonomy communication, and interaction. Further, the chapter has proposed how to assess the capability of SAS in
meeting these tenets. Combining current readiness assessments, for both technical systems and
educational taxonomy, has provided human systems engineers, evaluators, and educators with a
taxonomy to identify the overall readiness level of a SAS to team with the necessary human-autonomy
two-way trust. To ensure new proposed competency levels are accurately assessed requires testing
to be completed in matched systematic phases that include the simulated environment, hardwarein-the-loop, and operational environment using contemporary test and evaluation methods
(Joiner et al. 2019). Throughout these phases, general and high-stress scenarios are assessed as
necessary for the human-autonomy team to develop all the tenets of meaningful teaming
fully and to identify both optimum performance and areas for improved performance or learning
while also evolving the sociotechnical principle of users are the system. This rigor in stressing is
entirely analogous to the cyber resilience trade-offs for through-life management documented by
Joiner et al. (2018).
57
58
4 Life Learning of Smart Autonomous Systems for Meaningful Human-Autonomy Teaming
SAS involved in meaningful teaming with humans are likely to require governance through-life
that itself is augmented with AI (watchdog AI). Further, the governance regime is likely to need
similar levels of education and training oversight through-life as high-performance human operators (i.e. pilot, surgeon, etc.) and to include regular team-building competency assessments focused
on situation awareness. Throughout the iterative lifelong learning, a team of human-autonomy
experts, including the introduction of a smart autonomy educator, will be required to ensure iterative education and training. Together, the supervisor, watchdog AI agents, and educator are necessary to ensure the success of SAS to meaningfully team alongside the four critical human control
tenets (Table 4.1).
Our research is verifying how the HAT methodology proposed can be applied to new Australian
research on the herding of sheep using airborne drones. The proposed research will involve the
teaming of farmers with the autonomous capability to assure MHC for the farmers and their public
obligations. This application potentially solves extant ethical challenges in shepherding in Australia
concerning the use of dogs and timely monitoring and action in vast sheep stations. Still, it also
raises new ethical challenges around the continually evolving AI in the system.
The proposed systematic approach to the readiness of M-HAT can assist in meeting new autonomy design standards, rigorously assessing readiness levels for teaming, and promoting throughlife situational awareness assessments against new proposed levels.
Acknowledgment
The photos (Figures 4.2 and 4.3) presented in this chapter form part of the research approved by
the University of New South Wales Animal Ethics Committee (ACEC 19/122B).
References
Abbass, H., Petraki, E., Merrick, K. et al. (2016a). Trusted autonomy and cognitive cyber Symbiosis:
open challenges. Cognitive Computation 8 (3): 385–408.
Abbass, H.A., Leu, G., and Merrick, K. (2016b). A review of theoretical and practical challenges of
trusted autonomy in big data. IEEE Access 4: 2808–2830.
Abbass, H.A., Harvey, J., and Yaxley, K.J. (2018). Lifelong testing of smart autonomous systems by
shepherding a swarm of watchdog artificial intelligence agents. arXiv preprint (airXiv:1812.08960).
Baldock, N. and Sibly, R. (1990). Effects of handling and transportation on the heart-rate and behavior
of sheep. Applied Animal Behaviour Science 28 (1–2): 15–39.
Berens, M. (2007). Trust and betrayal in the workplace: building effective relationships in your
organization. Journal of Organizational Change Management 20 (3): 463–465.
Brennan, G., Joiner, K., and Sitnikova, E. (2019a). Bespoke versus open architectures: impacts on
cyber-resilience of mission-critical systems. Paper presented at the SETE 2019: Systems Engineering
Test and Evaluation Conference 2019, Canberra.
Brennan, G., Joiner, K.F., and Sitnikova, E. (2019b). Architectural choices for cyber resilience.
Australian Journal of Multidisciplinary Engineering 15: 68–74.
Brey, P. (2000). Method in computer ethics: towards a multi-level interdisciplinary approach. Ethics
and Information Technology 2 (2): 125–129.
Chan, S. (2018). Prototype orchestration framework as a high exposure dimension cyber defense
accelerant amidst ever-increasing cycles of adaption by attackers. Paper presented at the CYBER
2018: The Third International Conference on Cyber-Technologies and Cyber-Systems, Athens.
Reference
Clark, J.O. (2008). System of systems engineering and family of systems engineering from a standards
perspective. In 2008 IEEE International Conference on System of Systems Engineering, Singapore,
pp. 1–6.
Clayton, N.R. and Abbass, H. (2019). Machine teaching in hierarchical genetic reinforcement learning:
curriculum design of reward functions for Swarm Shepherding. Paper presented at the 2019 IEEE
Congress on Evolutionary Computation (CEC), Wellington.
Costa, A.C. and Anderson, N. (2011). Measuring trust in teams: development and validation of a
multifaceted measure of formative and reflective indicators of team trust. European Journal of Work
and Organizational Psychology 20 (1): 119–154. https://doi.org/10.1080/13594320903272083.
Cummings, L.L. (1983). Performance-evaluation systems in context of individual trust and
commitment. In: Performance Measurement and Theory (eds. F. Landy, S. Zedeck and J. Cleveland),
89–96. New Jersey: Erlbaum Hillsdale.
DeCostanza, A.H., Gallus, J.A., and Babin, L.B. (2015). Global teams in the military. In: Leading Global
Teams: Translating Multidisciplinary Science to Practice, 295–322. New York, NY: Springer New York.
U.S. Department of Defense (2016a). Defense Science Board (DS) Summer Study on Autonomy.
U.S. Department of Defense (2016b). Technology Readiness Assessment Guide: Best Practices for
Evaluating the Readiness of Technology for Use in Acquisition Programs and Projects.
Washington: GAO.
Denisi, A.S. and Pritchad, R.D. (2006). Performance appraisal, performance management and
improving individual performance: a motivational framework. Management and Organization
Review 2 (2): 253–277.
Douglas, M.A. and Strutton, D. (2009). Going “purple”: can military jointness principles provide a key
to more successful integration at the marketing-manufacturing interface? Business Horizons 52 (3):
251–263.
Endsley, M.R. (1995). Toward a theory of situation awareness in dynamic systems. Human Factors: The
Journal of Human Factors and Ergonomics Society 37 (1): 32–64.
Endsley, M.R. (1997). Level of automation: Integrating humans and automated systems. Proceedings of
the Human Factors and Ergonomics Society 41st Annual Meeting 1: 200–204.
Endsley, M.R. (2013). Situation awareness. In: The Oxford Handbook of Cognitive Engineering (eds.
J.D. Lee and A. Kirlik). New York: Oxford University Press.
Favero, N., Meier, K.J., and O’Toole, L.J. Jr. (2016). Goals, trust, participation, and feedback: linking
internal management with performance outcomes. Journal of Public Administration Research and
Theory 26 (2): 327–343.
Floreano, D. and Wood, R.J. (2015). Science, technology and the future of small autonomous drones.
Nature 521: 460–466.
Gee, A. and Abbass, H. (2019). Transparent machine education of neural networks for Swarm
shepherding using curriculum design. Paper presented at the 2019 International Joint Conference
on Neural Networks (IJCNN), Budapest.
Goldberg, K. (2019). Robots and the return to collaborative intelligence. Nature Machine
Intelligence 1: 2–4.
Gunkel, D.J. (2017). Mind the gap: responsible robotics and the problem of responsibility. Ethics and
Information Technology https://doi.org/10.1007/s10676-017-9428-2.
IEEE (2015). Terms, definitions and abbreviated terms. In: ISO/IEC/IEEE 15288 Systems and Software
Engineering – System Life Cycle Processes. Switzerland: IEEE.
IEEE (2017). P7009 – Standard for Fail-Safe Design of Autonomous and Semi-Autonomous Systems.
https://standards.ieee.org/project/7009.html (accessed 8 July 2020).
IEEE Code of Ethics (2020). https://www.ieee.org/about/corporate/governance/p7-8.html (accessed 8
July 2020).
59
60
4 Life Learning of Smart Autonomous Systems for Meaningful Human-Autonomy Teaming
Jobin, A., Ienca, M., and Vayena, E. (2019). The global landscape of AI ethics guidelines. Nature
Machine Intelligence 1: 389–399.
Joiner, K.F. and Tutty, M.G. (2018). A tale of two allied defence departments: new assurance initiatives
for managing increasing system complexity, interconnectedness and vulnerability. Australian
Journal of Multi-Disciplinary Engineering 14 (1): 4–25.
Joiner, K.F., Ghildyal, A., Devine, N. et al. (2018). Four testing types core to informed ICT governance
for cyber-resilient systems. International Journal of Advances in Security 11: 313–327.
Joiner, K.F., Efatmaneshnik, M., and Tutty, M. (2019). Test and evaluation toolset. In: Evolving Toolbox
for Complex Project Management (eds. A. Gorod, L. Hallo, V. Ireland and I. Gunawan), 339–370.
Boca Raton, FL: Auerbach Publications.
Katina, P.F. (2016). Systems theory as a foundation for discovery of pathologies for complex system
problem formulation. In: Applications of Systems Thinking and Soft Operations Research in
Managing Complexity, 227–267. Cham: Springer.
Katina, P.F., Tolk, A., Keating, C.B., and Joiner, K.F. (2020). Modelling and simulation in complex
system governance. International Journal of System of Systems Engineering 10 (3): 262–292.
Keating, C.B. and Bradley, J.M. (2015). Complex system governance reference model. International
Journal of System of Systems Engineering 6 (1–2): 33–52. https://doi.org/10.1504/ijsse.2015.068811.
Keating, C.B. and Katina, P.F. (2020). Enterprise governance toolset. In: Evolving Toolbox for Complex
Project Management (eds. A. Gorod, L. Hallo, V. Ireland and I. Gunawan), 153–181. New York:
Auerbach Publications.
Kelly, E. (2011). Material Ethics of Value: Max Scheler and Nicolai Hartmann. Dordrecht: Springer.
Klemas, T.J. and Chan, S. (2018). Harnessing machine learning, data analytics, and computer-aided
testing for cyber security applications. Paper presented at the CYBER 2018: The Third International
Conference on Cyber-Technologies and Cyber-Systems, Athens.
Krathwohl, D.R. (2002). A revision of Bloom’s taxonomy: an overview. Theory into Practice 41 (4):
212–218.
Laukyte, M. (2017). Artificial agents among us: should we recognize them as agents proper? Ethics and
Information Technology 19 (1): 1–17.
Lyons, J.B., Ho, N.T., Hoffman, L.C. et al. (2018). Trust in sensing technologies and human wingmen:
analogies for human-machine teaming. Augmented Cognition: Intelligent Technologies 10915:
148–157.
Matessa, M., Vu, K.-P., Strybel, T.Z. et al. (2018). Using distributed simulation to investigate humanautonomy teaming. In: Human Interface and the Management of Information. Information in
Applications and Services, vol. 10905, 541–550. Cham: Springer.
Mayer, R.C., Davis, J.H., and Schoorman, F.D. (1995). An integrative model of organizational trust. The
Academy of Management Review 20 (3): 709–734.
Muller, H.A. (2017). The rise of intelligent cyber-physical systems. Computer 50 (12): 7–9.
Munoz, C.A., Campbell, A.J.D., Hemsworth, P.H., and Doyle, R.E. (2019). Evaluating the welfare of
extensively managed sheep. PLoS One 14 (6): e0218603. https://doi.org/10.1371/journal.pone.0218603.
Petraki, E. and Abbass, H.A. (2014). On trust and influence: a computational red teaming game
theoretic prospective. Paper presented at the 2014 Seventh IEEE Symposium on Computational
Intelligence for Security and Defence Applications (CISDA), Hanoi.
Animal Health Australia (AHA) (2014). Australian Animal Welfare Standards and Guidelines – Sheep.
Version: 1.0, January 2016 Endorsed. www.animalwelfarestandards.net.au (accessed 23
February 2020).
Quigley, J. (2013). The leadership cycle: how to enable collective leadership: James Quigley, CPA,
details strategy for creating successful teams. Journal of Accountancy 215 (6): 28–30.
Reference
Reina, D.S. and Reina, M.L. (1999). The need for trust. In: Trust & Betrayal in the Workplace: Building
Effective Relationships in Your Organization, 1e, 3–12. San Francisco: Berrett-Koehler Publishers Inc.
Reynolds, C. (1987). Flocks, herds and schools: a distributed behavioral model. ACM 21 (4): 25–34.
Robbins, C. and Steffen, M.R. (2018). The future of autonomous ground and surface systems testing.
The ITEA Journal of Test and Evaluation 39: 82–85.
Roff, H. and Moyes, R. (2016). Meaningful human control, artificial intelligence and autonomous
weapons. In: Briefing Paper Prepared for the Informal Meeting of Experts on Lethal Autonomous
Weapons Systems, 1–6. Geneva: UN Convention on Certain Conventional Weapons.
Ryan, M. (2018). Human-Machine Teaming for Future Ground Forces. Washington: Center for Strategic
and Budgetary Assessments.
Scholtz, J. (2003). Theory and evaluation of human robot interactions. Paper presented at the Proceedings
of the 36th Annual Hawaii International Conference on System, Sciences, 2003, Big Island.
Sharkey, A. (2017). Can we program or train robots to be good? Ethics and Information Technology
2017: 1–13.
Silver, D., Huang, A., Maddison, C.J. et al. (2016). Mastering the game of Go with deep neural
networks and tree search. Nature 529: 484–489.
Silver, D., Schrittwieser, J., Simonyan, K. et al. (2017). Mastering the game of Go without human
knowledge. Nature 550 (7676): 354–359.
Singh, H., Campbell, B., Elsayed, S., et al. (2019). Modulation of force vectors for effective shepherding
of a swarm: a bi-objective approach. Paper presented at the 2019 IEEE Congress on Evolutionary
Computation (CEC), Wellington.
Stearns, J.P. (2018). Motivating teams through the impossible. Strategic Finance 100 (2): 23–24. 26.
Strömbom, D., Mann, R.P., Wilson, A.M. et al. (2014). Solving the shepherding problem: heuristics for
herding autonomous, interacting agents. Journal of the Royal Society 11: 20140719. https://doi.
org/10.1098/rsif.2014.0719.
Strybel, T.Z., Keeler, J., Mattoon, N. et al. (2018). Measuring the effectiveness of human-autonomy
teaming. Paper presented at the Advances in Neuroergonomics and Cognitive Engineering, Cham.
The Australian Code for the Responsible Conduct of Research (2018). www.nhmrc.gov.au/sites/
default/files/documents/attachments/grant%20documents/The-australian-code-for-the-responsibleconduct-of-research-2018.pdf (accessed 28 August 2020).
Tolk, A. (2017). Code of ethics. In: The Profession of Modeling and Simulation: Discipline, Ethics,
Education, Vocation, Societies and Economics, 35–52. Hoboken, NJ: Wiley.
Tolk, A., Madhavan, P., Jain, L.C., and Tweedale, J.W. (2009). Agents and decision support systems. In:
Agent-Directed Simulation and Systems Engineering (eds. L. Yilmaz and T. Ören), 399–431. Hoboken,
NJ: Wiley.
Tolk, A., Adams, K.M., and Keating, C.B. (2011). Towards intelligence-based systems engineering and
system of systems engineering. In: Intelligence-Based Systems Engineering, 1–22. Springer.
U.S. Government Accountability Office (2018). Weapon Systems Cybersecurity: DOD Just Beginning to
Grapple with Scale of Vulnerabilities. Washington, DC: U.S. Government Accountability Office.
Wickens, C.D., Lee, J., Liu, Y., and Gordon-Becker, S. (2014). Human-computer interaction. In: An
Introduction to Human Factors Engineering, 2e, 363–397. New York: Pearson Prentice Hall.
Zador, A.M. (2019). A critique of pure learning and what artificial neural networks can learn from
animal brains. Nature Communications 10 (1) https://doi.org/10.1038/s41467-019-11786-6.
Zanero, S. (2017). Cyber-physical systems. Computer 50 (4): 14–16.
61
63
Section 2
Domain Deep Dives
65
5
Modeling the Evolution of Organizational Systems
for the Digital Transformation of Heavy Rail
Grace A. L. Kennedy, William R. Scott, Farid Shirvani, and A. Peter Campbell
SMART Infrastructure Facility, University of Wollongong, Wollongong, NSW, Australia
5.1 Introduction
The engineering problems of the twenty-first century require innovative approaches that deal with
the increasing complexity of contemporary problems and their system solution spaces; novel
methods are also required if the organizations that manage and govern these systems are to remain
aligned (Keating et al. 2014). Meeting the customer’s needs while maintaining value becomes progressively more challenging as the focus shifts from product-based development to service and
capability-based solutions that are holistic and integrated across the whole life cycle and supply
chain (Kemp and Daw 2014; Purchase et al. 2011). This book chapter describes a case study application of how model-based systems engineering (MBSE) can be used to manage the introduction
of new technologies, with a focus on the “soft enterprise” or organizational issues. Within the
human systems engineering (HSE) framework described in this book, the case study is positioned
within the transportation (Australian heavy rail systems) domain. The modeling approach presented can be applied to many sociotechnical system (STS) types depending on the scope of the
system of interest. The user of the new technologies may be considered as an operator of a technical system (e.g. a rail protection officer operating a tablet) or as an entity that is contained by a
system (e.g. a train driver utilizing new onboard train control systems). Finally, the STS can be
viewed from an abstract organizational system level where the humans involved form a system in
itself. As a primary aim of the research was to address the impact of new technology introduction
on human factors (HF) concerns, it follows that many of the assessments presented in this chapter
speculate on the earlier stages of the future system life cycle (e.g. concept and design) and comparison with the equivalent functionality of the existent system (usually in operational stage). However,
the models can consider the various technological systems at any stage in the system life cycle and
enable insight into the management of concurrent systems with staggering life cycles as the organization evolves over time.
An enterprise can be described as “one or more organizations sharing a definite mission, goals,
and objectives to offer an output such as a product or service” (ISO 2019). INCOSE defines an engineered system as “a system designed or adapted to interact with an anticipated operational environment to achieve one or more purposes while complying with applicable constraints” (Silitto
et al. 2019). This definition has recently been updated to reflect that although engineered systems
A Framework of Human Systems Engineering: Applications and Case Studies, First Edition.
Edited by Holly A. H. Handley and Andreas Tolk.
© 2021 The Institute of Electrical and Electronics Engineers, Inc. Published 2021 by John Wiley & Sons, Inc.
66
5 Modeling the Evolution of Organizational Systems for the Digital Transformation of Heavy Rail
are traditionally technological in nature, abstractions exist that are nontechnical and can be engineered for a purpose. Given these two definitions, it can be inferred that enterprises can be systems
and that they can be engineered. Enterprise systems are not a new concept (Rouse 2005; Valerdi
et al. 2008). However, within the field of systems engineering (SE), there is some disagreement
around their epistemology (in particular, the overlaps between systems of systems [SoS] and STS
[Pennock and Rouse 2016]). Pennock and Rouse (2016) define an enterprise system as “a collection
of interacting organizations that construct and/or operate one or more technological systems to
achieve a goal.” The capabilities of the enterprise system depend on both the technological systems
and the organizations involved. Improvements in capability require some form of transformation,
and it is essential to consider the enterprise system if businesses are to attain the value planned successfully. Optimizing design improvements, reducing costs, streamlining processes, and managing
the effectiveness of supply chains are commonplace in business. These initiatives, however, are
often performed in isolation, while generating improvement in one area may be less optimal in others (Rouse 2005). Enterprise architecture frameworks (AF) enable enterprise systems to be modeled
from various viewpoints in an integrated manner while managing the complexity of the information (ISO 2019). A vast plethora of enterprise AF exist and vary in scope of interpretation
(Schekkerman 2004); these differences are due to the focus and application of the framework (from
genericity and domain to national differences). Within the last decade, there have been efforts in
the field of human systems integration (HSI) to include a complete view of the organizational
aspects and how they integrate into the enterprise architecture. Bruseberg (2008) first developed the
human view as part of the Ministry of Defense Architecture Framework (MODAF) in the United
Kingdom, while around a similar epoch, Handley and Knapp (2014) were developing the human
view in NAF and later Department of Defense Architecture Framework (DoDAF). Most recently,
the Unified Architecture Framework (UAF) by the Object Management Group (OMG) included a
new personnel view to explicitly address the integration of these concepts (Hause and Wilson 2017).
This case study describes an MBSE tool developed through funding from the Australasian Centre
for Rail Innovation (ACRI) to enable business stakeholders to consider the evolution of organizational systems as new technologies are introduced named the Organizational Capability Maturity
Model (OCMM). This chapter discusses how the framework has been applied specifically for
organizational system evolution (within the context of the framework developed) and considers
the organizational aspects and how the organizational system(s) must both adapt to and inform
the design and introduction of technologies to provide new capabilities for the enterprise system.
The chapter is structured as follows: Section 5.2 introduces the characteristics of organizational
systems and how such systems evolve. Section 5.3 provides a brief introduction to the benefits of
MBSE and how MBSE principles have been utilized in this case study. Section 5.4 summarizes the
authors’ approach. Section 5.5 discusses the implementation and how portals have been created to
balance utility with usability. Section 5.6 provides an example case study application. Finally,
Section 5.7 summarizes the chapter and draws conclusions.
5.2 Organizational System Evolution
5.2.1 Characteristics of Organizational Systems
HSI is concerned with ensuring that human capabilities and limitations are considered within the
SE activities of a project throughout the system life cycle in order to optimize the performance of
the system (while also supporting the well-being of the human) (INCOSE 2015). Within the field
5.2 Organizational System Evolutio
of HF (also known as ergonomics), the organizational aspects represent one of three interlinked
domains (the other two domains being cognitive and physical). The organizational system concerns the interacting set of people working toward a common purpose and how the interfaces to
technological systems and other organizations are managed. The organizational system considers
the various aspects of the humans involved:
●●
●●
●●
●●
●●
●●
●●
●●
The organizational system is an abstract concept, and it exists within one or more enterprise
systems (ISO 2019; Pennock and Rouse 2016).
Organizational systems are recursive or scalable, depending on the scope and boundaries considered. Organizational systems may include suborganizations within them or may consider
other organizations separately in scope (ISO 2015).
Organizational systems support the top-down enterprise strategy (the strategy should be propagated, decomposed, and instantiated throughout the organizational system) (Galbraith and
Lawler 1993).
Organizational systems can be designed but also exhibit variability, learning, and self-organizing
properties.
Organizational systems support the enterprise at the different stages of the system life cycle
(ISO 2015). The organizational system may include suborganizations or interface with other organizations that perform system development, installation, operations, maintenance, and disposal.
Organizational systems consider the impact of the individual, team, and structure on the behavior of the organization (Robbins et al. 2017).
Organizational systems can be structured in different ways. These structures are not confined to
the traditional hierarchical organization chart but may represent formal and informal networks,
as well as static and dynamically changing relationships. Organizations display all these types of
structures. The formal static structure is required to understand control structures and maintain
governance. However, the informal dynamic structures enable the organization a degree of compensatory fit (Gulati and Puranam 2009) and hence flexibility.
Organizational systems consider the “soft” organizational characteristics such as role interactions, team working, cultural values, knowledge distribution, competencies, training, and decision making (Hubbard et al. 2010).
HSE is concerned with various STS types. Although it would seem contrary in HSI to consider
the organizational and technical as separate concepts, an STS consists of an organization interacting with a technical systems (Pennock and Rouse 2016). The organizational system is scalable and
can be viewed with different boundaries; this can be anywhere from the users being an embedded
part of the STS, a user of the STS, or at levels of abstraction where the users themselves are the STS.
5.2.2 The Organization in Flux
Organizational systems are not closed systems. They are not static institutions that exist in an independent microcosm from society. Organizational systems are subject to macro-environmental factors – in this context, the systems must be flexible to simultaneously seek out strategic opportunities
and exhibit resilience to changes in the political, economic, societal, technological, legal, and environmental landscapes. The dynamic nature of the environment requires organizations to display
agility to change, and thus the organization is in a state of flux as it adapts and learns (Galbraith
and Lawler 1993). Conversely, organizations are also in flux from an internal perspective as organizations seek continuous improvement strategies, from new management paradigms, efficiency,
and lean principles to troubleshooting recognized problematic areas.
67
68
5 Modeling the Evolution of Organizational Systems for the Digital Transformation of Heavy Rail
The workforce in an organization is also transient. New workers commence employment, some
retire, and some will leave employment – it is estimated that during their working life, Australians
will make 17 changes in employers across five different careers (FYA 2017); this, in turn, yields
challenges in the retention of skills and organizational knowledge. Workers also tend to move
around within organizations as part of career development plans. Although organizations may
have a semi-stable, formal organizational structure, the informal networks, teaming, and shared
experiences are composed of a history of day-to-day momentary situations.
Enterprise SoS, or extended enterprises, are created when organizations are required to work
closely with other organizations but maintain separate goals, governance, and structures. Supply
chains and collaborations add a layer of complexity to the organizational system as interfaces must
be managed, and each organization may need to compromise its individual goals to meet the overall goal of the enterprise SoS. The enterprise SoS is dynamic in nature as component organizations
change to meet the capability needs from phase to phase, and the boundaries may become blurry.
5.2.3
Introducing New Technologies
In this section the epistemology of enterprise systems (Pennock and Rouse 2016) is revisited to
consider the hypothetical introduction of new technologies. Figure 5.1 expands on some of the
concepts from Pennock and Rouse’s notional view of enterprise systems by considering their evolution over time. The top plane represents an abstract enterprise system at an arbitrary point in
time (t1) that acts as the initial point of interest. The middle plane is the same enterprise system at
a further point in time (t2), and the bottom plane (t3) chronologically advanced from there.
At any point in time, an enterprise system will consist of a number of organizations that are
dealing with a number of systems that are at different phases of their system life cycle (e.g. from
concept, development, production, operations, support/maintenance, and disposal). Table 5.1
Organization α
System C lifecycle
System B lifecycle
System A lifecycle
Enterprise system (t1)
System A
System C
Enterprise system (t2)
Organization α
System D lifecycle
System A
System B
Organization β
System C
Organization γ
System D
Enterprise system (t3)
Organization α
System A
Figure 5.1
System B
Organization β
Organizational system evolution.
System B
Organization β
System C
Organization γ
System D
5.2 Organizational System Evolutio
Table 5.1
Organizational evolution example.
System life cycle stage
Time
System A
System B
System C
System D
t1
Operate
t2
Disposal
Install
Develop
—
Operate
Install
Develop
t3
{Legacy}
Upgrade
Operate
Install
summarizes the systems that are being considered at each transition point. Note that this table
does not include all system life cycle stages, but a simplified subset to introduce the concept that
organizations will have different needs at different stages.
At t1 the enterprise system consists of two organizations that are developing or operating three
systems. At this stage, System A is in the operational stage, System B has been developed and is
being installed, and System C is being developed. Systems B and C are coupled together as an
SoS. In our example, organization β is the primary organizational system of interest, while organization α represents a maintenance subcontractor. Organization α is maintaining System A and is
involved in the planning for future maintenance of System B. Organization β has been developing
and is installing System B, and simultaneously developing System C.
At t2 a new Organization γ and a new System D are introduced to the existing enterprise system.
On this plane level, the previous systems (A–D) are now further along their system life cycle.
System A is reaching the end of its system life cycle, and Organization α is decommissioning it.
System B is now in operation, and Organization α is maintaining it, while Organization β is still
concerned with managing the system as they have planned to upgrade the functionality in stages.
System C is now being installed, and as identified earlier, Systems C and B are tightly coupled.
System C will operate on parts of System B. This added layer of complexity must be managed by
Organization β. To make matters more complicated, a new Organization γ has been introduced as
a vendor for a future System D, which is at the conceptual stage of systems development. It will be
integrated with the upgraded System B and operational System C. Organization β decides not to
outsource the maintenance for System C and must start resourcing workforces that can operate
and maintain the future system.
Finally, at t3, System A is now part of Organization α’s legacy and organizational history.
Although System A no longer exists, the components of the organization still exist with knowledge
and experience of working within that STS. System B is upgraded by Organization β, and
Organization α will continue to maintain System B into the future after the upgrade. System C has
now been deployed and is in operational stage. Organization β can use the knowledge gained
through installing and operating System B to integrate System C. System D is being installed by
Organization γ and will be part of an SoS (B, C, and D) that will be operated by Organization β.
Table 5.1 summarizes the enterprise system stages at all three points in time.
This hypothetical enterprise system seems complicated but is not an uncommon situation in
large-scale complex enterprises where there may be SoS, diversity of systems, collaborations,
and convoluted supply chains. All the organizational systems (α, β, and γ) must include different competencies, training, tasks, safety procedures, and resourcing for the current stages of
systems they are concerned with while at the same time planning for the future stages. In
69
70
5 Modeling the Evolution of Organizational Systems for the Digital Transformation of Heavy Rail
addition to evolving the organizational systems to meet the system life cycle changes, they must
also adapt and evolve with the changing interfaces between the other organizations to ensure
seamless transitions between planes. The planes depicted in Figure 5.1 have been simplified
and are unlikely to be conveniently synchronous as system life cycle stages do not necessarily
all transition simultaneously. Different systems stages have different durations, and slippage
invariably occurs. Although organizational change appears continuous, it is not feasible, nor
time and labor efficient to model every detailed shift and change. Businesses will need to carefully select a set of discrete points (planes) that will be analyzed. As a first step, consideration
should be made of the extent of the envisaged change and possible impact on the enterprise.
Purchase et al. (2011) suggest that there are three candidate criteria for distinguishing such
transformations:
1) Response to radical changes in the environment
2) Fundamental alteration of context
3) Step change in performance
In order to understand the nature of human work in the future of an engineered system, it is
necessary to consider how the human systems will be integrated throughout all the SE activities.
To do this, human systems engineers need to build models or representations of the various aspects
of STS for analysis and simulation. From an organizational perspective, all these HSE activities
and models need to then be integrated across the portfolio of engineering projects. Modeling of the
evolution of organizational systems pose specific challenges such as:
●●
●●
●●
●●
●●
●●
●●
●●
●●
Dealing with enterprise system complexity (both from the environment and internally).
Integrating the organizational system and the other parts of the enterprise system.
Ensuring consistency between parts of the integrated organizational system.
Forward-looking planning to ensure that the organizational system is positioned effectively to
meet future goals.
Feedforward of changes to assess the extent of adaptability for different solutions.
Maintaining traceability of organizational decisions made.
Storage of organizational history, knowledge, and experience for the future.
Level of effort required to model and maintain the evolving models.
Information overload as the size of the models increases over time, meaning that the information will require careful management so that the content of the views can be constrained.
SE aims to manage changes in systems to ensure that they are fit for purpose; therefore these
practices may be applied (with tailoring) to manage an organizational system.
5.3 Model-Based Systems Engineering
MBSE is defined as “the formalized application of modeling to support system requirements,
design, analysis, verification, and validation, beginning in the conceptual design phase and continuing throughout development and later life cycle phases” (INCOSE 2007). One of the major
trends in the field of SE this century is the movement toward being a model-based discipline, as
engineering practices evolve toward the digital transformation of enterprise systems. So, MBSE
must also transform to meet these new challenges to become a key component in managing the
increasing complexity of the systems (Madni and Sievers 2018; Peterson 2019). MBSE enables
businesses to model the enterprise system and create digital versions of the SE artifacts that are
integrated and provide a “single source of truth” (thus improving traceability and consistency).
5.4 Modeling Approach for the Development of OCM
MBSE also creates a digital copy of the project history and decisions made. Madni and Purohit
(2019) discuss the promise of MBSE:
●●
●●
●●
●●
●●
●●
Capture and harmonize information across multiple disciplines.
Create an integrated digital model of the system.
Auto-propagation of changes through dependencies in the system.
Consistent and current information.
Replication of models in the hierarchy and opportunities for reuse/tailoring.
Consistent, complete, and traceable.
Ultimately, MBSE (when done well) improves the efficiency of the organization through helping to
manage complexity and reducing cost and risk. To manage the complexity of the models, an AF is
required to organize the categorization and storage of the information as well as the mechanisms for
retrieving the correct amount of information from across the model to ensure that it is fit for purpose.
MBSE tools utilize object-orientated databases to contain information that is commonly presented
in one of several formats, including diagrams, tables, matrices, and Gantt charts. The database is
used to control the information with changes made in one part of the model automatically conveyed
to other parts of the model using common model elements, thereby reducing effort and ensuring
consistency. Visual modeling is a practical and pragmatic method for participatory modeling and
leads to effectively capture and review of information about the system from various subject matter
experts (SMEs). MBSE enables modelers not only to consider the holistic system but also to consider
different levels of abstraction and decomposition, from overlapping alternative viewpoints, to
understand the nature of the interactions and to break down the complexity of the system.
The tool has been developed using a combination of the Systems Modeling Language (SysML)
and a tailored form of the UAF. SysML was established and formally specified by OMG in 2006 and
was recently released as version v1.6 (OMG 2019). The purpose of SysML is given as:
A standard modeling language for systems engineering to analyze, specify, design, and verify complex systems. It is intended to enhance systems quality, improve the ability to
exchange systems engineering information amongst tools, and help bridge the semantic gap
between systems, software, and other engineering disciplines. (OMG 2019)
While SysML provides a language for “how” to express information, UAF provides a baseline of
“what” to model. UAF (OMG 2017) began as the Unified Profile for DoDAF and MODAF (UPDM).
This framework enables the capture of a wide variety of aspects about a system, including the
organization (with associated vision and required capabilities), risk, operational concept, and project information. Utilizing this standard ensures that the underlying model is based on international best practice but is tailored specifically to meet the identified stakeholders’ concerns and
information needs. Although the UAF profile formed the basis of the initial framework in the work
described in this chapter, expansion and tailoring were required to create additional conceptual
elements that would enable the users to meet their HF modeling needs.
5.4 Modeling Approach for the Development of OCMM
The OCMM was designed to manage the evolution of the organizational system in response to
technology changes using MBSE technologies. The approach – to understand a technology change
and how the organization will change in response – consists of a five-step process, as shown in
Figure 5.2. The approach is presented as sequential to depict the flow of how the changes are
71
72
5 Modeling the Evolution of Organizational Systems for the Digital Transformation of Heavy Rail
Project information
Technology
specification
Capture
system
change
Capture
organization
change
Organization
change
management
Socio-technical system model
Analysis
Figure 5.2
Analysis
Analysis
Analysis
Analysis
OCMM development approach.
managed. However, in practice, these processes are parallel efforts feeding each other through the
evolving understanding contained within the STS model (the STS being composed of one or more
technical systems interacting with one or more organizations [Pennock and Rouse 2016]).
Enterprises at a given point in time will have a project portfolio. The “starting point” in the authors’
approach is to consider the projects of interest (these could be of varying maturity, for an existing
or future state), and pertinent information was gathered about the projects (whether from a technical or management perspective). Each of these processes is described in the following subsections.
Concept demonstrators were created and reviewed at regular intervals with the rail operator project stakeholders to gather information, elucidate feedback, and validate the models and functionality of the tool being developed.
5.4.1 Technology Specification
The first step in the process captures the specific information about the new technology and the
timeline about its development and deployment, which is commonly found within the volume of
information developed in the originating project. This information is necessary to gain an understanding of the technology being introduced and the view of how the technology will be operated
and maintained. Projects often focus on the information directly associated with the technology
and leave the receiving organization responsible for understanding how the technology will be
incorporated into its broader systems and processes. These processes have been separated from an
understanding of how the wider system that envelopes the new technology will change. The data
associated with understanding the specific technology is often “owned” by the companies (or alliance depending on the acquisition strategy) that is responsible for the technology’s development.
In contrast, the recipient organization controls the understanding of the wider system. For example, a project will develop new technology, but the recipient organization will be the operator/
maintainer that is responsible for the operation and maintenance of the system. Based on this
understanding of the technology, the organization needs to plan how the organization will change
in response to the technology needs, such as incorporating the technology processes within the
organization processes (discussed below).
5.4 Modeling Approach for the Development of OCM
5.4.2 Capture System Change
This part of the model development process captures how the wider system will change with the
introduction of new technology and how the associated processes need to be modified. For an
extensive, complex system such as heavy rail, understanding the introduction of new technology
can be difficult as there can be a variety of configurations where the latest technology touches
upon the existing infrastructure and the shift toward the adoption and integration of technologically mature COTS solutions. As heavy rail systems have evolved in Australia for over a century
(the first railway in NSW was installed in 1849), there are often variations in the interfaces that
need to be considered to maintain interoperability. This is particularly acute with the introduction
of digital control systems into what have been customarily analog-based systems.
The broader functions also need to be considered as to how the specific mechanisms provided by
the technology will fit strategically into the capabilities of the system. Some local processes may
have to be tailored for particular circumstances; for example, there are locations (such as tunnels
and bridges) where workers cannot be used as lookouts to detect approaching rail traffic and,
therefore, other (often higher) forms of track worker protection are required.
5.4.3 Capture Organizational Changes
The introduction of new technology will stimulate changes in the organization that need to be
captured, such as changes in roles, responsibilities, and competencies. At this step, formal information around the organizational structure can be gathered and captured, alongside any envisaged
future configurations. Various models of the organization are developed from the information
about key processes, organizational units, or roles of interest. This provides a vehicle for demonstrating how the humans and tasks involved will transition as the system changes (as captured in
Section 5.4.2).
5.4.4
Manage Organization Change
This step examines the necessary change in the organization to develop plans to realize the
changes. These plans need to ensure that the transformation is completed on time that is aligned
with the technology transformation. These activities may be incorporated into broader training
management processes associated with other objectives, such as competency maintenance.
5.4.5 Analyze Emergent System
Once the STS model is of an appropriate level of maturity (this could be aligned to the planned
phase gates of the project but should be of sufficient detail to provide meaningful results that will
support the decision makers), analyses can be performed to provide insight into the various stakeholders’ HF concerns (e.g. competencies, training, situational awareness, workload, organizational
culture, safety assurance, and cybersecurity). This step in the approach is iterative and can be fed
back into the STS model to improve the design and be available in the central repository for other
types of analyses. The analyses are stored “live” alongside the models and become a formal part of
the project documentation (improving the traceability of any decisions made).
Many analyses need to be undertaken to validate the emerging STS after all changes have been
made. Each of these analyses is intended to address a specific concern but can have an overlap in
their content or effect on one another. For example, a risk assessment (Shirvani et al. 2019) may
include the examination of the effects of people’s competency in various circumstances or generate
73
74
5 Modeling the Evolution of Organizational Systems for the Digital Transformation of Heavy Rail
new competency requirements for risk mitigation. Similarly, activities may be appended to processes for risk mitigation that may affect other analyses such as workload and situation awareness
(SA) that consider a wider set of tasks being undertaken. The OCMM tool contains a set of example
analyses to demonstrate how the integrated STS model can be assessed. However, the framework
is intended to be flexible to accept other HF assessment techniques and methods (on a needs basis
as determined by the HSI specialists who would use the tool).
The five steps outlined in this approach have a threefold benefit for HSE. Firstly, they enable the
HSI SMEs (i.e. the HSI practitioners or HSI domain specialists who are experts in their relative
domains) to access the current system development at any stage as it matures and create HF models
and analyses that can be fed back into the development of the system; in particular, this brings the
HSI earlier into the system life cycle from as early as concept through to disposal. Secondly, the HSI
integrator (the role that integrates all the HSI activities for the projects) will be able to get an overview of the current HSI activities and ensure consistency between shared artifacts between HF
models and analyses for the system of interest. The HSI integrator (as part of the SE team) will also
be able to act as a conduit between the HSI activities and the SE activities to ensure project planning
and management is fed both ways. Where MBSE evolved from a need for seamless SE modeling for
development of the system alongside the technical modeling, so too should the HSI activities. The
third benefit is to the HSI manager or policy makers in a business. The OCMM approach enables
the full project portfolio to be assessed at various states in time (i.e. the planes in Figure 5.1); the
HSI manager can ensure that governance is being adequately enacted for each project at its appropriate phase and that the overall business plans and resourcing requirements will be met.
5.5 Implementation
The OCMM was developed as an AF that employed ISO 42010 principles (ISO 2011) and based on
UAF (OMG 2017) was implemented to manage the models, organize information effectively, and
address the complexity emerging from the interconnected, evolving models (Shirvani et al. 2019).
This framework was developed to be used by various stakeholders (usually managers within the
business) who would be responsible for managing the specific areas of concern resultant from the
technological changes. Using a standardized AF also enables the models created within OCMM to
be aligned with other MBSE artifacts being created within the business and vice versa. The intention is that as businesses adopt MBSE activities as part of the digital thread, the OCMM would fit
within the greater suite of models created (rather than a stand-alone tool).
The AF uses the concept of viewpoints and views to provide stakeholders with their particular
capability needs while shielding them from the full complexity of the whole system. At the same
time, the AF structure ensures that interdependencies and linkages are maintained across the
entire system being modeled. The ISO 42010 standard was adopted to create a method for developing the proposed AF in this study. The method steps are as follows:
Identifying the stakeholders who are concerned about the system of interest.
Identifying the concerns of each stakeholder.
Identifying the viewpoints (types of information) required for addressing the concerns.
Developing the metamodel representing the data structure of the viewpoints:
●● Borrowing from existing metamodels and frameworks (e.g. UAF/UPDM).
●● Creating new elements and relationships that will be fit for purpose to meet the stakeholder’s needs.
5) Defining the model kind(s) for the viewpoint.
1)
2)
3)
4)
5.5 Implementatio
The OCMM tool has been developed in MagicDraw™, an MBSE software environment (Dassault
Systems 2020). MagicDraw was selected due to the authors’ familiarity with the software; in addition to built-in profiles for UAF and SysML, MagicDraw also provides multiple timeline and configuration functionality, which enables simple management of the evolutionary nature of the
models and change.
5.5.1
User Portals
The OCMM was developed with the set of key stakeholders identified in the AF, and their envisaged use cases for the tool were identified and explored with the SMEs within the rail operator
organizations. Thirteen types of users of the tool were identified. To present the viewpoints of each
kind of user, user portals were developed as an interface to present the pertinent information to
address their concerns but also to manage the input of information from that user and to allocate
it in the correct areas of the database underlying the architecture. Sets of libraries were created to
manage the information that populates the models. As the concerns are often overlapping, users
will require access to information from a subset of the set of libraries. Table 5.2 shows a mapping
of the user portals and the libraries of information that each user requires access to. Access levels
can be set for each user portal, enabling libraries (and certain determined models) to be shared
with other user portals. A generic set of organizational models was first created to demonstrate the
functionality of the tool. These generic models were then extended and tailored to create organizational-specific models using information specific to two Australian heavy rail operators.
5.5.2 OCMM Metamodel
The first step in analyzing a domain utilizing a model-based approach, regardless of the purpose of
analysis, is to capture the domain information in a standard format that will be interpreted in a
common manner by the domain stakeholders. Using an abstract model of the domain (aka a metamodel) allows for consistent generation of domain models that provide a common understanding
of the domain concepts. The OCMM metamodel was developed where possible using elements
from within the UAF profiles (e.g. organization, function, post, competence, resource) that would
provide the building blocks of the models. Abstract organizational models were created for each of
the stakeholder concerns to provide additional elements (not available within UAF) and the relationships between the concepts. Each of the models within the OCMM contains an overlapping
subset of the elements from the metamodel. Figure 5.3 shows an excerpt of the OCMM metamodel, showing a subset of the pertinent aspects across the HF concerns spectrum, and their interactions. Each small box shows an element (or class), which provides a type of building block from
which models can be created, and the connectors between them are the relationships (or associations). The small text along the connectors describes the relationship in the direction of the arrow.
An additional layer of information is overlaid on top of the metamodel to show how groupings of
subsets of elements might appear in one type of model but are also shared between types of models. Five example metamodel groupings are shown in Table 5.3.
While some models have clear boundaries and interactions (such as the relationships between
competency and training), other types of models are more interconnected (the process modeling
and safety assurance are overlapping because the OCMM safety assurance is focused on task-based
analyses). To show the complete OCMM metamodel would be too complicated to convey in one
diagram easily. It should be noted that the metamodel is not exhaustive of all possible components
and relationships within a generic organizational system, the metamodel is explicitly tailored to
75
Table 5.2
Mapping the user portals to information libraries.
User portals to
information libraries
Competencies Training Safety hazards Risks Cyber Culture Project Regulations and Project
library
library
library
library library library details Standards library timeline
Project manager
✓
✓
Change manager
✓
✓
Culture manager
✓
✓
✓
✓
✓
✓
✓
✓
✓
✓
✓
✓
✓
✓
✓
✓
✓
✓
✓
✓
✓
✓
✓
✓
✓
✓
✓
✓
✓
✓
✓
✓
✓
Training provider
Training manager
✓
Workforce manager
✓
Competency manager
✓
Internal auditors/assessors ✓
Cybersecurity manager
✓
✓
✓
✓
✓
✓
✓
✓
✓
✓
✓
Regulations manager
✓
Safety assurance
✓
✓
✓
Various roles affected
✓
✓
✓
✓
Tool manager
✓
✓
✓
✓
✓
Generic
OrganizationOCMM model specific model
✓
✓
✓
✓
✓
✓
✓
✓
✓
✓
✓
✓
✓
✓
✓
Organizational structure
Competency
act as
requires
requires
«stereotype»
has
«stereotype»
AQF Qualification
«stereotype»
Skill Set
[Class]
[Class]
«stereotype»
Skill
is an attribute of
«stereotype»
«stereotype»
is an attribute of Knowledge
Competency
[Class]
[Class]
«stereotype»
Unit of Competency
[Class]
affects
«stereotype»
«stereotype»
«stereotype»
Organization
[Class]
«stereotype»
Experience
is an attribute of
[Class]
«stereotype»
Process modeling
S
«stereotype» applied to
Function
[Activity]
«stereotype»
TLX Task
has
[Class]
«stereotype»
Training Course
«stereotype»
On the Job Training
«stereotype»
Simulated Training
[Class]
[Class]
[Class]
[Class]
[Class]
Figure 5.3 OCMM metamodel (excerpt).
[CalBehaviorAction]
«stereotype»
Cyber Threat
[Class]
«stereotype»
Workload Variable
«stereotype»
RA SCI Roles
[Class]
[Dependency]
involved in tasks
applied to
«stereotype»
FinalEffectOfFailure
[Action, Class]
applied to
results in
«stereotype»
Situational Awareness Task
«stereotype»
Safety Assessment Scenario
«stereotype»
Failure Mode
[Action, Class]
[Action]
[Class]
applies to
Safety assurance
«stereotype»
e-Learning
affects
allocated as
«stereotype»
FunctionAction
«stereotype»
Mentoring
Training
mitigated by
Resource Artifact
[Class]
performs
performs
[Class]
«stereotype»
Training
[Class]
System
[Class]
required for
«stereotype»
Source
requires
provides
«stereotype»
Role
[Class]
interacts with
[Class]
is an attribute of
provides
«stereotype»
Training Provider
has
Organisational Cultural Value
[Class]
[Class]
[Class]
Security Control
[Class]
has
is an attribute of «stereotype»
Attitude
«stereotype»
NUC Element
Post
[Class]
Person
[Class]
Non-Technical/Soft Competency
[Class]
[Class]
«stereotype»
fils
«stereotype»
«stereotype»
78
5 Modeling the Evolution of Organizational Systems for the Digital Transformation of Heavy Rail
Table 5.3
Model groupings in metamodel.
Model grouping
Position in Figure 5.3 and key
Competency
Upper left
Training
Lower left
Organizational structure
Upper right
Process modeling
Central
Safety assurance
Lower right
address the stakeholders’ concerns and was built from the bottom up, as an integrated aggregation
of various smaller-scale HF models.
5.6 Case Study: Digital Transformation in the Rail Industry
Demonstrator versions of the OCMM were created for two heavy rail organizations as part of the
ACRI project PF12. The Australian rail industry is currently focused on introducing a range of new
digital technology systems over the next 5–10 years (Australian Railway Association and Deakin
University 2018). These demonstrator versions scoped the technologies, processes, and concerns
(held within user portals) based on stakeholders’ input and the amount of information available
from which to build the model. Table 5.4 shows the final scope of the demonstrators. However, for
brevity, the focus in this case study section will be placed on the mechanisms created to support the
various HFs concerns. Note that the user portals scoped within this section are a subset of interest
to the stakeholders of the case study from those listed in Table 5.2.
Note that the models and analyses shown are only for demonstration and have been sanitized
not to show any proprietary information. They should not be reused as assessments without first
being tailored and reassessed by SMEs of the system on which it is to be applied. The example to
be presented here focuses on the introduction of the European Train Control System (ETCS) technologies. The following subsections follow the same steps as outlined in the approach section.
Table 5.4
Demonstrator scope.
Technologies
●●
●●
●●
●●
●●
●●
●●
●●
European Train Control System (ETCS)
Drones
Tablets
Customer Information Systems (CIMS)
Advanced Train Management Systems
(ATMS)
Enterprise asset management (EAM)
Data storage cloud
Customer interactions
Processes
●●
●●
●●
●●
●●
Track work procedures
Train operation
Train control
Drone operation
–– Overhead wire Inspection
Customer information
management
User portals
●●
●●
●●
●●
●●
●●
●●
Track worker
Competency manager
Training manager
Safety assurance
Workforce manager
–– Role modeling
–– Resourcing
–– Workload
–– Situational awareness
Cybersecurity manager
Culture manager
5.6 Case Study: Digital Transformation in the Rail Industr
5.6.1 Technology Specification
As with all major transformation projects, ETCS will have an associated timeline of when systems
will be installed and subsequently brought into service. Figure 5.4 is an example of a generic set of
timelines for two systems to be introduced. The project managers can create the stages that are
appropriate to the projects and update the durations and milestones for the various locations.
These timelines are crucial to enable understanding of when transitions are being made. The timelines within this step will be used throughout the STS model, with assessments linked directly to a
timeline in a row. The timelines are critical to also understanding the effects of multiple technology introductions. Figure 5.1 described how organizational systems should evolve alongside the
introduction of different systems with different life cycles. At any two defined points in time, comparisons can be made between the current STS state and the future STS state. Sub-timelines can
also be used to represent staggered introductions or alternative configurations (see Section 5.6.2 for
more details on system configurations).
The technology introduction can also include other information such as the design of the system
and the use cases of how the systems are intended to be used. These are typical process products generated by the SE process to ensure that the system is fit for purpose. At this step, existing information
sources about the new technology and key stakeholder managers/representatives were identified.
5.6.2 Capture System Change
While the project focuses on the technology itself, the absorption of the new technology into the
preexisting system is likely to be far more complex. The introduction of ETCS into a heavy rail
system is a pertinent example as there are many combinations of systems that ETCS will interact
Project Name
Start Date
End Date
System 1
01/06/2017
30/09/2026
Development
01/06/2017
01/06/2018
Installation
01/06/2018
02/12/2018
Operation
01/01/2019
29/09/2025
Decommission
30/09/2025
30/09/2026
System 2
01/08/2019
31/12/2026
Development
01/08/2019
01/09/2021
Installation
01/09/2021
01/03/2022
Operation
01/03/2022
01/09/2026
Decommission
01/09/2026
31/12/2026
Figure 5.4
Example system introductions.
2017 2018 2019 2020 2021 2022 2023 2024 2025 2026 2027
79
80
5 Modeling the Evolution of Organizational Systems for the Digital Transformation of Heavy Rail
with across the breadth of a rail network. A model of the rail network system (e.g. by lines, depots,
or rail segments) is required to understand how the technology will be rolled out. The various
combinations need to be captured to enable validation across the network.
Figure 5.5 shows an example of the system resources (modeled within the resources taxonomy
part of the UAF), which depicts an instance of ETCS level 2 in one configuration of systems. Each
configuration presents the system elements within a specific context and their relationships, which
are subsequently linked to their physical locations within the rail network. This approach enables
multiple locations to be examined collectively due to the common combination of systems, thereby
reducing effort yet allowing the separation to of problematic network locations.
The physical system configurations are then augmented by the modified processes required to
operate and maintain the system. The processes can be modeled at various levels of decomposition,
from high-level use cases through to functions, operational procedures, activities, sequence diagrams, and task actions. The processes are stored hierarchically to different levels of decomposition,
depending on how much detail is required. The OCMM supports decomposition of the high-level
functions and use cases to processes and then down to activity, action, and task level, and this provides traceability to the models, which are also easily traversable by the user. Figure 5.6 shows the
example high-level use cases for the ETCS L2 onboard operational modes as specified in AS7711
(RISSB 2018), while Figure 5.7 shows an activity diagram for a decomposed part of the process.
The processes that have been modeled augment the use cases (provided by a project) by placing
them in various contexts. For example, software on a tablet being used by a protection officer to
interact with the network controller to indicate when track work begins or ends needs to be aligned
with the wider track safety processes that include crew safety briefings, the layout of warning
signs, and deployment of lookouts to monitor for rail traffic. These processes feed into the overall
STS model as they include how the technical system elements interact with various roles as they
undertake specific tasks.
5.6.3 Capture Organization Changes
The understanding of how the new system will behave drives change in the organization (and vice
versa). For example, automation often replaces roles that were previously occupied by people,
thereby reducing the need to employ a human in that role. The organization may, however, wish to
retain the skills in a set of people to be able to undertake the role in specific circumstances, or the
role may shift to be more supervisory, which will require consideration of system design, handover
of control, new procedures, and user interfaces. It is necessary to understand how the organizational HF is then changing in response to the technology and how the HF can shape how the
technical system is designed and used.
The OCMM captures the elements of the organizational system in three ways:
1) The organizational structure identifies the posts people fill, the roles that they may be called upon
to undertake, and the hierarchy of control and communication between people. Organization
charts are commonly used to model the formal structure; however, the informal structures provide a complementary view of the organizational behavior within different contexts.
2) Role allocation links the roles to the activities that are to be undertaken as a part of that role. The
use of activity diagrams (such as Figure 5.7) enables the traceable allocation of activities to roles.
3) Specification of the competencies required to undertake a role or task. This is powerful as allocation of competency to a role or activity can then be automatically allocated to all people that
undertake that role or activity.
Resources Taxonomy
[
]SV-1 ETCS Level 2 Structure]
«System Configuration»
ETCS Level 2
«ResouceArtifacts»
Rolling Stock
«ResouceArtifact»
«ResouceArtifact»
Radio Block Centre
Rail Segment
«Post»
ETCS L2 Train Driver
«ResourceArtifact»
Trackside Sensors
IE2 Movement Contrl Signal
«ResourceArtifact»
Driver Machine Interface
«ResourceArtifacts»
Juridicial Recording Unit
IE4 Journey Data
«ResourceArtifact»
IE2 Movement Control Signal
IE3 Position information
Radar
«ResourceArtifact»
Axle counter
«ResourceArtifact»
GSM-R
«ResourceArtifact»
European Vital Computer
«ResourceArtifact»
Balise
IE3 Position information
«ResourceArtifact»
Balise Receiver
«ResourceArtifact»
Euroloop
IE3 Position information
Figure 5.5 ETCS level 2 system structure.
82
5 Modeling the Evolution of Organizational Systems for the Digital Transformation of Heavy Rail
package ETCS L2 Operate Train Process [
ETCS L2-Modes]
ETCS on-board operational modes
(from AS7711:2018)
Full supervision
«Role»
ETCS L2 Train Driver
«include»
«include»
Operate train
Limited
supervision
«Role»
ATP on-board
«include»
«include»
On-sight
«include»
Shunting
Staff responsible
Figure 5.6
Operate train (ETCS L2 onboard operation modes).
«ResourceArtifact»
Rolling Stock
«ResourceArtifact»
European Vital Computer
«Role»
ETCS L2 Train Driver
«System Element»
«ResourcePerformer»
«ResourceArtifact»
Driver Machine Inteface
: Respond to In-Cab Signals
Apply Track
Work signal
data to
movement
authorities
Display Track
Work signal on
approach
Sound alarm
and visual
warning about
approaching
limits
Receive info
about Track
Work
Slow down
on approch
to Limits?
No
Yes
Apply brakes
No
Apply brakes
intervention to
avoid SPAD
STOP at
signal?
Yes
Respond to
intervention
Wait at STOP
Signal
Figure 5.7 Partial activity diagram for ETCS L2 stop at signal.
5.6 Case Study: Digital Transformation in the Rail Industr
Libraries of information and models of the following organizational elements are contained
within the OCMM:
●●
●●
●●
●●
●●
●●
●●
●●
Formal organizational structure plus informal structures.
Sets of elements for posts (jobs) and role requirements under different technologies.
Models of competency requirements for tasks or roles.
Roles allocation models linked to tasks and processes.
Models of training mechanisms linked to providers, competencies, and roles.
Models of organizational culture at individual, group, and organizational level.
Models for the workload at both task level and system level.
Model for situational awareness linked to roles performing tasks.
Figure 5.8 shows an output from the model using one of the methods for allocating roles to the
tasks. In this example, the roles pre- and post-ETCS introduction are shown and allocated via a
dependency that specifies the nature in which the role is involved in that task. The RASCI (Smith
et al. 2005) roles are defined as follows:
Responsible (R) – The role that is responsible for performing the task (i.e. the “doers”).
Accountable (A) – The role that ultimately is accountable for or controlling a task being
completed.
Supporting (S) – Those roles that are supporting the responsible role.
Consultant (C) – The roles that provide advice and information (usually a two-way communication) within a task.
Inform (I) – The role that is a recipient of the outcome or information at the end of the task.
The assessor allocates roles to the processes that will transform as new technology is introduced.
Roles may be allocated directly (as shown in Figure 5.8) or allocated via visual models of the processes. Once the roles have been allocated, role structure diagrams are automatically generated
(Figure 5.9), which provide a visual summary/overview of which roles are involved and the nature
Legend
ETCS RASCI Analysis
Existing Scope
Accountable
ETCS Scope
Train Inspection
Train Marshalling
3
3
2
4
3
3
3
3
2
4
3
Network Controller
6
6
Signallers
3
3
Station Staff
1
1
Train Crew
3
3
Train Driver
13 13
ETCS Scope
ATP on-board
6
6
ETCS L2 Train Driver
10
10
ETCS Network Controller
2
2
ETCS Signaller
2
2
Figure 5.8
Role allocation (RASCI).
Start Up
Start up
3
3
Normal Running
Normal running
3
4
Managing system problems
Managing Train Defects
4
1
1
3
3
5
3
5
1
3
3
5
3
5
Degraded Running
Managing system behavior
1
Existing Scope
Support
Intervention with ETCS
Driver debrief
ETCS RASCI Analysis
Responsible
Debrief
Degraded running
Inform
Operate train-ETCS L2
Operate train - pre-ETCS
Consult
83
84
5 Modeling the Evolution of Organizational Systems for the Digital Transformation of Heavy Rail
Debrief
Degraded Running
Start Up
ATP on-board
Normal Running
ETCS Scope
Managing System Problems
ETCS L2 Train Driver
Intervention with ETCS
ETCS Network Controller
Operate train- ETCS L2
ETCS Signaller
Legend
Accountable
Additional Content Calc
Consulted in Task
Information in Task
Responsible for Task
Support to Task
Multiple (two-way)
Figure 5.9
RASCI role structure for operate train process under ETCS.
of their involvement within the set of processes of interest. Different visual patterns can be indicative of a variety of issues. For example, if the responsibility is shared among some different roles,
then attention may be required to coordinate these processes. These diagrams are alternate representations that show the role allocations to the various tasks, which illustrates the flexibility in
OCMM’s ability to represent information depending on the assessor’s needs and preferences.
The organizational models for this case study demonstrator have been developed for the existing
(or pre-change) state and the post-implementation state (i.e. pre-change and post-change); however, it is acknowledged that such change will not necessarily occur in a “big bang” fashion.
Business managers and modelers should use the timelines in Figure 5.4 to specify the granularity
of the transition by specifying specific phases as individual timelines (e.g. staggered transitional
stages). These models should also evolve as the system development matures, and further decisions are made on how to manage the change (in this case study, the system being introduced is
still at a conceptual stage).
5.6.4 Organization Change Management
Given the changes being made to the organization, activities need to be planned to ensure that
changes are made promptly. This is supported by several gap analyses that need to be aligned with
each other to ensure consistency. First is the identification of training required by personnel.
OCMM supports this by first identifying the changes in competency requirements for personnel
through the automatic generation of a report of the changes in competency needs driven by the
new technologies. The result is a model of how the organization needs to be shaped in response to
the changes.
5.6 Case Study: Digital Transformation in the Rail Industr
With the improved and traceable understanding of which roles require additional competencies,
the OCMM enables the specification of valid mechanisms to attain the identified competencies.
While the focus is mostly on training, other required mechanisms can be captured, such as mentoring, certification, or experience. A new report can then also be reissued to determine the training required by individuals holding (or planned for) specific roles, so they are suitably prepared for
the introduction of new technology in a timely manner. This information can also feed the longerterm plans necessary to ensure the retention of the competencies over long technology transition
periods.
OCMM also contains functionality to ensure the training is provided in a window aligned with
the deployment of the system elements. Training timelines can be linked to the project timelines
(Figure 5.4) so that the timing of the activities can be assessed. OCMM automatically compares the
completion dates to determine if training is not completed before the systems are brought into
service or, conversely, the training is completed more than a nominated period (such as 90 days)
before the competencies are needed, which may cause unused skills to atrophy. When these occur,
an error is raised for the user to investigate. Further specifics and examples of this step in the
approach can be found in the authors’ previous publication (Shirvani et al. 2019).
5.6.5 Analyze Emergent System
While some assessments have been created such as safety assurance (Shirvani et al. 2019) and
cybersecurity, the focus in this section will be on two HF concerns, namely, SA and workload
analysis (WA). This case study demonstrates how commonly used HF assessment methods
and techniques can be integrated into an MBSE environment (the framework is, however, flexible
in accepting other assessments and techniques). It is essential that SMEs undertake this step of
the approach with appropriate working knowledge of the HF techniques, the organization, and
the system of interest; liaison with SME teams responsible for other interacting parts of the model
or overlapping assessments will likely be required.
5.6.5.1
Situation Awareness
SA is described as “the perception of elements in the environment within a volume of time and
space, the comprehension of their meaning and the projection of their status in the near future”
(Endsley and Garland 2009). This definition allays itself to a critical aspect of STS that enable the
users to be adequately informed of their environment and the context within which they currently
exist. SA allows users to make appropriate actions, and poor SA is often a factor in incorrect or
unsafe operation by users.
SA evaluation techniques were first developed in the context of air crew assessment. When considering suitable techniques for assessing SA for OCMM, it was important to account for the nature
of the information that could be modeled, as well as its suitability for the rail domain. Literature
(Bearman et al. 2013; Salmon et al. 2009) provides an excellent summary of SA theories and measures for the Australian rail industry, whereas Gulati and Puranam (2009) discuss the pros and cons
of the application of SA techniques in rail signaling in particular. Some candidate techniques were
considered including the Rail Ergonomics Situation Awareness (RESA) tool (Wilson et al. 2001)
and Endsley’s (1995) Situation Awareness Global Assessment Technique (SAGAT) as well as techniques such as the Situation Awareness Rating Technique (SART) (Taylor 1990). It was decided to
keep the analysis within OCMM as simple as possible and to consider which technique best fits the
application to a conceptual design (rather than getting into the cognitive assessment of individuals). Hence, the OCMM uses the initial stages of the SAGAT.
85
5 Modeling the Evolution of Organizational Systems for the Digital Transformation of Heavy Rail
Goals
Functions
State of the environment
Situation
awareness
86
Processes
Activity
Level 3
• Projection of
future status
Level 2
• Comprehension of
current situation
Level 1
• Perception of
elements in
current situation
System capability
Interface design
Complexity
Automation
Stress and workload
Cultural Values
Figure 5.10
Perform
action
Decision
Information processing
mechanisms
Competency
Training
OCMM model of situation awareness. Source: Based on Endsley (1995).
Endsley’s model of SA is well accepted by peers and has suitable genericity to be considered for
any industry and application. OCMM enables the user to consider the conceptual design and outputs of any task analyses to assess and record information about any tasks of interest being undertaken pre- and post-technology introduction for the SA factors at the three levels of SA provided in
the model (see the area bounded by the dashed rounded rectangle in Figure 5.10). This knowledge
may then be used to derive the survey questions for SAGAT (the actual survey and performing of
SA assessment on individuals are outside of the scope of OCMM).
Endsley’s model of SA contains contextual information around the SA levels. An assessor needs
to be able to use the context of the decision being made and how they affect the decisions and performance of an operator. Figure 5.10 shows a conceptual model of SA for use within OCMM; it is
based on Endsley’s model (Endsley 1995) but shows further linkages to other parts of the organizational models. Within OCMM, the assessor can access the evolving system capability and design
models, interfaces, information interactions, goals, workload, cultural values, competencies, and
training from within the same tool. OCMM provides the assessor with a means to consider the SA
levels for various tasks pre- and post-technology introduction. The assessor is provided with simple
activity diagrams to guide their use of the tool, with annotations to describe each step. Figure 5.11
shows an example activity diagram for a SA assessment of the operate train process during preETCS and post-ETCS introduction.
Not all processes are associated with SA, and it may not be practicable to assess every possible
process to the nth degree. Therefore, the assessor begins by reviewing the existing processes (provided from other user’s processes such as defining the system’s concept of operations) and identify
which processes need be included for task analysis (or existing task analyses may be imported into
the tool). The assessment may be applied at any level of decomposition of the function, process, or
action/task level, and it is left to the assessor to determine the level that best gives the appropriate
detail required.
The next step involves assessing the situational awareness factors for tasks for the various states
of the system (such as current, during the introduction of the technology, and once the technology
5.6 Case Study: Digital Transformation in the Rail Industr
activity Situational Awareness Assessment [
Situational Awareness Assessment ]
Workforce Manager
«structured»
Perform High Level Task Analysis
UOW have provided an example for train
driver SA for the introduction of ETCS. It
is envisaged that the high level goals will
remain stable regardless of technology
introduction. This may be replaced with
actual task analyses if available.
Operate Train Process
«structured»
Identify Current Situational Awareness Factors
For each task, identify what the situational
awareness factors are in terms of
Endsley’s Levels (Level1: Perception, Level
2: Comprehension, Level 3: Projection)
Operate Train SA
Factors
«structured»
Identify New Situational Awareness Factors
Identify SA factors for tasks under the
new technlogy
Operate ETCS Train SA
Factors
The pre state
should be on the
rows and the post
state on the
columns
«structured»
Summary of Situational Awareness Factors
SA pre and post
View a summary of how the SA factors
willl change pre and post technology
introduction
Operate Train SA
Factors-PreETCS->ETCS
Outside the scope ofOCMM
«structured»
Determine the queries
Not within the scope of OCMM, however
an example for train drivers is included
(Rose et, al, 2018)
Example SAGAT Questions
Perform SA
assessment
Performed and measured during
simulations. Not in scope of
OCMM.
Figure 5.11
Situational awareness assessment (operate train example).
insertion is completed). The SA levels for each task used are described in Endsley (1995). Table 5.5
shows an example of the SA factors assessment for the pre-ETCS operate train process. The figure
illustrates the separation of aspects required to perceive, comprehend, and respond to their understanding of the situation.
Once the assessor has completed the assessment of the SA factors in the various states, the
OCMM automatically generates a summary table to view the SA factors side by side for direct comparison. Table 5.6 shows the summary of SA factors for the operate train tasks and how they will
change when the technology is introduced. In this example, the maintain correct speed task
(shown in the bold dashed rectangle) has more aspects under consideration after ETCS has been
introduced to improve the situational awareness of the train driver. In particular, the automatic
train protection (ATP) is supporting the driver in not exceeding the speed limits and providing digital displays of not just the train speed but the location-specific factors. The assessor can build up
their situational awareness model from these perceptions into the comprehension of these inputs
and finally into a decided projection of the actions to be undertaken to anticipate these changes.
87
Table 5.5
#
1
2
Task-based SA assessment (pre-ETCS example).
Name
perception
comprehension
projection
Operate train-pre-ETCS
Normal running
3
Communicate with Train Control
4
Maintain correct speed
5
Monitor for external threats
6
Operate for correct track profile
7
Respond to alarms
8
Respond to environment conditions
9
Respond to signals
Awareness of incoming communication
Ascertain what the communication is
Ascertain what actions to take
Current speed
Current speed limit
Speed limit changes
Obstruction on line
Distance to obstruction
Amount of difference in speed and limit
Adjust speed
Assessment of whether under or over speed Anticipate speed limit changes coming up
Current location
Track profile details
Operating procedure
Audible alarm
Visual alarm
Ascertain whether obstruction is a threat
Ascertain what obstruction is
Ascertain what actions are required
Ascertain what actions are required
under different track profile scenarios
Apply brakes at correct level to stop in time
Contact Train Control check what obstruction may be
Ascertain which alarm
Ascertain what the alarm means
Respond to the alarm
Perception of buff and draft forces on train Ascertain whether conditions will impact
Outside track temperature
how train is operated
Weather conditions
Track condition
Authority limits
Signal state
Anticipate imminent track profile changes
Apply brakes to adjust speed before track profile change
Reduce speed to match conditions
Check environment conditions with Train Control
Table 5.6
#
1
2
3
Summary of SA factors (operate train example).
Name
perception
New Perception
comprehension
New Comprehension
projection
New projection
Operate train-pre-ETCS
Normal running
Communicate with Train Control
Awareness of incoming
Awareness of incoming audible communicatio Ascertain what the communications is
Ascertain the source of the communica
communication
Awareness of incoming visual communication Ascertain what actions to take
Ascertain what the communication is
Form appropriate plan of action
Confirm communication received
Ascertain what actions to take
4
5
Maintain correct speed
Monitor for external threats
6
Operate for correct track profile
7
Respond to alarms
8
Respond to environmental
conditions
Current speed
Current speed
Amount of difference in speed and limit
Amount of difference in speed and limit Adjust speed
Respond to ATP speed warning
Current speed limit
ATP warning on speed
Assessment of whether under or over
Assessment of whether under or over
Adjust speed
Speed limit changes
DMI Current speed limit
Understand the ATP speed warning
DMI Speed limit changes
Understand the DMI information
Anticipate speed limit changes coming u
Anticipate speed changes coming up
Obstruction on line
DMI Location
Obstruction on the line
Ascertain whether obstruction is a thre
Ascertain whether obstruction is a thre Apply brakes at correct level to stop in
Apply brakes at correct level to stop in time
Distance to obstruction
Distance to the obstruction
Ascertain what obstruction is
Ascertain what the obstruction is
Contact Train Control to check what obstruction
Track work movement authority displayed
Ascertain what actions are required
Ascertain what actions are required
Current location
Current location
Ascertain what actions are
Ascertain whether ETCS level change r Anticipate imminent track profile change
Track profile details
DMI track profile details
required under different track
Operating procedures
profile scenarios
Ascertain what actions are
required under different track
profile scenarios
Apply brakes to adjust speed before track Apply brakes to adjust speed before track profile
Operating procedure
Audible alarm
Audible alarm
Ascertain which alarm
Ascertain which alarm
Respond to the alarm
Visual alarm
Visual alarm
Ascertain what the alarm means
Ascertain what alarm means
Perception of buff and draft f
Perception of buff and draft
Ascertain whether conditions will
Ascertain whether conditions will
Reduce speed to match conditions
outside track temperature
outside track temperature
impact how train is operated
impact hoe train is operated
Check environment conditions with Track Check environmental conditions with Train Control
Weather conditions
Condition monitoring sensor information
Track condition
Track condition
Contact Train Control to check what obj
Anticipate imminent changes in track profile
Respond to alarm
Use other knowledge to build big picture of the tr
Reduce speed to match conditions
Estimate duration of conditions
Weather conditions
Condition beginning
Condition ending
9
Respond to signals
Authority limits
DMI movement authorities
Ascertain what the DMI is conveying
Confirm signal is received
Signal state
Movement authority limits
Understand what changes to train open
Alter train operation plans
Current location
90
5 Modeling the Evolution of Organizational Systems for the Digital Transformation of Heavy Rail
The final stages of the SA assessment enable the assessor to use the SA factors to derive the questions in a SAGAT, which in turn can be used to design a practical SA assessment (the questions are
typically used alongside simulator trials to gauge whether the operator has the correct perception,
comprehension, and projection as expected).
5.6.5.2 Workload Analysis
With the introduction of new technologies, understanding is needed on how staff workloads will
change as a result. This evaluation needs to provide understanding not only of the resulting workload but the workload during the transition phase between the introduction of the new technology
until the retirement of the existing technologies.
The workload can be defined as “the effort demanded from people by the tasks they have to do.
It can be the effort demanded at a single point in time, or over a whole shift” (RSSB 2008). It can
be challenging to decide on suitable workload assessment methods because there are differing
interpretations of what constitutes workload among practitioners. Wilson et al. (2005) outline a
number of workload-related areas recognized within the rail industry. Alternative, interrelated
views of workload considerations can be:
●●
●●
●●
●●
Task complexity (number and interactions between tasks).
Performance and capacity based (balancing of the load in terms of the amount of work under
time constraints such as time pressures or % hours worked or job design) (Smith et al. 2005).
Synonymous with the manifestation of physiological stress and fatigue measurement (Hancock
and Desmond 2000).
Most commonly, perceptions of the mental or cognitive demands and ISO (2017) (Young
et al. 2015).
Wilson et al. (2005) further suggest that there is an essential distinction in understanding workload that is imposed by a system and the perception of workload on individuals. There are arguments that one cannot consider workload purely at system level as the individuals within the
system will have variability and, alternately, that workload cannot be assessed validly through
survey of individuals, because it is based on the perception of workload, not actual workload, or
can be mistaken for level of performance (i.e. an operator may perceive that the workload was high
if they did not manage to perform the task, and vice versa) (Hart and Staveland 1988). It would
seem beneficial to provide then a selection of workload tools that can be used to yield insight from
these various viewpoints. OCMM contains two additional methods of assessing workload for comparison in addition to the RASCI analysis previously described and to illustrate how MBSE can
support alternative assessment approaches. Each method uses a different approach and understanding of workload, which may be used independently or in conjunction to give different viewpoints. These methods are:
●●
●●
In2Rail Workload Predesign – Considers the effects on the workload of a system encountering a
step change (i.e. a holistic assessment including people, process, and technology dimensions)
(Evans 2017).
NASA TLX – Considers the workload at an individual process or task level (Hart 2006).
Each of these approaches is described below.
In2Rail Workload Predesign This assessment method evaluates the impact on workload
due to the introduction of a system change. A holistic systems approach may be taken when assessing the workload for rail traffic management systems (Evans 2017). OCMM utilizes the prediction
5.6.5.2.1
5.7 OCMM Receptio
part of Evans’ method to forecast the likely workload changes from a people, process, and technology perspective by considering the various states of the system as the technology is introduced and
guides the assessor to consider multiple variables that may affect workload.
This workload assessment method considers the changes to workload at a system level as a new
technology is introduced. The method assumes that the design of the future state of the system is
mature enough to be assessed. However, this could be applied at various stages of the system development life cycle to assess early design concepts and inform design choices as the design matures
further. The assessor (and SMEs) should consider each of the variables, in turn assessing what the
effect on workload (positive, negative, or static) will be for each transition between states, how
safety or performance is impacted, and recommendations for further assessment or design considerations. Table 5.7 shows an example assessment of how aspects will change for both the better and
worse for the case of introducing ATMs.
5.6.5.2.2 NASA TLX Workload Survey The NASA TLX workload survey is a quantitative task-based
WA that considers the cognitive demands of the operator performing the task. The NASA TLX
workload survey (Hart 2006) is one of the most well-known workload assessment tools. The survey
consists of six dimensions of workload (mental demand, physical demand, temporal demand,
overall performance, effort, and frustration level). After a task has been performed, the operator
rates each of the dimensions based on their perceptions of workload. Pairwise comparison is used
to identify the relative weightings/importance of each of the dimensions. The workload index is
calculated as a percentage of the weighted sum of the measured dimensions. OCMM uses these
scales to enable the assessor to forecast an estimated workload for an operator using an envisaged design.
Although this method is usually applied as a survey during or shortly after an individual performs a set of tasks, the workload demand scales are useful to apply to a “generic” role holder
undertaking an envisaged task. As the design matures and simulators and finally trials are run, the
NASA TLX survey may be applied repeatedly to assess how the workload is changing (in particular,
there is value in considering whether design changes are mitigating risks as intended). Table 5.8
shows an example of a NASA TLX assessment of workload for different processes under different
technologies. Once the assessor completes the demand scales and weightings, the workload index
is calculated automatically for the assessor using the NASA TLX formula. In this example, it can be
seen that the introduction of ETCS L1 represents a higher workload due to the overlaying of information upon existing infrastructure, which subsequently decreases once ETCS L2 is introduced.
Hely et al. (2015) suggest that ATP does indeed increase the workload for train drivers due to overlaid information. It should be noted that these workload assessments consider that the operator is
experienced in using the technology and undertaking the tasks (the assessor can confirm this by
viewing the information held within the OCMM competency portals). The assessor may add additional NASA TLX stereotyped tasks to other existing processes of interest that are anticipated to be
affected by new technology introduction.
5.7 OCMM Reception
The OCMM was demonstrated and subsequently delivered to several Australian heavy rail operators during which many salient points were raised. First was a general acceptance and acknowledgment that the use of such a system would resolve some of their existing issues, particularly
concerning information management and sharing. However, there were concerns about the level
91
92
5 Modeling the Evolution of Organizational Systems for the Digital Transformation of Heavy Rail
Table 5.7 Workload by variables (ATMS example).
#
Name
1
Variables that affect the objective
2
Control room environment
Temperature
3
Effect On Workload
Summary Of
Workload Change
Effect On Safety Or
Performance
lighting and workstation
design ergonomically supportive
4
Lighting
5
Noise
6
Track
8
Assets
9
Operations
10
Tasks
11
Areas of control
12
Degraded modes
Traffic volume
15
Timetable
16
Variables that affect system’s a
17
Process
Rules and standards
ATMS will provide tracking of trains
to aid the train controller in
coordinating
–1
It is assumed that the number and
frequency of tasks will be
–1
decreased as automation takes over
Areas of control will be scatable
Will need to consider various
degraded mode scenarios
Decreased
performance and safety
Undertake workload
assessments on tasks,
receive feedback from
users for improvement
Improved performance
Increased performance
Will need to consider
effects of complacency
and boredom
Need more information
+1
Possible safety issue
Increased traffic volume will
increase workload, however
automating some coordination
functionalties will reduce train
controller workload
ATMS will provide optimisation and
dynamic timetabling
19
Process and procedures
20
Team working
New procedures will be created,
workload will be high until operator
is experienced
Better situational awareness
between train controller interfaces
21
Communication
Improved communications, more
efficient
22
+1
Iterate assessments in
design process to
ensure that lighting
design remains
appropropriate for any
changes ATMS brings in
Consider failure modes,
compromised
operations and
recovery of the system.
Traffic
14
18
Consider levels of noise large
open plan
Improved performance
Recommendations
Infrastructure
7
13
–1
Legacy
Systems To
Use
May need to perform
workload assessments
for the pre and post
ATMS tasks in order to
understand the
workload change
–1
+1
Provide team based
training
–1
–1
Improved performance
Provide training to use
new comms
People
23
Roles
Need more information on what
the new roles will be (e.g. there
was creation of roles)
24
Culture
Is there a culture or overloading or
underloading? How do they
support these scenarios?
25
Shift patterns
26
Training
Need further investigation
Need more information
Training to use the new systems
–1
Provide training and
perform workload
assessments on tasks
of effort required to introduce and maintain such a model. The OCMM is intended to be scalable
so that the model can not only be used to address the current set of concerns but later be expanded
to the wider user group. The OCMM was also designed to support existing processes, and therefore,
only minimal additional effort above the existing processes was anticipated.
The proliferation of different MBSE and digital thread software tool sets yield software and data
interoperability issues for the engineering industry (Aerospace and Defense PLM Action
Group 2019; Shani et al. 2016). Within the Australian heavy rail industry, there was inconsistent
Table 5.8 Workload assessment by process (excerpt).
#
1
Name
Responsible for task
Workload Index
Mental Demand Mental Demand Physical Demand Physical Demand
Weighting
Scale
Weighting
Scale
Workload by NASA TLX
2
ETCS
3
+
Operate train - pre-ETCS
Train Driver
63.33
80
5
40
1
12
+
Operate train - ETCS L1
ETCS L1 Train Driver
72.00
90
5
40
1
18
+
Operate train - ETCS L2
ETCS L2 Train Driver
60.00
70
5
40
1
25
ATMS
26
Existing Train Control Process
Network Controller
75.33
90
4
10
1
27
ATMS Train Control Process
ATMS Network Controller 73.00
75
4
10
1
94
5 Modeling the Evolution of Organizational Systems for the Digital Transformation of Heavy Rail
adoption and maturity of application of MBSE software during the research project’s duration;
while some rail operators were in the process of selecting a software tool that could be mandated
throughout the supply chain, others were adopting different MBSE tools in an ad hoc manner from
suborganizational unit to unit. Others were investigating the use of third-party software to translate and interface from vendor to vendor. As a part of the adoption process, the OCMM is expected
to be interfaced with existing tools rather than replacing them. Therefore, users can use their preferred tool sets that exchange data with the OCMM for better data consistency and transparency.
The user portals interface was well received for its ease of use and constraining of complexity by
restricting the information provided to that which the user needs to address their concerns. The
user guide was embedded as annotations directly within the user activities and models so that
novice users could quickly navigate around the models with confidence.
5.8 Summary and Conclusions
This chapter has discussed the characteristics of organizational systems and why it is important to
consider how they will evolve within the context of the enterprise system. The authors’ approach
to modeling the organizational system evolution has been introduced, and the implementation of
the OCMM tool described using AF principles. A case study populated with tailored models for an
Australian rail operator was provided to demonstrate for a set of examples to inform the reader
further.
The OCMM should be tailored and maintained by businesses and aligned to existing HSI activities to offer practitioners context to the current and forecast future states of the organizational
system and to provide a mechanism to record the information and decisions as the system evolves.
The OCMM has been validated through stakeholder feedback and by creating proof-of-concept
demonstrators for two rail organizations. Further development will be required to expand and
align the HF activities with those in the existing businesses. Industry engagement with the model
has been positive and recognizes the potential for the improved integration of information while
reducing the amount of effort.
The use of MBSE technologies can be time and labor intensive (transferring from legacy systems,
training users, cost of software, integration of data, and risk) to initiate within a company, and
decisions will need to be made as to the extent required to leverage the most value. Madni and
Purohit (2019) propose a methodology for assessing the economic value of MBSE that enables
organizations to objectively decide whether to invest in MBSE by quantifying the gains based on
various measures. As digital thread practices become ubiquitous across the fields of engineering,
MBSE will be an essential activity to manage the ever-increasing complexity of the enterprise system. In turn, it will become commonplace for engineering companies to embed the practices into
their day-to-day business, and model-based approaches such as OCMM will become easier to
embed and integrate the HSE into MBSE activities.
References
Aerospace & Defense PLM Action Group (2019). Model-Based Systems Engineering Data Interoperability.
CIMdata.
Australian Railway Association & Deakin University (2018). Smart Rail Route Map. ARA.
Bearman, C., Naweed, A., Dorrian, J. et al. (2013). Evaluation of Rail Technology – A Practical Human
Factors Guide, 1e. Surrey, England: Ashgate.
Reference
Bruseberg, A. (2008). Human views for MODAF as a bridge between human factors integration and
systems engineering. Journal of Cognitive Engineering and Decision Making 2 (3): 220–248.
Dassault Systems (2020). MagicDraw. https://www.nomagic.com/products/magicdraw (accessed
6 February 2020).
Endsley, M. (1995). Toward a theory of situation awareness in dynamic systems. Human Factors
37: 32–64.
Endsley, M. and Garland, D. (2009). Situation Awareness Analysis and Measurement (e-Book Ed.).
Mahwah: Lawrence Erlbaum Associates.
Evans, J. (2017). A systems approach to predicting and measuring workload in rail traffic management
systems. In: H-Workload 2017: The First International Symposium on Human Mental Workload.
Dublin, Ireland: Dublin Institute of Technology.
FYA (2017). The New Work Mindset. The Foundation for Young Australians.
Galbraith, J.R. and Lawler, E.E. (1993). Organizing for the Future – The New Logic for Managing
Complex Organisations. San Francisco: Jossey-Bass.
Gulati, R. and Puranam, P. (2009). Renewal through reorganization: the value of inconsistencies
between formal and informal organization. Organization Science 20 (2): 422–440.
Hancock, P. and Desmond, P. (2000). Stress, Workload, and Fatigue. Boca Raton: Taylor & Francis.
Handley, H.A. and Knapp, B.G. (2014). Where are the people? The human viewpoint approach for
architecting and acquisition. Defence ARJ 21 (4): 852–874.
Hart, S. (2006). NASA-task load index (NASA TLX) 20 years later. Proceedings of the Human Factors
and Ergonomics Society 50th Annual Meeting, San Francisco (16–20 October 2006).
Hart, S. and Staveland, L. (1988). Development of NASA-TLX: results of empirical and theoretical
research. In: Human Mental Workload (ed. H.A. Meshkati), 77–106. New York: Elsevier.
Hause, M. and Wilson, M. (2017). Integrated human factors view in the unified architecture
framework. INCOSE International Symposium, Adelaide (15–20 July 2017).
Hely, M., Shardlow, T., Butt, B. et al. (2015). Effects of automatic train protection on human factors and
driving behaviour. Proceedings of the 19th Triennial Congress of the IEA, Melbourne (9–14
August 2015).
Hubbard, E., Siemieniuch, C., Sinclair, M., and Hodgson, A. (2010). Working towards a holistic
organisational systems model. 5th International Conference on Systems of Systems Engineering,
Loughborough (22–24 June 2010).
INCOSE (2007). Systems Engineering Vision 2020. INCOSE.
INCOSE (2015). Systems Engineering Handbook – A Guide for System Lifecycle Processes and Activities.
Hoboken, NJ: Wiley.
ISO (2011). ISO/IEC/IEEE 42010:2011 Systems and Software Engineering – Architecture Description.
Geneva: ISO.
ISO (2015). ISO/IEC/IEEE 15288:2015 Systems and Software Engineering – System Life Cycle Processes.
Geneva: ISO.
ISO (2017). ISO 10075-1:2017 Ergonomics Principles Related to Mental Workload. Geneva: ISO.
ISO (2019). ISO 15704:2019 Enterprise Modeling and Architecture – Requirements for EnterpriseReferencing Architectures and Methodologies (ISO 15704:2019). Geneva: ISO.
Keating, C., Polinpapilinho, F., and Bradley, J. (2014). Complex system governance: concept, challenges,
and emerging research. International Journal of System of Systems Engineering 5 (3): 263–288.
Kemp, D. and Daw, A. (2014). Capability Systems Engineering Guide. INCOSE UK.
Madni, A. and Purohit, S. (2019). Economic analysis of model-based systems engineering. Systems
7 (1): 12.
Madni, A. and Sievers, M. (2018). Model-based systems engineering: motivation, current status and
research opportunities. Systems Engineering 21 (3): 172–190.
95
96
5 Modeling the Evolution of Organizational Systems for the Digital Transformation of Heavy Rail
OMG (2017). Unified Architecture Framework – Version 1.0 Appendix C. OMG.
OMG (2019). OMG Systems Modeling Language v1.6. OMG.
Pennock, M.J. and Rouse, W.B. (2016). The epistemology of enterprises. Systems Engineering 19: 24–43.
Peterson, T. (2019). Systems engineering: transforming digital transformation. INCOSE International
Symposium 29: 434–447.
Purchase, V., Parry, G., Valerdi, R. et al. (2011). Enterprise transformation: why are we interested, what
is it, and what are the challenges? Journal of Enterprise Transformation 1 (1): 14–33.
RISSB (2018). AS 7711 Signalling Principles. Canberra: RISSB.
Robbins, S.P., Judge, T.A., Millett, B., and Boyle, M. (2017). Organisational Behaviour. Melbourne:
Pearson Australia.
Rouse, W.B. (2005). Enterprises as systems: essential challenges and approaches to transformation.
Systems Engineering 8: 138–150.
RSSB (2008). Understanding Human Factors – A Guide for the Railway Industry. Rail Safety
Standards Board.
Salmon, P., Stanton, N., Walker, G. et al. (2009). Measuring situation awareness in complex systems:
comparison of measures study. International Journal of Industrial Ergonomics 39: 490–500.
Schekkerman, J. (2004). How to Survive in the Jungle of Enterprise Architecture Frameworks. Victoria,
Canada: Trafford.
Shani, U., Jacobs, S., Wengrowicz, N., and Dori, D. (2016). Engaging ontologies to break MBSE tools
boundaries through semantic mediation. Conference on Systems Engineering Research,
Huntsville, AL.
Shirvani, F., Scott, W., Kennedy, G., and Campbell, A. (2019). Enhancement of FMEA risk assessment
with SysML. Australian Journal of Multi-Disciplinary Engineering 15: 52–61.
Shirvani, F., Scott, W., Kennedy, G., Rezaibagha, F., & Campbell, A. (2019). Developing a modelling
framework for aligning the human aspects to the physical system in large complex systems. IEEE
SysCon, Orlando.
Silitto, H., Martin, J., McKinney, D. et al. (2019). Systems Engineering and System Definitions. INCOSE.
Smith, M., Erwin, J., and Diaferio, S. (2005). Role & responsibility charting (RACI). Project
Management Forum (PMForum).
Taylor, R. (1990). Situational awareness rating technique (SART). In: Situational Awareness in
Aerospace Operations. Neuilly sur Seine: NATO-AGARD.
Valerdi, R., Nightingale, D., and Blackburn, C. (2008). Enterprises as systems: context, boundaries, and
practical implications. Information Knowledge Systems Management 7 (4): 377–399.
Wilson, J., Cordiner, L., Nichols, S. et al. (2001). On the right track: systematic implementation of
ergonomics in railway network control. Cognition, Technology and Work 3 (4): 238–253.
Wilson, J., Pickup, L., Norris, B. et al. (2005). Understanding of mental workload. In: Rail Human
Factors Supporting the Integrated Railway (eds. J.R. Wilson, B. Norris, T. Clarke and A. Mills),
309–318. Aldershot: Ashgate.
Young, M., Brookhuis, K., Wickens, C., and Hancock, P. (2015). State of science: mental workload in
ergonomics. Ergonomics 58: 1–17.
97
6
Human Systems Integration in the Space Exploration
Systems Engineering Life Cycle
George Salazar1 and Maria Natalia Russi-Vigoya2
1
2
Johnson Space Center, NASA, Houston, TX, USA
KBR, Houston, TX, USA
6.1 Introduction
Space travel risks are present in every phase of the mission, from the launch to the reentry and
recovery operations. Elimination or mitigation of crew risks and hazards will help ensure mission
success. An effective Human systems integration (HSI) program as part of the National Aeronautics
and Space Administration (NASA) Systems Engineering (SE) process is critical from the initial
stages of the design to the final design. As the programs evolve, it is crucial to learn to enhance how
the crew and the ground support interact with systems and products. HSI has been successfully
adopted by several federal agencies (e.g., US Department of Defense (DoD), Nuclear Regulatory
Commission (NRC), and the Federal Railroad Administration) as a methodology for reducing system Life Cycle Costs (LCCs) and increased in safety in operating systems. NASA has been working
on HSI requirements since the early 2000s and has cared about focusing on the human (despite the
lack of formal mandate) safety and health. An HSI practitioner’s guide (NASA, 2015b) enables the
incorporation of agency HSI policies and processes into the development and deployment of NASA
systems. The practitioner’s guide has information about the importance of following HSI practices
and aids to implement HSI, how it embeds into the SE processes, and ways for planning and implementing of HSI in NASA practices. Salazar and Russi-Vigoya (2019) explained that future missions
need to have iterative system maturity innovation and adaptation; HSI needs to be embedded into
the system design at all levels, and support from the organization culture is important to ensuring
successful missions, reducing LCCs while maintaining the safety of the human operating complex
systems. NASA has a history of considering astronaut health and performance in spacecraft and
mission design, particularly in mission planning and system design.
NASA is actively planning for future long-duration missions. Communication latencies, crew
size, and vehicle complexity will pose new challenges for NASA human missions. Researchers
(Holden et al., 2020) have identified and validated a list of tasks that the crew will have to perform
in future long-duration missions that will require autonomous interactions with smart spacecraft.
The ground supports many tasks right now. However, future spacecraft will need more onboard
autonomy to enhance the crew capabilities (Vera et al., 2019). NASA has investigated the preliminary onboard capability requirements for future missions (Wu and Vera, 2019) and also has
A Framework of Human Systems Engineering: Applications and Case Studies, First Edition.
Edited by Holly A. H. Handley and Andreas Tolk.
© 2021 The Institute of Electrical and Electronics Engineers, Inc. Published 2021 by John Wiley & Sons, Inc.
98
6 Human Systems Integration in the Space Exploration Systems Engineering Life Cycle
identified potential human performance standards and guidelines for autonomous missions that
are available in the literature that could apply to space research (Holden et al., 2019).
Future long-duration missions will also have the challenges that current missions have, but on a
larger scale. These challenges include isolation and confinement, changes in gravitational fields,
radiation, and operation paradigms (Salazar and Russi-Vigoya, 2019). This chapter discusses future
mission challenges. It identifies how the HSI technical and management of the domains integrated
into the SE process can help mitigate mission risks and hazards and optimize total system performance while reducing cost and schedule.
6.2 Spacecraft History
Since the Mercury program, NASA human spaceflight missions have grown in complexity. With
time, NASA has learned to master mission design/planning, training, and spacecraft system development processes to take the crew to space. As technologies evolve to enhance crew interactions
with the space vehicle, the crew interactions become more determinant of mission success. To be
able to learn about our challenges of future missions, it is important to understand what has been
done in the past that could enhance crew capabilities in future long-duration missions. The following sections describe a historical evolution of NASA spacecraft, including Mercury/Gemini/
Apollo, Space Shuttle, International Space Station (ISS), and Orion Spacecraft.
6.2.1
Mercury/Gemini/Apollo
The early spacecraft displays and controls (D&C) subsystems from Mercury to Skylab pretty much
consisted of the D&C of the same type switches (toggle, rotary, and pushbutton), displays (moving/
fixed pointer), numeric, and status lights. As more subsystems and features were added, more
switches and displays were added to support the complexity of the vehicles. Mercury had approximately 120 D&C components (Swenson et al., 1966). It had no onboard computer but rather relied
on the ground for uplink commanding.
Gemini had over 200 D&C interfaces (McDonnell Company, 1965) as well as having the first
onboard computer as well as added D&C capability for rendezvous and docking maneuvers. In
addition, rotational and translational hand controllers were added to control the spacecraft to provide a linkage from the astronaut to the stabilization and control to override the automatic control
mode. Figures 6.1 and 6.2 show the progression of D&C complexity going from a one-person cockpit to a two-person cockpit, respectively.
Figures 6.3 and 6.4 show an increase in D&C layout complexity for the Apollo program (North
American Rockwell Corp. 1968). Figure 6.3 shows the layout of the Apollo command module
(CM) that had nearly 700 D&C interfaces. The overall layout is composed of the forward section of
the pressurized cabin that contained the crescent-shaped main display panel composed of three
panels. Each of the three panels was associated with the responsibilities of each of the three crewmembers. The mission commander’s panel (left side) dealt with the vehicle velocity, attitude, and
altitude indicators as well as the primary flight controls. The pilot handled the center panel. The
panel included the guidance and navigation computer controls and the service propulsion system.
The Lunar Module (LM) pilot that served as the systems engineer handled the right-side panel. He
had access to the fuel cell gauges and controls, the electrical and battery controls, and the communications controls. In total, the D&C are composed of 24 instruments, 566 switches, 40 event indicators, and 71 lights.
6.2 Spacecraft Histor
Figure 6.1
Mercury spacecraft displays and controls. Source: Credit NASA.
Figure 6.2
Gemini spacecraft displays and controls. Source: Credit NASA.
Figure 6.4 shows the layout for the lunar lander that only accommodated two astronauts. The
LM display and control subsystem consists of a variety of equipment. All controls were of two basic
types: (i) switches and (ii) variable controls. Displays were of four basic types: (i) Moving pointer,
(ii) Fixed pointer, (iii) Numeric, and (iv) Status indicators. In all, there were a total of 388 switches,
99
100
6 Human Systems Integration in the Space Exploration Systems Engineering Life Cycle
Figure 6.3
Apollo command module displays and controls. Source: Credit NASA.
Figure 6.4
Lunar lander displays and controls. Source: Credit NASA.
indicators, instruments, and lights. Though not discussed in this paper, Skylab D&C comprised
much of the same type of D&C interfaces as Apollo.
6.2.2
Space Shuttle
According to NASA (2013b), the Space Shuttle was a complex spacecraft that launched like a rocket,
orbited like a satellite, and returned to Earth like a plane. It comprised well over 2500 displays and
controls (D&C) switches, displays, hand controllers, and status lights. These were spread throughout the pressurized cabin area but mostly in the flight deck. The flight deck contained the D&C used
6.2 Spacecraft Histor
Figure 6.5
Space Shuttle flight deck. Source: Credit NASA.
to pilot, monitor, and control the orbiter, the integrated shuttle vehicle, and the mission payloads.
Up to four crewmembers could be seated in the flight deck. The midsection contained seating for up
to three crewmembers. It served as the living area where the astronauts ate and slept. The mid-deck
as contained the airlock and avionics equipment compartments. Figure 6.5 shows the flight deck.
6.2.3
International Space Station
Unlike the previous spacecraft that contained dedicated D&C panels, the ISS was designed with a
multipurpose workstation as well as distributed control of the vehicle via laptops called PCS (portable computer system). They run on a Linux operating system that can operate as bus controllers
or remote terminals. On the Russian side, the laptops called “Russian laptops” run/command the
Russian segment. Both the PCS and Russian laptop used graphical interfaces for their respective
ISS module to enables the user to select the ISS module they wish to interact with, the system, and
then the specific piece of hardware. Similarly, both the Japanese modules provided by the Japanese
space agency and the European modules are controlled with laptops. In addition, there are also
laptops associated with the less critical Ethernet operational local area network – used for lowcriticality applications such as viewing procedures, performing supply inventory, recording notes,
sending an e-mail, and video conferencing as well as social media.
Figure 6.6 shows the ISS Cupola workstation as a representation of how ISS is controlled by the
crew using laptops. Its seven windows in the Cupola are used to conduct experiments, dockings,
and observations of Earth. The space station remote manipulator system is controlled from there.
In addition, the large viewing area provides an opportunity to spend time viewing earth.
The ISS still contains switches and pushbutton to control some of the subsystems. However, for
the most part, the laptops have dramatically reduced the number of dedicated D&C devices.
6.2.4 Orion Spacecraft
After the Space Shuttle retirement, the Orion became the next American spacecraft to take astronauts to station, moon, Mars, and beyond. The spacecraft is the continued work done from the
canceled Constellation Program. The first crewed mission will be Artemis Mission 2 (AM-2)
101
102
6 Human Systems Integration in the Space Exploration Systems Engineering Life Cycle
Figure 6.6
ISS Cupola workstation. Source: Credit NASA.
Figure 6.7 Mockup of the Orion D&C glass cockpit. Source: Credit NASA.
designed for four-person crew support for up to a 21-day independent mission. As shown in
Figure 6.7, the AM-2 will contain a crew console that includes the “glass-cockpit” station for the
crew to monitor and operate the vehicle.
The glass cockpit replaces on the order of 2000 manual switches to operate the vehicle. The crew
console still contains several pushbutton and toggle switches necessary for critical operations.
However, they are primarily for outside contingency scenarios. The displays provide the status of
the spacecraft systems with the capability to display vehicle status and to command vehicle systems via menu-selected display formats. Each of the screens can display two formats. Therefore,
there will be six display formats shown across the console. Between the upper and lower display
formats, a title bar with six simultaneous display formats is displayed to the crew.
6.3 Human Systems Integration in the NASA Systems Engineering Process
Given the discussion of increased vehicle complexity, for the Artemis Gateway (the orbiting
moon station) and Mars vehicles, it is not hard to see that the increased mission complexity will
result in vehicle control design new to NASA. The NASA Human Research Program (HRP) that is
investigating gaps in technology to support these future space missions has identified one of the 33
gaps being “inadequate human–computer interaction.” This gap was based on the HRP HCI risk
states that “Given that human-computer interaction and information architecture designs must
support crew tasks, and given the greater dependence on HCI in the context of long-duration
spaceflight operations, there is a risk that critical information systems will not support crew tasks
effectively, resulting in flight and ground crew errors and inefficiencies, failed mission and program objectives, and an increase in crew injuries” (NASA, 2015a).
6.3 Human Systems Integration in the NASA Systems
Engineering Process
The formal mandate of HSI as part of NASA’s human spaceflight program/project development
processes did not occur until 2013. However, since the Mercury program, NASA has always considered the human in the safety, health, and performance of human spaceflight missions. In the early
2000s, NASA developed HSI requirements at the technical level (NASA, 2010). To optimize aerospace systems and reduce human error, Human-In-The-Loop (HITL) training and testing are an
integral part of the spacecraft system development effort. These activities form part of the humancentered design (HCD) process to be discussed later in this chapter. The NASA practitioner’s guide
(NASA, 2015b) provides a formal framework to implement HSI for NASA projects as part of the SE
process. Figure 6.8 shows the six domains defined by NASA, along with a short description of each
domain. HSI is not just the technical process to ensure human performance issues related to hardware (H/W) and software (S/W) are addressed as part of the SE process but also the management
process to ensure human-related concerns are addressed at all aspects of the program/project life
cycle phases related to human system requirements, risk management, planning, etc.
As shown in Figure 6.9, the heart of the HSI effort is HFE. The HFE activity ensures all domains
are addressed in the SE process and integrated to factor the human element. Also, note that all
domains are not necessarily organizational/engineering entities but rather technical disciplines
that have Subject Matter Experts (SME) that participate in HSI activities. The integration of the HSI
domains occurs at unified requirements level to ensure all domains are considered in development
of requirements and at the trade off level where requirements are analyzed to ensure no conflicting
domain/system requirements. Each of the domains affects the crew, ground operators, and trainers,
as well as shipping and receiving personnel. It is important that as the system design begins early in
the life cycle, the SMEs ensure the design does not put constraints on both the system and the users.
6.3.1
NASA Systems Engineering Process and HSI
The NASA SE process is composed of three sets of conventional technical processes as defined in
NPR 7123.1B (NASA, 2013a), NASA Systems Engineering (SE) Processes and Requirements: system design, product realization, and technical management. For Human Systems Integration to be
effective, it must be included early on of the project in each of those sets of processes. Figure 6.10
shows the NASA Systems Engineering (SE) engine composed of 17 conventional technical processes to engineer system products. These conventional technical processes, along with Systems
Engineering (SE) tools and methods and a knowledgeable/skilled workforce, make up the NASA
Systems Engineering (SE) capability. At a high level, the NASA Systems Engineering (SE) engine
involves analysis, design, and development activities along with technical management of those
103
104
6 Human Systems Integration in the Space Exploration Systems Engineering Life Cycle
Design systems interactions
factoring capabilities and
limitations to enhance human
performance, safety, and satisfaction
Design for flight and
ground crew objectives
and constraints including
autonomy and automation
Human
Factors
Engineering
Operation
Resources
Safety
Minimize/mitigate risk to
personnel and ensure
design meets mission
success criteria
HSI
Design for
optimizing/simplifying
human resources in
support of maintenance
and support with given
mission constraints
Maintainability
and
Supportability
Training
Habitability
and
Environment
Design of efficient and
effective mission training
systems.
Ensure design living and working
conditions support human health
and performance
Figure 6.8
NASA HSI domains. Source: Adapted from NASA (2015b).
Habitability and
environment
Habitability
analysis
• User I/F design
• Workload analysis
• Space availability
• Living/working (L/W) conditions
Resource modeling
and planning
• User I/F Req’ts
• L/W condition Req’ts
Human factors
engineering
Safety assessment
M&S tasks
Feedback
• Trades for function
allocation autonomy
• Human error
• Performance
• Hazard analysis inputs
Safety
Training
• Instructional design
• Ops scenarios
• Task analysis
Operations
Task analysis
• User I/F design
• Inputs to M&S analysis
Safety assessment
M&S tasks analysis
Figure 6.9
Maintenance and
supportability
Resource modeling and planning
Notional HSI domain interaction. Source: Adapted from NASA (2015b).
Feedback
6.3 Human Systems Integration in the NASA Systems Engineering Process
Requirements flow down
from level above
Realized products
to level above
Technical management
processes
System design
processes
Technical solution
definition processes
3. Logical decomposition
4. Design solution definition
Product transition
processes
10. Technical planning
Requirements definition
processes
1. Stakeholders expectations
definition
2. Technical requirements
definiton
Product realization
processes
Technical planning
processes
Crosscutting
Technical control
processes
11. Requirement management
12. Interface management
13. Technical risk management
14. Configuration management
15. Technical data management
9. Product transition
Crosscutting
Technical assessment
processes
16. Technical assessment
Evaluation processes
8. Product validation
7. Product verification
Design realization
processes
6. Product integration
5. Product implementation
Technical decision
analysis process
17. Decision analysis
Requirements flow down
to level below
Realized products
from level below
System design processes
applied to each product
layer down through system
structure
Product realization
processes applied to each
product layer up through
system structure
Figure 6.10
NASA systems engineering engine. Source: Credit NASA
activities. The requirements definition process defines the analysis aspect of the program/project.
Technical solutions encompasses the design and development activities of the program/project.
Moreover, the design realization and product evaluation delineate the test and evaluation aspect of
the program/project.
HSI and the NASA SE process also involve a considerable amout of interaction during system
development activities. Figure 6.11 shows a high-level notional interaction between HSI and the
NASA SE process for the development of a system/subsystem. It is important early on that HSI and
SE personnel agree on the processes, activities, and milestones to develop the system/subsystem.
Similarly, an important element of both HSI and SE working together is the system’s technical
requirements definition. A sound technical requirement development effort that factors the capabilities and limitation of the human element ensures that an effective design solution and system
verification and validation are produced.
HSI is a vital part of SE and must be conducted concurrently with the SE process. This simultaneous activity means that communication effectiveness between HSI and SE practitioners is
important as design and human factors personnel may have communication difficulties – designers typically are driven by requirements, specifications, and design documents, and the HFE
personnel design viewpoint is from a human user perception. Early planning in the HSI/SE effort
ensures different perspectives of system development are aligned – hardware, software, and
the human.
Figure 6.12 shows a notional holistic view of NASA HSI and SE process in the NASA human
spaceflight SE life cycle. Early on, both the SE and HSI technical management engage in defining
105
106
6 Human Systems Integration in the Space Exploration Systems Engineering Life Cycle
Project product
teams
Support/products
• Design/trade analysis
support
• Task/workload analysis
• System safety results
• Design review support
Program
management
Requirements
• Requirements
• Design/verification
• Technical management
•
•
•
•
HSI
Human-centered design support
HSI plan/SEMP inputs
Human element requirements
Human modeling
System engineering and
integration
Figure 6.11
Test plans/procedures
Feedback
• Risks
• Products
• Reviews
• Test assessment
Test support/products
Test and
evaluation
Notional systems engineering and HSI interaction. Source: Adapted from NASA (2015b).
the Roles and Responsibilities (R/Rs) of SE and HSI. For large projects, an HSI Plan (HSIP) or a
Systems Engineering Management Plan containing the HSIP would include defining the R/Rs as
well as where HSI processes/activities in the SE process occurs. By engaging HSI early on, risks
associated with the design that affects the crew can be identified, controlled, eliminated, or mitigated. The HSI key process areas related to analysis, design, and test/evaluation are performed as
part of the SE effort to ensure objectives in crew requirements, risks/performance associated with
human–computer interface optimization, maintenance, operations, training, and safety are met.
Note that HSI is not only involved with system design, product realization, and technical management but also heavily involved in the major milestone life cycle reviews (SRR, SDR, PDR, CDR,
etc.). Though not shown, the iteration continues even after deployment, where feedback on the
operational use of the system provides additional opportunities to improve the system – particularly if it is software related.
A critical HSI process to the SE effort is HCD. This is a methodology used to ensure that a design
accommodates human capabilities and limitations. Figure 6.13 shows the high-level process use in
the development of human interactive systems that iterate on the design until the usability of the
system meets the crew acceptance and capabilities operating the system while maximizing system
performance and reducing risks and costs. HCD is an iterative activity that uses data gathered from
the users of the system and evaluations to update the design. Key aspects of the human-centered
effort are given below (ISO 9241-210 2019) and adapted for space applications:
●●
●●
●●
●●
The design is based on an explicit understanding of the crew, the task, and the environments.
The crew throughout the design and development process.
The design and requirements are defined by the evaluation of the prototype system.
The process is iterative.
Mission success is optimized when attention is paid to human interfaces that provide operational clarity and consistency and reduce the potential for human error, performance failure,
or injury.
Approval for
implementation
SE engine processes
Reviews
Pre-A
concept
studies
MCR
SRR
Implementation
B
Preliminary
design &
technology
completion
SDR
D
System assembly
integration & test,
launch
PDR
CDR
SIR
TRR
SAR
ORR
FRR
F
Close out
Life cycle
phases
A
Concept &
technology
development
C
Final design
& fabrication
NASA
Formulation
E
Operational
sentiment
Approval for
formulation
PLAR
DR
Technical management process
Requirement
definition
processes
Technical
solution
definition
Design
realization
processes
Evaluation
processes
Product transition
processes
HSI key areas
Technical Management Process (plan, control, assessment, and decision analysis)
•
•
•
•
•
Planning
Initial
planning
Analysis
and design
Deployment
Human Centered Design
Evaluation
Figure 6.12
Requirements management
Technical risk management
Configuration management
Technical data management
Technical assessment
Testing
Implementation
Notional holistic view of NASA HSI and the SE life cycle. Source: Adapted from NASA (2015b).
108
6 Human Systems Integration in the Space Exploration Systems Engineering Life Cycle
IISI
planning
Ensure all phases includes human-centered design
• HSI plan
• Practitioner assignment
• Resources and timing of activities
System performance
Ensure needs of use are met
Context
of use and
environment
•
•
•
•
•
Design
solutions
Support mission and scenarios development
Support concept operations
Identify human element requirements
Support allocation and functions between user
and system
Perform user task analysis
Visualize design concepts
• Support h/w and s/w development
• Conduct/support user evaluation and feedback
Poor
Excellent
Cost
Low
High
Risk
Evaluate early and iteratively
Evaluation
design
solutions
• Conduct reviews of system
• Conduct testing
• Improve fidelity of system through early
evaluations
• Support run for the correct testing
Min
Max
Design solution meets objectives of task
Figure 6.13 Human-centered design. Source: Adapted from NASA (2014) and Salazar and RussiVigoya (2019).
6.4 Mission Challenges
6.4.1
Innovation and Future Vehicle Designs Challenge
The space industry is growing, and as it grows and bold space vehicle concepts pursued, there will
be more opportunities for future innovative vehicle designs. However, as vehicle complexity
increases, the demand to add automation to help the crew control the vehicle will also increase.
These vehicles will involve many different system/subsystem developers and the means of controlling them. Potentially, the variability of system/subsystem control could affect human performance. Crewmembers can be highly trained in one system, but dealing with controls/usage of
different system interfaces and interactions may create performance issues. Autonomous system
control must always provide the crewmember situational awareness of the system/subsystem state
in the event autonomy override is necessary.
As noted, the vehicles and systems of the future will be much more complicated than NASA has
ever built. Therefore, it is important to work closely with human factors practitioners on task analysis, human performance measures (workload, usability, and situation awareness), Human Factors
Engineering (HFE) design (anthropometry and biomechanics, crew functions, habitat architecture), HITL evaluation, human error analysis, human system interface, system design, and HFE
analysis. The simplicity of the design plays a very important role, along with usability, safety, and
ways in which the system enhances the users (crew and ground) performance.
NASA has extensive experience with Low Earth Orbit (LEO) space psychology and the effects
of microgravity and living/working in small spaces. However, interplanetary travel is a new area
for NASA. Therefore, each of the HSI domains will also need to work with medical and design
6.4 Mission Challenge
engineers to arrive at ways of helping to keep the crew psychologically healthy. Monitoring the
crew and making sure the crew is physically and mentally healthy will be a challenge. Researchers
and practitioners need to work together to identify stress-relieving systems. An example of such
systems is XR technologies (i.e. virtual reality, augmented reality, hybrid realities, and physical
realities) and biometrics relations to enhance human health and performance.
Deep space missions may have different effects on the human body that could aggravate the
crew’s health. For instance, radiation will be higher than on Earth. Therefore, the crew needs to
be prepared to protect themselves to avoid cognitive and physical problems. The crew will also be
working in hostile closed environments (i.e., controlled temperature, oxygen, pressure, lighting,
noise, and space). Preparing for long-duration missions, the vehicles should account for environmental support to enhance the crew life and mission; the isolation and confinement of the crew
could have behavioral issues, limited communication, circadian desynchronization, and changes
on sleep schedules. Technologies must be able to support long-duration isolation and confinement to maintain crew mental and physical health. The gravitational field changes can create
changes in bone densities and changes in the internal body fluid pressures. Long-duration missions have multiple gravitational targets. Future designs need to account for gravitation factors for
job designs.
These interplanetary missions will have long communication delays, resulting in lesser communications with Earth only getting worse as the missions extend deeper into space. Innovations in
higher communication data rates and experience and decision making aids to respond to anomalies or to manage resources will be very important. The complexity of these new missions demand
that all of the HSI domains are considered in the design to ensure the vehicle and systems factors
the crew health, safety, and mission performance.
6.4.2 Operations Challenges
Future deep space missions will need to have powerful considerations of the resources required for
operations planning and execution. The crew will be isolated from all resources they can find in
Earth and will be in a confined environment (spacecraft and suit) in space. Coming back from
Mars is expected to take about three years. The crew will not be able to come back quickly to Earth
to get what they need. There is a need to plan for the long term and plan for unexpected situations.
If resources are not wisely used or if there are issues that limit the number of resources (e.g. anomalies that result in limited resources), the crew may need to be more frugal while using the
resources. Operations process design for both ground and flight crew, human–machine resource
allocation, mission operations, resource modeling, and complexity analysis. Vera et al. (2019)
pointed out the importance of intelligent systems that facilitate crew decision making in future
missions. These intelligent systems may also need to look at the onboard capabilities and provide
the crew with simpler interfaces than the ones available for the ground operations. Also, these
interfaces should help navigate the crew in an efficient and effective matter for troubleshooting
and decision making.
The crew may need to be more empowered for flight operations and procedure development.
The crew may have to make decisions on equipment without Mission Control (MC) support. It is
possible that while learning about the systems, the crew will learn new ways to improve their
work. Therefore, these smart systems should be flexible to give the crew the capability to improve
the system and to recover from changes in the system that did not work. Also, these systems should
be able to provide a data-driven means to inform decision making and performance risk mitigation
on anomalies during an exploration mission.
109
110
6 Human Systems Integration in the Space Exploration Systems Engineering Life Cycle
6.4.3
Maintainability and Supportability Challenges
As NASA’s missions extend beyond LEO, having access to resources for maintainability and support will place a burden on the crew as well as the mission. The distance of the missions and the
time it will take to get additional resources to perform maintenance and support for operations will
call for good logistics. Maintenance procedures need to be intuitive and simple to strategically
utilize all resources (i.e., human resources, equipment, spares, system repurposing, and consumables). In-flight maintenance and housekeeping technologies are going to require greater utility and
usability while minimizing system complexity. Ground maintenance and assembly should not be
much different.
Traditionally, developers have only considered space missions as a weightless environment.
However, future missions will have destinations where gravitational environments will change.
Biomechanic theories may need to be evaluated for those environments and investigate the optimum interaction possibilities given the environment limitation changes. As we learn from new
environments and challenges, these systems must be sustainable and able to adapt and enhance
capabilities and support crew limitations.
Maintenance and supportability verification and validation are rarely done before certification
of a vehicle/system. New ways of performing maintainability and supportability ground training
using flight-like mock-ups to ensure that the vehicle/system was designed properly for the human
to repair and maintain.
6.4.4
Habitability and Environment Challenges
Currently, NASA has identified multiple physical and virtual/augmented/mix reality developments that enhance human life in space. However, it is imperative to consider human capabilities
and limitations with respect to the interface design of the space habitats, vehicles, and other systems and how these interactions and interfaces may need to change on long-duration journeys
beyond LEO. Environmental factors such as changes in temperature, availability, changes in
microgravity, acceleration, vibration, availability of air and quality of the air, sounds, and noise,
radiation, isolation, and confinement characterize these missions. Therefore, the development of
habitat is a very important factor that helps to determine mission success. It is expected that these
factors are not going to get better as we go further and beyond into deep space missions. When
these factors are not considered for future exploration, there is a risk of vehicle/habitat design that
is incompatible with human capabilities and limitations. Future space missions shall have a habitat that is adaptable and modular. The habitats have to enable crew not only to survive but also to
live and expand developments. Humans perform better when their environment allows them to
perform better. Future missions may need to identify crew architecture and countermeasures that
enhance their existence.
6.4.5
Safety Challenges
Safety is paramount for mission success. The usability of the system contributes to enhancing
system safety. Other times, the usability of the system takes second place to enhance safety. For
instance, looking at the spacesuit, you will note that user mobility is very restricted. In this case,
the usability of the spacesuit is limited by the need to keep the crew safe. The spacesuit helps the
astronaut to be protected from extreme changes of temperature, allows the astronaut to breathe as
it provides oxygen, provides water to the astronaut, and protects the crew from getting hurt
6.5 Conclusion
(NASA, 2019). The suit design has improved, but it is clear that the design most important factor
is safety. Future missions will have to think about deeper/more in-depth safety analysis. For
instance, not only usability and utility may need to be improved but also system reliability for
crew safety. For instance, if the suit rips open for any reason, it will put the crew at risk. It is
important to identify mechanisms that identify system anomalies and rapidly recover from them.
Future long-duration missions may have limited communication with the ground. So technical
support may not be time available. Systems need to have reliability and quality. Perhaps, developing materials and systems that can regenerate will be important to support the crew. Factors of
survivability for long-duration missions may change. There may be more research needed to
enhance the capabilities of survivability and a need to evaluate if the systems are assessed with
human analysis and hazard analysis in mind.
6.4.6 Training Challenges
Training systems will play a very important role. Researchers have shown that many capabilities
on the ground will be to be transferred to onboard activities, especially to respond to anomalies.
Vera et al. (2019) and Holden et al. (2020) stated the importance of advanced training systems,
including the need to know the core vehicle/habitat systems and accurately be able to predict
issues, training to anticipate issues, and training for maintenance and support. The researchers
also noted the importance of refresher and Just-In-Time (JIT) training for long-duration missions. Many times crews have come back from their mission and stated that they were not trained
on activities that they did not experience often. After three years on an isolated mission, they
should be able to retrain or train to resolve anomalies. Vera et al. (2019) identified that MC currently has many capabilities and training that are reinforced to enhance their decisions. Their
research showed that training on troubleshooting and problem solving might need to be on board
to facilitate operations when there is no communication with MC. In addition, there is maybe the
need for high-fidelity systems that facilitate learning stress-inducing simulation training in
analogs.
Additionally, crew time and staffing/qualifications analysis may not be able to be done by MC on
time. Future missions need to aid the crew to optimize their schedule and support new capabilities.
6.5 Conclusions
This chapter summarizes the space history of the evolution of spacecraft system design. It briefly
details the HSI process and its domains. All vehicles that NASA has developed for human space
flight (i.e. Mercury, Gemini, Apollo, Shuttle, and ISS) have presented different challenges and
learning opportunities. As we prepare for future long-duration missions, new challenges will have
to be addressed to satisfy the mission requirements. Going back to the moon and interplanetary
missions will bring new challenges that could affect human capabilities and limitations. Safety and
crew health is paramount in all space vehicles. The crew and the ground will be supported for
operations with an autonomous mission and new ways to address the mission challenges. It is
expected that future spacecraft will have smarter systems to support autonomous missions.
Training methodologies and strategies will need to satisfy new mission requirements. All HSI
domains will need to address future challenges supporting the crew. This chapter describes the
importance of HSI, given the different mission challenges that future long-duration missions will
face. Each of the domains defines some of the challenges.
111
112
6 Human Systems Integration in the Space Exploration Systems Engineering Life Cycle
References
Holden, K., Russi-Vigoya, M.N., Adelstein, B., and Munson, B. (2019). Human Capabilities Assessment
for Autonomous Missions (HCAAM). Phase I: Human Performance Standards and Guidelines
(February). Internal NASA Report Prepared for the Human Factors and Behavioral Performance
Element of the Human Research Program.
Holden, K., Munson, B., Russi-Vigoya, M.N. et al. (2020). Human Capabilities Assessment for
Autonomous Missions (HCAAM). Phase II: Development and Validation of an Autonomous
Operations Task List (January). Internal NASA Report Prepared for the Human Factors and
Behavioral Performance Element of the Human Research Program.
International Organization for Standardization (ISO) 9241-210 (2019). Ergonomics of Human-system
Interaction, Part 210 Human-centered Design for Interactive Systems (ISO 9241-210).
McDonnell Company (1965). NASA Project Gemini Supplement Familiarization Manual (Control no.
119162). McDonnell Company https://www.ibiblio.org/apollo/Documents/GeminiManualVol1Sec2.
pdf (accessed 28 August 2020).
National Aeronautics and Space Administration (NASA) (2010). Human Systems Integration
Requirements Revision C (HSIR Revision E) (November). NASA-CXP70024. Houston, TX: Lyndon
B. Johnson Space Center https://history.nasa.gov/SP-407/part3.htm (accessed 28 August 2020).
National Aeronautics and Space Administration (NASA) (2013a). NASA Procedural Requirements
(NPR) 7123.1B (2013). NASA Systems Engineering Processes and Requirements (April). https://nodis3.
gsfc.nasa.gov/displayDir.cfm?t=NPR&c=7123&s=1B (accessed 28 August 2020).
National Aeronautics and Space Administration (NASA) (2013b). What Was the Space Shuttle?
(November). https://www.nasa.gov/audience/forstudents/k-4/stories/nasa-knows/what-is-thespace-shuttle-k4.html
National Aeronautics and Space Administration (NASA) (2014). Human Integration Design Processes
(HIDP) (NASA/TP-2014-218556) (September).
National Aeronautics and Space Administration (NASA) (2015a). Human Research Program Integrated
Research Plan (Plan: HRP-47065) (March).
National Aeronautics and Space Administration (NASA) (2015b). Human Systems Integration (HSI)
Practitioner’s Guide (Report No.: NASA/SP–2015-3709) (November). https://ntrs.nasa.gov/archive/
nasa/casi.ntrs.nasa.gov/20150022283.pdf (accessed 28 August 2020).
National Aeronautics and Space Administration (NASA) (2019). What Is a Spacesuit? (May). https://
www.nasa.gov/audience/forstudents/k-4/stories/nasa-knows/what-is-a-spacesuit-k4.html (accessed
28 August 2020).
North American Rockwell Corp (1968). Apollo Spacecraft (September). North American Rockwell Corp.
Salazar, G. and Russi-Vigoya, M.N. (2019). Human systems integration relationships between deep
space and deepwater exploration challenges. Off-Shore Technology Conference 2020, Houston, TX.
Swenson, L.M., Grimwood, J.M., and Alexendar, C.C. (1966). The New Ocean-The History of the
Mercury Program, The NASA Historical Series. Washington, DC: National Aeronautics and Space
Administration (NASA).
Vera, A., Holden, K., Dempsey, D. et al. (2019). Contextual Inquiries and Interviews to Support Crew
Autonomous Operations in Future Deep Space Missions: Preliminary Requirements and Proposed
Future Research (February). Internal NASA Report Prepared for the Human Factors and Behavioral
Performance Element of the Human Research Program.
Wu, S.C. and Vera, A.H. (2019). Supporting Crew Autonomy in Deep Space Exploration: Preliminary
Onboard Capability Requirements and Proposed Research Questions (Report No.: NASA/TM-2019-22034).
https://ntrs.nasa.gov/archive/nasa/casi.ntrs.nasa.gov/20190032086.pdf (accessed 28 August 2020).
113
7
Aerospace Human Systems Integration
Evolution over the Last 40 Years
Guy André Boy
CentraleSupélec, Paris Saclay University, Gif-sur-Yvette, and ESTIA Institute of Technology, Bidart, France
7.1 Introduction
For the last forty years, aerospace systems evolved tremendously, mainly due to constant increasing
automation, improvement of design, and development methods and tools, and most importantly
under the constant search for more safety, efficiency, and usability. Air traffic management (ATM)
is a matter of system of systems (SoS), which requires a more solid systemic approach where
technology, organizations, and people are properly considered in an integrated framework. The
search for such an approach is the main objective of this chapter. What are the purposeful attributes
of ATM systems? What are purposeful nominal and off-nominal contexts of ATM systems? What
are ATM disruptive factors? What are ATM intrinsic and extrinsic factors? What is the best ATM
topological model that can support analysis, design, and evaluation of the growing real ATM
system? What are the new ATM metrics in terms of operational performance, decision making,
trust, and collaboration, for example? What is the role of human-in-the-loop simulation (HITLS)
in SoS design?
This chapter first presents the evolution of aviation and the difficult issue of separability in the
overall aeronautical community. Section 7.2 then discusses how software took the lead on
hardware during the last fifty years or so, introducing a drastic shift from automation to autonomy
in the aerospace domain. In addition to human models and related human factors approaches,
human roles drastically changed in the real world. Human models shifted from single-agent to
multi-agent representations and related approaches. This evolution contributed to the emergence
of new disciplines (Section 7.3). Digitalization of industrial processes during the whole life cycle
of products brought forward tangibility issues (Section 7.4). The consideration of unexpected
situations urges us to augment, and in some cases replace, rigid automation produced during the
twentieth century by flexible autonomy (Section 7.5). All these observations lead to the
development of an appropriate human-centered systemic framework in the form of a conceptual
framework, which will be useful for human systems integration (HSI) (Section 7.6). The
conclusion will emphasize future endeavors of HSI as a generic process in our increasingly
digitized society.
A Framework of Human Systems Engineering: Applications and Case Studies, First Edition.
Edited by Holly A. H. Handley and Andreas Tolk.
© 2021 The Institute of Electrical and Electronics Engineers, Inc. Published 2021 by John Wiley & Sons, Inc.
114
7 Aerospace Human Systems Integration
7.2 Evolution of Aviation: A Human Systems
Integration Perspective
At beginning of aviation, air traffic controllers (ATCOs) had to guess both current and future
aircraft positions in order to reduce uncertainty (Figure 7.1).
During the second phase, based on the use of radar technology, ATCOs know aircraft positions
but still have to guess future aircraft positions. We remain in this era despite saturation that in
bustling airports demands shifting to the next phase, which is trajectory management, also called
trajectory-based operations (TBO). In TBO, ATCOs know both current and future aircraft positions, which is intended to reduce uncertainty considerably. While this looks great, a new problem
emerges from the implementation of the TBO solution, which is necessary planning (e.g. 4D trajectories). Planning involves rigidity. Whenever rule-bound procedures are applicable, everything
runs smoothly, but when unexpected situations occur, air traffic managers require flexibility.
Rigidity and flexibility are contradictory concepts! This is the reason we now need to think in terms
of flexible trajectory planning.
Another observation worth noting is that even if pilots and ATCOs are interacting at operations
time, aircraft and ATC manufacturers and suppliers are very different institutions that rarely talk
to each other. By contrast, human-centered design (HCD) requires participatory design of complex
systems (Boy 2013). The space shuttle design and development is a good example of such an HCD
approach where onboard and ground systems were designed and developed in concert. TBO
requires such a multi-agent design approach. Methods were developed to this end (Boy 1998, 2011),
and the TOP model should be used toward the best articulation of technology, organizations, and
people in the HCD of the overall aeronautical system (Figure 7.2).
ATM complexity and automation are two major concepts in contemporary aviation. Aeronautical
automation effectively started in commercial aviation in the 1930s (e.g. the Boeing 247 commercial
aircraft flew with an autopilot in 1933). Aeronautics has then a long experience in automation.
However, a big jump happened during the 1980s when glass cockpits started to be developed. This
kind of digital automation drastically changed the way pilots interacted with their aircraft
(Wiener 1989). Technologically speaking, we moved from analog mechanical instruments to
digital displays (e.g. primary flight display and navigation display) and controls (e.g. sidesticks and
auto-throttle). If the number of instruments in the cockpit drastically decreased, the quantity of
information exponentially increased. A typical question is: how could such information be
organized within the limited space provided by cockpit screens? Substantial research efforts have
been carried out to answer this question (Boy 1995; Doyon-Poulin et al. 2012; Letondal et al. 2018).
More generally, complexity exponentially increased (i.e. the number of processed parameters and
Today
Procedural
Guess aircraft current
and future positions
Trajectory
Radar
Know current positions
and guess future positions
of aircraft
Know aircraft current
and future positions
Figure 7.1 ATC-to-ATM
evolution from procedural
control to trajectory
management.
7.2 Evolution of Aviation: A Human Systems Integration Perspectiv
People
related systems increased), shifting from mechanical to
digital complexity.
These digital systems were developed to take care of
handling qualities, navigation, and many other mechanical
things. Systems invaded aircraft to the point that pilots
Humancentered
ended up with an system of systems (SoS), not externally
design
yet, but internally to the cockpit. Such a digitalization
induced incremental production of layers and layers of
Technology
Organizations
electronics and software, added on top of each other, and
resulting in the deeper separation of pilots from the real Figure 7.2 The TOP model. Source: Boy
physical world. For example, two decades ago, we started (2020). © 2020, Taylor & Francis.
to talk about “interactive” cockpits, not because pilots
interacted mechanically with engines, flaps, and slats as they used to do since the beginning of
aviation, but because they are now interacting with a pointing device on cockpit screens. We are
talking about human–computer interaction (HCI) in the cockpit (Boy 1993).
In addition to cockpit automation (the technological side), the number of technical aircrew
members in transoceanic flights was reduced over the last sixty years or so: five until the 1950s
when the radio navigator was removed (the radio navigator was dedicated to voice communication
equipment), four until the 1970s when the navigator was removed (when inertial navigation systems were introduced), three until the 1980s when the flight engineer was removed (new monitoring equipment for engines and aircraft systems were introduced), and two to date. The next change
will shortly happen if the single-pilot operations (SPO) goal is reached. Reducing crews involves
organizational changes that need to be seriously considered, again in terms of safety, efficiency,
and comfort. At this point, it is crucial to understand whether such changes are evolutionary or
revolutionary. Circa the end of the 1980s, we became conscious of this sociotechnical distinction
when the Airbus 320 was certified. The A320 was highly automated compared with other commercial aircrafts of its category. Many experts thought that it was easier to fly. Some others claimed
that such automation was dangerous. We did not realize at that time that even if we thought that
automation was developed incrementally, almost linearly (we thought!), the nature of pilot’s job
radically changed from control to management (i.e. from control of aircraft trajectory to management of systems, which were controlling the trajectory). Once this job shift was understood, everything went right. This is the reason why systems engineering (SE) requires taking into account HSI
since the beginning of the design and development process.
Historically, the design of a system was done in silos, and, in many cases, systems were only connected just before operations, which is not a problem when subsystems in the system are separable
(Figure 7.3). Clumsy integration, often done too late in the development process, is likely to cause
surprises and, sometimes, a few catastrophes. This is the reason why adjustments are always
required, either operationally via adapted procedures and/or interfaces, and in the worst case more
drastic redesign of the system itself. The separability concept has been used for a long time by
physiologists to denote the possibility of separating an organ from the human body to work on it
separately and put it back. Some organs (i.e. systems) are separable, that is, the overall body (i.e. an
SoS) does not die from this momentary separation. Some other organs, such as the brain, cannot be
separated because the human being could die from this separation. Therefore, those organs have to
be investigated and treated while connected to the rest of the body.
In addition, twentieth-century engineering involved technicians who were, and still are, working
in isolation and focused on a specific field or discipline. They were, and still are, barely aware of
the integration of the overall complex SoS, i.e. “the whole picture” that they build. HSI has to
115
116
7 Aerospace Human Systems Integration
Figure 7.3 Example of separability property of a system of systems (SoS). Four sub-SoSs of the SoS are
separable and therefore can be analyzed, designed, and evaluated in isolation. Source: Boy (2020).
© 2020, Taylor & Francis.
consider interconnected SoSs, where systems include people and machines. This kind of
requirement does not fit the current urgency of fast market economy. . . or fast anything for that
matter! It takes time to get complex systems working well and maturing from three points of view:
technology, people’s experience, and society. Anticipation, which involves creativity, and HITLS
using appropriate scenarios enable to explore and test possible futures.
The lack of consideration for the separability issue in ATM is a good example, where, for a long
time, most air and ground technologies have been designed and developed in isolation. Recent
programs, such as Single European Sky ATM Research (SESAR), try to associate air and ground
stakeholders. The TOP model is a good framework for design and development teams to understand
and rationalize interdependencies of technology, organizations, and people. This objective requires
that various activities be observed and analyzed using modeling and simulation, in order to
discover emerging properties and functions of the airspace technologies under development, and
not await the discovery of these emerging properties and functions at operations time.
7.3 Evolution with Respect to Models, Human Roles,
and Disciplines
7.3.1
From Single-Agent Interaction to Multi-agent Integration
For a long time in aeronautics, we were essentially centered on single-agent interaction with
cockpit instruments and controls in the cockpit and with traffic displays and radio on the ground.
Focusing on cockpits, for several decades of the twentieth century, electrical engineering, computer
science, and information technology incrementally penetrated commercial aircraft. Many kinds of
embedded systems (ESs) were developed in four steps that Captain Etienne Tarnowski called “the
four loops of automation” (Figure 7.4).
Everything started with automation around the center of gravity using yoke or sidestick and
thrust levers. The first loop consisted in a single agent, the autopilot, regulating parameters, such
as speed and heading, one parameter at a time. Time constant of the feedback is around 500
milliseconds. Pilots had to adapt to this control loop by changing from the control of flight
parameters to supervising the behavior of flight control with respect to a set point.
The guidance loop was developed circa the early 1980s. This second feedback loop involves
several parameters. Its time constant is around 15 seconds. Note that this feedback loop has been
typically implemented on top of the flight control loop. High-level modes of automation appeared
7.3 Evolution with Respect to Models, Human Roles, and Discipline
DCDU
Air traffic
system unit
CDU
Flight
management
Flight
control
Guidance
RMP
~.5 sec
15 sec
ATC
datalink
1 min
10 min
Figure 7.4
Aircraft
Flying
around Cg
Guiding on
basic trajectory
Guiding on
flight plan
Air traffic
management
loop
The four loops of automation of the airspace. Source: Tarnowski (2006).
and were managed on the flight control unit panel. At the same time, integrated and digital
autopilot and auto-throttle were installed.
The third loop concerns navigation automation with a time constant of about one minute.
Guidance and flight management was integrated circa mid-1980s. This was the first real revolution
in the development of avionics systems. We were shifting from control of flight parameters to
management of avionics systems, which grew exponentially as software became dominant. For
that matter, pilots now have to deal with a variety of avionics systems that qualify as softwarebased agents, which generate problems as they become more interconnected.
Technology continued to improve and aircraft cockpits became more computerized. As already
described elsewhere (Boy 1998, 2011), commercial aircrafts were equipped with autopilots for a
long time (since the 1930s), but what drastically changed is the amount of software in avionics
systems. The notion of systems quickly became persistent, and pilots’ work radically changed from
handling flight qualities (manual control) to aircraft systems management. A pilot’s role shifted
from control to management, exactly like when someone becomes a manager in an organization
and has a team of agents to manage. In this case, pilots had to learn how to manage very advanced
systems and coordinate their activities. It was not obvious when suddenly a pilot had to become a
manager (of systems). This new emerging cognitive function (i.e. systems management) had to be
learned and stabilized.
The fourth loop concerns ATM with a time constant of about 10 minutes. We now deal with
airspace “automation.” This is about air-ground integration. This is a new revolution, where new
considerations, such as authority sharing, air traffic complexity management (Hilburn 2004), and
organizational automation, have become essential (Boy and Grote 2009). Note that this ATM loop
is multidimensional and multi-agent.
7.3.2
Systems Management and Authority Sharing
There was a big controversy during the late 1980s when the first highly automated glass cockpits
of commercial aircraft were delivered and used (i.e. integration of the first three loops described
above). This controversy started with social issues in the beginning of the 1980s because the
commercial aircraft industry went from three-crewmen cockpits to two-crewmen cockpits, and
downsizing the technical crew was not universally accepted. The role that was previously performed
117
118
7 Aerospace Human Systems Integration
by a flight engineer was shared among the captain, first officer, and avionics systems. Function
allocation was at stake and we had to find out how to certify these new cockpits. Therefore, we
developed human factors methods that enabled the evaluation of aircrew workload and
performance, comparing various types of configurations. We needed to demonstrate that a forwardfacing cockpit with two crewmembers was as safe as the previous types of cockpits.
At the same time, the number of aircrafts grew exponentially and induced new issues related to
traffic density and airspace capacity. New systems came on board, such as the traffic alert and
collision avoidance system (TCAS), which provided a new kind of information to the pilot. Not
only the TCAS provided traffic alerts, but also advice to climb or descend to avoid a converging
aircraft. Not only were the collision avoidance orders from ATCOs replaced by the TCAS, but also
these orders were, and remain, on board and given by a machine. Authority shifted from the
ground to the aircraft and from humans to machines. We can see here that technology has resulted
in the emergence of a different practice related to a different authority allocation.
The PAUSA1 project investigated practical issues in authority sharing in the airspace (Boy and
Grote 2009; Boy et al.,2008). In this project, we extensively analyzed the 2002 Überlingen mid-air
collision due to a wrong TCAS usage. TCAS introduced a gradual shift from central control to
decentralized self-organization (Weyer 2006). The PAUSA approach to authority was grounded in
a multi-agent approach that enables the expression of function distribution, the notion of a
common frame of reference, task delegation, and information flows among agents. The metaphor
of the shift from the army to an orchestra (Boy 2009), which represents the ongoing evolution of the
airspace multi-agent system, emerged from multiple experience-based investigations within PAUSA.
7.3.3
Human-Centered Disciplines Involved
At this point, it is important to clarify the relationship between the task/activity distinction and
distinctions between sociotechnical disciplines. More specifically, we need to define the following
concepts: task, activity, human factors, ergonomics, HCI, HCD, and HSI. A task is what is prescribed
to human operators or users. An activity is what is effectively performed by human operators or users.
For the last sixty years, sociotechnical evolution can be decomposed into three eras in which
three communities2 emerged (Figure 7.5):
●●
HFE was developed after World War II to correct engineering production and generated the
concepts of human–machine interfaces or user interfaces (UI) and operational procedures;
activity-based evaluation could not be holistically performed before products were finished or
almost finished, which enormously handicapped possibilities of redesign. Sometimes, activity
analyses were carried out prior to designing a new product, based on existing technology and
practice; however, this HFE approach forced continuity, reduced risk taking, and most of the
time prevented disruptive innovation.
1 PAUSA is a French acronym for “authority distribution in the aeronautical system.” This national project was
sponsored by the French Aviation Administration (DPAC) and the aeronautical industry. Nine organizations
participated in this project. This work was carried out when the author was the director of the PAUSA project at the
European Institute of Cognitive Sciences and Engineering (EURISCO).
2 The author is qualified to talk about these three communities. He is still the chair of the Aerospace Technical
Committee of the International Ergonomics Association (IEA), which encapsulates most HFE societies around the
world. From 1995 to 1999, he was the executive vice-chair of the Association for Computing Machinery (ACM)
Special Interest Group on Computer–Human Interaction (SIGCHI) and senior member of the ACM. He is currently
co-chair of the Human Systems Integration Working Group of the International Council on Systems Engineering
(INCOSE).
7.3 Evolution with Respect to Models, Human Roles, and Discipline
1950s 1960s 1970s 1980s 1990s 2000s 2010s
Observe activity when everything is built
(Corrective ergonomics)
HFE
Analyze and consider tasks at design time
(Interaction design)
HCI
Observe and consider activity at design time
HSI
Figure 7.5
●●
●●
(Tangible HCD in SE)
Human-centered design evolution.
HCI was developed during the 1980s to better understand and master human interaction with
computers; it contributed to the shift from corrective ergonomics to interaction design mainly
based on task analysis. Activity-based analysis was introduced within the HCI community by
people who understood phenomenology (Winograd and Flores 1986) and activity theory
(Kaptelinin and Nardi 2006).
HSI emerged from the need to officially consider human possibilities and necessities as variables
in SE; incrementally combined, SE and HCD lead to HSI to take care of systems during their
whole life cycle (Boy and Narkevicius 2013). HCD involves looking beyond human factors
evaluations and task analyses. It involves activity analysis at design time using virtual prototyping
and HITLS (e.g. we can model and simulate an entire aircraft, fly it as a computing game, and
observe pilot’s activity). HCD also involves creativity, systems thinking, risk taking, prototype
development using agile approaches, complexity analyses, organizational design, and management,
as well as HSI knowledge and skills.
7.3.4
From Automation Issues to Tangibility Issues
During the 1980s and 1990s, automation drawbacks emerged from several HFE studies, such as
“ironies of automation” (Bainbridge 1983), “clumsy automation” (Wiener 1989), and “automation
surprises” (Sarter et al. 1997). These studies considered neither technology maturity nor maturity
of practice. Automation can be modeled as cognitive function transfer from people to systems
(Boy 1998). If automation considerably reduced people’s burdens, it also caused problems such as
complacency, which is an emerging cognitive function (i.e. not predictable at design time, but at
operations time).
Today, we can develop an entire aircraft on computers from inception of design to finished
product. Therefore, we are able to test its operability from the very beginning and along its life cycle
using HITLS and an agile approach. Consequently, we are able to observe, and therefore analyze,
human activity using systems in a simulated environment at design time. The operability of
complex systems can then be tested during design. This is the reason why HCD has become a
discipline in its own right. HCD enables us to better understand HSI during the design process and
then have an impact on requirements before complex systems are concretely developed.
HITLS enables activity analysis at design time, albeit in virtual environments. Even if these
environments are very close to the real world, their tangibility must be questioned and most
importantly validated.
119
120
7 Aerospace Human Systems Integration
What is tangibility? It has two meanings. First, physical tangibility is the property of an object
that is physically graspable (i.e. you can touch it, hold it, sense it, and so on). Second, figurative
tangibility is the property of a concept that is cognitively graspable (i.e. you can understand it,
appropriate it, feel it, and so on). If I try to win an argument with you, you may argue back, “what
you are telling me is not tangible!” This means that you do not believe me; you cannot grasp the
concept I am trying to provide. We also may say that you do not have the right mental model to
understand it or that I do not have enough empathy to deliver the message appropriately.
Tangibility is about situational awareness both physically and cognitively. For example, Tan
developed the first versions of the Onboard Context-Sensitive Information System (OCSIS) for
airline pilots on a tablet PC (Tan 2015). Physical tangibility considerations led to a better
understanding of whether OCSIS should be handheld or fixed in the cockpit. Other considerations
led to the choice of figurative displays of weather visualization going from vertical cylinders to
more realistic cloud representations (figurative tangibility). A set of pilots gave their opinions on
various kinds of OCSIS tablet configurations. It is interesting to note that the pilots always naturally
used the term “tangible” to express their opinions.
Therefore, tangibility metrics should be developed to improve the assessment of complex systems
operability. This is where subject matter experts and experienced people enter into play. We
absolutely need such people in HCD to help assess HSI tangibility. For example, very realistic
commercial aircraft cockpits, professional pilots, and realistic scenarios are mandatory to assess
tangibility incrementally. OCSIS was tested from the early stages of the design process using HITLS
by recording what pilots were doing while using it and analyzing their activity. Such formative
evaluations lead to system modifications and improvements. HCD is iterative and agile3 in the
SE sense.
While the twenty-first-century shift from software to hardware is not necessarily straightforward,
it is the next dilemma we must address, especially now that we can 3D print virtual systems and
transform them into physical systems. We will denote resulting systems, tangible interactive
systems (TISs) (Boy 2016). The TIS concept is very close to the cyber–physical systems (CPSs)
concept, which are usually defined as a set of collaborative elements controlling physical entities
(Lee 2008). CPSs are often qualified as ESs, but there is a distinction between ESs as purely
computational elements and CPSs as computational and physical elements intimately linked
(Wolf 2014). We can say that CPSs are extended avionics systems. Both TISs and CPSs are strongly
based on the multi-agent concept, unlike twentieth-century automation that was based on the
single-agent concept. TISs cannot be considered without an organizational approach. More
generally, the coevolution of people’s activities and technology necessarily lead to a tangible
organizational evolution.
7.4
From Rigid Automation to Flexible Autonomy
When we know the domain well, both technically and operationally, it is possible to define
appropriate procedures that can either be implemented as computer programs (i.e. automation of
machines) or followed by human operators (i.e. automation of people). Figure 7.6 shows how, in a
3 The Manifesto for Agile Software Development (www.agilemanifesto.org) has been written to improve the
development of software. It values individuals and interactions over processes and tools, working software over
comprehensive documentation, customer collaboration over contract negotiation, and responding to change
(flexibility) over following a plan (rigidity).
7.4 From Rigid Automation to Flexible Autonom
Procedures
Automation
Problem solving
Automation
of
people
Automation
of
machines
Autonomy
of agents
(mainly humans)
Automation
of
human
functions
Automation
of
system
functions
Coordination
of functions
of autonomous
agents
Allocation
of
human and machine functions
Figure 7.6 Procedures, automation, and problem solving leading to the allocation of human and machine
functions. Source: Boy (2020). © 2020, Taylor & Francis.
very well-known and/or expected validity space, procedures and automation lead to automation
of, respectively, human and machine functions. Everything goes fine within the validity space (i.e.
in nominal situations). However, outside the validity space, the rigidity of both procedures and
automation rapidly leads to instability.
In off-nominal situations (i.e. unexpected, unknown, abnormal, or emergency situations),
people need to solve problems (Pinet 2015). Problem solving is a matter of knowledge and knowhow. The more they have such knowledge and know-how, the more people are autonomous. They
also need to have appropriate technological and/or organizational support. Altogether, autonomy
is a matter of appropriate technological support enabling flexibility, coordinated organizational
support, and people’s knowledge and know-how. Off-nominal situations management involves
functions of autonomous human and machine agents that need to be coordinated.
In all cases, functions from automated or autonomous agents need to be correctly allocated to
the right agents whether they are people or machines. Such allocation cannot be done entirely
statically, but dynamically with the evolution of context.
A fully autonomous agent, whether human or machine, does not exist, or may exist in very
limited contexts. Indeed, no agent can always be aware of the overall situation, nor is always
capable of making the right decision at the right time, nor act appropriately in the right context.
The reason is that there are too many parameters entering into play. Flexible autonomy of an agent
will have to be investigated using the following claims:
●●
●●
●●
An agent is defined as a society of agents (Minsky 1985).
Each agent owns appropriate knowledge and processing capabilities, in terms of function(s) and
structure(s), to perform a given task.
The more agents become autonomous in a society of agents, the more coordination rules are
needed to keep the stability and sustainability of the overall system.
In other words, agents become increasingly autonomous once they have acquired appropriate
knowledge and improved capacities of coordinating with others. The concept of “appropriate
knowledge” can be defined as knowledge suitable to have in a given context. The concept of
“coordination” can be defined as both prescribed and effective coordination in a given context.
121
122
7 Aerospace Human Systems Integration
Prescribed coordination is a matter of coordinated tasks (i.e. like symphony scores produced
by the composer to coordinate the various musical instruments). Effective coordination is a
matter of coordinated activity (i.e. a conductor coordinating the various musicians of the
orchestra).
Aerospace experience shows the need for deeper support in terms of systemic framework. Over
the years, we accumulated ESs, now extended to CPSs, Internet of Things, and other systems. Even
if each of these systems can be useful and usable, when they are put together and operated by
people, they can become extremely difficult to manage. In critical situations, operational
complexity, situation awareness, and workload are directly impacted. Consequently, there is a need
for improving HSI. This need leads to a more fundamental requirement, that is, defining what a
system is really about.
7.5
How Software Took the Lead on Hardware
During most parts of the twentieth century, hardware and mechanical machines were primary
engineering concerns. We built washing machines, cars, aircraft, and industrial plants using
mechanical engineering methods and tools. At the end of the twentieth century, we started to
introduce electronics and software into these machines, to the point that we manage to shift
practices from mechanical manipulation to HCI. Computers invaded our lives as mediators
between people and mechanical systems. The computer-based UI became a primary issue and
solution everywhere in HCI. In aeronautics, we ended up with the concept of interactive cockpits,
not because pilots interacted with mechanical things, but because they now interact using pointing
devices on computer displays. HFE combined with HCI and cognitive science, as a new discipline
often called cognitive engineering, supported machine developments by studying, designing, and
evaluating UIs, added after a mechanical machine was developed. Software contributed to adding
automated functions to machines, with these functions offering new capabilities to people, who
had to learn how to interact with automation safely, efficiently, and comfortably. In addition,
automation came in the form of incrementally added layers of software that increased situation
awareness issues (Endsley 1996).
It is interesting to notice that, since the beginning of the twenty-first century, most projects start
on computers, with a PowerPoint slide deck, a computing model and visualization, a simulation,
and in some cases a computer-based HITLS. For example, the Falcon 7X, developed by Dassault,
was entirely built as a giant interconnected piece of software that led to a sophisticated computer
game flown by test pilots. For the time, we were able to observe end user activity at design time,
even before any piece of hardware was developed. Once such software models and simulation are
tested, they enable design teams to develop appropriate requirements for making hardware parts
and, in many cases now, 3D printed software models. We have moved from software to hardware,
inverting the twentieth century’s approach that moved from hardware to software. As a result,
automation is less of an issue as it was before because HITLS enables testing functional safety,
efficiency, and usability since the beginning of the design process. The problem is then to better
understand the tangibility issue induced by the shift from software models and simulations to the
concrete structural world. Tangibility is not only a matter of physics, but it is also a matter of
intersubjectivity (i.e. mutual understanding) between end users and designers. In other words, end
users should be able to understand what machines are doing at appropriate levels of granularity.
This is the reason why complexity analysis has become tremendously important in our increasingly
interconnected world.
7.6 Toward a Human-Centered Systemic Framewor
System knowledge, design flexibility, and resource commitments are three parameters that
should be followed carefully during the whole life cycle of a system. HSI aims to increase the
following sufficiently early (Boy 2020):
●●
●●
●●
System knowledge that is knowing about systems at design, development, operations, and
closeout times and how the overall system, including people and machines, works and behaves.
Design flexibility that is keeping enough flexibility for systems changes later in development
and usages.
Resource commitments that is keeping enough “money” for choosing adapted resource
management during the whole life cycle of the overall system.
When a technology-centered approach is used (typically what we have done up to now), system
knowledge increases slowly in the beginning, growing faster toward the end of the cycle. Design
flexibility drops very rapidly, leaving very few alternatives for changes, because resource
commitments were too drastic too early during design and development processes.
Instead of developing technology first, software models are used for the development and use of
HITLS, which enables activity observation and analysis, and therefore the discovery of emergent
properties and functions, which in turn can be considered incrementally in design. This is a typical
HCD process. Consequently, system knowledge increases more rapidly during such an agile design
and development process. At the same time, design flexibility drops much more slowly, with an
inverted concavity, enabling possible changes later in the life cycle. Software-based modeling and
HITLS enable testing various kinds of configurations and scenarios, enabling softer resource
commitments in the beginning and leaving more comfortable space for appropriate changes.
At this point, we see the need for modeling and simulation for HCD and consequently HSI. If
twentieth-century automation, that is, putting software into hardware or transferring human
functional knowledge into a machine, brought human functional issues, twenty-first-century
tangibilization, that is, transforming software models into real-world tangible (concrete) human
machine systems, is currently raising architectural issues. Before we provide a topological approach
to HSI in Section 7.4, let us present and discuss the shift from rigid automation to flexible autonomy.
7.6 Toward a Human-Centered Systemic Framework
7.6.1
System of Systems, Physical and Cognitive Structures and Functions
Historically, engineers used to think about a system as an isolated system, or a quasi-isolated
system, which has an input and produces an output (Figure 7.7). Comparatively an agent, in the
artificial intelligence (AI) sense, has sensors and actuators, and a system, in the SE sense, has
sensors to acquire an input and actuators to produce an output.
Today, systems are highly interconnected, and we talk about a system as an SoS, which means
that a system can be represented as an organization of other systems. More generally, a system
belongs to a bigger system and is interconnected with other systems (Figure 7.8). The same holds
for agents in AI, which can be organized within a society of agents (Minsky 1985).
Following up on the separability concept for an SoS, it is now
crucial to have a clear definition of what the system means.
Input
Output
Isolated
A system is a representation of:
1) A human or more generally a natural entity (e.g. a bird,
a plant).
system
Figure 7.7 An isolated system.
123
124
7 Aerospace Human Systems Integration
Figure 7.8 A system of systems
represented as an infrastructure
(i.e. a society of agents or a structure
of structures).
Cognitive
can be
Function
can be
Physical
has
Human
represents
Human
system
can be
can be
System
can include
can include
Machine represents
system
Machine
has
Physical
Figure 7.9
can be
Structure
can be
Cognitive
Synthetic view of the system representation.
2) An organization or a social abstraction (e.g. a team, a community, a law, a legally defined
country, a method).
3) A machine or a technological entity (e.g. a car, a motorway, a washing machine, a chair).
Consequently, this system definition breaks the traditional meaning of system, conceived as a
machine only, but instead encapsulating humans, organizations, and machines.4 Figure 7.9
presents a simple ontological definition of the “system” conceptual representation.
A system can be either cognitive (or conceptual), physical, or both (Boy 2017). It also has at least
one structure and one function. Today, machines have software-supported cognitive functions (e.g.
the cruise control function on a car enables the car to maintain a set speed). In practice, a system
has several structures, and several functions articulated within structures of structures and
functions of functions. It is interesting to recall the analog definition of an agent in AI provided by
Russell and Norvig (2010), which is an architecture (i.e. structure) and a program (i.e. function).
4 This systemic view takes Herbert Simon’s view of the Sciences of the Artificial (Simon, 1996), in the sense that he
rejected treating human sciences using the exclusive model of the natural sciences (i.e. submission to natural laws)
and to break between science and humanities by looking for a common ground that links them. The science of the
artificial seeks new constructs that would explain things, which were not previously understood. These artificial
constructs could be a language, an ontology, a conceptual model, or any kind of representation that makes sense.
7.6 Toward a Human-Centered Systemic Framewor
Figure 7.10
A function of functions mapped onto a structure of structures.
Figure 7.11
Emerging functions (yellow) and structures (pink) within an active system of systems.
Each system is interconnected to other systems either structurally (in terms of a systemic
infrastructure) or functionally (in terms of functions appropriately allocated to systems).
Summarizing, a system, as an SoS, is represented by an infrastructure where a network of functions
could be dynamically allocated (i.e. a function of functions mapped onto the structure of structures;
Figure 7.10).
7.6.2
Emergent Behaviors and Properties
At this point, a distinction should be made between deliberately established functions allocated
onto an infrastructure and functions that necessarily emerge from system activity. Indeed, systems
within a bigger system (i.e. an SoS) interact with each other to generate an activity. von Bertalanffy
(1968)5 said “a system is a set of elements in interaction.” Emerging functions are discovered from
such activity (Figure 7.11). The integration of such emergent functions into the SoS may lead to the
generation of additional structures, which we also call emerging structures.
5 https://www.sebokwiki.org/wiki/What_is_a_System%3F
125
126
7 Aerospace Human Systems Integration
7.6.3
System of Systems Properties
The system’s purpose is logically defined by its task space (i.e. all tasks the system can perform
successfully). Each task is performed by the system using a specific function that produces an
activity that can be fully or partially observable (Figure 7.12).
A system’s function is teleologically defined by three entities:
1) Its role within the related system.
2) Its context of validity that frames the boundaries of the system’s performance.
3) Its set of resources required to perform its role within its context of validity. Resources are
systems themselves that have their own cognitive and/or physical functions.
Therefore, according to these definitions, a system can be represented by the recursive schema
presented in Figure 7.13.
Let us consider a postman represented as a system (or an agent in the AI sense) with the function
of delivering letters. The postman as a system is part of an SoS, which is the postal services. The
role of this system is “delivering letters.” The context of validity is, for example, seven hours a day
five days a week (i.e. a time-wise context in France, for example) and a given neighborhood (i.e.
space-wise context). Resources can be physical (e.g. a bicycle and a big bag) and cognitive (e.g. a
pattern-matching algorithm that enables the postman to match the name of the street, the number
on the door, and the name of the recipient). The corresponding pattern-matching algorithm is a
cognitive function. Let us consider now that there is a strike and most postmen are no longer
available for delivering letters. Remaining postmen should have longer hours of work in more
significant neighborhood until this expansion is so extreme that the postmen need helpers to
achieve the delivery task successfully.
In this case, a tenure postman should have cognitive resources such as “training,” “supervising,”
and “assessing” temporary personnel. We see that the cognitive function of “delivering letters”
owned by a postman (i.e. an agent or a system) has to be decomposed into several other functions
allocated to temporary postmen. We start to see an
organization developed as an answer to a strike.
More generally, a function of functions can be disTask
Function
Activity
tributed among a structure of structures.
7.7 Conclusion and
Perspectives
Figure 7.12 A function logically
transforms a task into an activity.
Structure
System
Role
Function
Human
machine
Context
Resources
Physical
cognitive
Figure 7.13 HSI recursive definition of a system.
This chapter benefited from years of aerospace
experience that contributed to the genesis of a HSI
conceptual framework, useful for the HCD of complex systems, where safety, efficiency, and comfort
are most required. The HSI experience, concepts,
and methods that have been developed in aerospace can be extended to other industrial and public sectors, such as mobility and medicine. More
specifically, the concept of the system described
in this chapter can be used for the rationalization
of HSI in a large variety of domains. In addition,
contemporary technology and organizations are
becoming digital, and modeling and simulation
Reference
will naturally develop over the next few years, providing tremendously useful capabilities to HSI
endeavors in engineering design and other processes of the life cycle of systems (i.e. SE).
A question worth asking is: should we continue to talk about human-centered or life-centered
technology and organizations? In this chapter, we introduced the first contribution to an HSI ontology (see Figure 7.10). However, it would be great to expand this approach to life in general, including natural entities and environmental issues. Indeed, aeronautics is increasing in sensitivity to
climate change, for example, by trying to find solutions to this major planetary issue. From a general
standpoint, we need to address appropriate life-critical constraints and goals for technology design
and development (e.g. safety, efficiency, and comfort). More specifically, sustainability should be
part of these constraints and goals, including social, economic, and environmental factors.
A shift from the old army pyramidal model to the Orchestra model is currently emerging (see the
Orchestra model in Boy 2013). For example, technology and emergent practices have led people to
change ways of communicating with each other. The army model induced mostly descendent vertical communication. Transversal communication (e.g. using telephone, e-mail, and the Web) contributed to the emergence of the Orchestra model (Boy 2009; Boy and Grote 2009). This functional
evolution is now changing organizations themselves (i.e. structures). For example, smartphones and
the Internet have contributed to change in both industrial and everyday life organizations.
The Orchestra model provides a usable framework for HSI. It requires a definition of a common
frame of reference (music theory), as well as jobs such as the ones of human-centered designers
and systems architects (composers) who provide coordinated requirements (scores), highly competent sociotechnical managers (conductors) and performers (musicians), and well-identified end
users and engaged stakeholders (audience). Having this organizational model in mind, it is now
crucial to use it in HCD. More specifically, in the framework of this chapter, it can be very useful
for ATM research and design.
It is time to further develop methods and tools for the integration of people and organizations in
the life-critical design and development of new technology. To do this, HSI foundations need to be
further developed to support HCD. This chapter presented conceptual solutions to this endeavor.
More is to come, and HSI research needs to be promoted and supported.
References
Bainbridge, L. (1983). Ironies of automation. Automatica 19 (6): 775–779.
von Bertalanffy, L. (1968). General System Theory: Foundations, Development, Applications. New York:
George Braziller revised edition 1976.
Boy, G.A. (1993). Human-computer interaction in the cockpit. Invited lecture at Inter-CHI’93,
Amsterdam, NL.
Boy, G.A. (1995). “Human-like” system certification and evaluation. In: Expertise and Technology:
Issues in Cognition and Human-Computer Cooperation (Expertise Series) (eds. J.M. Hoc, E. Hollnagel
and P.C. Cacciabue). Hillsdale, NJ: Lawrence Erlbaum Associates, Inc. Publishers.
Boy, G.A. (1998). Cognitive Function Analysis. USA: Praeger/Ablex.
Boy, G.A. (2009). The orchestra: a conceptual model for function allocation and scenario-based
engineering in multi-agent safety-critical systems. Proceedings of the European Conference on
Cognitive Ergonomics, Otaniemi, Helsinki area, Finland (30 September–2 October).
Boy, G.A. (2011). Introduction. In: Handbook of Human-Machine Interaction: A Human-Centered
Design Approach. UK: Ashgate.
Boy, G.A. (2013). Orchestrating Human-Centered Design. UK: Springer.
Boy, G.A. (2016). Tangible Interactive Systems. UK: Springer.
127
128
7 Aerospace Human Systems Integration
Boy, G.A. (2017). Human-centered design of complex systems: an experience-based approach. Design
Science Journal 3: E8. https://doi.org/10.1017/dsj.2017.8.
Boy, G.A. (2020). Human Systems Integration – From Virtual to Tangible. Boca Raton, FL: CRC Press,
Taylor & Francis.
Boy, G.A. and Grote, G. (2009). Authority in increasingly complex human and machine collaborative
systems: application to the future air traffic management construction. In Proceedings of the 2009
International Ergonomics Association World Congress, Beijing, China.
Boy, G.A. and Narkevicius, J. (2013). Unifying human centered design and systems engineering for
human systems integration. In: Complex Systems Design and Management (eds. M. Aiguier,
F. Boulanger, D. Krob and C. Marchal). UK: Springer.
Boy, G.A., Salis, F., Figarol, S. et al. (2008). Authority Sharing in the Airspace. PAUSA: Final Technical
Report. Paris, France: DGAC-DPAC.
Doyon-Poulin, P., Ouellette, B., and Robert, J.-M. (2012). Visual clutter – more than meets the eye.
Proceedings of HCI-Aero 2012: International Conference on Human-Computer Interaction in
Aerospace, Bruxelles, Belgium. Also in ACM Digital Library.
Endsley, M.R. (1996). Automation and situation awareness. In: Automation and Human Performance:
Theory and Applications (eds. R. Parasuraman and M. Mouloua), 163–181. Mahwah, NJ: Lawrence
Erlbaum.
Hilburn, B. (2004). Cognitive Complexity in Air Traffic Control: A Literature Review. Project
COCA – COmplexity and CApacity. EEC Note No. 04/04.
Kaptelinin, V. and Nardi, B. (2006). Acting with Technology: Activity Theory and Interaction Design.
Cambridge: MIT Press.
Lee, E.A. (2008). Cyber Physical Systems: Design Challenges. http://www.eecs.berkeley.edu/Pubs/
TechRpts/2008/EECS-2008-8.html (accessed 10 May 2015).
Letondal, C., Vinot, J.L., Pauchet, S. et al. (2018). Being in the sky: framing tangible and embodied
interaction for future airliner cockpits. Proceedings of TEI 2018 12th International Conference on
Tangible, Embedded and Embodied Interactions, Stockholm, Sweden (March). doi:https://doi.
org/10.1145/3173225.3173229. hal-01715317.
Minsky, M. (1985). The Society of Mind. New York: Simon and Schuster.
Pinet, J. (2015). Facing the Unexpected in Flight – Human Limitations and Interaction with Technology
in the Cockpit. Boca Raton, FL: CRC Press, Taylor & Francis.
Russell, S. and Norvig, P. (2010). Artificial Intelligence – A Modern Approach, 3e. Boston, MA: Prentice Hall.
Sarter, N.B., Woods, D.D., and Billings, C.E. (1997). Automation surprises. In: Handbook of Human
Factors & Ergonomics, 2e (ed. G. Salvendy). New York: Wiley.
Simon, H.A. (1996). The Sciences of the Artificial, 3e. Cambridge, MA, USA: The MIT Press.
Tan, W. (2015). Contribution to the Onboard Context-Sensitive Information System (OCSIS) of
commercial aircraft. PhD dissertation, School of Human-Centered Design, Innovation and Arts,
Florida Institute of Technology.
Tarnowski, E. (2006). The 4-loop approach to aeronautical automation evolution. Keynote, HCIAero’06, Seattle, USA.
Weyer, J. (2006). Modes of governance of hybrid systems. The mid-air collision at Überlingen and the
impact of smart technology. Science, Technology and Innovation Studies 2: 127–149.
Wiener, E.L. (1989). Human Factors of Advanced Technology (“Glass Cockpit”) Transport Aircraft.
NASA Contractor Report 177528. CA, USA: NASA ARC.
Winograd, T. and Flores, F. (1986). Understanding Computers and Cognition: A New Foundation for
Design. Boston, MA: Addison-Wesley.
Wolf, M. (2014). High-Performance Embedded Computing: Applications in Cyber-Physical Systems and
Mobile Computing, 2e. Amsterdam: Morgan Kaufmann.
129
Section 3
Focus on Training and Skill Sets
131
8
Building a Socio-cognitive Evaluation Framework to
Develop Enhanced Aviation Training Concepts for Gen Y
and Gen Z Pilot Trainees
Alliya Anderson1, Samuel F. Feng1, Fabrizio Interlandi2, Michael Melkonian3,
Vladimir Parezanović1, M. Lynn Woolsey3, Claudine Habak3, and Nelson King1
1
Khalifa University of Science and Technology, Abu Dhabi, United Arab Emirates
Capt, Etihad Aviation Training, Abu Dhabi, United Arab Emirates
3
Emirates College for Advanced Education, Abu Dhabi, United Arab Emirates
2
8.1 Introduction
The $5.7 billion flight simulator market (2019 estimate) is projected to grow by 5% per year. Airbus
(2019) estimates that 550 000 new pilots will need to be trained in the next 20 years to offset retirement and attrition and to meet the demands of growing international and domestic airline markets. According to the 2018 “Pilot Demand Outlook” report, “Airlines and their training partners
will need to produce an average of 70 new type-rated pilots per day globally to match the record
high aircraft delivery rate and account for pilot attrition” (CAE 2016). With the recruitment rates
and the increasing demand for pilots, airlines are already coping with pilot shortages (Garcia 2018;
Okal and Kearns 2018; Prokopovič 2019). While this demand has been significantly affected by the
recent Covid-19 outbreak, it can be expected that pilot training requests will return to growth once
the effects of the outbreak have subsided.
While there have been efforts to incentivize and recruit more trainees, the aviation industry is
creating training tools that can support the development of modern pilot’s competencies (e.g. Airbus
VR Flight Trainer). This study focuses on the development of the novice pilots and trainees and the
possible integration of the newly available technology with the training methodology. These low
experienced pilot trainees are typically millennials (also known as Gen Y) and the younger Gen Z.
Low experienced pilots have less than 200 flying hours or with no previous flight experience on
high-performance, complex aircraft. Depending on the definition, millennials are persons reaching young adulthood in the early twenty-first century. Therefore, the 1981–1996 birth cohort is a
“widely accepted” definition. Generation Z, the demographic cohort after the millennials, typically
use the mid-1990s to mid-2000s as starting birth years.
Evidence-based training (EBT), adopted by some airlines in the past decade, helps experienced
pilots increase their resilience as they practice competencies that address actual errors and situations encountered by other pilots. Resilience represents the capability of the crew to deal effectively with unexpected occurrences that do not fit with standard operating procedures. In order to
be resilient, the pilot necessarily has to be well prepared for anticipated failures but also to be
“prepared to be unprepared” (Paries 2011). Therefore, modern pilot training focuses on the
A Framework of Human Systems Engineering: Applications and Case Studies, First Edition.
Edited by Holly A. H. Handley and Andreas Tolk.
© 2021 The Institute of Electrical and Electronics Engineers, Inc. Published 2021 by John Wiley & Sons, Inc.
132
8 Building a Socio-cognitive Evaluation Framework to Develop Enhanced Aviation Training Concepts
development of core competencies, previously known as both technical and nontechnical knowledge, skills, and attitudes, aligning the training content with the actual competencies necessary in
the context of contemporary aviation. EBT recognizes the need to develop and evaluate crew performance according to a set of competencies without necessarily distinguishing between the “nontechnical” (e.g. CRM) and the “technical” competencies needed to operate safely (International
Civil Aviation Organization 2013).
United Arab Emirates (UAE)-based Etihad Aviation Training (EAT) was an early adopter of EBT
for all its pilots. EAT approached the research team to see if their novice pilot training program
could better support, in particular, younger pilot recruits, most of whom are from Generation Y and
Z age groups. EAT is particularly interested in taking advantage of emerging digital technologies.
We take the perspective of other leaders in aviation like Nick Scarnato (director of global
strategy – Collins Aerospace). Scarnato believes, “A training approach that includes time with an
instructor in low- and high-fidelity simulators may produce pilots more efficiently, especially if
there are appropriate ways to measure a student’s progress” (Parsons et al. 2016). New digital technologies provide opportunities to develop low-fidelity simulators that historically have not been
available to trainees. Digital technologies also allow gamification to measure progress.
Just adding new technologies does not address the underlying question of what support the
trainees actually need. The goal of the project is to examine the social and cognitive differences in
mastering an automated complex system (i.e. cockpit) with the current EBT approach. Generational
and cultural differences are suspected of playing a role and will be addressed specifically. A gap
analysis approach determines the tasks that these pilots have the most difficulty with; once these
gaps have been identified, the appropriate training interventions can be proposed. We expect that
gamification in learning and new technologies (e.g. virtual reality [VR] or augmented reality [AR])
will emerge from this initial gap analysis as a way to increase proficiency in the use of flight instruments early in the training program.
The challenges low experienced pilots face in an EBT-based training curriculum have yet to be
documented in the academic or professional literature. However, it is discussed anecdotally in the
profession. Thus, EAT must pioneer enhanced aviation training methods to satisfy its internal
standards without the documented experiences of others in the industry. The team takes a human
systems engineering (HSE) approach to the development of the training program such that the
required interactions between trainees, instructors, and the training technology provide efficient
data exchange and retention (Handley 2019). The training system design considers the limitations
of the trainees and the mismatch of required competencies to take advantage of the advanced
technologies available to trainees in later stages of training (e.g. Level D flight simulator).
This industry–academic partnership brings together visualization technologists, cognition and
neuroscientists, and educational specialists. While there have been previous studies with similar goals
for the cognitive analysis, to our knowledge, they do not fully utilize the biosensor data (Entzinger
et al. 2018) or modern statistical methods particularly geared toward multimodal high-frequency data
(Uenking 2000). Using an interdisciplinary approach will help us effectively answer the question:
what are the system elements for a gamified learning environment to increase pilot trainee motor skill
proficiency? Addressing this question could potentially allow millennial, Generation Z, and low
experienced pilots (target group) to increase their functional competencies before engaging with EBT.
8.1.1 Gamification Coupled with Cognitive Neuroscience and Data Analysis
Gamified learning (Landers 2014), a theory that links the emerging fields of specific gaming and
the gamification of learning, raises engagement with training manuals, the authoritative source of
knowledge for operating an aircraft, and the training environment. The research proposes that a
8.1 Introductio
more important role of gamified learning will be in developing cognitive control (Kimura and
Nakano 2019), automatic movement skills, and coordination to support motor learning (Pacheco
et al. 2019). These skills are necessary for a pilot to translate procedural knowledge into action.
Anecdotal evidence suggests that millennials in US aviation respond well to the use of technology and specifically gamified learning (Niemczyk and Ulrich 2009). However, more realism in a
simulated environment does not necessarily translate to better performance (van Lankveld
et al. 2017; Buttussi and Chittaro 2018; Makransky et al. 2019). Gamified learning for pilot training
takes the form of motor skill development to master the flight instruments and automated controls
of a cockpit. Rather than trying to create a mental model of flight instruments from thousands of
pages of training material, this research proposes developing physical and virtual training aids that
use newer technologies such as AR and VR.
Psychological testing allows for the monitoring of workload to determine the impact of different
technologies on attention, engagement, and performance. Visual interventions will be developed
to address the deficiencies identified by the biosensor analysis. The analysis draws from recent
advances in high-dimensional data analysis (e.g. deep neural networks) along with dynamic timeseries prediction models widely used by researchers for analyzing neural signals (Ozaki 2012).
Electroencephalography (EEG) data will be used to track the subjects’ cognitive load, attentional
focus, and resilience during specific control tasks during flight simulator training (Kumar and
Kumar 2016).
AR continues to be underutilized in aviation (Anne et al. 2015). We anticipate that these
interventions should reduce workload or improve performance. Cognitive factors, such as attention
and memory, are especially crucial for motor learning when people are in demanding or complex
environments (Warren and Warren 2006), such as a flight simulator. Accordingly, increased
attention is linked to superior action control in pilot trainees (Yildiz et al. 2014).
Gamification in a flight training context provides measurable task repetition whose benefit can
be measured by in-exercise and postexercise assessments. Post-task surveys or recall tests provide
limited information (Macchiarella and Vincenzi 2004), so we will rely on cognitive measures and
neurocognitive monitoring to determine training gaps as they occur. These biosensors potentially
include EEG, eye tracking, galvanic skin response, and others as appropriate. The biosensor data
will show the changes in cognitive workload as the trainee progresses through the gamified tasks
or repeats the task (Ghasemian et al. 2017). These data will help predict breaks in attentional
focus (as opposed to predicting errors) and recovery of focus, along with the resilience to
distractors/stressors. Gamified exercises can then be developed with biosensor monitoring to
determine improvements in task performance at a cognitive level. Merely flying more often in VR
may not be the most effective training intervention, especially if trainees have limited time.
Gamification and VR take many different forms. In this context, rather than tracking gameplay,
gamification will be used to track training activities and task performance. AR can be as traditional
as interactive and smart textbooks or further augmented technology (e.g. smart glasses). For example, trainees may struggle with recalling a checklist in a specific set of flight conditions. Intelligent
prompts may enable them to move forward with the rest of the checklist they do remember.
8.1.2 Generational Differences in Learning
The widespread consideration of generational differences between younger and older members of
a given society is often popularized in terms of a “generation gap” (Bengtson 1970; Friedenberg
1969). Typically, the particular age-related cohorts placed into generational groupings may
be characterized as being significantly distinct from each other in terms of intergenerational
perceptions (Mannheim 1952; Mead 1970; Shapiro 2004), displayed attitudes and dispositions
133
134
8 Building a Socio-cognitive Evaluation Framework to Develop Enhanced Aviation Training Concepts
(Fengler and Wood 1972; Arsenault 2004), and aspects of their lives such as their methods of social
engagement and their career development (PricewaterhouseCoopers 2013).
In contrast to the popular and often stereotypical beliefs reported by the general media, the
results of research investigating the presence of significant generational differences are largely
inconsistent (Brink et al. 2015; Costanza and Finkelstein 2015, 2017). Some studies (Giancola 2006;
Costanza and Finkelstein 2015), including a meta-analysis of 20 studies investigating generationbased differences (Costanza et al. 2012), report no significant generational differences, proposing
that “mythical” differences are individual rather than group dependent and largely the application
of generational stereotypes. However, other research is less clear about the absence of differences
(Ng and Feldman 2010; Parry and Urwin 2011) and propose further examination to better understand the concepts involved (Inglehart 1981; Parry and Urwin 2011; Rudolph and Zacher 2017)
and the methods of investigation (Costanza and Finkelstein 2017).
Despite the lack of construct clarity or research support for a generation gap within organizations, the perception of generational differences and organizational concerns regarding how to
recruit and retain young talent to replace retiring older workers continues to prompt investigation
(Smola and Sutton 2002; Cennamo and Gardner 2008; Twenge et al. 2010). The accounting firm
PricewaterhouseCoopers was concerned by a high attrition rate among its millennial employees
and conducted a global survey of 44 000 employees to establish what, if any, generational difference might be influencing the loss of young employees (PricewaterhouseCoopers 2013). The report
concluded that despite some interesting generational preferences by millennials in terms of an
improved work–life balance, a greater emphasis on teamwork, more need for recognition, and
choice of work styles, overall, more similarities than differences were found to exist between the
different generations (PricewaterhouseCoopers 2013).
The aviation sector, like other areas of industry, has also undergone substantial changes as the
result of technological advances (Kantowitz and Campbell 1996; Schultz 2018), and these changes
have been regarded as both beneficial and challenging by pilots (Wiener et al. 1991). Additionally,
and in conjunction with the technological advances in aircraft manufacture and equipment, it is
the growing ubiquity of technology that has not only been felt in the aviation industry but within
all aspects of everyday life, including education.
As populations age, the demographic of employees in the general workplace also changes. This
change has not gone unnoticed within the aviation industry. It is recognized that with this change
is the attendant need to maintain an understanding of the evolving workforce. Specifically, the
need to understand how any perceived generational differences may impact the education of
incoming trainee pilots. Therefore, it is important to examine how the modern generation of
trainee pilots may be perceived to differ from earlier generations. It is important to explore not only
their attitudes, work ethic, and other considered generational differences but also their usage of,
accepted reliance on, and attitudes toward technology. Irrespective of the presence of a “generation gap,” it is of value to investigate student and instructor perceptions of current pilot training
methods and procedures for the presence and/or absence of considered generational or age-related
differences to establish a frame of understanding that may provide insight to improve pilot training
within the twenty-first century.
8.2 Virtual Technologies in Aviation
The value of AR in aviation has long been recognized because of the ability to merge synthetic and
real objects in an integrated scene (Macchiarella and Vincenzi 2004). Military combat pilots
particularly benefit from VR as they always swivel their heads to look up and around for potential
8.2 Virtual Technologies in Aviatio
threats. However, recent naval aviation training approaches use VR to go beyond noncombat
situations. They are using VR to research human performance, including simulator sickness,
spatial disorientation countermeasures, fatigue/eye strain, and vergence–accommodation conflict
issues (Biggs et al. 2018).
Virtual technologies are not the panacea, though AR is used in aviation maintenance training
programs such as for assembly and maintenance training tasks (Wang et al. 2016). AR does have
its limitations, especially with early generations of technology, in which inadequate frame rates
cause simulator sickness. But beyond the technology, it is unclear how performance improvements
are measured. As a result, AR continues to be underutilized in aviation (Anne et al. 2015). Hence,
the team focuses on a scientific approach to first identify the gaps before considering different
forms of virtual technology. Early advocates of VR in pilot training were for military aviators who
need to scan the skies around them for threats for which VR is well suited. Commercial pilots
spend most of their time looking forward at their displays or through the forward-facing cockpit
windows. Different trade-offs come into play for commercial pilot training including the burden of
wearing a headset for extended periods of time.
8.2.1
Potential Approaches for Incorporating Virtual Technologies
The project takes a more traditional educational intervention approach (e.g. training and learning
approaches and instructor training) done in parallel with trying to understand the socio-cognitive
impact of gamified technologies on the acquisition of procedural knowledge and the corresponding motor skills associated with the procedure. In essence, how do new technologies such as AR,
mixed reality (MR), and VR help the trainee? Some of the procedures performed by pilots could be
perceived as boring to learn and memorize or quite lengthy such as the “cold and dark” start of an
aircraft (i.e. from all systems shut down to engine start). New training technologies could help
change those perceptions or at least make them more interesting to learn.
Neurocognitive testing and monitoring are the underlying foundation of this research, as cognitive factors are strong predictors of student flight performance (Emery 2011). Test batteries are
predictive for pilot performance, including acquired knowledge, perceptual processing, motor
abilities, controlled attention, and general ability (ALMamari and Traynor 2019). Rather than relying on self-reports of satisfaction with technology or instructor perception of skill improvement,
this research uses neurocognitive testing in conjunction with the gamification of teaching interventions to provide a quantitative basis for improvement.
An extension of interactive and smart manuals and their augmentation would be an immersive
training manual for the problematic procedures. VR offers such an environment where the procedural knowledge is combined with the requisite motor learning; VR training of this type has been
shown to transfer learning to real-world contexts (Kim et al. 2019).
Partial task simulators represent a class of training devices that allow for the repetition of spatial
and procedural tasks with reasonable fidelity. For example, a dial can be turned digitally with the
swipe of one finger. The spatial dimensions are preserved, and the procedural sequence can be
programmed. These training devices, some of which can be 3D, represent physical mock-ups of a
set of controls or an entirely digital representation of select portions of an instrument panel. These
devices do not replicate the entire cockpit, as this can be done in hobby flight simulators to some
extent already. Partial task simulators are not intended to replicate the flight training device or the
Level D+ flight simulator that already faithfully reproduces not only the physical cockpit but also
the associated motions of flight.
The bulk of expected learning probably still occurs in studying manuals on tablets or computers
or through instructor-led training. Recording the computer-based training (CBT) sessions will
135
136
8 Building a Socio-cognitive Evaluation Framework to Develop Enhanced Aviation Training Concepts
allow us to observe how the students use these materials, along with eye tracking and other physiological measures (e.g. brain activity), while engaged in tasks.
8.3 Human Systems Engineering Challenges
The HSE approach taken in this project recognizes that the trainees work within a training system
that prepares them to function effectively in a high-fidelity simulated training system (i.e. users
operating a system). We are trying to engineer the training system to increase the integration with
the existing simulation system. While some generational and/or cultural differences likely exist,
the study seeks to identify gaps in trainee preparation, which probably results from at least some
of the numerous factors alluded to in this chapter. The entire training system needs to be explored,
not just the training that takes place in a high-fidelity simulator. Arguably, the front end of training
has the most significant impact on the cognitive development of trainees.
Neurocognitive monitoring and analysis (e.g. deep neural network) allow engineers to determine
the socio-cognitive demands placed upon operators performing tasks. Such knowledge allows
engineers to redesign the controls and displays or develop appropriate training using state-of-theart visualization technologies, including AR, VR, and 3D immersive technologies.
This research recognizes that system complexity, and the corresponding workload, takes different
forms. For example, an airline cockpit presents a dense set of controls and displays within arm’s
reach of a pilot. The later phases of the research apply artificial intelligence (AI) analysis methods
to human intelligence to commercial aviation pilot training. The plethora of biological responses
collected from in situ experiments (e.g. hours of multichannel brain data) requires big data capture,
storage, analysis, and retrieval methods.
Complex control systems, such as cockpits and control towers, put operators under high cognitive workload as they must quickly make decisions and execute sequences of control tasks based
on a system’s stimuli. System designers seek to automate many of these tasks, which trades off less
complicated control panels with the need to retain a mental model of the underlying control system. The consumer electronics analogy is the Apple operating system. That system predetermines
what can be done, whereas the Linux operating system makes available all functionality if the user
knows what to do. Apple products are easy to use but offer limited access to functionality compared with other operating systems. In the case of complicated controls, the real challenge for
pilots is “to be into the loop,” maintaining a proper situational awareness, trying to understand the
underlying logic of the systems and their interactions even if it is almost impossible to know thoroughly such a complex architecture (Chialastri 2011).
The complexity of control systems can result from the density of controls and displays,
embeddedness of procedures due to automation, frequency of decisions, spatial richness (e.g.
dimensions of visual input), and the required degree of vigilance. A cockpit consists of tightly
packed physical controls in which the modern aircraft embeds automation. Complexity affects
human performance and cognition, and workload tells us whether performance can be sustained
through biosensor measurements, especially EEG. In addition, a recent study of trust in
automated systems suggests that novice military pilots do not understand the full costs and
potential benefits, which effectively puts their trust in a system not well understood (Lyons
et al. 2017). The challenge faced by engineers designing the operation of control systems is to
consider all the cognitive aspects of their design, so the design is more comfortable for human
brains to use. Understanding the contributors to complexity (Habak et al. 2019) becomes increasingly important as AI plays an increasing role in technology. Numerous examples exist on the
Acknowledgemen
cognitive limitation of human systems integration, which often result in contradictory demands.
For example, a driver of a self-driving car must remain vigilant despite the car driving itself
except in those rare unanticipated moments when the control system fails to detect a hazard.
However, humans do not remain vigilant in those settings. This research, in its later phases, will
go deeper than usability to emphasize human systems integration that reflects the socio-cognitive aspects of operators.
8.4 Potential Applications Beyond Aviation Training
The potential benefits of the project extend beyond the training of pilots to a broader view of operator performance to enhance functional fidelity (i.e. simulated operational tasks) (Matthews
et al. 2011). The findings from this research could also extend to other knowledge-intensive digital
workplaces. While the role of cognition has been documented for physically active work (e.g.
sports), little has been written about the role of cognition in the digital workplace for both training
and resiliency in operations. The digital workplace typically requires the mastery of an automated
control system, whether it be the cockpit or the control room of a process plant. All of these control
systems require memorization and rapid recall of checklists and procedures, so we expect the principles gained from aviation training to be applicable to many other domains that require this particular combination of cognitive and fast procedure control, such as disaster control, emergency
response teams, police force, energy plant control, security procedures, and even healthcare that
borrows heavily from aviation safety protocols.
8.5 Looking Forward
The project, as described in this chapter, takes an HSE approach to the training of new commercial
aviation pilots. Most of the attention gets focused on the realism of the flight simulator with the
trainee expected to acquire the mental model to operate a complex system through manuals and
CBTs. However, the training system has not explicitly accounted for the social and cognitive limitations of trainees. By taking a critical look at the training system, the project seeks out both pedagogical and technological interventions that, at the very least, increase the motivation of the trainee
to acquire the skills necessary to take advantage of the Level D flight simulators.
With advances in computing and AI and the growing market demand for qualified commercial
pilots, R2-D2 from Star Wars as a copilot is seeming less like science fiction and more like a not-sodistant possibility for commercial airlines. For example, the US Pentagon’s Defense Advanced
Research Projects Agency (DARPA) has already started testing Aircrew Labor In-Cockpit
Automation System (ALIAS) in the UH-60 Black Hawk, the largest fleet in the US Army, for that
exact purpose – “‘offloading pilots’ cognitive burden [to free] them to focus on mission execution”
(DARPA 2019). This project could provide the foundation for identifying which tasks are suited for
automation and which tasks may build pilot resiliency.
Acknowledgement
A portion of this publication is based upon work supported by the Khalifa University of Science
and Technology under Award No. RC2 DSO.
137
138
8 Building a Socio-cognitive Evaluation Framework to Develop Enhanced Aviation Training Concepts
References
Airbus (2019). Global Services Forecast 2019–2038. https://services.airbus.com/content/dam/corporatetopics/strategy/global-market-forecast/GMF-2019-2038-Airbus-Commercial-Aircraft-book.pdf
(accessed 15 January 2020).
ALMamari, K. and Traynor, A. (2019). Multiple test batteries as predictors for pilot performance: a
meta-analytic investigation. International Journal of Selection and Assessment 27 (4): 337–356.
https://doi.org/10.1111/ijsa.12258.
Anne, A., Wang, Y., and Ropp, T. (2015). Using augmented reality and computer-generated threedimensional models to improve training and technical tasks in aviation. In: 18th International
Symposium on Aviation Psychology, 452. Wright State University – Conferences & Events.
Arsenault, P.M. (2004). Validating generational differences: a legitimate diversity and leadership Issue.
Leadership and Organization Development Journal 25 (2): 124–141. https://doi.
org/10.1108/01437730410521813.
Bengtson, V.L. (1970). The generation gap: a review and typology of social-psychological perspectives.
Youth & Society 2 (1): 7–32. https://doi.org/10.1177/0044118X7000200102.
Biggs, L., Geyer, D., Schroeder, V. et al. (2018). Adapting Virtual Reality and Augmented Reality Systems
for Naval Aviation Training. No. NAMRU-D-19-13. Naval Medical Research Unit Dayton, WrightPatterson AFB, United States.
Brink, K.E., Zondag, M.M., and Crenshaw, J.L. (2015). Generation is a culture construct. Industrial and
Organizational Psychology 8: 335–340. https://doi.org/10.1017/iop.2015.45.
Buttussi, F. and Chittaro, L. (2018). Effects of different types of virtual reality display on presence and
learning in a safety training scenario. IEEE Transactions on Visualization and Computer Graphics 24
(2): 1063–1076. https://doi.org/10.1109/TVCG.2017.2653117.
CAE (2016). Airline Pilot Demand, 10-year Outlook at a Glance, p. 36. https://www.cae.com/media/
documents/Civil_Aviation/CAE-Airline-Pilot-Demand-Outlook-Spread.pdf (accessed 29
January 2020).
Cennamo, L. and Gardner, D. (2008). Generational differences in work values, outcomes and
person-organisation values fit. Journal of Managerial Psychology 23 (8): 891–906. https://doi.
org/10.1108/02683940810904385.
Chialastri, A. (2011). Resilience and ergonomics in aviation. In: Resilience Engineering in Practice:
A Guidebook (eds. E. Hollnagel, É. Rigaud and D. Besnard), 65–71. Farnham, UK: Ashgate
Publishing Ltd.
Costanza, D.P. and Finkelstein, L.M. (2015). Generationally based differences in the workplace: is
there a there there? Industrial and Organizational Psychology 8 (3): 308–323. https://doi.
org/10.1017/iop.2015.15.
Costanza, D.P. and Finkelstein, L.M. (2017). Generations, age, and the space between: introduction to
the special issue. Work, Aging and Retirement 3: 109–112. https://doi.org/10.1093/workar/wax003.
Costanza, D., Badger, J., Fraser R., Severt, J. and Gade, P. (2012) ’Generational differences in workrelated attitudes: a meta-analysis’, Journal of Business and Psychology, 27, pp. 375–394. http://about.
jstor.org/terms (accessed 8 April 2020).
DARPA (2019). US army tests DARPA autonomous flight system, pursuing integration with Black
Hawk. Defense Advanced Research Projects Agency. https://www.darpa.mil/news-events/2018-10-29
(accessed 30 January 2020).
Emery, B. (2011). Neurocognitive predictors of flight performance of successful solo flight students.
Doctoral dissertation. Available from PQDT Open (3489209).
Reference
Entzinger, J.O., Uemura, T., and Suzuki, S. (2018). Individualizing flight skill training using simulator
data analysis and biofeedback. 31st Congress of the International Council of the Aeronautical
Sciences, ICAS 2018, Boca Raton.
Fengler, A.P. and Wood, V. (1972). The generation gap: an analysis of attitudes on contemporary issues.
Gerontologist 12 (2): 124–128. https://doi.org/10.1093/geront/12.2_Part_1.124.
Friedenberg, E.Z. (1969). The generation gap. The Annals of the American Academy of Political and
Social Science 382 (1): 32–42. https://doi.org/10.1177/000271626938200105.
Garcia, M. (2018) A “perfect storm” pilot shortage threatens global aviation, Forbes, p. 3. https://www.
forbes.com/sites/marisagarcia/2018/07/27/a-perfect-storm-pilot-shortage-threatens-global-aviationeven-private-jets/#2738d9c71549 (accessed 29 January 2020).
Ghasemian, M., Taheri, H., Saberi Kakhki, A., and Ghoshuni, M. (2017). Electroencephalography
pattern variations during motor skill acquisition. Perceptual and Motor Skills 124 (6): 1069–1084.
https://doi.org/10.1177/0031512517727404.
Giancola, F. (2006). The generation gap: more myth than reality. Human Resource Planning 29 (4): 32.
Habak, C., Seghier, M.L., Brûlé, J. et al. (2019). Age affects how task difficulty and complexity
modulate perceptual decision-making. Frontiers in Aging Neuroscience 11 https://doi.org/10.3389/
fnagi.2019.00028.
Handley, H. (2019). Human system engineering. In: Topics in Safety, Risk, Reliability and Quality, 7–15.
Netherlands: Springer https://doi.org/10.1007/978-3-030-11629-3_2.
Inglehart, R. (1981). Post-materialism in an environment of insecurity. American Political Science
Review 75 (4): 880–900. https://doi.org/10.2307/1962290.
International Civil Aviation Organization (2013). Manual of evidence-based training (1). Quebec: IATA,
https://www.iata.org/contentassets/c0f61fc821dc4f62bb6441d7abedb076/ebt-implementation-guide.
pdf (accessed 8 April 2020).
Kantowitz, B.H. and Campbell, J.L. (1996). Pilot workload and flightdeck automation. In: Automation
and Human Performance: Theory and Applications, 3–17. Boca Raton, FL: CRC Press https://doi.
org/10.1201/9781315137957.
Kim, A., Schweighofer, N., and Finley, J.M. (2019). Locomotor skill acquisition in virtual reality shows
sustained transfer to the real world. Journal of Neuroengineering and Rehabilitation 16 (1): 113.
https://doi.org/10.1186/s12984-019-0584-y.
Kimura, T. and Nakano, W. (2019). Repetition of a cognitive task promotes motor learning. Human
Movement Science 66: 109–116. https://doi.org/10.1016/j.humov.2019.04.005.
Kumar, N. and Kumar, J. (2016). Measurement of cognitive load in HCI systems using EEG power
spectrum: an experimental study. Procedia Computer Science 84: 70–78. https://doi.org/10.1016/j.
procs.2016.04.068.
Landers, R.N. (2014). Developing a theory of gamified learning: linking serious games and
gamification of learning. Simulation and Gaming 45 (6): 752–768. https://doi.org/10.1177/
1046878114563660.
van Lankveld, G., Sehic, E., Lo, J.C. et al. (2017). Assessing gaming simulation validity for training
traffic controllers. Simulation and Gaming 48 (2): 219–235. https://doi.
org/10.1177/1046878116683578.
Lyons, J.B., Ho, N.T., Van Abel, A.L. et al. (2017). Comparing trust in auto-GCAS between experienced
and novice air force pilots. Ergonomics in Design 25 (4): 4–9.
Macchiarella, N.D. and Vincenzi, D.A. (2004). Augmented reality in a learning paradigm for flight and
aerospace maintenance training. AIAA/IEEE Digital Avionics Systems Conference – Proceedings. doi:
https://doi.org/10.1109/dasc.2004.1391342.
139
140
8 Building a Socio-cognitive Evaluation Framework to Develop Enhanced Aviation Training Concepts
Makransky, G., Terkildsen, T.S., and Mayer, R.E. (2019). Adding immersive virtual reality to a science
lab simulation causes more presence but less learning. Learning and Instruction 60: 225–236.
https://doi.org/10.1016/j.learninstruc.2017.12.007.
Mannheim, K. (1952). The Sociological Problem of Generation. In: Essays on the Sociology of
Knowledge, 163–195. New York: Harcourt, Brace and World.
Matthews, G., Warm, J., Reinerman-Jones, L. et al. (2011). The functional fidelity of individual
differences research: the case for context-matching. Theoretical Issues in Ergonomics Science 12 (5):
435–450. https://doi.org/10.1080/1463922X.2010.549247.
Mead, M. (1970). Culture and Commitment: A Study of the Generation Gap. The Bodley Head.
Ng, T.W.H. and Feldman, D.C. (2010). The relationships of age with job attitudes: a meta-analysis.
Personnel Psychology 63 (3): 677–718. https://doi.org/10.1111/j.1744-6570.2010.01184.x.
Niemczyk, M. and Ulrich, J.W. (2009). Workplace preferences of millennials in the aviation industry.
International Journal of Applied Aviation Studies 9 (2): 207–219.
Okal, A. and Kearns, S. (2018). Pilot shortage: sustainability perspective. National Training Aircraft
Symposium (NTAS). https://commons.erau.edu/ntas/2018/presentations/5 (accessed 29 January 2020).
Ozaki, T. (2012). Time Series Modeling of Neuroscience Data (eds. N. Keiding et al.). Boca Raton, FL:
CRC Press https://doi.org/10.1201/b11527.
Pacheco, M.M., Lafe, C.W., and Newell, K.M. (2019). Search strategies in the perceptual-motor
workspace and the acquisition of coordination, control, and skill. Frontiers in Psychology 10
(August) https://doi.org/10.3389/fpsyg.2019.01874.
Paries, J. (2011). Lessons from the Hudson. In: Resilience Engineering in Practice (eds. E. Hollnagel,
J. Paries, D.D. Woods and J. Wreathall), 9–26. Ashgate Publishing Limited.
Parry, E. and Urwin, P. (2011). Generational differences in work values: a review of theory and
evidence. International Journal of Management Reviews 13 (1): 79–96. https://doi.org/10.1111/
j.1468-2370.2010.00285.x.
Parsons, B., Magill, T., Boucher, A. et al. (2016). Enhancing cognitive function using perceptualcognitive training. Clinical EEG and Neuroscience 47 (1): 37–47. https://doi.org/10.1177/
1550059414563746.
PricewaterhouseCoopers (2013) PwC’s NextGen: A Global Generational Study. PriceWaterhouseCoopers,
the University of Southern California and the London Business School, p. 16. www.pwc.com/structure
(accessed 8 April 2020).
Prokopovič, K. (2019) Pilot-hungry airlines struggle with global pilot shortage, Aviation Voice. https://
aviationvoice.com/pilot-hungry-airlines-struggle-with-global-pilot-shortage-201906101447 (accessed
29 January 2020).
Rudolph, C.W. and Zacher, H. (2017). Considering generations from a lifespan developmental
perspective. Work, Aging and Retirement 3 (2): 113–129. https://doi.org/10.1093/WORKAR/WAW019.
Schultz, T.P. (2018). The Problem with Pilots: How Physicians, Engineers, and Airpower Enthusiasts
Redefined Flight. Johns Hopkins University Press.
Shapiro, A. (2004). Revisiting the generation gap: exploring the relationships of parent/adult-child
dyads. International Journal of Aging & Human Development 58 (2): 127–146. https://doi.
org/10.2190/EVFK-7F2X-KQNV-DH58.
Smola, K.W. and Sutton, C.D. (2002). Generational differences: revisiting generational work values for
the new millennium. Journal of Organizational Behavior 23 (special issue): 363–382. https://doi.
org/10.1002/job.147.
Twenge, J., Campbell, S., Hoffman, B., and Lance, C. (2010). Generational differences in work values:
leisure and extrinsic values increasing, social and intrinsic values decreasing. Journal of
Management 36 (5): 1117–1142. https://doi.org/10.1177/0149206309352246.
Reference
Uenking, M.D. (2000). Pilot biofeedback training in the cognitive awareness training study (CATS).
Modeling and Simulation Technologies Conference. doi: https://doi.org/10.2514/6.2000-4074.
Wang, Y., Anne, A., and Ropp, T. (2016). Applying the technology acceptance model to understand
aviation students’ perceptions toward augmented reality maintenance training instruction.
International Journal of Aviation, Aeronautics, and Aerospace 3 (4) https://doi.org/10.15394/
ijaaa.2016.1144.
Warren, W.H. and Warren, H. (2006). The dynamics of perception and action. Psychological Association
113 (2): 358–389. https://doi.org/10.1037/0033-295X.113.2.358.
Wiener, E.L., Chidester, T.R., Kanki, B.G. et al. (1991). The Impact of Cockpit Automation on Crew
Coordination and Communication. Volume 1: Overview, LOFT Evaluations, Error Severity, and
Questionnaire Data. NASA archives.
Yildiz, A., Quetscher, C., Dharmadhikari, S. et al. (2014). Feeling safe in the plane: neural mechanisms
underlying superior action control in airplane pilot trainees – a combined EEG/MRS study. Human
Brain Mapping 35 (10): 5040–5051. https://doi.org/10.1002/hbm.22530.
141
143
9
Improving Enterprise Resilience by Evaluating Training
System Architecture
Method Selection for Australian Defense
Victoria Jnitova1, Mahmoud Efatmaneshnik2, Keith F. Joiner3, and Elizabeth Chang4
1
School of Engineering and Information Technology, University of New South Wales at Australian Defence Force Academy, Canberra,
ACT, Australia
2
Defence Systems Engineering at the University of South Australia (UNISA), Adelaide, SA, Australia
3
Capability Systems Center, School of Engineering and Information Technology, University of New South Wales at Australian Defence
Force Academy, Canberra, ACT, Australia
4
University of New South Wales at Australian Defence Force Academy, Canberra, ACT, Australia
9.1 Introduction
Military organizations are undergoing a dramatic change in their operational environment and
capabilities (Bitzinger 2016). Defense posture has shifted from the Cold War to the global antiterrorism war (Jordan et al. 2016), and its capability systems are struggling to stay on top of rapid
technological progress and future uncertainty while remaining secure and closed from potential
probing by adversaries and competitors (Alberts et al. 2000; Joiner and Tutty 2018; U.S. Government
Accountability Office 2018). Department of Defense (DoD) capability systems are required to be
trusted that they are able to effectively respond to new or changing conditions in a wide range of
operational contexts (Joiner et al. 2019). To effectively manage these challenges and uncertainties
while addressing the capability gaps and anticipating future requirements, DoD increasingly relies
on systems thinking from the perspective of systems engineering (SE) discipline. The Australian
Defense Force (ADF) headquarters and individual service commands are leading the systems
thinking implementation in the integrated defense capability life cycle (DCLC) context. They focus
on future-proofing the systems’ design and overcoming traditional “stovepiping” and separations
between defense departments, processes, and artifacts (Schuel 2018; Unewisse 2016). The challenge is to extend the SE practices to nontraditional SE areas such as human resources and training
and to “engineer” human factors as described in Chapter 1 into the organizational design.
We propose to meet this challenge by applying systems thinking in the defense training organization context to engineer a resilient Defense Training System (DTS). The “As Is” and “To Be” DTS
design is determined in the phased whole Defense Survey, followed by the system architecture
development using the DoD Architecture Framework (DoDAF) and modular design methodologies. The DTS resilience attributes and their associated measures are derived from the reviewed
academic literature and embedded into the DTS architectural framework to support model-based
measurement of the system resilience.
A Framework of Human Systems Engineering: Applications and Case Studies, First Edition.
Edited by Holly A. H. Handley and Andreas Tolk.
© 2021 The Institute of Electrical and Electronics Engineers, Inc. Published 2021 by John Wiley & Sons, Inc.
144
9 Improving Enterprise Resilience by Evaluating Training System Architecture
This chapter presents an initial phase of this project, where the DTS is defined and conceptualized, followed by the resilience-focused literature review to support our effort of formulating a
model-based conceptual resilience framework and measurement methodology. Basic factors and
measures for DTS resilience are proposed in the DTS case study section of the chapter to guide
development of the transformation road map from “As Is” to “To Be” DTS design targeting
improved system’s resilience.
9.2 Defense Training System
9.2.1
DTS Conceptualization
Defense Learning Manual (DLM) and Individual Service Training Policies mandate use of the
Systems Approach to Defense Learning underpinned by analyze/design/develop/implement/evaluate (ADDIE) methodology across the DoD for training planning and management. Fakult et al.
(1988) argue that instructional design models such as ADDIE are derivatives of the systems thinking approach, grounded in the SE discipline, but developed in isolation from SE common tools and
innovations. Indeed, DoD Systems Approach to Defense Learning does neither describe numerous
DTS artifacts and processes in SE terms nor use standard SE practices. Moreover, with its academic
underpinning almost 45 years old and strong accretional focus on individual training, the ADDIE
model is likely not adequately equipped to prepare the DoD workforce to operate in the modern
workplace and to deal with new emergent challenges of the global anti-terrorism war, complexities
of collective training and rapidly evolving technologies, and uncertainties associated with a changing strategic environment, which could potentially impact the DTS fitness for purpose and resilience.
We argue DTS is a complex sociotechnical system with its boundaries extending far beyond
SADL and ADDIE. DTS require a more context-specific suite of tools and processes to address the
combination of its human and system components. As stated in Chapter 1, human factors are traditionally employed in systems’ approach and concerned with manpower, personnel, training,
human factors engineering, health and safety, habitability, and survivability – all of which need to
be integrated into the DTS architecture together with traditional “technical” training resources
and services. The emphasis of the DTS engineering effort is therefore on the trade-offs within and
across these domains. With relation to human factors integration into the system design, one of the
SE traditional design challenges is a trade-off between the design usability and cost effectiveness.
In commercial setting, the SE needs to ensure the system design is competitive; therefore commercial systems are traditionally designed for usability to be achieved at a lowest possible cost. In
contrast, DoD is a noncommercial enterpriser with its capability systems that are not commonly
designed for usability but rely heavily on training the individuals to use them. As such, the DoD
integrates DTS in its architecture and places a much higher importance on the DTS enabling service compared with commercial extended enterprisers. In this research, DTS is conceptualized as
a sociotechnical system, setting a foundation for our future work to formulate DTS design alternatives integrating DTS workforce and comparing these alternatives in terms of their resilience.
9.2.2
DTS as an Extended Enterprise Systems
DTS is best described as an extended enterprise system as defined in the reviewed academic literature. Boardman and Sauser (2008) define enterprise as a collection of parts and relationships
assembled to form a whole with properties, attributes, and purpose that make it essentially
9.2 Defense Training Syste
different from its components. An enterprise is also defined as a complex system consisting of
people, processes, information systems, and technology infrastructure to produce goods or services using physical, financial, and human resources (Fiksel 2015). What lies outside the enterprise is as important as what lies inside it, because for a resilient system it is necessary to observe
how an enterprise can most effectively adapt when facing both external and internal disruptions.
Ignatiadis and Nandhakumar (2007) use the term enterprise systems to refer to the enterprisewide information systems and applications that support business functions, processes, operations, and services of the enterprise. The effective use of enterprise systems can provide timely
information and faster decision-making abilities that result in increased system’s flexibility, agility, and adaptability.
Enterprise systems are required to have the ability to access resources and information quickly
and to change their processes rapidly in order to satisfy emerging business needs (Boardman and
Clegg 2001). This need for agility requires a shift to more integrated, open, and collaborative enterprise structures, where the enterprise is viewed as a whole along with its environment and stakeholders. Applications, people, and data are connected and integrated in an extended inter- and
intra-enterprise processes in order to improve their efficiency and effectiveness (Kosanke
et al. 1999). The concept of extended enterprise emerged from the need to collaborate, interact, and
share information and resources among the distributed parts of the enterprise and across its
boundaries. This need is primarily driven by market globalization and a competitive environment
that requires increased efficiency; reduced cycle times, cost, and effort; and increased customer
satisfaction (Gold-Bernstein and Ruh 2004). An extended enterprise is viewed as a system of enterprises that assumes particular characteristics not necessarily present in any of its components
(Boardman and Sauser 2008).
9.2.3
Example: Navy Training System
The DTS key design considerations and associated measures of its success are illustrated using the
Navy Training System example, considered in DTS and DoD contexts.
9.2.3.1
Navy Training System as a Part of DTS
Navy Training System is an integral part of the DTS extended enterpriser. Success of the Navy
Training System stated intent is continually assessed through measuring the achievement of the
associated actions as illustrated in Table 9.1.
9.2.3.2
Navy Training System as a Part of DoD
Navy Training System is also considered in a wider context of the DoD extended enterprise systems. It is one of the enablers of the four Navy strategic objectives as stated in the Royal Australian
Navy (RAN) Plan Pelorus, namely, (1) warfighting, (2) capability, (3) workforce, and (4) reputation
and reform. According to the Navy Training Force Plan 2018, the Navy Training System support for
each of the objectives is as follows:
1) Sea Training Group provides collective training against prescribed competencies in direct support to the Fleet Commander.
2) Training Force is a critical stakeholder in projects delivering new Navy capability.
3) Training authorities provide career and position prerequisite training.
4) Contribution to RAN reputation and reform: training is delivered to equip each sailor and
officer to achieve their full potential as ethical leaders throughout their careers.
145
Table 9.1
RAN training Force intent, associated actions, and measures of achievement.
Intent
Associated actions
Measures of achievement
Training delivery
Exploit existing and
explore new training
technologies
●●
●●
●●
●●
●●
●●
Identify opportunities to use simulation
Implement learner-centric training technique
Identify opportunities for e-learning
Implement coaching focused in sea training and assessment
Replace paper-based sea training assessment with the digital
technologies
Participate in acquisition projects to continuously support
meeting training requirements
●●
●●
●●
●●
●●
●●
Simulation-based training and assessment become a norm not an exception
PowerPoint presentations are challenged and replaced by innovative learner-centric
methods
Use of distance learning methods, ADELE and Google apps
Positive engagement and coaching by the Sea Training Group become a norm not an
exception
Sea training assessment is digitalized, and feedback is implemented
New capabilities introduction into service are supported by simulators, new
technologies, infrastructure, and modern information management means
Training pipeline efficiency
Optimize the
efficiency and
effectiveness of the
training pipelines
●●
●●
●●
Manage resources to meet training requirements within time
and cost constraints
Continuously review schedules and processes to minimize
wastage
Evaluate training to seek the most efficient delivery approach
●●
●●
●●
Courses are delivered at maximum capacity and at a minimum cost feasible
Delivering category/PQ training blocks to enable cohort postings and 100% job
readiness
Courses are continuously internally evaluated to identify gaps, with external
evaluation is conducted to confirm and address the gaps
Professional development (PD)
PD opportunities for
TS community to
learn new TS skills
●●
●●
●●
●●
●●
●●
PD training and coaching is provided where required
Individual development and succession planning
Annual instructor evaluation and tracking gaps if identified
Identify instructional exemplars and internally develop them
Provide coaching training to all in the Sea Training Group
Award exceptional instructors
●●
●●
●●
●●
●●
●●
TS Officers are seen as SADL and National Training Framework professional experts
Training delivery is learner centric, innovative, and in a learning conducive environment
All instructors are evaluated, and the identified gaps are addressed
Provision of TS advice and PD workshops on a regular basis
Certification of the sea trainers includes coaching training
Instructional talents are acknowledged through the honors and award system
Training governance
Ensure
implementation and
ongoing scrutiny of
SADL governance
●●
●●
●●
Course documentation is reviewed to meet the standard
Senior TS are accountable for training development, quality
control, and training governance
The findings of navy training audits and Defense
Seaworthiness Boards are addressed
Source: Extract from the RAN Training Force Plan 2018.
●●
●●
●●
Version controlled, accessible via defense information management system and
meets the standard
Senior TS manage and report training development, quality control, and training
governance in their respective areas of responsibility
Achieving a measurable reduction in deficiencies identification by the navy training
audits and Defense Seaworthiness Boards
9.3 Concept of Resilience in the Academic Literatur
9.3 Concept of Resilience in the Academic Literature
Resilience emerges as a desirable system attribute demanded at all levels within the DoD due to
uncertainties and the continuous need to change and adapt quickly in turbulent periods while
retaining a desired level of performance to consistently satisfy stakeholder needs and requirements. Resilience is often discussed in various disciplines, but the plethora of the concept interpretations present a challenge for defining a meaningful set of resilience measures for a given system.
There is little consensus regarding what resilience is, what it means for organizations, and, more
importantly, how they may achieve greater resilience in the face of increasing threats. Although it
is not our intent to provide an in-depth review of such diverse literature, we conduct a multidisciplinary literature review to form a holistic view of resilience and to gather insights to support our
study of model-based DTS resilience framework.
More than 90 papers were selected for this review, of which about half are related to each part.
The papers for this review were selected using combinations of the following keywords: military
training, workforce planning, system, resilience, measuring resilience, future-proofing, resilience
engineering, measuring resilience, enterpriser, architecture, and others.
9.3.1
Definition of Resilience: A Multidisciplinary and Historical View
The reviews emphasize multidisciplinary nature and role of resilience and provide examples of
definitions from the disciplines of ecology, psychology, engineering, organizational or enterprise
supply chain management, economics, SE, computer science, materials science, disaster management, organizational theory, risk management, sociology, and defense, to name a few. There are
several comprehensive literature reviews of the resilience concept, for example, in Kamalahmadi
and Parast (2016), McManus (2008), Burnard and Bhamra (2011), and Bhamra et al. (2011). Several
other papers offer tabulated summaries of the multidisciplinary resilience definitions (Downes
et al. 2013; Fraccascia et al. 2017; Francis and Bekera 2014), while others provide a historical perspective (Bouaziz 2018; De Sanctis et al. 2018; Erol et al. 2010c) or tailor their reviews to their
projects but highlight the multidisciplinary origin of the selected definitions (Conz and
Magnani 2019; Dalziell and McManus 2004).
9.3.2
Definition of Resilience: Key Aspects
This great variety of resilience definitions in the academic literature calls for a critical analysis
aimed at clarifying the main aspects of the concept and identifying commonalities and differences
in its interpretations. For this literature review, we will seek to critically analyze the literary
responses to the following three key questions:
●●
●●
●●
What? (resilience is/is not)
Why? (resilience triggers)
How? (resilience mechanisms and how resilience response can be measured)
The result of this research effort is presented below.
9.3.2.1 What? (Resilience Is and Is Not)
Due to a vast variation in the resilience definitions in the reviewed academic literature, we commenced our effort by identifying the “like terms” and different terminology perspectives to facilitate our comparative analysis. To achieve this, we divided the resilience definitions into their
147
148
9 Improving Enterprise Resilience by Evaluating Training System Architecture
Table 9.2
Key elements of resilience definition and their associated vocabulary.
Resilience is
●●
●●
●●
●●
●●
●●
●●
●●
●●
●●
●●
●●
Ability
(Dynamic/adaptive/
potential) capacity
Capability
Attribute
Collection of
attributes
Property
Emergent property
Characteristic
Factor
Response
Reaction
Form of control
Resilience of what?
●●
●●
●●
●●
●●
●●
●●
●●
●●
●●
●●
●●
●●
●●
System
Complex system
Ecosystem
Social system
Socio-ecological system
Engineered system
System of systems
Organization
Enterpriser
Business
DoD
(System/network/enterpriser/
organizational/operational/
service) architecture
People (individuals, teams,
employees, workers, human
resources)
Supply chain
To do what?
●●
●●
●●
●●
●●
●●
●●
●●
●●
●●
●●
●●
●●
●●
●●
●●
●●
●●
Absorb
Adapt
Anticipate
Avoid
Cope
Evolve
Learn
Predict
Prepare
React
Recover
Reduce
Resist
Respond
Restore
Retain
Survive
Tolerate
To achieve what?
●●
●●
●●
●●
●●
●●
●●
●●
Reduce vulnerability
Resist disorder
Restore original state and
evolve post-disturbance
Reduce the probabilities
of disruptions
Cope with unexpected
disturbances
Recognize and adapt to
handle unanticipated
perturbations
Recover from irregular
variations, disruptions,
and degradation of
expected working
conditions. Respond and
develop new features in
the face of change
Prepare for unexpected
events
common conceptual elements and identified the variations in terminology associated with those
elements with examples provided in Table 9.2.
We select the “attribute” and “system” from Table 9.2 to represent the like terms for “resilience”
and the entity that possesses it to use in this paper.
Our analysis of the reviewed literature revealed two common trends in defining resilience, namely:
●●
●●
Resilience as a singular attribute of the entity.
Resilience as a collection of attributes.
9.3.2.1.1 Resilience as a Singular System’s Attribute Resilience is defined as a singular system
attribute in 36 out of 91 reviewed papers. When comparing these definitions, we noticed they were
closely aligned with each other, with the main difference being adding new components to simpler
versions of the definition. Based on our literature review, we propose six “increments” of resilience
definitions that take the system from a simple response triggered by a change to a system’s creative
continuous learning and adjustment to adapt and evolve in an uncertain and changing environment. The six increments and their respective examples of the resilience definitions from the
reviewed academic literature are in Table 9.3:
Several reviewed papers also categorize the resilience concepts using similar criteria to ours, for
example, resilience perspectives proposed in Giannoccaro et al. (2018) and Lengnick-Hall et al.
(2011). They, however, focus not only on analysis of resilience definitions but also on resilience
mechanism alternatives. These considerations are further detailed in the resilience mechanisms
and measurements section of this chapter.
9.3.2.1.2 Resilience as a Collection of System’s Attributes Resilience is described as a collection of
attributes in 48 of 91 reviewed papers. Our analysis of the “resilience attributes” presented a
9.3 Concept of Resilience in the Academic Literatur
Table 9.3
Six “increments” of resilience concept.
Paper
Element 3: To do what?
Element 4: To achieve what?
Increment 1: Deal with the changes as they occur while retaining original system design
Holling (1973)
To absorb change and disturbance
To maintain the same relationships
between populations or state
variables still
Uday and Marais
(2015)
To combine survivability and
recoverability, to bounce back
Reduce the likelihood of failure and to
recover from unexpected disturbances
in the operating environment
Walker et al.
(2004)
To absorb disturbances and reorganize
while changing
To retain essentially still the same
functions, structures, identity, and
feedbacks
Increment 2: Prepare and deal with the changes while retaining original system design
Ayyub (2014)
To prepare for and adapt to changing
conditions
To withstand and recover rapidly from
disruptions
Increment 3: Anticipate, prepare, and deal with the changes while retaining original system design
Tran et al. (2017)
To apply classical reliability methods, such
as redundancy at the component level and
use of preventative maintenance at the
system level
To anticipate and resist disruptions
Hollnagel and
Woods (2006)
To create foresight, recognize, and
anticipate
To defend against the changing shape
of risk before adverse consequences
occur
Small et al. (2017)
To create through design choices an
inherent system quality
To maintain system performance
objectives in the face of diverse
operational challenges, in either a
preparative or recovery sense, within
acceptable time and cost parameters
Increment 4: Anticipate, prepare, deal, and learn from the changes (might alter original system design as part
of lessons learnt)
Lengnick-Hall
et al. (2011)
To effectively absorb, develop situationspecific responses to, and ultimately
engage in transformative activities
To capitalize on disruptive surprises
that potentially threaten organizational
survival
Menéndez Blanco
and Montes
Botella (2016)
To take both proactive and reactive
measures including knowledge, learning,
and innovation to balance efficiency and
adaptability
To survive in response to adversity and
achieve competitive advantage
Erol et al. (2010c)
To maintain positive adjustment under
challenging conditions. The term
“challenging conditions” is used to
describe disruptive events such as discrete
errors, scandals, crises, shocks, disruptions
of routines, and ongoing risks (e.g.
competition) that cause stress and strain.
Accordingly, creating organizational
resilience is associated with personnel and
management concerns
Such that the organization emerges
from those conditions strengthened
and more resourceful
(Continued)
149
150
9 Improving Enterprise Resilience by Evaluating Training System Architecture
Table 9.3
(Continued)
Paper
Element 3: To do what?
Element 4: To achieve what?
Increment 5: Anticipate, prepare, deal, and learn to live with uncertain changes (continuous system adaptation
to new conditions)
Berkes (2007)
(1) Learn to live with change and
uncertainty
(2) Nurture various types of ecological,
social, and political diversity for increasing
options and reducing risks
(3) Increase the range of knowledge for
learning and problem solving
(4) Create opportunities for selforganization, including cross-scale
linkages and problem-solving networks
To deal with uncertainty and future
change and to cope with change
characterized by surprises and
unknowable risks
Increment 6: Resilience is an emergent property of a continuously evolving system
Erol et al. (2010a)
Interaction of the characteristics and
capacities of a system, which will
eventually evolve in the case of a
disruptive event
To adapt to an uncertain and changing
environment and recover from the
impacts of the disruptive event
Park et al. (2013)
The outcome of a recursive process that
includes sensing, anticipation, learning,
and adaptation where resilience is the
emergent property of a system undergoing
adaptive process – that is, not as
something a system has, but a
characteristic of the way it behaves
Preparing for and living with the
unexpected, where hazards cannot be
identified with certainty
biggest challenge to us due to a plethora of different interpretations of what resilience attributes
are and are not and the lack of uniformed terminology and agreed standard to represent resilience concept. For example, Erol et al. (2009) state that extended enterprise resilience and flexibility is a function of agility, efficiency, and adaptability, while the same authors in their 2010
paper formulate resilience as a function of vulnerability, flexibility, adaptability, and agility.
Ponomarov and Holcomb (2009) select readiness and preparedness, response and adaption, and
recovery or adjustment as resilience attributes. Tierney and Bruneau (2007) propose their “R4”
model of resilience consisting of robustness, redundancy, rapidity, and resourcefulness, while Ma
et al. (2018) argue that the attributes such as robustness, redundancy, and recovery are concepts
overlapping with, but not resilience. In our literature review, we noticed that some of the attributes of resilience where used frequently and in multiple papers, while others feature in a single
source only. Examples of the common and frequently used resilience attributes from the reviewed
literature are illustrated in Table 9.4, followed by examples of resilience attributes from a single
source in Table 9.5.
Further synthesis and analysis of the reviewed definitions are required to reconcile the differences in the attributes’ interpretations and to tighten the pool of the available attribute propositions. However, despite the differences in terminology and lack of agreement between the
academics on the matter of resilience attributes, we were able to identify nine attributes that featured most prominently in the reviewed publications, namely, (1) flexibility, (2) agility, (3) adaptive
capacity, (4) adaptability, (5) robustness, (6) vulnerability reduction, (7) redundancy, (8) recovery/
9.3 Concept of Resilience in the Academic Literatur
Table 9.4
Attributes commonly associated with the concept of resilience.
Attribute
Is an attribute of resilience
Flexibility
●●
●●
●●
●●
●●
●●
●●
●●
Agility
●●
●●
●●
●●
Adaptive
capacity
●●
●●
●●
●●
●●
●●
●●
●●
●●
●●
●●
Adaptability
●●
●●
An attribute of a resilient system (Erol et al. 2010c)
Resilience can be achieved by increasing flexibility
(Gomes 2015)
Implicit in the proposed supply chain resilience
definition (Kamalahmadi and Parast 2016)
Integrated into the supply chain resilience factors and
measures (Falasca et al. 2008)
Flexibility versus stiffness: the system’s ability to
restructure itself in response to external changes or
pressures (Woods 2017)
System ability linked to the static perspective of
resilience (Giannoccaro et al. 2018)
One of four traits of resilience in small enterprisers
(Bhamra et al. 2011)
Identified as one of the top-level attributes, resulting
from the application of one or more resilience
architecture principles (Nuss et al. 2017)
An attribute of a resilient system (Erol et al. 2010c)
Implicit in the proposed supply chain resilience
definition (Kamalahmadi and Parast 2016)
One of the supply chain resilience enablers (Soni
et al. 2014)
A dimension of organizational resilience (Bouaziz 2018)
Is not resilience
●●
●●
●●
●●
●●
System attribute that closely
relates to resilience in the
system’s design (Uday and
Marais 2015)
Overlapping but different
from resilience (Xiao and
Cao 2017)
Might overlap but insufficient
to describe resilience
(Lengnick-Hall et al. 2011)
Overlapping but different
from resilience (Xiao and
Cao 2017)
Might overlap but insufficient
to describe resilience
(Lengnick-Hall et al. 2011)
An attribute of a resilient system (Erol et al. 2010c)
One of three resilience capacities (Francis and
Bekera 2014)
Adaptation ability is one of the dimensions of
organizational resilience (Chen 2016)
Adaptive capability is one of the supply chain resilience
enablers (Soni et al. 2014)
Resilience is a function of McManus (2008)
Lee et al. (2013) agree with and quote McManus (2008)
Resilience is a function of Dalziell and McManus (2004)
A dimension of system resilience (Fraccascia et al. 2017)
Resilience metric: the ability to change itself and adapt
to the changing environment (Erol et al. 2010a)
System ability linked to a dynamic perspective of
resilience (Giannoccaro et al. 2018)
Often interchangeable with resilience (Limnios
et al. 2014)
Implicit in the proposed supply chain resilience
definition (Kamalahmadi and Parast 2016)
Is considered one of the main capabilities of the supply
chain resilience (Carvalho 2011)
●●
●●
Adaptability overlapping but
different from resilience (Xiao
and Cao 2017)
Adaptability might overlap
but insufficient to describe
resilience (Lengnick-Hall
et al. 2011)
(Continued)
151
152
9 Improving Enterprise Resilience by Evaluating Training System Architecture
Table 9.4
(Continued)
Attribute
Is an attribute of resilience
Robustness
●●
●●
●●
●●
An attribute of a resilient system (Erol et al. 2010c)
A part of R4 resilience framework (Tierney and
Bruneau 2007)
A dimension of organizational resilience (Bouaziz 2018)
System ability linked to the static perspective of
resilience (Giannoccaro et al. 2018)
Is not resilience
●●
●●
●●
Vulnerability
reduction
●●
●●
●●
●●
●●
Redundancy
●●
●●
●●
Recovery/
restorative
capacity
●●
●●
●●
●●
Form of
control
Efficiency
●●
●●
●●
Resilience can be achieved by reducing vulnerability
(Gomes 2015)
(Keystone vulnerabilities) resilience is a function of
(McManus 2008)
Lee et al. (2013) agree with and quote McManus (2008)
Resilience is a function of Dalziell and McManus (2004)
Resilience metric (a system’s capability to decrease its
level of vulnerability to expected and unexpected events)
(Erol et al. 2010a)
Resilience can be achieved by creating redundancy
(Gomes 2015)
A part of R4 resilience framework (Tierney and
Bruneau 2007)
Integrated into the supply chain resilience factors and
measures (Falasca et al. 2008)
One of three resilience capacities (Francis and
Bekera 2014)
A dimension of system resilience (Fraccascia et al. 2017)
Resilience metric: system’s ability to recover in the least
possible time in case of a disruptive event (Erol
et al. 2010a)
System ability linked to the static perspective of
resilience (Giannoccaro et al. 2018)
System resilience is a form of control. A system is in
control when “it is able to minimise or eliminate
unwanted variability” (Hollnagel and Woods 2006)
Focus of engineering resilience (Dalziell and
McManus 2004)
Savings from reusable services; is related to optimal use
of resources (Erol et al. 2009)
●●
●●
●●
●●
System attribute that closely
relates to resilience in the
system’s design (Uday and
Marais 2015)
Overlapping but different
from resilience (Xiao and
Cao 2017)
Influence resilience but
narrow: recognize a single
stable state where the system
can return after perturbation
and are usually applied to
improve systems efficiency
(Limnios et al. 2014)
A concept to define or
measure the resilience of
systems (Erol et al. 2010c)
Overlapping but different
from resilience (Xiao and
Cao 2017)
(Recovery) overlapping but
different from resilience (Xiao
and Cao 2017)
Reduction in control may
serve in some circumstances
as an enabler to
organizational resilience
(Ignatiadis and
Nandhakumar 2007)
9.3 Concept of Resilience in the Academic Literatur
Table 9.4
(Continued)
Attribute
Is an attribute of resilience
Reliability
●●
●●
●●
Tolerance
●●
●●
Absorptive
capacity
●●
●●
Capacity
●●
●●
Cohesion
●●
●●
Is not resilience
System attribute that closely relates to resilience in the
system’s design (Uday and Marais 2015)
Resilience replaced reliability as a richer metric (Han
et al. 2012)
Not resilience; the ability of a system and its components
to perform required functions under stated conditions
for a specified period (Uday and Marais 2015)
How a system behaves near a boundary – whether the
system gracefully degrades as stress/pressure increase or
collapses when pressure exceeds adaptive capacity
(Woods 2017)
Identified as one of the top-level attributes, resulting
from the application of one or more resilience
architecture principles (Nuss et al. 2017)
One of three resilience capacities: the degree to which a
system can absorb the impacts of system perturbations
and minimize consequences with little effort; attained
through the system’s practice of adverse event mitigation
(Francis and Bekera 2014)
(Buffering capacity) the size or kinds of disruptions the
system can absorb or adapt to without a fundamental
breakdown in performance or the system’s structure
(Woods 2017)
Identified as one of the top-level attributes, resulting
from the application of one or more resilience
architecture principles (Nuss et al. 2017)
Availability of assets to enable sustained production
levels (Fiksel 2015)
Is considered one of the main capabilities of the supply
chain resilience (Carvalho 2011)
Identified as one of the top-level attributes, resulting
from the application of one or more resilience
architecture principles (Nuss et al. 2017)
restorative capacity, and (9) efficiency. Examples of the nine attributes’ definitions as reported in
the reviewed academic literature are in Table 9.6.
Analysis of proposed definitions of the selected nine resilience attributes revealed, again, the
lack of consistency and uniformity. For example, according to Erol et al. (2010c), efficiency, agility,
and adaptability are sub-attributes of flexibility; Golden and Powell (2000) define flexibility as “the
capacity to adapt through the use of efficiency, responsiveness, versatility and robustness,” while
Bhamra et al. (2011) consider flexibility to be one of the traits of resilience of a small enterprise. We
propose our interpretation of the nine selected resilience attribute definitions elicited from the
reviewed academic literature:
1) Flexibility is a system’s ability to adapt to change with minimum time and effort. It is a complex
attribute of resilience consisting of multiple sub-attributes, such as agility, efficiency, and adaptability. It is also enabled by system’s robustness, redundancy, and restorative capacity.
153
Table 9.5
Resilience attributes as proposed in a single source.
Attribute
Definition
Improvisation
Overlapping but different from resilience (Xiao and Cao 2017)
Diversity
Is considered one of the main capabilities of the supply chain resilience
(Carvalho 2011)
Shared vision
One of the dimensions of organizational resilience (Chen 2016)
Willingness to learn
One of the dimensions of organizational resilience (Chen 2016)
Cooperative awareness
One of the dimensions of organizational resilience (Chen 2016)
Work enthusiasm
One of the dimensions of organizational resilience (Chen 2016)
The organizational capability
to change in responses to
unexpected events such as
shocks or disasters
One of the two resilience capabilities (Xiao and Cao 2017)
The organizational capability One of the two resilience capabilities (Xiao and Cao 2017)
to anticipate the occurrence of
such unexpected events
Nodes density (centralization
vs. dispersion)
One of the supply chain resilience factors and measures (Falasca
et al. 2008)
Nodes criticality (cost vs.
resilience)
One of the supply chain resilience factors and measures (Falasca
et al. 2008)
Nodes complexity (flexibility
One of the supply chain resilience factors and measures (Falasca
and redundancy vs. efficiency) et al. 2008)
Collaboration among players
One of the supply chain resilience enablers (Soni et al. 2014)
Information sharing
One of the supply chain resilience enablers (Soni et al. 2014)
Sustainability in supply chain
One of the supply chain resilience enablers (Soni et al. 2014)
Risk and revenue sharing
One of the supply chain resilience enablers (Soni et al. 2014)
Supply chain visibility
One of the supply chain resilience enablers (Soni et al. 2014)
Supply chain structure
One of the supply chain resilience enablers (Soni et al. 2014)
Overall situational awareness
●●
●●
Resilience is a function of McManus (2008)
Lee et al. (2013) agree with and quote McManus (2008)
Resourcefulness
A part of R4 resilience framework (Tierney and Bruneau 2007)
Rapidity plus technology
A part of R4 resilience framework (Tierney and Bruneau 2007)
Integrity
A dimension of organizational resilience (Bouaziz 2018)
Margin
How closely or how precarious the system is currently operating relative to
one or another kind of performance boundary (Woods 2017)
Motivation
One of four traits of resilience in small enterprisers (Bhamra et al. 2011)
Perseverance
One of four traits of resilience in small enterprisers (Bhamra et al. 2011)
Optimism
One of four traits of resilience in small enterprisers (Bhamra et al. 2011)
Risk
The concept that helps to define or measure the resilience of systems (Erol
et al. 2010c)
Disruptions
The concept that helps to define or measure the resilience of systems (Erol
et al. 2010c)
Innovation
Critical for organizational resilience (Menéndez Blanco and Montes
Botella 2016)
Efficiency
●●
●●
The focus of engineering resilience (Dalziell and McManus 2004)
Savings from reusable services; is related to optimal use of resources
(Erol et al. 2009)
Table 9.6 Examples of the nine resilience attributes’ definitions.
Attribute
Description and comments
Reporting paper
1) Flexibility
The ability of a system to adapt to the changing requirements of its environment and its stakeholders with minimum
time and effort
De Leeuw and Volberda (1996)
To rapidly adapt to its changing environment
Helaakoski et al. (2007)
The capacity to adapt through the use of efficiency, responsiveness, versatility, and robustness
Golden and Powell (2000)
Relates to agility and adaptability
Helaakoski et al. (2007)
The ability of an enterprise to adapt to changing business and stakeholder requirements more efficiently, easily, and
quickly
Erol et al. (2009)
Real-time adjustment of actions in response to actual events
Ma et al. (2018)
●●
●●
●●
Flexibility in sourcing: ability to quickly change inputs or the mode of receiving inputs (subfactors: common
product platforms, supply contract flexibility, supplier capacity, supplier expediting, alternate suppliers)
Flexibility in manufacturing: the ability to quickly and efficiently change the quantity and type of outputs
(subfactors: product/service modularity, multiple pathways, and skills, manufacturing postponement, changeover
speed, batch size, manufacturing expediting, reconfigurability, scalability, rerouting of requirements
Flexibility in fulfillment: ability to quickly change the method of delivering outputs (subfactors: multisourcing,
demand pooling, inventory management, alternate distribution modes, multiple service centers, transportation
capacity, transportation expediting)
Resilience is a system’s ability to bounce back from disruptions and disasters by building in redundancy and
flexibility
●●
●●
2) Agility
Emphasize efficiency, agility, and adaptability
Requires the integration of business processes and systems within the enterprise and across the partners of the
enterprise. Alignment of business processes and information technology is also an enabling factor for enterprise
flexibility that requires a simple and manageable enterprise architecture
Fiksel (2015)
Hu et al. (2008)
Erol et al. (2010c)
The ability to change rapidly
Fricke and Schulz (2005)
Agility has been used in conjunction with flexibility as a defining attribute of resilience (Carpenter et al. 2001;
Christopher and Peck 2004; Walker et al. 2004)
Erol et al. (2010c)
Agility characterizes a system’s ability to change rapidly
Fricke and Schulz (2005)
Agility may introduce new risks and vulnerabilities that result in lower resilience
Morello (2002)
(Continued)
Table 9.6 (Continued)
Attribute
3) Adaptive
capacity
Description and comments
Reporting paper
The system’s ability to respond to changes in an uncertain and quickly evolving environment
Helaakoski et al. (2007)
Resilience involves agility, and it helps a system to reorganize itself rapidly
Christopher and Peck (2004)
Related to more timely and faster response to rapidly changing business requirements
Erol et al. (2009)
Agility dimension includes items assessing how easily and rapidly firms adapt to changing circumstances
Kantur and Say (2015)
The ability of a supply chain to rapidly respond to change by adapting its initial stable configuration
Kamalahmadi and Parast (2016)
The reactive dimension of resilience, connected with the responsiveness of supply chains in case of disruptions and
emergencies
Wieland and Marcus
Wallenburg (2013)
Responding rapidly to changes in demand, in terms of both volume and variety
Cabral et al. (2012)
The capability to change and move in and out of different domains
Ma et al. (2018)
An aspect of resilience that reflects learning; the flexibility to experiment and adopt novel solutions and development
of generalized responses to broad classes of challenges
Walker et al. (2004)
Indicates the ability of systems to revert to their initial state after partial damage
Zhang (2008)
In order to enhance resilience, adaptive capacity should be increased even after a disruption. Adaptive capacity has
also been related to concepts of robustness, agility, and adaptability. The adaptive capacity of a system in the case of
disruption can be increased by designing, planning, and building flexibility in systems (Carpenter et al. 2001; Walker
et al. 2004; Sheffi and Rice 2005)
Erol et al. (2010c)
Functional redundancy is a way to increase a system’s adaptive capacity
He (2008)
The ability of an enterprise to alter its strategy, operations, management systems, governance structure, and decision
support capabilities to withstand perturbations and disruptions
Starr et al. (2003)
Connect resilience to redundancy and adaptive capacity
Dalziell and McManus (2004)
●●
●●
●●
●●
The ability of an enterprise to alter its “strategy, operations, management systems, governance structure, and
decision-support capabilities” to withstand perturbations and disruptions
Organizations that focus on their resilience in the face of disruption generally adopt adaptive qualities and
proactive responses. Furthermore, they emphasize positive behavior within the enterprise and employees and look
at disruptions as being opportunities for advancement
McManus (2008)
The adaptive capacity of a system also reflects the learning aspect of system behavior in response to a disruption.
Within organizations, adaptive capacity refers to the ability to cope with unknown future circumstances
Flexibility to change in response to new pressures
Bhamra et al. (2011)
Attribute
Description and comments
4) Adaptability
●●
●●
●●
5) Robustness
Erol et al. (2010c)
The capability to reestablish a state of fit with a changing environment
Ma et al. (2018)
Ability to modify operations in response to challenges or opportunities (subfactors: seizing advantage from
disruptions, alternative technology development, learning from experience, strategic gaming and simulation,
environmental sustainability)
Fiksel (2015)
Requires that systems do not get any damage; characterizes the ability to forego hyper-responses to changing
environments
Fricke and Schulz (2005)
Redundancy and robustness as the two primary attributes of resilience
Haimes et al. (2008)
●●
●●
6) Vulnerability
reduction
The ability to adapt to changing environments while delivering the intended functionality under varying operating
conditions Fricke and Schulz (2005)
The ability of an enterprise to respond to the changing business requirements and to change its business processes
Is associated with the integration of new and existing systems and processes
Reporting paper
The property of a system that allows it to satisfy a fixed set of requirements, despite changes in the environment or
within the system
No performance loss is allowed in the case of robustness; a resilient system may permit a (sometimes temporary)
performance loss in “bouncing back” from the adverse event
Uday and Marais (2015)
The robustness dimensions included items aiming to measure the resistance capacity of the firms
Kantur and Say (2015)
Not resilience, to take hits with minimal damage to functional capability, which sometimes can capitalize on
environmental disruptions to create new options and capabilities
Ma et al. (2018)
Proactive dimension of resilience
Wieland and Marcus
Wallenburg (2013)
●●
●●
Vulnerability is being at risk and the likelihood of having disruptions
The level of its vulnerability can measure the resilience of a system to a specific risk
Christopher and Peck (2004)
Vulnerability assessment should be a part of strategic planning for resilience. The level of a vulnerability is the
probability of the occurrence of disruption and the extent of the ensuing consequences. As the probability of the
occurrence of any disruption and the severity of the consequences increases, the system’s vulnerability quotient will
be higher
Sheffi and Rice (2005)
Is a measure of the criticality, preparedness, and susceptibility of the components of an organizational system and
that vulnerability is but one of the components of resilience, if a given system is highly resilient then it has a low
vulnerability
McManus (2008)
(Continued)
Table 9.6 (Continued)
Attribute
Description and comments
7) Redundancy
●●
●●
●●
●●
●●
●●
Sheffi and Rice (2005)
The ability of certain components of a system to support the functions of failed components without any
considerable effect on the performance of the system itself
Resilience is a system’s ability to bounce back from disruptions and disasters by building in redundancy and
flexibility
Haimes et al. (2008)
The extra capacity of an enterprise to withstand potentially high impact disruptive events
Redundancy and robustness as the two primary attributes of resilience
Hu et al. (2008)
Dalziell and McManus (2004)
Functional redundancy as a way to increase a system’s adaptive capacity
He (2008)
●●
●●
9) Efficiency
To keep extra capacity or resources kept in reserve to be used in case of a disruption
Redundancy and flexibility are keys to producing resilience
Redundancy relates to the adaptive capacity of the system. Researchers suggest that resilience can be enhanced by
increasing the adaptive capacity of the system, either by ensuring that the system design includes enough
redundancy to provide continuity of a function or through increasing the ability and speed of the system to evolve
and adapt to new situations as they arise
●●
8) Recovery
(restorative
capacity
Reporting paper
The ability of a system to persist even when some parts of it are compromised
Not resilience
Adding extra functions in a system that can play a role when other functions fail
Ma et al. (2018)
Returns to its baseline conditions
Ma et al. (2018)
Ability to return to normal operational state rapidly (subfactors: equipment repairability, resource mobilization,
communications strategy, crisis management, consequence mitigation)
Fiksel (2015)
A time interval or period from the time the system failed to function to the time the system gets back with its
function; the input to the model is a failure event; the output is the recovery time
Raj et al. (2014)
Performance with modest resource consumption
Bhamra et al. (2011)
Is related to the optimal use of resources
Erol et al. (2009)
Capability to produce outputs with minimum resource requirements (subfactors: labor productivity, asset utilization,
quality management, preventive maintenance, process standardization, resource productivity)
Fiksel (2015)
Organizational resilience focus management could be understood as a strategy of continuous anticipation and
adjustment to disturbances by balancing efficiency and adaptability and, accordingly, an organization’s ability to
continuously create competitive advantages based on innovations
Kayes (2015)
9.3 Concept of Resilience in the Academic Literatur
2) Agility is a sub-attribute of flexibility, which describes a system’s capacity to change easily, rapidly, and timely in response to changes in an uncertain and quickly evolving environment; if
not balanced with other resilience attributes, it may introduce new risks and vulnerabilities and
result in lower resilience.
3) Adaptability is a sub-attribute of flexibility, which describes a system’s capacity to reestablish fit
with the environment and presume a new, externally determined equilibrium in the desired state.
4) Efficiency is a sub-attribute of flexibility, which describes a system’s capacity to achieve desired
outcomes with minimum effort and resource consumption.
5) Robustness is a system’s ability to withstand stresses and demands without suffering any damage, degradation, or loss of function. Robustness enables a system’s flexibility to respond to
changes in the environment or within the system to ensure that the set of system’s requirements
continues to be satisfied.
6) Recovery (restorative capacity) is a system’s capacity to rapidly return to equilibrium in the system’s desired state in response to changes in the environment or within the system. It enables
the system’s flexibility and is measured as a time interval from the moment the system failed to
function to the time the system gets back to perform its function.
7) Redundancy is the extra capacity of a system, or resources kept in reserve to be used in case of a
disruption to prevent system’s failure or considerable effect on the performance and continuity
of its functions where certain components of a system can support the functions of failed components, or through increasing the ability and speed of a system to evolve and adapt to new situations as they arise. Redundancy is an enabler of the system’s flexibility and adaptive capacity.
8) Adaptive capacity is an aspect of resilience that reflects learning, the flexibility to experiment
and adopt novel solutions and develop generalized responses to broad classes of challenges
enabling an organization’s capacity to alter its “strategy, operations, management systems, governance structure and decision-support capabilities” to withstand perturbations and to evolve
and adapt to new situations as they arise.
9) Vulnerability level is achieved through a system’s resilience and is a measure of the criticality,
preparedness, and susceptibility of the components of an organizational system to risk and the
likelihood of having disruptions. If a given system is highly resilient, then it has a low vulnerability level.
Based on the above, we propose our original interpretation of the interrelationships between the
nine attributes in Figure 9.1, as elicited from the reviewed academic literature. It is intended to use
Figure 9.1 to derive resilience measures for our DTS case study. The system resilience is described
via the level of its vulnerability. The higher the system resilience is, the lower is its vulnerability to
threats or changes in the system’s environment. The decrease in the system’s vulnerability can be
achieved through the increase in the system’s flexibility, which, according to Erol et al. (2010c), is
a function of agility, efficiency, and adaptability. Flexibility, however, is insufficient for a comprehensive system resilience evaluation as it does not include the system’s adaptive capacity that captures system’s ability to evolve and settle in a new equilibrium rather than simply returning to the
same equilibrium as experienced before the impact. The higher the system’s adaptive capacity is,
the more resilient it is. The system’s flexibility and adaptive capacity are enabled by the system’s
physical characteristics such as robustness, restorative capacity, and redundancy.
9.3.2.2 Why? (Resilience Triggers)
The notion of resilience requiring some form of a trigger to manifest itself is featuring in all 91
papers selected for the review. There are, however, variations in interpretations of what the “trigger” is, with the area of application and trigger types summarized in Table 9.7.
159
9 Improving Enterprise Resilience by Evaluating Training System Architecture
Resilience
Flexibility
Vulnerability level
Agility
Efficiency
Adaptability
Enablers
160
Robustness
Figure 9.1
Recovery
(restorative capacity)
Adaptive capacity
Redundancy
Resilience attributes’ interrelationships.
As depicted in Table 9.7, resilience is triggered by changes, either in circumstances, processes, or
environment. These changes are predominantly negative but could be any that are significant
enough to trigger the system’s reaction. The uncertain nature of these changes is featuring prominently in the resilience-focused academic literature with more than a third of the papers reporting
the challenges of building resilience against “unexpected”/“potential” events and “unforeseeable”/
“unknown”/“unpredictable” hazards/changes/disturbances.
Some papers take the uncertainty argument further by firmly linking resilience to uncertainty.
For example, Park et al. (2013) state that resilience thinking requires consideration of all types of
inherent uncertainties – including internal variability and dynamics, external drivers, and shocks.
Hollnagel and Woods (2006) add that due to uncertainty, the only potential for resilience could be
measured but not resilience itself. They compare the measurement of reliability as the probability
that a given function or component would fail under specific circumstances to measuring resilience that includes recovery from irregular variations, disruptions, and degradation of expected
working conditions.
9.3.2.3
How? (Resilience Mechanisms and Measures)
System design must incorporate resilience to provide stakeholders with the solution most appropriate for their life cycle needs (Ferris 2019). To incorporate resilience, the resilience mechanisms
and parameters need to be determined, followed by establishing metrics for the system’s resilience.
Jackson et al. (2015b) highlight the challenge of measuring system resilience as it means different
things to different people and in different contexts and concern with different types of systems and
different aspects of resilience. The lack of common terminology and agreed resilience framework
in a vast and fast-growing resilience literature exacerbates this problem even further. In response
to this challenge, several reviewed papers propose their conceptual models and perspectives of
resilience to support analysis of the system performance and behavior in response to a threatening
situation or a change, as well as their solutions to measure them. Below is our selection of the
resilience mechanisms and measures, as reported in the reviewed literature for consideration in
our research.
9.3 Concept of Resilience in the Academic Literatur
Table 9.7 Resilience triggers.
Source
Area of application
Terms used
Trigger type: negative change
Akgün and Keskin (2014) Organizations (business)
Disruptions, environmental turbulence that
involves technological discontinuities
Azvedo et al. (2011)
Supply chain
Disturbance occurrence
Berkes (2007)
Organizational learning
(HRM)
Previous crises
Bhamra et al. (2011)
Multidisciplinary (lit review)
The diverse and ever-changing environment
Bukowski (2016)
System of systems
The impact of a hazard (technical) or disaster
(social)
Carpenter et al. (2001)
Socioecological system
Disturbance
Carthey et al. (2001)
Organizations (healthcare)
Adversity
Carvalho and Machado
(2007)
Supply chain
Disturbance topology: natural events,
accidents, human-made events
Cooper et al. (2014)
Organizations (HRM)
Failure
Crichton et al. (2009)
Organizations (emergency
response)
Accident or incident
Dalziell and McManus
(2004)
Systems
Disaster event, failure
Kamalahmadi and Parast
(2016)
Supply chain
Disruptions
Kantur and Say (2015)
Organizations (HRM)
Natural disasters and crises situations
including economic, political, and social
events
Downes et al. (2013)
Multidisciplinary
Undesirable changes
Erol et al. (2009, 2010c)
Enterpriser (system)
Turbulent change, disruption
Falasca et al. (2008)
Supply chain
Disasters, disturbances due to internal and
external risks
Ferris (2019)
Engineering (system)
Threat encounters, adversity
Gilbert et al. (2012)
Business transformation
Changes in business environment turning
business model into disruptive
Gomes (2015)
Enterprise architecture
(system)
External and internal disruptions
Han et al. (2012)
System of systems
Different levels of failure
Henry and RamirezMarquez (2010)
Enterpriser (systems)
Man-made and natural disasters and
calamities
Kayes (2015)
Organizations (learning)
Disturbances and organizational failures
Kim et al. (2015)
Supply network
Disruption
Lee et al. (2013)
Organizations (emergency
response)
Emergencies, crisis, rapid change
Limnios et al. (2014)
Organizations (resilience
architecture)
External and internal disturbances
Lucero (2011)
Organizations (DoD)
New CONOPs, external threats, late discovery
of defects, suboptimal engineering tools that
are not standardized
(Continued)
161
162
9 Improving Enterprise Resilience by Evaluating Training System Architecture
Table 9.7 (Continued)
Source
Area of application
Terms used
Mafabi et al. (2012)
Organizations (knowledge
management)
Environmental demands and threats
Mallak (1999)
Organizations (employee
resilience)
Rapid amounts of change from many sources
McManus (2008)
Organizations (business)
Hazard event
Munoz and Dunbar
(2015)
Supply chain
Operational disruptions
Pettit et al. (2016)
Operational resilience (military Changing environment, environmental
aviation)
exposure, disruptive conditions
Ponomarov and Holcomb Supply chain
(2009)
Disruptions
Raj et al. (2014)
Supply chain
Consequences of unavoidable risk events or
disruptions
Rosenkrantz et al. (2009)
Service-oriented networks
(system)
Failures and attacks
Tierney and Bruneau
(2007)
Disaster resilience
Environmental shocks and disruptive events
Uday and Marais (2014)
System of systems
Change over their lifetimes to recover from
Uday and Marais (2015)
System of systems
Disturbances and disruptions
Walker et al. (2004)
Socio-ecological systems
Disturbance
Ahlquist et al. (2003)
Enterpriser
Disruption/disaster
Alliger et al. (2015)
Team resilience
Stressors and chronic and acute challenges,
team challenges (resources, assignments,
conflicts etc.); normalization of deviance
Bardoel et al. (2014)
HRM (employee resilience)
Individuals’ exposure to subjectively
significant threat, risk, or harm
Chen (2016)
Organizations (R&D teams
and businesses)
Incremental change and sudden disruptions;
unexpected, stressful, adverse situations
Trigger type: any changes
Cumming et al. (2005)
Complex systems
A potential and specific change in the system
De Sanctis et al. (2018)
Organizations (HRM context)
Unexpected (i.e. failures or other disruptions)
and expected events (i.e. cross-training,
personnel relocation)
Erol et al. (2010a, 2010b)
Enterpriser (system)
Expected and unexpected threats/events;
changing environment, disruptive event
Fraccascia et al. (2017)
Complex systems
Operational management of internal and
external resources, disruptions, and
unexpected events
Hoffman and Hancock
(2017)
Organizations (HRM)
Circumstances that push the system beyond
the boundaries
Kativhu et al. (2018)
Organizations (business)
Disruptive events are weighted according to
their predictability, potential to disrupt a
system, and whether the disruption is internal
or external
9.3 Concept of Resilience in the Academic Literatur
Table 9.7 (Continued)
Source
Area of application
Terms used
Menéndez Blanco and
Montes Botella (2016)
Organizations (business)
Unexpected disruptions and change measures
to achieve competitive advantage
Sitterle et al. (2015)
Resilience engineering (DoD
systems)
External and internal changes
Trigger type: unexpected change (uncertainty)
Annarelli and Nonino
(2016)
Organizations (supply chain)
Disruptions and unexpected events, e.g.
natural disasters, pandemic disease, terrorist
attacks, economic recession, equipment
failure, and human errors
Ayyub (2014)
Disaster risk reduction
Changing conditions and disruptions, natural
disasters, includes uncertainty context
Baran (2016)
Organizations (HRM)
Catastrophic failures, calamities
Bouaziz (2018)
Organizations (HRM)
Terrorist attacks, economic downturns, global
financial crises, uncertainties in the competitive
market, and political and social conditions
Buchanan et al. (2015)
Resilience engineering (DoD
systems)
Disruption, adversity in the context of
uncertainty
Burnard and Bhamra
(2011)
Organizations (complex
systems)
Systematic discontinuities; potentially
devastating implications of disruptions;
unexpected complexity and disorder
Cabral et al. (2012)
Supply chain
Unexpected disturbance, in conjugation with
environmental responsibilities
Conz and Magnani (2019) Organizations (business)
An unexpected critical event, shocks
Goerger et al. (2014)
Resilience engineering (DoD
systems)
Rapid changes in missions and mission
requirements, as well as the emergence of new
asymmetric threats in the operational
environment, create uncertainties and surprises
Ho et al. (2014)
Organizations (HRM)
Disruptions to organizational life through
natural disasters or economic crises
Hollnagel and Woods
(2006)
Systems (resilience
engineering)
Complexity, unexpected events
Jackson et al. (2015b)
Engineering (systems)
Threat conditions and events
Jackson et al. (2015a)
Engineering (systems)
Threat event
Fiksel (2006)
Enterpriser (systems)
Disturbances and turbulent changes,
perturbations and unexpected changes
Fiksel (2015)
Complex supply chains
Unexpected disruptions, turbulent change,
and catastrophic disruptions
Francis and Bekera (2014) Engineering (system)
Realized risk events in the context of
uncertainty, unforeseeable hazards in design
and management activities
Giannoccaro et al. (2018)
Disturbance
Hard (industrial) and soft
(social) infrastructure systems
Lengnick-Hall et al. (2011) Organizations (HRM)
Unexpected, stressful, adverse situations
Ma et al. (2018)
Disruptions, unforeseen events
Organizations (emergency
response)
(Continued)
163
164
9 Improving Enterprise Resilience by Evaluating Training System Architecture
Table 9.7 (Continued)
Source
Area of application
Terms used
Mansouri et al. (2009)
Transportation system of
systems
Illness, change, or misfortune, potential
disruption
Nuss et al. (2017)
System architectures
Changing conditions, failures or losses before
their failures are investigated to identify root
causes
Park et al. (2013)
Systems (emergency response) Changing conditions, failure, unknown hazards
Sawalha (2015)
Organizations (business)
Disasters and crises, potential risks
Sharma and Sharma
(2016)
Team resilience
Setbacks, significant changes, the potential
negative effect of stressors
Shirali et al. (2016)
Process industry (systems)
Regular and irregular disruptions and
disturbances
Small et al. (2017)
Resilience engineering
(systems)
Environmental and adversarial threats and
future evolving threats
Soni et al. (2014)
Supply chain
Unpredicted disruptions
Tran et al. (2017)
Complex systems
Disruptions, potential threats, or failures
Woods (2015)
Organizations (resilience
engineering)
Trauma, unanticipated side effects, and
sudden dramatic failures
Woods (2017)
Organizations (resilience
engineering)
Disruptions, external changes, or pressures
Xiao and Cao (2017)
Organizations (business)
Crises and disasters, emergency, and
disruption in an ever-changing and uncertain
environment
Resilience Mechanisms The literature reports different perspectives on how resilience
works, with the most common listed below followed by an explication of each:
9.3.2.3.1
a)
b)
c)
d)
e)
Engineering and ecological resilience
Conditional and total resilience
Structural resilience
Static and dynamic resilience
System equilibrium and state transitions resilience models
Engineering and ecological resilience. Pritchard and Gunderson (2002) and Dalziell and McManus
(2004) distinguish two types of resilience: ecological and engineering, with the former focusing on
the magnitude of disturbance the system can withstand before it is modified and the latter on the
speed of system’s return to equilibrium. High engineering resilience implies maximizing the efficiency of systems and processes, whereas ecological resilience is concerned with the system’s flexibility to continue functioning in the face of adversity and often at an efficiency expense.
Conditional and total resilience. Han et al. (2012) develop their original propositions to facilitate
resilience measurement in a system-of-systems (SoS) context. Conditional resilience is a percentage of the SoS’s performance that remains after a failure of a specific set of systems within that
SoS. The total resilience is how the SoS’s performance gradually degrades as more and more of its
components fail until the SoS performance breaches the “minimum required performance” threshold constituting a total failure of the SoS.
9.3 Concept of Resilience in the Academic Literatur
Structural resilience. We propose the term “structural resilience” as a superficial construct to
represent the resilience perspectives from the academic literature that focuses on the resilience of
system architectures. For example, Gomes (2015) proposes dimensions and activities for the enterprise architecture (EA) development focused on supporting the system resilience requirements.
Kim et al. (2015) formulate a structural perspective of the supply chain network resilience. Their
study conceptualizes supply network disruption and resilience by examining the structural relationships among entities in the network architecture. They propose that resilience can change with
the change in the network architecture configuration. The network resilience is measured by the
number of system failures recorded for different system configurations, each achieved by manipulating the network structural factors, namely, density, length, connectivity, and criticality.
Static and dynamic resilience perspective. Giannoccaro et al. (2018) propose to divide the resilience concept into static and dynamic perspectives. Static resilience focuses on the system’s ability
to absorb disturbance and bounce back to the original equilibrium state maintaining its core functions when shocked, with its focus on the recovery of the original shape and features once stretched
(robustness) and the capacity of the system to take alternative positions to respond better to change
(flexibility). Dynamic resilience is defined as the system’s ability to evolve and to move to a new,
more favorable equilibrium state from which to react to the disturbances experienced. Dynamic
resilience concerns the adaptive capacity of the system, which can react to disturbance by changing its structure, processes, and functions in order to increase its ability to persist or in an organismic context to evolve. A similar proposition is featured in Lengnick-Hall et al. (2011) that presents
a small literature review of two resilience perspectives: one focused on returning to original state
post-disruption, while the other adds development of new capabilities and system modifications to
keep pace with and create new opportunities. Park et al. (2013) add to the discussion a system view
of resilience, where it is represented as the outcome of the dynamic system behavior that includes
sensing, anticipation, learning, and adaptation. In this approach, resilience displays characteristics
of the system’s emergent property that enables the system to prepare for and to live with uncertainty, where hazards are not fully known. Haimes et al. (2008) highlight the importance of understanding the organizational emergent properties, which they define as those system features that
are not designed in advance but evolve based on sequences of collected events that create the
motivation and responses for properties that ultimately emerge into system features. System’s resilience response is an example of the system’s emergent properties where it cannot be directly measured within the “as-is” state of a system; it can only be predicted. In other words, a reliable measure
of enterprise resilience cannot be deduced from the normal operation of the enterprise. Enterprise
resilience is the sum of those characteristics and abilities that will eventually evolve in the case of
disruptive events, and so in order to measure resilience, it is important to identify both the inherent
and adaptive attributes of the enterprise to confront such events, as will be defined in the later sections of this chapter.
The concept of dynamic resilience is also reflected in the organismic evolution of a complex system
through governance mechanisms by Keating and Bradley (2015), as further engineered by Keating
et al. (2019) into enterprises using a pathological approach to the enterprise governance. Another
interpretation of the static and dynamic resilience perspectives is proposed by Erol et al. (2010c):
wherefrom one perspective, resilience relies upon the anticipating unexpected disruptive events and
designing solutions to eliminate errors, and the other suggests that resilience is more about detecting
unexpected events sooner when they can be more easily corrected and building the capacity to
recover from such events. Rose and Liao (2005) also distinguish two characteristics of resilience
that they title inherent and adaptive. They define inherent resilience as the ability under normal
circumstances and adaptive resilience as the ability in crises to draw upon ingenuity and extra effort.
165
166
9 Improving Enterprise Resilience by Evaluating Training System Architecture
Small et al. (2017) also consider a similar approach to resilience perspectives but in the context of
defense organizations: (1) system response to known threats using existing system characteristics
and (2) developing new system features to deal with new threats. The first perspective is titled
“Mission resilience,” defined as “the ability of a system to repel, resist, absorb, and recover from
environments and threats that occur on planned missions.” The second perspective, titled “Platform
resilience,” is defined as “the ability of a system to adapt to new missions and new threats.”
System equilibrium and state transitions resilience models. Resilience representation as a transition between the system states in response to change is featured prominently in the reviewed literature, for example, in Bhamra et al. (2011), Buchanan et al. (2015), Burnard and Bhamra (2011),
Carpenter et al. (2001), Holling et al. (1995), Limnios et al. (2014), Mafabi et al. (2012), Park et al.
(2013), Sawalha (2015), Tran et al. (2017), and others. We selected six examples of this perspective
from the reviewed literature for consideration in our research as follows:
●●
●●
●●
●●
●●
●●
●●
Adaptive cycle
Four qualities model
Resilience Architecture Framework
Operational resilience
Thermodynamic system states model
Five-state model
Generic state-machine model
Holling et al. (1995) introduce a concept of the “adaptive cycle,” where “the dynamical systems such
as ecosystems, societies, corporations, economies, nations and socio-ecological systems do not commonly function in some stable or equilibrium condition, but pass through the following four phases
[system states]: rapid growth and exploitation (r), conservation (K), collapse or release (“creative
destruction” [Ω]), or/and renewal or reorganization (α).” Resilience changes throughout the adaptive
cycle, and different aspects of resilience assume prominence at different times during the cycle.
Hollnagel and Woods (2006) presented a four qualities model that considers system resilience to
be a form of control. A system is in control when “it is able to minimise or eliminate unwanted
variability, either in its own performance, in the environment, or in both.” The authors propose
three qualities a system must have to be in control and therefore resilient, with time as a fourth,
dependent quality. The three main qualities are (1) anticipation (based on the knowledge what to
expect), (2) attention (based on the competence of what to look for), and (3) response (based on
resources and knowledge of what is required to be done). These qualities must be exercised continuously and are not sequential. The transition between them could occur in any direction and
between any of the pairs of these qualities. The system must constantly be watchful and prepared
to respond and constantly update its knowledge, competence, and resources by learning from successes and failures – its own as well as those of others. This concept of the importance of continuous adaptive control is also evident in the meta-functions of the complex system governance model
(Keating and Bradley 2015).
Limnios et al. (2014) propose a Resilience Architecture Framework that examines the relationship between the magnitude of system resilience and desirability of system state. In this model, the
relationships are presented as four possible scenarios:
1)
2)
3)
4)
“Adaptability quadrant” (high magnitude and high desirability)
“Vulnerability quadrant” (low magnitude and high desirability)
“Rigidity quadrant” (low magnitude and low desirability)
“Transient quadrant” (high magnitude and low desirability)
9.3 Concept of Resilience in the Academic Literatur
The Resilience Architecture Framework is used to differentiate between two opposing manifestations of resilience as either offense (adaptation) or defense (resistance) to internal or external
disturbance and then to recognize when resilience is desirable or undesirable depending on the
system state.
Pettit et al. (2016) propose an operational resilience model using their variation of state transition model in a defense context. They define operational resilience as “the ability of an organisation to avoid disruption, and if unsuccessful in avoidance, to recover as quickly as possible,” based
on a priori assumption that organizations change their modes of operation (states in the Jackson
et al., 2015b, model) to achieve this. The operational resilience relies on policies and procedures
associated with the transition between operational modes. These authors are working on identifying generalizable principles and practices that may enhance resilience in all types of operations
and organizations concerning effective transition between the modes.
Fiksel (2003) presents his simplified conceptual model of thermodynamic system states to
explain the state transition-based mechanism of resilience. According to this model, each system
has a stable state representing the lowest potential energy at which the system maintains its order
and function. When triggered by a change event, the stable state might transition to the higher
potential energy adjustment state. The system operating within a narrow band of possible states
constitutes low resilience. These systems can resist small disturbances from its equilibrium state
but have low resilience to larger-scale or high-impact events. The broader the system’s operational
band of possible states is, the larger-scale or higher-impact events the system can cope with. Some
systems have multiple equilibrium states and can shift to different states under certain conditions,
enabling the system to tolerate larger perturbations. However, the shift to a different equilibrium
point represents a fundamental change in the system’s structure and function.
Henry and Ramirez-Marquez (2010) formulate a five-state conceptual model of system resilience and associated quantitative approach to measure it. The five states of resilience are as follows: stable original state, disruptive event, impact/disrupted state, resilience response, and stable
recovered state. A system passes through five states starting from the original stable state. A disruptive event, which could be a combination of internal and external factors, triggers the system’s
disrupted state. Resilience action is then taken in response, enabling the system to bounce back to
a recovered state.
Jackson et al. (2015a, 2015b) propose a system resilience model consisting of seven states and
their associated transitions. The states range from a fully operational system to the system’s decommissioning. The transitions between the states are in essence transition scenarios that contain a
description of the transition trigger, such as threat encounter, system response to mitigate the
threat, systems’ post-threat restoration, decommissioning event, and to what state the system is
transitioning as a result. These authors present an initial 28 of these scenarios with more likely to
be identified as the work progresses.
9.3.2.3.2 Measuring Resilience According to Ferris (2019), the assessment of the system resilience
enables the system stakeholders to determine if the system resilience level is appropriate to achieve
its purpose and how the changes in the system design and operation affect this level. The measurement method should incorporate the effect of the uncertainty on the system and account for interdependencies between the resilience and other system attributes. Ideally, the resilience measure
should also be useful to guide management choices during the system life cycle. There is a growing
pool of academic literature devoted to the development and application of resilience measurement
methodologies. Some useful examples follow that build on earlier reviewed resilience concepts.
167
168
9 Improving Enterprise Resilience by Evaluating Training System Architecture
Carpenter et al. (2001) propose to measure resilience based on the adaptive cycle model by
Holling et al. (1995) in the context of their two original case studies of socio-ecological systems.
The authors emphasize the importance of a careful selection of the key system state variables associated with the adaptive cycle phases, and determination of the preferred state, the timescale, and
period within which the system resilience is to be measured. Walker et al. (2004) add the notion of
the “cross-scale effects” to the system resilience consideration. According to the authors, the adaptive cycle model is based on observed system changes and does not imply fixed or regular cycling.
Systems can move back from K toward r, or from r directly into Ω, or back from α to Ω, and the
cycles occur at several scales and interact with other cycles across multiple scales. Cumming et al.
(2005) also use adaptive cycle model in combination with potential future scenarios to distinguish
different future states of the system in question. The authors propose to determine a priori notion
of system identity that constitutes the system’s “healthy” resilient state and a priori set of alternative future system states that would indicate a loss of identity for the purpose of operational assessment of the system’s resilience.
The five-state model by Henry and Ramirez-Marquez (2010) is used to develop measures of
resilience. To measure the resilience of the system of interest, the functions performed by system
S are captured as performance variables “PVi.” These should be quantifiable and measurable.
While the system could perform many functions, only the functions that are relevant to resilience
are selected. For example, the system would require resources to perform its functions, so these are
captured as resource variables “RVi.” Commonly, one or more resources would be required to perform a function. Also, one resource could be required by more than one function. Hence a manyto-many relationship could exist between performance variables and resource variables.
Erol et al. (2009) then propose the attributes to base the resilience metrics upon and define enterprise resilience and enterprise flexibility as a function of agility, efficiency, and adaptability and list
the attributes of SOA, the business outcome of each attribute, and each attribute’s impact on agility, efficiency, and adaptability.
The (Ferris 2019) system resilience measurement and analysis approach lie in recognizing the
purpose of engineering of systems to provide a service to one or more stakeholders whose primary
interest in the system is the service it provides rather than the system itself. Ferris approach is
based on a variation of the generic state-machine model by Jackson et al. (2015a, 2015b). These are
tailored to a specific system context to measure resilience by enumerating the events that could
cause state transitions (E), then selecting the number of the system’s functional capability levels
(F), followed by determination of the number of system states (Q). The values are then allocated to
the (E), (F), and (Q) variables for input into the following two functions to enable discrete automation of the resilience of the system in question:
a) Function N that relates every pair of elements (𝑒𝑡, 𝑞𝑡) from E and Q to the next state qt+1, i.e. the
state transitions
b) Function W that relates every pair of elements (𝑒𝑡, 𝑞𝑡) to an element in F, i.e. ft+1.
The conventional system design approach to decide between multiple design options is to establish a trade-space model to find a figure of merit (FOM) for each contending choice. To develop the
system resilience measures for the purpose of finding FOM of the realized and proposed system
designs, the authors first select the set of attributes or measures that are instrumental for their
system’s resilience. The number of attributes needs to be sufficient to account for all key influences
but carefully selected to ensure the impact of each of the attributes on the decision is not diluted.
Then they determine relative importance weights for each attribute in the set followed by determination of value-for-scale functions for each attribute in the set. The measure of each attribute likely
9.4 DTS Case Study Methodolog
to be achieved under normal operating conditions is estimated for each design proposal in the
analysis, followed by determining the value of each proposal, usually as the sum of the product of
the attribute weights and the value-for-scale functions of the achievable quantity of that attribute.
9.4 DTS Case Study Methodology
Our approach uses our interpretation of Ferris (2019) system resilience measurement and analysis
methodology combined with the DoDAF methodology and our original resilience attributes and
their interrelationships concept in Figure 9.1, tailored to our DTS case study to develop a modelbased framework for DTS design for resilience. We also use an original survey to determine the
current and desired DTS architectures. These methodologies are further outlined below.
9.4.1
DTS Resilience Measurement Methodology
We use Ferris (2019) system resilience measurement and analysis approach outlined in
Section 9.3.2.3.2. The authors propose five generic resilience attributes manifestation to base the
system’s resilience measures’ development upon. The DTS resilience is measured using the main
resilience manifestations. These are the failure probability of the system elements and the probability of occurrence of the external threats to the system and the nature of the impairments they
cause. Restorative transition events occur as a result of maintenance of the system, in whole or in
part, and can be incorporated into the model as distributions of the time to affect a repair. We propose the DTS resilience driving factors in Figure 9.2 to be further refined based on results of our
DTS Resilience Survey outlined in Section 9.4.3.
We map our set of nine resilience attributes in Figure 9.1, with the system resilience manifestations proposed in Ferris (2019) in Table 9.8 to form the basis for development of the DTS Resilience
Survey, which is further described in Section 9.4.3.
9.4.2
DTS Architecture
We choose to use DoDAF methodology to conceptualize the DTS design. This methodology provides a simplified and well-defined view of the system’s key elements, enables the alignment of
technology and business, and supports system’s integration. We also propose to enhance the
DoDAF views with the human systems engineering framework presented in Chapter 1 of this book
to ensure DTS workforce is placed on more equal footing with design elements such as hardware
and software. When utilized together, systems integration and system architecture result in connectivity within the extended enterprise and help in achieving agility, adaptability, and flexibility
that should support the resilience at the extended enterprise level. EA also helps to identify the
interrelationships and interdependencies between the elements of the extended enterprise and
therefore can be used as a tool to assess the vulnerabilities. EA thus has a significant role in creating enterprise resilience by addressing design parameters that can lead to increased system’s resilience. EA has a role in facilitating the integration and alignment of enterprise information systems,
further leading to timely response and adaptation to change (Hoogervorst 2009).
Erol et al. (2010c) propose a framework with two key enablers of enterprise resilience. The first
enabler is the capability of an enterprise to connect people, processes, and information in a way
that allows the enterprise to become more flexible and responsive to the dynamics of its environment, stakeholders, and competitors. Such connectivity requires integration within the enterprise
169
170
9 Improving Enterprise Resilience by Evaluating Training System Architecture
External threats to the training system:
• Fluctuations in demand: too low/too high for the TS capacity
• Resource availability
○ Instructor availability
○ Sessions availability
○ Equipment availability
○ Course capacity (min/max numbers)
• Resource quality and flexibility
○ Impacted by the lacking policy
○ Lack of training composability and modularity
○ Poor preparation of TS specialists
○ Poor quality control practices (feedback loops)
○ Lack of OQE
• Project issues (FMS repatriation; non-compatible formats)
• Lack of multidimensionality (multi-factorial influences)
• Disconnect of training products across the lifecycle; services; training
continuation
Probability of occurrence of the external threats
to the system and the nature of the impairments
they cause
Training system elements:
• Training courses (content; format; theory and practice balance; versatility to address
different learning styles)
• Training pipelines (workgroups, specializations, equipment application-career-general
•
•
•
•
•
skills; from individual to collective, sequence, hierarchy
(from simple to complex or from career to equipment application);
composability and modularity)
Training delivery (mode face-to-face; instructor driven or facilitated student
centered – e-learning – blended; duration; location)
Training lifecycle: from acquisition to disposal (e.g. project delivered training; transition
training, repatriation of training from Foreign Military Sales);
Training resources:
○ Workforce (Training Specialists; Instructors; Support Personnel (administrators,
maintainer/operators of training equipment; planners etc.)
○ Technology (simulators, emulators; e-learning packages; various training support
equipment, e.g. computer, stationary)
Target audience (trainees)
Workplace:
○ Job role/tasks (core and auxiliary)
○ Supervisory arrangements
○ Capability (needs and requirements)
The failure probability
of the system elements
Distributions of the time
to effect repair
(restorative transition events)
Nature of the impairments to the elements that could be caused by external threats
• Ineffective training for the work role:
○ Undertraining
○ Overtraining
○ Irrelevant training
○ Lack of appropriate practice opportunities
• Ineffective training delivery
○ Different Learner styles not addressed
○ Disrupted/disjointed (instructor availability, venue availability; poor schedule
planning with competing priorities)
○ Unbalanced supply/demand relationship (lack of availability; insufficient demand)
○ Poor transition planning
• Disjointed training continuum:
○ Training products not logically progress throught the training continuum from
individual to collective
○ Disjointed governance across the training continuum
Stakeholder competing interests and priorities are not reconciled
Figure 9.2
DTS resilience driving factors.
9.4 DTS Case Study Methodolog
Table 9.8
Resilience attributes and their manifestations.
Resilience attributes
Flexibility (a function of):
Agility
●● Adaptability
●● Efficiency
●●
Ferris (2019) resilience manifestations
●●
●●
●●
Agnostic of threat type
Generalizable to any engineered system
Agnostic of the outcome, both short and long term,
following a threat encounter
Enablers (robustness, recovery, and redundancy)
Cognizant that performance is multidimensional
Adaptive capacity
Cognizant that threat events occur at any time during
the life cycle, with statistically predictable frequency
Source: Based on Ferris (2019).
and across the partners, suppliers, and customers of the enterprise. The second enabler is the
alignment of information technology and business goals. Attaining this alignment requires simplification of the underlying technology infrastructure and creation of a consolidated view of,
and access to, all available resources in the enterprise. A well-defined EA provides a simple and
consolidated view of the enterprise and supports the integration and connectivity at inter- and
intra-enterprise levels.
Our DTS architecture development is guided by the Cumming et al. (2005) five-step approach as
follows:
Step 1: Define current system: First conceptualize the four essential system attributes (structural
components, functional relationships, innovation, and continuity) most relevant to our research
hypothesis. Second, for each of these, select specific variables that are most likely to change in
response to changes in the intensity or extent of the drivers we selected. The degree of identity
change that occurs in multivariate space (and in particular, whether the system crosses any key
identity thresholds) then becomes the response variable of interest that best represents whether
or not the systems are resilient to the changes brought about by increased connectivity.
Step 2: Define possible future systems – same and different identities. The second element of our
research design is to define a small number of plausible future identities for each study system
using a scenario-building approach. We attempt to define a set of systems that our system might
conceivably become, including entirely new systems as well as systems that retain the same
identity while having experienced growth and reorganization. If we see no scope for the maintenance of system identity, the system lacks resilience; the focus of the exercise then shifts to the
management of change, both to mitigate negative outcomes and enhance positive outcomes. An
important objective is to specify quantitatively the amount of change in the key variables comprising identity that would constitute a new system.
Step 3: Clarify change trajectories. This step is undertaken interactively with the second step. It
involves defining the main causes of change in the system, with particular relevance to their
impacts on properties of interest. At this stage, we also identify the kinds of perturbation and
disturbance against which resilience will be assessed.
Step 4: Assess likelihoods of alternate futures. Are we likely to lose the system properties of interest, or not? If system identity is likely to be lost, our system is not very resilient. By contrast, if
our system is likely to maintain its identity across a broad range of scenarios, it is resilient. If
both identity and the likelihood of identity change in alternate scenarios are rigorously and
quantitatively determined, the likelihood of a change in identity (and its magnitude) will provide a quantitative measure of resilience.
171
172
9 Improving Enterprise Resilience by Evaluating Training System Architecture
Step 5: Identify mechanisms and levers for change. These mechanisms are used to suggest manipulation points, or levers, at which changes in the system trajectory could be brought about.
Ultimately, if we (that is, the community of stakeholders) are working with an agenda in which
we desire to facilitate or prevent certain kinds of system change, this step will identify some of
the key issues that would need to be addressed by planners and policy makers (policies often
constitute mechanisms).
Source: Cumming et al. (2005). © Springer Nature.
9.4.3
DTS Resilience Survey
We use the DTS survey to determine the relative weights and the value-for-scale functions for each
attribute in accordance with the (Ferris 2019) system resilience measurement approach. The survey’s purpose is to determine resilience of the current and desired DTS architecture as perceived
by the DTS stakeholders. Our approach to the survey design and conduct is outlined below.
9.4.3.1
DTS Resilience Survey Design
The survey questionnaire in Annex A is formulated for the five key stakeholder groups, namely:
●●
●●
●●
●●
●●
Training specialist
Defense training instructor
Trainee
Supervisor
Capability stakeholders
The survey contains demographic section followed by the DTS resilience questions informed by
the resilience attributes and their manifestations in Table 9.8. An example of the resilience questions developed for training specialist is provided in Table 9.9. The survey questionnaires for the
remaining four target audiences contain the same value questions but formulated from the perspective of their respective groups. For example, Question 2.1 from Table 9.9 reads for different
target groups as follows:
●●
●●
●●
●●
Training specialist and instructor:
“In your experience, does defense individual training adequately prepare defense personnel to
perform their collective [unit, task group and joint operation] tasks?”
Trainee:
“In your experience, does defense individual training adequately prepare you to perform their
collective [unit, task group and joint operation] tasks?”
Supervisor:
“In your experience, has defense individual training adequately prepared your subordinates to
perform their collective [unit, task group and joint operation] tasks?”
Capability stakeholder:
“In your experience, has defense individual training adequately prepared your capability users
to perform their collective [unit, task group and joint operation] tasks?”
9.4.3.2
DTS Resilience Survey Conduct
The ADF ethics committee has approved our survey design. The survey is implemented in a phased
approach, with the phase 1 that is currently under way. The survey implementation phases are as follows:
Phase 1: Inaugural distribution. The RAAF training establishment has been selected for the
inaugural survey conduct. Trip to Melbourne to meet inaugural RAAF stakeholders. Survey results
9.4 DTS Case Study Methodolog
Table 9.9
DTS resilience questions for training system specialist.
#
Main question
1
Is DTS and its products agnostic of threat (change) type (agility)?
1.1
To your knowledge, is the
following statement about
defense training resources
true?
1.2
To your knowledge, is the
following statement about
defense training true?
Supporting questions
●●
●●
●●
●●
●●
●●
●●
●●
1.3
In your experience, are the
following statements about
defense use of training
technology true?
●●
●●
●●
●●
●●
Possible values
Insufficient
Inconsistent across defense
Some gaps due to scheduling and sharing issues
Sufficient
Not sure
Never
Sometimes
Often
Always
There is often a long wait to attend courses
Inconsistent across defense
Often under-subscribed
Available and fully subscribed
Not sure
Never
Sometimes
Often
Always
Obsolescent (legacy) and hard to replace
Different across training pipelines making it hard to
learn
Meets serving members’ expectations
Meets new recruits’ expectations
State of the art
Not sure
Never
Sometimes
Often
Always
1.4
Does defense training develop students’ learning skills, e.g. by focusing on study
techniques and best learning practices?
2
Is DTS and its products generalizable to any capability systems engineering (adaptability)?
2.1
In your experience, does defense individual training adequately prepare defense
personnel to perform their collective (unit, task group, and joint operation) tasks?
Not sure
Never
Sometimes
Often
Always
2.2
To your knowledge, can
same defense courses be
delivered to different
audiences?
Different ranks of the same workgroup within one
service
Same workgroup across two or three services
More than one workgroup within one service
More than one workgroup across two or three
services
Cross-defense
Not sure
Never
Sometimes
Often
Always
Different ranks of the same workgroup within one
service
Same workgroup across two or three services
More than one workgroup within one service
More than one workgroup across two or three
services
Cross-defense
Not sure
Never
Sometimes
Often
Always
●●
●●
●●
●●
●●
2.3
To your knowledge, can be
a defense course delivered
as a whole to one group
and partially (as a selection
of some of its modules) to
another group?
●●
●●
●●
●●
●●
Not sure
Never
Sometimes
Often
Always
(Continued)
173
174
9 Improving Enterprise Resilience by Evaluating Training System Architecture
Table 9.9 (Continued)
#
Main question
2.4
To your knowledge, can
defense training be
delivered at different
levels?
Supporting questions
●●
●●
●●
●●
2.5
To your knowledge, is
defense training delivered
in the following formats?
●●
●●
●●
●●
●●
●●
Possible values
As basic/intermediate/advanced skill levels
If different depth is required by different
workgroups
Cross-service collaboration
For professional development
Not sure
Never
Sometimes
Often
Always
Instructor led (e.g. PowerPoint presentation)
Instructor facilitated (e.g. facilitator answers your
questions)
Apprenticeship
Online course
Reading package
Combination of the above
Not sure
Never
Sometimes
Often
Always
3
Is DTS and its products agnostic of the outcome, both short and long term, following a threat
encounter (efficiency)?
3.1
Have you experienced the
following issues during
defense training?
●●
●●
●●
●●
3.2
To your knowledge, does
the following occur during
defense training?
●●
●●
●●
●●
●●
Over-training
Under-training
Irrelevant training
Negative training
Not sure
Never
Sometimes
Often
Always
Training session not reaching minimum trainee
numbers
Training bottleneck (many waiting to start)
Training backlog (many waiting to enroll)
Training failures
Non-release of nominees for training
Not sure
Never
Sometimes
Often
Always
3.3
To your knowledge, how often on job training (OJT) is used to consolidate defense
training?
3.4
To your knowledge, are the
following approaches used
in the workplace to
consolidate defense
training?
●●
●●
●●
●●
●●
●●
●●
Competency log
Task book
Competency log
Task book
Authorization matrix
Platform endorsement
Work under supervision
Not sure
Never
Sometimes
Often
Always
Not sure
Never
Sometimes
Often
Always
4
Is DTS and its products cognizant that performance is multidimensional (enabler: robustness)?
4.1
Have you experienced a
diminished defense
training service similar to
examples listed below?
●●
●●
●●
●●
●●
Total loss of training service
Partial loss of service (limited availability or reduced
content)
Delivered but at a lower quality
Delivered but at a higher cost
Service is of the lowest cost and at the required
standard
Not sure
Never
Sometimes
Often
Always
9.4 DTS Case Study Methodolog
Table 9.9
(Continued)
#
Main question
4.2
Have you experienced the
following restoration
scenarios of defense
training conduct after
disruption?
Supporting questions
●●
●●
●●
●●
●●
Remain disrupted with no restoration plans
Next reporting period
For the next session of the course
On the same day
Immediately and comprehensively
Possible values
Not sure
Never
Sometimes
Often
Always
5
Is DTS and its products cognizant that performance is multidimensional (enablers: recovery and
redundancy)?
5.1
To your knowledge, is
defense training affected
by the following factors?
●●
●●
●●
●●
5.2
5.3
5.4
In your opinion, are the
following statements about
defense personnel
transitioning between
platforms and/or
equipment true?
Please select responses that
best describe your
experience of ad hoc
training in defense
To your knowledge, are the
following training delivery
options available in
defense?
●●
●●
●●
●●
●●
●●
●●
●●
●●
●●
●●
●●
●●
Unavailability of instructors
Unavailability of appropriate training equipment
and facilities
Unavailability of “on location” training
Unavailability of suitable schedule options
Not sure
Never
Sometimes
Often
Always
Same platform and equipment for the career
duration
Transition between platforms and equipment is rare
and is conducted ad hoc
It is possible to transition, but the process is difficult
The transition process is well defined and well
implemented
Not sure
Never
Sometimes
Often
Always
Used in emergency only; stressful and strains
resources
Used primarily to fill the planned training gaps
Easily available; supports training scheduling and
PD
Not sure
Never
Sometimes
Often
Always
More than one delivery location
Many schedule options throughout a year
Options to attend as intensive delivery, or over a
longer period
Same training could be attended in class, as a
computer package, and/or a mix of both
Can adjust to different learning styles
Can adjust to different learner abilities and prior
knowledge
Not sure
Never
Sometimes
Often
Always
6
Is DTS and its products cognizant that threat events occur at any time during the life cycle, with
statistically predictable frequency (adaptive capacity)?
6.1
In your opinion, does
defense adapt its training
well to the following
changes in its internal
environment?
●●
●●
●●
●●
●●
●●
●●
New or updated capabilities
New or updated equipment
New or updated functionality
New or updated technology
New specializations
New positions
Commencement of a retiring and transitioning
processes
Not sure
Never
Sometimes
Often
Always
(Continued)
175
176
9 Improving Enterprise Resilience by Evaluating Training System Architecture
Table 9.9
(Continued)
#
Main question
6.2
In your opinion, does
defense adapt its training
well to the following
changes in its external
environment?
Supporting questions
●●
●●
●●
●●
●●
●●
●●
●●
●●
6.3
6.4
Have you experienced the
following defense training
scenarios due to changes in
defense capability
requirements?
Have you experienced the
following methods to
increase defense training
capacity?
●●
●●
●●
●●
●●
●●
●●
●●
Possible values
Rapid escalation of anti-terrorism warfare
Rapid escalation of cyber and information warfare
Rapid increase of unmanned warfare
Unforeseeable circumstances (e.g. fire, flood,
epidemics)
Rapidly evolving technology
Extensive use of modeling, simulation, and AI
Complex problem solving assisted by technology
Globalization
Preparing for future uncertainties
Not sure
Never
Sometimes
Often
Always
Training fails to adapt to the change
Training adapts well, but introduced with a
significant delay
Training is well planned and well adapted to the
change
Not sure
Never
Sometimes
Often
Always
Increase in max numbers of students per course
session
Increase in number of course sessions per year
Changes to the course and personnel rotation
schedules
Increasing the training specialist workforce
Training policy change
Not sure
Never
Sometimes
Often
Always
Free responses
7
Are there any key Defense Training System performance measures that you use (should use)? Please
specify
8
In your opinion, on what learning needs should Defense Training System focus more?
9
In your opinion, what could be done to improve defense training?
to form the basis for the DTS architecture and resilience measurement. The survey population is
asked for the feedback for the questions and resilience measurement scale to be incorporated into
the future phases of the survey.
Phase 2: Cross-DoD distribution. The postinaugural version of the survey is to be distributed to
a randomly selected sample of targeted populations from the three services.
Phase 3: Mitigation distribution. If any of the data is insufficient, the phase 3 of the survey will
be conducted to address any information gaps from the previous phases.
Phase 4: Publishing the survey methodology and results. It is intended to publish a separate article in a peer-reviewed journal outlining the results of the survey effort.
9.5
Research Findings and Future Directions
Our research established that DTS is worthy of an enterprise resilience approach, especially in the
Australian context where SE input and processes appear not to have kept pace, and therefore there
is a good prospect of significant improvements from such an approach. A substantial literature
Reference
review of enterprise resilience found differences in terminology and lack of agreement between
the academics on the matter of resilience attributes. However, we were able to identify nine attributes for our research use that featured most prominently in the reviewed publications, namely, (1)
flexibility, (2) agility, (3) adaptive capacity, (4) adaptability, (5) robustness, (6) vulnerability reduction, (7) redundancy, (8) recovery/restorative capacity, and (9) efficiency.
The literature review also found different perspectives on resilience mechanism, wherefrom the
most common reviewed, we selected a resilience model with system equilibrium, and state transitions called the generic state-machine model by Jackson et al. (2015a, 2015b). The preferred
approach to implementing this model we chose is that of Ferris (2019). His approach to developing
a system resilience measurement and analysis methodology was tailored to our DTS case study and
overviewed here. Basic factors and measures for DTS resilience were proposed and supported by
DTS Resilience Survey to determine the current DTS design and to guide the DTS transformation
road map development from “As Is” to “To Be” architecture.
Our future work is to implement the training system surveys to measure these resilience measures and build the resilience model to research what limitations can be addressed to improve the
resilience of the DTS. Having established the attributes of interest, we then proceed to establish the
relevant causes of change in these attributes and how they might respond to both gradual and
abrupt kinds of change. This process, in turn, leads to the elaboration of a small number of plausible futures, designed to cover a range of uncertainty rather than produce any single “correct” prediction. By assessing the likelihood that the system will change in certain specified ways in the
future, we obtain a surrogate measure of resilience that will tell us how likely it is that the system
properties that we are interested in will be maintained at a specified time interval in the future.
The research used here to establish a defense enterprise resilience method to improve training
systems has wide applicability for any enterprise seeking to be more resilient, especially through
better engineering of its training systems and personnel.
R
eferences
Ahlquist, G., Irwin, G., Knott, D., and Allen, K. (2003). Enterprise resilience. Best’s Review 104
(3): 88–88.
Akgün, A.E. and Keskin, H. (2014). Organisational resilience capacity and firm product innovativeness
and performance. International Journal of Production Research 52 (23): 6918–6937.
Alberts, D.S., Garstka, J.J., and Stein, F.P. (2000). Network Centric Warfare Developing and Leveraging
Information Superiority: Command and Control Research Program (CCRP). Washington, DC: US
Office of the Secretary of Defence.
Alliger, G.M., Cerasoli, C.P., Tannenbaum, S.I., and Vessey, W.B. (2015). Team resilience.
Organizational Dynamics 44 (3): 176–184.
Annarelli, A. and Nonino, F. (2016). Strategic and operational management of organizational
resilience: current state of research and future directions. Omega 62: 1–18.
Ayyub, B.M. (2014). Systems resilience for multihazard environments: definition, metrics, and
valuation for decision making. Risk Analysis 34 (2): 340–355.
Azvedo, S.G., Govindan, K., Carvalho, H. et al. (2011). GResilient index to assess the greenness and
resilience of the automotive supply chain. Discussion Papers on Business and Economics (August).
University of Southern Denmark, Department of Business and Economics.
Baran, B.E. (2016). High-reliability HR: preparing the enterprise for catastrophes. People & Strategy
39 (1): 34–38.
177
178
9 Improving Enterprise Resilience by Evaluating Training System Architecture
Bardoel, E.A., Pettit, T.M., De Cieri, H., and McMillan, L. (2014). Employee resilience: an emerging
challenge for HRM. Asia Pacific Journal of Human Resources 52 (3): 279–297.
Berkes, F. (2007). Understanding uncertainty and reducing vulnerability: lessons from resilience
thinking. Natural Hazards Review 41 (2): 283–295.
Bhamra, R., Dani, S., and Burnard, K. (2011). Resilience: the concept, a literature review and future
directions. International Journal of Production Research 49 (18): 5375–5393.
Bitzinger, R.A.E. (2016). Emerging Critical Technologies and Security in the Asia-Pacific. Hampshire,
UK: Palgrave Macmillan.
Boardman, J.T. and Clegg, B.T. (2001). Structured engagement in the extended enterprise. International
Journal of Operations & Production Management 21: 795–811.
Boardman, J. and Sauser, B. (2008). Systems Thinking: Coping with 21st Century Problems. New York:
CRC Press.
Bouaziz, F. (2018). Strategic human resource management practices and organizational resilience.
Journal of Management Development 37 (7): 537–551. https://doi.org/10.1108/JMD-11-2017-0358.
Buchanan, R.K., Goerger, S.R., Rinaudo, C.H. et al. (2015). Resilience in engineered resilient systems.
The Journal of Defense Modeling Simulation: 1548512918777901. https://doi.
org/10.1177/1548512918777901.
Bukowski, L. (2016). System of systems dependability – theoretical models and applications examples.
Reliability Engineering System Safety 151: 76–92.
Burnard, K. and Bhamra, R. (2011). Organisational resilience: development of a conceptual framework
for organisational responses. International Journal of Production Research 49 (18): 5581–5599.
Cabral, I., Grilo, A., and Cruz-Machado, V. (2012). A decision-making model for lean, agile, resilient
and green supply chain management. International Journal of Production Research 50 (17):
4830–4845.
Carpenter, S., Walker, B., Anderies, J.M., and Abel, N. (2001). From metaphor to measurement:
resilience of what to what? Ecosystems 4 (8): 765–781.
Carthey, J., de Leval, M., and Reason, J. (2001). Institutional resilience in healthcare systems. BMJ
Quality Safety 10 (1): 29–32.
Carvalho, H. (2011). Resilience index: proposal and application in the automotive supply chain. Paper
presented at the Proceedings of the 18th EUROMA conference, Cambridge, UK.
Carvalho, H. and Machado, V.C. (2007). Designing principles to create resilient supply chains. Paper
presented at the IIE Annual Conference Proceedings.
Chen, S.-H. (2016). Construction of an early risk warning model of organizational resilience: an
empirical study based on samples of R&D teams. Discrete Dynamics in Nature Society 2016: 4602870.
https://doi.org/10.1155/2016/4602870.
Christopher, M. and Peck, H. (2004). Building the resilient supply chain. The International Journal of
Logistics Management 15 (2): 1–14.
Conz, E. and Magnani, G. (2019). A dynamic perspective on the resilience of firms: a systematic
literature review and a framework for future research. European Management Journal 38: 400–412.
Cooper, C.L., Liu, Y., and Tarba, S.Y. (2014). Resilience, HRM practices and impact on organizational
performance and employee well-being. International Journal of Human Resource Management 25
(17): 2466–2471.
Crichton, M.T., Ramsay, C.G., and Kelly, T. (2009). Enhancing organizational resilience through
emergency planning: learnings from cross-sectoral lessons. Journal of Contingencies Crisis
Management 17 (1): 24–37.
Cumming, G.S., Barnes, G., Perz, S. et al. (2005). An exploratory framework for the empirical
measurement of resilience. Ecosystems 8 (8): 975–987.
Reference
Dalziell, E.P. and McManus, S.T. (2004). Resilience, vulnerability, and adaptive capacity: implications
for system performance. First International Forum for Engineering Decision Making (IFED), Stoos,
Switzerland (5–8 December 2004).
De Leeuw, A.C. and Volberda, H.W. (1996). On the concept of flexibility: a dual control perspective.
Omega 24 (2): 121–139.
De Sanctis, I., Ordieres Meré, J., and Ciarapica, F.E. (2018). Resilience for lean organisational network.
International Journal of Production Research 56 (21): 6917–6936.
Downes, B.J., Miller, F., Barnett, J. et al. (2013). How do we know about resilience? An analysis of
empirical research on resilience, and implications for interdisciplinary praxis. Environmental
Research Letters 8 (1): 014041.
Erol, O., Mansouri, M., and Sauser, B. (2009). A framework for enterprise resilience using service
oriented Architecture approach. Paper presented at the 2009 3rd Annual IEEE Systems
Conference.
Erol, O., Henry, D., and Sauser, B. (2010a). 3.1.2 Exploring resilience measurement methodologies.
Paper presented at the INCOSE International Symposium.
Erol, O., Henry, D., Sauser, B., and Mansouri, M. (2010b). Perspectives on measuring enterprise
resilience. Paper presented at the 2010 IEEE International Systems Conference.
Erol, O., Sauser, B., and Mansouri, M. (2010c). A framework for investigation into extended enterprise
resilience. Enterprise Information Systems 4 (2): 111–136.
Fakult, N., Pfledderer, J.A., and Bills, C.G. (1988). Comparison of instructional system development
(ISD) with systems engineering from the training system perspective. Paper presented at the
Proceedings of the IEEE 1988 National Aerospace and Electronics Conference, Dayton, OH, USA
(23–27 May 1988).
Falasca, M., Zobel, C.W., and Cook, D. (2008). A decision support framework to assess supply chain
resilience. Paper presented at the Proceedings of the 5th International ISCRAM Conference.
Ferris, T.L. (2019). A resilience measure to guide system design and management. IEEE Systems
Journal 13 (4): 3708–3715.
Fiksel, J. (2003). Designing resilient, sustainable systems. Environmental Science Technology 37 (23):
5330–5339.
Fiksel, J. (2006). Sustainability and resilience: toward a systems approach. Sustainability: Science,
Practice 2 (2): 14–21.
Fiksel, J. (2015). From risk to resilience: learning to deal with disruption. In: Resilient by Design, 19–34.
Springer.
Fraccascia, L., Giannoccaro, I., and Albino, V. (2017). Rethinking resilience in industrial symbiosis:
conceptualization and measurements. Ecological Economics 137: 148–162.
Francis, R. and Bekera, B. (2014). A metric and frameworks for resilience analysis of engineered and
infrastructure systems. Reliability Engineering System Safety 121: 90–103.
Fricke, E. and Schulz, A.P. (2005). Design for changeability (DfC): principles to enable changes in
systems throughout their entire lifecycle. Systems Engineering 8 (4): 342–359.
Giannoccaro, I., Albino, V., and Nair, A. (2018). Advances on the resilience of complex networks.
Complexity 2018: 8756418. https://doi.org/10.1155/2018/8756418.
Gilbert, C., Eyring, M., and Foster, R.N. (2012). Two routes to resilience. Harvard Business Review 90
(12): 65–73.
Goerger, S.R., Madni, A.M., and Eslinger, O.J. (2014). Engineered Resilient Systems: A DoD Perspective.
Army Corps of Engineers Vicksburg Ms Engineer Research and Development Center.
Gold-Bernstein, B. and Ruh, W. (2004). Enterprise Integration: The Essential Guide to Integration
Solutions. Addison Wesley Longman Publishing Co., Inc.
179
180
9 Improving Enterprise Resilience by Evaluating Training System Architecture
Golden, W. and Powell, P. (2000). Towards a definition of flexibility: in search of the Holy Grail? Omega
28 (4): 373–384.
Gomes, R. (2015). Resilience and enterprise architecture in SMES. ISTEM-Journal of Information
Systems 12 (3): 525–540.
Haimes, Y.Y., Crowther, K., and Horowitz, B.M. (2008). Homeland security preparedness: balancing
protection with resilience in emergent systems. Systems Engineering 11 (4): 287–308.
Han, S.Y., Marais, K., and DeLaurentis, D. (2012). Evaluating system of systems resilience using
interdependency analysis. Paper presented at the 2012 IEEE International Conference on Systems,
Man, and Cybernetics (SMC).
He, Y. (2008). A novel approach to emergency management of wireless telecommunication system.
Master dissertation, Department of Mechanical Engineering, University of Saskatchewan
Saskatoon, Saskatchewan, Canada
Helaakoski, H., Iskanius, P., and Peltomaa, I. (2007). Agent-based architecture for virtual enterprises to
support agility. Paper presented at the Working Conference on Virtual Enterprises.
Henry, D. and Ramirez-Marquez, J.E. (2010). 3.1.1 A generic quantitative approach to resilience: a
proposal. Paper presented at the INCOSE International Symposium.
Ho, M., Teo, S.T., Bentley, T. et al. (2014). Organizational resilience and the challenge for human
resource management: conceptualizations and frameworks for theory and practice. Paper presented
at the International Conference on Human Resource Management and Professional Development
for the Digital Age (HRM&PD). Proceedings.
Hoffman, R.R. and Hancock, P.A. (2017). Measuring resilience. Human Factors 59 (4): 564–581.
Holling, C. (1973). Resilience and stability of ecological systems. Annual Review of Ecology 4 (1): 1–23.
Holling, C.S., Gunderson, L., and Light, S. (1995). Barriers and Bridges to the Renewal of Ecosystems.
New York: Columbia University Press.
Hollnagel, E. and Woods, D.D. (2006). Epilogue: resilience engineering precepts. In: Resilience
engineering: Concepts (eds. E. Hollnagel, D.D. Woods and N. Leveson), 347–358. Aldershot:
Ashgate.
Hoogervorst, J.A. (2009). Enterprise Governance and Enterprise Engineering. The Netherlands: Springer
Science & Business Media.
Hu, Y., Li, J., and Holloway, L.E. (2008). Towards modeling of resilience dynamics in manufacturing
enterprises: literature review and problem formulation. Paper presented at the 2008 IEEE
International Conference on Automation Science and Engineering.
Ignatiadis, I. and Nandhakumar, J. (2007). The impact of enterprise systems on organizational
resilience. Journal of Information Technology 22 (1): 36–43.
Jackson, S., Cook, S., and Ferris, T.L. (2015a). A generic state-machine model of system resilience.
Insight 18 (1): 14–18.
Jackson, S., Cook, S.C., and Ferris, T.L. (2015b). Towards a method to describe resilience to assist
system specification. Paper presented at the INCOSE International Symposium.
Joiner, K.F. and Tutty, M.G. (2018). A tale of two allied defence departments: new assurance initiatives
for managing increasing system complexity, interconnectedness and vulnerability. Australian
Journal of Multi-Disciplinary Engineering 14 (1): 4–25.
Joiner, K.F., Atkinson, S.R., Castelle, K., and Bradley, J. (2019). Near-term Asian war: impacts and
options for Australia’s submarine program. Paper presented at the 5th Submarine Science,
Technology and Engineering Conference (SubSTEC5), Fremantle, Western Australia (18–22
November 2019).
Jordan, D., Kiras, J.D., Lonsdale, D.J. et al. (2016). Understanding Modern Warfare. Cambridge, U.K.:
Cambridge University Press.
Reference
Kamalahmadi, M. and Parast, M.M. (2016). A review of the literature on the principles of enterprise
and supply chain resilience: major findings and directions for future research. International Journal
of Production Economics 171: 116–133.
Kantur, D. and Say, A.I. (2015). Measuring organizational resilience: a scale development. Journal of
Business Economics Finance 4 (3): 456–472.
Kativhu, S., Mwale, M., and Francis, J. (2018). Approaches to measuring resilience and their
applicability to small retail business resilience. Problems Perspectives in Management 16 (4): 275–284.
Kayes, D.C. (2015). Organizational Resilience: How Learning Sustains Organizations in Crisis, Disaster,
and Breakdown. USA: Oxford University Press.
Keating, C.B. and Bradley, J.M. (2015). Complex system governance reference model. International
Journal of System of Systems Engineering 6 (1–2): 33–52. https://doi.org/10.1504/ijsse.2015.068811.
Keating, C.B., Katina, P.F., Jaradat, R.M. et al. (2019). Framework for improving complex system
performance. INCOSE International Symposium 29 (1): 1218–1232. https://doi.
org/10.1002/j.2334-5837.2019.00664.x.
Kim, Y., Chen, Y.-S., and Linderman, K. (2015). Supply network disruption and resilience: a network
structural perspective. Journal of Operations Management 33: 43–59.
Kosanke, K., Vernadat, F., and Zelm, M. (1999). CIMOSA: enterprise engineering and integration.
Computers in Industry 40 (2–3): 83–97.
Lee, A.V., Vargo, J., and Seville, E. (2013). Developing a tool to measure and compare organizations’
resilience. Natural Hazards Review 14 (1): 29–41.
Lengnick-Hall, C.A., Beck, T.E., and Lengnick-Hall, M.L. (2011). Developing a capacity for
organizational resilience through strategic human resource management. Human Resource
Management Review 21 (3): 243–255.
Limnios, E.A.M., Mazzarol, T., Ghadouani, A., and Schilizzi, S.G. (2014). The resilience architecture
framework: four organizational archetypes. European Management Journal 32 (1): 104–116.
Lucero, S. (2011). Engineered Resilient Systems-DoD Science and Technology Priority. Washington, DC:
Office of the Deputy Assistant Secretary of Defense (Systems Engineering) https://apps.dtic.mil/
dtic/tr/fulltext/u2/a586459.pdf (accessed 28 August 2020).
Ma, Z., Xiao, L., and Yin, J. (2018). Toward a dynamic model of organizational resilience. Nankai
Business Review International 9 (3): 246–263.
Mafabi, S., Munene, J., and Ntayi, J. (2012). Knowledge management and organisational resilience:
organisational innovation as a mediator in Uganda parastatals. Journal of Strategy Management
Research Review 5 (1): 57–80.
Mallak, L.A. (1999). Toward a theory of organizational resilience. Paper presented at the PICMET’99:
Portland International Conference on Management of Engineering and Technology. Proceedings
Vol-1: Book of Summaries (IEEE Cat. No. 99CH36310).
Mansouri, M., Sauser, B., and Boardman, J. (2009). Applications of systems thinking for resilience
study in maritime transportation system of systems. Paper presented at the 2009 3rd Annual IEEE
Systems Conference.
McManus, S.T. (2008). Organisational resilience in new zealand. PhD thesis, University of Canterbury.
https://ir.canterbury.ac.nz/bitstream/handle/10092/1574/?sequence=1 (accessed 28 August 2020).
Menéndez Blanco, J.M. and Montes Botella, J.L. (2016). What contributes to adaptive company
resilience? A conceptual and practical approach. Development Learning in Organizations: An
International Journal 30 (4): 17–20.
Morello, D.T. (2002). The Blueprint for the Resilient Virtual Organization Spurred by the Needs for Security,
Protection and Recovery, Enterprises Are Taking on the New Challenge of Deliberately Designing
Resilience into Their Management of People, Places, Infrastructure and Work Processes. Gartner, Inc.
181
182
9 Improving Enterprise Resilience by Evaluating Training System Architecture
Munoz, A. and Dunbar, M. (2015). On the quantification of operational supply chain resilience.
International Journal of Production Research 53 (22): 6736–6751.
Nuss, A.J., Blackburn, T.D., and Garstenauer, A. (2017). Toward resilience as a tradable parameter
during conceptual trade studies. IEEE Systems Journal 12 (4): 3393–3403.
Park, J., Seager, T.P., Rao, P.S.C. et al. (2013). Integrating risk and resilience approaches to catastrophe
management in engineering systems. Risk Analysis 33 (3): 356–367.
Pettit, T.J., Simpson, N.C., Hancock, P.G. et al. (2016). Exploring operational resilience in the context of
military aviation: finding the right mode at the right time. Journal of Business Behavioral Sciences
28 (2): 24.
Ponomarov, S.Y. and Holcomb, M.C. (2009). Understanding the concept of supply chain resilience.
The International Journal of Logistics Management 20 (1): 124–143.
Pritchard, L. and Gunderson, L.H. (2002). Resilience and the Behavior of Large Scale Systems.
Island Press.
Raj, R., Wang, J., Nayak, A. et al. (2014). Measuring the resilience of supply chain systems using a
survival model. IEEE Systems Journal 9 (2): 377–381.
Rose, A. and Liao, S.Y. (2005). Modeling regional economic resilience to disasters: a computable
general equilibrium analysis of water service disruptions. Journal of Regional Science 45 (1): 75–112.
Rosenkrantz, D.J., Goel, S., Ravi, S., and Gangolly, J. (2009). Resilience metrics for service-oriented
networks: a service allocation approach. IEEE Transactions on Services Computing 2 (3): 183–196.
Sawalha, I.H.S. (2015). Managing adversity: understanding some dimensions of organizational
resilience. Management Research Review 38 (4): 346–366.
Schuel, D. (2018). Force integration – integrated capability realisation for the ADF. Paper presented at
the Systems Engineering Test & Evaluation Conference, Sydney (2 May 2018).
Sharma, S. and Sharma, S.K. (2016). Team resilience: scale development and validation. Vision
20 (1): 37–53.
Sheffi, Y. and Rice, J.B. Jr. (2005). A supply chain view of the resilient enterprise. MIT Sloan
Management Review 47 (1): 41.
Shirali, G.A., Motamedzade, M., Mohammadfam, I. et al. (2016). Assessment of resilience engineering
factors based on system properties in a process industry. Cognition, Technology Work 18 (1): 19–31.
Sitterle, V.B., Freeman, D.F., Goerger, S.R., and Ender, T.R. (2015). Systems engineering resiliency:
guiding tradespace exploration within an engineered resilient systems context. Procedia Computer
Science 44: 649–658.
Small, C., Parnell, G., Pohl, E. et al. (2017). Engineered resilient systems with value focused thinking.
Paper presented at the INCOSE international symposium.
Soni, U., Jain, V., and Kumar, S. (2014). Measuring supply chain resilience using a deterministic
modeling approach. Computers Industrial Engineering 74: 11–25.
Starr, R., Newfrock, J., and Delurey, M. (2003). Enterprise resilience: managing risk in the networked
economy. Strategy and Business 30: 70–79.
Tierney, K., & Bruneau, M. (2007). Conceptualizing and measuring resilience: a key to disaster loss
reduction. TR News(250). http://www.trb.org/Publications/Blurbs/158982.aspx (accessed 28
August 2020).
Tran, H.T., Balchanos, M., Domerçant, J.C., and Mavris, D.N. (2017). A framework for the quantitative
assessment of performance-based system resilience. Reliability Engineering System Safety 158: 73–84.
U.S. Government Accountability Office (2018). Weapon Systems Cybersecurity: DOD Just Beginning to
Grapple with Scale of Vulnerabilities. Washington, DC.
Uday, P. and Marais, K.B. (2014). Resilience-based system importance measures for system-of-systems.
Procedia Computer Science 28: 257–264.
Reference
Uday, P. and Marais, K. (2015). Designing resilient systems-of-systems: a survey of metrics, methods,
and challenges. Systems Engineering 18 (5): 491–510.
Unewisse, M. (2016). The new Defence Capability Lifecycle: a conceptual overview. Paper presented at
the Systems Engineering, Test and Evaluation, Melbourne.
Walker, B., Holling, C.S., Carpenter, S., and Kinzig, A. (2004). Resilience, adaptability and
transformability in social–ecological systems. Ecology Society 9 (2) https://www.gbcma.vic.gov.au/
downloads/wshop_resilience_reading/resilience_2.pdf (accessed 28 August 2020).
Wieland, A. and Marcus Wallenburg, C. (2013). The influence of relational competencies on supply
chain resilience: a relational view. International Journal of Physical Distribution 43 (4): 300–320.
Woods, D.D. (2015). Four concepts for resilience and the implications for the future of resilience
engineering. Reliability Engineering System Safety 141: 5–9.
Woods, D.D. (2017). Essential characteristics of resilience. In: Resilience Engineering, 21–34. CRC Press.
Xiao, L. and Cao, H. (2017). Organizational resilience: the theoretical model and research implication.
Paper presented at the ITM Web of Conferences.
Zhang, W. (2008). Resilience Engineering – A New Paradigm and Technology for Systems. Canada:
University of Saskatchewan.
183
185
10
Integrating New Technology into the Complex System
of Air Combat Training*
Sarah M. Sherwood1, Kelly J. Neville2, Angus L. M. T. McLean, III3,
Melissa M. Walwanis4, and Amy E. Bolton5
1
Naval Medical Research Unit Dayton, Wright-Patterson AFB, OH, USA
The MITRE Corporation, Orlando, FL, USA
3
Collins Aerospace, Cedar Rapids, IA, USA
4
Naval Air Warfare Center Training Systems Division, Orlando, FL, USA
5
Office of Naval Research, Arlington, VA, USA
2
10.1 Introduction
Training fighter aircrew is a time-consuming, expensive, and challenging process. A critical part of
ensuring their readiness is live air combat training, which is especially resource intensive, requiring large amounts of airspace, fuel, and personnel and contributing to the wear and tear of valuable assets. Training resources are stretched thin to provide as much live training as possible, and
recent advances in air combat technology have introduced new training requirements with new
resource demands. These demands include the need for larger range spaces to support long-range
tactics, opportunities to practice against larger numbers of adversary aircraft, and opportunities to
practice against faster and more capable adversary aircraft.
For many years, the military has strategically employed simulation-based training to reduce
the cost and risk of air combat training and increase training opportunities (Ausink et al. 2011;
Rickard et al. 2013). However, though simulation training is valuable, it has its limits. For example,
simulation training does not give aircrew the opportunity to practice while experiencing the
stressors of live combat, including G-forces, cockpit noise and vibration, and potential high-severity
consequences. Simulation training does not allow aircrew to become attuned to many of the perceptual details of the live environment, such as vibration associated with aircraft performance or visual
artifacts such as the smoke trails of a missile. Simulation training also exposes aircrew to more
artificialities than they experience in live training due to its relatively limited fidelity. These artificialities can lead to negative transfer of training, i.e. the development of habits that work well in the
simulated environment but not in live combat.
Simulation-based training is valuable, but live training remains a critical last stop prior to
deployment. In an effort to maintain the effectiveness of live training in the face of rising fuel and
maintenance costs and next-generation threats, the US military is considering the augmentation of
*Approved for Public Release; Distribution Unlimited. Public Release Case Number 20-0871.
A Framework of Human Systems Engineering: Applications and Case Studies, First Edition.
Edited by Holly A. H. Handley and Andreas Tolk.
© 2021 The Institute of Electrical and Electronics Engineers, Inc. Published 2021 by John Wiley & Sons, Inc.
186
10 Integrating New Technology into the Complex System of Air Combat Training
live training with virtual and constructive aircraft. The virtual and constructive aircraft will be
controlled by aircrew in simulators and software agents, respectively. These non-live assets will
enable the virtual extension of training ranges and amplification of adversary capabilities in live
training events. The proposed variant of Live, Virtual, Constructive (LVC) training will differ from
previous LVC variants in the way live operational aircraft and their crews participate. In past LVC
exercises, live aircraft populated the environments of virtual and constructive participants, but the
relationship was not reciprocal. The non-live entities did not populate the live aircraft’s training
environment. In the proposed new variant, the aircrew of live aircraft will see non-live simulated
entities on the radar and sensor system displays of their aircraft. To the aircrews in the air, it will
appear as though these non-live aircraft are flying around in the sky with them. When appropriate
for training, the non-live aircraft may also operate beyond the physical boundaries of the range and
employ advanced tactics that live aircraft would be restricted or prevented from executing.
Despite the potential for LVC technology to overcome key live training limitations, many unknowns
exist regarding its effect on the sociotechnical system of air combat training. In live air combat training, there is an ever-present risk of costly mishap with aircrew lives at stake. Flying fighter jets will
never be perfectly safe; there will always be an assumed level of danger. Nevertheless, the Navy air
combat training system has evolved over decades to continuously optimize both training effectiveness and the safety of operating in a complex and dynamic high-stakes environment. In other words,
the sociotechnical training system has developed a resilience that allows it to operate effectively
and safely across a wide range of challenging conditions. This system consists of, for example, the
Navy’s rigorous briefing, debriefing, and instruction practices; training rules; training exercise oversight practices; and the Naval Air Training and Operating Procedures Standardization (NATOPS)
program (COMNAVAIRFOR, 2016), as well as personnel, aircraft, and other technologies.
For the most part, this training system is not designed to prevent specific mishaps. Instead, it is
designed to be resilient to safety threat events in general, both foreseeable and unpredictable. The
system has evolved over time to protect itself, its mission, and the well-being and safety of the elements and actors within it. It has evolved to be able to detect a wide range of threats ranging from
routine to rare and to respond to threats so they do not precipitate into an actual mishap. In the
case that a mishap does occur, the system is designed to limit the damage and recover.
This view of the air combat training system is consistent with principles of resilience engineering (Hollnagel et al. 2006). It contrasts with the more static and linear view taken by safety management systems, such as Heinrich’s (1931) domino model, which tend to focus on the nominally
emergent resilience (NER) features of an organization (i.e. the resilience features that can be
reduced and/or predicted from a combination of individual agent properties). The resilience engineering approach draws from complexity science and systems theory to improve the robustness of
real-world, complex organizations against threats. Typically, in addition to NER, such organizations also exhibit weakly emergent resilience (WER) (Pariès 2006). WER refers to the resilience
features of an organization that cannot be predicted on the macro level based on individual agent
properties without performing a one-to-one simulation. In essence, the whole is not always equal
to the sum of its parts, which presents an interesting challenge to test and evaluation (T&E) and
safety management professionals alike: how does one evaluate the robustness of an organization
against threats that one cannot foresee?
Safety is an emergent property of a complex system. The interaction of individual agent components, such as the Navy’s training rules and its briefing and debriefing practices, produces an
aggregate air combat safety system that is more flexible and adaptive than its component parts.
Such systems should be engineered with a certain amount of residual disorder. That is, the system
processes should not be optimized to protect against specific safety threats. Although this
10.2 Metho
engineering choice will, of course, result in system features that do not produce the best results on
the agent level, these same features will enable the system to better maintain stability and resilience at the macro level despite variability in the environment (Hollnagel et al. 2006; Pariès 2006).
The stability and resilience of the Navy’s air combat training system additionally depends on a
balance between two high-priority system objectives – safety during training exercises and adequate fidelity to prepare aviators for combat. The introduction of non-live entities into this system
has the potential to disrupt this balance as well as the mechanisms that provide each individual
objective its stability and resilience.
The introduction of non-live entities into live air combat training will involve the incorporation
of a complex simulation paradigm into the already complex sociotechnical naval flight training
system. In its most basic form – a single exercise in isolation – the new LVC training system will
involve interactions by virtual and constructive entities with one another, technical system components, live exercise participants, and exercise management personnel. However, if one digs a little
deeper, the interactions among these system elements take place in the context of the Navy’s methods of exercise planning, briefing, and debriefing; training rules; standard operating procedures;
emergency procedures; and the air combat community culture. These are also part of the training
system. In a system of such complexity, unanticipated emergent behavior – including new threats
to aircrew safety or training and readiness – can arise. In addition to these intra-system interactions, external financial and environmental pressures on the system could lead to further emergent
behavior, some of which could be hazardous.
The remainder of this chapter describes evaluation work conducted to determine whether the
new LVC training paradigm will introduce new safety risks, increase the likelihood or severity of
existing risks, or compromise training effectiveness and aircrew readiness (which we treat as a risk
to post-training safety). The methods used are adapted from and influenced by cognitive engineering, resilience engineering, safety management, and action research paradigms. Results were used
to guide the development of recommended requirements for a subsequent training system acquisition program.
10.2 Method
10.2.1
Data Collection
Participants. Twelve active duty Navy pilots, six former Navy and Air Force pilots, one active duty
Naval Flight Officer (NFO), one National Air Guard pilot, and two military modeling-and-simulation (M&S) experts with experience coordinating large-scale training exercises participated in
interviews of approximately one hour.
All but one of the interviewed pilots had experience flying high-performance jets (Table 10.1).
Active Navy pilot participants reported an average of 1180.8 flight hours (range: 340–1800 hours)
in their primary aircraft. Nine of the active Navy pilots and the NFO were TOPGUN or Strike
Fighter Advanced Readiness Program (SFARP) instructors. Four former military pilot participants
reported an average of 2612.0 flight hours in their primary aircraft (range: 2150–3600 hours; flight
hours of the fifth pilot are missing). To protect participant anonymity, flight hours are not reported
for single representatives of a given experience category. Participants other than the M&S experts,
who considered the interview to be a discussion among colleagues, were given an informed consent
document to read and sign. All participants, including the M&S experts, were asked for permission
to audiotape the interview.
187
188
10 Integrating New Technology into the Complex System of Air Combat Training
Table 10.1
Aircraft flown by participants.
Platform
Participants
F/A-18 Hornet/Super Hornet
Service
Tactical aircraft
Status
13
USN
Yes
In service
F-14 Tomcat
2
USN
Yes
Retired
F-16 Fighting Falcon
1
ANG
Yes
In service
F-15 Eagle/Strike Eagle
1
USAF
Yes
In service
F-111 Aardvark
1
USAF
Yes
Retired
Tornado
1
GAF
Yes
In service
E-2 Hawkeye
1
USN
No
In service
Notes. USN, US Navy; ANG, Air National Guard; USAF, US Air Force; GAF, German Air Force.
Two research team members conducted event-centered interviews with individuals (n = 12) and
groups (n = 9; two groups of five sharing one common participant). Six of the interview sessions
with individuals were conducted over the telephone. All other interviews were conducted in person.
Procedure. At the start of each interview session, participants were briefed on the LVC training
concept and the Navy’s goal of using it to improve training efficiency and meet training requirements
of next-generation aircraft. They were told that the purpose of the interview was to identify
potential safety issues, training concerns, and training benefits associated with introducing nonlive entities into live air combat training.
To conduct the interviews, we used an adaptation of the Critical Decision Method (CDM)
(Flanagan 1954; Klein et al. 1989), a technique used to elicit expert knowledge. Participants were
asked to describe past training exercises and scenarios and to envision and describe potential impacts
of including non-live entities in them. We posed what-if questions such as “What if the first package
of blue-force fighters had been constructive?” to prompt interviewees to consider further impacts of
LVC technology on training. Some interviewees brought pre-identified concerns and objections
with them to the interview session. We listened to their concerns and objections and, for each, asked
them to describe a past event or other type of experience in which something similar occurred.
Interviews were captured by audio recording. When permission to audio record was not obtained,
the research team took detailed notes that were reviewed and elaborated by the interviewees.
10.2.2
Data Analysis
Data analysis consisted of a thematic analysis performed to identify specific hazards and hazard
categories, and an evaluation of the level of risk associated with each hazard and hazard category.
Figure 10.1 depicts a visual overview of the analysis process.
Low-Level Thematic Analysis. We performed a thematic analysis (Braun and Clarke 2006) of the
interview data. Interview notes and transcripts were reviewed to identify statements made by interviewees about potential LVC hazards, training concerns, and training benefits. Each statement was
reviewed in the context of the interview narrative and assigned a code corresponding to the hazard or
training issue being described. As statements, referred to as data extracts, were identified and coded,
we iteratively expanded the set of codes and reassessed previously coded data in light of new codes.
Once this iterative coding process was complete, data extracts describing potential LVC hazards – the focus of this paper – were reorganized by their associated code, hereafter referred to
simply as a hazard, although at this stage each was considered to be a hypothesized hazard. For
each hazard, we organized the associated data extracts into contrasting positions, representing
ways LVC training should versus should not be implemented with respect to the potential hazard.
10.2 Metho
Low-level thematic analysis
High-level thematic analysis
Interview
transcripts
Operational risk management (ORM) risk assessment
Baseline RAC
ratings
ORM risk
assessment
Change in hazard
exposure ratings
LVC RAC ratings
Hazards
Data extracts
Hazard categories
LVC RAC ratings
for hazard
categories
Change in hazard
exposure ratings
for hazard
categories
Figure 10.1 Overview of the data analysis procedure. Notes. ORM, operational risk management; RAC, risk
assessment category; LVC, Live, Virtual, Constructive.
Table 10.2
Naval air combat expert profiles.
Expert 1
Expert 2
7600 total flight hours
8000 total flight hours
2400 F/A-18 flight hours
2800 F/A-18 flight hours
Three deployments
Three deployments
Navy adversary pilot (3 yr)
Navy adversary pilot (13 yr)
Navy range training officer (6 yr)
Navy range training officer (10 yr)
Expert Review. Two naval air combat experts (see expert demographics in Table 10.2) reviewed
and critiqued hazards. We presented a subset of the hazards, together with summaries of the
associated interview data extracts to both experts during a 2.5-hour meeting. During two subsequent
four-hour meetings, we presented each remaining hazard and associated interview data to Expert
1. Each expert commented and elaborated on each presented hazard. Expert responses during the
first meeting were captured in researcher notes. The second and third meetings were audio
recorded and captured in researcher notes.
High-Level Thematic Analysis. A second thematic analysis was conducted on the identified
hazards. Three researchers independently categorized the hazards according to the underlying
interviewee concerns they represented using a bottom-up assessment approach. The researchers
then met to reconcile their categorizations of the hazards. The result of this process was the
identification of hypothesized hazard categories.
Risk Level Evaluation. Two researchers independently assessed the safety risk level associated
with each hazard using the severity and probability scales of the Navy’s operational risk
management (ORM) system (Department of the Navy 2010). On the basis of related interview
data, the researchers assessed the severity and probability of the consequences of each hazard if
the non-live entities and LVC training system were to be implemented without any changes to the
Navy’s air combat training system (i.e. in the future unmitigated LVC environment). The researchers then made a second set of independent severity and probability assessments of the consequences of each hazard in the current air combat training environment (i.e. in the baseline
environment in which non-live entities do not participate).
189
190
10 Integrating New Technology into the Complex System of Air Combat Training
Hazard severity was assessed on a four-point scale ranging from I to IV, with category I representing hazards with the most severe consequences. Severity is defined by the ORM system as the “potential consequence that can occur as a result of a hazard and is defined by the degree of injury, illness,
property damage, loss of assets (time, money, personnel), or effect on the mission or task” (Department
of the Navy 2010, p. 8). Probability was assessed on a four-point scale ranging from A to D, with A
indicating a high degree of probability that a hazard will occur. Probability is defined as “an assessment of the likelihood that a potential consequence may occur as a result of a hazard and. . .by
assessment of such factors as location, exposure (cycles or hours of operation), affected populations,
experience, or previously established statistical information” (Department of the Navy 2010, p. 9).
The ORM risk assessment system specifies mappings between risk levels and combinations of
probability and severity ratings. For example, a probability rating of A (likely) and a severity rating
of III map to a Risk Assessment Code (RAC) of 2. The RAC is the level of risk for each hazard,
expressed as an Arabic number ranging from 1 to 5. A RAC of 2 indicates a serious level of risk
(Department of the Navy 2010).
Researcher agreement on initial hazard RAC assessments was assessed using a linear weighted
kappa, which indicated a good level of agreement (κ = 0.68, 95% CI: 0.52, 0.83). Once their
independent ratings were completed, the researchers met to reconcile their ratings.
We assigned RACs to each overarching hazard category based on the RACs of the individual
hazards within it. If a hazard category contained hazards of differing RACs, it was assigned the
highest of those hazards’ RACs. The hazard and hazard-category RACs for baseline and unmitigated
LVC environments were compared to determine each hazard and hazard category’s potential
change in hazard exposure.
10.3
Results and Discussion
The thematic analysis produced 26 hazards that fall into the following seven hazard categories:
●●
●●
●●
●●
●●
●●
●●
Unseen tracks flying within visual range (WVR) of live aircraft.
Unexpected virtual and constructive (non-live) aircraft behavior.
Complacency and increased risk taking.
Inadequate support for human–machine interaction.
Inadequate support for exercise management.
Reduced big picture awareness.
Negative transfer of training to the operational environment.
It is important to keep in mind that these hazard categories represent sets of potential,
hypothesized hazards.
The assessed RACs of the hazard categories ranged from 1 (critical) to 4 (minor), as shown in
Column 2 of Table 10.3. Five of the hazard categories exist in both the baseline and unmitigated
LVC environments. This means they do not represent new hazards and so should be mitigated by
existing safety and resilience mechanisms of the air combat training system. However, one of these
five hazard categories, unseen tracks flying within visual range, was rated as more probable in an
LVC environment. This indicates a potential for increased hazard exposure. Two additional hazard
categories represent a new type of hazard and thus a potential increase in hazard exposure during
air combat training.
Each hypothesized hazard category is described below. The description of each hazard category
is followed by an overview of how similar hazards are dealt with in current naval air combat
10.3 Results and Discussio
Table 10.3 Results of the assessment of potential LVC training hazards using the Navy operational risk
management system.
Hazard category
Assessed
risk level
Comparison with hazards
in baseline environment
Projected change
in hazard exposure
Unseen aircraft within visual range
1
Similar
Increase
Unexpected virtual and constructive (non-live)
aircraft behavior
2
Similar
No change
Complacency/risk taking
2
Similar
No change
Inadequate support for human–machine
interaction
2
New
Increase
Inadequate support for exercise management
3
Similar
No change
Reduced big picture awareness
3
New
Increase
Negative transfer of training to the operational
environment
4
Similar
No change
training exercises (i.e. in the baseline environment) and a discussion of whether the given hazard
category could introduce new or unmitigated risk to live training exercises (i.e. whether it represents a change in hazard exposure).
10.3.1
Unseen Aircraft Within Visual Range
Within-visual-range (WVR) training exercises involve fighter jets flying within visual proximity of
each other. Once within visual range, pilots head to “the merge,” a head-on neutral pass within
close proximity after which air combat maneuvering (i.e. dogfighting) may begin. When entering
the merge, pilots must focus their visual attention on the environment outside their aircraft while
monitoring their own cockpit systems. The pilot’s cognitive workload increases substantially
during this period. “Tremendous workload, channelized attention, and misprioritization are very
common [in WVR engagements],” said one interviewee.
The introduction of non-live aircraft during this period of intense workload was seen as a
potential source of confusion and distraction that could lead to a fatal misjudgment. One pilot gave
the following example: “[You expect] to look left [and see] a virtual entity that appears on your
radar screen when you’ve actually got a real world aircraft on your right – something in your
attention is drawing you to the left side of the cockpit when the actual physical threat is to the
right.” In addition, because non-live aircraft would only appear on cockpit displays, pilots might
miss critical visual information outside their cockpits while looking down at their sensor displays.
Two examples of hazards in this category include the following:
●●
●●
The pilot could become distracted by trying to keep track of live versus non-live aircraft.
When a pilot goes to the merge with a mixed group of live and non-live aircraft, his or her radar
could erroneously lock onto a non-live aircraft instead of the live aircraft the pilot was trying to
target. The pilot, seeing nothing in their target designator (TD) box when they expect to see a live
aircraft, could then end up searching the sky for the missing live aircraft. They meanwhile would
be neglecting to attend to the other aircraft in the sky for longer than would be safe, risking a
collision.
191
192
10 Integrating New Technology into the Complex System of Air Combat Training
Comparison with Hazards in Baseline Environment. Confusion, distraction, and looking down at
cockpit sensor system displays instead of out the window are all existing hazards in the WVR
environment. In fact, the radar display is known as the “drool cup” due to pilots’ tendency to fixate
on it. Another existing source of tunneled attention is loss of sight or failure to obtain sight (“a
visual”) of adversary aircraft. This situation is similar to what a pilot in an LVC exercise would
experience if he or she erroneously tried to obtain sight of a non-live aircraft out the canopy.
Measures that are currently in place to help pilots stay safe include codes they can use at any time
to end an engagement (by rocking their aircraft’s wings or transmitting “terminate”) or an exercise
(by transmitting “knock-it-off”) if they become confused or distracted (Naval Strike and Air
Warfare Center n.d.).
Change in Hazard Exposure. This hazard category was assessed as increasing hazard exposure
because non-live entities are an additional source of pilot confusion and distraction. Since non-live
aircraft do not exist in present-day training, they could increase the likelihood of collision with
other live aircraft. In the words of one interviewee, “Mixing non-live targets with real airplanes
risks channelized attention on something that cannot hurt you at the expense of something that
can.” Furthermore, since non-live entities are only visible on cockpit displays and not out the
window, pilot head-down time – and therefore risk of collision – is increased.
Existent safety measures, in particular the wing-rock, terminate, and knock it off codes, increase
the acceptability of pilot exposure to additional sources of distraction introduced by LVC training.
However, these safety measures, although robust, are not infallible even in the current live training
environment. For instance, in live training, communication lines are limited, and exercise
participants frequently “step on” one another’s communications. Consequently, as a number of
interviewed pilots have pointed out, terminate and knock-it-off calls can be missed. Moreover, this
problem is not isolated to verbal cues; visual cues, most notably wing rocking, are only effective if
the engaging aircraft has a visual on the terminating aircraft.
A pilot who calls terminate or knock-it-off is usually experiencing elevated workload and
confusion. Without mitigations, LVC training has the potential to further increase this confusion.
Consider the following scenario: A live aircraft is engaged by a non-live aircraft and, for whatever
reason, the pilot of the live aircraft signals to terminate the exercise by rocking their wings. The
engaging non-live aircraft does not detect the rocking wings of the terminating live aircraft and
fails to disengage. Since live pilots sometimes fail to detect wing rocking, the terminating pilot
must assume that the engaging aircraft could be live. If this were a typical training engagement
with a live adversary, the live pilot would still have his or her radar and separation tactics as a
fallback. However, in this LVC scenario, while the engaging non-live aircraft is visible on the live
pilot’s radar, it is not visible outside his or her window. The live pilot, assuming that the engaging
aircraft on their radar could be live, searches for it in the sky. This futile search, driven by the
inconsistency between the live pilot’s radar and out-the-window view, could add to the confusion
of the situation. In short, non-live aircraft could make it more complicated for pilots to terminate
or knock it off in a moment of crisis.
That being said, the ability of a pilot to end an engagement or exercise when the situation
becomes potentially hazardous is an important safety measure that is largely effective and, despite
the additional risk exposure potentially posed by the introduction of non-live aircraft, is expected
to transfer well to the LVC training environment once appropriate mitigations are developed. One
potential solution to prevent pilot confusion due to radar and out-the-window view mismatch is to
provide pilots with a control that allows them to “turn off” all LVC data on their displays. Another
solution, advocated by all pilot interviewees, is to prevent non-live aircraft from entering the WVR
arena. The prevention of non-live aircraft WVR could be accomplished procedurally through
10.3 Results and Discussio
training rules or technically, e.g. by automatically turning all non-live aircraft away when they
approach within 10 nautical miles of a live aircraft.
10.3.2
Unexpected Virtual and Constructive Aircraft Behavior
The LVC training paradigm involves the implementation of state-of-the-art incipient technology.
Injected constructive and virtual tracks will need to be responsive to myriad factors and forces in
the fast-moving complexity of live air combat. In addition, this responsiveness needs to be
manifested in both their behavior and in the sensor system displays of their behavior. Non-live
tracks that respond in unexpected, unnatural ways could interfere with pilot performance and
impact safety. Unexpected or inappropriate behavior by constructive entities, such as “continuing
to trundle down range” after someone ends the exercise with a “knock-it-off” call, could lead to
live pilot reactive maneuvering, attentional tunneling, or distraction. “You see something behaving
not right,” says one interviewee. “You find yourself glommed into trying to solve it – figure out why
it is acting weird – and that becomes a situation awareness (SA) suck hole.” Unexpected or
inappropriate behavior by constructive entities could also confuse the E-2 Hawkeye controllers
who serve airborne early warning, airborne battle management, and command and control
functions. In essence, they are airborne air traffic control and the “eyes of the fleet,” responsible for
tagging and directing aircraft on radar, identifying friend or foe, and conducting threat analysis.
Unnatural non-live aircraft behavior could draw their eyes away from the big picture and undermine
tactical decision making (NASC 2018).
Of particular concern is the use of “magic moves” by non-live entities and the possibility of a
delay or absence of constructive entity response to dynamic training events. “Magic moves,” such
as the sudden disappearance, appearance, unrealistic exercise physics, or violation of physical
airspace limits by non-live tracks, could result in both E-2 controller and pilot confusion. If nonlive tracks disappear due to an exercise reset or after being shot down, pilots and controllers might
question whether the disappeared track was actually a live aircraft that suffered a mishap or lost its
transponder. “If I’m going into the merge,” says one pilot, “and I lose radar SA. . .if they just like
disappear, that’s going to make me very nervous.” If this uncertainty distracts a pilot during this
cognitively demanding period of time, a collision could occur. In addition, non-live tracks are not
bound by physical airspace limits. Less experienced pilots could follow non-live entities performing magic moves that involve flying into off-limits airspace or unsafe maneuvering. “Watch one of
our new dudes chase him out there,” says one pilot with a laugh. Critically, the use of non-live
aircraft in place of live adversary aircraft would mean a loss of the exercise-safety oversight that
adversary pilot role-players traditionally provide.
Comparison with Hazards in Baseline Environment. At present, it is not uncommon to witness
inappropriate behavior by live tracks on cockpit sensor systems. Radar is not infallible, and the
expert reviewers reported that pilots sometimes see tracks disappear, reappear, or even fly
underground at Mach 2. Likewise, E-2 Hawkeye radar is known for producing less than perfect
information, a fact mentioned by many of the interviewees. Another point made by the expert
reviewers is that unexpected events occur in real-world operations and one goal of training is to
learn to expect the unexpected.
Change in Hazard Exposure. This hazard category was assessed as posing no change in hazard
level because “magic moves” already exist in the training system in the form of radar anomalies.
Current training rules accept the risks associated with imperfect radar and seek to mitigate them
by stipulating that a pilot can call “terminate” or “knock-it-off” if he or she loses SA. “The way we
deal with it is we brief that right up front,” says one expert, referring to the many ways an exercise
193
194
10 Integrating New Technology into the Complex System of Air Combat Training
or mission can deviate from the plan. “We brief if you have a failure. . .. It’s the real world. . .your
system goes out, your sensors are jammed. . .it’s a contested environment out there.” It is also possible that computer-generated tracks will be less likely to deviate from the intended ground truth
than real radar tracks. Further, ongoing work in modeling and simulation is expected to result in
computer-generated track behavior that is increasingly realistic in its responsiveness to live pilot
tactics.
10.3.3 Complacency and Increased Risk Taking
While Navy pilots are highly skilled professionals, flying high-performance jets is not an easy task,
and pilots will take advantage of any factors that will increase their performance. In a training
scenario, the upper hand could be gained through gaming the system and exploiting training
artificialities. This is not to suggest that pilots would deliberately break training rules in order to
gain the upper hand; rather, during periods of exceptionally high workload and stress, pilots will
make use of any advantages they have in order to increase their performance and/or decrease their
workload. “If you’re not cheating, you’re not trying,” stated one pilot.
Thus, it is possible that LVC training could increase the possibility of pilot complacency and risktaking behavior. For instance, pilots might be tempted to marginalize tracks that they know to be
non-live (if non-live tracks are represented using unique symbols) or suspect to be non-live (if nonlive tracks are not given unique symbols). In the presence of non-live entities, pilots might be more
likely to cross altitude block boundaries or break other training rules, to cut corners in the heat of
an engagement if they are being outmaneuvered, or to continue flying an engagement despite
degraded SA. They may take risks rather than calling “terminate” or “knock-it-off” because there
is “less metal” in the sky. Even if live and non-live radar tracks are represented using the same
symbol set, it is possible that pilots could implicitly categorize tracks as live, virtual, or constructive
based on their characteristics and behavior and then treat them differently. If presumed non-live
tracks turn out to be live aircraft tracks, a collision could occur. In addition, aircrew would be
practicing a way of flying that differs from how they need to fly with live aircraft.
Comparison with Hazards in Baseline Environment. Complacency and risk taking are threats to
safety in the current air combat training system. The mindfulness and discipline required to follow
training rules and safety practices add to pilots’ high mental workload, and the potential for
relaxing vigilance is ever present. Because relaxed vigilance and training rule violations are a risk
in the current training environment, reinforcement methods are already in place. Training rule
violations are kept in check by consistent enforcement. “We are brutal with people who break
training rules,” said one instructor pilot, “and then we shake hands and it will never happen again.”
This community-wide reinforcement and provision of direct feedback helps aircrew learn and
make it a priority to practice diligence and stay within boundaries.
Change in Hazard Exposure. This hazard category was assessed as posing no change in hazard
level because the Navy air combat training system already includes multiple mechanisms for
detecting unacceptable risk taking and training rule violations. Pilots will be expected to treat all
entities as if they are live aircraft and to adhere to all training rules despite the presence of non-live
aircraft.
However, the use of non-live entities in training exercises may weaken a key mechanism for
detecting training rule violations: the exercise staff playing the role of adversary pilots. Staff in the
role of adversary pilot have multiple responsibilities. One responsibility is to monitor the exercise
and exercise participants in order to detect if anyone loses SA or violates training rules. If training
exercises replace a high proportion of adversary pilots with non-live aircraft as planned, the ability
10.3 Results and Discussio
to effectively monitor exercise participants might be compromised. Additional research is needed
to determine the adaptations required to maintain the safety system’s integrity when fewer exercise
staff members are in a position to monitor exercise safety.
10.3.4
Human–Machine Interaction
LVC training technology will introduce new capabilities and sources of information to the aircrew’s
work environment. It is therefore likely that system controls and displays will need to be updated
so that aircrew have access to these new capabilities. However, changes to the interface design
must be well considered; poor integration of LVC training capabilities with existing system
components could result in new hazards. Examples of interface design changes that impact the
safety of the system include the following:
●●
●●
●●
●●
An introduced LVC super-mode for weapons control during LVC training would need to ensure
that pilots could not accidentally fire a live weapon, thinking that it is simulated. Potential errors
would need to be immediately detectable and recoverable.
Cockpit controls used to initiate and clear non-live entities shown on sensor system displays
need to be distinct from existing controls. If cockpit controls will be used by pilots to clear nonlive entities when they become overwhelmed, the controls must be intuitive and easy to find and
operate under stress.
Pilots must be given continuous feedback on the status of non-live aircraft presentation on their
sensor system displays. This design consideration is important because if the source of live
aircraft information were to malfunction, the Link-16 Multifunctional Information Distribution
System (MIDS) in particular, pilots need to immediately recognize that, although their displays
are still populated with aircraft, those aircraft are all non-live and they are not seeing the live
aircraft any longer.
If non-live entities are to be represented using a new, unique symbol set, the symbols need to be
designed such that they are not confusable with live aircraft symbols. Furthermore, the additions made to the non-live symbols must be designed so that if a live and a non-live track overlap,
the pilot can see that there is real metal in that airspace.
Comparison with Hazards in Baseline Environment. In this study we did not examine the design
of air combat aircraft cockpits. Human–machine interface designs in the cockpits of combat
aircraft benefit from decades of work to improve safety in aviation. Nevertheless, the addition of
software to automate the work of flying has resulted in pilot-automation miscommunications that
have contributed to numerous mishaps and near-mishaps (Corrao 2009; Sarter et al. 1997;
Williams 2006). System developers frequently count on humans in the system to adapt their work
to the new technology (Hoffman et al. 2009). Frequently the humans do, but just as frequently,
adaptation occurs through a process of lessons learned and trial and error. The resulting adaptations
often interfere with getting work done efficiently and are known by names such as kludge, workaround, and make-work (Koopman and Hoffman 2003).
Change in Hazard Exposure. The specific interface changes to be introduced in support of LVC
training will be novel, and if the “human-will-adapt” approach is taken for the design of LVC
training system controls, feedback, symbology, and so forth, the resulting user interface will
increase the hazard level of air combat training. Solutions must provide pilots with continuous
knowledge and control of LVC training system status and artifacts, including non-live entities
and simulated weapons, across all situations. To what extent the design solutions achieve that
goal versus inadvertently adding to the risk of training depends partly on developers’ methods.
195
196
10 Integrating New Technology into the Complex System of Air Combat Training
The authors recommend an approach such as the Practitioner’s Cycles Framework (Hoffman
et al. 2010) whereby designs are evolved based on early and ongoing user interactions before they
are implemented in a final form.
10.3.5
Exercise Management
LVC training technology will enable exercise management personnel to inject a greater number of
aircraft into a given training exercise. The exercise management workload for these personnel will
also increase, since they must monitor more participants while also keeping track of which are live
and which are not. The increase in demands has the potential to undermine the effectiveness of
exercise management and oversight. Thus, the effects will need to be monitored and mitigated by
better exercise monitoring support tools, improved backup and support relationships among
exercise management staff, and perhaps the definition of an additional exercise management role
to ensure safety monitoring is not compromised.
The effect of LVC on the work of exercise management personnel will not be limited to a simple
quantitative increase in attentional demands. Rather, LVC might also necessitate qualitative
changes in their exercise management and oversight responsibilities. For example, new
responsibilities will likely include decisions about whether to clear all non-live tracks or individual
non-live tracks from participants’ cockpit displays in order to decrease the complexity of a situation
or to help a pilot regain SA. They might also include ensuring that interlopers, commercial and
private aircraft that occasionally transit through exercise airspace, do not fly near or over the
location of non-live aircraft. The non-live aircraft would not be visible to these interlopers, who are
not linked into the exercise. Although judged unlikely by most pilot interviewees, it is possible for
data correlation algorithms or an E-2 controller to correlate an interloper’s radar return with a
non-live track label as it passes over or near the track’s location. The risk of this potential hazard
will be mitigated if all tracks are assumed to be and are treated as live. As long as exercise
participants treat all aircraft as though they are live, loss-of-separation incidents are unlikely to
increase and hazard levels for live aircraft should not increase.
There are a number of technical challenges affecting LVC exercise management that will need to
be resolved before LVC training is officially adopted. The ultimate form of the solutions to these
technical challenges will determine the potential for hazards. A fundamental technical challenge
is the selection or development of a technology for transmitting LVC exercise data. Issues to be
considered include bandwidth requirements, security, and reliability. There is also a requirement
to limit LVC exercise data transmission to exercise participants. In a nonexclusive LVC network
(e.g. the current Link-16 system), all aircraft using that network for flight operations at the same
time as an LVC training exercise is taking place will be able to see non-live entities even if they are
not participating in the exercise. Nonparticipating pilots might not have been briefed on the
presence of non-live entities in the area, and the disparity between their displays and their out-thewindow view could result in substantial confusion.
Comparison with Hazards in Baseline Environment. Current exercise management practices
have evolved over multiple decades to maintain a safe training environment with an acceptable
level of risk. The training exercise monitor, a range training officer (RTO) or range safety officer
(RSO), is supported in his or her safety objectives by adversary pilots who report witnessed training
rule violations or suspected loss of SA by exercise participants. He or she is backed up by training
rules and the responsibility of every exercise participant to declare “terminate” or “knock-it-off” if
safety is in question. Complex, higher workload training exercises are staffed by both an RTO
and RSO.
10.3 Results and Discussio
Although the transmission of exercise data is not always reliable in existing training exercises,
work-arounds exist. For example, when pilots’ data quality is reduced by Link-16 malfunctions,
radar data are used to compensate. One pilot interviewee noted that an incomplete link is “not a
reason to call [the exercise] off. . .it’s basically a crutch for us. . .it just means that you’re going to
have to work even harder to make sure you know exactly where everybody is.” As another example, for a period of time, certain adversary aircraft did not carry the Tactical Advanced Computer
(TAC) pods that enable them to appear on RTO and RSO exercise monitoring displays. To compensate, those aircraft were paired with TAC pod-equipped aircraft during exercises. This work-around
did not lead to any reported mishaps, but one interviewee did report experiencing confusion
as an RTO.
Change in Hazard Exposure. This hazard category was assessed as posing no change in hazard
level. Anticipated exercise management-related hazards were viewed as similar to existing hazards
and manageable within the existing system, pending the effectiveness of LVC design and
implementation solutions. Certainly, Link-16 malfunctions take on new significance in the LVC
training environment. Loss of live track data in the midst of non-live tracks could be difficult to
detect, and failed detection of the situation could easily lead to a mishap. LVC pilot interfaces will
need to reliably and clearly inform pilots about the status of their live track data. The loss of nonlive track data represents less of a threat to safety. However, there are no backup radar data to be
used to compensate for its loss, and expert reviewers noted that the LVC training environment is
qualitatively different from the live training environment. They recommended that the loss of nonlive tracks be clearly and immediately communicated to exercise participants to reduce the risk of
confusion or distraction.
Furthermore, additional research might be needed to assess the potential need for new exercise
management roles and/or the possibility that both an RTO and RSO will be required, as is sometimes
the case for very large live training exercises. Potentially, LVC exercises will include one or more
simulation environment controller, or puckster, roles responsible for controlling the non-live entities
and integrating them with live-force tactics and flow. An observation of high puckster workload
during an LVC test exercise at Nellis Air Force Base suggests the use of more than one puckster
(Observation, 16 August 2012). In addition, a report of delays between air intercept controller
(AIC) communications and puckster inputs to non-live entities during a 2012 demonstration at
the University of Iowa’s Operator Performance Laboratory suggests a need to study LVC exercise
management information flow.
10.3.6
Big Picture Awareness
In the context of air combat operations, the “big picture” typically refers to a visuospatial
representation of all active aircraft and aircraft activity in a given air operation. In other words, it
is a form of global SA. If a pilot has a good awareness of the big picture, he or she is keeping track
of aircraft both within and outside his or her immediate surroundings – usually by monitoring the
radar, other cockpit system indications, and communications – while considering their implications
based on his or her experience and the preflight briefing. In large-force exercises, this awareness is
essential to staying coordinated with the team, staying on the mission’s timeline, providing timely
assistance to other team elements, and anticipating what will happen next.
Communication is critical to the maintenance of global SA. Communications eavesdropping, or
listening in to the radio chatter of other friendly forces, helps pilots to develop and maintain their
big picture awareness (Neville et al. 2003). However, the natural language capabilities of constructive aircraft are limited relative to human language capabilities, and therefore it is likely that there
197
198
10 Integrating New Technology into the Complex System of Air Combat Training
will be significantly fewer communications and certainly less radio chatter generated by these
aircraft during an exercise. While this limitation will not affect the initial implementation of LVC
training, wherein only adversaries will be non-live, future evolutions of LVC training technology
might introduce non-live friendly force aircraft. These non-live aircraft could be used, for example,
to stand in for air platforms that are not available for a given exercise or to add additional sections
to increase the complexity of tactical flow decision making. However, given pilots’ reliance on
communications eavesdropping for big picture awareness, the use of multiple constructive friendly
force aircraft could negatively impact pilots’ big picture awareness.
Comparison with Hazards in Baseline Environment. Air combat missions sometimes require
communications silence or encounter communications jamming. This represents a precedent for
operating under conditions of sparse communications. One interviewee discussed the difficulty of
flying under those circumstances. This discussion suggested that hazard exposure is significantly
heightened when communications are absent. This situation is not the same as reducing communications through the addition of non-live exercise participants. However, its difficulty, together
with the role of eavesdropping in team SA (Neville et al. 2003; Vuckovic et al. 2004), indicates an
increase in risk.
Change in Hazard Exposure. In the near term, this hazard category, which involves the
maintenance of SA primarily through monitoring team verbal communications, does not pose a
concern for the safety of training exercises since the US Navy does not plan to use constructive
friendly force exercise participants in its initial implementation of non-live entities. However, as
military aviators become more comfortable with LVC technology over time, the Navy might begin
to experiment with using constructive aircraft in friendly force roles. If and when this possibility
starts gaining momentum, its potential to produce a hazard situation will need to be investigated.
In particular, research will be needed to determine whether certain friendly force roles need to be
filled by live aircraft; whether a certain percentage of aircraft will need to be live during large-scale
exercises to improve communication, and thereby, big picture awareness; and whether a loss in big
picture awareness actually occurs. If a loss in big picture awareness is detected, it will be important
to determine whether that loss poses a safety risk and, if it does, whether the risk is acceptable in
light of other training benefits. It is possible that awareness will only be lowered for the location
and activities of non-live aircraft, which may not be as serious a concern as lowered awareness of
the overall big picture.
10.3.7 Negative Transfer of Training to the Operational Environment
Although this paper is concerned with the safety ramifications of introducing change into live
naval air combat training, there are also training concerns that ultimately could degrade
safety – that is, the likelihood of success and survival – in combat operations. LVC technology will
presumably introduce artificialities into training. The nature of these artificialities will depend on
the specific LVC engineering solutions produced but could include non-live tags added to track
symbols of non-live aircraft, radar tracking that is better than what is possible with live aircraft
systems, display graphics that designate live aircraft as kill removal as they try to exit the exercise
area after being hit by a simulated missile, non-live tracks that disappear when they reach a certain
distance from live friendly force aircraft, and a lower-complexity communications environment
than would exist if all players were live and verbally communicating.
Notably, pilot interviewees expressed concern about losing the habits and mindfulness that they
develop while training with live aircraft that present a real collision risk. This concern is of particular importance if non-live aircraft track symbols are distinguishable from live aircraft track symbols.
10.4 Conclusio
Another concern raised by participants was that artificially perfect radar tracking of non-live
aircraft or other perfect sensor indications in the LVC training environment could reduce the quality of practice with translating real-world cockpit displays into an understanding of the big picture.
The development and maintenance of big picture awareness, or global SA, is reportedly very challenging, and the associated skills are difficult to acquire. Brobst and Brown (1996) describe these
F/A-18 pilot skills as “very time intensive to re-build once lost” (p. 36). Their acquisition should be
monitored to assess potential impacts of LVC artificialities. Potentially, non-live aircraft might be
used to benefit their acquisition by increasing the complexity of the big picture and providing more
advanced big picture awareness training opportunities.
Developing skill in team communication in high-complexity environments may also be impacted
if part of the team is not verbally participating. Although non-live aircraft initially would serve
only as adversaries, if they eventually are used to populate the blue force in large numbers and
with regularity, this could have a negative effect on comm brevity mindfulness and skill. Comm
brevity skills reduce incidents of air wing team members “stepping” on one another’s
communications and help the teams coordinate despite very limited communication resources.
Practice that encourages improvement of these skills increases safety (chances of survival and
success) in real-world combat.
Comparison with Hazards in Baseline Environment. Artificialities in live air combat training
currently exist to keep that training as safe as possible. For example, pilots know they can declare
“knock-it-off” or “terminate” at any time. In addition, altitude blocks are used to keep aircraft
separated, pilots are told to treat 5000 ft above ground level (AGL) as the ground, head-on missile
shots are not allowed within a mile and a half, and aircraft are required to maintain 500 ft of
separation during engagements (Naval Strike and Air Warfare Center n.d.), none of which would
be true for combat. Artificialities also exist as a result of unavoidable constraints, such as the need
to allow “killed” aircraft to exit the exercise airspace and the need to compensate for a limited
number of aircraft by using one aircraft to represent many.
Change in Hazard Exposure. The effects of LVC artificialities on hazard exposure will depend on
the roles and numbers of non-live aircraft participating in training exercises. Because of the criticality of skills for maintaining separation from and coordinating with a wingman, the Navy proposed that non-live aircraft would not be used in the role of wingman. They additionally proposed
to use non-live aircraft only as adversaries, which avoids effects on team coordination and communication skills. They further proposed to only use non-live aircraft outside the merge to minimize bad habits such as focusing on sensor systems versus looking out the canopy.
On the positive side, LVC technology may negate the need for certain existing training exercise
artificialities. For example, “killed” non-live aircraft could disappear from aircraft sensor systems
in much the way they would in real-world combat, and, as an especially valuable increase in
realism, non-live adversary aircraft could fly at more realistic speeds and execute more advanced
tactics.
10.4 Conclusion
A fundamental premise of our evaluation work is that Navy air combat training is a complex system that has achieved, over time, a high level of resilience and stability. New technology may
introduce novel disruptions that differ from what the system has evolved to handle. We found that
most potential disruptions, or hazards, posed by the introduction of non-live aircraft into the training system could be mitigated by sources of resilience that already exist in the system. We also
199
200
10 Integrating New Technology into the Complex System of Air Combat Training
found that three categories of hazard will likely require adaptations to the system once non-live
aircraft begin participating. Adaptations may take multiple forms in this sociotechnical system.
They can include preliminary cockpit and exercise management design requirements for the
future LVC training system acquisition program. They can also include extensions and adaptations
to training rules to address virtual and constructive aircraft participation. The design of these mitigations was accomplished in follow-on work and is described in Neville et al. (2016).
This work demonstrates a human systems engineering approach that uses multidisciplinary
methods to contribute to the preliminary design of an LVC-based air combat training system. The
approach considers humans and other non-technology elements to be as much a part of the system
as the technology elements. It uses a combination of qualitative ethnography, typically not associated with the engineering discipline, and a risk management method that is common in systems
engineering. Both play important and complementary roles in understanding critical human–
technology relationships within the system and their impact on system function.
The ethnographic portion of the evaluation can be classified as an example of action research
(Susman and Evered 1978) in that it involved collaboration with representatives of the training
systems’ main stakeholder, the air combat community. Representatives included two naval air
combat experts who participated in data collection and analysis. In the follow-on work cited
above (Neville et al. 2016), domain experts led discussions with air combat interviewees to
generate community-driven mitigations. The involvement of air combat community members
contributed to the identification of system characteristics and mechanisms that provide the
training system with its resilience and stability. An example is the local and highly redundant
control over safety in the form of engagement and exercise termination codes that anyone in or
involved with the exercise can transmit. Community member participants also revealed competing
but balanced sources of tension within the training system, such as the tension between exercise
fidelity and safety.
By engaging individual aviators, cross-scale interactions between downward and upward
resilience are better foreseen and managed (Woods 2006). The manner by which organizational
context either creates or facilitates the resolution of tensions or goal conflicts in the system (i.e.
downward resilience) can interact with adaptations made by agents on the micro level, such as
work-arounds or new tactics (i.e. upward resilience) that could undermine the organization’s
attempts to command compliance with broad standards. Take, for example, the hypothetical
scenario in which the introduction of non-live entities into training is improperly handled at the
organizational level and pilot workload is increased to unmanageable levels. In response, pilots
might find work-arounds to reduce their workload, such as excessive use of the non-live “on–off”
switch (currently under consideration as a safety measure) to reveal which aircraft are real and
which are not and then treat non-live aircraft as less important.
This sort of work-around by pilots could render the Navy’s attempts to command compliance
with proposed training rules – for example, that all tracks shall be treated as live – as futile. It is,
however, an example of the self-organization that takes place in complex systems to manage and
protect the competing subsystem objectives and overall system goals. By involving pilots and other
system personnel in the technology-introduction process, we were able to identify and assess ways
the system might react to and self-organize in response to perceived threats and disruptions.
Hoffman and Woods (2011) propose five sources of tension that are common to complex systems
and which achieve a form of system-specific balance. Balance is achieved through trade-offs and
negotiations via self-organizing that is responsive to internal tensions, environmental pressures,
and the need to stay within bounds of effective functioning. Non-live entities are a disruption
that could affect the balance attained among sources of tension. For instance, adding a non-live
10.4 Conclusio
aircraft “on–off” switch to the cockpit affects the bounded effectiveness trade space, where a given
system attains a balance between the delegation of authority to the lowest level and high-level
control over system elements (including pilot choices in this case). New LVC technologies and
capabilities introduce new sources of control that reduce aircrew control. In response, pilots might
feel compelled to seek more individual authority through use of the on-off switch.
An additional example involves the kill removal procedures governing the exit of aircraft from
the training arena after being hit by a simulated missile. These procedures may not be required for
non-live aircraft, yet they are part of the doctrine of the current training system. If changes are
made to training rules to allow a killed non-live aircraft to just disappear, said changes may be
worked out in what Hoffman and Woods call the bounded ecology trade space, where trade-offs are
made between system specialization and generalizability/resilience. Training rules that are
specialized to each type of aircraft, live and non-live – or even live, virtual, and constructive – are
one side of that trade space. On the other side is a single set of training rules that does not
distinguish between live and non-live aircraft. If either extreme is chosen, work-arounds and
informal practices are unlikely to emerge because adherence to training rules is a fundamental
requirement of air combat training. Flexibility in the form of informal adaptation is not an option.
However, the training system does have built-in flexibility, i.e. a resilience mechanism, in the form
of a process for community-driven training rule changes. Using this process, the system can adjust
to a middle ground on this dimension that is a better fit.
The competition of tensions within trade spaces is complicated by interplay among organizational
levels. Using the research approach described in this paper, cross-scale relationships between
macro- and microlevel influences on system balance and resilience can be foreseen and managed.
The manner by which organizational context either creates or facilitates the resolution of pressures
and goal conflicts in the system can provide flexibility that supports rapid adaptation by agents on
the micro level, such as the ability to try work-arounds or new tactics in response to sudden changes
or events. When organizational flexibility is lacking, these work-arounds are more likely to involve
unattractive choices and risk taking.
Our work demonstrates an approach to integrating new technology into a complex sociotechnical
system, a challenging process involving numerous variables and many possible missteps leading to
potential calamities but for which little guidance exists (Madni and Sievers 2014). By describing
the types of disruptions and associated hazards that need to be monitored and evaluated in the air
combat training system, we additionally contribute to the successful use of the LVC air combat
training paradigm and to the advancement of high-fidelity military training (Brooks et al. 2002;
Carroll 1999; George et al. 1999; Smith et al. 2007).
This evaluation has set the stage for a phased introduction of non-live entities that allows the LVC
paradigm and air combat training system to coevolve, an integration strategy based on principles of
resilience in complex systems (Benbya and McKelvey 2006; Kitano 2004). Future work, as noted
previously, has involved the identification of hazard mitigations and their translation into
recommended procedural changes and requirements for a future LVC air combat training system.
Beyond this particular effort, we hope to extend lessons learned about the effect of new technologies on established complex systems. The dominant paradigm for introducing new technologies
and other changes into complex systems is one that places most of the burden of coping and adapting on the host system. The change is introduced, and the host system must weather negative
consequences of misalignment, cope with new tensions, and adapt to a new status quo. As we
describe above, complex systems self-organize in response to disruptions that destabilize balanced
tensions or interfere with core system goals. However, systems do not always recover well, depending on the extent of the disruption and its management. For example, Trist and Bamforth (1951)
201
202
10 Integrating New Technology into the Complex System of Air Combat Training
describe the destabilizing impacts of new longwall mining technology on not just the mining operation, but the entire mining community. On the other hand, agents within a system often simply
bar change from occurring. Examples abound of technology transition failures (Standish
Group 2015), and it is no wonder: high costs are at stake; in some cases, national security is at
stake; in many cases, human lives and well-being are at stake.
We need effective tools and methods to guide change in high-stakes complex systems. This evaluation provides a method for managing a change and its interactions with the system as a whole.
It is grounded in complex systems theory, as described above, and provides a constructive option
to the unproven and suspect assumption that technology users are simply resistant to change. This
method and its use to explore sociotechnical system dynamics and responses to change represent
a valuable contribution and progress along the path to improved transition of technology and
change into our increasingly complex systems.
A
cknowledgments
This research was sponsored by the Office of Naval Research (ONR). The authors wish to thank
our extended research team members at Collins Aerospace and the Operator Performance Lab
(OPL) at the University of Iowa, especially Dr. Tom Schnell (OPL). We also wish to thank John
“Bam-Bam” Mooney and Derek “Baffle” Ashlock for their valuable input. Finally, we thank all of
our interviewees for taking time out of their busy schedules to talk to us in-depth about the air
combat training domain.
The views expressed in this paper are those of the authors and do not represent the official views
of the organizations with which they are affiliated. An author’s affiliation with The MITRE
Corporation is provided for identification purposes only and is not intended to convey or imply
MITRE’s concurrence with, or support for, the positions, opinions, or viewpoints expressed by the
author. This paper has been approved for Public Release; Distribution Unlimited; Case Number
43-341-14. ©2020 The MITRE Corporation. ALL RIGHTS RESERVED.
R
eferences
Ausink, J.A., Taylor, W.W., Bigelow, J.H., and Brancato, K. (2011). Investment Strategies for Improving
Fifth-Generation Fighter Training (Document No. TR-871-AF). Santa Monica, CA: RAND
Corporation http://www.dtic.mil/dtic/tr/fulltext/u2/a537970.pdf (accessed 21 August 2020).
Benbya, H. and McKelvey, B. (2006). Using coevolutionary and complexity theories to improve IS
alignment: a multi-level approach. Journal of Information Technology 21 (4): 284–298.
Braun, V. and Clarke, V. (2006). Using thematic analysis in psychology. Qualitative Research in
Psychology 3 (2): 77–101.
Brobst, W.D. and Brown, A.C. (1996). Developing Measures of Performance for F/A-18 Aircrew Skills
(CRM 96-129.00). Alexandria, VA: Center for Naval Analyses.
Brooks, R.B., Breitbach, R.A., Pegg, S. et al. (2002). Innovative C2 Training Solutions for Air Force
Modular Control Systems (AFRL-RH-AZ-PR-2002-0003). Mesa, AZ: Air Force Research Laboratory
Warfighter Readiness Research Division.
COMNAVAIRFOR (2016). NATOPS General Flight and Operating Instructions Manual (CNAF
M-3710.7). https://www.public.navy.mil/airfor/vaw120/Documents/CNAF%20M-3710.7_WEB.PDF
(accessed 23 August 2020).
Reference
Carroll, L.A. (1999). Multimodal integrated team training. Communications of the ACM 42 (9): 68–71.
Corrao, P.A. (2009). An examination of the MH-60s common cockpit from a design methodology and
acquisitions standpoint. Master’s thesis. Naval Postgraduate School, Monterey, CA. Retrieved from
the Defense Technical Information Center (ADA501110).
Department of the Navy, Office of the Chief of Naval Operations (2010). OPNAV instruction 3500.39C
(OPNAVINST 3500.39C). https://www.public.navy.mil/airfor/vaw120/Documents/OPNAVINST%20
3500.39C%20(ORM%20Inst).pdf (accessed 23 August 2020).
Flanagan, J.C. (1954). The critical incident technique. Psychological Bulletin 5: 327–358.
George, G.R., Breitbach, R.A., Brooks, R.B. et al. (1999). Synthetic forces in the Air Force command
and control distributed mission training environment, current and future. In: Proceedings of the 8th
Conference on Computer Generated Forces and Behavioral Representations, 319–331. Orlando, FL:
Simulation Interoperability Standards Organization.
Heinrich, H.W. (1931). Industrial Accident Prevention. New York: McGraw-Hill.
Hoffman, R.R. and Woods, D.D. (2011). Beyond Simon’s slice: five fundamental trade-offs that bound
the performance of macrocognitive work systems. Intelligent Systems, IEEE 26 (6): 67–71.
Hoffman, R.R., Neville, K., and Fowlkes, J. (2009). Using cognitive task analysis to explore issues in the
procurement of intelligent decision support systems. Cognition, Technology & Work 11 (1): 57–70.
Hoffman, R.R., Deal, S.V., Potter, S., and Roth, E.M. (2010). The practitioner’s cycles, part 2: solving
envisioned world problems. IEEE Intelligent Systems 25 (3): 6–11.
Hollnagel, E., Woods, D.D., and Leveson, N. (2006). Resilience Engineering: Concepts and Precepts,
43–54. Burlington, VT: Ashgate.
Kitano, H. (2004). Biological robustness. Nature Reviews Genetics 5 (11): 826–837.
Klein, G.A., Calderwood, R., and MacGregor, D. (1989). Critical decision method for eliciting
knowledge. IEEE Transactions on Systems, Man and Cybernetics 19 (3): 462–472.
Koopman, P. and Hoffman, R.R. (2003). Work-arounds, make-work, and kludges. IEEE Intelligent
Systems 18 (6): 70–75.
Madni, A.M. and Sievers, M. (2014). System of systems integration: key considerations and challenges.
Systems Engineering 17 (3): 330–347.
Naval Air Systems Command (2018). E-2 Hawkeye early warning and control aircraft. https://www.
navy.mil/DesktopModules/ArticleCS/Print.aspx?PortalId=1&ModuleId=724&Article=2160986
(accessed 23 August 2020).
Naval Strike and Air Warfare Center (n.d.). TOPGUN Training Rules. Fallon Naval Air Station,
NV: NSAWC.
Neville, K., Fowlkes, J.E., Nelson, M.M.W., and Bergondy-Wilhelm, M.L. (2003). A cognitive task
analysis of coordination in a distributed tactical team: implications for expertise acquisition. In:
Proceedings of the Human Factors and Ergonomics Society Annual Meeting, 359–363. Los Angeles,
CA: Sage.
Neville, K., Sherwood, S., Mooney, J. et al. (2016). An assessment of a complex military training
system’s resilience to change. In: Proceedings of the 2016 Annual Meeting of the Human Factors and
Ergonomics Society. Thousand Oaks, CA: Sage.
Pariès, J. (2006). Complexity, emergence, resilience. In: Resilience Engineering: Concepts and Precepts
(eds. E. Hollnagel, D.D. Woods and N. Leveson), 43–54. Burlington, VT: Ashgate.
Rickard, R.N., Bennett, W.R., and Colgrove, C. (2013). Development of fighter aircraft live, virtual, and
constructive (LVC) interface standards. In: Proceedings of the Fall Simulation Interoperability
Workshop, 250–261. Red Hook, NY: Curran Publishing.
Sarter, N.B., Woods, D.D., and Billings, C.E. (1997). Automation surprises. In: Handbook of Human
Factors and Ergonomics, 2e (ed. G. Salvendy), 1926–1943. Hoboken, NJ: Wiley.
203
204
10 Integrating New Technology into the Complex System of Air Combat Training
Smith, E., McIntyre, H., Gehr, S.E. et al. (2007). Evaluating the Impacts of Mission Training via
Distributed Simulation on Live Exercise Performance: Results from the US/UK “Red Skies” Study
(AFRL-HE-AZ-TR-2006-0004). Mesa, AZ: Air Force Research Laboratory Warfighter Readiness
Research Division.
Standish Group (2015). The Chaos Report 2015. https://www.standishgroup.com/sample_research_
files/CHAOSReport2015-Final.pdf (accessed 23 August 2020).
Susman, G. and Evered, R. (1978). An assessment of the scientific merits of action-research.
Administrative Science Quarterly 23: 582–603.
Trist, E.L. and Bamforth, K. (1951). Defences (sic) of a work group in relation to the social structure
and of coal-getting: an examination of the psychological situation and some social and psychological
consequences of the longwall method and technological content of the work system. Human
Relations 4: 3–38.
Vuckovic, N.H., Lavelle, M., and Gorman, P. (2004). Eavesdropping as normative behavior in a cardiac
intensive care unit. JHQ Online 5: 1–6.
Williams, K.W. (2006). Human Factors Implications of Unmanned Aircraft Accidents: Flight Control
Problems (TR DOT/FAA/AM-06/8). Washington, DC: FAA OAM.
Woods, D.D. (2006). Essential characteristics of resilience. In: Resilience Engineering: Concepts and
Precepts (eds. E. Hollnagel, D.D. Woods and N. Leveson), 21–34. Burlington, VT: Ashgate Publishing
Company.
205
Section 4
Considering Human Characteristics
207
11
Engineering a Trustworthy Private Blockchain for Operational
Risk Management
A Rapid Human Data Engineering Approach Based on Human
Systems Engineering
Marius Becherer, Michael Zipperle, Stuart Green, Florian Gottwalt,
Thien Bui-Nguyen, and Elizabeth Chang
University of New South Wales at Australian Defence Force Academy, Canberra, ACT, Australia
11.1 Introduction
This chapter presents a rapid human data engineering (HDE) approach based on human systems
engineering (HSE) principles for the development of a big data management tool – known as
trustworthy private blockchain. It not only places humans in the center of the blockchain-enabled
human data integrated (HDI) system but also human-centered system design by engaging the subject
matter expert and systems engineers for a human-centered trustworthy enterprise private blockchain
development. It supports the human effort by automated data or transaction recording, processing,
reporting, tracking, and analytics, from a trusted single source of truth data repository, to improve
human performance by mitigating the operational risks in the context of compliance, assurance,
financial accountability, and capability readiness, particularly for large complex enterprises.
11.2 Human Systems Engineering and Human Data Engineering
According to work by Handley (2019a, 2019b), Tolk (2012), and Mittal and Tolk (2020), the HSE
approach applies to human principles, models, and techniques to optimize system design and performance by continuously taking human capabilities and limitations into consideration. We use
this as the key principle for any large complex system development. One typical system is big data
management, which leads us to adopt HSE for HDE and user data interaction design (UDID):
●●
●●
HDE applies human principles, models, and techniques to optimize big data repository design
and interaction including trust and security of the big data sources with continuous focus on
human capabilities and limitations. This includes (i) trustworthiness of the big data repositories,
(ii) understanding and interpretation of big data, and (iii) knowledge discovery and decision
support from the big data.
UDID addresses how easily humans can access all forms of big data including structured
and unstructured, such as sound, video, transactions, individual profiles such as roles and
responsibilities, and accountabilities, not only timeliness but also trustworthiness.
A Framework of Human Systems Engineering: Applications and Case Studies, First Edition.
Edited by Holly A. H. Handley and Andreas Tolk.
© 2021 The Institute of Electrical and Electronics Engineers, Inc. Published 2021 by John Wiley & Sons, Inc.
208
11 Engineering a Trustworthy Private Blockchain for Operational Risk Management
Today, no databases can provide such confidence, except the blockchain. Blockchain provides
the trust of the data sources that were always needed but never existed, particularly in the last 30
years of Internet development and distributed networked economy. HSE principles open new and
exciting opportunities for the designing of big data management systems, HDE, HDI, and UDID,
particularly in the Fourth Industrial Revolution (4IR) era.
We present a rapid HDE through the use of the HSE approach to trustworthy private blockchain
design, development, and deployment. There is a vast amount of work that needs to be completed
on UDID, as presented in Mittal and Tolk (2020) along with metrics to evaluate the trust between
humans and systems, for example, those presented by Freedy et al. (2007). Here, we will focus on
the building of the trustworthy private blockchain or a trustworthy data repository that is secure,
immutable, distributed, and efficient and effective for human-centered big data management.
A specific application area is operational risk management.
11.3
Human-Centered System Design
The trustworthy blockchain is a human-centered big database system that primarily considers how
human operators can use and trust the databases or the blockchain; how human operators can
experience the single source of truth, data immutability, data transparency, and data auditability
(Casino et al. 2019; Christidis and Devetsikiotis 2016); how humans are accountable for their
transactions; and how humans can trust the ledgers and so forth. The human-centered system design
focuses on how the blockchain system can be built so that the trust between the human operators, the
hierarchy of management, the peer networks, and the big data can lead to efficiency and productivity
in transaction processing, reporting, tracking, and analysis in this dynamic complex environment.
The human-centered system design in the HDE focuses on reducing human manual-based tasks
such as the mental load on analyzing data, timely reporting, and decision making. The system
automatically identifies human roles, responsibilities, and accountabilities and improves human
operators’ efficiency and transactions overload. It also addresses constraints imposed by a dynamic
changing environment, human capabilities, and limitations as well as the slow progress imposed
by a highly regulated hierarchy workforce.
In the project “Blockchain for Operational Risk Management” funded by the Department of
Defence, we were guided by the human-centered system engineering (HSE) methodology. We
worked together with frontline officers, subject matter experts, civil–military transactors, to trustworthy private blockchain system design, development, and deployment. In addition, we utilize
rapid HSE for rapid development and deliveries, an approach against the traditional overlord IT
procurement approach, where human operators are left out in terms of requirement definitions,
technical specifications, and user experience, which results in complex contracts under management and incurring huge costs, delayed schedules, and merely useful products or tools at the end
of a development life cycle, which has been detrimental to all stakeholders.
11.4 Practical Issues Leading to Large Complex Blockchain
System Development
11.4.1
Human-Centered Operational Risk Management
One important operational risk in large complex enterprises is the compliance and assurance with
regard to the accurate finance or asset or data/information management, which impacts the
organization’s reputation and capability preparedness. However, transaction recording, reporting,
11.4 Practical Issues Leading to Large Complex Blockchain System Developmen
tracking, and analysis are the job of big data, either in physical or digital format. An example is the
supply chain network in defense logistics and sustainment including multidimensional data management, which needs to address the whole capability life cycle, among military services and joint
forces, as well as restricting workforces with a hierarchy. Managing and reporting such data is
intensive, mandraulic, time consuming, and error prone. There have been no satisfactory tools
proposed to support big data management particularly in defense logistics over the last 20–30
years. Not only does it hinder human performance but also wastes officers’ valuable time away
from undertaking higher-order tasks such as strategic planning or force design.
11.4.2
Issues Leading to Risk Management Innovation Through Blockchain
In the case of defense departments with billions of dollars of annual government-funded defense
enterprise and assets held in its IT systems, they are distinctly exposed to risks, which exist in the
form of findings being placed against defense financial statements. This can invariably result in an
audit qualification being administered. In 2004, the Australian Department of Defense’s auditing
agency expressed a lack of confidence in auditing processes and placed findings against defense
with qualified statements. Poor data management issues led to discrepancies among data and
transactions for which no one was accountable. This led to millions of dollars expenditure over
10 years to rectify, and, to date, very little has been learned from this experience. The Australian
Department of Defense had been operating under a relationship verified by the clear demonstration of fast tracking back to the potential financial qualification of statements once the governance
regime was lifted. There were limited tools to help root cause analysis. The misalignment in the
data across databases continues to haunt the Australia Department of Defense’s reputation in
financial accountability and poor data management, leading to poor compliance assurance and
risk management. Defense’s response was to re-instigate the overlord approach to data and IT
management in 2014. A solution is still unavailable to all stakeholders.
Private blockchains are enterprise blockchains that address the needs for trustworthy data and
transactions as well as accountability of human operators with a single source of truth. It is the solution for the next generation of enterprise data management and modernized workforce and human
operations within the organization and between the organizations, and it is suitable for both public
and private sectors. Enabling this characteristic requires trusted data sources and access between
human operators or users of the private blockchain and among several groups of users at intra- and
inter-organization settings.
In this case, a rapid HSE and HDE framework of compliance and assurance risk management
tool was established as an extremely reactive response to the critical position that was identified
pertaining to the Australian Department of Defense’s financial statements.
11.4.3
Issues in Engineering Trustworthy Private Blockchain
The trust of private blockchain, such as Hyperledger Fabric, has encountered many challenges due
to its centralized key management. Centralized data management creates the opportunity for data
manipulation, data tempering, and multiple truths, leading to a discrepancy in reports and distrust
among the stakeholders. Besides, it has a complex human hierarchy, employee type, and user
identifications as part of private blockchain engineering for the workforce and the enterprise.
Furthermore, there are very limited public resources available to support such human-centered
systems engineering to private blockchain design and development.
To address this issue, the frontline operators must be closely involved with subject matter experts
and domain knowledge workers in every stage of the private blockchain database system development.
209
210
11 Engineering a Trustworthy Private Blockchain for Operational Risk Management
We use Hyperledger Fabric, which is one available open-source approach for private blockchain
(Mazumdar and Ruj 2019). Many researchers have tried to develop blockchain (Tama et al. 2017;
Zheng et al. 2018), such as blockchain applications in stream data management with IoT
(Conoscenti et al. 2016), big data management (Karafiloski and Mishev 2017), cybersecurity and
trust management (Hebert and Di Cerbo 2019; Khan and Salah 2018; Seebacher and Schüritz 2017),
and other data quality aspects (Koteska et al. 2017; Yli-Huumo et al. 2016). The key issues of trust
and use of the private blockchain have barely been discussed or successfully implemented in the
existing literature (Hebert and Di Cerbo 2019). In this chapter, we present the use of the HSE
approach to private blockchain system development to achieve trust and accelerate government
and large complex enterprise adoptions of private blockchain.
11.5 Framework for Rapid Human Systems–Human
Data Engineering
The aims of the HSE framework mitigate human performance shortfalls and maximize system
effectiveness by integrating well-defined HSE and HSI processes and activities (Handley 2019a).
The framework presents from human-centered design (HCD) to HSE to HDE and HDI as presented in Figure 11.1. It includes important elements and relationships to the utilization of HSE
and allows subject matter experts, domain specialists, system designers, and software engineers, as
well as the hierarchy of program managers to provide design ideas and feedback from the prototype systems to determine appropriate requirements for the system and tool development.
The dimensions and descriptions of the framework are as follows:
A) Human-centered system design – This dimension represents the different levels and types of
users that interact with the system designer and engineers to build the system. The system
design has three phases with a problem area such as risk management, understanding enterprise policies and processes, and defining user and technical requirements of the system.
B) HSE – An engineering life cycle is presented from planning, design, implementation, testing,
and maintenance to continuing system improvement.
C) HDE and HDI – These are the result of HSE that produced trustworthy blockchain databases
that have the capability to manage operational risks. Humans are an integral part of all
transactions and are recorded by blockchain as one entry of a ledger. This reinforces roles,
responsibility, and accountability at any point of time and can be accessed at point of need.
The framework also presented the rapid development timelines including human engagement
in the design and engineering processes along with prototype field validation of human data
interaction as seen in Figure 11.2.
11.6
Human Systems Engineering for Trustworthy Blockchain
11.6.1
Engineering Trustworthy Blockchain
Trustworthy blockchain lies on the public key infrastructure (PKI), where key pairs are a central
trust component. With this, PKI is used to satisfy several key concepts of trusted communications
such as authenticity, message integrity, and confidentiality. The key and certification management
depend on a central authority within this ecosystem to issue digital certificates and manage public
1 week
1 month
3 days
2 days
4. Plan and
analyze module
requirements
2. Analysis of policy
and processes
On-
nths
Human centered system design
Human
system
engineering
Human data interaction system
Executive branch
Divisional
directors
Unit
managers
9. System
deployment
Al
Ledger
Ledger
8. Maintenance
and iterative
improvement
Continuing improvement
Ledger Ledger
Ledger
Ledger
3w
ee
ks
Enterprise wide distributed private blockchain
Human data engineering/interaction
Figure 11.1
6. Module
implementation
Ledger
Transactors
Ledger
5. Module
design
goin
3. Specification of risk
controls and data sources
to monitor risks
2 mo
1. Risk assessment
and prioritisation
g
Fied operators, subject matter experts, system designers
The rapid human-centered systems engineering and human data engineering framework.
s
th
7. User
acceptance
testing
3
on
m
212
11 Engineering a Trustworthy Private Blockchain for Operational Risk Management
Figure 11.2 User data interaction design (UDID) of trustworthy blockchain illustrated in the locationbased risk map.
and private key pairs. There is little information about the parameters used for validating trustworthy private blockchain like Hyperledger Fabric. Existing solutions of Private Hyperledger Fabric
Blockchain deal with keys and certificates in a centralized orderer. Such solutions, however, violate
one key significance of blockchain technology – that being decentralization through decentralized
key management. In contrast, the private blockchains rely on centralized key management and the
centralized authority. In order to develop a trustworthy private blockchain, we designed and
engineered a unique PKI in private blockchains. Among other trust issues, we present the challenges
faced in the implementation and solutions to keys and certificate management to ensure trustworthy
communications with the blockchain including hosts, nodes, and participants of organizations.
11.6.2
Issues and Challenges in Trustworthy Private Blockchain
A public blockchain has its own reputation of trust in the public domain due to its distributed trust
mechanism as well as high levels of security in terms of data immutability, decentralization, and
no-central authority. An upsurge in adoption of blockchain in all types of government, commerce,
and industry is aimed at achieving the trust between the organizations and individuals (Tapscott
and Tapscott 2017).
A trustworthy blockchain network consists of numerous distributed nodes across different
regions or continents. Different organizations that are part of the blockchain network can run their
own blockchain nodes within their own enterprise IT infrastructure. This will allow users within
their organizations to access various forms of data based on permission policies defined within the
private blockchain network to which the nodes are connected. Policies reflected as smart contracts
describe how the blockchain transactions are verified.
Unlike public blockchain, the private blockchain network is intended to be used indirectly by
various users within the enterprise or consortium enterprises. Users that are interacting directly
with the blockchain will be able to configure elements of the blockchain network such as the
number of peers or leader peers (orderers) within their organizations.
There is little information about the parameters used for validating trustworthy private
blockchain like Hyperledger Fabric such as:
●●
●●
How to establish trust between the enterprise existing physical security infrastructure and the
security infrastructure enforced by the blockchain and how to integrate both infrastructures.
Users or peers can dynamically join and exit the public blockchain network anywhere and at any
time. However, in the private blockchain, how is trust established in the newly joined users,
peers, and organizations in such a dynamic environment?
11.6 Human Systems Engineering for Trustworthy Blockchai
●●
●●
●●
●●
●●
How does one ensure the trust of the dynamic policies in the permission-based private
blockchain? Unlike a public blockchain, which is a permission-less blockchain, the policy for
transactions is not permitted to change. However, a private blockchain allows the users to change
the policies of its blockchain network.
What endorsement should be set as the trustworthy policies and how to decide on existing,
updated, and configured policies?
How is trust determined in the private blockchain databases and where is the backup of the
blockchain hosted?
What restrictions should be set for creating a user account and is the user account holder
trustworthy, and how can trust be established to handle deletion of accounts?
What happens when nodes are compromised?
11.6.3 Concepts Used in Trustworthy Private Blockchain
The concepts used for engineering trustworthy private blockchain systems are:
●●
●●
●●
●●
●●
●●
●●
●●
●●
●●
●●
●●
●●
●●
User – An individual member that uses a blockchain system or applications within the blockchain
network.
Entity – An individual user, an actor, or a node in the blockchain.
Identity – Information associated with a certificate about the permission of a user in a blockchain
network.
Peer – A Hyperledger Fabric network node in the private blockchain that has a copy of
the ledger.
Orderer – A higher-level peer or a super node that is responsible for ordering transactions into
blocks (or to a ledger/blockchain).
Certificate authority (CA) – A specific entity that issues digital certificates to other entities.
Certificate – A document that binds a public key to a particular entity of the private blockchain
network. It includes information such as the name of the certificate holder and the CA that
issued the certificate.
Organization – An entity that can join a blockchain network by providing its service to the
network. It has its own organizational structure and manages its own entities (users, admins,
peers, etc.).
Consortium – The set of all organizations within a blockchain network that can form alliances
or partnerships, also known as channels.
Channel – A private communication between different organizations, also known as subnet. Each
channel contains its own distributed, blockchain ledger, set of entities involved, and policies
governing interactions between the entities. Multiple channels can exist within a consortium.
Membership Service Provider (MSP) – The set of certificates that are used to define an organization
and its entities (users, admins, peers, etc.).
Consensus – The mechanism for reaching agreement between different entities about transactions
and/or blocks in the private blockchain such as Hyperledger Fabric. The private blockchain
consensus mechanism involves many more steps than a public blockchain, an example of which
is Bitcoin.
Smart contract – A specific business logic that is in line with the data models that are stored/
retrieved in the blockchain ledger.
Endorsement – Peer executing some smart contracts and determines whether later steps should
be followed to commit the transactions to the blockchain ledger.
213
214
11 Engineering a Trustworthy Private Blockchain for Operational Risk Management
●●
●●
●●
●●
●●
●●
●●
●●
●●
●●
●●
Policy – An endorsement policy that defines which entities must endorse a transaction within
the transactional flow of a private blockchain such as Hyperledger Fabric.
Hardware security module (HSM) – A physical computing device that can be used to store
sensitive information (e.g. digital keys). HSM are tamper resistant and can be configured to
destroy all keys if a security breach occurs.
Software development kit (SDK) – A collection of software tools used for software development.
Gateway – Network servers that expose a REST API SDK server to allow users to interact with
the blockchain applications (e.g. create transactions, query the databases).
Cluster – A group of services that are connected and communicate with each other to fulfill
common objectives.
Root certificate authority (RCA) – The RCA issues certificates for the trustworthiness of the
subordinate entity.
Intermediate certificate authority (ICA) – Subordinate certificate authority that issues certificates
instead of RCA to increase security through a void.
Docker – An open-source software tool involving containerization technology.
Docker Secrets – A concept to store sensitive data within Docker Swarm.
Reverse proxy – Serves as a proxy to hide the accessible services from external actors.
Public key infrastructure – A system for issuing, distributing, and validating certificates and
managing key pairs to secure communication.
11.6.4
Prototype Scenario for Trusted Blockchain Network
This section provides our design of a trustworthy private blockchain with Hyperledger Fabric
blockchain. The blockchain is composed of peers, users, certificate authorities, gateways, numerous
databases, and reverse proxies all running inside Docker containers. These components can
communicate with each other to form a single Hyperledger Fabric channel for testing, which forms
the blockchain and its ledger. Three virtual machines are used for hosting the blockchain network,
and the network topology is static in this deployment plan for simplicity. The deployment plan
outlines the key points of three topics including prototype scenario, PKI, and network topology.
The prototype scenario involves two different organizations, Org1 and Org2, that wish to form a
blockchain network. A third trusted organization, referred to as OrdererOrg, is used to facilitate
trust between these two organizations in terms of setting up the blockchain networks and providing
the ordering service. Overall, the purpose of the blockchain network is to provide transparency
with asset management data utilizing the key properties of a blockchain such as an immutable and
distributed ledger to record the transactions from those projects. Each virtual machine will hold
network components of at least two of the organizations to showcase the distributive nature of the
blockchain (Brinkman 2017), management of security features, the underlying PKI, and fault
tolerance capabilities. The blockchain network will be resilient to a single virtual machine failure
with minimal or no consequences. The different network entities will be Docker containers that
can contain each across the three different virtual machines via Docker Swarm.
11.6.5
Systems Engineering of the Chain of Trust
In this section, we provide our proposal of trustworthy distributed key management for private
blockchain through a unique design of private and public key infrastructure that contains several
steps to create the chain of trust between users or peers, between organizations, and within
consortium partnerships.
11.6 Human Systems Engineering for Trustworthy Blockchai
A specific sequence of steps must be followed to configure and set up the blockchain network
in production mode. Most of the complexity in deployment arises from PKI, with different
network nodes requiring their certificates at certain times. The entire deployment procedure is,
therefore, divided into manageable subsections with supporting diagrams to help illustrate the
process.
Hereby, only the conceptual blockchain network is described as the nodes and can be distributed
arbitrarily (but evenly to avoid single points of failure) on the virtual machines provided by
enterprise. Furthermore, most of these steps are automated using scripts and are only shown for
future reference for more complex deployment settings.
11.6.6
Design Public Key Infrastructure (PKI) for Trust
The PKI of a Hyperledger Fabric network involves all entities of the blockchain network. All
network node credentials (private/public key pairs) will be generated inside an HSM or software
vault. These keys will use the Elliptic Curve Digital Signature Algorithm (ECDSA) with curve
“prime256v1” and size 256 bits to meet current state-of-the-art requirements (Barker and
Roginsky 2019). All private keys of peers, orderers, and CAs will be stored in an HSM. However,
the RCA credentials will be stored in a separate HSM that can be taken offline to increase security.
In contrast to this, less sensitive certificates will be centrally managed using Docker Secrets within
a Swarm for simplified deployment. A single administrator will preferably manage these Swarms
having control of a subset of their organization’s network nodes. Swarms from different locations
can communicate with each other by exposing a reverse proxy that redirects requests to different
services inside its network.
Besides the Fabric nodes, all user credentials will also be generated and stored dynamically in an
HSM or software vault. This process will involve users first registering via the application, which
will call an endpoint on one of the gateways. This endpoint can be used to indirectly communicate
with either an HSM or a software vault to generate the user’s public/private key pair. Hence, all
user credentials will be stored server-side, and only a permissioned administrator will have access
to perform these user operations. The servers must have temporary read access to their user’s
private key to sign blockchain transactions.
11.6.6.1
Design of Certificate Authority (CA)
In practice, the entire deployment process will likely be a rare event; manual execution of these
steps is acceptable. However, for testing purposes, scripts should be used to automate all key
generation and key signing.
The RCA is added first to the network to create the CA credentials within the HSM, referred to
as RCA-HSM (Schuh et al. 2012). The certificate can be self-signed as well as signed from existing
PKI. Afterwards, the setup of credentials for ICAs allows the respective organization to join the
network. This involves generating the public/private key pairs for each organization within their
appropriated HSM (i.e. Org1-HSM for Org1). Overall, each organization requires two different CA
certificates for further steps: endorsement CA and TLS CA.
Each generated key pair inside the ICA-HSM has to be signed from the RCA as shown in
Figure 11.3. After the signing of the RCA, certificates will be produced for each of the ICAs
(Hyperledger 2019). With this, all ICA credentials have been set up, and their Docker containers
should be initialized alongside their databases used to track issued certificates.
At this point, the RCA should then be taken “offline” through disabling the HSM to avoid
external access to RCA. Now, the design of the certification authorities is completed as shown in
215
216
11 Engineering a Trustworthy Private Blockchain for Operational Risk Management
Figure 11.3
certificate.
Step 1: Generate public/private key pair
Distribution of key pairs and
Step 2: Obtain certificate
(issued by external CA or
self signed)
Root CA for
blockchain
network
Step 4: Generate and
send CSRs to RCA
Step 3: Generate public/private
key pairs for all ICAs
Org1
Figure 11.4
OrdererOrg
Org2
Key and CSR generation for ICAs.
Figure 11.4. Authentication between the ICAs and their databases is secured via Transport Layer
Security (TLS) and an additional authentication method such as username/password, whereas the
secrets are stored in the organization’s HSM. A reverse proxy will be used to provide load balancing
for each CA cluster.
11.6.6.2
Design the Trusted Gateways
The gateways are considered next in the deployment plan. Hereby, the Docker containers for these
gateways getting authenticated through appropriate credentials in Docker Secrets enroll their
preconfigured organization administration. It is essential that each organization enroll the
preconfigured admin for both the endorsement CA and the TLS CA. The current implementation
for these servers will automatically enroll the admin on start-up. The gateways should also be
deployed in clusters but with different administrators that use the HSM to store/retrieve user
credentials.
Specifically, public/private key pair and a signing request for the certificate are generated for
each administrator when a gateway is initialized. The requests are sent to the appropriate CAs,
outputting certificates for the administrators. Any CA node within a cluster can issue a certificate.
This abstraction hides the internal network configuration from the gateways alongside allowing
future additions of users, peers, and orderers to follow the same process. The CAs respond with
their certificate chains and the new admin certificates to the gateways, which comprise the MSP
information for their organization. These certificates should be published (e.g. via a central
database) to allow other organizations to know about their organization MSP information, which
is required to create channels. All communication between the gateways and a CA cluster will go
through the associated reverse proxy cluster as shown in Figure 11.5.
11.6 Human Systems Engineering for Trustworthy Blockchai
Step 5: RCA signs CSRs with
private key and sends back certificates
Figure 11.5
11.6.6.3
Design of trusted gateways.
Involving Trusted Peers and Orderers
After the admin credentials have been set up, peers and orderers can then be added to the respective
organizations. Different steps are required to initialize the peers and orderers though some
elements can be configured concurrently (Raj 2018a, 2018b). In this section, peer configuration is
shown first for simplicity.
The key pairs for endorsement and TLS have to be generated first for each participating peer and
orderer inside their organization’s HSM. Associated certificates for each of these key pairs must also be
requested through the gateways to the respective CAs (Barker and Roginsky 2019; Thakkar et al. 2018).
Each peer and user receive signed certificates alongside the MSP information of their organization.
With all the cryptographic materials required (Barker and Roginsky 2019), the peers can then be
initialized. This involves initializing the world state databases and configuration of each peer to
receive their credentials from the appropriated HSM, in detail, credentials from the admin, the CA,
endorsement certificate, and the TLS certificate. Afterward, the gateway from the orderer organization queries the MSP information of all organizations in the entire blockchain network.
An important observation is that the gateways could potentially be used to call endpoints of the
HSMs to generate the keys and CSRs for new peers and orderers. These servers could handle all
blockchain interactions and cryptography generation (indirectly), which leaves bringing up the
peer and orderer containers as separate steps for a network administrator. However, the
initialization of Docker containers with the correct configurations could also be automated
(Tam 2019). This means that network administrators could also use the gateways in future to add/
remove nodes without having to call HSM endpoints themselves.
Given the MSP information of all participating organizations, the orderers can then be
initialized (Singh 2019). Hyperledger Fabric requires the orderers to be “bootstrapped” with a
Genesis Block that will be used as the Genesis Block for new blockchains when initialized. This is
only used to specify which organizations can create channels (i.e. blockchains). The certificates of
each organization’s MSP are used to generate a Genesis Block. Now, the peers and orderers in the
respective organizations are setups as illustrated in Figure 11.6.
11.6.6.4
Facilitate Trust Through Channels
The channel creation involves sending the previously generated channel creation transaction
through one of the gateways. Currently, the transaction is automatically accepted and sent to the
other organizations’ gateways, which will agree to sign the transaction with their administrator’s
credentials. Once the signed transactions are received, the gateway sends the result to the orderer
Cluster. Consequently, the initial channel consists of the orderers defined in the prospective
217
218
11 Engineering a Trustworthy Private Blockchain for Operational Risk Management
Step 6: Take
RCA offline
Step 7: Bring up CA DBs
Step 8: Bring up CAs
Step 9: Bring up reverse
proxy servers for load
balancing
Figure 11.6
Endoresment CA cluster
TLS CA cluster
Design of trusted peers and orderers to form a preliminary blockchain network.
SDK
SDK
SDK
Step 27: Peers are joined to the channel
Figure 11.7 Trusted channel among the consortium.
channel transactions. By this, the blockchain ledger will contain the Genesis Block as well as
additional configuration.
Peers of each organization can then be added to the channel as shown in Hyperledger (2019).
Note that the correct gateway must be used to add peers, as only peers with certificates from the
same organization as that gateway will be verified correctly. Furthermore, a minimal amount of
default peers must be defined within connection profiles of the gateways. This information should
define the peers that will be used as anchors for the organization. Organizations will also only need
to define information regarding their own peers. If an organization obtained the peer information
of another organization, it would still not be able to join that peer to the channel as there is a
mismatch between the peer’s organization listed in its certificate and that of the administrator
attempting to perform that join. Once complete, the peers and users will be logically connected in
a shared channel as shown in Figure 11.7.
11.8 Future
Work for Trust in Human Systems Engineerin
11.7 From Human System Interaction to Human
Data Interaction
The HSE-based human data interaction architecture of the trustworthy blockchain is shown in
Figure 11.8. It is designed through the close collaboration between the subject matter expert and
system design engineers and putting humans’ activity and capability as the center of the big data
system specification, design, implementation, and deployment.
11.8 Future Work for Trust in Human Systems Engineering
This section describes the notable trust issues in the engineered system such as large complex
automated systems. According to Tolk et al. (2009), trust refers to the expectation of another in the
context of human interaction with systems engineered to provide decision support. Human trust
in engineered systems is the most important question and should be a foundation for human–
machine integration and cooperation and a centerpiece of HSE. Work in this area has just started
to scratch the surface (Tolk et al. 2009), despite the significant amount of work that has been done
including social and technical systems (Getty et al. 1995; Handley 2019a), agents and decision
support systems (Tolk 2012; Tolk et al. 2009), human–machine interaction (Madhavan and
Wiegmann 2007), fault tolerance and reliability (Lee and Anderson 2012), and the like. The next
section provides possible future work of trust in HSE.
11.8.1
Software Engineering of Trust for Large Engineered Complex Systems
Figure 11.9 presents where HSE is in terms of a trend based on work undertaken by Schuh et al.
(2012) tracking development between 1970 and 2010 with Chang and Jensen (2017b) considering
2020–2030 onward. The intelligence of the complex system has been improved through artificial
intelligence (AI) and big data management. Significant progress has been made through software
engineering efforts particularly in the areas of public blockchain, machine learning, AI, cloud
computing, and so forth. It is likely that software will play a critical role in building trust for
future engineered systems particularly in the areas of privacy, security, and safety of large
complex systems.
e
fin
De
SME Specif
yd
s
k
ris
ata
Risk controls
CARM
blockchain
CARM
machine
learning
sou
rce
s
Structured and
Unstructured
data
Human activity and capability centered
data and system specification
CARM
intuitive UI
Operators
end users
CARM
elastic DB
Design and implementation of the
automation for human efficiency
Human data-system interaction
Figure 11.8 Systems engineering of human data interaction of the trustworthy blockchain.
219
11 Engineering a Trustworthy Private Blockchain for Operational Risk Management
We are here
Complex system composition
Human system engineering trend
100%
90%
80%
Mechanics
70%
60%
50%
40%
30%
Electronics
20%
10%
0%
1970
1980
1990
Engineering
trust for
complex
systems
will lie on
Big data and
Al in the
near future.
Software
2000
2010
2020
2030
Figure 11.9 Future of human systems engineering trend based on VDMA prediction. Source: Chang and
Jensen (2017b) and Schuh et al. (2012).
Engineered systems over the last 100 years
from automation to autonomy
Engineering complex systems
220
Unmanned
systems
Smart things
Mobile
Networks
PCs
Mainframes
Radio
1890
Telephones
1920
1940
1960
1980
2000
2010
2020
2030
2050
Figure 11.10 Future of human systems engineering trend. Source: Chang et al. (2008) and Chang and
Jensen (2017a).
11.8.2
Human-Centered AI for the Future Engineering of Intelligent Systems
Human-centered AI will be a new area in the HSE, addressing ethical issues of humanity and trust
of any large complex system development and deployment particularly in the area of embedded
systems, IoT, cyber–physical systems, and future cyber warfare systems. Figure 11.10 presents 100
years of systems engineering and the need to address human-centered AI in future engineering of
intelligent systems.
11.8.3 Trust in the Private Blockchain for Big Complex Data Systems in the Future
Public blockchain systems not only provide community-based distributed trust among peers and
agents in the networks but also address critical issues of human trust to the large engineered
massive networked database system, such as Ethereum. It is the achievement of the trust of a big
11.9 Conclusio
data repository, a type of large complex system, after 40 years of ICT evolution because it creates
trust from humanity. However, this does not apply to a private blockchain due to key management
infrastructure.
The trust involved with the blockchain system focuses on key management. This refers to where
and how the trust credentials of the network and users should be handled. The keys must be
secured for all entities as they are the core mechanism behind the trust of the private blockchain.
If a private key is compromised, an attacker could effectively impersonate the owner of that private
key. For a CA, this implies the generation of arbitrary certificates. Hence, all certificates issued
under that CA would need to be revoked. For peers and users, “fake” results could be created for
transaction endorsements and block orderings. Furthermore, data transmitted via TLS for nodes
would be insecure for them if their TLS private keys were compromised. Attackers that obtain the
private keys of end users could perform queries against the ledger data and effectively create
arbitrary transactions under the name of the key owner.
To ensure trust, HSMs should be used to store the private keys of all entities in the network.
However, HSMs can be costly and should be considered based on different business needs. For
example, since the host computer for a gateway requires read access to end user keys for signing, it
suggests that a software key management such as Vault from HashiCorp could be used.
Bugs in the Current Hyperledger Fabric. Since Hyperledger Fabric is open-source software, it
relies on contributors to implement its functionalities. In terms of future product release, the trust
issues exist with backward and forward compatibility and data migration issues.
Smart contract implementations incorporate certain levels of risk, and the assurance in incorrect
endorsements of transactions is one of the issues. Furthermore, overlooked chaincode could result
in organizations accepting the smart contract to which they agree but do not fully understand.
The trust in the private blockchain server and issues with the gateway is related to software
capability, admin power, and route exposure. Lack of software capability to authenticate end users
is detrimental. Users that are incorrectly authenticated would have indirect access to another
user’s private key. They would then be able to perform blockchain operations as another user. To
mitigate this, a strong input validation system should be used for user passwords. This means
users must create passwords of acceptable length and entropy. Furthermore, an appropriate
password hash algorithm should be applied. For instance, the “bcrypt” password hashing function
can be used with a number of rounds. The number should be dependent on the host machine’s
specifications and large enough to deliberately slow down password verification/hashing to a set
limit. More recent password hashing functions have been released, such as Argon2, that should be
considered to maximize security.
11.9 Conclusion
In this chapter, we used our prototype systems as a demonstration to discuss identified trust issues
to address private blockchain. We adopted an HSE approach to the development of the trustworthy
private blockchain and its application for operational risk management in large enterprises.
Through our engineering process, we have discovered the potential trust issues in the private
blockchain. We engineered the trust infrastructure through unique design of public and private
key management systems. We believe key management in the private blockchain is critical to
human trust in the private blockchain, and this will impact the adoption of blockchain in large,
complex extended enterprise environments such as the banking sector, defense sector, and any
large public and private enterprises. Finally, we presented suggested future work in the building of
trust in HSE.
221
222
11 Engineering a Trustworthy Private Blockchain for Operational Risk Management
Acknowledgment
This research is funded by the Department of Defense, Australian Government. We would particularly like to thank Deputy Secretary of CASG Defense, Tony Fraser, for the Innovation Award
December 2019 and Director General Ed Louis of the Materiel Logistics at the DoD for the financial support of the project between 2018 and 2020.
References
Barker, E. and Roginsky, A. (2019). Transitioning the Use of Cryptographic Algorithms and Key Lengths.
https://doi.org/10.6028/NIST.SP.800-131Ar2.
Brinkman, R. (2017). Blockchain: How Should You Organize Your Peers? The Green Grid. https://www.
thegreengrid.org/en/newsroom/blog/blockchain-how-should-you-organize-your-peers (accessed 21
June 2020).
Casino, F., Dasaklis, T.K., and Patsakis, C. (2019). A systematic literature review of blockchain-based
applications: current status, classification and open issues. Telematics and Informatics 36: 55–81.
Chang, E. and Jensen, A. (2017a). 25 years of e-Business Engineering, where we are now and where
we are going, Keynote speech. 14th IEEE International. Conference on e-Business Engineering,
Shanghai, Chain (November 2017).
Chang, E. and Jensen, A. (2017b). Predictive analytics for warehousing and logistics operations. Invited
Keynote Speech, Smart Warehouse Summit 2017, Sydney, Australia (24–25 October 2017).
Chang, E., Dillon, T., and Calder, D. (2008). Human system interaction with confident computing. The
mega trend. 2008 Conference on Human System Interactions, Krakow, Poland (25–27 May 2008).
Christidis, K. and Devetsikiotis, M. (2016). Blockchains and smart contracts for the internet of things.
IEEE Access 4: 2292–2303.
Conoscenti, M., Vetro, A., and De Martin, J.C. (2016). Blockchain for the internet of things: a
systematic literature review. In: 2016 IEEE/ACS 13th International Conference of Computer Systems
and Applications (AICCSA), Agadir, Morocco (12 June 2017), 1–6. IEEE.
Freedy, A., DeVisser, E., Weltman, G., and Coeyman, N. (2007). Measurement of trust in human-robot
collaboration. In: 2007 International Symposium on Collaborative Technologies and Systems, Orlando,
USA (25 May 2007), 106–114. IEEE.
Getty, D.J., Swets, J.A., Pickett, R.M., and Gonthier, D. (1995). System operator response to warnings of
danger: a laboratory investigation of the effects of the predictive value of a warning on human
response time. Journal of Experimental Psychology: Applied 1 (1): 19.
Handley, H.A. (2019a). A socio-technical architecture. In: The Human Viewpoint for System
Architectures, 27–38. Springer.
Handley, H.A. (2019b). The Human Viewpoint for System Architectures, vol. 35. Springer.
Hebert, C. and Di Cerbo, F. (2019). Secure blockchain in the enterprise: a methodology. Pervasive and
Mobile Computing 59: 101038.
Hyperledger (2019). Channels. Hyperledger Fabric. https://hyperledger-fabric.readthedocs.io/en/
release-1.4/channels.html (accessed 21 June 2020).
Karafiloski, E. and Mishev, A. (2017). Blockchain solutions for big data challenges: a literature review.
In: IEEE EUROCON 2017 – 17th International Conference on Smart Technologies, Ohrid, Macedonia
(6–8 July 2017), 763–768. IEEE.
Khan, M.A. and Salah, K. (2018). IoT security: review, blockchain solutions, and open challenges.
Future Generation Computer Systems 82: 395–411.
Reference
Koteska, B., Karafiloski, E., and Mishev, A. (2017). Blockchain implementation quality challenges: a
literature. SQAMIA 2017: 6th Workshop of Software Quality, Analysis, Monitoring, Improvement, and
Applications, Belgrade, Serbia (11–13 September 2017).
Lee, P.A. and Anderson, T. (2012). Fault Tolerance: Principles and Practice. Springer-Verlag.
Madhavan, P. and Wiegmann, D.A. (2007). Similarities and differences between human–human and
human–automation trust: an integrative review. Theoretical Issues in Ergonomics Science 8 (4):
277–301.
Mazumdar, S. and Ruj, S. (2019). Design of anonymous endorsement system in hyperledger fabric.
IEEE Transactions on Emerging Topics in Computing https://doi.org/10.1109/TETC.2019.2920719.
Mittal, S. and Tolk, A. (2020). Complexity Challenges in Cyber Physical Systems: Using Modeling and
Simulation (M&S) to Support Intelligence, Adaptation and Autonomy. Wiley.
Raj, V. (2018a). Hyperledger Fabric Peer Roles. medium.com (24 November). https://medium.com/@
raj_63596/hyperledger-fabric-peer-roles-b4477451f97c (accessed 21 June 2020).
Raj, V. (2018b). Hyperledger Fabric Architecture: Explained in Detail. Skcript (29 January). https://dev.
to/skcript/hyperledger-fabric-architecture-explained-in-detail-32bb (accessed 21 June 2020).
Schuh, G., Neugebauer, R., and Uhlmann, E. (2012). Future trends in production engineering. In:
Proceedings of the First Conference of the German Academic Society for Production Engineering
(WGP), Berlin, Germany, 8th–9th June 2011. Springer Science & Business Media.
Seebacher, S. and Schüritz, R. (2017). Blockchain technology as an enabler of service systems: a
structured literature review. International Conference on Exploring Services Science, Rome, Italy
(24–26 May 2017).
Singh, S.P. (2019). Detail Analysis of Raft & Its Implementation in Hyperledger Fabric. https://medium.
com (May). https://medium.com/@spsingh559/detail-analysis-of-raft-its-implementation-inhyperledger-fabric-d269367a79c0 (accessed 21 June 2020).
Tam, K. (2019). Hyperledger Fabric. https://hyperledger-fabric.readthedocs.io/en/release-1.4/identity/
identity.html#what-are-pkis (accessed 21 June 2020).
Tama, B.A., Kweka, B.J., Park, Y., and Rhee, K.-H. (2017). A critical review of blockchain and its
current applications. 2017 International Conference on Electrical Engineering and Computer Science
(ICECOS), Palembang, Indonesia (22–23 August 2017).
Tapscott, D. and Tapscott, A. (2017). How blockchain will change organizations. MIT Sloan
Management Review 58 (2): 10.
Thakkar, P., Nathan, S., and Viswanathan, B. (2018). Performance benchmarking and optimizing
hyperledger fabric blockchain platform. 2018 IEEE 26th International Symposium on Modeling,
Analysis, and Simulation of Computer and Telecommunication Systems (MASCOTS), Milwaukee,
USA (25–28 September 2018).
Tolk, A. (2012). Engineering Principles of Combat Modeling and Distributed Simulation. Wiley.
Tolk, A., Madhavan, P., Jain, L., and Tweedale, J. (2009). Agents and Decision Support Systems, vol. 14.
Wiley Online Library.
Yli-Huumo, J., Ko, D., Choi, S. et al. (2016). Where is current research on blockchain technology? – a
systematic review. PloS One 11 (10): e0163477.
Zheng, Z., Xie, S., Dai, H.-N. et al. (2018). Blockchain challenges and opportunities: a survey.
International Journal of Web and Grid Services 14 (4): 352–375.
223
225
12
Light’s Properties and Power in Facilitating
Organizational Change
Pravir Malik
First Order Technologies, LLC, Berkeley, CA, USA
12.1 Introduction
The practice of integrating the action of light with any challenging situation can be used as a technique to expedite holistic change. This is because light is not just the physically proven electromagnetic universal phenomenon, as we have come to scientifically understand it, but exists at different
speeds as can more easily be perceived by the mind’s eye. The result of the relationship of light at
different speeds can also be seen as responsible for the existence of quanta and for an ongoing
causal quantum-level computation that results in the generation of different types and categories
of information as has been explored in some detail in the nine-book Cosmology of Light series
(Malik 2017a, 2017b, 2017c; Malik and Pretorius 2017b; Malik 2018a, 2018b, 2018c, 2019a, 2019b)
and in a series of related IEEE and other journal articles (Malik et al. 2017a; Malik and
Pretorius 2018a, 2019; Malik 2020). Hence, light has a causal power that, if leveraged in the right
way, can holistically affect a large portfolio of organizational challenges.
Further, it will be found that the information and possibilities embedded in light can be categorized by four organizational principles. One can easily get a glimpse of this by understanding that
four fundamental aspects of experienced reality arise because of the finite speed of light as will be
explored in Section 12.1. These are the notions of past, present, future, and matter that are surrogates for the deeper organizational principles of presence, power, knowledge, and harmony,
respectively. There is concrete evidence that this group of four organizes matter and life as will be
explored in Section 12.2, as manifest in the fourfold structuring of the electromagnetic spectrum,
quantum particles, the periodic table, any living cell, and fundamental capacities of self, among
other emergences. Hence there is an ubiquity of light, present also in all of matter and life, and
light can be thought of as existing in every iota of existence. Being able to perceive light differently
allows us to leverage it differently, and this is what gives power to begin to bring about a different
category of inherently holistic organizational change, as will be explored in Section 12.3. Such
change is holistic because of the fact that light connects everything and because everything, including changes in information about situations, arise due to light.
This chapter, hence, will examine implicit properties and a fundamental mathematical model
of light (Section 12.1), the process by which properties of light organize all material and life existence (Section 12.2), and then, based on a series of workshops conducted primarily at Zappos.com
A Framework of Human Systems Engineering: Applications and Case Studies, First Edition.
Edited by Holly A. H. Handley and Andreas Tolk.
© 2021 The Institute of Electrical and Electronics Engineers, Inc. Published 2021 by John Wiley & Sons, Inc.
226
12 Light’s Properties and Power in Facilitating Organizational Change
LLC, among other places through 2019, will suggest ways in which this technology can be integrated into day-to-day organizational functioning to facilitate a range of issues and challenges
typically faced by an organization (Section 12.3). Section 12.4 will offer a brief summary and
conclusion.
12.2 Implicit Properties and a Mathematical Model of Light
Practically, the finite speed of light implies that light will take a finite amount of time to travel from
one point to another. This is significant even when viewed at the atomic scale. If there is a source
of electromagnetic radiation in the nucleus or due to the electrons changing orbits around a
nucleus, that radiation will be experienced only a finite time later. It can be inferred that this phenomenon is related to quanta. Energy of quanta is specified by (12.1), where E is energy of quanta,
h is Planck’s constant, and υ is frequency of the radiation – hence Equation 12.1:
E
h
Eq. 12.1: Energy of quanta
Further, the speed of light c, frequency of radiation υ, and wavelength of radiation λ are related
by Equation 12.2:
c
Eq. 12.2: Speed of light
Combining (12.1) and (12.2) the inverse relationship between c and h can be observed in Equation
12.3 for any fixed level of E:
E
hc
Eq. 12.3: Inverse relationship between c and h
Assume now a thought experiment to bring home the creative nature of light and why all of life
would possibly emerge from it.
Imagine light traveling at an infinite speed. If this were so, then the inverse relationship between
c and h would necessitate that h approach 0. In other words, matter would be unable to form.
Conversely if light were to slow down, to approach c, then h would progressively increase to some
threshold where energy is able to sustain itself in quanta and matter would emerge. So finite speed
of light creates quanta, which creates matter. Therefore, all of matter emerges from light.
Further, in this view, it can be seen that the Big Bang is nothing other than light slowing down
and creating matter as a result of that (Malik 2018a). So, if all matter is an action of light, then any
universe arising is only a result of it. There are then likely some overarching properties that would
be true of light and therefore also true of everything that was to arise in any such universe. It may
even be that these properties would be fundamental and would determine structure of matter and
everything that emerges out of it.
So, what can be inferred about the properties of light?
The speed of light is known to have implications on the experienced nature of reality. The finiteness, c, at 186 000 miles per second in a vacuum creates an upper bound to the speed with which
any object may travel. This also implies that objective reality will be experienced as a past, a
12.2 Implicit Properties and a Mathematical Model of Ligh
present, and a future, from the point of view of that object (Einstein 1995). These characteristics – a past, a present, and a future – can therefore be thought of as implicit in the nature of light
and become part of objective reality because of the speed of light.
Further, as just suggested, c also creates a lower bound when inverted (1/c) being proportional to
Planck’s constant, h. h as we know pegs the minimum amount of energy or quanta required for
expression at the subatomic level (Isaacson 2008). Planck’s constant, h, therefore, allows matter to
form (Lorentz 1925) and for the reality of nature with a past, present, and future to also be progressively experienced as a phenomenon of connection between seemingly independent islands of
matter. This characteristic of “connection” is therefore also proposed to be implicit in the nature of
light and becomes part of objective reality because of the speed of light.
As suggested in Connecting Inner Power with Global Change (Malik 2009), a “future” implies
the notion of a cause, or seed, or direction and suggests the “mentality” or meaning that perhaps
drives the emergence of phenomena. A “present” implies the working out of the play of forces
and suggests the “vitality” of nature where the most energetic or powerful force will express
itself over others. A “past” can be viewed as established reality as defined by what the eye or
other lenses of perception can see. Such lenses see what has already “physically” been formed
in time.
These implicit characteristics of the nature of light as experienced at the layer of reality set up by
a finite speed of light may hence be summarized by Equation 12.4, where CU refers to the speed of
light of 186 000 miles per second, which has created the perceived nature of reality, U:
CU : Physical, Vital, Mental, Connection
Eq. 12.4: Nature of reality due to light at C
It is known however that at quantum levels the nature of reality is at least characterized by
wave–particle duality. Light itself (Feynman 1985) and matter (De Broglie 1929) may be experienced as both particles and waves (Ekspong 2014). Such duality, as will be explored shortly, is
related to the notion of quantum. But for matter to be experienced as waves implies that h has
become a fraction of itself, hfraction. This further implies that c must have become greater than itself,
cN, such that the inequality specified by Equation 12.5 holds:
cN
cU
Eq. 12.5: Speed of light inequality
Note that what is implied here is that just as there is a nature of reality specified by U that is the
result of the speed of light being 186 000 miles per second, so too there is another nature of reality
specified by N that is the result of a speed of light greater than 186 000 miles per second. The existence of other realities is perhaps consistent with recent developments in physics with the notion of
property spaces being separate from but influencing physical space as explored by Nobel physicist
Frank Wilczek (2016), among others. But further in Slow Light Perkowitz’s recent treatment of
today’s breakthroughs in the science of light (Perkowitz 2011), he states: “Although relativity
implies that it’s impossible to accelerate an object to the speed of light, the theory may not disallow
particles already moving at speed c or greater.”
It stands to reason that current instrumentation, experience, and normal modes of thinking having developed as a by-product of the characteristics so created in the layer of reality U may be
inadequate to access N without appropriate modification.
227
228
12 Light’s Properties and Power in Facilitating Organizational Change
The notion of wave–particle duality already challenges the notion of normal thinking perhaps
because wave-like phenomena is a function of faster than c motion and particle-like phenomena is
a function of less than or equal to c motion. That these may be happening simultaneously is reinforced by principles such as complementarity in which experimental observation may allow measurement of one or another but not of both (Whitaker 2006).
But then taking this trend of a possible increase in the speed of light to its limit, this will result
in a speed of light of infinite miles per second. The question is, what is the nature of reality when
light is traveling at infinite miles per second? In any space-time continuum, be it an area or volume, regardless of scale, light originating at any point will instantaneously have arrived at every
other point. Hence light will have a full and immediate presence in that space-time continuum.
Further, that light will know everything that is happening in that space-time completely instantaneously – that is know what is emerging, what is changing, what is diminishing, what may be
connected to what, and so on – or have a quality of knowledge. It will connect every object in that
space-time completely and therefore have a quality of connection or harmony. Finally, nothing
will be able to resist it or set up a separate reality that excludes it and hence it will have a quality
of power.
These implicit characteristics of the nature of light as experienced at the layer of reality set up by
light traveling infinitely fast may hence be summarized by Equation 12.6, where c refers to the
speed of light of miles per second, which has created the perceived nature of reality, :
c : Presence, Power, Knowledge, Harmony
Eq. 12.6: Nature of reality due to light at
But it can also be noticed from (12.4) that “physical” is related to presence, “vital” is related to
power, “mental” is related to knowledge, and “connection” is related to harmony.
The question then, is how do these apparent qualities at precipitate, translate into, or become
the physical-vital-mental-connection-based diversity experienced at U? This may be achieved
through the intervention or action of a couple of mathematical transformations. First, the essential characteristics of presence, power, knowledge, and harmony that it is posited exist at every
point instant by virtue of the ubiquity of light at will need to be expressed as sets with up to
infinite elements. Such a precipitation is none other than an act of quantization since something
implicit in the layer where light travels faster is collecting in “quanta” to be expressed more materially in the layer where light travels slower. Second, elements in these sets will need to combine
together in potentially infinite ways to create a myriad of seeds or signatures that then become the
source of the immense diversity experienced at U. This, similarly, is also an act of quantization or
the action of a “quantization function.” This suggests that all that is seen and experienced at U
may be nothing other than “information” or “content” of light and as such that there are fundamental mathematical symmetries at play where everything at U is essentially the same thing that
exists at .
It may also be inferred that wherever wave–particle duality exists, it does so because of a
more observable quantum translation from one speed of light to another through the device
of quanta.
Assuming that the first transformation occurs at a layer of reality K where the speed of light is
cK, such that cU < cK < c , this may be expressed by Equation 12.7:
cK : SPr , SPo , SK , SH
Eq. 12.7: Nature of reality due to light at K
12.2 Implicit Properties and a Mathematical Model of Ligh
SPr signifies “set of presence” and may have elements associated with the qualities of being present everywhere or of creating a physical basis in or on which other functions or characteristics can
manifest. Hence SPr may have elements as expressed by Equation 12.8:
SPr Service, Diligence, Perseverance, Stability,
Eq. 12.8: Set of presence
SPo signifies “set of power” and may have elements associated with the qualities of being powerful or of the play of vitality and experimentation that creates all possibility. Hence SPo may have
elements as expressed by Equation 12.9:
SPo Power, Energy, Adventure, Experimentation,
Eq. 12.9: Set of power
SK signifies “set of knowledge” and may have elements associated with the qualities of knowledge or the search and codification of knowledge. Hence SK may have elements as expressed by
Equation 12.10:
SK Knowledge, Making of Laws, Spread of Knowl.,
Eq. 12.10: Set of knowledge
SH signifies “set of harmony” and may have elements associated with the qualities of harmony
or creating relationship and love. Hence SH may have elements as expressed by Equation 12.11:
SH Harmony, Relationship, Love, Specialization,
Eq. 12.11: Set of harmony
Assuming that the second transformation occurs at a layer of reality N where the speed of light
is cN, such that cU < cN < cK < c , this may be expressed by Equation 12.12:
cN : f SPr SPo SK SH
Eq. 12.12: Nature of reality due to light at N
The unique seeds are therefore a function, f, of some unique combination of the elements in the
four sets SPr, SPo, SK, SH.
The relationship between the layers of light may be hypothesized by the following matrix
(Equation 12.13):
c : Pr, Po, K , H
RCK
f RC
cK : SPr , SPo , SK , SH
RCN
f RCK
cN : f SPr SPo SK SH
RCU
f RCN
cU : P,V , M , C
Light
Eq. 12.13: Relationship between layers of light
229
230
12 Light’s Properties and Power in Facilitating Organizational Change
The matrix suggests a series of transformations leading from the ubiquitous nature of light
implicit in a point – presence, power, knowledge, and harmony – to the seeming diversity of matter
observed at the layer of reality U, which is fundamentally the same presence, power, knowledge,
and harmony projected into another form of itself.
The first transformation is summarized by Equation 12.14:
RCK
f RC
Eq. 12.14: First transformation
This is suggesting that the reality at the layer specified by the speed of light cK, RCK is a function
of the reality at the layer specified by the speed of light c . This transformation translates the essential nature of a point into the sets described by (12.8–12.11). Note that (12.14) is essentially a quantization function, in that something of the reality of light existing at RC is translated into reality
experienced at RCK .
The second transformation is summarized by Equation 12.15:
RCN
f RCK
Eq. 12.15: Second transformation
This is suggesting that the reality at the layer specified by the speed of light cN, RCN is a function
of the reality at the layer specified by the speed of light cK. This transformation combines elements
of the sets into unique seeds as suggested by (12.12). This transformation can also be thought of as
the result of a quantization function such that something of RCK is collected as unique seeds at RCN .
The third transformation is summarized by Equation 12.16:
RCU
f RCN
Eq. 12.16: Third transformation
This is suggesting that the reality at the layer specified by the speed of light cU, RCU is a function
of the reality at the layer specified by the speed of light cN. This transformation builds on the
unique seeds suggested by (12.12) to create the diversity of U as specified by (12.4). This transformation is therefore also the result of a quantization function such that the seed aspect of RCN is
translated into the immense diversity experienced at RCU .
In this framework the notion of wave–particle duality hence may become complementary block–
field–wave–particle quadrality where block refers to phenomenon resident to , field to phenomenon resident to N, wave to phenomenon resident to K, and particle to phenomenon resident to
U. The essential translation from one level to the next is due to a series of quantization functions
so that (12.13) summarizes an algorithm for life (Malik and Pretorius 2019), where an implicit
quaternary basis of presence, power, knowledge, and harmony sets up potentially infinite number
of elements derived from sets of presence, power, knowledge, and harmony.
12.3 Materialization of Light
The preceding section elaborated a fourfold architecture to light. This architecture can be thought
of as organized by four implicit properties of light. These properties can in turn be thought of as
organizational principles, which it can be extrapolated, drive all the complex materialization of
12.3 Materialization of Ligh
matter, life, and beyond. This section will suggest some concrete examples of such fourfold materialization starting from the subtle to the overt.
12.3.1 The Electromagnetic Spectrum
As relates to the electromagnetic spectrum, the four characteristics of light are expressed by the
range of wavelengths implicit in the electromagnetic spectrum (knowledge), its implicit energy
gradient (power), the speed c with which it is propagated (harmony), and the potential for mass
(presence) also implicit in it, respectively.
Specifically, from the range of different types of waves from radio waves to gamma rays, determined as a function of frequency and wavelength of light, the electromagnetic spectrum itself is a
repository of knowledge of a vast range of phenomena experienced in the universe as indicated by
Equation 12.17:
f
Knowledge
Eq. 12.17: Knowledge aspect of electromagnetic spectrum
But further, there is a large variance in the frequency of light in the electromagnetic spectrum,
and this provides for a large variation in energy or power implicit in the electromagnetic spectrum
as suggested by Equation 12.18, where v is the frequency of the electromagnetic wave:
Power
hv
Eq. 12.18: Power aspect of electromagnetic spectrum
As already suggested the principle of harmony is related to the speed of light at U, CU, due to
possibilities of connection between mass-based entities existing in the reality so set up by light, and
as highlighted by Equation 12.19:
Harmony
CU
Eq. 12.19: Harmony aspect of electromagnetic spectrum
Finally, mass potential can be expressed in the following way since E = mc2 or m
tuting hv for E as in Equation 12.20:
Presence
hv
E
and substic2
c2
Eq. 12.20: Presence aspect of electromagnetic spectrum
Further, (12.12) has suggested how unique seeds can be created. Elaborating an equation for such
seeds that fulfills (12.12) can be adapted from Malik et al. (2015) and is summarized in Equation 12.21:
X
Seed
Xa Yb0
n
where
SPr , SPo , SK , SH
Y
SPr , SPo , SK , SH
a,b
b are integers; a b
Eq. 12.21: Unique seeds
Reproducing (12.12), CN: f(SPr × SPo × SK × SH), it can be seen that (12.21) combines elements from
each of the sets of the essential characteristics of light to conceivably spawn an infinite set of seeds.
Yb0 n implies that the Y or secondary element may be repeated multiple times.
231
232
12 Light’s Properties and Power in Facilitating Organizational Change
Now as an example, an application of (12.17) suggests seeds for the knowledge element or structure of the electromagnetic spectrum in Equation 12.22:
X
Seed EMSpectrum Structure
Xa Yb0
n
where
SK
Y
SPr , SPo , SK , SH
a, b are integers; a b
Eq. 12.22: Structure of electromagnetic spectrum
12.3.2 Quantum Particles
At the quantum level it is suggested that quarks are a precipitation of light’s property of knowledge. Quarks are the only fundamental particle contributing to creating the nucleus of an atom.
Protons, which determine atomic number, are composed of two “up” quarks and one “down”
quark. Atomic number in turn uniquely identifies the element from the periodic table. Hence, an
atomic number of 47, for example, specifies that the element is silver. In other words, it can be suggested that the unique properties of an element – the knowledge of what it is and how it will
behave in the universe – are related to the quark. This is summarized by Equation 12.23:
Knowledge
f quarks
Eq. 12.23: Knowledge aspect of quantum particles
Electrons can be considered as a precipitation of light’s property of power. If the apparent characteristics of leptons are considered, they appear to be point-like particles without internal structure (Olive et al. 2014). While quarks only exist in composite particles with other quarks, leptons
are solitary particles. The best-known lepton is the electron. In his book Representing Electrons: A
Biographical Approach to Theoretical Entities, Arabatzis (2006) details the characteristics of electrons. The electron may be considered as a surrogate for the lepton class. The electron appears to
be the associated with the flow of energy and power. Further they appear to be the adventurers,
easily leaving the atom they are a part of. They also lock or form bonds with other atoms through
the force of attraction and repulsion. This is summarized by Equation 12.24:
Power|Energy
f leptons
Eq. 12.24: Power aspect of quantum particles
Bosons are thought of as force carriers. They allow all known quantum particles to interact. The
three fundamental bosons in this category are the photon, the W and Z bosons, and the gluon. The
carrier particle of the electromagnetic force is the photon. The carrier particle of the strong nuclear
force that holds quarks together is the gluon. The carrier particle for the weak interactions, responsible for the decay of massive quarks and leptons into lighter quarks and leptons, is the W and Z
bosons. Bosons can be thought of as the precipitation of what creates relationship and harmony at
the quantum level. Hence, they can be thought of as the precipitation of light’s property of harmony as summarized by Equation 12.25:
Harmony
f bosons
Eq. 12.25: Harmony aspect of quantum particles
This leaves the other discovered fundamental particle the Higgs boson. In ordinary matter, most
of the mass is contained in atoms, and the majority of the mass of an atom resides in the nucleus,
12.3 Materialization of Ligh
made of protons and neutrons. Protons and neutrons are each made of three quarks. It is the
quarks that get their mass by interacting with the Higgs field (Olive et al. 2014). Hence the Higgs
boson can be thought of as the mass giver. In other words, it is what gives presence to the quarks,
and it can be thought of as the precipitation of light’s property of presence as summarized by
Equation 12.26:
Presence
f Higgs _ boson
Eq. 12.26: Presence aspect of quantum particles
Just as there are multiple particles in each of the other “families,” it is likely that there will be
multiple particles in the Higgs boson family. Recent research at CERN indicates that the Higgs
boson may have a cousin (Overbye 2015).
Further, as an example from the layer of quantum particles, the seed for the family of leptons
with the primary x-element deriving from the set of power is suggested by Equation 12.27:
X
Seed Leptons
Xa Yb0
n
where
SPo
Y
SPr , SPo , SK , SH
a, b are integers; a b
Eq. 12.27: Signature of leptons
12.3.3 The Periodic Table and Atoms
All atoms in the periodic table can be classified by the p-group, d-group, d-group, and f-group.
The p-group of elements are those with a valence shell specified by the p-orbital, indicating that
the probability of the existence of an electron is equally likely on either side of the nucleus. There
are some very significant elements in this group that are part of the metal, metalloid, nonmetal,
halogen, and noble gas subgroupings. Carbon, nitrogen, oxygen, and silicon are some of the sample elements. In some sense this grouping summarizes all the element possibilities within it. It is
perhaps that the possibility of ideas behind all elements has precipitated in this group, and one can
hypothesize that this group may be a reflection of the set of knowledge, forming archetypes from
which all other elements are created.
Philosophically, the one probability cloud (s), to be discussed shortly, becoming two (p) signifies
an essential polarity created within a unit space. Considering the hypothesis that the form is a
“switching” function that attracts function into form, then this dual manifestation may be viewed
as the prerequisite condition by which a larger number of such “switches” also come into being.
These “essential two” created along three dimensions of space may allow a threshold meta-function experimentation to come into being. Being the first instance of this variability in space, it could
be that it therefore becomes an attractor for all the essential element archetypes to precipitate.
But further, the essential elements that allow both thinking and virtual thinking machines to
come into being are also contained within this group. Carbon is the basis of DNA and of all life.
The fact that silicon (Si), directly below it in the periodic table and therefore sharing essential
qualities, is considered the basis of all virtual thinking machines is perhaps significant and may
reinforce the notion that the p-group is a precipitation of light’s property of knowledge, as summarized by Equation 12.28:
Knowledge
f p _ orbital
Eq. 12.28: Knowledge aspect of periodic table
233
234
12 Light’s Properties and Power in Facilitating Organizational Change
The d-group comprises the transition metals. These metals are generally hard and strong, exhibit
corrosive resistance, and can be thought of as workhorse elements. Many industrial and wellknown elements sit in this group: titanium, chromium, manganese, iron, cobalt, nickel, copper,
zinc, silver, platinum, and gold, among others.
The d-orbital itself is a probability space characterized by four lobes around the nucleus. Four
lobes occurring in five possible planes around the nucleus will likely create a space of stability,
since there is a possibility of four lobes creating the four vertices of a tetrahedron that has been
implicitly positioned as one of the most stable shapes (Fuller 1982). Work done in crystal field
theory (UCDAVIS-CFT 2015) reinforces this concept. The general stability of the transition metals
is reinforced by the d-orbital arrangement.
Much of the constructed world around us is created from these elements. Further, most of the
series in the group easily lose one or more electrons to form a vast array of compounds. It can be
seen that these metals exist for service, to help bring about perfection in the constructed world, to
help much of the machinery in which they are used, and to assist the processes dependent on them
to be completed with diligence. Hence, these transition metals appear to be a precipitation of
light’s property of presence, as suggested by Equation 12.29:
Presence
f d _ orbital
Eq. 12.29: Presence aspect of periodic table
Exploring the s-group, one sees that it consists primarily of alkali metals and alkali earth metals.
These groups are extremely electropositive, easily losing electrons and forming positive ions and
releasing a lot of energy while doing so. In his book Essential Elements, Tweed (2003) refers to these
groups as the “violent world of the s-block.” Gray (2009), in The Elements, points out that stars
shine because they are transmuting vast amounts of hydrogen into helium, both of which are
s-block elements. This characteristic of easily released energy that the elements of this group share
suggests that the s-group may parallel or be a precipitation of light’s property of power as suggested
by Equation 12.30:
Power
f s _ orbital
Eq. 12.30: Power aspect of periodic table
Philosophically the s-orbital as a probability cloud indicates the equal likelihood that an electron can be anywhere in a symmetrical sphere around a nucleus. Since all other orbitals can be
thought of as occurring within the cloud specified by the s-orbital, in some sense, this is like an
imprint or precipitation from meta-levels that allows future and more varied meta-functions to
more easily precipitate at the level of U. The elements that are part of the s-group may be thought
of as the adventurers with courage who venture into a brave new world to create some foundation
by which all other element creations can follow. The fact that H and He constitute 98% of the
universe (Heiserman 1991) relative to other elements therefore makes sense in this view, especially since H and He provide the fuel with which the star furnaces manufacture all other
elements.
The f-group comprises the lanthanides and actinides. Philosophically, the f-orbital consists of six
probability lobes around the nucleus in seven different planes, implicitly suggesting the notion of
extended relationship and collectivity: the attempt to build larger and larger bonds within a small
space. Continuing to draw the link with the quaternary architecture, it is likely that this group is a
precipitation of light’s property of harmony.
12.3 Materialization of Ligh
Thinking about lanthanides, some interesting facts may reinforce this notion:
●●
●●
First, the spin of electrons in the valence shell is aligned, creating a very strong magnetic field.
The notion of creating a strong magnetic field seems to be consistent with the notion of engendering a collectivity through the ordered attraction and repulsion of elements.
Second, these elements curiously occur together in nature often in the same ores and are chemically
interchangeable (Gray 2009), also suggesting the notion of forming a tight intragroup collectivity.
The following observations as it relates to actinides can be made:
1) Actinides are inherently radioactive. This implies that these elements have inherently crossed a
threshold of stability and have the urge, over their own half-lives, to decompose into other elements. This natural urge may suggest some boundary conditions on the notion of collectivity
and nurturing, giving insight into these conditions.
2) The entire actinide group, as opposed to the lanthanide group that is inherently stable, is unstable. It is curious that both these should be part of the f-group and they must provide insight into
boundary conditions into the notion of collectivity in elements.
Equation 12.31 summarizes the correlation with light’s property of harmony:
Harmony
f f _ orbital
Eq. 12.31: Harmony aspect of periodic table
The seed for the family of lanthanides with an f-orbital valence shell with the primary x-element
deriving from the set of harmony, as an example from this category of atoms, is suggested by
Equation 12.32:
X
Seed Lanthanides
Xa Yb0
n
where
SH
Y
SPr , SPo , SK , SH
b are integers; a b
a,b
Eq. 12.32: Signature of lanthanides
12.3.4 A Living Cell
In The Machinery of Life, Goodsell, an associate professor of molecular biology at the Scripps
Research Institute (Goodsell 2010), suggests that every living thing on Earth uses a similar set of
molecules to eat, to breathe, to move, and to reproduce. There are molecular machines that do the
myriad things that distinguish living organisms that are identical in all living cells. This nanoscale
machinery of cells uses four basic molecular plans with unique chemical personalities: nucleic
acids, proteins, lipids, and polysaccharides.
Nucleic acids basically encode information. They store and transmit the genome, the hereditary
information needed to keep the cell alive. They function as the cell’s librarians and contain information on how to make proteins and when to make them. They are, hence, the keepers of a cell’s
knowledge, its wisdom, and its ability to make laws and the vehicle to spread knowledge within
cells and to the next generation of cells. Nucleic acids can therefore be thought of as a precipitation
of light’s property of knowledge at the cellular level as specified by Equation 12.33:
SK
cell
Knowledge, Wisdom, Law Making, Spread of Knowl
Eq. 12.33: Nucleic acids as set of knowledge
235
236
12 Light’s Properties and Power in Facilitating Organizational Change
This relationship may also be summarized more simply as Equation 12.34:
Knowledge
f nucleic acids
Eq. 12.34: Knowledge aspect of a living cell
Proteins are the cells’ workhorses. Proteins are found working in any part of the cell. Proteins are
built in thousands of shapes and sizes, each performing a different function. As Goodsell describes,
“some are built simply to adopt a defined shape, assembling into rods, nets, hollow spheres, and
tubes. Some are molecular motors, using energy to rotate, or flex, or crawl. Many are chemical catalysts that perform chemical reactions atom-by-atom, transferring and transforming chemical
groups exactly as needed.” With their wide potential for diversity, proteins are constructed to perform most of the everyday tasks of the cells. In fact, human cells build around 30 000 different
kinds of proteins to execute on the diverse array of cellular level tasks.
Proteins, hence, exist for service, to bring about perfection at the level of the cell, are characterized by extreme diligence and perseverance and so on. Proteins can therefore be thought of as a
precipitation of light’s property of presence at the cellular level as specified by Equation 12.35:
SPr
cell
Service, Perfection, Diligence, Perseverance,
Eq. 12.35: Proteins as set of presence
This relationship may also be summarized more simply as Equation 12.36:
Presence
f proteins
Eq. 12.36: Presence aspect of a living cell
Lipids by themselves are tiny molecules, but when grouped together form the largest structures
of the cell. When placed in water lipid molecules aggregate to form huge waterproof sheets. These
sheets easily form boundaries at multiple levels and allow concentrated interactions and work to
be performed within a cell. Hence, the nucleus and the mitochondria are contained within lipiddefined compartments. Similarly, each cell itself is contained within a lipid-defined boundary.
Lipids are therefore promoters of relationship, of harmony in the cell, of nurturing the cell-level
division of labor, of allowing specialization and uniqueness to emerge, and hence perhaps even of
early forms of compassion and love. This function of harmonization suggests that lipids can therefore be thought of as a precipitation of light’s property of harmony at the cellular level as specified
by Equation 12.37:
SH
cell
Love, Compassion, Harmony, Relationship,
Eq. 12.37: Lipids as set of harmony
This relationship may also be summarized more simply as Equation 12.38:
Harmony
f lipids
Eq. 12.38: Harmony aspect of a living cell
Polysaccharides are long, often branched chains of sugar molecules. Sugars are covered with
hydroxyl groups, which associate to form storage containers. As a result, polysaccharides function
as the storehouse of cell’s energy. In addition, polysaccharides are also used to build some of the
most durable biological structures. The stiff shell of insects, for example, is made of long
polysaccharides.
12.3 Materialization of Ligh
Polysaccharides function to create energy, power, courage, and strength, thereby readying the cell for
adventure, among related functions. Providing energy and strength, polysaccharides can be thought of
as a precipitation of light’s property of power at the cellular level as specified by Equation 12.39:
SPo cell Power, Courage, Adventure, Justice,
Eq. 12.39: Polysaccharides as set of power
This relationship may also be summarized more simply as Equation 12.40:
Power
f polysaccharides
Eq. 12.40: Power aspect of a living cell
The seed for the family of proteins with the primary x-element deriving from the set of presence,
as an example from the layer of cells, is suggested by Equation 12.41:
X
Seed protein
Xa Yb0
n
where
SPr
Y
SPr , SPo , SK , SH
a, b are integers; a b
Eq. 12.41: Signature of a protein
As an illustration, (12.41) could yield a vast number of functional proteins: in fact, it may be possible that the 30 000 or so known proteins created by the human cell could each be specified by a
signature equation of this nature.
12.3.5
Fundamental Capacities of Self
Fundamental capacities of self, such as sensations, wills, desires, feelings, urges, and thought, can
also be seen to be emergences of the essential organizing principles implicit in light.
Sensations are those things we experience with our senses. We see things, hear things, smell
things, taste things, and can touch things. This ability to enter into relationship with objects
through sensation is nothing other than a result of the emergence of light’s property of presence.
We become present to presence through the device of sensation. Sensation can be thought of as the
means by which this property of light – presence – molds or ingrains itself in us as human beings.
Its potentiality, all of which is contained in this aspect of light, becomes available to us through the
power of sensation. Equation 12.42 generally represents the family of sensations. Some of the elements in the sets that it would comprise of may be “tangible” and “take notice of,” among others:
X
Sigsensation
Xa Yb0
n
where Y
SSystem Pr
SSystem Pr , SSystem P , SSystem K , SSystem N
a, b are integers; a b
Eq. 12.42: Sensation
But there is also a deeper experience of sensation that is possible. When we see things, for
instance, what are we seeing? Is it just the surface rendering of the play of matter, or do we see that
the fullness of light is still there, with all its potentiality and possibility, in the smallest thing we
look at? Do we see that the whole universe and more is present in all its fullness in the least thing
that we easily ignore, or belittle, or loathe? When we touch things, is it the seeming concreteness
of the play of the particles or atoms or chains of molecules that we touch? Or is it the love and light
237
238
12 Light’s Properties and Power in Facilitating Organizational Change
and the vastness of all that IS that allows itself to be as a small corner that we touch so as to make
infinity be felt by something so finite?
Such a deeper contact offered through sensation suggests a subset of (12.42) with secondary elements perhaps described as “fullness of light” and “contacting infinity,” among others, thus also
yielding an equation:
X
Sigdeeper
sensation
Xa Yb0
n
where Y
SSystem Pr
SSystem Prr , SSystem P , SSystem K , SSystem N
a, b are integers; a
b
Eq. 12.43: Deeper sensation
This relationship may also be summarized more simply as Equation 12.44:
Presence
f sensations
Eq. 12.44: Presence aspect of fundamental capacities of self
Urges and desires and wills are similarly a play of the emergence of light’s property of power. In
the mystery of focus, the vastness of light has projected itself in us into an apparent smallness that
is in reality everything that is. And this smallness is trying through urge and desire and will to connect viscerally or even intentionally to other smallnesses that similarly are nothing other than the
fullness of light projected into a small smorgasbord of selected function. So the urge or desire for
food, or companionship, or of possession, or of climbing a peak, is nothing other than light’s compressed property of power, trying to reach more of the fullness that it is through a fulfillment of the
urge or desire or will that it masquerades as. Hence urges can be represented as Equation 12.45:
X
Sig urges
Xa Yb0
n
where Y
SSystem P
SSystem Pr , SSystem P , SSystem K , SSystem N
a, b are integers; a b
Eq. 12.45: Urges
Elements may be of the type of “grasp,” “possess,” and “deeply connect,” among others.
This relationship may also be summarized more simply as Equation 12.46:
Power
f urges
Eq. 12.46: Power aspect of fundamental capacities of self
Feelings and emotions are a play of the emergence of light’s property of harmony. Its instrument is
the heart, and it generates an array of emotions that are an indication or active radar of whether we
are moving toward or away from a reality of harmony, whether based on our small self or some larger
self of light. Gradually, by navigating with these emotions and feelings, we can get to a state where we
always feel positive emotions, which basically means we have more truly entered into relationship
with some larger continent of light. An equation for feelings is as represented by Equation 12.47:
X
Sigfeelings
Xa Yb0
Eq. 12.47: Feelings
n
where Y
SSystem N
SSystem Pr , SSystem P , SSystem K , SSystem N
a, b are integers; a b
12.4 Leveraging Light to Bring About Organizational Chang
This relationship may also be summarized more simply as Equation 12.48:
Harmony
f feelings
Eq. 12.48: Harmony aspect of fundamental capacities of self
Thoughts are a play of the emergence of light’s property of knowledge. Through the thought we
can become greater or conceptualize things greater or begun to enter into relationship with some
things other than our small self. Thought allows us to connect to more “othernesses” or even the
oneness of the reality of light. An equation for thoughts, Equation 12.49, is the following:
X
Sig thoughts
Xa Yb0
n
where Y
SSystem K
SSystem Pr , SSystem P , SSystem K , SSystem N
a, b are integers; a b
Eq. 12.49: Thoughts
This relationship may also be summarized more simply as Equation 12.50:
Knowledge
f thoughts
Eq. 12.50: Knowledge aspect of fundamental capacities of self
12.4 Leveraging Light to Bring About Organizational Change
The previous section illustrates how the four properties implicit in light of knowledge, power, presence, and harmony act as organizational principles to structure progressively more complex layers
of matter, starting from the electromagnetic spectrum and ending in molecular plans at the level
of living cells. By extrapolation all tissues, composed of living cells, and therefore all organs, and
therefore the very body of all living things, are nothing other than a materialization of light. It was
also suggested that fundamental capacities of self are ordered by the four principles implicit in
light. Such ordering at the level of matter and life also implies that all collectivities comprising
groups of human beings, and therefore also, larger and larger collections of collectivities bordering
on and including civilizations, can also be reseen as emerging from light.
Further, as human beings and through force of habit, it is easy for us to always approach an issue
or a problem in the same way. We each have a set of beliefs, assumptions, and behaviors, with
which we process circumstance. As a result, in the arbitration of possibility, we tend to only reinforce dynamics at U, at the bottom layer in (12.13). In other words, we rarely invoke the other layers
of light present in (12.13) because usually a conception or activation of these is not part of our usual
processing instrumentation. If, however, we consciously allow light to enter into our conception of
circumstances, then the arbitration of possibility taps into super-sets of functionality and possibility resident at meta-layers of light, as a result of which the potential outcomes may be superior than
in the absence of the availability of such super-sets. This has implications for HSE in that systems
can be engineered to prod individuals to process circumstance differently by helping them to overcome habitual patterns and perceptions faster. Experimentations using an emotional intelligencebased system, aligned with the math introduced in this chapter, have been used in a complex
medical environment to help individuals shift emotional patterns (Malik and Pretorius 2018b).
Imagining light or reseeing that everything is in fact emergent from light hence viscerally connects us with light, and this initiates an automatic and more complete real-time quantum computation in which the information field accompanying or defining a circumstance or event is changed.
239
240
12 Light’s Properties and Power in Facilitating Organizational Change
Recall that quanta are a bridge between a faster-moving layer of light and a slower-moving one.
Quanta in fact collect possibility from a faster-moving layer of light and make it more materially
available in a slower-moving layer of light. Reseeing any situation as constituted in light more easily connects us with the full complexity imagined by (12.13) and allows possibility present in metalayers to become more relevant in arbitrating possibility that occurs at U. Such an arbitration
involving quanta connecting multiple layers of light is none other than an act of quantum computation. Contemporary schemes involving quantum computation are more based on probability, as
proposed by quantum scientists such as MIT’s Seth Lloyd (2007), in contrast to the more deterministic approach (Malik et al. 2017a) framed by possibilities existing in each layer of (12.13), as proposed here.
The output of any computation is always information of some sort. Further, all circumstance,
intimately composed of emergent layers of light and always influenced by meta-layers of light, is
encapsulating nothing but a sophisticated array of information. Reseeing a situation from the bottom up, starting at the level of the electromagnetic spectrum, through quantum particles, through
atoms, through molecules, and so on, is in fact a master act that allows the greater logic, possibilities, and information content of light-based emergent and meta-layers to automatically become
active in the reseen situation. This further allows the reseen situation to admit of a larger set of
dynamics than just the beliefs, perceptions, and assumptions with which it is seen by an observer,
thereby allowing the information field of that reseen situation to change. The changing of the
information field allows different potential outcomes to emerge than would have been possible in
the absence of such an act of reseeing.
Hence, no matter what the situation and no matter how complex it is, it is possible to alter it
through a conscious act of reseeing or reenvisioning it. Note though that meta-layers of light,
involving super-sets, unique seeds, and implicit properties, have a different logic than the layer of
reality created by light traveling at c and when invoked will likely result in an outcome aligned with
a more global perspective than a perspective engendered by a more myopic individual view. In
other words, while the outcome of a reseen situation will be enhanced, a person or group of people
involved in such reseeing should not expect that they can mold outcomes based on their perceptions, beliefs, and assumptions alone. While people can act to change a circumstance through an
act of reseeing it, they will need to give up expectations on likely outcomes and trust instead that
the best thing from a more global perspective is what will happen. Light, a priori, is envisioned as
being ubiquitous, connecting things in a single embrace, and with a power and knowledge that is
radically different than what any individual or group of individuals is capable of.
Over the last one year, the author has conducted a number of workshops both within and outside Zappos.com LLC. These have involved people with diverse backgrounds representative of all
functions within a complex Internet technology organization. Typically, up to 15 people have participated in a single 2.5-hour workshop. Most participants have no background in any of the materials they are exposed to in a workshop and essentially come in cold to a workshop. The first half
of the workshop summarizes the theoretical basis of light, as laid out in Sections 12.1 and 12.2. The
materials though are presented pictorially and in a nonmathematical way. The first half of the
workshop aims at addressing two questions through interactive inquiry. First, what is light made
up of? Second, what is made up of light? At the end of the first half of the workshop, usually participants will experience some “aha” moment and conceptually acknowledge that in fact light can
be in everything and that everything can emerge from light. Once this is experienced, the participants are ready for the second half of the workshop.
The second half, by contrast, is practical and involves reenvisioning objects and situations as
light. While the guided sessions of the workshop start off with simple reenvisioning, seeing, for
12.4 Leveraging Light to Bring About Organizational Chang
example, a rose as emerging from light, these reenvisionings progressively become more complex
involving work projects or even unresolved conflict situations. In the self-practice part of the workshop, which usually happens closer to the end of the second half, situations envisioned by participants often expand to encompass the full range of issues typically experienced by an organization.
The following summarize light maxims that structure the workshops and can be thought of as
individual takeaways aimed at helping participants facilitate ongoing change:
1) Fluency in light dynamics is like a muscle that needs to be built: The biggest obstacle to change is
one’s own continued reinforcement of individual perceptions, beliefs, and assumptions. In reality each individual is highly creative. The only problem is that the reality being created is always
created using the same materials derived from one’s own limited perceptions, beliefs, and
assumptions. Therefore, the outcome is always the same and it appears as though nothing is
really changing. The very possibility of a continuous and persistent quantum computation
though reinforces that change is possible at every instant. The only thing stopping it is one’s
own programming. Actively using light dynamics, to the point where it is an automatic feature
in individual processing of circumstances, can therefore be a very powerful thing. But such an
active use of light dynamics will not happen just by itself or through one or two guided sessions.
It has to be taken on seriously and practiced consistently for it to become second nature and for
it to begin to influence change in a meaningful way.
2) Learn to perceive light differently – light is in everything, and everything arises from light: With
eyes closed or open, it is possible to see that light is in everything and that everything arises
from light. Even though light is everywhere and even though in its known manifestation of the
electromagnetic spectrum, it is foundational to most technologies that drive the world, and
even though without it life would not exist, we just take it for grated without even contemplating what it really is. Yes, artists, scientists, and mystics have focused on it to try to penetrate
something of its mystery. But such penetration does not require us to be either artist, or scientist, or mystic. Since we are ourselves intimately built from it, it is each individual’s natural right
and privilege to know it once one begins to see it and resee all in it. The more one resees in light,
the more one connects with its global and freeing nature, and progressively even, becomes
something or someone entirely different.
3) Creating one’s own light sphere will help facilitate any kind of change: Every person has a natural
center within them, and often this is within the heart. In reference to (12.13) the center of a
person can be thought of as that place where the unique seed formed through action of metalayers of light resides within a person. This unique seed can be thought of as the anchor or
center of the personality unique to a person. To create one’s light sphere, one begins by focusing
on this center and revisualizing it as a small sphere of light. Slowly and gradually one can envision this light sphere growing so that more and more of one’s own body and being is encompassed by it. Gradually one can further expand one’s light sphere to become larger than oneself.
At each step of the expansion, it is important to try to experience the nature of light – its warmth,
its glow, its dynamism, and its love. From the bottom up, given that every single part of us is
emergent from light, as discussed in detail in Sections 12.2 and 12.3, envisioning such a light
sphere connects us with our own ever-present source of light, which is of the nature of light in
its fullness and as embodied, at least mathematically, by (12.13). Connecting with and nurturing this light sphere allow us to participate more consciously and actively in the persistent and
ongoing quantum computation that influences all things. It is like turning on and keeping on
our own personal computing device, just as we turn on, keep on, and use computing devices
such as smartphones and computers. Except the computational machinery that animates the
241
242
12 Light’s Properties and Power in Facilitating Organizational Change
light sphere is intimately connected with all other life and all other objects in a way in which we
cannot imagine, and the dynamics that it has access to and can influence are essentially
unbounded and become bounded only by the paucity of our own imagination.
4) Any person or situation or condition can be invited into one’s light sphere and be reseen in light:
One’s light sphere is essentially dynamic, with living light flows and a body of light. Experiencing
light within one’s light sphere connects one, even if one does not quite feel this, with the essential oneness and nature of light. And being so connected it is easier to resee anything or anyone
or any circumstance within one’s light sphere. In fact, the process of beginning to bring about
holistic change to any circumstance is simply to begin to invite that circumstance into one’s
personal light sphere. It is then necessary, without judgment, without any expectation of outcome or result to see that the light in one’s light sphere is completely filling and flowing through
the object or person or circumstance that has been invited into the light sphere. That invited
entity has to be reseen in light. If one sees that there are thoughts or emotions or feelings or
sensations that arise from the invited entity, or even from the reseeing of oneself within one’s
light sphere, one needs to see that all these too are nothing but light itself. This needs to be
reseen again and again. The invited entity or situation within one’s light sphere needs to continually be flooded with light. This action needs to continue until one feels that it cannot be
continued anymore.
5) Light has its own logic and will change the information field of anything in one’s light sphere: The
nature of light, regardless of the speed it may be traveling at, is one. When one connects with
some image of light in oneself, one is essentially connecting with the full nature of light,
whether one feels or sees or realizes this or not. That is the power of reseeing in light. It immediately brings one into full contact with the multidimensional power of light. Light is multidimensional along the separate dimensions of knowledge, of power, of harmony, and of presence
or service. Each of these dimensions generates a vast amount of information, as suggested by
Equations (12.7)–(12.12). When one resees something or someone or some situation in light,
then the essential observer–observee dynamic as suggested by numerous experiments in quantum physics (Lanza and Berman 2009) can basically alter the active information fields, as a
result of which the active dynamics related with that something or someone or situation can
change. The change is not something that can be architected as per one’s own narrow wants.
But light itself, having been invoked, will begin to alter the information field in subtle ways and
as per the vaster view and logic contained in its natural ubiquity.
6) The power to positively influence change is limited only by the relationship with one’s own light
sphere: It is easy to resign to circumstance and to continue to see everything with the embedded
lenses that are habitually used to see and to think and to feel. But the very repetition of the act
of seeing or feeling or thinking in the same way is nothing other than a highly creative act in
which past models of personal reality are reinforced in every new moment to recreate the range
of effective dynamics in that moment. Hence, the more one invests in one’s own light sphere,
being able to dynamically resee any situation or person or groups of persons or objects as light
and flooded with light, and the more one is able to see that light has its own logic and therefore
that personal expectation and wanting of a particular outcome or result can be quite ineffective,
the more powerful light dynamics within one’s own light sphere can become, and the more
effectively can circumstance, regardless of scale and complexity, be directly influenced to
change into something better from a more global and impersonal perspective. Being able to
change things, then, comes down to developing a relationship with one’s own light sphere.
These six light maxims also surface additional design considerations to be incorporated in any
HSE framework.
Reference
12.5 Summary and Conclusion
Even though light is present everywhere, drives most of our technologies, and is responsible for all
of life on earth, we hardly know it, understand it, nor cultivate it. Yet it is among the most easily
accessible of all phenomena, and as this chapter suggests, has intimately architected the emergence of all of matter, life, and even what may lie beyond these.
The infinite information codified in light is suggested to be due to the all possibility of its nature
as perceived when light travels infinitely fast and is organized along four axes or dimensions that
we call knowledge, power, presence, and harmony. The infinite diversity that exists when light
travels at c is suggested to be due to a process of materialization involving quanta. Such materialization ordered along the four implicit properties or dimensions within light becomes apparent as
one perceives the natural fourfold ordering that exists at increasing levels of complexity through
matter and life, as made evident in the electromagnetic spectrum, quantum particles, atoms,
molecular plans, and fundamental capacities of the self.
The arbitration of possibility is suggested to be due to a constant quantum computation that happens at every moment and points to the inherently creative aspect of existence, whether in life, or
in matter, or in individuals. Habitual thinking and perceiving in individuals easily reinforce the
reality that an individual tends to be anchored to. But this can easily change through a process of
reseeing or reenvisioning everything in light.
The power to change things starts here and starts now. The most important protagonist in that
change is not leadership, but the individual, who by virtue of an intimate connection with light can
make change happen without permission and as the visceral urge to do so arises. HSE efforts need
to design for this possibility proactively. Instead of being victimized, an individual can through
practice, more effectively change the information field associated with any circumstance, as a
result of which a different outcome is likely to result. This is the ultimate act of power and has to
become part and parcel of the circumstance-processing capability of each individual. This is what
the light technology presented here aims to inculcate, and this is how real change can be effectively
facilitated by each person, all the time. This insight also suggests additional factors to be considered in any HSE effort. It is likely that such additional factors will have a positive effect by not only
chipping away at human limitations but also allowing existing human capabilities to be heightened.
References
Arabatzis, T. (2006). Representing Electrons: A Biological Approach to Theoretical Entities. Chicago:
University of Chicago.
De Broglie, L. (1929). The Wave Nature of the Electron. Nobel Lecture.
Einstein, A. (1995). Relativity: The Special and General Theory. New York: Broadway Books.
Ekspong, G. (2014). The Dual Nature of Light as Reflected in the Nobel Archives. Nobel Media AB 2014
(15 October). Nobelprize.org.
Feynman, R.P. (1985). The Strange Theory of Light and Matter. Princeton, NJ: Princeton
University Press.
Fuller, B. (1982). Synergetics: Explorations in the Geometry of Thinking. New York: MacMillan
Publishing Co.
Goodsell, D. (2010). The Machinery of Life. New York: Springer.
Gray, T. (2009). The Elements: A Visual Exploration of Every Known Atom in the Universe. New York:
Black Dog & Leventhal Publishers.
243
244
12 Light’s Properties and Power in Facilitating Organizational Change
Heiserman, D. (1991). Exploring Chemical Elements and Their Compounds. New York: McGraw-Hill.
Isaacson, W. (2008). Einstein: His Life and Universe. New York: Simon and Schuster.
Lanza, R. and Berman, B. (2009). Biocentrism: How Life and Consciousness Are the Keys to
Understanding the True Nature of the Universe. Dallas: Benbella Books.
Lloyd, S. (2007). Programming the Universe: A Quantum Computer Scientist Takes on the Cosmos.
New York: Vintage.
Lorentz, H.A. (1925). The Science of Nature, vol. 25, 1008. Springer.
Malik, P. (2009). Connecting Inner Power with Global Change: The Fractal Ladder. New Delhi: Sage
Publications.
Malik, P. (2017a). A Story of Light. Amazon Kindle & Google Books.
Malik, P. (2017b). Emergence. Amazon Kindle & Google Books.
Malik, P. (2017c). Quantum Certainty. Amazon Kindle & Google Books.
Malik, P. (2018a). Super Matter. Amazon Kindle & Google Books.
Malik, P. (2018b). Cosmology of Light. Amazon Kindle & Google Books.
Malik, P. (2018c). The Emperor’s Quantum Computer. Amazon Kindle & Google Books.
Malik, P. (2019a). The Origin and Possibilities of Genetics. Amazon Kindle & Google Books.
Malik, P. (2019b). The Second Singularity. Amazon Kindle & Google Books.
Malik, P. (2020). Light-based interpretation of quanta and implications for quantum computing. 2020
IEEE 9th Annual Computing and Communication Workshop and Conference (CCWC), Las Vegas,
NV (7 January).
Malik, P. and Pretorius, L. (2017b). Oceans of Innovation. Amazon Kindle & Google Books.
Malik, P. and Pretorius, L. (2018a). Symmetries of light and emergence of matter. Indian Journal of
Science and Technology 11 (14): 1–11. https://doi.org/10.17485/ijst/2018/v11i14/110789.
Malik, P. and Pretorius, L. (2018b). A case study validation of the application of a generalised equation
of innovation in complex adaptive systems. South African Journal of Industrial Engineering 29 (1):
1–20. https://doi.org/10.7166/29-1-1780.
Malik, P. and Pretorius, L. (2019). An algorithm for the emergence of life based on a multi-layered
symmetry-based model of light. 2019 IEEE 9th Annual Computing and Communication Workshop
and Conference (CCWC). doi:https://doi.org/10.1109/CCWC.2019.8666554.
Malik, P., Pretorius, L., and Winzker, D. (2015). A mathematical basis of innovation. Conference
Proceedings IAMOT 2015.
Malik, P., Pretorius, L., and Winzker, D. (2017a). Qualified determinism in emergent-technology
complex adaptive systems. In: 2017 IEEE Technology & Engineering Management Conference
(TEMSCON), Santa Clara, CA, 113–118. IEEE https://doi.org/10.1109/TEMSCON.2017.7998363.
Olive, K.A. et al. (2014). Particle data group. Chinese Physics C 38: 090001.
Overbye, D. (2015). Physicists in Europe find tantalizing hints of a mysterious new particle. New York
Times (15 December).
Perkowitz, S. (2011). Slow Light. London: Imperial College Press.
Tweed, M. (2003). Essential Elements: Atoms, Quarks, and the Periodic Table. New York: Walker &
Company.
UCDAVIS-CFT (2015). Description of Orbitals.
Whitaker, A. (2006). Einstein, Bohr and the Quantum Dilemma: From Quantum Theory to Quantum
Information. Cambridge: Cambridge University Press.
Wilczek, F. (2016). A Beautiful Question: Finding Nature’s Deep Design. New York: Penguin Books.
245
Section 5
From the Field
247
13
Observations of Real-Time Control Room Simulation
Hugh David with an editor introduction by Holly A. H. Handley
Chartered Institute of Ergonomics and Human Factors, Birmingham, UK
13.1 Introduction
13.1.1 What Is a “Real-Time Control Room Simulator”?
Real-time control room simulation is a method of investigating the design and operation of control
rooms. It is sometimes called “man-in-the-loop” simulation, a phrase that should be avoided since
not only is it sexist, but it implies an exclusively mechanical view of human activity. A real-time
control room simulator consists principally of a copy of the control room, with inputs provided by
computer data processors, with “simulator pilots” simulating the actions of vehicles under control
(usually under computer prompting) and skilled participants simulating operators of adjacent
control centers, where needed.
Traditionally, simulators have mostly been dedicated to a specific system, although the simulator
at the EUROCONTROL Experimental Centre, originally designed in the early 1970s, was the first
digital general-purpose simulator. The EUROCONTROL real-time simulator can be configured to
provide up to 40 working positions with 20 simulation staff, showing 200 aircraft simultaneously
in up to 20 sectors. A simulation study may take up to five weeks, with up to four 60- to 90-minute
runs on five days per week. It is still simulating many different air traffic control rooms, although
all parts of it have been renewed several times over the years (like Jack Hobbs’s cricket bat – three
new blades and two new handles but still the same bat.)
13.1.2 What Is It Used For?
Real-time control room simulators are used for elementary and advanced training and to test
proposed modifications to the system controlled. They will, in the future, be used increasingly
for skill maintenance, including practicing for emergencies. (Although emergencies are normally
Editor’s Note: Hugh David, an expert in control room simulations, provided this chapter based on his observations
of users while writing his book Control Room Simulation – The Real Life of Real-Time, David (2017). It appears
here in its entirety in Hugh’s colorful writing style as a set of practitioner’s field notes recording his “real-life”
experiences. We are happy to provide you this unedited chapter both for your information and enjoyment as one
of our final chapters. As such the views expressed in this chapter are the author’s own.
A Framework of Human Systems Engineering: Applications and Case Studies, First Edition.
Edited by Holly A. H. Handley and Andreas Tolk.
© 2021 The Institute of Electrical and Electronics Engineers, Inc. Published 2021 by John Wiley & Sons, Inc.
248
13 Observations of Real-Time Control Room Simulation
unexpected, their probable nature can be predicted with a reasonable level of accuracy, if not
absolutely.) Real-time simulators can also be used where a system is being planned to avoid
costly mistakes in constructing the new system or forensically (if proper records have been kept)
to investigate disasters where the actual control room has been destroyed or is otherwise
unavailable.
13.1.3 What Does It Look Like?
The physical design of control rooms is now sufficiently standardized to form the subject of an
international standard (ISO 11064-1 2000, ISO 11064-2 2000, ISO 11064-3 1999, ISO 11064-4 2004,
ISO 11064-5 2008, ISO 11064-6 2005, ISO 11064-7 2006). Workstations have one, two, or occasionally three large screen displays in a single row. Most control rooms now consist of several rows of
workstations arranged in pairs, facing a large display at the end of the room. This display may
show an overall view of the plant, a schematic of the process, a number of CCTV displays, or anything of common concern to the operators. A supervisor’s position is placed behind the work positions, usually slightly raised to provide a view of all working positions. The visitors’ gallery (if any)
is placed behind the supervisor’s position and ideally should be separated from the control room
by a transparent panel. Figure 13.1 shows a representative modern control room. This could be
either a real or simulated control room.
Figure 13.1 Contemporary control room. Source: David (2017).
13.2 Future General-Purpose Simulator
13.1.4
How Will They Develop?
Modern control systems tend to centralize control, often at locations remote from the area of
activity. This is partly due to a desire to reduce costs and partly due to security and safety
considerations. Modern systems are digital – controlled by digital computers. The software of
these systems is increasingly modular. Data input, checking, and cyber defense modules are
essentially similar in many fields. Control room display, control input, and feasibility checking are
equally modular and determined largely by human abilities, modified to a decreasing extent by
tradition, wishful thinking, and willful blindness. The future development of real-time control
room simulation will probably diverge into general-purpose simulators, designed to provide
services to all users of standardized control rooms, and special-purpose simulators, incorporated
into operational control facilities.
13.2 Future General-Purpose Simulators
Figure 13.2 provides a schematic of a future general-purpose simulator. Although this is necessarily
a simplified version, it shows the main features of such a simulator. A number of different sets of
“static data” describing the real world would be available. In air traffic control, for instance, these
data would include definitions of the performances of different types of aircraft; digitized files of
the positions of airfields, positions of beacons, and routes if these are still in use; flight plans; and
potential weather patterns. It would also include the algorithms necessary to simulate traffic. In a
Figure 13.2 Future general-purpose
simulator. Source: David (2017).
CreateSpace Independent Publishing
Platform © Amazon.com.
Real-world static data
Air traffic control
Synthetic
record
generator
Rail network
Road trafic
Electricity grid
Stored
input
record
Synthetic
input
record
Pipeline system
Display/control interface
(field-specific)
Simulated
control
room
Pilot
and
‘feed’
operators
(replay/
rerun)
Simulated
control
record
Special measures
ISA/heart rate
keystrokes
249
250
13 Observations of Real-Time Control Room Simulation
pipeline system, it would contain digitized maps of the system, details of pumping stations,
communications links, and remote sensors. It would include schedules of planned pumping
operations and, for training purposes, algorithms to simulate the effects of system failures. Similar
sets of data would be available for other fields of interest, such as rail networks, road networks, and
electricity grids.
A synthetic record generator would draw on the field-specific information to generate preplanned
traffic, including particular situations of interest. In air traffic control, these might include potential
conflicts between aircraft. (The generator will ensure that the problems posed were reasonable, for
example, that aircraft were not already in conflict when they entered the area simulated or that
three aircraft did not converge on one entry point at the same time). This generator would produce
a synthetic input record, a “script” in the same form as that produced in the real control room.
The synthetic input record, or a stored real input record, is played to the simulated control room
via a display/control interface. This will usually be the same in most control rooms in a particular
field of activity. In addition to the operators in the simulated control room, there may be additional
“simulator pilots” who simulate the onboard crew of vehicles in the system using prompts
generated by the simulator and inserting the verbal orders they receive in coded form. These
“simulator pilots” are trained but need not be fully qualified to perform the “piloting” task in the
real world. Equally, there may be a requirement for “feed” operators, who simulate adjacent areas
of responsibility. These are usually experienced qualified operators. As such, they do not appreciate
the names of “ghost” or even “dummy” operators, sometimes employed.
In a general-purpose simulator, some additional standard measurement technique will be
applied. The measurement of simulations – or of real operations – is a difficult problem and will
be dealt with in detail later.
A simulation run will produce a simulated control record in the same format as used in the real
world. It will contain additional measures not required in the real world, such as records of
incomplete or canceled input orders. The same analysis and data reduction programs will be used
as are applied to real operational records, with additional programs for additional measures.
13.2.1
Future On-Site Simulators
Figure 13.3 provides a schematic of a future on-site special-purpose simulator. Again, this is a
simplified version. On the right-hand side, the actual working control room is shown, taking
information from the real world, concentrating it, and processing it. (This processing includes
various data checking and anti-hacking measures, which should not be discussed here.) An input
record is created at this time, as the information is fed into the field-specific display/control
interface, which refers to the real-world static data to provide meaningful information to the
operators. The operators act on the real world, forming a closed loop. Their actions are recorded in
a control record, which is correlated with the input record.
On the left-hand side, the on-site simulator facility uses an input record, either the current or an
archived version, to present the situation via the same display/control interface to operators for
training using producing a simulated control record, which can be analyzed by the same suite of
analysis programs. Additionally, it will be possible to rerun a recorded sequence of events,
substituting control records of inputs for the operator inputs, to allow “post-mortems” of accidents
or near accidents, for forensic, safety, and instructional purposes. The working positions used will
be those provided for use where operational working positions become unserviceable or require
routine maintenance or updating. Very little additional hardware or software will be required to
add a simulation facility to a modular digital system.
13.3 Operator
Figure 13.3 Future on-site simulator
Source: David (2017). CreateSpace
Independent Publishing Platform
© Amazon.com.
Real-world static data
e.g. A/C performance
routes, beacons
Real world
Actual
input
record
Display/control interface
(field-specific)
“Spare”
working
positions
Data concentrator
Display/control interface
(field-specific)
Acutal
control
room
(replay/
rerun)
Simulated
control
record
Actual
control
record
13.3 Operators
Having described in schematic form the probable future development of real-time simulation
hardware and software, with the proviso that real systems will always face unexpected problems
and may need specific solutions, we can now consider the most important part of the system – the
operators.
It is vital to remember that operators are not the “naïve subjects” of experimental psychology.
They are usually highly trained, responsible, experienced experts in their particular field. Their
opinions may be decisive for the future of the system. They will often have reached what is
sometimes called the “samurai” state of operation, where they are so familiar with their task that
they are not consciously aware of how they do it. They usually respect “scientists” and assume they
know what they are talking about. However, they are usually good judges of people and quick to
detect bluff or bullshit. They often have a “tribal” attitude, with more or less conscious admission
rituals. Investigators should be prepared to ingest alcohol in larger or smaller quantities and
tolerate with apparent enjoyment attitudes they would regret in normal life. Gender differences
may be an advantage or handicap depending on circumstances best left unspecified.
Like all human beings, they are not equipped with a “pause” or a “reset” function, but they learn
consciously or unconsciously and cannot disregard what they have learned. This presents severe
methodological problems. Most simulations are set up using the familiar models of experimental
design, developed in agriculture and experimental psychology. These models suppose that the
experimenter can vary some parameters of the situation while holding all others constant. In
practice, there are many uncontrolled and uncontrollable factors in any large-scale simulation so
that the “residual variation” is always large.
251
252
13 Observations of Real-Time Control Room Simulation
Most simulations require familiarization runs at the start, while operators adapt to the
unavoidable differences from their normal routine. (They will often be away from home, working
during the day only, instead of doing shift work, with equipment that differs in detail or radically
from their norm and with colleagues whom they do not know.) In most organizations, operators
work in teams, working the same shifts for months and years. Informal social patterns develop, for
example, “Bill wakes up slowly – Jill cannot stay late – Momo needs to be free at prayer times – Fred
always has a hangover on Mondays.” It is rarely practical for a complete team to be detached for a
simulation, so a “shakedown” is always necessary.
13.4 Data
The raw material for the simulation (the data on which it operates) is always subject to problems.
A random sample of traffic will always contain some anomalous events. It may turn out that the
real situation is significantly different from what management supposes. Many organizations have
rule books that have been amended and modified in detail over the years so that it is, in fact,
impossible to follow them in practice. Recourse to the advice of participants may help. But Dubey
(2000) points out that participants often feel that they “own” the data, since it is their daily concern,
and may raise objections to data as a means of expressing disquiet with other aspects of the
simulation that they feel are determined by management.
Because traffic is inherently variable, different traffic samples vary in difficulty. The degree of
difficulty is generally difficult to define. It is tempting to use the same traffic sample on several
occasions – perhaps with different possible organizations. It has been found that operators do not
usually recognize a repeated sample, particularly if it is disguised (for example, in air traffic control,
by changing aircraft call signs). However, neurological studies suggest that learning occurs on a
subconscious level.
In air traffic control, traffic patterns tend to be repetitive. A particular flight leaves a given airport
and flies a standard route to the same destination each day. Controllers spend considerable time
learning these regularities, and it can be argued that purely random traffic is therefore unrepresentative.
Not all traffic is repetitive, however. A possible solution is to develop a sample of about twice the
expected traffic level and make random selections of different percentages of traffic. This also solves
the problem that the task must not be so easy that any organization can cope, nor so hard that no
organization can cope. Similar considerations probably apply in other potential fields of application.
13.5
Measurement
Once a simulation has been established, we need to measure it. To measure it, we need to know
what we are looking for. Generally, simulations are used to establish the capacity of a system, to
check that as the proposed system is workable, or to assess its effect on the operators. It may be
useful to bear in mind the difference between “stress” (the demands of the tasks required) and
“strain” (the effects of “stress” on the operators). There are almost as many definitions of “stress”
and “strain” as there are authors. This text follows the engineering definition rather than the
journalistic one.
The classic experimental paradigm is to measure the speed and accuracy of subjects’ performance.
In simulation, the speed is normally determined by the process being simulated, and the degree of
accuracy required is such that errors are too few for statistically (or practically) significant
differences to be established. The experimental psychology approach is therefore not useful.
13.5 Measuremen
We usually attempt to make objective and subjective measurements. Many methods have been
tried, and a few have stood the test of time. There are no absolute standards and no mechanical
assessment procedure. Knowledge, judgment, and sensitivity are required to reach a useful conclusion.
13.5.1 Objective Measures
It is clearly preferable to have objective measurements, where they may be relevant. Such measures
tend to measure the stress on the operators rather than the strain experienced by the operators.
They also tend to depend on the nature of the process being controlled. Some general points can
however be made.
13.5.1.1
Recommended
Among objective measures may be the amount of time spent in communication, the number of
communications, and any delays or potential conflicts observed. Even these obvious measures
need careful supervision. For example, one simulation run showed unusually high use of the
frequency on which controllers communicate with the aircraft. Investigation showed that the
(Italian) controllers, after a mostly liquid farewell lunch, were singing “O Sole Mio” in chorus on
the frequency. These are measures of stress.
Another measure used in air traffic control studies is the frequency of “conflicts” (dangerously
close approaches of aircraft). In normal operation, serious conflicts are very rare, although the
formal limits are sometimes infringed where no danger exists. As a measure, conflict frequency is
of little use, since if it is high enough for statistical analysis, it is far too high to be realistic. Similar
considerations may apply in other fields of study.
One measure that may sometimes be useful is heart rate. It is now possible to measure heart rate
with nonintrusive methods using standard sports or self-training applications to perform remote
monitoring and recording. Although we know that there are many factors that will affect heart
rate, both physical and psychological, it is possible to define a threshold heart rate for operators,
above which the situation merits investigation. It is tempting, but ultimately unrewarding, to try to
filter out interfering variables.
13.5.1.2
Not Recommended
There are (at least) three lines of investigation that have been developed but should, in the light of
experience, be avoided. Secondary tasks have been used in experimental psychology to measure
the extent to which an experimental subject is occupied by a task. The subject is asked to carry out
a secondary task, such as mental arithmetic, as much as he can while doing his primary task.
Although this may work empirically when studying simple tasks, it assumes that the human
operator has the characteristics of a machine, with a fixed maximum capacity. In the real (or
simulated) world, operators are carrying out complex tasks, planning their future workload,
monitoring displays, recognizing situations, worrying about their mortgage or their marriage, and
carrying out a variety of conscious or unconscious activities.
They have no rigid upper limit to their activity.
Embedded secondary tasks can however sometimes be identified. These are tasks that are not
strictly necessary but normally required. Often the system can carry them out if the operator omits
them. Dropping these tasks may be a valid indication of overload. Identifying such tasks requires
familiarity with the system, and such tasks do not always exist.
A considerable effort has been devoted to the identification of psychophysiological measures of
strain. These involve the measurement of body activity such as heart rate, electroencephalographic
activity, or the measurement of hormones associated with stress in blood or saliva. Heart rate in
253
254
13 Observations of Real-Time Control Room Simulation
itself may be a useful measure, as mentioned above. Other measures, such as respiration rate, sinus
arrhythmia (the minor irregularities observed in normal beat-to-beat heart rate, rather than the
major irregularities indicative of imminent heart failure), and muscle tremor, are all intimately
linked and require elaborate analysis for very little added information.
Considering electroencephalography (EEG), there are some basic methodological problems.
Although we know more about the activity of the brain than we did a decade ago, we still do not
know enough to understand what is actually going on in practical terms. We know that the brain
is not a computer but has a complex and specialized structure. Much research has been carried out
using Fourier analysis of EEG signals. These are essentially correlational studies, which may show
that certain frequencies are associated with specific activities but shed no light on the functional
relationship. We also find that individuals vary greatly in their EEG activity.
Hormonal studies have similar problems. Although we know a lot about the complex relations
of hormones within the human body, we find that they are affected by many intervening factors,
such as the time of day, diet, coffee drinking, menstrual cycle, and psychological type. Some of
these parameters are intensely personal and subject to considerations of personal privacy, which
operators should not be asked to sacrifice without more justification than simulation studies
provide.
An additional ethical question arises where it becomes clear from such measures that an operator
is at or over the boundaries of normal physiological responses and may be at risk of physical injury.
Equally, it may become clear that the operator is using drugs or other substances that may affect
their performance. Drawing attention to the problem may cost the operator his job and be a breach
of confidentiality. Not drawing attention may risk the life of the operator and potentially the lives
of many more. If you are not a qualified medical practitioner acting in your professional capacity,
you may be legally as well as morally liable for these consequences.
Eye movement studies have become considerably easier in recent years, requiring less calibration
and less intrusive equipment. They remain very expensive. It is now practically possible to
determine where the operator is looking with within about 10 cm on a desk display. It is not, so far,
possible to identify which aircraft the operator is looking at on a radar display or to correlate that
information to other simulation data. There are also interpretation problems. It is not necessarily
true that an operator spends less time looking at a better organized display. As an operator pointed
out to me, he may simply find it somewhere to rest his eyes while thinking of something else.
There are sometimes simplifications that can be made. For example, when an operator is, as air
traffic controllers say, “losing the picture,” their gaze tends to jump around the display, making
more and shorter fixations. Another simple observation may be that operators never look at some
display. Practically, an eye movement study may suggest which displays should be at the center of
the operators’ field of vision, because they are used most, and which displays are looked in sequence
so that they should be adjacent.
Although the attraction of modern “cutting-edge” equipment is considerable, it is sometimes
possible to achieve the same results by systematic observation, either online or by analyzing a
video recording (David 1986). It is also considerably cheaper, quicker, and less intrusive.
13.5.2
Subjective Measures
The obvious way to determine how a simulation affects the operators is to ask them. Although it is
generally true, operators’ opinions may need to be treated with some reserve. Oppenheim (1992) is
a useful guide to the design of questionnaires and the conduct of interviews. Gawron (2000) is a
very comprehensive handbook of human performance measures.
13.5 Measuremen
In general, it seems preferable to use a simple, rapid “online” method to assess the overall
difficulty of the task, particularly when this varies with the arrival of traffic, combined with a more
elaborate form immediately following the exercise. Most simulations start with an empty task load,
building up to a level, and would lead to a similar decline of traffic at the end. It is usual to discard
records for the period of traffic buildup and to halt the simulation when no further traffic load is
expected.
13.5.2.1
Recommended
The instantaneous self-assessment (ISA) method requires a five-key keyboard or a touch-sensitive
or point-and-click display incorporated into the working display. The operator is required to assess
his own workload at regular intervals (usually two or three minutes) when cued by the flashing of
the keys. The five keys are marked as in Figure 13.4. The display flashes until the operator responds
or for 20 seconds. The operators’ responses and the time taken to respond are recorded and form a
practical record of the operators’ subjective responses. The operators’ responses may be shown to
the simulation supervisor in graphic form to provide warnings of difficulties during the simulation.
When analyzing the data, “VERY HIGH” or “HIGH” readings are more significant than “LOW” or
“VERY LOW” readings so that simple averaging can be misleading. Although the mean of two
“VERY HIGH” and eight “VERY LOW” readings is less than that of 10 “FAIR” readings, the first
simulation is clearly more problematic than the second.
The NASA Task Load Index (NASA-TLX) is applied immediately after each exercise and requires
the operators to rank the simulation on six scales, as in Figure 13.5. As originally devised, the
scores on the six scales are weighted by a prior ranking derived by paired comparisons of scales for
each operator. However, Hart (2001 [“The NASA-Tlx scales may be analysed independently”]) in a
personal communication confirmed practical experience that the scales could be analyzed
separately. The “Physical Demand” scale, for example, is rarely significant in real-time simulations.
The Performance scale runs in the opposite direction to the other scales and is sometimes
misunderstood by operators.
13.5.2.2
Not Recommended
The Subjective Workload Assessment Technique (SWAT) is a self-reporting technique, similar to
ISA above. The operator is asked to report how stressed (s)he is on three scales – time load, mental
effort load, and psychological stress load. Each scale has three levels. SWAT requires a ranking of
Value
5
Level
VERY
Colour
Red
HIGH
4
HIGH
3
FAIR
2
LOW
1
Symbol
++
VERY
LOW
Figure 13.4 ISA key values.
Definition
Completely occupied,
some tasks missed
+
Amber
Almost completely occupied,
but task can be completed
=
Green
Steady, reasonable workload.
Some breaks
–
Cyan
Little work,
much spare time
– –
Magenta
Practically no work,
boredom, lack of stimulus
255
256
13 Observations of Real-Time Control Room Simulation
Mental
How much mental and perceptual activity was required (e.g. thinking,
demand
deciding, calculating, remembering, looking, searching, etc.)? Was the task
easy or demanding, simple or complex, exacting or forgiving?
LOW |__|__|__|__|__|__|__|__|__|__|__|__|__|__|__|__|__|__|__| HIGH
Physical
How much physical activity was required (e.g. pushing, pulling, turning,
demand
controlling, activating, etc.)? Was the task easy or demanding, slow or brisk,
slack or strenuous, restful or laborious?
LOW |__|__|__|__|__|__|__|__|__|__|__|__|__|__|__|__|_ _|__|__| HIGH
Temporal
How much time pressure did you feel due to the rate or pace at which the
demand
tasks or task elements occurred? Was the pace slow and leisurely or rapid and
frantic?
LOW |__|__|__|__|__|__|__|__|__|__|__|__|__|__|__|__|__|__|__| HIGH
Performance
How successful do you think you were in accomplishing the goals of the task
Careful!
set by the experimenter (or yourself)? How satisfied were you with your
performance in accomplishing these goals?
GOOD |__|__|__|__|__|__|__|__|__|__|__|__|__|__|__|__|__|__|__| POOR
Effort
How hard did you have to work (mentally and physically) to accomplish your
level of performance?
LOW |__|__|__|__|__|__|__|__|__|__|__|__|__|__|__|__|__|__|__| HIGH
Frustration
How insecure, discouraged, irritated, stressed and annoyed versus secure,
level
content, relaxed and complacent did you feel during the task?
LOW |__|__|__|__|__|__|__|__|__|__|__|__|__|__|__|__|__|__|__| HIGH
Figure 13.5 NASA-TLX scales.
the different scales by a complex method, requiring a computer-based weighting program.
Unfortunately, the designated supplier of this software appears to be defunct – rendering the
method generally unavailable. (In any case, a comparative study suggests that it is significantly
more intrusive than ISA and does not produce independent scales in use [David and Pledger 1995;
Pledger 1994].)
Considerable effort has been put into attempts to measure “mental fatigue.” The KonzentrationsLeistungs-Test and the Grammatical Reasoning Test (David 1985) are examples of such tests.
Unfortunately, operators recover from any such fatigue at the levels acceptable in simulation,
sufficiently fast that any test carried out even immediately after a simulation shows no
significant effect.
Structured interviews require a trained interviewer to ask an operator for his opinions and
suggestions on a series of specific aspects of the exercise, according to a prepared script of questions.
Interviewers are trained to draw out the operator and may follow up unplanned aspects if they
seem important. It is a major skill of the interviewer to extract an impression of what the operators
really feel about the organizations being examined. (Structured interviews can only be held after
enough exercises have been completed for the operators to have formed opinions.)
Reference
Operators, like any other interviewees, are extremely sensitive to minor, nearly subliminal signals from the interviewer, which may lead to operator effects. There is a moderate risk that the
interviewer may not be able to obtain definite responses to some questions. Inexperienced interviewers or those unfamiliar with the culture, language, or attitudes of the operators may lose their
confidence and will obtain no useful data. Operators generally do their best to give truthful, realistic answers to the problems they see. There is, however, a moderate risk that they may give
responses that are either what they think the group of which they are part will think or what they
think the observer wants to hear (Langford and Deana 2003; (Oppenheim 1992).
Peer assessment, where equally competent operators observe the operators and judge the extent
to which they are under strain, is very expensive in personnel and is subject to bias because the
assessors tend to judge by what they would have done, rather than what the operators in fact did.
13.6 Conclusion
Real-time simulation is essentially an empirical process. Although considerable efforts have been
made to place it on a “scientific” basis, they have not generally been successful.
Simulations are subject to many controlled, uncontrolled, or unknown disturbances. It is rarely
possible to carry out sufficient trials to produce statistically significant results in the classic sense.
Bayesian statistics may be applied, although they employ an unfamiliar concept of probability that
is not always acceptable. The final conclusions of a real-time simulation are not always based on
formal experimental methods. The judgment of the simulation leader is usually the determining
factor. Fortunately, in most simulations, the results are so clearly unambiguous that the deficiencies in scientific terms do not matter.
Disclaimer
The views expressed in this chapter are the author’s own and are not necessarily endorsed by
EUROCONTROL or its management.
References
David, H. (1985). Measurement of Controllers’ Mental State in a Real Time Simulation Environment.
EEC Report No. 183. Bretigny sur Orge, France: EUROCONTROL Experimental Centre.
David, H. (1986). Comparison of three methods of assessing eye movements of air traffic controllers.
Ergonomics Society Annual Conference 1986, Durham, England.
David, H. (2017). Control Room Simulation: The Real Life of the Real Time. R+D Hastings: Amazon Books.
David, H. and Pledger, S. (1995). Speech Recognition and Keyboard Input for Control and Stress Reporting
in an Air Traffic Control Simulation. Contemporary Ergonomics 1995. London: Taylor and Francis.
Dubey, G. (2000). Social Factors in Air Traffic Control Simulation. EEC Report No. 348. Bretigny sur
Orge, France: EUROCONTROL Experimental Centre.
Gawron, V.J. (2000). Human Performance Measures Handbook. Mahwah, NJ: Lawrence Earlbaum
Associates.
ISO 11064-1 (2000). Principles for the Design of Control Centres. Geneva, Switzerland: International
Standards Organisation.
257
258
13 Observations of Real-Time Control Room Simulation
ISO 11064-2 (2000). Principles for the Arrangement of Control Suites. Geneva, Switzerland: International
Standards Organisation.
ISO 11064-3 (1999). Control Room Layout ISO 11064-3:1999/Cor 1:2002. Geneva, Switzerland:
International Standards Organisation.
ISO 11064-4 (2004). Layout and Dimensions of Workstations. Geneva, Switzerland: International
Standards Organisation.
ISO 11064-5 (2008). Displays and Controls. Geneva, Switzerland: International Standards Organisation.
ISO 11064-6 (2005). Environmental Requirements for Control Centres. Geneva, Switzerland: International
Standards Organisation.
ISO 11064-7 (2006). Principles for the Evaluation of Control Centres. Geneva, Switzerland: International
Standards Organisation.
Langford, J. and Deana, M. (2003). Focus Groups. London: Taylor and Francis.
Oppenheim, A.N. (1992). Questionnaire Design, Interviewing and Attitude Measurement. London: Cassel.
Pledger, S. (1994). Effects of self-assessment on performing air traffic control. M.Sc. thesis. Loughborough
University, Loughborough, Leicestershire.
259
14
A Research Agenda for Human Systems Engineering
Andreas Tolk
The MITRE Corporation, Charlottesville, VA, USA
14.1 The State of Human Systems Engineering
The case studies and examples provided in this volume clearly demonstrate a wide range of contributions by human-centered disciplines to systems engineering disciplines, from traditional systems engineering (Sage 1992) to system of systems engineering approaches (Keating et al. 2003)
and enterprise architecture engineering efforts (Bernard 2012) to the new paradigm of mission
engineering (Sousa-Poza 2015). All these systems engineering disciplines are recognizing the role
of the human when using the system or when being part of the system, as systems are becoming
increasingly sociotechnical and complex.
Engineers often struggle with the fact that the human being, which defies precise specification
and prescription, is a core system component, even if not standardizable. While some degree of
emergence and complexity can be observed in most technical systems, the moment humans are
part of the system, this is guaranteed to increase. Humans have often been the source of “messy
details” that do not follow prescribed system behavior. The complexity they introduce is contrary
to the orderly reductionism sought by traditional engineering approaches. Traditional engineering
approaches therefore tend to be inadequate for the engineering of systems that encompass technology and human organizations, i.e. sociotechnical systems such as found in healthcare, city
planning, hospital utilization, policy assessment, etc. (Nemeth et al. 2004).
Another aspect that increases complexity and adds unexpected trajectories through the system
state space is that humans do not always follow the specifications of the intended use, but affordance is often more important: how can I use the technical parts of the system and their functionality best to fulfill my current needs. As a result, humans often use systems in a different way than
the systems engineer originally intended. Particularly in systems of systems environments, where
systems are used in a new and often highly dynamic and agile context, systems will not only be
used in well-engineered, preconceived ensembles, but they will also self-organize in collectives,
possibly exposing emergent attributes and behavior (Mittal et al. 2018).
The general topic of the examples given above is that humans introduce complexity. They do not
always follow standards and specifications. They differ not only in physical traits but also in their
behaviors, expectations, choices, emotions, and level of skill. Yet, they are a vital and undeniable
part of almost all systems. Human-centered disciplines have knowledge, methods, and tools that
A Framework of Human Systems Engineering: Applications and Case Studies, First Edition.
Edited by Holly A. H. Handley and Andreas Tolk.
© 2021 The Institute of Electrical and Electronics Engineers, Inc. Published 2021 by John Wiley & Sons, Inc.
260
14 A Research Agenda for Human Systems Engineering
can help systems engineering adapt to and meet these challenges. For example, there is the work
that has accumulated in the field of cognitive systems engineering. Hollnagel and Woods (1983)
proposed the discipline of cognitive systems engineering to address the human gap in systems
engineering, as covered in more detail in Woods and Roth (1988). Cognitive systems engineering
focuses on principles and methods for engineering systems that perform cognitive work, such as
information processing and decision making. This discipline considers a system to consist of all
interacting elements – not just the technical. The recent rise of the Internet of Things (Ashton 2009)
and of cyber–physical systems (Baheti and Gill 2011) introduced new challenges for systems engineering methods. The parallel development of more and more decentralized computing in the
form of cloud computing, sensor clouds, fog computing, and related technology, as discussed by
Sehgal et al. (2014), added another dimension of challenge. Once again, human-centered disciplines offer tools that can help systems engineering rise to these challenges.
We understand today that a much broader approach than relying purely on traditional engineering methods is needed to address the engineering of modern sociotechnical systems. We must
address the various skills and capabilities, both physical and cognitive, to ensure that the technical
parts of the system collaborate effectively and efficiently with the human parts. Human–machine
interfaces and interactions are only a small facet of the challenge of cooperation in human–
machine teams, as envisioned by Hoc (2000), among others, and exemplified for cyber–physical
systems in Mosterman and Zander (2016). We need to include the anthropological perspectives as
well, as humans have the potential to act differently across instances of the same set of local information, as a result of context sensitivity that extends to organizational, cultural, and historical
contexts (Avison and Myers 1995). These observations can and need to be extended to organizations, adding another layer of complexity, ranging soon from human–machine challenges to
organization system of systems challenges.
Within the leading chapter to this volume, we introduced a framework for human systems engineering. We want to use this framework and the various contributions of the experts who contributed chapters to this volume to identify gaps and shortcoming and, more importantly, a research
agenda to close these gaps and overcome the shortcomings, following the examples given by Tolk
and Rainey (2015). With this agenda, we hope to contribute to a discussion on the next steps,
encourage doctoral students to look for relevant research topics, and provide inputs for professional organizations to identify challenges.
14.2
Recommendations from the Chapter Contributions
The authors of the various chapters of this volume implicitly and explicitly identified research
topics that need to be better addressed. These research points are grouped by the topic of research,
trying to provide a more general call for research action than the individual chapters do.
14.2.1
Data and Visualization Challenges
The use of big data methods to collect, analyze, and provide information to the human is addressed
for traditional visual displays as well as for novel displays, such as wearable solutions used in the
public safety and other domains. Generally, the data needs to be evaluated – sometimes in real
time – and noteworthy events and aggregated valuable information need to be displayed.
A key challenge in the realm of big data is context-sensitive information filtering, integration,
and management. This is especially difficult for systems operating in complex environments in
14.2 Recommendations from the Chapter Contribution
which context is continuously shifting. Not all data are always equally important. Their relevance
depends on the context of the situation and the goals of the user and may vary with the age of the
data available. Interactive and immersive visualization tools and techniques, as discussed in Bach
et al. (2017) and Cordeil et al. (2019), need to be further explored regarding their ability to provide
information to the human when it is needed and in the form needed for the given context.
Understanding the way information provided is perceived by people will require close collaboration with experts of the human sensory systems, such as perceptual psychologists. The way information is perceived and used is also highly influenced by the autonomic nervous system; experts
in this domain will also be needed. This is highly important when humans are part of the system:
how do the short- and long-term stress responses influence individuals and what does this mean
for the system. Experts in perception and stress response will need to translate their research
results into applicable solutions and best practices for systems engineers.
The second topic deals with the availability of data, technically and legally. While the literature
on big data extracted from social media or other huge and heterogeneous data sources is growing,
human systems engineering may encounter a new challenge: how to understand if the correct data
is available. What if the available data is heavily biased or otherwise misleading? Can we develop
tests that can be applied to avoid the use such data?
Finally, real-world data tends to be incomplete, contradictive, vague, and rarely collected with
the required accuracy and resolution. How can trust in the data be increased? How can we ensure
that by cleaning the data, we are not losing data that could easily hint toward an unexpected event,
as often observed in complex environments? Data scientists often start with the assumption that
the answer lies in the data, but the way we collect data already limits the questions we can ask, as
we use a data model to collect data that specifies the abstraction level and scope of the data to be
collected. If an important piece of evidence is exposed by data not perceived to be important when
the data model is created, how can we collect the related important information? Philosophy of
science can help to ask the right questions to come closer to a possible solution or at least derive
heuristics (Gelfert 2016).
14.2.2
Next-Generation Computing
Many systems of interest to the human systems engineering community will be software-intensive
systems. Within the information age, our ability to store, communicate, and compute information
grew exponentially over the last years. Today, digital communication surpasses every other means
by far. Some examples are given in Hilbert and López (2011), estimating that 99.9% of telecommunication has been digital since 2007 and 94% of the technological memory uses digital formats.
Human systems engineering must take advantage of this data richness under the constraints discussed in the section on data and visualization.
What is going to support better access to digital information for the human are developments in
sensing, imaging, and communication. As observed in Passian and Imaan (2019), accessibility
through cloud, fog, and mist computing technologies and the advancement in nanotechnology
allow not only for continuous integration into the data world, but it also allows for new, potentially
more human-centered access of data, e.g. using augmented reality, context-sensitive displays, etc.
Some recent examples are given in Fraga-Lamas et al. (2018).
The danger is sensory overload, but the technological opportunities seem to be endless. However,
what is technically feasible and what is useful for the human is the subject of ongoing research.
Again, tight collaboration between experts in human perception and sensorics with technology
experts is pivotal to maximize the benefit for human systems engineering.
261
262
14 A Research Agenda for Human Systems Engineering
14.2.3 Advanced Methods and Tools
Four interrelated but individual methods and supporting tools of additional interest for future
research are utilized in the chapters, namely, modeling and simulation, artificial intelligence, digital twins, and autonomy. These technologies are used individually or in concert to drive a control
room of the future, evaluate and compare alternative cockpits of aircraft and spacecraft, and help
to support latest breakthrough solutions in engineering.
Modeling and simulation is often discussed as its own discipline but shows exceptional potential
when combined with systems engineering methods. Tolk et al. (2017) show the potential when
model-based systems engineering is extended to enable the execution of the models as simulation
not only individually but also as simulated entities with a portfolio of enterprise-wide operations.
Recent years have seen some research on the possible alignment of artifacts that will allow us to
standardize the use of simulation within systems engineering beyond the scope of proprietary tool
solutions, such as Mittal (2006), Shuman (2010), or recently Traoré (2019).
What may be more important than technological advances could be the application of modeling
and simulation in the era of complexity and human systems engineering. In flight training, simulators are used to immerse pilots early into a high-fidelity representation of their environment, as
close as possible to the real thing. The philosophy is to learn the theory, e.g. by studying the manuals, build a mental model, and then practice first in the virtual, and later in the real environment.
However, we may miss a chance to use simulation to develop the best mental model, particularly
when the system the human will use, or will be part of, is complex. Introducing the trainee gradually to these new systems, using different increasing degrees of complexity and difficulty to build
up an experience, is often underutilized. Again, experts in human learning can be of significant
help to avoid such shortfalls in human systems engineering approaches.
Artificial intelligence is needed whenever technical systems expose intelligent behavior. This can
be the behavior of a robot, the behavior of an entity within the system – or the simulation thereof, or
any of its components. In recent years, machine learning and deep learning experienced a revival, as
the computational power of today allows us to utilize huge amounts of data to train neural networks
and evaluate the data using multivariable correlation analysis tools. Although initial approaches are
established to make artificial intelligence interpretable, such as summarized in Došilović et al.
(2018), this topic remains a rich research field. How can we build trust into machine decisions?
Digital twins were originally developed in the manufacturing domain. They are digital replicas
that allow us to couple the system with its virtual counterpart in support of continuous collection
and evaluation of data to not only monitor the system but also to continuously optimize it within
the desired process. They allow “what-if” analysis and evaluations of alternatives in real time without having to interrupt the supported process. They are often understood as a bridge between the
physical world and its cyber representation. It is possible to build the digital twin before the original system, which loops us back to the executable versions of systems engineering artifacts. The
number of digital twins representing other systems or components is growing daily. How can they
be used to better support human-centric processes in the future? Can digital twins replace standardized interfaces with individual interfaces for each user of the system? Can the technology be
used to better adapt the system behavior to the individual need of humans within or using the
system? How can they support better training?
Finally, autonomy has been addressed as well. The US Armed Forces used these categories to
identify the following definition for classes of autonomous systems (Williams 2008):
●●
Human-operated systems are fully controlled by humans. All activities result from human
initialization, eventually based on provided sensor information.
14.3 Uniting the Human Systems Engineering Stakeholder
●●
●●
●●
●●
●●
Human-assisted systems perform activities in parallel with human inputs, augmenting the
human’s ability.
Human-delegated systems perform limited control activities. Humans can overrule the system
at any time.
Human-supervised systems conduct all activities needed to perform a given mission, but they
inform the human consistently, including providing explanations for decisions.
Mixed initiative systems are capable of human–machine teams and can take over given tasks
independently.
Fully autonomous systems require no human intervention or presence. They conduct all
activities, across all ranges of conditions.
Besides ensuring the level of required autonomy, research is needed regarding what level of
autonomy will be needed and accepted by humans in the various application domains of human
systems engineering. Does it make sense to strive for full autonomy, or does it make more sense to
put the emphasis on human–machine teams, in which case the machines will have a lower degree
of autonomy?
14.2.4
Increased Integration of Social Components into System Artifacts
Human-centered disciplines are interested in social components as much, if not more, as technical
components. The systems engineering community has an abundance of experience with frameworks
and languages that can be applied to do so, such as the System Markup Language (SysML), the
Universal Markup Language (UML), and business process modeling (BPM). The rigor and precision
of these languages have been intriguing for some time, as documented by books like Eriksson and
Penker (1999). Only recently, after working with members from the humanities, the experience was
captured in Tolk et al. (2018). Contributions for a recent Defense Advanced Research Projects Agency
on computational representation of human and social behavior are captured in Davis et al. (2019).
Despite these success stories, questions remain: Are these engineering artifacts the best way for
addressing humans in human systems engineering? Are there better alternatives to elicit knowledge and capture it unambiguously for better integration? Is the critical decision method, designed
to gather data on the bases for proficient performance of naturalistic tasks, applicable (Klein
et al. 1989)? What are better alternatives?
14.3 Uniting the Human Systems Engineering Stakeholders
A common topic of challenges is the need to bring the various stakeholders together. They are
coming from different backgrounds and various disciplines and often do not share common
methods and tools. Systems engineering and system of systems engineering focus more on the
technical aspects; enterprise architectures emphasize the organizational aspects; human–machine
interfaces and human–machine teams focus on the human views. The community came a long
way from seeing people as a disturbing factor in an otherwise well-specified and well-behaved
system to the need of systems to take physical and cognitive diversity of humans into account and
adapt to them. Nonetheless, to better support all aspects of affordance, an even tighter connection
to the humanities – including anthropology, psychology, and sociology – will be needed, adding to
the variety and diversity of terms and tools, as these disciplines unquestionably differ, often
significantly, from traditional engineering approaches.
263
264
14 A Research Agenda for Human Systems Engineering
The following three subsections address fundamental aspects that must be understood and
supported to allow human systems engineering to overcome some of the current shortfalls. First,
a truly transdisciplinary approach is needed. Second, this approach is utilizing common formalisms,
and these common formalisms allow thirdly for common metrics to be used to evaluate and validate approaches.
14.3.1 Transdisciplinary Approach
Traditional disciplines are highly specialized in their topics and successfully help to grow knowledge over decades. However, from the second half of the twentieth century, the challenges resulting from relying too much on reductionism led to a desire for more collaboration, creating new
knowledge connecting the contributing traditional disciplines (Apostel et al. 1972). A recent
National Academy of Sciences report on interdisciplinary research identified four primary drivers,
namely, (i) the recognition of the inherent complexity of nature and society and the inability of
reductionism to cope with these challenges, (ii) exploring problems and questions that are not
confined to a single discipline, (iii) growing societal problems that require a broader approach on
a shorter timescale, and (iv) emergence of new technologies that are applicable in more than one
discipline (National Academy of Sciences 2004).
A recent overview of the various interdisciplinary ideas and applications in academia and industry has been compiled in Frodeman et al. (2017). Within this compilation, examples for various
degrees of collaboration between the participating disciplines are observed and mapped to the
taxonomy proposed by Klein (2017), who distinguishes between multidisciplinarity, interdisciplinarity, and transdisciplinarity as the main categories.
In multidisciplinary teams a loose and temporary coupling of disciplines to solve a common problem
is observed. This juxtaposes disciplines and their methods. The multidisciplinary team coordinates
and sequences their contributions, which often are conducted within the hosting discipline. The
contributions complement each other, often only connected via the exchange of results. The definition
of terms is aligned with a focus on the collaborative effort; the information exchange is established ad
hoc by the team. Once the common problem is coped with, the team usually disengages.
Interdisciplinarity collaboration creates a closer linkage between disciplines. Data are aligned,
and processes are orchestrated, supporting a much higher degree of integration. The interdisciplinary team focuses on identifying overlapping domains of knowledge and uses integrated solutions
in its participating disciplines. By doing so, they are building permanent bridges that link domains
together. In addition to the research results, common concepts and common semantics of terms
are established that become part of the originating disciplines. This allows them to collaborate on
a whole set challenges, and teams often continue to work on the mutual extension of the knowledge of their disciplines, resulting in common methods and tools.
The strongest coupling of disciplines is captured by the transdisciplinary approach, which transcends, transgresses, and transforms the disciplines and specialties into something new. Concepts,
terms, and activities are not only described in common terms, but also they are systematically
integrated, and new interactions across the sectors of original disciplines are defined. While
knowledge components are used to complement each other in multidisciplinary teams,
transdisciplinarity hybridizes the knowledge. This teams are often permanent, leading to new
disciplines. Complexity science is an example.
In order to succeed, human systems engineering must become transdisciplinary. While a
coordinated use of methods and tools of the human-centered systems engineering disciplines is a
necessary and valuable start, they will not be sufficient to address the challenges in a sustainable
14.3 Uniting the Human Systems Engineering Stakeholder
fashion. The first step is a better alignment of our terminology. The use of common formalisms will
provide a foundation for transdisciplinarity, but the concerned effort for this closest form of
collaboration needs to come from the community.
14.3.2 Common Formalisms
A powerful example of what will happen in the absence of a common formalism, or even a common terminology, is described in Chen and Crilly (2016). The authors describe their analysis of two
teams, both working in the complexity domain. The first team worked on synthetic biology challenges, while the second team was engineering swarm robotics solutions. The research showed
that the problem space of both teams overlapped significantly, even more than the problem
domains of the parent disciplines of biology and engineering. However, as the terminology of these
disciplines is different, the complexity teams were not aware of the possibility to share and reuse
results from the other group. We know similar observations from our daily experiences as well. For
example, the term virtual reality has many interpretations in the various communities. While technology-oriented groups mainly think about head-mounted displays or virtual glasses of the latest
generation, the cognitive scientist is more interested in how the brain processes the new workload.
That does not mean that we all have to use the same terms, but we must be aware of their meaning
in the different contexts they are used in.
While changing the terminology of established disciplines is unlikely, capturing the research in
a mathematically rigorous formalism is a possibility. Such a formalism ensures high-quality
research, dissemination of the results, and the general contribution to the archived body of knowledge that provides a comprehensive and concise representation of concepts, terms, and activities
needed to make up a professional scientific domain. If this formalism can be read and processed by
machines, a significant amount of work when it comes to components matching for compositions,
or selection of alternatives, becomes possible. The “digital engineering initiative” within the US
Department of Defense (DoD) is an example to strive for a common description of contributing
elements to the DoD Enterprise, which contributes to “deliberate planning, analyzing, organizing,
and integrating of current and emerging operational and system capabilities to achieve desired
operational mission effects” as envisioned for mission engineering (Defense Aquisition
University 2017) to allow for operational agility of the military commander.
A common formalism allows one to comprehend, share, and reproduce research results to
increase knowledge over time. Without such precise communication means, the human systems
engineering community is doomed to run into the same problems as discussed by Chen and Crilly,
particularly when working with the humanities to improve the understanding of humans in all
their roles. Furthermore, such a formalism allows us to transfer solutions more easily, such as
improvements in the use of artificial intelligence, data science, machine learning, and other
common methods of interest.
In this context, the use of ontologies and taxonomies is a valuable first contribution, as these
formal presentations of knowledge facilitate communication. The foundations for such
representations have been compiled in Sowa (1999). The framework used to organize the various
contributions to this volume is an example of a possible taxonomy to address the challenges. Other
examples that may also contribute are the contributions to the classification of human–robot
interaction, such as provided by Yanco and Dury (2002) and updated by Yanco and Dury (2004).
These later taxonomies are starting to look at teams of humans and robots, and we can generalize
this to humans and systems, and how the task to be accomplished will influence the team structure
and the distribution of subtasks.
265
266
14 A Research Agenda for Human Systems Engineering
14.3.3 Common Metrics
Traditional systems engineering starts from a set of requirements. A physical architecture provides
the system components and their interconnections to host the functions needed to fulfill the
requirements. The functional architecture defines the orchestrated set of these functions. Finally,
a set of metrics is defined that measures the performance in order to evaluate if the requirements
indeed are met by the engineered system. We need such a set of metrics as well, not only for the
engineered components but also for the humans interacting with or within the system, as well as
for the human–machine collaboration parts. While it makes sense to start with the established sets
of measures of performance (how well are the system’s functions performed) and measures of
effectiveness (how well does the system contribute to the operational objective of the portfolio it is
part of), this is only a first step. The use of trusted private blockchain technology in the context of
human systems engineering is one example.
Developing metrics to test and evaluate organizational resilience is another topic of interest. In
the context of resilience for cyber–physical systems, some examples are given in Haque et al.
(2019). They identify requirements for metrics, mainly focusing on resilience, that should be applicable in the context of human systems engineering as well, but additional research is needed.
However, the metrics cannot be limited to the cyber–physical components but must include the
behavior of humans as well as organizations. A long-term goal may be to replace the current risk
assessment and mitigation methods with an organizational resilience framework, which will help
to move from optimized point solutions toward robust and stable solutions that can remain useful
even in complex and changing environments. Ultimately, we do not only want to achieve resilient
systems, but we want to engineer antifragile systems as introduced by Taleb (2012). These systems
do not only survive changes in their environment, they even get better under stress by adapting
their components and rules accordingly. Such a framework must represent resilience at the system
level, where system resilience is a function of technical and social interactions and dynamics. The
research summarized in Kantur and İşeri-Say (2012) can help with some of the organizational
aspects, but a comprehensive approach bringing together systems engineering, system of systems
engineering, and human and organizational disciplines together is still missing.
14.4
Summary
In this final chapter, a selection of research topics challenges has been compiled into several categories. The enumeration is obviously neither complete nor exclusive, and the categorization is just
a first approach of grouping these challenges. Nonetheless, we hope that members of the scholastic community will contribute to the improvement of this first topology of challenges as well as the
framework for human systems engineering itself. One observation is that we have already seen
additional ideas to extend the framework and to apply higher fidelity in the various dimensions in
some of the contributing chapters to this volume. However, what has not yet been approached
sufficiently is the question of which measures of merit to be applied, including which parameters
to collect and which metrics to use.
Furthermore, engineering management research has shown that for new ideas to be successfully
applied in real-world solutions, three components are needed:
●●
New methods must be supported by a set of mature tools with interfaces that make it easy to
integrate them into the existing workflow, preferably with little additional work for the workforce.
The more parameters that can be collected automatically, the better.
Reference
●●
●●
The workforce needs to be educated and trained in new processes and tools. They may seem
obvious to the process creator and the tool developer, but the diversity of the workforce requires
a good education to maximize the use of the innovative ideas.
The management needs to buy into the new ideas. If the management is not integrated into the
new processes and does not actively promote the change, there is a high likelihood that everybody will fall back to the old solutions, as soon as first obstacles are encountered.
This should not imply that the introduction will happen in well-defined sequences. Cognitive
systems engineering and complexity science show us that new ideas and the hosting work systems
will coevolve in a very agile process with many interdependencies and feedback loops.
Finally, human systems engineering may learn some valuable lessons from the emerging field of
socio-environment systems modeling, which addresses some interesting overlaps with our human
systems engineering challenges. In their recent research paper, Elsawah et al. (2020) identify eight
grand challenges that also look for a common formal approach to allow bridging epistemologies
across disciplines, integrated treatment of modeling uncertainties, combining qualitative and
quantitative methods and data sources, dealing with various scales and scaling, capturing systemic
changes in the system of interest, integrating the human dimension, leveraging new data types and
data sources, and elevating the resulting models and impacts on policy and decision making. All
these topics should be addressed in a research agenda for human systems engineering as well.
As observed in the introductory remarks to this volume, the necessity to improve methods to
integrate the human element into systems engineering will only increase. The integration of the
human as the critical element of the system, as a component or user, remains one of the major
challenges. With the cases of human systems engineering presented in this volume, we hope to
contribute ideas that contribute to the formation of a transdisciplinary paradigm and to a more
robust, varied, and comprehensive set of tools that allow us to tackle modern complex sociotechnical systems more effectively.
Disclaimer
The author’s affiliation with The MITRE Corporation is provided for identification purposes only
and is not intended to convey or imply MITRE’s concurrence with, or support for, the positions,
opinions, or viewpoints expressed by the author. This paper has been approved for Public Release;
Distribution Unlimited; Case Number 19-01906-20.
References
Apostel, L., Berger, G., Briggs, A., and Michaud, G. (1972). Interdisciplinarity: Problems of Teaching and
Research in Universities. Paris: ERIC.
Ashton, K. (2009). That “internet of things” thing. RFID Journal 22 (7): 97–114.
Avison, D.E. and Myers, M.D. (1995). Information systems and anthropology: and anthropological
perspective on IT and organizational culture. Information & People 8 (3): 43–56.
Bach, B., Sicat, R., Beyer, J. et al. (2017). The hologram in my hand: how effective is interactive
exploration of 3d visualizations in immersive tangible augmented reality? IEEE Transactions on
Visualization and Computer Graphics 24 (1): 457–467.
Baheti, R. and Gill, H. (2011). Cyber-physical systems. The impact of control technology 12: 161–166.
267
268
14 A Research Agenda for Human Systems Engineering
Bernard, S.A. (2012). An Introduction to Enterprise Architecture. AuthorHouse.
Chen, C.-C. and Crilly, N. (2016). Describing complex design practices with a cross-domain framework:
learning from synthetic biology and swarm robotics. Research in Engineering Design 27 (3): 291–305.
Cordeil, M., Cunningham, A., Bach, B. et al. (2019). IATK: an immersive analytics toolkit. In: IEEE
Conference on Virtual Reality and 3D User Interfaces, 200–209. Osaka, Japan: IEEE Press.
Davis, P.K., O’Mahony, A., and Pfautz, J. (2019). Social-Behavioral Modeling for Complex Systems.
Hoboken, NJ: Wiley.
Defense Acquisition University. (2017). Defense Acquisition Guidebook.
Došilović, F.K., Brčić, M., and Hlupić, N. (2018). Explainable artificial intelligence: a survey. In: 41st
International Convention on Information and Communication Technology, Electronics and
Microelectronics (MIPRO), 210–215. IEEE Press.
Elsawah, S., Filatova, T., Jakeman, A.J. et al. (2020). Eight grand challenges in socio-environmental
systems modeling. Socio-Environmental Systems Modeling 2: 16226.
Eriksson, H.-E. and Penker, M. (1999). Business Modeling with UML: Business Patterns at Work.
Hoboken, NJ: Wiley.
Fraga-Lamas, P., Fernández-Caramés, T.M., Blanco-Novoa, Ó., and Vilar-Montesinos, M.A. (2018).
A review on industrial augmented reality systems for the industry 4.0 shipyard. IEEE Access 6:
13358–13375.
Frodeman, R., Klein, J.T., and Pacheco, R.C. (2017). The Oxford Handbook of Interdisciplinarity. Oxford
University Press.
Gelfert, A. (2016). How To Do Science with Models: A Philosophical Primer. Cham, Switzerland:
Springer International Publishing.
Haque, M.A., Shetty, S., and Krishnappa, B. (2019). Cyber-physical system resilience: frameworks,
metrics, complexities, challenges, and future directions. In: Complexity Challenges in Cyber Physical
Systems (eds. S. Mittal and A. Tolk), 301–337. Hoboken, NJ: Wiley.
Hilbert, M. and López, P. (2011). The World’s technological capacity to store, communicate, and
compute information. Science 332 (6025): 60–65.
Hoc, J.-M. (2000). From human-machine interaction to human-machine cooperation. Ergonomics 43
(7): 833–843.
Hollnagel, E. and Woods, D.D. (1983). Cognitive systems engineering: new wine in new bottles.
International Journla on Man-Machine Studies 18 (6): 583–600.
Kantur, D. and İşeri-Say, A. (2012). Organizational resilience: a conceptual integrative framework.
Journal of Management & Organization 18 (6): 762–773.
Keating, C., Ralph Rogers, R.U., David Dryer, A.S.-P., and Rabadi, G. (2003). System of systems
engineering. Engineering Management Journal 15 (3): 36–45.
Klein, J.T. (2017). Typologies of interdisciplinarity: the boundary work of definition. In: The Oxford
Handbook of Interdisciplinarity, 2e (eds. R. Frodeman, J.T. Klein and R.C. Pacheco), 21–34. Oxford
University Press.
Klein, G.A., Calderwood, R., and Macgregor, D. (1989). Critical decision method for eliciting
knowledge. IEEE Transactions on Systems, Man, and Cybernetics 19 (3): 462–472.
Mittal, S. (2006). Extending DoDAF to allow integrated DEVS-based modeling and simulation. Journal
of Defense Modeling and Simulation 3 (2): 95–123.
Mittal, S., Diallo, S.Y., and Tolk, A. (2018). Emergent Behavior in Complex Systems Engineering: A
Modelingand Simulation Approach. Hoboken, NJ: Wiley.
Mosterman, P.J. and Zander, J. (2016). Cyber-physical systems challenges: a needs analysis for
collaborating embedded software systems. Software and Systems Modeling 15 (1): 5–16.
Reference
National Academy of Sciences (2004). Facilitating Interdisciplinary Research. Washington, DC:
National Academies Press.
Nemeth, C.P., Cook, R.I., and Woods, D.D. (2004). The messy details: insights from the study of
technical work in healthcare. IEEE Transactions on Systems, Man, and Cybernetics 34 (6): 689–692.
Passian, A. and Imaan, N. (2019). Nanosystems, edge computing, and the next generation of
computing systems. Sensors (Basel) 19 (18): 4048.
Sage, A.P. (1992). Systems Engineering. Hoboken, NJ: Wiley.
Sehgal, V., Patrick, A., and Rajpoot, L. (2014). A comparative study of cyber physical cloud, cloud of
sensors and internet of things: their ideology, similarities and differences. In: IEEE International
Advance Computing Conference, 708–716. Gurgaon, India: IEEE.
Shuman, E.A. (2010). Understanding executable architectures through an examination of language
model elements. In: Summer Computer Simulation Conference, 483–497. San Diego, California:
SCS Press.
Sousa-Poza, A. (2015). Mission engineering. International Journal of System of Systems Engineering
6 (3): 161–185.
Sowa, J.F. (1999). Knowledge Representation: Logical, Philosophical and Computational Foundations.
Pacific Grove: Brooks/Cole Publishing.
Taleb, N.N. (2012). Antifragile: Things That Gain from Disorder. New York, NY: Random House
Incorporated.
Tolk, A. and Rainey, L.B. (2015). Towards a research agenda for M&S support for system of systems
engineering. In: Modeling and Simulation Support for System of Systems Engineering Applications
(eds. L.B. Rainey and A. Tolk), 581–592. Hoboken, NJ: Wiley.
Tolk, A., Glazner, C.G., and Pitsko, R. (2017). Simulation-based systems engineering. In: Guide to
Simulation-Based Disciplines (eds. S. Mittal, U. Durak and T. Ören), 75–102. Cham, Switzerland:
Springer International Publishing.
Tolk, A., Wildman, W.J., Shults, F.L., and Diallo, S.Y. (2018). Human simulation as the lingua franca
for computational social sciences and humanities: potential and pitfalls. Journal of Cognition and
Culture 18 (5): 462–482.
Traoré, M.K. (2019). Unified approaches to modeling. In: Model Engineering for Simulation (eds.
L. Zhang, B.P. Zeigler and Y. LaiLi), 43–56. Academic Press.
Williams, R. (2008). Autonomous Systems Overview. Technical report. BAE Systems.
Woods, D.D. and Roth, E.M. (1988). Cognitive systems engineering. In: Handbook of Human-Computer
Interaction, 1e (ed. M.G. Helander), 3–43. Amsterdam, The Netherlands: North-Holland.
Yanco, H.A. and Dury, J.L. (2002). A taxonomy for human-robot interaction. In: AAAI Fall Symposium
on Human-Robot Interaction, 111–119). Technical Report FS-02-03. Falmouth, Massachusetts: AAAI.
Yanco, H.A. and Dury, J.L. (2004). Classifying human-robot interaction: an updated taxonomy. In:
International Conference on Systems, Man and Cybernetics, 2841–2846. IEEE Press.
269
271
Index
a
Adaptability 70, 145, 150, 153, 159, 166, 168,
169, 177
Adaptive capacity 150, 159, 165, 179
Agent 23–25, 27, 29, 43–54, 57–58, 113, 114,
116–118, 120–121, 123–124, 126, 186–187,
200–202, 219, 220
Agile 8, 20, 22, 25, 36, 38, 119, 120, 123, 259,
266, 267
Agility 20, 44, 67, 145, 150, 153, 159, 168, 169,
177, 265
Air combat training 8, 185–202
Air Traffic Control 247, 249, 250, 252, 254
Air traffic controllers 114, 254
Air traffic management (ATM) 113, 114, 116,
117, 127
Aircraft pilots 43, 53, 114–120, 131, 135, 136,
187, 191–201, 250
Application Programming Interface (API) 25
Artificial intelligence (AI) 8, 11, 19–39, 43, 123,
136, 219, 262, 265
Automation 15, 46–47, 80, 108, 113–117,
119–123, 136–137, 168, 195
Autonomous systems 5, 43–58, 262, 263
Autonomy 8, 43–58, 97, 108, 113, 120–123,
262, 263
Aviation Training 8, 137
b
Bayesian Belief Network (BBN)
Bayesian network 24, 27, 29
Bell Labs 19
Behavioural ethics 54, 57
33
Big Data 13, 14, 136, 207, 208, 209, 210, 219,
260, 261
Biometric Information Privacy Act (BIPA) 16
Blockchain 8, 207–221, 266
c
California Consumer Privacy Act (CCPA) 16
Change management 84–85
Chemical, Biological, Radiation, Nuclear and
Environmental (CBRNE) 13
Closed Circuit Television (CCTV) 13, 248
Coalitions 23
Cognitive Cyber Physical 43
Comfort 115, 123, 126, 127, 136, 198
Complex Systems 4, 43, 45, 71, 97, 114, 116,
119, 120, 126, 200, 201, 202, 219–220
Cognitive 8, 31, 43–50, 52, 67, 85, 90–91, 109,
117, 119, 122–124, 126, 131–137, 187, 191, 260,
263, 265, 267
Cognitive systems engineering 260, 267
Complex Systems Governance 43
Complexity 20–21, 23, 31, 38, 43, 45, 47, 51,
54–55, 65–66, 68–71, 74, 90, 94, 97–98, 103,
108–110, 114–115, 117, 119, 122, 136, 144,
186–187, 193, 196, 198–199, 215, 240, 242–243,
259–260, 262, 264–265, 267
Computer vision 11
Context 3, 6, 8, 11–17, 24–25, 46, 57, 66–67,
70, 80, 85–86, 94, 103, 113, 120–121, 126,
132–133, 135, 143–145, 160, 164–168, 176,
187–188, 197, 200–201, 207, 219,
259–261, 265–266
Control Room 8, 137, 247–257
A Framework of Human Systems Engineering: Applications and Case Studies, First Edition.
Edited by Holly A. H. Handley and Andreas Tolk.
© 2021 The Institute of Electrical and Electronics Engineers, Inc. Published 2021 by John Wiley & Sons, Inc.
272
Index
h
Crew capabilities 97, 98
Crew mental and physical health 109
Critical Decision Method (CDM) 188, 263
d
Defence Training System (DTS) 143, 144, 145,
159, 169–177
DevOps 21, 22
Digital Engineering 21, 265
Digital twins 22, 23–24, 27, 36, 262
Department of Defense (DoD) 4, 19, 48, 51, 66,
97, 143, 144, 147, 176, 209, 222, 265
Domain Awareness System (DAS) 12
e
Evidence Based Training (EBT) 131, 132
Efficiency 16, 17, 54, 71, 113, 115, 122, 127,
145, 150, 153, 159, 164, 168, 177, 188, 208
Electronic Identification Mechanisms
(eIDs) 16
Emergent behavior 44, 50, 51, 125, 187
Engineered system 65, 70, 219, 266
Enterprise architecture engineering 259
Enterprise modelling 33
Enterprise systems 66, 67, 68, 144–145
Entropy 23, 33, 221
Ergonomics 3–4, 67, 85, 118–119
Ethical design processes 55
f
Flexibility 67, 84, 114, 120, 121, 123, 145, 150,
153, 159, 164, 165, 168, 169, 177, 201
Framework 3–9, 12, 20, 22–23, 25–26, 28–29,
65–66, 71, 74, 85, 103, 113, 116, 122–126,
131–137, 143–144, 147, 160, 166–167,
169, 196, 209–211, 230, 242, 260, 263,
265–266
Function 12, 43, 45, 50, 54, 75, 80, 86, 108,
116–119, 121–126, 136, 145, 150, 159–160,
165–169, 172, 193, 200, 221, 228–231, 233,
234–238, 240, 251, 266
g
Gamification 132, 133, 135
Gen Y 131–137
Gen Z 131–137
General Data Protection Regulation (GDPR)
General-purpose simulator 247, 249–251
16
Holistic systems 90
Human Autonomy Teaming (HAT) 8, 43–58
Human-centered disciplines 3–4, 118–119, 259,
260, 263
Human-Centered Design (HCD) 103, 106, 108,
114, 118, 119, 120, 123, 126, 127, 210
Human-computer Interaction (HCI) 8, 46, 103,
115, 118, 119, 122
Human Data Engineering (HDE) 207–211
Human Data Integration (HDI) 8, 207, 208, 210
Human Factors (HF) 3, 4, 5, 8, 65, 67, 71, 73,
74, 75, 78, 80, 85, 94, 105, 108, 113, 118, 119,
143, 144
Human Factors and Ergonomics (HFE) 3, 4,
103, 105, 108, 118, 119, 122
Human Factors Engineering (HFE) 3, 4, 103,
105, 108, 118, 119, 122, 144
Human Factors Integration (HFI) 4, 144
Human in the loop Simulation (HITLS) 113,
116, 119, 120, 122, 123
Human life in space 110
Human-machine interfaces 118, 195, 260, 263
Human-machine teams 24, 263
Human performance 5, 98, 103, 108, 135, 207,
209, 210, 254
Human System(s) Engineering (HSE) 3–9,
19–21, 25, 36–37, 44, 57, 65, 67, 70, 74, 94, 132,
136–137, 169, 200, 207–221, 239,
242–243, 259–267
Human Systems Engineering
Framework 3–8, 169
Human System(s) Integration (HSI) 3–5, 9, 11,
13, 16–17, 66–67, 74, 94, 97–111, 113–127,
137, 210
Human Systems Interaction 4
Hyperledger Fabric 209, 210, 212, 214, 215,
217, 218, 221
i
Inexperienced pilots 111, 131
Interaction 4–5, 8, 14, 16, 22–24, 26, 28, 31, 33,
44, 46–49, 51–53, 55, 57, 67, 71, 75, 86, 90,
97–98, 103–106, 108, 110, 115–117, 119,
125, 132, 136, 186–187, 190, 195–196, 200, 202,
207, 210, 212, 213, 217, 219, 232, 236,
260, 264–266
Index
Internet of Things (IOT)
220, 260
13, 14, 15, 122, 210,
k
Knowledge, power, presence, and
harmony 239, 243
l
Life learning 43–58
Live, Virtual, Constructive (LVC) 186, 187, 188,
189, 190, 192, 193, 194, 195, 196, 197, 198, 199,
200, 201
Long-duration missions 97, 98, 109, 111
Low-experience pilots 131, 132, 193
m
Machine heuristic 14
Meaningful Human Control 8, 44
Mission engineering 259, 265
Mobile Driver’s License (mDL) 16
Mobility 110, 126
Model-based Systems Engineering (MBSE) 21,
65, 70–71, 262
Modeling and simulation 21, 116, 123, 126,
187, 194, 262
n
Naval Air Training and Operating Procedures
Standardization (NATOPS) 186
Naval Flight Officer (NFO) 187
NASA systems engineering process 103–108
Netflix 21
New York Police Department (NYPD) 12
Nominally Emergent Resilience (NER) 186
o
Operation Risks 16, 97, 103, 106, 207, 209
Operational Risk Management (ORM) 8,
189, 207–221
Organizational Capability Maturity
Model 66
Organizational principles 8, 225, 239
Organizational systems 65, 94
Organizational system evolution 66–70, 94
p
Past, present, future, and matter 225
Personally Identifiable Information (PII)
16
Physical 5, 13, 24, 67, 80, 91, 109–110, 115, 120,
123–125, 133, 135–137, 145, 159, 185–186, 191,
193, 209, 212, 214, 225, 227–229, 248, 253–255,
259–260, 262–263, 266
Pilot trainee 131–137
Privacy 12, 15, 16–17, 50, 219, 254
Problem solving 111, 121
Procedures 16, 69, 80, 101, 110, 114, 115, 118,
120, 121, 131, 134, 135, 136, 137, 167, 186,
187, 201
Public Key Infrastructure (PKI) 210, 212,
214, 215
Public-Private Partnership (PPP) 12
Public Safety 8, 11, 12, 13, 14, 15, 17, 260
r
Real-Time Simulation 251, 255, 257
Recovery/ Restorative capacity 177
Reducing system Life Cycle Costs 97
Redundancy 150, 153, 159, 177
Resilience 8, 47, 57, 67, 131, 133, 143–177,
186–187, 190, 199–201, 266
Resources 15, 22, 80, 109, 110, 126, 143, 144,
145, 159, 166, 168, 171, 185, 199, 209
Risk Assessment 23, 25, 27, 30, 73, 188, 189,
190, 266
Robustness 150, 153, 159, 165, 177, 186
s
Safety 4, 8, 11–15, 17, 50, 69, 73, 75, 80, 85,
91, 97, 103, 106, 108–111, 113, 115, 122,
126–127, 137, 144, 186–190, 192–200, 219,
249–250, 260
Safety in operating systems 97
SAS Competency Matrix 44, 49
SAS Cognitive Competence Level 48
Scaled Agile Framework (SAFe) 20, 12, 14, 15,
20, 21, 22, 31, 36, 38, 44, 50, 51, 110, 118, 186,
191, 192, 196, 199
SCRUM 20, 22, 36
Security 8, 11, 12, 13, 15, 16, 47, 157, 196, 202,
207, 212, 214, 215, 216, 219, 221, 249
Sensors 11, 13, 14, 15, 31, 36, 43, 123, 133,
194, 250
Simulation 21, 50–51, 53, 55, 57, 70, 111, 116,
122–123, 126–127, 136, 185–187, 194, 197,
247–257, 262
273
274
Index
Situation(al) awareness (SA) 11, 12, 13, 14, 15,
16–17, 53, 58, 74, 85–90, 108, 122, 193, 194,
196, 197, 198, 199
Smart Autonomous System (SAS) 43–58
Socio-technical system 3, 5–7, 9, 19, 23–25,
27, 44–47, 65, 144, 186, 200–202,
259–260, 267
Socio-temporal 26, 29–30
Spacecraft system design 111
Specific-purpose Simulator 247, 250
Strain 5, 22, 38, 46, 65, 70, 90, 94, 103, 127, 135,
199, 208, 252, 253, 257, 261
Stress 8, 50, 55, 57, 90, 109, 111, 133, 159, 185,
194, 195, 252, 253, 255, 261, 266
Strike Fighter Advanced Readiness Program
(SFARP) 187
Structure 5, 7, 28, 33, 37, 46, 49, 67, 68, 73,
74, 80, 81, 83, 84, 121, 124, 125, 126, 159,
165, 167
Subject Matter Experts (SME) 5, 85, 103, 120,
208, 209, 210
Systemigrams 23
System architecture 143–177
System complexity 70, 110, 136
System design 4, 5, 6, 9, 19, 65, 80, 97, 103, 106,
108, 111, 132, 136, 144, 160, 167, 168, 207, 208,
210, 219
System engineer 208
System(s) Engineering (SE) 3–8, 19–39, 65–66,
70–71, 97–111, 115, 132, 136–137, 169, 200,
207–220, 259–267
System life cycle 4, 47, 65–70, 74, 97, 167
System of system 20, 113, 116, 123–125, 126,
164, 259, 260, 263, 266
System resilience 143, 147, 159, 160, 165, 166,
167, 168, 169, 172, 177, 266
t
Tangibility 113, 119–120, 122
Technology Readiness Level (TRL) 48, 57
Thematic analysis 188, 189, 190
Training system 8, 111, 132, 136–137, 143–177,
186–187, 189–190, 193–195, 199–201
Training system engineering 136, 143–144,
147, 164, 168, 169, 177, 186–187
Trustworthy Private Blockchain 207–221
u
Uighurs 12
Unified Architecture Framework (UAF) 66, 71,
74, 75, 80
User Data Interaction Design (UDID) 207,
208, 212
v
Virtual technologies 134–136
Vulnerability reduction 150, 177
w
Watchdog-AI 51, 52, 53, 57, 58
Weakly Emergent Resilience (WER) 186
Within Visual Range (WVR) 191–193
Workload Analysis 85, 90