/


Текст
Fatigue of Materials
Written by a leading researcher in the field, this revised and updated second edition
of a highly successful book provides an authoritative, comprehensive and unified
treatment of the mechanics and micromechanisms of fatigue in metals, nonmetals
and composites.
The author discusses the principles of cyclic deformation, crack initiation and
crack growth by fatigue, covering both microscopic and continuum aspects. The
book begins with discussions of cyclic deformation and fatigue crack initiation in
monocrystalline and polycrystalline ductile alloys as well as in brittle, semi-
crystalline and noncrystalline solids. Total-life and damage-tolerant approaches are
then introduced in metals, nonmetals and composites along with such advanced
topics as multiaxial fatigue, contact fatigue, variable amplitude fatigue, creep-
fatigue, and environmentally assisted fatigue. Emphasis is placed upon scientific
concepts and mechanisms and the basic concepts are extended to many practical
cases wherever possible. The book includes an extensive bibliography and a problem
set for each chapter, together with worked-out example problems and case studies.
The book will be an important reference for students, practicing engineers and
researchers studying fracture and fatigue in materials science and engineering,
mechanical, civil, nuclear and aerospace engineering, and biomechanics.
Fatigue of Materials
SECOND EDITION
S. SURESH
Massachusetts Institute of Technology
CAMBRIDGE
UNIVERSITY PRESS
CAMBRIDGE UNIVERSITY PRESS
Cambridge, New York, Melbourne, Madrid, Cape Town, Singapore, Sao Paulo
Cambridge University Press
The Edinburgh Building, Cambridge CB2 2RU, UK
Published in the United States of America by Cambridge University Press, New York
www.cambridge.org
Information on this title: www.cambridge.org/9780521570466
© Subra Suresh 1998
This publication is in copyright. Subject to statutory exception
and to the provisions of relevant collective licensing agreements,
no reproduction of any part may take place without
the written permission of Cambridge University Press.
First published 1998
Reprinted 2001 (with corrections), 2003, 2004
A catalogue record for this publication is available from the British Library
Library of Congress Cataloguing in Publication data
Suresh, S. (Subra)
Fatigue of materials / S. Suresh. - 2nd ed.
p. cm.
Includes bibliographical references and index.
ISBN 0 521 57046 8 (hardcover). - ISBN 0 521 57847 7 (pbk.)
1. Materials - Fatigue. 2. Fracture mechanics. I. Title.
TA418.38.S87 1998
620.1' 126-dc21 98-15181 CIP
ISBN-13 978-0-521-57046-6 hardback
ISBN-10 0-521-57046-8 hardback
ISBN-13 978-0-521-57847-9 paperback
ISBN-10 0-521-57847-7 paperback
Transferred to digital printing 2006
To
My wife Mary and our children,
Nina and Meera
Contents
Preface to the second edition xvii
Preface to the first edition xix
Introduction and overview 1
1.1 Historical background and overview 1
1.1.1 Case study: Fatigue and the Comet airplane 8
1.2 Different approaches to fatigue 11
1.2.1 Total-life approaches 12
1.2.2 Defect-tolerant approach 13
1.2.3 A comparison of different approaches 14
1.2.4 'Safe-life' and 'fail-safe' concepts 14
1.2.5 Case study: Retirement for cause 15
1.3 The need for a mechanistic basis 17
1.4 Continuum mechanics 18
1.4.1 Elements of linear elasticity 20
1.4.2 Stress invariants 21
1.4.3 Elements of plasticity 22
1.4.4 Elements of linear viscoelasticity 26
1.4.5 Viscoplasticity and viscous creep 28
1.5 Deformation of ductile single crystals 29
1.5.1 Resolved shear stress and shear strain 30
Exercises 33
PART ONE: CYCLIC DEFORMATION AND FATIGUE CRACK
INITIATION 37
Cyclic deformation in ductile single crystals 39
2.1 Cyclic strain hardening in single crystals 40
2.2 Cyclic saturation in single crystals 40
2.2.1 Monotonic versus cyclic plastic strains 45
2.3 Instabilities in cyclic hardening 45
2.3.1 Example problem: Identification of active slip systems 47
2.3.2 Formation of dislocation veins 49
2.3.3 Fundamental length scales for the vein structure 52
2.4 Deformation along persistent slip bands 52
2.5 Dislocation structure of PSBs 53
2.5.1 Composite model 57
vn
Vlll
Contents
2.5.2 Example problem: Dislocation dipoles and cyclic
deformation 58
2.6 A constitutive model for the inelastic behavior of PSBs 60
2.6.1 General features 60
2.6.2 Hardening in the PSBs 61
2.6.3 Hardening at sites of PSB intersection with the free surface 61
2.6.4 Unloading and reloading 62
2.6.5 Vacancy generation 62
2.7 Formation of PSBs 63
2.7.1 Electron microscopy observations 63
2.7.2 Static or energetic models 65
2.7.3 Dynamic models of self-organized dislocation structures 68
2.8 Formation of labyrinth and cell structures 69
2.8.1 Example problem: Multiple slip 71
2.9 Effects of crystal orientation and multiple slip 72
2.10 Case study: A commercial FCC alloy crystal 74
2.11 Monotonic versus cyclic deformation in FCC crystals 78
2.12 Cyclic deformation in BCC single crystals 79
2.12.1 Shape changes in fatigued BCC crystals 80
2.13 Cyclic deformation in HCP single crystals 82
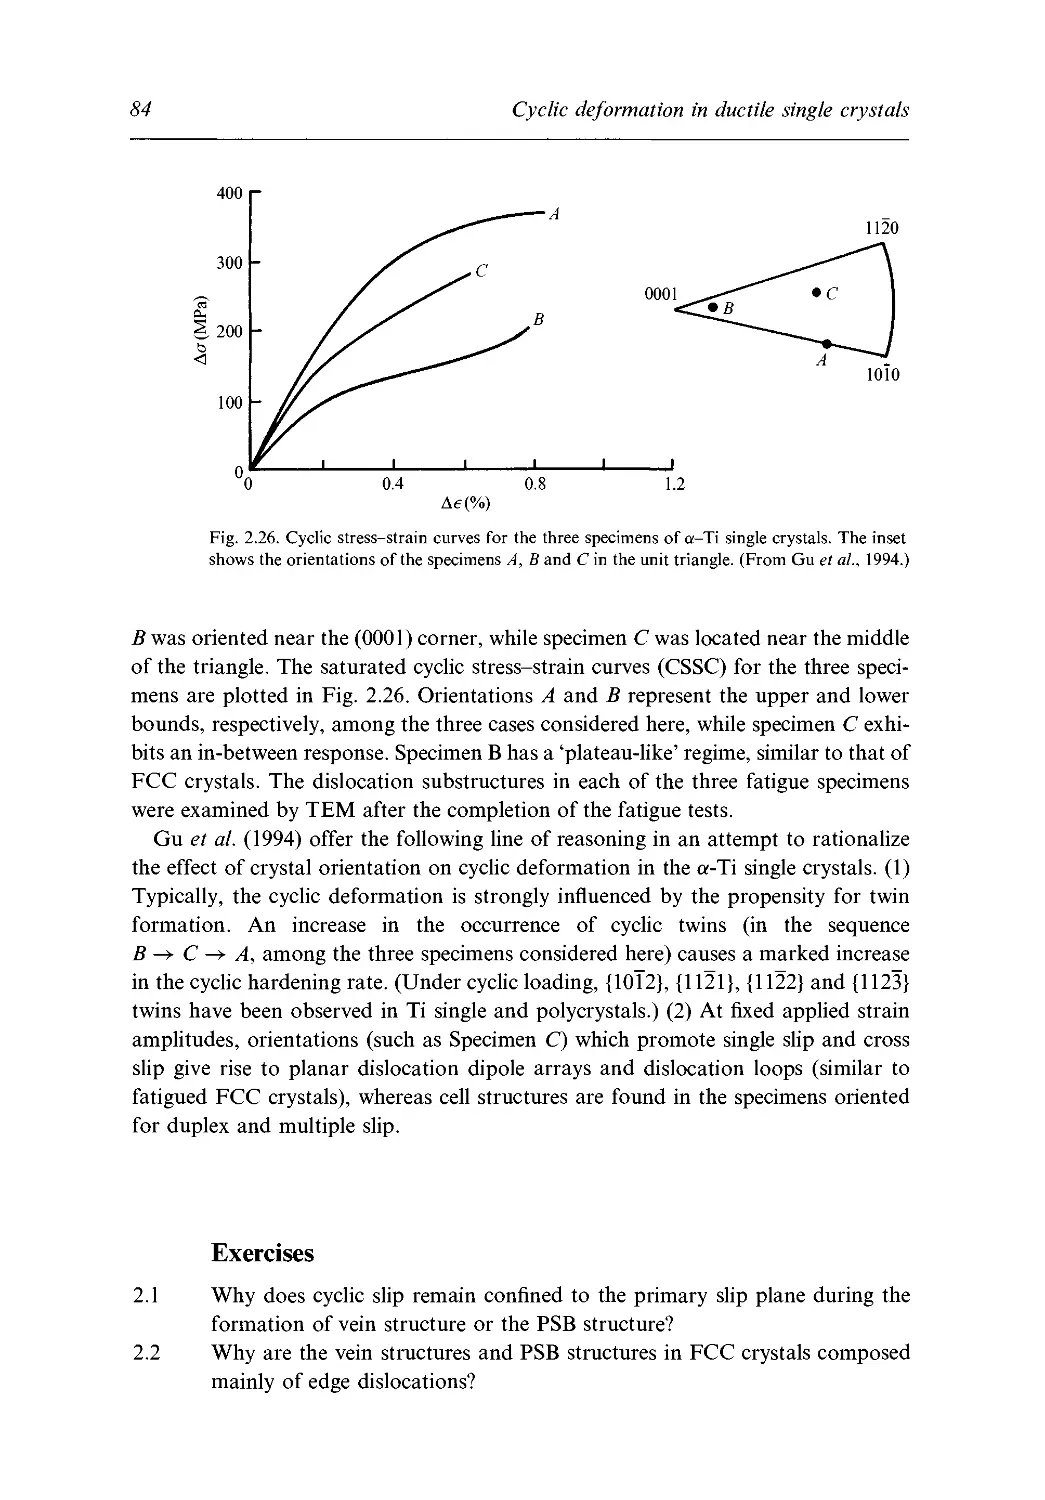
2.13.1 Basic characteristics of Ti single crystals 83
2.13.2 Cyclic deformation of Ti single crystals 83
Exercises 84
3 Cyclic deformation in polycrystalline ductile solids 86
3.1 Effects of grain boundaries and multiple slip 86
3.1.1 Monocrystalline versus polycrystalline FCC metals 87
3.1.2 Effects of texture 89
3.2 Cyclic deformation of FCC bicrystals 89
3.2.1 Example problem: Number of independent slip systems 91
3.3 Cyclic hardening and softening in polycrystals 91
3.4 Effects of alloying, cross slip and stacking fault energy 95
3.5 Effects of precipitation 97
3.6 The Bauschinger effect 97
3.6.1 Terminology 98
3.6.2 Mechanisms 99
3.7 Shakedown 101
3.8 Continuum models for uniaxial and multiaxial fatigue 102
3.8.1 Parallel sub-element model 104
3.8.2 Field of work hardening moduli 106
3.8.3 Two-surface models for cyclic plasticity 110
3.8.4 Other approaches 112
3.9 Cyclic creep or ratchetting 113
3.10 Metal-matrix composites subjected to thermal cycling 115
3.10.1 Thermoelastic deformation
3.10.2 Characteristic temperatures for thermal fatigue
3.10.3 Plastic strain accumulation during thermal cycling
3.10.4 Effects of matrix strain hardening
3.10.5 Example problem: Critical temperatures for thermal fatig
in a metal-matrix composite
3.11 Layered composites subjected to thermal cycling
3.11.1 Thermoelastic deformation of a bilayer
3.11.2 Thin-film limit: the Stoney formula
3.11.3 Characteristic temperatures for thermal fatigue
Exercises
4 Fatigue crack initiation in ductile solids
4.1 Surface roughness and fatigue crack initiation
4.1.1 Earlier observations and viewpoints
4.1.2 Electron microscopy observations
4.2 Vacancy-dipole models
4.3 Crack initiation along PSBs
4.4 Role of surfaces in crack initiation
4.5 Computational models for crack initiation
4.5.1 Vacancy diffusion
4.5.2 Numerical simulations
4.5.3 Example problem: Effects of vacancies
4.6 Environmental effects on crack initiation
4.7 Kinematic irreversibility of cyclic slip
4.8 Crack initiation along grain and twin boundaries
4.9 Crack initiation in commercial alloys
4.9.1 Crack initiation near inclusions and pores
4.9.2 Micromechanical models
4.10 Environmental effects in commercial alloys
4.11 Crack initiation at stress concentrations
4.11.1 Crack initiation under far-field cyclic compression
Exercises
5 Cyclic deformation and crack initiation in brittle solids
5.1 Degrees of brittleness
5.2 Modes of cyclic deformation in brittle solids
5.3 Highly brittle solids
5.3.1 Mechanisms
5.3.2 Constitutive models
5.3.3 On possible effects of cyclic loading
5.3.4 Elevated temperature behavior
5.4 Semi-brittle solids
5.4.1 Crack nucleation by dislocation pile-up
Contents
5.4.2 Example problem: Cottrell mechanism for sessile dislocation
formation 180
5.4.3 Cyclic deformation 182
5.5 Transformation-toughened ceramics 184
5.5.1 Phenomenology 185
5.5.2 Constitutive models 187
5.6 Fatigue crack initiation under far-field cyclic compression 191
5.6.1 Example problem: Crack initiation under far-field cyclic
compression 196
Exercises 197
6 Cyclic deformation and crack initiation in noncrystalline solids 200
6.1 Deformation features of semi-/noncrystalline solids 200
6.1.1 Basic deformation characteristics 200
6.1.2 Crazing and shear banding 201
6.1.3 Cyclic deformation: crystalline versus noncrystalline materials 203
6.2 Cyclic stress-strain response 205
6.2.1 Cyclic softening 205
6.2.2 Thermal effects 207
6.2.3 Example problem: Hysteretic heating 207
6.2.4 Experimental observations of temperature rise 209
6.2.5 Effects of failure modes 210
6.3 Fatigue crack initiation at stress concentrations 211
6.4 Case study: Compression fatigue in total knee replacements 213
Exercises 217
PART TWO: TOTAL-LIFE APPROACHES 219
7 Stress-life approach 221
7.1 The fatigue limit 222
7.2 Mean stress effects on fatigue life 224
7.3 Cumulative damage 227
7.4 Effects of surface treatments 228
7.5 Statistical considerations 231
7.6 Practical applications 235
7.6.1 Example problem: Effects of surface treatments 235
7.6.2 Case study: HCF in aircraft turbine engines 236
7.7 Stress-life response of polymers 237
7.7.1 General characterization 237
7.7.2 Mechanisms 238
7.8 Fatigue of organic composites 239
7.8.1 Discontinuously reinforced composites 240
7.8.2 Continuous-fiber composites 240
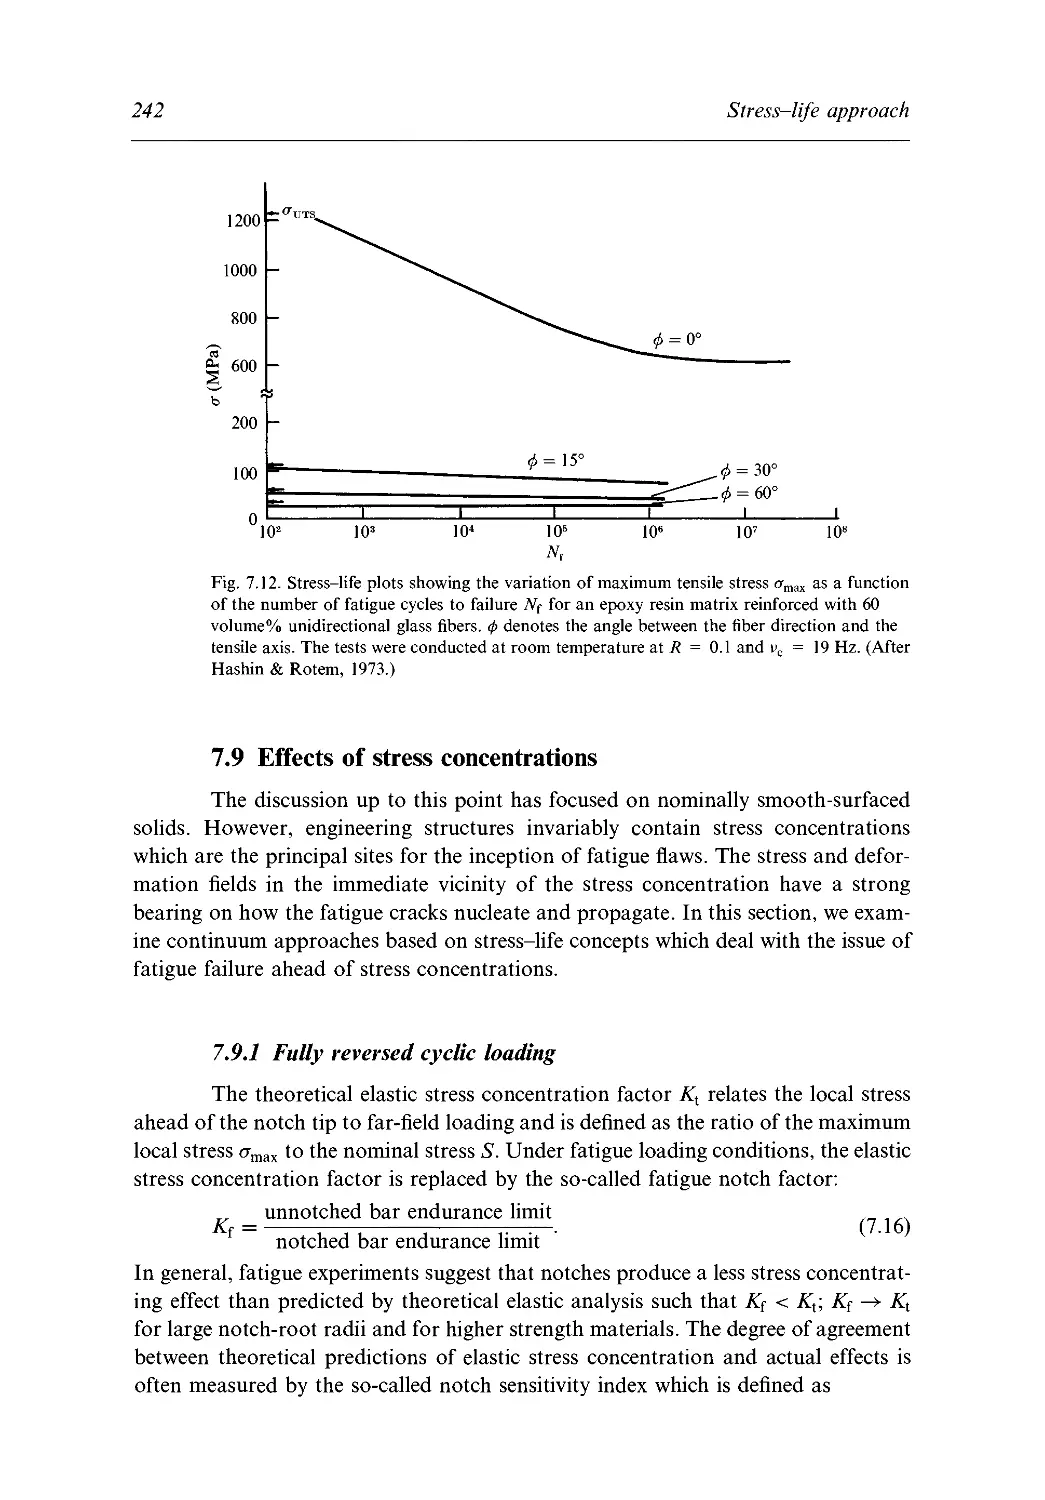
7.9 Effects of stress concentrations 242
7.9.1 Fully reversed cyclic loading 242
XI
7.9.2 Combined effects of notches and mean stresses 243
7.9.3 Nonpropagating tensile fatigue cracks 244
7.9.4 Example problem: Effects of notches 244
7.10 Multiaxial cyclic stresses 246
7.10.1 Proportional and nonproportional loading 246
7.10.2 Effective stresses in multiaxial fatigue loading 247
7.10.3 Stress-life approach for tension and torsion 248
7.10.4 The critical plane approach 250
Exercises 254
Strain-life approach 256
8.1 Strain-based approach to total life 256
8.1.1 Separation of low-cycle and high-cycle fatigue lives 256
8.1.2 Transition life 257
8.1.3 Example problem: Thermal fatigue life of a metal-matrix
composite 260
8.2 Local strain approach for notched members 262
8.2.1 Neuber analysis 263
8.3 Variable amplitude cyclic strains and cycle counting 265
8.3.1 Example problem: Cycle counting 265
8.4 Multiaxial fatigue 268
8.4.1 Measures of effective strain 268
8.4.2 Case study: Critical planes of failure 269
8.4.3 Different cracking patterns in multiaxial fatigue 271
8.4.4 Example problem: Critical planes of failure in multiaxial
loading 273
8.5 Out-of-phase loading 276
Exercises 278
PART THREE: DAMAGE-TOLERANT APPROACH 281
Fracture mechanics and its implications for fatigue 283
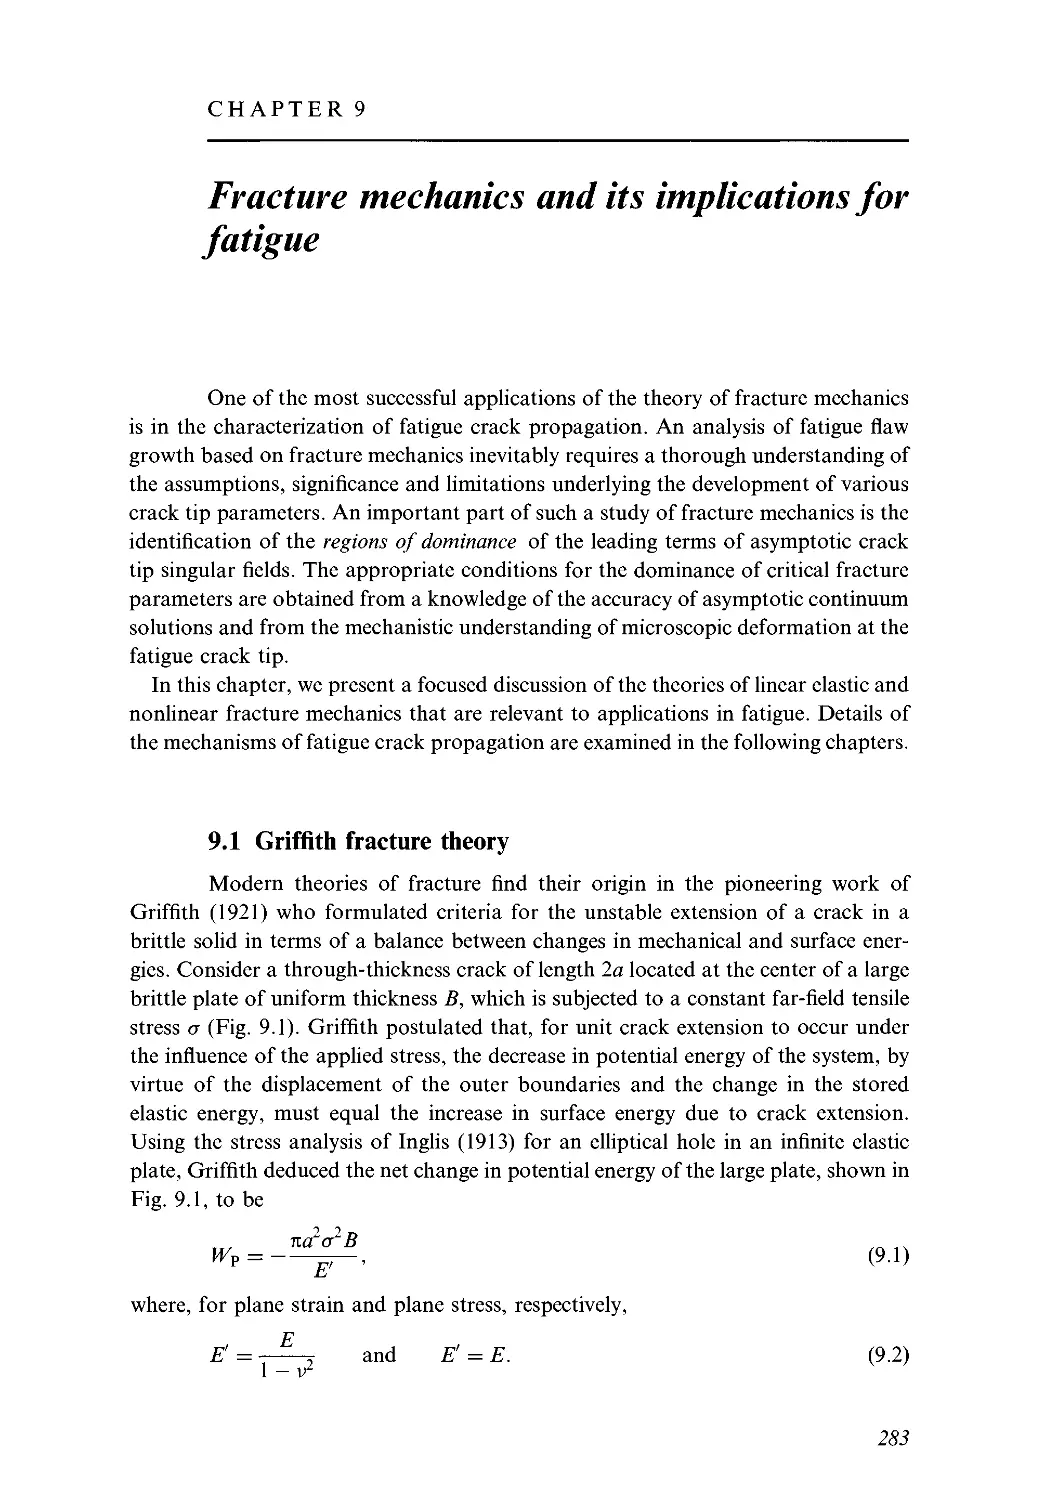
9.1 Griffith fracture theory 283
9.2 Energy release rate and crack driving force 285
9.3 Linear elastic fracture mechanics 288
9.3.1 Macroscopic modes of fracture 288
9.3.2 The plane problem 289
9.3.3 Conditions of A^-dominance 295
9.3.4 Fracture toughness 296
9.3.5 Characterization of fatigue crack growth 296
9.4 Equivalence of Q and K 297
9.4.1 Example problem: Q and K for the DCB specimen 298
9.4.2 Example problem: Stress intensity factor for a blister test 300
9.5 Plastic zone size in monotonic loading 302
9.5.1 The Irwin approximation 302
9.5.2 The Dugdale model 303
Contents
9.5.3 The Barenblatt model 304
9.6 Plastic zone size in cyclic loading 304
9.7 Elastic-plastic fracture mechanics 307
9.7.1 The /-integral 307
9.7.2 Hutchinson-Rice-Rosengren (HRR) singular fields 308
9.7.3 Crack tip opening displacement 309
9.7.4 Conditions of/-dominance 310
9.7.5 Example problem: Specimen size requirements 312
9.7.6 Characterization of fatigue crack growth 313
9.8 Two-parameter representation of crack-tip fields 316
9.8.1 Small-scale yielding 318
9.8.2 Large-scale yielding 318
9.9 Mixed-mode fracture mechanics 319
9.10 Combined mode I-mode II fracture in ductile solids 320
9.11 Crack deflection 322
9.11.1 Branched elastic cracks 324
9.11.2 Multiaxial fracture due to crack deflection 326
9.12 Case study: Damage-tolerant design of aircraft fuselage 327
Exercises 328
10 Fatigue crack growth in ductile solids 331
10.1 Characterization of crack growth 331
10.1.1 Fracture mechanics approach 332
10.1.2 Fatigue life calculations 334
10.2 Microscopic stages of fatigue crack growth 335
10.2.1 Stage I fatigue crack growth 335
10.2.2 Stage II crack growth and fatigue striations 335
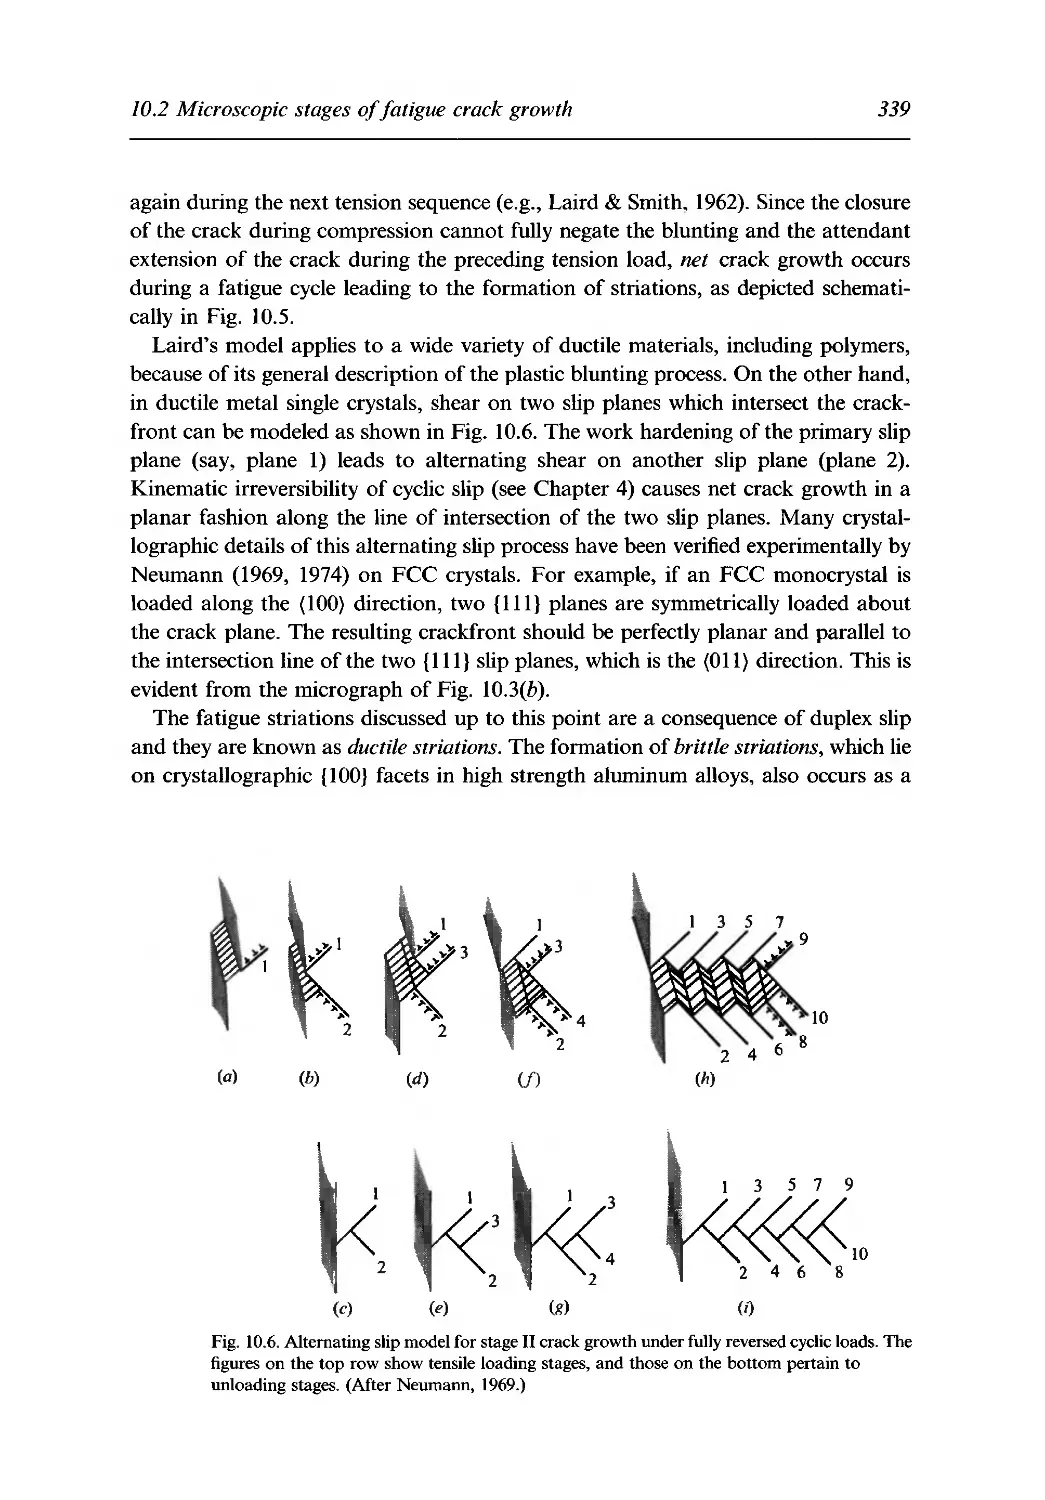
10.2.3 Models for striation formation 337
10.2.4 Environmental effects on stage II fatigue 340
10.3 Different regimes of fatigue crack growth 341
10.4 Near-threshold fatigue crack growth 343
10.4.1 Models for fatigue thresholds 345
10.4.2 Effects of microstructural size scale 346
10.4.3 Effects of slip characteristics 347
10.4.4 Example problem: Issues of length scales 351
10.4.5 On the determination of fatigue thresholds 352
10.5 Intermediate region of crack growth 354
10.6 High growth rate regime 357
10.7 Case study: Fatigue failure of aircraft structures 358
10.8 Case study: Fatigue failure of total hip components 364
10.9 Combined mode I-mode II fatigue crack growth 368
10.9.1 Mixed-mode fatigue fracture envelopes 369
10.9.2 Path of the mixed-mode crack 370
10.9.3 Some general observations 372
10.10 Combined mode I-mode III fatigue crack growth 373
Xlll
10.10.1 Crack growth characteristics 374
10.10.2 Estimation of intrinsic growth resistance 378
Exercises 379
Fatigue crack growth in brittle solids 383
11.1 Some general effects of cyclic loading on crack growth 384
11.2 Characterization of crack growth in brittle solids 385
11.2.1 Crack growth under static loads 385
11.2.2 Crack growth under cyclic loads 386
11.3 Crack growth resistance and toughening of brittle solids 388
11.3.1 Example problem: Fracture resistance and stability of crack
growth 389
11.4 Cyclic damage zone ahead of tensile fatigue crack 392
11.5 Fatigue crack growth at low temperatures 393
11.6 Case study: Fatigue cracking in heart valve prostheses 396
11.7 Fatigue crack growth at elevated temperatures 399
11.7.1 Micromechanisms of deformation and damage due to
intergranular/interfacial glassy films 399
11.7.2 Crack growth characteristics at high temperatures 402
11.7.3 Role of viscous films and ligaments 403
Exercises 406
Fatigue crack growth in noncrystalline solids 408
12.1 Fatigue crack growth characteristics 408
12.2 Mechanisms of fatigue crack growth 411
12.2.1 Fatigue striations 411
12.2.2 Discontinuous growth bands 413
12.2.3 Combined effects of crazing and shear flow 417
12.2.4 Shear bands 419
12.2.5 Some general observations 420
12.2.6 Example problem: Fatigue crack growth in epoxy adhesive 422
12.3 Fatigue of metallic glasses 424
12.4 Case study: Fatigue fracture in rubber-toughened epoxy 426
Exercises 430
PART FOUR: ADVANCED TOPICS 433
Contact fatigue: sliding, rolling and fretting 435
13.1 Basic terminology and definitions 435
13.2 Mechanics of stationary contact under normal loading 439
13.2.1 Elastic indentation of a planar surface 440
13.2.2 Plastic deformation 442
13.2.3 Residual stresses during unloading 443
13.2.4 Example problem: Beneficial effects of surface compressive
stresses 444
Contents
13.3 Mechanics of sliding contact fatigue 445
13.3.1 Sliding of a sphere on a planar surface 446
13.3.2 Partial slip and complete sliding of a cylinder on a planar
surface 447
13.3.3 Partial slip of a sphere on a planar surface 448
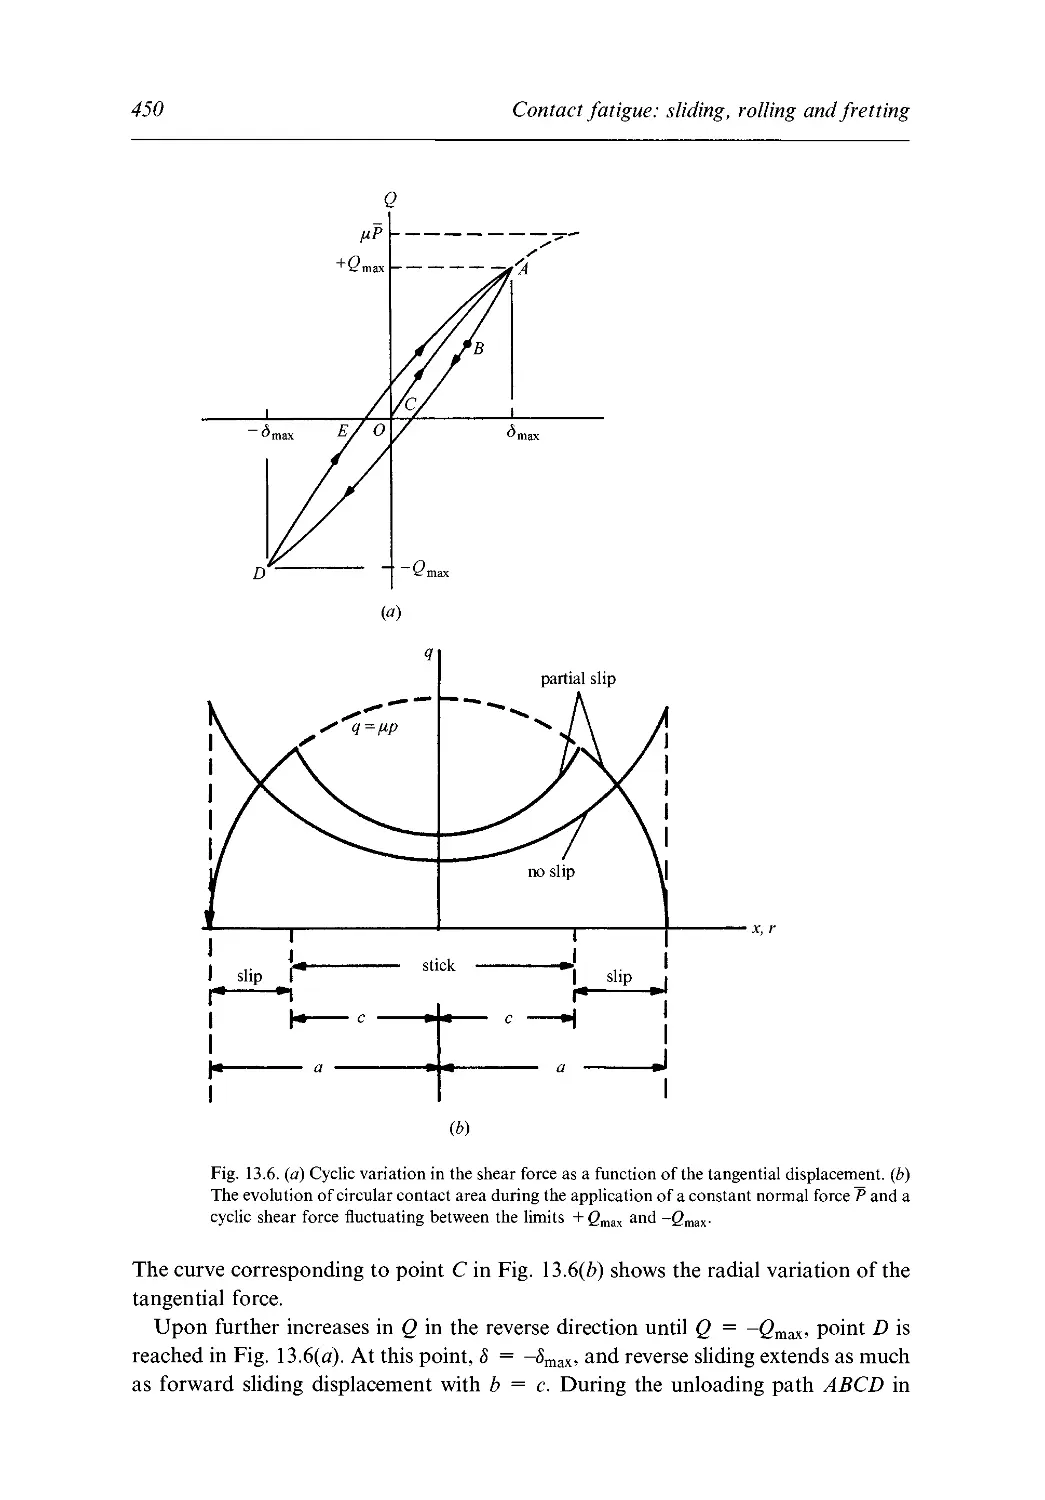
13.3.4 Cyclic variations in tangential force 449
13.4 Rolling contact fatigue 451
13.4.1 Hysteretic energy dissipation in rolling contact fatigue 452
13.4.2 Shakedown limits for rolling and sliding contact fatigue 453
13.5 Mechanisms of contact fatigue damage 457
13.5.1 Types of microscopic damage 457
13.5.2 Case study: Contact fatigue cracking in gears 457
13.6 Fretting fatigue 462
13.6.1 Definition and conditions of occurrence 462
13.6.2 Fretting fatigue damage 463
13.6.3 Palliatives to inhibit fretting fatigue 466
13.6.4 Example problem: Fracture mechanics methodology for
fretting fatigue fracture 469
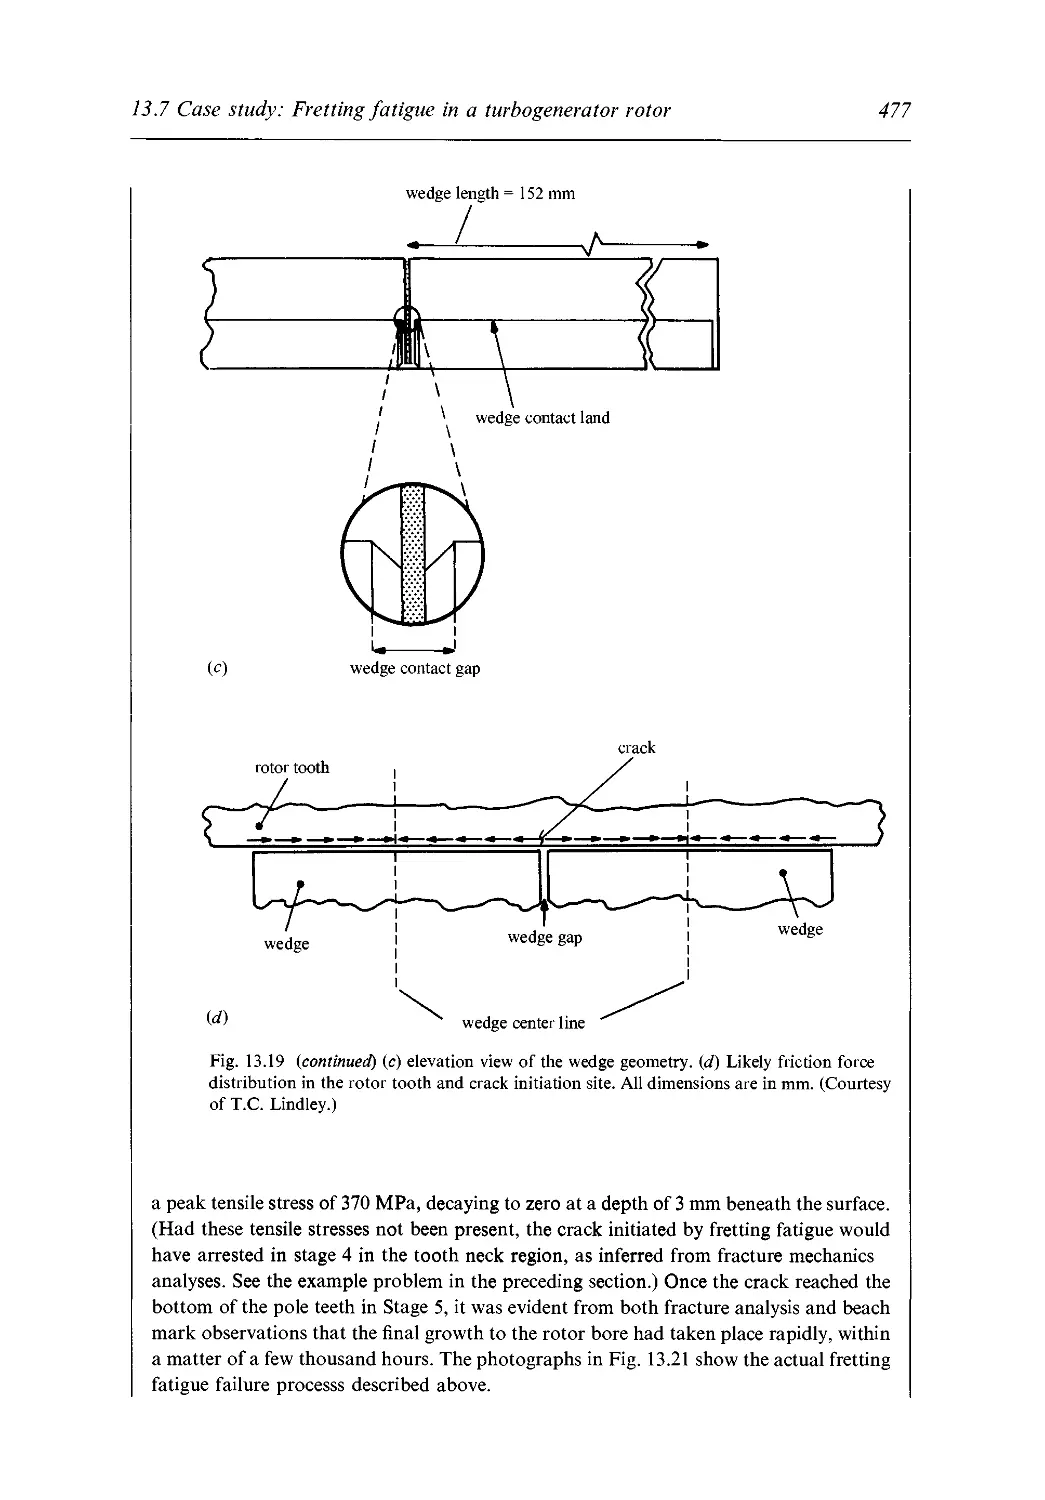
13.7 Case study: Fretting fatigue in a turbogenerator rotor 474
13.7.1 Design details and geometry 474
13.7.2 Service loads and damage occurrence 474
Exercises 481
Retardation and transients in fatigue crack growth 483
14.1 Fatigue crack closure 484
14.2 Plasticity-induced crack closure 486
14.2.1 Mechanisms 486
14.2.2 Analytical models 490
14.2.3 Numerical models 493
14.2.4 Effects of load ratio on fatigue thresholds 494
14.3 Oxide-induced crack closure 496
14.3.1 Mechanism 496
14.3.2 Implications for environmental effects 497
14.4 Roughness-induced crack closure 500
14.4.1 Mechanism 500
14.4.2 Implications for microstructural effects on threshold
fatigue 501
14.5 Viscous fluid-induced crack closure 503
14.5.1 Mechanism 503
14.6 Phase transformation-induced crack closure 504
14.7 Some basic features of fatigue crack closure 505
14.8 Issues and difficulties in the quantification of crack closure 506
14.9 Fatigue crack deflection 507
14.9.1 Linear elastic analyses 508
14.9.2 Experimental observations 511
XV
14.9.3 Example problem: Possible benefits of deflection 512
14.10 Additional retardation mechanisms 515
14.10.1 Crack-bridging and trapping in composite materials 515
14.10.2 On crack retardation in advanced metallic systems 518
14.11 Case study: Variable amplitude spectrum loads 519
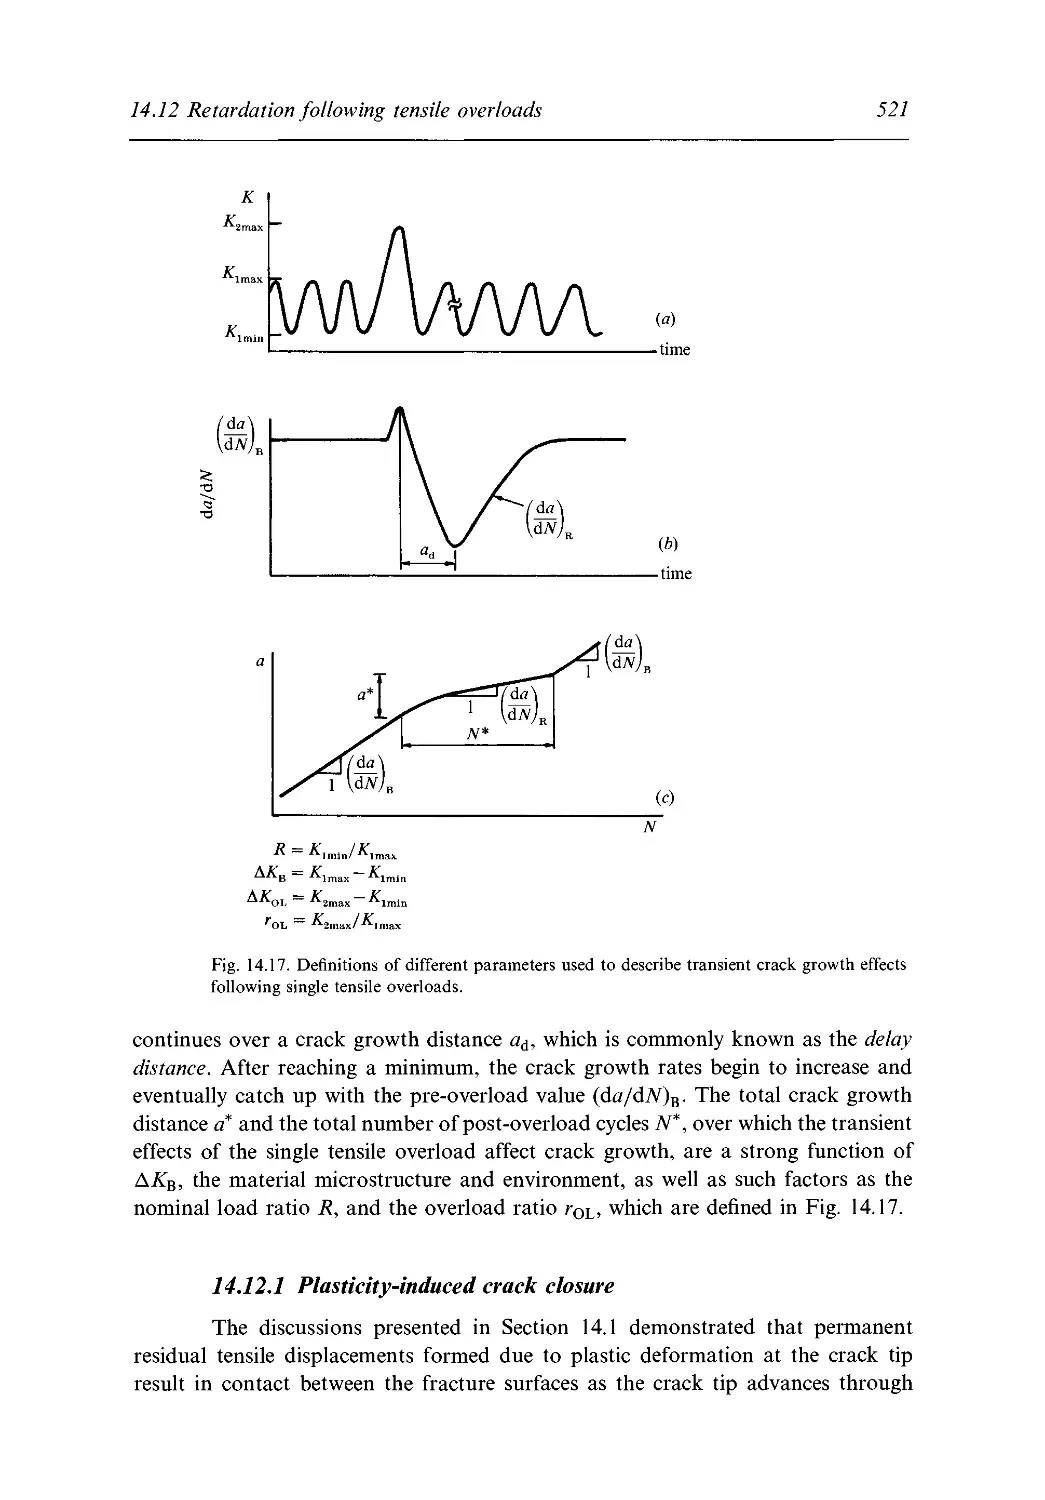
14.12 Retardation following tensile overloads 520
14.12.1 Plasticity-induced crack closure 521
14.12.2 Crack tip blunting 522
14.12.3 Residual compressive stresses 523
14.12.4 Deflection or bifurcation of the crack 523
14.12.5 Near-threshold mechanisms 524
14.13 Transient effects following compressive overloads 526
14.13.1 Compressive overloads applied to notched materials 529
14.14 Load sequence effects 529
14.14.1 Block tensile load sequences 530
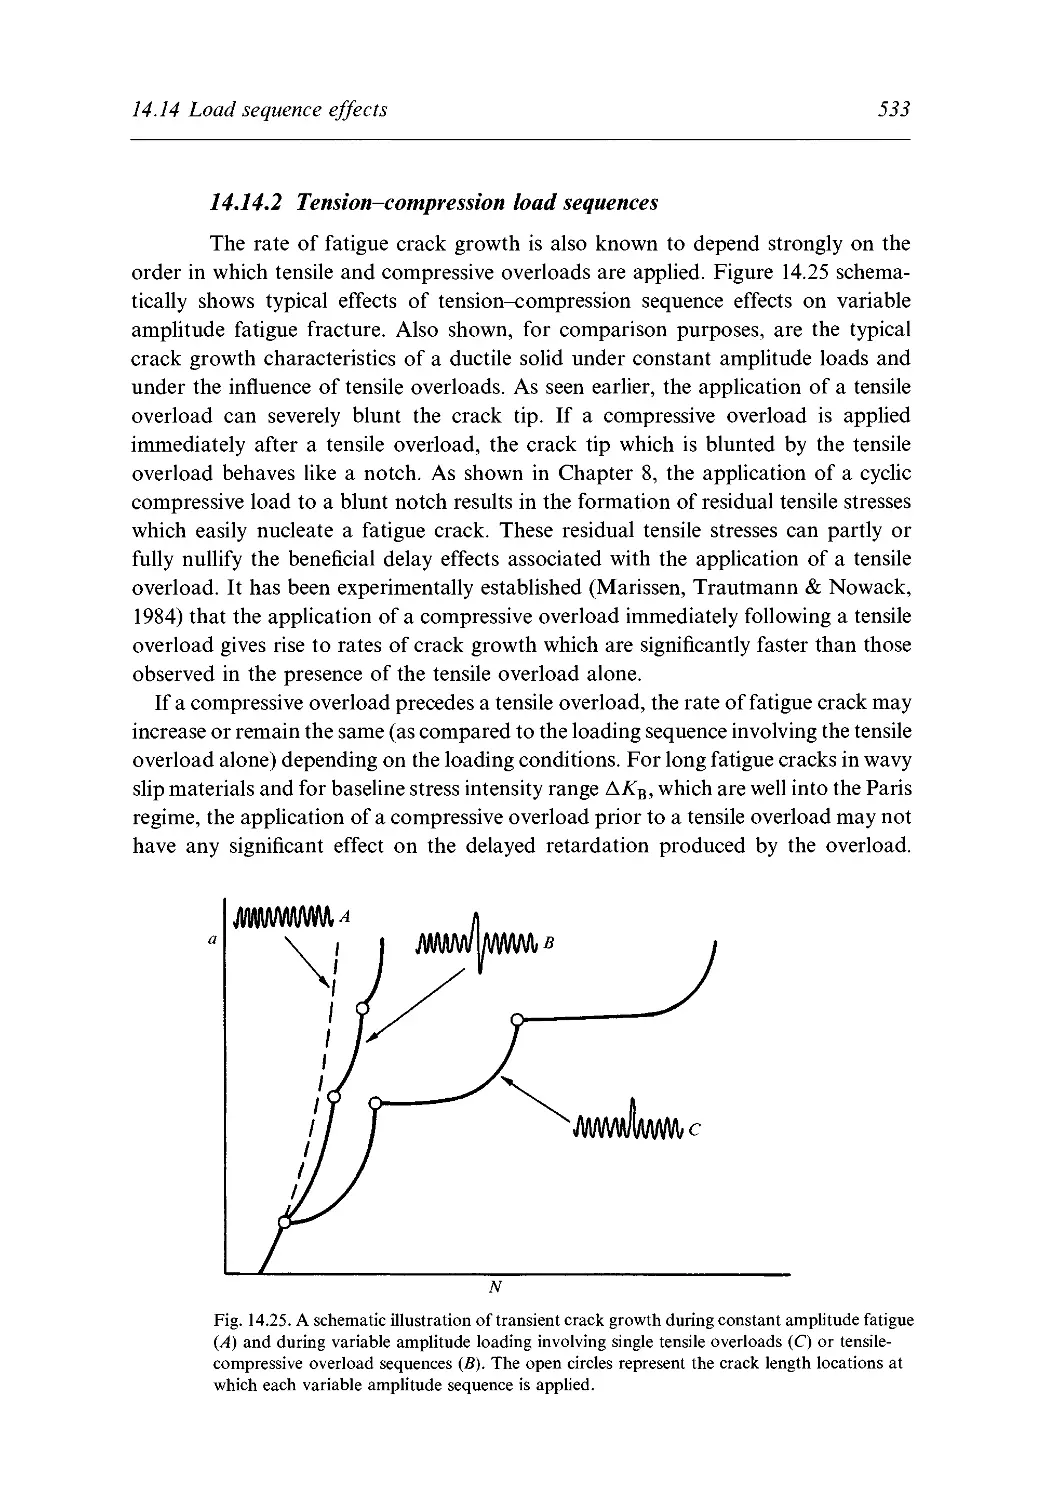
14.14.2 Tension-compression load sequences 533
14.15 Life prediction models 534
14.15.1 Yield zone models 534
14.15.2 Numerical models of crack closure 535
14.15.3 Engineering approaches 536
14.15.4 The characteristic approach 536
Exercises 537
Small fatigue cracks 541
15.1 Definitions of small cracks 543
15.2 Similitude 543
15.3 Microstructural aspects of small flaw growth 544
15.4 Threshold conditions for small flaws 545
15.4.1 Transition crack size 545
15.4.2 Critical size of cyclic plastic zone 547
15.4.3 Slip band models 548
15.5 Fracture mechanics for small cracks at notches 550
15.5.1 Threshold for crack nucleation 551
15.5.2 Example problem: Crack growth from notches 552
15.6 Continuum aspects of small flaw growth 554
15.6.1 Two-parameter characterization of short fatigue cracks 554
15.6.2 Near-tip plasticity 556
15.6.3 Notch-tip plasticity 556
15.7 Effects of physical smallness of fatigue flaws 559
15.7.1 Mechanical effects 559
15.7.2 Environmental effects 561
15.8 On the origins of 'short crack problem' 562
15.9 Case study: Small fatigue cracks in surface coatings 564
15.9.1 Theoretical background for cracks approaching interfaces
perpendicularly 564
Contents
15.9.2 Application to fatigue at surface coatings 566
Exercises 568
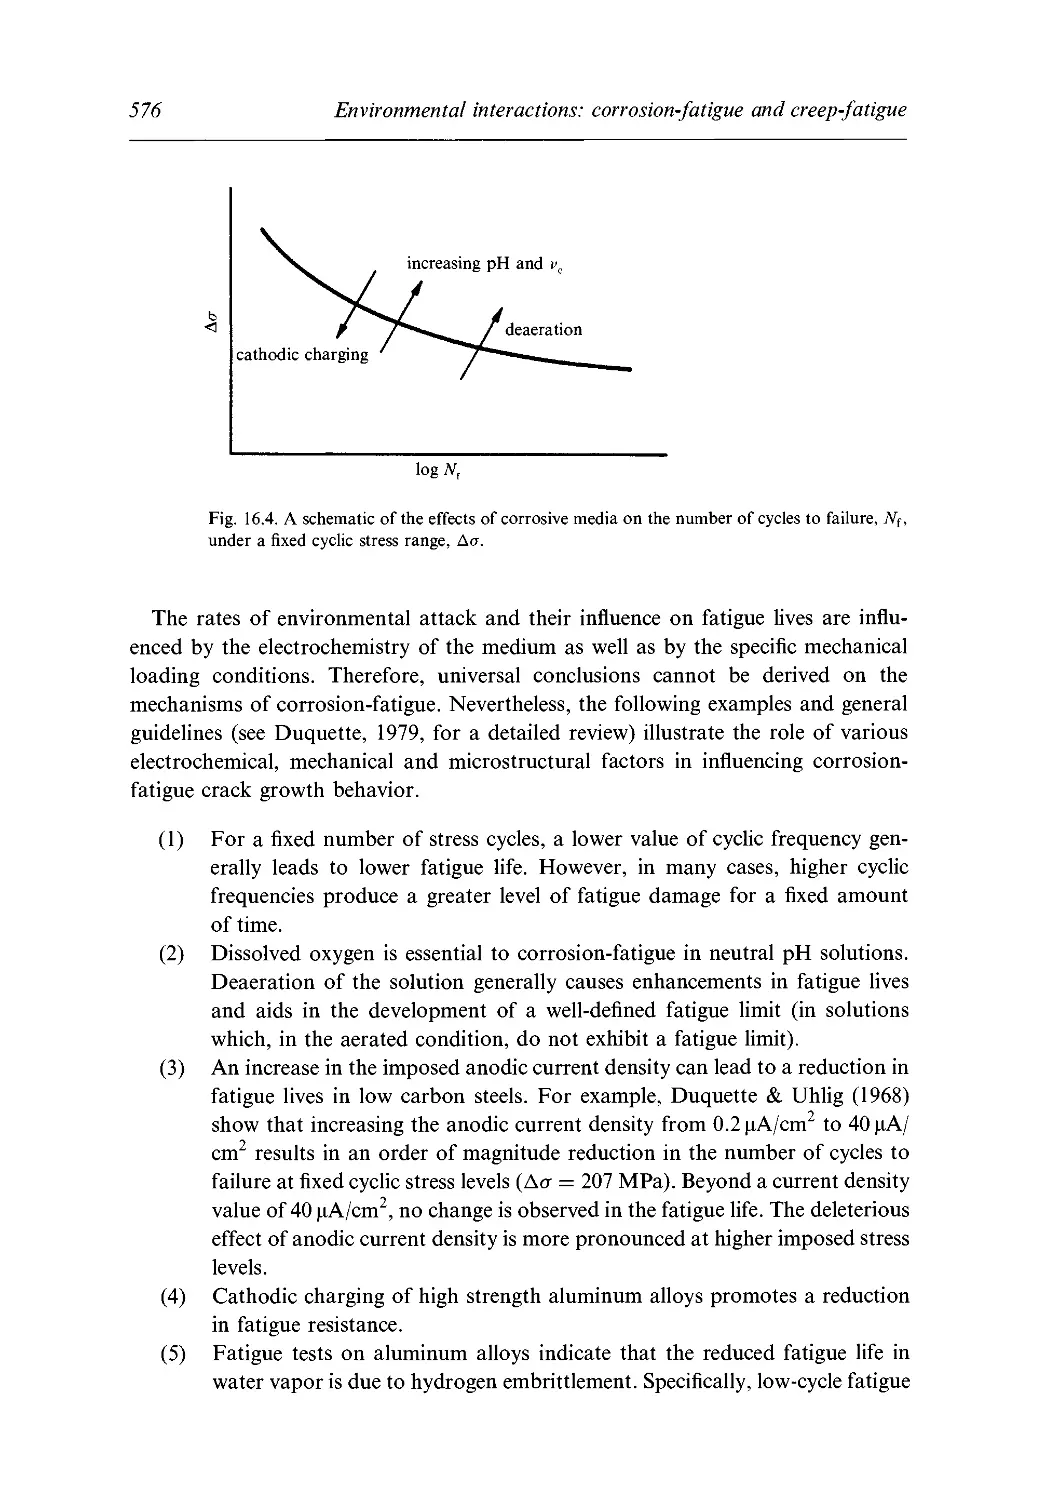
Environmental interactions: corrosion-fatigue and creep-fatigue 570
16.1 Mechanisms of corrosion-fatigue 570
16.1.1 Hydrogenous gases 571
16.1.2 Aqueous media 572
16.1.3 Metal embrittlement 574
16.2 Nucleation of corrosion-fatigue cracks 574
16.2.1 Gaseous environments 575
16.2.2 Aqueous environments 575
16.3 Growth of corrosion-fatigue cracks 577
16.3.1 Types of corrosion-fatigue crack growth 579
16.3.2 Formation of brittle striations 581
16.3.3 Effects of mechanical variables 583
16.3.4 Models of corrosion-fatigue 585
16.4 Case study: Fatigue design of exhaust valves for cars 586
16.5 Fatigue at low temperatures 588
16.6 Damage and crack initiation at high temperatures 589
16.6.1 Micromechanisms of damage 590
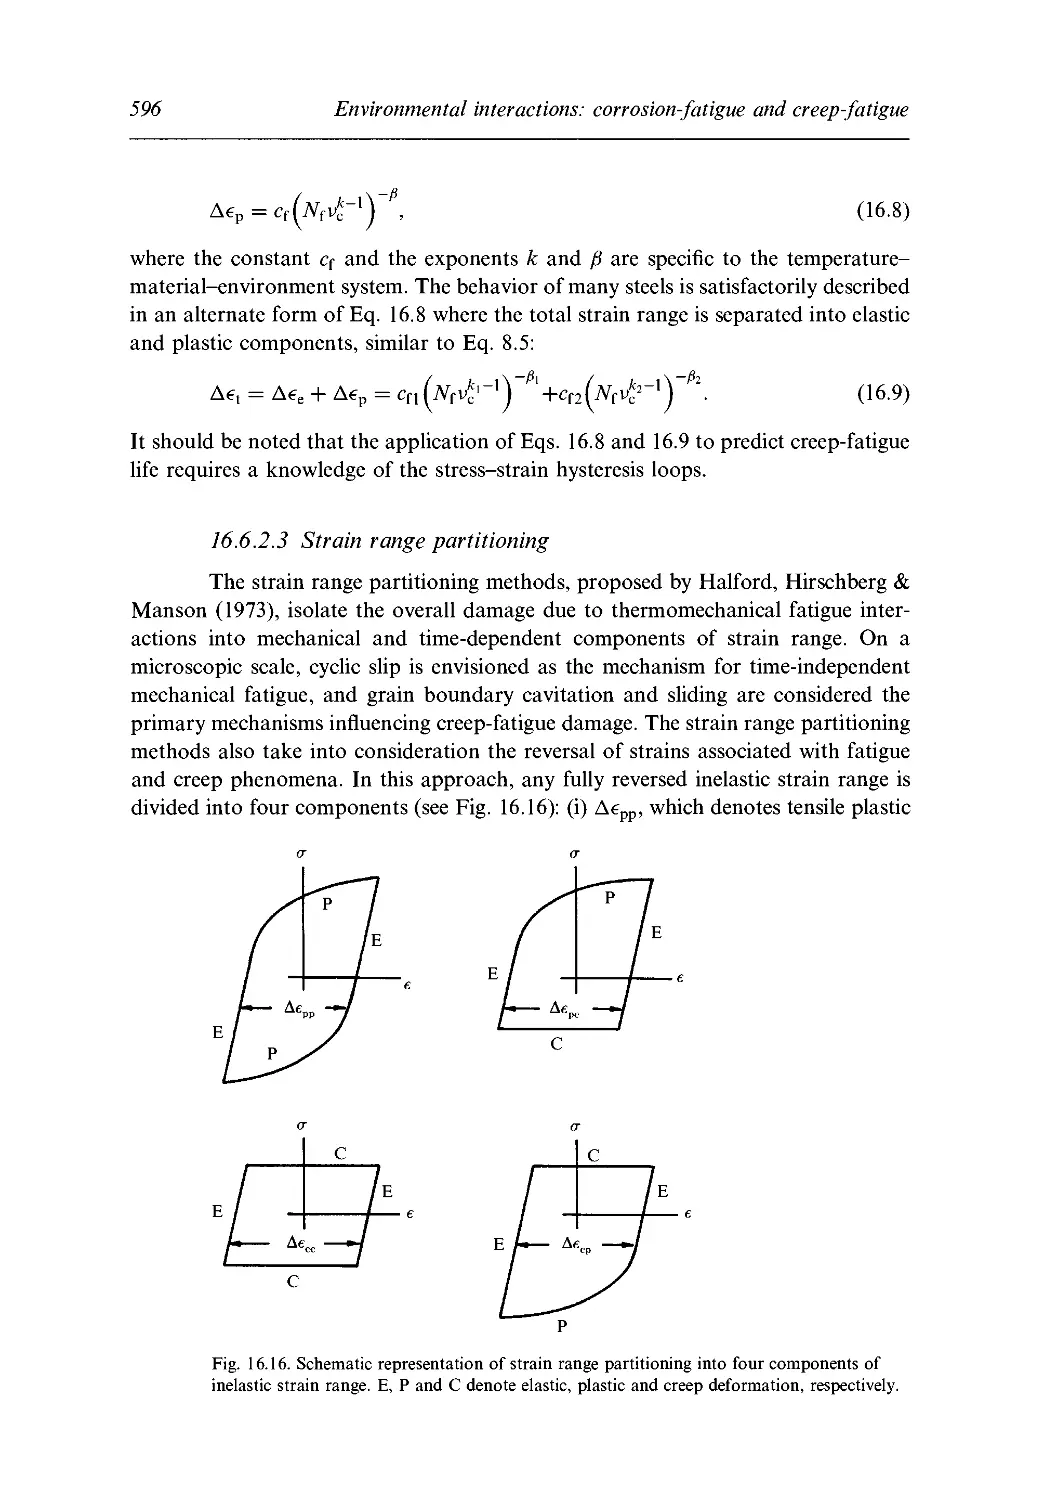
16.6.2 Life prediction models 594
16.7 Fatigue crack growth at high temperatures 598
16.7.1 Fracture mechanics characterization 598
16.7.2 Characterization of creep-fatigue crack growth 601
16.7.3 Summary and some general observations 603
16.8 Case study: Creep-fatigue in steam-power generators 604
Exercises 608
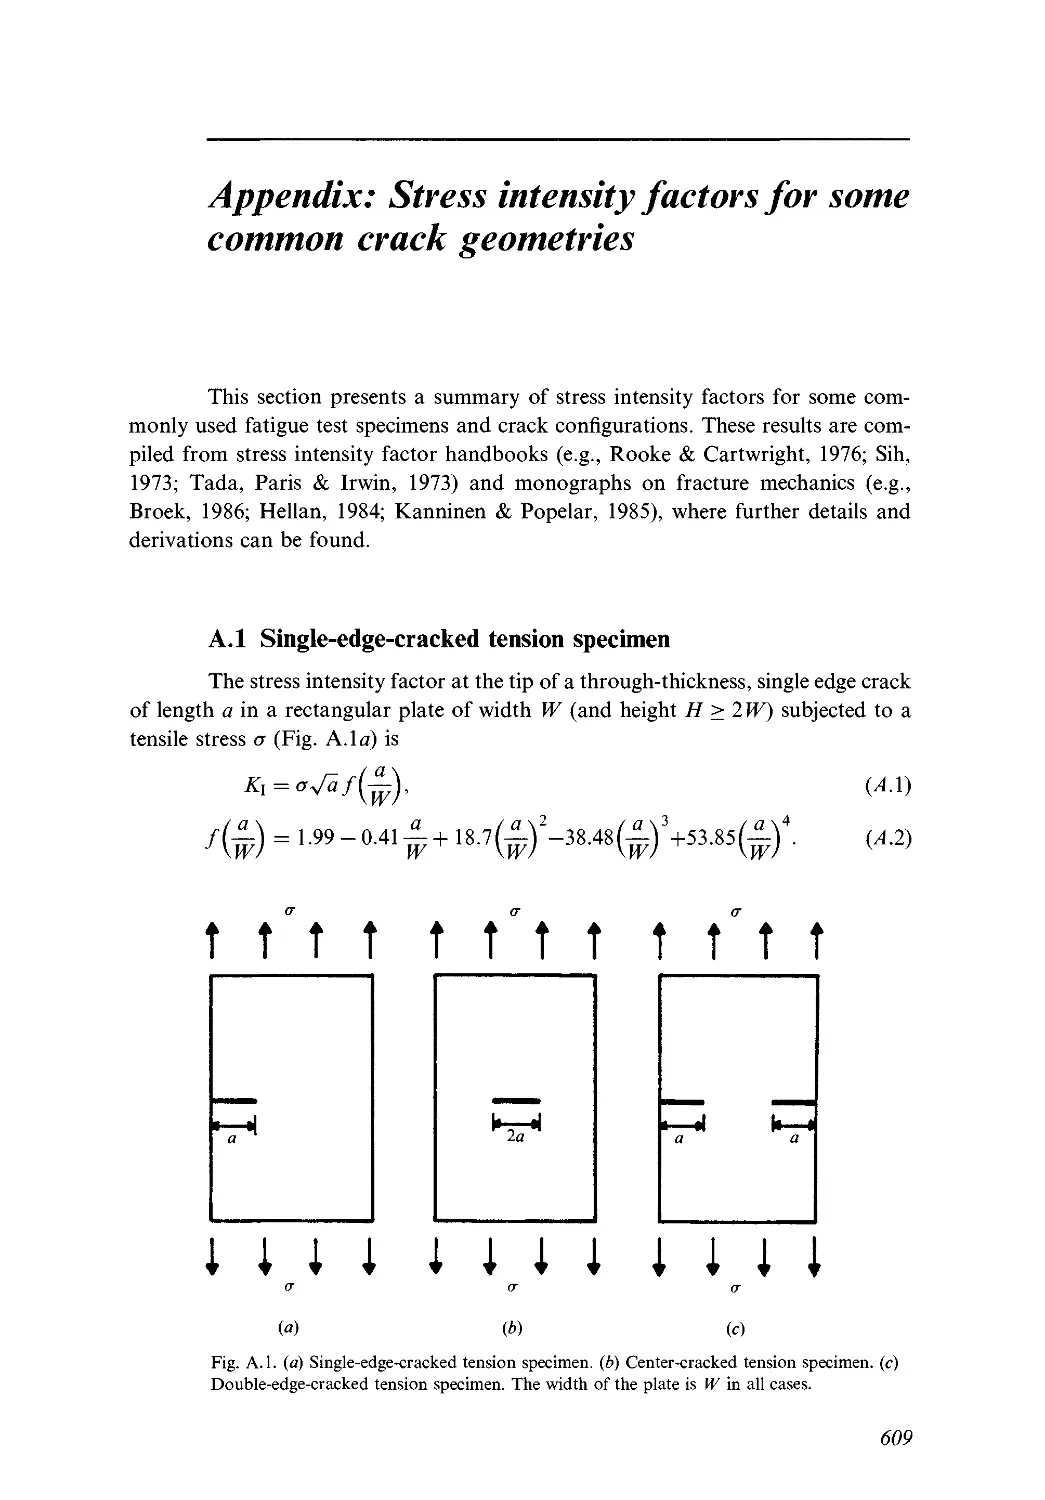
Appendix 609
References 614
Author index 659
Subject index 669
Preface to the second edition
The first edition of this book was written primarily as a research monograph
for the Solid State Science Series of Cambridge University Press. Since its first
publication, however, the book has found wide readership among students and
practicing engineers as well as researchers. In view of this audience base which
evolved to be much broader than what the book was originally intended for, it
was felt that now would be an appropriate time for the preparation of an updated
and revised second edition which includes newer material, example problems, case
studies and exercises. In order to have the greatest flexibility in the incorporation of
these new items in the book, it was also decided to publish the second edition as a
'stand-alone' book of Cambridge University Press, rather than as a research
monograph of the Solid State Science Series.
In writing the second edition, I have adhered to the objectives which are stated in
the preface to the first edition. In order to structure the expanded scope coherently,
the book is organized in the following manner. The introduction to the subject of
fatigue, the overall scope of the book and background information on some of the
necessary fundamentals are provided in the first chapter. The book is then divided
into four parts. Cyclic deformation and fatigue crack nucleation in ductile, brittle
and semi-crystalline or noncrystalline solids are given extensive coverage in Part
One. This is followed by discussions of stress-based and strain-based approaches
to fatigue in Part Two. Principles of fracture mechanics and the characteristics of
fatigue crack growth in ductile, brittle and semi-crystalline or noncrystalline solids
are then taken up in separate chapters in Part Three. Part Four comprises advanced
topics where, in addition to separate chapters on crack growth retardation under
constant and variable amplitude fatigue, small cracks, and environmental
interactions, a new chapter on contact fatigue is included. In each chapter, updated material
and references, as well as case studies and worked-out and practice problems are
included.
Since the publication of the first edition, numerous students, research colleagues
and engineers from many countries have provided valuable feedback, constructive
criticisms and suggestions. The first edition was translated into the Chinese language
in 1993 under the sponsorship of the Chinese Academy of Sciences. Z. G. Wang and
his colleagues of the State Key Laboratory for Fracture and Fatigue in Shenyang
deserve special thanks for diligently going over the entire manuscript of the first
edition and offering many helpful suggestions. Every attempt has been made to
respond to these comments in the second edition, while trying to adhere to the
main objectives of writing this book. The first edition as well as drafts of the second
xvn
xvm
Preface to the second edition
edition were also used by the author as text material for subjects taught for graduate
students at the Massachusetts Institute of Technology, Harvard University and
Brown University.
I am thankful to many individuals who supplied me with information and original
micrographs for the second edition. They include H. Azimi, U. Essmann, W.
Milligan, T. Nakamura, A. Pineau, R.O. Ritchie and D.F. Socie. A number of
colleagues, especially J. Dominguez, T.C. Lindley, F.A. McClintock, T. Nicholas
and L. Pruitt, kindly read drafts of some chapters and offered helpful suggestions.
During the preparation of this second edition, I have had the good fortune to
interact extensively with four colleagues, A.E. Giannakopoulos, L.P. Kubin, H.
Mughrabi and C.F. Shih, who read many sections of the book, and provided helpful
criticisms, suggestions on key references, solutions to some practice problems and
advice on improvement of presentation. I am most grateful to them for their
scholarly feedback and strong interest in this book.
I wish to thank S. Capelin of the Cambridge University Press for his strong and
continued support of this book project and for giving me considerable flexibility in
the preparation of the manuscript, and to M. Patterson for her efficient copy-editing
of the manuscript. K. Greene, D. LaBonte, G. LaBonte, C.-T. Lin and L. Ward
deserve special mention for their cheerful help with the preparation of figures and
references.
My research work on fatigue has been supported over the years by the U.S.
Department of Energy, Office of Naval Research, Air Force Office of Scientific
Research, and National Science Foundation. This support is gratefully
acknowledged. I thank the Department of Materials Science and Engineering at the
Massachusetts Institute of Technology for giving me the flexibility and the time
for the preparation of this second edition through the award of the R.P. Simmons
Endowed Professorship. In addition, I thank the Swedish Research Council for
Engineering Sciences for awarding me the Swedish National Chair in Mechanical
Engineering for the period 1996-98 at the Royal Institute of Technology (Kungl
Tekniska Hogskolan, KTH), Stockholm, where a significant portion of the new
material for the second edition was written. I thank the colleagues in the
Departments of Solid Mechanics and Materials Science and Engineering at KTH
for their hospitality during my stay in Stockholm.
Finally, I express my deepest gratitude to my wife Mary and our daughters Nina
and Meera for all their patience and support during the time I spent writing this
book. Without their care, affection and tolerance, this project could not have been
completed.
S. Suresh
Preface to the first edition
Fatigue of materials refers to the changes in properties resulting from the
application of cyclic loads. Research into the deformation and fracture of materials
by fatigue dates back to the nineteenth century. This branch of study has long been
concerned with engineering approaches to design against fatigue cracks initiation
and failure. However, along with the development of 'science of materials' and
'fracture mechanics' in recent decades, fatigue of materials has also emerged as a
major area of scientific and applied research which encompasses such diverse
disciplines as materials science (including the science of metals, ceramics, polymers, and
composites), mechanical, civil and aerospace engineering, biomechanics, applied
physics and applied mathematics. With the increasing emphasis on advanced
materials, the scope of fatigue research continues to broaden at a rapid pace.
This book is written with the purpose of presenting the principles of cyclic
deformation and fatigue fracture in materials. The main approach adopted here focuses
attention on scientific concepts and mechanisms. Since fatigue of materials is a topic
of utmost concern in many engineering applications, this book also includes
discussions on the extension of basic concepts to practical situations, wherever
appropriate. In writing this book, I have attempted to achieve the following objectives:
(i) To present an integrated treatment, in as quantitative terms as possible, of
the mechanics, physics and micromechanisms of cyclic deformation, crack
initiation and crack growth by fatigue,
(ii) To provide a unified scientific basis for understanding the fatigue behavior
of metals, nonmetals and composites,
(iii) To develop a balanced perspective of the various approaches to fatigue, with
a critical analysis of the significance and limitations of each approach.
The topics addressed in this book are developed to the extent that the presentation
is sufficiently self-explanatory. The scope of the book is spelled out in Chapter 1.
Some background information on the relevant topics is also provided in the first
chapter to set the scene for later developments. This book could serve as a state-of-
the-art reference guide to researchers interested in the fatigue behavior of materials
and as a text for a graduate course on fatigue. Sections of the book could also be
used for an introductory course on fatigue for practicing engineers. Senior
undergraduate and graduate students taking courses on mechanical behavior of materials
or fracture mechanics may find this monograph useful as a supplement to their
textbooks.
xix
XX
Preface to the first edition
Since there exists a vast amount of published information on fatigue of materials
which spans a time period of well over a hundred years, it is not feasible to cover
all the topics and results on this subject in a single monograph. This situation is
further compounded by the fact that fatigue is a research area in which one
encounters considerable empiricism and conflicting viewpoints. Therefore, I had
to rely on my own judgement in the selection of topics and references in order to
balance the aforementioned objectives of writing this book. My interpretations of
this research area have been shaped over the past twelve years through
collaborations, discussions and correspondence with numerous colleagues in the United
States and abroad. Their contributions are cited throughout the text and in the
bibliography.
In organizing various sections of this book, I have resisted the temptation to
categorize materials systems in terms of their individual composition or microstruc-
ture, as commonly done in many books on materials. Instead, I have chosen to
present a unified treatment of fatigue in different broad classes of materials while,
at the same time, pinpointing the significant role of microstructure in influencing
cyclic deformation and fracture. The mechanistic and mechanics aspects of fatigue
are developed in the early chapters primarily in the context of ductile metals and
alloys. These concepts are then extended to brittle solids (such as ceramics and
ceramic composites) and to semi-crystalline and noncrystalline solids (such as
polymers and organic composites) in later chapters of the book.
I am thankful to many colleagues who supplied me with information and original
photographs. These individuals include R.W. Hertzberg, H. Kobayashi, T.C.
Lindley, T. Nicholas, T. Ogawa, CM. Rimnac, R.O. Ritchie and M.T. Takemori.
I am indebted to J.R. Brockenbrough, C. Laird, M. Miller, H. Mughrabi, P.
Neumann, R.M.N. Pelloux and A.K. Vasudevan for reviewing drafts of various
chapters and for offering helpful comments. A special note of gratitude is extended
to A.S. Argon who provided insightful suggestions on the presentation of
fundamental concepts and to C.F. Shih who kindly read drafts of all the sections dealing
with fracture mechanics.
My research work on fatigue has been sponsored over the years by U.S.
Department of Energy, National Science Foundation and Office of Naval
Research. This support is very much appreciated. My colleagues and students in
the Solid Mechanics and Materials Science Groups in the Division of Engineering at
Brown University have greatly contributed to my research by providing an
intellectually stimulating and friendly environment.
This project was initiated with the encouragement and support of R.W. Cahn. His
enthusiasm and interest in this work provided a strong motivation throughout the
preparation of the manuscript. A special mention should also be made of R. Bentley,
S. Capelin and I. Pizzie of Cambridge University Press for their efficient editorial
work on the manuscript and for promptly responding to my queries and concerns. T.
Judd skillfully helped with the preparation of figures.
Contents
xxi
I express my profound gratitude to my wife Mary for her support, devotion and
patience throughout this project. The company of our little daughters Nina and
Meera provided joyful breaks from long hours of concentrated work.
Finally, I wish to dedicate this book to my mother Lakshmi on the occasion of her
sixtieth birthday. Her countless sacrifices for the sake of my education are gratefully
acknowledged.
S. Suresh
CHAPTER 1
Introduction and overview
The word fatigue originated from the Latin expression fafigare which
means 'to tire'. Although commonly associated with physical and mental weariness
in people, the word fatigue has also become a widely accepted terminology in
engineering vocabulary for the damage and failure of materials under cyclic loads. A
descriptive definition of fatigue is found in the report entitled General Principles for
Fatigue Testing of Metals which was published in 1964 by the International
Organization for Standardization in Geneva. In this report, fatigue is defined as a
term which 'applies to changes in properties which can occur in a metallic material
due to the repeated application of stresses or strains, although usually this term
applies specially to those changes which lead to cracking or failure'. This description
is also generally valid for the fatigue of nonmetallic materials.
Fatigue failures occur in many different forms. Mere fluctuations in externally
applied stresses or strains result in mechanical fatigue. Cyclic loads acting in
association with high temperatures cause creep-fatigue; when the temperature of the
cyclically loaded component also fluctuates, thermomechanicalfatigue (i.e. a combination
of thermal and mechanical fatigue) is induced. Recurring loads imposed in the
presence of a chemically aggressive or embrittling environment give rise to corrosion
fatigue. The repeated application of loads in conjunction with sliding and rolling
contact between materials produces sliding contact fatigue and rolling contact
fatigue, respectively, white fretting fatigue occurs as a result of pulsating stresses along
with oscillatory relative motion and frictional sliding between surfaces. The majority
of failures in machinery and structural components can be attributed to one of the
above fatigue processes. Such failures generally take place under the influence of
cyclic loads whose peak values are considerably smaller than the 'safe' loads
estimated on the basis of static fracture analyses.f
1.1 Historical background and overview
Fatigue is a branch of study which encompasses many scientific disciplines
and which offers a rich variety of phenomena for fundamental and industrial research.
From published reports, research on the fatigue of materials can be traced back to the
' Failing to recognize this fact was the primary cause of catastrophic accidents involving the first
commercial jet aircraft, the Comet. A case study of the Comet aircraft failures is provided in Section 1.1.1.
1
2
Introduction and overview
first half of the nineteenth century. Since that time, scores of scientists and engineers
have made pioneering contributions to the understanding of fatigue in a wide variety
of metallic and nonmetallic, brittle and ductile, monolithic and composite, and natural
and synthetic materials. It is not feasible to present, in a few pages, a comprehensive
survey of the historical development of these contributions to fatigue. Nevertheless, in
an attempt to highlight the salient topics of fatigue and to set the scene for the scope of
this book, an overview of major advances and of key areas in fatigue is given in this
section. The chapters to follow provide detailed discussions of various fatigue
phenomena along with the relevant historical backgrounds wherever appropriate.
The expression fatigue has been in use for a very long time. In the days of long
distance travel aboard sailing vessels, the straining of masts due to the frequent
hoisting of sails was referred to as fatigue. The first study of metal fatigue is believed
to have been conducted around 1829 by the German mining engineer W.AJ. Albert
(see Albert, 1838). He performed repeated load proof tests on mine-hoist chains
made of iron. One end of the chain was loaded while the chain was supported on
a 360-cm (12-ft) disc. The chain links were repeatedly subjected to bending, at a rate
of 10 bends per minute up to 100000 bends, by a crank coupling which oscillated the
disc through an arc.
Interest in the study of fatigue began to expand with the increasing use of ferrous
structures, particularly bridges in railway systems. The first detailed research effort
into metal fatigue was initiated in 1842 following the railway accident near Versailles
in France which resulted in the loss of human lives (The Times of London, May 11,
1842; for a comprehensive description of this accident, see Smith, 1990). The cause of
this accident was traced to fatigue failure originating in the locomotive front axle. As
early as 1843, W.J.M. Rankine, a British railway engineer who later became famous
for his contributions to mechanical engineering, recognized the distinctive
characteristics of fatigue fractures and noted the dangers of stress concentrations in machine
components. The Institution of Mechanical Engineers in Britain also began to
explore the so-called 'crystallization theory' of fatigue. It was postulated that the
weakening of materials leading to eventual failure by fatigue was caused by the
crystallization of the underlying microstructure. In 1849, the British Government
commissioned E.A. Hodgkinson to study the fatigue of wrought and cast iron used
in railway bridges. The report of this commission (Hodgkinson, 1849) described
alternating bending experiments on beams whose midpoints were repeatedly
deflected by a rotating cam. In this time period, research on fatigue fracture was
also documented in the work of Braithwaite (1854) who employed the term fatigue
exclusively to denote the cracking of metals under repeated loading. (Braithwaite
(1854), however, credits one Mr. Field for coining this term. Poncelet (1839) is also
generally given credit for introducing the term fatigue in connection with metal
failure, although it had been used earlier in the context of other phenomena.)
A. Wohler conducted systematic investigations of fatigue failure during the period
1852-1869 in Berlin, where he established an experiment station. He observed that
1.1 Historical background and overview
3
the strength of steel railway axles subjected to cyclic loads was appreciably lower
than their static strength. Wohler's studies involving bending, torsion and axial
loading included fatigue tests on full-scale railway axles for the Prussian Railway
Service and on a variety of structural components used in small machines. His work
(e.g., Wohler, 1860) also led to the characterization of fatigue behavior in terms of
stress amplitude-life (S-N) curves and to the concept of fatigue 'endurance limit'.
The rotating bending machine widely used today for cyclically stressing metals is
conceptually the same as the one designed by Wohler. Although his rotating bending
apparatus had a maximum speed of only 72 revolutions per minute, one of his
fatigue test specimens was subjected to 132 250 000 stress cycles without producing
fracture.
Another well known fatigue researcher of this era was W. Fairbairn who
performed tests on riveted wrought iron girders for the British Board of Trade; in
some cases, as many as 3100000 load cycles were applied. On the basis of his
experiments, Fairbairn (1864) concluded that the wrought iron girders subjected
to cyclic stresses with a maximum of only one-third of the ultimate strength
would fail. In 1874, the German engineer H. Gerber began developing methods
for fatigue design; his contribution included the development of methods for fatigue
life calculations for different mean levels of cyclic stresses. Similar problems were
also addressed by Goodman (1899).
The notion that the elastic limit of metals in reversed loading can be different from
that observed in monotonic deformation was popularized by Bauschinger (1886).
His work essentially identified the occurrence of cyclic softening and cyclic strain
hardening. Bauschinger also confirmed many of the results reported earlier by
Wohler. By the end of the nineteenth century, some eighty papers on fatigue had
been published in such diverse application areas as railway rolling stock axles,
crankshafts, chains, wire ropes, and marine propeller shafts (see, for example, the
survey by Mann, 1958).
Interpretations of fatigue mechanisms based on the old crystallization theory were
laid to rest by the pioneering work of Ewing & Rosenhain (1900) and Ewing &
Humfrey (1903). These researchers investigated the fatigue of Swedish iron and
published optical micrographs of cyclic damage on the specimen surface. It was
convincingly shown that slip bands developed in many grains of the polycrystalline
material. These slip bands broadened with the progression of fatigue deformation
and led to the formation of cracks; catastrophic failure of the specimen was
instigated by the growth of a single dominant flaw. They showed that the slip bands
intersecting the polished surface caused slip steps in the form of elevations and
depressions which we now commonly refer to as 'extrusions' and 'intrusions',
respectively. (The micromechanisms of fatigue damage and crack nucleation in metals
form the topics of discussion in Chapters 2-4 of this book.)
In 1910, O.H. Basquin proposed empirical laws to characterize the S-N curves of
metals. He showed that a log-log plot of the stress versus the number of fatigue
4
Introduction and overview
cycles resulted in a linear relationship over a large range of stress. Significant
contributions to the early understanding of cyclic hardening and softening in metals
were also made by Bairstow (1910). Using multiple-step cyclic tests and hysteresis
loop measurements, Bairstow presented results on the hysteresis of deformation and
on its relation to fatigue failure. In France, Boudouard (1911) conducted fatigue
experiments on steel bars which were subjected to vibrations by means of an
electromagnetic apparatus similar to the one designed earlier by Guillet (1910). The effect
of heat treatments on the fatigue resistance of steels was the subject of Boudouard's
study. Other notable contributions of this time period included those of Smith
(1910), Bach (1913), Haigh (1915), Moore & Seeley (1915), Smith & Wedgwood
(1915), Ludwik (1919), Gough & Hanson (1923), Jenkin (1923), Masing (1926)
and Soderberg (1939). In 1926, a book entitled The Fatigue of Metals was published
by H.J. Gough in the United Kingdom. A year later, a book bearing the same title
was published by H.F. Moore and J.B. Kommers in the United States. By the 1920s
and 1930s, fatigue had evolved as a major field for scientific research. Investigations
in this time period also focused on corrosion fatigue of metals (Haigh, 1917;
McAdam, 1926; Gough, 1933), damage accumulation models for fatigue failure
(Palmgren, 1924; Miner, 1945), notch effects on monotonic and cyclic deformation
(e.g., Neuber, 1946), variable amplitude fatigue (Langer, 1937), and statistical
theories of the strength of materials (Weibull, 1939). A prolific researcher of this period
was Thum (e.g., Thum, 1939) who, along with many German colleagues, reported
experimental results on such topics as fatigue limits, stress concentration effects,
surface hardening, corrosion fatigue and residual stresses in numerous publications.
Gassner (1941) was another prominent German researcher whose studies of variable
amplitude fatigue found applications in the German aircraft industry. (A
comprehensive survey of the contributions of German engineers and scientists to the field of
fatigue, particularly during the period 1920-1945, can be found in Schutz, 1996.)
Chapters 7 and 8 discuss the key features of these developments in the context of
total-life approaches.
The occurrence of fretting was first documented by Eden, Rose and Cunningham
(1911) who reported the formation of oxide debris between the steel grips and the
fatigue specimen that was contacted by the grips. Tomlinson (1927) performed the
first systematic experiments on fretting fatigue by inducing repeated small amplitude
rotational movement between two contacting surfaces, and introduced the term
'fretting corrosion' to denote the oxidation due to this repeated contact. The deleterious
effects of fretting damage on the fatigue properties of metals, as reflected in the
formation of pits on the fretted surface and in the marked reduction in fatigue strength,
were reported by Warlow-Davies (1941) and McDowell (1953). Discussions of fatigue
failures arising from fretting as well as sliding and rolling are considered in Chapter 13.
The notion that plastic strains are responsible for cyclic damage was established by
Coffin (1954) and Manson (1954). Working independently on problems associated
with fatigue due to thermal and high stress amplitude loading, Coffin and Manson
1.1 Historical background and overview
5
proposed an empirical relationship between the number of load reversals to fatigue
failure and the plastic strain amplitude. This so-called Coffin-Manson relationship
(described in Chapter 8) has remained the most widely used approach for the strain-
based characterization of fatigue.
Although the fatigue of metals by the development of slip bands and the slow
growth of microscopic flaws was documented in the work of Ewing and Humfrey in
the early 1900s, the mathematical framework for the quantitative modeling of fatigue
failure was not available. The stress analyses of Inglis (1913) and the energy concepts
of Griffith (1921) provided the mathematical tools for quantitative treatments of
fracture in brittle solids. However, these ideas could not be directly employed to
characterize the fatigue failure of metallic materials. Progress in this direction came
with the pioneering studies of Irwin (1957) who showed that the amplitude of the
stress singularity ahead of a crack could be expressed in terms of the scalar quantity
known as the stress intensity factor, K. With the advent of this so-called linear elastic
fracture mechanics approach, attempts were made to characterize the growth of
fatigue cracks also in terms of the stress intensity factor. Paris, Gomez &
Anderson (1961) were the first to suggest that the increment of fatigue crack advance
per stress cycle, da/dN, could be related to the range of the stress intensity factor,
AK, during constant amplitude cyclic loading. Although their original paper on this
topic was not accepted for publication by the leading journals in this field, their
approach has since been widely adapted for characterizing the growth of fatigue
cracks under conditions of small-scale plastic deformation at the crack tip. The
major appeal of the linear elastic fracture mechanics approach is that the stress
intensity factor range, determined from remote loading conditions and from the
geometrical dimensions of the cracked component, uniquely characterizes the
propagation of fatigue cracks; this method does not require a detailed knowledge of the
mechanisms of fatigue fracture (Paris, Gomez & Anderson, 1961; Paris & Erdogan,
1963). (A detailed review of the fracture mechanics concepts and of their applications
to fatigue is provided in Chapter 9.)
The effects of various mechanical, microstructural and environmental factors on
cyclic deformation as well as on crack initiation and growth in a vast spectrum of
engineering materials have been the topics of considerable research in the past four
decades. In this period, substantial progress has been made in the understanding of
cyclic deformation and crack initiation mechanisms in fatigue, thanks to advances in
optical and electron microscopy. Notable among these developments are studies
which identified key microscopic features of fatigue deformation and fracture.
Thompson, Wadsworth & Louat (1956) demonstrated that slip bands along which
deformation was concentrated in fatigued metals persistently reappeared at the same
locations during continued cycling even after some material was removed near the
surface; they termed these surface markings 'persistent slip bands'. Zappfe &
Worden (1951) documented observations of characteristic ripple markings on fatigue
fracture surfaces which are now known as fatigue striations. Correlations of the
6
Introduction and overview
spacing between adjacent striations with the rate of fatigue crack growth, first
published by Forsyth & Ryder (1960), became central to the development of various
theories for fatigue crack growth (Chapters 10 and 12) and to the analysis of fatigue
failures in engineering structures. Studies in this area by many researchers have
provided valuable information on substructural and microstructural changes
responsible for the cyclic hardening and softening characteristics of materials (Chapters 2
and 3) and on the role of such mechanisms in influencing the nucleation (Chapters 4—
6) and growth (Chapters 10-12) of fatigue cracks.
With the application of fracture mechanics concepts to fatigue failure, increasingly
more attention was paid to the mechanisms of subcritical crack growth. Conceptual
and quantitative models were developed to rationalize the experimentally observed
fatigue crack growth resistance of engineering materials (e.g., Laird & Smith, 1962;
McClintock, 1963; Weertman, 1966; Laird, 1967; Rice, 1967; Neumann, 1969;
Pelloux, 1969). Concomitant with this research, there was expanding interest in
understanding the processes by which the stress intensity factor range could be
altered by the very history of crack advance. An important contribution in this
direction came from the experimental results of Elber (1970, 1971) who showed
that fatigue cracks could remain closed even when subjected to cyclic tensile loads.
This result also implied that the rate of fatigue crack growth might no longer be
determined by the nominal value of stress intensity factor range, AAT, but rather by
an effective value of AAT which accounted for the details of fracture surface contact
in the wake of the advancing fatigue crack tip. Elber's work focused on the influence
of prior plastic deformation on crack closure during fatigue fracture. Although
Elber's conclusion about the role of crack closure in influencing fatigue crack growth
has since remained controversial, it also became evident from the studies of a
number of researchers in the 1970s and early 1980s that Elber's arguments of premature
contact between the crack faces (based on the effects of prior crack tip plasticity)
represented just one mechanism associated with the phenomenon of fatigue crack
closure. From a survey of published information and on the basis of new results
obtained from their own investigations, Ritchie, Suresh & Moss (1980), Suresh,
Zamiski & Ritchie (1981), and Suresh & Ritchie (1984a) categorized the basic
features and implications of various types of crack closure and coined the expression
'plasticity-induced crack closure' for Elber's mechanism of crack face contact due to
prior plastic deformation. Further contributions to crack closure may arise from
fracture surface oxidation, viscous environments trapped within the crack walls and
stress-induced phase transformations. In addition, periodic deflections in the path of
a fatigue crack can cause reductions in the effective driving force for fatigue fracture
(Suresh, 1983a, 1985a) by partially 'shielding' the crack tip from applied stresses. A
discussion of the historical development of these concepts is presented in Chapter 14.
A significant outcome of the investigations of different types of crack shielding
processes is the realization that the rate of fatigue crack growth is not only affected
by the instantaneous value of imposed AAT, but also by prior loading history and
1.1 Historical background and overview
7
crack size. As the mechanics of fatigue fracture become dependent on the
geometrical conditions, the similitude concept implicit in the nominal use of fracture
mechanics, namely the notion that cracked components of different dimensions
exhibit the same amount of crack growth when subjected to the same value of
AAT, is no longer applicable. This breakdown of the similitude concept is further
accentuated by the experimental observations that small fatigue flaws (typically
smaller than several millimeters in length and amenable to be characterized in
terms of linear elastic fracture mechanics) often exhibit growth rates which are
significantly faster than those of longer flaws (typically tens of millimeters in length),
when subjected to identical values of far-field AAT. Furthermore, fatigue flaws of
dimensions comparable to or smaller than the characteristic microstructural size
scale often exhibit rates of crack growth which diminish with an increase in crack
length. Such crack growth cannot be satisfactorily analyzed in terms of available
theories of fracture mechanics. This so-called 'short crack problem', apparently first
identified by Pearson (1975), most severely affects the development of design
methodology for large structural components on the basis of experimental data gathered
from smaller-sized laboratory test specimens. It is, therefore, not surprising to note
that a significant fraction of research effort since the late 1970s has been devoted to
the study of crack closure phenomena and crack size effects on the progression of
fatigue fracture. Associated with this research effort are attempts to develop
characterization methodology for the propagation of fatigue flaws in the presence of
large-scale plastic deformation and in the vicinity of stress concentrations (see
Chapters 4, 7, 8 and 15).
Although fatigue failure under fixed amplitudes of cyclic stresses generally forms
the basis for fundamental studies, service conditions in engineering applications
invariably involve the exposure of structural components to variable amplitude
spectrum loads, corrosive environments, low or elevated temperatures and multiaxial
stress states. The development of reliable life prediction models which are capable of
handling such complex service conditions is one of the toughest challenges in fatigue
research. Although major advances have been made in these areas, the application of
fatigue concepts to practical situations often involves semi-empirical approaches.
Available models for fatigue involving conditions of multiaxial stress conditions,
complex load spectra and detrimental environments are discussed in Chapters 3, 7,
8, 10 and 16.
The majority of fatigue research reported in the open literature pertains to metallic
materials. There has, however, been a surge in interest aimed at nonmetallic materials
and composites which offer the potential for mechanical, thermal and environmental
performance hitherto unobtainable in conventional metals. This growing interest has
also generated a corresponding increase in research into the fatigue behavior of
advanced ceramics (e.g., Suresh, 1990a,b; Roebben et ai, 1996), polymers (e.g.,
Hertzberg & Manson, 1980; Hertzberg, 1995), and their composites. While the
existence of cyclic slip has traditionally been considered a necessary condition for the
8
Introduction and overview
occurrence of fatigue failure in ductile solids, it is now recognized that mechanical
fatigue effects in nonmetallic materials can arise in some cases from the kinematic
irreversibility of microscopic deformation under cyclic loads even in the absence of
cyclic dislocation motion. Mechanisms which impart kinematic irreversibility of
deformation during fatigue can be as diverse as microcracking, stress-induced
phase transformations, dislocation plasticity, creep, interfacial sliding or 'craze'
formation. An extension of existing knowledge on the fatigue of metallic systems to these
advanced materials and the identification of new mechanistic phenomena associated
with the fatigue of nonmetals and metal-nonmetal composites form the basis for
many ongoing research efforts. Chapters 3, 5, 6, 11, and 12 in this book provide a
detailed description of the fatigue characteristics of a wide variety of brittle and
noncrystalline materials, including many nonmetallic composites and layered solids.
/././ Case Study: Fatigue and the Comet airplane
The dramatic effect of subcritical crack growth by fatigue on the mechanical
integrity of aircraft structures was clearly brought to light by the series of crashes
involving the first commercial jet aircraft, the Comet. This airplane was manufactured by
the de Havilland Aircraft Company, England, and was designed to capture the rapidly
growing long-distance air travel business, spurred by the economic recovery of Great
Britain and Continental Europe after World War II. The fatigue failures of the Comet
cabin structures, which led to several accidents in the 1950s, also obstructed the
prominent role played by the British in the commercial jet aircraft industry. It is widely
believed that the fatigue problem of the Comet may have served as a catalyst in the
eventual emergence of the rival Boeing Aircraft Company in the United States as a world
leader in commercial aviation.
The use of the jet engine, pioneered by Sir Frank Whittle in Great Britain, for propelling
the commercial jet aircraft was still an untested proposition at the time of design of the
Comet. The fuel consumption rate of a jet engine was more than twice that of a piston
engine. In order to limit the fuel consumption rate of a jet aircraft to a level no higher than
that of one propelled by a piston engine, the plane had to travel twice as fast.f This meant
flying in the rarefied atmosphere of high altitude, typically around 12 000 m (or 40 000 ft),
which was more than double the altitude at which the World War II vintage aircraft flew.
The speed of sound is approximately 1200 km/h (or 760 miles per hour) at sea level; at an
altitude of 12000 m, it drops to about 1060 km/h. At this high altitude, termed the lower
stratosphere, the coldest air with a temperature of approximately -56 °C exists, and clouds
There are several basic requirements for the optimum performance of a passenger jet aircraft. Firstly, it
must travel as fast as possible for optimizing such factors as fuel efficiency, number of flights per unit
time period, and return on capital expenses. Secondly, it must fly below the speed of sound in order to
avoid a precipitous rise in the specific energy consumption, which is related to the ratio of thrust to
weight or to the ratio of drag to lift. Thirdly, the colder the air through which the aircraft flies, the
greater the efficiency of the jet engine. Fourthly, an aircraft should not fly at an altitude higher than what
is necessary because flying through rarefied atmosphere requires oversized wings. For passenger jet
aircraft, the first two requirements suggest a maximum cruising speed typically in the neighborhood
of 90% of the speed of sound or Mach 0.9, and the last two requirements suggest an optimum altitude of
10000-12000 m (Tennekes, 1996).
1.1 Historical background and overview
9
and thunderstorms are rare so that meteorological conditions do not impede flight
schedules during cruising. The colder outside air at such altitudes also enhances the
efficiency of the jet engines as the difference between the intake temperature and the
combustion temperature is raised.
A particularly important issue for high altitude flights was the design of the cabin
wherein the temperature and pressure had to be at near-ground levels for the comfort of
the passengers and the crew. The aircraft fuselage would have to be repeatedly stressed
from no pressure differential between the inside and the outside whilst on the ground to a
large pressure difference between the inside passenger cabin and the rarefied atmosphere
outside during cruising. The fuselage, therefore, had to be capable of withstanding high
stresses arising from cabin pressurization during such high altitude flights in thin air. It
would turn out that the fatigue stress cycles induced on the metal skin of the fuselage by
the repeated pressurization and depressurization of the cabin during each flight
contributed to the catastrophic fracture in several Comet airplanes (e.g., Dempster, 1959;
Petroski, 1996).
On the first anniversary of commercial jet aircraft operation, May 2, 1953, a de
Havilland Comet airplane disintegrated in mid-air soon after take-off from the airport in
Calcutta, India. The crash occurred during a heavy tropical thunderstorm. The official
organization investigating the crash concluded that the accident was the result of some
form of structural fracture, possibly arising from higher forces imposed on the airframe
by the stormy weather, or from the overcompensation by the cockpit crew in trying to
control the plane in response to such forces. Consequently, the design of the aircraft
structure was not viewed as a cause for concern.
On January 10, 1954, another Comet aircraft exploded at an altitude of 8230 m
(27 000 ft) in the vicinity of Elba Island in the Mediterranean Sea, after taking off from
Rome in good weather. Once again, no flaws in design were identified, and the aircraft
was placed back in service only weeks after this second crash.
The third accident took place soon afterwards on April 8, 1954, when a Comet
exploded in mid-air upon departure from Rome, after a brief stopover during a flight
between London and Cairo. The wreckage from the crash fell in deep sea water and could
not be recovered. This led investigators from the Royal Aircraft Establishment (RAE),
Farnborough, England, to renew efforts to recover pieces from the second crash over
Elba. Evidence began to emerge indicating that the tail section was intact from the Elba
crash, and that the pressurized cabin section had torn apart before fire broke out.
In order to probe into the origin of cabin explosion, RAE engineers retired a Comet
airplane from service and subjected its cabin to alternate pressurization and
depressurization, to about 57kPa (8.25 psi) over atmospheric pressure, by repeatedly
pumping water into it and then removing it. During such simulated cabin pressurization,
the wings of the aircraft were also stressed by hydraulic jacks to mimic wing loading
during typical flight conditions. After about 3000 pressurization cycles, a fatigue crack
originating in a corner of a cabin window advanced until the metal skin was pierced
through. Figure 1.1 schematically shows the location of cracks in a failed Comet airplane.
The Comet, being the first commercial jetliner, was designed and built at a time when
the role of fatigue in deteriorating the mechanical integrity of airframe components was
not appreciated, and when subcritical fatigue crack growth had not evolved into a topic
10
Introduction and overview
crack along top center line of fuselage
front fuselage separated at front spar
attachments in downward direction
rear fuselage
and tail unit
separated at
rear spar
main failure
between ribs
12 and 13
failure probably downwards
symmetrical with starboard
wing failure
IIC /
y
frame 13a
Vfra
-peeling off failure
frame 26
frame 18
secondary cracking by bending
of center portion over outer portion
top (^ of aircraft
peeling off failures
skin pulled over rivets on window frame
peeling off failures
Fig. 1.1. Schematic diagram illustrating the location of fatigue cracks in a failed Comet
airplane. (After Petroski, 1996.)
of extensive research. It was assumed that the possibility of one fatigue cycle per flight,
due to cabin pressurization upon take-off and depressurization during landing, would not
be significant enough to advance any flaws in the fuselage to catastrophic proportions.
The cabin walls were designed to contain a pressure of 138 kPa (20psi), two and a half
times the service requirements. As an added demonstration of safety, the passenger cabin
of each Comet was pressurized once to 114kPa (16.5psi) in a proof test, before the plane
was placed in service. The investigative report of the Court of Inquiry into the Comet
failures noted that the de Havilland designers believed '... that a cabin (which) would
1.2 Different approaches to fatigue
11
survive undamaged a test to double its working pressure ... would not fail in service under
the action of fatigue...'. This notion was proven erroneous, at a significant cost to de
Havilland and to the British commerical aircraft industry.
The RAE tests revealed that the cabin failures in the first three Comet accidents were
due to fatigue cracking which was aided by stress elevation at the rivet holes located near
the window openings of the passenger cabin. In subsequent designs of the new Comet 4
models, which facilitated trans-Atlantic commercial jet travel for the first time, the
window sections were replaced with a new reinforced panel which had much greater
resistance to fatigue failure.
No aircraft has contributed more to safety in the jet age than the Comet. The lessons it
taught the world of aeronautics live in every jet airliner flying today.
D.D. Dempster, 1959, in The Tale of the Comet
1.2 Different approaches to fatigue
There are different stages of fatigue damage in an engineering component
where defects may nucleate in an initially undamaged section and propagate in a
stable manner until catastrophic fracture ensues. For this most general situation,
the progression of fatigue damage can be broadly classified into the following
stages:
(1) Substructural and microstructural changes which cause nucleation of
permanent damage.
(2) The creation of microscopic cracks.
(3) The growth and coalescence of microscopic flaws to form 'dominant' cracks,
which may eventually lead to catastrophic failure. (From a practical
standpoint, this stage of fatigue generally constitutes the demarkation between
crack initiation and propagation.)
(4) Stable propagation of the dominant macrocrack.
(5) Structural instability or complete fracture.
The conditions for the nucleation of microdefects and the rate of advance of the
dominant fatigue crack are strongly influenced by a wide range of mechanical,
microstructural and environmental factors. The principal differences among
different design philosophies often rest on how the crack initiation and the crack
propagation stages of fatigue are quantitatively treated.
It is important to note here that a major obstacle to the development of life
prediction models for fatigue lies in the choice of a definition for crack initiation.
Materials scientists concerned with the microscopic mechanisms of fatigue are
likely to regard the nucleation of micrometer-size flaws along slip bands and
grain boundaries, and the roughening of fatigued surfaces as the crack inception
stage of fatigue failure. A practicing engineer, on the other hand, tends to relate
12
Introduction and overview
the limit of resolution of the (nondestructive) crack detection equipment (typically
a fraction of a millimeter) with the nucleation of a fatigue crack and with the
initial crack size used for design. Scattered within the limits of this broad range
of choices, there lies a variety of definitions for crack nucleation which are
specific to certain classes of fatigue-critical engineering applications. The total
fatigue life is defined as the sum of the number of cycles to initiate a fatigue
crack and the number of cycles to propagate it subcritically to some final crack
size. In light of the foregoing discussion on what constitutes crack initiation,
making a clear demarkation between crack initiation and crack propagation
can become a critical task.
1.2.1 Total-life approaches
Classical approaches to fatigue design involve the characterization of
total fatigue life to failure in terms of the cyclic stress range (the S-N curve
approach) or the (plastic or total) strain range. In these methods, the number of
stress or strain cycles necessary to induce fatigue failure in initially uncracked
(and nominally smooth-surfaced) laboratory specimens is estimated under
controlled amplitudes of cyclic stresses or strains. The resulting fatigue life
incorporates the number of fatigue cycles to initiate a dominant crack (which can be as
high as some 90% of the total fatigue life) and to propagate this dominant flaw
until catastrophic failure occurs. Various techniques are available to account for
the effects of mean stress, stress concentrations, environments, multiaxial stresses
and variable amplitude stress fluctuations in the prediction of total fatigue life
using the classical approaches (see Chapters 7, 8 and 14). Since the crack
initiation life constitutes a major component of the total fatigue life in smooth
specimens, the classical stress-based and strain-based methods represent, in many
cases, design against fatigue crack initiation. Under high-cycle, low stress fatigue
situations, the material deforms primarily elastically; the failure time or the
number of cycles to failure under such high-cycle fatigue has traditionally been
characterized in terms of the stress range. However, the stresses associated with
low-cycle fatigue are generally high enough to cause appreciable plastic
deformation prior to failure. Under these circumstances, the fatigue life is characterized
in terms of the strain range. An example of a situation, where the classical
(short-life) strain-based approach (also referred to as the low-cycle fatigue
approach) has found much appeal, involves the prediction of fatigue life for
the initiation and early growth of a crack within the strain field associated
with the fully plastic region ahead of a stress concentration (see Fig. 1.2). The
low-cycle approach to fatigue design has found particularly widespread use in
ground-vehicle industries.
1.2 Different approaches to fatigue
13
Fig. 1.2. Schematic diagram illustrating the various stages of fatigue in an engineering
component and the approaches used to estimate the fatigue life. (After Coffin, 1979.)
1.2.2 Defect-tolerant approach
The fracture mechanics approach to fatigue design, on the other hand,
invokes a 'defect-tolerant' philosophy. The basic premise here is that all engineering
components are inherently flawed. The size of a pre-existing flaw is generally
determined from nondestructive flaw detection techniques (such as visual, dye-penetrant
or X-ray techniques or the ultrasonic, magnetic or acoustic emission methods). If no
flaw is found in the component, proof tests are conducted whereby a structure, such
as a pressure vessel, is subjected to a simulation test a priori at a stress level slightly
higher than the service stress. If no cracks are detected by the nondestructive test
method and if catastrophic failure does not occur during the proof test, the largest
(undetected) initial crack size is estimated from the resolution of the flaw detection
technique. The useful fatigue life is then defined as the number of fatigue cycles or
time to propagate the dominant crack from this initial size to some critical
dimension. The choice of the critical size for the fatigue crack may be based on the fracture
toughness of the material, the limit load for the particular structural part, the
allowable strain or the permissible change in the compliance of the component. The
prediction of crack propagation life using the defect-tolerant approach involves
empirical crack growth laws based on fracture mechanics. In terms of the
requirements of linear elastic fracture mechanics, the defect-tolerant method is applicable
under conditions of small-scale yielding (i.e. away from the plastic strain field of any
stress concentrators), where the crack tip plastic zone is small compared to the
characteristic dimensions of the cracked component (including the crack size) and
where predominantly elastic loading conditions prevail. Various methods are
available to incorporate the effects of mean stresses, stress concentrations, environments,
variable amplitude loading spectra and multiaxial stresses in the estimation of useful
14
Introduction and overview
crack growth life (see Chapters 7, 8, 10 and 14-16). This intrinsically conservative
approach to fatigue has been widely used in fatigue-critical applications where
catastrophic failures will result in the loss of human lives; examples include the
aerospace and nuclear industries.
1.2.3 A comparison of different approaches
The different approaches to fatigue also provide apparently different
guidelines for the design of microstructural variables for optimum fatigue resistance.
These differences are merely a consequence of the varying degrees to which the
role of crack initiation and crack growth are incorporated in the calculation of useful
fatigue life. For example, in many structural alloys the resistance to the growth of
long fatigue cracks generally increases with an increase in grain size (or a decrease in
yield strength) at low AK values where a significant portion of subcritical crack
growth life is expended. On the other hand, the total fatigue life estimated on the
basis of stress-life plots generally exhibits the opposite trend; higher strength
materials and finer grained microstructures usually lead to a longer fatigue life. The
apparent contradiction between the two approaches can be reconciled by noting that the
former approach to fatigue deals primarily with the resistance to fatigue crack
growth, while the latter approach based on nominally defect-free laboratory
specimens focuses mainly on the resistance to fatigue crack initiation. The choice of a
particular microstructural condition for improved fatigue life is then predicated
upon the design philosophy for a specific application. Optimization of
microstructural characteristics for improved resistance to both crack initiation and crack
growth would require a trade-off between the recommendations of the two
approaches.
1.2.4 'Safe-life' and fail-safe' concepts
The safe-life and fail-safe design approaches were developed by aerospace
engineers. In the safe-life approach to fatigue design, the typical cyclic load spectra,
which are imposed on a structural component in service, are first determined. On the
basis of this information, the components are analyzed or tested in the laboratory
under load conditions which are typical of service spectra, and a useful fatigue life is
estimated for the component. The estimated fatigue life, suitably modified with a
factor of safety (or an ignorance factor), then provides a prediction of 'safe life' for
the component. At the end of the expected safe operation life, the component is
automatically retired from service, even if no failure has occurred during service (and
the component has considerable residual fatigue life). Although an estimate of life
may be obtained from practical tests on the actual component, the safe-life method is
intrinsically theoretical in nature. This procedure invariably has to account for
1.2 Different approaches to fatigue
15
several unknowns, such as unexpected changes in load conditions, errors in the
estimates of typical service load spectra, scatter in the test results, variation in
properties among different batches of the same material, existence of initial defects
in the production process, corrosion of the parts used in the component, and human
errors in the operation of the component. By selecting a large margin of safety, a safe
operating life can be guaranteed, although such a conservative approach may not be
desirable from the viewpoints of economy and performance. On the other hand, if
fatigue cracks are nucleated in the component during service, the component may
well fail catastrophically. As noted by Gurney (1968), the safe-life approach depends
on achieving a specified life without the development of a fatigue crack so that the
emphasis is on the prevention of crack initiation. The fail-safe concept, by contrast,
is based on the argument that, even if an individual member of a large structure fails,
there should be sufficient structural integrity in the remaining parts to enable the
structure to operate safely until the crack is detected. Components which have
multiple load paths are generally fail-safe because of structural redundancy. In addition,
the structure may contain crack arresters to prevent undesirable levels of crack
growth. (The case study in Section 9.12 provides an example of this concept.) The
fail-safe approach mandates periodic inspection along with the requirement that the
crack detection techniques be capable of identifying flaws to enable prompt repairs
or replacements. Whatever philosophy is employed in design, it is often preferable
(and even required in some safety-critical situations, e.g., aircraft and nuclear
industries) that the critical components of a structure be inspected periodically. This step
eliminates dangerous consequences arising from false estimates and errors in the
design stage, especially with the safe-life approach.
1.2.5 Case study: Retirement for cause
The design and maintenance of gas turbine engine components have traditionally
involved estimates of fatigue life on the basis of low-cycle fatigue concepts. In this
approach, entire classes of components are retired from service when some
predetermined design life is reached. For typical rotor components, such as discs which have
been serviced and maintained by the United States Air Force in the past several decades,
this approach meant that 1000 discs could be retired from service when, statistically, only
one among them had developed a small fatigue crack (typically 0.75 mm or less in depth).
In other words, 99.9% of the discs, which had considerable residual fatigue life, were
retired prematurely.
The development of a new fatigue control methodology for gas turbine engine
components provides an example of the practical use of the fail-safe concept. In 1985, the
United States Air Force began implementing the so-called 'retirement for cause' (RFC)
component life management methodology for its existing F100 aircraft engines,
principally for cost savings, in lieu of the traditional approaches based on pre-determined
life (Harris, 1987). In this program, the retirement of a gas turbine engine component
from service occurs when the unique fatigue life of that particular component (as opposed
16
Introduction and overview
to the predicted life for the entire population of the same component) is considered to be
utilized. The individual component is retired from service when there is a specific reason
or cause for removal from service, such as the existence of a flaw of a certain (maximum)
allowable or detectable size. This system replaced classical low-cycle fatigue approaches
where an entire population of components of a certain type were retired, regardless of the
condition, when a pre-determined time or number of cycles was expended.
Analyses of crack growth and damage tolerance were carried out to identify which, if
any, components were candidates for RFC. Subsequently, a list of components and
combinations of inspection sizes and intervals were identified.t The F100 engine, for
which the RFC program has initially been implemented, is currently in service in the
twin-engine F-15 military aircraft built by the McDonnell Douglas Corporation and in
the single-engine F-16 fighter aircraft built by the General Dynamics Corporation. There
are over 3200 such engines in the operational inventory of the US Air Force. A total of
twenty-three components used in such parts as fan, compressor and low pressure turbine
rotors are being managed under this philosophy. The F100 engine overhaul manuals have
been revised such that the RFC procedure replaces the classical time to retirement
guidelines.
There were several developments for damage tolerance analysis and maintenance
which evolved from the RFC program. One such development is the refinement of a
nondestructive inspection method, based on eddy current monitoring, which is now
commonly used under the RFC program management. Another outcome of this program
is a cryogenic spin pit test for some titanium alloy discs. In this procedure, the component
is spun at a low temperature where the fracture resistance drops. If the disc does not burst
during the spin and safe operation is guaranteed above a certain 'inspection' size, the disc
is placed back in service until the next inspection. It was also demonstrated that if cracks
below the inspection size were to be present, the cryogenic spin pit test would not further
extend these cracks or cause the damage zone dimensions at the crack tip to be altered.
Whereas RFC was implemented on an F100 engine which was already designed and built,
improvements to damage-tolerant design were implemented by another effort termed the
ENgine Structural Integrity Program (ENSIP). Under ENSIP (Nicholas, Laflen, &
VanStone, 1986; Cowles, 1988), all critical structural components in an engine had to be
designed such that they could be inspected and, based on the inspection flaw size, could
be flown safely until the next inspection. Thus, all components became, by definition,
candidates for RFC. Since the inception of such damage tolerance procedures in the
design Stage, failure incidents due to low-cycle fatigue have been essentially eliminated
from the US Air Force jet engine inventory.
The economic implications of such changes in failure control philosophy are also
substantial. Initial estimates by the US Air Force reveal that, over the time period 1986—
2005, the (life cycle) cost savings realized from the implementation of the RFC
methodology to the F100 engines alone will amount to nearly $1 billion. Additional
savings, amounting to as much as $655 million, are projected over this time period as a
consequence of reductions in labor and fuel costs arising from the extension of maintenance
intervals for the upgraded F100 core engines.
' All of the components which were analyzed did not meet the criteria for RFC; the ones which failed the
criteria are still being retired after their design life, predicated upon low-cycle fatigue estimates, is
expended.
1.3 The need for a mechanistic basis
17
Another example of the fail-safe approach is the so-called leak-before-break criterion,
which was first proposed by Irwin (1964). This methodology is widely used in the
structural design of pressure vessels and pipes. The leak-before-break criterion is
developed as a means of ensuring that a pressure vessel or a pipe has the necessary
structural integrity and service use even if a surface crack propagates through the thickness
of the pressure vessel or pipe wall. Thus, the vessel or pipe would first 'leak' before any
catastrophic fracture occurs so that the fatigue flaw could be easily detected and repaired.
The implementation of this criterion would, therefore, require that the critical crack size at
the design stress level of the material be greater than the wall thickness of the vessel.
Examples of fracture mechanics analyses used in conjunction with the leak-before-break
criterion can be found in any book on the subject (e.g., Barsom & Rolfe, 1987).
1.3 The need for a mechanistic basis
Fatigue of materials is a branch of study which provides a broad variety of
complex mechanistic processes for scientific investigation. The size scales of
observation that are of interest in this research area range from submicrostructural (even
atomistic) levels to dimensions of structural components spanning tens or hundreds
of meters. Implications of fatigue failure encompass many aspects of our lives. The
practical significance of fatigue has even generated fictional stories and motion
pictures whose themes have centered around fatigue failures (e.g., the novel No
Highway by Nevil Shute, 1948, and its motion picture adaptation entitled No
Highway to Heaven). The consequences of fatigue failure become most apparent
when stories of disasters, such as aircraft accidents involving the loss of human
lives, are publicized.!
Although considerations of fatigue failure are intimately tied to the practical
aspects of structural integrity in engineering components, the mechanistic and
scientific basis for the study of fatigue cannot be ignored because of the following
reasons:
(1) The size scale over which permanent damage occurs at the tip of a fatigue
crack is generally comparable to the characteristic microstructural
dimension of the material, even if the component dimensions and the crack size are
orders of magnitude larger than the scale of the microstructure.
(2) The total life and fracture mechanics approaches provide methods for
characterizing the resistance of the material to crack initiation and growth under
cyclic loads. However, these concepts alone cannot offer a quantitative
description of the intrinsic resistance of the material to fatigue. This
information can be obtained only if there exists a thorough understanding of the
* The 1985 crash of a Japan Airlines Boeing 747 due to a catastrophic fatigue failure of the rear pressure
bulkhead and the resulting loss of 520 human lives is a case in point. A failure analysis of this accident is
presented in Chapter 10.
18
Introduction and overview
micromechanisms of failure. There is ample evidence from published work
on a wide variety of materials that subtle changes in the microstructure (and
the environment) can lead to drastic alterations in the extent of cyclic
damage and failure life. Thus, optimizing the microstructural characteristics
of a material for improving the fatigue resistance inevitably requires a
scientific knowledge of failure mechanisms.
(3) A significant portion of the fatigue crack growth life is spent at low AK
levels where the maximum crack tip opening displacement during a loading
cycle is typically smaller than a micrometer for most structural components.
Since this dimension is smaller than the characteristic microstructural size
scale in most materials, microstructural effects can markedly affect the
resistance to fracture even if the crack size is significantly larger than the
microstructural dimension.
(4) Even when a structural component is designed conservatively, fatigue failure
may occur because of unexpected changes in service conditions.
'Post-mortem' analyses of fatigue failures often involve tracing the origin of fatigue
failure via microscopic features present on the fracture surfaces, such as
'clam shell' markings and striations. These features can provide valuable
information about the location where fracture initiated as well as about the
magnitude of loads imposed upon the failed component. (See the various
case studies in this book for an illustration of this point.) A fundamental
knowledge of the link between the characteristic features observed on the
fatigue fracture surfaces, the microscopic mechanisms of failure and the
macroscopic rates of crack advance is vital to the success of such
postmortem analyses.
1.4 Continuum mechanics
Continuum descriptions of cyclic deformation and fatigue failure require
an understanding of elasticity and plasticity theories. In this section, we present a
brief review of the theories of linear elasticity and plasticity which provide the
foundation for the derivations and discussions presented in various chapters of
this book. The contents of this section are intentionally brief and confined only
to those topics that are pertinent to the scope of this book. More elaborate details
and derivations on these topics can be found in standard textbooks (e.g., Hill,
1950; Malvern, 1969).
Consider the infinitesimal element of volume in a stressed solid, shown in Fig. 1.3.
The stress at a point is the local area intensity of the force which is transmitted
between adjacent parts of the solid through an imaginary surface that divides the
solid, such as the faces of the cubic element in Fig. 1.3. The stress can be represented
by its scalar components, ay, normal and tangential to the surface. For the cartesian
1.4 Continuum mechanics
19
Fig. 1.3. Definition of stress components on an infinitesimal volume element.
coordinate system shown in Fig. 1.3, the stress components at a point are contained
in the matrix
K] -
tfll
<T21
031
au
a22
<*32
^13
CT23
^33
= cr,
yx
Jxy
Jyy
cr,
yz
(1.1)
a7.
a.
zy
where i,j = 1, 2, 3, and ay is the /th component of the force per unit area on a plane
whose outward normal points toward the positive Xj direction; X\ — x, X2 — y9 and
x3 = z. Each infinitesimal volume element in the body must be in mechanical
equilibrium. Since there can be no net torque on the element, Oy = ay,-. Similarly, no net
force can act on the element, so that
dcru dcr2i dcr3i
dxx dx2 3x3
/ = 1,2,3,
(1.2)
where bt is the /th component of the body force per unit volume. In the absence of
body forces, Eq. 1.2 can be expressed as
dxj
(1.3)
where summation over j is implied. Equations 1.2 and 1.3 are known as the
equilibrium equations.
Under the influence of applied forces, let ut be the components of displacement at
a point in the body. The components of infinitesimal strain are defined as
1 (dUi duj\
2 \dxj dxj'
(1.4)
When / ^j in this equation, the shear strains are obtained. However, it is
important to note that, for / ^j, Eq. 1.4 provides only one-half of the shear strains that are
commonly defined in engineering where yy = ley. In Eq. 1.4, six components of
small strain, €y, have been expressed in terms of three components of the displace-
20
Introduction and overview
ment. This implies that the strains must be interrelated. For the strain components in
the xi-x2 plane,
From Eqs
<?11 =
du\
9xi
e22
9w2
9x2'
qs. 1.5, one finds that
92e„
dx\
-2
92e12
9X[ 9x2
92e22
+ 9x2
1 /9«i 9w2\
2 \9x2 9xi/
«i2 =^kr + ^r- 0-5)
= 0, (1.6)
for deformation on the Xi-x2 plane. Equation 1.6 is one of the so-called compatibility
equations.
A state of plane stress or plane strain is characterized by the conditions
9( )/9x3 = 0 and a^ = ct23 = 0, with x\ and x2 taken as independent variables.
For plane stress, the stress-strain relationships (to be discussed in the next
subsection) are used along with the additional condition that ct33 = 0. Similarly, for plane
strain, the stress-strain relationships are applied with e33 = 0. An anti-plane state is
characterized by the conditions that cru = a22 = ^33 = a\2 = 0-
Standard procedures of coordinate transformation (see, for example, Malvern,
1969) are used to derive the equilibrium and compatibility equations and strain-
displacement relationships for the cylindrical coordinate system from the results
discussed above for the cartesian reference system, Eqs. 1.3 and 1.6. These results
for the cylindrical coordinate reference are presented in Section 9.3.2.
The equilibrium conditions are fulfilled automatically if the stresses are expressed
in terms of the so-called Airy stress function x, which is defined by the relationships
92X 92X d2X n -.
CTll=TT' CT22 = T3. g12 = ~ „ „ . (I-/)
dx\ 9xf axidx2
in the cartesian coordinate system. Similarly, the compatibility condition, Eq. 1.6,
when expressed in terms of the Airy stress function, becomes
94x &x &x
^4 + 2^^ + ^4 = 0. (1.8)
9x* 9Xj9x2 dx\
Similar expressions for the equilibrium and compatibility conditions in terms of
polar coordinates are given in Chapter 8. A complete solution is obtained by
satisfying Eq. 1.8 and the prescribed boundary conditions.
1.4.1 Elements of linear elasticity
When the material undergoes only elastic deformation, the stresses and
strains are related by Hooke's law,
aij = Cykfikh (1-9)
where Cijkl are the elastic constants which, for isotropic material response, are
Cijki = kSySki + G(SikSji + SaSjk). (1-10)
1.4 Continuum mechanics
21
X is known as the Lame constant and G is the shear modulus. Sy is the Kronecker
delta with the property that Sy = 0 for / j^j and that Sy = 1 for / =j. The isotropic
elastic constants defined by Young's modulus E and Poisson's ratio v are related to
G and A. by the expressions
G(3X + 2G) X
e = -gTx— = 2g{1 + v1 v = 2(gTx)- (ul)
Young's modulus E is the ratio of the axial stress to the axial strain, whereas
Poisson's ratio v represents the ratio of transverse contraction to (axial) elongation
in simple tension. The strains can be related to the stresses in terms of the elastic
constants,
1 r m !
*u=-jj.\?u — K°r22 + an)h *\i = 2Gau'
e22 =^[cr22 - V(°rll + °r33)]. (23 = 2QCr23<
<?33 = ^fe - v(crU + C22)]. e3i = — CT31- (1-12)
When the volume element shown in Fig. 1.3 deforms reversibly by an infinitesimal
strain increment de,-,, the stresses do work on the element by the amount
dw = Oydty = Cykl€kld€y. (1.13)
Under conditions of reversible and isothermal elastic deformation, the differential
work per unit volume dw in Eq. 1.13 is also equal to the change in the Helmholtz free
energy dF, which is an exact differential. For the conditions stated, the work of
deformation is a single-valued function in strain space, such that
1 dw
w = 2 Cmi€iJ€kh (or) ay = —, (1.14)
which is useful for later discussion.
1.4.2 Stress invariants
For any general three-dimensional stress state given by Eq. 1.1, one can find
via coordinate tranformation three normal stresses, known as principal stresses,
which act on orthogonal planes that are free of shear stresses. The principal stresses,
o\, o2 and o^, are the roots of the cubic equation,
A.3-/iA.2-/2A.-/3=0, (1.15)
where
h = oa = ax + a2 + <r3,
h=\ (oyOy - if) = -{o\02 + cr2cr3 + a^i),
I3 = det[<7y] = ax a2cr3. (1.16)
The coefficients I\, I2 and 73 are independent of the orientation of the coordinate
system chosen to describe the stress components. These coefficients are termed stress
22
Introduction and overview
invariants because the principal stresses are physical quantities at the point in the
solid under consideration. Any combination of these stress invariants also results in
an entity which is an invariant.
The normal mean stress or the hydrostatic stress, aH, is defined as
<?H =5(^11 + (?22 +<?x) = J<?kk= J, (1-17)
where the subscript k = 1, 2, 3. The hydrostatic stress crK causes a change only in
volume (and not in shape) in an isotropic continuum. From Eqs. 1.11, 1.12 and 1.17,
the compressibility g, the ratio of the negative of the dilatation e = en + e22 + £33 to
the pressure p = —era, can be written as
p 3X + 2G B
where B is the bulk modulus.
The deviatoric components of stress are defined as
sv = crv-^-. (1.19)
These deviatoric stress components, unlike the hydrostatic stress, bring about a
change of shape in the body and influence the plastic deformation. Analogous to
the stress invariants IUI2 and 73, a new set of scalar invariants, J\,Ji and y3, based on
the principal components of the deviatoric stress tensor, s\, s2 and 53, can be defined:
J\ = ou ~ h = 0,
_ 1 1 r ? 2 21
h = 2 sijsij = 2 \Sl + 52 + ■*> j.
y3 = 3 (sySjkSki) = sis2s3- (1.20)
1.4.3 Elements of plasticity
When a ductile metallic material is loaded beyond the elastic limit, it
undergoes permanent plastic deformation. Plastic flow in metals can be assumed
incompressible. The total strain imposed on an elastic-plastic solid e/y- can be written as the
sum of the elastic and plastic strains e^ and e?, respectively. The elastic strains are
related to the stresses by Hooke's law, Eq. 1.9. The assumption of incompressibility
of the material during plastic deformation leads to the condition that eft = 0.
The plastic behavior under complex multiaxial loading conditions is described by
invoking constitutive laws which relate either the total strain to current stress state
(so-called deformation theories) or the increment of plastic deformation to the stress
and strain increment for a given state of the material (so-called flow or incremental
theories). Any general theory of plasticity has the following major components:
(1) A yield condition, which specifies the onset of plastic deformation for
different combinations of applied stresses.
1.4 Continuum mechanics
23
(2) A hardening rule, which prescribes the work hardening of the material and
the change in yield condition with the progression of plastic deformation.
(3) A flow rule, which relates the increments of plastic deformation or the
components of plastic rate-of-deformation to the stress components.
Plastic deformation is determined by a yield condition which is a function /(cry) of
the current stress state. In most cases, the associative flow rule is used which assumes
that the plastic strain increments are proportional to a function f(oy) which depends
on the current plastic state of the material. All rate-independent plasticity theories
postulate that the material response is elastic for f{atJ) < 0. Elastic unloading occurs
from a plastic state when f(oy) = 0 and {df/doy^doy < 0, where do-,-, is the stress
increment. Plastic deformation occurs when /(or,-,-) = 0 and {df/do^doy > 0. If the
material deformation is isotropic, the yield function is an isotropic function of stress
such that/(cr,-,) =f{I\, I2, h) =/(cri> °2>03 )• Since the deformation of metallic
materials is insensitive to moderate levels of hydrostatic stress o-H, the yield function
depends only on the deviatoric stress Sy, If the yield response of the material is the
same in tension and compression, i.e. if the material does not exhibit the Bauschinger
effect (Chapter 3),f(sy) =f(—sy). Then/ is an even function of y3.
The von Mises and Tresca yield conditions are the most widely used flow criteria
for metals. The von Mises condition states that
f = j2-k? = l1sgsij-ki = 0, (1.21)
or, in terms of principal stresses,
/ = l6 [to - °2? + (02 ~ c3)2 + (0-3 - a,)2] - k2 = 0. (1.22)
A: is a constant for an elastic-perfectly plastic solid and it is influenced by the prior
strain history in a work-hardening material. Since J2 is a measure of the distortional
energy for an isotropic material, implied in the von Mises yield condition is the
assumption that plastic flow occurs when the distortional energy reaches a critical
value. For uniaxial tension, o\ = cry, 0-2=0-3 = 0, and k = ay/V3, where ay is the
tensile yield stress. For pure shear, o\ = —0-3 = ry, a2 = 0, and k = xy, where xy is the
shear yield stress.
The Tresca yield condition states that the material will yield when the maximum
shear stress reaches a critical value:
L\ai-oi\=k, (1.23)
where the principal stresses are arranged in the order a\ > a2 > 0-3. For uniaxial
tension, the Tresca condition predicts that k = cry/2.
The yield condition f(cry) = 0 for an isotropic material is represented in three-
dimensional stress space with the principal stresses a\, a2 and 0-3 as the coordinate
axes. In this principal stress space, Fig. 1.4(a), the shape of the yield surface
representative of the von Mises yield condition, Eq. 1.22, is a right circular cylinder, while
the Tresca yield condition, Eq. 1.23, is represented by the surface of a regular
hexagonal prism. The surfaces are parallel to the hydrostatic stress line OG, which
24
Introduction and overview
(a)
Fig. 1.4. (a) The yield surface drawn in three-dimensional principal stress space. The von Mises
and Tresca conditions for yield are represented by the right circular cylinder and the inscribed
hexagonal prism, respectively, (b) von Mises ellipse and Tresca hexagon for a state of biaxial
stress.
denotes the condition o\ = cr2 = a3.f The surfaces of the von Mises cylinder or the
Tresca hexagonal prism are perpendicular to the deviatoric plane or n plane (such as
the plane ABCDEF in Fig. 1.4(a)), which describes the condition o\ + a2 + <r3 = 0.
In a biaxial stress state represented by the principal stress coordinates o\ and a2, the
von Mises yield condition is represented by an ellipse and the Tresca condition is
shown by the inscribed hexagon, Fig. 1 A(b). Since net work has to be expended on
the body during plastic deformation, the rate of energy dissipation is nonnegative,
such that
^•deP>0. (1.24)
Geometrically, this condition implies that the yield surface must be convex. Thus the
yield condition requires the stress point to be on the yield surface and to be directed
outward from the surface. At a smooth point on the yield surface, Eq. 1.24 implies
that the incremental plastic strain vector de? must be normal to the yield surface, and
that the vector denoting the incremental change in stress day must have an acute
angle with the strain vector. At a corner on the Tresca yield surface, this criterion
must be applied separately to the two surfaces intersecting the corner.
This normality of the plastic strain increment to the yield surface is reflected by the
flow rule,
d4 = d.|-, (1.25)
where dk is a positive scalar that can be taken to denote an effective stretching. By
analogy with Eq. 1.14,/ can be regarded as a plastic potential.
' This is so because if the stress state characterized by (at, a2, <r3) lies on the yield surface, so does
((T] + <rH, <r2 + <rH, <r3 + <rH), where <rH is any value of the hydrostatic stress defined in Eq. 1.17.
1.4 Continuum mechanics
25
Given the representation of the flow criterion in terms of the yield surface, it is
important to know how the yield surface changes during plastic deformation. The
theory of perfectly (or ideally) plastic solids assumes that the yield function is
unaffected by plastic deformation. If the material exhibits increasing resistance to plastic
deformation with plastic straining, the simplest approach to handle such strain
hardening is to invoke the so-called isotropic hardening model. During isotropic
hardening, the yield surface expands uniformly, but it has a fixed shape and its center
remains fixed in stress space. The dependence of the size of the yield surface on
deformation can be determined by developing a universal stress-strain relationship
hi d?pY
(1.26)
which relates two scalar quantities through the function h: the effective stress at
(which measures the size of the yield surface) and the effective plastic strain
increment d?p. If one uses the von Mises criterion for yield,
at = 4^h = yJjSySij. (1.27)
The numerical constant on the right hand side of this equation is chosen such that
at = \an\ in uniaxial loading. The effective plastic strain increment is defined as
d?P = J±d4d4, (1.28)
3 ^ij^ij
where the numerical factor is chosen such that in a state of uniaxial stress on,
d?p = de^ = -2d<?22 = -2d4.
An alternative statement of the isotropic hardening rule is obtained from the
argument that the size of the yield surface is a function F only of the total plastic
work, such that
FM,
0^4, (1.29)
where the integration is carried out over the actual strain path. This condition
provides results equivalent to Eq. 1.26.
The use of isotropic hardening for tension-compression cyclic deformation in
many metallic materials does not rationalize the differences in elastic limit commonly
found between forward and reverse loading. In an attempt to account for this so-
called Bauschinger effect, an alternative hardening rule, known as kinematic
hardening, has been proposed. In the classical models of kinematic hardening, the yield
surface does not change its shape and size, but simply translates in stress space in the
direction of its normal. The application of isotropic hardening and various
kinematic-type hardening rules to cyclic deformation is described in Chapter 3.
The discussions up to this point have focused on the incremental ox flow theories
of plasticity. There is also a different approach, known as the deformation or total
strain theory, which is adopted in plasticity problems mainly in view of its
mathematical simplicity. The deformation theory, where the total strain e,-, is taken to be a
26
Introduction and overview
function of the current stress, is merely a nonlinear elasticity theory. It is assumed
here that
4 = VSy, (1.30)
where u is a positive scalar function during loading and a negative scalar function
during unloading. From Eq. 1.30, it is readily seen that
at takes the value given in Eq. 1.27 and ?p = .V(2/3)e?e?. This can be used in
conjunction with a universal stress-strain relationship of the form given in Eq. 1.26.
Under proportional loading (i.e. for loading in which the components of the stress
tensor vary in constant proportion), the incremental and deformation theories of
plasticity exhibit agreement, while substantial differences are encountered between
the two approaches for severely nonproportional loading.
1.4.4 Elements of linear viscoelasticity
Deformation which exhibits such features as stress-strain hysteresis, stress
relaxation, creep, or dynamic response to stresses which fluctuate sinusoidally with
time represents a material behavior which is both elastic and viscous. Such a
deformation is known as viscoelastic. Examples of viscoelastic behavior are commonly
found in high polymers.
Continuum models characterizing the viscoelastic constitutive behavior commonly
involve series and parallel arrangements of springs and dashpots. Figures 1.5(a)-(c)
show three simple examples of such models where the viscoelastic solid is subjected
to a force F. The Maxwell element, Fig. 1.5(a), comprises a series arrangement of a
linear spring, which produces an instantaneous displacement u in response to F, and
a dashpot, whose velocity ii is instantaneously proportional to F. The Kelvin-Voigt
element is a linear spring and a dashpot in parallel, Fig. \,5{b). The spring constant
and the coefficient of viscosity of the dashpot are denoted as K and r\, respectively.
These idealized models qualitatively capture the relaxation, decay and creep
phenomena, although their quantitative predictions can deviate considerably from the
behavior of real viscoelastic materials. Further refinements to these models can be
made by incorporating additional elements. Figure 1.5(c) shows an example of a so-
called standard linear solid where an extra spring is placed in parallel with a Maxwell
element.
The applied force F and the displacement u at the point of application of the force
are related in the following way.
ii = ^ + -, F(0) = £k(0), for the Maxwell model, (1.32)
K r)
F = Ku + r\ii, u(0) = 0, for the Kelvin—Voigt model, (1.33)
Here, (t) after a variable denotes the value of the variable at time t, and (') denotes
the rate of change with t.
1.4 Continuum mechanics
27
Maxwell model
Kelvin-Voigt model
\
V
Standard linear model
V K, \ (T . N_rT_V\AV-|
H WAr—+F ^ K *F \ K +>
n—vW- 1 >■—WM< 1
Creep response
Relaxation response
Fig. 1.5. Schematic arrangement (top row), creep response (middle row) and relaxation response
(bottom row) of (a) the Maxwell element, (b) the Kelvin-Voigt element, and (c) a standard
linear model. The creep response includes loading and unloading.
The Maxwell element thus characterizes steady creep under a constant load F0
after an initial glassy response with the displacement F0/K. in the following manner:
K, r\
(1.34)
If a displacement u(t) is suddently applied such that u(t) = 0 when t < 0 and
u{i) = u0 when t > 0, stress relaxation characterized by the Maxwell solid takes
the form:
_ r*-<K/n>'
F(t) = Ke
«o-
(1.35)
The ratio x = r)/K denotes the relaxation time which is the rate of decay of the force
according to the exponential law in Eq. 1.35 after the sudden imposition of the
28
Introduction and overview
displacement produces an instantaneous reaction by the linear spring. The relaxation
time t is the time required for the force to relax to l/e times its initial value JCuq.
The Kelvin-Voigt element does not exhibit any instantaneous elastic response or
glassy response because the linear spring and the dashpot are in parallel. If a force F0
is imposed on the element at ;=0 and held fixed with the passage of time, the
solution to Eq. 1.33 for u{t) gives the retarded elasticity response:
"(0 = §(l-e-'/T), (1.36)
where the retardation time x is the time required for {(F0//C) — u} to be reduced by a
factor of l/e. Equation 1.36 thus indicates that the equilibrium displacement is
approached only asymptotically.
In the standard linear model shown in Fig. 1.5(c),
ER(u + rFu) = F + ruF, ER-rF- u(0) = ruF(0), (1.37)
where tf is a constant which denotes the time of relaxation of u under constant F,
and tu is the time of relaxation of F under constant u. With different values of the
spring constants and viscosity, different values of ER, tf and tu result, and thus the
model may be described by a constitutive equation of the form: F +f\F = ii\u + m2m,
where/i and w, are constants. This equation typically characterizes in a qualitative
way the deformation of a cross-linked polymer.
A generalized Kelvin-Voigt model, which comprises a number of Kelvin-Voigt
elements in series, or a generalized Maxwell model, which comprises a number of
Maxwell elements in parallel, are commonly used to 'fit' the creep response of metals
and polymers with greater degrees of precision (see, for example, Malvern, 1969). An
example of the transient viscoelastic response of polymers subjected to cyclic
variations in applied stress is presented in Chapter 6.
1.4.5 Viscoplasticity and viscous creep
A fluid exhibiting Newtonian viscous behavior develops a straining rate
which is proportional to the applied shear stress, from the very onset of the
application of the stress. On the other hand, a viscoplastic (or Bingham-plastic) material
resists straining until a critical value of the shear stress is reached, beyond which the
rate of plastic straining is in proportion to the stress. Sour dough, clay, and paste are
materials which provide examples of such viscoplastic response.
Consider the case of simple shear with axy = ayx = x and exy = €cyx = ec; all other
components of stress a{j and creep strain rate ^ vanish. In this case of the so-called
Bingham material (Bingham, 1922), the onset of straining occurs when the absolute
value of t exceeds a critical value k, such that
2^c = 0, if/y<0; 2^c=/yr, if/y>0; fy=(\-^-\. (1.38)
7.5 Deformation of ductile single crystals
29
Here, r) is the coefficient of viscosity and/y is a yield function. Assuming incompres-
sibility, Hohenemser and Prager (1932) generalized Bingham's model to the general
state of stress where
2^4 = 0, if/y < 0; 2^4 =fySij, iffy > 0; fy = (l - -^=Y
(1.39)
Recall that stj is the component of the deviatoric stress defined in Eq. 1.19, and that
J2 is the second invariant of the deviatoric stress, Eq. 1.20. Further extensions of this
approach, including the assumption of compressibility, have been introduced in the
literature.
Most commonly, tensile tests are carried out at different strain rates and
temperatures to characterize the viscoplastic creep response of materials. The results of such
tests are commonly analyzed using empirical approximations of the form:
a = ^TV)", (1-40)
where a is the uniaxial tensile stress, ec is the viscous part of the true strain, ec is the
viscous strain rate, m is the strain-rate sensitivity parameter, n is the strain hardening
exponent, and a0 is a material parameter. In steady-state creep, where the strain rate
remains roughly constant, the constitutive response is given by the so-called Norton-
Odqvist law:
,("c-l)^..
4 = ^v(- -. d-41)
*-m
where at is the von Mises effective stress, Eq. 1.27, cry is the yield strength, ey is the
yield strain rate and nc is the power-law creep exponent.
Since creep deformation is a thermally activated process, the mechanistic origins
of the evolution of strain rate are tied to an Arrhenius-type equation,
j = Ae~{Q/*T>, (1.42)
where Q is the activation energy, T is the absolute temperature and R is the universal
gas constant. Note that Eq. 1.42 essentially denotes the temperature-dependence of
viscosity r\ which is implicit in Eq. 1.38.
1.5 Deformation of ductile single crystals
The most comprehensive mechanistic details of cyclic deformation and
fatigue fracture have been obtained on ductile single crystals. In an attempt to develop
some background information for the discussions of fatigue in metallic crystals (to
be presented in the next two chapters), this section focuses on the terminology and
methods used to describe the deformation of ductile single crystals. Further details
on this subject can be found in any introductory text on physical or mechanical
metallurgy.
30
Introduction and overview
1.5.1 Resolved shear stress and shear strain
The anisotropic deformation of single crystals is characterized in terms of
the resolved shear stress, tr, and resolved shear strain, yR, acting on a specific slip
plane along a specific slip direction. Figure 1.6 shows a cylindrical specimen of a
single crystal of cross-sectional area A, which is subjected to a uniaxial tensile or
compressive load P. Let the slip plane normal and the slip direction be oriented at an
angle 0O and A.0, respectively, with respect to the loading axis, n and b are the unit
vectors normal to the slip plane and along the slip direction, respectively. Xo ( =
90° — 0O) is the complementary of 0O-
The load P can be resolved along b to give a shear force, Pcos X.0, acting in the slip
direction. The corresponding initial shear stress, tRo, resolved on the slip plane is the
shear force, PcosX.0, divided by the area of the slip plane, A/cos4>o, so that
Tr„ = —cos0n cosA-n = crcos0n cos kn.
0 A
(1.43)
The condition for the onset of plastic deformation is given by the so-called Schmid
law which states that a crystalline solid flows plastically when the resolved shear stress,
tRo, acting along the slip direction in the slip plane reaches a critical value, tc:
a cos 0o cos A-o = a sin xo cos X.0 = Ma = rc. (1-44)
M is known as the Schmid factor, which has a maximum value of 0.5 corresponding
to the orientation 0O = ^-o = 45°.
Fig. 1.6. A schematic diagram of a single crystal showing the orientations of the slip plane and
the slip direction.
7.5 Deformation of ductile single crystals
31
Consider the geometrical changes in the slip system as the initially cylindrical
crystal deforms plastically (Fig. 1.7). A reference gage length vector £0 along the
axis of the cylinder prior to deformation changes in both magnitude and direction
with the progression of slip. Let £ be the instantaneous gage length vector at any
point during plastic deformation. It can be shown by simple geometrical arguments
that
* = -£<)+ KR(4)-n)b, (1.45)
where • denotes a dot product. In order to express £ in terms of £q, consider
£■£ = £0-£0 + yi£0- n)2 (b b) + 2yR£0 -n)£0- b). (1.46)
Equivalently,
I2 = l02 (1 + 2yR cos 0o cos X0 + yR cos2 4>0). (1.47)
If yR is expressed in terms of the instantaneous and original gage lengths, I and l0,
respectively, and the initial orientation of the slip plane and slip direction 0O and A.0,
we find that
1
Vr
COS 0o
JgT*
sin A-o — cosA-o
(1.48)
In an actual tensile test on a single crystal, the ends of the crystal are gripped to the
testing machine and the gage length vectors £0 and £ are confined to remain parallel
to the initial longitudinal axis of the cylinder (i.e. along the loading axis).
Consequently, the single slip displacement schematically illustrated in Fig. 1.7 is
tantamount to the rotation of both the slip plane and the slip direction toward the
tensile axis as deformation proceeds in a real experiment. The initial orientation
angles 0O an<i ^-o will decrease with increasing plastic deformation.
The Schmid factor also relates the increment of shear strain dj/R on a slip system
to the increment in longitudinal strain de. For instantaneous orientation angles 0
and A. and small strain increments,
^ = ^ = _L = L_. (1.49)
de tr M cos 0 cos A.
When (j>=X = 45°, M = 0.5, tr = 0.5<r.
The instantaneous value of resolved shear stress, tr, may be obtained by noting
that the glide plane, with the cross-sectional area A/cos(j>0, remains undistorted by
slip. Since the longitudinal axis at any point during slip is inclined at an angle X to
the slip direction,
P
xR = —cos 0o cos A. = cr cos 0o cos A.. (1-50)
A
From Eq. 1.45, we note that
cosA. = £-b/l= ^/l -(l0sinX0/l)2. (1.51)
Combining Eqs. 1.50 and 1.51, the instantaneous value of resolved shear stress can
be written as
32
Introduction and overview
Fig. 1.7. A schematic diagram of change in the gage length vector from l0 to I due to slip.
tr = - cos 0o yl -(tosinX0/i)2.
(1.52)
The measurement of the applied force P and the instantaneous length of the
crystal I during a uniaxial test producing single slip in a single crystal can thus be
converted into a plot of the resolved shear stress tr and resolved shear strain yR
using Eqs. 1.52 and 1.48, respectively. It is seen from Eq. 1.52 that tr increases with
the elongation of the crystal (for a fixed value of the applied force P). This
phenomenon is known as 'geometrical softening'. It is important to note that, while the slip
system rotates toward the tensile axis in a monotonically loaded crystal, fully
reversed fatigue loads do not cause any orientation change.
Figure 1.8 shows a typical stress-strain curve at room temperature for an FCC
single crystal, oriented initially for single slip and subjected to uniaxial tension. Here
the variation of the resolved shear stress tr with the resolved shear strain yR exhibits
three distinct stages. Stage I commences at the critical stress t0 after an initial elastic
deformation. This region of 'easy glide' is characterized by primary slip and by
straight and uniformly spaced slip lines. As the crystal deforms and the slip systems
rotate with respect to the loading axis, secondary slip is activated. This onset of
secondary slip and the attendant decrease in mean slip distance generally marks the
beginning of stage II where the crystal exhibits a significant increase in the rate of
work hardening. With the progression of plastic deformation in stage II, the increase
in dislocation density and the propensity for cross slip promote the formation of
Exercises
33
Fig. 1.8. A typical stress-strain curve for an FCC single crystal exhibiting three distinct stages of
deformation.
dislocation cell structures. With an increase in applied stress (and/or temperature),
the dislocations become increasingly more capable of circumventing (by cross slip)
barriers which were generated during the high-hardening stage II deformation. The
onset of cross slip in stage III is accompanied by a reduction in work hardening.
Materials, such as aluminum, with a high stacking fault energy (i.e. with a high
propensity for cross slip), exhibit pronounced stage III deformation even at low
applied stresses. A detailed discussion of the mechanisms of monotonic deformation
in ductile single crystals, for different conditions of crystallographic orientation, test
temperature and strain rate, can be found in any textbook on mechanical metallurgy.
Several example problems illustrating the methods to identify active slip systems in
cubic crystals are presented in the next chapter.
Exercises
1.1 The design of the twin-engine Boeing 777 aircraft was launched in the late
1980s with the objective of capturing the long-distance air travel market.
The aircraft was designed to fill a gap between the four-engine 747 with a
passenger capacity of around 400 and the twin-engine 767 with a passenger
capacity of approximately 200. During the development of the 777, Boeing
had to face competition for the 300-350 passenger 777 aircraft from the
newer generation of planes introduced by rival manufacturers, i.e. the 323-
seat MD-11 from McDonnell-Douglas which replaced the DC-10 with more
efficient engines, and the four-engine A-340 and the twin-engine A-330 from
Airbus. The airlines which worked with Boeing in the development of the
34
Introduction and overview
111 forged an agreement early on in the design that its fuselage would be
much wider than that of the MD-11, A-330 or A-340.
(a) Speculate about the implications of the larger fuselage on the strength,
weight and power requirements.
(b) Speculate about the implications of the larger fuselage on damage
tolerance considerations and design against fatigue fracture.
1.2 A circular shaft of length / and radius a is twisted at the ends by a torque T,
which results in an angle of twist a per unit length of the shaft. The shear
modulus of the material is G.
(a) Find the magnitude of the nonzero components of stress in the shaft.
(b) Derive expressions for the strain energy density and the total strain
energy.
1.3 For an isotropic elastic solid, derive expressions for the strain energy density
in terms of the components of stress or strain tensors for (a) plane strain and
(b) plane stress.
1.4 For a homogeneous and isotropic elastic medium, show that the principal
axes of the stress and strain tensors coincide.
1.5 The octahedral plane is defined as the plane which makes equal angles with
the principal stress directions.
(a) Show that the octahedral shear stress, which is the shear stress on the
octahedral plane, is
tfoct = 5 yJ(Pl - <y2)2 + (°2 - <*!? + fo - ^l)2'
where ax, a2 and cr3 are the principal stresses.
(b) Show that (3/2)alct = J2, where J2 is the second invariant of the devia-
toric stress tensor defined in Eq. 1.20.
(c) Describe the von Mises yield condition, Eq. 1.22, in terms of the
octahedral shear stress.
1.6 Equations which relate the plastic strain increments to the stress deviator
components are known as the Prandtl-Reuss equations (i.e. de? = SydX
where Sy and dA. are defined in Eqs. 1.19 and 1.25, respectively).
(a) Show that when/(a,y) = J2, the plastic potential equations 1.25 become
the Prandtl-Reuss equations. / is the plastic potential function defined
in Eq. 1.25 and J2 is the second invariant of the deviatoric stress tensor
defined in Eq. 1.20.
(b) Show that the Prandtl-Reuss equations correspond to incompressible
plastic deformation.
1.7 Identify the slip systems with the same Schmid factor in a face-centered
cubic crystal where the stress axis for push-pull fatigue loading is along
the [110] direction.
Exercises
35
1.8 A cubic crystal contains a screw dislocation. The Burgers vector of the
dislocation is parallel to [001]. A crack propagates rapidly in the crystal
along the (001) plane in the [110] direction. Sketch the geometry and
orientation of the steps formed on the fracture surface.
Part one
CYCLIC DEFORMATION
AND FATIGUE CRACK
INITIATION
CHAPTER 2
Cyclic deformation in ductile single crystals
Studies which link the origin of fatigue damage to microscopic deformation
processes date back to the work of Ewing & Rosenhain (1900) and Ewing &
Humfrey (1903) who reported cracking along traces of active slip planes in fatigued
iron. With the invention of electron microscopes, considerable progress has been
made in developing a detailed understanding of substructural and microstructural
changes induced by cyclic straining. Research work in the past several decades has
clearly established the existence of a rich variety of fundamental mechanisms that are
specific to cyclic loading conditions. A thorough knowledge of these phenomena is
essential for microstructural design for fatigue resistance in engineering materials.
The most conclusive results of deformation mechanisms in fatigue have been
obtained on high purity materials, in particular single crystals of face-centered
cubic (FCC) metals.f In commercial materials, on the other hand, microstructural
complexities often preclude clear identification and quantitative treatment of fatigue
mechanisms. Cyclic deformation mechanisms in commercial materials are also
strongly influenced by processing methods and impurity content.
In this chapter, attention is focused on the mechanisms and micromechanics of
deformation in single-crystalline metals and alloys with FCC crystal structures. Also
included are brief descriptions of known cyclic-deformation characteristics of body-
centered cubic (BCC) and hexagonal close-packed (HCP) crystals. Cyclic
deformation in some rock salt crystals is addressed in Chapter 5. This discussion is followed
by a treatment of continuum formulations for uniaxial and multiaxial fatigue
deformation in polycrystalline ductile solids in Chapter 3. Fatigue crack nucleation in
monocrystalline and polycrystalline metals and alloys is considered in Chapter 4.
Cyclic deformation and crack initiation in brittle solids, such as ceramics and
ceramic composites, and in semi-crystalline and noncrystalline solids, such as polymers
and organic composites, are considered in Chapters 5 and 6, respectively. Cyclic
damage has also been extensively investigated using stress-life or strain-life
approaches where the deformation, crack initiation and crack growth events are
all incorporated within the context of phenomenological continuum descriptions;
these methods are examined in Chapters 7 and 8.
Engineering alloys are used occasionally in monocrystalline form in some fatigue-prone structures. An
example is a gas turbine engine for aircraft in which the turbine blades are made of nickel-base super-
alloy single crystals. See Section 2.10 for the cyclic deformation mechanisms in this alloy system.
39
40
Cyclic deformation in ductile single crystals
2.1 Cyclic strain hardening in single crystals
When well-annealed FCC single crystals, suitably oriented for single slip, are
subjected to cyclic strains under fully reversed loading, rapid hardening (that is, a
rapid increase in flow stress with increasing number of cycles) is noticed even in the
initial few cycles. With continued cyclic straining, the rate of hardening progressively
diminishes and a quasi-steady state of deformation, known as 'saturation', is
reached. Once saturation occurs, the variation of the resolved shear stress rR with
the resolved shear strain yR is not altered by further cycling and the stress-strain
hysteresis loop develops a stable configuration. (See Section 1.5.1 for definitions of
the resolved shear stress and the resolved shear strain, and Section 2.3.1 for an
example problem on the identification of active slip systems.)
It is well established that plastic strains are necessary for the inducement of fatigue
fracture in ductile single crystals. Under typical cyclic loading conditions involving
low values of imposed strains, the resolved plastic shear strain amplitude ypi is only a
fraction of the total strain amplitude yt because of reversible slip, and it decreases
with cyclic work hardening. Consequently, fatigue tests conducted with a fixed total
strain amplitude do not provide a clear description of the progression of cyclic
deformation. Instead, the most common method of performing strain-controlled
tests involves fixed amplitudes of plastic strains. Figure 2.1 shows typical hysteresis
loops associated with initial hardening and the attainment of a stable hysteresis loop
upon saturation after Ns cycles. The maximum value of the resolved shear stress at
saturation is denoted as rs at the total applied shear strain of yts.
A nominal measure of damage accumulation under cyclic loads is the cumulative
plastic strain which is defined as
N
r = 4^>pU, (2.1)
7=1
where ypii is the resolved plastic shear strain amplitude in the iih cycle and N is the
total number of cycles. For fully-reversed straining under a fixed plastic strain
amplitude ypU T = 4ypiN. It is important to note that the parameter T is only an
approximate measure of global fatigue damage and that it does not accurately
capture the extent of permanent damage at low plastic strain amplitudes where a
significant fraction of dislocation motion can be reversible.
2.2 Cyclic saturation in single crystals
Experiments of fully reversed fatigue under fixed amplitudes of resolved
plastic shear strain, yph point to the existence of a saturation stress after initial
(rapid) cyclic work hardening. A plot of the peak resolved shear stress at saturation,
rs, as a function of yp[ provides the 'cyclic stress-strain curve' for a single crystal,
which was first experimentally measured by Mughrabi (1978). Figure 2.2 schemati-
2.2 Cyclic saturation in single crystals
41
T,
0
c
c
•V
c
i
1
C
#c
"3
u
a
t-
C
£
c
c
compression
'Pi ^*""
,1/—
5 1
: 15f
\ 20r
[ 3o/
\ 50 / """
> l
100 J—
200 f——
600 L——^Z^0
1
| N,
■ J600
/200
/100
—/50
1 CA
sycl
. /10
r
—^ tension
i ]
1
-yls
resolved shear strain, yR
+y,s
Fig. 2.1. Schematic illustration of typical variations in resolved shear stress, rR, as a function of
the resolved shear strain, yR, for an FCC single crystal oriented for single slip and fatigued at a
fixed value of resolved plastic shear strain amplitude = ypl. zR increases rapidly during the
initial fatigue cycles. After Ns cycles, the hysteresis loops saturate with a peak tensile stress of rs
at a total applied shear strain of yu.
cally shows such a curve for FCC single crystals oriented for single slip. Actual
stress-strain data obtained for a number of FCC metals fatigued at different
temperatures are listed in Table 2.1.
There are three regions, marked A, B and C, which exhibit distinctly different
strain hardening characteristics in Fig. 2.2. At low values of plastic strain
amplitude (ypi < ypiab)> denoted region A, work hardening occurs during cyclic loading.
(This hardening behavior is measured in terms of the saturation stress and is
different from the rapid cyclic hardening prior to saturation, at a fixed value of
yph discussed in Section 2.1.) Region A is followed by a 'plateau' in the stress-
strain curve (region B). This latter regime, where the saturation stress, r*, is
independent of the plastic strain, extends until Ypisc- A further increase in ypl results in
an increase in r*, stage C.
In region A, work hardening displayed by the cyclic stress-strain curve is almost
entirely due to the accumulation of primary dislocations. Microscopically, saturation
of the hysteresis loops corresponds to a state where a dynamic equilibrium is
achieved between bundles of edge dislocations and the surrounding matrix plied
42
Cyclic deformation in ductile single crystals
(«)
(b)
0 vol. % PSB
100 vol. %PSB
dislocation cells
<p\,AB
p\,BC
Fig. 2.2. (a) Hysteresis loops with the resolved shear stress at saturation, z^, plotted against the
resolved plastic shear strain, ypl. The stress-strain curve is drawn through the tips of stable
hysteresis loops, (b) A schematic diagram showing different regimes of the saturation stress-
strain curve.
by screw dislocations. Under these conditions, fine slip markings are observed on the
free surfaces; the specimen could withstand an infinite number of fatigue cycles
because the cyclic plastic strain does not cause progressively degenerating damage.
One of the most visible features of cyclic saturation is the localization of slip along
bands. This process is nucleated at strain amplitudes corresponding to the beginning
of region B in the cyclic stress-strain curve (Fig. 2.2) and is intensified as the applied
plastic strain is increased. Early observations, e.g., Ewing & Humfrey (1903) and
Gough (1933), showed that fatigue failure initiated as a fine crack along those bands
where slip was particularly intense. These slip lines were termed 'persistent slip
2.2 Cyclic saturation in single crystals
43
Table 2.1. Cyclic stress-strain characteristics of FCC single crystals.
Material Yp\,ab Yp\,bc t* (MPa) Reference
Cu (523 K) 1.0 x 10"4 1.0 x 10"3 14.0 Lisiecki & Weertman (1990)
Cu(295K) 6.0 xlO"5 7.5 x 10"3 27.5 Mughrabi (1978)
Cu(77.4K) — 8.0 xlO"3 48.0 Basinski, Korbel & Basinski
(1980)
Cu (4.2 K) — — 73.0 Basinski, Korbel & Basinski
(1980)
Cu-2.0 Al (at.%) 1.0 x 10"4 3.0 x 10"3 33.0 Wilhelm & Everwin (1980)
(295 K)
Cu-5.0 Al (at.%) — — 32.0 Woods (1973)
(295 K)
Cu-16.0 Al (at.%) — — 20.0-25.0 Li & Laird (1994)
(295 K)
Cu-2.0 Co (at.%) 3.0 x 10"4 5.0 x 10"3 27.5 Wilhelm & Everwin (1980)
(295 K)
Ni(295K) 1.0 xlO-4 7.5 x 10⁻³ 52.0 Mughrabi, Ackermann, & Herz
(1979)
Ni (293 K) 1.0 x 10"4 8.0 x 10"3 50.0 Bretschneider, Holste & Tippelt
(1997)
Ni(600K) 7.5 x 10"5 5.0 x 10"3 20.5 Bretschneider, Holste & Tippelt
(1997)
Ni(750K) — — 12.0-16.0 Bretschneider, Holste & tippelt
(1997)
Ag(295K) 6.0 xlO"5 7.5 x 10"3 17.5 Mughrabi, Ackermann & Herz
(1979)
Al-1.6 Cu (at.%) 1.5 x 10⁻⁵ 1.5 x 10⁻³ 95.0 Lee & Laird (1983)
(295 K)
Fe-llNi-16Cr-2Mo — — 59.0 Yan et al. (1986)
(wt%)(295K)
Fe-19Ni-llCr-2Mo — — 59.0 Kaneko, Morita & Hashimoto
(wt%)(295K) (1997)
bands' (PSBs) by Thompson, Wadsworth & Louat (1956) who found that in Cu and
Ni, the bands persistently reappeared at the same sites during continued cycling even
after a thin layer of the surface containing these bands was removed by electropol-
ishing. Numerous studies, including Laufer & Roberts (1966), Lukas, Klesnil &
Krejci (1968), Watt, Embury & Ham (1968), and Woods (1973), have conclusively
44
Cyclic deformation in ductile single crystals
demonstrated that the PSBs form through the bulk of the single crystals, and that the
bands of coarse slip merely mark their egress at the specimen surfaces.
Static deformation experiments after fatigue loading (Broom & Ham, 1959) and
microhardness measurements on fatigue-induced slip bands (Helgeland, 1965) reveal
that the PSBs are much softer than the matrix. These results imply that, during
saturation in the plateau region of the cyclic stress-strain curve, essentially the entire
deformation is carried by the PSBs. In fact, the very formation of the PSBs appears
to be closely related to the occurrence of the plateau. These slip bands first appear at
ypi ~ Yp\.AB> and their volume fraction,/, increases linearly to nearly 100% as ypl is
raised to a value of yv\,bc- F°r Cu, Ni and Ag, fatigued at room temperature, the
ratio of the threshold saturation stress for PSB formation (tpsb « r*) to the shear
modulus (G) is approximately the same (^ 6.5 x 10~ ), Mughrabi, Ackermann &
Herz (1979). Figure 2.3 shows the markings exhibited by PSBs on the surface of a Cu
single crystal subjected to 15000 cycles of fatigue at ypi values of 1.5 x 10⁻³ and
(«)
<M
Fig. 2.3. PSB markings on the surface of a Cu single crystal subjected to 15 000 cycles of fully
reversed fatigue loads at two different values of resolved plastic shear strain amplitude, yp\. (o)
ypl = 1.5 x 10~3. (/>) YP\ = 4.5 x 10"3. Width of the specimen = 4.7 mm. (From Winter, 1974.
Copyright Taylor & Francis, Ltd. Reprinted with permission.)
2.3 Instabilities in cyclic hardening
45
4.5 x 10 3. Note the increase in the volume of the crystal covered by the PSBs due to
the increase in ypl.
2.2.1 Monotonic versus cyclic plastic strains
An approximate, but direct, comparison of strain hardening under
monotonic and cyclic loading can be made if the cumulative plastic shear strain amplitude
in a fatigue test is taken to be analogous to the resolved shear strain in a monotonic
tensile test. Figure 2.4 shows such a comparison for Cu. It becomes evident here that
strain hardening under monotonic tension occurs much faster than that under cyclic
loading. Whereas cumulative plastic strains T ~ 10 are necessary to achieve the
saturation stress, r* = 28 MPa (at ypl = 4.5 x 10~3), a shear strain of only 0.3
produces the same stress level in a monotonic load test. This difference becomes even
more substantial at lower values of yp\.
2.3 Instabilities in cyclic hardening
Cyclic strain hardening under a constant value of plastic strain amplitude
results in a monotonically rising stress-strain curve (Figs. 2.1 and 2.4). However, if
the single crystal is subjected to an increasing stress amplitude (ramp loading), the
resulting strain amplitude exhibits a sequence of maxima and minima (Fig. 2.5),
which were termed strain bursts by Neumann (1968). Although the absolute values
of stress amplitudes at which strain bursts take place are not well denned, their
I
cyclic
deformation
2 4 6
cumulative resolved shear strain
Fig. 2.4. Resolved shear stress plotted against cumulative resolved shear strain for copper single
crystals subjected to tension and fatigue. (After Wilkens, Herz & Mughrabi, 1980.)
46
Cyclic deformation in ductile single crystals
10 20 30
resolved shear stress (MPa)
40
50
Fig. 2.5. Strain bursts observed in a copper single crystal subjected to increasing stress
amplitude at 7.1 kPa/cycle at 90 K. (After Neumann, 1968.)
relative occurrence seems to be perfectly periodic in that they appear whenever the
stress amplitude is raised by at least 11.5% within about fifty fully reversed fatigue
cycles. These strain bursts have been observed in single crystals of Cu, Ag, Mg and
Zn (Neumann, 1968) and of Cu-Al alloys (Desvaux, 1970).
The effects of loading mode on the possible occurrence of strain bursts can be
rationalized from the arguments presented by Neumann (1974, 1983). If the crystal is
subjected to sufficient fatigue cycles (at a given stress amplitude), hardening due to
the mutual trapping of dislocations progressively reduces yp\. This effect continues
until the mean free path for dislocation motion is smaller than their mean spacing.
Consequently, the probability of close encounters among dislocations decreases. If
the stress amplitude is slowly raised, the disintegration of dipoles leads to an
avalanche of free dislocations. Macroscopically, this process is manifested in the form of
a strain burst. At the higher stress level, the released dislocations are trapped again
during subsequent deformation.
This discontinuous hardening trend is also known to occur locally during the very
early hardening stage of a constant plastic strain amplitude fatigue test. Neumann
suggests that whether such local strain bursts can be seen macroscopically depends
strongly upon their interactions throughout the gage length of the specimen. Under
increasing stress amplitude conditions, experiments appear to show the occurrence of
strain bursts (coherently) through the entire gage length. However, coherent strain
bursts are not compatible with constant plastic strain control. Therefore, the
discontinuous hardening behavior adds up to asynchronously or slowly varying
macroscopic plastic strain amplitude in a strain-controlled test. If the fatigue specimens
which exhibit strain bursts are subjected to monotonic tensile deformation, they
undergo easy glide of zero strain hardening where coarse slip steps are formed
(Broom & Ham, 1959; Neumann, 1968).
2.3 Instabilities in cyclic hardening
47
2.3.1 Example problem: Identification of active slip systems
The discussions presented in the preceding sections and those to follow in
this and subsequent chapters in the context of cyclic deformation in ductile
single crystals require a quantitative understanding of the nature of microscopic
slip. Here, the procedures used to identify active slip systems are illustrated with
the aid of a worked example.
Problem:
Consider a face-centered cubic crystal that is subjected to tension loading.
Initially, the crystal with a circular cylindrical geometry and cross-sectional area
A, has its tensile axis oriented along [T23].
(i) Identify the slip system which is activated initially,
(ii) As plastic deformation occurs, show how the relative orientation between
the stress axis and the glide direction changes,
(iii) Calculate the applied tensile strain at which duplex slip involving the
primary and the conjugate slip systems is activated.
Solution:
(i) According to the Schmid law, the slip system which operates first is the
one for which the resolved shear stress, denned in Eq. 1.44, is a maximum.
The product cos 0O cos A.0 for each of the twelve slip systems in an FCC
crystal is estimated from the 'cosine formula'. This formula states that the
cosine of the angle, 0, between the normals, (hxkxlx) and (hjkjh)* to two
planes in a cubic crystal is:|
™* a hxh2 + kxk2 + hh
cos <p =—;^=^^=^=. (2.2)
J{h\+k\ + l\).J{h\+kl + ll)
For example, cosine of the angle 0 between the normal to the plane (111)
and the direction [T23] is: (-1 + 2 + 3)/(vW3) = 4/(v/l4v/3).
Similarly, cosine of the angle A. between the slip direction [lTO] and the
loading direction [T23] is: (-1 + 2 + 0)/(vT4V2) = -3/(vT4V5).
For the FCC crystals which glide along the {111}(110) slip system, the
three [UVW] ((110)) slip directions located on each of the four (hkl)
({111}) planes can be identified by recourse to the Weiss zone law which
states:
hU + kV + lW = 0. (2.3)
With the above information, the cosine of the angle between the slip plane
normal and the tensile loading axis, cos <p, and the cosine of the angle
' More generally, if r^ and n2 are the unit vectors normal to the two planes, then r^ • n2
| ni | • |n2| • cos0. See Section 2.8.1 for further discussion.
Cyclic deformation in ductile single crystals
Table 2.2. Crystallographic geometric relationships for the FCC crystal with its
tensile axis initially along [123].
Slip
system
Plane)
Direction] Notation
cos</>
cos X
cos</>cosA.
Primary
Conjugate
Cross-slip
Critical
111)[110] A2
111)[101] A3
lll)[0ll] A6
TTl)[l!0] B2
TTl)[101] B4
TTl)[011] B5
14V5
4
14V2
4
14V5
4
14V2
1
14V5
14V2
14V3
2
14V2
2
14V5
2
14V2
5
14V5
111)[110]
lll)[l01]
111)[011]
Tii)[iio]
111)[101]
lll)[0ll]
ci
C3
C5
Dl
D4
D6
14V2
1
14V2
4
14V2
5
14V3
14V5
14V3
VT4V2
1
14 V2
2
i
UV5
-12
14V6
16
14V6
4
14V6
14V6
4
14V6
10
14V6
14V6
12
14V6
6
14V6
between the glide direction on the slip plane and the tensile loading axis,
cos A., are determined for each of the twelve possible slip systems, as shown
in Table 2.2. For a given tensile load P and crystal cross-sectional area, A,
the last column of this table gives the initial Schmid factors, M, for the
different slip systems, and the maximum value of | cos0 • cos A.| identifies
the slip system with the highest resolved shear stress, as shown in Section
1.5.1. The last column of Table 2.2 reveals that for the given orientation of
the crystal, single slip occurs initially along the A3 slip system.
As slip deformation occurs along the A3 slip system, the axis of the
cylindrical crystal begins to rotate. Consequently, the stress axis
moves towards the [101] glide direction. This process is visualized most
(ii)
2.3 Instabilities in cyclic hardening
49
(iii)
010
Fig. 2.6. A stereographic projection showing the rotation of the loading axis, initially at [123],
towards the primary glide direction [T01] until [Tl2]. This rotation is marked by the arrow.
conveniently by examining the [001] stereographic projection, which is
shown in Fig. 2.6. (Basic descriptions of stereographic projection can be
found in an introductory text on mechanical metallurgy.) After this
rotation, when [Tl2] is reached, the stress axis lies between the zones [001] and
[111], and both the primary and conjugate slip systems are equally
stressed.
The applied tensile strain, eapp, at which duplex slip involving the primary
and conjugate systems is activated is readily calculated with reference to
Fig. 1.7:
" " " sinA-o
eapp —
-1
sin A.
-1.
In the present case,
cosA.0 = cos/{(123)[101]} =
Likewise,
14V2"
cosX = cos/{(112)[101]} =
►A.„ = 40.89°.
►A. = 30°.
vW2
Combining Eqs. 2.4-2.6, one finds that eapp = 0.31.
(2.4)
(2.5)
(2.6)
2.3.2 Formation of dislocation veins
Transmission electron microscopy (TEM) of cyclic strain hardening in Cu
single crystals, oriented for single slip and subjected to equal tension-compression
cyclic straining, show the following general trends.
50
Cyclic deformation in ductile single crystals
• The initial few cycles of alternating strain produce dislocations that
accumulate on the primary glide plane (e.g., Basinski, Basinski & Howie, 1969;
Hancock & Grosskreutz, 1969).
• Fully reversed cyclic loading produces approximately equal numbers of
positive and negative edge dislocations. One may envision the possibility
of frequent encounters between dislocations of opposite sign, which attract
one another. When such encounters occur over small distances, the strong
attraction between dislocations of opposite sign will trap the dislocations,
thereby creating a dislocation dipole. Only edge dislocations of opposite
sign are likely to form such dipoles because positive and negative screw
dislocations can easily cross slip and mutually annihilate (provided that
the stacking fault energy is sufficiently high). The process of mutual trapping
of edge dislocations continues until the entire dislocation arrangement
within the veins is composed of edge dislocation dipoles.
• The generation of primary dislocations is a consequence of the geometrical
condition that, during fully reversed fatigue straining, there is no rotation of
the slip system with respect to the loading axis. Therefore, the primary slip
system remains the most highly stressed. Microscopy results by many
researchers, which document the absence of any lattice rotation between
adjacent channels, suggest that the average Burgers vector within the
veins is close to zero because of equal numbers of positive and negative
edge dislocations (e.g., Mughrabi, 1980). Thus, the veins do not produce
long-range internal stresses. One of the most notable distinctions between
monotonic and cyclic hardening of FCC single crystals at low amplitudes of
imposed strains is this absence of long-range internal stresses under fatigue
deformation. (The stresses due to the edge dislocation dipoles in the veins
are significantly more short-ranged (oc 1/r2) than those arising from the pile-
up of dislocations (oc 1/a/F), where r is the radial distance from the core of
dislocation; see, for example, Neumann, 1983.) The absence of long-range
internal stresses has also been identified by X-ray measurements (Hartman
& Macherauch, 1963; Wilkens, Herz & Mughrabi, 1980).
• With continued cycling, accumulation of dislocations occurs predominantly
in the form of mutually trapped primary edge dislocation dipoles.
• These networks of edge dislocation dipoles are commonly referred to as
veins, bundles, or loop patches. The veins have an elongated shape; their
long axis is parallel to the primary dislocation lines and their cross
section normal to the long axis is equi-axed. The veins are separated by
channels, which are relatively dislocation-free and are of a size
comparable to that of the veins. The width of the veins is about 1.5 |xm in
copper fatigued at 20 °C. A reduction in temperature promotes a finer
dislocation structure.
• The dislocation density within the vein is of the order of 1015 m~2 which
corresponds to a mean dislocation spacing of 30 nm. The dislocation density
2.3 Instabilities in cyclic hardening
51
within the channels is three orders of magnitude smaller, which implies that
the average dislocation spacing in the channels is comparable to the width of
the channels.
• The veins contribute to rapid hardening in the early stage of fatigue by
partially impeding dislocation motion on the primary slip system.
Increasing the number of cycles leads to an increase in both the dislocation
density within the veins and the number of veins per unit volume. This
results in an enlargement of the network of interconnected veins packed
tightly with primary edge dislocations which occupy up to 50% of the
volume of the material. In the dislocation-poor regions between the veins,
screw dislocations ply back and forth during cyclic straining.
Figure 2.7 is an example of the vein structure in a copper single crystal, oriented
for single slip under ypl control. This micrograph shows the view of the primary slip
plane which, in the notation used by Basinski, Korbel & Basinski (1980), is (111); the
primary slip vector is along [101] (which is normal to the vein structure). Primary
screw dislocations can be seen in the channels dividing the veins.
S.
4r*
1,
' S-
s
. 2>m .
Fig. 2.7. A transmission electron micrograph of matrix vein structure in a section parallel to the
primary glide plane of a single crystal of Cu fatigued to saturation at 77.4 K. (From Basinski,
Korbel & Basinski, 1980. Copyright Pergamon Press pic. Reprinted with permission.)
52
Cyclic deformation in ductile single crystals
2.3.3 Fundamental length scales for the vein structure
The characteristic dimensions associated with the dislocation structure of
the veins can be rationalized in terms of the physical mechanisms, Neumann (1983).
The most fundamental characteristic length associated with the vein structure, i.e.
the mean spacing of the edge dislocations in the veins, can be related to the trapping
distance, dtiap, of the edge dislocations at the saturation stress, rs:
^trap ~ ~^-7\ ^— - (2-7)
57l(l — V)TS
where G is the shear modulus, b is the magnitude of the Burgers vector and v is
Poisson's ratio. Taking Gb = 11 Jm~2, v = 0.33 and rs = 28MPa (the maximum
value of the saturated peak stress for the vein structure) for Cu at room temperature,
one obtains dtrap < 24 nm. This compares reasonably well with the mean dislocation
spacing of 30 nm estimated from the measurement of dislocation densities.
For cyclic hardening to take place, there is a need for significant dislocation
multiplication. In a high purity single crystal, this is only possible by the bowing out of
dislocations by a Frank-Read mechanism. In this process, the channel areas
adjacent to the veins with a diameter equal to the Orowan-Frank-Read length
dbr~1.5— (2.8)
are required. The channel diameter given in Eq. 2.8 represents the maximum distance
over which two ends of a semi-circular dislocation arc can be separated under a
resolved shear stress rs. Substituting the appropriate values for Cu, it is found that
c?Or ^ 0.6 um. This is of the order of the experimentally measured channel width of
1.5 um which separates adjacent veins in fatigued Cu.
2.4 Deformation along persistent slip bands
Winter (1974) developed a two-phase model to illustrate the mechanisms by
which plastic strain is carried by the PSBs. At equilibrium, where the stress
amplitude, the hysteresis loop and the volume fraction of the crystal occupied by the PSBs
are invariant during saturation (for fixed yp]), let the plastic strain amplitudes in the
PSBs and the matrix be ypSB and ym, respectively. Noting that/ is proportional to
yph the average plastic strain amplitude may be expressed in terms of the law of
mixtures,
Kpi = /Ypsb + (l-/)Km- (2-9)
This linear relationship suggests that ypSB and ym are constants, which are
independent of yp\. Winter argued that irrespective of the value of yph the softer phase
comprising the PSBs is fatigued at a strain amplitude of ypSB and the matrix (the
harder phase) at ym. The crystal deforms at the appropriate ypl by adjusting the
2.5 Dislocation structure of PSBs
53
relative amounts of the two phases (i.e. by changing/) within the plateau (region B)
of the saturation cyclic stress-strain curve. The parameters, ym and »sb> m Eq. 2.9
correspond to yPiAB and Kpi,bc> respectively, in Fig. 2.2 and Table 2.1. This line of
reasoning, albeit simplistic, provides an appealing rationale for the similarities in the
conditions that govern the formation of PSBs in single crystals of a variety of metals
and alloys.
Winter's two-phase model also has limitations (e.g., Brown, 1977). Firstly, the
model implies reversibility, contrary to the reality of a fatigue experiment where a
decrease in ypl does not lead to the disappearance of the PSBs. Secondly, the model is
not applicable for materials where fatigue loads alter the microstructure; for
example, precipitation-hardened alloys (in which cyclic straining can shear the
strengthening precipitates) or work-hardened materials (in which fatigue softening occurs).
Thirdly, the two-phase model is not applicable to cyclic deformation involving
dislocation climb, i.e. above about half the melting point.
As the PSBs penetrate through the bulk of the crystal, the strain carried by them is
macroscopically reversible in that the local strain at the maximum value of the
applied tensile stress is identical to that at the compressive maximum (Finney &
Laird, 1975). On a polished surface, slip steps visible to the naked eye disappear
and reappear every quarter cycle. Although the surface slip steps form in proportion
to Yph tne displacements within the band are not fully reversed. This leads to the
formation of slip offsets and a rough topography within the bands which appears to
be the precursor to crack nucleation (see Chapter 4). There is considerable variation
in the thickness and distribution of slip, with the coarse PSBs consisting of narrower
slip bands known as micro-PSBs.
It is generally recognized that the PSBs are a pre-requirement for the formation of
fatigue cracks in pure crystals. Therefore, the observation of threshold stress (or
strain) for the formation of PSBs automatically implies the existence of a fatigue
(stress or strain) limit below which no cyclic failure occurs (Laird, 1976; Mughrabi,
1978).
2.5 Dislocation structure of PSBs
A PSB is composed of a large number of slip planes (~ 5000 in Cu at 20 °C)
which form a flat lamellar structure and span the entire cross section of the single
crystal. A periodic array of dislocation ladders or walls further divides the PSB
lamellae into channels, Fig. 2.8. Note that this figure is an oversimplification insofar
as the edge dislocations are not infinitely long, but are elongated dislocation dipole
loops (debris). The PSB walls, predominantly made up of edge dislocations, are
normal to the primary Burgers vector, b. The plastic deformation in the channels
in-between the walls occurs mainly by the glide of screw dislocations.
54
Cyclic deformation in ductile single crystals
gliding
screw
segment
(a)
■at least 100 \aa-
b
bowing-out
edge segment
gliding
screw segment
walls
[111] (&)
i 1.3 |im
tens of micrometers
(c)
[101]
Fig. 2.8. Dislocation arrangements in FCC metals, (a) Vein structure in the matrix, (b) An
enlarged view of the dipolar walls and dislocation debris within a PSB. (c) A three-dimensional
sketch of PSB geometry formed in Cu at 20 °C. (After Mughrabi, 1980, and Murakami, Mura &
Kobayashi, 1988.)
The dislocation structure found within the PSBs is considerably different from
that of the matrix. The matrix contains, about 50% by volume, vein-like structures
consisting of dense arrays of edge dislocations. On the other hand, the PSB structure
is generated due to the mutual blocking of glide dislocations and the formation of
parallel wall (ladder) structures which occupy about 10%, by volume, of the PSBs
(Laufer & Roberts, 1966; Woods, 1973; Mughrabi, 1980). The walls are 0.03-
0.25 um in thickness with a spacing of about 1.3 um and they consist of dipoles.
The dislocation densities in the matrix veins and PSB walls are 10n-1012 cm and
are two to three orders of magnitude greater than those in the in-between channels
containing screw dislocations. Weak-beam TEM studies of copper crystals reveal the
presence of about two-thirds vacancy dipoles and one-third interstitial dipoles of
primary edge dislocations (Antonopoulos, Brown & Winter, 1976; Antonopulos &
Winter, 1976). A schematic of the dislocation arrangements in the veins and in the
PSBs is given in Fig. 2.8.
Figure 2.9 is an arrangement of several electron micrographs showing the three-
dimensional geometry of the matrix veins and PSB structures in Cu. The (121) plane
clearly shows the ladder-like arrangement of the walls in the PSB, which are oriented
perpendicularly to the primary Burgers vector b. Figure 2.10 is a TEM micrograph
of a (121) section of a Cu crystal which shows the ladder structure in the PSB and the
matrix vein structure consisting of dislocation bundles.
2.5 Dislocation structure of PSBs
55
/ if
Fig. 2.9. A three-dimensional view, constructed from several TEM images, of the matrix vein
and PSB dislocations in Cu cycled to saturation at 20 'C at ypi = 1.5 x 10~3. The specimen
loading axis, indicated by the dashed line, is almost on the (121) plane and it makes an angle of
47° with the primary Burgers vector b. (From Mughrabi. Ackermann & Herz. 1979. Copyright
American Society for Testing and Materials. Reprinted with permission.)
The matrix veins accommodate plastic strains only of the order of 10~ , and hence
they undergo only microyielding. On the other hand, PSBs support high plastic shear
strains of the order of 0.01 and undergo macroyiclding. This can involve dislocation
multiplication by the bowing-out of the edge dislocations (from the walls) and by
their transport along the channels: the screw dislocations in the channels may also
draw the edge dislocations out of the walls (see the schematic in Fig. 2.8(6)). Figure
2.11 is an electron micrograph of a section parallel to the primary glide plane, (111),
of monocrystalline Cu at 20 °C. The primary edge dislocations bowing out of the
walls are also evident. The same sense of curvature is exhibited by dislocations of the
same sign.
Two different mechanisms have been proposed to rationalize the quasi-steady
state deformation of the saturation stress-strain curve. Deformation within the
matrix veins is believed to be accomplished by the back and forth ('flip-flop') motion
of dislocation loops that are produced by jogs during cross slip of screw dislocations
under cyclic straining (Feltner, 1965; Finney & Laird. 1975). It has been suggested by
Grosskreutz & Mughrabi (1975) that this flip-flop mechanism can accommodate
plastic strains of the order of 10~4, and hence accounts for the saturation behavior
56
Cyclic deformation in ductile single crystals
M PSB M PSB
ft
N
>
7
X*
«
1 urn
Fig. 2.10. TEM image of dislocation structures in a Cu crystal fatigued at ypi = 10~3 at room
temperature. A view of the (121) section revealing the matrix veins (M), PSB walls and screw
dislocations in the channels between the walls. (From Mughrabi, Ackermann & Herz. 1979.
Copyright American Society for Testing and Materials. Reprinted with permission.)
/
*
. V
. - » w~. t
1 pm
Fig. 2.11. TEM of a section parallel to the primary slip plane of single crystal Cu fatigued to
saturation at ypi = 5 x 10~3. Fast neutron irradiation was employed to pin the dislocations at
the peak tensile stress of the fatigue cycle. (From Mughrabi, Ackermann and Herz, 1979.
Copyright The American Society for Testing and Materials. Reprinted with permission.)
2.5 Dislocation structure of PSBs
57
in the veins either during rapid hardening or during saturation in region A. On the
other hand, a dynamic equilibrium between dislocation multiplication and
annihilation is considered responsible for saturation within the PSB in the plateau regime of
the cyclic stress-strain curve. Consequently, the local densities of edge and screw
dislocations are kept constant (Essmann & Mughrabi, 1979). Dislocation
multiplication occurs by the bowing out of edge dislocations between the walls, whilst
annihilation occurs by climb of edge dislocations of opposite sign on glide planes 1.6 nm
apart in the wall structure of PSBs. Furthermore, the annihilation of screw
dislocations (on glide planes 50 nm apart) at room temperature is also believed to occur in
the dislocation-poor channels of the PSBs.
2.5.7 Composite model
Mughrabi (1981, 1983) proposed a composite model for fatigued crystals
containing dislocation walls and cell structures. His analysis examines the
development of long-range internal stresses as a natural consequence of deformation
compatibility among the substructures. As large differences exist between the local
dislocation densities in the walls and channels of the PSBs, let rw and rc denote
the local flow stresses in the walls and channels, respectively. Under an imposed
far-field stress, the deformation of the composite, consisting of walls and channels,
occurs in the following sequence: (i) elastic straining of both the walls and channels,
(ii) elastic straining of the walls, plastic yielding of the in-between channels, and (iii)
plastic yielding of the channels and walls. Processes (ii) and (iii) denote plastic micro-
yielding and macro-yielding, respectively. The composite yields plastically under the
action of an applied stress r:
*=/w*w+/c*c> (2-10)
where /w and fc are the area fractions of the walls and channels, respectively, in the
glide plane. If it is assumed, for strain continuity at the interface between walls and
channels, that the total strain yT is the same in the walls and channels,
KT = Kpl.w + Kel.w = Kpl.c + Xel.o (2-11)
where ypiw and ye] w are the plastic and elastic shear strains, respectively, in the walls,
and yp]C and ye]c are the corresponding strains in the channels. From Eqs. 2.10 and
2.11 and the condition that/c +/w = 1,
*w = t +/c(tw - tc) = r + G/c(kpi?c - KpliW), (2.12)
where G is the shear modulus, and yp\x - yp]w = ye]w - yeix. Similarly,
*c = * -/wOw - tc) = t - G/W(ypi,c - KpliW). (2.13)
An outcome of Eqs. 2.12 and 2.13 is that at the macroscopic yield stress r, the local
stress in the walls is larger than r by
Arw = G/c()/pi,c - Xpi.w), (2-14)
and the local stress in the channels is smaller than r by
Arc = -G/w(xpliC - KpliW). (2.15)
58
Cyclic deformation in ductile single crystals
Equations 2.14 and 2.15 together must satisfy the condition that
/cArc +/wArw = 0. (2.16)
The local stresses, Eqs. 2.14 and 2.15, are long-range internal stresses that develop
due to different amounts of deformation in the walls and channels which have
different dislocation distributions. Thus, a crystal with a heterogeneous dislocation
distribution exhibits local deformation similar to that of a composite. This effect has
important implications for a wide variety of fatigue phenomena, such as cell
formation (Sections 2.8 and 2.9), the Bauschinger effect (Chapter 3), cyclic slip
irreversibility and fatigue crack nucleation (Chapter 4).
The composite model discussed above rationalizes, in a simple manner, the
accommodation of plastic strains in the plateau regime of the cyclic stress-strain
curve. However, the development of quantitative criteria for the inception of a
fatigue crack requires detailed constitutive formulations of the inelastic
deformation in the PSBs.
2.5.2 Example problem: Dislocation dipoles and cyclic deformation
Problem:
Consider an elongated edge dislocation dipole loop, which is shown
schematically in Fig. 2.12(a). The length of the dipole loop is /d and the separation
distance of the dipole dislocations from glide plane to glide plane is sd.
(i) Examine the condition for the stability of the dipole loop under the
influence of an applied shear stress, by identifying the ratio, ld/sd, for
which the dislocation bowing stress, rbow, and the dipole passing stress,
dipole, are just equal.
(ii) Now consider a fatigued Cu crystal whose dislocation arrangement
consists essentially of uniformly distributed edge dislocation dipoles. The
length of the dipoles, /d = 0.5 um, and the glide plane separation,
sd = 20 nm. Assume that the dipole density Pdipoie = 1020m~3, and
that the cyclic plastic strains are accommodated exclusively by the dipole
superjog
(retained from
cross slip)
(b)
Fig. 2.12. (a) Schematic illustration of the dislocation dipole. (b) Glide path for dipole flip-
flop.
2.5 Dislocation structure of PSBs
59
flip-flop mechanism. Find the cyclic stress amplitude
required for the operation of the flip-flop mechanism.
(iii) What would be the maximum shear strain amplitude?
Solution:
which would be
(i) The dipole passing stressf can be estimated from Eq. 2.7, from which it is
seen that
Gb
Tdipole - 8ti(1 -v)sA
The dislocation bowing stress is
^Gb
^bow ~ ~1 •
'd
(2.17)
(2.18)
Equating these two stresses, we find the condition for the stability of the
dipole loop to be
/d « 8tc(1 - v)sd, or ^-«15.
(ii) Substituting G = 42 GPa, b = 0.25 nm, v = 0.33,
(2.19)
and sd = 20 nm
(which are typical values for Cu) in Eq. 2.17, we find that the amplitude
of the stress necessary for the flip-flop mechanism is
r — ~ 31 MPn
TdiPoie-87i(1_uKi~31MPa.
This is of the order of the stresses seen for Cu at room
(iii) The total dislocation density is
P = Pdipoie x /d = 1020 x 0.5 x 10-6 m"2 = 0.5 x 10¹⁴ m
The average glide path, schematically sketched in Fig. 2
(2.20)
temperature.
"2. (2.21)
12(b), is (72 • sd).
Since there are two dislocations in the dipole, the average glide path per
dislocation is,
Lg\ = -r ■ 4l ■ sd = 0.7 x 20 = 14 nm.
The shear strain amplitude is:
ypi = ±p-b- Lgl
= ±0.5 x 10¹⁴ (m-2) x 0.25 x 10-9 (m) x 14 x 10-9
= ±1.75x 10⁻⁴.
(2.22)
(m)
(2.23)
Strictly speaking, the dipole passing and dislocation bowing processes should be treated as functions of
dislocation displacement.
60
Cyclic deformation in ductile single crystals
2.6 A constitutive model for the inelastic behavior of PSBs
In this Section, we examine a constitutive model for PSBs in FCC single
crystals which is predicated upon the work of Repetto & Ortiz (1997), where a
complete list of references to prior studies on relevant crystal elasticity and plasticity
theories can be found. The formulation discussed here is amenable for
implementation in finite-element simulations of fatigue crack initiation; some examples of such
simulations will be presented in Chapter 4.
2.6.7 General features
As a starting point to the analysis, assume that the plastic strains are carried
entirely within the PSBs, primarily by single glide, with the surrounding matrix taken
to be elastic. At the free surfaces where the PSBs exit the crystal, however,
considerations of multiple slip are necessary. Since transient cyclic deformation prior to
cyclic saturation constitutes only a small portion of the fatigue life, attention is
focused on deformation occurring after saturation. Consequently, the dislocation
densities in all the slip systems are assumed to remain constant.
The total deformation in the FCC crystal is envisioned as being composed of three
mechanisms which allow a multiplicative decomposition of the total deformation
gradient F (Lee, 1969):
F = FeFpFv. (2.24)
Here, Fe is the elastic part accounting for lattice distortion including rotation,! Fp is
the plastic part accounting for the cumulative effect of slip in the PSBs (which leaves
the lattice undistorted as well as unrotated), and Fv is a factor representing the effects
of vacancy generation.
Let tr be the resolved shear stress acting in the slip system a along the direction s"
(i.e. a (110) direction) on a slip plane (i.e. a {111} plane) whose normal is nf*. If x is
the Kirchhoff stress tensor,
xl = saTTma; so; = Fesa and m" = Fernf\ (2.25)
where the superscript T refers to the transpose of the tensor. The flow rule derived
from the kinematics of slip is written as (Rice, 1971):
pPFP-i = J2 ya r <g> nf*, (2.26)
a
where ya is the shear strain rate on the slip system a and <g> denotes a vector dyadic
product. This constitutive formulation is completed by writing an equation for the
evolution of ya on the basis of the type of loading (e.g., fully reversed and yp]
controlled) and the material behavior (e.g., rate-independent plastic response).
' Details for extracting Fe for FCC crystals can be found in Teodosiu (1982).
2.6 A constitutive model for the inelastic behavior of PSBs
61
2.6.2 Hardening in the PSBs
As the resolved shear stress rR causes dislocations to move within the PSB
along the primary slip system a, it is conceivable that this motion is restricted by the
mutual trapping of edge dislocations of opposite sign. The plastic hardening due to
this trapping process leads to a shear strain evolution which depends on rR as
follows:!
where b is the magnitude of the Burgers vector, pa is the dislocation density in the
primary slip system, and w is the distance of separation between the walls in the PSB.
The term [1 — P(rR)] denotes the subfraction of destabilized dislocations that are
trapped by the nearest wall, and 1/[1 — P(tR)] signifies the average number of jumps
taken by a dislocation, from one dislocation wall to a neighboring wall in the PSB,
before being trapped in a stable position. P(ra) can be determined directly from
experimentally measured stable hysteresis loops of rR versus ypl, similar to the
ones shown in Fig. 2.2(a).
2.6.3 Hardening at sites of PSB intersection with the free surface
While considerations of single slip are appropriate for describing the
deformation within the ladder structure of a PSB, modeling of multiple slip is required at
the site of egress of a PSB at the free surface of the crystal. A possible mechanism for
hardening here is postulated on the basis of obstacles to the motion of primary
dislocations by forest dislocations. When the obstacles are randomly distributed in
the slip plane, the underlying kinetic equation can be analytically stated (Cuitino &
Ortiz, 1992) in the form of a hardening rule:
*--£• «r-*@)JU[(D
-\\. (2.28)
Here haa is the self-hardening modulus, h" = t"/y" is the characteristic hardening
modulus, t" = CGb^/nn01 is the characteristic flow stress (with G being the shear
modulus and C, a nondimensional constant), and y" = (bpa)/(2*frf) is a
characteristic glide strain. The density of obstacles created by forest dislocations, n01, takes the
form
rt° = JVV, (2.29)
where p1 denotes all relevant slip systems other than the primary system a. The
interaction coefficients a01^, which depend on the nature of the dislocation junctions
' Equation 2.27 is an oversimplification in that it does not account for the link between the hardening
process and the motion of screw dislocations in the channels or the increasing densities of loops and
dislocation debris.
62
Cyclic deformation in ductile single crystals
or jogs formed by the intersection of primary dislocations with forest dislocations,
have been exprimentally determined for the 12 slip systems of FCC crystals
(Franciosi & Zaoui, 1982). In the multi-slip regions of the PSB, the trapping
mechanism in the primary system and the forest hardening mechanism should both be
considered.
2.6.4 Unloading and reloading
The discussion up to this point deals with monotonic loading. Upon
repeated reversals of the load, the kinetic equation (Ortiz & Popov, 1982) for
unloading and reloading can be formulated as:
P(r0) = ,nWf , , (2.30)
\+P(Tmm)(e-v*'v**-\)
where rmax is the maximum resolved shear stress attained during loading and r0 is the
critical resolved shear stress for the onset of reversed slip. The function P carries the
same meaning as in Eq. 2.27. Implicit in this derivation is the notion that r0 —> 0
when the resolved shear strain yp] significantly exceeds a characteristic value, yp] c.
Thereafter, the reversed slip gradually facilitates the dissolution of the dislocation/
obstacle arrangement. Any subsequent reloading returns the deformation to
conform to the virgin stress-strain response. During reloading, elastic deformation
prevails until tr —> r0. Thus, the model ostensibly accounts for the Bauschinger effect
(see Chapter 3), although its predictions have not been rigorously checked with
experimental observations.
2.6.5 Vacancy generation
Once cyclic saturation is attained in the plateau regime of the cyclic stress-
strain curve, the density of dislocations within the PSBs is maintained at an
approximately constant value (~ 6 x 10¹⁵ m~ ) by the establishment of a dynamic
equilibrium between dislocation multiplication and annihilation. It has been pointed out
(Mughrabi, Ackermann and Herz, 1979) that the bowing of edge dislocation
segments out of the walls, at radii greater than the critical Frank-Read radius, is the
most probable mechanism for dislocation multiplication (see Fig. 2.11). Dislocation
annihilation is facilitated when two edge dislocation segments of opposite sign get
closer than the critical separation distance, ye «s 1.6 nm (Essmann & Mughrabi,
1979).| Figure 2.13 is a schematic of an elongated dislocation loop in a PSB in
which the pure edge segments (which are parallel to the walls) are at the critical
separation ye. The length of the loop L may be identified with the width of the
specimen. The reduction of the spacing y and the eventual annihilation of the
' Note that the above argument does not take into account the process of annihilation of screw
dislocations in the channels. In addition, care should be exercised in analyzing the annihilation process since it
may involve dislocation climb or merely a mechanical collapse due to very high local interaction stresses.
2.7 Formation of PSBs
63
Fig. 2.13. A schematic showing the annihilation of dislocation loops and the attendant
production of vacancies.
edge segments necessarily involves dislocation climb until the area of the loop Ly
vanishes by generating point defects (which, as seen earlier, are predominantly
vacancies). Vacancy generation also has the concomitant effect of promoting a
steady elongation of the PSB along the nominal slip plane, which gives rise to surface
protrusions. The rate of deformation induced by dislocation climb due to the
annihilation of edge dislocations is found (Repetto & Ortiz, 1997) to be
rvrv_1 = cv <f <g> <f = Qpay2eya) r®r. (2.31)
The rate of elongation of the PSB is thus established via the vacancy generation rate
(cv) and the known slip rate. The implications of this PSB elongation process, along
with that of vacancy diffusion, to fatigue crack initiation will be considered in
Chapter 4.
2.7 Formation of PSBs
At the beginning of stage B in the saturation cyclic stress-strain curve,
structural changes must take place within the matrix to accommodate high values
of plastic strains because the dislocation veins in the matrix cannot accommodate
strains in excess of approximately 10~ . The ensuing formation of PSBs has been the
subject of a number of electron microscopy studies (e.g., Mughrabi, Ackermann &
Herz, 1979; Mecke, Blochwitz & Kremling, 1982; Jin, 1989; Holzwarth & Essmann,
1993).
2.7.7 Electron microscopy observations
Holzwarth & Essmann (1993) presented a study of the mechanism by which
the matrix vein structure is transformed into the wall structure of a PSB. They
started with a saturated matrix vein structure in a Cu single crystal at ypl = 10~4,
64
Cyclic deformation in ductile single crystals
using a fully-reversed plastic-strain control test, until saturation to a cumulative
plastic strain of T = 15 at ts = 28MPa at 300 K. The crystal was then subjected
to a sudden increase in ypl to 4 x 10~4 which caused an instant jump in flow stress to
33 MPa and which initiated the formation of PSBs. The number of fully-reversed
strain cycles at the higher ypi was varied from specimen to specimen in order to
gather information on the consecutive stages of PSB evolution. Continued cycling at
the higher ypl caused a rapid decline in the flow stress which dropped from 33 MPa to
a steady-state value of 28 MPa within 1000 cycles.
These experiments reveal that the transformation from the matrix vein structure to
the PSB wall structure most likely commences at the centers of the veins wherein
exist small areas that are dislocation-poor. These soft areas are surrounded by a
harder shell of higher dislocation density, wherein develop the first dislocation walls.
In the plateau regime, the walls shift at a rate of 1-2 nm/cycle, and this shift plays an
important role in establishing the typical ladder pattern in the PSBs.
Figure 2.14 shows the dislocation arrangements in a Cu crystal subjected
uniformly to fully reversed plastic straining at yv\ = 4 x 10~4 (without a change in
ypi from a prior lower value). Here, an inhomogeneous matrix vein structure is
Fig. 2.14. The evolution of a PSB wall structure in the dislocation-poor region of the matrix
veins (marked by arrows), g = (111). ypi = 4 x I0~4. (From Holzwarth & Essmann, 1993.
Copyright Springer-Verlag. Reprinted with permission.)
2.7 Formation of PSBs
65
evident, with dislocation-poor interior regions in the veins. Consider the PSB in
this figure which cuts through a row of veins. From the geometry of the nascent
wall structure and the surrounding vein structure, it is noted that the walls
originate from the vein shells and that they have to move very little to establish
their spacing during PSB evolution. The destruction of veins is seen to begin
preferentially in the dislocation-poor regions where each vein forms two walls.
The scenario emerging from Fig. 2.14 is essentially the same as that put forth for
Ni by Mecke, Blochwitz & Kremling (1982), and for Cu by Jin (1989).
2.7.2 Static or energetic models
A quantitative description of the formation of dislocation structures within
the veins and PSBs can potentially be obtained from calculations of the equilibrium
positions of finite populations of dislocations. Although theoretical models of the
evolution of PSBs are in their infancy, the few results available to date appear to
provide some fundamental justification for the experimentally observed geometrical
arrangement of dislocations in fatigued crystals. Detailed numerical simulations are
necessary to establish a link between the conditions for the stability of dislocation
structures and the geometries of dislocation arrangements that develop during
fatigue. The basis for the earlier models (such as the low-energy dislocation structures
(LEDS) model of Kuhlmann-Wilsdorf, 1979) was the Taylor-Nabarro lattice
(Taylor, 1934; Nabarro, 1952). This lattice consists of regular arrangements (of
parallel straight edge dislocations) extending to infinity. The infinite Taylor-
Nabarro lattices cannot explain the existence of dislocation-free channels between
the veins and the sharp transition in dislocation density from the veins to the in-
between channels.
It has been shown by Neumann (1983, 1986) that finite sections of Taylor-
Nabarro lattices of certain shapes are stable. Neumann has considered a regular
planar array of positive and negative edge dislocations (say, on the x-y plane)
with the dislocation lines extending along the z direction. The Burgers vector of a
dislocation is then given by b = (£SZ>, 0,0), £s = ±1, b > 0. The position of the
dislocation, with respect to the origin of the coordinate system, is described by the
position vector Tj = r(Xj,yj), j = 1,..., n, such that the slip plane of they'th
dislocation is y = yj. When a stress ra is applied, the force per unit length on the z'th
dislocation is given by
F/ = Jra + *|>iKr^)|; B = ^^Vy (2-32)
(x; - Xj){(Xj - Xj)2 - (yt - yj)2}
{(xt-xj)2+(y;-yj)2}2
jKr„ r,) =V ' J 2 JJ "' T ' - (2.33)
66
Cyclic deformation in ductile single crystals
For mechanical equilibrium, all dislocation structures must be relaxed, i.e. the net
stress on a dislocation line (due to the applied stress and due to all the other
dislocations) must be zero. This can be accomplished by shifting the dislocations within
their slip planes (i.e. with yj fixed) into appropriate positions Xj. Mathematically, this
process reduces to equating the right hand side of Eq. 2.32 to zero, which results in n
nonlinear equations for the n unknowns Xj. In this way, the stability of veins can be
modeled by using various shapes of the finite Taylor-Nabarro lattices as the starting
configurations.
Figure 2.15(a) shows such a relaxed configuration of a diamond-shaped section of
Taylor-Nabarro lattice in which all the dislocations are at their equilibrium positions
at zero applied stress. It is found that, for this section, the application of a stress
results in the emergence of dipolar walls of dislocations from the polarization of the
initial configuration, Fig. 2.15(Z>). Figure 2.15(c) shows the equilibrium configuration
of a wall structure of dislocations. Here the ratio of wall spacing to wall height is of
the order of unity, in concurrence with the experimental observations of ladder
(a)
XTXT
XTXTXT
XTXTXTXT
XTXTXTXTXT
XTXTXTXTXTXT
TXTXTXTXTXT
TXTXTXTXT
TXTXTXT
TXTXT
TXT
XTXTXTXTXTXTXTX
TXTXTXTXTXTXTX
TXTXTXTXTXTXTXTX
TXTXTXTXTXTXTXTXTX
TXTXTXTXTXTXTXTXTXTX
TXTXTXTXTXTXTXTXTXT
TXTXTXTXTXTXTXTXT
TXTXTXTXTXTXTXT
TXTXTXTXTXTXT
(b)
XT
JTXT
TXT
T
XT
XT
XT
XT
XT
T
XT
XT
XT
XT
XT
XT
XT
T
XT
XT
XT
XT
XT
XT
XT
XT
XT
T
XT
XT
XT
XT
XT
XT
XT
XT
XT
XT
XT
T
XT
XT
XT
XT
XT
XT
XT
XT
XT
XT
XT
XT
XT
T
XT
XT
XT
XT
XT
XT
XT
XT
XT
XT
XT
XT
XT
XT
XT
T
XT
XT
XT
XT
XT
XT
XT
XT
XT
XT
XT
XT
XT
XT
XT
XT
XT
X
XT
XT
XT
XT
XT
XT
XT
XT
XT
XT
XT
XT
XT
XT
XT
XT
X
XT
XT
XT
XT
XT
XT
XT
XT
XT
XT
XT
XT
XT
XT
X
XT
XT
XT
XT
XT
XT
XT
XT
XT
XT
XT
XT
X
XT
XT
XT
XT
XT
XT
XT
XT
XT
XT
X
XT
XT
XT
XT
XT
XT
XT
XT
X
XT X
XT XTX
XT XT XTX
XT XT XT
XT XT
XT
(c)
XT
IT
IT
IT
IT
1TT
"^ d
a
IT
XT
XT
IT
IT
XT
IT
XT
ff
XT
a
Fig. 2.15. (a) and (b) show equilibrium states of finite Taylor-Nabarro lattices at ra = 0 and
ra = 0.425rj,ax, respectively, (c) is the computed equilibrium structure of dipole walls at
Dy = bd/lp. Figure (a) is an example of a 9 x 9 quadrupole structure. Figure (c) is an example
of walls (parallel columns) each of which consists of four dipoles. (From Neumann, 1986.
Copyright Elsevier Sequoia S.A. Reprinted with permission.)
2.7 Formation of PSBs
67
structures shown in Fig. 2.10. For the arrangements seen in Fig. 2.15(c), the dipole
strength is bd/lp, where d is denned in Fig. 2.15(c) and the inset in Fig. 2.16. (It
should be noted that for an isolated dipole, the dipole strength is denned by the
relationship Dy = b(y+ — y~), where y+ is the y coordinate of the positive dislocation
and y~ is the y coordinate of the negative dislocation in the dipole, and b is the
magnitude of the Burgers vector.)
When the applied stress ra reaches a certain critical value, rmax, the initial
dislocation configuration (made up of multipoles) begins to decompose into dipolar walls.
Figure 2.16 shows the variation of the decomposition stress, rmax, calculated from
the foregoing numerical simulation, as a function of the total number of dislocations
used in the model. In this figure, rmax is normalized by the decomposition stress, r^ax,
of the most narrow elementary dipole of the configuration, with the separation
distance between the dislocations in the dipole being d in a direction normal to
the slip plane. r^ax (oc b/4d) is the passing stress of two dislocations (say, the z'th
and kth dislocations which have opposite signs, with yt —yk = d). The veins in this
0 2 4 6 8 10
size of dislocation configuration, Na
Fig. 2.16. Normalized decomposition stress, T = rmax/r£ax, vs the size of dislocation
configuration for diamond-shaped Taylor-Nabarro lattice and for the wall structure. The inset
shows an elementary quadrupole for which h = 2d. The matrix vein structure is represented
here by assemblies of elementary quadrupoles, as in Fig. 2.15(a). The PSB wall structure is
modeled by columns of dipole walls, as in Fig. 2.15(c). (After Neumann, 1986.)
68
Cyclic deformation in ductile single crystals
figure are composed of elementary quadrupoles (see inset in Fig. 2.16) which make
up a diamond-shaped Taylor lattice.
Figure 2.16 indicates that the wall structure is more stable than the vein structure
(at comparable values of t^ax). This result provides a rationale for the experimental
observation that, at saturation, the decomposing veins cannot rearrange into a
different vein structure with smaller d values, but transform into a ladder structure.
This numerical model, albeit limited and very simplistic in its consideration of the
arrangements of dislocations in fatigued crystals, provides encouraging possibilities
for developing a physical basis for fatigue deformation.
2.7.3 Dynamic models of self-organized dislocation structures
Attempts have also been made to develop analytical models of continuous
concentration fields of dislocations in fatigued crystals (Walgraef & Aifantis, 1985;
Aifantis, 1987). In this approach, the dislocations are represented only by a density,
p(x, t), which is a function of space and time. The to-and-fro motion of dislocations
under a cyclic stress is modeled in one dimension as a diffusion phenomenon with a
flux term D(d2p/dx2), where D is an effective diffusion coefficient and p is the density
of dislocations. Two populations of dislocations are considered: immobile
dislocations of density p\ (to represent those within the PSB walls) and free dislocations of
density pm (to represent those within the in-between channels). Walgraef and
Aifantis arrive at the following set of coupled differential equations for densities
of trapped and free dislocations:
^i = D>-^ + S(Pi) ~ 7Pi + CPmpl
9Pm r, 9 Pm , -5 2 /"> i/i\
~aT m ~dxr A ~cpmPx' ^
In these equations, the parameter P is related to the maximum stress or plastic strain
rate, x is the dislocation glide direction, and c measures the pinning rate of freed
dislocations by immobile dislocations. The function g(p,) is a dislocation generation/
loss function whose initial value is zero and whose derivate with respect to time is
positive at low dislocation densities (i.e. when dipole density increases) and becomes
negative at high densities (i.e. when increased dipole destruction occurs). The
subscripts T and 'm' denote quantities corresponding to the immobile and mobile
dislocations, respectively. (The reader may consult the original references for further
details.)
Solution of Eqs. 2.34 predicts instabilities in the form of oscillations in time and
spatial patterning. These two instabilities have been related to the occurrence of
strain bursts and the formation of PSBs, respectively. However, this analysis relies
on rather global assumptions on the diffusion of dislocations and ignores the specific
dislocation geometries within dipolar PSB walls and channels.
2.8 Formation of labyrinth and cell structures
69
Differt & Essmann (1993) have proposed a dynamic model for edge dislocation
walls within a reaction-transport modeling framework. In this work, the reaction
terms are consistent with the experimentally observed properties of fatigue-
induced dislocation structures (which overcome some of the limitations of the
Walgraef & Aifantis model). Two important length scales are introduced in the
reaction terms: (i) the critical annihilation distance of a dipole under the influence
of an applied stress and (ii) the critical distance for the spontaneous annihilation
of closely spaced dipoles. The analysis shows how the walls move. Edge
dislocations are deposited on the walls by the moving screws. If the fluxes on both sides
of the wall are not balanced, the wall is destructed on one side and reconstructed
on the other. The wall moves until the fluxes get balanced. This mechanism
rationalizes why a freshly-formed PSB is less periodic and imperfect than a
mature one.
In summary, the dislocation arrangements in fatigue can be broadly classified
into two basic groups (e.g., Glazov, Llanes & Laird, 1995) : (i) structures in which
equilibrium is maintained, and (ii) nonequilibrium self-organized dislocation
structures. The former group includes the low-energy dislocation structure (LEDS)
discussed earlier in this section and includes the Taylor-lattice calculations. The
latter includes models of the type postulated by Walgraef & Aifantis. The non-
equilibrium structures have been shown to provide a rationale for the instigation of
fatigue instabilities such as the formation of ladder structures in PSBs and strain
bursts.
We close this section by noting that several approaches have emerged to
rationalize the patterning seen in fatigue by recourse to computer simulations.
Hesselbarth & Steck (1992) have confirmed the Neumann model for equilibrium
structures through two-dimensional cellular automata simulations of stress-induced
patterning from an initial random configuration of edge dislocations. Devincre &
Pontikis (1993) have studied the periodicity of dipolar walls as a function of
applied stress and edge dislocation density, while full three-dimensional simulations
of dislocation structures under cyclic stressing have been undertaken by Devincre
& Kubin (1997).
2.8 Formation of labyrinth and cell structures
Electron microscopy of fatigued Cu crystals (oriented for single slip)
provide further insights into the dislocation structures formed in the range of ypl
« 10~4-10~2 (Ackermann, Kubin, Lepinoux & Mughrabi, 1984). For ypl < 10 ,
the slip band structure is characterized by the hard matrix comprising veins and
the softer PSBs with the wall structure. An increased contribution of secondary slip
(which becomes more pronounced at higher ypl) and a gradual evolution of 'laby-
70
Cyclic deformation in ductile single crystals
Jy*m"
[100] b2
«
I
\ ,2Hm
Fig. 2.17. A view of the (010) section of a Cu crystal that was cycled to saturation at
ypi = 5 x 10~3, revealing the labyrinth structure. (
Pergamon Press pic. Reprinted with permission.)
ypi = 5 x 10 , revealing the labyrinth structure. (From Ackermann et at, 1984. Copyright
rinth' and 'cell' structures are noticed for ypi > 2 x 10~3. Figure 2.17 is a TEM
image of a (010) section of the Cu crystal that was subjected to fatigue at
ypl = 5 x 10~3. Note the formation of a labyrinth structure with its walls oriented
parallel to the (100) direction with a mean spacing of about 0.75 um. The labyrinth
consists of two sets of orthogonal Burgers vectors; bi and b2 denote the primary
and conjugate Burgers vectors, respectively. Labyrinth walls are also known to be
produced during cyclic deformation of Cu-Ni alloys (Charsley & Kuhlmann-
Wilsdorf, 1981), of ionic crystals (Majumdar & Burns, 1982) and of BCC metals
(e.g., Mori, Tokuwame & Miyazaki, 1979). The occurrence of walls of labyrinth
structures has been rationalized on the basis of a geometrical argument by
Dickson, Boutin & L'Esperance (1986), who considered a three-dimensional
stacking of twin dislocation loops of rectangular shape. The directions in which the
stacking of the loops was geometrically most favorable was shown to be consistent
with the crystallographic orientations of labyrinth structures actually observed in a
variety of metal crystals.
Ackermann et al. (1984) have suggested the following changes at the higher ypi
end of the saturation stress-strain curve (Fig. 2.2) for FCC crystals: matrix phase
with labyrinth structure —► PSBs and labyrinth structure —» cell structure.
Secondary slip (prevalent in region O originates at the PSB-matrix interface
and spreads in the form of an expanding cell structure which fills the PSBs. The
transformation of all the PSBs into a cell structure appears to occur after 106
cycles. This marks the beginning of secondary hardening in region C. The above
structural changes reported for Cu have also been found in Ni (Mecke, Blochwitz
& Kremling, 1982). Figure 2.18 shows an example of a cell structure formed in Cu
in regime C.
2.8 Formation of labyrinth and cell structures
71
• ■ 4
^ 1 ^im
Fig. 2.18. A view of the (121) section of a Cu crystal that was cycled to saturation at yp] =
1.45 x 10⁻², revealing cell structures formed by multiple slip in regime C. The primary
Burgers vector is along b. (Photo courtesy of H. Mughrabi. Reprinted with permission.)
2.8.1 Example problem: Multiple slip
Problem:
(i) A single crystal of an FCC metal, with a (001) orientation along the stress
axis, is deformed until the onset of plasticity. How many equivalent slip
systems are activated? What is the Schmid factor for these slip systems? Is
the deformation accompanied by a change of axial orientation?
(ii) Answer the above questions for a BCC single crystal with a (111)
orientation which deforms on slip systems of the type {T01}(111).
Solution:
(i) A repeat of the calculations, similar to those listed in Table 2.2, readily
reveals that there are eight slip systems for this case with
M = |cos0-cosA| = 1/(V3a/2) = 0.408. In other words, the slip
systems A2, A3, B2, B4, CI, C3, Dl and D4 have the same Schmid factor,
M. These eight slip systems comprise four {111} slip planes, each
containing two (110) directions inclined equivalently to the stress axis [001], The
resolved shear stress on the other four slip systems (A6, B5, C5 and D6) is
zero for this initial orientation because the four directions in the {111}
plane are perpendicular to the stress axis. Therefore, these slip systems are
not activated.!
The Schmid factor, M, can also be computed in a more concise manner,
for the slip system (111)[101] for example, by ascribing the following
x
In a real experiment, however, errors in alignment and orientation may lead to the activation of slip
systems which differ from this predicted behavior. See Section 3.1 for a further discussion of this point.
72
Cyclic deformation in ductile single crystals
values: slip plane normal, n = [111], slip direction b = [101], and stress
axis, s = [001], such that
M = -^- x -^- = 0.408. (2.35)
|n| • |s| |n| • |b|
In view of the symmetry of the slip systems with respect to the stress axis,
no orientation change occurs,
(ii) For the BCC crystal, proceed similarly to the previous case. In this case,
there are six equivalent {110}<111) slip systems comprising three
equivalent (inclined) {110} planes, each containing two equivalent (111) slip
directions. The Schmid factor is also computed in a similar fashion for
these slip systems. For example, for the (110)[lTl] slip system, assign:
n = [110], b = [111], and s = [111]. Substituting these values in Eq.
2.35 yields that M = 0.27. As in the previous case, in view of the
symmetry of the slip systems with respect to the stress axis, no orientation
change occurs.
2.9 Effects of crystal orientation and multiple slip
As shown in Section 2.2, the cyclic deformation of FCC single crystals
oriented for single slip exhibits two prominent features: (i) the existence of a plateau
region, and (ii) the formation of persistent slip bands with their characteristic wall
structures. An extension of the fatigue mechanisms seen in monocrystalline FCC
metals to polycrystalline metals and alloys, however, requires a knowledge of cyclic
deformation in different orientations, including those involving multiple slip.
Table 2.3 summarizes the results from a number of experimental studies of the
effects of duplex and multiple slip on cyclic deformation. It is evident that the
possibility of occurrence of a plateau in the cyclic stress-strain curve, as well as
the extent of the plateau region are strongly influenced by the crystallographic
direction of the FCC crystal along which the fatigue loading is imposed. (See the
worked example in Section 2.3.1 for the identification of single and multiple slip
systems for a given crystal orientation.)
Gong, Wang & Wang (1997) have studied the effect of [001] multiple slip on the
cyclic stress-strain curve in Cu crystals. They found an absence of a plateau regime,
and in the strain range ypi = 1.0 x 10~4-3.0 x 10~3, no PSBs were found to occur.
Fatigued [001] crystals comprise principally labyrinth structures of primary and
critical dislocations, which can more easily accommodate multiple slip and cross slip than
the ladder structures. The labyrinths consist of two types of mutually orthogonal wall
arrangements of dislocations: one is always parallel to (001) (i.e. normal to the stress
axis), while the other is along (100) or (210) or (120). Figure 2.19 shows an example of
2.9 Effects of crystal orientation and multiple slip
73
Table 2.3. Effects of crystallographic orientation and multiple slip on the cyclic stress-
strain response of FCC single crystals at 20° C.
Metal
Cu
Ni
Loading
axis
[001]
[111]
[111]
[112]
[012]
[122]
[001]
[034]
[117]
[001]
[OH]
[001]
[111]
Observation
Higher hardening rate than
in single slip
No plateau
Higher cyclic hardening rate
in multi-slip than in duplex
slip
Pseudo plateau than in single
slip
No plateau
No plateau, no PSBs
A clear plateau over
ypl = 1.1 x 10⁻⁴ - 7.2 x 10"3;
small, irreversible rotation of
slip system during symmetric
tension-compression loading
which causes deformation
bands to form
Pseudo plateau in regime B
Reference
Kemsley & Paterson (1960)
Lepisto & Kettunen (1986)
Jin & Winter (1984) and Jin
(1983)
Gong et al. (1995)
Gong et al. (1995)
Gong, Wang & Wang (1997)
Li et al. (1998)
Mecke & Blockwitz (1982)
such a structure. The interactions among different slip systems in the labyrinth and the
attendant formation of Lomer-Cottrell locks causes a much higher cyclic hardening
rate in multi-slip orientations than in single glide. The labyrinths accommodate
different imposed plastic strains by appropriately adjusting their channel widths: an
increase in ypl is accommodated by a reduction in the channel width of the labyrinth.
Another noteworthy feature of multiple slip during cyclic deformation is the
apparent improvement in the fatigue limit. In the [001] specimens, the fatigue
limit, denned as the critical value of ypl below which (nonpersistent) slip bands do
not form, is approximately 1.7 x 10~ , compared to 6.0 x 10~5 for single slip fatigue
of Cu. Further implications of such multiple slip for fatigue deformation and for the
cyclic response in polycrystals will be discussed in the next chapter.
74
Cyclic deformation in ductile single crystals
b=(a/2)[101]
Fig. 2.19. A transmission electron micrograph of the labyrinth structure formed in a single
crystal of Cu fatigued in equal tension-compression along the [001] stress axis at ypi = 1.8 x
10~3 at room temperature. The TEM foil is parallel to (120). The symbols 'p' (for primary)
and 'c' (for critical) denote the projections of [T01] and [101] screw dislocation segments on
the (120) plane along the [425] and [425] directions, respectively. (From Wang, Gong &
Wang, 1997. Copyright Elsevier Ltd. Reprinted with permission.)
2.10 Case study: A commercial FCC alloy crystal
Face-centered cubic Ni-base alloys find important technological applications
wherein high temperatures (up to about 1100 °C) are encountered. In some of these
components where essentially uniaxial stresses exist, as in the turbine blades of aircraft
jet engines, it is commonly known that the elimination of transverse grain boundaries
promotes substantial improvements in creep and fatigue lives. As a result,
directionally solidified and single crystalline superalloys are widely used as materials
for turbine blades in gas turbine engines.f
Nickel-base superalloys typically contain a solid solution of 5-20 wt% Cr for
enhancing oxidation resistance. In addition, Al and Ti (1-5 wt%) are added to increase
strength. Precipitation hardening results in the formation of an ordered Ni3(Al,Ti) y'
phase which has the Ll2 structure. The volume fraction of the y phase can be varied over
the range 20-70% by controlling the Al and Ti concentration, while its size and shape can
be closely controlled by thermomechanical treatments. The excellent strength of Ni-base
superalloys at elevated temperatures is attributable to the presence of y precipitates. In
addition, elements such as Fe, Co, Mo, Nb, W and Ta, are added to monocrystalline
Ni-base alloys to solid-solution-strengthen the y and y phases.
In this section, we consider aspects of the microscopic cyclic deformation of a Ni-base
superalloy ((001) orientation for loading). The concentration, in wt%, of this alloy,
commercially known as PW (Pratt & Whitney) 1480, is Al (4.8%), Ti (1.3%), Ta (11.9%),
' Single crystal Ni-base superalloys are also used as blades in the turbopump of the Space Shuttle main
engine.
2.10 Case study: A commercial FCC alloy crystal
75
— "A
lum
Fig. 2.20. TEM micrograph of the initial microstructure showing the y/y precipitate
structure, g = {200). (From Milligan & Antolovich. 1987. Copyright Metallurgical
Transactions. Reprinted with permission.)
Cr (10.4%), Co (5.3%) and W (4.1%), with the balance being Ni; the C content is 42
ppm. Figure 2.20 is the initial TEM micrograph showing the y/y precipitate structure of
this alloy prior to mechanical testing. This example also illustrates the evolution of
dislocation networks and stacking faults as a result of uniaxial cyclic loading and of
the interactions between dislocations and precipitates at different temperatures. The
results summarized here are from the work of Milligan & Antolovich (1987, 1991).
Distinct changes occur in the monotonic and fully-reversed cyclic deformation of the
PW 1480 alloy crystal in different temperature regimes. Orientation dependence of the
critical resolved shear stress in the family of {111}(110> slip systems, tension-compression
asymmetry as well as anisotropic strain hardening result from a highly anisotropic
octahedral slip, at temperatures typically below 760 °C. This trend has been attributed to
the ease of cube cross-slip and to a multitude of active slip systems. Above about 800 CC,
however, deformation is mostly isotropic, with the mechanism being largely governed by
the by-pass of y' particles by the dislocations which causes pronounced wavy slip. This
behavior is strain-rate sensitive, with increasing strain rate extending slip planarity and
anisotropic deformation of higher temperatures.
Figure 2.21(a) shows a typical dislocation structure of PW1480 subjected to 6 cycles of
fully reversed strain-controlled fatigue. Dislocations and stacking faults with the y'
precipitates on the primary {111} slip planes are seen. The dislocation pairs (marked by
arrows) were determined to be of primary a/2(110) Burgers vector. Figure 2.21(b) is from
the same area, with the primary slip plane viewed edge on. It is seen here that (i) the
dislocation pairs in the matrix are ostensibly in the same slip bands that contain the
faulted dislocation loops within the precipitates, and that (ii) the slip deformation is
highly planar. These micrographs also imply that the deformation mechanism involves
the shearing of the y precipitates by dislocations with the primary Burgers vector.
76
Cyclic deformation in ductile single crystals
< * > ■ *
,-4
*.-N
100 nm
(o)
200 nm
(*)
Fig. 2.21. Dislocation substructure in the superalloy crystal after six fully reversed cycles at
20 C with yp] = 1.1 x 10¹³, and yp, = 8.7 x 10³ s_1. (a) A bright-field TEM micrograph
showing stacking faults and faulted loops in the precipitate, and matrix pairs (arrows)
between the precipitates, b = {200}. (b) A bright-field micrograph of the same area looking
edge on. The planar nature of the structure is evident, g = (111). (From Milligan &
Antolovich, 1991. Copyright Metallurgical Transactions. Reprinted with permission.)
(o)
0.1 urn
Projected
b=[ioi]
|g = [030]
i-
0.2 urn
W
Fig. 2.22. y precipitates in the PW1480 Ni-base superalloy sheared by {lll}o/2(110>
dislocations after a plastic strain of 0.08% at 705 C. (a) A bright-field TEM micrograph.
g = {111}, (b) A dark-field micrograph using the (030) superlattice spot, b denotes the
Burgers vector of the dislocation which is oriented at 45 . Dislocations are invisible here
because the g ■ b = 0 criterion is satisfied. (From MiUigan & Antolovich, 1987. Copyright
Metallurgical Transactions. Reprinted with permission.)
S
\
\
\
•*
\
i
V
1
'1
300 nm
Fig. 2.23. Dislocations by-passing the y precipitates after 765 fatigue cycles at
yp, = 2.3 x 10"3 and )>pl = 8.7 x 10"3 s"1 at 1093 JC. g = {200). (Photograph courtesy of
W.W. MiUigan. Reproduced with permission.)
77
78
Cyclic deformation in ductile single crystals
Faulted dislocation loops are left behind by this shearing process as deformation debris.
A more direct evidence for such shearing is available in Figs. 2.22(a) and (b) which show
the shearing of a / precipitate by {111} a/2 (110) dislocations after a plastic strain of
0.08% at 705 °C.
Figure 2.23 shows an example of the dislocation by-passing of y precipitates in the
same alloy subjected to 765 fatigue cycles. This process essentially homogenizes the
macroscopic fatigue deformation response which becomes isotropic in tension and
compression.
2.11 Monotonic versus cyclic deformation in FCC crystals
There are some similarities between the dislocation structures discussed
above for cyclic deformation and those known to develop during uniaxial,
monotonic tension in FCC single crystals. At very low ypi (< 5 x 10~4), the dislocation
configurations first generated during rapid cyclic hardening correlate well with the
substructures found during Stage I deformation of FCC monocrystals in monotonic
tension, with the exception that the matrix 'veins' seen in fatigue are akin to the cell
structures in Stage II of monotonic tension. At higher strain amplitudes, the
dislocation structures in the cyclic work hardening stage are similar to the unidirectional
Stage I configurations only during the first few cycles. The similarity then disappears
with the progressive formation of persistent slip bands. At high plastic strain
amplitudes, corresponding to regime C of the cyclic stress-strain curve, the formation of
cell structures and the associated rapid hardening during the early fatigue cycles finds
an analogy in Stage II deformation of FCC single crystals in unidirectional tension.
The formation of PSBs at the onset of saturation is somewhat analogous to coarse
slip band development during Stage III deformation of FCC single crystals in
monotonic tension.
There are also some significant differences between the dislocation structures
developed during monotonic and cyclic deformation:
• The density of dislocations produced during cyclic loading is significantly
higher than that generated, at comparable stresses, during monotonic
tension.
• During monotonic tensile deformation of a single crystal, both the slip
plane and the slip direction rotate toward the tensile axis (see Section
1.5). However, there is no such orientation change during fully reversed
cyclic loading of the crystal. This results in a preponderance of primary
dislocations and the absence of long-range internal stresses during cyclic
hardening.
• The evolution of persistent slip bands with their wall structure of edge
dislocations is specific to cyclic deformation.
2.12 Cyclic deformation in BCC single crystals
79
extrusion
intrusion
(a)
Fig. 2.24. (a) A series of steps resembling a staircase pattern produced by monotonic plastic
strain, (b) A rough surface consisting of hills and valleys produced by cyclic plastic strain.
A striking feature of fatigue deformation is the establishment of a saturated
state where the peak resolved shear stress is independent of the plastic shear
strain amplitude.
Because of the short-range interactions among dislocations during to-and-
fro motion in fatigue, there develops a high density of point defect clusters
(~ 1015 cm-3). The resultant friction stress can be as high as 25% of the
peak shear stress at 20 °C.
The flow stress of FCC crystals exhibits a stronger dependence on
temperature and strain rate in fatigue than in tension.
One of the most visible distinctions between monotonic and cyclic
deformation is in the development of surface roughness. Whereas monotonic loading
leads to the formation of surface slip steps which resemble a staircase
geometry, cyclic deformation produces sharp peaks and valleys (known as
'extrusions' and 'intrusions', respectively) at sites where the persistent slip
bands emerge at the specimen surface (Fig. 2.24). (Recall that the
cumulative plastic strains in fatigue are significantly greater than those in
monotonic tension, Fig. 2.4.) Details of the formation of extrusions and intrusions
are discussed in Chapter 4.
2.12 Cyclic deformation in BCC single crystals
Pure BCC crystals such as a-Fe, Mo and Nb, when oriented for single slip
are known to behave significantly differently from the FCC crystals. Generally, the
core of the screw dislocation in BCC metals does not dissociate, and the particular
nature of the screw dislocation core structure in BCC induces very high lattice
friction (so-called Peierls stress). Effects such as strain-rate sensitivity, strong
temperature dependence of cyclic deformation, relative mobility of edge and screw
dislocations, as well as asymmetry of slip between tension and compression are a
consequence of the special role of screw dislocations in the BCC metals.
Mughrabi, Herz & Stark (1976), Mughrabi & Wuthrich (1976) and Mughrabi,
Ackermann & Herz (1979) report different regimes in the variation of mean
80
Cyclic deformation in ductile single crystals
saturation axial stress as a function of the axial plastic strain range during cyclic
deformation of a-Fe single crystals at 295 K. At low plastic strain amplitudes
(< 10~3), essentially no hardening occurs and the cyclic strain is a manifestation
of the motion of edge dislocations only. However, at higher strain amplitudes,
deformation proceeds by the large-scale motion of edge and screw dislocations
and culminates in the formation of a cell structure; pronounced cyclic hardening
as well as changes in the shape of the crystal are observed due to the asymmetric
slip of screw dislocations in tension and compression. These distinctions between
low and high strain fatigue are peculiar to BCC crystals. Although no PSBs have
been identified in either regime of plastic strain amplitudes, ill-defined bands of
slip, which could lead to crack nucleation, have been noticed. In agreement with
these findings, TEM investigations of dislocation structures ahead of fatigue
cracks (described in Chapter 4) have identified the existence of PSBs in polycrys-
talline Cu but not in pure a-Fe.
The following differences between FCC and BCC crystals point to some causes
for the distinctions in their fatigue response: (i) At 295 K and at low plastic strain
amplitudes, thermally-activated glide of screw dislocations as well as dislocation
multiplication are strongly suppressed in BCC a-Fe. (ii) Whereas FCC metals are
only weakly strain rate-sensitive, the flow stress of BCC metals is strongly
dependent upon the strain rate. For this reason, the cyclic stress-strain curves for BCC
crystals should be obtained at constant values of imposed strain rates. It is
generally seen that, as a consequence of dynamic strain-ageing,f high
temperatures, very low strain rates and the addition of impurity atoms (such as carbon,
nitrogen and oxygen) to the BCC metal promote cyclic damage that is more
similar to that found in FCC metals. Mughrabi, Ackermann & Herz (1979)
report that the addition of 30 weight ppm carbon to a-Fe single crystals leads
to cyclic stress-strain curves closer to those measured for FCC metals and slip
bands analogous to the PSBs. PSBs are also known to form in both the surface
and interior grains of polycrystalline low carbon steels (Pohl, Mayr &
Macherauch, 1980). These results show that any comparison of dislocation
structures and cyclic slip characteristics reported by different investigators must be
made with caution because even a small impurity content can lead to marked
variations in fatigue micromechanisms.
2.12.1 Shape changes in fatigued BCC crystals
If slip occurs on different planes during tension and compression portions of
fatigue, a crystal must undergo shape changes due to this slip asymmetry. This effect,
observed in BCC crystals (Nine, 1973; Neumann, 1975; Mughrabi & Wuthrich, 1976;
' Dynamic strain-ageing refers to the phenomenon whereby certain materials (e.g., low carbon steels)
generally exhibit an increase in yield and fatigue strengths over certain temperature ranges as a result of
the interaction between dislocations and solute atoms (e.g., carbon and nitrogen). Details of the
mechanisms of dynamic strain-ageing can be found in any textbook on mechanical metallurgy.
2.12 Cyclic deformation in BCC single crystals
81
Guiu & Anglada, 1980), effectively transforms an initially circular cross section of a
cylindrical crystal into an ellipse. Neumann showed that the shape change produced
by cyclic straining can be correlated with slip irreversibility, which is an important
factor for crack nucleation. Here we follow Guiu and Anglada for the derivation of
slip irreversibility due to shape changes in BCC crystals.
Consider a BCC crystal in which it is assumed that slip occurs on several different
planes in tension and compression in one direction denned by the unit vector b. Since
all these planes are parallel to b, they can be represented in terms of two basic
reference planes of the same zone with unit normal vectors i^ and n2, which can
be arbitrarily chosen. The glide strain in tension can be represented by the total glide
strain alt in plane i^ and by the total glide strain a2t in plane n2. Similarly, the total
glide strains in compression can be represented by alc and a2c on planes i^ and n2,
respectively.
In BCC crystals, any macroscopic slip plane can be visualized as being composed
of microscopic slip steps on planes of the {110} and {112} types. Assume that the
crystal is subjected to the same magnitude of plastic strain ep in both compression
and tension; the length of the crystal can then be taken to be unchanged. If the slip
direction for both cases is b, it can be shown that the net displacement after N
fatigue cycles of a point in the crystal is
Au(r) = 2Ny\
lx^xi^)
1 • n2
(r.„)b, n = ^±M. pjQ
Y
Here, r is the vector that locates the point under consideration with respect to the
origin of the coordinate system (Fig. 2.25), Ki(=alt —alc) is the net (irreversible)
shear strain on plane i^, 1 is the unit vector along the cylindrical crystal axis (i.e.
deformation axis), n is a vector which is perpendicular to both b and 1,
y = l^m + y2n2| and Yi = a2t — a2c- The above result is most directly applicable
to BCC crystals which undergo shape changes as a consequence of glide along
(111). For such cases, a more convenient representation of Eqs. 2.36 is in terms of
the angles f, f, <j>i and 02; f is the angle between the tensile axis and the slip direction,
and <t>\, <t>2 and f are the angles made by the reference planes nl5 n2 and the maximum
resolved shear stress plane, respectively, with the plane of the same zone whose axis
is the slip direction. One finds that
Au(r)=^(r.„)b; ^tanft-JQ-tanft-fc)
sin | 2cosf
and fg is the fraction of glide strain in plane i^ in tension which is not reversed in
compression, and etot = 4iVep. If the initial diameter of the single crystal is d0, it will
undergo a shape change into an ellipse which has major and minor diameters of d\
and d2, respectively, after N fatigue cycles. The following relationship is also
satisfied:
82
Cyclic deformation in ductile single crystals
Fig. 2.25. Nomenclature for the determination of shape changes induced by tension-
compression slip asymmetry during the cyclic straining of BCC single crystals. See text for
details. (After Guiu & Anglada, 1980.)
Ffe
gctot
(dl/d2) - 1
yfidjdi)
(2.38)
The slip irreversibility, Eqs. 2.36 and 2.37, is known to play an important role in
the nucleation of fatigue cracks in BCC crystals. Furthermore, microcrack nuclea-
tion at the boundaries of surface grains in polycrystalline a-Fe has also been
linked to the shape changes produced by the asymmetry of slip. Further
discussions of the effects of slip irreversibility on crack initiation will be provided in
Chapter 4.
2.13 Cyclic deformation in HCP single crystals
Hexagonal metals, such as Ti, Mg, Co, Zr and Be, are used in many
engineering applications where deformation and cracking under cyclic loads are topics of
interest. Compared to the volume of research done on the fatigue of FCC and BCC
metals, less information is available on the cyclic deformation response of hexagonal
closed-packed (HCP) metal crystals (see, for example, the earlier studies of Partridge
(1969), Stevenson & Vander Sande (1974) and Kwadjo & Brown (1978) on
magnesium crystals).
Among HCP crystals, the most comprehensive experimental studies of cyclic
deformation have been carried out on Ti crystals. In this section, we review some
2.13 Cyclic deformation in HCP single crystals
83
results for Ti in order to compare and contrast its cyclic behavior with that of ductile
FCC metals and to identify micromechanisms which are specific to hexagonal
metals.
2.13.1 Basic characteristics of Ti single crystals
Titanium single crystals exhibit the following prominent features:
• Upon cooling, the BCC(/J) ->• HCP(a) transformation occurs in Ti at
approximately 880 °C.
• As with BCC crystals, the deformation characteristics of Ti crystals are
strongly influenced by impurity and interstitial content.
• The stacking fault energy (SFE) of Ti is about 0.15 Jm~2 (as compared to
0.04 Jm~2 for Cu). Although the possibility of formation of stacking faults
in Ti has been questioned in view of its high SFE (which is expected to
promote cell formation), microscopy work on both monotonically and
cyclically loaded Ti crystals has shown the presence of stacking faults.
• In transition HCP metals such as Ti, the choice of the operative slip system
is strongly influenced by the electronic properties. The core of a screw
dislocation in Ti has a three-dimensional structure that preferentially moves in
the prismatic plane with a high Peierls force. Such an HCP crystal then
behaves like a BCC metal under monotonic loading, while the divalent
HCP metals, such as Be, Mg, Zn and Cd which have basal slip, behave
more like FCC metals.
• In HCP metals, deformation twinning is a dominant mode of plastic
deformation. Ti crystals deform by {1124}, {1122}, and {1011} twins during
compression along the c-axis, and by {10T2}, {1123}, and {1121} twins during
tensile loading along the c-axis.
We now examine the effects of crystal orientation and equal tension-compression
cyclic straining on substructure evolution in a high purity Ti single crystal (with
oxygen and carbon concentrations of 116 and 22 ppm, respectively, and total
other impurity content of 45 ppm). This discussion is derived from the work of
Gu et al. (1994).
2.13.2 Cyclic deformation of Ti single crystals
The inset on the right side of Fig. 2.26 shows the unit triangle for the (0001)
stereographic projection for Ti and the orientations of three a-Ti single crystals,
marked A, B and C in the triangle, which were used for the fatigue tests. Specimen
A was oriented on the (OOOI)-(IOIO) border which is subject to duplex slip. Specimen
84
Cyclic deformation in ductile single crystals
— A
1120
0001 ^^-"""'^ *C 1
1010
J J
"0 0.4 0.8 1.2
Ae(%)
Fig. 2.26. Cyclic stress-strain curves for the three specimens of a-Ti single crystals. The inset
shows the orientations of the specimens A, B and C in the unit triangle. (From Gu et al., 1994.)
B was oriented near the (0001) corner, while specimen C was located near the middle
of the triangle. The saturated cyclic stress-strain curves (CSSC) for the three
specimens are plotted in Fig. 2.26. Orientations A and B represent the upper and lower
bounds, respectively, among the three cases considered here, while specimen C
exhibits an in-between response. Specimen B has a 'plateau-like' regime, similar to that of
FCC crystals. The dislocation substructures in each of the three fatigue specimens
were examined by TEM after the completion of the fatigue tests.
Gu et al. (1994) offer the following line of reasoning in an attempt to rationalize
the effect of crystal orientation on cyclic deformation in the a-Ti single crystals. (1)
Typically, the cyclic deformation is strongly influenced by the propensity for twin
formation. An increase in the occurrence of cyclic twins (in the sequence
B ->• C ->• A, among the three specimens considered here) causes a marked increase
in the cyclic hardening rate. (Under cyclic loading, {10T2}, {1121}, {1122} and {1123}
twins have been observed in Ti single and polycrystals.) (2) At fixed applied strain
amplitudes, orientations (such as Specimen C) which promote single slip and cross
slip give rise to planar dislocation dipole arrays and dislocation loops (similar to
fatigued FCC crystals), whereas cell structures are found in the specimens oriented
for duplex and multiple slip.
Exercises
2.1 Why does cyclic slip remain confined to the primary slip plane during the
formation of vein structure or the PSB structure?
2.2 Why are the vein structures and PSB structures in FCC crystals composed
mainly of edge dislocations?
4VV
Exercises
85
2.3 What are the characteristic dimensions associated with the geometry of the
vein structure and what is the physical basis for such dislocation
configurations? What are the effects of changes in test temperature (either increase or
decrease) on the geometry of dislocation arrangements within the vein
structure and within the channels separating the veins?
2.4 Discuss the effects of stacking fault energy on the deformation of a ductile
solid in monotonic tension and in tension-compression fatigue.
2.5 A long crystal is bent to a semicircular shape with a radius of 20 cm. The
crystal has a square cross section (2 cm x 2 cm).
(a) If it is assumed that all bending is accommodated by the generation of
edge dislocations, calculate the total number of dislocations.
(b) If the magnitude of the Burgers vector of the edge dislocations is
0.32 nm, calculate the dislocation density.
2.6 Discuss the mechanisms responsible for dynamic strain-ageing.
2.7 There is a similarity between the hexagonal close-packed (HCP) and body-
centered cubic (BCC) crystal structures.
(a) Show which plane in the BCC structure is similar to the basal plane in
the HCP structure.
(b) Draw the arrangement of atoms in this plane and determine the
stacking arrangement normal to this plane in the BCC structure. Is the
stacking the same as in the HCP structure?
CHAPTER 3
Cyclic deformation in polycrystalline
ductile solids
Following the discussion of cyclic deformation in ductile single crystals, we
now direct attention to polycrystalline metals and alloys. Firstly, experimental
observations are discussed to show how the cyclic deformation of single crystals oriented
for multiple slip can be correlated with that of polycrystalline aggregates.
Continuum characterization of cyclic hardening and softening of polycrystals is
addressed, along with the effects of slip characteristics, alloying and precipitation.
The Bauschinger effect is then introduced, wherein both microscopic and continuum
viewpoints are presented to rationalize the dissimilar yield responses seen in tension
and compression during load reversals. Continuum models for uniaxial and multi-
axial cyclic deformation, which are of interest for engineering structures, are the
focus of subsequent sections. Lower bound and upper bound theorems for elastic
shakedown under cyclic loading are presented, and the origins of cyclic creep and
ratchetting are then examined. The chapter concludes with the derivation of critical
temperatures which signify distinct transitions in the cyclic deformation
characteristics of particle-reinforced metal-matrix composites and layered materials. While
this chapter confines attention to ductile crystalline solids, the cyclic deformation
characteristics of brittle solids as well as semi-crystalline and noncrystalline solids are
taken up in Chapters 5 and 6.
3.1 Effects of grain boundaries and multiple slip
The mechanisms of cyclic damage observed in ductile single crystals are also
known to be generally applicable to the deformation of near-surface grains in
polycrystalline metals of high purity. However, the presence of precipitates, impurities,
inclusions and grain boundaries in commercial materials gives rise to fatigue
deformation characteristics which may significantly deviate from those discussed for
monocrystalline solids. It is pointless to include here the vast amount of empirical
information gathered to date on the cyclic stress-strain behavior of a wide spectrum
of engineering alloys. However, in an attempt to develop an overall perspective on
fatigue damage in many broad classes of materials, we present representative
experimental data and mechanistic interpretations on the effects of grain boundaries,
alloying and precipitation. Also included in these descriptions are the phenomeno-
logical constitutive laws for cyclic hardening and softening of metals and alloys.
Studies of polycrystalline metals have established that PSBs can form within the
bulk of the material. Winter, Pedersen & Rasmussen (1981) investigated fatigue
86
3.1 Effects of grain boundaries and multiple slip
87
deformation within the bulk of polycrystalline Cu, of 100-300 |am grain size, by
examining TEM foils taken at various depths below the free surface. At strain
amplitudes of about 10~4, PSBs confined to a single slip system and of a wall
structure similar to that of single crystals were identified in the interior of the
polycrystalline fatigue specimen. Pohl, Mayr & Macherauch (1980) have also observed
PSBs in the interior sections of fatigued polycrystalline low carbon steel. Although
PSBs can traverse through low angle boundaries, large angle grain boundaries are
impervious to them. When the strain amplitude is raised to values beyond 10~ ,
labyrinth and cell structures are observed in polycrystalline copper, as in the case
of single crystals (Chapter 2).
Experimental studies of polycrystalline metals have also identified the existence of
regimes in the cyclic stress-strain curve where PSB formation has a significant effect
(Lukas & Kunz, 1985). Specifically, the saturation stress-strain curves for
coarsegrained Cu exhibit a region of low cyclic strain hardening (somewhat analogous to
the plateau for the single crystal); the occurrence of this region corresponds to a
continuous increase in the volume of the material occupied by the PSBs, which carry
a higher plastic strain than the matrix.
3.1.1 Monocrystalline versus polycrystalline FCC metals
It was shown in Chapter 2 that single crystals of FCC metals, oriented for
single slip, exhibit a plateau in the cyclic stress-strain curve which spans a wide range
of resolved plastic shear strain amplitude, ypl, Fig. 2.2. In this plateau regime, with a
fixed value of the saturated peak resolved shear stress rs = r*, deformation localizes
along persistent slip bands whose volume fraction increases with increasing ypl in
order to accommodate cyclic deformation at a fixed value of r*. In the FCC crystals
oriented for multiple slip, however, well-defined PSBs are not commonly found; even
crystals oriented for duplex slip show only a very weak plateau (Table 2.1). Instead,
dislocation arrangements which promote multiple slip and cross slip, such as the
labyrinth structure in the [001] Cu crystals, are observed.
Studies of monocrystalline Cu oriented for multiple slip provide insights into the
cyclic response of polycrystals. As shown later in Section 3.3, the cyclic stress-strain
curve for many fine-grained FCC metals can be approximated, in a limited regime of
plastic strain amplitudes, by a power-law equation of the type:
where Aer/2 and Aepl/2 are the applied uniaxial stress and plastic-strain amplitudes,
respectively, k is an experimentally determined material constant, and «f is the cyclic
strain hardening exponent. The equation can be recast into a form amenable for use
with single crystals by employing the Taylor factor, MT (= 3.06 for randomly-
textured polycrystalline FCC metals):
88
Cyclic deformation in polycrystalline ductile solids
For fine-grained polycrystalline Cu, k' = 146 MPa and «f = 0.205 (Lukas & Kunz,
1985).
Figure 3.1 shows a comparison of the cyclic stress-strain curves for monocrystal-
line Cu, oriented for single slip and multiple slip, and polycrystalline Cu. The solid
line is the CSS curve for Cu single crystals oriented for single slip which shows a
plateau at a saturation stress of 28 MPa in regime B. The symbols are from the
experiments of Gong, Wang & Wang (1997) for [001] Cu single crystals which
have eight symmetric slip systems.f Note the absence of the plateau in the Cu multi-
slip crystal. The dashed line in Fig. 3.1 is the power-law function, Eq. 3.2, for Cu
polycrystals, corrected for the Taylor factor. It can be inferred from Fig. 3.1 that the
absence of a plateau in the polycrystalline FCC metals is similar to that in the
multiple-slip Cu single crystal.%
As a general trend, two factors clearly distinguish polycrystalline FCC metals
from single crystals oriented for single slip:
(1) Grains in a polycrystalline ensemble have a variety of slip orientations.
(2) The incompatibility of elastic and plastic deformation between adjacent
grains in a polycrystalline ensemble promotes local multiaxial loading and
predominantly multiple slip.
For fine-grained polycrystalline FCC metals, these two factors lead to multiple slip
deformation which resembles the cyclic response of single crystals oriented for
multiple slip. For coarse-grained FCC metals, however, these two factors may not
dominate cyclic response since, statistically, the majority of the grains may not have their
orientations along the edges of the standard triangle of the stereographic projection.
Many of the crystal orientations here may fall within the triangle. Consequently,
coarse-grained polycrystalline FCC metals may exhibit cyclic deformation which
nearly resembles that of single-slip oriented monocrystals, with a low strain
hardening or even a mild plateau (e.g., Polak, Klesnil & Lukas, 1974).
' See the worked example in Section 2.8 for the identification of the symmetric slip system for the [001]
orientation. Although all eight systems would, in principle, be expected to have the same Schmid factor,
small errors during the alignment, machining or mounting of the fatigue specimen can lead to a
preferentially higher Schmid factor in one of the eight systems. On the basis of their slip trace observations,
Gong et al. (1997) identify the BA system to operate first as the primary system for which the resolved
shear stress and plastic shear strain are computed.
+ It is also of interest to note here that the work of Mughrabi & Wang (1981) showed an excellent
agreement between the cyclic deformation results at low plastic strain amplitudes (regime A) for Cu
single crystals (single slip orientation, where the effects of incompatibility stresses were ignored) and
polycrystals by employing the Sachs orientation factor. Above regime A, they found that the effective
orientation factor was larger than the Sachs factor, but smaller than the Taylor factor.
3.2 Cyclic deformation of FCC bicrystals
89
60 r-
s
40
S
\s
y
/
20 -
10"
10"
10"
10"
y,
pi
Fig. 3.1. A comparison of the cyclic stress-strain (CSS) curves of Cu single crystals (—) and
polycrystals ( ) at 20 °C. The dashed line is a plot of the stress-strain response of Cu
polycrystals (from Lukas & Kunz, 1985), corrected by the Taylor factor, MT. The symbols (•)
denote the CSS response of Cu single crystals oriented for multiple slip with the loading axis
along [001]. (After Gong, Wang & Wang, 1997.)
3.1.2 Effects of texture
Differences in slip characteristics (i.e. single slip versus multiple slip
deformation) within the individual grains of a polycrystalline FCC metal are also known
to promote strong texture effects during cyclic loading (e.g., Mughrabi & Wang,
1981). The experiments of Llanes et al. (1993) and Peralta et al. (1995) on
coarsegrained polycrystalline Cu (grain size ~ 700 um) reveal that a cyclically stronger
(111)-(100) texture coaxial with the loading axis promotes a high cyclic hardening,
whereas a 'random' texture of nearly the same grain size results in a much softer CSS
curve as a result of dominant single slip. A comparison of the texture effects for the
coarse-grained and finer-grained Cu (~ 700 um and 100 um grain size, respectively)
showed that the effects of crystallographic texture were much stronger than the
effects of grain size on the CSS curves.
3.2 Cyclic deformation of FCC bicrystals
When a bicrystal, whose component crystals are elastically and plastically
anisotropic, is subjected to cyclic loads, stresses evolve at the grain boundary in such
90
Cyclic deformation in polycrystalline ductile solids
a way that deformation is compatible between the grains. Crystallographic
orientations of the two grains strongly influence the compatibility stresses near the
boundary which, in turn, may markedly alter the slip characteristics in the vicinity of the
boundary and hence influence the propensity for crack formation.
Here we briefly examine the experimental results of Hu & Wang (1997) on the
cyclic stress-strain response of a [345]/[Tl7] Cu bicrystal fatigued at 20 °C at
ypl = 2.8 xlO-4 - 6.45 x 10"3. They show that the dislocation structures of the
fatigued bicrystal are similar to those of multiple-slip-oriented single crystals (see
Section 2.9) and coarse-grained Cu polycrystals, especially at ypl > 9 x 10~ where
predominantly cell structures evolve. Hu and Wang compute the resolved shear
stress rs and the resolved plastic shear strain amplitude ypl for the bicrystal in the
following manner:
Til Til Tl + r2 2fpl
Ti = asMx, r2 = ctsM2, rs = —-—, ypl = ^ \, , (3.3)
Mx+M2
where the subscripts 1 and 2 denote the [345] (single-slip orientation) and [Tl7]
(double-slip orientation) components, respectively, M\ and M2 are the Schmid
factors for the primary slip systems BA of the two crystals, ers and rs are the saturation
values of the axial stress applied to the crystal and the resolved shear stress,
respectively, and epl is the applied axial plastic strain amplitude. Figure 3.2 is a plot of rs vs
Yv\ for the [345]/[Tl7] Cu bicrystal for symmetric tension-compression loads with
plastic strain control. Note the absence of a plateau in the CSS curve. Also plotted
here are the stress-strain data for a coarse-grained Cu polycrystal with a grain size of
45
35
25
15
r
j?
O bicrystal
A polycrystal
10"
10"
10"
y,
pi
Fig. 3.2. Cyclic stress-strain curves of [345]/[Tl7] Cu bicrystal (after Hu & Wang, 1997) and
coarse-grained Cu polycrystal (after Lukas & Kunz, 1985) appropriately modified by the Taylor
factor.
3.3 Cyclic hardening and softening in polycrystals
91
1.2 mm. For the Cu polycrystal, ers and ep[ were converted into rs and ypi using the
Taylor factor, MT = 3.06 in the following manner: rs = crs/MT and yv\ = ^rePi-
The CSS curve of the bicrystal overlaps with that of the coarse-grained
polycrystal, when modified appropriately by the Taylor factor, Fig. 3.2. (Recall that a similar
overlap was demonstrated in Fig. 3.1 between a Cu single crystal oriented for multi-
slip and a Cu polycrystal.) The foregoing results illustrate that under some
conditions, it is possible to correlate the cyclic deformation response of polycrystals with
the corresponding behavior seen in single crystals and bicrystals.
3.2.1 Example problem: Number of independent slip systems
Problem:
von Mises recognized that, in a deformed polycrystal, arbitrary shape
changes of a crystallite are possible only if at least five independent slip systems
operate. Provide a simple physical reasoning to justify this requirement.
Solution:
An arbitrary shape change is brought about by translations and rotations.
There are six possible degrees of freedom, in general: three for translation and
three for rotation. During plastic deformation of crystalline materials, however,
the volume remains constant because deformation occurs by shear in
preferential slip systems. This leaves five independent components for the strain tensor.
Since shape changes must be accommodated by shear on the slip systems,
arbitrary shape changes are possible only if at least five independent slip systems
operate.
3.3 Cyclic hardening and softening in polycrystals
The uniaxial deformation of engineering alloys subjected to cyclic loads is
usually characterized by the cyclic stress-strain (CSS) curve, similar to that discussed
for single crystals. The transient phenomena typically associated with cyclic
deformation are schematically illustrated in Fig. 3.3. In the case of constant amplitude,
fully-reversed stress control, Fig. 3.3(a), cyclic hardening or softening of the material
is reflected by a reduction or an increase, respectively, in the axial strain amplitude.
Similarly, under constant amplitude, strain-controlled fatigue loading, cyclic
hardening or softening of the material causes an increase or decrease, respectively, in the
axial stress amplitude, Fig. 3.3(Z>).
In both stress-controlled and strain-controlled fatigue, the respective strain
amplitude and stress amplitude reach a stable saturation value after an initial 'shakedown'
period. This saturation state gives rise to stable hysteresis loops. During
'shakedown', there is a continual change in dislocation substructure until a stable config-
92
Cyclic deformation in poly crystalline ductile solids
WAr, »tesSK, 'Mf,
(a) stress-controlled
loading
strain response for
cyclic hardening
strain response for
cyclic softening
•fww, "M^ •fess?,
strain-controlled
loading
stress response for
cyclic hardening
stress response for
cyclic softening
Fig. 3.3. Phenomena associated with transient effects in fatigue. <r, e and t denote stress, strain
and time, respectively.
uration representative of the saturated state is reached. Beyond this point, the
hysteresis loop remains essentially the same cycle after cycle over the life of the test
specimen. The parameters used to describe the salient features of cyclic hysteresis
loops are denned in Fig. 3.4(a). The locus of the tips of stable hysteresis loops
provides the cyclic stress-strain curve, Fig. 3.4(b).
Stress- and strain-controlled fatigue represent extremes of fully unconstrained and
fully constrained loading conditions. In real engineering components, there is usually
some structural constraint of the material at fatigue-critical sites. It thus seems
appropriate to characterize fatigue response of engineering materials on the basis
of data obtained under strain-controlled fatigue rather than cyclic stress-controlled
conditions.
Strain-controlled tests have gained increasing use in the determination of CSS
curves for engineering alloys. Three commonly used strain-controlled test methods
are indicated in Fig. 3.4(c). In the constant amplitude test, the specimen is cycled
within a constant plastic strain limit (until failure) to obtain a single stable
hysteresis loop. Multiple test specimens are needed to determine the entire CSS
curve using this method. In the multiple step method, a specimen is cycled
between constant plastic strain limits until a saturation loop results. Then the
plastic strain limits are incremented until another stable hysteresis loop is
obtained. This process is continued until the entire CSS curve is measured
from a single test specimen. In the incremental step method, the specimen is
subjected repeatedly to a strain pattern comprising linearly increasing and
decreasing amplitudes, from zero to a certain maximum total strain. The resulting
stable hysteresis loop provides the CSS plot. In some alloys exhibiting planar slip
deformation, the incremental step method provides a CSS response which is
different from the other direct methods because of the variations in the
development of dislocation structures.
3.3 Cyclic hardening and softening in polycrystals
93
cyclic stress-
strain curve'
(a)
°VWA ■
(6)
constant plastic
strain limit
oWAtyWV
multiple step,
increasing plastic
strain limit after
saturation at each
step
incremental step,
repeated patterns
consisting of linearly
increasing and
decreasing strain limits
Fig. 3.4. (a) A schematic of a stable hysteresis loop and the nomenclature. Aee, Aep and Ae
denote the elastic, plastic and total strain range, respectively, (b) Cyclic stress-strain curve
drawn through the tips of stable hysteresis loops, (c) Procedures for obtaining cyclic stress-
strain curves.
The monotonic stress-strain behavior of ductile solids under uniaxial tension is
generally represented by a constitutive law, such as the Ramberg-Osgood
relationship:
a (o\ i/«m ,„ ^
* = E+U ' (14)
where E is Young's modulus, A is a constant commonly referred to as the monotonic
strength coefficient, e is the uniaxial strain, a is the uniaxial stress, and nm is the
94
Cyclic deformation in poly crystalline ductile solids
Table 3.1. Monotonic and cyclic stress-strain characteristics of some common
engineering alloys.
Oy/Oy
Alloy
Copper-base
OFHC
Brass 365
Cu-Be 172
Aluminum-base
2024
6061
7075
Iron-base
SAE 1015
Ferrovac E
SAE 1045
AISI 4340
Mar M-300
Condition
Annealed
As-rolled
As-drawn
T4
T651
T6
Normalized
Annealed
Q + T
Q + T
Annealed
(MPa)/(MPa)
20/140
172/248
641/490
303/448
290/296
469/517
225/240
48/159
1365/825
1172/814
952/800
"m/"f
0.40/0.24
0.13/0.21
0.02/0.15
0.20/0.09
0.04/0.10
0.11/0.10
0.26/0.22
0.36/0.19
0.08/0.15
0.07/0.15
0.03/0.08
oy and a'y refer to monotonic and cyclic yield strengths, respectively.
Q and T refer to quenched and tempered conditions, respectively.
Source: Landgraf (1978) and Hertzberg (1995).
strain hardening exponent. The typical range of nm for alloys is 0-0.5. In the applied
mechanics community, the strain hardening exponent is often denoted by n = \/nm.
Here n = 1 for a linear elastic material and n = oo for an elastic-perfectly plastic
solid.
In an analogous fashion, the cyclic stress-strain response is characterized by the
relationship
Ae Aa /Ao\l/n<
-2=2E+{2*) ' (3-5)
where A' is the cyclic strength coefficient and «f is the cyclic strain hardening
exponent. For most metals, «f varies between 0.1 and 0.2 despite vast differences in their
cyclic hardening and softening characteristics. Table 3.1 provides a list of the strain
hardening characteristics in some common engineering alloys. As a general rule-of-
thumb, well-annealed, polycrystalline metals of high purity exhibit cyclic hardening
due to dislocation multiplication, as evidenced by an increase in the stress amplitude
3.4 Effects of alloying, cross slip and stacking fault energy
95
with fatigue cycles (at a fixed strain amplitude); work-hardened materials undergo
strain softening under cyclic loading. The rearrangement of prestrain-induced
dislocation networks due to fatigue causes cyclic softening.
3.4 Effects of alloying, cross slip and stacking fault energy
A clear demonstration of the relationship among the slip characteristics of
the material, the development of dislocation structures, and the overall cyclic stress-
strain behavior is found in the work of Feltner & Laird (1967a,b). They conducted
an investigation of the effects of prior loading history, slip planarity, plastic strain
amplitude and temperature on cyclic hardening and softening of polycrystalline Cu,
Al and Cu-7.5 wt % Al. They illustrated that pure FCC metals harden or soften
under fatigue loads to a characteristic steady-state saturation flow stress after an
initial transient period. For wavy slip materials, with a high stacking fault energy
and a strong propensity for cross slip, the steady-state cyclic flow stress is
independent of load history and of the degree of prior cold work at large plastic strain
amplitudes (see Fig. 3.5a); here only the plastic strain amplitude and temperature
influence the flow characteristics in fatigue.f Pure FCC metals fatigued at high strain
amplitudes exhibit a cell structure at steady state, regardless of the dislocation
structure which existed before cyclic straining. The cell size, which is independent
of the history of the material, increases with decreasing plastic strain amplitude and
increasing temperature.
In contrast to this behavior, when a planar slip mode is introduced by the
addition of 7.5 wt % Al in Cu (which reduces the stacking fault energy), the
cyclic stress-strain curve becomes sensitive to both prior deformation and thermal
history, Fig. 3.5(Z>). Inhibition of cross slip in this case precludes the attainment
of a common steady-state dislocation structure in fatigue from an initially hard
(cold-worked) or soft (annealed) condition. The low stacking fault energy Cu-7.5
Al alloy does not develop a cell structure during cyclic saturation, but exhibits
dissociated dislocations arranged in planar bands. Furthermore, the saturation
dislocation structures in the cold-worked conditions of the alloy were significantly
different, with the latter microstructure consisting of fewer bands and a greater
density of tangled interband dislocations that are apparently inherited from prior
cold work.
Experimental studies of substructure developments during fatigue in different
wavy slip metals have documented a one-to-one correspondence between the
saturation stress and the deformation-induced cell size. Based on their own investigations
' It is now generally recognized that the ease of cross slip plays a decisive role in determining the slip
mode. Stacking fault energy, however, is not the only parameter influencing cross slip. For example,
Gerold & Karnthaler (1989) demonstrate that short range order can also strongly influence cross slip.
96
Cyclic deformation in polycrystalline ductile solids
monotomc cw
monotonic
cold-worked (cw)
monotonic
annealed
plastic strain
(a)
plastic strain
(b)
Fig. 3.5. (a) Schematic showing that the cyclic stress-strain curve is independent of prior
deformation history in wavy slip materials, (b) History-dependent behavior for planar slip
materials. (After Feltner & Laird, 1967a.)
and from a literature review, Plum tree & Pawlus (1988) developed the following
empirical relationship for the dependence of saturation stress on cell size:
B-
K
(3.6)
In Eq. 3.6, crs is the saturation stress, a0 is the back stress, E is Young's modulus, b is
the magnitude of the Burgers vector, Xs is the linear intercept cell size and B is a
material constant which increases in proportion to the stacking fault energy (SFE).
The works of Pratt (1967), Feltner & Laird (1967b), Abdel-Raouf & Plumtree (1971),
Saga, Hayashi & Nishio (1977) and Kayali & Plumtree (1982) collectively show that
the constant B is 7.8 for Al (SFE = 200 x 10~3 Jm~2) and 3.6 for Cu (SFE = 40 x
10~3 Jm~2). Equation 3.6 does not appear to be a function of the type of
deformation in that it describes the steady-state flow stress-cell size data for both monotonic
and cyclic loading conditions.
For aluminum fatigued at a total strain range of 1 % at room temperature, the
cell size and the misorientation between neighboring cells remains constant from
the onset of saturation until final failure despite noticeable changes in the cell
morphology. One may then infer that the dislocation density remains relatively
constant upon the attainment of saturation. A survey of relevant literature shows
that the operative mechanism during cyclic saturation is the irreversible bowing of
dislocation segments from the cell walls. After being emitted from the cell walls,
the dislocation segments traverse the cell and enter the adjacent walls where they
are annihilated by dynamic recovery. This equilibrium between work hardening
(dislocation generation) and dynamic recovery (dislocation annihilation) is
believed to result in a constant maximum stress and dislocation density during
the saturation stage.
3.6 The Bauschinger effect
97
3.5 Effects of precipitation
Cyclic hardening and softening in precipitation-hardened alloys is promoted
by a mechanism in which the precipitate geometry and distribution as well as
dislocation-particle interactions can be altered by cyclic straining. Existing
experimental evidence reveals that initial cyclic hardening occurs in these materials due to an
increase in dislocation density and due to dislocation-precipitate interactions (e.g.,
Brett & Doherty, 1978). Subsequently, cyclic softening is highly favored if the
precipitates in the age-hardened alloy are easily sheared by dislocations, i.e. if they are
fine, closely spaced and coherent with the matrix. A particularly interesting feature
of deformation in these alloys is that the formation of PSBs causes cyclic softening
without reaching a saturation stage. Various mechanisms have been proposed to
rationalize cyclic softening in precipitation-hardened alloys:
(a) Reversion or re-solution by which the metastable strengthening precipitates
completely dissolve in the matrix after being cut by dislocations to a size smaller
than the critical size for particle nucleation (Broom, Mazza & Whittaker, 1957).
(b) Disordering of ordered precipitates due to the motion of single dislocations
through them which leads to a loss of strength (Calabrese & Laird, 1974).
(c) Micro structural inhomogeneities (due to pre-straining or quenching prior to
ageing) in the form of slip bands, that are depleted of strenghening metastable
precipitates and are replenished with stable particles (Laird & Thomas, 1967).
(d) Over-ageing, which leads to the substitution of metastable precipitates in the
matrix by coarsely distributed, stable ones (Broom, Mazza & Whittaker, 1957).
(e) Dissolution due to Ostwald ripening of unsheared precipitates, adjacent to the
sheared ones on the slip lines at the expense of the smaller precipitates in the slip
band (Sargent & Purdy, 1974). (Ostwald ripening refers to the process by which the
interfacial free energy between the precipitate and the matrix causes precipitate
coarsening upon further annealing, even after precipitation from supersaturated
solid solution is complete. The larger particles grow at the expense of the smaller
ones, thereby releasing excess surface energy and causing the microstructure to
coarsen; see, for example, Martin, 1980.) The difference between this and the
reversion mechanism is that the critical radius for Ostwald ripening is much larger than
the value for precipitate growth from the supersaturated solid solution.
3.6 The Bauschinger effect
The Bauschinger effect refers to the experimental result that, after a certain
amount of forward plastic deformation in tension or compression, the material
yields at a lower stress when the direction of loading is reversed than for continued
forward deformation (Bauschinger, 1886). A knowledge of the mechanisms
underlying the Bauschinger effect is essential for the development of the constitutive
models for complex cyclic deformation, for a fundamental understanding of the
98
Cyclic deformation in poly crystalline ductile solids
work hardening phenomena, and for rationalizing such fatigue effects as mean stress
relaxation and cyclic creep (Chapter 8). For example, many commercial aluminum
alloys containing nonshearable strengthening precipitates (such as the peak-aged and
over-aged 7075 alloys used in aircraft applications) are stretched prior to temper
treatments to relieve thermal residual stresses. Since many of these alloys are known
to exhibit Bauschinger effects, low flow stresses may result under service conditions if
the material is loaded in a direction opposite to the stretching direction. It is also
known that the Bauschinger effect in precipitation-hardened commercial alloys can
persist even after the cyclic hysteresis loops are stabilized. On a more fundamental
level, the Bauschinger effect can be used to identify the contributions to strain
hardening from different kinds of dislocation mechanisms. The study of the
Bauschinger effect is, therefore, commonly regarded as a 'litmus test' for the validity
of strengthening theories in the sense that any complete hardening theory must be
capable of quantitatively accounting for the Bauschinger effect.
3.6.1 Terminology
One of the common methods of quantifying the Bauschinger effect involves
the definition of the reverse strain. This reverse strain is the magnitude of additional
strain after load reversal which makes the reverse yield stress equal in magnitude to
the maximum flow stress attained in the forward deformation. However, a
realization of the differences between forward and reverse flow stresses at any strain value
can be achieved by recourse to the construction schematically depicted in Fig. 3.6. In
Fig. 3.6(a), ABC represents the forward deformation in uniaxial tension, with C
being the point of unloading. CD is the tensile unloading segment and DEF is the
reverse (compression) loading segment. The magnitudes of the stress and the
accumulated strain are replotted in Fig. 3.6(6) irrespective of the direction of loading.
(a)
w
o
BS*
A
1/e
Id
\e\ (ac
C
• F
.cumulate
(6)
Fig. 3.6. (a) Schematic of the stress-strain curve for fully reversed loading, (b) Only the
magnitudes of the stress and the accumulated strain are replotted to illustrate the Bauschinger
effect.
3.6 The Bauschinger effect
99
Here, ABCD represents the tensile segment and DEF is the compression loading
portion. If the forward hardening segment is extrapolated (until point C"), the
instantaneous difference between the flow stress levels Acrb in the (nearly parallel)
segments CC and EF provides an indication of the Bauschinger effect in terms of
stress and characterizes the extent of 'permanent softening'. Similarly, the difference
in strain values Aeb between the forward and reversed deformation at the maximum
forward tensile stress amplitude (point C) characterizes the Bauschinger strain.
3.6.2 Mechanisms
The origins of the Bauschinger effect are related to the changes in
dislocation substructure induced by reversed loading and in the changes in the internal
stress systems. In polycrystalline metals where dislocation walls and subgrain
boundaries form during forward straining, the dissolution of cell walls or sub-boundaries
upon stress reversals is considered a contributing factor to the Bauschinger effect
(Hasegawa, Yakou & Kocks, 1986). Furthermore, long-range internal stresses
induced by strain incompatibility between the PSB walls and channels can lead to
easier reverse flow in materials which form well-defined PSBs.
For particle-hardened alloys, the mechanistic basis for the Bauschinger effect is
often provided in terms of the interaction of dislocations with the strengthening
particles (Orowan, 1959). Age-hardened alloys can be broadly classified into two
groups: (i) those containing precipitates which are coherent with the matrix and
which can be sheared by dislocations, and (ii) those containing larger semi-coherent
or incoherent particles which are not penetrable by dislocations. The two types of
particles can give rise to very different hardening response in monotonic and cyclic
loading. Furthermore, the Bauschinger effects seen in the two cases are also
distinctly different.
When the matrix contains permeable particles, mobile dislocations cut through
these barriers with essentially no dislocation pile-up. If the material is subjected to a
compressive stress following a tensile stress, the impingement of the shearable
barriers with dislocations once again leads to a reverse flow stress comparable in
magnitude to that seen in forward deformation due to the paucity of dislocation pile-up.
Consequently, there is little contribution to the flow stress from internal stresses
(Wilson, 1965; Stoltz & Pelloux, 1976).
In the case of alloys with coarse, incoherent and impermeable particles, the mono-
tonic stress-strain curve exhibits a large hardening rate. For these alloys, a simple
model to rationalize the Bauschinger effect is often formulated in terms of the
following three factors which influence the forward yield stress: (i) a contribution,
cr0, to strength from solid solution hardening and the stress to bow out the first set of
dislocations past the obstacles, (ii) forest hardening, ad, due to the interactions of
mobile dislocations with forest dislocations, and (iii) a mean internal or back stress,
100
Cyclic deformation in polycrystalline ductile solids
aM, which is exerted on the matrix by the particles. The total flow stress during
forward deformation is
orf = cr0+crd + OM- (3-7)
At reverse strains of the order of the forward strain, the deformation must be cap-
able of overcoming cr0 and crd. However, crM now assists reverse deformation, rather
than opposing it and hence the total reverse flow stress becomes
<rr — <r0 + <rd- aM. (3.8)
From Eqs. 3.7 and 3.8, Acrb in Fig. 3.6(Z>) becomes
Aah = o{-oT = 2<tm. (3-9)
The back stress which arises from the internal stress system in the material is very
localized in the matrix, and it is believed to be a consequence of the inhomogeneity of
plastic deformation on a microscopic scale. The term Acrb is sometimes referred to as
'permanent softening'.
A large Bauschinger effect has been documented in Al-4Cu alloys containing
nonshearable 9' (CuAl2) precipitates, Al-Cu-Mg alloys containing 5" (Al2CuMg)
precipitates, and Al-Cu-Zn-Mg alloys containing r] (MgZn2) precipitates (Wilson,
1965; Abel & Ham, 1966; Stoltz & Pelloux, 1976; Wilson & Bate, 1986). Using X-ray
diffraction measurements of directional lattice strains in two-phase cubic alloys,
Wilson (1965) demonstrated that reverse loading destroys the internal stresses,
reducing them to zero at some strain value. At this point, the stress difference between the
forward extrapolated and the knee portion of the reverse stress-strain curves, Fig.
3.6(b), was equal to 1.9om. Here the mean stress in the matrix, cr^, was estimated
using X-rays after unidirectional plastic deformation. Note that this experimental
correlation is quantitatively consistent with the prediction of Eq. 3.8.
Some of the most comprehensive studies of the Bauschinger effect have been
conducted on dispersion-strengthened metals. In their study of plastic deformation
in Cu-Si02, Brown & Stobbs (1971a,b) and Atkinson, Brown & Stobbs (1974)
related the internal stresses to the formation of dislocation shear (Orowan) loops
around hard particles on many slip planes. In the unrelaxed state typical of low
temperatures and low strains, there are two contributions to strengthening: (i) A
homogeneous mean stress in the matrix is produced by the Orowan loops left around
the particles. This stress state is amenable to a transformation strain analysis because
the Orowan loops may be regarded equivalent to the transformation strains in
Eshelby's classical inclusion problem (Eshelby, 1957). This mean internal stress,
<tm, in the matrix opposes continued forward deformation during tensile loading,
(ii) The Orowan loops also give rise to an additional inhomogeneous stress locally at
the particle because the presence of the loops around the particles repels successive
dislocations. This increase in internal stress over and above the initial Orowan stress
has been termed the 'source-shortening stress' by Atkinson, Brown & Stobbs (1974).
The occurrence of a Bauschinger effect upon load reversal is then viewed as a
consequence of plastic relaxation which can arise due to (a) the removal of Orowan
3.7 Shakedown
101
loops by the formation of secondary dislocations and prismatic loops of primary
Burgers vectors (Atkinson, Brown & Stobbs 1974), or (b) the shrinkage of Orowan
loops by climb via pipe diffusion (Gould, Hirsch & Humphreys, 1974). These
mechanisms have also been extended to rationalize the Bauschinger effect in
metal-matrix composites reinforced with hard particles and fibers (e.g., Brown &
Clarke, 1977; Lilholt, 1977).
3.7 Shakedown
Ductile metals are often subjected to cyclic loads in such a manner that the
early fatigue cycles lead to the build-up of residual stresses. Repeated contact loading
in ball bearings and railway rails, for example, commonly engenders plastic yielding.
A consequence of this plastic flow is the generation of residual stresses, which can
possibly be of such a magnitude that a steady-state is attained after some load
reversals wherein a closed cycle of entirely elastic reversed deformation is promoted.
For this situation, there is no net accumulation of plastic strain in subsequent cycles
and the system is said to have undergone shakedown. In other words, the residual
stresses generated during the early load reversals alleviate the applied loads by
inhibiting further plastic deformation in subsequent cycles, and induce a state of
reversible elastic response. Note that during shakedown, the maximum applied load
alone is of a magnitude which violates the yield condition.
The limiting value of the applied load below which no continued accumulation of
plastic strain is possible during cyclic loading is known as the shakedown limit. If the
shakedown limit is exceeded, plastic strains continue to accumulate during each cycle
and this phenomenon is commonly known as ratchetting, cyclic creep or incremental
collapse.
The conditions governing the occurrence of shakedown can be formulated in
terms of the so-called shakedown theorems, for elastic-perfectly plastic solids:
• Statical, lower-bound theorem (Melan, 1938): Shakedown occurs whenever a
system of residual stresses, that satisfies equilibrium requirements, acts in
conjunction with applied loads in such a manner that the yield criterion is
not violated.
• Kinematical, upper-bound theorem (Koiter, 1956): If any kinematically
admissible plastic strain cycle could be identified in which the internal plastic
work is exceeded by the work done by the applied loads, then shakedown
will not take place. Under these conditions, cyclic plasticity and incremental
collapse are possible.
Elastic shakedown occurs when the development of residual stresses results in a
steady state in which cyclic deformation is purely elastic. Plastic shakedown, on the
other hand, refers to a state of deformation where a closed cycle of alternating
102
Cyclic deformation in polycrystalline ductile solids
plasticity occurs without any accumulation of plastic strains, ratchetting or
incremental collapse. Examples of both types of shakedown are discussed in Chapter 13
in the context of rolling contact fatigue. The shakedown limits for the thermal
fatigue of metal-matrix composites and for different types of contact fatigue are
considered in Section 3.10.2 and Chapter 13.
3.8 Continuum models for uniaxial and multiaxial fatigue
The two strain hardening rules which are widely used in metal plasticity are
those involving isotropic hardening and kinematic hardening. If the yield surface
(which represents the yield condition in stress space) expands uniformly during
plastic flow with no shape change or translation, isotropic hardening occurs. On
the other hand, kinematic hardening takes place when the yield surface does not
change its size or shape, but simply translates in stress space in the direction of the
outward normal. These hardening models can be written in terms of the functions F
and h:
F(aiJ-^J)-h(Xh) = 0, (3.10)
where ay are the components of the symmetric stress tensor, l-y denote the translation
of the initial yield surface, Xh is a scalar function of the plastic strain and h(Xh) is a
function quantifying the expansion of the yield surface. When i-y = 0, isotropic
hardening occurs and when h(Xh) is a constant, kinematic hardening is induced.
The hysteresis loop for an isotropically hardening solid is schematically sketched
in Fig. 3.7(a). Here OAB represents the tensile loading segment with strain
hardening. When the load is reversed, yielding in compression commences at C, with the
stress at C having the same magnitude as at B. Continued compression loading
causes further hardening. If the load is reversed at D, subsequent tensile yielding
occurs at E when the stress reaches the same magnitude as at D. In descriptions of
isotropic hardening, the relationship between the increase in flow strength and
equivalent strain is independent of stress state. The Bauschinger effect is non-existent
for an ideally isotropically hardening material.f
The solid lines in Fig. 3.7(b) schematically represent the uniaxial stress-strain
curve for an elastic-plastic solid in which compressive yielding begins at point C
as a consequence of the Bauschinger effect. The dashed lines in this figure denote the
constitutive response derived from a kinematic hardening model (e.g., Prager, 1956;
Ziegler, 1959). If a linear hardening assumption is used (i.e. if §,-,• in Eq. 3.10 is
determined from the law d£,y = cdeL where de? are the increments of the plastic
strain and c is a constant), the plastic portion of tensile deformation in Fig. 3.7(b) is
' If the ductile solid is reinforced with a brittle phase, the overall Bauschinger effect for the composite can
be rationalized even when the plastic deformation of the matrix is described by an isotropic hardening rule.
The Bauschinger effect in this case arises from the constrained flow of the matrix material between the
brittle particles (e.g., Llorca, Needleman & Suresh, 1990).
3.8 Continuum models for uniaxial and multiaxial fatigue 103
<T
r
L
D
F
'1
J.
(a) (b)
Fig. 3.7. (a) Shapes of hysteresis loops associated with (a) isotropic hardening and (b) kinematic
hardening.
approximated by the straight line A'B. Upon load reversal at B, the behavior
follows elastic unloading line BC. Subsequent plastic compression is represented
by the dashed line C D' which is parallel to A'B. If c is assumed to be a function of
the stress invariants, the slope of the stress-strain curve at C will depend on the value
of the stress and hence on the location of C. Note that the kinematic hardening
model does predict the existence of the Bauschinger effect. This theory has been
implemented into many finite element codes.
Consider now the case of tension-compression loading over many cycles. The
kinematic hardening rule predicts that a steady state of alternating plastic flow
will set in after the first cycle of loading. On the other hand, the isotropic hardening
model suggests that the specimen will 'shake down' to an elastic state. However, as
seen in Figs. 3.3 and 3.4, a steady state of plastic strain amplitude is reached only
after an initial transient behavior. Thus, it is noted that simple isotropic and
kinematic hardening rules may not provide an adequate description of plasticity, when a
material is subjected to periodic unloading and reloading along a different stress
path (e.g., Mroz, 1967).
In this section, a brief summary of some prominent models for cyclic plasticity is
presented, and their strengths and limitations are pinpointed. More comprehensive
reviews of these formulations are available in the literature (Drucker & Palgen, 1981;
Dafalias, 1984; Chaboche, 1986). Any complete model for cyclic plasticity must be
capable of rationalizing the following fatigue characteristics:
(1) the Bauschinger effect,
(2) elastic shakedown,
104
Cyclic deformation in polycrystalline ductile solids
(3) cyclic hardening or softening prior to the attainment of a stable hysteresis
loop,
(4) cyclic creep, ratchetting, or incremental collapse, whereby a mean plastic
strain accumulates in each cycle in the direction of the mean stress in
stress-controlled fatigue with a nonzero mean stress (see Section 3.9),
(5) mean stress relaxation, whereby the mean stress in a fatigue specimen
subjected to strain-controlled fatigue (with a nonzero mean stress) tends toward
zero with the progression of cyclic deformation (see Chapter 8),
(6) the characterization of small strain, multiaxial cyclic deformation under
proportional tension-torsion loading on the basis of equivalent strain
amplitudes which provide a cyclic deformation response which is equivalent to
that seen in uniaxial loading,
(7) the largest degree of cyclic strain hardening in nonproportional (out-of-
phase) tension-torsion, with a phase difference between tension and torsion
cycles of 90 degrees.
Many models for cyclic plasticity have been proposed over the years which
rationalize the foregoing cyclic phenomena with varying degrees of success. In addition to
the Prager-Ziegler kinematic hardening model described earlier in this section, the
available approaches to modeling cyclic plasticity can be classified into the following
groups: (i) the parallel sub-element model, (ii) field of work hardening moduli,
(iii) two-surface models, and (iv) other developments involving combined
isotropic-kinematic hardening models or internal variable concepts. The following
sections describe the features of each of these approaches.
3.8.1 Parallel sub-element model
In the sub-element model of Masing (1926), Fig. 3.8(a), the solid is viewed as
being composed of a set of n elastic-perfectly plastic elements of the same
dimensions, but with different yield points. These elements are arranged in parallel and are
symmetric in tension and compression. Consider the following sequence of events:
(1) When the material is loaded in tension, the weakest element yields first at a
stress cr\.
(2) If loading is continued further, the second weakest element yields at a tensile
stress a2.
(3) The total load on the material is a2 ■ A (where A is the total cross-sectional
area), whereas the total load on element 1 is o\A\, where A\ is the area of
element 1. Upon unloading, the residual stress on element 1 equals
—(cr2 ~ a\) while the residual stress on each of the other (« — 1) elements
(which are all elastic at this point) is (a2 — <J\)/(n — !)■
(4) If forward loading were to be continued beyond a2 to a far-field tensile
stress, a^, the residual stress on element 1 would become —(cr^ — crx) and
3.8 Continuum models for uniaxial and multiaxial fatigue
105
1
2
3
4
(a)
Fig. 3.8. (a) Masing's parallel sub-element model, (b) Three types of kinematic hardening
behavior which can be extracted from the sub-element model. (After Asaro, 1975.)
on element 2, —(03 — a2) and so forth. For this case, reverse plastic straining
would begin at —aR where |crR| = a\ + a2 — <r3.
(5) If the forward tensile loading curve has the form a =f{e), then the reverse
loading curve takes the form a = 2/(5 e).
On the basis of the Masing sub-element approach, Asaro (1975) presented micro-
mechanical arguments for three types of kinematic hardening. The premise here is
that, at fixed values of strain rate e and temperature T, the applied stress required to
achieve a certain mechanical state is a function of the internal structure such that
a = cr(al,a2,ai,...).
(3.11)
It is assumed that the internal structures form in the indicated sequence a\,a2,a-i
during forward loading and cause the yield surface to translate by the increment
d§,y(ari, a2, a3,...). The order in which the recovery of individual events a,- occurs
during reverse loading determines the type of kinematic hardening.
If ai,a2,013, etc. (which are the microstructural variables determining the flow
strength) are viewed as being the plastic strains in the various sub-elements, then
one has the situation where the recovery has the sequence 2a\, 2a2, 2a3, etc. In other
words, element 1 deforms plastically twice as much in compression before element 2
yields as it did originally in tension. It is also implied here that (da/dai) is not a
function of a2, a3, etc. and likewise for (da/da2), (9a/da3), etc. This sequence, when
represented by a stress-strain plot, results in the type I behavior schematically shown
as loop OABCDEGHJB in Fig. 3.8(Z>). The type I kinematic hardening model
rationalizes the Bauschinger effect in a number of alloys with shearable precipitates. In
these materials, dislocation cells are envisioned as the elastic-plastic elements which
generate the internal stress systems. The type I sub-layer model has also been found
106
Cyclic deformation in polycrystalline ductile solids
to provide a reasonable description of the Bauschinger effect in spherodized plain
carbon steels (Wilson & Bate, 1986).
If the structural operations occurring during the forward loading are reversed
upon unloading in exactly the same sequence, hardening of type II, loop
OABCDD'F'FGHH'A in Fig. 3.8(6), is obtained. The resulting loops contain
inflection points which are symmetric about the origin. Reversible twinning could be
characterized by this scheme if the initial twins are not relaxed by the accompanying
plastic flow.
The third type of hardening arises from a recovery sequence a3,a2,ai, which is
opposite to that in the previous case. This behavior, path OABCDF"FGHH"A in
Fig. 3.8(6), appears to be represented by reversible collapse of linear dislocation pile-
ups and by the shape memory effect in Cu-Zn alloys (Pops, 1970). The type III
scheme manifests as reversible recovery on a microscale causing a nonlinear elastic
response.
The Bauschinger effect in aluminum alloys containing nonshearable precipitates,
dispersion-hardened copper crystals, and oxide-dispersed superalloys can be
rationalized on the basis of type III kinematic hardening behavior. Typical characteristics
of materials which exhibit type II or type III behavior involve: (i) a large fraction of
elastic second phase, (ii) local dislocation reversibility, and (iii) stabilization of the
dislocation array around the precipitates against plastic relaxation. Extensions of the
Masing-type multicomponent models to thermo-mechanical fatigue have also been
explored by Maier & Christ (1996).
3.8.2 Field of work hardening moduli
Mroz (1967, 1969) introduced the concept of a 'field of work hardening
moduli' to generalize the known rules of kinematic hardening to cyclic loading.
This field involves a configuration of surfaces of constant work hardening moduli
in stress space. A similar concept was also proposed independently by Iwan (1967),
who rationalized the Bauschinger effect and multiaxial cyclic deformation using a
collection of yield surfaces. Although each one of the yield surfaces in such a model
obeys a linear work hardening rule, the combined effect of the nested yield surfaces
gives rise to a nonlinear work hardening law. In this section, we discuss in some
detail the anisotropic hardening model due to Mroz.
As a starting point to this discussion, it is instructive to define the linear and
nonlinear moduli in uniaxial deformation. The total strain increment de is composed
of the elastic part dee and the plastic part dep:
de = dee + dep. (3.12)
If dcr is the stress increment, de = dcr/Et, dee = dcr/£*, and dep = dcr/Ep, where Et,
Ep, and £* are the tangent, plastic and elastic moduli, respectively. From Eq. 3.12, it
is readily seen that
3.8 Continuum models for uniaxial and multiaxial fatigue
107
During elastic deformation, Et = Ee. As plastic deformation is initiated, there is a
change in Ep from an initial value of infinity (in the vicinity of the elastic limit) to
some finite value. The tangent modulus, Et, can be used as a direct measure of the
plastic modulus, Ep, during plastic flow because Ee is constant.
Consider a fatigue specimen of an initially isotropic material which is first
subjected to tensile loading, as indicated by the segment OABCDE in Fig. 3.9(a). Once
plastic deformation begins at point A, the tangent modulus decreases. Let the stress-
strain curve be approximated by n linear segments of constant tangent moduli
Ei, E2,..., E„, Fig. 3.9(a). In stress space, this approximation is represented by n
hypersurfaces S0, S{,..., S„, where S0 is the initial yield surface and Sl,S2,...,S„
are the regions of constant work-hardening.
For the initially isotropic material, the yield surfaces S0, Sit ..., S„ are similar and
concentric, and centered on the origin O. In two-dimensional stress space, these
surfaces form a family of circles, Fig. 3.9(b). Consider proportional loading, where
different components of the stress tensor increase in constant proportion to one
another. Assume first that all yield surfaces translate in stress space without changing
their shape or orientation. When the applied stress reaches the elastic limit, point A
in Fig. 3.9(a), the initial yield surface S0 starts to move along the a2 axis until it
touches the circle S{ at B. During this period, all the other surfaces remain fixed.
Between A and B, the plastic strain is denned by the tangent modulus E{. Similarly,
as the stress is increased from B to C, the surfaces Sq and S\ translate together until
the point C is reached where S0 and S{ contact the surface S2 which until now had
been stationary. The tangent modulus between B and C has a constant value E2.
Beyond C, the surfaces Sq, S{ and S2 translate together as the stress is raised until
point D is reached. Figure 3.9(b) shows the situation where the applied stress
corresponds to the point E.
Now let the specimen be unloaded from the stress point E and reversed into
compression. When point G is reached, reverse plastic flow occurs; the surface So
starts to move downward until it touches surface S{. This corresponds to the stress
point H. The difference between stresses at H and G is twice the difference between
stresses B and A. Similarly, loading between the stress points HI and // corresponds
to the previously described steps BC and CD. Note that the curve of inverse loading
is obtained by symmetry with respect to the curve OABCDE. The curve of reverse
loading EGHIJK is uniquely denned by the primary loading curve OABCDE. If
a =/(e) is the equation of the primary curve OABCDE and if a new coordiante
system (a, e) is chosen with its origin at E and rotated 180°, the curve EGHIJK is
denned by
<r = 2/(1/2?). (3.14)
This result is identical to that predicted by the Masing model. Equation 3.14 also
indicates that aK = 2aE; therefore, aK = —aE. From K, subsequent loading KNE is
108
Cyclic deformation in poly crystalline ductile solids
<*K = ~<?E
Fig. 3.9. (a) Representation of the stress-strain curve by regions of constant tangent moduli, (b)
Representation in stress space. (After Mroz, 1967.)
identical to that of EHK. Upon reaching point E, deformation follows a steady cycle
EHKNE.
Mroz also extended the above model to situations involving nonproportional
multiaxial loading. As an example, consider the case where the specimen is unloaded
partially to a stress point Q inside S0 from the stress point E, Fig. 3.9(b), whereupon
the stress point moves along QR contacting the surface S0 at T. The surface S0 must
move such that the point T makes contact with the surface S\ without intersecting it.
(Therefore, translation will not occur along the normal at T, i.e., along the
extrapolation of OqT.) Thus T will move to a point U on S{. As the stress point moves
along TR, the surface S0 will touch S{ at W and subsequently they move together to
touch 5*2 at Z and so on. When the stress path meets the surface S4, the work
hardening modulus on the loading path becomes equal to that at E.
Mroz's geometrical model can be mathematically stated using a typical situation
sketched in Fig. 3.10. Sj and S!+l are two yield surfaces whose centers are at 0/ and
3.8 Continuum models for uniaxial and multiaxial fatigue
109
/
<r2
>
\
h./vlP\
v /y- // )
7$
• /
/
1 S(+1
"l
Fig. 3.10. Two yield surfaces St and 5;+1; the translation of surface St along P/? is defined by its
relative position with respect to 5/+1. (After Mroz, 1967.)
0/+i, respectively. These centers are denned by the position vectors §v and fj,+ \
respectively, from the origin O. Si and St+l, respectively, are denned by the following
equations:
/H - 4°) - KV1 = 0. f^j ~ 4/+") - {4/+1)}"' = 0, (3-15)
where/ is a homogeneous function of order n{ of its arguments and <r0 and cr^ ' are
constants. If P lies on the surface Sh the instantaneous translation of Si will occur
along PR, where R is a point on S!+l corresponding to the same direction of outward
normal. The position of R is determined by drawing from Ot+\ a vector Ol+\R
parallel to 0{P. From the homogeneity of/ in Eq. 3.15 and by denoting the stresses
at P and R by a^ and crj^+1), respectively, one obtains
J/+i)
(/+1) _ <.(/+l) _ ^0
y
cr,
(-?-«?)•
The translation of 5*/ is given by
d<?
<=% [K+I) - ^K - (*m+i) - c1^)]-
(3.16)
(3.17)
(3.18)
The parameter dq is obtained from the continuity condition that the stress point
remain on the yield surface,
^ = 0 d W/toijfag
Mroz's model can be extended to situations where, in addition to translation, the
yield surfaces expand or contract. An important difference between the Mrbz model
and the Prager-Ziegler model is in the direction in which the yield surface translates.
K-d^)£=0' d*=
110
Cyclic deformation in polycrystalline ductile solids
The Mroz formulation captures many of the salient features of uniaxial fatigue
deformation described earlier in this section. However, it does poorly for asymmetric
cyclic deformation (White, Bronkhorst & Anand, 1990).
3.8.3 Two-surface models for cyclic plasticity
Dafalias & Popov (1975) and Krieg (1975) independently proposed
continuum models for nonlinearly hardening ductile solids subjected to random uniaxial
and multiaxial cyclic loads. Their approach introduces the concept of a bounding
surface in stress space which always encloses the loading surface. The two-surface
model provides a practical simplification of the aforementioned multiple loading
surface approach of Mrbz by analytically prescribing the variation of the plastic
modulus.
Consider a ductile solid which is subjected to a fully reversed stress cycle; the
stress-strain curve for this loading history is shown in Fig. 3.11. The material
deforms elastically along OA; path ABC denotes plastic deformation. At point C,
the material is elastically unloaded along CD. This is followed by plastic loading in
compression along DEF. FG denotes the path for elastic unloading at F and GHBC
represents subsequent plastic reloading. Beyond point B, the line HX' coincides with
the prior loading line BC. Corresponding to each load reversal, three regions, which
characterize the manner in which the plastic modulus Ep changes, can be identified.
Consider, for example, the loading path starting at F. The first part FG represents
elastic deformation. The second part GH represents the plastic portion in which the
Fig. 3.11. Schematic illustration of the line bounds in stress-strain space. (After Dafalias &
Popov, 1975.)
3.8 Continuum models for uniaxial and multiaxial fatigue
111
value of Ep changes from point G to point H. The third part HX' also represents
plastic behavior; however, Ep has a constant value in the region. This third part lies
on lines such as XX' or YY' which provide bounds.
Dafalias & Popov postulated that the instantaneous value of the plastic modulus
Ep is determined by (i) the relative position of the current plastic loading point with
respect to the bounding line (<5ys in Fig. 3.11) and (ii) the amount of plastic work,
wp = Jcrdep, accumulated during plastic deformation prior to the elastic
deformation preceding the current plastic state. The value of <5ys at the initial yield point is <5in.
All loading states lying on a line drawn parallel to XX' in Fig. 3.11 have the same
values of <5ys and Ep.
The generalization of the above model to multiaxial loading conditions in stress
space is schematically illustrated in Fig. 3.12. This figure shows two circles, where the
inner circle with its center at k represents the loading surface and the outer circle with
its center at r represents the bounding surface. Let point a on the loading surface
represent the current plastic state of the material. Given point a, there is a
corresponding point b on the bounding surface, and the distance between a and b, denoted
as <5ys, determines the value of the generalized plastic modulus at point a for the
multiaxial case. Point b can be denned in a number of ways: (i) if the two surfaces are
congruent, b can be taken as the point determined from the condition of congruency
with respect to a; (ii) b can be obtained by the intersection of the normal to the
loading surface at a with the bounding surface; or (iii) b can be taken as the point of
intersection of the line drawn through ka with the bounding surface, as shown in Fig.
3.12. If cry are the coordinates at a and a*j are the coordinates at b, the distance, <5ys,
can be denned as
Sys = ^{ot-o^iol-oy). (3.19)
Let K be the generalized plastic modulus for the multiaxial case. Assuming the
associated flow rule, Eq. (1.25), and that the plastic strain increment de? is propor-
O
Fig. 3.12. Schematic illustration of the loading and bounding surfaces in stress space and of the
motion of these surfaces during multiaxial loading. (After Dafalias & Popov, 1975.)
112
Cyclic deformation in polycrystalline ductile solids
tional to the projection da of the stress increment day on the unit normal o to the
loading surface,
d^=^dawv. (3.20)
In Fig. 3.12, c is the point on the bounding surface where the outward normal to it
lies on the same direction as the normal to the loading surface. If m is the unit vector
along the line that joins a and c, the translation of the bounding surface along m
fulfills the condition that the point of contact is also the current stress state.
Dafalias & Popov formulated various conditions for the deformation and
translation of the loading surface as well as of the bounding surface according to different
hardening rules, particularly with reference to well known kinematic hardening rules.
In general, the inner yield surface is taken to follow kinematic hardening rules while
the outer yield surface follows isotropic hardening. The use of the two-surface model
to rationalize cyclic creep is illustrated in Section 3.9.
Modifications of the two-surface models of cyclic plasticity have been examined by
Moosbrugger & McDowell (1989) within the context of various isotropic and
kinematic hardening formulations. These workers also show that the two-surface models
for rate-independent plasticity offer superior correlation with experimental data on
nonproportional cyclic deformation in stainless steels.
3.8.4 Other approaches
Bodner & Partom (1975) introduced an internal state variable approach to
characterize the resistance of the material to plastic flow. The internal variable,
referred to as the 'hardness', was taken to be a function of the plastic work. This
approach was extended by Bodner, Partom & Partom (1979) to model uniaxial cyclic
loading of elastic-viscoplastic materials. The evanescent hardening model is a phe-
nomenological approach analogous to the Prager-Ziegler hardening rule, with the
exception that the direction and amount of displacement of the yield surface are
modified by the back stress (e.g., Chaboche, 1986). The endochronic or internal time
approach uses an internal time variable as a measure of the history of deformation
(e.g., Valanis, 1980).
White, Bronkhorst & Anand (1990) have formulated a phenomenological rate-
independent plasticity model with combined isotropic-kinematic hardening. Here,
the isotropic component of the resistance to plastic flow is shown to soften initially
during a load reversal. This softening is taken to represent a dynamic recovery of the
underlying dislocation substructure. The model captures the basic characteristics of
small strain cyclic deformation in uniaxial loading, and some aspects of
nonproportional strain cycling in tension-torsion. However, the predictions deviate
significantly from experiments for large strain torsion.
3.9 Cyclic creep or ratchetting
113
3.9 Cyclic creep or ratchetting
As alluded to in the preceding section, when a fixed amplitude of cyclic
stresses is imposed on a material, a phenomenon known as cyclic creep or ratchetting
takes place if the plastic deformation during the loading portion is not opposed by
an equal amount of yielding in the reverse loading direction. Figure 3.13(a) shows an
example of this process for a fatigue softening material subjected to cyclic loads with
a tensile mean stress, where cyclic creep occurs in the direction of increasing tensile
strains. Here the accumulation of damage is accelerated by two processes: (i) an
increase in cyclic plastic strain from cycle to cycle as a result of cyclic softening,
and (ii) the displacement of the mean strain to higher tensile strain levels. Similarly, a
compressive mean stress may enhance the conditions for buckling, as shown in Fig.
3.13(6). Cyclic creep can also be found, even under equal tension-compression
loading, in materials in which pronounced yield anisotropy exists between tension and
compression. Examples include cast iron, maraging steel and most composites.
From a continuum viewpoint, cyclic creep may be rationalized by recourse to the
two-surface models of cyclic plasticity (Section 3.8.3). Consider, for example, the
case of cyclic creep under a tensile mean stress, Fig. 3.14. Assume that cyclic loading
is imposed between the uniaxial stresses, a2 > 0 and ax < 0, with (a2 — I a\ l)/2 > 0.
In Fig. 3.14, A\, A2, A3, A4, etc., denote points at which load reversal occurs. k{ is
the point in stress space where yielding initiates prior to approaching the bound ax in
compression. Similarly, k2 is the corresponding point for the onset of yield prior to
reaching the bound a2 in tension. The value of the plastic modulus Ep changes
between k{ and ax and between k2 and a2, according to the distance <5ys of the
instantaneous stress point from the bounding lines YY' or XX', respectively. As
noted in Section 3.8.3, the smaller the value of <5ys (i.e. the closer the stress point is
to the bounding line), the smaller is the value of Ep.
Assume that at the onset of plastic deformation, the distance between the lines
a = k2 and XX' is smaller than the distance between the lines a = k{ and YY'. In this
case, the values of the distance <5ys for tensile deformation are smaller than the
corresponding values for compressive deformation. On the other hand, the plastic
work done before each load reversal, Wp = Jcrdep, is approximately equal.
<r
<T
(a) (b)
Fig. 3.13. Cyclic creep under (a) tensile and (b) compressive mean stress.
114
Cyclic deformation in poly crystalline ductile solids
Fig. 3.14. A rationale for the occurrence of cyclic creep in terms of the bounding surface
concept. (After Dafalias & Popov, 1975.)
Therefore, from Section 3.8.3, the plastic modulus is smaller for the stress states lying
on the loading paths k2<y2 than for the ones on k\0\. The cyclic loops, therefore, are
not closed and they progressively shift to the right of the strain axis as shown in Fig.
3.14. This argument thus provides one rationale for the occurrence of cyclic creep.
With continued shift to increasing mean strains, the distance between a = k{ and
XX' and that between a = k2 and YY' tend to become equal. At this point, the
plastic moduli also become equal and the loops become stabilized.
Cyclic creep or ratchetting has major implications for fatigue in a variety of
engineering applications. For example, in rolling or sliding contact fatigue,
combinations of high normal and shear tractions are imposed on a thin layer of material
near the contacting surfaces. Within this layer, which is 10-50 um thick in gears and
bearings and about 2 mm thick in railway track, shear strains as high as 100% are
accumulated with repeated applications of the load. Under conditions of free rolling
or low traction (where the traction coefficient, i.e. the ratio of the shear to the normal
traction, /xt < 0.25), an unsymmetrical cycle of shear is imposed on the highly
deforming region which is confined beneath the surface. For high traction
(/xt > 0.25), on the other hand, the critically stressed material lies at the surface.
For this latter case, the material is subjected to a nonproportional load cycle which is
made up of tension, followed by shear, followed by compression. An example of the
application of cyclic creep models to contact fatigue problems is found in the work of
Bower & Johnson (1989), who employed phenomenological nonlinear kinematic
hardening models for analyzing the effects of strain hardening on cyclic creep
contact fatigue. Further discussions of cyclic creep and ratchetting can be found in
Section 13.4.4.
3.10 Metal-matrix composites subjected to thermal cycling
115
3.10 Metal-matrix composites subjected to thermal cycling
The deformation mechanisms of precipitation-hardened and
particle-reinforced alloys under cyclic mechanical loads were discussed in the earlier sections of
this chapter. We now direct attention at continuum analyses of cyclic plastic
deformation in metal-matrix composites. The problem considered here pertains to
situations where the reinforced metal is subjected to cyclic variations in temperature. The
stresses and plastic strains in the composite arise as a result of thermal expansion/
contraction mismatch between the matrix and the reinforcement. The thermal
cycling conditions to be analyzed here are such that plastic flow in the matrix
dominates over any creep or thermal shock effects. We seek to derive closed-form
solutions for different characteristic temperatures which signify the onset and spread
of cyclic plasticity in the metallic matrix. As shown later in Chapter 8, these results
for cyclic plasticity are useful for estimating the fatigue lives of reinforced metals, by
invoking different damage and failure criteria. The results presented here are from
Olsson, Giannakopoulos & Suresh (1995).
3.10.1 Thermoelastic deformation
Consider a ductile alloy which is reinforced uniformly with spherical
particles of a brittle material, e.g., a ceramic. Figure 3.15(a) shows a spherical volume
element of the composite, where the outer hollow sphere is the matrix alloy (phase 1)
and the concentric inner sphere is the ceramic reinforcement (phase 2). Each phase is
assumed to be homogeneous and isotropic, with the interface between them
mechanically well-bonded. For the volume element with spherical symmetry, the
field quantities are functions only of the radial position r, the material properties,
and the concentration of the brittle phase. The radial and tangential directions are
identified with subscripts r and 9, respectively. The inner region occupied by the
ceramic particle is 0 < r < r{, and the outer region occupied by the metal is
Fig. 3.15. (a) Geometry of the representative volume element for the thermal cycling analysis for
the metal-matrix composite, (b) Thermal loading history.
116
Cyclic deformation in polycrystalline ductile solids
r{ < r < r0. The volume fraction of the ceramic particle is,/p = 0"j/ro)3, while that
occupied by the metal is (1 —fp). The concentration of the particles,^, can be dilute
or nondilute with only the proviso that the particles be well dispersed within the
matrix without forming an interpenetrating composite. For the small strain analysis
considered here, the radial and tangential strains are related to the radial
displacement u by
dw u d
*r=-r> €9=-, er=—{ree). (3.21)
dr r dr
The last of these three equations provides the condition for compatible strains. The
equation for equilibrium in the radial direction is:
^L + 2( ) = 0. (3.22)
dr r
If both the matrix and the particle initially deform elastically,f the stress-strain
relations are written as
ar-2va0 (1 - vH - vo>
er = \-aAT, €0 = \-aAT, (3.23)
where E is Young's modulus, v is Poisson's ratio, and a is the thermal expansion
coefficient, with the subscripts 1 and 2 denoting the matrix and the particle,
respectively.
Consider a uniform change in temperature, AI, from an initial stress-free
temperature. For an increase or a decrease in temperature, Ar>0orAT<0,
respectively. For this pure thermal loading case, where the composite is free of any external
kinematical constraint, the appropriate outer boundary condition for the volume
element in Fig. 3.15(a) is that ar = 0. The stresses in the spherical particle are then
readily determined from straightforward thermoelastic analysis to be
2Ei (tt2-tti)(l-/p)Ar
ar2 = -p, ae2 = -p, p = — j^ £ , (3.24)
3(1 -VI) !_2|«,(1_/p)
and the stresses in the matrix are
In Eq. 3.24, the elastic mismatch parameter Mel is denned as
l-vi\ Ei E2 \
For a metallic matrix with a ceramic reinforcement (c^ > a2) and for a decrease in
temperature, AT < 0, the interface pressure ar2 = —p < 0.
' The thermomechanical properties of the two phases are assumed to be temperature-independent over
the range of thermal excursions considered here. The temperature-dependence, however, can easily be
incorporated within the context of this analysis by recourse to numerical solutions.
3.10 Metal-matrix composites subjected to thermal cycling
117
3.10.2 Characteristic temperatures for thermal fatigue
If the change in temperature AT from the initial stress-free temperature
becomes sufficiently large, plastic yielding occurs in the ductile matrix. Since the
effective stress in the matrix is
3 /p /r-x3
ov = \<y«\ — o.\\ =
; K7) • (3-27)
2(1-/p)'
the maximum effective stress develops at the interface which is the site for the onset
of plastic flow. The temperature change necessary to initiate plastic flow at the
interface, A 7^, is found by setting (ae){ = ay at r = r„ where ay is the yield strength
of the matrix:
|Arj=|f^{l-^(l-/p)). (3.28)
The plastic zone which commences at the interface spreads outwards.
The spread of the plastic zone is analyzed conveniently by assuming that the
matrix is an elastic-perfectly plastic solid. Within the volume element shown in
Fig. 3.15(a), three deformation regions can be identified: (i) the volume occupied
by the reinforcement particle within which only elastic deformation occurs, (ii) an
elastic-plastic region, r, < r < rp, within which (a^i = cry, and (iii) an elastic outer
region, rp < r < r0, with a stress-free boundary at r = r0. Continuity of radial stress
and displacement across the boundaries between these regions and the condition that
(cr^Y = cry, lead to
\(a2-al)ATl\ =
3"
E{
GH'KfH-©
(3.29)
This equation provides a direct connection between the size of the plastic zone rp and
the magnitude of thermal strain (a2 — a{)ATi, and reduces to Eq. 3.28 when rp = r{.
As the plastic zone continues to spread under a monotonic temperature change
\AT\, another critical value of \AT\, which we shall term lAT^I, is reached at which
the entire matrix becomes plastic. The magnitude of AT"3 is determined by setting
rp = r0 in Eq. 3.29:
gy(l -vi) f 1 2Mel
iAr3i=V?—~\ 7-+-ril°g/p • <3-3°)
^ll«2 -«ll l/p 3 V)
Now consider temperature cycles, 0 < |A7"| < A7^, commencing at the stress-free
temperature,! Fig- 3.15(6). The first unloading in the thermal cycle corresponds to
the excursion from point A to point B.
If the yield strength of the matrix is the same in tension and compression, it can be
readily shown that there exists a characteristic temperature change, AT^ = 2A7,1,
' Equations 3.28 and 3.30 pertain to the first thermal loading ramp from | AT| = 0 to |AT| = AIa (point
A in Fig. 3.15(A)). In general, AT and ATa can be positive or negative. For simplicity, we consider
positive values of the characteristic temperatures in subsequent discussion.
118
Cyclic deformation in polycrystalline ductile solids
below which a zone of reverse plasticity does not occur. In other words, if
|Ara| < AT2, there is no accumulation of plastic strains during thermal cycling.
Therefore, AT2 represents a shakedown limit for the thermal fatigue of a metal-
matrix composite. For \ATa\ < AT2, only elastic conditions prevail after the first
unloading (i.e. after point B).
If, on the other hand, \ATa\ > AT2, a zone of reversed plastic flow of radius rc
develops at the particle-matrix interface. Repeated thermal cycling causes rc to
expand outward. Referring to Fig. 3.15(6), if the temperature is first increased
(decreased) from some initial stress-free temperature (point O) to a maximum
(minimum) value at point A, and then decreased (increased) to the current temperature
AT, the size of the reversed or cyclic plastic zone rc is given by
\(a2-al)(ATil-AT)\ =
2<ry(l - vi)
(^---heN -®
(3.31)
The right hand sides of Eqs. 3.29 and 3.31 differ only by a factor of 2 and by a
change from rp to rc. A remarkable feature of Eqs. 3.28-3.31 is that both the
monotonic and cyclic plastic zones initiate at the particle-matix interface and spread
monotonically outwards during cyclic variations in temperature.
As the cyclic plastic zone spreads outwards, there exists another critical
temperature at which the entire matrix begins to undergo reversed plastic yielding. This
characteristic temperature AT4 is obtained by setting rc = r0 in Eq. 3.31, from
which it is readily seen that AT4 = 2A7,3. Figure 3.16 schematically shows the
spread of rp and rc for different values of ATa with respect to the various
characteristic temperatures.
For the uniform spatial distribution of spherical particles, the conditions that
|A7^1 < |Ar2| and that \AT{\ < \AT^\ always hold. However, the condition that
IA 7^ | < |A7,3| need not always be true, i.e. the first monotonic temperature change
from O to A in Fig. 3.15(Z?) may cause complete yielding of the matrix with no cyclic
plastic zones induced upon subsequent unloading (from A to B). From Eqs. 3.28 and
3.29 and from the condition for shakedown (A7,2 = 2AT{), it can be shown that
there exists a critical concentration of the reinforcement, fp = f*, at which
AT2 = A73, which obeys the equation:
1 - 2/p* + ^Vp*{log(/p*) + 2(1 -/p*)} = 0. (3.32)
The value of f* is unique for a fixed combination of the matrix and reinforcement,
and is bounded by 0.203-c.Zp* <0.586. If fp >f*, AT2 > AT3, and the composite
matrix undergoes no plastic strain accumulation during thermal cycling, although
the matrix is fully yielded during the first thermal excursion from the initial stress-
free state.
3.10 Metal-matrix composites subjected to thermal cycling
119
(a)
(b)
\ATj < AT, AT, < \ATJ < AT3 AT3 < \ATj
\ATJ < AT2 AT2 < \ATj < AT4 AT4 < \ATj
(c)
ATi<\ATj<AT2 AT2<\ATj<AT4
AT4 < \ATJ
| | elastic response
£2 plastic zone (monotonic)
[J2j reversed plastic zone (cyclic)
Fig. 3.16. The evolution of monotonic and cyclic plastic zones at different temperature
amplitudes, (a) Monotonic thermal loading corresponding to point A in Fig. 3.15(A).
(b) Temperature cycling for AT2 < AT3 corresponding to points B, C, D,... in Fig. 3.15(A).
(c) Temperature cycling for AT2 > AT3 corresponding to points B, C, D,... in Fig. 3.15(A).
3.10.3 Plastic strain accumulation during thermal cycling
Consider the situation where an elastic-ideally plastic metal reinforced with
ceramic particles is thermally cycled in such a way that | A7"2| < | A7"a| < lAT^I,
which is a possible scenario for/p <fp. The general expressions for the tangential
and radial components of the plastic strain in the matrix are
4=s
<Ty(l -V\) C
^ = 2Sgy(1-yi)-2%
(3.33)
where S = sign{(a2 -etx)&T] = {(a2 -ai)AT}/\(a2 -ax)AT\ is either +1 or-1,
depending on whether the plastic flow is forward or reversed. The constant C\ is
obtained from the continuity conditions to be
C, = Sr
- 3<ry(l - vO
for Iat;
IA7U
(3.34)
Since the radial stress and the effective stress (and hence the tangential stress) are
continuous across the plastic zone boundary, the plastic strains are also continuous.
120
Cyclic deformation in polycrystalline ductile solids
From Eq. 3.33, the effective plastic strain is found which, for the present geometry,
reduces to
de
pi
eff
2|d^|,
(3.35)
because of proportional plastic strains. At the initial stress-free temperature (point
0),e
pi
eff
0.
Beginning with the first thermal excursion O-A, the accumulated plastic strain is
found by substituting Eq. 3.34 in Eq. 3.35 and integrating Eq. 3.35:
2<rv(l - Vl) f/r.O
eeff
(/■) = ■
'{&)'
r\<r< rp.
(3.36)
Unloading from A to B in Fig. 3.15(6) causes a reversed yield zone of radius rc to
develop. Inside this zone, ejjff(r) differs from that given in Eq. 3.36. Upon changing
the temperature from B to C, the flow condition is satisfied up to rp, but in the region
rc < r < rp, the plastic strains remain unaltered. Thus, for lAT^I < | A7"a| < lAT^I,
and constant-amplitude temperature cycling, 0 < |A7"| < |A7"a|, the plastic strains
change only inside the cyclic plastic zone. The radius of this zone, rc, is found from
Eq. 3.31 by setting AT = 0 (fully unloaded state). Using Eqs. 3.34 and the
continuity of plastic strains, the accumulated effective plastic strain after NT
temperature reversals is found as
pl,NT _ 2gy(l - V))
ceff
If I AT,
iat;
|Ar4|,
pi,nt _ 2gy(l - vQ
ceff
+
El
4ay(l
■1
+ 2(JVT - 1)
©!
1
(3.37)
1 +
fpEilcii-cuWATi-ATi
a (1 - v,)
-1
vi)
(NT - 1)
£)'
-1
(3.38)
The reversed flow zone size rc in Eq. 3.38 is given by Eq. 3.31. The first term on the
right hand side of Eq. 3.38 gives e^ T during the first temperature excursion from O
to A, and the second term gives the accumulated value in the next (A^T — 1)
temperature reversals. It should be noted that the rate of plastic strain accumulation in
Eqs. 3.37 and 3.38 is the same, i.e. the second terms on the right hand side of these
two equations are identical. Thus, the difference in the magnitude of the
accumulated plastic strain is only that due to the difference developed in the first
temperature excursion.
3.10.4 Effects of matrix strain hardening
The preceding results were restricted to metallic matrices which do not show
any strain hardening. If the matrix undergoes cyclic strain hardening, the following
modifications to the results are anticipated.
3.10 Metal-matrix composites subjected to thermal cycling
121
(1) For cycling between fixed temperature limits, the four characteristic
temperatures, ATh i=l,... ,4, are constants for an elastic-ideally plastic
matrix. For a strain-hardening matrix, however, these temperatures change
with the number of thermal cycles; they can still be denned based on the
plastic strain distribution.
(2) The accumulation of plastic strain near the particle-matrix interface
increases the flow strength of the hardening matrix. Further accumulation
of plasticity is thereby suppressed.
(3) The result of the preceding section that plastic strain accumulation occurs
only within the cyclic plastic zone, still applies to the hardening matrix. The
rate of accumulation, however, is affected by the hardening rate.
Consider a matrix alloy with isotropic, linear strain hardening H, which
captures the cyclic hardening characteristics of the matrix. The matrix yield
strength <ry is now modified to include hardening in the following way:
<ry + Hf£f(r). Let 77 = 2H(l - vx)/Ex. It can be readily shown (Olsson,
Giannakopoulos & Suresh, 1995) that the plastic strain increment during each
load reversal is explicitly given by
\M,NT _ ,pl,(ArT+l) _ ,,
^eeff — eeff eeff
pl,ArT _ 4gy(l - vQ
'(l+tf)^
'©'
1 -H'
\+H
NT-\
(3.39)
For H = 0 (no hardening), the results of the preceding section are recovered. An
examination of Eq. 3.40 reveals that Ae^ T ->• 0 as NT ->■ oo. Therefore, unlike the
case of an ideally plastic matrix for which the plastic strain accumulation during
thermal fatigue is unbounded, the accumulated plastic strain for a strain-hardening
matrix asymptotically approaches a limiting value at large numbers of thermal cycles
in the following manner:
Ae1
pi, oo
eff
= Ae
pU
eff
<->•©'■*'-'
(3.40)
where Ae^1 is the plastic strain accumulated after the first thermal excursion. The
limiting strain in Eq. 3.40 has a maximum value at the particle-matrix interface. If
the ductility of the matrix alloy exceeds this maximum value, an endurance limit for
thermal fatigue is expected. This temperature endurance limit is higher than AT2
because of strain hardening.
All of the foregoing analytical results pertain to situations where Eu vu au a2,
cry and H are temperature-independent. The same approach can be adapted for
analyzing thermal fatigue by including the temperature-dependence of these
properties by recourse to numerical simulations (see, for example, Olsson et al.,
1995).
122
Cyclic deformation in polycrystalline ductile solids
3.10.5 Example problem: Critical temperatures for thermal fatigue
in a metal-matrix composite
Problem:
A 2024-T6 aluminum alloy, reinforced with 20 volume% of spherical SiC
particles, is thermomechanically processed at 250 °C. At this temperature, the
composite is almost free of internal stresses and its reinforcement is well-bonded
to the matrix. The isotropic properties of the matrix are: al = 22 x 10~6 °C_1,
Ei = 72 GPa, vi = 0.33, <ry = 393 MPa, and melting temperature,
^meit = 660 °C. (All the symbols are denned in Section 3.10.1.) The matrix
exhibits essentially no strain hardening. The isotropic properties of the SiC
particles are: a2 = 4.7 x 10"6 °C_1, E2 = 450 GPa, v2 = 0.17, and
[ melt
= 660°C.
(i) If the reinforced alloy is uniformly cooled to room temperature (25 °C),
what is the temperature at which plastic yielding begins during cooling
from the processing temperature? (In order to obtain analytical results,
assume that the mechanical properties of both phases of the composite
are independent of temperature for the range of temperatures and
heating/cooling rates considered.)
(ii) What is the volume fraction of the matrix which has undergone plastic
yielding upon cooling?
(iii) If the composite is thermally cycled between room temperature and the
processing temperature, compute the plastic strain accumulation per
cycle.
(iv) Now suppose that the yield strength of the matrix decreases linearly with
increasing temperature, and that the Poisson's ratios, Young's moduli
and thermal expansion coefficients for both phases remain temperature-
independent, for the range of temperatures considered. Explain briefly
how the temperature dependence of yield strength of the matrix would
affect (a) the critical temperatures AT\ and ATt, and (b) the mono tonic
plastic zone radius rp.
Solution:
It is given that:/p = {rjr0f = 0.2, and rproc = 250 °C, rroom = 25 °C,
and |ATI = rproc - rroom = 225 °C. Since |Ar| is less than one half of the
melting temperature, it may be assumed that creep effects are less dominant
compared to plasticity effects (i.e. when long hold periods at temperatures are
not involved). Denoting the properties of the matrix by the subscript '1' and
those of the particle by the subscript '2' and substituting the appropriate
values in Eq. 3.26, it is found that the elastic mismatch parameter
Md = 0.35.
3.11 Layered composites subjected to thermal cycling
123
(i) Substituting the numerical values of the various terms in Eq. 3.28, we
find that the temperature change, from the initial stress-free temperature
(250 °C) at which plastic yielding begins is: lAT^I = 172 °C, i.e. at 250 -
172 = 78 °C.
(ii) To find the plastic zone radius rp for a temperature change of
\AT\ = 225 °C, replace AT^ in Eq. 10.2 by \AT\. Substituting the
appropriate numerical values for | A7"| and the various material parameters, it
is seen that
1.0467pM -0.2333log fe\ =1.0644, or fe\ « 1.025. (3.41)
The volume fraction of the matrix which has undergone plastic yielding
upon cooling from the processing temperature to room temperature is:
^-^-T^(G)1-')- ^
Substituting the value of rp from Eq. (2) into this equation, it is seen that
Vpl « 0.63%.
(iii) We note that the characteristic temperature change below which a zone
of reversed plastic flow does not develop in the matrix is:
|AT^I = 2|AT^i| = 344°C. Since the temperature range for thermal
cycling | A7"| = 225 °C < lAT^I, it is apparent that repeated thermal
cycling between room temperature and the processing temperature will
not lead to any continued accumulation of plastic strains in the matrix.
(iv) (a) As the yield strength decreases with increasing temperature, both A7\
and A T$ will be lowered compared to the case where the yield strength is
independent of temperature, (b) The monotonic plastic zone size, rp,
increases because of the lower yield strength at higher temperatures.
There is a corresponding increase in the volume of the matrix material
which has undergone plastic yielding.
3.11 Layered composites subjected to thermal cycling
Layered materials represent a broad class of composites which find diverse
applications in mechanical, thermal, electronic, magnetic, ferroelectric, optical and
biomechanical components or devices. They also facilitate maintenance of clearance/
tolerance or enhance appearance and biocompatibility. In many applications,
fluctuations in externally imposed stresses or pulsations in internal stresses arising from
such factors as the thermal expansion mismatch between the layers during repeated
temperature excursions can lead to cyclic deformation and fracture. Examples of
layered structures in which thermal cycling or thermo-mechanical fatigue is a topic
124
Cyclic deformation in poly crystalline ductile solids
of interest include: (i) laminated composites comprising organic or inorganic
matrices and discontinuous or continuous reinforcements, (ii) thermal-barrier or
wear-resistant coatings comprising a ceramic outer coating and an in-between
metallic bond coat on a metallic substrate, and (iii) semiconductor devices with patterned
metallic conduction lines, passivated by a glassy layer or a ceramic or a polymer, on
the Si single-crystal substrates.
In this section, we consider the cyclic deformation response of layered structures
subjected to fluctuations in temperature. This section begins with a basic treatment
of the thermoelastic deformation of a bilayer by recourse to classical beam/plate
theories. This is followed by the derivation of stresses in thin films on substrates
which are subjected to thermal excursions. Attention is then directed at some critical
temperatures for the occurrence of distinct transitions in the cyclic deformation
response of a ductile layer in a metal-ceramic bilayer system which undergoes cyclic
variations in temperature, similar to the analyses presented in the preceding section
on metal-matrix composites.
3.11.1 Thermoelastic deformation of a bilayer
Consider a general bilayer, schematically shown in Fig. 3.17(a), which is
subjected to uniform temperature changes at all times. The uniform thicknesses of
layers 1 and 2 are hi and h2, respectively. For a start, the interface between the two
layers is assumed to be mechanically well bonded, and the two layers are taken to
exhibit in-plane elastic and thermal isotropy with Young's moduli, E\ and E2,
Poisson's ratios, v\ and v2, and coefficients of thermal expansion, a\ and a2. The
in-plane shape of the bilayer is a rectangle with length Lx and width Ly.
Let the bilayer plate be flat and devoid of any internal stresses at some initial
reference temperature T0, which could be identified with the processing, diffusion-
bonding or softening temperature. Let the temperature of the bilayer be now
changed uniformly by AT to some instantaneous value T (with T — T0 = AT > 0
denoting heating and AT < 0 denoting cooling) in such a way that the entire plate is
always at the same temperature T. The thermal expansion or contraction mismatch
between the layers causes gradients in stresses to develop through the thickness of
each layer. As a result, the initially flat plate bends with a curvature kr (which is the
inverse of the radius of bending). If LX~S> hl+ h2 and Ly 3> hi + h2, a state of
equi-biaxial stresses exists in the plate such that axx = cryy and exx — eyy (i.e. the
curved plate has the same state of stress as the skin of a balloon which is internally
pressurized).!
' Near the free edges of the bilayer where the interface intersects the free surfaces, the stresses have to be
modified locally so as to satisfy the stress-free boundary conditions at the free surfaces of the
unconstrained bilayer plate. Consequently, there develops a three-dimensional stress state which comprises
both in-plane and out-of-plane normal and shear stresses. The size of this 'edge zone', measured from
each edge, is of the order of the total layer thickness. The analysis presented in this section is valid only
away from this edge-zone.
3.11 Layered composites subjected to thermal cycling
125
(a)
lA/cl
residual
curvature
(b)
layer 1
layer 2
Ar,
onset of
inelastic deformation ideally plastic
elastic ~^>f 1 s'
s^ ' X ^elastic
yT • yr unloading
| onset of reverse
| inelastic deformation
! 1 i
A7-,
IA7-I
Fig. 3.17. (a) Geometry of the bilayer and the associated nomenclature, (b) Schematic
representation of the variation of curvature with temperature for a metal-ceramic bilayer where
the metallic layer is elastic-perfectly plastic. All material properties are assumed to be
independent of temperature.
The thermoelastic strain in the bilayer, in regions away from the free edges,
consists of two parts: (i) an in-plane normal strain, e0, which arises from a uniform
stretch or contraction, and (ii) the strain due to bending, krz, where z is the thickness
coordinate:
£xx(z) = eyy(z) = e(z) = e0 + krz.
The only nonzero components of stress in the two layers are
Ex(z)
<rXx,\(z) = °yy,l(z) = ClO) =
°xx,l(z) = ayy,l(z) = ^200 =
1 - V!(Z)
E2(z)
1 - v2(z}
|€(z) - [«i(z)An},
y(z)-[a2(z)AT]}.
(3.43)
(3.44)
The subscripts '1' and '2' refer to quantities associated with layers 1 and 2,
respectively, in Fig. 3.17(a). Static equilibrium dictates that the net force and the net
126
Cyclic deformation in poly crystalline ductile solids
moment arising from the stresses in Eq. 3.44 should be offset by any externally
imposed force Fap and moment, Map. For the unconstrained bilayer plate subjected
only to a uniform temperature excursion, these force and moment equilibrium
conditions give:
<r2(z)dz-|- <r1(z)dz = 0, and
J-h2 Jo
j-0 (•/!,
<r2z(z)dz + o-!z(z)dz = 0. (3.45)
J-A, Jo
Combining Eqs. 3.43-3.45, and solving for e0 and kr yields
a:
AT
e0 =7r-{Ci«i + C2a2 + C^{Ah\ax + 4h\a2 + ?>hxh2[ax +a2])}, (3.46)
and
where
KK=^-6hxh2{hx+h2\ (3.47)
Ci = £iM, C2 = E22h42, C3 = ~E{E2hxh2,
C4 = Ci + C2 + [C3(4A? + 6AiA2 + 4*1)],
£>! =£i£2(«i -a2)Ar,
£1=—^—, and £2=tj— • (3-48)
1 — vi 1 — v>2
Substituting Eqs. 3.46-3.48 into Eq. 3.44, it is readily shown that the stresses at the
outer surfaces of the two layers and at the interfaces are:
•»~-i:{g<«+3»*>+g}-
*2l„-„,=^(-^(2/>5 + 3M2)+£lj,
^U=^{&(4*i + 3*,*2)-^}. (3.49)
Note that the stresses vary linearly with z within each layer to a maximum value at
the interface, and that there occurs a sharp jump in the magnitude of the stress at the
interface between the two layers. While the foregoing analysis pertains to a bilayer,
the same approach can be used to analyze the thermoelastic deformation of a
multilayer comprising any number of layers. In such a case, the equilibrium equations, Eq.
3.45, can be solved numerically using a personal computer where additional effects
3.11 Layered composites subjected to thermal cycling
127
involving temperature-dependence of material properties in the multilayer, plastic
yielding and strain hardening in the ductile layers, in-plane anisotropy of elastic
properties, continuous gradients in composition and properties through one or
more layers, steady-state creep, as well as heat conduction arising from nonuniform
temperature variations through the thicknesses of the layers can all be incorporated
(e.g., Finot & Suresh, 1994).
3.11.2 Thin-film limit: the Stoney formula
In many practical applications, thin coatings are deposited on much thicker
substrates. Examples include ceramic coatings on metal alloys for protection against
elevated temperatures, environmental attack or contact fatigue damage. A very
useful result, commonly known as the Stoney formula (after Stoney, 1909), for the
estimation of the uniform stress in a thin film on a thick substrate can be derived
from the above bilayer result.
Consider the thin-film limit of the bilayer shown in Fig. 3.17(a), where hx <£ h2.
With this geometric condition, Eq. 3.47 becomes
kr = 6=r-±(pn - a2)AT, hx «h2. (3.50)
E2h\
In addition, Eqs. 3.48 and 3.49 give, for the thin-film limit,
o"iU=a, «-Ei(ai -a2)AT, and O]\z=0 « -Ex{ax -a2)AT. (3.51)
In other words, the equi-biaxial stress in the thin film is essentially uniform. It is also
readily seen from Eq. 3.49 that, for hi <3C h2, the magnitude of the stresses in the thick
substrate is very small.
Combining Eqs. 3.47 and 3.51, and denoting the various parameters associated
with the film and the substrate with the subscripts 'film' and 'sub', respectively,
°film —
1 / £sub \
6 \1 - vSub/
*k. jj_ L
''film l-Kc -Kc.O
(3.52)
where Rc 0 is the initial radius of curvature of the thin-film/substrate system at some
reference temperature and Rc is its radius of curvature after some temperature
change A T. In other words, if the radius of bending before and after a temperature
change can be measured experimentally, the stress in the film is computed easily
using Eq. 3.52.f Note that once the curvature change is known for a thermal
excursion, the film stress is determined with the knowledge only of the film and substrate
thicknesses and of the elastic properties of the substrate. In other words, the elastic
properties of the film, which are often very difficult to obtain, are not needed. The
minus sign for the film stress in Eq. 3.52 simply implies that if the bilayer is convex
' In view of its simplicity, the Stoney equation, Eq. 3.52, is commonly used to determine the thin film
stresses in the microelectronics and structural coatings industries where scanning laser interferometry
methods are widely used to determine the radius of curvature of the thin-film/substrate system before
and after thermal excursions.
128
Cyclic deformation in poly crystalline ductile solids
shaped on the thin-film side (i.e. positive kr), then the stress in the film should be
compressive. From Eq. 3.50, we see that such a situation arises when the coefficient
of thermal expansion of the film is higher than that of the substrate and the bilayer is
subjected to heating from a stress-free initial reference temperature.
3.11.3 Characteristic temperatures for thermal fatigue
Four different characteristic temperatures, which signify different distinct
transitions in the evolution of cyclic deformation, were denned in Section 3.10.2 for
the thermal cycling of a metal reinforced with brittle spherical particles. Four such
characteristic temperatures for the thermal fatigue can also be analytically derived
for the bilayer in Fig. 3.17(a) (for any arbitrary combination of layer thicknesses h\
and h2) where one or both layers is a metal (Suresh, Giannakopoulos & Olsson,
1994).
Let layer 1 in Fig. 3.17(a) be a metal and layer 2 be a brittle solid, such as a
ceramic. With this choice, we see that in general, (c^ — a2) > 0. Let the plastic
deformation of the metallic layer be characterized by an elastic-perfectly plastic
deformation behavior, with a yield strength, ay\ (which is the same in magnitude
but opposite in sign for tension and compression). Layer 2 remains a linear elastic
solid throughout any changes in temperature. Let the bilayer be subjected to uniform
temperature changes which fluctuate with a constant amplitude A 7^.
Starting with the stress-free temperature 7^, consider the first uniform change in
temperature |A7"|. Initially both layers deform elastically. When |AT"| reaches a
critical value IA 7^1, the metallic layer begins to yield plastically at the interface.
Setting the stress at the interface in layer 1 to equal <ryl for this critical condition,
it is found that
IATI- ^yi^Q n„,
lAlll-Dl.[C2 + Ci(4h\ + 3hlh2)Y ^
where the various parameters are denned in Eq. 3.48.
If now the temperature continues to change monotonically beyond lAT^I, the
plastic zone which initiates at the interface spreads outwards to the free surface of
the metallic layer. After a further temperature change, there occurs a critical
condition, |AT11 = |A7^| that the entire metallic layer becomes fully plastic, where
<M [1,1
(al-a2)[Ei E2
4^ + 9
h2
(IHI/
(3.54)
If the metallic layer does not strain harden, this limit temperature for full yielding
also signifies the condition for a limiting curvature, kr,l- That is, any further change
in temperature beyond lAT^I does not cause any change in the curvature of the
bilayer. This limiting curvature is
Exercises
129
^L=^{y+M- a55)
If the applied temperature amplitude for thermal cycling | A7"a| is always smaller
than | A 7^1, plastic deformation will not occur in the metallic layer. If
| AT1! | < | A7"a| < | Ar31, the metallic layer will not undergo complete plastic yielding.
Figure 3.17(6) schematically shows the evolution of curvature as a function of
temperature for a metal-ceramic bilayer where the metallic layer exhibits elastic-per-
fectly plastic response.
For fluctuations in temperature, there are two additional limiting possibilities for
the evolution of cyclic plastic zones in the metallic layer: (i) there occurs no reversed
plastic yielding in layer 1, or (ii) the limiting curvature (kr = krxJ which develops at
| Ara| = | AT^I is exactly reversed during each temperature reversal. Consider case (i)
for which a characteristic temperature, lAT^I = 21A T^j |, exists. When | A7"a| < lAT^I,
no reversed plastic zone develops and thermal cycling does not lead to the
accumulation of plastic strains in the metallic layer. It can be shown (e.g., Suresh,
Giannakopoulos & Olsson, 1994) that the highest characteristic temperature
corresponding to the complete reversal of the limiting curvature from kr = krl to
kr — -krl, case (ii), is: IAT4I < 2|A7,3|. For a general bilayer with any general
combination of hx and h2, it is typically seen that |Ar4| > \AT3\ > \AT2\ > \ATX\.
For the thin-film limit,
ATl = AT3==-^ 7, hl«h2,
Ex(ax -a2)
AT2 = AT4 = 2Ar3, hx «h2. (3.56)
The effects of temperature-dependence of material properties, strain hardening in
the metallic layer, and free edges (where singular fields and multiaxial stress
states develop) on the evolution of monotonic and cyclic plastic deformation
in the metal-ceramic bilayers are addressed in Suresh, Giannakopoulos & Olsson
(1994).
Exercises
3.1 It was shown in Chapters 1 and 2 that the resolved shear stress in a single
slip system is related to the applied stress by the Schmid factor, M. For a
polycrystal, a = MTr, where MT is commonly referred to as the Taylor
factor. The value of MT is computed such that the continuity of slip at
the grain boundary satisfies the requirement for five independent slip
systems to operate in each grain. The values of MT are computed by invoking
the principle of virtual work. Convince yourself, by consulting appropriate
130
Cyclic deformation in polycrystalline ductile solids
references and standard textbooks on mechanical metallurgy, that for
random orientations of grains,
(a) For FCC polycrystals, MT = 3.06.
(b) For BCC polycrystals, MT = 2.00.
(c) Taylor-type calculations are not possible for HCP polycrystals where
twinning and nonbasal slip influence deformation.
3.2 The Taylor factor MT is based on the assumption of multiple slip. Sachs
formulated an alternative orientation factor Ms (= 2.24 for FCC
polycrystals), assuming that individual grains deform in single slip. (Consult
standard textbooks on mechanical metallurgy where appropriate references can
be found.)
(a) What are the limitations of this assumption in terms of plastic
strain?
(b) It has been observed that the orientation factor in general is closer to the
Sachs factor for moderately deformed crystals, but then assumes larger
values approaching MT at higher imposed strains. Why?
3.3 Silver solder joints can withstand a much higher normal stress than a tensile
specimen made entirely of the solder material. Why?
3.4 Discuss possible effects of reinforcement volume fraction and shape (i.e.
spheres, particles with sharp corners, and whiskers) on the development
of the Bauschinger effect in metal-matrix composites.
3.5 Two engineering materials are subjected to fully-reversed, strain-controlled,
cyclic deformation at room temperature. The first, a substitutional solid
soution alloy, exhibits an isotropic hardening response. The second is a
composite whose matrix is identical to the first alloy; spherical ceramic
particles, 25% by volume, are uniformly dispersed in this matrix.
(a) Speculate on the dislocation-particle interactions in the second material
during cyclic plastic deformation.
(b) Schematically sketch the shape of the cyclic stress-strain curve during
repeated tension-compression loading.
(c) Discuss the type of hardening rule you would use to model the cyclic
constitutive behavior of the composite.
3.6 Using the bounding surface concept and a rationale similar to that used in
connection with Fig. 3.14, provide an explanation for the occurrence of
cyclic creep in the direction of increasing compressive strain.
3.7 Discuss the cyclic deformation of a material in terms of the two-element
Masing model, assuming elastic-perfectly plastic response.
(a) Construct the hysteresis loops for a small amplitude at which only the
softer elements yield plastically and for a larger amplitude at which both
elements yield plastically.
Exercises
131
(b) Show that the so-called 'permanent softening' is expected only in one of
the two cases and that the amount of permanent softening is equal to
twice the internal back stress in the soft elements.
(c) Considering both cases, can permanent softening be considered an
unambiguous measure of the back stress?
(d) Describe the occurrence of the Bauschinger effect in terms of
deformation-induced internal stresses and the yielding of the softer elements
upon load reversal.
3.8 Discuss the effects of cyclic strain hardening on the shakedown limit derived
in Section 3.10.2 for the metal-matrix composite subjected to thermal cycling.
3.9 An aluminum film, 1 um in thickness, is deposited onto a silicon substrate
which is 500 um thick and 100 mm in diameter. The isotropic properties of
Al and Si are: EM = 66 GPa, vA1 = 0.33, aM = 23 xlO"6 °C_1, Esi = 130
GPa, vSi = 0.28, aSi = 3xl0~6 °C_1. At some reference stress-free
temperature, this thin-film/substrate system is flat (i.e. zero curvature). This
bilayer is now uniformly cooled by 50 °C.
(a) What is the average stress in the aluminum film?
(b) Is it tensile or compressive?
(c) Describe the direction in which the bilayer bends during the above
thermal excursion.
(d) If the yield strength of the thin aluminum film is 140 MPa, what is the
temperature change needed to cause plastic yielding in the aluminum
film?
(e) If the thin-film/substrate system is thermally cycled between the stress-
free initial temperature and some high temperature Tcyde, what is the
minimum value of Tcycle needed to induce fully reversed plastic flow in
the entire aluminum film?
3.10 A 50 mm x 50 mm bilayer plate is made by diffusion bonding a plate of pure
Ni, 3 mm in thickness, to a plate of pure A1203, 2 mm in thickness, at
827 °C. The isotropic properties of Ni are: ENi = 214 GPa, v^ = 0.31,
and aNi = 17.8 xlO-6 °C_1 at 827 °C and 13.4 xlO"6 °C_1 at 20°C. The
yield strength of Ni as a function of temperature, ay^i(T), are: 148 MPa
(20 °C), 140 MPa (227 °C), 115 MPa (427 °C), 69 MPa (627 °C) and 45 MPa
(827 °C). The isotropic properties of the polycrystalline A1203 plate are:
£ai2o3 = 380 GPa, vAl2o3 = 0.25, and aAl2o3 = 9.4 x 10"6 °C~l at
827 °C and 5.4 x 10"6 °C_1 at 20 °C. You may ignore the strain hardening
characteristics of Ni for the purpose of this problem.
(a) If the bilayer is uniformly cooled to room temperature (20 °C), what is
the temperature at which plastic yielding begins during cooling from the
bonding temperature?
(b) Is it possible to cause yielding of the entire Ni layer before reaching the
room temperature?
CHAPTER 4
Fatigue crack initiation in ductile solids
The initiation of fatigue cracks is an event whose very definition is strongly
linked to the size scale of observation. For example, materials scientists are likely to
consider the nucleation of flaws along persistent slip bands as the initiation stage of
fatigue failure, whilst a mechanical engineer may associate the resolution of crack
detection with the threshold for crack nucleation. Between this wide range of
viewpoints lies a variety of failure mechanisms that are affiliated with the inception of
microscopic flaws at grain boundaries, twin boundaries, inclusions, microstructural
and compositional inhomogeneities, as well as microscopic and macroscopic stress
concentrations. The differences in the approaches to fatigue crack initiation
constitute the fundamental distinction between the fatigue design philosophies currently
practiced in industry. From a scientific standpoint, developing a quantitative
understanding of crack initiation processes must be regarded as one of the most important
tasks.
In this chapter, attention is first directed at the mechanisms of fatigue crack
initiation in nominally defect-free (unnotched) pure metals and alloys, and
commercial materials. Models for fatigue crack initiation are described and their significance
and limitations are pinpointed. Also addressed are the mechanisms by which fatigue
cracks initiate ahead of stress concentrations under fully compressive cyclic loads.
Continuum aspects of crack initiation based on stress-life and strain-life approaches
are addressed in Chapters 7 and 8, respectively, where the initiation of fatigue cracks
at stress concentrations under tension and tension-compression fatigue are treated.
Possible ways in which the seemingly conflicting viewpoints based on crack initiation
and crack growth can be brought together are described in Chapter 15. Fatigue crack
initiation in brittle solids and noncrystalline solids are considered in Chapters 5 and
6, respectively.
4.1 Surface roughness and fatigue crack initiation
The origin of fatigue cracks in metals and alloys of high purity is often
rationalized by mechanisms of the type first proposed by Wood (1958). The basic
premise of Wood's postulate is that repeated cyclic straining of the material leads to
different amounts of net slip on different glide planes. The irreversibility of shear
displacements along the slip bands then results in the 'roughening' of the surface of
the material. This roughening is manifested as microscopic 'hills' and 'valleys' at sites
132
4.1 Surface roughness and fatigue crack initiation
133
where slip bands emerge at the free surface. The valleys so generated function as
micronotches and the effect of stress concentration at the root of the valleys
promotes additional slip and fatigue crack nucleation.
4.1.1 Earlier observations and viewpoints
The first documentation of slip-induced surface roughening during fatigue
was by Forsyth (1953). He reported that, in a solution-treated Al-4 wt% Cu alloy,
thin ribbons of the metal (0.1 um thick and 10 urn long) 'extruded' at the specimen
surface from the persistent slip bands. Similar extrusions were also seen in single
crystals and polycrystals of silver chloride (Forsyth, 1957). The valleys and hills
formed on the fatigued surface are commonly referred to as 'intrusions' and
'extrusions', respectively. The formation of an intrusion-extrusion pair during fatigue was
identified by Forsyth & Stubbington (1955) in Al-4.5 wt% Cu and by Cottrell &
Hull (1957) in Cu. Figures 4.1(a) and (b) show a pair of intrusions and extrusions,
which were formed within 1 % of the expected fatigue life, along slip bands in Cu
cyclically strained at —183 C. Both micrographs were taken from the surface of the
same fatigue specimen.
Wood's hypothesis on the creation of surface roughness due to the to-and-fro
motion of slip bands does not explain why the intrusions progressively deepen. In
an attempt to rationalize the development of net slip offsets, Mott (1958) proposed a
qualitative model. His suggestion was that screw dislocations, moving along
different paths in the slip bands of a crystal during forward and reverse glide, repeat their
paths by cross slip. The screw dislocations complete a circuit during a fatigue cycle;
the volume encompassed by the circuit is then translated parallel to the dislocation
by a distance equal to its Burgers vector. This displacement manifests itself in the
•w /./ ri
■ ■'•' ,< ''
*
(b) ' ' ' > 2nm
Fig. 4.1. (a) Intrusions and (b) extrusions along slip bands in polycrystalline Cu fatigued at
-183 °C. (From Cottrell & Hull, 1957. Copyright The Royal Society, London. Reprinted with
permission.)
/
(a)
>Y-
*
i ^ r
134
Fatigue crack initiation in ductile solids
form of an extrusion at the specimen surface. Although Mott's proposal formed the
basis for a number of subsequent models for surface roughening, its basic feature
that screw dislocations travel in a closed circuit has not been convincingly
substantiated by experiments. Kennedy (1963) emphasized the need for a gating mechanism
which would modify the forward-reverse oscillations of screw dislocations into
irreversible displacements. The formation of obstacles to dislocation motion, such as
creation of jogs as a consequence of edge-screw intersections and the intersection of
two screw dislocations with a third dislocation at a node in a free surface, have all
been suggested as possible gating mechanisms which would provide net irreversible
slip during fatigue (see Lin & Lin, 1979 for a critical review).
The first quantitative statistical model for random slip leading to the formation of
hills and valleys on fatigued surfaces was published by May (1960a,b) who adapted a
variation of Mott's cross slip mechanism. The assumption here is that the reverse
glide of dislocations is shifted from the forward path in a random manner. If the
amount of this shift is comparable to the width of the slip band, this is tantamount to
stating that random distribution of slip in each half-cycle is independent of the
distribution in the previous cycles. Thus, hills and valleys are formed on the surface,
with subsequent slip concentrating in the valleys in proportion to their depths. May
assumed that if f(z, N) is the fraction of the valleys (of width w) with a depth
between z and z + dz after N cycles of fatigue, f(z, N) obeyed a diffusion equation
where k and f5 are factors of the order of unity, b is the magnitude of the Burgers
vector, and y is the plastic strain in the slip band which is equivalent to ■/?$% in Eq.
2.9. Solving Eq. 4.1, May showed that
/ =
Fexp(- jv^z + w)-■>/*'} /byN
(4.2)
where F is a slowly varying function of z and N. For small values of N, the exponential
factor is very small and the deepening of the valleys would not be significant. The main
criticism of this statistical model is that it does not contain a sufficient number of
physical variables which incorporate the random slip process in a realistic form.
4.1.2 Electron microscopy observations
A quantitative measurement of the height of slip steps formed during the
fatigue of Cu single crystals has been conducted by Finney & Laird (1975) and Laird,
Finney & Kuhlmann-Wilsdorf (1981). Using interferometric measurements, they
showed that surface slip steps form in proportion to the applied plastic strain.
However, individual steps were found to undergo irreversible slip. The irreversibility
of slip steps was noticed even in the inert environment of dry nitrogen. Later studies
by Cheng & Laird (1981) revealed that crack nucleation occurred preferentially at
the site of the PSBs with the highest slip offset and the largest strain localization. For
4.1 Surface roughness and fatigue crack initiation 135
Cu single crystals, ypl and the slip offset (denoted by ndb. where nd is the number of
dislocations and b is the modulus of Burgers vector) were related by the expression,
ypl a (ndb)mv. (4.3)
For Cu single crystals subjected to a plastic strain amplitude in the range of 10~3 to
10"2, njp « 0.78 and ndb = 0.3-3 um.
A technique, known as the taper-sectioning method, introduced by Wood (1958),
has allowed high-resolution imaging of surface morphology in fatigued crystals. In
this method, the specimen is sectioned along a plane which is oriented at a small
angle a (i.e. a few degrees) to the specimen surface. The profile of the surface, as
observed on the sectioned plane, is magnified by a factor of (1/ sin a), over and above
the magnification obtained by other visual methods such as scanning electron
microscopy, optical microscopy and optical interferometry. Hunsche & Neumann (1986)
have refined this technique to obtain sections with sharp edges normal to the
specimen surface so that the surface features can be recorded to a resolution of 20 nm in
the scanning electron microscope. Basinski & Basinski (1984), Hunsche & Neumann
(1986), and Ma & Laird (1989a,b) have utilized this method to examine the details of
surface roughening in fatigued Cu. Their results collectively indicate the following
general trends:
(1) The surface of the fatigued crystal is covered with PSB extrusions, intrusions
and protrusions. A protrusion is a surface uplift (a large extrusion), many
micrometers in height, where a macro-PSB, tens of micrometers wide and
containing tens of matrix and/or PSB lamellae, emerges at the free surface.
A protrusion may contain several intrusions and extrusions. Figure 4.2 is a
scanning electron micrograph obtained using the sectioning method which
Fig. 4.2. Protrusions with extrusions and intrusions on the surface of a Cu crystal fatigued at
room temperature for 120000 cycles at yv\ = 0.002. (From Ma & Laird, 1989a. Copyright
Pergamon Press pic. Reprinted with permission.)
136
Fatigue crack initiation in ductile solids
shows PSB protrusions with superimposed extrusions and intrusions in a Cu
crystal fatigued for 120000 cycles at a constant resolved plastic shear strain
amplitude of 0.002.
(2) The extrusions, with a triangular cross section (base width « 1 — 2 um and
height % 2 — 3 um), grow at rates of 1 — 10 nm (cycle)-1, whereas the growth
rate of protrusions is an order of magnitude smaller.
(3) The lamallae within the protrusions undergo constrained slip in the
direction of the primary Burgers vector. Concomitantly with the formation of
protrusions, there develops a population of negative protrusions or
encroachments.
(4) The protrusion height increases in proportion to the width of the macro-
PSBs.
(5) Optical interferometry indicates that a greater than average local strain
develops at the PSB-matrix interface.
The contour of a PSB profile, imaged directly by focusing on the specimen edge, is
provided in Fig. 4.3. This figure shows a protrusion on the side surface of a Cu
specimen fatigued at 77 K for 35 000 cycles at ypl = 0.002. The loading axis is along
the vertical direction and b is the direction of the primary Burgers vector. A similar
extrusion/protrusion is found on the opposite side of the crystal (not shown in Fig.
4.3).
Numerical simulations of the random slip processes have also been attempted to
quantify the extent of surface protrusions produced by fatigue. Differt, Essmann &
/
I lio.m
Fig. 4.3. The contour of a PSB profile created in a Cu crystal. (From Differt, Essmann &
Mughrabi, 1986. Copyright Taylor & Francis, Ltd. Reprinted with permission.)
4.2 Vacancy-dipole models
137
Mughrabi (1986) considered cyclic slip of a stack of planes by a random distribution
of irreversible microscopic displacements. The mechanism for the development of
slip irreversibility was taken to be the dynamic equilibrium between dislocation
multiplication (at a Frank-Read source) and annihilation within the PSBs (see
Section 4.2), which produces microscopic extrusions and depressions on the
specimen surface. For an individual PSB, the mean width (peak to valley) of the
roughness profile was predicted to be
w = 2F^NbyPSBpPSBhp, (4.4)
where F is a nondimensional factor, b is the magnitude of the Burgers vector for the
dislocations within the PSB, N is the number of fatigue cycles, pPSB is the ratio of the
irreversible strain to the total strain within the PSB, and hp is the thickness of the
PSB. For Cu single crystals, taking b — 0.256 nm, hp = 1000 nm (for a PSB lamella
composed of 5000 atomic planes with a mean spacing of 0.2 nm), pPSB « 0.3,
YpSB — 0.0075 (from Section 2.4) and F ~ 1, the mean height of the extrusion at
N = \0 strain cycles is found to be ~ 0.76 um. This value is of the order of the slip
step height observed in experiments. It should be pointed out that this model, where
the quantitative estimates for the parameters for slip within a PSB are only rough
estimates, cannot account for the interaction among closely spaced PSBs or for the
formation of intrusions below the average level of the surface.
4.2 Vacancy-dipole models
The nucleation of PSBs at the beginning stages of cyclic saturation is also
accompanied by the formation of extrusions. This surface roughening appears to be
instigated when the average dislocation distance in the fatigued matrix approaches
the annihilation distance for dislocations. Transmission electron microscopy studies
reveal that there is a critical spacing between dislocations, below which their
annihilation is favored. Consider two screw dislocations of opposite signs (left hand
screw Slh and right hand screw Srh), gliding in the PSB channels (see Fig.
4.4(a)). When the distance between this pair of dislocations becomes less than a
critical spacing, ys « 50 nm at room temperature, they annihilate each other by
cross slip (Mughrabi, Ackermann & Herz, 1979; Essmann, Gosele & Mughrabi,
1981). Similarly, a dipole consisting of edge dislocations of opposite sign will
annihilate to form a vacancy if the spacing of the edge dislocations, ye, becomes smaller
than about 1.6 nm, as shown in Fig. 4.4(a). (Note that the edge dislocation pair in
Fig. 4.4(a) is a vacancy dipole. An interstitial dipole is one where the signs of the
edge dislocations on the two parallel planes, 1 and 2, are opposite to those shown in
this figure.) It has been found in TEM that the majority of the dislocation dipoles
that are observed after fatigue are of vacancy-type (Antonopoulos, Brown & Winter,
1976). This result also finds direct experimental support in the electrical conductivity
measurements by Johnson & Johnson (1965) and Polak (1970), which show that
138
Fatigue crack initiation in ductile solids
::r.i
2-
->-_I:
V
^'
(«)
*T
(*)
! >^ interface
x dislocation
(c)
Fig. 4.4. (a) The critical annihilation distance for screw and edge dislocations, (b) Mechanism of
extrusion formation by combined glide and dislocation annihilation, (c) Irreversible slip in the
PSB creating effective interfacial dislocations which put the slip band in a state of compression.
(d) The combined effects of applied stresses and internal stresses. Bigger arrows indicate
repulsive forces on interfacial dislocations and smaller arrows denote forces caused by the
applied load. (After Essmann, Gosele & Mughrabi, 1981.)
vacancies, of concentration ~ 10~ , are generated during fatigue of metals. Such
vacancy generation has also been clearly demonstrated by Argon & Godrick
(1969) in LiF crystals fatigued at elevated temperature (see Chapter 5). It therefore
appears reasonable to suppose that individual or clusters of vacancies produced by
cyclic slip are responsible for the swelling of the material which produces protrusions
and extrusions in fatigue, as in Fig. 4.3.
Essmann, Gosele & Mughrabi (1981) developed a model for surface roughening
and crack nucleation on the basis of the hypothesis that the annihilation of the
dislocations within the slip bands is the origin of slip irreversibility. Without anni-
4.2 Vacancy-dipole models
139
hilation, the to-and-fro motion of dislocations within the walls and channels of the
PSB would be reversible and no permanent changes in surface topography would
result. Essmann et al. propose the following sequence of events:
(a) Dislocations that are generated at dislocation sources (e.g., point S in Fig.
4.4(b)) are terminated by mutual annihilation before the reversal of strain.
(b) The annihilation of vacancy-type dipoles, shown in Fig. 4.4(b), is the dominant
point defect generation process. Dislocations moving during the tensile portion of
the fatigue cycle are denoted by solid symbols and those moving during the
compression portion by open symbols. During tensile loading, slip is transmitted across
the specimen by the sequence of microscopic processes extending from A to A'.
(c) At locations where the edge dislocations are annihilated (e.g., the PSB walls in
Cu), the plane on which slip is dominant is changed because of the annihilation
process. Therefore, the effective slip plane A-A' is not parallel to the primary
Burgers vector b, but is slightly inclined to b. Slip steps are created at surface
locations A and A' during the tensile portion of fatigue.
(d) On reversing the strain into compression, slip steps are formed at B and B1 by a
similar process. The steps A-B and A-B! thus constitute an extrusion. If interstitial-
type dipoles, rather than vacancy-type dipoles, are considered, then intrusions,
rather than extrusions, form by a process analogous to that described in Fig. 4.4(b).
(e) The extrusion in Fig. 4.4(b) ceases to grow when the concentration of vacancies
formed by edge dislocation annihilation attains a saturation value, [Cv]sat
(w3x 10~4 for Cu), within the slip band. At saturation, the effective slip plane no
longer deviates from b.
(f) While Fig. 4.4(b) illustrates the formation of extrusions by two microscopic slip
processes, Fig. 4.4(c) schematically shows this phenomenon for the situation
involving the superposition of multiple slip processes. The path X-Y denotes the zig-zag
glide of a combined slip process aided by annihilation, just as in Fig. 4.4(b). For
clarity, the other paths are merely represented by straight lines. These lines join edge
dislocations which have either survived the annihilation process and arrived at the
free surface or have been deposited at the PSB-matrix interface. These latter
interface dislocations have the same sign and give rise to internal stresses. Thus, the net
result of the irreversible slip process after one cycle is a row of edge dislocations at
the PSB-matrix interface. The extra half planes of atoms of these edge dislocations
face into the PSB.
(g) If all the interface dislocations emerge at the free surface, the resulting surface
roughness of the PSB lamellae in the direction of the active slip vector is given by
e = [Cv]sat-4)/cos<9, (4.5)
where d0 is the diameter of the crystal and 6 is the angle between b and the specimen
surface. If all the dislocations remain at the PSB-matrix interface, the mean
separation S[ of the interface edge dislocations is
S; = — = . (4.6)
[CyU ecosfl
140
Fatigue crack initiation in ductile solids
Taking typical values for b and [Cv]sat for Cu, one obtains S{ fa 1 (im.
(h) The arrangement of interface dislocations in Fig. 4.4(c) leads to an elastic
compressive stress within the PSB acting along b and to a tensile stress in the matrix
adjoining the PSB. Essmann et al. estimate that this compressive stress in the PSBs is
of the order of 2 MPa for Cu.
(i) The combined effect of the applied stress and the internal stress produced by
the interface dislocations is shown in Fig. 4.4(d). The bigger arrows denote the
internal stress arising from the mutual repulsions of the interface dislocations. The
smaller arrows refer to the stress resolved in the direction of the PSB due to the far-
field axial load, which reverses sign during every half fatigue cycle. Thus, A and A'
serve as stress concentration points in tensile loading where the internal stress and
the applied stress combine to produce high local stresses. B and & are stress
concentrating sites during compression where the two stresses oppose each other.
Starting with a set of initial assumptions similar to those of Essmann et al.,
Antonopoulos, Brown & Winter (1976) developed a model of dislocations at PSB-
matrix interfaces by considering a continued increase in the density of vacancy
dipoles during fatigue. Their approach is different from the foregoing model of
Fig. 4.4 in that Antonopoulos et al. did not consider the annihilation of vacancy
dipoles (which are continually replenished) to form vacancies. They concluded that
the material in the PSB is fiber-loaded in tension parallel to b after the attainment of
cyclic saturation. This prediction is contradictory to that of Essmann et al. A
possible clue to this apparent contradiction can be obtained by noting that both models
assume the sign of the internal stress to remain unchanged during fully reversed
loading. Brown & Ogin (1985) have pointed out that if the effective slip plane
does not switch (from A—A' to B—B1 in Fig. 4.4) as the applied load is changed
from tension to compression, then the internal stress also changes sign. Despite
their differences, both models clearly pinpoint the significant role of vacancy dipoles
and interfacial dislocations in promoting surface roughness. Both groups of authors
also propose that cracks initiate at the surface steps created at the PSB-matrix
interface. This prediction is consistent with a variety of experimental observations,
to be described in Section 4.3.
Micromechanical models have also been proposed to describe the formation of
intrusions and extrusions on the surfaces of metals due to glide on parallel planes
(Lin & Ito, 1969; Lin & Lin, 1979; Tanaka & Mura, 1981). A feature common to
these analyses is the assumption that the forward and reverse slip displacements
during a fatigue cycle are accommodated within two closely-located, parallel layers,
i.e. the most favorably oriented slip planes. Such an assumption apparently finds its
basis from the experiments of Forsyth (1953) and Charsley & Thompson (1963), who
found that the slip plane accommodating plastic deformation during the forward
(tensile) loading and the one during reversed (compressive) loading are closely
spaced, but distinct from each other. Both slip planes are still part of the same
slip band.
4.3 Crack initiation along PSBs
141
If the dislocations piled up on a slip plane (layer I) under the maximum
(positive) shear stress glide in the opposite direction along the same slip band
upon load reversal, there is no net dislocation buildup. In order to incorporate
slip irreversibility in the model, it is postulated that the irreversibility of
dislocation motion in the two adjoining layers arises from the different levels of back
stress during slip in the forward direction on layer I and in the reversed direction
on layer II (Tanaka & Mura, 1981). The first tensile loading causes dislocation
pile-up on layer I. The positive back stress (which opposes the stress causing
dislocation motion) due to positive dislocations on layer I facilitates the pile-up
of negative dislocations on layer II during reversed loading. The back stress due
to dislocations on layer II helps further pile-up of dislocations on layer I during
the following forward cycle. This process leads to dislocation pile-up with
increasing number of fatigue cycles.
This model has been modified by Venkataraman et al. (1990) to represent the
matrix-PSB interfaces as an array of vacancy dipoles. The analysis shows that
there exists a critical number of fatigue cycles above which the accumulation of
interface dislocations becomes energetically unfavorable as a result of an
increase in stored elastic strain energy. Crack initiation occurs in the PSB at
this point.
4.3 Crack initiation along PSBs
The interface between the PSB and matrix is a plane of discontinuity across
which there are abrupt gradients in the density and distribution of dislocations. One
may then expect these interfaces to serve as preferential sites for fatigue crack
nucleation. As noted earlier, this was also the inference derived from the model of
Essmann, Gosele & Mughrabi (1981). Direct experimental evidence of crack
initiation at the interface has also been obtained by Hunsche & Neumann (1986) and Ma
& Laird (1989a,b).
Figure 4.5 shows a fatigue crack nucleated along the leading edge of a macro-PSB
protrusion in Cu fatigued at a constant plastic strain amplitude of 0.002.
Concomitant interferometric observations of this test specimen revealed that the
strains within the PSB are highly inhomogeneous and localized at the PSB-matrix
interface. These results imply that fatigue crack initiation is strongly biased by the
roughening of the surface. The population of these fatigue cracks increases linearly
with the number of cycles and the applied strains. Furthermore, the statistical
distribution of the crack sizes corresponds to the distribution of localized strains
measured at the PSBs using white light interferometry.
Direct evidence of crack initiation and early crack growth along PSBs has been
obtained in fatigued, polycrystalline Cu by Katagiri et al. (1977). With high voltage
TEM observations of dislocation arrangements ahead of pre-cracks, Katagiri et al.
142
Fatigue crack initiation in ductile solids
+C
«*
Fig. 4.5. Fatigue crack initiation (denoted by an arrow) at a PSB-matrix interface in a Cu
crystal fatigued for 60000 cycles at ypl = 0.002 at 20 °C. (From Ma & Laird, 1989b. Copyright
Pergamon Press pic. Reprinted with permission.)
clearly established that, in materials that form PSBs, crack nucleation and early
crack growth occur in the PSB. Figure 4.6 is a TEM image showing two PSBs (of
length ~ 100 um, which is comparable to the grain size) in a Cu specimen where a
surface layer, approximately 2 um thick, containing intrusions has been removed by
electropolishing. A nascent crack is seen within one of the PSBs and the presence of
the crack does not appear to modify their dislocation structure. An optical
micrograph of the crack is also shown in the inset. A similar TEM image of the Cu
specimen obtained by Katagiri et al. also revealed cracks nucleating along the
PSB-matrix interface at the root of a surface intrusion.
20 um
&• •J* ' * " Sum
T+„ «* ^ crack '
electron
diffraction pattern
Fig. 4.6. A nascent fatigue crack along the ladder structure of a PSB in fatigued, polycrystalline
copper. Inset at left is an optical micrograph showing the location of the crack with respect to
the free surface. (From Katagiri et al., 1977. Copyright Metallurgical Transactions. Reprinted
with permission.)
4.5 Computational models for crack initiation
143
4.4 Role of surfaces in crack initiation
As discussed in Chapter 2, it is now well accepted that a single PSB can
extend throughout the cross section of a ductile monocrystal and that, in poly-
crystalline metals, slip bands form even within interior grains. It is, therefore, of
interest to investigate whether a rough surface topography created by the
presence of intrusions alone is responsible for crack nucleation or whether internal
dislocation structures can play an equally significant role in determining the
nucleation events and the overall fatigue life. In polycrystals (see Chapter 3),
PSBs formed within interior grains produce slip that is confined to the individual
grain. The large transfer of material causing the creation of rough topography is
possible at surface grains, but not in the interior ones because of constraint from
the surrounding matrix.
Experiments dating back to the work of Thompson, Wadsworth & Louat (1956)
have suggested that removing the intrusions and extrusions by electropolishing the
specimen surface increased fatigue life. More conclusive evidence for the argument
that the surface geometry determines fatigue life is found in the study of Basinski,
Pascual & Basinski (1983). These researchers demonstrated that, even in single
crystals where coarse PSBs traverse through the bulk, elimination of surface roughness
by electropolishing leads to a drastic enhancement in total fatigue life. This
rejuvenation takes place at both low and high plastic strain amplitudes, i.e. at both the
beginning and end of regime B in Fig. 2.2.
4.5 Computational models for crack initiation
Finite element simulations of fatigue crack initiation have been carried out
by recourse to the constitutive model for the inelastic deformation of PSBs, which
was discussed in Section 2.6. The roughening of the surface of the crystal due to
vacancy diffusion and the ensuing crack initiation process, as revealed by
computational simulations based on these models, are considered here.
4.5.1 Vacancy diffusion
The concentration of vacancies produced within the PSBs is markedly larger
than that in the vicinity of the free surface. The annihilation of edge dislocation
pairs, schematically sketched in Fig. 2.13, also causes the vacancy concentration in
the PSB to surpass that in the matrix. The attendant steep gradient in vacancy
concentration provides a driving force for the diffusion of vacancies within the
PSBs in the direction of the free surface. This mechanism occurs by lattice diffusion
in the crystal matrix as well as by pipe diffusion along the dislocation lines. Since
high-cycle fatigue necessarily involves a sufficiently long period of time for the
nucleation of a critical fatigue flaw in initially smooth-surfaced high-purity single
144
Fatigue crack initiation in ductile solids
crystals, one would expect sufficient time to be available for such diffusive processes,
even at room temperature.
The evolution of vacancy concentration can then be estimated on the basis of the
following considerations and approximations (Repetto & Ortiz, 1997). (1) The stress
concentrations arising at the free surface by the roughening induced by the egress of
the PSB produces strain energy density gradients, which in turn promote stress-
assisted diffusion. (2) The vacancy concentration at the free surface remains at its
equilibrium value given by
where A(7V is the incremental change in free energy per vacancy, k is Boltzman's
constant, and T is the absolute temperature. (3) An effective diffusion coefficient for
vacancy mobility by both pipe and lattice diffusion is determined from a rule-of-
mixture type approximation based on the dislocation density. (4) Since the screw
dislocations in the channels between the walls are parallel to the direction of vacancy
flux to the free surface, they are postulated to contribute more strongly to vacancy
diffusion than edge dislocations.
With the above line of reasoning, the flux of vacancies from the PSBs to the free
surface is expected to follow the diffusion equation:
^ = V0 ■ ([A.,1 + (b2pSJDpipes ® s)] (V0cv + A; A w)) + \pay\y\ (4.8)
where DUx and Dpipe are the lattice and pipe diffusion coefficients, respectively, I is
the identity tensor, b is the magnitude of the Burgers vector, ps is the density of screw
dislocations in the channels, s is the direction of the Burgers vector in the unde-
formed configuration of the crystal, R is the universal gas constant, and W is the
elastic strain energy density. The last term on the right hand side of Eq. 4.8 is the
vacancy generation rate defined in Eq. 2.31. The symbol V0 is the material gradient
operator defined such that (Vq/)7 = df/dXj, where (X\, X2, X^) refer to the material
reference frame defined with respect to the undeformed configuration of the crystal.
The term within the square brackets in Eq. 4.8 equals -Jv, where Jv is the vacancy
flux through the crystal.
The net outward flow of vacancies causes the surface of the crystal to move
inward, thereby forming an intrusion. The outward velocity of the vacancies,
relative to the undeformed configuration of the crystal, is Vv = Jv/cv. If one
considers a small area on the undeformed surface of the crystal with a unit
outward normal N, the inward velocity of the surface region due to the egress
is VN = Jv N.f
It is worth noting that the possibly significant process of annihilation of screw dislocations in the
channels is not taken into account in this formulation.
4.5 Computational models for crack initiation
145
4.5.2 Numerical simulations
The constitutive model discussed in Section 2.6 and the fully-coupled
vacancy diffusion model discussed in Section 4.5.1 have been incorporated into a
finite-element program by Repetto & Ortiz (1997) with the aim to simulate surface
roughening in a Cu single crystal. Figure 4.7 shows the deformed mesh from the
finite-element simulation where a large surface protrusion is clearly visible. A
comparison of Fig. 4.7 with Fig. 4.3 shows that experimental trends of protrusion
formation are captured by the numerical model. The shape of the protrusion is
determined by a competition between two mechanisms: lengthening of the PSB
which causes material to be pushed out of the matrix, and vacancy flux which
causes the surface to recede. The former process dominates in the center of the
PSB which facilitates the formation of a protrusion. It is also seen that PSB
formation, multiple slip at corners and vacancy flux cause grooves to form at
both the corners of the protrusion. These grooves serve as critical sites for the
nucleation of fatigue cracks.
376.5 -
459.0 459.5 460.0 460.5 461.0 461.5
fo.m
Fig. 4.7. Surface roughening in a [125] Cu single crystal oriented for single slip under symmetric
tension-compression loading with ypl = 6x 10~"3. The figure shows the deformed mesh from the
finite-element simulation after about 65000 cycles. (After Repetto & Ortiz, 1997.)
146
Fatigue crack initiation in ductile solids
4.5.3 Example problem: Effects of vacancies
Problem:
Repeated cyclic loading on an FCC crystal can produce a high density of
vacancies. Show that if a cubic crystal is filled randomly with vacancies to a
concentration xv,
„ /AL Aa\
where AL/L is the fractional change of the external edge dimension of the
crystal due to the introduction of the defects, and Aa/a is the fractional change
of the lattice parameter (as measured by X-ray diffraction) due to the defects.!
Solution:
In order to arrive at the desired result, carry out the operation of
introducing vacancies in the crystal in the following steps:
Step 1:
Create the vacancies inside the crystal by taking atoms from the interior
and placing them on various free surfaces of the crystal. Apply, however, a set of
body forces around the vacant sites so that no strains develop due to atomic
relaxation. If L, (i = 1, 2, 3) are the linear dimensions of the crystal, and if AL;
denote the corresponding changes in linear dimensions, the total fractional
volume change is
A V _ _ ALj AL2 AL3
But,
ALj AL2 AL3
AL
~AV~
_ V _
= 3
stepl
"AL"
L
(4.9)
(4.10)
stepl
In addition, note that (Aa/a) = 0 for step 1 since no atomic relaxation is
permitted.
Step 2:
Now release the body forces. During the subsequent relaxation, the
crystal shrinks homogeneously because the vacancies are distributed at random. In
this process, the fractional decrease in the lattice parameter (i.e. the fractional
decrease in interplanar spacings) must equal the fractional decrease in the linear
dimensions of the crystal. Therefore,
~AV~
_ V _
= 3
step2
"AL"
L
= 3
step2
~Aa~
. a .
(4.11)
step2
The author thanks Professor R.W. Balluffi of the Massachusetts Institute of Technology for bringing
this problem to his attention.
4.6 Environmental effects on crack initiation
147
Combining Eqs. 4.10 and 4.11, it
3
"AL"
L
+3
stepl
"AL"
_ L
= 3
step2 L
is seen that
"A a"
a
+xv.
step2
However,
3
3
"AL"
L
~Aa~
L a
+3
stepl
+3
stepl
"AL"
_ L
Aa
a
= 3
step2
= 3
step2
"AL
L
"Aa"
L a
= 3
total
= 3
total
"AL"
L
"Aa"
a
Using Eqs. 4.10-4.13, it is seen that
„ /AL Aa\
^ = 3{-L-^>-
(4.12)
•
(4.13)
4.6 Environmental effects on crack initiation
Surface roughening and fatigue crack initiation can occur in pure materials
in vacuo and at temperatures down to 4.2 K (McCammon & Rosenberg, 1957).
However, the fraction of fatigue life at which crack nucleation occurs can be
significantly affected by the test environment. There is a wealth of experimental
evidence indicating that the environment plays an important role in dictating the extent
of slip irreversibility and fatigue life. For example, it was demonstrated a long time
ago by Gough & Sopwith (1932) and by Thompson, Wadsworth & Louat (1956) that
fatigue life is markedly improved in vacuo or in dry, oxygen-free media as compared
to moist laboratory air.
Consider the case of fatigue in pure metals in vacuo or in an inert environment.
Single slip during the tensile loading cycle produces slip steps at the surface. The
extent of surface slip offset can be diminished by reverse slip during unloading or
subsequent compression loading in fully reversed fatigue. In inert environments,
surface roughening during fatigue occurs primarily by a random process (see
Section 4.1.1). On the other hand, when slip steps form during the tensile portion
of a fatigue cycle in laboratory air or in a chemically aggressive medium, the
chemisorption of the embrittling species (such as oxygen or hydrogen) or the
formation of an oxide layer on the freshly formed slip step makes reverse slip
difficult on the same slip plane upon load reversal. In the embrittling medium,
this process (schematically shown in Fig. 4.8) can provide a mechanism of
enhanced surface roughening as well as easier transport of the embrittling species
to the bulk of the material preferentially along the persistent slip bands, thereby
facilitating crack nucleation.
148
Fatigue crack initiation in ductile solids
tension
\
compression
V
second tension
vzz.
vm%
^
V7P7/T
My////////,
mm/
W777
Fig. 4.8. A model for fatigue crack nucleation near a free surface by the synergistic effect of
single slip and environmental interactions. (After Thompson, Wadsworth & Louat, 1956, and
Neumann, 1983.)
4.7 Kinematic irreversibility of cyclic slip
The preceding discussions focused on the irreversibility of displacements
during the forward and reverse slip of dislocations. The various mechanisms of cyclic
slip irreversibility can be summarized as follows:
(1) Cross slip of screw dislocations and different paths for their forward and
reverse glide during a complete fatigue cycle.
(2) The extrusions, with a triangular cross section (base width « 1 — 2 (im and
height « 2 — 3 (im), grow at rates of 1 — lOnm (cycle)"1, whereas the growth
rate of protrusions is an order of magnitude smaller.
(3) Random distribution of slip (independent of prior history) with the
progressive, preferential deepening of valleys at surfaces.
(4) Dislocation-dislocation interactions leading to the formation of nodes, jogs
or dislocation locks which impede motion during part of a fatigue cycle.
(5) Production of point defects during saturation, due to the dynamic
equilibrium between dislocation generation and annihilation.
(6) Irreversibility due to shape changes (see Section 2.12.1) as well as differences
in dislocation back stress due to slip on different glide planes during the
tension and compression portions of fatigue.
(7) Reduction in slip displacement during unloading due to the adsorption of an
embrittling species or due to the oxidation of slip steps, and the attendant
creation of net slip irreversibility.
4.8 Crack initiation along grain and twin boundaries
149
In brittle solids and semi- or noncrystalline materials, kinematic irreversibility of
cyclic deformation can come about even in the complete absence of dislocation
motion. The underlying mechanisms are examined in Chapters 5 and 6.
4.8 Crack initiation along grain and twin boundaries
The nucleation of fatigue cracks at grain boundaries occurs under the
influence of embrittling environments (which preferentially attack grain boundaries and
the particles, if any, on them) and elevated temperatures (at which grain boundary
cavitation and sliding are promoted). Intergranular failure is also commonly
observed in brittle solids due, at least in part, to the residual stresses induced by
thermal contraction mismatch between adjacent grains or to the presence of grain
boundary glass phases. The occurrence of grain boundary fatigue crack nucleation in
a ductile solid, in the absence of grain boundary particles, creep deformation or
environmental influences, is relatively less common. There have been some
documented cases of purely mechanical fatigue failure along grain facets (e.g., Porter &
Levy, 1960; Kim & Laird, 1978; Figueroa & Laird, 1983; Watanabe, 1985).
Using optical interferometric measurements of slip step heights at grain facets in
fatigued copper, Kim & Laird (1978) noted that fatigue cracks may nucleate at grain
boundaries if: (i) the grain boundaries separate highly misoriented grains, (ii) the
active slip system of at least one of the grains is directed at the intersection of the
boundary with the specimen surface, and (iii) the traces of the high angle grain
boundaries in the free surface make a large angle (30-90°) with the tensile stress axis.
In general, grain boundary cracking may arise from one of two mechanisms
during cyclic loading:
(1) At low to intermediate plastic strain amplitude, the impingement of PSBs at
grain boundaries causes cracking (e.g., Figueroa & Laird, 1983; Mughrabi,
et al., 1983). Figure 4.9(a) shows an example of this crack initiation
mechanism after 7000 cycles at a plastic strain range of ±5 x 10~4 in copper at sites
where primary slip bands intersect a grain boundary.
(2) At high plastic strain amplitudes, grain boundary cracking occurs as a
consequence of surface steps formed at the boundary. Figure 4.9(6) is an
example of this process. It shows optical interferograms of a slip-step of height
0.9 (im formed in polycrystalline Cu after 60 cycles of fully reversed fatigue
loading at a plastic strain of ±7.6 x 10⁻³. Fringes shifted from left to right
indicate depressions.
In BCC metals such as commercially pure iron, intergranular crack nucleation has
also been observed under reversed bending and push-pull axial loading over the
cyclic frequency range 0.01-1000 Hz (Guiu, Dubniak & Edward, 1982). It was
mentioned earlier (Section 2.12) that the asymmetry of slip associated with the
glide of screw dislocations in tension and compression can induce shape changes
150
Fatigue crack initiation in ductile solids
W
\ -
\
\
\\
\V
\
t
120 urn |
(ft)
Fig. 4.9. (a) Nucleation of flaws (denoted by arrows) along a grain boundary. (From Figueroa
& Laird, 1983. Copyright Elsevier Sequoia, S.A. Reprinted with permission.) (ft) White light
interferograms showing slip-step formation at grain boundary in fatigued Cu. (From Kim &
Laird, 1978. Copyright Pergamon Press pic. Reprinted with permission.) The dark diagonal
lines parallel to the arrow are fiducial markers whose separation is 100 urn.
4.8 Crack initiation along grain and twin boundaries
151
in BCC single crystals. The surface roughness created by similar shape changes in the
near-surface grains of polycrystalline BCC metals, such as a-iron, can cause inter-
granular crack nucleation (Mughrabi, Herz & Stark, 1981).
The process of slip involves a simple translation of atoms across a glide plane such
that a rigid block of solid on one side of the slip plane moves with respect to the
other in the direction of slip. Slip occurs by translations in whole multiples of the
Burgers vector, so that the relative crystallographic orientation of different regions in
a slipped material remains the same. On the other hand, a twin boundary is a surface
where the atom positions in the twin on one side of the boundary are a mirror image
of those in the untwinned matrix material on the other side of the boundary.
Therefore, one observes a shape change in a twinned body.
Although twin boundaries are grain interfaces with the lowest energy, their role in
crack nucleation has long been known (e.g., Thompson, Wadsworth & Louat, 1956;
Boettner, McEvily & Liu, 1964; Neumann & Tonnessen, 1988). In FCC metals, twin
boundaries are parallel to the slip planes so that the PSBs can fit into the region of
high local stresses at the boundary. Therefore, the geometric relationship between
the boundary and the slip plane may provide possible clues to the role of twins in
fatigue crack nucleation. An intriguing aspect of fatigue crack nucleation at twin
boundaries is that, in a stack of lamellar twins, there is a propensity for slip bands
and cracks to form only at every other twin boundary (Boettner, McEvily & Liu,
1964). This trend has also been studied in greater detail in the context of annealing
twins formed in polycrystalline Cu, Ni and austenitic stainless steel (Neumann &
Tonnessen, 1988). Figure 4.10 shows an example of fatigue crack nucleation at every
other twin boundary in Cu fatigued at room temperature.
\
V
30[irr.
Fig. 4.10. Nucleation of fatigue cracks along every other twin boundary (indicated by arrows) in
polycrystalline Cu fatigued at room temperature. (From Neumann & Tonnessen, 1988.
Reprinted with permission from P. Neumann.)
152
Fatigue crack initiation in ductile solids
Using the taper sectioning technique (discussed in Section 4.1.2) and electron
channeling method in the SEM, Neumann & Tonnessen have detected the
orientations of grains and the nucleation of microcracks at twin boundaries in FCC metals.
They found that, at low imposed stress amplitudes, PSB formation within the grains
was suppressed. However, PSBs were found exclusively parallel to and coincident
with twin interfaces. Careful grain orientation measurements revealed that, even
when slip activity ceases within the interior of grains, slip bands are activated at
some twin interfaces as a consequence of local stress concentrations.
Neumann & Tonnessen have rationalized the observations of fatigue crack
formation at every other twin boundary utilizing a mechanism which relies on the
elastic anisotropy of the material containing the twins. For example, the shear
modulus of Cu varies with direction by as much as a factor of 3.2. In order to ensure
strain compatibility at twin boundaries in the elastically anisotropic material,
internal stresses must be generated in the vicinity of the twin boundaries. Consider a stack
of lamellar twins, where the crystallographic orientation of the lamellae changes
back and forth from that of the matrix to the twin to the matrix as one traverses
across the boundaries. With the change in orientation, there is also a change in the
direction of internal stresses. The internal stresses act in concert with the resolved
stresses from the applied loads at every other twin boundary. When the resultant
stress is of sufficiently high magnitude, a PSB is formed near the twin-matrix
interface and eventually develops into a fatigue crack. At the alternate boundaries, the
internal stresses oppose the resolved stresses so that slip is obstructed. Neumann &
Tonnessen used this approach to predict the internal stress field in the vicinity of twin
boundaries using elasticity theory. Their simulation, in conjunction with electron
channeling measurements of orientation of grains, correctly predict the twin
boundaries at which fatigue cracks are likely to nucleate.
4.9 Crack initiation in commercial alloys
In engineering components made of commercial materials, the principal
sites of heterogeneous fatigue crack nucleation include voids, slag or gas entrap-
ments, inclusions, dents, scratches, forging laps and folds, macroscopic stress
concentrations, as well as regions of microstructural and chemical nonuniformity. While
surface grains are the most likely locations for crack initiation in metals and alloys of
high purity, the formation of fatigue cracks is feasible at both near-surface and
interior locations in commercial alloys.
4.9.1 Crack initiation near inclusions and pores
The fatigue lifetime and the maximum fatigue strength of commercial alloys
are decreased by the presence of inclusions and pores (generally classified as defects).
4.9 Crack initiation in commercial alloys
153
The mechanisms of fatigue crack initiation at defects depend upon a number of
mechanical, microstructural and environmental factors. These factors involve the
slip characteristics of the matrix, the relative strength values of the matrix and the
defect, the strength of the matrix-inclusion interface and the relative susceptibility of
the matrix and the inclusion to corrosion in the fatigue environment (e.g.,
Cummings, Stulen & Schulte, 1958; Bowles & Schijve, 1973).
The effect of inclusions on fatigue crack initiation is often specific to the alloy
system. Here we consider three examples.
(a) In high strength steels containing MnS particles, the initial stage of fatigue
damage is the debonding of the inclusion from the matrix. This occurs by a quasi-
static mode of failure in that the interfacial separation is induced during the very first
tensile loading at far-field stress levels close to the threshold stress range for infinite
fatigue life. Figure 4.11 shows an example of a partial debonding of an MnO-Si02-
A1203 inclusion from the matrix of a 4340 steel and the nucleation of a fatigue crack
normal to far-field tension.
(b) In aluminum alloys, constituent particles such as the S-phase (Al2CuMg) and
/J-phase (Al7Cu2Fe), typically 1-10 um in diameter, provide sites for fatigue crack
nucleation. The type of cracking, however, is a function of microstructure and test
conditions, (i) In 2024-T4 aluminum alloy, Grosskreutz & Shaw (1969) noticed the
debonding of the particle-matrix interface after cyclic damage within the matrix
over a large number of fatigue cycles, (ii) Another type of crack nucleation in the
2024-T4 alloys involves cracking along slip bands emanating from or terminating
at the inclusions. Figure 4.12 presents the experimentally determined relative
debond
seam
Fig. 4.11. Scanning electron micrograph showing the nucleation of a fatigue crack normal to the
tensile axis (vertical direction) at the site of an MnO Si02-Al203 inclusion which is partially
debonded from the 4340 steel matrix denoted M. (From Lankford & Kusenberger, 1973.
Copyright Metallurgical Transactions. Reprinted with permission.)
154
Fatigue crack initiation in ductile solids
• Al2CuMg (S phase)
X Al7Cu2Fe(/3 phase)
.1 I L_
0 5 10 15
particle thickness (\im)
Fig. 4.12. Relative probability of crack initiation versus the constituent particle thickness
normal to the stress axis for S and /3 inclusions in 2024-T4 aluminum alloy. (After Kung & Fine,
1979.)
probability for the initiation of fatigue cracks at two different types of constituents,
S-phase and /J-phase particles, in a commercial 2024-T4 aluminum alloy as a
function of the particle thickness, measured in the direction normal to the stress
axis. Here, the number of particles in the vicinity of which matrix cracks were
initiated was determined as a function of the particle size. This number was divided
by the particle size distribution to give the relative fatigue crack initiation
probability curves (Kung & Fine, 1979). Note the precipitous increase in crack
nucleation probability with an increase in the size of the inclusion and the scatter
associated with the measurements due to the variability in the size and distribution
of the inclusions.
(c) In high strength nickel-base superalloys, crack initiation has been identified
with the existence of large defects, either pores or nonmetallic inclusions (e.g.,
Hyzak & Bernstein, 1982). At room temperature, crystallographic cracking at or
near the surface is initiated at the sites of the defects at both low and high strain
ranges. At an elevated temperature of 760 °C, low strain range fatigue results in
crack nucleation at the interior of the specimen. Figure 4.13 shows an example of
this process in a complex nickel-base superalloy (made by powder metallurgy
methods conforming to a commercial designation AF-115 and consisting
principally of Ni-Cr-Co-W-Ti-Al-Mo-Hf-Cb-C) where subsurface crack initiation
occurs at an Hf02 inclusion. At high strain range values, however, near-surface
crack nucleation is dominant.
c
o
■^
"c
_*
o
cd
<D
s,
£
S>
Qi
<u
5
4
3
2
n
4.9 Crack initiation in commercial alloys
155
1000 nm
Fig. 4.13. Subsurface fatigue crack initiation at an Hf02 inclusion in an AF-115 nickel-base
superalloy at 760 C. (From Hyzak & Bernstein, 1982. Copyright Metallurgical Transactions.
Reprinted with permission.)
4.9.2 Micromechanical models
Several analytical models which estimate the number of fatigue cycles
required for crack nucleation in the vicinity of defects have been developed over
the years. These models, which have been compared with experimental results with
varying degrees of success, can be broadly categorized into the following groups:
(a) Analyses wherein the voids or debonded inclusions are regarded as notches and
the fatigue limit is estimated from the reduction in fatigue strength due to these
defects (e.g., Tanaka & Mura, 1982). Notch effects on crack initiation are addressed
in Chapters 7 and 8.
(b) Analyses wherein the pile-up of dislocations at the inclusion is considered
responsible for cracking of the inclusion or interfacial debonding with the attendant
inception of a fatigue flaw within the matrix.
(c) Formulations wherein the threshold stress intensity factor range is related to
the square root of the (statistical average) projected area of the defects on a plane
normal to the maximum tensile stress (e.g., Murakami & Endo. 1986).
In a set of models developed for fatigue crack nucleation from intermetallic
particles, Chang, Morris & Buck (1979) and Morris & James (1980) considered a
dislocation pile-up process which views crack initiation as being composed of two
successive events: cracking inside the brittle particle and the onset of crack advance
from the brittle particle into the ductile matrix. The first stage of particle cracking
was assumed to occur when a critical elastic strain energy was reached inside the
156
Fatigue crack initiation in ductile solids
particle near the site of dislocation pile-up. The second stage, i.e. crack advance
inside the matrix, was assumed to occur when the total energy of the system attained
a minimum. The total energy comprises four terms: the elastic strain energy from the
stress field of the piled-up dislocation array, the effective surface energy needed for
crack advance, the work done by the applied stress in opening the crack, and the
elastic strain energy of the crack under the applied stress field.
Tanaka & Mura (1982) presented an extension of the parallel layer model for
surface roughening and slip band fracture to include crack initiation from interme-
tallic particles in high strength steels and aluminum alloys. The initiation of the crack
was assumed to be determined by the energy criterion that the fatigue flaw initiates
when the self strain energy of dislocation dipoles accumulated at the inclusion
reaches a critical value. Tanaka & Mura considered three different processes of
fatigue crack initiation: a slip band crack emanating from a debonded inclusion, a
slip band crack initiating from an uncracked inclusion and inclusion cracking due to
the impingement of slip bands. For the last mechanism, which is believed to be
representative of inclusion cracking in aluminum alloys, the solution was obtained
using Eshelby's equivalent inclusion method (Eshelby, 1957).
4.10 Environmental effects in commercial alloys
If a cyclically loaded engineering component is exposed to a chemically
aggressive medium during service, preferential attack of the environment at select
locations on the material surface may provide nucleating sites for fatigue cracks (Fig.
4.14). These sites are generally corrosion pits which form at surface locations where:
(1) Slip steps or intrusions are created at the surface.
(2) Grain boundaries, either embrittled by temper treatments (as in alloy steels)
or surrounded by precipitate-free zones (as in age-hardened alloys) intersect
the surface.
(3) The protective oxide layer on the surface is partially broken, exposing the
underlying fresh metal to preferential chemical attack.
(4) Inclusions, such as MnS particles in steels, debond from the surrounding
matrix at near-surface locations.
(5) One of the constituent phases in a multiphase alloy is preferentially
corroded.
Corrosion pits are typically smaller than a millimeter in depth and serve as micro-
notches which locally elevate the stress level. Furthermore, the pH level of the
corrosive medium inside the pit can be more acidic than that in the bulk, causing
possible acceleration in the rate of fatigue crack growth. Experimental results
obtained for Ni-Cr-Mo-V steels, austenitic stainless steels and aluminum alloys
4.11 Crack initiation at stress concentrations
157
' v .*
~ * V-
9
I
{ •
r
i
\
\
\
J tlSO Mill,
Fig. 4.14. A fatigue crack initiated at corrosion pits in stress relief groove in a low pressure
turbine rotor made of Ni Cr-Mo-V steel. (From Lindley, 1982. Reprinted with permission
from T.C. Lindley.)
have established that the formation of corrosion pits on the initially smooth surfaces
of the fatigue specimen results in a significant reduction in the fatigue strength.
Figure 4.14 shows an example of fatigue cracks initiated at corrosion pits in stress
relief groove in a low pressure turbine rotor made of a Ni-Cr-Mo-V steel. The rotor
consists of stepped shafts with shrunk-on discs which carry the turbine blades. A
combination of the steady mean stress due to the shrink fit and the pulsating stresses
caused by the self-weight bending resulted in the initiation of fatigue cracks at
corrosion pits. In the case of the turbine component shown in Fig. 4.14, the fatigue
cracks led to the complete failure of the low pressure turbine shaft.
4.11 Crack initiation at stress concentrations
The initiation of fatigue cracks at stress concentrations is a topic of
considerable interest in a wide variety of engineering applications. The issue of crack
initiation at notches and other stress raisers subjected to cyclic tension or tension-
compression fatigue has been investigated extensively in the context of stress-life
approach, strain-life approach and fracture mechanics approach. These approaches
will be addressed in Chapters 7-9.
Here we consider the processes by which fatigue cracks initiate ahead of stress
concentration under fully compressive cyclic loads, primarily because the
mechanistic origins of crack inception in this case can be treated without recourse to the total
158
Fatigue crack initiation in ductile solids
life approaches or defect-tolerant approach. Fatigue crack initiation in ceramics and
polymers subjected to cyclic compression loading is examined in Chapters 5 and 6,
respectively.
4.11.1 Crack initiation under far-field cyclic compression
The analysis of fatigue cracking is generally based on the premise that fully
compressive cyclic loads or compressive stresses superimposed periodically or
randomly upon tensile cyclic loading patterns do not significantly modify the inception
and growth of fatigue cracks. This notion arises from the tacit assumption that
fatigue cracks remain closed during compression loading or even below a certain
tensile load known as the crack closure load (see Chapter 14). There is, however, a
wealth of information available in the literature which has unequivocally established
that far-field compressive stresses can have a marked effect on both the initiation and
propagation of fatigue cracks in both brittle and ductile solids. A neglect of the
influence of compression cycles in fatigue can lead to a nonconservative estimate
of the useful fatigue life.
The initiation and growth of fatigue cracks under the influence of imposed cyclic
compressive stresses are problems of significant practical importance in a wide
variety of engineering applications. Examples of metallic structural components
periodically subjected to compressive stress cycles include: landing gear and wing-root
sections of aircraft,! coil springs, shellings and fillets joining the web and head of
rails in railroad applications, near-surface regions of shot-peened materials, weld-
men ts containing residual compressive stresses, and components of deep-diving sub-
mersibles. The occurrence of this phenomenon can easily be tested in cast iron by
subjecting it to a few cycles of zero-compression-zero loading. Small fatigue cracks,
initiating around the defects and cavities in this material, are readily visible after
such compression fatigue. J
It has long been recognized (e.g., Gerber & Fuchs, 1968) that the application of
uniaxial cyclic compressive loads to notched plates of metallic materials causes the
nucleation and growth of fatigue cracks along the plane of the notch, in a direction
normal to the far-field compressive stress. The cracks propagate at a progressively
slower rate until complete crack arrest takes place at a fatigue crack length, a* (Fig.
4.15). Figures 4.16(a) and (b) are examples of cracks initiated ahead of stress
concentrations in an intermetallic and a metal-matrix composite, respectively, under
fully compressive cyclic loads. Although this phenomenon of noncatastrophic
crack growth from notches under cyclic compression is apparently similar to the
' The compression fatigue failure of upper spar cap on the wing of an F-15 military aircraft is a typical
example (see Rich, Pinckert & Christian, 1986).
♦ A case study of fatigue cracking under cyclic compression in a total hip femoral component is presented
in Chapter 10.
4.11 Crack initiation at stress concentrations
159
■time
:i/w
n _ min
lA^I = l<in-<J
(a)
(b)
number of compression cycles, A'
Fig. 4.15. Schematic showing (a) the loading of a notched specimen in cyclic compression and
(b) typical variation of crack length, measured from the notch tip, as a function of the number
of compression cycles.
behavior of 'nonpropagating' cracks nucleated under cyclic tension (Chapter 7), the
mechanisms underlying the two processes are different.
Observations of controlled crack initiation in cyclic compression of notched
metallic materials were first reported in the 1960s. Hubbard (1969) reported a fracture
mechanics-based study of crack growth in a center-notched plate of 7075-T6
aluminum alloy. He found that fatigue cracks grew from the tip of the notch over distances
of several millimeters. Similar observations have been made subsequently in a variety
160
Fatigue crack initiation in ductile solids
Fig. 4.16. Examples of mode I fatigue cracks initiated at stress concentrations under far-field
cyclic compression:^) Ti-48 Al intermetallic with a predominantly y-phase microstructure. (b)
Al-3.5 Cu alloy reinforced with 20 volume% of SiC particles. The cyclic compression loading
axis is vertical in both cases. (Photographs courtesy of P.B. Aswath and Y. Sugimura,
respectively.)
of ferrous and nonferrous alloys (Saal. 1971; Reid, Williams & Hermann. 1979:
Suresh, 1985b; Pippan, 1987).
The mechanism by which a fatigue crack initiates and advances in a direction
normal to the imposed compression axis is dictated by the development of a cyclic
plastic zone ahead of the notch tip upon unloading from the far-field compressive
stress. In zero-tension fatigue, there develops a region of reversed flow ahead of a
tensile crack within which residual stresses comparable in magnitude to the flow
4.11 Crack initiation at stress concentrations
161
stress in compression exist.f If one considers the case of a 'sharp' nonclosing notch
which is subjected to a zero-compression-zero fatigue cycle, it is seen that the reverse
flow induced within the monotonic plastic zone ahead of the notch tip upon
unloading from the maximum compressive stress generates a zone of residual tensile stresses
at the notch tip (Fig. 4.17). Full field finite element simulations of the generation of
residual tensile stresses in notched plates of ferrous alloys have been reported by
Holm, Blom & Suresh (1986). Quantitative and in-situ measurements of the
evolution of residual tensile stresses ahead of stress concentrations subjected to cyclic
compression loading have been reported by Pruitt & Suresh (1993); see Chapter 6.
Residual stresses are induced ahead of the notch tip during unloading from the
far-field compressive stress because there is no contact (closure) in the wake of the
notch tip. (If a long, sharp fatigue crack, rather than a notch, is subjected to cyclic
compression, such a residual tensile field may not be generated because of the
complete closure of the crack during far-field compression loading and unloading.) Once
a fatigue crack emanates from the notch tip, the faces of the crack tend to remain
partially or fully closed during some portion of the loading cycle. Experimental
load
V)A
time
load
+
time
w
(b)
Fig. 4.17. (a) A schematic of a zone of residual compression ahead of a sharp notch (with a
small included angle at the notch tip) subjected to cyclic tension in an elastic-perfectly plastic
solid. rc is the cyclic plastic zone defined in Eq. 9.74. (b) A zone of residual tension for the
nonclosing notch subjected to cyclic compression.
' As shown in Section 9.6, the size of the cyclic plastic zone ahead of a stationary fatigue crack in an
elastic-perfectly plastic solid subjected to zero-tension cyclic loading in plane stress is about one-quarter
the size of the monotonic plastic zone.
162
Fatigue crack initiation in ductile solids
measurements of crack closure (Suresh, Christman & Bull, 1986) reveal that as the
length of the fatigue crack increases, the fraction of the loading cycle during which
the crack remains open progressively diminishes. This increasing closure causes the
crack to arrest completely after growth over a distance a*, as shown in Fig. 4.15. The
total distance of crack growth ahead of the notch is a complex function of such
variables as the size of the residual tensile zone created during the first cycle, the
stress state, load range, notch tip geometry and the microscopic roughness of the
fatigue crack faces. The distance a* is dependent upon the rate of exhaustion of the
residual tensile zone and the rate of increase in closure stress with increasing fatigue
crack length.
As crack advance under far-field cyclic compression is governed by local tensile
stresses, the influence of microstructure on crack growth behavior is found to be
similar to that seen under far-field cyclic tension. However, the mechanisms of
fracture surface contact and abrasion are different for the two cases.
Since the size and shape of the monotonic and cyclic plastic zones and the extent
of crack closure are strongly influenced by whether plane stress or plane strain
conditions prevail (see Fig. 9.15 and Chapter 14), the stress state is expected to
have a marked effect on the characteristics of crack initiation and growth in notched
components subjected to cyclic compression. Plane stress conditions, where the
monotonic and reversed plastic zone sizes directly ahead of the notch tip are
about three times greater than those for plane strain, Eq. 9.77, a substantially faster
rate of crack initiation and a greater crack growth distance a* are promoted in plane
stress than in plane strain. Holm, Blom & Suresh (1986) conducted a numerical
simulation of the effects of stress state on crack growth in edge-notched plates of
a bainitic steel under cyclic compression using elastic-plastic finite element
calculations with an isotropic hardening model. Geometrical aspects of crack propagation
were modeled by releasing the crack tip node at the peak of each compression cycle
(<Tmax), by changing the boundary conditions, and by solving the contact problem to
determine the stress level of the compression cycle (ctc1) at which the freshly formed
crack faces would first contact during the loading portion. Their results reveal that
the crack remains open during a larger fraction of the compression cycle in plane
stress than in plane strain.
Exercises
4.1 The roughening of the surface of a material by the formation of slip steps
plays an important role in the nucleation of fatigue cracks. Consider a cube
which is made of an FCC single crystal. One of the corners of the cube is
located at the origin of the Cartesian coordinate system (with axes x, y and
z, and unit vectors along the axes i, j and k, respectively). A closed
dislocation loop lies on the plane x = a/2, where a is the edge length of the cube.
Exercises
163
The loop consists of dislocation segments of pure edge, pure screw and
mixed edge-screw characters. If the loop expands in its own plane under
the influence of an applied stress, slip steps will be formed on some faces of
the crystal when all segments of the loop intersect the faces of the crystal.
Indicate the faces of the cube on which the slip steps will form in the
following cases:
(a) The Burgers vector of the dislocation loop is b = bj.
(b) The Burgers vector of the dislocation loop is b = bk.
4.2 An edge dislocation (J.t) is located on the plane x — X\ i x, y and z are the
axes of the Cartesian coordinate system and i, j and k are the corresponding
unit vectors along these coordinate axes. The Burgers vector of _Li is bi = b\
and the dislocation line is parallel to k. A second edge dislocation line ±2,
also oriented parallel to k, is at the origin. Calculate the glide and climb
forces ±i would experience due to the presence of ±2, in terms of xx and 6
(i.e. the angle between the x-axis and the line on the x-y plane connecting the
two dislocations) for the case where the Burgers vector of _L2 is ^2 = *i-
4.3 A crystal contains a single edge dislocation (Burgers vector, b = bi and
dislocation line vector parallel to k, where i, j and k are the unit vectors
along the Cartesian coordinate axes, x, y and z, respectively).
(a) The crystal is subjected to a tensile stress <rt = axx. Calculate the force
on the dislocation. Is it a glide or a climb force?
(b) The stress is now reversed into compression with the compressive stress
ctc = —2axx. Recalculate the magnitude and direction of the force on the
dislocation.
(c) Find the magnitude and direction(s) of the maximum force on a screw
dislocation (oriented parallel to k with a Burgers vector, b = b k) in a
crystal subjected to a shear stress, axz.
4.4 Consider two parallel screw dislocations of the same sign. Obtain an
expression for the force on the dislocations as a function of their relative positions.
Comment on the stability of this arrangement.
4.5 Describe the process of point defect production by the annihilation of two
edge dislocations of opposite signs which are separated by two atomic
planes. The extra planes of atoms in both the dislocations are on the outside
of the slip planes for the dislocations. Use schematic diagrams to show the
orientations, glide directions, and atomic arrangements before and after
annihilation. Are the point defects vacancies or interstitials?
4.6 Consider two parallel edge dislocations of the same sign. Let 6 be the angle
between the line connecting the two dislocations and the direction of their
Burgers vectors.
(a) Calculate the variation of the glide force and the climb force for the two
dislocations as a function of the relative positions of the dislocations
(i.e. as a function of 6).
164
Fatigue crack initiation in ductile solids
(b) Which of the following configurations is more stable and why?
Configuration A: The two dislocations align themselves one below the
other along a direction normal to their slip planes. Configuration B: The
two dislocations align themselves one beside the other along a direction
normal to their slip planes.
(c) Give examples of at least two practical situations where the more stable
configuration in part (b) is observed.
(d) Repeat part (a) for the situation where the two parallel edge dislocations
are of opposite sign.
4.7 A dislocation dipole contains two coplanar edge dislocations of the same
magnitude of Burgers vector but opposite signs. The dislocation lines are
separated by a distance S.
(a) Calculate the shear stress due to the dipole on a parallel plane a distance
k away from the plane of the dipole, for k^> S.
(b) Determine the positions of equilibrium of a positive edge dislocation on
the y = k plane.
CHAPTER 5
Cyclic deformation and crack initiation in
brittle solids
In this chapter, we examine the mechanics and mechanisms of cyclic damage
and crack nucleation in a wide range of brittle materials, including ceramics, glasses
and ionic crystals. The fatigue behavior of brittle polymers is considered in the next
chapter. Although the discussion of cyclic deformation and fatigue crack initiation
for ductile materials was provided earlier in separate chapters, the corresponding
descriptions for brittle materials warrant a single, unified presentation because of the
nebulous demarkation between deformation mechanisms and flaw nucleation. For
example, crack nucleation along grain boundaries can be regarded as the initial stage
of the cyclic deformation process in some brittle materials. Fatigue crack growth in
brittle ceramics and polymers are considered in Chapters 11 and 12, respectively.
It is also pertinent at this juncture to clarify the terminology used in the
description of cyclic failure of brittle solids. In the metallurgy, polymer science and
mechanical engineering communities, the word fatigue is a well accepted term for describing
the deformation and failure of materials under cyclic loading conditions. However,
in the ceramics literature, the expression static fatigue refers to stable cracking under
sustained loads in the presence of an embrittling environment (which is commonly
known as stress corrosion cracking in the metallurgy and engineering literature). The
expression cyclic fatigue is used in the ceramics community to describe cyclic
deformation and fracture. In keeping with the well-established universal conventions, and
in an attempt to avoid confusion, we use the term fatigue in this book to denote
deterioration and fracture of both metals and nonmetals due only to cyclic loads.
Earlier discussions of fatigue in metallic materials (Chapters 2-A) underscored the
role of kinematically irreversible cyclic slip in promoting permanent damage and
crack nucleation. Since cyclic stress effects in ductile metals are intimately related to
the to-and-fro motion of dislocations, it has traditionally been assumed that
dislocation motion (slip) is a necessary condition for fatigue. A broader examination of the
requirements for cyclic fracture in both ductile and brittle solids clearly indicates that
kinematically irreversible microscopic deformation can arise not only from cyclic
slip, but also from microcracking, martensitic transformation, interfacial sliding or
creep. The processes which impart kinematic irreversibility to microscopic
deformation during the fatigue of brittle materials include:
(1) Frictional sliding of the mating faces of microcracks that are nucleated at
grain boundaries (in single phase systems), at interphase regions (in
multiphase systems), and along the interfaces between the matrix and the
reinforcement (in brittle composites) under the influence of the applied loads.
165
166
Cyclic deformation and crack initiation in brittle solids
(2) Progressive wear and breakage, under repeated cyclic loading, of bridging
ligaments which connect the faces of microcracks and long flaws in brittle
solids at low and elevated temperatures.
(3) Wedging of the mating surfaces of microscopic and macroscopic flaws by
debris particles which are formed as a consequence of repeated contact
between the crack faces, especially under fully compressive or tensile-com-
pressive cyclic stresses.
(4) Microcracking due to the release of thermal residual stresses at grain
boundaries and interfaces, which gives rise to a permanent transformation strain.
(5) The inelastic strain arising from shear or dilatational transformations such
as mechanical twins or martensitic lamellae.
(6) The viscous flow of glassy phases that are introduced during processing and/
or formed as a result of environmental interactions at elevated temperature,
and the associated interfacial cavitation in ceramics and ceramic composites
during high temperature fatigue. The strain-rate dependence of viscous
deformation causes the fatigue response of the brittle solid with glassy
films to be both time-dependent and cycle-dependent.
5.1 Degrees of brittleness
Before embarking on a discussion of the mechanisms of cyclic damage in
brittle solids, it is essential to examine as to what constitutes brittle behavior. In
silicate glass, which is a good example of a highly brittle solid, the strength of the
atomic bonds primarily determines the resistance to fracture. Other examples of very
brittle materials include crystals of diamond structure, quartz and sapphire, and
many ceramics at room temperature (Table 5.1). As noted by Lawn & Wilshaw
(1975), flaws in highly brittle solids are characterized by three features: (i) the
flaws need not be large in size to affect the strength significantly, (ii) the flaws are
induced mainly on the surface of the material, as a result of such mechanisms as
contact damage, although flaws in the bulk may also be introduced during
processing (see next section), and (iii) the flaws exhibit wide variations in size, location and
orientation, unless they are intentionally introduced by a controlled process. Design
of brittle materials on the basis of Weibull statistics (Weibull, 1939) separates flaw
populations into surface and volume flaws.
Nonbrittle or ductile solids, such as FCC metals, in which (dislocation) plasticity
plays the dominant role in controlling cyclic deformation and fracture, are at the
other end of the spectrum in this classification of brittleness. In-between these two
distinct groups of brittle and nonbrittle solids lies a category of materials called semi-
brittle solids (Table 5.1). In this class of materials, limited plastic flow occurs prior to
the growth of a brittle crack. Consequently, the component of the resolved shear
stress on the active slip plane becomes as important a factor in deformation and
5.2 Modes of cyclic deformation in brittle solids
167
Table 5.1. Classification of the degree of brittleness according to crack initiation
mechanisms and examples of material types which fit this clasification at room
temperature.
Classification
Main factors
Material
Highly brittle
Bond rupture
Diamond structure, zinc
blende structure, silicates,
alumina, mica, B, W,
carbides, nitrides
Semi-brittle
Bond rupture,
dislocation
mobility
Sodium chloride structure,
other ionic crystals, HCP
metals, most BCC metals,
glassy polymers
Nonbrittle
or ductile
Dislocation
mobility
FCC metals, nonglassy
polymers, silver halides,
some BCC metals
Source: Lawn & Wilshaw, 1975.
fracture as the component of the normal tensile stress on the ensuing crack plane.
This inference is also supported by experimental observations which show that
cracks in semi-brittle solids are nucleated as easily in compression as in tension.
(This behavior is distinctly different from that of brittle solids, which are many
times stronger in compression than in tension.) Semi-brittle solids generally do not
contain a sufficient number of slip systems to accommodate plastic strains. Recall
from Chapter 3 that five independent slip systems are needed to ensure strain
compatibility in a poly crystalline solid. Therefore, the initiation of a brittle crack may be
the principal factor responsible for relieving the strains accommodated by a limited
amount of slip in these materials. Damage evolution by craze formation is another
mode of semi-brittle deformation in polymers, which is discussed in the next chapter.
Increases in temperature tend to reduce the degree of brittleness in a material.
While the classification in Table 5.1 is primarily intended for quasi-static loading
conditions, it should be noted that strain rate and temperature strongly affect the
degree of brittleness in many materials.
5.2 Modes of cyclic deformation in brittle solids
In ductile metals and alloys, the occurrence of cyclic deformation and
fatigue fracture is clearly identified with to-and-fro dislocation motion either in the bulk
168
Cyclic deformation and crack initiation in brittle solids
or in the immediate vicinity of the crack tip. In brittle solids, however, it is generally
not so straightforward to identify a clear cyclic effect. This difficulty arises because
fluctuations in applied loads can lead to a large influence on the cyclic stress-strain
curve and in the crack initiation/propagation life (compared to static loads of the
same peak value) even when there are no discernable differences in the deformation
and damage mechanisms between the static and cyclic loading cases. In this chapter,
and in Chapters 6, 11 and 12, we demonstrate the following effects of cyclic loading
on deformation and cracking in brittle solids.
(1) Cyclic loading resulting in an increased hysteresis or gradual shift in the
stress-strain curve as a result of progressive damage evolution involving
microcracking, crazing, cavitation or phase transformations at both low
and high temperatures.
(2) Cyclic response of semi-brittle ionic crystals at elevated temperatures
wherein the dislocation structures are apparently similar to those of fatigued
ductile FCC crystals at room temperature.
(3) Elevated temperature cyclic response of ceramic composites in which the
cyclic deformation characteristics at the tip of a crack are distinctly different
from those immediately ahead of a statically loaded crack.
In addition, it is shown in this chapter and in Chapters 6, 11 and 12 that an
identifiable fatigue effect, as seen by an enhanced or reduced time to failure or
crack propagation rate compared to a static load of the same peak value or mean
value, can occur in many brittle solids at room and elevated temperature, even when
the mechanisms of deformation and damage are the same under both static and cyclic
loads. The following processes which lead to such fatigue effect are considered in this
connection.
(1) The formation of crazes during cyclic loading results in cyclic softening in
brittle polymers (next chapter).
(2) The inducement of a permanent deformation (such as microcracking or
crazing) within the cyclic damage zone ahead of the notch in a brittle
ceramic or polymer at room temperature results in a mode of crack initiation
and growth under cyclic loads which is distinctly different from that
observed under monotonic compression loads (see Chapters 6, 11 and 12).
(3) The progressive breakdown of bridging ligaments in the wake of a fatigue
crack results in a much higher crack velocity at room temperature under
cyclic loads than under sustained loads of the same peak stress intensity
(Chapter 11).
(4) The bridging of the wake of a fatigue crack by glassy ligaments (formed
from the viscous flow of the glassy films left from the processing additives or
formed in-situ as a result of environmental interactions) leads to a much
lower crack velocity at high temperature under cyclic loads than under
sustained loads of the same peak stress intensity (Chapter 11).
5.3 Highly brittle solids
169
5.3 Highly brittle solids
In highly brittle solids with strong covalent or ionic bonding and very little
mobility of point defects and dislocations, no distinct differences are known to exist
between static and cyclic loading conditions as far as the mechanisms of microscopic
deformation or microcrack nuleation are concerned. However, once microscopic
flaws are induced in a 'static mode', frictional sliding of the faces of the cracks
can impart an apparent plasticity to the deformation of the material, most notably
under compression loading conditions. Consequently, one may envision the
possibility of observing differences in the manner and rate of growth of the internal flaws
under monotonic and cyclic loading conditions.
5.3.1 Mechanisms
There exist several possibilities for introducing crack nuclei during the
fabrication and service of a brittle solid:
(a) Brittle solids contain a population of small microscopic flaws, commonly
known as Griffith flaws. The presence of these flaws can cause marked reductions
in fracture strength. On the free surface, the Griffith flaws can be initiated due to the
impingement of hard dust particles, such as quartz, which are prevalent in the
atmosphere. Within the bulk, defects such as pores, inclusions or gas bubble entrapments
are likely to develop in a commercially-processed material. These internal defects
serve as potential sites for the nucleation of a dominant crack.
(b) The free surface is almost invariably 'rough' on an atomic level. Surfaces
typically consist of steps, grooves, ridges, pits, etc., as a result of crystal growth,
dissolution, cleavage or ion bombardment, even when the surface preparation
techniques and the specimen surfaces are 'clean'. These atomically rough surface features
can serve as local stress raisers in brittle solids where atomic bond rupture is the
principal mode of failure.
(c) In materials such as ceramics, rocks, cement mortar and concrete, distributed
microcracking in the bulk is known to occur along grain facets and/or interfaces. In
noncubic, single phase brittle solids and brittle composites, residual stresses
generated at grain boundary facets and interfaces give rise to microcracking during
cooling from the processing temperature as a result of thermal contraction mismatch
between adjacent grains or phases. Furthermore, the residual stresses may aid in the
nucleation of intergranular flaws under the influence of an external stress. In
transformation-toughened ceramics (to be discussed in Section 5.5), microcracking occurs
in conjunction with stress-induced martensitic transformations.
(d) Brittle materials, when exposed to certain embrittling environments, can suffer
strength degradation and increased susceptibility to flaw nucleation. For example,
the large sodium ion in the glass network is replaced by a smaller species, such as H+
in an acid solution or Li+ in a molten salt. Furthermore, local devitrification of glass
can provide a preferential site for crack nucleation.
170
Cyclic deformation and crack initiation in brittle solids
Although it is experimentally difficult to identify and quantify the extent of stable
microcracking in smooth specimens of brittle solids at room temperature, especially
under tensile loading conditions, observations of confined microcracking damage
ahead of stress concentrations and cracks have been reported for a wide variety of
brittle solids. Figure 5.1(a) shows a zone of grain boundary microcracks formed
ahead of a notch in a single edge-notched specimen of A1203 (average grain size
ss 18 um) subjected to compression loading. Figure 5.\{b) documents a zone of
microcracks, as observed in a TEM foil taken 0.5 um below the tensile fracture
surface, in a transforming ceramic which contains an A1203 matrix with 23% meta-
stable tetragonal Zr02. In this figure, microcracks were nucleated around the Zr02
particles following their transformation from a tetragonal to a monoclinic phase (see
Section 5.5 for details of phase transformations).
5.3.2 Constitutive models
In a linear elastic solid containing a population of open microcracks, the
flaws are generally characterized by a nondimensional density /J, which depends on
their geometry and spatial distribution:
„ 2NC
n
S2\
(5.1)
where Nc is the number of microcracks per unit volume, S is the area of a microcrack
and P is its perimeter. The symbol { } denotes a volume average.
'* , . t
f ■^ mc mc
*\
«
I
>
1 I mt
to
3, ' ' IK jr
1 l0^m (£>) lum
Fig. 5.1. (a) A zone of grain boundary microcracks formed ahead of a single edge-notch in an
A1203 subjected to uniaxial compressive stresses in a direction normal to the plane of the notch.
(From Suresh & Brockenbrough, 1988. Copyright Pergamon Press pic. Reprinted with
permission.) (b) Microcracks ('mc'), denoted by arrows, as seen in a TEM foil taken 0.5 um
from the tensile fracture surface in Zr02-toughened A1203. (From Riihle, Clausen & Heuer,
1986. Copyright American Ceramic Society. Reprinted with permission.)
5.3 Highly brittle solids
171
The change in elastic moduli as a function of the microcrack density, geometry
and orientation has been investigated. Some representative results for a select
number of crack systems are given in Fig. 5.2 for an initially isotropic material with an
initial Poisson's ratio, v0 = 0.25. The indicated moduli E/E0 are measured in a
direction normal to the crack planes and the loading is such that all microcracks
are open. Figure 5.2 compares the results for various crack systems in terms of the
crack density fi, as denned in Eq. 5.1. For a random distribution of equal-sized
penny-shaped cracks, fi = Nca3, where a is the crack radius (Budiansky &
O'Connell, 1976).
Generalized constitutive models for multiaxial loading conditions are well
developed for elastic-plastic solids (see Chapter 3). A number of formulations, analogous
to the deformation and incremental theories of plasticity (Section 1.4), have evolved
from both experimental and theoretical attempts to characterize the constitutive
response of brittle solids, such as concrete and rocks, in monotonic compression
(e.g., McClintock & Walsh, 1962; Nemat-Nasser & Horii, 1982).f
0.0 0.2 0.4 0.6
fi
Fig. 5.2. Variation of the elastic modulus E for a microcracked solid, normalized by its modulus
E0 when no microcracks exist, is plotted as a function of the microcrack density £ for the
indicated crack systems. (After Laws & Brockenbrough, 1987.)
The preponderance of research effort directed at monotonic compression deformation is a consequence
of the fact that brittle solids are many times stronger in compression than in tension and that they are
most commonly used in compression-dominated applications.
172
Cyclic deformation and crack initiation in brittle solids
The development of constitutive models for a microcracking solid in monotonic
and cyclic deformation requires the assumption of a microcrack nucleation criterion.
The nucleation of microcracks is dictated by such complex factors as the
composition of the matrix and grain boundary phases, the occurrence of any stress-induced
phase changes in the microstructure, characteristic microstructural dimensions such
as grain size, prior processing history (and the attendant thermal residual stresses
generated upon cooling from the processing temperature), stress state and test
temperature.
A characteristic stress-strain curve commonly used for the constitutive behavior
of a microcracking ceramic in one cycle of zero-tension-zero loading is
schematically shown in Fig. 5.3. Below a certain threshold stress ct0, the material deforms as if
it were an uncracked solid with Young's modulus E0 and Poisson's ratio v0. Beyond
ct0, microcracking is assumed to increase continuously until a certain saturation
stress cts is reached. A completely saturated state of microcracking, independent of
the applied stress, is assumed based on the notion that the sites for microcrack
nucleation become exhausted above some applied stress level, as, when the local
(thermal) residual stresses dictate microcracking (e.g., Hutchinson, 1987). Above
as, a reduced elastic modulus Es governs elastic deformation. Unloading from
tension gives rise to a permanent strain eT, Fig. 5.3. This strain is viewed as a
transformation strain arising from microcracking due to the release of local residual stresses.
Criteria have been postulated for the evolution of microcrack density f$ as a
function of the applied stress (between the threshold a0 and the saturation as).
Microcrack nucleation at a critical value of principal tensile stress (e.g., Ortiz &
Fig. 5.3. Stress-strain curve for a microcracking material subjected to a zero-tension-zero load
cycle. The strain axis is enlarged for clarity.
5.3 Highly brittle solids
173
Giannakopoulos, 1990) and at a critical mean stress (e.g., Hutchinson, 1987) have
been considered. Other constitutive models for isotropic microcracking have also
been proposed where microcrack nucleation between the threshold and saturation
stages is considered to be governed by an effective stress a. For example,
Charalambides & McMeeking (1987) use the following small strain, nonlinear elastic
constitutive relation to characterize the deformation of a microcracking solid:
Eey = [h(o) + v]a,j - vakkSij, (5.2)
where atj and e,y are components of the stress and strain tensors, respectively, v is
Poisson's ratio, Sy is Kronecker's delta (denned in Section 1.4),
h{&) =
i-T**>
(5.3)
for a random distribution of penny-shaped microcracks, and
£ = V°ry°r!/- (5-4)
With respect to the different regimes of the loading curve in Fig. 5.3, Charalambides
& McMeeking assumed that
fi = 0 for a < ct0,
P = k(a — ct0) for ct0 < a < as,
/( = ft = k(as — a) for a > as, (5.5)
where A; is a factor which governs the rate of microcracking with stress.
In an independent study, Brockenbrough & Suresh (1987) used a similar
assumption of penny-shaped flaws to develop a constitutive model for their numerical
simulation of compression fatigue crack nucleation in highly brittle solids. Using
in situ video photography and acoustic emission measurements, they measured the
threshold stress a0 for microcrack nucleation in edge-notched specimens of
monolithic alumina loaded in uniaxial cyclic compression (Fig. 5.1a shows notch tip
microcracking from one such test). Microcrack nucleation was assumed to follow
the relationship:
P = Al--l\ for |a|>|a0|, p < ft,
£ = 0 for \a\ < \a0\, (5.6)
where A is a factor which, analogous to k in Eq. 5.5, controls the rate of
microcracking with stress, n is an exponent of order unity and a is as denned in Eq. 5.4.
ft = ft for a > cts. Unlike the earlier approaches, the assumption of a saturation in
microcrack density is not essential for the numerical procedure employed for
modeling crack initiation in cyclic compression. Figure 5.4 illustrates the stress-strain
curve (path A) for compression loading.
Let the total density of open microcracks which exist at the maximum far-field
compressive stress of the fatigue cycle be ftnax. Out of this total population, let a
certain fraction of microcracks, of density ft, close fully upon complete unloading
/ 74 Cyclic deformation and crack initiation in brittle solids
(T
+
■//)
///!/--
//Jr^
/<?
0
^0
cs
-
+
e
Fig. 5.4. Constitutive behavior of a microcracking brittle solid in cyclic compression. The strain
axis is enlarged for clarity.
from the far-field compressive stress. The development of permanent strains after
one compression cycle can then be quantified by an unloading parameter,
*=1-7T-- (5-7)
Pmax
The unloading path B in Fig. 5.4 corresponds to the idealized situation where all the
microcracks, of density j6max (= fis if saturation occurs) existing at the maximum far-
field compressive stress, gradually close upon unloading. In this case, fiu = j6max,
A = 0 and no permanent strains exist in the fully unloaded state. Path D represents
the other extreme case where all the microcracks nucleated during compression
loading are blocked by the presence of debris within them or they are locked in
friction. Here, A = 1 and unloading occurs with the same slope as the initial loading
portion of curve A. If the frictional sliding taking place between the faces of the
microcracks during compression loading is partially reversed upon unloading,
0 < fiu < j6max, 0 < A < 1, and unloading occurs along path C. Thus the linear
unloading parameter A conveniently characterizes permanent strains representing
the entire range of linear unloading paths. The elastic secant moduli during
unloading are given by
Eu = E0k + Em{\ - A), vu = v0A + vm(l - A). (5.8)
Em and vm are the values of Young's modulus and Poisson's ratio, respectively, at
the maximum far-field compressive stress.
5.3 Highly brittle solids
175
Using a finite element analysis, Brockenbrough & Suresh (1987) showed that when
the unloading path leads to permanent strains, i.e. for A. > 0, the resulting residual
stresses that arise in the matrix material in the vicinity of a stress concentration are
distinctly different from those induced under monotonic loading conditions. This
effect of permanent strains causes a mode of failure which is unique to cyclic loading
conditions. More significantly, the results imply that kinematic irreversibility of
microscopic deformation (in this case, the differences in the opening and closing
of microcracks) occurring during fatigue in a brittle solid is qualitatively similar to
the development of stress-strain hysteresis due to slip irreversibility in metal fatigue.
Note the similarity of the above formulation for the compression fatigue of brittle
solids to the process of compression fatigue in metals discussed in Section 4.11. A
similar conceptual framework was used by Lawn et al. (1994) to rationalize the
progressive evolution of microcracking during cyclic indentation of brittle ceramics.
A constitutive model similar to that shown in Fig. 5.4 has also been used to predict
the size and shape of the cyclic damage zones developing ahead of tensile fatigue
cracks in microcracking ceramic materials, Suresh & Brockenbrough (1990). These
cyclic damage zones are taken up for discussion in Chapter 11.
5.3.3 On possible effects of cyclic loading
Cyclic load experiments conducted on smooth-surfaced specimens of brittle
solids generally exhibit considerable scatter in number of cycles to failure or time to
rupture. This difficulty arises as a consequence of the variability associated with
initial flaw populations which, as discussed earlier, depend strongly on such factors
as processing methods and specimen surface preparation techniques. In situations
where a small artificial surface flaw is introduced to expedite failure, the results often
are a strong function of the initial flaw size.
Available experimental results generally point to some effects of cyclic loading on
time to rupture vis-d-vis that under static loads on account of the following possible
mechanisms:f
(1) When environmental effects primarily dictate the rupture behavior, the
lifetime is controlled by time-dependent damage and failure mechanisms (see
Chapter 16) and cyclic frequency or waveform has no effect the time to
rupture (see Fig. 5.5).
(2) When purely mechanical cyclic loading leads to a progressive evolution of
damage as, for example, in the exacerbation of intergranular microcracking
during repeated cyclic loading (especially in the compression portion of
tension-compression loading), a detrimental effect of cyclic loading can
result. Under such circumstances, higher cyclic frequencies are generally
more damaging.
' Usually, for comparison of times to rupture under static and cyclic loads, the maximum nominal stress
corresponding to the fatigue cycle is taken to be the same as that of the static stress for smooth specimens.
176
Cyclic deformation and crack initiation in brittle solids
time-dependent
rupture
-Ul
extrinsic factors
promoting a
beneficial effect
of cyclic loading „ -""
no fatigue effect
controlled by ** ^ '
environment | synergistic "1
• effects of .
I environment I
environment
and fatigue | cycle-dependent failure
causing detrimental effect of fatigue
cyclic frequency (log scale)
Fig. 5.5. A schematic illustration of possible beneficial or detrimental effects of cyclic loading on
the time to rupture in brittle solids.
(3) When extrinsic factors, such as deflection of microscopic flaws, wedging of
the faces of microcracks by debris particles which are produced as a result of
repeated contact or the closure of microcrack faces, prominently influence
cyclic deformation behavior, an apparently beneficial effect of cyclic
loading, vis-a-vis static loading, is feasible, as shown in Fig. 5.5.
5.3.4 Elevated temperature behavior
An elevation in temperature tends to lower the degree of brittleness in most
materials. In some ceramics, several micromechanisms concurrently play an active
role in dictating the overall creep deformation. These mechanisms include: atomic
diffusional processes within the bulk of the grains and along grain boundaries and
interfaces, grain boundary sliding, and even dislocation plasticity. In some other
systems, such as many aluminum oxides subjected to certain combinations of
temperatures and strain rates, apparent ductility at elevated temperatures may simply
arise from the growth of microcracks along the facets of elastically deforming grains.
The growth of intergranular flaws may be caused by local diffusion processes or by
viscous flow of any amorphous films deposited along grain facets from the additives
or impurities introduced during fabrication.
This latter mechanism of interfacial microcracking by viscous flow of an
amorphous phase in an otherwise elastic medium can be illustrated with the example of a
SiC whisker-reinforced A1203 matrix composite. It is known that SiC, when exposed
to oxygen-containing media at temperatures typically in excess of 1250 °C, oxidizes
5.3 Highly brittle solids
177
to form an amorphous Si02 glass phase. The viscous flow of this phase at the
elevated temperature leads to the nucleation of cavities and microcracks along the
interfaces between the alumina matrix and the SiC particles. Figure 5.6(a) shows an
example of interfacial cavities formed at every corner of a SiC particle in an A1203-
33 volume% SiC whisker composite fatigued in 1400 °C air. The presence of the
amorphous interfacial film and the kinematically irreversible cyclic displacements
associated with the opening and closing of the interfacial microcracks promote
tensile fatigue deformation mechanisms which can be different, in some cases,
from those seen under sustained tensile loads. The reinforcement phase also breaks
under cyclic loading conditions; Fig. 5.6(b) is a micrograph of a SiC whisker broken
by cyclic tensile loads in 1400 °C air. In this figure, the meniscus of the silica glass
phase can be seen within the broken whisker.
Environmental effects at high temperatures can influence deformation and
fracture in brittle solids subjected to cyclic loads in a manner which is different from that
observed under static stresses. If the material does not contain any macroscopic
cracks or stress concentrations, the fatigue mechanisms described above are confined
to the near-surface region, where oxygen is available. If through-thickness stress
concentrations are present in the material, the transport of the environment to the
tip of the defect causes a damage zone to develop under the influence of an applied
stress. In the example shown in Fig. 5.6, the oxidation of SiC whiskers giving rise to
interfacial microcracking is essentially the same for monotonic and cyclic loading
conditions. However, mechanisms associated with microcrack opening and closure,
bridging of the flaws by reinforcement particles and the breaking of debonded
whiskers are affected in different ways depending upon whether the composite is
subjected to monotonic or cyclic loads.
Direct tensile fatigue tests at 1000-1200 °C on hot-pressed Si3N4 unidirectionally
reinforced (along the tensile axis) with 30 vol.% SiC (SCS-6) fibers also reveal a
gradual reduction in the elastic modulus with the progression of fatigue damage
(Holmes, 1991). No such changes in compliance were observed in specimens which
are subjected to low stress cycles below the endurance limit (at 2 x 10 cycles).
Fatigue-induced changes in elastic properties were observed at maximum stress levels
that were above the monotonic proportional limit, with both mechanical fatigue and
creep influencing progressive damage. This regime of fatigue is characterized by
decreasing stiffness, increasing stress-strain hysteresis, and strain ratchetting (cyclic
creep). However, when the maximum stress level in fatigue is below the monotonic
proportional limit, only creep deformation occurs. This creep regime of loading is
characterized by strain ratchetting, but no change in elastic properties. Holmes has
also shown that the fatigue life deteriorates markedly with decreasing tensile load
ratio R. Figure 5.7 contains experimental data on the changes in the cyclic stress-
strain hysteresis loops with increasing number of fatigue cycles. Note the occurrence
of cyclic creep (as in metals, Section 3.9) and of increase in specimen compliance due
to repeated stress cycles.
178
Cyclic deformation and crack initiation in brittle solids
SiC Kt
^ SiC
0.2 nm
SiC
s^
0.3 jim
(b) - I
Fig. 5.6. Microscopic deformation mechanisms ahead of a crack tip in an Al203-33 volume%
SiC whisker composite fatigued at a stress ratio. R = <ym[n/amzyi = 0.15 and a load frequency of
0.15 Hz (sinusoidal waveform) in 1400 'C air. (a) TEM photograph showing nucleation of
cavities at the interfaces between SiC whiskers and matrix A1203 grains, (b) A SiC whisker
broken under cyclic loads. The meniscus of the amorphous glass phase can be seen within the
broken whisker. (From Han & Suresh, 1989. Copyright American Ceramic Society. Reprinted
with permission.)
5.4 Semi-brittle solids
179
strain (%)
Fig. 5.7. Uniaxial tensile cyclic stress-strain behavior of a Si3N4-SiC fiber composite at
maximum stress levels above the proportional limit (196 MPa). The number of stress cycles is
indicated along with each hysteresis loop. Test temperature, T = 1200 °C, laboratory air
environment, R = 0.1, and vc = 10 Hz. Number of cycles to failure, N( = 6.5 x 10*. (After
Holmes, 1991.)
5.4 Semi-brittle solids
Among nonmetallic crystalline materials conforming to the definition of
semi-brittle behavior, the fatigue deformation characteristics of ionic crystals have
been the subject of much investigation. Experimental studies of monotonic
deformation in rock-salt-type materials have shown that the pile-up of dislocations at
obstacles or at other dislocations can lead to the nucleation of cracks. It is also known
that, under some restricted conditions of temperature and strain rate, cyclic loading
can produce slip bands and cellular structures in rock salt crystals similar to those
observed in FCC metals.
5.4.1 Crack nucleation by dislocation pile-up
When the resolved shear stress exceeds a critical value on a favorably
oriented low index plane of a semi-brittle crystal, such as MgO, dislocation sources
of the Frank-Read type are activated. If the glide of the dislocation loops, moving
outwardly from the source, is impeded by an obstacle such as a grain boundary or an
inclusion, a pile-up of the dislocations occurs at the barrier. Since the piled-up
coplanar dislocations are of the same sign, the mutually repulsive forces between
them cause a concentration of stress at the obstacle. One may then postulate (Zener,
1948) that a brittle crack nucleates at the obstacle if the energy associated with the
pile-up of dislocations is sufficient to compensate for the surface energy term ys
associated with the creation of new crack surfaces. This scenario is the basis of
180
Cyclic deformation and crack initiation in brittle solids
the well known 'Petch' relationship (Petch, 1953) for the grain size-dependence of
yield strength:
.0 _ JkGYs
d„
TXy-T%=J—^, (5.9)
where rxy is the resolved shear stress on the glide plane, x\y is the friction stress
(which is to be overcome before the dislocations glide on the slip plane), G is the
shear modulus and d„ is the grain size of the material. Equation 5.9 is derived by
assuming that the Frank-Read source is located at the center of the grain.
Evidence of dislocation pile-up at grain boundaries and of the attendant nuclea-
tion of a crack at the boundary is available for a number of semi-brittle solids. The
birefringence of transmitted polarized light in Fig. 5.8(a) shows stress
concentrations, generated at the tip of slip bands obstructed by a grain boundary, in a bicrystal
of MgO. Transgranular crack formation at the site of slip band obstruction at the
grain boundary is evident in the micrograph of the etched MgO bicrystal, Fig. 5.8(6).
Figure 5.9 illustrates some mechanisms by which the pile-up of dislocations can
nucleate a brittle crack. The nucleation of a microcrack or a wedge-shaped cavity by
the pile-up of dislocations at an obstacle such as a grain boundary (GB) is shown in
Fig. 5.9(a). The stress gradients ahead of a dislocation pile-up are similar to those
found in front of a shear (mode II) crack. If the interface in Fig. 5.9(a) is weak,
preferential cracking occurs along the interface.
The crack nucleation mechanism shown in Fig. 5.9(b), which was first proposed by
Cottrell (1958), is a process in which two intersecting slip planes provide the nucleus
for a crack, even in the absence of a pre-existing obstacle to slip. This process has
also been suggested as a mechanism for the initiation of subsurface fatigue cracks
along {001} cleavage planes of /S phase in Ti alloys composed of a-/S duplex micro-
structures (Ruppen et al., 1979).
5.4.2 Example problem: Cottrell mechanism for sessile dislocation
formation
Problem:
Consider the dislocation reaction involving a [111] dislocation on the
(101) slip plane and the [111] dislocation on the (T01) plane in iron. This process
is similar to that schematically sketched in Fig. 5.9(b).
(i) Write down the dislocation reaction and find the product dislocation,
(ii) Show that this dislocation reaction is energetically feasible,
(iii) Show that the product of this dislocation reaction is a sessile dislocation.
Solution:
(i) The Burgers vector of the product dislocation is the vectorial sum of the
Burgers vectors of the dislocations on the two intersecting planes:
5.4 Semi-brittle solids
181
• ■•- . . * ^ • •
'%. i ~
-4
(a) | 0.5 mm
•
v . •
*
•
• *
(b) I 30 urn I
Fig. 5.8. (#) Stress concentrations revealed by the birefringence of transmitted polarized light in
an MgO bicrystal at a location where a grain boundary obstructs slip. (From Ku & Johnston,
1964. Copyright Taylor & Francis, Ltd. Reprinted with permission.) (b) Transgranular cracks
formed at sites where slip is impeded by the grain boundary in the MgO bicrystal. (From
Johnston, Stokes & Li, 1962. Copyright Taylor & Francis, Ltd. Reprinted with permission.)
182
Cyclic deformation and crack initiation in brittle solids
(a)
Fig. 5.9. Mechanisms for the nucleation of cracks by (a) dislocation pile-up at a grain boundary
(GB) and (b) dislocation reactions.
a [Hl]nnn + ?[111]
4001].
(5.10)
2 l—J(ioi) ' 2 LlilJ('oi)
Thus, the Burgers vector of the product dislocation is a[001].
(ii) Note that the energy of a dislocation is proportional to the square of the
magnitude of the Burgers vector. The sum of the energies of the two
reacting dislocations is proportional to 3a /2. The energy of the product
dislocation is proportional to a2. Since there occurs a net reduction in
energy, this reaction is energetically favorable,
(iii) The product dislocation is of pure edge character, whose extra plane of
atoms lies parallel to the (001) cleavage plane of BCC a-iron. Since this
dislocation is not favorably oriented for slip (i.e. {110} plane and (111)
direction), it cannot glide. It is a sessile dislocation and forms an obstacle
to other dislocations gliding down the (101) and (101) planes.
5.4.3 Cyclic deformation
Under appropriate cyclic loading conditions, semi-brittle solids can exhibit
characteristics of fatigue damage which are apparently similar to those found in
ductile metal crystals. In his work on surface roughening, Forsyth (1957)
demonstrated that intrusions and extrusions form on the surfaces of cyclically strained
AgCl crystals in much the same way as the development of surface roughness in
FCC metals and alloys (Chapter 4). Figure 5.10 is a micrograph, prepared under
transmitted light, showing surface extrusions and crevices in AgCl. Forsyth found
that the crevices eventually developed into fatigue cracks.
Conditions for the possible development of cell structures in BCC and HCP metals
were examined in Sections 2.12 and 2.13, respectively. There has long been a search
for similar ductile modes of fatigue deformation in semi-brittle crystal structures.
Earlier investigations (e.g., McEvily & Machlin, 1961; Subramanium & Washburn,
1963; Argon & Godrick, 1969) of reversed fatigue in a rotating bend configuration in
NaCl, LiF and MgO at room temperature did not reveal any substructural devel-
5.4 Semi-brittle solids
183
f
«
m
I
m
{
/-.
Fig. 5.10. Intrusions and extrusions formed on the surface of fatigued AgCl crystal. (From
Forsyth, 1957. Copyright The Royal Society, London. Reprinted with permission.)
opments comparable to those found in cyclically strained FCC metals. It has,
however, been shown by Argon & Godrick (1969) that the elevated temperature fatigue
deformation of LiF is similar to the room temperature cyclic deformation
characteristics of ductile FCC metals. They found that above 673 K (which is 59% of the
absolute melting temperature), cross slip and dislocation climb were favored. Cyclic
loading in this temperature regime produced pores throughout the highly strained
volume of the crystal. Continued cyclic straining resulted in a gradual change in the
density of the crystal as a consequence of cavitation. Argon and Godrick measured a
fractional density change of 3 x 10~8 per cycle in LiF crystals fatigued at 783 K at a
strain amplitude of 2.5 x 10~3. Similar pore development was also observed in AgCl
crystals which were fatigued above 423 K (58% of the absolute melting temperature).
Majumdar & Burns (1981) also employed direct push-pull fatigue loading in
smooth specimens of LiF crystals at elevated temperatures and showed that
dislocation banding occurred within subgrains. Microcracking also appeared to take place
along the (110) directions at low strain amplitudes and at large numbers of fatigue
cycles. Associated with the bands are alternate regions of high and low dislocation
density which seem to be sites where dynamic recovery occurs. As the temperature is
raised, the behavior of the LiF crystal appears to resemble more closely that of FCC
metals. A 'PSB-like' slip pattern emerges in the fatigued crystal at a temperature of
573 K, and at low strain rates and strain amplitudes. Ladder-like dislocation
structures appear to exist within the PSBs, Fig. 5.11. The arrangement and the spacing of
dislocations within the ladders of PSBs, however, are different from those of ductile
crystals. The fatigued crystal also exhibits a plateau where the saturation value of the
shear stress is independent of the plastic strain amplitude as in FCC crystals (Fig.
2.2). Further increases in test temperature and strain amplitude cause a cellular
structure to form, similar to the trend seen in regime C of Fig. 2.2.
V
,'.'
184
Cyclic deformation and crack initiation in brittle solids
Vv
i:
^ B
A,* _'v^
ll.lVVCv^ v\v 40um
V »V' •»
v-?-
Fig. 5.11. PSB-like dislocation structure in LiF single crystal fatigued at 573 K.. Aep/2 = 0.5%,
and e = 10~3 s_1. Note that the rungs of the PSB ladder structure are bent, as, for example, at
location A. The curved dark lines running across the micrographs are cleavage steps and their
positions oscillate with the PSB structure, probably as a result of local stresses. (From
Majumdar & Burns. 1982. Copyright Pergamon Press pic. Reprinted with permission.)
Majumdar & Burns (1987) also conducted fully reversed fatigue tests on MgO
single crystals at 743 K. They found that dense bundles of dislocations developed
as a consequence of reversed straining, similar to the vein structure evolving from
the early stages of fatigue in FCC metals (Fig. 2.2). These bundles were aligned
normal to the Burgers vector. Bowed out screw dislocations were observed
between the edge dislocation bundles suggesting that the screws were largely
mobile.
In summary, one of the principal contributing factors for the pronounced brittle-
ness of ionic crystals at low temperatures is the limited possibility for cross slip.
However, when certain combinations of temperature and strain rate favor cross slip,
it is not surprising to observe the aforementioned similarities between their fatigue
deformation characteristics and those of ductile FCC metals.
5.5 Transformation-toughened ceramics
Transformation-toughened ceramics constitute a special class of brittle
solids in which 'plasticity' can be introduced by means of phase changes under the
influence of an applied stress. The phase change imparts a propensity for nonlinear
deformation and for stable fracture in monotonic and cyclic loading. Like the TRIP
steels which exhibit TRansformation-Induced Plasticity, transforming ceramics offer
5.5 Transformation-toughened ceramics
185
the possibility of optimizing strength and ductility by the proper dispersion of a
metastable phase in a stable matrix.
5.5.1 Phenomenology
Tetragonal (?) to monoclinic (m) phase changes occur as a martensitic
transformation in ceramics which contain metastable tetragonal Zr02. This tetragonal
phase may be present in a stable cubic matrix phase in the form of a precipitate (as in
partially stabilized zirconia, PSZ), or a dispersoid (as in Zr02-toughened alumina,
ZTA), or may be formed as the fine matrix phase in the (nearly) 100% ?-Zr02
polycrystals, TZP. Since the seminal paper of Garvie, Hannick & Pascoe (1975)
on this topic, it has been acknowledged that the dilatational and shear strains
accompanying the t to m transformation can account for the remarkable toughening
properties of Zr02-containing ceramics at low temperatures (typically below 700 °C).
Among the various transforming ceramic microstructures, a large body of
research has centered around the monotonic and cyclic deformation and fracture
characteristics of Zr02, partially stabilized with MgO (commonly referred to as Mg-
PSZ). Figure 5.12(a) is a microstructure of a peak-aged (maximum strength) Mg-
PSZ containing 9 mol.% MgO. This material is composed of cubic phase zirconia
grains, of 50 urn average diameter, with the MgO in solid solution. Lens-shaped
tetragonal precipitates, which are 300 nm long and metastable at room temperature,
populate the interior of the grains. The tetragonal c-axis of the precipitates is parallel
to their smallest dimension. The precipitates are oriented within the cubic phase
grains in such a way that their c-axis is parallel to one of the three cubic axes.
Experimental studies by Chen & Reyes Morel (1986) and others reveal that the
mechanism by which microscopic strains induced by martensitic transformation are
converted to macroscopic plastic strains is via shear localization. Figure 5.12(a)
shows an interior section of the material, deformed under a hydrostatic compressive
stress of 200 MPa, showing shear bands within the grains. It is seen that the shear
bands, which span the entire grain, have different orientations in different grains; the
bands within individual grains appear to be parallel. In order for the transformation
of individual tetragonal particles to cause a macroscopic shear strain via shear
banding, it appears necessary that the particle transformation be correlated, as
shown in Fig. 5.12(6).
Shear bands in 'transformation plasticity' can thus be deemed functionally
equivalent to the slip bands in 'dislocation plasticity' of polycrystalline metals. Although
the shear characteristics of the two phenomena are similar in this respect, there are
also some major differences between them. While dislocation plasticity is volume-
preserving, transformation plasticity induces both microscopic and macroscopic
dilatational strains. For unconstrained t ->• m transformation in Mg-PSZ, the
maximum amounts of volumetric and shear strains are 0.04 and 0.16, respectively. When
embedded in an elastic matrix, correlated transformation of the particles leads to the
186
Cyclic deformation and crack initiation in brittle solids
*,* v.
*-
fc
*\ N
*J*.
! 4
(a)
" • 'til
%■ "• • •- S.
v%
»,«
x
S
*
50 um
*
^
(«
Fig. 5.12. (a) Transgranular shear band formation due to martensitic transformation. (From
Chen & Reyes Morel, 1986. Copyright American Ceramic Society. Reprinted with permission.)
(b) Correlated transformation of particles leading to the formation of a shear band.
5.5 Transformation-toughened ceramics
187
nucleation of shear bands, whose orientation varies from grain to grain. Thus, the
average shear strain over the particle for constrained transformation is less than 0.16,
although the dilatant transformation strain is still 0.04 for the particle. It is also
known that martensitic transformation can lead to microcracking as a consequence
of the intersection of shear bands and grain boundaries, as well as by the decohesion
of the transformed particle from the surrounding matrix. The opening of a
population of microcracks also produces macroscopic dilatational strains.
Permanent phase changes cause stress-strain hysteresis in transforming ceramics
upon loading and unloading, similar to the behavior found in metallic materials.
Figure 5.13 is a stress-strain diagram of the peak-aged Mg-PSZ subjected to one
cycle of uniaxial tensile loading. Beyond a tensile stress of about 275 MPa, fully
irreversible phase transformation takes place; the resulting constitutive response
becomes highly nonlinear. Elastic unloading is observed in the nonlinear regime;
reloading occurs with an elastic modulus which is identical to that of the initial
elastic regime. These results indicate how nonlinear effects associated with
martensitic phase transformations can provide a mechanism for stable fatigue damage to
occur in nominally brittle solids.
5.5.2 Constitutive models
Constitutive models for general multiaxial loading conditions have been
proposed to quantify the monotonic and cyclic deformation response of
transforming ceramics in uniaxial loading. Initial developments in this direction have come
from attempts aimed at estimating the extent of toughening due to phase changes
ahead of a crack tip (e.g., McMeeking & Evans, 1982; Budiansky, Hutchinson &
strain (x 103)
Fig. 5.13. Uniaxial tensile loading and unloading behavior of peak-strength Mg-PSZ. (After
Marshall, 1986.)
188
Cyclic deformation and crack initiation in brittle solids
Lambropoulos, 1983). These models, which are described in some detail below,
neglect the shear component associated with the transformation and invoke the
assumption that the dilatant transformation occurs at a critical mean stress am.
In the analysis of Budiansky et al., the constitutive behavior is formulated for a
linear elastic matrix with embedded metastable particles which undergo irreversible
inelastic volume expansion. Assume that the matrix material deforms linearly under
both hydrostatic tension and compression with bulk modulus B, according to
axa = ^akk = B^kk,
(5.11)
where ay and €y are stress and strain tensors, respectively, and €kk is the total
dilatation.
When the mean stress due to a monotonically increasing load is less than a critical
value o^, the particles satisfy Eq. 5.11 with the same bulk modulus B, as shown in
Fig. 5.14. However, once am > o^, the incremental response of the particle is
governed by B1 where
am = Etikk. (5.12)
The inelastic or transformed portion of the dilatation 6V is the difference between the
total and elastic dilatation:
#p — €kk
B
(5.13)
Upon complete transformation, the incremental response is again governed by the
bulk modulus B at large values of €kk, as per the relation
&m = Bikk. (5.14)
particles
matrix
composite
(c)
Fig. 5.14. Stress-strain response due to purely dilatant transformation of particles in the elastic
matrix of the two-phase composite. The shear behavior is linear and the shear modulus is the
same for both the particle and the matrix. (After Budiansky, Hutchinson & Lambropoulos,
1983.)
5.5 Transformation-toughened ceramics
189
In this model, the particle and the matrix are assumed to exhibit the same shear
behavior; the shear modulus of the composite is G at all strains. The incremental
response of the composite for am > o£, is
am = Bekk, - + 4G/3 = B,+ P4G/3 + B + 4J/3 , (5.15)
where fp is the volume fraction of the toughening particles. In the intermediate
segment of Fig. 5.14, the dilatation of the transformed composite is
«-('-D(«»-f> (5l6)
with 9 =fp0p. The maximum dilatation upon complete transformation is 6T —fv0p.
If B1 < —AG/3 in Eq. 5.15, a particle in an infinite elastic matrix with bulk and shear
moduli B and G, respectively, transforms completely to 0^ as soon as the critical
mean stress is imposed. Even if such a transformation occurs at a critical mean stress,
a distribution of critical mean stresses may exist in a composite consisting of a
distribution of particle sizes. In this case, the incremental bulk modulus may never
drop below 4G/3. If the particle distribution is sufficiently wide, supercritical
transformation, i.e. B < —4G/3, may never happen. Budiansky et al. term B = —4G/3 as
the condition denoting a critically transforming composite and B > —4G/3 as the
condition denoting a subcritical transformation. This latter case, with G > 0, is the
condition for a real longitudinal wave speed.
Budiansky et al. use an incremental formulation, similar to that employed for an
elastic-plastic solid (Section 1.4.3), where loading occurs on the transforming branch
of the stress-strain curve if kkk > 0, and
<ym = B€kk and 0=M--W. (5.17)
Unloading occurs if kkk < 0 and
<?m = B£kk and 0 = 0. (5.18)
Upon unloading to zero stress, the permanent dilatation is 6. If 6 < 6T, only partial
(subcritical) transformation is seen. For this purely dilatant transformation, the
stress-strain relations in three dimensions are
€iJ = 2GSiJ + jBam8iJ + 3e8ij' aij = 2Geij + B(€kk-Q)Sij' (5-19)
where Sy are the components of the stress deviator (Section 1.4.2) and
ey (= €y — [&ij£kk\/3) are the components of the strain deviator, respectively.
In an attempt to address the issue of combined dilatational and shear effects on
the multiaxial constitutive response, an experimentally based formulation has been
suggested by Chen & Reyes Morel (1986). They carried out unconstrained and
constrained compression experiments on cylinders of Mg-PSZ at room temperature.
Their experimental results, showing the variation of axial plastic compression strain
(denoted -A), radial strain (denoted R) and volumetric strain (denoted V) as a
function of the differential axial compressive stress E for a superimposed pressure
190
Cyclic deformation and crack initiation in brittle solids
P = 200 MPa, are plotted in Fig. 5.15. A, R and V scale with the applied differential
stress in the ratio of —2 : 3 : 4.
The yield condition for transformation plasticity, which can be derived from the
multiaxial compression experiments, is
f = °e +
OYr
<Xe* > 0,
(5.20)
where <xe is the effective stress, Eq. 1.27, <xm is the mean pressure, and a* and <x^ are
measures of hardness.
The experiments of Chen & Reyes Morel also suggest the following yield criterion
consistent with Eq. 5.20:
Yc=Y{j + acP, (5.21)
where Yq and Yc are the compressive yield stress values at pressures of 0 and P,
respectively, and ac is a constant, which is about two for a wide range of strain
values, except for very small and very large strains. Experiments on Mg-PSZ suggest
that <7* = 3Yq/5 and a^ = 0.5Yq. The numerical value ac = 2, along with the
assumption of normality flow, produces a ratio A : R : V of — 2 : 3 : 4, which is
consistent with the results of Fig. 5.15. Furthermore, since this formulation is phe-
nomenological, it also accounts for the effects of microcracking (induced by
transformation) on deformation.
m+p
0.018
0.016
0.014
0.012
§ 0.010
8 0.008
"3.
0.006
0.004
0.002
1000 1200 1400 1600 1800 2000 2200 2400
|X| (MPa)
Fig. 5.15. Experimentally determined variation of axial (^4), radial (R) and volumetric (V)
strains plotted as a function of the differential axial compressive stress E for Mg-PSZ
(maximum strength condition) under an imposed hydrostatic pressure, P = 200 MPa and a
strain rate, e = 10"4 s"1. (After Chen & Reyes Morel, 1986.)
5.6 Fatigue crack initiation under far-field cyclic compression 191
This experimentally based model has been used to rationalize observations of
tension and compression yield anisotropy in Mg-PSZ. Suresh & Brockenbrough
(1988) have also implemented this constitutive formulation, in conjuction with the
incremental (flow) theory of plasticity, to model the development of transformation
zones and residual stresses ahead of stress concentrations in Mg-PSZ subjected to
cyclic compression loads. For compression fatigue, the model (incorporating elastic
unloading and reloading behavior in fatigue) provided accurate predictions of the
direction of crack nucleation as well as the maximum distance of fracture.
5.6 Fatigue crack initiation under far-field cyclic compression
The possibility that fatigue crack initiation and stable crack growth,
attributable solely to cyclic variations in applied loads, can occur at room temperature
(even in the absence of an embrittling environment) in single phase ceramics,
transformation-toughened ceramics, and ceramic composites was first demonstrated for
cyclic compression loading of notched plates (Ewart & Suresh, 1986, 1987). This
fatigue crack growth phenomenon is a true mechanical fatigue effect on account of
the following experimental observations: (i) Fatigue crack initiation and growth
occur perpendicularly to the compression axis in brittle solids subjected only to cyclic
loads. Monotonic compressive stresses promote a splitting mode of failure parallel
to the stress axis, (ii) There is a gradual increase in crack length with an increase in
the number of compression cycles, (iii) Although an embrittling environment can
modify the rate of crack growth, fatigue fracture in cyclic compression is not a
consequence of environmental effects in that it can take place even in vacuo, (iv)
The rate of crack growth is strongly influenced by such mechanical fatigue variables
as mean stress, stress range, and stress state, (v) The overall crack growth
characteristics of fatigue crack initiation and growth at a macroscopic level are qualitatively
similar to those observed in ductile metals and alloys (see Section 4.11) and semi- or
noncrystalline polymers and polymeric composites (see next chapter).
Brittle solids such as ceramics, rocks or concrete are known to fracture in mono-
tonic compression in one of several mechanistically dissimilar modes (McClintock &
Walsh, 1962; Nemat-Nasser & Horii, 1982):
(1) The frictional sliding of pre-existing flaws produces opening displacements
at the crack tip which are sufficient to initiate a locally tensile mode of
failure. Consequently, in unconstrained axial or radial compression, cracks
extend across planes of local maximum principal tension and curve in a
direction parallel to the maximum principal axis of compression. This
process causes the material to 'split' parallel to the compression axis.
(2) The coalescence of pre-existing microcracks or weak interfaces results in a
shear failure under small confining pressures.
192
Cyclic deformation and crack initiation in brittle solids
(3) Large confining pressures promote a relatively more homogeneous, pseudo-
ductile deformation by limiting the coalescence of micro-defects.
Under cyclic compression loading conditions, however, brittle solids with stress
concentrations exhibit a completely different mode of crack initiation which is
macroscopically similar to that found in metallic materials (Section 4.11). When
notched plates of brittle solids are subjected to some combinations of (cyclic
compression) stress amplitude and mean stress, confined microcracking occurs at the tip
of the notch (see Fig. S.\a). If even a fraction of this microcracking deformation at
the notch tip is permanent (i.e. when microcracks do not open and close the same
way during compression loading and unloading), residual tensile stresses are created
within the microcrack zone upon unloading from the maximum far-field
compression stress. Similarly, permanent strains associated with stress-induced phase
changes, frictional sliding, or creep can also cause residual tensile stresses to develop
ahead of stress concentrations under far-field cyclic compression. Examples of
fatigue crack growth in cyclic compression ahead of stress concentrations in brittle
solids are shown in Figs. 5.16(a) and (b).
Brockenbrough & Suresh (1987) conducted a finite element simulation of near-
tip fields in notched plates of a polycrystalline aluminum oxide subjected to
uniaxial cyclic compression. They used a constitutive model for microcracking
which was described earlier in Fig. 5.4 and in Eqs. 5.4-5.8. Their predictions
of the variation of residual stresses normal to the plane of the notch, ayy
(which is the stress ayy perpendicular to the plane of the notch, normalized by
the product of the maximum far-field compressive stress a°° and the elastic stress
concentration factor for the notch tip Kt), are plotted in Fig. 5.17 as a function
of the distance directly ahead of the notch tip x, normalized by the notch tip
radius p. These computations were made using the following values for the
variables in Eq. 5.6: cr0/(cr°°Kt) = 0.0076, A = 0.004, n = 1, and & = 0.4 for penny-
shaped microcracks. When the microcracking deformation ahead of the notch tip
leaves no permanent strains, i.e. when X = 0, (see Eq. 5.7 and Fig. 5.4), essentially
no residual stresses are induced ahead of the notch tip after one compression
cycle. On the other hand, when X > 0, a region of large residual tension is created
at the notch tip after the far-field compressive stress is removed. Note that
residual stresses are self-equilibrating. A zone of residual tension in the immediate
vicinity of the notch tip is accompanied by a zone of residual compression away
from the notch tip, Fig. 5.17.
The effect of this residual stress zone is that residual tensile stresses easily exceed
the tensile strength of the brittle solid over a distance of the order of the notch root
radius. This implies that a mode I crack will develop over this distance upon
unloading from the far-field compression stress, an inference which is supported by
experimental observations. Once a fatigue crack initiates from the notch tip, its rate of
growth during subsequent compression cycles is dictated by such factors as the
exhaustion of the residual stress zone created during the first cycle, formation of
5.6 Fatigue crack initiation under far-field cyclic compression 193
Fig. 5.16. Examples of mode I fatigue cracks initiated at stress concentrations under far-field
cyclic compression: (a) Polycrystalline A1203. (b) Cement mortar. The compression axis is
vertical in both cases. (From Ewart & Suresh (1986) and Suresh, Tschegg & Brockenbrough
(1989), Reprinted with permission.)
debris particles of the brittle solid due to repeated contact between the crack faces,
the generation of a residual stress field in subsequent cycles, and the development of
closure due to an increase in crack length. Experiments by Ewart & Suresh (1987) on
polycrystalline alumina show that the high frequency contact between the crack faces
generates debris particles of the ceramic, typically of the order of 1 urn in size, within
the crack. The presence of the debris particles promotes a wedging effect. Periodic
removal of the debris particles by ultrasonic cleaning of the crack leads to a
significant increase in the total distance of crack growth (Fig. 5.18). In ceramics with
grain sizes in the range 1-30 um, crack growth over a distance of the order of 1 mm
194
Cyclic deformation and crack initiation in brittle solids
-0.10
0.0 0.5
2.0
x
2.5
3.0
3.5 4.0
Fig. 5.17. Finite element predictions of the normalized stress ayy as a function of the normalized
distance x/p directly ahead of the notch tip for different unloading paths, A. (After
Brockenbrough & Suresh, 1987.)
0 8 16 24 32
number of compression cycles, N ( x 10"4)
Fig. 5.18. Variation of fatigue crack length a, measured from the notch tip, as a function of the
number of compression cycles in a-alumina of grain size = 18 um (curve A). Curve B shows the
increase in crack growth rates as a consequence of reducing crack closure by the removal of
debris particles from the crack after every 5000 compression cycles using ultrasonic cleaning.
(After Ewart & Suresh, 1986.)
5.6 Fatigue crack initiation under far-field cyclic compression 195
has been observed under fully compressive far-field cyclic loads. The fatigue cracks
arrest after growth over this distance because of the development of crack closure in
cyclic compression and the exhaustion of the residual tensile field.
At the maximum far-field compressive stress, there exists a state of compression
immediately ahead of the notch tip. Complete unloading, however, gives rise to a zone
of residual tension at the notch tip. Numerical simulations by Brockenbrough &
Suresh (1987) reveal that residual tensile stresses are generated only after unloading
occurs below a certain critical value, aCI, of compressive stress, i.e. when
aCI < cr00 < <xmax, Fig. 5.17. This result implies that the mean stress of the compression
fatigue cycle will have an important effect on the magnitude and extent of the residual
stress field. As the mean stress is pushed far below the zero level, the extent of residual
tension will decrease and, consequently, crack initiation from the notch tip will become
more difficult. Such predictions have been confirmed independently by experimental
studies of the effects of cyclic compressive mean stress on crack initiation in /S-alumina
(James, Tait & Mech, 1991) and in brittle polymers (Pruitt & Suresh, 1993).
An important feature of the phenomenon of crack initiation from notches under
cyclic compression is that both monolithic and composite (brittle or ductile) solids
with vastly different microscopic deformation modes exhibit a macroscopically
similar mode I fatigue crack growth behavior. The principal reason for this universal
trend is that residual tensile stresses are induced within the notch tip damage zone
during cyclic compression as long as permanent deformation occurs ahead of the
notch tip; such permanent deformation can be a consequence of dislocation
plasticity, phase transformation, microcracking, interfacial sliding or creep. Since the zone
of residual tension is embedded within a compressive residual stress field, crack
initiation and growth in cyclic compression is intrinsically stable even in brittle
solids. Results of numerical analysis of the residual stress fields ahead of notches
subjected to cyclic compression have been reported by Suresh & Brockenbrough
(1988) and Suresh (1990a) for single phase ceramics, transforming ceramics, creeping
solids, and cement mortar.
Experimental studies of crack initiation in cyclic compression in ceramic
composites have pointed out the potentially deleterious effects that fatigue loads can have on
the service life of a structural component (see, for example, Suresh, 1990a). Consider,
for example, the case of hot-pressed Si3N4 which is reinforced with SiC whiskers. It is
known that the addition of 20-30 volume % SiC to the Si3N4 matrix can lead to an
increase in fracture toughness by more than a factor of two over that of the unrein-
forced matrix material. However, when the composite contains stress concentrations,
the application of cyclic compressive loads causes fatigue cracks to initiate more easily
in the composite than in monolithic Si3N4. This effect can be rationalized by noting
that the stress-strain curve for the composite is more nonlinear than that for the
matrix material. Unloading from a far-field compressive stress can promote a higher
degree of permanent deformation which, in turn, may lead to larger residual tensile
stresses ahead of the stress concentration (see Fig. 5.17).
196
Cyclic deformation and crack initiation in brittle solids
Crack initiation ahead of stress concentrations subjected to cyclic compression
also offers a capability to introduce controlled fatigue pre-cracks in brittle materials
prior to the determination of fracture toughness, creep crack growth, or fatigue
crack growth in tension. An advantage of this technique is that fatigue cracks can
be introduced in brittle solids such as ceramics and ceramic composites and in ductile
metals using similar cyclic compression test conditions and specimen geometries.
Furthermore, the cyclic compression pre-cracking method is the only known
technique for introducing fatigue pre-cracks in circumferentially notched cylindrical rods
of brittle solids (which are used for quasi-static and dynamic mode I and mode III
fracture tests).
5.6.1 Example problem: Crack initiation under far-field cyclic
compression
Problem:
A polycrystalline ceramic plate containing a through-thickness edge notch
is subjected to uniaxial cyclic compression loading at room temperature. The
specimen is placed between two perfectly parallel surfaces and the cyclic
compressive loads are applied in a direction normal to the plane of the (nonclosing)
notch. The peak load of the fatigue cycle is <xmax and the lowest load is <xmin. (For
fully compressive cyclic loading, where <xmax and <xmin are both negative,
^min <~ ^max* l^maxl <~ l^min
| and R = \crmin\/\amix\ > 0.) Assuming that grain
boundary microcracking due to the applied loads is the primary source of
inelastic deformation, answer the following questions.
(i) Four experiments are conducted where <xmin is held fixed and constant-
amplitude compressive stress cycles with the following R ratios are used:
(a) 2, (b) 10, (c) 30, and (d) oo (which corresponds to zero-compression
cyclic loading with <xmax = 0). How would you expect the initial rate of
crack growth and the maximum distance of crack growth under cyclic
compression (before complete crack arrest) to vary as a function of R for
these four cases?
(ii) Three additional experiments are conducted where <xmax is held fixed and
the following R ratios are used: (a) 2, (b) 10, and (c) 30. How would you
expect the initial rate of crack growth and the maximum distance of crack
growth under cyclic compression (before complete crack arrest) to vary as
a function of R for these three cases?
Solution:
On the basis of the information provided, assume that the trends
predicted by the simulations in Fig. 5.17 apply to the polycrystalline ceramic
considered here.
Exercises
197
(i) It is evident from the preceding section and the given information that,
for fixed <xmin, the extent of permanent damage developed ahead of the
notch during compression loading is the same in all four cases. The extent
of residual tensile stresses generated upon unloading then is dependent on
the <xmax. That is, the closer is the value of <xmax to zero far-field stress (and
hence the higher the R ratio), the larger would be the tensile stress
generated at the notch tip. Therefore, the maximum tensile residual stress
field (or a distance ahead of the notch tip over which a tensile stress of
some level is developed) would be expected to increase with an increase in
the applied R ratio. Consequently, the initial rate of crack growth and the
maximum distance of crack growth under cyclic compression (before
complete crack arrest) would both increase with an increase in R ratio.
(ii) For a fixed value of applied <xmax, amin increases with increasing R. Larger
the value of R, greater would be the amount of permanent deformation
(in this case, microcracking) at the notch-tip. As a simple approximation,
one would then expect A. to be higher for higher values of R. From Fig.
5.17, it could then be argued again that the extent of tensile residual stress
field, the initial rate of crack growth and the maximum distance of crack
growth under cyclic compression (before complete crack arrest) would all
increase with an increase in R ratio.
Exercises
5.1 Two dislocations in BCC a-iron with Burgers vectors a0/2 [111] and
a0/2 [111] (where a0 is the lattice dimension) glide along two intersecting
(110}-type slip planes meet.
(a) Write down the dislocation reaction and show that it is energetically
favorable.
(b) Discuss the orientation of a possible cleavage crack which could be
triggered by this Cottrell mechanism.
5.2 A cubic crystal contains a mixed dislocation (i.e. a dislocation with
combined edge and screw components) with a Burgers vector parallel to [001].
What would be the orientation and geometry of the steps on the cleavage
fracture surface for a crack propagating along the cleavage plane (001)?
Discuss various possibilities for the crack-dislocation intersection.
5.3 Consider a brittle elastic solid which is subjected to cyclic loading. The
material is first loaded in uniaxial tension. At a threshold tensile stress <xT,
microcracks initiate in the material; a further increase in tensile stress to a
peak value of ormax results in a progressive increase in both the number of
microcracks per unit volume and the average size of the microcracks, and in
198 Cyclic deformation and crack initiation in brittle solids
the release of the residual thermal strain. The specimen is unloaded at olmm.
During unloading, the microcracks remain open until a far-field tensile
stress of aTcont. Below aTcont, lowering the far-field stress to zero and
subsequent load reversal into compression results in a gradual recovery of
stiffness until all the microcrack surfaces are closed (where the far-field
stress is crcdose). Further increases in compressive stress to a peak value of
acmax are borne by the fully dense elastic solid. Unloading from the far-field
compressive stress results in the elastic recovery of a fully dense solid until
the microcracks reopen at a far-field compressive stress of <xcopen> with
laCopenl > laCclosel-
(a) Plot the variation of the far-field stress against the average inelastic
strain (i.e. total strain minus the elastic strain for the fully dense
solid) for one full fatigue cycle involving
zero-tension-zero-compression-zero loading.
(b) How is the stress-strain curve in (a) affected by the presence of a
population of pre-existing microcracks prior to fatigue loading.
(c) Suppose that, in (a), frictional sliding occurs between the faces of the
microcracks (as, for example, along grain boundaries or shear bands)
upon unloading from the far-field compressive stress. Schematically
sketch the stress-strain curve by incorporating the sliding mechanism.
5.4 Cyclic indentation of a brittle solid exhibits some features which are
qualitatively similar to those discussed in connection with the cyclic compression
loading of a notched brittle solid. Discuss the similarities and differences
between the initiation of a fatigue crack in a notched brittle solid subjected
to cyclic compression loading and the cracking that occurs beneath the tip of
an indenter repeatedly pressing against the surface of a brittle solid.
5.5 The mechanism for the nucleation of a crack by the pile-up of dislocations,
Fig. 5.9(a), at an obstacle (such as a grain boundary) was proposed by A.N.
Stroh (Proceedings of the Royal Society, London A223, p. 404, 1954, and
A232, p. 548, 1955). Since the dislocation pile-up leads to stress
concentration in much the same way as a mode II crack, the near tip stress fields ahead
of a mode II crack, Eqs. 9.47, can also be used to model the fields ahead of
piled-up dislocations. Stroh postulated that cleavage fracture will nucleate
at an obstacle when the maximum local tensile stress, o99 reaches a critical
value.
(a) Using Eq. 9.47, show that a90 is a maximum at an angle of-70.5° from
the plane of dislocation pile-up.
(b) Following a procedure similar to that used in the previous problem on
the Petch relationship, show that the cleavage fracture stress takes the
form:
aF = <T; + k¥dg11 ,
Exercises
199
where ct; is the friction stress associated with lattice resistance, kF is a
material constant, and d$ is the mean spacing of the obstacles.
5.6 List three reasons why the crack growth characteristics of brittle ceramics
and ceramic composites from stress concentrations subjected to cyclic
compression are qualitatively similar to those seen in notched metallic plates.
5.7 A silicon nitride ceramic matrix is reinforced with 10, 20 and 30 volume% of
SiC short fibers. Uniaxial tensile tests conducted on the unreinforced as well
as the reinforced ceramics show that the stress-strain curve exhibits greater
nonlinearity with an increase in the concentration of SiC. An increase in SiC
content also leads to an apparently higher overall fracture toughness.
Discuss possible effects of SiC reinforcement and the effects of SiC
concentration on the propensity of notched silicon nitride matrix ceramic to sub-
critical crack growth under cyclic compression.
CHAPTER 6
Cyclic deformation and crack initiation in
noncrystalline solids
The cyclic deformation and fatigue crack initiation characteristics of semi-
crystalline and noncrystalline solids are the subjects of discussion in this chapter.
Attention is devoted to a consideration of the response of polymers and organic
composites. The principal objective of this chapter will be to document the
prominent mechanisms of fatigue in amorphous materials and, in particular, to
present a detailed description of the similarities and differences between the fatigue
characteristics of crystalline and noncrystalline materials. As in the case of brittle
ceramics and composites, the discussion of cyclic deformation and crack initiation
is presented here in a single chapter because in many instances, microscopic
cracking processes (such as crazing) constitute prominent mechanisms which influence
fatigue response. Also addressed in this chapter is the topic of fatigue crack
initiation at stress concentrations in polymers. Stress-based and strain-based approaches
to fatigue life of polymers are considered in Chapters 7 and 8, respectively. Fatigue
crack growth in semi-/noncrystalline solids is taken up in Chapter 12.
6.1 Deformation features of semi-/noncrystalline solids
6.1.1 Basic deformation characteristics
A noncrystalline material can be a metallic glass (e.g., Pd-20 at.% Si alloy),
an inorganic glass (e.g., silicate glass), or an organic glass (i.e. a polymer).
Amorphous materials exhibit a variety of permanent deformation modes depending
on their basic structural unit. This fundamental unit is a single atom for a metallic
glass whereas, for an inorganic glass, the building block is a Si04 tetrahedron. A
long-chain molecule built upon a tetravalent carbon atom is the basic structural unit
for an organic glass. The deformation of an amorphous solid can take place
homogeneously through the bulk of the material or heterogeneously along shear bands or
crazes. On a macroscopic scale, the deformation of an amorphous solid can be as
varied as linear elastic, plastic or Newtonian viscous depending on the temperature,
applied stress and strain rate. With the increasing technological importance of
materials such as plastics in structural applications, the fatigue of amorphous solids has
also become a topic of major practical interest.
The formation of long-chain molecules is the main feature of the structural
constitution of polymers that differs from the basic building block of atomic solids (such
as ceramics and metals) or space networks (such as oxide glasses). The obstacles to
200
6.1 Deformation features of semi-jnoncrystalline solids
201
complete crystallization in polymeric solids arise from the very existence of the long-
chain molecule and of the chain branches and side groups. Consequently, the
structure of a polymer can be fully amorphous or of a semi-crystalline arrangement in
which folded molecular chains are formed amid an amorphous phase.
With the exception of some modes of deformation such as craze formation or the
rotation of molecular chains, the mechanisms of deformation and failure in
polymeric solids exhibit many similarities to those discussed earlier in this book for
metals and ceramics. Under cyclic loading, polymers display deformation modes
(such as stress-strain hysteresis and cyclic softening) and subcritical crack growth
analogous to atomic solids. It was shown earlier in the context of fatigue in metals
and alloys (Chapters 2-A) and in ceramic materials (the preceding Chapter) that
kinematic irreversibility of microscopic deformation is an important reason for the
onset of true mechanical fatigue effects. In polymeric solids, such kinematically
irreversible deformation can be manifested as crazing, shear band formation,
rotation or other changes in the orientation of molecular chains, or a combination of
these mechanisms.
6.1.2 Crazing and shear banding
Homogeneous deformation in glassy polymers is effected by the
displacement of segmented molecular chains and by the gradual orientation of the long axis
of the initially unaligned molecules with the tensile loading axis. Crazing and shear
flow are the two most common modes of deformation during the fatigue of
polymers. Crazing generally has the connotation of brittle failure, whereas deformation
by shear banding represents a more ductile process. The relative dominance of these
two processes during fatigue is dictated by many mutually competitive mechanisms
which depend on the molecular structure, specimen geometry, processing methods,
test temperature, loading rate, stress state, fiber reinforcements, and the degree of
plasticization.
Crazes occur in glassy polymers, such as polystyrene (PS),
polymethylmethacrylate (PMMA) and polysulfone (PSF) and in some semi-crystalline ones such as
polyethylene (PE), polypropylene (PP), polyethyleneteraphthalate (PETP), and
polyoxymethylene (POM) (see, e.g., Kramer (1983) and Kramer & Berger
(1990)). When these polymeric solids are subjected to tensile stresses at low
temperatures, fine crack-like features appear which apparently resemble surface flaws
in ceramics. There is a continuity of material across a craze, whereas the faces of a
Griffith crack in a brittle solid are fully separated. Crazes are always oriented
perpendicularly to the maximum principal tensile stress, while the Griffith flaws
in a brittle solid with an equi-axed grain structure essentially have a random
distribution. However, crazes can be regarded as the polymer analogue of dilatant
transformations arranged perpendicularly to the maximum principal tensile stress.
202
Cyclic deformation and crack initiation in noncrystalline solids
In this sense, crazes lead to inelastic strains in much the same way as the shear
and/or dilatant transformations in metals and ceramics (such as mechanical twins
or martensitic lamallae). Furthermore, purposely promoting the formation of
crazes at lower stress levels in an attempt to develop appreciable dilatational
plasticity is viewed as a possible means of toughening polymers (e.g., Argon,
1989). This approach is conceptually similar to the mechanisms of microcrack or
transformation toughening in brittle solids (see Chapter 5). Cyclic deformation and
the subcritical advance of fatigue fracture in many polymers are dictated by the
nucleation, growth and breakdown of crazes.
A craze contains fibrils of highly oriented molecules (craze matter) separated by
porous regions. The density of the craze matter is only 40 to 60% of the matrix
density and the molecular fibrils are oriented along the direction of the maximum
tensile stress. Figures 6.1(a) and (b) are electron micrographs of a newly formed craze
Y
♦ *
0.5 nm
(a)
0.3 (im *
(*)
Fig. 6.1. (a) A newly formed craze in a thin slice of PS. Note the orientation of the craze normal
to the tensile stress axis (indicated by the arrow) and of the fibrils parallel to the tensile stress
axis, (b) An electron micrograph of the central section of another craze. (From Beahan, Bevis &
Hull, 1971. Copyright Taylor & Francis, Ltd. Reprinted with permission.)
6.1 Deformation features of semi-1 noncrystalline solids
203
in a thin slice of PS which was loaded on a mini-tensile straining device. Note that
the craze is oriented normal to the uniaxial tensile stress and that the fibrils within
the craze are aligned with the tensile axis. (The craze geometry is discussed in further
detail in Chapter 12.) It is generally known that the criterion for the nucleation of a
craze in a three-dimensional stress state is of the form:
<W - <Vin > A(70 + ^^, (6.1)
where <rmax and amin are maximum and minimum principal stresses, respectively,
A(T) and Q\(T) are material constants which depend on the temperature, and <rH
is the hydrostatic stress (Section 1.4). Even if the overall hydrostatic stress is
negative, a craze can advance if there exists one tensile stress component (with the craze
extending normal to the tensile stress direction). The nucleation of crazes in crazable
polymers has been investigated in detail, and the criteria for their formation have
been developed in terms of the tensile hydrostatic stress component and the devia-
toric stress component of the imposed stress state (e.g., Argon & Hannoosh, 1977;
Argon, 1989).
The growth of crazes is also a topic of considerable interest because cracking in
many polymers is preceded by the formation of a craze. In this sense, the craze zone
ahead of a crack in a polymer is somewhat analogous to the plastic zone in front of a
crack in a ductile metallic material. Under an imposed stress, the craze extends by
drawing more polymer from its surface into the fibril while the fibrils themselves
deform by creep, Kramer & Hart (1984); see Section 12.2 for further details.
Shear localization is also a prominent feature of deformation and failure in many
polymers. At stress levels lower than the tensile strength of the glassy polymer,
'plastic' deformation can be initiated by the formation of shear bands. In polymers
susceptible to shear banding, the onset of 'yielding' is associated with the inception
of shear bands. Figure 6.2 shows shear bands in plastically stretched PETP. Shear
bands are always oriented along the direction of the maximum shear stress.
6.1.3 Cyclic deformation: crystalline versus noncrystalline materials
There are many apparent differences in the cyclic deformation
characteristics of metals and polymers at room temperature. These distinctions stem from the
differences in their homologous temperature (in relation to the test temperature),
thermal diffusivity and structural constitution.
(1) Whether a metallic material undergoes cyclic hardening or softening
depends on such factors as the degree of prior cold work, composition,
and heat treatment. Polymeric materials, on the other hand, exhibit only
cyclic softening behavior. Drastic changes in composition, molecular
structure, temperature, and strain rate alter only the degree to which cyclic
softening occurs in polymers. Even cyclic stability is rarely observed; it may
occur only under conditions of small strain amplitudes.
204
Cyclic deformation and crack initiation in noncrystalline solids
*s
sb
sb
X
50 urn
Fig. 6.2. Shear bands (sb) and crazes (c) in plastically stretched PETP. (From Argon, 1980.
Copyright Academic Press. Reprinted with permission.)
(2) The second major distinction between fatigue of metals and polymers is the
degree to which the loading rate influences the stress-strain characteristics
and failure modes. For many polymeric materials, even room temperature is
a significant fraction of the homologous temperature. Furthermore, hystere-
tic damping effects are substantial in thermoplastics as a result of their
strong nonlinear viscous behavior, which is not the case for metals. These
factors, coupled with the poor thermal diffusivity of polymers, can result in
marked increases in temperature during cyclic deformation at sufficiently
high strain rates. The attendant thermal softening becomes an important
consideration and may even dominate over any intrinsic mechanical fatigue
effects. These interactions between adiabatic thermal effects and mechanical
fatigue are complex. For certain combinations of stress amplitudes and
strain rates, thermal effects exacerbate the fatigue failure process while, in
other cases, the combination of the thermal and mechanical effects is not
deleterious to fatigue life. The imposition of low strain rates to circumvent
6.2 Cyclic stress-strain response
205
thermal softening effects may promote other time-dependent deformation
processes such as creep.
(3) Repeated dislocation glide along crystallographic slip systems is the
dominant mode of fatigue deformation in metallic materials. However, there
exists a variety of microscopic deformation modes in polymeric materials.
The underlying mechanisms may include homogeneous deformation
involving normal and shear yielding, disentanglement, reorientation and slip of
chain segments, crystallization, or heterogeneous deformation arising from
shear banding and crazing.
6.2 Cyclic stress-strain response
Comprehensive studies of the cyclic stress-strain characteristics of
polymeric materials have been reported by Rabinowitz & Beardmore (1974) and
Beardmore & Rabinowitz (1975). These investigators have shown that cyclic
softening is the general fatigue phenomenon in ductile polymers, irrespective of the
underlying molecular structure, although cyclic softening becomes more pronounced
with increasing ductility. Amorphous and semi-crystalline polymers as well as
polymer-matrix composites exhibit cyclic softening. Changes in the extent of crystallinity
mainly affect the degree and rate of cyclic softening. For example, when subjected to
low strain amplitudes, amorphous polymers exhibit an incubation period prior to
strain-softening; this incubation period diminishes with increasing values of imposed
strain amplitudes. The cyclic stress-strain curves of homopolymers develop stable
hysteresis loops. However, polymer-matrix composites undergo cyclic softening
throughout the fatigue life without ever attaining a saturated state. This behavior
may result from the gradual development of microscopic damage in the matrix, in
the reinforcement or along the matrix-reinforcement interface.
6.2.1 Cyclic softening
Figure 6.3(a) shows the cyclic softening behavior of polycarbonate (PC)
subjected to strain-controlled fatigue at 298 K. While the stress-strain hysteresis
loops are generally symmetric about the origin in metallic materials, the initial
hysteresis loop (in the first full cycle of loading) for polycarbonate exhibits a
propeller-like shape at room temperature as a consequence of inelastic deformation. By
repeating this strain-controlled fatigue experiment at several different strain
amplitude levels, the cyclic stress-strain curve shown in Fig. 6.3(b) is obtained (which is the
same as the strain-controlled test method described in Chapter 3 for metals). In the
low strain regime, the mono tonic and cyclic tension responses are identical. The
amount of cyclic softening increases with increasing strain values. A compressive
206
Cyclic deformation and crack initiation in noncrystalline solids
strain (%)
(b)
Fig. 6.3. Cyclic softening in PC subjected to strain-controlled fatigue at 298 K. (a) Change in the
size and orientation of the hysteresis loops with the progression of fatigue deformation, (b)
Stress-strain response in monotonic tension and fatigue. (From Rabinowitz & Beardmore,
1974. Copyright Chapman & Hall. Reprinted with permission.)
stress-strain curve in monotonic and cyclic loading can also be obtained in a similar
fashion. The origin of the differences between monotonic and cyclic response is
linked to the molecular rearrangements. During cyclic deformation, the strains are
accommodated by molecular rearrangements at the microscopic level, whereas
monotonic loading promotes more macroscopic permanent deformation associated
with molecular rearrangements.
6.2 Cyclic stress-strain response
207
6.2.2 Thermal effects
As noted earlier, the local temperature rise associated with hysteretic heating
in fatigue-loaded polymers can result in thermal softening even in room temperature
fatigue for certain combinations of strain rates and cyclic stresses/strains. The typical
differences between the thermal and mechanical fatigue effects are illustrated in the
photographs of failed specimens of PMMA shown in Fig. 6.4.
6.2.3 Example problem: Hysteretic heating
Problem:
The temperature increase in the polymer is precipitated by the
accumulation of hysteretic heat during each fatigue cycle. Consider a polymer subjected to
a sinusoidal variation of cyclic stress,
a = o0 sin cot, (6.2)
where a is the stress at time t, a0 is the peak value of the stress cycle, and
to = 2nvc is the angular frequency, vc being the number of stress cycles per
unit time. If the viscoelastic behavior of the polymer is linear (see Section
1.4.4), the strain will also fluctuate sinusoidally, but it will be out of phase
with the stress by a phase angle S, which is a function of co. The peak values
of the stress and strain, ct0 an^ ^o, respectively, are related by the complex
modulus E*, where
Fig. 6.4. Examples of failure due to cyclic thermal softening (top) and mechanical fatigue
(bottom) in PMMA. The total length of the test specimen is 110 mm. (From Constable,
Williams & Burns, 1970. Copyright Council of the Institution of Mechanical Engineers.
Reprinted with permission.)
208
Cyclic deformation and crack initiation in noncrystalline solids
E* =E + if, \E* | = ^ = Me*)2 + (e")2. (6.3)
eo
E is known as the storage modulus and it denotes the ratio of the stress in phase
with the strain to the strain. The imaginary number i = V—T. E is the loss
modulus and it is the ratio of the stress which is 90° out of phase with the strain
to the strain. The linear viscous deformation due to sinusoidal fatigue loading
can also be characterized in terms of the complex compliance,
D*=-^ = D'-iD", (6.4)
where, analogous to the storage modulus and loss modulus, D' and D" denote
the storage compliance and loss compliance, respectively. The entity
tan 8 = E /E = D"/D' is known as the loss tangent.
(i) Find the rate of hysteretic energy dissipated per fatigue cycle.
(ii) If H represents the heat transfer coefficient for loss of heat from the
specimen surface to the surroundings, and T and T0 are the instantaneous
specimen temperature and the ambient temperature, respectively, derive
an expression for the rate of temperature increase assuming adiabatic
heating conditions.
Solution:
(i) The rate of hysteretic energy dissipated as heat, Q, per unit volume of the
material during fatigue loading is given by
■ „.„ 2kvclt' tan8
Q=ae = ^ , (6.5)
where e is the strain rate and the superscripts ' and " indicate the real and
imaginary components, respectively (Constable, Williams & Burns, 1970).
Combining Eqs. 6.2 and 6.5 with the result that a2 =a (1 + tan2 8), one
obtains the energy loss per stress cycle,
^ f*^ noo tan 8 tr rx
Q= Qdt = ^ 2 ■ (6.6)
Jo E l+tanzS
The average energy dissipation rate per unit volume is
• co kvcct2 tan 8 „ 2
Q = Q^ = —— 7——-2-z = nvcD a0. (6.7)
2tt £ 1 + tanz 8
For cyclic loading with a zero mean stress, the peak stress value of the
fatigue cycle is the same as the stress amplitude Act.
(ii) If adiabatic heating conditions prevail (i.e. heating in which all of the heat
generated within the polymer is manifested as a temperature rise and
none is lost to the surroundings), the time rate of change of temperature
dT/dt is given by
6.2 Cyclic stress-strain response
209
dJT
dt
nvcD"ol
pcp
(6.8)
where p is the mass density and cp is the specific heat. In reality, however,
some heat is lost to the surroundings. Equation 6.8 may be modified to
account for heat loss:
dJT
dt
7TvcZ>"ct0 HA
(T - T0).
(6.9)
pcp pcp V
Here A and V are the surface area and volume of the fatigue test
specimen, respectively. Note that the loss compliance D" depends strongly on
both tempeature and strain rate. As the specimen temperature increases
and approaches a critical softening temperature, the specimen becomes
too soft to support the load and suffers catastrophic fracture.
6.2.4 Experimental observations of temperature rise
The experimentally determined rise in temperature T for polytetrafluoro-
ethylene (PTFE) subjected to fatigue at a frequency of 30 Hz in the room
temperature environment is plotted in Fig. 6.5 as a function of the number of fatigue cycles
for several different values of the imposed stress range Act. The endurance limit Actc
of this polymer (i.e. the stress range below which fatigue failure does not occur for at
least 106 stress cycles) is 6.5 MPa for the conditions of the experiment. Figure 6.5
reveals that, when Act > Actc, a rapid increase in temperature occurs with increasing
o
210
150
90
in
"
A
C ^
B f T
~ 1
E
Ao- (MPa)
A 10.3
£9.0
C8.3
D 7.6
E6.9
F6.3
1 1
F
1
103
104
105 106
number of cycles to failure, N,
107
Fig. 6.5. Effect of the applied stress range Act on temperature rise in PTFE subjected to stress-
controlled fatigue. The symbol x denotes failure of the specimen. (After Riddell, Koo &
O'Toole, 1966.)
210 Cyclic deformation and crack initiation in noncrystalline solids
number of cycles. The rate of initial elevation in temperature is higher for the larger
values of Act. However, when Act < Actc (i.e. for curve F), the temperature increase
is not sufficient to cause thermal failure. Consequently, the temperature stabilizes
after prolonged fatigue loading, and the specimen is essentially capable of sustaining
an infinite number of fatigue cycles.
Koo, Riddell & O'Toole (1967) performed fatigue experiments in an attempt to
quantify the effect of thermal softening on fatigue life in three fluoropolymers:
PTFE, polychlorotrifluoroethylene (PCTFE), and polyvinylidenefluoride (PVF2).
They derived estimates of the loss compliance D" during fatigue on the basis of
dynamic modulus measurements using a torsional pendulum. It was found that
hysteretic heating caused a significant increase in loss compliance (Fig. 6.6). With
an elevation in material temperature, the specimen became too soft to fail by purely
mechanical fatigue, but instead suffered a loss in fatigue strength by thermal
softening. This damage was at least partially recoverable by annealing the specimen in
the early and intermediate stages of temperature rise (see Fig. 6.5). The most
significant effect of temperature rise on fatigue damage was observed in the stress cycles
just prior to final failure.
6.2.5 Effects of failure modes
In addition to the aforementioned effects of homogeneous deformation on
cyclic response, the microscopic failure modes responsible for inhomogeneous
deformation can also strongly influence the cyclic stress-strain behavior. Figure 6.7
illustrates the cyclic deformation characteristics of PC at 77 K. At this temperature, PC is
susceptible to craze formation. Since crazes form only under local tensile stresses,
cyclic softening is observed only in the tensile portion of fatigue, and the hysteresis
2.0 xlO"11
2 1.5x10-"
x
£ 1 x 10"11
5xl0"12
20 60 100 140
T(°C)
Fig. 6.6. Change in loss compliance D" due to temperature rise in PTFE subjected to stress-
controlled fatigue at room temperature at a cyclic frequency of 30 Hz. (After Koo, Riddell &
O'Toole, 1967.)
6.3 Fatigue crack initiation at stress concentrations
211
lOOMPai-
Fig. 6.7. Anomalous fatigue deformation of PC at 77 K where craze formation leads to cyclic
softening only in the tensile portion of cyclic loading. (From Rabinowitz & Beardmore, 1974.
Copyright Chapman & Hall. Reprinted with permission.)
loop remains stable in the compression portion. This type of anomalous softening is
also seen in the stress-strain response of polymers when the deformation mechanism
involves the stable growth of microscopic cracks under fatigue loading (Beardmore
& Rabinowitz, 1975).
The overall fatigue response of a polymer is dictated by a combination of factors
involving the molecular structure, deformation modes, and cyclic loading conditions
(Hertzberg & Manson, 1980, 1986), which include:
(1) polymer composition, molecular weight and distribution, and
thermodynamic state,
(2) structural and morphological changes induced by the mechanical loads and
the environment, such as bond breakage, molecular alignment and
disentanglement, or crystallization,
(3) the type of deformation, such as elastic, linear viscoelastic or nonlinear
viscoelastic response,
(4) the mode of microscopic failure, such as crazing or shear banding,
(5) thermal softening, and
(6) the time-scale of the experiment vis-a-vis the kinetic rate of the processes
causing structural changes.
6.3 Fatigue crack initiation at stress concentrations
It was shown in Sections 4.11 and 5.6 that the application of uniaxial cyclic
compressive loads to notched plates of metals and ceramics, respectively, resulted in
212 Cyclic deformation and crack initiation in noncrystalline solids
the nucleation and growth of fatigue cracks along the plane of the notch. A similar
phenomenon was reported for polymeric materials by Pruitt & Suresh (1993).
Figures 6.8(a) and (b) show examples of fatigue crack growth normal to the far-
field cyclic compression axis in notched specimens of an untoughened polystyrene
and a high-impact polystyrene comprising 7.5 wt% butadiene rubber in the form of
gel particles with an average diameter of 1-2 um. (The rubber particles are added to
the polystyrene to enhance its toughness through increased craze formation.)
Inelastic deformation at the tip of notch, arising from such irreversible
deformation processes as shear localization and rotation of molecular chains, generates a
zone of residual tensile stresses upon unloading from the first compression cycle. If
the magnitude of such compressive stresses exceeds the craze strength, crazes
oriented parallel to the plane of the notch and normal to the far-field compression
(a)
0.1 mm
(b)
" 0.1 mm
Fig. 6.8. Fatigue crack initiation and growth normal to the cyclic compression axis in (a) an
untoughened PS (weight-average molecular weight, M„ = 300000 and polydispersity = 2.4),
and (b) a high-impact polystyrene comprising 7.5 wt% butadiene rubber in the form of gel
particles with an average diameter of 1-2 um (M„ = 240000 and polydispersity = 2.8). The
compression axis is vertical. (From Pruitt & Suresh, 1993. Copyright Taylor & Francis, Ltd.
Reprinted with permission.)
6.4 Case study: Compression fatigue in total knee replacements 213
axis (i.e. normal to the local maximum tensile stress) are induced ahead of the notch-
tip. This provides a strong kinematically irreversible damage mechanism for the
generation of residual tensile stresses in the subsequent cycles and for the advance
of the crack.
The white region immediately ahead of the notch in Fig. 6.8(6) is approximately
indicative of the region in which crazing occurs during cyclic compression. Figure
6.9(a) shows a transmission electron micrograph of a typical craze observed within
this region during the cyclic compression loading of the toughened polystyrene.
Figure 6.9(b) shows the craze penetrating through the rubber particle and the
matrix. The features of the craze formed under imposed cyclic compression are
the same as those produced during monotonic or cyclic tension (Pruitt & Suresh,
1993).
In-situ photoelastic and laser interferometric measurements have also been carried
out in notched plates of a photoelastic resin to quantify the evolution of residual
tensile stresses ahead of the stress concentration upon unloading from the far-field
compression axis. Figure 6.10 shows the evolution of an increasing tensile residual
stress field at the notch tip upon unloading from a maximum applied compressive
stress of-16.5 MPa. Plotted in Fig. 6.10 are the contours of constant ayy (i.e. stress
normal to the plane of the notch) at different stages of unloading. At an applied
compressive stress of-2.76 MPa, tensile stresses with a magnitude in excess of +4.96
MPa span a distance of 0.07 mm ahead of the notch tip. Upon unloading to -0.92
MPa, the stresses exceed + 7.6 MPa over a distance of 0.11 mm. Further unloading
to -0.55 MPa causes the residual tensile stresses to exceed + 9.1 MPa over a distance
of nearly 0.1 mm. Given that the tensile strength of the brittle photoelastic resin is
only 6.7 MPa, the stress measurements shown in Fig. 6.10 provide a justification for
the nucleation of a fatigue crack ahead of the notch under cyclic compression
loading. The overall initiation and growth characteristics of compression fatigue cracks
in polymers are qualitatively similar to those of metals and ceramics (see Sections
4.11 and 5.6).
6.4 Case study: Compression fatigue in total knee replacements
Compression-dominated fatigue is a common occurrence in orthopedic polymer
inserts used for total knee replacements. Figure 6.11 schematically shows the geometry of
interest and the associated nomenclature for a total knee replacement. Ultrahigh
molecular weight polyethylene (UHMWPE) has been successfully used as a material for
total knee and hip orthoplasty. Quantitative analyses of the polymer damage in the total
knee replacements have shown that the degree of degradation is linked to compression-
dominated fatigue processes which stem from cyclic contact between the metal and the
UHMWPE components of the artificial joints (Wright, Burstein & Bartel, 1985).
214
Cyclic deformation and crack initiation in noncrystalline solids
W
0.1 um
(*)
0.5 um
Fig. 6.9. (a) A transmission electron micrograph of a typical craze produced ahead of the notch
during the cyclic compression loading of the toughened polystyrene, (b) shows the craze
penetrating through the rubber particle and the matrix. The far-field compression axis is
approximately perpendicular to the craze in both figures. (From Pruitt & Suresh. 1993.
Copyright Taylor & Francis, Ltd. Reprinted with permission.)
As the articulating surfaces of the knee joint move during flexion, the polymer
component is subjected to complex stress distributions within and at the surface of the
UHMWPE insert. In a total knee replacement, the polymer insert is compressed by the
metal component and results in compressive stresses perpendicular to the articulating
surface (Bartel, Bicknell & Wright, 1986). The delamination and pitting of the tibial insert
6.4 Case study: Compression fatigue in total knee replacements 215
A
B
c —
0
+ 0.6 MPo
+ 1.6 MPo
•+3.2 MPo
+■ 4.9 MPo
(a)
A —
B -
C —
D —
(b)
— + 1.9 MPo
— + 3.4 MPo
-+S.5 MPo
— + 7.6 MPo
(c)
A —
B -
C —
D
+ 6.7 MPO
+ 2.9 MPo
+ S.4 MPO
— + 7.4 MPO
+ 9.1 MPo
L,
0.3mm
Fig. 6.10. In-situ photoelastic and laser interferometric measurements of the evolution of tensile
residual stresses in a photoelastic resin during different stages of unloading from a maximum
far-field compressive stress of-16.5 MPa. Far-field compressive stress magnitudes: (a) -2.75
MPa, (b) -0.92 MPa, and (c) -0.55 MPa. (After Pruitt & Suresh, 1993.)
also produces polymer debris which is known to cause osteolysis, infection and loosening
of the implants (Mirra, Marder & Amstuz, 1982).
Bartel, Bicknell & Wright (1986) have used a three-dimensional finite-element model
(FEM) to analyze the stresses in condylar-type knee replacements, Fig. 6.12. This
model comprises a metal-backed UHMWPE with a uniform concave surface and the
arrangement is loaded by a metal component with a convex surface. The contact
surfaces are defined by two radii of curvature as the knee prosthesis has distinct radii
for extension and flexion. For the analysis, the contact forces were chosen to simulate
in-vivo conditions with femoral-tibial contact forces ranging from 4.3-4.9 times the
216
Cyclic deformation and crack initiation in noncrystalline solids
Fig. 6.11. A schematic representation of the geometry of interest in total knee replacement.
body weight of a typical patient. For the total knee replacement, it was found that the
maximum principal stress occurred at the surface of the UHMWPE and along the
tangent to the articulating surface. The greatest magnitudes of stresses were found to be
compressive and located at the center of contact. Further, the stresses were found to be
cyclic in nature through the natural action of flexion and extension. The model
demonstrated that the maximum principal stress at a point near the surface of a total
condylar type tibial knee component can range from lOMPa of tension to more than
20MPa of compression as the contact area sweeps across the surface in the action of knee
flexion, Fig. 6.12. From this work, it was established that the primary damage
mechanisms in the total knee replacement are driven by compressive or compression-dominated
cyclic loading.
In an attempt to simulate the potentially deleterious effects of cyclic compressive
loads in nucleating fatigue cracks at corners and stress concentrations in knee
prosthesis, Pruitt & Suresh (1993) and Pruitt et al. (1995) carried out systematic
experiments of compression fatigue cracking at notches in sterilized and unsterilized
UHMWPE. On the basis of these laboratory experiments and from the information
available from knee replacement components, it was concluded that the inception and
growth of sharp fatigue cracks which have initiated under cyclic compressive loading
can be further extended by subsequent action of cyclic tensile stresses to such a critical
crack length that pitting, delamination and fatigue failure can occur at the UHMWPE
surface.
Exercises
217
(b) (c)
Fig. 6.12. (a) A schematic of the condylar-type tibial insert made of UHMWPE. The finite
element mesh is also superimposed in this figure to illustrate the geometry analyzed, (b)
Magnitudes of the maximum principal stress (in units of MPa) at the surface of the knee
replacement during extension, (c) Magnitudes of the maximum principal stress (in units
of MPa) at the surface of the knee replacement during flexion. (After Bartel, Bicknell &
Wright, 1986.)
Exercises
6.1 A mechanical test is conducted on three different materials. In this
experiment, a constant tensile stress is applied instantly to a specimen. The first
material, a rubber, deforms rapidly during the application of the stress, with
218 Cyclic deformation and crack initiation in noncrystalline solids
the extent of deformation becoming progressively less until it reaches an
equilibrium gage length. The second, a thermosetting material, reacts to the
applied stress by deforming almost instantaneously to an equilibrium
extension. The third, a thermoplastic material, initially deforms to substantial
extension in response to the stress and then deforms further with the
extension varying linearly with time.
(a) Describe the behavior of each material with an appropriate
combination of springs and dashpots.
(b) Describe the behavior of each material following the removal of the
tensile stress.
6.2 Discuss the effects of (a) quenching rate of molten polymer and (b) plasti-
cization on the dynamic mechanical properties (such as loss modulus). Also
discuss the implications of such effects to fatigue deformation.
6.3 Two organic composites are made with the same matrix material, same size
and concentration of unidirectional fiber reinforcements, and same interfa-
cial properties between the fibers and the matrix. The spatial distribution of
the fibers in the matrix, however, is different for the two cases. If crazing
occurs in the polymeric matrix of the two composites, would you expect the
monotonic and cyclic stress-strain response to be different for the two
materials? Explain.
6.4 If crazing is the primary mode of damage in a polymer during cyclic
deformation, would you expect cyclic softening to occur in both the tensile and
compressive portions of a fully-reversed stress cycle? Explain.
6.5 If shear banding is the primary mode of damage in a polymer during cyclic
deformation, would you expect cyclic softening to occur in both the tensile
and compressive portions of a fully-reversed stress cycle? Explain.
6.6 It was shown in Section 6.3 that mode I fatigue crack growth occurs in
notched specimens of polymers when subjected to fully compressive far-
field cyclic loads.
(a) What are the mechanisms responsible for this effect?
(b) Discuss the possible effects of compressive stress amplitude and load
ratio on the characteristics of crack initiation and growth from notches
in polymers subjected to fully compressive cyclic loads.
(c) Can a fatigue crack be induced along the plane of a notch in a unidir-
ectionally reinforced graphite-epoxy composite subjected to uniaxial
cyclic compression, with the axis of the graphite fiber parallel to the
compression axis and with the plane of the notch perpendicular to the
compression axis?
6.7 Repeat the example problem in Section 5.6.1 for the case of a notched plate
of a polymer which is subjected to applied cyclic compression loading
normal to the plane of the notch.
Part two
TOTAL-LIFE APPROACHES
CHAPTER 7
Stress-life approach
The preceding chapters were concerned with the evolution of permanent
damage under cyclic deformation and with the attendant nucleation of a fatigue
crack. While these discussions pertain to micromechanical processes, phenomenolo-
gical continuum approaches are widely used to characterize the total fatigue life as a
function of such variables as the applied stress range, strain range, mean stress and
environment. These stress- or strain-based methodologies, to be examined in Part
Two, embody the damage evolution, crack nucleation and crack growth stages of
fatigue into a single, experimentally characterizable continuum formulation. In these
approaches, the fatigue life of a component is defined as the total number of cycles
or time to induce fatigue damage and to initiate a dominant fatigue flaw which is
propagated to final failure. The philosophy underlying the cyclic stress-based and
strain-based approaches is distinctly different from that of defect-tolerant methods
to be considered in Part Three, where the fatigue life is taken to be only that during
which a pre-existing fatigue flaw of some initial size is propagated to a critical size.
The stress-life approach to fatigue was first introduced in the 1860s by Wohler.
Out of this work evolved the concept of an 'endurance limit', which characterizes the
applied stress amplitude below which a (nominally defect-free) material is expected
to have an infinite fatigue life. This empirical method has found widespread use in
fatigue analysis, mostly in applications where low-amplitude cyclic stresses induce
primarily elastic deformation in a component which is designed for long life, i.e. in
the so-called high-cycle fatigue (HCF) applications.! When considerable plastic
deformation occurs during cyclic loading as, for example, a consequence of high
stress amplitudes or stress concentrations, the fatigue life is markedly shortened.
Here, fatigue design inevitably calls for the so-called low-cycle fatigue (LCF)
approach. Realizing the important role of plastic strains in inducing permanent
fatigue damage, Coffin (1954) and Manson (1954) independently proposed a plastic
strain-based continuum characterization of LCF.
This chapter deals with the stress-life approach to fatigue where the effects of
stress concentrations, mean stresses, surface modifications, variable amplitude cyclic
loads, and multiaxial loads are also discussed. Total-life characterization of fatigue
in nonmetallic materials is also addressed wherever appropriate. The stress-based
and strain-based approaches have found widespread application, most notably in the
design of many fatigue-critical components for automobiles and other surface
vehicles. Strain-based approaches to total fatigue life are considered in the next chapter.
' A case study of the HCF fatigue problem in aircraft gas turbine engines is presented in Section 7.6.
221
222
Stress-life approach
7.1 The fatigue limit
Methods for characterizing the fatigue life in terms of nominal stress
amplitudes using experimental data obtained from rotating bend tests on smooth
specimens emerged from the work of Wohler (1860) on fatigue of alloys used for railroad
axles. In this approach, smooth (unnotched) test specimens are typically machined to
provide a waisted (hour-glass) cylindrical gage length, which is fatigue-tested in
plane bending, rotating bending, uniaxial compression-tension (push-pull) or
tension-tension cyclic loading. Test methods for determining the stress-life response are
spelled out in detail in ASTM Standards E466-E468 (American Society for Testing
and Materials, Philadelphia).
From such an experiment, the stress amplitude aa for fully reversed loading (equal
to one-half of the stress range from the maximum tension to maximum
compression), is plotted against the number of fatigue cycles to failure, N{, Fig. 7.1. The solid
line illustrates the stress-life plot (also known as the S-N curve) observed for mild
steels and other materials which harden by strain-ageing. Under constant amplitude
loading conditions, these alloys exhibit a plateau in the stress-life plot typically
beyond about 106 fatigue cycles. Below this plateau level, the specimen may be cycled
indefinitely without causing failure. This stress amplitude is known as the fatigue
limit or endurance limit, at. The value of at is 35% to 50% of the tensile strength aTS
for most steels and copper alloys. The intercept of the stress-life curve with the
ordinate is aTS at one-quarter of the first fatigue cycle. (For single crystals of FCC
metals, the steady state value of the peak saturation stress Tj, Fig. 2.2, may be
regarded as an endurance limit.)
I I I 1 1
103 104 105 106 107
cycles to failure, N{
Fig. 7.1. Typical S-N diagram showing the variation of the stress amplitude for fully reversed
fatigue loading of nominally smooth specimens as a function of the number of cycles to failure
for ferrous and nonferrous alloys.
7.1 The fatigue limit
223
Table 7.1. Cyclic endurance limit of some common engineering alloys.
Material
Al alloys"
2024
6061
Steels1'
1015
1015
1040
4340
4340
4340
HY140
Condition
T3
T6
Annealed
60% CW
Annealed
Annealed
QAff (204 °C)
QAff (538 °C)
QAff (538 °C)
<tts (MPa)
483
310
455
710
670
745
1950
1260
1030
ffy (MPa)
345
276
275
605
405
475
1640
1170
980
"e (
138
97
240
350
345
340
480
670
480
"Endurance limit based on 5 x 10 cycles. Source: Aluminum Standards and Data, The
Aluminum Association, New York, 1976.
b Endurance limit based on 107 cycles. Source: Structural Alloys Handbook, Mechanical
Properties Data Center, Traverse City, Michigan, 1977.
'Refers to quenched and tempered condition; the data within parentheses refer to tempering
temperature.
Many high strength steels, aluminum alloys and other materials do not generally
exhibit a fatigue limit (see dashed line in Fig. 7.1). For these materials, o^ (or Acr)
continues to decrease with increasing number of cycles. An endurance limit for such
cases is defined as the stress amplitude which the specimen can support for at least
107 fatigue cycles. Table 7.1 lists the fatigue endurance limits for a variety of
engineering alloys along with crTS and the monotonic yield strength, ay.
If Fig. 7.1 is redrawn on a log-log scale, with the (true) stress amplitude plotted as
a function of the number of cycles or load reversals! to failure, a linear relationship
is commonly observed. The resulting expression relating the stress amplitude,
o^ = Aa/2, in a fully-reversed, constant-amplitude fatigue test to the number of
load reversals to failure, 27Vf, is (Basquin, 1910)
^L = a3 = a'{(2Nr)b, (7.1)
where a[ is the fatigue strength coefficient (which, to a good approximation, equals
the true fracture strength a{, corrected for necking, in a monotonic tension test for
most metals) and b is known as the fatigue strength exponent or Basquin exponent
A constant amplitude cycle is composed of two load reversals. As shown later in this chapter and the
next one, the use of the number of load reversals, instead of the number of fatigue cycles, is helpful in
analyzing variable amplitude fatigue.
224
Stress-life approach
Nt (log scale)
Fig. 7.2. Contributions of crack initiation and crack propagation processes to total fatigue life
in a nominally smooth specimen.
which, for most metals, is in the range of —0.05 to —0.12. Typical values of a\ for
many engineering alloys are tabulated in the next chapter.
The S-N curve schematically shown in Fig. 7.1 strictly pertains to the total
fatigue life of a nominally smooth-surfaced, 'defect-free' material. Here total life
implies the number of cycles to initiate fatigue cracks in the smooth specimen plus
the number of cycles to propagate the dominant fatigue crack to final failure. This
two-stage process involving initiation and propagation is represented in the S-N
curve shown in Fig. 7.2. The fraction of the fatigue life which is expended in
nucleating a dominant fatigue crack of engineering size (typically a fraction of a mm) may
vary from essentially 0%, for specimens containing severe stress concentrations,
rough surfaces or other surface defects, to as high as 80% in very carefully prepared,
nominally defect-free, smooth specimens of high purity materials.
7.2 Mean stress effects on fatigue life
The aforementioned empirical descriptions of fatigue life pertain to fully
reversed fatigue loads where the mean stress of the fatigue cycle am is zero.
However, fully reversed stress cycles with a zero mean stress are not always
representative of many applications. The mean level of the imposed fatigue cycle is known
to play an important role in influencing the fatigue behavior of engineering
materials. Figure 7.3 schematically shows a fatigue cycle of sinusoidal waveform with a
nonzero mean stress. In this case, the stress range, the stress amplitude and the mean
stress, respectively, are defined as
7.2 Mean stress effects on fatigue life
225
Fig. 7.3. Nomenclature for stress parameters which affect fatigue life. The variation of stress a
with time t is shown.
Act = a„
^m3i &rc
cr„
cra =
+ <*n
(7.2)
The mean stress is also characterized in terms of the load ratio, R = crmin/crmliX. With
this definition, R = — 1 for fully reversed loading, R = 0 for zero-tension fatigue, and
R = 1 for a static load.
When the stress amplitude from a uniaxial fatigue test is plotted as a function of
the number of cycles to failure, the resultant S-N curve is generally a strong function
of the applied mean stress level. Figure 7.4(a) shows the typical S-N plots for
metallic materials as a function of four different mean stress levels, amX, am2, am3
and amA. One observes a decreasing fatigue life with increasing mean stress value.
Mean stress effects in fatigue can also be represented in terms of constant-life
diagrams, as shown in Fig. 7.4(b). Here, different combinations of the stress
amplitude and mean stress providing a constant fatigue life are plotted. Most well known
among these models are those due to Gerber (1874), Goodman (1899),| and
Soderberg (1939). The life plots, represented in Fig. 7.4(b), are described by the
following expressions:
Soderberg relation : aa
■ cr~\„ =f]
1
(7.3)
Modified Goodman relation :
ox = cra
1--
cr„
°TS
(7.4)
Gerber relation :
aa = a.
a l<rm=0
=n 1
<rTS
(7.5)
where aa is the stress amplitude denoting the fatigue strength for a nonzero mean
stress, ctJo^o is the stress amplitude (for a fixed life) for fully-reversed loading
(am = 0 and R = —1), and ay and aTS are the yield strength and tensile strength of
the material, respectively.
' The modified Goodman equation, Eq. 7.4, is generally considered to be a modification of methods
originally proposed by a number of different engineers.
226
Stress-life approach
Fig. 7.4. (a) Typical stress amplitude-life plots for different mean stress values, (b) Constant life
curves for fatigue loading with a nonzero mean stress.
As a general rule-of-thumb, the following observations can be made about the
foregoing models for the effects of mean stress on fatigue life.
(1) Equation 7.3 provides a conservative estimate of fatigue life for most
engineering alloys.
(2) Equation 7.4 matches experimental observations quite closely for brittle
metals, but is conservative for ductile alloys. For compressive mean stresses,
however, it is generally nonconservative. To circumvent this problem, one
may assume that compressive mean stresses provide no beneficial effect on
fatigue life.
(3) Equation 7.5 is generally good for ductile alloys for tensile mean stresses. It
clearly does not distinguish, however, between the differences in fatigue life
due to tensile and compressive mean stresses.
The constant life diagram for different mean stress levels, also commonly referred
to as the Haigh diagram (Haigh, 1915, 1917), is schematically represented as shown
in Fig. 7.5. In this figure, the maximum and minimum stresses of the fatigue cycle,
both normalized by the tensile strength, are plotted. The dashed lines denote
experimentally determined values of combinations of maximum and minimum stress levels
(representing different mean stresses) which represent constant fatigue lives for the
indicated number of cycles. This figure affords a convenient graphical representation
of the effects of mean stress on S-N fatigue response, although considerable
experimental effort is needed to determine empirically the information needed for this plot.
Similar diagrams are also developed for notched members where the net-section
stresses are used.
While the Basquin relation, given by Eq. 7.1, is valid only for zero mean stress,
Morrow (1968) has presented a modification of the Basquin relation which accounts
for mean stress effects (for any crm) in the following form:
a, = (a'{-am)(2N{)b. (7.6)
7.3 Cumulative damage
227
Fig. 7.5. A schematic representation of the Haigh diagram showing constant life curves for
different mean stress levels in terms of the maximum and minimum stresses of the fatigue cycle.
The number of cycles to fatigue failure for any nonzero mean stress, JVf, can then be
written as
{1 1/6
1-^rJ -A^o, (7-7)
where JVflg. 0 is the number of cycles to failure for zero mean stress.
7.3 Cumulative damage
The principles of stress-based characterization of total fatigue life are only
relevant for constant amplitude fatigue loading. In reality, however, engineering
components are invariably subjected to varying cyclic stress amplitudes, mean
stresses and loading frequencies.
A simple criterion for predicting the extent of fatigue damage induced by a
particular block of constant amplitude cyclic stresses, in a loading sequence consisting of
various blocks of different stress amplitudes, is provided by the so-called Palmgren-
Miner cumulative damage rule (Palmgren, 1924; Miner, 1945). Implicit in this linear
damage rule are the assumptions that:
(1) The number of stress cycles imposed on a component, expressed as a
percentage of the total number of stress cycles of the same amplitude necessary
to cause failure, gives the fraction of damage.
(2) The order in which the stress blocks of different amplitudes are imposed
does not affect the fatigue life.
228
Stress-life approach
(3) Failure occurs when the linear sum of the damage from each load level
reaches a critical value.
If rij is the number of cycles corresponding to the rth block of constant stress
amplitude aai in a sequence of m blocks, and if N{i is the number of cycles to failure
at oai, then the Palmgren-Miner damage rule states that failure would occur when
It will be shown in later chapters that damage accumulation and failure under
variable amplitude loading conditions are dictated by several concurrent
mechanisms and that the linear damage rule may lead to erroneous predictions of variable
amplitude fatigue behavior in many situations. For example, the Palmgren-Miner
damage rule predicts a greater degree of fatigue damage due to a higher amplitude of
cyclic stresses. However, it is well established that tensile overloads applied to
notched and cracked metallic materials reduce the rate of fatigue crack growth
and that the application of compressive overloads generally has the opposite trend
(see Chapter 14).
Even for smooth specimens, the linear damage rule may provide incorrect results
because of its omission of load sequence effects. Consider a smooth fatigue specimen
which is subjected to nx and n2 cycles of two different amplitudes of cyclic stresses,
crai and oa2, respectively, which have the same R ratio. As shown in Fig. 7.6,
aa\ > aai- Let the fatigue life (number of cycles to failure) at aai and aa2 be JVf]
and iVf2, respectively.
Case 1:
First consider the loading sequence in which aa2 is applied after aai. The
extent of damage induced by this lower stress level may be in excess of the damage
rule prediction of n2/N{2, if the preceding application of aai for nx cycles had
nucleated cracks or significantly contributed to the number of cycles necessary at
the lower stress level to nucleate cracks. Consequently, one may observe for this case
that J2 ttf/Nfj < 1. In this case, damage may occur even if oa2 is below the endurance
limit.
Case 2:
Now consider the reverse situation where the application of aa2 precedes
that of oa\. If the material strain-ages, the application of oa2 prior to oa\ may
enhance the fatigue limit even if oa2 is lower than the fatigue limit. This phenomenon
is known as coaxing. For this case, Yl n,-/iVf,- > 1.
7.4 Effects of surface treatments
The free surface of a component is a common site for the nucleation of a
fatigue crack. Therefore, the manner in which the surface is prepared during man-
7.4 Effects of surface treatments
229
4
Case 2
(b)
,-±
_jfa2_
1
1
I
1
1
-+
1 _
Nt21
i
(c)
Fig. 7.6. Block loading sequence for (a) case 1 and (b) case 2. (c) Fractional life expended as
estimated by the Palmgren-Miner rule.
ufacturing of the component has a decisive role in dictating the initiation life for
fatigue cracks.
There exists a variety of surface treatments, such as carburizing, nitriding, flame
hardening, induction hardening and shot-peening, which are designed to impart high
strength, wear resistance or corrosion resistance locally in the near-surface regions of
the material. Furthermore, common machining operations such as grinding,
polishing and milling cause different degrees of surface roughness to develop. The valleys
on the rough surface serve as stress concentrations, which, in turn, induce different
levels of resistance to fatigue crack nucleation (see Chapters 4 and 15 for further
discussions on this issue).
In addition to the roughness of the surfaces, the residual stresses that are induced
by the surface treatments have an important effect on the fatigue life. Residual
stresses are generated in a component as a consequence of thermal, chemical or
mechanical treatments:
(1) Mechanical working, which causes nonuniform plastic deformation, may be
used to provide a favorable residual stress distribution. Shot-peening of
surfaces, surface rolling of fillets, and auto-frettage of gun tubes or pressure
230
Stress-life approach
vessels are some examples. Deleterious residual stress patterns may also
arise from mechanical working, as, for example, in the undesirable
development of tensile stresses due to cold straightening (e.g., Osgood, 1982).
(2) Local volume changes associated with precipitation, chemical reactions, or
phase transformations induce residual stresses in a component. Case
hardening of a surface by nitriding produces compressive stresses in the diffusion
region.
(3) Each fabrication technique, such as grinding, milling, polishing, rolling, and
welding, produces its own characteristic residual stress patterns.
(4) Even in the absence of phase changes, nonuniform thermal expansion or
contraction produces residual stresses. An example of the development of
thermal residual stresses can be found in processes involving rapid
quenching and in thermal fatigue.
Residual stresses arising from fabrication or surface and heat treatments, when
superimposed with the applied fatigue loads, alter the mean level of the fatigue cycle
and the fatigue life for crack nucleation. In general, residual stresses affect the fatigue
behavior of materials in the same way as the static mechanical stresses superimposed
on a cyclic stress amplitude. Therefore, residual stresses are favorable, if compressive,
and detrimental, if tensile; this is especially true for high strength materials. The
beneficial effect of residual stresses introduced by surface treatments becomes less
significant at larger applied stresses (at lower fatigue lives) because a large amplitude of the
pulsating stress easily 'relaxes' the residual stress, particularly in softer materials.
Consider, for example, the case of shot-peening, which is widely used to improve
the fatigue life of many engineering structural parts. Examples of shot-peened
components include chassis, valve springs, gears and shafts for automobiles, and exhaust
stack for aircraft engines. In the shot-peening process, a stream of small, hard
spheres (typically 0.1 to 1 mm in diameter) is shot at a surface which is to be treated.
Depending on the diameter of the shots, the velocity of their impingement on the
surface and the duration of the process, the maximum (long range) compressive
residual stress generated by the localized plastic deformation of the surface layer
can reach about one-half the yield strength of the material. The compressive residual
stress zone spans a depth of about one-quarter to one-half the diameter of the shots.
As the shot-peened surface layer has a compressive mean stress, it acts to enhance
significantly the total fatigue life by reducing the damaging effect of the tensile
portion of fully reversed cyclic loads. Figure 7.7 shows an example of the beneficial
effect of shot-peening on the endurance limit of steels with different levels of surface
finish. A worked example quantifying the benefits of shot-peening in contact fatigue
applications is presented in Chapter 13, where the combined effects of surface
roughness, peening and lubrication on S-N fatigue behavior and the endurance limit are
also examined.
Caution should be exercised in designing the parameters for shot-peening. If shot-
peening is done for a longer time span than necessary, it may induce cracks along slip
7.5 Statistical considerations
231
0 500 1000 1500 2000
<re (MPa)
Fig. 7.7. Beneficial effect of shot-peening on the fatigue life of steels of different strength levels.
The endurance limit <xe (defined at 2 x 10⁶ stress cycles) is plotted against the tensile strength,
<tts. (After Mann, 1967.)
bands in such materials as Ni-base superalloys. In addition, the surface roughness
induced by shot-peening can also, in some cases, make it easier for fatigue cracks to
initiate, thereby countering the beneficial effects of compressive residual stresses.
Laser shock peening is another surface treatment method where a high intensity,
short pulse duration laser beam is impacted on a surface to induce reversed plastic
flow and compressive residual stresses. Here, residual compressive stresses extend
deeper into the material (typically up to 2.5 mm) than in shot-peening. As an
example, consider the turbine engine for aircraft in which the leading edge of the fan blade
is laser shock peened to improve the resistance to fatigue cracking in the presence of
foreign object damage (see Section 7.6).
7.5 Statistical considerations
There are a number of sources of uncertainty in the analysis of fatigue
results, in general, and in the use of the stress-life approach. These arise from:
(1) Uncertainties and/or errors in the estimation of material properties which
include microstructural variability from one specimen or batch to another as
232
Stress-life approach
well as experimental errors in the measurement of properties in the same
batch of materials.
(2) Uncertainties in the modeling of applied stresses, for a given service
condition and environment. This variability stems from two sources: (i) the
variability in stress amplitudes during a known service cycle as a consequence of
such factors as vibrations, and (ii) lack of knowledge about the exact
distribution of stress cycles which occur over the design.
(3) Uncertainties in the a priori estimation of the 'environment', and in the
ensuing variation in loading intensity. For example, in wind-turbine and
high-speed transportation applications, the 'environment' and 'loading
intensity' refer to the wind speed. In the fatigue analysis of automobiles,
they generally refer to the 'driver profile' or the 'road condition'. In offshore
structural design, they refer to the 'sea state', e.g., Veers, 1996.
(4) Uncertainties in modeling, predictions and life estimates for fatigue
processes.
Such uncertainties are analyzed using known statistical approaches to derive the
level of reliability or probability of failure. A detailed review of such approaches to
fatigue can be found in the following references: ASTM STP 744 (The American
Society for Testing and Materials, Philadelphia), Tangjitham & Landgraf (1993),
Sobczyk & Spencer (1992), Wirsching (1995), and Veers (1996). Here we present
some basic concepts commonly adopted for the statistical characterization of fatigue
data.
A parameter which is widely used to describe the uncertainty is the coefficient of
variation (CVar) which is defined as:
i Ns , Ns
^Var = ~~~ > mx,vv = TT / ,-*Tvi' &x,rv = ~Tjr / \xtvj ~ mx,rv) ■ (.'•"/
Here, 7VS denotes the number of samples of a random variable xrv (such as the stress
amplitude in an S-N fatigue test), and mXJV and ax„ denote the mean and the
standard deviation, respectively.
A distribution in the value of the random variable is usually characterized in terms
of normal distribution, log-normal distribution, or Weibull distribution. For
example, the probability density function for normal distribution is defined as
/n(x„) = ) exp(-l(X"~^")2}, (7.10)
V^Krv) I 2V ""Jen ) \
where the mean mx „ and the standard deviation axrv are as defined previously.
Usually, the fatigue strength or the endurance limit values listed from experiments
represent the arithmetic mean derived from multiple experiments. In brittle solids,
such as ceramics and polymers, and in metallic alloys with considerable microstruc-
tural variability arising from processing, the extent of scatter in fatigue data may be
large as a result of a large scatter in microscopic flaw size distribution. Consequently,
7.5 Statistical considerations
233
different sets of experiments conducted on the same material may not give the same
arithmetic mean of the critical strength parameter. To address this issue, Weibull
(1939) proposed the concept of a probability of failure, P, at a given failure strength,
<rf normalized by an average value of a critical stress crcr>ave (which may be identified
with the average value of tensile fracture strength au for a brittle solid or with the
fatigue endurance limit, ae for a metallic alloy). At low values of a{, P ->• 0, and at
very high values of a{, P ->• 1. Weibull defined the failure probability as follows:
P=l-Ps = l-exp(-f^ "I, (7.11)
where mw is known as the Weibull modulus, and a{0 is a reference strength. Note
that P in Eq. 7.11 represents the fraction of the total number 7VS of identical test
specimens in a batch for which the failure strength falls below cr{. Similarly, Ps, the
probability of survival, represents the fraction of the total number JVS of identical test
specimens in a batch for which the failure strength exceeds a{. When Of/o^o = 1,
P=\ — exp(-l) = 0.633. In other words, the reference stress a[0 represents the
stress level for which the cumulative probability of failure of all specimens in the
same batch at a stress level a{ or lower, is 63.3%. Equation 7.11 can be rearranged to
give
Taking the logarithm of both sides once again,
In
ln1^]=«wln(^-). (7.13)
It is readily apparent that a plot of the double-logarithm of 1/(1 — P) (ordinate)
against the logarithm of a{ (abscissa), based on experiments conducted on a number
of identical specimens, yields a straight line whose slope is mw and whose intercept
with the ordinate is —mw In crf0. Such a plot is referred to as the Weibull diagram.
Figure 7.8(a) schematically shows the probability of failure, Eq. 7.11, and Fig. 7.8(Z>)
illustrates the Weibull diagram, Eq. 7.13. In practice, the Weibull modulus is
commonly determined using the following steps. (1) A data sample of JVS identical
specimens from the same batch of materials is tested to failure under static and/or cyclic
loading conditions, and the appropriate strength value a{ for each specimen is
measured. (2) The values of a{ are ordered from the smallest to the largest. The smallest
strength value is ascribed an index value / of 1, the next higher value an index value
of 2, and so forth. The highest strength is then assigned an index of 7VS. (3) Calculate
P = i/(Ns + 1), for I <i<Ns. (4) Calculate ln{ln[l/(l - P)]} and plot it against
lncrf. (5) The slope of this plot gives the Weibull modulus mw.
The overall objective of incorporating probabilistic analyses into fatigue design is
to ensure that a low probability exists for a combination of higher than average
cyclic stress amplitude and a lower than average fatigue endurance limit (or stress
234
Stress-life approach
(«)
ln{ln[^]}
-»Iwln(fffn)
(*)
Fig. 7.8. (a) A Weibull plot of failure probability against the normalized failure strength, (b) The
Weibull diagram, based on Eq. 7.13, whose slope is the Weibull modulus, mw.
amplitude at a fixed life) to cause failure. In practical design involving the stress-
based approach to total fatigue life, however, an endurance limit is first established
on the basis of experiments conducted on carefully prepared smooth test
specimens. This limit is then lowered by applying modifying factors (commonly known
as the 'knock-down factors') to account for such effects as surface finish, size
effects and constraints, temperature, stress corrosion, fretting, and numerous
unknown effects. The damaging effects of repeated contact and corrosion at
surfaces (arising, for example, from fretting fatigue), and the mitigation, at least in
part, of such deleterious effects by recourse to shot-peening and lubrication are
addressed in Chapter 13.
7.6 Practical applications
235
7.6 Practical applications
7.6.1 Example problem: Effects of surface treatments
Problem:
A high strength steel is to be used as a material for leaf springs in a
ground transportation vehicle. During service, cyclic loading is expected to
result in a load ratio, R = 0 (i.e. zero-tension cyclic loading). The 'as-heat-
treated' condition of this alloy has an endurance limit, oe, of 400 MPa which
was determined from laboratory tests conducted under fully reversed cyclic
loading conditions. The tensile strength of the steel is 1500 MPa. The surface
finish of the final product is expected to have an average roughness which, from
prior experience in fatigue design, is known to 'knock down' the endurance limit
by 40% from that measured in 'smooth' laboratory specimens. Shot-peening of
the product prior to the assembly of the vehicle is known to introduce a
maximum surface compressive stress of-550 MPa. Determine the maximum stress
amplitude which the surface of the leaf spring, which has to be designed for an
infinite fatigue life, can sustain.
Solution:
The endurance limit of the product with a rough surface finish is 40%
lower than the value measured in the laboratory. The design endurance limit
then is: 400 x 0.6 = 240 MPa. This value pertains to fully reversed cyclic
stressing, i.e. for R = -1 or om = 0.
The applied loading involves R = 0 and a stress amplitude, oa. From Eq. 7.2,
it is seen that oa = om = Ao/2 for R = 0. The compressive surface stress arising
from shot-peening lowers the mean stress in surface to a new value: o'm = (om -
550) = (<ja - 550) MPa. Assuming that the modified Goodman approximation,
Eq. 7.4, provides a reasonably accurate measure of the high-cycle fatigue life
under nonzero mean stress, we see that
^ + ^E-=1. (7.14)
°e "IS
Substituting the appropriate values,
Or. Or. — 550 , ,„ , „
—— + — =1 (7 15)
240 + 1500 K '
This equation gives: oa = 283 MPa. Thus, the leaf spring could be subjected
to an applied stress amplitude of up to 283 MPa for infinite life. (Note that the
possible beneficial effect of shot-peening in enhancing the fatigue endurance
limit has not been taken into account in the numerical calculations. Thus, the
stress amplitude estimate is likely to be very conservative.)
236
Stress-life approach
7.6.2 Case study: HCF in aircraft turbine engines
Fatigue cracking under low-amplitude, high-cycle loading is the dominant failure
process in a number of engineering applications. In this section, which is largely
predicated upon a review by Cowles (1996), we examine the origins and effects of high-
cycle fatigue in advanced gas turbine jet engines used in military aircraft.
The principal cause of failure of components, from which a gas turbine jet engine of a
modern military aircraft is made, is high-cycle fatigue. As illustrated in Fig. 7.9(a), fatigue
failure accounts for 49% of all component damage in jet engines. High-cycle fatigue
(HCF) is responsible for nearly half of all these failures, whilst low-cycle fatigue (LCF)
and all other modes of fatigue lead to the remainder of fatigue failures in roughly equal
proportions. Failure by HCF affects a variety of engine components, as shown in Fig.
7.90).
The origin of HCF in the gas turbine aircraft engine can be attributed to one or more
of the following causes.
(1) Mechanical vibration arising from rotor imbalance (which affects plumbing,
nonrotating structures and external members) and rub (which affects blade tips
and gas path seals).
(2) Aerodynamic excitation occurring in upstream vanes, downstream struts and
blades, whereby engine excitation frequencies and component response
frequencies corresponding to different modes of vibration may overlap.
(3) Aeromechanical instability, primarily in blades, accompanying aerofoil flutter.
(4) Acoustic fatigue of sheet metal components in the combustor, nozzle and
augmentor.
The above sources of low-amplitude, HCF are augmented by the following damage
processes which create microscopic notches and other sites at which fatigue cracks can
nucleate and advance subcritically to catastrophic proportions.
(a) (*)
Fig. 7.9. (a) Distribution of different failure modes in jet engines, (b) Susceptibility of
different components to HCF problems. (After Cowles, 1996.)
7.7 Stress-life response of polymers
237
(1) Foreign object damage (FOD), which usually occurs in compressor and fan
blades: FOD can induce micronotches, tears, dents and gouges that may vary in
dimensions from tens of micrometers to tens of millimeters, depending on the
size, nature and severity of impact of the foreign object. Sources of FOD are as
diverse as sand particles and birds. As noted earlier, the leading edge of the fan
blade, which is susceptible to FOD, is laser shock peened for improved fatigue
resistance.
(2) Domestic object damage (DOD), which arises from a dislodged debris or
component from another location of the engine.
(3) Fretting fatigue, which occurs at blade and disc attachment surfaces (dove-tail or
fir-tree section), bolt flanges, and shrink-fit areas. See Chapter 13 for terminology
definitions and detailed discussions pertaining to fretting fatigue.
(4) Galling, which occurs in the same regions as fretting, except that it involves greater
displacements due to major engine throttle and speed changes.
(5) HCF-LCF interactions, where HCF is exacerbated by LCF as, for example, when
creep and thermo-mechanical fatigue in hot sections (such as turbine blades) cause
further reductions in fatigue life, over and above that due to vibrations.
Current methods to assess the HCF life of critical components in aircraft gas
turbine engines entail the following general steps, (i) Appropriate stress analysis
(largely based on the finite-element method) are performed to determine the mean
stress level, (ii) Structural dynamics simulations are carried out to determine resonant
frequencies and excitation modes, (iii) The design of the component is then carried
out in such a way that (a) it meets the criteria for safe life for HCF with the
appropriate mean stress level (using the modified Goodman diagram), and (b) no
resonance-related problems arise. The parameters that serve as input to design are
gathered from specimen testing and component testing, and the stress-life approach is
empirically modified to allow for reductions in life due to FOD, DOD, fretting and
galling.
7.7 Stress-life response of polymers
7.7.1 General characterization
The characterization of the fatigue life of polymeric materials on the basis of
stress amplitudes is done in much the same way as for metals. Figure 7.10 is a typical
Wohler (S-N) curve for a polymer, where three distinct regions are seen in
the variation of the stress amplitude aa as a function of the number of cycles to
failure JVf.
The existence of region I and the slope of the Aa-N{ plot in this region
depend on whether crazes form at the high values of Aa, and on whether the
crazes cause microscopic cracks to nucleate. PS and PMMA, which are prone to
craze formation, exhibit a well denned region I where the fatigue life depends
strongly on Act. If the maximum tensile stress in the very first cycle is not
238
Stress-life approach
logJVr
Fig. 7.10. Schematic representation of the typical variation of stress amplitude <xa with the
number of cycles to failure Nf for polymeric materials.
sufficiently large to form crazes, a distinct region I may not exist and the slope
of the Aa-Nf curve at the high Act end will be a mere extrapolation of that in
region II.
The dependence of total fatigue life on the stress amplitude in region II is a
manifestation of the enhanced role of microscopic crack growth on fatigue fracture.
At the higher aa end of region II, slow growth of crazes and their transformation into
cracks are dominant mechanisms of failure. A slope of 14MPa per decade of JVf
seems to be characteristic of region II in a variety of polymeric materials fatigued at
room temperature. As the test temperature is raised, there is a competition between
shear banding and crazing in this region, as in the case of tensile deformation.
The high-cycle fatigue region represented in region III essentially forms the
endurance limit for the polymer. The fatigue life here is controlled by the
incubation time for the nucleation of microscopic flaws. The relative dominance of
nucleation and growth of crazes and cracks constitutes the main distinction
between regions II and III.
7.7.2 Mechanisms
The mechanisms controlling the total fatigue life of polymers also vary with
many morphological, thermal, mechanical and environmental factors.
(1) When the cyclic loading involves high strain rates, the material is prone to
hysteretic heating and to thermal softening. Consequently, increasing the
test frequency (typically beyond 10 Hz for experiments conducted in the
laboratory environment) results in a reduction in fatigue life. In an attempt
to address these issues, the American Society for Testing and Materials
(Philadelphia) developed standard methods in 1971 for the fatigue testing
of polymers. These procedures are spelled out in Specification D-671-71.
The standard calls for the measurement of temperature at fatigue failure
unless it can be demonstrated that the heat rise is not significant.
Furthermore, when thermal softening controls fatigue fracture, this
standard defines the fatigue failure life operationally as the number of loading
7.8 Fatigue of organic composites
239
cycles at a fixed stress amplitude which leads to an apparent reduction in
modulus of 30% from the commencement of the fatigue test.
(2) The increase in the temperature of the polymer during high frequency
fatigue loading also depends on the dimensions of the specimen. In thinner
specimens, a greater fraction of the heat generated by damping is lost to
the environment. Therefore, thicker fatigue test specimens, which retain a
larger fraction of the temperature rise induced by hysteretic heating, exhibit
a lower fatigue endurance limit (Riddell, Koo & O'Toole, 1967). In an
analogous fashion, increases in test temperature (caused by external heating)
also cause reductions in fatigue life.
(3) Most polymeric solids exhibit a longer fatigue life in inert environments
than in chemically aggressive media. Such deleterious effects of aggressive
environments are caused by complex synergistic interactions between the
structure of the polymer and the surrounding medium. For example, the
absorption of a nonsolvent can reduce the glass-transition temperature and
modulus to the point that cavitation and crack initiation are promoted
(Gent, 1970). Some liquid media, such as water, change the state of a
polymer by processes involving plasticization or antiplasticization.
Similarly, a small amount of acetone can transform polycarbonate from
a glass to a crystalline solid. Specific combinations of material,
environment and load can also improve the fatigue resistance (Manson &
Sperling, 1976).
(4) Although current understanding of the effects of molecular properties on
fatigue life is incomplete, it appears that the total fatigue life increases with
increasing molecular weight (Sauer, Foden & Morrow, 1977) and crystal -
linity (Riddell, Koo & O'Toole, 1967), and with decreasing level of cross-
linking (Sauer, 1978).
(5) As in the case of metallic materials, the total fatigue life derived from
constant stress-amplitude fatigue decreases with increasing mean stress.
7.8 Fatigue of organic composites
The reinforcement of polymeric matrices with particles, whiskers and
continuous fibers provides many possibilities for improving the strength, stiffness and
resistance to creep and fatigue. The extent to which the improvements in the
resistance to fatigue are realized is, of course, dictated by the specific combinations of
matrix and reinforcement materials, processing methods, geometrical factors
associated with the arrangement of the reinforcement phase in the matrix, and interfacial
characteristics. Discontinuous and continuous fiber reinforcements of glass, boron,
carbon, and high modulus organic materials such as aromatic polyarides are
commonly used in the synthesis of polymeric composites. Polymers widely used
240
Stress-life approach
as matrices for organic composites include polyesters, epoxies, Nylon 66, PC,
polyphenylenesulphide, polyamideimide, PSF, PVC, and polyetherimide.
7.8.1 Discontinuously reinforced composites
The fatigue behavior of polymers reinforced with particulates and short
fibers has been extensively reviewed in Hertzberg & Manson (1980, 1986). In this
section, we present two examples to illustrate: (i) how the introduction of a strong
second phase can enhance the resistance of a polymer to high cycle fatigue, and (ii)
how such improvements are influenced by the specific choice of the reinforcement
phase.
The stress-life curves for tension fatigue in several injection-molded composites
with PSF matrices and with carbon or glass (short) fibers are presented in Fig.
7.11. Also included in this figure, for comparison purposes, are the stress-life
characteristics of the unreinforced matrix material with a similar processing
history. It is clear that the polymeric composites offer a superior (total) fatigue life
than the unreinforced matrix, with the resistance to fatigue fracture increasing
with increasing concentration of the glass fibers. The superiority of the
reinforcement with carbon fibers to that of glass fibers is also evident. The high stiffness
of the carbon whiskers contributes to the fatigue life by reducing the cyclic
strains in the matrix at a given stress amplitude. Furthermore, the high thermal
conductivity of carbon moderates the temperature rise due to hysteretic heating.
It should, however, be noted that the beneficial effects of whisker reinforcements
shown in Fig. 7.11 may be markedly reduced if the fatigue tests are conducted at
higher cyclic frequencies where thermal softening begins to control the fatigue
life.
7.8.2 Continuous-fiber composites
Cyclic loading of organic composites with continuous and unidirectional
fibers can engender a more deleterious effect on service life than monotonic loading.
The residual strength, toughness, and elastic response are all adversely affected by
prolonged cyclic loading. This effect is clearly demonstrated in the stress-life data
plotted in Fig. 7.12 for an organic composite with an epoxy resin (Bakelite ERL
2256) matrix and 0.6 volume fraction of unidirectional E-glass fibers. When the
composite is subjected to tension fatigue at a stress ratio of 0.1 and a test frequency
of 19 Hz in the direction of fiber orientation, an endurance limit of about 686 MPa
results. This value is significantly lower than the static tensile strength of 1245 MPa.
Also shown in Fig. 7.12 are the results of fatigue tests conducted for different
orientations, <p, of the tensile axis with respect to the fiber direction. It is seen that
an increase in <p leads to a monotonic reduction in the endurance limit, with the
7.8 Fatigue of organic composites
241
o I I I I I I I 1_
10° 102 104 10"
N,
Fig. 7.11. A stress-life plot showing the variation of maximum tensile stress <xmax as a function
of the number of fatigue cycles to failure Nf for injection-molded PSF which is reinforced
with different amounts of short glass fibers and with 40% short carbon fibers. The results
are based on room temperature fatigue tests conducted at R = 0.1, and i>c = 5-20 Hz. The
small arrows denote that no failure occurred at the indicated number of cycles. (After Mandell
et al, 1983.)
matrix playing an increasingly dominant role in the fatigue process. Similar
characterizations of fatigue failure have also been developed using strain-based
approaches (e.g., Dharan, 1975; Talreja, 1987).
Nondestructive test methods based on acoustic emission, radiography, and
modulus and damping measurements of fiber composites subjected to fatigue loads show
fiber breakage, debonding, or matrix cracking fairly early in the fatigue process. The
growth of such microscopic degradations continues to result in the lowering of the
stress at which failure occurs with increasing numbers of fatigue cycles. In view of this
progressive degradation, the useful fatigue life of many continuous-fiber composites is
often defined as the number of cycles needed to cause a certain reduction in the elastic
modulus. It is also common to characterize the distributed (microscopic) fatigue
damage using Weibull statistics (see, for example, Talreja, 1987). At high cyclic
frequencies, hysteretic heating also becomes an important factor. Furthermore,
anomalous improvements in fatigue life may result in some cases due to the realignment of
fibers, crack blunting, periodic overloads or frequency fluctuations.
242
Stress-life approach
1200
1000
800
'J?
^ 600
b
200
100
~ ^UTS
-
*=-
1
<j> = 15°
—I- 1
56 = 0°
r
,56 = 30°
_$6 = 60°
1 1
102
10s
104
106
10"
10'
108
Fig. 7.12. Stress-life plots showing the variation of maximum tensile stress <xmax as a function
of the number of fatigue cycles to failure N( for an epoxy resin matrix reinforced with 60
volume% unidirectional glass fibers. <f> denotes the angle between the fiber direction and the
tensile axis. The tests were conducted at room temperature at R = 0.1 and vc = 19 Hz. (After
Hashin & Rotem, 1973.)
7.9 Effects of stress concentrations
The discussion up to this point has focused on nominally smooth-surfaced
solids. However, engineering structures invariably contain stress concentrations
which are the principal sites for the inception of fatigue flaws. The stress and
deformation fields in the immediate vicinity of the stress concentration have a strong
bearing on how the fatigue cracks nucleate and propagate. In this section, we
examine continuum approaches based on stress-life concepts which deal with the issue of
fatigue failure ahead of stress concentrations.
7.9.1 Fully reversed cyclic loading
The theoretical elastic stress concentration factor Kt relates the local stress
ahead of the notch tip to far-field loading and is defined as the ratio of the maximum
local stress crmax to the nominal stress S. Under fatigue loading conditions, the elastic
stress concentration factor is replaced by the so-called fatigue notch factor:
unnotched bar endurance limit
notched bar endurance limit
In general, fatigue experiments suggest that notches produce a less stress
concentrating effect than predicted by theoretical elastic analysis such that Kt < Kx; K( -> Kt
for large notch-root radii and for higher strength materials. The degree of agreement
between theoretical predictions of elastic stress concentration and actual effects is
often measured by the so-called notch sensitivity index which is defined as
7.9 Effects of stress concentrations
243
« = ^r- <717)
The parameter q varies from zero for no notch effect to unity for the full effect
predicted by the elasticity theory. Kt is a function only of the component geometry
and loading mode and is available in many handbooks (e.g., Peterson, 1959).
However, K{ is determined from experimental measurements or empirical,
engineering 'rules-of-thumb'. An example of such a measure of K( is the well known Peterson
equation for ferrous wrought alloys (Peterson, 1959):
{1 + (AJp)}
where An is a constant whose value depends on the strength and ductility of the
material (An ~ 0.25 mm for annealed steels and An ~ 0.025 mm for steels of very
high strength) and p is the notch-root radius.
The stress-life approach is employed for high-cycle fatigue failures ahead of stress
concentrations by appropriately modifying the smooth specimen (unnotched)
endurance limit at. This involves either dividing the stress range Act for all fatigue lives by
the factor K{ (which often leads to very conservative results) or merely reducing the
fatigue limit cre by a factor of K{. This method is unsuitable for situations where
considerable plastic deformation occurs ahead of the stress concentration.
7.9.2 Combined effects of notches and mean stresses
Now we consider a notched member which is subjected to cyclic loading
with a nonzero mean stress in such a way that only elastic conditions prevail at all
times throughout the member. If S, Sm, and Sa are the instantaneous value, the mean
value, and the amplitude, respectively, of the nominal far-field cyclic stress imposed
on the notched member (Fig. 7.13), the local stress amplitude and the mean stress at
the tip of the notch can be computed from the fatigue notch factor K( such that
oa = K(Sa, am = K(Sm, (7.19)
where the peak value of K(S is always smaller than the yield strength of the material
cry in both tension and compression. In order to assess the effect of the mean stress
on fatigue life, the modified Goodman equation, Eq. 7.4, or some other approach
discussed in Section 7.2 may be employed. Using the modified Goodman diagram
for the notched member, we see that
Sa=%^-(l-^4 for *f-S|max<ay. (7.20)
K[ [ crTS J
Figure 7.13 schematically shows the modified Goodman diagram for smooth and
notched specimens which are subjected to cyclic loading under a nonzero mean
stress. These specimens are subjected to an applied stress amplitude of Sa and
K[Sa, respectively, as indicated in the figure. Note that for the elastically deforming
notched member, the intercepts in both the ordinate and the abscissa are reduced by
a factor of Kt as compared to the unnotched fatigue specimen.
244
Stress-life approach
Fig. 7.13. The effect of mean stress on fatigue life as determined from the modified Goodman
diagram for notched and unnotched fatigue specimens.
7.9.3 Nonpropagating tensile fatigue cracks
An intriguing phenomenon associated with tensile fatigue cracks growing
ahead of stress concentrations involves the so-called nonpropagating flaws. It was
first shown by Frost & Dugdale (1957) and Frost (1960) that fatigue cracks
emanating from notches can arrest completely after growing some distance. A number of
subsequent studies have unequivocally documented the existence of nonpropagating
fatigue cracks ahead of stress concentrations in ductile solids (e.g., Smith & Miller,
1978; El Haddad et al. 1980; Tanaka & Nakai, 1983). Experimental measurements
based on total life have shown that the nonpropagation or arrest of fatigue flaws
occurs only ahead of sharp notches, above a certain critical value of Kt. Figure 7.14,
where the fatigue limit is plotted as a function of Kt, schematically illustrates the
conditions for the occurrence of nonpropagating fatigue flaws. Here, the threshold
stress for crack initiation, expressed as the unnotched fatigue limit ae divided by K{
or Kt, is lower than the stress required to cause catastrophic fracture of
nonpropagating cracks above the critical Kt. A discussion of the possible causes for the arrest
of fatigue cracks ahead of stress concentrations is provided in Chapter 15 in
connection with the topic of short fatigue cracks.
7.9.4 Example problem: Effects of notches
Problem:
A circumferentially notched cylindrical rod of a high-strength, low alloy
steel is subjected to repeated bending at a nominal stress amplitude,
7.9 Effects of stress concentrations
245
no cracks
complete failure
nonpropagating cracks \
AaJKt
Fig. 7.14. Threshold stress range (fatigue limit) for crack initiation at a notch tip, characterized
by the unnotched fatigue limit A<re divided by Kf or Kt and plotted as a function of Kt.
(After Frost, Marsh & Pook, 1974.)
Sa = 200 MPa, and a mean stress, Sm = 250 MPa. For the notch geometry of
the rod, the elastic stress concentration factor, Kt, and the notch sensitivity
index, q, are found from appropriate handbooks to be 2.3 and 0.92, respectively.
Fully reversed cyclic stress tests conducted on smooth (unnotched) laboratory
specimens give the following material parameters for the Basquin equation, Eq.
7.1: crf = 1000 MPa and b = -0.12. The endurance limit was estimated from
these tests to be 280 MPa. The yield and tensile strengths of the steel are
ay = 600 MPa and crTS = 1050 MPa. Estimate the high-cycle fatigue life of
the notched rod.
Solution:
From Eq. 7.17, we find that the fatigue notch factor, K( = 1.2. For the
given loading conditions, i.e. Sm = 250 MPa, Sa = 200 MPa, we then find an
equivalent value of fully reversed cyclic stress, Sa\am=0, for an unnotched
specimen using Eq. 7.20. For this purpose, we rewrite Eq. 7.20 as:
-l
=o —
Kf
1-
crTS
(7.21)
it is seen that
in Eq. 7.20 that
0 = 336 MPa exceeds
Substituting the appropriate numerical values,
Salcrm=o = 336 MPa. (Note that the requirement
K{ ■ S\max < cry is satisfied.) The equivalent value of Sa\an
the fatigue endurance limit of 280 MPa. Thus, the specimen is expected to have a
finite life. Using Eq. 7.1,
a'((2Ndb= 1000(2Aff)-°-12 , =► 2Nt = 8855. (7.22)
Thus, the number of stress reversals to failure is 8855, or the number of cycles to
failure is 4427.
246
Stress-life approach
7.10 Multiaxial cyclic stresses
The discussions up to this point dealt with total fatigue life characterization
for loading on the basis of uniaxial cyclic stresses involving primarily elastic
conditions. There are, however, many practical applications where fatigue-critical
components undergo multiaxial cyclic loading. For example, the fuselage of an aircraft is
subjected to hoop and longitudinal cyclic stresses due to repeated pressurization and
depressurization. Similarly, pressure vessels, tubes and pipes are subjected to biaxial
stresses which arise from internal pressures. Transmission shafts in automobiles
experience combined shear stresses arising from torque which is superimposed on
axial stresses generated by bending.
In general, different modes of imposed loads (such as tension and torsion) may
occur either in a static mode (as, for example, due to a steady bending moment, mean
pressure or steady torque) or they may fluctuate in phase or out of phase. The overall
fatigue life under general multiaxial conditions is inevitably dictated by the complex
phase relations between the different modes of loading. In this section, we consider
stress-based approaches to total life under multiaxial loading conditions. The
corresponding discussions of multiaxial strain-based approaches are taken up in the next
chapter.
7.10.1 Proportional and nonproportional loading
Consider a fatigue specimen which is subjected to multiaxial cyclic loads.
Proportional loading is considered to occur if, during changes and fluctuations in the
imposed loads, the different components of the stress tensor vary in constant
proportion to one another. At a given reference point in the material, proportional
loading exists if the principal stresses at that point, ax, a2 and a^, vary in the
following manner:
^ = XU ^ = X2. (7.23)
Here Xi and X2 are scalar constants which may vary from point to point, but are
constants for a given material point in the solid.
As an example, an increase in the internal pressure of a close-ended, thin-walled
cylindrical tube causes the hoop stress crhoov and the axial stress craxial to vary in
proportion to each other so that at all times, crhoop/craxial = 2. If the thin-walled
cylinder is subjected to an axial tension P and a torque about the axis T,
proportional loading occurs only if P oc T. Any other mutual variation of P and T gives
rise to nonproportional loading. Further discussions of nonproportional and out-
of-phase loading are considered in the next chapter in the context of strain-life
fatigue.
7.70 Multiaxial cyclic stresses
247
7.10.2 Effective stresses in multiaxial fatigue loading
We begin with a consideration of fully reversed cyclic loading (zero mean
stress) where all cyclic loads are perfectly in phase or 180° out of phase with one
another. Let ax, ay and az denote the three normal components of stress applied to a
fatigue specimen and let xxy, xyz and xzx denote the three shear stress components. Let
CTi» ai, CT3 denote the principal stresses, with ax >a2>ai,. The effective stress which
characterizes the deformation of the material is then assumed to be that given by the
von Mises criterion based on the octahedral shear stress,f roct:
3 1 /
Oe = -7= *oct = -7= V (°"l - alf + (02 ~ aif + (°3 ~ G\f >
= -7= \](Px ~ Cy)1 + (o> - °z)2 + iPz ~ <r*)2 + 6(t^ + x2yz + x2zx).
(7.24)
Another measure of the intensity of the multiaxial stress state (and used in the Tresca
yield criterion which was discussed in Section 1.4.3) is the maximum shear stress,
rmax, which acts on at most three mutually perpendicular sets of planes that intersect
the principal stress axes at 45°:
lCTl _ CT3| ,_ ~~
*max = max I—-—|. (7.25)
For fluctuating multiaxial stresses, Eq. 7.24 is written in terms of the amplitudes of
principal stresses er,-a (/ = 1, 2, 3) and the amplitude of the effective stress aat as
Ca.e = -7= V (°"la ~ ^2af + foa ~ ^a)2 + (^a - Vlaf ■ (7.26)
In the most elementary stress-life analysis for multiaxial fatigue involving a zero
mean stress, the Basquin exponent b and the fatigue strength coefficient a[ in Eq. 7.1,
which are determined from experiments conducted on smooth specimens subjected
to fully reversed uniaxial cyclic loads, are used in conjunction with the following
stress-life equation for multiaxial stresses to determine the fatigue life, Nf.
aa,e = cr'tCNtf. (7.27)
In some cases, a steady, nonfluctuating load in one mode (such as bending) may be
superimposed on cyclic stresses in another mode (such as cyclic torsion). Here, the
effects of mean stress on fatigue failure should be considered. If it is assumed that the
controlling mean stress is related to the steady value of the hydrostatic stress, an
effective value of this mean stress, am, may be defined in terms of the mean values of
the principal stresses, aim (i = 1, 2, 3), as
^m = CTlm + CT2m + CT3m = axm + aym + azm- (7.28)
Recall from Chapter 1 that the octahedral shear stress is the resolved shear stress on the n-plane, which
is the plane oriented at equal angles to the three principal stress directions.
248
Stress-life approach
Alternatively, an effective mean stress may be defined based on the octahedral shear
stress as
^m.e = —^V (CTlm ~ ^m) + (CT2m ~ CT3m) + (CT3m ~ ^lm) > (7.29)
The simplest way to invoke stress-based approaches to fatigue in the presence of
multiaxial stresses which involve a nonzero mean stress is to combine the effective
stress amplitude cra e, determined from Eq. 7.26, and the effective mean stress as, for
example, determined from Eq. 7.29, with the modified Goodman equation to obtain
°a,e = cra,el«im=°| J -^Ml- (7-30)
«2m=» I crTS J
With this equation, the generalization of the modified Goodman equation to multi-
axial fatigue then involves an equivalent fully-reversed uniaxial cyclic stress. The
fatigue life under multiaxial cyclic stresses involving nonzero mean stresses is next
determined using Eq. 7.27.
One of the major drawbacks of such effective stress approaches is that the
differing effects of axial tension and compression mean stresses in a multiaxial fatigue test
may not be accurately captured. In addition, the orientation of fatigue cracks with
respect to the loading axes is not quantitatively determined from such criteria.
Furthermore, a wide variety of experimental observations (to be discussed next)
reveal that the normal stress also plays a critical role in influencing fatigue lives in
multiaxial loading.
7.10.3 Stress-life approach for tension and torsion
For uniaxial tensile loading with a nonzero mean stress, the only nonzero
components of stress are crla and erlm. For this case, as anticipated, Eq. 7.30 reduces
to Eq. 7.4. Now consider pure torsion loading only. The only nonzero components
of stress in this case are the amplitude and mean value of the shear stress, xxy a and
%>,m> respectively. From Eqs. 7.24, 7.26 and 7.28, it is readily seen that
°a,e = V^ rxy,a and am = 0. (7.31)
An interesting point to observe here is that am = 0 even if the mean shear stress for
torsional loading is nonzero. A variety of independent experimental studies (see, for
example, the work dating back to Sines, 1959) have shown that a superimposed mean
static torsion has no effect on the fatigue limit of metals subjected to cyclic torsion,
although a superimposed static tension or bending stress has a marked effect on the
fatigue life in normal cyclic loading.
The differing effects of torsion and tension loading on the microscopic and
macroscopic modes of cracking and on the overall fatigue life are illustrated in Figs. 7.15(a)
and (b), respectively, for an Inconel 718 alloy. Essentially throughout the fatigue life,
failure occurs on planes of maximum shear. This damage process is classified as
regime A in Fig. 7.15(a). In this regime, the cracks were confined to the planes of
7.10 Multiaxial cyclic stresses
249
1.0
0.8
0.6
0.4
0.2
n
■*
i
, 1
'
regime A
•
, 1 .
»■ !■*— regime
"^'\
\.
^
i i
10z
103
10* 10
N{ (cycles)
10°
107
Nf (cycles)
Fig. 7.15. The evolution of different regimes of fatigue failure during (a) torsion fatigue and (/>)
tension fatigue of an Inconel 718 alloy (yield strength, ay = 1160MPa. (From Socie, 1993.
Copyright American Society for Testing and Materials, Philadelphia. Reproduced with
permission.)
maximum shear through the fatigue life. The fraction of life, N/N{, expended in
initiating a dominant shear crack is less than 0.1; the remaining 90% of life is spent
in propagating this shear crack. For Nf > 106 cycles, the local mode of failure occurs
on planes oriented normal to the local principal tensile stress, with the microscopic
tensile cracks oriented at 45° to the shear cracks. This failure process is categorized
as regime B in Fig. 7.15(a). The fraction of life expended in initiating the dominant
crack rises to 0.2 at N/Nf ~ 107 cycles.
When the Inconel 718 alloy is subjected to axial tension fatigue, Fig. 7.15(b), a
different failure pattern emerges throughout the life. In both the low-cycle and high-
250
Stress-life approach
cycle fatigue failure regimes, the macroscopic crack plane is approximately normal to
the tensile loading axis. For N( < 105 cycles, regime A, the local mode of
microscopic cracking is along planes of maximum shear stress. As discussed in detail in
Chapter 10, this microscopic mode of initial crack advance in tension fatigue is
commonly referred to as Stage I, where single-slip failure along planes of local
maximum shear induces a serrated or faceted fracture morphology. Such features
are clearly evident in the micrograph shown in Fig. 7.15(Z?). Within regime A, the
fraction of life expended in nucleating a dominant fatigue crack gradually rises from
approximately 0.1 at N( ~ 103 cycles to about 0.4 at N{ ~ 105 cycles. For N{ > 106
cycles, regime B, a tensile mode of failure emerges under imposed tension fatigue,
with the fraction of total life expended in nucleating a dominant fatigue flaw (1 mm
in size) gradually rising to as high as 0.9 at N{ ~ 10 cycles. Such a mode of failure is
commonly referred to as Stage II, whose microscopic mechanisms are examined in
detail in Chapter 10.
The extent to which regimes A and B individually dominate the total fatigue life,
and the fraction of total life expended in creating a dominant flaw within each of
these regimes is a strong function of the composition and microstructure of the
material, and of the test environment. Locally tensile failure patterns can also be
induced in some alloys subjected to cyclic torsion, especially in the high-cycle fatigue
regime.
7.10.4 The critical plane approach
When the multiaxial fatigue cycles involve proportional loading, the most
critical plane on which damage and cracking occur (e.g., the plane on which the
tensile normal stress or the shear stress is a maximum) stays fixed relative to the
loading axis. Under such circumstances, the critical plane can be identified in a
relatively straightforward manner, as discussed later in this section. Such a situation
continues to hold even if the cyclic stresses are of variable amplitude. By contrast,
when the components of the principal stress tensor do not vary in constant
proportion to one another, the orientations of the critical planes in the specimen vary with
time and loading path. As a result, an instantaneous definition of these critical planes
derived from local stress analyses is needed. The critical plane approach to multiaxial
fatigue life estimation then involves the following steps: (1) identification of the
orientation of the plane which represents the critical site in the material for the
onset of damage based on some criterion (such as the maximum normal/shear
stress/strain criterion, or a combined normal stress/shear stress criterion) and (2)
estimation of the number of cycles to initiate a fatigue crack or the total number of
cycles to failure using experimental results on stabilized cyclic stress-strain curves
and fatigue lifes, preferentially from uniaxial stress-life data obtained under fully
reversed loading conditions (in conjunction with the modified Goodman diagram or
7.70 Multiaxial cyclic stresses
251
some other approach to account of the effect of mean stresses; see later discussion in
this chapter).
Figure 7.16(a) schematically shows a fatigue specimen subjected to bending-tor-
sion cyclic loads. The reference coordinate axes, x, y and z, are marked on the figure.
Let the orientation of a critical plane be denned with reference to this original
coordinate system with the aid of two angles: the angle, y, between the axis of the
specimen (the x axis) and the line of intersection of the critical plane with the surface,
and the angle, <p, between the normal to the critical plane, which is along the z
direction in Fig. 7.16(Z?), and the z axis. A new set of coordinate axes, x, y and
z, is denned in Fig. 7.16(b) to facilitate the visualization of the critical plane
orientation. Using straightforward methods for coordinate transformation, the components
of the stress and strain tensor in the x , y and z coordinate system are written as
ay = SkiokiSij, €y = SkiekiSjj,
(cos y — cos <p sin y — sin <p sin y ^
siny cos^cosy sin<pcosy . (7.32)
0 — sin cp — cos cp y
Then the important components of the stress acting on the potentially critical plane
are identified as: the normal stress (cryz/), the (in-plane) shear stress (a'yiz>) which
produces a mode II type crack opening, and the (out-of-plane) shear stress which
produces a mode III type crack opening (see Chapter 9 for further discussions of
mode II and mode III).
y
A
(a)
(b)
Fig. 7.16. Schematic of a fatigue specimen subjected to bending-torsion cyclic loads (a) and the
definition of the critical plane and the associate nomenclature (b).
252
Stress-life approach
In general, the identification of the orientations of the critical planes for general
multiaxial loading with nonproportional stress fluctuations can become very
cumbersome. However, as reviewed by Chu, Conley & Bonnen (1993), some
simplifications can be extracted by noting that most fatigue cracking initiates at the surface.
Given the state of plane stress at the surface elements of the specimen, criteria based
on mode I (tensile failure) and mode III (torsional or out-of-plane shear failure) type
damage lead to cp = 90° as the critical orientation, whereas mode II type failure
based on in-plane shear stresses lead to cp = 45° as the critical orientation. With this
fixed orientation of cp, only variations in the angle y need to be calculated. If such
approximations cannot be applied to a given material or loading situation, detailed
computations based on the critical plane approach need to be undertaken.
7.10.4.1 Critical plane criteria invoking normal and shear stresses
On the basis of experimental observations of fatigue crack initiation
patterns in steels and aluminum alloys, Findley (1959) postulated a criterion for multi-
axial fatigue failure which is predicated upon the combined effects of normal stress
and maximum shear stress. In his model, fatigue failure is deemed to occur when
*a + acrnmax = ]3. (7.33)
Here, a and fi are material parameters determined experimentally, which are
constants for a given life. An increase in the maximum normal stress crn max acting on the
plane of the critical alternating shear stress causes a corresponding reduction in the
permissible cyclic shear stress ra as per Eq. 7.33, for a fixed fatigue life. McDiarmid
has proposed several variations of the Findley criterion, the most recent of which
attempts to account for different types of cracking patterns observed during multi-
axial fatigue (McDiarmid, 1994).
The justification for the incorporation of a normal stress component, in the form
of either a maximum normal stress or a hydrostatic stress, in Eq. 7.33 and in other
critical plane criteria presented in subsequent sections and in the next chapter, stems
from the differing effects on crack growth from tensile and compressive mean
stresses, f From a mechanistic viewpoint, one possible rationale for such an effect
is that interlocking and closure of the microscopic irregularities of the crack faces
seen, for example, in the Stage I transgranular crack growth process seen in Fig.
7.15(Z?), can influence the transmission of shear tractions. The magnitude of tensile or
compressive normal stresses can consequently determine how effectively such
contact between crack faces and the attendant transmission of shear loads occurs. One
may then envision the possibility of a minimization or elimination of such contact,
and a resultant increase in the rate of advance of the crack, due to tensile mean
stresses. Such a situation is demonstrated in the case study on multiaxial fatigue
' Historically, criteria for multiaxial fatigue failure on the basis of both shear and normal stresses have
also been considered in the earlier works of Gough, Pollard & Clenshaw (1951) and Stulen & Cummings
(1954). A survey of historical developments in the area of multiaxial fatigue is given by Garud (1981).
7.70 Multiaxial cyclic stresses
253
presented in Chapter 8. A number of criteria have also been put forth to identify
critical planes of failure on the basis of different combinations of normal and shear
strains for proportional and nonproportional loading. These approaches are also
discussed in Chapter 8.
7.10.4.2 Criteria invoking effective stresses
In order to develop a criterion which quantitatively captures the effects of
superimposed normal loads on the observed fatigue limits, Crossland (1956)
postulated that
V^T + affH,max<A (7-34)
where /2a is the amplitude of the second invariant of the stress deviator denned in
Section 1.4, crH m = am/3 (see Eq. 7.28) is the mean value of the hydrostatic stress
during a multiaxial fatigue loading cycle, and crH max is the maximum value of the
hydrostatic stress during multiaxial loading; crH max = crH m + crH a (where crH a is the
amplitude of the hydrostatic stress during a multiaxial fatigue loading cycle), and a
and ft are material constants determined experimentally.
Sines (1959) modified the Crossland criterion in the following manner:
/72a" + aaHjm<^. (7.35)
Let re _! be the endurance limit measured from a fully reversed cyclic torsion test
(where aHm = 0 and /2a = rei_i) and let crB0 be the endurance limit determined
from a zero-to-tension (R = 0) uniaxial or bending cyclic load test (where
h* = °b,o/V3 and <xH,m = <rB,o/3). Then, a = [(3re,_i/crB0) - 73] and £ = xe_x
in Eq. 7.35. The Sines criterion correctly captures the experimental observations that
(a) the fatigue limit in torsion is independent of a mean shear stress and that (b) the
endurance limit in bending varies linearly with a static normal stress. Following the
same line of reasoning, the material parameters in Eq. 7.34 are:
a = [(3re _!/crB _j) — V3] and fi = re _i, where crB _j is the endurance limit
measured under fully reversed bending.
A number of subsequent variations of the Crossland (1956) and Sines (1959)
criteria have been reported. For example, Dang Van (1973) has formulated a
criterion where a linear combination of the shear stress acting on the plane of maximum
shear stress and the instantaneous hydrostatic pressure, both of which are
determined from local stress analyses, are used in an equation analogous to Eqs. 7.34 and
7.35. Such a criterion has also been suitably modified for damage and cracking
predictions under in-phase and out-of-phase loading in multiaxial fatigue as well
as contact fatigue. A variation of such an approach has also been suggested by
Papadopoulos et al. (1997) who use volume-averaged stress quantities, ostensibly
to simulate differing crystallographic orientations in a polycrystalline ensemble.
Experimental studies of proportional and nonproportional loading with fully
reversed cycles in a variety of high-strength metals have shown that the ratio of
the fatigue limit in torsion to that in normal/bend loading, re,_i/crB _i « 0.57-0.80
254
Stress-life approach
(Zenner, Heidenreich & Richter, 1985; Froustey & Lasserre, 1989). For a phase
difference of 0° between torsional and bending stress cycles, all of the foregoing
theories give essentially the same result. For 90° out-of-phase loading, larger
differences are seen among the different criteria. A quantitative comparison of the
predictions of the foregoing theories with experimental results for in-phase and out-of-
phase loading of high-strength metals is given in Papadopoulos et al. (1997).
Exercises
7.1 The S-N curve for an elastic material is characterized by the Basquin
relationship, cra = C ■ N[, where C is a material constant, cra is the stress
amplitude, N[ is the number of fully reversed stress cycles to failure and b is the
Basquin exponent approximately equal to -0.09. When the stress amplitude
is equal to the ultimate tensile strength of the material in this alloy, the
fatigue life is 1/4 cycle. If a specimen spends 70% of its life subject to
alternating stress levels equal to its fatigue endurance limit ae, 20% at
l.lcre and 10% at 1.2cre, estimate its fatigue life using the Palmgren-Miner
linear damage rule.
7.2 Explain why the modified Goodman diagram can be rewritten in terms of
the endurance limit, cre, as
i 11 a"
Ge = OeU =0 { 1 — ■
CTTSJ
where cre|CTm=0 is the endurance limit for zero mean stress cyclic loading.
7.3 A circular cylindrical rod with a uniform cross-sectional area of 20 cm2 is
subjected to a mean axial force of 120kN. The fatigue strength of the
material, cra = crfs, is 250 MPa after 106 cycles of fully reversed loading
and crTS = 500 MPa. Using the different procedures discussed in this
chapter, estimate the allowable amplitude of force for which the shaft should be
designed to withstand at least one million fatigue cycles. State all your
assumptions clearly.
7.4 A rotating bending machine produces a pure bending moment uniformly
over the gage length of a fatigue specimen. Show that, in a bending specimen
rotating at an angular velocity co, the cyclic stress will be of the form
Act = A sin cot, where A is the peak stress amplitude and t is the time.
7.5 Why is tempered glass more resistant to tensile fracture than ordinary glass?
7.6 A cylindrical shaft of circular cross section is subjected to a bending moment
of constant amplitude over its entire length. The deformation of the shaft
material can be approximated by an elastic-perfectly plastic constitutive
model and the yield strength in tension can be considered equal to that in
compression. If the outer fibers of the shaft yield plastically over a depth of
1/4 of the diameter during the application of the bending moment, qualita-
Exercises
255
tively discuss the development and distribution of mechanical residual
stresses along the diameter of the shaft when the bending moment is fully
removed.
7.7 Find the nonzero components of the principal values of the mean stress aim
(i = 1, 2, 3) and the nonzero components of the principal stress amplitudes
cr,a (i = 1, 2, 3) for uniaxial cyclic loading with R = 0.2.
7.8 A thin-walled cylinder with closed ends is subjected to a steady twisting
moment T, which is oriented parallel to the axis of the cylinder. The internal
radius of the cylinder is r\ and its wall thickness is t.
(a) If the cylinder is now subjected additionally to an internal pressure p
which fluctuates between zero and a maximum value, pmax, comment on
the variation in the principal stress directions during a complete cycle in
P-
(b) Under what conditions would you expect the principal stresses to be
nearly aligned with the axial and hoop directions?
CHAPTER 8
Strain-life approach
The information derived from cyclic-stress-based continuum analysis mainly
pertains to elastic and unconstrained deformation. In many practical applications,
engineering components generally undergo a certain degree of structural constraint
and localized plastic flow, particularly at locations of stress concentrations. In
these situations, it is more appropriate to consider the strain-life approach to
fatigue.
In this chapter, strain-based approaches to total fatigue life are discussed for
smooth-surfaced and notched components subjected to constant amplitude and
variable amplitude cyclic loading of metals and nonmetals. Also examined are available
methods for fatigue life estimation for multiaxial cyclic loading.
8.1 Strain-based approach to total life
Coffin (1954) and Manson (1954), working independently on thermal
fatigue problems, proposed a characterization of fatigue life based on the plastic strain
amplitude. They noted that when the logarithm of the plastic strain amplitude,
Aep/2, was plotted against the logarithm of the number of load reversals to failure,
2iVf, a linear relationship resulted for metallic materials, i.e.
^> = 4(2Nt)c, (8.1)
where e{- is the fatigue ductility coefficient and c is the fatigue ductility exponent. In
general, e{- is approximately equal to the true fracture ductility ef in monotonic
tension, and c is in the range of -0.5 to -0.7 for most metals. Typical values of
€f and c for a number of engineering alloys are listed in Table 8.1.
8.1.1 Separation of low-cycle and high-cycle fatigue lives
Since the total strain amplitude in a constant strain amplitude test, Ae/2,
can be written as the sum of elastic strain amplitude, Aee/2, and plastic strain
amplitude, Aep/2,
Ae _ Aee Aep
256
8.1 Strain-based approach to total life
257
Table 8.1. Cyclic strain-life data for some engineering metals and alloys.
Material
Al alloys*
1100
2014
2024
5456
7075
Steels*
1015
4340
TV alloys*
Ti-6A1-4V
Ni-base alloys
Inconel X
Condition
annealed
T6
T351
H311
T6
aircooled
tempered
solution-treated + ag
t
annealed
a,* (MPa)
97
462
379
234
469
228
1172
ed 1185
700
at (MPa)
193
848
1103
724
1317
827
1655
2030
2255
1.80
0.42
0.22
0.46
0.19
0.95
0.73
0.841
1.16
b
-0.106
-0.106
-0.124
-0.110
-0.126
-0.110
-0.076
-0.104
-0.117
c
-0.69
-0.65
-0.59
-0.67
-052
-0.64
-0.62
-0.69
-0.75
'Source: Osgood, 1982
+Refers to the monotonic yield strength
(8.3)
the Coffin-Manson relationship, Eq. 8.1, provides a convenient engineering
expression for characterizing the total fatigue life. Using the Basquin equation (Eq. 7.1)
and noting that
Aee Act cra
~Y = ~2E = ~E'
where E is Young's modulus, it is found that
^ = ^(2N{)b. (8.4)
Combining Eqs. 8.1, 8.2 and 8.4, one obtains
^ = ?±(2N[)b + e'[(2N[y. (8.5)
The first and second terms on the right hand side of Eq. 8.5 are the elastic and plastic
components, respectively, of the total strain amplitude. Equation 8.5 forms the basis
for the strain-life approach to fatigue design and has found widespread application
in industrial practice. Table 8.1 provides a list of representative data for the stress-
life and strain-life characterization of some commonly used engineering alloys.
8.1.2 Transition life
The variations of the elastic, plastic and total strain amplitudes are plotted
in Fig. 8.1 as functions of the number of load reversals to failure, 2Nf, from Eqs. 8.4,
258
Strain-life approach
(2ATf),
2N, (log scale)
Fig. 8.1. The total strain amplitude versus life curve obtained from the superposition of the
elastic and plastic strain amplitude versus life curves.
8.1, and 8.5, respectively. In order to examine the implications of Fig. 8.1 for 'short'
and 'long' fatigue lives, it is useful to consider a transition life, which is denned as the
number of reversals to failure (2N{\ at which the elastic and plastic strain amplitudes
are equal. From Eqs. 8.1 and 8.4,
(2iVf)t=(-V) . (8.6)
At short fatigue lives, i.e. when 2Nf < (2N()t, plastic strain amplitude is more
dominant than the elastic strain amplitude and the fatigue life of the material is
controlled by ductility. At long fatigue lives, i.e. when 2N{ 2> (2N()V the elastic
strain amplitude is more significant than the plastic strain amplitude and the
fatigue life is dictated by the rupture strength. Optimizing the overall fatigue
properties thus inevitably requires a judicious balance between strength and
ductility (e.g., Mitchell, 1978).
Mean stress effects have also been incorporated into the uniaxial strain-based
characterization of fatigue life in a simple manner (Morrow, 1968). Assuming that
a tensile mean stress reduces fatigue strength a\, such that (see Eq. 7.6):
a. = (ai - am)(2Nr)b,
the strain-life relationship, Eq. 8.5, can be rewritten (see Section 7.2) as
Ae a'[ — a„
(2N[)b + e'[(2N[Y
(8.7)
(8.8)
Cycle-dependent relaxation of the mean stress under strain-controlled fatigue
loading is a counterpart of the cyclic creep mechanism discussed earlier (Section 3.9) in
connection with stress-controlled fatigue. Consider a ductile solid which is
subjected to a fixed amplitude of cyclic strains, where the mean strain is tensile, Fig.
8.2(a). If the material exhibits cyclic softening behavior, the flow stress at the
8.1 Strain-based approach to total life
259
•to"
(*)
Fig. 8.2. Mean stress relaxation in a cyclically softening material subjected to strain-controlled
fatigue.
imposed strain level C is expected to be lower than that at A. With a tensile mean
strain level, the tendency for similar behavior in compression is not significant, and
consequently, the shape of the hysteresis loop for the portion C to D will be
roughly the same as that from A to B. This process results in a progressive
reduction in the mean stress with increasing strain cycling, as shown in Fig.
8.2(b). The rate of decrease in mean stress progressively diminishes as the mean
stress level approaches zero.
Mean stress relaxation can also occur in cyclically hardening materials (e.g.,
Sandor, 1972), although the mechanisms here are less obvious. Cyclic hardening
reduces the plastic strain range and increases the stress range for a fixed total strain
amplitude. With reference to Fig. 8.2(a), the material develops a higher flow stress at
C than at A. However, with a tensile mean stress, the material yields more in tension
than in compression. This preferential plastic straining alters the shape of the
hysteresis loops in such a way that the stress at point D is lower than that at B, although C
is at a higher stress level than at A. The net result is that a relaxation of mean stress
occurs in a cyclically hardening material as well.
We conclude this section by noting that the low-cycle fatigue behavior of
polymeric materials is also often characterized empirically using strain-based approaches.
Figure 8.3 shows the variation of total strain amplitude Ae (log scale) as a function
of the number of load reversals to failure 2N{ (log scale) for polycarbonate at 298 K.
Note the similarity of this curve with the corresponding one for metals presented in
Fig. 8.1.
260
Strain-life approach
0.2 i-
0.1 -
0.08 -
0.06 -
Ae
0.04 -
0.02 -
0.01 -
0.008 E L
10° 102 104 106
2Nt
Fig. 8.3. Total strain amplitude Ae plotted against the number of load reversals to failure 2JVf
(log-log scale) for polycarbonate at 298 K. (After Beardmore and Rabinowitz, 1975.)
8.1.3 Example problem: Thermal fatigue life of a metal-matrix
composite
Problem:
Refer to the example problem of a metal-matrix composite (Section
3.10.5) which is subjected to thermal cycling. Now consider situations under
which the metallic matrix of the composite undergoes reversed plastic yielding
during thermal cycling.
Let the matrix, a 2024 aluminum alloy, be reinforced with 25 volume % of
spherical SiC particles. The composite is first cooled from a stress-free
temperature of 400 °C to 25 °C. Subsequently, it is thermally cycled between these two
temperature limits. It was determined from experiments and microscopic
observations that damage arising from plastic deformation was more significant for
thermal fatigue life than that from creep, for the particular testing conditions
employed.
(i) Compute the cyclic plastic zone size for one temperature reversal between
40 °C and 25 °C. Assume that the properties of the matrix alloy are the
same as those given in the example problem in Section 3.10.5. In order to
get analytical results, assume for a start that the mechanical properties of
both phases of the composite are independent of temperature for the
range of temperatures and heating/cooling rates employed.
(ii) Find the plastic strain accumulation per thermal cycle between 400 °C and
25 °C.
8.1 Strain-based approach to total life
261
(iii) If the fatigue ductility coefficient, e'{ = 0.22, and the fatigue ductility
exponent, c = -0.59 (in Eq. 8.1), find the number of temperature
reversals to failure. Identify the location at which failure initiates on the basis
of Coffin-Manson criterion.
(iv) The results obtained in the above three parts are an oversimplification
in that they do not account for the temperature-dependence of material
properties. If the properties vary with temperature in the same manner
as in part (iv) of the example problem in Section 3.10.5, discuss the
effects of such temperature-dependence on your results in items (i)-(iii).
Solution:
It is given that:/p = (r{/r0f = 0.25, and Tini = 400 °C, Tmom = 25 °C,
and the applied temperature amplitude (see Fig. 3.16(Z?)),
\ATa\ = Tini — TT00m = 375 °C. It is noted that creep effects are less dominant
compared to plasticity effects. Denoting the properties of the matrix by the
subscript T and those of the particle by the subscript '2' and substituting the
appropriate values in Eq. 3.26, it is found that the elastic mismatch parameter
Mel = 0.35. Substituting the numerical values of the various terms in Eq. 3.28,
we find that the temperature change, from the initial stress-free temperature
(400 °C) at which plastic yielding begins is: lAT^I = 174°C, i.e. at 400 -
174 = 226 °C. The temperature change beyond which any reversal in
temperature induces a reversed plastic zone is lAT^I = 21AT^x| = 348°C, i.e. at 400 -
174 = 52 °C. Since the first cooling is down to 25 °C, subsequent thermal
cycling would induce a reversed yield zone.
(i) Substituting the numerical values of geometrical and material parameters
into Eq. 3.31, and solving iteratively for the reversed plastic zone rc, we
see that that (rc/r{f « 1.06.
(ii) It can easily be shown, from the information provided in Section 3.10.3,
that the maximum plastic strains develop at the particle-matrix interface,
i.e. at r = r;. The second term on the right hand side of Eq. 3.37 can be
used to estimate the rate of plastic strain acumulation per cycle.
Substituting r = r; into this term, we note that the rate of plastic strain
accumulation per cycle (for the given thermal amplitude AT"a), is
Aep! = ^(1-^)
, 3
^ 1
(8.9)
Substituting the appropriate material properties and the result for rc from
part (i), it is seen that Aepl = 4.4 x 10~4.
(iii) The interface between the particle and the matrix develops the maximum
plastic strain which fully reverses during one complete thermal cycle.
From Eq. 8.1,
262
Strain-life approach
Aepl /AeplV/C
— = f?t(2Nt)c, => 2tff=l —1 . (8.10)
Substituting the values of e'f and c from the given information, and
noting that the plastic strain range during a thermal fatigue cycle is
Aepl = 4.4 x 10~4 and that the plastic strain amplitude is
Aepl/2 = 2.2 x 10~4, from part (ii), it is seen that 2Nt ss 36000.
(iv) As discussed in part (iv) of Section 3.10.5, a decrease in yield strength of
the matrix with increasing temperature causes the monotonic plastic
zone to increase. However, the cyclic plastic zone size is not expected
to be affected to a significant extent because of the counteracting effect of
an increasing yield strength during cooling. Therefore, the cyclic plastic
zone size, the plastic strain accumulation per cycle and the total life
would be expected to be affected only in a moderate manner. Precise
estimates of the effects of changing properties during thermal cycling can
only be quantified through numerical solutions of the relevant equations.
8.2 Local strain approach for notched members
The local strain approach relates deformation occurring in the immediate
vicinity of a stress concentration to the remote stresses and strains using the
constitutive response determined from fatigue tests on simple laboratory specimens. The
analysis is divided into two steps:
(1) From a knowledge of the imposed loads on a notched component, the local
stress and strain histories at the tip of the notch must be known.
(2) The fatigue life that can be expected for the local stress and strain histories
must be determined.
For the first part, either simple analytical expressions or detailed finite element
simulations of the notch tip deformation (using constitutive laws and hardening rules
described in Section 3.3) are developed to relate the local stresses and strains to far-
field loading. Alternatively, the notch tip deformation is experimentally monitored
with the aid of strain gages or other displacement/strain measurement techniques.
This is perhaps the most challenging aspect of design against fatigue fracture ahead
of stress concentrations. For the second part, the damage accumulation from the
local stress and strain histories must also be estimated so that the safe fatigue life of
the component can be assessed based on the low cycle fatigue properties measured
on smooth laboratory test specimens. For design purposes, it is often more
convenient to relate notch tip fields to nominal (far-field) loading by simple engineering
approximations. This section describes some such commonly adapted methods.
8.2 Local strain approach for notched members
263
8.2.1 Neuber analysis
The stress and strain concentration factors are of the same value when only
elastic deformation occurs at the tip of the notch. However, once the material yields
at the notch tip, the stress and strain concentration factors take different values.
(Note that the strain concentration factor Ke is the ratio of the maximum local strain
to the nominal strain.) Under conditions of plastic deformation, the theoretical
elastic stress concentration factor is given approximately by the geometrical mean
of the stress and strain concentration factors, Ka and K(, respectively, as per the well
known Neuber's rule (Neuber, 1961):
Ki = jKJC,. (8.11)
The prediction of fatigue lives for notched members has found increasing use of local
strain approaches, which are modifications and applications of the Neuber's rule to
fatigue loading conditions. In these approaches, the following expressions for fatigue
notch factors are found to provide satisfactory predictions of the fatigue behavior in
notched members of a wide variety of steels (Topper, Sandor & Morrow, 1969;
Dowling, Brose & Wilson, 1977):
Kt = JKJC, (8.12)
for plastic deformation ahead of notches and
^Aa^E (813)
for elastic deformation. In Eq. 8.13, Acr°°, Aa and Ae are the amplitudes of the fully
reversed nominal stress, notch tip stress and notch tip strain, respectively. For fixed
values of the imposed stress range Aa°°, Eq. 8.13 is an equation of a rectangular
hyperbola,
Ao-Ae = (K{Aa°°)2/E = constant. (8.14)
There is a family of curves, with different combinations of Aa and Ae, which satisfies
this equation. Kt can be uniquely determined by simultaneously solving Eq. 8.13
with the cyclic stress-strain constitutive equation, Eq. 3.5, for the material.
Multiplying both sides of Eq. 3.5 by Aa, one obtains
&a&cJAf + &a^"\ (8,5)
From Eqs. 8.14 and 8.15,
^>2 + iJMIM=(^2. (8.16)
\w\
IE \2K'\ IE
The factor '2' is introduced in the denominator on both sides of the equation because
the stress amplitude is one-half of the total range, Aa°°, for fully reversed loading.
Figure 8.4 is a schematic diagram of the approach outlined in Eqs. 8.11-8.16.
Since the stress-strain response for the region at the tip of the notch must coincide
264
Strain-life approach
o
k
cyclic o- e curve.
\
N
ae = constant
' hysteresis curve (Aa vs. Ae)
■ AcrAe = constant
\
Fig. 8.4. Schematic illustration of the procedure used to determine the local stresses and strains
at a notch tip.
with the characteristic cyclic stress-strain behavior of the material, the local stress o\
and the local strain e\ at the notch tip corresponding to a far-field tensile stress of is
determined by the intersection of two curves: (i) the Neuber hyperbola represented
by the condition that oe = (K{ooc)2/E = constant, and (ii) the cyclic stress-strain
curve given by e = o/E + (o/K')l/"f. Point Q in Fig. 8.4 represents the local stress-
strain coordinates at the notch tip corresponding to a far-field tensile stress of.
If the far-field stress is now reversed to a (compressive) value of, the stress range
causing this reversal is Ao°° = of - of. The corresponding local stress range and
strain range values for the notch tip are Act and Ae, respectively. To determine these
values, the origin of the stress-strain coordinate system is now located at point Q.
The stress-strain hysteresis curve obtained from the cyclic deformation tests is now
used in conjunction with the Neuber rule, AcrAe = (KjAo00)2/E = constant, to
locate the stress-strain coordinates for the notch tip for a far-field stress value of
of. This is represented by Eq. 8.16 and by the point R in Fig. 8.4.
All subsequent reversals of loading employ Eqs. 8.14-8.16 to determine the local
fields at the notch tip. This local strain approach can easily be implemented in a
computer code.
In practical situations, particular attention has to be paid to the relationship
between accumulated damage under variable amplitude loading and that measurable
in a laboratory specimen under constant amplitude loading conditions. Cycle
counting techniques have been developed to reduce complex fatigue loading histories to a
series of discrete events so that cyclic damage could be properly accounted for. A
number of counting techniques have been proposed to accomplish these goals: these
include the so-called rainflow counting, range pair, level crossing and peak counting
methods.
8.3 Variable amplitude cyclic strains and cycle counting
265
The extent to which any of the aforementioned methods for local strain analysis
will provide successful predictions of fatigue life in a material depends on the
fraction of fatigue life expended to initiate small flaws ahead of the notch and on the
remaining fraction to propagate this flaw to failure. In addition to the local stress
and strain calculations, fracture mechanics-based analyses of the stress and
deformation fields ahead of notches are of considerable interest in developing a rational
approach to this notch fatigue problem.
8.3 Variable amplitude cyclic strains and cycle counting
In variable amplitude fatigue, cycle counting methods are often employed to
reduce the random load history into a series of discrete events which can be analyzed
using the laboratory data obtained for constant amplitude fatigue loads. Cycle
counting methods are commonly used in many life prediction models in the context
of both local strain approach and defect-tolerant approach. A number of cycle
counting methods have been developed over the years, on the basis of 'trial-and-
error' approaches and 'educated guesswork'. Although empirical in their
formulation, such counting methods have been tested (with varying degrees of success) on a
wide variety fatigue-critical engineering components and have been found to provide
useful guidelines for fatigue design. A detailed description of the various cycle
counting techniques can be found in the reviews by Dowling (1972), Fuchs & Stephens
(1980), Bannantine, Comer & Handrock (1990) and Dowling (1993). In this section,
an example of the widely used rainflow counting procedure is presented to illustrate
how complex loading histories imposed on a component can be reduced to a series of
stress-strain hysteresis loops.
8.3.1 Example problem: Cycle counting
Problem:
Figure 8.5(a) shows an example of a strain-time loading sequence. The
corresponding stress-time history (derived, for example, from uniaxial fatigue
tests on smooth specimens) is shown in Fig. 8.5(Z?). (Note that a clear functional
relationship does not exist between the stress-time and strain-time plots because
of plastic deformation of the material. As an example, events 3^1 and 5^1' have
identical values of mean strain and strain amplitude. However, the
corresponding values of mean stress and stress amplitude are different.) Simplify the strain
history using the rainflow counting method, and suggest strategies for fatigue
life estimate for this variable amplitude cyclic straining.
Solution:
In order to simplify the strain history using the rainflow counting
method, it is more convenient to replot Fig. 8.5(a) with the time axis oriented
266
Strain-life approach
b 0
(a)
time
(b)
time
strain
Fig. 8.5. (a) A random strain-time history imposed on a ductile solid, (b) The corresponding
stress-time history, (c) Fig. (a) replotted with the time axis pointing downward, to illustrate
the rainflow technique, (d) Stress-strain hysteresis loops extracted from the rainflow counting
method. (After Landgraf & LaPointe, 1974.)
downward, as shown in Fig. 8.5(c). Imagine now that the lines connecting the
strain peaks are a series of 'pagoda roofs' and that rain is dripping down these
roofs (hence the name 'rainflow counting method'). Several rules are imposed on
rain dripping down the roofs so that equivalent hysteresis loops can be extracted
from the strain history (e.g., Dowling, 1972; Anzai & Endo, 1979). The
following rules are imposed to define the flow of rain on the roofs: (i) The strain
history is plotted such that the first and last peaks or valleys have the largest
magnitude of strain. This ordering eliminates counting half cycles, (ii) Rainflow
initiates at each peak (such as point 1) and is allowed to drip down continuously.
However, the flow of rain from a peak must stop whenever it drips down a point
which has a more positive strain value than the one from which it drips. For
example, rain dripping down peak 2 must stop opposite peak 4 because the
latter location has a more positive strain value than the former location.
Similarly, the flow must stop when it comes opposite a minimum more negative
than the minimum from which it is initiated. For example, flow from valley 5
must stop opposite valley 6 because the latter location is more negative than the
former, (iii) Rainflow must stop if it encounters rain from the roof above. For
example, during flow from points 3 to 4, rain dripping down from point 2 is
8.3 Variable amplitude cyclic strains and cycle counting
267
encountered and hence flow must stop at point 2'. Note that every part of the
strain-time history is counted once and only once.
Now apply the above rules to the strain history in Fig. 8.5(c). Rainflow begins
on the outside at the highest peak strain and follows the pagoda roof down to
the peak at 2. At this point, the flow drips down to location 2' and continues
down to point 4. From 4, rainflow continues down to location 4' (which has the
same strain magnitude as that at 4). From there, the flow path is along 4' to 6, 6
to 7, and 7 to 1'. The stress-strain path from this sequence of events corresponds
to the hysteresis loop defined by the circuit 1 —>• 4,4' —>• 1', i.e. the outermost
loop in Fig. 8.5(<f).
Three additional hysteresis loops can be defined from the rainflow analysis of
the remaining paths. These include paths 2 —>• 3 —>• 2', 5 —>• 4' —>• 5', and
6 ->• 7 ->• 6' in Fig. 5(c). Note that these hysteresis loops are not symmetrical
about the origin of the strain axis.
If the random strain history shown in Fig. 8.5(a) were to be repeated m
times, the rainflow method would characterize all of these random loading
events in terms of the four hysteresis loops shown in Fig. 8.5(d), with each
loop repeated m times. Constant amplitude, uniaxial fatigue data can now be
generated on smooth laboratory test specimens using these hysteresis loops
and the material constants b, c, a[ and €{ are determined experimentally.
Mean stress effects on fatigue life are accounted for by recourse to Eq.
8.8, for example, where Ae and am appropriate for a particular strain cycle
are substituted along with the foregoing material properties to obtain the
number of cycles to failure, N{, representative of that strain cycle. These
results could be used in conjunction with the Palmgren-Miner rule to sum
the fatigue damage. Specifically, this entails the summation of damage for
each strain cycle to obtain
M m
E£=* (8-17)
where M (= 4 in the example shown in Fig. 8.5) is the total number of key
events (in the form of strain cycles) identified from the rainflow counting
method and d is the accumulated fractional damage. Alternatively, the
cycle counting method can be used in conjunction with the life prediction
methods employing variable amplitude crack growth, which are discussed in
Chapter 14.
Computer algorithms for cycle counting are available in the ASTM Annual
Book of Standards section 3, vol. 03.01, 1986 (American Society for Testing and
Materials, Philadelphia). Some simple algorithms have also been published by
Downing & Socie (1982).
268
Strain-life approach
8.4 Multiaxial fatigue
Stress-based phenomenological approaches to total life under multiaxial
fatigue were discussed in the preceding chapter. We now consider multiaxial loading
under low-cycle fatigue conditions where combinations of different loading modes
induce failure which is at least partly dictated by the critical values of different
components of cyclic strains.
8.4.1 Measures of effective strain
In parallel with the definitions of effective stress quantities presented in the
context of multiaxial stress-life approach in the preceding chapter, it is instructive to
examine first the basic definitions of some effective strain quantities in the context of
low-cycle fatigue. Following the discussion in Section 7.10, the effective intensity of
the multiaxial stress/strain state is usually characterized in terms of the conjugate
scalar pairs Toct and yoct (i.e. the octahedral shear stress and strain, respectively) in
the von Mises distortional energy theory or in terms of rmax and ymax (i.e. the
maximum shear stress and strain, respectively) in the Tresca yield theory. The
effective strain in multiaxial loading is
y
(€l-€2)2 + (€2-€3f + (€3-€lf
V2(l+v)
(8.18)
where for the fully plastic state, the Poisson's ratio, v = 0.5 and for the elastic state,
v = 0.33 for most metals and alloys. In Eq. 8.18, €\, e2 and e3 are the three principal
strains, with e\ > e2 > e3. The effective plastic strain based on the distortional energy
theory is written as
I 1/2
1
7!
KL = {f4-4) • (8-19)
where the superscript 'p' denotes plastic strains. The corresponding effective strain
measures based on the maximum shear strain values are
ee=T^ = TT7. and el=\YU=\{e\-el). (8.20)
The objective of the theories of multiaxial fatigue is to predict fatigue life under
complex loading conditions in terms of laboratory data of strain-life curves gathered
from uniaxial fatigue tests using simple criteria for failure. If the amplitude of the
maximum principal strain, &.€\/2, determines failure, Eq. 8.5 may be rewritten to
obtain
^ = ?±(2N{)b + e'{(2Nf)c- (8.21)
In terms of the von Mises criterion, the strain-based expression for multiaxial fatigue
life becomes
8.4 Multiaxial fatigue
269
^ = a±(2Nt)b + e'{(2Nty, (8.22)
where the effective strain is denned in Eq. 8.18. Similarly, with the Tresca criterion, it
is useful to note the correlation between axial strain and shear strain,
Aye (l+v)Aee
(8.23)
2 2
Combining Eqs. 8.22 and 8.23 and taking v = 0.3 for elastic deformation and v = 0.5
for plastic deformation, it is seen that
^ = 1.3|(27Vf)* + 1.5^(27Vf)c. (8.24)
The main drawback of these effective strain measures is that they do not adequately
capture the effects of mean stress on multiaxial fatigue life. In an attempt to
overcome this limitation, Smith, Watson & Topper (1970) suggested a simple 'energy-
based approach' to account for mean stress effects. In their approach, multiplying
both sides of Eq. 8.5 by the maximum stress (<rmax = am + (A<r}/2) results in
<rmaxf = ^-(2N{)2b +<y'{e'f(2N{)b+c. (8.25)
This model is predicated on the premise that no fatigue damage occurs when
<rmax < 0, which can be at variance with experimental observations.
These rather strong limitations of the foregoing theories led to considerations of
other approaches, such as the critical plane approach to multiaxial fatigue failure
(Section 7.10), which is taken up in the following subsections specifically in the
context of low-cycle fatigue.
8.4.2 Case study: Critical planes of failure
Conditions governing the identification of critical planes for the onset of fatigue
damage and cracking were discussed in Section 7.10.4 by recourse to the stress-life
approach to high-cycle multiaxial fatigue. In this section, we present a particular case
study which illustrates the existence of critical planes of failure for strain-controlled,
constant-amplitude cycling of an Inconel 718 alloy, which can be predicted on the basis of
the maximum shear strain amplitude. In addition, this example, which is derived from the
works of Socie & Shield (1984) and Socie (1993), clearly illustrates the pronounced effect
of the normal stress on the rate of progression of damage and cracking on the critical
plane.
Consider the three multiaxial loading paths schematically illustrated in Figs. 8.6(a)-(c).
These figures signify three different experiments conducted with different combinations
of axial strains and torsional shear strains on cylindrical tubes of Inconel 718 alloy. The
multiaxial loading in these three experiments is designed such that they all have cyclic
proportional straining with the same maximum shear strain amplitudes. Each specimen
also experiences a static mean strain. The differences between the three experiments are
that the normal stresses and strains across the plane of the maximum shear strain are
270
Strain-life approach
(a)
shear
strain y n
'max''-'
(e)
Fig. 8.6. (a)-(c) Three different proportional loading paths for the multiaxial straining
experiments which have the same maximum shear strain amplitudes, but different normal
stresses and strains across the planes of maximum shear strain, (d) Mohr's circle construction
showing the orientations of the planes of maximum shear strain, (e) A schematic illustration
of the orientations of the two planes of maximum shear strain. (After Socie, 1993.)
different. Figure 8.6(d) is the Mohr's circle of strain for these cases, where it is seen that
two mutually perpendicular planes are subjected to the same maximum shear strain
amplitudes. The orientations of these planes are schematically sketched in Fig. 8.6(e).
Since the sign of the shear strain has no physical significance, these two planes would be
expected to undergo the same extent of damage if shear strain amplitude alone
determined the evolution of damage. Figures 8.7(a)-(c) show the orientations of the
cracks formed for the three different loading paths sketched in Figs. 8.6(a)-(c),
respectively. It is apparent that the cracking angles seen in Figs. 8.7(a)-(c) closely match
the orientations of maximum shear strain planes predicted by the Mohr circle in Figs.
8.6(d) and (e). This also implies in this case that the maximum shear strain plane controls
the evolution of damage and cracking in the Inconel 718 alloy. The loading paths shown
in Figs. 8.6(a) and (c) give rise to crack planes oriented at -70° and + 20°, respectively, as
seen from the angles of cracks in Figs. 8.7(a) and (c), respectively. The loading history
shown in Fig. 8.6(6) promotes a crack angle of-20°, as seen in Fig. 8.7(6), because its
loading direction is the reverse of that in the other two cases.
8.4 Multiaxial fatigue
271
Fig. 8.7. (a)-(c) Observations of crack paths for the proportional straining histories shown in
Figs. 8.6.(a)-(c), respectively. (From Socie (1993). Copyright the American Society for
Testing and Materials. Reproduced with Permission.)
It is also apparent from Fig. 8.6(e), however, that the maximum normal strains on the
two critical planes with the highest shear strain amplitude are different. Although the
loading paths followed in the experiments entail proportional straining, the principal axes
of stress and strain are not coincident, and consequently, the maximum normal stresses
on the two planes of maximum shear strain amplitude are not the same. Observations of
subcritical crack growth on the different planes clearly reveal that the maximum shear
strain planes which have the highest tensile normal stress across them exhibit the highest
crack propagation rates and the lowest fatigue lives. Compressive normal stresses inhibit
the advance of cracks, while the tensile normal stresses facilitate crack growth.
The results discussed in this section thus clearly show how maximum shear strain
amplitudes govern the initiation of fatigue cracking and how mean stresses on the planes
of maximum shear influence fatigue crack growth and overall fatigue life. It is thus
evident that the critical plane theories for multiaxial fatigue should incorporate the effects
of both shear and normal components of multiaxial stresses/strains for life prediction.
This case study also serves to provide a mechanistic justification for the various stress-life
criteria described in Section 7.10 and for the additional criteria based on cyclic strains to
be presented in the following sections.
8.4.3 Different cracking patterns in multiaxial fatigue
Brown & Miller (1973) suggest two different patterns for crack growth at
surfaces of materials subjected to multiaxial fatigue loading on the basis of the
orientations of the planes of maximum shear strain amplitude with the free surface.
Consider the situation schematically sketched in Figs. 8.8(c) and (e), where a cubic
element of a material is subjected to multiaxial strain cycles. The free surface plane is
marked in these figures. Figures 8.8(f)) and (c) show the planes of maximum shear
strain amplitude wherein a small, stage I crack initiates by single shear process at the
free surface and advances during subsequent cycling. In these figures, the shear stress
acts parallel to the free surface (i.e. the front surface of the cube) and there is no
shear stress acting normally to that surface. That is, the unit normal vectors to the
272
Strain-life approach
ex>e2>e
surface
plane
Case A
e1>€2>€:
surface
plane
(a)
(b)
(c)
CaseB
//
)k/
/
(/)
fe)
(d)
(A)
Fig. 8.8. Schematic illustrations of case A and case B fatigue cracking in multiaxial fatigue: (a)
and (e) show multiaxial strains, (b), (c), (f) and (g) denote planes of maximum shear strain
amplitude and the planes and directions of stage I crack growth for case A and case B. (d) and
(h) show the planes and directions of stage II crack growth for case A and case B, respectively.
planes of maximum shear strain amplitude lie on the specimen surface plane. Under
these circumstances, the cracks advance more in a direction parallel to the surface
than normal to the surface, thereby increasing the aspect ratio of the crack. This
pattern of cracking has been termed 'case A' by Brown & Miller. When the case A
cracks become longer, i.e. when their critical dimensions span several grain
diameters, stage II crack growth occurs as a result of simultaneous or alternating slip
involving more than one slip system. At this time, the direction of crack advance and
the plane on which it occurs are as shown in Fig. 8.8(d).
Now consider the possibility shown in Fig. 8.8(e) where the magnitudes of
principal strains are such that the planes of maximum shear strain amplitude occur on the
planes schematically sketched in Figs. 8.8(/*) and (g). Here, the stage I cracks initiate
at the surface and advance at 45° angles into the material, and this mode of cracking
has been termed 'case B\ (The fatigue crack growth process along persistent slip
bands (Chapter 4) for ductile single crystals represents case B cracks.) The direction
of stage II crack growth for case B is also from the free surface into the material, as
sketched in Fig. 8.8(/j). Uniaxial tension fatigue leads to the same shear stress for
case A and case B and hence it can facilitate either mode of failure. Mixed tension-
torsion fatigue loading, however, invariably promotes case A cracks.
Brown & Miller (1973) postulate that the criterion for cracking for case A and case
B follows the general relationships:
A/max = f \ Afnl Aymax = f Aen
■=/a
(8.26)
8.4 Multiaxial fatigue
273
where Aymax/2 and Aen/2 are maximum shear strain amplitude and normal strain
amplitude, respectively, during the low-cycle fatigue loading, and fa and fb are
different nonlinear functions of their arguments for case A and case B, respectively.
The examples shown in the preceding subsection on Inconel 718 and the work of
Fatemi & Socie (1988) demonstrate that the peak normal stress to the plane of
maximum shear strain amplitude influences the propagation of stage I cracks
under a variety of multiaxial loading conditions that induce case A and case B
cracking.
8.4.4 Example problem: Critical planes of failure in multiaxial
loading
Problem:
The cylindrical tube is subjected to different combinations of fluctuating
torsional moment (AT) and static axial load (P) as well as static internal
pressure {p). On the basis of the discussions presented in Sections 7.10.3, 7.10.4, 8.4.2
and 8.4.3, suggest possible orientations of (a) planes of maximum shear strain
amplitude, (b) planes of maximum normal stress amplitude, (c) planes on which
stage I shear cracks may form and (d) planes on which tensile cracks may form,
and (e) the expected relative fatigue life, for the following four cases of loading.f
(i) Case 1: The thin-walled cylindrical tube which is subjected to cyclic
torsion loading only (i.e. AT is nonzero, P = 0 and p = 0).
(ii) Case 2: Repeat the above problem for the situation where a static axial
tensile load is imposed on the cylindrical tube which is subjected to cyclic
torsional loading (i.e. AT is nonzero, P > 0 and/> = 0).
(iii) Case 3: Repeat the above problem for the situation where a static axial
compressive load is imposed on the cylindrical tube which is subjected to
cyclic torsional loading (i.e. AT is nonzero, P < 0 and p = 0).
(iv) Case 4: Repeat the above problem for the situation where a static axial
compressive load and a static internal pressure are imposed on the
cylindrical tube which is subjected to cyclic torsional loading (i.e. AT is
nonzero, P < 0 and p is nonzero).
Solution:
For all the cases considered in this problem, we indicate orientations of
critical planes where the cyclic strains are marked by double-ended arrows and
static stresses are indicated by single-ended arrows. Possible critical planes are
denoted by dashed lines.
(i) Case 1: For pure torsional cyclic loading, the maximum shear strains
occur along the axial and hoop directions. These are also the planes
' This problem is adapted from a discussion in Socie (1993).
274
Strain-life approach
along which stage I, shear cracks (see Sections 7.10.3 and 7.10.4) are
likely to form. The planes on which the tensile normal strains are
maximum are oriented at 45° to the axis of the tube. Tensile cracking would
be expected to occur on these planes. These results are schematically
sketched in Fig. 8.9.
(ii) Case 2: For torsional cyclic loading with superimposed axial tension,
there develops a superimposed tensile stress on only one of the two
shear planes (i.e. the added tensile stress acts only parallel to the axial
direction). Shear cracking due to stage I would then preferentially occur
only on this plane (see Fig. 8.10), and the overall fatigue life would be
expected to be smaller than that in part (i). Superimposed tension is not
expected to alter the stresses on the vertical shear plane. The
superimposed static tension would, however, raise the stresses equally on both the
tension planes oriented at 45° to the tube axis. The resulting possibilities
for failure are schematically shown in Fig. 8.10. Thus, the addition of an
axial tensile load to a cyclically twisted cylindrical tube is expected to be
detrimental to fatigue life, irrespective of whether the failure occurs by a
shear mode or a tensile mode.
(iii) Case 3: For torsional loading with superimposed axial compression, one
of the two shear planes (i.e. the plane normal to the applied compression
axis) develops a normal compressive stress and hence is not expected to
develop any cracks. On the other hand, the other shear plane which is
parallel to the applied compression axis can easily develop a shear crack,
and hence the overall fatigue life may not be higher compared to the
shear failure for Case 1 or Case 2. The two 45° planes on which tensile
stresses develop would both exhibit a reduced propensity for cracking as
AT
fQ}
cyclic shear strain («—••)
cyclic torsion (AT)
stage I microcracks
(shear damage)
-ii
cyclic tensile strain («—••)
tensile damage
Fig. 8.9. A schematic illustration of the evolution of cyclic shear strains, normal strains, shear
damage and tensile damage for cyclic torsional loading of the cylindrical tube, Case I.
8.4 Multiaxial fatigue
275
cyclic torsion (AT)
static tension (P)
cyclic shear strain («—••)
static tensile stress (——)
stage I microcracks
(shear damage)
1/ \
cyclic tensile strain («—••)
static tensile stress (—»)
tensile damage
Fig. 8.10. A schematic illustration of the evolution of cyclic shear strains, normal strains,
shear damage and tensile damage for cyclic torsional loading of the cylindrical tube with a
superimposed axial tensile load, Case 2.
(iv)
a consequence of the applied compressive load. These possibilities are
schematically sketched in Fig. 8.11. One may thus conclude that while
the superimposed compressive load may offer a beneficial effect on
fatigue life for materials which fail by tensile failure under cyclic torsion, it
may not have any effect on fatigue life for materials which undergo a
stage I shear failure.
Case 4: For torsional loading with a superimposed static compression as
well as a static internal pressure, a compressive normal stress is induced
cyclic torsion (AT)
static compression (-P)
cyclic shear strain («—••)
static compressive stress (—»)
cyclic tensile strain (•—»)
stage I microcracks
tensile damage
Fig. 8.11. A schematic illustration of the evolution of cyclic shear strains, normal strains,
shear damage and tensile damage for cyclic torsional loading of the cylindrical tube with a
superimposed axial compressive load, Case 3.
276
Strain-life approach
cyclic shear strain (•—»)
static tensile stress
or compressive stress (—-)
cyclic tensile strain (•—»)
cyclic torsion (AT)
static compression (-P)
static internal pressure (p)
stage I microcracks
(shear damage)
tensile damage
Fig. 8.12. A schematic illustration of the evolution of cyclic shear strains, normal strains,
shear damage and tensile damage for cyclic torsional loading of the cylindrical tube with a
superimposed axial compressive load and a static internal pressure, Case 4.
on the horizontal shear plane due to axial compression, and a tensile
hoop stress develops on the vertical shear plane. Thus, shear failure,
should it occur, would preferentially take place on the vertical shear
plane (Fig. 8.12). Because of the superimposed tensile opening stress on
this plane, materials which exhibit a shear mode of failure would be
expected suffer a reduction in the fatigue life. On the two tension planes
oriented at 45°, the stresses induced by the axial load would offset those
stresses arising from the hoop stress; hence the overall tensile stress would
remain the same as in Case 1 on these two planes (Fig. 8.12). Thus the
superimposed static stresses would be expected to have a large influence
on the shear mode of failure while having no effect on the tensile mode of
failure. This situation is thus the opposite of that seen in Case 2.
The situations considered in this problem thus clearly show the need for
carefully examining the evolution of damage and cracking on all the
potential critical planes.
8.5 Out-of-phase loading
As a start to this discussion, the loading path for proportional and non-
proportional loading is schematically illustrated in Fig. 8.13. A cylindrical specimen
which is subjected to combined tension and torsion cyclic loads is shown in Fig.
8.13(a). The variations of axial strain e and shear strain y/\/3 with time are
illustrated in Fig. 8.13(Z>) for proportional loading. Here, the axial and shear strains vary
8.5 Out-of-phase loading
277
time
(a)
•I +
time
(b)
time
proportional
loading path
normal strain
90° out-of-phase
loading path
W)
Fig. 8.13. (a) A cylindrical specimen subjected to combined axial and torsional fatigue loads, (b)
Strain-time history for proportional loading where the axial and torsional strains are in phase.
(c) Strain-time history for nonproportional loading where the axial and torsional strains are 90°
out of phase, (d) The loading path for in-phase and 90° out-of-phase loading in strain space, for
the strain histories considered here.
in constant proportion to each other and the phase angle between them is zero.
Multiaxial fatigue involving 90° out-of-phase variation between the axial and
shear strains is shown in Fig. 8.13(c). The loading path for proportional loading
corresponds to a straight line in strain space, Fig. 8.13(d), where the axial strain is
plotted against the shear strain. The 90° out-of-phase loading path is a circle in
normalized strain space.
There exists experimental evidence which appears to suggest that in-phase cyclic
straining is more damaging to fatigue life at low strain amplitudes, while out-of-
phase cyclic straining is more damaging at high strain amplitudes, when the
amplitudes of the applied tension (or bending) or torsion for proportional and
nonproportional loading are comparable. It should, however, be noted that to obtain the
same strain range, the applied normal and shear strains for nonproportional loading
must be increased compared to those for proportional loading. This is because for
278
Strain-life approach
comparable applied strains, the maximum strains are smaller for nonproportional
loading than for proportional loading. When the maximum strains are held
comparable for the two cases, it is almost always seen that nonproportional loading is at
least as damaging, and generally more damaging, than proportional loading.
Available approaches to handle nonproportional fatigue loading can be broadly
classified into two groups. The first group regards effective values of cyclic stress or
strain without regard to their variations along specific planes or crack growth
directions. For example, Taira, Inoue & Yoshida (1968) integrated the octahedral shear
strains throughout a cycle, in order to circumvent the problem of changes in the
direction of stresses. The second group of methods used to characterize
nonproportional loading considers the conditions on a critical plane, which were discussed in
detail in the preceding subsections.
It is of interest to consider here the multiaxial fatigue experiments of Lamba &
Sidebottom (1978) on tubular specimens of OFHC copper. Their results show that a
plot of the maximum Mises equivalent plastic stress range with the maximum plastic
strain range provides a unique (stable) hysteresis loop for symmetric
strain-controlled loading in tension-compression, cyclic torsion or in-phase tension-torsion.
Here the cyclic deformation is independent of the loading direction as long as the
loading direction remains unaltered during the fatigue test (i.e. for proportional
loading).
A completely different picture emerges when the tension and torsion cyclic loads
are 90° out of phase with each other. For a fixed value of maximum plastic strain
range, the out-of-phase fatigue test results in a 40% higher stress level (in the
stabilized hysteresis loop) than the proportional or in-phase multiaxial test. Similar trends
have also been seen by Kanazawa, Miller & Brown (1979). This additional hardening
occurs for out-of-phase loading as well as for any changes in cycling direction. These
differences do not depend on whether the fatigue specimen is initially subjected to
uniaxial loading or not. However, this additional hardening obtained in out-of-phase
cyclic loading can be erased if uniaxial fatigue having the same maximum strain
range is imposed after the multiaxial test.
Exercises
8.1 A metallic material is shot-peened in an attempt to improve its fatigue life.
The shot-peening process results in a compressive residual stress of 250 MPa
at the surface of the material. The material has the following monotonic and
fatigue characteristics in the as-fabricated condition (before shot-peening):
E = 210 GPa, A' = lOOOMPa, a'{ = HOOMPa, e'{ = 1.0, «f = 0.13, b =
-0.08, and c = -0.63. (See the discussions related to Eqs. 3.5, 7.1 and 8.5 for
the definition of these variables.) On a log-log plot, show the variation of the
total strain amplitude Ae/2 with the number of reversals to failure 2N{ for the
material in both the as-fabricated and shot-peened conditions.
Exercises
279
8.2 Consider a double-edge-notched plate of the following dimensions: width
W = 2.54 cm, height H = 3.05 cm, thickness B = 0.25 cm, length of each
notch a0 = 0.254 cm and the net-section, theoretical stress concentration
factor at the notch-tip Kt = 2.4. The monotonic and fatigue properties of
the engineering alloy are as follows: E = 210 GPa, A' = 1050 MPa,
wf = 0.1, cr'f = 1150 MPa, €{ = 1.15, b = -0.075, and c = -0.7. (These
variables are denned in connection with Eqs. 3.5 and 8.5.) The plate is
subjected to a fully reversed (R = -1) tensile load of maximum value
equal to 44.5 kN. Assuming that the plastic strains developed in the plate
are small, determine the total fatigue life of the notched plate using the
Neuber analysis.
8.3 In the example problem in Section 8.1.3, discuss the possible effects of cyclic
strain hardening on the thermal fatigue life.
8.4 If the compressive axial load in Case 4 of the example problem in Section
8.4.4 were to be replaced by a tensile axial load, suggest possible orientations
of (a) planes of maximum shear strain amplitude, (b) planes of maximum
normal stress amplitude, (c) planes on which stage I shear cracks may form
and (d) planes on which tensile cracks may form, and (e) the expected
relative fatigue life.
Part three
DAMAGE-TOLERANT
APPROACH
CHAPTER 9
Fracture mechanics audits implications for
fatigue
One of the most successful applications of the theory of fracture mechanics
is in the characterization of fatigue crack propagation. An analysis of fatigue flaw
growth based on fracture mechanics inevitably requires a thorough understanding of
the assumptions, significance and limitations underlying the development of various
crack tip parameters. An important part of such a study of fracture mechanics is the
identification of the regions of dominance of the leading terms of asymptotic crack
tip singular fields. The appropriate conditions for the dominance of critical fracture
parameters are obtained from a knowledge of the accuracy of asymptotic continuum
solutions and from the mechanistic understanding of microscopic deformation at the
fatigue crack tip.
In this chapter, we present a focused discussion of the theories of linear elastic and
nonlinear fracture mechanics that are relevant to applications in fatigue. Details of
the mechanisms of fatigue crack propagation are examined in the following chapters.
9.1 Griffith fracture theory
Modern theories of fracture find their origin in the pioneering work of
Griffith (1921) who formulated criteria for the unstable extension of a crack in a
brittle solid in terms of a balance between changes in mechanical and surface
energies. Consider a through-thickness crack of length 2a located at the center of a large
brittle plate of uniform thickness B, which is subjected to a constant far-field tensile
stress a (Fig. 9.1). Griffith postulated that, for unit crack extension to occur under
the influence of the applied stress, the decrease in potential energy of the system, by
virtue of the displacement of the outer boundaries and the change in the stored
elastic energy, must equal the increase in surface energy due to crack extension.
Using the stress analysis of Inglis (1913) for an elliptical hole in an infinite elastic
plate, Griffith deduced the net change in potential energy of the large plate, shown in
Fig. 9.1, to be
wr = -™p, (9.1)
where, for plane strain and plane stress, respectively,
E' =—^-2 and E' = E. (9.2)
283
284
Fracture mechanics and its implications for fatigue
1 1 1 1 1 i 1
Fig. 9.1. A large plate of an elastic material containing a crack of length la.
Here E is Young's modulus and v is Poisson's ratio. The surface energy of the crack
system in Fig. 9.1 is
Ws = 4aBys, (9.3)
where ys is the free surface energy per unit surface area. The total system energy is
then given by
U =WP +WS =
na
Wb
E'
+ 4aBys.
Griffith noted that the critical condition for the onset of crack growth is:
AU dW? dWs
naa
+ 2ys = 0,
(9.4)
(9.5)
AA AA AA E'
where A = 2aB is the crack area and dA denotes an incremental increase in the crack
area. Note that the total surface area of the two crack faces is 2A. The resulting
critical stress for fracture initiation is
a{ =
2E'ys
na
(9.6)
As the second derivative d U/da is negative, the above equilibrium condition, Eq.
9.6, gives rise to unstable crack propagation.
Griffith's idealized model for brittle fracture considers a sharp crack for which the
near-tip stresses exceed the cohesive strength of the material. In common engineering
materials, nonlinear deformation processes are induced near the crack tip under the
influence of the applied stress. Thus, although the Griffith concept laid the
foundation for the physics of fracture, its energy balance considerations cannot be directly
9.2 Energy release rate and crack driving force
285
applied to most engineering solids. Orowan (1952) extended Griffith's brittle fracture
concept to metals by simply supplementing the surface energy term in Eq. 9.6 with
plastic energy dissipation. The resultant expression for fracture initiation is
OTf =
na
(9.7)
where yp is the plastic work per unit area of surface created. Note that yp is generally
much larger than ys.
9.2 Energy release rate and crack driving force
Consider an elastic plate of uniform thickness B, as shown in Figs. 9.2 and
9.3. The plate contains an edge crack of length a. Let the plate be rigidly fixed at the
upper end. The lower end of the plate is loaded with a force F and the displacement
of the load point is u. (One may, in a broader sense, regard the variables F and u as a
generalized force and a generalized displacement, respectively. F and u are work
conjugate variables. For example, when F is taken to be the torque, u is the
corresponding rotation.) The total mechanical potential energy of the cracked plate, WP,
is denned as
WP = <t> - WF,
(9.8)
//////////////////
displacement
(b)
Fig. 9.2. (a) An elastic plate containing an edge crack subjected to dead weight loading.
(b) Changes in the force-displacement curve and components of mechanical energy during
incremental crack growth.
286
Fracture mechanics and its implications for fatigue
T
F
T
-<5F
(a)
displacement
(6)
Fig. 9.3. (a) An elastic plate containing an edge crack subjected to displacement controlled
loading, (b) Changes in the force-displacement curve and components of mechanical energy
during incremental crack growth.
where <t> is the stored elastic strain energy and WF is the work done by the external
forces.
Irwin (1956) proposed an approach for the characterization of the driving force
for fracture in cracked elastic bodies, which is conceptually equivalent to that of the
Griffith model. Irwin introduced, for this purpose, the energy release rate Q which is
denned as
Consider the estimation of Q for the following two loading situations.
Case (1): Load-control or dead-weight loading
The cracked plate is subjected to a fixed force F by the application of a dead
weight as shown in Fig. 9.2(a). In this load-controlled case, the components of
mechanical energy (for a fixed crack length a) are written as
<t>
-IT
~2}0
Tau = — ,
and WF = Fu,
(9.10)
Wv> = -<t> :
(9.11)
where T, in general, is the applied load (which equals a fixed value, F, for the
particular case of dead-weight loading). Combining Eqs. 9.8 and 9.10, it is seen that
Fu
' 2 '
Now consider an increase in crack length from a to a + Sa. This causes a
corresponding increase in displacement from u to u + Su under the fixed force F, as shown in
Fig. 9.2(b). From Eqs. 9.9 and 9.11, the energy release rate for dead-weight loading is
written as
«~5
'dW„
da
F fixed
F
2B
(9.12)
. F fixed
9.2 Energy release rate and crack driving force
287
As shown in Fig. 9.2(b), the advance of the crack by an increment Sa (with F fixed)
leads to a net increase in the stored strain energy by the amount
SO
F fixed
FSu FSu
■^ + FSu = — .
(9.13)
Case (2): Displacement-controlled loading
Now consider the situation shown in Fig. 9.3, where the displacement u is
controlled and the force F varies accordingly. When the crack advances by an
increment Sa under a fixed displacement u, the change in WF is zero, and hence
SWP = 8<S>. From Eq. 9.9,
SO
8<t>
3a
J u fixed
U
IB
da
(9.14)
J u fixed
= -QSA, or g=-
u fixed
As shown in Fig. 9.3(b), the advance of the crack by an increment Sa (with u fixed)
leads to a net decrease in the stored strain energy by the amount
uSF
'~2~'
SO
(9.15)
u fixed
The compliance, C, of a cracked plate, which is the inverse of the stiffness, is
denned as
C = j. (9.16)
Combining Eq. 9.16 with Eqs. 9.12 and 9.14, it is seen that
<=£■£■
Equation 9.17 holds for both load control and displacement control, i.e. the energy
release rate Q is independent of the type of loading.f This result can also be
rationalized by noting that the magnitudes of the change in stored energy under load
control (Eq. 9.13) and displacement control (Eq. 9.15) differ only by (SF ■ Su)/2,
which is a negligible quantity. For crack advance by an increment Sa with a given
F and u, therefore,
SO
= -<5<t>
F fixed
(9.18)
u fixed
It is noted that the definition of Q given in Eq. 9.9 is valid for both linear and
nonlinear elastic deformation of the body (see the Section 9.7.1). Q is a function of
the load (or displacement) and crack length, and is independent of the boundary
conditions (i.e. type of loading) for the cracked body. The Griffith criterion for
fracture initiation in an ideally brittle solid can be re-phrased in terms of Q such that
Q =
no a
2ys-
(9.19)
This is to be expected since, as shown later, the critical value of the energy release rate is related to the
fracture toughness, which is a property of a material.
288
Fracture mechanics and its implications for fatigue
9.3 Linear elastic fracture mechanics
While the aforementioned theories regard fracture from an energy
standpoint, the critical conditions for the growth of flaws can be formulated in more
precise terms by means of linear elastic stress analyses. In this section, we provide
a detailed discussion of linear elastic fracture mechanics.
9.3.1 Macroscopic modes of fracture
Before considering the variation of the stress and deformation fields in
cracked bodies subjected to external loads, it is appropriate to examine the different
modes of fracture. The crack surface displacements in the three basic modes of
separation are schematically shown in Fig. 9.4. Mode I is the tensile opening mode
in which the crack faces separate in a direction normal to the plane of the crack and
the corresponding displacements of the crack walls are symmetric with respect to the
x-z and the x-y planes. Mode II is the in-plane sliding mode in which the crack faces
are mutually sheared in a direction normal to the crack front. Here the displacements
of the crack walls are symmetric with respect to the x-y plane and anti-symmetric
with respect to the x-z plane. Mode III is the tearing or anti-plane shear mode in
which the crack faces are sheared parallel to the crack front. The displacements of
the crack walls in this case are anti-symmetric with respect to the x-y and x-z planes.
The crack face displacements in modes II and III find an analogy to the motion of
edge dislocations and screw dislocations, respectively.
Irwin (1957), using the analytical methods of Westergaard (1939), quantified the
near-tip fields for the linear elastic crack in terms of the stress intensity factor. Since
the methods of characterizing the propagation of long fatigue cracks under a vast
spectrum of microstructural, environmental and loading conditions are largely based
on linear elastic fracture mechanics, we present here a detailed derivation of near-tip
fields for mode I linear elastic fatigue cracks.
(«) (b) (c)
Fig. 9.4. The three basic modes of fracture, (a) Tensile opening (mode I), (b) In-plane sliding
(mode II). (c) Anti-plane shear (mode III).
9.3 Linear elastic fracture mechanics
289
9.3.2 The plane problem
Consider a semi-infinite crack in an infinite plate of an isotropic and
homogeneous solid (Fig. 9.5) in an attempt to develop crack solutions for plane strain and
generalized plane stress. For the plane problem (i.e. for modes I and II), the in-plane
displacements ur and ue in the radial and angular coordinate directions, respectively,
of a crack tip element are functions only of the polar coordinates r and 0, centered at
the crack tip. In the absence of body forces, the equilibrium equations (see Section
1.4) in polar coordinates are
da„
r dO r
0,
da,
r6
+
1 da,
ee
+
2a,
r6
= 0,
(9.20)
dr r dO
where r and 8 are the polar coordinates shown in Fig. 9.5. The in-plane strain
components are related to the in-plane radial and angular displacements according
to
^rr —
br0
dur
Ur'
Ur 1 dug
7 + 7 He'
1 dur dUg
~r~d~e + ~dr
r
The condition of strain compatibility (in polar coordinates) requires that
9 tee . 2 9%$
dr2 r dr
i a2^
r drdO
J_ 9frt>
-2 86>
i ^^ ~r ">
1 dei
de2
1 derr
r dr
= 0.
(9.21)
(9.22)
The components of stress and strain in the r-6 plane are related by Hooke's law
wherein, for plane stress (azz = 0),
Fig. 9.5. Coordinate system and stresses in the near-tip region of a crack in a plate.
290
Fracture mechanics and its implications for fatigue
Eerr = a„ — vogg,
Eeee = aee — van,
2fiere = nyrt = ar0, (9.23)
where /x is the shear modulus and, for plane strain (ezz = 0),
2/xe„ = (1 - v)a„ - vam,
lueee = (1 - v)am - va„,
2ix€r0 = are. (9.24)
For the plane problem, the equations of equilibrium, Eqs. 9.20, are satisfied when the
stress components are expressed by the Airy stress function x through
13*1 a2x 9"x a (\ dx\ ,Q,<.
The compatibility condition, Eq. 9.22, when expressed in terms of the Airy stress
function, satisfies the biharmonic equation,
vW = o, *.£ + I! + ^. (9.26)
The boundary conditions for the plane problem of the plate containing a traction-
free crack are
am = are = 0 for 6 = ±jt. (9.27)
The choice of the Airy stress function for the present crack problem should be such
that x has a singularity at the crack tip and is single-valued. A possible form of x
which satisfies this requirement is
X = r2p(r, 6) + q(r, 6), (9.28)
where p and q are harmonic functions of r and 6 which satisfy the Laplace equations
V2p = 0 and V2q = 0.
Following the approach of Williams (1957), we consider solutions of separable
form for the Airy stress function, x = R(r)&(0), based on
p = AirxcosXB + A2rl sin XB,
q = Bir(l+2)cos(X + 2)8 + B2r(l+2) sin (X + 2)6, (9.29)
which lead to
X = r(l+2) [Ai cos k6 + Bx cos (k + 2)6]
+ r(k+2)[A2 sin k6 + B2sm(k + 2)6]. (9.30)
This equation consists of a symmetric part (the term within the first set of brackets
on the right of the equality sign) and an anti-symmetric part (the term within the
second set of brackets on the right of the equality sign). The symmetric part, which is
an even function of 6, provides the mode I solution for crack tip fields and the
antisymmetric part, which is an odd function of 6, provides the mode II solution.
Taking only the first term here to obtain the mode I fields,
9.3 Linear elastic fracture mechanics
291
dr
2 = (k + 2) (k + 1) rVi cos A.0 + 5; cos (k + 2)6>],
9 Z1 dA
0re-~Jr \~rWj
= (k+l)rl[kAlsmk6 + (k + 2)Bl sin (A + 2)6]. (9.31)
Now applying the boundary conditions, Eq. 9.27, one obtains
041 + BX) cosXtt = 0,
[kAi + (k + 2)Bl] sinA.7r = 0. (9.32)
The admissible cases are: (i) cos kn = 0 and hence
* = ^±!. (9.33,
where Z is an integer including zero, and
Bi=~Alt (9.34)
or (ii) sin kn = 0 and hence
k = Z and Bl = -Al. (9.35)
Since the governing equations 9.20-9.24 are linear, any linear combination of the
admissible solutions also provides a solution. Hence, from Eqs. 9.33-9.35,
A. = |, (9.36)
where Z is a positive or negative integer, including zero. Although, from a purely
mathematical standpoint, there is no basis to reject any value of k, the solution can
be chosen to be of the lowest order singularity which is consistent with physical
arguments. From Eqs. 9.31, it is seen that atj ~ / and €y ~ /. Therefore, the strain
energy density is given by
* = \°M ~ r2k. (9.37)
The total strain energy within any annular area of inner and outer radii r0 and R,
respectively, centered at the crack tip, is
r2n rR 1 i>27l rR
<D = - ay€y r dr d<9 ~ r(2x+l) dr d<9. (9.38)
Jo Jr0 2 Jo Jro
Invoking the argument that <t> should be bounded (i.e. <t> < oo) as r0 -> 0, we see that
k > — 1. (k = — 1 gives the trivial solution that cry = 0.) Note that, since the
displacements u; ~ r(1+1), the boundedness of displacements also requires that k > — 1. Thus,
the physically admissible values of k are
* = -^> 0, \, \,\,2,..., (or) A. = |, (9.39)
where Z is -1, 0, or a positive integer. Taking the most dominant singular term
represented by k = —1/2 (and B\ = Ai/3),
292
Fracture mechanics and its implications for fatigue
?>2AX
6 1 36>"
cos- + - cosy
+ o(r2)+o(r5/2) +
a9 = A.r-'l1 a\{6) + Q^r0) + Ov(rl/2) +
(9.40)
The second term on the right hand side of Eq. 9.40, with an exponent of 0 for r, is a
nonsingular, but nonvanishing, term. The higher order terms, with exponents greater
than zero, vanish as r —> 0. Rewriting A\ = Ki/\/2k,
^Inr
5^6) + TS!xS
■jx
+ (terms which vanish at crack tip),
(9.41)
where there is no summation over x in the second term on the right hand side. K\ is
known as the stress intensity factor for mode I loading. Sy is the Kronecker delta
denned in Section 1.4.1. In terms of the in-plane stress components,
Jxy
K,
M
5\y(ey
+
(ID
Vi^r \alyM 5lyy(e)J
+ (terms which vanish at crack tip),
(9.42)
where the first term is the leading singular term for linear elastic mode I crack
problems. The second term, generally referred to as the lT term', contains the non-
singular stress axx = T (Williams, 1957; Irwin, 1960; Larsson & Carlsson, 1973; Rice,
1974). For example, a brittle crack of length 2a lying on the x-z plane under
remotely uniform biaxial stresses a^x and <r~, is subjected to
K,=o\
yy
na
and
= ov
(9.43)
Although the leading singular term of the asymptotic solution, Eqs. 9.41-9.43, is
adequate for characterizing most linear elastic fatigue crack growth problems, the
omission of the T-stress can introduce significant errors in certain fatigue situations.
Examples of such situations include: (i) short fatigue cracks, (ii) cracks subjected to
mixed-mode loading where the in-plane shear stresses are substantially larger than
the tensile stresses, and (iii) small cracks inclined at a small angle to the far-field
tensile axis. Furthermore, different geometries of cracked specimens can influence
the near-tip yield behavior in different ways because of the differences in the T-stress
term. This effect and the attendant influence on fatigue crack closure are considered
in Chapter 14.
For the plane problem, the leading terms for mode I stress fields in cartesian
coordinates are
36> 1
ov
J xy }
Kx 6
-1= cos-
J2nr 2
1 — sin- sin —
2 2
. e . 36
1 + sin- sin —
. 6 36
sin- cos —
2 2
(9.44a)
9.3 Linear elastic fracture mechanics
293
When written in cylindrical coordinates, the stress fields for mode I have the
following leading terms:
■ 2<
1 + sin ;
ar,
<?re
KY 0
■7= cos-
/2jrr 2
cos
sin- cos-
2 2
°zz = Vi(oxx + ayy) = vx{a„ + am),
°xz = 0>z = °rz = a0z = 0.
The corresponding displacements are
(9.446)
«x]
Uy\
«!■]
"(9 J
Ai
2£
*i
2£ 1
rv
V 2tt
rr
V 2tt
(1+v)
(1+v)
(1+v)
(1+v)
6> 301
(2k— 1) cos- — cos —
x • 6> . 301
(2k + l)sin- — sin —
6> 301
(2k— 1) cos- —cos —
" „ . 0 . 301
—(2k— l)sin- + sin —
(V2Z\ (V2Z\
(9.45)
For plane stress,
(3-v)
K = ■
V] =0, V>2 = u>
(1+V)
and, for plane strain,
k = (3 - 4v), vx = v, v2 = 0. (9.46)
The term K\ in Eqs. 9.44 and 9.45 is the mode I stress intensity factor which
incorporates the boundary conditions of the cracked body and is a function of loading,
crack length and geometry. For plane problems, it is independent of the elastic
constants.
The near-tip fields for mode II can be derived in a similar fashion by applying the
boundary conditions, Eq. 9.27, to the antisymmetric part of the Airy stress function,
Eq. 9.30. The resulting asymptotic solutions for mode II are:
30^
"yy
Jlnr
— sin - 12 + cos - cos —
.0 0 . 30
sin- cos- sin —
2 2 2
cos-
/, . 0 . 30\
I 1 — sin - sin — I
V 2 2)
(9.47a)
and, in cylindrical coordinates,
294
Fracture mechanics and its implications for fatigue
&re
Kn
i2kt
(l - 3Wf)
sin- I 1
—3 sin - cos
cos
H'-
3sinz
azz = v\{axx + ayy) = vx(arr + aee),
axz = Oyz = Orz = a6z = 0.
IE \2n
(1+v)
-(1+v)
',* ^ ■ e • 3(9"
(2k+ 3) sin- + sin —
(2k — 3) cos - + cos —
ur
ue
K\\
2E
rv
V 2n
(1+v)
(1+v)
0 3#"
—(2*r—l)sin- + 3sin —
0 39'
—(2/c+l)cos- + 3cos —
«z = _(-§r) (^ + ^w) = -(~§~) ^a" + a<*>)-
For mode III, it can be shown (e.g., Anderson, 1995) that
or
K,
in
o,
yz _
/2;rr
-sin:
O0z
K,
in
'2td-
cos-
sin-
cos
2 J
°jo: — ayy — arr — a90 — azz — 0
axy = arf) = 0.
« = u,, = Ur
2(l+v)sin-},
(9.476)
(9.48)
(9.49)
(9.50)
V*y — ~r — Ug — 0.
The above singular solutions for all three modes of fracture indicate that the
stresses and displacements, respectively, are of the form
h/L =
KU [*Mm>
'2nr
WM=ff MzM6)]m'
(9.51)
9.3 Linear elastic fracture mechanics
295
where the subscript M refers to the modes of failure, I, II, and III. The appropriate
stress intensity factor for each mode is denned as
K\ — lim { Vzirnx
r^O ' yy
Ku — lim \ V2nraxv
11 r-s-O ' y
Km = lim {w2nraYZ
r—>-0 '
9=0
9=0 J
1. (9.52)
9=0 J
Stress intensity factor calibrations for a wide range of specimen and crack
geometries, and loading conditions can be found in the Appendix.
9.3.3 Conditions of K-dominance
The stress intensity factors in Eqs. 9.51-9.52 are a measure of the intensity of
the near-tip fields under linear elastic conditions. The radial component term *>/2nr
and the angular component term ay(6) in Eq. 9.51 depend only on the spatial
coordinates. These terms determine the distribution of the near-tip fields.
There exists an annular zone ahead of the crack tip, known as 'the region of K-
dominance', within which the stress intensity factor provides a unique measure of the
intensity of stress, strain or deformation. The outer radius of the annular zone is
determined by the radial distance at which the approximate, asymptotic singular
solutions Eqs. 9.44-9.50 deviate significantly (say, by more than 10%) from the
full elasticity solutions which include the higher order terms, e.g., the T-term and
the nonsingular terms in Eqs. 9.40-9.43. The higher order terms need to be included
beyond the annular zone because they begin to influence the overall accuracy of the
solutions. The foregoing near-tip solutions were determined on the basis of the
assumption of a sharp crack (of tip radius -»■ 0). However, the /^-concept holds
even when the crack is not sharp and when there is nonlinear deformation in a small
zone near the crack tip. In ductile solids, the material at the crack tip yields when the
near-tip stresses exceed the flow strength and the linear elastic solutions lose their
validity within this plastic zone. Even if the crack tip plastic deformation zone is very
small or nonexistent (as, for example, in the case of brittle ceramics), the foregoing
continuum solutions are not expected to hold within the near-tip region of intense
deformation (such as the zone of microcracking or phase transformation). Thus, the
inner radius of the region of /^-dominance is dictated by the size scale of microscopic
failure processes (generally referred to as the 'process zone'). The near-tip fields
within the plastic zone will be considered in Section 9.7.
The usefulness of the /^-fields to characterize the onset or continuation of crack
advance in materials that undergo inelastic deformation, such as plasticity, creep,
microcracking or phase transformations, is predicated on conformity to the so-called
'small-scale yielding' condition. This condition requires that the crack tip zone of
inelastic deformation, whatever its origin, be confined well inside the region of
296
Fracture mechanics and its implications for fatigue
/^-dominance over which the asymptotic results, Eqs. 9.44-9.50, provide a
reasonable approximation to the full solution. As alluded to earlier, an understanding of
the conditions of /^-dominance is essential for the characterization of fatigue fracture
involving highly crystallographic crack growth, mixed-mode loading conditions or
small fatigue flaws. A detailed discussion of each of these cases will be taken up in
later chapters.
9.3.4 Fracture toughness
In linear elastic fracture mechanics, the initiation of crack advance under
monotonic, quasi-static loading conditions is characterized by the critical value of
the stress intensity factor, Kc. The value of Kc is a function of the mode of loading,
the chemical environment, the material microstructure, the test temperature, strain
rate, and the state of stress (i.e. plane stress or plane strain). The experimental test
specimens used for the determination of critical stress intensity factor must conform
to the requirements of small-scale yielding and other conditions of /^-dominance
which are spelled out in detail in the fracture test standard E-399 developed by the
American Society for Testing and Materials (Philadelphia) in 1974. The critical value
of the mode I stress intensity factor measured under plane strain conditions is
commonly referred to as the fracture toughness, K^c, of the material at the particular
test temperature. (Plane strain conditions are assumed to exist in the fracture
toughness test specimen when the thickness of the test specimen is at least about 25 times
the monotonic plastic zone size, which is denned in Section 9.5.) The corresponding
fracture toughness values in the sliding and tearing modes are designated as KUc and
Kmc, respectively.
9.3.5 Characterization of fatigue crack growth
Under cyclic loading conditions, the onset of crack growth from a
preexisting flaw or defect can occur at (maximum) stress intensity values that are well
below the quasi-static fracture toughness. For conditions of small-scale yielding,
where the nonlinear zone at the crack tip is a mere perturbation in an otherwise
elastic material, Paris, Gomez & Anderson (1961) and Paris & Erdogan (1963)
postulated that the growth of a crack under cyclic loading should be governed by
the 'law',
^ = CAKm, (9.53)
dN
where da/dN is the change in the length of the fatigue crack per load cycle (a is the
crack length and N is the number of fatigue cycles) and AK is the stress intensity
factor range denned as
AK = Kmax-Kmia. (9.54)
9.4 Equivalence of Q and K
297
A^ax and Kmm, respectively, are the maximum and minimum stress intensity factors
corresponding to the maximum load, Pmax (or maximum nominal stress, amax) and
the minimum load, Pm;n (or minimum nominal stress, amin). Recall that
^max = Yomax^/na and Kmin = Yo^m^/™ f°r a center-cracked plate containing a
crack of length 2a which is subjected to tensile fatigue with a far-field stress range,
Act = <Tmax — CTmin- Y is the finite size correction factor for the plate. The terms C and
m in Eq. 9.53 are empirical constants which are functions of the material properties
and microstructure, fatigue frequency, mean stress or load ratio, environment,
loading mode, stress state and test temperature. The empirical crack growth law, Eq.
9.53, due to Paris et al. is the most widely used form of characterizing fatigue crack
growth rates for a vast spectrum of materials and test conditions. Equation 9.53 also
represents one of the most useful applications of the theory of linear elastic fracture
mechanics. Further details of the fracture mechanics-based approach to
characterizing fatigue will be considered in subsequent chapters.
9.4 Equivalence of Q and K
The stress intensity factor approach to fracture has a direct equivalence to
the energy approach. Consider the definition of energy release rate for the
displacement boundary value problem involving the fixed-grip case, Eq. 9.17. Here, the
change in strain energy (per unit thickness of the crackfront) as the length of the
crack is increased from a to a + Sa is given by
ra+Sa i
<5<t> « -2 - (cfyyUy + axyu x + azyu z) Ax. (9.55)
The factor 2 before the integral sign appears because of the displacement of the two
opposing crack surfaces, and the factor 1/2 after the integral sign is introduced
following the assumption of proportionality between the stresses and displacements.
Substituting the appropriate stresses a;j for r = x — a and 6 = 0 and displacements u,
for r = a + da — x and 6 = 0 from the previous section into Eq. 9.55, it is readily
seen, in the limit of Sa -»■ 0, that
g = -—
da
Q\ + Gii + Gin- (9.56)
The energy release rate Q and the stress intensity factors K\, Ku and Km in the three
modes of fracture are uniquely related. For the general three-dimensional case
involving plane strain and anti-plane strain loading,
a = ^(tf + *„)+^*SI (9-57)
and, for plane stress,
G = ± {Kl + Kl). (9.58)
298
Fracture mechanics and its implications for fatigue
Note that, when the crack advances in its own plane, i.e. for self-similar, coplanar
crack growth, the energy release rates for the different modes of fracture are simply
additive. This relationship also provides a means for developing mode-invariant
criteria for the onset of failure under multiaxial loading conditions.
9.4.1 Example problem: Q and K for the DCB specimen
Problem:
The double-cantilever beam (DCB) specimen is one of the widely used
fracture test specimens for both brittle and ductile solids.
(i) Using the concepts discussed in Section 9.2, calculate the energy release
rate for the DCB specimen subjected to a mode I load as shown in Fig.
9.6.
(ii) Using the result from (i) and Eqs. 9.57 and 9.58, determine the stress
intensity factor for the DCB specimen.
(iii) Discuss how stress intensity factor calibrations may be obtained
experimentally for the DCB specimen using measurements of compliance
changes.
Solution:
(i) As illustrated in Fig. 9.6(a), the out-of-plane end deflection u/2 of a
slender cantilever beam (a 3> 2h) of length a and height h subject to an
end load F is given by beam theory:
(9.59)
u
2 =
^. i.
3EI'
Bhl
l2~'
From Eq. 9.17 and Fig. 9.6(c),
a-
F2 dC(a)
F2a2
\2F2a2
v 2B da ~ BEI ~ EB2h} ' (960)
(ii) From Eqs. 9.57, 9.58 and 9.60, the mode I stress intensity factor for plane
stress is derived as
and, for plane strain, as
K\ 2 \2F2a2 2V3 a F
-e{X-v) = g=-eW k>=7T^72'Wb- (9"62)
(iii) From Eq. 9.60, for plane strain,
^-^ = 0=l-^kKa)F2 = l-^F2. (9.63)
9.4 Equivalence of Q and K
299
2h
(«)
\IC(a)
displacement, u
(b)
3,
a
(c)
Fig. 9.6. (a) The double cantilever beam specimen, (b) A plot of the load versus the
displacement showing the compliance, (c) Compliance change as a function of crack length.
300
Fracture mechanics and its implications for fatigue
_ dc(a) ^l-v2,?,x , , , / E dc(a) ,n ,.,
Thus, -L2= 2 _*?(«), *K«) = ^^_^.-U, (9.64)
where fcf(a) is the stress intensity factor per unit applied load and
c(a) = C(a)/B.
In order to calibrate the stress intensity factor for a DCB specimen, prepare a
number of specimens with different crack lengths, a. Use a clip gage to measure
the opening displacement u at the loading point, shown in Fig. 9.6(a), as a
function of F. For each specimen with a known crack length, plot F versus u
as in Fig. 9.6(c) and the slope C(a). Control the load such that no crack
extension occurs during this experiment. From similar results on multiple DCB
specimens, plot c(a) versus a. Find k[(a) and K^a) using Eqs. 9.63 and 9.64.
9.4.2 Example problem: Stress intensity factor for a blister test
Problem:
The interface toughness of an adhesive is to be estimated on the basis of a
proposed method which entails the bonding of a thin elastic disk with the
adhesive on to a rigid substrate. Pressure is applied to the bonded side of the
disk through a tiny hole in the substrate, by pumping a fluid. This pressurization
results in the partial debonding of the disk and the formation of a 'bulge' or
'blister' in the disk. This method is hence referred to as the pressurized 'bulge
test' or 'blister test'.
Consider a two-dimensional version of this test which is shown in Fig. 9.7. A
thin beam is adhesively bonded to a rigid surface through which an
incompressible fluid is forced resulting in a blister of half-width /. Assuming that all
concepts of linear elastic fracture mechanics may be extended to this case,
apply the compliance method to determine the tensile 'crack-tip' stress intensity
factor in terms of the blister dimension / and the piston displacement q. Assume
that q = 0 when the beam is undeflected, and that all length dimensions normal
to the plane of the figure are unity. Let the thickness of the beam and its elastic
modulus be h and E, respectively, as shown in Fig. 9.7. You are given the
following information.
(i) The transverse deflection of an elastic double cantilever beam of length 2/
subjected to a uniform pressure p is
"W-^w^- (9-65>
(ii) A measure of compliance c(l) may be denned as q = c(l)Q, where Q is the
force acting on the piston per unit thickness as shown in the figure.
9.4 Equivalence of Q and K
301
Fig. 9.7. A schematic of the pressurized bulge or blister test and the associated nomenclature.
(iii)
w(x)dx = qH.
(9.66)
(iv) From the compliance interpretation of the energy release rate, Q, it is
known that
* = 2d7^
(9.67)
Solution:
The compliance of the system is denned as
q = c{t)Q. (9.68)
Observe that (i) the pressurized liquid is incompressible, (ii) the pressure under
the blister is equal to the pressure in the piston, and (iii) the pressure in the
piston is directly related to Q by
Substituting Eq. 9.65 in Eq. 9.66, we obtain
15 EqHh?
P =
I5 '
Now substitute Eq. 9.69 into Eq. 9.70 to get
1 I3
;Q-
*~15Eh3H2
Arranging this equation into the form of Eq. 9.68, we note that
(9.69)
(9.70)
(9.71)
302
Fracture mechanics and its implications for fatigue
The compliance interpretation of Q is given by Eq. 9.67. Noting that there are
two crack tips at the blister in Fig. 9.7 and taking the result from Eq. 9.72,
„ 1 dc ^2 4 1 f ■)
g=g^=AMQ=6-E¥mQ- (9-73)
But q = c(l)Q. With this result, Eq. 9.73 is rewritten as
For plane stress, we take this equation with the link between K\ and Q to get
Ki = {GE}1/2=
75 ,h3H2 2)1/2 , , Tjr 5 [3 HhVh „ ,ft „„
32*—« ' (°r) ^ = Ai2-¥-qE- (975)
Young's modulus E appears in this equation because Ki has been written in
terms of the displacement q. Instead, if use is made of Eq. 9.71, the stress
intensity factor becomes
a i1
This equation gives us the desired result.
9.5 Plastic zone size in monotonic loading
9.5.1 The Irwin approximation
Estimates of the boundary of the plastic zone ahead of a crack in a ductile
solid can be derived by considering the crack tip zone within which the von Mises
equivalent stress (which is denned in Eq. (1.22) and calculated from the stress
analysis of Section 9.3) exceeds the tensile flow stress ay (Irwin, 1960). The extent of the
plastic zone rp ahead of the crack tip (0 = 0) is proportional to the square of the
stress intensity factor. In mode I,
3ti VV
=l(-)2-
for plane strain,
for plane stress. (9.77)
Precise analyses of the plastic zone size and shape in modes I and II in strain-
hardening solids are discussed in Section 9.10 for plane strain and plane stress.
Following similar arguments, the plastic zone size ahead of a mode III crack is
found to be
9.5 Plastic zone size in monotonia loading
303
-:£)•
(9.78)
where xy is the shear yield stress of the material.
9.5.2 The Dugdale model
The size of the yield zone ahead of a mode I crack in a thin plate of an
elastic-perfectly plastic solid (subject to plane stress deformation) was estimated by
Dugdale (1960). In the Dugdale model, the plastic region is envisioned as a narrow
strip (of near-zero height) which extends a distance rp ahead of the crack tip and is
loaded by the traction ayy = ay over the length rp (Fig. 9.8). If ayy were to be zero
over the whole length |jc| < a + rp, y = 0, a far-field tensile stress a°° would produce
a positive stress intensity factor K\ = a°°y/n(a + rp) (in an infinitely large plate). If
the traction ayy = ay were to be applied simultaneously along the length of the strip
a < \x\ < a + rp, it would superimpose a negative stress intensity factor K\ on K\
where
4 = -<?yJn(a + rp) + 2ay^^-^sm ! {^rj-
(9.79)
The requirement of bounded stresses at the point x = a + rp provides the condition
that Ki + Ki = 0. Solving for rp, one finds that
^ = sec^Vl.
a \ 2ay J
(9.80)
For a°° <<i ay and hence for rp <£ a, this equation asymptotically leads to a plastic
zone size
t t t t
2o(a)
-Li
EEUif
jtttTI
r 'p
1 I I 1 J
Fig. 9.8. A schematic representation of the Dugdale plastic zone model.
304
Fracture mechanics and its implications for fatigue
'.-1(f)2- <'-8l>
This asymptotically exact result due to Dugdale compares well with the Irwin
approximation, Eq. 9.77, for plane stress.
In the above model, one notes that an opening displacement S = 2v(a) at x = ±a
and y = 0 exists (which may be regarded as a consequence of necking ahead of the
crack). It can be shown that the crack tip opening displacement takes the form
8orya
TlE
A2*J.
sec
(9.82)
or asymptotically, when a°° <& ay
St = ^%. (9.83)
9.5.3 The Barenblatt model
The strip zone model due to Barenblatt (1962) provides an analogue for
ideally brittle materials of the Dugdale plastic yield zone analysis. For the perfectly
brittle solid, one may envision, in Fig. 9.8, that the crack face traction ayy = erth,
where erth is the theoretical bond rupture strength «» E/10 (see, for example, Lawn,
1993). The critical condition for the fracture of the brittle solid may then be
expressed in terms of the critical size of the cohesive zone at the crack tip,
rp = rc0, or in terms of the critical crack opening displacement Sc = 2vc (Rice,
1968) such that
= 2 CFyyAV =
Jo
%* = 2y,. (9.84)
9.6 Plastic zone size in cyclic loading
The existence of a reversed plastic zone ahead of a fatigue crack has long
been recognized (e.g., Paris, 1960; McClintock, 1963; Rice, 1967). The stresses within
the reverse yield zone at the fatigue crack tip can be estimated from the analysis of
Rice (1967). Consider a cracked plate of an elastic-perfectly plastic solid which is
subjected to a far-field tensile load P. The yielding of the material at the crack tip
under the influence of this load creates a monotonic plastic zone of dimension rp
given by Eq. 9.66 and shown in Fig. 9.9(a). For large plane strains and
well-developed plane stress yielding, one may expect proportional plastic flow to hold, i.e. the
components of the plastic strain tensor are expected to remain in constant
proportion to one another at each point of the plastic region. If the load P is reduced by an
amount AP to a tensile load P — AP, reverse plastic flow is instigated. If the extent
of crack tip blunting is assumed to be negligible, the infinitely large stress concentra-
9.6 Plastic zone size in cyclic loading
305
ttt
m-A?
«•„(*. °)
Hi
Tm(X, 0)
(a)
Ml
w
I ♦ \P-AP
<rylx, 0)
cyclic plastic zone
monotonic plastic zone
\\\
(c)
Fig. 9.9. Schematic representation of the development of cyclic plastic zone upon unloading.
(After Rice, 1967.) (a) Monotonic plastic zone created by a far-field load P. (b) Stress
distribution due to the reduction of the load by AP which, when superimposed with (a), gives
the result in (c).
tion factor at the tip of the sharp crack leads to the formation of a reversed flow zone
which is embedded within the monotonic plastic zone.
For proportional loading, the changes in the near-tip fields due to the reduction of
the load are given by the solution derived earlier for monotonic loading (Section 9.3)
with the exception that the loading parameter is replaced by the load range AP and
that the yield stress and strain are replaced by twice their values corresponding to the
load P. This modification is introduced to obtain the correct values of stresses in the
reversed flow zone after subtracting the changes due to the load reduction AP, Fig.
9.9(b). If closure of the crack faces is not encountered, the superposition of the near-
306
Fracture mechanics and its implications for fatigue
=(
tip stresses in the fully loaded state, Fig. 9.9(a), and in the partially unloaded state,
Fig. 9.9(6), leads to the stress distribution at the tip of the crack under the far-field
load P — AP, Fig. 9.9(c). Thus, for a crack which is only partially unloaded from a
far-field tensile load, there exists within the monotonic plastic zone a region of
reversed flow (termed the 'cyclic plastic zone') of size rc in which residual
compressive stresses are induced. For an elastic-perfectly plastic solid undergoing
proportional flow, the stress within the cyclic plastic zone is equal to the flow stress in
compression (—ay). The size of rc is derived by replacing KY by AKt and ay by — 2ay
in Eq. 9.66 so that, for plane stress,
1*)'
For zero-tension-zero loading, AA^ = KY and rc = rp/4. For materials which
cyclically harden or soften, ay in Eq. 9.85 should be replaced by the cyclic yield
strength, o'y.
There are some interesting consequences of reversed plastic flow during unloading
from a far-field load:
(1) Even after the far-field load is fully removed, there exists a zone of residual
compressive stress ahead of the fatigue crack which has (previously) been
subjected to far-field cyclic tension. This residual stress zone can have
important implications for transient crack growth phenomena observed
under variable amplitude fatigue (see Chapter 14).
(2) Since residual stresses are self-equilibrating, the residual compressive
stresses at the crack tip must be offset by residual tensile stresses away
from the crack tip.
(3) If a nonclosing flaw (such as a sharp notch) is unloaded from a far-field
compressive load, reversed plastic flow at the notch-tip creates residual
tensile stresses. This zone of residual tension can induce stable mode I
fatigue crack growth in notched plates loaded in uniaxial cyclic compression
(see Chapter 4).
(4) A cyclic variation in the stress intensity factor AKi, from 0 to K\, gives rise
to a cyclic crack tip opening displacement A<St, which is one half of the total
opening displacement S under a monotonic stress intensity factor KY, Eq.
9.83:
A K ^
ASt^—^=. (9.86)
2ayE
(5) In the absence of crack closure, the value of rc and cyclic variations in
stresses, strains and displacements depend only on AP and are independent
of the maximum load P.
(6) When crack closure does not occur, the plastic superposition is valid up to
the point when rc = rp, that is, for complete load reversal involving equal
tension-compression fatigue.
9.7 Elastic-plastic fracture mechanics
307
Whereas the cyclic plastic zone size for a stationary fatigue crack in an elastic-
perfectly plastic solid is one-quarter the size of the monotonic plastic zone, a plane
stress analysis by Budiansky & Hutchinson (1978) shows that the reversed yield zone
for an extending fatigue crack is less than 10% of the Dugdale monotonic yield zone
size. This point is taken up for further discussion in Chapter 14. Analyses of cyclic
damage zones ahead of fatigue cracks in ceramics are discussed in Chapter 11.
9.7 Elastic-plastic fracture mechanics
The stress intensity factor K provides a unique characterization of the near-
tip fields under small-scale yielding conditions, while the corresponding loading
parameter for the characterization of monotonic, nonlinear fracture in
rate-independent materials is the /-integral proposed by Rice (1968). Although some of the
features of this integral were embedded in the energy concepts derived by Eshelby
(1956) and were discussed independently by Sanders (1960) and Cherepanov (1969),
the particular form of this line integral proposed by Rice (1968) has led to the
unifying theoretical basis for nonlinear fracture mechanics.
9.7.1 The J-integral
Consider a cracked body subjected to a monotonic load, Fig. 9.10.
Assuming that the tractions T are independent of crack size and that the crack
p
O u
ha
s
o
Fig. 9.10. A contour around a crack tip and the nomenclature used in the definition of the J
integral.
308
Fracture mechanics and its implications for fatigue
faces are traction-free, the line integral J along any contour V which encircles the
crack tip is given by
J
= J (wdj-T-gdA (9.87)
where u is the displacement vector, y is the distance along the direction normal to the
plane of the crack, s is the arc length along the contour, T is the traction vector and w
is the strain energy density of the material. The stresses ay are related to w by the
relation Oy = dw/dey. For a material which is characterized by linear or nonlinear
elastic behavior (i.e. by deformation plasticity), J is independent of the path T taken
to compute the integral.
Rice (1968) showed that J is the rate of change of potential energy (with respect to
crack advance) for a nonlinear elastic solid and that J reduces to the energy release
rate Q for a linear elastic material:
J = Q=-^. (9.88)
da
If T is regarded as the contour which just encircles the cohesive zone in the
Barenblatt model, it is found that J is equal to the energy release rate given in Eq.
9.84: J = Qc = 2ys. Furthermore, if the line integral is applied to the Dugdale model,
the following relationship between J and the crack tip opening displacement <St, Eq.
9.83, is obtained:
J = aySt. (9.89)
9.7.2 Hutchinson-Rke-Rosengren (HRR) singular fields
Consider an elastic-power law plastic material whose uniaxial constitutive
response is characterized by the Ramberg-Osgood relationship, Eq. 3.4. Since the
elastic strains are negligible compared to the power law terms near the crack tip, Eq.
3.4 can be approximated by the pure power law, e/ey = a(a/ay)n, where cy = ay/E.
This relationship, when generalized to multiaxial stress states using the J2
deformation theory (see Section 1.4.3), can be written as
For nonlinear elastic solids undergoing monotonic, small-strain deformation,
Hutchinson (1968) and Rice & Rosengren (1968) showed that the strength of the
near-tip fields is the /-integral and that the stresses, strains and displacements exhibit
r-i/(«+i)> r-«/(«+i) and ri/(«+D singularity, respectively. These so-called 'HRR fields'
are written as
9.7 Elastic-plastic fracture mechanics
309
V(n+i)
/ J \ "/("+1)
n/(n+l)
J/(»+l) i
u, = aey ( J \ ril(n+l) ut(0, ri). (9.91)
\aayeyI„J
The universal functions dy(9, ri), ey(9, ri), and Uj(0, ri) in Eqs. 9.91 vary with the polar
angle 9, the strain hardening exponent n and the state of stress, i.e. plane stress or
plane strain. The factor /„ depends mildly on the strain hardening exponent n.
Since / is a measure of the intensity of crack-tip fields, the onset of crack advance
under quasi-static loads can be formulated on the basis of a critical value, J = Jc.
When conditions of /-dominance (see Section 9.7.4) are satisfied in the plane strain
test specimen, the measured critical value of plane strain fracture toughness is
denoted by Jk. Detailed test procedures for the experimental measurement of JIc
are spelled out in the test standard E-813 developed by the American Society for
Testing and Materials (Philadelphia) in 1981. Under linear elastic, plane strain
conditions,
•/ic = ^(l-A (9.92)
This relation is used to infer an equivalent A^Ic value from JIc measurements in high
toughness ductile solids in which valid K\c testing will require unreasonably large test
specimens.
9.7.3 Crack tip opening displacement
Expressions for the crack tip opening displacement <St, Eqs. 9.83 and 9.89,
were derived earlier using the Dugdale yield zone model. More precise estimates of <St
can be obtained for strain-hardening materials from the solutions (Eqs. 9.91) for
crack face displacements. The definition of <St is somewhat arbitrary because the
distance between the crack faces, S = uy(x, 0+) — uy(x, 0~), varies as (—x)1/("+1) as
the crack tip is approached. A commonly used operational definition of St is based
on the distance between two points on the upper and lower crack faces where two
45° lines drawn from the deformed crack tip intercept the crack faces (Fig. 9.11).
With this definition,
St = d„-, (9.93)
where d„ is a function of a, cy, and n. d„ ranges in value from about 0.3 to 0.8 as n is
varied from 3 to 13 (Shih, 1981).
The crack tip opening displacement provides a measure of the size of the region at
the crack tip where finite strain deformation is dominant. The condition for the onset
of quasi-static fracture can also be stated as <St = <Stc, where <Stc is a critical crack tip
310
Fracture mechanics and its implications for fatigue
Fig. 9.11. Definition of crack tip opening displacement, Su
opening displacement for the material under consideration. This approach to
determining critical conditions for fracture initiation is sometimes appealing in that <St
provides a physical length scale for fracture which is often needed for developing the
vital link between microscopic failure processes and macroscopic fracture toughness.
The magnitude of <St varies continuously during fatigue due to the fluctuations in
load. The effective range of <St in a given fatigue cycle is determined by the following
factors: (i) the extent of reversed flow ahead of the crack tip, as seen in the
development of Eq. 9.86, (ii) the roughness of the fracture surfaces (which is influenced by
the microscopic fatigue mechanisms and the microstructural size scale), and (iii) the
presence of any corrosion films or residual stretch of plastically deformed or
transformed material on the fracture surfaces which cause premature closure of the crack
even at a far-field tensile stress (see Chapter 14).
Noting the connection between J and K from Eqs. 9.57, 9.58 and 9.88, an
expression for cyclic crack tip opening displacement can be derived. It is of the form given
in Eq. 9.86.
9.7.4 Conditions of J-dominance
The /-integral provides a unique measure of the strength of singular fields in
nonlinear fracture. However, some conditions must be ascertained before J can be
used to characterize fracture in real ductile materials. The following list of
requirements for the use of/ is taken from a review article by Hutchinson (1983):
(1) The deformation theory of plasticity must be an adequate model of the
small-strain behavior of real elastic-plastic materials under the monotonic
loads being considered.
9.7 Elastic-plastic fracture mechanics
311
(2) The region in which finite strain effects dominate and the region in which
microscopic failure processes occur must each be contained well within the
region of the small-strain solution dominated by the singular fields, Eqs.
9.91.
The HRR fields exactly satisfy the first requirement for the use of deformation
theory of plasticity if proportional loading occurs everywhere. Then, the singularity
fields, Eqs. 9.91, based on the deformation theory assumptions are also solutions to
the corresponding J2 flow (incremental) theory equations (Section 1.4.3). Although
this requirement for proportional loading is not exactly fulfilled in general in an
elastic-power law plastic solid, the conditions encountered during the application
of monotonic, uniaxial loads to stationary cracks do provide a reasonable
justification for the use of deformation theory.
The aforementioned second requirement for the validity of J to characterize
nonlinear fracture provides the physical basis for determining the inner radius, r0, of the
annular zone of /-dominance. Let R denote the outer boundary of the zone of J-
dominance which may be taken as the maximum distance ahead of the crack tip
within which the singularity solutions, Eqs. 9.91, match (say, within 10% error) the
full solutions (estimated using techniques such as the finite-element method) for the
particular specimen geometry under consideration. Finite-element, flow theory
model calculations of the crack-tip fields by McMeeking (1977) and McMeeking
& Parks (1979), which take into account crack tip geometry changes, reveal that
the finite strain effects are significant only over a distance of at most 3<St. This result
provides a measure of r0. From a microstructural standpoint, r0 should be bigger
than the size of the process zone; for example, the grain size for transgranular
cleavage or intergranular fracture, and the mean spacing of void-nucleating particles
for ductile failure by void growth. Numerical simulations of near-tip fields for small-
scale yielding conditions in power law hardening materials show that the HRR
singular solutions hold over a distance of 20-25% of the size of the plastic zone
directly ahead of a mode I crack for essentially the entire range of strain hardening
exponents found in ductile alloys.
Under large-scale yielding, however, the size of the region of J dominance is
strongly dependent on specimen configuration. For these cases, where the entire
uncracked ligament may be fully engulfed in a plastic zone, the size of the region
of J dominance, R, is as small as 1 % of the length of uncracked ligament for a
center-cracked tension specimen or 7% of the length of the uncracked ligament for a
deeply cracked bend bar or a compact tension specimen (McMeeking & Parks,
1979). This is the reason why standardized test procedures for determining the
critical value of J in quasi-static loading, JIc, require the use of deeply cracked
bend or compact tension specimens where the initial pre-crack length to the specimen
width ratio is at least 0.5 (see ASTM Standard E-813 for JIc testing; American
Society for Testing Materials, Philadelphia). With this requirement and the result
that the zone of finite strains at the crack tip spans a distance of 3<St, it can be shown
312
Fracture mechanics and its implications for fatigue
that the minimum uncracked ligament size, b, needed to obtain a valid JIc estimate is:
b = 25J\c/oy.
For /-controlled crack growth, Hutchinson & Paris (1979) have suggested that the
regime of elastic unloading and nonproportional loading should be confined to well
within the zone of /-dominance. In other words,
^»4 and Aa^R. (9.94)
aa R
The growth of cracks also causes changes in the near-tip fields as compared to
those predicted by the HRR solutions for stationary cracks. Asymptotic analyses of
near-tip stress fields during quasi-static crack growth in an elastic-perfectly plastic
solid reveal that the stresses are generally unchanged from the Prandtl slip line fields
representative of stationary crack tips (e.g., Rice, Drugan & Sham, 1980), except
behind the crack tip where differences of about 10% emerge as a result of a wedge of
elastic unloading for 112° <0< 162° (see Fig. 9.5 for the coordinate system).
However, the near-tip strain distribution for a growing crack has a logarithmic
singularity which is weaker than the \/r strain singularity for a stationary crack.
9.7.5 Example problem: Specimen size requirements
Problem:
A low strength steel is to be used in an application which requires
appreciable damage tolerance. It is known from prior testing that the alloy has a plane
strain fracture initiation toughness, Klc = 175 MPaVm. The yield strength of
the steel is ay = 350 MPa.
(i) If the fatigue crack growth characteristics of this alloy in zero-tension
cyclic loading are to be experimentally measured over the entire range of
crack growth until final failure, determine the minimum specimen size
requirements for a compact (tension) specimen which conform to
ASTM Standard E-399. It is desired to have plane strain conditions
during the entire range of crack growth. A schematic of the geometry of the
compact specimen is given in Fig. A.2(a) in the Appendix. It may be
assumed that the final failure occurs in this case when the the maximum
stress intensity factor for the fatigue cycle approaches Klc.
(ii) For the same alloy and specimen geometry, determine the minimum
specimen size requirements for a 'valid' Jic test which conforms to the
specifications of ASTM Standard E-813.
Solution:
For the steel, the values of Young's modulus and Poisson ratio are taken
as E = 210 GPa and v = 0.33.
9.7 Elastic-plastic fracture mechanics
313
(i) In order to carry out a 'valid' plane strain fracture initiation toughness
test, small-scale yielding should be ensured. For the compact specimen
shown in Fig. A.2(a), this implies that the length of the crack, a, the size
of the uncracked ligament, (W — a), and the specimen thickness, B,
should be larger than at least 25 times the plane strain plastic zone size
(Eq. 5.1), i.e.
2
a, {W - a), B > 25 x — -^ • (9-95)
in \ ay )
It is thus seen that a, {W — a), B > 66.3 cm (26.12 inches). This rather
severe requirement for specimen size makes testing very difficult,
(ii) For Jlc testing which conforms to ASTM specifications, start with a
deeply cracked compact specimen whose initial crack length to width
ratio a/W> 0.5. The geometrical requirement in this is that the
uncracked ligament length be
(W-a)>25 —. (9.96)
ay
For small-scale yielding, Jlc and Kic are related by Eq. 9.92 so that the
above equation can be rewritten as
K2
{W-a)>25-^-{\- v2). (9.97)
Eay
Substitution of the appropriate numerical values gives the result that
{W — a) = 9.3 mm. For materials with high fracture toughness and
low yield strength values, the measurement of/Ic thus provides an
appealing test procedure for the estimation of fracture toughness.
9.7.6 Characterization of fatigue crack growth
Although conditions of nonproportional loading and the occurrence of
elastic unloading would appear to violate the fundamental basis on which the
application of/-integral to fracture problems is predicated, Dowling & Begley (1976) and
Dowling (1977) have proposed a power law characterization of fatigue crack
advance under elastic-plastic conditions based on the cyclic /-integral, Jc (also
referred to as AJ), during a fatigue cycle, i.e. da/dN oc (Jc)m, where m is an
exponent analogous to m in Eq. 9.53. This approach, despite its apparent
shortcomings, provides suprisingly good characterization of the growth of short fatigue
cracks of length comparable to the near-tip plastic zone size and longer fatigue flaws
in nearly fully yielded specimens in some materials under certain cyclic loading
conditions.
For the cyclic loading of a specimen under displacement control, the /-integral is
usually determined in a straightforward manner by employing Eqs. 9.56 and 9.87
314
Fracture mechanics and its implications for fatigue
(Dowling & Begley, 1976). This procedure is schematically illustrated in Fig. 9.12(a).
Here the rising part of the load-displacement hysteresis loops for two different crack
lengths ax and a2 are shifted to a common origin. The /-integral is then obtained
from the potential energy difference corresponding to the shaded area and from Eqs.
9.56 and 9.88.
For the cyclic loading of a specimen under load control, there is some ambiguity in
denning the proper limits of integration in the determination of the strain energy.
(a)
(b)
(c)
Fig. 9.12. Determination of /-integral with stabilized cyclic hysteresis loops, (a) Hysteresis loops
for two different crack lengths in displacement-controlled fatigue and the translation of the
rising part of the stabilized hysteresis loop to a common origin, (b) Similar method for load-
controlled fatigue with the minimum load being employed as the reference point, (c)
Determination of J using a single specimen.
9.7 Elastic-plastic fracture mechanics
315
Sadananda & Shahinian (1979) have suggested use of the minimum load of the
fatigue cycle as a reference point for shifting the load-displacement curves, Fig.
9.12(b). Here the rising portions of the load-displacement curves are translated to
a common origin at the minimum load. The shaded area gives the potential energy
from which the /-integral for cyclic loading can be computed. Note that these
methods require the measurement of at least two load-displacement curves
corresponding to two different crack lengths. Approximate methods have been developed
in an attempt to overcome this limitation and to determine / from a single specimen.
Figure 9.12(c) schematically illustrates this method. If ^4e is the total area under the
load-displacement curve (shaded region), / for characterizing fatigue crack growth
(for an edge-cracked or compact tension specimen) is determined from
J = ~k {aiAt + a2jP(Smax " Smin)}' (9-98)
where B is the thickness of the specimen, b is the length of the uncracked ligament, P
is the load, <Smax and <Smin are the maximum and minimum displacements shown in
Fig. 9.12(c), and c^ and a2 are correction coefficients which are functions of the
crack length and have been published by Merkle & Corten (1974).
The justification for the above methods apparently rests on the argument that the
phenomenological constitutive models for cyclic plasticity (Chapter 3) can be
formulated in terms of stable hysteresis loops and that, if such loops can be
mathematically translated to a common origin after each load reversal, the requirement for
the stress to be proportional to the current plastic strain can be effectively satisfied.
Although many researchers have employed the /-integral to characterize fatigue
fracture at room and elevated temperatures, it should be noted that the cyclic /
approach can seriously violate the basic assumptions leading to the development
of the /-integral. Severe nonproportional loading and the rapid advance of the
fatigue crack promote conditions where material descriptions based on the
deformation theory of plasticity do not hold. At this point, experimental documentation of
a reasonably good characterization of fatigue crack growth under some elastic-
plastic conditions is the main justification that can be provided for the application
of /-integral to cyclic loading. See Chapter 15 for a further discussion of this topic.
An alternative approach for characterizing fatigue crack growth under elastic-
plastic conditions is often formulated in terms of crack opening displacements. Here,
the fatigue crack growth rate is envisioned as being proportional to the cyclic crack
tip opening displacement, A<St, denned in Eq. 9.86 such that da/dN oc A<St. This
type of analysis provides a size scale, A<St, for comparisons with striation spacing,
residual crack wake stretch or fracture surface oxide thickness to correlate crack
growth and crack closure (see Chapters 10 and 14). Furthermore, the crack opening
displacement offers a convenient means for comparing the fatigue crack growth rates
in different modes of fracture on a common scale. It can be seen from Eq. 9.93 that
characterizations of crack advance based on / and on <St are essentially equivalent for
316
Fracture mechanics and its implications for fatigue
proportional loading. The implications and limitations of the approaches for fatigue
crack growth under nonlinear fracture conditions are examined in later chapters.
9.8 Two-parameter representation of crack-tip fields
Consider the small-strain, linear elastic solution, Eqs. 9.41-9.43, where the
first two terms provide an adequate solution for the crack tip stress fields:
av = -A= a}j{e) + TSuSij. (9.99)
\Z2nr
Under small-scale yielding, different levels of hydrostatic stresses induced at the
crack tip in different specimen geometries can be characterized in terms of the non-
dimensional parameter, T/ay, where ay is the yield strength (Bilby et al, 1986;
Hariin & Willis, 1988; Betagon & Hancock, 1991; Parks, 1992). The use of KY and
T, as two parameters which fully characterize the near-tip fields, becomes
increasingly more invalid as the plastic zone size at the crack tip enlarges beyond the limits
of small-scale yielding.
It was ostensibly first noted by McClintock (1971) that the states of near-tip stress
fields in fully yielded cracked specimens require more than a single parameter, such
as the /-integral, to adequately capture the triaxial fields. For example, center-
cracked panels with large-scale yielding exhibit markedly reduced triaxial stresses
at the crack tip than fully-yielded, deeply-cracked compact and bend specimens. In
order to account for the role of differing states of triaxial stresses in influencing
crack-tip fields and to overcome the inadequacy of the Kt-T two-parameter
characterization under large-scale yielding, O'Dowd & Shih (1991, 1992) have proposed
the so-called two-parameter J-Q theory. The salient features of this theory are
outlined next.
Within the context of the small-strain deformation plasticity theory and an elastic-
power law plastic material model, the stress fields at the crack tip take the form
au = erv I — I <?«(#, n) + higher order terms. (9.100)
\aayeylnrj
The first term on the right hand side of Eq. 9.100 may easily be recognized as the
HRR singular stress field, (<r,y)HRR, see Eq. 9.91. Higher order asymptotic analyses of
crack-tip fields under large-scale yielding have been carried out by Li & Wang
(1986), Sharma & Aravas (1991) and Xia, Wang & Shih (1993). These studies reveal
that, in the region ahead of the crack tip where |0| < jc/2 and J/ay < r < 5J/ay, Eq.
9.100 can be approximated in the following manner:
av = (^)hrr + evr m<%> (9-ioD
where Q is a measure of the crack tip stress triaxiality, denned as
9.8 Two-parameter representation of crack-tip fields
317
Q = Oe0~ {aee)iiRR at 0 = 0, r = —.
crv
(9.102)
That is, in this operational definition, Q represents the difference, normalized by the
yield strength ery, between the actual hoop stress at the crack tip and that given by the
HRR singular field at a fixed distance 2J/ay directly ahead of the crack tip. The
distance r = 2J/oy is chosen so as to lie just outside the blunting zone characterized
by the finite strains; under such conditions, Q is found to be essentially independent
of r.
Alternatively, the ^-dominated small-scale yielding field, (crrj)SSY;T=0' can also
serve as the reference solution. O'Dowd & Shih (1991, 1992) define Q as
Q =
&66 ~ (CTi9#)sSY;T=
at
= 0,
2/
(9.103)
In terms of the hydrostatic or mean stresses, Q can also be denned as
Cm =
Cm - (<7m)
mJSSY;T=0
at
Ov
= 0,
2/
<7v
(9.104)
Equations 9.102 and 9.103 can be interpreted in the following manner. Positive
(negative) values of Q raise (reduce) the level of crack-tip hydrostatic stress from
that given by the HRR solutions or the small-scale yielding solution.
The variation of hoop stress, aee, as a function of the normalized distance ahead of
the crack tip, r/(J/ay), for plane strain and for E/ay = 500 and v = 0.3 are plotted
in Fig. 9.13(a) and (b) for small strain (HRR solution) and finite strain, respectively,
for different values of n and for 6 = 0. These pertain to the reference fields: T = 0
and g = 0.
6.0
5.0
4.0 -
3.0-
2.0
6.0
5.0
-J i l i i i i
3.0
2.0
/••v
"/ N
»y
-
/
/
i ••
y,;'/
\
N
?.rT~
• * ■
s'
\« = 3
^5
■4?
•••...
tt=oo
~"^
~~
1
^--_
— —
._
,
'-LL.1-
• i
0.0 1.0 2.0 3.0 4.0 5.0 0.0 1.0 2.0 3.0 4.0 5.0
r/(J/ay) rl(Jloy)
(a) (b)
Fig. 9.13. The variation of hoop stress, am, as a function of the normalized distance ahead of the
crack tip, r/(J/ay), for plane strain and for E/ay = 500 and v = 0.3 for (a) small strain (HRR
solution) and (b) finite strain, respectively, for different values of n and $ = 0 for the reference
fields: T = 0 and Q = 0. (After O'Dowd & Shih, 1991, 1992.)
318
Fracture mechanics and its implications for fatigue
O'Dowd & Shih have calculated Q and Qm for several finite width geometries and
find the difference between them to be always smaller than 0.1. Consequently, the
definition of Q given in Eq. 9.103 has been recommended as the basis upon which
crack-tip stress triaxiality is quantified.
9.8.1 Small-scale yielding
The two-parameter characterization of crack tip fields by Kt and T or by J
and Q have equivalence under small-scale yielding. Recall from Section 9.7.1 that
under plane strain and small-scale yielding,
J = § (1-v2). (9.105)
Also, from dimensional considerations, it can be shown that
^=^Gtv*£>- (9-io6)
Making use of Eq. 9.103, we write
^=(^)ssY;r=o+^y%- (9-107)
For a power-law hardening solid characterized by the two-term solutions in Eqs.
9.99 and 9.101, a unique relationship can be defined between Q and T in the
following form:
Q = F^-;n\ (9.108)
for given E/ay and v. Figure 9.14 shows the variation of Q (based on the definition in
Eq. 9.103) with T/ay for different values of n. These plots are essentially the same for
both small strain and finite strain deformation at crack tip.
9.8.2 Large-scale yielding
Under large-scale yielding, the equivalence between K and /, and that
between T and Q breaks down. For this situation, O'Dowd & Shih (1991, 1992)
identify the following crack tip fields for plane strain based on the two parameters J
and Q:
ui = -hi(-^-,e,-,n,v;Q). (9.109)
Within the J-Q annulus, the fields are adequately represented by the form of Eq.
9.107. Values of Q for a variety of specimen geometries and crack sizes (a/ W) can be
found in O'Dowd & Shih (1991, 1992). Implications of the two-parameter approach
to fatigue crack growth characterization is discussed in Chapter 15.
9.9 Mixed-mode fracture mechanics 319
0.5
0.0
-0.5
Q
-1.0
-1.5
-2.0
-1.0 -0.5 0.0 0.5 1.0
TlOy
Fig. 9.14. The variation of Q with T/oy for different values of n (for E/oy = 500 and v = 0.3).
(After O'Dowd & Shih, 1991, 1992.)
9.9 Mixed-mode fracture mechanics
The stress analyses discussed thus far have centered around the development
of near-tip fields for stationary, mode I cracks. Fatigue cracks in structural materials,
however, are generally subjected to combined-mode loading conditions. In order to
develop proper design methodologies for combined-mode fatigue fracture, it is
necessary to gain insights into the nature of near-tip fields under conditions of
load mixture. Even when a component containing a fatigue crack is subjected to
purely tensile far-field loading, mixed-mode conditions may prevail ahead of the
crack tip if it is inclined at some arbitrary angle to the tensile axis, or microstructural
and environmental factors promote a nonplanar fatigue crack growth. In composite
materials consisting of two dissimilar components, a fatigue crack located at the
interface between the two materials is subjected to local mixed-mode loading even
when the far-field stresses are purely in mode I. The inducement of such mixed-mode
conditions at the tip of a fatigue crack can lead to pronounced changes in the
'effective driving force' for crack advance, the size of the crack tip plastic zone,
the rate of crack propagation, the extent of fatigue crack closure and the microscopic
mechanisms of damage.
320
Fracture mechanics and its implications for fatigue
Among mixed-mode fracture problems, complete solutions of the near-tip fields
are available for combined mode I-mode II cracks subjected to small-scale nonlinear
deformation due to power law plasticity (Shih, 1974) and transient power law creep
(Brockenbrough, Shih & Suresh, 1991). We first present here the elastic-plastic
solutions for mode I-mode II cracks in strain-hardening materials. This is followed
by a discussion of mixed-mode near-tip fields for deflected and branched cracks.
9.10 Combined mode I-mode II fracture in ductile solids
The linear elastic fracture mechanics solutions, Section 9.3, and the HRR singular
fields, Section 9.7.2, can be extended to provide the near-tip fields for mode I-mode
II crack problems. Under conditions of small-scale yielding, the far-field stress
components for a crack subjected remotely to tensile opening and sliding stress intensity
factors, Ki and Ku, respectively, are given by
ay = -±= [K^iO) + Kndy\6)], (9.110)
VInr
where r and 0 are the polar coordinates centered at the crack tip (see Fig. 9.5) and
o\(6) and ajj(6) are the dimensionless universal functions described in Eqs. 9.44 and
9.47. For small-scale yielding, the /-integral is related to mixed-mode stress intensity
factors by
^ = ^(^i2 + ^n), (9.1H)
where E' is denned in Eq. 9.2. The relative strengths of KY and Kn can be
characterized in terms of an elastic mixity parameter, M6, which is denned as (Shih,
1974)
2
Me = -tan"
71
lim^ = 0)
>o <rr9(r, 6 = 0)
2
= -tan
71
Ai,
(9.112)
In this characterization, Me = 0 for pure mode II, Me = 1 for pure mode I, and
0 < Me < 1 for different mixities of modes I and II.
The near-tip fields for the mixed-mode crack problem in an elastic-plastic solid
whose constitutive response is represented by the nonlinear elastic (deformation)
theory are analogous to the HRR fields for mode I described in Eq. 9.91 and are
of the form
°ij
<7e
4
= oyKllr-l«n+»aij(e,Mp,n),
= aytf&r-1/<"+1>ae(0,Mp,/i)>
= ^(Kfo"r-"^$(e,Mp,n)
OLO,
^(^)V^+1)^,MP,«). (9.113)
9.10 Combined mode I-mode II fracture in ductile solids
321
The dimensionless functions a;j, ae, ey, and ut depend only on the polar angle 6, the
strain hardening exponent n, and the near-tip plastic mixity parameter, Mp, which is
denned similar to Me as
Mr = gtan-'{lim^ = ^
= 2tan_1j^=01Mj)j
where Mp equals 0 for pure mode II, 1 for pure mode I, and 0 < Mp < 1 for
different mixities of modes I and II. The strength of the singular fields given in
Eqs. 9.113 is the parameter K^. The superscript P denotes that it is a plastic stress
intensity factor and the subscript M refers to the mixed-mode condition. A definite
meaning to this parameter has been given (Shih, 1974) by setting the maximum value
of the ^-variation of the effective stress, ae = ^/{(J/Tjs^Sg}, to unity where
Sij = oy— (Pkk/yfiij. The strength of the dominant mixed-mode singularity, Ky\,
can be related to the /-integral via Mp:
J = {1^{^ + Kl)=a-iln{M')(Kl\)n+\ (9.115)
where 7„(MP) is a numerical constant which is a function of the strain hardening
exponent n and the plastic mixity factor Mp. Thus, for combined-mode fracture, the
two parameters, Kp and Mp, completely specify the near-tip fields for a given value
of n, irrespective of whether small-scale yielding conditions prevail. A complete
description of the near-tip fields in terms of J and M6 (or, equivalently, KY and
Ku) requires that the relationship between Me and Mp be specified. By performing
a detailed finite element analysis of mixed-mode loading under small-scale yielding,
Shih (1974) has computed the relationship between Me and Mp for values of n =
1-99. While Me = Mp for n = 1, Mp > M6 for n > 1, with the difference between
Mp and Me increasing with increasing n.
The (circumferential) 6-variations of the universal dimensionless functions dy, €y
and <je are shown in Fig. 9.15 in order of increasing asymmetry. One observes a
pronounced decrease in the hoop stress dm and in the hydrostatic stress, and a
noticeable change in the distribution of plastic strains as the mode of loading is
changed from pure tension (mode I) to pure sliding (mode II).
This effect of plasticity on the near-tip fields is more directly evident in Fig. 9.16,
where the elastic-plastic boundaries are shown as functions of n and M6 for plane
stress and plane strain. At the same amplitude of far-field loading (that is, at a fixed
amplitude of /), the plastic zone size in mode II is up to five times bigger than that in
mode I. This result implies that any deviation of the fatigue crack from the nominal
mode I growth plane, as often found in crystallographic crack propagation, causes
not only a change in near-tip stress intensity factors due to the inducement of mixed-
mode conditions, but also leads to an increase in the size of the plastic zone ahead of
the crack tip. The consequences of this effect are especially important in the study of
322
Fracture mechanics and its implications for fatigue
-180 90
90 180
Fig. 9.15. Circumferential variations of stresses and strains shown in order of increasing load
asymmetry for small-scale yielding and plane strain loading conditions. Strain hardening
exponent, n = 13. (From Shih, 1974. Copyright American Society for Testing and Materials.
Reprinted with permission.)
short fatigue cracks where plastic zone dimensions comparable in size to the crack
length cause uncertainties in characterization.
9.11 Crack deflection
Tensile fatigue cracks in both brittle and ductile solids can deviate
significantly from their normal mode I growth plane under the influence of far-field multi-
axial stresses, interaction of the crack tip with microstructural inhomogeneities such
as grain boundaries and interfaces, variable amplitude loading in the form of
overloads, crystallographic separation, or the embrittling effect of an aggressive
environment. As the local, near-tip stress intensity factor which is responsible for the
9.11 Crack deflection
323
M'= 1
plane strain
Fig. 9.16. Contours of plastic zones shown for different values of the strain hardening exponent
n for mode I and mode II cracks subjected to plane stress and plane strain loading. (After Shih,
1973, 1974.)
advance of a deflected or branched crack (i.e. an 'effective driving force') can be
considerably smaller than that of a straight crack of the same (projected) length,
periodic changes in crack path lead to apparently beneficial (slower) fatigue crack
growth rates (for a fixed amplitude of far-field loading). The deflection of a tensile
crack from the nominal mode I plane induces mixed-mode near-tip conditions even if
the far-field loading is purely mode I. Under cyclic loading conditions, the increase in
the roughness of the fracture surface created by crack deflections can also cause an
increase in the far-field stress at which the crack faces begin to close upon unloading
from the maximum tensile stress. This enhanced closure level leads to further
reductions in the near-tip 'driving force' for fatigue crack growth (see Chapter 14).
It should be recognized at the outset that microstructurally induced crack
deflection in engineering materials is a problem for which it is very difficult to develop
accurate continuum solutions. The mixed-mode fracture solutions are useful for
deflected cracks only if the kink length greatly exceeds the size scale of the micro-
structural inhomogeneity responsible for crack deflection and the size scale of the
near-tip plastic zone. Furthermore, if the entire crackfront does not deflect
uniformly, multiaxial conditions involving modes I, II and III would be expected to
develop. The discussions in this section are, therefore, intended to provide only a feel
for the changes in 'effective driving force' arising as a consequence of simple
deflections in the path of a linear elastic fatigue crack.
324
Fracture mechanics and its implications for fatigue
9.11.1 Branched elastic cracks
Figure 9.17(a) is a schematic representation of an idealized line crack
containing a kink of length b inclined at an angle a from the plane of the main crack of
length a. A symmetrically forked crack with an included angle la is shown in Fig.
9.17(6). For a pupative kink (b -*■ 0), the local mode I and mode II stress intensity
factors, ki and k2, respectively, can be expressed in the form
(«)
I-
I
Fig. 9.17. A schematic representation of (a) kinked and (b) forked crack geometries and the
associated nomenclature.
9.11 Crack deflection
325
kx = an(a)Kx+ ax2(a)Kxl,
k2 = all(a)Kl + a22(a)Ku,
(9.116)
where K\ and Ku denote the mode I and mode II stress intensity factors for the main
crack in the absence of the kink or fork. To a first order approximation in a, the
dimensionless factors for the infinitesimal kink are (Bilby, Cardew & Howard, 1977;
Cotterell & Rice, 1980)
.a 3a
3 cos — + cos —
1 ( . a . 3a\
fli2(«)= ~4(sin2 + siny)'
<*22(a) = 4~(cosf
a . 3a
sin- +sin—■
3a
+ 3 cos —
(9.117)
Suresh & Shih (1986) have presented a summary of available stress intensity factor
solutions for kinked and forked cracks as functions of the deflection angle and the
length of the deflected part of the crack. The variations of the near-tip stress intensity
factors, k\ and k2, for a line crack containing a kink of length b = 0.1a and subjected
to a far-field tensile stress intensity factor KY are plotted in Fig. 9.18(a) as a function
of the kink angle, a. Similar results for a symmetrically forked crack with a fork
length b = 0.1a are presented in Fig 9.18(£) as a function of the included fork angle,
2a (Kitagawa, Yuuki & Ohira, 1975; Lo, 1978). Note that k2 vanishes at 2a = 32° for
b/a = 0.1. A similar observation was made by Bilby, Cardew & Howard (1977) who
calculated the included angle 2a for k2 = 0 to be 36° for b/a = 0.025.
1.0
0.8
0.6
0.4
0.2
0.0
0
(a)
"~~\ *'♦
>v \
\
s' \
/ 1 1 1 1 1 1
k,
* = 0.1
a
k,
Ai
\fci
a:,
30 60
a (degrees)
90
(b)
60 120 180
2a (degrees)
Fig. 9.18. Variation of normalized k, and k2 for b/a = 0.1 as a function of (a) kink angle a and
(b) fork angle 2a. (After Kitagawa, Yuuki & Ohira, 1975.)
326
Fracture mechanics and its implications for fatigue
The studies discussed above also show that for b/a > 0.5, kx and k2 are
independent of b/a. A similar trend is observed for symmetrically forked elastic cracks. This
is consistent with the known result that the kinked and forked crack solutions for
b/a > 0.5 approach those for a crack inclined at an angle p" (radians) (fi = n/2 - a)
to a remote tensile stress intensity Kf.
k\ . *> „
AT8"1 *
*2 • „ „
— = sin p cos p.
(9.118)
9.11.2 Multiaxial fracture due to crack deflection
For an elastic crack containing an infinitesimal kink (b/a -*■ 0) subjected to
pure mode I far-field loading, the functions an and an in Eq. 9.116 can also be
obtained to a reasonable degree of accuracy from coordinate transformations
(Lawn, 1993). Here,
k\ = Kxom, k2 = Kxar6,
(9.119)
where axm and alr9 are denned in Eq. 9.44.
The crack deflection processes discussed thus far pertain to the tilt configuration
represented by the rotation of the crack plane about an axis parallel to the crack
front, axis Oz in Fig. 19(a). Whereas this tilt deflection gives rise to near-tip mode I-
mode II displacements for far-field mode I loads, the twist deflection represented by
the rotation of the crack plane about an axis parallel to the initial direction of crack
advance, axis Ox in Fig. 9.19(6), induces mode I and mode III displacements at the
crack tip. For an infinitesimal twist angle </>,
(a)
Fig. 9.19. Crack deflection leading to (a) tilting and (b) twisting of the crack front.
9.12 Case study: Damage-tolerant design of aircraft fuselage 327
k^K^, k3 = Kx^, (9.120)
where the functions o^ and a^ can be found listed in Lawn (1993). Equations 9.120
provide only a crude result since the twisting of a crack plane, Fig. 9.19(6), causes the
formation of steps along the crack path; this may promote mode II displacements as
well. Furthermore, the near-tip stress intensity factors may deviate considerably
from the predictions of Eqs. 9.120 as a consequence of frictional sliding along the
deflected segments of the crack.
The elastic solutions for k\ and k2 for kinked or forked cracks are strictly valid
only when the plastic zone size is smaller than the zone of dominance of the kx and k2
singular fields, which itself is a fraction of the kink or fork length b. From a
knowledge of (i) the elastic solutions for kx and k2 as a function of the deflected crack
geometry, (ii) the universal mixed-mode plastic near-tip fields, and (iii) the
numerically determined relationship between M6 and Mp as a function of the strain
hardening exponent n for a given deflected crack geometry, Suresh & Shih (1986) have
determined the near-tip fields ahead of a kinked or a forked crack for plane strain
and small-scale yielding conditions. Their results show that the combined effects of
crack tip plasticity and crack deflection can promote a more beneficial crack growth
resistance than deflection alone.
9.12 Case study: Damage-tolerant design of aircraft fuselage
The fuselage of a passenger jet aircraft is one of the most complicated structures in
the aircraft. It is a stiffened, thin-walled cylinder. Its diameter to wall thickness ratio is
approximately 2000, somewhat analogous to a fully pressurized toy balloon. At cruising
altitude, the differential pressure between the passenger cabin and the outside is
approximately 55 kPa (8 psi), as discussed in Section 1.1.1. The cabin pressure causes a
tensile stress in the hoop direction. The bending induced by routine flight loads causes
tensile loads in the crown section (top part of the fuselage), shear loads on the sides of the
fuselage, and compressive loads in the bottom of the fuselage (keel) in the longitudinal
direction (e.g., Budiman, 1996).
Stiffeners are used in the following manner in order (i) to prevent bending, (ii) to avoid
instability due to bending and (iii) to maintain the circular shape of the fuselage.
(1) Stiffeners in the circumferential direction, termed the frames. The spacing between
neighboring frames in a medium-range passenger aircraft, such as the Boeing 737,
is 500 mm (20 in.).
(2) Stiffeners in the longitudinal direction, termed the longerons. The spacing between
neighboring longerons in a medium-range passenger aircraft, such as the Boeing
737, is 250 mm (10 in.).
Consider the following possibility for an accident. A turbine blade, dislodged from one
of the jet engines of the aircraft during the course of a flight, penetrates the skin of the
fuselage which is fully pressurized. The likely orientation for a through-thickness crack
formed by this impact would be along the hoop direction. The hoop stress of the
328
Fracture mechanics and its implications for fatigue
cylindrical fuselage with stiffeners, however, is nearly twice that of the longitudinal stress.
Consequently, the worst situation here would be for the crack to be oriented along the
axial direction. In order to arrest the advance of such a crack, tear straps or crack
arresters are commonly introduced under the frames, midway between two neighboring
frames, and under the longerons. The thickness of the tear straps is approximately the
same as that of the fuselage skin.
The spacing between adjacent tear straps provides the basis for the maximum crack
size in design. It means that, for the medium-range passenger transport aircraft, the
fuselage has to be designed with provisions for the existence of a longitudinal crack as
long as 500 mm.
Exercises
9.1 In the compliance calibration of an edge-cracked fracture toughness test-
piece of an aluminum alloy, it was observed that a load of 100 kN produced
a displacement between the loading pins of 0.3 mm when the crack length
was 24.5 mm, and 0.3025 mm when the crack length was 25.5 mm. The
fracture load of an identical testpiece containing a crack of length
25.0 mm was 158 kN. Calculate the critical value of the mechanical potential
energy release rate Q at fracture and hence the plane strain fracture
toughness Klc of the alloy. All testpieces were 25 mm thick. For the alloy, Young's
modulus, E = 70 GPa and Poisson's ratio, v = 0.3.
9.2 Starting with the unsymmetric part of the Airy stress function, Eq. 9.30,
where
X = r2p(r,e) + q(r,0),
and assuming that x is separable, i.e. x = R(r) • ®(0), derive the leading term
of the asymptotic singular solution for mode II,
/2nr
following the procedure discussed in Section 9.3.2 for Mode I. Write
complete expressions for the different components of the stress field and
compare your results with Eq. 9.47.
9.3 Use the result from the previous problem to show that the expression for the
leading terms for the displacements is of the form
where fi is the shear modulus. Derive complete expressions for ux and uy and
compare your results with those given in Eq. 9.48.
9.4 A piston (89 mm in diameter) is designed to increase the internal pressure in
a cylinder from 0 to 55MPa. The cylinder (closed at the other end!) is
200 mm long with internal diameter = 90 mm, outer diameter = 110 mm,
Exercises
329
and made of 7075-T6511 aluminum alloy (extruded bar with yield
strength = 550 MPa, and Klc = 30 MPaVm). On one occasion, a
malfunction in the system caused an unanticipated failure and the cylinder burst.
Examination of the fracture surface revealed a metallurgical defect in the
form of an elliptical flaw 4.5 mm long at the inner wall, 1.5 mm deep, and
oriented normal to the hoop stress in the cylinder. Compute the magnitude
of the pressure at which failure took place. (For the purpose of this problem,
assume that the stress intensity factor for the elliptical flaw is
K = (1.12/^/Q) a-s/na, where a is the appropriate normal stress and Q is
a shape factor. The calibration for Q as a function of the aspect ratio of the
flaw is given in Section A.7.)
9.5 A steel used for an engineering application has a specified yield strength of
1000 MPa and a plane strain fracture toughness of 150 MPa Vm.
(a) Calculate the minimum dimensions required to carry out a 'valid' plane
strain fracture toughness test.
(b) Estimate the weight of the single edge cracked bend specimen and of the
compact specimen of this steel which would have sufficient dimensions
to provide valid plane strain fracture toughness. (See the Appendix
section for K calibrations for different specimen geometries.) Assume
that a/W = 0.45.
(c) Estimate the load capacity of the mechanical testing machine you would
need to carry out the fracture test.
(d) If the available testing machine has a load capacity of 200 kN, do you
need to alter the dimensions of the specimens to obtain a valid K\c1 If
so, what will you do?
9.6 The ASTM standard test method based on linear elastic fracture mechanics
(standard E-399, 1974) for plane strain fracture toughness of metallic
materials requires that the characteristic specimen dimensions (such as the crack
size, the size of the uncracked ligament and specimen thickness) be greater
than 2.5 x (Kic/oy) , where Kic is the mode I fracture toughness in plane
strain and ay is the yield strength of the material. Similarly, the standard test
method for the elastic-plastic fracture toughness Jic (standard E-813, 1981)
requires that the size of the uncracked ligament and the specimen thickness
be greater than 25JIc/ay, where JIc is the critical value of the /-integral for
fracture initiation.
(a) Noting the relationship between J and K, Eqs. 9.57 and 9.8, derive an
expression for the ratio bK/bj for a linear elastic material, where bK is
the uncracked ligament length for a Kic test specimen and bj is that for a
Jic test specimen. ay, E and v, respectively, are yield strength, Young's
modulus and Poisson's ratio for the material.
(b) Calculate the ratio bK/bj for a steel for which Kic = 250 MPaVm",
ay = 350 MPa, E = 200 GPa and v = 0.33.
330
Fracture mechanics and its implications for fatigue
9.7 For plane strain and small-scale yielding conditions, the region of
/-dominance spans a distance R of up to 25% of the size of the monotonic plastic
zone at the crack tip. Assuming the requirement for /-dominance to be that
R > 35t (where St is the crack tip opening displacement defined in Section
9.7.3) and noting that St *=» 0.6J/ay for a low hardening material, prove that
the requirement for /-dominance is always satisfied for a low hardening steel
with the following properties: E/ay = 500 and Poisson's ratio, v = 0.33.
9.8 Two engineering alloys, of the same overall yield strength (300 MPa) and
elastic properties, are being considered as candidate materials for a
particular structural application. Material 1 has a grain size of 10 um, while the
grain size of Material 2 is 220 um. Both alloys fail in an intergranular
fracture mode by the nucleation, growth and coalescence of voids at grain
boundaries. The structural component, for which the alloys are being
considered, is subjected to a tensile stress of 85 MPa. It contains a through-
thickness single edge crack of length a = 25 mm. The thickness of the part
containing the crack is 30 mm and its width is 100 mm. (The equations
necessary to calculate the stress intensity factor for this problem can be
found in the Appendix.)
(a) Comment on the extent and validity of /-dominance for the two
materials under consideration.
(b) An examination of the ASTM standard (E813) for elastic-plastic
fracture toughness testing of these two materials reveals the requirement
that the depth of the initial crack (i.e. the notch length plus the length of
the fatigue pre-crack) be at least one-half of the width of the specimen
(e.g., compact tension, three-point bend specimen, or four-point bend
specimen). Why?
9.9 Derive expressions for the near-tip mode I and mode II stress intensity
factors, k\ and k2, respectively, for a center-cracked plate containing a
crack which is inclined at an angle /J to the far-field tensile load and
subjected to a far-field mode I stress intensity factor, Kt. Check your answers
withEq. 9.118.
CHAPTER 10
Fatigue crack growth in ductile solids
As discussed in earlier chapters, the total life of a cyclically loaded
component is composed of both the crack initiation and crack propagation stages. Modern
defect-tolerant design approaches to fatigue are based on the premise that
engineering structures are inherently flawed; the useful fatigue life then is the time or the
number of cycles to propagate a dominant flaw of an assumed or measured initial
size (or the largest undetected crack size estimated from the resolution of the
nondestructive inspection method) to a critical dimension (which may be dictated by the
fracture toughness, limit load, allowable strain or allowable compliance change). In
most metallic materials, catastrophic failure is preceded by a substantial amount of
stable crack propagation under cyclic loading conditions. The rates at which these
cracks propagate for different combinations of applied stress, crack length and
geometrical conditions of the cracked structure, and the mechanisms which influence
the crack propagation rates under different combinations of mean stress, test
frequency and environment, are topics of considerable scientific and practical interest.
In this chapter, we examine the mechanics and micromechanisms of stable crack
propagation in ductile solids subjected to uniaxial and multiaxial cyclic loads of fixed
amplitudes. Attention is focused on circumstances for which linear elastic fracture
mechanics concepts are expected to be valid. Fatigue crack advance where
considerable nonlinear deformation occurs ahead of a crack tip or notch tip is considered in
Chapters 15 and 16. Situations involving crack growth under variable amplitude
fatigue are examined in Chapter 14. It is also worth noting here that mechanisms
of crack propagation to be discussed in this chapter pertain to those of 'long' fatigue
cracks, typically several millimeters or more in all dimensions, for which growth
rates are independent of the crack size. The corresponding discussions of small
crack growth, including detailed definitions of what constitutes a 'small' crack,
can be found in Chapter 15. Fatigue crack growth processes in brittle solids and
semi-/noncrystalline solids are described in Chapters 11 and 12, respectively. Aspects
of fatigue crack growth under some contact fatigue conditions are addressed in
Chapter 13.
10.1 Characterization of crack growth
The rate of growth of a fatigue crack subjected to constant amplitude stress
reversals is expressed in terms of the crack length increment per cycle, da/dN. Values
of da/dN for different loading conditions are determined from experimentally deter-
331
332
Fatigue crack growth in ductile solids
mined changes in crack length over a number of elapsed fatigue cycles. When the
applied stress range is held constant, the rate of growth of a fatigue crack generally
increases with increasing number of fatigue cycles. (Exceptions to this trend are
discussed in Chapter 15.) Figure 10.1 schematically illustrates a typical fatigue
crack growth curve.
10.1.1 Fracture mechanics approach
One of the goals in fatigue design is to develop reliable methods for
characterizing the crack growth rate in terms of an appropriate loading parameter which
enables a quantification of the intrinsic resistance of the material to fatigue crack
growth for different combinations of applied stresses, specimen geometry and crack
geometry. When cyclic stresses applied to a component are so small that the zone of
plastic deformation ahead of the advancing fatigue crack is a minor perturbation in
an otherwise elastic field, linear elastic fracture mechanics solutions provide
appropriate continuum descriptions for fatigue fracture. As noted in the preceding
chapter, Paris, Gomez & Anderson (1961) and Paris & Erdogan (1963) suggested that for
a cyclic variation of the imposed stress field, the linear elastic fracture mechanics
characterization of the rate of fatigue crack growth should be based on the stress
intensity factor range,
AK = K„
■Kr
(10.1)
^max and K,
are the maximum and minimim values, respectively, of the stress
intensity factor during a fatigue stress cycle. For an edge-cracked fatigue test
specimen,
-"■max — * ^max
AK = 7 Act <Jna, Act = ct,
na,
na,
K„
Yo„
na,
(10.2)
number of cycles, N
Fig. 10.1. Typical crack growth behavior in constant amplitude fatigue loading.
70.7 Characterization of crack growth
333
where Y is a geometrical factor which depends on the ratio of crack length a to the
width of the specimen W, and <rmax and <rmin are the maximum and minimum values,
respectively, of the fatigue stress cycle. Paris, Gomez & Anderson (1961) and Paris &
Erdogan (1963) showed that the fatigue crack growth increment da/dN is related to
the stress intensity factor range by the power law relationship
^L=C(AK)m, (10.3)
where C and m are scaling constants. These constants are influenced by such
variables as material microstructure, environment and temperature (both of which could
promote a strong effect of cyclic load frequency and waveform), and load ratio, R.
The load ratio is defined as
^=GWn = *min (1Q 4)
^max -"-max
The exponent m in Eq. 10.3 is typically between two and four for ductile metallic
alloys. Equation 10.3 is applicable for a single mode of far-field loading and for a
fixed value of R. For tensile fatigue, it is understood that AK refers to the range of
mode I stress intensity factors during the stress cycle. Similarly, a stress intensity
factor range AKn or AKm can also be used in Eq. 10.3 to characterize fatigue crack
growth in mode II or mode III, respectively.!
Although the fracture mechanics approach to fatigue crack growth was a subject
of some controversy in the early 1960s, experimental data gathered for a wide range
of metallic materials confirmed a power law relationship of the form given in Eq.
10.3. Specifically, crack growth experiments on aluminum alloys with different
combinations of stress range and crack length and with different specimen geometries
(e.g., Paris & Erdogan, 1963) unambiguously established the validity of such a
characterization. Although Eq. 10.3 is empirical, it has remained one of the most
useful expressions in the analysis of fatigue crack growth for a vast spectrum of
materials and fatigue test conditions. It is important to note here that stable fatigue
crack growth occurs at stress intensity factor levels, Kmax = AK/(l — R), that are
well below the quasi-static fracture toughness, Kic. In very ductile metallic materials
with high fracture toughness, such as low strength steels, the onset of fatigue crack
growth can occur at Kmax values as low as one-hundredth of Kic.
As noted earlier, it has been known since the 1960s that the unique
characterization of fatigue crack growth using Eq. 10.3 holds only for fixed values of the load
ratio, R, and fixed environmental conditions. If environmental conditions, including
temperature, have a strong effect on fatigue fracture, loading parameters such as
cyclic freqency and waveform would also be expected to have a pronounced effect on
crack growth rates (see Chapter 16). Changes in these test conditions can lead to
changes in the empirical constants C and m and in the fatigue crack growth rates.
For fixed environmental conditions, one would then expect the crack growth to be
' This definition of a 'driving force' for fatigue crack growth pertains to situations where the crack
remains fully open during the entire fatigue cycle.
334
Fatigue crack growth in ductile solids
strongly influenced not only by AK, but also by the load ratio, R. This possibility
then naturally gives rise to the notion that the general mechanical conditions
governing fatigue crack growth are most accurately characterized by two parameters, i.e.
AK and R, or equivalently, AK and Kmax, for constant amplitude fatigue because
Kmax = AK/(l - R):
^ =f(AK, R) = g(AK, Kmax), (10.5)
where/ and g are functions which determine the numerical values of C and m in Eq.
10.3. The need for such a two-parameter characterization was ostensibly first
demonstrated by Schmidt & Paris (1973) with experimental results for the threshold stress
intensity factor range, AK0, for fatigue crack growth in steels. They showed that the
magnitude of the threshold for the onset of fatigue crack growth, AK0, is intimately
linked to the existence of a threshold value of applied AK and a critical value of R, or
equivalently, to the threshold values of AK and Kmax. Similar interpretations can
also be gained from the experimentals of Doker & Marci (1983). Two-parameter
characterizations involving AK and Kmax have also been advanced to rationalize the
subcritical fatigue crack growth characteristics of ceramics and organic composites
by Kishimoto et al. (1987) and Hojo et al. (1987), respectively (see the next chapter
for a discussion of these approaches for nonmetallic materials). On the basis of a
survey of available experimental information, Vasudevan & Sadananda (1995) have
shown how the conditions for the onset of fatigue crack growth are governed by the
intrinsic threshold values of both AK and Kmax. A more detailed discussion of these
approaches is taken up in Sections 10.4 and 11.2.2.
10.1.2 Fatigue life calculations
The simplicity of the Paris power law relationship provides a means of
estimating the useful life of a fatigued component for design or failure analysis.
The fatigue life or the number of fatigue cycles to failure is calculated by integrating
Eq. 10.3 from an assumed initial defect size a0 to a critical crack size a{. When the
stress intensity factor is denned as in Eq. 10.2,
^-=C{YAoJB)m, (10.6)
djv
for a fixed value of the load ratio, R. If fatigue loading involves a constant amplitude
of far-field stresses and a crack length change (a{ — a0) over which Y is roughly
constant,
CYm(A<r)mnm'2 dN= -^. (10.7)
The resulting fatigue life is
N{ = (m- 2)CYm(Aa)mKm/2 \(a0fm-2)'2 ~ (a{fm-2)'2\ (1°'8)
70.2 Microscopic stages of fatigue crack growth
335
for m^2 and
Nt = t^ Hn- (10.9)
CY2(Aa)2n Oq
for m = 2. In general, Y varies with a and hence the integration is performed
numerically. It is easily seen from Eq. 10.8 that when a0 «; a{ (which is usually the case for
ductile alloys), N{ is not very sensitive to a{, but is markedly influenced by a0.
10.2 Microscopic stages of fatigue crack growth
The microscopic mode of fatigue crack growth is strongly affected by the
slip characteristics of the material, characteristic microstructural dimensions, applied
stress level and the extent of near-tip plasticity. In ductile solids, cyclic crack growth
is envisioned as a process of intense localized deformation in macroscopic slip bands
near the crack tip.
10.2.1 Stage I fatigue crack growth
When the crack and the zone of plastic deformation surrounding the crack
tip are confined to within a few grain diameters, crack growth occurs predominantly
by single shear, in the direction of the primary slip system, Figs. 10.2(a) and (b). This
single slip mechanism leading to a zig-zag crack path has been termed stage I crack
growth by Forsyth (1962). Stage I crack growth has also been observed in a variety
of ferrous, aluminum and titanium alloys even for crack length values substantially
larger than the grain size provided that the zone of near-tip plasticity is smaller than
the grain dimensions (i.e. for very low AK levels). Further discussion of stage I crack
growth is given in later sections.
10.2.2 Stage II crack growth and fatigue striations
At higher stress intensity range values, the plastic zone at the crack tip
encompasses many grains. The attendant crack growth process involves
simultaneous or alternating flow along two slip systems. This duplex slip mechanism, termed
stage II by Forsyth (1962), results in a planar (mode I) crack path normal to the far-
field tensile axis, Figs. 10.3(a) and (b). In single crystals, the transition from stage I to
stage II growth causes the formation of dislocation cell structures and the
breakdown of PSBs at the crack tip.
While the fracture surfaces created by stage I fatigue exhibit a serrated or faceted
profile, stage II crack growth in many engineering alloys leads to the formation of
fatigue 'striations'. These striations, first observed by Zappfe & Worden (1951), are
ripples on the fracture surface. Figure 10.4 shows an example of fatigue striations
formed in cyclic tension. (Additional examples are provided in Section 10.7 and
336
Fatigue crack growth in ductile solids
(«)
. X
I
i 60 \\m |
ib)
Fig. 10.2. (a) A schematic of stage I fatigue crack growth, (b) An example of stage I fatigue
crack growth in a single crystal of Mar M-200 nickel-base superalloy. The tensile axis is vertical.
The {100} plane is normal to the tensile axis. (Photograph from P.B. Aswath & S. Suresh.)
Chapter 14.) For cyclic loads in the Paris regime of fatigue crack advance, it has been
found that the spacing between adjacent striations correlates with the experimentally
measured average crack growth rate per cycle. Such correlations, first shown by
Forsyth & Ryder (1960), have been most clearly documented for stage II crack
growth in aluminum alloys and have led to the widespread use of striation spacing
as an a posteriori indicator of crack growth history for failure analysis in both
constant amplitude and variable amplitude fatigue.
It is important to note that not all engineering materials form striations during
stage II fatigue. Striations are clearly seen in pure metals and many ductile alloys.
Many engineering polymers also exhibit well-defined fatigue striations on the
fracture surfaces (see Chapter 12). However, in steels they occur very infrequently and
are often barely visible in cold-worked alloys. The possibility of striation
development is also known to be strongly influenced by the value of AK, stress state,
environment and alloy content (e.g., Pelloux, 1970; Lankford & Davidson, 1983;
Roven, Langoy & Nes, 1987). Furthermore, as shown in later sections, microvoid
coalescence and intergranular failure associated with 'static modes' are seen at high
AK levels, whereas faceted crack advance has been documented for low AK levels.
10.2 Microscopic stages of fatigue crack growth
337
slip bands
(«)
fatigue crack
(b)
1 mm
Fig. 10.3. (a) An idealization of stage II fatigue crack growth, (b) An example of stage II crack
growth in a Cu single crystal. Two sets of {111) slip planes (white areas) are seen. The tensile
axis is vertical. (From Neumann, 1969. Copyright Pergamon Press pic. Reprinted with
permission.)
10.2.3 Models for striation formation
A number of conceptual models have been proposed over the years to
rationalize the formation of fatigue striations and the planar growth of Stage II
fatigue cracks. Of these, an appealing physical concept is the plastic blunting
idealization of Laird (1967). In this model, the increment of crack extension per fatigue
cycle is envisioned as occurring due to the plastic blunting of the crack tip. A crack
tip amenable to duplex slip plastically blunts as shown in Fig. 10.5 upon the
application of a tensile stress. The blunting process also effectively results in the extension of
the crack by a distance of the order of the crack tip opening displacement. If the far-
field stress is reversed into compression, the crack tip re-sharpens only to be blunted
338
Fatigue crack growth in ductile solids
»k J
X
^7
I i
/
1 iim
Fig. 10.4. Fatigue striations on the etched failure surface in 2024-T3 aluminum alloy. The arrow
indicates crack growth direction. (From Pelloux, 1969. Copyright American Society for Metals.
Reprinted with permission.)
(*)
(c)
S
^
Fig. 10.5. An idealization of plastic blunting and re-sharpening which leads to stage II fatigue
crack growth in fully-reversed fatigue, (a) Zero load, (b) small tensile load, (c) peak tensile load,
(d) onset of load reversal, (e) peak compressive load, and (/) small tensile load in the subsequent
tensile cycle. Arrows indicate slip direction. (After Laird, 1967.)
10.2 Microscopic stages of fatigue crack growth
339
again during the next tension sequence (e.g., Laird & Smith, 1962). Since the closure
of the crack during compression cannot fully negate the blunting and the attendant
extension of the crack during the preceding tension load, net crack growth occurs
during a fatigue cycle leading to the formation of striations, as depicted
schematically in Fig. 10.5.
Laird's model applies to a wide variety of ductile materials, including polymers,
because of its general description of the plastic blunting process. On the other hand,
in ductile metal single crystals, shear on two slip planes which intersect the crack-
front can be modeled as shown in Fig. 10.6. The work hardening of the primary slip
plane (say, plane 1) leads to alternating shear on another slip plane (plane 2).
Kinematic irreversibility of cyclic slip (see Chapter 4) causes net crack growth in a
planar fashion along the line of intersection of the two slip planes. Many crystal-
lographic details of this alternating slip process have been verified experimentally by
Neumann (1969, 1974) on FCC crystals. For example, if an FCC monocrystal is
loaded along the (100) direction, two {111} planes are symmetrically loaded about
the crack plane. The resulting crackfront should be perfectly planar and parallel to
the intersection line of the two {111} slip planes, which is the (Oil) direction. This is
evident from the micrograph of Fig. 10.3(£>).
The fatigue striations discussed up to this point are a consequence of duplex slip
and they are known as ductile striations. The formation of brittle striations, which lie
on crystallographic {100} facets in high strength aluminum alloys, also occurs as a
(«) (b) {d) {/) (h)
(c) (e) 0?) (!)
Fig. 10.6. Alternating slip model for stage II crack growth under fully reversed cyclic loads. The
figures on the top row show tensile loading stages, and those on the bottom pertain to
unloading stages. (After Neumann, 1969.)
340
Fatigue crack growth in ductile solids
consequence of environmental interactions (e.g., Forsyth & Ryder, 1960; Laird,
1967; Wanhill, 1975; Lynch, 1981). The term cleavage striations is also employed
to describe these brittle striations (see Section 16.3.2).
10.2.4 Environmental effects on stage II fatigue
Some aspects of the effects of environment on the formation of fatigue
striations can also be incorporated into the above 'unzipping' model of Neumann.
It was first shown by Meyn (1968) that striation formation may be completely
suppressed in vacuo in aluminum alloys which form well-defined striations in moist air.
Similar findings were also reported by Pelloux (1969, 1970) for 2024-T3, 7075-T6 and
Ti-6A1-4V alloys fatigued in a vacuum of 5 x 10~6 torr. Pelloux suggested that the
alternating shear process is reversible unless an oxide film is formed on the slip steps
created at the crack tip. This oxide layer impedes slip upon load reversal. Figure 10.7
illustrates the opening and closing of a crack during two fully reversed fatigue cycles
in air and in vacuo. Pelloux postulated that the inhibition of reverse slip due to
oxidation results in a larger net fatigue crack growth increment per cycle in air
than in vacuo. Furthermore, the crack profiles associated with the opening and
closing of the fatigue crack in vacuo do not produce any fatigue striations such as those
found in air, Fig. 10.7.
>
>
/
A
A/
ft
AA
two cycles
two cycles
(«)
irreversible slip
(oxidation)
(*)
reversed slip
(vacuum)
loading and
unloading
Fig. 10.7. Effects of environment on fatigue crack growth by alternating slip. See text for details.
(After Pelloux, 1969.)
10.3 Different regimes of fatigue crack growth
341
This idealization found experimental backing on several accounts: (i) Fatigue
striations were not found in vacuo in a number of alloys which formed striations
in air. (ii) The macroscopic rate of fatigue crack growth in vacuo was more than an
order of magnitude slower than that in air. It has also been suggested (e.g.,
Neumann, 1983) that enhanced rubbing of the crack faces (due to the absence of
any protective surface films on the freshly formed macroscopic fracture surfaces)
leads to the obliteration of fatigue striations by fretting and causes a reduction in the
rate of crack growth in vacuo.
10.3 Different regimes of fatigue crack growth
The Paris power law relationship, showing a linear variation of log da/dN
with log AK, pertains to stable fatigue fracture over only a portion of the total crack
growth resistance curve for an alloy. At extreme values of AK, both below and
above that of the Paris regime, there is a precipitous rise in crack growth rates
with increasing AK. For most engineering alloys, a plot of log da/dN against
logAAT exhibits a sigmoidal variation, as shown schematically in Fig. 10.8. In this
plot, three distinct regimes of crack growth can be identified: regime A, in which the
average growth increment per cycle is smaller than a lattice spacing, is associated
with the existence of a threshold stress intensity factor range AKq. Below this
threshold, cracks either remain dormant or grow at undetectable rates; above the
threshold, there is a steep increase in da/dN with AK. Regime B, known as the Paris
regime, exhibits a linear variation of log da/dN with log AK, Eq. 10.3. Regime C
10-
10-
s
•a
10"
10-
regime A
•-one lattice
spacing ■
per cycle
logAis:
mm/min
X
o
— 1 mm/hour
— 1 mm/day »
mm/week
Fig. 10.8. Schematic illustration of the different regimes of stable fatigue crack propagation.
342
Fatigue crack growth in ductile solids
Table 10.1. Characteristics of the three regimes of fatigue crack growth.
Regime
Terminology
Microscopic failure
mode
Fracture surface
features
Crack closure levels
Microstructural
effects
Load ratio effects
Environmental effects
Stress state effects
Near-tip plasticity '
A
Slow-growth rate
(near-threshold)
Stage I, single shear
Faceted or serrated
High
Large
Large
Large
—
rc<dg
B
Mid-growth rate
(Paris
Stage II
regime)
, (striations)
and duplex
Planar,'
Low
Small
Small
*
Large
rc>dg
with
; slip
ripples
C
High-growth rate
Additional static
modes
Additional cleavage or
microvoid
coalescence
—
Large
Large
Small
Large
rc »rfg
*Large influence on crack growth for certain combinations of environment, load ratio and
frequency.
' rc and d„ refer to the cyclic plastic zone size given in Eq. 9.85, and the grain size, respectively.
pertains to the range of high AK values where crack growth rates increase rapidly
causing catastrophic failure.
In ductile engineering alloys, the maximum stress intensity factor value
corresponding to the fatigue threshold, A^max0 (= AK0/{1 — R}), is only a small fraction
of the fracture toughness, Kic. For example, in a low strength structural material,
such as the AISI A533-B pressure vessel steel, the threshold stress intensity factor
range AK0 is as low as about 3 MPay'm for high load ratio (R = 0.75) fatigue
loading, although the fracture toughness is as high as 300 MPay'm- This observation
implies that fatigue loading of the structural component due to high frequency, low
amplitude vibrations and other load fluctuations can cause undesirable levels of
stable crack growth over prolonged periods of operation.
Table 10.1 lists the salient characteristics of crack advance in the three regimes
of stable fatigue fracture. The following sections provide a detailed discussion of
the mechanisms and characteristics of stable crack growth in each of the three
regimes.
10.4 Near-threshold fatigue crack growth
343
10.4 Near-threshold fatigue crack growth
Fatigue crack propagation in regime A deals primarily with noncontinuum
failure processes, where the increment of average crack extension is less than 10~6
mm/cycle. In this region, the stress intensity factor range approaches the fatigue
crack growth threshold AK0. An operational definition for AK0 is commonly used
in terms of a maximum crack growth rate (typically 10~8 mm/cycle), based on the
accuracy of the crack monitoring system and the number of elapsed cycles. For
example, if the method used for crack length measurement is accurate to at least
0.1 mm, and if no crack advance is detected for at least 107 fatigue cycles, a crack
growth threshold is considered to have been reached.
Structural engineers are often faced with the task of designing components which
can withstand very high frequency, low amplitude loads over fatigue lifetimes as high
as 1010 — 1012 load reversals. A high speed turbine rotor operating at 3000
revolutions per minute may be subjected to 1010 stress cycles over a typical life span of 20
years. If fatigue crack growth were to occur in this rotor at a seemingly insignificant
rate of 3 x 10~9 mm/cycle (i.e. one-hundredth of an atomic spacing per cycle), this
would still represent a total crack advance of 30 mm during the life of the rotor,
which is sufficient to cause catastrophic failure. Although fatigue design based on
AK0 may prove to be overly conservative in very ductile alloys, information on
fatigue thresholds is often included in the analysis of failure in turbine blades,
turbine shafts, and alternator rotors, as well as in acoustic fatigue of welds in gas
circuitry used in nuclear reactors. From both the scientific and practical viewpoints,
near-threshold fatigue offers a challenging research topic in that large changes in the
values of AK0 (and hence in the total fatigue life) can be effected by alterations in the
material microstructure, load ratio, environment and crack size (see Table 10.1).
There have been many research studies on the near-threshold fatigue of
engineering alloys. Several international conferences (e.g., Davidson & Suresh, 1984) and a
research monograph (Taylor, 1989) have been devoted exclusively to the discussion
of fatigue thresholds. Figure 10.9 shows the typical range of AK0 values as a function
of load ratio, R, for a variety of Fe, Ni, Cu, Ti and Al alloys. Note that the threshold
values for different microstructures of the same alloy system as well as for different
alloys exhibit significantly less variation at high R values than at low R values.f
Some mechanisms underlying this trend will become evident from the discussions to
be presented in Chapter 14.
It is evident from Fig. 10.9 that the threshold AKq values for Fe and Ni alloys
decrease with increasing R before reaching a constant plateau. This dependence of
AK0 on R was examined first in detail by Schmidt & Paris (1973), as discussed earlier
in Section 10.1.1. They rationalized the occurrence of a fatigue threshold, for any load
ratio R, in terms of two critical values: a constant value of the stress intensity factor
' From a comprehensive survey of published data, Liaw, Leax & Logsdon (1983) note that AK0 values,
when modified to exclude the effects of crack closure, vary in proportion to Young's modulus for a wide
variety of alloy systems.
344
Fatigue crack growth in ductile solids
0.0 0.2 0.4 0.6 0.8 1.0
R
Fig. 10.9. Typical range of threshold AK0 values measured in room temperature air and plotted
as a function of the load ratio, R, for a variety of engineering alloys. (After Liaw, Leax &
Logsdon, 1983.)
range, AA^ and a critical value of the load ratio, RCI. These two critical parameters to
characterize the fatigue threshold can also be expressed in terms of AK0 and
^max.o = AAT0/(1 - R), as shown in Fig. 10.10. In this figure, AKtb is the lowest
value of AK0 (at R > i?cr) below which a fatigue crack does not advance at any R.
Schmidt & Paris showed that when the fatigue crack growth threshold is
characterized in terms of the amplitude of the stress intensity factor, AK0, there exists a
critical value of R = RCI, below which a decrease in R causes an increase in the
apparent AK0. For R> Rcr, AK0 = AKth is independent of R. Alternatively, when
the fatigue crack growth threshold is characterized in terms of the maximum value of
the stress intensity factor, Kmax0, it is found that Kmax0 is a constant for R < Rcv.
For R > i?cr, Kmax 0 increases with R, consistent with a constant value of AK0 ( =
^max.o x (1 _ R))- For any R, one would then expect that there exist two critical
driving force parameters, AK0 and Kmax0 which govern the threshold condition for
10.4 Near-threshold fatigue crack growth
345
final failure.
AK,h-
load ratio, R
Fig. 10.10. Schematic variation of the amplitude or the maximum value of the threshold stress
intensity factor as a function of load ratio.
crack growth. A constant value of the former one determines the threshold
conditions at high R values while a constant value of the latter one determines the
threshold at low R.-f
Vasudevan & Sadananda (1995) have plotted the trends shown in Fig. 10.10 in
terms of AK0 versus Kmax 0 for a variety of available experimental data on fatigue
thresholds. These plots show how fatigue cracks begin to advance when intrinsic
values of both AKtil and A^,rax th are exceeded for a given constant amplitude cyclic
loading condition. Vasudevan and Sadananda thus demonstrate for a wide range of
alloys that the threshold for fatigue crack growth is governed by critical values of
both AK and Km!tY.
10.4.1 Models for fatigue thresholds
The existence of a fatigue crack growth threshold was first postulated by
McClintock (1963). He used the criterion that fatigue crack growth occurs when a
critical value of local strain or accumulated damage over certain characteristic
distance ahead of the crack tip reaches a critical value. Using elastic-plastic analyses,
McClintock argued that fatigue cracks may cease to advance when the extent of
t
Schmidt & Paris (1973) rationalize the increase in
K,
max.O :
force'; see Chapter 14.
A.Kth/(l - RCT) versus R for R < Ra
AK0 with decreasing R or the plateau in
in terms of reduction to the effective 'driving
346
Fatigue crack growth in ductile solids
near-tip plasticity becomes comparable to some characteristic microstructural size
scale. Frost (1966) presented experimental evidence supporting the existence of a
fatigue threshold when the value of the empirical characterization parameter, a\a,
where <ra is the stress amplitude and a the crack length, attained a critical value. With
the advent of fracture mechanics and its application to characterize fatigue crack
growth, it soon became apparent, particularly from the work of Paris et al. (1972)
and Schmidt & Paris (1973), that the threshold for the nonpropagation of long
fatigue cracks can be associated with a critical stress intensity factor range, AA^.
In addition to the postulated relationship between the existence of a fatigue
threshold and the cyclic plastic zone size, models have been proposed based on the notion
that the threshold for the onset of crack growth occurs when the crack tip opening
displacement attains a value comparable to the critical microstructural dimension
(e.g., Donahue et al., 1972). From the expression for the crack tip opening
displacement presented in the preceding chapter, one finds that
A^o oc JffyE'l*, (10.10)
where <ry is the yield strength, E' is Young's modulus in plane strain and I* is the
microstructural size scale such as grain size. The prediction that the threshold
increases with increasing flow strength is generally inconsistent with experiment.
Sadananda & Shahinian (1977) proposed that the threshold for crack growth is
reached when the shear stress, x, required to nucleate and move a dislocation from
the crack tip reaches a critical value. This criterion led to the result that
AKo<xxVb, (10.11)
where b is the magnitude of the Burgers vector. This model, as well as other
arguments where a fatigue threshold is expected to be attained when a critical stress or
strain is exceeded over a characteristic microstructural distance (Weiss & Lai, 1974),
fail to capture the effects of various microstructural factors on fatigue thresholds.
10.4.2 Effects of microstructural size scale
The transition from the near-threshold regime to the intermediate stage of
fatigue crack growth is also accompanied by a noticeable change from a microstruc-
ture-sensitive to a microstructure-insensitive fracture behavior. Experimental
observations of such transitions and of the dependence of such transitions on
metallurgical variables, particularly the grain size and slip characteristics, have
now been reported for titanium alloys (e.g., Irving & Beevers, 1974; Lindigkeit et
al., 1979; Yoder, Cooley & Crooker, 1979), aluminum alloys (e.g., Asaro, Hermann
& Baik, 1981; Carter et al, 1984; Suresh, Vasudevan & Bretz, 1984), ferrous alloys
(e.g., Masounave & Ba'ilon, 1976; Ritchie, 1979; Taira, Tanaka & Hoshina, 1979;
Gray, Williams & Thompson, 1983) and nickel-base superalloys (King, 1982).
The transition in fatigue failure modes from the slow growth rate regime to the
Paris regime typically occurs when the size of the cyclic plastic zone rc becomes
10.4 Near-threshold fatigue crack growth
347
comparable to the characteristic microstructural dimension /* of the alloy system. If
the stress intensity factor range corresponding to this transition is termed AKT,
(AK
Here a'y is the cyclic yield strength and a = l/4n is a numerical factor from Eq. 9.85.
Rearranging this equation, it is seen that
AKToca'y^/F. (10.13)
Some of the clearest examples of a transition from a microstructure-sensitive to a
microstructure-insensitive growth behavior at AKT have been reported by Yoder,
Cooley & Crooker (1979) for beta-annealed Ti-6A1-4V and Ti-8Al-lMo-lV alloys
with Widmanstatten structures. Here the size of the Widmanstatten packet size is the
characteristic microstructural size scale, f. Yoder et al. found that the transition
from a crystallographic, serrated mode of fracture to a striated mode of failure
occurred at a value of AKT which increased with the Widmanstatten packet size
as per Eq. 10.13. Similar results have also been reported for ferritic-pearlitic steels by
Yoder, Cooley & Crooker (1983). In this case, the threshold AA^ (taken to be
approximately equal to AKT in view of the steep slope in crack growth curve in
the near-threshold regime) is found to be of the form
AK0=A + Byfdg, (10.14)
where dg is the ferrite grain size, and A and B are material constants. Taira, Tanaka
& Hoshina (1979) also found a similar trend in low carbon steels. These latter
authors postulated a criterion for predicting AA^ (^ AKT) based on a critical slip
band zone size, which is analogous to the cyclic plastic zone size. Taira et al. assumed
that a crack growth threshold is determined by whether the slip band near the crack
tip propagates into the adjacent grain or not. When the size of the slip band zone at
the crack tip, rs, becomes greater than the grain size dg, the slip band can traverse the
grain boundary and propagate into the adjacent grain. For low carbon steels, Taira
et al. found that rs oc dg.
10.4.3 Effects of slip characteristics
Even when the size of the cyclic plastic zone at the tip of a near-threshold
crack is the same for two different microstructures (with the same grain size),
different fatigue thresholds may result because of the differences in slip characteristics.
The influence of slip behavior on thresholds is best illustrated with the example of a
precipitation-hardened alloy system. Consider the case of under-aged and over-aged
microstructures of an aluminum alloy, where the two ageing conditions are designed
to give the same macroscopic yield strength. In the case of the under-aged alloy, the
matrix consists of shearable and coherent precipitates. These strengthening particles
are amenable to be sheared by slip bands ahead of a fatigue crack.
r.
(10.12)
348
Fatigue crack growth in ductile solids
It was suggested by Hornbogen & Zum Gahr (1976) that in such heterogeneously
deforming microstructures, dislocation glide occurs within grains predominantly
along a single slip system. The single shear failure promotes a highly serrated and
tortuous crack path in the under-aged condition, with the wavelength of crack path
tortuosity being of the order of the grain size. On the other hand, incoherent
precipitates present in the over-aged alloy are bypassed, rather than sheared, by
dislocations which form (Orowan) loops around the particles. The resulting
deformation mode in the over-aged alloys is one of duplex slip and the
near-threshold cracks exhibit a planar transgranular fracture profile, f Furthermore, the
kinematic irreversibility of cyclic slip is more restricted in the over-aged alloy than in the
under-aged condition. This difference is viewed as a factor contributing to the more
beneficial crack growth characteristics of the under-aged aluminum alloys observed
in the near-threshold regime. (It will be shown in Chapter 14 that, in addition to
these intrinsic microstructural effects, crack deflection mechanisms associated with
the more tortuous crack paths in the under-aged condition and the attendant
possibility of contact between crack faces can promote lower crack growth rates than in
the over-aged microstructure.)
The dramatic effect of slip characteristics on the path of a fatigue crack is evident
in the optical micrographs, shown in Fig. 10.11, of near-threshold cracks in an Al-
Cu-Li alloy commercially available under the trade name Weldalite 049. When this
alloy is age-hardened to a T3 temper (under-aged condition), a tortuous, crystal-
lographic crack path is observed, Fig. 10.11(a). However, over-aging (T8 temper)
promotes a perfectly straight planar crack growth, Fig. 10.11(6), in accord with the
expectations based on the above arguments.
The under-aged and over-aged microstructures of an aluminum alloy, with the
same yield strength and grain structure, can also exhibit vastly different threshold
AK0 values in both vacuum and moist air, Fig. 10.12. For similar ageing treatments
and flow strength values, increases in grain size result in an improvement in AK0. As
AK levels are increased to higher values corresponding to the Paris regime, the large
plastic zones (of average dimensions greater than the grain size) promote duplex slip
in both the ageing conditions, thereby minimizing the sensitivity of crack growth to
the underlying microstructure.
The above results clearly point to the dilemma faced by materials scientists when
designing engineering alloys with optimum fatigue resistance. In the near-threshold
regime of fatigue crack growth, where a significant portion of stable crack growth
life is expended, an increase in the grain size of the material or a decrease in yield
strength generally results in a marked reduction in the near-threshold fatigue crack
growth rates and an increase in AK0. On the other hand, the resistance of a (smooth-
surfaced) material to fatigue crack initiation, expressed in terms of an endurance
' Cleavage-like growth of fatigue cracks along grain boundaries and through grains have also been
observed in the near-threshold region for a wide variety of alloy systems (e.g., Irving & Beevers,
1974). These failure modes, termed cyclic cleavage, do not represent cleavage fracture in the true
sense because they exhibit slow, progressive failure rather than a brittle separation.
10.4 Near-threshold fatigue crack growth
349
XA
* ~
(«)
100 urn direction of
' crack growth
€
*'*
100 urn ,
f j\ direction of
crack growth
Fig. 10.11. Profiles of near-threshold fatigue cracks observed in (a) an under-aged condition (T3
temper) and (b) an over-aged condition (T8 temper) of an Al Cu-Li alloy in laboratory air at
a high load ratio, R. (From Blankenship & Starke, 1991. Copyright Pergamon Press pic.
Reprinted with permission.)
limit, often increases with decreasing grain size and increasing strength of the
material. Although these results may appear contradictory, they can be rationalized by
noting that the former inference is valid solely for fatigue crack growth, especially at
low stress intensity range levels, whereas the latter conclusion pertains primarily to
crack initiation. If pre-existing flaws are not of a major concern, a finer grain size
which promotes higher strength and higher endurance limit is favored. On the other
hand, if a defect-tolerant design is adopted and the flawed component is expected to
be subjected to high frequency, low stress amplitude loading over a prolonged time
span, a coarser grained microstructure would be more appealing. Optimization of
the microstructural dimensions for improved resistance to both crack initiation and
crack growth would require a trade-off in the choice of grain size or even the
development of a structure with a distribution of grain sizes.
It is necessary to emphasize here that one of the principal factors contributing to
the dependence of fatigue thresholds on microstructural variables (such as grain size
350
Fatigue crack growth in ductile solids
>
a*
<
vacuum
under-aged (UA)
peak-aged (PA)
*&-.
■^t
^
■*
p over-aged (OA)
moist air
^_ (95% RH)
.-J"""-auA
—OPA
AqA
0.0
0.2
0.4
0.6
0.8
1.0
R
Fig. 10.12. Variation of the threshold AKq as a function of the load ratio, R, for under-aged and
over-aged conditions of a 7075 aluminum alloy. Both microstructures have the same yield
strength, ay = 450 MPa and an average grain size of 90 \un. (After Suresh, Vasudevan & Bretz,
1984. Results for AK0 at R = 0.33 in vacuum are courtesy of A.K. Vasudevan.)
and yield strength), mechanical factors (such as load ratio) and environment is the
development of a tortuous or deflected crack path (which is promoted by stage I
mechanism) and the resultant possibility of crack face contact. These effects can alter
the 'effective driving force' for fatigue crack growth. Consequently, the parameters
used to characterize fatigue crack growth, Eqs. 10.1-10.3, should be appropriately
modified to account for the changes in the near-tip stress intensity factor range.
Failure to develop a quantitative description of the changes in driving force due
to crack deflection and the attendant 'crack closure' effects has resulted in opposing
viewpoints and controversy about the mechanisms of fatigue failure in many alloy
systems. In Chapter 14, a detailed discussion is presented on the effects of crack
deflection and crack face contact on the propagation of fatigue cracks, particularly in
the near-threshold regime.
Since the rate of crack advance is slow in the near-threshold regime, embrittling
environments can have a marked effect on fracture resistance. Environmental
influence on apparent AK0 values has been documented even when the maximum stress
intensity factor value at threshold is appreciably smaller than the threshold for stress
corrosion cracking ^Trscc under static loads. Mechanisms of corrosion fatigue in the
near-threshold regime are discussed in Chapters 14 and 16.
10.4 Near-threshold fatigue crack growth
351
10.4.4 Example problem: Issues of length scales
Problem:
Consider a low strength alloy steel which has the following mechanical
properties: Young's modulus, £■ = 210 GPa, Poisson's ratio, v = 0.33, mono-
tonic yield strength, ay = 400 MPa, stabilized cyclic yield strength, a'y = 440
MPa, plane strain fracture initiation toughness, Klc = 100 MPa.y'm, and
nominal values of fatigue crack growth threshold stress intensity factor range,
AK0 = 7 MPaVm and 3 MPaVm at R values of 0.0 and 0.75, respectively, at
room temperature. The characteristic microstructural length scale for this alloy is
the average diameter of an equiaxed grain which is approximately 50 nm. The
near-threshold crack growth in this alloy leads to a fracture path which leads to
the formation of an average asperity height of 3 ^m at both R values. All the
fatigue crack growth measurements in this alloy were made with specimens
containing long cracks (crack length greater than at least 15 mm) where plane strain
and small-scale yielding conditions were ensured at all times. Compute all the
characteristic length scales associated with fatigue fracture in this alloy at AK
and Kmax values close to the fatigue threshold and compare them with the micro-
structural and other important dimensions. Speculate about the mechanisms
which might possibly be associated with such length scales, and comment on
the applicability of the various microscopic mechanisms to this alloy.
Solution:
The maximum plastic zone size at the fatigue crack growth threshold is:
l/Wo\=±/_ &K0
2
m = 95.5 urn, for R = 0.75. (10.15)
3tt \0.2
'.25 x 400;
Thus the monotonic plastic zone is fully confined within an average grain at
R = 0.0, and it spans less than two grain diameters at R = 0.75. One would
thus expect stage I mechanisms to be operational in this alloy at AK values close
to the threshold.
The cyclic plastic zone size at threshold is:
3tt \ 2a'y
\ 2
m = 6.7 urn, for R = 0.0,
^ 1 f 7 \
3tt \2 x 440/
= T- U 3,-.J m = 1.2 urn, for R = 0.75.
3tt \2 x 440/
(10.16)
352
Fatigue crack growth in ductile solids
It is evident that the criterion for transition from stage I to stage II crack
growth, which is implicit in Eq. 10.12, would not hold in this case because the
critical crack length /* is much smaller than the grain size; values of
AK » AK0 would be predicted in this case for such a transition.
The maximum crack tip opening displacement, Eq. 9.93, at threshold is:
K(\ - RYEoyJ
0.51 7y~ (,°;f)Z] 1 m = 0.26 urn, for R = 0.0,
\^2 x 210 x 103 x 400/
0.5 ( 3 [1 -(0.33)] \ m = Q J6 for R = Q 75
\(0.25)2 x 2 x 210 x 103 x 400/
(10.17)
It is evident that the maximum extent of crack tip opening displacement is small
compared to the characteristic microstructural dimension, and even smaller than
the fracture surface asperity dimension. If oxidation of the fracture surfaces (as,
for example, from corrosion of the alloy in a highly moist or aqueous
environment) can lead to corrosion products whose dimensions within the crack are
comparable to the crack opening displacement, it is possible to close the crack
even under an imposed tensile cyclic stress. Similarly, if there is severe asperity
locking between the crack faces during cyclic loading, the 'effective driving
force' for fracture can be significantly smaller than the apparent or nominal
AK in the near-threshold regime. As a result, the crack may prematurely arrest.
(See Chapter 14 for further discussions of these effects.)
10.4.5 On the determination of fatigue thresholds
The experimental determination of threshold AK0 and near-threshold crack
growth rates is strongly influenced by the artifacts of the test methods. AK0 values
are generally measured using the so-called load-shedding technique. In this method,
a fatigue pre-crack is initiated ahead of a starter notch in a compact tension (CT) or
a center-notched specimen at AK values corresponding to the Paris regime of crack
growth. The far-field stress range, and hence the value of AK, are successively
reduced in stages, with the cyclic frequency and load ratio held constant. At each
stage of constant far-field load range, the fatigue crack is allowed to propagate over
distances of the order of a millimeter (or at least four times the maximum current
plastic zone size) before the far-field AK is reduced by an amount not more than
10%. This step is repeated until the threshold, AK0, for no crack growth or crack
growth typically smaller than 10~8 mm/cycle is reached. With the ready availability
10.4 Near-threshold fatigue crack growth
353
of computer-controlled electro-servohydraulic fatigue test machines, load-shedding
procedures for measuring fatigue thresholds can be carried out automatically
without human intervention. For example, Saxena, et al. (1978) suggested that a
particular K gradient can be achieved during load-shedding by controlling cyclic loads
such that the following relationship is satisfied:
Kj = K0 exp [C(aj - a0)], (10.18)
where Kj and K0 are the instantaneous and initial values of the stress intensity factor,
C is a normalized gradient of K which is equal to (dK/da)/K, and cij and a0 are the
instantaneous and initial values, respectively, of fatigue crack length. If C is assigned
a pre-determined negative value, the imposed AK values and the resulting crack
growth rates will decrease with the progression of the fatigue test.
If the far-field AK is dropped rapidly, the growth of the current crack tip through
the greatest prior plastic zone induced at the previous higher load level will cause
artificial retardation or even complete arrest of fatigue crack growth (see Chapter 14
for the mechanisms associated with such retardation effects during changing load
amplitudes). However, if the AK values are reduced very slowly, the development of
crack closure in some materials may once again result in premature closure of the
crack faces and an apparently high value of AK0 due to fracture surface oxidation in
moist environments. The choice of a particular gradient of AK is somewhat arbitrary
and can lead to considerable experimental uncertainties and errors in the
measurement of fatigue thresholds. Furthermore, reductions in imposed AK with increasing
crack length lead to the determination of a crack growth arrest threshold rather than
the threshold for the onset of crack growth. It is this latter quantity which is of
significance in most practical applications.
Extensive threshold testing programs involving a number of different metallic
materials have resulted in the development of Standard E-647-86a by the
American Society for Testing and Materials (Philadelphia) for cyclic load reductions
to measure fatigue thresholds. However, the load-shedding methods, in general, have
come under considerable criticism in recent years in view of the aforementioned
experimental uncertainties. At least two alternative methods have been proposed:
(i) Suresh (1985b) and Christman & Suresh (1986) proposed a technique whereby
self-arresting fatigue pre-cracks are introduced in notched specimens under fully
compressive far-field cyclic loads. Subsequently, the specimen is subjected to cyclic
tensile loads beginning at stress intensity levels well below the anticipated threshold
AK0 value. If no crack growth is detected, the value of AK is raised by a small
percentage. This procedure is repeated until the threshold AK0 for the onset of crack
growth is reached; beyond this point the fatigue test can be carried out at constant
far-field cyclic load levels, (ii) Herman, Hertzberg & Jaccard (1988) have popularized
a method of increasing R ratio to measure an intrinsic fatigue threshold. In this
method, the imposed Kmax is held fixed and AK is progressively reduced by raising R.
The argument here is that when the maximum stress intensity factor of the fatigue
cycle is held fixed, the size of the maximum plastic zone at the crack tip remains
354
Fatigue crack growth in ductile solids
unaltered. Therefore, load reductions would not be expected to cause retardation
effects typical of variable amplitude fatigue. Furthermore, closure of the crack faces
is virtually eliminated for the high load ratio levels at which AK0 is measured. This
latter method, by its very design, cannot be used to measure the effects of load ratio
on near-threshold crack growth rates.
It is perhaps worth noting that the use of widely different methods for the
determination of fatigue thresholds has resulted in considerable differences in the degree
of accuracy and meaning of the data reported in the literature. Caution should be
exercised in the interpretation of crack growth mechanisms because the artifacts of
the test method can often dominate the intrinsic effects of the microstructural or
mechanical variables on fatigue thresholds. In addition to the various methods by
which AK0 is measured, the operational definition of AK0, corresponding to the
detectable limit of crack growth, itself is somewhat arbitrary. Fatigue tests
conducted at conventional test frequencies (typically 0.1 to 100 Hz) take AK0 to be
the value of AK corresponding to a maximum growth rate of 10~7 - 10~8 mm/cycle.
However, with the use of ultrasound methods capable of imposing frequencies as
high as 20000 Hz, it is feasible to measure average crack growth rates as low as 10-11
mm/cycle in about the same time period as it takes to measure AK0 using
conventional frequencies (e.g., Mitsche, Stanzl & Burkert, 1973; Weiss et al., 1979). The
threshold values measured with the ultrasound method are generally lower than
those obtained at conventional test frequencies.
10.5 Intermediate region of crack growth
The intermediate or Paris region of fatigue crack growth in engineering
alloys has been the subject of most extensive research. The microscopic mechanisms
of fatigue crack growth (involving duplex slip and crack blunting and re-sharpening)
in the intermediate regime are also generally well represented by the discussions and
conceptual models described in detail in Section 10.2.
It is clear from the discussions up to this point that the rates of fatigue crack
growth are influenced by several concurrent and mutually competitive mechanistic
processes involving the microstructure, mechanical load variables and environment,
as well as by crack closure effects. Therefore, it is not surprising to note that no
single theory can successfully predict crack propagation rates for a wide variety of
test conditions, even for a single alloy system, from fundamental principles. Despite
this limitation, numerous attempts have been made in the past several decades to
predict the rate of fatigue crack growth in the Paris regime from physical principles.
These quantitative models of fatigue crack growth provide useful information for
both scientific and practical purposes: (i) In many engineering applications, it is
desirable to predict residual lives of components from a knowledge of stresses and
crack lengths using models of crack growth, (ii) Theoretical analyses based on
10.5 Intermediate region of crack growth
355
realistic mechanisms provide valuable parametric evaluations of the dependence of
crack growth rates on different variables, which may not otherwise be done
experimentally in a controlled manner, (iii) Crack growth models are sometimes useful for
relative ranking of different microstructures in terms of their resistance to fatigue
crack growth.
The multitude of theories proposed to predict constant amplitude fatigue crack
growth in terms of AK can be broadly classified into the following groups.
(a) Geometrical models based on the crack tip displacement which, in the Paris
regime of crack growth, is related to the crack length increment per cycle (Laird,
1967; Lardner, 1967; McClintock (1967) cited in Pelloux, 1969). The physical basis
for these models evolves from the experimental correlations of striation spacings
with crack growth rates and from the geometrical relationship between the striation
spacing and the crack tip blunting process. Since the cyclic crack tip opening
displacement A<5t is related to the stress intensity factor by Eq. 9.86,
where a'y is the cyclic yield strength, E' is Young's modulus in plane strain, and /J is a
function of yield strain, cyclic strain hardening exponent, the efficiency of blunting
and re-sharpening in fatigue, and the numerical constant relating AS, and AK in Eq.
9.86. Note that this equation predicts a Paris exponent m of 2, which is reasonable
for many alloys. The expectation that da/dN is inversely proportional to E is
generally true for metallic materials. However, the prediction that (da/dN) oc (l/<r'y) is
rarely observed. Furthermore, the quantitative prediction of da/dN based on Eq.
10.19 is good only in some small segments of the Paris regime.
(b) Damage accumulation models which invoke various criteria for fatigue fracture
based on the critical value of accumulated strains or plastic work at the crack tip.
The first such model was apparently due to McClintock (1963) who employed a
Coffin-Manson type damage law. In this model, fatigue crack growth occurs
when the following function of the local average plastic strain amplitude yf and
the true plastic strain for monotonic fracture /]?, integrated over the number of
fatigue cycles N, reaches unity:
4(^1 d»=l, (10.20)
o
<IH
where k is an exponent taken to be 1 or 2. Using the near-tip strain fields for shear
cracks, McClintock also characterized the growth rates of fatigue cracks in terms of
the radius of the plastic zone. His damage theory predicts crack growth in
proportion to the square of the plastic zone size, or to the fourth power of AK.
Weertman (1966) and Rice (1967) independently proposed essentially identical
damage accumulation models which also predict that the Paris exponent m in Eq.
10.3 is 4. Both analyses are based on the plasticity model of a discrete surface of
tensile yielding or slip ahead of the crack. Rice considered the deformation history of
356
Fatigue crack growth in ductile solids
a particular point in an elastic-perfectly plastic solid from when that point was first
engulfed by the plastic zone to when the crack tip reached that point. Crack growth
was assumed to occur when the total absorbed hysteresis energy equaled a postulated
critical value U* per unit area of newly created fracture surface. If Auy(x, 0) is the
plastic displacement of tensile yielding per load reversal when the crack tip is at
x = 0 and if crack growth rate is assumed to be constant for fracture over a distance
of a cyclic plastic zone rc, the increment of crack advance is given by
^ = ^£AMy(*,0)dx, (10.21)
where ay is the flow strength. Obtaining Auy(x, 0) by doubling the yield strength and
strain in the monotonic loading situation (see the discussion in Section 9.6), Eq.
10.21 becomes, for small-scale yielding,
da _ 571(1 -v%ay(AK\4
dN~ 96U* \ay) ■ U '
ey is the yield strain and v is the Poisson's ratio. For cyclically hardening or softening
materials, ay and ey should be replaced by the corresponding values for cyclic
loading.
Using the Bilby, Cottrell & Swinden (1963) model of infinitesimal dislocations
distributed on a crack plane to calculate displacements in the crack tip yield zone,
Weertman (1966) developed a damage accumulation theory similar to that of Rice.
His analysis, as well as its subsequent extensions to work-hardening materials (e.g.,
Weertman, 1973; McCartney, 1976), revealed that
^oc^, (10.23)
dN Ga2yV* y '
where G is the shear modulus. It is worth noting here that a feature common to all of
the damage accumulation models is that they predict a Paris exponent of 4, in
agreement with experimental observations for most metals.
Attempts have also been made to experimentally determine the magnitude of U*
during fatigue crack growth. Ikeda, Izumi & Fine (1977) measured the local stress-
strain curves in the plastic zone around a propagating fatigue crack in a 7075
aluminum alloy using miniature strain gages. The areas in the stress-strain hysteresis
loops were integrated over the plastic zone for a unit area of crack advance to give an
approximate value of U*. Davidson & Lankford (1977), on the other hand,
calculated the energy dissipated by the advancing fatigue crack in Fe-0.05C steel using
microstructural considerations. Their method utilized measurements of the
distribution of subcell sizes in the vicinity of the crack plane using the channeling contrast
technique in the scanning electron microscope. While Ikeda et al. estimated that
[/**6x 105 J/m2 for the 7075-T76 aluminum, Davidson & Lankford reported
that U* values were 17.3 x 10⁵ and 5.7 x 10⁵ J/m2 for the Fe-0.05C steel in dry
nitrogen and wet air, respectively. The values of U* needed to match the predictions
10.6 High growth rate regime
357
of the damage accumulation models with observed crack growth rates differed
considerably from experimental measurements.
A number of damage accumulation models, which employ low cycle fatigue data
to quantify damage at the crack tip, have also been developed (e.g., Majumdar &
Morrow, 1974; Antolovich, Saxena & Chanani, 1975; Chakrabortty, 1979).
Charkrabortty, for example, envisions fatigue crack growth as a consequence of
the exhaustion of ductility due to the cyclic plastic strain in the reverse yield zone
ahead of the crack tip. Exhaustion of ductility is described by the Coffin-Manson
low cycle fatigue rule, Eq. 8.1. The main criticism of this approach is that the
microscopic damage phenomena and the gradients in the field quantities ahead of
a fatigue crack tip are not truly represented by low-cycle fatigue data obtained on
smooth test specimens.
10.6 High growth rate regime
At very high AK values, the fatigue crack growth rates are significantly
higher than those observed in the Paris regime. The sensitivity of crack growth to
microstructure, load ratio and stress state (i.e. plane stress and plane strain loading)
is also very pronounced. However, crack propagation rates are too rapid to be
affected strongly by the test environment.
Figure 10.13 shows the variation of crack propagation rates as a function of AK
and load ratio, R. The enhanced influence of load ratio in regime C is a consequence
of the critical condition that the maximum stress intensity factor value for the fatigue
cycle, Kmax, approaches the fracture toughness of the material, Kc (or Kic, in plane
strain):
on
o
low R
logA/s:
Fig. 10.13. A schematic representation of the effect of load ratio, R, on fatigue crack growth
behavior.
358
Fatigue crack growth in ductile solids
K^ = (T^RJ^Kc- (10'24)
Since the AK values at which Kmax begins to approach Kc are lower for high R ratios,
the catastrophic fatigue failure occurs at lower AK values with an increase in load
ratio.
As the fracture toughness is strongly influenced by the stress state, fatigue crack
growth in regime C is also susceptible to the influence of constraint along the crack-
front. Plane stress conditions and the possibility of a macroscopic shear mode of
failure (for low constraint along the thickness direction of the specimen) promote
apparently higher fracture toughness and high values of critical AK for catastrophic
failure. It should be noted that at high values of AK in ductile solids, the plastic zone
dimensions become large in typical laboratory test specimens; consequently, linear
elastic fracture mechanics characterization of fatigue crack growth may become
invalid as Kmax -*■ Klc. At high AK levels approaching fast fatigue fracture, static
fracture modes, such as cleavage, intergranular separation and fibrous failure, occur
in addition to striation growth (Richards & Lindley, 1972; Ritchie & Knott, 1973).
These additional static modes cause a marked sensitivity of propagation rates to
microstructure.
Many semi-empirical and empirical models for fatigue crack growth have been
proposed in the literature to account for the load ratio dependence of da/dN and the
deviation of crack growth behavior in the near-threshold and final failure regimes
from that described by the Paris law. Among these models, the most notable and
widely used (for industrial design purposes) are the empirical approaches of Forman,
Kearney & Engle (1967) and Walker (1970). These models are described,
respectively, by the following two equations:
da „ f AKm* 1 „ft„^
and
^ = Cbt7^™J. 00-26)
f AKm» 1
'to-*)*)'
where Ca, Cb, wa, m^ and q are Paris-type material constants. These models do not
account for any micro structural or environmental effects and should be further
modified empirically when marked levels of crack closure develop.
10.7 Case study: Fatigue failure of aircraft structures
Fracture by the nucleation and growth of fatigue cracks is a topic of utmost
concern in the design of airframe structures. Major structural components are subjected
to repeated loads during the take-off and landing of an aircraft. For example, the
fuselage is subjected to pressurization and depressurization during each flight. These
variable loads may cause nucleation and growth of fatigue cracks which, if undetected,
70.7 Case study: Fatigue failure of aircraft structures
359
can lead to catastrophic failure. An example of such an event is an accident involving
an Aloha Airlines Boeing 737 jet in which much of the upper half of a fuselage section
was 'blown off during a flight. The cause was fracture resulting from the undetected
growth of multiple fatigue cracks (see New York Times, May 1, 1988, p. 1), which were
initiated by the corrosion-induced delamination of the adhesive between the aluminum
skin panels. In this section, we consider the case history of the crash of a Japan Airlines
Boeing 747 in 1985 due to the fatigue failure of the rear pressure bulkhead.
On August 12, 1985, a Boeing 747SR (short range) owned by Japan Airlines, crashed
into the mountains of Ueno village in Gumma Prefecture during a flight from Tokyo to
Osaka. Of the 524 occupants of the aircraft, 520 persons (505 passengers and fifteen crew
members) were killed; the four surviving passengers were seriously injured. This plane
crash, resulting from the growth of fatigue cracks, is the worst air accident in the history
of aviation involving a single aircraft. Fracture originated in the rear pressure bulkhead
(Fig. 10.14) when the airplane reached an altitude of 7200 m (24000 feet), about twelve
minutes after take-off and, consequently, the vertical fin was blown off.
The rear pressure bulkhead has the shape of a hemispherical dome with an edge-to-
edge diameter of 4.56 m, a radius of curvature of 2.56 m, and a height of 1.39 m. The
main structure of this rear pressure bulkhead consists of eighteen webs which form the
shape of the dome, four straps which form concentric circles and thirty-six edge-to-edge
stiffeners which form radial lines. Furthermore, a short-length stiffener is placed at each
middle point of the above arrangement; all the above parts are riveted. The upper webs,
lower webs and straps are made of 2024-T42 clad aluminum alloy (of 0.8 mm, 0.9 mm
Fig. 10.14. Details of the geometry of the rear pressure bulkhead of the crashed Boeing 747
SR aircraft. (After Kobayashi, 1987.)
360
Fatigue crack growth in ductile solids
and 1.0 mm thick sections, respectively) and the edge-to-edge and short-length stiffeners
are made of 2024-T42 aluminum alloy (of 2.4 mm and 1.0 mm thickness, respectively).
The rivets are made of a 2017-T3 aluminum alloy.
This aircraft had an earlier accident in June, 1978, in which the rear pressure bulkhead
was damaged. The aircraft was repaired by replacing one-half of the bulkhead structure,
as shown in Figs. 10.14(6) and (c). Also included in this figure are the areas containing
defective joints which spanned a distance of 91.4 cm. To compensate for local short edge
margins in areas 2 and 3 (shown in Fig. 10.15), an additional splice plate, shown by the
cross-hatched region in Fig. 10.14(c), was sandwiched between the old and new structural
parts of the bulkhead. An error during final installation resulted in full load transfer
across one row of rivets.
Figure 10.15 is a view of the left side of the rear bulkhead. The row of rivets along
which tensile fatigue fracture occurred (denoted as row L18) is also indicated. The shaded
areas marked 2 and 3 are regions adjacent to which only one row of rivets sustained all
the loads produced by the fluctuations in the cabin pressure. The changes in cabin
pressure due to each flight resulted in fatigue crack nucleation and growth from the rivet
holes. The fatigue crack had propagated through a number of rivet holes during 12319
flights (16 196 flight hours, with approximately six flights per day) since the 1978 repair.
The dominant fracture occurred through the line connecting the rivet holes on the first
row, starting at the lower edge of the upper web (see Figs. 10.14 and 10.15). Failure
analysis indicated that fracture of the rear bulkhead originated from this crack as the
cabin pressure increased during the ascent of the aircraft on its final flight. The cabin
pressure vented, following failure of the rear bulkhead, into the vertical fin which was
unable to sustain the additional loads. Since all the hydraulic systems were concentrated
Fig. 10.15. Details of the left side of the rear pressure bulkhead. (After Kobayashi, 1987, and
Kobayashi, Arai & Nakamura, 1987.)
70.7 Case study: Fatigue failure of aircraft structures
361
in the base of the fin, hydraulic power was lost and the flight crew lost normal control.
The airplane crashed into the mountains about thirty minutes later.
Post-crash analyses of the fracture zones revealed subcritical crack growth by fatigue.
Figure 10.16 is a histogram showing the percentage of area that suffered fatigue damage
between adjacent rivet holes versus the rivet hole (designation) number along the LI8
row. Note that, in the region between rivets 35 and 55 of this row, most of the cross
section suffered considerable fatigue damage. Evidence of subcritical crack growth by
fatigue was also obtained with the aid of scanning electron fractography of the failed
surfaces of the rear bulkhead. Figure 10.17(a) is a microscopic view of fatigue striations
observed at a distance of 0.28 mm from rivet hole 34. The average striation spacing is
0.23 urn; this value, for the 2024 aluminum alloy, corresponds to a stress intensity factor
range, AK s» 10 — 15 MPaVm (assuming that the striation spacing correlates with the
crack growth increment per fatigue cycle). Figure 10.17(6) shows the fracture surface
features of the same fatigue crack, taken at a distance of 3.05 mm from the same rivet
hole. Note the significant increase in striation spacing from that seen at the shorter crack
length. This observation implies a significant increase in fatigue crack growth rate with
increasing numbers of flights. Figure 10.17(6) represents the fatigue crack growth regime
just prior to the critical condition.
Laboratory simulations of fatigue crack growth are often conducted to gage the crack
growth resistance of alloys used in fatigue-critical structures of commercial aircraft. Such
studies are prompted by the identification of cracks nucleated at rivets, known as multi-
site damage or MSD (Goranson and Miller, 1989). In order to analyze the rate of growth
of a fatigue crack emanating from a rivet hole, it is necessary to estimate the stress
intensity factor for the plate containing the rivet holes. For the particular case of a fatigue
100 r
2/3 30/31 56/57 82/83 08/109 132/133
outer rivet hole number center
Fig. 10.16. A plot of the fractional area between rivet holes which had undergone failure by
fatigue versus the designation number of the rivet holes along row LI 8. (After Kobayashi,
1987.)
362
Fatigue crack growth in ductile solids
(°) 5 nm
crack emanating from both sides of a centrally located rivet hole, the crack tip stress
intensity factor, K\, can be determined using standard procedures (see, for example,
Broek. 1986). so that
1 aW
Kx=-o^Ta + —=, (10.27)
2 L^Jna
where a is the nominal tensile stress on the plate, la is the total length of the crack (which
is the sum of the radius of the rivet hole and the length of the fatigue crack), and W is the
width of the plate. (Note that this equation is valid only for a single rivet hole in an
infinite plate and that it is a considerable oversimplification for the aircraft structures.)
For the case of fatigue cracks emanating from the rivet holes on the fuselage skin, the
first term on the right hand side of Eq. 10.27 would indicate an increase in stress intensity
factor range with an increase in crack length. However, the second term causes a
reduction in stress intensity with an increase in crack length. These two factors result in a
70.7 Case study: Fatigue failure of aircraft structures
363
(*) 5 |im
I 1
Fig. 10.17. Scanning electron fractographs showing fatigue striation markings near rivet hole
34 along the L18 row. (a) Fatigue fracture surface at about 0.28 mm from the rivet hole, (b)
Fatigue fracture surface at about 3.05 mm from the rivet hole. (From 'Final Report of the
JAL Boeing Crash', The Japan Ministry of Transportation, Tokyo, 1987. Photos courtesy of
H. Kobayashi, Tokyo Institute of Technology.)
nearly constant value of stress intensity factor range (A A" « 15 MPav'nT and R «s 0) over
several millimeters of fatigue crack growth from the rivet holes prior to catastrophic
failure. For the 2024 aluminum alloy, this corresponds to an average crack growth rate of
0.1 — 0.2um/cycle (Paris regime of crack growth). Striation spacing measurements made
on the fatigue fracture surfaces, such as those seen in Fig. 10.17, typically reveal crack
growth increments of this magnitude per fatigue cycle.
364
Fatigue crack growth in ductile solids
10.8 Case study: Fatigue failure of total hip components
Total hip replacement is a commonly accepted treatment for diseased or damaged
hip joints in people. One of the complications resulting from the hip replacement
procedure is the possibility of fatigue failure in the metallic femoral component. This fracture
process is known to depend on such factors as the material and design of the component,
the surgical technique, and the weight and activity level of the patient. A case history of
such fracture phenomena in hip replacement components is presented in this section to
illustrate the reality and complexity of fatigue in implant devices. This example is based
on the work of Rimnac et al. (1986).
A metallic total hip component, known as the Trapezoidal-28™, was developed in the
early 1970s in an attempt to improve mobility, stability and stem strength over previous
hip designs. The name T-28 was given for this component because of the trapezoidal cross
section of its stem and neck, and the 28 mm diameter of its femoral head. The T-28
femoral component was made of surgical grade 316L stainless steel in the wrought and
lightly cold-worked condition. The trapezoidal shape of the stem was preferred over prior
considerations of a diamond shape because it maximized the pressure of the acrylic grout
in the femur when the prosthesis was inserted. Between 1973 and 1979, 805 patients
received this implant at The Hospital for Special Surgery in New York City. Out of this
population, at least twenty-one patients are known to have received medical treatment
for the removal of a fractured femoral component. This failure rate was four times higher
than that reported for other femoral component designs. In an effort to investigate the
origin of fracture, a failure analysis was conducted on all twenty-one fractured femoral
parts.
Eighteen of the twenty-one components failed by fracture of the stem. This fracture
generally occurred within the proximal third of the stem portion, as shown in Fig.
10.18(a). In the remaining three cases, fracture occurred in the neck region. Multiple
cracks were observed in the majority of the components, where crack nucleation was
sighted on the medial side of the stem, Fig. 10.18(Z>). A closer examination of the
fracture surface by optical microscopy revealed that the dominant crack initiation site
was the posterior corner on the medial side of the stem, region A in Fig. 10.19. Near
the central portion of the trapezoidal stem cross section, a step was usually observed on
the fracture surface. This step was identified as the boundary between the medial crack
and a crack which originated on the lateral side of the stem. The lateral crack exhibited
clam shell markings (region B in Fig. 10.19), which are typically found on fatigue
fracture surfaces.
On the basis of a number of observations, the origin of the femoral component failure
was traced to fatigue loading. This conclusion was also supported by related results which
showed that 316L stainless steel is resistant to stress corrosion cracking in the
physiological environment. Microscopic observations in the transmission electron microscope
(TEM), conducted by means of two-stage replication of the fracture surfaces, revealed
isolated locations with fatigue striation markings that were associated with the medial
cracks. On the lateral side, however, more uniform and greater numbers of striations were
observed, Fig. 10.20; the striation spacing increased with increasing distance from the
crack initiation site.
10.8 Case study: Fatigue failure of total hip components
365
proximal distal
head
neck (a) |2cm|
lateral
\
V
medial , 1 cm
(ft) ' '
Fig. 10.18. (a) Photograph of the failure of the T-28 femoral component showing the
proximal and distal sections and the femoral head and neck regions, (ft) Micrograph showing
multiple cracks which initiate on the medial side of the stem of the femoral component.
(From Rimnac et al., 1986. Copyright American Society for Testing and Materials.
Reprinted with permission.)
With the information derived from striation spacing measurements, the stress intensity
factor solution for a corner crack, and the fatigue crack growth characteristics of 316L
stainless steel, the stress intensity factor range, AK. and the stress range, Act. to which the
components were subjected on the lateral side were estimated. Table 15.1 shows these
results for the lateral side cracks in four of the failed femoral components. It is seen that
the lateral side cracks were subjected to a tensile cyclic stress of 115 to 244 MPa. Note
that this estimation procedure assumes that the striation spacing measured on the
fracture surface corresponds to the fatigue crack growth rate per cycle which, in turn, is
taken to be characterized by the nominal value of AK.
366
Fatigue crack growth in ductile solids
V V. *
» \ .
Fig. 10.19. Optical fractograph of the failed T-28 stem showing crack growth from the
posteromedial corner, region A. and clam shell markings originating from the anterolateral
corner, region B. (From Rimnac et al., 1986. Copyright American Society for Testing and
Materials. Reprinted with permission.)
Although crack growth from the medial side apparently exhibited a tensile fatigue
mechanism, stress analysis revealed that the combination of axial and bending loads on
the femoral component resulted in cyclic compressive stresses on the medial side
where the cracks first initiated. Rimnac et al. used curved beam theory and the finite-
element method to estimate the magnitude of stresses on the medial side; a typical
sequence of loads was used in the simulation. This sequence consisted of an overload with
a bending moment of HONm and a compressive force of 4.3 kN, which corresponded to
a load on the femoral head equivalent to seven times the body weight for a 91 kg (200 lb)
individual. This caused the development of a compressive stress level of 604 MPa on the
medial side and a tensile stress level of 556 MPa on the lateral side. Noting that the yield
strength of the steel in (both compression and tension) is approximately 550 MPa. plastic
yielding would be expected to occur. From the discussion of cyclic plasticity (Chapters 4
and 9), a residual tensile stress of at least 275 MPa is expected to be created on the medial
side.
The overload was followed by normal cyclic loads which consisted of a bending
moment of 55 Nm and a compressive force of 2.17 kN; these values correspond to a load
on the femoral head which is equivalent to 3.5 times the normal body weight for a 91 kg
individual. (It is well known in the biomechanics community that even the seemingly mild
10.8 Case study: Fatigue failure of total hip components
367
R
t
f\--" ' |
^
\
A
*
0.75 [im
Fig. 10.20. Fatigue striations observed on the fracture surface of a lateral crack in the femoral
component. The arrow indicates the fatigue crack growth direction. (From Rimnac et at,
1986. Copyright American Society for Testing and Materials. Reprinted with permission.)
activity of standing on one foot can translate into a load equivalent to 1.5 times the body
weight on the implanted hip components.) This constant amplitude load sequence
subjects the medial side to a maximum compressive stress of 207 MPa and the
lateral side to a tensile stress of 289 MPa. The stresses estimated from the striation
spacing measurements (Table 10.2) were in reasonable agreement with this independent
prediction of cyclic stresses on the lateral side.
Fatigue failure of hip components is controlled by many variables and it is very
difficult to identify and quantify a posteriori the various factors which led to the failure.
As a result of these uncertainties, the mechanisms responsible for such failures are the
subject of much controversy. However, on the basis of microscopic observations and
stress analyses, the following sequence of events was proposed by Rimnac el al. for the
fracture of the femoral stem. Residual tensile stresses induced by the large compressive
overload on the medial side of the stem result in the growth of a fatigue crack prior to
crack nucleation on the lateral side. With crack growth, there occurs a progressive
reduction in the extent of residual tensile stresses (and an increase in the extent of crack
closure) ahead of a fatigue crack subjected to cyclic compressive loads (see Chapter 14).
Consequently, the medial cracks decelerate or arrest after a certain amount of crack
advance. The nucleation of the medial crack enhances the stress levels to which the lateral
side of the stem is exposed. Therefore, a crack originates on the lateral side and eventually
links up with the medial crack. The coalescence of the two crackfronts, originated at
opposite locations, produces a step on the fracture surface. This line of reasoning is
368
Fatigue crack growth in ductile solids
Table 10.2. Estimation of the stress intensity factor range, AK, and cyclic stress
range, Aa,from the measurements of striation spacing, s, on four of the fractured
femoral components.
Crack length,
a (mm)
3.0
5.0
9.0
7.0
9.0
3.0
7.5
1.5
11.0
s (mm)
2.15 x 10~4
3.00 x 10~4
4.15 x 10~4
7.73 x 10~5
1.80 x 10~4
1.35 x 10~4
2.75 x 10~4
6.70 x 10~5
2.60 x 10~4
AK
(MPaVm)
18.1
20.9
25.0
13.7
17.0
15.6
20.0
13.4
19.6
Act
(MPa)
233
208
186
115
127
201
163
244
132
Source: Rimnac et al., 1986.
consistent with the experimental observations discussed earlier. Rimnac et al. concluded
that the failure of the femoral stem was a consequence of the combined effects of the
trapezoidal cross sectional design and of the material properties of the stainless steel used
to make the component.
Surgical implants using the trapezoidal design were discontinued in 1978. Newer
designs involve a rectangular cross section and a micro-grained (forged) Co alloy, which
replaced the surgical grade 316L stainless steel.
In closing this section, we note that there is a continual search for nonmetallic
materials for use in hip arthoplasty in view of the following drawbacks of a metallic hip
prosthesis: (1) The metallic ions released as a result of wear of the prosthesis can lead
to undesirable side effects, such as hypersensitivity, in patients with metallic hip
components. (2) The stiffness of the metallic implant is much higher than that of the cortical
bone. For example, the surgical grade 316L stainless steel and Ti-6A1-4V alloy have
Young's modulus values which are approximately six and four times higher, respectively,
than Young's modulus of the cortical bone which is the load-carrying member in the
human femur. This elastic mismatch preferentially shields the stress in such a way that
bone loosening and prosthesis fracture result. In view of these problems, composite
materials such as carbon-fiber-reinforced poly(ether ether ketone), C/PEEK, are also
considered candidates as implant materials.
10.9 Combined mode I-mode II fatigue crack growth
The discussion up to this point dealt with the growth of nominally mode I
fatigue cracks in ductile solids. We now direct attention at mixed-mode crack
growth.
10.9 Combined mode I-mode II fatigue crack growth 369
10.9.1 Mixed-mode fatigue fracture envelopes
Gao et al. (1985) studied the growth of fatigue cracks in several ferrous and
nonferrous alloys where biaxial loading was introduced in two different specimen
geometries: an edge-notched specimen subjected to asymmetric four-point bend
cyclic loading, and a plate with an inclined center crack subjected to biaxial tension.
Figure 10.21 is the fatigue fracture envelope for combined mode I-mode II crack
growth, where the nominal value of the in-plane shear stress intensity factor range
AKU is plotted against the nominal value of the mode I stress intensity factor range
AKt; both AKU and AKt are normalized by the threshold stress intensity factor
range in mode I, AKW. The solid curve in this figure indicates the lower bound
threshold condition below which no crack growth is detected at a load ratio,
R = 0.2, and cyclic frequency, vc = 15-80 Hz. The dashed line is the fracture
locus outside of which predominantly mode I crack growth occurred on a plane
normal to the maximum value of the near-tip tensile stress, cr00. Between these two
curves, the characteristics of crack growth were strongly influenced by the frictional
rubbing of the crack faces. The location of the upper bound curve (corresponding to
1.6
1.2
<l
:*T 0.8
<l
0.4
0.0
0.0 0.2 0.4 0.6 0.8 1.0
AKJAKW
Fig. 10.21. Combined mode I-mode II fatigue fracture envelope for AISI 316 stainless steel
showing the locus for the onset of fatigue crack growth (solid curve). The dashed line indicates
the mixed-mode loading conditions at which fatigue fracture occurred on a plane normal to the
maximum hoop stress, am. (After Gao et ah, 1985.)
\
\
L \
\
370
Fatigue crack growth in ductile solids
the onset of mode I crack growth) was dependent on crack closure due to the
interlocking of fracture surface asperities and on the formation of oxide debris.
Such crack closure also promoted crack arrest in the region bounded by the two
curves. When the amount of crack closure was reduced by increasing the load ratio
of the stress cycle in tension, the upper bound curve began to approach the lower
bound threshold curve. When slit cracks (where closure in the wake of the crack tip is
not a consideration), instead of sharp fatigue cracks, were subjected to mixed-mode
loading, the upper bound curve for the onset of mode I crack growth coincided with
the threshold (lower bound) curve. These results clearly point to the significant role
of frictional sliding in influencing mixed-mode fatigue crack growth.
Gao et al. also found that, for certain combinations of mixed-mode loading, the
rate of crack growth was severely affected by the ^-stress. It may be recalled from
Section 9.3 that the ^-stress is the nonsingular stress acting parallel to the crack
plane. Crack growth rates increased with increasing values of ^-stress at high AKy-
AKU levels, although the threshold fracture envelope was unaffected by the ^-stress.
10.9.2 Path of the mixed-mode crack
If frictional effects associated with contact between the crack faces are not
significant, the path of the fatigue crack under combined mode I-mode II loading or
in pure mode II loading can be predicted on the basis of several criteria. In order to
quantify the path of the fatigue crack for different combinations of mode I and mode
II load parameters, it is instructive to consider here an approach commonly adopted
in conjunction with monotonic loading. In this method, the near-tip mode mixity is
denned by a single phase angle,
^M = tan-1{|ij. (10.28)
<Pm varies from zero for pure mode I to n/2 for pure mode II.
The Griffith theory or the maximum energy release rate theory postulates that
combined mode I-mode II fracture takes place in an elastic solid along a plane
(oriented at an angle 0 to the plane of the pre-crack) which maximizes the energy
release rate. Implicit in this approach (see, for example, He & Hutchinson, 1989) is
the notion that the resistance of the material to fracture, expressed in terms of the
Griffith energy release rate Q is independent of the mode-mixity <pM. To a good
approximation, the fracture locus for mode I-mode II growth on the basis of the
maximum strain energy release rate criterion can be expressed by the equation
(Palaniswamy & Knauss, 1978):
(£H (£)'=■•
where Klc is the mode I fracture initiation toughness. For pure mode II fracture, this
theory predicts that KUc = V2/3 Kic (where KUc is the mode II fracture initiation
toughness) and that 0 = 77.4°.
70.9 Combined mode I-mode II fatigue crack growth
371
According to the maximum (tensile) hoop stress theory, the crack advances in a
direction (oriented at an angle 0 to the pre-crack) in which the hoop stress at the
crack tip is maximum (Erdogan & Sih, 1963). For brittle fracture, the crack advances
when the hoop stress over a certain distance ahead of the crack tip reaches a critical
value. The hoop stress under combined mode I-mode II loading is
=/I(0) + -gL/II(0),
(10.30)
V27rr *v ' \f2nr"
where fi(6) and fn(0) are the universal dimensionless angular functions defined in
Eqs. 9.44 and 9.47. For a given combination of mode I and mode II, the direction of
the maximum hoop stress is determined from the condition (dcr^/dO) = 0, from
which 0 is determined. Substituting this value of 6 in Eq. 10.30, one finds that
g-fM + ^Mff)-
K,
K,,
1.
(10.31)
Mc AIc
For pure mode II fracture, the maximum hoop stress theory predicts that
Knc = O.S66Klc and that 0 = 70.5°.
The values of 0 derived from the maximum strain energy release rate theory and
from the maximum hoop stress theory for different mode mixities <pM are plotted in
Fig. 10.22. Also shown in this figure are the trends predicted by the criterion which
states that the crack advances in a direction along which Ku = 0 (He & Hutchinson,
1989). Note that little difference is found among the predictions of the different
theories for brittle fracture. In addition to the above theories, it has been proposed
Fig. 10.22. Predictions of initial crack growth angle 0 in combined mode I-mode II loading as a
function of the crack-tip mixity expressed by the phase angle <pM.
372
Fatigue crack growth in ductile solids
by Sih (1974) that the mixed-mode crack advances in a direction along which the
strain energy density S (which is a function of K\ and Ku) is the lowest. For pure
mode II fracture, the strain energy density theory predicts that KUc = 1.054KIc and
that 0 = 79.2° (for Poisson's ratio, v = 0.22). Experimental studies (Tanaka, 1974;
Kitagawa et al., 1985) indicate that this approach, among the various criteria
discussed here, generally leads to nonconservative estimates of critical conditions for
mixed-mode fatigue. A review of results for mixed-mode fracture and fatigue is
presented in Suresh et al. (1990) and Qian & Fatemi (1996).
When the load ratio R for the fatigue cycle is zero, the mixed-mode failure criteria
can be applied by replacing Kt and Ku by Klmax and KUmax, respectively. For R > 0,
Tanaka (1974) and Kitagawa et al. (1985) have employed nominal values of AK^ and
AKU in place of K\ and Ku, respectively, in an attempt to predict the mixed-mode
fatigue thresholds (such as the lower bound threshold curve in Fig. 10.21). This
choice was based on the earlier results of Frost & Dugdale (1957) who reported
that the condition for the nonpropagation of fatigue cracks ahead of stress
concentrations was insensitive to the mean level of the cyclic tensile loads. For combined
mode I-mode II fatigue of aluminum at R = 0.65 (where crack closure is minimal),
Tanaka and Kitagawa et al. compared their experimental results with the predictions
of the various criteria listed above, and found that the maximum strain energy
release rate theory and the maximum hoop stress theory provided conservative
estimates of mixed-mode fatigue thresholds. It should, however, be noted that
because of crack face contact in mixed modes I and II, the nominal use of any of
the foregoing failure criteria is not likely to provide perfect agreement with
experimental observations (Hourlier et al., 1985; Pook, 1985).
10.9.3 Some general observations
One of the major complications in the study of mixed-mode fatigue crack
growth is the frictional contact of the mating crack faces. The following trends are
observed in fatigue under combined mode I-mode II loading.
(1) If a fatigue crack is subjected to pure mode II displacements, the crack
flanks are always in contact. As a result, any coplanar crack growth in
mode II invariably terminates in crack arrest (as in the region bounded
by the two curves shown in Fig. 10.21). The fracture surfaces of specimens
subjected to mode II fatigue show evidence of wear debris formation.
Because of the frictional contact in pure mode II, fracture can also proceed
by the development of a mode I branch crack. Closure effects can be
minimized or even completely eliminated only if a tensile load is superimposed.
(2) Since mixed-mode fracture (with a stronger mode II component than mode
I component) is severely affected by crack flank rubbing, the crack growth
rates are a function of the crack length itself. Specimens with different pre-
crack lengths exhibit different fatigue crack growth characteristics. If speci-
70.70 Combined mode I-mode HI fatigue crack growth
373
mens containing slits, rather than fatigue pre-cracks, are subjected to mixed-
mode fatigue, lower mode II thresholds are often observed (despite the fact
that the tip of the slit crack is blunter than that of the fatigue pre-crack).
(3) In a study of mode II fatigue crack growth in structural steel, Smith & Smith
(1988) identified three sources of crack growth attenuation: compressive
residual stresses ahead of the fatigue pre-crack, interlocking of fracture
surface asperities, and gross plastic deformation of the interlocking
asperities. They estimated the effective stress intensity range in mode II to be less
than one-half of the nominal value.
10.10 Combined mode I-mode III fatigue crack growth
Fatigue failure as a consequence of cyclic torsional loads is commonly
encountered in many components used in automotive applications and in
turbogenerator shafts in electric power generation and transmission systems. Failure under
cyclic torsion may occur in anti-plane shear (mode III) along the transverse shear
plane or along the longitudinal shear plane, or in mode I along ±45° to the axis of
the shaft along planes of maximum principal tensile stresses (Fig. 10.23). A
thumbnail crack in either of the two (longitudinal or transverse) shear planes will be
subjected to mode II displacements where the thumbnail intersects the surface;
however, mode III fracture will be induced as the thumbnail crack penetrates the interior
of the rod (Hurd & Irving, 1982). With rare exceptions (e.g., Pook, 1985), laboratory
simulations of mode III fatigue crack involve torsional loading of a circular cylinder
with a pre-exising flaw (i.e. a circumferential notch plus a concentric fatigue pre-
crack) introduced normal to the axis of the cylinder. At low stress values, typically
less than 70% of yield, locally mode I growth dominates over mode III failure. As a
result, torsional failure takes place either in a macroscopic tensile mode with a helical
fracture surface, in a microscopic tensile mode with a 45° branch crack, or by a
combination of these two modes.
OP
Fig. 10.23. The state of stress in a cylindrical rod subjected to cyclic torsion.
374
Fatigue crack growth in ductile solids
It is perhaps instructive to begin the discussion of mode III fatigue crack growth
with a brief reconsideration of some fracture mechanics concepts discussed in
Chapter 9. As shown in Eq. 9.78, the plastic zone at the tip of a mode III crack
has a circular shape with a diameter
„=l(f). (.032,
where ry is the shear yield strength. (Note that the extent of plasticity ahead of the
torsional crack is greater than that ahead of a tensile crack at comparable
magnitudes of K\ and Km. Because of this, it is difficult to maintain small-scale yielding
conditions in torsional fracture specimens, of circular cylindrical rod shape and
typically 15-30 mm in diameter, over the entire range of mode III fatigue crack
growth rates.) The displacement of the crack tip in mode III is given by
(CTD)in**-—, (10.33)
TC fXTy
where n is the shear modulus. The range of (CTD)m in fully reversed torsional
fatigue (R = — 1) is given by
(ACTD),,,**-^-, (10.34)
analogous to the definition of the cyclic crack tip opening displacement,
(ACTD)! = ASt, in mode I, Eq. 9.86.
10.10.1 Crack growth characteristics
Studies of mode III fatigue crack growth have identified the following basic
characteristics in ductile solids (Hurd & Irving, 1982; Nayeb-Hashemi, McClintock
& Ritchie, 1983a,b; Tschegg, 1983a,b,c; Gross, 1985; Pook, 1985).
(a) At low amplitudes of cyclic torsion, the fatigue cracks propagate locally in a
tensile opening mode. This leads to the formation of the so-called factory-roof
appearance on the fracture surface, as shown in Fig. 10.24(a). At high amplitudes
of cyclic torsion, pure torsional crack growth (in the radial direction) occurs causing
a flat fracture surface morphology to develop, Fig. 10.24(6).
(b) Because of the tortuous crack path and the attendant frictional contact
between the crack faces at low cyclic torsional loads, the characterization of fatigue
crack growth in mode III or in combined mode I-mode III becomes a difficult task.
Obviously, nominal values of AKm do not provide a unique characterization of
mode III fatigue crack growth. Indeed, any nominal 'driving force' for fatigue
crack growth is likely to differ markedly from the effective driving force responsible
for cyclic fracture. Despite this limitation, the nominal value of cyclic crack tip
displacement (ACTD)m is commonly used to characterize torsional fatigue because
of its simple definition. (This choice is also tacitly based on the notion that fracture
occurs when the crack tip displacement attains a critical value; see Chapter 9 and
10.10 Combined mode 1-mode 111 fatigue crack growth
375
\V
,.,. !»
i-^i-J (a) (ft)
\» •
,, t,
0.5 mm
1 - f
(c)
Fig. 10.24. (a) 'Factory-roof fracture (radial mode [II with 45° mode I branch cracks) at
nominal AKln = 12 MPa^/m, and (b) macroscopically flat, coplanar mode III fracture at
AA^n = 45 MPa,/m in AISI 4340 steel tempered at 650 C (tensile flow strength, ay = 956
MPa) subjected to fully-reversed cyclic torsion. (From Tschegg & Stanzl, 1988. Copyright
American Society for Testing and Materials. Reprinted with permission.) (c) A higher
magnification view of the 'factory roof fracture mode. (Courtesy of E.K. Tschegg, Technical
University of Vienna.)
376
Fatigue crack growth in ductile solids
earlier sections of this chapter.) Furthermore, with the cyclic crack tip displacement
as a characterizing parameter, the crack propagation rates in all three modes of
failure (modes I, II and III) can be compared on a common scale. Nayeb-
Hashemi, McClintock & Ritchie (1983a) have used a cyclic plastic strain intensity
parameter, Arm, for characterizing mode III fatigue crack growth. This approach is
essentially the same as the CTD approach in that (ACTD)m «* 2Arm.
(c) A significant outcome of the factory-roof type fracture at low values of
imposed A^Tin is that the fracture surface asperities interlock during cyclic torsion.
Figure 10.25 schematically illustrates possible mechanisms of this 'sliding mode
crack closure' (Tschegg, 1983a,b). As a consequence of frictional contact between
the crack face asperities, the apparent crack growth rates measured at such stress
intensities are substantially lower than the corresponding mode I crack growth rates
at identical magnitudes of nominal AK^. This trend is evident in Fig. 10.26, which
shows the rates of fatigue crack growth da/dN in mode I and mode III plotted as a
function of (ACTD), and (ACTD)m, respectively, for 4340 steel (650 °C temper)
subjected to fully reversed torsional loads. (Here, a small axial load, K\ = 3
MPaVni, was superimposed on cyclic torsion to enable accurate crack length
measurements.)
Fig. 10.25. Schematic illustration of the mechanisms of sliding mode crack closure showing (a)
interlocking of asperities, (b) frictional contact, and (c) formation of fretting debris. (From
Tschegg, 1983a. Copyright Chapman & Hall. Reprinted with permission.)
10.10 Combined mode I-mode III fatigue crack growth
377
Fig. 10.26. Variation of mode I and mode III fatigue crack growth rates with nominal values of
(ACTD), and (ACTD)m, respectively, in 4340 steel. (After Tschegg, 1983a.)
(d) Micromechanical models for torsional fatigue crack growth have been based
on the assumption that crack growth in mode III takes place by the coalescence, in
mode II shear, of voids parallel to, and in the vicinity of, the mode III crack front
(Nayeb-Hashemi, McClintock & Ritchie, 1983a,b). Two methods which are similar
to those discussed earlier in this chapter for mode I fatigue have been employed for
macroscopic fatigue fracture: (i) the crack tip displacement model, in which growth
rates in anti-plane shear are related geometrically to rates of mode II shear
coalescence along the crackfront, on the basis of the assumption that the crack increment is
proportional to the instantaneous ACTD, and (ii) the damage accumulation model,
in which a relationship between mode III crack advance and mode II shear along the
crackfront is developed by invoking the assumption that damage accumulation, of
the Coffin-Manson type, governs the rate of shear coalescence. Controlled
experiments in model microstructures are needed to substantiate the validity of these
models.
(e) At low mode III fatigue crack growth rates, approaching the threshold, the
fracture mode is in fact representative of combined mode I-mode III failure with
typical factory-roof features. Although some investigators (e.g., Pook, 1985) define a
threshold A^m for the onset of torsional fatigue crack growth, others (e.g., Hurd &
Irving, 1982; Tschegg, 1983a) merely associate the occurrence of faceted fracture
with the existence of a fatigue threshold in mode III. This latter approach is
somewhat more appealing than the former one because, near the fatigue threshold in
torsion, pure shear fracture is not observed.
3 78 Fatigue crack growth in ductile solids
10.10.2 Estimation of intrinsic growth resistance
Two experimental methods have been commonly adopted to circumvent the
issue of crack closure in influencing mode III fatigue crack growth and to estimate an
intrinsic crack propagation rate in mode III. In the first approach due to Tschegg
(1983a), the variation of da/dN in mode III as a function of crack length a is
experimentally determined at several different values of nominal 'driving force',
e.g., AKm or (ACTD)m. Each of these curves, representing a fixed level of far-
field cyclic loading, is extrapolated to zero crack length to obtain the crack growth
rate in the absence of any fracture surface interference. Figure 10.27 shows the
results of such a plot for AISI 1018 steel (annealed at 870 °C for 1 h, ay = 260
MPa). The main disadvantage of this method is that it requires several different
measurements of crack growth rates at different crack sizes to infer a single value
of intrinsic crack growth rate at a fixed far-field loading level. However, this
technique does illustrate clearly how the crack growth rates decelerate with increasing
crack face interference in torsional fracture. Tschegg (1983a) showed that the
intrinsic mode III crack growth rates obtained using this procedure (from the extrapolated
values at zero crack length) are somewhat higher than the corresponding mode I
10"3
i(r6
io-7
0.0 0.5 1.0 1.5
a (mm)
Fig. 10.27. Variation of mode III fatigue crack growth rates as a function of crack depth a
(measured from the tip of the circumferential notch in the cylindrical specimen) in AISI 1018
steel. The numbers shown for each curve correspond approximately to fixed values of
(ACTD)ln in millimeters. (After Tschegg, 1983b.)
(ACTD),„ « 0.04 mm
Exercises
379
fatigue crack growth rates at an identical range of CTD. This result implies that the
principal reason for the apparently superior resistance to fatigue crack growth in
mode III, as compared to the mode I growth, is the existence of crack closure. (This
inference, however, is not fully substantiated since the effects of crack path tortuosity
on mode III crack tip fields and the effects of crack closure on mode I growth rates
were not considered.) It is of interest to note here that this extrapolation procedure
to derive an intrinsic fracture resistance has also been employed by Tschegg & Suresh
(1988) to estimate the effect of frictional sliding on mode III fracture toughness in
4340 steel (200 °C temper). It was found that the mode III fracture toughness
increased by as much as a factor of two as the depth of the fatigue pre-crack in
the circumferentially notched cylindrical specimen (19 mm diameter) was varied
from 0.2 to 1.2 mm.
In the second approach aimed at minimizing the complications of fracture surface
interference in torsional fatigue, a static tensile load is superimposed on the cyclic
torsion loads in order to separate the interlocking fracture surface asperities. With
this technique, the application of even a small static tensile load, under certain
conditions, can markedly increase the rate of mode III fatigue crack growth by
reducing the extent of crack closure (Nayeb-Hashemi, McClintock & Ritchie,
1983a; Tschegg, 1983a). However, the amount of tensile load needed to fully
separate the fracture surfaces is a function of the material properties, the amplitude of the
cyclic torsional loads, and the micromechanisms of crack growth. In high strength
materials, a substantial tensile opening load is required to eliminate crack face
contact. The superposition of such large tensile loads, however, induces strong mixed-
mode conditions at the crack tip.
In agreement with the acceleration of cyclic mode III crack growth upon the
superposition of a static mode I load, the works of Hourlier, McLean & Pineau
(1978) and Akhurst, Lindley & Nix (1983) suggest that the superposition of static
Km on cyclic K\ causes the mode I crack to decelerate. This extent of reduction in
growth rates increases with the increasing values of K\\\.
Exercises
10.1 A very large plate in an engineering component, which is in continuous
operation for 10 hours each day, is subjected to a mean tensile stress of
200 MPa during service. Superimposed on this operating stress are
fluctuations arising from vibrations, which have an amplitude of 15 MPa (i.e. total
range of 30 MPa) and a cyclic loading frequency of 50 Hz. Nondestructive
crack detection techniques, which have a resolution of 0.2 mm in crack size,
do not reveal any flaws in the component. If a crack were to exist at the
critical location, the operating stress would be normal to the plane of the
centrally located, through-thickness crack and small-scale yielding condi-
380
Fatigue crack growth in ductile solids
tions would prevail in the plate. The plane strain fracture initiation
toughness of the material from which the plate is made is 100 MPaVni. The
fatigue threshold stress intensity factor range, AK0, of the material is 3
MPaVm for load ratio R = 0, and 1.5 MPaVm for R = 0.85, and can
be assumed to be independent of the cyclic frequency.
(a) Which of the following factors is/are most significant in the safe design
of the component against catastrophic fracture: (i) the plane strain
fracture toughness, K\c, (ii) the threshold stress intensity factor range,
AK0, or (iii) the rate of crack growth in the Paris regime? Why?
(b) Suggest a procedure for the calculation of fatigue life in the plate.
10.2 Consider stage II crack growth by alternating slip in an FCC crystal. Prove
that
(a) The line of intersection of two {111} slip planes in an FCC crystal
subject to tension fatigue along the (100) direction lies along the (011)
direction.
(b) Crack growth occurs on the {100} plane with the crack front parallel to
the (011) direction.
10.3 Compare and contrast the anticipated effects of (a) stacking fault energy, (b)
grain size, and (c) load ratio on the fatigue life predicted on the basis of the
following three approaches to fatigue: (i) stress-life, (ii) strain-life, and (iii)
fracture mechanics.
10.4 Performing a fatigue threshold test using manual load controls in a servo-
hydraulic testing machine can be an extremely time-consuming task.
Calculate the minimum number of days required to determine the threshold
stress intensity factor range, AK0, of a material at a cyclic frequency of 1 Hz,
if AK0 is denned as the threshold corresponding to a growth rate of no more
than 10-11 m/cycle and if the resolution of the crack detection technique is
0.05 mm.
10.5 Fatigue crack growth thresholds can be determined much more quickly
using ultrasonic loading devices than with conventional servohydraulic
test machines. If the fatigue test in the previous problem were to be
conducted under ultrasonic loading at a frequency of 15 000 Hz, estimate the
amount of time required to determine the fatigue threshold. Discuss the
advantages and disadvantages of the ultrasonic test method over those of
the conventional test method.
10.6 A disgruntled employee in an engineering company is intent on destroying a
large steel plate used in a valuable engineering component. One evening,
after the normal working hours, he cuts a very sharp notch in the edge of the
plate. He orients the sharp flaw normal to the direction in which tensile
stresses are applied to the plate, with the hope that the flaw would eventually
result in catastrophic fracture of the plate. As he is committing the crime, a
bystander telephones the plant foreman at the foreman's home. The fore-
Exercises
381
man, who leaves his home two minutes after the notification is received,
travels to the scene of crime on his bicycle at an average speed of 15 km/hr.
Would he have reached the plant in time to shut off the equipment before
the plate fractures catastrophically? Here are some useful data for your
analysis: (i) The plate is cyclically loaded uniformly from 5 to 85 kN at a
frequency of 75 Hz. (ii) The plate is 18 cm wide and 0.5 cm thick, (iii) The
yield strength of the steel is 1250 MPa and the plane strain fracture
toughness is 48 MPaVm. (iv) The flaw introduced by the employee is 1 cm in
length, through the thickness of the plate, (v) The bystander, who notified
the foreman, reported to the police, by phone, that, in his judgement, the
crack in the plate was propagating at a velocity proportional to the crack tip
opening displacement corresponding to the peak load of each cycle, (vi)
Post-failure fractographic examination revealed the presence of fatigue
striations with a mean spacing of 2.5xl0~4mm where the crack was
2.5 mm long, (vii) The distance from the foreman's home to the factory is
5 km. (viii) The time interval between the two phone calls was 10 minutes.
State all your assumptions clearly.
10.7 A piston, 9 cm in diameter, is used to increase the internal pressure in a
cylinder from 0 to 50 MPa. The cylinder, which is made of peak-aged
aluminum alloy (yield strength = 500 MPa, Kic = 35 MPaVnT), has the
following dimensions: length = 20 cm, inner diameter = 9 cm and outer
diameter = 11 cm. The piston-cylinder arrangement suffered a
malfunction which caused the cylinder to burst. Post-failure analyses showed the
presence of a defect in the form of an elliptical flaw 4.4 mm long at the
inner wall, 1.5 mm deep and oriented normal to the hoop stress in the
cylinder. Compute the magnitude of the pressure at which the cylinder
burst.
10.8 Consider a piston-cylinder arrangement, identical to the one in the previous
problem, where the cylinder contains a semi-circular flaw 0.5 mm in radius
instead of an elliptical flaw. If the fatigue crack growth behavior of the
aluminum alloy is characterized by the relationship da/dN =
2 x 10~10(AiT)3, where da/dN is in m/cycle and AK is in MPaVm, how
many pressure cycles could the cylinder withstand before bursting?
10.9 The fuselage of a prototype commercial jet aircraft has a diameter of 2.6 m.
The aircraft is used typically for an average of six short-haul passenger
flights each day. During each flight, the cabin is pressurized to 52 kPa.
The fuselage skin, 0.9 mm in thickness, is made of an aluminum alloy
with Young's modulus, E = 75 GPa, yield strength, ay ss 400 MPa, and
plane strain fracture toughness, K\c « 30 MPaVm. In laboratory tests, the
aluminum alloy exhibited the following fatigue crack growth characteristics.
The threshold stress intensity factor range, AKq «* 3.0 MPaVm for R = 0.
382
Fatigue crack growth in ductile solids
In the Paris regime, da/dN — 10~6 mm/cycle and 10~5 mm/cycle at
AK = 5 and 9 MPaVm, respectively, for R = 0.
(a) When a routine maintenance check was conducted on the aircraft, the
presence of a 0.4-mm long, through-thickness crack in the fuselage skin,
oriented parallel to the longitudinal axis of the fuselage, was left
undetected due to human error. If the aircraft fuselage is designed such that
the cabin pressure could be sustained even with a longitudinal through-
thickness crack of up to 10 cm length, find the safe fatigue lifetime of the
aircraft from the time of the maintenance.
(b) What would be the safe lifetime in part (a) if the crack were to be
oriented along the circumference of the fuselage skin?
CHAPTER 1 1
Fatigue crack growth in brittle solids
The mechanisms of fatigue crack growth in ductile metals and alloys, which
were discussed in the preceding chapter, involve cyclic dislocation motion along one
or two glide systems at the crack tip. The ensuing subcritical crack growth process in
very ductile metals can typically cover a stress intensity factor range which spans a
(threshold) value of 1-7 MPaVni to one that corresponds to final failure of well over
100 MPaVni. Another noteworthy feature of fatigue cracking in ductile alloys is that
there exist some distinct microscopic markings, such as striations, on the fracture
surfaces from which the occurrence of failure unique to cyclic loading can be clearly
identified in many situations.
Subcritical crack growth in brittle solids under cyclic loads, however, involves
much more complex phenomena. In many brittle solids, there are no known
differences between the micromechanisms of static and cyclic crack growth at low
temperatures. Despite this apparent similarity of deformation and failure mechanisms,
the superimposition of a cyclic load on a static mean stress can lead to noticeable
differences in the lifetime and, in some cases, the rate of crack growth may become a
strong function of cyclic frequency. Furthermore, some macroscopic crack growth
phenomena may occur solely as a consequence of the imposition of cyclic loads as,
for example, in the case of crack initiation ahead of stress concentrations under fully
compressive cyclic loads (see Chapter 5).
This chapter deals with the growth of cracks in brittle solids subjected to
fluctuating loads. The focus here is primarily on the mechanistic origins of the
experimentally observed effects of cyclic loading on the growth of cracks in brittle solids.
Consequently, no attempt will be made to review the vast amount of empirical
data on fatigue crack growth reported for ceramics and other brittle solids. A survey
of such observations can be found in Roebben et al. (1996). The reader is also
advised to review the introduction to Chapter 5 before proceeding with the sections
to follow in this chapter.
This chapter begins with a summary of various situations under which a 'cyclic
effect' may occur in brittle solids. This is followed by a discussion of methods to
characterize the rate of crack growth. The evolution of resistance curves (R-curves)
in ceramics and the stability of subcritical crack growth are then addressed.
Mechanisms of fatigue crack growth facilitated by crack-tip and crack-wake
phenomena are considered next. The chapter concludes with a discussion of mechanisms
of fatigue crack growth in brittle solids at elevated temperatures where particular
attention is paid to the effects of intergranular amorphous films. Fatigue crack
383
384
Fatigue crack growth in brittle solids
growth in brittle polymers and polymeric composites is considered in the next
chapter.
11.1 Some general effects of cyclic loading on crack growth
Distinct effects of cyclic loading on the growth of cracks have been
documented in a wide range of ceramics and ceramic composites. A close examination of
these effects reveals the following mechanistic features.
(1) In ceramic materials containing long cracks (whose main dimensions are
significantly larger than the characteristic microstructural size scale such as
the grain size), cyclic loading is generally found to cause a pronounced
increase in crack growth rate compared to static load experiments at
room temperature. This deleterious effect, which is most clearly evident in
ceramics and ceramic composites that exhibit a strong R-curve behavior (i.e.
ceramics with an increasing resistance to quasi-static fracture with crack
advance), primarily stems from the progressive breakdown of the bridging
ligaments in the wake of the crack tip by repeated contact (Grathwohl, 1988;
Evans, 1980; Horibe & Hirahara, 1991; Lathabai, Rodel & Lawn, 1991;
Kishimoto et al., 1994; Ramamurty, Hansson & Suresh, 1994). This
deleterious effect of cyclic loading is more accentuated at lower stress intensity
factor values and lower temperatures.
(2) Residual stresses arising from thermal and elastic anisotropy between the
grains in a polycrystalline ensemble can promote spontaneous distributed
intergranular microcracking during thermal excursions (e.g., during cooling
from the processing temperature). Such microcracking can be exacerbated
by mechanical loads involving axial compression as well as indentation (see
Chapter 5). When a zone of microcracking is so formed ahead of a stress
concentration or around the contact region of an indented surface, the
release of the compressive mechanical load or the indenter engenders a
zone of tensile residual stresses. A macroscopic crack then initiates and
advances perpendicularly to this tensile residual field (Brockenbrough &
Suresh, 1987; Lawn et al., 1994). Repeated compressive cycling of notched
ceramics or cyclic indentation can lead to a growth of the crack in a sub-
critical manner.
(3) At elevated temperatures, intergranular glassy films added during the
processing of the ceramic become viscous. In addition, environmental
interactions, such as oxidation, can lead to the in-situ formation of viscous glassy
films at grain boundaries and interfaces in some ceramic materials. The
viscous flow of these amorphous films during cyclic loading imparts a strong
sensitivity to cyclic frequency, waveform and mean stress (Han & Suresh,
1989; Ewart & Suresh, 1992; Lin et al, 1992; Dey, Socie & Hsia, 1995).
11.2 Characterization of crack growth in brittle solids
385
(4) In ceramics and ceramic composites with coarse grains or elongated grain
structure arising from in-situ reinforcements, the bridging of crack faces can
be promoted by both intact grains and glassy ligaments (Liu, Chen & Tien,
1994; Ramamurty, Hansson & Suresh, 1994).
(5) The mutual competition among the corrosive effects of environment, the
viscous flow of pre-existing and in-situ formed intergranular and interfacial
glassy films, and the breakdown of bridging ligaments due to repeated crack
face contact determines whether cyclic loading is beneficial or detrimental to
crack growth.
11.2 Characterization of crack growth in brittle solids
11.2.1 Crack growth under static loads
Many ceramics exhibit a tendency for subcritical crack growth under static/
quasi-static loads owing to their susceptibility to stress corrosion by an agressive
environment, to the existence of an R-curve effect which stems from a variety of
toughening mechanisms, or to creep cavitation at elevated temperatures. In these
situations, the time rate of growth of a long crack, da/dt, is characterized on the
basis of linear elastic stress intensity factor, K, such that
% = A{Kf, (11.1)
where A and p are experimentally determined constants.! This characterization
generally holds from a threshold value of K until K approaches the fracture
toughness of the material.
If the ceramic is toughened, the 'driving force' for crack growth can be
significantly altered as a result of mechanisms which are operational either at the crack tip
or in the crack wake. These mechanisms include stress-induced martensitic
transformations, crack deflection at grain boundaries and interfaces between the matrix and
the reinforcements, and crack bridging by intact grains, fracture surface asperities,
particles or fibers. (A discussion of such mechanisms is presented in Chapter 14.) A
consequence of the toughening mechanisms is that the effective stress intensity
factor, Keff, at the crack tip is reduced from the nominal or applied K by the shielding
component, Ks, such that
Keff = K-Ks. (11.2)
As discussed in detail in Chapters 9 and 16, the conditions of validity of linear elastic fracture mechanics
should first be ensured, especially at elevated temperatures. Methods to characterize high-temperature
crack growth are discussed further in Chapter 16.
386
Fatigue crack growth in brittle solids
11.2.2 Crack growth under cyclic loads
It was shown in Chapter 10 that the cyclic crack growth characteristics of
metals are generally characterized on the basis of the Paris law. Here the rate of
crack advance per cycle, da/dN, is related to the stress intensity factor range
AK = Kmax - Kmin; Kmax and Kmin denote the maximum and minimum values of
K, respectively. For a fatigue load cycle of constant-amplitude,
^=C(AK)m, (11.3)
where C and m are experimentally determined constants. The Paris exponent m for
metallic materials is typically in the range 2-4. The fatigue crack growth rates, as
shown in Chapter 10, are also strong functions of the stress ratio R, microstructure
and environment.
Brittle materials, on the other hand, exhibit very limited subcritical crack growth
at low temperatures. Within this restricted range of damage tolerance, it is of interest
to know whether the cyclic component of the imposed loads induces subcritical
fracture by a purely mechanical fatigue effect, or whether crack advance under the
applied fluctuations in loads is merely a consequence of stable fracture facilitated by
a static mean level of the applied load. One way to quantify this distinction is to
estimate the rate of fatigue crack growth per cycle on the basis of experimentally
determined static crack velocities, Eq. 11.1. Such an approach, commonly employed
for the prediction of corrosion fatigue crack growth rates on the basis of stress
corrosion crack velocities (see Chapter 16), was used by Evans & Fuller (1974) for
ceramics. They estimated the time to failure under cyclic loading conditions on the
basis of experimentally determined values of the material constants in Eq. 11.1. This
approach implicitly invokes the following assumptions.
(1) The mechanisms of failure under cyclic loads are the same as those
occurring under static loading conditions.
(2) Fluctuations in applied loads can be modeled as a series of small increments
in fixed loads.
(3) Compressive stresses do not induce any crack growth; only the tensile
portion of the fatigue cycle is considered in the calculation of crack growth rate.
(4) The crack propagation rate per fatigue cycle is obtained by integrating the
crack velocity for static load, Eq. 11.1, over the time period of the fatigue
cycle, l/vc, where vc is the cyclic frequency, such that
da
dN
■l/Vc
A(Kfdt. (11.4)
o
With the above assumptions, the growth of a crack per unit period of time (i.e. for
cyclic loads, the time period of a fatigue cycle) can be determined for any time-
dependent stress o(t). Consider, for example, a cracked specimen for which the stress
intensity factor is given by
11.2 Characterization of crack growth in brittle solids
387
K=Yo{t)*/a, (11.5)
where Y is a parameter which depends on specimen geometry, crack geometry, and
crack length, a. Substituting this expression for K in Eq. 11.1 and integrating within
the limits t — 0 and t = tf (where tf is the time to failure) gives:
{a(t)Ydt =
\{p-2)AY"
£-2
2
p±2.
(11.6)
Here a0 is the initial crack size and act the critical crack size, both of which are
assumed to be the same for static and cyclic failures.
If
^static is the static stress under which the crack advances and a(i) is the cyclic
stress which fluctuates between a maximum of amax and a minimum of amin = Rcrmax
(where R is the load ratio), the ratio of the time to failure under static stress to that
under cyclic stress, obtained from Eq. 11.6, is
*u
*f, cyclic
l/yc
2a(t)
o„
dt
2tfe,
owO + R)
(11.7)
,(1-/?)J
This ratio can be evaluated numerically for any waveform of the cyclic load.
The above approach of integrating the static crack growth response to derive the
fatigue crack growth rates can also be used to assess if a pure mechanical fatigue
effect or a synergistic effect involving cyclic loads and environmental interactions
occurs. Let (da/dA^)ex be the experimentally determined crack growth rate under
cyclic loading conditions for a given Kmax and R. If the difference
da
d~N
exp
l/vc
A(Kf dt
^0,
(11.8)
it is inferred that the mechanisms of failure or crack-wake contact conditions under
static loads may be different from those occurring under cycling loads. Whether the
difference is greater than or less than zero indicates whether cyclic loading leads to a
detrimental or beneficial effect, respectively, compared to static loading.
The isolation of the contributions to crack growth from static loads, as influenced
by the Kmax, and those from cyclic loads, as influenced by AK, can also be
accomplished in a different manner. Kishimoto et al. (1987) carried out systematic
experiments on sintered silicon nitride in an attempt to identify the contributions to
fracture from Kmax control and an effective AK control. Following the work of
Hojo et al. (1987) on organic composites, they proposed a power-law
characterization which involves both Kmax and AK. This approach has been adopted for metals
and nonmetals by others (e.g., Vasudevan & Sadananda, 1995; Jacobs & Chen, 1995)
who present crack growth rates in terms of a modified Paris-type equation:
^ = B(Kmaxf(AKf. (11.9)
In most monolithic ceramics subjected to constant-amplitude, tension-tension
fatigue at room temperature, the static crack growth exponent g in Eq. 11.9 can be as
much as a factor of ten or more greater than the cyclic crack growth exponent q.
388
Fatigue crack growth in brittle solids
11.3 Crack growth resistance and toughening of brittle solids
Before considering the crack growth characteristics under static and cyclic
loads, it is instructive to examine the resistance of brittle solids to subcritical crack
growth and the stability of the fracture process under a given loading configuration.
Indeed, as alluded to earlier in this chapter and as shown in more detail in
subsequent sections, the resistance of brittle solids to quasi-static crack growth has a
strong bearing on their cyclic crack propagation characteristics and on the extent
of fatigue damage tolerance. In addition, the stability of subcritical crack growth is a
topic which has important implications for the fracture testing of brittle solids, as
illustrated in the example problem which follows this section.
Consider the large plate with the central crack of initial length 2a;, Fig. 9.1. When
a tensile stress a is applied to this plate, the strain energy release rate is given by Eq.
9.19. First consider a plate material whose resistance to static fracture remains
constant during crack growth. The resistance curve (R-curve) for this case, marked
QR, is schematically shown in Fig. 11.1(a). Here it is evident that the critical value of
the strain energy release rate during crack growth remains unaltered at Q = Qc in this
material. Equivalently, the critical condition for crack growth can be formulated in
terms of the mode I stress intensity factor Kc, since Q = K2/E', Eqs. 9.58 and 9.59. If
the applied stress is o{, the initial value of the strain energy release rate is G\ oc a\av
Since G\ < Gc, no crack growth occurs at the applied stress of ax. As the applied
stress is raised progressively from o\ to a2 to ct3, there comes a critical stress ct3 at
which G\ = Gc- Beyond this point, marked A in Fig. 11.1(a), the strain energy release
rate (or the stress intensity factor) corresponding to the applied stress and the initial
crack size begins to exceed the intrinsic fracture resistance of the material
characterized by Gc or Kc, and causes the onset of unstable fracture. Thus, unstable crack
growth occurs when
G, Sf
unstable -
/
%/
/
/.
\\
stable
(«)
onset of instability /
/
/
■T
a.
(b)
Fig. 11.1. Schematic variation of the driving force for fracture versus the material resistance to
crack growth for a material with (a) a flat R-curve and (b) a rising R-curve.
11.3 Crack growth resistance and toughening of brittle solids
389
d£ d£R
-^>-p. (11.10)
da da
Now consider the cracked plate which is made of a brittle solid whose resistance to
continued fracture is enhanced as a result of some toughening mechanism, Fig.
11.1(6). As described in Chapters 5 and 14, this mechanism may involve (i) the
development of a dilatational transformation zone which is displaced to the wake
of the crack-tip during crack growth, causing a net reduction in the effective crack
opening displacement and 'driving force', (ii) the bridging of the crack faces by fibers,
intact grains or fracture surface asperities, or (iii) periodic microscopic deflections in
the path of the crack. Such a material exhibits a rising R-curve, marked QR in Fig.
11.1(6). For applied stress levels ax and a2, a small amount of crack extension occurs
when Q\ intersects the QR curve. However, crack growth terminates quickly because
the material resistance QR rises faster with crack growth than the strain energy release
rate due to the applied stress. The conditions for such stable fracture are that
da dCR
G = gR and -f<-f^. (11.11)
da da
When the applied stress ct3 is of such a magnitude that at the point of tangency to the
QR curve, i.e. at the point where Q = Qc, the rate of increase of the strain energy
release rate due to the applied stress with crack growth exceeds the rate of increase of
QR with crack advance, unstable fracture ensues. The initial value of Q at which crack
growth begins and the steady-state value of Q = Qss are known to differ by as much
as a factor of ten or more for toughened ceramics.
Whereas the driving force for fracture, Q oc a, for the centrally cracked wide plate,
Q oca for the double-cantilever beam specimen (see the worked example in Section
9.4.1). It is thus evident that the dependence of the variation of the driving force with
crack extension is a strong function of the loading system, the crack geometry and
the specimen geometry. Thus, while the critical value of the strain energy release rate
Qc is expected to be unaffected by the loading configuration, the stability of crack
growth is strongly influenced by it. Therefore, when performing static and cyclic
fracture experiments on brittle solids such as ceramics, it is important to consider
loading modes, such as displacement control and double-cantilever specimens, which
facilitate stability of subcritical crack growth in brittle solids. These ideas are further
illustrated with the following example.
11.3.1 Example problem: Fracture resistance and stability of
crack growth
Problem:
In this worked example, we discuss the driving force for fracture in brittle
solids and the issues of stability of subcritical crack growth by recourse to the
concepts of strain energy release rate which were discussed in Section 9.1.
Consider a cracked specimen which is loaded under compliant conditions in
390
Fatigue crack growth in brittle solids
mode I, as shown in Fig. 11.2. The specimen has unit thickness (B = 1). The
symbol C is the compliance (a function of crack length a) of the specimen and
CM is the compliance of the testing machine (which may be regarded as a spring)
in which the specimen is loaded in tension. The testing machine is connected in
series with the specimen. Let Ar be the total displacement which can be
regarded as prescribed.
Cm
C
AT = A + CMP=A +
(11.12)
The potential energy is given by
WP
<s> + \cmp2
1^1 + I^A2
2 C 2 C2
:lC-lA2 + l-[CM-\AT-A?].
(11.13)
2 2'
(i) Show that CM = 0 corresponds to fixed grip loading (constant
displacement), and that CM -> oo corresponds to dead load,
(ii) Show that the mechanical strain energy release rate,
Q =
d(Wv)
da
2 da'
(11.13)
and therefore, does not depend on the compliance of the testing
machine,
(iii) Show that [f*]A depends on the nature of the loading system.
P, A
Fig. 11.2. A schematic of the cracked specimen and the loading arrangement.
11.3 Crack growth resistance and toughening of brittle solids
391
(iv) For an ideally brittle solid, show that crack advance is stable if
[|]a^ 0» and that Jt is unstable if [ILr> °-
Solution:
(i) For fixed grip loading, AT = A. Substituting this in Eq. 11.12, we note
that CM/C = 0 and CM = 0. For dead-weight loading, the rate of
change of load P with time is zero, i.e.
P = ~ = 0, (11.15)
where A is the rate of change of displacement. Combining with Eq.
11.12,
From this, we note that CM -> oo for dead-weight loading,
(ii) Using Eq. 9.9 and the information that B = 1, the mechanical strain
energy release rate is
AW
Q = -~L- (H.17)
da
Combining Eqs. 11.12-11.14, we obtain
At
2(c+cMy
At
WP = ——^-—-, and
Q = -
d(Wp)
da
AT AC
(11.18)
At 2(C + CM)2 da
= ~=P, and AT = AM + A. (H-19)
Note that
At = Am = A
cT cM c
From this equation, we note that CM + C = CT. Combining these
results with Eq. 11.14, it is seen that
P2 AC
Note that this expression for Q does not involve the compliance of the
testing machine,
(iii) From part (ii),
dQ AT fdC\2 1 AT d2C
da (C + CM)3 \daj 2(C + CM)2 da2
P2 /dC\2 P2d2C
(C + CM)\daJ + 2 da2' (H'
Note that this equation involves the compliance of the testing
machine, and hence the nature of the loading system.
392
Fatigue crack growth in brittle solids
(iv) For an ideally brittle solid, dQR/da = 0 (see Fig. 11.1). Combining Eq.
11.21 with Eqs. 11.10 and 11.11, it is readily seen that crack advance is
stable if [fg]A < 0, and that it is unstable if [|f]A > 0.
11.4 Cyclic damage zone ahead of tensile fatigue crack
The phenomenon of crack growth under cyclic compression, which was
discussed in Section 5.6, is a consequence of the development of a cyclic damage
zone ahead of the stress concentration. Similar cyclic damage zones and residual
stress fields also develop ahead of cracks in ceramic materials that are subjected to
tensile fatigue loads. Although cyclic damage in tension fatigue of ceramics is
qualitatively similar to that described in Section 9.6 for metals, a brief, focused
discussion for brittle solids is perhaps appropriate here because of the vast differences in
the constitutive responses of ductile and brittle materials.
As noted in the preceding section, cyclic damage zones evolve when permanent
strains are retained within the deformation zone ahead of a flaw or a notch. The
evolution of permanent strains in the damage zone is evident from the existence of
open microcracks in the fully unloaded state in Fig. 5.1(a) (cyclic compression
loading of A1203 at room temperature).
Suresh & Brockenbrough (1990) carried out finite-element analyses of the
evolution of a reversed damage zone ahead of a tensile fatigue crack in coarse-grained
alumina which undergoes stress-induced microcracking. By employing the
constitutive model described in Section 5.3.2, they simulated the near-tip fields after one
zero-tension-zero fatigue cycle for a brittle solid with a population of penny-shaped
microcracks.
Figure 11.3(a) shows the normal stress ahead of the crack tip (corresponding to
the peak far-field tensile stress) as a function of the distance x directly ahead of the
crack tip (normalized by p). In this figure, oyy^/np/Kmax denotes the nondimensional
value of the normal stress ayy on the plane of the main crack. For this condition,
tensile stresses prevail everywhere in the edge-cracked solid. Figure 11.3(6) shows the
unloaded state where the residual compressive stress zone which, for the conditions
of the simulation, spans a distance of 9p ahead of the crack tip. Beyond this distance,
tensile residual stresses exist so as to satisfy equilibrium requirements. Note that for
the conditions of the analysis, the predicted size of the cyclic damage zone due to
microcracking is significantly smaller than the size of the reverse plastic zone for the
elastic-perfectly plastic solid (Section 9.6). Also indicated in Fig. 11.3 are the
contours of constant microcrack density f$ drawn with x/p as the abscissa and y/p as the
ordinate. This example serves to illustrate the origin of a reversed damage zone in a
brittle solid which develops distributed microcracking ahead of a notch or a crack as
a result of the release of residual stresses induced by processing, phase
transformations or grain-boundary shear-induced tensile opening (see Section 5.3). This cyclic
11.5 Fatigue crack growth at low temperatures
393
, VQi/o)
K"-
1.0
0.8
0.6
0.4
1/
0.2-
-rro3A
yip
-10
cyclic- 8
damage ,
4
0.36 \
7 TfO 2^rt~6 8/10 12
:0.24
crack ! \
-0.4
-0.8
-1.0 -
(b)
Fig. 11.3. Variation of normal stress as a function of distance directly ahead of the crack tip
(solid curve) in a microcracking brittle solid (a) at the peak tensile stress and (b) upon
unloading. The dashed lines denote the contours of stable damage zone shapes for the indicated
values of p. (After Suresh & Brockenbrough, 1990.) See text for details.
damage zone is expected to have an effect on fatigue phenomena such as transient
crack growth following tensile overloads.
11.5 Fatigue crack growth at low temperatures
The phenomenon of mode I crack growth under cyclic compression (Section
5.6) provides an example of failure where the macroscopic mode of crack growth
under cyclic loads is distinctly different from the monotonic fracture mode in brittle
solids. Even when the mechanisms and macroscopic modes of failure are similar in
monotonic and cyclic loading, apparent differences may arise between the rates of
crack growth in the two cases as a consequence of the mechanical contact of the
crack faces and/or environmental interactions. The origins of such differences in
crack growth in ceramic materials subjected to tension-tension or
tension-compression fatigue at room temperature can be ascribed to a number of factors.
The thermal and elastic mismatch between adjacent grains in brittle solids with
noncubic crystal structures can engender residual stresses upon cooling from the
processing temperature (e.g., Evans, 1978; Ortiz & Suresh, 1993). In coarse grained
ceramics, compressive residual stresses at grain boundaries can exert a 'clamping'
action which leads to the attachment of intact grains to one or both crack faces.
During the early fatigue cycling process and during short crack growth, the frictional
contact between the pulled-out grains and the crack faces, and the associated crack
bridging stresses promote an energy dissipation mechanism which serves to 'shield'
the crack from the far-field loads. This beneficial effect on crack growth resistance is
394
Fatigue crack growth in brittle solids
also manifested as a rising R-curve behavior in monotonic fracture. Repeated cyclic
loading, in conjunction with the 'smashing together' of the crack surfaces,
progressively leads to a degradation of these bridging tractions, and an ensuing elevation in
the effective driving force for fracture. Consequently, the rates of fatigue crack
growth progressively increase with increasing number of cycles of constant
amplitude fluctuation in the nominal stress intensity factor. The effective crack opening
displacement also registers a progressive increase with the breakdown of bridging
ligaments which comprise intact grains in coarse-grained monolithic ceramics or
reinforcement particles in ceramic composites (Kishimoto et al., 1994). Figure 11.4
schematically shows the variation of the applied load as a function of the crack
opening displacement at load point for a polycrystalline ceramic. Here the
progression of tension-compression cycling and the attendant degradation of the frictional
bridging ligaments in the crack wake lead to an increase in the apparent compliance
and hysteresis in the tensile portion (e.g., Guiu, Reece and Vaughan, 1991). The
extent of deterioration in crack shielding with cyclic loading can be a strong function
of the grain size distribution, reinforcement particle size and distribution, maximum
stress intensity factor level, mean stress, and the accumulation of debris particles
released from the loss of bridging tractions within the crack faces (e.g., Grathwohl,
1988; Horibe & Hirahara, 1991; Lathabai, Rodel & Lawn, 1991; Ogawa, 1992;
Dauskardt, 1993; Jacobs & Chen, 1995).
Figure 11.5 shows an example of the crack growth characteristics of a 99% pure
alumina (grain size «a lO^im) subjected to fully reversed cyclic loads (R = —1) and to
static loads in the room temperature air environment. In this figure, the fatigue crack
growth rates da/dN obtained in direct push-pull using a wedge-opening load
specimen are plotted as a function of the maximum stress intensity factor of the fatigue
crack opening displacement
Fig. 11.4. A schematic of the cyclic variation of the applied load as a function of the load point
displacement for a coarse-grained polycrystalline ceramic subjected to tension-compression
fatigue at room temperature.
11.5 Fatigue crack growth at low temperatures 395
i<r3
1(T4
10'"
2 3 4 5
Knm (MPaVm)
Fig. 11.5. Variation of fatigue crack growth rate Aa/AN as a function of the maximum stress
intensity factor Kmhx under fully reversed cyclic loads (vc = 5 Hz). Also indicated are the rates
of crack growth per cycle derived from static load fracture data. (After Reece, Guiu & Sammur,
1989.)
cycle, A^max. Also shown in Fig. 11.5 are the static crack growth data for the alumina,
where the crack velocity da/dt is converted to crack growth rate per cycle using the
relationship da/dN = (da/dt)/vc and is plotted against the (fixed) stress intensity
factor Kmax at which the static test was performed. The crack growth rates in the
cyclic loading case are significantly faster than those seen in static tension.
Transforming ceramics, which exhibit stable crack growth in monotonic loading,
are also known to be susceptible to progressive degradation under fully or partially
tensile cyclic loading. Subcritical fatigue crack growth also occurs under cyclic
tension in transformation-toughened ceramics, such as polyerystalline Zr02, which is
partially stabilized with MgO (Swain & Zelizko, 1988; Sylva & Suresh, 1989;
Dauskardt, Marshall & Ritchie, 1990). Here, the exponent g in Eq. 11.19 is more
than an order of magnitude higher than the exponent q, implying that the maximum
value of the stress intensity factor, rather than its amplitude, determines the overall
crack growth rates. Consistent with this trend, it is seen that despite the occurrence
of an accelerated crack growth under cyclic loads, no differences exist between the
mechanisms of monotonic and cyclic fracture. Furthermore, the bounds of the
fatigue crack growth curve scale with the fracture toughness of the material; crack
extension commences at a threshold value which is approximately 50% of the
toughness (Kc) for all the heat treatments. The strains associated with phase transforma-
# cyclic, R
^ static
J i L
396
Fatigue crack growth in brittle solids
tions are essentially the same for both monotonic and cyclic loading conditions, and
the crack propagation rates are influenced by the specimen geometry and crack size
(Sylva & Suresh, 1989).
These results collectively show that the aforementioned crack-wake phenomena
associated with contact between the surfaces, which in this particular case are
accentuated by the translation of the transformed material (with an increase in volume) to
the wake of the crack tip, most likely determine this apparent fatigue effect. The
accelerated crack growth rates seen upon switching from a static stress intensity
factor to a cyclic stress intensity factor of the same peak value ostensibly stem
from the degradation of the bridging ligaments in the wake of the crack, even in
this transformation-toughened ceramic material. Moisture-containing environments,
such as humid air, lead to higher crack growth rates as compared to inert media
under both static and cyclic loads.
11.6 Case study: Fatigue cracking in heart valve prostheses
The foregoing discussions of the characteristics of fracture in brittle solids under
cyclic loading conditions deal primarily with mechanistic phenomena. There are many
practical applications of such cyclic fractures in a wide variety of engineering structures,
biomechanical devices and components used in microelectronic structures and packages.
In this section, we consider a case study which highlights the possible role of cyclic
loading in inducing failure in synthetic heart valves.f
Artificial heart valves implanted in humans continuously regulate blood flow.
Components of the valve should exhibit mechanical endurance to fluctuating stresses,
bending, contact fatigue and wear at articulating surfaces and resistance to stress
corrosion cracking and cavitation erosion in the physiological environment.
The use of metallic components, made from such materials as titanium and Co-Cr
alloys, for the complex-shaped housing of the heart valve necessitate such fabrication
methods as welding and casting. These methods, however, are prone to severe structural
damage arising from fatigue failure of the housing. Consequently, a brittle, ceramic-like
solid made from pyrolytic carbon and/or pyrolytic carbon/graphite laminated composite
has been used to fabricate heart valves. Over 600 000 of these have already been
implanted in patients, and they constitute the majority of synthetic heart valves that are
commercially produced in the United States.
The mechanism for regulating blood flow in artificial heart valves commonly involves
two semi-circular leaflets (bileaflets) or a tilting disc, which open(s) and close(s) during
heart beat. The leaflets (or the disc) are housed in a circular orifice, which is stiffened by a
metallic restraining ring in some designs. In order to enable attachment to the cardiac
tissue, the outer diameter is linked to a cloth sewing ring.
Damage and cracking under cyclic loads can be a significant form of failure for
mechanical heart valves. The fatigue loading arises from the pumping of the human heart
This case study is derived from a review by Ritchie (1996).
11.6 Case study: Fatigue cracking in heart valve prostheses
397
at a rate of 72 beats per minute (i.e. at a cyclic frequency of 1.2 Hz), which translates to
approximately 38 million beats per year. The physiological environment in which this
loading occurs is usually simulated by carrying out fatigue tests in Ringer's solution at
37 °C. The load ratio, R, of this cyclic loading pattern is zero, which is representative of
the mean stress conditions of fatigue in vivo. Both total-life and fracture mechanics based
methodologies for fatigue life estimation have been developed over the years for metallic
and nonmetallic heart valves. However, since fatigue cracking in the heart valves can
pose a life-critical situation, the regulations of the Food and Drug Administration
(FDA)f in the United States require that defect-tolerant design principles be used to
safeguard against the catastrophic failure of mechanical heart valves in the physiological
environment.
In view of its durability, strength, resistance to wear, high thromboresistance, and
cellular biocompatibility with human blood and soft tissue, the low-temperature isotropic
(LTI) form of pyrolytic carbon has found application in the mechanical heart valve.
Silicon-alloyed LTI pyrolytic carbon is used in mechanical heart valves either in the form
of a coating, approximately 250-|im thick, on a polycrystalline graphite substrate or as a
monolithic material. Up to 20 wt% Si is added to improve mechanical response of the
carbon without any appreciable loss of biocompatibility. There exists a residual stress,
aR, due to thermal mismatch between the carbon coating and the graphite substrate,
which from stress measurements has been estimated to be in the range 20-48 MPa.
Figures 11.6(a) and (b) show examples of bileaflet and tilting disc valves, respectively,
made of the LTI pyrolytic carbon. Figure 11.7(a) shows the inside of the seating lip of the
cross section of a 29-mm mitral valve housing, where the highest dynamic stressing occurs
during repeated heart beat. At this location, the maximum surface stress, estimated from
finite-element simulations, is of the order of 5.5 MPa under static conditions and
30.1 MPa under dynamic conditions. This site is one critical location for the inception
and growth of a fatigue flaw. Figure 11.7(6) shows another location on the outside
surface of the housing at the upper corner of the stellite stiffening ring groove. At this site,
the maximum surface stress is about 43 MPa for a corner root radius of 70 |im. In
addition to these mechanical loads at these sites, the residual stresses, aR, remaining from
the processing steps should be considered in the fatigue life calculations.
Laboratory experiments show that when cyclic loads with a load ratio R **> 0 are
applied, the rates of crack growth in the pyrolytic carbon valve material are significantly
faster than those measured under a static load of the same peak value. This indicates a
potential deterioration in the damage tolerance of this material due to stress fluctuations.
The chances of occurrence of a catastrophic in-vivo failure solely as a result of cyclic
loads in an initially (nominally) flaw-free synthetic heart valve are generally expected to
be very small. It is, however, acknowledged that should defects be introduced at a critical
site, such as the one shown in Fig. 11.7(a) or (b), either as a result of poor fabrication and
manufacturing quality or during prosthetic surgery, the subcritical advance of the defects
during heart beat can lead to catastrophic failure well within the design life of the valve.
Replacement heart valve guidance document. Food and Drug Administration, Division of Respiratory
and Neurological Devices, U.S. Department of Health and Human Services, Washington, D.C., 1994.
398
Fatigue crack growth in brittle solids
(a)
(«
Fig. 11.6. (a) Bileaflet and (b) tilting disc valves, respectively, made of the LTI pyrolytic
carbon. (Photographs courtesy of R.O. Ritchie. Reprinted with permission.)
11.7 Fatigue crack growth at elevated temperatures
399
stiffening
ring groove
crack
inner
surface
crack
(a)
(b)
Fig. 11.7. (a) The inside of the seating lip of the cross section of a 29-mm mitral valve
housing, where the highest dynamic stressing occurs during repeated heart beat, (b) Another
location on the outside surface of the housing at the upper corner of the stellite stiffening ring
groove. (After Ritchie, 1996.)
11.7 Fatigue crack growth at elevated temperatures
At temperatures, typically in excess of 1000-1200 °C, grain boundary
diffusion, grain boundary sliding and stress corrosion cracking from environmental
interactions become prominent in most ceramic materials. In addition, the glassy films at
grain boundaries exert a dominant effect on deformation at these elevated
temperatures, a consequence of which is enhanced cavitation and sliding at grain facets and
possibly enhanced environmental interactions.
11.7.1 Micromechanisms of deformation and damage due to
intergranular I interfacial glassy films
In most commercially synthesized ceramics, liquid-phase forming sintering
additives are introduced during fabrication. In some structural ceramics such as
silicon nitride, the presence of sintering additives, which invariably promote the
formation of intergranular glassy films, is necessary in order to achieve full densifi-
cation. At least a fraction of these additives invariably remains as intergranular
glassy films in the material upon completion of all the processing steps. When the
ceramic is exposed to a high temperature, the amorphous phase becomes viscous as
the temperature surpasses the glass transition temperature of the phase. The flow of
the glass phase (under the influence of an applied stress) along grain boundaries
imparts a nonlinear (creep) deformation at the crack tip (e.g., Clarke, 1987;
400
Fatigue crack growth in brittle solids
Thouless, 1988; Ohji et al., 1990). The ensuing damage processes during deformation
and fracture involve the following mechanisms.
(1) The viscous flow of the glassy films at high temperatures promotes enhanced
grain boundary sliding as well as cavitation at the grain boundary triple
junctions. Such processes occur within the bulk of the ceramics, or during
fracture, preferentially at the highly stressed region within the creep zone
ahead of the crack tip.
(2) The glassy films at grain boundaries can serve as preferential short-circuit
paths for diffusion, thereby obviating the need for a slower lattice diffusion
process, and for stress-corrosion cracking.
(3) Even in ceramics which may contain only a limited amount of glassy films at
grain facets after processing (e.g., some aluminum oxides reinforced with
SiC particles or whiskers), in-situ oxidation during high-temperature
exposure (e.g., the oxidation of SiC) can lead to the formation of glassy films. In
unnotched or uncracked specimens, this oxidation occurs primarily at free
surfaces. In cracked ceramics, however, the access of the environment to the
highly-stressed region of the crack tip facilitates preferential formation of a
high concentration of in-situ-formed glass at grain boundaries and interfaces
immediately ahead of the crack tip. Figure 11.8(a) shows an example of a
region of material (white in color) which has been oxidized around a
growing crack in an Al203-SiC composite subjected to crack growth under cyclic
loads at 1400 °C. During crack advance, this transformed region is displaced
to the wake of the crack tip.
(4) During static or cyclic loading, the cavities which form in conjunction with
the viscous flow of glassy films along grain triple points extend along grain
facets (in monolithic ceramics) and along interfaces (in ceramic composites)
to create microscopic flaws. Figure 11.8(6) is an example of such micro-
cracking in the region immediately ahead of the crack tip in an alumina
ceramic reinforced with SiC whiskers.
(5) As the population of such microcracks increases in the crack-tip region, a
diffuse microcrack zone evolves ahead of the crack, Fig. 11.9(a). Note that
the presence of open microcracks in the fully unloaded state is indicative of
the development of permanent strains within the crack-tip damage zone.
(6) Bridging of the faces of the microcracks by the whiskers, Fig. 11.9(b), and
frictional sliding along the debonded matrix-whisker interface in the
damage zone ahead of the crack tip may modify the near-tip stress intensity
factor. In addition, the crack faces may be bridged by glassy ligaments, e.g.,
Fig. 11.8(a).
(7) These mechanisms of crack-tip and crack-wake damage are essentially the
same under static and cyclic loading conditions. However, the strain-rate
sensitivity of the viscous flow of the amorphous film, in conjunction with the
time-dependence of environmental interactions, renders the crack growth
11.7 Fatigue crack growth at elevated temperatures
401
\*
lOiim
(«)
0.3 urn
(*)
Fig. 11.8. Crack-tip and crack-wake damage processes facilitated by the glass phase in an
Al203-matrix composite reinforced with 33 volume% SiC whiskers, which is subjected to
tension fatigue (in a bend geometry) at R = 0.15 and vc = 0.1 Hz at a temperature of 1400 °C in
air. (a) A zone of material around the crack in which oxidation of SiC leads to the formation of
glassy phase, (b) TEM observations of debonding along the whisker-matrix interface within the
crack tip damage zone. (From L.X. Han and S. Suresh, Brown University, Providence, Rhode
Island, 1990.)
process apparently frequency-sensitive under cyclic loads (see further
discussions on this issue in subsequent sections).!
(8) The foregoing mechanistic processes associated with the effects of glassy
films are also seen in unreinforced alumina which contains impurities and
amorphous intergranular films that remain from the processing additives
(e.g.. Ewart & Suresh, 1992).
' Transmission electron microscopy has identified some differences between the high-temperature crack-
tip damage processes under static and cyclic loads (Han & Suresh, 1989). Such differences are
highlighted in Section 5.3.3 and Fig. 5.5.
402
Fatigue crack growth in brittle solids
«
*
(«)
^
SiC
0.1 um
(W
Fig. 11.9. (o) The development of a diffuse microcrack zone ahead of a crack in Al203-33
volume% SiC whisker composite subjected to zero-tension fatigue cycle at 1500 C. (b)
Debonding along the whisker-matrix interface at 1400 C. (From Han & Suresh, 1989.
Copyright American Ceramic Society. Reprinted with permission.)
(9) In ceramic systems, such as SiC-reinforced Si3N4, where heat treatments
have been carried out to crystallize the amorphous intergranular'interfacial
films, it is found that crystallization promotes an enhanced resistance to
fatigue crack growth at high temperatures (Zhang, Edwards &
Plumbridge, 1998).
11.7.2 Crack growth characteristics at high temperatures
Figure 11.10 shows the crack velocity da/dt for an A1203—33 volume% SiC
whisker composite as a function of the stress intensity factor K\ under monotonic
loads in the 1400 C air environment. Also shown in this figure are the crack
velocities da/dt = da/dN x vc measured under cyclic loads at R = 0.15 and at
frequencies vc = 0.1 and 2 Hz in the same high temperature environment. In this figure, the
11.7 Fatigue crack growth at elevated temperatures
403
KT1
10~2
10~3
10~4
10~5
10~6
10"
creep-fatigue
■ « = 0.15, i-t = 2Hz
•« = 0.15, vc = 0.1 Hz
d sustained load creep
crack growth
10
nominal Kt or A^maic (MPaVm)
Fig. 11.10. Crack growth characteristics of Al203-33 volume% SiC whisker composite in
1400 °C air. Variation of fatigue crack velocity Aa/At as a function of A^max under static and
cyclic loading conditions. (After Han & Suresh, 1989.)
crack velocities under cyclic loads are lower than those under static loads.
Furthermore, the cyclic crack growth response is apparently affected by the
frequency of the stress cycle. The same trend has also been found for 90% pure alumina
ceramic with intergranular glassy films during static and cyclic crack growth at
1050 °C (Ewart & Suresh, 1992). A rationale for this apparently beneficial effect of
cyclic loading is considered in the next subsection.
It should be noted that the characterization of crack growth involving linear
elastic fracture mechanics, as in Fig. 11.10, must necessarily involve small-scale
creep conditions at the tip of the crack. For crack advance under both static and
cyclic load, methods to ensure the validity of such characterization are outlined in
Section 16.7.2.
11.7.3 Role of viscous films and ligaments
It was shown above that the presence of viscous films imparts an apparent
ductility to the brittle solid at elevated temperature whereby enhanced levels of
subcritical crack growth are facilitated as a consequence of grain boundary and
interfacial sliding, cavitation ahead of the crack tip and bridging of the crack
faces by viscous ligaments. This process, which is mechanistically nearly the same
under static and cyclic loading conditions, is influenced by the loading rate, cyclic
frequency and waveform.
Quantitative models have been developed in an attempt to rationalize the
apparently enhanced resistance to crack growth under cyclic loads, especially at higher
cyclic frequencies and maximum stress intensity values. By invoking an analogy
between cavitation in the glassy film ahead of the crack tip and bridging of the
404
Fatigue crack growth in brittle solids
faces of a linear elastic crack by viscous films, Thouless (1988) postulated an
expression linking the crack-tip stress intensity factor, Ktip(t), and the applied (nominal)
stress intensity factor, K{t):
d*tip(0 , Ktip(t) K{t)
Hip
dt
• +
8q
(11.22)
where t* is the characteristic time for the rate-sensitive viscous deformation of the
glassy ligaments bridging the crack faces, Em is Young's modulus of the matrix
material, rj is the effective viscosity of the ligaments. For a static nominal stress
intensity factor, A^static, Eq. 11.22 predicts the following time-dependent near-tip
stress intensity factor.
^tiP(0 = Static {1 -exp
m
(11.23)
The effectiveness of viscous glassy ligaments in bridging the crack and altering the
'driving force' for fracture was quantitatively assessed by Lin et al. (1992) for poly-
crystalline alumina subjected to static and cyclic loads. They numerically integrated
Eq. 11.22 for high-temperature cyclic loading tests conducted at a frequency of 2 Hz
and load ratio of 0.1 to obtain the effective near-tip stress intensity factor for
different creep times. They compared cyclic loading whose peak stress intensity factor
Kmax was the same as that of the static crack growth test, and forced t\ to match
experiments to extract the effective viscosity r). Figure 11.11 shows the variation of
the near-tip stress intensity factor, normalized by the maximum applied stress
intensity factor, as a function of time normalized by the characteristic time, t*. It is seen
that the effective stress intensity factor under cyclic loads is only about one-half of
the maximum stress intensity factor Kmm which is the imposed driving force for
Fig. 11.11. The evolution of effective crack-tip stress intensity factor as a function of time under
static and cyclic loads for polycrystalline alumina subjected to fatigue at vc = 2 Hz and
R = 0.1 at 1200°C. The imposed A^max for the fatigue loading was the same as the stress
intensity factor for static loading. (After Lin et al, 1992.)
11.7 Fatigue crack growth at elevated temperatures
405
static crack growth. This simple calculation rationalizes the beneficial effect of cyclic
load and hence the apparently lower rate of crack growth compared to the static load
fracture experiment. For the conditions of the experiments simulated in Fig. 11.11,
the time period of one fatigue cycle is 0.5 s (i.e. the inverse of 2 Hz) whereas the
t\ = 1.25 s.
Some general trends, which are consistent with experimental observations, emerge
from these simulations:
(1) The rates of fatigue crack growth typically decrease with increasing cyclic
frequency.
(2) For fixed values of the maximum stress intensity factor and cyclic frequency,
an increase in fatigue crack growth rates occurs in the following sequence of
waveforms: triangular -> sinusoidal -> trapezoidal or square.
(3) These results imply that the time spent at the maximum stress intensity
primarily governs the crack growth response, and that the attendant crack
growth process is primarily time-dependent rather than cycle-dependent.
Different types of ceramics (e.g., silicon carbide, silicon nitride and aluminum
oxide) exhibit different sensitivity to subcritical crack growth at elevated
temperature. For example, silicon carbide ceramics can be synthesized in such a way that
they contain little or no intergranular glassy films. At elevated temperatures, they
exhibit essentially no difference in crack growth rates between static and cyclic loads.
Polycrystalline alumina containing large amounts of impurities and glassy phase
(e.g., 5-10 volume%) typically shows static and cyclic crack growth characteristics
similar to those illustrated in Fig. 11.10 for alumina-based composites. However,
when the extent of glassy films is significantly reduced in the polycrystalline alumina,
the propensity for subcritical crack growth is also markedly suppressed (Ewart &
Suresh, 1992). In this case, the crack growth curve essentially follows the limits for
subcritical fracture seen in the R-curve for the ceramic.
In silicon-nitride ceramics with elongated grains introduced for toughening
purposes, both grain bridging and viscous ligament bridging are known to occur during
static and cyclic crack growth at elevated temperatures (Liu, Chen & Tien, 1994;
Ramamurty, Hansson & Suresh, 1994). Whether crack growth under cyclic stresses
is slower or faster compared to that under static stresses of the same peak values is
determined by whether crack bridging by glassy ligaments or pulled-out grains,
respectively, dominates crack-wake contact. As a result, beneficial or detrimental
effects of cyclic loads on high temperature fracture (vis-a-vis static load fracture)
are possible in silicon-nitride ceramics.
We conclude this section by noting that the preferential evolution of damage at
grain boundaries and interfaces at elevated temperatures in brittle solids containing
glassy films can also dominate over other types of deformation, such as matrix
plasticity within the grains by dislocation motion. This trend has been seen in moly-
disilicide-based intermetallics containing intergranular and interfacial glassy films
406
Fatigue crack growth in brittle solids
where cavitation induced by the amorphous films is the dominant crack-tip damage
process, although the test temperature (above the brittle-to-ductile transition
temperature) is capable of promoting slip within the grains. The overall effects of the
introduction of glassy films to a brittle solid are that: (1) the threshold stress intensity
factor at which stable crack growth commences is reduced under both static and
cyclic loading conditions (which constitutes a detrimental effect) and (2) the range of
stress intensity factors over which subcritical crack growth occurs is increased (which
constitutes a beneficial effect from the viewpoint of damage tolerance). Thus,
allowance for the existence of glassy films in brittle solids should be made such that these
competing trends are judiciously balanced for optimal damage tolerance as well as
for optimizing other mechanical properties at high temperatures.
Exercises
11.1 Toughening of brittle solids by crack deflection, by the addition of a second
phase, has received considerable attention. Consider the combined mode I-
mode II loading experienced at the tip of a deflected fatigue crack in a brittle
solid which is loaded remotely in pure mode I to a stress intensity factor K\.
If the angle of deflection (kink) is a and the deflected segment (length b in
Fig. 9.17a) is very much smaller than the straight segment (length a in Fig.
9.17a), show that the near-tip mode I and mode II stress intensity factors, kl
and k2 are related to Kt by the angular functions, au(a) and a2l(a),
respectively, in Eq. 9.117. (Hint: See Eq. 9.118.)
11.2 In the previous problem, if the remote loading includes both mode I and
mode II, i.e. K\ and Ku, derive expressions relating kx and k2 to Kt and Ku
in terms of the tilt angle, a.
11.3 Consider the elevated temperature crack growth characteristics of ceramics
in which glassy films at grain boundaries undergo viscous deformation at
high temperature. Provide a physical reason for the argument in Section
11.7.3 that, for fixed values of the maximum stress intensity factor and cyclic
frequency, an increase in fatigue crack growth rates occurs in the following
sequence of waveforms: triangular —> sinusoidal —> trapezoidal or square.
11.4 Consider the crack growth results shown in Fig. 11.10 for the alumina-
silicon carbide composite at 1400 °C. Using the procedure outlined in
Section 11.2.2 predict the crack growth characteristics under cyclic loads
on the basis of the static crack growth results by assuming that the
mechanisms of static and cyclic fracture are the same at the elevated temperature.
Compare your predictions with the measured fatigue crack growth rates for
both frequencies and discuss possible reasons for the discrepancies, if any,
between your predictions and the experimentally determined growth rates.
Exercises
407
11.5 The K\c value of a ceramic is 3MPaVin- Its tensile rupture strength and
Young's modulus are 250 MPa and 375 GPa, respectively. If a circumferen-
tially cracked cylindrical rod of this ceramic is fractured in cyclic torsion, the
average height of an asperity on the fracture surface is 0.75 mm due to
locally mode I fracture at 45° to the axis of the rod. With appropriate
calculations, show that the fracture surface asperities of the ceramic in
mode III can never be fully separated by the superposition of a mode I
load and that the apparent fracture or fatigue cracking resistance of this
ceramic in mode III is always likely to be higher than that in mode I.
CHAPTER 12
Fatigue crack growth in noncrystalline
solids
The crack growth characteristics of ductile and brittle crystalline solids were
the topics of attention in the two preceding chapters. We now direct focus on semi-
crystalline and noncrystalline materials including metallic glasses and a wide variety
of polymers. The main purpose here, as in Chapter 6, is to compare and contrast the
mechanisms of fatigue fracture in crystalline and amorphous solids, and to highlight
those failure features which are specific to semi-crystalline and noncrystalline
materials. Further information on the topics discussed here, including more details on
experimental observations, can be found in the relevant literature cited throughout
this chapter.
12.1 Fatigue crack growth characteristics
Early attempts to characterize the rate of fatigue crack growth in rubbery
solids invoked an energy approach along the lines of the Griffith concept (Section
9.1). Rivlin & Thomas (1953) extended the surface energy concept of Griffith to
situations involving large strains and nonlinear elastic deformation, such as that
found in rubber, and characterized the critical condition for the onset of fracture
in terms of the surface work parameter, T. This parameter is a function of strain
energy density and crack length. For the case of a single edge-notched panel, the
surface work parameter is defined as
T = mxaU, (12.1)
where Wj is a constant which is mildly sensitive to the material properties, a is crack
length, and U is strain energy density. For a linear elastic solid subjected to uniform
far-field stresses, U = cr2/2E. With mx = n, one finds that T in Eq. 12.1 is equivalent
to the strain energy release rate Q introduced in Chapter 9.
A vast amount of empirical work has shown that, for time-independent fatigue
fracture, the rate of crack growth can be characterized in terms of the surface work
parameter, such that
— =C"T. (12.2)
AN y '
Here C is a material constant and m is an exponent with a value roughly equal to two
for natural rubber. This equation is strictly applicable for zero-tension loading,
where the minimum value of T is Tmin = 0 (e.g., Andrews, 1974). Although T is
sometimes replaced by its amplitude AT for nonzero mean stress, there is no
408
12.1 Fatigue crack growth characteristics
409
convincing experimental evidence that da/dN is uniquely related to AT, except when
T = 0
1 mm — "•
A more common method of characterizing fatigue crack growth in polymers under
conditions of small-scale damage ahead of the crack tip involves use of the Paris law:
da
dN
= C(AK)"
(12.3)
This approach is merely an extension of the application of linear elastic fracture
mechanics, widely adopted in metal fatigue, to the fatigue of polymers as well. It is
now known (e.g., Hertzberg & Manson, 1980, 1986) that the variation of fatigue
crack growth in a wide variety of amorphous and semi-crystalline polymers can be
characterized in terms of the stress intensity factor range, AK. Figure 12.1 shows
examples of this linear elastic fracture mechanics characterization in PMMA, PS,
PVC, PA, PDVF and Nylon 66. Also indicated in this figure, for comparison
purposes, are the fatigue crack growth characteristics of 7075-T651 aluminum alloy and
a 2gCr-lMo steel (bainitic microstructure with yield strength, ay = 500 MPa).
Several observations can be drawn from these results.
(1) When characterized in terms of the nominal values of AK, polymers exhibit
a markedly inferior resistance to fatigue crack growth than metal alloys.
/ 2|Cr-l Mo
steel
10
AA'(MPavm)
60 80
Fig. 12.1. Fatigue crack growth characteristics of several amorphous and semi-crystalline
polymers represented by dashed and solid lines, respectively. Also shown for comparison
purposes are the fatigue crack growth rates of an aluminum alloy and a steel. (After Hertzberg
Nordberg & Manson, 1970; Hertzberg, Skibo & Manson, 1979.)
410
Fatigue crack growth in noncrystalline solids
(2) There is a correlation between fatigue crack growth rates and fracture
toughness in that polymers with a higher toughness generally exhibit a
lower fatigue crack growth rate. This is similar to the trend exhibited by
transformation-toughened ceramics (Section 11.4), but is in sharp contrast
to the behavior of ductile alloys where no unique correlation exists between
fatigue crack growth rates and fracture toughness in the near-threshold and
Paris regimes.
(3) Since the materials for which the fatigue characteristics are plotted in Fig.
12.1 have very different elastic moduli, it is instructive to replot the crack
growth rates from this figure in terms of A.K/E where E is the relevant
Young's modulus. This normalized plot is shown in Fig. 12.2. As discussed
in Section 10.4, the differences in fatigue crack growth characteristics of
various metallic materials are, in general, substantially diminished when
AK is normalized by Young's modulus. In the case of polymers, however,
this normalization does not eliminate the vast differences in crack growth
response.
(4) Similar to the trends noted in connection with fatigue crack initiation
(Chapter 6), semi-crystalline polymers exhibit a greater resistance to fatigue
crack growth than amorphous polymers.
10"
10"
^io-3
I 10"
io-
io-
PMMA
" / //
/ epoxy // /
%l ////Nyl°n
I V
/ //
/
PVDF
10"4 2 4 6 8 10"
AK.
-£-(vm)
Fig. 12.2. Fatigue crack growth rates shown in Fig. 12.1 replotted as a function of AK/E. (After
Hertzberg, Skibo & Manson, 1979; Manson, Hertzberg & Bretz, 1981.)
12.2 Mechanisms of fatigue crack growth
411
Although Figs. 12.1 and 12.2 show fatigue crack growth only in the Paris regime,
the fatigue crack growth curves for many polymeric materials, with log (da/diV)
plotted as a function of log (AK), exhibit a sigmoidal variation consisting of three
distinct regimes (near-threshold, intermediate growth rate and high growth rate),
analogous to the behavior shown in Fig. 10.8 for ductile solids. An example of
this sigmoidal growth behavior is presented in a later section.
12.2 Mechanisms of fatigue crack growth
12.2.1 Fatigue striations
The discussions of fatigue crack growth in metals (Chapter 10) dealt with
the mechanisms of striation formation and the usefulness of fatigue striations in the
analysis of failure. Under some loading conditions, many polymers also exhibit clear
striation markings on the fracture surfaces. The term striation in metal fatigue
usually refers to a growth band on the fatigue fracture surface, irrespective of
whether the striation spacing correlates with the crack growth rate per cycle or
not. In the polymer fatigue literature, the term striation is exclusively used to denote
growth bands on the fracture surface whose spacing equals the rate of crack growth
in each stress cycle. This restriction is in view of the fact that other types of
discontinuous growth marks (where the fatigue crack does not advance in each stress
cycle), which apparently resemble striations, are also formed during the fatigue
fracture of polymers (see the next subsection).
Figures 12.3(a) and (b) show examples of fatigue striations formed in PSF and
PMMA, respectively. These striation markings are oriented normal to the crack
growth direction. Skibo, Hertzberg & Manson (1976) and Hertzberg, Skibo &
20 (im 20 pm
(a) w ►—I (6) . I 1
Fig. 12.3. Fatigue striations formed in (a) PSF and (b) PMMA. The arrow indicates the crack
growth direction. (From Hertzberg, Skibo & Manson, 1979. Copyright American Society for
Testing and Materials. Reprinted with permission.)
412
Fatigue crack growth in noncrystalline solids
Manson (1979) conducted a comprehensive study of striation formation in semi-
crystalline and amorphous polymers, and showed that the striation spacing could
be related to the macroscopic crack growth rates. The variation of fatigue crack
growth rates da/dN with the stress intensity factor range A.K is plotted in Fig. 12.4
for two polymeric materials: PSF and PMMA. The data shown in this figure were
obtained at a fixed load ratio, R = 0.1, at room temperature from macroscopic
measurements of crack growth rates made during the fatigue tests, as well as from
post-failure measurements of striation spacing in the scanning electron microscope.
The results of this figure support the argument that the crack growth rate per cycle
corresponds to the striation spacing for the materials and loading conditions under
consideration.
The conditions under which striations form in polymeric materials are somewhat
different from those found in metals.
(1) Polymers exhibit striated growth at high A.K values (typically
da/dN > 5 x 1(T4 mm/cycle). On the other hand, the one-to-one
correspondence between da/dN and s generally occurs in metals at lower growth rates
in the Paris regime.
10-
2:
•o
10"
PMMA
0 macro
■ micro
1
o
■ o
0 L-F
■ r
0
i "
#*
0
4
*
a
n i
0.2
PSF
0.5 1.0
AK (MPaVm)
2.0
Fig. 12.4. Macroscopic fatigue crack growth rates da/dN (open symbols) and post-failure
measurements of striation spacing s = da/dN (filled symbols) plotted against the stress intensity
factor range AAT for PSF and PMMA. (After Hertzberg, Skibo & Manson, 1979.)
12.2 Mechanisms of fatigue crack growth
413
(2) The most popular interpretation of striation formation in metals relates the
striation spacing to the crack-tip opening displacement. As shown in Section
10.2.3, this viewpoint invariably leads to the prediction that the Paris
exponent m in Eq. 12.3 is 2. Such a trend is in distinct contrast to the results
obtained for polymers where the exponent m is neither equal to 2 nor
constant. Instead, m for polymers exhibiting striated fatigue crack growth varies
from about 4 to 20. For this reason, the development of models based on the
crack tip opening displacement to rationalize striation formation in
polymers is not likely to produce realistic quantitative results.
(3) In metallic materials, post-failure analysis of striation spacing can be
exploited, in conjunction with Eq. 10.19, to infer a posteriori the AK
conditions that prevailed at the time of fatigue fracture for certain ranges
of crack growth rates. The case studies discussed in Chapter 10 provide
some examples of this approach. In polymeric solids, however, only
empirical correlations exist between striation spacing and macroscopic
crack growth rates. Therefore, no quantitative estimates of AK can be
derived without recourse to independent experimental measurements of
crack growth rates.
12.2.2 Discontinuous growth bands
Another fatigue fracture surface feature in polymers is the so-called
discontinuous growth band (DGB). These growth bands corresponding to a single burst of
fatigue crack advance after every several hundred fatigue cycles have been found in
polyvinylchloride (PVC). These bands apparently resemble striations, although their
spacing is considerably larger than the crack length increment per cycle. The broad
generality of the discontinuous growth process to many amorphous and
semi-crystalline polymers was established in the work of Skibo et al. (1977). These authors
coupled in situ cinematographic observations with acoustic emission signals of
audible 'clicks' during bursts of fatigue crack growth to document the conditions for the
formation of DGBs in PVC. It is now known that the DGBs form predominantly at
low AK levels. The possibility of formation of DGBs and the spacing between them
is strongly dependent upon the chemistry and molecular weight of the polymer as
well on upon the AK level, test temperature and loading frequency. Figure 12.5
shows discontinuous growth bands oriented perpendicularly to the fatigue crack
growth direction in PVC.
Interpretations of the formation of discontinuous growth bands center around the
notion that the accumulation of damage ahead of the fatigue crack over many cycles
causes the crack to jump suddenly. At low AK levels approaching the threshold for
fatigue crack growth, the microscopic deformation at the crack tip involves crazing
for many polymers. Drawing an analogy between the craze zone at the crack tip in a
polymer and the plastic zone at the crack tip in a metal, Elinck, Bauwens & Homes
414
Fatigue crack growth in noncrystalline solids
100 nm
I 1
Fig. 12.5. Discontinuous fatigue crack growth bands seen on the fracture surface of PVC. The
arrow indicates the crack growth direction. (From Skibo et al., 1977. Courtesy of R.W.
Hertzberg, Lehigh University.)
(1971) used the Dugdale strip yield model (Section 9.5.2) to estimate the maximum
craze length to be
where acz is the stress at which crazing occurs (which is assumed constant over the
length of the craze) and Kmax is the maximum value of the stress intensity factor
during a stress cycle. Hertzberg, Skibo & Manson (1979) measured the craze length
rcz at different Kmm levels in several polymers and estimated acz using Eq. 12.4. These
calculated values of ocz agreed well with the values reported in the literature for
tensile fracture. Furthermore, the value of craze stress estimated by this procedure
was roughly a constant over the entire range of AK values where discontinuous
crack growth was observed. The value of acz was also comparable to the tensile
yield strength for many polymers. A notable outcome of these investigations is the
realization that the discontinuous crack increment occurs within the craze zone
which develops at the crack tip.t The burst of fatigue crack growth is illustrated
by the micrographs shown in Fig. 12.6.
Figure 12.7 shows another example of the type of damage that evolves ahead of a
fatigue crack tip in a crazable polymer. This figure is a transmission electron micro-
Fatigue fracture profiles resulting from crack growth through a single craze or a bundle of crazes are
termed 'mirror' and 'mist' regions, respectively, by Skibo, Hertzberg & Manson (1976).
12.2 Mechanisms of fatigue crack growth
415
N = 0
i N = 100
• crack tip
I W = 200
^_ i AT = 300
stretch zone
new crack tip
(*)
7^ = 450
75 um
(a)
Fig. 12.6. (a) Micrographs revealing the positions of the crack tip (arrows on the left) and of the
tip of the craze (arrows on the right) in fatigued PVC. The number of fatigue cycles N
corresponding to the stress cycles imposed between each observation is indicated. (From
Hertzberg & Manson, 1973. Photo courtesy of R.W. Hertzberg. Lehigh University.) A
schematic representation of the crack tip craze zone is also provided in (b).
0.2 urn
Fig. 12.7. Transmission electron micrograph of a craze within the cyclic damage zone ahead of a
fatigue crack in polycarbonate which was subjected to tension tension fatigue at room
temperature. (From Pruitt & Suresh, 1993. Reprinted with permission.)
416
Fatigue crack growth in noncrystalline solids
graph taken within the craze damage zone ahead of a long fatigue crack in
polycarbonate which was subjected to cyclic tension loading. Note the fibrils of the
polymer filling the surfaces of the craze which is oriented perpendicularly to the
applied tensile loading axis.
These experimental observations can be rationalized on the basis of a conceptual
model, Fig. 12.8, which schematically illustrates the mechanisms of discontinuous
crack advance. The maximum opening of the craze zone at the crack tip <5CZ is
estimated from the crack tip opening displacement, Eq. 9.83, such that
5CZ = ^. (12.5)
During cyclic loading, the accumulation of fatigue damage results in a gradual
increase in <5CZ even though the crack tip remains stationary. When <5CZ reaches a
critical value, crack growth occurs in one spurt. The precise mechanisms by which
this damage is accumulated or the processes responsible for fatigue crack advance
within the craze are by no means clearly understood. Furthermore, there is
considerable controversy as to whether the fatigue crack propagates over the entire length of
the craze or over only a fraction of its length, and whether micro voids form in the
craze midribs (e.g., Hertzberg, Skibo & Manson, 1979; Mackay, Teng & Schultz,
1979; Mills & Walker, 1980). Despite these uncertainties, it has been hypothesized
(e.g., Konczol, Schincker & Doll, 1984; Takemori, 1984) that the crack grows
initially along the craze-matrix interface and subsequently along the fibril midrib until
crack arrest. The nonplanar microscopic path is sketched in Fig. 12.8. This process
repeats itself causing dark bands of discontinuous growth to appear on the fatigue
fracture surface. These bands are, therefore, the locations of successive crack tips
which are repeatedly blunted, advanced and arrested.
It is appropriate at this juncture to examine the quasi-static subcritical crack
growth process involving crazes, which has been investigated in some detail in the
theoretical study of Kramer & Hart (1984). Their analysis shows that a crack
extending with a constant velocity v and having a coplanar craze of constant length ahead
of its tip is shielded by the craze from the far-field loading. The fracture of the craze
path of crack
midrib of fibrils
interface between
craze and matrix
Fig. 12.8. An idealization of the path of a fatigue crack within the craze zone.
12.2 Mechanisms of fatigue crack growth
417
occurs by a local creep process. The fracture time tf of the craze matter is related to
the local stress o\ (= ka, where k is the craze fibril extension ratio and a is the local
craze traction) by the expression
«i W
tl=T\-±\ • (12-6)
where l/e( is the craze fibril failure time under a local craze true stress o\ and mc is an
empirically determined exponent (wc = 12 for PMMA). The dependence of the
crack velocity da/dt on the net crack tip stress intensity factor K is given by
da 2e\D$
dt (mc - 2)
\oly/2nD0J
where D0 is the craze fibril spacing and cr(D0) = K/^/2nD0. This quasi-static creep
process can have some applicability to the fatigue fracture of crazable polymers,
although repeated cyclic loading may additionally exacerbate craze fracture by
aiding in the breakdown of craze matter.
12.2.3 Combined effects of crazing and shear flow
The foregoing discussion of discontinuous crack growth focused on fatigue
fracture which was promoted by crazing ahead of the crack tip. In some polymeric
materials subjected to low AK levels, discontinuous crack growth occurs as a
consequence of both crazing and shear banding ahead of the crack tip. The resultant
crack tip process zone has the shape of the Greek letter e (epsilon), and hence this
fracture process is commonly referred to as epsilon discontinuous crack growth.
Mills & Walker (1980) and Takemori & Kambour (1981) made the experimental
observation that fatigue cracks in smooth specimens of polycarbonate exhibited an
unusually shaped crack tip plastic zone which consisted of a pair of shear bands and
a single craze. The shear bands arch forward asymptotically at 45° above and below
the crack plane, whereas the craze is formed directly ahead of the crack tip. In
subsequent studies, Takemori (1982) observed that this combined craze-shear
feature of the short surface cracks was distinctly different from the manner in which
longer, through-thickness cracks advanced. The longer cracks typically exhibited
discontinuous crack growth due to the presence of a single craze or a bundle of
crazes at the tip (as discussed in the preceding section) or advanced purely by the
shear banding process. This difference in the lateral profile was evident even when
the nominal AK values for the surface flaws (as wide as 10 mm) and for the
corresponding longer flaws emanating from notches were identical. In this respect, the
epsilon discontinuous crack growth process may be regarded as the polymer-version
of the well known short fatigue crack anomaly discussed in Chapter 15 in the context
of metal fatigue. The development of epsilon plastic zones for short cracks has been
identified in at least four polymeric materials: PC, PSF, a polyester carbonate
copolymer, and a polyarylate block copolymer (Mills & Walker, 1980; Takemori, 1982;
Rimnac, Hertzberg & Manson, 1983).
418
Fatigue crack growth in noncrystalline solids
In the epsilon-shaped plastic zone, the shear bands originate at the crack tip and
arch forward asymptotically along planes oriented at 45° to the mode I crack plane.
The plane of the craze, which bisects the shear bands, coincides with the crack plane.
Figure 12.9 shows a sequence of optical micrographs in which the discontinuous
crack growth bands associated with the epsilon plastic zone are evident.
The growth behavior of (physically) short and long fatigue cracks in PC is
presented in Fig. 12.10, where the discontinuous growth associated with the short part-
through surface cracks is indicated by the closed symbols. The remainder of the data
points were collected using a compact tension specimen containing a long, through-
number of
cycles
o 4
100
\
200
300
400
500
600
•^r
<- —
100 um
I 1
Fig. 12.9. A sequence of optical photographs taken after every 100 stress cycles of loading which
show discontinuous crack growth in PC by the formation of an epsilon-shaped deformation
zone. The arrows indicate the occurrence of sudden jumps of the crackfront. (From Takemori,
1982. Reprinted with permission.)
12.2 Mechanisms of fatigue crack growth
419
10"21—
10-
s
s,
•o
10"4 —
10s —
io-
¥%r
_L
0.4
0.6
0.8 1.0
AA^MPaVm)
2.0
3.0
Fig. 12.10. Fatigue crack growth rate data for PC at room temperature. The filled symbols
denote discontinuous cracking in initially smooth specimens due to the development of an
epsilon-shaped process zone. The open symbols represent growth data obtained from compact
tension specimens. (After Takemori, 1984.)
thickness crack. Note that the overall shape of this plot is similar to that shown in
Fig. 10.8 for ductile metallic materials.
In the regime of A.K where surface cracks exhibit epsilon discontinuous growth,
the propagation rates are generally less than expected on the basis of discontinuous
crack growth by crazing alone. Furthermore, the growth rates corresponding to the
epsilon fracture mode are less than those predicted by the extrapolation of crack
growth from higher AK levels (where the epsilon plastic zones do not develop). This
apparently beneficial and anamolous behavior associated with the epsilon fracture
process has been attributed to the larger amount of work expended in creating the
shear bands and crazes (than that needed for craze formation alone) and to the
shielding of the crack tip by the plastic zone.
12.2.4 Shear bands
Experimental results indicate that increases in the applied A.K or test
temperature generally cause the microscopic fracture mode in polymers (which are prone
to shear deformation) to change in the following sequence: discontinuous growth
bands formed by crack tip crazing —> epsilon discontinuous growth bands formed by
the combined effects of crazing and shear banding —> formation of shear bands. For
420
Fatigue crack growth in noncrystalline solids
the part-through surface cracks which exhibit epsilon discontinuous growth bands,
this transition to a shear crack occurs after growth over a certain distance, which is
up to 1 mm in PC and PSF (Takemori, 1984). Figure 12.11 shows such a transition
for a fatigue crack in PC. Here the initial growth of the crack occurs by a
combination of shear banding and crazing which leads to epsilon-shaped lateral profiles. The
last pair of slip bands in this figure is not accompanied by a craze and there is a
transition from shear-craze fracture to pure shear failure.
12.2.5 Some general observations
It is perhaps worth examining here some of the commonly observed effects
of various morphological, mechanical and environmental factors on the rates of
fatigue crack growth in polymers. A survey of published work indicates that an
increase in molecular weight has a significant effect on the resistance to fatigue
crack growth. Experimental results on PS, PVC, PA, Nylon 66, PMMA and PE
show a clear trend toward decreasing crack growth rates with an increase in the
molecular weight of the polymer. Figure 12.12 shows this trend for PMMA and PVC
where da/AN varies as exp(l/M), M being the molecular weight. An increase in \/M
by a factor of three results in a three orders of magnitude increase in the crack
growth rate at a fixed value of AK.
On the basis of experimental information available in the literature, Hertzberg &
Manson (1980) suggest that only molecules longer than some characteristic size scale
V \ V
\
75 |im
Fig. 12.11. Shear band cracks ahead of a fatigue crack in PC. The crack propagates from a free
surface by a combined shear-craze process which leads to an epsilon-shaped lateral profile. The
last pair of shear bands is not accompanied by a craze; it denotes pure shear failure. (From
Takemori, 1982. Reprinted with permission.)
12.2 Mechanisms of fatigue crack growth
421
5 10
(\/M)x 10s
Fig. 12.12. Variation of fatigue crack propagation rates, at fixed values of AA^ (= 0.6 MPav'm)
and test frequency vc (= 10 Hz), as a function of reciprocal molecular weight for PMMA and
PVC. (After Kim et al., 1977.)
(related to the width of the crazes) form an entanglement network which is capable
of resisting crack growth. In other words, the craze is populated with an
entanglement network consisting of several molecules, rather than individual molecular
chains. Hertzberg & Manson suggest that the networks are entangled by fatigue
loading. A reduced possibility of disentanglement as well as enhanced orientation
hardening at higher molecular weights may then promote an increased resistance to
fatigue crack growth. It is noted that the effect of M on fatigue crack growth is much
stronger than that on the glass transition temperature, yield strength and elastic
modulus. These latter (monotonic) properties are governed by the bulk behavior
in that they are a reflection of some weighted average of the weak and strong
molecular entanglements of widely differing chain lengths. Therefore, above a
certain critical M, the monotonic properties are not significantly enhanced by M
provided that there is a finite number of weakly entangled molecular chains. By contrast,
in fatigue fracture involving crazes, the core of the craze fibrils is made up of strongly
entangled molecular chains; the craze possesses a relatively high M with a relatively
narrow distribution of molecular weight. Hertzberg & Manson postulate that the
rate of fatigue crack growth should decrease with increasing M because only the
highest M entanglements are left in the craze fibrils. This line of reasoning also
appears to find experimental backing in the effect of molecular weight distribution
on fatigue crack growth.
An increase in the degree of crystallinity also causes a similar reduction in the rate
of fatigue crack growth (Fig. 12.1). On the other hand, increases in test temperature
422
Fatigue crack growth in noncrystalline solids
and the degree of cross-linking, or the introduction of a chemically aggressive
environment generally promote a weakened resistance to fatigue fracture. It is often
difficult to derive conclusions on the individual contributions to the overall fatigue
crack growth rate from each of these factors because controlled experiments in
simple polymeric systems have been attempted only infrequently. Furthermore,
only in relatively few instances has attention been devoted to a careful examination
of the microscopic fracture modes vis-a-vis the morphology of the polymer and the
macroscopic crack propagation rates. A comprehensive survey of experimental data
on various factors influencing fatigue crack growth can be found in the reviews by
Hertzberg & Manson (1980, 1986).
We conclude this discussion by recalling that the application of cyclic compressive
loads to notched plates of polymeric solids can lead to the growth of a mode I fatigue
crack from the notch tip in much the same way compression fatigue occurs in ductile
metals (Chapters 4-6). In polymers, permanent deformation caused by the formation
of crazes and/or shear bands ahead of the notch tip can generate a zone of residual
tensile stresses upon unloading from the far-field compressive stress. A mode I
fatigue crack propagates at a progressively slower rate under the influence of the
localized residual tensile field at the notch tip.
12.2.6 Example problem: Fatigue crack growth in epoxy
adhesive
Problem:
Two plastic beams are glued together using an epoxy adhesive as shown in
Fig. 12.13. The air bubbles trapped in the adhesive during the joining process
lead to the formation of several flat, circular, disk-like cracks in the adhesive;
these cracks are aligned parallel to the interface between the two plastic beams
which are joined together. The dominant flaw is usually a semi-circular
(thumbnail) crack located along the interface in the adhesive near the outer surface of
the composite beam. The average radius of such a crack is a = 1.2 mm. The bi-
layer beam, of dimensions shown in Fig. 12.13 is loaded in three-point bending.
(i) If the fracture toughness of the epoxy is 0.8 MPaVm, calculate the
maximum load P which the beam can support.
(ii) During service, the load P fluctuates between zero and one-half of the
maximum value calculated in part (i), and during each fluctuation the
crack in the adhesive advances according to the relationship:
^L = C(AK)\ (12.8)
where C = 6 x 10~6 (MPa)~8-nrr3. Find the number of load fluctuations
before final failure occurs.
12.2 Mechanisms of fatigue crack growth
423
epoxy
adhesive joint
L = 1.7m, W= 10cm, B = 7.5cm
Fig. 12.13. Crack in the joint between two beams which are glued together and subjected to
three point-bending.
Solution:
(i) The maximum bending moment Mmax in the simply supported beam
occurs at the point of application of the load P:
P L PL
Mn
(12.9)
'max - 2 2 - 4 •
The tensile opening stress acting perpendicularly to the interface cracks is
a
-BW*
My 1
—, where / = -.
The maximum value of this stress, cra
y = W/2, such that
(12.10)
occurs at the outer fiber where
Mr,
W
PL
12
w
PL
(12.11)
7 2 4 BW* 2 2 BW2'
Assume that the worst-case scenario is one where the semi-circular,
thumb-nail crack is located near the outer fiber on the tension side of
the beam, and that the crack is located entirely within the adhesive (so
that the complications arising from interface fracture can be ignored). For
this geometry, the stress intensity factor is given by Eq. A. 14 in the
Appendix which is:
^ = 1.12a V^ (1212)
V2
From Eq. A. 12 in the Appendix, we see that «/Q «s 7t/2. Substituting this
value of Q and the given information that L = 1.7 m, W = 100 mm,
B = 75 mm, ^ = Klc = 0.8 MPaVm, and a = 1.2 mm into Eqs. 12.11
and 12.12, and solving for P, the maximum load which the beam can
support is found to be
424
Fatigue crack growth in noncrystalline solids
max 3xl.l2xIxVS 3^/3 in. u^-i^
(ii) The fatigue crack is subjected to a tensile load which fluctuates between
0 and Pmax/2 = 2688 N. The load range for fatigue loading is:
A.P = Pmax - 0 = 2688 N. We first find the critical value of the crack length
acr at which the stress intensity factor KY for the semi-circular crack
approaches A^Ic. For this purpose, we assume that the crack retains its
semi-circular shape until a = acr. Thus,
1.12 x 2 x a,
max
— = *ic. (12.14)
71
Noting that Acr = <rmax= 9.14 MPa for Pmax/2 = 2688 N, and that
Klc = 0.8 MPaVm, this equation gives acr = 4.8 mm. Next, the crack
growth equation is integrated to obtain the fatigue life:
— = C(AKf = c\lA2 X2 X<Tmax X ^
dN=\ ,, (12.15)
Jo J«0 6.5 x C x (Acr)8
where N{ is the number of fatigue cycles to failure, a0 = 1.2 mm is the
initial crack radius, C = 6 xl(T6 (MPa)-8 m~3, Acr = 9.14 MPa, and
acr = 4.8 mm. Integrating, we find that N{ = 99 698 load cycles.
12.3 Fatigue of metallic glasses
When molten metals are cooled extremely rapidly, at rates of the order of
106 K/s, an amorphous micro structure develops. These metallic glasses with a
noncrystalline structure have found commercial applications in power transformers,
magnetic sensors, magnetic switches, and recording heads for video and audio
equipment. Metallic glasses are generally fabricated in the shape of thin ribbons by rapid
solidification processes when the molten metal is cooled upon coming into contact
with the surface of a rotating drum. Some examples of metallic glasses are Pd80Si2o,
Pd77Cu6Si17, Pt64Ni16P20, Fe78B13Si9, and Co66Fe4Ni1B14Si15, wherein the
subscripted number for each element indicates the concentration of that element in
atomic per cent.
Metallic glasses exhibit some unusual mechanical properties and deformation
response. They have very high tensile strengths (of the order of 2% of Young's
modulus), which approach the theoretical strength values. At low temperature and
low applied stresses, metallic glasses undergo linear elastic deformation. An increase
in temperature promotes viscoelastic response at low stresses. Elevating the applied
12.3 Fatigue of metallic glasses
425
stress level induces plastic deformation prior to fracture. Viscous flow of the material
at high temperature occurs uniformly through the bulk of the material. On the other
hand, plastic deformation is restricted to narrow bands of shear within which strains
in excess of unity are produced. In compression, deformation proceeds by multiple
shear banding with essentially no work hardening. Deformation in tension is
generally concentrated along a singularly intense shear band, and tensile failure occurs
coincident with yielding.
Only a limited amount of work on the fatigue of metallic glasses has been reported
in the literature (e.g., Davis, 1975; Ogura, Fukushima & Masumoto, 1975; Chaki &
Li, 1984). Most of these studies have been performed using thin specimens (i.e. under
predominantly plane stress conditions) because of the fabrication of these materials
in the form of ribbons that are only tens of micrometers in thickness. An
examination of the results reveals the fatigue crack growth behavior of metallic glasses is
similar to that of metals in that three distinct regimes of growth (threshold regime,
Paris regime and fast fracture regime) are observed.
Experimental results obtained by Ogura et al. (1975) and Chaki & Li (1984) for
Co72Fe6Mo2Bi5Si5 and Pd80Si2o, respectively, indicate threshold AK$ values in the
range 7-9 MPa,/m, Paris exponents m in the range 2-4, and maximum stress
intensity factor at final failure, Kmax = AK/(l — R), in the range 10-20 MPaVm at
R = 0.1. Permanent deformation ahead of the fatigue crack occurs by the formation
of shear bands with a clearly visible plastic zone. Fig. 12.14, somewhat analogous to
that seen in metals. Ogura et al. report that the plastic zone dimensions observed in
PdsoSi2o compare well with those predicted by linear elastic fracture mechanics.
Under some conditions of fatigue loading, metallic glasses also exhibit striations
and equiaxed vein patterns indicative of localized shear rupture (Davis, 1975).
Because of their susceptibility to plastic deformation, metallic glasses also exhibit
transient retardation characteristics similar to those found in metals (Chapter 14),
although the extent of such retardation is significantly less pronounced than in
metals (Chaki & Li, 1984).
Fig. 12.14. Slip bands around a fatigue crack in Pd80Si2o metallic glass subjected to zero-tension
cyclic loads at room temperature. (From Ogura, Fukushima & Masumoto, 1975. Copyright
Pergamon Press pic. Reprinted with permission.)
200 urn
426
Fatigue crack growth in noncrystalline solids
12.4 Case study: Fatigue fracture in rubber-toughened epoxy
It was shown in Chapter 7 how the introduction of a strong second phase can
enhance the fatigue life of a polymer, and how such improvements are influenced by the
specific choice of the reinforcement phase. In this section, we demonstrate similar
beneficial effects associated with fatigue crack propagation in two different polymeric
matrices reinforced with different particles, fibers or fillers.
Owing to their creep and solvent resistance, which is promoted by a cross-linked
structure, epoxies have been broadly used as matrices for structural components in
automotive and aircraft applications. The cross-linked structure of the epoxy,
however, promotes a very weak resistance to fatigue crack propagation. In order to
circumvent the difficulties with the poor damage tolerance, epoxy matrices are
reinforced in one of several ways: (a) compliant rubbery particles are added to the
matrix, or (b) the matrix is reinforced with rigid inorganic fillers or thermoplastic
particles. In the former case, apparent toughening and enhancement in damage
tolerance stems from a reduction in effective 'driving force' for fracture by such
mechanisms as cavitation, plastic void growth and shear banding in the vicinity of
the crack tip. In the latter case, such processes as bowing and deflection of the crack
tip around the reinforcement phase and the bridging of the crack faces by the
reinforcement apparently improve the crack growth resistance.f
In this section, we consider an example of the beneficial effects of rubber-particle and
glass-filler additions to epoxy matrices on the overall fatigue crack growth behavior.
These results are taken from the work of Azimi (1994) and Azimi, Pearson & Hertzberg
(1995).
Figure 12.15 shows the fatigue crack growth behavior of an epoxy matrix (comprising
a diglycidyl ether of bisphenol A) with and without rubber modifiers. Two different types
of rubber modifiers are considered in this figure: (i) a liquid carboxyl terminated
butadiene-acrylonitrile (CTBN) in volume fractions of 0.01 or 0.10 with a particle size of
approximately 1.5 \\m, and (ii) structured core-shell PMMA particles, of volume fraction
0.10 with a particle size of 0.2 |am, comprising a methacrylated butadiene-styrene
copolymer (MBS) with a small amount of carboxyl groups (COOH) included in the
PMMA shell (this reinforcement is hereafter referred to as MBS-COOH). It is evident
from Fig. 12.15 that even a small concentration of CTBN particles (volume fraction as
low as 0.01) is sufficient to enhance crack growth resistance at high AK levels. An
increase in the volume fraction of the particles to 0.10 significantly diminishes the rate of
fatigue crack growth as well as the slope m of the Paris regime of fatigue fracture. It is
also evident that the smaller particles of the MBS-COOH reinforcement are more
effective in reducing crack growth rates than the CTBN, at a fixed volume fraction. In
this last case, the beneficial effect of the reinforcement is evident through the entire range
of fatigue crack growth.
The mechanistic origins of these beneficial effects of rubber toughening have been
interpreted by recourse to the fractographs taken in different regimes of fatigue failure.
On the basis of these observations, Azimi (1994) has concluded that the bridging of the
crack faces by intact rubber particles plays a dominant role in enhancing the resistance to
fatigue failure at low AK levels. In the Paris regime as well as in the final failure regime,
Detailed discussions of such mechanisms are presented in Chapter 14.
12.4 Case study: Fatigue fracture in rubber-toughened epoxy
427
io-'i-
10"
10"
10"
10"
10"
0.5
O unmodified epoxy
# epoxy+ CTBN (0.01)
O epoxy+ CTBN (0.10)
A epoxy + MBS-COOH (0.10)
AK (MPaVm)
Fig. 12.15. The effects of rubber particle concentration and type on the fatigue crack growth
characteristics of the epoxy matrix. Test conditions: R = 0.1, frequency = 10 Hz, and
temperature = 20 °C. (After Azimi, 1994.)
10"
10"
■3 10"
10"
10"
10"
■ unfilled epoxy
O epoxy + HGS
D epoxy + TSGS
• epoxy + SGF
A£ (MPaVm)
Fig. 12.16. The effects of inorganic filler concentration and type on the fatigue crack growth
characteristics of the epoxy matrix. Test conditions: R = 0.1, frequency = 10 Hz, and
temperature = 20 °C. (After Azimi, 1994.)
428
Fatigue crack growth in noncrystalline solids
the reductions in the effective 'driving force' for fatigue fracture were attributed to the
growth of cavities in the epoxy around the rubber particles which debonded from the
surrounding matrix and to the formation of shear bands which linked the rubber
particles. The overall size of the 'plastic zone' at the tip of the fatigue crack also
correlated well with that estimated on the basis of the Irwin approximation (see Section
9.5.1).
Different types of crack-tip 'shielding' mechanisms, which promote a reduction in
the apparent 'driving force' for fatigue fracture, are activated when the epoxy matrix
is reinforced with inorganic fillers. For this purpose, we consider a solid diglycidyl ether
resin matrix which is filled with three types of modifiers all of which have an average size
of roughly 50 um and a volume fraction of 0.10: (i) hollow glass spheres (HGS), (ii) silane
treated solid glass spheres (TSGS), and (iii) short glass fibers. Figure 12.16 shows the
A
A
\
0
20 um
(o)
r
20 um
. I
(b)
Fig. 12.17. Fractographs indicating (a) bowing of the crack front between the TSGS
modifiers at AK = 0.6 MPav'm and (b) cavitation around the modifiers at &K = 1.5
MPa^/ni. Test conditions: R = 0.1, frequency = 10 Hz, and temperature = 20°C. (From
Azimi, 1994. Photographs courtesy of H. Azimi. Intel Corporation, Chandler, Arizona.
Reprinted with permission.)
12.4 Case study: Fatigue fracture in rubber-toughened epoxy
429
fatigue crack growth response of the unfilled and filled epoxy matrix. Hollow glass
spheres do not appear to be very effective as fillers, especially at low AK levels, from the
viewpoint of fatigue crack growth resistance. While the solid glass spheres provide a
tangible improvement in fatigue damage tolerance, the short glass fibers facilitate a
marked enhancement in crack growth resistance. Figures 12.17(a) and (b) point to
possible causes of such beneficial effects in the TSGS-filled epoxy at AK values of 0.6 and
1.5 MPaVm, respectively. The larger arrow in Fig. 12.17(a) shows the direction of fatigue
crack advance at the low AK, and the smaller arrows indicate the bowing of the crack
between the filler particles. It is evident that the crack front bends so as to circumvent the
intact particles; this process leads to a reduction in the effective 'driving force' for
fracture. At the higher AK, however, debonding of the fillers from the surrounding
matrix is apparent, Fig. 12.17(6), although some evidence exists of the crack bowing
mechanism between particles.
The presence of short glass fibers in the epoxy matrix promotes significant levels of
crack-tip deflection and fiber-bridging of the crack faces. These mechanisms engender a
million-fold reduction in the crack growth rate compared to the unfilled epoxy matrix.
Quantitative effects of these processes on the rates of fatigue crack propagation will be
considered in Chapter 14.
We conclude this section by illustrating that similar enhancements of fatigue damage
resistance can also be activated in other polymeric matrices. Consider the results of Fig.
12.18 for polyethersulfone which is reinforced with glass fibers. The plot of da/dN versus
10-I I I I
0.5 1.0 2.0 3.0
AK(MPn\/m)
Fig. 12.18. Fatigue crack growth characteristics of polyethersulfone with and without
reinforcements of short fibers of glass at vc = 5 Hz and R = 0.2. The open and closed symbols
refer to fracture parallel to and normal to the mold-fill direction, respectively. (After Voss &
Walter, 1985.)
430
Fatigue crack growth in noncrystalline solids
nominal AK shifts to higher values of AK as the concentration of the fibers is increased.
The values of threshold AK0 for fatigue crack growth, the Paris exponent m, and the
overall toughness are all higher for the composites than for the unreinforced matrix. Note
that the fatigue crack growth resistance in this material is not isotropic; resistance to
tensile fatigue fracture normal to the mold-fill direction is superior to that along the
mold-fill direction.
Exercises
12.1 Explain how you would distinguish between fatigue striations and
discontinuous growth bands on the fracture surfaces of polymers.
12.2 Repeat the example problem in Section 12.2.6 for the case where the
dominant flaw is a through-thickness edge crack of length 1.2 mm (instead of a
thumb-nail crack).
12.3 A laminated composite is made by bonding two long thin strips of steel with
an adhesive epoxy, as shown in Fig. 12.19(a). A patch of the adhesive was
intentionally left out in the central section in order to create a central crack
of length 2a in the bilayer plate. The joined plates are pulled apart by equal
and opposite tensile forces, P, as shown in Fig. 12.19(a). From beam theory,
it is known that the deflection of the beam, S, for the loading under
consideration is
2 = 2417' / = ->T' (E121)
where E = 200 GPa is Young's modulus of the steel. The delamination
fracture toughness of the steel-adhesive interface, as defined by the critical
value of the energy release rate, Qc = 300 Pa m. Ignore all nonlinear effects
and complex interface fracture mechanisms.
(a) Using the compliance method (see Section 9.2), find the critical load Pcr
for fracture if 2a = 60 mm, H = 0.97 mm and B = 10.1 mm. Since
there are two crack fronts in this geometry, use
P2 AC
1Q = 2-B-Ta (E122)
(b) Calculate, in addition, the critical loads for 2a = 70 mm and 80 mm,
and plot the PS curves for these two crack lengths along with the result
from part (a). For each crack length, mark the location where fracture
occurs by the symbol, 'x'. Connect all the 'x's to obtain the 'toughness
locus', as shown schematically in Fig. 12.19(6).
Exercises
431
adhesive
P,d/2
(b)
2a~-
= 60 mm
\
N
N
'70
mm-
^ toughness locus
^-—^-""""""'^ """"~~ —
-80 mm
Fig. 12.19. (a) Geometry and loading of the joined plates, (b) Procedure to obtain the toughness
locus.
(c) Compute the area bounded by the PS curves for 2a = 70 mm and
80 mm, and the toughness locus. Using this area, estimate the critical
energy release rate Qc, and show that it is approximately equal to 300
Pam.
12.4 Discuss possible mechanisms which improve the fatigue crack growth
resistance of rubber-toughened epoxy as compared to that of the untoughened
matrix, as shown in Fig. 12.15.
12.5 Discuss possible mechanisms which improve the fatigue crack growth
resistance of epoxy containing inorganic fillers as compared to that of the
unfilled matrix, as shown in Fig. 12.16.
Part four
ADVANCED TOPICS
CHAPTER 13
Contact fatigue: sliding, rolling and fretting
The term contact fatigue broadly refers to the surface damage process that
leads to pitting, wear debris formation and fatigue cracking when the surfaces of two
bodies repeatedly touch each other. The relative motion between the bodies may
involve global/partial slip or rolling, or a combination of these modes of contact.
Usually either or both surfaces in contact may also be subjected to fluctuating
stresses from vibration or other mechanical loads.
In this chapter, attention is directed at the mechanics and mechanisms of different
contact fatigue phenomena. Table 13.1 provides the definitions of key terminology
encountered in contact fatigue, along with examples of practical situations where
such phenomena apply. These processes will be discussed in detail in various sections
of this chapter.
13.1 Basic terminology and definitions
Figure 13.1 provides a general frame of reference with which the various
parameters of interest in contact mechanics are denned. In this figure, adapted from
Johnson (1985), two surfaces in nonconforming contact are shown whose shapes
prior to contact deformation are characterized by the functions, Zj(x, y) and z2(x, y).
The separation between the surfaces is h{x,y) = zx+ z2. Let Vj and V2 denote the
linear velocity of surfaces 1 and 2, respectively, and let f2j and Q2 be their respective
angular velocities. The frame of reference, centered at the instantaneous contact
point O, moves with linear and angular velocities \0 and f20, respectively, so as
to preserve its orientation to the indicated common tangent plane and the common
normal at O.
The linear velocity v and angular velocity o> of the two bodies, with respect to the
reference frame, are:
v1=V1-V0, v2 = V2-V0, <al = Ql-Q0, a>2 = Q2-&o
(13.1)
In order that the two surfaces be in continuous contact without either separating or
interpenetrating, the contact should be continuous, i.e. the cartesian components of
the velocity of the two surfaces along the common normal must be equal, with
V2l = Vzl = Vz0 or v2l = vzl = 0. With this reference frame, the three basic types
of motion relevant to contact fatigue can now be denned.
435
436
Contact fatigue: sliding, rolling and fretting
Table 13.1. Some basic definitions in contact problems.
Terminology
Definition
Example
Conforming
contact
Nonconforming
contact
Sliding contact
Fretting
Free rolling
contact
Tractive rolling
contact
Spin
Contact between surfaces
whose profiles fit exactly
without deformation
Contact between surfaces whose
profiles do not match exactly
Contact which arises due to a
relative linear displacement
Degradation of properties due
to a repeated sliding between
surfaces over small relative
displacements
Contact which arises due to a
relative angular displacement
between surfaces about an
axis located in their common
tangent plane
Rolling accompanied by
tangential tractions between
contacting surfaces
Contact which arises due to a
relative angular displacement
between surfaces about a
common normal to tangent
plane
Journal bearings, flat slider
bearings
Gear teeth, ball and roller bearings
Skidding of a locked wheel of
vehicle on a track, some aspects
of contact between gear teeth
Riveted joints, dove-tail section of
jet engines, interwire contacts in
cables, shaft, keyways; also see
Table 13.3
Contact along the pitch line of
gears, wheel on a railwaytrack
(in the absence of a skid);
V1=V2
Contact above and below the pitch
line of gears
Rotational motion induced in a
wheel while turning a corner
(1) The relative linear velocity, vr, between the two surfaces at the instantaneous
contact point characterizes sliding: vr = Vj - v2 = \\ - V2. The cartesian
components of the sliding velocity on the common tangent plane are: vrx = vxi - vx2 and
vry = vy\ — vyl. Here one may envision sliding contact fatigue to occur in one of
several ways, (a) The contact area between two surfaces is displaced in one direction,
as a result of global sliding, and then the surfaces are disengaged and moved back to
the original point of first contact; this process repeats itself at some frequency. The
sliding displacement amplitude then is the total distance of linear relative motion
between the contacting surfaces from the point of first contact to the point of
complete loss of contact, (b) Complete relative sliding between the two surfaces
occurs in one direction, followed by sliding in the reverse direction without any
loss of contact.
13.1 Basic terminology and definitions
437
Fig. 13.1. (a) Nomenclature associated with the contact of two nonconforming surfaces, (b) An
enlarged view of the contact area around O showing the various forces and moments.
Oscillatory slipping can also take place by small relative displacements (typically
with a cyclic amplitude of 5-50 ^m) only over a portion (near the outer periphery) of
the contact area. Here, the two surfaces are 'stuck together' in the central portion of
the contact region. This process is commonly referred to as fretting. The small-
amplitude cyclic slip, in conjunction with superimposed cyclic loads in one or
both contacting members, leads to fretting fatigue. Descriptions of fretting fatigue,
438
Contact fatigue: sliding, rolling and fretting
including a more detailed definition of what constitutes fretting fatigue, will be
presented in Section 13.6.
(2) The motion of the two contacting bodies produces a relative angular velocity
about an axis on the common tangent plane, with the cartesian components of the
relative angular velocity given by: corx = coxl — cox2 = £2xi — Q.X2 and
cory = coyl — coy2 = Qyi — £ly2- Repeated contact established by this rolling action
leads to rolling contact fatigue.
(3) Spinning refers to the relative angular displacement whereby there arises a
difference in the angular velocities of the two contacting bodies about the common
normal: corz — wzl — wz2 = £lz\ - £2Z2- In cyclic contact, spinning usually occurs in
conjunction with sliding and/or rolling.
We conclude this section by examining the forces transmitted between the
contacting surfaces, Fig. 13.1(6). The net force arising from contact between the surfaces
can be resolved into a normal force P which acts along the common normal, and a
tangential force Q which is on the common tangent plane. Overall equilibrium of
forces requires that
p(x,y)dA, Qx
qx(x,y)dA, Q
qy(x,y)dA,
(13.2)
where p{x, y) is the pressure or normal traction, and qx(x, y) and qy(x, y) are the
cartesian components of the shear or tangential tractions.f Assuming that the
contact area lies almost entirely on the x-y plane, the equilibrium of moments leads to:
Mr
p(x,y)yAA,
My=-
p(x,y)xdA,
M,
[qy{x,y)x - qx{x,y)y)dA.
(13.3)
The tangential force arises as a consequence of friction between the contacting
surfaces with Q < ixP, where /x is the coefficient of limiting kinetic friction. This
frictional force acts in a direction counter to the direction of pure sliding, with
cartesian components denned as
_ -vrxjxP _ -vryixP
yjtfx + Vly y/rfx + V^y
(13.4)
The deformation of the asperities of the mating surfaces induces contact over a
finite area instead of at a single contact point. A consequence of such deformation is
that both forces and moments are transmitted across the contact area. The rolling
moments, Mx and My in Eq. 13.3, oppose rolling motion by providing frictional
resistance. The spin component of the moment, M2, arises from friction within the
contact area.
Contact fatigue usually occurs by the conjoint action of one or more of the
foregoing contact phenomena. Consider, for example, a deep-groove ball bearing. When
' The discrete nature of asperity contact may lead to the transmission of forces and moments non-
uniformly and discontinuously over the contact area A.
13.2 Mechanics of stationary contact under normal loading 439
the ball rolls on the race support, pure rolling contact fatigue occurs only along the
two line contacts schematically shown in Fig. 13.2. All other contact points between
the ball and the race undergo both repeated tangential motion with friction (sliding
contact fatigue) and rolling contact fatigue. Similarly, mating gear teeth are generally
subject to both sliding and rolling contact fatigue, with the point of contact moving
along with the rotation of the gear teeth.
13.2 Mechanics of stationary contact under normal loading
To set the scene for basic analyses and to motivate interpretations of the
mechanistic processes relevant to contact fatigue, we begin with some classical results
of normal indentation. Attention is confined to the simple cases of a sphere and a
cylinder contacting a planar surface of the same material. These two cases provide
insights into the contact fatigue situations encountered in a number of practical
situations. These analyses are followed by discussions of the mechanics and micro-
mechanisms of different types of relative motion between the contacting surfaces.
The discussion is necessarily brief and is confined only to those issues with which
connection can be made to fatigue damage processes. More details of contact
mechanics can be found in Gladwell (1980), Johnson (1985) and Hills & Nowell
(1994).
J-_
-|-» forward sliding
\Z— pure rolling
backward sliding
rolling contact lines
Fig. 13.2. Combined sliding and rolling contact in a deep-groove roller bearing and the local
variation of surface velocity.
440
Contact fatigue: sliding, rolling and fretting
13.2.1 Elastic indentation of a planar surface
13.2.1.1 Sphere indenting a planar surface
Let a sphere, of radius 7?,f be pressed against a flat surface by a normal force
P, as illustrated in Fig. 13.3(a). Assume that the contact between the surfaces is
nonconforming and frictionless, involving small strains, and that the dimensions
of the two bodies in contact are significantly larger than the contact area. For this
Hertzian contact (Hertz, 1882), the radius of the circular contact zone is
3PR
\4E*
1/3
1
E*
\-v\ \-v\
Ei E2 '
(13.5)
If
(<o
i
i
■« »« »i
a a
z
(b)
Fig. 13.3. (a) Normal contact between a sphere and a planar surface, (b) Plan view of circular
contact area and cylindrical coordinate axes.
' In the general case of two nonplanar surfaces in frictionless contact, where the significant radii of
curvature of the indenter and the substrate are R] and R2, respectively, a relative radius of curvature
is defined: R = {(!/«,) + (\/R2)}~i.
13.2 Mechanics of stationary contact under normal loading
441
where E and v are Young's modulus and Poisson's ratio, respectively, the subscripts
'1' and '2' refer to the sphere and the flat surface, respectively, and E* is a composite
modulus of the indenter-substrate system. When the two contacting bodies are made
of the same material with El = E2 = E and vl = v2 = v (which will be the case in all
subsequent discussions), Eq. 13.5 becomes
P1T(1-V)
(13.6)
The pressure, p(r), within the contact area (0 < r < a) is
(,\ 1/2
1-4 • O37)
/
The maximum pressure in the contact area, /?max, is 1.5 times the mean pressure, /?m.f
The mutual approach of remote points in the two bodies is represented by the
distance h (see Fig. 13.3):
a2 f9P2(l-v2)2lV3
In the idealized case of frictionless contact with only a normal force P, the following
general results are obtained from the Hertz analysis:
(1) The maximum value of the von Mises effective stress occurs in the substrate
along the loading axis (i.e. the z-axis in Fig. 13.3) at a depth z = 0.48a
beneath the reference planar surface, for v = 0.3.
(2) The maximum tensile normal stress, ar = (1 - 2v)/?max/3, occurs on the
surface (z = 0) at the contact perimeter (r = a).
(3) The maximum shear stress, tmax = 0.31/?max, exists beneath the surface at
r = 0 and z = 0.48a.
(4) The foregoing results imply that a brittle mode of failure is likely to initiate
near the contact perimeter at the surface, whilst the onset plastic yielding is
favored beneath the surface.
13.2.1.2 Cylinder indenting a planar surface
It was seen in Fig. 13.2 that the roller of the roller bearing makes a line
contact with the supporting race. In general, line contact is produced when the
shapes of two bodies are such that conforming contact arises in one direction
while a nonconforming contact exists in a perpendicular direction. Such a situation
occurs when two cylinders, with parallel axes, are pressed against each other. J
' If the contact area is an ellipse whose major and minor radii are a and b, respectively, the maximum
Hertzian pressure is pmax = 3P/(2nab).
* The macroscopic contact between the blade and the compressor rotor in a turbine jet engine could be
likened approximately to a two-dimensional line contact, whilst the indentation of rough surface
asperities between the contacting surfaces of the rotor and the blade may be modeled on a microscopic scale
by the Hertzian contact of a sphere indenting a fiat surface.
442
Contact fatigue: sliding, rolling and fretting
Consider the two-dimensional case of a circular cylinder, of radius R, which is
pressed against a planar surface in such a way that its axis is parallel to the surface.
In the notation used in Fig. 13.1, the axis of the cylinder is parallel to the j-axis, and
contact occurs over a strip of width 2a along the j-axis. In the absence of interface
friction, the distribution of normal tractions is given by the Hertz theory:
p(x) = ^Vaz -x\ a=\—-r
naz [ nE
1/2
(13.9)
/W=;^^l-6ay, (13.10)
where P is the applied normal load per unit length of the cylinder. The maximum
contact pressure, pmax = 2P/(na) = (4/n)pm. The maximum shear stress,
Tmax = 0.3/?max exists beneath the contact interface at x = 0 and z = 0.78a. At the
contact interface, ax = ay = —p(x). All stresses vanish at the surface outside the
contact interface.
13.2.2 Plastic deformation
We now present a brief summary, following Johnson (1983), of the plastic
deformation of the substrate indented by a normal load. The onset of plastic yielding
for normal indentation by a sphere occurs at a depth of approximately 0.5a beneath
the indented surface when the applied load P reaches a value Py signifying the onset
of yield. For the spherical indenter, the maximum Hertzian pressure at the
commencement of plastic flow is:
3f
where ay is the yield strength of the indented material in compression. Essentially the
same maximum pressure develops for a general elliptical contact zone (with any
combination of a and b) at P — Py.
The nascent plastic zone formed at P = Py below the indenter is engulfed by
elastic material. Further increases in P lead to an enlargement of the plastic zone
as the material is compressed along the loading axis and stretched in the radial
direction parallel to the indented surface.
At the other limiting case of fully plastic deformation, slip-line field theory
solutions are available, particularly for rigid straight-sided indenters such as flat punches
and cones (Shield, 1955). A wide variety of analyses, corroborated by experiments,
have shown that, for a rigid indenter pressed against a rigid-perfectly-plastic
substrate,
pm*3<?y, (13.11)
for essentially all geometries of general interest of the two contacting bodies and for
all shapes of contact zones. The contact pressure is also approximately the same
everywhere.
For strain-hardening materials, Eq. 13.11 could be extended by replacing ay with
<5y, where ay is the stress required to induce a representative strain cR in a uniaxial
compression test. For a spherical indenter, cR & 0.2a/R (Tabor, 1951). For a strain-
13.2 Mechanics of stationary contact under normal loading
443
hardening engineering alloy whose plastic deformation may be approximated by a
pure power-law function, e/ey = (o/oyf, the mean contact pressure and the pressure
distribution take the form (Mathews, 1980):
P- = 2n-Tl\9^-y\ ' P{r)=P-^n-y-^\ ' (13"12)
For n = 1 (a linear elastic solid with E = ay/ey), Eq. 13.12 reduces to the Hertzian
elastic result, Eq. 13.7. For the other extreme case of n —>■ oo (an ideally plastic
solid), pm «* 3ay becomes uniformly the same everywhere (i.e. independent of r).
This result is the same as that of Eq. 13.11. Equation 13.12 may be rewritten in
terms of ay and ey as
_ _pm_ 2nay f 8a V'n _ _ 8a f 2n V
°y~ 3 2«+ll97rJRcy| ' €y ~ 9nR\2n + \\ ' U '
Note that cy ranges from 0.188a/R to 0.17la/R as n is changed from 1 to oo in Eq.
13.13. This narrow range of ey is close to the empirical value of 0.2a/R proposed by
Tabor (1951) for the spherical indenter.
13.2.3 Residual stresses during unloading
When a zone of permanent inelastic deformation is induced during
indentation, releasing the applied load causes a zone of residual stresses to be generated in
the deformed region. This process is analogous to the creation of a residual stress
field and a cyclic plastic zone at the tip of a crack or a notch which is subjected to
loading and unloading (see Sections 4.11 and 9.6). The residual stresses which remain
in the material after the release of the indenter can play a significant role in
influencing the fatigue response as well as brittle failure processes.
For an ideally plastic solid, the stresses directly beneath the indenter (i.e. along the
z axis, r = 0) evolve in such a way that the Tresca yield criterion, Eq. 1.23, gives the
following result:
az-ar = -ay, (13.14)
where az and ar are the normal and the radial stresses (which are also the principal
stresses and hence the shear stresses are zero along the z axis). Elastic unloading
causes an effective superposition of a uniform tension (negative pressure),
approximately equal to 3ay (as shown in Eq. 13.11), at the contact interface. A uniform
tension of 3ay acting on the contact area gives (Timoshenko & Goodier, 1951), upon
unloading,
(az - o>)lmax = 0-66 x (3ay) at z = 0.64a. (13.15)
Using superposition, we combine Eqs. 13.14 and 13.15, to obtain the residual stress
upon unloading the indenter (as indicated by the subscript 'R'), at z = 0.64a (which
is the location at which both the maximum Tresca and von Mises effective stresses
develop)
444
Contact fatigue: sliding, wiling and fretting
iPz ~ o>)Ir = P x 0.66) - \]ay = 0.98ay. (13.16)
Thus, at the location of maximum effective stress at z = 0.64a, the material is nearly
at a point of reverse plastic flow when the normal load is released.
At the surface outside the contact area, the stress state during elastic-plastic
loading involves radial compression and a small circumferential tension. If, during
unloading, a uniform tensile stress of 3ay is superimposed, there occurs a net increase
in the radial compression and circumferential tension by:
* = ^ = I(.-2^4. ,>* (.3,7,
3 r
This result is simply the circumferential and radial stress distribution corresponding
to a tensile point force of 3ayna2 (as seen from far away from the contact area)
according to the classical Boussinesq solution (Boussinesq, 1885). Plastic flow is thus
assisted by the uniform stress generated during unloading. As noted by Johnson
(1983), this result provides a rationale for the observation that semi-brittle materials,
such as PMMA and some ceramics which are capable of plastic flow or microcrack-
ing within the hydrostatic stress field under the indenter, form radial cracks upon
release of the indenter (since the principal circumferential stress is tensile).
13.2.4 Example problem: Beneficial effects of surface compressive
stresses
Problem:
Shot peening and cold rolling are palliatives that are commonly used to
suppress the formation of a fatigue crack on surfaces that are subjected to
sliding, fretting and rolling contact fatigue. These processes produce a layer of
equi-biaxial compressive residual stresses (ax\R = o^Ir)-!
Let a sphere be normally pressed against a flat surface. Assume that the
contact is frictionless. Let the indented surface contain an equi-biaxial
compressive residual stress, ax\R = ay\R ->• — ay; ctz|r=0 on planes parallel to the
indented surface (e.g., from shot peening). Show how much higher normal
force P can be applied without plastically yielding the surface with a residual
stress induced by shot peening as compared to the untreated surface with no
residual stress. Assume the indented surface to be elastic-ideally plastic.
Solution:
The equi-biaxial residual compressive stress is added to the radial stress to
give a net radial stress of [ar + crx\R]. When the sphere is indented on to the flat
surface with a load P, plastic yielding is suppressed if, as per the Tresca yield
condition,
l[0-r + ^lR]-0-zl<0-y (13-18)
The simple example problem presented here is derived from Hills & Ashelby (1982).
13.3 Mechanics of sliding contact fatigue
445
We consider situations where the residual surface compressive stresses are
approaching the yield strength, i.e.
Kkl = KIrI ^ °y (13-19)
Combining Eqs. 13.18 and 13.19,
ar-az<2ay. (13.20)
As seen from general result (3) in Section 13.2.1.1, however, elastic indentation
of the surface by a sphere gives rise to
K - climax = 2tmax = 0.62/?max at z = 0.48a. (13.21)
Combining Eqs. 13.20 and 13.21, it is found that plastic yielding of the indented
surface is suppressed during loading (as well as during unloading, as seen from
Eq. 13.16) when
/W^Q-^y (or) pmax<3.2ay. (13.22)
A comparison of Eq. 13.10 (which gives the maximum pressure for the spherical
indentation of a flat surface without any residual stress) with Eq. 13.22 readily
shows that the maximum Hertzian contact pressure which is imposed by the
indenter on the surface is elevated by a factor of two when a state of equi-biaxial
compressive residual stress, approaching the yield strength in compression, is
introduced. Since pmax scales with P1/3 (see Eqs. 13.6 and 13.7), the surface with
the residual compressive stress is capable of bearing an indentation load which is
up to eight times (i.e. 23) larger without undergoing plastic flow. Thus, surface
modification techniques such as shot peening can lead to significant
enhancements in contact fatigue resistance (see Fig. 13.16).
13.3 Mechanics of sliding contact fatigue
Any propensity for sliding to occur engenders a tangential frictional force,
Q, during frictional contact. This force acts counter to the direction of motion on
each surface. So long as there exists a steady sliding motion between the bodies, the
tangential force Q may be envisioned as a force of kinetic friction between the
surfaces. Before assessing the effects of tangential forces on the stress fields and
displacements, recall that the two surfaces 'conform' to each other when their elastic
properties are the same. The size and shape of the contact area as well as the contact
pressure are then controlled only by the profiles of the contacting surfaces and by P,
and not by Q. Consequently, the interactions between the normal pressure and the
tangential friction can be neglected, if the two materials are the same, and the
tangential stress, q(x, y) and the contact pressure p(x, y) on the sliding surfaces
can be superimposed to determine the overall elastic stresses in the bodies. This
situation will be assumed in all subsequent analyses.
446
Contact fatigue: sliding, rolling and fretting
13.3.1 Sliding of a sphere on a planar surface
If /x is the coefficient of kinetic friction for relative motion between the
surfaces, the relationship between q(x, y) and p(x, y) is usually postulated to follow
the Amonton-Coulomb friction law:
l^^)l I4! = „. (13.23)
p(x, y) f
Combining Eqs. 13.5-13.7 with this equation, we obtain the radial variation of the
interface tangential stress within the contact area:
</W = ^vV->-2, (13.24)
which always acts in a direction counter to the direction of sliding (i.e. along the
negative or positive x-axis).
From the surface tractions, Eqs. 13.7 and 13.24, the stress fields on the contact
surface (x-y plane) and in the symmetry plane (y-z plane) have been extracted by
Hamilton & Goodman (1966) for /x = 0.25 and 0.50 and for v = 0.3 by recourse to
a method proposed by Green (1949) and to the work of Mindlin (1949). Hamilton
(1983) and Sackfield & Hills (1983) extended these results by reporting explicit
expressions for the stresses at any point beneath the sliding contact for Hertzian
loading. The following general trends can be captured from the above studies.
(1) The maximum value of the von Mises effective stress, which occurs along the
loading axis (z = 0.48a and r = 0) for frictionless Hertzian contact (/x = 0), is
raised to the sliding surface when the friction coefficient /x > 0.3. In this latter
case, the second invariant of the deviatoric stress tensor, J2 (denned in Eq. 1.22)
becomes:
, /4x f(l-2v)2 , (l-2v)(2-v)/x7t , (16-4v + 7v2)/x27t2|
/2-^~(—3~~ + 4 + 64 J' °3-25)
Note that J2 can be identified with t2, where xy is the shear yield strength of the
material.
(2) The maximum tensile normal stress, a„ = (1 — 2v)pmax/3, occurs on the surface
(z = 0) at the contact perimeter (r = a) for /x — 0. The tangential friction force
elevates the local compressive stress at the leading edge of the sliding contact
(jc = +a, z = 0), while the tensile stress intensifies at the trailing edge (x = -a,
z = 0).
(3) For frictional sliding with /x > 0.3, the maximum tensile normal stress occurs at
the surface at (x = -a, z = 0):
,l-2v 4 + v
(al)max = °rr = Pmax \ 5 1 5~" ^71
(13.26)
13.3 Mechanics of sliding contact fatigue
447
13.3.2 Partial slip and complete sliding of a cylinder on a planar
surface
If friction is introduced along the contact interface between the cylinder and
a flat surface, which was considered in Section 13.2.1.2, the distribution of the
tangential tractions is of the form:
Q
q{x)
(13.27)
7i -J a1 — x2
whereas the normal traction distribution, p(x), is given in Eq. 13.9. An examination
of this equation readily reveals that the shear tractions approach infinity at the edges
of the contact (x = ±a). In reality, such high tractions can not be accommodated by
finite values of /x. Instead, the high shear stresses at the contact rim are relieved by
small relative slip between the bodies, termed microslip, which initiates at the contact
perimeter and spreads radially inward. Thus, the contact region comprises a region
of 'stick' in the center, which is surrounded by an annular zone of microslip
extending from the periphery of the stick region to the outer boundary of contact. Note
that all points within the microslip region move in the same direction. This process of
partial slip exists as long as the magnitude of the tangential frictional force Q is less
than the limiting force for the onset of sliding, ixP. Figure 13.4 schematically
illustrates this partial slip behavior.
q=fip
slip direction
Fig. 13.4. Schematic illustration of the variation of tangential stresses at the contact interface
during partial slip. Equation 13.27 describes the curve for no slip, while Eq. 13.29 describes the
curve for partial slip.
448
Contact fatigue: sliding, rolling and fretting
Quantitative analyses for partial slip were presented by Cattaneo (1938), Mindlin
(1949) and Deresiewicz (1954). The radius of the central stick region, c, which is
concentric with the contact circle, is
11/2
0<c/a<l. (13.28)
c
a
">-4T
In the stick region, the tangential tractions are
q(x) = W^ (V^T? - Vc2 - x2); -c<\x\<c. (13.29)
At the edge of the stick region (c < |x| < a), q(x) = fip{x).
The conditions governing the occurrence of partial slip (which, as shown in
Section 13.6, plays a major role in fretting fatigue) can now be formulated from
the above equations. If we hold P fixed and slowly increase Q, partial slip initiates at
the edges of contact and spreads inward. Eventually, as Q ->■ /xP, c ->■ 0, i.e. the stick
zone shrinks down to a line at x = 0. Any propensity for Q to increase further
would cause the entire cylinder to slide on the flat surface.
13.3.3 Partial slip of a sphere on a planar surface
Equation 13.24 provides the tangential traction distribution at the onset of
complete sliding of a sphere on a planar surface. If only partial slip occurs, the radius
of the central stick region, c, which is concentric with the contact circle, is:
H1-^! ; °-c/a-L (1130)
Within the region of microslip at the contact rim, the resultant tangential tractions,
q(r), are also given by Eq. 13.24. Inside the stick region, the shear tractions are
q(r) = Of™* JvV - r2 - Vc2 - r2); 0 < r < c. (13.31)
The relative tangential displacement of the substrate with respect to the sphere (in
the direction of Q), as shown in Fig. 13.5, is
, 3/zP
AEa
(2-v)(l + v) l-(l-il) . (13.32)
Obviously, 8 = 0 for Q = 0. When Q ->• /xP, full sliding is initiated. At this point,
dQ/d8 = 0, and a limiting state of global sliding with 8 = 8sl is reached. The initial
slope of the Q-8 curve and 8sl are given by
dO, 32<j w, „ „ 3u,P ,^ w, „ „„„„^
^l7-=o=-g-(2-v)(l + v), *si«^(2-v)(l + v). (13.33)
Once full sliding begins, the tangential stiffness of spherical contact is lost, and any
subsequent sliding of the sphere on the planar surface can only be facilitated by
displacement control.f
' This situation is termed slide, whereas the term slip is reserved for relative tangential displacement over
only a portion of the contiguous surfaces.
13.3 Mechanics of sliding contact fatigue
449
/Eq. 13.33a
limit load
Fig. 13.5. Variation of frictional force with the relative tangential displacement during the
partial slip and complete sliding of a sphere on a planar surface.
13.3.4 Cyclic variations in tangential force
Consider an elastic sphere indenting a planar surface of the same material
under a fixed normal load P and a cyclic tangential load Q which fluctuates between
the constant limits +Qmax and -Qmax- Partial slip conditions are considered here
such that Qmax < /xP, and that the deformation is elastic.
During the first increase in Q from 0 to + Qmax, i.e. loading path OA in Fig.
13.6(a), a partial slip zone develops as described in the preceding section. Figure
13.6(6) shows the radial variations of the tangential force Q (for a fixed normal load
P) corresponding to this situation. For this point, S = <5max, as determined from Eq.
13.32.
When the tangential load is reduced from Qmax, slip of opposite sign develops near
the outer periphery of the contact region (b < r < a). The size of this zone of reversed
slip at point B in Fig. 13.6(a) is found to be
1 -
timax \l
2jxP
1/3
Upon unloading further to point C in Fig. 13.6(a), where Q
of the tangential tractions become
(13.34)
0, the radial variation
3/xP
2na3
3/xP
V a2 — r2, b < r < a,
3{v/a2-r2-2y/Z)2-r2), c < r < b,
■|^5 (vV - r2 - 2vV - r2 + V?^?}, r<
(13.35)
450
Contact fatigue: sliding, rolling and fretting
-i
D
max
+emax
e/o
fi
'¥
/
~ t/max
4
7s
y
'A
"max
partial slip
(b)
Fig. 13.6. (a) Cyclic variation in the shear force as a function of the tangential displacement, (b)
The evolution of circular contact area during the application of a constant normal force P and a
cyclic shear force fluctuating between the limits +2max and -2max-
The curve corresponding to point C in Fig. 13.6(6) shows the radial variation of the
tangential force.
Upon further increases in Q in the reverse direction until Q = -(?max, point D is
reached in Fig. 13.6(a). At this point, S = -8max, and reverse sliding extends as much
as forward sliding displacement with b = c. During the unloading path ABCD in
13.4 Rolling contact fatigue
451
Fig. 13.6(a), the variation of the shear traction with displacement follows the
relationship
„ 3/zP(2 - v)(l + "^ / n -n\2/3 / n \2/3
4Ea
- 2('-%^) -('"7?) -1 (1336)
The situation at point D is the complete reversal of that at A. The next reversal of Q
from -(?max to + (?max (i.e. from point D to point E to point A) leads to a situation
that is similar to the unloading path ABCD but with an opposite sign. Thus, the Q-S
loop becomes closed and this trend repeats itself for constant-amplitude partial cyclic
slip between -gmax and +gmax.
The area enclosed by the hysteresis loop ABCDEA in Fig. 13.6(a) is indicative of
the irreversible energy, AW, dissipated by the frictional microslip in the regime
c <r < a. From the analysis of Mindlin et al. (1952), it is known that
IxP ) 6/xP
( 0 \2/3'
/ i ^max \
IMP )
(13.37)
13.4 Rolling contact fatigue
During rolling contact fatigue, which was introduced in Section 13.1, elastic
deformation from normal loading generates a contact area whose features are
described by the Hertz theory. As seen in Section 13.1, relative sliding between the
two bodies occurs during rolling if the tangential velocities V! and V2 are not equal,
and there exists a tangential force Q at the contact interface. Following the
discussions in Section 13.3.3, it is to be expected that during tractive rolling, a fraction of
the contact area undergoes microslip while the surfaces stick together in the
remaining fraction. The difference between the circumferential strains in the two bodies in
the stick region of the contact area ostensibly leads to a small slip displacement
which is widely known as creep.
The foundations for analyzing rolling contact fatigue are generally predicated
upon the mechanics of contact presented in earlier sections of this chapter. A
detailed discussion of the mechanics of rolling contact fatigue, which is strongly
influenced by the specific geometries, material response and boundary conditions
pertinent to different applications, will not be undertaken here. The interested reader
is referred to the monograph by Johnson (1985) for the theory of rolling contact.
In this section, we begin with a consideration of energy loss during repeated rolling
contact. This is followed by a discussion, in the next section, of the shakedown limits
for sliding and rolling contact fatigue. The microscopic mechanisms of contact fatigue
are considered next. The discussion of rolling contact fatigue is then concluded with a
case study of crack initiation in gear teeth in a ground vehicle application.
452
Contact fatigue: sliding, rolling and fretting
13.4.1 Hysteretic energy dissipation in rolling contact fatigue
Figure 13.7 schematically shows the variation of stress state with location on
a stationary, planar substrate on which a cylinder of radius R and unit length is
rolled with an angular velocity co. The interface is assumed to have negligible friction;
the normal load is P. Assuming that Hertzian contact conditions prevail, the rate of
elastic strain energy storage per unit time period is found to be
W = 2-^, (13.38)
3tt
where a is shown in Fig. 13.7. If the imperfect elastic response of the material leads to
the dissipation of stored energy, as for example due to the microscopically inelastic
deformation arising from asperity contact, a fraction of the stored energy is
irreversibly dissipated. Let this fraction be denoted as hhys. The moment My on the rolling
cylinder required to maintain motion is then found by setting the net work done
equal to the energy dissipated, so that
-+ MR = l^ = *hy,^-s, (13-39)
MyCO ■
hhys W :
'hys"
3tt ' ™ PR nys37LR'
where /xR is the coefficient of rolling friction (Tabor, 1955). For an elliptical or
circular contact, /xR = (3hhysa)/l6R. This simple analysis, where the loss factor
/(hys is simply chosen as a fraction of the stored energy, does not account for the
variation of hysteresis energy loss with strain, nor is it amenable to be generally
correlated with uniaxial properties of materials. For metallic materials, hhys ~ 0.01,
whereas for polymers and rubber /*hys has much higher values.
y£. 1
□
VQ -*ry-ax £7/
Fig. 13.7. Rolling of a cylinder on a planar surface and the associated nomenclature and stress
fields. (After Johnson, 1985.)
13.4 Rolling contact fatigue
453
13.4.2 Shakedown limits for rolling and sliding contact fatigue
The generation of residual stresses upon unloading the indenter can
suppress subsequent plastic yielding during cyclic indentation, as shown in Section
13.2.3. For the case of frictionless normal cyclic indentation, the conditions
governing the onset of reversed yielding, i.e. the shakedown limits, are uniquely prescribed
by analyses such as the ones presented in Section 13.2.3. For cyclic indentation with
friction, however, the shakedown limits fall between two bounds. The upper bound
and lower bound theorems, discussed in Section 3.7 for this shakedown
phenomenon, have been applied to contact fatigue problems. In this section, we examine the
shakedown limits for sliding and rolling contact fatigue for two-dimensional line
contact (between a cylinder and a planar surface) and for three-dimensional point
contact (between a sphere and a planar surface).
13.4.2.1 Shakedown limits for two-dimensional contact
The mechanics of frictionless normal indentation of a cylinder on a planar
surface was examined in Section 13.2.1.2. The cylinder is placed on the flat surface
with its axis parallel to the j-axis and the friction force acts along the x-axis in Fig.
13.1. It may be recalled from that discussion that the maximum contact pressure,
pmax = 2P/(na) = (4/n)pm (where P is the applied load per unit length of the
cylinder), that the maximum shear stress, tmax = 0.3/jmax exists beneath the contact
interface at x = 0 and z = 0.78a, and that ax = ay = —p(x) at the contact interface.
Consider the situation where the long cylinder, oriented parallel to the y axis, rolls
freely without friction in the x direction on the planar surface (x-y plane), as shown
for example in Fig. 13.7. For this case, the statically admissible field of residual
stresses that satisfy symmetry and equilibrium requirements includes only the
components ax\R and ay\R (where, as shown in Section 13.2.3.1, the subscript 'R' denotes
a residual stress). These stresses are functions only of z and not of x and y.
In plane strain (applicable to the plane of symmetry, the x-z plane), the von Mises
yield condition is written as
{K + o-*Ir] - crz}2+{az - [cry + o>|r]}2+6tz2x < 2ay, (13.40)
where ay is the yield strength of the indented material in simple compression.
Johnson (1962) applied Melan's lower bound theorem (see Section 3.7) to this
case to derive the shakedown limits in pure rolling. For this purpose, the terms
within the braces { } in Eq. 13.40 can be made to vanish by appropriately
choosing ax\R ando,,|R to give
Tz*lmax=^=, (13.41)
where tzx\max is the maximum value of the shear stress on the x-z plane which
contains the direction of sliding. From the Hertzian analysis, it is known (e.g.,
454
Contact fatigue: sliding, rolling and fretting
Johnson, 1985) that Tzx|max = 0.25 pmax, occurs at x = V3a/2 and z = a/2. Thus,
the shakedown limit for free rolling of the cylinder occurs when
^== = 4= = 2.309. (13.42)
Similarly, in terms of the Tresca yield condition, the magnitude of the maximum
principal shear stress is equated to the yield strength k in simple shear to determine
the maximum contact pressure pmax for first yield and shakedown. Note that
k = ay/y/3. Combining this result with Eq. 13.42, it is seen that the shakedown
limit for pure rolling is:
P^ = 4. (13.43)
k
For tractive rolling involving both rolling and frictional sliding with line contact,
Johnson & Jefferis (1963) applied Melan's theorem in conjunction with both Tresca
and von Mises yield criteria. They derived the shakedown limits as a function of the
traction coefficient, /x = Q/P, as plotted in Fig. 13.8. When the friction coefficient is
low (/x < 0.3), yielding occurs beneath the surface. For higher values of friction, the
yield point moves to the surface. For tractive rolling of a cylinder which involves
combined rolling and sliding with an interface friction coefficient /x > 0.3, the
maximum principal shear stress in the plane of deformation is found to be /x/?max.
Applying the Tresca yield criterion, the shakedown limit for tractive rolling with
high friction then satisfies the equation
; /'max 1 /i-> a a\
WW = k, or —— = -. (13.44)
k /x
Thus, pure rolling has a shakedown limit which is 4/x times larger than the
shakedown limit for tractive rolling with /x > 0.25. This behavior is plotted graphically in
Fig. 13.8. At loads above the shakedown limit, the surface layers of the substrate are
subjected to a progressive, tangential shear displacement with respect to the material
underneath. This shearing causes ratchetting and incremental collapse.f
13.4.2.2 Shakedown limits for three-dimensional contact
The shakedown limits for three-dimensional point contact under sliding and
rolling are available from the work of Ponter, Hearle & Johnson (1985) who
employed Koiter's kinematical upper bound theorem (see Section 3.7). Figure 13.9
shows their results for the steady-state response of a circular contact area subjected
to repeated normal and tangential loads. The evolution of plastic yielding is divided
into different regimes in this figure.
(1) When the maximum normal contact pressure, pmAX/k, for any value of the
traction coefficient /x = Q/P, is below the line labeled 'elastic limit', no
plastic flow occurs for any number of contact fatigue cycles.
Note that the analyses here do not take into account the strain hardening of the substrate material.
13.4 Rolling contact fatigue
455
first yield (von Mises)
shakedown
Fig. 13.8. Shakedown limits for combined rolling and sliding of a cylinder on a planar surface.
(After Johnson & Jefferis, 1963.)
(2) In the regime marked 'elastic shakedown', plastic flow occurs during the first
load. However, the development of residual stresses suppresses further
plastic flow and a steady state of elastic deformation occurs during repeated
tractive rolling. No cyclic plasticity occurs in this regime. Both lower bound
and upper bound to this elastic shakedown are plotted in Fig. 13.9.
(3) Both upper bound and lower bound estimates for elastic shakedown show
that pmax/k = l//x for /x > 0.3. This result is the same as that derived in the
preceding subsection for the shakedown limit for the tractive rolling of a
cylinder under high friction.
(4) In the region marked 'cyclic plasticity' or 'plastic shakedown', a closed cycle
of plastic straining is developed in a region of the substrate beneath the free
surface. In this material, which is fully surrounded by undeforming material,
progressive accumulation of plastic strains is suppressed. Such a zone of
plastic shakedown is specific to the three-dimensional point contact, and is
456
Contact fatigue: sliding, rolling and fretting
ratchetting
0.0 0.1 0.2 0.3 0.4 0.5
Traction coefficient, fj. = QIP
0.6
Fig. 13.9 Shakedown limits for combined rolling and sliding of a sphere on a planar surface.
(After Ponter, Hearle & Johnson, 1985. The lower bound to the elastic shakedown limit marked
by the dashed line is from Hills & Sackfield, 1984.)
not seen in the two-dimensional line contact analyzed in the preceding
subsection.
(5) Above the upper bound for the plastic shakedown, marked by the path
XX'YY', plastic strain accumulation takes place causing ratchetting and
incremental collapse.
The foregoing analyses deal with contact situations where the substrate is modeled
as elastic-ideally plastic with no strain hardening. Dang Van & Maitournam (1994)
have reported a steady-state elastoplastic formulation to calculate shakedown limits
in sliding with repeated contact reversals where von Mises associative plasticity was
used along with linear kinematic hardening. (The hardening modulus was taken to
be 8% of the elastic modulus.) The sliding was assumed to extend several times the
contact diameter and the elastic sliding tractions were used in the calculations. The
shakedown limits obtained by these authors are consistent with the the results of
Hills & Ashelby (1982) and of Ponter, Hearle & Johnson (1985) for /x > 0.3. For
0 < /x < 0.3, Dang Van & Maitournam predict an almost linear variation of the
shakedown limit between 4 (/x = 0) and 3 (/x = 0.3).
13.5 Mechanisms of contact fatigue damage
457
13.5 Mechanisms of contact fatigue damage
13.5.1 Types of microscopic damage
We now direct attention at microscopic failure processes in contact fatigue.
The nature of specific failure mechanism is strongly influenced by such factors as the
geometry and properties of the contacting bodies, and of the lubricant, if any,
between the surfaces, the topology of the surfaces of the contacting bodies, the
mechanical loading conditions, and the environment. While it is not feasible to
generalize the failure modes for all contact fatigue situations, it is possible to identify
a set of prominent failure modes for different contact conditions. Table 13.2 provides
the terminology and definitions of the prominent damage mechanisms commonly
encountered during rolling and sliding contact fatigue. The case study presented in
the next subsection illustrates how damage evolves during rolling and sliding contact
fatigue.
13.5.2 Case study: Contact fatigue cracking in gears
We examine in this section the mechanics of contact fatigue crack initiation in
case-hardened gear teeth. This case study, dealing with cracking in gears used in a heavy
ground vehicle, is based on the work of Olsson (1998).
Figure 13.10(a) is an optical micrograph of a surface spall, which has the typical shape
of a sea shell, formed during the repeated contact occurring on the tooth of an involute
pinion. The pitch line of the gear is visible in the center of the figure (region marked A).
The positive radial direction of the gear is towards the top of the figure in the vertical
direction, which is also the direction of motion for tooth-to-tooth contact. Figure
13.10(6) is a view of the cross section made along the spalling symmetry plane, where also
the 'wing cracks' at the bottom of the spalling crater are visible. The main cracks, that
create the spall, advance at an angle, 0jnit, to the surface. As the crack advances, its
orientation to the surface changes. The irregular profile of the bottom of the spall crater,
as well as the presence of 'wing cracks', which kink out of the main crack path, are also
observed in this figure.
As shown schematically in Fig. 13.11(a), the point of contact in the driving gear
commences at the root of the gear tooth and progressively moves to the outer tip of the
tooth during operation. For the gear which is the follower, the reverse situation occurs,
i.e. the point of contact moves from the outer tip to the root of the tooth. The
corresponding gear teeth contact forces are sketched in Fig. 13.11(a), and the relative
sliding velocity as a function of contact position is shown in Fig. 13.11(6) for the driver.
As seen in this figure and in Fig. 13.2, pure rolling occurs along the pitch line. Above the
pitch line, the friction force acts in the positive radial direction causing positive slip (i.e.
tangential force directed toward the tip of the gear tooth), whereas below the pitch line it
is oriented in the negative radial direction causing negative slip (toward the root of the
gear tooth), Fig. 13.11(a). Regions experiencing negative slip are known to be more
susceptible to cracking than the positive slip region.
458
Contact fatigue: sliding, rolling and fretting
Table 13.2. Some prominent damage processes in contact fatigue.
Terminology Description
Galling Transfer of material in macroscopic patches from one contacting surface
to the other, and possibly back to the first surface. This process occurs
under high tractions acting over multi-asperity dimensions.
Consequences include: increased vibrations, positioning errors and
lubricant contamination.
Surface distress Micro-scale spalling fatigue of rolling contact surfaces due mainly to
asperity-level normal contact loads. This damage process is aided by
burnished surface areas, asperity-level microcracks, and micro-spall
craters. Can cause spalling fatigue.
Spalling Macro-scale Hertzian contact fatigue leading to the formation of
macroscopic craters in the contact region. Can cause fractures and
seizures.
Pitting Formation of microscopic surface notches and cavities due to the
combined action of contact fatigue and environmental interactions. See
Fig. 4.14 for an example of pitting and fatigue crack initiation from the
pit due to the combined action of fretting fatigue and environment.
Figure 13.12(a) shows the microcracks which initiate first on the gear teeth in the
region where large slip (i.e. away from the pitch line) occurs. These cracks, typically 10-
30 |im in depth, are oriented roughly at 45° to the contacting surfaces; they are numerous
in the region of negative slip and very much less frequent at locations of positive slip.
Closer to the pitch line, where essentially pure rolling takes place with little or no slip, the
crack initiation angle with respect to the free surface is much smaller, as shown in Fig.
13.12(fc). The vast majority of these surface microcracks in the same region of the gear
teeth have roughly the same orientation angle and length. One may, therefore, infer that
their initiation conditions are governed primarily by the main loading mode, which is
Hertzian spherical contact (which simulates asperity contact) with either small or large
frictional slip (depending on the location with respect to the pitch line). The secondary
mode of failure is the development of wing cracks which branch away from the main
crack and lead to spallation.
Many factors, in general, govern the onset and advance of the spall cracks during the
contact fatigue of gear teeth (e.g., Murakami, Sakae & Ichimaru, 1994; Olsson, 1998).
These factors include:
(1) The local geometry of the tooth,
(2) Contact pressure,
(3) The extent of positive or negative slip (i.e. the relative velocity between the mating
gear teeth), which increases linearly from the pitch line to the outer tip or to the
root, respectively,
(4) The nature of elastohydrodynamic lubrication, including the pressure dependent
viscosity, thickness and contamination of the lubricant,
(o)
*
0.5 mm
I I
m
50u.m
I l—i
Fig. 13.10. (a) Top view of a spall crater, (b) Cross section revealing inclined growth of small
cracks and wing cracks branching out of the main crack, (c) A schematic showing the
location and orientation of the spall crater in (a) on the gear tooth. (Photographs courtesy of
M. Olsson. Reprinted with permission.)
459
460
Contact fatigue: sliding, rolling and fretting
contact begins contact ends
driver* I > driver f\
^t' follower
N
follower
(a)
movement
contact point
01
w
^m©
(«
Fig. 13.11. (a) Contact forces on the gear teeth on either side of the pitch circle, (b) The
relative velocity of the contact point of the driver.
to
10 urn
(«
10 um
I __l
Fig. 13.12. (a) Microcracks initiating at the contacting surface in a region of large slip.
(b) Microcracks initiating at the contacting surface in a region of small slip. (Photographs
courtesy of M. Olsson. Reprinted with permission.)
(5) The topology of the contacting surfaces and the changes in the surface asperity
profile during contact fatigue as a consequence of microcracking and spallation,
(6) Residual stresses in the near-surface regions of the gear teeth, which are generally
case-hardened, and the changes in the residual stress field due to microcracking and
spallation,
(7) Embrittling effects of corrosive environments, if any, including pitting, and
(8) Debris particles trapped within the gear teeth which promote abrasive wear.
13.5 Mechanisms of contact fatigue damage
461
While each of these factors can, in general, play an important role in influencing the
contact fatigue life of gear teeth, a simple analysis of the mechanics of crack initiation and
of the initial direction of cracking is considered here to provide a rationale for the
observations shown in Fig. 13.10. For this purpose, we begin with a consideration of
Hertzian spherical contact with interfacial friction, where cracking is postulated to be
governed primarily by the trajectory of the principal tensile stress. Here spherical contact
is envisioned as that occurring between the asperities on one gear tooth (with
approximately spherical tip) and the microscopically flat surface of the mating gear tooth.
Figure 13.13(a) schematically shows this geometrical idealization along with the
orientation angle <p of the maximum principal tensile stress plane (on which the principal
stress <7i acts) with respect to the vertical axis z. From simple Mohr's circles construction,
the orientation angle of the principal stress plane <p is found, in terms of the shear stress
arz and the normal stresses az and ar, to be
2 tan <p 2an
tan 2<p =
1 — tan2 4> a: — ar
(13.45)
Solving this equation for tan <p, it is found that
tan<£;
dr
2<7„
crz"(74±1/i + |cr-'"crf
2arz
(13.46)
For r » z, Tl = J(r2 + z2) « r and (1/ tan 20) » 1, and dr/dz « (tan20)/2.
For a start, we view the contact loading from outside the contact area and
approximate the contact loads by a concentrated normal force P and a concentrated
tangential force /j,P where /j, is the friction coefficient, Fig. 13.13(6). It is then postulated
that a fatigue crack initiates at a radial distance r0 (which is of the order of the contact
radius, a). We then invoke the criterion that as the fatigue crack penetrates the substrate,
its orientation, defined by the angle 0jn;t in Fig. 13.13(6), is normal to the local maximum
principal tensile stress. The stresses in the substrate, i.e. ar, az and arz, are approximated
//P«—
0
'0
1
fatigue
crack path
(a)
(b)
Fig. 13.13. (a) Schematic diagram showing the stresses due to asperity contact on a gear tooth
during tractive rolling, (b) The postulated path of a fatigue crack and the associated
nomenclature.
462
Contact fatigue: sliding, rolling and fretting
by superposing the well-known Boussinesq (1885) solution (for the concentrated normal
load, P) and the Cerruti (1882) solution (for the concentration tangential force, fiP).
These stresses are then substituted in Eq. 13.46 to obtain
dr_
1 - 2v 2(1 + v)
(13.47)
3/i 3
Integrating this equation with respect to both r and z, the function z(r) is found. Invoking
the limiting case, z ->■ oo, the asymptotic value of the initial orientation of the fatigue
crack with respect to the free surface is obtained:
dz
cinit = — ~ tan
l^+3!ffi.
For steel-steel contact, v = 0.3 and 0.3 < n < 1 in the region of large slip. These values
give: 45° < <9;njt < 49°. This estimation of #in;t is close to the initial crack angle seen in Fig.
13.12(a) for large slip.
Along or in the immediate vicinity of the pitch line of the gear, where essentially pure
rolling conditions prevail with little slip, Eq. 13.46 can be solved for the appropriate
rolling contact conditions without friction using only the Boussinesq solution. This gives
the result
~r^J • (13-49)
For v = 0.3, 0init = 27° for pure rolling.f This prediction is in agreement with the
crack initiation angle seen in Fig. 13.12(6) for rolling with small slip. This case study thus
serves to illustrate how approximate quantitative guidelines can be developed to
rationalize experimentally observed cracking patterns and spallation processes in gear teeth
subjected to contact fatigue.
13.6 Fretting fatigue
13.6.1 Definition and conditions of occurrence
When two different members of a component are in contact,
small-amplitude relative oscillatory sliding displacements between the contacting surfaces may
arise as a result of high-frequency, low-amplitude vibrations in the component or
due to cyclic loading of one of the contacting members. Differences in thermal
expansion or contraction between the members during temperature fluctuations in
service, or repeated impact of one member on the other in the presence of a
fluctuating mechanical load may also lead to small-amplitude oscillatory contact between
surfaces. Under room-temperature ambient conditions, such oscillatory frictional
sliding between the contacting metal surfaces promotes oxide debris formation.
The ensuing deterioration of the surfaces is commonly referred to as fretting wear.
' Observe that Eq. 13.49 cannot be obtained by simply settings = OinEq. 13.48 because of the manner
in which the limit z —>■ oo influences the final result.
13.6 Fretting fatigue
463
In the presence of an aggressive environment, such degradation is termed fretting
corrosion. When the repeated tangential displacement also facilitates a reduction in
the fatigue endurance limit and promotes an earlier nucleation and/or growth of
fatigue cracks, the resulting damage is referred to as fretting fatigue. Examples of
some prominent engineering applications where fretting fatigue is of concern are
listed in Table 13.3.
As noted in Section 1.1, early studies of fretting (Eden, Rose & Cunningham,
1911; Tomlinson, 1927) and fretting fatigue (Warlow-Davies, 1941; McDowell,
1953) documented the deleterious effects of oscillatory sliding contact on cyclically
loaded structures. The large body of experimental work carried out since these early
studies has established that the deterioration in the fatigue resistance of a material
due to fretting occurs by complex synergistic interactions from such factors as (see,
for reviews, Waterhouse, 1992; Hills & No well, 1994; Waterhouse & Lindley, 1994;
Fouvry et al., 1996; Lindley, 1997):
• the amplitude of the cyclic slip displacement (typically 5-50 um),
• the mismatch in the elastic and plastic properties between the contacting
surfaces,
• cyclic frequency, waveform and hold periods,
• the normal contact pressure,
• the coefficient of friction between the fretted surfaces which is strongly
influenced by the roughness of the surface asperities,
• environment and temperature,
• residual stresses induced by surface modification techniques such as shot-
peening or coating, or by heat treatments, welding and other joining
operations,
• mechanical loads imposed on one or both members engaged in fretting
contact, and
• microstructural changes and phase transformations, if any, produced by the
local temperature rise in the vicinity of the fretted surfaces.
13.6.2 Fretting fatigue damage
Laboratory simulations of fretting fatigue usually involve a gage section of a
specimen which is subjected to uniaxial fluctuating stresses under load or
displacement control, with a portion of the gage length of the specimen subjected to a
transverse normal contact via a bridge-type pad, a sphere or a rounded-tip punch.f
Generally, two contact points transverse to the specimen axis are used to ensure
symmetry of the loading system. The frictional forces at the contact surfaces should
be monitored in order to derive an independent measure of the friction coefficient
and its variation as a function of the number of fatigue loading cycles. The extent of
' Fretting contact arising from a sphere or a rounded-tip punch results in finite stresses at the interface,
whereas a flat-ended punch induces a stress singularity at the sharp corners.
464
Contact fatigue: sliding, rolling and fretting
Table 13.3. Examples of practical applications where fretting fatigue failures are
known to occur.
Application
Location of fretting fatigue failure
Steam or gas turbine engines
The seating of the turbine disk on the drive shaft in land-
based turbines
The dove-tail or fir-tree section of aircraft jet engines where
the blade is attached to the disk
The flanged joint between the disk/bevelled gear and the
drive shaft in gas turbine transmission system in helicopters
Rotor-tooth contact land area in the vicinity of the gaps
between the stiffness compensation wedges in axially
slotted turbogenerator rotors (see Section 13.7 for a case
study).
Cabes and ropes
Fretting and rubbing in interwire contacts, with fluctuating
loads arising from wind or water flow
Examples include:
Electric power transmission lines
Ropes used for cable cars
Hawsers and mooring ropes in marine environments
Joints in fatigue-loaded
structures
Bio-implant devices
Rivets in wing/fuselage structures of aircraft
Splines and keyways in shafts in couplings
Shrink-fitted components
Fracture on the underside of the screwhead and the
countersink of the hole in the base plates that are
screwed into the bone
Fretting fatigue at the femoral stem in total hip
replacements where the lesser trochometer bone is wired
around the stem of the femoral component
partial slip displacement can be easily controlled by adjusting the specimen
geometry, the contact pad geometry, and the normal load associated with the contact. A
review of the experimental and theoretical methods employed to simulate fretting
fatigue damage can be found in Hills & Nowell (1994), Waterhouse & Lindley (1994)
and Szolwinski & Farris (1996).
The conditions typical of fretting fatigue are such that partial slip develops at the
periphery of contact area; the mechanics of microslip is completely described by the
analyses presented in Sections 13.3.2 and 13.3.3. Repeated sliding in the partial slip
region which surrounds the stick regime of the contact area generally leads to
oxidation of the fretted surface. This results in wear debris formation and cracking. In
13.6 Fretting fatigue
465
addition, microplasticity may arise in the partial slip region as a result of asperity
contact or when high friction conditions prevail at the contact interface. (Recall from
Section 13.3 that the site of maximum effective stress during sliding moves to the
surface when the friction coefficient is high.) The region of microslip, therefore, has a
distinctly different 'worn out' appearance when compared to the remainder of the
contact area.
Figure 13.14(a) schematically shows the annular region of the fretting scars which
develops within the partial slip regime at the outer rim of the contact area. For a
fixed normal force and cyclic variations in the tangential tractions between the fixed
limits, -Qmax and + Qmax, the partial slip displacements for fretting contact between
a sphere and a planar surface are given by Eq. 13.36. Figure 13.14(b) is a plan view of
a fretting scar produced in a 6061-T6 aluminum alloy subjected to a contact by a
sphere of the same alloy (of tip radius 12.7 mm) under a fixed normal force (15 N)
and cyclic tangential stress (±13 MPa) with a friction coefficient /x «s 0.6 after
±g„
*— frettinp 7nne5 —'
• fretting zones ■
(«)
*
50 u.m
(b)
Fig. 13.14. (a) A schematic representation of fretting scars produced under a fixed normal load
P and fluctuating tangential force -£>max < Q < +2max- (b) A plan view of the fretting annulus
observed in a 6061 T6 aluminum alloy. (Photograph courtesy of P.B. Birch, J. Dominguez & B.
Wittkowsky, Massachusetts Institute of Technology.)
466
Contact fatigue: sliding, rolling and fretting
1.7x 10⁵ fatigue cycles; the aluminum alloy substrate was simultaneously subjected to
a fully reversed cyclic stress of ±13 MPa.
The energy dissipated within the region of partial slip is a source of vibration
damping. During fretting fatigue, the maximum amplitude of the tangential force,
2max <^ /J-P- Under these conditions, the energy loss associated with frictional micro-
slip, Eq. 13.37 reduces to
[AW]
fretting
IP-W+'V..,. (13.50,
9/j,PaE
In other words, the energy loss associated with frictional microslip is proportional to
the cube of the cyclic tangential force amplitude, Qmax. A comparison of Eqs. 13.50
and 13.36 reveals that the fretting microslip displacement is nearly proportional to
the square of Qmax.
While the energy loss, Eq. 13.50, can potentially be used to develop a measure of
fretting fatigue damage, other ad-hoc formulations that are amenable for easier
implementation into component design have been postulated. For example, on the
basis of their studies of simulated fretting fatigue failure in the dovetail sections of
aircraft jet engines, Ruiz, Boddington & Chen (1984) have hypothesized that the
overall fretting damage is not determined individually by either the micro-slip
displacement 8, or the interface shear stress q. Instead, the extent of fretting damage was
taken to be given by a parameter whose magnitude equals aiat ■ S ■ q, where <7fat is the
surface stress introduced along the line of contact from the fatigue loads. The clear
physical basis for the use of such a parameter, however, awaits further
experimentation.
The relationships among fretting microslip amplitude S (expressed in um), fretting
wear volume loss, and the fatigue life (expressed in number of cycles to initiate a
critical flaw, N{) are plotted in Fig. 13.15 for steels, based on the studies of Sproles &
Duquette (1978) and Vingsbo & Soderberg (1988). This figure shows that the wear
volume loss increases monotonically with the slip amplitude, with the rate of increase
being more pronounced under conditions of gross slip. The fatigue life, however, is
most severely affected in the partial slip region typical of fretting fatigue (i.e. for 8 ~
8-20 um), where fatigue cracks are nucleated at the contact surface during repeated
sliding. (See the case study in Section 13.7 for examples of such fretting cracks.)
During full sliding, the rapid removal of material by fretting wear can cause these
fatigue cracks to disappear, and thus can ostensibly result in an increase in fatigue
life, since newer cracks should be initiated after removal of the surface layer by wear.
13.6.3 Palliatives to inhibit fretting fatigue
Several approaches are commonly employed in industrial practice to combat
damage and failure arising from fretting fatigue. These can be broadly classified into
two groups:
13.6 Fretting fatigue
467
t ■ r
slip displacement amplitude
Fig. 13.15. A schematic representation of the dependence of fretting wear and fretting fatigue
life on the cyclic slip amplitude.
(1) Methods by which a layer of compressive residual stresses is induced in the
vicinity of the surface which undergoes fretting fatigue. These methods
include: shot-peening, cold working, and laser shock peening.
(2) Methods by which the coefficient of friction between the fretted surfaces is
reduced by introducing lubricants such as polytetrafluoroethylene (PTFE or
Teflon), molybdenum disulphide (MoS2).f
Figure 13.16 shows the beneficial effects of different palliative treatments on the
total fatigue life (characterized by the S-N curves) of a 2014 aluminum alloy fretted
with a 3.5%NiCrMoV steel bridge pad. Here, the use of both shot-peening and
lubrication leads to a much better improvement in total fatigue life than either
peening or lubrication only. It is, however, clear that the total fatigue life in the
absence of fretting is still superior to that with fretting where both peening and
lubrication are used as palliatives.
' Caution should be exercised in deciding to introduce lubricants as palliatives, for the following reasons.
(a) Repeated fretting over tens of thousands or more cycles inevitably leads to the removal or
disappearance of the lubricant in most practical situations, thereby eventually enhancing the interfacial
friction, (b) The slip displacement amplitude depends in a complex manner on the friction coefficient
(Eq. 13.36). Experiments show (e.g., Lindley & Nix, 1992) that for a fixed amplitude of fatigue loading,
the slip amplitude increases with increasing effectiveness of lubricant. Such an increase in slip amplitude
may, in fact, introduce conditions of partial slip whereby the fretting fatigue damage is exacerbated (see
Fig. 13.15).
468
Contact fatigue: sliding, rolling and fretting
140
120
■ as machined
X machined+ MoS 2
▲ machined + PTFE
O glass bead peened
A peened + PTFE
• .^ no fretting
//
60 -
40
20
105
infinite life
±1_
_1 1 ' ■ I"
106 107
number of cycles to failure, N(
_i i ■ ■ ■ ■' i
108
Fig. 13.16. The effects of different palliative treatments on the S-N curves for a 2014 aluminum
alloy fretted with a 3.5%NiCrMoV steel bridge pad. (After Lindley & Nix, 1992.)
A three-dimensional computational simulation of fretting fatigue under conditions
of partial slip has been carried out by Giannakopoulos & Suresh (1998). They
examine the effects of superimposed compressive stresses on the evolution of stress
fields in the vicinity of the contact area, in an attempt to rationalize the beneficial
effects of shot-peening in fretting and to develop guidelines for the introduction of
compressive residual stresses. It is found that when a zero mean stress or a tensile
mean stress is superimposed on the fatigue specimen subjected to cyclic stresses and
fretting contact, the location of the maximum principal tensile stresses occurs in the
wake of the sliding contact. When a compressive mean stress is imposed, however,
the location of the principal tensile stress moves to the front of the contact region.
Thus, the onset of cracking is preferentially moved to the leading edge of fretting
contact in the presence of compressive residual stresses, a phenomenon
experimentally observed by Kuno et al. (1989). Giannakopoulos & Suresh also note that the
compressive mean stresses diffuse the effective stresses along the slip direction,
thereby reducing the depth to which these stresses penetrate into the substrate
under fretting.
The characterization of the detrimental effects of fretting fatigue is made in Fig.
13.16 by recourse to total life approaches. We note, however, that fracture mechanics
method can also be applied to the study of cracking induced in fretting fatigue. Such
defect tolerant approaches are considered in the example problem and the case study
to be presented in the following sections.
13.6 Fretting fatigue
469
13.6.4 Example problem: Fracture mechanics methodology for
fretting fatigue fracture
Problem:^
The singular stresses which develop at the edges of contact between a
sharp-ended pad and a planar surface can be determined from the asymptotic
crack-tip fields for equivalent geometries of cracked bodies. This asymptotic
matching technique, described in detail in Giannakopoulos, Lindley & Suresh
(1998), can be used in some cases to derive a life prediction methodology for
fretting fatigue. Conditions under which such a 'crack analogue' is applicable
include the contact between a rigid punch and a flat surface, or situations where
the combination of elastic properties of the sharp-edged punch and the planar
surface lead to square-root singularities.
Consider the two-dimensional contact between a flat-ended, straight-sided
punch which is fretted against a planar substrate with large outer dimensions,
Fig. 13.17(a). The normal contact force per unit contact length (which is normal
to the plane of the figure) is P and the tangential contact force per unit contact
length is Q. Assuming essentially incompressible deformation, the distribution
of normal contact pressure, p(x), and the tangential traction, q(x), for this
problem are known to be (e.g., Johnson, 1985)
p(x)= ZL^, q{x) = —j^==. (13.51)
7tv a1 - x1 nwa1 - xl
The loading conditions in Fig. 13.17(a) are such that P is constant while Q
cyclically varies in the range — Qmax < Q < +Qmax. The width of the punch is
2a. It may be assumed that the plane-strain contact fatigue problem considered
here can be treated primarily as linear elastic and that any plastic zones which
might develop at the contact boundaries are much smaller than the contact
width 2a.
(i) The asymptotic singular fields which develop at the boundaries of contact
in Fig. 13.17(a) can be determined by recourse to the asymptotic stress
fields at the tip of a double edge-cracked specimen which is schematically
shown in Fig. A. 1(c). For this purpose, the width of the contact zone 2a in
Fig. 13.17(a) is made equal to the uncracked ligament length (W — 2d) in
Fig. 13.17(6), and the crack length a is assumed to be infinitely large in
Fig. A. 1(c) because of the large dimensions of the substrate in Fig. 17(a).
(If W is the width of the fretted substrate in Fig. 13.17(a), then the crack
length a in Fig. A. 1(c) is identified with {W — 2a)/2 in Fig. 13.17(a).) This
analogy is illustrated schematically as the double edge-cracked plate in
Fig. 13.17(6) which is loaded with a compressive normal (mode I) load P
(per unit length) and an in-plane (mode II) shear load Q (per unit length).
This example problem is derived from Giannakopoulos, Lindley & Suresh (1998).
470
Contact fatigue: sliding, rolling and fretting
Ao„
-a
\ /^
\ r
p(x)
\
rrn
-H
*
1
-I-
0
v
^
fretting pad
a x,x
substrate /
(«)
Ao.
(*)
Fig. 13.17. (a) Schematic of the contact between a flat-ended punch and a planar surface of
the same material, and the associated nomenclature, (b) Equivalent geometry of a double
edge-cracked plate and the definitions of various geometrical and loading parameters
associated with fretting fatigue fracture.
By asymptotically matching the stress fields at the boundaries of the
contact in Fig. 13.17(a) with the corresponding crack-tip stress fields in
the equivalent crack geometry shown in Fig. 13.17(6), find the stress
intensity factors Kt and Ku for the cracked plate in Fig. 13.17(6).
(ii) The contact conditions are such that P = 39.4 kN/m, while Q cyclically
varies in the range ~2max < Q < +2max> with Qmax = 16 kN/m, and
2a = 12.7 mm. It is known from fatigue crack growth experiments that
the threshold stress intensity factor range, AK0, for small fatigue cracks
(of characteristic length typically smaller than 1.5 mm) varies with load
ratio R in the following manner: AK0 = (2.7 - 1.9J?) MPaVm. It is found
experimentally that a fatigue crack of length, /c = 0.64 mm in Fig.
13.17(6), initiates at the left contact edge at an angle a. If it can be
assumed that the continued growth of this fatigue crack occurs along a
13.6 Fretting fatigue
471
direction where Ak2 = 0, and that linear elastic fracture mechanics can
be applied to characterize fatigue crack growth, find (a) the angle a and
(b) whether the crack would arrest or continue to advance.
(iii) Now consider the situation where the contact loads are significantly
increased: P = 176.5 kN/m, while Q cyclically varies in the range
~2max 5 Q 5 +2max> with Qmax = 236.2 kN/m. The contact width 2a
remains the same as before. The fretted substrate is now additionally
subjected to a uniform cyclic tensile stress which fluctuates in the range
110 MPa < <7app < 140 MPa. In this case, the fatigue crack would initially
start from the contact edge at an angle a under the influence of P and AQ.
However, once it propagates over some critical length lc, its continued
growth is expected to be governed solely by the applied uniform fatigue
stress A<7app. Consequently, the crack would be expected to deflect in such
a way that it advances perpendicularly to the direction along which A<rapp
is applied, as shown in Fig. 13.17(6). (a) For these conditions, find a and
lc. (b) Does the crack arrest in this case?
(iv) For the loading conditions in part (iii), determine the total fretting fatigue
life if the fracture toughness of the substrate, Kic = 95 MPaVm and if its
crack growth rate (over the entire range of crack advance considered here
for any R ratio) can be characterized by the Paris law, dl/dN = C(Ak\)m,
where C = 10.8 x 10"12 (MPa)"3m"1/2, m = 3 and / is the appropriate
crack length dimension.
Solution:
(i) In order to carry out asymptotic matching between Figs. 13.17(a) and (b),
move the coordinate system from the center of contact to the edge of
contact in Fig. 13.17(a). In this new coordinate system, x* = x - a, and
y* = y. The x*-y* axes are also located at the crack-tip in Fig. 13.17(6).
Now consider the asymptotic stress fields for the traction distributions
given in Eq. 13.51 in the limit of x* —*■ 0, from which it is seen that
for mode I,
for mode II. (13.52)
K*j2ax*
Q
"xy x-y r: r>
7tV2ax*
Using Eq. 9.52, we note that
as x* -+ 0. (13.53)
yy V2^' xy V2^'
Comparing Eqs. 13.52 and 13.53, it is apparent that
P O
K! = —=, Kn=-f=. (13.54)
Vfttf vita
472
Contact fatigue: sliding, rolling and fretting
These stress intensity factor results are exactly the same as those listed in
stress intensity factor handbooks (e.g., Tada, Paris & Irwin, 1973) for the
double edge-cracked plate geometry shown in Fig. 13.17(6). Note also
that the above mode I stress intensity factor is the limiting value of Eq.
A.4 for a -*■ oo. (The negative value of Kt in Eq. 13.54 is a consequence of
P being compressive. Implicit in this stress intensity calculation is the
assumption that the crack is nonclosing under compression.)
Thus we have shown that there exists an equivalence, in the asymptotic
limit, between the singular stress fields at the contact boundaries and
those at the tips of cracks in analogous geometries. Consequently,
known fracture mechanics solutions can be applied to contact
mechanics problems or vice versa, under appropriate geometrical and
loading conditions. It should be emphasized, however, that this
equivalence of fields holds only in the asymptotic limit,
(ii) It is stated that the crack advances in a plane in which Ak2 = 0. The local
stress intensity factors for the deflected crack geometry can be determined
from the solutions given in Eqs. 9.116 and 9.117.
(a) Specifically, use the expression for k2 in Eq. 9.116, in conjunction with
Eqs. (1) (where P = 39.4 kN/m, AQ = ±16 kN/m, and a = 6.35 mm is
one-half of the contact width), and solve for a by invoking the condition
that Ak2 = 0. Numerical solution yields that a = 36°.
(b) Note from Eq. 9.116 that although P (and hence K\) is fixed, k\
fluctuates because Ku fluctuates. Using Eqs. 9.116 and 9.117 with
a = 36°, we find that, for the given loading conditions, Ak\ «s 0.4
MPaVni- This value of the local mode I stress intensity factor range is
much smaller than the threshold stress intensity factor range, AK0, for any
R ratio. Hence, we conclude that the small fatigue crack inclined at an
angle of 36° to the surface would arrest.
Comment: Fretting fatigue experiments (Lindley & Nix, 1991) conducted
on a rotor steel for the same geometrical and loading conditions as in the
present example have shown that the small fatigue crack initiates at an
angle of 30° to the fretted surface, and that it arrests after growth over a
distance, lc * 0.6 mm. See the case study in the next section for further
details,
(iii) Use the expression for k2 in Eq. 9.116, in conjunction with Eqs. 13.54
(where P = 176.5 kN/m, AQ = ±236.2 kN/m, and a = 6.35 mm is one-
half of the contact width), and solve for a by invoking the condition that
Ak2 = 0. Numerical solution yields that a = 57°. Substituting this value
ofa in Eq. 9.116, it is seen that A^! = 7.2 MPaVm. Since this value of the
mode I stress intensity factor range is significantly larger than AK0, the
fatigue crack is expected not to arrest.
13.6 Fretting fatigue
473
As shown in Fig. 13.17(6), the fatigue crack which initiates at an angle
of 57° to the surface would first propagate under the influence of P and
A Q over a distance of lc, before deflecting again to advance normally to
A<7app. This transition in crack growth occurs when the local 'driving
force' for fatigue crack growth due solely to A<7app begins to exceed
that due solely to P and AQ. At the critical length lc, the local Aki due
to Aorapp is:
I 1/2
Aki = 1.12Aorapp{rt • (/csina)} ' > 7.2 MPaVm, (13.55)
where (/c sin a) is the projected length of the fatigue crack normal to the
uniform cyclic tensile stress. Using A<rapp = 125 MPa, a = 57°, we find
that /c = 1 mm.
Comment: Experiments by Lindley & Nix (1991) show that for the
conditions of the calculations carried out in this part, a «* 60°.
(iv) The total number of fatigue cycles, N, prior to catastrophic failure
comprises two parts: (1) the number of cycles, N\, of fatigue crack growth
along the initial angle a, and (2) the number of cycles, N2, of fatigue crack
growth perpendicular to A<7app, such that N = N\ + N2.
Integrating the Paris equation for the initial crack growth along the
angle a, with Aki = 7.2 MPaVm, lc = 1 mm along with the given
values of C and m, it is seen that
rk
d/ lc 2.48 x 10⁵ cycles. (13.56)
0 C(Akx)m C(Akx)>
The fatigue crack would propagate perpendicularly to A<rapp until a crack
length of hc, as shown in Fig. 13.17(6), when the maximum stress intensity
factor of the uniform tensile loading approaches the fracture toughness of
the material, i.e. until
l-12orapPiinaxV/ir^^. Klc. (13.57)
Substituting orapp>max = 140 MPa and Klc = 95 MPaVm into this
equation, we find that hc = 117 mm.
The number of cycles N2 is found from
^ d/
N,=
/csina C(1.12A<7appV7t/)"
1 2
■j(/csin«)(2-m)/2-^2-m)/2j
C(1.12ACTappVS)m m-2
= 2.42 x 10⁵ cycles. (13.58)
The total fatigue life then is N = N\ + N2 = 4.9 x 10⁵ cycles.
474
Contact fatigue: sliding, rolling and fretting
13.7 Case study: Fretting fatigue in a turbogenerator rotor
This case study deals with the failure of a 660 MW turbogenerator rotor in
England during the 1970s as a result of fatigue cracking. The crack initiated and
advanced by fretting fatigue in the rotor tooth contact land in the vicinity of the gaps
between the longitudinal stiffness compensation wedges. This case study is predicated on
the failure analysis by Lindley & Nix (1991).
13.7.1 Design details and geometry
The difference in flexural stiffness between the winding and pole axes of generator
rotors is generally compensated by one of two methods. In one approach, transverse slots
are machined in each pole face (the so-called 'cross-gashing' technique). In the other
method, relevant to the present case study, longitudinal slots are machined along the
entire length of the pole faces to facilitate stiffness compensation, Fig. 13.18(a). A
consequence of this procedure is that the flexural stiffness is reduced. However, since high
magnetic flux densities occur in the pole, steel filler blocks and retaining wedges, Fig.
13.18(6), are used to replace most of the machined away steel in order to minimize
magnetic saturation. The rotor shaft is made of an AISI 3.5%NiCrMoV steel, while the
wedges are made of an AISI l%CrMo steel and the filler block, of mild steel.
Figure 13.19(a) shows the overall detail of the pole face slot and the location of the
wedges and filler blocks. The cross section and elevation views of the wedge geometry are
illustrated in Figs. 13.19(6) and (c), respectively. The gaps between the stiffness
compensation slot wedges in the rotor tooth contact land were the sites for the initiation
of fatigue cracks. There is no restriction, in principle, on the precise location of the
wedges in the slots and on the gap between adjacent wedges. The wedge ends, however,
were chamfered at the contact land, as shown in Fig. 13.19(c), to ensure a minimum
wedge gap of approximately 1 mm. Figure 13.19(0*) shows the likely distribution of
frictional forces at the maximum load, and the location where a fretting fatigue crack
initiated.
13.7.2 Service loads and damage occurrence
Most high-cycle fatigue problems, including fretting fatigue, in the rotors of
turbogenerators arise from self-weight bending. Mean stresses vary with rotational speed
due to centrifugal forces and to the changes in the level of shrink fit. The normal contact
pressure varies with rotational speed; as the speed increases, the stresses due to shrink fit
generally decline whereas the stresses due to centrifugal loading increase. This trend
results in different fretting fatigue conditions at any one critical location during operation
at the following three typical running speeds: (1) barring which is a low speed operation
intended to avoid thermal distortion due to sagging which arises from self-weight
bending;f (2) normal operation at 3000 rpm; and (3) overspeed testing at approximately
With the relatively high thermal efficiency of the 660 MW turbogenerator, barring would be kept to a
minimum. But, during maintenance periods, such as those arising during the repair of a boiler problem,
the barring operation would be carried out.
13.7 Case study: Fretting fatigue in a turbogenerator rotor
475
(£ of poles
<f)
(*)
Fig. 13.18. (a) Schematic of a section through the longitudinally slotted pole face of a
turbogenerator rotor. The outer diameter of the pole face is 1.12 m. (b) Details of the pole
face slot showing the wedge and the filler block. After Lindley & Nix (1991).
3300 rpm. The contact pressure between the wedge and the rotor tooth contact land
(Figs. 13.19(a) and (b)) during barring was estimated to be 30 MPa, while that during
normal operation was 300 MPa.
The occurrence of a marked increase in the vibration levels of the generator rotor
prompted ultrasonic inspection which confirmed the presence of several major cracks
near the mid-span of the rotor, Fig. 13.20. Subsequently, two large 660 MW generators
were taken out of service and were subjected to metallographic and fractographic
analyses. It was discovered that the relative movement between the retaining wedge and
the rotor teeth contact lands had led to the initiation of cracks by fretting fatigue, under
the influence of the cyclic self-weight bending stresses.
Under typical service conditions at 3000 rpm, the retaining wedges effectively stick to
the rotor contact lands under the high contact pressure (~ 300 MPa) arising from
centrifugal loading. Given this 'stick contact', the free edge at the gap between the wedge
and the rotor tooth (see Fig. 13.19(d)) becomes a site of stress concentration at which a
small fretting fatigue crack (typically 0.25 mm deep) begins to advance into the rotor
tooth. This is illustrated as stage 2 in Fig. 13.20(6). The bending of the tooth head, as a
consequence of the centrifugal forces applied by the wedges and filler blocks, induces high
tensile stresses locally around the tooth neck fillet radius. These tensile stresses cause
continued growth of the fretting fatigue crack, which is marked as stage 3 in Fig. 13.20(6).
The presence of high tensile residual stresses introduced by slot machining caused crack
growth in stage 4 both across and down the tooth neck. Residual stress measurements
were made both by employing the X-ray method and by hole-drilling at the center of a
strain gage rosette to obtain the three-dimensional profile. These measurements indicated
476
Contact fatigue: sliding, rolling and fretting
rotor tooth
filler block
(«)
wedge contact land
width of contact zone = 5 mm
crack locations
Fig. 13.19. Details of the fretting fatigue location, (a) Overall view of the pole face slot.
(b) Cross section view.
13.7 Case study: Fretting fatigue in a turbogenerator rotor
477
wedge length = 152 mm
U.
nA-
* wedge contact land
\
\
(c)
wedge contact gap
crack
rotor tooth
wedge center line
Fig. 13.19 (continued) (c) elevation view of the wedge geometry, (d) Likely friction force
distribution in the rotor tooth and crack initiation site. All dimensions are in mm. (Courtesy
of T.C. Lindley.)
a peak tensile stress of 370 MPa, decaying to zero at a depth of 3 mm beneath the surface.
(Had these tensile stresses not been present, the crack initiated by fretting fatigue would
have arrested in stage 4 in the tooth neck region, as inferred from fracture mechanics
analyses. See the example problem in the preceding section.) Once the crack reached the
bottom of the pole teeth in Stage 5, it was evident from both fracture analysis and beach
mark observations that the final growth to the rotor bore had taken place rapidly, within
a matter of a few thousand hours. The photographs in Fig. 13.21 show the actual fretting
fatigue failure processs described above.
478
Contact fatigue: sliding, rolling and fretting
(£ of poles
Stage 3.—
Growth around
radius
Stage 2.
Initial crack
growth
Stage 4.
Growth around
T-slot
Stage 5
Growth into
rotor body
Stage 1.
Fretting initiation
(a)
(b)
Fig. 13.20. (a) Regions of major cracking in the rotor mid-span position where the maximum
bending moment occurs, (b) Different stages of crack development. After Lindley & Nix
(1991).
'»,
\
■*
1 ^
(°)
-•CSl
Fig. 13.21. (a) An overall view of the fatigue failure in the pole face slot near the rotor mid-
span.
13.7 Case study: Fretting fatigue in a turbogenerator rotor
479
\
crack initiation
point
2 cm
(6)
:^V .
"v
&*-~'
'/* *v
.V
(c)
Fig. 13. 21 (continued) (b) Crack development from the tooth-wedge contact land, (c) The
initiation of a small fretting fatigue crack, very similar to that found in the cracked rotor,
in a laboratory simulation of the failure. The arrows denote the crack tip. (Photographs
courtesy of T.C. Lindley.)
480
Contact fatigue: sliding, rolling and fretting
On the basis of computational stress analyses of the rotor components, under
representative service conditions, and from the estimation of local effective stress
intensity factors using the numerical methods available at the time of failure analysis,
Lindley & Nix (1991) estimated the likelihood of propagation of fretting fatigue cracks in
the generator rotor. Figure 13.22 shows the estimated values of the effective applied stress
intensity factor range, AATapp, and effective threshold stress intensity factor range, AATth,
as a function of the depth of the crack initiated at the contact land (Fig. 13.19(d)), with
and without fretting, for loading conditions pertaining to barring. Note that fretting
markedly raises AATapp. The value of AATth is determined by the material, and the local
stress fields which influence the effective mean stress; these threshold stress intensity
values were determined from long crack fatigue threshold data for the rotor steels
subjected to mode I tension-tension and tension-compression fatigue loading.f The
small increase in AATth for fretting stems from the elevated level of compressive stress due
to contact pressure, which lowers the mean stress. The point of intersection of the AATapp
vs a and AATth vs a curves gives the critical size of the defect, acr, which is capable of
subsequent growth by fatigue. Figure 13.22 shows that aa « 0.25 mm, a crack size
similar to the likely initial defect for the generator rotor. Under nonfretting conditions,
several millimeters of initial crack depth would have been necessary for the crack to grow
by fatigue, since AKth > AATapp.
In summary, the analyses of fracture in the generator rotor indicated that the growth
of small fretting fatigue cracks occurring at the gap between the longitudinal stiffness
25
20-
1 15
a,
s
5 io
fretting
AKa,
no fretting
0.0
0.2
0.4 0.6
crack depth (mm)
1.0
Fig. 13.22. Estimates of the effective applied stress intensity factor range, AA^app, and
effective threshold stress intensity factor range, AA,h, as a function of the depth of the crack
initiated at the contact land. The plots show the crack driving force with and without fretting.
After Lindley & Nix (1991).
Although these estimates could be improved somewhat by considering small crack threshold data and
mixed-mode effective threshold stress intensities representative of local fretting conditions, the simple
criteria adopted in the original failure analyses appear to have captured the salient features of the actual
failure processes reasonably accurately.
Exercises
481
compensation wedges was likely to occur under barring conditions. The critical defect
size, acr « 0.25 mm, for the continued advance of the crack during barring was
comparable to the size of the fretting defects likely to be present at the rotor tooth contact
land, due to cyclic slip (fretting) between the wedge and the contact land during barring
when the contact pressure was low. The analyses thus predicted that the rotor would be
under a high risk of fretting fatigue failure at this location, consistent with the actual
occurrence during the service life of the generator rotor.
As a consequence of the above failure in the generator rotor arising from fretting
fatigue at the ends of short wedge bars, the design was changed to continous wedge bars,
with no gaps, made from a high strength aluminum alloy to avoid further failure
occurrence.
Exercises
13.1 Frictionless normal indentation of a surface by a sphere was considered in
Section 13.2.1.1.
(a) Prove the statement in that section that the maximum tensile normal
stress is
<*r =—3—/W- (E13.1)
(b) Show that it occurs at the periphery of contact, r = a.
(c) Discuss the consequences of this maximum stress for fatigue cracking in
(a) polycrystalline aluminum oxide, (b) PMMA and (c) commercially
pure aluminum during cyclic indentation.
(d) Describe qualitatively how a layer of residual compressive stress at the
surface would affect the magnitude and location of this maximum
stress.
13.2 The surfaces of metallic materials are usually shot-peened for the purpose of
suppressing crack formation due to contact fatigue.
(a) Suggest at least three methods for enhancing the contact fatigue
resistance of ceramic surfaces.
(b) List the advantages and disadvantages of each method.
13.3 Consider the example problem in Section 13.2.3.1 where a planar surface
with a residual compressive stress is subjected to cyclic normal indentation
without friction. If the equi-biaxial residual compressive stresses at the
indented surface were to be ax\R = cry\R = — 0.5<ry, where ay is the yield
strength of the material, calculate how much higher normal indentation
force P can be applied without plastically yielding the surface as compared
to the case where the surface has no residual compressive stresses.
13.4 Compare the shakedown limits for pure rolling (no friction) with those for
tractive rolling (with a high friction coefficient). Which is higher? Why?
482
Contact fatigue: sliding, rolling and fretting
13.5 List at least four practical applications where each of the following contact
fatigue damage processes is possible: (a) galling, (b) spallation, and (c)
pitting.
13.6 Consider the example problem in Section 13.6.4. If the substrate which is
contact-loaded with a punch were to be of finite width W = 6a (where 2a is
the width of the contact zone), instead of being infinitely wide, repeat part (i)
of that problem and find the mode I and mode II stress intensity factors for
the equivalent crack analogue. You may assume that the depth of the
substrate beneath the punch is infinitely large.
13.7 Consider a circular cylinder which is pressed 'end on' against a flat surface
of the same material.
(a) Find an equivalent geometry of a cracked body where the asymptotic
crack-tip fields are the same as those around the contact zone boundary
between the cylinder and the flat surface.
(b) Determine the distribution of crack-tip fields using fracture mechanics
solutions and compare them with the solutions given in any monograph
on contact mechanics. Show that they are equal in the asymptotic limit.
CHAPTER 14
Retardation and transients in fatigue
crack growth
The discussions presented in Chapters 9-12 focused on constant amplitude
cyclic loading situations where the nominal stress intensity factor amplitude (for
fixed load ratio and environmental conditions) and/or the maximum stress intensity
factor uniquely govern the rates of crack advance in ductile and brittle solids. There
are, however, a variety of situations where the local or effective stress intensity factor
range or peak value at the crack tip, which is responsible for fatigue crack growth,
can be markedly different from the nominal imposed value. These differences
between the apparent and actual 'driving force' for fatigue fracture may stem
from such effects as (i) premature closure of the crack faces even under fully tensile
far-field cyclic loads, (ii) periodic deflections in the path of the crack due to mciros-
tructural impediments to fracture or changes in local stress state and mode mixity,
(iii) shielding of the crack tip from the far-field, applied loads by the residual stress
fields generated within the cyclic plastic zone or stress-induced phase
transformations, and (iv) by the bridging of the faces of the crack by fibers, particles, intact
grains or corrosion products. These processes, many of which are applicable to
crystalline and noncrystalline as well as brittle and ductile solids, can lead to an
apparent retardation of the fatigue crack growth and hence can possibly enhance the
damage-tolerance characteristics of fatigue-prone materials and structures. It is,
therefore, not surprising to note that considerable research effort has been devoted
to the study of these 'extrinsic' mechanisms of fatigure fracture whereby the apparent
crack propagation rates can be markedly altered even when the intrinsic resistance of
the material to fracture remains unaltered. The study of crack retardation
mechanisms under constant amplitude fatigue loading is essential for developing accurate
life prediction models and for improving microstructural design for enhanced
damage tolerance.
While the study of constant amplitude fatigue provides valuable insights into the
mechanistic processes by which fatigue failure occurs, structural components used in
practical applications are invariably subjected to variable amplitude fatigue loads.
The extrapolation of scientific knowledge gathered on the constant amplitude fatigue
of materials to the more realistic situations involving varying amplitudes of cyclic
stresses or strains is a challenge for engineers and scientists alike. This problem is
further compounded by the seemingly different effects induced by variable amplitude
fatigue loads on the resistance of a material to crack initiation and crack growth.
Traditional models based on the damage accumulation concepts (see Chapter 7)
imply that the total fatigue life of a (nominally defect-free) component is decreased
by the application of periodic overloads. However, experimental observations on
483
484
Retardation and transients in fatigue
variable amplitude fatigue crack growth in a wide variety of metallic and
non-metallic materials have unambiguously established that the application of peridoic
overloads can significantly decelerate the rate of fatigute fracture. As discussed in
Chapter 1, this apparent contradiction is merely a reflection of the degree to
which the crack initiation stage of fatigue is quantitatively accounted for in the
life prediction models.
In this chapter, we begin with a discussion of various mechanisms by which crack
growth retardation occurs in materials even under constant amplitude cyclic loading.
These mechanisms include different types of crack closure processes, crack
deflection, phase transformations and crack bridging. We then direct attention at crack
growth retardation or acceleration under variable amplitude fatigue where the effects
of tensile and compressive overloads, block overloads and underloads, as well as
load sequence effects are examined. It is demonstrated that variable amplitude and
spectrum loads can have a distinctly different effect on the characteristics of fatigue
crack growth than on fatigue crack initiation (which was addressed in Chapters 7
and 8).
14.1 Fatigue crack closure
The possibility that a fatigue crack can close even at a far-field tensile load
was first rationalized by Elber (1970, 1971) on the basis of experimental
observations. By monitoring changes in the compliance of thin sheets of cracked 2024-T3
aluminum alloy, Elber argued that a zone of residual tensile deformation is left in the
wake of a fatigue crack tip. The attendant reduction in crack opening displacement
gives rise to premature contact between the faces of the crack and causes a reduction
in the apparent 'driving force' for fatigue crack advance.
Additional mechanisms of crack closure have been identified which have
broadened the application of crack closure to rationalize a significantly greater number of
fatigue crack growth characteirstics than what was originally anticipated from
Elber's work. Experimental observations published in the later 1970s and early
1980s established that Elber's mechanism was not the sole cause of closure, but
that other types of closure phenomena also influence the rate of fatigue crack
advance. On the basis of their own results and of the work of other researchers,
Ritchie, Suresh & Moss (1980), Suresh, Zamiski & Ritchie (1981), and Suresh &
Ritchie (1982a, 1984a) categorized the various forms of fatigue crack closure that are
induced by a variety of mechanical, microstructural and environmental factors, and
coined the expression 'plasicity-induced crack closure' for Elber's closure due to
residual plastic stretch at crack wake. The additional sources of closure arise as a
result of: (i) corrosion layers formed within a fatigue crack (oxide-induced crack
closure), (ii) microscopic crack closure), (iii) viscous fluids penetrated inside the
14.1 Fatigue crack closure
485
crack (viscous fluid-induced crack closure), and (iv) stress- or strain-induced phase
transformations at the crack tip (transformation-induced crack closure).
While concepts of fatigue crack retardation were developed over the years mainly
in the contact of fatigue in conventional metals, expanding interest in the fatigue of
advanced metallic systems, nonmetallic materials and composites has led to a surge
in research on several other mechanisms which impede the growth of (constant
amplitude) fatigue crack growth. These mechanisms include: (i) crack deflection,
(ii) crack-bridging or trapping, and (iii) crack-shielding due to microcracking,
crazing and phase transformations. Figure 14.1 schematically illustrates the various
mechanisms by which the growth of a fatigue crack can be retarded. These processes
are considered in this chapter in the context of constant amplitude and variable
amplitude fatigue, f
plastic
wake fatigue
crack
current
plastic
zone
(fl)
oxide film
(b)
(e)
transformed zone
crack
if)
obstacle
fracture surface asperity
(g)
crack
(c)
fibers
viscous fluid
crack
particles
W)
(h)
Fig. 14.1. A schematic illustration of the mechanisms which promote retardation of fatigue
crack growth in constant amplitude fatigue, (a) plasticity-induced crack closure; (b) oxide-
induced crack closure; (c) roughness-induced crack closure; (d) fluid-induced crack closure; (e)
transformation-induced crack closure; if) crack deflection; (g) crack-bridging by fibers; (h)
crack-bridging (trapping) by particles.
t Quantitative analyses of the mechanics of these processes were addressed in Chapters 5, 6, 9, 11 and 12.
486
Retardation and transients in fatigue
It is noted at the outset that the evolution of different crack closure and
retardation mechanisms during both constant amplitude and variable amplitude fatigue is a
process that can not be quantified accurately. These processes can be strongly
influenced by even small variations in the path of the crack, environmental conditions,
loading conditions and testing methods. Different retardation mechanisms assume
different levels of significance in different microstructures even in the same class of
materials. In addition a number of these mechanisms can simultaneously influence
the overall crack growth behavior such that it is often impossible to identify the
individual contributions to the overall crack growth rates from each of these
retardation or shielding mechanisms. It is, therefore, not surprising that there exists
considerable controversy and difference of opinion on the applicability and
significance of different retardation mechanisms to the fatigue crack propagation. Since it
is not possible to draw universal conclusions on the influence of each mechanism in a
broad range of fatigue situations, we present in this chapter, in as quantitative and
general terms as possible, the mechanistic origins, conditions of applicability, and
dependence on microstructural, environmental and loading conditions of various
retardation mechanisms.
14.2 Plasticity-induced crack closure
The application of linear elastic fracture mechanics to characterize the rate
of fatigue crack growth is predicated upon the assumption that a fatigue crack can be
idealized as a saw-cut of zero thickness. Such an assumption has the tacit implication
that the fields ahead of the fatigue crack tip uniquely determine the conditions for
the propagation of the crack in small-scale yielding. Experiments by Elber (1970,
1971) suggested that crack growth rates are not only influenced by the conditions
ahead of the crack tip, but also by the nature of crack face contact behind the crack
tip. Since the conditions extant in the wake of the crack tip are a result of such
factors as the history of loading, the length of the crack and the stress state, Elber's
work also brought to light the very dependence of fatigue crack growth rates on
prior history.
14.2.1 Mechanisms
An atomically sharp notch or a saw-cut closes only at zero or compressive
loads. However, the propagation of a fatigue crack gives rise to a wake of material
that has previously been deformed plastically. Figure 14.2 shows the development of
a plastic wake for three different crack lengths for a fatigue crack which propagates
under a constant amplitude of cyclic tensile stresses (i.e. an increasing AK value).
During one cycle of crack growth, residual tensile strains are left in the material
behind the advancing crack front, as only elastic recovery occurs after the creation of
14.2 Plasticity-induced crack closure
487
notch fatigue crack
/ / plastic zone
«yu
Fig. 14.2. The development of an envelope of prior plastic zones around an advancing fatigue
crack. (After Elber, 1970, 1971.)
the fracture surfaces. With an increase in the stress intensity factor and the size of the
plastic zone due to crack advance, the material which has previously been deformed
permanently within the plastic zone now forms an envelope of plastic zones in the
wake of the crack front.
By mounting strain gages above and below the plane of the crack, about 2 mm
behind the crack tip, along the side surfaces of a center-cracked aluminum alloy
specimen, Elber measured the far-field tensile load at which the two fracture surfaces
opened completely during the fatigue cycle (Fig. 14.3). If one monitors the variation
of the applied stress a or load P as a function of the displacement of the crack faces S
(or the displacement of two reference points located just above and below the crack
plane) at some distance behind the crack tip, the stress in the fatigue cycle at which
the crack becomes fully open can be inferred. A schematic of the typical variation
between a and S, as the specimen is unloaded fully from the far-field stress, is
provided in Fig. 14.3.
In the regions between points A and B, the a—8 plot exhibits a constant slope
which is equal to the measured stiffness of an identical sheet with a saw-cut of the
same length as the fatigue crack. This implies that the fatigue crack is fully open until
the nominal stress is reduced from <rmax to aop. As unloading continues from point B
to point C, the second derivative of the stress-displacement curve, d2<r/d<52 becomes
negative. Closure of the crack faces is the only possible mechanism which can induce
a change in d2a/dS2 as shown in the region between points B and C in Fig. 14.3. In
the final stages of unloading beyond point C, the stress-displacement curve exhibits
Retardation and transients in fatigue
strain
gage
fatigue
crack
(«)
Fig. 14.3. A schematic of the relationship between the applied stress and the displacement
measured by the strain gages. (After Elber, 1970.)
a linear variation, with the slope of the line CD being equal to the stiffness of an
identical notched plate without the fatigue crack (shown in Fig. 14.3 by the straight
line OE). This result indicates that the crack is closed below the stress level
corresponding to point C. Under zero far-field stress, S0 is the residual crack opening
displacement which is equal to the difference in the S values between the saw-cut and
the fatigue crack at the crack length where the reference strain gages are mounted.
The compliance plot in Fig. 14.3 can also be presented in terms of the stress intensity
factor K rather than the stress.
Figure 14.4(a) schematically shows a compliance curve typical of many alloys
where the variation of the stress intensity factor during both the loading and
unloaded
fully
open
crack
partially"
open
crack _£_
fully
closed
crack _1_
Fig. 14.4. (a) A plot of the stress intensity factor K as a function of the crack opening
displacement during a complete fatigue cycle, (b) Modification of the compliance plot using the
offset procedure.
14.2 Plasticity-induced crack closure
489
ing portions of the fatigue cycle is plotted against the displacement measured on the
side or back faces of the specimen (by strain gages) or at the crack mouth (by a clip
gage). As the cracked specimen is loaded in tension, it initially remains closed until a
certain stress intensity factor (denoted by the open circle in Fig. 14.4(a)) is reached.
At this point, the crack gradually begins to 'peel open'. The crack opens fully at the
stress intensity factor Kop. Upon unloading, the first contact between the crack faces
occurs at the closure stress intensity Kd. Below this loading point, the crack
gradually closes. Complete crack closure occurs at the tensile stress intensity factor
denoted by the open circle.
An offset procedure is commonly used to identify the crack opening stress
intensity from the compliance curve. In this method, an offset displacement <5off is
computed by subtracting a displacement corresponding to the fully open configuration of
the crack. Between Kop and Kmax, the displacement S = aK, where a is a
proportionality constant. The offset procedure for closure measurement involves the
subtraction of a proportion of the load signal from the displacement transducer signal using
a simple summing amplifier. The resulting signal may be amplified electronically by a
factor of up to 1000 (e.g., Fleck & Smith, 1982). The offset displacement is defined as
<5off = Gi(S — aK), where Gj is the gain of the electronic circuit. When the crack is
fully open, <5off = 0. When the crack begins to close, the <5off trace takes a nonzero
value. Figure 14.4(6) illustrates the variation of the stress intensity factor with the
offset displacement during a complete fatigue cycle.
The following points should be noted in the context of crack closure
measurements: (i) Since the crack closes gradually during a reduction in the far-field stress
intensity factor, there is no unique definition for the closure stress intensity factor.
Sometimes an average closure stress intensity factor, which is the mean value of the
stress intensity factors corresponding to the points of complete opening and
complete closure, is used, (ii) The stress intensity level for the first contact between the
crack faces during unloading and the stress intensity level required for the complete
separation of the fracture surfaces during loading are generally different because of
compressive crushing induced by crack closure (see the next subsection). Such
deformation and frictional contact between the mating fracture surface asperities also
introduces a hysteresis in the K—S plot, as shown in Fig. 14.4.
Elber argued that the crack can propagate only during that fraction of the fatigue
loading cycle in which the crack faces are separated. The effective stress range, A<reff,
and the corresponding effective stress intensity factor range, AATeff, which are
responsible for crack growth are then given by
A<reff = <rmax - <70p = UAcr, AA:eff = Kmax - Kop = U AK, (14.1)
where Act and AK are the applied stress range and the stress intensity factor range,
respectively. The corresponding characterization of fatigue crack growth rates based
on LEFM becomes
% = C(AKeK)m = C(UAK)m. (14.2)
490
Retardation and transients in fatigue
For the 2024-T3 aluminum alloy sheet specimen fatigue-tested (under predominantly
plane stress conditions) over a AK range of 13 to 40 MPaVm at test frequencies of
1 Hz and 30 Hz, and for variations in load ratio, R, of —0.1 to 0.7, Elber determined
that
—^ = 0.5+0.17? +OAR2. (14.3)
■**-max
While a plot of da/dN versus nominal AK (in the Paris regime) varied noticeably
with the load ratio R in Elber's experiments, a reformulation of the same set of data
in terms of the effective stress intensity factor range AKeK using Eq. 14.1 collapsed
the results for different R values into a single curve. Numerous subsequent studies
have provided empirical modifications to Eq. 14.3, which are specific to the
particular choice of material and testing conditions. It is now recognized that, in addition
to its dependence on R, U is strongly influenced by the specimen geometry, the stress
state, the stress intensity factor range and environment.
14.2.2 Analytical models
An analysis providing a justification for the use of AATeff to characterize
fatigue crack growth was developed by Budiansky & Hutchinson (1978). Their
model is presented in this section.
The main assumptions of this model are: (i) The (long) fatigue crack is subjected to
steady-state growth under plane stress and small-scale yielding conditions and is
propagated under constant Kmax. (ii) The crack opening displacements estimated
from the Dugdale analysis describe the opening profile of the fatigue crack at
Kmax with the exception that a residual stretch of previously yielded material is
attached to the crack faces, (iii) Upon unloading, this residual stretch leads to
contact over the entire length of the fatigue crack, (iv) In the immediate vicinity of the
crack tip, the residual displacements are determined by the reversed flow zone, (v) In
the region ahead of the crack tip, beyond the cyclic plastic zone, the plastic stretch
created at K = Kmax is left unaltered upon unloading.
The Dugdale expressions (see Section 9.5.2) for the plastic zone size and crack tip
opening displacement, respectively, are
^2
rp=KC
■=*(f). g©=yr^i-iiog
and <5t= — • (14.4)
y/ ayE
With the origin of the cartesian coordinate system located at the crack tip, the
variation of plastic stretch over the distance (0, rp) is given by
S
It
i + yr^l
l-yr^i
(14.5)
Given the possibility of compressive yielding over the distance, rc = rp/4, during
unloading from Kmax (Section 9.6), the residual plastic stretch at K\ = Kmin = 0 over
the interval (0, rp/4) becomes
14.2 Plasticity-induced crack closure
491
S
<K
1 ('
Ax
(14.6)
where <5t is the crack tip opening displacement at ATmax. In the interval (rc, rp), the
plastic stretch equals that given by Eq. 14.7. The plastic stretch at Kmin = 0 is one-
half the value at Kmax.
Budiansky & Hutchinson assume that for steady-state fatigue crack growth, a
plastic stretch of magnitude SR/2, which leads to crack closure all along the crack
length at Kmin = 0, is appended to the upper and lower crack faces. Using
Mushkelishvili's complex potentials formulation, it can be shown that this
approximation, in conjunction with the assumptions listed earlier, leads to the following
expressions for plastic stretch:
8r
St
k a
£-«
A(£)d£,
8r
St
k a
£
'£-«
A(£)d&
where
1
AG) = -*'(*) = 2 lo8
l+VT^l
(14.7)
(14.8)
and a is the ratio of cyclic plastic zone size rc for the growing crack to the mono tonic
plastic zone size (at Kmax) for the stationary fatigue crack. Equations 14.7 and 14.8
reduce to
(14.9)
A(*)d*
yfW^u)
K
~2
The numerical solution of Eq. 14.9 gives a = 0.092 86 and 8R/8t = 0.8562. In other
words, the reverse plastic zone size for a growing fatigue crack is less than 10% the
size of the maximum monotonic plastic zone and is less than 40% the size of the
cyclic plastic zone for a stationary fatigue crack in an ideally plastic solid.
Furthermore, the residual stretch left behind the advancing fatigue crack is as
high as 86% of the crack tip opening displacement at Kmax.
When the far-field stress intensity factor is reduced from Kmax, the crack opening
displacement along x < 0 varies with K as
S
si
J"©"©'©-
(14.10)
where
4 V KmJ
(14.11)
is the instantaneous size of the cyclic plastic zone at any point in the unloading
sequence. Noting that Eq. 14.10 has a local minimum in the interval (—oo, 0), the
values of x and rc at which the first contact between the fracture surfaces occurs (at
K„
K = Ka
< Kmax) during unloading can be determined from the conditions,
492
Retardation and transients in fatigue
The solution of Eqs. 14.12, in conjunction with the previously cited finding that
SR/St = 0.8562 and that a = 0.092 86, leads to the result
Kc,
K„
=1-J1-
C£=
0.483.
(14.13)
Figure 14.5(a) shows the process of crack closure as the far-field stress intensity
factor is reduced from a peak value of Kmax to the minimum value Kmin = 0. Note
the development of crack closure as the value of K/Kmax is decreased below 0.48.
Budiansky & Hutchinson further extend their analysis to predict the opening stress
intensity levels during reloading to K = Kmsix. As the fatigue crack is reloaded, the
crack faces open by a gradual peeling process whereby the boundary of the contact
region shifts toward the crackfront. K > Kop is the point of complete separation of
the crack faces. Figure 14.5(6) shows the crack opening profile and the development
of crack tip plasticity. Note the opening of the crack faces for K/Kmax values greater
than 0.557. As the crack attempts to retrieve its original configuration at K = Kmsix,
note that, for a/rp < x < 1, the yield stress oy is barely re-established and that no
further stretching occurs. It is also seen that, for plane stress plasticity-induced crack
closure, Kop/Kmax is only a function of load ratio R and that the predicted
relationship is quite close to that reported by Elber. Furthermore, the model leads to the
result that
<5t - <5R ^ 0.73
v-**-max -**-op/
Eov
8t-SR^ 0.54
v-**-max -*^cont7
Eav
(14.14)
#-=10 =rr=i*^.^_ x/r
-0.1-6.5 0 0.05 0.1 p
0.6
K,
K,
.cont _ 0 4g
o mih
0.1-0.050 0.050.1 Amax
M^n 0.94
o.8 in^
(«)
(7 = +(7 (7 = —(7
87
0.79
0.56
I1==i_ 0
(ft)
Fig. 14.5. (a) The process of plasticity-induced crack closure as the fatigue crack is unloaded
from K = Kmax to K = Kmja = 0. (b) The process of crack opening as the fatigue crack is
reloaded to K = KmiK. (After Budiansky & Hutchinson, 1978.)
14.2 Plasticity-induced crack closure
493
When compared with Eq. 9.86, this result implies that AATeff is a valid characterizing
parameter for fatigue crack advance under small-scale yielding conditions.
Budiansky & Hutchinson also explored the effects of strain hardening on
plasticity-induced closure. It was found that cyclic strain hardening enhanced the effects
of crack closure, whereas cyclic softening reduced closure levels.
The closure model by Budiansky & Hutchinson (1978) provides a comprehensive
theoretical treatment of the phenomenon of crack closure. The strength of the model
rests on the following features: (i) The analyses provide a theoretical justification for
the use of AATeff to characterize fatigue crack advance, (ii) The results rationalize the
effect of R ratio on crack closure in the Paris regime of fatigue and are consistent
with the experimental observations of Elber (1971) and of subsequent researchers for
aluminum alloys, (iii) The calculations provide valuable insights into the
development of monotonic and reversed flow plastic zones and plastic stretch during steady-
state fatigue crack growth and into the effects of strain hardening on closure. The
limitations of the model are: (i) The analysis pertains to plane stress deformation
whereas predominantly plane strain conditions exist over a wide range of fatigue
crack growth rates for most metals, especially in the near-threshold regime where the
strongest effect of closure is usually observed, (ii) The approach does not invoke any
mechanisms of fatigue crack growth, (iii) The model addresses just one aspect of
fatigue crack closure, while, as discussed in the sections to follow, other microstruc-
turally and/or environmentally enhanced crack closure effects may dominate over
plasticity-induced crack closure.
14.2.3 Numerical models
One of the earliest finite-element models of plasticity-induced crack closure
in plane stress was published by Ohji, Ogura & Yoshiji (1975). In their analysis, an
incremental plasticity model incorporating kinematic hardening was used and crack
growth was simulated by extending the fatigue flaw in each stress cycle by a
prescribed length which was equal to the finite-element mesh size. For a crack growth
distance of 0.5 mm (ten times the mesh size), the opening stress ratio U in Eq. 14.1
was found to be as low as 0.5 for a fatigue crack emanating from a sharp notch.
Although Ohji et al. did not explore the validity of AATeff to characterize fatigue
fracture over a wide range of R ratio or nominal AK values, their results indicated
that the strain amplitude in the vicinity of the crack tip scaled with AATeff.
In a parallel study, Newman (1976) also performed a two-dimensional
finite-element analysis for plane stress using the incremental theory of plasticity. The model
simulated crack growth by releasing the crack tip nodes and accounted for changing
boundary conditions associated with crack extension and intermittent contact of the
crack faces, without invoking any criterion for crack advance. The predictions of the
dependence of crack closure on R ratio were found to be consistent with the
experimental observations of Elber (1970) for aluminum alloys. These analyses have also
494
Retardation and transients in fatigue
been extended to study constant and variable amplitude fatigue in plane stress and
plane strain using the finite element method (e.g., Newman, 1976; Blom & Holm,
1985; Fleck & Newman, 1988; McClung & Sehitoglu, 1989) and the finite difference
method (Llorca & Sanchez Galvez, 1990).
There appears to be a consistency among the finite-element results in that they all
indicate a markedly reduced level of crack closure in plane strain than in plane stress.
This trend is also reflected in the three-dimensional elastic-plastic finite-element
analyses of fatigue crack growth in 'thick' center-cracked plates (Chermahini et
al, 1989). These authors found that the crack closure and opening stress varied
through the thickness of the cracked plate. On the specimen side surface and in
the mid-thickness plane, the crack opening stress levels approached the
two-dimensional solutions for plane stress and plane strain, respectively. There also exists an
apparent effect of specimen geometry on plastcity-induced crack closure in plane
strain. This effect can be rationalized in terms of the T-stress', which is the non-
singular term in the asymptotic expansion for the in-plane stresses in the linear
elastic crack analysis, Eq. 9.42. For a range of specimen geometries, the crack tip
displacement and the plastic zone size for stationary cracks in elastic-ideally plastic
materials are uniquely defined by the stress intensity factor K and the nonsingular
stress T (Fleck & Newman, 1988). While a variation in T-stress (induced by a
variation in crack geometry) has no significant effect on closure in plane stress, its
role in modifying plane strain closure for different crack geometries can be
pronounced.
The numerically predicted trends are also in qualitative agreement with the
experimental measurements of closure by Fleck & Smith (1982) at the surface and mid-
thickness sections of a 24 mm thick compact tension specimen of a low strength steel
(at AK — 25 MPaVm and R = 0.05) using a strain gage and a push-rod compliance
gage, respectively.! These experiments showed a reduced level of closure in plane
strain than in plane stress.
14.2.4 Effects of load ratio on fatigue thresholds
The effect of load ratio R on the fatigue threshold was discussed in Figs.
10.9 and 10.10. Schmidt & Paris (1973) employed crack closure concepts to
rationalize this influence of R ratio on fatigue threshold stress intensity factor AK0,
although plasticity effects on crack closure in plane strain are not dominant. For
a 2024-T3 aluminum alloy, they found a monotonic reduction in AKq with
increasing R up to a critical value (i?cr), beyond which AK0 was load ratio-independent
t In this method, closure measurements are made by interrupting the fatigue test and drilling two parallel
holes, 1.5 mm in diameter, behind the crackfront and along the mid-thickness section of the specimen.
From the top surface of the specimen, one hole is drilled to a depth of 1 mm below the fracture plane,
while the other one terminates at about 1 mm above the fracture plane. A push-rod assembly is then
attached to the specimen and the test is re-started. During fatigue loading, the relative displacements of
the bottoms of the holes are measured with a double cantilever clip gage. The point of change in slope in
the load-displacement plot is then used to measure the mid-thickness, plane strain closure level.
14.2 Plasticity-induced crack closure
495
dry hydrogen and helium
J I 1 L
0
0.0 0.2
0.4
R
(d)
0.6 0.8
Fig. 14.6. A model, due to Schmidt & Paris (1973), for the dependence of AK0 on R. (a)
Definition of nominal and effective stress intensity factors, (b) and (c) Predicted variation of
AK0 and Ko.max, respectively, with R. (d) Experimentally determined variation of AKo and
Ao.max with R for a 2iCr-lMo (AISI A542 Class 3) steel (bainitic microstructure, monotonic
tensile yield strength = 500 MPa) in laboratory air (23 °C, 30% relative humidity) and in
dehumidified hydrogen and helium environments. (After Suresh, Zamiski & Ritchie, 1981, and
Suresh & Ritchie, 1982b, 1984a.)
(Fig. 14.6). Assuming that (i) fatigue crack growth begins at a constant effective
threshold stress intensity factor range AKtb for a given material, and that (ii) the
closure stress intensity factor Kcl at the threshold is independent of R, Schmidt &
Paris provided a rationale for the two distinct regions in the AKq versus R plot. For
R < Rcr,
K,
AK»
0,max —
l-R
Kd + AKtl
Kmj„ < Kc\
whereas for R> Rc
AK0 = AK,
th'
Kmin > Kd.
(14.15)
(14.16)
As R ->• RCT, Kmin ->• Kd and AA:0 ->• AA^.
This model provides an explanation for the load ratio dependence of fatigue
thresholds and is consistent with experimental data for aluminum alloys as well as
ferritic-pearlitic, bainitic and martensitic steels, e.g., Fig. 14.6(d). However, this line
of reasoning did not offer mechanistic descriptions of closure, nor did it explain the
pronounced effects of environment, e.g., Fig. 14.6(d), and microstructure on fatigue
496
Retardation and transients in fatigue
thresholds. Furthermore, the Schmidt and Paris model does not justify the high
levels of closure observed under predominantly plane strain, near-threshold
conditions, a result which is apparently counter to many experimental observations
(Lindley & Richards, 1974; McEvily, 1977) and to the aforementioned numerical
results. It is, therefore, evident that plasticity-induced crack closure alone cannot
explain the influence of various mechanical, microstructural and environmental
factors on fatigue crack growth, especially in the near-threshold regime.
14.3 Oxide-induced crack closure
The mechanism of oxide-induced crack closure evolved as a consequence of
attempts to rationalize apparent anomalies in the effects of environment on near-
threshold fatigue crack growth in steels and aluminum alloys. Many researchers,
particularly Paris et al. (1972), Ryder & Lynch (1977), Skelton & Haigh (1978), Tu &
Seth (1978), Ritchie, Suresh & Moss (1980), Stewart (1980), Suresh, Zamiski &
Ritchie (1981), and Liaw, Leax & Logsdon (1983), made references to the possibility
of crack closure due to fracture surface oxidation during fatigue at both ambient and
elevated temperatures. The differences between oxidation kinetics near the fatigue
threshold and at higher growth rates were also qualitatively described by Benoit,
Namdar-Irani & Tixier (1980) for austenitic stainless steels. Suresh, Zamiski &
Ritchie (1981) reported the first quantification of the influence of oxide layers formed
within fatigue cracks on the threshold fatigue behavior in ferritic-pearlitic, bainitic
and martensitic steels. Using scanning Auger spectroscopy, they estimated the
thickness of oxide layers on fracture surfaces over a wide range of fatigue crack growth
rates and found the oxide thickness within the fatigue crack to be comparable to the
scale of the crack tip opening displacement near the threshold. In a parallel study,
Vasudevan & Suresh (1982), employing secondary ion mass spectroscopy to measure
the oxide layer thickness, noted the significance of oxide-induced closure to near-
threshold fatigue fracture in 2XXX and 7XXX series aluminum alloys. Oxide-
induced crack closure is also known to have a decisive effect on the near-threshold
crack propagation response of copper (Liaw et al., 1982) and nickel-base superalloys
(King, 1982; Yuen, Roy & Nix, 1984) fatigued in oxidizing media.
14.3.1 Mechanism
During the propagation of a fatigue crack, the presence of a moist
atmosphere leads to oxidation of the freshly formed fracture surfaces. At low amplitudes
of cyclic crack tip opening displacements, i.e. at near-threshold AK levels and low R
ratios, the possibility of repeated crack face contact during tensile fatigue is
enhanced as a consequence of locally mixed-mode crack opening, microscopic
roughness of the fracture surfaces and some plasticity-induced closure. There occurs,
14.3 Oxide-induced crack closure
497
at low AK levels, a continual breaking and reforming of the oxide scale behind the
crack tip. The attendant 'fretting' mechanism can lead to the build-up of oxide layers
which are up to 0.2 um thick at threshold AAT0 in lower strength steels fatigue-tested
in moist (40% relative humidity) laboratory air at R = 0.05. This oxide layer is about
twenty times thicker than that formed on a freshly prepared surface which is exposed
to the same moist environment for the same length of time as the fatigue test
specimen. Noting that the maximum crack tip opening displacement at threshold for most
lower strength steels (at low R ratios) is also of the order of a small fraction of a
micrometer, one may envision the possiblity of complete wedging of the crack by the
oxide film. It can be shown by means of simple calculations involving density and
molecular weights of iron oxides that 1 cc of Fe oxidizes to 1.76cc of FeO, 2.07 cc of
Fe304 and 2.13cc of Fe203. If it is assumed that the oxide emerges only at the free
surface of the crack (which is consistent with experimental observations), the oxide
thickness measurement made on any one fracture surface represents roughly the
excess oxide thickness inside the crack (Suresh, Zamiski & Ritchie, 1981).
At high R ratios, where the possibility of crack face contact is minimized because
of the larger crack tip opening displacements at any AK level, or at high AK levels
where the rate of crack advance is generally too rapid to promote copious oxidation
of any R value, the fretting oxidation mechanism is not expected to play a significant
role in influencing closure. In Fig. 14.7(a), regions of corrosion deposits are clearly
visible on the fatigue fracture surface (at growth rates that fall in the near-threshold
regime) in a 2|Cr-lMo steel fatigue-tested at a low R ratio of 0.05. In the high R
ratio test, however, significantly less oxidation takes place even in the near-threshold
regime. This is more clearly seen in the corresponding quantitative estimates of the
oxide thickness (based on argon ion sputter methods in the scanning Auger
spectrometer), Fig. 14.7(6). Here the oxide thickness is plotted as a function of crack length
and crack growth rates for the same specimens fatigue tested at low and high R
levels.
14.3.2 Implications for environmental effects
The excess oxide layer thickness on the fracture surface varies considerably
along the crack wake, Fig. 14.7(6), and the extent of oxidation is strongly dictated by
specific conditions of microstructure, environment, AK, and load ratio. It is,
therefore, a formidable task to formulate predictive models for oxide-induced crack
closure and for its effects on crack growth rates. One may, however, develop an
estimate of the effect of fracture surface corrosion on near-threshold crack 'driving
force' by considering the simple analogy of a rigid wedge of constant thickness d0
inside a linear elastic fatigue crack. If the wedge extends all along the length of the
fatigue crack and its edge terminates at a distance 2/ behind the crack tip, the sole
mechanical effect of the rigid barrier to the closure of the fatigue crack yields a
closure stress intensity factor of
498
Retardation and transients in fatigue
AK„
notch-
-A/C„
-notch
T3
R = 0.05 R = 0.75
(a)
0.2
0.1 -
10"6 -
£ ,0"
10-
-
——o-
R = 0.75
I/? = 0.05
—o w-»w m ,-^.
I 111111s
threshold
'(ill
10
2 4 6 8
fatigue crack length, a (mm)
(measured from the starter notch tip)
(*)
Fig. 14.7. (a) Macroscopic appearance of oxide deposits on near-threshold fatigue fracture
surfaces in a 2^Cr-lMo bainitic steel fatigue tested in moist air at R = 0.05 and 0.75. (b)
Corresponding Auger measurements of oxide layer thickness as a function of crack length and
crack growth rates. (From Suresh, Zamiski & Ritchie, 1981. Copyright Metallurgical
Transactions. Reprinted with permission.)
^1 =■
d$E
■ /— , , (14-17)
4V^/(l-v2)
where E and v are Young's modulus and Poisson's ratio of the cracking material,
respectively. Taking typical values of / = 0.2 um and d0 = 0.2 um from experiments
on lower strength steels (Suresh, Parks & Ritchie, 1982), it is found that
Kd as 2.3 MPa-v/rri- This estimate of the closure K due to wedge contact, although
14.3 Oxide-induced crack closure
499
too simplistic to account for all the effects associated with the complex process of
oxide-induced closure, provides a justification for the experimentally observed
differences in the AK$ values of 2|Cr-lMo steels in dry and moist environments at low
load ratios. Figure 14.8 shows the fatigue crack growth characteristics of a marten-
sitic 2|Cr-lMo steel (commercial designation AISI A542 Class 2) in moist
laboratory air and in dehumidified, ultra high purity hydrogen and helium (138 kPa
pressure) at R = 0.05 and 0.75. The near-threshold crack propagation in both the
dry gaseous environments are up to two orders of magnitude higher and the AKq
about 50% lower than in air at the lower R ratio (also see Fig. 14.6). The mechanism
underlying this trend can be explained using the following line of reasoning.
Corrosion deposit formation, leading to an oxide thickness comparable in size to
the crack opening displacements, is promoted in the moist environment at near-
threshold growth rates and at low load ratios. However, when the advancing near-
threshold crack is exposed to dehumidified environments, fracture surface oxidation
and the attendant closure are suppressed due to the paucity of moisture. Because of
the reduced level of oxide-induced closure, the AK0 values of the steel in the
dehumidified hydrogen and helium environments is lower than that in moist air (Ritchie,
Suresh & Moss, 1980; Stewart, 1980; Suresh, Zamiski & Ritchie, 1981).
Suresh et al. found that the addition of moisture to hydrogen or helium led to
crack growth retardation at low AK levels and R ratios due to oxide formation,
while the dehumidification of the moist laboratory air promoted a marked accelera-
s
l(T3r
lour
io-
io-
• moist air
o moist air
A hydrogen
A hydrogen
a helium
x helium
R
0.75
0.05
0.05
0.75
0.05
0.75
helium
R = 0.75
lo-8 L
im jt&t
\* hydrogei
A
*
i
*&
a
hydrogen
£—air A8J^mml,
to o
AK,
I I
6 8 10
AA:(MPaVm)
20
30
Fig. 14.8. Effects of dry and moist environments on near-threshold fatigue crack growth in
23Cr-lMo steel (AISI A542 Class 2, martensitic microstructure, monotonic tensile yield
strength = 769 MPa) at low and high load ratios. (After Suresh, Zamiski & Ritchie, 1981.)
500
Retardation and transients in fatigue
tion in the near-threshold crack growth rates. At the high R ratio of 0.75, oxide-
induced crack closure is essentially nonexistent in both wet and dry media because of
the large minimum crack opening displacement (at Kmin). Consequently, the AKq
values are about the same in moist air, dry helium and dry hydrogen. Although these
results are counter to the expectations based on conventional corrosion fatigue
processes, they are fully consistent with the concept of oxide-induced crack closure.f
Oxide-induced crack closure is promoted by moisture-containing environments,
elevated temperatures, low load ratios, low AK levels, high cyclic frequencies, and
lower strength and coarser-grained microstructures where fretting and rubbing along
fracture surface asperities become favorable. It is also known that, for a fixed alloy
composition and yield strength, the variation in precipitation, induced by ageing
treatments, can have a decisive effect on fracture surface oxidation during the fatigue
of aluminum alloys (Vasudevan & Suresh, 1982). Although oxide-induced crack
closure, in conjunction with plasticity-induced closure, provides a mechanistic
rationale for many experimentally observed effects of environment and load ratio
on crack propagation in certain regimes of crack growth in a number of materials,
it does not account for microstructural effects on fatigue crack advance.
14.4 Roughness-induced crack closure
Roughness-induced crack closure has come to be recognized as one of the
mechanisms by which some of the apparent microstructural effects on fatigue crack
growth can be rationalized. This phenomenon provides an explanation for many
apparently anomalous effects of microstructure on fatigue crack growth, especially
in the near-threshold regime, which are counter to conventional interpretations. It
has traditionally been regarded that finer-grained materials and wavy slip
deformation modes generally lead to an improved resistance to fatigue fracture. However,
research on near-threshold fatigue crack growth behavior has revealed that, in many
alloy systems, coarser-grained materials and enhanced planar slip deformation
modes give rise to a superior fatigue crack growth threshold.
14.4.1 Mechanism
Experimental observations in a wide range of ductile materials reveal that
crack propagation in the near-threshold fatigue regime occurs by means of a single
slip mechanism (see Section 10.2.1). At low AK levels, where the maximum plastic
t The beneficial effects of moist environments in promoting oxide-induced closure are specific to certain
regimes of crack growth and to certain combinations of materials, environments and mechanical loads.
It is emphasized that classical corrosion fatigue processes involving metal dissolution and hydrogen
embrittlement are known to cause significant deterioration in fatigue crack growth resistance in a wide
variety of situations. These deleterious effects of environments on fatigue are discussed in Chapter 16.
14.4 Roughness-induced crack closure
501
zone size, on the average, is typically smaller than a characteristic microstructural
dimension such as a grain size, a crystallographic fracture process is promoted. This
stage I growth mechanism leads to a highly serrated or faceted fracture morphology
and an elevation in the crack closure stress. It is also known that permanent plastic
deformation ahead of the crack tip, as well as the possibility of slip irreversibility
during unloading from the peak stress, cause mis-match between the fracture surface
asperities. In situ observations in the scanning electron microscope of the opening
and closing of fatigue cracks in aluminum alloys have documented a strong mode II
component associated with the fatigue crack opening displacements and the
occurence of premature contact between the crack face asperities (Nowack et al., 1979;
Halliday & Beevers, 1981; Minakawa & McEvily, 1981; Ritchie and Suresh, 1981).
The tortuous crack path promoted by the crystallographic growth mechanisms, in
conjunction with the occurrence of mixed-mode sliding of crack faces and the
mismatch between the crack face asperities, immediately provides a mechanism for
enhanced crack closure. The maximum crack opening displacement at threshold
(for low R ratios) for most metallic materials is of the order of a fraction of a
micrometer. Given the development of rough fracture surface asperities, whose
height can be tens of micrometers in coarser-grained materials, one may envision
the ease with which crack closure can develop at low load ratios and growth rates.
14.4.2 Implications for microstructural effects on threshold fatigue
The role of coarser grains and rough fracture surfaces in promoting slower
near-threshfold crack propagation rates at low load ratios as a consequence of
roughness-induced crack closure is clearly documented in the study of Gray,
Williams & Thompson (1983). In a fully pearlitic eutectoid steel, these authors
examined the effects of prior austenite grain size on fatigue crack growth at low
and high load ratios using well-controlled heat treatments whereby the pearlitie
interlamellar spacing and colony size as well as the flow strength of the alloy were
roughly kept constant. (The pearlite colony size = 9—lOum, pearlite interlamellar
spacing = 0.24-0.245 um, and the 0.2% offset yield strength = 406-11 MPa for the
microstructures investigated.) the coarser-grained material shows a significantly
higher fatigue threshold at low load ratios, Fig. 14.9. However, grain size has little
effect on near-threshold fatigue crack growth at R = 0.1 where even the minimum
crack opening displacement of the fatigue cycle is well above zero. By repeating the
experiments in a dry helium environment and conducting crack closure
measurements, Gray et al. established that the apparently higher fatigue crack growth
resistance observed in the coarser-grained material at R = 0.1 was due to roughness-
induced crack closure. The differences between the AKq values at R = 0.l were
slightly lower in helium than in moist air for the two grain sizes, although the overall
behavior at high load ratios was the same for the two environments.
502
Retardation and transients in fatigue
s
a,
10 20
AA:(MPaVm)
40
60 80
Fig. 14.9. The effect of prior austenite grain size on fatigue crack growth in a pearlitic eutectoid
steel at R = 0.1 and 0.7. (After Gray, Williams & Thompson, 1983.)
Roughness-induced crack closure is promoted by: (i) low stress intensity factor
levels where plastic zone dimensions at the crack tip are typically smaller than an
average grain dimension, (ii) small crack tip opening displacements (at low AK levels
and low R ratios) which are of a size scale comparable to the average height of the
fracture surface asperities (see the example problem in Section 10.4), (iii) microstruc-
tures consisting of coarser grains and shearable and coherent precipitates which
generally engender highly planar, crystallographic slip, (iv) periodic deflections in
crack path induced by grain boundaries, second phase particles, composite
reinforcements or abrupt load changes, and (v) enhanced slip irreversibility, especially due
to slip step oxidation in moist environments. The most dramatic effects of
roughness-induced crack closure are often observed whenever microstructurally induced
crack deflections generate premature contact between fatigue fracture surfaces.
14.5 Viscous fluid-induced crack closure
503
Examples of such effects as well as analytical models for the joint influence of crack
deflection and roughness-induced crack closure are presented in Section 14.9.
14.5 Viscous fluid-induced crack closure
Problems of rolling contact fatigue in lubricated ball bearings have
generated considerable research interest in the effects of oil environments on fatigue life
(e.g., Endo, Okada & Hariya, 1972; Ryder, Martin & Abdullah, 1977). In the
significant majority of these studies, the principal role of an oil medium is viewed as one
of suppressing, or occasionally exacerbating, the effect of environment on fatigue
life. For example, noncorrosive oils, such as mineral or silicone oils, are known to
promote slower stage II fatigue crack growth rates, compared to air, in both ferrous
and nonferrous alloys. However, when water is present in such oils, pitting corrosion
fatigue processes occur as a result of which the surface fatigue life in lubricated
bearing steels is severely diminished. Similarly, the presence of 4700 ppm (saturation
level) concentration of H2S in sour crude oil is known to increase stage II fatigue
crack growth rates by as much as twenty times in high strength low alloy (HSLA)
pipeline steels (Vosikovsky, 1976).
74.5.7 Mechanism
The mechanisms by which viscous fluids penetrating within growing fatigue
cracks influence propagation rates have also been the subject of widely differing
interpretations. Way (1935), for example, proposed that the wedge formed within
the crack by a penetrating viscous fluid would accelerate crack growth rates,
especially in the case of lower viscosity fluids which penetrate the crack more easily. On
the other hand, Endo, Okada & Hariya (1972) differently interpreted the same
mechanism by arguing that the hydrodynamic oil pressure generated by the complete
penetration of the crack by the fluid would decelerate the crack by reducing the
effective stress range. Since the oil pressure (for full penetration) is directly
proportional to the kinematic viscosity, higher viscosity oils are expected to decelerate
fatigue cracks, as per the model of Endo et al.
Tzou, Suresh & Ritchie (1985) conducted an experimental study of the influence of
dehumidified silicone and paraffin oils with different kinematic viscosities on fatigue
crack propagation in low strength bainitic steel. They identified three distinct, but
mutually competitive, mechanisms for the apparent effects of dry viscous
environments on fatigue crack propagation: (i) the suppression of hydrogen embrittlement
or metal dissolution, primarily in the Paris regime of fatigue crack growth, (ii) the
minimization of oxide-induced crack closure in the near-threshold regime of crack
growth, and (iii) the development of crack closure due to the hydrodynamic wedging
action of the oil inside the crack.
504
Retardation and transients in fatigue
The net effect of oil environments in influencing crack closure is strongly
dependent upon several competing factors such as suppression of environmental embrit-
tlement, minimization of oxide-induced crack closure, penetration of fluids within
cracks and the hydrodynamic wedging action. Therefore, it is difficult to extract
from the analysis general trends pertaining to viscous fluid-induced closure.
However, both experiments and calculations appear to indicate that crack closure
promoted by viscous fluids may not be as significant as that arising from therough-
ness or oxidation of the fracture surfaces.
14.6 Phase transformation-induced crack closure
It has long been recognized that phase transformations at the tip of a
fatigue crack can lead to a retardation in crack growth rates (e.g., Pineau &
Pelloux, 1974; Hornbogen, 1978a). This phenomenon is commonly referred to as
the TRIP (77?ansformation-/nduced Plasticity) effect in the metals literature
(Zackay, Parker, Fahr & Busch, 1967; Chanani, Antolovich & Gerberich, 1972).
The TRIP effect is characterized by phase changes at the tip of a crack leading to a
net increase in the volume of the transforming region. As the enlarged material in
the transformed zone is left behind the advancing fatigue crack tip, a net reduction
in the crack opening displacement ensues. With reference to fatigue crack closure,
crack tip phase transformation is analogous to crack tip plasticity in the sense that
compressive residual stresses are induced within the nonlinear zone during cyclic
tension. Furthermore, in both cases, the residual displacements left in the wake of
the extending fatigue crack act to close the crack prematurely at a far-field tensile
stress.
Pineau & Pelloux (1974) and Hornbogen (1978a) studied fatigue crack growth in
metastable austenitic stainless steels and showed that strain-induced martensitic
transformation generally resulted in reduced crack growth rates at low to mid-A AT
levels. The crack propagation rates increased in the following sequence of micro-
structural variations: metastable austenite —► stable austenite —► martensite of the
same composition. Direct measurements of crack closure due solely to strain-
induced martensitic transformation in metals have not been attempted. However,
experiments suggest that such transformation-induced closure is promoted by phase
changes which lead to a dilation (about 4% due to martensitic transformation in
ferrous alloys) of the region undergoing transformation, and by conditions which
promote phase changes, viz., higher strain rates, lower temperatures and increased
metastability of the transforming phase. As in the case of plasticity-induced closure,
the constraint of the surrounding elastic material on the deformed region at the crack
tip is necessary to promote transformation-induced closure since the transformation
of the entire specimen would not result in appreciable crack face contact. For this
14.7 Some basic features of fatigue crack closure
505
reason, transformation-induced closure is strongly influenced by the size and
geometry of the test specimen and of the fatigue crack.
As discussed in detail in Chapters 5 and 11, transformation toughening has been
the subject of considerable research in the ceramics field since the discovery of stress-
induced martensitic transformations in zirconia-containing ceramics.f For purely
dilatational transformations and for monotonic loading, McMeeking & Evans
(1982) and Budiansky, Hutchinson & Lambropoulos (1983) calculated the reduction
in stress intensity factor due to transformation-induced closure to be
Ki - KtK = ^- V[€TE*/hT, (14.18)
1 — v
where V( and hT are the volume and height, respectively, of the transformed zone, eT
is the transformation strain, and E and v are Young's modulus and Poisson's ratio,
respectively.
14.7 Some basic features of fatigue crack closure
It is evident from the previous five sections that crack closure is a
phenomenon whose influence on fatigue crack growth rates is strongly dictated by micro-
structural and environmental factors, and mechanical loading parameters. However,
there are some basic characteristics and trends which are common to various types of
crack closure and to a wide variety of materials.
(1) Crack closure is generally more dominant at lower A AT levels and at lower R
ratios because of the smaller minimum crack opening displacements of the
fatigue cycle. For plasticity-induced or transformation-induced crack
closure, the possibility of enhanced crack closure may also increase as a result
of the larger crack wake stretch or transformed zone size at higher A AT levels
and R ratios; however, this increased propensity for closure is offset by the
larger minimum crack opening displacements.
(2) There is a characteristic size scale associated with each closure process, such
as the height of the residual plastic crack wake for plasticity-induced crack
closure, the thickness of the fracture surface oxide layer for oxide-induced
crack closure, the height of the fracture surface asperities (and the extent of
mode II displacements) for crack closure due to roughness, and the height of
the transformation zone for closure arising from phase changes. When the
size of this characteristic 'closure dimension' becomes comparable to the
crack opening displacement, premature crack face contact has a marked
effect on the rate of fatigue crack growth.
t Fatigue-induced transformation to a covalently bonded grey tin is also known to occur in metallic tin
cycled below room temperature (Lohberg & Mustofon, 1976). Furthermore, among polymers, a
transformation leading to a dilation of about 1 % has been observed in polytetrafluoroethylene (PTFE) at
19°C(Hornbogen, 1978b).
506
Retardation and transients in fatigue
(3) As a fatigue crack emerges from a free surface or a stress concentration, the
extent of crack closure generally increases with an increase in crack length
up to a saturation crack length, beyond which closure is normally crack
length-independent.
(4) Closure is produced by mechanisms which are operative both at the tip of
the fatigue crack, such as plastic deformation or phase transformations, as
well as phenomena which occur in the wake of the fatigue crack tip, such as
fracture surface oxidation. For the former two crack tip processes, inelastic
deformation should be constrained; if the entire specimen deforms
plastically or undergoes martensitic transformation, closure would not influence
crack growth.
(5) No unique conclusion can be reached about the effect of stress state on the
extent of crack closure. While it is generally seen that plasticity-induced
crack closure under cyclic tension is more dominant in plane stress than in
plane strain (Section 14.1), the reverse situation is known to occur for crack
growth under cyclic compression (see Section 4.11).
14.8 Issues and difficulties in the quantification of crack
closure
There are a number of complex issues which pose a formidable challenge to
experimental and theoretical attempts aimed at quantifying the effect of crack
closure on fatigue behavior in engineering materials:
(1) Crack closure is often very specific to the conditions of the experiment and
its magnitude is influenced by the synergistic effects of material microstruc-
ture, test environment, and stress state.
(2) Even small fluctuations in micros truetural path of crack advance (induced,
for example, by grain boundaries, impurities or other inhomogeneities in
local microstructure) can cause large fluctuations in crack propagation rates,
especially near the fatigue threshold where the crack opening displacements
are small. Similarly, small differences in the moisture content of the test
environment can cause marked variations in the extent of oxide-induced
crack closure in some materials.
(3) Standard procedures, such as the 'load-shedding method', for the
measurement of fatigue crack propagation rates at near-threshold stress intensity
levels often lead to artificially high values of crack closure. In most metallic
materials, if the AK values are decreased 'too rapidly', premature crack
arrest may occur as a consequence of overload effects. On the other hand,
if the rate of load reduction is 'too slow', an artificially high threshold may
still occur due to oxide-induced crack closure. The 'correct' rate of load
reduction is often arbitrarily chosen.
14.9 Fatigue crack deflection
507
(4) Even when micro structural and environmental effects are set aside, crack
closure is still strongly influenced by the specimen size and geometry, crack
size, stress state, prior load history and the location, with respect to the
crack tip, where closure is measured. Therefore, different methods for
detecting crack closure can provide different estimates of closure.
(5) Fatigue crack closure is a phenomenon which leads to the breakdown of the
similitude concept of fracture mechanics. Therefore, the application of
nominally identical values of AK may lead to different levels of crack closure
(and hence apparently different crack growth rates) in the same material for
different crack sizes (see Chapter 15).
(6) Bulk measurements of crack closure (such as those based on compliance
changes that are estimated from strain gages, clip gages and push-rod gages,
the ultrasonic or acoustic emission methods, or changes in electrical
potential) do not distinguish between the different mechanisms of crack closure
discussed earlier. These bulk measurement techniques do not provide
insights into the fundamental closure phenomena because multiple closure
mechanisms may simultaneously influence the rate of fatigue crack growth.
14.9 Fatigue crack deflection
Methods by which the path of a crack can be periodically deflected from its
nominal growth plane offer one possible way of enhancing the apparent resistance to
fatigue crack growth (Suresh, 1983a, 1985b). Crack deflection is viewed as one of the
mechanisms for the toughening of brittle and ductile matrix composites, wherein the
obstacles in the path of the crack (reinforcements) may cause apparently beneficial
resistance to crack growth by tilting or twisting the crackfront (e.g., Faber & Evans,
1983).
Improving the resistance of engineering materials to fatigue crack growth via crack
deflection processes inevitably requires an understanding of the following issues:
(1) How should the micro- and macro structure of a material be designed by
optimizing the crack deflection characteristics?
(2) How does the structure of the material affect the fatigue crack path?
(3) What is the sole effect of crack path on the overall resistance to fatigue crack
growth?
The answers to the first two questions are specific to the material microstructure
and thermomechanical processing conditions, and have been thoroughly investigated
only for a limited number of material systems. However, an understanding of the last
issue can be achieved by theoretically exploring the geometrical consequences of
crack deflection to the overall crack growth resistance. Such analyses are also essen-
508
Retardation and transients in fatigue
tial for identifying the differences between the intrinsic and apparent crack growth
resistance of a material under cyclic loading conditions.
In this section, we discuss the implications of the geometrical effects of crack
deflection and of the combined influence of deflection and roughness-induced
crack closure on the growth of fatigue flaws. This is followed by examples which
illustrate the feasibility of improving fatigue crack growth resistance by crack
deflection processes.
14.9.1 Linear elastic analyses
Deflections in the path of a nominally mode I fatigue crack are generally
ignored in the characterization of fatigue behavior because of the difficulties in
estimating the effective near-tip driving force. However, it is now established (see,
for example, Section 9.11) that even small deflections in the path of a fatigue crack
(compared to the length of the crack) can lead to a reduction in crack growth rates
by several orders of magnitude, especially in the near-threshold fatigue regime.
Although the realistic issue of three-dimensional deflections and the attendant
fatigue crack closure effects are virtually impossible to track by way of analytical
formulations, a quantitative understanding can be gained by examining the case of
periodic two-dimensional deflections in the path of a fatigue crack.
Consider first the idealized case of a fatigue crack which consists of segments of
periodic deflections in its path such as the one shown in Fig. 14.10(a). In this
segment, 6 is the kink angle, D is the distance over which the tilted crack advances along
the kink, and 51 is the distance over which the plane of the growing crack is normal to
I*- s -1
k- - —I'
(a)
.A
V,
^
AS
(b)
—^yl—1
A<?*T\~
^C
Fig. 14.10. (a) Idealization of a segment of a deflected crack with periodic tilts, (b) Schematic
representation of a deflected crack in the fully opened condition at the peak load of the fatigue
cycle (on the left) and relative mismatch between the crack faces leading to a premature crack
closure during unloading. (After Suresh, 1983a, 1985b.)
14.9 Fatigue crack deflection
509
the far-field tensile axis. The dimensions D and 51 are considerably smaller than the
total length of the fatigue crack, a. The degree of tilting deflections, expressed in
terms of the tilt angle 6 and the extent of tilt, D = D/(D + S), are the same for all the
segments, although the deflections are induced in opposite directions in any two
adjoining segments. A first order estimate of the role of deflection on fatigue
crack growth can be formulated by assuming that (i) the size of the plastic zone at
the tip of the fatigue crack is much smaller than D and 51 (which is representative of
near-threshold crack growth in some materials) and (ii) the sharp corners, such as A
and B in fig. 14.10(a) do not have a significant effect on crack growth along the
segments AB and BC, respectively.
These periodic deflections in the path of a fatigue crack affect the overall crack
growth rates by means of the following three effects:
(1) When the crack tip is deflected from its nominal mode I growth direction,
the effective driving force for crack growth is typically smaller than that of a
straight crack of the same total (projected) length which is subjected to the
same far-field AK. Therefore, the propagation of a deflected crack at the
same rate as the corresponding straight crack requires an apparently larger
driving force.
(2) If crack length is measured along the mode I growth direction, a deflected
crack propagates at an apparently slower rate than a straight crack subjected
to the same effective driving force.
(3) During the closing of the fatigue crack, even a small mismatch between the
mating crack faces can lead to premature contact at far-field tensile stresses,
Fig. 14.10(Z>). This crack closure effect would further amplify the apparent
driving force required for the propagation of a deflected crack at the same
rate as a corresponding straight crack.
For the elastic solutions for kinked cracks, Eqs. 9.116 and 9.117, the local mode I
and mode II stress intensity factors, kx and k2, respectively, for growth along the
kink, of span D in Fig. 14.10(a), are
/q\ /9\ /9\
kx ^ auKi =cos3(- I K\, k2 & a^K^ = sinl - I cos21 - J Kit (14.19)
where K\ is the instantaneous value of nominal mode I stress intensity factor for the
fatigue cycle. The effective stress intensity factor, k, for coplanar growth along the
deflected segment D is provided by the energy release rate criterion, Eq. 9.57 or 9.58,
under elastic conditions, to be
k =
y/k\+k22. (14.20)
The effective stress intensity factor range for crack growth along the deflected span D
and the straight span 51 is given, respectively, by
AA: = &max - kmin and Ak = AKi, (14.21)
510
Retardation and transients in fatigue
where &max and km\n represent the values of A: at the maximum and minimum loads of
the fatigue cycle, respectively, and AKX is the nominal far-field stress intensity factor
range. Combining Eqs. 14.20-14.21, the weighted average of effective stress intensity
factor range, Ak, for the periodically deflected crack is written as
Ak =
Z>cos2l-l +S
D + S
AKl = \Dcos2(^\+(1-D)\aK1. (14.22)
If the crack length is always measured along the mode I growth direction, the
apparent crack propagation rate for a periodically deflected crack along the projected
mode I plane will be
(^)=0cose + (l-D)}^)L, (14.23)
where (da/dJV)L is the growth rate of a straight crack subjected to the same effective
stress intensity factor range.
Equations 14.22 and 14.23 describe the modifications to crack driving force and
growth rates due solely to deflection. However, as discussed in Section 14.4,
premature contact is promoted between the asperities of mating fatigue fracture surfaces
because of the net mismatch between them (which arises from a variety of irreverisble
deformation mechanisms). This mismatch causes roughness-induced crack closure
and further reduces the effective driving force for fatigue crack growth in Eq. 14.22.
Figure 14.10(Z>) shows the opening profile of a segment of a fatigue crack (located
just behind the crack tip) at the maximum far-field tensile stress; the opening
displacement between the crack faces is AS. As the crack unloads in both mode I and
mode II, it is assumed that a net mismatch uu develops above the Kmin for the fatigue
cycle. Note that C/u is not the mode II displacement due to the local stress intensity
factor, k2. At the instance offirst contact due to the lateral shift uu, the cyclic crack
opening displacement is A8* = AS — U\ = uu tan#, where U\ is the mode I
displacement from the peak of the fatigue cycle to the point of first contact. (This
approximation is strictly valid for the case when R = 0 and AK = Kmax.) Representing the
extent of mismatch by the nondimensional parameter, x = Uu/u\, the magnitude of
the closure effect is deduced as AKd/AKi = *JA8*/A8. The resulting ratio of the
apparent to effective stress intensity factor range is
A*, ^ {DcosHe/D + s]'1!^ I xtanfl 1"' {UM)
Ake{t I D + S II yl+xtan#
Thus, the nominal stress intensity factor ragne AKt required to propagate a deflected
crack at the same rate as a straight crack is always greater than that for the latter
(undeflected) crack (where AA:eff = AK\) by a factor equal to the right hand side of
Eq. 14.24. (This inference is based on the assumption that the effective stress
intensity factor range for the straight crack and the deflected crack are the same and that
crack deflection and roughness-induced closure are the only processes affecting the
14.9 Fatigue crack deflection
511
rate of crack growth.) Equation 14.24 represents the closure level at any R where
fracture surface contact is geometrically possible as a result of mismatch, i.e. for
<5min < DsinO, where <5min is the crack opening displacement at Kt = Kmin.
14.9.2 Experimental observations
It is known from many independent studies on 7xxx series aluminum alloys
that the over-aged (T7351) heat treatment condition leads to a predominantly
straight (undeflected) fatigue crack profile over a wide range of growth rates
(10~8—10~ mm/cycle in vacuum). If one examines the under-aged microstructure
(of roughly the same yield strength level) of the same alloy under identical test
conditions in vacuum, it is found that a highly serrated and crystallographic, trans-
granular crack path is promoted. The fracture surface roughness in the under-aged
alloy is increased with increasing grain size. The differences in the path of the crack
for the two ageing conditions are promoted by the differences in their precipitation
characteristics. Whereas the coherent strengthening precipitates in the under-aged
condition are easily sheared by dislocations, the large incoherent precipitates in the
over-aged microstructure form obstacles to dislocation motion with the result that
the dislocations loop around the particles and bypass them (see Section 10.4.3).
Figure 14.11 shows the fatigue crack growth rates for two 7475 aluminum alloys,
of grain sizes 18 um and 80 um, whose under-aged and over-aged (T7351) micro-
structures were fatigue-tested in vacuum at R = 0.1. The yield strength values for the
under-aged and over-aged microstructures were 505 MPa and 455 MPa, respectively,
for the 18um grain size material, and 451 MPa and 445 MPa, respectively, for the
80 um grain size material (Carter et al, 1984). The ratio of the true length of the
fatigue crack measured along the actual crack path to the projected length for the
under-aged and over-aged tempers was 1.13 and 1.05, respectively, for the 18um
grain size material, and 1.67 and 1.09, respectively, for the 80 um grain size material.
Figures 14.12(a) and (b), respectively, show examples of the near-threshold fatigue
crack profile for the under-aged and T7351 tempers of the 7475 aluminum alloy
(80 um grain size) in vacuum at R = 0.1. Figure 14.12(c) shows a micrograph of
the closing of a near-threshold fatigue crack in an another aluminum alloy. The
mismatch x in this case is 0.25-0.50.
The following inferences can be drawn from Figs. 14.11 and 14.12: (i) The under-
aged tempers lead to a substantially more tortuous crack path, whose roughness
increases with increasing grain size, (ii) The under-aged tempers exhibit a markedly
lower fatigue crack growth rate in the near-threshold regime than the over-aged
alloys, with the threshold AK0 increasing with increasing grain size. These trends
point to the possibility that the principal cause of the extrinsic differences in the
fatigue crack growth response of the two microstructures stems from crack deflection
and the attendant roughness-induced closure. (Note that oxide-induced crack closure
512
Retardation and transients in fatigue
10-3r
10-
10-
io-
10"
▲ under-aged (80 um)
• under-aged (18 um)
A over-aged (80 um)
O over-aged (18 um)
6 8 10
AA: (MPaVm)
20
30
Fig. 14.11. Experimentally measured fatigue crack growth rates in room temperature vacuum
for under-aged and over-aged (T7351) conditions of a 7475 aluminum alloy, of grain sizes 18 um
and 80 um, at R = 0.1 and frequency, vc = 30 Hz. (After Carter et al, 1984.)
is essentially suppressed in vacuum, and that closure induced by plasticity is
comparable for the two ageing conditions because of their similar yield strength levels.)
14.9.3 Example problem: Possible benefits of deflection
Problem:
The solid line in Fig. 14.13 indicates the typical near-threshold fatigue
crack growth curve for the over-aged (T7351) condition of 7x75 (7075 or 7475)
aluminum alloy tested in vacuo at room temperature at R = 0.1. This material
exhibits a straight crack path, with D & 0 and 6 as 0° in the deflection model. An
examination of the under-aged (T351) microstructure of the same alloy shows
periodic deflections in crack path.
Invoking the assumption that the differences in the fatigute crack growth
rates between the under-aged and the over-aged alloy stem primarily from the
differences in their crack path, predict the fatigue crack growth rates for the
under-aged alloy (using the deflection analysis given earlier in this section) for
different values of the mismatch parameter x, on the basis of the fatigue crack
14.9 Fatigue crack deflection
513
* *.
X
U !
4
(b) I
I mm
X
(c) lS ^m
Fig. 14.12. (a) Typical near-threshold fatigue crack growth profiles of (a) under-aged and (b)
over-aged (T7351 temper) of a 7475 aluminum alloy (grain size = 80 um) tested in vacuum at
R = 0.1. (from Carter et al., 1984. Copyright Metallurgical Transactions. Reprinted with
permission.) (c) A micrograph of the closing of the crack in a peak-aged Al Li Mg alloy
showing the mismatch between the fracture surface asperities. (From Starke & Williams, 1989.
Copyright American Society for Testing and Materials. Reprinted with permission.)
514
Retardation and transients in fatigue
10"
lour*
•s io-
10-
io-'
10-
1 = 45°, -P— = 0.75
D + S
x = o.oo
0 = 0'
X = 0.25
,x = °-50
D + S
2 3 4 5 6 7 8 910 20 30 40 50
nominal stress intensity range, A^ (MPaVm)
Fig. 14.13. Predicted variation, from Eqs. 14.23 and 14.24, of the fatigue crack growth rates
for under-aged alloys of the 7x75 aluminum alloy series for 0 = 45°, D = 0.75, and / = 0.00,
0.25 and 0.50 (dashed lines) from a knowledge of the typical upper bound crack growth rate
curve (solid line) for the 7x75-T7351 alloy of comparable yield strength. (After Carter et al,
1984.)
growth rates given for the over-aged alloy in Fig. 14.13. For this purpose,
assume that = 45°, D = 0.75, and x = 0.00, 0.25 and 0.50.
Solution:
The dashed lines in Fig. 14.13 shows the predicted variations, from Eqs.
14.23 and 14.24, in the rates of fatigue crack growth due to crack deflection
alone for 6 = 45° and D = 0.75 (which are typical deflection parameters for
under-aged 7x75 aluminum alloys in vacuum) and x = 0 (no closure).
Specifically, Eq. 14.24 gives the rise the nominal AA^ for the deflected crack,
as compared to that of the straight crack (i.e. the extent of shift of the solid line
in Fig. 14.13 to the right). Equation 14.23 gives the drop in the crack growth rate
for the deflected crack, as compared to that of the straight crack (i.e. the extent
of shift of the solid line in Fig. 14.13 to the bottom).
Also shown in Fig. 14.13 are the growth rate predictions for high levels of
fracture surface mismatch, x = 0-25 and 0.50. It is seen that the shape of the
fatigue curves and the improvements in the fatigue behavior predicted for the
deflected cracks are qualitatively similar to those measured experimentally (see
Figs. 14.11 and 14.12).
It is emphasized here that this example does not deal with any intrinsic
improvements in the resistance of the material to fatigue fracture. Crack
deflections induced by microstructural modifications merely reduce the apparent
driving force for fracture. It is feasible that some microstructural design methods
14.10 Additional retardation mechanisms
515
which enhance crack deflection processes could also markedly reduce the
intrinsic resistance of the material to both fatigue crack initiation and growth in which
case the overall crack growth rates may in fact be increased.
14.10 Additional retardation mechanisms
14.10.1 Crack-bridging and trapping in composite materials
In composite materials with unidirectional, continuous fiber reinforcements,
different failure mechanisms occur under far-field tension. If the fiber strength is
sufficiently high, the tensile cracks extend completely through the matrix and the
crack faces are bridged by the fibers. This type of failure is known to occur in brittle
ceramics and glasses reinforced with SiC and carbon fibers (e.g., Marshall, Cox &
Evans, 1985) as well as in titanium alloys reinforced with SiC fibers (Sensmeier &
Wright, 1990). On the other hand, if the fiber strength is lower than a certain critical
value, matrix failure results in complete failure of the composite since the fibers
break in the wake of the advancing crack. There have been numerous theoretical
studies of quasi-static toughening improvements associated with crack-bridging (e.g.,
Aveston & Kelly, 1973; Marshall, Cox & Evans, 1985; McCartney, 1987; Marshall &
Cox, 1987).
Marshall et al. and Marshall & Cox developed a fracture mechanics analysis for
fiber-reinforced composites where brittle matrix-cracking precedes fiber failure and
where only frictional bonding exists between the fibers and the matrix. Consider the
crack configuration schematically shown in Fig. 14.14(a) where continuous fibers
aligned along the tensile loading direction bridge the crack over a distance b in the
wake of the crack tip; a is the total length of the crack, such a crack-bridging process
has, in fact, been observed in titanium-matrix composites, e.g., Fig. 14.14(Z>). The
(SCS-6) SiC fibers bridging the crack over the distance b are subjected to a fiber pull-
out force which is a function of the crack opening displacement, the interfacial
sliding stress, the properties of the constituents of the composite and the diameter
of the fiber. The effect of the frictional sliding force of the fibers bridging the crack
faces, crf(x) in Fig. 14.14(a), is modeled by imposing crack closure pressure, p(x),
where x is the position on the crack surface. Following the analysis of Marshall et al.
for penny cracks, the closure pressure, for situations where the crack size a is
significantly larger than the fiber spacing, is given by
p(x) =fa{(x), (14.25)
where/ is the volume fraction of the fibers. The effect of the far-field tensile stress a°°
on the crack tip is reduced by the closure pressure such that the near-tip stress
intensity factor for the composite becomes
516
Retardation and transients in fatigue
(b)
0.3 mm
l I
Fig. 14.14. (a) A schematic representation of crack bridging, (b) Bridging of a fatigue crack by
SiC fibers (32 volume%) in a Ti 6A1 4V alloy. (From Sensmeier & Wright, 1990. Copyright The
Minerals, Metals and Materials Society. Reprinted with permission.)
-^F
-p(X)]XdX
JY^x1
(14.26)
where X — x/a. The closure pressure is related to the crack opening displacement by
the relationship
p(x) — a^u(x) for x > c, p(x) = 0 for x < c,
(14.27)
14.10 Additional retardation mechanisms
517
where
a =
/ 4zf2E{Ec
(14.28)
Here, R is the radius of the fibers, E{, Em and Ec are Young's moduli of the fiber,
matrix and composite, respectively, and r is the frictional stress at the fiber-matrix
interface. Equation 14.28 is valid when the interfacial shear stresses are neglected
beyond the region of fiber/matrix slip. The crack opening displacement, u(x), in the
wake of the crack tip is obtained from the distribution of surface tractions such that
u(X) =
4(1 - vl)a
(14.29)
where s and § are normalized position coordinates and v is Poisson's ratio for the
composite. Numerical solution of Eqs. 14.27 and 14.29 followed by the evaluation of
the integral in Eq. 14.26 gives the effective stress intensity for the bridged crack.
Experimental studies of crack bridging during fatigue of titanium alloy-SiC fiber
composites show that the rate of crack growth reaches a steady-state value as a
consequence of reductions in near-tip AK induced by pressure on the crack faces
by the bridging fibers. While the value of da/dN increases monotonically for (long)
fatigue crack growth in a monolithic material subjected to a fixed value of far-field
stress range, Act00, the growth rate for the composite attains a AAMndependent
steady-state value, as shown in Fig. 14.15. Further descriptions of fatigue in fiber-
matrix
logAA:
Fig. 14.15. Schematic representation of fatigue crack growth rate, da/dN, as a function of the
nominal AK for a composite in which the fibers bridge the crack faces.
518
Retardation and transients in fatigue
reinforced metal-matrix and ceramic-matrix composites can be found in McMeeking
& Evans (1990), Evans, Zok & McMeeking (1995) and Cox (1996).
While the phenomenon of crack bridging promotes apparent improvements in the
resistance to fatigue crack growth in composites with continuous fiber
reinforcements, the interaction of the crack tip with discontinuous particles is also known
to have a strong effect on the geometry on the crackfront and the rate of crack
growth. The influence of particles on fatigue fracture can come about by one of two
mechanisms: (i) The particles, if impenetrable, deflect the crack tip and cause a
reduction in the effective AK. (ii) The particles, dispersed in the ductile matrix,
trap (bridge) the crackfront (see Fig. 14.1(h)); the attendant changes in the geometry
of the crackfront can lead to apparent improvements in fatigue crack growth
resistance, depending on the size, shape and distribution of the particles and on whether
the particles are tougher or more brittle than the matrix. Analyses of crack trapping
have been published by Rice (1985) and extended to fatigue by Bower & Ortiz (1990).
14.10.2 On crack retardation in advanced metallic systems
The various retardation mechanisms discussed in this chapter offer
possibilities for improving the crack growth resistance of engineering alloys by
compositional and/or micro structural modifications, and by the addition of a reinforcement
phase. Research in the areas of metal-ceramic composites provides some illustrative
examples of such enhancements in the resistance to fatigue crack growth.
The need to exercise caution in the interpretation of fatigue crack growth
resistance becomes abundantly clear in the case of metal-matrix composites. For
example, ductile-matrix composites reinforced with brittle unidirectional fibers (which are
oriented normal to the plane of the crack) generally exhibit lower fatigue crack
growth rates than the unreinforced matrix alloy as a result of crack bridging.
However, such beneficial fatigue properties cannot be guaranteed if the fiber
orientation is parallel to the crack plane. This directionality of fatigue behavior is also
strongly reflected in the stress-life (S-N) data for fiber-reinforced metal-matrix
composites. In this latter case, the fatigue life decreases markedly as the loading direction
changes from the axis of the fibers to the transverse direction normal to the fiber
orientation.f In addition, the chemistry of the fiber-matrix interface and the
differences between the coefficients of thermal expansion of the fiber and the matrix play a
strong role in determining the mechanisms of fatigue damage. The far-field fatigue
loading must be capable of overcoming the thermal residual stresses before the
interface between the fiber and the matrix can be debonded. The competition
among different failure mechanisms, such as fiber breakage, matrix cracking or
interfacial debonding, is dictated by the compositional and geometrical properties
of the composite as well as by the magnitude of the far-field cyclic loads vis-a-vis the
t The trend here is similar to that described in Fig. 7.12 for organic composites.
14.11 Case study: Variable amplitude spectrum loads
519
magnitude of the thermal residual stresses. Note that the composite is also highly
susceptible to damage by pure thermal fatigue as a consequence of the vast
differences in properties between the constituent phases.
An example of the role of the microscopic damage mechanism in influencing the
fatigue properties is also found in the case of metal-matrix composites discontinu-
ously reinforced with brittle particles. Aluminum alloys reinforced with particles or
whiskers of SiC generally exhibit better near-threshold fatigue crack growth
characteristics than the unreinforced matrix alloy if fatigue failure occurs predominantly
within the ductile matrix (Christman & Suresh, 1989; Shang & Ritchie, 1989).
Deflection of the fatigue crack by the brittle particles, enhanced crack closure and
crack trapping contribute to this improved fatigue resistance in the composite by
lowering the effective crack-tip opening displacement. Similar trends have also been
seen in in-situ reinforced Ti-matrix composites with TiB whiskers (Sobeyejo, Ledrich
& Sastry, 1995). However, if the particular combination of processing conditions,
particle size, particle concentration and ageing treatment promotes particle fracture
or interfacial separation, the fatigue crack growth resistance of the composite can be
significantly lower than that of the matrix alloy (e.g., Sugimura & Suresh, 1992).
Similarly, the low-cycle fatigue properties of the composite can also be inferior to
those of the matrix (Bonnen, Allison & Jones, 1991).
14.11 Case study: Variable amplitude spectrum loads
The topics discussed thus far in this chapter have centered around fatigue crack growth
in engineering materials subjected to a constant amplitude of cyclic loads. We now direct
attention at concepts of variable amplitude fatigue crack growth. Particular attention is
focused on the phenomenology and micromechanical processes associated with transient
crack growth effects following single, periodic or block overloads in tension or
compression.
There is a multitude of examples of variable amplitude loading in fatigue-critical
structural components. Blades in gas turbine engines experience low amplitude, high
frequency vibration during operation, superimposed on a relatively smaller number of
cycles of fatigue loading due to start-up and shut-down. Railway tracks are subjected to
random loading depending on the frequency and loading conditions associated with the
passage of trains. The rotors and bearings of a turbogenerator are subjected to an
overload during every start-up.
As an example of spectrum loading, the typical stress history to which the lower wing
skin of a transport aircraft is subjected is shown in Fig. 14.16, where am is the mean stress
corresponding to an undisturbed flight. On the ground, the lower wing skin of the aircraft
is loaded in compression. During flight, variable loads due to gust are superimposed on a
mean tensile load corresponding to an undisturbed flight. The transition from a
compressive mean stress on the ground to a tensile stress during flight is an important
load cycle in itself and is usually referred to as the ground-air-ground cycle. Standard air
spectra have also been developed to simulate the load sequence for transport aircraft
520
Retardation and transients in fatigue
gust loads
I
time
ground phase
Fig. 14.16. Typical stress-time plot for the lower wing skin of a transport aircraft. (After
de Jonge & Nederveen, 1980.)
wing tension skins near the main landing gear attachment. This program, known as
Transport Wing STandard (TWIST), can account for ten different types of gust loading
ranging from 'stormy' to 'tranquil' conditions. TWIST includes approximately 100 stress
cycles per flight.
14.12 Retardation following tensile overloads
During the growth of a fatigue crack, load excursions in the form of single
tensile overloads or high amplitude-low amplitude block loading sequences can
result in the retardation of crack advance or even in the complete arrest of the
crack. Figure 14.17 schematically illustrates the typical crack growth behavior
following a single tensile overload.
During fatigue crack growth at a baseline stress intensity factor range AKB, the
material exhibits a characteristic crack growth rate (da/diV)B. If a tensile overload is
now applied, the ductile solid generally exhibits a small amount of temporarily
accelerated growth which mainly occurs during the application of the overload
(e.g., Corlby & Packman, 1973). The marking on the fracture surface corresponding
to the rapid extension of the crack during the overload cycle is sometimes referred to
as the stretch zone. These stretch zone markings are commonly observed when A^2max
is significantly greater than K\ max. If the overload causes a change in the microscopic
or macroscopic fracture mode, accelerated crack growth may persist over many post-
overload cycles.
The burst of accelerated crack advance, shown in Figs. 14.17(Z>) and (c), is
generally followed by a prolonged period of decelerated crack growth, when the post-
overload fatigue crack is subjected to the same baseline stress intensity factor range
AK% as in the pre-overload regime. This progressive reduction in crack velocity
14.12 Retardation following tensile overloads
521
IS
K —
vwv
(«)
-time
a*\ ..
1 (a*).
N*
/\W)R
Sx W;„
to
Af
•^ = ^imin/^lir
'riT. ==: -"-on
-K„
In
Fig. 14.17. Definitions of different parameters used to describe transient crack growth effects
following single tensile overloads.
continues over a crack growth distance ad, which is commonly known as the delay
distance. After reaching a minimum, the crack growth rates begin to increase and
eventually catch up with the pre-overload value (da/dN)B. The total crack growth
distance a* and the total number of post-overload cycles N*, over which the transient
effects of the single tensile overload affect crack growth, are a strong function of
AKB, the material microstructure and environment, as well as such factors as the
nominal load ratio R, and the overload ratio rOL, which are denned in Fig. 14.17.
14.12.1 Plasticity-induced crack closure
The discussions presented in Section 14.1 demonstrated that permanent
residual tensile displacements formed due to plastic deformation at the crack tip
result in contact between the fracture surfaces as the crack tip advances through
522
Retardation and transients in fatigue
the prior plastic zone. Elber (1970, 1971) argued that such plasticity-induced crack
closure can also account for the transient retardation phenomena due to overloads.
The application of an overload produces a larger plastic stretch in the wake of the
fatigue crack tip (as compared to the baseline AK), as the fatigue crack propagates
through the overload plastic zone. The attendant fracture surface contact causes an
enhancement in the level of plasticity-induced crack closure in the post-overload
regime which, in turn, promotes a retardation of growth rates. Since some crack
growth through the overload plastic zone is needed for the residual plastic stretch to
induce premature closure behind the crack tip, one would expect a delayed
retardation based on this interpretation. Furthermore, it has been suggested (von Euw,
Hertzberg & Roberts, 1972) that the increased levels of crack closure and the
increase in frictional contact between the crack faces following the overload can
obliterate any surface markings, such as striations. This line of reasoning was
ostensibly consistent with experimental observations on aluminum alloys which showed
crack growth with striations prior to the overload and abraded fracture surfaces with
no striation markings following the overload. Direct experimental measurements of
closure using the push-rod compliance gage (see Section 14.1) also show higher levels
of crack closure in plane stress following the application of a tensile overload (Fleck,
1988).
Although there is a variety of experimental evidence (e.g., Elber, 1970; Himmelein
& Hill berry, 1976) supporting the role of plasticity-induced crack closure in
influencing retardation effects, many observations on delay effects in a number of alloy
systems are also inconsistent with this mechanism, (i) As discussed in Section 14.1,
plasticity-induced crack closure generally leads to a greater reduction in effective AK
in plane stress than in plane strain. However, more enhanced levels of post-overload
retardation have been documented in some materials in plane strain than in plane
stress (Suresh, 1983b). (ii) Many characteristic features of post-overload retardation,
such as changes in the mode of failure following overloads and in the effects of
microstructure on crack growth in many aluminum alloys, are inconsistent with
the descriptions of plasticity-induced crack closure concepts (Knott & Pickard,
1977; Bucci et al, 1980; Suresh, 1983b; also see later sections).
14.12.2 Crack tip blunting
It has been argued that the blunting of the crack tip by the overload cycle,
which can persist even during post-overload crack growth, can lead to crack growth
retardation (Christensen, 1959; Rice, 1967). The underlying mechanism for
retardation is that the blunted crack tip behaves like a notch with a less severe stress
concentration than the originally sharp crack tip. Blunting of overloaded fatigue
cracks is also observed in polymeric materials such as polycarbonate (Banasiak,
Grandt & Montulli, 1977) and in a number of metal alloys (e.g., Lankford &
Davidson, 1981); see Fig. 14.18 for an example of crack tip blunting following an
14.12 Retardation following tensile overloads
523
overload. Although crack tip blunting does influence the rate of post-overload crack
growth and provides a basis for interpreting certain load sequence effects (see
Section 14.13), it cannot account for the existence of delayed retardation and
cannnot quantitatively rationalize the experimentally observed reductions in post-
overload crack growth.
14.12.3 Residual compressive stresses
Reverse yielding ahead of a fatigue crack loaded in cyclic tension produces
residual compressive stresses (Section 9.6). When a tensile overload is applied, the
size of the zone of residual compression is increased. X-ray measurements of stress
fields ahead of fatigue cracks in steels (Allison, 1979; Taira & Tanaka, 1979) also
indicate an enlarged residual compressive zone following tensile overloads (as
compared to the pre-overload case). It has been suggested (Willenborg, Engle & Wood,
1971; Wheeler, 1972) that these residual compressive stresses can retard
post-overload crack growth. As discussed in later sections, some of the most widely used life
prediction models tacitly employ the concept of retardation due to residual
compressive stresses. However, one encounters some fundamental difficulties with
rationalizing a number of retardation events solely on the basis of residual compressive
stresses: (i) The largest residual compressive stresses exist in the immediate vicinity
of the crack tip (see Fig. 9.9). Hence, instantaneous retardation or crack arrest,
rather than delayed retardation, is predicted contrary to experimental observations,
(ii) Experiments show (e.g., Suresh, 1983b) that retardation can persist even when the
post-overload crack has traversed through the (predicted) zone of residual
compressive stresses.
14.12.4 Deflection or bifurcation of the crack
In some engineering alloys with a propensity for planar slip deformation,
and in certain loading situations that involve plane stress conditions, the application
of a tensile overload promotes deflections of the crack tip from the nominal mode I
crack growth plane (Schijve, 1974; Lankford & Davidson, 1981; Suresh, 1983b).
Figure 14.18 shows an example of crack deflection in an underaged Al-Li-Cu-Zr
alloy in which the application of a tensile overload resulted in a severe bifurcation of
the crack tip throughout the thickness of the edge-notched (compact) tensile
specimen. Note that the fatigue crack remains blunted even after complete unloading
from the far-field tensile stress. The enhanced planarity of slip due to the presence of
8' (Al3Li) precipitates in this material has been identified as a major factor in
promoting such bifurcated crack profile in the intense strain region ahead of the fatigue
crack tip.
The growth of the fatigue crack along a deflected path implies a reduced crack
propagation resistance away from the mode I growth plane. Thus, temporary accel-
524
Retardation and transients in fatigue
Fig. 14.18. Branching of a fatigue crack upon application of a tensile overload in an under-aged
Al-2.lLi-2.9Cu-0.12Zr alloy. Arrow indicates the crack growth direction. (From Suresh et al,
1987. Copyright Pergamon Press pic. Reprinted with permission.)
eration in crack growth rates can occur during the application of the overload.
However, from a continuum standpoint, a bifurcated crack tip profile is subjected
to a lower effective A A" than a straight crack of the same projected length subjected
to an identical value of far-field AA" (Section 9.11). On the basis of experimental
results obtained on aluminum alloys and of linear elastic analyses of branched
cracks, it has been demonstrated that a reduction in effective AA" of approximately
25% can be realized in the post-overload regime solely from the crack deflection
process (Suresh, 1983b). Thus, the geometrical effects associated with the bifurcation
of the fatigue crack tip by tensile overloads can, in certain cases, contribute markedly
to retardation effects. The development of changes in crack tip geometry during
variable amplitude fatigue is a strong function of microstructure, stress state and
baseline AK levels. It should be noted that if crack deflection occurs preferentially
along a path of low fracture resistance (such as a weak interface) in some materials
(such as composites), it is likely to accelerate rather than retard post-overload
growth rates.
14.12.5 Near-threshold mechanisms
When a fatigue crack is subjected to tensile overloads, the development of
enhanced levels of plasticity-induced crack closure, residual compressive stresses or
crack deflection results in a post-overload stress intensity factor range whose
effective value is much lower than the nominal baseline value AA^B. Therefore, even when
the post-overload AA"B is well into the Paris regime of fatigue crack growth, the
corresponding effective AA" may fall in the near-threshold fatigue regime for the
material. In such cases, additional mechanisms of fatigue crack growth retardation,
which are of significance to constant amplitude near-threshold fatigue, are also
14.12 Retardation following tensile overloads
525
Fig. 14.19. Bands of oxide formed on the fracture surface in a 7010-T7 aluminum alloy fatigued
in moist air with 8000 constant stress amplitude fatigue cycles separating tensile overloads
(overload ratio = 1.8). Spacing between oxide bands =» 0.3-0.4 mm. (From Bucci et erf., 1980.
Copyright American Society for Testing and Materials. Reprinted with permission.)
activated in the post-overload regime (Suresh. 1983b). For many alloys, these
additional retardation mechanisms typically involve stage 1 crack growth as well as
oxide-induced and roughness-induced crack closure. Figure 14.19 shows an example
of oxide layer formation on the fracture surface of a 7010-T7 aluminum alloy which
was subjected to a single tensile overload (K2maK = 1.8/^max) after every 8000 cycles
of constant amplitude fatigue crack growth at AKB = 7 — lOMPaVm and R = 0.33.
(This is a regime of growth in which oxide-induced closure is not significant during
constant amplitude fatigue in the moist air environment.) Each dark band of oxide
observed in this micrograph corresponds to retarded crack growth after one tensile
overload.
The activation of near-threshold mechanisms in the post-overload regime is not
the primary cause of retardation; it is a process which prolongs retardation. This
interpretation is consistent with the observations of delayed retardation because the
near-tip AK should be reduced first to near-threshold levels by other processes
before the typical near-threshold growth and closure mechanisms for the materials
begin to influence post-overload failure. (Oxide-induced and roughness-induced
closure are referred to as near-threshold mechanisms in the present discussion primarily
because their influence on crack growth is stronger at lower AK levels.)
Experimental evidence of the signficance of near-threshold mechanisms to post-
overload crack growth is found in a number of aluminum alloys (Suresh, 1983b).
Studies of constant amplitude fatigue in under-aged, peak-aged and over-aged
aluminum alloys of 2xxx and 7xxx series indicate that the threshold stress intensity
factor range AK0 decreases and that the near-threshold growth rates increase with
an increase in the degree of ageing (see the examples provided in Section 10.4). In the
Paris regime of crack growth, however, the opposite trend is observed for most
aluminum alloys, with the over-aged microstructure exhibiting the lowest crack
propagation rates. If periodic overloads are superimposed on the constant amplitude
stress cycles in the Paris regime, the ranking of different microstructures in terms of
resistance to crack growth is switched. The pre-overload crack growth resistance at a
fixed baseline stress intensity factor range, AK%, may increase in the microstructural
sequence: under-aged -> peak-aged -> over-aged condition. However, the post-
526
Retardation and transients in fatigue
overload crack growth resistance at the same baseline stress intensity range increases
in the opposite sequence: over-aged ->• peak-aged ->• under-aged (Knott & Pickard,
1977; Bucci et al, 1980). These interpretations of the role of threshold mechanisms in
variable amplitude fatigue also find supporting evidence in the earlier data reported
in the literature on aluminum and titanium alloys (Hertzberg & Mills, 1976; Hopkins
et al., 1976; Nowack et al., 1979).
14.13 Transient effects following compressive overloads
The application of fracture mechanics concepts to fatigue crack growth
characterization is generally based on the premise that crack advance occurs only
during that portion of the fatigue cycle where the crack faces do not touch. Implicit
in this approach is the notion that compressive stresses do not cause any significant
changes in crack growth rates because (long) fatigue cracks remain closed during the
compressive loading (Hudson & Scardina, 1969). However, there has been a growing
body of evidence which unequivocally shows that, for both long and short fatigue
cracks, the application of compressive overloads can lead to an acceleration in crack
growth rates.
It was shown in Chapters 4-6 that fully compressive cyclic loads of both constant
and variable stress amplitudes result in the nucleation and growth of fatigue cracks
ahead of stress concentrations. The mechanisms underlying this effect involve the
generation of residual tensile stresses upon unloading. The harmful effects of
compressive loads on the growth of long tensile fatigue cracks has also been well
documented. Crooker (1971) presented the results of a study which showed that the
compression portion of a fully reversed, tension-compression cycle can contribute
substantially (up to 50%) to fatigue crack growth rates in medium to high strength
steels and in titanium alloys.
Some of the clearest evidence of the deleterious effects of compressive overloads
on crack growth resistance is also found in the work of Topper & Yu (1985). These
authors measured the propagation rates of fatigue cracks, 2 to 5 mm in length, in
center-cracked plates of 2024-T351 aluminum alloy which were subjected to periodic
compressive overloads superimposed on zero-tension fatigue. Figure 14.20 shows
the variation of fatigue crack growth rates, da/dN, plotted as a function of the
maximum stress intensity of the fatigue spectra, Kmax = AKB, for different
frequencies of application of a compressive overload of fixed amplitude (which was several
times the magnitude of the maximum tensile stress of the fatigue cycle). The results
given in this figure indicate that the near-threshold fatigue crack growth rates
measured using a loading spectrum with periodic compressive overloads are always
higher than those of constant amplitude, zero-tension fatigue (iVc —>• oo); this
observation is true for all the values of JVC defined in Fig. 10.6. Similar results have also
been reported by other workers. For example, de Jonge & Nederveen (1980) show
14.13 Transient effects following compressive overloads 527
10-5
10-'
0.1 1.0 10
A/C(MPav/m)
Fig. 14.20. Influence of compressive overloads on the rates of fatigue crack growth in a 2024-
T351 aluminum alloy. (After Topper & Yu, 1985.) The growth rates are characterized in terms
of the maximum stress intensity factor range. The inset shows the normalized stress intensity
factor for the loading sequence as a function of time. Nc denotes the number of baseline tensile
fatigue stress cycles in-between two overloads.
that when the ground-air-ground cycles are removed from the lower wing skin
loading spectrum, Fig. 14.16, the fatigue life improves by as much as a factor of
3.3. A nonpropagating (compression) fatigue crack ahead of a stress concentration is
also found to reinitiate upon the application of compressive overloads (Aswath et ah,
1988).
Interpretations of the plausible reasons for crack growth acceleration due to
compressive overloads have centered around crack closure concepts. It has been
postulated (Topper & Yu, 1985) that compressive overloads lead to the flattening of
fracture surface asperities. Since most aluminum alloys are known to be susceptible
to high levels of crack closure due to the premature contact between fracture surface
asperities, this line of reasoning provides an appealing rationale for the lowering of
crack growth resistance in the presence of compressive overloads. Observations of
fracture surface abrasion induced by compressive overloads have also been reported
for some alloys. Figure 14.21 is a scanning electron micrograph of the fracture
surface in an AISI A542 Class 3 steel (of bainitic microstructure and with tensile yield
strength = 500 MPa). This photograph shows compression-induced abrasion marks
(marked by the letter 'A') in an area immediately behind the crack tip. In this case,
J L
528
Retardation and transients in fatigue
» * . * i jit *» »x»
/;* *- ^-.
1 '*\ .". f>
^' ■»!»# "1
>' A
,•' o
A
• .- v ,-*
. 20 nm .
Fig. 14.21. Abrasion marks (denoted by A) on the fracture surface of an AISIA542 Class 3 steel
subjected to compressive overloads. (From Aswath et al.. 1988.)
the crack was propagated ahead of a stress concentration under fully compressive
far-field cyclic loads until crack arrest occurred. Subsequent application of
compressive overloads reinitiated the fatigue crack. The abrasion marks correspond to the
crack growth region where the compressive overloads were applied. Note that the
abrasion lines on two different grains on the fracture surface are parallel. Had these
marks been a consequence of cyclic slip traces, their orientations in different grains
would have been different.
The influence of compressive overloads on the growth of long fatigue cracks is
strongly dependent on the micromechanisms of crack growth, in particular on prior
development of crack surface morphology and roughness-induced crack closure.
These factors, in turn, depend on such microstructural dimensions as the grain
size. Since roughness-induced crack closure has a more dominant effect near the
threshold than in the Paris regime, the role of abrasion in affecting fatigue crack
growth is also expected to be significant for baseline AK values which fall in the
near-threshold regime. Therefore, compressive overloads are likely to have a more
dominant effect on near-threshold fatigue crack growth than in the higher growth
rate regimes of fatigue. Similarly, the generation of residual tensile stresses upon
unloading from the peak compressive stress is less likely for a long fatigue crack.
However, such effects can become important for short cracks emanating from stress
concentrations (Chapters 8 and 15) and for long cracks previously blunted by a
tensile overload (see next section).
14.14 Load sequence effects
529
14.13.1 Compressive overloads applied to notched materials
Aswath et al. (1988) conducted a series of systematic experiments to
investigate the role of stress amplitude of the very first compression cycle on subsequent
compression fatigue crack growth, while maintaining the stress state, specimen
geometry, notch geometry and the rest of the loading sequence fixed. It was found that
whereas stable crack growth (prior to crack arrest) occurs from the root of the notch
over hundreds of thousands of compression cycles, the amplitude of the very first
compression cycle played the most decisive role in determining the rate and total
distance of crack advance. Specifically, a three-fold increase in the stress amplitude
during the first compression cycle alone led to a ten-fold increase in the total distance
of crack growth a*, even though the subsequent million or more fatigue cycles were
kept identical. Figure 14.22 shows the remarkable increase in the crack growth
distance due to the increase in the amplitude of the first compression cycle.
Numerical simulations rationalize this increase in a* on the basis of the increase in
the extent of the tensile residual stress zone generated by the compressive overload in
the first cycle (Aswath et al., 1988). These results clearly demonstrate the significant
role of compressive overloads on crack initiation and growth ahead of stress
concentrations. This mechanism is expected to have a profound effect on the fatigue life
of structural components where cyclic compression loading occurs during service.
14.14 Load sequence effects
The preceding discussion has focused on the role of single overloads on
crack growth. In this section, some examples of how different combinations of cyclic
loads influence fatigue fracture are taken up.
time
{a)
-3.0
« 2.0
■* 1.0
0.0
> ♦ ♦
• 1 (no compressive overload)
a 2 (100% compressive overload)
♦ 3 (200% compressive overload)
aa
_J_
_1_
0.0 0.5 1.0 1.5
number of compression cycles (millions)
(b)
Fig. 14.22. (a) Schematic showing constant amplitude loading (test 1) and variable amplitude
loading where a 100% (test 2) and 200% (test 3) overload was applied only in the first cycle. The
applied stress amplitude of the remaining cycles was held fixed, (b) The effect of the stress
amplitude of the very first compression cycle on crack growth behavior from a notch tip in an
AISI A542-3 steel (tensile yield strength = 500 MPa) under plane stress. (After Aswath et al,
1988.)
530
Retardation and transients in fatigue
14.14.1 Block tensile load sequences
One of the most important load sequences in the study of variable amplitude
fatigue fracture is that involving blocks of different cyclic stress amplitudes and/or
load ratios. Let us now consider some examples of transient effects induced by block
loads. Figure 14.23 is a scanning electron fractograph showing fatigue striations in a
2024-T3 aluminum alloy subjected to a high-low block loading sequence, which is
Fig. 14.23. Typical fractography resulting from a high low-high block loading sequence applied
to a 2024-T3 aluminum alloy. Crack growth corresponding to each block and the crack growth
direction (large arrow) are indicated. The fatigue loading sequence is shown where the applied
cyclic stress, normalized by its maximum value alrax, is plotted as a function of time /. (From
McMillan & Pelloux, 1967. Copyright American Society for Testing and Materials. Reprinted
with permission.)
14.14 Load sequence effects
531
shown along with the micrograph. In this case, the amplitude of the cyclic loads in all
three blocks is the same. Block B consists of 21 load cycles, whereas block A consists
of four load cycles. Block B leads to the formation of well-defined striation markings
during each load cycle, with the striation spacing corresponding to the rate of crack
extension per cycle. Upon switching from block B to block A (i.e. from peak B21 to
valley Al), crack growth continues at a slower rate with a corresponding reduction
in striation spacing. (The four narrowly spaced striations just prior to the stretch
zone marked S denote crack growth in load block A.) [f the loading is switched again
from block A to block B (i.e. from valley A4 to peak Bl), a stretch zone (denoted S)
is created as a consequence of the abrupt increase in the peak tensile stress. This
sudden burst of crack advance is followed by uniform fatigue crack growth rates
characteristic of the stress amplitude in block B.
Figure 14.24 shows another example of tensile block loading where the peak
tensile stresses for the blocks are the same and the stress amplitude in each block
is different. Blocks B and C cause crack growth, with the rate of crack advance per
cycle corresponding to the respective striation spacings seen in the figure. The stress
r
(I
///// . „.i.
Fig. 14.24. Typical fracture surface due to block loading in a 2024-T3 aluminum alloy. Regions
of crack growth corresponding to blocks B and C are marked. No crack growth occurred due to
the application of block A. The fatigue loading sequence is shown in the inset where the applied
cyclic stress, normalized by its maximum value (rm„ is plotted as a function of time t. (From
McMillan & Pelloux, 1967. Copyright American Society for Testing and Materials. Reprinted
with permission.)
.*!
" I
532
Retardation and transients in fatigue
amplitude of block A was too small to cause any crack growth. Note the absence of
any stretch zones or temporary acceleration in this loading sequence with a constant
value of maximum stress intensity factor. (Although the examples in Figs. 14.23 and
14.24 show clear striations, it should be noted that, as discussed in Chapter 10, the
striation spacing does not always correlate with crack growth rates, and that not all
materials exhibit well marked striations.)
The following transient effects are commonly observed when high-low or low-
high block loading sequences are applied: (i) The application of a low-high block
loading sequence can cause a stretch zone or a bifurcation crack tip profile,
depending on the relative amplitudes and load ratios of the blocks, (ii) A transient
acceleration in crack growth may be induced during the initial stages of ahigh amplitude
block which follows a low amplitude block, if the blunting of the crack tip by the
high block reduces the pre-existing level of fatigue crack closure (i.e. increases
AAgff). (iii) Sudden reductions in Kmax corresponding to a high-low sequence with
a reduced R ratio or AK can cause pronounced retardation or even complete crack
arrest, (iv) Significant changes can occur in the mechanisms of crack growth upon
changing from one block to another; the attendant transient effects are dictated by
the specific microstructural properties of the material.
Load interaction effects associated with block loading sequences are often
quantified in terms of the so-called acceleration factor, y. This factor is defined as
(da/dJV)s,exp
y = ld^dN^> (14J0)
where (da/dN)s exp is the experimentally measured crack growth rate per block
loading sequence and (da/dN)sp is the growth rate per sequence predicted on the basis of
linear summation of the constant amplitude crack growth response, y = 1 denotes
no interaction effects, whereas y > 1 indicates acceleration in crack growth due to
load interactions; y < 1 indicates retardation. For the block loading programs
shown in Figs. 14.23 and 14.24, y & 2 (for crack growth where small-scale yielding
conditions prevailed). Many researchers (e.g., Nisitani & Takao, 1978), who
employed block tensile overloads and underloads (similar to the sequence shown
in Fig. 14.24) to study interaction effects in steels, also reported acceleration factors
significantly greater than unity.
In materials prone to certain types of crack closure, growth retardation (y < 1)
may also occur as a consequence of load interaction effects. Suresh & Ritchie (1981)
found that crack growth retardation occurred in a bainitic steel, if near-threshold
tensile fatigue crack growth was interrupted with millions of cycles of tensile
underloads (with AK < AK0 and a low load ratio) and then resumed at the same baseline
AK. A similar trend was also reported by Kobayashi et al. (1984) for AISI A508-3
steel. This coaxing-like retardation effect is believed to be a result of enhanced oxide
formation on the crack faces during the application of underloads.
14.14 Load sequence effects
533
14.14.2 Tension-compression load sequences
The rate of fatigue crack growth is also known to depend strongly on the
order in which tensile and compressive overloads are applied. Figure 14.25
schematically shows typical effects of tension-compression sequence effects on variable
amplitude fatigue fracture. Also shown, for comparison purposes, are the typical
crack growth characteristics of a ductile solid under constant amplitude loads and
under the influence of tensile overloads. As seen earlier, the application of a tensile
overload can severely blunt the crack tip. If a compressive overload is applied
immediately after a tensile overload, the crack tip which is blunted by the tensile
overload behaves like a notch. As shown in Chapter 8, the application of a cyclic
compressive load to a blunt notch results in the formation of residual tensile stresses
which easily nucleate a fatigue crack. These residual tensile stresses can partly or
fully nullify the beneficial delay effects associated with the application of a tensile
overload. It has been experimentally established (Marissen, Trautmann & Nowack,
1984) that the application of a compressive overload immediately following a tensile
overload gives rise to rates of crack growth which are significantly faster than those
observed in the presence of the tensile overload alone.
If a compressive overload precedes a tensile overload, the rate of fatigue crack may
increase or remain the same (as compared to the loading sequence involving the tensile
overload alone) depending on the loading conditions. For long fatigue cracks in wavy
slip materials and for baseline stress intensity range AKB, which are well into the Paris
regime, the application of a compressive overload prior to a tensile overload may not
have any significant effect on the delayed retardation produced by the overload.
N
Fig. 14.25. A schematic illustration of transient crack growth during constant amplitude fatigue
(A) and during variable amplitude loading involving single tensile overloads (C) or tensile-
compressive overload sequences (B). The open circles represent the crack length locations at
which each variable amplitude sequence is applied.
534
Retardation and transients in fatigue
However, for low AKB values and in planar slip materials prone to marked levels of
roughness-induced closure, a compressive overload preceding a tensile overload may
cause some reduction in the extent of delayed retardation and hence an increase in
crack growth rate as compared to the application of the tensile overload alone.
14.15 Life prediction models
The ultimate aim of fatigue research is to develop quantitative models for
the prediction of useful life in cyclically loaded structures. In view of the complexity
of the mechanisms underlying variable amplitude fatigue, it is not surprising that
only semi-empirical approaches are capable of providing reasonable estimates of
service life in engineering components subjected to complex loading histories.
Available life prediction methods can be broadly classified into two categories: the
cycle-by-cycle approach and the characteristic approach. In the cycle-by-cycle
approach, the extent of cyclic damage or crack advance associated with each cycle
is added to predict the overall fatigue life. The most well known cycle-by-cycle model
is the Palmgren-Miner linear damage rule, Eq. 7.8, in which load interaction effects
are not considered. The cycle-by-cycle summation concept can also be extended to
fatigue crack growth. Here, the crack growth increment per cycle may be assumed to
equal the crack growth rate associated with constant amplitude loading of the same
magnitude; alternatively, it may also be deduced from a load interaction model (see
below).
One of the critical issues in the use of the cycle-by-cycle method is to define what is
meant by a fatigue cycle in variable amplitude loading. As noted in Chapter 8,
several cycle counting techniques are available for the analysis of variable amplitude
loads in conjunction with the low-cycle fatigue and fracture mechanics concepts.f In
finite element simulations of variable amplitude crack growth, a fatigue cycle is
represented by some pre-determined crack advance (usually one mesh dimension),
rather than one fluctuation in stress or stress intensity factor. In this section, we
examine the salient features of the cycle-by-cycle approach and the characteristic
approach.
14.15.1 Yield zone models
Willenborg, Engle & Wood (1971) suggested a retardation model, the basic
premise of which is that delayed growth is due to the increased levels of residual
compressive stresses ahead of a fatigue crack induced by overloads. These
compressive residual stresses cause a reduction in crack tip stress intensity factor by an
amount Kred. This reduction in K is a function of the forward plastic zone size
associated with the current load cycle of a random load spectrum and of the max-
t See Chapter 8 for an example of a cycle counting method.
14.15 Life prediction models
535
imum plastic zone size created by the overloads. Crack growth retardation is
predicted by this model if the minimum stress intensity factor Kmin of the current
loading cycle is less than Krei.
Although widely used in the aerospace industry, some of the basic features of this
model run counter to current mechanistic understanding of crack closure. For
example, the model implies that the delay in crack growth is due to a reduction in Kmax,
rather than a reduction in AKeff.
Wheeler (1972) introduced a simple retardation model using similar assumptions.
In this approach, the variable amplitude crack growth rate, (da/dN)YA, in a fatigue
cycle is related to the equivalent constant amplitude growth rate at the same nominal
AK, (da/dN)CA, by a retardation factor, p, so that
$\A&h ><£)■
Here, rpi is the plastic zone size associated with the ith (post-overload) stress cycle
and rmax is the distance from the current crack tip to the greatest prior elastic-plastic
boundary created by the overload, k is an exponent which is empirically chosen to
obtain the best overall crack growth predictions for a given material and loading
spectrum. Implicit in the Wheeler model is the notion that the main cause of
retardation is the zone of residual compressive stresses at the crack tip created by the
overload.
14.15.2 Numerical models of crack closure
On the basis of Elber's work (1970) on crack closure, many attempts have
been made to develop models for variable amplitude fatigue. Experiments indicate
that the crack closure stress varies in every cycle when the block of random loading
history consists of many cycles. On the other hand, when the block length is short,
the crack closure stresses remain roughly constant. The former (long) loading history
is termed nonstadonary and it denotes a loading sequence which repeats itself after a
crack growth increment of greater than the largest prior plastic zone. The latter
(short) loading waveform is termed stationary and it represents the loading sequence
which is repeated regularly and exactly.
Crack closure concepts have also been developed into predictive models using
detailed finite-element programs where iterative solution procedures are invoked
for a cycle-by-cycle calculation of closure (e.g., Newman, 1983). Newman's finite-
element formulation for plasticity-induced crack closure predicts a change in crack
opening load after a fixed amount of crack growth rather than after each load cycle.
It can, therefore, be used for both stationary and nonstationary loading histories.
The main drawback of these models is that they are based on formulations which do
not incorporate crack closure effects due to oxidation or fracture surface roughness
on variable amplitude fatigue life. Other developments in the numerical modeling of
536
Retardation and transients in fatigue
crack closure in variable amplitude fatigue can be found in the volumes edited by
Newman & Elber (1988) and Petit et al. (1988).
14.15.3 Engineering approaches
Many researchers (e.g., Socie, 1977; Schijve, 1980; Kikukawa, Jono &
Mikami, 1982; Sunder, Seetharam & Bhaskaran, 1984) have employed the crack
closure concept in conjunction with various cycle counting methods to predict
crack growth life in variable amplitude fatigue involving random and block program
loads. These approaches, which predict fatigue lives to within an accuracy of a factor
of two, involve the following assumptions, (i) The crack opening stress intensity
factor Kop is constant during each block of variable amplitude loading. -Kop is
fixed by the maximum stress intensity factor (Kmax)VA and the minimum stress
intensity factor (Kmin)YA in each program block. In addition, the crack opening
load is assumed equal to that in a constant amplitude fatigue test with an equivalent
AK, i.e. SK = Kmax - Kmin = (Amax)VA - (^min)VA- (») Crack growth is integrated on
a cycle-by-cycle basis. This involves the modified Paris rule,
^=cl(A*effr,
where AKs(( = Kmax - Kop, if ^min < ^op,
= Kmax — Kmin, if Kmin > Kop. (14.32)
Here da/dN is the crack growth rate due to an effective stress intensity factor range,
AKe{{, and C\ and m\ are empirical constants obtained from constant amplitude
data based on da/dN versus AA^ plots.
(iii) Cycles are counted using the rainflow, range-pair or other methods (see
Chapter 8). The main appeal of this approach is that one can deduce the crack
opneing behavior in variable amplitude loading on the basis of fatigue crack growth
response measured using constant amplitude loading.
14.15.4 The characteristic approach
This approach was first proposed by Paris (1960) for random loading. The
basic hypothesis here is that, because of similarity, the random variation of the crack
tip fields are describable in terms of the root-mean-square value of the stress intensity
factor range, A^ms. The variable amplitude crack growth rates are then given by the
Paris-type relationship
^=C(AAnnsr, (14.33)
where C and m are, as discussed in Chapter 10, material constants and
Exercises
537
AK,
rms
Eaa?
N ^ 1. (14.34)
Here, AKS is the stress intensity factor range in the ith cycle in a sequence consisting
of n stress cycles. Note that AKrms = AK for constant amplitude fatigue. Therefore,
the characteristic approach suggests that the average crack growth rate in spectrum
fatigue can be predicted from constant amplitude fatigue data using Eq. 14.34.
Although empirical, this approach has been widely used in a number of fatigue-
critical applications; examples include variable amplitude fatigue of steel bridges
(Barsom, 1976). However, in some applications, such as flight simulation of gust
loading spectra for aircraft, random loading and its statistically equivalent program
loading are known to provide different results (Schijve, 1973).
Exercises
14.1 Discuss the advantages and disadvantages of each of the following methods
for measuring (i) crack length and (ii) crack closure loads:
(a) Crack mouth opening displacement gage.
(b) Strain gages mounted in the wake of the crack, above and below the
plane of the crack.
(c) Strain gages mounted immediately ahead of the crack tip.
(d) Back-face strain gage.
(e) DC electrical potential drop.
(f) AC electrical potential drop.
(g) Ultrasonics.
(h) Acoustic emission.
(i) Travelling microscope providing a direct optical image of the crack on
the specimen surface.
Also discuss the experimental procedures you would use for the
calibration of crack length and crack closure, where appropriate, for each of the
above methods.
14.2 For each of the following cases, plot the load (P) versus the crack opening
displacement (S) curve for a metallic material subjected to loading and
unloading phases in zero-tension-zero fatigue:
(a) Plastic deformation at crack tip; no change in crack configuration (i.e.
crack opening and crack length); loading phase.
(b) Gradual opening of the crack during the loading phase and plastic
deformation at crack tip.
(c) Elastic behavior at constant crack configuration during the loading
phase.
538
Retardation and transients in fatigue
(d) Effect of plastic behavior = effect of configuration change on the PS
plot during the unloading phase.
(e) Effect of plastic behavior > effect of configuration change on the PS
plot during the unloading phase.
(f) Effect of plastic behavior < effect of configuration change on the PS
plot during the unloading phase.
(g) Configuration change during the unloading, with negligible plastic
deformation at crack tip.
14.3 Derive Eq. 14.24 following the discussion in Section 14.9.
14.4 The nominal variation of the fatigue crack growth rate, da/dN, as a
function of the nominal stress intensity factor range, AK, for a hypothetical,
fine-grained alloy is the same as that shown by the solid line in Fig. 14.12.
This crack growth response was obtained at room temperature at a load
ratio of zero. Optical microscopy of the crack profiles reveals a highly planar
(straight) fracture path normal to the tension fatigue loading direction.
Measurements of changes in compliance during loading and unloading do
not show any crack closure over the entire range of AK. This material was
given a proprietary heat treatment which results in a drastic change in the
fracture mode, without altering the overall stress-strain characteristics of
the alloy or the grain size. The heat-treated alloy exhibited a highly tortuous
crack path, with periodic deflections of 45° from the nominal mode I growth
plane and a deflected segment ratio (D/[D + S}) of 0.5. For R = 0,
(a) Predict the variation of da/dN with AK for the heat-treated alloy, by
accounting for the combined effects of (i) changes in crack-tip stress
intensity factor due to crack deflection, (ii) changes in apparent crack
growth rate due to crack deflection, and (iii) no mismatch between
fracture surface asperities.
(b) Repeat the calculations in (a) by considering crack closure due to
fracture surface mismatch with the mismatch factor, x = 0.1 and 0.25.
Assume small-scale yielding and that crack deflection and the associated
contact between the crack faces are the primary source of the change in
crack propagation behavior.
14.5 Discuss how possible effects of crack tip plasticity (under conditions of
plane strain and small-scale yielding) would modify the predictions of the
model for fatigue crack deflection, Eqs. 14.23 and 14.24. (Hint: See the
discussion in Section 9.11.2.)
14.6 Discuss a set of conditions under which the application of a tensile overload
to a component can result in (i) an improvement, (ii) a reduction, or (iii)
no change in fatigue life. Provide at least one practical example for each
situation.
14.7 Repeat the previous problem for the case of a compressive overload.
Exercises
539
14.8 Consider the engineering component with a stress concentration which is
schematically sketched in Fig. 1.2. The component is subjected to variable
amplitude fatigue which consists of constant amplitude stress cycles mixed
with periodic overloads. The component is made of a high strength material
and the extent of plastic deformation is small compared to the root radius of
the notch in the component.
(a) Outline a procedure for the determination of the number of cycles to
initiate and propagate the crack ahead of the stress concentration.
(b) Discuss the beneficial or detrimental effects of the overloads on the
fatigue life.
14.9 A fatigue crack in a structural component made of an aluminum alloy, of
yield strength ay = 300 MPa, propagates at a constant amplitude stress
intensity factor range of 6 MPa ~/m with a load ratio of zero. A malfunction
in the operation of the component results in a single tensile overload with a
peak stress which is 50% higher than the peak stress in the previous constant
amplitude stress intensity fluctuation. After the overload, the component
returns to normal operation.
(a) If the Wheeler model for retardation is used with k = 1 in Eq. 14.31,
how much does the post-overload crack growth rate differ from the pre-
overload crack growth rate immediately upon resumption of normal
operation after the overload? Plane stress conditions exist throughout
the range of fatigue crack growth.
(b) Calculate the distance that the crack has to advance after the
application of the overload to resume pre-overload crack growth rate.
(c) Calculate the retardation factor /? when the crack has extended a
distance of 25 |im after the application of the overload.
(d) Discuss the limitations of this approach.
14.10 A fatigue crack, propagating at a constant amplitude stress intensity factor
ragne AK = 3 MPaVm and load ratio R = 0.2, is subjected to a tensile
overload with AKOL = 6 MPaVS. Following the single overload, the
crack is subjected to a constant amplitude AK = 3 MPaVm and load
ratio, R = 0.1. The application of the overload results in crack bifurcation,
with the branched crack having a forked crack-tip which is symmetric about
the mode I growth plane (i.e. the crack develops a geometry similar to that
shown in Fig. 9.17(6); a = 45° and b/a = 0.1). The pre-overload crack
growth rate followed the relationship,
^ = 2.5xlO-"(A*)<,
where da/dN is in units of m/cycle and AK is in MPaVm. Assuming that (i)
b is much larger than the crack-tip plastic zone size, (ii) the crack advances
along the arms of the fork, and (iii) the changes induced in the geometry of
540
Retardation and transients in fatigue
the crack are the principal factors influencing growth retardation, calculate
the crack propagation rate in the post-overload regime.
14.11 The effect of the amplitude of the first compression cycle on crack growth
from notches under far-field cyclic compression was discussed in Section
14.13.1. Speculate about the effects of the following loading patterns on
mode I fatigue crack growth from notches under cyclic compression:
(a) The fatigue crack is propagated ahead of a stress concentration under a
constant amplitude of imposed cyclic compressive loads. The cracks
arrest naturally after advancing a distance of ten times the notch-tip
radius. At this point, the notched specimen is subjected to a 100%
compressive overload. Will the application of the compressive overload
result in the reinitiation of the crack? Why?
(b) The same situation as in the previous problem, except that the distance
of total crack growth under constant amplitude cyclic compression is
one-half of the notch-tip radius (instead of ten times the notch-tip
radius). At this point, the notched specimen is subjected to a 100%
compressive overload. Will the application of the compressive overload
result in the reinitiation of the crack? If so, is the extent of crack growth
following the overload greater than or less than that in part (a)?
Explain.
CHAPTER 15
Small fatigue cracks
The practice of characterizing the growth of fatigue cracks on the basis of
fracture mechanics primarily relies on laboratory fatigue tests on specimens
containing 'long' flaws which are typically tens of millimeters in length. There are, however,
a number of fatigue-critical engineering components, such as turbine discs and
blades, whose design requires an understanding of the propagation of fatigue cracks
of significantly smaller dimensions. In the majority of investigations where
continuum approaches have been adopted for the characterization of small fatigue flaws
(of size range from a fraction of a millimeter to several millimeters), it has been
shown that the growth rates of small flaws can be significantly greater than the
corresponding rates of long flaws when characterized in terms of the same nominal
driving force (see Fig. 15.1). The direct application of laboratory data (derived from
experiments on long fatigue cracks) to design against the failure of safety-critical
components containing short flaws can, therefore, lead to dangerous overestimates
of fatigue lives. Research effort in this area has led to an awareness of the apparently
anomalous behavior of short fatigue cracks and has provided possible ways in which
many seemingly conflicting viewpoints of total-life and defect-tolerant fatigue
approaches can be rationalized in a unified fashion.
To focus attention on the practical significance of the 'short crack problem',
consider the effect of crack growth characterization on the estimated fatigue life
of a commercial alloy, Fig. 15.2. This figure contains experimental data on the
number of fatigue cycles to failure for cracks of different initial dimensions in a
nickel-base superalloy, commercially known as Astroloy. This alloy is used as a
disc material for aircraft gas turbine engines. Current design methodology based
on linear elastic fracture mechanics (LEFM) provides accurate estimates of fatigue
life in this material when the initial size of the fatigue flaw is larger than 0.3 mm.
However, when the material contains defects that are smaller than this size, life
predictions nominally based on LEFM may give nonconservative values (even if
small-scale yielding conditions prevail). This complication arises because the actual
growth characteristics, crack path tortuosity or closure processes for small flaws can
be different from those of longer flaws. The problem is further exacerbated by the
fact that the limit for the detection of flaw size with existing nondestructive
inspection methods is about 0.3 mm.
In this chapter, we present a discussion of the different types of small fatigue
cracks which exhibit apparently anomalous growth behavior compared to long
fatigue flaws. This is followed by an examination of the mechanisms of the growth of
short fatigue cracks, models for the initiation and growth of short flaws,
541
542
Small fatigue cracks
-a
-a
60
O
short crack
from notch
long crack
(LEFM)
crack length, a (or) log AK
Fig. 15.1. A schematic of the typical fatigue crack growth behavior of long and short cracks at
constant values of imposed cyclic range and load ratio.
methods of characterization as well as conditions for the breakdown of fracture
mechanics.
1.0 r-
« 0.1
| 0.01
0.001
NT
from small crack
growth kinetics
10a
from LEFM
10* 105 106
cycles to failure, Nt
10'
108
Fig. 15.2. The significance of the short crack problem is illustrated for an Astroloy. The plot
shows the number of fatigue cycles to failure, estimated using LEFM and small crack growth
kinetics, as a function of the initial flaw size. (After Hudak et ah, 1988.)
15.2 Similitude
543
15.1 Definitions of small cracks
There are different size scales below which the growth rates of a fatigue
crack may be found to exhibit a crack size dependence. Suresh & Ritchie (1984b)
suggested the following definitions by which short cracks can be broadly classified:!
(1) Fatigue cracks for which the crack size is comparable to the scale of the
characteristic microstructural dimension such as the grain size for
monolithic materials and the interparticle spacing for particulate-reinforced
composites; these are referred to as microstructurally small flaws.
(2) Small fatigue cracks in smooth specimens for which the near-tip plasticity is
comparable to the crack size, or cracks which are engulfed by the plastic
strain field of a notch; these are referred to as mechanically small flaws.
(3) Fatigue flaws which are significantly larger than the characteristic micro-
structural dimension and the scale of local plasticity, but are merely
physically small with length typically smaller than a millimeter or two.
(4) Fatigue cracks which are nominally amenable to linear elastic fracture
mechanics analyses, but exhibit apparent anomalies in propagation rates
below a certain crack size as a consequence of the dependence of
environmental stress corrosion fatigue effects on crack dimensions; these flaws are
sometimes referred to as chemically small cracks.
A chief reason for the interest in the study of short fatigue cracks can be traced to
the experimental findings that cracks which conform to any one of the foregoing
definitions of smallness often propagate at rates which are not amenable to an
unambiguous characterization based on continuum mechanics or linear elastic
fracture mechanics parameters.
15.2 Similitude
The characterization of fatigue crack advance on the basis of linear elastic
fracture mechanics principles is predicated upon the concept of similitude. This
concept merely implies the fact that for a particular material-environment system
subject to some particular loading history, identical near-tip conditions will prevail
in specimens of different sizes containing different crack geometries if the magnitude
of the characterizing parameter (e.g., Kt in small-scale yielding) is the same. Since
LEFM uniquely characterizes the growth of a linear elastic fatigue crack (in the
absence of the crack retardation mechanisms discussed in the previous chapter),
the crack propagation mechanisms in these different specimens would be expected
to be the same. However, when far-field loading conditions differ markedly from the
' Although the expressions 'small cracks' and 'short cracks' are often used interchangeably, sometimes a
distinction is made between the two cases in that the former definition is employed for flaws which are
small in all three dimensions whereas the latter type are taken to denote through-thickness flaws which
are small in all but one dimension (e.g., Ritchie & Lankford, 1986).
544
Small fatigue cracks
near-tip conditions (see the case study at the end of this chapter) and when the size of
the fatigue crack appreciably contributes to such differences, the similitude concept
based on nominal values of the characterizing parameter is no longer applicable.
Thus, the small crack problem is essentially an outcome of the inapplicability of the
fracture mechanics parameters to uniquely characterize the growth of fatigue cracks
independent of the crack size.
15.3 Microstructural aspects of small flaw growth
The first reported observations of the accelerated growth of short fatigue
cracks are apparently due to Pearson (1975) who examined the effect of crack size on
propagation rates in a precipitation-hardened aluminum alloy. He found that short
surface flaws, 0.006 to 0.5 mm deep, grew up to 100 times faster than longer flaws,
tens of millimeters in size, which were subjected to the same nominal AK. This
investigation also indicated the possibility of the advance of short fatigue flaws at
nominal stress intensity levels below the threshold AK0 for long cracks. Subsequent
fatigue studies on 7075 aluminum alloy (Lankford, 1982), silicon iron (Tanaka, Hojo
& Nakai, 1983), and on a number of other alloy systems have documented several
transient acceleration and retardation characteristics associated with the subcritical
growth of short fatigue cracks (see, for example, conference proceedings edited by
Miller & de los Rios, 1986; Ritchie & Lankford, 1986; Kitagawa & Tanaka, 1990).
Figure 15.3 is a schematic of the short crack growth behavior for a peak-aged 7075
aluminum alloy. This figure shows a marked reduction in the rate of growth of the
microstructurally short crack with increasing crack length; the growth rate of the
retarded short crack subsequently increases with crack length until it merges with the
long crack growth data characterized by LEFM. The retardation of the crack occurs
when the crack tip reaches a grain boundary in the material. Periodic retardations of
the short flaw have also been reported whenever the crack tip encounters a grain
boundary in aluminum alloys (Morris, 1979, 1980), low strength mild steels (Tanaka,
Nakai & Yamashita, 1981), titanium alloys (Wagner et ah, 1986) and nickel-base
superalloys (Sheldon et ah, 1981).
Note that the retardation of a short flaw, at least in the context of LEFM, is
somewhat anomalous in that an increase in crack length, at fixed far-field cyclic
stresses, is expected to increase the nominal AK for crack growth and the attendant
crack growth rates. However, such transient effects have been rationalized by several
mechanisms associated with short flaw growth:f
' Small flaws in transformation-toughened ceramics are also known to exhibit periodic growth
retardation and arrest as a consequence of crack tip-grain boundary interactions and the development of
closure as the transformed material is left in the wake of the advancing crack tip (Sylva & Suresh, 1989).
15.4 Threshold conditions for small flaws
545
-a
-a
60
O
short
cracks —..^ «>
^ \
long crack
(LEFM)
crack length, a (or) log AK
Fig. 15.3. A schematic of sub-threshold growth and transient retardation characteristics of a
microstructurally small fatigue crack (dashed lines). </g2 > dg!.
(1) Crack tip-grain boundary interactions which have the following
consequences: (i) Cessation of crack growth occurs until a sizeable plastic zone
is established in the neighboring grain (James & Morris, 1983), (ii) Slip
bands emanating from the crack tip are pinned at the grain boundary
(Tanaka, Nakai & Yamashita, 1981). (iii) A change in crack tip driving
force is caused by crack deflection associated with the crystallographic
reorientation of the crack tip as it traverses through the grain boundary into the
adjacent grain (Suresh, 1983a). Experiments indicate that small crack
retardation generally occurs when the crack size a is comparable to or is a
multiple of the grain size, d%. The depth of the retardation well also depends on
the crystallographic orientations of the neighboring grains (Lankford,
1982).
(2) An increase in crack closure with an increase in crack length (Morris, 1980)
and with crack deflection (Suresh, 1983a).
15.4 Threshold conditions for small flaws
15.4.1 Transition crack size
The predominantly stage I growth of microstructurally small flaws and the
attendant retardation and arrest behavior point to the existence of threshold condi-
546
Small fatigue cracks
tions which may be very different from those of long fatigue cracks. The similitude
concept of fracture mechanics implies that the intrinsic threshold stress intensity
factor range AKth for a long crack should be crack size independent with
AKth = AK0. On the basis of the short crack growth rate data obtained for a wide
variety of ductile materials, Kitagawa & Takahashi (1976) demonstrated that there
exists a critical crack size a0 below which AKth decreases with decreasing crack
length, a. For a < a0, it is found from a survey of results for a wide variety of
engineering alloys (see Fig. 15.4) that the threshold condition is characterized by a
critical stress A<rth which approaches the smooth bar fatigue limit <re for vanishingly
small crack sizes. For a > a0, AKth = AK0 and AKth is independent of crack size.
Thus, one may infer from Fig. 15.4 that
b
<
b
<
J («)
2
J
0.01
1.0
0.5
0.2
0.1
2
<&
- /
S
L 1 1 1
0.1
a/a0
(b)
10
100
Fig. 15.4. The effect of crack size on (a) threshold stress and (b) threshold stress intensity factor
range for a wide variety of engineering alloys with yield strength values ranging from 30 to 770
MPa. (After Tanaka, Nakai & Yamashita, 1981.)
15.4 Threshold conditions for small flaws
547
_ 1 /A*o
AKth = AK0 for a > a0,
A<rth = <re for a < an. (15.1)
Attempts have been made to establish a link between the transition crack size an and
the characteristic microstructural dimensions in a vast spectrum of materials (e.g.,
Kitagawa & Takahashi, 1976; Tanaka, Nakai & Yamashita, 1981; Taylor & Knott,
1981; Lankford, 1982, 1983; Brown & Hicks, 1983; Wagner et al., 1986). For very
high strength steels, of monotonic yield strength <ry up to 2000 MPa, an *» 1 — 10 urn
and for very low strength steels with <ry as low as 200 MPa, a0 «* 100 — 1000 urn.
Although there is no unique definition of an which is representative of all materials, it
is worth noting that a measure of a0 can be extracted from continuum level
measurements involving the fatigue limit <re (from S-N curves obtained from fully reversed
cyclic stressing) and the long crack fatigue threshold AK0 (from fracture mechanics
approach to fatigue). In this sense, the field of a short fatigue crack promotes a
marriage of several apparently contradicting philosophies associated with the total-
life (Chapters 7 and 8) and the defect-tolerant (Chapters 9-12) approaches to fatigue.
The transition crack size an has also been employed as an empirical parameter to
account for the differences in growth rates between long and short fatigue cracks. El
Haddad, Topper & Smith (1979) suggested that when a fictitious or intrinsic crack
length an, defined in Eq. 15.1, is added to the fatigue crack length a, the resulting
characterization based on LEFM provides crack propagation rates that are
independent of crack size. Here,
AK = QA<T°°y/n(a + a0), (15.2)
where A<r°° is the far-field stress range and Q is the finite size correction factor.
Equation 15.2 implies that an is the smallest crack size which is amenable to an
LEFM characterization. El Haddad et al. demonstrated that the differences in the
fracture mechanics-based growth characterization for long and short flaws vanish
when the fictitious crack size an is used by recourse to Eq. 15.2. The major drawback
of this empirical approach is that attempts to provide a physical reasoning for the
validity of Eq. 15.2 have so far remained unconvincing.
15.4.2 Critical size of cyclic plastic zone
The threshold conditions based on the transition crack size (Fig. 15.4)
involve a critical stress criterion for short flaws and a critical stress intensity criterion
for long cracks. Ohuchida, Usami & Nishioka (1975), Usami & Shida (1979), and
Usami (1982) suggested a single criterion for fatigue thresholds which rationalized
the overall shape of the threshold plots in Fig. 15.4. These researchers postulated
that the fatigue limit is reached when a critical value of the cyclic plastic zone size, r*,
548
Small fatigue cracks
is reached. Using the Dugdale plastic zone estimate, Eq. 9.81, to derive the cyclic
plastic zone size for positive load ratios (R > 0), it was shown that
;rA<7th
rr = a\ sec——-- 1
4<7V
(15.3)
Noting that r* is a constant which is independent of crack size, it is seen that Eq. 15.3
simulates the shape of the Aerth versus a plot shown in Fig. 15.4(a). Usami & Shida
have also extended this approach to include the effects of negative load ratios on
short crack growth. Despite the apparent success of this hypothesis to predict the
overall variation of the threshold stress with crack size, the basic premise of the
model, namely that r* is a constant for different crack sizes, remains to be established
by experiments or by physical reasoning.
15.4.3 Slip band models
Alternative interpretations for the threshold conditions for small fatigue
flaws have been formulated in terms of (crack tip) slip band-grain boundary
interaction. Tanaka, Nakai & Yamashita (1981) postulate that the threshold for short
cracks is dictated by whether the grain boundaries obstruct or are penetrated by the
slip bands emanating from crack tips. An analysis of the condition for the blockage
of slip bands (see Fig. 15.5) by grain boundaries (see Tanaka, Nakai & Yamashita,
1981, for further details) provides the following results for <rth and Kth:
(«)
Fig. 15.5. Schematic representation of the slip band model, (a) A slip band emanating from a
crack tip is blocked by a grain boundary, (b) Nomenclature associated with the coplanar slip
band for an isolated crack. (After Tanaka, Nakai & Yamashita, 1981.)
15.4 Threshold conditions for small flaws
549
Kth = ath^a= K™.l + 2.-alcos-H-\. (15.4)
\ b V K \h/
In Eqs. 15.4, b is the sum of the crack length a and the width of the blocked slip band
zone H>0, <Tfr is the friction stress for dislocation motion in the band, and K™ is the
microscopic stress intensity factor at the tip of the slip band. For long cracks,
wherein w0 <£. a, the threshold stress intensity is given by
K0 = JC + 2AfrV^. (15.5)
V K
For vanishingly small fatigue flaws, the fatigue limit <re is obtained by letting a = 0 in
Eq. 15.4 such that
Km
<re = <%+—?=. (15.6)
There are several interesting implications of this analysis: (i) If one takes
<Tfr = 0, K0 = K™ and w0 = a0 in Eqs. 15.4, it is found that
°* = -T== and Kth = -^= (15.7)
Vn(a + a0) y/(a + a0)
This result is the same as the characterization based on the fictitious crack length a0
assumption, Eq. 15.1. (ii) Similarly, the critical rc hypothesis, Eq. 15.3, is found to be
a special case of the blocked slip band model by setting K™ = 0 in Eqs. 15.4. (iii)
Since one may envision the slip band to be confined within a single grain (at the
fatigue limit), w0 may be assumed to be of the order of one half the grain size, d%.
With this assumption, Eqs. 15.6 and 15.7 imply that the threshold stress intensity for
long cracks AK0 increases with increasing grain size while the threshold stress for
small flaws (<rth -> <re) decreases with increasing grain size.
This prediction has the consequence that microstructural modifications, such as
increased yield strength and reduced grain size, which offer an enhanced resistance to
crack initiation and the growth of small fatigue flaws may in fact have a detrimental
effect on the growth of long fatigue cracks. These expectations are borne out by
experiments in a number of different alloy systems: 300M maraging steels of
different strengths (Ritchie, 1979), maraging steel and cast iron (Usami & Shida, 1979),
and dual-phase steels (Suzuki & McEvily, 1979; Dutta, Suresh & Ritchie, 1984).
Figure 15.6, for example, illustrates this effect where the threshold conditions are
plotted as a function of the surface roughness (to simulate crack size) for a maraging
steel and a cast iron. The high strength maraging steel has a superior resistance to
crack initiation and short crack growth as compared to cast iron; the reverse
situation is found for the growth of long flaws.
550
Small fatigue cracks
W
i
b
<
W
10
pin-hole
inclusion carbide
•<7
j_
_L
J_
10"' 10"
10"
10"' 10°
101
102
surface roughness (mm)
Fig. 15.6. Thresholds for the growth of long and short fatigue flaws in cast iron (filled circles, <ry
= 113 MPa) and maraging steel (open circles, <ry = 1906 MPa). The surface roughness is used
to simulate crack size. The roughness scale associated with inclusions and pin-hole carbides is
also illustrated. (After Usami & Shida, 1979.)
15.5 Fracture mechanics for small cracks at notches
Linear elastic fracture mechanics solutions of the near-tip fields for sharp
cracks (of tip radius, p -> 0) were derived in Chapter 9. If instead of a crack, one
considers a notch where p > 0, similar solutions can be derived to characterize the
fields at the tip of the notch. Consider the case of a sharp notch in a body subjected
remotely to tensile stresses in a direction normal to the plane of the notch (Fig. 15.7).
Linear elastic analyses of Creager & Paris (1967) show that elastic fields in the
vicinity of the notch take the form:
.6 .36
Jyy
Jxy
1
1 +
sin- sin-
. 6 . 36
sin- sin —
2 2
sin
■cos
cos
36
cos —
2
— sin-
(15.8)
where the cylindrical coordinates r and 6 and the notch-root radius p are defined in
Fig. 15.7. In Eq. 15.8, K^ is the stress intensity factor at the tip of a sharp crack which
is subjected to the same loading conditions as the notch and is of the same length as
the notch in Fig. 15.7. The first term on the right hand side of Eq. 15.8 is identical to
the near-tip fields for a sharp crack, Eqs. 9.44. The second term reflects the
modification to the sharp crack solutions due to the bluntness of its tip. Note that, on the
75.5 Fracture mechanics for small cracks at notches
551
t
notch
y
H
-—1
/
r<»
Y\6
t
III-'-
p
Fig. 15.7. Reference coordinates and stresses in the near-tip region of a notch in a plate.
plane of the notch (y = 0 in Fig. 15.7), the stress singularities for sharp notches of
low p values is centered at a distance of p/2 behind the notch tip, which is the origin
of the coordinate system.
15.5.1 Threshold for crack nucleation
During the application of a far-field cyclic load of amplitude Act00, the
maximum stress intensification occurs at the notch tip (x = p/2). The stress
amplitude at the notch tip is given (by taking 6 = 0 and examining only the ayy component
for mode I from Eqs. 15.8) by
2 A K
A<rmax = Kt(A<r°°) = -=—±, (15.9)
where AA^ is the stress intensity factor range at the tip of a fatigue crack, of the same
length as the notch, subjected to the same far-field cyclic load Act00. Equation 15.9
holds true strictly for the case of a vanishingly small notch-root radius. However, it
has been found that Eq. 15.9 is accurate to within 10% of the results obtained from
more detailed finite-element calculations of notch tip fields under small-scale yielding
conditions for notch tip radii p < 4.5 mm, and for a notch length significantly greater
than the root-radius, (e.g., Barsom & Rolfe, 1987).
The particular form of Eq. 15.9 suggests that the number of fatigue cycles to
initiate a fatigue crack ahead of a stress concentration can possibly be correlated
equivalently with either A<rmax or AKi/^/p, following the stress-life approach to
fatigue, Chapter 7. Barsom & McNicol (1974) studied the initiation of fatigue cracks
under uniaxial zero-tension cyclic loads in double edge-notched plates of HY-130
steel where the notch-root radius was systematically varied. They found that the
initiation of a fatigue crack was characterized by a constant threshold value of the
parameter AKi/^fp for the different notch tip geometries (Fig. 15.8), in accordance
552
Small fatigue cracks
104
I
102
p = 0.20 mm
p = 9.53 mm
-L
l
10s 104 105 106
number of cycles for crack initiation, Nt
Fig. 15.8. Fatigue life plots correlating the number of cycles to initiate an engineering-sized
crack (NJ with the parameter AA^/^p for double edge-notched specimens of HY-130 steel
(<ry = 1000 MPa) with notch-root radii p = 0.2-9.5 mm. (After Barsom & McNicol, 1974.)
with the predictions of Eq. 15.9. From a comparison of Figs. 7.1 and 15.8, and from
Eq. 15.9, it is readily seen that this threshold value is essentially an endurance limit
for notched bars expressed in terms of linear elastic fracture mechanics.
15.5.2 Example problem: Crack growth from notches
As a linear elastic fatigue crack begins to propagate ahead of a notch, its
'driving force' is affected by the elastic stress concentration at the notch tip.
Once the length of the crack exceeds a certain fraction of the notch tip radius,
the geometry of the notch tip region no longer has a bearing on the near-tip
fields for the advancing fatigue crack. Issues pertaining to the role of stress
concentrations in influencing the growth of small flaws that emanate from
them and to the validity of the use of standard stress intensity calibrations for
sharp fatigue cracks are clearly illustrated in this example problem, taken from
Dowling (1979).
Problem:
Consider a large plate containing a central hole of radius c, as shown by
the inset in Fig. 15.9. A fatigue crack emanates from the tip of the hole in
response to the application of a far-field zero-tension fatigue cycle of amplitude
a°°. As a fatigue crack initiates at the stress concentration and advances
perpendicularly to the applied load, analytically determine transition crack size at
which linear elastic fracture mechanics begins to provide a valid characterization
75.5 Fracture mechanics for small cracks at notches
553
Fig. 15.9. Variation of stress intensity factor K^/a^^/c as a function of the fatigue crack
length / (normalized by the radius of the circle c). (After Dowling, 1979.) The numerical
values for the ordinate are given for Kt = 3 and F = 1. Limiting stress intensity solutions,
Aup = Ks and Ktip = Kh from Eqs. 15.10 and 15.11, respectively, are plotted along with the
numerical predictions of Newman (1971).
of the 'driving force' for fracture. Ignore any nonlinear deformation processes at
the root of the stress concentration.
Solution:
When the length of the fatigue crack / is small compared to the radius of
the circle, the limiting analytical stress intensity factor solution for the short
fatigue crack (assuming negligible plasticity in the vicinity of the hole and the
crack) at the maximum imposed stress of the fatigue cycle is given by
Ks = lA2KtacoV^l. (15.10)
Here Kt is the theoretical elastic stress concentration factor (equal to three for a
circle), the pre-multiplier 1.12 on the right hand side is the free surface
correction factor, and the subcript S on the left hand side refers to the fact that Eq.
15.10 is the stress intensity solution for a 'short' crack ahead of a stress
concentration. As the length of the fatigue crack / increases and a = c + I becomes
large compared to c, the stress intensity factor for the 'long' fatigue crack is
given by
Kx = Facos/na. (15.11)
554
Small fatigue cracks
For a large plate whose semi-width is W :» (c + l), F = 1. Figure 15.9 shows
the variation of the stress intensity factor, predicted from Eqs. 15.10 and 15.11,
as a function of the fatigue crack length /. In this figure, the numerical values for
the ordinate are given for Kt = 3 and F = 1. The intersection of the two curves
corresponding to the limiting cases of short and long fatigue cracks provides a
transition crack size /0 beyond which fracture is controlled by the nominal stress
intensity factor rather than by the stress concentration factor at the notch tip.
Equating Eqs. 15.10 and 15.11, one finds that
/0=? — _ (15.12)
[(1.12A:t/F)2-l]
Numerical calculations by Newman (1971) for a crack emanating from a stress
concentration, shown by the dashed line in Fig. 15.9, closely follow the limiting
stress intensity factor solutions for short and long cracks.
15.6 Continuum aspects of small flaw growth
One of the major factors contributing to the apparent anomalies in the
growth of small flaws is the inappropriate use of continuum mechanics and fracture
mechanics methodologies for the characterization of fatigue cracks. While the
limitations associated with the interpretation of microstructurally small fatigue crack
growth in terms of continuum stress analysis are somewhat obvious, it has also
become evident in recent years that there are some serious restrictions implicit in
the nominal use of both linear elastic and nonlinear fracture mechanics for different
types of short fatigue flaws.
15.6.1 Two-parameter characterization of short fatigue cracks
The leading singular term of the asymptotic expansion for the linear elastic
crack problem, Eq. 9.44, is generally adequate for the complete description of near-
tip fields for uniaxially loaded fatigue cracks under small-scale yielding conditions.
For long fatigue cracks, the size of the zone of A^-dominance is typically 10% of the
characteristic dimension (i.e. crack size). As the length of the fatigue crack becomes
smaller, the zone of ^-dominance is also reduced. Furthermore, when the crack size
is small, higher order terms including the T-stress' (see Section 9.3) and the terms
which vanish at the crack tip should be incorporated into the expressions for the
near-tip fields. These higher order terms not only serve to modify the stress and
deformation fields ahead of the small fatigue crack, but they also influence the
size of the plastic zone and the attendant plasticity-induced crack closure in its
wake (Allen & Sinclair, 1982; Suresh & Ritchie, 1984b; Fleck & Newman, 1988).
The near-tip stress distribution and the hydrostatic stress level at the crack tip can be
significantly affected by the T-stress even if the strength of the singularity (i.e. /) is
15.6 Continuum aspects of small flaw growth
555
unaffected. In addition, these effects of the higher order terms are expected to be
further enhanced when crack deflections associated with the stage I growth of small
flaws promote strong mode II displacements.
It was shown in Section 9.8 that different levels of hydrostatic stresses induced at the
crack tip in different specimen and crack geometries can be uniquely characterized,
under small-scale yielding conditions, by the stress intensity factor K^ and the T-stress.
It was also shown in that discussion that under large-scale yielding conditions, the
corresponding two-parameter characterization involves the /-integral and the triaxi-
ality measure Q. The need for a two-parameter characterization of the near-tip fields
for small fatigue cracks can become significant on account of the following factors.
(1) The fatigue crack, which generally initiates at a free surface (i.e. essentially
under plane stress conditions), advances into a region of increasing
constraint as the crack tip penetrates into the subsurface material. There is a
need to characterize, in a unique manner, the changes to the near-tip fields
which involve differing levels of near-tip triaxiality as the small crack
advances.
(2) The growth of short fatigue cracks (of dimensions of the order of several
grain diameters) is markedly more sensitive to the elastic and plastic
mismatch between adjacent grains. It is generally known that when the crack tip
approches an interface (such as a grain boundary) between an elastically or
plastically weaker material to one that is elastically or plastically stronger,
the energy release rate at the tip of the crack is 'shielded' (i.e. reduced from
the applied, remote value) as the crack tip approaches the interface from the
weaker material (see the case study presented later in this chapter).
Conversely, if the crack tip approaches the interface from the elastically
or plastically stronger material, the energy release rate is 'amplified' locally.
The extent of such shielding or amplification of the local energy release rate
can be a strong function of the extent of constraint, as quantified by the T-
stress or Q (Sugimura et ai, 1995; Kim, Besson & Pineau, 1998). Similarly,
small fatigue cracks which initiate in the surface coatings and advance into
the bond-coat or the substrate can experience a strong effect of T or Q as
they approach the interface.
(3) Small cracks (of microstructural size scale) usually propagate along crystal-
lographic directions. The ensuing local mixed-mode loading also promotes a
stronger effect of T-stress or Q (see, for example, Eq. 9.43) than the growth
conditions for longer flaws.
(4) If plasticity-induced crack closure plays a significant role in influencing
crack growth, its magnitude and influence on fatigue fracture are also
dependent on the extent of triaxiality (see Section 14.2).
(5) During fretting fatigue, the small crack which initiates at the fretting contact
region experiences an effective T-stress as it advances deeper into the fretted
556
Small fatigue cracks
substrate, when the substrate is subjected to a uniform (static or cyclic)
tensile or compressive load (see the example problem in Section 13.6.4).
15.6.2 Near-tip plasticity
When the (self-generated) plastic zone size of a small fatigue crack becomes
comparable to its length, the use of LEFM becomes invalid and elastic-plastic
characterization offers a possible means of accounting, at least partially, for the
apparent differences in the growth behavior of long and short fatigue cracks.
Dowling (1977) has suggested that the cyclic / integral, Jc (= A J), provides a
measure of the driving force for elastic-plastic fatigue crack growth (see the discussion in
Chapter 9). By measuring the amplitude of the cyclic stress range Act and the plastic
strain range Aep from stable hysteresis loops (Fig. 15.10a), Dowling has suggested
the following expression for Jc to characterize the growth of small semi-circular
flaws in initially smooth low cycle fatigue specimens:
w. l.6Aa2a 5.0AaA€na
J° « 3.2AWea + 5.0AWDa = + -^-, (15.13)
p E «f +1
where A We and A Wp are the elastic and plastic components of the nominal strain
energy density, a is the depth of the surface flaw which is assumed to be half its
surface length 2c, and (l/«f) is the fatigue hardening exponent.
Dowling argued for the effectiveness of J° characterization, computed from Eq.
15.13, for small flaws based on his experimental results for long and short fatigue
crack growth rate data on AISI A533B nuclear pressure vesssel steel of yield
strength, <ry = 480 MPa (Fig. 15.10/?). A closer fit was obtained between the fatigue
behavior of long flaws (crack size > 25 mm, filled symbols) and short flaws (crack
size < 0.18 mm) using this method. Dowling's method provides a noticeable
improvement over other types of characterization techniques for elastic-plastic
short flaws. Despite this good experimental correlation, the general applicability of
the cyclic / integral to characterize rapidly growing small fatigue cracks remains
questionable (see Chapter 9).
15.6.3 Notch-tip plasticity
Methods for the analysis of the growth and fatigue lives of flaws in notched
components were discussed in detail in the preceding chapter. Here we focus our
attention on the issue of the growth of a small fatigue flaw typically shorter than the
inelastic strain field zone size of the notch.
When fatigue cracks emanate from notches in brittle solids, the initial growth of
the nascent cracks is influenced by the plastic deformation occurring at the root of
the notch. One of the commonly used definitions of a short crack pertains to flaws
which emanate from stress concentrations and which are submerged within the strain
field of the notch (see Section 15.1). Figure 15.11(a) schematically shows an example
15.6 Continuum aspects of small flaw growth
557
10-
1(T
io-
10"
scatter band from -
large specimens
(LEFM)
(b)
0.001 0.01
cyclic J (MPa m)
Fig. 15.10. (a) A method for estimating cyclic J from stable hysteresis loops for the
characterization of small cracks propagating under elastic-plastic conditions, (b) Variation of
crack growth rates Aa/AN as a function of f(AJ) for long and short fatigue cracks in AISI
A533B steel. The symbols, open squares, open circles, + and x, refer to a crack length smaller
than 0.18 mm and the filled symbols refer to cracks longer than 25 mm. The data pertain to
different values of imposed strain range which varied from 0.005 to 0.04. (After Dowling, 1977.)
of a crack of length / propagating from the tip of a notch of depth c and root radius
p. These small flaws often exhibit transient crack growth effects until the tip of the
small flaw is relieved of the strain field associated with notch tip deformation during
fatigue. A behavior often seen in such cases is the temporary retardation (and some-
558
Small fatigue cracks
t '_ t
crack tip plastic zone
plastic zone of notch
„ notch field boundary
(b)
crack length, a (or) log AK
Fig. 15.11. (a) Schematic representation of a short crack which is submerged within the strain
field of a notch and the associated nomenclature, (b) Elastic-plastic and linear elastic crack
growth behavior for small flaws emanating from notches.
times even complete crack arrest, Section 8.3) as the small fatigue flaw advances
ahead of the notch tip (see Fig. 15.1 lb).
Both fracture mechanics-based models and empirical damage models for notch
fatigue have been proposed for the prediction of such deceleration of short crack
growth in notch fatigue. These arguments center around previously described
procedures based on: (i) elastic-plastic analyses based on the variation of J integral, (ii)
the fictitious crack length (a0) concept (El Haddad, Topper & Smith, 1979), and (iii)
the constant cyclic plastic zone size (r*) criterion (Usami, 1982). Such approaches,
75.7 Effects of physical smallness of fatigue flaws
559
however, do not provide convincing descriptions of notch-field plasticity effects for
small flaws for the following reasons: (i) none of the foregoing viewpoints allows for
the possibility of a decrease in the effective driving force for fatigue fracture with an
increase in crack length without recourse to crack closure arguments and (ii) the
growth behavior of the small flaw initiated from a notch (Fig. 15.11) has a strong
similarity to that of a microstructurally small crack in a smooth specimen (Fig. 15.3),
where notch tip plasticity effects are nonexistent. The only continuum level
mechanisms which could account for both of these observations involve reduction in
effective crack tip driving force as a consequence of the development of crack closure with
an increase in crack length and/or the deflection of the fatigue crack. The influence of
these retardation mechanisms is examined in detail in the next section.
15.7 Effects of physical smallness of fatigue flaws
15.7.1 Mechanical effects
One of the most troublesome aspects of the short fatigue crack problem, as
viewed from an engineering design standpoint, involves the so-called physically short
flaws. These fatigue cracks, typically of the order of 0.5-2.0mm in length, are in
many cases significantly longer than both the scale of the microstructure and the size
of the near-tip yield zone. Consequently, they are amenable, at least in principle, to
an unambiguous characterization on the basis of linear elastic fracture mechanics.
However, numerous investigators (e.g., McCarver & Ritchie, 1982; James & Morris,
1983; Suresh, 1983a, 1985b; Tanaka & Nakai, 1983) have demonstrated that
physically small flaws can also propagate appreciably faster than long cracks subjected to
the same nominal value of the stress intensity factor range.
As discussed in the previous chapter, the phenomenon of crack closure plays a
major role in promoting marked differences between the effective (near-tip) AK and
the nominal (far-field) AK. Since crack closure mechanisms arise as a result of
premature contact between the crack faces behind the advancing crack tip, and
since, by definition, a short crack has a limited wake, crack closure effects are less
pronounced for a short flaw propagating in a smooth specimen or ahead of a notch
tip. A clear illustration of this closure-induced difference between long and short
fatigue cracks is found in the work of James & Morris (1983), Fig. 15.12. These
researchers measured the nil-load crack tip opening displacement St, after complete
unloading following a fatigue test, as a function of the crack size in a Ti-6Al-4Zn-
2Sn-6Mo alloy (<ry = 1140 MPa, primary a grain size «* 4um and ^ grain size
« 12um). With an increase in crack length from 50 um to 150um, there was an
increase in <5t, reflecting an enhanced level of closure primarily attributable to
fracture surface roughness. This measure of the extent to which the fracture surfaces
were 'propped-open' leveled off at a crack length of 200 um, beyond which closure
was crack size-independent. This closure effect, in conjunction with the other (crack
560
Small fatigue cracks
0.3 r
0.2
S
3.
0.1
0.0
100
200 300
la (um)
400
500
Fig. 15.12. The variation of the crack tip opening displacement ,5, at zero far-field load as a
function of crack length 2a in a Ti-Al-Zn-Sn-Mo alloy. (After James & Morris, 1983.)
wake) retardation mechanisms, provides a rationale for the apparently higher
growth rates found in the case of physically small flaws.
Finite-element simulations of plasticity-induced closure for (physically) small
flaws also show that the development of crack closure in the wake of the advancing
small crack can lead to a reduction in the effective driving force as the length of the
crack increases. Finite-element computations by Newman (1983) of the evolution of
closure for small fatigue cracks thus provide a numerical justification of the transient
retardation behavior observed experimentally. However, it is worth noting that such
numerical models are highly idealized and that they do not take into consideration
the important effects of microstructural impediments to short crack growth or of
crack deflection and fracture surface roughness.
The role of lower crack closure levels in enhancing the nominal growth rates of
small flaws is now documented from a variety of experimental methods: (i) Tanaka
& Nakai (1983) measured the closure loads for long and short fatigue cracks in a
structural mild steel using compliance methods. The large differences between the
long and short flaws, observed when the growth rates were characterized by nominal
AK, vanished when the closure-corrected effective driving force AKe[{ was used, (ii)
Crack closure and crack tip opening displacements in aluminum and
titanium-aluminum alloys based on highly precise laser interferometric techniques (Lee & Sharpe,
1986; Larsen et ah, 1986) and stereoimaging and selected area electron channeling
methods (Davidson & Lankford, 1986) have unequivocally shown that closure
stresses for short cracks are substantially smaller than those of longer cracks (in plane
stress) at the same nominal AK. (iii) When the wake of a long fatigue crack (tens of
millimeters in length) with fully developed closure stresses is removed either by
drilling behind the crack tip or by machining away the crack wake leaving only a
flaw of sub-millimeter length, it is found that crack propagation rates increase by
15.7 Effects of physical smallness of fatigue flaws
561
several orders of magnitude upon resumption of fatigue loading at the pre-removal
AK level (e.g., Minakawa, Newman & McEvily, 1983; Pineau, 1986). (iv) When
through-thickness short fatigue cracks, a fraction of a millimeter in length, are
introduced by cyclic compression in notched plate specimens, subsequent tensile
fatigue loading leads to much higher growth rates and lower thresholds than those
observed for long fatigue cracks (Suresh, 1985a; Christman & Suresh, 1986).
15.7.2 Environmental effects
Environmental interactions promote another situation involving physically
small fatigue cracks where the smallness of the crack is responsible for anomalously
faster crack propagation rates despite the validity of LEFM characterization as well
as the absence of mechanical closure effects. This effect of the chemically short crack
(definition (4) in Section 15.1) is a consequence of the strong dependence of
corrosion fatigue phenomena on crack size. The significance of the chemically short crack
problem was first realized from the work of Gangloff (1981) whose results for an
AISI 4140 steel (<ry = 1300 MPa) are plotted in Fig. 15.13. Gangloff showed that, in
the ambient temperature, laboratory air environment, long fatigue cracks
(a ~ 50 mm) and small fatigue cracks (a ~ 0.1 - 0.8 mm), both of which are
amenable to a valid LEFM characterization, exhibit essentially the same growth rates in
the Paris regime. Thus, in the nonaggressive environment of laboratory air,
similitude based on LEFM is found to hold. However, in the embrittling environment of
3% NaCl, the short fatigue cracks propagated up to two orders of magnitude faster
than the long cracks.
The chemical effects on short crack growth are not confined to the sodium
chloride-steel system, but are known to occur in ferrous and aluminum alloys fatigued in
hydrogen-containing or hydrogen-producing gaseous or aqueous media (Lankford,
1983; Saxena et al., 1985). Quantitative modeling of the environmental effects based
on crack size is still in its infancy. Existing experimental evidence appears to suggest
an enhanced electrochemical production of hydrogen within small cracks as a result
of lowering of the pH level (increased acidification) and restricted oxygen reduction
(which consumes H+). Gangloff & Wei (1986) identify the following crack size
dependent mechanisms which influence corrosion fatigue in some ferrous alloys:
(i) oxide- and roughness-induced crack closure in the wake of the small fatigue
crack; (ii) hydrogen-enhanced crack tip straining; and (iii) mass transport/reaction
to produce hydrogen within occluded cracks. The crack surface area to crack
solution volume ratio affects the acidity and chemistry of the crack tip environment
below a certain critical crack size which is specific to the combination of micro-
structure, environment, applied stress range and specimen geometry.
562
Small fatigue cracks
10-'
10-
s
£
•o
10"
10-
3% NaCl
short
long crack
scatter band for
both short and
long cracks in air
10
20
AK (MPa Vm)
40
60
Fig. 15.13. The growth of long (a as 50 mm) and physically short (a as 0.1 — 0.8 mm) linear
elastic fatigue cracks in laboratory air and 3% NaCl at room temperature. (After Gangloff,
1981.)
15.8 On the origins of 'short crack problem'
In this chapter, we have presented a variety of reasons for the apparent
discrepancies associated with the growth of small fatigue cracks. These issues,
which promote a lack of similitude, can be summarized as follows:
(1) Local microscopic discontinuities, such as grain boundaries, inclusions,
precipitates and reinforcements, can affect the path and the rate of advance of
small fatigue cracks because their size scale may be comparable to the depth
of an incipient, microstructurally small flaw. These geometric and structural
discontinuities as well as the crystallographic orientations of the grains have
a substantially diminished impact on the growth of a long fatigue crack; in
this case, the crack tip samples many grains and the fracture behavior is
dictated principally by the bulk properties.
(2) Microscopic growth mechanisms of small fatigue flaws may be vastly
different from those of long cracks at nominally identical values of AK because
of the differences in the constraint imposed by the surrounding elastic
15.8 On the origins of 'short crack problem'
563
material. The restraint exerted on a small fatigue crack emanating at a free
surface in a smooth specimen is different from that experienced by the tip of
a through-thickness long crack in the same material (Schijve, 1982). The
crystallographic, stage I growth of the near-surface small flaw also promotes
severe mixed-mode loading at the crack tip.
(3) Because of the possible differences in the extension mechanisms of micro-
structurally short and long fatigue cracks, the modifications to effective
driving force arising from crack deflection processes (see Chapters 9 and
14) also differ considerably. Deformation of small flaws submerged within
individual grains is dictated by crystal plasticity and the crystallographic
growth of these flaws promotes strong mixed-mode conditions at the crack
tips. Consequently, the combined effects of crack deflection and crack tip
plasticity for small flaws are also different from those of long fatigue cracks.
(4) Even when the loading conditions and the crack size satisfy the
requirements for LEFM characterization, the physical smallness of the fatigue flaw
generates faster crack propagation rates. In other words, a crack with a long
wake benefits more substantially from premature contact due to a variety of
closure mechanisms.
(5) In some corrosive media, the similitude normally expected for a fatigue
crack with minimal or saturated levels of crack closure is violated as a
consequence of corrosion fatigue mechanisms that are crack size-dependent.
Since the small crack problem is associated with some limiting situations involving
the violation of continuum approximations or of similitude, which is vital to the
successful use of fracture mechanics, no simple solutions are available for engineers
faced with developing design guidelines for fatigue-critical components containing
small flaws. However, recent advances and the tools available for further research in
this area should provide help in tackling several of the issues connected with the
small fatigue crack effect: (i) Crystal plasticity models for polycrystalline ensembles
have not received enough attention from researchers in the field of fatigue. However,
such crystalline models offer hope for at least partial success in handling the crack tip
fields and growth behavior of microstructurally small fatigue flaws, (ii) Advances in
the experimental capabilities (such as laser interferometry) for monitoring the near-
tip opening displacements for small flaws may lead to a solution for characterizing
small flaws whose dimensions are comparable to the scale of near-tip plasticity, (iii)
Progress in the technology for the processing of monolithic and composite materials
comprising both ductile and brittle matrices offer numerous possibilities for the
improved control of fatigue crack path deflection, crack tip shielding or even
complete crack arrest. Thus judicious processing techniques may, in the not-too-distant-
future, lead to microstructural design procedures whereby problems associated with
the paucity of a reliable characterization methodology for short fatigue cracks can be
circumvented.
564
Small fatigue cracks
15.9 Case study: Small fatigue cracks in surface coatings
Fatigue crack initiation and the growth of small fatigue flaws are topics of
considerable interest for the life assessment of structural coatings. Surface coatings,
produced by such processes as physical vapor deposition (PVD), chemical vapor
deposition (CVD) or plasma spray (e.g., PVD-processed CrN, CVD-processed TiC and
TiN, and plasma-sprayed Cr203 and Al203-Zr02) are applied to such tribologically-
critical and fatigue-critical automotive components as crank shafts, cam lobes, valve
stems, piston rings, and turbocharger bearings. In turbine engines for aircraft, thermal-
barrier coatings (e.g., plasma-sprayed 7 wt% Y203-stabilized Zr02 over an underlying
plasma-sprayed NiCoCrAlY bond coat) are deposited on to the combustor liner, stator
vanes and turbine blades.
In this section, we present a case study dealing with some issues related to the fatigue
design of ceramic surface coatings on metallic substrates. This case study addresses some
methods by which the fatigue life of wear- and contact-resistant coatings could be
improved.
15.9.1 Theoretical background for cracks approaching interfaces
perpendicularly
Fatigue cracks generally initiating at the surface coating advance through the
coating in a direction approximately perpendicular to the interface between the coating
and the substrate. Theoretical studies of the conditions governing the continued advance
of a crack across an interface between two materials of different elastic and/or plastic
properties provide helpful guidelines for rationalizing the fatigue crack growth response
in such surface coatings. We, therefore, begin with some relevant results from such
studies.
Consider first the idealized case of a linear elastic crack which perpendicularly
approaches a 'sharp', well-bonded interface between two isotropic materials that have the
same elastic properties but very different yield strengths. Begin with the situation where
the crack is propagating normally toward to the interface entirely within the plastically
weaker material. The crack tip is still within this material, at some distance from the
interface, but the plastic zone just begins to spread across the interface. Finite-element
simulations (Sugimura et al., 1995; Kim, Suresh & Shih, 1997) have shown that the
/-integral at the crack-tip, /tip (computed from the contour integral taken entirely within
the weaker material) becomes smaller than the remotely applied /-integral, /app (=
Ki(l - v2)/E, where KY is the applied stress intensity factor, and v and E are the Poisson
ratio and Young's modulus, respectively, of both the materials on either side of the
interface). In other words, the crack tip is partially shielded from the applied loads as the
plastically stronger material further ahead of the crack tip bears a greater magnitude of
the opening stress than the weaker material directly in front of the crack tip. Figure
15.14(a) shows this trend where the numerically computed ratio /tip//app is plotted as a
function of Ki/(ayVL). Here <xy is the yield strength of the plastically weaker material and
L is the distance from the crack-tip to the interface, as shown schematically in Fig.
15.14(6). When the crack approaches the interface from the plastically stronger solid,
15.9 Case study: Small fatigue cracks in surface coatings
565
crack
(*)
material 1 x,
J"—x,
material 2
- interface
plastic ~_^ //'<-
zone fcf*V
crack
\ "yl > wy2
material 1
interface
material 2 material 1
interface
material 2
M
Fig. 15.14. (a) Numerically predicted variation of/tip//app as a function of Ki/(ay-JV) for a
crack approaching an interface perpendicularly. <xyl and <xy2 are the yield strengths of
materials 1 and 2, respectively, with the crack always approaching the interface from material
1. oy refers to the lower of the two yield strengths, (b) The interlayer geometry is
schematically sketched along with the associated nomenclature, (c) Definitions of 7tip and
7app. (After Sugimura et ah, 1995.)
however, the near-tip energy release rate, as quantified by the /-integral, is amplified, i.e.
/tip//app > 1, Fig. 15.14(a). (Recall that for a homogeneous material, /tip = /app as the
/-integral is path-independent.)
These predictions for the possible shielding or amplification of local energy release
rates for cracks that approach interfaces perpendicularly find some backing in the
experiments of Suresh, Sugimura & Tschegg (1992). Such experiments reveal that the
conditions governing the growth or arrest of a fatigue crack at a normally oriented, well-
bonded interface between a ferritic steel and an austenitic steel (with essentially the same
elastic properties) are determined by whether it advanced toward the interface from the
plastically weaker (ferritic) steel or the plastically stronger (austenitic) steel. In addition,
experiments of fatigue crack growth across interfaces oriented at 30, 45 and 60° to the
plane of the fatigue crack in this steel bimaterial also show trends which are consistent
with the shielding and amplification processes discussed above (Sugimura, Grondin &
Suresh, 1995).
566
Small fatigue cracks
It has been found that the extent of shielding and amplification is generally a function
of the direction of crack advance relative to the interface, the distance from the crack tip
to the interface, the finite thickness of the interface, the gradients in properties, including
elastic, plastic and thermal mismatch, of the material across the interface and the level of
constraint imposed by the interface (Sugimura et al., 1995; Kim, 1996; Kim, Suresh &
Shih, 1997; Kim, Besson & Pineau, 1998). If, in addition to the plastic mismatch, an
elastic mismatch is superimposed, the extent of overall shielding and amplification can be
influenced by how these two mismatches in properties differ. Further changes in the
'driving force' for the crack near the interface can arise from thermal residual stresses.
15.9.2 Application to fatigue at surface coatings
Consider the example of plasma-sprayed chromia (Cr203) coatings, typically 100-
500 um in thickness, which are commonly deposited inexpensively and in large volumes
on to small and large structural components, for the specific purpose of improving
resistance to contact fatigue. When such coatings are deposited directly upon a steel
substrate, the thermal mismatch stresses generated upon cooling from the processing can
lead to the debonding of the coating from the substrate. Even if the coating adheres to the
substrate, it is generally seen that the fatigue cracks, which initiate at the surface run
quickly through the thickness of the brittle, porous coating (with typically 8-15 volume%
porosity); the interface then delaminates and a new fatigue crack initiates in a nearby
location in the substrate and causes long cracks to develop in the substrate due to fatigue.
Figure 15.15(a) shows an example of such a fatigue crack in a 0.45 wt% C steel which was
plasma-spray-coated with Cr203. The reason for the attraction of the crack in the
chromia layer to the interface and the continued advance of this crack into the steel
(b)
chromia surface coating
chromia/Ni-Al interface
Ni-Al bond coat
Ni-Al/steel interface
Fig. 15.15. Optical micrographs showing small fatigue crack growth in a chromia coated steel
(a) with and (b) without a Ni-Al bondcoat. (From Suresh, Sugimura & Ogawa, 1993.
Copyright Elsevier, Ltd. Reprinted with permission.)
(«)
Cr>"-V
Crack
Surface
Cr20,
Steel
200 um
90 um
15.9 Case study: Small fatigue cracks in surface coatings
567
substrate (even if the interface remains bonded) can be qualitatively justified from the
trends shown in Fig. 15.14(a) for the case of the crack approaching the interface from the
stronger material (where /tip/-4pp > 0-
A plasma-sprayed interlayer or bond coat of Ni-5 wt% Al (typically 50-100 um in
thickness) is usually deposited between the chromia coating and the steel substrate. If the
thickness of this bond coat is at least several times larger than the plastic zone when the
small fatigue crack approaches the interface between the chromia and the bond coat, one
would expect the propensity for the crack to jump across the bond coat to be suppressed.
Under these conditions, the results shown in Fig. 15.14(a) suggests that the crack would
penetrate the chromia/Ni-Al interface and continue to advance through the bond coat.
However, when the crack-tip plastic zone overlaps with the interface between the (soft)
bond coat and the (relatively much harder) steel substrate (both of which have nearly the
same Young's modulus and Poisson ratio), while the fatigue crack tip is still in the bond
coat, the results shown in Fig. 15.14(a) suggest that the crack-tip would be shielded from
the imposed fatigue loads. It would be expected to arrest before penetrating the Ni-Al/
steel interface (since /tip//app < !)■ This is indeed seen in the micrograph of the fatigue
crack taken on a cross-section plane normal to the interface and shown in Fig. 15.15(6).
The fatigue crack, in an attempt to avoid the interface, bifurcates and continues to
advance well within the soft bond coat, along a plane parallel to the Ni-Al/steel interface,
where final failure eventually occurs. The arrest of the fatigue crack significantly enhances
the fatigue crack growth resistance of the material.
The overall benefits of the surface coating and the bond coat can be illustrated in a
concise manner by recourse to the stress-life (S-N) plot shown in Fig. 15.16. This plot
shows the stress amplitude (for fully reversed cyclic stressing) versus the number of
fatigue cycles to failure, obtained from rotating bending fatigue tests conducted on the
uncoated 0.45 wt% C steel and on that coated with chromia as well as with both chromia
and Ni-Al. Compared to the uncoated steel, the steel deposited only with the chromia
surface coating exhibits improved S-N fatigue response at all lives because a hard surface
Steel coated with
O 430nmCr2O3
■ 400nmCr2O3 + 50nm
Ni-5A1 interlayer
^"lO3 104 105 106 107 108 109
number of cycles to failure, N{
Fig. 15.16. S-N fatigue curves for the 0.45 wt% C steel without any coating, with only the
chromia coating, and with the chromia coating and Ni-Al bondcoat. (After Suresh,
Sugimura & Ogawa, 1993.)
800
700
600
3 500
400
300
A Steel blasted with alumina powder
and annealed (no coatings)
■
O
AA0" ■
A o
A
A
A
A
infinite life
o—
A—
^nn
i i
_i L
568
Small fatigue cracks
layer enhances the resistance to fatigue crack initiation. When the bond coat is
introduced between the chromia and the steel substrate, the resistance to fatigue crack
initiation (by virtue of a hard outer surface) and the resistance to fatigue crack
propagation (by virtue of the bifurcation of the small fatigue crack before it penetrates
the Ni-Al/steel interface) are both improved. As a result, the coated steel, with an
appropriately designed bond coat, enhances the highest life at any cyclic stress amplitude
level compared to the other two cases.
The design of a bond coat is commonly predicated upon considerations of interfacial
strength and protection against environmentally induced degradation (as, for example, in
the case of the NiCoCrAlY bond coat used between the Ni-based superalloy substrate
and the zirconia thermal-barrier coating used in aircraft jet engine components). The case
study presented here demonstrates the possibility that, in addition to such considerations,
interlayers and bond coats could be designed for the specific purpose of enhancing
thermomechanical fatigue resistance in thermal-barrier and wear-resistant surface
coatings. With advances in the processing and thermo-mechanical modeling of functional
(structural) materials with stepwise or continuous gradients in the composition,
microstructure and properties, there exist further possibilities for enhancing the damage-
tolerance of coatings.
Exercises
15.1 Explain the concept of similitude in fracture mechanics. Under what
conditions is it likely to fail in (a) quasi-static fracture and (b) cyclic fracture.
15.2 A steel has the following monotonic and cyclic properties: yield strength
oy = 1000 MPa, smooth bar fatigue limit, <re = 600 MPa, threshold stress
intensity factor range, AK0 = 6 MPaVm.
(a) Plot the approximate variation of the threshold stress for no crack
growth Acrth as a function of the crack size a for this material.
Assume plane strain conditions.
(b) Plot the approximate variation of the threshold stress intensity factor
range for no crack growth AKth as a function of the crack size a under
plane strain conditions.
(c) What is the crack size above which characterization of fatigue crack
growth using linear elastic fracture mechanics can be justified?
15.3 A plate, 10 cm wide, 12 cm high and 1 cm thick, has a centrally located hole
of 2 cm radius. The plate is subjected to a nominal (far-field) cyclic tensile
stress of 100 MPa at R — 0. Two mode I fatigue cracks nucleate at the
edges of the hole (as shown in Fig. 15.9) and propagate at a rate da/
dN = C(AK)3, where C has a magnitude of 10"11 when da/dN is in units
of m/cycle and AK is expressed in units of MPaVm.
(a) What is the transition crack size, /t, below which the growth of the
fatigue crack is affected by the elastic strain field of the notch?
Exercises
569
Assume small-scale yielding conditions at the tip of the fatigue crack
and neglect the possibility of plastic deformation in the vicinity of the
hole,
(b) If the crack initiates during the first stress cycle, calculate the number of
fatigue cycles necessary to propagate the crack a distance of 1.5 cm on
either side of the circular hole.
15.4 Comment on the effects of T-stress on the growth of a fatigue crack which
initiates at the free surface of a metal and propagates into the interior of the
material. Specifically, discuss in general qualitative terms the possible role of
constraint and crack length in influencing the T-stress and the crack growth
rates.
15.5 A large plate of a brittle ceramic material contains a single edge notch. The
plate is subjected to a far-field tensile load of 5 kN. The plate dimensions
are: width W = 5.0 cm, height H = 6.0 cm and thickness B = 1.2 cm. The
notch length oq is 2 cm and the notch-root radius p = 0.5 mm.
(a) Estimate the minimum length of the pre-crack one has to introduce at
the tip of the notch to avoid possible effects of the strain field of the
notch on subsequent fracture behavior.
(b) Calculate the stress intensity factors if through-thickness pre-cracks of
the following lengths are introduced at the notch-tip: (i) lOum, (ii)
0.5 mm and (iii) 3 mm.
15.6 Discuss possible effects of thermal mismatch stresses on the propensity for
crack growth and crack arrest in the coated steel in the case study presented
in this chapter. Assume that the substrate is heated to a temperature of
200 °C during the plasma spray process.
CHAPTER 16
Environmental interactions: corrosion-
fatigue and creep-fatigue
The effects of environments on the nucleation and growth of fatigue cracks
were highlighted in previous chapters. These discussions touched upon the influence
of oxygen-containing media on the kinematic irreversibility of cyclic slip (Chapter 4),
crack initiation at corrosion pits (Chapter 4), the formation of brittle fatigue stria-
tions (Chapter 10), the role of fracture surface oxidation in promoting crack closure
in constant amplitude and variable amplitude fatigue (Chapter 14), and the
apparently anomalous growth of 'chemically short' fatigue cracks (Chapter 15). It is clear
from these earlier descriptions that the usually deleterious (and occasionally
beneficial) effects of environment must constitute an integral part of any complete
mechanistic theory or design methodology for fatigue fracture.
This chapter deals specifically with the effects of environment on fatigue behavior.
The discussions are presented in two parts: corrosion-fatigue effects and
creep-fatigue effects. The first part begins with a survey of the micromechanisms of corrosion-
fatigue. This is followed by examples which illustrate the effects of gaseous and
aqueous media on fatigue failure for different mechanical conditions of cyclic
loading. This section is concluded with a brief examination of models of corrosion-
fatigue. In the second part, factors influencing the creep-fatigue behavior of
engineering alloys are considered and many life prediction models are discussed.
Particular attention is devoted to the mechanisms of high temperature fatigue
deformation and to the issues pertaining to the characterization of creep crack growth
using different fracture mechanics parameters.
16.1 Mechanisms of corrosion-fatigue
The deterioration of fatigue properties in engineering materials can be
caused by an external medium in the form of a solid, liquid or gas. Metal
embrittlement is the weakening of a higher melting point metal when it is in contact with
certain lower melting point metals. Liquid metal embrittlement is a special case of
metal embrittlement where the embrittling medium is a liquid metal. The
embrittlement of alloys resulting from aqueous solutions is commonly referred to as stress
corrosion cracking (SCC). In hydrogenous gases (such as H2, H2S, or water vapor)
and in aqueous media, hydrogen can be introduced into the metal by the dissociation
of hydrogen molecules into atomic hydrogen or by the release of hydrogen by metal
dissolution, respectively. The resulting damage to mechanical response is known as
570
16.1 Mechanisms of corrosion-fatigue
571
hydrogen embrittlement. Under cyclic loading conditions, the embrittling
environment can accelerate the initiation of a surface flaw in an initially crack-free material
and then propagate the flaw to certain critical size. Corrosion-fatigue is a term which
is commonly used to denote the damage and failure of a material under the
combined action of cyclic stresses and any embrittling medium, although its most
widespread adaptation is in the context of aqueous environments.
16.1.1 Hydrogenous gases
In metals exposed to hydrogenous gases, the key steps in the inducement of
hydrogen embrittlement involve:
(1) the physisorption of hydrogen on the freshly created slip step or fatigue
crack surface (e.g., Henaff, Marchal & Petit, 1995),
(2) the dissociation of the hydrogen molecule into atomic hydrogen,
(3) the transport of hydrogen by random walk diffusion through the lattice, by
pipe diffusion along interfaces such as grain boundaries, or by transport
along with mobile dislocations in plastically deforming regions to critical
sites in the lattice or to regions of high triaxiality ahead of the crack tip (Fig.
16.1).
Once atomic hydrogen enters the subsurface regions, embrittlement of the material
is promoted by one or a combination of the following processes:
(1) decohesion of atomic bonds or interfaces (e.g., Morlet, Johnson & Troiano,
1958; Oriani & Josephic, 1974; Gerberich & Chen, 1975),
(2) formation of molecular hydrogen at internal voids or defects by the
recombination of transported hydrogen atoms and the attendant generation of
large internal pressure (Zappfe & Sims, 1941),
fatigue crack
Fig. 16.1. An idealization of the critical steps involved in hydrogen embrittlement in
hydrogenous gas media. (1) Transport of gaseous hydrogen. (2) Surface adsorption. (3)
Dissociation into hydrogen atoms. (4) Hydrogen intake into the lattice. (5) Transport in
material to regions of high tensile hydrostatic stresses.
572 Environmental interactions: corrosion-fatigue and creep-fatigue
(3) lowering of surface energy due to adsorbed hydrogen (Petch, 1956),
(4) hydride precipitation (in some alloys of Ti, Zr, V and Nb).
Although a single theory is unlikely to account for all the effects of hydrogen seen
in metallic materials under monotonic and cyclic loading conditions, decohesion
theories appear to offer at least a partial explanation of hydrogen embrittlement
in high strength steels. In these approaches, the reduction in cohesive strength is
assumed to be proportional to the local concentration of hydrogen ch, where
ch = c0exp(aHv/R0T). (16.1)
Co is the equilibrium concentration of hydrogen in the unstressed ferrous lattice, v is
the partial molar volume of hydrogen in iron, <rH is the tensile hydrostatic stress, R0
is the universal gas constant, and T is the absolute temperature. The fracture of a
metal in the presence of hydrogen generally occurs in one of two ways: (i) the rate of
failure is accelerated by the presence of hydrogen although there is no change in the
microscopic mode of fracture, or (ii) a transition from a normally ductile mode of
failure to a brittle mode of failure in the presence of hydrogen.
16.1.2 Aqueous media
For ductile alloy/aqueous environment systems subjected to both mono-
tonic and cyclic loads, interpretations of embrittlement involve the mechanism of
electrochemical reaction at freshly formed slip steps or at the crack tip. This process
includes two principal candidate mechanisms of environmental damage: anodic slip
dissolution or hydrogen embrittlement. The advance of fracture by slip dissolution
(see Fig. 16.2a) occurs by:
(1) the diffusion of the active species (such as water molecules or halide anions),
(2) the rupture of the protective oxide film at a slip step or in the immediate
wake of a crack tip by strain concentration or fretting contact between the
crack faces, respectively,
(3) the dissolution of the exposed surface,
(4) the nucleation and growth of oxide on the bared surface.
For the alternative mechanism of hydrogen embrittlement in aqueous media, the
critical steps (Fig. 16.26) involve:
(1) the diffusion of water molecules or hydrogen ions between the crack walls
toward the crack tip,
(2) the reduction of these species to create adsorbed hydrogen atoms at the
crack tip surface,
(3) the surface diffusion of adsorbed atoms to preferential surface locations,
(4) the absorption of the adatoms to a critical location (e.g., a grain boundary,
the region of high triaxiality ahead of a crack tip, or a void).
16.1 Mechanisms of corrosion-fatigue
573
rupture of
"^y oxide film
metal
dissolution
passivation
e
*(2)
-(6)
rupture of
oxide film
(b)
Fig. 16.2. A schematic illustration of (a) slip dissolution and (b) hydrogen embrittlement in
aqueous media. (1) Liquid diffusion. (2) Discharge and reduction. (3) Hydrogen adatom
recombination. (4) Adatom surface diffusion. (5) Hydrogen absorption in metal. (6) Diffusion
of absorbed hydrogen. (After Ford & Silverman, 1979.)
In situations involving the formation of a passivating oxide film on the freshly
created surface, the reaction at the crack tip which influences dissolution, hydrogen-
ion reduction, or crack growth is controlled (at a given electrochemical potential) by
three factors: the oxide rupture rate, the solution renewal rate, and the passivation
rate.
Under cyclic loading conditions, fretting contact between the mating crack faces,
pumping of the aqueous environments to the crack tip by the crack walls, and
continual blunting and resharpening of the crack tip by the reversed loads will
strongly influence the rate of anodic dissolution. Therefore, both cyclic frequency
and stress waveform are known to strongly influence crack growth. It is also known
from the crack tip strain measurements of Davidson & Lankford (1981) that defor-
574
Environmental interactions: corrosion-fatigue and creep-fatigue
mation fields ahead of a fatigue crack are strongly affected by the presence of an
aggressive environment.
16.1.3 Metal embrittlement
Many materials exhibit a substantially lower resistance to fatigue crack
initiation and growth in an embrittling liquid metal (such as Hg) than in aqueous
and hydrogen environments. The rapid progression of fracture in the liquid metal
environment is caused by the adsorption of the embrittling metal atom (rather than
by chemical reaction) at slip steps and crack tips. Conventional models for liquid
metal embrittlement postulate that adsorption of the liquid metal lowers the stress
necessary for the tensile separation of atoms; this decohesion process is not
considered to affect the slip distribution around crack tips. Similar decohesion models
(Stoloff & Johnston, 1963; Westwood & Kamdar, 1963) have also been advanced
to rationalize the embrittlement of metals by other solid metals in contact with their
surfaces, Fig. 16.3(a). An alternative mechanism for LME has also been popularized
by Lynch (1988). In this model, the adsorbed atom of the liquid metal is believed to
weaken the resistance of the material to plastic flow, Fig. 16.3(6). Mainly on the basis
of metallographic and fractographic observations, Lynch postulates that the
adsorption of the embrittling species facilitates the injection of dislocations from crack tips
and promotes the coalescence of cracks with voids formed ahead of crack tips (see
Section 16.3 for further details).
16.2 Nucleation of corrosion-fatigue cracks
Experimental work dating back to the studies of Gough & Sopwith (1932)
and Thompson, Wadsworth & Louat (1956) shows that oxygen-containing media,
and moist and aqueous environments, generally reduce the fatigue lives of ductile
solids. There is ample experimental evidence in a wide range of engineering alloys
slip bands
adsorbed _J!hOQC
metal atom ~^Q|0OC
crack tip
region
I \
(a) (b)
void formation
fatimip rrarIr
Fig. 16.3. Idealization of (a) solid or liquid metal embrittlement due to decohesion, and (b)
liquid metal embrittlement due to increased local plastic flow and void growth.
16.2 Nucleation of corrosion-fatigue cracks
575
indicating that inert atmospheres or vacuum enhance the fatigue limit and/or the
fatigue life above the fatigue limit.
16.2.1 Gaseous environments
It is well established from experimental work conducted over many decades
that noninert gaseous surroundings can reduce the fatigue lives of ductile solids.
There are two different mechanistic interpretations to rationalize the phenomena
underlying such deleterious effects of aggressive gaseous media. In the first type,
which is based on the work of Thompson, Wadsworth & Louat (1956), the gaseous
environment is believed to strongly affect the growth of the fatigue crack, but not
the conditions for crack nucleation. In this model (Fig. 4.8), oxygen dissolved at the
freshly formed slip steps is deemed responsible for enhanced slip irreversibility under
cyclic loading and for the preclusion of the rewelding of nascent crack surfaces. In
the second type, the mechanistic models (e.g., Shen, Podlaseck & Kramer, 1966) are
based on the argument that the surfaces of the ductile alloys are strengthened with an
oxide film. Under cyclic loads, the accumulation of dislocations in the surface
regions leads to the formation of cavities and voids which eventually grow into
cracks. Implicit in this interpretation is the assumption that, in the absence of
oxygen, dislocations readily escape from the surface, thereby retarding crack nucleation.
Water vapor is also known to be a major contributing factor to the nucleation of
fatigue cracks in precipitation-hardened aluminum alloys. Here the environmental
influence may arise from enhanced slip irreversibility due to the oxidation of slip
steps or from hydrogen embrittlement (see Fig. 16.3).
16.2.2 Aqueous environments
Figure 16.4 schematically illustrates the commonly observed effects of
aqueous environment on the fatigue life of most metallic alloys. Models for the initiation
of fatigue cracks in aqueous media have generally been based on the following
mechanisms:
(1) Stress concentration at the roots of corrosion pits which serve as crack
nucleation sites (e.g., Fig. 4.14).
(2) Enhanced slip irreversibility due to the oxidation of slip steps.
(3) Preferential electrochemical attack at regions (such as the PSBs) where
plastic deformation is localized, with the relatively less deformed
surrounding regions serving as cathodes.
(4) Preferential electrochemical attack at locations on the surfaces of a fatigued
metal where the protective oxide film is ruptured.
(5) A reduction in the surface energy of the alloy as a consequence of the
adsorption of the environmental species, and the increased rates of micro-
crack growth.
576
Environmental interactions: corrosion-fatigue and creep-fatigue
increasing pH and v
deaeration
cathodic charging
logJV,
Fig. 16.4. A schematic of the effects of corrosive media on the number of cycles to failure, Nf,
under a fixed cyclic stress range, Act.
The rates of environmental attack and their influence on fatigue lives are
influenced by the electrochemistry of the medium as well as by the specific mechanical
loading conditions. Therefore, universal conclusions cannot be derived on the
mechanisms of corrosion-fatigue. Nevertheless, the following examples and general
guidelines (see Duquette, 1979, for a detailed review) illustrate the role of various
electrochemical, mechanical and microstructural factors in influencing corrosion-
fatigue crack growth behavior.
(1) For a fixed number of stress cycles, a lower value of cyclic frequency
generally leads to lower fatigue life. However, in many cases, higher cyclic
frequencies produce a greater level of fatigue damage for a fixed amount
of time.
(2) Dissolved oxygen is essential to corrosion-fatigue in neutral pH solutions.
Deaeration of the solution generally causes enhancements in fatigue lives
and aids in the development of a well-defined fatigue limit (in solutions
which, in the aerated condition, do not exhibit a fatigue limit).
(3) An increase in the imposed anodic current density can lead to a reduction in
fatigue lives in low carbon steels. For example, Duquette & Uhlig (1968)
show that increasing the anodic current density from 0.2 |xA/cm2 to 40 |xA/
cm2 results in an order of magnitude reduction in the number of cycles to
failure at fixed cyclic stress levels (Act = 207 MPa). Beyond a current density
value of 40 |xA/cm2, no change is observed in the fatigue life. The deleterious
effect of anodic current density is more pronounced at higher imposed stress
levels.
(4) Cathodic charging of high strength aluminum alloys promotes a reduction
in fatigue resistance.
(5) Fatigue tests on aluminum alloys indicate that the reduced fatigue life in
water vapor is due to hydrogen embrittlement. Specifically, low-cycle fatigue
16.3 Growth of corrosion-fatigue cracks
577
experiments on Al-Zn-Mg alloy reveal that pre-exposure to humid air is
just as detrimental to fatigue life as the presence of water vapor in the test
environment. However, when the test specimens are stored in vacuum long
enough to remove hydrogen (by allowing sufficient time for bulk diffusion
with an assumed diffusion coefficient of 10~13 m2/s), the pre-exposure
embrittlement effect is reversed (Ricker & Duquette, 1988).
(6) In high strength aluminum alloys which are susceptible to hydrogen
embrittlement, the degree of embrittlement is affected by the extent of stress triaxi-
ality ahead of the crack tip; see Eq. 16.1. For torsional loading, the triaxial
component of stress at the crack tip is nominally zero. There is some
experimental evidence indicating that environmental effects under conditions of
mode III (anti-plane strain) loading are somewhat less pronounced than
under mode I loading (where significant hydrostatic stresses are induced
ahead of the crack tip) (Duquette, 1979).
(7) Grain boundary precipitates can influence the fatigue behavior of aluminum
alloys exposed to aqueous media by three different mechanisms
(Vasudevan, Liu & Ricker, 1987): (i) The precipitates influence the rate of
electrochemical reactions by aiding in the removal of material from the
crack tip and by affecting the rate of hydrogen evolution, (ii) The grain
boundary precipitates can modify the chemistry of the crack tip solution,
thereby influencing the stability of the passivating layer at the crack tip. (iii)
The size, shape and distribution of the grain boundary precipitates can alter
the fracture stress at the crack tip which, in turn, can influence the manner in
which the environment interacts with the advancing fatigue crack.
16.3 Growth of corrosion-fatigue cracks
It is convenient to characterize the effects of environment on the rates of
fatigue crack growth by considering different combinations of crack growth rates
measured under purely mechanical fatigue and under stress corrosion conditions.
Figure 16.5(a) schematically illustrates (following the detailed discussions of Chapter
6) the sigmoidal variation of fatigue crack growth as a function of stress intensity
factor range (on log-log scale) under purely mechanical cyclic loading conditions
(i.e. in inert environments). The typical variation in crack velocity da/dt as a
function of the applied stress intensity factor K is plotted (on log-log scale) in Fig.
16.5(b) for sustained load crack growth of metallic materials in the presence of an
environment. In this latter figure, the environment has no effect on the fracture
behavior of the material below a static stress intensity factor value ^Iscc, where the
subscript denotes stress corrosion cracking in mode I. Above ^Iscc, the crack velocity
exhibits a precipitous increase with increasing stress intensity factor K (region I).
This is followed by a region of growth (region II) in which the crack increment per
578
Environmental interactions: corrosion-fatigue and creep-fatigue
logAtf
(«)
aggressive
logA-K
(c)
logA-K
(d)
inert
Fig. 16.5. Schematic representations of the combinations of mechanical fatigue and
environmentally assisted crack growth, (a) Fatigue crack growth behavior in inert
environments, (b) Stress corrosion crack growth under sustained loads, (c) True corrosion-
fatigue arising from synergistic effects of cyclic loads and aggressive environment, (d) Stress
corrosion-fatigue behavior obtained from a superposition of mechanical fatigue (a) and stress
corrosion cracking (b). (e) Mixed corrosion behavior obtained from a combination of (c) and
(d). (After McEvily & Wei, 1972.)
unit time is essentially independent of the applied K. As the stress intensity factor
values approach the fracture toughness of the material (region III), there is a steep
rise in crack velocity.
It is evident from Fig. 16.5(6) that subcritical crack growth can occur in the
presence of an environment at stress intensity values that are significantly lower
than the critical stress intensity for quasi-static fracture initiation Kc (in inert
media). For example, AISI 4340 steel with a monotonic yield strength, ay = 1690
MPa, has a plane strain fracture toughness A^Ic of 56 MPaVm, while its A^Iscc value in
sea water is as low as 17 MPaVm (Hertzberg, 1995). For a low strength 2^Cr-l Mo
steel (AISI A542 Class 3, ay = 500 MPa) with Klc = 295 MPaVm, the value of Klscc
in dry gaseous hydrogen (138 kPa pressure) is approximately 85 MPaVm-
16.3 Growth of corrosion-fatigue cracks
579
16.3.1 Types of corrosion-fatigue crack growth
Corrosion-fatigue crack growth in metallic materials can be schematically
represented in three different ways (McEvily & Wei, 1972). Figure 16.5(c) illustrates
the so-called true corrosion-fatigue behavior where the environment alone (in the
absence of cyclic loads) is taken to have no effect on crack growth behavior. Instead,
the environment accelerates crack growth rates, only under cyclic loading conditions,
by embrittling the material by time-dependent, temperature-dependent, or
electrochemical processes, such as those examined in Section 16.1. True corrosion-fatigue
influences cyclic fracture even at maximum stress intensity factor values Kmax
(= AK/{1 — R}) in fatigue that are less than Klscc. Figure \2.5(d) shows the so-called
stress corrosion-fatigue process which is a simple superposition of mechanical fatigue
(Fig. 16.5a) and stress corrosion cracking (Fig. 16.56). Note that stress corrosion-
fatigue occurs only when Kmax > A^Iscc. The combination of true corrosion-fatigue
and stress corrosion-fatigue results in a mixed corrosion behavior which is
schematically depicted in Fig. 16.5(e).
Figure 16.6 shows typical fatigue crack growth characteristics of high strength
steels where the effects of gaseous and aqueous environments are illustrated. In these
high strength materials, the presence of an aggressive environment accelerates crack
growth rates by several orders of magnitude when Kmax > Klscc. This acceleration of
fatigue fracture is more pronounced at lower cyclic frequencies (where there is more
time per stress cycle for the environment to interact with the crack tip). Furthermore,
the threshold AK value, AKT, at which stress corrosion-fatigue effects begin to
influence crack growth rates, decreases with increasing load ratio because Kmax
f*
*6
air
logA-K
Fig. 16.6. Schematic illustration of the effects of environment, test frequency and R ratio on
fatigue crack growth in high strength steels.
increasing gas pressure
decreasing frequency
T3
increasing R
laboratory
580 Environmental interactions: corrosion-fatigue and creep-fatigue
(= AK/{\ — R}) begins to approach Klscc at lower AK levels. The superposition of
mechanical fatigue and stress corrosion cracking, therefore, provides a reasonably
accurate description of corrosion fatigue in many high strength materials in certain
environments (see Section 16.3.4 for further details).
Lower strength materials, however, exhibit corrosion-fatigue characteristics which
are not amenable to such superposition of mechanical and environmental cracking
modes. The definition of Klscc and its incorporation into corrosion-fatigue modeling
for lower strength materials is less reliable because of the following factors:
(1) Low strength materials exhibit crack tip blunting under the sustained
loading conditions used to measure ^Iscc. However, under repeated cyclic
loading, the crack tip may be continually resharpened.
(2) Fretting fatigue contact in the immediate wake of the crack tip under cyclic
loading can rupture the protective oxide film. The attendant exposure of
fresh surface to the environment leads to the modification of material-
environment interactions.
(3) The deformation of lower strength materials exhibits a higher sensitivity to
variations in strain rate. Thus environmental interactions with the highly
strained crack tip region are likely to be different under fatigue loading than
under monotonic loading.
The classification of corrosion-fatigue processes illustrated in Fig. 16.5 does not
account for the increase in crack closure due to the formation of corrosion deposits
within fatigue cracks, especially at near-threshold AK levels. As discussed in Section
14.3, the enhanced levels of crack closure promoted by corrosion deposits can reduce
the rate of near-threshold fatigue crack growth. This trend runs counter to the
predictions of the classical corrosion-fatigue processes discussed in Section 16.1. In
a study of environmental effects on AISI A542 Class 3 steel subjected to cyclic loads
in gaseous hydrogen (138 kPa pressure) at room temperature, Suresh & Ritchie
(1982b) found that the apparent increase in crack growth rates in dry gaseous
hydrogen over those in moist air was a consequence of the absence of oxide-induced
crack closure in the dry gas (Fig. 14.8). However, in the Paris regime, at AK > 20
MPay/m, the presence of hydrogen caused pronounced accelerations in crack growth
rates, where the mechanisms of hydrogen assisted fatigue were attributed to
hydrogen embrittlement. The features of hydrogen assisted cyclic fracture in this steel
included: (i) a transition from a transgranular mode of fracture below AKT to an
intergranular mode above AKT, (ii) an increase in crack growth rate with decreasing
cyclic frequency and increasing hydrogen pressure above AKT, and (iii) a decrease in
AKT with increasing R ratio. The onset of hydrogen-assisted fatigue crack growth in
the lower strength steel, however, occurred at Kmax (= AKT/{ 1 - R}) values of 20
MPaVm which were significantly lower than the /sTIscc value of 80 MPaVm.
As noted earlier, many experimental studies have shown that the susceptibility of
a cyclically loaded material to gaseous environments is dependent upon the mate-
16.3 Growth of corrosion-fatigue cracks
581
101 io2 io3
partial pressure of H20 vapor (Pa)
IO5 H20 content (ppm)
IO4
Fig. 16.7. The influence of water vapor content on crack growth rates in 7075-T6 (Alclad)
aluminum alloy fatigued at 57 Hz at room temperature. (After Hartman et al., 1967, and Wei,
1970.)
rial-environment combination and the composition and pressure of the gas. For
example, the presence of water vapor within a fatigue crack in steels, aluminum
and titanium alloys adversely affects its growth rates. Furthermore, fatigue crack
propagation rates in steels and titanium alloys are known to be accelerated in the
presence of hydrogen gas. Aluminum alloys, however, do not generally exhibit
accelerated hydrogen-assisted crack growth in gaseous hydrogen, presumably
because of the protective oxide film which readily forms on fresh fracture surfaces.
On the other hand, water vapor has a marked effect on corrosion-fatigue crack
growth in aluminum alloys. Figure 16.7 shows the variation of fatigue crack
growth rate da/dN of a 7075-T6 aluminum alloy as a function of the partial
pressure of water vapor at two different values of imposed AK. For both AK
values, a partial pressure of 10 Pa (or 100 ppm) is sufficient to cause an order of
magnitude increase in fatigue crack propagation rates. The role of moisture in
enhancing crack growth rates in aluminum alloys has also become evident from
experiments conducted in dry and wet environments of argon, hydrogen and
oxygen (e.g., Hartman, 1965; Wei, 1970).
16.3.2 Formation of brittle striations
The formation of fatigue striations and the spacing between adjacent
striations is affected by the presence of an environment. Figure 16.8 is an example of
brittle striations formed in aggressive environments and of ductile striations formed
in the presence of an inert gas in a Ni single crystal (with specimen axis close to the
(100) orientation) which has been fatigued at room temperature at a frequency of 1
Hz. In mercury and gaseous hydrogen (100 kPa pressure), brittle striations form on
{100} planes and their spacing is roughly the same in the liquid metal and in H2 gas.
No difference in the mode of fatigue crack growth is evident for the two environ-
582 Environmental interactions: corrosion-fatigue and creep-fatigue
Hg evaporated
Fig. 16.8. Scanning electron micrograph of fatigue fracture surface of Ni single crystal produced
by cyclic loading at 1 Hz and 20 °C first in mercury, then in dry hydrogen after evaporating
mercury and then in dry argon. The symbol 'x' in the inset shows the orientation of the
specimen axis with respect to the standard triangle of the stereographic projection. (From
Lynch, 1981. Copyright The Metallurgical Society. Reprinted with permission.)
ments. However, when fatigue tests are resumed in dry argon atmosphere (100 kPa
pressure), ductile striations are formed whose spacing is about one-fifth of that seen
in Hg or H2. In all three environments, crack growth occurred on {100} planes in
(110) directions. Similar modes of crack growth were also observed for Al-Zn-Mg
alloy subjected to the same three environments.
For the liquid metal environment, the adsorption of the embrittling atom is
considered responsible for the enhancement in crack growth rates. However, for gaseous
H2, different theories have been proposed which postulate that either dissolved H2 or
adsorbed H2 is the cause of embrittlement. On the basis of fractographic evidence,
Lynch (1981, 1988) has proposed that adsorbed (rather than dissolved) hydrogen is
responsible for accelerated crack growth in hydrogen-bearing environments. His
hypothesis rests on the following experimental observations: (i) The crystallographic
aspects of crack growth as well as slip line traces at crack tips in hydrogen-containing
environments are very similar to those produced by adsorption-induced liquid metal
embrittlement. (ii) Hydrogen charging prior to the fatigue test in inert gases has no
effect on crack growth, (iii) Brittle crack growth in the environment can occur at
velocities that are too high to permit the diffusion of hydrogen directly ahead of the
crack tip. Lynch argues that adsorption of hydrogen facilitates localized plastic flow
which, depending on the environment, causes apparent differences in the formation
of fatigue striation spacings. It should, however, be recognized that the strain rate-
sensitivity of liquid metal embrittlement in many alloys is significantly less than that
in gaseous or aqueous media.
16.3 Growth of corrosion-fatigue cracks
583
16.3.3 Effects of mechanical variables
As noted in several preceding discussions, mechanical load variables such as
test frequency, stress waveform and load ratio have a marked effect on the rate of
corrosion-fatigue crack growth. In this section, examples of such mechanical load
effects are presented. Figure 16.9 shows the fatigue crack growth behavior of a mill-
annealed Ti-8Al-lMo-lV alloy in 3.5% NaCl at cyclic frequencies, vc = 0.5, 2.5,
5.0, 15.0, and 50.0 Hz at R = 0.05 at room temperature. Also indicated in this figure
are the fatigue crack growth curves for this material in dry argon at R = 0.05 and at
0.5 Hz
10 20 50
A^CMPaVm)
Fig. 16.9. Influence of frequency on the rate of fatigue crack growth in mill-annealed Ti-8A1-
lMo-lV alloy in 3.5% NaCl and in argon gas at R = 0.05 and sinusoidal cyclic load variation
at room temperature. The dashed curve at left shows the fatigue crack propagation behavior in
3.5% NaCl at R = 0.75 and at 5 Hz frequency. (After Bucci, 1970.)
584 Environmental interactions: corrosion-fatigue and creep-fatigue
0.5 and 5.0 Hz. Although a change in frequency in the inert environment has no
major influence on fatigue crack propagation, lowering the frequency (i.e. increasing
the time for environmental interactions per stress cycle) in the NaCl environment
causes an appreciable increase in the crack growth rate. Note that the environmental
effects are pronounced at Kmax > Klscc («» 20-30 MPa^/m) in NaCl. At high growth
rates, where the crack velocities are too rapid to be influenced by chemical effects,
the inert gas and NaCl lead to similar crack extension behavior. Increasing the load
ratio in the NaCl environment promotes a lowering of AKT as per the description
presented in connection with Fig. 16.6.
For a fixed cyclic frequency, the shape of the stress wave can have a strong effect
on corrosion-fatigue fracture. An illustration of the effect of waveform is provided
by the results of Barsom (1972) for 12Ni-5Cr-3Mo steel fatigued in 3% NaCl
solution at 0.1 Hz. His results, Fig. 16.10, indicate that when the stress wave is of
a square or negative sawtooth form, the NaCl environment has a negligible effect on
crack growth over that of room temperature air (all waveforms). In contrast to this
behavior, triangular, sinusoidal or positive sawtooth load fluctuations cause
noticeable increases in fatigue crack growth rates, with the other mechanical variables held
2xl0"5
l x io-3
& 5x10-"
T3
C
2x10"*
1 x IO"1
20 40 80 100
AK(MPav'm)
Fig. 16.10. The effect of stress waveform on fatigue crack growth in 12Ni-5Cr-3Mo steel in 3%
NaCl solution at 0.1 Hz at room temperature. (After Barsom, 1972.)
scatter band
for air data
i
:
A AAA
d ruu
t aaaa
• NM\N
L
sinusoidal
triangular
square
positive sawtooth
negative sawtooth
±
_I
_L
16.3 Growth of corrosion-fatigue cracks
585
fixed. Barsom rationalized this waveform effect by noting that, when the rising
portion of the stress cycle is slow enough to permit sufficient time for environmental
interactions, environmentally assisted crack growth results. For the square and
negative sawtooth waves, loading occurs in one step, and consequently no
environmental effects are evident. Note that for this lower strength steel, environmentally
assisted crack growth occurs at Kmax values that are well below Klscc in NaCl. This
result is probably an outcome of the continual rupture of the protective oxide film in
the vicinity of the crack tip by repeated cyclic loads.
16.3.4 Models of corrosion-fatigue
Corrosion-fatigue is a process which is an outcome of synergistic
interactions among the environment, material microstructure, and cyclic loads. Since the
mechanisms of corrosion-fatigue are specific to a particular material-environment-
load system, it is not surprising that quantitative modeling of this complex process is
still in its infancy. There does not exist a single model which is capable of
quantitatively predicting the essential features of environmentally assisted fatigue for broad
classes of materials and environments.
A simple approach to modeling corrosion-fatigue involves the so-called
superposition approach (Bucci, 1970; Wei & Landes, 1970). This model assumes that the
overall crack growth rates (da/dN) of a material under corrosion-fatigue conditions
can be determined by a linear superposition of the crack extension rates due solely to
mechanical fatigue (da/dN)F (determined in inert environments) and the stress
corrosion crack growth rate (da/dN)sc (derived from the sustained load crack velocity
da/dt), such that
The second term on the right hand side is obtained by integrating the
environmentally assisted crack growth rate da/dt, which is influenced by the stress intensity
factor K, over the time period of one fatigue cycle, such that
U)SCH0 d7(*)d'- (i6-3)
Note that the effects of cyclic frequency, waveform, and load ratio can be
incorporated into this model. The model provides a reasonable prediction of corrosion-
fatigue behavior in a limited number of systems such as high strength steels.
However, this linear superposition model implies that there is no synergistic
interaction between the mechanical and environmental components of corrosion-fatigue.
The model also invokes the tacit assumption that the mechanisms of (sustained load)
stress corrosion cracking and corrosion-fatigue are the same. These two assumptions
of the model run counter to experimental observations available for many
engineering alloys, especially lower strength materials.
586 Environmental interactions: corrosion-fatigue and creep-fatigue
A consequence of the above superposition model is that corrosion-fatigue effects
are predicted only when Kmax > Klscc. This prediction is also not in accord with the
experimental results available in the literature for many lower strength materials (see
Fig. 16.10, for example). To overcome this limitation, Weir et al. (1980) and Wei &
Simmons (1981) proposed an extension of Eq. 16.2, where
(%)<%) A® A%1-
The last term on the right hand side of this equation represents the true corrosion
crack growth rate (at Kmax < Klscc) which is a synergistic effect arising from the
interaction of cyclic loading and environment. Wei & Simmons hypothesize that
this cycle-dependent contribution arises from the reaction of the environment with
fresh crack surfaces produced by fatigue, and that it is a function of surface reaction
during one loading cycle. For material-environment combinations which lead to
high reaction levels, this contribution also depends on the rate of transport of the
aggressive environment to the crack tip.
An alternative approach to modeling corrosion-fatigue has been postulated by
Austen & Mclntyre (1979). These workers suggest that the processes of fatigue
and stress corrosion cracking are mutually competitive. According to this process
competition model, a crack will grow at the fastest available rate pertinent to the
prevailing stress intensity factor.
The limitations of the foregoing models become apparent upon reexamination of
the results discussed in Section 15.7.2. It may be recalled from this section that
corrosion-fatigue crack growth rates are strongly influenced not only by the specific
combinations of cyclic loads, material and environment, but also by the crack size.
These results imply that critical steps in corrosion processes which depend on crack
size, such as the rate of transport of the embrittling species to the crack tip, the rate
of pumping the environment by the opening and closing of the crack walls, and the
development of crack closure and fretting contact along the crack flanks, must be
incorporated into any complete model for environmentally assisted fatigue.
Considerable collaborative research among materials scientists, mechanical
engineers, chemists and surface scientists is necessary before such quantitative models
can be developed.
16.4 Case study: Fatigue design of exhaust valves for cars
Exhaust valves in automobile engines provide an example of an engineering
component where the effects of fatigue, high-temperature creep, creep-fatigue
interactions, corrosive environments, galling and wear pose a considerable challenge for
successful design. We consider here some critical issues in the design of internal
combusion engine exhaust valves for automobiles. This case study is based on the work of
Dowling et al. (1993).
16.4 Case study: Fatigue design of exhaust valves for cars
587
The material from which the valve is made should have an optimum combination of
the following features:
(1) Low density. Light-weight valves lead to improved fuel efficiency, reduced noise
and vibration, and better overall performance. They also facilitate operation at
higher engine speeds and enable faster opening and closing. These benefits stem
from the fact that
(a) a lower density leads to lower valve-spring loads to maintain valve toss
speeds (for a given performance goal),
(b) a reduced valve-spring load lowers mechanical friction which must be
overcome for the operation of the valve train.
The extent of the overall benefit from low density, however, is very specific to
the engine and the valve train mechanism.
(2) High thermal conductivity and low thermal expansion coefficient. Valve
temperature and thermal gradients are reduced as a result of high thermal
conductivity. This, in conjuction with a low coefficient of thermal expansion,
reduces thermal stresses and valve-induced knock limitations. Consequently, the
operating temperature of the valve can be increased.
(3) Stiffness. The valve should have a Young's modulus which is high enough for
desirable valve train dynamics while, at the same time, being low enough to
promote valve sealing on a distorted seat.
(4) Manufacturability and low cost. The large volume production of exhaust valves
inevitably requires that the composition and microstructure of the material from
which it is made be controllable within a narrow range for predictable
performance, while the cost of manufacture is kept low. Consider, for example, a
typical engine manufactured by the Ford Motor Co. in the 1990s. One to two
million exhaust valves are required per annum for each engine type. With a mass
of 30 g per valve, the material needed for valves is 80 000 kg/year, assuming a 75%
material efficiency.
Figure 16.11 schematically shows the failure modes commonly encountered in exhaust
valves of spark-ignited gasoline engines. The impingement of exhaust gases causes the
creep
corrosion and oxidation
thermomechanical fatigue
^
/
galling fatigue
creep and plastic deformation
Fig. 16.11. Possible failure modes in the automobile exhaust valve. (After Dowling et al,
1993.)
588 Environmental interactions: corrosion-fatigue and creep-fatigue
highest temperatures, typically in the range 650-800 °C, to develop at the valve stem
blend and underhead radius; the maximum temperature, however, is very specific to the
type of engine. The highest stresses, typically 35-70 MPa, also occur in the valve
underhead radius and the seat area; again, the magnitudes of these stresses depend on
such factors as the valve geometry, alignment and combusion gas pressure. These sites are
also regions where creep deformation can occur. Corrosion and oxidation are also
potential damage mechanisms in the valve seat area.
Mechanical fatigue and creep-fatigue cracking can occur at the site of the stem/blend
radius, where the stresses are typically less than 20 MPa if the valve is properly aligned
with the valve seat. Should misalignment occur here due, for example, to seat distortion,
the bending stresses can become as high as 250 MPa. The valve stem and tip regions
typically undergo wear, galling and mechanical fatigue.
Conventional austenitic stainless steels, such as 21-2N, are commonly used for exhaust
valves for maximum temperatures in the range 650-800 °C. Inconel 751 is a commercial
alloy which is widely used for high-performance exhaust valves in cars. The need for
lower valve mass and higher valve temperatures, in order to move towards higher engine
speeds and near-stoichiometric fuel to air ratios, has led to a continual search for newer
materials for automobile exhaust valves. In view of their high-temperature capabilities
and proven record in aircraft jet engine components, Ni-base superalloys are possible
considerations despite their high density and high cost. The lower densities of
conventional Ti alloys, TiAl intermetallics and ceramics also make them possible candidates for
low-weight valves. The most critical obstacle to the use of such advanced materials in
exhaust valves is cost-effective processing and manufacturing.
16.5 Fatigue at low temperatures
The initiation and growth of fatigue cracks at sub-zero temperatures is a
topic of considerable interest in many practical applications. Some examples of these
situations include: transportation vehicles used in cold climates such as the arctic
environments, equipment used for the transportation and storage of liquefied fuels,
and superconducting machinery and electrical transmission systems. In this section,
we examine some general trends associated with the low-cycle fatigue and fatigue
crack growth characteristics of engineering alloys at low temperatures.
As the temperature of the environment surrounding a metallic material is lowered,
its yield strength increases, and its ductility and fracture toughness decrease. The
(smooth specimen) endurance limit of the material, which is typically 0.3-0.5 times
the tensile strength, will be expected to increase with a drop in temperature. The
cyclic strain-life plot for the material characterizing the low-cycle fatigue behavior
can, in general, be estimated from the change in tensile properties as a function of
temperature. For example, as shown in Section 8.1, the fatigue life of the material is
controlled by ductility at high imposed plastic strains and short lives (the second
term in Eq. 8.5). Since ductility drops with decreasing temperature, the short life
fatigue resistance also deteriorates with decreasing temperature. At long lives, where
16.6 Damage and crack initiation at high temperatures
589
00
o
room
temperature
air
' liquid N.
logA/f
(b)
Fig. 16.12. Schematic illustration of the effect of low temperatures on (a) strain-based total
fatigue life, and (b) fatigue crack growth in metallic materials.
the fatigue life is controlled by strength (the first term in Eq. 8.5), lower temperatures
will be expected to promote a higher number of cycles to failure. These effects of
temperature on the overall strain-life curve are schematically sketched in Fig.
16.12(a).
The reduction in cyclic plasticity accompanying low temperature fatigue also
causes pronounced variations in the rates of fatigue crack growth from that seen
at room temperature. Since the fracture toughness of the material decreases with
decreasing temperature, regime III of (catastrophic) fatigue failure will occur at
lower nominal AK values than at room temperature, as shown in Fig. 16.12(Z>).
The reduced levels of cyclic plasticity at cryogenic temperatures also make it difficult
for fatigue cracks to advance at low AK, with the result that the apparent threshold
stress intensity range values are elevated at lower temperatures (e.g., Tschegg &
Stanzl, 1981).
16.6 Damage and crack initiation at high temperatures
Failure-critical components in aircraft engines and power generating plants
are subjected to cyclic loads at elevated temperatures. Consider, for example, some
components used in a gas turbine aeroengine. The typical design life of the engine is
25 000 h involving some 30 000 civilian flights (Coles, 1980). In this engine, the
compressor disc and casing, made of Ni-base alloy and age-hardened stainless steel,
respectively, are subjected to high strain fatigue at 400 °C. The combustor liner,
made of Co-base alloy, is subjected to thermal fatigue at 982 °C. The turbine blades,
fabricated from Ni-base superalloy, undergo thermomechanical fatigue, high-cycle
fatigue and/or stress rupture, at temperatures of up to 982 °C. The turbine discs,
made of Ni-base alloy, are susceptible to high strain fatigue and creep in the
temperature range of 371-649 °C. It is readily seen from this example that the initiation
and growth of cracks at elevated temperatures is a topic of major concern. This
subject constitutes one of the most complex topics in materials research because
590
Environmental interactions: corrosion-fatigue and creep-fatigue
elevated temperature fatigue, in general, is a consequence of the conjoint action of
creep, cyclic loads and environmental corrosion. Although our current knowledge of
these complex interactions is far from complete, there is a rich variety of mechanistic
processes which have been documented in elevated temperature fatigue. A
comprehensive survey of this subject area is available in several reviews and volumes (e.g.,
Sadananda & Shahinian, 1981; Skelton, 1983; Riedel, 1987). This and the following
sections provide a summary of the micromechanisms, models and characterization
methodology for fatigue crack initiation and growth at elevated temperatures.
16.6.1 Micromechanisms of damage
Fatigue crack nucleation in an alloy at elevated temperatures is influenced
by a number of different microscopic processes which depend on the temperature,
applied stress level and environment. The mechanisms responsible for the inception
of fatigue flaws can be generally grouped into the following categories: (i) cracking
induced by cyclic slip, (ii) grain boundary cavitation, (iii) grain boundary sliding and
the attendant development of wedge cracks, (iv) nucleation and growth of voids at
inclusions and precipitates, and (v) oxidation and corrosion.
16.6.1.1 Cyclic slip
The nature of cyclic slip is affected by temperature. The following
observations provide an illustration of the role of temperature in cyclic slip.
(1) At temperatures in excess of one-half of the homologous temperature, most
materials begin to exhibit wavy slip characteristics. In solid solution alloys,
the stacking fault energy usually increases with increasing temperature (e.g.,
Remy, Pineau & Thomas, 1978). Thermal activation also permits
dislocation climb and cross slip.
(2) The kinematic irreversibility of cyclic slip is enhanced by oxidation and/or
gas diffusion at elevated temperatures.
(3) The tendency for wavy slip may be opposed, in some materials, by dynamic
strain ageing which favors slip planarity.
(4) The time-dependence of dislocation climb also renders elevated temperature
deformation strain rate-sensitive.
(5) The stability of microstructure in most engineering materials breaks down
at elevated temperatures. Thermally activated microstructural changes may
arise as a result of strain-ageing (e.g., carbon steels in the temperature range
of 230-370 °C), recovery (e.g., AISI 316 stainless steel at about 800 °C;
Challenger & Moteff, 1972) or precipitation (e.g., M23Q carbide formation
in AISI 316 stainless steel; Weiss & Stickler, 1972). These metallurgical
changes can be beneficial or detrimental to fatigue resistance; in either
case, they considerably modify the cyclic stress-strain characteristics.
16.6 Damage and crack initiation at high temperatures
591
16.6.1.2 Creep cavitation
At temperatures spanning one-third to two-thirds of the melting point and
at low imposed stresses, most metals, alloys and ceramics exhibit creep deformation
by grain boundary cavitation. These cavities nucleate at grain boundary triple point
junctions, grain boundary particles or ledges on the intergranular facets. In many
engineering alloys, creep cavities nucleate well below a nominal stress level of 100
MPa, and their nucleation occurs continuously over a substantial fraction of the
creep life (Riedel, 1987). Shear sliding of the grain boundary facets also aids in the
nucleation of cavities. A particularly interesting aspect of creep cavitation under
cyclic loads is that the extent of cavitation is strongly affected by the shape of the
stress wave. Slow tension-going and fast compression-going strain rates, i.e. loading
wave shapes with long hold times at tensile stresses, exhibit a greater propensity for
cavitation than balanced load cycles where the magnitude of the tensile loading part
varies in an identical manner to the magnitude of the compression phase (Fig.
16.13a), e.g., Majumdar & Maiya (1980) and Baik & Raj (1982).
Riedel (1987) considered several different theories for creep cavitation for slow-
fast fatigue loading and presented a mechanism map (Fig. 16.13Z>) for fatigue life as a
function of temperature, for fixed values of strain range Ae and test frequency. At
Nv M Nv
balanced
slow-fast
(a)
fast-slow
Fig. 16.13. (a) A schematic of balanced, slow-fast and fast-slow fatigue loading, (b) Mechanism
map for fatigue life as a function of temperature (at fixed values of nonlinear strain range and
frequency) for slow-fast creep-fatigue loading. (After Riedel, 1987.)
592
Environmental interactions: corrosion-fatigue and creep-fatigue
intermediate temperatures represented by regime C in Fig. 16.13(Z>), diffusive cavity
growth occurs, where cavities nucleate continuously throughout the creep-fatigue
test. At low values of accumulated strains 2AeN(, the effects of frequency vc and
temperature T in regime C are described by the relation, N{ <x (vc77<5gDb)2/5, where
<5g is the thickness of the grain boundary, and Db is the grain boundary diffusion
coefficient. At larger values of N(, regime B, the accumulated strain is so large that
the cavity density saturates early in the fatigue life. For this case, N( <x vcTSDh. At
lower temperatures represented by region A, plastic hole growth is postulated to be
the dominant mechanism. This process is independent of frequency if the formation
of cavity surfaces is fully irreversible.
At higher temperatures, region D, the cavities grow so rapidly that the imposed
strain rate (which is assumed constant within the framework of Fig. 16.13Z>) can no
longer accommodate the cavity volume. Consequently, cavity growth in the slow-
fast loading mode becomes constrained. At still higher temperatures, region E,
constrained cavity growth occurs in tension and shrinkage of cavities occurs in the fast
compression segment. Since the diffusion rates are high at these temperatures, cavity
growth begins to be constrained in both tension and compression. This causes
essentially zero net growth of cavities and hence, improved fatigue life.
16.6.13 Grain boundary sliding
Many experimental studies (Driver, 1971; Min & Raj, 1979) have shown
that grain boundary sliding plays an important role in the nucleation of intergra-
nular cavities in creep-fatigue. This process is also one of the mechanistic
considerations in the empirical partitioning of inelastic strain range in creep-fatigue life
calculations (see next section). On the supposition that grain boundary sliding is
the rate-limiting step in the nucleation of triple-junction cracks and that it does not
occur above a certain critical value of the imposed strain rate ecr, Min & Raj (1979)
developed a model which shows that
kTdgfcdp
Here <xy is the yield strength of the material, £1 is the atomic volume, k is the
Boltzmann constant, T is the absolute temperature, d% is the grain size, fh is the
volume fraction of the cavity nucleating particles on the grain boundary, dp is the
average size of the particles, and the remaining terms are as defined in the preceding
subsection. According to this theory, if the wave shape is such that the tension-going
and compression-going strain rates are below the critical value, no net damage is
produced since grain boundary sliding will occur equally in the forward and reverse
loading directions. With slow-fast loading and with the strain rate in the
compression phase greater than ea, maximum damage is produced. Although this model is
an oversimplification of the grain boundary sliding process, it offers insights into the
effects of wave shape on high temperature fatigue in many alloys.
16.6 Damage and crack initiation at high temperatures
593
Grain boundary cavitation is also known to be affected by the relative variations
of temperature and stress with time. Experiments by Fujino & Taira (1980) on low
carbon steel and AISI 304 stainless steel show that in-phase cyclic variations in
temperature and strain (i.e. tension-going strain phase accompanied by increasing
temperature) produces more fatigue damage than out-of-phase thermomechanical
fatigue loading. Furthermore, out-of-phase thermomechanical cyclic loading
produces a lower fatigue life than isothermal mechanical fatigue. This variation of
fatigue resistance for different thermomechanical loading conditions appears to
exhibit a correlation with the extent of grain boundary sliding.
16.6.1.4 Inclusions and precipitates
Subsurface nucleation of fatigue cracks can occur at elevated temperature
by the decohesion of inclusions and second phase particles from the surrounding
matrix (see Fig. 4.13 for an example of this mechanism). In some aluminum alloys,
void nucleation around grain boundary precipitates causes intergranular cavitation
even at low temperatures (Vasudevan & Doherty, 1987). Furthermore, enhanced
precipitation during elevated temperature fatigue provides a greater number of
void nucleation sites.
16.6.1.5 Oxidation and corrosion
The presence of an oxidizing or aggressive environment can influence, in
many ways, the mechanisms of high temperature fatigue crack nucleation.
(1) The presence of an environment may preclude the sintering or closure of
cavities at elevated temperature.
(2) If a grain boundary near a free surface is not protected by an oxide layer,
oxygen gas or other embrittling species may diffuse along the boundary and
react with grain boundary precipitates. Under the influence of an applied
stress, cavities initiate around the grain boundary precipitates (e.g., Wells,
1979). Furthermore, the precipitation of residual gases may provide the
nuclei for cavities, with the internal gas pressure accelerating the growth
of cavities.
(3) The combination of surface diffusion and slip step oxidation promotes
enhanced kinematic irreversibility of cyclic slip (see Section 4.2), which
causes fatigue cracks to nucleate in the absence of other mechanisms (Fig.
16.14). This process is commonly known as the Fujita mechanism (Fujita,
1963).
(4) Preferential oxidation at certain microstructural sites, such as at the
intersection of a grain boundary with a free surface, causes microscopic stress
concentrations (notches) to develop. The micronotches elevate the local
stresses and promote crack nucleation (Duquette, 1979).
594
Environmental interactions: corrosion-fatigue and creep-fatigue
adsorption of
gas
gas adsorption
and diffusion
tension
compression
Fig. 16.14. A schematic of the Fujita mechanism for fatigue crack nucleation.
(5) Repeated fatigue loads rupture the protective oxide film on the surface of
the material. The absence of a protective film provides an active path for
chemical attack. Furthermore, the cracking of the brittle oxide film, by
itself, may lead to the growth of a catastrophic fatigue flaw (Wells, 1979).
For many materials, the deterioration of fatigue resistance at elevated temperature
is merely a consequence of environmental interactions. The experimental basis for
this inference is illustrated by the results of Coffin (1973) for AISI A286 ferrous
alloy, Fig. 16.15. Here the variation of plastic strain range Aep with the number of
cycles to failure N{ is unaffected by either the temperature or the frequency in vacuo.
However, lowering the test frequency severely reduces the low-cycle fatigue life in
elevated temperature air.
16.6.2 Life prediction models
Numerous approaches have been developed over the years to predict the
total failure life of engineering materials subjected to elevated temperature fatigue.
1.0
O air 593 °C
% vacuum 593 °C
A vacuum 20 °C
Fig. 16.15. A plot of Aep versus N( for AISI A286 alloy in laboratory air and vacuum at 593 °C.
Numbers adjacent to the data points denote the frequency in cycles per minute. The solid lines
represent regression analysis of data. (After Coffin, 1973.)
16.6 Damage and crack initiation at high temperatures
595
Comprehensive reviews of the available life prediction models can be found in Coffin
(1974), Tomkins & Wareing (1977), and Batte (1983). The most widely used methods
for life prediction can be classified into the following three groups: (i) damage
accumulation models, (ii) frequency-modified Coffin-Manson equations, and (iii)
strain range partitioning. A brief summary of each of these methods is presented
in this section.
16.6.2.1 Damage accumulation models
The simplest approach to predicting creep-fatigue life involves the linear
damage summation model. In this method, the damage accumulated by mechanical
fatigue and by creep are linearly superposed, such that
?f + ?c=L (16.6)
where ff and fc are the fractional damage due to fatigue and creep, respectively. If
the material is subjected to n, fatigue cycles at a stress amplitude of Act,- and the
number of cycles to failure at this stress amplitude is 7Vf„ the fraction of fatigue
damage is given (see the Palmgren-Miner rule in Section 7.3) by the expression
£ ni/N(i, where the summation is carried out over the total number of stress blocks
with different amplitudes. Similarly, if tj is the average time under an average
imposed stress ct, and tRj is the time to rupture at that stress level, then X^'y'/'R/'
denotes the amount of damage accumulated by creep. For variable amplitude
loading at elevated temperatures, the damage summation rule is written as
£i+£^' <167)
where d is the accumulated damage fraction which is often taken to be unity.
This approach is widely used in conjunction with strain-controlled fatigue tests
with dwell periods under load. As noted by Batte (1983), one encounters at least
three problems in the implementation of the linear damage summation concept: (i)
Under fixed strain dwell periods, the stresses continue to relax, (ii) Cyclic hardening
or softening leads to different levels of stress relaxation during continued fatigue
straining, (iii) Stress rupture data used to predict life in Eq. 16.7 are commonly
derived from monotonic load tests and they are not, in general, representative of
creep-fatigue behavior.
16.6.2.2 Frequency-modified Coffin-Manson equation
The frequency-modified strain range-life relationship was proposed by
Coffin (1973) to account for the effect of cyclic frequency on elevated temperature
cyclic response (such as that shown in Fig. 16.15). This relationship, which phenom-
enologically incorporates the frequency term vc in the Coffin-Manson relationship,
Eq. 8.1, takes the form
596
Environmental interactions: corrosion-fatigue and creep-fatigue
Aep = cf(7V^-1)"^
(16.8)
where the constant cf and the exponents k and fi are specific to the temperature-
material-environment system. The behavior of many steels is satisfactorily described
in an alternate form of Eq. 16.8 where the total strain range is separated into elastic
and plastic components, similar to Eq. 8.5:
Aet = Aee + Aep = ^(jVfvM^'+c^JVfi^-1)-*. (16.9)
It should be noted that the application of Eqs. 16.8 and 16.9 to predict creep-fatigue
life requires a knowledge of the stress-strain hysteresis loops.
16.6.2.3 Strain range partitioning
The strain range partitioning methods, proposed by Halford, Hirschberg &
Manson (1973), isolate the overall damage due to thermomechanical fatigue
interactions into mechanical and time-dependent components of strain range. On a
microscopic scale, cyclic slip is envisioned as the mechanism for time-independent
mechanical fatigue, and grain boundary cavitation and sliding are considered the
primary mechanisms influencing creep-fatigue damage. The strain range partitioning
methods also take into consideration the reversal of strains associated with fatigue
and creep phenomena. In this approach, any fully reversed inelastic strain range is
divided into four components (see Fig. 16.16): (i) Aepp, which denotes tensile plastic
./
L Ae
C
A
J
cc 1
Fig. 16.16. Schematic representation of strain range partitioning into four components of
inelastic strain range. E, P and C denote elastic, plastic and creep deformation, respectively.
16.6 Damage and crack initiation at high temperatures
597
deformation reversed by compressive plastic deformation; (ii) Aecp, which denotes
tensile creep reversed by compressive plastic deformation; (iii) Aepc, which denotes
tensile plastic deformation reversed by compressive creep; and (iv) Aecc, which
denotes tensile creep reversed by compressive creep.
The cyclic endurance is related to the four components of strain range by Coffin-
Manson type power law relationships which take the form
pp — pp pp '
Af = r N~^2 etc
cpJ'cp
(16.10)
Figure 16.17 shows the fatigue-life relationships for the partitioned strain ranges.
The total fatigue life is then determined by the summation of the damage fractions
from the four modes of deformation such that
1
1
• + -
1
• +
1
Nn
(16.11)
J__
N{ ~ Npp ' 7Vcp ' Npc
where the subscripts denote the same modes as those of the strain ranges. Sometimes
the damage fractions are also weighted in proportion to the magnitude of the strain
ranges in each of the four modes. Many empirical modifications of this approach are
also available for incorporating the effects of slow-fast fatigue loading (including the
effects of different tension-going and compression-going parts of the cycle) and of
creep-fatigue dwell periods into the fatigue life calculation (see, for a review, Batte,
1983).
cycles to failure, N,
Fig. 16.17. Schematic of partitioned strain ranges and fatigue life relationships.
598 Environmental interactions: corrosion-fatigue and creep-fatigue
16.7 Fatigue crack growth at high temperatures
At temperatures that are significant fractions of the homologous
temperature, the mechanisms responsible for fracture become time-dependent rather than
cycle-dependent. Time-dependent processes may be controlled by creep and/or
environment, both of which are, in general, thermally activated. For time-dependent
fatigue crack propagation, the stress intensity factor range is still the controlling
parameter if the zone of inelastic deformation at the crack tip is small in size
compared to crack length and the size of the uncracked ligament. However, at very high
temperatures and low test frequencies, the limitations of linear elastic fracture
mechanics become apparent as the inelastic zone becomes an appreciable fraction
of the characteristic specimen dimensions. Furthermore, the decrease in flow
strength of the material at elevated temperatures causes a greater extent of nonlinear
deformation to develop. In this section, different fracture parameters used to
characterize elevated temperature crack growth are examined, and the conditions for the
validity of each parameter are pinpointed. This is followed by discussions of elevated
temperature crack growth in engineering alloys.
16.7.1 Fracture mechanics characterization
Consider an elastic-nonlinear viscous material for which the total strain rate
in uniaxial tension is given by
e = - + ey(-) , (16.12)
where E is Young's modulus, <xy is the reference yield strength, ey is the reference
creep strain rate, and «c is the power law creep exponent. When the nonlinear creep
strain rate dominates over the elastic strains, Eq. 16.12 can be approximated by the
pure power law, e/ey = a(cr/cry)"c, where a is a constant related to the material
parameters in Eq. 16.12. (With no loss of generality, a can be taken to be unity in
the present discussion.) For multiaxial stress states, the nonlinear creep strain rate is
given by
where stj are the components of the deviatoric stress tensor and at is the effective
stress defined by a^ = {?>/2)sijSij. Note that the constitutive model for power law
creep, Eq. 16.13, is analogous to that for power law plasticity (see Section 9.7.2).
Consider a stationary edge crack in an infinite plate of the elastic-nonlinear
viscous material. Let the plate be suddenly loaded in mode I at the far-field boundary at
time t = 0. At this point, the crack tip fields are completely specified by the
asymptotic elastic singular solutions presented in Section 9.3. After some creep has
occurred, there develops a region at the crack tip (for «c > 1) where the inelastic
part of deformation is more dominant than the elastic part. If this region is very
16.7 Fatigue crack growth at high temperatures
599
small, small-scale creep conditions prevail, and fatigue crack growth at the elevated
temperature is still amenable to a characterization based on AK. For contours far
from the crack tip (i.e. in regions where elastic strains prevail), the value of the
./-integral is
1 -v2 ,
Jo=—^K2 (16.14)
for plane strain conditions. At time t > 0 and at regions close to the crack tip, the
near-tip stresses cry, creep strain rates e^, and the displacement rates ut are given by
the universal fields of the HRR-type discussed in Section 9.7.2, Eqs. 9.91. This is a
consequence of the similarity between Eq. 16.13 and the pure power-law model
described in Section 9.7.2. With respect to the polar coordinates centered at the
crack tip,
a* = "A^M/) °lj{ c)'
Cfy€yInjJ
C(t\ \ «cA"c + l)
^-) rV^mrQ. (16.15)
The amplitude of the singularity is C(t), which depends on the elapsed time t, the
magnitude of the far-field loads, the crack geometry, and the material constants
given in Eq. 16.12. The near-tip fields in creeping solids scale with C(t) in the
same way the rate-independent plastic fields scale with J in an elastic-plastic solid.
Therefore, C(t) can be expressed as a line integral on any counterclockwise path T
around the crack tip which lies within the region where the creep strains are well in
excess of the elastic strains (Bassani & McClintock, 1981):
4 = ««>
C(t) =
■r{(j^TT>^-^4 (16-16)
Here «, is the^-component of the unit outward normal along r. Note the similarity
of Eq. 16.16 to Eq. 9.87. The C(t) integral is path-independent in the region where
the creep strain rates are significantly greater than the elastic strain rates.
The extent of the creep zone is defined by the boundary ahead of the crack tip
where the creep strain measure, ?° = /(2/3)e?e?, is equal to the elastic strain
measure, e6 = J(2/3)€y€fj; ee is the deviatoric elastic strain determined from the initial
elastic .K-field. Using this definition, Riedel & Rice (1980) argued that the total strain
well within the creep zone depends uniquely on the stress. The self-similar nature of
the inner fields leads to the following relation between J and C(t):
Ji = C(i)(ne+l)t, (16.17)
where the subscript for J denotes the inner field. Invoking the assumption that J{
equals J0, Eq. 16.14, Riedel & Rice estimated that
600
Environmental interactions: corrosion-fatigue and creep-fatigue
C™ = < ' nF,^ (16-18)
(«c + \)Et
CRR denotes the Riedel-Rice estimate of C(t) based on the assumption that J{ = J0.
For short creep times, CRR = C(t), and the amplitude of the near-tip fields decays as
\/t. At long times where extensive creep develops, the situation is analogous to the
fully plastic state. For this case, steady-state conditions are attained and C{f)
approaches a value C* which is path-independent everywhere:
/p\ "c + l
C* = €yayal-—\ function («c, geometry), (16.19)
where P and P0 are the applied load and reference load, respectively, and a is the
crack length. It is apparent that, for the same specimen and crack configurations,
values of C* are obtained from solutions developed for J. Expressions for C* for
different specimen geometries and loading conditions have been published by
Kumar, German & Shih (1981). The amplitude factor C(t) for any creep condition
is given by
Cit) = (KTWtK2 + c*- (16-20)
The time for transition, tT, from small-scale creep to extensive creep is obtained by
equating the two terms on the right hand side of Eq. 16.20 and solving for t;
■ (1-v2)*2 (16.21)
' (nc+\)EC*
C* and C(t) have been suggested as candidate parameters for characterizing elevated
temperature crack growth under mono tonic loads (Landes & Begley, 1976; Riedel &
Rice, 1980; Ohji, Ogura & Kubo, 1980).
Under small-scale creep conditions, Riedel & Rice (1980) estimate the size of the
creep zone to be
rcr = ~K2{EBxt)2l(n'-X)Fc{6), (16.22)
where B\ is a constant related to the material parameters in Eq. 16.12 and Fc is a
function of the polar angle 6. In a finite element study of the dominance of near-tip
fields for stationary cracks, Li, Needleman & Shih (1988) found that, for nc = 5, the
HRR-type fields, Eqs. 16.7.1, described near-tip stresses and deformation over the
inner one-fifth of the creep zone; finite strain effects dominated over a region
comparable to the extent of the crack tip opening displacement. It is also of interest to
note that microstructurally induced changes in crack path, which promote mixed-
mode fracture, can have a marked effect on the rate of growth of the creep zone. The
numerical analysis of Brockenbrough, Shih & Suresh (1991) shows that, for nc = 5,
the creep zone grows about seven times faster in mode II than in mode I, with a
corresponding decrease in the transition time, tT, from small-scale to extensive creep.
Landes & Begley (1976) have also presented an interpretation of C* in terms of the
stress-power dissipation rate in cracked bodies. This interpretation provides a useful
16,7 Fatigue crack growth at high temperatures
601
(and experimentally measureable) value of C* at the loading pins for fracture
specimens in which mainly steady-state creep deformation exists.
The fracture mechanics parameter C{f) for nonsteady-state conditions is a near-tip
amplitude factor which cannot be measured at the loading pins in a fracture test
specimen. Its value is only calculated using Eq. 16.16. To overcome this limitation,
Gieseke & Saxena (1989) suggest the use of another crack tip parameter, Ct, which is
based on the stress-power dissipation rate definition of C*:
Ct = ~-Rd-f, 06.23)
B da
where U* is the instantaneous power release rate and B is the thickness of the
cracked specimen. (Note the analogy between Eqs. 16.23 and 9.88.) Bassani,
Hawk & Saxena (1986) showed that the parameter Ct is uniquely related to the
rate of expansion of the creep zone under small-scale creep by the equation
Ct = 2(1-v2)i^fv- (16-24)
Here W is the width of the cracked specimen, Dx is the stress intensity calibration
factor defined as Dx = (K/P)B~JW, D\ = ADX/A{a/W), and bx is a scaling factor
which is determined numerically.
The discussions presented thus far in this section pertain to stationary creep
cracks. Certain aspects of near-tip fields for growing creep cracks have been reported
by Hart (1980) and Hui & Riedel (1981). The latter authors conclude that, for «c > 3,
the stress singularity varies as r_1/("c_1> and that the scalar multiplier (i.e. the
amplitude of the singularity) depends only on the crack growth rate (and not the applied
load). For crack growth rates greater than some minimum value, no steady-state
conditions appear to exist.
To summarize this section, it should be noted that there are several different
parameters which have been proposed for the characterization of creep crack
growth. The choice of a particular parameter is dictated by the temperature, the
material constants in the constitutive equation for creep, and the size of the creep
zone in relation to the characteristic dimensions of the test specimen. The above
considerations are exclusively based on continuum analyses and they do not account
for microstructural aspects of failure, the stability of microstructure, or
environmental interactions.
16.7.2 Characterization of creep-fatigue crack growth
Under cyclic loading conditions at elevated temperature, the conditions
governing the choice of an appropriate characterizing parameter can be estimated
by comparing the cycle time tc (i.e. the duration of the fatigue cycle) with the
transition time tT (Riedel, 1983). Small-scale creep conditions occur when tc <SC tT
and extensive creep conditions prevail when tc~2> tT. Based on this comparison, three
distinct regions of fatigue crack growth can be identified. At lower temperatures and
602
Environmental interactions: corrosion-fatigue and creep-fatigue
higher cyclic frequencies (i.e. low tc), fatigue crack growth is essentially
cycle-dependent and it is reasonably well characterized by AK. At very high temperatures and
low frequencies (i.e. high tc), crack growth is completely controlled by
time-dependent processes. For this purpose, C*, C(t) and Ct have been used as candidate
parameters depending on the material, environment and loading conditions. In the
region lying between these two extremes, fatigue crack growth is an outcome of the
synergistic interactions between cycle-dependent and time-dependent processes. For
this creep-fatigue situation, two different approaches have emerged (e.g., Gieseke &
Saxena, 1989): superposition of crack growth rates and superposition of crack
driving forces.
In the first approach, the mechanical fatigue and time-dependent creep
components of crack growth are linearly superposed to derive an overall crack extension
rate (e.g., Saxena, 1988). The total fatigue crack growth rate is then given by
where the subscripts F and CR denote the contributions from fatigue and creep,
respectively. Note the similarity of this equation with Eq. 16.2 for corrosion-fatigue.
Similar partitioning methods and their various empirical adaptations have also been
employed in the context of thermomechanical fatigue where both the loads and
temperatures vary cyclically (e.g., Nicholas, Heil & Haritos, 1989). The fatigue
component of high temperature crack growth is then characterized by
under small-scale inelastic conditions, where AK and A^ff can be taken as the
nominal and effective values of the stress intensity factor range, respectively, and
C, C\, m and mx are the usual empirical constants in the Paris equation. Under large-
scale plasticity, attempts have been made to characterize the mechanical fatigue
component in terms of /° (= A J), where (da/dN)F = C2(Jc)m2; C2 and m2 are
empirical correlation constants (e.g., Dowling & Begley, 1976). Similary, the time-
dependent component (da/d.A0CR is characterized by
(SCR = C^«1'"' <1627>
where Cj, and m3 are material constants. PCR is the creep fracture parameter which is
chosen to be C* by Landes & Begley (1976), C(t) by Saxena (1988) and Ct by
Bassani, Hawk & Saxena (1986). One of the methods for converting da/dt into
(da/d.A0CR is to use the relationship (e.g., Saxena, 1988)
(l/v< da
da\
Wcr~
dt(PCR)<lt. (16.28)
This approach, in principle, can also account for the effect of test frequency and
waveform on the rates of high temperature crack growth.
16.7 Fatigue crack growth at high temperatures
603
Some researchers (e.g., Okazaki & Koizumi, 1983; Riedel, 1987) have proposed
characterization for combined elastoplastic-creep under cyclic loads using a
partitioning of Jc into an elastic component (AJe = (1 — v2)AK2/E) and an inelastic
component which is taken as the sum of the contributions from plastic and creep
deformation. (The cyclic ./-integral has also been termed the Z integral by Wiithrich,
1982, and Riedel, 1987.) Although success has been claimed for the characterization
of inelastic creep-fatigue interactions using such approaches, there is doubt about the
validity of cyclic /-based concepts under creep-fatigue conditions involving severely
nonproportional loading. The main justification at this time is that these concepts
appear to provide somewhat reasonable characterization for limited material-
environment-loading combinations.
Finally, it is worth noting that under extensive creep in some materials, the crack
growth rates have been assumed proportional to the net section stress and crack
length. Furthermore, numerous micromechanical models have been proposed for
fatigue crack growth based on the mechanisms (described in Section 6) of diffusion,
grain boundary sliding and intergranular cavitation. A review of these models can be
found in Sadananda & Shahinian (1981) and Riedel (1987).
16.7.3 Summary and some general observations
Although the use of linear elastic fracture mechanics to characterize room
temperature fatigue crack growth has found widespread appeal, similar applications
for elevated temperature fatigue failure must be approached with caution. For mixed
fatigue-creep crack growth involving extensive near-tip deformation, there is no
consensus at present on the validity of any one fracture mechanics parameter.
Furthermore, the linear superposition models, albeit applicable in some cases, do
not generally account for the experimentally observed mechanistic dissimilarities
between time-dependent and cycle-dependent failure. The possibility of premature
closure in the wake of the advancing fatigue crack, nonproportional deformation at
the crack tip and rapid crack growth rates would obviously rule out the scientific basis
for the nominal use of nonlinear fracture parameters for high temperature fatigue.
Increases in temperature and decreases in cyclic frequency generally lead to an
increase in the rate of fatigue crack growth in most alloys (e.g., James, 1972) as a
result of the environmental effects and damage processes discussed in Section 16.6.
However, this trend may not be observed in situations where corrosion deposits
formed at elevated temperatures block the faces of the crack (e.g., Skelton &
Haigh, 1978), when cyclic waveforms and dwell periods cause changes in
deformation mechanisms (e.g., Sadananda & Shahinian, 1981) or when changes in test
temperature or frequency cause a change in the micromechanisms of damage ahead of
the crack tip (e.g., Pineau, 1983). It is also emphasized that the effects on fatigue
crack growth of most test variables are specific to the particular combination of
material, environment, test temperature and mechanical loads.
604
Environmental interactions: corrosion-fatigue and creep-fatigue
16.8 Case study: Creep-fatigue in steam-power generators
Approaches to characterize creep-fatigue were discussed earlier in this chapter
wherein the complexities associated with choosing an appropriate characterization
methodology were highlighted. In this section, we present a case study of the assessment
of residual life of a material which was tested after thirty years of service in the high-
temperature turbine casing of a steam-power generation plant in France. This case study
is based on the work of Mudry & Pineau (1983) and Moline, Piques & Pineau (1991).
In view of their hardenability and the amenability to undergo large changes in
mechanical properties in response to heat treatments and precipitation, Cr—Mo-V steels
are used for such components as boilers, steam pipes, forged turbine rotors and cast
turbine casings. During service, many components of the steam power plant are prone to
crack initiation and growth due to the combined effects of cyclic loading and creep. In the
case of thick sections of turbine casings, in particular, fatigue cracks initiate as a result of
thermal transients generated during start-up and shut-down. The most damaging
transients are introduced between 150 and 200 °C at the locations between the steam
admission valves. Once initiated by fatigue, these cracks then advance subcritically by
creep at the operating temperature of 540 °C under steady loads. Figure 16.18(a) shows
an enlarged view of such a crack in the turbine casing. Figure 16.18(6) is the view of the
cracked region after weld repair.
A research effort was sponsored in the 1980s by Electricite de France to assess the
remnant creep life of a lCr-lMo-0.25V steel which was taken out of a large turbine
casing of a 125 MW thermal power station. Over a period of thirty years, this steel had
been subjected to approximately 2000 start-up/shut-down fatigue cycles and 150 000
hours of operation.
The material that was exposed to long-term service at temperature in the power plant
was examined for changes in composition, microstructure and mechanical properties.
Auger spectroscopy studies of the steel identified the segregation of P to grain
boundaries. Tensile as well as Charpy-impact experiments showed that during service, long-
term aging at 540 °C for 150 000 hours had produced only small variations in tensile
strength, a modest shift (by approximately 20 °C) in the ductile—brittle transition
temperature (which was ascribed to the grain boundary segregation of P), a small change in
creep ductility, and a reduction in time to creep rupture by as much as a factor of 3 to 5
(as compared to material taken from a cold section of the turbine).
Creep crack initiation and growth experiments were carried out on the specimen taken
from the hot section of the turbine casing (i.e. the aged specimen) and the one taken from
the cold section (unaged). Compact geometry test specimens were used for this purpose
(see Section A.4 in the Appendix where the mode I stress intensity factor Kj for this
geometry is given). The value of C* was estimated on the basis of the experimental
measurements in the following way:
Here nc is the stress exponent for secondary creep law, Ft (a/ W) (*» 2 for the plane strain
compact specimen) is a nondimensional function of the crack length to specimen width
ratio (a/W) and nc, P is the applied load, A = (dA/df is the load-line displacement rate
16.8 Case study: Creep-fatigue in steam-power generators
605
100 mm
(a)
\*
i
1000 mm
(«
Fig. 16.18. (a) An enlarged view of the crack (after grinding) in the thick-section turbine
casing of a 125 MW steam power plant, (b) View of the initially cracked region which was
repaired by welding. Compare the region between the bolts in Figs, (a) and (b). (From Mudry
& Pineau (1983). Photographs courtesy of A. Pineau, Ecole des Mines, Evry, France.
Reprinted with permission.)
(where t is the time), Bvgn is the minimum thickness of the specimen at the v-groove
notch, a is the crack length, ( W — a) is the width of the uncracked ligament and the
subscript 'exp' denotes that the subscripted quantity is estimated on the basis of
experimental measurements.
606
Environmental interactions: corrosion-fatigue and creep-fatigue
Experiments revealed that, for both the hot section and cold-section specimens, the
time to initiate the growth of a creep crack, f;, exhibited the following power-law
dependence on Cexp:
h • {Q*xP}°'85= constant. (16.30)
This result indicates that there exists a unique correlation between the creep crack
initiation time and Cexp, which reduces to C* (see Eq. 16.19) under conditions of large
scale power-law creep. Since the effect of aging on creep strain rate was included in the
experimentally-based assessment of Cexp and since the creep ductility of the material was
not strongly influenced by long exposures to high temperature, the correlation given in
Eq. 16.30 was independent of the initial condition of the material.
The transition time from small-scale creep to extensive creep, Eq. 16.21, for the steel
taken from the hot-section, tT « 12 h, while the experimentally determined time to
initiate the advance of a creep crack, f; « 975 h. Similarly, for the cold-section steel, fT «
23 h, while ?j « 1000 h. Since the transition time analysis is mainly valid for a stationary
crack, it is not surprising to observe a reasonable correlation between ?j and Cexp, Eq.
16.30. (Note that fT and fj are functions of the applied stress.)
The creep fracture of both the hot-section and cold-section steel specimens exhibited a
two-stage crack growth process at high temperatures: (1) Stage I, which corresponded to
a threshold value of Cjxp, below which a pre-existing crack did not advance under a
steady creep load and above which even a small change in Cjxp resulted in a precipitous
rise in the crack velocity, a = da/df, and (2) Stage II, which corresponded to a steady
creep crack growth regime wherein log a had a linear dependence on log CgXp. In this
latter regime, both a and Aexp (and hence, Cjxp) advance precipitously by creep crack
growth. The crack growth process involves primarily intergranular separation of the
material, as shown in the micrograph of Fig. 16.19. Let the transition time between Stage
I and Stage II crack growth be denoted as fstage.
Once the creep crack begins to advance rapidly, i.e. when t > fstage, the experimentally
determined load-line displacement Aexp(a, t) changes because of creep deformation as
well as an increase in crack length. Thus,
dAexp(a, t) _ 9Aexp(a, t) 9Aexp(a, t) da
df ~ dt da ' dt' V '
where the first term on the right hand side denotes the creep component of the load-line
displacement rate, while the second term on the right-hand side denotes the crack-growth
component. By setting the magnitudes of these two components equal, one can define a
transition time, tl^ge. From the experimental measurements of the change in load-line
displacement rate during the creep fracture experiments, fsfage can be computed using a
reference stress concept (which is outlined in Moline et al. 1991). An experimental
assessment of this transition time, tf^it can also be made from transition from Stage I to
Stage II during creep crack growth. A good agreement was found between such
calculated and experimentally determined transition times between Stage I and Stage II
crack growth for both the hot-section and cold-section steels. These correlations were
also in agreement with transition time estimates derived from finite-element analyses.
The foregoing results reveal that in the steam power plant turbine casing, fatigue
cracks, initiated due to the start-up and shut-down cycles, advance under a steady creep
load. The conditions for the initiation of growth of such creep cracks was shown to be
16.8 Case study: Creep-fatigue in steam-power generators
607
200 um
^*
•*.
V
i*
%
y
- *>;
.• K
•I ^
• »>\\
-*
A
o
p '
<?
V
«
o
-o *
-0 '•
"J1 a* r^
1
•
rK
VV"»* ,■ *
lw.»^
50 (un
(b)
Fig. 16.19. (a) Intergranular creep crack growth in the Cr-Mo-V steel. Note also the presence
of secondary cracks in this polished and etched specimen surface, (ft) A higher magnification
micrograph showing creep cavities along grain boundaries. (From Mudry & Pineau (1983).
Photographs courtesy of A. Pineau, Ecole des Mines, Evry, France. Reprinted with
permission.)
directly related to CeXp. Once rapid creep crack growth begins at the end of Stage I at
t > f stage, the commencement of Stage II creep fracture could also be correlated with C^p
on the basis of the transition time from Stage I to Stage II. This case study thus serves to
illustrate how fracture mechanics principles for creep failure can be applied, with suitable
modifications, to industrial components.
608 Environmental interactions: corrosion-fatigue and creep-fatigue
Exercises
16.1 Prove the statement in Section 14.3 that 1 cc of Fe oxidizes to 1.76 cc of
FeO, 2.07 cc of Fe304 and 2.13 cc of Fe203. (The ratio of the volume of
oxide produced to the volume of metal consumed is commonly known as the
'Pilling-Bedworth' ratio.)
16.2 Calculate the Pilling-Bedworth ratio for the formation of A1203 from Al
and compare the efficacy of oxide-induced crack closure for aluminum
alloys with that for steels solely on the basis of the volume of oxide
produced on the fatigue fracture surface.
16.3 From the results presented in Eq. 9.49, show that the hydrostatic stress
ahead of a mode III fatigue crack is nominally zero. List a few mechanistic
processes for which the hydrostatic stress is likely to have a large influence
on the corrosion-fatigue crack growth characteristics.
16.4 Figure 11.10 shows the crack growth characteristics of a ceramic composite
under both static and cyclic loading conditions in 1400 °C air. See if linear
elastic fracture mechanics provides valid characterization for the conditions
of the experiments.
16.5 A hypothetical engineering alloy is subjected to high temperature fatigue
crack growth at a cyclic frequency of 5 Hz. The transition time from small-
scale creep to extensive creep, Eq. 16.21, under those testing conditions is
50 s. Comment on the validity of different fracture mechanics parameters to
characterize the creep-fatigue fracture of the alloy.
16.6 List a set of conditions under which the similitude concept implicit in the
nominal use of fracture mechanics is likely to lose validity during (a) stress-
corrosion cracking, (b) corrosion-fatigue fracture and (c) creep-fatigue
fracture.
Appendix: Stress intensity factors for some
common crack geometries
This section presents a summary of stress intensity factors for some
commonly used fatigue test specimens and crack configurations. These results are
compiled from stress intensity factor handbooks (e.g., Rooke & Cartwright, 1976; Sih,
1973; Tada, Paris & Irwin, 1973) and monographs on fracture mechanics (e.g.,
Broek, 1986; Hellan, 1984; Kanninen & Popelar, 1985), where further details and
derivations can be found.
A.l Single-edge-cracked tension specimen
The stress intensity factor at the tip of a through-thickness, single edge crack
of length a in a rectangular plate of width W (and height H > 2 W) subjected to a
tensile stress a (Fig. A.la) is
Kx = o4~af(~), 04.1)
'(W) = .*-04.i+.8.7(^-38^)"+53.85(^. (,,,
t t t t t t t T t t T t
I 1 i I i i I I I 1 I I
(a)
(b)
(c)
Fig. A. 1. (a) Single-edge-cracked tension specimen, (b) Center-cracked tension specimen, (c)
Double-edge-cracked tension specimen. The width of the plate is W in all cases.
609
610
Appendix
A.2 Center-cracked tension specimen
The stress intensity factor for a center crack of length 2a in a plate (width
W) which is subjected to a remote tensile stress a (Fig. A. 16) is
Aj = a^nai sec—)
(A3)
A.3 Double-edge-cracked tension specimen
The stress intensity factor of a plate of width W which contains two edge
cracks each of length a (Fig. A.lc) is
K1=cr^f(^j, (A A)
A.4 Compact specimen
The mode I stress intensity factor for a compact specimen (Fig. A.2a)
subjected to a tensile load P is
P „/a
K,=
/(£)•
(2 + {a/W))
J\W) (\-{a/W)f'2
„,86 + 4.64©-,332(^,4,^)'-,^
(A.6)
(A.7)
A.5 Single-edge-cracked bend specimen
The stress intensity factor for an edge-cracked bend specimen of span S,
width W and thickness B (Fig. A.2b) is
K,
PS
'&)•
w)
3(a/W)i/2
tf="times"I — £0/3/2
f(±)=
J\W) 2(1 + 2{a/W\) (1- [a/W}f2
»-m-w)\™-Mwh»(w)'\
(A.$)
(.4.9)
Stress intensity factors for some common crack geometries
611
A- /
i A
^ H-a-»)
- u w —►
1 © J
1 /
(a)
P
1
/ ♦
w
2*
5^ /
. Aft
5
/
*T/»/2
AW
(*)
(c)
Fig. A.2. (a) Compact specimen. (6) Single-edge-cracked bend specimen, (c) Circumferentially
cracked cylindrical specimen.
A.6 Circumferentially cracked cylindrical specimen subjected to
tension and/or torsion
The mode I and mode III stress intensity factors for a circumferentially
cracked cylindrical specimen (uncracked ligament diameter d[, outer diameter d0,
and D = {djd0}) subjected to tension and torsion (Fig. A.2c) is
1/2
X
{1 + 0.5D + 0375D2 - 0.363P3 + 0.731P4},
6T [nd{
KlU=nd? I 2
1/2
04.10)
{1 + 0.5D + 0.375D2 + 0.3125D3 + 0.273D4 + 0.208D5}.
(.4.11)
612
Appendix
A.7 Large plates with elliptical and semi-elliptical cracks
Consider a plate specimen containing an elliptical crack. Let the major and
minor axes of the ellipse be 2c and 2a, respectively, as shown in Figure A.3. The
stress intensity factor for the embedded elliptical flaw varies along the crackfront as a
function of the angle 0 (see Fig. A3b). When the dimensions of the cracked body are
much larger than a and c,
^=^/in20 + ^cos2 \ {AUa)
where * is the elliptical integral of the second kind, which is given by
2\ 1 '/2
* =
*/2|
1
1
d0.
04.126)
Ki is maximum when 0 = 90°. Using a series expansion for *, it can be shown that
' 2\
3ti 7i la'
04.12c)
(*)
Fig. A.3. (a) A large plate containing an embedded elliptical crack, (b) Details of the crackfront.
Stress intensity factors for some common crack geometries
613
When a = c, we obtain the solution for a circular (penny-shaped) crack. In this case,
Eqs. A. 12 reduce to
Kx=-oJna. (.4.13)
71
The solutions given by Eqs. A. 12 can also be applied to the case of semi-elliptical
surface cracks. For the semi-elliptical surface flaw (thumb-nail crack) in a finite size
plate, the stress intensity factor at the mid-point (i.e. end of the minor axis, 4> = n/2)
is
where the pre-multiplier 1.12 is the free-surface correction factor, Q is the flaw shape
parameter extracted from ^ in Eq. A. 126, 2c is the surface length of the crack, and a
is the maximum depth (at 0 = n/2) of the crack into the material. Q = *2 in the
elastic limit, a/cry -> 0, where a is the applied stress and ay is the yield strength of the
material. Additional corrections may have to be made to Eq. A. 14 to account for the
proximity of the free surface to the crackfront (depending on the relative magnitudes
of a and the specimen thickness B) and for crack-tip plasticity. The modified value of
Q incorporating the plasticity correction is usually taken to be
Q « *2 - 0.212(ct2/ct2).
References
Abdel-Raouf, H. & Plumtree, A. (1971). The influence of deformation rate on the cyclic
behavior of pure iron. Metallurgical Transactions 2A, 1863-7.
Abel, A. & Ham, R.K. (1966). The cyclic strain behaviour of crystals of aluminium^ wt.%
copper-I. The Bauschinger effect. Acta Metallurgica 14, 1489-94.
Ackermann, F., Kubin, L.P., Lepinoux, J. & Mughrabi, H. (1984). The dependence of
dislocation microstructure on plastic strain amplitude in cyclically strained copper
single crystals. Acta Metallurgica 32, 715-25.
Aifantis, E.C. (1987). The physics of plastic deformation. International Journal of Plasticity 3,
211^7.
Akhurst, K.N., Lindley, T.C. & Nix, K.J. (1983). The effect of mode III loading on fatigue
crack growth in a rotating shaft. Fatigue of Engineering Materials and Structures 6,
345-8.
Albert, W.A.J. (1838). Uber Treibseile am Harz. Archive fur Mineralogie, Geognosie, Bergbau
und Huttenkunde 10, 215-34.
Allen, R.J. & Sinclair, J.C. (1982). The behaviour of short cracks. Fatigue of Engineering
Materials and Structures 5, 343-7.
Allison, J.E. (1979). Measurement of crack-tip stress distributions by X-ray diffraction. In
Fracture Mechanics, Special Technical Publication 677, pp. 550-62. Philadelphia:
American Society for Testing and Materials.
Anderson, T.L. (1995). Fracture mechanics: fundamentals and applications, second edition.
Boca Raton, FL: CRC Press.
Andrews, E.H. (1974). A generalized theory of fracture mechanics. Journal of Materials
Science 9, 887-94.
Antolovich, S.D., Saxena, A. & Chanani, G.R. (1975). A model for fatigue crack propagation.
Engineering Fracture Mechanics 7, 649-52.
Antonopoulos, J.G., Brown, L.M. & Winter, A.T. (1976). Vacancy dipoles in fatigued copper.
Philosophical Magazine 34, 549-63.
Antonopoulos, J.G. & Winter, A.T. (1976). Weak-beam study of dislocation structures in
fatigued copper. Philosophical Magazine 33, 87-95.
Anzai, H. & Endo, T. (1979). On-site indication of fatigue damage under complex loading.
International Journal of Fatigue 1, 49-57.
Argon, A.S. (1980). Inelastic deformation and fracture in oxide, metallic, and polymeric
glasses. Glass Science and Technology 5, 79-132.
Argon, A.S. (1989). Sources of toughness in polymers. In Advances in Fracture Research (eds.
K. Salama, K. Ravi-Chandar, D.M.R. Taplin & P. Rama Rao), vol. 4, pp. 2661-81.
Oxford: Pergamon Press.
Argon, A.S. & Godrick, J.A. (1969). Fatigue of lithium fluoride crystals at elevated
temperatures. In Fracture 1969 (ed. P.L. Pratt), pp. 576-86. London: Chapman-Hall.
614
References
615
Argon, A.S. & Hannoosh, J.G. (1977). Initiation of crazes in polystyrene. Philosophical
Magazine 36, 1195-216.
Asaro, R.J. (1975). Elastic-plastic memory and kinematic-type hardening. Acta Metallurgica
23, 1255-65.
Asaro, R.J., Hermann, L. & Baik, J.M. (1981). Transitions in fatigue crack closure in 2048
aluminum. Metallurgical Transactions 12 A, 1133-5.
Aswath, P.B., Suresh, S., Holm, D.K. & Blom, A.F. (1988). Load interaction effects on
compression fatigue crack growth in ductile solids. Journal of Engineering Materials
and Technology 110, 278-85.
Atkinson, J.D., Brown, L.M. & Stobbs, W.M. (1974). The work-hardening of copper-silica.
IV. The Bauschinger effect and plastic relaxation. Philosophical Magazine 30,
1247-80.
Austen, I.M. & Mclntyre, P. (1979). Corrosion-fatigue of high-strength steel in low-pressure
hydrogen gas. Metal Science 13, 420-8.
Aveston, J. & Kelly, A. (1973). Theory of multiple fracture of fibrous composites. Journal of
Materials Science 8, 352-62.
Azimi, H.R. (1994). Toughened epoxy polymers: fatigue crack propagation mechanisms.
Ph.D. thesis. Bethlehem, PA: Lehigh University.
Azimi, H.R., Pearson, R.A. & Hertzberg, R.W. (1995). Role of crack tip shielding mechanisms
in fatigue of hybrid composites containing rubber and solid glass spheres. Journal of
Applied Polymer Science 58, 449-63.
Bach, C. (1913). Die maschinen-elemente, 1. Band, 11. Auflage, Kroner Verlag Leipzig.
Baik, S. & Raj, R. (1982). Mechanisms of creep-fatigue interaction. Metallurgical
Transactions 13A, 1215-21.
Bairstow, L. (1910). The elastic limits of iron and steel under cyclic variations of stress.
Philosophical Transactions of the Royal Society, London 210, 35-55.
Banasiak, D.H., Grandt, A.F. & Montulli, L.T. (1977). Fatigue crack retardation in
polycarbonate. Journal of Applied Polymer Science 21, 1297-309.
Bannantine, J.A., Comer, J.J. & Handrock, J.L. (1990). Fundamentals of Metal Fatigue
Analysis. Englewood Cliffs: Prentice-Hall.
Barenblatt, G.I. (1962). The mathematical theory of equilibrium cracks in brittle fracture.
Advances in Applied Mechanics 7, 55-129.
Barsom, J.M. (1972). Effect of cyclic-stress form on corrosion-fatigue crack propagation
below Kjscc in a high-yield-strength steel. In Corrosion Fatigue: Chemistry, Mechanics
and Microstructure (eds. O.F. Devereux, A.J. McEvily & R.W. Staehle), vol. NACE-
2, pp. 426-36. Houston: National Association of Corrosion Engineers.
Barsom, J.M. (1976). Fatigue crack growth under variable-amplitude loading in various
bridge steels. In Fatigue Crack Growth Under Spectrum Loads, Special Technical
Publication 595, pp. 217-35. Philadelphia: American Society for Testing and
Materials.
Barsom, J.M. & McNicol, R.C. (1974). Effect of stress concentration on fatigue crack
initiation in HY-130 steel. In Fracture Toughness and Slow-Stable Cracking, Special
Technical Publication 559, pp. 183-204. Philadelphia: American Society for Testing
and Materials.
Barsom, J.M. & Rolfe, S.T. (1987). Fracture and Fatigue Control in Structures, 2nd edn.
Englewood Cliffs: Prentice-Hall.
616
References
Bartel, D.L., Bicknell, V.L. & Wright, T.M. (1986). The effect of conformity, thickness and
material on stresses in ultra-high molecular weight components for total joint
replacements. Journal of Bone Joint Surgery 68, 1041-51.
Basinski, S.J., Basinski, Z.S. & Howie, A. (1969). Early stages of fatigue in copper single
crystal. Philosophical Magazine 19, 899-924.
Basinski, Z.S. & Basinski, S.J. (1984). Formation and growth of subcritical fatigue cracks.
Scripta Metallurgica 18, 851-6.
Basinski, Z.S., Korbel, A.S. & Basinski, S.J. (1980). The temperature dependence of the
saturation stress and dislocation structure in fatigued copper single crystals. Acta
Metallurgica 28, 191-207.
Basinski, Z.S., Pascual, R. & Basinski, S.J. (1983). Low amplitude fatigue of copper single
crystals - I. The role of the surface in fatigue failure. Acta Metallurgica 31, 591-602.
Basquin, O.H. (1910). The exponential law of endurance tests. Proceedings of the American
Society for Testing and Materials 10, 625-30.
Bassani, J.L., Hawk, D.E. & Saxena, A. (1986). Evaluation of the C, parameter for
characterizing creep crack growth rate in the transient regime. In Nonlinear Fracture
Mechanics, Special Technical Publication 995, pp. 7-26. Philadelphia: American
Society for Testing and Materials.
Bassani, J.L. & McClintock, F.A. (1981). Creep relaxation of stress around a crack tip.
International Journal of Solids and Structures 17, 479-92.
Batte, A.D. (1983). Creep-fatigue life predictions. In Fatigue at High Temperature (ed. R.P.
Skelton), pp. 365-401. London: Elsevier Applied Science.
Bauschinger, J. (1886). Ueber die Veranderungen der Elastizitatsgrenze und der festigkeit des
Eisens und Stahls durch Strecken, Quetschen, Erwarmen Abkiihlen und durch
oftmals wiederholte Belastung. Mitt: Mech-Tech Lab., XIII Miinchen.
Beahan, P., Bevis, M. & Hull, D. (1971). The morphology of crazes in polystyrene.
Philosophical Magazine 2A, 1267-79.
Beardmore, P. & Rabinowitz, S. (1975). Fatigue deformation of polymers. Treatise on
Materials Science and Technology 6, 267-331.
Benoit, D., Namdar-Irani, R. & Tixier, R. (1980). Oxidation of fatigue fracture surfaces at low
growth rates. Materials Science and Engineering 45, 1-7.
Betagon, C. & Hancock, J.W. (1991). Two-parameter characterization of elastic-plastic crack-
tip fields. Journal of Applied Mechanics 58, 104-10.
Bilby, B.A., Cardew, G.E. & Howard, I.C. (1977). Stress intensity factors at the tips of kinked
and forked cracks. In Fracture 1977 (ed. D.M.R. Taplin), vol. 3, pp. 197-200. New
York: Pergamon Press.
Bilby, B.A., Cottrell, A.H. & Swinden, K.H. (1963). The spread of plastic yield from a notch.
Proceedings of the Royal Society, London Sill, 304-14.
Bilby, B.A., Cardew, G.E., Goldthorpe, M.R. & Howard, I.C. (1986). A finite element
investigation of the effect of specimen geometry on the fields of stress and strain at
the tips of stationary cracks. In Size Effects in Fracture, pp. 37-46. London: The
Institution of Mechanical Engineers.
Bingham, E.C. (1922). Fluidity and plasticity. New York, NY: McGraw-Hill Book Company.
Blankenship, C.P. & Starke, E.A. (1991). The fatigue crack growth behavior of the Al-Cu-Li
alloy Weldalite 049. Fatigue and Fracture of Engineering Materials and Structures 14,
103-14.
References
617
Blom, A.F. & Holm, D.K. (1985). An experimental and numerical study of fatigue crack
closure. Engineering Fracture Mechanics 22, 997-1011.
Bodner, S.R. & Partom, Y. (1975). Constitutive equations for elastic-viscoplastic strain-
hardening materials. Journal of Applied Mechanics 42, 385-95.
Bodner, S.R., Partom, I. & Partom, Y. (1979). Uniaxial cyclic loading of elastic-viscoplastic
materials. Journal of Applied Mechanics 46, 805-10.
Boettner, R.C., McEvily, A.J. & Liu, Y.C. (1964). On the formation of fatigue cracks at twin
boundaries. Philosophical Magazine 10, 95-106.
Bonnen, J. J., Allison, J.E. & Jones, J.W. (1991). Fatigue behavior of a 2XXX series aluminum
alloy reinforced with 15 v/o SiCp. Metallurgical Transactions 22A, 1007-19.
Boudouard, O. (1911). Essai des metaux par amortissement de leurs vibrations. Memoires de
la Societe d'Encouragement a I'industrie Rationale, pp. 545.
Boussinesq, J. (1885). Application des potentials a l'etude de I'equilibre et du mouvement des
solides elastiques. Paris: Gauthier-Villars.
Bower, A.F. & Johnson, K.L. (1989). The influence of strain hardening on cumulative plastic
deformation in rolling and sliding contact. Journal of the Mechanics and Physics of
Solids 37, 471-93.
Bower, A.F. & Ortiz, M. (1990). Solution of three dimensional crack problems by a finite
perturbation method. Journal of the Mechanics and Physics of Solids 38, 443-80.
Bowles, C.Q. & Schijve, J. (1973). The role of inclusions in fatigue crack initiation in an
aluminum alloy. International Journal of Fracture 9, 171-9.
Braithwaite, F. (1854). On the fatigue and consequent fracture of metals. Proceedings of the
Institution of Civil Engineers, London 13, 463-75.
Bretschneider, J., Holste, C. & Tippelt, B. (1997). Cyclic plasticity of nickel single crystals at
elevated temperatures. Acta Materialia 45, 1775-83.
Brett, S.J. & Doherty, R.D. (1978). Loss of solute at the fracture surface in fatigued
aluminium precipitation-hardened alloys. Materials Science and Engineering 32,
255-65.
Brockenbrough, J.R., Shih, C.F. & Suresh, S. (1991). Transient crack tip fields for mixed-
mode power law creep. International Journal of Fracture 49, 177-202.
Brockenbrough, J.R. & Suresh, S. (1987). Constitutive behavior of a microcracking brittle
solid in cyclic compression. Journal of the Mechanics and Physics of Solids 35,
721-12.
Broek, D. (1986). Elementary Engineering Fracture Mechanics, 4th edn. The Hague: Martinus
Nijhoff.
Broom, T. & Ham, R.K. (1959). The hardening of copper single crystals by fatigue.
Proceedings of the Royal Society, London A251, 186-99.
Broom, T., Mazza, J.A. & Whittaker, V.N. (1957). Structural changes caused by plastic strain
and by fatigue in aluminium-zinc-magnesium copper alloys corresponding to
DTD683. Journal of the Institute of Metals 86, 17-23.
Brown, C.W. & Hicks, M.A. (1983). A study of short fatigue crack growth behaviour in
titanium alloy IMI 685. Fatigue of Engineering Materials and Structures 6, 67-76.
Brown, L.M. (1977). Dislocation substructures and the initiation of cracks by fatigue. Metal
Science 11, 315-20.
Brown, L.M. & Clarke, D.R. (1977). The work hardening of fibrous composites with
particular reference to the copper-tungsten system. Acta Metallurgica 25, 563-70.
618
References
Brown, L.M. & Ogin, S.L. (1985). Role of internal stresses in the nucleation of fatigue cracks.
In Fundamentals of Deformation and Fracture (eds. B.A. Bilby, K.J. Miller & J.R.
Willis), pp. 501-28. Cambridge University Press.
Brown, L.M. & Stobbs, W.M. (1971a). The work hardening of copper-silica I. A model based
on internal stresses, with no plastic relaxation. Philosophical Magazine 23, 1185-99.
Brown, L.M. & Stobbs, W.M. (1971b). The work hardening of copper-silica II. The role of
plastic relaxation. Philosophical Magazine 23, 1201-33.
Brown, M.W. & Miller, K.J. (1973). A theory for fatigue failure under multiaxial stress-strain
conditions. Proceedings of the Institute of Mechanical Engineers, 187, 745-55.
Bucci, R.J. (1970). Environment enhanced fatigue and stress corrosion cracking of a titanium
alloy plus a simple model for the assessment of environmental influence on fatigue
behavior. Ph.D. Thesis, Bethlehem: Lehigh University.
Bucci, R.J., Thakker, A.B., Sanders, T.H., Sawtell, R.R. & Staley, J.T. (1980). Ranking 7XXX
aluminum alloy fatigue crack growth resistance under constant amplitude and
spectrum loading. In Effect of Load Spectrum Variables on Fatigue Crack Initiation
and Propagation, Special Technical Publication 714, pp. 41-78. Philadelphia:
American Society for Testing and Materials.
Budiansky, B. & Hutchinson, J.W. (1978). Analysis of closure in fatigue crack growth. Journal
of Applied Mechanics 45, 267-76.
Budiansky, B., Hutchinson, J.W. & Lambropoulos, J.C. (1983). Continuum theory of dilatant
transformation toughening in ceramics. International Journal of Solids and
Structures 19, 337-55.
Budiansky, B. & O'Connell, J. (1976). Elastic moduli of a cracked solid. International Journal
of Solids and Structures 12, 81-97.
Budiman, H. (1996). Mechanisms of damage tolerance and arrest in pressurized composite
cylinders. Ph.D. Thesis. Cambridge, MA: Massachusetts Institute of Technology.
Calabrese, C. & Laird, C. (1974). Cyclic stress-strain response of two-phase alloys. Part I.
Microstructures containing particles penetrable by dislocations. Materials Science
and Engineering 13, 141-57.
Carter, R.D., Lee, E.-W., Starke, E.A. & Beevers, C.J. (1984). Effect of microstructure and
environment on fatigue crack closure in 7475 aluminum alloy. Metallurgical
Transactions 15A, 555-63.
Cattaneo, C. (1938). Sul contatto di due corpi elastici: distribuzion locale degli sforzi.
Reconditi dell Accademia nazionale dei Lincei 27, 342-48, 434-6, 474-8.
Cerruti, V. (1882). Roma Accademia Lincei, Mem. fis. mat.
Chaboche, J.L. (1986). Time-dependent constitutive theories for cyclic plasticity. International
Journal of Plasticity 2, 149-88.
Chaki, T.K. & Li, J.CM. (1984). Overload effect and fatigue crack propagation in amorphous
metallic alloys. Scripta Metallurgica 18, 703-8.
Chakrabortty, S.B. (1979). A model relating low cycle fatigue properties and microstructure to
fatigue crack propagation rates. Fatigue of Engineering Materials and Structures 2,
205-30.
Challenger, K.D. & Moteff, J. (1972). Characterization of the deformation substructure of
AISI 316 stainless steel after high strain fatigue at elevated temperatures.
Metallurgical Transactions 3A, 1675-8.
References
619
Chanani, G.R., Antolovich, S.D. & Gerberich, W.W. (1972). Fatigue crack propagation in
TRIP steels. Metallurgical Transactions 3A, 2661-72.
Chang, R., Morris, W.L. & Buck, O. (1979). Fatigue crack nucleation at intermetallic particles
in alloys - A dislocation pile-up model. Scripta Metallurgica 13, 191—4.
Charalambides, P.G. & McMeeking, R.M. (1987). Finite element method simulation of crack
propagation in a brittle microcracking solid. Mechanics of Materials 6, 71-87.
Charsley, P. & Kuhlmann-Wilsdorf, D. (1981). Configurations of {100} dislocation walls
formed during fatigue. Philosophical Magazine A 44, 1351-61.
Charsley, P. & Thompson, N. (1963). The behaviour of slip lines on aluminium crystals under
reversed stresses in tension and compression. Philosophical Magazine 8, 77-86.
Chen. I.-W. & Reyes Morel, P.E. (1986). Implications of transformation plasticity in Zr02
containing ceramics: I. Shear and dilatation effects. Journal of the American Ceramic
Society 69, 181-9.
Cheng, A.S. & Laird, C. (1981). Fatigue life behavior of copper single crystals. Part I:
Observations of crack nucleation. Fatigue of Engineering Materials and Structures 4,
331-11.
Cherepanov, G.P. (1969). On crack propagation in solids. International Journal of Solids and
Structures 5, 863-71.
Chermahini, R.G., Shivakumar, K.N., Newman, J.C. & Blom, A.F. (1989). Three-
dimensional aspects of plasticity-induced fatigue crack closure. Engineering Fracture
Mechanics 34, 393^402.
Christensen, R.H. (1959). Metal Fatigue. New York: McGraw-Hill.
Christman, T. & Suresh, S. (1986). Crack initiation under far-field cyclic compression and the
study of short fatigue cracks. Engineering Fracture Mechanics 23, 953-64.
Christman, T. & Suresh, S. (1989). Effects of SiC reinforcement and aging treatment on
fatigue crack growth in an Al-SiC composite. Materials Science and Engineering
A102, 211-16.
Chu, C.-C, Conley, F.A. & Bonnen, J.J.F. (1993). Multiaxial stress-strain modeling and life
prediction of SAE axle shafts. In Advances in Multiaxial Fatigue (eds: D.L.
McDowell and R. Ellis), pp. 37-54. Philadelphia, PA: American Society for Testing
and Materials.
Clarke, D.R. (1987). On the equilibrium thickness of intergranular glass phases in ceramic
materials. Journal of the American Ceramic Society 70, 15-22.
Coffin, L.F. (1954). A study of the effects of cyclic thermal stresses on a ductile metal.
Transactions of the American Society of Mechanical Engineers 76, 931-50.
Coffin, L.F. (1973). Fatigue at high temperatures. In Fatigue at Elevated Temperatures, Special
Technical Publication 520, pp. 5-36. Philadelphia: American Society for Testing and
Materials.
Coffin, L.F. (1974). Fatigue at high temperature - prediction and interpretation. Proceedings
of the Institution of Mechanical Engineers 188, 109-27.
Coffin, L.F. (1979). Fatigue in machines and structures-Power generation. In Fatigue and
Microstructure (ed. M. Meshii), pp. 1-27. Metals Park: American Society for Metals.
Coles, A. (1980). Material considerations for gas turbine engines. In Mechanical Behaviour of
Materials (eds. K.J. Miller & R.F. Smith), vol. I, pp. 3-11. Oxford: Pergamon Press.
Constable, I., Williams, J.G. & Burns, D.J. (1970). Fatigue and cyclic thermal softening of
thermoplastics. Journal of Mechanical Engineering Science 12, 20-9.
620
References
Corlby, D.M. & Packman, P.F. (1973). On the influence of single and multiple peak overloads
on fatigue crack propagation in 7075-T6511 aluminum. Engineering Fracture
Mechanics 5, 479-97.
Cotterell, B. & Rice, J.R. (1980). Slightly curved or kinked cracks. International Journal of
Fracture 16, 155-69.
Cottrell, A.H. (1958). Theory of brittle fracture in steel and similar metals. Transactions of the
Metallurgical Society, 192-203.
Cottrell, A.H. & Hull, D. (1957). Extrusion and intrusion by cyclic slip in copper. Proceedings
of the Royal Society, London A242, 211-13.
Cowles, B.A. (1988). Life Prediction in High Temperature Environments: Overview of a
Current Gas Turbine Engine Approach. Materials Science and Engineering A103,
63-69.
Cowles, B. (1996). High cycle fatigue in aircraft gas turbines-an industry perspective.
International Journal of Fracture 80, 147-63.
Cox, B.N. (1996). Life prediction for bridged fatigue cracks. In Life Prediction Methodology
for Titanium Matrix Composites (eds. W.S. Johnson, J.M. Larsen and B.N. Cox).
Special Technical Publication 1253, pp. 552-72. Philadelphia: American Society for
Testing and Materials.
Creager, M. & Paris, P.C. (1967). Elastic field equations for blunt cracks with reference to
stress corrosion cracking. International Journal of Fracture Mechanics 3, 247-52.
Crooker, T.W. (1971). Effects of tension-compression cycling on fatigue crack growth in high
strength alloys. Journal of Engineering for Industry 93, 893-6.
Crossland, B. (1956). Effect of large hydrostatic pressures on the torsional fatigue strength of
an alloy steel. In Proceedings of the International Conference on Fatigue of Metals,
pp. 138^49. London: The Institution of Mechanical Engineers.
Cuitino, A.M. & Ortiz, M. (1992). Computational modeling of single crystals. Modeling and
Simulation in Materials Science and Engineering 1, 255-63.
Cummings, H.N., Stulen, F.B. & Schulte, W.C. (1958). Tentative fatigue strength reduction
factors for silicate-type inclusions in high strength steels. Proceedings of the American
Society for Testing and Materials 58, 505-12.
Dafalias, Y.F. (1984). Modelling cyclic plasticity: simplicity versus sophistication. In
Mechanics of Engineering Materials (eds. C.S. Desai & R.H. Gallagher), pp. 153-78.
New York: Wiley.
Dafalias, Y.F. & Popov, E.P. (1975). A model of nonlinearly hardening materials for complex
loading. Acta Mechanica 21, 173-92.
Dang Van, K. (1973). Sur la resistance a la fatigue des metaux. These de Doctorat es Sciences.
Paris: Scientifique et Technologique l'Armenent.
Dang Van, K. & Maitournam, M.H. (1994). Elasto-plastic calculations on the mechanical
state in reciprocating moving contacts: application to fretting fatigue. In Fretting
Fatigue, European Structural Integrity Society Volume No. 18 (eds: R.B. Waterhouse
and T.C. Lindley), pp. 161-8. London: Mechanical Engineering Publications.
Dauskardt, R.H. (1993). A frictional wear mechanism for fatigue-crack growth in crack
bridging. Acta Metallurgica et Materialia 41, 2165-81.
Dauskardt, R.H., Marshall, D.B. & Ritchie, R.O. (1990). Cyclic fatigue-crack propagation in
magnesia-partially-stabilized zirconia. Journal of the American Ceramic Society 73,
893-903.
References
621
Davidson, D.L. & Lankford, J. (1977). Determination of the energy of fatigue crack
propagation and its alteration by wet air. In Environment-Sensitive Fracture of
Engineering Materials (ed. Z.A. Foroulis), pp. 581-94. Warrendale: The
Metallurgical Society of the American Institute of Mining, Metallurgical and
Petroleum Engineers.
Davidson, D.L. & Lankford, J. (1981). The effect of water vapor on fatigue crack tip stress
and strain range distribution and the energy required for crack propagation in low-
carbon steel. International Journal of Fracture 17, 257-75.
Davidson, D.L. & Lankford, J. (1986). High resolution techniques for the study of small
cracks. In Small Fatigue Cracks (eds. R.O. Ritchie & J. Lankford), pp. 455-70.
Warrendale: The Metallurgical Society of the American Institute of Mining,
Metallurgical and Petroleum Engineers.
Davidson, D.L. & Suresh, S. (1984). Editors, Fatigue Crack Growth Threshold Concepts.
Warrendale: The Metallurgical Society of the American Institute of Mining,
Metallurgical and Petroleum Engineers.
Davis, L.A. (1975). Fracture of Ni-Fe base metallic glasses. Journal of Materials Science 10,
1557-64.
Dempster, D.D. (1959). The Tale of the Comet. New York, NY: David McKay.
Deresiewicz, H. (1954). Contact of elastic spheres under an oscillating torsional couple.
Journal of Applied Mechanics 21, 52-6.
Desvaux, M.P.E. (1970). Strain bursts in Cu-12 at.% Al single crystals. Zeitschrift fur
Metallkunde 61, 206-13.
Devincre, B. & Kubin, L.P. (1997). Mesoscopic simulations of dislocations and plasticity.
Materials Science and Engineering A A234-236, 8-14.
Devincre, B. & Pontikis, V. (1993). Computer modelling of dynamically-induced dislocation
patterning. In Proceedings of the Materials Research Society Symposium, vol. 291,
pp. 555-60. Warrendale, PA: The Materials Research Society.
Dey, N., Socie, D.F. & Hsia, K.J. (1995). Modeling static and cyclic fatigue in ceramics
containing a viscous grain boundary phase. Acta Metallurgica et Materialia 43,
2163-75.
Dharan, C.H. (1975). Fatigue failure in graphite fibre and glass fibre-polymer composites.
Journal of Materials Science 10, 1665-70.
Dickson, J.I., Boutin, J. & L'Esperance, G. (1986). An explanation of labyrinth walls in
fatigued f.c.c. metals. Acta Metallurgica 34, 1505-14.
Differt, K. & Essmann, U. (1993). Dynamic model of the wall structure in persistent slip bands
of fatigued metals. Materials Science and Engineering A A164, 295-9.
Differt, K., Essmann, U. & Mughrabi, H. (1986). A model of extrusions and intrusions in
fatigued metals II. Surface roughening by random irreversible slip. Philosophical
Magazine A 54, 237-58.
Doker, H. & Marci, G. (1983). Threshold range and opening stress intensity factor in fatigue.
International Journal of Fatigue 5, 187-91.
Donahue, R.J., Clark, H.M., Atanmo, P., Kumble, R. & McEvily, A.J. (1972). Crack opening
displacement and the rate of fatigue crack growth. International Journal of Fracture
8, 209-19.
Dowling, N.E. (1972). Fatigue failure predictions for complicated stress-strain histories.
Journal of Materials 7, 71-87.
622
References
Dowling, N.E. (1977). Crack growth during low-cycle fatigue of smooth axial specimens. In
Cyclic Stress-Strain and Plastic Deformation Aspects of Fatigue Crack Growth,
Special Technical Publication 637, pp. 97-121. Philadelphia: American Society for
Testing and Materials.
Dowling, N.E. (1979). Notched member fatigue life predictions combining crack initiation and
propagation. Fatigue of Engineering Materials and Structures 2, 129-38.
Dowling, N.E. (1993). Mechanical Behavior of Materials: Engineering Methods for
Deformation, Fracture and Fatigue. Englewood Cliffs, NJ: Prentice-Hall.
Dowling, N.E. & Begley, J.A. (1976). Fatigue crack growth during gross plasticity and the
/-integral. In Mechanics of Crack Growth, Special Technical Publication 590, pp.
82-103. Philadelphia: American Society for Testing and Materials.
Dowling, N.E., Brose, W.R. & Wilson, W.K. (1977). Notched member fatigue life predictions
by local strain approach. In Fatigue under Complex Loading - Analysis and
Experiments, pp. 55-84. Warrendale: Society of Automotive Engineers.
Dowling, Jr., W.E., Allison, A.E., Swank, L.R. & Sherman, A.M. (1993). TiAl-based alloys
for exhaust valve applications. In New Engine Design and Engine Component
Technology, Special Publication-972, pp. 31-38. Warrendale, PA: Society of
Automotive Engineers.
Downing, S.D. & Socie, D.F. (1982). Simplified rainflow counting algorithms. International
Journal of Fatigue 4, 31^40.
Driver, J.H. (1971). The effect of boundary precipitates on the high temperature fatigue
strength of austenitic stainless steels. Metal Science 5, 47-50.
Drucker, D.C. & Palgen, L. (1981). On the stress-strain relations suitable for cyclic and other
loading. Journal of Applied Mechanics 48, 479-85.
Dugdale, D.S. (1960). Yielding of steel sheets containing slits. Journal of the Mechanics and
Physics of Solids 8, 100-8.
Duquette, D.J. (1979). Environmental effects I: General fatigue resistance and crack
nucleation in metals and alloys. In Fatigue and Microstructure (ed. M. Meshii), pp.
335-63. Metals Park: American Society for Metals.
Duquette, D.J. & Uhlig, H.H. (1968). Effect of dissolved oxygen and NaCl on corrosion
fatigue of 0.18% carbon steel. Transactions of the American Society for Metals 61,
449-56.
Dutta, V.B., Suresh, S. & Ritchie, R.O. (1984). Fatigue crack propagation in dual phase steels:
Effects of ferritic-martensitic microstructures on crack path morphology.
Metallurgical Transactions 15A, 1193-207.
Eden, E.M., Rose, W.N. & Cunningham, F.L. (1911). The endurance of metals. Proceedings of
the Institution of Mechanical Engineers 4, 839-974.
El Haddad, M.H., Dowling, N.E., Topper, T.H. & Smith, K.N. (1980). /-integral applications
for short fatigue cracks at notches. International Journal of Fracture 16, 15-30.
El Haddad, M.H., Topper, T.H. & Smith, K.N. (1979). Prediction of nonpropagating cracks.
Engineering Fracture Mechanics 11, 573-84.
Elber, W. (1970). Fatigue crack closure under cyclic tension. Engineering Fracture Mechanics
2, 37-15.
Elber, W. (1971). The significance of fatigue crack closure. In Damage Tolerance in Aircraft
Structures, Special Technical Publication 486, pp. 230—42. Philadelphia: American
Society for Testing and Materials.
References
623
Elinck, J.P., Bauwens, J.C. & Homes, G. (1971). Fatigue crack growth in polyvinyl chloride).
International Journal of Fracture 7, 277-87.
Endo, K., Okada, T., Hariya, T. (1972). Fatigue crack propagation in bearing metals lining of
steel plates in lubricating oil. Bulletin of the Japan Society of Mechanical Engineers
15, 439-15.
Erdogan, F. & Sih, G.C. (1963). On the crack extension in plates under plane loading and
transverse shear. Journal of Basic Engineering 85, 519-27.
Eshelby, J.D. (1956). The continuum theory of lattice defects. In Progress in Solid State
Physics (eds. F. Seitz & D. Turnbull), vol. 3, pp. 79-144. New York: Academic Press.
Eshelby, J.D. (1957). The determination of the elastic field of an ellipsoidal inclusion and
related problems. Proceedings of the Royal Society, London A241, 376-96.
Essmann, U., Gosele, U. & Mughrabi, H. (1981). A model of extrusions and intrusions in
fatigued metals. I. Point-defect production and the growth of extrusions.
Philosophical Magazine A 44, 405-26.
Essmann, U. & Mughrabi, H. (1979). Annihilation of dislocations during tensile and cyclic
deformation and limits of dislocation densities. Philosophical Magazine A 40,
731-56.
von Euw, E.F.J., Hertzberg, R.W. & Roberts, R. (1972). Delay effects in fatigue crack
propagation. In Stress Analysis and Growth of Cracks, Special Technical Publication
513, part I, pp. 230-59. Philadelphia: American Society for Testing and Materials.
Evans, A.G. (1978). Microfracture from thermal expansion anisotropy-I. Single phase
systems. Acta Metallurgica 26, 1845-53.
Evans, A.G. (1980). Fatigue in ceramics. International Journal of Fracture 16, 485-98.
Evans, A.G. & Fuller, E.R. (1974). Crack propagation in ceramic materials under cyclic
loading conditions. Metallurgical Transactions 5A, 27-33.
Evans, A.G., Zok, F.W. & McMeeking, R.M. (1995). Fatigue of ceramic-matrix composites.
Acta Metallurgica et Materialia 43, 859-75.
Ewart, L. & Suresh, S. (1986). Dynamic fatigue crack growth in polycrystalline alumina under
cyclic compressive loads. Journal of Materials Science Letters 5, 774-8.
Ewart, L. & Suresh, S. (1987). Crack propagation in ceramics under cyclic loads. Journal of
Materials Science 22, 1173-92.
Ewart, L. & Suresh, S. (1992). Elevated-temperature crack growth in polycrystalline alumina
under static and cyclic loads. Journal of Materials Science 27, 5181-91.
Ewing, J. A. & Humfrey, J.C. (1903). The fracture of metals under rapid alterations of stress.
Philosophical Transactions of the Royal Society, London A200, 241-50.
Ewing, J. A. & Rosenhain, W. (1900) Experiments in micro-metallurgy:-Effects of strain.
Preliminary notice. Philosophical Transactions of the Royal Society, London A199,
85-90.
Faber, K.T. & Evans, A.G. (1983). Crack deflection processes: I. Theory. Acta Metallurgica
31, 565-74.
Fairbairn, W. (1864). Experiments to determine the effect of impact, vibratory action, and
long continued changes of load on wrought iron girders. Philosophical Transactions
of the Royal Society, London 154, 311.
Fatemi, A. & Socie, D.F. (1988). A critical plane approach to multiaxial fatigue damage
including out-of-phase loading. Fatigue and Fracture of Engineering Materials and
Structures 11, 149-65.
624
References
Feltner, C.E. (1965). A debris mechanism of cyclic strain hardening for F.C.C. metals.
Philosophical Magazine A 12, 1229^48.
Feltner, C.E. & Laird, C. (1967a). Cyclic stress-strain response of F.C.C. metals and alloys-I.
Phenomenological experiments. Acta Metallurgica 15, 1621-32.
Feltner, C.E. & Laird, C. (1967b). Cyclic stress-strain response of F.C.C. metals and alloys-II.
Dislocation structures and mechanisms. Acta Metallurgica 15, 1633-53.
Figueroa, J.C. & Laird, C. (1983). Crack initiation mechanisms in copper polycrystals cycled
under constant strain amplitudes and in step tests. Materials Science and Engineering
60, 45-58.
Findley, W.N. (1959). A theory for the effect of mean stress on fatigue of metals under
combined torsion and axial load or bending. Journal of Engineering for Industry 81,
301-6.
Finney, J.M. & Laird, C. (1975). Strain localization in cyclic deformation of copper single
crystals. Philosophical Magazine A 31, 339-66.
Finot, M. & Suresh, S. (1994). Multitherm, Personal computer software for the
thermomechanical modeling of multilayered and graded materials. Copyright
Massachusetts Institute of Technology, Cambridge, MA. Further information on
this program can be found in Finot, M. (1996). Deformation of multi-layered and
graded materials: theory and experiments. Doctor of Science Thesis. Massachusetts
Institute of Technology.
Fleck, N.A. (1988). Influence of stress state on crack growth retardation. In Basic Questions in
Fatigue, Special Technical Publication 924, vol. I, pp. 157-83. Philadelphia:
American Society for Testing and Materials.
Fleck, N.A. & Newman, J.C. (1988). Analysis of crack closure under plane strain conditions.
In Mechanics of Fatigue Crack Closure, Special Technical Publication 982, pp.
319^41. Philadelphia: American Society for Testing and Materials.
Fleck, N.A. & Smith, R.A. (1982). Crack closure - is it just a surface phenomenon?
International Journal of Fatigue 4, 157-60.
Ford, F.P. & Silverman, M. (1979). Mechanistic aspects of environment-controlled crack
propagation in steel/aqueous environment systems. Report No. HTGE-451-8-12.
Schenectady, NY: General Electric Company.
Forman, R.G., Kearney, V.E. & Engle, R.M. (1967). Numerical analysis of crack propagation
in cyclic-loaded structures. Journal of Basic Engineering 89, 459-64.
Forsyth, P.J.E. (1953). Exudation of material from slip bands at the surface of fatigued
crystals of an aluminium-copper alloy. Nature 171, 172-3.
Forsyth, P.J.E. (1957). Slip band damage and extrusion. Proceedings of the Royal Society,
London A242, 198-202.
Forsyth, P.J.E. (1962). A two stage process of fatigue crack growth. In Crack Propagation:
Proceedings of Cranfield Symposium, pp. 76-94. London: Her Majesty's Stationery
Office.
Forsyth, P.J.E. & Ryder, D.A. (1960). Fatigue fracture. Aircraft Engineering 32, 96-9.
Forsyth, P.J.E. & Stubbington, A. (1955). The influence of substructure on the slip observed in
pure aluminium and some aluminium alloys when subjected to fatigue stresses.
Journal of the Institute of Metals 84, 173-5.
Fouvry, S., Kapsa, Ph., Vincent, L. & Dang Van, K. (1996). Theoretical analysis of fatigue
under dry friction for fretting loading conditions. Wear 195, 21-34.
References
625
Franciosi, P. & Zaoui, A. (1982). Multislip in F.C.C. crystals: a theoretical approach
compared with experimental data. Acta Metallurgica 30, 1627-37.
Frost, N.E. (1960). Notch effects and the critical alternating stress required to propagate a
crack in an aluminium alloy subject to fatigue loading. Journal of Mechanical
Engineering Science 2, 109-19.
Frost, N.E. (1966). The growth of fatigue cracks. In Proceedings of the First International
Conference on Fracture (ed. T. Yokobori), pp. 1433-59. Sendai: The Japan Society
for Strength and Fracture of Materials.
Frost, N.E. & Dugdale, D.S. (1957). Fatigue tests on notched mild steel plates with
measurements of fatigue cracks. Journal of the Mechanics and Physics of Solids 5,
182-92.
Frost, N.E., Marsh, K.I. & Pook, L.P. (1974). Metal Fatigue. Oxford: Clarendon Press.
Froustey, C. & Lasserre, S. (1989). Multiaxial fatigue endurance of 30Ncdl6 steel.
International Journal of Fatigue 11, 169-75.
Fuchs, H.O. & Stephens, R.I. (1980). Metal Fatigue in Engineering. New York: John Wiley
Fujino, S. & Taira, S. (1980). Effect of thermal cycle on low cycle fatigue life of steels and
grain boundary sliding characteristics. In Mechanical Behaviour of Materials (eds.
K.J. Miller & R.F. Smith), vol. II, pp. 49-58. Oxford: Pergamon Press.
Fujita, F.E. (1963). Oxidation and dislocation mechanisms in fatigue crack formation. In
Fracture of Solids (eds. D.C. Drucker & J.J. Gilman), pp. 657-70. New York:
Interscience.
Gangloff, R.P. (1981). The criticality of crack size in aqueous corrosion fatigue. Res
Mechanica Letters 1, 299-306.
Gangloff, R.P. & Wei, R.P. (1986). Small crack-environment interactions: the hydrogen
embrittlement perspective. In Small Fatigue Cracks (eds. R.O. Ritchie & J.
Lankford), pp. 239-64. Warrendale: The Metallurgical Society of the American
Institute of Mining, Metallurgical and Petroleum Engineers.
Gao, Hua, Alagok, N., Brown, M.W. & Miller, K.J. (1985). Growth of fatigue cracks under
combined mode I and mode II loads. In Multiaxial Fatigue, Special Technical
Publication 853, pp. 184-202. Philadelphia: American Society for Testing and
Materials.
Garud, Y.S. (1981). Multiaxial fatigue: A survey of the state of the art. Journal of Testing and
Evaluation 9, 165-78.
Garvie, R.C., Hannick, R.H. & Pascoe, R.T. (1975). Ceramic steel? Nature 258, 703^1.
Gassner, E. (1941). Auswirkung betriebsahnlicher Belastungsfolgen auf die Festigkeit von
Flugzeugbauteilen. Jahrbuch 1941 der deutschen Luftfahrtforschung, 472-83.
Gent, A.N. (1970). Hypothetical mechanism of crazing in glassy plastics. Journal of Materials
Science 5, 925-32.
Gerber, H. (1874). Bestimmung der zulassigen Spannungen in Eisen-konstructionen.
Zeitschrift des Bayerischen Architeckten und Ingenieur-Vereins 6, 101-10.
Gerber, T.L. & Fuchs, H.O. (1968). Analysis of non-propagating cracks in notched parts with
compressive mean stress. Journal of Materials 3, 359-74.
Gerberich, W.W. & Chen, Y.T. (1975). Hydrogen-controlled cracking-An approach to
threshold stress intensity. Metallurgical Transactions 6A, 271-8.
Gerold, V. & Karnthaler, H.P. (1989). On the origin of planar slip in F.C.C. alloys. Acta
Metallurgica 37, 2177-83.
626
References
Giannakopoulos, A.E., Lindley, T.C. & Suresh, S. (1998). Aspects of equivalence between
contact mechanics and fracture mechanics: theoretical connections and a life
prediction methodology for fretting-fatigue. Acta Materialia 46, 2955-67.
Giannakopoulos, A.E. & Suresh, S. (1998). A three-dimensional analysis of fretting fatigue.
Acta Materialia 46, 177-92.
Gieseke, B. & Saxena, A. (1989). Correlation of creep-fatigue crack growth rates using crack-
tip parameters. In Advances in Fracture Research (eds. K. Salama, K. Ravi-Chandar,
D.M.R. Taplin & P. Rama Rao), vol. 1, pp. 189-96. Oxford: Pergamon Press.
Gladwell, G.M.L. (1980). Contact problems in the classical theory of elasticity. Amsterdam,
The Netherlands: Sijthoff and Noordhoff.
Glazov, M., Llanes L.M. & Laird, C. (1995). Self-organized dislocation structures (SODS) in
fatigued metals. Physica Status Solidi (a) 149, 297-321.
Gong, B., Wang, Z., Zhang, Y.W. & Wang, Z.G. (1995). The cyclic deformation of copper
single crystal oriented for double slip. Materials Science and Engineering A A194,
171-8.
Gong, B., Wang, Z.G. & Wang, Z. (1997). Cyclic deformation behavior and dislocation
structures of [001] copper single crystals-I. Cyclic stress-strain response and surface
feature. Acta Materialia 45, 1365-77.
Goodman, J. (1899). Mechanics Applied to Engineering. London: Longmans Green.
Goranson, U.G. & Miller, M. (1989). Aging jet transport structural evaluation programs. In
Aeronautical Fatigue in the Electronic Era (ed. A. Berkovits), pp. 319-53. Warley:
Engineering Materials Advisory Services.
Gough, H.J. (1926). The Fatigue of Metals. London: Benn.
Gough, H.J. (1933). Crystalline structure in relation to failure of metals - especially by fatigue.
Edgar Marburg Lecture. Proceedings of the American Society for Testing and
Materials 33, Part II, 3-114.
Gough, H.J. & Hanson, D. (1923). The behaviour of metals subjected to repeated stresses.
Proceedings of the Royal Society, London A104, 535-65.
Gough, H.J., Pollard, H.V. & Clenshaw, W.J. (1951). Some experiments on the resistance of
metals under combined stress. Aeronautical Research Council Reports and
Memoranda No. 2522. London: Ministry of Supply, His Majesty's Stationery Office.
Gough, H.J. & Sopwith, D.G. (1932). Atmospheric action as a factor in fatigue of metals.
Journal of the Institute of Metals 49, 93-122.
Gould, D., Hirsch, P.B. & Humphreys, F.J. (1974). The Bauschinger effect, work-hardening
and recovery in dispersion-hardened copper crystals. Philosophical Magazine 30,
1353-77.
Grathwohl, G. (1988). Fatigue of ceramics under cyclic loading. Materialwissenschaften
Werkstofftechnik 19, 113-24.
Gray, G. T., Williams, J.C. & Thompson, A.W. (1983). Roughness-induced crack closure: an
explanation for microstructurally sensitive fatigue crack growth. Metallurgical
Transactions 14A, 421-33.
Green, A.E. (1949). On Boussinesq's problem and penny-shaped cracks. Proceedings,
Cambridge Philosophical Society 45, 251-66.
Griffith, A.A. (1921). The phenomenon of rupture and flow in solids. Philosophical
Transactions of the Royal Society, London A221, 163-97.
References
627
Gross, T.S. (1985). Frictional effects in mode III fatigue crack propagation. Scripta
Metallurgica 19, 1185-8.
Grosskreutz, J.C. & Mughrabi, H. (1975). Description of the work-hardened structure at low
temperature in cyclic deformation. In Constitutive Equations in Plasticity (ed. A.S.
Argon), pp. 251-326. Cambrige, Mass.: MIT Press.
Grosskreutz, J.C. & Shaw, G.C. (1969). Critical mechanisms in the development of fatigue
cracks in 2024-T4 aluminum. In Fracture 1969 (ed. P.L. Pratt), pp. 620-9, Oxford:
Pergamon Press.
Gu, H., Guo, H., Chang, S. and Laird, C. (1994). Orientation dependence of cyclic
deformation in high purity titanium single crystals. Materials Science and
Engineering A A188, 23-36.
Guillet, A. (1910). Intervention de l'amortissement dans l'essai des fers. Revue des Metall.
Memoires, pp. 885.
Guiu, F. & Anglada, M. (1980). Irreversible glide and shape changes in the cyclic deformation
of b.c.c. crystals. Philosophical Magazine A 42, 271-6.
Guiu, F., Dubniak, R. & Edward, R.C. (1982). On the nucleation of fatigue cracks in pure
polycrystalline or-iron. Fatigue of Engineering Materials and Structures 5, 311-21.
Guiu, F., Reece, M.J. & Vaughan, D.A.J. (1991). Cyclic fatigue in some structural ceramics. In
Fatigue of Advanced Materials (eds. R.O. Ritchie, R.H. Dauskardt and B.N. Cox),
pp. 193-210. Birmingham, England: Mechanical and Component Engineering
Publications Ltd.
Gurney, T.R. (1968). Fatigue of Welded Structures. Cambridge University Press.
Haigh, B.P. (1915). Report on alternating stress tests of a sample of mild steel received from
the British Association Stress Committee. Report of the British Association. 85,
163-170.
Haigh, B.P. (1917). Experiments on the fatigue of brasses. Journal of the Institute of Metals 18,
55-77.
Halford, G.R., Hirschberg, M.H. & Manson, S.S. (1973). Temperature effects on the strain
range partitioning approach for creep-fatigue analysis. In Fatigue at Elevated
Temperatures, Special Technical Publication 520, pp. 658-67. Philadelphia:
American Society for Testing and Materials.
Halliday, M.D. & Beevers, C.J. (1981). Some aspects of crack closure in two contrasting
titanium alloys. Journal of Testing and Evaluation 9, 195-201.
Hamilton, G.M. (1983). Explicit equations for the stresses beneath a sliding spherical contact.
Proceedings of Institution of Mechanical Engineers 197C, 53-9.
Hamilton, G.M. & Goodman, L.E. (1966). The stress field created by a circular sliding
contact. Journal of Applied Mechanics 33, 371-6.
Han, L.X. & Suresh, S. (1989). High temperature crack growth in an alumina-silicon carbide
whisker composite: Mechanisms of fatigue crack tip damage. Journal of the American
Ceramic Society 72, 1233-8.
Hancock, J.R. & Grosskreutz, J.C. (1969). Mechanisms of fatigue hardening in copper single
crystals. Acta Metallurgica 17, 11-91.
Harlin, G. & Willis, J.R. (1988). The influence of crack size on the ductile-brittle transition.
Proceedings of the Royal Society, London A415, 197-226.
Harris, J.A. (1987). Engine component retirement for cause. Volume I-Executive summary.
Technical Report-87-4069. Dayton: Air Force Wright Aeronautical Laboratories.
628
References
Hart, E.W. (1980). A theory for stable crack extension rates in ductile materials. International
Journal of Solids and Structures 16, 807-23.
Hartman, A. (1965). On the effects of oxygen and water vapor on the propagation of fatigue
cracks in 2024-T3 Alclad sheet. International Journal of Fracture 1, 167-88.
Hartman, A., Jacobs, F.J., Nederveen, A. & Derijk, R. (1967). National Laboratory for
Research, Technical Note No. M. 2182, Amsterdam; cited in Wei, R.P. & Simmons,
G.W. (1981).
Hartman, R.J. & Macherauch, E. (1963). Die Veranderung von rontgen-interferenzen
Hysterese und obserflachenbild bei ein- und wechselseitig Beanspruchung von
Messing, Nickel und Stahl. Zeitschrift fur Metallkunde 54, 161-72.
Hasegawa, T., Yakou, T. & Kocks, U.F. (1986). Forward and reverse arrangements of
dislocations in tangled walls. Materials Science and Engineering 81, 189-99.
Hashin, Z. & Rotem, A. (1973). A fatigue failure criterion for fiber reinforced composites.
Journal of Composite Materials 7, 448-64.
He, M.-Y. & Hutchinson, J.W. (1989). Kinking of a crack out of an interface. Journal of
Applied Mechanics 56, 270-8.
Helgeland, O. (1965). Cyclic hardening and fatigue of copper single crystals. Journal of the
Institute of Metals 93, 570-5.
Hellan, K. (1984). Introduction to Fracture Mechanics. New York: McGraw-Hill.
Henaff, G., Marchal, K. & Petit, J. (1995). On fatigue crack propagation enhancement by a
gaseous atmosphere: experimental and theoretical aspects. Acta Metallurgica et
Materialia 43, 2931^2.
Herman, W.A., Hertzberg, R.W. & Jaccard, R. (1988). A simplified laboratory approach for
the prediction of short crack behavior in engineering structures. Fatigue and Fracture
of Engineering Materials and Structures 4, 303-20.
Hertz, H. (1882). Uber die Beriihrung fester elastischer Korper. (On the contact of elastic
solids.) /. reine und angewandte Mathematick 92, 156-71.
Hertzberg, R.W. (1995). Deformation and Fracture Mechanics of Engineering Materials, 4th
edn. New York: Wiley.
Hertzberg, R.W. & Manson, J.A. (1973). Micromechanisms of fatigue-crack advance in PVC.
Journal of Materials Science 8, 1554-8.
Hertzberg, R.W. & Manson, J.A. (1980). Fatigue of Engineering Plastics. New York:
Academic Press.
Hertzberg, R.W. & Manson, J.A. (1986). Fatigue. Encyclopedia of Polymer Science and
Engineering, vol. 7, pp. 378^453. New York: Wiley.
Hertzberg, R.W. & Mills, W.J. (1976). Character of fatigue fracture surface micromorphology
in ultra-low growth rate regime. In Fractography-Microscopic Cracking Processes,
Special Technical Publication 600, pp. 220-34. Philadelphia: American Society for
Testing and Materials.
Hertzberg, R.W., Nordberg, H. & Manson, J.A. (1970). Fatigue crack propagation in
polymeric materials. Journal of Materials Science 5, 521-6.
Hertzberg, R.W., Skibo, M.D. & Manson, J.A. (1979). Fatigue fracture mechanisms in
engineering plastics. In Fatigue Mechanisms, Special Technical Publication 675, pp.
471-500. Philadelphia: American Society for Testing and Materials.
Hesselbarth, H.W. & Steck, E. (1992). A simulation of dislocation patterning by cellular
automata. Solid State Phenomena 23 & 24, 445-54.
References
629
Hill, R. (1950). The Mathematical Theory of Plasticity. Oxford: Clarendon Press.
Hills, D.A. & Ashelby, D.W. (1982). The influence of residual stresses on contact load bearing
capacity. Wear 75, 221—40.
Hills, D.A. & Nowell, D. (1994). Mechanics of fretting fatigue. Dordrecht, The Netherlands:
Kluwer Academic Publishers.
Hills, D.A. & Sackfield, A. (1984). Yield and shakedown states in the contact of generally
curved bodies. Journal of Strain Analysis for Engineering Design 19, 9-14.
Himmelein, M.K. & Hillberry, B.M. (1976). Effects of stress ratio and overload ratio on
fatigue crack delay and arrest behavior due to single peak overloads. In Mechanics of
Crack Growth, Special Technical Publication 590, pp. 321-30. Philadelphia:
American Society for Testing and Materials.
Hodgkinson, E.A. (1849). Report of the Commissioners Appointed to Enquire into the
Application of Iron to Railway Structures, Command Paper No. 1123. London: His
Majesty's Stationery Office.
Hohenemser, K. & Prager, W. (1932). Uber die Ansatze der Mechanik isotroper Kontinua.
Zeits. angew.Math. u. Mech. 12, 216-26.
Hojo, M., Tanaka, K., Gustafson, C.G. & Hayashi, R. (1987). Effect of stress ratio on near-
threshold propagation of delamination cracks in unidirectional CFRP. Composites
Science and Technology 29, 273-92.
Holm, D.K., Blom, A.F. & Suresh, S. (1986). Growth of cracks under far-field cyclic
compressive loads: Numerical and experimental results. Engineering Fracture
Mechanics 23, 1097-106.
Holmes, J.W. (1991). Influence of stress ratio on the elevated temperature fatigue of a SiC
fiber-reinforced Si3N4 composite. Journal of the American Ceramic Society 74,
1539-45.
Holzwarth, U. & Essmann, U. (1993). The evolution of persistent slip bands in copper single
crystals. Applied Physics A A57, 131-41.
Hopkins, S.W., Rau, C.A., Leverant, G.R. & Yuen, A. (1976). Effects of various program
overloads on the threshold for high frequency fatigue crack growth. In Fatigue Crack
Growth under Spectrum Loads, Special Technical Publication 595, pp. 125—41.
Philadelphia: American Society for Testing and Materials.
Horibe, S. & Hirahara, R. (1991). Fatigue crack propagation of sintered silicon nitride in
vacuum and air. Fatigue and Fracture of Engineering Materials and Structures 14,
863-70.
Hornbogen, E. (1978a). Martensitic transformation at a propagating crack. Acta Metallurgica
26, 147-52.
Hornbogen, E. (1978b). Shape change during the 19 °C-phase transformation of PTFE.
Progress in Colloid and Polymer Science 64, 125-31.
Hornbogen, E. & Zum Gahr, K.-H. (1976). Microstructure and fatigue crack growth in a
y-Fe-Ni-Al alloy. Acta Metallurgica 24, 581-92.
Hourlier, F., d'Hondt, H., Truchon, M. & Pineau, A. (1985). Fatigue crack path behavior
under polymodal fatigue. In Multiaxial Fatigue, Special Technical Publication 852,
pp. 228—48. Philadelphia: American Society for Testing and Materials.
Hourlier, F., McLean, D. & Pineau, A. (1978). Fatigue crack growth behaviour of Ti-5A1-
2.5Sn alloy under complex stress (mode I + steady mode III). Metals Technology 5,
154-8.
630
References
Hu, Y.M. & Wang, Z.G. (1997). Cyclic stress-strain response and dislocation structures of
[345]/[l 17] copper bicrystals. Acta Materialia 45, 2655-70.
Hubbard, R.P. (1969). Crack growth under cyclic compression. Journal of Basic Engineering
91, 625-31.
Hudak, S.J., Davidson, D.L., Chan, K.S., Howland, A.C. & Walsch, M.J. (1988). Growth of
Small Cracks in Aeroengine Disc Materials, Report No. AFWAL-TR-88—W90.
Dayton: Air Force Wright Aeronautical Laboratories.
Hudson, CM. & Scardina, J.T. (1969). Effects of stress ratio on fatigue-crack growth in 7075-
T6 aluminum-alloy sheet. Engineering Fracture Mechanics 1, 429-46.
Hui, C.Y. & Riedel, H. (1981). The asymptotic stress and strain field near the tip of a growing
crack under creep conditions. International Journal of Fracture 17, 409-25.
Hunsche, A. & Neumann, P. (1986). Quantitative measurement of persisent slip band profiles
and crack initiation. Acta Metallurgica 34, 207-17.
Hurd, N.J. & Irving, P.E. (1982). Factors influencing propagation of mode III fatigue cracks
under torsional loading. In Design of Fatigue and Fracture Resistant Structures,
Special Technical Publication 761, pp. 212-23. Philadelphia: American Society for
Testing and Materials.
Hutchinson, J.W. (1968). Singular behavior at the end of a tensile crack in a hardening
material. Journal of the Mechanics and Physics of Solids 16, 13-31.
Hutchinson, J.W. (1983). Fundamentals of the phenomenological theory of nonlinear fracture
mechanics. Journal of Applied Mechanics 50, 1042-51.
Hutchinson, J.W. (1987). Crack tip shielding by micro-cracking in brittle solids. Acta
Metallurgica 35, 1605-19.
Hutchinson, J.W. & Paris, P.C. (1979). Stability analysis of/-controlled crack growth. In
Elastic-Plastic Fracture, Special Technical Publication 668, pp. 37-64. Philadelphia:
American Society for Testing and Materials.
Hyzak, J.M. & Bernstein, I.M. (1982). The effect of defects on the fatigue crack initiation
process in two P/M superalloys: Part I. Fatigue origins. Metallurgical Transactions
13A, 33-13.
Ikeda, S., Izumi, Y. & Fine, M.E. (1977). Plastic work during fatigue crack propagation in a
high strength alloy steel and in 7050 Al-Alloy. Engineering Fracture Mechanics 9,
123-36.
Inglis, C.E. (1913). Stresses in a plate due to the presence of cracks and sharp corners.
Transactions of the Institute of Naval Architects 55, 219—41.
Irving, P.E. & Beevers, C.J. (1974). Microstructural influences on fatigue crack growth in
Ti-6A1-4V. Materials Science and Engineering 14, 229-38.
Irwin, G.R. (1956). Onset of fast crack propagation in high strength steel and aluminum
alloys. In Proceedings of the Second Sagamore Conference vol. II, pp. 289-305. New
York: Syracuse University.
Irwin, G.R. (1957). Analysis of stresses and strains near the end of a crack traversing a plate.
Journal of Applied Mechanics 24, 361—4.
Irwin, G.R. (1960). Plastic zone near a crack and fracture toughness. In Proceedings of the
Seventh Sagamore Ordnance Materials Conference, vol. IV, pp. 63-78. New York:
Syracuse University.
Irwin, G.R. (1964). Structural aspects of brittle fracture. Applied Mechanics Research 3,
65-81.
References
631
Iwan, W.D. (1967). On a class of models for the yielding behavior of continuous and
composite systems. Journal of Applied Mechanics 34, 612-7.
Jacobs, D.S. & Chen, I.-W. (1995). Cyclic fatigue in ceramics: a balance between crack
shielding accumulation and degradation. Journal of the American Ceramic Society
78, 513-20.
James, L.A. (1972). The effect of frequency upon fatigue crack growth of Type 304 stainless
steel at 1000°F. In Stress Analysis and Growth of Cracks, Special Technical
Publication 513, pp. 218-29. Philadelphia: American Society for Testing and
Materials.
James, M.N., Tait, R.B. & Mech, D.G. (1991). Compression fatigue in /5-alumina. Fatigue and
Fracture of Engineering Materials and Structures 14, 227-35.
James, M.R. & Morris, W.L. (1983). Effect of fracture surface roughness on growth of short
fatigue cracks. Metallurgical Transactions 14A, 153-5.
Jenkin, C.F. (1923). The fatigue failure of metals. Proceedings of the Royal Society, London
A103, 121-38.
Jin, N.Y. (1983). Dislocation structures in fatigued copper single crystals oriented for double-
slip. Philosophical Magazine A A48, L33-L38.
Jin, N.Y. (1989). Formation of dislocation structures during cyclic deformation of F.C.C.
crystals.-I. Formation of PSBs in crystals oriented for single-slip. Acta Metallurgica
37, 2055-66.
Jin, N.Y. & Winter, A.T. (1984). Cyclic deformation of copper single crystals oriented for
double slip. Acta Metallurgica 32, 989-95.
Johnson, E.W. & Johnson, H.H. (1965). Imperfection density of fatigued and annealed copper
via electrical resistivity measurements. Transactions of the Metallurgical Society 233,
1333-9.
Johnson, K.L. (1962). A shakedown limit in rolling contact. In Proceedings of the 4th US
National Congress of Applied Mechanics, pp. 971-80. New York, NY: American
Society of Mechanical Engineers.
Johnson, K.L. (1983). Inelastic contact: plastic flow and shakedown. In Contact Mechanics
and Wear of Rail I Wheel Systems, pp. 79-101. Waterloo, Ontario: University of
Waterloo Press.
Johnson, K.L. (1985). Contact Mechanics. Cambridge: Cambridge University Press.
Johnson, K.L. & Jefferis, J.A. (1963). Plastic flow and residual stresses in rolling and sliding
contact. In Proceedings of the Institution of Mechanical Engineers, pp. 50-9. London:
Institution of Mechanical Engineers.
Johnston, T.L., Stokes, R.J. & Li, C.H. (1962). Crack nucleation in magnesium oxide
bicrystals under compression. Philosophical Magazine 1, 23-34.
de Jonge, J.B. & Nederveen, A. (1980). Effect of gust load alleviation on fatigue and crack
growth in ALCLAD 2024-T3. In Effect of Load Spectrum Variables on Fatigue Crack
Initiation and Propagation, Special Technical Publication 714, pp. 170-84.
Philadelphia: American Society for Testing and Materials.
Kanazawa, K., Miller, K.J. & Brown, M.W. (1979). Cyclic deformation of l%Cr-Mo-V steel
under out-of-phase loads. Fatigue of Engineering Materials and Structures 2, 217-28.
Kaneko, Y., Morita, Y. & Hashimoto, S. (1997). Change in shape of hysteresis loops during
cyclic deformation on austenitic stainless steel single crystals oriented for single slip.
Scripta Materialia 37, 963-8.
632
References
Kanninen, M.L. & Popelar, C.H. (1985). Advanced Fracture Mechanics. New York, NY:
Oxford University Press.
Katagiri, K., Omura, A., Koyanagi, K., Awatani, J., Shiraishi, T., & Kaneshiro, H. (1977).
Early stage crack tip morphology in fatigued copper. Metallurgical Transactions 8A,
1769-73.
Kayali, E.S. & Plumtree, A. (1982). Stress-substructure relationships in cyclically and
monotonically deformed wavy slip mode metals. Metallurgical Transactions 13A,
1033-11.
Kemsley, D.S. & Paterson, M.S. (1960). The influence of strain amplitude on the work
hardening of copper crystals in alternating tension and compression. Acta
Metallurgica 8, 453-67.
Kennedy, A.J. (1963). Processes of Creep and Fatigue in Metals. New York: Wiley.
Kikukawa, M., Jono, M. & Mikami, S. (1982). Fatigue crack propagation and crack closure
behavior under stationary varying loadings-test results of aluminum alloy (in
Japanese). Journal of the Society of Materials Science Japan 31, 438-87.
Kim, A.S. (1996). Fracture normal to layered and graded interfaces. Ph.D. thesis. Providence,
RI: Brown University.
Kim, A.S., Besson, J. & Pineau, A. (1998). Global and local approaches to fracture normal to
interfaces. International Journal of Solids and Structures, submitted.
Kim, A.S., Suresh, S. & Shih, C.F. (1997). Fracture normal to interfaces with homogeneous
and graded compositions. International Journal of Solids and Structures 34, 3415-32.
Kim, S.L., Skibo, M.D., Manson, J.A. & Hertzberg, R.W. (1977). Fatigue crack propagation
in poly(methyl methacrylate): effect of molecular weight and internal plasticization.
Polymer Engineering and Science 17, 194-203.
Kim, W.H. & Laird, C. (1978). Crack nucleation and stage I propagation in high strain fatigue
- II. Mechanism. Acta Metallurgica 26, 789-99.
King, J. E. (1982). Surface damage and near-threshold fatigue crack growth in a Ni-base
superalloy in vacuum. Fatigue of Engineering Materials and Structures 5, 177-88.
Kishimoto, H., Ueno, A. & Kawamoto, H. (1987). Fatigue crack propagation in ceramics.
Society of Materials Science Japan, 36, 1122-7.
Kishimoto, H., Ueno, A., Okawara, S. & Kawamoto, H. (1994). Crack propagation behavior
of polycrystalline alumina under static and cyclic load. Journal of the American
Ceramic Society 11, 1324-8.
Kitagawa, H. & Takahashi, S. (1976). Applicability of fracture mechanics to very small cracks
or the cracks in the early stage. In Proceedings of Second International Conference on
Mechanical Behavior of Materials, pp. 627-31. Metals Park: American Society for
Metals.
Kitagawa, H. & Tanaka, T. (1990). Editors, Fatigue 90. Birmingham: Materials and
Components Engineering Publications.
Kitagawa, H., Yuuki, R. & Ohira, T. (1975). Crack-morphological aspects in fracture
mechanics. Engineering Fracture Mechanics 1, 515-29.
Kitagawa, H., Yuuki, R., Tohgo, K. & Tanabe, M. (1985). AK dependency of fatigue crack
growth of single and mixed-mode cracks under biaxial stresses. In Multiaxial
Fatigue, Special Technical Publication 853, pp. 164-83. Philadelphia: American
Society for Testing and Materials.
References
633
Knott, J.F. & Pickard, A.C. (1977). Effects of overloads on fatigue crack propagation:
Aluminum alloys. Metal Science 11, 399^104.
Kobayashi, H. (1987). On the examination report of the crashed Japan Airline Boeing 747
plane - Failure analysis of the rear pressure bulkhead (in Japanese). Journal of the
Japan Society for Safety Engineering 26, 363-72.
Kobayashi, H., Arai, Y. & Nakamura, H. (1987). Fatigue failure analysis of the rear pressure
bulkhead of the crashed Boeing 747 jumbo jet plane (in Japanese). Journal of the
Society of Materials Science Japan 36, 1084-9.
Kobayashi, H., Ogawa, T., Nakamura, H. & Nakazawa, H. (1984). Measurement of crack
closure and evaluation of near threshold characteristics in fatigue crack growth for
A508-3 steel (in Japanese). Transactions of the Japan Society of Mechanical
Engineers 50, 309-19.
Koiter, W.T. (1956). Koninkl. Ned. Ak. Wetenschap B59, 24-50.
Konczol, L., Schincker, M.G. & Doll, W. (1984). Interference optical measurements during
continuous and discontinuous crack propagation in fatigue loaded polymers. Journal
of Materials Science 19, 1605-15.
Koo, G.P., Riddell, M.N. & O'Toole, J.L. (1967). Fatigue properties of
polytetrafluoroethylene and related fluoropolymers. Polymer Engineering and
Science 7, 182-8.
Kramer, E.J. (1983). Microscopic and molecular fundamentals of crazing. In Advances in
Polymer Science (ed. H.H. Kausch), vol. 52/53, pp. 1-56. Berlin: Springer-Verlag.
Kramer, E.J. & Berger, L.L. (1990). Fundamental processes of craze growth and fracture. In
Advances in Polymer Science (ed. H.H. Kausch), vol. 91/92, pp. 1-68. Berlin:
Springer-Verlag.
Kramer, E.J. & Hart, E.W. (1984). Theory of slow, steady state crack growth in polymeric
glasses. Polymer 25, 1667-78.
Krieg, R.D. (1975). A practical two-surface plasticity theory. Journal of Applied Mechanics 47,
641-6.
Ku, R.C. & Johnston, T.L. (1964). Fracture strength of MgO bicrystals. Philosophical
Magazine 9, Ti\-M.
Kuhlmann-Wilsdorf, D. (1979). Dislocation behavior in fatigue. IV. Quantitative
interpretation of friction stress and back stress derived from hysteresis loops.
Materials Science and Engineering 39, 231-45.
Kumar, V., German, M.D. & Shih, C.F. (1981). An engineering approach to elastic-plastic
analysis, Report No. NP 1931. Palo Alto: Electric Power Research Institute.
Kung, C.Y. & Fine, M.E. (1979). Fatigue crack initiation and microcrack growth in 2024-T4
and 2124-T4 aluminum alloys. Metallurgical Transactions 10A, 603-10.
Kuno, M., Waterhouse, R.B., Nowell, D. & Hills, D.A. (1989). Initiation and growth of
fretting fatigue cracks in the partial slip regime. Fatigue and Fracture of Engineering
Materials and Structures 12, 387-98.
Kwadjo, R. & Brown, L.M. (1978). Cyclic hardening of magnesium single crystals. Acta
Metallurgica 26, 1117-32.
Laird, C. (1967). The influence of metallurgical structure on the mechanisms of fatigue crack
propagation. In Fatigue Crack Propagation, Special Technical Publication 415, pp.
131-68. Philadelphia: The American Society for Testing and Materials.
Laird, C. (1976). The fatigue limits of metals. Materials Science and Engineering 22, 231-6.
634
References
Laird, C, Finney, J.M. & Kuhlmann-Wilsdorf, D. (1981). Dislocation behavior in fatigue. VI.
Variation in the localization of strain in persistent slip bands. Materials Science and
Engineering 50, 127-36.
Laird, C. & Smith, G.C. (1962). Crack propagation in high stress fatigue. Philosophical
Magazine 8, 847-57.
Laird, C. & Thomas, G. (1967). On fatigue-induced reversion and overaging in dispersion
strengthened alloy systems. International Journal of Fracture Mechanics 3, 81-97.
Lamba, H.S. & Sidebottom, O.M. (1978). Cyclic plasticity for nonproportional paths, Part 1.
Cyclic hardening, erasure of memory, and subsequent strain hardening experiments.
Journal of Engineering Materials and Technology 100, 96-103.
Landes, J.D. & Begley, J.A. (1976). A fracture mechanics approach to creep crack growth. In
Mechanics of Crack Growth, Special Technical Publication 590, pp. 128^48.
Philadelphia: American Society for Testing and Materials.
Landgraf, R.W. (1978). Control of fatigue resistance through microstructure - Ferrous alloys.
Fatigue and Microstructure (ed. M. Meshii), pp. 439-66. Metals Park: American
Society for Metals.
Landgraf, R.W. & LaPointe, N.R. (1974). Cyclic stress-strain concepts applied to component
fatigue life prediction. Transactions of the Society of Automotive Engineers 83,
1198-207.
Langer, B.F. (1937). Fatigue failure from stress cycles of varying amplitude. Journal of Applied
Mechanics 59, 160-2.
Lankford, J. (1982). The growth of small fatigue cracks in 7075-T6 aluminum. Fatigue of
Engineering Materials and Structures 5, 233^18.
Lankford, J. (1983). The effect of environment on the growth of small fatigue cracks. Fatigue
of Engineering Materials and Structures 6, 15-31.
Lankford, J. & Davidson, D.L. (1981). The effect of overloads upon fatigue crack tip opening
displacement and crack tip opening/closing loads in aluminum alloys. In Advances in
Fracture Research (ed. D. Franccois), vol. 2, pp. 899-906. Oxford: Pergamon Press.
Lankford, J. & Davidson, D.L. (1983). Fatigue crack micromechanisms in ingot and powder
metallurgy 7xxx aluminum alloys in air and vacuum. Acta Metallurgica 31, 1273-84.
Lankford, J. & Kusenberger, F.N. (1973). Initiation of fatigue cracks in 4340 steel.
Metallurgical Transactions 4A, 553-9.
Lardner, R.W. (1967). A dislocation model for fatigue crack growth in metals. Philosophical
Magazine 17, 71-82.
Larsen, J.M., Nicholas, T., Thompson, A.W. & Williams, J.C. (1986). Small crack growth in
titanium-aluminum alloys. In Small Fatigue Cracks, (eds. R.O. Ritchie & J.
Lankford). pp. 499-512. Warrendale: The Metallurgical Society.
Larsson, S.G. & Carlsson, A.J. (1973). Influence of non-singular stress terms and specimen
geometry on small-scale yielding at crack tip in elastic-plastic solids. Journal of the
Mechanics and Physics of Solids 21, 263-77.
Lathabai, S., Rodel, J. & Lawn, B.R. (1991). Cyclic fatigue from degradation at bridging
grains in alumina. Journal of the American Ceramic Society 74, 1340-8.
Laufer, E.E. & Roberts, W.N. (1966). Dislocations and persistent slip bands in fatigued
copper. Philosophical Magazine 14, 67-78.
References
635
Lawn, B.R., Padture, N.P., Guiberteau, F. & Cai, H. (1994). A model of microcrack initiation
and propagation beneath Hertzian contacts in polycrystalline ceramics. Acta
Metallurgica et Materialia 42, 1683-93.
Lawn, B. & Wilshaw, T.R. (1975). Fracture of Brittle Solids. Cambridge University Press.
Lawn, B. (1993). Fracture of Brittle Solids, 2nd edition. Cambridge University Press.
Laws, N. & Brockenbrough, J.R. (1987). The effect of microcrack systems on the loss of
stiffness of brittle solids. International Journal of Solids and Structures 23, 1247-68.
Lee, E.H. (1969). Elastic-plastic deformation at finite strains. Journal of Applied Mechanics
36, 1-6.
Lee, J.J. & Sharpe, W.N. (1986). Short fatigue cracks in notched aluminum specimens. In
Small Fatigue Cracks, (eds. R.O. Ritchie & J. Lankford). pp. 323-39. Warrendale:
The Metallurgical Society.
Lee, J.-K. & Laird, C. (1983). Strain localization during fatigue of precipitation hardened
aluminum alloys. Philosophical Magazine A 47, 579-97.
Lepisto, T.K. & Kettunen, P.O. (1986). Comparison of the cyclic stress-strain behavior of
single- and {111} (111) multiple-slip oriented copper single crystals. Materials Science
and Engineering 83, 1-15.
Li, F.Z., Needleman, A. & Shih, C.F. (1988). Characterization of near-tip stress and
deformation fields in creeping solids. International Journal of Fracture 36, 163-86.
Li, X.W., Wang, Z.G., Li, G.Y., Wu, S.D. & Li, S.X. (1998). Cyclic stress-strain response and
surface deformation features of [Oil] multiple-slip oriented copper single crystals.
Acta Materialia 46, in press.
Li, Y. & Laird, C. (1994). Cyclic response and dislocation structures of AISI 316L stainless
steel. 2. Polycrystals fatigued at intermediate strain amplitude. Materials Science and
Engineering A A186, 87-103.
Li, Y.C. & Wang, T.C. (1986). High-order asymptotic field of tensile plane strain nonlinear
crack problems. Scientia Sinica (Series A) 29, 941-55.
Liaw, P.K., Leax, T.R. & Logsdon, W.A. (1983). Near-threshold fatigue crack growth
behavior in metals. Acta Metallurgica 31, 1581-7.
Liaw, P.K., Leax, T.R., Williams, R.S. & Peck, M.G. (1982). Near-threshold fatigue crack
growth behavior in copper. Metallurgical Transactions 13A, 1607-18.
Lilholt, H. (1977). Hardening in two-phase materials-I. Strength contributions in fiber-
reinforced copper-tungsten. Acta Metallurgica 25, 571-85.
Lin, C.-K. J., Socie, D.F., Xu, Y. & Zangvil, A. (1992). Static and cyclic fatigue of alumina at
high-temperatures. 2. Failure analysis. Journal of the American Ceramic Society 75,
637-18.
Lin, T.H. & Ito, Y.M. (1969). Mechanics of fatigue crack nucleation mechanism. Journal of
the Mechanics and Physics of Solids 17, 511-23.
Lin, T.H. & Lin, S.R. (1979). Micromechanics theory of fatigue crack initiation applied to
time-dependent fatigue. In Fatigue Mechanisms, Special Technical Publication 675,
pp. 707-28. Philadelphia: American Society for Testing and Materials.
Lindigkeit, J., Terlinde, G., Gysler, A. & Lutjering, G. (1979). The effect of grain size on the
fatigue crack propagation behavior of age-hardened alloys in inert and corrosive
environments. Acta Metallurgica 27, 1717-26.
Lindley, T.C. (1982). Near threshold fatigue crack growth: experimental methods,
mechanisms and applications. In Subcritical Crack Growth due to Fatigue, Stress
636
References
Corrosion and Creep (ed. L.H. Larsson), pp. 167-213. London: Elsevier Applied
Science.
Lindley, T.C. (1997). Fretting fatigue in engineering alloys. International Journal of Fatigue,
19, Supplement Number 1, S39-S49.
Lindley, T.C. & Nix, K.J. (1991). Case studies in power engineering plant. In Fatigue Crack
Initiation and Damage Counters. Paris: Societe de Metallurgie.
Lindley, T.C. & Nix, K.J. (1992). Fretting fatigue in the power generation industry. In
Standardization of Fretting Fatigue Test Methods and Equipment (eds: H.A. Attia
and R.B. Waterhouse) Special Technical Publication 1159, pp. 153-69. Philadelphia:
American Society for Testing and Materials.
Lindley, T.C. & Richards, C.E. (1974). The relevance of crack closure to fatigue crack
propagation. Materials Science and Engineering 14, 281-93.
Lisiecki, L.L. & Weertman, J.R. (1990). Orientation effects on the elevated temperature
fatigue of copper single crystals. Acta Metallurgica et Materialia 38, 509-19.
Liu, S. -Y., Chen, I.-W. & Tien, T.-Y. (1994). Fatigue-crack growth of silicon-nitride at 1400
degrees C - A novel fatigue-induced crack-tip bridging phenomenon. Journal of the
American Ceramic Society 11, 137^42.
Llanes, L., Rollet, A.D., Bassani, J.D. & Laird, C. (1993). Effects of grain size and annealing
texture on the cyclic response and its substructure evolution of polycrystalline
copper. Acta Metallurgica et Materialia, 41, pp. 2667-79.
Llorca, J., Needleman, A. & Suresh, S. (1990). The Bauschinger effect in whisker-reinforced
metal-matrix composites. Scripta Metallurgica et Materialia 24, 1203-8.
Llorca, J. & Sanchez Galvez, V. (1990). Modelling plasticity-induced fatigue crack closure.
Engineering Fracture Mechanics 37, 185-96.
Lo, K.K. (1978). Analysis of branched cracks. Journal of Applied Mechanics 45, 797-802.
Lohberg, K. & Mustofon, H. (1976). Einfiu/S einer mechanischen Wechselbeanspruchung auf
die Zinnumwandlung. Zeitschrift fur Metallkunde 67, 333-7.
Ludwik, P. (1919). Uber die Anderung der Festigkeitseigenschaften der Metalle bei
wechselnder Beanspruchung. Zeitschrift fur Metallkunde 11, 157-68.
Lukas, P., Klesnil, M. & Krejci, J. (1968). Dislocations and P.S.B.s in copper single crystals
fatigued at low strain amplitude. Physica Status Solidi 27, 545-58.
Lukas, P. & Kunz, L. (1985). Is there a plateau in the cyclic stress-strain curves of
polycrystalline copper? Materials Science and Engineering 74, LI-5.
Lynch, S.P. (1981). A comparative study of stress-corrosion cracking, hydrogen-assisted
cracking and liquid-metal embrittlement in Al, Ni, Ti, and Fe-based alloys. In
Hydrogen Effects in Metals (eds. I.M. Bernstein & A.W. Thompson), pp. 863-70.
Warrendale: The Metallurgical Society of the American Institute of Mining,
Metallurgical and Petroleum Engineers.
Lynch, S.P. (1988). Environmentally assisted cracking: Overview of evidence for an
adsorption-induced localised-slip process. Acta Metallurgica 36, 2639-61.
Ma, B.-T. & Laird, C. (1989a). Overview of fatigue behavior in copper single crystals - I.
Surface morphology and stage I crack initiation sites for tests at constant strain
amplitude. Acta Metallurgica 37, 325-36.
Ma, B.-T. & Laird, C. (1989b). Overview of fatigue behavior in copper single crystals - II.
Population, size, distribution and growth kinetics of stage I cracks for tests at
constant strain amplitude. Acta Metallurgica 37, 337-48.
References
637
McAdam, D.J. (1926). Stress-strain relationships and the corrosion fatigue of metals. In
Corrosion Fatigue, Special Technical Publication 26, pp. 224-54. Philadelphia:
American Society for Testing and Materials.
McCammon, R.D. & Rosenberg, H.M. (1957). The fatigue and ultimate tensile strength of
metals between 4.2 and 293 K. Proceedings of the Royal Society, London A242,
203-11.
McCartney, L.N. (1976). The effect of periodic-random loading on fatigue crack growth.
International Journal of Fracture 12, 273-88.
McCartney, L.N. (1987). Mechanics of matrix cracking in brittle-matrix fibre-reinforced
composites. Proceedings of the Royal Society, London A409, 329-50.
McCarver, J.F. & Ritchie, R.O. (1982). Fatigue crack propagation thresholds for long and
short cracks in Rene 95 nickel-base superalloy. Materials Science and Engineering 55,
63-7.
McClintock, F.A. (1963). On the plasticity of the growth of fatigue cracks. In Fracture of
Solids (eds. D.C. Drucker & J.J. Gilman), vol. 20, pp. 65-102. New York: Wiley.
McClintock, F.A. (1971). Plasticity aspects of fracture. In Fracture: An Advanced Treatise (ed:
H. Liebowitz), vol. Ill, pp. 47-225. New York: Academic Press.
McClintock, F.A. & Walsh, J.B. (1962). Fracture in compression of brittle solids. In
Proceedings of the Fourth U.S. Congress on Applied Mechanics, vol. 2, pp. 1015-23.
New York: American Society of Mechanical Engineers.
McClung, R.C. & Sehitoglu, H. (1989). On the finite element analysis of fatigue crack closure.
Engineering Fracture Mechanics 33, 237-72.
McDiarmid, D.L. (1994). A shear stress based critical-plane criterion of multiaxial fatigue
failure for design and life prediction. Fatigue and Fracture of Engineering Materials
and Structures 17, 1475-84.
McDowell, J.R. (1953). Fretting corrosion tendencies of several combinations of materials. In
Fretting Corrosion, Special Technical Publication 144, pp. 24-39. Philadelphia:
American Society for Testing and Materials.
McEvily, A.J. (1977). Current aspects of fatigue. Metal Science 11, 274-84.
McEvily, A.J. & Machlin, E.S. (1961). The effect of cyclic loading on MgO single crystals.
Transactions of the Metallurgical Society 221, 1086-8.
McEvily, A.J. & Wei, R.P. (1972). Fracture mechanics and corrosion fatigue. In Corrosion-
fatigue: Chemistry, Mechanics and Microstructure (eds. O.F. Devereux, A.J. McEvily
& R.W. Staehle), vol. NACE-2, pp. 381-95. Houston: National Association of
Corrosion Engineers.
Mackay, M.E., Teng, T.-G. & Schultz, J.M. (1979). Craze roles in the fatigue of
polycarbonate. Journal of Materials Science 14, 221-7.
McMeeking, R.M. (1977). Finite deformation analysis of crack tip opening in elastic-plastic
materials and implications for fracture initiation. Journal of the Mechanics and
Physics of Solids 25, 357-81.
McMeeking, R.M. & Evans, A.G. (1982). Mechanics of transformation toughening in brittle
materials. Journal of the American Ceramic Society 65, 242-5.
McMeeking, R.M. & Evans, A.G. (1990). Matrix fatigue cracking in fiber composites.
Mechanics of Materials 9, 217-32.
638
References
McMeeking, R.M. & Parks, D.M. (1979). On the criteria for J dominance of crack tip fields in
large-scale yielding. In Elastic-Plastic Fracture, Special Technical Publication 668,
pp. 175-94. Philadelphia: American Society for Testing and Materials.
McMillan, J.C. & Pelloux, R.M.N. (1967). Fatigue crack propagation under program and
random loads. In Fatigue Crack Propagation, Special Technical Publication 415, pp.
505-35. Philadelphia: American Society for Testing and Materials.
Maier, H.J. & Christ, H.-J. (1996). Modelling of cyclic stress-strain behavior under
thermomechanical fatigue conditions - a new approach based upon a multi-
component model. Scripta Materialia 34, 609-15.
Majumdar, B.S. & Burns, S.J. (1981). Crack tip shielding - An elastic theory of dislocations
and dislocation arrays near a sharp crack. Acta Metallurgica 29, 579-88.
Majumdar, B.S. & Burns, S.J. (1982). Push-pull fatigue of LiF at elevated temperatures - II.
Microstructures. Acta Metallurgica 30, 1751-60.
Majumdar, B.S. & Burns, S.J. (1987). TEM study of the recovery process of cyclically
deformed MgO single crystals. Journal of Materials Science 22, 1157-62.
Majumdar, S. & Maiya, P.S. (1980). A mechanistic model for time-dependent fatigue. Journal
of Engineering Materials and Technology 102, 159-67.
Majumdar, S. & Morrow, J.D. (1974). Correlation between fatigue crack propagation and low
cycle fatigue properties. In Fracture Toughness and Slow Stable Cracking, Special
Technical Publication 559, pp. 159-82. Philadelphia: American Society for Testing
and Materials.
Malvern, L.E. (1969). Introduction to the Mechanics of a Continuous Medium. Englewood
Cliffs, NJ: Prentice-Hall.
Mandell, J.F., McGarry, F.J., Huang, D.D. & Li, C.G. (1983). Some effects of matrix and
interface properties on the fatigue of short fiber-reinforced thermoplastics. Polymer
Composites 4, 32-9.
Mann, J.Y. (1958). The historical development of research on the fatigue of materials and
structures. Journal of Australian Institute of Metals 3, 222-41.
Mann, J.Y. (1967). Fatigue of Materials: an introductory text. Melbourne University Press.
Manson, J.A., Hertzberg, R.W. & Bretz, P.E. (1981). Normalization of fatigue crack
propagation behavior in polymers. In Advances in Fracture Research (ed. D.
Francois), vol. I, pp. 443-8. Oxford: Pergamon Press.
Manson, J.A. & Sperling, L.H. (1976). Polymer Blends and Composites. New York: Plenum
Press.
Manson, S.S. (1954). Behavior of materials under conditions of thermal stress. National
Advisory Commission on Aeronautics: Report 1170. Cleveland: Lewis Flight
Propulsion Laboratory.
Marissen, R., Trautmann, K.H. & Nowack, H. (1984). The influence of compression loads
and of dK/da on the crack propagation under variable amplitude loading.
Engineering Fracture Mechanics 19, 863-79.
Marshall, D.B. (1986). Strength characteristics of transformation toughened zirconia. Journal
of the American Ceramic Society 69, 173-80.
Marshall, D.B. & Cox, B.N. (1987). Tensile fracture of brittle matrix composites: influence of
fiber strength. Acta Metallurgica 35, 2607-19.
Marshall, D.B., Cox, B.N. & Evans, A.G. (1985). The mechanics of matrix cracking in brittle-
matrix fiber composites. Acta Metallurgica 33, 2013-21.
References
639
Martin, J.W. (1980). Micromechanisms in Particle-Hardened Alloys. Cambridge University
Press.
Masing, G. (1926). Eigenspannungen und verfestigung beim Messing. In Proceedings of the
Second International Conference of Applied Mechanics, pp. 332-5. Zurich.
Masounave, J. & Ba'ilon, J.-P. (1976). Effect of grain size on threshold stress intensity factor in
fatigue of a ferritic steel. Scripta Metallurgica 10, 165-70.
Mathews, J.R. (1980). Indentation hardness and hot pressing. Acta Metallurgica 28, 311-18.
May, A.N. (1960a). A model of metal fatigue. Nature 185, 303-4.
May, A.N. (1960b). Random slip model of fatigue and Coffin's law. Nature 188, 573-4.
Mecke, K. & Blochwitz, C. (1982). Saturation dislocation structures in cyclically deformed
nickel single crystals of different orientations. Crystal Research Technology 17,
743-58.
Mecke, K., Blochwitz, C. & Kremling, U. (1982). The development of the dislocation
structures during the fatigue process of F.C.C. single crystals. Crystal Research and
Technology 17, 1557-70.
Melan, E. (1938). Sitzungberichte der Ak. Wissenschaft, Wien, Series 2A, 147, 73-80.
Merkle, J.G. & Corten, H.T. (1974). A J integral analysis of the compact specimen,
considering axial force as well as bending effects. Journal of Pressure Vessel
Technology 96, 286-92.
Meyn, D.A. (1968). Observations of micromechanisms of fatigue crack propagation in 2024
aluminum. Transactions of the American Society for Metals 61, 42-51.
Miller, K.J. & de los Rios, E.R. (1986). Editors, The Behaviour of Short Fatigue Cracks.
London: Mechanical Engineering Publications.
Milligan, W.W. & Antolovich, S.D. (1987). Deformation modeling and constitutive modeling
for superalloys. NASA Report No. 4215 (unrestricted release). Cleveland, OH:
National Aeronautics and Space Administration, Lewis Research Center.
Milligan, W.W. & Antolovich, S.D. (1991). The mechanisms and temperature dependence of
superlattice stacking fault formation in the single-crystal superalloy PWA 1480.
Metallurgical Transactions A 22A, 2309-18.
Mills, N.J. & Walker, N. (1980). Fatigue crack initiation in glassy plastics in high strain fatigue
tests. Journal of Materials Science 15, 1832-40.
Min, B.K. & Raj, R. (1979). A mechanism for intergranular fracture during high temperature
fatigue. In Fatigue Mechanisms, Special Technical Publication 675, pp. 569-91.
Philadelphia: American Society for Testing and Materials.
Minakawa, K. & McEvily, A.J. (1981). On crack closure in the near-threshold region. Scripta
Metallurgica 15, 633-6.
Minakawa, K., Newman, J.C. & McEvily, A.J. (1983). A critical study of the crack closure
effect on near-threshold fatigue crack growth. Fatigue of Engineering Materials and
Structures 6, 359-65.
Mindlin, R.D. (1949). Compliance of elastic bodies in contact. Journal of Applied Mechanics
16, 259-68.
Mindlin, R.D. & Deresiewicz, H. (1953). Elastic spheres in contact under varying oblique
forces. Journal of Applied Mechanics 75, 327-44.
Mindlin, R.D., Mason, W.P., Osmer, J.F. & Deresiewicz, H. (1952). Effects of an oscillating
tangential force on the contact surfaces of elastic spheres. In Proceedings of the First
640
References
US National Congress of Applied Mechanics, pp. 13-9. New York, NY: American
Society of Mechanical Engineers.
Miner, M.A. (1945). Cumulative damage in fatigue. Journal of Applied Mechanics 12, 159-64.
Mirra, J.M., Marder, R.A. & Amstuz, H.A. (1982). The pathology of failed total joint
arthoplasty. Clinical Orthopaedics 170, 175-83.
Mitchell, M. (1978). Fundamentals of modern fatigue analysis for design. In Fatigue and
Microstructure (ed. M. Meshii), pp. 385-437. Metals Park: American Society for
Metals.
Mitsche, R., Stanzl, S. & Burkert, D.G. (1973). Hoch-frequenzkinemato-graphie in der
Metallforschung. Wissenschaftlieher Film 14, 3-10.
Moline, E., Piques, R. & Pineau, A. (1991). Behaviour of a lCr-lMo-0.25V steel after long-
term exposure-I. Charpy impact toughness and creep properties, II. Creep crack
initiation and creep crack growth. Engineering Fracture Mechanics 14, 531-63.
Moore, H.F. & Kommers, J.B. (1927). The Fatigue of Metals. New York: McGraw-Hill.
Moore, H.F. & Seeley, F.B. (1915). The failure of metals under repeated stress. Proceedings of
the American Society for Testing and Materials 15, part 2, 437-66.
Moosbrugger, J.C. & McDowell, D.L. (1989). On a class of kinematic hardening rules for
nonproportional cyclic plasticity. Journal of Engineering Materials and Technology
111, 87-98.
Mori, H., Tokuwame, M. & Miyazaki, T. (1979). Cyclic deformation of silicon-iron single
crystals oriented for single glide. Philosophical Magazine A 40, 409-22.
Morlet, J.G., Johnson, H.H. & Troiano, A.R. (1958). A new concept of hydrogen
embrittlement in steel. Journal of Iron and Steel Institute 189, 37-44.
Morris, W.L. (1979). Microcrack closure phenomena for Al 2219-T851. Metallurgical
Transactions 10A, 5-11.
Morris, W.L. (1980). The noncontinuum crack tip deformation behavior of surface
microcracks. Metallurgical Transactions 11A, 1117-23.
Morris, W.L. & James, M.N. (1980). Statistical aspects of fatigue crack nucleation from
particles. Metallurgical Transactions 11A, 850-1.
Morrow, J.D. (1968). Fatigue Design Handbook-Advances in Engineering, vol. 4, Sec. 3.2, pp.
21-29. Warrendale, PA: Society of Automotive Engineers.
Mott, N.F. (1958). A theory of the origin of fatigue cracks. Acta Metallurgica 6, 195-7.
Mroz, Z. (1967). On the description of anisotropic work hardening. Journal of the Mechanics
and Physics of Solids 15, 163-75.
Mroz, Z. (1969). An attempt to describe the behavior of metals under cyclic loads using a more
general workhardening model. Acta Mechanica 7, 199-212.
Mudry, F. & Pineau, A. (1983). Rapport d'expertise corps MPT centrale de Violaines. Evry
Cedex, France: Ecole Nationale Superieure des Mines de Paris.
Mughrabi, H. (1978). The cyclic hardening and saturation behaviour of copper single crystals.
Materials Science and Engineering 33, 207-23.
Mughrabi, H. (1980). Microscopic mechanisms of metal fatigue. In The Strength of Metals and
Alloys (eds. P. Haasen, V. Gerold & G. Kostorz), vol. 3, pp. 1615-39. Oxford:
Pergamon Press.
Mughrabi, H. (1981). Cyclic plasticity of matrix and persistent slip bands in fatigued metals.
In Continuum Models of Discrete Systems 4 (eds. O. Brulin & R.K.T. Hsieh), pp.
241-57. London: North-Holland.
References
641
Mughrabi, H. (1983). Dislocation wall and cell structures and long-range internal stresses in
deformed metal crystals. Acta Metallurgica 31, 1367-79.
Mughrabi, H., Ackermann, F. & Herz, K. (1979). Persistent slip bands in fatigued face-
centered and body-centered cubic metals. In Fatigue Mechanisms, Special Technical
Publication 675, pp. 69-105. Philadelphia: American Society for Testing and
Materials.
Mughrabi, H., Herz, K. & Stark. X. (1976). The effect of strain-rate on the cyclic deformation
properties of or-iron single crystals. Acta Metallurgica 24, 659-68.
Mughrabi, H., Herz, K. & Stark, X. (1981). Cyclic deformation and fatigue behaviour of a-
iron mono- and polycrystals. International Journal of Fracture 17, 193-220.
Mughrabi, H. & Wang, R. (1981). Cyclic deformation of face-centered cubic polycrystals: a
comparison with observations of single crystals. In Deformation of Polycrystals:
Mechanisms and Microstructures (eds: N. Hansen, A. Horsewell, T. Leffers and H.
Lilholt), Proceedings of the Second Risoe International Symposium, pp. 87-98.
Roskilde, Denmark: Risoe National Laboratory.
Mughrabi, H., Wang, R., Differt, K. & Essmann, U. (1983). Fatigue crack initiation by cyclic
slip irreversibilities in high-cycle fatigue. In Quantitative Measurement of Physical
Damage (eds. J. Lankford, D.L. Davidson, W.L. Morris and R.P. Wei), Special
Technical Publication 811, pp. 5-45. Philadelphia, PA: American Society for Testing
and Materials.
Mughrabi, H. & Wiithrich, Ch. (1976). Asymmetry of slip and shape changes during cyclic
deformation of or-iron single crystals. Philosophical Magazine A 33, 963-84.
Murakami, Y, & Endo, M. (1986). Effects of hardness and crack geometries on AKth of small
cracks emanating from small defects. In The Behaviour of Short Fatigue Cracks,
Publication 1 of the European Group on Fracture, pp. 275-93. London: Mechanical
Engineering Publications.
Murakami, Y., Mura, T. & Kobayashi, M. (1988). Change of dislocation structures and
macroscopic conditions from initial state to fatigue crack nucleation. In Basic
Questions in Fatigue, Special Technical Publication 924, vol. I, pp. 39-63.
Philadelphia: American Society for Testing and Materials.
Murakami, Y., Sakae, C. & Ichimaru, K. (1994). Three-dimensional fracture mechanics
analysis of pit formation mechanism under lubricated rolling-sliding contact
loading. Tribology Transactions 37, 445-54.
Nabarro, F.R.N. (1952). Mathematical theory of stationary dislocations. Advances in Physics
1, 269-395.
Nayeb-Hashemi, H., McClintock, F.A. & Ritchie, R.O. (1983a). Micromechanical modelling
of mode III fatigue crack growth in rotor steels. International Journal of Fracture 23,
163-85.
Nayeb-Hashemi, H., McClintock, F.A. & Ritchie, R.O. (1983b). Influence of overloads and
block loading on mode III fatigue crack propagation in A469 rotor steel. Engineering
Fracture Mechanics 18, 736-83.
Nemat-Nasser, S. & Horii, H. (1982). Compression-induced nonplanar crack extension with
application to splitting, exfoliation and bursting. Journal of Geophysical Research 87,
6805-21.
Neuber, H. (1946). Theory of Notch Stresses: Principle for Exact Stress Calculations. Ann
Arbor, MI: Edwards.
642
References
Neuber, H. (1961). Theory of stress concentration for shear-strained prismatical bodies with
arbitrary nonlinear stress-strain law. Journal of Applied Mechanics 28, 544-50.
Neumann, P. (1968). Strain bursts and coarse slip during cyclic deformation. Zeitschrift fur
Metallkunde 59, 927-34.
Neumann, P. (1969). Coarse slip model of fatigue. Acta Metallurgica 17, 1219-25.
Neumann, P. (1974). Modelling of changes in dislocation structure in cyclically deformed
crystals. In Constitutive Equations in Plasticity (ed. A.S. Argon), pp. 251-326.
Cambridge, Mass.: MIT Press.
Neumann, P. (1983). Fatigue. In Physical Metallurgy (eds. R.W. Cahn & P. Haasen), pp.
1554-93. Amsterdam: Elsevier Science.
Neumann, P. (1986). Low energy dislocation configurations: a possible key to the
understanding of fatigue. Materials Science and Engineering 81, 465-75.
Neumann, P. & Tonnessen, A. (1988). Crack initiation at grain boundaries in FCC materials.
In Strength of Metals and Alloys (eds. P.O. Kettunen, T.K. Lepisto & M.E.
Lehtonen), vol. 1, pp. 743-8. Oxford: Pergamon Press.
Neumann, R. (1975). Probenformanderungen von Niob-einkristallen bei symmetrischer
Wechselbeanspruchung. Zeitschrift fur Metallkunde 66, 26-32.
Newman, J.C. (1971). An improved method of collocation for the stress analysis of cracked
plates with various shaped boundaries. National Aeronautics and Space
Administration Technical Note D-6376, Langley, Virginia.
Newman, J.C. (1976). A finite element analysis of fatigue crack closure. Mechanics of Fatigue
Crack Growth, Special Technical Publication 590, pp. 281-301. Philadelphia:
American Society for Testing and Materials.
Newman, J.C. (1983). A nonlinear fracture mechanics approach to the growth of small cracks.
In Behavior of Short Cracks in Airframe Components, Proceedings 328, pp. 6.1-20.
Neuilly sur Seine (France): Advisory Group for Aerospace Research and
Development.
Newman, J.C. & Elber, W. (1988). Editors, Mechanics of Fatigue Crack Closure, Special
Technical Publication 982. Philadelphia: American Society for Testing and
Materials.
Nicholas, T., Heil, M.L. & Haritos, G.K. (1989). Predicting crack growth under thermo-
mechanical loading. International Journal of Fracture 41, 157-76.
Nicholas, T., Laflen, J.H., and VanStone, R.H. (1986). A damage tolerant design approach to
turbine engine life prediction. Proceedings: Conference on Life Predidction for High-
Temperature Gas Turbine Materials (eds.V. Weiss and W. T. Bakker), pp. 4-1-4-61.
EPRI AP-4477, Syracuse, NY: Syracuse University,
Nine, H.D. (1973). Asymmetric deformation in fatigue of body-centered cubic single crystals.
Journal of Applied Physics 44, 4875-81.
Nisitani, H. & Takao, K. (1978). Fatigue crack acceleration and closure in rotating bending
tests of 0.54% carbon steel. Engineering Fracture Mechanics 10, 855-66.
Nowack, H., Trautmann, K.H., Schulte, K. & Liitjering, G. (1979). Sequence effects on
fatigue crack propagation; mechanical and microstructural contributions. In
Fracture Mechanics, Special Technical Publication 677, pp. 36-53. Philadelphia:
American Society for Testing and Materials.
References
643
O'Dowd, N.P. & Shih, C.F. (1991). Family of crack-tip fields characterized by a triaxiality
parameter: Part I - Structure of fields. Journal of the Mechanics and Physics of Solids
39, 989-1015.
O'Dowd, N.P. & Shih, C.F. (1992). Family of crack-tip fields characterized by a triaxiality
parameter: Part II - Fracture applications. Journal of the Mechanics and Physics of
Solids 40, 939-63.
Ogawa, T. (1992). Tensile fatigue crack growth of polycrystalline magnesia. In Fracture
Mechanics of Ceramics (eds. R.C. Bradt, D.P.H. Hasselman, D. Munz, M. Sakai
and V. Ya. Shevchenko), 9, pp. 455-64. New York: Plenum Press.
Ogura, T., Fukushima, K. & Masumoto, T. (1975). Propagation of fatigue cracks in
amorphous metals. Scripta Metallurgica 9, 979-83.
Ohji, K., Ogura, K. & Kubo, S. (1980). Stress field and modified J integral near a crack tip
under condition of confined creep deformation. Journal of the Society of Materials
Science Japan 29, 465-71.
Ohji, K., Ogura, K. & Yoshiji, O. (1975). Cyclic analysis of a propagating crack and its
correlation with fatigue crack growth. Engineering Fracture Mechanics 7, 457-64.
Ohji, T., Yamauchi, Y., Kanematsu, W. & Ito, S. (1990). Dependence of high-temperature
tensile strength on displacement rate for hot-pressed silicon nitride. Journal of
Materials Science 25, 2990-6.
Ohuchida, H., Usami, S. & Nishioka, A. (1975). Fatigue limit of steel with cracks. Bulletin of
the Japan Society of Mechanical Engineers 18, 1185-93.
Okazaki, M. & Koizumi, T. (1983). Effect of strain wave shape on thermal-mechanical fatigue
crack propagation in a cast low-alloy steel. Journal of Engineering Materials and
Technology 105, 81-7.
Olsson, M. (1998). Contact fatigue and tensile stresses. In Engineering Against Fatigue (eds:
R.A. Smith and T.C. Lindley), Proceedings of an International Conference,
Sheffield, March, 1997. In press.
Olsson, M., Giannakopoulos, A.E. & Suresh, S. (1995). Elastoplastic analysis of thermal
cycling: ceramic particles in a metallic matrix. Journal of the Mechanics and Physics
of Solids 43, 1639-71.
Oriani, R.A. & Josephic, P.H. (1974). Equilibrium aspects of hydrogen-induced cracking in
steels. Acta Metallurgica 22, 1065-77.
Orowan, E. (1952). Fundamentals of brittle behavior of metals. In Fatigue and Fracture of
Metals (ed. W. M. Murray), pp. 139-67. New York: Wiley.
Orowan, E. (1959). Causes and effects of internal stresses. In Internal Stresses and Fatigue in
Metals (eds. G.M. Rassweiler and W.L. Grube), pp. 59-80. New York: Elsevier.
Ortiz, M. & Giannakopoulos, A.E. (1990). Mixed-mode crack tip fields in monolithic
ceramics. International Journal of Solids and Structures 26, 705-23.
Ortiz, M. & Popov, E.P. (1982). A statistical theory of polycrystalline plasticity. Proceedings of
the Royal Society, London A379, 439-58.
Ortiz, M. & Suresh, S. (1993). Statistical properties of residual stresses and microfracture in
ceramic materials. Journal of Applied Mechanics 60, 244-9.
Osgood, C.C. (1982). Fatigue Design, 2nd edn. New York: Pergamon Press.
Palaniswamy, K. & Knauss, W.G. (1978). On the problem of crack extension in brittle solids
under general loading. In Mechanics Today (ed. S. Nemat-Nasser), pp. 87-148. New
York: Pergamon Press.
644
References
Palmgren, A. (1924). Die Lebensdauer von Kugellagern. Zeitschrift des Vereins Deutscher
Ingenieure 68, 339-41.
Papadopoulos, I.V., Davoli, P., Gorla, C, Filippini, M. & Bernasconi, A. (1997). A
comparative study of multiaxial high-cycle fatigue criteria for metals. International
Journal of Fatigue 19, 219-35.
Paris, P.C. (1960). The Growth of Cracks Due to Variations in Loads. Ph.D. Thesis. Bethlehem:
Lehigh University.
Paris, P.C, Bucci, R.J., Wessel, E.T., Clark, W.G. & Mager, T.R. (1972). Extensive study of
low fatigue crack growth rates in A533 and A508 steels. In Stress Analysis and
Growth of Cracks, Special Technical Publication 513, pp. 141-76. Philadelphia:
American Society for Testing and Materials.
Paris, P.C. & Erdogan, F. (1963). A critical analysis of crack propagation laws. Journal of
Basic Engineering 85, 528-34.
Paris, P.C, Gomez, M.P. & Anderson, W.P. (1961). A rational analytic theory of fatigue. The
Trend in Engineering 13, 9-14.
Parks, D.M. (1992). Advances in characterization of elastic-plastic crack-tip fields. In Topics
in Fracture and Fatigue (ed. A.S. Argon), pp. 59-98. Berlin: Springer-Verlag.
Partridge, P.G. (1969). Effect of cyclic stresses on the microstructures of hexagonal close
packed metals. Czech Journal of Physics B19, 323-32.
Pearson, S. (1975). Initiation of fatigue cracks in commercial aluminum alloys and the
subsequent propagation of very short cracks. Engineering Fracture Mechanics 7,
235-47.
Pelloux, R.M.N. (1969). Mechanisms of formation of ductile fatigue striations. Transactions of
the American Society for Metals 62, 281-5.
Pelloux, R.M.N. (1970). Crack extension by alternating shear. Engineering Fracture
Mechanics 1, 697-704.
Peralta, P., Llanes, L., Czapka, A. & Laird, C. (1995). The effect of texture and grain size as
independent factors in the cyclic behavior of polycrystalline copper. Scripta
Metallurgica et Materialia 32, 1877-81.
Petch, N.J. (1953). The cleavage strength of polycrystals. Journal of the Iron and Steel Institute
Y1A, 25-6.
Petch, N.J. (1956). Lowering of fracture stress due to surface adsorption. Philosophical
Magazine 1, 331-7.
Peterson, R.E. (1959). Notch sensitivity. In Metal Fatigue (eds. G. Sines and J.L. Waisman),
pp. 293-306. New York: McGraw-Hill.
Petit, J., Davidson, D.L., Suresh, S. & Rabbe, P. (1988). Editors, Fatigue Crack Growth under
Variable Amplitude Loading. London: Elsevier Applied Science.
Petroski, H. (1996). Invention by Design: How Engineers Get from Thought to Thing.
Cambridge, MA: Harvard University Press.
Pineau, A. (1983). High temperature fatigue behaviour of engineering materials in relation to
microstructure. In Fatigue at High Temperature (ed. R.P. Skelton), pp. 305-64.
London: Elsevier Applied Science.
Pineau, A. (1986). Short fatigue crack behavior in relation to three-dimensional aspects and
crack closure effect. In Small Fatigue Cracks (eds. R.O. Ritchie & J. Lankford), pp.
191-211. Warrendale: The Metallurgical Society of the American Institute of
Mining, Metallurgical and Petroleum Engineers.
References
645
Pineau, A.G. & Pelloux, R.M.N. (1974). Influence of strain-induced martensitic
transformations on fatigue crack growth rates in stainless steels. Metallurgical
Transactions 5A, 1103-12.
Pippan, R. (1987). The growth of short crack under cyclic compression. Fatigue and Fracture
of Engineering Materials and Structures 9, 319-28.
Plumtree, A. & Pawlus, L.D. (1988). Substructural developments during strain cycling of wavy
slip mode metals. In Basic Questions in Fatigue, Special Technical Publication 924,
vol. I, pp. 81-97. Philadelphia: American Society for Testing and Materials.
Pohl, K., Mayr, P. & Macherauch, E. (1980). Persistent slip bands in the interior of a fatigued
low carbon steel. Scripta Metallurgica 14, 1167-9.
Polak, J. (1970). The effect of intermediate annealing on the electrical resistivity and shear
stress of fatigued copper. Scripta Metallurgica 4, 761-4.
Polak, J., Klesnil, M. & Lukas, P. (1974). High cycle plastic stress-strain response of metals.
Materials Science and Engineering 15, 231-7.
Poncelet, J.V. (1839). Introduction a la Mecanique, Industrielle, Physique ou Experimentale.,
pp. 317-8. Deuxieme edition, Imprimerie de Gauthier-Villars, Paris.
Ponter, A.R.S., Hearle, A.D. & Johnson, K.L. (1985). Application of the kinematical
shakedown theorem to rolling and sliding point contacts. Journal of the Mechanics
and Physics of Solids 33, 339-62.
Pook, L.P. (1985). The fatigue crack direction and threshold behaviour of mild steel under
mixed mode I and III loading. International Journal of Fatigue 7, 21-30.
Pops, H. (1970). Stress-induced psuedo-elasticity in ternary Cu-Zn based beta prime phase
alloys. Metallurgical Transactions 1A, 251-8.
Porter, J. & Levy, J.C. (1960). The fatigue curves of copper. Journal of the Institute of Metals
89, 86-9.
Prager, W. (1956). A new method of analyzing stresses and strains in work-hardening of
plastic solids. Journal of Applied Mechanics 23, 493-6.
Pratt, J.E. (1967). Dislocation sub-structure in strain-cycled copper as influenced by
temperature. Acta Metallurgica 15, 319-27.
Pruitt, L., Koo, J., Rimnac, CM., Suresh, S. & Wright, T.M. (1995). Cyclic compressive
loading results in fatigue cracks in ultra-high molecular weight polyethylene. Journal
of Bone Joint Surgery 13, 143-6.
Pruitt, L. & Suresh, S. (1993). Cyclic stress fields for fatigue cracks in amorphous solids-
Experimental measurements and their implications. Philosophical Magazine A 67,
1219-45.
Qian, J. & Fatemi, A. (1996). Mixed-mode fatigue crack growth: a literature survey.
Engineering Fracture Mechanics 55, 969-90.
Rabinowitz, S. & Beardmore, P. (1974). Cyclic deformation and fracture of polymers. Journal
of Materials Science 9, 81-99.
Ramamurty, U., Hansson, T. & Suresh, S. (1994). mechanisms of high-temperature crack
growth in monolithic and SiC-reinforced Si3N4 under static and cyclic loads. Journal
of the American Ceramic Society 77, 2985-99.
Ramamurty, U., Suresh, S., & Petrovic, J.J. (1994). The effect of carbon addition on elevated
temperature crack growth resistance in (Mo,W)Si2-SiCp composite. Journal of the
American Ceramic Society 11, 2681-88.
646
References
Rankine, W.J.M. (1843). On the causes of unexpected breakage of the journals of railway
axles and the means of preventing such accidents by observing the law of continuity
in their construction. Proceedings of the Institute of Civil Engineers, London 2, 105-8.
Reece, M.J., Guiu, F. & Sammur, M.F.R. (1989). Cyclic fatigue crack propagation in alumina
under direct tension-compression loading. Journal of the American Ceramic Society
72, 348-52.
Reid, C.N., Williams, K. & Hermann, R. (1979). Fatigue in compression. Fatigue of
Engineering Materials and Structures 1, 267-70.
Remy, L., Pineau, A. & Thomas, B. (1978). Temperature dependence of stacking fault energy
in close-packed metals and alloys. Materials Science and Engineering 36, 47-63.
Repetto, E.A. & Ortiz, M. (1997). A micromechanical model of cyclic deformation and fatigue
crack nucleation in f.c.c. single crystals. Acta Materialia 45, 2577-95.
Rice, J.R. (1967). Mechanics of crack tip deformation and extension by fatigue. In Fatigue
Crack Propagation, Special Technical Publication 415, pp. 247-309. Philadelphia:
American Society for Testing and Materials.
Rice, J.R. (1968). A path independent integral and the approximate analysis of strain
concentrations by notches and cracks. Journal of Applied Mechanics 35, 379-86.
Rice, J.R. (1971). Inelastic constitutive relations for solids: an internal-variable theory and its
applications to metal plasticity. Journal of the Mechanics and Physics of Solids 19,
433-57.
Rice, J.R. (1974). Limitations to the small scale yielding approximation for crack tip plasticity.
Journal of the Mechanics and Physics of Solids 22, 17-26.
Rice, J.R. (1985). First order variations in elastic fields due to variation in location of a planar
crack front. Journal of Applied Mechanics 52, 571-9.
Rice, J.R., Drugan, W.J. & Sham, T.-L. (1980). Elastic-plastic analysis of growing cracks. In
Fracture Mechanics: Twelfth Conference, Special Technical Publication 700, pp. 189-
221. Philadelphia: American Society for Testing and Materials.
Rice, J.R. & Rosengren, G.F. (1968). Plane strain deformation near a crack tip in a power law
hardening material. Journal of the Mechanics and Physics of Solids 16, 1-12.
Rich, D.L., Pinckert, R.E. & Christian, T.F. (1986). Fatigue and fracture mechanics analysis
of compression loaded aircraft structure. In Case Histories Involving Fatigue and
Fracture Mechanics, Special Technical Publication 918, pp. 243-58. Philadelphia:
American Society for Testing and Materials.
Richards, C.E. & Lindley, T.C. (1972). The influence of stress intensity and microstructure on
fatigue crack propagation in ferritic materials. Engineering Fracture Mechanics 4,
951-78.
Ricker, R.E. & Duquette, D.J. (1988). The role of hydrogen in corrosion fatigue of high purity
Al-Zn-Mg exposed to water vapor. Metallurgical Transactions 19A, 1775-83.
Riddell, M.N., Koo, G.P. & O'Toole, J.L. (1967). Fatigue mechanisms in thermoplastics.
Polymer Engineering and Science 6, 363-8.
Riedel, H. (1983). Crack tip stress fields and crack growth under creep-fatigue conditions. In
Elastic Plastic Fracture, Special Technical Publication 803, vol. I, pp. 505-20.
Philadelphia: American Society for Testing and Materials.
Riedel, H. (1987). Fracture at High Temperatures. Berlin: Springer-Verlag.
References
647
Riedel, H. & Rice, J.R. (1980). Tensile cracks in creeping solids. In Fracture Mechanics:
Twelfth Conference, Special Technical Publication 700, pp. 112-30. Philadelphia:
American Society for Testing and Materials.
Rimnac, CM., Hertzberg, R.W. & Manson, J.A. (1983). In Fatigue in Polymers, pp. 9.1-9.10.
London: Plastics and Rubber Institute.
Rimnac, CM., Wright, T.M., Bartel, D.L. & Burstein, A.H. (1986). Failure analysis of a total
hip femoral component: A fracture mechanics approach. In Case Histories Involving
Fatigue and Fracture Mechanics, Special Technical Publication 918, pp. 377-88.
Philadelphia: American Society for Testing and Materials.
Ritchie, R.O. (1979). Near-threshold fatigue-crack propagation in steels. International Metals
Reviews 20, 205-30.
Ritchie, R.O. (1996). Fatigue and fracture of pyrolytic carbon: a damage-tolerant approach to
structural integrity and life prediction in "ceramic^ heart valve prosthesis. Journal
of Heart Valve Disease 5, Supplement 1, S-9-S-31.
Ritchie, R.O. & Knott, J.F. (1973). Mechanisms of fatigue crack growth in a low alloy steel.
Acta Metallurgica 21, 639-50.
Ritchie, R.O. & Lankford, J. (1986). Editors, Small Fatigue Cracks. Warrendale: The
Metallurgical Society of the American Institute of Mining, Metallurgical and
Petroleum Engineers.
Ritchie, R.O. & Suresh, S. (1981). Some considerations on fatigue crack closure at near-
threshold stress intensities due to fracture surface morphology. Metallurgical
Transactions 13A, 937-40.
Ritchie, R.O., Suresh, S. & Moss, CM. (1980). Near-threshold fatigue crack growth in 2\ Cr-
1 Mo pressure vessel steel in air and hydrogen. Journal of Engineering Materials and
Technology 102, 293-9.
Rivlin, R.S. & Thomas, A.G. (1953). Rupture of rubber. I. Characteristic energy for tearing.
Journal of Polymer Science 10, 291-318.
Roebben, G., Steen, M., Bressers, J. & Van der Biest, O. (1996). Mechanical fatigue in
monolithic non-transforming ceramics. Progress in Materials Science 40, 265-331.
Rooke, D.R. & Cartwright, D.J. (1976). Compendium of Stress Intensity Factors. Uxbridge:
Hillingdon Press.
Roven, H.J., Langoy, M.A. & Nes, E. (1987). Striations and the fatigue crack growth
mechanism in a micro-alloyed steel. In Fatigue '87 (eds. R.O. Ritchie & E.A. Starke),
vol. I, pp. 175-84. Warley: Engineering Materials Advisory Services.
Riihle, M., Clausen, N. & Heuer, A. (1986). Transformation and microcrack toughening as
complementary processes in Zr02-toughened Al203. Journal of the American
Ceramic Society 69, 195-7.
Ruiz, C, Boddington, P.H.B. & Chen, K.C. (1984). An investigation of fatigue and fretting in
a dovetail joint. Experimental mechanics 24, 208-17.
Ruppen, J., Bhowal, P., Eylon, D. & McEvily, A.J. (1979). On the process of subsurface
fatigue crack initiation in Ti-6A1-4V. In Fatigue Mechanisms, Special Technical
Publication 675, pp. 47-68. Philadelphia: American Society for Testing and
Materials.
Ryder, D.A. & Lynch, S.P. (1977). The effect of environment and frequency on crack
nucleation, stage I and stage II crack growth in two aluminium zinc magnesium
648
References
alloys. In The Influence of Environments on Fatigue, pp. 21-6. London: The Institute
of Mechanical Engineers.
Ryder, D.A., Martin, M. & Abdullah, M. (1977). Some factors influencing stage I fatigue
crack growth. Journal of Metal Science 11, 340-4.
Saal, H. (1971). Fatigue crack growth in notched parts with a compressive mean load. Journal
of Basic Engineering 93, 1-6.
Sackfield, A. & Hills, D.A. (1983). A note on the Hertz contact problem: a correlation of
standard formulae. Journal of Strain Analysis 18, 195-7.
Sadananda, K. & Shahinian, P. (1977). Prediction of threshold stress intensity for fatigue
crack growth using a dislocation model. International Journal of Fracture 13,
585-94.
Sadananda, K. & Shahinian, P. (1979). A fracture mechanics approach to high temperature
fatigue crack growth in Udimet 700. Engineering Fracture Mechanics 11, 73-86.
Sadananda, K. & Shahinian, P. (1981). Creep-fatigue crack growth. In Cavities and Cracks in
Creep and Fatigue (ed. J. Gittus), pp. 109-95. London: Elsevier Applied Science.
Saga, J., Hayashi, M. & Nishio, Y. (1977). Effect of grain size on fatigue damage in pure
aluminum. Journal of the Society of Materials Science Japan 26, 289-95.
Sanders, J.L. (1960). On the Griffith-Irwin fracture theory. Journal of Applied Mechanics 27,
352-3.
Sandor, B.I. (1972). Fundamentals of Cyclic Stress and Strain. Madison: University of
Wisconsin Press.
Sargent, CM. & Purdy, G.R. (1974). Dissolution of small precipitates. Scripta Metallurgica
8, 569-72.
Sauer, J.A. (1978). Static and dynamic properties of monodisperse polystyrenes: Influence of
molecular weight. Polymer 19, 859-60.
Sauer, J.A., Foden, E. & Morrow, D.R. (1977). The influence of molecular weight on fatigue
behavior of polyethylene and polystyrene. Polymer Engineering and Science 17,
246-50.
Saxena, A. (1988). A model for predicting the effect of frequency on fatigue crack growth at
elevated temperature. Fatigue of Engineering Materials and Structures 3, 247-55.
Saxena, A., Hudak, S.J., Donald, J.K. & Schmidt, D.W. (1978). Computer-controlled
decreasing stress intensity technique for low rate fatigue crack growth testing.
Journal of Testing and Evaluation 6, 167-74.
Saxena, A., Wilson, W.K., Roth, L.D. & Liaw, P.K. (1985). The behavior of small fatigue
cracks at notches in corrosive environments. International Journal of Fracture 28,
69-82.
Schijve, J. (1973). Effect of load sequences on crack propagation under random and program
loading. Engineering Fracture Mechanics 5, 269-80.
Schijve, J. (1974). Fatigue damage accumulation and incompatible crack front orientation.
Engineering Fracture Mechanics 6, 245-52.
Schijve, J. (1980). Prediction methods for fatigue crack growth in aircraft material. In Fracture
Mechanics: Twelfth Conference, Special Technical Publication 700, pp. 3-34.
Philadelphia: American Society for Testing and Materials.
Schijve, J. (1982). Differences between the growth of small and large fatigue cracks in relation
to threshold K values. In Fatigue Thresholds (eds. J. Backlund, A.F. Blom & C.J.
Beevers), vol. 2, pp. 881-908. Warley: Engineering Materials Advisory Services.
References
649
Schmidt, R.A. & Paris, P.C. (1973). Threshold for fatigue crack propagation and the effects of
load ratio and frequency. In Progress in Flaw Growth and Fracture Testing, Special
Technical Publication 536, pp. 79-94. Philadelphia: American Society for Testing
and Materials.
Schiitz, W. (1996). A history of fatigue. Engineering Fracture Mechanics 54, 263-300.
Sensmeier, M.D. & Wright, P.K. (1990). The effect of fiber bridging on fatigue crack growth in
titanium matrix composites. In Fundamental Relationships between Microstructures
and Mechanical Properties of Metal Matrix Composites (eds. P.K. Liaw & M.N.
Gungor), pp. 441-57. Warrendale: The Minerals, Metals and Materials Society.
Shang, J.K. & Ritchie, R.O. (1989). On the particle-size dependence of fatigue-crack
propagation thresholds in SiC-particulate-reinforced aluminum-alloy composites:
role of crack closure and crack trapping. Acta Metallurgica 37, 2267-78.
Sharma, S.M. & Aravas, N. (1991). Determination of higher-order terms in asymptotic
elastoplastic crack tip solutions. Journal of the Mechanics and Physics of Solids 39,
1043-72.
Sheldon, G.P., Cook, T.S., Jones, T.W. & Lankford, J. (1981). Some observations on small
fatigue cracks in a superalloy. Fatigue of Engineering Materials and Structures 3,
219-28.
Shen, H., Podlaseck, S.E. & Kramer, I.R. (1966). Effect of vacuum on the fatigue life of
aluminum. Acta Metallurgica 14, 341-6.
Shield, R.T. (1955). On plastic flow of metals under conditions of axial symmetry. Proceedings
of the Royal Society, London A223, 267-87.
Shih, C.F. (1973). Elastic-plastic analysis of combined mode crack problems, Ph.D. Thesis.
Cambridge, Mass.: Harvard University.
Shih, C.F. (1974). Small-scale yielding analysis of mixed-mode plane strain crack problems. In
Fracture Analysis, Special Technical Publication 560, pp. 187-210. Philadelphia:
American Society for Testing and Materials.
Shih, C.F. (1981). Relationships between the 7-integral and the crack opening displacement
for stationary and extending cracks. Journal of the Mechanics and Physics of Solids
29, 305-26.
Shute, N. (1948). No Highway. London: Heinemann.
Sih, G.C. (1973). Handbook of Stress Intensity Factors. Bethlehem: Lehigh University.
Sih, G.C. (1974). Strain-energy-density factor applied to mixed-mode crack problems.
International Journal of Fracture 10, 305-20.
Sines, G. (1959). Behavior of metals under complex static and alternating stresses. In Metal
Fatigue (eds. G. Sines and J.L. Waisman), pp. 145-69. New York: McGraw-Hill.
Skelton, R.P. (1983). Editor, Fatigue at High Temperature. London: Elsevier Applied Science.
Skelton, R.P. & Haigh, J.R. (1978). Fatigue crack growth rates and thresholds in steels under
oxidising conditions. Materials Science and Engineering 36, 17-25.
Skibo, M.D., Hertzberg, R.W. & Manson, J.A. (1976). Fatigue fracture processes in
polystyrene. Journal of Materials Science 11, 479-90.
Skibo, M.D., Hertzberg, R.W., Manson, J.A. & Kim, S. (1977). On the generality of
discontinuous fatigue crack growth in glassy polymers. Journal of Materials Science
12, 531^t2.
Smith, J.H. (1910). Some experiments on the fatigue of metals. Journal of Iron and Steel
Institute 91, 365-97.
650
References
Smith, J.H. & Wedgwood, G.A. (1915). Stress-strain loops for steel in the cyclic state. Journal
of Iron and Steel Institute 82, 246-318.
Smith, M.C. & Smith, R.A. (1988). Toward an understanding of mode II fatigue crack
growth. In Basic Questions in Fatigue: Volume I, Special Technical Publication 924,
pp. 260-80. Philadelphia: American Society for Testing and Materials.
Smith, R.A. (1990). The Versailles railway accident of 1842 and the first research into metal
fatigue. In Fatigue 90 (eds. H. Kitagawa & T. Tanaka), vol. IV, pp. 2033-41.
Birmingham: Materials and Component Engineering Publications.
Smith, R.A. & Miller, K.J. (1978). Prediction of fatigue regimes in notched components.
Journal of Mechanical Engineering Science 20, 201-6.
Smith, R.N., Watson, P. & Topper, T.H. (1970). A sress-strain parameter for the fatigue of
metals. Journal of Materials 5, 767-78.
Sobczyk, K. & Spencer, B.F. (1992). Random fatigue: from data to theory. San Diego, CA:
Academic Press.
Sobeyejo, W.O., Lederich, R.J. & Sastry, S.M.L. (1995). Mechanical behavior of damage
tolerant TiB whisker-reinforced in-situ titanium matrix composites. Acta
Metallurgica et Materialia 42, 2579-91.
Socie, D.F. (1977). Prediction of fatigue crack growth in notched members under variable
amplitude loading histories. Engineering Fracture Mechanics 9, 849-65.
Socie, D. (1993). Critical plane approaches for multiaxial fatigue damage assessment. In
Advances in Multiaxial Fatigue (eds: D.L. McDowell and R. Ellis), Special Technical
Publication 1191, pp. 7-36. Philadelphia, PA: American Society for Testing and
Materials.
Socie, D. & Shield, T.W. (1984). Mean stress effects in biaxial fatigue of Inconel 718. Journal
of Engineering Materials and Technology, 106, 227-32.
Soderberg, C.R. (1939). Factor of safety and working stress. Transactions of the American
Society of Mechanical Engineers 52, 13-28.
Sproles, F.S. & Duquette, D.J. (1978). The mechanism of material removal in fretting. Wear
49, 339-52.
Starke, E.A. & Williams, J.C. (1989). Microstructure and the fracture mechanics of fatigue
crack propagation. In Fracture Mechanics: Perspectives and Directions, Special
Technical Publication 1020, pp. 184-205. Philadelphia: American Society for Testing
and Materials.
Stevenson, R. & Vander Sande, J.B. (1974). The cyclic deformation of magnesium single
crystals. Acta Metallurgica 22, 1079-86.
Stewart, A.T. (1980). The influence of environment and stress ratio on fatigue crack growth at
near-threshold stress intensities in low alloy steels. Engineering Fracture Mechanics
13, 463-78.
Stoloff, N.S. & Johnston, T.L. (1963). Crack propagation in liquid metal environment. Acta
Metallurgica 11, 251-6.
Stoltz, R.E. & Pelloux, R.M.N. (1976). The Bauschinger effect in preci-pitation strengthened
aluminum alloys. Metallurgical Transactions 7A, 1295-306.
Stoney, G.G. (1909). The tension of metallic films deposited by electrolysis. Proceedings of the
Royal Society, London A82, 172-5.
References
651
Stulen, F.B. & Cummings, H.N. (1954). A failure criterion for multiaxial fatigue stresses.
Special Technical Publication 54, pp. 822-35. Philadelphia: American Society for
Testing and Materials.
Subramanium, K.N. & Washburn, J. (1963). Fatigue deformation of magnesium oxide.
Journal of Applied Physics 34, 3394-7.
Sugimura, Y., Grondin, L.& Suresh, S. (1995). Fatigue crack growth at arbitrary angles to
bimaterial interfaces. Scripta Metallurgica et Materialia 33, 2007-12.
Sugimura, Y., Lim, P.G., Shih, C.F. & Suresh, S. (1995). Fracture normal to a bimaterial
interface: effects of plasticity on crack-tip shielding and amplification. Acta
Metallurgica et Materialia 43, 1157-69.
Sugimura, Y. & Suresh, S. (1992). Effects of SiC content on fatigue crack growth in aluminum
alloys reinforced with SiC particles. Metallurgical Transactions A 23A, 2231-42.
Sunder, R., Seetharam, S.A. & Bhaskaran, T.A. (1984). Cycle counting for fatigue crack
growth analysis. International Journal of Fatigue 6, 147-56.
Suresh, S. (1983a). Crack deflection: implications for the growth of long and short fatigue
cracks. Metallurgical Transactions 14A, 2375-85.
Suresh, S. (1983b). Micromechanisms of fatigue crack growth retardation following overloads.
Engineering Fracture Mechanics 18, 577-93.
Suresh, S. (1985a). Fatigue crack deflection and fracture surface contact: micromechanical
models. Metallurgical Transactions 16A, 249-60.
Suresh, S. (1985b). Crack initiation in cyclic compression and its applications. Engineering
Fracture Mechanics 21, 453-63.
Suresh, S. (1990a). Mechanics and micromechanisms of fatigue crack growth in brittle solids.
International Journal of Fracture 42, 41-56.
Suresh, S. (1990b). Fatigue crack growth in ceramic materials at ambient and elevated
temperatures. In Fatigue 90 (eds. H. Kitagawa & T. Tanaka), vol. II, pp. 759-68.
Birmingham: Materials and Components Engineering Publications.
Suresh, S. & Brockenbrough, J.R. (1988). Theory and experiments of fracture in cyclic
compression: single phase ceramics, transforming ceramics and ceramic composites.
Acta Metallurgica 36, 1455-70.
Suresh, S. & Brockenbrough, J.R. (1990). Cyclic damage zones ahead of tensile fatigue cracks
in ceramic materials. In Fatigue 90 (eds. H. Kitagawa & T. Tanaka), vol. II, pp. 739-
44. Birmingham: Materials and Components Engineering Publications.
Suresh, S., Christman, T. & Bull, C. (1986). Crack initiation and growth under far-field cyclic
compression: Theory, experiments and applications. In Small Fatigue Cracks (eds.
R.O. Ritchie & J. Lankford), pp. 513-40. Warrendale: The Metallurgical Society of
the American Institute of Mining, Mineral and Petroleum Engineers.
Suresh, S., Giannakopoulos, A.E. & Olsson, M. (1994). Elastoplastic analysis of thermal
cycling: layered materials with sharp interfaces. Journal of the Mechanics and Physics
of Solids 42, 979-1018.
Suresh, S., Parks, D.M. & Ritchie, R.O. (1982). Crack tip oxide formation and its influence on
fatigue thresholds. In Fatigue Thresholds (eds. A. F. Blom, J. Backlund & C.J.
Beevers), vol. 1, pp. 391-408. Warley: Engineering Materials Advisory Services.
Suresh, S. & Ritchie, R.O. (1981). On the influence of fatigue underloads on cyclic crack
growth at low stress intensities. Materials Science and Engineering 51, 61-9.
652
References
Suresh, S. & Ritchie, R.O. (1982a). A geometric model for fatigue crack closure induced by
fracture surface morphology. Metallurgical Transactions 13A, 1627-31.
Suresh, S. & Ritchie, R.O. (1982b). Mechanistic dissimilarities between environmentally-
influenced fatigue-crack propagation at near-threshold and higher growth rates in
lower strength steels. Metal Science 16, 529-38.
Suresh, S. & Ritchie, R.O. (1984a). Near-threshold fatigue crack propagation: a perspective on
the role of crack closure. In Fatigue Crack Growth Threshold Concepts (eds. D.L.
Davidson & S. Suresh), pp. 227-61. Warrendale: The Metallurgical Society of the
American Institute of Mining, Mineral and Petroleum Engineers.
Suresh, S. & Ritchie, R.O. (1984b). Propagation of short fatigue cracks. International Metals
Reviews 29, 445-76.
Suresh, S. & Shih, C.F. (1986). Plastic near-tip fields for branched cracks. InternationalJournal
of Fracture 30, 237-59.
Suresh, S., Shih, C.F., Morrone, A. & O'Dowd, N.P. (1990). Mixed-mode fracture toughness
of ceramic materials. Journal of the American Ceramic Society 73, 1257-67.
Suresh, S., Sugimura, Y. & Tschegg, E.K. (1992). Growth of a fatigue crack approaching a
perpendicularly-oriented bimaterial interface. Scripta Metallurgica et Materialia 27,
1189-94.
Suresh, S., Sugimura, Y. & Ogawa, T. (1993). Fatigue cracking in materials with brittle surface
coatings. Scripta Metallurgica et Materialia 29, 237-42.
Suresh, S., Tschegg, E.K. & Brockenbrough, J.R. (1989). Crack growth in cementitious
materials under cyclic compressive loads. Journal of Cement and Concrete Research
19, 827-33.
Suresh, S., Vasudevan, A.K. & Bretz, P.E. (1984). Mechanisms of slow fatigue crack growth in
high strength aluminum alloys: Role of microstructure and environment.
Metallurgical Transactions 15A, 369-79.
Suresh, S., Vasudevan, A.K., Tosten, M.H. & Howell, P.R. (1987). Microscopic and
macroscopic aspects of fracture in lithium-containing aluminum alloys. Acta
Metallurgica 35, 25-46.
Suresh, S., Zamiski, G.F. & Ritchie, R.O. (1981). Oxide-induced crack closure: an explanation
for near-threshold corrosion fatigue crack growth behavior. Metallurgical
Transactions 12A, 1435-43.
Suzuki, H. & McEvily, A.J. (1979). Microstructural effects on fatigue crack growth in low
carbon steels. Metallurgical Transactions 10A, 475-81.
Swain, M.V. & Zelizko, V. (1988). Comparison of static and cyclic fatigue on Mg-PSZ alloys.
In Advances in Ceramics-Science and Technology of Zirconia III (eds. S. Somiya, N.
Yamamoto & H. Yanagida), vol. 24, pp. 595-606. Westerville: American Ceramic
Society.
Sylva, L.A. & Suresh, S. (1989). Crack growth in transforming ceramics under cyclic tensile
loads. Journal of Materials Science 24, 1729-38.
Szolwinski, M.P. & Farris, T.N. (1996). Mechanics of fretting fatigue crack formation. Wear
198, 93-107.
Tabor, D. (1951). Hardness of Metals. Oxford: Oxford University Press.
Tabor, D. (1955). The mechanism of rolling friction: the elastic range. Proceedings of the Royal
Society, London A251, 378-90.
References
653
Tada, H., Paris, P.C. & Irwin, G.R. (1973). Stress Analysis of Cracks Handbook. Hellertown,
PA: Del Research Corporation.
Taira, S., Inoue, T. & Yoshida, T. (1968). Low cycle fatigue under multiaxial stresses. In
Proceedings of the Eleventh Japan Congress on Materials Research, pp. 60-65. Kyoto:
Japan Society of Materials Science.
Taira, S. & Tanaka, K. (1979). Local residual stress near fatigue crack tip. Transactions of the
Iron and Steel Institute of Japan 19, 411-18.
Taira, S., Tanaka, K. & Hoshina, M. (1979). Grain size effect on crack nucleation and growth
in long-life fatigue of low carbon steel, In Fatigue Mechanisms, Special Technical
Publication 675, pp. 135-73. Philadelphia: American Society for Testing and
Materials.
Takemori, M.T. (1982). Fatigue fracture of polycarbonate. Polymer Engineering and Science
22, 937-45.
Takemori, M.T. (1984). Polymer fatigue. Annual Review of Materials Science 14, 171-204.
Takemori, M.T. (1990). Competition between crazing and shear flow during fatigue. In
Advances in Polymer Science (ed. H.H. Kausch), vol. 91/92, pp. 263-300. Berlin:
Springer-Verlag.
Takemori, M.T. & Kambour, R.P. (1981). Discontinuous fatigue crack growth in
polycarbonate. Journal of Materials Science 16, 1108-10.
Talreja, R. (1987). Fatigue of Composite Materials. Lancaster, PA: Technomic.
Tanaka, K. (1974). Fatigue crack propagation from a crack inclined to the cyclic tensile axis.
Engineering Fracture Mechanics 6, 493-507.
Tanaka, K., Hojo, M. & Nakai, Y. (1983). Crack initiation and early propagation in 3%
silicon iron. In Fatigue Mechanisms: Advances in Quantitative Measurement of
Fatigue Damage, Special Technical Publication 811, pp. 207-32. Philadelphia:
American Society for Testing and Materials.
Tanaka, K. & Mura, T. (1981). A dislocation model for fatigue crack initiation. Journal of
Applied Mechanics 48, 97-102.
Tanaka, K. & Mura, T. (1982). A theory of fatigue crack initiation at inclusions.
Metallurgical Transactions 13A, 117-23.
Tanaka, K. & Nakai, Y. (1983). Propagation and non-propagation of short fatigue cracks at a
sharp notch. Fatigue of Engineering Materials and Structures 6, 315-27.
Tanaka, K., Nakai, Y. & Yamashita, M. (1981). Fatigue growth threshold of small cracks.
International Journal of Fracture 17, 519-33.
Tangjitham, S. & Landgraf, R.W. (1993). Probability based methods for fatigue analysis. In
Fatigue Research and Applications, Special Publication 1009, pp. 225-35.
Warrendale, PA: Society of Automotive Engineers.
Taylor, D. (1989). Fatigue Thresholds. London: Butterworths.
Taylor, D. & Knott, J.F. (1981). Fatigue crack propagation behavior of short cracks: the
effects of microstructure. Fatigue of Engineering Materials and Structures 4, 147-55.
Taylor, G.I. (1934). The mechanism of plastic deformation of crystals. Part I. Theoretical.
Proceedings of the Royal Society, London A145, 362-87.
Tennekes, H. (1996). The Simple Science of Flight: From Insects to Jumbo Jets. Cambridge,
MA: The Massachusetts Institute of Technology Press.
Teodosiu, C. (1982). Elastic Models of Crystal Defects. New York, NY: Springer-Verlag.
654
References
Thompson, N., Wadsworth, N.J. & Louat, N. (1956). The origin of fatigue fracture in copper.
Philosophical Magazine 1, 113-26.
Thouless, M.D. (1988). Bridging and damage zones in crack growth. Journal of the American
Ceramic Society 71, 408-13.
Thum, A. (1939). Festigkeitspriifung bei schwingender Beanspruchung. Siebel, Handbuch der
Werkstoffpriifung, 2. Bd. S. 175/231. Berlin: Verlag Springer.
Timoshenko, S. & Goodier, J.N. (1951). Theory of Elasticity, 3rd edition. New York:
McGraw-Hill.
Tomkins, B. & Wareing, J. (1977). Elevated temperature fatigue interactions in engineering
materials. Metal Science 11, 414-24.
Tomlinson, G.A. (1927). The rusting of steel surfaces in contact. Proceedings of the Royal
Society, London A115, 472-83.
Topper, T.H., Sandor, B.I. & Morrow, J. (1969). Cumulative damage under cyclic strain
control. Journal of Materials 4, 189-99.
Topper, T.H. & Yu, M.T. (1985) The effect of overloads on threshold and crack growth.
International Journal of Fatigue 7, 159-64.
Tschegg, E.K. (1983a). Mode III and Mode I fatigue crack propagation behaviour under
torsional loading. Journal of Materials Science 18, 1604-14.
Tschegg, E.K. (1983b). Sliding mode crack closure and mode III fatigue crack growth in mild
steel. Acta Metallurgica 31, 1323-30.
Tschegg, E.K. (1983c). The influence of the static load mode I and R ratio on mode III fatigue
crack growth behaviour in mild steel. Materials Science and Engineering 59, 127-37.
Tschegg, E.K. & Stanzl, S. (1981). Fatigue crack propagation and threshold in b.c.c. and fee.
metals at 77 and 293 K. Acta Metallurgica 29, 33-40.
Tschegg, E.K. & Stanzl, S.E. (1988). The significance of sliding mode crack closure on mode
III fatigue crack growth. In Basic Questions in Fatigue: Volume I, Special Technical
Publication 924, pp. 214-32. Philadelphia: American Society for Testing and
Materials.
Tschegg, E.K. & Suresh, S. (1988). Mode III fracture of 4340 steel: effects of tempering
temperature and fracture surface interference. Metallurgical Transactions 19A,
3035-44.
Tu, L.K.L. & Seth, B.B. (1978). Threshold corrosion fatigue crack growth in steels. Journal of
Testing and Evaluation 6, 66-74.
Tzou, J.-L., Suresh, S. & Ritchie, R.O. (1985). Fatigue crack propagation in oil environments:
I. Crack growth behavior in silicone and paraffin oils. Acta Metallurgica 33, 105-16.
Usami, S. (1982). Application of threshold cyclic-plastic-zone-size criterion to some fatigue
limit problems. In Fatigue Thresholds (eds. J. B acklund, A.F. Blom & C.J. Beevers),
pp. 205-38. Warley: Engineering Materials Advisory Services.
Usami, S. & Shida, S. (1979). Elastic-plastic analysis of the fatigue limit for a material with
small flaws. Fatigue of Engineering Materials and Structures 1, 471-81.
Valanis, K.C. (1980). Fundamental consequence of a new intrinsic time measure- Plasticity as
a limit of the endocronic theory. Archives of Mechanics 32, 171-91.
Vasudevan, A.K. & Doherty, R. (1987). Grain boundary ductile fracture in precipitation
hardened aluminum alloys. Acta Metallurgica 35, 1193-219.
Vasudevan, A.K., Liu, J. & Ricker, R.E. (1987). Mechanism of stress corrosion crack growth
resistance of Al-Li-Cu alloys: Role of grain boundary precipitates. In Environmental
References
655
Degradation of Engineering Materials (eds. M.R. Louthan, R.P. McNitt & R.D.
Sisson), pp. 321-7. University Park: Pennsylvania State University.
Vasudevan, A.K. & Sadananda, K. (1995). Classification of fatigue crack growth behavior.
Metallurgical Transaction 26A, 1221-34.
Vasudevan, A.K. & Suresh, S. (1982). Influence of corrosion deposits on near-threshold
fatigue crack growth behavior in 2XXX and 7XXX series aluminum alloys.
Metallurgical Transactions 13A, 2271-80.
Veers, P.S. (1996). Statistical considerations in fatigue. In Fatigue and Fracture, ASM
Handbook, Vol. 19, pp. 295-302. Materials Park, OH: The American Society of
Materials, International.
Venkataraman, G., Chung, Y.-W., Nakasone, Y. & Mura, T. (1990). Free energy formulation
of fatigue crack initiation along persistent slip bands: calculation of S-N curves and
crack depths. Acta Metallurgica et Materialia 38, 31-40.
Vingsbo, O. & Soderberg, D. (1988). On fretting maps. Wear 126, 131-47.
Vosikovsky, O. (1976). Fatigue crack growth in an X65 pipe-line steel in sour crude oil.
Corrosion 32, 472-5.
Voss, H. & Walter, R. (1985). Fracture and fatigue of short glass-fibre reinforced
polyethersulfone composites. Journal of Materials Science Letters 4, 1174-7.
Wagner, L., Gregory, J.K., Gysler, A. & Liitjering, G. (1986). Propagation behavior of short
cracks in Ti-8.6 Al alloy. In Small Fatigue Cracks (eds. R.O. Ritchie & J. Lankford),
pp. 117-28. Warrendale: The Metallurgical Society of the American Institute of
Mining, Mineral and Petroleum Engineers.
Walgraef, D. & Aifantis, E.C. (1985). Dislocation patterning in fatigued metals as a result of
dynamical instabilities. Journal of Applied Physics 58, 688-91.
Walker, K. (1970). The effect of stress ratio during crack propagation and fatigue for 2024-T3
and 7075-T6 aluminum. In Effects of Environment and Complex Load History for
Fatigue Life, Special Technical Publication 462, pp. 1-14. Philadelphia: American
Society for Testing and Materials.
Wang, Z., Gong, B. & Wang, Z. (1997). Cyclic deformation behavior and dislocation
structures of [001] copper single crystals-II. Characteristics of dislocation structures.
Acta Materialia 45, 1379-91.
Wanhill, R.J.H. (1975). Formation of brittle fatigue striations. Metallurgia 31, 66-71.
Warlow-Davies, E.J. (1941). Fretting corrosion and fatigue strength: brief results of
preliminary experiments. Proceedings of the Institution of Mechanical Engineers 146,
32-8.
Watanabe, T. (1985). Structural effects on grain boundary segregation, hardening and
fracture. Journal de Physique C4, 555-66.
Waterhouse, R.B. (1992). Fretting fatigue. International Materials Reviews 37, 11-91.
Waterhouse, R.B. & Lindley, T.C. (1994). Fretting fatigue, European Structural Integrity
Society Publication Number 18. London: Mechanical Engineering Publications Ltd.
Watt, D.F., Embury, J.D. & Ham, R.K. (1968). The relation between surface and interior
structures in low-amplitude fatigue. Philosophical Magazine 17, 199-203.
Way, S. (1935). Pitting due to rolling contact. Journal of Applied Mechanics 2, A49-58.
Weertman, J. (1966). Rate of growth of fatigue cracks calculated from the theory of
infinitesimal dislocations distributed on a crack plane. International Journal of
Fracture 2, 460-7.
656
References
Weertman, J. (1973). Theory of fatigue crack growth based on a BCS crack theory with work
hardening. International Journal of Fracture 9, 125-31.
Wei, R.P. (1970). Some aspects of environment-enhanced fatigue-crack growth. Engineering
Fracture Mechanics 1, 633-51.
Wei, R.P. & Landes, J. (1970). Correlation between sustained-load and fatigue crack growth
in high strength steels. Materials Research and Standards 9, 25-7, 44-6.
Wei, R.P. & Simmons, G.W. (1981). Recent progress in understanding environment assisted
fatigue crack growth. International Journal of Fracture 17, 235-47.
Weibull, W. (1939). A statistical theory of the strength of materials. Proceedings 151.
Stockholm: Royal Swedish Academy of Engineering Sciences.
Weir, T.W., Simmons, G.W., Hart, R.G. & Wei, R.P. (1980). A model for surface reaction and
transport controlled fatigue crack growth. Scripta Metallurgica 14, 357-64.
Weiss, B. & Stickler, R. (1972). Phase instabilities during high temperature exposure of 316
austenitic stainless steel. Metallurgical Transactions 3A, 851-66.
Weiss, B., Stickler, R., Fembock, J.F. & Pfaffinger, K. (1979). High cycle fatigue and
threshold behavior of powder metallurgical Mo and Mo alloys. Fatigue of
Engineering Materials and Structures 2, 73-84.
Weiss, V. & Lai, D.L. (1974). A note on the threshold condition for fatigue crack propagation.
Metallurgical Transactions 5A, 1946-9.
Wells, C.H. (1979). High-temperature fatigue. In Fatigue and Microstructure (ed. M. Meshii),
pp. 307-31. Metals Park: American Society for Metals.
Westergaard, H.M. (1939). Bearing pressures and cracks. Journal of Applied Mechanics 61,
A49-53.
Westwood, A.R.C. & Kamdar, M.H. (1963). Concerning liquid metal embrittlement,
particularly of zinc monocrystals in mercury. Philosophical Magazine 8, 787-804.
Wheeler, O.E. (1972). Spectrum loading and crack growth. Journal of Basic Engineering 94,
181-6.
White, C.S., Bronkhorst, C. & Anand, L. (1990). An improved isotropic-kinematic hardening
model for moderate deformation metal plasticity. Mechanics of Materials 10, 97-117.
Wilhelm, M. & Everwin, P. (1980). Cyclic deformation behavior of or-copper and underaged
copper-cobalt alloy single crystal. In The Strength of Metals and Alloys (eds. P.
Haasen, V. Gerold & G. Kostorz), vol. 2, pp. 1089-99. Oxford: Pergamon Press.
Wilkens, M., Herz, K. & Mughrabi, H. (1980). An X-ray diffraction study of cyclically and of
unidirectionally deformed copper single crystals. Zeitschrift fur Metallkunde 71,
376-84.
Willenborg, J., Engle, R.M. & Wood, H. (1971). A crack growth retardation model using an
effective stress intensity concept. Technical Report TFR 71-701. Los Angeles: North
American Rockwell.
Williams, M.L. (1957). On the stress distribution at the base of a stationary crack. Journal of
Applied Mechanics 24, 109-14.
Wilson, D.V. (1965). Reversible work hardening in alloys of cubic metals. Acta Metallurgica
13, 807-14.
Wilson, D.V. & Bate, P.S. (1986). Reversibility in the work hardening of spherodized steels.
Acta Metallurgica 36, 1107-20.
Winter, A.T. (1974). A model for the fatigue of copper at low plastic strain amplitudes.
Philosophical Magazine 29, 719-38.
References
657
Winter, A.T., Pederson, O.B. & Rasmussen, K.V. (1981). Dislocation microstructures in
fatigued copper polycrystals. Acta Metallurgica 29, 735-48.
Wirsching, P.H. (1995). Probabilistic fatigue analysis. In Probabilistic Structural Mechanics
Handbook (ed: C. Sundarrajan), pp. 146-65. New York, NY: Chapman & Hall.
Wohler, A. (1860). Versuche fiber die Festigkeit der Eisenbahnwagenachsen. Zeitschrift fur
Bauwesen 10; English summary (1867). Engineering 4, 160-1.
Wood, W.A. (1958). Formation of fatigue cracks. Philosophical Magazine 3, 692-9.
Woods, P.J. (1973). Low-amplitude fatigue of copper and copper-5 at.% aluminium single
crystals. Philosophical Magazine 28, 155-91.
Wright, T.M., Burstein, A.H. & Bartel, D.L. (1985). Retrieval analysis of total joint
replacements: a six year experience. In Proceedings of the Second Symposium on
Corrosion and Degradation of Implant Materials, pp. 415-28. Philadelphia, PA:
American Society for Testing and Materials.
Wfithrich, C. (1982). The extension of the 7-integral concept to fatigue cracks. International
Journal of Fracture 20, R35-7.
Xia, L., Wang, T.C. & Shih, C.F. (1993). Higher-order analysis of crack-tip fields in elastic
power-law hardening materials. Journal of the Mechanics and Physics of Solids 41,
665-87.
Yan, B.D., Cheng, A.S., Buchinger, L., Stanzl, S. & Laird, C. (1986). The cyclic stress-strain
response of single-crystals of Cu-16 at.% Al alloy. 1. Cyclic hardening and strain
localization. Materials Science and Engineering 80, 129-42.
Yoder, G.R., Cooley, Y.A. & Crooker, T.W. (1979). Quantitative analysis of microstructural
effects on fatigue crack growth in Widmanstatten Ti-6A1-4V and Ti-8Al-lMo-lV.
Engineering Fracture Mechanics 11, 805-16.
Yoder, G.R., Cooley, Y.A. & Crooker, T.W. (1983). A critical analysis of grain size and yield
strength dependence of near-threshold fatigue crack growth in steels. In Fracture
Mechanics, Special Technical Publication 791, pp. vol. I, 348-65. Philadelphia:
American Society for Testing and Materials.
Yuen, J.L., Roy, P. & Nix, W. (1984). Effect of oxidation kinetics on the near threshold
fatigue crack growth behavior of a nickel base superalloy. Metallurgical
Transactions 15A, 1769-75.
Zackay, V.F., Parker, E.R., Fahr, D. & Busch, R. (1967). The enhancement of ductility in high
strength steels. Transactions of the American Society for Metals 60, 252-9.
Zappfe, C. & Sims, C.E. (1941). Hydrogen embrittlement, internal stress and defects in steel.
Transactions of the American Institute of Mining, Metallurgical and Petroleum
Engineers 145, 225-71.
Zappfe, C.A. & Worden, CO. (1951). Fractographic registrations of fatigue. Transactions of
the American Society for Metals 43, 958-69.
Zener, C. (1948). Micromechanism of fracture. In Fracturing of Metals, pp. 3-12, Cleveland:
American Society for Metals.
Zenner, H., Heidenreich, R. & Richter, I. (1985). Mehrachsige ermfidung. Zeitschrift
Werkstofftechnik 16, 101-12.
Zhang, Y.H., Edwards, L. & Plumbridge, W.J. (1998). Effect of crystallization on fatigue
crack growth in a SiC-reinforced silicon nitride composite at 1200 °C Acta
Materialia, in press.
658 References
Ziegler, H. (1959). A modification of Prager's hardening rule. Quarterly of Applied
Mathematics 17, 55-65.
Author index
Abdel-Raouf, H. 96
Abdullah, M. 503
Abel, A. 100
Ackermann, F. 43-4, 55-6,62-3, 69-70, 79-
Aifantis, E.C. 68-9
Akhurst, K.N. 379
Alagok, N. 369-70
Albert, W.A.J. 2
Allen, R.J. 554
Allison, J.E. 519, 523, 586-7
Amstuz, H.A. 215
Anand, L. 110, 112
Anderson, T.L. 294
Anderson, W.P. 5, 296, 332-3
Andrews, E.H. 408
Anglada, M. 81-2
Antolovich, S.D. 75-7, 357, 504
Antonopoulos, J.G. 54, 137, 140
Anzai, H. 266
Arai, Y. 360
Aravas, N. 316
Argon, A.S. 138, 182-3, 202-4
Asaro, R.J. 105, 346
Ashelby, D.W. 444-5, 456
Aswath, P.B. 160, 336, 527-9
Atanmo, P. 346
Atkinson, J.D. 100-1
Austen, I.M. 586
Aveston, J. 515
Awatani, J. 141-2
Azimi, H.R. 426-8
Bach, C. 4
Baik, J.-M. 346
Baik, S. 591
Ballon, J.-P. 346
Bairstow, L. 4
Balluffi, R.W. 146
Banasiak, D.H. 522
Bannantine, J.A. 265
Barenblatt, G.I. 304
Barsom, J.M. 17, 537, 551-2, 584
Battel, D.L. 213-15, 217, 364-8
Basinski, S.J. 43, 50-1, 135, 143
Basinski, Z.S. 43, 50-1, 135, 143
Basquin, O.H. 3, 223
Bassani, J.L. 89, 599, 601-2
Bate, P.S. 100, 106
Batte, A.D. 595, 597
1,137 Bauschinger, J. 3, 97
Bauwens, J.C. 413
Beahan, P. 202
Beardmore, P. 205-6, 211, 260
Beevers, C.J. 346, 348, 501, 512-14
Begley, J.A. 170, 313-14, 600, 602
Benoit, D. 496
Berger, L.L. 201
Bernasconi, A. 253^1
Bernstein, I.M. 154-5
Besson, J. 555, 564, 566
Betagon, C. 316
Bevis, M. 202
Bhaskaran, T.A. 536
Bhowal, P. 180
Bicknell, V.L. 214-15, 217
Bilby, B.A. 316, 325, 356
Bingham, E.C. 28
Birch, P.B. 465
Blankenship, C.P. 349
Blochwitz, C. 63, 65, 70, 73
Blom, A.F. 161-2, 494, 527-9
Boddington, P.H.B. 466
Bodner, S.R. 112
Boettner, R.C. 151
Bonnen, J.J. 252, 519
Boudouard, O. 4
Boussinesq, J. 444, 462
Boutin, J. 70
Bower, A.F. 114, 518
Bowles, C.Q. 153
Braithwaite, F. 2
Bressers, J. 7, 383
Bretschneider, J. 43
Brett, S.J. 97
Bretz, P.E. 346, 350, 410
Brockenbrough, J.R. 170-1, 173, 175, 191-5, 320,
384, 392-3, 600
Broek, D. 362, 609
Bronkhorst, C. 110, 112
Broom, T. 44, 46, 97
Brose, W.R. 263
Brown, C.W. 547
660
Author index
Brown, L.M. 53-4, 82, 100-1, 137, 140
Brown, M.W. 271-2, 278, 369-70
Bucci, R.J. 346, 496, 522, 525-6, 583, 585
Buck, O. 155
Budiansky, B. 171, 187-9, 307, 490-3, 505
Budiman, H. 327
Bull, C. 162
Burkert, D.G. 354
Burns, D.J. 207
Burns, S.J. 70, 183-4
Burstein, A.H. 213, 364-8
Busch, R. 504
Buschinger, L. 43
Cai, H. 384
Calabrese, C. 97
Cardew, G.E. 316, 325
Carlsson, A.J. 292
Carter, R.D. 346, 512-14
Cartwright, D.J. 609
Cattaneo, C. 448
Cerruti, V. 462
Chaboche, J.L. 103, 112
Chaki, T.K. 425
Chakrabortty, S.B. 357
Challenger, K.D. 590
Chan, K.S. 542
Chanani, G.R. 357, 504
Chang, S. 83-1
Chang, R. 155
Charalambides, P.G. 173
Charsley, P. 70, 140
Chen, I.-W. 185-6, 189-90, 385, 387, 394, 405
Chen, K.C. 466
Chen, Y.T. 571
Cheng, A.S. 43, 134
Cherepanov, G.P. 307
Chermahini, R.G. 494
Chu, C.-C. 252
Chung, Y.-W. 141
Christ, H.-J. 106
Christensen, R.M. 522
Christian, T.F. 158
Christman, T. 162, 353, 519, 561
Clark, H.M. 346, 496
Clark, W.G. 346
Clarke, D.R. 101, 399
Clausen, N. 170
Clenshaw, W.J. 252
Coffin, L.F. 4, 13, 221, 256-7, 594-5
Coles, A. 589
Comer, J.J. 265
Conley, F.A. 252
Constable, I. 207
Cook, T.S. 544
Cooley, Y.A. 346-7
Corlby, D.M. 520
Corten, H.T. 315
Cotterell, B. 325
Cottrell, A.H. 133, 181, 356
Cowles, B.A. 16, 236
Cox, B.N. 515-18
Creager, M. 550
Crooker, T.W. 346-7, 526
Crossland, B. 253
Cuitifio, A.M. 61
Cummings, H.N. 252
Cunningham, F.L. 4, 463
Czapka, A. 89
Dafalias, Y.F. 103, 110-12, 114
Dang Van, K. 253, 456, 463
Dauskardt, R.H. 394, 395
Davidson, D.L. 336, 343, 522-3, 536, 542, 560, 573
Davis, L.A. 425
Davoli, P. 253-1
Dempster, D.D. 9, 11
Deresiewicz, H. 448, 451
Derijk, R. 581
Desvaux, M.P.E. 46
Devincre, B. 69
Dey, N. 384
Dharan, C.H. 241
Dickson, J.I. 70
Differt, K. 69, 136, 149
Doherty, R.D. 97
Doker, H. 334
Doll, W. 416
Dominguez, J. 465
Donahue, R.J. 346
Donald, J.K. 353
Dowling, N.E. 244, 263, 265-7, 313-14, 552-3,
556-7, 602
Dowling, W.E. 586-7
Driver, J. 592
Drucker, D.C. 103
Drugan, W.J. 312
Dubniak, R. 149
Dugdale, D.S. 244, 303, 372
Duquette, D.J. 466, 576-7, 593
Dutta, V.B. 549
Eden, E.M. 4, 463
Edward, R.C. 149
Edwards, L. 402
Elber, W. 6, 484, 486-90, 493, 522, 535-6
El Haddad, M.H. 244, 547, 558
Elinck, J.P. 413
Embury, J.D. 43
Endo, K. 155,503
Author index
Endo, T. 266
Engle, R.M. 358, 523, 534
Erdogan, F. 5, 295, 332-3, 371
Eshelby, J.D. 100, 156, 307
Essmann, U. 57, 62-4, 69, 136-41, 149
von Euw, E.F.J. 522
Evans, A.G. 187, 384, 386, 393, 504, 507,
Everwin, P. 43
Ewart, L. 193-1, 384, 401, 403, 405
Ewing, J.A. 3, 39, 42
Eylon, D. 180
Faber, K.T. 507
Fahr, D. 504
Fairbairn, W. 3
Farris, T.N. 464
Feltner, C.E. 55, 95-6
Fembock, J.F. 354
Fatemi, A. 273
Figueroa, J.C. 149-50
Filippini, M. 253-1
Findley, W.N. 252
Fine, M.E. 154, 356
Finney, J.M. 53, 55, 134
Finot, M. 127
Fleck, N.A. 489, 494, 522, 554
Foden, E. 239
Ford, F.P. 573
Forman, R.G. 358
Forsyth, P.J.E. 6, 133, 140, 182-3, 335-6,
Fouvry, S. 463
Franciosi, P. 62
Frost, N.E. 244-5, 345, 372
Froustey, C. 254
Fuchs, H.O. 158,265
Fuller, E.R. 386
Fujino, S. 593
Fujita, F.E. 593-1
Fukushima, K. 425
Gangloff, R.P. 561-2
Gao, Hua 369-70
Garud, Y.S. 252
Garvie, R.C. 185
Gassner, E. 4
Gent, A.N. 239
Gerber, H. 3, 225
Gerber, T.L. 158
Gerberich, W.W. 504, 571
German, M.D. 600
Gerold, V. 95
Giannakopoulos, A.E. 115, 121, 128-9, 173
468-73
Gieseke, B. 601-2
Gladwell, G.M.L. 439
661
Glazov, M. 69
Godrick, J.A. 138, 182-3
Goldthorpe, M.R. 316
Gomez, M.P. 5, 296, 332-3
Gong, B. 72-4, 88-9
Goodier, J.N. 443
5, 518 Goodman, J. 3, 225
Goodman, L.E. 446
Goranson, U.G. 361
Gorla, C. 253-1
Gosele, U. 137-41
Gough, H.J. 4, 42, 147, 252, 574
Gould, D. 101
Grandt, A.F. 522
Grathwohl, G. 384, 394
Gray, G.T. 346, 501-2
Green, A.E. 446
Gregory, J.K. 544, 547
Griffith, A.A. 5, 283
Grondin, L. 565
Gross, T.S. 374
Grosskreutz, J.C. 50, 55, 153
Gu, H. 83-1
Guiberteau, F. 384
Guillet, A. 4
Guiu, F. 81-2, 149, 394-5
Guo, H. 83-4
Gurney, T.R. 15
Gustafson, C.G. 334, 387
10 Gysler, A. 346, 544, 547
Haigh, B.P. 4, 226
Haigh, J.R. 496, 603
Halford, G.R. 596
Halliday, M.D. 501
Ham, R.K. 43-1, 46, 100
Hamilton, G.M. 446
Han, L.X. 178,384,401-3
Hancock, J.R. 50
Hancock, J.W. 316
Handrock, J.L. 265
Hannick, R.H. 185
Hannoosh, J.G. 203
Hanson, D. 4
Hansson, T. 384, 385, 405
Haritos, G.K. 602
Harlin, G. 316
Hariya, T. 503
Harris, J.A. 15
Hart, E.W. 203, 416, 601
Hart, R.G. 586
Hartman, A. 581
Hartman, R.J. 50
Hasegawa, T. 74, 99
Hashimoto, S. 43
662
Author index
Hashin, Z. 242
Hawk, D.E. 601-2
Hayashi, M. 96
Hayashi, R. 334, 387
He, M.-Y. 370-1
Hearle, A.D. 454-6
Heidenreich, R. 254
Heil, M.L. 602
Helgeland, O. 44
Hellan, K. 609
Henaff, G. 571
Herman, W.A. 353
Hermann, L. 346
Hermann, R. 160
Hertz, H. 440
Hertzberg, R.W. 7, 94, 211, 240, 353, 409-17,
420-2, 426, 522, 526
Herz, K. 43-5, 50, 55-6, 62-3, 79-80, 137, 151
Hesselbarth, H.W. 69
Heuer, A. 170
Hicks, M.A. 547
Hill, R. 18
Hillberry, B.M. 522
Hills, D.A. 439, 444-6, 456, 463, 464, 468
Himmelein, M.K. 522
Hirahara, R. 384, 394
Hirsch, P.B. 101
Hirschberg, M.H. 596
Hodgkinson, E.A. 2
Hohenemser, K. 29
Hojo, M. 334, 387, 544
Holm, D.K. 161-2, 494, 527-9
Holmes, J.W. 177, 179
Holste, C. 43
Holzwarth, U. 63^4
Homes, G. 413
Hopkins, S.W. 526
Horibe, S. 47, 384, 394
Horii, H. 171, 191
Hornbogen, E. 348, 504, 505
Hoshina, M. 346, 347
Hourlier, F. 372, 379
Howard, I.C. 316, 325
Howell, P.R. 524
Howie, A. 50
Howland, A.C. 542
Hsia, K.J. 384
Hu, Y.M. 90
Huang, D.D. 241
Hubbard, R.P. 159
Hudak, S.J. 353, 542
Hudson, CM. 526
Hui, C.Y. 601
Hull, D. 133, 202
Humfrey, J.C. 3, 39, 42
Humphreys, F.J. 101
Hunsche, A. 135, 141
Hurd, N.J. 373, 374, 377
Hutchinson, J.W. 172-3, 187-9, 307-8, 310, 312,
370-1, 490-3, 505
Hyzak, J.M. 154-5
Ichimaru, K. 458
Ikeda, S. 356
Inglis, C.E. 5, 283
Inoue, T. 278
Irving, P.E. 346, 348, 373, 374, 377
Irwin, G.R. 5, 17, 286, 288, 292, 302, 609
Ito, S. 400
Ito, Y.M. 140
Iwan, W.D. 106
Izumi, Y. 356
Jaccard, R. 353
Jacobs, D.S. 387, 394
Jacobs, F.J. 581
James, L.A. 603
James, M.N. 195, 545, 559-60
James, M.R. 155
Jefferis, J.A. 454-5
Jenkin, C.F. 4
Jin, N.Y. 63, 65, 73
Johnson, E.W. 137
Johnson, H.H. 137, 571
Johnson, K.L. 114, 435, 439, 442-4, 451-6
Johnston, T.L. 181, 574
Jones, J.W. 519
Jones, T.W. 544
de Jonge, J.B. 520, 526
Jono, M. 536
Josephic, P.H. 571
Kambour, R.P. 417
Kamdar, M.H. 574
Kanazawa, K. 278
Kaneko, Y. 43
Kanematsu, W. 400
Kaneshiro, H. 141-2
Kanninen, M.L. 609
Kapsa, Ph. 463
Karnthaler, H.P. 95
Katagiri, K. 141-2
Kawamoto, H. 334, 384, 387, 394
Kayali, E.S. 96
Kearney, V.E. 358
Kelly, A. 515
Kemsley, D.S. 73
Kennedy, A.J. 134
Kettunen, P.O. 73
Kikukawa, M. 536
Author index
663
Kim, A.S. 555, 564, 566
Kim, S. 413,414,421
Kim, W.H. 149-50
King, J.E. 346, 496
Kishimoto, H. 334, 384, 387, 394
Kitagawa, H. 325, 372, 544, 546, 547
Klesnil, M. 43, 88
Knauss, W.G. 370
Knott, J.F. 358, 522, 526, 547
Ko, H.N. 435
Kobayashi, H. 334, 359-63, 532
Kobayashi, M. 54
Kocks, U.F. 99
Koiter, W.T. 101
Koizumi, T. 603
Kommers, J.B. 4
Konczol, L. 416
Koo, G.P. 209-10, 239
Koo, J. 216
Korbel, A.S. 43, 51
Koyanagi, K. 141-2
Kramer, E.J. 201, 203,416
Kramer, I.R. 575
Krejci, J. 43
Kremling, U. 63, 65, 70
Krieg, R.D. 87, 110
Ku, R.C. 181
Kubin, L.P. 69-70
Kubo, S. 600
Kuhlmann-Wilsdorf, D. 65, 70, 134
Kumar, V. 600
Kumble, R. 346
Kung, C.Y. 154
Kuno, M. 468
Kunz, L. 87-90
Kusenberger, F.N. 153
Kwadjo, R. 82
Laffen, J.H. 16
Laird, C. 6, 43, 53, 55, 69, 83-1, 89, 95-7, 134-5,
141-2, 149-50, 337-10, 355
Lai, D.L. 346
Lamba, H.S. 278
Lambropoulos, J.C. 188-9, 505
Landes, J.D. 585, 600, 602
Landgraf, R.W. 94, 232, 266
Langer, B.F. 4
Langoy, M.A. 336
Lankford, J. 153, 336, 522-3, 543-6, 547, 560, 561
573
LaPointe, N.R. 266
Lardner, R.W. 355
Larsen, J.M. 560
Larsson, S.G. 152, 292
Lasserre, S. 254
Lathabai, S. 384, 394
Laufer, E.E. 43, 54
Lawn, B.R. 166-7, 304, 326-7, 384, 394
Laws, N. 171
Leax, T.R. 343-1, 496
Lederich, R.J. 519
Lee, E.H. 346
Lee, E.-W. 512-14
Lee, J.J. 560
Lee, J.-K. 43
Lepinoux, J. 69-70
Lepisto, T.K. 73
L'Esperance, G. 70
Leverant, G.R. 526
Levy, J.C. 149
Li, C.G. 241
Li, C.H. 181
Li, F.Z. 400
Li, G.Y. 73
Li, J.C.M. 425
Li, S.X. 73
Li, X.W. 73
Li, Y. 43
Li, Y.C. 316
Liaw, P.K. 343-1, 496, 561
Lilholt, H. 101
Lim, P.-G. 555, 564-6
Lin, C.-K.J. 384, 404
Lin, S.R. 133, 140
Lin, T.H. 133, 140
Lindigkeit, J. 346
Lindley, T.C. 157, 358, 379, 463, 464, 467-81
Lisiecki, L.L. 43
Liu, J. 577
Liu, S.-Y. 385, 405
Liu, Y.C. 151
Llanes, L.M. 69, 89
Llorca, J. 102, 494
Lo, K.K. 325
Logsdon, W.A. 343-1, 496
Lohberg, K. 505
Louat, N. 5, 43, 143, 147-8, 151, 574-5
Ludwik, P. 4
Lukas, P. 43, 87-90
Lutjering, G. 346, 501, 526, 544, 547
Lynch, S.P. 340, 496, 574, 582
Ma, B.-T. 135, 141-2
McAdam, D.J. 4
McCammon, R.D. 147
McCartney, L.N. 356, 515
McCarver, J.F. 559
McClintock, F.A. 6, 171, 191, 304, 316, 345, 355,
374, 376, 377, 379, 599
McClung, R.C. 494
664
Author index
McDiarmid, D.L. 252
McDowell, D.L. 112
McDowell, J.R. 4, 463
McEvily, A.J. 151, 180, 182, 346, 501, 549, 561,
578-9
McGarry, F.J. 241
Macherauch, E. 50, 80, 87
Machlin, E.S. 182
Mclntyre, P. 586
Mackay, M.E. 416
McLean, D. 372, 379
McMeeking, R.M. 173, 187, 311, 505
McMillan, J.C. 530-1
McNicol, R.C. 551-2
Mager, T.R. 346, 496
Maier, H.J. 106
Maitournam, M.H. 456
Maiya, P.S. 591
Majumdar, B.S. 70
Majumdar, S. 183-4, 357, 591
Malvern, L.E. 18, 28
Mandell, J.F. 241
Mann, J.Y. 3, 231
Manson, J.A. 7, 211, 239, 240, 256-7, 409-17,
420-2
Manson, S.S. 4, 221, 596-7
Marchal, K. 571
Marci, G. 334
Marder, R.A. 215
Marissen, R. 533
Marsh, K.L. 245
Marshall, D.B. 187, 395, 515
Martin, J.W. 97
Martin, M. 503
Masing, G. 4, 104
Mason, W.P. 451
Masounave, J. 346
Masumoto, T. 425
Mathews, J.R. 443
May, A.N. 133
Mayr, P. 80, 87
Mazza, J.A. 97
Mech, D.G. 195
Mecke, K. 63, 65, 70, 73
Melan, E. 101
Merkle, J.G. 315
Meyn, D.A. 340
Mikami, S. 536
Miller, K.J. 244, 271-2, 278, 369-70, 544
Miller, M. 361
Milligan, W.W. 75-7
Mills, N.J. 416, 417
Mills, W.J. 526
Min, B.K. 591
Minakawa, K. 501, 561
Mindlin, R.D. 446, 448
Miner, M.A. 4, 227
Mirra, J.M. 215
Mitchell, M.R. 258
Mitsche, R. 354
Miyazaki, T. 70
Moline, E. 604-7
Montulli, L.T. 522
Moore, H.F. 4
Moosbrugger, J.C. 112
Mori, H. 70
Morita, Y. 43
Morlet, J.G. 571
Morris, W.L. 155, 544, 545, 559-60
Morrone, A. 372
Morrow, D.R. 239
Morrow, J.D. 226, 258, 263, 357
Moss, CM. 6, 484, 496, 499
Moteff, J. 590
Mott, N.F. 133
Mroz, Z. 103, 106, 108-9
Mudry, F. 604-7
Mughrabi, H. 40, 43-5, 50, 53-7, 62-3, 69-71,
79-80, 88-9, 136-41, 149, 151
Mura, T. 54, 140-1, 155-6
Murakami, Y. 54, 155,458
Mustofon, H. 505
Nabarro, F.R.N. 65
Nakai, Y. 244, 544-8, 559
Nakamura, H. 360, 532
Nakasone, Y. 141
Nakazawa, H. 532
Namdar-Irani, R. 496
Nayeb-Hashemi, H. 374, 376, 377, 379
Nederveen, A. 520, 526, 581
Needleman, A. 102, 600
Nemat-Nasser, S. 171, 191
Nes, E. 336
Neuber, H. 4, 263
Neumann, P. 6, 45-6, 50, 52, 65-7, 135, 141, 148,
151-2, 336, 339, 341
Neumann, R. 80
Newman, J.C. 493-4, 535-6, 553-4, 560-1
Nicholas, T. 16, 560,602
Nine, H.D. 80
Nishio, Y. 96
Nishioka, A. 547
Nisitani, H. 532
Nix, K.J. 379, 467-8, 474-81
Nix, W.D. 496
Nordberg, H. 409
Nowack, H. 501, 526, 533
Nowell, D. 439, 463, 464, 468
Author index
665
O'Connell, J. 171
O'Dowd, N.P. 316-19, 372
Ogawa, T. 394, 532, 566-7
Ogin, S.L. 140
Ogura, K. 493, 600
Ogura, T. 425
Ohira, T. 325, 372
Ohji, K. 493, 600
Ohji, T. 400
Ohuchida, H. 547
Okada, T. 503
Okawara, S. 334, 384, 387, 394
Okazaki, M. 603
Olsson, M. 115, 121, 128-9, 457-62
Omura, A. 141-2
Oriani, R.A. 571
Orowan, E. 99, 285
Ortiz, M. 60-3, 144-5, 172, 393, 518
Osgood, C.C. 230, 257
Osmer, J.F. 451
O'Toole, J.L. 209-10, 239
Packman, P.F. 520
Padture, N.P. 384
Palaniswamy, K. 370
Palgen, L. 103
Palmgren, A. 4, 227
Papadopoulos, I.V. 253—1
Paris, P.C. 5, 296, 304, 312, 332-4, 343-6,
495-6, 536, 550, 609
Parker, E.R. 504
Parks, D.M. 311, 316,498
Partom, 1.112
Partom, Y. 112
Partridge, P.G. 82
Pascoe, R.T. 185
Pascual, R. 112, 143
Paterson, M.S. 73
Pawlus, L.D. 96
Pearson, R.A. 426
Pearson, S. 7
Peck, M.G. 496
Pedersen, O.B. 86
Pelloux, R.M.N. 6, 99-100, 336, 338, 340, 355,
530-1
Peralta, P. 89
Petch, N.J. 180
Peterson, R.E. 243
Petit, J. 536, 571
Petroski, H. 9-10
Pfaffinger, K. 354
Pickard, A.C. 522, 526
Pinckert, R.E. 158
Pineau, A. 379, 504, 555, 561, 564, 566, 590,
603-7
Pippan, R. 160
Piques, R. 604-7
Plumbridge, W.J. 402
Plumtree, A. 96
Podlaseck, S.E. 575
Pohl, K. 80, 87
Polak, J. 88, 137
Pollard, H.V. 252
Poncelet, J.V. 2
Ponter, A.R.S. 454-6
Pontikis, V. 69
Pook, L. 245, 372, 373, 374, 377
Popelar, C.H. 609
Popov, E.P. 62, 110-12, 114
Pops, H. 106
Porter, J. 149
Prager, W. 29, 102
Pratt, J.E. 96
Pruitt, L. 161, 195, 212, 214-16, 415
Purdy, G.R. 97
Rabbe, P. 536
Rabinowitz, S. 205-6, 211, 260
Raj, R. 591-2
Ramamurty, U. 384, 385, 405
Rankine, W.J.M. 2
Rasmussen, K.V. 86
Rau, C.A. 526
Reece, M.J. 394-5
Reid, C.N. 160
Remy, L. 590
Repetto, E.A. 60, 63, 144-5
Reyes Morel, P.E. 185-6, 189-90
Rice, J.R. 6, 60, 292, 304-5, 307-8, 312, 325,
355-6, 518, 522, 599-600
Rich, D.L. 158
Richards, C.E. 358
Richter, I. 254
Ricker, R.E. 577
Riddell, M.N. 209-10, 239
Riedel, H. 590-1, 599-603
Rimnac, CM. 216, 364-8, 417
de los Rios, E.R. 544
Ritchie, R.O. 6, 346, 358, 374, 376, 377, 379,
395-9,484,495-503, 532, 543-1, 549, 554, 559,
580
Ritter, M.A. 353
Rivlin, R.S. 408
Roberts, R. 522
Roberts, W.N. 43, 54
Rodel, J. 384, 394
Roebben, G. 7, 383
Rolfe, S.T. 17, 551
Rollet, A.D. 89
Rooke, D.R. 609
666
Author index
Rose, W.N. 4, 463
Rosenberg, H.M. 147
Rosengren, G.F. 308
Rosenhain, W. 3, 39
Rotem, A. 242
Roth, L.D. 561
Roven, H.J. 336
Roy, P. 496
Riihle, M. 170
Ruiz, C. 466
Ruppen, J. 180
Ryder, D.A. 6, 336, 340, 496, 503
Saal, H. 160
Sackfield, A. 446, 456
Sadananda, K. 315, 334, 345, 346, 387, 590, 603
Saga, J. 96
Sakae, C. 458
Sammur, M.F.R. 395
Sanchez Galvez, V. 234
Sanders, J.L. 307
Sanders, T.H. 522, 525-6
Sandor, B.I. 139, 259, 263
Sargent, CM. 97
Sastry, S.M.L. 519
Sauer, J.A. 239
Sawtell, R.R. 522, 525-6
Saxena, A. 353, 357, 561, 601-2
Scardina, J.T. 526
Schijve, J. 153, 523, 536, 537, 563
Schincker, M.G. 416
Schmidt, D.W. 353
Schmidt, R.A. 334, 343-6, 495
Schulte, K. 501, 526
Schulte, W.C. 153
Schultz, J.M. 416
Schutz, W. 4
Seeley, F.B. 4
Seetharam, S.A. 536
Sehitoglu, H. 494
Sensmeir, M.D. 515-16
Seth, B.B. 496
Shahinian, P. 315, 346, 590, 603
Sham, T.-L. 312
Shang, J.-K. 271, 519
Sharma, S.M. 316
Sharpe, W.N. 560
Shaw, G.C. 153
Sheldon, G.P. 544
Shen, H. 575
Sherman, A.M. 586-7
Shida, S. 547, 549, 550
Shield, R.T. 442
Shield, T.W. 269
Shih, C.F. 309, 316-23, 325, 372, 555, 564-6, 600
Shiraishi, T. 141-2
Shivakumar, K.N. 494
Shute, N. 17
Sidebottom, O.M. 278
Sih, G.C. 371-2, 609
Silverman, M. 573
Simmons, G.W. 586
Sims, C.E. 364, 571
Sines, G. 248, 253
Skelton, R.P. 496, 590, 603
Skibo, M.D. 409-14, 416, 421
Smith, G.C. 6, 339
Smith, J.H. 4
Smith, K.N. 244, 547, 558
Smith, M.C. 373
Smith, R.A. 2, 244, 373, 489, 494
Smith, R.N. 269
Sobczyk, K. 232
Sobeyejo, W.O. 519
Socie, D.F. 249, 267, 269-71, 273, 384, 404, 536
Soderberg, C.R. 4, 225
Soderberg, D. 466
Sopwith, D.G. 147, 574
Spencer, B.F. 232
Sperling, L.H. 239
Sproles, F.S. 466
Staley, J.T. 522, 525-6
Stanzl, S. 43, 354, 375, 589
Stark, X. 151
Starke, E.A. 346, 349, 512-14
Steck, E. 69
Steen, M. 7, 383
Stephens, R.I. 265
Stevenson, R. 82
Stewart, A.T. 496, 499
Stickler, R. 354, 590
Stobbs, W.M. 76, 100-1
Stokes, R.J. 181
Stoloff, N.S. 574
Stoltz, R.E. 99-100
Stoney, G.G. 127
Stroh, A.N. 198
Stubbington, A. 133
Stulen, F.B. 252
Subramanium, K.N. 182
Sugimura, Y. 160, 519, 555, 564-7
Sunder, R. 536
Suresh, S. 6-7, 102, 115, 121, 127-9, 160-2, 170,
173, 175, 178, 191-5, 212, 214-16, 320, 325,
336, 343, 346, 350, 372, 379, 384, 385, 392-3,
395-6, 401-3, 405, 415, 468-73, 484, 495-501,
507-8, 519, 522-9, 532, 536, 543-5, 549, 554-5,
559, 564-7, 580, 600
Suzuki, H. 549
Swain, M.V. 395
Author index
667
Swank, L.R. 586-7
Swinden, K.H. 356
Sylva, L.A. 395-6, 544
Szolwinski, M.P. 464
Tabor, D. 442-3, 452
Tada, S. 609
Taira, S. 278, 346, 347, 523
Tait, R.B. 195
Takahashi, S. 546-7
Takao, K. 532
Takemori, M.T. 416-20
Talreja, R. 241
Tanaka, K. 140-1, 155-6, 244, 334, 346, 347, 372,
387, 523, 544-8, 560
Tangjitham, S. 232
Taylor, D. 343, 547
Taylor, G.I. 65
Teng, T.-G 416
Tennekes, H. 8
Teodosiu, C. 60
Terlinde, G. 346
Thakker, A.B. 522, 525-6
Thomas, A.G 408
Thomas, B. 590
Thomas, G. 97
Thompson, A.W. 346, 501-2, 560
Thompson, N. 5, 43, 140, 143, 147-8, 151, 574-5
Thouless, M.D. 400, 404
Thum, A. 4
Tien, T.-Y. 385, 405
Timoshenko, S. 443
Tippelt, B. 43
Tixier, R. 496
Tokuwame, M. 70
Tomkins, B. 595
Tomlinson, GA. 4, 463
Tonnessen, A. 151-2
Topper, T.H. 244, 263, 269, 526-7, 547, 558
Tosten, M.H. 524
Trautmann, K.H. 501, 526, 533
Troiano, A.R. 571
Tschegg, E.K. 193, 374-9, 565, 589
Tu, L.K.L. 496
Tzou, J.-L. 503
Ueno, A. 334, 384, 387, 394
Uhlig, H.H. 576
Usami, S. 547, 549, 550, 558
Valanis, K.C. 90, 112
Van der Biest, O. 7, 383
Vander Sande, J.B. 82
Van Stone, R.H. 16
Vasudevan, A.K. 334, 345, 346, 350, 387, 496, 500,
524, 577
Vaughn, D.A.J. 394
Veers, P.S. 232
Venkataraman, G. 141
Vincent, L. 463
Vingsbo, O. 466
Vosikovsky, O. 503
Voss, H. 429
Wadsworth, N.J. 5, 43, 143, 147-8, 151, 574-5
Wagner, L. 544, 547
Walgraef, D. 68-9
Walker, K. 358
Walker, N. 416, 417
Walsch, M.J. 542
Walsh, J.B. 171, 191
Walter, R. 429
Wang, R. 88-9, 149
Wang, T.C. 316
Wang, Z. 72-4, 88-90
Wang, Z.G 72-1, 88-9
Wanhill, R.J.H. 340
Wareing, J. 595
Warlow-Davies, E.J. 4, 463
Washburn, J. 182
Watanabe, T. 149
Waterhouse, R.B. 463, 464, 468
Watson, P. 269
Watt, D.F. 43
Way, S. 503
Wedgwood, GA. 4
Weertman, J. 6, 355-6
Weertman, J.R. 43
Wei, R.P. 561-2, 578-9, 581, 585-6
Weibull, W. 4, 166
Weir, T.W. 586
Weiss, B. 354, 590
Weiss, V. 346
Wells, C.H. 593-1
Wessel, E.T. 346, 496
Westergaard, H.M. 288
Westwood, A.R.C. 574
Wheeler, O.E. 523, 535
White, C.S. 110, 112
Whittaker, V.N. 97
Wilhelm, M. 43
Wilkens, M. 45, 50
Willenborg, J. 523, 534
Williams, J.C. 346, 501-2, 560
Williams, J.G. 207
Williams, K. 160
Williams, M.L. 149, 290, 292
Williams, R.S. 496
Willis, J.R. 316
668
Author index
Wilshaw, T.R. 166-7
Wilson, D.V. 99-100, 106
Wilson, W.K. 263, 561
Winter, A.T. 44, 52, 54, 73, 86, 137, 140
Wirsching, P.H. 232
Wittkowsky, B. 465
Wohler, A. 2-3, 221-2
Wood, H. 523, 534
Wood, W.A. 132, 135
Woods, P.J. 43, 54
Worden, CO. 5, 335
Wright, P.K. 515-16
Wright, T.M. 213-17,364-8
Wu, S.D. 73
Wiithrich, Ch. 79-80, 603
Xia, L. 316
Xu, Y. 384, 404
Yakou, T. 74, 99
Yamashita, M. 544-8
Yamauchi, Y. 400
Yan, B.D. 43
Yoder, G.R. 346-7
Yoshida, T. 278
Yoshiji, O. 493
Yu, M.T. 526-7
Yuen, A. 526
Yuen, J.L. 496
Yuuki, R. 325, 372
Zackay,V.F. 504
Zamiski, G.F. 6, 484, 495-9
Zangvil, A. 384, 404
Zaoui, A. 62
Zappfe, C.A. 5, 335, 571
Zelizko, V. 395
Zener, C. 179
Zenner, H. 254
Zhang, Y.H. 402
Zhang, Y.W. 73
Ziegler, H. 102
Zum Gahr, K.-H. 348
Subject index
acceleration factor 532
acoustic emission 13, 413
additional static modes 336, 342, 358
adhesive epoxy, fatigue of 422^1
adiabatic heating 207-11
aircraft accidents 8-11, 358-63
Airy stress function 20, 290
alloying effects on cyclic deformation 95-6
Amonton-Coulomb friction law 446
annihilation of dislocations 138^10, 144
anodic slip dissolution 572-4
anti-plane shear fracture 288
anti-plane state 20
aqueous media, corrosion-fatigue in 350
Arrhenius equation 29
Astroloy 541
asymptotic solutions 288-95
auto-frettage 229
back stress 99-101
Barenblatt model 304
barring 474-81
Basquin exponent 223
Basquin relationship 3-4, 223, 226
Bauschinger effect 3, 97-103
Bauschinger strain 98-9
Bauschinger stress 98-9
continuum models 97-112
definition and terminology 97-9
micromechanisms 99-101
metal-matrix composites 100-1
plastic relaxation 100-1
biharmonic equation 290
Bingham-plastic material 28-9
bio-implant devices 464
blister test 300-2
block overloads (see load sequence effects)
blunting of crack tip following overload 522-3
body-centered cubic (BCC) crystals 79-82, 85, 182
dislocation structures 79
fatigue-induced shape changes 80-2
slip asymmetry 80-2
Boeing 777 33-34
bounding surface 111,113-14
branched cracks
elastic near-tip fields 324-6
multiaxial fracture 326-7
plastic near-tip fields 327
bridging (see crack bridging)
brittle materials, fatigue of 165-99, 383^06
brittle ceramics 167-70, 383-406
compression fatigue 173-5, 191-7, 211-17
constitutive models 170-5
cyclic damage zones in tension fatigue 392-3,
415,425
cyclic stress-strain curves 167-8, 171 4, 178-9,
394
cyclic tension and tension-compression fatigue
170-3, 175, 213-17
definition of cyclic fracture 165, 175-6
degrees of brittleness 166-7
elevated temperature behavior 176-9
static fatigue 165
brittle striations (see striations)
bulk modulus 22
bulkhead of aircraft 358-63
bundles of edge dislocations 49-52
C-integral 599
C*-integral 600
cabin pressurization, aircraft 9, 358-63
carburizing 229
cell size 96
cement mortar 193
center-cracked tension specimen 610
ceramic materials 165-99, 383^106
ceramic-matrix composites 165-99, 383^106
characteristic approach, the 536-7
characterization of fatigue crack growth 296-7,
331-5
chemically short fatigue cracks 543, 561-2
clam shell markings 18
cleavage striations (see striations)
clip gage 486-8
closure (see crack closure)
closure dimension 505
coatings (see surface coatings)
coefficient of rolling friction 452
Coffin-Manson rule 4, 5, 256-7
Coffin-Manson rule, frequency-modified 595-6
cohesive strength 572
cold rolling 444
670
Subject index
Comet airplane 1, 8-11
compact (tension) specimen 610
compatibility equations 20
complex modulus 208
compliance, cracked body 286-8, 298-300
composite modulus 441
compressibility 22
compression fatigue
cement mortar 193
ceramics and ceramic composites 191-7
knee implants 213-17
metals and metal-matrix composites 157-62
polymeric materials 211-17
conforming contact 436
constrained deformation 92
contact fatigue 1, 435-82
fretting contact 1, 157, 436-7, 462-81
gears, of 457-62
mechanisms 457-68
plastic deformation 442-5
repeated indentation 443
residual stresses 443-5
rolling contact 1, 436, 438, 451-6
sliding contact 1, 436, 445-51
spherical indentation 440-5
contact pressure 441
contact radius 440
continuum mechanics 18-29
corrosion deposits (see oxide-induced crack
closure)
corrosion-fatigue 570-608
crack initiation 153, 156-7, 574-7, 586-8
crack growth 371-82, 577-86
definition 1
mechanisms 570-4
models 570-86
stages of 570-5
types of 570-86
corrosion pits 156-7
cosine formula 47
Cottrell mechanism 180-2, 197
crack analogue model 469-73
crack branching (see crack deflection or branched
cracks)
crack bridging
fiber bridging 485, 515-19
glassy ligaments 166, 168, 399-406
grains 166, 168, 385, 393-5, 485
whisker bridging 402, 485, 518-19
crack closure
basic features 505-6
compression fatigue 192-5, 212-13
critical issues 506-7
fluid-induced 503-t
historical background 6
introduction 6
measurement techniques 484-507, 537
offset procedure 488-9
oxide-induced 496-500
plasticity-induced 6, 484-96
roughness-induced 500-2, 507-15
sliding mode 507-15
small cracks 559-61
transformation-induced 485, 504-5
crack deflection 322-7
elastic near-tip fields 324-7
implications for fatigue 507-11
introduction 322-7
multiaxial fracture 326-7
plastic near-tip fields 327
retardation following overloads 521-6
small cracks 545
crack detection techniques 10, 11
crack growth from notches (see compression
fatigue or nonpropagating tensile fatigue
cracks or notch fatigue)
crack initiation (see initiation of fatigue cracks)
crack opening displacement 309-10, 374, 377-9,
560
crack tip opening displacement 309-10, 560
crack tip-grain boundary interactions 544-5
crack tip shielding due to
crack closure 6
microcracking 392-3
phase transformation 485, 504-5
crack trapping 515-19
crazes
competition with shear flow 202-6
craze matter 202-3
cyclic stress-strain response 203-11
fibrils 202-1,416
formation 201-6
sub-critical crack growth 413-19
creep, in rolling contact fatigue 451
creep cavitation 589-92
creep-fatigue 1, 399-406
crack growth 402-6
definition 1
fracture mechanics characterization 598-607
life prediction models 594-607
mechanisms 589-94
creep zone 598-601
critical plane approach 250-4, 269-71, 273-8
cross-gashing 474
Crossland criterion 253
cross-linking 426-30
cross slip, cyclic deformation 95-7
crystal elasticity 60
crystal plasticity 60-1
crystallization theory 2
Subject index
671
cumulative damage (see damage accumulation)
cumulative plastic strain 40, 45
curvature of load-displacement plot 488-9,
537-8
cycle counting 264-7, 534
cyclic cleavage 348
cyclic crack tip opening displacement 306, 315, 560
cyclic creep 104, 113-14
cyclic fatigue, definition of 165
cyclic hardening (see strain hardening)
cyclic 7-integral (A7) 313-16, 556-7
cyclic plastic zone 160-2, 342, 346, 547-8
cyclic saturation (see saturation)
cyclic slip at high temperature 590-2
cyclic softening (see strain softening)
cyclic stress-strain curve (see stress-strain curves)
damage accumulation
creep-fatigue 589-97
fatigue crack growth 355-6
introduction 5
multiaxial fatigue 246-54, 268-78
Palmgren-Miner rule 227-8, 534
total life approaches 227-8, 246-54, 260-2
variable amplitude fatigue 227-8, 265-7
damage-tolerant approach (see defect tolerant
approach)
damage (deformation) zone 295
damping 204, 207-8
dead-weight loading 285-7
deaeration, effects on corrosion-fatigue 575-6
debonding of inclusions 152^1
decohesion theory for corrosion-fatigue 571-4
decohesion theory for metal embrittlement 574
defect-tolerant approach 13-14
deflection of a crack (see crack deflection)
deformation gradient 60
deformation theory 22, 25-6
degrees of brittleness 166-7
delay distance in variable amplitude fatigue 521
design approaches to fracture 11-17
deviatoric stress 22
diffusion model for dislocations 68-9
dilatation 22, 202, 504-5
dilatational strains (transformation) 184-91, 504-5
dipolar walls 66-8
dipoles of edge dislocations 50, 58-9, 66-8, 164
dislocation passing stress 58-9
dislocation pile-up (see pile-up of dislocations)
dislocation walls in PSBs 53-7
disordering of precipitates 97
dispersion-strengthened alloys 100-1, 106
displacement, crack tip opening (see crack tip
opening displacement)
displacement-controlled loading 287
displacement fields (see singular fields)
dissociation of hydrogen 571-4, 574-5
distortional energy 23
domestic object damage 237
dominance of singular fields 283, 295-6
A^-dominance 295-6
7-dominance 311
dominant crack 12
double cantilever beam specimen 298-300
double-edge-cracked tension specimen 610
driving force for crack growth 332-4, 345, 350,389,
483-90, 507-10, 552
driving force for fracture 285-8
ductile single crystals 39-85
ductile striations (see striations)
Dugdale model
crack closure 490-3
crack opening displacement 309
craze formation in polymers 413-16
plastic zone size 303^1
plastic zone size (cyclic) for extending cracks 307,
491-3
duplex slip 335^41
dye-penetrant techniques 13
dynamic equilibrium 57, 62, 137
dynamic strain-ageing 80
easy glide 32
edge effects in layered materials 124-5
effective strain 268-9
effective stress 247-8
effective stretching 24
elastic limit 107
elastic mixity parameter (see mixity parameter)
elastic moduli (constants) 21
elastic strain energy 283^1
elastic stress concentration factor 242^1
elasticity theory 20-2
elastohydrodynamic lubrication 458
electrochemical effects 572-7
elliptical cracks 612-13
endochronic model 112
endurance (fatigue) limit 3-4, 53, 221-4, 233^t
energy
fracture 283-7
Griffith criterion 283-5, 371
mechanical 283-7
plastic 285
strain 283-5
surface 284
energy release rate 285-8, 388-92
engineering approaches to variable amplitude
fatigue 265-7
ENSIP program 16
envelope of previous plastic zones (see plastic zone)
672
Subject index
environmental effects on fatigue
crack initiation in ceramics 165, 169, 175-6
crack initiation in metals 574-7
crack initiation in commercial alloys 152-5
fatigue of polymers 239
growth of long cracks 577-86
growth of short cracks 543, 561-2
striation formation 340-1, 581-2
epoxy, fatigue of 422^1
epoxy, rubber-toughened 426-30, 431
epoxy-matrix composites, fatigue of 426-30
epsilon plastic zone 417-19
equilibrium equations 19, 289
equivalence of Q and K 297-300
equivalence of J and Q 308
equivalent stress/strain concepts 247-8, 268-9
evanescent hardening model 112
exhaust valves for automobiles, fatigue of 586-8
extrinsic mechanisms, fatigue crack growth 483-6
extrusions 3, 79, 133^4
face-centered cubic (FCC) crystals 30-56
cyclic saturation 40-5
cyclic strain hardening 3, 41-5
deformation along PSBs 52-3
dislocation structure of PSBs 53-7
formation of cell structures 69-71
formation of labyrinth structures 69-71
formation of PSBs 63-9
instabilities in cyclic hardening 45-6
factory-roof fracture mode 374-6
fail-safe concept 14-17, 327-8
fast-slow fatigue loading 591-2
fatigue
bicrystals 89-91
definition 1, 2
historical background 1-11
stages of 12
types of 1
word origin 1
fatigue life calculations 334-5
fatigue limit (see endurance limit)
fatigue limit for notched members 242-5
fatigue notch factor 242-5
fatigue striations (see striations)
fatigue threshold (see threshold)
femoral component 158
fiber pull-out 402, 515-17
fictitious crack length 547
field of work hardening moduli 106-10
finite-element method for crack closure 493^1,
535-6
flame hardening 229
flip-flop mechanism 55, 59
flow theory 22^t
flow rule 23-4, 60
fluid-induced crack closure (see crack closure)
foreign object damage 237
forest hardening 99
forked crack 324
Forman relationship 358
fracture initiation toughness (see fracture
toughness)
fracture mechanics 5
elastic-plastic 307-19
elevated temperature 598-607
linear elastic 5, 288-307
mixed-mode 319-27, 368-79
multiaxial fracture 326-7
notched components 550-4
two-parameter characterization 316-19, 554-6
fracture toughness
linear elastic 296, 311-13
elastic-plastic 309, 311-13
Frank-Read source 52, 137
free rolling contact 436
frequency effects
corrosion-fatigue 576, 579-80, 583-6
creep-fatigue 601-3
fretting 4, 156-7, 436, 462-81
fretting corrosion 4, 156-7, 463
fretting damage parameter 466
fretting fatigue 1, 4, 237, 462-81
fretting wear 462, 466-7
fretting zone 465
friction stress 79
Fujita mechanism 593^1
fuselage, damage-tolerant design 327-8
galling 237, 458
gating mechanism 134
geometric softening 32
Gerber relationship 225-6
glasses 166-70, 200-1, 424-5
glass phase 176-8
Goodman relationship, modified 3, 225-6, 235, 248
grain boundaries 86-91
grain boundary sliding 592-3
grain bridging 166, 168, 385, 393-5, 485
grain size effects
crack initiation 86-91
small cracks 544-5
Griffith flaws 169,201
Griffith fracture theory 5
gust loading fatigue spectra for aircraft 519-20
Haigh diagram 226-7
hardening rule 20, 23-5
HCF (see high-cycle fatigue)
HCF-LCF interactions 237
Subject index
673
heart valve, fatigue of 396-9
heat transfer coefficient 206
Helmholtz free energy 21
Hertzian contact 440-5
hexagonal close-packed (HCP) crystals 82-5, 182
high-cycle fatigue 12, 221-55, 236-7, 256-8
high growth rate regime 357-8
hip joint failure 364-8
Hooke's law 20-1
HRR fields 308-9, 316-17
Hutchinson-Rice-Rosengren fields (see HRR
fields)
hydrogen charging 576
hydrogen embrittlement 571
hydrogenous gases 571-2, 575
hydrostatic stress, terminology 22
hysteresis loops
ceramic composites 177, 179
ceramic materials 172-4, 177, 179
FCC single crystals 40, 42
load-displacement loops 314
polycrystalline alloys 93^1
polymers 205-11
sliding contact fatigue 449-51
zirconia-containing ceramics 184-91, 395-6
hysteretic energy 208
in rolling contact 452
identification of active slip systems 47-9, 71-2
incremental collapse 102-3
incremental step test 92-3
inclusions 152^4
incompressibility 22
incremental plasticity theory 22-5
independent slip systems 91
induction hardening 229
initiation of fatigue cracks, computational models
143-5
initiation of fatigue cracks, effects of
environments 147-8, 156-7, 574-7
grain boundaries 149-52, 592-3
inclusions 152^4
mechanical models 155-6
persistent slip bands 141-2, 183
surfaces 143
surface roughness 132-7
twin boundaries 151-2
vacancy dipole models 137 41
in-plane shear (see modes of fracture)
in-situ-tormed glass 400
inspection of crack 333
instability of fracture 388-92
instabilities in cyclic hardening 45-6
interface dislocations 137 41
interfaces in composites (see composite materials)
internal stresses 50, 57-8, 99-101
internal time approach 112
intrinsic crack growth resistance 378-9
intrinsic crack length 547
intrusions 3, 79, 133—4
ionic crystals 182-4
irreversibility of slip (see kinematic irreversibility)
isotropic hardening 25, 102-4
./-controlled crack growth 312
7-dominance 311
./-integral 307-8
./-integral, cyclic or AJ (see cyclic 7-integral)
7-gannulus 318-19
J-Q theory 316-19
J2 flow theory 446
K-T theory 316-19
A^-dominance 295-6
A^-field (see singular fields)
Kelvin-Voigt model 26-8
kinematic hardening 25, 102^1
kinematic irreversibility of
cyclic slip 134, 148-9
deformation 8, 165-6
kinked crack 324, 507-10
Kitagawa-Takahashi diagram 546
knock-down factor 234, 235
Kronecker's delta 21
labyrinth structures 69-71
ladders of PSBs 54
Lame constant 21
lamellae of PSBs 54
Laplace equation 290
large-scale yielding 311
laser interferometry 213, 215
laser shock peening 231
lattice rotation 30-2
LCF (see low-cycle fatigue)
length scales, fundamentals
fatigue crack growth 351-2
veins 52
level crossing 264
life prediction models for
crack growth 334-5
creep-fatigue 594-607
fatigue thresholds 341-50
variable amplitude fatigue 265-267
limit load 331
linear elastic fracture mechanics, historical 5
lithium fluoride crystals 182-184
load ratio
crack growth rate, effects on 349-50, 395
definition 225, 333
674
Subject index
load ratio (com.)
fatigue threshold, effects on 341-50, 494-6
multiaxial fatigue life, effects on 247-50, 268-73
load reversal 223
load sequence effects 520-36
load-shedding method 352^1
local strain approach 262-5
long-chain molecule 200-1
long-range internal stresses 50
loop patches 50-2
loss compliance 467
loss modulus 208
loss tangent 208
low-cycle fatigue 12, 221, 236-7, 256-8, 262-5
low-energy dislocation structures (LEDS) 65-9
magnesia-partially stabilized zirconia
constitutive models 184-91
fatigue crack growth 395-6
mechanisms of deformation 185-7
magnesium oxide 179-81
Manson-Coffin relationship (see Coffin-Manson
relationship)
martensitic transformation
strain-induced 485, 504
stress-induced 184-91, 504-5
Masing sub-element model (see parallel sub-
element model)
maximum shear strain criterion 268
maximum shear stress criterion 247
Maxwell model 26-8
mean stress (see load ratio)
mean stress effects on total life 224-7, 235, 242-5,
258-9, 267
mean stress relaxation 104, 258-9
mechanical fatigue 1
mechanically small fatigue cracks 543, 554-62
mechanistic basis for fatigue 17-18
medial side of hip component 365
metal embrittlement 570, 574
metallic glasses 457, 492-3, 424-5
metal-matrix composites
Bauschinger effect 99-101
compression fatigue 156-62
crack-bridging 485, 518-19
crack trapping 515-19
thermal fatigue 115-23, 260-2
microcrack density 170-5
microcracking in fatigue of ceramics 165-6, 170-5,
191-7, 392-3
microslip 447
microstructurally small fatigue cracks 543-50
Miner's rule (see Palmgren-Miner damage rule)
mirror region of fatigue fracture surface 414
von Mises yield condition 23, 25
mismatch parameter 510-15
mist region of fatigue fracture surface 414
mixed-mode fracture mechanics 320-7
branched (deflected) cracks 322-6
ductile solids 320^t
mixed-mode fracture envelopes 369-70
path of mixed-mode crack 324-7, 370-3
singularity 321
mixity parameter
elastic 320
plastic 321
mode I crack tip fields 292-3
mode II crack tip fields 293-4
mode III crack tip fields 294, 374
modes I, II, III 288
modes of fracture
in-plane shear (sliding) 288
tearing (anti-plane shear) 288
tensile opening 288
molecular structure, effects on fatigue of 201-5,
239, 420-2
Mroz's model (see field of work hardening moduli)
multiaxial fatigue
deformation 104, 106-10, 268-9
introduction 8
out-of-phase loading 104, 106-10, 246-54, 276-8
total life 246-54, 268-78
multiaxial fracture 297-8
multiple slip 71-4, 86-7
multiple step method 92-3
mutual trapping of edge dislocations 50
near-threshold fatigue
mechanisms 341-50
mixed-mode fatigue thresholds 369-70
post-overload retardation, relationship to 524-6
net slip offset 133
Neuber's hyperbola 263^1
Neuber's rule 263
nickel-base superalloys 39, 74-8, 154-5, 336
nonbrittle solids 166-7
nonconforming contact 436
nondestructive evaluation 331
nonpropagating fatigue cracks
compression fatigue 159, 191-7, 211-13
multiaxial fatigue 369-70
notch fatigue 556-9
tension fatigue 244-5, 544-5, 556-9
nonproportional loading (see out-of-phase loading)
nonstationary loading history 535
Norton-Odqvist law 29
notch fatigue 156-62, 211-17, 242-5, 262-5, 550-4
notch sensitivity index 242-3
notch tip plasticity 262-5
nucleation criteria for microcracks 170-4
Subject index
675
octahedral plane 34
octahedral shear stress 34
organic composites 239-42
organic glass 200
Orowan fracture theory 285
Orowan-Frank-Read length 52
Orowan loops 99-101
Ostwald ripening 97
out-of-phase loading 104, 107, 276-8
overload effects on total life 132^4, 361
overloads
compressive 526-9
life prediction models 534-7
load sequence effects 531-4
tensile 520-6
oxidation at high temperatures 593^1
oxide glasses 200
oxide-induced crack closure 485, 496-500
implications for crack growth 497-500
mechanism 496-7
post-overload retardation 524-6
scanning Auger spectroscopy 497-500
oxygen reduction 570-4
palliatives, for fretting fatigue 466-8
Palmgren-Miner damage rule 132^4, 361
paraffin oils 503^1
parallel sub-element (Masing) model 104-7
Paris law 5, 296, 332
Paris law (modified) 387
damage accumulation models 355-6
geometrical models 355
Paris (intermediate) regime of crack growth 5, 296,
331-5, 354-7
partial slip 447
path-independent integral (see ./-integral)
peak counting 264
Peierls stress 79
penetration of cracks by fluids 503^1
permanent softening 100
persistent slip bands
channels 53-7
composite model 52-3, 57-8
constitutive model 60-3
deformation 42-4, 52-3, 78-9
dislocation structure 53-7
dynamic models 68-9
formation 63-5
geometrical model of deformation 52-3
hardening 61-2
historical background 5
ladders (walls) 53-7
lithium fluoride crystals 182^1
precipitation effects 97, 100-1
static or energetic models 65-8
three-dimensional view 55
two-phase model 52-3
Petch relationship 180
Peterson equation 243
pi (n) plane 24
phase angle 370-2
phase transformations (see transformation)
physically small fatigue cracks 543, 559-62
pile-up of dislocations 179-82, 197-8
pitting corrosion 157, 458
plane problem 289-95
plane strain
ASTM fracture testing standards 296,309,312-13
definition 20
fracture toughness 296, 312-13
mode I fields 292-3, 322-3
mode II fields 293-4, 322-3
plastic zone size 296, 302, 322-3, 374
plane stress
definition 20
generalized 288-95
mode I fields 292-3, 322-3
mode II fields 293-4, 322-3
plastic zone size 296, 302, 322-3
plastic zone size (cyclic) for extending cracks 307
plastic mixity parameter (see mixity parameter)
plastic modulus 106-10
plastic potential 24
plastic strain amplitude 256-8
plastic strain intensity 376
plastic stretch 486-7
plastic work 25, 110-11
plastic zone 295-6, 302-7
critical dimensions 296
cyclic 304-7
Dugdale model 303^1
envelopes of previous plastic zones 486-7
Irwin approximation 302-3
mixed-mode loading 323
mode III (torsion) loading 374
plane strain 302-3
plane stress 302-4
reversed (see plastic zone, cyclic)
strain hardening materials 323
plasticity-induced crack closure
analytical models 490-3
introduction 485-90
mechanism 487-90
numerical models 493-4, 535-6
overload effects 521-2
plane strain 485-96
plane stress 485-96
plasticity theories
polycrystals 22-6
single crystals 30-3
676
Subject index
point defects created by fatigue 78-9
Poisson's ratio 21
polymeric composites 239-42
polymer-matrix composites (see organic
composites)
polymers, fatigue of
compression fatigue 211-17
crack growth characterization 408-11
crack growth mechanisms 411-24
cyclic stress-strain response 203-11
deformation 200-11
discontinuous growth bands 413-17
molecular weight, effect of 204, 211-13, 420-2
striation formation 411-13
thermal effects 207-11
total-life approaches 237-42, 259-60
post-mortem (post-failure) analyses 18
Prager-Ziegler model 112
Prandtl-Reuss equations 34
Prandtl slip line fields 312
primary dislocations
edge 50
screw 50
principal strains 268-73
principal stresses 21
probability density function 232
probability of crack initiation 144-5
probability of failure (see statistical analysis)
process competition model 586
process zone 295
proof tests 13
propagation of cracks 13-15
proportional loading 104, 246, 268-78
protrusion 135-6
proximal side of hip component 365
PSBs (see persistent slip bands)
push-rod gage 494
pyrolitic carbon 396-9
quadrupoles of dislocations 66-8
quenching, residual stresses due to 230, 393
R-curve 383, 385, 388-9
stability of crack growth 388-92
-R-ratio (see load ratio)
rainflow counting 264-7
Ramberg-Osgood relationship 93, 308
range pair counting 264
rapid hardening 40
ratchetting 102-3, 113-14, 456
rate-independent plasticity 22-6
rear bulkhead of aircraft 358-63
relaxation of mean stress (see mean stress
relaxation)
relaxation time 27-8
residual stresses 306, 384, 393, 460
compression fatigue 161-2, 192-5, 213-15, 306
fatigue life, effects on 229-31
post-overload retardation, effects on 523, 534-5
thermal 124-8
resolved shear strain 31-3
resolved shear stress 30-3
retardation factor 535
retardation of crack growth
constant amplitude fatigue 483-519
variable amplitude fatigue 519-37
retirement for cause 15-17
reverse flow stress 97-9
reversible slip 40
reversion (re-solution) of precipitates 97
RFC (see retirement for cause)
rolling contact fatigue (see contact fatigue)
rotating bending fatigue 3, 222
rotation of slip system 30-2
roughness-induced crack closure 372-6, 500-2,
507-15
implications for crack growth 507-15
mechanism 500-2
small fatigue cracks 559-61
S-N curve (diagram) 3, 222-7, 237
Sachs factor 88
safe-life concept 14-17
saturation, cyclic
polycrystals 91-5
single crystals 31-2, 38-41
saturation of microcracking 171-5
saturation stress 41-5
Schmid factor 30-1, 34, 47-9, 71-2
Schmid law 30, 47
secondary slip 32-3, 47-9
semi-brittle solids 167, 179-84
semi-crystalline polymers (see polymers)
semi-elliptical cracks 612-13
shakedown
elastic 101-3, 456
kinematical, upper bound theorem 101
plastic shakedown 101-2, 456
statical, lower bound theorem 101
three-dimensional contact 454-6
two-dimensional contact 453^4
shape changes in fatigued BCC crystals 80-2
shear flow or shear bands
metallic glasses 425
polymers 202-6, 417-20
shearable precipitates 348
shielding (see crack tip shielding)
short fatigue cracks 7, 541-69
short-range order 95
shot-peening 229-31, 444-5
Subject index
677
silicone oils 503—1
silver chloride crystal 182-3
similitude 7, 543-1
single-edge-cracked bend specimen 610
single-edge-cracked tension specimen 609
single shear model 335-6, 348
single slip 30-2
singular fields
HRR 308-9
mode I 292-3
mode II 293-1
mode III 294
singularity 294-5
size scales of observation 11-13, 132
slide, in contact fatigue 448
sliding contact fatigue (see contact fatigue)
sliding mode crack closure 369-70
slip asymmetry 80-2
slip irreversibility (see kinematic irreversibility)
slip kinematics 60
slip steps 156, 162-3
slow-fast fatigue loading 591-2
small fatigue cracks 541-69
continuum aspects 550-61
definitions 543
polymers 417-19
slip band models 548-9
threshold conditions 545-50
small-scale creep 599
small-scale yielding 295, 311
Soderberg relationship 225-6
sodium chloride crystal 182-4
solid solution strengthening 99
source shortening stress 100
Space Shuttle engine 74
spalling 458
spectrum loads 529-33
spherical normal contact 440-5
spin 436, 438
stacking fault energy (SFE) 33, 83, 95-7
stage I crack growth 335-6
stage II crack growth 335^41
standard linear model 26-8
static fatigue 165
static modes 336, 342, 358
stationary loading history 535
statistical analysis, probability analysis 99-100,
166, 233-1
log-normal distribution 232
normal distribution 232
probability density function 232
probability of failure 233
probability of survival 233
statistical model for surface roughness 99-100
Weibull diagram 233—1
Weibull statistics 166, 233-1
steady creep 27
steam power generator, creep fatigue 604-7
stereographic projection 49
stick-slip 447-8
Stoney formula 127-8
storage compliance 208
storage modulus 208
strain
cyclic 256-8
definition 19, 21
elastic range 256-8
gages, back face 486-9, 537
gages, side face 486-9, 537
plastic range 256-8
total range 256-8
strain bursts 45-6
strain concentration factor 263
strain fields at crack tip (see singular fields)
strain hardening ahead of crack tip 308-9, 322-3
strain hardening exponent 91-5
strain hardening in polycrystals 25
cyclic loads 91-6
strain hardening in single crystals
cyclic loads 41-5
monotonic loads 32-3
strain-life approach
Coffin-Manson equation 256-7
introduction 4, 5
multiaxial fatigue 268-78
notch fatigue 262-5
polymers 259-60
transition life 257-8
strain range partitioning 596-7
strain softening in
polycrystalline metals 91-6
polymers 203-11
stress, definition 15
stress concentration factor (see elastic stress
concentration factor)
stress corrosion cracking 363, 385
stress corrosion fatigue 577-80
stress fields at crack tip (see singular fields)
stress intensity factor
calibration for different specimens 609-13
closing 489-90
definition 293-5, 332-3
effective 385, 489
maximum 296, 332-3
minimum 296, 332-3
nominal 559
opening 489-90
range 296, 332-3
effective 489
nominal 489
678
Subject index
stress intensity factor (com.)
root-mean-square value 536-7
shielding component 385
stress invariants 21-2
stress-life approach 221-55
stress relaxation 27
stress reversal 223
stress state effects on compression fatigue 160-2,
192-5
stress-strain curves, cyclic
Bauschinger effect 98
bicrystals 89-91
ceramic composites 177, 179
ceramic materials 172-4, 177, 179
plateau 41-3, 73, 87-9
polycrystalline metals 86-96, 257
polymers 205-11
single crystals of metals, single slip 40-5
single crystals of metals, multiple slip 12-A
Ti single crystals 83-4
stretch zone 415
striations
aircraft accident analysis 8-11, 358-63
brittle 339
cleavage 340
ductile 339
hip femoral component failure analysis 364-8
historical background 5-6
models for formation 337-41
polymers 411-13
variable amplitude fatigue 7, 530-2
strip yield models
Barenblatt 304
Dugdale 303-4
subcritical transformation 187-91
sub-element model (see parallel sub-element model)
supercritical transformation 187-91
superjog 58
superposition model 585
surface coatings
amplification of driving force 566-8
crack arrest at bondcoats 566-8
crack tip shielding 566-8
driving force for fatigue cracks 564-6
surface distress 458
surface energy (see energy)
surface treatments 228-31, 235
surface work parameter 408
T-stress
definition 292
mixed-mode fracture 292
plasticity-induced crack closure 494
small fatigue cracks 554-6
tangent moduli 107-10
taper sectioning method 135, 152
Taylor factor 87-8, 90-1
Taylor-Nabarro lattice 65-8
tearing mode 288
temperature effects on fatigue
high temperatures 590-607
low temperatures 588-9
tempered glass 254
texture effects on cyclic deformation 89
thermal fatigue 1, 115-31
characteristic temperatures 117-18, 122-3, 128-9
layered materials 123-31
metal-matrix composites 115-23, 130, 260-2
plastic strain accumulation 119-23, 260-2
polymers 207-10
shakedown limit 118
thermal softening in polymers 207-10, 238-9
thermomechanical fatigue 1, 260-2
thin-film stress 127-8, 131
threshold stress intensity factor
definition 341-2
grain size effects 346-7
measurement techniques 352-4
microstructural effects 345-52, 501-3
mixed-mode 369-70
models 345-6
slip characteristics 347-50
threshold for
crack growth 341-50
mixed-mode crack growth 369-70
notch fatigue 156-62, 211-17, 242-5, 262-5,
417-19, 551-2
short (small) cracks 545-50
stress corrosion cracking 577-9
titanium alloys 82-5, 180
total fatigue life 12, 221, 224, 239
Coffin-Manson relationship 4-5, 256-7
introduction 4-5
mean stress effects 224-7, 242-5, 257-8, 267
multiaxial fatigue 268-78
polymers 237-42, 259-60
total hip femoral component 158, 364-8
total knee replacements 213-17
total-life approaches 12, 219-79
total strain theory 25-6
toughening of brittle solids 388
tractive rolling contact 436
transformation plasticity 184-91
constitutive models 187-90
mechanisms 184-7
yield condition 190
transformation strain due to microcracking 187
transformation toughening 184-91, 388, 395
transformation zone in crack wake 401, 544
transient effects on crack growth
Subject index
679
compressive overloads 526-9
tensile overloads 520-6
transition crack size, small cracks 545-7
transition life 257-8
trapezoidal hip component 364-8
trapping (see crack trapping)
Tresca yield condition 23
triaxiality 316-19
triaxiality parameter 316-19
TRIP steels 184,504
true corrosion fatigue 577-80
turbine components 156-7, 343, 441
turbogenerator rotor 474-81
twin boundaries 149-52
twinning 82^4
TWIST spectra 519-20
two-parameter characterization of fracture
316-19
small-scale yielding 318
small fatigue cracks 554-6
large-scale yielding 318
two-surface models of cyclic plasticity 110-12
ultrasonics 13
uncracked ligament length 311-13
unloading parameter for microcracking 174
unzipping model for crack growth 340
vacancy diffusion 143-4
vacancy generation 60-63, 146-7
vacuum, fatigue crack growth 340-1
variable amplitude fatigue 7, 227-8, 265-7
veins of dislocations 49-52
veins, channels between 50-2
viscoelasticity theory 26-8
viscoplasticity theory 28-9
viscosity coefficient 26, 404
viscous creep theory 28-9
viscous flow of glassy films 166, 176-8, 384-5,
399-403
viscous fluids (see crack closure)
wake of fatigue crack 396, 484-519
Walker relationship 358
water vapor, effects on corrosion-fatigue 350
waveform, effects on corrosion-fatigue 584-5
wear debris 166, 194
wedging of fatigue cracks by debris 166, 174-5,
192-4, 496-500
Weibull diagram 233^1
Weibull modulus 233^t
Weibull statistics 166, 233^t
Weiss zone law 47
weldments 230
Wheeler model 535
Willenborg model 534-5
wing cracks, in gear teeth 457-62
Wohler curve (diagram) (see S-N curve (diagram))
work hardening in tension 25-6
work hardening moduli 106-10
X-ray techniques 13
yield anisotropy 79-82
yield condition 22-5
yield surface 23^4
yield zone models
craze formation in polymers 413-16
variable amplitude fatigue 534-5
Young's modulus 21
zirconia 184-91, 395-6
zone, creep (see creep zone)
zone, damage (see damage zone)
zone, plastic (see plastic zone)
zone, process (see process zone)