/


Текст
Principles for Dealing with
THE CHANGING
WORLD ORDER
Why Nations
Succeed and Fail
RAY DALIO
AUTHOR OF THE #1 NEW YORK TIMES BESTSELLER PRINCIPLES
AND FOUNDER OF THE WORLD’S LARGEST HEDGE FUND
Thank you for downloading this
Simon & Schuster ebook.
Get a FREE ebook when you join our mailing list. Plus, get updates on new releases,
deals, recommended reads, and more from Simon & Schuster. Click below to sign up
and see terms and conditions.
CLICK HERE TO SIGN UP
Already a subscriber? Provide your email again so we can register this ebook and send
you more of what you like to read. You will continue to receive exclusive offers in your
inbox.
Principles for Dealing with
THE CHANGING
WORLD ORDER
RAY DALIO
AVID READER PRESS
NEW YORK LONDON TORONTO SYDNEY NEW DELHI
To my grandchildren and those of their generation who will be
participants in the continuation of this story: may the Force of
Evolution be with you.
WITH APPRECIATION
To all who helped me learn, you each have my deep gratitude for giving me
valuable bits and pieces that I could put together to make this book. If it wasn’t
for the conversations we had, the thoughts you shared in your writings, and the
histories and statistics that you dug out from archives, this book would have not
been possible. In some cases you are still with us and in some cases you are not,
but you are all in my thoughts. I am especially grateful to Henry Kissinger, Wang
Qishan, Graham Allison, Lee Kuan Yew, Liu He, Paul Volcker, Mario Draghi,
Paul Kennedy, Richard N. Haass, Kevin Rudd, Steven Kryger, Bill Longfield,
Neil Hannan, H. R. McMaster, Jiaming Zhu, Larry Summers, Niall Ferguson,
Tom Friedman, Heng Swee Keat, George Yeo, Ian Bremmer, and Zhiwu Chen.
I also want to thank Peer Vries, Benjamin A. Elman, Pamela Kyle Crossley,
Sybil Lai, James Zheng Gao, Yuen Yuen Ang, Macabe Keliher, David Porter,
Victor Cunrui Xiong, David Cannadine, Patricia Clavin, Duncan Needham,
Catherine Schenk, and Steven Pincus, among others for their valuable
perspectives.
I am also very grateful to those who helped convert these concepts and writings
into a book, which was nearly as much of an undertaking as coming up with
them. I am grateful to Mark Kirby above all others for his unwavering devotion,
talent, and patience. I am also grateful to Michael Kubin, Arthur Goldwag, and
Phil Revzin, who all provided helpful comments on the manuscript, and to Jim
Levine, my literary agent, and Jofie Ferrari-Adler, my editor, who helped create
this book and get it out there.
Beyond these people were many others, including Gardner Davis, Udai
Baisiwala, Jordan Nick, Michael Savarese, Jonathan Bost, Stephen McDonald,
Elena Gonzalez Malloy, Khia Kurtenbach, Alasdair Donovan, Floris Holstege,
Anser Kazi, Chris Edmonds, Julie Farnie, and Brian De Los Santos, who
contributed significantly behind the scenes—as did all the people at Bridgewater,
who together created the most amazing learning platform imaginable.
HOW TO READ THIS BOOK
In writing this book I wrestled with whether to make it complete or concise
and decided to try to make it both by bolding passages to create a quick-
read version. If you want to read the concise version, read what is in
bold, and if you want more, it’s all available to you.
I also wanted to convey some principles that are timeless and universal
truths for dealing with reality well, which I denoted by « putting a red dot in
front of them and italicizing.
For some subjects, I had embellishments that I thought would be
interesting to some but not all readers, so I chose to present them as an
addendum to the respective chapter. Feel free to read or skip as you like.
At the back of this book, you can find a glossary that explains the
abbreviations you see in some of the charts.
Finally, to keep this book from becoming much too long, there is also a lot
of supplemental material available at economicprinciples.org, including
reference material, citations, more data on the indices, etc.
INTRODUCTION
The times ahead will be radically different from those we’ve experienced
in our lifetimes, though similar to many times in history.
How do I know that? Because they always have been.
Over the last 50 or so years, in order to handle my responsibilities well, I have
needed to understand the most important factors that go into making countries
and their markets succeed and fail. I learned that to anticipate and handle
situations that I had never faced before I needed to study as many analogous
historical cases as possible to understand the mechanics of how they transpired.
That gave me principles for dealing with them well.
A few years ago, I observed the emergence of a number of big
developments that hadn’t happened before in my lifetime but had
occurred numerous times in history. Most importantly, I was seeing the
confluence of huge debts and zero or near-zero interest rates that led to massive
printing of money in the world’s three major reserve currencies; big political and
social conflicts within countries, especially the US, due to the largest wealth,
political, and values gaps in roughly a century; and the rising of a new world
power (China) to challenge the existing world power (the US) and the existing
world order. The most recent analogous time was the period from 1930 to 1945.
This was very concerning to me.
I knew that I couldn’t really understand what was happening and deal
with what would be coming at me unless I studied past analogous periods,
which led to this study of the rises and declines of empires, their reserve
currencies, and their markets. In other words, to develop an
understanding of what is happening now and might happen over the next
few years, I needed to study the mechanics behind similar cases in history
—e.g., the 1930—45 period, the rise and fall of the Dutch and British
empires, the rise and fall of Chinese dynasties, and others.-. I was in the
midst of doing those studies when the COVID-19 pandemic struck, which was
another one of those big events that never happened in my lifetime but had
happened many times before. Past pandemics became a part of this study and
showed me that surprising acts of nature—e.g., diseases, famines, and floods—
need to be considered as possibilities because those surprising big acts of nature
that rarely come along were by any measure even more impactful than the biggest
depressions and wars.
As I studied history, I saw that it typically transpires via relatively well-
defined life cycles, like those of organisms, that evolve as each generation
transitions to the next. In fact, the history and the future of humanity can be
seen as just the aggregate of all the individual life stories evolving through time. I
saw these stories flow together as one all-encompassing story from the beginning
of recorded history up to this moment, with the same things happening over and
over again for basically the same reasons, while still evolving. By seeing many
interlinking cases evolve together, I could see the patterns and cause/effect
relationships that govern them and could imagine the future based on
what I learned. These events happened many times throughout history
and were parts of a cycle of rises and declines of empires and most aspects
of empires—e.g., of their education levels, their levels of productivity, their levels
of trade with other countries, their militaries, their currencies and other markets,
etc.
Each of these aspects or powers transpired in cycles, and they were all
interrelated. For example, nations’ levels of education affected their levels of
productivity, which affected their levels of trade with other countries, which
affected the levels of military strength required to protect trade routes, which
together affected their currencies and other markets, which affected many other
things. Their movements together made up the economic and political cycles that
occurred over many years—e.g., a very successful empire or dynasty could have its
cycle last 200 or 300 years. All the empires and dynasties I studied rose and
declined in a classic Big Cycle that has clear markers that allow us to see
where we are in it.
This Big Cycle produces swings between 1) peaceful and prosperous
periods of great creativity and productivity that raise living standards a
lot and 2) depression, revolution, and war periods when there is a lot of
fighting over wealth and power and a lot of destruction of wealth, life,
and other things we cherish. I saw that the peaceful/creative periods lasted
much longer than the depression/revolution/war periods, typically by a ratio of
about 5:1, so one could say that the depression/revolution/war periods were
transition periods between the normally peaceful/creative periods.
While the peaceful/creative periods are certainly more enjoyable for most
people, all these realities have their purposes for advancing evolution, so in the
broader sense they are neither good nor bad. The depression/revolution/war
periods produce a lot of destruction, but like cleansing storms, they also get rid of
weaknesses and excesses (such as too much debt) and produce a new beginning in
the form of a return to fundamentals on a sounder footing (albeit painfully).
After the conflict is resolved, it is clear who has what power, and because most
people desperately want peace, there is a resolution that produces new monetary,
economic, and political systems—together, a new world order—and fosters the
next peaceful/creative period. Within this Big Cycle are other cycles. For example,
there are long-term debt cycles that last about 100 years and short-term debt cycles
that last about eight years. This short-term cycle also has within it longer,
prosperous expansion periods that are interrupted by shorter recession periods,
and within these cycles are shorter cycles, and so on.
Before I get your head spinning with all this cycle stuff, the main thing
I want to convey is that when the cycles align, the tectonic plates of
history shift, and the lives of all people change in big ways. These shifts will
sometimes be terrible and sometimes terrific. They certainly will happen in the
future, and most people will fail to anticipate them. In other words, • the swinging
of conditions from one extreme to another in a cycle is the norm, not the exception. It was a
very rare country in a very rare century that didn’t have at least one
boom/harmonious/prosperous period and one depression/civil war/revolution
period, so we should expect both. Yet, most people throughout history have
thought (and still think today) that the future will look like a slightly modified
version of the recent past. That is because • the really big boom periods and the really
big bust periods, like many things, come along about once in a lifetime and so they are
surprising unless one has studied the patterns of history over many generations. Because
the swings between great and terrible times tend to be far apart * the future we
encounter is likely to be very different from what most people expect.
For example, my dad and most of his peers who went through the Great
Depression and World War II never imagined the post-war economic boom
because it was more different from than similar to what they had experienced. I
understand why, given those experiences, they wouldn’t think of borrowing and
putting their hard-earned savings into the stock market, so it’s understandable
that they missed out on profiting from the boom. Similarly, I understand why,
decades later, those who only experienced debt-financed booms and never
experienced depression and war would borrow a lot in order to speculate and
would consider depression and war implausible. The same is true with money:
money used to be “hard” (i.e., linked to gold) after World War II until
governments made money “soft” (i.e., fiat) to accommodate borrowing and
prevent entities from going broke in the 1970s. As a result, most people at the
moment of my writing this book believe that they should borrow more, even
though borrowing and debt-financed booms have historically led to depressions
and internal and external conflicts.
Understanding history in this way also raises questions whose answers provide
us with valuable clues on what the future will be like. For example, throughout
my life, the dollar has been the world’s reserve currency, monetary policy has been
an effective tool for stimulating economies, and democracy and capitalism have
been widely regarded as the superior political and economic systems. Anyone who
studies history can see that • no system of government, no economic system, no currency,
and no empire lasts forever, yet almost everyone is surprised and ruined when they fail.
Naturally I asked myself how would I and the people I care about know when we
are entering one of these depression/revolution/war periods and how would we
know how to navigate them well. Because my professional responsibility is to
preserve wealth regardless of the environment, I needed to develop an
understanding and strategy that would have worked throughout history,
including through these sorts of devastating times.
The purpose of this book is to pass along what I learned that has helped me
and that I believe might help you. I present it for your consideration.
HOW I LEARNED TO ANTICIPATE THE FUTURE BY STUDYING THE
PAST
While it might seem odd that an investment manager who is required to make
investment decisions on short time frames would pay so much attention to long-
term history, through my experiences I have learned that I need this perspective.
My approach isn’t an academic one created for scholarly purposes; it is a very
practical one that I follow in order to do my job well. The game I play requires me
to understand what is likely to happen to economies better than the competition
does, so I have spent roughly 50 years closely observing most major economies and
their markets—as well as their political conditions, since those affect both—trying
to understand what is happening well enough to bet on it. From my years of
wrestling with the markets and trying to come up with principles for doing it well,
I’ve learned that • one's ability to anticipate and deal well with the future depends on one's
understanding of the cause/effect relationships that make things change, and one's ability to
understand these cause/effect relationships comes from studying how they have changed in
the past.
I arrived at this approach after the painful learning that the biggest mistakes in
my career came from missing big market moves that hadn’t happened in my
lifetime but had happened many times before. The first of these big surprises for
me came in 1971 when I was 22 years old and clerking on the floor of the New
York Stock Exchange as a summer job. I loved it because it was a fast-pasted game
of making and losing money played on a trading floor with people who liked to
have a blast with each other—so much so that traders used to have water pistol
fights right on the trading floor. I was engrossed in this game of watching the big
developments in the world and betting on how they would drive the markets.
Sometimes it could be dramatic.
On a Sunday night—August 15, 1971—President Richard Nixon announced
that the US would renege on its promise to allow paper dollars to be turned in for
gold. As I listened to Nixon speak, I realized that the US government had
defaulted on a promise and that money as we knew it had ceased to exist. That
couldn’t be good, I thought. So on Monday morning I walked onto the floor of
the exchange expecting pandemonium as stocks took a dive. There was
pandemonium all right, but not the sort I expected. Instead of falling, the stock
market jumped about 4 percent as the dollar plummeted. I was shocked. That’s
because I hadn’t experienced a currency devaluation before. In the days that
followed, I dug into history and saw that there were many cases of currency
devaluations that had had similar effects on stock markets. By studying further, I
figured out why, and I learned something valuable that would help me many
times in my future. It took a few more of those painful surprises to beat the
realization into my head that I needed to understand all the big economic and
market moves that had happened in the last 100-plus years and in all major
countries.
In other words, if some big and important event had happened in the past (like
the Great Depression), I couldn’t say for sure that it wouldn’t happen to me, so I
had to figure out how it worked and be prepared to deal with it. Through my
research I saw that there were many cases of the same types of things happening
(e.g., depressions) and that by studying them just like a doctor studies many cases
of a particular type of disease, I could gain a deeper understanding of how they
work. I studied these qualitatively and quantitatively through my experiences, by
speaking with preeminent experts, reading great books, and digging into statistics
and archives with my great research team.
From that learning came a visualization of an archetypical sequence of how
rises and declines in wealth and power typically happen. The archetype helps me
see the cause/effect relationships that drive how these cases typically progress.
With that archetypical template specified, I can study deviations from it to try to
explain them. Then I put these mental models into algorithms both to monitor
conditions relative to my archetypes and to help me make decisions based on
them. This process helps me refine my understanding of the cause/effect
relationships to the point where I can create decision-making rules—i.e.,
principles for dealing with my realities—in the form of “if/then” statements—i.e.,
if X happens, then make Y bet. Then I watch actual events transpire relative to
that template and what we are expecting. I do these things in a very systematic way
with my partners at Bridgewater Associates. If events are on track, we continue to
bet on what typically comes next; if events start to deviate from our template, we
try to understand why and course correct. This process has helped me both
understand the big cause/effect sequences that typically drive their progressions
and gain a lot of humility. I do this continuously and will continue to do it until I
die, so what you are reading is a work in progress.-
THIS APPROACH AFFECTS HOW I SEE EVERYTHING
Seeing events in this way helped shift my perspective from being caught in the
blizzard of things coming at me to stepping above them to see their patterns
through time.- The more related things I could understand in this way, the more I
could see how they influence each other—e.g., how the economic cycle works
with the political one—and how they interact over longer periods of time.
I believe that the reason people typically miss the big moments of
evolution coming at them in life is because they experience only tiny pieces
of what’s happening. We are like ants preoccupied with our jobs of
carrying crumbs in our very brief lifetimes instead of having a broader
perspective of the big-picture patterns and cycles, the important
interrelated things driving them, where we are within the cycles, and
what’s likely to transpire. From gaining this perspective, I’ve come to believe
that throughout history there are only a limited number of personality types-
going down a limited number of paths, which lead them to encounter a limited
number of situations to produce a limited number of stories that repeat over time.
The only things that change are the clothes the characters are wearing, the
languages they are speaking, and the technologies they’re using.
THIS STUDY AND HOW I CAME TO DO IT
One study led to another, which led me to do this study. More specifically:
Studying money and credit cycles throughout history made me
aware of the long-term debt and capital markets cycle (which
typically lasts about 50 to 100 years), which has led me to view what
is happening now in a very different way than if I hadn’t gained that
perspective. For example, interest rates hit 0 percent and central banks
printed money and bought financial assets in response to the 2008 financial
crisis. I had studied that happening in the 1930s, which helped me see how
and why central bank actions of creating a lot of money and credit/debt 90
years ago pushed financial asset prices up, which widened the wealth gap
and led to an era of populism and conflict. We are now seeing the same
forces at play in the post-2008 period.
In 2014,1 wanted to forecast economic growth rates in a number of
countries because they were relevant to our investment decisions. I used the
same approach of studying many cases to And the drivers of growth and
come up with timeless and universal indicators for anticipating countries’
growth rates over 10-year periods. Through this process, I developed a
deeper understanding of why some countries did well and others did
poorly. I combined these indicators into gauges and equations that we used
(and continue to use) to produce 10-year growth estimates across the 20
largest economies. Besides being helpful to us, I saw that this study could
help economic policy makers because, by seeing these timeless and universal
cause/effect relationships, they could know that if they changed X, it would
have Y effect in the future. I also saw how these 10-year leading economic
indicators (such as the quality of education and the level of indebtedness)
were worsening for the US relative to big emerging countries such as China
and India. This study is called “Productivity and Structural Reform: Why
Countries Succeed and Fail, and What Should Be Done So Failing
Countries Succeed.” (This study, and every other study mentioned here, is
es.org.
Soon after the Trump election in 2016 and with increases in populism in
developed countries becoming more apparent, I began a study called
“Populism: The Phenomenon.” That highlighted for me how gaps in
wealth and values led to deep social and political conflicts in the 1930s that
available for free at economicprincipl
are similar to those that exist now. It also showed me how and why
populists of the left and populists of the right are more nationalistic,
militaristic, protectionist, and confrontational—and what such approaches
led to. I saw how powerful the conflict between the economic/political left
and right could become and the significant impact this conflict has on
economies, markets, wealth, and power, which gave me a better
understanding of events that were and still are transpiring.
From doing these studies, and from observing numerous things that were
happening around me, I saw that America was experiencing very large gaps
in people’s economic conditions, which were obscured by looking only at
economic averages. So I divided the economy into quintiles, looking at the
top 20 percent of income earners, the next 20 percent, and so on down to
the bottom 20 percent, and examined the conditions of these populations
individually. This resulted in two studies. In “Our Biggest Economic,
Social, and Political Issue: The Two Economies—The Top 40% and the
Bottom 60%,” I saw the dramatic differences in conditions between the
“haves” and the “have-nots,” which helped me understand the greater
polarity and populism I saw emerging. Those findings, as well as the close
contact my wife and I were having through her philanthropic work with
the reality of wealth and opportunity gaps in Connecticut communities
and their schools, led to the research that became my study called “Why and
How Capitalism Needs to Be Reformed.”
At the same time, through my many years of international dealings in and
research on other countries, I saw huge global economic and geopolitical
shifts taking place, especially in China. I have been going to China for 37
years and am lucky enough to have become well-acquainted with the
thinking of top economic policy makers and a broad range of others.
Having this direct contact has helped me see up close the reasoning
behind their actions, which have produced remarkable advances. It is
a fact that these people have led China to become an effective competitor
with the US in production, trade, technology, geopolitics, and world capital
markets, so how they’ve done this must be examined and understood
without bias.
My most recent study, on which this book is based, came about because of
my need to understand three big forces that hadn’t happened before in my
lifetime and the questions they prompt:
1. The Long-Term Debt and Capital Markets Cycle: At no point in our
lifetimes have interest rates been so low or negative on so much debt
as they are as of this writing. The value of money and debt assets is
being called into question by the supply-and-demand picture for
them. In 2021, more than $16 trillion of debt was at negative
interest rates and an unusually large amount of additional new debt
will soon need to be sold to finance deficits. This is happening at the
same time as huge pension and healthcare obligations loom large on the
horizon. These circumstances raised some interesting questions for me.
Naturally I wondered why anyone would want to hold debt yielding a
negative interest rate and how much lower interest rates could be pushed. I
also wondered what will happen to economies and markets when they can’t
be pushed lower and how central banks could be stimulative when the next
downturn inevitably comes. Would central banks print a lot more currency,
causing its value to go down? What would happen if the currency that the
debt is denominated in goes down while interest rates are so low? These
questions in turn led me to ask what central banks would do if investors flee
debt denominated in the world’s major reserve currencies (i.e., the dollar,
the euro, and the yen), which would be expected if the money that they are
being paid back in is both depreciating in value and paying interest rates
that are so low.
A reserve currency is a currency that is accepted around the world
for transactions and savings. The country that gets to print the
world’s primary currency (now the US, but as we’ll see this has
changed through history) is in a very powerful position, and debt
that is denominated in the world’s reserve currency (i.e., US dollar-
denominated debt now) is the most fundamental building block for
the world’s capital markets and the world’s economies. It is also the
case that all reserve currencies in the past have ceased to be reserve
currencies, often coming to traumatic ends for the countries that enjoyed
this special power. So I also began to wonder whether, when, and why the
dollar will decline as the world’s leading reserve currency, what might
replace it, and how that would change the world as we know it.
2. The Internal Order and Disorder Cycle: Wealth, values, and political
gaps are now larger than at any other point during my lifetime. By
studying the 1930s and other prior eras when polarization was also high, I
learned that which side wins out (i.e., left or right) will have very big
impacts on economies and markets. So naturally I wondered what today’s
gaps will lead to. My examinations of history have taught me that • when
wealth and values gaps are large and there is an economic downturn, it is likely that
there will be a lot of conflict about how to divide the pie. How will people and
policy makers interact with each other when the next economic downturn
arrives? I was especially concerned because of the limitations on central
banks’ abilities to cut interest rates adequately to stimulate the economy. In
addition to these traditional tools being ineffective, printing money and
buying financial assets (now called “quantitative easing”) also widens the
wealth gap because buying financial assets pushes up their prices, which
benefits the wealthy who hold more financial assets than the poor do. How
would that play out in the future?
3. The External Order and Disorder Cycle: For the first time in my life,
the United States is encountering a true rival power. (The Soviet
Union was only a military rival, never a significant economic one.)
China has become a rival power to the United States in most ways
and is becoming strong in most ways at a faster rate. If trends continue,
China will be stronger than the United States in the most important ways
that an empire becomes dominant. Or at the very least, it will be a worthy
competitor. I have seen both countries up close for most of my life, and I
now see how conflict is increasing fast, especially in the areas of trade,
technology, geopolitics, capital, and economic/political/social ideologies. I
can’t help but wonder how these conflicts, and the changes in the world
order that will result from them, will transpire in the years ahead and what
effects that will have on us all.
To gain the perspective I needed about these factors and what their confluence
might mean, I looked at the rises and declines of all the major empires and their
currencies over the last 500 years, focusing most closely on the three biggest ones:
the US Empire and the US dollar, which are most important now; the British
Empire and the British pound, which were most important before that; and the
Dutch Empire and the Dutch guilder before that. I also focused less closely on the
six other significant, though less financially dominant, empires of Germany,
France, Russia, Japan, China, and India. Of those six, I gave China the most
attention and looked at its history back to the year 600 because 1) China was so
important throughout history, 2) it’s so important now and will likely be even
more important in the future, and 3) it provides many cases to look at of dynasties
rising and declining, which helped me better understand the patterns and the
forces behind them. In these cases, a clearer picture emerged of how other
influences, most importantly technology and acts of nature, played significant
roles.
From examining all these cases across empires and across time, I saw
that the great empires typically lasted roughly 250 years, give or take 150
years, with big economic, debt, and political cycles within them lasting
about 50 to 100 years. By studying how these rises and declines worked
individually, I could see how they worked on average in an archetypical way, and
then I could examine how they worked differently and why. Doing that taught
me a lot. My challenge now is trying to convey it to you.
You can miss seeing these cycles if you watch events too close up or if you are
looking at the averages rather than the individual cases. Almost everyone talks
about what is happening now and nobody talks about these big cycles, even
though they are the biggest drivers of what is happening now. When looking at
the whole or at averages, you don’t see the individual cases of rises and declines,
which are far greater. For example, looking at a stock market average (e.g., the S&P
500) and not looking at individual companies will lead you to miss the important
fact that almost all the individual cases that make up the average have periods of
birth, growth, and death. If you experienced any one of these, you would have had
a hell of a ride up followed by a hell of a ride down into ruin unless you diversified
and rebalanced your bets (e.g., the way it is done by S&P to create the index) or
were able to discern the rising periods from the declining periods ahead of the
crowd so as to be able to move well. By “move” I don’t just mean move your
position in markets—in the case of rising and falling empires, I mean “move” in
nearly everything, including where you live.
This leads me to my next point: • to see the big picture, you can't focus on the
details. While I will attempt to paint this big, sweeping picture accurately, I can’t
paint it in a precise way. Also, in order for you to see it and understand it, you
can’t try to do so in a precise way. That is because we are looking at mega-macro
cycles and evolution over very long time frames. To see them, you will have to let
go of the details. Of course, when the details are important, which they often are,
we will need to go from the very big imprecise picture to a more detailed one.
Looking at what happened in the past from this mega-macro perspective will
radically alter how you see things. For example, because the span of time covered
is so large, many of the most fundamental things that we take for granted and
many of the terms we use to describe them do not exist over the full period of
time. As a result, I will be imprecise in my wording so that I can convey the big
picture without getting tripped up on what might seem to be big things but, in
the scope of what we are looking at, are relative details.
For example, I wrestled with how much I should worry about the differences
between countries, kingdoms, nations, states, tribes, empires, and dynasties.
Nowadays we think mostly in terms of countries. However, countries as we know
them didn’t come into existence until the 17th century, after the Thirty Years’
War in Europe. In other words, before then there were no countries—generally
speaking, though not always, there were states and kingdoms instead. In some
places, kingdoms still exist and can be confused with being countries, and in some
places they are both. Generally speaking, though not always, kingdoms are small,
countries are bigger, and empires are biggest (spreading beyond the kingdom or
the country). The relationships between them are often not all that clear. The
British Empire was mostly a kingdom that gradually evolved into a country and
then into an empire that extended way beyond England’s borders, so that its
leaders controlled broad areas and many non-English peoples.
It’s also the case that each of these types of singularly controlled entities—
states, countries, kingdoms, tribes, empires, etc.—controls its population in
different ways, which further confuses things for those who seek precision. For
example, in some cases empires are areas that are occupied by a dominant power,
while in other cases empires are areas influenced by a dominant power through
threats and rewards. The British Empire generally occupied the countries in its
empire while the American Empire has controlled more via rewards and threats—
though that is not entirely true, as at the time of this writing the US has military
bases in at least 70 countries. Though it is clear that there is an American Empire,
it is less clear exactly what is in it. Anyway, you get my point—that trying to be
precise can stand in the way of conveying the biggest, most important things. So
you are going to have to bear with my sweeping imprecisions. You will also
understand why I will henceforth imprecisely call these entities countries, even
though not all of them were countries, technically speaking.
Along these lines, some will argue that my comparing different countries with
different systems in different times is impossible. While I can understand that
perspective, I want to assure you that I will seek to explain whatever major
differences exist and that the timeless and universal similarities are much greater
than the differences. It would be tragic to let the differences stand in the way of
seeing the similarities that provide us with the lessons of history we need.
REMEMBER THAT WHAT I DON’T KNOW IS MUCH GREATER THAN
WHAT I KNOW
In asking these questions, from the outset I felt like an ant trying to understand
the universe. I had many more questions than answers, and I knew that I was
delving into numerous areas that others have devoted their lives to studying. One
of the benefits of my circumstances is that I can speak with the world’s best
scholars who have studied history in depth as well as with the people who are in,
or have been in, the positions of making history. This allowed me to triangulate
with the best of them. While each had in-depth perspectives on some pieces of the
puzzle, none had the holistic understanding that I needed to adequately answer all
my questions. But by speaking with all of them and triangulating what I learned
with the research I did myself, the pieces started to fall into place.
The people and tools at Bridgewater were also invaluable to this research.
Because the world is a complicated place, playing the highly competitive game of
making sense of the past, processing what’s going on in the present, and using that
information to bet on the future requires hundreds of people and great computer
power. For example, we actively consume about a hundred million data series that
are run through our logic frameworks that systematically convert this information
into trades in every market we can trade within every major country in the world.
I believe that our ability to see and process information about all major countries
and all major markets is unparalleled. It was through this machine that I could see
and attempt to understand how the world I’m living in works and I relied on it in
doing this study.
Still, I can’t be sure that I’m right about anything.
While I have learned an enormous amount that I will put to good use, I know
that what I know is still only a tiny portion of what I need to know to be
confident in my outlook for the future. I also know from experience that if I wait
to learn enough to be satisfied with what I know before acting or sharing, I’d
never be able to use or convey what I have learned. So please understand that
while this study will provide you with my very top-down, big-picture perspective
on what I’ve learned and my very low-confidence outlook for the future, you
should approach my conclusions as theories rather than facts. Keep in mind that
even with all of this, I have been wrong more times than I can remember, which is
why I value diversification of my bets above all else. So please realize that I’m just
doing the best I can to openly convey my thinking to you.
You might be wondering why I wrote this book. In the past, I would have been
silent about what I’ve learned. However, I am now in the phase of my life that
silently achieving more isn’t as important to me as passing along what I have
learned in the hope that it can be of use to others. My main objectives are to
convey to you my model for how the world works—to share with you a single
digestible story of the last 500 years that shows how and why history “rhymes”
with what is happening today—and to help you and others make better decisions
so we all might have a better future.
HOW THIS STUDY IS ORGANIZED
As with all my studies, I will attempt to convey what I learned in both
shorter, simpler ways (such as videos you can find online), longer, more
comprehensive ways (like this book), and even more comprehensive ways
for those who want additional charts and historical examples (available
along with everything else not printed in the book at
economicprinciples.org). In order to make the most important concepts easy to
understand, this book is written in the vernacular, favoring clarity over precision.
As a result, some of my wording will be by and large accurate but not always
precisely so.
In Part I, I will summarize all that I learned in a simplified archetype of
the rises and declines of empires, drawing from all my research of specific
cases. I will first distill my findings into an index of the total power of empires,
which provides an overview of the ebbs and flows of different powers and which
is constituted from eight indices of different types of power. I will then go into
more detail on a list of 18 determinants that I believe to be the key forces behind
the rises and falls of empires and then I will cover in more detail the three big
cycles mentioned previously. In Part II, I will show the individual cases in
greater depth, walking through the story of the major reserve currency
empires over the last 500 years, including a chapter focused on the present
day conflicts between the US and China. Finally, in the concluding Part
III, I will discuss what all of this means for the future.
1 To be clear, while I am describing these cycles of the past, I’m not one of those people who believes that
what happened in the past will necessarily continue into the future without understanding the cause/effect
mechanics that drive changes. My objective above all else is to have you join with me in looking at the
cause/effect relationships and then to use that understanding to explore what might be coming at us and
agree on principles to handle it in the best possible way.
r. For example, I have followed this approach for debt cycles because I’ve had to navigate many of them over
the last 50 years and they are the most important force driving big shifts in economies and markets. If you are
interested in my template for understanding big debt crises and seeing all the cases that make it up, you can
get Principles for Navigating Big Debt Crises in free digital form at economicprinciples.org or in print form
for sale in bookstores or online. I’ve studied many big, important things (e.g., depressions, hyperinflation,
wars, balance of payments crises, etc.) by following this approach, usually because I was compelled to
understand unusual things that appeared to be germinating around me. It was that perspective that allowed
Bridgewater to navigate the 2008 financial crisis well when others struggled.
-. I approach just about everything this way. For example, in building and running my business, I had to
understand the realities of how people think and learn principles for dealing with these realities well, which I
did using this same approach. If you are interested in what I learned about such non-economic and non-
market things, I conveyed it in my book Principles: Life and Work, which is free in an iOS/Android app
called Principles in Action or is for sale in the usual bookstores.
-. In my book Principles: Life and Work, I share my perspective on these different ways of thinking. I won’t
describe them here but will direct you there should you be interested.
PARTI
HOW THE WORLD WORKS
CHAPTER 1
THE BIG CYCLE IN A TINY NUTSHELL
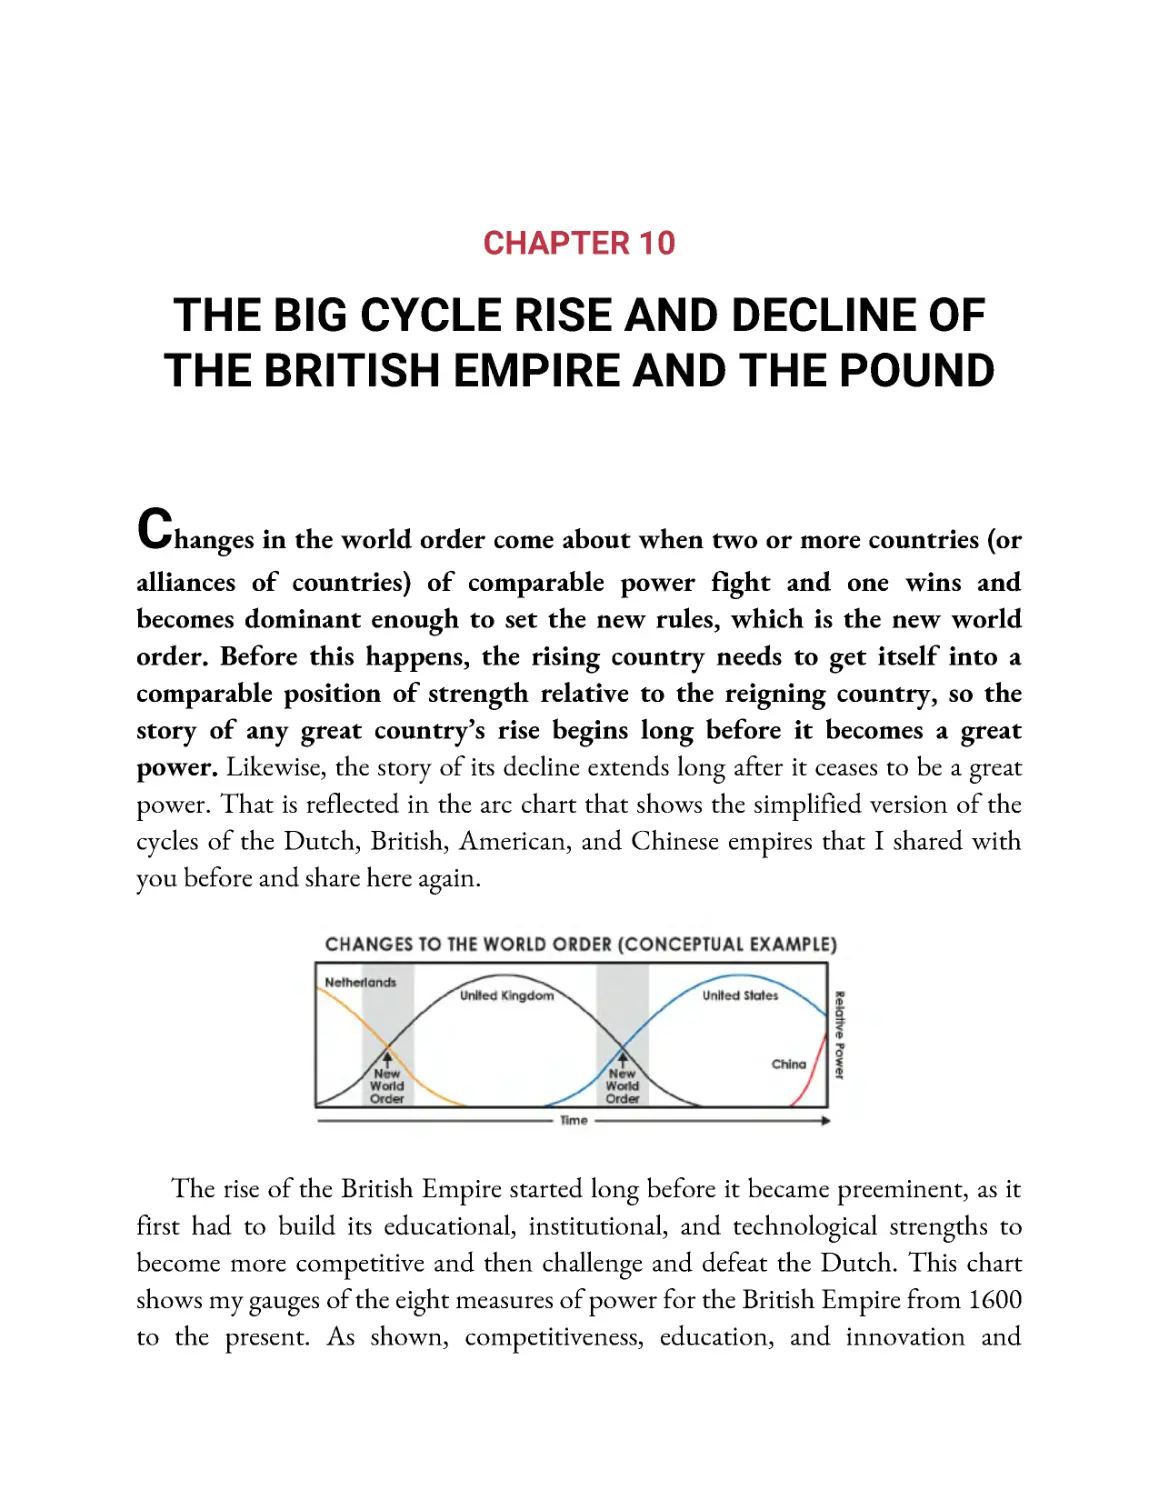
As explained in the introduction, the world order is now rapidly shifting
in important ways that have never happened in our lifetimes but have
happened many times before. My objective is to show you those cases and
the mechanics that drove them and, with that perspective, attempt to
imagine the future.
What follows here is an ultra-distilled description of the dynamics that I saw in
studying the rises and declines of the last three reserve currency empires (the
Dutch, the British, and the American) and the six other significant empires over
the last 500 years (Germany, France, Russia, India, Japan, and China), as well as
all of the major Chinese dynasties back to the Tang Dynasty in around the year
600. The purpose of this chapter is simply to provide an archetype to use when
looking at all the cycles, most importantly the one that we are now in.
In studying these past cases, I saw clear patterns that occurred for logical
reasons that I briefly summarize here and cover more completely in subsequent
chapters. While the focus of this chapter and this book are on those forces that
affected the big cyclical swings in wealth and power, I also saw ripple-effect
patterns in all dimensions of life, including culture and the arts, social mores, and
more, which I will touch on later. Between this simple archetype and the cases
shown in Part II, we will see how the individual cases fit the archetype (which is
essentially just the average of those cases) and how well the archetype describes the
individual cases. Doing this, I hope, will help us better understand what is
happening now.
I’m on a mission to figure out how the world works and to gain
timeless and universal principles for dealing with it well. It’s both a
passion and a necessity for me. While the curiosities and concerns that I
described earlier pulled me into doing this study, the process of conducting it gave
me a much greater understanding of the really big picture on how the world
works than I expected to get, and I want to share it with you. It made much
clearer to me how peoples and countries succeed and fail over long swaths of time,
it revealed giant cycles behind these ups and downs that I never knew existed, and,
most importantly, it helped me put into perspective where we now are.
For example, through my research, I learned that the biggest thing
affecting most people in most countries through time is the struggle to
make, take, and distribute wealth and power, though they also have
struggled over other things too, most importantly ideology and religion.
These struggles happened in timeless and universal ways and had huge
implications for all aspects of people’s lives, unfolding in cycles like the tide
coming in and out.
I also saw how, throughout time and in all countries, the people who
have the wealth are the people who own the means of wealth production.
In order to maintain or increase their wealth, they work with the people
who have the political power, who are in a symbiotic relationship with
them, to set and enforce the rules. I saw how this happened similarly
across countries and across time. While the exact form of it has evolved and
will continue to evolve, the most important dynamics have remained pretty much
the same. The classes of those who were wealthy and powerful evolved over time
(e.g., from monarchs and nobles who were landowners when agricultural land was
the most important source of wealth, to capitalists and elected or autocratic
political officials now that capitalism produces capital assets and that wealth and
political power are generally not passed along in families) but they still cooperated
and competed in basically the same ways.
I saw how, over time, this dynamic leads to a very small percentage of
the population gaining and controlling exceptionally large percentages of
the total wealth and power, then becoming overextended, and then
encountering bad times, which hurt those least wealthy and least powerful
the hardest, which then leads to conflicts that produce revolutions and/or
civil wars. When these conflicts are over, a new world order is created, and
the cycle begins again.
In this chapter, I will share more of this big-picture synthesis and some
of the details that go along with it. While what you’re reading here are my
own views, you should know that the ideas I express in this book have been well-
triangulated with other experts. About two years ago, when I felt that I needed to
answer the questions I described in the introduction, I decided to immerse myself
in studying with my research team, digging through archives, speaking with the
world’s best scholars and practitioners who each had in-depth understandings of
bits and pieces of the puzzle, reading relevant great books by insightful authors,
and reflecting on the prior research I’ve done and the experiences that I’ve had
from investing globally for nearly 50 years.
Because I view this as an audacious, humbling, necessary, and fascinating
undertaking, I am worried about missing important things and being wrong, so
my process is iterative. I do my research, write it up, show it to the world’s best
scholars and practitioners to stress test it, explore potential improvements, write it
up again, stress test it again, and so on, until I get to the point of diminishing
returns. This study is the product of that exercise. While I can’t be sure that I have
the formula for what makes the world’s greatest empires and their markets rise and
fall exactly right, I’m pretty confident that I got it by and large right. I also know
that what I learned is essential for my putting what is happening now into
perspective and for imagining how to deal with important events that have never
happened in my lifetime but have happened repeatedly throughout history.
UNDERSTANDING THE BIG CYCLE
For reasons that are explained in this book, I believe that we are now
seeing an archetypical big shift in relative wealth and power and the world
order that will affect everyone in all countries in profound ways. This big
wealth and power shift is not obvious because most people don’t have the
patterns of history in their minds to see this one as “another one of those.” So in
this first chapter, I will describe in a very brief way how I see the archetypical
mechanics behind rises and declines of empires and their markets working. I have
identified 18 important determinants that have explained almost all of the basic
ebbs and flows through time that have caused ups and downs in empires. We will
look at them in a moment. Most of them transpire in classic cycles that are
mutually reinforcing in ways that tend to create a single very big cycle of ups and
downs. This archetypical Big Cycle governs the rising and declining of empires
and influences everything about them, including their currencies and markets
(which I’m especially interested in). The most important three cycles are the
ones I mentioned in the introduction: the long-term debt and capital
markets cycle, the internal order and disorder cycle, and the external order
and disorder cycle.
Because these three cycles are typically the most important, we will be looking
at them in some depth in later chapters. Then we will apply them to history and
the present day so that you can see how they play out in real examples.
These cycles drive swings back and forth between opposites—swings between
peace and war, economic boom and bust, the political left and political right
being in power, the coalescing and disintegrating of empires, etc.—that typically
occur because people push things to extremes that surpass their equilibrium levels,
which leads to swings that get overdone in the opposite direction. Embedded in
the swings in one direction are the ingredients that lead to the swings in
the opposite direction.
These cycles have remained essentially the same through the ages for essentially
the same reason that the fundamentals of the human life cycle have remained the
same over the ages: because human nature doesn’t change much over time. For
example, fear, greed, jealousy, and other basic emotions have remained constants
and are big influences that drive cycles.
While it is true that no two people’s life cycles are exactly the same and the
typical life cycle has changed over the millennia, the archetype of the human life
cycle—of children being raised by parents until they are independent, at which
point they raise their own children and work, which they do until they get old,
retire, and die—remains essentially the same. Similarly the big
money/credit/capital markets cycle, which builds up too much debt and debt
assets (e.g., bonds) until the debts can’t be serviced with hard money, remains
essentially the same. As always, this leads to people trying to sell their debt assets to
make purchases and finding out they can’t because there are far too many debt
assets relative to the amount of money and the value of stuff there is to buy. Once
this happens, defaults prompt those who manufacture money to make more.
That cycle has been essentially the same for thousands of years. So have the cycles
of internal order and disorder and external order and disorder. We will explore
how human nature and other dynamics drive these cycles in the coming chapters.
EVOLUTION, CYCLES, AND THE BUMPS ALONG THE WAY
Evolution is the biggest and only permanent force in the universe, yet we struggle
to notice it. While we see what exists and what happens, we don’t see evolution
and the evolutionary forces that make things exist and happen. Look around you.
Do you see evolutionary change? Of course not. Yet you know that what you are
looking at is changing—albeit slowly from your perspective—and you know that
in time it won’t exist and other things will exist in its place. To see this change, we
have to devise ways to measure things and watch the measurements change. Then,
once we can see the change, we can study why it happens. This is what we must
do if we are going to successfully think about the changes ahead and how to deal
with them.
Evolution is the upward movement toward improvement that occurs
because of adaptation and learning. Around it are cycles. To me, most
everything transpires as an ascending trajectory of improvement with
cycles around it, like an upward-pointing corkscrew:
Evolution is a relatively smooth and steady improvement because the gaining
of knowledge is greater than the losing of knowledge. Cycles on the other hand
move back and forth, producing excesses in one direction that lead to reversals
and excesses in the other, like the swinging of a pendulum. For example, over time
our living standards rise because we learn more, which leads to higher
productivity, but we have ups and downs in the economy because we have debt
cycles that drive actual economic activity up and down around that uptrend.
These evolutionary and sometimes revolutionary changes around the trend are
not always smooth and painless. Sometimes they are very abrupt and painful as
mistakes are made, learning occurs, and better adaptations result.
Together evolution and cycles make the upward corkscrew-type movements
that we see in everything—wealth, politics, biology, technology, sociology,
philosophy, etc.
Human productivity is the most important force in causing the world’s
total wealth, power, and living standards to rise over time. Productivity—
i.e., the output per person, driven by learning, building, and inventiveness—has
steadily improved over time. However, it has risen at different rates for different
people, though always for the same reasons—because of the quality of people’s
education, inventiveness, work ethic, and economic systems to turn ideas into
output. These reasons are important for policy makers to understand in order to
achieve the best possible outcomes for their countries, and for investors and
companies to understand in order to determine where the best long-term
investments are.
This constantly increasing trend is the product of humanity’s capacity to
evolve, which is greater than any other species’ because our brain gives us a unique
capacity to learn and think abstractly. As a result, our inventions of technologies
and ways of doing things have advanced uniquely. That evolution has led to the
continuous evolutions that make up the changing world order. Technological
advances in communications and transportation have brought everyone in the
world closer together, which has changed the nature of relationships of people
and empires in profound ways. We see such evolutionary improvements apparent
in just about everything—greater life expectancy, better products, better ways of
doing things, etc. Even our way of evolving has evolved in the form of coming up
with better ways to create and innovate. This has been true for as long as human
history has been written. As a result of this, charts of most everything show more
upward slopes toward improvement than up and down movements.
This is shown in the following charts: estimated output (i.e., estimated
real GDP) per person and life expectancy over the last 500 years. These are
probably the two most widely agreed-upon measures of well-being, though
they are imperfect. You can see the magnitudes of their evolutionary
uptrends relative to the magnitudes of the swings around them.
The fact that the trends are so pronounced relative to the swings
around the trends shows how much more forceful the power of human
inventiveness is relative to everything else. As shown from this top-down,
big-picture perspective, output per person appears to be steadily
improving, though very slowly in the early years and faster starting in the
19th century, when the slope up becomes much steeper, reflecting the
faster productivity gains. This shift from slower productivity gains to faster
productivity gains was primarily due to the improvements in broad learning and
the conversion of that learning into productivity. That was brought about by a
number of factors going as far back as Gutenberg’s printing press in Europe in the
mid-15th century (printing had already been in use in China for centuries), which
increased the knowledge and education available to many more people,
contributing to the Renaissance, the Scientific Revolution, the Enlightenment,
the invention of capitalism, and the First Industrial Revolution in Britain. We will
delve into these shortly.
Global real GDP is primarily a mix of European countries before 1870 due to limited
reliable data coverage across other countries before trsat point
GLOBAL LIFE EXPECTANCY AT BIRTH
Dashed line based on experience of Great Britain only
The broader-based improvements in productivity that came from the
invention of capitalism, entrepreneurship, and the Industrial Revolution also
shifted wealth and power away from an agriculture-based economy in which
landownership was the principal source of power, and monarchs, nobles, and the
clergy worked together to maintain their grip on it. The shift moved toward an
industry-based economy in which inventive capitalists created and owned the
means of production of industrial goods and worked together with those in
government to maintain the system that allowed them to have the wealth and
power. In other words, since the Industrial Revolution, which brought about that
change, we have been operating in a system in which wealth and power have
primarily come more from the combination of education, inventiveness, and
capitalism, with those who run governments working with those who control
most of the wealth and education.
How this evolution with big cycles around it happens also continues to evolve.
For example, while ages ago agricultural land and agricultural production were
worth the most and that evolved into machines and what they produced being
worth the most, digital things that have no apparent physical existence (data and
information processing) are now evolving to become worth the most.- This is
creating a fight over who obtains the data and how they use it to gain wealth and
power.
THE CYCLES AROUND THE UPTREND
While significant, because these learnings and productivity improvements
are evolutionary, they don’t cause big abrupt shifts in who has what
wealth and power. The big abrupt shifts come from booms, busts,
revolutions, and wars, which are primarily driven by cycles, and these
cycles are driven by logical cause/effect relationships. For example, the forces
of increased productivity, entrepreneurship, and capitalism that marked the end
of the 19th century also produced big wealth gaps and overindebtedness that led
to economic downturns that, in the first half of the 20th century, led to anti-
capitalism, communism, and big conflicts over wealth and power within and
between countries. What you can see is evolution marching on with big cycles
around it. • Throughout time, the formula for success has been a system in which well-
educated people, operating civilly with each other, come up with innovations, receive funding
through capital markets, and own the means by which their innovations are turned into the
production and allocation of resources, allowing them to be rewarded by profit making.
However, over the long run capitalism has created wealth and opportunity
gaps and overindebtedness that have led to economic downturns and
revolutions and wars that have caused changes in the domestic and world
orders.
As you can see in the following charts, history shows us that almost all of these
turbulent times were due to fighting over wealth and power (i.e., conflicts in the
form of revolutions and wars, often driven by money and credit collapses and big
wealth gaps), and severe acts of nature (like droughts, floods, and epidemics). It
also shows that how bad these periods get depends almost exclusively on how
strong countries are and their ability to endure them.
• Countries with large savings, low debts, and a strong reserve currency can withstand
economic and credit collapses better than countries that don't have much savings, have a lot
of debt, and don't have a strong reserve currency. Likewise those that have strong and
capable leadership and civil populations can be managed better than those that
don’t have these, and those that are more inventive will adapt better than those
that are less inventive. As you will see later, these factors are measurable timeless
and universal truths.
GLOBAL DEATHS BY CATEGORY (RATE PER TOOK PEOPLE, 15YMA)
ESTIMATED DEATHS FROM CONFLICT
(MAJOR POWERS, %POPULATION, 15YMA)
• Internal Conflict • External Conflict Total
WWII. Holocaust,
communist revolutions
1400 1500 U00 1700 1800 1900 2000
Based on deaths as a shore of the population for the major powers and thus wl differ
from the estimate of global conflict deaths shown In rhe prior chart
Because these turbulent times are small in relation to the evolutionary
uptrend of humanity’s capacity to adapt and invent, they barely show up
in the previous charts of GDP and life expectancy, appearing only as
relatively minor wiggles. Yet these wiggles seem very big to us because we
are so small and short-lived. Take the 1930-45 depression and war period, for
example. The levels of the US stock market and global economic activity are
shown in the next chart. As you can see, the economy fell by about 10 percent,
and the stock market fell by about 85 percent and then began to recover.
----Global RGDP Per Capita (2017 USD, log) --USA Equities Cumulative Return
This is part of the classic money and credit cycle that has happened for as long
as there has been recorded history and that I will explain more completely in
Chapter 3. Briefly, a credit collapse happens because there is too much debt.
Typically, the central government has to spend a lot of money it doesn’t have and
make it easier for debtors to pay their debts and the central bank always has to
print money and liberally provide credit—like they did in response to the
economic plunge driven by the COVID pandemic and a lot of debt. The 1930s
debt bust was the natural extension of the Roaring ’20s boom that became a debt-
financed bubble that popped in 1929. That produced a depression that led to big
central government spending and borrowing financed by big money and credit
creation by the central bank.
Back then, the popping of the bubble and the resulting economic bust were
the biggest influences on the 1930-45 period’s internal and external fights for
wealth and power. Then, like now and like in most other cases, there were large
wealth gaps and conflict, which when heightened by debt/economic collapses, led
to revolutionary changes in social and economic programs and big wealth
transfers that were manifest in different systems in different countries. Clashes
and wars developed over which of these systems—e.g., capitalism or communism,
democracy or autocracy—were best. There are always arguments or fights
between those who want to make big redistributions of wealth and those
who don’t. In the 1930s, Mother Nature also gave the US a painful drought.
Looking over the whole of the cases I examined, past economic and market
declines lasted about three years, give or take a few years, depending on how long
it took to do the debt restructuring and/or debt monetization process. The
quicker the printing of money to fill the debt holes, the quicker the closing of the
deflationary depression and the sooner the worrying about the value of money
began. In the 1930s US case, the stock market and the economy bottomed the day
that the newly elected president, Franklin D. Roosevelt, announced that he would
default on the government’s promise to let people turn in their money for gold,
and that the government would create enough money and credit so that people
could get their money out of the banks and others could get money and credit to
buy things and invest. That took three-and-a-half years from the initial stock
market crash in October 1929.-
Still there was fighting over wealth and power within and between countries.
The emerging powers of Germany and Japan challenged the existing leading
world powers of Great Britain, France, and eventually the US (which was dragged
into World War II). The war period raised the economic output of things that
were used in the war, but it would be a misnomer to call the war years a
“productive” period—even though when measured in output per person, it was—
because there was so much destruction. At the end of the war, global GDP per
capita had fallen by about 12 percent, much of which was driven by declines in
the economies of countries that lost the war. The stress test that these years
represented wiped out a lot, made clear who the winners and losers were, and led
to a new beginning and a new world order in 1945. Classically that was followed
by a lengthy period of peace and prosperity that became overextended so that all
countries are now, 75 years later, being stress tested again.
Most cycles in history happen for basically the same reasons. For
example, the 1907-19 period began with the Panic of 1907 in the US, which, like
the 1929-32 money and credit crisis following the Roaring ’20s, was the result of
a boom period (the Gilded Age in the US, which was the same time as the Belle
Epoque in continental Europe and the Victorian Era in Great Britain) becoming a
debt-financed bubble that led to economic and market declines. These declines
also happened when there were large wealth gaps that led to big wealth
redistributions and contributed to a world war. The wealth redistributions, like
those in the 1930-45 period, came about through large increases in taxes and
government spending, big deficits, and big changes in monetary policies that
monetized the deficits. Then the Spanish flu intensified the stress test and the
resulting restructuring process. This stress test and global economic and
geopolitical restructuring led to a new world order in 1919, which was expressed
in the Treaty of Versailles. That ushered in the 1920s debt-financed boom, which
led to the 1930-45 period and the same things happening again.
These periods of destruction/reconstruction devastated the weak, made
clear who the powerful were, and established revolutionary new
approaches to doing things (i.e., new orders) that set the stage for periods
of prosperity that eventually became overextended as debt bubbles with
large wealth gaps and led to debt busts that produced new stress tests and
destruction/reconstruction periods (i.e., wars), which led to new orders
and eventually the strong again gaining relative to the weak, and so on.
What are these destruction/reconstruction periods like for the people who
experience them? Since you likely haven’t been through one of these and the
stories about them are very scary, the prospect of being in one is worrisome to
most people. It is true that these destruction/reconstruction periods have
produced tremendous human suffering both financially and, more importantly,
in lost or damaged human lives. While the consequences are worse for some
people, virtually no one escapes the damage. Still, without minimizing them,
history has shown us that typically the majority of people stay employed in
depressions, are unharmed in shooting wars, and survive natural disasters.
Some people who struggled through them have even described these very
difficult times as bringing about important, good things like drawing people
closer together, building strength of character, learning to appreciate the basics,
etc. For example, Tom Brokaw called the people who went through the 1930-45
period “the Greatest Generation” because of the strength of character it gave
them. My parents and aunts and uncles who went through the Great Depression
and World War II, as well as others of their era whom I’ve spoken to in other
countries who went through their own versions of this destruction period, saw it
that way too. Keep in mind that economic destruction periods and war periods
typically don’t last very long—roughly two or three years. And the lengths and
severities of natural disasters (like droughts, floods, and epidemics) vary, though
they typically lessen in painfulness as adaptations are made. One rarely gets all
three of these types of big crises—economic, revolution/war, and natural disaster
—at the same time.
My point is that while these revolution/war periods typically lead to a lot
of human suffering, we should never, especially in the worst of times, lose
sight of the fact that one can navigate them well—and that humanity’s
power to adapt and quickly get to new and higher levels of well-being is
much greater than all the bad stuff that can be thrown at us. For that
reason, I believe that it is smart to trust and invest in humanity’s adaptability and
inventiveness. So, while I am pretty sure that in the coming years both you and I
and the world order will experience big challenges and changes, I believe that
humanity will become smarter and stronger in very practical ways that will lead us
to overcome these challenging times and go on to new and higher levels of
prosperity.
Now let’s look at the cycles of rises and declines in the wealth and power of the
major countries over the last 500 years.
PAST BIG CYCLE SHIFTS IN WEALTH AND POWER
The chart of rising productivity shown earlier was for the whole world (to the best
of our ability to measure it). It doesn’t show the shifts in wealth and power that
occurred between countries. To understand how those happen, let’s start with the
big-picture basics. Throughout recorded history various forms of groups of
people (e.g., tribes, kingdoms, countries, etc.) have gained wealth and power by
building it themselves, taking it from others, or finding it in the ground. When
they gathered more wealth and power than any other group, they became the
world’s leading power, which allowed them to determine the world order. When
they lost that wealth and power, which they all did, the world order—and all
aspects of life—changed in profound ways.
The next chart shows the relative wealth and power of the 11 leading
empires over the last 500 years.
RELATIVE STANDING OF GREAT EMPIRES
Each one of these indices^ of wealth and power is a composite of eight
different determinants that I will explain shortly. Though these indices aren’t
perfect because all data through time isn’t perfect, they do an excellent job of
painting the big picture. As you can see, nearly all of these empires saw periods of
ascendancy followed by periods of decline.
Take a moment to study the thicker lines on the chart, which represent the
four most important empires: the Dutch, British, American, and Chinese. These
empires held the last three reserve currencies—the US dollar now, the British
pound before it, and the Dutch guilder before that. China is included because it
has risen to be the second most powerful empire/country and because it was so
consistently powerful in most years prior to around 1850. To very briefly
summarize the story this chart shows:
China was dominant for centuries (consistently out-competing
Europe economically and otherwise), though it entered a steep
decline starting in the 1800s.
The Netherlands, a relatively small country, became the world’s
reserve currency empire in the 1600s.
The UK followed a very similar path, peaking in the 1800s.
Finally, the US rose to become the world’s superpower over the last
150 years, though particularly during and after World War II.
The US is now in relative decline while China is rising again.
Now let’s look at the same chart that extends the data all the way back
to the year 600.1 focused on the first chart (which covers just the last 500 years)
rather than the second (which covers the last 1,400 years) because it highlights the
empires I studied most intently and is simpler—though with 11 countries, 12
major wars, and over 500 years, it can hardly be called simple. Still, the second is
more extensive and worth glancing at. I left out the shading of the war periods to
lessen the complexity. As shown, in the pre-1500 period, China was almost
always the most powerful, though the Middle Eastern caliphates, the
French, the Mongols, the Spanish, and the Ottomans were also in the
picture.
RELATIVE STANDING OF GREAT EMPIRES
---United Stalos — China — United Kingdom ~ Netherlands
Mongol Empire — Spain Germany — France
India Japan — Dussia —— Ottoman Empre
An important thing to remember: while the leading powers covered in
this study were the richest and most powerful, they weren’t necessarily the
best-off countries for two reasons. First, while wealth and power are what
most people want and will fight over most, some people and their
countries don’t think that these things are the most important and
wouldn’t think of fighting over them. Some believe that having peace and
savoring life are more important than having a lot of wealth and power and
wouldn’t consider fighting hard enough to gain enough of the wealth and power
to make it into this study, though some of them enjoyed greater amounts of peace
than those who fought for wealth and power. (By the way, I think there is a lot to
be said for putting peace and savoring life ahead of gaining wealth and power—
interestingly, there was little correlation between the wealth and power of a nation
and the happiness of its people, which is a subject for another time.) Second, this
group of countries excludes what I will call the “boutique countries” (like
Switzerland and Singapore) that score very high in wealth and living standards but
aren’t large enough to become one of the biggest empires.
EIGHT DETERMINANTS OF WEALTH AND POWER
The single measure of wealth and power that I showed you for each
country in the prior charts is a roughly equal average of 18 measures of
strength. While we will explore the full list of determinants later, let’s begin by
focusing on the key eight shown in the next chart: 1) education, 2)
competitiveness, 3) innovation and technology, 4) economic output, 5)
share of world trade, 6) military strength, 7) financial center strength, and
8) reserve currency status.
This chart shows the average of each of these measures of strength
across all the empires I studied, with most of the weight on the most
recent three reserve countries (i.e., the US, the UK, and the Netherlands).-
The lines in the chart do a pretty good job of telling the story of why
and how the rises and declines took place. You can see how rising
education leads to increased innovation and technology, which leads to an
increased share of world trade and military strength, stronger economic
output, the building of the world’s leading financial center, and, with a
lag, the establishment of the currency as a reserve currency. And you can
see how for an extended period most of these factors stayed strong
together and then declined in a similar order. The common reserve
currency, just like the world’s common language, tends to stick around
after an empire has begun its decline because the habit of usage lasts longer
than the strengths that made it so commonly used.
I call this cyclical, interrelated move up and down the Big Cycle. Using
these determinants and some additional dynamics, I will next describe the Big
Cycle in more detail. But before I start, it’s worth reiterating that all of these
measures of strength rose and declined over the arc of the empire. That’s because
these strengths and weaknesses are mutually reinforcing—i.e., strengths and
weaknesses in education, competitiveness, economic output, share of world trade,
etc., contribute to the others being strong or weak, for logical reasons.
THE ARCHETYPICAL BIG CYCLE
Broadly speaking, we can look at these rises and declines as happening in three
phases:
The Rise:
The rise is the prosperous period of building that comes after a new
order. It is when the country is fundamentally strong because there
are a) relatively low levels of indebtedness, b) relatively small wealth,
values, and political gaps between people, c) people working
effectively together to produce prosperity, d) good education and
infrastructure, e) strong and capable leadership, and f) a peaceful
world order that is guided by one or more dominant world powers,
which leads to...
The Top:
This period is characterized by excesses in the form of a) high levels
of indebtedness, b) large wealth, values, and political gaps, c)
declining education and infrastructure, d) conflicts between
different classes of people within countries, and e) struggles between
countries as overextended empires are challenged by emerging rivals,
which leads to...
The Decline:
This is the painful period of fighting and restructuring that leads to
great conflicts and great changes and the establishment of new
internal and external orders. It sets the stage for the next new order
and a new period of prosperous building.
Let’s look at each of these in more detail.
THE RISE
The rise phase begins when there is...
... strong enough and capable enough leadership to gain power and
design an excellent system to increase the country’s wealth and
power. Looking at the historically great empires, this system typically
involves...
... strong education, which is not just teaching knowledge and skills; it also
includes teaching...
... strong character, civility, and work ethic development. These are
typically taught in families, schools, and/or religious institutions. If done
well, this provides a healthy respect for rules and laws and order within
society, leads to low corruption rates, and is effective in encouraging people
to work together to improve productivity. The better the country does this,
the more there will be a shift from producing basic products to...
... innovating and inventing new technologies. For example, the Dutch
were superbly inventive—at their peak they came up with a quarter of all
major inventions in the world. One of these were ships that could travel
around the globe to collect great riches. They also invented capitalism as we
know it. Innovation is generally enhanced by being...
... open to the best thinking in the world to be able to learn the best
ways of doing things and by...
... the workers, the government, and the military all working well
together.
As a result of all of these things, the country...
... becomes more productive and...
... more competitive in world markets, which shows up in its...
... share of world trade rising. You can see this happening today as the
US and China are now roughly comparable in both their economic outputs
and their shares of world trade.
As a country trades more globally, it must protect its trade routes and
foreign interests and it must be prepared to defend itself from attack so it
develops great military strength.
If done well, this virtuous cycle leads to...
... strong income growth, which can be used to finance...
... investments in infrastructure, education, and research and
development.
The country must develop systems to incentivize and empower those
who have the ability to make or get wealth. In all of these past cases, the
most successful empires used a capitalist approach to incentivize and
develop productive entrepreneurs. Even China, which is run by the
Chinese Communist Party, uses a state-capitalism approach to incentivize
and enable people. To do that incentivizing and financial enabling well, the
country...
... has to have developing capital markets—most importantly its lending,
bond, and stock markets. That allows people to convert their savings
into investments to fund innovation and development and share in the
successes of those who are making great things happen. The inventive
Dutch created the first publicly listed company (the Dutch East India
Company) and the first stock market to fund it. These were integral parts of
their machine that produced a lot of wealth and power.
As a natural consequence, all of the greatest empires developed the world’s
leading financial center for attracting and distributing the capital of their
times. Amsterdam was the world’s financial center when the Dutch were
preeminent, London was when the British were on top, New York is now,
and China is quickly developing its own financial center in Shanghai.
As the country expands its international dealings to become the largest
trading empire, its transactions can be paid in its currency, and people
around the world want to save in it, so it becomes the world’s leading
reserve currency, which enables the country to borrow more, and at lower
rates, than other countries because others want to lend in it.
This series of cause/effect relationships leading to mutually supportive financial,
political, and military powers has gone together for as long as there has been
recorded history. All of the empires that became the most powerful in the
world followed this path to the top.
THE TOP
In the top phase, the country sustains the successes that fueled its rise,
but embedded in the rewards of the successes are the seeds of decline. Over
time, obligations pile up, breaking down the self-reinforcing
circumstances that fueled the rise.
As people in the country, which is now rich and powerful, earn
more, that makes them more expensive and less competitive relative to
people in other countries who are willing to work for less.
At the same time people from other countries naturally copy the
methods and technologies of the leading power, which further
reduces the leading country’s competitiveness. For example, British
shipbuilders hired Dutch designers to design better ships that were built by
less expensive British workers, making them more competitive, which led
the British to rise and the Dutch to decline.
Also, as people in the leading country become richer, they tend to not
work as hard. They enjoy more leisure, pursue the finer and less
productive things in life, and at the extreme become decadent. Values
change from generation to generation during the rise to the top—from
those who had to fight to achieve wealth and power to those who inherited
it. The new generation is less battle-hardened, steeped in luxuries, and
accustomed to the easy life, which makes them more vulnerable to
challenges.
Additionally, as people get used to doing well, they increasingly bet
on the good times continuing—and borrow money to do that—
which leads to financial bubbles.
Within capitalist systems, financial gains come unevenly so the wealth
gap grows. Wealth gaps are self-reinforcing because rich people use their
greater resources to expand their powers. They also influence the
political system to their advantage and give greater privileges to
their children—like better education—causing the gaps in values,
politics, and opportunity to develop between the rich “haves” and
the poor “have-nots.” Those who are less well-off feel the system is
unfair so resentments grow.
As long as the living standards of most people are still rising, these
gaps and resentments don’t boil over into conflict.
During the top, the leading country’s financial picture begins to change. Having a
reserve currency gives it the “exorbitant privilege”- of being able to borrow more
money, which gets it deeper into debt. This boosts the leading empire’s spending
power over the short term and weakens it over the longer run.
Inevitably, the country begins borrowing excessively, which
contributes to the country building up large debts with foreign
lenders.
While this boosts spending power over the short term, it weakens the
country’s financial health—and weakens the currency—over the
longer term. In other words, when borrowing and spending are
strong, the empire appears very strong, but its finances are in fact
being weakened because the borrowing sustains the country’s power
beyond its fundamentals by financing both domestic
overconsumption and international military conflicts required to
maintain the empire.
Also the costs of maintaining and defending the empire become greater
than the revenue it brings in, so having an empire becomes unprofitable.
For example, the British Empire became massive, bureaucratic, and lost its
competitive advantages as rival powers—particularly Germany—soared,
leading to an increasingly expensive arms race and world war.
The richer countries get into debt by borrowing from poorer
countries that save more—that is one of the earliest signs of a wealth and
power shift. This started in the United States in the 1980s when it had a per
capita income 40 times that of China’s and started borrowing from the
Chinese who wanted to save in dollars because the dollar was the world’s
reserve currency.
If the empire begins to run out of new lenders, those holding their
currency begin to look to sell and get out rather than buy, save, lend,
and get in—and the strength of the empire begins to fall.
THE DECLINE
The decline phase typically comes from internal economic weakness together
with internal fighting, or from costly external fighting, or both. Typically, the
country’s decline comes gradually and then suddenly.
Internally...
When debts become very large, and there is an economic downturn and
the empire can no longer borrow the money necessary to repay its debts,
this creates great domestic hardships and forces the country to choose
between defaulting on its debts and printing a lot of new money.
The country nearly always chooses to print a lot of new money, at
first gradually and eventually massively. This devalues the currency and
raises inflation.
Typically at those times when the government has problems funding itself
—at the same time as there are bad financial and economic conditions, and
large wealth, values, and political gaps—there are great increases in
internal conflict between the rich and poor and different ethnic,
religious, and racial groups.
This leads to political extremism that shows up as populism of the
left or of the right. Those of the left seek to redistribute the wealth while
those of the right seek to maintain the wealth in the hands of the rich. This
is the “anti-capitalist phase,” when capitalism, capitalists, and the
elites in general are blamed for the problems.
Typically during such times taxes on the rich rise, and when the rich
fear their wealth and well-being will be taken away, they move to
places, assets, and currencies they feel safer in. These outflows reduce
the country’s tax revenue, which leads to a classic self-reinforcing,
hollowing-out process.
When the flight of wealth gets bad enough, the country outlaws it.
Those seeking to get out begin to panic.
These turbulent conditions undermine productivity, which shrinks
the economic pie and causes more conflict about how to divide the
shrinking resources. Populist leaders emerge from both sides and pledge
to take control and bring about order. That’s when democracy is most
challenged because it fails to control the anarchy and because the
move to a strong populist leader who will bring order to the chaos is
most likely.
As conflict within the country escalates, it leads to some form of
revolution or civil war to redistribute wealth and force the big
changes. This can be peaceful and maintain the existing internal order, but
it’s more often violent and changes the order. For example, the
Roosevelt revolution to redistribute wealth was relatively peaceful, while
the revolutions that changed the domestic orders in Germany, Japan, Spain,
Russia, and China, which also happened in the 1930s for the same reasons,
were much more violent.
These civil wars and revolutions create what I call new internal orders. I’ll explore
how internal orders change in a cyclical way in Chapter 5. But the important
thing to note for now is that internal orders can change without leading to a
change in the world order. It’s only when the forces that produce internal
disorder and instability align with an external challenge that the entire
world order can change.
Externally...
When there is a rising great power that is capable of challenging the
existing great power and existing world order, there is a rising risk
of great international conflict, especially if there is internal conflict
going on within the existing great power. Typically the rising
international opponent will seek to exploit this domestic weakness.
This is especially risky if the rising international power has built up
a comparable military.
Defending oneself against foreign rivals requires great military
spending, which has to occur even as domestic economic conditions
are deteriorating and the leading great power country can least afford it.
Since there is no viable system for peacefully adjudicating international
disputes, these conflicts are typically resolved through tests of power.
As bolder challenges are made, the leading empire is faced with the
difficult choice of fighting or retreating. Fighting and losing are the
worst, but retreating is bad too because it allows the opposition to progress
and it shows that one is weak to those other countries that are considering
what side to be on.
Poor economic conditions cause more fighting for wealth and power,
which inevitably leads to some kind of war.
Wars are terribly costly. At the same time, they produce the
necessary tectonic shifts that realign the world order to the new
reality of wealth and power.
When those holding the reserve currency and debt of the declining
empire lose faith and sell them, that marks the end of its Big Cycle.
When all of these forces line up—indebtedness, civil war/revolution at
home, war abroad, and a loss of faith in the currency—a change in the
world order is typically at hand.
You can see these forces summarized in their typical progression in the
following chart.
New Order
, 8 THE TOP
i
5 •
4 THE RISE THE DECLINE U?
3 ©
T - I 2 New Order
I i Strong teodetship
21 nventivene's
3 ) EducoUon
4 Strong culture
5 ) Good resource olocoticn
6 Good competitiveness
7 Strong ncome growth
8} Strong markets and
financki centers
? • Less productive
10 Overextended
IV LoMng competltivene»
12 //eaithgaos
ф Large debts
ф Hmting money
ф Internal ccnfficl
ф Loss ot reserve
currency
ф Weak leodennip
ф QMI wcrAevoluBon
I threw a lot at you in the last few pages. You might want to read them again
slowly so you can see if the sequence makes sense to you. Later, we will get into a
number of specific cases in greater depth and you will see the patterns of these
cycles emerge, albeit not in a precise way. The fact that they occur and the reasons
for them occurring are less disputable than the exact timing of their occurrences.
To summarize, around the upward trend of productivity gains that
produce rising wealth and better living standards, there are cycles that
produce prosperous periods of building in which the country is
fundamentally strong because there are relatively low levels of
indebtedness, relatively small wealth, values, and political gaps, people
working effectively together to produce prosperity, good education and
infrastructure, strong and capable leadership, and a peaceful world order
that is guided by one or more dominant world powers. These are the
prosperous and enjoyable periods. When they are taken to excess, which
they always are, the excesses lead to depressing periods of destruction and
restructuring in which the country’s fundamental weaknesses of high
levels of indebtedness, large wealth, values, and political gaps, different
factions of people unable to work well together, poor education and
infrastructure, and the struggle to maintain an overextended empire
under the challenge of emerging rivals lead to a painful period of fighting,
destruction, and then a restructuring that establishes a new order, setting
the stage for a new period of building.
Because these steps unfold in a logical sequence of timeless and
universal cause/effect relationships, it is possible to create a health index
of where a country stands by looking at these measures. When the
measures are strong/good, the condition of the country is strong/good and
the period ahead is much more likely to be strong/good; when the ratings
of these items are weak/bad, the condition of the country is weak/bad and
the period ahead is much more likely to be weak/bad.
In the following table, to help paint the picture, I converted most of
our measures into colors, with dark green being a very favorable reading
and dark red being a very unfavorable reading. It is the average of these
readings that defines which stage of the cycle a country is in, in much the same
way as it is the average of the eight readings of power that I use as my measure of
total power. Like those power readings, while one could reconfigure them to
produce marginally different readings, they are broadly indicative in a by-and-
large way. Here, I am showing this to exemplify the typical process, not to look at
any specific case. I will however show specific quantitative readings for all the
major countries later in this book.
ROUGH QUANTITATIVE SCORING OF
MEASURES BY STAGE IN CYCLE
Dark green = gauge is strong,'good
Dark red = gauge is weak/bad
Since all of these factors, both ascending and descending, tend to be mutually
reinforcing, it is not a coincidence that large wealth gaps, debt crises, revolutions,
wars, and changes in the world order have tended to come as a perfect storm. The
Big Cycle of an empire’s rise and decline looks like the following chart. The bad
periods of destruction and restructuring via depression, revolution, and war,
which largely tear down the old system and set the stage for the emergence of a
new system, typically take about 10 to 20 years, though variations in the range can
be much larger. They are depicted by the shaded areas. They are followed by more
extended periods of peace and prosperity in which smart people work
harmoniously together and no country wants to fight the world power because
it’s too strong. These peaceful periods last for about 40 to 80 years, though
variations in the range can be much larger.
CHANGES TO THE WORLD ORDER (CONCEPTUAL EXAMPLE)
For example, when the Dutch Empire gave way to the British Empire and
when the British Empire gave way to the US Empire, most or all of the following
things happened:
End of the Old, Beginning of the
New (e.g., Dutch to British)
Debt restructuring and debt crisis
Internal revolution (peaceful or
violent) that leads to large transfers
of wealth from the “haves” to the
“have-nots”
External war
Big currency breakdown
New domestic and world order
End of the Old, Beginning of the
New (e.g., British to US)
Debt restructuring and debt crisis
Internal revolution (peaceful or
violent) that leads to large transfers
of wealth from the “haves” to the
“have-nots”
External war
Big currency breakdown
New domestic and world order
A PREVIEW OF WHERE WE ARE NOW
As previously explained, the last major period of destroying and restructuring
happened in 1930-45, which led to the period of building and the new world
order that began in 1945 with the creation a new global monetary system (built in
1944 in Bretton Woods, New Hampshire) and a US-dominated system of world
governance (locating the United Nations in New York and the World Bank and
the International Monetary Fund in Washington, DC). The new world order was
the natural consequence of the US being the richest country (it then had two-
thirds of the world’s gold stock and gold was then money), the dominant
economic power (it then accounted for about half of world production), and the
strongest military (it then had a monopoly on nuclear weapons and the strongest
conventional forces).
At the time of my writing, it is now 75 years later, and the major old
empires, which are also the major reserve currency empires, are classically
approaching the end of a long-term debt cycle when there are large debts
and typical monetary policies don’t work well. Politically fragmented
central governments have recently tried to fill in their financial holes by
giving out a lot of money that they are borrowing, while central banks
have tried to help by printing a lot of money (i.e., monetizing government
debt). All this is happening when there are big wealth and values gaps and
a rising world power that is competing with the leading world power in
trade, technology development, capital markets, and geopolitics. And on
top of all this, as of this writing we have a pandemic to contend with.
Simultaneously, great human thinking, working with computer intelligence, is
creating great ways of addressing these challenges. If we can all deal with each
other well, we will certainly get past this difficult time and move on to a new
prosperous period that will be quite different. At the same time, I am equally
confident that there will be radical changes that will be traumatic for many
people.
That is how the world works in a nutshell. Now I will give a more expanded
description.
At this time, humanity is evolving its ways of thinking and increasing productivity in more dramatic ways
than ever before—even more dramatically than the discovery and usage of the scientific method. We are
doing this through the development of artificial intelligence, which is an alternative way of thinking via an
alternative brain that can make discoveries and process them into instructions of what should be done.
Humanity is essentially creating an alternative species that has enormous capacity to see past patterns and
process many different ideas very quickly, has little or no common sense, has trouble understanding the logic
behind relationships, and doesn’t have emotions. This species is simultaneously smart and stupid, helpful and
dangerous. It offers great potential and needs to be well-controlled and not blindly followed.
- . In 2008, it took two months from the crash to the printing of money; in 2020, it took just weeks.
Z. These indices are made up of a number of different statistics, some of which are directly comparable and
some of which are broadly analogous or broadly indicative. In some cases, a data series that stopped at a
certain point had to be spliced with a series that continued back in time. Additionally, the lines shown on the
chart are 30-year moving averages of these indices, shifted so that there is no lag. I chose to use the smoothed
series because the volatility of the unsmoothed series was too great to allow one to see the big movements.
Going forward, I will use these very smoothed versions when looking at the very long term and much less
smoothed or unsmoothed versions when looking at these developments up close because the most important
developments are best captured this way.
- . We show where key indicators were relative to their history by averaging them across the cases. The chart is
shown such that a value of 1 represents the peak in that indicator relative to history and 0 represents the
trough. The timeline is shown in years with 0 representing roughly when the country was at its peak (i.e.,
when the average across the gauges was at its peak). In the rest of this chapter, we walk through each of the
stages of the archetype in more detail.
“Exorbitant privilege” is a way of describing a reserve currency that was coined by French Finance Minister
Valery Giscard d’Estaing as a description of the position of the US.
— . Acts of nature, external order, and geology are not included in cycle analysis. Readings use proxies for
determinants with limited history.
CHAPTER 2
THE DETERMINANTS
I n the last chapter I described the Big Cycle in a tiny nutshell. In this and
the other chapters that follow in Part I, I will flesh out how I see the
perpetual-motion machine working. In this chapter, I will review the most
important determinants and summarize how I put them into my “model.”
As the saying goes, and most people agree, “history rhymes.” It “rhymes”
because its most important events repeat, though never in exactly the same way.
That is because, while the cause/effect relationships behind those events are
timeless and universal, all things evolve and influence each other in different ways.
By studying many analogous events in different times and places, their underlying
causes and effects become clearer. I have learned that history’s continuously
evolving story transpires like a perpetual-motion machine that is driven by
cause/effect relationships that both evolve and repeat over time.
To deal with the realities that are coming at me, my process is to...
Interact with this machine and try to understand how it works
Write down my observations of its workings, along with the
principles I have learned for dealing with them
Backtest those principles through time
Convert the principles into equations and program them into a
computer that helps me with my decision making
Learn from my experiences and my reflections on my experiences, so
I can refine my principles
Do that over and over again
Imagine a chess player who records their criteria for making different moves in
different situations, which they then encode into a computer that plays alongside
them like a partner. Each player brings what they are best at to the game. The
human player is more inventive, more lateral in thinking, and better able to
reason, while the computer can calculate more data faster, is better able to identify
patterns, and is much less emotional. This never-ending process of learning,
building, using, and refining in partnership with computers describes what I do,
except my game is global macro investing, not chess.
In this chapter, I will share my description of the workings of the
perpetual-motion machine that drives the rises and declines of empires
and their reserve currencies as I have come to understand it thus far,
giving you a glimpse into how I play my game. While I’m sure my mental
model is wrong and incomplete in any number of ways, it is the best one that I
have now and it has proven invaluable to me. I am passing it along for you to
probe and explore, take or leave, and build on as you like. My hope is that I will
prompt you and others to think about the timeless and universal cause/effect
relationships that drive the realities that are coming at us, and the best principles
for dealing with them. By stress testing and improving this model through full-
throated debate, we will get to the point where we have a largely agreed-upon
template of the processes and their causes. By using that template, we can then
strive to agree on which stage each country is in and what the best practices are for
interacting with it, whether we are individuals taking care of our own interests or
we are leaders taking care of our country’s.
In the last chapter, I conveyed a very simplified description of the determinants
of the evolution and cyclical rises and declines of empires—most importantly,
what I believe to be the primary drivers of the Big Cycles. In this chapter, I will
explain the model in much greater detail. It is based on what I saw happen
repeatedly through time in the 11 leading empires of the last 500 years, the 20
most important countries of the last 100 years, and the major dynasties of China
over the last 1,400 years. To be clear, I do not consider myself to be an expert
historian in these cases, and these cases represent only a small percentage of all
cases. I only glanced at some of the most important empires in early history, such
as the Roman, Greek, Egyptian, Byzantine, Mongol, Han, Sui, Arab, and Persian
empires, and I completely neglected many of the other empires that have risen and
declined throughout the world in Africa, South Asia, the Pacific Islands, and
precolonial North and South America. In other words, what I didn’t examine was
much greater than what I did examine. Still, I believe I have seen enough to
develop a good mental model that applies to most countries, which has been very
helpful to my efforts to understand what is going on today and which helps me to
form a valuable, though hazy, picture of the future.
THE CONSTRUCTION OF MY MENTAL MODEL OF THE
PERPETUAL-MOTION MACHINE
Just as we can see the arc of the human life cycle from birth to death and how one
generation impacts the next, we can do the same with countries and empires. We
can see how values, assets, liabilities, and experiences are handed down and how
their evolutionary effects ripple out across the generations. We can tell when an
empire is approaching its peak and when it is in decline.
• All peoples throughout history have had systems or orders for governing how they deal
with each other. I call the systems within countries "internal orders," those between countries
"external orders," and those that apply to the whole world "world orders." These orders affect
each other and are always changing. Such orders have always existed at every level—
within families, companies, cities, states, and countries, as well as internationally.
They determine who has what powers and how decisions are made, including
how wealth and political control are divided. What they are and how they run is a
function of human nature, culture, and circumstances. The US now has a certain
set of existing political conditions within its democratic system, but both the
conditions and the system are ever-changing because of the pressure of timeless
and universal forces.
The way I see it, at any moment in time there are both 1) the existing
set of conditions that include the existing domestic and world orders and
2) timeless and universal forces that cause changes in these conditions.
Most people tend to pay too much attention to what exists relative to the timeless
and universal forces that produce the changes. I do the opposite in my attempt to
anticipate change. Everything that has happened and everything that will
happen has had and will have determinants that make it happen. If we can
understand those determinants, we can understand how the machine
works and anticipate what will likely be coming at us next.
Since everything that happened and will happen was and is due to the
interactions of the parts of this perpetual-motion machine, one can say that
everything is predestined. I believe that, if we had a perfect model that took every
cause/effect relationship into consideration, we could perfectly forecast the future
—that the only thing that stands in the way is our inability to model all those
cause/effect dynamics. While that might or might not be right, it tells you where
I’m coming from and what I’m striving for.
Most people don’t see things that way. Most people believe the future is
unknowable and that destiny doesn’t exist. To be clear, while having a perfect
model that gives a nearly perfect picture of that predestined future would be great,
I don’t expect my model to come close to that. My goal is simply to have a crude
yet evolving model that gives me a leg up relative to the competition and relative
to the position I would be in if I didn’t have the model.
To build this model, I looked at history quantitatively as well as qualitatively
because 1) by measuring conditions and their changes, I can more objectively
determine the cause/effect relationships behind them, develop a likely range of
expectations, and systemize my decision making accordingly but 2) I can’t
measure everything quantitatively.
My process is to look at many cases to observe how their determinants
created the effects that define them. To give a simple example, a lot of debt
(a determinant) together with tight money (another determinant) will
typically produce a debt crisis (the effect). Similarly, when the three big cycles
that I described in the last chapter come together in a bad way (heavy
indebtedness with the central bank printing a lot of money; internal conflict
stemming from gaps in wealth, values, and politics; and the rise of one or more
competing powers), that typically leads to the decline of an incumbent empire.
In my mental model, the relationship between the determinants and
their effects in the various cases looks like this:
Case 1 How the Machine Works = (f)... Case 8 Case 9 Case Ю, Etc
Case 2 Case 3 Case 4 Case 5 Case 6 Case 7
Determinant 1 Effect Effect Effect Effect Effect Effect Effect Effect Effect Effect
Determinant 2 Effect Effect Effect Effect Effect Effect Effect Effect Effect Effect
Determinant 3 Effect Effect Effect Effect Effect Effect Effect Effect Effect Effect
Determinant 4 Effect Effect Effect Effect Effect Effect Effect Effect Effect Effect
Determinant 5 Effect Effect Effect Effect Effect Effect Effect Effect Effect Effect
Determinant 6 Effect Effect Effect Effect Effect Effect Effect Effect Effect Effect
Determinant 7 Effect Effect Effect Effect Effect Effect Effect Effect Effect Effect
Determinant 8 Effect Effect Effect Effect Effect Effect Effect Effect Effect Effect
Determinant 9 Effect Effect Effect Effect Effect Effect Effect Effect Effect Effect
Determinant 10 Effect Effect Effect Effect Effect Effect Effect Effect Effect Effect
Etc
Determinants lead to effects that become subsequent determinants that
produce subsequent effects that become linked together in many cases. So
we can look at each case and see what happened (the effect) and what made
it happen (its determinants). Or we can look at the determinants to see the
effects they had to make up the various cases. The determinants are both
what exists and the energy that produces changes; like energy and matter,
at the end of the day they’re the same. They create new circumstances and
new determinants that create the next changes.
That is how I quite literally try to model the perpetual-motion machine.
THE 3, THE 5, THE 8, AND THE 18 DETERMINANTS
In the last chapter, I introduced you to what I believe are the three big cycles and
the eight most important determinants of the rises and declines of empires and
their currencies. Because thinking about all of these determinants and their
interactions is complex, I suggest that you keep the three big cycles in
mind as the most important things to watch: 1) the cycle of good and bad
finances (e.g., the capital markets cycle), 2) the cycle of internal order and
disorder (due to degrees of cooperation and fighting over wealth and
power largely caused by wealth and values gaps), and 3) the cycle of
external order and disorder (due to the degrees of the competitiveness of
existing powers in fighting for wealth and power). I hope you will join me in
trying to understand these three cycles and know where countries are in them.
History and logic show that when a country simultaneously has all three in their
good phases it is strong and rising, and when all three are in their bad phases it is
weak and declining.
If I were to add two more determinants to keep in mind, they would be
4) the pace of innovation and technological development to solve problems
and make improvements and 5) acts of nature, most importantly droughts,
floods, and diseases. That is because innovation and technological advances
can solve most problems and further evolution, and acts of nature such as
droughts, floods, and diseases have had enormous impacts throughout
history. These are the five most important forces, which I call the “Big
Five,” so when they are moving in the same direction—toward improving
or toward worsening—most everything else follows.
I also introduced the eight powers that I could measure that seemed to
be the most important. You can review them along with the big cycles in
the following list. These indicators both reflect and drive the upswings and
downswings. The chart of the archetypical rise and decline by factor in Chapter 1
showed the average readings of these along the path of the archetypical cycle. Each
of these types of power rising and declining in cycles comes together with the
other cycles to make the one Big Cycle of the empire’s rise and decline.
And then there are the other determinants such as geology/geography,
rule of law, and infrastructure that matter too. The whole list of 18
factors- included in my model is shown on the next page. You can also read a
detailed description of all 18 at the end of Chapter 14.
THE THREE BIG CYCLES
Healthy Big Debt/Money/Capital Markets/Economic Cycle Unhealthy
◄ ►
Order Big Cycle of Internal Order and Disorder Disorder
Peace ◄ Big Cycle of External Order and Disorder War ►
OTHER KEY DETERMINANTS (EIGHT KEY MEASURES OF POWER)
High Education Low
w F
High Innovation & Technology Low
4 F
Strong J Cost Competitiveness Weak
w
Strong Military Strength Weak b.
F
Favorable Trade Unfavorable
F
High Economic Output Low
F
Strong Markets and Financial Center Weak
4
Strong Reserve Currency Status Weak
я ADDITIONAL DETERMINANTS
Favorable -d Geology Unfavorable
w F
Efficient Resource-Allocation Efficiency Poor ь.
w F
Beneficial Acts of Nature Disruptive
High Infrastructure and Investment Low
я
Strong -d Character/Civility/Determination Weak
w F
Strong Govemance/Rule of Law Weak
Я F
Small ◄ Gaps in Wealth, Opportunity & Values Large “►
I find measuring and weighing all these things in my head, plus all of the other
important dynamics at play, to be impossible. That is why I analyze them with the
aid of a computer. I will share my analysis for the top 11 countries in the appendix
after Chapter 14: The Future. I also provide detail on some components for the
top 20 countries at economicprinciples.org.
Though none of these determinants is determinative on its own, I think
you will find that when considered together they paint a pretty clear
picture of which part of its life cycle a country is in and the direction it is
headed in. For the fun of it you might want to go through a little exercise of
ticking off where each of those measures is for each country you’re interested in.
Rank each country on a 1-10 scale for each attribute, beginning with 10 on the
far left and 1 on the far right. If you add all these rankings up, the higher the
number, the greater the probability of the country rising on a relative basis. The
lower the number, the more likely it will fall. Take a moment to calculate where
the United States is, where China is, where Italy is, where Brazil is, and so on.
Because I systematize as much as I can, I push to quantify whatever possible
into a decision-making system. So, with the help of my team, I have developed
gauges that look at things like internal and external conflict, political gaps, etc., to
help me better understand where countries are in their cycles. Some of the less key
determinants are aggregated as subcomponents of the key determinants.
While I measure and describe the determinants discretely, they are not
separate. They interact with each other and blend together, typically
reinforcing each other and the whole cycle’s rise and fall. For example,
stronger education leads to stronger technological innovation, which leads to
increased productivity and increased shares of trade, greater wealth, more military
power, and eventually the establishment of a reserve currency. Further, having
strong leaders, a population that is well-educated and civil with each other, a
system that efficiently allocates capital and other resources, access to natural
resources, and favorable geography all help a lot, and when they decline, they tend
to decline together.
Of course, not all of the indicators can be expressed in numbers and
equations; things like human nature and the power dynamics that affect
behaviors and outcomes are better described in words. I call these things
dynamics. The following table shows a list of other main dynamics that I keep in
my head while trying to evaluate where nations are and what is likely to come
next.
DYNAMICS TO PAY ATTENTION TO
Country
Self-Interest
Individual
Important Desire to Gain Wealth and Power Not important
4 ►
Extensive Learning from History Limited
◄--------------------------------------------------------------------►
Strong Multigenerational Psychological Cycle Decadent
◄------------------------------------------------------------►
Long-Term Time Frame of Decision Making Short-Term
◄------------------------------------------------------------►
Competent Leadership Weak
◄------------------------------------------------------------►
Open Openness to Global Thinking Closed
◄------------------------------------------------------------►
Productive Culture Unproductive
◄------------------------------------------------------------►
Cooperative Class Relationships Divisive
◄------------------------------------------------------------►
Moderate Political Left/Right Partisan
4—-------------------------------—---------------------—►
Cooperative Prisoner's Dilemma At War
◄------------------------------------------------------------►
Win-Win Relationships Lose-Lose
Favorable
◄---------
Peace
◄---------
Balance of Power
Peace/War Cycle
Unfavorable
----------►
War
----------►
That’s a lot. It is both too little and too much—too little to do full justice to
the subjects (which have all been the focus of whole books and doctoral theses)
and too much to process and digest. I have tried to cram a small portion of what
I’ve learned about them into the summaries that follow. Fuller accounts of a
number of these dynamics are contained in an addendum immediately following
this chapter if you’re interested in diving more deeply into any of them. While
I’m sure that what follows doesn’t include all the most important
determinants, I also know that the ones I’m highlighting here and in the
following chapters represent the most important influences that have
repeatedly driven the most important events throughout history. Of
course, I look forward to being corrected and guided by others to make my
descriptions more complete.
EXPLORING THE DETERMINANTS AND DYNAMICS
I find that knowing the different circumstances countries face, as well as the
strategies and group dynamics they bring to facing these circumstances, helps me
understand what moves are likely to come next and how these moves will impact
the key determinants. I will explain a bit more about how these look to me, which
I will do by examining the machine from the top down.
As I see it, the determinants and dynamics that drive events fall into
two types:
1. Inherited Determinants: They include a country’s geography, geology,
and acts of nature such as weather and diseases.
2. Human Capital Determinants: They are the ways people are with
themselves and each other. They are driven by human nature and different
cultures (which differentiate their approaches).
These two big categories contain within them many important factors, ranging
from qualities that are highly specific to countries (like their geography) to those
that are universal (like the human tendency to favor short-term gratification over
long-term goals), and they can be discerned at every level, whether in individuals,
cities, countries, or empires.
INHERITED DETERMINANTS
By inherited determinants of a country’s well-being I mean its geography,
geology, genealogy, and acts of nature. These are big drivers of each country’s
and each people’s stories. For example, you can’t understand the success of the
United States without recognizing that it is separated from European and Asian
powers by two oceans and blessed with most of the minerals, metals, and other
natural resources it needs to be prosperous and self-sufficient, including the
topsoil, water, and temperate climate that allows it to produce most of its own
food. These factors enabled it to be largely isolationist until a little more than a
century ago while investing in education, infrastructure, and innovation in ways
that made it strong. Let’s briefly review those.
1. Geography. Where a country is, what’s around it, and what its terrain is
like are all important determinants. For example, the geographies of the
United States and China—both with large expanses of land bounded by large
natural barriers of water and mountains—created the inclination for them to be
one big whole, increasing the commonalities of their people (e.g., shared language,
government, culture, etc.). In contrast, the geography of Europe (i.e., having
many more natural boundaries within it) reinforced its divisions into different
states/countries, leading to fewer commonalities among its people (e.g., different
languages, governments, cultures, etc.).
2. Geology. The natural resources on and under a country’s surface are
critically important, but geology should not be overvalued relative to human
capital. History shows us that every commodity has declined in value (in inflation-
adjusted terms) with big up and down cycles around that downtrend. That is
because inventiveness changes what is in demand—e.g., new energy sources
replacing old ones, fiber-optic cable replacing copper wiring, etc.—and natural
resources are depleted over time. Many Middle Eastern countries’ wealth, power,
and relevance to the rest of the world rose with the importance of petroleum and
may fall as the world turns away from fossil fuels. The most vulnerable position to
be in is having a high reliance on one or a few commodities because they are highly
cyclical and sometimes lose value altogether.
3. Acts of Nature. Acts of nature come in many forms, such as epidemic
diseases, floods, and droughts. Throughout history they have affected the
well-being of countries and the course of their evolution even more than
wars and depressions. The Black Death killed an estimated 75-200 million
people in the years around 1350, and smallpox killed more than 300 million
people in the 20th century, which is more than double the number that died in its
wars. Droughts and floods have caused massive famines and loss of life. Such
catastrophes tend to come along unexpectedly and act as stress tests, revealing the
underlying strengths and weaknesses of societies.
4. Genealogy. Regarding genealogy, I’m no expert on genetics, so I have
little to offer other than to say that all people come into this world with
inherited genes that affect how they behave to some extent, so it is logical
that the genetic makeup of a country’s population should have some effect
on its outcomes. Having said that, I should point out that most of the evidence I
have seen indicates that only a small percentage (15 percent or less) of the
variations in the behaviors of people between populations could potentially be
explained by genetic differences, so genetics seems to be a relatively minor
determinant in relation to the other influences I am mentioning.
HUMAN CAPITAL DETERMINANTS
• While the inherited assets and liabilities of a country are very important, history has shown
that the way people are with themselves and others is the most important determinant. By
that I mean whether they hold themselves to high standards of behavior, whether
they are self-disciplined, and whether they are civil with others in order to be
productive members of their societies is most important. These qualities plus
flexibility and resilience (i.e., the capacity to adapt to both “bad” and “good”
things) allows people to minimize setbacks and maximize opportunities.
Character, common sense, creativity, and consideration in most people make for a
productive society.
Because capital is an income-producing asset, human capital can be defined as
a human who generates income. • When humans have the capacity to produce more
revenue than they expend, there is good human capital and self-sufficiency. I call this “self-
sufficient plus,” which is what all people, companies, and countries should strive
for in order for them individually and collectively to be strong financially. The
likelihood of having good human capital and being “self-sufficient plus” is
improved through quality education, a culture of hard work and cooperation,
training, etc. Societies that don’t have good human capital are either drawing
down their resources or getting deeper into debt they won’t be able to pay back
(i.e., they’re headed for trouble).
• While many countries have natural resources that they are able to draw upon, human
capital is the most sustainable capital because inherited assets that are drawn down
eventually disappear, whereas human capital can exist forever.
Human capital is why people who come up with new ideas and build them out
(e.g., entrepreneurs) beat giants with vast resources (just look at Elon Musk and
his startup Tesla, which rivals resource-rich General Motors, Ford, and Chrysler;
or Steve Jobs and Bill Gates, whose computer startups surpassed giants like IBM;
and so on). Great human capital allows people to overcome their weaknesses and
identify and capitalize on their opportunities. It is the attribute that has allowed
small countries like the Netherlands, England, Switzerland, and Singapore to
achieve great wealth and (in some cases) power.
THE MOST IMPORTANT HUMAN NATURE DETERMINANTS
Across societies and throughout time, people share the same human nature, which
makes them much more alike than different. People behave similarly when faced
with similar circumstances, driving the Big Cycles.
5. Self-Interest. Self-interest, especially self-survival, is the most powerful
motivator for most people, organizations, and governments. However,
which self-interest—e.g., the individual’s, the family’s, the country’s, etc.
—matters most is a critical determinant of the society’s success. See the
addendum that follows this chapter to learn more.
6. The Drive to Gain and Keep Wealth and Power. The quest for wealth and
power is a powerful motivator of individuals, families, companies, states, and
countries, though that’s not totally true because different individuals, families,
companies, states, and countries value wealth and power differently relative to
other things. For some, wealth and power are not nearly as important as other
things that life has to offer. But for most, especially those who become the most
wealthy and powerful, the pursuit of wealth and power is all-consuming. To be
successful over the long run, a country must earn an amount that is at least
equal to what it spends. Those that earn and spend modestly and have a
surplus are more sustainably successful than those that earn and spend a
lot more and have deficits. History shows that when an individual,
organization, country, or empire spends more than what it earns, misery
and turbulence are ahead. For more, see the addendum.
7. Capital Markets. The ability to save and obtain buying power through
one’s capital markets is essential to a country’s well-being. For that reason,
how well they are developed is an important determinant of a country’s success.
8. The Ability to Learn from History. Most people don’t have this, which is an
impediment, though it varies by society. For example, the Chinese are excellent at
this. Learning from one’s own experiences is not adequate because, as explained
earlier, many of the most important lessons don’t come in one’s lifetime. In fact,
many encounters in the future will be more opposite than similar to what one
encountered before in life. Since the peace/boom period at the beginning of the
cycle is opposite to the war/bust period at its end, the periods people face later in
their lives are more likely to be more opposite than similar to the ones they
encountered earlier in their lives. More specifically, in my opinion, if you don’t
understand what happened since at least 1900 and how that rhymes with what is
happening now, there is a high likelihood that you will find yourself in trouble.
9. The Big Multigenerational Psychological Cycle. Different generations
think differently because of their different experiences, which leads them
to make their decisions differently, which affects what happens to them
and to subsequent generations. This is reflected in the adage “from shirtsleeves
to shirtsleeves in three generations.” Three generations is also roughly the length
of time of a typical long-term debt cycle. However, history shows that when these
cycles are handled well—i.e., strong human capital is maintained over many
generations—they can go on for many generations. This multigenerational cycle
takes place over several stages that are described in the addendum to this chapter.
10. Favoring Short-Term Gratification over Long-Term Well-Being. This
is another differentiator of people’s and society’s successes. Those who favor long-
term well-being over short-term well-being tend to do better. The human
propensity to choose short-term enjoyment over long-term well-being naturally
exaggerates the highs and lows of the cycle because it pulls the good times forward
at the expense of the future. That happens in many harmful ways, most classically
by creating the debt boom and bust cycle. Governments are especially vulnerable
to this because of how the political dynamic works. More specifically, a)
politicians are motivated to prioritize the near term over the long term, b) they
don’t like to face limitations and difficult financial trade-offs (e.g., choosing
whether to spend on the military for defense or to spend on social programs), and
c) it is politically threatening to take money away from people by taxing them.
This leads to a host of political and other problems.
11. Humanity’s Inventiveness. Humanity’s greatest power is what drives
human evolution, which is manifest in increased productivity and higher
living standards. Unlike other species, humans have a unique capacity to learn
and evolve their intellectual understanding; plus, they invent things that
materially change their circumstances, producing advances in everything. These
advances produce the upward trending corkscrew I described in Chapter 1. To
imagine what it would be like if humankind didn’t have this ability, look at other
species. Without humanity’s unique ability to invent, our lives would be pretty
much the same generation after generation. Because there would be far fewer new
things, there would be fewer surprises and advances. In fact, some periods of
human history were very much like that. However, it varies greatly from one
society to another. For more, see the addendum to this chapter.
DETERMINANTS SHAPED BY CULTURE
12. Culture. As the saying goes, “culture is destiny.” Cultural differences
—differences in how people believe they should be with each other—
matter enormously. All societies create cultures based on how they think
reality works, and they all provide principles for guiding how people
should deal with reality, and most importantly how they should deal with
each other. Culture drives the formal and informal ways each society works.
Individuals known and unknown, such as Jesus, Confucius, Mohammed,
Buddha, Mahavira, Guru Nanak, Plato, Socrates, Marx, and many others, have
conveyed approaches to life that were captured in books such as the Hebrew Bible
and the New Testament, the Talmud, the Quran, the I Ching, the Five Books and
Four Classics, the Analects, the Upanishads, the Bhagavad Gita, the Brama Sutras,
Meditations, Republic, Metaphysics, The Wealth of Nations, and Das Kapital.
These, together with the discoveries of scientists, artists, politicians, diplomats,
investors, psychologists, etc., all encountering their realities and adapting to them
in their own ways, are what determines a people’s culture.
13. Openness to Global Thinking. This is a good leading indicator of
strength because isolated entities tend to miss out on the world’s best
practices, which weakens them, while learning about the best the world
has to offer helps people be their best. Isolation also prevents them from
benefiting from the challenge of facing off against the world’s best competitors.
History is littered with cases in which countries were isolated, sometimes because
they chose to cut themselves off to protect their cultures (e.g., the late Tang, late
Ming, and early PRC periods in China, and the Edo period in Japan) and
sometimes because of circumstances like natural disasters and internal fighting.
Both reasons lead them to fall behind in their technology, with terrible
consequences. In fact, it is one of the most common reasons for empires and
dynasties failing.
14. Leadership. Everything I’ve mentioned so far is influenced by the people in
leadership positions. Life is like a game of chess or the Chinese board game Go, in
which every move helps determine the outcome and some players know how to
make better moves than others. In the future, more and more of those moves will
be made with the aid of computers, but for now they are still made by people. In
reading history you see over and over how its course has been changed by the
uniqueness—sometimes excellence, sometimes terribleness—of a relatively few
people in key areas such as the government, the sciences, finance and commerce,
the arts, and so on. In each generation, roughly a few hundred people made all the
difference. Studying what these key people in these key roles were like, what they
did in different situations, and the consequences of what they did helps us
understand how this perpetual-motion machine works.
DETERMINANTS SHAPED BY HOW INDIVIDUALS AND
GROUPS INTERACT WITH EACH OTHER
15. Wealth Gaps. Large and widening wealth gaps tend to lead to periods of
greater conflict, especially when economic conditions become bad and people are
fighting over a shrinking pie.
16. Values Gaps. While wealth matters, it is not the only thing that people fight
over. Values (e.g., in religions and ideologies) matter a lot too. History shows us
that widening values gaps, especially during periods of economic stress, have
tended to lead to periods of greater conflict, while shrinking values gaps tend to
lead to periods of greater harmony. This dynamic is driven by the fact that people
tend to coalesce into tribes that are bound together (often informally) by the
magnetism of their members’ commonalities. Naturally, such tribes operate with
each other in ways that are consistent with their shared values. When under stress,
people with greater values gaps also prove to have greater conflict. They
frequently demonize members of other tribes rather than recognizing that those
other tribes, like themselves, are simply doing what is in their self-interest in the
best ways they know how.
17. Class Struggles. • In all countries throughout time, though to varying degrees, people
are sorted into "classes," either because they choose to be with people like themselves or
because others assign them to a class. Power is usually shared among three or four
classes who in aggregate make up only a small percentage of the population. The
classes people are in typically determine who their friends and allies are and who
their enemies are. They are sorted into these classes whether they like it or not
because people stereotype. While rich and poor are the most common class
distinctions, there are many other important ones, such as race, ethnicity, religion,
gender, lifestyle, location (e.g., urban versus rural), and politics (right versus left).
Early in the Big Cycle, when times are good, there is generally more harmony
among the classes, and when things are bad toward the end, there is more fighting.
Class warfare has profound effects on the internal order, which I will
explore in Chapter 5. For more on this determinant, see the addendum to this
chapter.
18. The Political Left/Right Cycle. In all societies there are swings between the
political left and the political right that determine how wealth and power are
distributed. The swings are sometimes peaceful and sometimes violent and are
always important to understand. Typically, the big cycle in the capital markets,
along with cycles in wealth, values, and class divisions, drive the political left/right
cycle because these create the motivations for political change. When capital
markets and economies are booming, wealth gaps typically increase. While some
societies succeed at striking a relatively sensible and steady balance between left
and right, more frequently we see cyclical swings between norms. These swings
typically occur throughout empires’ rises and declines, in roughly 10-year cycles.
The big economic crises that mark the end of the Big Cycle often herald
revolutions. For more, see the addendum to this chapter.
19. The Prisoner’s Dilemma Must Be Solved for Peace to Exist. The
prisoner’s dilemma is a concept from game theory that explains why, even when
the best thing for two parties to do is to cooperate, the logical thing for each to do
is to kill the other first. That is because survival is of paramount importance, and
while you don’t know for certain if your opponent will attack you, you do know
that it is in their interest to defeat you before you defeat them. It’s for this reason
that deadly wars are best avoided by both sides establishing mutually assured
protections against existential harms. Exchanging benefits and creating
interdependencies that would be intolerable to lose further reduces the risk of
conflict.
20. Whether There Are Win-Win Relationships or Lose-Lose
Relationships. It is up to both parties to choose what kind of relationship they
have. That is true at all levels of relationships, from individuals up to countries.
Most fundamentally, parties can choose whether to have a cooperative win-win
relationship or a threatening lose-lose relationship—i.e., to be allies or enemies—
though actions by both determine what type of relationship they will have and
whether it will work well. To be clear, win-win relationships can exist between
competitors as long as each side does not pose an existential risk to the other (see
the prisoner’s dilemma). All that’s required is that they know and respect each
other’s existential red lines. Parties in win-win relationships can have tough
negotiations, competing like two friendly merchants in a bazaar or two teams at
the Olympics. Having win-win relationships is obviously better than having lose-
lose relationships, but sometimes there are irreconcilable differences that must be
fought over because they can’t be negotiated away.
21. The Big Balance of Power Cycle That Drives the Big Peace/War Cycle
Both Within Countries and Between Countries. The balance of power
dynamic is the timeless and universal dynamic of allies and enemies working to
gain wealth and power. It drives virtually all struggles for power, from office
politics to local politics, and from national politics to geopolitics. In some cultures
this game is played a bit differently than in other cultures—e.g., in Western
society it is played more like chess while in Asian societies it is played more like Go
—though the objective is the same: to dominate the other side. It has always
existed and still exists everywhere and appears to transpire along a consistent series
of steps, which I describe in more detail when discussing the internal order in
Chapter 5 (even though these same forces apply equally to internal and external
power struggles). For a more complete explanation of how the balance of power
cycle works, see the addendum to this chapter.
22. Military Strength and the Peace/War Cycle. History shows us that
military strength—whether one’s own or another’s via alliances—is a critical
determinant of outcomes, sometimes because the mere threat of force is power
and sometimes because the use of force is required. Military strength is readily
observable and measurable, but it can also be qualitatively assessed.
Internationally, military strength is especially important because there is no
effective international judicial and enforcement system. This leads to countries
needing to fight to test their relative powers and a cycle of war and peace that I
will explain when discussing the external order cycle in Chapter 6.
ALL THESE THINGS COME TOGETHER TO DETERMINE
INTERNAL ORDERS, EXTERNAL ORDERS, AND HOW THEY
CHANGE
I have repeatedly seen all of these determine the levels and the rises and declines in
wealth and power of all peoples. I have seen them together create the
circumstances the people of a country and/or its leaders face and how they face
them. They drive the internal and world orders and changes in them.
• Like everything else, internal orders and world orders are constantly evolving and
moving circumstances forward through time, as existing circumstances interact with each
other and the forces that act on them to produce new circumstances.
Evolution occurs because of logical cause/effect relationships in which existing
conditions and determinants propel changes that create a new set of conditions
and determinants that propel the next changes and so on, like matter and energy
interacting in a perpetual-motion machine. Because a given set of circumstances
creates a limited set of possibilities, by properly identifying the circumstances and
understanding the cause/effect relationships, one can improve one’s
understanding of the possibilities of what will come next and how to make wise
decisions.
For example, all countries now have their existing way of choosing new leaders.
In the US, the president is chosen both by the voters in accordance with the
democratic system laid out in the Constitution and by how people choose to
operate within the system. How well this works depends on how effective both
are, which is a result of prior determinants, such as how effectively those in
previous generations dealt with and modified the system. The people now
interacting with the system are different from those of previous generations, who
were shaped by different circumstances, so we should expect different outcomes
based on how people today are different.
Not having the historical perspective to recognize those differences is a
handicap. Once we see them and understand how the perpetual-motion machine
works, we can see how different systems such as communism, fascism,
autocracies, democracies, and evolutionary descendants and hybrids of these, such
as state capitalism in China, evolve through time. Seeing this, we can imagine how
new forms of internal orders to divide wealth and allocate government political
power may evolve and affect our lives, based on how people choose to be with
each other and how human nature enters into their choices.
Now that I have described my mental model of how the world works rather
superficially, in the rest of Part I, I will focus on the most important determinants
—namely the three big cycles of debt and capital markets, internal order, and
external order—in more detail. I will also describe what I believe all this means for
investing. Before you go on to that, you might want to look over the addendum to
this chapter, which fleshes out some of the determinants that I only briefly
covered in this chapter. On the other hand, if you’re feeling bogged down, you
can skip it. That’s why I made it an addendum.
11 want to clarify the difference between a determinant and a cycle because sometimes I will use these terms
in ways that might not be clear. A determinant is a factor (e.g., the supply of money) while a cycle is a series of
self-reinforcing determinants that lead to events transpiring in a certain way—e.g., central banks making lots
of money and credit available eventually leads to strong economic growth, inflation, and bubbles, which then
prompt central banks to reduce the money supply, which produces market and economic downturns, which
then lead the central banks to increase the supply of money to... etc. So, cycles themselves are determinants
that are a collection of complementary forces that interact in a process to produce the same results again and
again through time.
CHAPTER 2
DETERMINANTS ADDENDUM
In Chapter 2 I introduced some concepts that I thought might be worth
explaining in greater depth but didn’t want to include in the body of the chapter
because these explorations could be too much, so I decided to include them here
as an addendum in case you are interested in exploring them further. To help you
make the connection I refer to each determinant or dynamic by title and number
from Chapter 2.
5. Self-Interest. While self-interest is the primary motivator for most
people, organizations, and governments, the question of which “selF’ is
most important—is it the individual, the family, the tribe (i.e.,
community), the state, the country, the empire, humankind, all living
things, the universe? The following diagram shows the possible units. The ones
on the top are more encompassing and the ones on the bottom are the less
consolidated. What are most people in your society, and what are you,
willing to die for?
THE UNIVERSE
♦
ALL LIVING THINGS
HUMANKIND
$
EMPIRE
COUNTRY
STATE
:
TRIBE
(i.e., community)
t
FAMILY
INDIVIDUAL
The “selF’ that people are most attached to is the one they will do the
most to protect and this will drive their behaviors. For example, when
people are willing to die for their country, their country will be more likely to be
protected than if the individual self is more important, in which case individuals
will run from deadly combat. Within countries one might see tribes be much
more important than countries, which would lead to an entirely different
dynamic than if the opposite were true. That is why I find this dynamic worth
keeping an eye on, especially in conflicts.
In looking at history across countries I saw changes in the primary unit
that most people and societies optimized for. For example, before around
1650-- tribes and states were more important than countries. History shows that
the groupings that people collect in and that are the most important to them
evolve. Gatherings of individuals and families make up a tribe (i.e., a community);
gatherings of tribes (or communities) make up a state (e.g., the state of Georgia);
gatherings of states make up a country (e.g., the United States); gatherings of states
or countries that are under unified control make up an empire (e.g., the British
Empire). Sometimes smaller groupings coalesce into bigger ones, changing
boundaries in the process. For example, over the last 150 years in Europe, states
coalesced into nations, many of which have coalesced into the European Union.
And sometimes they break up into smaller units. For example, the Soviet Union
broke up into its constituent countries, and some Middle Eastern countries have
broken up into warring tribes.
Over the last few years, the world has been moving from being more globalist
to being more nationalist. At the same time, the United States appears to be losing
its cohesion as people’s views about how they should be with each other are
becoming more divergent. These divergences are leading people to migrate to the
states that align with their preferences, causing those states to be more relevant
individually than as parts of a unified whole. History and logic show us that these
changes in domestic and international orders are typically accompanied by
conflicts because there is a lot of disagreement about how they should work—e.g.,
what states’ rights are relative to national rights. Because most people haven’t seen
such changes before, they fail to recognize them for what they are. They are
important to stay on top of because they show the changing locus of control,
which typically signals a change in one’s rights and obligations.
Think about it. What are you seeing happen? Are you seeing coalescing
or dissolving? From what level to what other level? What implications do
these changes have for you and where you want to be?
6. The Drive to Gain and Keep Wealth and Power. For the purposes of
discussing the big cycles in later chapters, it’s worth defining wealth a bit more
specifically and looking at its impact on countries that have it or lack it. I believe
the following to be by and large true:
Wealth = Buying Power. Without getting too nuanced, let’s call wealth
buying power to distinguish it from money and credit. That distinction is
important because the value of money and credit changes. For example, when a
lot of money and credit are created, they go down in value, so having more money
won’t necessarily give one more wealth or buying power.
Real Wealth Ф Financial Wealth. Real wealth is what people buy because
they want to have and use it, such as a house, car, streaming video service, etc. Real
wealth has intrinsic value. Financial wealth consists of financial assets that are held
to a) receive an ongoing income in the future and/or b) be sold in the future to get
money to buy the real assets people will want. Financial wealth has no intrinsic
value.
Making Wealth = Being Productive. Over the long run the wealth and
buying power you have will be a function of how much you produce. That is
because real wealth doesn’t last long and neither do inheritances. That is why
being continuously productive is so important. If you look at societies that
expropriated the wealth of the rich and tried to live off it and weren’t productive
(e.g., Russia after the revolutions of 1917), you will see that it didn’t take them
long to become poor. The less productive a society, the less wealthy and hence the
less powerful. By the way, spending money on investment and infrastructure
rather than on consumption tends to lead to greater productivity, so investment is
a good leading indicator of prosperity.
Wealth = Power. That is because if one has enough wealth one can buy most
anything—physical property, the work and loyalty of others, education,
healthcare, influential powers of all sorts (political, military, etc.), and so on.
Through time and across countries, history has shown that there is a symbiotic
relationship between those who have wealth and those who have political power,
and that the type of deal they have between them determines the ruling order.
That ruling order continues until the rulers are overthrown by others who grab
the wealth and power for themselves.
Wealth and power are mutually supportive. For example, in 1717 the British
East India Company effectively brought together financial capital, people with
commercial capabilities, and people with military capabilities to force India’s
Mughal emperor to trade with them, which was the first step toward the British
colonization of India, the fall of the Mughal Empire in the 18 th century, and then
its complete failure in the 19th century, when the British exiled the emperor and
executed his children after the 1857 Indian Rebellion. The British did these things
because they had the wealth and power to do them in pursuit of more wealth and
power.
Wealth Decline = Power Decline. There isn’t an individual, organization,
country, or empire that hasn’t failed when it lost its buying power. • To be
successful one must earn an amount that is at least equal to the amount one spends. Those
who spend modestly and have a surplus are more sustainably successful than those
who earn a lot more and have deficits. History shows that when an individual,
organization, country, or empire spends more than what they earn, misery and
turbulence are ahead. History also shows that countries that have higher
percentages of people who are self-sufficient tend to be more socially, politically,
and economically stable.
9. The Big Multigenerational Psychological Cycle. The rises and declines of
countries correspond to these psychological and economic cycles in the following
ways and stages. Because these stages are so useful in understanding the behavior
of a country’s people and leaders, I am always trying to assess what stages different
countries are in.
Stage 1: People and Their Countries Are Poor and They Think of
Themselves as Poor. In this stage, most people have very low incomes and
subsistence lifestyles. As a result they don’t waste money because they value it a
lot, and they don’t have much debt because nobody wants to lend to them. Some
people have potential and some do not, but in most cases their poverty and lack of
resources prevent them from gaining the education and other capabilities that
would allow them to pull themselves up. One’s inherited circumstances and
approach to life are the biggest determinants of who emerges richer from this stage
and who does not.
How fast countries evolve through this stage depends on their cultures and
their abilities. I call countries in this stage “early-stage emerging countries.”
Those that advance typically work hard and gradually accumulate more money
than they need to survive, which they save because they worry about not having
enough in the future. The evolution through this stage to the next typically takes
about a generation. Starting about 40 years ago until about 10 to 15 years ago the
“Asian Tigers” of Hong Kong, Singapore, Taiwan, and South Korea and then
China were examples of economies in this stage.
Stage 2: People and Their Countries Are Rich but Still Think of
Themselves as Poor. Because people who grew up with financial insecurity
typically don’t lose their financial cautiousness, people in this stage still work hard,
sell a lot to foreigners, have pegged exchange rates, save a lot, and invest efficiently
in real assets like real estate, gold, and local bank deposits, and in bonds of the
reserve currency countries. Because they have a lot more money, they can and do
invest in the things that make them more productive—e.g., human capital
development, infrastructure, research and development, etc. This generation of
parents wants to educate their children well and get them to work hard to be
successful. They also improve their resource-allocation systems, including their
capital markets and their legal systems. This is the most productive phase of the
cycle.
Countries in this stage experience rapidly rising income growth and rapidly
rising productivity growth at the same time. The productivity growth means two
things: 1) inflation is not a problem and 2) the country can become more
competitive. During this stage, debts typically do not rise significantly relative to
incomes and sometimes they decline. This is a very healthy period and a terrific
time to invest in a country if it has adequate property rights protections.
You can tell countries in this stage from those in the first stage because they
have gleaming new cities next to old ones, high savings rates, rapidly rising
incomes, and, typically, rising foreign exchange reserves. I call countries in this
stage “late-stage emerging countries.” While countries of all sizes can go
through this stage, when big countries go through it, they are typically emerging
into great world powers.
Stage 3: People and Their Countries Are Rich and Think of Themselves
as Rich. At this stage, people’s incomes are high, so labor becomes more
expensive. But their prior investments in infrastructure, capital goods, and
research and development are still paying off by producing productivity gains that
sustain their high living standards. Priorities shift from an emphasis on working
and saving in order to protect oneself from bad times, to savoring the finer things
in life. People become more comfortable spending more. Arts and sciences
typically flourish. This change in the prevailing psychology is reinforced as a new
generation of people who did not experience the bad times become an
increasingly large percentage of the population. Signs of this change in mindset are
reflected in statistics that show reduced work hours (e.g., typically there is a
reduction in the workweek from six days to five) and big increases in expenditures
on leisure and luxury goods relative to necessities. At their best, these periods are
early- and mid-stage “Renaissance periods.”
Large countries in this stage almost always become world economic and
military powers.- Typically, they develop their militaries in order to project and
protect their global interests. Prior to the mid-20th century, large countries at this
stage literally controlled foreign governments and created empires from them to
provide the cheap labor and cheap natural resources they needed to remain
competitive. Starting in the early to mid-20th century, when the US Empire began
ruling by “speaking softly and carrying a big stick,” American “influence” and
international agreements have allowed developed countries to have access to
emerging countries’ cheap labor and investment opportunities without directly
controlling their governments. In this stage countries are on top of the world and
are enjoying it. I call countries in this stage “peak health countries.” The
United States was in this stage from 1950 to 1965. China is now moving
into it. The key is to maintain the determinants leading to strength for as long as
possible.
Stage 4: People and Their Countries Are Poorer and Still Think of
Themselves as Rich. In this stage, debts rise relative to income. The
psychological shift behind this leveraging up occurs because the people who lived
through the first two stages have died off or become irrelevant and those whose
behavior matters most are used to living well and not worrying about the pain of
not having enough money. Because the workers in these countries earn and spend
a lot, they become expensive, and because they are expensive, they experience
slower real income growth rates. Since they are reluctant to constrain their
spending in line with their reduced income growth rates, they lower their savings
rates, increase their debts, and cut corners. Because their spending continues to be
strong, they continue to appear rich, even though their balance sheets are
deteriorating. The reduced level of efficient investments in infrastructure, capital
goods, and research and development slows their productivity gains. Their cities
and infrastructure become older and less efficient than in the two previous stages.
They increasingly rely on their reputation rather than on their competitiveness to
fund their deficits. Countries typically spend a lot of money on the military at this
stage to protect their global interests, sometimes in very large amounts because of
wars. Often, though not always, countries run “twin deficits”—i.e., both balance
of payments and government deficits. In the last few years of this stage, bubbles
frequently occur.
Whether because of wars- or bursting financial bubbles or both, what typifies
this stage is an accumulation of debt that can’t be paid back in non-depreciated
money. I call countries in this stage “early declining countries.” While
countries of all sizes can go through this stage, when big countries go through it,
they are typically approaching their decline as great empires.
Stage 5: People and Their Countries Are Poor and They Think of
Themselves as Poor. This is when the gaps described in Stage 4 cease to exist and
the reality of the country’s situation is hitting home. After bubbles burst and
deleveragings occur, private debts grow, while private sector spending, asset
values, and net worths decline in a self-reinforcing negative cycle. To compensate,
government debt and government deficits grow, and central bank “printing” of
money typically increases. Central banks and governments cut real interest rates
and increase nominal GDP growth so that it is comfortably above nominal
interest rates in order to ease debt burdens. As a result of these low real interest
rates, weak currencies, and poor economic conditions, their debt and equity assets
perform poorly. Increasingly, these countries have to compete with less expensive
countries that are in earlier stages of development. Their currencies depreciate and
they like it because it makes the deleveraging less painful. As an extension of these
economic and financial trends, countries in this stage see their power in the world
decline further. I call countries in this stage “clearly declined countries.” It
typically takes a long time—if it ever happens—for clearly declined empires’
psychologies and attributes to go through the full cycle that brings them to their
old peaks again. The Romans and the Greeks never have, though the Chinese have
a few times.
11. Humanity’s Inventiveness. • Humanity's capacity to invent solutions to its
problems and to identify how to make things better has proven to be far more powerful than
all of its problems combined. Because knowledge is gained more than it is lost, it
advances more in spurts and sputters than in cycles that have downs as well as ups.
The spurts come when societies are in the upward swings of the Big Cycle and the
sputters come when they are in the downward swings. The Renaissance periods of
great creativity that produce advances in just about all areas—the sciences, the
arts, philosophies about how people should be with each other and govern, etc.—
come more during the peaceful and prosperous parts of the Big Cycle, when the
systems for creating innovations are good rather than bad.
While specific inventions and the ways they come about have evolved through
time, they have unwaveringly evolved toward doing and making things better,
replacing manual labor with machines and automation, and making people
around the world more interconnected. There are always new inventions and
improvements. The most important and undeniable trend of technological
advancement has been toward higher living standards. That trend is likely to
accelerate in unimaginable ways. Beyond that, computerization is changing the
character of decision making, making it faster and less emotional. As helpful as
that is, it also poses certain dangers.
• The degree of inventiveness and innovation in a society is the main driver of its
productivity. An innovative and commercial spirit is the lifeblood of a thriving
economy. Without innovation, productivity growth would grind to a halt.
Innovations that allow a country’s workers to produce more relative to the rest of
the world feed into their cost competitiveness, making them more attractive places
to do business.
The drive to tinker and invent, to discover, to improve from prior failures—
this is how people learn and find new and better ways of creating things of value.
In a market-based system, the most powerful way to drive innovation is to bring
new ideas to market and to commercialize and profit from them. The marketplace
is incredibly efficient at weeding out bad ideas and pricing good ones. In this way
the concepts of innovation and commercialism go hand in hand. They capture
whether people in a society value new knowledge and the creation of new things,
and whether incentives are aligned to encourage them to seek a profit by
commercializing them.
In other words:
• Innovation + Commercial Spirit + Thriving Capital Markets
Great Productivity Gains
Increases in Wealth and Power
Because there are big differences in the strengths of these determinants, I try to
measure them and take them into consideration in my model.
17. Class Struggles. For as long as there has been recorded history, in
almost all societies a very small percentage of the population (the “ruling
classes” or “the elites”) have controlled most of the wealth and power
(though those percentages have varied).- Naturally those who benefit from
and control the system by and large like the system and seek to maintain it.
Because those with wealth can influence those with power and because those with
power can influence those with wealth, these ruling classes or elites have alliances
among themselves and want to maintain the existing order with everyone
following its dictums and laws, even as the system increases the gaps between
those with power and wealth and those without them. As a result, all internal
orders are run by certain classes of people who have wealth and power and who
operate in symbiotic relationships with each other to maintain the order. Though
aligned not to disrupt the order that benefits them, throughout time these elites
have struggled with each other over wealth and power and have also struggled
with non-elites who want wealth and power. When times are good and most
people prosper, the struggles are smaller; when times are bad, the struggles are
worse. And when things are very bad for a large percentage of the people—e.g.,
there is an unresolvable debt crisis, a very bad economy, a very bad act of nature—
the resulting suffering, stress, and struggles typically lead to revolutions and/or
civil wars.
As Aristotle said a long time ago: “The poor and the rich quarrel with
one another, and whichever side gets the better, instead of establishing a
just or popular government, regards political supremacy as the prize of
victory.”
Classically, the Big Cycle transpires with periods of peace and
productivity that increase wealth in a disproportionate way, which leads
to a very small percentage of the population gaining and controlling
exceptionally large percentages of the wealth and power, then becoming
overextended, which leads to encountering bad times that hurt those who
are the least wealthy and powerful the hardest, which then leads to
conflicts that produce revolutions and/or civil wars, which then lead to
the creation of a new order and the cycle beginning again.
• Throughout time and in all countries the people who have the wealth are the people who
own the means of wealth production and, in order to maintain it, they work with the people
who have the power to set and enforce the rules. While that has always been the case,
the exact form of it has evolved and will continue to evolve.
For example, as explained in Chapter 1, for most of the 13th through 19th
centuries, the prominent internal order all around the world consisted of the
ruling classes or elites being 1) the monarchy, which ruled in conjunction with 2)
the nobility, which controlled the means of production (at the time that capital
was agricultural land), and/or 3) the military. Workers were viewed as part of the
means of production and had essentially no say in how the order was run.
Even societies that had little or no contact with each other developed in similar
ways because they had similar situations to deal with and because the nature of
their decision making was similar.- Across countries there always were, and still
are, different levels of governance at the country level, the state/province level, the
municipality level, etc., and there are timeless and universal ways that they operate
and interact with each other that have been pretty consistent across the world.
The monarchs needed people to manage the day-to-day operations for them. The
top people were ministers, who oversaw the bureaucracies of people who did the
various jobs that needed to be done for government to work. What exists today is
simply the result of the natural evolutions of these timeless and universal ways of
interacting, with different countries’ own cultural flavors thrown in. For example,
the roles of the ministers who helped the monarchs evolved into the roles of prime
ministers and other ministers that now exist in almost all countries (though in the
United States they are called “secretaries”).
Over time, these systems have evolved in varied but logical ways as a result of
struggles for wealth and power. For example, in England around 1200 there was a
wealth and power struggle that evolved gradually at first and then abruptly into a
civil war, which is how these shifts tend to evolve, between the nobility and the
monarchy. Eike most of these struggles, the fight was over money and the power
to determine who got how much money. The monarchy under King John wanted
to get more tax money and the nobles wanted to give less tax money. They
disagreed over how much say the nobles should have on the matter, so they had a
civil war. The nobles won and gained more power to set the rules, which led to
what they first called a “council,” which soon became the first Parliament, which
evolved into what exists in England today. The peace treaty that formalized this
deal into law in 1215 is called the Magna Carta. Like most laws, this one didn’t
matter much relative to power so another civil war broke out in which the nobles
and the monarchy again fought over wealth and power. In 1225 they wrote up a
new Magna Carta under Henry III (King John’s son), which those with power got
to interpret and enforce. A few decades later, the fighting picked up again. In that
war, the nobles cut off tax payments to the monarchy, which forced Henry III to
give in to the nobles’ demands. These struggles went on constantly, leading the
orders to evolve.
Fast forward to the 15th, 16th, and 17th centuries and one can see that there
were big changes in the sources of wealth, at first because of global exploration
and colonialism (starting with the Portuguese and the Spanish) and later because
of the invention of capitalism (stocks and bonds) and labor-saving machines that
fueled the Industrial Revolutions (particularly helping the Dutch and then the
British), which made those who profited from these sources of wealth more
powerful—i.e., the shifts in wealth and power over these centuries were from a)
landowning nobles (who then had the wealth) and monarchies (who then had the
political power) to b) capitalists (who in the later period had the wealth) and
elected representatives or autocratic government leaders (who in the later period
had the political power). Almost all countries made these shifts—some peacefully
but most painfully.
For example, in France for most of the 17th and 18th centuries, the king ruled
in a balance of power arrangement with three other classes: 1) the clergy, 2) the
nobility, and 3) the commoners. There were representatives of these groups who
voted. The first two classes, who accounted for only 2 percent of the population,
had more votes than—or eventually the same number of votes as—the
commoners, who made up 98 percent of the population. They called this internal
order based on three classes the ancien regime (which means “old order”). Then
practically overnight it changed in a revolutionary way via the French Revolution,
which began on May 5, 1789, when the third class—the commoners—had
enough of that system, overthrew the others, and took the power for itself. In
most countries around the world at the time, the same basic ruling order prevailed
—i.e., the monarchy and nobles, who accounted for a very small percentage of the
population and had most of the wealth, ruled until all of a sudden there was a civil
war/revolution that led the old order to be replaced with a very different new
ruling order.
Though the internal orders for managing these class struggles were and are
different in different countries, they evolved similarly across countries. For
example, they evolved both gradually (through reforms) and abruptly (through
civil wars/revolutions) and they evolved into those orders that now exist in all
countries. I expect they will continue to evolve gradually and abruptly to produce
new domestic orders. While the classes who have the wealth and political power
change, the processes that produce these changes have remained pretty much the
same through time right up to today. These changes have occurred through
struggles that have led to both a) peaceful reforms through negotiations and b)
violent reforms via civil wars and revolutions. The peaceful reforms tend to come
earlier in the cycle and the violent civil wars and revolutionary reforms tend to
come later in the cycle for logical reasons that we will delve into later.
I cannot overstate the importance of class struggles relative to individual
struggles. We, especially those of us in the United States, which is thought of as a
“melting pot,” tend to focus more on individual struggles and not give adequate
attention to class struggles. I didn’t fully realize the importance of class struggles
until I did my extensive study of history, which led me to this principle:
• In all countries throughout time (though in varying degrees) people find themselves
within "classes" either because they choose to be with people like them or because others
stereotype them as part of certain groups. Power is usually shared among three or four
classes. Who and what people feel most connected with, are around most, and are
most like will determine which class or classes they are in; how people are classed
determines who their friends or allies are and who their enemies are. While rich
and poor and right (i.e., capitalist) and left (i.e., socialist) are the most common
big class distinctions, there are many other important distinctions, such as race,
ethnicity, religion, gender, lifestyle (e.g., liberal or conservative), and location (e.g.,
urban versus suburban versus rural). Generally speaking, people tend to cluster in
these classes, and when times are good early in the cycle there is more harmony
among these classes and when things are bad there is more fighting among them.
While I love that the United States is the country where these class distinctions
matter least, people’s classes still matter in the US and they matter a lot more
during stressful times when class conflicts intensify.
To help you get the picture in a more intimate way, let’s do a simple
exercise. Assume that most people who don’t know you well look at you as
being in a member of one or several classes, because that’s a good
assumption. Now, to imagine how you are perceived, look at the following
list and ask yourself which classes you fall into. After you answer that, ask
yourself which classes you feel an affinity for and expect to be your allies.
Which classes do you not like or view as your enemies? Which ones are the
ruling classes, and which ones are the revolutionary classes who want to
topple them? Which ones are on the ascent, and which ones are on the
decline? You might consider writing these down and thinking about them
because during periods of greater conflict the classes you are in or are assumed to
be in will become more important in determining who you will be with and
against, what you will do, and where you will end up.
1. Rich or poor?
2. Right, left, or moderate?
3. Race?
4. Ethnicity?
5. Religion?
6. Gender?
7. Lifestyle (e.g., liberal or conservative)?
8. Location (e.g., urban, suburban, or rural)?
Still today only a small percentage of the population, which comes from only a
few of these classes, has most of the wealth and power and rules as “the elites.” To
me it is clear that the capitalist class now has the most financial power in most
countries and political power in democracies lies in the hands of all the people
who choose to vote, while in autocracies it lies in the hands of the limited number
of people selected by whatever process they have to make selections.- So, for the
most part today, those are the “ruling classes” and “the elites” who oversee the
current domestic orders, though they are now under attack, so this is probably
shifting. For example, there is now a big movement in the United States to be
much more inclusive of members of different classes in both the capitalist money-
making world and in the political world. These shifts can be good or bad
depending on whether they are handled peacefully or violently and smartly or
stupidly. One timeless and universal truth that I saw go back as far as I
studied history, since before Confucius who lived around 500 BCE, is that
• those societies that draw on the widest range of people and give them responsibilities based
on their merits rather than privileges are the most sustainably successful because 1) they find
the best talent to do their jobs well, 2) they have diversity of perspectives, and 3) they are
perceived as the fairest, which fosters social stability.
I presume that the current internal orders of countries, like those of the past,
will continue evolving to become something different through the struggles of
different classes with each other over how to divide wealth and political power.
Because this wealth and power dynamic is very important, it is worth watching
closely to discern which classes are gaining and which ones are losing wealth and
power (e.g., Al and information technology developers are now evolving to gain it
at the expense of those who are being replaced by such technologies) and also to
discern the reactions to these shifts that lead the cycles to change.
So, as I see it, everything is changing in classic ways driven by a tried-and-true
perpetual-motion machine. This machine has produced, and is producing,
different systems, such as communism, fascism, autocracies, democracies, and
evolutionary descendants and hybrids of these, such as “state capitalism” in
China. It will produce new forms of internal orders to divide wealth and allocate
political power that will affect our lives greatly, all based on how people choose to
be with each other and how human nature enters into how they make their
choices.
18. The Political Left/Right Cycle. Capitalists (i.e., those of the right) and
socialists (i.e., those of the left) don’t just have different self-interests—they have
different deep-seated ideological beliefs that they are willing to fight for. The
typical perspective of the rightist/capitalist is that self-sufficiency, hard work,
productivity, limited government interference, allowing people to keep what they
make, and individual choice are morally good and good for society. They also
believe that the private sector works better than the public sector, that capitalism
works best for most people, and that self-made billionaires are the biggest
contributors to society. Capitalists are typically driven crazy by financial supports
for people who lack productivity and profitability. To them, making money =
being productive = getting what one deserves. They don’t pay much attention to
whether the economic machine is producing opportunity and prosperity for most
people. They can also overlook the fact that their form of profit making is
suboptimal when it comes to achieving the goals of most people. For example, in a
purely capitalist system, the provision of excellent public education—which is
clearly a leading cause of higher productivity and greater wealth across a society—
is not a high priority.
The typical perspective of the leftist/socialist is that helping each other, having
the government support people, and sharing wealth and opportunity are morally
good and good for society. They believe that the private sector is by and large run
by capitalists who are greedy, while common workers, such as teachers,
firefighters, and laborers, contribute more to society. Socialists and communists
tend to focus on dividing the pie well and typically aren’t very good at increasing
its size. They favor more government intervention, believing those in government
will be fairer than capitalists, who are simply trying to exploit people to make
more money.
I’ve had exposure to all kinds of economic systems all over the world and have
seen why * the ability to make money, save it, and put it into capital (i.e., capitalism) is an
effective motivator of people and allocator of resources that raises people's living standards.
But capitalism is also a source of wealth and opportunity gaps that are unfair, can be
counterproductive, are highly cyclical, and can be destabilizing. In my opinion, the greatest
challenge for policy makers is to engineer a capitalist economic system that raises
productivity and living standards without worsening inequities and instabilities.
21. The Big Balance of Power Cycle That Drives the Big Peace/War Cycle
Both Within Countries and Between Countries. In studying a lot of history
and experiencing a tiny sliver of it myself I have seen how the balance of power
dynamic drives virtually all struggles for power—e.g., office politics within
organizations, local and national politics in shaping the domestic order, and
international politics in shaping the world order. It applies equally well to
determining the formations and changes in world orders as in domestic orders.
The dynamic transpires in a series of steps explained here, though how exactly it
unfolds depends on the order and people at the time these stages unfold:
Step 1: The formation of alliances. When there isn’t roughly equal power
(e.g., if in the US the Democrats have much more power than the Republicans or
vice versa), the more powerful party will take advantage of and control the less
powerful party. To neutralize the stronger party, the weaker party naturally finds
other parties to join it in opposing the stronger party so collectively they can have
the same or more power as the opposition. The weaker party does this by giving
the other parties what they want in return for their support. If the formerly
weaker party collectively gains more power than the formerly stronger party from
doing this, the formerly stronger party cuts deals with other parties to ally with
them to eliminate the superiority of the opposition. As a result, allies who have
very different vested interests unite in opposing the common enemy—as the
saying goes, “the enemy of my enemy is my friend.” This dynamic naturally leads
to the different sides having roughly equal amounts of power and splits within
themselves. Sometimes the differences within the parties are so great that some
segments want to destroy the other segments in order to gain control of their
party. This alliance- and enemy-forming dynamic happens at all different levels of
relationships, from the most important international alliances that define the
most important elements of the world order down to the most important alliances
within countries that define the internal orders, down to those within states,
within cities, within organizations, and among individuals. The most important
evolutionary shift to affect these has been the shrinking of the world to make allies
and enemies more global. In the old days they were less global (e.g., European
countries formed alliances to fight other European countries, Asian countries did
the same in Asia, etc.), but as the world has shrunk because of improved
transportation and communications it has become more interconnected and
bigger and more global alliances have developed. That is why there were two big
sides in World Wars I and II and likely will be going forward.
Step 2: War to determine the winners and losers. Big fights typically
happen when both sides have roughly equal powers and existential differences
exist between them. Big fights typically don’t occur when there are big
asymmetries in power because it would be stupid for obviously weaker entities to
fight obviously stronger ones, and if they did fight, the fights would be small in
scale. However, sometimes when there are roughly equal levels of power on both
sides, stalemates and gridlocks rather than big fights can occur when the existential
threat of harming oneself in the process of trying to beat the other side is greater
than the gains that would come from having a fight to the death. For example,
when there is mutually assured destruction—e.g., as the US and the Soviet Union
faced—there is more likely to be a stand-off than a fight.
While these big fights are typically violent, they can be nonviolent if the
entities have nonviolent rules of engagement that they adhere to that allow the
resolution of disputes, most importantly the existential ones. For example, in the
2020 US election, the two political parties had roughly equal amounts of power
and irreconcilable differences so that they had a big fight for political control.
That led to the storming of the US Capitol on January 6, 2021, but eventually the
peaceful transfer of political power as set out in the Constitution prevailed.
History has shown that, when there are not clear rules and/or when the parties
don’t abide by them, the fighting will be far more brutal, often to the death.
Step 3: Fighting among the winners. History shows us that after the fight
for power in which the common enemy is defeated, those who united against the
common enemy typically fight among themselves for power and those in the
losing party do the same as they plan their next attack. I call this the “purge” state
of the balance of power dynamic. It has happened in all cases, with the Reign of
Terror in France and the Red Terror in the Soviet Union being the most well-
known. This same sort of fighting has happened between countries, as with the
US and the Soviet Union, who were allies in World War II. Similarly, the united
front of Chinese communists and nationalists that fought the Japanese in the war
immediately battled each other for power when the war was over. Understanding
this typical dynamic, one should look out for internal fighting among the winners
right after the big war is over. We should always watch whether the factions
within the same parties are inclined to fight each other for control of their parties.
When new regimes (i.e., the winning parties) come to power watch what they do
with the enemies they defeated. What happens next depends on the system and
the leaders in the system. In the US and generally in democracies, the rules allow
the losers to remain unharmed and unconstrained, which allows them to try to
regain power and fight again. In harsh autocracies, the losers are eliminated one
way or another.
Step 4: Peace and prosperity occur but eventually lead to excesses
reflected in large wealth and opportunity gaps and overindebtedness.
History shows us that because of this dynamic the best of times—i.e., when there
is peace and prosperity—typically happens after a war, when the leadership and
power structure are clearly established so there isn’t big fighting for power within
the country or with other countries—because there is an obviously more powerful
entity that enables the less powerful entities to have a good life.
Step 5: Increasing conflict leads to revolutionary changes in domestic
and world orders. For as long as there is peace and prosperity for the majority of
the people, which will only be the case if the system is fair and the majority of the
people remain self-disciplined and productive, peace and prosperity are likely to
continue. However, as previously discussed, periods of peace and prosperity also
tend to encourage big wealth gaps and debt bubbles that lead to conflicts when
prosperity fades and there are other things to fight over.
This cycle tracks the internal and external order and disorder cycles that we will
explore in Chapters 5 and 6.
1 The Peace of Westphalia in 1648 created countries—i.e., sovereign states—as we now know them.
-Japan from 1971 to 1990 is an exception with regards to the military.
_ Germany in World War I and the UK in World War II are classic examples.
-. For example, in the last century, the wealth share of the top 1 percent in the US ranged from close to 50
percent in the 1920s to a bit over 20 percent in the late 1970s; in the UK, it ranged from over 70 percent in
1900 to around 15 percent in the 1980s and is currently around 35 percent (figures from World Inequality
Database). These shifts in inequality can be seen at least as far back as the Roman Republic, as Walter
Scheidel describes in The Great Leveler.
-. For example, for much of history Europe, China, and most countries had monarchs and nobles as the ruling
classes, yet they were a bit different. In Europe, the church was also part of the ruling mix. In Japan, the
monarchy (the emperor and his ministers), the military, and the business community (the merchants and
artisans) were the ruling elites.
That doesn’t mean that those who run autocracies don’t ultimately report to the people because the people
could overthrow the government.
CHAPTER 3
THE BIG CYCLE OF MONEY, CREDIT,
DEBT, AND ECONOMIC ACTIVITY
What most people and their countries want most is wealth and power,
and money and credit are the biggest influences on how wealth and power
rise and decline. If you don’t understand how money and credit work, you
can’t understand how the system works, and if you don’t understand how
the system works, you can’t understand what’s coming at you.
For example, if you don’t understand how the Roaring ’20s led to a debt
bubble and a big wealth gap, how the bursting of that debt bubble led to the
1930-33 Great Depression, and how the depression led to conflicts over wealth
all over the world, you won’t understand why Franklin D. Roosevelt was elected
president in 1932. You also won’t understand why, soon after his inauguration, he
announced a new plan in which the central government and the Federal Reserve
would together provide a lot of money and credit, a change that was similar to
what was happening in other countries at the time and that is similar to what is
happening today in response to the pandemic-caused crisis. Unless you
understand how money and credit work, you can’t understand why the world
changed as it did in 1933 or what happened next (World War II), how the war was
won and lost, and why the new world order was created as it was in 1945. But
when you can recognize the underlying mechanics that drove all of those things in
the past, you can also understand what is happening now and have a much better
sense about what is likely to happen in the future.
In speaking with several of the world’s most renowned historians and political
practitioners, including current and former heads of state, foreign ministers,
finance ministers, and central bankers, we recognized that we each held different
pieces of the puzzle to explain how the world works. I had been lacking an
adequate practical understanding of the workings of politics and geopolitics, and
they lacked an adequate practical understanding of the way that money and credit
work. Several told me that understanding money and credit in this way has been
the biggest missing piece in their quest to understand the lessons of history, and I
explained to them that their perspectives helped me understand the political
dynamics that affect policy choices. This chapter is focused on the money, credit,
and economic piece.
Let’s start with money and credit.
THE TIMELESS AND UNIVERSAL FUNDAMENTALS OF
MONEY AND CREDIT
• All entities—people, companies, nonprofit organizations, and governments—deal with the
same basic financial realities, and always have. They have money that comes in (i.e.,
revenue) and money that goes out (i.e., expenses) that, when netted, make
up their net income. These flows are measured in numbers that appear in
income statements. If an entity brings in more than it spends, it has a
profit that causes its savings to go up. If it spends more than it earns, its
savings go down, or it makes up the difference by borrowing or taking
money from someone else. If an entity has many more assets than liabilities
(i.e., a large net worth), it can spend above its income by selling assets until
the money runs out, at which point it has to slash its expenses. If it doesn’t
have much more in assets than it has in liabilities and its income falls
beneath the amount it needs to pay out to cover the total of its operating
expenses and its debt-service expenses, it will have to cut its expenses or
will default or restructure its debts.
All of an entity’s assets and liabilities (i.e., debts) can be shown in its balance
sheet. Whether it writes those numbers down or not, every country, company,
nonprofit organization, and individual has them. When economists, for example,
combine each entity’s income, expenses, and savings, they get all entities’ incomes,
expenses, and savings. • The way entities collectively handle their finances as reflected in
their income statements and balance sheets is the biggest driver of changes in internal and
world orders. If you can take your understanding of your own income,
expenses, and savings, imagine how that applies to others, and put them
together, you will see how the whole thing works.
Take a moment to think about your own financial situation. How much
income do you have now relative to your expenses and how much will you have in
the future? How much savings do you have and what are those savings invested
in? Now play things out. If your income fell or disappeared, how long would your
savings last? How much risk do you have in the value of your investments and
savings? If that value fell by half, how would you be financially? Can you easily
sell your assets to get cash to pay your expenses or service your debts? What are
your other sources of money, from the government or from elsewhere? These are
the most important calculations you can make to ensure your economic well-
being. Now look at others—other people, businesses, nonprofit organizations,
and governments—realizing that the same is true for them. See how we are
interconnected and what changes in conditions might mean for you and others
who might affect you. Since the economy is the sum of these entities operating in
this way, it will help you understand what is happening and what is likely to
happen.
For example, since one entity’s spending is another’s income, when one
entity cuts its expenses, that will hurt not just that entity, but it will also
hurt others who depend on that spending to earn income. Similarly, since
one entity’s debts are another’s assets, an entity that defaults reduces other
entities’ assets, which requires them to cut their spending. This dynamic
produces a self-reinforcing downward debt and economic contraction that
becomes a political issue as people argue over how to divide the shrunken
pie.
As a principle, • debt eats equity. What I mean by that is that debts have to
be paid above all else. For example, if you own a house (i.e., you have
“equity” ownership) and you can’t make the mortgage payments, the
house will be sold or taken away. In other words, the creditor will get paid
ahead of the owner of the house. As a result, when your income is less than
your expenses and your assets are less than your liabilities (i.e., debts), you
are on the way to having to sell your assets.
Unlike what most people intuitively think, there isn’t a fixed amount of
money and credit in existence. Money and credit can easily be created by
central banks. People, companies, nonprofit organizations, and
governments like it when central banks make a lot of money and credit
because it gives them more spending power. When the money and credit
are spent, it makes most goods, services, and investment assets go up in
price. It also creates debt that has to be repaid, which requires people,
companies, nonprofit organizations, and governments to eventually spend
less than they earn, which is difficult and painful. That is why money,
credit, debt, and economic activity are inherently cyclical. In the credit-
creation phase, demand for goods, services, and investment assets and the
production of them are both strong, and in the debt-repayment phase,
both are weak.
But what if the debts never had to be paid back? Then there would be no
debt squeeze and no painful paying back period. But that would be terrible for
those who lent because they’d lose their money, right? Let’s think for a moment
to see if we can find a way of resolving debt issues without harming either
borrowers or lenders.
Since governments have the ability to both make and borrow money, why
couldn’t the central bank lend money at an interest rate of about 0 percent to the
central government to distribute as it likes to support the economy? Couldn’t it
also lend to others at low rates and allow those debtors to never pay it back?
Normally debtors have to pay back the original amount borrowed (principal) plus
interest in installments over a period of time. But the central bank has the power
to set the interest rate at 0 percent and keep rolling over the debt so that the
debtor never has to pay it back. That would be the equivalent of giving the
debtors the money, but it wouldn’t look that way because the debt would still be
accounted for as an asset that the central bank owns, so the central bank could still
say it is performing its normal lending functions. This is the exact thing that
happened in the wake of the economic crisis caused by the C OVID-19
pandemic. Many versions of this have happened many times in history.
Who pays? It is bad for those outside the central bank who still hold the
debts as assets—cash and bonds—who won’t get returns that would
preserve their purchasing power.
The biggest problem that we now collectively face is that for many
people, companies, nonprofit organizations, and governments, their
incomes are low in relation to their expenses, and their debts and other
liabilities (such as those for pensions, healthcare, and insurance) are very
large relative to the value of their assets. It may not seem that way—in fact, it
often seems the opposite—because there are many people, companies, nonprofit
organizations, and governments that look rich even while they are in the process
of going broke. They look rich because they spend a lot, have plenty of assets, and
even have plenty of cash. However, if you look carefully, you will be able to
identify those that look rich but are in financial trouble because they have
incomes that are below their expenses and/or liabilities that are greater than their
assets, so if you project what will likely happen to their finances in the future, you
will see that they will have to cut their expenses and sell their assets in painful ways
that will leave them broke. We each need to do those projections of what the
future will look like for our own finances, for others who are relevant to us, and
for the world economy. In a nutshell, for some people, companies, nonprofit
organizations, and countries, the liabilities are enormous relative to the net
incomes and the asset values that are required to meet those obligations, so
they are financially weak, but they don’t look that way because they spend
a lot financed by borrowing.
If anything I’ve written here is confusing to you, I urge you to take a moment
to try to apply it to your own circumstances. Pencil out what your financial safety
margin looks like (how long will you be financially OK if the worst-case scenario
happens—e.g., you lose your job and your investment assets fall to be only half as
much to account for possible price falls, taxes, and inflation). Then do that
calculation for others, add them up, and then you will have a good picture of the
state of your world. I’ve done that with the help of my partners at Bridgewater
and find it invaluable in imagining what is likely to happen J-
In summary, these basic financial realities work for all people,
companies, nonprofit organizations, and governments in the same way
they work for you and me, with the one big, important exception I
mentioned earlier. All countries can create money and credit out of the air
to give to people to spend or lend out. By producing money and giving it to
debtors in need, central banks can prevent the debt crisis dynamic that I just
explained. For that reason I will modify the prior principle to say: • debt eats equity
but central banks can feed debt by printing money instead. It should be no surprise that
governments print money when debt crises cause politically unacceptable
amounts of equity-eating debt and corresponding economic pain.
However, not all money that governments print is of equal value.
The monies (i.e., currencies) that are widely accepted around the world
are called reserve currencies. At the time of my writing this, the world’s
dominant reserve currency is the US dollar, which is created by the US central
bank, the Federal Reserve. A much less important reserve currency is the euro,
which is produced by the Eurozone countries’ central bank, the European Central
Bank. The Japanese yen, the Chinese renminbi, and the British pound are
relatively small reserve currencies now, though the renminbi is quickly growing in
importance.
• Having a reserve currency is great while it lasts because it gives a country exceptional
borrowing and spending power and significant power over who else in the world gets the
money and credit needed to buy and sell internationally. However, having a reserve
currency typically sows the seeds of a country ceasing to be a reserve currency
country. That is because it allows the country to borrow more than it could
otherwise afford to borrow, and the creation of lots of money and credit to service
the debt debases the value of the currency and causes the loss of its status as a
reserve currency. The loss of its reserve currency status is a terrible thing because •
having a reserve currency is one of the greatest powers a country can have because it gives
the country enormous buying power and geopolitical power.
In contrast, non-reserve currency countries often find themselves in need of
money in a reserve currency (e.g., dollars) when they have a lot of debt
denominated in that currency, which they can’t print, or they don’t have much
savings in that currency and their ability to earn the currency they need falls off.
When countries desperately need reserve currencies to service their reserve
currency-denominated debts, and to buy things from sellers who only
accept reserve currencies, they can go bankrupt. This has happened often in
the past and it is where things now stand for a number of countries. It is also
where things stand for local governments and states and for many of us. This
configuration of circumstances has been handled in the same way, so it’s easy to
see how this machine works—and that is what I will show you in this chapter.
Let’s start with the basics and build from there.
WHAT IS MONEY?
Money is a medium of exchange that can also be used as a storehold of
wealth.
By “medium of exchange,” I mean something that can be given to others to
buy things. Basically, people produce things in order to exchange them with
people who have other things they want. Because carrying around non-money
objects in the hope of exchanging them for what one wants (i.e., bartering) is
inefficient, virtually every society that has ever existed has created a form of money
(i.e., currency), which is something portable that everyone agrees is of value so it
can be exchanged for what they want.
By a “storehold of wealth,” I mean a vehicle for storing buying power between
acquiring it and spending it. While one of the most logical things to store wealth
in is a claim on money that can be used later, people also store their wealth in
assets that they expect will retain their value or appreciate (such as gold, silver,
gems, paintings, real estate, stocks, and bonds). By holding on to something that
appreciates, they figure that they can do a bit better than just holding on to the
currency—and, when needed, can always exchange the thing they’re holding to
get the currency to buy the things they want to buy. This is where credit and debt
come into the picture. It is important to understand the difference between
money and debt. Money is what settles claims—you pay your bills and are done.
Debt is a promise to deliver money.
When lenders lend, for example, they assume the money plus the interest they
receive back will buy more goods and services than if they had simply held on to
the money. When all goes well, the borrowers use the money productively and
earn a profit with it themselves, so they can pay the lenders back and still have
money left over. While the loan is outstanding, it is an asset for the lender (e.g., a
bond) and a liability (i.e., debt) for the borrower. When the money is paid back,
the assets and liabilities disappear, and both the borrower and lender are better off,
having essentially split the profits that came from the productive lending. Such
lending is also good for society, which benefits from the resulting productivity
2
gains.-
It’s important to realize that most money and credit (especially the
government-issued money that now exists) have no intrinsic value. They
are just journal entries in an accounting system that can easily be changed.
The purpose of that system is to help allocate resources efficiently so that
productivity can grow, rewarding both lenders and borrowers, but the
system periodically breaks down. When that happens (as it always has, since
the beginning of time), the currency supply is “monetized”- and currency values
fall or are destroyed, and wealth shifts in a big way, sending shockwaves through
the economy and markets.
What all this means is that the debt and credit machine doesn’t work perfectly.
Supplies, demands, and values of money cycle up and down. The upswings
produce joyful abundance. The downswings produce painful restructurings.
Let’s now get into how these cycles work, building from the fundamentals up
to where we are now.
MONEY, CREDIT, AND WEALTH
While money and credit are associated with wealth, they aren’t the same
thing as wealth. Because money and credit can buy wealth (i.e., goods and
services), the amount of money and credit you have and the amount of
wealth you have look pretty much the same. But you cannot create more
wealth simply by creating more money and credit. To create more wealth,
you have to be more productive. The relationship between the creation of
money and credit and the creation of wealth is often confused, yet it is the
biggest driver of economic cycles. Let’s look at it more closely.
There is typically a mutually reinforcing relationship between the creation of
money and credit and the creation of goods, services, and investment assets that
are produced, which is why they’re often confused as being the same thing.
Think of it this way: there is both a financial economy and a real economy.
Though they are related, they are different. Each has its own supply-and-
demand factors that drive it. In the real economy, supply and demand are
driven by the amount of goods and services produced and the number of buyers
who want them. When the level of goods and services demanded is strong and
rising and there is not enough capacity to produce the things demanded, the real
economy’s capacity to grow is limited. If demand keeps rising faster than the
capacity to produce, prices go up and inflation rises. That’s where the financial
economy comes in. Facing inflation, central banks normally tighten money and
credit to slow demand in the real economy; when there is too little demand, they
do the opposite by providing money and credit to stimulate demand. By raising
and lowering supplies of money and credit, central banks are able to raise
and lower the demand and production of financial assets, goods, and
services. But they’re unable to do this perfectly, so we have the short-term debt
cycle, which we experience as alternating periods of growth and recession.
Then of course there is the value of money and credit to consider, which is
based on its own supply and demand. When a lot of a currency is created relative
to the demand for it, it declines in value. Where the money and credit flow is
important to determining what happens. For example, when they no longer go
into lending that fuels increases in economic demand and instead go into other
currencies and inflation-hedge assets, they fail to stimulate economic activity and
instead cause the value of the currency to decline and the value of inflation-hedge
assets to rise. At such times high inflation can occur because the supply of money
and credit has increased relative to the demand for it, which we call “monetary
inflation.” That can happen at the same time as there is weak demand for goods
and services and the selling of assets so that the real economy is experiencing
deflation. That is how inflationary depressions come about. For these reasons we
have to watch movements in the supplies and demands of both the real
economy and the financial economy to understand what is likely to
happen financially and economically.
For example, how financial assets are produced by the government through
fiscal and monetary policy has a huge effect on who gets the buying power that
goes along with them, which also determines what the buying power is spent on.
Normally money and credit are created by central banks and flow into financial
assets, which the private credit system uses to finance people’s borrowing and
spending. But in moments of crisis, governments can choose where to direct
money, credit, and buying power rather than it being allocated by the
marketplace, and capitalism as we know it is suspended. This is what happened
worldwide in response to the COVID-19 pandemic.
Related to this confusion between the financial economy and the real
economy is the relationship between the prices of things and the value of
things. Because they tend to go together, they can be confused as being the
same thing. They tend to go together because when people have more
money and credit, they are more inclined to spend more and can spend
more. To the extent that spending increases economic production and
raises the prices of goods, services, and financial assets, it can be said to
increase wealth because the people who already own those assets become
“richer” when measured by the way we account for wealth. However, that
increase in wealth is more an illusion than a reality for two reasons: 1) the
increased credit that pushes prices and production up has to be paid back,
which, all things being equal, will have the opposite effect when the bill
comes due and 2) the intrinsic value of a thing doesn’t increase just because
its price goes up.
Think about it this way: if you own a house and the government creates
a lot of money and credit, there might be many eager buyers who would
push the price of your house up. But it’s still the same house; your actual
wealth hasn’t increased, just your calculated wealth. It’s the same with any
other investment asset you own that goes up in price when the government
creates money—stocks, bonds, etc. The amount of calculated wealth goes up but
the amount of actual wealth hasn’t gone up because you own the exact same thing
you did before it was considered to be worth more. In other words, using the
market values of what one owns to measure one’s wealth gives an illusion of
changes in wealth that don’t really exist. As far as understanding how the
economic machine works, the important thing to understand is that money and
credit are stimulative when they’re given out and depressing when they
have to be paid back. That’s what normally makes money, credit, and
economic growth so cyclical.
The central bankers who control money and credit (i.e., central banks)
vary the costs and availability of money and credit to control markets and
the economy. When the economy is growing too quickly and they want to slow it
down, central bankers make less money and credit available, causing both to
become more expensive. This encourages people to lend rather than borrow and
spend. When there is too little growth and central bankers want to stimulate the
economy, they make money and credit cheap and plentiful, which encourages
people to borrow and invest and/or spend. These variations in the cost and
availability of money and credit also cause the prices and quantities of goods,
services, and investment assets to rise and fall. But banks can only control the
economy within their capacities to produce money and credit growth, and their
capacities to do that are limited.
Think of the central bank as having a bottle of stimulant it can inject
into the economy as needed. When the markets and the economy sag, it
delivers shots of the money and credit stimulant to pick them up. When
the markets and economy are too strong, it gives them less or no
stimulant. These moves lead to cyclical rises and declines in the amounts
and prices of money and credit, and of goods, services, and financial assets.
These moves typically come in the form of short-term debt cycles and
long-term debt cycles. The short-term debt cycles of ups and downs
typically last about eight years, give or take a few. The timing is determined
by how long it takes the stimulant to raise demand to the point that it reaches the
limits of the real economy’s capacity to produce. Most people have seen enough
of these short-term debt cycles—popularly known as “the business cycle”—to
know what they are like, to such an extent that they mistakenly think they will go
on working this way forever. I distinguish them from the long-term debt
cycle, which typically plays out over 50 to 75 years (and so contains about
six to 10 short-term debt cycles).- Because the crises that occur as these
long-term debt cycles play out happen only once in a lifetime, most people
don’t expect them. As a result they typically take people by surprise and do a lot
of harm. The long-term debt cycle that is now in the late-cycle phase was
designed in 1944 in Bretton Woods, New Hampshire, and began in 1945,
when World War II ended and the dollar/US-dominated world order
began.
These long-term debt cycles are driven by the amount of stimulant left in the
central bank’s bottle. They start after previously existing excess debts have been
restructured and central banks have a full bottle of stimulant. They end when
debts are high and the bottle of stimulant is nearly empty or, more specifically,
when the central bank loses its ability to produce money and credit
growth that passes through the economic system to produce real economic
growth. Throughout history, central governments and central banks have
created money and credit, which weakened their own currencies and
raised their levels of monetary inflation to offset the deflation that comes
from deflationary credit and economic contractions. This typically
happens when debt levels are high, interest rates can’t be adequately
lowered, and the creation of money and credit increases financial asset
prices more than it increases actual economic activity. At such times those
who are holding the debt (which is someone else’s promise to give them
currency) typically want to exchange the debt they are holding for other
storeholds of wealth. Once it is widely perceived that money and debt
assets are no longer good storeholds of wealth, the long-term debt cycle is
at its end, and a restructuring of the monetary system has to occur.
Since these cycles are big deals and have happened virtually everywhere for all
of recorded history, we need to understand them and have timeless and universal
principles for dealing with them well. But most people, including many
economists, don’t even acknowledge their existence. That’s because to get a
sample size of observations that is large and diverse enough to give one a good
understanding, one has to have studied them over many hundreds of years in
many different countries. In Part II we will do just that, examining the most
important of these cycles across history and around the world, with reference to
the timeless and universal mechanics of why money and credit work and fail to
work as mediums of exchange and storeholds of wealth. In this chapter, I will
synthesize all those cases so I can show you how they work archetypically.
I will begin with the basics of the long-term debt cycle from way back when
and bring you up to the present, giving you the classic template. To be clear, I’m
not saying that all cases transpire exactly like this one, but I am saying that they
almost all follow this pattern closely.
THE LONG-TERM DEBT CYCLE
The long-term debt cycle transpires in six stages:
Stage 1: It begins with a) little or no debt and b) money being “hard.”
The debt burdens from the last cycle were largely wiped out by restructuring
and debt monetization, and because of the consequences of these, particularly
inflation, there is a return to hard money like gold and silver (and sometimes
copper and other metals like nickel) or sometimes a link to a hard currency. For
example, after the destruction of debt and money in Germany’s Weimar Republic
money became backed by gold-denominated assets and land and pegged to the
dollar, and after its destruction in Argentina in the late 1980s money became
linked to the dollar.
At this stage, money being “hard” is important because no trust—or credit—is
required to carry out an exchange. Any transaction can be settled on the spot,
even if the buyer and seller are strangers or enemies. There is an old saying that
“gold is the only financial asset that isn’t someone else’s liability.” When you
receive gold coins from a buyer, you can melt them down and exchange the metal
and still receive almost the same value as if you had spent them, unlike a debt asset
like paper money, which is a promise to deliver value (which isn’t much of a
promise, given how easy it is to print). When countries are at war and there is no
trust in their intentions or abilities to pay, they can still pay in gold. So gold (and,
to a lesser extent, silver) can be used as both a safe medium of exchange and a safe
storehold of wealth.
Stage 2: Then come claims on hard money (i.e., notes or paper money).
Because carrying a lot of metal money around is risky and inconvenient and
creating credit is attractive to both lenders and borrowers, credible parties arise
that put the hard money in a safe place and issue paper claims on it. These parties
came to be known as “banks,” though they initially included all sorts of
institutions that people trusted, such as temples in China. Soon people treat
these paper “claims on money” as if they are money itself. After all, they can
be redeemed for tangible money or used to buy things directly. This type of
currency system is called a “linked currency system” because the value of the
currency is linked to the value of something, typically “hard money,” such as gold
and silver.
Stage 3: Then comes increased debt.
At first there are the same number of claims on the “hard money” as
there is hard money in the bank. Then the holders of paper claims and the
banks discover the wonders of credit and debt. Holders of paper claims loan
them to banks in exchange for interest payments. The banks like to do that
because they can lend the money to others who can pay a higher interest rate,
allowing the banks to make a profit. Those who borrow from the bank like it
because it gives them buying power they didn’t previously have. And the whole
society likes it because it leads asset prices and production to rise. Since everyone is
happy with how things are going, they do a lot of it. More lending and borrowing
happens over and over again many times, there is a boom, and the quantity of the
claims on the money (i.e., debt assets) rises relative to the amount of actual goods
and services there are to buy. Eventually the claims become much larger than the
actual hard money in the bank.
Trouble approaches when there isn’t enough income to service one’s
debts, or when the amount of claims people are holding in the expectation
that they can sell them to get money to buy goods and services increases
faster than the amount of goods and services by an amount that makes the
conversion from that debt asset (e.g., a bond) impossible. These two
problems tend to come together.
Concerning the first of these problems, think of debt as negative earnings and a
negative asset that eats up earnings (because earnings have to go to pay it) and eats
up other assets (because other assets have to be sold to get the money to pay the
debt). It is senior—meaning it gets paid before any other type of asset—so when
incomes and the values of assets fall, there is a need to cut expenditures and sell off
assets to raise the needed cash. When that’s not enough, there needs to be a) debt
restructurings (in which debts and debt burdens are reduced, which is
problematic for both the debtor and the creditor because one person’s debts are
another’s assets) and/or b) the central bank printing money paired with the
central government handing out money and credit to fill in the holes in incomes
and balance sheets (which is what is happening now).
Stage 4: Then debt crises, defaults, and devaluations come, which leads to
the printing of money and the breaking of the link to hard money.
As for the second problem, this happens when holders of debt don’t believe
they are going to get adequate returns from it relative to other storeholds of
wealth and the costs of goods and services. Debt assets (e.g., bonds) are held by
investors who believe they are storeholds of wealth that can be sold to get money,
which can be used to buy things. When holders of debt assets try to make the
conversion to real money and real goods and services and find out that they can’t,
a “run” occurs, by which I mean that lots of holders of that debt try to make the
conversion to money, goods, services, and other financial assets. The bank,
regardless of whether it is a private bank or a central bank, is then faced with the
choice of allowing that flow of money out of the debt asset, which will raise
interest rates and cause the debt and economic problems to worsen, or of printing
money, in the form of issuing bonds and buying enough of the bonds to prevent
interest rates from rising and hopefully reverse the run out of them. Inevitably the
central bank breaks the link, prints the money, and devalues it because not doing
that causes an intolerable deflationary depression. The key at this stage is to create
enough money and devaluation to offset the deflationary depression but not so
much as to produce an inflationary spiral. When this is done well, I call it a
“beautiful deleveraging,” which I describe more completely in my book Principles
for Navigating Big Debt Crises. Sometimes that buying works temporarily;
however, if the ratio of claims on money (debt assets) to the amount of “hard”
money there is and the quantity of goods and services there is to buy are too high,
the bank is in a bind that it can’t get out of. It simply doesn’t have enough “hard”
money to meet the claims. When that happens to a central bank it has the choice
either to default or to break the link to the hard money, print the money, and
devalue it. Inevitably the central bank devalues. When these debt restructurings
and currency devaluations are too big, they lead to the breakdown and possible
destruction of the monetary system. The more debt (i.e., claims on money and
claims on goods and services) there is, the more it will be necessary to devalue the
money.
Remember, there is always a limited amount of goods and services because the
amount is constrained by the economy’s ability to produce. Also remember that,
as shown in our example of paper money being claims on hard money, there is a
limited amount of that hard money (e.g., gold on deposit), while the amount of
paper money (the claims on that hard money) and debt (the claims on that paper
money) is constantly growing. As the amount of paper money claims grows
relative to the amount of hard money in the bank and goods and services in the
economy, the risk increases that the holders of those debt assets may not be able to
redeem them for the amounts of hard money or goods and services that they
expect to receive for them.
A bank that can’t deliver enough hard money to meet the claims being made
on it is in trouble whether it is a private bank or a central bank, though central
banks have more options than private banks. That’s because a private bank can’t
print the money or change the laws to make it easier to pay their debts, while some
central banks can. Private banks must either default or get bailed out by the
government when they get into trouble, while central banks can devalue
their claims (e.g., pay back 50—70 percent) if their debts are denominated
in their national currency. If the debt is denominated in a currency that
they can’t print, then they too must ultimately default.
Stage 5: Then comes fiat money, which eventually leads to the debasement
of money.
Central banks want to stretch the money and credit cycle to make it last for as
long as it can because that is so much better than the alternative. So when the
system of hard money and claims on hard money becomes too painfully
constrictive, governments typically abandon it in favor of what is called “fiat
money.” No hard money is involved in fiat systems; there is just paper money that
the central bank can print without restriction. As a result, there is no risk that the
central bank will have its stash of hard money drawn down and have to default on
its promises to deliver it. Rather, the risk is that, freed from the constraints on the
supply of tangible gold, silver, or some other hard asset, the people who control
the printing presses (i.e., the central bankers working with the commercial
bankers) will create ever more money and debt assets and liabilities in relation to
the amount of goods and services being produced until the time comes when
those holding the enormous amount of debt will try to turn it in for goods and
services, which will have the same effect as a run on a bank and result in either
debt defaults or the devaluation of money.
The shift from a system in which the debt notes are convertible to a tangible
asset (e.g., gold and silver) at a fixed rate to a fiat monetary system in which there is
no such convertibility last happened in the US on the evening of August 15, 1971.
As I mentioned earlier, I was watching on TV when President Nixon told the
world that the dollar would no longer be tied to gold. I thought there would be
pandemonium with stocks falling. Instead, they rose. Because I had never seen a
devaluation before, I didn’t understand how it works.
In the years leading up to 1971 the US government had spent a lot of money
on military and social programs, then referred to as “guns and butter” policy, that
it paid for by borrowing money, which created debt. The debt was a claim on
money that could be exchanged for gold. Investors treated this debt as an asset
because they got paid interest on it and because the US government promised that
it would allow the holders of those notes to exchange them for the gold that was
held in US vaults. As the spending and budget deficits grew, the US had to issue
much more debt—i.e., create many more claims on gold—even though the
amount of gold in the bank didn’t increase. Investors who were astute enough to
notice could see that the amount of outstanding claims on gold was much larger
than the amount of gold in the bank. They realized that if this continued the US
would have to default, so they turned in their claims. Of course, the idea that the
US government, the richest and most powerful government in the world, would
default on its promise to give gold to those who had claims on it seemed
implausible at the time. So, while most people were surprised by Nixon’s
announcement and the effects on the markets, those who understood the
mechanics of how money and credit work were not.
When credit cycles reach their limit, it is the logical and classic response
for central governments and their central banks to create a lot of debt and
print money that will be spent on goods, services, and investment assets in
order to keep the economy moving. That was done during the 2008 debt crisis,
when interest rates could no longer be lowered because they had already hit 0
percent. It also happened in a big way in 2020 in response to the plunge triggered
by the COVID pandemic. That was also done in response to the 1929-32 debt
crisis, when interest rates had similarly been driven to 0 percent. At the time I am
writing this, the creation of debt and money has been happening in amounts
greater than at any time since World War II.
To be clear, printing money and giving it out for spending rather than
supporting spending with debt growth is not without its benefits—money spends
like credit, but in practice (rather than in theory) it doesn’t have to be paid back.
There is nothing wrong with having an increase in money growth instead of an
increase in credit/debt growth, if the money is put to productive use. The risk is
that it will not be. If money is printed too aggressively and it is not used
productively, people will stop using it as a storehold of wealth and shift their
wealth into other things.
History has shown that * we shouldn't rely on governments to protect us financially.
On the contrary, we should expect most governments to abuse their privileged
positions as the creators and users of money and credit for the same reasons that
you might commit those abuses if you were in their shoes. That is because no one
policy maker owns the whole cycle. Each comes in at one or another part of it and
does what is in their interest to do given their circumstances at the time and what
they believe is best (including breaking promises, even though the way they
collectively handle the whole cycle is bad).
Since early in the debt cycle governments are considered trustworthy and they
need and want money as much as or more than anyone else does, they are typically
the biggest borrowers. Later in the cycle, new government leaders and new central
bankers have to face the challenge of paying back debts with less stimulant in the
bottle. To make matters worse, governments also have to bail out debtors whose
failures would hurt the system—the “too big to fail” syndrome. As a result, they
tend to get themselves into cash flow jams that are much larger than those of
individuals, companies, and most other entities.
In virtually every case, the government contributes to the accumulation of
debt with its actions and by becoming a large debtor itself. When the debt bubble
bursts, the government bails itself and others out by buying assets and/or printing
money and devaluing it. The larger the debt crisis, the more that is true. While
undesirable, it is understandable why this happens. • When one can manufacture
money and credit and pass them out to everyone to make them happy, it is very hard to resist
the temptation to do so.- It is a classic financial move. Throughout history, rulers
have run up debts that won’t come due until long after their own reigns
are over, leaving it to their successors to pay the bill.
Printing money and buying financial assets (mostly bonds) holds interest rates
down, which stimulates borrowing and buying. Those investors holding bonds
are encouraged to sell them. The low interest rates also encourage investors,
businesses, and individuals to borrow and invest in higher-returning assets, getting
what they want through monthly payments they can afford.
This leads central banks to print more money and buy more bonds and
sometimes other financial assets. That typically does a good job of pushing up
financial asset prices but is relatively inefficient at getting money, credit, and
buying power into the hands of those who need them most. That is what
happened in 2008 and what happened for most of the time until the 2020
coronavirus-induced crisis. When money printing and purchasing of financial
assets fail to get money and credit to where they need to go, the central
government borrows money from the central bank (which prints it) so the
government can spend it on what it needs to be spent on. The Fed announced
that plan on April 9, 2020. That approach of printing money to buy debt (called
“debt monetization”) is vastly more politically palatable as a way of shifting wealth
from those who have it to those who need it than imposing taxes because those
who are taxed get angry. That is why central banks always end up printing
money and devaluing.
When governments print a lot of money and buy a lot of debt, they
cheapen both, which essentially taxes those who own it, making it easier
for debtors and borrowers. When this happens to the point that the
holders of money and debt assets realize what is going on, they seek to sell
their debt assets and/or borrow money to get into debt they can pay back
with cheap money. They also often move their wealth into better
storeholds, such as gold and certain types of stocks, or to another country
not having these problems. At such times central banks have typically
continued to print money and buy debt directly or indirectly (e.g., by
having banks do the buying for them) while outlawing the flow of money
into inflation-hedge assets, alternative currencies, and alternative places.
Such periods of “reflation” either stimulate a new money and credit expansion
that finances another economic expansion (which is good for stocks) or devalue
the money so that it produces monetary inflation (which is good for inflation-
hedge assets, such as gold, commodities, and inflation-linked bonds). Earlier in the
long-term debt cycle, when the amount of outstanding debt isn’t large and there is
a lot of room to stimulate by lowering interest rates (and failing that, printing
money and buying financial assets), there is a strong likelihood that credit growth
and economic growth will be good. Later in the long-term debt cycle, when the
amount of debt is large and there isn’t much room to stimulate, there is a much
greater likelihood of monetary inflation accompanied by economic weakness.
While people tend to believe that a currency is pretty much a
permanent thing and that “cash” is the safest asset to hold, that’s not true.
• All currencies devalue or die, and when they do, cash and bonds (which are promises to
receive currency) are devalued or wiped out. That is because printing a lot of
currency and devaluing debt is the most expedient way of reducing or
wiping out debt burdens. When debt burdens are sufficiently reduced or
eliminated, the credit/debt expansion cycles can begin again, as described in the
next chapter.
As I explained comprehensively in my book Principles for Navigating Big Debt
Crises, there are four levers that policy makers can pull to bring debt and
debt-service levels down relative to the income and cash flow levels
required to service debts:
1. Austerity (spending less)
2. Debt defaults and restructurings
3. Transfers of money and credit from those who have more than they
need to those who have less than they need (e.g., raising taxes)
4. Printing money and devaluing it
These levers typically progress from one to another for logical reasons:
Austerity is deflationary and doesn’t last long because it’s too painful.
Debt defaults and restructurings are also deflationary and painful because
the debts that are wiped out or reduced in value are someone’s assets; as a
result, defaults and restructurings are painful for both the debtor who goes
broke and has their assets taken away and for the creditor who loses wealth
when the debt is written down.
Transfers of money and credit from those who have more than they need to
those who have less than they need (e.g., raising taxes to redistribute wealth)
is politically challenging but more tolerable than the first two ways and is
typically part of the resolution.
Compared to the others, • printing money is the most expedient, least well-
understood, and most common big way of restructuring debts. In fact, it seems
good rather than bad to most people because:
_ It helps to relieve debt squeezes.
_ It’s tough to identify any harmed parties that the wealth was taken away
from to provide this financial wealth (though they are the holders of
money and debt assets).
_ In most cases it causes assets to go up in the depreciating currency that
people measure their wealth in, so it appears that people are getting
richer.
This is what has been happening during the coronavirus crisis as central
governments and banks send out large amounts of money and credit. Note that
you don’t hear anyone complaining about the money and credit creation; in fact,
people say that governments would be cheap and cruel if they didn’t provide a lot
more of it. Hardly anyone acknowledges that governments don’t actually have
this money to give out. Governments aren’t rich entities with piles of money lying
around. They are just their people collectively, who will ultimately have to pay for
the creation and giving out of money. Now imagine what those same citizens
would say if government officials cut expenses to balance their budgets and asked
them to do the same, making lots of them go broke, and/or if they sought to
redistribute wealth from those who have more to those who have less by raising
taxes. The money and credit producing path is much more acceptable politically
than either of those options. It’s as if you changed the rules of Monopoly to allow
the banker to make more money and redistribute it whenever too many players
are going broke and getting angry.
Stage 6: Then the flight back into hard money.
When taken too far, the overprinting of fiat currency leads to the
selling of debt assets and the earlier-described “bank run” dynamic, which
ultimately reduces the value of money and credit, which prompts people to
flee out of both the currency and the debt. History teaches us that people
typically turn to gold, silver, stocks that maintain their real value, and currencies
and assets in other countries not having these problems. Some people think that
there has to be an alternative reserve currency to go to for this flight to happen,
but that’s not true as the same dynamic of the breakdown of the monetary system
and the running to other assets has happened in cases in which there was no
alternative currency (e.g., in dynastic China and during the Roman Empire).
There are a lot of things people run to when money is devalued, including rocks
(used for construction) in Germany’s Weimar Republic. The debasement of the
currency leads people to run from it and from debt denominated in it and into
something else.
At this stage of the debt cycle there is typically economic stress caused by large
wealth and values gaps. These gaps lead to higher taxes and fighting between the
rich and the poor. This also makes those with wealth want to move to hard assets,
other currencies, and other countries. Naturally those who are governing the
countries that are suffering from this flight from their debt, their currency, and
their country want to stop it. So governments make it harder to invest in assets
like gold (by outlawing gold transactions and ownership, for example), foreign
currencies (via eliminating the ability to transact in them), and foreign countries
(by establishing foreign exchange controls to prevent money from leaving the
country). Eventually the debt is largely wiped out, usually by making the money
to pay it back plentiful and cheap, which devalues both the money and the debt.
When the devaluations and defaults become so extreme that the money
and credit system breaks down, necessity generally compels governments
to go back to some form of hard currency to rebuild people’s faith in the
value of money as a storehold of wealth. Quite often, though not always, the
government links its money to gold or a hard reserve currency with a promise to
allow holders of that new money to convert it to the hard money. Sometimes that
hard money is another country’s. For example, over the past decades many weak-
currency countries have linked their money to the US dollar or simply dollarized
their economy (i.e., used the dollar as their own medium of exchange and
storehold of wealth).
To review, holding debt as an asset that provides interest is typically
rewarding early in the long-term debt cycle when there isn’t a lot of debt
outstanding, but holding debt late in the cycle, when there is a lot of debt
outstanding and it is closer to being defaulted on or devalued, is risky
relative to the interest rate being given. So, holding debt is a bit like holding a
ticking time bomb that rewards you while it is still ticking and blows you up when
it stops. And as we’ve seen, that big blowup (i.e., big default or big devaluation)
happens something like once every 50 to 75 years.
These cycles of building debts and writing off debts have existed for
thousands of years and in some cases have been institutionalized. For example,
the Old Testament describes a year of Jubilee every 50 years, in which debts were
forgiven. Knowing that the debt cycle would happen on that schedule allowed
everyone to act in a rational way to prepare for it.
Helping you understand this debt cycle so that you are prepared for it, rather
than surprised by it, is my main objective in writing this book.
Ironically, the closer most people are to the blowup, which is also when
the claims outstanding are largest relative to the amount of hard money
and tangible wealth there is, the riskier the situation is but the safer
people tend to feel. That is because they have held the debt and enjoyed
the rewards of doing so. The longer it has been since the last blowup, the
more people’s memories of it have faded—even as the risks of holding the debt
rise and the rewards for holding it decline. To properly assess the risk/reward of
holding the time bomb, one must remain constantly aware of the amount of debt
that needs to be paid relative to the amount of hard money there is to pay it, the
amount of debt payments that have to be made relative to the amount of cash
flow the debtors have, and the amount of interest they bring in.
THE LONG-TERM DEBT CYCLE IN SUMMARY
For thousands of years, there have always been three types of monetary
systems:
Type 1: Hard money (e.g., metal coins)
Type 2: Paper money (claims on hard money)
Type 3: Fiat money
Hard money is the most restrictive system because money can’t be
created unless the supply of the metal or other intrinsically valuable
commodity that is the money is increased. Money and credit are more
easily created in the second type of system, so the ratio of the claims on
hard money to the actual hard money held rises, which eventually leads to
a run on the banks. The result is a) defaults, when the bank closes its doors
and depositors lose their hard assets, and/or b) devaluations of the claims
on money, which mean depositors get back less. In the third type of
system, governments can create money and credit freely, which works for
as long as people continue to have confidence in the currency and fails
when they no longer do.
Throughout history, countries have transitioned across these different types of
systems for logical reasons. When a country needs more money and credit than it
currently has, whether to deal with debts, wars, or other problems, it naturally
moves from Type 1 to Type 2, or Type 2 to Type 3, so that it has more flexibility
to print money. Then creating too much money and debt depreciates their value,
causing people to get out of holding debt and money as a storehold of wealth and
move back into hard assets (like gold and silver) and other currencies. Since this
typically takes place when there is wealth conflict and sometimes war, there is also
typically a desire to get out of the country. Such countries need to re-establish
confidence in their currency as a storehold of wealth before they can restore their
credit markets.
The following diagram conveys these different transitions. There are many
historical examples, from the Song Dynasty in China to Weimar Germany, of
countries making the full transition from constrained types of monetary systems
(Type 1 and Type 2) to fiat money (Type 3), then back to a constrained currency
as the fiat currency hyperinflates.
Type 2: Claims on Hard Money
(e.g., Banknotes)
Expands Credit. 'X.
Compromises Credibility
Type 1: Hard Money Type 3: Fiat Money
(eg., Metal Coins) (e.g.. USD Today)
Maximizes Credibility. Maximizes Credit,
Minimizes Credit ◄ Minimizes Credibility
This big cycle typically plays out over something like 50 to 75 years; its
ending is characterized by a restructuring of debts and the monetary
system itself. The abrupt parts of these restructurings—i.e., the periods of
debt and currency crisis—typically happen quickly, lasting only a few
months to up to three years, depending on how long it takes the
government to act. However, their ripple effects can be long-lasting, for
example, when a currency ceases to be a reserve currency. Within each of
these currency regimes there are typically two to four big debt crises—i.e., big
enough to cause banking crises and debt write-downs or devaluations of 30
percent or more—but not big enough to break the currency system. Because I
have invested in many countries for nearly half a century, I have experienced
dozens of them. They all run the same way, which I explain in greater depth in my
book Principlesfor Navigating Big Debt Crises.
In the next chapter, I will go into more detail on the causes of and risks
associated with money changing its value, showing what has happened in the past,
which is pretty shocking.
1 You can find more of my perspective on this in several papers at economicprinciples.org.
- While borrowers are typically willing to pay interest, which is what gives lenders the incentive to lend,
nowadays there are some debt assets that have negative interest rates, which is a weird story that we will
explore later.
- . Monetized means the central bank’s creation of money to buy debt.
- . By the way, please understand that these rough estimates of cycle times are just rough estimates, and to
know where we are in these cycles we need to look more at the conditions than the amount of time.
- . Some central banks have made acting on this temptation harder by separating themselves from the direct
control of politicians, but virtually every central bank has to bail out their government at some point, so
devaluations always happen.
CHAPTER 4
THE CHANGING VALUE OF MONEY
his chapter examines the concepts introduced in the prior chapter in a more
granular way to show you how consistent they are with the actual cases they are
derived from. While we will get a bit more into the mechanics here than we did in
Chapter 3, I have written this chapter in a way that should be accessible to the
general reader and, at the same time, precise enough to satisfy the needs of skilled
economists and investors.
As previously explained, there is a real economy and there is a financial
economy, and the two are closely entwined but different. Each has its own
supply-and-demand dynamics. In this chapter we will focus on the supply-
and-demand dynamics of the financial economy to explore what
determines the value of money.
Most people worry about whether their assets are going up or down;
they rarely pay much attention to the value of their currency. Think about
it. How worried are you about your currency declining? And how worried are
you about how your stocks or your other assets are doing? If you are like most
people, you are not nearly as aware of your currency risk as you need to be.
So, let’s explore currency risks.
ALL CURRENCIES ARE DEVALUED OR DIE
Of the roughly 750 currencies that have existed since 1700, only about 20
percent remain, and all of them have been devalued. If you went back to
1850, as an example, the world’s major currencies wouldn’t look anything like the
ones today. While the dollar, pound, and Swiss franc existed in 1850, the most
important currencies of that era have died. In what is now Germany, you would
have used the gulden or the thaler. There was no yen, so in Japan you might have
used the koban or the ryo instead. In Italy you would have used one or more of six
currencies. You would have used different currencies in Spain, China, and most
other countries as well. Some were completely wiped out (in most cases they were
in countries that had hyperinflation and/or lost wars and had large war debts) and
replaced by entirely new currencies. Some were merged into currencies that
replaced them (e.g., the individual European currencies were merged into the
euro). And some remain in existence but were devalued, like the British pound
and the US dollar.
WHAT DO THEY DEVALUE AGAINST?
The goal of printing money is to reduce debt burdens, so the most
important thing for currencies to devalue against is debt (i.e., increase the
amount of money relative to the amount of debt, to make it easier for
debtors to repay). Debt is a promise to deliver money, so giving more
money to those who need it lessens their debt burden. Where this newly
created money and credit then flow determines what happens next. In cases in
which debt relief facilitates the flow of this money and credit into
productivity and profits for companies, real stock prices (i.e., the value of
stocks after adjusting for inflation) rise.
When the creation of money sufficiently hurts the actual and
prospective returns of cash and debt assets, it drives flows out of those
assets and into inflation-hedge assets like gold, commodities, inflation-
indexed bonds, and other currencies (including digital). This leads to a
self-reinforcing decline in the value of money. At times when the central bank
faces the choice between allowing real interest rates (i.e., the rate of interest minus
the rate of inflation) to rise to the detriment of the economy (and the anger of
most of the public) or preventing real interest rates from rising by printing money
and buying those cash and debt assets, they will choose the second path. This
reinforces the bad returns of holding cash and those debt assets.
The later in the long-term debt cycle this happens, the greater the likelihood
there will be a breakdown in the currency and monetary system. This breakdown
is most likely to occur when the amounts of debt and money are already too large
to be turned into real value for the amounts of goods and services they are claims
on, the level of real interest rates that is low enough to save debtors from
bankruptcy is below the level required for creditors to hold the debt as a viable
storehold of wealth, and the normal central bank levers of allocating capital via
interest rate changes (which I call Monetary Policy 1, or MP1) and/or printing
money and buying high-quality debt (Monetary Policy 2, or MP2) don’t work.
This turns monetary policy into a facilitator of a political system that allocates
resources in an uneconomic way.
There are systemically beneficial devaluations (though they are always
costly to holders of money and debt), and there are systemically
destructive ones that damage the credit/capital allocation system but are
needed to wipe out debt in order to create a new monetary order. It’s
important to be able to tell the difference.
To do that I will start by showing how the values of currencies have
changed in relation to both gold and consumer-price-index-weighted
baskets of goods and services. These are relevant comparisons because gold
is the timeless and universal alternative currency, while money is meant to
buy goods and services so its buying power is of paramount importance. I
will also touch on how a currency’s value changes in relation to other
currencies/debt and in relation to stocks because they too can be
storeholds of wealth. The picture that all these measures convey is broadly
similar when a devaluation is big enough. Many other things (real estate, art, etc.)
are also alternative storeholds of wealth, but gold will make my point nicely.
IN RELATION TO GOLD
This chart shows spot exchange rates of the three major reserve currencies
in relation to gold since 1600. We will examine all of this in depth later.
For now I would like to focus on both the spot currency returns and the total
returns of interest-earning cash in all the major currencies since 1850.
RESERVE CURRENCIES VS GOLD (SPOT FX)
100%
80%
40%
40%
20%
0%
1600 1700 1000 1*00 2000
As the next two charts show, devaluations typically occur fairly
abruptly during debt crises that are separated by longer periods of
prosperity and stability. I noted six devaluations, but of course there were
many more of minor currencies.
SPOT FX VS GOLD
To properly compare the returns of holding cash in a currency to gold, we have
to take into account the interest one would earn on cash. This chart shows the
total return (i.e., price changes plus interest earned) on cash in each major
currency versus gold.
FX TOTAL RETURN VS GOLD (LOG)
Here are the most notable takeaways:
Big devaluations are abrupt and episodic rather than evolutionary.
Over the last 170 years, there were six time frames when really big
devaluations of major currencies occurred (and plenty more of minor
currencies).
In the 1860s, during its civil war, the US suspended gold convertibility and
printed paper money (known as “greenbacks”) to help monetize war debts.
Around the time the US returned to its gold peg in the mid-1870s, a
number of other countries joined the gold standard; most currencies
remained fixed against it until World War I. Major exceptions were Japan
(which was on a silver-linked standard until the 1890s, which led its
exchange rate to devalue against gold as silver prices fell during this period)
and Spain, which frequently suspended convertibility to support large fiscal
deficits.
During World War I, warring countries ran enormous deficits that were
funded by central banks’ printing and lending of money. Gold served as
money in foreign transactions, as international trust (and hence credit) was
lacking. When the war ended, a new monetary order was created with gold
and the winning countries’ currencies, which were tied to gold.
Still, between 1919 and 1922 several European countries, especially those
that lost the war, were forced to print and devalue their currencies. The
German mark and German mark debt sank between 1920 and 1923. Some
of the winners of the war also had debts that had to be devalued to create a
new start.
With debt, domestic political, and international geopolitical restructurings
done, the 1920s boomed, particularly in the US, inflating a debt bubble.
The debt bubble burst in 1929, requiring central banks to print money and
devalue it throughout the 1930s. More money printing and more money
devaluations were required during World War II to fund military spending.
In 1944-45, as the war ended, a new monetary system that linked the dollar
to gold and other currencies to the dollar was created. The currencies and
debts of Germany, Japan, and Italy, as well as those of China and a number
of other countries, were quickly and totally destroyed, while those of most
winners of the war were slowly but still substantially depreciated. This
monetary system stayed in place until the late 1960s.
In 1968-73 (most importantly in 1971), excessive spending and debt
creation (especially by the US) required breaking the dollar’s link to gold
because the claims on gold that were being turned in were far greater than
the amount of gold available to redeem them.
That led to a dollar-based fiat monetary system, which allowed the big
increase in dollar-denominated money and credit that fueled the inflation
of the 1970s and led to the debt crisis of the 1980s.
Since 2000, the value of money has fallen in relation to the value of gold
due to money and credit creation and because interest rates have been low
in relation to inflation rates. Because the monetary system has been free-
floating, it hasn’t experienced the abrupt breaks it did in the past; the
devaluation has been more gradual and continuous. Low, and in some cases
negative, interest rates have not provided compensation for the increasing
amount of money and credit and the resulting (albeit low) inflation.
Now let’s take a closer look at these events:
The returns from holding currencies (in short-term debt that collects
interest) were generally profitable between 1850 and 1913 relative to the
returns from holding gold. Most currencies were able to remain fixed
against gold or silver, and lending and borrowing worked well for those
who did it. That prosperous period is called the Second Industrial
Revolution, when borrowers turned the money they borrowed into
earnings that allowed their debts to be paid back at high interest rates.
Times were turbulent nevertheless. For example, in the early 1900s in the
US, a debt-financed speculative boom in stocks grew overextended,
causing a banking and brokerage crisis. That led to the Panic of 1907, at the
same time that the large wealth gap and other social issues (e.g., women’s suffrage
and trade unionization) were causing political tensions. Capitalism was
challenged, and taxes started to rise to fund the wealth redistribution
process. Both the Federal Reserve and the US federal income tax were instituted
in 1913.
Though a world away, China was impacted by the same dynamic. A stock
market bubble led by rubber production stocks (China’s equivalent of the
railroad stock bubbles that contributed to panics in the US throughout the 19th
century) burst in 1910, causing the crash that some have described as a factor in
the debt/money/economic downswing that brought about the end of Imperial
China.
But throughout most of that period, Type 2 monetary systems (i.e.,
those with notes convertible into metal money) remained in place in most
countries, and the holders of those notes got paid good interest rates
without having their currencies devalued. The big exceptions were the US
devaluation to finance its civil war debts in the 1860s, the frequent devaluations
of Spain’s currency due to its weakness as a global power, and the sharp
devaluations in Japan’s currency due to its remaining on a silver-linked standard
until the 1890s, while silver prices were falling relative to gold.
SPOT FX VS GOLD (1850-1913)
When World War I began in 1914, countries borrowed a lot to fund it.
This led to the late-debt-cycle breakdowns and devaluations that came
when war debts had to be wiped out, effectively destroying the monetary
systems of the war’s losers. The Paris Peace Conference that ended the war in
1918 attempted to institute a new international order around the League of
Nations, but those efforts at cooperation could not forestall the debt crises and
monetary instability caused by the huge war indemnities that were placed on the
defeated powers, as well as the large war debts that the victorious Allied powers
owed each other (particularly the US).
Germany suffered a complete wipeout of the value of money and credit,
which led to the most iconic hyperinflation in history during the Weimar
Republic (which I describe in great detail in Principles for Navigating Big Debt
Crises). The Spanish flu pandemic also occurred during the period, beginning in
1918 and ending in 1920. With the exception of the US, virtually every
country devalued its currency because they had to monetize some of their
war debts. Had they not done so, they wouldn’t have been able to compete in
world markets with the countries that did. China’s silver-based currency rallied
sharply relative to gold (and gold-linked currencies) near the end of the war as
silver prices rose, and then mechanically devalued as silver prices fell sharply amid
the post-war deflation in the US. That period of war and devaluation that
established the new world order in 1918 was followed by an extended and
productive period of economic prosperity, particularly in the US, known
as the Roaring ’20s. Like all such periods, it led to big debt and asset
bubbles and large wealth gaps.
SPOT FX VS GOLD (1913-1930)
Different versions of the same thing happened during the 1930s.
Between 1930 and 1933, a global debt crisis caused economic contractions
that led to money printing and competitive devaluations in virtually every
country, eroding the value of money moving into World War II. Conflicts
over wealth within countries led to greater conflicts between them. All the
warring countries built up war debts while the US gained a lot of wealth in the
form of gold during the war. Then, after the war, the value of money and
debt was completely wiped out for the losers (Germany, Japan, and Italy)
as well as for China, and was severely devalued for the UK and France,
even though they were among the winners. A new world order and a
period of prosperity followed the war. We won’t examine it, other than to
mention that the excessive borrowing that took place set in motion the next big
devaluation, which happened between 1968 and 1973.
SPOT FX VS GOLD (1930-1950)
By the mid-1950s, the dollar and the Swiss franc were the only
currencies worth even half of their 1850s exchange rate. As shown in the
following chart, the downward pressure on currencies and upward pressure on
gold started in 1968. On August 15, 1971, President Nixon ended the
Bretton Woods monetary system, devaluing the dollar and leaving the
monetary system in which the dollar was backed by gold and instituting a
fiat monetary system. (I will cover this episode in more detail in Chapter
И.)
SPOT FX VS GOLD (1966-1977)
Since 2000, we have seen a more gradual and orderly loss of total return in
currencies when measured in gold, consistent with the broad fall in real rates
across countries.
SPOT FX VS GOLD REAL LONG RATES
(1998-PRESENT) (1998-PRESENT)
In summary:
The average annual return of interest-earning cash currency between 1850
and the present was 1.2 percent, which was a bit higher than the average real
return of holding gold, which was 0.9 percent, though there were huge
differences in returns at various periods of time and in various countries.
You would have received a positive real return for holding bills in about half
of the countries during that period and a negative real return in the other
half. In the case of Germany, you would have been totally wiped out twice.
Most of the real returns from holding interest-earning cash currency would
have come in the periods of prosperity, when most countries were on gold
standards that they adhered to (e.g., during the Second Industrial
Revolution, when debt levels and debt-service burdens were relatively low
and income growth was nearly equal to debt growth).
The real return for bills since 1912 (the modern fiat era) has been -0.1
percent. The real return of gold during this era has been 1.6 percent. You
would only have made a positive real return holding interest-earning cash
currency in about half of the countries during this era, and you would have
lost meaningfully in the rest (over 2 percent a year in France, Italy, and
Japan, and over 18 percent a year in Germany, due to the hyperinflation).
CURRENCY AND GOLD REAL RETURNS OF MAJOR COUNTRIES
SINCE 1850 (VS CPI, ANN)
Country Real Returns (vs CPI), Ann
1850-Present 1850-1912 1912-Present
Continuous Govt Bill Investment Gold Continuous Govt Bill Investment Gold Continuous Govt Bill Investment Gold
United Kingdom 1.4% 0.7% 3.1% -0.1% 0.5% 1.1%
United States 1.6% 0.3% 3.6% -1.0% 0.4% 1.0%
Germany -12.9% 2.0% 3.0% -0.9% -18.2% 3.1%
France -0.7% 0.6% 2.6% -0.3% -2.6% 1.1%
Italy -0.6% 0.3% 4.7% -0.5% -2.6% 0.5%
Japan -0.7% 1.0% 5.0% 0.4% -2.2% 1.2%
Switzerland 1.5% 0.0% 3.4% -0.5% 0.5% 0.3%
Spain 1.4% 1.1% 4.5% 0.1% 0.3% 1.5%
Netherlands 1.4% 0.5% 3.3% 0.0% 0.4% 0.7%
China — 3.3% — — — 3.3%
Average 1.2% 0.9% 3.6% -0.3% -0.1% 1.6%
Data for Switzerland is since 1851; data for Germany, Spain, and Italy is since 1870; data for
Japan is since 1882; data for China is since 1926 (excluding 1948-50). Average return is
un-rebalanced and doesn’t include China.
The next chart shows the real returns from holding gold between 1850 and the
present. From 1850 to 1971, gold returned (through its appreciation) an amount
that roughly equaled the amount of money lost to inflation on average, though
there were big variations around that average both across countries (e.g., Germany
seeing large gold outperformance, while countries with only limited devaluations,
like the US, saw gold prices not keep up with inflation) and across time (e.g., the
1930s currency devaluations and the World War II-era devaluations of money
that were part of the formation of the Bretton Woods monetary system in 1944).
After the war, gold stayed steady in price across most countries, while money and
credit expanded until 1971. Then, in 1971, there was a shift from a Type 2
monetary system (notes backed by gold) to a Type 3 fiat monetary system. That
delinking of currencies from gold gave central banks the unconstrained ability to
create money and credit. That led to high inflation and low real interest rates,
which led to the big appreciation in the real gold price until 1980-81, when
interest rates were raised significantly above the inflation rate, leading currencies
to strengthen and gold to fall until 2000. That is when central banks pushed
interest rates down relative to inflation rates and, when they couldn’t push rates
any lower by normal means, printed money and bought financial assets, which
supported gold prices.
REAL RETURN OF GOLD (VS CPI. LOG)
---USA -GBR OEU — FRA — ITA
THE VALUE OF CURRENCIES IN RELATION TO GOODS AND
SERVICES
Thus far we have looked at the market values of currencies in relation to the
market value of gold. That raises the question as to whether gold is an appropriate
gauge of value. The next chart shows the value of interest-earning currency
in terms of the consumer price index (CPI) baskets of goods and services in
those currencies, reflecting their changes in buying power. As can be clearly
seen, the two World Wars were very bad and there have been ups and downs in
the years since. For about half of the currencies, interest-earning cash provided a
return above the rate of inflation. For the other half it provided negative real
returns. In all cases, there were big and roughly 10-year-long swings around those
averages. In other words, history has shown that there are very large risks in
holding interest-earning cash currency as a storehold of wealth, especially
late in debt cycles.
REAL RETURN OF BILLS (VS CPI)
THE PATTERNS OF COUNTRIES DEVALUING AND LOSING
THEIR RESERVE CURRENCY STATUS
A currency devaluing and a currency losing its reserve currency status
aren’t necessarily the same, though both are caused by debt crises. The loss
of reserve currency status is a product of chronic large devaluations. As
previously explained, increasing the supply of money and credit reduces the value
of money and credit. This is bad for holders of money and credit but a relief to
debtors. When this debt relief allows money and credit to flow into productivity
and profits for companies, real stock prices rise. But it can also damage the actual
and prospective returns of cash and debt assets enough to drive people out of
them and into inflation-hedge assets and other currencies. The central bank then
prints money and buys cash and debt assets, which reinforces the bad returns of
holding them. The later in the long-term debt cycle this happens, the greater the
likelihood that there will be a breakdown in the currency and monetary system.
Policy makers and investors must be able to tell the difference between
systemically beneficial devaluations and systemically destructive ones.
What do these devaluations have in common?
All the economies in the major cases that we examine in depth in
Part II experienced a classic “run” dynamic, in which there were
more claims on the central bank than there was hard currency
available to satisfy them. That hard currency was typically gold, though it
was US dollars for the UK reserve currency decline because at that time the
pound was linked to the dollar.
Net central bank reserves start falling prior to the actual
devaluation, in some cases years ahead. It’s also worth noting that in
several cases countries suspended convertibility before the actual
devaluation of the exchange rate. The UK did this in 1947 and ahead of the
1949 devaluation, and the US did it in 1971.
The run on the currency and the devaluations typically occur
alongside significant debt problems, often related to wartime spending
(e.g., the Fourth Anglo-Dutch War for the Netherlands, the World Wars
for the UK, and the Vietnam War for the US), which put pressure on the
central bank to print. The worst situations are when countries lose wars;
that typically leads to the total collapse and restructuring of their currencies
and their economies. However, winners of wars that end up with debts
much larger than their assets and reduced competitiveness (e.g., the UK
after the World Wars) also lose their reserve currency status, though more
gradually.
Typically, central banks initially respond by letting short-term rates
rise, but that is too economically painful, so they quickly capitulate
and increase the supply of money. After the money devalues, they
typically cut rates.
Outcomes diverge significantly across the cases, with a key variable
being how much economic and military power the country retains at
the time of the devaluation. The more it has, the more willing savers are
to continue holding their money there. More specifically for the major
reserve currencies:
_ For the Dutch, the collapse of the guilder was massive and relatively
quick; it took place over less than a decade, with the actual circulation of
guilders falling swiftly by the end of the Fourth Anglo-Dutch War in
1784. The collapse came as the Netherlands entered a steep decline as a
world power, first losing to the British and subsequently facing invasion
from France.
_ For the UK, the decline was more gradual: it took two devaluations
before it fully lost its reserve currency status after Bretton Woods,
though it experienced periodic balance of payments strains over the
intervening period. Many who held reserves in pounds continued to do
so because of political pressures, and their assets significantly
underperformed US assets during the same time.
_ In the case of the US, there were two big abrupt devaluations (in 1933
and 1971) and more gradual devaluations against gold since 2000, but
they haven’t cost the US its reserve currency status.
_ Typically, a country loses its reserve currency status when there is an
already established loss of economic and political primacy to a rising
rival, which creates a vulnerability (e.g., the Netherlands falling behind
the UK, or the UK falling behind the US), and there are large and
growing debts monetized by the central bank printing money and
buying government debt. This leads to a weakening of the currency in a
self-reinforcing run that can’t be stopped because the fiscal and balance
of payments deficits are too great for any cutbacks to close.
In Part II, we will see the last 500 years of history as one continuous
story of rises and declines of empires and the reasons for them, and you
will see the same cause/effect relationships driving the rises and declines.
But first we need to explore the big cycles of internal and external
order/disorder, which we will do in the next two chapters.
1 Due to a lack of data, several charts in this chapter do not show China.
CHAPTER 5
THE BIG CYCLE OF INTERNAL ORDER
AND DISORDER
How people are with each other is the primary driver of the outcomes
they get. Within countries there are systems or “orders” for governing
how people are supposed to behave with each other. These systems and the
actual behaviors of people operating within them produce consequences.
In this chapter, we will explore the timeless and universal cause/effect
relationships that shape the internal orders and the behaviors that drive
the shifts between periods of order and periods of disorder.
Through my research, I saw how changes in internal orders (i.e., countries’
systems for governing internally) and changes in the world order (i.e., the systems
determining power between countries) happen continuously and everywhere in
similar and increasingly interconnected ways that flow together as one all-
encompassing story from the beginning of recorded time up to this moment.
Seeing many interlinking cases evolve together helped me to discover the patterns
that govern them and to imagine the future based on what I’ve learned. Most
importantly I saw how the constant struggle for wealth and power produced
continuously evolving internal systems/orders and external systems/orders and
saw how these internal and external orders affect each other—with the whole
thing (i.e., the world order) working like a perpetual-motion machine that evolves
while doing the same things over and over again for basically the same reasons.
• The biggest thing affecting most people in most countries through time is how people
struggle to make, take, and distribute wealth and power, though they also struggle over other
things, most importantly ideology and religion. I saw how these struggles happened
in timeless and universal ways, and how these struggles had huge
implications for all aspects of people’s lives, starting with what happened
with taxes, the economy, and how people were with each other through
periods of boom and bust and peace and war, and how they unfolded in
cyclical ways, like the tide coming in and out.
I saw that when these struggles took the form of healthy competition that
encouraged human energy to be put into productive activities, they produced
productive internal orders and prosperous times, and when those energies took
the form of destructive internal fighting, they produced internal disorder and
painfully difficult times. I saw why the swings between productive order and
destructive disorder typically evolved in cycles driven by logical cause/effect
relationships and how they happened in all countries for mostly the same reasons.
I saw that those that rose to achieve greatness did so because of a confluence of key
forces coming together to produce that greatness and those that declined did so
because these forces dissipated.
At the time of this writing, there is growing disorder in a number of leading
countries around the world, most importantly in the United States. I wanted to
put that disorder into perspective so I built indices of it and conducted the
research I am sharing in this chapter. Because how the US handles its disorder will
have profound implications for Americans, others around the world, and most
economies and markets, in this chapter I am focusing more on the US than on
other countries.
This simplified chart shows approximately where the US and China are within
the archetypical Big Cycle, as measured by the previously described determinants.
The US is in the stage—which I call Stage 5—when there are bad financial
conditions and intensifying conflict at the same time the leading empire still has
other great strengths (e.g., technology and military) that are declining on a relative
basis. Classically this stage comes after periods of great excesses in spending and
debt and the widening of wealth and political gaps and before there are
revolutions and civil wars.
THE ЮР
CUN 7 X USA
/THE RISE THE DECLINE
To be clear, I am not saying that the United States or other countries are
inevitably headed into a period of greater decline or more internal and external
conflict. However, I am saying that it is important to watch the markers in order
to understand both what is happening and the full range of possibilities for the
period ahead. In this chapter, I explore those markers by drawing on the lessons
from analogous historical cases.
THE SIX STAGES OF THE INTERNAL CYCLE
Internal orders typically (though not always) change through a relatively
standard sequence of stages, like the progression of a disease. By looking at
their symptoms we can tell which stages countries are in. For example, just as
Stage 3 cancer is different from Stage 4 cancer in ways defined by different
conditions that exist and have come about as a result of things that happened in
prior stages, the same is true for the different stages of the big internal cycle. Like
diseases, different conditions warrant different actions to address them and they
produce a different range of probabilities that those actions will lead to. For
example, an old, unhealthy set of circumstances produces a range of possibilities
and warrants different actions than a young, healthy set. As with cancer, it is
best to stop the progress before getting into the later stages.
From studying history it appears to me that the stages of the archetypical cycle
from internal order to internal disorder and back are as follows:
Stage 1, when the new order begins and the new leadership
consolidates power, which leads to...
... Stage 2, when the resource-allocation systems and government
bureaucracies are built and refined, which if done well leads to...
... Stage 3, when there is peace and prosperity, which leads to...
... Stage 4, when there are great excesses in spending and debt and
the widening of wealth and political gaps, which leads to...
... Stage 5, when there are very bad financial conditions and intense
conflict, which leads to...
... Stage 6, when there are civil wars/revolutions, which leads to...
... Stage 1, which leads to Stage 2, etc., with the whole cycle happening over
again.
Each stage presents a different set of conditions that the people facing them
have to deal with. Some of these circumstances are much more difficult than
others to resolve. For example, early in the long-term debt cycle, when there is
plenty of capacity for governments to create debt to finance spending, it is easier
to deal with the circumstances at hand than late in the long-term debt cycle when
there is little or no capacity to create money and credit to finance spending. For
these reasons the range of possible paths forward and the challenges that leaders
face depend on where in the cycle a country is. These different stages present
different challenges that require different qualities, understandings, and skills
from leaders in order to effectively deal with them.-- How well those facing these
circumstances—e.g., you facing your circumstances and our leaders facing our
collective circumstances—understand and adapt to them affects how good or bad
the outcomes will be within the range of possibilities that exist given the
circumstances. Different cultures have established different ways of approaching
these circumstances. Those leaders and cultures who understand them and can
adapt to their circumstances will produce much better outcomes than those who
don’t. That is where timeless and universal principles come in.
While the length of time spent in each of these stages can vary a lot, the
evolution through them generally takes 100 years, give or take a lot and with big
undulations within the cycle. Eike evolution in general, the evolution of internal
orders occurs in a cyclical way in which one stage typically leads to the next
through a progression of stages that repeat and, in the process, evolve to higher
levels of development. For example, Stage 1 (when the new internal order is
created by new leaders who came to power via a civil war/revolution) normally
comes after Stage 6 (when there is a civil war/revolution, which is the low point in
the cycle), which leads to the next stage and so on up to Stage 3 (which is the high
point in the cycle because there is a lot of peace and prosperity in that stage),
which gets overdone in Stages 4 and 5 and so on, leading to the next new order
(Stage 1). That happens over and over again in an upward-evolving way. Again,
that archetypical cycle typically takes 100 years, give or take a lot. Within each
cycle there are similar, smaller cycles. For example, there is a short-term debt cycle
that leads to bubbles and recessions that come along roughly every eight years,
there are political cycles that move political control between the right and the left
that come along with roughly equal frequency, etc. Every country is now going
through them, and many of them are in different stages. For example,
China and India are in very different stages than the United States and
most European countries. Which stages countries are in versus other
countries affects the relations between countries and is the primary
determinant of the world order. We will explore all of this in the last
chapter of this book. The cycle’s archetypical evolution transpires as
shown in the following diagram.
1 Sew internal crder
ano пол* toadc-rsrio
2 Resource-alocation
systems and govecrvnent
tureaucrocies ore
tul* and refined
3 Peace and prosperity
4 Excesses and widenrvg
of wealth and other gaps
Q Bod financid
condffi ons and
intense conflicts
Q CMI wets ana
revoLilkrns
That is the complete internal order cycle. But of course the cycle repeats, with
new leaders replacing the old ones and the whole cycle beginning again. How
quickly a nation is able to rebuild and achieve new heights of prosperity depends
on 1) how severe the civil war/revolution that ended the prior cycle was and 2)
how competent the leaders of the new cycle are at establishing the things required
for success.
These cycles have taken place for as long as there has been recorded
history (and probably before), so many cycles are linked together, and they
are upward-sloping because of evolutionary gains that are made over time.
To see this at the country level, let’s look at China. The following chart
shows my estimates of China’s absolute powers and its figurative Big
Cycles going back to around the year 600. This is an ultra-simplified chart
(i.e., there were many more dynasties and complexities). I am presenting it in this
way so you can see how this evolution transpired from the 30,000-foot level.
MAJOR CHINESE DYNASTIES AND THEIR STAGES
(WITH INDICATIVE UPWARD EVOLUTION)
The next chart shows China’s relative powers. The differences between
the charts are due to the fact that the first one shows the absolute level of power
while the second one shows the level of power relative to other empires.
Since different countries are typically in different stages of the cycle
and since they take wealth and global political power from each other,
some countries are rising while others are declining, so the whole is less
volatile than any one country. In other words, the differences have had a
diversifying effect that has made the whole world’s evolution smoother than that
of any individual country. That is shown in the next chart, which is an update to
the global real GDP chart I showed you in Chapter 1. This chart is not a figurative
representation. It is literally the best estimate we have of real GDP per capita.
Embedded in this chart are the rises and falls of major empires (particularly the
Dutch and the British empires and the Ming and Qing dynasties), numerous wars,
and numerous booms and busts, all of which are called out. These events don’t
show up at the global level because they diversify each other and because they are
small relative to the big trends, even though they are huge from the perspective of
the people living through them.
GLOBAL RGDP PER CAPITA (2017 USD, LOG)
Beginning
of capitalism
(Amsterdam
Stock
Glorious
Revolution. French
Emergence 2008
ol German crisis.
м ughai
Empre
Dutch Rep
РОПЮ
of 1873
COVID-
z 1’
Deng
Xiaopng
reforms
World
Warll
Collapse
of Qing.
1 st Industrial Revolution
Global tGDP Is primarily a mix of European countries before 1870 due to limited
reliable data coverage across other countries before that point.
To reiterate, the figurative pictures of the archetypical six-stage cycle I just
painted are simplified versions of what really happens. I wanted to show you a
simplified version that conveys the essence of the stages and then descend into the
details. While the cycle by and large progresses as I described, it doesn’t always
progress exactly as I described. For example, like the stages of a disease (let’s say
Stage 3 cancer), being in one stage doesn’t mean that the progression to the next
stage is inevitable. But it does tell us a lot that is very valuable. As with a disease,
certain symptoms are clearly exhibited that allow one to identify which stage in
the cycle one is in, and being in that stage signifies the risks and ways of treating
the situation that are essential to know and are different from those that exist in
different stages. For example, being in Stage 5 means that certain conditions exist
that make it more likely that the cycle will progress to Stage 6 than if it were in
Stage 4 with Stage 4 conditions. By having clear and objective markers to identify
which stage each country (or state or city) is in, and by having an understanding
of the cause/effect relationships that produce changes, one can better know the
range of possibilities and position oneself accordingly, though one can never get
them exactly right.
As an example, we made an index of the number of economic red flags that
have existed at different times in history, including measures of high inequality,
high debt and deficits, inflation, and bad growth, to show how indicative they are
of subsequent civil wars and revolutions. The following chart shows the estimated
likelihood of a civil-war-type conflict based on the number of red flags. Based on
what we have seen in the past, we estimate that when there are 60-80 percent of
the red flags present, there is around a l-in-6 chance of severe internal conflict.
When lots of these conditions are in place (greater than 80 percent) there is
around a l-in-3 chance of a civil war or revolution—so not very probable but still
too probable for comfort. The US is in the 60-80 percent bucket today.
While I won’t take you through all of the factors in each stage and their various
configurations, I will outline the forces and milestones to pay most attention to in
each stage, with a special emphasis on the current state of disorder in the United
States and how things are progressing.
Delving into the Six Stages of the Cycle
We will now delve into what the archetypical six stages look like in greater detail so
we can identify them easily when we see them and so we can better imagine what
might come next.
Stage 1: When the New Order Begins and the New Leadership
Consolidates Power
To fight a civil war or to have a revolution—even a peaceful one—is to
have a great conflict in which one side wins and the other side loses and
the country suffers damages. Stage 1 is what follows the war; it is a time
when the winners gain control and the losers must submit. While the
winners were strong enough to win, at this first stage of the new order,
they must also be wise enough to consolidate power and rebuild the
country.
After winning power, the new leaders typically mop up the remaining
opposition and fight among themselves for power. In fact, one might say
that revolutions typically come in two parts—the first part is the fight to
bring down the established leaders and systems, and the second part is the
fight to remove those who were loyal to the former leaders and the fight
for power among those who won. I will call the second part “purges” and
touch on them in this section.
These consolidation of power/purge periods range widely in form and severity,
depending on the degrees of conflict between the new leaders and their
opposition, the amount of conflict between the new leaders themselves, and the
levels of development of the various government departments and bureaucracies
that they are inheriting.
This is the stage when, in some cases, the remaining opposition is killed or
imprisoned so that the new leaders are assured that their enemies won’t come back
fighting. It is also when those revolutionaries who were on the winning side of the
revolution fight against each other for power.
This stage has happened after virtually all civil wars/revolutions. Its intensity
varies, usually in proportion to the intensity of the civil war/revolution that
preceded this stage. At its worst, this post-revolution fighting to consolidate
power produced some of the most brutal periods in a given country’s history—
e.g., the post-1789 French Revolution period called the Reign of Terror, the post-
1917 Russian Revolution period called the Red Terror, the post-1949 Chinese
Civil War period called the Anti-Rightist Campaign, etc. In some cases these
purges happened a single time right after the revolution (e.g., the Reign of
Terror), while in other cases they came and went episodically over decades (e.g.,
China’s Cultural Revolution happened 17 years after the Chinese Communist
Party came to power). These purges are done to consolidate power and persecute
perceived ideological enemies or enemies of the state, and they are sometimes
more brutal than the revolution itself. At their best, and if conditions allow
because the basic system and respect for it is maintained, they’re like the period
after the US Civil War or during the peaceful Roosevelt revolution of the 1930s.
During this stage the leaders who do best are “consolidators of power.”
They typically have qualities similar to those who did best in the revolution in the
prior stage—as they are strong, smart fighters who are willing and able to win at all
costs. But in this stage they have to be much more politically astute because the
enemies are much less apparent. Tang Emperor Taizong and Rome’s Caesar
Augustus excelled at this stage. More recently, leaders such as the US Founding
Fathers, France’s Napoleon, and Germany’s Otto von Bismarck also exemplify
how to effectively move from the war period to the rebuilding period.
This stage is over when the new authorities are clear and everyone is sick of the
fighting and is well into the rebuilding.
Stage 2: When Resource-Allocation Systems and Government
Bureaucracies Are Built and Refined
I call this phase “early prosperity” because it is typically the beginning of a
peaceful and prosperous period.
After the new leaders have torn down the old order and consolidated power, or
overlapping with that time, the new leaders have to start building a new system to
better allocate resources. This is the stage when system and institution building
are of paramount importance. What is required is designing and creating a system
(order) that leads to people rowing in the same direction in pursuit of similar
goals, with respect for rules and laws, and putting together an effective resource-
allocation system that leads to rapidly improving productivity that benefits most
people. This redesigning and rebuilding period has to be done even after lost wars
because rebuilding still must occur. Examples of countries being in this stage
include the United States in the 15 years after it declared independence in 1776;
the early Napoleonic era immediately after Napoleon grabbed power in a coup at
the end of the French Revolution in 1799; the early Japanese Meiji Restoration
period immediately after the political revolution in 1868; the post-war periods in
Japan, Germany, and most countries in the late 1940s through most of the 1950s;
the post-civil war period in China; and Russia after the breakup of the Soviet
Union.
A timeless and universal principle to keep in mind during this stage is that • to
be successful the system has to produce prosperity for most people, especially the large
middle class. As Aristotle conveyed in Politics-. “Those states are likely to be well-
administered in which the middle class is large, and stronger if possible than both
the other classes... where the middle class is large, there are least likely to be
factions and dissensions... For when there is no middle class, and the poor are
excessive in number, troubles arise, and the state soon comes to an end.”
The leaders who are best during this stage are typically very different
from those who succeeded in Stages 6 and 1. I call them “civil engineers.”
While they need to be smart, and ideally they are still strong and
inspirational, above all else they need to be able to design and build the
system that is productive for most people, or they need to have people
working for them who can do that. The different qualities of leaders that are
required to succeed in the revolutionary Stages 6 and 1 and those that are required
in this rebuilding administrative Stage 2 are exemplified by Winston Churchill
and Mao being great “inspirational generals” and lousy “civil engineers.” Examples
of great leaders at this stage include Konrad Adenauer in Germany, Lee Kuan Yew
in Singapore, and Deng Xiaoping in China, who came to power after wars and
built systems that produced prosperity well beyond their lifetimes.
The most extraordinary leaders are those who took their countries
through Stages 6, 1, and 2—i.e., through the civil war/revolution, through
the consolidation of power, and through the building of the institutions
and systems that worked fabulously for a long time after them—and did it
at scale. The best ever probably were Tang Taizong (one of the revolutionary
founders of the Tang Dynasty in China in the 600s, which was followed by about
a century and a half of peace and prosperity that led China to become the world’s
largest and strongest country); Caesar Augustus (who became the first emperor of
Rome in 27 BCE and began roughly 200 years of relative peace and prosperity, in
which Rome became the world’s largest empire); and Genghis Khan (who
founded and led the Mongol Empire starting in 1206, which was followed by over
a century of prosperity when it became the world’s largest and strongest empire,
though failure to establish a sustainable succession produced civil wars, including
shortly after his death).
This sequence of rebuilding happens all the time in varying degrees depending
on the amount of change that is warranted. In some cases it comes after brutal
revolutions when there needs to be a rebuilding of nearly everything, and in other
cases it comes when the institutions and systems that are there just need to be
modified to suit the new leader.
Stage 3: When There Is Peace and Prosperity
I also call this phase “mid-prosperity.” It is the sweet spot of the internal
order cycle. It is when people have an abundance of opportunity to be
productive, are excited about it, work well together, produce a lot, get
rich, and are admired for being successful. In this stage conditions are
improving for almost everyone so most of the next generation is better off than
most of the prior generation, so there is broad optimism and excitement about the
future. History shows us that, when done well, there is wide and almost equal
access to education and merit-based placements in jobs. This draws on the widest
possible range of the population to access talent and yields a system that most
people believe is fair. Successful entrepreneurs, inventors, and adventurers
produce new ideas and take their societies to new places and become the heroes
who others aspire to be like because of how they come up with revolutionary new
ideas, make people’s lives better, and are rewarded for it. Debt growth fuels
productivity and in turn real income growth, which makes debts easy to service
and provides excess profits that make equity returns excellent. Incomes exceed
expenses and savings exceed liabilities with the savings financing investment in the
future. Stage 3 is an exciting period that has a lot of creativity, productivity, and
energy.
Examples of this period include most of the Victorian Era in Britain (covering
much of the 19th century, marked by Second Industrial Revolution inventions
producing a rapid increase in prosperity); the German Empire in the late 1800s
(with rapid industrialization, technological innovation, and a quickly
strengthening military); and the 1960s in the United States. For example, the
moon shot project exemplified the shared mission. The whole country cheered
and was brought closer together when the lunar landing happened.
This is the time for the “inspirational visionary” who can a) imagine
and convey an exciting picture of a future that never existed before, b)
actually build that future out, and then c) use the prosperity earned to
broaden the inclusiveness of it and to invest in the future. They do this
while d) maintaining sound finances and e) pursuing excellent
international relations, so that they protect or expand their empires
without any financially or socially debilitating wars. Examples include:
In the British Empire’s Victorian Age in the mid-to-late 1800s, Prime
Minister William Gladstone simultaneously maintained high levels of
productivity, imposed strict budget controls that led to strong finances, and
supported the general population so much that he was known as “The
People’s William.” He also ran a peaceful and prosperous foreign policy.
In the German Empire in the late 1800s, Chancellor Otto von Bismarck
united the disparate populations of 39 different states and people of
different religions to build Germany as a country and an economic
powerhouse. Under him Germany had an economic boom with sound
finances while brilliantly navigating international relations so it benefited
internally and avoided debilitating major wars.
Prime Minister Lee Kuan Yew successfully took Singapore through these
stages by running the country as prime minister from 1959 to 1990 and
mentoring until his death in 2015. He created the principles and shaped the
culture to be successful long after him and avoided wars without losing
power.
In the post-war US, John F. Kennedy in his 34 short months as president
from January 20, 1961, to November 22, 1963, inspired the country to go
to the moon, advanced the civil rights movement, undertook the War on
Poverty with Vice President Lyndon Johnson, and kept the United States
out of major wars while simultaneously strongly containing opposition to
the US Empire.
In China, Deng Xiaoping transitioned a weak and inefficient communist
system to a highly productive state capitalist system, quickly changing the
nation’s psychology to make these changes with sayings such as “it is
glorious to be rich” and “it doesn’t matter whether the cat is black or white
as long as it catches mice”; built China’s economy and finances to be very
strong; enormously improved the education and quality of life of most
people; dramatically increased life expectancies and reduced poverty rates;
successfully led China through internal political conflicts; and strictly
maintained China’s sovereignty while avoiding major external conflicts.
The longer countries stay in this stage, the longer their good times last.
During this stage the developments to pay attention to that reflect the
big risks that naturally develop and undermine the self-sustaining good
results are the widenings of the opportunity, income, wealth, and values
gaps accompanied by bad and unfair conditions for the majority, luxurious
and unfairly privileged positions for the elites, declining productivity, and
bad finances in which excess debts are created. The great empires and
great dynasties that were able to sustain themselves stayed in Stage 3 by
avoiding these risks. The failure to avoid these risks leads to Stage 4, which is a
period of excesses. This is the stage in which the temptation to do everything (and
borrow money to do it) can lead to the brink of conflict.
Stage 4: A Period of Excesses
I also call this the “bubble prosperity phase.” I will describe it briefly because
we touched on these elements before. Classically:
There is the rapidly increasing debt-financed purchases of goods, services,
and investment assets, so debt growth outpaces the capacity of future cash
flows to service the debts. So bubbles are created. These debt-financed
purchases emerge because investors, business leaders, financial
intermediaries, individuals, and policy makers tend to assume that the
future will be like the past so they bet heavily on the trends continuing.
They mistakenly believe that investments that have gone up a lot are good
rather than expensive so they borrow money to buy them, which drives up
their prices, which reinforces this bubble process. That is because as their
assets go up in value their net worth and spending-to-income level rise,
which increases their borrowing capacity, which supports the leveraging-up
process, and so the spiral goes until the bubbles burst. Japan in 1988-90,
the US in 1929, the US in 2006-07, and Brazil and most other Latin
American commodity producers in 1977-79 are classic examples.
There is a shift in the spending of money and time to more on
consumption and luxury goods and less on profitable investments. The
reduced level of investments in infrastructure, capital goods, and R&D
slows the country’s productivity gains and leads its cities and infrastructure
to become older and less efficient.
There is a lot of spending on the military at this stage to expand and protect
global interests, especially if the country is a leading global power.
The country’s balance of payments positions deteriorate, reflecting its
increased borrowing and reduced competitiveness. If the country is a
reserve currency country, this borrowing is made easy as the result of non-
reserve currency country savers having a preference to save in/lend to the
reserve currency.
Wealth and opportunity gaps are large and resentments between classes
emerge.
During this phase, the archetypical best leader is the “well-grounded,
disciplined leader” who understands and conveys sound fundamental
behaviors that yield productivity and sound finances and creates restraints
when the crowd wants to overdo things. These leaders are the ones who
lead the country to continue to reinvest a significant amount of their
earnings and their time into being productive when they become richer.
As mentioned, Lee Kuan Yew, the former prime minister of Singapore, ensured
that his country and fellow citizens had the culture to become well-educated,
disciplined, and of strong character even after becoming successful and rich.
However, these leaders are few and far between because fighting the ebullience of
the masses is very unpopular. In almost all cases, after becoming rich, the country
(and its leaders) become decadent, overspend, borrow to finance excess
consumption, and lose competitiveness. This period of decline is exemplified by
decadent leaders such as the notorious Emperor Nero (who used a citywide fire in
Rome to confiscate land to build an expansive palace), Louis XIV (who expanded
the Palace of Versailles while productivity fell and people endured hardships at the
height of his power), and the Ming Dynasty’s Wanli Emperor (who withdrew
from actively governing and focused on the construction of his own immense
tomb).
Stage 5: When There Are Bad Financial Conditions and Intense
Conflict
The most important influence that transpires in a Big Cycle is that of debt,
money, and economic activity. Because I covered that cycle comprehensively in
Chapters 3 and 4,1 won’t explain it here in detail. But to understand Stage 5, you
need to know that it follows Stage 3, in which there is peace and prosperity and
favorable debt and credit conditions, and Stage 4, in which excess and decadence
begin to bring about worse conditions. This process culminates in the most
difficult and painful stage—Stage 6—when the entity runs out of money and
there is typically terrible conflict in the form of revolution or civil war. Stage 5 is
the period during which the interclass tensions that go along with worsening
financial conditions come to a head. How different leaders, policy makers, and
groups of people deal with conflict has a major impact on whether the country
will undergo the needed changes peacefully or violently.
You can see signs of this happening now in a number of countries. Those that
have adequate financial conditions (i.e., have incomes that are greater than their
expenses and assets that are greater than their liabilities) are in relatively good
shape. Those that do not are in relatively bad shape. They want money from the
others. The problem is that there are many more who are in bad shape relative to
those that are in good shape.
You can also see that these different conditions are big drivers of the
differences in what is now happening to most aspects of these countries, states,
cities, companies, and people—e.g., their education, healthcare, infrastructure,
and well-being. You can also see big cultural differences in how countries
approach their stressful conditions, with some approaching them more
harmoniously than others who are more inclined to fight.
Because Stage 5 is such a pivotal stage in the internal cycle and because it’s the
stage that many countries, most importantly the US, are now in, I will devote
some time to going through the cause/effect relationships at play during it and the
key indicators to watch in examining its progression. Then I will turn more
specifically to where the United States stands.
The Classic Toxic Mix
• The classic toxic mix of forces that brings about big internal conflicts consists of 1) the
country and the people in the country (or state or city) being in bad financial shape (e.g.,
having big debt and поп-debt obligations), 2) large income, wealth, and values gaps within
that entity, and 3) a severe negative economic shock.
That confluence typically brings about disorder, conflict, and sometimes civil
wars. The economic shock can come about for many reasons, including financial
bubbles that burst, acts of nature (such as pandemics, droughts, and floods), and
wars. It creates a financial stress test. The financial conditions (as measured by
incomes relative to expenses and assets relative to liabilities) that exist at the time
of the stress test are the shock absorbers. The sizes of the gaps in incomes, wealth,
and values are the degrees of fragility of the system. When the financial problems
occur, they typically first hit the private sector and then the public sector. Because
governments will never let the private sector’s financial problems sink the entire
system, it is the government’s financial condition that matters most. When the
government runs out of buying power, there is a collapse. But on the way to a
collapse there is a lot of fighting for money and political power.
From studying 50-plus civil wars and revolutions, it became clear that the
single most reliable leading indicator of civil war or revolution is bankrupt
government finances combined with big wealth gaps. That is because when the
government lacks financial power, it can’t financially save those entities in the
private sector that the government needs to save to keep the system running (as
most governments, led by the United States, did at the end of 2008), it can’t buy
what it needs, and it can’t pay people to do what it needs them to do. It is out of
power.
A classic marker of being in Stage 5 and a leading indicator of the loss
of borrowing and spending power, which is one of the triggers for going
into Stage 6, is that the government has large deficits that are creating
more debt to be sold than buyers other than the government’s own central
bank are willing to buy. That leading indicator is turned on when
governments that can’t print money have to raise taxes and cut spending,
or when those that can print money print a lot of it and buy a lot of
government debt. To be more specific, when the government runs out of money
(by running a big deficit, having large debts, and not having access to adequate
credit), it has limited options. It can either raise taxes and cut spending a lot or
print a lot of money, which depreciates its value. Those governments that have the
option to print money always do so because that is the much less painful path, but
it leads investors to run out of the money and debt that is being printed. Those
governments that can’t print money have to raise taxes and cut spending, which
drives those with money to run out of the country (or state or city) because paying
more taxes and losing services is intolerable. If these entities that can’t print money
have large wealth gaps among their constituents, these moves typically lead to
some form of civil war/revolution.-
At the time of this writing, this late-cycle debt dynamic is now playing out in
the United States at both the state and federal levels, with the main difference
between them being that state governments can’t print money to pay their debts
while the federal government can. The federal government and many state and
city governments have large deficits, large debts, and large wealth gaps, and the
central bank (the Federal Reserve) has the power to print money. So, at the time
of this writing, the central bank is printing a lot of money and buying a lot of
federal government debt, which finances the government spending that is much
bigger than the federal government’s intake. That has helped the federal
government and those it is trying to help, though it has also cost those who are
holding dollars and dollar debt a lot in real purchasing power.
• Those places (cities, states, and countries) that have the largest wealth gaps, the largest
debts, and the worst declines in incomes are most likely to have the greatest conflicts.
Interestingly, those states and cities in the US that have the highest per capita
income and wealth levels tend to be the states and cities that are the most indebted
and have the largest wealth gaps—e.g., cities like San Francisco, Chicago, and New
York City and states like Connecticut, Illinois, Massachusetts, New York, and
New Jersey.
Facing these conditions, expenditures have to be cut or more money has
to be raised in some way. The next question becomes who will pay to fix
them, the “haves” or the “have-nots”? Obviously, it can’t be the have-nots.
Expenditure cuts are most intolerable for those who are poorest, so there needs to
be more taxation of people who can afford to pay more and there is a heightened
risk of some form of civil war or revolution. But when the haves realize that
they will be taxed to pay for debt service and to reduce the deficits, they
typically leave, causing the hollowing-out process. This is currently
motivating movements from some states to others in the US. If bad economic
conditions occur, that hastens the process. These circumstances largely drive the
tax cycle.
• History shows that raising taxes and cutting spending when there are large wealth gaps
and bad economic conditions, more than anything else, has been a leading indicator of civil
wars or revolutions of some type. To be clear they don’t have to be violent, though
they can be.
I see these cycles transpiring in my personal interactions. For example, I live in
the state of Connecticut, which has the highest per capita income in the country,
the largest wealth gap and income gap in the country, and one of the largest per
capita debt and unfunded pension obligations in the country. I see how the haves
and the have-nots are focused on their own lives and spend little time worrying
about the other because they don’t have much contact. I have windows into what
the lives of both the haves and the have-nots are like because I have contact with
the people in our community of haves and because the work my wife does to help
disengaged and disconnected high school students in disadvantaged communities
brings her into contact with people who live in the communities of the have-nots.
I see how terrible the conditions are in those have-not communities and how the
haves (who appear rich and decadent to the have-nots) don’t feel rich. I see how
they are all focused on their own struggles—with the haves struggling with
work/life balance, making sure their kids are well-educated, etc., and the have-nots
struggling with finding income, food security, avoiding violence, trying to get
their kids a quality education, etc.-
I see how both groups are more likely to have critical, stereotypical impressions
of each other that make them more inclined to dislike each other than to view
themselves empathetically as members of one community in which they should
help each other. I see how difficult it can be to help each other because of these
stereotypes and because the haves don’t feel that they have more than enough or
that the have-nots deserve their financial support, and I fear what the future might
hold because of the existing circumstances and how they are likely to worsen. I
have seen close up how COVID-inflicted health and budget shocks have brought
to the surface the terrible conditions of the have-nots and are worsening the
financial gaps that could bring about the classic toxic mix dynamic.
• Averages don't matter as much as the number of people who are suffering and their
power. Those who favor policies that are good for the whole—e.g., free trade,
globalization, advances in technology that replace people—without thinking
about what happens if the whole is not divided in a way that benefits most people
are missing the fact that the whole is at risk. • To have peace and prosperity, a society
must have productivity that benefits most people. Do you think we have this today?
What does history show as the path that bankrupt governments can follow to
raise productivity that benefits most people? It shows that restructuring and/or
devaluing enough of the previously created debt and non-debt obligations helps a
lot. That is classic in Stages 5 and 6. Once the restructuring or devaluation reduces
the debt burdens, which is typically painful at the time, the reduced debt burdens
allow for a rebuilding.
• An essential ingredient for success is that the debt and money that are created are used
to produce productivity gains and favorable returns on investment, rather than just being
given away without yielding productivity and income gains. If it is given away without yielding
these gains, the money will be devalued to the point that it won't leave the government or
anyone else with much buying power.
• History shows that lending and spending on items that produce broad-based productivity
gains and returns on investment that exceed the borrowing costs result in living standards
rising with debts being paid off, so these are good policies. If the amount of money being
lent to finance the debt is inadequate, it is perfectly fine for the central bank to
print the money and be the lender of last resort as long as the money is invested to
have a return that is large enough to service the debt. History shows and logic
dictates that investing well in education at all levels (including job training),
infrastructure, and research that yields productive discoveries works very well. For
example, big education and infrastructure programs have paid off nearly all the
time (e.g., in the Tang Dynasty and many other Chinese dynasties, in the Roman
Empire, in the Umayyad Caliphate, in the Mughal Empire in India, in Japan’s
Meiji Restoration, and in China’s educational development programs over the last
couple of decades), though they have long lead times. In fact, improvements in
education and infrastructure, even those financed by debt, were essential
ingredients behind the rises of virtually all empires, and declines in the quality of
these investments were almost always ingredients behind empires’ declines. If
done well, these interventions can more than counterbalance the classic toxic mix.
The classic toxic mix is usually accompanied by other problems. The more of
the following conditions that are in place, the higher the probability of having a
severe conflict like a civil war or revolution.
+ Decadence
While early in the cycle there is typically more spending of time and money on
productive things, later in the cycle time and money go more toward indulgent
things (e.g., the finer things, like expensive residences, art, jewelry, and clothes).
This begins in Stage 4 when such spending is fashionable, but by Stage 5 it begins
to appear grotesque. Often that decadent spending is debt-financed, which
worsens the financial conditions. The change in psychology that typically goes
along with these changes is understandable. The haves feel that they have earned
their money so they can spend it on luxuries if they like, while the have-nots view
such spending at the same time they are suffering as unfair and selfish. Besides
increasing resentments, decadent spending (as distinct from saving and investing)
reduces productivity. • What a society spends money on matters. When it spends on
investment items that yield productivity and income gains, it makes for a better future than
when it spends on consumption items that don't raise productivity and income.
+ Bureaucracy
• While early in the internal order cycle bureaucracy is low, it is high late in the cycle, which
makes sensible and needed decision making more difficult. That is because things tend to
get more complex as they develop until they reach the point where even obviously
good things can’t be done—necessitating revolutionary changes. In a legal and
contract-based system (which has many benefits), this can become a problem
because the law can stand in the way of doing obviously good things. I will give
you an example that I’m close to because my wife and I care about it.
Because the US Constitution doesn’t make education a federal government
responsibility, it has predominantly been a state and local responsibility with
school funding coming from revenue raised by local taxes in cities and towns.
Though it varies from state to state, typically those children in richer towns in
richer states receive a much better education than those in poorer towns in poorer
states. This is obviously unfair and unproductive even though most people agree
that children should have equal opportunities in education. But because this
structure is so ingrained in our political system, it is nearly impossible to fix
without a revolutionary reinvention of how we approach it. There are more
examples of the bureaucracy standing in the way of doing sensible, productive
things than I have time and space to convey here. It is now a big problem in
America.
+ Populism and Extremism
Out of disorder and discontent come leaders who have strong
personalities, are anti-elitist, and claim to fight for the common man.
They are called populists. Populism is a political and social phenomenon
that appeals to ordinary people who feel that their concerns are not being
addressed by the elites. It typically develops when there are wealth and
opportunity gaps, perceived cultural threats from those with different
values both inside and outside the country, and “establishment elites” in
positions of power who are not working effectively for most people.
Populists come into power when these conditions create anger among ordinary
people who want those with political power to be fighters for them. Populists can
be of the right or of the left, are much more extreme than moderates, and tend to
appeal to the emotions of ordinary people. They are typically confrontational
rather than collaborative and exclusive rather than inclusive. This leads to a lot of
fighting between populists of the left and populists of the right over irreconcilable
differences. The extremity of the revolution that occurs under them varies. For
example, in the 1930s, populism of the left took the form of communism and that
of the right took the form of fascism while nonviolent revolutionary changes took
place in the US and the UK. More recently, in the United States, the election of
Donald Trump in 2016 was a move to populism of the right while the popularity
of Bernie Sanders, Elizabeth Warren, and Alexandria Ocasio-Cortez reflects the
popularity of populism of the left. There are increased political movements
toward populism in a number of countries. It could be said that the election of
Joe Biden reflects a desire for less extremism and more moderation, though time
will tell.
Watch populism and polarization as markers. The more that populism
and polarization exist, the further along a nation is in Stage 5, and the
closer it is to civil war and revolution. In Stage 5, moderates become the
minority. In Stage 6, they cease to exist.
+ Class Warfare
In Stage 5, class warfare intensifies. That is because, as a rule, • during times of
increased hardship and conflict there is an increased inclination to look at people in
stereotypical ways as members of one or more classes and to look at these classes as either
being enemies or allies. In Stage 5, this begins to become much more apparent. In
Stage 6, it becomes dangerous.
A classic marker in Stage 5 that increases in Stage 6 is the demonization
of those in other classes, which typically produces one or more scapegoat
classes who are commonly believed to be the source of the problems. This
leads to a drive to exclude, imprison, or destroy them, which happens in
Stage 6. Ethnic, racial, and socioeconomic groups are often demonized. The most
classic, horrific example of this comes from the Nazi’s treatment of Jews, who
were blamed and persecuted for virtually all of Germany’s problems. Chinese
minorities living in non-Chinese countries have been demonized and scapegoated
during periods of economic and social stress. In the UK, Catholics were
demonized and scapegoated in numerous stressful periods, such as the Glorious
Revolution and the English Civil War. Rich capitalists are commonly demonized,
especially those who are viewed to be making their money at the expense of the
poor. Demonizing and scapegoating are a classic symptom and problem that we
must keep an eye on.
+ The Loss of Truth in the Public Domain
Not knowing what is true because of distortions in the media and
propaganda increases as people become more polarized, emotional, and
politically motivated.
In Stage 5, those who are fighting typically work with those in the
media to manipulate people’s emotions to gain support and to destroy the
opposition. In other words, media folks of the left join with others of the left and
media folks of the right join with others of the right in the dirty fight. The media
goes wild like vigilantes: people are commonly attacked and essentially tried and
found guilty in the media, and they have their lives ruined without a judge and
jury. A common move among 1930s populists of the left (communists) and of the
right (fascists) was to take control of the media and establish “ministers of
propaganda” to guide them. The media they produced was explicitly aimed at
turning the population against the groups that the governments considered
“enemies of the state.” The government of the democratically run United
Kingdom created a “Ministry of Information” during World War I and World
War II to spread government propaganda, and leading newspaper publishers were
elevated by the government if they did what the government wanted them to do
to win the propaganda war- or were vilified and suffered if they didn’t cooperate.
Revolutionaries did the same distorting of the truth in all sorts of publications.
During the French Revolution, newspapers run by revolutionaries pushed anti-
monarchist and anti-religious sentiment, but when those revolutionaries attained
power, they shut down dissenting newspapers during the Reign of Terror. During
times of great wealth gaps and populist thinking, stories that bring down elites are
popular and lucrative, especially those that bring down left-leaning elites in right-
leaning media outlets and those that bring down right-leaning elites in left-leaning
media outlets. History shows that significant increases in these activities are a
problem that is typical of Stage 5, and that when combined with the ability to
inflict other punishments, the media becomes a powerful weapon.
It is well-recognized this is happening at the time of this writing. The
perceived truth in media, both traditional and social, is lower than at any
other time in our lifetimes. For example, a 2019 Gallup poll found that
only 13 percent of Americans surveyed have “a great deal” of trust in the
media and only 41 percent of those surveyed have either a “fair” or “great
deal” of trust in the media. That compares with 72 percent who trusted
the media in 1976. This is not just a fringe media problem; it is a mainstream
media problem and a problem for our whole society. The dramatically decreased
trustworthiness has even plagued former icons of journalistic trust such as The
Wall Street Journal and The New York Times, which have seen their trust ratings
plunge. In addition to being politically motivated, sensationalistic stories have
become commercially rewarding at a time when the media business is in financial
trouble. Most of the media folks I speak with share my concerns, though they
typically won’t share them openly. Still, in reflecting on the problem, Martin
Baron, then executive editor of The Washington Post, said, “If you have a society
where people can’t agree on the basic facts, how do you have a functioning
democracy?” This dynamic is impeding free speech because people are afraid to
speak up because of how they will be attacked in both traditional and social media
by distortions that are meant to bring them down.
Even very capable and powerful people are now too afraid of the media
to speak up about important matters or run for public office. Since most
high-profile people are torn down, most everyone I speak with agrees that it is
dangerous to be a high-profile, vocal person who fights for truth and justice,
especially if one offends people who are inclined to use the media to fight.
Though not discussed in public because of fears of media reprisals, this issue is
continuously discussed in private. For example, during a lunch I had not long ago
with a general who had held a very high political position and had just left
government service, we explored what he would do next. I asked him what he was
most passionate about. He said, “Of course helping my country.” I asked him
whether he would consider running for elected office, and he explained that while
he was willing to die for his country he couldn’t bring himself to run for public
office because of how enemies would use the media and social media to make up
lies to harm him and his family. This general and almost everyone I know who we
should listen to are afraid to speak openly because they fear that attacks by
extremists who oppose them will be enabled and amplified by the sensationalistic
media. Many of my friends tell me that I’m crazy to speak so openly about
controversial things such as those covered in this book because it is inevitable that
some people or groups will try to take me down via the media. I think they are
probably right, but I won’t let the risks dissuade me.-
+ Rule-Following Fades and Raw Fighting Begins
• When the causes that people are passionately behind are more important to them than the
system for making decisions, the system is in jeopardy. Rules and laws work only when they
are crystal clear and most people value working within them enough that they are willing to
compromise in order to make them work well. If both of these are less than excellent, the
legal system is in jeopardy. If the competing parties are unwilling to try to be
reasonable with each other and to make decisions civilly in pursuit of the well-
being of the whole, which will require them to give up things that they want and
might win in a fight, there will be a sort of civil war that will test the relative
powers of the relevant parties. In this stage, winning at all costs is the game and
playing dirty is the norm. Late in Stage 5 is when reason is abandoned in favor of
passion. • When winning becomes the only thing that matters, unethical fighting becomes
progressively more forceful in seif-reinforcing ways. When everyone has causes that they are
fighting for and no one can agree on anything, the system is on the brink of civil
war/revolution.
This typically happens in a couple of ways:
Late in Stage 5 it is common for the legal and police systems to be
used as political weapons by those who can control them. Also
private police systems form—e.g., thugs who beat people up and take
their assets, and bodyguards to protect people from these things
happening to them. For instance, the Nazi party formed a paramilitary
wing before it came to power that then became an official force when the
Nazis were in power. The short-lived British Union of Fascists in the 1930s
and the Ku Klux Klan in the US were effectively paramilitary groups as
well. Such cases are quite normal, so view their development as a marker of
moving to the next stage.
Late in Stage 5 there are increasing numbers of protests that become
increasingly violent. Because there is not always a clear line between a
healthy protest and the beginnings of a revolution, leaders in power often
struggle over how to allow protests without giving the perceived freedom to
revolt against the system. Leaders must manage these situations well. A
classic dilemma arises when demonstrations start to cross over into
revolution. Both giving the freedom to protest and suppressing protests are
risky paths for leaders, as either path could lead the revolution to get strong
enough to topple the system. No system allows people to bring down the
system—in most, an attempt to do so is treason, typically punishable by
death. Nonetheless, it is the job of revolutionaries to bring down systems, so
governments and revolutionaries test each other to see what the limits are.
When broad-based discontent bubbles up and those in power allow it to
grow, it can boil over to the point that when they try to put a lid on it, it
explodes. The conflicts in the late part of Stage 5 typically build up to a
crescendo that triggers the violent fighting that signifies the transition into
what historians stamp as official civil war periods, which I am identifying as
Stage 6 in the Big Cycle. • People dying in the fighting is the marker that almost
certainly signifies the progression to the next and more violent civil war stage, which
will continue until the winners and losers are clearly determined.
That brings me to my next principle: • when in doubt, get out—if you don't want to be
in a civil war or a war, you should get out while the getting is good. This is typically late in
Stage 5. History has shown that when things get bad, the doors typically close for
people who want to leave. The same is true for investments and money as
countries introduce capital controls and other measures during such times.
• Crossing the line from Stage 5 (when there are very bad financial conditions and intense
internal and external conflict exist) to Stage 6 (when there is civil war) occurs when the
system for resolving disagreements goes from working to not working. In other words, it
happens when the system is broken beyond repair, people are violent with each
other, and the leadership has lost control.
As you might imagine, it is a much bigger deal to break a system/order and
build a new one than it is to make revolutionary changes within an existing
system/order. Though breaking a system/order is more traumatic, it isn’t
necessarily a worse path than operating within a system.
Deciding whether to keep and renovate something old that is not working well
or to dispose of it and replace it with something new is never easy, especially when
the something new is not clearly known and what is being replaced is as important
as the domestic order. Nonetheless, it happens, though typically it is not decided
on intellectually; it is more often emotionally driven.
• When one is in Stage 5 (like the US is now), the biggest question is how much the system
will bend before it breaks. The democratic system, which allows the population to do
pretty much whatever it decides to do, produces more bending because the people
can make leadership changes and only have themselves to blame. In this system
regime changes can more easily happen in a peaceful way. However, the “one
person, one vote” democratic process has the drawback of having leaders selected
via popularity contests by people who are largely not doing the sort of thoughtful
review of capabilities that most organizations would do when trying to find the
right person for an important job. Democracy has also been shown to break down
in times of great conflict.
Democracy requires consensus decision making and compromise, which
requires a lot of people who have opposing views to work well with each other
within the system. That ensures that parties that have significant constituencies
can be represented, but like all big committees of people who have widely
different views (and might even dislike each other), the decision-making system
does not lend itself to efficient decision making. « The biggest risk to democracies is
that they produce such fragmented and antagonistic decision making that they can be
ineffective, which leads to bad results, which leads to revolutions led by populist autocrats
who represent large segments of the population who want to have a strong, capable leader get
control of the chaos and make the country work well for them.
Also noteworthy: history has shown that during times of great conflict
federalist democracies (like the US) typically have conflicts between the states and
the central government over their relative powers. That would be a marker to look
out for that hasn’t yet arisen much in the US; its happening would signify the
continued progression toward Stage 6.
There are far too many breakdowns of democracies to explore, let alone
describe. While I looked into a number of them to see the patterns, I haven’t fully
mined them, and I’m not going to dive into them here. I will say that the factors
described in the explanations of Stage 5 when taken to the extreme—most
importantly, terrible finances, decadence, internal strife and disorder, and/or
major external conflict—lead to a dysfunctional set of conditions and a fight for
power led by a strong leader. Archetypical examples include Athens from the late
400s to the 300s BCE, the end of the Roman Republic in the century or so
preceding 27 BCE,Z Germany’s Weimar Republic in the 1920s, and the weak
democracies of Italy, Japan, and Spain in the 1920s and 1930s that turned to
autocracies of the right (fascism) to bring order to the chaos.
• Different stages require different types of leaders to get the best results. Stage 5 is a
juncture in which one path could lead to civil war/revolution and the
other could lead to peaceful and, ideally, prosperous coexistence. Obviously
the peaceful and prosperous path is the ideal path, but it is the much more
difficult path to pull off. That path requires a “strong peacemaker” who goes out
of their way to bring the country together, including reaching out to the other
side to involve them in the decision making and reshaping the order in a way that
most people agree is fair and works well (i.e., is highly productive in a way that
benefits most people). There are few such cases in history. We pray for
them. The second type is a “strong fighter” who is capable of taking the country
through the hell of civil war/revolution.
Stage 6: When There Are Civil Wars
C/V/7 wars inevitably happen, so rather than assuming "it won't happen here," which most
people in most countries assume after an extended period of not having them, it is better to be
wary of them and look for the markers to indicate how close one is. While in the last
section we looked at nonviolent revolutions that took place within the order, in
this section we will be looking at the markers and the patterns of civil wars and
revolutions that were almost always violent and toppled the old order and
replaced it with a new one. Though there are innumerable examples that I
could have examined to understand how they work, I chose what I believe
are the 29 most significant ones, which are shown in the following table. I
categorized this group into those that produced big changes to the
system/regime and those that did not. For example, the US Civil War was a
really bloody civil war that failed to overturn the system/order, so it is in the
second group at the bottom of the table, while those that toppled the
system/order are at the top. These categories are of course imprecise, but once
again we won’t let imprecision stand in the way of seeing what we couldn’t see if
we insisted on being precise. Most of these conflicts, though not all of them,
transpired in the archetypical way described in this section.
CONFLICT COUNTRY BEGAN IN...
Dutch Revolt NLD 1546
Engfch Civil War GBR 1642
Glorious Revolution GBR 1688
American Revolution USA 1775
French Revolution FRA 1789
Trienlo Liberal ESP 1820
French Revolution of 1848 FRA 1848
Melji Restoration JPN 1868
Xinhai Revolution CHN 1911
Russian Revolution and Civi War RUS 1917
German Revolufion/End of Monarchy DEU 1918
Rise of Hitler/Poliicol Violence DEU 1929
Rise of Japanese Militarists JPN 1932
Spanish Civil War ESP 1936
Chinese Civil War CHN 1945
Jacobite Risings GBR 1745
Pugachev's Rebelion RUS 1773
Dutch Patriot Revolt NLD 1781
White Lotus Rebellion CHN 1794
German Revolutions of 1848 DEU 1848
Taiping Rebelion CHN 1851
Panthay Rebellon CHN 1856
US Civil War USA 1861
Muslim Rebellion CHN 1862
Paris Commune FRA 1871
Boxer Rebellion CHN 1899
1905 Russian Revolution RUS 1905
National Protection War CHN 1915
6 February 1934 Crisis FRA 1934
Cases
that
created
changes
to the
system a
regime
Cases
that didn't
create
changes
to the
system or
regime
A classic example of a civil war breaking the system and having to build a new
system is the Russian Revolution/Civil War of 1917. This put into place the
communist internal order that eventually entered Stage 5 in the late 1980s, which
led it to attempt to make revolutionary changes within the system—called
perestroika (i.e., restructuring)—which failed and were followed by the collapse of
the Soviet Union’s order in 1991. The communist domestic order lasted 74 years
(from 1917 until 1991). That order was replaced by the new system/order that is
now governing Russia, which, after the collapse of the old order, was built in the
classic ways described earlier in this chapter in my explanations of Stages 1 and 2.
Another is Japan’s Meiji Restoration, which came about as a result of a three-
year revolution (1866-69) that happened because the Japanese were closed off to
the outside world and failed to advance. The Americans forced the Japanese to
open, which prompted a revolutionary group to fight and defeat the rulers (led by
the military shogun) in battle, which led to overturning the internal order then
run by the four classes—the military, farmers, artisans, and merchants—that had
ruled Japan. This old Japanese order run by traditional people was ultra-
conservative (e.g., social mobility was outlawed) and was replaced by
revolutionaries who were relatively progressive and changed everything by
reinstating the powers of a modernizing emperor. Early in this period there were
lots of labor disputes, strikes, and riots that resulted from the classic triggers of
wealth gaps and bad economic conditions. In the reform process the leadership
provided universal elementary education for both boys and girls, adopted
capitalism, and opened the country up to the outside world. They did this with
new technologies, which led them to become very competitive and gain wealth.
There are many such cases of countries that did the right things to produce
revolutionarily beneficial improvements, just as there are many cases of
revolutionaries doing the wrong things that inflicted terrible pain on their people
for decades. By the way, as a result of its reformations Japan went on to move
through the classic stages of the Big Cycle. It became extremely successful and
rich. But over time it became decadent, overextended, and fragmented, had an
economic depression, and fought expensive wars, all of which led to a classic
demise. Its Meiji order and its classic Big Cycle lasted for 76 years from 1869 to
1945.
• C/V/7 wars and revolutions inevitably take place to radically change the internal order.
They include total restructurings of wealth and political power that include complete
restructurings of debt and financial ownership and political decision making. These changes
are the natural consequence of needing to make big changes that can’t be made
within the existing system. Almost all systems encounter them. That is because
almost all systems benefit some classes of people at the expense of other classes,
which eventually becomes intolerable to the point that there is a fight to
determine the path forward. When the gaps in wealth and values become very
wide and bad economic conditions ensue so that the system is not working for a
large percentage of the people, the people will fight to change the system. Those
who are suffering the most economically will fight to get more wealth and power
from those who have wealth and power and who benefit from the existing system.
Naturally the revolutionaries want to radically change the system, so naturally
they are willing to break the laws that those in power demand they adhere to.
These revolutionary changes typically happen violently through civil wars, though
as previously described, they can come about peacefully without toppling the
system.
The periods of civil war are typically very brutal. Typically, early on these
wars are forceful and orderly struggles for power, and as the fighting and emotions
intensify and the sides do anything to win, the levels of brutality accelerate
unexpectedly such that the actual levels of brutality that occur in the Stage 6 civil
wars and revolutions would have been considered implausible in Stage 5. The
elites and moderates generally flee, are imprisoned, or are killed. Reading the
stories of civil wars and revolutions, such as the Spanish Civil War, the Chinese
Civil War, the Russian Revolution, and the French Revolution, made my hair
curl.
How do they transpire? Earlier I described the dynamics of Stage 5 that led to
crossing the line into Stage 6. During this stage all of those intensify greatly. I will
explain.
How Civil Wars and Revolutions Transpire
As previously described, the cycle of building wealth and wealth gaps that leads to
a very small percentage of the population controlling an exceptionally large
percentage of the wealth eventually results in the poor majority overthrowing the
rich minority via civil wars and revolutions. This has happened more times than
one can imagine.
While most of the archetypical civil wars and revolutions shifted power
from the right to the left, many shifted wealth and power to the right and
away from those on the left. However, there were fewer of them and they were
different. They typically happened when the existing orders slipped into
dysfunctional anarchies and a large percentage of the population yearned for
strong leadership, discipline, and productivity. Examples of revolutions from the
left to the right include Germany, Spain, Japan, and Italy in the 1930s; the fall of
the Soviet Union in the 1980s to the early 1990s; the 1976 coup in Argentina
replacing Isabel Peron with a military junta; and the coup leading to the Second
French Empire in 1851. All those that I examined worked or didn’t work for the
same reason. Like those of the left, these new internal orders succeeded when they
produced broad-based economic successes and failed when they did not. Because
broad economic prosperity is the biggest reason a new regime succeeds or fails, the
long-term trends have been to both greater total wealth and broader distribution
of the wealth (i.e., better economic and health outcomes for the average person).
That big picture can be easily lost when one is in and experiencing one part of the
Big Cycle.
Typically the people who led the civil war/revolution were (and still
are) well-educated people from middle-class backgrounds. For example,
three of the key revolutionary leaders of the French Revolution were Georges-
Jacques Danton, a lawyer raised in a bourgeois family; Jean-Paul Marat, a
physician, scientist, and journalist raised in a bourgeois family; and Maximilian
Robespierre, a lawyer and statesman also from a bourgeois family. This revolution
was initially supported by many liberal aristocrats, like the Marquis de Lafayette,
who were raised in moderately well-off families. Similarly, the leaders of the
Russian Revolution were Vladimir Lenin, who studied law, and Leon Trotsky,
who was raised in a bourgeois family of intellectuals. The Chinese Civil War was
led by Mao, who was from a moderately well-off family and studied a variety of
subjects such as law, economics, and political theory, and Zhou Enlai, who was
from a scholarly middle-class family of civil servants. These leaders also
typically were (and still are) charismatic and able to lead and work well
with others to build big, well-run organizations that have the power to
bring about the revolutions. If you want to look for the revolutionaries of
the future, you might keep an eye on those who have these qualities. Over
time they typically evolve from being idealistic intellectuals wanting to
change the system to be fairer to brutal revolutionaries bent on winning at
all costs.
While having large wealth gaps during economically difficult times was
typically the biggest source of conflict, there were always other reasons for
conflict that added up to a lot of opposition to the leadership and the
system. Typically in revolutions the revolutionaries with these different
grievances joined together to make revolutionary changes; while they looked
united during the revolution, after winning the revolution, they typically fought
with each other over issues and for power.
As previously mentioned, during the civil war/revolution stage of the
cycle the governments in power almost always had an acute shortage of
money, credit, and buying power. That shortage created the desire to grab
money from those who had it, which led those who had wealth to move it
into places and assets that were safe, which led the governments to stop
these movements by imposing capital controls—i.e., controls on
movements to other jurisdictions (e.g., other countries), to other
currencies, or to assets that are more difficult to tax and/or are less
productive (e.g., gold).
To make matters even worse, when there was internal disorder, foreign
enemies were more likely to challenge the country. This happens because
domestic conflict causes vulnerabilities that make external wars more likely.
Internal conflict splits the people within a country, is financially taxing on them,
and demands attention that leaves less time for the leaders to tend to other issues
—all things that create vulnerabilities for foreign powers to take advantage of.
That is the main reason why internal wars and external wars tend to come close
together. Other reasons include: emotions and tempers are heightened; strong
populist leaders who tend to come to power at such times are fighters by nature;
when there are internal conflicts leaders find that a perceived threat from an
external enemy can bring the country together in support of the leader so they
tend to encourage the conflict; and being deprived leads people/countries to be
more willing to fight for what they need, including resources that other countries
have.
• Almost all civil wars have had some foreign powers participating in attempt to influence
the outcome to their benefit.
• The beginnings of civil wars and revolutions aren't clear when they are happening,
though they are obvious when one is deeply in the middle of them. While historians assign
dates to the beginnings and ends of civil wars, they are arbitrary. The truth is that
almost no one at the time knows that a civil war has begun or that it has ended,
but they know when they are in them. For example, many historians have
designated July 14, 1789, as the day the French Revolution began because a mob
stormed an armory and prison called the Bastille. But nobody at the time thought
it was the beginning of the French Revolution or had any idea how terribly brutal
that civil war and revolution would become. While one might not know what’s to
come, one can have imprecise markers that help one place where one is, to see the
direction that one is moving in, and to know something about what the next stage
will be like.
Civil wars are incredibly brutal because they are fights to the death. Everyone is
an extremist because everyone is forced to pick a side and fight—also moderates
lose out in knife fights.
As for what types of leaders are best for civil wars and revolutions, they
are the “inspirational generals”—people who are strong enough to marshal
support and win the various types of battles they have to win. Because the
fight is brutal they have to be brutal enough to do whatever is necessary to
win.
The time that historians stamp as the civil war period typically lasts a few years
and determines the official winners and losers, which is conveyed by who gets to
occupy the government buildings in the capital. But like the beginnings, the ends
of civil wars/revolutions are not as clearly defined as historians convey. The
fighting to consolidate power can go on for a long time after the official civil war
has ended.
While civil wars and revolutions are typically extremely painful, they
often lead to restructurings that, if done well, can establish the foundation
for improved future results. What the future after the civil
war/revolution looks like depends on how the next steps are handled.
CONCLUSION
My study of history has taught me that nothing is forever other than evolution,
and within evolution there are cycles that are like tides that come in and go out
and that are hard to change or fight against. To handle these changes well it is
essential to know which stage of the cycle one is in and to know timeless and
universal principles for dealing with it. As conditions change the best approaches
change—i.e., what is best depends on the circumstances and the circumstances are
always changing in the ways we just looked at. For that reason it is a mistake to
rigidly believe that any economic or political system is always best because there
will certainly be times when that system is not best for the circumstances at hand,
and if a society doesn’t adapt it will die. That is why constantly reforming systems
to adapt well is best. The test of any system is simply how well it works in
delivering what most of the people want, and this can be objectively measured,
which we can do and will continue to do. Having said that, the lesson from
history that comes through most loudly and most clearly is that skilled
collaborations to produce productive win-win relationships to both grow and
divide the pie well, so that most people are happy, are much more rewarding and
much less painful than fighting civil wars over wealth and power that lead to one
side subjugating the other side.
1 To get a rich picture of what makes great leaders great in different types of circumstances, I recommend
Henry Kissinger’s forthcoming book on leadership.
- This chart is based on historical analysis of nine great powers (covering about 2,200 years of history in total).
The likelihood of conflict is based on major cases of civil war, rebellion, and revolution but excludes peaceful
revolutions that did not change the existing system. The analysis does not count the probability of conflict
arising in a period when a country is already in the midst of internal conflict (and the five years following) to
avoid counting periods in which economic conditions were bad because of the conflict itself.
To be clear, when a government’s finances are in bad shape that does not necessarily mean it will run out of
buying power. But it does mean that there is a much higher risk of that happening than if the government
were in a financially strong position.
-. Of course, these two kinds of struggles aren’t equivalent. Still, in both cases, I have found that people are
focused on their own issues and communities and don’t understand the circumstances of those they don’t
have direct contact with. In many communities, people—and most heartbreakingly the children—are
desperately poor and neglected. There is an acute shortage of money for basics, such as adequate school
supplies, nutrition, and healthcare, and an environment of violence and trauma that perpetuates a cycle in
which children are brought up intellectually and physically malnourished and traumatized; this leaves them
disadvantaged as they grow into adulthood, which makes it hard for them to earn a living, which perpetuates
the cycle. Consider this fact: a recent study that our foundation funded showed that 22 percent of the high
school students in Connecticut—the richest state in the country by income per capita—are either
“disengaged” or “disconnected.” A disengaged student is one who has an absentee rate of greater than 25
percent and is failing classes. A disconnected student is one who the system can’t track because they dropped
out. Imagine the consequences in 10 years and the human and social costs of this cycle. Our society has not
established limits to how terrible it will allow conditions to get.
- . Viscount Northcliffe, who controlled just under half of daily newspaper circulation in the UK around
World War I, was known for anti-German coverage and was made “Director of Propaganda in Enemy
Countries” by the government in 1918.
- . What can be done? The news media is unique in being the only industry that operates without quality
controls or checks on its power. I and most others believe that it would be terrible for our government to
regulate it and, at the same time, believe that something has to be done to fix the problem. Perhaps if people
protest enough the media could be motivated to create a self-regulatory organization to create and regulate
ratings the way the Motion Picture Association did. I don’t have a clue about what should be done because
this problem isn’t in my areas of expertise, and it’s not my place to offer suggestions to try to fix the problem;
however, it is my responsibility to point out that we are in an era in which sensationalism, commercialism,
and political desires to manipulate people’s views have superseded accuracy and journalistic integrity as the
primary objectives of most of those in the media and that this is like a cancer that threatens our well-being. If
you believe that fake and distorted media is a problem and you are interested in watching the
media/propaganda for clues about whether and how this is transpiring, here are a few commonly
recommended things to look out for. Ask yourself:
1) Does the story consist of emotionally triggering, unsubstantiated accusations, or are the facts
substantiated and the sources provided? When the facts are put aside to create an exciting story and
the sources are undisclosed, don’t believe the story.
2) Does the writer welcome or not welcome replies or arguments that refute what they are asserting, and
are they willing or not willing to publish them along with what they published?
3) Are the accusations in the story consistent with what has been identified and proven in the legal
system? If people or groups are accused in the media of doing bad things but they haven’t been
accused and judged to have done bad things in the legal system (which follows a process that tries to
weigh the evidence to get at what is true), at least ask yourself why that is and probably don’t believe
the story.
4) If the writer or outlet has previously shown themselves to be biased, assume that they and their stories
are biased.
Z The Roman Republic and Athens both had democratic elements, but not everyone was able to participate
or vote equally. Although democracies have existed for thousands of years, it is only recently that most people
were allowed to vote. For example, in the US, African-American men were not universally allowed to vote
until 1870, and women of all races until 1920.
CHAPTER 6
THE BIG CYCLE OF EXTERNAL ORDER
AND DISORDER
Relationships between people and the orders that govern them work in basically
the same ways, whether they are internal or external, and they blend together. In
fact, it wasn’t long ago that there were no distinctions between internal and
external orders because there were no clearly defined and mutually recognized
boundaries between countries. For that reason, the six-stage cycle of going
between order and disorder that I described in the last chapter about what
happens within countries works the same way between countries, with
one big exception: * international relations are driven much more by raw power
dynamics. That is because all governance systems require effective and
agreed-upon 1) laws and law-making abilities, 2) law enforcement
capabilities (e.g., police), 3) ways of adjudicating (e.g., judges), and 4) clear
and specified consequences that both suit crimes and are enforced (e.g.,
fines and incarcerations), and those things either don’t exist or are not as
effective in guiding relations between countries as they are in guiding
relations within them.
While attempts have been made to make the external order more rule-abiding
(e.g., via the League of Nations and the United Nations), by and large they have
failed because these organizations have not had more wealth and power than the
most powerful countries. When individual countries have more power than
the collectives of countries, the more powerful individual countries rule.
For example, if the US, China, or other countries have more power than
the United Nations, then the US, China, or other countries will determine
how things go rather than the United Nations. That is because power
prevails, and wealth and power among equals is rarely given up without a
fight.
When powerful countries have disputes, they don’t get their lawyers to plead
their cases to judges. Instead, they threaten each other and either reach agreements
or fight. The international order follows the law of the jungle much more
than it follows international law.
There are five major kinds of fights between countries: trade/economic
wars, technology wars, capital wars, geopolitical wars, and military wars.
Let’s begin by briefly defining them.
1. Trade/economic wars: Conflicts over tariffs, import/export restrictions,
and other ways of damaging a rival economically
2. Technology wars: Conflicts over which technologies are shared and which
are held as protected aspects of national security
3. Geopolitical wars: Conflicts over territory and alliances that are resolved
through negotiations and explicit or implicit commitments, not fighting
4. Capital wars: Conflicts imposed through financial tools such as sanctions
(e.g., cutting off money and credit by punishing institutions and
governments that offer it) and limiting foreign access to capital markets
5. Military wars: Conflicts that involve actual shooting and the deployment
of military forces
Most fights between nations fall under one or more of those categories (cyber
warfare, for example, has a role in all of them). They are over wealth and power
and the ideologies pertaining to them. While most of these types of wars don’t
involve shooting and killing, they all are power struggles. In most cases, the
first four kinds of war will evolve over time as intense competitions between rival
nations until a military war begins. These struggles and wars, whether or not
they involve shooting and killing, are exertions of power of one side over
the other. They can be all-out or contained, depending on how important
the issue is and what the relative powers of the opponents are. But once a
military war begins, all four of the other dimensions will be weaponized to
the greatest extent possible.
As discussed in the last several chapters, all of the factors that drive
internal and external cycles tend to improve and worsen together. When
things get bad, there are more things to argue over, which leads to greater
inclinations to fight. That’s human nature, and it is why we have the Big
Cycle, which oscillates between good times and bad ones.
• All-out wars typically occur when existential issues (ones that are so essential to the
country's existence that people are willing to fight and die for them) are at stake and they
cannot be resolved by peaceful means. The wars that result from them make it clear which
side gets its way and has supremacy in subsequent matters. That clarity over who sets
the rules then becomes the basis of a new international order.
The following chart shows the cycles of internal and external peace and
conflict in Europe going back to 1500 as reflected in the deaths they caused. As
you can see, there were three big cycles of rising and declining conflict,
averaging about 150 years each. Though big civil and external wars last
only a short time, they are typically the culmination of the longstanding
conflicts that led up to them. While World Wars I and II were separately driven
by the classic cycle, they were also interrelated.
EST EUROPEAN DEATHS FROM CONFLICT
(%POP, 15YR MOVING AVG)
As you can see, each cycle consisted of a relatively long period of peace
and prosperity (e.g., the Renaissance, the Enlightenment, and the
Industrial Revolution) that sowed the seeds for terrible and violent
external wars (e.g., the Thirty Years’ War, the Napoleonic Wars, and the
two World Wars). Both the upswings (the periods of peace and prosperity) and
the downswings (the periods of depression and war) affected the whole world.
Not all countries prosper when the leading powers do because countries gain at
the expense of others. For example, the decline of China from around 1840 to
1949, known as the “Century of Humiliation,” came about because the Western
powers and Japan exploited China.
As you read on, keep in mind that • the two things about war that one can be most
confident in are 1) that it won't go as planned and 2) that it will be far worse than imagined. It
is for those reasons that so many of the principles that follow are about ways to
avoid shooting wars. Still, whether they are fought for good reasons or bad,
shooting wars happen. To be clear, while I believe most are tragic and fought for
nonsensical reasons, some are worth fighting because the consequences of not
fighting them (e.g., the loss of freedom) would be intolerable.
THE TIMELESS AND UNIVERSAL FORCES THAT PRODUCE
CHANGES TO THE EXTERNAL ORDER
As I explained in Chapter 2, after self-interest and self-survival, the quest for
wealth and power is what most motivates individuals, families, companies, states,
and countries. Because wealth equals power in terms of the ability to build
military strength, control trade, and influence other nations, • domestic and military
strength go hand in hand. It takes money to buy guns (military power) and it takes
money to buy butter (domestic social spending needs). When a country fails to
provide adequate amounts of either, it becomes vulnerable to domestic and
foreign opposition. From my study of Chinese dynasties and European empires,
I’ve learned that • the financial strength to outspend one's rivals is one of the most
important strengths a country can have. That is how the United States beat the Soviet
Union in the Cold War. Spend enough money in the right ways, and you don’t
have to have a shooting war. Long-term success depends on sustaining both the
“guns” and the “butter” without producing the excesses that lead to their declines.
In other words, a country must be strong enough financially to give its people
both a good living standard and protection from outside enemies. The really
successful countries have been able to do that for 200 to 300 years. None has been
able to do it forever.
Conflict arises when the dominant power begins to weaken or an emerging
power begins to approach it in strength—or both. • The greatest risk of military war is
when both parties have 1) military powers that are roughly comparable and 2) irreconcilable
and existential differences. As of this writing, the most potentially explosive conflict
is that between the United States and China over Taiwan.
The choice that opposing countries face—either fighting or backing
down—is very hard to make. Both are costly—fighting in terms of lives
and money, and backing down in terms of the loss of status, since it shows
weakness, which leads to reduced support. When two competing entities each
have the power to destroy the other, both must have extremely high trust that
they won’t be unacceptably harmed or killed by the other. Managing the
prisoner’s dilemma well, however, is extremely rare (see the addendum to Chapter
2 for a full explanation).
While there are no rules in international relations other than those the most
powerful impose on themselves, some approaches produce better outcomes than
others. Specifically, those that are more likely to lead to win-win outcomes are
better than those that lead to lose-lose outcomes. Hence this all-important
principle: « to get more win-win outcomes one needs to negotiate with consideration given
to what is most important to the other party and to oneself, and know how to trade them.-,-
Skilled collaborations to produce win-win relationships that both increase and
divide up wealth and power well are much more rewarding and much less painful
than wars that lead to one side subjugating the other. Seeing things through your
adversary’s eyes and clearly identifying and communicating your red lines to them
(i.e., what cannot be compromised) are the keys to doing this well. « Winning means
getting the things that are most important without losing the things that are most important,
so wars that cost much more in lives and money than they provide in benefits are stupid. But
“stupid” wars still happen all the time for reasons that I will explain.
It is far too easy to slip into stupid wars because of a) the prisoner’s dilemma,
b) a tit-for-tat escalation process, c) the perceived costs of backing down for the
declining power, and d) misunderstandings existing when decision making has to
be fast. Rival great powers typically find themselves in the prisoner’s dilemma;
they need to have ways of assuring the other that they won’t try to kill them lest
the other tries to kill them first. Tit-for-tat escalations are dangerous in that they
require each side to escalate or lose what the enemy captured in the last move; it is
like a game of chicken—push it too far and there is a head-on crash.
Untruthful and emotional appeals that rile people up increase the dangers of
stupid wars, so it is better for leaders to be truthful and thoughtful in explaining
the situation and how they are dealing with it (this is especially essential in a
democracy, in which the opinions of the population matter). The worst thing is
when leaders are untruthful and emotional in dealing with their populations, and
it is worse still when they take over the media.
By and large, the tendency to move between win-win relationships and
lose-lose relationships happens in a cyclical way. People and empires are
more likely to have cooperative relationships during good times and to
fight during bad times. When the existing great power is declining in relation to
a rising power, it has a natural tendency to want to maintain the status quo or the
existing rules, while the rising power wants to change them to be in line with the
changing facts on the ground.
While I don’t know about the love part of the saying “all is fair in love
and war,” I know the war part is right. As an example, in the American
Revolutionary War, when the British lined up in rows for the fight and
the American revolutionaries shot at them from behind trees, the British
thought that was unfair and complained. The revolutionaries won
believing the British were foolish and that the cause of independence and
freedom justified changing the rules of war. That’s just how it is.
This leads me to one final principle: * have power, respect power, and use power
wisely. Having power is good because power will win out over agreements, rules,
and laws all the time. When push comes to shove, those who have the power to
either enforce their interpretation of the rules and laws or to overturn them will
get what they want. It is important to respect power because it’s not smart to fight
a war that one is going to lose; it is preferable to negotiate the best settlement
possible (that is unless one wants to be a martyr, which is usually for stupid ego
reasons rather than for sensible strategic reasons). It is also important to use power
wisely. Using power wisely doesn’t necessarily mean forcing others to give you
what you want—i.e., bullying them. It includes the recognition that generosity
and trust are powerful forces for producing win-win relationships, which are
fabulously more rewarding than lose-lose relationships. In other words, it is often
the case that using one’s “hard powers” is not the best path and that using one’s
“soft powers” is preferable.-
When thinking about how to use power wisely, it’s also important to decide
when to reach an agreement and when to fight. To do that, a party must imagine
how its power will change over time. It is desirable to use one’s power to negotiate
an agreement, enforce an agreement, or fight a war when one’s power is greatest.
That means that it pays to fight early if one’s relative power is declining and fight
later if it’s rising.
If one is in a lose-lose relationship, one has to get out of it one way or another,
preferably through separation, though possibly through war. To handle one’s
power wisely, it’s usually best not to show it because it will usually lead others to
feel threatened and build their own threatening powers, which will lead to a
mutual escalation that threatens both. Power is usually best handled like a hidden
knife that can be brought out in the event of a fight. But there are times when
showing one’s power and threatening to use it are most effective for improving
one’s negotiating position and preventing a fight. Knowing what matters most
and least to the other party, especially what they will and won’t fight for, allows
you to work your way toward an equilibrium that both parties consider a fair
resolution of a dispute.
Though it is generally desirable to have power, it is also desirable to not have
power that one doesn’t need. That is because maintaining power consumes
resources, most importantly your time and your money. Also, with power comes
the burden of responsibilities. I have often been struck by how much happier less
powerful people can be relative to more powerful people.
CASE STUDY: WORLD WAR II
Now that we have covered the dynamics and principles that drive the external
order and disorder cycle, which were derived by looking at many cases, I’d like to
briefly look at the World War II case because it provides the most recent example
of the iconic dynamic of going from peace to war. Though it is only one case, it
clearly shows how the confluence of the three big cycles—i.e., the overlapping and
interrelated forces of the money and credit cycle, the internal order/disorder cycle,
and the external order/disorder cycle—created the conditions for a catastrophic
war and laid the groundwork for a new world order. While the stories from this
period are very interesting in and of themselves, they are especially important
because they provide lessons that help us think about what is happening now and
what might be ahead. Most importantly, the United States and China are in an
economic war that could conceivably evolve into a military war and comparisons
between the 1930s and today provide valuable insights into what might happen
and how to avoid a terrible war.
THE PATH TO WAR
To help convey the picture of the 1930s, I will run through the geopolitical
highlights leading up to the official start of the war in Europe in 1939 and the
bombing of Pearl Harbor in 1941. Then I will quickly move through the war and
the start of the new world order in 1945, with the US at the peak of its power.
The global depression that followed the Great Crash of 1929 led to almost all
countries having big internal conflicts over wealth. This caused them to turn to
more populist, autocratic, nationalistic, and militaristic leaders and policies. These
moves were either to the right or to the left and occurred in varying degrees,
according to the countries’ circumstances and the strengths of their democratic or
autocratic traditions. In Germany, Japan, Italy, and Spain, extremely bad
economic circumstances and less well-established democratic traditions led to
extreme internal conflicts and a turn to populist/autocratic leaders of the right
(i.e., fascists), just as at different points in time the Soviet Union and China,
which also endured extreme circumstances and had no experience with
democracy, turned to populist/autocratic leaders of the left (i.e., communists).
The US and the UK had much stronger democratic traditions and less severe
economic conditions, so they became more populist and autocratic than they had
been, but not nearly as much as other nations.
Germany and Japan
While Germany had previously been saddled with tremendous reparation debts
following World War I, by 1929 it was beginning to emerge from under their yoke
via the Young Plan, which provided for considerable debt relief and the departure
of foreign troops from Germany by 1930.- But the global depression hit Germany
hard, leading to nearly 25 percent unemployment, massive bankruptcies, and
extensive poverty. As is typical, there was a struggle between populists of the left
(communists) and populists of the right (fascists). Adolf Hitler, the leading
populist/fascist, tapped into the mood of national humiliation to build a
nationalistic furor, casting the Treaty of Versailles and the countries that imposed
it as the enemy. He created a 25-point nationalistic program and rallied support
around it. In response to internal fighting and the desire to restore order, Hitler
was appointed chancellor in January 1933, drawing large support for his Nazi
Party from industrialists who feared the communists. Two months later, the Nazi
Party won the most support and the most seats in the German Parliament (the
Reichstag).
Hitler refused to pay any further reparation debts, left the League of Nations,
and took autocratic control of Germany in 1934. Holding the dual roles of
chancellor and president, he became the country’s supreme leader. In democracies
there are always some laws that allow leaders to grab special powers; Hitler seized
them all. He invoked Article 48 of the Weimar Constitution to put an end to
many civil rights and suppress political opposition from the communists, and
forced the passage of the Enabling Act, which allowed him to pass laws without
the approval of the Reichstag and the president. He was ruthless against any
opposition—he censored or took control of newspapers and broadcasting
companies, created a secret police force (the Gestapo) to root out and crush
opposition, deprived Jews of their rights of citizenship, seized the Protestant
Church’s finances, and arrested church officials who opposed him. Declaring the
Aryan race superior, he prohibited non-Aryans from serving in government.
Hitler took that same autocratic/fascist approach to rebuilding Germany’s
economy, coupled with big fiscal and monetary stimulation programs. He
privatized state-owned businesses and encouraged corporate investment, acting
aggressively to raise Aryan Germans’ living standards. For example, he set up
Volkswagen to make cars affordable and accessible, and he directed the building
of the Autobahn. He financed this substantially increased government spending
by forcing banks to buy government bonds. The debts that were produced were
paid back by the earnings of companies and the central bank (the Reichsbank)
monetizing debt. These fiscal policies by and large worked well in achieving
Hitler’s goals. This is another example of how borrowing in one’s own currency
and increasing one’s own debt and deficits can be highly productive if the money
borrowed is put into investments that raise productivity and produce more than
enough cash flow to service the debt. Even if it doesn’t cover 100 percent of the
debt service, it can be very cost-effective in achieving the economic goals of the
country.
As for the economic effects of these policies, when Hitler came to power in
1933 the unemployment rate was 25 percent. By 1938 it was nil. Per capita
income increased by 22 percent in the five years after Hitler took power, and real
growth averaged over 8 percent per year between 1934 and 1938. As shown in the
following charts, German equities rallied nearly 70 percent in a steady trend
between 1933 and 1938, until the onset of the hot war.
DEU EQUITY RETURNS
(LOCAL FX,
CUMULATIVE EXCESS)
DEU PER CAPITA INCOME
(2017 USD)
In 1935, Hitler began to build the military, making military service
compulsory for Aryans. Germany’s military spending increased much faster than
any other country because the German economy needed more resources to
fuel itself and it intended to use its military power to seize them.
Like Germany, Japan was also hit exceptionally hard by the depression
and became more autocratic in response. Japan was especially vulnerable to the
depression because, as an island nation without adequate natural resources, it
relied on exports for income to import necessities. When its exports fell by around
50 percent between 1929 and 1931, Japan was economically devastated. In 1931,
Japan went broke—i.e., it was forced to draw down its gold reserves, abandon
the gold standard, and float its currency, which depreciated it so greatly that Japan
ran out of buying power. These terrible conditions and large wealth gaps led
to fighting between the left and the right. By 1932, there was a massive
upsurge in right-wing nationalism and militarism, in the hope that order
and economic stability could be forcibly restored. Japan set out to get the
natural resources (e.g., oil, iron, coal, and rubber) and human resources
(i.e., slave labor) it needed by seizing them from other countries, invading
Manchuria in 1931 and spreading out through China and Asia. As with
Germany, it could be argued that Japan’s path of military aggression to get
needed resources was more cost-effective than relying on classic trading
and economic practices. In 1934, there was severe famine in parts of Japan,
causing even more political turbulence and reinforcing the right-wing, militaristic,
nationalistic, and expansionistic movement.
In the years that followed, Japan’s top-down fascist command economy
grew stronger, building a military-industrial complex to protect its
existing bases in East Asia and northern China and support its excursions
into other countries. As was also the case in Germany, while most Japanese
companies remained privately held, their production was controlled by the
government.
What is fascism? Consider the following three big choices that a
country has to make when selecting its approach to governance: 1)
bottom-up (democratic) or top-down (autocratic) decision making, 2)
capitalist or communist (with socialist in the middle) ownership of
production, and 3) individualistic (which treats the well-being of the
individual with paramount importance) or collectivist (which treats the
well-being of the whole with paramount importance). Pick the one from
each category that you believe is optimal for your nation’s values and ambitions
and you have your preferred approach. Fascism is autocratic, capitalist, and
collectivist. Fascists believe that top-down autocratic leadership, in which the
government directs the production of privately held companies such that
individual gratification is subordinated to national success, is the best way to make
the country and its people wealthier and more powerful.
The US and the Allies
In the US, debt problems became ruinous for American banks after 1929,
which curtailed their lending around the world, hurting international
borrowers. At the same time, the depression created weak demand, which led to
a collapse of US imports and other countries’ sales to the US. As incomes
weakened, demand fell and more credit problems occurred in a self-reinforcing
downward economic spiral. The US responded by turning protectionist to
safeguard jobs, raising tariffs via the passage of the Smoot-Hawley Tariff Act in
1930, which further depressed economic conditions in other countries.
• Raising tariffs to protect domestic businesses and jobs during bad economic times is
common, but it leads to reduced efficiency because production does not occur where it can be
done most efficiently. Ultimately, tariffs contribute to greater global economic
weakness, as tariff wars cause the countries that impose them to lose
exports. Tariffs do, however, benefit the entities that are protected by
them, and they can create political support for the leaders who impose
them.
The Soviet Union had yet to recover from its devastating 1917-22 revolution
and civil war, a lost war to Germany, a costly war with Poland, and a famine in
1921, and it was wracked by political purges and economic hardships throughout
the 1930s. China also suffered from civil war, poverty, and a famine in 1928-30.
So, when things worsened in 1930 and tariffs began, bad conditions
became desperate conditions in those countries.
To make matters worse, there were droughts in the US and in the Soviet Union
in the 1930s. • Harmful acts of nature (e.g., droughts, floods, and plagues) often cause
periods of great economic hardship that when combined with other adverse conditions lead to
periods of great conflict. In combination with extreme government policies, millions
died in the USSR. At the same time, internal political fighting and fears of Nazi
Germany led to purges of hundreds of thousands of people who were accused of
spying and shot without trials.
• Deflationary depressions are debt crises caused by there not being enough money in the
hands of debtors to service their debts. They inevitably lead to the printing of money, debt
restructurings, and government spending programs that increase the supply of, and reduce
the value of, money and credit. The only question is how long it takes for government officials
to make this move.
In the case of the US, it took three and a half years from the crash in
October 1929 until President Franklin D. Roosevelt’s March 1933 actions.
In Roosevelt’s first 100 days in office, he created several massive
government spending programs that were paid for by big tax increases and
big budget deficits financed by debt that the Federal Reserve monetized.
He instituted jobs programs, unemployment insurance, Social Security supports,
and labor- and union-friendly programs. After his 1935 tax bill, then popularly
called the “Soak the Rich Tax,” the top marginal income tax rate for individuals
rose to 75 percent (versus as low as 25 percent in 1930). By 1941, the top personal
tax rate was 81 percent, and the top corporate tax rate was 31 percent, having
started at 12 percent in 1930. Roosevelt also imposed a number of other taxes.
Despite all of these taxes and the pickup in the economy that helped raise tax
revenue, budget deficits increased from around 1 percent of GDP to about 4
percent of GDP because the spending increases were so large.- From 1933 until
the end of 1936 the stock market returned over 200 percent, and the
economy grew at a blistering average real rate of about 9 percent.
In 1936, the Federal Reserve tightened money and credit to fight
inflation and slow an overheating economy, which caused the fragile US
economy to fall back into recession and the other major economies to
weaken with it, further raising tensions within and between countries.
Meanwhile in Europe, the conflict in Spain between the populists of the left
(the communists) and the populists of the right (the fascists) flared into the brutal
Spanish Civil War. Right-wing Franco, with the support of Hitler, succeeded in
purging left-wing opposition in Spain.
• During periods of severe economic distress and large wealth gaps, there are typically
revolutionarily large redistributions of wealth. When done peacefully these are
achieved through large tax increases on the rich and big increases in the
supply of money that devalue debtors’ claims, and when done violently
they are achieved by forced asset confiscations. In the US and the UK, while
there were redistributions of wealth and political power, capitalism and
democracy were maintained. In Germany, Japan, Italy, and Spain they were not.
• Before there is a shooting war there is usually an economic war. As is also typical,
before all-out wars are declared there is about a decade of economic,
technological, geopolitical, and capital wars, during which the conflicting powers
intimidate each other, testing the limits of each other’s power. While 1939 and
1941 are known as the official starts of the wars in Europe and the Pacific, the
conflicts really began about 10 years before that. In addition to the
economically motivated conflicts within countries and the political shifts
that arose from them, all of these countries faced increased external
economic conflicts as they fought for greater shares of a shrinking
economic pie. Because power, and not law, rules international relations,
Germany and Japan became more expansionist and increasingly began to test the
UK, the US, and France in the competition over resources and influence over
territories.
Before going on to describe the hot war, I want to elaborate on the
common tactics used when economic and capital tools are weaponized.
They have been and still are:
1. Asset freezes/seizures: Preventing an enemy/rival from using or selling
foreign assets they rely on. These measures can range from asset freezes for
targeted groups in a country (e.g., the current US sanctions of the Iranian
Revolutionary Guard or the initial US asset freeze against Japan in World
War II) to more severe measures like unilateral debt repudiation or outright
seizures of a country’s assets (e.g., some top US policy makers have been
talking about not paying our debts to China).
2. Blocking capital markets access: Preventing a country from accessing
their own or another country’s capital markets (e.g., in 1887 Germany
banned the purchase of Russian securities and debt to impede Russia’s
military buildup; the US is now threatening to do this to China).
3. Embargoes/blockades: Blocking trade in goods and/or services in one’s
own country and in some cases with neutral third parties for the purpose of
weakening the targeted country or preventing it from getting essential items
(e.g., the US’s oil embargo on Japan and cutting off its ships’ access to the
Panama Canal in World War II) or blocking exports from the targeted
country to other countries, thus cutting off their income (e.g., France’s
blockade of the UK in the Napoleonic Wars).
If you’re interested in seeing how these tactics have been applied from 1600
until now, they are available at economicprinciples.org.
THE HOT WAR BEGINS
In November 1937, Hitler secretly met with his top officials to announce his
plans for German expansion to gain resources and bring together the Aryan race.
Then he put them into action, first annexing Austria and then seizing a part of
what was then Czechoslovakia that contained oil resources. Europe and the US
watched warily, not wanting to get drawn into another war so soon after the
devastation of World War I.
As with all wars, the unknowns were far greater than the knowns because a)
rival powers go into wars only when their powers are roughly comparable
(otherwise it would be stupidly suicidal for the obviously weaker power) and b)
there are way too many possible actions and reactions to anticipate. The only
thing that is known at the outset of a hot war is that it will probably be extremely
painful and possibly ruinous. As a result, smart leaders typically go into them only
if the other side has pushed them into a position of either fighting or losing by
backing down. For the Allies, that moment came on September 1, 1939, when
Germany invaded Poland.
Germany looked unstoppable; in short order it captured Denmark, Norway,
the Netherlands, Belgium, Luxembourg, and France, and strengthened its
alliances with Japan and Italy, which had common enemies and were ideologically
aligned. By seizing territory rapidly (e.g., oil-rich Romania), Hitler’s army was able
to conserve its existing oil resources and gain new ones quickly. The thirst for, and
acquisition of, natural resources remained a major driver of the Nazi war machine
as it pushed its campaigns into Russia and the Middle East. War with the Soviets
was inevitable; the only question was when. Although Germany and the USSR
had signed a non-aggression pact, Germany invaded Russia in June 1941, which
put Germany in an extremely costly war on two fronts.
In the Pacific in 1937, Japan expanded its occupation of China, brutally taking
control of Shanghai and Nanking, killing an estimated 200,000 Chinese civilians
and disarmed combatants in the capture of Nanking alone. While the US
remained isolationist, it did provide Chiang Kai-shek’s government with fighter
planes and pilots to counter the Japanese, putting a toe in the war. Conflicts
between the US and Japan began to flare. A Japanese soldier struck the US consul,
John Moore Allison, in the face in Nanking and Japanese fighter planes sank a US
gunship.
In November 1940, Roosevelt won re-election after campaigning on the
promise to keep the US out of the war, even though the US was already taking
economic actions to protect its interests, especially in the Pacific, using economic
supports to help countries it sympathized with and economic sanctions against
those it did not. Earlier in 1940, Secretary of War Henry Stimson had initiated
aggressive economic sanctions against Japan, culminating in the Export Control
Act of 1940. In mid-1940, the US moved the US Pacific Fleet to Hawaii. In
October, the US ramped up the embargo, restricting “all iron and steel to
destinations other than Britain and nations of the Western Hemisphere.” The
plan was to cut Japan off from resources in order to force them to retreat from
most of the areas they had taken over.
In March 1941, Congress passed the Lend-Lease Act, which allowed the US to
lend or lease war supplies to the nations it deemed to be acting in ways that were
“vital to the defense of the United States,” which included Great Britain, the
Soviet Union, and China. Helping the Allies was good for the US both
geopolitically and economically because it made a lot of money selling weapons,
food, and other items to these soon-to-be-allied countries who were struggling to
maintain production while waging war. But its motivations weren’t entirely
mercenary. Great Britain was running out of money (i.e., gold), so the US allowed
them to postpone payment until after the war (in some cases waiving payment
entirely). Although not an outright declaration of war, Lend-Lease effectively
ended the United States’ neutrality.
• When countries are weak, opposing countries take advantage of their weaknesses to
obtain gains. France, the Netherlands, and Great Britain all had colonies in Asia.
Overstretched by the fighting in Europe, they were unable to defend them against
the Japanese. Starting in September 1940, Japan invaded several colonies in
Southeast Asia, beginning with French Indochina, adding what it called the
Southern Resource Zone to its Greater East Asia Go-Prosperity Sphere. In 1941,
Japan seized oil reserves in the Dutch East Indies.
This Japanese territorial expansion was a threat to the US’s own Pacific
ambitions. In July and August 1941, Roosevelt responded by freezing all Japanese
assets in the United States, closing the Panama Canal to Japanese ships, and
embargoing oil and gas exports to Japan. This cut off three-fourths of Japan’s
trade and 80 percent of its oil. Japan calculated that it would run out of oil in two
years. This put Japan in the position of having to choose between backing down
or attacking the US.
On December 7 and 8, 1941, Japan launched coordinated attacks on US
military forces at Pearl Harbor and in the Philippines. This marked the beginning
of the declared war in the Pacific, which brought the US into the war in Europe
too. While Japan didn’t have a widely recognized plan to win the war, the most
optimistic Japanese leaders believed that the US would lose because it was fighting
a war on two fronts and because its individualistic/capitalist political system was
inferior to Japan’s and Germany’s authoritarian/fascist systems with their
command military-industrial complexes. They also believed that they had the
greater willingness to endure pain and die for their country, which is a big driver
of which side wins. • In war one's ability to withstand pain is even more important than
one's ability to inflict pain.
WARTIME ECONOMIC POLICIES
Just as it is worth noting what classic economic war tactics are, it is also worth
noting what classic wartime economic policies are within countries. These include
government controls on just about everything as the country shifts its resources
from profit making to war making—e.g., the government determines a) what
items are allowed to be produced, b) what items can be bought and sold in what
amounts (rationing), c) what items can be imported and exported, d) prices,
wages, and profits, e) access to one’s own financial assets, and f) the ability to
move one’s own money out of the country. Because wars are expensive, classically
the government g) issues lots of debt that is monetized, h) relies on non-credit
money such as gold for international transactions because its credit is not
accepted, i) governs more autocratically, j) imposes various types of economic
sanctions on enemies, including cutting off their access to capital, and k)
experiences enemies imposing these sanctions on them.
When the US entered the European and Pacific wars after the attack on Pearl
Harbor, classic wartime economic policies were put in place in most countries by
leaders whose more autocratic approaches were broadly supported by their
populations. The following table shows those economic controls in each of the
major countries.
WARTIME ECONOMIC CONTROLS
Rationing Production Controls Price/Wage Controls Import or Export Restrictions Takeover of Central Bank
Allies
United States Yes Yes Yes Yes Yes
United Kingdom Yes Yes Yes Yes Partial
Axis
Germany Yes Yes Yes Yes Yes
Japan Yes Yes Yes Yes Yes
The market movements during the hot war years were heavily affected by both
government controls and how countries did in battles as the odds of winning and
losing changed. The next table shows the controls over markets and capital flows
that were put in place by the major countries during the war years.
REGULATIONS IMPACTING ASSETS
Market Closures Asset Price Controls Asset Ownership Restrictions FX Controls Top Marginal Tax Rate Limits on New Issuance Limits on Corp Profits
Allies United States No Yes Yes Yes 94% — Yes
United Yes Yes Yes Yes 98% Yes Yes
Kingdom Axis Germany Yes Yes Yes Yes 60% Yes Yes
Japan Yes Yes Yes Yes 74% Yes Yes
Stock market closures were common in a number of countries, leaving
investors in stocks stuck without access to their capital. I should also note that
money and credit were not commonly accepted between non-allied countries
during the war because of a justifiable wariness about whether the currency would
have any value. As noted earlier, gold—or, in some cases, silver or barter—is the
coin of the realm during wars. At such times, prices and capital flows are typically
controlled, so it is difficult to say what the real prices of many things are.
Because losing wars typically leads to a total wipeout of wealth and power,
movements of those stock markets that remained open in the war years were
largely driven by how countries did in key battles as these results shifted the
probability of victory or defeat for each side. For example, German equities
outperformed at the beginning of World War II as Germany captured territory
and established military dominance, while they underperformed after Allied
powers like the US and the UK turned the tide of the war. After the 1942 Battle of
Midway, Allied equities rallied almost continuously until the end of the war,
while Axis equities were flat or down. As shown, both the German and Japanese
stock markets were closed at the end of the war, didn’t reopen for around five
years, and were virtually wiped out when they did, while US stocks were extremely
strong.
EQUITY RETURN INDEX (USD)
Protecting one’s wealth in times of war is difficult, as normal economic
activities are curtailed, traditionally safe investments are not safe, capital mobility
is limited, and high taxes are imposed when people and countries are fighting for
their survival. Protecting the wealth of those who have it is not a priority relative
to the need to redistribute wealth to get it to where it is needed most. As for
investing, sell out of all debt and buy gold because wars are financed by borrowing
and printing money, which devalues debt and money, and because there is a
justifiable reluctance to accept credit.
CONCLUSION
Every world power has its time in the sun, thanks to the uniqueness of their
circumstances and the nature of their character and culture (e.g., they have the
essential elements of a strong work ethic, smarts, discipline, education, etc.), but
they all eventually decline. Some do so more gracefully than others, with less
trauma, but they nevertheless decline. Traumatic declines can lead to some of the
worst periods in history, when big fights over wealth and power prove extremely
costly both economically and in human lives.
Still, the cycle needn’t transpire this way if countries in their rich and
powerful stages stay productive, earn more than they spend, make the
system work well for most of their populations, and figure out ways of
creating and sustaining win-win relationships with their most significant
rivals. A number of empires and dynasties have sustained themselves for
hundreds of years, and the United States, at 245 years old, has proven itself to be
one of the longest-lasting.
In Part II, I will turn to the US, the two reserve currency empires that preceded
it, and the one that may someday follow it. As we continue, I hope this
explanation of the archetypical Big Cycle and the three cycles that make it up will
help you see the patterns of history and what they portend. But before we delve
more deeply into the history, I’d first like to share how these big three cycles figure
into my approach as an investor.
1 To give an oversimplified example of a win-win approach, if each country picks the top 10 things that they
want to get or want to be protected against and allocates 100 points in total to these to express how much
they want these things, they could determine what the best trades would be. For example, I expect that high
on China’s list would be the reunification with Taiwan—so high in fact that they would go to war for it. I
can’t imagine that preventing that from happening peacefully would be nearly as high on the US’s list,
whereas something on the US’s list would be very high so that they should be willing to trade it to make both
sides happy.
- Though it might sound naive, I wish the power of thoughtful disagreement could be tapped to deal with the
US-China wars. For example, I visualize how wonderful it would be if leaders or representatives of each
country were to have a series of publicly aired thoughtful disagreements, like presidential debates, that the
populations of both countries could listen to in order to gain both sides’ perspectives. I’m sure it would make
us much more knowledgeable and empathetic, and improve the chances of peaceful resolutions.
- . For example, though I always had the ownership power to make decisions at Bridgewater autocratically, I
chose not to use that power. Instead, I created and operated an idea-meritocratic system (which I described in
Principles: Life and Work). I also chose to be far more generous with the people I worked with than I had to
be while maintaining extremely high standards because I knew that operating that way would produce the
amazing relationships and outcomes that we experienced—far better than if I had used my “hard powers”
more forcefully. So, it’s important to remember that great relationships give one great powers and that they
are wonderful rewards in and of themselves. There is nothing more powerful and rewarding for the individual
and the collective than the cooperation of capable people who care for each other and who will give each
other all they can.
- . Specific developments and detail on this period are explained in my book Principles for Navigating Big Debt
Crises.
- . Specific developments through the Great Depression are explained in great detail in my book Principles for
Navigating Big Debt Crises.
CHAPTER 7
INVESTING IN LIGHT OF THE BIG CYCLE
The game I play for handling both my life and my career is to try to
figure out how the world works, develop principles for dealing with it
well, and then place my bets. The research that I’m sharing with you in
this book was done for that purpose. Naturally, when I look at all that
we’ve covered up to this point, I think about how it applies to my
investing. For me to be comfortable that I am doing that well, I need to
know how my approach would have worked through time. If I can’t
confidently explain what happened in the past, or at least have a strategy
for dealing with it in light of what I don’t know, I consider myself
dangerously negligent.
As you saw from my study of the last 500 years up to now, there were
Big Cycles of great accumulations and great losses of wealth and power,
and of these, the greatest contributing factor was the debt and capital
markets cycle. From an investor’s perspective, this could be called the Big
Investing Cycle. I felt that I needed to understand these cycles well enough
to tactically move or diversify my portfolio to be protected against them
and/or to profit from them. By understanding them, and ideally realizing
where countries are in their cycles, I can do that.
Over my roughly 50 years as a global macro investor, I discovered many
timeless and universal truths that form my principles for investing. While
I won’t get deeply into all of them here, but will discuss most of them in
my next book, Principles: Economics and Investing, I will convey one
important principle.
• All markets are primarily driven by just four determinants: growth, inflation, risk
premiums, and discount rates.
That is because all investments are exchanges of lump-sum payments today for
future payments. What these future cash payments will be is determined by
growth and inflation, what risk investors are willing to take in investing in them as
compared to having cash in hand is the risk premium, and what they are worth
today, which is called their “present value,” is determined by the discount rate.-
How these four determinants change drives how investment returns
change. Tell me what each of these determinants is going to do and I can tell you
what the investments are going to do. Knowing this tells me how to connect what
is happening in the world to what is happening in the markets and vice versa. It
also shows me how to balance my investments so that my portfolio doesn’t have
any bias to any environment, which is what produces good diversification.
Governments influence these factors through their fiscal and monetary
policies. As a result, interactions between what governments want to
happen and what is actually happening are what drive the cycles.- For
example, when growth and inflation are too low, central banks create more money
and credit growth, which creates buying power, which causes economic growth to
pick up at first and then, with a lag, inflation to pick up as well. When central
banks constrain money and credit growth, the opposite happens: economic
growth and inflation both slow down.
There is a difference between what central governments and central
banks do in order to drive market returns and economic conditions.
Central governments determine where the money they use comes from and
goes to because they can tax and spend, but they can’t create money and
credit. Central banks on the other hand can create money and credit but
can’t determine what the money and credit go into in the real economy.
These actions from central governments and central banks influence the
purchases and sales of goods, services, and investment assets, driving their prices
up or down.
To me each investment asset reflects these drivers in its own way that is
logical in light of the effects on its future cash flows. Each investment asset
is a building block for a portfolio, and the challenge is to put together a
portfolio well in light of these things. For example, when growth is stronger
than expected, all else being equal, stock prices will likely rise, and when growth
and inflation are higher than expected, bond prices will likely fall. My goal is to
put these building blocks together in a portfolio that is well-diversified
and tactically tilted based on what is happening or is going to happen in
the world that is affecting these four drivers. These building blocks can be
broken out by country, by environmental bias, and all the way down to the level
of individual sectors and companies. When this concept is put into a well-
balanced portfolio, it looks like the following graphic. It is through this lens that I
look at the history of events, the history of the markets, and the behavior of
portfolios.
THE BUILDING BLOCKS OF A WELL-DIVERSIFIED PORTFOLIO
I understand that my approach is different from that of most investors for
two reasons. First, most investors don’t look for historically analogous periods
because they think history and old investment returns are largely irrelevant to
them. Second, they don’t look at investment returns through the lens I just
described. I believe that these perspectives give me and Bridgewater a competitive
advantage, but it’s up to you to take or leave them as you like.
Most investors base their expectations on what they have experienced in their
lifetimes and a few more diligent ones look back in history to see how their
decision-making rules would have worked back to the 1950s or 1960s. There are
no investors I know and no senior economic policy makers I know—and I know
many and I know the best—who have any excellent understandings of what
happened in the past and why. Most investors who look at longer-term returns
look at those in the US and the UK (the countries that won World War I and
World War II) as being representative. That is because there are not many stock
and bond markets that survived World War II. But these countries and time
periods are not representative because of their survivorship bias. In looking at the
returns of the US and the UK, one is looking at uniquely blessed countries in the
uniquely peaceful and productive time that is the best part of the Big Cycle. Not
looking at what happened in other countries and in times before yields a distorted
perspective.
Reasoning logically from what we know about Big Cycles, when we extend
our perspective just a few decades further back and look at what happened in
different places, we get a shockingly different perspective. I’m going to show you
this because I think you should have it.
In the 35 years before 1945, virtually all wealth was destroyed or confiscated in
most countries, and in some countries many capitalists were killed or imprisoned
because of anger at them when the capital markets and capitalism failed along
with other aspects of the old order. If we look at what happened over the past few
centuries, we see that such extreme boom/bust cycles happened regularly—there
were regular cycles of capital and capitalist boom periods (such as the Second
Industrial Revolution and the Gilded Age that happened in the late 19th and early
20th centuries) that were followed by transition periods (like the 1900-10 period
of rising internal conflict and rising international conflict over wealth and power)
that led to great conflict and economic bust periods (similar to those that
happened between 1910 and 1945). We can also see that the cause/effect
relationships that were behind the movements of those boom and bust periods are
now more aligned with the late-cycle bust and restructuring periods than the
early-cycle boom and building periods.
My goal was simply to see and try to understand what happened in the
past and do a good job of showing it to you. That is what I will now try to do.
I will start in 1350, though the story begins long before.
THE BIG CYCLE OF CAPITALISM AND MARKETS
Up until around 1350, lending with an interest rate was prohibited by
both Christianity and Islam—and in Judaism it was banned within the
Jewish community—because of the terrible problems it caused, with human
nature leading people to borrow more than they could pay back, which created
tensions and often violence between borrowers and lenders. As a result of this lack
of lending, currency was “hard” (gold and silver). A century or so later, in the Age
of Exploration, explorers went around the world collecting gold and silver and
other hard assets to make more money. That’s how the greatest fortunes were
built at the time. The explorers and those who backed them split the profits. It
was an effective incentive-based system for getting rich.
The alchemy of lending as we know it today was first created in Italy around
1350. Rules for lending changed and new types of money were made: cash
deposits, bonds, and stocks that looked pretty much like we know them today.
Wealth became promises to deliver money—what I call “financial wealth.”
Think about what a huge impact the inventions and developments of bond
and stock markets had. Before then, all wealth was tangible. Think about how
much more “financial wealth” was created by creating these markets. To imagine
the difference, consider how much “wealth” you would now have if your cash
deposits and stock and bond promises to pay you in the future didn’t exist. You
wouldn’t have much at all. You’d feel broke, and you’d behave differently—for
example, you’d build up more savings in tangible wealth. That is pretty much
what it was like before cash deposits, bonds, and stocks were created.
With the invention and growth of financial wealth, money was not
constrained by a link to gold and silver. Because money and credit, and with
them spending power, were less constrained, it was common practice for
entrepreneurs who came up with good ideas to create companies and borrow
money and/or sell a piece of those companies by selling stock to get money to buy
what they needed. They could do this because promises to pay became money
that took the form of journal entries. Around 1350 those who could do this, most
famously the Medici family in Florence, could create money. If you can create
credit—let’s say five times as much as there is actual money (which banks can do)
—you can produce a lot of buying power so you don’t need as much of the other
type of money (gold and silver) anymore. The creation of new forms of money
was and still is a kind of alchemy. Those who could create it and use it—bankers,
entrepreneurs, and capitalists—became very rich and powerful.-.
This process of expanding financial wealth has continued up to today, with
financial wealth becoming so large that the hard money (gold and silver) and other
tangible wealth (e.g., property) have become relatively unimportant. But of course
the more promises there are in the form of financial wealth the greater the risk
there is that these promises can’t be kept. That’s what makes the classic big
debt/money/economic cycle.
Think about how much financial wealth there is now relative to real wealth
and imagine if you and others who are holding it actually tried to convert it into
real wealth—that is, sell it and buy stuff. It would be like a run on a bank. It
couldn’t happen. The bonds and stocks are too sizable in value relative to what
they could buy. But remember that with fiat money the central banks can print
and provide the money needed to meet the demand. That is a timeless and
universal truth.
Also remember that paper money and financial assets (e.g., stocks and bonds)
that are essentially promises to pay aren’t of much use; it is only what they buy
that is of use.
As discussed in detail in Chapter 3, when credit is created, buying power is
created in exchange for a promise to pay back, so it is near-term
stimulating and longer-term depressing. That creates cycles. Throughout
history the desire to obtain money (by borrowing or selling stock) and the desire
to save it (by investing through lending or buying stock) have been in a symbiotic
relationship. This has led to growth in the form of buying power and
eventually to many more promises to pay than can be delivered and
broken-promises crises in the form of debt-default depressions and stock
market crashes.
That is when the bankers and capitalists are hanged both figuratively
and literally, vast amounts of wealth and lives are wiped out, and vast
amounts of fiat money (money that can be printed and has no intrinsic
value) are printed to try to relieve the crisis.
THE MORE COMPLETE PICTURE OF THE BIG CYCLE FROM
AN INVESTOR’S PERSPECTIVE
While it would be too burdensome for me and you to go through all the relevant
history between 1350 and now, I will show you what the picture would have
looked like if you had started investing in 1900. But before I do so I want to
explain how I think about risk because I’m going to highlight these risks in what I
show you.
As I see it, investment risk is failing to earn enough money to meet your
needs. It’s not volatility measured by standard deviation, which is the almost
exclusively used measure of risk.
To me, the three biggest risks most investors face are that their
portfolios won’t provide the returns needed to meet their spending needs,
that their portfolios will face ruin, and that a large share of their wealth
will be taken away (e.g., through high taxes).
While the first two risks sound analogous, they are in fact different because it is
possible to have average returns that are higher than required but also experience
one or more periods of devastatingly high losses.
To gain perspective, I imagined that I was dropped into 1900 to see how my
investments would have done in every decade since. I chose to look at the 10
greatest powers as of 1900 and skip less-established countries, which were more
prone to bad outcomes. Virtually any one of these countries was or could have
become a great, wealthy empire, and they were all reasonable places for one to
invest, especially if one wanted to have a diversified portfolio.
Seven of these 10 countries saw wealth virtually wiped out at least once,
and even the countries that didn’t see wealth wiped out had a handful of
terrible decades for asset returns that virtually destroyed them financially.
Two of the great developed countries—Germany and Japan, which at times one
easily could have bet on as being winners—had virtually all their wealth and many
lives destroyed in the World Wars. I saw that many other countries had similar
results. The US and the UK (and a few others) were the uniquely successful cases,
but even they experienced periods of great wealth destruction.
If I hadn’t looked at these returns in the period before the new world order
began in 1945, I wouldn’t have seen these periods of destruction. And had I not
looked back 500 years around the world, I wouldn’t have seen that this has
happened repeatedly almost everywhere.
The numbers shown in this table are annualized real returns for each decade,
which means that for the decade as a whole the losses are about eight times greater
than shown and the gains are about 15 times greater.d.
A LOOK AT ASSET RETURNS ACROSS THE GREAT POWERS
(Real Returns, 10-Year Window, Ann)
UNITED STATES GREAT BRITAIN JAPAN GERMANY
Equity Bond Cash Equity Bond Cash Equity Bond Cash Equity Bond Cash
1900- 10 9% 0% 1% 3% 2% 2% 4% 1% 4% 3% 2%
1910- 20 -2% -4% -3% -6% -7% -5% 1% -5% -4% -14% -10% -14%
1920- 30 16% 7% 5% 10% 8% 7% -3% 12% 10% -24% -95% -86%
1930- 40 0% 7% 3% 1% 5% 1% 6% 4% -1% 7% 11% 6%
1940- 50 3% -2% -5% 3% -1% -4% -28% -34% -33% -4% -16% -19%
1950- 60 16% -1% 0% 13% -1% -1% 27% -1% 5% 26% 5% 2%
1960- 70 5% -1% 2% 4% 0% 2% 8% 8% 2% 3% 5% 1%
1970- 80 -2% -1% -1% -4% -3% -3% 3% -2% -1% -7% 4% 0%
1980- 90 13% 9% 4% 16% 8% 5% 19% 9% 4% 10% 6% 3%
1990- 00 14% 6% 2% 12% 8% 5% -7% 9% 2% 13% 7% 3%
2000- 10 -3% 8% 0% 0% 4% 2% -3% 4% 1% -2% 6% 2%
2010- 20 11% 4% -1% 5% 5% -1% 10% 2% 0% 7% 5% -1%
A LOOK AT ASSET RETURNS ACROSS THE GREAT POWERS
(Real Returns, 10-Year Window, Ann)
FRANCE NETHERLANDS ITALY
Equity Bond Cash Equity Bond Cash Equity Bond Cash
1900- 10 1% 3% 2% 5% 1% 1% 3% 4%
1910- го -7% -8% -6% 1% -6% -3% -9% -8% -6%
1920- 30 -2% -1% -4% 1% 11% 6% -6% -5% -1%
1930- ДО -10% 2% 0% 2% 6% 3% 4% 5% 5%
1940- 50 -20% -22% -23% 2% -3% -6% -13% -30% -30%
1950- 60 17% 0% -2% 14% 0% -2% 20% 2% 1%
1960- 70 0% 2% 1% 2% 0% 0% 0% 2% 0%
1970- 80 -2% -3% 0% -3% 2% -2% -13% -8% -1%
1980- 90 16% 9% 5% 16% 7% 5% 15% 4% 6%
1990- 00 13% 10% 5% 20% 7% 4% 9% 15% 6%
2000- 10 -2% 5% 1% -6% 5% 1% -4% 5% 1%
2010- 20 7% 6% -1% 8% 5% -1% 3% 8% -1%
RUSSIA CHINA AUSTRIA-HUNGARY
Equity Bond Cash Equity Bond Cash Equity Bond Cash
1900- 10 -2% 3% 4% 7% 6% 3% 4% 3% 2%
1910- гО -100% -100% -36% 3% 1% 4% -9% -10% -8%
1920- 30 9% 6% 1% -6% -44% -44%
1930- ДО 2% -7% -6%
1940- 50 -100% -100% -73%
1950- 60
1960- 70
1970- 80
1980- 90
1990- 00
2000- 15% -2% 10 4% 1%
2010- 7% 4% 1% 20 2% 2% 0%
Perhaps this next chart paints a clearer picture, as it shows what percentage of
countries saw losses of a 60/40 stock/bond portfolio over five-year periods.
SHARE OF PORTFOLIOS LOSING X% OVER 5 YEARS BY COUNTRY
(60/40 PORTFOLIO, REAL RETURNS)
The following table shows the worst cases of investing in major countries in detail.
You will note that the US doesn’t appear on this table because it wasn’t among the
worst cases. The US, Canada, and Australia were the only countries that
didn’t experience sustained periods of losses.
WORST INVESTOR EXPERIENCES (ACROSS MAJOR COUNTRIES)
Major Cases of 60/40 Real Returns Below -40% over a 20-Year Window
Country 20yr Window Worst 20yr Return (Real, Cumul) Detail
Russia 1900-1918 -100% The Russian Civil War ended with communist rule, debt repudiation, and the destruction of financial markets.
China 1930-1950 -100% Asset markets closed during WWII and were destroyed when communist rule took hold in the late 1940s.
Germany 1903-1923 -100% Weimar Republic hyperinflation led to a collapse in assets following WWI.
Japan 1928-1948 -96% Japanese markets and currency collapsed as markets reopened post-WWII and inflation soared.
Austria 1903-1923 -95% Similar to Weimar Germany (though less infamous); hyperinflation led to poor asset returns post-WWI.
France 1930-1950 -93% The Great Depression, followed by WWII and German occupation, led to poor returns and high inflation.
Italy 1928-1948 -87% Similar to those of other Axis powers, Italian markets collapsed as WWII concluded.
Italy 1907-1927 -84% Post-WWI, Italy suffered from economic depression and high inflation, helping lead to Mussolini’s rise.
France 1906-1926 -75%
The early 20th century saw WWI, followed by France’s inflationary currency crisis in the early 1920s.
Italy 1960-1980 -72% Italy endured a series of recessions, high unemployment rate and inflation, and currency declines in the 1960-70s.
India 1955-1975 -66% Post-independence, a series of major droughts caused weak Indian economic growth and high inflation.
Spain 1962-1982 -59% The post-Franco transition to democracy coupled with the inflationary 1970s strained Spain’s economy.
Germany 1929-1949 -50% The Great Depression followed by the devastation of WWII led to a terrible period for German assets.
France 1961-1981 -48% Like other European nations, the 1960-70s saw weaker growth, currency declines, and high inflation.
UK 1901-1921 -46% The early 20th century saw World War I, followed by the depression of 1920-21.
6
Naturally I think about how I would have approached these periods if I had
been living through them. I’m certain that even if I had seen the signs of things
coming that I’m passing along in this book I never would have confidently
predicted such bad outcomes—as noted earlier, seven of 10 countries saw their
wealth wiped out. In the early 1900s, even those looking back over the past few
decades would never have seen it coming because there were plenty of reasons to
be optimistic based on what had happened during the second half of the 19th
century.
People today often assume that World War I must have been easy to foresee in
the years leading up to it, but that wasn’t the case. Before the war, there had been
about 50 years of almost no conflict between the world’s major powers. During
those 50 years the world experienced the greatest innovation and productivity
growth rates it had ever seen, which led to enormous wealth and prosperity.
Globalization was at new highs, with global exports up several multiples in the 50
years prior to World War I. Countries were more interconnected than ever. The
US, France, Germany, Japan, and Austria-Hungary were rapidly rising empires,
experiencing dizzying technological advancement. The UK was still the dominant
global power. Russia was rapidly industrializing. Of those countries shown in the
table of worst investor experiences, only China was obviously in decline. Strong
alliances among European powers were seen at the time as a means of keeping the
peace and maintaining the balance of power. Going into 1900 things looked great,
except for the fact that wealth gaps and resentments were increasing and debts had
become large.
Between 1900 and 1914 these conditions worsened and international tensions
increased. Then came the periods of terrible returns I just described.
But it was worse than just terrible returns.
In addition, the impacts on wealth of wealth confiscations, confiscatory taxes,
capital controls, and markets being closed were enormous. Most investors today
don’t know of such things and consider them implausible because they wouldn’t
have seen them by looking back on the past few decades. The following table
shows in which decades these events occurred. Naturally the most severe cases of
wealth confiscation came during periods in which there were large wealth gaps
and internal conflict over wealth when economic conditions got bad and/or there
was a war.
PERIODS OF WEALTH CONFISCATION
1900 1920 1940 1960 1980 2000
UK
USA Yes Yes
China
Yes
Yes
Germany Yes
France
Russia Yes Yes Yes
Austria-
Hungary
Italy Yes
Netherlands
Japan Yes
PERIODS OF STRICT/RISING CAPITAL CONTROLS
1900 1920 1940 1960 1980 2000
UK Yes Yes Yes Yes
USA Yes Yes
China Yes Yes Yes
Germany Yes Yes Yes Yes
France Yes Yes
Russia Yes Yes Yes Yes Yes Yes
Austria- Hungary Yes
Italy Yes
Netherlands Yes
Japan Yes Yes
The next chart shows the share of major countries that shut their stock markets
through time. Wartime stock market closures were common, and of course
communist countries shut their stock markets over a generation.
STOCK MARKET CLOSURES ACROSS MAJOR ECONOMIES
7
4
S
4
3
2
1
0
1900 1920 1940 1960 1980 2000 2020
The bad parts of all the cycles that took place prior to 1900 were similarly bad.
To make matters even worse, these periods of internal and external fighting
over wealth and power led to many deaths.
DEATHS IN MAJOR VIOLENT CONFLICTS (%P0PULATI0N)
INTERNAL AND EXTERNAL
1900 1910 1920 1930 1940 1950 1960 1970 1980 1990 2000 2010
UK 0% 2% 0% 0% 1% 0% 0% 0% 0% 0% 0% 0%
USA 0% 0% 0% 0% 0% 0% 0% 0% 0% 0% 0% 0%
China 0% 0% 1% 2% 3% 1% 1% 1% 0% 0% 0% 0%
Germany 0% 3% 0% 9% 15% 0% 0% 0% 0% 0% 0% 0%
France 0% 4% 0% 0% 1% 0% 0% 0% 0% 0% 0% 0%
Russia 0% 4% 5% 10% 13% 0% 0% 0% 0% 0% 0% 0%
Austria- Hungary 0% 2%
Italy 0% 2% 0% 0% 1% 0% 0% 0% 0% 0% 0% 0%
Netherlands 0% 0% 0% 1% 2% 0% 0% 0% 0% 0% 0% 0%
Japan 0% 0% 0% 1% 4% 0% 0% 0% 0% 0% 0% 0%
Even for the lucky investors who were in countries that won the wars (such as
the US, which was twice the biggest winner), there were two further headwinds:
market timing and taxes.
Most investors sell near the lows when things are bad because they need money
and because they tend to panic; they tend to buy near the highs because they have
plenty of money and they are drawn into the euphoria. This means that their
actual returns are worse than the market returns I showed. A recent study showed
that US investors underperformed US stocks by around 1.5 percent a year
between 2000 and 2020.
As for taxes, this table estimates the average impact of taxes for investors in the
S&P 500 over all 20-year periods (using average tax rates for the top quintile today
throughout the analysis period). The different columns represent different ways
of investing in the US stock market, including a tax-deferred retirement account
(where tax is paid only at the end of the investment) and holding physical equities
and reinvesting dividends annually like if stocks were held in a brokerage account.
While these different implementations have different tax implications (with
retirement accounts least impacted), all of them show a significant impact,
especially in real returns, where taxes can erode a significant portion of returns.
US investors lost about a quarter of their real equity returns on average to taxes in
any given 20-year period.
IMPACT OF TAXES ON ROLLING 20-YEAR S&P TOTAL RETURNS
Pre-Tax Post-Tax (401 [k]) Post-Tax (Brokerage)
Avg Ann Total Return 9.5% 8.2% 7.9%
Avg Drag from Taxes (Ann Total Return) -1.3% -1.6%
Avg Drag from Taxes (% of Total Returns) -14% -17%
Avg Ann Real Return 6.2% 4.9% 4.6%
Avg Drag from Taxes (Ann Real Return) -1.2% -1.6%
Avg Drag from Taxes (% of Real Returns) -20% -26%
REVIEWING THE BIG CAPITAL MARKETS CYCLE
Earlier, I explained how the classic big debt and capital markets cycle works.
To reiterate, in the upwave, debt is increased and financial wealth and
obligations rise relative to tangible wealth to the point that these promises
to pay in the future (i.e., the values of cash, bonds, and stocks) can’t be
met. This causes “run on the bank”-type debt problems to emerge, which
leads to the printing of money to try to relieve the problems of debt
defaults and falling stock market prices, which leads to the devaluation of
money and in turn to financial wealth going down relative to real wealth,
until the real (inflation-adjusted) value of financial assets returns to being
low relative to tangible wealth. Then the cycle begins again. That is a very
simplified description, but you get the idea—during the downwave in this cycle
there are negative real returns of financial assets relative to real assets and there are
bad times. It is the anti-capital, anti-capitalist part of the cycle that continues until
the opposite extreme is reached.
This cycle is reflected in the following two charts. The first shows the
value of total financial assets relative to the total value of real assets. The
second shows the real return of money (i.e., cash). I use US numbers rather
than global numbers because they are the ones that are most continuous since
1900. As you can see, when there is a lot of financial wealth relative to real
wealth it reverses and real returns of financial wealth, especially cash and
debt assets (like bonds), are bad. That is because interest rates and returns
for debt holders have to be low and bad in order to provide the relief to
the debtors who have too much debt and in order to try to stimulate more
debt growth as a way of stimulating the economy. This is the classic late-cycle
part of the long-term debt cycle. It occurs when printing more money is used to
reduce debt burdens and new debts are created to increase purchasing power. This
devalues the currency relative to other storeholds of wealth and relative to goods
and services. Eventually as the value of financial assets declines until they
become cheap relative to real assets, the opposite extreme is reached and
reverses, which is when peace and prosperity return, the cycle goes into its
up phase, and financial assets have excellent real returns.
USA FINANCIAL ASSETS SHARE OF TOTAL ASSETS
As explained earlier, during periods of the devaluation of money, hard
money and hard assets rise in value relative to cash. For example, the next
chart shows that periods when the value of the classic 60/40 stock/bond
portfolio declined were periods when gold prices rose. I am not saying
anything about gold being a good or bad investment. I am simply describing
economic and market mechanics and how they have been manifest in past market
movements and investment returns for the purpose of sharing my perspective on
what happened and what could happen and why.
GOLD RETURNS DURING 60/40 DRAWDOWNS
--Gold letums (In Global FX) Global 60/40 Drawdowns
One of the most important questions investors need to regularly ask
themselves is whether the amount of interest that is being paid more than
makes up for the devaluation risk they face.
The classic big debt/money/capital markets cycle, which has repeated through
time and in all places and is reflected in the charts I just showed you, is seen in the
relative values of 1) real/tangible money and real/tangible wealth and 2) financial
money and financial wealth. Financial money and financial wealth are valuable
only to the extent that they get you the real money and real wealth that have real
(i.e., intrinsic) value. The ways these cycles have always worked is that, in their
rising phases, the amounts of financial money and financial wealth (i.e., created
debt and equity assets) are increased relative to the amounts of real money and real
wealth that they are claims on. They are increased because a) it is profitable for
those capitalists who are in the business of creating and selling financial assets to
produce and sell them, b) increasing money, credit, and other capital market assets
is an effective way for policy makers to create prosperity because it funds demand,
and c) it creates the illusion that people are wealthier because the stated values of
financial investments go up when the value of the money and debt assets goes
down. In this way central governments and central bankers have always created
many more claims on real money and real wealth than could ever be turned in for
real wealth and real money.
In the rising parts of the cycle, stocks, bonds, and other investment assets go up
as interest rates go down because falling interest rates make asset prices rise, all else
being equal. Also putting more money in the system raises the demand for
financial assets, which lowers risk premiums. When these investments go up
because of lower interest rates and more money in the system, that makes them
seem more attractive at the same time as interest rates and the future expected
returns of financial assets are going down. The more outstanding claims there are
relative to what there are claims on, the more risk there is. This should be
compensated for by a higher interest rate, but it typically isn’t because at that
moment conditions seem good and memories of debt and capital market crises
have faded.
The charts that I showed you before to convey the cycles would not be
complete in painting the picture without some interest rate charts. Interest rates
are shown in the next four charts that go back to 1900. They show real (i.e.,
inflation-adjusted) bond yields, nominal (i.e., not inflation-adjusted) bond yields,
and nominal and real cash rates for the US, Europe, and Japan at the time of my
writing. As you can see they were much higher and now they are very low. Real
yields of reserve currency sovereign bonds, at the time of my writing this, are near
the lowest ever, and nominal bond yields are around 0 percent, also near the
lowest ever. As shown real yields of cash are even lower, though not as negative as
they were in the 1930-45 and 1915-20 great monetization periods. Nominal cash
yields are near the lowest ever.
What does this mean for investing? The purpose of investing is to have money
in a storehold of wealth that one can convert into buying power at a later date.
When one invests, one gives a lump-sum payment for payments in the future.
Let’s look at what that deal, as of this writing, looks like. If you give $100 today,
how many years do you have to wait to get your $100 back and then start
collecting the reward on top of what you gave? In US, Japanese, Chinese, and
European bonds you could have to wait roughly 45 years, 150 years, and 30 years-
respectively to get your money back (likely getting low or nil nominal returns) and
in Europe at the time of this writing you would likely never get your money back
given negative nominal interest rates. However, because you are trying to store
buying power you have to take into consideration inflation. At the time of this
writing, in the US and Europe, you may never get your buying power back (and in
Japan it will take over 250 years). In fact, in these countries with negative real
interest rates, you are almost guaranteed to have a lot less buying power in the
future. Rather than get paid less than inflation, why not instead buy stuff—any
stuff—that will equal inflation or better? I see a lot of investments that I expect to
do significantly better than inflation. The following charts show these payback
periods for holding cash and bonds in the US, in both nominal and real terms. As
shown, it is the longest ever and obviously a ridiculous amount of time.
NOMINAL PAYBACK REAL PAYBACK
PERIOD (YEARS) PERIOD (YEARS)
CONCLUSION
What I showed you here was the Big Cycle from an investor’s perspective since
1900. In looking around the world going back 500 years and in China going back
1,400 years I saw basically the same cycles occur repeatedly for basically the same
reasons.
As discussed earlier in the book, the terrible periods in the years prior to the
1945 establishment of the new world order are typical of the late Big Cycle
transition stage when revolutionary changes and restructurings occur. While they
were terrible, they were more than matched by terrific upswings that came after
the painful transition from the old order to the new order. Because these things
have happened many times before, and because I can’t say for sure what will
happen in the future, I can’t invest without having protections against these sorts
of things happening and my being wrong.
1 The discount rate is the interest rate that one uses to assess what an amount of money in the future is worth
today. To calculate it, one compares what amount of money today, invested at that interest rate (i.e., the
discount rate), would be worth a certain amount at a specific time in the future.
- If governments and their systems break down, non-government-directed forces take over, which is a whole
other story that I won’t get into now.
- . You can see this kind of alchemy at work today in the form of digital currency.
- . When compounded over a decade, gains are greater than losses because you keep building off of gains;
whereas as you experience losses and approach zero, future percent losses matter less in dollar terms. The
comparison of annualizing gains versus losses represents compounding from 10 percent annualized gains and
-5 percent annualized losses on average. At more extreme changes the multipliers change from there.
- . For China and Russia, bond data pre-1950 is modeled using hard currency bond returns held as though
hedged back to local currency by a domestic investor; stocks and bonds modeled as full default at time of
revolution. Annualized returns assume a full 10-year period even if markets closed during the decade.
- . Cases of poor asset returns in smaller countries such as Belgium, Greece, New Zealand, Norway, Sweden,
Switzerland, and across the emerging world are excluded from this table. Note that for conciseness the worst
20-year window is shown for each country/time period (i.e., including Germany in 1903-23 precludes
including Germany from 1915-35). For our 60/40 portfolios, we assumed monthly rebalancing across the
20-year window.
Z While this diagram is not exhaustive, I include instances where I could find clear evidence of each occurring
in the 20-year period. For this analysis, wealth confiscation was defined as extensive seizure of private assets,
including large-scale forced, non-economic sales by a government (or revolutionaries in the case of
revolution). Relevant capital controls were defined as meaningful restrictions on investors moving their
money to and from other countries and assets (although this does not include targeted measures directed only
at single countries, such as sanctions).
- .Tax impact for 401(k) method applies a 26 percent income tax rate (effective average federal tax rate for top
quintile from the Congressional Budget Office as of 2017) at the conclusion of each 20-year investment
period (i.e., tax-free investment growth). Tax impact for brokerage method separately taxes dividends (at the
same 26 percent income tax rate) and capital gains, paying taxes on all capital gains (at a 20 percent rate) from
both principal and dividend reinvestment at the conclusion of each 20-year investment period and netting
losses against any gains.
Based on August 2021 levels of 30-year nominal bond yields (treated as a perpetuity).
PART II
HOW THE WORLD HAS
WORKED OVER THE LAST
500 YEARS
CHAPTER 8
THE LAST 500 YEARS IN A TINY
NUTSHELL
I In Part I, I described how I believe the perpetual-motion machine works. In
Part II, I will show you what this perpetual-motion machine has produced over
the last 500 years of history. Just as I did in Part I, I’ll start by conveying
everything in a tiny nutshell. This chapter will set the stage for the remaining
chapters of Part II, which will cover in detail how the Big Cycle played out in the
Dutch, British, American, and Chinese cases. Finally, in Part III, I will attempt to
squint into the future by sharing with you what my model says about a number of
the leading countries today. But before we get there, we need to go back to 1500
to get a better picture of what the world was like when this story begins.
THE WORLD IN 1500
The world was very different in 1500 yet it operated the same way it does now.
That’s because while things have evolved a lot since 1500, they’ve done so in the
same ways they always have, with evolutionary uptrends producing advancements
and big cycles creating swings and bumps around the uptrends.
A few of the most important ways that the world was different in 1500 were:
The World Was Much “Bigger” Then. Five hundred years ago one could travel
about 25 miles in a day on horseback. Today it is possible to travel to the other
side of the world in the same amount of time. The Apollo astronauts traveled to
the moon and back much faster than it took a traveler to get from Paris to Rome
in 1500. As a result, the geographic areas of relevance—e.g., who could impact
whom—were much smaller so the world seemed much bigger. Europe was one
world, Russia was another, and China and the areas around it were an even more
remote world. States that in retrospect seem tiny and numerous did not seem that
way at all at the time. Because national boundaries didn’t exist as they do today,
there were almost constant fights with neighbors over wealth and power in their
neighborhoods.
But in 1500, that picture was changing quickly. The European powers were
well into their Age of Exploration, which was led by the Portuguese and the
Spanish and brought them into contact with faraway empires. Like all periods of
great evolution, the Age of Exploration was enabled by technological
developments that could make people rich—in this case, the invention of ships
that could travel the world to accumulate riches by trading with and taking wealth
from those who the explorers encountered. At the time, wealthy rulers funded the
expeditions in exchange for a share of the bounty that the explorers brought back
with them.
Countries Didn’t Exist—Instead, Territories Were Run by Families. Back
in 1500, there were no sovereign states with borders and ruling orders. They
hadn’t been invented yet. Instead there were big family estates called kingdoms
and dynasties run by kings and emperors that almost constantly fought
with their neighbors for wealth and power. When a kingdom conquered,
grew, and encompassed enough area, it was called an empire. Because the ruling
order was centered around families, kingdoms and dynasties at that time could
inherit other lands if their rulers died and there was no closer relative, similar to
how one would inherit property or a family company today. Arranged marriages
were logical ways the empire could stay in the hands of a tighter family group
rather than branching off and dissipating over the generations.
Religions and Religious Leaders Were Much More Powerful—and Science
as We Know It Today Didn’t Exist. In most of the world, the elites (i.e., that
small percentage of the population who had most of the wealth and power)
consisted of monarchs who supposedly gained their power from the divine, the
clergy who represented the divine, and the landowning nobles who oversaw the
peasants and largely treated them like oxen working the land. The monarchs had
ministers, bureaucracies, and militaries that controlled and defended their
territories for them.
Though the Europeans and the Chinese were on opposite sides of the world
and had virtually no contact with each other, they operated in essentially the same
way, though China’s institutions were bigger, more developed, and less religious
than Europe’s.
The World Was Much Less Egalitarian. The ideas that a) all people should be
treated equally and b) judged by the law didn’t exist at the time. This was true
both within kingdoms and between them; in both cases, power through arms and
violence ruled the day. Up until the 1300s and 1400s, serfdom (i.e., peasants being
essentially treated as the property of their rulers) existed in most of Western
Europe, which meant that the only way for most people to assert their power was
through revolt. While this had largely changed by 1500, the rights afforded to
common people remained weak until the Enlightenment in the 1700s.
THE WORLD’S EMPIRES IN 1500
Europe
The Habsburg family dynasty controlled Spain and all the territories
that Spain controlled plus a collection of territories that formed the
Holy Roman Empire. This included parts of what we now call the
Netherlands, Belgium, Italy, Germany, and Austria. It was the
Western world’s most powerful empire.
The Valois (later Bourbon) family dynasty, which was the main rival
to the Habsburgs, controlled France. This led to a lot of fighting
between the families.
The Tudor dynasty controlled England, which was not yet an
important force in Europe though it was growing in strength.
Florence, Venice, and Milan, which were frequently run as republics
with prominent families, were where the action was. Most of the
financial, commercial, intellectual, and artistic innovation coming out of
Europe in 1500 originated in these states. They were very rich and played a
central role in shaping Europe and the Western world at this time and for
centuries to come because of the revolutionary ideas they fostered, ideas I
will explore in more detail later.
The Papal States were run by the pope and the Catholic Church.
Throughout Christian Europe, relationships between monarchs, nobles,
and the church followed the typical formula of elites working in mutually
supportive ways to drive the ruling orders to their benefit. As a result of
this, the church acquired vast wealth, which it got mostly from poor
peasants who gave money to the church (through the system of tithes) and
worked without pay on church agricultural lands.
The Rurik dynasty, and later the Romanovs, ruled Russia, which was
a peripheral power at the time and seemed remote to Europeans.
The Ottoman Empire, named after its ruling family, was centered in
Constantinople, which it had conquered in 1453.
Additionally there were many hundreds, perhaps thousands, of family-
run states across Europe. They fought all the time because each had to
constantly defend and fight one’s neighbors. Allies and enemies were always
important and constantly changing. This map shows the major powers in Europe
in 1550. There were many more small states we couldn’t fit on this map.
Bunder
Russia
France
Ottoman Empire
Habsburg
Italy
Papal
Genoa $totcs
England
Countries
German
(non-Habsburg)
Hoy Roman
Empire Habsburg
Central
Europe
Venice
Folandlilhaania
Portugal Habsburg
Spain
Asia
The Ming Dynasty controlled almost all of China and was the most
advanced and powerful empire in the world. Like European empires, it
was family-controlled with an emperor who had the “mandate of heaven.”
The emperor oversaw a bureaucracy that was run and protected by
ministers and military leaders who worked in symbiotic—though
sometimes contentious—relationships with landowning noble families
who oversaw peasant workers. In 1500 the Ming Dynasty was
approaching its peak and was leaps and bounds ahead of Europe in wealth,
technology, and power. It had enormous cultural and political influence
all over East Asia and Japan.-
At the time, Confucian scholars were then seen to be near the top of the social
hierarchy, which helped them get ahead in politics. To get ahead one needed to
study Confucianism in depth and pass highly competitive exams. Political
decisions were frequently based on ruler’s interpretations of Confucian ideals.
“Neo-Confucianism,” which was dominant at the time, shifted the focus of the
belief system toward a more rational, philosophical, academic, and humanistic
form. This way of thinking, which was practical, evidence-based, and scientific,
was a key reason China pulled so far ahead of Europe in the Middle Ages. At the
time, scholars and scientists had significant power, which led to remarkable
technological advances (gun powder, the printing press, architecture, and more).
Literacy rates were extremely high relative to other places at the time, and China
was also advanced in medicine. For example, it had a widespread program of
fighting smallpox infection via an early form of vaccination, centuries before
Europe. Its financial system was relatively well developed with early forms of
corporations and banks, a history of using (and misusing) printed money, and
relatively sophisticated financial markets. And it was militarily very strong. The
Ming Dynasty had the largest navy in the world and a standing army of a million
troops.
In his wonderful book, The Rise and Fall of the Great Powers, historian Paul
Kennedy described it well:
“Of all the civilizations of premodern times, none appeared more advanced,
none felt more superior than that of China. Its considerable population,
100-130 million compared with Europe’s 50-55 million in the fifteenth
century; its remarkable culture; its exceedingly fertile and irrigated plains,
linked by a splendid canal system since the eleventh century; and its unified,
hierarchic administration run by a well-educated Confucian bureaucracy
had given a coherence and sophistication to Chinese society which was the
envy of foreign visitors.”
Ironically and typically, the enormity of the Ming Dynasty’s wealth and
power is one possible explanation of what eventually led to its fall.
Believing that they did not need anything else, the emperors put an end to
China’s exploration of the world, closed its doors, and retired to lives of
pleasure, and turned over the running of government to their ministers
and eunuchs, which led to dysfunctional infighting, corruption, weakness,
and vulnerability to attack. There was a shift away from pragmatic scientific
study and innovation toward pedantic scholarship. As we’ll see in Chapter 12, this
helped drive the decline of China relative to Europe.
Across the rest of Asia, the story in 1500 was one of fragmentation.
India was divided among several kingdoms, including the Delhi Sultanate
in the north and the Hindu Vijayanagara Empire in the south. It was not
an empire of note, though it was about to be, as in the 1520s the Mughal
Empire began its conquest of India, eventually leading it to be among the world’s
most powerful. Likewise Japan in 1500 was divided into many entities,
experienced civil war, and was isolated, so it too was not a power of note.
The Middle East
The Ottoman Empire, mentioned before, also came to control much
of the Middle East by the mid-1500s, with a key rival in the new
Safavid dynasty of Persia (modern-day Iran).
The Americas
The largest empires were the Aztec Empire centered in Mexico (its
capital, Tenochtitlan, probably had a greater population than any
city in Europe at the time) and the Incan Empire in South America.
But soon the Europeans arrived, devastating both powers and
leading to the emergence of new colonies, including the seedlings of
what would become the United States 276 years later.
Africa
A vast continent three times bigger than Europe was divided into
dozens of kingdoms, often separated by large, sparsely populated
areas. The biggest in the year 1500 was the Songhai Empire in West Africa,
which had a reputation as a center of trade and Islamic scholarship.
That was the lay of the land in 1500. The world order was about to change
in very big ways.
WHAT HAS HAPPENED SINCE 1500
As you might imagine, there are far too many important things that have
happened since 1500 for me to fit into this tiny nutshell. However, I can
hit the highlights of the story of how the world changed from 1500 until
now, with an emphasis on the key themes and shifts I will be expanding on
in the following chapters. The most important changes were the changes
in thinking that led to people changing behaviors, particularly about how
wealth and power should be shared. They were what made the story
transpire as it did. It is easy to identify the biggest periods of change because
they are generally called “revolutions” and “ages” (though sometimes they are
called other things).
When reading this short summary of the last 500 years, notice both the
evolutions and the cycles. You will see that there were both 1) several
revolutions in ways of thinking that led to tremendous evolution and
progress over hundreds of years and 2) many cycles of peaceful and
prosperous periods alternating with depressions and wars that marked the
ends of old orders and beginnings of new ones.
The Commercial Revolution (1100s-1500s)
The Commercial Revolution was the move away from a solely agriculture-
based economy to one that included trade in a variety of goods. This
evolution began in the 12th century, and by 1500, it was centered in the
Italian city-states due to a confluence of two factors that enabled them to
become terrifically wealthy. First, the wars between Christian Europe and the
Ottoman Empire significantly slowed land trade (especially for spices and
luxuries) between Europe and the rest of the world, which created a significant
opening for maritime trade. Second, a number of Italian city-states developed
republican governments modeled after the Roman Republic. Their governments
were more inventive and responsive than those in the rest of Europe, which
allowed a strong merchant class to develop.
Venice was a prime example of this, as its governance system was designed with
multiple checks and balances to ensure that there was a more meritocratic
approach to government than existed in the rest of Europe. Venice’s leader—
called the doge—did not have the right to name a successor and was restricted
from bringing family members into government. New doges were chosen by vote
by a series of committees whose members, in some cases, were chosen by lot from
among several hundred aristocratic families. The Italians produced well-
functioning capital markets, supported by new advances in bookkeeping and
impartial institutions to enforce contracts. While private and government
borrowing weren’t new, leading up to 1500, they tended to take place as bilateral
deals between wealthy citizens, and defaults on creditors (or the expulsion and
even execution of them) were extremely common. Because those who made
money from trade—the merchant class—could benefit from a well-functioning
financial system in which savings could be put into investments that fueled
productivity, they created a number of financial innovations, including credit
markets.
With the proceeds from trade flowing in and a need for standardized coinage,
coins minted in the Italian city-states, especially Florence’s gold florin, were of
solid value, were well-recognized as such, and, as a result, began to be accepted as
global currencies. On the basis of their solid currencies, these city-states developed
effective lending and a publicly traded bond market. Venice established a
perpetual bond early in the 12th century with a 5 percent coupon that the
government would either issue (i.e., borrow) or purchase back depending on the
finances/needs of the time. Venice’s merchants owned the bonds and had
significant influence on the government, so default could only be a last resort. The
centuries in which the bond existed without defaults gave lenders confidence in it
and institutions for trading bonds in secondary markets made it a liquid form of
investment.
The ability to borrow quickly at reasonable rates was an enormous
boon to Venice. Though Venice eventually defaulted after losing a series of wars
around 1500, liquid bond markets caught on elsewhere including in the
Netherlands and in the UK.
The Renaissance (1300s-1600s)
A new way of thinking in many respects modeled after the ancient Greeks
and Romans started in Italian city-states around 1300 and passed through
Europe until the 1600s, in a period known as the Renaissance. Renaissance
thinkers made a big pivot toward using logical reasoning instead of divine
intention as the way to explain how the world works. This shift contributed to
dizzyingly fast discoveries that led to artistic and technological advances in
Europe. It began in the city-states of northern Italy where the Commercial
Revolution had created riches that led to advances in trade, production, and
banking enabled by intellectualism and creativity. The Renaissance was one of
history’s greatest cases of a self-reinforcing cycle I described in Chapter 5:
peaceful periods in which creativity and commerce reinforce each other to
produce an economic boom and great advancements.
In the middle of it, and propelling it forward, were people and families like the
Medici, who were merchants and bankers, not feudal kings. They used their riches
to support the arts, architecture, and science.- Alongside the flourishing in art and
architecture were huge advances in science, technology, and business. Knowledge
and ideas spread rapidly because of the invention of the printing press in
the mid-15 th century.
BOOK/MANUSCRIPT PRODUCTION IN
MAJOR EUROPEAN COUNTRIES (MLN)
By the way, many of the European Renaissance innovations had already
been in place in China for centuries because the Chinese discovered the
key elements to produce it—e.g., the printing press, the scientific method,
and the meritocratic placements of people in jobs—much earlier. One can
think of China’s Neo-Confucianism, described earlier, as being like China’s
Renaissance because, as in Europe’s Renaissance, it led to more logic- and
evidence-based thinking and more inventive rather than religious worldviews.
As the new ideas spread across Europe in the late 16th and early 17th centuries,
luminaries such as Shakespeare and Francis Bacon in England, Descartes in
France, and Erasmus in the Netherlands had broad impacts. Living standards rose
dramatically, though much more for the elites than for peasants. In Italy, this
period of relative peace and prosperity eventually led to excesses, decadence, and
decline as the city-states became less competitive and their financial conditions
deteriorated.
The Age of Exploration and Colonialism (1400s-1700s)
The Age of Exploration began in the 1400s when Europeans traveled all
over the world in search of wealth, creating widespread contact between
many different peoples for the first time and beginning to shrink the
world. It roughly coincided with the Renaissance because the
technological marvels of the Renaissance translated into advancements in
shipbuilding and navigation, and the riches that those ships brought back
financed further Renaissance advancements.
Ruling families supported these money-making explorations and split
the profits with explorers. For example, Henry the Navigator, the brother of
the head of the Portuguese royal family, sponsored some of the earliest voyages
and established a trading empire in Africa and Asia. Spain followed suit, swiftly
conquering and colonizing significant portions of the Western Hemisphere,
including the precious-metal-rich Aztec and Incan empires. Though Portugal and
Spain were rivals, the unexplored world was huge, and when they had disputes,
they were successfully mediated. Spain’s integration into the Habsburg Empire
and its control over highly profitable silver mines made it stronger than Portugal
in the 1500s, and for a roughly 60-year period starting in the late 1500s the
Habsburg king ruled Portugal as well. Both translated their wealth into golden
ages of art and technology. The Spanish Empire grew so large it became known as
“the empire on which the sun never sets”—an expression that would later be used
to describe the British Empire.
As European nations found ways to make their explorations more
profitable, the rise of global trade transformed their economies. Most
notably, the flow of new riches (particularly silver) to Europe fueled a rise in
prices for basic goods and services. Referred to as the Spanish Price Revolution,
Europe went from hundreds of years of steady prices to a doubling of
prices every few decades, a reminder of how big shifts can have economic
impacts that seem unimaginable based on one’s most recent experiences.
UK CONSUMER
PRICE INDEX
SILVER PRODUCTION
FROM MEXICO AND
PERU (METRIC TON)
Eventually this push toward exploration led Europe to trade with—and
exploit—Asia, most notably China, Japan, and the Indian subcontinent.
The Portuguese were the first of these explorers to approach China in
1513, though other European explorers like Marco Polo had been in
contact before. Europeans were dazzled by the quality of Chinese porcelain, silk,
and other goods, which became highly sought after, but the Chinese weren’t
interested in buying European goods, which they considered inferior. However
they eagerly accepted silver, which was money in China as well as in Europe, as
payment. As we’ll cover later, China struggled for centuries with shortages of the
precious metals it needed to have a sufficient supply of money. However the
Europeans didn’t have enough silver to trade and the Chinese weren’t interested
in other goods, which eventually led to the Opium Wars and other interesting
stories that we will explore later.
China’s Ming Dynasty had its own version of the Age of Exploration
but abandoned it. Starting in the early 1400s, Ming Dynasty Emperor Yongle
empowered his most trusted admiral, Zheng He, to lead seven major naval
expeditions—“treasure voyages”—around the world. Though not colonizing
expeditions (and historians debate the extent to which they were commercial),
these naval missions helped project China’s power abroad. Yongle’s navy was the
largest and most sophisticated in the world, featuring larger and better-
constructed ships than any country in Europe would produce for at least a
century.
China’s international influence, as indicated by the number of foreign cities
engaged in formal tributary relationships with the mainland, increased rapidly.
However, the Ming emperors chose to end these voyages and pulled the empire
into itself. It remains a matter of conjecture whether that is because Yongle’s
military and naval expeditions were expensive or because the emperors believed
that they had all they needed within China so there was no need for this
exploration.
ROUGH COUNT OF TRIBUTARY AREAS
(BASED ON TRIBUTARY VOYAGES OVER 30YR WINDOW)
The result of this pullback was an Age of Isolationism in China and in
Japan as well, where it was called Sakoku. For the next several centuries,
China and Japan broadly moved away, in fits and starts, from openness
toward foreigners and toward distance and isolation.
The Reformation (1517-1648)
Beginning in the 1500s in Europe, Protestant religious movements
initiated a revolution against the Roman Catholic Church, which
contributed to a series of wars and the bringing down of the then-existing
European order. As previously explained, at the time, the existing order
consisted of monarchs, nobles, and the church in symbiotic relationships.
The Reformation took aim at the power and corruption of the Roman Catholic
Church and sought an independent religion in which people dealt with God
directly rather than one mediated by the church’s rules. At the time, many
Catholic bishops and other senior clergy lived like princes in palaces and the
church sold “indulgences” (a supposed reduction in time people would have to
spend in purgatory). The Roman Catholic Church was a nation as much as it was
a religion, directly governing a sizable share of modern Italy (the Papal States).
The Reformation started in 1517, when Martin Luther published his Ninety-
Five Theses, challenging the papal monopoly on the interpretation of the Bible and
on papal power in general. When he refused to recant his ideas, he was declared a
heretic and excommunicated. His ideas—and those of other theologians—
nonetheless took hold in large parts of Europe, thanks to the political support of
key nobles, as well as the new printing press technology. That move, together
with the usual constant fighting for power, broke down the existing
European world order.
In virtually all the major Christian powers, the immediate impact of the
Reformation was increased internal conflict and instability, and the instability
extended between countries too. The Wars of Religion were intertwined
with the wars against the existing orders and existing elites. They
included an extended civil war in France in which an estimated 3 million
people died and later contributed to an extended civil war in the UK. In
the end, the Reformation led to Protestants earning substantial rights and
freedoms. It also undermined the power of the Holy Roman Empire and
the Habsburgs, left Germany with deep divisions that would continue to
build through the end of the incredibly brutal Thirty Years’ War in the
mid-1600s, and led to civil wars for over a hundred years. As is typical, the
big war led to a new order, which was followed by a period of peace and
prosperity.
The New World Order Following the Thirty Years’ War (1648)
On its surface, the Thirty Years’ War pitted Protestant countries against
Catholic ones; however, the full story was more complicated with wider
geopolitical interests related to wealth and power playing a role of who
lined up with whom. At the end of the war the new order was laid out at
the Peace of Westphalia. The most important breakthroughs that came
from it were the establishment of geographic borders and the sovereign
rights of the people within those borders to decide what happens in their
domains. Like most periods after major wars and the establishment of new
orders, there was an extended time of peace between countries, with the
Dutch emerging from the chaos as the leading global economic power.
However, the battles for wealth and power—most importantly between declining
monarchies and their subjects—continued across the continent.
The Invention of Capitalism (1600s)
Beginning with the Dutch, the development of publicly available and
popularly used equity markets allowed savers to effectively transfer their
buying power to entrepreneurs who could put that buying power to
productive and profitable use. This significantly improved the allocation
of resources and was stimulative to economies because it produced new
buying power. It also produced the capital markets cycles. While there were
many elements involved in the creation of capitalism, a series of related economic
and financial developments—most notably the developments of publicly traded
stock and bond markets such as the opening of the Amsterdam Stock Exchange in
1602 and the Bank of England’s first government bond issuance (to fund the war
with France) in 1694—are associated with it. Along with the advances of the
Scientific Revolution, the invention of capitalism was a key reason behind the
shift from slow real GDP growth to the faster growth, as seen in the chart I
showed in Chapter 1. We will explore this innovation and its tremendous impact
in more detail in the following chapter.
The Scientific Revolution (1500s-1600s)
The Scientific Revolution was an extension of the Renaissance-era shift
from finding truth in religion to finding truth in logical reasoning and
the Reformation’s drive to question authority and think for oneself. These
factors led to the development of the scientific method, which improved
humanity’s understanding of the world, establishing protocols by which
scientific discoveries could be investigated and proven and ushering in
many discoveries that raised living standards.
The scientific method was pioneered by Francis Bacon in the early 1600s,
though many important advances in astronomy—particularly the work of
Copernicus and Galileo—took place earlier, in the 1500s. These discoveries vastly
expanded European knowledge about the solar system for the first time since the
Greco-Roman period and were paralleled by many others across anatomy,
mathematics, physics (e.g., Isaac Newton’s laws of motion), and many other
fields. European governments began to support and sponsor this research, with
the most famous example being the Royal Society in the UK, which was founded
in 1660 and proved instrumental in promoting the exchange of ideas and
discoveries (Newton was its president from 1703 to 1727). Over the centuries to
come, the discoveries of the Scientific Revolution helped unleash economic
growth and greater competitiveness for the major European powers, particularly
the UK. The ideas and methods that underpinned the revolution were applied to
more and more fields through the movement known as the Enlightenment.
The First Industrial Revolution (1700s-1800s)
Beginning in the UK in the 1700s, freeing people to be inventive and productive
and providing them with capital led many societies to shift to new machine-based
manufacturing processes, creating the first sustained and widespread period of
productivity improvement in thousands of years. These improvements began
with agricultural inventions that increased productivity, which led to a
population boom and a secular shift toward urbanization as the labor intensity of
farming declined. As people flocked to cities, industry benefited from the steadily
increasing supply of labor, creating a virtuous cycle and leading to shifts in wealth
and power both within and between nations. The new urban populations needed
new types of goods and services, which required the government to get bigger and
spend money on things like housing, sanitation, and education, as well as on the
infrastructure for the new industrial capitalist system, such as courts, regulators,
and central banks. Power moved into the hands of central government
bureaucrats and the capitalists who controlled the means of production.
Geopolitically, these developments most helped the UK, which pioneered
many of the most important innovations. The UK caught up to the Netherlands
in output per capita around 1800, before overtaking them in the mid-19th
century, when the British Empire approached its peak share of world output
(around 20 percent).
The Enlightenment and the Age of Revolutions (1600s-1700s)
Also known as the Age of Reason, the Enlightenment was essentially the
scientific method applied to how humans should behave. This way of
thinking became widespread in Europe in the 1700s and 1800s and was an
extension of the diminishing of the rights of the monarchy and the church
and the increasing of the rights of the individual that characterized earlier
intellectual movements. New fields like economics expanded thanks to thinkers
like Adam Smith, while figures like John Locke and Montesquieu pushed political
philosophy in new directions. In particular, the Enlightenment ideas of these and
other figures promoted rationality and individual liberties and undermined
monarchic and religious powers, creating a movement toward overthrowing
monarchies known as the Age of Revolutions. This wave of revolutions included
the American, French, Spanish, German, Portuguese, and Italian. As is typical,
this era of upheaval led some nations to seek out strong leaders who could bring
order to the chaos. In the case of France, that leader was Napoleon, who changed
the course not just of French history but of European history as he sought to
conquer all of Europe. Napoleon was the classic great benevolent dictator who
converted chaos into order and prosperity, and expanded the empire with his
military prowess. As is often the case, he overreached and failed.
The Napoleonic Wars and the New World Order that Followed (1803-
1815)
The Napoleonic Wars lasted from 1803 to 1815, when Great Britain and
its allies defeated Napoleon and his allies. As is usual, the victors got
together to create a new world order, which was hashed out at the
Congress of Vienna. It drew new boundaries to ensure that no European
power would become too dominant, based on balance of power concepts
that would avoid war. The British emerged as the world’s leading empire,
and as is typical after the war and the establishment of a new order, there
was an extended period of peace and prosperity—the Pax Britannica.
Western Powers Move into Asia (1800s)
The British and other Western powers brought their gunboats to India,
China, and Japan in the mid-1700s and into the 1800s, causing dramatic
disruptions to the course of their histories. At the time, both China and
Japan were isolationist. India was controlled by the Mughal Empire, which had
expanded into a significant power in South Asia but experienced rapid decline in
the 1700s. The Western powers, which were significantly more advanced
militarily at this time, wanted to force trade on all three. The Chinese attempted
to fight the British but lost; the Japanese saw this and opened themselves for trade
after US Commander Matthew Perry sailed four warships into Tokyo Bay in
1853. These developments led to the eventual fall of the Qing Dynasty, the
resignation of the Japanese government, and the continued control of
India by the British. Especially in Japan and China, it also led to the
realization that they needed to modernize, which prompted the Meiji
Restoration (in Japan) and the Self-Strengthening Movement (in China).
This move was very successful in Japan and not successful in China, which
continued to suffer in what the Chinese call the Century of Humiliation.
Second Industrial Revolution (1850s-early 1900s)
Beginning in the mid-1800s, a second big wave of innovation took place, centered
at first around steam-powered locomotion (e.g., railroads) and then electricity,
telephones, interchangeable manufacturing parts, and other innovations at the
turn of the 20th century. Whereas the First Industrial Revolution was centered on
the UK, the Second Industrial Revolution primarily benefited the United States.
As is typical, this period produced both great wealth and great wealth
gaps and excesses in the capital markets, leading to an era known as the
Gilded Age in the US.
Invention of Communism (1848)
The invention and development of communism in the mid-1800s came as a
reaction against both capitalism and the wealth gaps it created and the
benefits of the Industrial Revolutions going more to the owners of the
new technologies than to the workers. Conflicts between communists and the
established powers intensified around the turn of the century and led to a number
of major revolutions in the 20th century, including in both Russia and China
where communist governments took power.
That brings us to the 20th century, which had two big cycles of boom,
busts, wars, and new orders, the second of which we appear to be in the
late stages of. Because I review these comprehensively in Chapters 10
through 13, and because they are much more familiar to most readers, I
will end this overview here and dive now into the story of the Dutch and
how they rose to become the first global reserve currency empire.
.. By the way, the existence of familial relationships in a Chinese dynasty should not be mistaken for loving
and caring relationships, as, just like in Europe, fights between family members for control of dynasties were
brutal and often to the death.
- The Medici family, who ruled and developed Florence during the period (though Florence technically
remained a republic for much of their rule), acquired their wealth and power as business leaders and bankers.
The Medici used their wealth, power, and smarts to acquire more wealth and power and to contribute
enormously to the arts and sciences. They also acquired significant political power in Europe. For example, to
gain power and/or to provide public service, four popes came from the Medici family during their reign. A
number of Medici were themselves artists and political leaders who looked to help not only the rich but also
the middle and poorer classes in the city. However, like many multigenerational families and monarchies,
after a few generations a weak head of the family and leader of the state, together with perceived excesses at a
time of economic stress, led to a revolution. The Medici lost control of Florence on several occasions. While
the Medici returned to power over the subsequent three centuries and the Renaissance continued, they
struggled and failed in the mid-16th century as a result of wars, changing trade routes, and bad loan making,
which damaged their finances, and of changes in social norms and political practices.
CHAPTER 9
THE BIG CYCLE RISE AND DECLINE OF
THE DUTCH EMPIRE AND THE GUILDER
^Kfter a series of attempted revolts in the mid-1500s, the Dutch, who
were under the control of Habsburg Spain, finally became powerful
enough to gain de facto independence in 1581. From 1625 until their
collapse in 1795, the Dutch gained enough wealth and power to eclipse
both the Habsburgs and China as the world’s richest empire.
The Dutch Empire rose for all the classic reasons explained in earlier
chapters, peaking around 1650 in what is now remembered as the Dutch
Golden Age. While its small population and territorial footprint prevented it
from being the dominant military power on the European continent, it more than
made up for that through a combination of economic strength, financial
sophistication, and a strong navy that could protect its large empire of trading
posts and colonies around the world. This allowed its currency, the Dutch
guilder, to emerge as the first global reserve currency.
The following chart shows the eight powers that fueled the Dutch ascent and
eventual decline.
THE NETHERLANDS: INDEX OF KEY DETERMINANTS
Major Wan — Education — Innovation and Technology
— Competitiveness — Military — ¥ade
Economic Output Financial Center — Reserve FX Status
What the chart doesn’t show is the decline of the prior leading power, the
Habsburg Empire, which you can see in the next chart depicting the entire arc of
the Dutch Empire with key events noted. The numbers mark the approximate
times of the six stages of the internal order cycle.
DUTCH ARC 1550-1850
The story begins with the decline of the Spanish Habsburgs, which initiated the
first stage of the Dutch Big Cycle.
The Transition from the Spanish/Habsburg Empire to the Dutch
Empire
New empires rise when old ones become weak and decadent. The story of the
Dutch Empire began when the Habsburg Empire became weak, decadent, and
overextended in all the classic ways.
From 1519 until 1556, the Holy Roman emperor and head of the Habsburg
Empire was Charles V. The union of territories he controlled—which included
most of modern-day Netherlands, Belgium, Italy, Germany, Austria, and Spain—
made the Habsburg Empire the most powerful family empire in Europe. Spain
was especially strong- because of the wealth and power it acquired in the
Age of Exploration. The Spanish fleet was clearly the most powerful navy in
Europe. Spanish silver coinage came close to being a reserve currency—it was used
as far afield as China. Things began to change around the mid-1500s as the seeds
of decline that were planted in the top phase began to germinate and a
revolutionary shift in power began to brew.
HABSBURG SPAIN'S ARC IN THE 1500S AND 1600S
Major Wars — Spain — Netherlands
Global
Empire
Economic Problems
Muflipte sovereign defaults
(4)
Innovation
Ships &
Ape of
Exploration/
New
Order
Union
of spam J
8. Holy /
Roman /
Empire /(1)
/(2)
(3)
Internal
Conflict
Start at
tXifcn
Revolt
HatKtxxgs Сехи inert
innerP in the
Spain Americas
Spanish
Armada
defeated
1500
1540
Weak
Leadership
Ph»p II & III
0.3
0.2
0.1
External
Conflict
New Order
Peace at
Westprtala
(4)
Thirty Catalan 8 Habsburg
Years' Portuguese rue over
War reberion Spain ends
1620 1660 1700
SHARE OF MAJOR INVENTIONS EMPIRE SIZE
(TRAILING 30 YEARS)
16%
12%
8%
4%
0%
1400 1500 1400 1700 1800 1700
SHARE OF GLOBAL OUTPUT
-------------------7%
1400 1500 1600 1700 1800 1900
The decline of the Habsburgs happened in many of the classic ways.
There were revolutions against the elites who held wealth and power by
those without them, challenging the existing order. For example, as I
explained in the previous chapter, new religious ideas surfaced in the form
of the Reformation, a revolution against the Roman Catholic Church,
which was perceived as decadent and exploitative. At the time, the Catholic
Church and the Holy Roman Empire were a rich and powerful political force that
was integral to the existing order. The revolution started when a collection of
religious opposition groups known generally as Protestantism challenged
the system. Martin Luther published his Ninety-Five Theses in 1517, challenging
the papal interpretation of the Bible and papal power in general. When Luther
refused to recant, he was declared a heretic and excommunicated. His ideas
nonetheless took hold in large parts of Europe, thanks to the political support of
key nobles, as well as Europe’s new printing press technology.
This came at an economically difficult time, when conflicts were
intensifying, leading to instability and terrible civil wars,- eventually
culminating in the brutal Thirty Years’ War in the mid-1600s. Its biggest
negative impact was on the Holy Roman Empire and the Habsburgs.
Charles V failed to prevent the revolutionary impacts of the Reformation and
with it the damage to the existing order. He was forced to sign the Peace of
Augsburg in 1555, which weakened the Holy Roman Empire and the Habsburg
dynasty. He abdicated and divided his holdings in two: the Holy Roman Empire,
which he passed to his brother Ferdinand, and most of the rest of the Habsburg
Empire—most importantly Spain, but also the Netherlands, Belgium, significant
portions of Italy, and Spanish colonies abroad—which he passed on to his son
Philip II. From that point forward, the decline followed the classic script:
The empire was overextended militarily. Not only did Spain face a
lengthy revolt against its unpopular rule in the Netherlands, it also fought
with the Ottoman Empire, various Italian states, the French, and the
British. These wars were costly and chipped away at the Habsburg family
dynasty even before the Thirty Years’ War.
Terrible national finances caused the classic toxic mix of increased
taxation, money printing, and rising debt. Philip II defaulted on debts
four times during his reign.
The lower and middle classes suffered from rising food prices, which
were increasing at an unprecedented rate from the Spanish Price
Revolution.
Internal conflict grew, for all the previously mentioned reasons.
Leadership deteriorated. Philip II and his son Philip III preferred lavish
living to governing and ultimately used money printing to cover the large
deficits, which led to high inflation and economic pain. Those around them
behaved similarly.
This chart shows the value of the most popular commonly circulating coin in
silver terms. Adding cheap base metals to the monetary supply was the popular
way to “print” and devalue money at the time. You can see it started in the early
1600s.
SPANISH MARAVEDI COIN (GRAMS OF SILVER, INDEXED)
-------------------------------------------1 120
20
1500 1550 1600 1650 1700 1750 1800
The events of the 1500s were not the end of the Habsburg Empire, nor even to
its claim to control the Netherlands—that wouldn’t happen until the end of the
Thirty Years’ War in 1648. But they did create the conditions that allowed the
Dutch to rise.
THE RISE
From 1581 until around 1625, the Dutch Empire was built following the
classic steps of a rising empire outlined in Chapter 1. More specifically:
Led by William the Silent, the Dutch successfully revolted against Spain in
the Eighty Years’ War, which resulted in the Dutch Republic asserting its
independence in 1581. William, who was basically the father of the
Netherlands, was a skilled military commander and united the various
Dutch provinces against the Spanish.
While the Spanish and the Dutch continued to fight over the subsequent
decades, the Dutch were able to gain independence and the seeds were sown
for the rise of a more unified Dutch Republic (particularly as Philip II cut
off trade with the Dutch, forcing them to expand abroad on their own).
Because the republic was set up to allow each of the underlying
provinces to maintain a high degree of sovereignty, the rise of the
Dutch Empire was driven by a collective of statesmen rather than by
a single monarch or leader. Though nobles held the most important
roles, this system created checks and balances and a partnership that proved
effective.
Dutch values and culture emphasized education, saving, merit, and
tolerance.
The break from Spain allowed the Dutch to create a more open and
inventive society.
The Dutch invented ships that could go around the world to collect
riches, capitalism that could finance these and other productive
endeavors, and many more breakthroughs that made them rich and
powerful. The Dutch created the world’s first mega-corporation, the
Dutch East India Company, which accounted for about one-third of
world trade.- Dutch openness to new ideas, people, and technology
helped them rise quickly.
To support trade the Dutch government increased military
investments, which allowed the country to control still more trade by
holding off the British in a number of military conflicts.
The Dutch also created the world’s first reserve currency other than
gold and silver, the Dutch guilder, supported by an innovative
banking and currency system put into place via the establishment of
the Bank of Amsterdam.-
As a result of these classic and sound fundamental steps, the Dutch
became rich—income per capita in the Netherlands rose to over twice that
of most other European powers. The Dutch continued to invest heavily in
education and infrastructure to build on their successes. Dutch literacy rates
reached twice the world average. They continued to develop their capital markets
and Amsterdam became the world’s most important financial center. The
Dutch did all of this with a population of only 1-2 million people.
The following charts provide some perspective on the unique nature of Dutch
education, innovation, and trade in the 1600s and the impact these forces had on
Dutch incomes, all of which we will explore later in this chapter.
In short, the Dutch were superbly educated people who were very
hardworking and inventive—in fact, they came up with about a quarter of all
major inventions in the world when they were at their peak, a spike that began
shortly before Dutch independence from Spain.
NLD UNIVERSITIES FOUNDED NLD BOOKS PUBLISHED
(% WLD)
(% WLD)
1500 1600 1700 1800 1700 2000 1500 1600 1700 1800 1700 2000
NLD SHARE OF MAJOR NLD EXPORTS
INVENTIONS (OVER 30 YEARS) (% WLD)
40%
30%
20%
10%
0%
1500 1600 1700 1800 1700 2000 1500 1600 1700 1800 1900 2000
MAJOR INVENTIONS (PER MLN POPULATION)
REAL GDP PER CAPITA (2017 USD)
— eu« — Nio — gbr — esr oeu — fra
To reiterate, the two most important inventions they came up with
were 1) uniquely effective sailing ships that could take them all around the
world, which, with the military skills they acquired from the fighting they
did in Europe, allowed them to collect great riches, and 2) the capitalism
that fueled these endeavors.
The Capital Markets Cycle of the Dutch
The Dutch invented capitalism as we know it. This was great for the
Dutch and great for the world, but like most great inventions, it brought
with it some potentially deadly consequences. While production, trade, and
private ownership had existed before, the ability of large numbers of people to
collectively buy ownership in money-making endeavors through public
equity markets did not exist. The Dutch created that when they invented
the world’s first publicly listed company (the Dutch East India Company)
and the first stock exchange in 1602.
Like most inventions, these capital market developments arose out of
necessity and self-interest. The voyages across the world in search of new trade
routes were risky ventures, so it made sense for merchants to sell some of the risk
associated with the voyage to others in exchange for a share of the future profits.
At the time the Dutch introduced equity shares in their voyages in the mid-1500s,
it was revolutionary. Until 1600, these shares were held by only a small number of
merchants, largely lacked transparency, and were illiquid, so their attractiveness to
outside investors was limited.
The formation of the Amsterdam Stock Exchange in August 1602 and
the listing of the Dutch East India Company spread share ownership much
wider (more than one in 50 Dutch adults owned shares), and the exchange’s clear
rules about ownership and transfer of shares made the market much more
transparent. The Dutch East India Company was an equally revolutionary
invention. The world’s first transnational corporation, it had many of the
features you see in companies today—shareholders, a corporate logo, a board
of directors, etc. Capital markets enabled investors to save, merchants to raise
funds, and everyone to have a liquid market in which transfers of capital could
happen easily and efficiently, fueling a new era of wealth accumulation. At their
peak in the early 1700s, Dutch East India Company dividends accounted for
nearly $1 out of every $100 of total Dutch GDP.
Importantly, the Dutch outcompeted the Spanish and the Portuguese, which
led them to win the main prize—a higher share of the trading between Europe
and Asia, particularly China and Indonesia, which was very profitable.
DIVIDENDS (%GDP)
DUTCH EAST INDIA CO
0.8%
0.6%
0,4%
0.2%
0.0%
1625 1675 1725 1775
In addition to creating an equity market, the Dutch developed an
innovative banking system, which grew rapidly and began to finance
international trade for Dutch and non-Dutch merchants. Prior to the Dutch
banking innovations, the international currency situation was a mess. In the late
1500s, around 800 different foreign and domestic coins circulated in the
Netherlands, many of which were debased (i.e., had a lowered content of precious
metal in the coins) and difficult to distinguish from counterfeits. This created
uncertainty over the value of money, which made international trade slower and
more expensive.
In 1609, the Bank of Amsterdam was established as an exchange bank to
protect commercial creditors from unreliable commodity money in general
circulation. The Bank of Amsterdam undertook activities that would generate
monetary stability and put the Netherlands’ coinage, the bank’s letters of credit,
and the Dutch financial system at the center of global finance. Notably, this bank
guilder, though backed by hard currency, was essentially Type 2 money. That set
up the guilder as a true reserve currency, the first of its kind.
As a result of this system, the guilder remained effective as both a medium of
exchange and a storehold of wealth. Bank of Amsterdam bills of exchange
improved their status as a reserve currency. Baltic and Russian trade relied
solely on guilders and Bank of Amsterdam bills of exchange for pricing
and contract settlement.-
The New World Order: The Thirty Years’ War and the Peace of
Westphalia
Then came the Thirty Years’ War (1618-48). While the Dutch played a relatively
minor role in the Europe-wide conflict, it is worth covering this war in some detail
given its importance to the internal and external orders of Europe more broadly. It
is also a classic case of how internal and external orders work together.
All the classic balance of power dynamics came into play. In this case, the
Thirty Years’ War was a classic fight over wealth and power, just a lot longer one.
On one side was the Catholic emperor of Habsburg Austria, who was allied with
the German Catholic territories (most prominently Bavaria), as well as with Spain
and the Papal States. On the other side were the German Protestant nobles, allied
at different points in time with Denmark, the Netherlands, Sweden, and France.
The fighting was about money, religion (Protestants versus Catholics), and
geopolitics. The alliances were pretty complex. For example, the French monarchy
—despite being Catholic and having Cardinal Richelieu- driving policy—was
allied (first secretly, then openly) with both Eutheran Sweden and largely
Calvinist Netherlands. That is because money and geopolitics mattered more than
religious ideologies.
The Habsburgs lost the war. That left them in a meaningfully
weakened position. The treaty that established the new international order, the
Peace of Westphalia, expanded the autonomy of the individual princes of the
Holy Roman Empire, further eroding the limited authority of the Austrian
emperor over the other states. More importantly, the deal that was cut at
Westphalia invented countries as we know them, which is to say it allowed
sovereignty of the state with the ability to make choices within its
geographic borders (e.g., their religions, their languages, and all their rules) and
instituted respect for those boundaries so that no longer would borderless, free-
flowing power grabs occur (without, of course, the understanding that you’d be
starting a major war). The emergence of the concept of states led to nationalism
and the pursuit of national interests, which reshaped the concept of the balance of
power between rival states. It also made the religious authorities much less
powerful.
The Peace of Westphalia reflected what I call the “exhaustion of war,”
which contributed to a long period of peace and prosperity that followed.
Like all big wars, the Thirty Years’ War produced devastating losses of life,
property, and wealth. One quarter of the population of Europe died from
combat, disease, or starvation. Because wars are so much more terrible than
even those who are eager for them can imagine, they lead to treaties that
redefine the order and are followed by periods of peace, until the next big
war happens.
The Dutch benefited greatly from the new balance of power and period
of relative stability; probably most importantly, it protected them from the
threat of Habsburg domination.
It is also the case that • wars are devastating financially; that is true for the winners and
much more so for the losers. For example, France, though a “winner” and only
indirectly involved for much of the war, experienced such bad financial problems
and instability as a result that it was faced with widespread rebellions. The losing
Habsburg Empire was even more devastated. Relative to the French and Spanish,
the Dutch were less financially hurt. They benefited from the peace that fostered
the Dutch Golden Age. The Dutch also benefited from the military developments
that occurred in the war because, when coupled with the shipping capabilities of
the Dutch East India Company, this strong shipping and military combination
expanded Dutch power around the world.
THE TOP
The Dutch Golden Age led the Dutch to shift their attentions to “living
the good life” in a way that weakened their finances. Other powers rose
too and began to challenge them. The arrival of capitalism, combined with
the new approaches of the Enlightenment, led to an economic
transformation called the Industrial Revolution, which was centered in
Britain. The Dutch, who had been the unparalleled leaders in innovation, trade,
and wealth in the 1600s, failed to keep up. Eventually the cost of maintaining a
declining and overextended empire became unsustainable.
This chart shows a number of key steps.
DUTCH STANDING RELATIVE TO OTHER GREAT POWERS (EST)
08
0.7
0.4
0.5
0.4
0.3
0.2
0.1
0.0
1500 1550 1600 1650 1700 1750 1800 1850 1700 1750 2000
(A) The Dutch declare independence from Spain
(B) Dutch East India Co, Bank of Amsterdam, and stock exchange founded
(C) Rrst and Second Anglo-Dutch Wars
(D) Seven Years' War and Shadow Banking Crisis of 1763
(E) Fourth Anglo-Dutch War, run on the Bank of Amsterdam
(F) Dutch East India Co nationalized, downfall of the Dutch Empire
At the top, the Dutch saw a reversal of many of the classic ingredients we
discussed earlier:
The Dutch educational and technological edge eroded.
The Dutch became uncompetitive in general and via the decline of the
Dutch East India Company.
In the 1700s, the Industrial Revolution led the British to overtake
the Dutch as the preeminent economic and financial power in
Europe.
Slower economic growth relative to other powers made it more difficult to
pay for and maintain its vast empire (especially one controlled by such a
small nation). Increasing military conflicts (in attempts to protect their vast
wealth around the world) left the Dutch overextended and
overindebted.
This all set the stage for the decline in the guilder’s reserve currency
status, which ultimately deteriorated after the Dutch lost a war (and with
it, important assets) to the British.
With the Dutch Empire weakened, its financial center eroded, especially
after a series of debt crises and a run on the central bank and currency.
Even though the Peace of Westphalia brought relative peace and stability to
Europe, the Dutch were still engaged in a number of conflicts throughout their
time as an empire, as opponents saw their weaknesses and attacked, especially via
naval wars fought over trade. Here is a brief summary of the wars the Dutch
fought to build and then to hold on to its empire:
Eighty Years’War (1566—1648): This was the revolt by Protestant
Netherlands against Catholic Spain. The Dutch first declared independence
in 1581, but their full independence was not realized until the Peace of
Westphalia (1648) ended both the Thirty Years’ War and the Eighty Years’
War.
The First Anglo-Dutch War (1652—54): This was a trade war that began
when the English Parliament passed the Navigation Act of 1651,
mandating that all goods from its American colonies be carried by English
ships. The war was largely a stalemate and failed to resolve the trade rivalry
between the nations.
The Dano-Swedish War (1657—60): This began when Sweden declared
war on Denmark, a Dutch ally, threatening the highly profitable Baltic
trade routes. The Dutch defeated the Swedish.
The Second Anglo-Dutch War (1665—67): England and the
Netherlands fought over another trade dispute, which ended with a Dutch
victory.
The Franco-Dutch War (1672—78) and the Third Anglo-Dutch War
(1672-74): These were also fights over trade. The Dutch foiled French
plans to conquer the Netherlands and forced them to reduce some of their
tariffs, but at a tremendous cost.
The Fourth Anglo-Dutch War (1780—84): The British began the war in
retaliation for Dutch support of the colonies in the American Revolution.
It ended in a significant defeat for the Dutch, ushering in the end of the
guilder as a reserve currency.
Ironically, it was a military victory, one that began nearly a century of peace,
that led power to shift away from the Netherlands. In 1688, William III of Orange
married Mary II, who was the daughter of the unpopular king of England, and
successfully invaded England and took power. This was known as the Glorious
Revolution and created a new internal order for Great Britain. While it was
undoubtedly good for the Dutch in the short run to have William III on the
British throne, the second-order consequences of economic integration and
military cooperation played a major role in the decline of Dutch economic
power and the guilder over the next century.
After 1688, as Great Britain became more competitive, Dutch merchants
shifted their operations to London, hastening its rise as an international center of
finance. The alliance also gave English merchants access to Dutch trade. William
III moved to England instead of focusing his attention on ruling the Netherlands.
When he died heirless in 1702, the direct connection between the two nations was
broken, and the various Dutch provinces that had been unified under him began
to splinter. While England and the Netherlands continued to have military
partnerships against the French during most of the 80-plus years leading up to the
Fourth Anglo-Dutch War, by the mid-1700s they were beginning to bump into
each other in many of the same markets.
By the mid-18th century, the Dutch Empire was no longer the world’s leading
empire. Britain especially had learned from Dutch innovations and made their
own investments in education to strengthen their people’s capabilities. These
abilities, coupled with the use of capitalism, led to the advancements that made up
the Industrial Revolution, which brought about constant improvements on
existing concepts to make production more efficient, such as standardizing inputs
and moving production from individual artisans to factories. It also led to
transformative new inventions. This allowed the British to become more
productive, capture more trade, and build military might.
Additionally, and as is classic, as the Dutch became extremely wealthy,
they became less competitive—for example, their wages were generally higher
than those in other parts of Europe. The Dutch East India Company lost its
competitive edge as well. For example, it was ineffective in trading popular new
products like tea. Dutch economic growth slowed relative to other powers,
which made it more difficult for the Dutch to pay for and maintain their
vast empire. Increasing military conflicts to protect their vast wealth left them
overextended.
Thus, from around 1725 through around 1800 the financial decline unfolded
in the classic ways. These charts do a good job of conveying both the ascent and
the decline of the Bank of Amsterdam.
BANK OF AMSTERDAM
ACCOUNTS AT BANK HOLDINGS (%GDP)
As is classic, the reserve currency status of the guilder remained strong even as
the Netherlands’ other powers began to decline. Because bills of exchange were
the dominant vehicle for international trade credit, all merchants wishing to trade
with the Dutch were forced to open an account at the Bank of Amsterdam, which
led to around 40 percent of global trade being settled in Amsterdam using
bank guilders. The importance of the Dutch in trade and financial transactions,
the Bank of Amsterdam’s policies that made the guilder very effective as both a
medium of exchange and a storehold of wealth, and the fact that Dutch
commercial entities and banks insisted on its usage all cemented the guilder’s place
as the first global reserve currency.- This gave the Dutch the “extraordinary
privilege” of being able to get into a lot of debt.
THE DECLINE
Around 1750 the British (and the French) became stronger than the
Dutch, both because their own power had grown and because the Dutch
had become weaker. As is classic, the Dutch a) became more indebted, b)
experienced a lot of internal fighting over wealth,- and c) weakened
militarily. All this made them vulnerable to decline and attack.
As earnings from abroad fell, wealthy Dutch savers moved their cash into
British investments, which were more attractive due to their strong growth and
higher yields.- Despite this, the guilder remained widely used as a global reserve
currency. As explained earlier, reserve currency status classically lags the decline of
other key drivers of the rise and fall of empires. Then, as is typical, a rising great
power challenged the existing great power in a war.
Starting in the 1770s, the English began to interfere with Dutch shipping,
escalating the conflict after the Dutch traded arms with the colonies during the
American Revolution. In retaliation, the English delivered a massive blow to the
Dutch Navy in the Caribbean in 1781, taking over Dutch territories there and in
the East Indies as well. Having lost half its ships and access to its key trade routes,
the Dutch East India Company had to borrow heavily from the Bank of
Amsterdam to stay alive. Rival powers took the Dutch defeat as an opportunity to
grab still more of the Dutch shipping business. British blockades in the
Netherlands and in the East Indies caused a liquidity crisis. The financial
consequences of these events can be seen in the following charts.
Financial losses and large debts led to the classic move by the central
bank to print more money. As the Bank of Amsterdam printed more and
more paper money to provide loans to the Dutch East India Company, it
soon became clear that there would not be enough gold and silver to cover
all the paper claims on it. That led to the classic “run on the bank”
dynamic, in which investors exchanged their paper money for precious
metals. With the bank’s store of precious metals exhausted, the supply of guilders
soared, even as demand for them fell, as shown in the following chart.
BANK OF AMSTERDAM HOLDINGS (%GDP)
— Gold and Silver
----------------------------------I 7%
1700 1725 1750 1775 1800
The next chart shows this explosion of loans on the bank’s balance sheet
throughout the Fourth Anglo-Dutch War. (For reference, the full balance sheet at
the start of the war was about 20 million bank guilders outstanding, so this
represented a roughly 50 percent expansion in the Bank of Amsterdam’s balance
sheet.) The Bank of Amsterdam had no choice; the Dutch East India Company
was too big to fail because the government depended on loans from the company.
• Govt City Chamber Dutch East India Company
BANK OF AMSTERDAM LOANS OUTSTANDING (GUILDER. MLN)
14
12
10
8
6
4
2
0
1775 1780 1785 1790
Interest rates rose and the Bank of Amsterdam had to devalue,
undermining the credibility of the guilder as a storehold of wealth.— As a
result, the British pound replaced the Dutch guilder as the leading reserve
currency.
What happened to the Dutch was classic, as described in Chapter 1’s summary
of why empires rise and fall and Chapter 3’s description of how money, credit,
and debt work. The Bank of Amsterdam started with a Type 1 monetary
system (precious metal) that morphed into a Type 2 monetary system
(paper money linked to precious metal). As usual, this transition occurred at a
time of financial stress and military conflict. It was risky because the transition
decreased trust in the currency and added to the risk of a bank-run-like dynamic,
which is exactly what occurred. Bank of Amsterdam deposits (i.e., holdings of
short-term debt) had been a reliable storehold of wealth for nearly two centuries.
They began to trade at large discounts to guilder coins (which were made of gold
and silver). The bank used its holdings of coin and precious metals (i.e., its
reserves) to buy its currency on the open market to support the value of deposits,
but it lacked adequate foreign currency reserves to do this indefinitely. Accounts
backed by coins held at the bank plummeted from 17 million guilder in March
1780 to only 300,000 guilder in January 1783 as owners of these gold and silver
coins demanded them back. The bank run marked the end of the Dutch Empire
and the guilder as a reserve currency. In 1791 the bank was taken over by the City
of Amsterdam, and in 1795 the French revolutionary government overthrew the
Dutch Republic, establishing a client state in its place. After being nationalized in
1796, rendering its stock worthless, the Dutch East India Company’s charter
expired in 1799.
The following charts show the exchange rates between the guilder and the
pound and gold. As it became clear that the bank no longer had any credibility,
investors fled to other assets and currencies.—
DUTCH GUILDER
(A) Guilder stable through most of the decline era
(B) Fourth Anglo-Dutch War leads Io money printing and initial pressure on
the guilder (run on the Bank of Amsterdam)
(C) Short period of stabilization as investors seek safe havens al the start
of the French Revolution
(D) The French overthrow the Dutch; accounts at the bank basically
wiped out
VALUE OF THE
DUTCH GUILDER
— vs Gold — vs Silver — vs GBP
1.6
1.4
1.2
1.0
0.8
0.6
0.4
0.2
0.0
1600 1650 1700 1750 1800
BANK OF AMSTERDAM
RESERVE RATIO
(PRECIOUS METAL TO
MONETARY LIABILITIES)
A Her the Fourth
Anglo-Dutch War, there
Is a sharp decline in the
ratio of precious metal to
deposits (as depositors flee)
100%
80%
60%
40%
20%
0%
1600 1650 1700 1750 1800
The next chart shows the returns of holding Dutch East India Company stock
starting in various years. As with most bubble companies, it did great at first and
seemed to have great fundamentals. This attracted still more investors even after
those fundamentals began to weaken. Ultimately its failed fundamentals and
excessive debt burdens broke it.
DUTCH EIC TOTAL RETURNS BY YEAR OF INITIAL INVESTMENT
(100 = STARTING WEALTH, 50YR INTERVALS, LOG)
As is typical, the returns of investment assets in the declining empire fall
relative to the returns of investing in the rising empire. Returns on investment in
the British East India Company, for example, far exceeded those in the Dutch East
India Company, and the returns on Dutch government bonds were terrible
relative to British government bonds.
TOTAL EQUITY RETURNS
DUTCH BOND PRICES (TERM ANNUITIES)
U00 1650 1700 1750 1800
The decline of the Dutch Empire led to the next Big Cycle in world history:
the rise and decline of the British Empire and its reserve currency. That story—
which is basically the same story, just a century or so later in a more
technologically evolved form with people in different clothes speaking a different
language—is told in the next chapter.
1 By 1500, the territory of modern-day Spain was increasingly unified following more than 500 years of
conflict between Christian kingdoms and Muslim powers that had ruled most of the area since the 700s. The
two largest kingdoms, Castile and Aragon, were joined together following the marriage of their rulers in 1469,
and in 1492 they conquered Spain’s last Muslim kingdom in Granada. The emergent Spanish power had a
strong military and very close ties to the Catholic Church—significant portions of the Reconquista of
Muslim Spain took the form of papally supported crusades, and religious and monarchic authorities were
often closely aligned, as in the Spanish Inquisition.
r. For example, the Wars of Religion in France led to millions of deaths from 1550 to 1600, while England
violently switched faiths at several points in the 1500s as new monarchs came to the throne. Even later on, the
devastating English Civil Wars of the mid-1600s were significantly driven by religious strife.
- . Rough estimate based on my calculations.
- . In this chapter, when talking about the “guilder,” we are generally referring to guilder bank notes, which
were used at the Bank of Amsterdam, rather than to the physical coin (also called “guilder”), which was made
of a precious metal (i.e., Type 1 money).
- . By 1650, it was fairly common for, say, a merchant in London to pay for goods imported from Moscow
with a bill drawn on their deposit in Amsterdam. Both the number of accounts and deposit base of the bank
rose continually through 1650.
- . Cardinal Richelieu was the most important leader in France at the time, serving as chief minister from 1624
until 1642. Richelieu was a brilliant man who provided advice to the two rivals for control of the monarchy
in France: the queen mother and her young son Louis XIII. (You can’t make this stuff up.) Richelieu had his
own particular view of how an internal order should work, which was that the state should be all-powerful—
more important than what the monarchy, church, or nobility wanted. Besides being a great big-picture
thinker, he was a great administrator who made the system work well. He improved efficiency throughout the
kingdom, effectively collecting taxes and controlling power over the nobility and local authorities. He created
the notions of national interest and balance of power—e.g., focusing policy on the goal of having France
balance the Habsburg hegemony. This wasn’t that long after Machiavelli’s theories first circulated. His
concept of keeping Central Europe divided and balanced (because united it would dominate other areas)
worked from 1624 until the French Revolution (for more, see Henry Kissinger’s World Order).
1. Available payment data supports the claim that the guilder accounted for a large share of global trade: the
annual value of payments made through the bank peaked in the 1760s at about 1.5 times the Dutch
Republic’s annual GDP (with some estimates more than double that). Similar ratios for the United Kingdom
in 1868 and the United States in 1955 were 3.6 and 2.7, respectively.
A good example of this is the popularity of the Patriot Movement in the Netherlands around this time.
There was a general rise in foreign investment by the Dutch during this period. Examples include Dutch
purchases of stock in the British East India Company and the City of London selling term annuities (bonds)
to Dutch investors. For a further description, see Hart, Jonker, and van Zanden, A Financial History of the
Netherlands.
— . This chart only shows the financial results from the Dutch East India Company reported inpatria, i.e., the
Netherlands. It does not include the parts of the revenue and debt from its operations in Asia but does
include its revenue from goods it sourced in Asia and sold in Europe.
— . The Bank of Amsterdam was ahead of its time and used ledgers instead of real “paper money.” See Quinn
& Roberds, “The Bank of Amsterdam Through the Lens of Monetary Competition.”
— . Historical data suggests that by 1795 bank deposits were trading at a -25 percent discount to actual coin.
See Quinn & Roberds, “Death of a Reserve Currency.”
— . To fully represent the likely economics of a deposit holder at the Bank of Amsterdam, we assumed
depositors each received their pro-rated share of precious metal still in the bank’s vaults when it closed (that
was roughly 20 percent of the fully backed amount, thus the approximately 80 percent total devaluation).
CHAPTER 10
THE BIG CYCLE RISE AND DECLINE OF
THE BRITISH EMPIRE AND THE POUND
Changes in the world order come about when two or more countries (or
alliances of countries) of comparable power fight and one wins and
becomes dominant enough to set the new rules, which is the new world
order. Before this happens, the rising country needs to get itself into a
comparable position of strength relative to the reigning country, so the
story of any great country’s rise begins long before it becomes a great
power. Likewise, the story of its decline extends long after it ceases to be a great
power. That is reflected in the arc chart that shows the simplified version of the
cycles of the Dutch, British, American, and Chinese empires that I shared with
you before and share here again.
CHANGES TO THE WORLD ORDER (CONCEPTUAL EXAMPLE)
The rise of the British Empire started long before it became preeminent, as it
first had to build its educational, institutional, and technological strengths to
become more competitive and then challenge and defeat the Dutch. This chart
shows my gauges of the eight measures of power for the British Empire from 1600
to the present. As shown, competitiveness, education, and innovation and
technology levels rose sharply in the early 1600s and continued to increase steadily
from 1600 to 1800, which paid off from 1700 to 1900 as the UK’s output, share
of world trade, and military expanded together. With the typical lag, the
development of Britain’s financial markets and its financial center (London) to
become world leaders followed, and, with a greater lag, the pound overtook the
guilder as the global reserve currency.
UNITED KINGDOM: INDEX OF KEY DETERMINANTS
While the fall of the Dutch in the late 1700s removed the UK’s primary
trade and financial competitor, Britain's rise wasn’t complete until the
early 1800s because it had one last great rival power to defeat—France, led
by Napoleon. You see, Napoleon was on a tear to conquer Europe and be the
greatest power via the Napoleonic Wars. This created the usual sort of great
power rivalry and balance of power struggle dynamic that I described in the
addendum to Chapter 2, with all the alliances and escalation building to a great
crescendo. Later in this chapter, I will briefly drop into the French story, also an
iconic one, as part of explaining the rise of the British Empire. But for now I will
simply jump to the punchline, which is that Britain won through effective
economic as well as military warfare. Then, following the classic Big Cycle
script of what happens after wars that establish the dominant power,
there was a new world order set out by the winners followed by a long
period—in this case 100 years—of relative peace and prosperity. That is
when the British Empire became the greatest empire ever. At its peak, with
only 2.5 percent of the world’s population in the UK, the British empire
produced over 20 percent of the world’s income and controlled over 20 percent of
the world’s land mass and over 25 percent of the global population.
But I’m getting ahead of myself. As shown in the previous chart, the story of
Britain’s rise began around 1600, so we should start there. The following chart
shows the arc and the timing of key events. The numbers mark the approximate
times of the six stages of the internal order cycle.
UK ARC 1600-PRESENT
Major Wars — United Kingdom Netherlands — United States
THE RISE
To set the stage for the UK’s rise, we need to describe its situation, as well as the
broader backdrop of Europe, at the end of the 1600s. For both, the early 17th
century had massive conflicts that radically changed or overturned all the prior
orders. As explained in the last chapter, in Europe there was great devastation
and change that resulted from the Thirty Years’ War because it was a war
between ideologies, religions, and economic classes that created a new
European order through the Peace of Westphalia. This treaty established
countries as we know them and created a fractured Europe, which led to
different choices in different countries. Great Britain had its own turmoil over
wealth and power that took the forms of the English Civil War, which was a
brutally violent continuation of the centuries-long battles between classes, and the
Glorious Revolution, which less violently led to William III, a Dutch ruler,
becoming the king of England. What these conflicts have in common is that they
weakened the monarchy and strengthened Parliament. They also established
terms for the relationships between the kingdoms of England, Scotland, and
Ireland. The English Civil War specifically led to the king (Charles I) being
tried and executed and the monarchy being replaced by the
Commonwealth of England under the rule of the general who led the
revolt, Oliver Cromwell.
These conflicts established rule of law rather than rule of the monarchy
and they created a new balance of power between the king and Parliament
that set the foundation for Great Britain’s later rise. That is because a strong
Parliament allowed for a moderately meritocratic selection of national leaders, as
the prime minister had to command the confidence of Parliament rather than just
be a favorite of the royal court. Statesmen who led Britain during its later rise and
peak—such as William Pitt the Elder and his son, Will Pitt the Younger, Robert
Peel, William Gladstone, and Benjamin Disraeli—were strong forces for shaping
Britain. They all came from families of merchants, not the landed gentry.
This revolutionary strengthening of Parliament was heavily influenced by the
new Enlightenment thinking about who should have what powers and how
governments should work that had spread throughout Europe starting in the late
1600s. That was shaped by the earlier scientific thought of Englishman Francis
Bacon (1561-1626). At the core of this new, human-centric philosophy was
the idea that society should be based on reason and science and that the
government’s power comes from the people, not from God.
Debate and skepticism were encouraged. Improvements in basic
education (which caused literacy rates to rise), the dissemination of ideas
via printed materials (the first encyclopedias and dictionaries were printed
en masse at this time), and a growing number of transnational elites (who
were well-read and cultivated cross-border contacts) created a new and
wider “public sphere” of political and social thought. The key thinkers
during this time produced ideas and concepts that are still important in
the Western world.
Enlightenment ideas influenced different countries in different ways, ranging
from more autocratic monarchs like Catherine the Great in Russia to the more
representative form of government adopted by America’s Founding Fathers. The
UK particularly reaped the benefits of the Enlightenment’s strong
political institutions and rule of law alongside the Enlightenment’s
emphasis on science, which supported major discoveries.
While these strengths did not bring about immediate prosperity, over time
the British system’s respect for the rule of law, combined with strong
education, gave it the foundation to gain competitive advantages in
commerce and innovations that followed and led to the rise of the British
Empire.
At the same time, England became financially strong as it created a
powerful and centralized fiscal authority that allowed the state to raise
significantly more revenue than its international rivals. By the 18th
century, the tax burden in Britain was almost twice that of France. The
creation of the Bank of England in 1694 helped standardize and increase
the liquidity of UK government debt, improving its ability to borrow.
Consistent with these reforms, government bond yields fell drastically, both
outright and relative to other countries over the early 1700s.
GBR GOVT BOND YIELD
(VS MAJOR
GBR GOVT BOND YIELD COUNTRY MEDIAN)
1700 1750 1800 1850 1700 1750 1800 1850
GBR GOVT REVENUE (%GDP)
By the early 1700s, there were many other classic signs of an empire on the rise.
In these charts, you can see Britain’s leadership in innovation compared to its
main rivals at the time.
MAJOR INVENTIONS
(PER MLN POPULATION)
SHARE OF
MAJOR INVENTIONS
The Industrial Revolution
A well-educated population together with a culture of inventiveness and
the availability of capital to financially support the developments of new
ideas—especially about how machines could more efficiently do what
many were laboring to do—created a great wave of competitiveness and
prosperity. England’s geological endowments of iron and coal gave it a
great boost in producing this economic transformation known as the First
Industrial Revolution. As described in Chapter 8, this shift changed
Europe from a primarily rural and agrarian society in which most people
were poor and power resided with landowning elites to an urban and
industrial society in which people as a whole got a lot richer (though
benefits disproportionately accrued to the elites) and power resided with
central government bureaucrats and capitalists. Geopolitically, these
strengths led it to overtake the Dutch as the preeminent economic and
financial power in Europe around 1750, 30 years before the UK defeated
the Dutch in the battle and clearly became the world's leading empire.
The productivity revolution started with agriculture. Agricultural inventions
increased productivity, which reduced the labor intensity of farming. It also made
food more plentiful and cheaper, which led to a population boom. Together these
forces led to people flocking to cities, which benefited industry from the steadily
increasing supply of labor. The Industrial Revolution was driven not only by the
creation of brand-new inventions like the steam engine but also by adapting and
improving on existing concepts to make production more efficient, such as
standardizing inputs and moving production from individual artisans to factories.
Ample labor, energy, and connected global markets together helped support the
burst of innovation. This list gives a sense of the timing and pace of innovation in
the UK:
1712: Steam engine invented.
1719: Silk factory established.
1733: Flying shuttle (basic weaving machine) invented.
1764: Spinning jenny (multi-spindle weaving machine) invented.
1765: Separate condenser (for steam engines) invented.
1769: Water frame (hydraulic power for weaving machines) invented; steam
engine upgraded.
1785: Power loom invented; iron refining developed.
1801: Steam-powered locomotive on wheels invented.
1816: Steam-powered locomotive on rail patented.
1825: Railway construction initiated on a line connecting Manchester and
Liverpool.
Through these revolutionary changes to agriculture and industry Europe
became urban and industrial, with goods made by machines in city factories. The
new urban population required new types of goods and services, which required
the government to get bigger and spend money on things like housing, sanitation,
and education, as well as to set up the infrastructure for the new industrial
capitalist system to flourish, such as courts, regulators, and central banks. Power
was in the hands of central government bureaucrats and capitalists who
controlled the means of production.
This was most true in the United Kingdom, which pioneered many of the
most important innovations and which used the new methods of
production to pull ahead of other nations and become the world’s leading
superpower. As reflected in output per capita, the UK’s living standards caught
up to those in the Netherlands by around 1800 and overtook them in the mid-
19th century, when the UK approached the zenith of its share of world output
(around 20 percent). In parallel to this economic growth—and helping to
reinforce it—the UK became the world’s dominant trading nation, pulling
decisively ahead of the Dutch in the late 1700s and maintaining that position
through the 19th century. At the same time there was an acceleration in the
output of all countries through most of the 1800s. Most countries in the world
were then in Stages 3 and 4 of the internal order cycle.
REAL GDP PER CAPITA (2017 USD)
Naturally as it became a world economic power the UK needed to be able to
fight militarily to both protect and assert its interests. The UK's military
strength—especially its navy—helped it establish its colonies and take over
those of other European powers, as well as secure its control over global
trade routes. The profitability of the empire more than paid for its
military spending because it supported economic activities. Thanks to the
Bank of England’s financial innovations and the guilder’s collapse, London
became the world’s financial center and the pound sterling the world’s
reserve currency. In other words, Great Britain followed the classic Big
Cycle steps of a rising empire.
Britain also took the Netherlands’ mantle as the top trader with China. With
the Industrial Revolution, Europe no longer demanded nearly as much in the way
of manufactured luxury goods from China, but instead sought a commodity—
tea. China, for its part, wasn’t interested in European goods and continued to seek
payment in precious metals. That sowed the seeds of the great British-Chinese
conflict that led to the Opium Wars and China’s Century of Humiliation. Who
would have imagined that?
The story of Britain’s rise is obvious in retrospect. It’s easy to look back and
describe what happened. It’s another thing to position oneself well for it by
anticipating it and seeing it happen at the time. I wonder what I would have
thought at the time. I wonder whether in looking at the readings of my indicators
and systems and thinking about the situations whether I would have bet well.
That is why it is so important to me to have the data and the decision rules to see
what I would have actually done and what the results would have been. I can now
see what the indicators would have shown at the time and know that they would
have painted the picture I just described, and I can see from that that the picture
would not have been crystal clear that the British Empire would have gone on to
become the dominant world empire. If I were alive in the early 1700s and looking
at my indicators, I would have seen the Dutch still at their peak and Bourbon
France as a major power on the rise also, and I would have seen bullish conditions
for them both at that time.
Why Not the French?
In the early 1700s, France was a center of education and learning, a hub of the
Enlightenment with famous thinkers like Voltaire and Montesquieu, and a home
to a booming publishing industry, so my indicators would have shown the French
as being just as strong as the Dutch and British powers. From 1720 to 1780, the
number of books on the arts and science published in Paris doubled. As the
quantity of information increased, so did people’s literacy; over the course of the
18th century literacy rates in France close to doubled.
FRENCH UNIVERSITIES
LITERACY RATE (% POP)
France also would have shown up as economically strong in the early stage of a
big debt cycle upswing. It was just before an investment boom was about to turn
into a bubble which later turned into a bust. At the time, France’s most famous
economist was John Law (a Scotsman by birth) who thought the creation of new
money would stimulate the economy. In 1716 he created a national bank with the
ability to issue paper money backed by land, gold, silver, and state bills. That
began the upswing in the cycle. The original capital for this bank, Banque
Generale, was provided by shareholders, who also sat on the bank’s board. France
had had a stock market since 1673, when Finance Minister Jean-Baptiste Colbert’s
Ordinance of Trade was codified into commercial law,A so it had all the
ingredients for a classic capital markets upswing. At the same time, Law also
created the Company of the West. The Company of the West, or the Mississippi
Company, was a trading company with monopoly rights in French Louisiana
(half of the present-day United States). Law allowed French government debt to
be used to purchase shares in the Mississippi Company. With a new company that
had an exciting story about exploiting the opportunities of the new frontier and a
bank and government finances supporting this endeavor, all the right ingredients
were in place. As the company expanded, state debt holders jumped at the ability
to convert their debt into equity. This created what was perceived to be a great
investment. Would you have bought in? Would I have bought in? If we didn’t
would we have had regrets? The stock soared, eventually becoming a bubble in
the classic ways these things happen. When it burst, both shares and bills rapidly
lost their value because of the classic reason of the outstanding claims on real
assets being much greater than the real assets that were backing up the claims.
Naturally people in France fled from the depreciating paper money
toward hard currency coinage. New laws prohibited charging interest rates
above 5 percent, which meant that only the most credit-worthy borrowers and
most stable investments could receive capital. As a result, it became nearly
impossible for new businesses to receive funding. There wasn’t enough real
money.
On top of that, and quite typically, expensive wars made financial conditions
worse. A partial list of wars that France was in follows:
War of the League of Augsburg (1688—97): France, under the
leadership of Louis XIV, expanded into modern-day western Germany,
spurring war against England, Spain, Austria, and a number of German
states.
War of the Spanish Succession (1701—14): France, allied with Spain,
fought an alliance of England, Austria, and the Netherlands to contest the
inheritance of the Spanish throne. The war ended with the French heir
taking the throne of Spain, but with various concessions made to the other
powers (including giving up Spanish territory in Italy and Belgium to
Austria, and France giving England and the Netherlands colonial and trade
concessions).
War of the Austrian Succession (1740—48): France, in alliance with
Spain, Prussia, and other German principalities, fought against Austria and
the UK, in support of the German princes’ territorial ambitions against
Austria.
Seven Years’War (1756—63): France, allied with Austria, Sweden, and
Russia, fought against Britain and Prussia over German territories and
French and British colonies abroad, particularly in North America. (This
war is also known as the French and Indian War.)
American Revolution (1775—83): France and Spain allied with the
American revolutionary forces against the British government.
While a number of these wars produced territorial and strategic gains for
France, they turned out to cost much more than they brought in which eventually
severely damaged the French government’s finances. Without a modern financial
system, France had more difficulty funding its government through debt than
Britain did so it had to rely more on burdensome taxes, which were unpopular.
One example of France’s inferior financial position affecting its geopolitical
position is the differences in experiences of the British and the French during the
American Revolution. The French paid for the war effort entirely by floating
loans at interest rates at least double those the British government faced. This
caused France’s debt service payments to rise to over £14 million compared to
Britain’s £7 million (both had national debts of around £220 million). Because the
nobility, clergy, and even certain privileged towns often paid lower taxes, high
levels of taxation on the rest of society were imposed. That exacerbated France’s
already high income inequality. Many French laborers struggled to meet their
basic needs. That caused more class warfare.
Along with extreme income inequality, there was corruption and
extravagance at the top. The court of King Louis XVI was infamous for its
frivolous spending—for instance, Marie Antoinette’s Hamlet, an ornamental
farm near the gardens of Versailles built at great expense to replicate a rustic
village. Two major wars—the Seven Years’ War and the American
Revolution—led to massive deficits. During the American Revolution the
deficits were around 2-3 percent of GDP and about a third of France’s annual tax
revenue. Meanwhile, the American Revolution further popularized
Enlightenment ideas of liberty and equality, while bad harvests in 1788 and
1789 led to soaring bread prices and famines. It was a recipe for revolution.
Due to France’s inefficient and unrepresentative political decision-
making system, the government was unable to raise needed revenues or
enact needed changes. Decisions from the ancien regime could be and often
were undermined at virtually every lower level. The nobility and clergy resisted
decisions that hurt them and were able to carve out broad privileges for
themselves. Local authorities (called parlements) were needed to enact tax policy,
but often resisted doing so. The closest thing France had to a legislative body was
the Estates General, where representatives of France’s three estates (the clergy, the
nobility, and the commoners) met to approve certain legislation when summoned
by the king. Its consent was seen as necessary to levy new national taxes; however,
its powers and procedures were unclear, and basic questions—like how
representatives were chosen and how many votes each estate got—were unsettled.
In 1789, the Third Estate—representing the commoners, who made up 98
percent of the population—formed its own assembly, inviting members of the
First and Second Estates to join it. To stop this National Assembly from meeting,
the king closed their meeting hall.
Protests, riots, and insurrection arose. In 1791, a newly elected National
Convention declared France a republic, and in January 1793 Louis XVI (by
then officially called “Citizen Louis”) was sentenced to death. As is classic in
revolutions, violence began soon after, in which those who were deemed
insufficiently zealous were purged. It is estimated that between 20,000 and 30,000
people were executed during the French Reign of Terror. By 1795, France was
broke, and the assignat—the currency it printed to finance government spending
—was experiencing hyperinflation.
FRENCH INFLATION (5-YEAR AVG)
As is also classic, the revolution led to a counterreaction in which the revolution’s
leaders were themselves arrested and a new constitution written and approved.
The new system (the Directorate) proved to be ineffective and was immediately
crippled by financial problems. Still, the government continued to print
money and forced wealthy citizens to loan it funds. Ultimately, the
inflationary spiral was halted by the introduction of the hard currency that was
acquired through Napoleon’s successful military conquests in Italy and the
decision to declare bankruptcy on two-thirds of the government’s debt.
Additional measures such as increased taxes further strengthened the
government’s fiscal condition. In 1796, the government held a ceremony in which
it destroyed the presses it had been using to print money.
FRENCH CURRENCY VS GOLD (INDEXED. LOG)
1.000%.
100%
107.
1%
.1%
J01%
1750 1770 1790 1810 1830 1850 1870
Enter Napoleon
The bubble, the big wealth gaps, and the costly expense of war led to the bust and
then to revolution, which threw out the old order and put in a new one. That new
order consisted of revolutionary leaders who fought with each other, producing
10 years of painful chaos that required a strong leader to get control of the mess. It
was all consistent with the classic, melodramatic script that has played
innumerable times in the past. As if on cue, Napoleon entered the picture.
Napoleon was the classic hero rising to the occasion. He had gained a sterling
reputation as a military commander as France attempted to spread its republican
system across Europe, and he was very popular. So, in 1799, he led a coup to
install himself as first consul and eventually emperor, and held dictatorial powers
until 1814. Armed with centralized power and widespread support, he
stabilized the economy and professionalized the government; France was
widely seen as an empire on the rise and a formidable rival to other European
powers.
When Austria and Russia declared war on France, Napoleon scored sizable
early military victories. Before long, he controlled Spain, Portugal, Italy, and
much of Germany. I won’t go through the history of the Napoleonic Wars, except
to say that like other such leaders he overreached. Napoleon’s invasion of Russia
swung the tide of war against him. In the end, France was defeated. Great
Britain and Russia were the primary victors.
It should be noted that a significant factor in the war was the UK’s much
greater financial strength. Because of their financial strength, the UK was able to
lend a lot of money to the European coalition forces against France. It was
both its financial resources and its naval power that allowed Britain to stay in the
fight even as it and its allies suffered repeated defeats.
A New World Order: The Congress of Vienna
By now you know how these things go. After a war the victors come together and
create a new world order. That happened at the Congress of Vienna. Just as the
victors of the Thirty Years’ War had done at Westphalia, the quadruple alliance
of Great Britain, Austria, Prussia, and Russia reorganized the world order
in their favor at the Congress of Vienna (1814—15), creating a system of
checks and balances among the European powers that would more or less
hold for the next century. The geopolitical importance of these developments
is well-described by Henry Kissinger:
It may not have fulfilled all the hopes of an idealistic generation, but it gave
this generation something perhaps more precious: a period of stability
which permitted their hopes to be realized without a major war or a
permanent revolution... The period of stability which ensued was the best
proof that a “legitimate” order had been constructed, an order accepted by
all the major powers, so that henceforth they sought adjustment within its
framework rather than in its overthrow.
All the major powers were represented in Vienna, though the most important
decisions were negotiated by the core group and France itself. Like the US at the
Paris Peace Conference after World War I and in the negotiations after World
War II, the UK didn’t seek to gain significant new territories. Its primary goal
was to address the power imbalances in Europe that had led to wars. Areas
that had previously consisted of weak and divided states, such as Italy,
Germany, and the Low Countries, saw significant territorial consolidation
to counterbalance more centralized states like France, while agreements on
the navigation of international rivers supported the expansion of trade. Tactically,
the Treaties of Paris aimed to contain but not destroy France, which suffered only
a minimal loss of territory
The victorious powers were all monarchies, and many of the policies
they enacted were aimed at restoring the old status quo (for example,
returning the Bourbon dynasty to power in France). Even so, the new ideas of the
Enlightenment continued to have influence. Governments shifted to more
representative and rule-of-law-based systems, though to varying degrees
(Tsarist Russia remained largely autocratic). In England the liberalization
came about as a result of gradual reforms, while on the continent a series of
revolutions (most famously the liberal Revolutions of 1848) spurred the changes.
In time, nationalist movements led to the unification of Germany and
Italy, as well as the destabilization of the multiethnic Austrian and
Ottoman empires.
British Power Approaches Its Peak
No power benefited more from the new stability than the British Empire. Not
only were Britain’s main economic and military rivals weakened, but the
power equilibrium allowed the UK to avoid expensive military conflicts
close to home and focus on trade and its colonies, a policy known as
“splendid isolation,” which set the stage for its “Imperial Century.” Of
course there were some bad economic periods during those years (e.g., the Panic
of 1825 in the UK, and the panics of 1837 and 1873 in the US), and there were
military conflicts (e.g., the Crimean War between Russia on one side and the
Ottoman Empire and a coalition of Western European powers on the other). But
these were not significant enough to change the big picture, which was of a very
prosperous period with the British on top. As mentioned, at their peak in the late
19th century around 1870, the British produced 20 percent of the world’s income
and controlled 40 percent of global exports, 20 percent of the world’s land mass,
and 25 percent of the world’s population. And the pound, of course, became the
world’s undisputed reserve currency. The charts on the following pages help paint
the picture of Britain’s dominant strength.
Geopolitically, the UK continued to expand abroad throughout the 19th
century, eventually encompassing Canada, Australia, India, and large portions of
Africa.- And even where the British Empire didn’t explicitly take control, it was
increasingly able to intervene abroad in order to gain trade access on uneven terms
(e.g., the Opium Wars against China ending with a treaty ensuring the UK’s
ability to export opium to China despite local Chinese laws against it).
Maintaining these colonies gave the UK an assured source of commodities,
wealth, and income, and preferential trade arrangements. This chart clearly paints
the picture.
The pound’s status as a reserve currency complemented its dominance in colonial
expansion, military reach, global trade, and investment flows. The UK’s share of
global exports rose with the Industrial Revolution and the spread of the
empire, peaking around 1850 at about 40 percent of global exports. And
the share of trade denominated in sterling was greater than the UK’s trade share
alone. From 1850 to 1914, around 60 percent of global trade was denominated in
pounds. This set of conditions sowed the seeds of the decline that typify the top
phase of the Big Cycle.
GBR SHARE OF WORLD EXPORTS (% TOTAL)
Even as the UK’s share of world exports declined, the UK ran a persistent
current account surplus throughout this period. After 1870, this was comprised
of a persistent trade deficit funded by returns on overseas investments. The
income from the current account surpluses funded an increasing share of global
cross-border investment as other countries become more attractive to invest in.
INTERNATIONAL INVESTMENTS (% DEV WLD GDP)
In 1818, the English Rothschild bank made its first major government loan, to
Prussia. As the pound became increasingly liquid, a wave of other sovereign
borrowers followed, and global debt, global trade, and global capital flows all
came to be increasingly denominated in sterling.^. Trust in the pound was
bolstered by the economic management of the Bank of England, which
increasingly operated as a “lender of last resort” to mitigate the effects of banking
panics.-.
Even as the British Empire continued to expand its territorial and
financial reach over the final decades of the 19th century, the seeds of its
fall were evident, driven by the classic factors of 1) declining
competitiveness, 2) rising inequality and conflict, and 3) the rise of new
rivals, particularly Germany and the US.
Declining Competitiveness
Stepping back, the broader story of economic growth in the mid-to-late
1800s was the Second Industrial Revolution, a sustained period of innovation
in which science as well as engineering played a major role, as synthetics and new
alloys were produced and the use of new energy sources like petroleum and
electricity exploded. This was when the telephone and the incandescent light bulb
were developed and automobiles soon followed. Transportation,
communications, and infrastructure improved, and the rise of corporate
capitalism enhanced productivity. The result was a sizable increase in output
per worker in the countries able to make the switch efficiently—primarily
the US and Germany. The UK didn’t keep up, even though British inventions
were key to many of these new developments. The UK’s failure to reorganize its
industries led to marked declines in output per worker relative to the other leading
industrial powers. You can see the secular shift in innovation and economic power
in these charts.
INVENTIONS GDP
(% OF GLOBAL INVENTIONS) (% OF GLOBAL GDP)
1870 18»0 1»10 1870 18»0 l»10
Rising Inequality
The gains from industrialization were distributed very unevenly in the UK,
producing extreme levels of inequality. By the late 1800s, the top 1 percent of the
population owned over 70 percent of all wealth, more than in peer countries. The
UK’s top 10 percent owned an astounding 93 percent of its wealth.-- As shown in
the next chart, the peak in the wealth gap coincided with the peak in the British
Empire around 1900, which was the beginning of the next wave of conflict over
wealth and power due to large wealth gaps and the classic late Big Cycle
conditions described in Part I.
The combination of social change and rising inequality sparked significant
tensions. England’s policy response in the mid-1800s focused largely on reform
bills that expanded voting rights and reduced the corrupt practices that had made
elections less democratic. By the early 1900s, those political reforms were followed
by social reforms, which included the introduction of a public pension system,
medical and unemployment insurance, and the provision of free lunches for
school children. Organized labor was also on the rise, strengthening workers’
bargaining power. By 1911, around 25 percent of eligible men were union
members, and the Labour Party became a significant force in politics. This greater
power took the form of increasingly large strikes—for example, the first national
strike by coal miners in 1912, which led to a minimum wage for miners.
Geopolitical Rivals Emerge
In addition to its domestic issues, the UK faced challengers to its empire
abroad, competing for influence with France in Africa, Russia in the Middle East
and Central Asia, and the US in the Americas. Its most significant rivalry,
however, was with Germany. The United States, the other great rising power,
remained blissfully isolationist with a big ocean allowing it to largely ignore the
conflicts in Europe.
When the new world order began at the Congress of Vienna, Germany
was still divided into a number of smaller states. While the Austrian Empire,
ruled by the Habsburgs, had a lot of influence, Prussia was swiftly rising and had
one of the strongest armies in Europe. Over the next century, it successfully
unified the other German states, becoming a first-rate power. It achieved
this thanks in large part to Otto von Bismarck’s brilliant strategic and
diplomatic leadership- and the other classic ingredients for success: strong
education and competitiveness.
Once unified, Germany experienced the classic virtuous cycle of a power
on the rise. Viewing an effective education system as a crucial step in its
quest to raise its economy to the level of Great Britain’s, the new Germany
—and its predecessor states—built one from the ground up, focusing on
teaching both practical trade skills and high-level scientific knowledge, theoretical
and applied. Starting in the 1860s, primary education was mandatory for all and
enforced by law. Germany also established three new research universities.
In order to create a culture of innovation, the German government
provided credit to corporations, along with technical advice and
assistance; awarded grants to inventors and immigrant entrepreneurs;
bestowed gifts of machinery; and allowed rebates and exemptions of duties
on imports of industrial equipment. Germany also maintained a strong
rule of law, which was explicitly aimed at economic development.
SHARE OF WORLD PATENT
APPLICATIONS % OF NOBEL PRIZES WON
As a result of these efforts, Germany’s share of the world’s manufacturing
output increased from about 5 to 13 percent between 1860 and 1900 while the
other European powers’ shares stagnated or decreased. By 1900, Germany’s
GDP had surpassed Britain’s (excluding its empire), although the latter
was still the leading trading nation in the world.
While Bismarck was a skilled diplomat who prioritized economic development
and diplomacy with international competitors, his successors were less skilled and
more aggressive. When Wilhelm II became emperor in 1888, he forced
Bismarck to resign and adopted a policy of turning Germany into a world
power. This led other powers, primarily Russia and the UK, to increasingly align
with France (a bitter rival of Germany since the Franco-Prussian War in 1871) in
an effort to contain Germany. Wilhelm moved to build up Germany’s
military, particularly its navy, setting off an arms race with the UK. This
began the next rivalry between great powers.
WARSHIP TONNAGE SHARE OF GLOBAL MILITARY
(THOUSAND TONS) SPENDING (EST, 1OYR AVG)
The UK retained its naval advantage, but the arms race strained the finances of
the major powers and further destabilized the geopolitical order. The rivalry
between the UK and Germany was just one of many building across
Europe—France and Germany were at odds, Germany was increasingly
concerned about Russian industrialization, and Austria and Russia were
struggling for influence in the Balkans. Though these countries were
intertwined through marriage and commerce more than ever before, and
despite most people believing it wouldn’t happen, in 1914 the powder keg
exploded into all-out war. This was the first world war because this was
the first time the world had become so small and so interconnected that
most of the major parts of the world were involved in one way or another.
Given the complexity and scale of World War I, and how extensively it has
been written about, I will just attempt to convey the big picture: it was terrible.
The war killed about 8.5 million soldiers and 13 million civilians, leaving
all of Europe exhausted, weakened, and indebted. Russia devolved into
revolution in 1917; in 1918, the Spanish flu arrived, killing an estimated 20-50
million people around the world over the next two years. As a percentage of the
European population, more people died during this period than in either the
Napoleonic Wars or Thirty Years’ War. But the war ended and the next new
world order was created.
In 1919, the victors—the US, Britain, France, Japan, and Italy—met at
the Paris Peace Conference to lay out the new world order in the Treaty of
Versailles. The United States, now recognized as a leading power, played a big
role in the negotiations. In fact, the term “new world order” was coined to
describe US President Woodrow Wilson’s vision for a global governance system
(the League of Nations, though this quickly failed). If the Congress of Vienna in
1815 had created a relatively sustainable order, the terms of the Paris Peace
Conference did the opposite— it made a second war inevitable though it wasn’t
apparent at the time. The territories of the losing powers (Germany, Austria-
Hungary, the Ottoman Empire, and Bulgaria) were carved up, and they were
forced to pay reparations to the victors. Those debt burdens contributed to an
inflationary depression in Germany from 1920 to 1923. Elsewhere, much
of the world entered a decade of peace and prosperity, the Roaring ’20s.
As is typical, the debts and the wealth gaps that were built up burst in
1929, causing the Great Depression. These two big boom and bust cycles
came unusually close together, though they followed the classic stages. I
won’t digress into the 1920s boom to bust sequence here as it was covered
elsewhere in this book. But I will pick up the story in the Great
Depression.
The Great Depression coupled with the large wealth gaps led to a rise in
populism and extremism in nearly every major country. In some countries
—e.g., the US and the UK—this led to big redistributions of wealth and
political power while capitalism and democracy were maintained. In
others, particularly those with weaker economies (Germany, Japan, Italy,
Spain), populist dictators seized control and sought to expand their
empires.
Classically, before all-out wars begin, there is typically about a decade
of economic, technological, geopolitical, and capital skirmishing. The time
between the depression and World War II was consistent with this rule. As
Germany and Japan became more expansionist, they increasingly competed with
the UK, the US, and France for resources and influence over territories.
Ultimately, those tensions boiled over into war.
World War II, just two decades after World War I, was even more
costly in lives and money. Germany and Japan lost and the US, the UK,
and the Soviet Union won, though economically the UK and the Soviet
Union lost too and the US gained enormously in relative wealth. GDP per
capita in Germany and Japan fell by at least half, and their currencies collapsed in
the aftermath of the war, as these charts show. As is typical, the winners of the
war got together and determined a new world order in 1945.
35 37 39 41 43 45 47 49
35 37 39 41 43 45 47 49
----DEU Spot FX Vi USD (Indexed Io 1935)
----DEU Block Market Spot FX vs USD
(Indexed to 1935)
100
80
«0
40
20
0
35 37 3» 41 43 45 47 4»
JPN SPOT FX VS USD
(INDEXED TO 1935)
THE DECLINE
The Allied victory in 1945 produced a tremendous shift of wealth and
power, with the US emerging as the world’s dominant empire just as the
British had after the Napoleonic Wars. The British were left with large debts,
a huge empire that was more expensive to maintain than it was profitable,
numerous rivals that were more competitive, and a population that had big wealth
gaps that led to big political gaps.
It took another 20 years for the British pound to fully lose its status as
an international reserve currency. Just as the English language is so deeply
woven into the fabric of international business and diplomatic communications
that it would be difficult to replace, the same is true of reserve currencies. Other
countries’ central banks continued to hold sizable shares of their reserves in
pounds through the 1950s, and a third of all international trade was still
denominated in sterling in 1960. But the pound had been losing status since
the end of the war because smart investors recognized the great contrast
between the UK’s and the US’s financial conditions, the UK’s increased debt load,
and the UK’s low net reserves, which would make holding pound sterling debt a
bad deal.
The decline in the British pound was a protracted affair that involved
several significant devaluations. After attempts to make the pound convertible
failed in 1946-47, it was devalued by 30 percent against the dollar in 1949.
Though this worked in the short term, over the next two decades Britain’s
declining competitiveness led to repeated balance of payments strains that
culminated with the devaluation of 1967. Around this time the deutschemark
took the pound’s place as the world’s second most widely held reserve currency.
The following charts paint the picture.
GBP SHARE OF
GLOBAL RESERVES
(EX-GOLD, EST)
100%
80%
60%
40%
20%
0%
1900 I960 2020
GBP SHARE
OF GLOBAL
DEBT (ESI)
70%
60%
50%
40%
30%
20%
10%
0%
1900 I960 2020
GBP SHARE
OF GLOBAL
TRANSACTIONS
(EST)
1900
1935
1935
1970
1970 1900
The Pound's Suspended Convertibility in 1947 and Its Devaluation in
1949
The 1940s are frequently referred to as “crisis years” for the pound. The war
required the UK to borrow immensely from its allies and colonies, and those
obligations were required to be held in sterling. When the war ended, the UK
could not meet its debt obligations without either raising taxes or cutting
government spending, so it necessarily mandated that its debt assets (i.e., its
bonds) could not be proactively sold by its former colonies. The US was anxious
for the UK to restore convertibility as soon as possible, as the restrictions were
reducing liquidity in the global economy, affecting the US’s export profits. The
Bank of England was also eager to remove capital controls in order to restore the
pound’s role as a global trading currency, increase financial sector revenues in
London, and encourage international investors to continue saving in sterling. In
1946, an agreement was reached in which the US would provide the UK
with a loan of $3.75 billion (about 10 percent of UK GDP) to offer a buffer
against a potential run on the pound. As expected, the pound came under
considerable selling pressure when partial convertibility was introduced in July
1947, and the UK and the Sterling Area countries turned to austerity to maintain
the pound’s peg to the dollar. Restrictions were imposed on the import of luxury
goods, defense expenditures were slashed, dollar and gold reserves were drawn
down, and agreements were made among sterling economies to not diversify their
reserve holdings to the dollar. Prime Minister Clement Attlee gave a dramatic
speech calling for the spirit of wartime sacrifice:
We are engaged in another battle for Britain. This battle cannot be won by
the few. It demands a united effort by the whole nation. I am confident
that this united effort will be forthcoming and that we shall again conquer.
Immediately following the speech, the run on the pound accelerated. By the
end of August, convertibility was suspended, much to the anger of the US
and other international investors who had bought sterling assets in the
lead-up to convertibility. The governor of the National Bank of Belgium
threatened to stop transacting in sterling, requiring a diplomatic intervention.
The devaluation came two years later, as policy makers in both the UK and
the US realized that the pound couldn’t return to convertibility at the
current rate. Competitiveness returned, the current account improved, and by
the mid-to-late 1950s full convertibility was restored. The following charts paint
the picture.
The devaluation did not lead to a panic out of sterling, even though the
fundamentals remained poor, because a very large share of UK assets was held by
the US government, which was willing to take the valuation hit in order to restore
convertibility, and by Sterling Area economies, such as India and Australia, whose
currencies were pegged to the pound for political reasons. Still, the immediate
post-war experience made it clear to knowledgeable observers that the
pound would not enjoy the same international role it had prior to World
War II.
The Failed International Efforts to Support the Pound in the 1950s
and 1960s and the Devaluation of 1967
Though the 1949 devaluation helped in the short term, the pound faced recurring
balance of payments strains. These were very concerning to international policy
makers, who feared that a collapse in the value of sterling or a rapid shift to the
dollar could prove highly detrimental to the new Bretton Woods monetary system
(particularly given the backdrop of the Cold War and concerns around
communism). As a result, numerous efforts were made to shore up the
pound and preserve its role as a source of international liquidity. In
addition, the UK mandated that all trade within the Common Market would be
denominated in pounds and all its currencies pegged to sterling. The result was
that for the 1950s and early 1960s, the UK was best understood as a regional
economic power and sterling as a regional reserve currency. Yet those measures
still didn’t fix the problem: the UK was too indebted and too uncompetitive; it
couldn’t pay its debts and still buy what it needed to import. Sterling had to be
devalued again in 1967. After that, even Sterling Area countries were
unwilling to hold their reserves in pounds unless the UK guaranteed their
underlying value in dollars.
GBR REAL FX VS TWI
GBR SHORT RATES
(DIFFTO USA)
60 62 64 66 68 70
USD/GBP (INV)
60 62 64
66
70
0.45
After the devaluation, little faith remained in the pound. Central banks began
to sell their sterling reserves and buy dollars, deutschemarks, and yen, as opposed
to simply accumulating fewer pounds in new reserve holdings. The average share
of sterling in central bank reserve holdings collapsed within two years. Countries
that continued to hold a high share of their reserves in pounds after 1968
were holding de facto dollars because the Sterling Agreement of 1968
guaranteed 90 percent of their dollar value.
AVERAGE SHARE OF POUNDS IN
CENTRAL BANK RESERVES (%TOTAL)
Central banks begin seling their sterling
reserves following the devaluation. Tire
share of the pound collapses.
Sterling Agreement countries promise to
continue holding pounds, bul only 1 to
percent ot their dollar value is guaranteed
by the British government
Europe after World War II
As we’ve seen again and again, the terrible costs of war push countries to create
new world orders in their aftermaths in an attempt to ensure that such wars can
never happen again. Naturally, new world orders revolve around the victor, which
is often the newly ascendant empire. After World War II, that was clearly the US.
The most important geopolitical elements of the post-war order were:
The US was the dominant power, which made it the de facto global
police force. Naturally, tensions almost immediately arose between the US
and the world’s second leading power, the Soviet Union. The US and its
allies formed a military alliance called NATO and the Soviet states formed
the Warsaw Pact, and the two faced off in the Cold War.
The United Nations was established to resolve global disputes. As is
classic, it was headquartered in the heart of the ascendant empire (in this
case, New York), with its main power organ, the Security Council,
dominated by the war’s victors, as is also classic.
The most important financial elements of the new world order
consisted of:
The Bretton Woods monetary system, which established the dollar
as the world’s reserve currency.
The IMF and the World Bank, designed to support the new global
financial system.
New York as the new global financial center.
From the European perspective, the key aspect of the new world order
was the shift from a balance of power in which the preeminent European
powers were on top to a world in which they were exhausted and
overshadowed by new superpowers that dwarfed any one European state
(especially as their colonies gained independence). Given these pressures and the
clear lesson of the costs of division that the World Wars had taught, the value of
European unity was clear. That was the impetus for the new European order that
gradually developed into the European Union.
The story of Robert Schuman, a key founder of the EU, helps explain why
Europe came together. Schuman’s father was a French citizen who became a
German citizen when his home region of Alsace-Lorraine was annexed by the
Germans in 1871. Schuman was born a German citizen, but became a French
citizen when Alsace-Lorraine was returned to France after World War I. As a
politician in World War II, he joined the Vichy government before abandoning it
for the French Resistance. He ended the war in hiding, with a 100,000
Reichsmark bounty on his head. A key partner to Schuman was West Germany’s
first post-war chancellor, Konrad Adenauer. A centrist mayor, he had been driven
from political life by the Nazis and sent to a concentration camp in 1944.
Following his election as chancellor as a Christian Democrat in 1949, his policies
focused on rebuilding the German economy, reconciling with other European
powers, and opposing communism. Schuman and Adenauer’s project, along with
the rest of the EU’s founders, was to make war “not merely unthinkable, but
materially impossible.”
Their first step was to create the European Coal and Steel Community. It
sounds like a narrow economic pact, but its explicit goal was to create a European
federation. From the Schuman Declaration:
The pooling of coal and steel production should immediately provide for
the setting up of common foundations for economic development as a first
step in the federation of Europe, and will change the destinies of those
regions which have long been devoted to the manufacture of munitions of
war, of which they have been the most constant victims.
The agreement created supranational bodies—a High Authority, a Common
Assembly, and a Court of Justice—that bound individual countries to its
decisions and regulations, had the ability to levy taxes, could issue loans, and set
up programs for worker welfare. Six nations signed on, and more joined over time.
Eventually, it evolved into a customs union (in 1957, via the Treaty of Rome),
opened up countries’ borders (in 1985, via the Schengen Agreement), and
eventually agreed on the framework for a political and economic union, including
a shared European citizenship (in 1992, via the Maastricht Treaty).
As is classic, this new European geopolitical order came with a new
financial/economic order. The Maastricht Treaty created the basis for a new
common currency (the euro) and common economic rules, including rules
around government deficits. The integration of its 27 member states (and their
more than 400 million people), many of whom had been at war with one another
in the past, is an impressive feat—one that puts the EU on a similar standing to
the other great powers.
THE EUROZONE COMPARED TO THE US AND CHINA
EUR USA CHN
Empire Score (0 to 1 )* 0.55 0.87 0.75
GDP Per Capita (2017 USD, PPP 41,504 60,236 16,411
Adj)
GDP (%WLD, PPP Adj) 13% 17% 23%
Population (%WLD) 4% 4% 18%
Exports (%WLD) 12% 11% 15%
Military Spending (%WLD) 9% 28% 19%
College Grads (%WLD) 13% 20% 22%
Patents (%WLD) 11% 17% 41%
Nobel Prizes (%WLD) 11% 32% 2%
Equity Mkt Cap (%WLD) 8% 55% 10%
Inti Transactions in Currency (%WLD) 28% 55% 2%
Official Reserves Held in Currency (%WLD) 21% 62% 2%
*Europe Empire Arc treats major Eurozone countries as of comparison.
The European Union’s relative declines and crises in the early 21st century
occurred for the classic reasons Big Cycle declines occurred, which are reflected in
the eight measures of power and other indicators described in Chapter 2. These
are the same reasons that other empires have experienced crises. More specifically,
Europe’s debt is large, its economy is fundamentally weak, its internal conflicts are
relatively large, its vitality and level of inventiveness are relatively weak, and its
military is not strong. The wealth and income inequalities between and within its
member countries have fueled the rise of populists, many of whom oppose the
European Union, and who succeeded in causing the UK to leave it. In short, from
its position of a leading empire not long ago, Europe as a whole (and the UK with
it) has slipped to a position of secondary power.
GDP PER CAPITA GDP PER CAPITA
Let’s now turn our attentions to the American and Chinese powers.
This law created monopolistic joint-stock companies to trade in both the East and West Indies. Colbert’s
ordinance was motivated by the desire to fund the trading companies using private funds, and not through
the government.
- The Treaty of Paris in 1814 saw France restore its borders to what they were in 1792, which meant France
actually got back some of the colonial territories that the UK had taken during the wars. The Treaty of Paris
in 1815, after Napoleon returned from exile and was defeated a second and final time, was less favorable,
requiring France to pay a large indemnity, accept an army of occupation, and cede some additional territory,
but still left France with the vast majority of the land it had controlled at the time of the French Revolution.
- . A crucial dimension of the UK’s early expansion was the role played by the British East India Company,
which starting in the late 18th century and continuing into the 19th century consolidated its political and
economic control of modern-day India, Pakistan, and Bangladesh. This vast area remained under the private
control of the company until a major rebellion in 1857 led the British state to step in and take over India as a
British territory.
- . While there were widespread private holdings of pounds internationally, it’s worth noting that for most of
the 1800s there wasn’t much in the way of central bank holdings, particularly relative to the role that the
dollar plays in central bank portfolios today. Through World War I, central bank assets outside their own
currency were generally held in precious metals.
- . The Panic of 1866 demonstrates this well. To simplify the events, the London money markets were the
most liquid markets for trade finance, but after a decade of boom lots of lenders were overextended and a big
one (Overend, Gurney & Co.) went bust. It was the 19th century equivalent of Lehman Brothers. However,
the crisis resolved within days as the Bank of England’s demonstrated willingness to serve as the “lender of last
resort” stemmed the loss of confidence in the system.
- . GBR GDP share includes income of countries controlled by the British Empire.
Z For comparison, the top 1 percent’s share of wealth in the UK today is about 20 percent and the top 10
percent’s share is about 50 percent.
While Prussia, and later the German Empire, were monarchies ruled by the Hohenzollern family, Bismarck
had immensely effective powers, having been appointed by the monarch first as minister president of Prussia,
and then as chancellor of Germany from unification in 1871 until 1890. According to historian Eric
Hobsbawm, “[Bismarck] remained undisputed world champion at the game of multilateral diplomatic chess
for almost twenty years after 1871.”
- This chart shows the official exchange rate between dollars and deutschemarks as well as an unofficial (black
market) rate that was based on actual transactions between New York and Germany during that time period.
The unofficial rate shows that the true value of the deutschemark was collapsing during the period.
CHAPTER 11
THE BIG CYCLE RISE AND DECLINE OF
THE UNITED STATES AND THE DOLLAR
This chapter covers the Big Cycle rise of the US beginning in the 19th
century, its gradual surpassing of the UK as the world’s most powerful
empire, and its recent decline. As the story of the US as the world’s leading
empire is still unfolding and is highly relevant to the world today, I will be
going through its Big Cycle in more detail than I did for the Dutch and
British, especially as it relates to the dollar’s status as a global reserve currency and
the economic and monetary policy forces that have impacted it.
The chart on the next page shows the eight types of power that make up our
overall US arc. In them you can see the story behind the US’s rise and
decline since 1700. The strong development and excellence in education led to
advances in innovation and technology, competitiveness in world markets, and
economic output, all of which fueled the development of financial markets and
the US as a financial center, its leadership in military strength and world trade,
and, with a significant lag, the emergence of the dollar as a reserve currency. The
relative advantages in education, competitiveness, and trade have fallen, while
those in innovation and technology, reserve currency status, and financial markets
and financial center status remain strong. What this chart doesn’t show are
the deviations in the US income and balance sheet conditions and its
internal conflicts, both of which are more concerning. (For a more complete
current picture, see the final chapter of this book.)
UNITED STATES: INDEX OF KEY DETERMINANTS
This next chart combines all the factors to show the overall arc of the US from
before the Revolutionary War, marking the key events along the way. The
numbers mark the approximate times of the six stages of the internal order cycle.
US ARC 17S0-PRESENT
Mojo» Wors — United States — United Kingdom — China
Now we will go through the US’s story from the beginning until the time of my
writing.
THE RISE
As with all new countries and dynasties, the US went through the usual
revolution and post-revolution process in which it created a new domestic
order as 1) a coordinated group of strong leaders fought to gain control, 2)
that group won and consolidated control, 3) the new leadership had a
vision supported by the population, but 4) it split into factions that had
conflicts over how the government should work to implement that vision.
Eventually, these factions 5) figured out the system for control and laid it
out in agreements (in the US case, at first in the Articles of Confederation
and then in the Constitution), 6) set up the parts of government (e.g., the
money and credit system, the legal system, the legislative systems, the
military, etc.), and 7) put people in jobs and made it work well. The US did
these things in a uniquely peaceful way through negotiations, near-total respect
for agreements, and good designs for governance that gave it a great start.
In the chart showing the eight types of power, you can see that rapidly
improving levels of education preceded the big rises in innovation, technology,
and competitiveness, which lasted until the World Wars, with an interruption
during the US Civil War. There were many ups and downs in both domestic and
external money/debt, economic, and military circumstances. I won’t take you
through them in detail, though I will note that all of them followed the
archetypical patterns driven by the same basic cause/effect relationships
previously described here. While the ascent of the US was most pronounced after
World War II, it really started in the late 1800s. That’s where we’ll pick up the
story.
After the US Civil War came the Second Industrial Revolution, which
was one of those classic times in which the peaceful pursuit of wealth and
prosperity created great gains in incomes, technologies, and wealth in
England, continental Europe, and the United States.
In the US, these gains were financed through a system of free-market
capitalism that, as is classic, produced both lots of wealth and big wealth
gaps. These gaps led to discontent and Progressive Era policies that broke up rich
and powerful monopolies (“trust busting”) and raised taxes on the rich, starting
with the passage of a constitutional amendment to allow federal income taxes in
1913. The US’s increased strengths were reflected in its rising shares of global
economic output and world trade, as well as its growing financial strength
(exemplified by New York becoming the world’s leading financial center),
continuing leadership in innovation, and great usage of its financial products.
The Long Ascent of the Dollar and US Capital Markets
The dollar’s path to being the world’s dominant reserve currency was far from
straightforward. In the US’s first century of existence its financial system was
completely underdeveloped. Banking worked in the United States in the classic
ways it did in most countries, as I described in Chapters 3 and 4. In other words,
hard money was put into banks that together lent out much more than they had.
That Ponzi scheme unraveled, so banks failed to meet their commitments and
devalued the money. The US had no central bank to control financial markets or
act as a lender of last resort. The US went through many boom/bust cycles, in
which classically a flurry of debt-financed investments (into land,
railroads, etc.) became overextended, leading to credit losses and a credit
crunch. As a result, banking system panics were extremely common. In
New York alone, eight significant banking panics occurred between 1836 and
1913, and regional banking panics were also common. This was because the
highly fragmented banking system had a rigid amount of currency, no deposit
insurance, and a pyramidal reserve system (with a small number of large banks in
New York serving as “correspondents” or holding reserves for a high percentage of
the nation’s banks) that heightened the risk of contagion from one bank going
under.
Like London, New York was well-established as a trading center long
before it became a global financial center, a development that didn’t occur
until after the turn of the 20th century. Only two US banks made the list of
the top 20 largest global banks in 1913, at numbers 13 and 17. In comparison,
British banks occupied nine slots, including three of the top five. For perspective,
at this point the US was far larger than the UK in economic output, and they were
neck and neck in export market share.
Many of the most important financial innovations in the emerging
New York financial center came out of its needs as a large trading center.
Investment banking took off in the US and emerged in the 1800s as a
clearinghouse for capital—much of it flowing from Europe—to finance the US
boom over the period. Like in London earlier, insurance companies developed
more rapidly than banking; in the pre-war period the large insurance trusts were
bigger than the large banks.
The fact that the US economy was more dynamic and rapidly changing
compared to European and British markets was also reflected in the US stock
market, which boomed starting right after the US Civil War. As previously
explained, the second half of the 19th century was a boom period of peace
and prosperity that has been called “the Second Industrial Revolution,”
“the Gilded Age,” and “the Robber Barron Era” because it was the period
in which capitalism and innovation flourished, wealth gaps widened
enormously, decadence was apparent, and resentment built. The backlash
started around 1900, and there was a classic debt bust in 1907. This turbulence
led to the creation of the Federal Reserve central banking system in 1913. By
1910, US stock market capitalization had surpassed that of Great Britain. New
sectors and companies rose to prominence quickly, such as US Steel, which was
founded in 1901 and became the most valuable US company only 15 years later.
Then World War I, the war few people expected to happen and nobody
expected to last so long, began in 1914 and ended in 1918. The US was not
in World War I for most of it and was the only major country to maintain
convertibility to gold during the war. Not only were the economies and markets
of Europe badly hurt from the wartime efforts, but the policies undertaken by
European governments also further undermined the faith in their currencies. In
contrast, the United States’ relative financial and economic position benefited
from the war. That the Allies’ wartime debts were largely owed to the US boosted
the use of the dollar for denominating global government debt.
Following the standard script, the winning powers—in this case the
US, Britain, France, Japan, and Italy—met after the war to set out the new
world order. That meeting, called the Paris Peace Conference, took place
in early 1919, lasted for six months, and led to the Treaty of Versailles. In
that treaty, the territories of the losing powers (Germany, Austria-Hungary, the
Ottoman Empire, and Bulgaria) were carved up and put under the control of the
winning empires. The losing powers were put into deep debt to the winning
powers to repay the winning countries’ war costs. These debts were payable in
gold.
SPOT FX RATE VS USD (INDEXED)
-------GBR ---FRA DEU
110
100
90
80
1910 1911 1912 1913 1914 1915 1914 1917 1918 1919
Geopolitically, the United States also benefited because it played a key role in
shaping the new world order, though it remained more isolationist while Britain
continued to expand and oversee its global colonial empire. The monetary system
in the immediate post-war period was in flux. While most countries endeavored to
restore gold convertibility, currency stability against gold came only after a period
of sharp devaluations and inflation.
As is typical, after the war years and with the new world order came a
period of peace and prosperity fueled by great innovations and
productivity and a capital markets boom that produced big debts and big
wealth gaps late in the upswing. In the Roaring ’20s a lot of debt
(promises to deliver paper money that was convertible to gold) was created
to buy speculative assets (particularly stocks). To curtail that, the Federal
Reserve tightened monetary policy in 1929, which caused the bubble to
burst and the global Great Depression to begin. It brought economic
suffering to virtually all nations, which led to fighting over wealth within
and between countries, which led to the hot wars that began a decade
later.
I covered the events leading up to and during World War II in depth in
Chapter 6 as an example of the war period of the big external order/disorder cycle.
The important thing to remember here is that the Allied victory in 1945 produced
the next shift in the world order. It was a tremendous shift of wealth and power.
On a relative basis the US came out the big winner because the US sold and
lent a lot before and during the war, basically all of the fighting took place
off of US territory so the US wasn’t physically damaged, and US deaths
were comparatively low in relation to those of most other major countries.
THE TOP
The Post-War Geopolitical and Military System
Following the standard script, the victorious powers met to determine the
new world order and its new money and credit systems.
The US, Russia (then the USSR), and Great Britain emerged from the fighting
as the world’s great powers with the US clearly the richest and most powerful
militarily. Germany, Japan, and Italy were largely destroyed; Great Britain was
essentially bankrupt, and France was devastated by the war and contributed little
to the victory. China was in civil war, which resumed right after Japan’s surrender.
While there was relatively good cooperation between the US and Russia
immediately after the war, it didn’t take long for the two greatest powers
with opposing ideologies to enter a “cold” war. The next chart shows the
aggregate power indices for the US, the UK, Russia, and China since the end of
World War II. As you can see, Russia rose relative to the US until 1980 but it was
never nearly as powerful, though it was much more powerful than China. After
1980, Russia began its decline while China then began its rapid ascent and the US
continued its gradual decline.
RELATIVE STANDING OF GREAT EMPIRES
The split between the US- and Russian-controlled blocs had been clear from
the outset. President Harry Truman outlined what is now referred to as the
Truman Doctrine in a March 1947 speech:
Every nation must choose between alternative ways of life. The choice is
too often not a free one. One way of life is based upon the will of the
majority, and is distinguished by free institutions, representative
government, free elections, guarantees of individual liberty, freedom of
speech and religion, and freedom from political oppression. The second
way of life is based upon the will of a minority forcibly imposed upon the
majority. It relies upon terror and oppression, a controlled press and radio,
fixed elections, and the suppression of personal freedoms. I believe that it
must be the policy of the United States to support free peoples who are
resisting attempted subjugation by armed minorities or by outside
pressures.
As I explained in Chapter 6, compared to domestic governance, • international
relations are driven much more by raw power dynamics. That is because there are laws
and standards of behavior within countries, whereas between them raw
power matters most, and laws, rules, and even mutually agreed-upon
treaties and organizations for arbitration (such as the League of Nations,
the United Nations, and the World Trade Organization) don’t matter
much. That is what makes having a strong military and strong military
alliances so important. In 1949, 12 countries in the US camp (with more joining
later) formed the North Atlantic Treaty Organization (NATO) military alliance,
and in 1954 the Southeast Asia Treaty Organization (SEATO) was established
among the US, the UK, Australia, France, New Zealand, the Philippines,
Thailand, and Pakistan. Eight countries in the Soviet camp formed the Warsaw
Pact in 1955.
As shown in the following chart, the Americans and Soviets invested
massively in building up their nuclear weapons and a number of other
countries followed. Today, 11 countries have nuclear weapons or are on the
brink of having them, in varying amounts and degrees of capability. Having
nuclear weapons obviously gives one a big negotiating chip in the world power
game, so it’s understandable why some countries would want to have them and
other countries would not want other countries to have them. While there have
been no nuclear wars, the US has fought a number of conventional wars since
World War II, most notably the Korean War in the 1950s, the Vietnam War in
the 1960s and 1970s, the two Gulf Wars in 1990 and 2003, and the War in
Afghanistan from 2001 to 2021. These were costly in terms of money, lives, and
public support for the United States. Were they worth it? That’s for others to
decide. For the Soviet Union, which had a much smaller and weaker economy
than the US, spending enough to compete with the US militarily and maintain its
empire pushed it into bankruptcy.
NUCLEAR WEAPONS STOCKPILE (# WARHEADS, LOG)
Of course, military power consists of a lot more than nuclear weapons and a lot
has changed since the Cold War. While I’m no military expert, I get to speak to
some who have led me to believe that, while the US remains the strongest military
power overall, it is not dominant in all parts of the world in all ways, and military
challenges to it are rising. There is a significant chance that the US would lose wars
against China and Russia in their geographic areas of strength—or at least would
be unacceptably harmed—and it could also be unacceptably harmed by some
second-tier powers too. This is not the good of days of right after 1945 when the
US was the sole dominant power. While there are a number of high-risk scenarios,
in my opinion, the most worrying is a forceful move by China to bring Taiwan
under its control.
What will the next high-stakes military conflict look like? Because of new
technologies, it will be very different from previous ones. Classically the country
that wins wars spends more, invests more, and outlasts the opposition. But it is a
delicate balance.
• Because spending on the military takes government money away from spending on
social programs, and because military technologies go hand in hand with private sector
technologies, the biggest military risk for the leading powers is that they lose the economic
and technology wars.
In dealings between countries the transactions are more at arm’s length. That
means it is less easy to make the currency artificially cheap, harming the holders of
it, so internationally traded currencies are more likely to be better value currencies.
This is relevant when currencies are a storehold of wealth in the form of debt
denominated in them. Sometimes there is too much debt around the world and it
is in all governments’ interests to devalue their currencies. At such times gold (and
recently digital currencies) can be preferable. Also at such times governments are
more likely to outlaw these alternative currencies, though they can’t fully outlaw
them. When the money and credit systems based on fiat currencies break down, it
eventually leads to hard money monetary systems.
The Post-War Monetary and Economic Systems
As for the new post-war monetary and economic systems, there was one
for the US-led camp and one for the Soviet-led camp, though there were also
some nonaligned countries that had their own nonaligned currencies that were
not widely accepted. Representatives of 44 countries gathered in Bretton Woods,
New Hampshire, in 1944 to make a monetary system that linked the dollar to gold
and other country’s currencies to the dollar. The Soviet Union’s system was built
around the ruble, which nobody wanted. • Transactions between countries are very
different from transactions within countries. Governments want to control the money
that is used within their borders because by increasing and decreasing its supply,
its cost of borrowing, and its value the government has enormous power.
Because money and economics are so important I want to return to the
subject, revisiting how the system works and is working. In the post-war monetary
system, within countries, people and companies used the government-controlled
paper money. When they wanted to buy something from another country,
they typically exchanged their own country’s paper currency for the other
country’s paper currency with the help of their central bank that settled
with the other country’s central bank in gold. If they were American, they
paid in dollars and the seller from another country either exchanged them at their
central bank for the local currency or held on to them believing that they were
better storeholds of wealth than their own money. The results were that gold left
the US central bank’s reserve account and went into the accounts of other
country’s central bank and dollars accumulated abroad.
As a result of the Bretton Woods Agreement, the dollar became the
world’s leading reserve currency. This was natural because the two World
Wars had made the US the richest and most powerful country by far. By
the end of World War II the US had amassed its greatest gold/money savings ever
—about two-thirds of all the government-held gold/money in the world, the
equivalent to eight years of import purchases. Even after the war, it continued to
earn a lot of money by exporting.
The economies of Europe and Japan had been destroyed by the war. As
a solution, and to fight the spread of communism, the US supplied them
with massive aid packages (known as the Marshall and Dodge plans),
which were a) good for these devastated nations, b) good for the US
economically because these countries used the money to buy US goods, c)
good for the US’s geopolitical influence, and d) good for reinforcing the
dollar’s position as the world’s dominant reserve currency.
As for monetary policy, from 1933 until 1951, the amount of money, the cost
of money (i.e., interest rates), and where that money went was controlled by the
Federal Reserve to serve the greater objectives of the country rather than the free
market J More specifically, the Fed printed a lot of money to buy debt, capped
interest rates that lenders could charge, and controlled what money was allowed to
go into, so high inflation did not drive interest rates to unacceptable heights and
government regulations prevented other investment options from becoming
much more attractive than the debt the government wanted people to save in.
Following a brief post-war recession that was due to the decline of
military spending, the US entered a prolonged period of peace and
prosperity as is typical when a new Big Cycle begins.
The post-war recession saw the unemployment rate double (to around 4
percent), as around 20 million people needed to find employment outside of the
military and other adjacent jobs. But at the same time, the removal of rationing
laws, which had limited people’s ability to buy consumer goods, fueled a
consumer spending surge. Cheap mortgages were also available for veterans,
which led to a housing boom. The return to profit-making activities raised the
demand for labor, so employment rebounded very quickly. Exports were strong
because the Marshall and Dodge plans fueled foreign appetite for US goods; also
the US private sector went global and invested abroad from 1945 through the
1970s. Stocks were cheap and dividend yields were high; the result was a
multidecade bull market that reinforced New York’s dominance as the world’s
financial center, bringing in still more investment and further strengthening the
dollar as a reserve currency. All of this was classic; it was a mutually self-
reinforcing Big Cycle upswing.
There was enough money for the US to improve education, invent
fabulous technologies (e.g., those that allowed it to go to the moon), and a
lot more. The stock market hit its high in 1966, which marked the end of
the good times for 16 years, though nobody knew it then. That was around
the time that my own direct contact with events began. I started investing in 1961
at age 12. Of course, I didn’t know what I was doing and had no appreciation for
how lucky my contemporaries and I were. I was born at the right time and in the
right place. The United States was the leading manufacturing country, so labor
was valuable. Most adults could get a good job, and their kids could get a college
education and rise without limitation. Since the majority of people were middle
class, the majority of people were happy.
The US did all the classic things that helped the world become more dollarized.
Its banks increased their operations and lending in foreign markets. In 1965, only
13 US banks had foreign branches. By 1970, 79 banks had them, and by 1980
nearly every major US bank had at least one foreign branch, and the total number
of branches had grown to 787. Global lending boomed. However, as is also
typical, a) those who prospered overdid things by operating financially
imprudently while b) global competition, especially from Germany and Japan,
increased. As a result, American lending and America’s finances began to
deteriorate as its trade surpluses disappeared.
Americans never thought about how much the space program, the War
on Poverty, and the Vietnam War would cost. Because they felt so rich and
the dollar seemed secure as a reserve currency Americans assumed they
could afford a “guns and butter” fiscal policy indefinitely. As the 1960s
came to a close, real GDP growth was near 0 percent, inflation was around 6
percent, the short-term government interest rate was around 8 percent, and
unemployment was around 4 percent. During this decade, US stocks returned 8
percent on an annual basis while bonds trailed, with equity-volatility-matched
bonds returning -3 percent annually. The official gold price remained fixed in
dollar terms, with some modest market price appreciation later in the decade, and
commodities continued to be weak, returning 1 percent annually.
The 1970s: The Balance of Payments Problem Unfolds—Low Growth,
High Inflation
As explained in Chapter 3, when claims on hard money (i.e., notes or paper
money) are introduced, at first there is the same number of claims on the hard
money as there is hard money in the bank. However, the holders of the paper
claims and the banks soon discover the wonders of credit and debt. Debt holders
like it because they can lend these paper claims to the bank in exchange for an
interest payment so they get interest. The banks that borrow it from them like it
because they can lend the money to others, who pay a higher interest rate so the
banks make a profit. Those who borrow the money from the bank like it because
it gives them buying power that they didn’t have. And the whole society likes it
because asset prices and productivity rise.
After 1945, foreign central banks had the option of holding interest-rate-
paying debt or holding non-interest-rate-earning gold. Because dollar-
denominated debt was considered as good as gold, was convertible to gold, and
was higher-earning because it provided interest, central banks shrank their gold
holdings relative to their dollar-denominated debt holdings from 1945 until 1971.
As explained in Chapter 4, investors making such a move is a classic
behavior and ends when a) the claims on the real money (i.e., gold)
substantially exceed the amount of real money in the bank and b) one can
see that the amount of real money in the bank (i.e., gold reserves) is going
down. That is when no interest rate can be high enough for it to make
sense to hold the debt (i.e., claims on the hard money) rather than to turn
one’s paper money in for gold. At that time a run on the bank occurs and a
default and debt restructuring have to happen. That is what led to the
breakdown of the gold-linked Bretton Woods monetary system.
As inflation accelerated and the economy weakened in 1969-70, the Fed could
not afford to maintain a tight monetary policy, so the US’s balance of payments
worsened and the dollar took a nosedive. Rather than running surpluses, the US
ran unsustainably huge balance of payments deficits (i.e., the US bought more
from the rest of the world than it sold to the rest of the world). In the summer of
1971, Americans traveling in Europe had difficulty exchanging their dollars for
German marks, French francs, and British pounds. The Nixon administration
vowed not to “devalue” the dollar, but in August 1971, the US defaulted
on its commitments to pay in gold, offering paper money instead. Money
and credit growth were no longer constrained, and the decade of stagflation had
begun. At the same time, other industrialized countries had regained their
economic strength, becoming very competitive in the world markets.
Rather than seeing these problems as signs of things to come,
Americans viewed them as nothing more than a temporary setback. Yet as
the decade progressed, economic problems contributed to political
problems and vice versa. The Vietnam War and the Watergate affair dragged
on, and there were OPEC-induced oil price increases and drought-induced food
price hikes. As costs rose, Americans borrowed more in order to maintain their
lifestyles, and the Fed allowed accelerated money supply growth to accommodate
the high borrowing and prevent unacceptably high interest rates.
The dollars these deficits produced went to countries that were running
budget surpluses, which deposited them in American banks, which lent them to
Latin American and other emerging, commodity-producing countries. Savings
and loan associations borrowed short to make longer-term mortgages and other
loans, using the positive spread between short rates (which they borrowed at) and
long rates (which they lent at) as a source of profits. Inflation and its effects on
markets came in two big waves that were bracketed by periods of extreme
monetary tightness, steep stock market declines, and deep recessions. Early in the
1970s, most Americans had never experienced inflation, so they weren’t
wary of it and allowed it to blossom. By the end of the decade, they were
traumatized by it and assumed that it would never go away.
By the end of the 1970s real GDP growth was around 2 percent, inflation was
around 14 percent, short-term interest rates were around 13 percent, and
unemployment was around 6 percent. Over the decade, gold surged and
commodities kept up with rising inflation, returning around 30 percent and 15
percent on an annualized basis, respectively. But the high rate of inflation wiped
out the modest 5 percent annual nominal return for stocks and 4 percent return
for treasuries matched to equity volatility.
The Post-Bretton Woods System
After the 1971 delinking of the dollar and other currencies from gold, the
world moved to an unanchored fiat monetary system (or, Type 3, as I
explained in Chapter 3) and the dollar fell in value against gold, other
currencies, stocks, and eventually just about everything. The new monetary
system was negotiated by the leading economic policy makers of the United
States, Germany, and Japan.- Paul Volcker was Nixon’s undersecretary of
international monetary affairs when Nixon severed the link with gold, and he was
head of the Federal Reserve from 1979 until 1987. He did more to shape and
guide the dollar-based monetary system before, during, and after these years than
anyone. I was lucky enough to know him well so I can personally attest that he
was a person of great character, capabilities, influence, and humility—a classic
hero/role model in a world that lacks hero/role models, especially in economic
public service. I believe that he and his thinking deserve to be studied more.
I remember the inflation psychology of that time very well; it led
Americans to borrow money and immediately take their paychecks to buy
things to “get ahead of inflation.” They also bought things that you couldn’t
make more of, like gold and waterfront properties. The panic out of dollar debt
also led interest rates to rise and drove the gold price from the $35 that it was fixed
at in 1944 and officially stayed at until 1971 to $850 in 1980.
While most people didn’t understand how the money and credit dynamic
worked, they felt the pain of it in the form of high inflation and high interest
rates, so it was a chronic political issue. At the same time, there was a lot of
conflict and rebellion due to the war in Vietnam, oil embargoes that led to high
gas prices and gas rationing, labor union fights with companies over wages and
benefits, Watergate and the Nixon impeachment, etc. These problems peaked in
the late 1970s when 52 Americans were held hostage for 444 days at the US
Embassy in Tehran. Americans felt that the country was falling apart. But what
most Americans didn’t understand was that economic conditions in communist
countries were even worse.
As we’ll see in the next chapter, Mao Zedong’s death in 1976 brought
Deng Xiaoping to power in a China that was stumbling economically and
facing internal conflict. Deng’s market reforms led to a shift in economic
policies that included capitalist elements like private ownership of
businesses, the development of debt and equities markets, entrepreneurial
technological and commercial innovations, and even the flourishing of
billionaire capitalists—all under the strict control of the Chinese
Communist Party. This shift in leadership and approaches, while
seemingly insignificant at the time, would germinate into the biggest
single force to shape the 21st century.
The 1979-1982 Move to Tight Money and Conservatism
President Jimmy Carter, who like most political leaders didn’t understand the
monetary mechanics very well, knew that something had to be done to stop
inflation and appointed a strong monetary policy maker (Volcker) as head of the
Federal Reserve in August 1979. In October 1979, Volcker announced that he
would constrain money (Ml) growth at 5.5 percent. I ran the numbers,
which led me to figure that, if he really did what he said he was going to do, there
would be a great shortage of money that would send interest rates through the
roof, bankrupting debtors who could not get the credit they needed to cover their
debt-service expenses. Volcker stuck to the plan despite great political backlash,
driving interest rates to the highest levels seen “since Jesus Christ,” according to
German Chancellor Helmut Schmidt.
In the 1980 presidential election Carter was voted out and Ronald
Reagan, who was perceived as a conservative who would impose discipline
where it was needed, was elected. Leading countries at the time (reflected
in the G7, which consisted of the US, the UK, Germany, Japan, France,
Italy, and Canada—which shows how different the world power balance
was 40 years ago versus today) made analogous moves in electing
conservatives to bring discipline to their inflationary chaos. Early in their
terms, both Reagan in the US and Margaret Thatcher in the UK had landmark
fights with labor unions.
• Economics and politics have swings between the left and the right in varying extremes
as the excesses of each become intolerable and the memories of the problems of the other
fade. It’s like fashion—the widths of ties and the lengths of skirts change
through time. When there is great popularity of one extreme, one should
expect that it won’t be too long before there will be a comparable move in
the opposite direction. The move to monetary tightness broke the backs of
debtors and curtailed borrowing, which drove the world economy into its worst
downturn since the Great Depression. The Federal Reserve slowly started to cut
interest rates, but the markets continued to decline. Then Mexico defaulted on its
debt in August 1982. Interestingly, the US stock market rallied in response.
What happened next created a jarringly painful learning experience for me.
While I was able to anticipate the debt crisis, which was profitable for me, it also
led me a) to anticipate a debt-default-triggered depression that never came and b)
to lose a lot of money betting on it. As a result of my personal losses and the losses
of clients, I had to let everyone in my fledgling company, Bridgewater Associates,
go and was so broke I had to borrow $4,000 from my dad to help pay my family’s
bills. At the same time this was one of the best things that ever happened to me
because it changed my whole approach to decision making. What I had missed
was that when debts are in the currencies that central banks have the ability to
print and restructure, debt crises can be well-managed so they are not systemically
threatening. Because the Federal Reserve could provide money to the banks that
made the loans that weren’t being paid back, they didn’t have a cash flow
problem, and because the American accounting system didn’t require the banks
to account for these bad debts as losses, there was no big problem that couldn’t be
worked out. I learned that the value of assets is the reciprocal of the value of
money and credit (i.e., the cheaper money and credit are, the more
expensive asset prices are) and the value of money is the reciprocal of the
quantity of it in existence, so when central banks are producing a lot of
money and credit and making it cheaper, it is wise to be more aggressive in
owning assets.
The Disinflationary and Booming 1980s
In the 1980s there was a stock market and economic boom that was accompanied
by falling inflation and falling interest rates in the United States at the same time
as there were inflationary depressions in the debt-burdened emerging economies
that didn’t have central banks to bail them out. The debt-restructuring process
progressed slowly from 1982 until 1989 when an agreement called the Brady Plan,
named after Nicholas Brady, who was the US Treasury secretary at the time, was
created and started to bring an end to the “lost decade” in these countries (as
agreements were reached with different countries through the early ’90s). This
whole 1971—91 up-and-down debt cycle, which profoundly affected just
about everyone in the world, was the result of the US going off the gold
standard, the inflation that followed it, and having to break the back of
the inflation through tight monetary policies that led to the strength in
the dollar and the dramatic fall in inflation. In the markets that big cycle
showed up via a) the soaring of inflation and inflation-hedge assets and bear
markets in bonds in the 1970s, b) the 1979-81 bone-crushing monetary
tightening that made cash the best investment and led to a lot of deflationary debt
restructuring by non-American debtors, and then c) falling inflation rates and
excellent performance of bonds, stocks, and other disinflationary assets in the
1980s. The following charts convey this very well, as they show the swings up and
down in dollar-denominated inflation rates and interest rates from 1945 to the
present. One needs to keep these moves and the mechanics behind them in mind
when thinking about the future.
— USA long Rafes — USA Core Inflation
— USA Short Rales — USA Headline Inflation
45 55 65 75 85 75 05 15 45 55 65 75 85 95 05 15
Through it all, the dollar remained the world’s leading reserve currency. The
entire period was a forceful demonstration of the benefits to the US of having the
currency that most of the world’s debts are denominated in.
1990-2008: Globalizing, Digitalizing, and Booming Financed by Debt
Because of its economic failures, the Soviet Union could not afford to
support a) its empire, b) its economy, and c) its military in the face of
Reagan’s arms-race spending. As a result, the Soviet Union broke down in
1991. It was apparent that communism had failed or was failing everywhere, so
many countries moved away from it and the world entered a very prosperous
period of globalization and free-market capitalism.
Since then, three economic cycles have brought us to where we are at
the time of my writing—one that peaked in the 2000 dot-com bubble that
led to the recession that followed, one that peaked in the 2007 bubble that
led to the 2008 global financial crisis, and one that peaked in 2019, just
before the 2020 coronavirus-triggered downturn. In addition to the
decline of the Soviet Union, this period also saw the rise of China,
globalization, and advances in technologies that replaced people, which
was good for corporate profits but widened wealth and opportunity gaps.
Countries and their borders faded in importance; goods and the incomes they
produced were generally made wherever they could be most cost-effectively
produced, which led to production and development in emerging countries,
accelerating mobility of people between countries, narrowing wealth gaps
between countries, and ballooning wealth gaps within them. Lower- and middle-
income workers in developed countries suffered, while workers in productive
emerging countries saw big relative gains. Though a bit of an oversimplification,
it’s accurate to say that this was a period in which workers in other
countries, especially those in China, and machines replaced middle-class
workers in the United States.
The following chart shows the balances of goods and services- for the United
States and China since 1990 in real (i.e., inflation-adjusted) dollars. As you will see
when we look at China in the next chapter, China’s economic reforms and open-
door policies after Deng Xiaoping came to power in 1978 and China’s being
welcomed into the World Trade Organization in 2001 led to an explosion of
Chinese competitiveness and exports. Note the accelerations in Chinese surpluses
and the US deficits from around 2000 to around 2010 and then some narrowing
of these differences (which have recently ticked up during the pandemic), with
China still tending to run surpluses and the US still running deficits. These
surpluses have given China big savings that are a great financial power.
EXPORTS OF GOODS AND SERVICES MINUS IMPORTS
• Most people pay attention to what they get and not where the money comes from to pay
for it, so there are strong motivations for elected officials to spend a lot of borrowed money
and make a lot of promises to give voters what they want and to take on debt and non-debt
liabilities that cause problems down the road. That was certainly the case in the 1990-
2008 period.
Throughout the long-term debt cycle, from 1945 until 2008, whenever the
Federal Reserve wanted the economy to pick up it would lower interest rates and
make money and credit more available, which would increase stock and bond
prices and increase demand. That was how it was done until 2008—i.e., interest
rates were cut, and debts were increased faster than incomes to create
unsustainable bubbles. That changed when the bubble burst in 2008 and interest
rates hit 0 percent for the first time since the Great Depression. As explained more
comprehensively in my book Principles for Navigating Big Debt Crises there are
three types of monetary policy: 1) interest-rate-driven monetary policy (which I
call Monetary Policy 1 because it is the first to be used and is the preferable way to
run monetary policy), 2) printing money and buying financial assets, most
importantly bonds (which I call Monetary Policy 2 and is now popularly called
“quantitative easing”), and 3) coordination between fiscal policy and monetary
policy in which the central government does a lot of debt-financed spending and
the central bank buys that debt (which I call Monetary Policy 3 because it is the
third and last approach to be used when the first two cease to be effective). The
next charts show how the debt crises of 1933 and 2008 both led to interest rates
hitting 0 percent and were followed by big money printing by the Federal
Reserve.
— USA Interest Rotes — USA Monetary Base (%GDP)
1900 1920 1940 1960 1900 2000 2020
This change in monetary policy had big effects and implications.
The 2008-2020 Money-Financed Capitalist Boom
In 2008 the debt crisis led to interest rates being lowered until they hit 0
percent, which led the three main reserve currency central banks (led by the Fed)
to move from an interest-rate-driven monetary policy to a monetary policy of
printing money and buying financial assets. Central banks printed money and
bought financial assets, which put money in the hands of investors who bought
other financial assets, which caused financial asset prices to rise, which was helpful
for the economy and particularly beneficial to those who were rich enough to
own financial assets, so it increased the wealth gap. Basically, borrowed money
was essentially free, so investment borrowers and corporate borrowers took
advantage of this to get it and used it to make purchases that drove stock prices
and corporate profits up. This money did not trickle down proportionately, so
wealth and income gaps continued to grow. Wealth and income gaps grew to the
largest since the 1930-45 period.
USA INCOME SHARES
USA WEALTH SHARES
In 2016, Donald Trump, a blunt-speaking businessman and
capitalist/populist of the right, led a revolt against establishment
politicians and “elites” to get elected president by promising to support
people with conservative values who had lost jobs and were struggling. He
went on to cut corporate taxes and run big budget deficits that the Fed
accommodated. While this debt growth financed relatively strong market-
economy growth and created some improvements for lower-income earners, it
was accompanied by a further widening of the wealth and values gap, leading the
“have-nots” to become increasingly resentful of the “haves.” At the same time,
the political gap grew with increasingly extreme Republicans on the one
side and increasingly extreme Democrats on the other. This is reflected in
the next two charts. The first one shows how conservative Republicans in the
Senate and House and how liberal Democrats in the Senate and House have
become relative to the past. Based on this measure they have become more
extreme, and their divergence has become larger than ever before. While I’m not
sure that’s exactly right, I think it’s by and large right.
IDEOLOGICAL POSITIONS OF THE MAJOR PARTIES
The next chart shows the percentage of votes along party lines for the average
representative, which is the highest ever. This continues to be reflected in the
reduced willingness to cross party lines to compromise and reach agreements. In
other words, the political splits in the country have become deep and intransigent.
SHARE OF CONGRESSIONAL MEMBERS' VOTES
CAST ALONG PARTY LINES
This chart show» the avetage ptedlcfiveness of a given member» lefl/right
Ideology In determining the* vole across chambers for each congressional session
as measured by NOMINATE, an academic model of Ideological preference.
Trump took a more aggressive negotiating posture concerning
economic and geopolitical disagreements with international rivals,
particularly China and Iran, and allies such as Europe and Japan regarding
trade and paying for military expenditures. The conflicts with China over
trade, technology, geopolitics, and capital were intensifying as his term ended in
2021; economic sanctions such as those that were used in the 1930-45 period
were being used or put on the table for possible use.
In March 2020 the coronavirus pandemic hit, and incomes,
employment, and economic activity plunged as the country (and much of
the world) went into lockdown. The US government took on a lot of debt
to give people and companies a lot of money, and the Federal Reserve
printed a lot of money and bought a lot of debt. So did other central
banks. As a reflection of this, the following charts show the unemployment rates
and central bank balance sheets of major countries for as far back as data is
available. As shown, all the levels of central banks’ printing of money and buying
of financial assets rose to near or beyond the previous record amounts in the war
years.
UNITED STATES
USA CB Balance Sheet (%GDP)
40%
30%
20%
10%
----------------------------a%
OO 20 40 60 80 00 20
UNITED KINGDOM
JAPAN
JPN Unemployment Pate
67.
---------------------------- 0%
OO 20 40 60 80 00 20
JPN CB Balance Sheet (%GDP)
As history has shown and as explained in Chapter 4, • when there is a great
increase in money and credit, it drives down the value of money and credit, which drives up
the value of other investment assets.
The printing and buying of debt that the Fed undertook in 2020 was much
like Roosevelt’s March 1933 move, Nixon’s August 1971 move, Volcker’s August
1982 move, Ben Bernanke’s November 2008 move, and Mario Draghi’s July 2012
move. It has become standard operating procedure for central banks, and it will
persist until it no longer works.
WHERE THE US IS NOW IN ITS BIG CYCLE
The stats in my model suggest that the US is roughly 70 percent through
its Big Cycle, plus or minus 10 percent. The United States has not yet
crossed the line into the sixth phase of a civil war/revolution, when the
active fighting begins, but internal conflict is high and rising. The recent
elections show how split the country is—almost 50/50, along seemingly
irreconcilable lines.
The next graphic represents what the population looked like 50 years ago—i.e.,
the majority of each party were moderates and the extremists were less extreme.
POLITICAL SPECTRUM 50 YEARS AGO
Now it looks like this—i.e., with a greater concentration and number of people
at the extremes.
POLITICAL SPECTRUM 2021
History has shown us that • greater polarization equals either a) greater risk of
political gridlock, which reduces the chances of revolutionary changes that rectify the
problems orb) some form of civil war/revolution.
In Chapter 5, I described the classic markers signaling the probabilities of
escalation from Stage 5 to Stage 6. The three most important markers I am
watching now are: 1) the rules being disregarded, 2) both sides
emotionally attacking each other, and 3) blood being spilled.
In the final chapter of this book, I will share the quantitative measures that I
use to track how things are going. I will continue to watch these and share what
I’m seeing with you at economicprinciples.org. But first, we will look at a rising
world power, China, and the ways in which it is coming into conflict with the US.
1 While 1933 to 1951 was the period from the Roosevelt peg break to the Monetary Accord between the
Federal Reserve and Treasury, the policy of explicit yield curve control, in which the Federal Reserve
controlled the spread between short-term and long-term interest rates, lasted from 1942 to 1947.
- If you want to read a great description of this process of figuring out how to go from the old monetary
system to the new fiat one, I recommend Changing Fortunes by Paul Volcker and Toyoo Gyohten.
This measures whether the country as a whole is spending more than it’s earning.
-. Shading indicates degree of polarization.
CHAPTER 12
THE BIG CYCLE RISE OF CHINA AND THE
RENMINBI
Emotions have been running so high between the US and China that many
people have urged me not to publish this chapter. We are in a kind of war, they
say; any complimentary things you write about China will alienate US readers,
while criticism of China will infuriate the Chinese—and the media will make
things worse by distorting everything you say. That’s probably true, but I can’t
not speak openly because the US-China relationship is too important to be left
unmentioned by anyone who knows both countries as well as I do. To not speak
honestly would cost me my self-respect.
I’m not afraid of criticism; I welcome it. What I am passing along here is just
the latest iteration of my learning process, which is to develop my perspectives
through direct experiences and research, to write up what I learn, to stress test it
by showing it to smart people, to explore our differences if and when we have
them, to evolve my thinking some more, and do that over and over again until I
die. While this study reflects nearly 40 years of doing just that with China, it is still
incomplete; it is right and wrong in ways that have yet to be discovered, and it is
provided to you to use or criticize in the spirit of finding out what’s true.
This chapter is focused on China and Chinese history; the following
chapter is on US-China relations. What I hope to provide in this chapter is a
better understanding of where the Chinese are coming from—of how they see us
and themselves as a result of having lived through their history. While I’m not a
scholar of Chinese culture and the Chinese way of operating, I believe that my
numerous direct encounters with China, my historical and economic research,
and my US and global perspective give me a unique sense of its past and present.
After you read this, you can decide for yourself whether or not that’s true.
China’s culture, by which I mean its people’s innate expectations about
how families and communities should behave with each other and how
leaders should lead and followers should follow, evolved over thousands of
years through the rises and falls of its many ruling dynasties and the
development of Confucian and Neo-Confucian philosophy as well as other
beliefs. I have seen these typical Chinese values and ways of operating
manifested over and over again; for example, in the economic and leadership
approaches of two men: Lee Kuan Yew, the former long-time prime minister of
Singapore, and Deng Xiaoping, who initiated China’s reform and opening up.
Both combined Confucian values with capitalist practices, in Deng’s case creating
a “socialist market economy with Chinese characteristics.”
Over the last couple of years, as part of my study of the rises and
declines of empires and their currencies, I have also undertaken a study of
Chinese history to help me understand how the Chinese think—especially
their leaders, who are greatly influenced by history. I began my research
with the year 600, just before the Tang Dynasty.-1 While I can be pretty
certain about my impressions of the people and things that I have had direct
contact with, I of course can’t be as certain about those I haven’t. My thoughts
about historical figures such as Mao Zedong are based on facts gathered, experts’
thinking gathered from conversations and books, and conjecture. What I can say
is that between my own experience, the efforts of my research team, and my
extensive triangulation with some of the most knowledgeable China scholars and
practitioners on the planet, I have a high degree of confidence in my conclusions.
Since my first trip to China in 1984,1 have come to know many Chinese, from
the lowest to the highest in rank, in an up-close, personal way, and I have
experienced their recent history as directly as I have experienced America’s. As a
result, I believe that I understand both the American and Chinese perspectives
pretty well. I urge those of you who haven’t spent considerable time in China to
look past the caricatured pictures that are often painted by biased parties and rid
yourself of any stereotypes you might have that are based on what you thought
you knew about the old “communist China”—because they’re wrong.
Triangulate whatever you are hearing or reading with people who have spent a lot
of time in China working with the Chinese people. As an aside, I think the
widespread media distortions and the blind and near-violent loyalties that stand in
the way of the thoughtful exploration of our different perspectives are a
frightening sign of our times.
To be clear, I’m not ideological. I don’t choose a side on an issue based on
whether it aligns with American, Chinese, or my own personal beliefs. I’m
practical; I approach things like a doctor who relies on logic and cause/effect
relationships and believes in what works well through time. The only thing I can
do is beg for your patience and open-mindedness as I share what I’ve learned with
you.
I laid out the factors that I believe are most important to a country’s health
when I discussed the 18 determinants at the beginning of this book. Of those, I
highlighted eight measures of power: education, competitiveness,
innovation/technology, trade, economic output, military, financial center status,
and reserve currency status. When I judge China’s strengths and weaknesses, it is
through the lens of those factors. I also try to understand China’s circumstances as
the Chinese themselves do, through their eyes.
To refresh your memory, this chart shows the relative standing of the
world’s leading countries as measured in indices that measure eight
different types of power. In examining the rises and declines of the great
empires since 1500,1 looked at each of these measures. I will now do the same for
China, briefly conveying the long arc of its history while diving into its highlights
in a more granular way.
RELATIVE STANDING OF GREAT EMPIRES
Major Wars United Slates — China — United Kingdom
— Netherlands - Spain Germany — France
Breaking this rise down further, the following chart shows the eight
measures of power for China between 1800 and the present.
CHINA: INDEX OF KEY DETERMINANTS
Unlike the cycles for the Dutch, British, and American empires, which
began with their rises and were followed by their protracted declines,
China’s cycle over the past 200 years was a long decline followed by a
rapid rise. Though the order is reversed, the same forces drove the cycle.
Seven of the eight powers hit their lowest points in the 1940—50 period.
Since then, most of them—notably, economic competitiveness, education,
and military power—improved gradually until around 1980, when
China’s economic competitiveness and trade took off. That was right after
Deng Xiaoping’s open-door and reform policies began. That is no
coincidence. From my first visit to China in 1984 until about 2008, debt
growth was in line with economic growth, which was very strong. In other
words, extremely rapid improvements were made without loading the economy
up with debt. Then the 2008 financial crisis came along and China, like the rest of
the world, used a lot of debt to stimulate its economy, so debts rose relative to
incomes. When Xi Jinping came to power in 2012, he improved China’s debt and
economic management dramatically, continued growth in innovation and
technologies, strengthened education and the military, and encountered greater
conflict with the US. China is now roughly tied with the US in being the
leading power in trade, economic output, and innovation and technology,
and it is a strong and quickly rising military and educational power. It is
an emerging power in the financial sector but is lagging as a reserve
currency and financial center. We will explore all of this in more detail
later in the chapter, but in order to understand China’s present we first
need to wade into its tremendous history.
CHINA’S GIANT HISTORY IN A TINY NUTSHELL
Anyone who wants to have a fundamental understanding of China needs to know
the basics of its history, the many patterns that repeat within it, and the timeless
and universal principles that its leaders have gained from studying those patterns.
Getting even a basic understanding of Chinese history is a considerable
undertaking. Spanning some 4,000 years, it is so vast and complicated, and has
inspired so many different and sometimes contradictory interpretations, that I am
confident that there is no single source of truth—and I am especially confident
that I’m not it. Still, there is a lot that knowledgeable people agree on, and many
scholars and practitioners, both Chinese and non-Chinese, have shared valuable
insights with me. Trying to piece together all that I have learned has not only been
a valuable experience for me but also a fascinating one. While I can’t guarantee
that my perspectives are the best, I can guarantee that they have been well-
triangulated with some of the most informed people in the world.
China’s civilization began around 2000 BCE with the Xia Dynasty, which
lasted about 400 years and is credited with bringing the Bronze Age to Asia.
Confucius, who developed the philosophy that most influences how the Chinese
behave with each other to this day, lived from 551 to 479 BCE. The Qin Dynasty
united most of the geographic area that we now call China around 221 BCE and
was followed by the 400-year Han Dynasty, which pioneered governance systems
that are still in use. The Tang Dynasty came to the fore in 618 CE.
This chart applies to China the same overall power gauge that I showed
you in the chart of great empires, covering the more than 1,400 years
between 600 and today. With the notable exception of the period from
around 1840 to 1950, when it experienced a steep decline, China has
historically stood among the most powerful empires in the world. As it
emerged from civil war, it began to rise again, at first slowly and then very
rapidly. Today it is second only to the US and is poised to surpass it.
Major Wars — Rough Estimate of China's Relative Standing vs Great Powers
Most of the dynasties that ruled China over the course of this time span were
as cultured as they were powerful. (I only name the most prominent in the chart;
there were many others.) Each of these dynasties has its own fascinating story, but
to do those stories justice would take far more space than can fit in this chapter.
The Tang Dynasty (618—907) is considered by many Chinese to be a
high point of Imperial China. The Tang came to power after a
prolonged period of disunion and civil war, which had culminated in China
being reunified by the short-lived Sui Dynasty, which immediately
preceded the Tang. The dynasty was established by a father-son pair of
strong leaders—with the son, the Tang’s second Emperor Taizong, being
especially notable. They not only militarily unified China, but also
established a stable government system and policies that were highly
effective, producing quality education, excellent development of
technologies, international trade, and diverse ideas. Taizong was a great
revolutionary leader who was able to consolidate power, build a great
dynasty, and transition well so that the dynasty remained strong without
him. A period of great prosperity lasted about 150 years, with a particularly
strong military that helped the Tang control valuable trade routes in
Central Asia. By the late 700s, however, the Tang slipped into decline for
the classic reasons: the quality of governance fell, fragmentation over
economic and values gaps led to a weakened and corrupt central
government (which, combined with internal conflict, led to a series of
rebellions), its finances deteriorated, and natural disasters increased in
impact.
Then came the Northern and Southern Song dynasties (960—1279),
during which China was the most innovative and dynamic economy
in the world. The deterioration of the Tang Dynasty led to its own period
of civil war and disunion in the 900s. Out of this conflict the Song Dynasty
came to power under the rule of Emperor Taizu in 960. Taizu was one of
those classic strong revolutionary leaders who needed to and could bring
order to chaos. He successfully rose to power as a military leader and, when
in power, implemented widespread reforms to a) bring together the
different factions that had previously fought for power, b) create a
centralized, top-down system of military and civilian governance, and c)
expand education and the quality of governance (particularly through
reforming the imperial examination system). These investments in
education and meritocracy under Taizu and his successors set the Song
Dynasty on the classic good path that led to immense scientific and
technological advancement.- However, after a few generations, around the
year 1100, the dynasty declined due to a combination of weak leadership,
financial problems, and other classic factors. In its weakened state, it
became vulnerable to external powers. During the 1100s and 1200s, the
Song first lost control of the northern half of China, then, after a revival
period known as the Southern Song Dynasty, were conquered by Mongol
leader Kublai Khan.
Kublai Khan founded the comparatively short-lived Yuan Dynasty
(1279-1368). For much of his rule, Kublai Khan governed well and
behaved like a classic dynastic founder: he encouraged education, unified
the state, and, relative to many other Mongol leaders, stood out for his
meritocratic and open-minded style of governing. Under Kublai Khan,
China’s economy and trade strengthened after a long period of conflict. At
the same time, the Yuan pursued expensive wars of conquest. Corruption
grew later in his rule, and the failure to establish a stable succession
structure led to frequent civil wars and crises after his death. This
corruption and instability helped produce rebellions that ended the dynasty
after less than a century.
The Ming Dynasty (1368—1644) presided over an empire that was
largely prosperous and peaceful. It was founded by the Hongwu
Emperor, who was born into poverty and rose to be a great general
who captured Beijing and threw out the Mongol rulers. He
consolidated power in a 14-year purge that led to about 30,000
executions. After winning power through a successful rebellion against the
unpopular Yuan Dynasty, early Ming leaders built a meritocratic society
with excellent education and civil behavior that fostered innovation. Over
time the Ming Dynasty expanded trade with Europe (as Chinese goods
were of superior quality), which brought in enormous amounts of silver
and redirected the nation’s energies from subsistence agriculture to
industry. However, the Ming’s failure to manage monetary and fiscal policy
well, to consistently support China’s influence over international trade, and
to adequately respond to a series of crises left China exposed and
vulnerable. To make matters worse, the Little Ice Age led to agricultural
disaster and famine. In the end, war, famine, and ecological disaster—
combined with a rigid and ineffectual state—created an unrecoverable
catastrophe that led to the collapse of the nearly three-centuries-old Ming
Dynasty by 1644.
The Qing Dynasty (1644—1912) came to power when the
neighboring Manchu people capitalized on instability and rebellions
in Ming China to challenge it. This culminated in the sacking of Beijing
by rebels during which the last Ming emperor committed suicide. Then
the cycle began again under the Qing Dynasty. China achieved its
maximum territorial expansion, governing over a third of the
world’s population while reforms under the reigns of three long-
ruling emperors led to an extended period of economic prosperity.-
Then the European powers arrived. Earlier in this book we saw how the
European powers, in the Age of Exploration, used their military strength to
trade with and exploit resource-rich but militarily weaker foreigners. That’s
what happened starting in the early 1800s, which began what is called the
Century of Humiliation in China. The Europeans came offering to trade
but the Chinese didn’t want anything they had to offer. This led to the
British bringing opium into China to get the Chinese addicted, so that they
would trade for it. A series of military confrontations followed during the
1800s (most notably the Opium Wars), which sped China’s decline.
Chinese moves to stem their decline failed and there was great internal
conflict and uprisings (most notably the Taiping Rebellion), which
continued until the collapse of the Qing Dynasty in 1912.
The lessons this history provides remain very much in the forefront of the
minds of China’s current leaders and are fascinating to me, especially in the
context of the patterns of history.
How the Typical Dynastic Cycle Transpires
The typical major Chinese dynasty, like the typical empire, lasted about 250 years,
give or take 150 years, and by and large followed the same pattern of rises and
declines.- You can especially see the internal order cycle, described in Chapter 5, at
play time and time again. As a reminder of that cycle:
Stage 1, when the new order begins and the new leadership
consolidates power, which leads to...
... Stage 2, when the resource-allocation systems and government
bureaucracies are built and refined, which if done well leads to...
... Stage 3, when there is peace and prosperity, which leads to...
... Stage 4, when there are great excesses in spending and debt and
the widening of wealth and political gaps, which leads to...
... Stage 5, when there are very bad financial conditions and intense
conflict, which leads to...
... Stage 6, when there are civil wars/revolutions, which leads to...
... Stage 1, which leads to Stage 2, etc., with the whole cycle happening over
again.
Let’s review this cycle quickly. The typical cycle begins with strong leaders
who win control and implement improvements needed to build a great
empire. As with most other empires, the initial winning of the war for control is
typically followed by struggling to get most of the population in line and
united (often through conflict to establish the leadership’s power). That is
typically followed by a peace that is due to no entities wanting to challenge the
dominant power (Stage 1).
Then the new ruler turns to building up the empire. To be successful an
empire needs a smart and determined population that works well with each
other. It also needs to be strong financially. These things are obtained by
systems that train and produce people who have strong education and self-
discipline. Getting the most capable people into the most important roles
requires the meritocratic selection of people. In Chinese dynasties, the
imperial exams often played that role, and it was common for new
dynasties to implement educational reforms. It also requires an effective
resource-allocation system (Stage 2).
During that period of peace and rising power, the empire typically works well
economically and improves its financial condition. While the empire typically
starts with limited financial resources and low debts because the previous empire’s
debts have been wiped out, in some cases it has assets that were acquired as an
outcome of the prior war that it won. In the case of Chinese history, key variables
were the distribution of land ownership and taxation of it—often the arrival of a
new dynasty weakened or overturned the “corrupt elites” of the prior system,
vastly improving the resources available to the state. With these resources, the
dynasty profits and expands. It builds commercial, technological, and military
strengths that reinforce each other. For example, having strong technologies helps
the dynasty economically and militarily because they can be used for both
purposes and because being strong militarily protects the country’s commercial
interests (e.g., protects trade routes), which also strengthens the dynasty
financially. At its peak, the dynasty’s government is functioning well, its resources
and people are employed productively, and prior investments are yielding new
gains. The economy is strong and self-sustaining, and the people are prosperous
and produce great achievements in scholarship, the arts, trade, architecture, and
other elements of great civilizations (Stage 3).
The decline of the empire typically happens because the forces that
strengthened it fade and a rival power emerges. Leadership weakens, often
becomes corrupt, and/or allows corruption in others.- Also, the dynasty typically
becomes overextended and quite often becomes heavily indebted, which causes it
to have debt problems that are typically dealt with by printing lots of money,
which in turn devalues the money. The dynasty’s population also becomes
increasingly fragmented and loses its unity of purpose and ability to work well
together. The wealth gap increases, which undermines productivity and leads to
political conflict. Often there is some form of natural disaster, frequently a
drought or a flood that exacerbates the dynasty’s problems. The more of these
that happen at the same time, the greater the chance that the dynasty will fall.
The fall itself comes with escalating rebellions and then a bloody civil war
(Stage 5 and Stage 6). Eventually a strong new leader emerges, wins the conflict,
and begins the cycle again with a new dynasty (Stage 1 again).
There are common themes in the decline of the different dynasties—
themes also visible in the decline of some of the other powers mentioned in
this book:
1. Growing inequality and fiscal problems over the course of the
dynasty are critical drivers of the decline. Dynasties often started with
more equal land and wealth holdings, as the concentrated holdings of the
old dynasty’s elites were redistributed—which helped with preventing
social conflict and helped the fiscal position (because elites often were more
able to shelter themselves from taxes than the broader base of small
landholders). But over the years, land became concentrated in fewer and
fewer families, who could evade taxes (via bribery, using official influence,
and finding other ways to hide/shelter their wealth from taxation)—which
in turn allowed them to build their wealth further. The inequality this
produced helped directly spawn conflict, and the weakening tax base of the
state made the state weaker and more vulnerable to crisis.
2. Monetary problems were common contributors to the decline of the
empires. In the Song, Yuan, and Ming dynasties, the government struggled
to maintain a large enough money supply in metal coins and resorted to
money printing, especially in times of war and natural or human-caused
disaster. The problems with collecting taxes made the incentive to print
even stronger. This caused high inflation or hyperinflation, making matters
worse.
3. The quality of governance and infrastructure tended to rise early in
each dynasty and then fall over the course of the dynasty. Later in the
Song, Ming, and Qing dynasties, years of underinvestment in public works
built up, leaving China vulnerable to famines and floods. And while it’s
hard to generalize over dozens of emperors, the visionary founder of the
dynasty (e.g., the founders of the Song and Yuan dynasties who embraced
technology and science) was typically succeeded by rulers who were more
rigid and conservative (e.g., in the Qing Dynasty), too focused on imperial
riches and luxuries (e.g., the last rulers of the Northern Song Dynasty),
and/or less supportive of foreign trade (in the Ming Dynasty).
4. Internal conflict usually arose from economic differences combined
with bad times (most typically caused by agricultural problems, high
debts, poor governance, and natural disasters, and sometimes by
conflicts with outside forces). Significant natural disasters and periods of
quick climate change that were painfully disruptive often coincided with
the fall of dynasties. The classic downward spiral has been that 1)
inadequate technology and investment (both new projects and
maintenance) leaves infrastructure susceptible to natural disasters; 2) a
disaster hits (in China’s case this was typically via droughts and flooding
from the major rivers), which damages crop yields and, in some cases,
destroys communities, as lower crop yields lead to food scarcity and famine;
and 3) domestic populist uprisings result from the disasters. This process
played a significant role in the declines of the Song, Yuan, Ming, and Qing
dynasties.
5. Bad conditions and large wealth gaps led to the most significant
uprisings, which were due to the common man rebelling against the
excesses of the elite (e.g., the Fang La Rebellion in the Song Dynasty, the
Red Turban Rebellion in the Yuan Dynasty, and the White Lotus
Rebellion in the Qing Dynasty). Conversely, domestic stability arising from
good conditions for most people was a key characteristic of the more
prosperous periods.
6. Isolation and Confucian cultural influences that favored scholarship
over commerce, technology, and military strength led to China’s
weaker competitiveness in business, technology, and the military,
which led it to be beaten by or fall behind stronger “barbarians”—
e.g., the Mongols, the foreign powers in the Opium Wars, and the
rest of the world in the Mao isolation period.
China’s physical geography and geology have also had a big impact on
the rise and fall of dynasties. The main thing to know is that China’s terrain is
varied and often volatile. For example, the north is colder, flatter, and drier, and
the south is more mountainous, much warmer, and wetter, which leads to China’s
different areas having often inconsistent crop production. However, a united
China is largely self-contained because the diversification and coordination of the
parts make it that way. Still, these conditions plus shortages of clean water,
cropland, and coastal marine fisheries have historically made China vulnerable to
food shortages. For that reason, China has often been food-insecure and even
today imports a lot of food. China also has shortages of important natural
resources, such as oil, some minerals, and some foodstuffs. It also has bad air
pollution that adversely affects the health of its people and its agriculture,
though it is quickly improving these conditions.
Such events led past and current leaders of China to learn lessons and
establish protections against these natural and political disasters being
repeated or leading to unacceptable consequences. In other words, there are many
lessons embedded in these histories, and—believe me—all of them influence the
decision making of China’s leaders today, whether they are planning for the long
term or dealing with cases at hand.
What is especially interesting to me is seeing how far back in history the
patterns of the archetypical Big Cycle go, since China’s history is both so ancient
and so well-documented. I was also fascinated to see what happened when the
Eastern and Western worlds interacted more significantly from the 17th through
the 19th centuries, and how, as the world became much smaller and more
interconnected, the Chinese and Western Big Cycles affected each other.
Probably the most important thing I gained from studying the history of so
many countries is the ability to see the big patterns of causes and effects. Shifting
my perspective to the very long term felt like zooming out in Google Maps
because it allowed me to see contours that I couldn’t see before and how the same
stories play out over and over again for basically the same reasons. I also came to
understand how having so much history to study has affected the Chinese way of
thinking, which is very different from the American way of thinking, which is
much more focused on what is happening now. Most Americans believe their
own history is just 300 or 400 years old (since they believe the country began with
European settlement), and they aren’t terribly interested in learning from it.
Whether they are interested or not, 300 years seems like a very long time ago to
Americans, but for the Chinese, it isn’t long at all. While the prospect of a
revolution or a war that will overturn the US system is unimaginable to most
Americans, both seem inevitable to the Chinese because they have seen those
things happen again and again and have studied the patterns that inevitably
precede them. While most Americans focus on particular events, especially those
that are happening now, most Chinese leaders view current events in the context
of larger, more evolutionary patterns.
Americans are impulsive and tactical; they fight for what they want in the
present. Most Chinese are strategic; they plan for how they can get what they
want in the future. I have also found Chinese leaders to be much more
philosophical (literally, readers of philosophy) than American leaders. For
example, I had a meeting with a Chinese leader who had just met President
Donald Trump and had concerns about the possibility of a US-China conflict.
He explained how he approached the meeting, which struck me as starkly
different from how President Trump likely had. This leader and I have known
each other for many years, during which time we have talked mostly about the
Chinese and world economies and markets. Over those years we have developed a
friendship. He is a very skilled, wise, humble, and likable man. He explained that
going into his meeting with Trump, he was concerned about the worst-case
scenario where tit-for-tat escalations could get out of control and lead to war. He
referred to history and gave a personal story of his father to convey his perspective
that wars were so unimaginably harmful and the damage of the next war could be
worse than the last war, which had killed more people than any other. He focused
on World War I as an example. He said that to calm himself down and gain
equanimity he read Critique of Pure Reason by Immanuel Kant, and he realized
that he could only do his best and then the outcomes would take their course. I
told him about the Serenity Prayer- and suggested meditation to him. I went
home and read Critique of Pure Reason again, which I found challenging. I did,
and still do, admire him and value his perspective greatly.
I tell this story to share with you one Chinese leader’s perspective on the risk of
wars and to also give one example of the many interactions I’ve had with this
leader and of the many interactions I’ve had with many Chinese leaders and
Chinese people in order to help you see them through my eyes and through their
eyes.
Chinese history and philosophy, most importantly
Confucian/Taoist/legalist/Marxist philosophies, have a much bigger
influence on Chinese thinking than American history and its Judeo-
Christian/European philosophical roots have on American thinking. An
esteemed Chinese historian told me that Mao read the mammoth 20-volume
chronicle Comprehensive Mirror for Aid in Government, which covers the 16
dynasties and 1,400 years of Chinese history from around 400 BCE to 960 CE,
and the even more mammoth Twenty-Four Histories several times, as well as
numerous volumes about Chinese history and the writings of non-Chinese
philosophers, most importantly Marx. He also wrote and spoke philosophically,
wrote poetry, and practiced calligraphy. If you are interested in what Mao
thought or, more importantly, how he thought, I suggest you read On Practice,
On Contradiction, and of course The Little Red Book, which is a compendium of
his quotations on a number of subjects.^
The planning horizon that Chinese leaders concern themselves with is
well over a century because that’s at least how long a good dynasty lasts.
They understand that the typical arc of development has different
multidecade phases in it, which they plan for.
The first phase of the current Chinese Empire occurred under Mao when the
revolution took place, control of the country was won, and power and
institutions were solidified. The second phase of building wealth, power, and
cohesiveness without threatening the leading world power (i.e., the United States)
occurred under Deng and his successors up to Xi. The third phase of building on
these accomplishments and moving China toward where it has set out to be on
the 100th anniversary of the People’s Republic of China in 2049—which is to be
a “modern socialist country that is prosperous, strong, democratic, culturally
advanced, and harmonious”—is occurring under Xi and his successors. Its
ultimate goal is to make the Chinese economy about twice the size of the
US’s and to have the benefits of its growth broadly shared.- Nearer-term
goals and ways to achieve them were set out in the Made in China 2025 plan,- Xi’s
new China Standards Plan 2035, and the usual five-year plans.—
Chinese leaders don’t just try to implement their plans; they set out
clear metrics by which to judge their performance, and they achieve most
of their goals. I’m not saying that this process is perfect because it isn’t, and I’m
not saying that they don’t have political and other challenges that lead to
disagreements, including some brutal fights over what should be done, because
they do (in private). What I am saying is that the Chinese have much longer-term
and historically based perspectives and planning horizons, which they break down
into shorter-term plans and ways of operating, and they have done an excellent job
of achieving what they have set out to do by following this approach.
Coincidentally, my own search for patterns in history and my way of dealing with
tactical decisions has had a similar effect on how I see and do things—e.g., I now
view the last 500 years as recent history, the most relevant historical arcs seem
about 100-plus years long, and the patterns I’ve gleaned from this perspective help
me anticipate how events are likely to transpire, and how I should be positioned
for them over the coming weeks, months, and years.
CHINA’S LESSONS AND ITS WAYS OF OPERATING
Chinese culture developed as an extension of the experiences the Chinese had and
the lessons they learned from them over the course of millennia. These were set
out in philosophies about how things work and what ways work best in dealing
with those realities, which made clear how people should be with each other, how
political decision making should be done, and how economic systems should
work. In the Western world, the dominant philosophies are Judeo-Christian,
democratic, and capitalist/socialist, and each individual pretty much chooses from
them to come up with a mix that suits them. In China, the main philosophies
were Confucian, Taoist, and legalist until the early 20th century, when Marxism
and capitalism entered the mix. Emperors typically choose their own preferences,
put them into practice, learn, and adapt. If the mix works, the dynasty survives
and prospers (in their parlance, it has the “mandate of heaven”). If it doesn’t, it
fails and is replaced by another. This process has gone on from before history was
recorded and will go on for as long as there are people who have to decide how to
do things collectively.
While I can’t do these philosophies justice in a couple of sentences, here are my
attempts:
Confucianism seeks to bring about harmony by ensuring that people
know their roles in the hierarchy and how to play them well, starting
from within the family (between the husband and the wife, the father and
the son, the older sibling and the younger sibling, etc.) and extending up to
the ruler and their subjects. Each person respects and obeys those above
them, who are benevolent and at the same time impose strict standards of
behavior. All people are expected to be kind, honest, and fair.
Confucianism values harmony, broad-based education, and meritocracy.
Legalism favors the rapid conquest and unification of “everything
under heaven” by an autocratic leader. It argues that the world is a kill-
or-be-killed jungle in which strict obedience to the emperor’s central
government is required, without much benevolence given in return. The
Western equivalent of legalism is fascism.
Taoism teaches that it is of paramount importance to live in
harmony with the laws of nature. Taoists believe that nature is
composed of opposites—yin and yang—and that harmony is achieved
when they are balanced well.
Until the early 20th century, when Marxism gained favor with Mao and his
successors, Confucianism and Neo-Confucianism were the most influential
philosophies, usually with some legalism thrown in. I will briefly explain Marxism
when we get into the 20th century.
All of these Chinese systems are hierarchical and nonegalitarian. Wang
Qishan, the vice president of China and a remarkable historian and explorer of
different cultures, told me that the core difference between Americans and the
Chinese is that Americans hold the individual above all else while the Chinese put
the family and the collective above everything. America is run from the bottom
up (e.g., democracy) and optimized for the individual; China is run from
the top down and optimized for the collective. The Chinese word “country”
consists of the two characters for “state” and “family,” he explained, so Chinese
leaders seek to run their state the way they think parents should run their families,
with each person knowing their place and having filial respect for those above
them. As a result, the Chinese are more humble, respectful, and rules-bound,
while Americans are more arrogant, egalitarian, and rules-averse. I’ve observed
that while the Chinese are more interested in asking questions and learning,
Americans are more interested in telling you what they think.
As for governance structure (i.e., who reports to whom within the hierarchy of
the central government and how that extends down to interactions with regional
and local governments), the Chinese have evolved well-developed approaches over
many dynasties and thousands of years; to go into them in depth would require
too great a digression.
Unlike other great empires that have conquered and occupied other countries,
it was relatively uncommon for China to occupy distant states. China is basically
a giant plain surrounded by big natural borders (mountains and seas),
with the bulk of its population spread across the plain. Most of China’s
world was confined within those borders, and most of its wars were
fought for control of it, mostly among the Chinese, though sometimes
between foreign invaders and the Chinese.
Traditional Chinese military philosophy teaches that the ideal way to
win a war is not by fighting but by quietly developing one’s power to the
point that simply displaying it will cause an opponent to capitulate. It also
calls for the extensive use of psychology to influence opponents’ behaviors.—.
Still, there have been numerous violent dynastic wars inside China. The
few wars that were fought outside China were for the purpose of
establishing China’s relative power and opening trade.
Scholars believe that China was loathe to expand its empire because its land
mass was already so large and difficult to control and because they have preferred
to maintain a cultural purity that is best achieved through isolation.
Traditionally the Chinese have preferred to enter into relations with
empires outside their borders in a manner that is similar to what one
might expect from the previously mentioned philosophies—i.e., with the
parties knowing their places and acting accordingly. If China was more
powerful, which was typically the case, the less powerful states paid “tribute” with
gifts and favors and typically received guarantees of peace, recognition of their
authorities, and trading opportunities in return. These subordinate countries
typically maintained their customs and experienced no interference in how their
1 ?
countries were run.—.
CHINA’S MONETARY AND ECONOMIC HISTORY
As for money, credit, and the economy, the history is very long and
complicated. That said, China has gone through the full range of
money/credit/economic systems and cycles that I described earlier when
discussing the big cycle of money and credit. The currency the Chinese used
the most was metal (mostly copper coins, and some silver, domestically), which
continued long after China invented paper money in the 9th century, until the
introduction of the yuan in the late 19th century. Silver was the main currency
used internationally, though gold was also sometimes used.
Understanding the different systems is especially important for China, as they
shifted frequently between them and it helped produce prosperity or ruin in
different periods, depending on how the system was managed. China experienced
several cycles of 1) transitioning from hard currency to paper backed by hard
currency (Type 1 to Type 2), then 2) seeing trust in the currency increase until the
paper currency was circulated with no backing, (Type 2 to Type 3), then 3)
having the paper currency collapse due to overprinting and loss of faith, leading to
the return to a hard currency (Type 3 to Type 1).
As I explained in Chapter 3 there are three basic types of monetary systems. In
the first, which I call a Type 1 monetary system, money has intrinsic value
(because the coins are made from gold, silver, and copper). In the second, which I
call a Type 2 monetary system, money is linked to assets that have intrinsic value
(typically in the form of paper notes that can be exchanged for gold or silver at a
fixed price). In a Type 3 (or fiat) monetary system, money is not linked to
anything objective. The following diagram conveys an ultra-simplified picture of
how these currency systems rotated throughout China’s history since the Tang
Dynasty. In fact, different parts of China had different currencies and at times
used coins and ingots from other countries (e.g., Spanish silver dollars in the late
16th century). Still the diagram is broadly indicative and meant to show
that China had the same range of monetary systems as the rest of the
world, and they worked in essentially the same ways, most importantly,
with cycles in which hard money was abandoned due to debt problems,
leading to inflation, hyperinflation, and finally a return to hard money.
TRANSITIONS ACROSS DIFFERENT TYPES
At the start of the Tang Dynasty, money primarily consisted of copper coins
(i.e., hard currency). But as is classic, the supply of hard currency proved to be
constraining—China was growing quickly, and the supply of copper wasn’t
keeping up to provide enough money. Additionally, each copper coin was of low
value, and so to trade, merchants had to physically carry perhaps hundreds of
thousands of copper coins, which was impractical. These pressures led to the
invention of the earliest forms of non-hard, money-like instruments. “Flying cash”
started out as essentially drafts from a bank (like checks), but merchants would
circulate them like money. Eventually, the Tang government started to supervise
their issuance and use.— That said, day-to-day monetary transactions continued
to be mainly in copper coinage.
True paper money (i.e., designed to be in widespread use as legal tender) came
a bit later in Chinese history. In the early 1100s during the Song Dynasty, the
government took over the money-making industry and created the first
commodity-backed paper money. The paper money soon was accepted and what
it was backed by took on a subordinate importance. Thus began an early version
of a fiat monetary system. However, similar to bonds, the paper money had a
maturity date, after which it was retired.
The Song Dynasty not only invented fiat money, they also were the first to
overprint and devalue paper money. By the mid-1100s the financial demands on
the Song treasury were extremely high, due to foreign wars and domestic revolts.
As is quite typical of the declines of empires, rather than increasing taxes or
cutting spending, which they didn’t want to do because it would have increased
discontent, they printed fiat currency to fund their deficits. Initially, the
monetization of deficits was manageable—the first fiat currency, known as huizi
notes, was issued in modest quantities starting in 1160 and traded at near face
value for more than 30 years. But the Song government soon printed more freely,
more than tripling the amount of huizi in circulation. As internal and external
conflicts continued to strain the imperial treasury, the money supply nearly
tripled again between 1209 and 1231. As a result, the market value of that paper
money (measured in specie coins) fell by over 90 percent between 1195 and the
1230s.
The same patterns repeated several more times. The Yuan Dynasty, feeling
constrained by metal currency, created a new paper currency (which Marco Polo
marveled at), but then overprinted it, causing the currency to eventually collapse.
The early Ming Dynasty, also feeling constrained by metal currency, created paper
money to provide funds to establish a new state, but then overprinted it,
eventually causing the currency to collapse. These are fascinating stories I won’t
delve into now.
Following the failure of fiat money at the start of the Ming Dynasty, China
gave up experimentation with paper currencies until the 20th century. Instead,
from the mid-14th century to around 1933, China had different types of metal
coins, primarily silver. The intrinsic value of that silver constituted the significant
majority of their value, though there was some premium placed on the coins
themselves. For a major portion of that time, largely up until 1933, China didn’t
mint, and the coins came first from Spain, then Mexico, then North America. In
1933, the Chinese chose to create their own national coinage, which began to
circulate. Two years later, the Chinese government decided to replace the yuan
with the fabi (which means “legal tender”), in order to move from a currency they
couldn’t print to one they could. The fabi in turn experienced increasingly
rampant hyperinflation due to overprinting by the Republic of China
government in World War II and the final phases of the Chinese Civil War that
followed. Following the foundation of the People’s Republic of China (PRC),
the renminbi was introduced and remains in use to this day.
As for China’s broader economy, it went from being primarily agricultural and
feudal through a variety of manufacturing incarnations, such as the Bronze Age
and the Iron Age, and developed various approaches to trading with foreigners
(most importantly through the Silk Road). This gave rise to a rich merchant class,
producing cycles in which big wealth gaps developed followed by uprisings in
which their wealth was seized. Since China has always been an intelligent and
industrious society, numerous technological inventions moved its economy
forward. Private entrepreneurial businesses also arose at different times in China’s
history, producing cycles in which wealth disparities grew, until governments
expropriated and redistributed wealth in countless ways. China experienced debt
cycles like those described in Chapter 3 as well, which took place for the same
reasons. There were stable periods within these big debt cycles when debt growth
wasn’t excessive; bubble periods when it was; crisis periods when there wasn’t
enough money to service debt; and inflationary (and sometimes
hyperinflationary) periods when money was printed to alleviate the debt crises.
It’s interesting to note that while the most powerful empires had global reserve
currencies, this has not been true for China’s most powerful dynasties.
That is because:
In the years prior to frequent oceanic travel, there was no such thing as a
global reserve currency (trade was limited and generally conducted in
precious metals), and throughout its history, China never became such an
extensive empire (i.e., a “world power”) that a large portion of the world
wanted to transact with and hold its promissory notes as storeholds of
wealth. China never established a financial center rivaling those in Europe,
and it was much less commercial. While China was ahead in financial
market development in the Song Dynasty (establishing the first stock
companies and using paper currency), by the 1600s financial/capital market
developments in China were far behind those in Europe. Culturally, being
commercial was not held in high regard by China’s leaders so there was less
development of the commercial legal system and the financial markets.
Because of that lesser commercial development and its more isolationist
policies, China generally fell behind Europe in terms of innovation, which
we will discuss later.
Further, China’s support for private commerce and financial markets was
inconsistent—stronger in the Song and Tang periods and then more hostile
in the Ming and Qing, when global trade empires were first being
established. As a result, the social and legal structures were less conducive to
capital accumulation/investment (e.g., corporate law was much less
developed than in Europe and Chinese businesses tended to be family-
owned). Also, the state overall was less willing and able to invest in strategic
industries or push innovation. Confucian ideology probably played a role
in this, as merchants/businesspeople were of lower status compared to
scholars, a viewpoint that strengthened as more conservative strains of
Confucianism gained sway in the Ming and Qing dynasties.
Debt grew dramatically during the civil unrest and wars of the 1920s and AOs,
which led to the classic cycle in which promises to deliver money far exceed
capacities to do so. This caused widespread defaults, which classically led to the
abandonment of the metal standard and the outlawing of metal coins and private
ownership of silver. As previously explained, currencies are used for 1)
domestic transactions, which the government has a monopoly in
controlling (and hence can be carried out with fiat or even flimflam
currencies) and 2) international transactions, in which case the currencies
must be of real value or they won’t be accepted. The test of the real value
of a currency is whether it is actively used and traded at the same exchange
rate internationally as domestically. When there are capital controls that
prevent the free exchange of a domestic currency internationally, that
currency is more susceptible to being devalued. By definition reserve
currencies have no such controls. So, as a principle: • when you see capital
controls being put on a currency, especially when there is a big domestic debt problem, run
from that currency.
China had two currencies in the 1930s—a fiat paper one for domestic
transactions, and a gold one for international payments. The fiat paper one was
printed abundantly and frequently devalued. After the turbulence of World War
II and the Chinese Civil War, in December 1948, the first renminbi was issued as
a fiat currency and it was kept in limited supply to end the hyperinflation. In
1955, a second issuance of renminbi was made, and in 1962 a third. From 1955 to
1971 the exchange rate was fixed at 2.46 to the US dollar. Then there was another
round of high inflation in the 1970s and ’80s, which was caused by the global
devaluation of money against gold in 1971, global inflationary pressures, China
phasing out its price controls, easy credit, and a lack of spending controls among
state-owned enterprises. In 2005, the peg to the dollar was ended.
The next chart shows Chinese inflation rates going back to 1750, including the
periods of hyperinflation. The era of relatively stable inflation early on was largely
the result of China using metals (silver and copper) as money, which were valued
by weight. When the Qing Dynasty broke down, provinces declared
independence and issued their own silver and copper coins, which were also
valued by their weights. This is why there were not exceptionally high levels of
inflation, even during this terrible period.
CHINESE INFLATION (Y/Y)
30%
20%
10%
0%
-10%
1750 1775 1800 1825 1850 1875 1700 1725 1750 1775 2000 2025
The following charts show the value of Chinese currency in dollar and gold
terms since 1920, plus the inflation and growth rates over that period. As you can
see, there were two major periods of devaluation: the first when the new exchange
rate was set up in 1948, and between 1980 and the 1990s when there was a series
of devaluations aimed to support exporters and manage current account
deficits,— which caused very high inflation. As shown, growth was relatively fast
and erratic until around 1978, then fast and much less erratic until the recent brief
plunge due to the COVID-19 pandemic.
GOLD PRICE (IN CNY, INV)
CHN REAL GROWTH (Y/Y)
----------------130%
CHN INFLATION (Y/Y)
-20%
------------------------------- 30%
1920 1970 2020
While most Chinese have a strong desire to save and an appropriate sense of
risk that innately drives them to store their wealth in safe liquid assets (e.g., cash
deposits) and tangible assets (e.g., real estate and some gold), some investors have
limited experiences with riskier assets such as equities and risky debt and so can be
naive, though they are learning very fast. But when it comes to Chinese policy
makers’ understanding of money, credit, monetary policy, fiscal policy, and how
to restructure bad debts, I have found them to have the same kinds of deep and
timeless perspectives that they have for the rest of their history.
FROM 1800 UNTIL NOW
I’ll begin with a brief overview of the period between 1800 and the
foundation of the People’s Republic of China in 1949, examine the Mao
period a bit more closely, then take a deeper look at the period spanning
the rise of Deng Xiaoping (from 1978 to 1997) and the advent of Xi
Jinping (in 2012) until now. Then, in the next chapter, we will look at US-
China relations.
The Decline from 1800 until 1949
China’s post-1800 decline began when a) the last Chinese royal dynasty
(the Qing Dynasty) became decadent and weak at the same time that b) the
British and some other Western countries became strong, which led
British and other capitalist/colonialists to increasingly take control of
China economically. Meanwhile, c) China’s financial and monetary system
broke down under the burden of debts that couldn’t be paid and the
printing of money that caused a collapse in its value, while d) there were
massive domestic rebellions and civil wars.— That severe Big Cycle decline,
in which all the major strengths were in mutually reinforcing free falls,
continued from around 1840 until 1949. The end of World War II in 1945
led to the repatriation of most foreigners in China (except for Hong Kong and
Taiwan) and a civil war to determine how the wealth and power would be divided
—i.e., a war between the communists and the capitalists—on the Chinese
mainland. This long period of decline was a classic case of the archetypical
Big Cycle, and it was followed by an equally classic case of a Big Cycle
upswing, in which a new leader wins control, consolidates power, and
begins building the basic structures that are passed on to succeeding
generations, who build on each other’s accomplishments.
As discussed in previous chapters, the early 1800s was the time of
Britain’s rise and expansion across the globe—which brought the rising
British Empire into greater contact with China. The British East India
Company wanted tea, silk, and porcelain from China because it was extremely
lucrative to sell back home. However, the British didn’t have anything that the
Chinese wanted to trade for so they had to pay for these goods in silver, which was
a global money at the time. When the British began to run out of silver, they
smuggled opium into China from India, which they sold for silver, which they
then used to pay for Chinese goods. The Chinese fought to stop those sales,
which led to the First Opium War, in which the technologically superior
British Navy defeated the Chinese in 1839—42, leading Britain to impose a
treaty that gave the British Hong Kong and opened up a number of
Chinese ports, most notably Shanghai, to traders from Britain (as well as
other powers in subsequent treaties), which eventually led to the loss of
large parts of northern China to Russia and Japan and the loss of what we
now call Taiwan to Japan.
The Qing government borrowed heavily from foreigners to fight internal
rebellions. Reparations, especially after the Boxer Rebellion (a Chinese rebellion
against foreigners in 1901), also created huge liabilities. When the rebellion failed,
the victorious foreign powers demanded the equivalent of about 18,000 tons of
silver, which was structured around a 40-year debt that was guaranteed by the
tariff income on the ports they controlled. The Qing government, starved of
financial resources, faced many uprisings over the couple decades following the
Opium Wars and spent down their savings to finance fighting them. The
combination of 1) not having strong leadership, 2) not having sound
finances, 3) having internal rebellions that undermined productivity and
were costly in money and lives, 4) fighting foreigners, which was costly
financially and in lives, and 5) experiencing some big disruptive acts of
nature produced the mutually and self-reinforcing decline known as the
Century of Humiliation.
It is easy to see the important role that period has played in shaping
Chinese leaders’ perspectives—e.g., why Mao saw capitalism as a system in
which companies pursued profits through imperialism (i.e., through the
control and exploitation of countries, just as the British and other
capitalist powers did to China), enriching the greedy elites while
exploiting workers. Mao’s view of capitalism differs from my own because his
experience with it was so different, though both of our views of it are true.
Capitalism has provided me and most others I know, including immigrants from
all over the world, with enormous opportunities. The America I came of age in
was the land of opportunity, in which one could learn, contribute, and be
rewarded fairly and without boundaries. This experience of seeing through
another’s eyes was another reminder for me of how important radical open-
mindedness and thoughtful disagreement are to finding out what is true. It led me
to study Marxism a bit, so I could understand why it made sense to Mao and
others as a philosophy. My inclination up until then was to think of it as at best
impractical and at worst a potentially evil threat, yet I was ignorant about what
Marx had actually said.
Enter Marxism-Leninism
Before I examined it for myself, I’d assumed that Marxism-Leninism was a
dysfunctional system in which resources were theoretically distributed “from each
according to his abilities, to each according his needs” that failed to produce much
because of its lack of incentives to be inventive and efficient. I didn’t appreciate
that Marx was a brilliant man who came up with some good theories and some
seemingly bad ones that he would probably agree were not adequately tested and
refined by the evolutionary system he espoused. Now I wonder how Marx, a very
practical man who believed that philosophies should only be judged by the
successes and failures they produce, would have diagnosed communism’s near
total and universal failure and changed his thinking as a result.
Marx’s most important theory/system is called “dialectical
materialism.” “Dialectical” refers to how opposites interact to produce change,
and “materialism” means that everything has a material (i.e., physical) existence
that interacts with other things in a mechanical way. In a nutshell, dialectical
materialism is a system for producing change by observing and influencing
the “contradictions” of “opposites” that produce “struggles” that, when
resolved, produce progress. Marx meant it to apply to everything. The
conflict and struggle between the classes that is manifest in the conflict
between capitalism and communism is just one of many such examples.
Much of that sounds right to me.
Though I’m no expert on Marxism, the process of dialectical materialism is
similar to the process that I discovered for myself and explained in my book
Principles: Life and Work, in which I struggle with conflicts, reflect on them,
write down the principles I derive from them, and then improve them—and do
that over and over again, in a never-ending, evolutionary way that I describe as
“looping.” In other words, I believe, and it sounds like Marx believed, that
learning and evolving from conflicts and mistakes is the best approach.
It is also my opinion that capitalism—an incentive system that rewards the
people who are most inventive and productive, and that has capital markets that
reward good capital allocation decisions and penalizes bad ones—will lead to a)
more productivity over the long run (and hence a bigger total pie), b) big wealth
differences, and c) capital markets (especially debt markets) that become
overextended and then break down. When there is a capital market/economic
breakdown at the same time that there are big wealth and values disparities, that is
likely to lead to some form of revolution. Such revolutions can end harmoniously
and productively, but most are preceded by great conflict and destruction. So,
thus far the way Marx appeared to see things and the way I see things aren’t
radically different, though what we would choose and what we would think
should be done are probably radically different. If you asked me a) whether I’d
rather have what capitalism has delivered or what communism delivered and b) if
I think the capitalist path we have now is more logical than the communist path
we have seen, I’d choose capitalism as my answer to both. On the other hand, if
you asked me a) if both the capitalist and the communist systems need to be
reformed to make the pie grow more effectively and to be distributed more fairly
and b) if Marx’s dialectical materialism approach to evolving and my 5-Step
Process to evolving are broadly similar and the best ways of evolving well, I would
say yes to both questions (without getting hung up on how, exactly, our two
approaches are different). Also, as far as the wealth gap goes, I share the view that
it has been a big issue throughout history that can threaten all systems. I too
believe that conflicts produce struggle and that working through struggle
produces progress. I consider the conflicts between the classes (i.e., the “haves”
and the “have-nots”) to be among the main drivers of the rise and decline of
empires, and hence the progress of history, with those drivers being the three big
cycles—money and credit, internal order/disorder, and external order/disorder—
discussed earlier in this book.
All of those cycles across the leading countries were in their
decline/conflict phases between 1930 and 1945, which led to revolutions
and wars in China and all over the world. But as always happens, the
forces of decline ran their course and new domestic and world orders
began. More specifically, the external war ended in 1945 and foreign
forces left most of mainland China. China’s communists and capitalists
then fought an internal war that ended in 1949, which led to a new
domestic order, which was communism under Mao. Put yourself in Mao’s
position during the 1900—49 period. Imagine him reading what Marx
wrote, and think about his actions during that period and in the post-
1949 period. It makes sense that Mao was a Marxist and held the
established Confucian approach to harmony in disdain. Democracy as we
know it doesn’t have any roots in China. Legalism, with its autocratic
approach, does. Capitalism, on the other hand, is growing and becoming
much more deeply rooted today.
Lenin built on what Marx said to create a two-step process for building the
state, in which there is at first a vanguard of workers though “democratic
centralism” (in which only members of the party vote), which eventually leads to a
higher communist state in which there is common ownership of the means of
production, social and economic equality, and general prosperity. Mao liked the
Marxist-Leninist approach, in which the achievement of the communist
ideal came at the end of a very long evolutionary process. Deng Xiaoping
reiterated this view in an interview with “60 Minutes” in 1986, in which
he said that the capitalism he was adopting and communism were not
incompatible. “According to Marxism,” he said, “communist society is
based on material abundance... Only when there is material abundance can
the principle of a communist society—‘from each according to his ability,
to each according to his needs’—be applied. Socialism is the first stage of
communism...” Maybe that’s true and maybe it’s not. Time will tell. To me,
thus far capitalism—in China or anywhere else—is winning the competition.
However, there can be no question that the Chinese mix of communism and
capitalism has produced remarkable economic results over the last 40 years.
In the next section I will very briefly summarize what happened between 1949
and now. Then I will delve into each of its phases in greater detail.
The Rise from 1949 until Now
Though it’s a bit of an oversimplification, we can think of China’s
evolution from 1949 until now as occurring in three phases:
1. The Mao phase, from 1949 to 1976.
2. The Deng and Deng’s successors phase, from 1978 to 2012 when Xi
Jinping came to power.
3. The Xi Jinping phase from 2012 until now.
Each phase moved China along the arc of its long-term development,
building on its earlier accomplishments. In brief, events transpired as
follows:
From 1949 until he died in 1976, Mao (with his various ministers,
most importantly Zhou Enlai) consolidated power; built China’s
foundation of institutions, governance, and infrastructure; and
ruled China as a communist emperor. Isolated from the rest of the
world, China followed a strict communist system in which the government
owned everything and maintained tight bureaucratic controls. Immediately
following the deaths of Mao and Zhou Enlai, there was a power struggle in
1976-78 between the Gang of Four hardliners and the reformists. Deng
Xiaoping and the reformists emerged victorious in 1978, leading to the
second phase.
Deng and his ministers ran China directly or indirectly until his
death in 1997. During this phase China moved to a more collective
leadership model, opened up to the outside world, introduced and
developed market/capitalist practices, and became much stronger
financially and more powerful in other ways that didn’t appear threatening
to the United States or to other countries. To finance what was then viewed
as a symbiotic relationship in which the US bought items that were
attractively priced from China, China lent Americans money. As a result,
the US acquired US dollar-denominated debt liabilities and the Chinese
acquired dollar-denominated assets. After Deng’s death his successors Jiang
Zemin and Hu Jintao (and those who led China with them) continued in
the same direction so China’s wealth and power grew in fundamentally
sound ways that did not appear threatening to the US. In 2008, the global
financial crisis came along, which led to greater tensions over wealth in the
United States and other developed countries, increased resentment at the
flight of manufacturing jobs to China, and increased debt-financed growth
in all countries, including China.
Xi Jinping came to power in 2012, presiding over a richer, more
powerful China that was becoming overly indebted, too corrupt, and
increasingly at odds with the United States. He accelerated economic
reforms, took on the challenge of trying to contain debt growth while
aggressively reforming the economy, supported the building of leading
technologies, and took an increasingly global stance. He also became more
proactive in reducing China’s gaps in education and its income inequality,
in protecting the environment, and in consolidating political control. As
China’s powers grew and Xi’s bold objectives (e.g., the Belt and Road
Initiative and the Made in China 2025 plan) became more apparent,
tensions with the US rose, especially after Donald Trump was elected
president (a populist/nationalist who campaigned on stanching the US’s
loss of manufacturing jobs to China). China’s position vis-a-vis the US
became one of a rapidly strengthening power challenging the dominant
one.
Now let’s take a closer look.
Phase One: Building the Foundation (1949-1976)
Mao and the communists won the civil war and started the People’s Republic of
China in 1949 and quickly consolidated power. Mao became the de facto
emperor (titled “chairman of the People’s Republic of China”) and Zhou Enlai
his prime minister (titled “premier”). Domestically, the new government quickly
repaired transportation and communications infrastructure and nationalized the
banking system under the aegis of the new central bank, the People’s Bank of
China. To bring down inflation it tightened credit and stabilized the value of the
currency. The government also nationalized most businesses and redistributed
agricultural land from large landowners to the peasants who farmed the land.
Whether one worked or not, one received basic pay. There was no merit-based
pay. The protections that these guaranteed basic incomes and benefits provided
everyone were collectively called “the iron rice bowl.” These changes created a
stable economy but little motivation.
Internationally, China was isolationist, though it wasn’t long before the new
government found itself in a war. As explained in the last chapter, in 1945 the new
world order divided the world into two main ideological camps—the democratic
capitalists led by the United States and the autocratic communists led by the
Soviet Union—with a third group of countries that were not committed to either
side. Many of these nonaligned countries had until recently been colonies, most
notably under the declining British Empire. China was clearly in the Soviet-led
camp. On February 14, 1950, Mao and Stalin signed the Treaty of Friendship,
Alliance, and Mutual Assistance to cooperate and come to each other’s aid
militarily.
At the end of World War II, Korea was divided at the 38th parallel, with the
Russians controlling the north and the Americans the south. In June 1950, North
Korea invaded South Korea. The Chinese stayed out of the fighting initially, as
they were preoccupied with their own challenges and didn’t want to be drawn
into a war. In conjunction with the United Nations, the United States responded
by bringing its forces into the fighting, taking the war into North Korea, which
borders China. The Chinese viewed this as a threat, especially since US General
Douglas MacArthur made it clear that he would attack China. Though the
Soviets and the Chinese had a pact to support each other, Stalin didn’t want to go
war with the United States so he didn’t provide China with the military support it
expected. Though the Chinese were ill-prepared for war against the much greater
(and nuclear-armed) American power, the Chinese entered the war, pushing the
American and UN troops back to the previously established border. This was
Mao’s first great challenge, and it is considered a great victory by the Chinese.
Between the PRC’s founding in 1949 and Mao’s death in 1976, the
Chinese economy grew rather quickly, at an average annual rate of about 6
percent, with an average annual inflation rate of around 1—2 percent,
accumulating around $4 billion dollars in foreign exchange reserves. This
represented a modest improvement, but China remained poor. And there
was a lot of volatility along the way. Specifically:
Between 1952 and 1957, with the help of the Soviets, industrial production
grew at 19 percent a year, national income grew at 9 percent a year, and
agricultural production grew by 4 percent a year. The Chinese government
built industrial facilities and imported lots of equipment from the Soviets.
It also reformed its agricultural practices and methods by creating
cooperatives to achieve economies of scale by having farmers work together.
These were highly productive years. However, after Stalin’s death in 1953,
Nikita Khrushchev came to power, criticized Stalin and his policies, and
alienated Mao, which led to these Chinese and Soviet leaders openly
criticizing each other, which began a period of reduced Soviet support.
Around 1960 the Soviet Union shifted from being an ally to being an
enemy and withdrew economic support.
From 1958 through 1962, due to a drought, economic mismanagement
from the top-down mandated attempt to become an industrial power called
the Great Leap Forward, and reduced Soviet economic support, the
economy contracted by 25 percent and an estimated 16-40 million people
died of famine. Estimates suggest that over that period industrial output fell
by 19 percent in aggregate, with a fall of around 36 percent from the 1959
peak. Historians agree that it was a terrible period, though there is some
disagreement about how much it was terrible because of terrible
management by Mao versus other causes.
Between 1963 and 1966, the economy recovered and went to new highs.
But then came the Cultural Revolution.
As is classic in all cycles, challenges to Mao’s leadership and ideology arose.
Since most Chinese emperors were taken down by insiders, this risk had to be on
Mao’s mind (and everyone else’s). So from 1966 until 1976, he fostered a political
revolution, called the Cultural Revolution, to “purify class ranks” and reinforce
“Mao Zedong Thought.” Mao won the political/ideological battle, purging his
rival Lin Biao, who died in a plane crash during a botched coup he was accused of
organizing, and “Mao Zedong Thought” was written into the constitution. The
cost of Mao’s triumph was appalling. The Cultural Revolution curtailed
education and damaged or cost countless lives (estimates range from hundreds of
thousands to as many as 20 million dead) and dealt a huge blow to the Chinese
economy. By the early 1970s the situation had begun to stabilize under the
operational leadership of Premier Zhou Enlai. In 1969, there were clashes between
Chinese and Russian troops along the border.
1971 was a year of great change in China. The Cultural Revolution was
producing turmoil and Mao’s health was declining. That contributed to Zhou
Enlai playing an increasing leadership role from the background, which led to him
being elected “vice chairman of the Communist Party” in 1973, putting him in
the position of appearing to be Mao’s successor. Also in 1971 China was
threatened by the Soviet Union, which was militarily much more powerful and
shared a 2,500-mile border with China, leading to increasing border threats. In
1975, after the US withdrew from Vietnam, which shares a 900-mile border with
southern China, Russia built an alliance with Vietnam and moved in troops and
arms. Mao had a geopolitical principle to identify the main enemy, neutralize the
enemy’s allies, and draw them away from the enemy. Mao identified the Soviet
Union as China’s main enemy and recognized that the Soviets were in a war with
the United States that hadn’t yet turned hot but could. That led him to make the
strategic move of approaching the US. Henry Kissinger quoted Chinese officials
as saying, “The last thing the US imperialists are willing to see is a victory by Soviet
revisionists in a Sino-Soviet war, as this would [allow the Soviets] to build up a big
empire more powerful than the American empire in resources and manpower.”
I also know that Zhou Enlai, a reformist, had wanted to build a strategic
relationship with the United States for decades because a close Chinese friend of
mine, Ji Chaozhu, who was Zhou Enlai’s interpreter for 17 years and interpreted
in the first Kissinger-Zhou Enlai talks, told me that that was the case.— China
wanted to open a relationship with the United States to neutralize the Russian
threat and to enhance its geopolitical and economic position. Because in 1971 it
was especially clear that it was in the interests of China and the United
States to build a relationship, they both made overtures to establish
relations. In July 1971 Kissinger—and then in February 1972 President Richard
Nixon—went to China and in October 1971 the United Nations recognized the
Mao-led communist Chinese government and gave China a seat on the Security
Council. During Nixon’s visit, Nixon and Zhou Enlai signed an agreement
—the Shanghai Communique—in which the US stated that it
“acknowledges that all Chinese on either side of the Taiwan Strait
maintain that there is but one China and that Taiwan is part of China.
The United States government does not challenge that position. It reaffirms its
interest in a peaceful settlement of the Taiwan question by the Chinese
themselves.” Despite those assurances, reunification with Taiwan still
remains the most consistently contentious issue between China and the
US.
Following those moves of rapprochement, US relations with China and trade
and other exchanges began.
Then, in January and September 1976, first Zhou Enlai and then Mao
died and communist China faced its first succession crisis. From 1976 to
1978, there was a fight for power between the Gang of Four (hardline
conservatives who fostered the Cultural Revolution) and the reformists (who
wanted economic modernization and an opening up to the outside world). The
reformists won, and Deng Xiaoping became the paramount leader in 1978.
Phase Two: Deng and His Successors Gain Strengths Through
Economic Reforms and Opening Up Without Creating Threats to
Other Countries (1978-2012)
Deng Xiaoping was 74, with a wealth of experience under his belt. From
1978 until he died in 1997 his most important policies were conveyed in a
single phrase: reform and opening up. “Reform” meant market reforms,
using markets to help allocate resources and incentivize people, and
“opening up” meant interacting with the outside world to learn, improve,
and trade. Capitalism became a part of the communist mix. China was still
extremely poor—its per capita income was less than $200 a year. Deng knew these
moves would make China financially stronger if they were not disrupted by the
far stronger foreign powers who wanted China to remain weak; the key was to
pursue them in ways that benefited and didn’t threaten them. In 1979, he
established full diplomatic relations with the US.
Early on, Deng set out a 70-year plan to a) double incomes and ensure
that the population would have enough food and clothing by the end of
the 1980s, b) quadruple GDP per capita by the end of the 20th century
(which was achieved in 1995, five years ahead of schedule), and c) increase
per capita GDP to the levels of medium-level developed countries by 2050
(on the 100th anniversary of the PRC). He made it clear that China would
achieve those goals by having a “socialist market economy,” which he also
referred to as “socialism with Chinese characteristics.” He made that radical
shift without criticizing Marxism-Leninism; indeed, as noted earlier, he did not
see the two systems as fundamentally at odds, but rather viewed them through the
lens of dialectical materialism, as opposites that could be resolved, leading to
progress along the long arc toward communism’s ideal state.
During his term, Deng also reformed the decision-making structure of
government. More specifically, he moved its decision-making process from one
that was dominated by a single leader (previously Mao) to one in which the
Politburo Standing Committee took votes when a consensus couldn’t be reached.
He also changed the system of choosing the standing members of the Politburo
from one in which the supreme leader personally selected them to one in which
candidates—generally qualified government officials—were chosen via
consultation and negotiation with experienced party elders. To institutionalize his
governing philosophy, Deng shaped the new Chinese constitution, which was
adopted in 1982. This new constitution also made a number of changes to
facilitate the economic reforms and open-door policies that Deng wanted. It
established term limits for leaders (two five-year terms) and discouraged autocratic
decision making by formalizing his “collective leadership/democratic centralist”
policies. The new constitution also provided for greater freedom of religion,
opinion, speech, and the press, to encourage the Chinese to “seek truth from
facts.” These reforms enabled the first orderly transition of power to the
next-generation Politburo Standing Committee, led by Jiang Zemin, and
then on to Hu Jintao, with their transitions following the prescribed two
five-year terms. Each successive leadership team kept to Deng’s basic path
of making China richer and more powerful by making its economy more
market-driven/capitalist and by increasing China’s trade with and
learning from other countries, with those in other countries feeling more
excited than threatened by their interactions and trade with China.
Regaining territories it lost during its Century of Humiliation was also
a very important long-term goal. In 1984, after a lot of haggling with the UK,
it was agreed that Hong Kong would return to Chinese sovereignty in 1997, with
a “one country, two systems” approach. Then in 1986, China reached an
agreement with Portugal to obtain Macau’s return to Chinese sovereignty in
1999.
In 1984, I had my first direct contact with China. I visited China at the
invitation of the China International Trust Investment Corporation (CITIC),
China’s only “window company” (which meant that it was allowed to deal freely
with the outside world), whose leaders had asked me to help them understand
how world financial markets work. The company had been set up as an extension
of Deng’s reform and opening-up policies and was run by Rong Yiren, an old
Chinese capitalist who had chosen to stay in China even after his family’s business
was nationalized.
China was very poor and backward then. However, it was immediately clear to
me that its people were smart and civilized and its poverty was widely shared. In
this regard, it wasn’t like most other undeveloped countries I’d been to, where the
poor seemed to live in a different century. China’s backwardness stemmed from a
general lack of access to what was available in the outside world and from its
demotivating system. For example, I gave out $10 calculators as gifts, and even the
highest-ranking people thought they were miraculous devices. At the time, all
businesses (including small restaurants) were government-owned and
bureaucratic. The Chinese couldn’t choose their jobs, never mind their careers,
and received no financial incentives for working well. There was no private
ownership of property, such as one’s home, and there was no contact with what
the world had to offer in terms of best practices and products.
Because it was clear to me that the closed door was the reason for China’s
poverty, I believed that its removal would naturally equalize its standards of living
with the developed world, just as unconstrained water naturally seeks the same
level. It was easy to visualize that happening. I remember being on the 10th floor
of CITIC’s “Chocolate Building” to give a lecture. I pointed out the window at
the two-story hutongs (poor neighborhoods) below us and told my audience that
it would not be long before they would be gone and skyscrapers would stand in
their place. “You don’t know China,” they said in disbelief. I told them that they
did not know the power of the economic arbitrages that would occur as a result of
opening up.
While the opening up created a great natural opportunity, the Chinese made
the most of it and performed even beyond my highest expectations. They did that
by making and implementing Deng’s reforms, supported by uniquely Chinese
cultural influences. The expressed goal that I heard a lot of in those early days of
reform was to “break the iron rice bowl,” which was to no longer provide
demotivating guaranteed employment and ensured basic benefits and replace
them with more incentive-based compensation. Globalization also helped a lot;
the world wanted to include China.
Deng was an eager learner and he directed his policy makers to learn from
outsiders in the same way that he did. He especially relied on Lee Kuan Yew of
Singapore and other leaders of the culturally aligned “Asian Tiger” economies for
advice. I remember a dinner with the head of China’s MOFTEC (which was their
ministry of commerce), in which he rattled off details about the operations of
Singapore’s airport (including how long a passenger had to wait to get their bags at
the baggage claim), how Singapore achieved such great results, and how China
was going to implement those practices itself. Many years later I had the
opportunity to host Lee Kuan Yew at my house, along with some other esteemed
guests. We asked him to share his thoughts about leaders of the present and past.
We were eager to get his perspective because he had known most of them over the
last 50 years and was one of the greats himself. Without hesitating, he said that
Deng was the greatest leader of the 20th century. Why? Because he was smart and
wise and open-minded, he was extremely practical, and he delivered great results
for his country of a billion people.
While Deng formally stepped down from the Politburo’s Standing Committee
in 1987, he remained the de facto leader of China, which continued to open up
and become more capitalist at a breakneck pace. I played a small part in its
evolution over the years. In 1989, my CITIC friend Wang Li (who was
responsible for bond trading) introduced me to the group of people who, along
with her, had been designated to create the organization that would set up the first
stock markets in the new China (the Stock Exchange Executive Council, known
as SEEC). They had been appointed by seven companies at the request of the
visionary economic reformer and historian Wang Qishan.
China was still very poor, and SEEC’s office was in a dingy hotel because the
group lacked adequate funding. Still, they had what mattered most—a clear
mission to create big changes, smart people of good character, open-mindedness
to allow rapid learning, and determination to achieve their goals. This was not a
job to them; it was a noble mission to improve their country. I was thrilled to help
them. And over the decades that followed, I saw how they and many others built
the Chinese financial markets to become among the largest in the world.
Then, a shock happened that led everyone to question just about everything.
In 1989, a movement to democratize China grew into the demonstrations that led
to the crackdown known as the Tiananmen Square incident. The leadership was
split on how to handle the movement. Deng made the defining choice, which was
to sideline the liberal forces and go ahead with the conservatives’ crackdown.
Most Chinese people I spoke with at the time were worried that China would slip
back into its old Mao/Gang-of-Four-type ways. A very close friend from CITIC,
Madame Gu, whose brother was China’s minister of defense, happened to be
staying with my family at the time, so I saw events unfold through her eyes as well
as through the eyes of other Chinese friends. Madame Gu had been an idealistic
follower of Mao in the early years after “liberation.” When the Cultural
Revolution came along she lost her husband to persecution and was shunned by
friends. She got past that terrible experience to work on behalf of the country she
loved and rose to a senior job at CITIC. She cried at the prospect of a return to
those terrible old days. Tiananmen Square significantly set back most countries’
relationships with China, but it didn’t keep Deng and his government from
continuing their reforms. Over time, most of my Chinese friends who were
heartbroken about the crackdown came to believe that the government had made
the right move because their greatest fear was revolutionary disorder.
Over the next decade, the economy continued its strong growth, and relations
and trade with the West became better than ever. Globalization, which helped
China immensely, can be said to have begun in 1995 with the formation of the
World Trade Organization (the epoch effectively ended with the election of
Donald Trump in 2016). China joined the WTO in 2001 and its position in
world trade soared. That year, the United States had more trade than China with
80 percent of WTO member countries. Now China is a larger trading partner
than the United States for about 70 percent of those countries.
During this period of globalization, a symbiotic relationship developed
between China and the US in which the Chinese manufactured consumer
goods in an extremely cost-effective way and loaned the US money to buy
them. It was a hell of a “buy now, pay later” deal for the Americans, and
the Chinese liked it because they built their savings in the world’s reserve
currency. It struck me as odd that the Chinese, who were earning about a 40th of
Americans on average, would be lending money to Americans, since rich people
are in a better position to lend than poor ones. To me, it was a shocking reflection
of how deeply Americans were willing to get into debt to finance their
overconsumption and how much more the Chinese valued saving. It was also a
reflection of how emerging countries that want to save in the bonds/debt of the
leading reserve currency countries can lead those countries to become
overindebted.
In 1992, China’s “triangular” debt crisis came to a head. These were debt and
economic problems that arose from China’s five major government-owned banks
lending to large, inefficient, and unprofitable state-owned enterprises with the
implicit guarantee of the central government. Zhu Rongji, a bold reformer at the
top of the party, led the efforts to restructure the economy to become more
efficient. This process was extremely controversial and hurt a lot of people who
had benefited from the old system, so it took a lot of courage and intelligence, as
well as support from the top, to execute. Best practices (e.g., using “bad banks” to
take, sell off, and wind down the bad debts) were used and modified for the
Chinese environment. Zhu became premier in 1998 and in that capacity
continued to aggressively pursue reforms to modernize and make the Chinese
economy more efficient, until he retired in 2003. Many of his former aides are
among China’s senior economic policy makers today.
In 1995, I sent my 11-year-old son Matt to China, where he lived with
Madame Gu and her husband and attended what was then a poor local
school {Shi Jia Hu Tong Xiao Xue). Matt had been to China with me many
times since he was 3 years old and had gotten to know Madame Gu well. He
didn’t speak the language, so he would have to learn through immersion, which he
did. Though his school was poor (for example, there wasn’t heat until late
November, so students wore their coats in class), it had smart and caring teachers
who provided the children with an excellent, complete education that included
character development. Though Matt was deprived of some comforts he was used
to (he couldn’t take hot showers because the old apartment building he lived in
only had hot water two days a week, for example), he was superbly educated,
loved, and better developed than he would have been in our rich community. He
built deep attachments with his teachers and friends that still exist. The experience
led him to set up a foundation to help Chinese orphans that he ran for 12 years.
Around that time I also hired a Chinese team to invest American
institutional money in Chinese businesses. I pursued the effort for a
couple of years but had to discontinue it because I found it too difficult to
run it and Bridgewater at the same time.
In 1995-96 it became widely known that Deng’s health was failing. Chinese
leaders worried that his death would be viewed as an opportunity to challenge
Chinese authority. They were especially worried that the Taiwanese would hold a
referendum in favor of independence. President Lee Teng-hui, whom China
regarded as a pro-independence leader, had just made a controversial visit to the
US, shortly in advance of his nomination for Taiwan’s 1996 presidential election.
Madame Gu knew the Chinese official in charge of relations with Taiwan and
arranged for me to meet with him. He told me that China would do anything,
including going to war, to prevent Taiwanese independence. Should a new
Chinese leader permit a referendum, he explained, the Chinese people would
regard him as too weak to lead. China had seen how Russia’s brutal suppression of
rebels in the Chechen Republic had led to reduced support for independence; the
Chinese hoped that a series of missile tests in the Taiwan Strait would similarly
dampen Taiwan’s enthusiasm. In March 1996, President Bill Clinton, who was
facing re-election, sent two aircraft carriers into the Taiwan Strait. Further
military movements and threats on both sides followed. At the end of the day, the
Taiwanese never held the referendum, so my Chinese friends thought their moves
had been successful, while the Americans believed that they had humiliated the
Chinese (which I only recently found out from an American friend who was
involved in the decision to send in the American warships). As a result of the
“Third Taiwan Strait Crisis,” the Chinese significantly built up their military
capabilities in the region. I point this out to convey a) how important Taiwan’s
reunification with China is and b) how risky the situation was 25 years ago, when
China was not nearly as strong militarily as it is now. In short, I would worry a
lot if we were to see a “Fourth Taiwan Strait Crisis.”
Deng died on February 19, 1997, having transformed China almost
beyond recognition. When he came to power, 90 percent of the population
lived in extreme poverty; at the time of his death that number had fallen
by more than half, and as of the most recent data is below 1 percent. From
the start of his reforms in 1978 until his death in 1997, the Chinese
economy grew at an average rate of 10 percent a year, sextupling in size
while experiencing an average inflation rate of just 8 percent. Its reserves
grew from $4 billion to nearly $150 billion (inflation-adjusted to today’s dollars,
its reserves grew by over $250 billion). Those reserves covered 60 percent of
annual imports in 1978. By 1998, they covered more than 125 percent of imports
(and nearly 800 percent of foreign debt service).
Deng’s successors Jiang Zemin and Hu Jintao and their teams continued
the reforms and the advances through many ups and downs (though more
ups than downs). In 1997, the Asian financial crisis came along. With Zhu
Rongji assigned to run the effort, China did a very successful debt and corporate
restructuring, which included sales of unprofitable state-owned enterprises, the
building up of exports and foreign exchange reserves, a crackdown on corruption,
and the further development and improvement of markets and market
functioning. These and other changes were all important evolutionary steps. I felt
lucky to be intimately involved at the grassroots level with some of them—e.g., the
debt restructuring and asset sales. Though these events seemed bigger at the time
than they appear in retrospect, they were all significant achievements. I also ran
into cases of corruption and bad behavior, and witnessed close-up the ongoing
struggle between the good and the bad that led to further reforms.
As is typical of post-war periods of peace and prosperity, when the
leading power isn’t threatened and emerging countries aren’t yet
threatening, emerging countries can learn a lot from the leading powers as
they work together in a symbiotic way, until the emerging power becomes
powerful enough to threaten the leading power. In addition to benefiting
from the learning, they benefit from trading with each other (until that
becomes disadvantageous), and they benefit from using the capital markets
to their mutual benefit (until that becomes disadvantageous).
More specifically, the 1978—2008 period of fast growth in China came
about because 1) the world was still in the peace and prosperity phase of
the Big Cycle in which globalization and capitalism—i.e., the belief that
goods and services should be produced wherever is most cost-effective,
there should be free flows of talented people without prejudice toward
their nationalities, nationalism is bad, and global equal opportunity and
profit-seeking capitalism are good—were understood to be the widely
accepted paths to a better world, while at the same time 2) Deng Xiaoping
swung the pendulum from communist and isolationist policies that
worked terribly to market/state-capitalist and open-door policies that
worked terrifically. That led China to learn a lot, attract a lot of foreign
capital, and become a giant exporter and big saver.
As the Chinese became more capable of producing cost-effectively, they
provided the world with inexpensive goods at first and more advanced goods later,
becoming much richer in the process. Other emerging countries did so as well, the
world expanded, and the wealth gaps between the richest countries and the
poorest countries narrowed as the poorest countries rose the most while the
richest countries grew at slower rates. These circumstances lifted most boats,
especially the boats of the global elites. China rose to be a nearly comparable
power to the United States, and together they created most of the world’s new
wealth and new technologies. Europe, which had been the source of the greatest
global powers from the 15th to the 20th centuries, became relatively weak, and
Japan and Russia became secondary powers. All other countries were peripheral.
While emerging countries like India improved their conditions, none of them
achieved world power status.
Phase Three: The Emergence of US-China Conflicts and the End of
Globalization (2008-Present)
As is classic, periods of prosperity financed by debt growth lead to debt
bubbles and large wealth gaps. In the US, the bubble burst in 2008 (as it did in
1929), and the world economy contracted and middle-class Americans and those
in other countries were hurt (as in 1929-32). Interest rates were pushed down to
0 percent (as in 1931), which still wasn’t enough easing, so central banks printed a
lot of money and bought a lot of financial assets after 2008 (like in 1934), which
drove up their prices in most countries starting in 2009 (as happened in 1933-36).
This benefited the “haves” (people who had financial assets) more than the “have-
nots” (those without them) so the wealth gaps grew wider still (as they did in the
1933-38 period). The “have-nots,” especially those whose jobs were being taken
by the Chinese and immigrants, began to rise up against the elites who were
benefiting from globalization. As is typically the case when economic bad times
coincide with large wealth gaps, populism and nationalism grew around the world
(as they also did in the 1930s). That is when the threat the rising powers pose
becomes more apparent to the leading powers. The era of peace, prosperity,
and globalization began to wane, giving way to an era of conflicts between
the rich and the poor within countries and between the rising country
(China) and the dominant world power (the US).
The Chinese were holding a lot of US dollar-denominated debt—especially
from US government agency lenders Fannie Mae and Freddie Mac. For quite a
while, the US government didn’t let the Chinese holders of this debt know
whether it would stand behind it. I had conversations with top Chinese holders of
this debt, as did David McCormick (who is now CEO of Bridgewater and was the
US Treasury’s undersecretary for international affairs at the time) and Hank
Paulson (who was the US Treasury secretary). We were all impressed with the
consideration and cooperation with which the Chinese approached the dilemma
that the US had caused them. They were calm, empathetic, and cooperative.
In November 2008, leaders of the G20 countries gathered in Washington, DC,
and agreed to jointly stimulate their economies through aggressive fiscal and
monetary policies. These required a substantial increase of government debt,
which was financed by having central banks create more money and credit. Debt
growth in China was significantly faster than economic growth between
2009 and 2012 as a result of those policies.
Becoming a World Power
In 2012, Xi Jinping came to power and a new administration was chosen.
Following the well-established sequence, first Politburo members were chosen,
then ministers, vice ministers, and their senior subordinates. Then the first rounds
of plans were made. As when most new leaders take power, there was a lot of
excitement and an eagerness to strengthen both the rule of law by purging
corruption and China’s economy by strengthening and adding to its market-based
reforms. There were a number of brainstorming sessions, and I was lucky enough
to participate in a few. They were wonderful collaborations of people with
different perspectives who wanted to help; the frankness, open-mindedness,
friendliness, and intelligence that they brought to the table was remarkable.
Since then, I have closely followed China’s financial and economic
circumstances and have had numerous conversations with its top economic policy
makers about such matters as excessive debt growth, the development and
management of their shadow banking system, the vulnerabilities in their financial
systems, their trade disputes with the US, and more. I always tried to see things
from their perspective and think about what I would do if I were in their shoes. I
shared what I saw with them as frankly as a doctor discussing a medical case with
colleagues, in much the same way as I am sharing it with you in this book.— As
you probably know by now, I believe that everything works like a machine, with
timeless and universal cause/effect relationships. Chinese leaders do too, so we
almost always came to similar conclusions.
Over the years, the Xi administration has aggressively pursued policies
to reform and open up its markets and its economy; manage its debt
growth; more flexibly manage its currency; support entrepreneurship and
market-oriented decision making, especially in industries that China
wants to be world leaders in; establish sensible regulations run by well-
developed regulatory organizations; build its capabilities in the
technologies and industries of the future; broaden the economic benefits
extended to the people and regions that were lagging the most; and
control pollution and environmental degradation. Yet many people don’t see
it that way, which I suspect is because a) the reforms are coming at the same time
as other controls are tightening up, b) some of the supports (like credit
availability) for small- and medium-size organizations are not as good as they are
for larger state-owned enterprises (which has more to do with technical challenges
than any reduced desire to foster the development of small- and medium-size
organizations), c) the government directs the economy from the top down,
sometimes expecting banks and companies to make uneconomic loans (because it
wants to do what is best for the country as a whole), d) China coordinates with its
businesses in pursuit of national goals, e) it doesn’t let some foreign companies
operate on the same terms as Chinese companies, and f) it coordinates fiscal and
monetary policy to regulate the economy much more than is done in the major
reserve currency countries—all of which are typically unpopular with capitalist
outsiders.
Certainly many Americans are critical of these policies. While I won’t delve
into the merits of them, I will say that we should expect all countries’ leaders
to try to get the best balance between “state” (government influence and
control of the economy) and “capitalism” (free-market control of the
economy and capital markets) through the proper management and
coordination of monetary and fiscal policies, and we should try to
understand the thinking behind their approaches. For example, President Xi
has said he wants to a) reduce the government’s role in pricing and allocating
resources, develop the capital markets, and stimulate entrepreneurship while also
b) strongly directing the macro economy and regulating markets and other aspects
of life to be what he and the party believe are best for most Chinese. In other
words, he wants a mix of capitalism and Marxist communism. This is
understandably confusing to those who aren’t used to seeing capitalism and
communism go together, aren’t watching closely, and haven’t spoken with the
policy makers to understand their circumstances and perspectives, so they can’t
see the consistencies that exist amid the seemingly great inconsistencies
(i.e., “the dialectics” as Marx and the Chinese leaders would call them).
To understand their circumstances and perspectives, I suggest that you
not view what they are doing through stereotypes (e.g., of “what
communists do”) and accept that they are trying, and will continue to try,
to juggle these two seemingly inconsistent things. In their view capitalism
is a way of raising the living standards of most people and is not meant to
serve capitalists. Whether one thinks this approach is good or bad, their
results have been extremely impressive so we should not expect the
Chinese to abandon it for an American or Western approach. Rather, we
should study it to see what we can learn from it, the same way that the
Chinese have studied and learned from the West. After all, what we have
is a competition of approaches that we need to understand in order to play
this competitive game well.
As far as foreign policy is concerned, China has become stronger and
more forceful while the United States has become more confrontational.
More specifically, from 2012 until the time of my writing China’s
strengths have grown, which has become increasingly apparent and more
openly shown (e.g., the Made in China 2025 plan trumpets its plans to
dominate certain industries that the United States currently controls).
This has sparked a strong reaction in the US, which became most evident
after the election of Donald Trump in 2016.
Trump tapped into the resentments of those left behind by globalization, who
believed that China was unfairly competing and stealing their jobs, and nurtured a
new spirit of protectionism and nationalism. It wasn’t just Trump. China’s
strength had become a provocation for more moderate policy makers as
well. Where there had been synergy there was now raw competition.
Basically China does not want to be contained and the United States
(and some other countries) want to contain it. What does that mean
geopolitically? As you know by now, countries’ boundaries have
constantly changed over time, they are often in dispute, and international
law isn’t worth a hill of beans relative to power in resolving these disputes.
In 2009 China declared to the United Nations that it has “indisputable
sovereignty over” an area in the East and South China Seas. The area is
marked by a “nine-dash line” on a World War II era map presented by
China; it covers offshore waters east of Vietnam, north of Malaysia, and
west of the Philippines, which include a bunch of islands, are important
for shipping that China needs, and are believed to have undiscovered oil
reserves, which I imagine China would love to have given its huge
imported oil needs and the risk of oil imports from the Middle East being
cut off. If you read the World War II case study in Chapter 6 and saw how
the US cut off resources to Japan, you know the issue: China has a great
need for oil and other imports that currently come through a choke point
at the Strait of Malacca.
As a result of all of this and other assertions, the perception of China as
a threat/enemy has emerged, globalization has reversed, and “wars” have
intensified, starting with the trade and economic wars, expanding to the
technology and the geopolitical wars and, most recently, to the capital
war. All remain relatively mild in relation to what they could be, but they
should be watched closely. Eventually the actual powers of a country that
are recognized become consistent with the actual powers that exist. The
actual powers that exist are reflected in the gauges and other facts that I’m
watching for guidance.
China has continued to grow internally and to expand its investment and
business activities outside its borders. It has invested heavily in the developing
world, most notably through the Belt and Road Initiative, which extends
through Central Asia, starting with the countries on its border
(Kazakhstan, Pakistan, Tajikistan, and Afghanistan) to Europe, and
through the Arabian Peninsula and South Asia into the Mediterranean
and Africa. The amounts invested and earmarked for investment are
enormous—the largest such program since the Marshall Plan. It is a good
demonstration that wealth = power. While these moves have been appreciated
by the countries that received the benefits from roads and other infrastructure,
resources, and trade, they have also sparked resentments from recipient countries
who are having problems paying back their loans and find that China is too
controlling, and from the United States because China’s assertions of soft power
have lessened American influence in those countries.
As far as China’s internal politics are concerned, in 2018 Xi a)
consolidated power around himself and his supporters (called “the core”
leadership), b) amended the Chinese constitution to make it clear that the
Chinese Communist Party has control over everything, c) eliminated term
limits for the president and vice president, d) created supervisory
commissions to ensure that government officials are operating consistently
with the party’s wishes, and e) enshrined Xi’s perspective, called “Xi
Jinping Thought,” into the constitution. As of this writing, big political
changes, increased controls, and wider distribution of wealth are all
underway. Some people are concerned that Xi is becoming more autocratic than
Mao. I’m no expert on Chinese politics so I don’t have much to offer when it
comes to China’s internal political matters, but I will pass along what I am told,
which is that Xi’s controversial moves to tighten his control came about because
of the belief that China is entering a more difficult phase in a more challenging
world, and that at such times, unity and continuity of leadership are especially
important, and that will be the case even more over the next few years. As
mentioned earlier, • during periods of great crisis, more autocratic and less democratic
leadership tends to be preferred.
Then, in late 2019, the COVID-19 pandemic began in China, sparking a
worldwide economic downturn in 2020 and the massive printing and creation of
money and credit, which coincided with various types of conflicts in the US (most
obviously, protests related to racial injustice, and a very contentious presidential
campaign). That brings us up to today.
Looking back over the last four decades, China’s shift from isolation to
opening up and from hard-core communism to “market reforms” and
capitalism have had a greater impact on the economies of China, the US,
and the rest of the world than anything else. China transitioned from one of
the most backward countries in the world to one of the two most powerful
economically, technologically, militarily, and geopolitically. Most of that progress
occurred during an era of peace and prosperity, when the leading empire wasn’t
threatened and globalization and cooperation flourished. The period lasted until
the bursting of the debt bubble in 2008, when the United States and much of the
rest of the world became more nationalistic, protectionist, and confrontational,
following the archetypical Big Cycle progression.
The results of China’s reform and opening up are reflected in the following
table, which shows just a few representative statistics. Output per person has
increased 25 times, the percentage of people living below the poverty line has
fallen from 96 percent to less than 1 percent, life expectancy has increased by an
average of about 10 years, and the average number of years of education has
increased by 80 percent. I could go on and on, rattling off equally impressive
statistics in virtually every area.
CHINA'S DEVELOPMENT SINCE 1949 AND 1978
1949 1978 2018 Д Since 1949 Д Since 1978
RGDP Per Capita* 348 609 15,243 44x 25x
Share of World GDP 2% 2% 22% 12x 11x
Population Below the Poverty Line ($1.90/Day)** — 96% 1% at least -96% -96%
Life Expectancy 41 66 77 +36 Yrs +11 Yrs
Infant Mortality Rate (per 1,000 Births) 200 53 7 -96% -86%
Urbanization 18% 18% 59% +41% +41%
Literacy 47% 66% 97% +50% +31%
Avg Yrs of Education 1.7 4.4 7.9 +6.2 Yrs +3.5 Yrs
*USD 2017, PPP-adjusted
**The World Bank only has poverty data back to 1981
While the indicators of China’s rise are broadly representative, they aren’t
precise because the powers can’t be precisely measured. Take education, for
example. While our index for education rises at a fairly brisk pace, it fails to fully
capture the relative improvements in China because it is made up of average as
well as total levels of education. This distortion is best conveyed in the next table.
As you can see, while the average education level in China is considerably below
the average education level in the US, China’s total number of people who have
attained higher-level education is significantly greater than the United States’. Its
total number of STEM (science, technology, engineering, and math) graduates is
about three times the United States’. At the same time, there are reasons to believe
that the average quality of Chinese education isn’t as high, especially at the college
level. For example, in a recent ranking, only two Chinese universities appeared
among the top 50 universities in the world (Tsinghua University at number 29
and Peking University at number 49) while 30 American universities did. This
picture, in which the average of something in China is below the average of the
same thing in the United States but the total in China is greater than the total in
the US, is because the average level of development in China is lower while the
Chinese population is more than four times as large as the American population.
That comes across in a number of stats. For example, while the United States is
militarily stronger in total all over the world, the Chinese appear to be militarily
stronger in the East and South China Seas area, and there is a lot that is unknown
about both countries’ military powers because they are kept secret.
UNITED STATES CHINA
1980 Today Change Change 1980 Today Change Change
(%) (%)
Average Years of Schooling 11.9 13.6 +1.7 +14% 4.6 7.9 +3.3 +72%
Govt Spending on Education (% of GDP) 5.30% 5.50% 0.20% +4% 1.90% 5.20% 3.30% +174%
Est Population w/ Tertiary Education (Mln) 25 60 +35 +140% 3 120 +117 +3,900%
Population w/ Tertiary Education (% Working-Age Pop) 17% 28% 11% +68% 1% 12% 11% +2,272%
Population w/ Tertiary Education (% World) 35% 15% -20% -57% 4% 31% +27% +590%
STEM Majors (Mln) 3 8 +5 +141% 1 21 +21 +4,120%
STEM Majors (% World) 29% 11% -18% -62% 5% 31% +26% +535%
In conclusion, this modern era for China has led to some of the most
rapid improvements in basic living conditions in history as well as an
obvious climb in the factors that create powerful empires. In all respects,
China is now a major and expanding power. Next we will turn to the US-
China relationship in light of where it is now and what matters most to
Americans and the Chinese.
.. The entire report on China’s dynasties is available at economicprinciples.org.
- Among the many inventions of the Song Dynasty were the moveable-type printing press, a compass for
navigation, and paper currency.
- . China’s share of world GDP rose to 30 percent and the population more than doubled during the 1700s.
- .To clarify, most dynasties were minor, short-lived dynasties or regional dynasties that swiftly rose and fell
during periods of instability in China. Different sources give different numbers for the total number of
dynasties because it’s not even clear what constituted a minor or regional dynasty versus some other form of
administration. Concerning the major dynasties, there were roughly nine that unified China and often ruled
for extended periods. This group includes the five our case study focuses on from 600 to the present (the
Tang, Song, Yuan, Ming, and Qing), and four from the 800 years prior (the Qin, Han, Jin, and Sui).
- Typically, the “bad” emperors were distant from managing the affairs of the empire and tolerated—or even
participated in—corruption while ignoring public investment needs. Several were known for greater
ideological rigidity, for their poor judgement and the poor judgment of their top advisors, and for being
preoccupied with the luxuries that their positions afforded them. The last emperors of most dynasties often
came after the dynasty was already weakened and often had limited control or even involvement in political
events (e.g., child emperors).
“God, grant me the serenity to accept the things I cannot change, the courage to change the things I can,
and the wisdom to know the difference.”
Z. I’d like to thank Kevin Rudd, former prime minister of Australia and current president and CEO of the
Asia Society Policy Institute, for pointing me to these books and helping me understand Chinese politics.
- . Because China’s population is about four times as large as the US’s, it only takes an income that is half as
much per capita to have twice as much in total. There is nothing that I can see that stands in the way of China
and the US having comparable per capita incomes over time, which would make China four times bigger.
The Made in China 2025 plan is for China to be largely self-sufficient in most areas and to be world leaders
in high-tech fields, including artificial intelligence, robotics, semiconductors, pharmaceuticals, and aerospace.
— .In March 2021 China released their 14th Five-Year Plan and targets for 2035.
— . If you haven’t read Sun Tzu’s The Art of War, I suggest you do to get the flavor of what I am referring to.
—.In his excellent book The Chinese World Order: Traditional China’s Foreign Relations, the historian John
Fairbank described China’s relations with non-Chinese states as follows: “The graded and concentric
hierarchy of China’s foreign relations included other peoples and countries which we may group into three
main zones—first, the Sinic Zone, consisting of the most nearby and culturally similar tributaries, Korea and
Vietnam, parts of which had anciently been ruled within the Chinese empire, and also Liu-ch’iu (Ryuku)
Islands and, at brief times, Japan. Secondly, the Inner Asian Zone, consisting of tributary tribes and states of
the nomadic or seminomadic peoples of Inner Asia who were not only ethnically and culturally non-Chinese
but were also outside or on the fringes of the Chinese cultural area, even though sometimes pressing upon the
Great Wall frontier. Third, the Outer Zone, consisting of the ‘outer barbarians’ (wai-i) generally, at further
distance overland or sea, including eventually Japan and other states of Southeast and South Asia and Europe
that were supposed to send tribute when trading.”
_.1 produced this diagram working with Professor Jiaming Zhu.
— . These promissory notes were similar to what today would be called a bill of exchange. Earlier promissory
notes were denominated in variable units, but eventually government-issued notes were in fixed
denominations. The government office issued these notes (known as jiaozi and huizi) in exchange for cash
coins.
— . The devaluations in 1985-86 and 1993 came after a period of opening up trade and an expansion in
Special Economic Zones. These openings created immense demand for foreign currency and imports to build
production capacity—but it would still be a couple more years before those zones yielded much higher
exports. That mismatch contributed to China’s growing current account deficit.
— . The massive Taiping Rebellion—one of the bloodiest wars in human history, which led to an estimated
20-30 million killed—caused a giant fiscal crisis that led to an issuance of debt that got monetized and led to
high inflation.
—Ji Chaozhu was raised in the United States until he was a junior at Harvard. His brother was close to Zhou
Enlai, who sent the brother and Ji Chaozhu to the United States to try to build good relations with
Americans. When the Korean War broke out he returned to China, became Zhou’s interpreter, and later
served in the first Chinese delegation to the UN and as China’s ambassador to England. While he told me a
lot that I won’t discuss to respect his privacy, I don’t believe that this is sensitive information.
— . I never ask questions that put them in the awkward position of having to choose between conveying
confidential information and having to decline my request. I make it clear at all times that my sole desire is to
understand and help.
CHAPTER 13
US-CHINA RELATIONS AND WARS
In this chapter I will be looking at the positions that the US and China
now find themselves in and what being in these positions means for US-
China relations. Because the US and China are now rival powers in a
number of domains, they are in “conflicts” or “wars” in these domains, so I
will be looking at where these stand. Because for the most part these are
just new versions of old and classic conflicts (e.g., new technologies in a
classic technology war, new weapons in a classic military war, etc.), I will
be putting them in the context of what has happened repeatedly in history
and with the timeless and universal principles we have learned from
studying these cases. While I will explore the range of possibilities that one
might consider, I will be doing that without getting into what the future might
look like. I will do that in the concluding chapter of this book. In this chapter I
will also be moving a bit more from just conveying facts to sharing opinions (i.e.,
sharing my uncertain conjectures).
I am primarily focusing on US-China relations in this chapter, but in truth the
game macro investors and global policy makers are playing is like
multidimensional chess that requires each player to consider the many positions
and possible moves of a number of key players (i.e., countries) that are also playing
the game, with each of these players having a wide range of considerations
(economic, political, military, etc.) that they have to weigh to make their moves
well. The relevant other players that are now in this multidimensional game
include Russia, Japan, India, other Asian countries, Australia, and European
countries, and all of them have many considerations and constituents that will
determine their moves. From playing the game I play—global macro investing—I
know how complicated it is to simultaneously consider all that is relevant in order
to make winning decisions. I also know that what I do is not as complicated as
what those in the seats of power do and I know that I don’t have access to
information that is as good as what they have, so it would be arrogant for me to
think I know better than they do about what’s going on and how to best handle it.
For those reasons I am offering my views with humility. With that equivocation I
will tell you how I see the US-China relationship and the world setting in light of
these wars, and I will be brutally honest.
THE POSITIONS THE AMERICANS AND CHINESE ARE IN
As I see it, destiny and the Big Cycle manifestations of it have put these
two countries and their leaders in the positions they are now in. They led
the United States to go through its mutually reinforcing Big Cycle
successes, which led to excesses that led to weakening in a number of areas.
Similarly they led China to go through its Big Cycle declines, which led to
intolerably bad conditions that led to revolutionary changes and to the
mutually reinforcing upswings that China is now in. So, the United States
appears to be in decline and China appears to be on the rise for the all the
classic reasons.
Destiny and the big debt cycle led the US to find itself now in the late-cycle
phase of the long-term debt cycle in which it has too much debt and needs to
rapidly produce much more debt, which it can’t service with hard currency. So it
has to monetize its debt in the classic late-cycle way of printing money to fund the
government’s deficits. Ironically, and classically, being in this bad position is the
consequence of the United States’ successes leading to these excesses. For example,
it is because of the United States’ great global successes that the US dollar
became the world’s dominant reserve currency, which allowed Americans
to borrow excessively from the rest of the world (including from China),
which put the US in the tenuous position of owing other countries
(including China) a lot of money which has put those other countries in
the tenuous position of holding the debt of an overly indebted country
that is rapidly increasing and monetizing its debt and that pays
significantly negative real interest rates to those holding its debt. In other
words, it is because of the classic reserve currency cycle that China wanted to save
a lot in the world’s reserve currency, which led it to lend so much to Americans
who wanted to borrow so much, which has put the Chinese and the Americans in
this awkward big debtor-creditor relationship when these wars are going on
between them.
Destiny and the way the wealth cycle works, especially under capitalism, led to
incentives and resources being put into place that allowed Americans to make
great advances and produce great wealth—and eventually created the large wealth
gaps that are now causing conflicts and threatening the domestic order and
productivity that is required for the US to stay strong. In China it was the
classic collapse of its finances due to debt and money weaknesses, internal
conflicts, and conflicts with foreign powers that led to its Big Cycle
financial declines at the same time that the US was ascending, and it was the
extremity of these terrible conditions that produced the revolutionary changes
that eventually led to the creation of incentives and market/capitalist approaches
that produced China’s great advances, great wealth, and the large wealth gaps that
it is understandably increasingly concerned about.
Similarly, destiny and the way the global power cycle works have now put the
United States in the unfortunate position of having to choose between fighting to
defend its position and its existing world order or retreating. For example, it is
because the United States won the war in the Pacific in World War II that it,
rather than any other country, will have to choose between defending Taiwan—
most Americans don’t know where in the world it is or how to spell it—or
retreating. It is because of that destiny and that global power cycle that the United
States now has military bases in more than 70 countries in order to defend its
world order even though it is uneconomical to do so.
• History has shown that all countries' success depends on sustaining the strengthening
forces without producing the excesses that lead to countries' declines. The really successful
countries have been able to do that in a big way for 200-300 years. No country has been able
to do it forever.
Thus far we’ve looked at the history of the last 500 years focusing especially on
the rise and decline cycles of the Dutch, British, and American reserve currency
empires and briefly at the last 1,400 years of China’s dynasties, which has brought
us up to the present. The goal has been to put where we are in the context of the
big-picture stories that got us here and to see the cause/effect patterns of how
things work so that we can put where we are into better perspective. Now we need
to drop down and look at where we are in more detail, hopefully without losing
sight of that big picture. As we drop down, things that seem imperceptibly small
in retrospect—Huawei, Hong Kong sanctions, closing consulates, moving
battleships, unprecedented monetary policies, political fights, social conflicts, and
many others—will at the time appear much larger, and we will find ourselves in
the blizzard of them that comes at us every day. Each warrants more than a
chapter-long examination, which I don’t intend to do here, but I will touch on the
major issues.
History has taught us that there are five major types of wars: 1)
trade/economic wars, 2) technology wars, 3) geopolitical wars, 4) capital
wars, and 5) military wars. To these I would add 6) culture wars and 7) the
war with ourselves. While all sensible people wish that these “wars” weren’t
occurring and instead that cooperation was happening, we must be practical in
recognizing that they exist. We should use past cases in history and our
understandings of actual developments as they are taking place to think about
what is most likely to happen next and how to deal with it well.
We see these wars transpiring in varying degrees now. They should not
be mistaken for individual conflicts but rather recognized as interrelated
conflicts that are extensions of one bigger evolving conflict. In watching
them transpire we need to observe and try to understand each side’s
strategic goals—e.g., are they trying to hasten a conflict (which some Americans
think is best for the US because time is on China’s side because China is growing
its strengths at a faster pace) or are they trying to ease the conflicts (because they
believe that they would be better off if there is no war)? In order to prevent these
conflicts from escalating out of control, it will be important for leaders of both
countries to be clear about what the “red lines” and “trip wires” are that signal
changes in the seriousness of the conflict.
Let’s now take a look at these wars with the lessons from history and the
principles they provide in mind.
THE TRADE/ECONOMIC WAR
Like all wars, the trade war can go from being a polite dispute to being
life-threatening, depending on how far the combatants want to take it.
Thus far we haven’t seen the US-China trade war taken very far. It
features classic tariffs and import restrictions that are reminiscent of those we have
repeatedly seen in other similar periods of conflict (e.g., the Smoot-Hawley Tariff
Act of 1930). We have seen the trade negotiations and what they achieved
reflected in a very limited “phase one” trade agreement from 2019 that was
tentatively implemented. As we have seen, this “negotiation” was about testing
each other’s powers rather than looking to global laws and judges (like the World
Trade Organization) to achieve fair resolution. Tests of power are how all these
wars will be fought. The big question is how far these tests of power will go and
what form will they take.
Beyond the trade dispute there are three major economic criticisms the
US has about China’s handling of its economy:
1. The Chinese government pursues a wide range of evolving
interventionist policies and practices aimed at limiting market access for
imported goods, services, and businesses, thus protecting its domestic
industries by creating unfair practices.
2. The Chinese offer significant government guidance, resources, and
regulatory support to Chinese industries, most notably including
policies designed to extract advanced technologies from foreign companies,
particularly in sensitive sectors.
3. The Chinese are stealing intellectual property, with some of this
stealing believed to be state-sponsored and some of it believed to be outside
the government’s direct control.
Generally speaking, the United States has responded both by trying to alter
what the Chinese are doing (e.g., to get them to open their markets to Americans)
and by doing its own versions of these things (closing American markets to the
Chinese). Americans won’t admit to doing some of the things they are doing (e.g.,
taking intellectual property) any more than the Chinese will admit to doing them
because the public relations costs of admitting to doing them are too great. When
they are looking for supporters of their causes, all leaders want to appear to be the
leaders of the army that is fighting for good against the evil army that is doing bad
things. That is why we hear accusations from both sides that the other is doing evil
things and no disclosures of the similar things that they are doing.
• When things are going well it is easy to keep the moral high ground. However, when the
fighting gets tough, it becomes easier to justify doing that which was previously considered
immoral (though rather than calling it immoral it is called moral). As the fighting becomes
tougher a dichotomy emerges between the idealistic descriptions of what is being
done (which is good for public relations within the country) and the practical
things that are being done to win. That is because in wars leaders want to
convince their constituents that “we are good and they are evil” because that is the
most effective way to rally people’s support, in some cases to the point that they
are willing to kill or die for the cause. Though true, it is not easy to inspire people
if a practical leader explains that “there are no laws in war” other than the ethical
laws people impose on themselves and “we have to play by the same rules they
play by or we will stupidly fight by self-imposing that we do it with one hand
behind our backs.”
I believe that we have pretty much seen the best trade agreement that
we are going to see and that the risks of this war worsening are greater
than the likelihood that they will lessen, and that we won’t see any treaty
or tariff changes anytime soon from the Biden administration. Whatever
approach they eventually take will be a big influence on how Americans and the
Chinese approach the Big Cycle destinies that are in the process of unfolding. As
it now stands, the one thing—maybe the only thing—that both US political
parties agree on is being hawkish on China. How hawkish and how exactly that
hawkishness is expressed and reacted to by the Chinese are now unknown.
How could this war worsen?
Classically, the most dangerous part of the trade/economic war comes
when countries cut others off from essential imports. The case study of the
US and Japan leading up to World War II (found in Chapter 6) is a useful
analogue to US-China circumstances because the geographies and the issues are
analogous. For example, the US cutting off China’s imports of oil, other needed
commodities, technologies, and/or other essential imports from the US or other
countries would be clear and obvious signs of the war escalating. Likewise, China
could escalate by cutting off companies like General Motors (which sells more
cars in China than in the US) and Apple, or cutting off US imports of rare earth
elements that are needed for the production of lots of high-tech items, automobile
engines, and defense systems. I’m not saying such moves are likely, but I do want
to be clear that moves to cut off essential imports from either side would
signal a major escalation that could lead to a much worse conflict. If that
doesn’t happen, evolution will take its normal course so international balances of
payments will evolve primarily based on each country’s evolving competitiveness.
For these reasons both countries, especially China, are shifting to more
domestic production and “decoupling.”- As President Xi has said, the world is
“undergoing changes not seen in a century” and “[i]n the face of an external
environment characterized by rising protectionism, global economic downturn,
and a shrinking international market... [China must] give full play to the
advantage of a huge domestic market.” Over the last 40 years it has acquired the
abilities to do this. Over the next five years we should see both countries become
more independent from each other. The rate of reducing one’s dependencies that
can be cut off will be much greater for China over the next five to 10 years than
for the United States.
THE TECHNOLOGY WAR
The technology war is much more serious than the trade/economic war
because whoever wins the technology war will probably also win the
military wars and all the other wars.
The US and China are now the dominant players in the world’s big tech
sectors and these big tech sectors are the industries of the future. The Chinese
tech sector has rapidly developed domestically to serve the Chinese in
China and to become a competitor in world markets. At the same time
China remains highly dependent on technologies from the United States
and other countries. That makes the United States vulnerable to the increased
development and competition of Chinese technologies and makes the Chinese
vulnerable to being cut off from essential technologies.
The United States appears now to have greater technology abilities
overall, though it varies by type of technology and the US is losing its lead.
For example, while the US is ahead in advanced Al chip development, it is behind
in 5G. As an imperfect reflection of the present stage of the US’s advantage, the
market capitalizations of US tech companies in total are about four times the size
of China’s. This calculation understates China’s relative strength because it
doesn’t include some of the big private companies (like Huawei and Ant Group)
and the non-company (i.e., government) technology developments, which are
larger in China than they are in the United States. The largest public Chinese tech
companies (Tencent and Alibaba) are already the seventh and eighth largest
technology companies in the world, right behind some of the largest US
“FAAMG” stocks. Some of the most important technology areas are being led by
the Chinese. Consider that 40 percent of the world’s largest civilian
supercomputers are now in China, and it is leading in some dimensions of the
Al/big data race and some dimensions of the quantum
computing/encryption/communications race. Similar leads in other technologies
exist, such as in fintech where the volume of e-commerce transactions and mobile-
based payments in China is the highest in the world and well ahead of that in the
US. There are likely technologies that even the US’s most informed intelligence
services don’t know about that are being developed in secret.
China will probably advance its technologies, and the quality of
decision making that is enabled by them, faster than the US will because
big data + big Al + big computing = superior decision making. The
Chinese are collecting vastly more data per person than is collected in the US (and
they have more than four times as many people), and they are investing heavily in
Al and big computing to make the most of it. The amount of resources that are
being poured into these and other technology areas is far greater than those in the
US. As for providing money, both venture capitalists and the government are
providing virtually unlimited amounts to Chinese developers. As for providing
people, the number of science, technology, engineering, and math (STEM)
graduates that are coming out of college and pursuing tech careers in China is
about eight times that in the US. The United States has an overall technology lead
(though it is behind in some areas) and of course has some big hubs for new
innovations, especially in its top universities and its big tech companies. While the
US isn’t out of the game, its relative position is declining because China’s
technological innovation abilities are improving at a faster pace. Remember that
China is a country whose leaders 37 years ago marveled at the handheld
calculators I gave them. Imagine where they might be 37 years from now.
To fight the technology threats, the United States has responded at
times by preventing Chinese companies (like Huawei) from operating in
the United States, trying to undermine their usage internationally, and
possibly hurting their viability through sanctions that prevent them from
getting items needed for production. Is the United States doing that because
China is using these companies to spy in the United States and elsewhere, because
the United States is worried about them and other Chinese technology companies
being more competitive, and/or because they are retaliating for the Chinese not
allowing American tech companies to have free access to the Chinese market?
While that is debatable, there is no doubt that these and other Chinese companies
are becoming more competitive at a fast pace. In response to this competitive
threat the United States is moving to contain or kill threatening tech companies.
Interestingly, while the United States is cutting off access to intellectual property
now, it would have had a much greater power to do so not long ago because the
United States had so much more intellectual property relative to others. China has
started to do the same to the United States, which will increasingly hurt because
Chinese IP is becoming better in many ways.
Regarding the stealing of technologies, while it is generally agreed to be
a big threat,- it does not fully explain actions taken against Chinese tech
companies. If a company is breaking a law within a country (e.g., Huawei in the
US) one would expect to see that crime prosecuted legally so one could see the
evidence that shows the spying devices embedded within the technologies. We
aren’t seeing this. Fear of growing competitiveness is as large, or larger, a motivator
of the attacks on Chinese technology companies, but one can’t expect policy
makers to say that. American leaders can’t admit that the competitiveness of US
technology is slipping and can’t argue against allowing free competition to the
American people, who for ages have been taught to believe that competition is
both fair and the best process for producing the best results.
Stealing intellectual property has been going on for as long as there has been
recorded history and has always been difficult to prevent. As we saw in earlier
chapters, the British did it to the Dutch and the Americans did it to the British.
“Stealing” implies breaking a law. When the war is between countries there are no
laws, judges, or juries to resolve disputes and the real reasons decisions are made
aren’t always disclosed by those who are making them. I don’t mean to imply that
the reasons behind the United States’ aggressive actions are not good ones; I don’t
know if they are. I’m just saying that they might not be exactly as stated.
Protectionist policies have long existed to insulate companies from foreign
competition. Huawei’s technology is certainly threatening because it’s better in
some ways than American technology. Look at Alibaba and Tencent and compare
them with American equivalents. Americans might ask why these companies are
not competing in the US. It is mostly for the same reasons that Amazon and a
number of other American tech companies aren’t freely competing in China. In
any case, there is a tech decoupling going on that is part of the greater
decoupling of China and the US, which will have a huge impact on what
the world will look like in five years.
What would a worsening of the tech war look like?
The United States has a technology lead (though it’s shrinking fast). As
a result, the Chinese currently have great dependencies on imported
technologies from both US and non-US sources that the US can influence.
This creates a great vulnerability for China, which in turn creates a great
weapon for the United States. It most obviously exists in advanced
semiconductors, though it exists in other technologies as well. The dynamic with
the world’s leading chip maker—Taiwan Semiconductor Manufacturing
Company, which provides the Chinese and the world with needed chips, and
which can be influenced by the United States—is one of many interesting
dynamics to watch, especially since it is located in Taiwan. There are many such
Chinese technology imports that are essential to China’s well-being and many
fewer American imports from China that are essential to the United States’ well-
being. If the United States shuts off Chinese access to essential
technologies, that would signal a major step up in the risk of a shooting
war. On the other hand, if events continue to transpire as they have been
transpiring, China is poised to be much more independent and in a much
stronger position than the United States technologically in five to 10 years, at
which time we will likely see these technologies much more decoupled. This
picture changes by the day, and it is important to stay on top of it.
THE GEOPOLITICAL WAR
Sovereignty, especially as it relates to the Chinese mainland, Taiwan, Hong
Kong, and the East and South China Seas, is probably China’s biggest
issue. Beyond these are several other areas of strategic economic
importance, such as those countries involved in China’s Belt and Road
Initiative.
As you might imagine, the Century of Humiliation in the 19th century and
the invasions by foreign “barbarians” during it gave Mao and the Chinese leaders
to this day compelling motivations to have complete sovereignty within their
borders, get back the parts of China that were taken away from them (e.g., Taiwan
and Hong Kong), and never again be so weak that they can be pushed around by
foreign powers. China’s desire for sovereignty and for maintaining its distinct
ways of doing things (i.e., its culture) are why the Chinese reject American
demands for them to change Chinese internal policies (e.g., to be more
democratic, to handle the Tibetans and Uighurs differently, to change its
approach to Hong Kong and Taiwan, etc.). In private some Chinese point out
that they don’t dictate how the United States should treat people within its
borders. They also believe that the United States and European countries are
culturally prone to proselytizing—i.e., to imposing on others their values, Judeo-
Christian beliefs, morals, and ways of operating—and that this inclination has
developed through the millennia, since before the Crusades.
To the Chinese the sovereignty risk and the proselytizing risk make a
dangerous combination that could threaten China’s ability to be all it can be by
following the approaches that it believes are best. The Chinese believe that their
having sovereignty and the ability to approach things the way that they believe is
best as determined by their hierarchical governance structure is sacrosanct.
Regarding the sovereignty issue, they also point out that there are reasons for
them to believe that the United States would topple their government—the
Chinese Communist Party—if it could, which is also intolerable.-. These are the
biggest existential threats that I believe the Chinese would fight to the death to
defend and the United States must be careful in dealing with China if it wants to
prevent a hot war. For issues not involving sovereignty, I believe the Chinese
expect to look to influence them nonviolently and avoid a hot war.
Probably the most dangerous sovereignty issue is Taiwan. Many Chinese
people believe that the United States will never follow through with its implied
promise to allow Taiwan and China to unite, unless the US is forced to do so.
They point out that when the US sells the Taiwanese F-16 fighter jets and other
weapons systems it sure doesn’t look like the United States is facilitating the
peaceful reunification of China. As a result, they believe that the only way to
ensure that China is safe and united is to have the power to oppose the US in the
hope that the US will sensibly acquiesce when faced with a greater Chinese power.
My understanding is that China is now stronger militarily in that region of the
world. Also, the Chinese military is likely to get stronger at a faster pace, though
deterrence through mutually assured destruction is most likely the case. So, as I
mentioned earlier, I would worry a lot if we were to see an emerging fight
over sovereignty, especially if we were to see a “Fourth Taiwan Strait
Crisis.” Would the US fight to defend Taiwan? Uncertain. The US not fighting
would be a great geopolitical win for China and a great humiliation for the US. It
would signal the decline of the US Empire in the Pacific and beyond in much the
same way as the British loss of the Suez Canal signaled the end of the British
Empire in the Middle East and beyond. The implications of that would extend
well beyond that loss. For example, in the British case it signaled the end of the
pound as a reserve currency. The more of a show the US makes of defending
Taiwan the greater the humiliation of a lost war or a retreat would be. That is
concerning because the United States has been making quite a show of defending
Taiwan while destiny appears to be bringing a direct conflict to a head before
long. If the US does fight, I believe that a war with China over Taiwan that costs
American lives would be very unpopular in the US and the US would probably
lose that fight, so the big question is whether that would lead to a broader war.
That scares everyone. Hopefully the fear of that great war and the destruction it
would produce, like the fear of mutually assured destruction, will prevent it.
At the same time, from my discussions it is my belief that China has a
strong desire not to have a hot war with the US or to forcibly control
other countries (as distinct from having the desire to be all it can be and to
influence countries within its region). I know that the Chinese leadership
understands how terrible a hot war would be and worries about unintentionally
slipping into one, a la World War I. They would much prefer a cooperative
relationship if such a relationship is possible, and, I suspect, they would happily
divide the world into different spheres of influence. Still they have their “red
lines” (i.e., limits to what can be compromised on that if crossed would lead to a
hot war) and they expect more challenging times ahead. For example, as President
Xi said in his 2019 New Year’s address, “Looking at the world at large, we are
facing a period of major change never seen in a century. No matter what these
changes bring, China will remain resolute and confident in its defense of national
sovereignty and security.”-
Regarding influence around the world, for both the United States and
China there are certain areas that each finds most important, primarily on
the bases of proximity (they care most about countries and areas closest to
them) and/or of obtaining essentials (they care most about not being cut
off from essential minerals and technologies), and to a lesser extent of
their export markets. The areas that are most important to the Chinese are first
those that they consider to be part of China, second those on their borders (in the
China seas) and those in key supply lanes (Belt and Road countries) or those that
are suppliers of key imports, and third other countries of economic or strategic
importance for partnerships.
Over the past few years China has significantly expanded its activities in these
strategically important countries, especially Belt and Road countries, resource-rich
developing countries, and some developed countries. This is greatly affecting
geopolitical relations. These activities are economic and are occurring via
increasing investments in targeted countries (e.g., loans, purchases of assets,
building infrastructure facilities such as roads and stadiums, and providing
military and other support to countries’ leaders) while the US is receding from
providing aid to these places. This economic globalization has been so extensive
that most countries have had to think hard about their policies regarding allowing
the Chinese to buy assets within their borders.
Generally speaking, the Chinese appear to want tributary-like
relationships with most non-rival countries, though the closer their
proximity to China, the greater the influence China wants over them. In
reaction to these changing circumstances most countries, in varying
degrees, are wrestling with the question of whether it is better to be
aligned with the United States or with China, with those in closest
proximity needing to give the most consideration to this question. In
discussions with leaders from different parts of the world I have repeatedly heard
it said that there are two overriding considerations—economic and military. They
almost all say that if they were to choose on the basis of economics, they would
choose China because China is more important to them economically (in trade
and capital flows), while if they were to choose on the basis of military support,
the United States has the edge but the big question is whether the United States
will be there to protect them militarily when they need it. Most doubt that the US
will fight for them, and some in the Asia-Pacific region question whether the US
has the power to win.
The economic benefits that China is providing these countries is significant
and is working in a way that is broadly similar to the way the United States
provided economic benefits to key countries after World War II to help secure the
desired relationships. It was not many years ago that there were no significant
rivals to the United States, so it was quite easy for the United States to simply
express its wishes and find that most countries would comply; the only rival
powers were the Soviet Union (which in hindsight wasn’t much of a rival) and its
allies and a few of the developing countries that were not economic rivals. Over
the last few years Chinese influence over other countries has been
expanding while US influence has been receding. That is also true in
multilateral organizations—e.g., the United Nations, the IMF, the World Bank,
the World Trade Organization, the World Health Organization, and the
International Court of Justice—most of which were set up by the United States at
the beginning of the American world order. As the United States has been pulling
back from them, these organizations are weakening and China is playing a greater
role in them.
Over the next five to 10 years, in addition to there being decoupling in
other areas, we will be seeing which countries align themselves with each
of these leading powers. Beyond money and military power, how China and the
US interact with other countries (how they use their soft powers) will influence
how these alliances will be made. Style and values will matter. For example, during
the Trump years I heard leaders around the world describe both countries’ leaders
as “brutal.” While you don’t hear that as much with President Biden, other
countries broadly fear that they will be punished if they don’t do exactly what
these two countries’ leaders want, and they don’t like it to the point of being
driven into the other’s arms. It will be important to see what these alliances
will look like because throughout history, as we’ve seen, the most powerful
country is typically taken down by alliances of countries that are less
powerful but collectively stronger.
Perhaps the most interesting relationship to watch is between China and
Russia. Since the new world order began in 1945, among China, Russia, and the
United States, two out of the three have become allied to attempt to neutralize or
overpower the third. Russia and China each has a lot of what the other needs
(natural resources and military equipment for China from Russia and financing
for Russia from China). Also, because Russia is militarily strong it would be a
good military ally. We can start to see this happening by watching where the
countries line up on the issues; for example, whether to allow Huawei in, with the
United States or China.
In addition to the international political risks and opportunities, there
are of course big domestic political risks and opportunities in both
countries. That is because there are different factions who are fighting for
control of both governments and there will inevitably be changes in
leadership that will produce changes in policies. While nearly impossible to
anticipate, whoever is in charge will be faced with the challenges that now exist
and that are unfolding in the Big Cycle ways we have been discussing. Since all
leaders (and all other participants in these evolutionary cycles, including all of us)
step on and get off at different parts of these cycles, they (and we) face a certain set
of likely situations to be encountered. Since other people in history have stepped
on and off at the same parts of past cycles, by studying what these others
encountered and how they handled their encounters at the analogous stages, and
by using some logic, we can imperfectly imagine the range of possibilities.
THE CAPITAL WAR
As history has shown, one of the biggest risks in a conflict is that access to
one’s money/capital can be shut off. This can happen by a) the moves of
one’s opponents and/or b) self-inflicted harmful actions (e.g., getting into
too much debt and devaluing one’s money) that lead those who provide
capital to not want to provide it. In Chapter 6, I reviewed classic capital war
moves. Some of these are now being used and could be used in a more forceful
way, so they have to be watched closely.
The goal in a capital war is to cut the enemy off from capital because no
money = no power.
The degrees to which these things occur correspond to the severity of the
conflict. “Sanctions” as they are now called and employed come in many forms,
with the broad categories being financial, economic, diplomatic, and military.
Within each of these categories there are many versions and applications. I’m not
going to delve into the various versions and targets because that would be too
much of a digression.
The main things to know are:
The United States’ greatest power comes from having the world’s
leading reserve currency, which gives the US enormous buying
power because it gives it the ability a) to print the world’s money
and have it widely accepted abroad and b) to control who gets it.
The United States is at risk of losing its reserve currency status.
The US dollar remains the dominant world reserve currency because it is used
for trade, global capital transactions, and reserves much more than any other
currency. History and logic show that the leading reserve currency is slow to be
replaced for the same reasons that the leading world language is slow to be
replaced—because so many people have adopted it and because it is entwined
within the system. The existing positions of reserve currencies as reflected by the
amounts held by central banks are shown here:
SHARE OF CENTRAL BANK RESERVES BY CURRENCY
USD 51%
EUR 20%
Gold 12%
JPY 6%
GBP 5%
CNY 2%
Based on data through 2019
Because the dollar is the dominant currency in world trade, capital
flows, and reserves, it is the world’s leading reserve currency, which puts
the US in the enviable position of being able to print the world’s money
and to inflict sanctions on its enemies. The US now has an arsenal of
sanctions, which is its most used arsenal of weapons. As of 2019, there were
approximately 8,000 US sanctions in place targeted at individuals, companies, and
governments. Through these powers the US can get the money it needs and it can
cut off opposing countries from getting money and credit by preventing financial
institutions and others from dealing with them. These sanctions are by no means
perfect or all-encompassing, but they are generally effective.
The United States is at risk of losing its dominant position as a reserve currency
because:
The amounts of dollar-denominated debt in foreigners’ portfolios,
such as central bank reserves and sovereign wealth funds, are
disproportionately large based on a number of measures of what the
size of reserve currency holdings should be.-
The US government and the US central bank are increasing the
amounts of dollar-denominated debt and money at an
extraordinarily fast pace, so it will likely be hard to find adequate
demand for US debt without the Federal Reserve having to monetize
a lot of it, while at the same time the financial incentives to hold this
debt are unattractive because the US government is paying a
negligible nominal yield and a negative real yield on it.
Holding debt as a medium of exchange or as a storehold of wealth
during wartime is less desirable than during peacetime, so if there
were movements toward war, the value of debt (which is a promise
to receive fiat currency) and fiat currency would likely go down
relative to other things. This is not currently an issue but would become
one if wars intensify.
The roughly $1 trillion of US debt that China holds is a risk but not
an unmanageable one as that equals only around 4 percent of the
roughly $28 trillion outstanding (as of May 2021). However, because
other countries realize that actions taken against China could be
taken against them, any actions taken against Chinese holdings of
dollar assets would likely increase the perceived risks of holding
dollar-debt assets by other holders of these assets, which would
reduce the demand for such assets. This is not currently an issue though
it appears to be close to becoming an issue.
The dollar’s role as a reserve currency largely depends on its being
freely exchanged between countries, so to the extent that the US
might in the future put controls on its flows and/or run monetary
policy in ways that are contrary to the world’s interests in pursuit of
its own interests, that would make the dollar less desirable as the
world’s leading reserve currency. This is not currently an issue but will
become one if foreign exchange controls are raised as a possibility, which is
typical at the next stage of the cycle.
Countries being hurt by US sanctions are developing ways to get
around them or undermining the United States’ power to impose
them. For example, Russia and China, which both are encountering these
sanctions and are at great risk of encountering more of them in the future,
are each now developing and cooperating with the other to develop an
alternative payment system. China’s central bank has created a digital
currency, which will make China less exposed to US sanctions.
There are no good currency alternatives because:
The dollar (51 percent of central bank reserves) has weakening
fundamentals in the way described in Chapter 11, which I won’t repeat
here.
The euro (20 percent) is a weakly structured fiat currency made by
smaller, uncoordinated countries with weak finances that are tenuously
held together by a highly fragmented currency union. Because the
European Union is financially, economically, and militarily at best a
secondary power, buying its currency and debt denominated in its
currency, which its central bank is free to print, is not an enticing thing to
do.
Gold (12 percent) is a hard currency that is held because it has worked the
best over the ages and because it is an effective diversifier to other assets
held, particularly fiat currencies. While before 1971 gold was at the
foundation of the world’s currency system, at this time it is a relatively dead
asset since there are no significant international trade and capital
transactions in it and it isn’t used to balance external accounts. It is also a
market that is too small to become a high share of wealth at current prices.
A move to gold from fiat-currency-based assets (i.e., credit assets), which
would only come in the event of an abandonment of that system (which
history shows could come), would lead to an explosion in gold’s price.
The yen (6 percent) is a fiat currency that is also not widely used
internationally by non-Japanese people and suffers from a lot of the same
problems that the dollar has including having too much debt that is
increasing quickly and being monetized so that it is paying unattractive
interest rates. Also Japan is only a moderate global economic power and is a
weak military power.
The pound (5 percent) is an anachronistically held fiat currency that has
relatively weak fundamentals, and the UK is relatively weak in almost all of
our measures of a country’s economic/geopolitical power.
The renminbi (2 percent) is the only fiat currency to be chosen as a
reserve currency because of its fundamentals. China’s potential is sizable. Its
shares of world trade, world capital flows, and world GDP are roughly
equal to the United States’.- China has managed its currency to be relatively
stable against other currencies and against goods and services prices, it has
large foreign exchange reserves, it doesn’t have a 0 percent interest rate and a
negative real interest rate, and it isn’t printing and monetizing a lot of debt.
Increasing investments in China strengthens the currency because those
purchases have to be made in its currency. Those are the positives. The
negatives are that China has a relatively large amount of domestic debt that
has to be restructured, the renminbi is not a currency that is widely used for
global trade and financial transactions, China’s clearing system is
undeveloped, and money is not allowed to freely flow in and out of the
currency.
So there are no attractive world reserve currencies to compete with the
dollar.
• History has shown that whenever a) currencies are not desired and b) there are no other
currencies that are attractive to go into, the currencies are still devalued and the capital finds
its way into other investments (e.g., gold, commodities, stocks, property, etc.). As a result,
there is no need to have a strong alternative currency for a devaluation of a currency to take
place.
Things will change. To the extent that the United States and China are
in a capital war, the development of Chinese currency and capital markets
would be detrimental for the United States and beneficial for China.
Without the US attacking China’s currency and capital markets in an
attempt to weaken them, and/or the Chinese hurting their own currency
and capital markets (by making policy shifts that make these markets less
attractive), China’s currency and capital markets will probably develop
quickly to increasingly compete with US markets. It is up to American
policy makers to decide whether or not they will try to disrupt this
evolutionary path by becoming more aggressive or accept that evolution,
which will likely lead to China becoming relatively stronger, more self-
sufficient, and less vulnerable to being squeezed by the US. Though the
Chinese have less power to hurt the US dollar and its capital markets, and its best
moves would be to strengthen its own currency, there are some possibilities that it
will attempt to harm the dollar.
As explained in my study of past cycles, the war typically intensifies as the cycle
progresses. Comparing historical cases with their modern-day equivalents—e.g.,
moves by the US and Japan prior to World War II with moves by the US and
China now—should be helpful as the cycle progresses.
THE MILITARY WAR
I am not a military expert but I get to speak with military experts and I do research
on the subject, so I will pass along what has been shared with me. Take it or leave
it as you wish.
• It is impossible to visualize what the next major military war will be like, though it
probably will be much worse than most people imagine. That is because a lot of
weaponry has been developed in secret and because the creativity and capabilities
to inflict pain have grown enormously in all forms of warfare since the last time
the most powerful weapons were used and seen in action. There are now more
types of warfare than one can imagine and, within each, more weapons systems
than anyone knows. While of course nuclear warfare is a scary prospect, I have
heard equally scary prospects of biological, cyber, chemical, space, and other types
of warfare. Many of these are untested so there is a lot of uncertainty about how
they would go.
Based on what we do know the headline is that the United States and
China’s geopolitical war in the East and South China Seas is escalating
militarily because both sides are testing the other’s limits. China is now
militarily stronger than the United States in the East and South China
Seas so the US would probably lose a war in that region, while the United
States is stronger around the world and overall and would probably “win”
a bigger war. But a bigger war is too complicated to imagine well because of the
large number of unknowns, including how other countries would behave in it and
what technologies secretly exist. The only thing that most informed people agree
on is that such a war would be unimaginably horrible.
Also notable, China’s rate of improvement in its military power, like its other
rates of improvement, has been extremely fast, especially over the last 10 years, and
the future rate is expected to be even faster, even more so if China’s economic and
technological improvements continue to outpace those of the United States.
Some people imagine that China could achieve broad military superiority
in five to 10 years. I don’t know if that is true.
As for potential locations of military conflict, Taiwan, the East and
South China Seas, and North Korea are the hottest spots, and India and
Vietnam are the next (for reasons I won’t digress into).
As far as a big hot war between the United States and China is concerned, it
would include all the previously mentioned types of wars plus more pursued at
their maximums because, in a fight for survival, each would throw all it has at the
other, the way other countries throughout history have. It would be World War
III, and World War III would likely be much deadlier than World War II, which
was much deadlier than World War I because of the technological advances in the
ways we can hurt each other.
Proxy wars are also part of the picture and should be watched as they are very
effective in chipping away at a leading world power’s strength and global
influence.
In thinking about the timing of a war, I keep in mind the principles that: •
when countries have big internal disorder, it is an opportune moment for opposing countries
to aggressively exploit their vulnerabilities. For example, the Japanese made their moves
to invade China in the 1930s when China was divided and exhausted by its
ongoing civil war.
• History has taught us that when there are leadership transitions and/or weak leadership
at the same time that there is big internal conflict, the risk of the enemy making an offensive
move should be considered elevated. Because time is on China’s side, if there is to be a
war, it is in the interest of the Chinese to have it later (e.g., five to 10 years from
now when it will likely be stronger and more self-sufficient) and in the interest of
the US to have it sooner.
I’m now going to add two other types of war—the culture war, which will
drive how each side will approach these circumstances, including what they would
rather die for than give up, and the war with ourselves, which will determine how
effective we are and which will lead us to be strong or weak in the critical ways we
explored in Chapter 1.
THE CULTURE WAR
• How people are with each other is of paramount importance in determining how they will
handle the circumstances that they jointly face, and the cultures that they have will be the
biggest determinants of how they are with each other. What Americans and the Chinese
value most and how they think people should be with each other determine how
they will deal with each other in addressing the conflicts that we just explored.
Because Americans and the Chinese have different values and cultural norms that
they will fight and die for, if we are going to get through our differences peacefully
it is important that both sides understand what these are and how to deal with
them well.
As described earlier, Chinese culture compels its leaders and society to
make most decisions from the top down, demanding high standards of
civility, putting the collective interest ahead of individual interests,
requiring each person to know their role and how to play it well, and
having filial respect for those superior in the hierarchy. They also seek
“rule by the proletariat,” which in common parlance means that
opportunities and rewards are broadly distributed. In contrast, American
culture compels its leaders to run the country from the bottom up,
demanding high levels of personal freedom, favoring individualism over
collectivism, admiring revolutionary thinking and behavior, and not
respecting people for their positions as much as for the quality of their
thinking. These core cultural values drove the types of economic and
political systems each country chose.
To be clear, most of these differences aren’t obvious in day-to-day life; they
generally aren’t very important relative to the shared beliefs that Americans and
the Chinese have, which are numerous, and they aren’t held by all Chinese or all
Americans, which is why many Americans are comfortable living in China and
vice versa. Also, they are not pervasive. For example, the Chinese in other
domains, such as Singapore, Taiwan, and Hong Kong, have had governance
systems that are similar to Western democratic systems. Still these cultural
differences subtly affect most everything, and in times of great conflict, they are
the defining differences that determine whether the parties fight or peacefully
resolve their disputes. The main challenge the Chinese and Americans have
with each other arises from some of them failing to understand and
empathize with the other’s values and ways of doing things, and not
allowing each other to do what they think is best.
While the opening up of both countries has increased their interactions and
their increasingly shared practices (e.g., their similar economic freedoms that
produce similar desires, products, and outcomes) have made both environments
and their people much more similar than they ever were before, the differences in
approaches are still notable. They are reflected in how each country’s government
and its people interact with each other and how Americans and the Chinese
interact especially at the leader-to-policy-maker level. Some of these cultural
differences are minor and some of them are so major that many people
would fight to the death over them—e.g., most Americans believe in “give me
liberty or give me death” while to the Chinese individual liberty isn’t nearly as
important as collective stability is.
These differences are also reflected in everyday life. For example, the Chinese
government, being more paternal, regulates what types of video games children
play and how many hours a day they can play them, whereas in the United States
video games aren’t government-regulated because such things are considered an
individual parent’s decision to make. One could argue the merits of either
approach.
The Chinese hierarchical culture makes it natural for the Chinese to simply
accept the government’s direction, while the American nonhierarchical culture
makes it acceptable for Americans to fight with their government over what to do.
Similarly, different cultural inclinations influenced how Americans and the
Chinese reacted to being told that they had to wear masks in response to C OVID-
19, which led to second-order consequences because the Chinese followed the
instructions and Americans often didn’t, affecting the numbers of cases and
deaths and the economic impact. These culturally determined differences in how
things are handled affect how the Chinese and Americans react differently to
many things— information privacy, free speech, free media, etc.—which add up
to lots of ways that the countries operate differently.
While there are pros and cons to these different cultural approaches, and I’m
not going to explore them here, I do want to get across that the cultural
differences that make Americans American and the Chinese Chinese are
deeply embedded. Given China’s impressive track record and how deeply
imbued the culture behind it is, there is no more chance of the Chinese giving up
their values and their system than there is of Americans giving up theirs. Trying to
force the Chinese and their systems to be more American would, to them, mean
subjugation of their most fundamental beliefs, which they would fight to the
death to protect. To have peaceful coexistence Americans must understand that
the Chinese believe that their values and their approaches to living out these
values are best, as much as Americans believe their American values and their ways
of living them out are best.
For example, one should accept the fact that when choosing leaders most
Chinese believe that having capable, wise leaders make the choices is preferable to
having the general population make the choice on a “one person, one vote” basis
because they believe that the general population is less informed and less capable.
Most believe that the general population will choose the leaders on whims and
based on what those seeking to be elected will give them in order to buy their
support rather than what’s best for them. Also, they believe—like Plato believed
and as has happened in a number of countries—that democracies are prone to slip
into dysfunctional anarchies during very bad times when people fight over what
should be done rather than support a strong, capable leader.
They also believe that their system of choosing leaders lends itself to better
multigenerational strategic decision making because any one leader’s term is only a
small percentage of the time that is required to progress along its long-term
developmental arc2 They believe that what is best for the collective is most
important and best for the country and is best determined by those at the top.
Their system of governance is more like what is typical in big companies,
especially multigenerational companies, so they wonder why it is hard for
Americans and other Westerners to understand the rationale for the Chinese
system following this approach and to see the challenges of the democratic
decision-making process as the Chinese see them.
To be clear, I’m not seeking to explore the relative merits of these decision-
making systems. I am simply trying to make clear that there are arguments
on both sides and to help Americans and the Chinese see things through
each other’s eyes and, most importantly, to understand that the choice is
between accepting, tolerating, and even respecting each other’s right to do
what each thinks is best or having the Chinese and Americans fight to the
death over what they believe is uncompromisable.
The American and Chinese economic and political systems are different
because of the differences in their histories and the differences in their cultures
that have resulted from these histories. As far as economics is concerned the two
different viewpoints—the classic left (favoring government ownership of the
means of production, the poor, the redistribution of wealth, etc., which the
Chinese call communism) and the classic right (favoring private ownership of the
means of production, whoever succeeds in the system, and much more limited
redistributions of wealth)—exist in China as in the rest of the world, and there
have been swings from one to the other in all societies, especially in China, so it
would not be correct to say that the Chinese are culturally left or right. Similar
swings in American preferences have existed throughout its much more limited
history. I suspect that if the United States had a longer history we would have seen
wider swings, as we have in Europe through its longer history.
For these reasons these “left” versus “right” inclinations appear to be more big
cycle swings around revolutionary trends than evolving core values. In fact, we are
seeing these swings now taking place in both countries, so it’s not a big stretch to
say that policies of the “right,” such as capitalism, are close to being more favored
in China than in the United States and vice versa. In any case, when it comes to
economic systems, there don’t appear to be a lot of clear distinctions rooted in
deep cultural preferences. In contrast to economic systems, the inclination of the
Chinese to be top-down/hierarchical versus bottom-up/nonhierarchical appears
to be deeply embedded in their culture and in their political systems while
Americans are strongly inclined to be bottom-up/nonhierarchical. As for which
approach will work best and win out in the end, I will leave that for others to
debate, hopefully without bias, though I will note that most knowledgeable
observers of history have concluded that neither of these systems is always good or
bad. • What works best varies according to a) the circumstances and b) how people using
these systems are with each other. No system will sustainably work well—in fact all will break
down—if the individuals in it don't respect it more than what they individually want and if the
system is not flexible enough to bend with the times without breaking.
As we imagine how Americans and the Chinese will handle their shared
challenge to evolve in the best possible way on this shared planet, I try to
imagine where their strong cultural inclinations, most importantly where
the irreconcilable differences that they would rather die for than give up,
will lead them. For example, most Americans and most Westerners would fight
to the death for the ability to have and express their opinions, including their
political opinions. In contrast, the Chinese value the respect for authority more,
which is reflected in and demonstrated by the relative powers of individuals and
the organizations they belong to and the responsibility to hold the collective
organization responsible for the actions of individuals in the collective.
Such a culture clash took place in October 2019 when the then-general
manager of the Houston Rockets (Daryl Morey) tweeted an image expressing
support for Hong Kong’s pro-democracy protest movement. He quickly pulled
down his tweet and explained that his views weren’t representative of his team’s
views or the NBA’s views. Morey was then attacked by the American side (i.e., the
press, politicians, and the public) for not standing up for free speech, and the
Chinese side held the whole league responsible and punished it by dropping all
NBA games from China’s state television, pulling NBA merchandise from online
stores, and reportedly demanding that the league fire Morey.
This clash arose because of how important free speech is to Americans and
because Americans believe that the organization should not be punished for the
actions of the individual. The Chinese, on the other hand, believe that the
harmful attack needed to be punished and that the group should be held
accountable for the actions of the individuals in it. One can imagine much bigger
cases in which much bigger conflicts arise due to such differences in deep-seated
beliefs about how people should be with each other.
When they are in a superior position, the Chinese tend to want a) the
relative positions to be clear (i.e., the party in a subordinate position
knows that it is in a subordinate position), b) the subordinate party to
obey, and c) the subordinate party to know that, if it doesn’t do so, it will
be punished. That is the cultural inclination/style of Chinese leadership. They
can also be wonderful friends who will provide support when needed. For
example, when the governor of Connecticut was desperate to get personal
protective equipment in the first big wave of COVID-19 illnesses and deaths and
couldn’t get it from the US government or other American sources, I turned to
my Chinese friends for help and they provided what was needed, which was a lot.
As China goes global a number of countries’ leaders (and their populations) have
been both grateful for and put off by China’s acts of generosity and strict
punishments. Some of these cultural differences can be negotiated to the parties’
mutual satisfaction, but some of the most important ones will be very difficult to
negotiate away.
I think the main thing to realize and accept is that the Chinese and
Americans have different values and will make different choices for
themselves than the other would like. For example, Americans might not like
how the Chinese handle their human rights issues and the Chinese might not like
how Americans handle their human rights issues. The question is: what should be
done about that—should Americans fight with the Chinese to impose what they
think the Chinese should do on them and vice versa, or should they agree not to
intervene into what each other does? In my opinion it is too difficult,
inappropriate, and probably impossible to force others in other countries to do
what they strongly believe is not good for them. The United States’ ability to
impose things on the Chinese and China’s ability to impose things on the
United States will be a function of their relative powers.
While I just explored the US-China war issues conveying the little that I know
about them relative to what I need to know, I want to remind you that these wars
are far more complex than one-to-one conflicts. They are like multidimensional
chess games because many countries are involved with many other countries in
many dimensions. For example, when I think of US-China relations I have to
think way beyond their bilateral relations to think about their multilateral
relationships in all important dimensions—e.g., with all notable Asian, European,
and Middle Eastern governments and private sectors, and with all of those
countries’ important relationships with the other countries, etc. In other words, in
order to think about the US-China relationship I have to think about the Saudi
Arabia-US and the Saudi Arabia-China relationship and to that I have to think
about the Saudi Arabia-Iran relationship, the Saudi Arabia-Israel, the Saudi
Arabia-Egypt, and many other relationships in all of their important dimensions,
plus the other analogous relationships. Without the aid of a good computer and a
whole lot of data, it is impossible to follow, let alone understand, what’s going on.
It is way beyond me, and frankly when I speak with world leaders I find it
shocking how little they really understand what the others in this
multidimensional chess game are really thinking.
THE RISK OF UNNECESSARY WAR
As I explained in Chapter 6, stupid wars often happen as a result of a tit-
for-tat escalation process in which responding to even small actions of an
adversary is more important than being perceived as weak, especially when
those on both sides don’t really understand the motivations of those on
the other side. History shows us that this is especially a problem for declining
empires, which tend to fight more than is logical because any retreat is seen as a
defeat.
Take the issue of Taiwan. Even though the US fighting to defend Taiwan
would seem to be illogical, not fighting a Chinese attack on Taiwan might be
perceived as being a big loss of stature and power over other countries that won’t
support the US if it doesn’t fight and win for its allies. Additionally, such defeats
can make leaders look weak to their own people, which can cost them the political
support they need to remain in power. And, of course, miscalculations due to
misunderstandings when conflicts are transpiring quickly are dangerous. All these
dynamics create strong pulls toward wars accelerating even though such mutually
destructive wars are so much worse than cooperating and competing in more
peaceful ways.
There is also risk of untruthful, emotional rhetoric taking hold in both
the US and China, creating an atmosphere for escalation. For example, in a
recent Pew survey a record 73 percent of Americans had an unfavorable opinion
of China, 73 percent believed the United States should promote human rights in
China, and 50 percent believed the US should “hold China responsible” for the
role it played in COVID-19. Though I don’t have surveys of Chinese public
opinion of the United States, I am told by many people that it has deteriorated. It
wouldn’t take much to have these people demand accelerations of the conflicts.
Ultimately, it would be wise for leaders and citizens of both countries
to recognize that the US and China are in a competition of systems and
abilities. Each will inevitably follow the system that they believe works best for
them, Americans have a slight lead in power but it is shrinking and they’re
outnumbered, and history has shown that while numbers of people can matter a
lot, other factors (e.g., the 18 determinants listed in Chapter 2) matter more, so
even small-population empires become leading world powers if they manage
themselves well. That all implies that what’s most important to being strong is
how we act with ourselves.
THE WAR WITH OURSELVES: THE ENEMY IS US
Our greatest war is with ourselves because we have the most control over how
strong or weak we are. Because it is pretty clear what makes countries strong and
weak, and because these strengths and weaknesses are measurable, it is easy to see
how each country is doing. These factors were laid out in the first and second
chapters and measured by 18 determinants. I will briefly review them here, and in
the next and final part, I will show these determinants for most countries and will
explore the leading indicators of them so that we can make projections of what’s
to come.
Before we do that, let’s review the specific items that help make a great
empire. They are...
... leadership that is strong enough and capable enough to provide
the essential ingredients for success, which include...
... strong education. By strong education I don’t just mean teaching
knowledge and skills; I also mean teaching...
... strong character, civility, and a strong work ethic, which are
typically taught in the family as well as in school. These lead to improved
civility that is reflected in factors such as...
... low corruption and high respect for rules, such as the rule of law.
... People being able to work well together, united behind a common
view of how they should be together, is also important. When people
have knowledge, skills, good character, and the civility to behave and work
well together, and there is...
... a good system for allocating resources, which is significantly
improved by...
... being open to the best global thinking, the country has the most
important ingredients in order to succeed. That leads to it gaining...
... greater competitiveness in global markets, which brings in revenues
that are greater than expenses, which leads the country to have...
... strong income growth, which allows it to make...
... increased investments to improve infrastructure, education, and
research and development, which lead it to have...
... rapidly increasing productivity (more valuable output per hour
worked). Increasing productivity is what increases wealth and productive
capabilities. When the country achieves higher productivity levels, it can
become productive inventors in...
... new technologies. These new technologies are valuable for both
commerce and the military. As the country becomes more competitive in
these ways, naturally it gains...
...a rising and significant share of world trade, which requires it to
have...
...a strong military to protect its trade routes and to influence those who
are important to them outside their borders. In becoming economically
preeminent the country develops...
... strong and widely used currency, equity, and credit markets.
Naturally those dominant in trade and capital flows have their currency
used much more as the preferred global medium of exchange and the
preferred storehold of wealth, which leads to their currency becoming a
reserve currency and the building of...
...at least one of the world’s leading financial centers for attracting and
distributing capital and expanding their trade globally.
Whatever makes these measures go up is good and whatever makes
them go down is bad. For this reason it is wise for citizens of all countries
to ask themselves how well they collectively and their leaders are doing at
making the lines in these measures go up. I also hope that they will
remember the cause/effect relationships, avoiding the excesses and
divisions that lead to declines.
As for the case at hand, the internal wars and challenges in both China
and the US are more important and bigger than external wars and
challenges. These include political wars within the leadership of the country and
at all levels of government, wars between different factions (e.g., the rich and the
poor, the rural and the urban, conservatives and progressives, ethnic groups, etc.),
demographic changes, climate change, etc. Fortunately, the most important of
these forces are within our control and are measurable, which allows us to see how
we are doing and, if we’re not doing well, to make changes so these things move in
the right directions. By and large we will get what we deserve. As Churchill
said to the British people, “Deserve Victory!”
1 Decoupling, while required given the circumstances, will be difficult and will lead to significantly reduced
efficiency. China’s main program for building self-sufficiency goes under the name of “dual circulation.” One
knowledgeable party described it as a compartmented rather than a broad-based decoupling, which makes
sense to me.
- One in five North America-based companies in a 2019 CNBC Global CFO Council survey claimed to have
had intellectual property stolen by Chinese companies.
- . It is widely recognized that “regime change” has been commonly employed by the United States for
managing its world order.
- . This statement was made in connection with the Taiwan reunification issue.
- . The shares of dollar-denominated debt are large in relation to a) the percentage of asset allocations that
international investors would hold to balance their portfolios well, b) the sizes of reserve currency holdings
that are appropriate to meet trade and capital flow funding needs, and c) the size and importance of the US
economy relative to other economies. Dollar-denominated debt is now disproportionately large because the
dollar is the world’s leading reserve currency, which means it is perceived as a safer asset than it really is, and
because dollar borrowings have been disproportionately large. Now most of those who are responsible for
determining what the shares of their holdings should be in different markets are not inclined to increase the
shares in line with the greater amounts of US bonds to be sold and are in fact considering reducing their
shares held in US debt, which, if it happens, will require larger purchases by the Federal Reserve.
This data is adjusted for purchasing power parity.
Z In fact, it is a challenge for the Chinese to deal with the lack of continuity of policies and directions in the
US arising from seemingly whimsical shifts in what matters to the American public as expressed in whom
they choose to represent them.
PART III
THE FUTURE
CHAPTER 14
THE FUTURE
H
Пе who lives by the crystal ball is destined to eat ground glass” is a
market adage I learned when I was about 14. Since I’ve personally
experienced it to be true, it has affected how I look at both the future and
the past. I have learned to look at the past 1) to determine what’s likely to
happen and 2) to protect myself and others I am responsible for against
the possibility I am wrong or missing something important. While you and
I and others can argue about the patterns and cause/effect relationships described
in this book, if you are reading this for practical purposes rather than just
casual interest, then you, like me, need to do those two things well.
The purpose of this chapter is to share my thoughts about how I
approach the future. While what I don’t know about the future is
probably much more than what I do know, what I do know is also a lot.
Dealing with the future is all about 1) perceiving and adapting to what is
happening, even if it can’t be anticipated; 2) coming up with probabilities
for what might happen; and 3) knowing enough about what might
happen to protect oneself against the unacceptable, even if one can’t do
that perfectly.
Knowing how things have changed in the past leads me to consider the
possibility that something similar might happen in the future. That is a big
advantage relative to being unaware. For example, there are numerous examples in
history of revolutions, wars, and acts of nature leading to violent events in which
virtually all wealth is wiped out or confiscated. Knowing this, I am constantly
looking for leading indicators of the same things happening again, and having
leading indicators of these things, even if they aren’t perfect, puts me in a better
position to protect myself than remaining blissfully unaware and unprepared for
what might happen.
While that example is of a worst-case scenario, being unaware of best-case
scenarios can be equally bad. I remember very well how my dad and his friends
failed to take advantage of the boom that followed the Great Depression and
World War II, as their mindsets had been formed by those awful eras. In playing
the game of life it pays to do one’s best to understand how the world works,
imagine the full range of possibilities (including their risks and rewards), and
know how to spread one’s bets around well.
While I will pass along my thinking, please remember that everything I say is
debatable; the purpose of this whole project is to improve my assessed
probabilities of being right. As such, it is a work in progress, and I hope you will
join me in evolving it. To that end, I plan to continually update my
understandings of these patterns and lessons at economicprinciples.org, where we
can interact to refine the picture.
MY APPROACH
To quickly review, my approach is based on my ideas about a) evolution,
which causes changes over time, generally toward improvement, such as
increasing productivity, b) cycles, which cause rhythmic ups and downs in
the economy (like debt bubbles and busts) and bumps along the way (non-
rhythmic ups and downs, like acts of nature), and c) indicators that can
help us see where we are in the cycles and what might come next. I will
briefly recap my thoughts on each.
EVOLUTION
The most important things evolve in ways that are easy to see and
extrapolate forward, so it’s not difficult to get a pretty good sense of roughly
where they are likely to be in the future, so long as a once-in-500-years-type game
changer doesn’t come along. The following charts tell the story about population,
life expectancy, and prosperity.
Let’s start with world population. The chart on the left starts at 1500 and the
one on the right starts at 1900.1 show them both because I want you to see how
different one’s perspective would be if one were looking back 100 years from 1900
versus 100 years from today. Note how dramatically the population grew in the
20th century. Also note that the major historical events mentioned in this book—
including the Great Depression, the two World Wars, and any number of natural
catastrophes—had no visible effect on the larger evolutionary trend.
The next two charts show the population growth rate. Notice the big ups and
downs that don’t show up in the prior charts because they are so minor in
comparison to the long-term trend. If we had personally experienced any of this
volatility, it would have felt like a life or death experience (which it very much
was).
The next two charts show a similar picture for life expectancy. There are a lot
more wiggles in these charts than in the previous ones because average life
expectancy changes more when there are big events like wars and pandemics (I
will show you what those big killers were and where they occurred at
economicprinciples.org). Note how life expectancy stayed roughly the same
(about 25-30 years) for about 350 years and then accelerated starting around
1900, when there were big improvements in infant mortality rates and several
medical advances, like antibiotics.
GLOBAL LIFE EXPECTANCY AT BIRTH
80
70
60
50
40
30
20
10
1500 1600 1700 1800 1900 2000
1557 influenza outbreak Spanish flu
pandemic 8. famine pandemic
1900 1925 1950 1975 2000 2025 —
Now let’s look at economic prosperity as measured by real (i.e., inflation-
adjusted) GDP. The first chart shows a similarly, sweeping picture: the real value
of what was produced per person grew slowly until the 19th century and then
accelerated, with that broad evolutionary trend dominant relative to the wobbles
within it.
GLOBAL RGDP
PER CAPITA (LOG)
и
10
7
8
7
1500 1600 1700 1800 1700 2000
GLOBAL RGDP
PER CAPITA (2017 USD)
The next chart shows real wealth per capita since 1900. From 1900 until 1945,
there was no increase to speak of as that was the late-cycle transition phase from
the 19th century boom to the new world order in 1945. Peace and prosperity
followed the creation of the new world order, and the uptrend was strong and
pretty steady (averaging 4 percent per year), even though the movements around
it felt big when we went through them.
100.000
GLOBAL REAL WEALTH PER CAPITA
(ROUGH ESTIMATE. 2017 USD. LOG)
2006 financial
1920
I960 1980 2000 2020
10.000
1900
1 000
With these evolutions in mind, let’s start looking toward the future.
If we look back carefully to see how the present was created, we can see that
these evolutionary advances didn’t just happen on their own: every day, there
were events that affected the present while people’s actions shaped them. At the
same time, we know that we never could have anticipated them individually—if
we had tried to predict each of the specific wars, droughts, pandemics, inventions,
prosperous periods, declines, etc., we would have failed. But even without
knowing about any of those specific developments, we could have pretty
confidently said that advances would occur that would enable significantly larger
populations to live significantly longer while enjoying significantly higher
standards of living because of the evolution that has already occurred, and that we
have every reason to expect to continue to occur, from humanity’s inventiveness.
We could have also confidently asserted that there would be booms and busts,
feasts and famines, and periods of great health and disease along the way.
Based just on what happened in the past 100 years, one might conclude that
one can get pretty good estimates just by extrapolating the past forward. As an
example, by simply extrapolating the past 100 years, it would be reasonable to
expect that in the next 10 years the world’s population will be around 10-15
percent higher than it is today, the output per person will be about 20 percent
higher, the wealth per person will be 30 percent higher, and the average life
expectancy will be 7.5 percent higher, give or take a bit. It would be reasonable to
expect that in the next 20 years they will be up 25-30 percent, 45 percent, 70
percent, and around 15 percent, respectively, without knowing specifically how
that will happen.
That simple, not-especially-thoughtful analysis paints a picture that probably
won’t be far off—but it could be. It is easy to paint this picture in much greater
detail by looking at the same stats for each country and each sub-group within a
country in this way. Processing all of this information is pretty complicated for
the human mind alone, but not for a good human mind working with a
computer.
But we can see that a picture drawn from pure extrapolation is not good
enough. For example, standing in 1750, it would have been reasonable to believe
that it was a timeless and universal truth that monarchies and landowning nobles
overseeing peasants with the help of soldiers would be the governance system in
the future, that agricultural land would continue to be the most important
money-earning asset, that per capita incomes would grow at only around half a
percent per year, and that life expectancy would remain steady at about 30 years.
That was how it had always been. You would not have imagined capitalism and
democracy as we now know it, let alone that there would be a United States and
that it would be the leading world power.
The big curveballs come when a few really big things cause a paradigm shift
that alters the evolutionary rates of change. The paradigm shifts that came in the
early 19th century arose from the confluence of the invention of modern tools of
finance, machines that could do the work of people, the development of more
inclusive societies that broadened opportunities to be inventive and productive,
the increased use of books and libraries so knowledge could be more broadly
shared, and the application of the scientific method. While these things couldn’t
be anticipated, they could have been perceived, understood, and adapted to.
That’s why • while extrapolating the past is generally a reasonable thing to do, also be
prepared to be surprised because the future will be much different than you expect it to be.
Throughout my roughly 50 years of investing, I have seen a number of well-
established beliefs based on both what happened before and what seemed logical
at the time be proven wrong (to choose a recent example, the belief that bond
yields can’t go negative). The greatest recent disruptor of well-established beliefs
was the Digital Revolution. Through these experiences and observations I learned
that • identifying, understanding, and adapting to paradigm shifts is essential, even if one
can't anticipate them—though trying to anticipate them with good indicators that help is
important too. Having good indicators can also help you tell when what looks like a
paradigm shift is only a passing fad, which is just as important.
CYCLES AND BUMPS ALONG THE WAY
Cycles and bumps were covered comprehensively in prior chapters, but
they warrant reflection now that we are shifting our attention from the
past to the future.
Though they barely register when compared to the mega-macro
picture, they can damage and kill large numbers of people. Just look at the
following charts that show depressions, declines in wealth, deaths in wars,
and deaths via pandemics over the past 500 years to gain some perspective
about them. Those bad times were even worse than they look because the charts
capture them in terms of averages; as such they understate the severity of the
experience for the people who were most directly affected. Most people don’t
think about this darker picture. They look at the positive post-1945 trends and
extrapolate them forward. It’s up to you to decide if you’re in that camp too. As
for me, seeing that these big, deadly things have happened in the past leads me to
distrust the belief that they won’t happen again. Unless and until someone shows
me better evidence that they won’t happen again than the simple fact that they
haven’t happened yet, I am going to assume they will and try to protect myself
from their consequences.
1500 1600 1700 1800 1900 2000
1900 1920 1940 1940 1980 2000 2020
GLOBAL REAL WEALTH PER CAPITA DRAWDOWNS
GLOBAL DEATHS BY CATEGORY
(RATE PER 100K PEOPLE, 15YMA)
ESTIMATED DEATHS FROM CONFLICT
(MAJOR POWERS, %POP, 15YMA)
• Intone! ConfScI • External Confficl -Total
WWII. Holocaust,
communist
revolutions
1400 1500 1400 1700 1800 1900 2000
One of the overarching principles I derived from my research and my 50-plus
years of investing experience is • in the markets and in life, to be successful one should
bet on the upside that comes from a) evolution that leads to productivity improvements, but
not so aggressively that b) cycles and bumps along the way knock you out of the game. In
other words, betting on things being better—e.g., real earnings being greater—is
pretty much a sure bet. But betting too much on that so that a bump along the
way can ruin you is bad. That’s why having quality indicators helps a lot.
QUALITY INDICATORS
Because everything that happens is the result of events that have happened
before, I have some pretty good and logical, though imperfect, leading and
coincident indicators of important changes. Some can be quantified, while
others can’t be.
As previously explained, I found 18 determinants that explain most of
the conditions and changes in wealth and power both within and between
nations. I will soon show you the readout of all of these 18 determinants
for each of the 11 major powers I’m following in this book (more detail on
the top 20 countries is shown at economicprinciples.org). But first I want
to share some big-picture thoughts about the five determinants that have
had the biggest impacts in the past and that I believe will have the biggest
impacts on what happens in the years ahead: innovation, the
debt/money/capital market cycle, the internal order and disorder cycle,
the external order and disorder cycle, and acts of nature. When looking at
the charts, remember that in some cases the determinants rise and fall together
because they are mutually reinforcing, while in others one country’s gains are at
the expense of another’s. For example, inventing new technologies raises all of
humanity’s living standards, but it puts the countries that are better at inventing
in a superior position. Rising levels of military strength are clearly less beneficial
for humanity, as they benefit some countries at the expense of others.
HUMANITY’S INVENTIVENESS
As previously discussed, innovation and inventiveness are clearly the most
powerful determinant of a country’s conditions.
Think about all the things that we can’t imagine not having that were invented
or discovered in just the last 150 years. Before we had them, nobody could have
imagined them—e.g., the telephone (1876), the electric light bulb (1879), the
internal combustion powered vehicle (1885), the radio (1895), movies (1895), the
airplane (1903), television (1926), antibiotics (1928), the computer (1939),
nuclear weapons (1945), nuclear power plants (1951), GPS (1973), digital
cameras (1975), online shopping (1979), the internet (1983), online search (1990),
online banking (1995), social media (1997), Wi-Fi (1998), the iPhone (2007),
CRISPR gene editing (2012), etc., etc., etc. Progress unfolds in big and steady
ways to shape the future but does so through specific breakthroughs that we can’t
imagine. That is what evolution in technologies and techniques looks like.
Evolution in most everything else—approaches to life, domestic and international
politics, etc.—happens in a similar way.
I believe that humanity’s evolution through its inventiveness is
accelerating and that most people will benefit from it. That is because the
most significant inventions we are now seeing, and that we know we will see many
more of, improve the quality and quantity of all thinking. These inventions are
coming in the forms of advances in computers, Al, and other thinking-related
technologies. Because they can be applied to many domains of human activity and
decision making, it seems obvious to me that the rate of invention and
improvement in most areas will accelerate at an even faster pace, rapidly raising
productivity and living standards.
Humans now have computers to help them think in ways in which they are
comparatively handicapped (e.g., computers have far more memory than the
human brain and it is readily accessible, they can process more data at a
fantastically faster rate, and they do not make emotional mistakes); at the same
time, humans can help computers get past their inherent limitations (e.g., their
complete absence of imagination, intuition, common sense, value judgements,
and emotional intelligence). This collaboration between humans and computers
will increase both the quantity and quality of thinking,- portending radical
improvements in almost every area of life. I know this because I have experienced
it, and I can already see some of these improvements on the horizon.
In other words, the abilities of both computers and humans will improve
at an increasing pace. Perhaps most importantly, advances in and the
wider use of quantum computing with Al will lead to unimaginable
advances in rates of learning and improvement and changes in global
wealth and power. These changes will occur in varying degrees in the next
five to 20 years, but I believe they will add up to the greatest shift in
wealth and power that the world has ever seen. Quantum computing with
Al will be to traditional computing what the computer was to the abacus,
providing humanity with vastly more power to see, understand, and shape
things. That makes me long-term very optimistic and eager to bet on great
new discoveries.
Even without the boosts from quantum computing, I’d expect the human
lifespan to increase by a lot over the next two decades (by 20-25 percent or more),
for reasons we can see and for many more reasons that we can’t yet see. A few
inventions that are already on the horizon are Al and robotics in healthcare, health
monitoring, and advice-providing wearables; advances in and the practical use of
genome sequencing and gene editing; mRNA improvements in vaccines; and
breakthroughs in nutrition and drugs. And if the past is any guide (and it is) there
will be many more inventions that we can’t yet fathom.
Naturally I can’t help but imagine the implications for investing. All else being
equal, equities in the companies making new inventions and the companies that
benefit from them are the right ones to own if you want to bet on evolution
happening, but whether the returns to investors match the performance of the
innovations depends on how governments decide to divide the profits of
productivity. If the world is financially overextended and has large wealth gaps,
this creates headwinds. Also, price matters. It’s possible to invest in great
companies and lose money because they are so expensive and invest in bad
companies and make money because they are so cheap. Finally, and as with
everything else, there are downsides. Humanity’s inventiveness and the new
technologies it produces can have bad as well as good effects. Advances in
technologies for inflicting harm will certainly occur alongside advances in medical
care. So my view is that inventiveness and increases in living standards will
probably get a lot better a lot faster—if humanity doesn’t kill itself first.
The next chart shows our latest reading on the inventiveness, technological
advancement, and entrepreneurship we see in major countries. The arrows on the
top of the bars show whether the trend in each country’s standing has been up,
sideways, or down. This gauge gives about half its weight to 1) a combination of
external rankings and measures of innovation per capita (to help capture how
widespread innovation is in the economy) and half to 2) the country’s absolute
share of key innovation metrics (e.g., researchers, R&D spending, patents, Nobel
Prizes, and venture capital funding). Like all my gauges, it is approximately right
but not perfectly right, so it’s meant to be broadly indicative. As shown, the US
is at the top of these measures with a marginal lead over China, which
ranks second (primarily due to the US’s share of global research spending,
researchers, and its lead in other areas such as venture capital funding).
But the US’s position is steady, while China’s position in the standings is
rising fast. Remember that whoever wins the technology war usually wins
the economic and military wars. For more detail on all the gauges shown in this
chapter, please refer to the end of this chapter, where you can read a short
description of each.
CURRENT INNOVATION AND TECHNOLOGY SCORE
------------------------------------------------------------------------ -1.53
USA CUN EUR JPN DEU NLD GBR FRA RUS ESP IND
THE DEBT/MONEY/CAPITAL MARKET/ECONOMIC CYCLE
As I explained earlier, this cycle is the biggest driver of the ups and downs in
economies that have big implications for internal and external politics and wars,
so knowing where countries are in this cycle is essential to anticipating what’s
likely to come next.
Based on my readings of history, my readings of existing conditions,
and my understanding of how the economic machine works, the promises
that are denominated in the world’s reserve currencies, most importantly
the dollar, are too large and growing too fast to be paid in hard money. In
other words, the debt that is denominated in these currencies is an
overhang, so money will probably be printed to service debts and debt
growth- and interest rates will probably be held below inflation and
economic/income growth rates. This reflects the fact that the major
reserve currency countries are late in their debt/money/capital
market/economic cycles and that wealth will probably be increasingly
redistributed from those who have a lot of it to those who don’t have
enough of it in one way or another. The extent to which these things will
be true will vary from country to country, though it will likely be
worldwide.
For that reason, the biggest risk in the long run is the “currency value of
money” risk, which most people don’t pay enough attention to. I hope
Chapter 4 helps people understand and deal with it better.
To be clear, because the reserve currency countries that are running big deficits
have their deficits and debts denominated in their own currencies, their ability to
print the money to service the debts transfers the risks from them as debtors to
those who are holding the debt as creditors. So, the big risk is not that those
big debtors will default; it is that creditors will hold assets that will be
devalued—i.e., that the returns from holding debt assets will be less than
the inflation rate. I believe a great transfer of wealth from creditors to debtors
(as happened in the biblical years of Jubilee, as explained in Chapter 3) is coming
for the same reasons it has always come in the past.
What does that mean for the dollar (most importantly) and the other
more minor reserve currencies? Will they decline and others replace them?
Most probably they will decline analogously to past reserve currency
declines: slowly for a long time and then very quickly. As we saw in those
cases, the pace of reserve currency decline significantly lags the pace of the declines
in other measures of strength. Reserve currencies tend to live on long after their
fundamentals cease to justify their prominence because they become deeply
entrenched in the ways things are done and there is a strong inclination to keep
them. Then they abruptly plunge when it becomes clear that the fundamentals
behind the currency make holding debt in it a bad deal.
The fall happens fast because the currency’s rate of decline outpaces the
interest rate paid to the holders of the debt; the net losses lead to selling, which
causes more losses, so the spiral becomes self-reinforcing. The Dutch guilder and
the British pound both plunged in this way due to geopolitical crises/defeats
happening when they had large debts. Those events made it clear to creditors that
their fundamentals were weaker than they had assumed and the interest rate
couldn’t compensate for the decline.
While I have very good indicators to identify this kind of decline happening as
it happens, and some pretty good leading indicators that indicate when it will
happen in the short term, my long-term leading indicators are only so-so for
timing purposes. That is because they are financial and based on supply and
demand. It is pretty easy to assess the financial conditions of countries in the same
ways that one assesses the financial conditions of people and companies (by
checking whether they are running surpluses or deficits and have more assets than
liabilities, and finding out if their debts are in their own or foreign currencies and
who is funding them and why). Because these are all long-term drivers, it is also
pretty easy to see which countries and currencies are vulnerable. But anticipating
exactly when the big fall will happen is difficult.
The debt burden gauge shown next is based on a combination of a) debt
levels relative to asset levels, b) the sizes of external and internal surpluses
and deficits, c) the sizes of debt service costs relative to GDP, d) the
amount of debt in a country’s own currency versus foreign currency, e) the
amount of debt held by its own citizens versus foreigners, and f) its credit
rating. I composed it this way because this way has proven to be the most reliable
way we have of foreshadowing declines in the real value of money and the debt
assets that are promises to receive money, whether they come in the form of debt
defaults that result from not creating enough money and credit to satisfy excessive
debt needs or devaluations that come from creating more than enough money and
credit to satisfy excessive debt needs. I constructed this index to exclude reserve
currency status so that I can see the exposure a country would have if it lost its
reserve currency status. Reserve currency status is shown in the chart that follows.
Together these charts paint a pretty clear picture. For example, while the US’s
debt burdens are high, its debt is denominated in dollars, the world’s
leading reserve currency, so it has the ability to print money to service its
debts. This reduces its risk of default but increases its devaluation risk. As
you can see, if the US lost its reserve currency status, it would be in serious
financial trouble. Russia and Germany rank strongest on the debt burden gauge
because they are the least indebted. Russia has no reserve currency status, and
Germany has a fair amount because it uses the euro, now the second most
important reserve currency. China is in the middle of the rankings on the debt
burden gauge because its debts are moderately high, mostly in its own currency,
and mostly held by the Chinese. Its reserve currency status is emerging.
DEBT BURDEN (UP = WORSE FINANCIAL POSITION)
-------------------------------------------------------------------2
USA ESP GBR FRA JPN EUR IND CHN NLD RUS DEU
RESERVE CURRENCY STATUS
USA EUR JPN GBR CHN RUS IND
THE INTERNAL ORDER AND DISORDER CYCLE
Luo Guanzhong’s classic book Romance of the Three Kingdoms begins: “The
empire long divided must unite and long united must divide. Thus it has
ever been. ” That has been true of China and most other places, and it is likely to
continue, so it’s a good principle. I explained the big cycle of internal order and
disorder in Chapter 5, so I won’t reiterate it here other than to remind you of a
key principle: • peace is profitable and war is costly.
That holds both within countries and between them. When parties cooperate
and compete well, and don’t waste resources on fighting, productivity and living
standards rise. When they fight, they waste resources (sometimes including lives),
they destroy more than they produce, and living standards fall. It is for this reason
that the degree of conflict within a country is such an important indicator.
As of this writing there are varying amounts of conflict going on
within different countries, as shown in the next chart. Internal conflict is
especially high in the United States, which appears to be in Stage 5 of the
cycle (when there are bad financial conditions and intense conflict), while
China appears to be in Stage 3 (when there is peace and prosperity).
Changes to this measure can happen quickly—e.g., the changes that produced
the Arab Spring, the conflicts in Hong Kong, internal wars in Syria and
Afghanistan, recent big protests in Peru and Chile, etc.—leading to revolutionary
changes in their internal orders. Because I expect that these readings will be
out of date by the time this book is in your hands, I will update them
regularly at economicprinciples.org.
RELATIVE INTERNAL CONFLICT GAUGE Z-SCORE FOR
MAJOR POWERS TODAY (UP = MORE CONFLICT)
2.5
2.0
1.5
1.0
0.5
00
•0.5
-1.0
-1.5
NLD JPN DEU CHN FRA GBR ESP RUS USA
At the end of the day, * power rules and tests of power are the ways one learns who
rules. Sometimes that happens within a framework of rules that are respected. In
those cases, fights for power occur in a mutually agreed-upon and productive way
that supports the internal order. But they can also happen in unproductive, no-
holds-barred ways that can lead to the violent disruption of both the leadership
and the internal order. While I think that the odds of the US devolving into
a Stage 6 (civil-war-type) dynamic within the next 10 years are only
around 30 percent, that is a dangerously high risk that must be protected
against and watched closely via my coincident and leading indicators.
All internal orders, even those that are not democratic, have rules about how
decisions are made and how power is gained and shared. Because one can usually
see how well these governance rules are respected or ignored, it is pretty easy to see
when an internal order is being threatened by an emerging civil war. For example,
when close elections are adjudicated and the losers respect the decisions, it is clear
that the order is respected. When power is fought over and grabbed, that clearly
signals the significant risk of a revolutionary change with all its attendant disorder.
There have been signs of that happening in the US, with some people
contesting the validity of elections and expressing a willingness to fight for their
aims. This bears watching.
There is also an exceptional amount of polarization in the US right
now, as reflected in the stats. Survey data about the sentiments of the voters
paints a picture of polarization and intransigence. For example, in a 2019 Pew
survey 55 percent of Republicans and 47 percent of Democrats viewed the other
as more immoral than other Americans, and 61 percent of Republicans and 54
percent of Democrats said that those of the other party don’t share their values.
When asked whether they had warm or cold feelings to those of the other party,
79 percent of Democrats and 83 percent of Republicans said they had “cold” or
“very cold” feelings for members of the other party (of that, 57 percent of
Democrats and 60 percent of Republicans selected “very cold”). Another study
reported that 80 percent of Democrats think that the Republican Party has been
taken over by racists and 82 percent of Republicans think that the Democratic
Party has been taken over by socialists. A 2010 study showed that nearly half of
Republican parents and a third of Democratic parents would be displeased if their
child married someone from the other political party. That compares with about
5 percent for both parties in 1960. One recent survey showed that 15 percent of
Republicans and 20 percent of Democrats thought the country would be better
off if large numbers of the other side “just died.”
Very important and very telling political conflicts and changes lie ahead in the
next few years. They will be indicative of what the next stage in the increasingly
disorderly internal orders will be like in the major countries, especially in the US.
While the United States looks like it is in the precarious Stage 5 of the
cycle, it also has the longest-lasting and most widely admired internal
order (its constitutional system). As explained in Chapter 5, this makes it less
likely that it will be abandoned, but more traumatic if it is. The most reliable signs
of an escalation to civil war are 1) the rules being disregarded, 2) both sides
emotionally attacking each other, and 3) blood being spilled. While Stage 6 is the
most dysfunctional and harmful stage, increasing amounts of dysfunction happen
in the stages leading up to it. These sorts of conflicts can exist throughout society,
not just in government.
Shown next is how the conflict gauge has changed for the US since the late
1700s, including the breakdowns between the two sub-gauges. What these charts
reflect is that the overall level of conflict within the United States is now as
high as it’s been since the civil rights and Vietnam War protests of the late
1960s, but meaningfully less than it was then. The “internal strife” index
(which mostly reflects demonstrations in the streets) is moderately high,
and the “political conflict” index is the highest it’s been since the early
1920s, when a deep post-war recession and massive labor unrest- contributed to
big electoral losses for the Democrats.
USA INTERNAL CONFLICT GAUGE Z-SCORE
(UP = MORE CONFLICT)
1780 1810 1840 1870 1700 1730 1760 1770 2020
USA INTERNAL CONFLICT GAUGE BREAKDOWN
Note that the comparable periods before then were the 1900s-1910s (which
saw a backlash against the “robber barons,” the rise of the Progressive movement,
and eventually World War I), and the 1860s, when economic and values conflicts
led to civil war. The risks are high, but not unprecedentedly so. Still, the
picture should be scary for Americans and scary for the world because the world’s
leading power is on the brink and could tip one way or the other. Fractured
conditions within the US are now contributing to instability in other parts of the
world. Any worsening would be at least as disruptive as those past periods.
So what does this all mean for the US? As I explained in Chapter 11, our
measures suggest that it is very roughly 70 percent through its big cycle. Can it
slow or reverse its relative decline? History shows us that reversing a decline is
very difficult because it requires undoing so many things that have already
been done. For example, if one’s spending is greater than one’s earnings
and one’s liabilities are greater than one’s assets, those circumstances can
only be reversed by working harder or consuming less. The question is
whether we Americans can face our challenges honestly and adapt and
change to meet them. For example, while the capitalist profit-making system
allocates resources relatively efficiently, Americans now need to ask themselves:
“Who is it optimizing these efficiencies for?” “What should be done if the benefits
are not broad-based?” “Will we modify capitalism so that it both increases the size
of the pie (by increasing productivity) and divides it well?” These questions are
especially important to answer in an era when, thanks to new technologies,
employing people will increasingly become unprofitable, inefficient, and
uncompetitive. “Should we, or should we not, invest in people to make them
productive, even when it’s uneconomic to do so?” “What if our international
competitors choose robots over people?” These and so many more important,
difficult questions come to mind. But while we can’t know for certain
whether the splits and conflicts in the US will increase or reverse, we do
know that the long-term momentum is toward increasing division and
this is a serious risk. The fact that the US is simultaneously deeply
indebted, its international standing is weakening, and it is experiencing
serious conflict should be concerning both to Americans and to non-
Americans who depend on them. At the same time, in its 245-year history the
US has shown a great capacity to bend without breaking. The greatest challenges
it faces are internal ones: can it remain strong and united, or will it continue
to allow division and internal struggles to lead to decline?
THE EXTERNAL ORDER AND DISORDER CYCLE
• All empires decline and new ones rise to replace them. Understanding when that
change might happen requires watching all of the indicators and tracking the
relative conditions of countries. Remember from earlier in the book that there are
five major types of wars that have existed throughout history: 1) trade/economic
wars, 2) technology wars, 3) capital wars, 4) geopolitical wars, and 5) military
wars. The external conflict gauge shown here measures the levels of economic,
political/cultural, and military conflict between pairs of major countries. As
shown, the greatest conflict is between the US and China, the two greatest powers
in the world that have comparable amounts of power—more than enough to
make a war between them the most devastating in history.
LATEST INTERCOUNTRY CONFLICT Z-SCORE
(UP = MORE CONFLICT)
t
USA GBR GBR USA USA CHN CHN USA USA
JPN DEU JPN GBR DEU JPN GBR RUS CHN
The amount of this conflict is 1 standard deviation above normal,
which is pretty severe in relation to past conflicts between countries.
This next chart shows my index of conflict just between the US and
China since 1970.
Based on what we have been seeing, the United States and China are clearly in
four types of war (trade/economic war, technology war, capital war, and
geopolitical war), though not intensely but they are intensifying. They are not yet
in the fifth type of war (military war). As shown in the previous cases, in
particular the 1930-1945 case, these four types of wars precede military wars by
about five to 10 years. Though the risks of military war seem relatively low, they
are increasing.
Looking back over the last 500 years, one can see that military wars between
major empires started on average about once every 10 years, give or take a couple
of years, and it has been about 75 years since the last really big one (World War II).
Since 1500, major powers have been at war a little bit more than half the time.Z
From that perspective, the odds of a big military war in the next 10 years are about
50/50, but of course that’s simple minded. Let’s look at the picture a bit more
carefully.
The following chart shows the current individual readings of my
military strength gauge. While overall these readings make sense—the US
is the most powerful by most measures, China is the next most powerful,
Russia comes next, etc.—they don’t capture the important realities
beneath these summary numbers. For example, they don’t show that some
countries are as powerful as or more powerful than the United States in
specific geographic areas (e.g., right around China) and in some types of
warfare (e.g., space, cyber, etc.) Also, they don’t consider the effects of
military cooperation and alliances (e.g., China and Russia), and they can’t
account for what unknown military abilities countries may have. For me,
the big headline is that there are lots of ways these countries can hurt or
destroy each other in the most contested geographic areas.
CURRENT MILITARY STRENGTH (UP = STRONGER)
USA CHN RUS EUR IND JPN ERA GBR DEU ESP NLD
History shows that wars are terribly costly in lives and money, and the capacity
to inflict harm has advanced exponentially since nuclear weapons were developed
and used in World War II. I am unable to imagine what the next military war
would look like. I have also seen that those who are most informed on both sides
are not fully informed because a lot is unknown and because military wars always
transpire in unexpected ways. For those reasons, it is impossible to confidently
say who the winners and losers in the next big war would be. We also know
from logic and from studying history that the losers of really big wars are
completely wiped out and the winners lose too, as they suffer severe consequences
and end up with big debts. What that means for economies and markets was
explained earlier in the book, but in a word, it is devastating.
Students of history know that the doctrine of mutually assured destruction
prevented the US and the USSR from entering a hot war before the Soviet Empire
fell, mostly due to the failure to grow its other strengths in the face of big military
spending. China is roughly comparable in power to the United States in the most
important ways, and it is on its way to becoming more powerful in many ways.
China won’t be as easy to defeat in any of the five types of war as the USSR was,
and the USSR wasn’t easy to defeat. That means the wars are likely to intensify
and increasingly favor China, especially if the US doesn’t turn around the other
fundamental underpinnings of strength that are highlighted in this chapter.
However, it seems like it will be a long time before China can win a war without
having the war lead to its own destruction as well.
So, in summary, my computer and I working together now believe that
because for the foreseeable future China and the US will be powerful
enough to inflict unacceptable harm on each other the prospect of
mutually assured destruction should prevent military war, though there
almost certainly will be dangerous skirmishes. I expect this to be true
unless some unexpected technological breakthrough, like dramatic
advances in quantum computing, gives one of these powers such an
asymmetrical advantage that mutually assured destruction would cease to
exist. Also, though of less importance, an impediment to fighting is the
interlinked well-being of Americans and the Chinese in this highly interconnected
world.
However, as time passes the risks increase. If the US continues to
decline and China continues to rise, what matters most is whether or not
each can do so gracefully. The big risk is that when existential
irreconcilable differences exist and there is no mutually agreed-upon party
or process to adjudicate the conflict, there is a good chance that there will
be a fight. As explained in the last chapter, the main seemingly irreconcilable
difference between the US and China is over Taiwan, so I am watching
developments there very closely. Taiwan is a one-of-a-kind interest that China
would fight for because of its belief that “there is but one China and Taiwan is
part of China.” It is doubtful that the US would consider it worth a major fight to
defend, though it might. This seems to me to be the only possible trigger for a
military war between the two greatest powers in the next 10 years.
The next locations to pay attention to are the areas immediately around China,
like those countries surrounding the East and South China Seas, and other
neighbors such as India, Russia, South Korea, North Korea, Japan, Afghanistan,
Pakistan, etc. Considering what China’s culture is like and what’s most beneficial
for China, I believe it will work to influence those countries through an exchange
of benefits but won’t fight to control them outright.
While the most important conflicts are between the United States and
China, there are other important players operating in this classic drama of
the balance of power and the prisoner’s dilemma. It is important to watch the
actions of China’s and the United States’ allies and friends. As previously
discussed, the alignments are gradually changing, with China gaining allies and the
United States losing them. Overextended and less willing to lose lives fighting for
others, the US is now in the position of trying to cat herd its allies without catnip.
In the past, the US merely needed to hint at what it wanted other countries to do
for them to do it. Now they go their own ways.
In the end, which country wins the game of obtaining the most wealth and
power depends most on their internal capacities, which is why I monitor those
factors in my indices as I do for military strength. As the Chinese know very well
(and it would be good for others to keep in mind), * the best way to fight a war is to
get strong and show one's opponent one's strength so they don't want to fight violently. This
will most likely be the dynamic that we see in the years ahead.
All of this is to say that I think the odds favor intensifying
trade/economic wars, technology wars, capital wars, and geopolitical wars
as China becomes even more competitive and increasingly goes global in
these areas. As Graham Allison explained in his excellent book, Destined for
War, in the past 500 years, when two nearly equal powers experienced
irreconcilable differences, there were military wars in 12 out of 16 cases, and big
military buildups were associated with major wars in 80-90 percent of cases.- I
balance those historical insights with the logic of mutually assured destruction,
which lowers the odds of war. On net, I would conclude that the probability of a
big war in the next 10 years is 35 percent, give or take, which is essentially a wild
guess. In any case, it’s a dangerously high risk.
ACTS OF NATURE
Throughout history, droughts, floods, pandemics, and other severe natural and
biological disasters have inflicted more harm on people than people have inflicted
on themselves, killing millions, disrupting economies, and contributing to the falls
of many empires and dynasties. This chart shows some of the major events.
GLOBAL DEATHS BY CATEGORY
(RATE PER 100K PEOPLE)
While we all know about climate change, no one knows precisely how much
damage and how many deaths it will ultimately cause. But based on expert
projections, there is reason to believe that all of these kinds of disasters will be
bigger in the years ahead than they were before. While I’m no expert on the
subject myself, I can show you some interesting stats and pass along what I’ve
learned.
The next chart on the right shows the world’s average temperature and
the amount of CO2, indicating global warming. There is little doubt this
is happening, will pick up, and will have big and costly effects. What is
notable is this is increasing at a faster rate. The chart on the left shows the
very long-term perspective on temperature (since 0 CE).
GLOBAL TEMPERATURE
VS 1961-1990 AVG
(°C, SINCE 0 CE)
1.0
0.5
0.0
•0.5
IjO
0 -WO 1000 1500 2000
---Global land and Ocean Tempmafure
Anomallet (°C)
----Carbon Dioxide Concentration (PPM)
This chart captures extreme environmental events. The headline is that
from 1970 to 2020 they increased from fewer than 50 per year to nearly
200 per year and are trending higher.
The next chart shows the estimated dollar cost of these events (adjusted for
inflation). As shown, this is also trending higher, with extreme spikes.
TOTAL LOSSES FROM CATASTROPHES SINCE 1970
It is pretty clear to me that humanity and natural evolution together
are doing great damage to the environment that will be very costly in both
money and quality of life. This will affect countries very differently, in ways
that we can broadly anticipate based on their locations, climates, and—most
importantly—industries. At the same time, this is a slow, steady, and well-
telegraphed change, which lends itself to the kind of adaptation and innovation
humanity is uniquely able to do, though often too slowly and only in response to
pain. I am inclined to believe that slowly and reactively is how it will happen.
Having said that, I don’t know enough about the subject to know what it means
for every country and locality.
The next chart shows an index of climate change vulnerability across
major countries based on an equal average of the Notre Dame-Global
Adaptation Index (ND-GAIN) Country Index, which quantifies a
country’s vulnerability to climate change, and academic estimates of the
future impact of climate change on GDP by country.
CLIMATE CHANGE VULNERABILITY (UP = MORE VULNERABLE)
2 9 £ J
о z a 3
ac S Z
О 3 i £ ? 2Й 2 = 2 O ; X J 5 c < 9 z j
IN SUMMARY
Based on just these five indicators, it appears to me that:
Humanity’s inventiveness will probably lead to great advances while
the debt/economic cycle, the internal order cycle, the external order
cycle, and worsening acts of nature will almost certainly pose
problems. In other words, there will be a battle between humanity’s
inventiveness and these other challenges.
Very different conditions exist within and between countries, which
will determine which countries will rise and decline and in what
ways.
All of this reflects my thinking about the future of the world’s 11 major
countries based on just five of the 18 determinants. Now let’s look at all 18
indicators to see what they tell us.
ALL THE MAJOR DETERMINANTS ACROSS THE WORLD
The following table paints a much richer picture of what’s happening and what is
likely to happen across the 11 major countries. While I have many of these
readings for the top 20 countries, I don’t have the space to show them here; you
can find the complete set at economicprinciples.org. While this table might look
like a bunch of numbers and arrows at first glance, when you get into it a clearer
picture will emerge.
But first, here’s how to read the table and how these gauges work. The
first column shows the determinant being measured. The second rates the
quality of the gauge. It is provided because for some of these important
determinants we have good, clear measurements (e.g., for education, innovation
and technology, cost competitiveness, productivity and output growth) and for
some we don’t (e.g., acts of nature), and I want to show which is which.
Additionally, there are other determinants that aren’t shown because they are
either too subjective or too difficult to quantify (e.g., leadership). The quality of
leadership can’t be measured as objectively as the amount of economic output
(e.g., how can you measure whether Donald Trump was a good leader or a bad
one?). Each is an aggregate of many indicators that I combined in the way that I
felt best captured that particular determinant, giving consideration to both
quantity and quality. For example, a country with a large population like China,
India, and the United States when compared to a country with a small population
like Singapore, the Netherlands, and Switzerland might have more of something
but of lesser quality. I tried to structure these weightings so that I could imagine
who would win if they had a competition like the Olympics or a war.
CURRENT READINGS ACROSS MAJOR POWERS
(Z-Score and 20-Year Change Denoted by Arrows)
Gauge Quality USA CHN EUR DEU
EMPIRE SCORE (0-1) 0.87 0.75 0.55 0.37
Debt Burden (Big Economic Cycle) Good -1.8 * 0.3 -0.3 1.6
Expected Growth (Big Economic Cycle) Good -0.7 0.4 -1.0 -1.0 ►
Internal Conflict (Internal Order; low is bad) Good -2.0 * 0.2 0.4 0.7
Education Good 2.0 1.6 0.3 -0.2
Innovation & Technology Good 2.0 1.5 0.4 -0.1
Cost Competitiveness Good -0.4 1.2 -0.6 -0.6
Military Strength Good 1.9 1.0 0.3 -0.6
Trade Good 1.1 1.8 1.3 0.6
Economic Output Good 1.7 1.8 0.6 -0.1
Markets & Financial Center Good 2.6 0.5 0.4 -0.2
Reserve Currency Status (0-1) Good 0.55 0.04 0.23
Geology Good 1.4 0.9 -0.4 -0.7 ►
Resource-Allocation Efficiency OK 1.3 0.0 -0.8 0.6
Acts of Nature OK -0.2 -0.1 0.0 1.1
Infrastructure & Investment Good 0.7 2.7 0.2 -0.3
Character/Civility/Determination OK 1.1 1.5 -1.0 -0.5
Governance/Rule of Law Good 0.7 -0.7 -0.4 0.7
Gaps in Wealth, Opportunity & Values OK -1.6 -0.4 0.3 0.7
Scanning the table, you can quickly get a picture of each country’s
circumstances and the overall state of the world. For example, by looking
at the empire scores and the arrows next to them you can see that the
United States is the most powerful country but declining and China is
close behind and rising quickly. You can see in what ways the United
States is exceptionally strong—i.e., its reserve currency status, military
strength, economic output, innovation and technology, and education—
and you can see in what ways it is weak—i.e., its internal conflicts, wealth
gaps, indebtedness, and expected economic growth.
You can also see that China is close behind the US in most other key
areas and that it is relatively strong in its infrastructure and investment,
innovation and technology, education, cost competitiveness, economic
output, trade, military strength, and trade/capital flows, and relatively
weak because of its reserve currency status, rule of law/corruption, and
wealth gaps. I find this data invaluable. It’s crucial to watch for changes in it
when thinking about what’s happening and what is likely to happen.
Gauge Quality JPN IND GBR FRA
EMPIRE SCORE (0-1) 0.30 0.27 0.27 0.25
Debt Burden (Big Economic Cycle) Good -0.4 0.1 -1.6 * -0.8
Expected Growth (Big Economic Cycle) Good -1.1 1.1 -0.8 -0.9 ►
Internal Conflict (Internal Order; low is bad) Good 1.1 -0.3 -0.1
Education Good 0.2 -1.2 -0.2 -0.5
Innovation & Technology Good 0.2 -1.2 -0.3 -0.5
Cost Competitiveness Good -0.3 2.4 -0.3 -0.6
Military Strength Good -0.1 0.2 -0.3 -0.3
Trade Good -0.5 * -0.8 -0.6 -0.5 ►
Economic Output Good -0.3 -0.2 -0.3 -0.5
Markets & Financial Center Good 0.1 -0.8 0.0 -0.3
Reserve Currency Status (0-1) Good 0.07 0.0 0.07
Geology Good -1.1 0.3 -0.9 -0.5 ►
Resource-Allocation Efficiency OK 0.1 0.2 0.3 -1.3
Acts of Nature OK 1.5 -2.4 0.4 0.0
Infrastructure & Investment Good -0.2 -0.3 * -0.6 -0.2
Character/Civility/Determination OK 0.5 1.3 -0.4 J -1.5 ►
Governance/Rule of Law Good 0.8 -1.1 1.2 0.3
Gaps in Wealth, Opportunity & OK 0.9 -1.8 -0.2 1.1
Values
Gauge Quality NLD RUS ESP
EMPIRE SCORE (0-1) 0.25 0.23 0.20
Debt Burden (Big Economic Good 0.8 J*. 1.0 " -1.7
Cycle)
Expected Growth (Big Economic Good -0.8 -0.2 -1.1
Cycle)
Internal Conflict (Internal Order; Good 1.2 -0.5 " -0.4
low is bad)
Education Good -0.7 -0.5 -0.9
Innovation & Technology Good -0.3 -0.7 -1.0
Cost Competitiveness Good -0.8 0.7 -0.6
Military Strength Good -1.9 0.4 -0.8
Trade Good -0.6 -0.9 -0.9
Economic Output Good -0.3 -1.4 -0.9
Markets & Financial Center Good -0.5 -1.1 -0.6
Reserve Currency Status (0-1) Good 0.0
Geology Good -0.5 1.9 -0.6
Resource-Allocation Efficiency OK -0.1 1.3 -1.6
Acts of Nature OK 0.5 -0.1 -0.7
Infrastructure & Investment Good -0.4 -1.0 -0.6
Character/Civility/Determination OK -0.3 0.1 -1.0
Governance/Rule of Law Good 1.0 -1.9 -0.7
Gaps in Wealth, Opportunity & OK 0.6 0.4
Values
For example, as shown before, when 1) a country’s finances are
deteriorating at the same time as 2) the level of internal conflict is high
(e.g., over wealth and/or values differences), while 3) the country is being
challenged by one or more strong foreign rivals, that typically produces 4)
a mutually and self-reinforcing decline. That’s because the country’s
deteriorating finances make it impossible for it to satisfy domestic
spending needs and finance the war, which causes worse outcomes.
Now that these things are quantified, we can see them happening in the table
and make projections. The greater the number of important determinants that are
worsening and the more severely they are worsening, the surer and more severe the
decline will be. For example, if a few other determinants are weak and weakening
at the same time that others are faltering, the expected severity of the decline
increases. Because I, with the help of my computer, can monitor such things, I can
assess a country’s relative health, vulnerabilities, and future prospects. For
example, many of the most worrying conditions now exist in the United States,
even though the United States is still the most powerful country in the world.
That merits close attention.
As conveyed in some earlier charts, we saw that 1) these determinants tend
to reinforce each other, whether in strength (e.g., stronger education tends
to create stronger incomes) or weakness (e.g., weakening trade leads to
higher indebtedness), so they tend to transpire in cycles that come
together to create the Big Cycle, and 2) when the determinants are weak
and weakening, the empires are weak and weakening/? Big swings up occur
when lots of determinants are strengthening and big swings down occur
when lots of determinants are weakening.
Our computers use this data to generate written reports, which are
available to read at economicprinciples.org. They project real GDP growth
rates for the next 10 years, along with the gauge readings for each factor
that leads to those estimates. The data, and hence the projections, is more
reliable for some countries than others, which is conveyed in the readouts. Still,
they do a good job of reflecting the current health of a country and serve as
leading indicators of their future health. Based on backtesting, these estimates
would have predicted a country’s average growth rate over the next decade within
1 percent of the actual growth 59 percent of the time, and within 2 percent about
90 percent of the time, with a correlation to subsequent growth of 81 percent. I
have found them to be invaluable.
REAL GDP GROWTH ESTIMATE (NEXT 10 YEARS, ANN)
While these are good and useful indicators, they have to work hand in hand
with my thinking. Consider the question, “What is the mix of powers that makes
a country powerful?” While the total power index at the top of the current
readings tables is intended to indicate that and is arrived at via a weighted average
of the indices below it, the truth is that the type of power that is most important
to have at any one time varies according to circumstances. For example, military
power is expensive and it typically sits around doing nothing until it is the most
important power to have. How do I properly weight that against economic
output that consists of mostly nonessentials? The answer is not well. I don’t have
it modeled well, but I think about it a lot and apply my experience and intuition
to it. In time I will have it modeled better, but I know that I will always need to
have what is in my head work with what’s in the computer, as the computer and I
need each other to be at our best.
THE NEXT 10 YEARS
While this book is about the really big cycles, I’d like to focus now on
the dynamics within these cycles that will be most important over the next
10 years. As I’ve explained, there are cycles within cycles within cycles, with the
little ones adding up to the bigger ones, plus there are non-cyclical bumps that all
together determine what happens. Over the next 10 years, the most
important dynamics are the short-term debt/money/economy cycle (also
called the business cycle), the internal political cycle, and the escalating
conflicts/reducing interdependencies between the US and China. I find that
keeping these cycles in mind, thinking about how they affect each other, and
assessing where things stand within them are helpful for timing my decisions.
As discussed in Chapter 4, the short-term debt/money/economic cycle
consists of alternating periods of central banks stimulating the economy by
creating money and credit and then attempting to slowing it down by reducing
the flow of them. They never get this precisely right, which is what produces the
excesses that lead to bubbles, busts, and the cycle beginning again. Sometimes
other negative events happen around the same time as a downturn—September
11, 2001 was such a case.
This cycle typically takes about eight years, give or take a few, though the
timing is less the result of how long it’s been since the last one and more the result
of the underlying economic drivers themselves. Most importantly, the amount of
slack in the economy, the amounts and types of financial bubbles, the amount of
central bank tightening, and the markets’ and economies’ sensitivity to tightening
all matter. The last cycle began in April 2020 with largest dose of fiscal and
monetary stimulation ever. The one before that began in 2008, which was also a
giant dose though much less big. The ones before that began in 2001, 1990, 1982,
1980, 1974, 1970, 1960, etc. With the amounts of stimulation injected into this
recent downturn being so enormous (especially in the US), with the slack in the
major economies being relatively limited (especially in the US), with the signs of
bubbles now being moderate to strong, and with the interest rate sensitivity of
markets and the economy being high, my guess is that the next downturn will
come sooner than is typical. I’d estimate in about four years from the publication
of this book, give or take a couple of years (which is about five-and-a-half years
from the bottom).
Don’t bet on what I just said happening because that configuration is not
precise. I will need to monitor the factors I just mentioned, especially the rate of
rebound in inflation and how quick and strong central bank tightening will be in
order to home in on the precise timing. Also, I would expect any downturn to be
promptly followed by a quick reversal of central bank policies toward the next big
round of stimulation. That makes me less worried about the impact of the
downturn and more worried about the excess money printing and the loss of
value of money (particularly cash and debt in dollars, euros, and yen). Of course
what happens in this economic cycle will be affected by what happens with the
other cycles and the bumps along the way, just as this cycle will affect the other
cycles.
As far as the internal order/disorder cycle is concerned, it typically lags the
debt/economic cycle because people are less confrontational in good times than in
bad ones. When these cycles interact strongly, it can lead to major changes. In the
US the short-term political cycles of change come every two years with
congressional elections and every four years with presidential elections, with an
eight-year limit on the total presidential term. In China the changes come every
five and 10 years with the next big one happening around the time of this book’s
publication (November 2021). There is no limit on the presidential term. While
we can look at the calendars and know something about what’s ahead, there will
be lots of uncertainties, some of which can be really impactful. Based on my
estimates, there is a significant chance the next downturn will come around the
time of the next presidential election in the US.
The external order/disorder cycle has traditionally followed the path of
accelerating conflicts that lead to wars. As mentioned earlier, the United States
and China are now preparing themselves for increasing intensity in the five types
of war. They are operating with roughly five-year plans to gain greater amounts of
self-sufficiency and preparedness for each of these wars, which will give them
greater ability to wage them, though it’s doubtful that either will become
dominant enough to ignore the deterrent of mutually assured destruction. Since
China’s strength is gaining relative to that of the US, it would seem to imply that
important changes will come neither too soon nor too far ahead. As mentioned
earlier, there is significant risk that we are approaching a conflict between an
unstoppable force and an immovable object regarding Taiwan and the East and
South China Seas—i.e., China is an unstoppable force for change to Taiwan’s
current status and the United States is an immovable object against it. Beyond the
US and China, other nations—most notably Russia, India, Japan, Korea, and the
key European and Middle Eastern powers—will play important roles in this
global drama. Over the next five years or so, alliances are likely to harden.
These things point toward the next big risk point being around five
years from this writing, give or take a couple of years.
To reiterate, there is nothing precise about the timing of these cycles.
They’re like hurricane/typhoon seasons; we know they are likely to happen at
roughly certain times so we prepare for them, and when those times come, we
watch for storms emerging, follow them closely, and do our best to get out of
harm’s way. While we can’t say exactly when they will come and exactly how
strong they will be, we do know that the trend and the fundamentals have been
for them to get stronger, so we should be prepared for that possibility.
Despite all the analytical work I do, I know that the unknown is still much
greater than the known. While history can be told pretty precisely, the future is
exactly the opposite. I am not aware of a single case of the future being foretold
accurately in any detail. For an investor, understanding history accurately is of no
use relative to being a bit more right than wrong about the future. Since non-
investors place bets in the form of their life decisions, that’s true for them too.
That brings me to the final point of this chapter, which is about knowing how to
place one’s bets based on the assumption that one is likely to be wrong a lot.
DEALING WITH WHAT YOU KNOW AND WHAT YOU DON’T
KNOW
Whatever success I’ve had has been more due to my knowing how to deal with
what I don’t know than anything I know. Betting on the future is betting on
probabilities and nothing is certain, not even the probabilities. That’s just the way
it is. While what I’ve given you up until this point is what I believe I know about
the future based on my reasoning about the past, what I want to pass along that is
probably more important is how I make decisions in life and in the markets based
on what I don’t know. In a nutshell, here’s what I try to do:
• Know all the possibilities, think about the worst-case scenarios, and then find ways to
eliminate the intolerable ones. Identifying and eliminating the intolerable worst-case
scenarios comes first. That’s because the most important thing in playing the
game (of life or the markets) is to not get knocked out of it. I learned that from a
big mistake I made in 1982, which nearly broke me. After that painful loss I
calculated what my basic needs would cost and worked toward having enough
money stashed away so my worst-case scenario would be tolerable. As I built up
from nothing, I remember regularly calculating how many weeks, then months,
and then years my family and I would be fine if not another dime came in. I now
have an “end of the world” portfolio that I know will keep us fine in the worst-
case scenarios, and I build from there. From reading this book, you can probably
see that I imagine a lot of worst-case scenarios, including depressions,
devaluations, revolutions, wars, pandemics, my big mistakes, health problems, and
death from different causes. I start by trying to protect myself against all of them
and more. While you might think that my paying so much attention to
eliminating worst-case scenarios is depressing and prevents me from making the
most of opportunities, the opposite is true. It’s liberating and exciting to operate
this way because knowing that the worst-case scenarios are covered gives me the
safety, freedom, and ability to go for great results.
• Diversify. In addition to making sure I’ve covered all the worst-case scenarios I
can think of, I try to cover those I can’t think of by diversifying well. I learned the
math of it and I’m drawn to it instinctively. Essentially, if I have a bunch of bets
that are attractive but unrelated, I can reduce my risks by up to 80 percent
without reducing my upside at all. While this sounds like an investment strategy
it’s actually an old and well-established good life strategy that I apply to
investments as well. There is a Chinese saying that “a smart rabbit has three
burrows,” meaning three places to go to in case any one of them becomes
dangerous. This principle has saved many people’s lives when things got bad, and
it’s one of my most important principles.
• Put deferred gratification ahead of immediate gratification so you will be better off in the
future.
• Triangulate among the smartest people possible. I tag along with the smartest
people I can find, so I can stress test my thinking and learn from them.
It is through these principles that I got so much upside with relatively little
downside and a steadily improving future, albeit with bumps along the way.
That’s why I recommend these principles to you, though as always, you should
feel free to take them or leave them as you like.
One more thing for policy makers, those they report to, and others who are
interested:
Use the gauges I gave you, or take the stats and make your own, to 1) measure
the health of your country and other countries you’re interested in, 2) see if it is
improving or worsening and in what ways, and 3) make changes in the
determinants of the future to get a better future.
That’s it.
I now feel that doing all this has given me an adequate understanding of the
possibilities, both worst-case scenarios and opportunities, and a time-tested plan
for dealing with them well. I also believe that I have adequately conveyed to you in
this book and on economicprinciples.org the most important things I know about
how the lessons of the past can help you deal with the future. I hope you find
them to be of some use. I plan to evolve all of this to make it better, which I hope
we can do together.
May the Force of Evolution be with you,
MORE DETAIL ON EACH OF THE GAUGES
Education: This gauge measures basic and higher education, split about
evenly between the two. Half of the measure captures the absolute quantity
of educated people at various levels and about half is placed on quality such
as higher education rankings, test scores, and average years of education.
The US ranks highest in this gauge (driven by strong absolute and relative
measures of higher education), with China close behind (due to its large
number of educated people).
Innovation & Technology: This gauge measures inventiveness,
technological advancement, and entrepreneurship. It gives about half its
weight to the country’s absolute share of key innovation metrics (e.g.,
patents, researchers, R&D spending, and venture capital funding) and half
to a combination of external rankings and measures of innovation per
capita (to help capture how widespread innovation is in the economy). The
US is at the top of this measure due to its strength across a variety of
metrics, while China ranks second due to its large share of global research
spending, researchers, and patents. China is rising quickly in this area.
Cost Competitiveness: This gauge measures what one gets for what one
pays. We want to see this because countries that produce the best at costs
that are too expensive aren’t in good shape, even though they rank high in
quality. We look at quality-adjusted and productivity-adjusted labor costs,
along with other productivity measures. Major developing economies
(particularly India) rank highest in this gauge, while the US ranks around
the middle of the pack and European countries rank lowest (due to high
labor costs).
Infrastructure & Investment: This gauge measures the quantity of
infrastructure and investment spending and the quality of it. It captures a
country’s absolute share of global investment, as well as the extent to which
a country prioritizes quality of infrastructure and productivity-enhancing
investments. The gauge weighs measures of investment as a share of world
investment, overall infrastructure quality, investment and savings as a share
of GDP, and logistics performance. China is currently the strongest
according to this gauge (having risen sharply over the past 20 years) because
of its high rates of productive investment relative to both the world and the
size of its own past investment; the US is second, due largely to its high
share of global productive investment, though it is worsening.
Economic Output: This gauge measures the strength of a country’s
economic resources. We measure output primarily through GDP levels as a
share of world total (adjusted for price differences across countries). We
allocate some weight to GDP per capita rather than total GDP to capture
quality. China ranks first in this gauge, insignificantly ahead of the US but
also rising fastest, due its large PPP-adjusted GDP share. Europe ranks
third.
Expected Growth (Big Economic Cycle): This gauge measures how well
a country is positioned to grow its economy over the next 10 years. We look
at a variety of metrics to estimate forward-looking 10-year economic
growth, placing two-thirds weight on metrics that predict productivity and
one-third on metrics that predict the impact of indebtedness on growth.
Currently India is predicted to grow the fastest, followed by China, with
the US predicted to grow a bit slower than average, and with Japan and a
number of European countries predicted to grow least.
Trade: This gauge measures how strong of an exporter a country is. It looks
at the absolute level of a country’s exports as a share of the world. China
scores highest (being the largest exporter in the world), followed by Europe
and the US.
Military Strength: This gauge is driven mostly by the absolute share of
military spending and strength measured by the number of personnel, the
number of nuclear weapons, and external indices of military capabilities. It
does not look at military powers in varying regions or of various types,
failing to capture some military superiorities Russia and China have in
certain geographic areas, certain types of military technologies, or the role of
alliances. The US is still the strongest overall military power based on these
measures, with a strong lead in spending and a nuclear weapons program
that is only rivaled by Russia. China is now ranked second and is rising
quickly.
Financial Center: This gauge measures the level of development and sizes
of a country’s financial markets and financial center. We look at absolute
measures of transaction shares and market capitalizations, as well as external
indices of financial center cities. The US remains the top-ranked power in
this metric by a significant margin (driven primarily by its very large share of
world equity and debt markets), with China and Europe ranking second
and third, respectively.
Reserve Currency Status: This gauge measures the extent to which a
country’s currency operates as a global reserve currency. We measure reserve
currency status by the share of transactions, debts, and central bank reserves
that are denominated or held in a country’s currency. Similar to financial
center status, the US remains the top-ranked power in this metric by a
significant margin, with Europe and Japan ranking second and third,
respectively.
Debt Burden (Big Economic Cycle): This gauge is based on a
combination of a) debt levels relative to asset levels, b) the sizes of external
and internal surpluses and deficits, c) the sizes of debt service costs relative
to GDP, d) the amount of debt in a country’s own currency versus foreign
currency, e) the amount of debt held by its own citizens versus foreigners,
and f) its credit rating. We composed it this way because it has proven itself
to be the most reliable way we have of foreshadowing declines in the value
of real wealth, whether they come in the form of debt defaults that result
from not creating enough money and credit to satisfy excessive debt needs
or devaluations that come from creating more than enough money and
credit to satisfy excessive debt needs. I constructed this index to exclude
reserve currency status so that I could see the exposure a country would
have if it lost its reserve currency status.
Internal Conflict (Internal Order): This gauge looks at how much
domestic conflict and discontent there is. It measures actual conflict events
(e.g., protests), political conflict (e.g., partisanship), and general discontent
(based on surveys). The US ranks highest in this gauge among the major
countries, driven by measures of partisanship and higher incidence of
internal conflict events, and it has been rising fast.
Governance/Rule of Law: This gauge measures the extent to which a
country’s legal system is consistent, predictable, and conducive to growth
and advancement. It combines rule of law measures (based primarily on
business surveys of doing business in the country) and corruption measures
(via a combination of external corruption indices and surveys of
businesses). Russia and India score lowest (worst) on the gauge, while the
UK, the Netherlands, and Japan score highest (best), with Germany and the
US close behind.
Geology: This gauge measures each country’s geographic endowment,
including land size and the value of its natural resources. It includes the
total production of energy, agriculture, and industrial metals in order to
capture the absolute production capacity of each nation, as well as net
exports to capture relative self-reliance for each of the categories (in
addition to measuring some other natural resources like freshwater supply).
Russia and the US score highest (followed by China, which relies more on
the rest of the world to cover its natural resource needs), while Japan and
the UK score lowest.
Gaps in Wealth, Opportunity & Values: This gauge measures how big
the gaps in wealth/income, opportunities, and values are. It combines
measures of both a) wealth and income inequality (e.g., how much does the
top 1 percent have versus the rest) and b) political conflict (e.g., how split is
the legislature on ideology). India, the US, and China score worst because
of very large wealth and income gaps (and in the case of the US also
significant political gaps). At the other end of the spectrum are the
European nations and Japan, which generally speaking have lower income
and wealth inequality.
Character/Civility/Determination: This gauge attempts to measure to
what extent the attitudes of each country’s people create an environment
that’s supportive to civility and hard work, which supports growth and
advancement. It uses a) surveys around attitudes toward working hard and
success and b) other measures that proxy how much a society values self-
sufficiency and work (e.g., government transfer payments size, effective
retirement age) to quantify this. China and India score highest (the US is
third), and the European countries (notably Spain and France) score lowest.
Resource-Allocation Efficiency: This gauge attempts to measure how
efficiently each country is using its labor and capital. It looks at whether the
country has chronically high unemployment (i.e., not finding efficient ways
to employ its people), if debt growth generates commensurate income
growth over time, and external indices and surveys about the rigidity of the
labor market and ease of getting loans. Much of Europe (particularly France
and Spain) score lowest on these measures, while the US and Germany score
near the top. Developing countries (particularly Russia, but also China and
India) also score fairly well in this measure—as generally speaking they
produce more income growth per unit of debt growth.
Acts of Nature: This gauge measures how vulnerable to and impacted by
acts of nature each country is. While it is difficult to quantify all the various
acts of nature that might affect a country, we used expert assessments of
future climate change impact on each country’s GDP, external assessments
of each country’s preparedness for natural disasters, and the outcomes from
the COVID pandemic (as that was a real-time test against an act of nature).
I consider this rating so-so and find that there is still a lot more we want to
capture to make this gauge better, hence its low quality.
External Conflict: While not a part of the model for individual countries,
the external conflict gauge measures the levels of economic,
political/cultural, and military conflict between pairs of major countries.
Within each category, we tried to come up with a mix of structural
indicators (to establish a baseline level of conflict between countries) and
timely indicators (to flag major escalations above that baseline). For
example, for economic conflict we track bilateral trade between countries,
tariff rates, and timely news around sanctions, trade wars, etc.
1 Importantly, a number of the charts shown on these pages rely on the record from fewer countries further
in the past, due to limited reliable data history. Life expectancy prior to the 1800s is solely based on Great
Britain (marked by the dotted line). Global RGDP is primarily a mix of European countries before 1870.
And there are not good records of total wealth prior to the 1900s, so I can’t show you the picture before then.
- Soon not being able to read and write computer code will be like not being able to read and write words.
- .Arrows denote the 20-year change in the gauge.
- . As a result, debt assets (especially cash) will probably perform poorly and debt liabilities will probably be
good to have, especially if invested in profitable, disruptive technologies and solid investments that have
higher returns than the cost of funding them.
- . Individual European countries are not shown on the reserve currency status gauge due to the European
Monetary Union (all these countries use the euro)—so only the Europe aggregate is shown. The measure
shows an average of what share of global transactions, debts, and official central bank reserve holdings are
denominated in each country’s currency.
- . In 1919, over 20 percent of the US labor force went on strike.
Z. There have been just over 50 wars between great powers since 1500, per Steven Pinker’s The Better Angels of
Our Nature (2011). Eighty percent of the years before 1800 had wars; it’s been 20 percent since.
- . We may be seeing such a buildup now. China’s military spending has risen sharply in dollar terms over the
past decade, though as a share of GDP it remains relatively steady (at around 2 percent). At around 3 percent
of GDP, military spending has fallen a bit for the US.
Determinants like geology (i.e., minerals in the ground) are relatively easy to measure, though the
implications of having them might change. Determinants that evolve like humanity’s innovations and
technologies can typically be seen emerging by watching the trends. Those that transpire in cycles (like debt
and capital markets) can be understood by understanding the cycles. The fact that acts of nature like
pandemics, droughts, and floods come along shouldn’t be a surprise, though their timing often is.
APPENDIX
COMPUTER ANALYSIS OF THE
CONDITIONS OF, AND PROSPECTS FOR,
THE WORLD'S LEADING COUNTRIES
I described earlier, I feed data into a computer that can create an output
summarizing the conditions of, and long-term prospects for, the world’s leading
countries. These computer-generated summaries follow on the next few pages. I
use these outputs to supplement my own thinking and other computer models I
run to help me understand the world. This system is a never-ending work in
progress. I will update these summaries on economicprinciples.org at least
annually or more frequently if any big changes take place.
The text for each country highlights a few of the major gauges and a few of the
stats within each gauge that reflect the broad trends we are seeing. The aggregate
gauges and final country power score I am showing include hundreds of
individual stats that we aggregate based on relevance, quality, and consistency
across countries and time. To best capture the overall strength of a country, I gave
considerations to both quantity and quality, but structured things to best capture
who would win in a competition or war.
THE POWERS AND PROSPECTS OF THE UNITED STATES
This is our computer-generated reading for the United States as of August
2021.
Based on the latest readings of key indicators, the United States appears to be a
strong power (No. 1 among major countries today) in gradual decline. As
shown in the table, the key strengths of the United States that put it in
this position are its strong capital markets and financial center, its
innovation/technology, its high level of education, its strong military, its
reserve currency status, and its high economic output. Its weaknesses are
its unfavorable economic/financial position and its large domestic
conflicts. The eight major measures of power are very strong today but are, in
aggregate, trending downward. In particular, the United States’ relative position
in education, its importance to global trade, and its relative military strength are
declining.
The table shows our aggregate country power gauge and the major drivers, as well
as the rank of each measure of power across 11 major countries today and the
trajectory over the past 20 years.
To understand a country, we start by looking at the big cycles, as well as
measures of power that both reflect and drive the rise and fall of a country.
While we refer to these factors individually, they are not separate; they interact
with and reinforce one another to move a country along its cycle.
For the United States, the big cycles look unfavorable.
The United States is in an unfavorable position in its economic and
financial cycles, with a high debt burden and relatively low expected real growth
over the next 10 years (1.1 percent per year). The United States has significantly
more foreign debts than foreign assets (net IIP is -64 percent of GDP). Non-
financial debt levels are high (277 percent of GDP), and government debt levels
are high (128 percent of GDP). The bulk of these debts (99 percent) are in its own
currency, which mitigates its debt risks. The ability to use interest rate cuts to
stimulate the economy is low (short rates at 0.1 percent), and the country is
already printing money to monetize debt. That said, being the world’s leading
reserve currency is extremely beneficial to the US. If this were to change, it would
significantly weaken the US position.
UNITED STATES-KEY DRIVERS OF OUR COUNTRY POWER SCORE
Overall Empire Score (0-1) Level: 0.87 Rank: I
The Big Cycles Level Z-Score Rank Trajectory
Economic/Financial Position Unfavorable -1.7 10
Debt Burden High Debt -1.8 11
Expected Growth 1.1% -0.7 4
Internal Order High Risk -1.8 11
Wealth/Opportunity/Values Gap Large -1.6 9
Internal Conflict Very High -2.0 10
External Order At Risk
Eight Key Measures of Power
Markets & Financial Center Very Strong 2.6 1 -►
Innovation & Technology Very Strong 2.0 1 -►
Education Very Strong 2.0 1
Military Strength Very Strong 1.9 1
Reserve Currency Status Very Strong 1.7 1
Economic Output Very Strong 1.7 2
Trade Strong 1.1 3
Cost Competitiveness Average -0.4 6 >
Additional Measures of Power
Geology Strong 1.4 2 **
Resource-Allocation Efficiency Strong 1.3 2
Infrastructure & Investment Strong 0.7 2
Character/Determination/Civility Strong 1.1 3
Governance/Rule of Law Strong 0.7 5
Acts of Nature Average -0.2 9
Я Getting better ¥ Getting worse + Flat
Internal disorder is a high risk. Wealth, income, and values gaps are large.
Regarding inequality, the top 1 percent and top 10 percent in the United States
capture 19 percent and 45 percent of income (both the second highest shares
across major countries). Our internal conflict gauge is very high. This gauge
measures actual conflict events (e.g., protests), political conflict (e.g.,
partisanship), and general discontent (based on surveys).
External disorder is a risk. Most importantly, the United States and China,
which is fast-rising and the No. 2 power (all things considered), are having
significant conflict.
Looking in more detail at the eight key measures of power, the United
States has the largest capital markets and the strongest financial center
among major countries. Its equity markets are a majority of the world total (55
percent of total market cap and 64 percent of volume), and a majority of global
transactions happen in dollars (55 percent). In addition, the United States has
the strongest reading on our measures of technology and innovation
among major countries. A large share of global patent applications (17 percent),
global R&D spending (26 percent), and global researchers (26 percent) are in the
United States. The United States also has the strongest position in
education among major countries. The United States has a large share of the
world’s bachelor’s degrees (20 percent). On years of education, the United States
is good—students have on average 13.7 years of education versus 11.5 in the
average major country. PISA scores, which measure the proficiency of 15-year-old
students across countries, are around average—495 versus 483 in the average
major country. The United States also has a mix of other strengths, as detailed in
the table.
THE POWERS AND PROSPECTS OF CHINA
This is our computer-generated reading for China as of August 2021.
Based on the latest readings of key indicators, China appears to be a strong
power (No. 2 among major countries today) in rapid ascent. As shown in
the table, the key strengths of China that put it in this position are its
strong economic and financial position, its infrastructure and investment,
its importance to global trade, its high economic output, its people’s self-
sufficiency and strong work ethic, its high level of education, and its
strong military. The eight major measures of power are somewhat strong today
and are, in aggregate, trending sharply upward. In particular, China’s importance
to global trade, its innovation and technology, and its importance as a financial
center are increasing.
The table shows our aggregate country power gauge and the major drivers, as well
as the rank of each measure of power across 11 major countries today and the
trajectory over the past 20 years.
To understand a country, we start by looking at the big cycles, as well as
measures of power that both reflect and drive the rise and fall of a country.
While we refer to these factors individually, they are not separate; they interact
with and reinforce one another to move a country along its cycle.
For China, the big cycles look somewhat favorable.
China is in a somewhat favorable position in its economic and financial
cycles, with a low debt burden and relatively high expected real growth over the
next 10 years (4.3 percent per year). China has slightly more foreign assets than
foreign debts (net IIP is 12 percent of GDP). Non-financial debt levels are high
(263 percent of GDP), though government debt levels are low (48 percent of
GDP). The bulk of these debts (96 percent) are in its own currency, which
mitigates its debt risks. The ability to use interest rate cuts to stimulate the
economy is modest (short rates at 1.9 percent).
CHINA-KEY DRIVERS OF OUR COUNTRY POWER SCORE
Overall Empire Score (0-1) Level: 0.75 Rank: 2
The Big Cycles Level Z-Score Rank Trajectory
Economic/Financial Position Somewhat Favorable 0.4 3
Debt Burden Low Debt 0.3 4
Expected Growth 4.3% 0.4 2
Internal Order Moderate Risk -0.1 7 4
Wealth/Opportunity/Values Gap Relatively Large -0.4 8 4
Internal Conflict Average 0.2 5 4
External Order At Risk
Eight Key Measures of Power
Trade Very Strong 1.8 1
Economic Output Very Strong 1.8 1 Я
Education Strong 1.6 2
Innovation & Technology Strong 1.5 2 Я
Cost Competitiveness Strong 1.2 2
Military Strength Strong 1.0 2
Markets & Financial Center Average 0.4 2 Я
Reserve Currency Status Weak -0.7 5
Additional Measures of Power
Infrastructure & Investment Very Strong 2.7 1 Я
Character/Determination/Civility Strong 1.5 1 4
Geology Strong 0.9 3 Я
Resource-Allocation Efficiency Average 0.0 7 4
8
Governance/Rule of Law
Weak
-0.7
Acts of Nature
Average -0.1 8
Я Getting better > Getting worse -► Flat
Internal disorder is a moderate risk. Wealth, income, and values gaps are
relatively large. Regarding inequality, the top 1 percent and top 10 percent in
China capture 14 percent and 41 percent of income (respectively the third and
fourth highest shares across major countries). Our internal conflict gauge is
average. This gauge measures actual conflict events (e.g., protests), political
conflict (e.g., partisanship), and general discontent (based on surveys).
External disorder is a risk. Most importantly, China and the United States,
which is declining but remains the No. 1 power (all things considered), are having
significant conflict.
Looking in more detail at the eight key measures of power, China is the
largest exporter among major countries. It exports 14 percent of global
exports. In addition, China has the largest economy among major
countries. A large share of global economic activity (22 percent; adjusted for
differences in prices across countries) is in China. China also has the second
strongest position in education among major countries. China has a large
share of the world’s bachelor’s degrees (22 percent). China also has a mix of other
strengths, as detailed in the table.
THE POWERS AND PROSPECTS OF THE EUROZONE
This is our computer-generated reading for the Eurozone as of August
2021.
Based on the latest readings of key indicators, the Eurozone appears to be a
strong power (No. 3 among major countries today) on a flat trajectory. As
shown in the table, the key strengths of the Eurozone are its importance to
global trade and its reserve currency status. Its weaknesses are its people’s
lower-than-average work ethic and low self-sufficiency and its relatively
poor allocation of labor and capital. The eight major measures of power are
somewhat strong today but are, in aggregate, moving sideways.
The table shows our aggregate country power gauge and the major drivers, as well
as the rank of each measure of power across 11 major countries today and the
trajectory over the past 20 years.
To understand a country, we start by looking at the big cycles, as well as
measures of power that both reflect and drive the rise and fall of a country.
While we refer to these factors individually, they are not separate; they interact
with and reinforce one another to move a country along its cycle.
For the Eurozone, the big cycles look mixed.
The Eurozone is in a moderately unfavorable position in its economic and
financial cycles, with a moderately high debt burden and relatively low expected
real growth over the next 10 years (0.3 percent per year). The Eurozone has similar
levels of foreign debts and foreign assets (net IIP is 0 percent of GDP). Non-
financial debt levels are high (241 percent of GDP), though government debt
levels are typical for major countries today (104 percent of GDP). The ability to
use interest rate cuts to stimulate the economy is very low (short rates at -0.5
percent), and Europe is already printing money to monetize debt.
EUROZONE-KEY DRIVERS OF OUR COUNTRY POWER SCORE
Overall Empire Score (0-1) Level: 0.55 Rank: 3 4
The Big Cycles Level Z-Score Rank Trajectory
Economic/Financial Position Moderately Unfavorable -0.9 6
Debt Burden Moderately High Debt -0.3 6 4
Expected Growth 0.3% -1.0 8 4
Internal Order Low Risk 0.3 5 Я
Wealth/Opportunity/Values Gap Typical 0.3 6
Internal Conflict Average 0.4 4 -►
External Order
Eight Key Measures of Power
Trade Strong 1.3 2 4
Reserve Currency Status Average 0.1 2
Economic Output Strong 0.6 3
Markets & Financial Center Average 0.4 3 4
Innovation & Technology Average 0.4 3
Education Average 0.3 3 -►
Military Strength Average 0.3 4
Cost Competitiveness Weak -0.6 8 4
Additional Measures of Power
Infrastructure & Investment Average 0.2 3
Geology Average -0.4 5 4
Governance/Rule of Law Average -0.4 7
Resource-Allocation Efficiency Weak -0.8 9
Character/Determination/Civility Weak -1.0 10 -4
Acts of Nature Average 0.0 5
Я Getting better ¥ Getting worse + Flat
Internal disorder is a low risk. Wealth, income, and values gaps are typical.
Regarding inequality, the top 1 percent and top 10 percent in the Eurozone
capture 11 percent and 35 percent of income (respectively the eighth and seventh
highest shares across major countries). Our internal conflict gauge is average. This
gauge measures actual conflict events (e.g., protests), political conflict (e.g.,
partisanship), and general discontent (based on surveys).
Looking in more detail at the eight key measures of power, the Eurozone is
the second largest exporter among major countries. It exports 12 percent of
global exports. In addition, the Eurozone has the second strongest reserve
currency among major countries. A large share of global currency reserves are
in euros (21 percent), and a large share of global debt is denominated in euros (22
percent).
This summary reflects our estimate of the power of the Eurozone in aggregate. For
most stats, we 're using an aggregate across the eight major countries in the Eurozone.
THE POWERS AND PROSPECTS OF GERMANY
This is our computer-generated reading for Germany as of August 2021.
Based on the latest readings of key indicators, Germany appears to be a middle-
of-the-pack power (No. 4 among major countries today) on a flat
trajectory. As shown in the table, the key strengths of Germany are its
strong economic and financial position and its high internal order. The
eight major measures of power are somewhat strong today but are, in aggregate,
moving sideways.
The table shows our aggregate country power gauge and the major drivers, as well
as the rank of each measure of power across 11 major countries today and the
trajectory over the past 20 years.
To understand a country, we start by looking at the big cycles, as well as
measures of power that both reflect and drive the rise and fall of a country.
While we refer to these factors individually, they are not separate; they interact
with and reinforce one another to move a country along its cycle.
For Germany, the big cycles look mostly favorable.
Germany is in a somewhat favorable position in its economic and financial
cycles, with a low debt burden but very low expected real growth over the next 10
years (0.3 percent per year). Germany has significantly more foreign assets than
foreign debts (net IIP is 71 percent of GDP). Non-financial debt levels are typical
for major countries today (183 percent of GDP), as are government debt levels for
major countries today (69 percent of GDP). Germany’s debts are largely in euros,
which increases Germany’s debt risks, since this is not a currency that Germany
directly controls. The ability to use interest rate cuts to stimulate the economy is
low for the Eurozone (short rates are at -0.5 percent), and Europe is already
printing money to monetize debt.
GERMANY-KEY DRIVERS OF OUR COUNTRY POWER SCORE
Overall Empire Score (0-1) Level: 0.37 Rank: 4 4
The Big Cycles Level Z-Score Rank Trajectory
Economic/Financial Position Somewhat Favorable 0.4 4
Debt Burden Low Debt 1.6 1 Я
Expected Growth 0.3% -1.0 9 4
Internal Order Low Risk 0.7 3 Я
Wealth/Opportunity/Values Gap Narrow 0.7 3 4
Internal Conflict Low 0.7 3
External Order
Eight Key Measures of Power
Trade Strong 0.6 4 4
Economic Output Average -0.1 4
Innovation & Technology Average -0.1 5
Education Average -0.2 5 -►
Markets & Financial Center Average -0.2 6
Military Strength Weak -0.6 9 4
Cost Competitiveness Weak -0.6 10 4
Reserve Currency Status
Additional Measures of Power
Resource-Allocation Efficiency Strong 0.6 3 Я
Governance/Rule of Law Strong 0.7 4 4
Infrastructure & Investment Average -0.3 7 -4
Character/Determination/Civility Average -0.5 8 4
Geology Weak -0.7 9 4
Acts of Nature Strong 1.1 2
Я Getting better ¥ Getting worse + Flat
Internal disorder is a low risk. Wealth, income, and values gaps are narrow.
Regarding inequality, the top 1 percent and top 10 percent in Germany capture
13 percent and 38 percent of income (respectively the fourth and fifth highest
shares across major countries). Our internal conflict gauge is low. This gauge
measures actual conflict events (e.g., protests), political conflict (e.g.,
partisanship), and general discontent (based on surveys).
On the eight key measures of power, Germany looks somewhat strong in
aggregate. It has no particularly prominent strengths or weaknesses that I
will call out.
THE POWERS AND PROSPECTS OF JAPAN
This is our computer-generated reading for Japan as of August 2021.
Based on the latest readings of key indicators, Japan appears to be a modest
power (No. 5 among major countries today) in gradual decline. As shown
in the table, the key strength of Japan is its high internal order. Its
weaknesses are its unfavorable economic/financial position and its relative
lack of natural resources. The eight major measures of power are somewhat
strong today but are, in aggregate, trending downward. In particular, Japan’s share
of global output, its importance to global trade, and its innovation and
technology are declining.
The table shows our aggregate country power gauge and the major drivers, as well
as the rank of each measure of power across 11 major countries today and the
trajectory over the past 20 years.
To understand a country, we start by looking at the big cycles, as well as
measures of power that both reflect and drive the rise and fall of a country.
While we refer to these factors individually, they are not separate; they interact
with and reinforce one another to move a country along its cycle.
For Japan, the big cycles look mixed.
Japan is in an unfavorable position in its economic and financial cycles,
with a moderately high debt burden and very low expected real growth over the
next 10 years (0 percent per year). Japan has significantly more foreign assets than
foreign debts (net IIP is 68 percent of GDP). Non-financial debt levels are very
high (400 percent of GDP), as are government debt levels (241 percent of GDP).
The bulk of these debts (99 percent) are in its own currency, which mitigates its
debt risks. The ability to use interest rate cuts to stimulate the economy is very low
(short rates at -0.1 percent), and the country is already printing money to
monetize debt.
JAPAN-KEY DRIVERS OF OUR COUNTRY POWER SCORE
Overall Empire Score (0-1) Level: 0.30 Rank: 5
The Big Cycles Level Z-Score Rank Trajectory
Economic/Financial Position Unfavorable -1.1 7 4
Debt Burden Moderately High Debt -0.4 7 4
Expected Growth 0.0% -1.1 11 4
Internal Order Low Risk 1.0 1 Я
Wealth/Opportunity/Values Gap Narrow 0.9 2
Internal Conflict Low 1.1 2 Я
External Order
Eight Key Measures of Power
Reserve Currency Status Weak -0.5 3
Education Average 0.2 4 4
Innovation & Technology Average 0.2 4
Markets & Financial Center Average 0.1 4
Cost Competitiveness Average -0.3 4 4
Trade Average -0.5 5
Military Strength Average -0.1 6 4
Economic Output Average -0.3 7
Additional Measures of Power
Governance/Rule of Law Strong 0.8 3 4
Character/Determination/Civility Average 0.5 4
Infrastructure & Investment Average -0.2 4
Resource-Allocation Efficiency Average 0.1 6
Geology Weak -1.1 11 -4
Acts of Nature Strong 1.5 1
Я Getting better ¥ Getting worse + Flat
Internal disorder is a low risk. Wealth, income, and values gaps are narrow.
Regarding inequality, the top 1 percent and top 10 percent in Japan capture 12
percent and 43 percent of income (respectively the sixth and third highest shares
across major countries). Our internal conflict gauge is low. This gauge measures
actual conflict events (e.g., protests), political conflict (e.g., partisanship), and
general discontent (based on surveys).
On the eight key measures of power, Japan looks somewhat strong in
aggregate. It has no particularly prominent strengths or weaknesses that I
will call out.
THE POWERS AND PROSPECTS OF INDIA
This is our computer-generated reading for India as of August 2021.
Based on the latest readings of key indicators, India appears to be a modest
power (No. 6 among major countries today) in gradual ascent. As shown in
the table, the key strengths of India are its strong economic and financial
position and its cost-competitive labor (on a quality-adjusted basis). Its
weaknesses are its large domestic conflicts, its weak relative position in
education, its bad reading on innovation and technology, its corruption
and inconsistent rule of law, and its lack of reserve currency status. The
eight major measures of power are somewhat strong today and are, in aggregate,
trending upward. In particular, India’s relative military strength, its innovation
and technology, and its importance to global trade are increasing.
The table shows our aggregate country power gauge and the major drivers, as well
as the rank of each measure of power across 11 major countries today and the
trajectory over the past 20 years.
To understand a country, we start by looking at the big cycles, as well as
measures of power that both reflect and drive the rise and fall of a country.
While we refer to these factors individually, they are not separate; they interact
with and reinforce one another to move a country along its cycle.
For India, the big cycles look mixed.
India is in a highly favorable position in its economic and financial cycles,
with a moderately low debt burden and high expected real growth over the next
10 years (6.3 percent per year). India has slightly more foreign debts than foreign
assets (net IIP is -12 percent of GDP). Non-financial debt levels are low (125
percent of GDP), though government debt levels are typical for major countries
today (75 percent of GDP). The bulk of these debts (91 percent) are in its own
currency, which mitigates its debt risks. The ability to use interest rate cuts to
stimulate the economy is modest (short rates at 3.4 percent).
INDIA-KEY DRIVERS OF OUR COUNTRY POWER SCORE
Overall Empire Score (0-1) Level: 0.27 Rank: 6 Я
The Big Cycles Level Z-Score Rank Trajectory
Economic/Financial Position Highly Favorable 0.8 1
Debt Burden Moderately Low Debt 0.1 5
Expected Growth 6.3% 1.1 1
Internal Order High Risk -1.8 10 4
Wealth/Opportunity/Values Gap Large -1.8 10 4
Internal Conflict Very Low
External Order
Eight Key Measures of Power
Cost Competitiveness Very Strong 2.4 1
Military Strength Average 0.2 5 Я
Economic Output Average -0.2 5 4
Reserve Currency Status Weak -0.8 6
Trade Weak -0.8 9 Я
Markets & Financial Center Weak -0.8 10 4
Innovation & Technology Weak -1.2 11
Education Weak -1.2 11 4
Additional Measures of Power
Character/Determination/Civility Strong 1.3 2 -►
Geology Average 0.3 4 4
Resource-Allocation Efficiency Average 0.2 5
Infrastructure & Investment Average -0.3 6 Я
Governance/Rule of Law Weak -1.1 10
Acts of Nature Very Weak -2.4 11
Getting better Si Getting worse -► Flat
Internal disorder is a high risk. Wealth, income, and values gaps are large.
Regarding inequality, the top 1 percent and top 10 percent in India capture 21
percent and 56 percent of income (both the highest shares across major countries).
However, a wide wealth gap is less concerning in a fast growing country like India
because the fast growth can create rising prosperity for all.
Looking in more detail at the eight key measures of power, India has the
cheapest labor among major countries. Adjusted for worker quality, labor is
significantly cheaper than the global average.
We net this against its weak relative position in education, its bad reading
on innovation and technology, and its lack of reserve currency status. On
years of education, India is bad—students have on average 5.8 years of education
versus 11.5 in the average major country. PISA scores, which measure the
proficiency of 15-year-old students across countries, are bad—336 versus 483 in
the average major country. With innovation and technology, a small share (less
than 1 percent) of global patent applications, a small share (3 percent) of global
R&D spending, and a moderate share (3 percent) of global researchers are in
India.
THE POWERS AND PROSPECTS OF THE UNITED KINGDOM
This is our computer-generated reading for the United Kingdom as of
August 2021.
Based on the latest readings of key indicators, the United Kingdom appears to
be a modest power (in the bottom half of major countries today) on a flat
trajectory. As shown in the table, the key strength of the United Kingdom
is its strong rule of law/low corruption. Its weaknesses are its unfavorable
economic/financial position and its relative lack of natural resources. The
eight major measures of power are somewhat weak today and are, in aggregate,
moving sideways.
The table shows our aggregate country power gauge and the major drivers, as well
as the rank of each measure of power across 11 major countries today and the
trajectory over the past 20 years.
To understand a country, we start by looking at the big cycles, as well as
measures of power that both reflect and drive the rise and fall of a country.
While we refer to these factors individually, they are not separate; they interact
with and reinforce one another to move a country along its cycle.
For the United Kingdom, the big cycles look mostly unfavorable.
The UK is in an unfavorable position in its economic and financial cycles,
with a high debt burden and relatively low expected real growth over the next 10
years (0.9 percent per year). The UK has modestly more foreign debts than foreign
assets (net IIP is -28 percent of GDP). Non-financial debt levels are high (260
percent of GDP), though government debt levels are typical for major countries
today (106 percent of GDP). The bulk of these debts (90 percent) are in its own
currency, which mitigates its debt risks. The ability to use interest rate cuts to
stimulate the economy is low (short rates at 0.1 percent), and the country is
already printing money to monetize debt.
UNITED KINGDOM-KEY DRIVERS OF OUR COUNTRY POWER SCORE
Overall Empire Score (0-1) Level: 0.27 Rank: 7 4
The Big Cycles Level Z-Score Rank Trajectory
Economic/Financial Position Unfavorable -1.7 9
Debt Burden High Debt -1.6 9
Expected Growth 0.9% -0.8 6
Internal Order Moderate Risk -0.2 8
Wealth/Opportunity/Values Gap Relatively Large -0.2 7
Internal Conflict Average -0.3 7
External Order
Eight Key Measures of Power
Reserve Currency Status Weak -0.6 4 4
Markets & Financial Center Average 0.0 5
Cost Competitiveness Average -0.3 5 4
Education Average -0.2 6
Economic Output Average -0.3 6 4
Innovation & Technology Average -0.3 7 -►
Trade Weak -0.6 7 4
Military Strength Average -0.3 8 4
Additional Measures of Power
Governance/Rule of Law Strong 1.2 1 4
Resource-Allocation Efficiency Average 0.3 4 4
Character/Determination/Civility Average -0.4 7
Infrastructure & Investment Weak -0.6 10
Geology Weak -0.9 10 -4
Acts of Nature Average 0.4 4
Я Getting better ¥ Getting worse + Flat
Internal disorder is a moderate risk. Wealth, income, and values gaps are
relatively large. Regarding inequality, the top 1 percent and top 10 percent in the
United Kingdom capture 13 percent and 36 percent of income (respectively the
fifth and sixth highest shares across major countries). Our internal conflict gauge
is average. This gauge measures actual conflict events (e.g., protests), political
conflict (e.g., partisanship), and general discontent (based on surveys).
On the eight key measures of power, the United Kingdom looks somewhat
weak in aggregate. It has no particularly prominent strengths or
weaknesses that I will call out.
THE POWERS AND PROSPECTS OF FRANCE
This is our computer-generated reading for France as of August 2021.
Based on the latest readings of key indicators, France appears to be a modest
power (in the bottom half of major countries today) on a flat trajectory. As
shown in the table, the key weaknesses of France that put it in this
position are its unfavorable economic/financial position, its people’s
lower-than-average work ethic and low self-sufficiency, and its relatively
poor allocation of labor and capital. The eight major measures of power are
somewhat weak today and are, in aggregate, moving sideways.
The table shows our aggregate country power gauge and the major drivers, as well
as the rank of each measure of power across 11 major countries today and the
trajectory over the past 20 years.
To understand a country, we start by looking at the big cycles, as well as
measures of power that both reflect and drive the rise and fall of a country.
While we refer to these factors individually, they are not separate; they interact
with and reinforce one another to move a country along its cycle.
For France, the big cycles look mostly unfavorable.
France is in an unfavorable position in its economic and financial cycles,
with a moderately high debt burden and relatively low expected real growth over
the next 10 years (0.4 percent per year). France has slightly more foreign debts
than foreign assets (net IIP is -25 percent of GDP). Non-financial debt levels are
high (268 percent of GDP), though government debt levels are typical for major
countries today (105 percent of GDP). France’s debts are largely in euros, which
increases France’s debt risks, since this is not a currency that France directly
controls. The ability to use interest rate cuts to stimulate the economy is low for
the Eurozone (short rates are at -0.5 percent), and Europe is already printing
money to monetize debt.
FRANCE-KEY DRIVERS OF OUR COUNTRY POWER SCORE
Overall Empire Score (0-1) Level: 0.25 Rank: 8 4
The Big Cycles Level Z-Score Rank Trajectory
Economic/Financial Position Unfavorable -1.2 8
Debt Burden Moderately High Debt -0.8 8
Expected Growth 0.4% -0.9 7 4
Internal Order Low Risk 0.5 4 4
Wealth/Opportunity/Values Gap Narrow 1.1 1
Internal Conflict Average -0.1 6 -►
External Order
Eight Key Measures of Power
Trade Average -0.5 6 4
Military Strength Average -0.3 7 4
Markets & Financial Center Average -0.3 7 4
Education Average -0.5 7 4
Innovation & Technology Average -0.5 8
Economic Output Weak -0.5 9
Cost Competitiveness Weak -0.6 9 4
Reserve Currency Status
Additional Measures of Power
Infrastructure & Investment Average -0.2 5
Governance/Rule of Law Average 0.3 6 4
Geology Average -0.5 7 4
Resource-Allocation Efficiency Weak -1.3 10
Character/Determination/Civility Weak -1.5 11 -4
Acts of Nature Average 0.0 6
Я Getting better ¥ Getting worse + Flat
Internal disorder is a low risk. Wealth, income, and values gaps are narrow.
Regarding inequality, the top 1 percent and top 10 percent in France capture 10
percent and 32 percent of income (both the ninth highest shares across major
countries). Our internal conflict gauge is average. This gauge measures actual
conflict events (e.g., protests), political conflict (e.g., partisanship), and general
discontent (based on surveys).
On the eight key measures of power, France looks somewhat weak in
aggregate. It has no particularly prominent strengths or weaknesses that I
will call out.
THE POWERS AND PROSPECTS OF THE NETHERLANDS
This is our computer-generated reading for the Netherlands as of August
2021.
Based on the latest readings of key indicators, the Netherlands appears to be a
modest power (in the bottom half of major countries today) on a flat
trajectory. As shown in the table, the key strengths of the Netherlands are
its high internal order and its strong rule of law/low corruption. Its
weaknesses are its relatively weak military and its relatively expensive
labor (on a quality-adjusted basis). The eight major measures of power are
somewhat weak today and are, in aggregate, moving sideways.
The table shows our aggregate country power gauge and the major drivers, as well
as the rank of each measure of power across 11 major countries today and the
trajectory over the past 20 years.
To understand a country, we start by looking at the big cycles, as well as
measures of power that both reflect and drive the rise and fall of a country.
While we refer to these factors individually, they are not separate; they interact
with and reinforce one another to move a country along its cycle.
For the Netherlands, the big cycles look somewhat favorable.
The Netherlands is in a somewhat favorable position in its economic and
financial cycles, with a low debt burden but relatively low expected real growth
over the next 10 years (1 percent per year). The Netherlands has significantly more
foreign assets than foreign debts (net IIP is 90 percent of GDP). Non-financial
debt levels are high (286 percent of GDP), though government debt levels are low
(53 percent of GDP). The Netherlands’ debts are largely in euros, which increases
the Netherlands’ debt risks, since this is not a currency that the Netherlands
directly controls. The ability to use interest rate cuts to stimulate the economy is
low for the Eurozone (short rates are at -0.5 percent), and Europe is already
printing money to monetize debt.
NETHERLANDS-KEY DRIVERS OF OUR COUNTRY POWER SCORE
Overall Empire Score (0-1) Level: 0.25 Rank: 9 4
The Big Cycles Level Z-Score Rank Trajectory
Economic/Financial Position Somewhat Favorable 0.0 5
Debt Burden Low Debt 0.8 3
Expected Growth 1.0% -0.8 5
Internal Order Low Risk 0.9 2 4
Wealth/Opportunity/Values Gap Narrow 0.6 4
Internal Conflict Low 1.2 1 Я
External Order
Eight Key Measures of Power
Innovation & Technology Average -0.3 6 4
Economic Output Average -0.3 8 4
Markets & Financial Center Weak -0.5 8 4
Trade Weak -0.6 8 4
Education Weak -0.7 9 4
Cost Competitiveness Weak -0.8 11 4
Military Strength Very Weak -1.9 11
Reserve Currency Status
Additional Measures of Power
Governance/Rule of Law Strong 1.0 2 4
Character/Determination/Civility Average -0.3 6 Я
Geology Average -0.5 6 4
Resource-Allocation Efficiency Average -0.1 8
Infrastructure & Investment Average -0.4 8 4
Acts of Nature
Average
0.5
3
Л Getting better Getting worse + Flat
Internal disorder is a low risk. Wealth, income, and values gaps are narrow.
Regarding inequality, the top 1 percent and top 10 percent in the Netherlands
capture 7 percent and 29 percent of income (both the 10th highest shares across
major countries). Our internal conflict gauge is low. This gauge measures actual
conflict events (e.g., protests), political conflict (e.g., partisanship), and general
discontent (based on surveys).
Looking in more detail at the eight key measures of power, we would call
out its relatively weak military and its relatively expensive labor (on a
quality-adjusted basis). A small share of global military spending (less than 1
percent) is by the Netherlands, and it has a small share of the world’s military
personnel (less than 1 percent). With labor cost, once we adjust for worker
quality, labor is somewhat more expensive than the global average.
THE POWERS AND PROSPECTS OF RUSSIA
This is our computer-generated reading for Russia as of August 2021.
Based on the latest readings of key indicators, Russia appears to be a modest
power (in the bottom half of major countries today) on a flat trajectory. As
shown in the table, the key strengths of Russia are its strong economic and
financial position, its wealth of natural resources, and its relatively strong
military. Its weaknesses are its relatively small economy, its corruption and
inconsistent rule of law, and its relative unimportance as a global financial
center. The eight major measures of power are somewhat weak today and are, in
aggregate, moving sideways.
The table shows our aggregate country power gauge and the major drivers, as well
as the rank of each measure of power across 11 major countries today and the
trajectory over the past 20 years.
To understand a country, we start by looking at the big cycles, as well as
measures of power that both reflect and drive the rise and fall of a country.
While we refer to these factors individually, they are not separate; they interact
with and reinforce one another to move a country along its cycle.
For Russia, the big cycles look somewhat favorable.
Russia is in a somewhat favorable position in its economic and financial
cycles, with a low debt burden and modest expected real growth over the next 10
years (2.5 percent per year). Russia has modestly more foreign assets than foreign
debts (net IIP is 33 percent of GDP). Non-fmancial debt levels are low (99
percent of GDP), as are government debt levels (14 percent of GDP). A
significant share of Russia’s debt (25 percent) is denominated in foreign
currencies, which increases its debt risks. The ability to use interest rate cuts to
stimulate the economy is high (short rates at 6.6 percent).
RUSSIA-KEY DRIVERS OF OUR COUNTRY POWER SCORE
Overall Empire Score (0-1) Level: 0.23 Rank: 10
The Big Cycles Level Z-Score Rank Trajectory
Economic/Financial Position Somewhat Favorable 0.5 2
Debt Burden Low Debt 1.0 2 Я
Expected Growth 2.5% -0.2 3
Internal Order Moderate Risk -0.5 9 Я
Wealth/Opportunity/Values Gap
Internal Conflict Average -0.5 9 Я
External Order
Eight Key Measures of Power
Cost Competitiveness Strong 0.7 3
Military Strength Average 0.4 3 4
Reserve Currency Status Weak -0.8 6
Education Weak -0.5 8 4
Innovation & Technology Weak -0.7 9 4
Trade Weak -0.9 10 -►
Markets & Financial Center Weak -1.1 11 4
Economic Output Weak -1.4 11 4
Additional Measures of Power
Geology Very Strong 1.9 1 4
Resource-Allocation Efficiency Strong 1.3 1
Character/Determination/Civility Average 0.1 5
Infrastructure & Investment Weak -1.0 11
Governance/Rule of Law Very Weak -1.9 11 -►
Acts of Nature Average -0.1 7
Я Getting better ¥ Getting worse + Flat
Internal disorder is a moderate risk. Our internal conflict gauge is average.
This gauge measures actual conflict events (e.g., protests), political conflict (e.g.,
partisanship), and general discontent (based on surveys).
Looking in more detail at the eight key measures of power, Russia has a
relatively strong military. A moderate share of global military spending (7
percent) is by Russia, and it has a moderately large share of the world’s military
personnel (13 percent).
We net this against its relatively small economy and its relative
unimportance as a global financial center. Russia’s equity markets are a small
share of the world total (less than 1 percent of total market cap and less than 1
percent of volume).
THE POWERS AND PROSPECTS OF SPAIN
This is our computer-generated reading for Spain as of August 2021.
Based on the latest readings of key indicators, Spain appears to be a modest
power (in the bottom half of major countries today) on a flat trajectory. As
shown in the table, the key weaknesses of Spain that put it in this position
are its unfavorable economic/financial position, its relatively poor
allocation of labor and capital, its relative unimportance to global trade,
and its bad reading on innovation and technology. The eight major measures
of power are somewhat weak today and are, in aggregate, moving sideways.
The table shows our aggregate country power gauge and the major drivers, as well
as the rank of each measure of power across 11 major countries today and the
trajectory over the past 20 years.
To understand a country, we start by looking at the big cycles, as well as
measures of power that both reflect and drive the rise and fall of a country.
While we refer to these factors individually, they are not separate; they interact
with and reinforce one another to move a country along its cycle.
For Spain, the big cycles look mostly unfavorable.
Spain is in an unfavorable position in its economic and financial cycles,
with a high debt burden and very low expected real growth over the next 10 years
(0 percent per year). Spain has significantly more foreign debts than foreign assets
(net IIP is -73 percent of GDP). Non-financial debt levels are high (249 percent of
GDP), as are government debt levels (114 percent of GDP). Spain’s debts are
largely in euros, which increases Spain’s debt risks, since this is not a currency that
Spain directly controls. The ability to use interest rate cuts to stimulate the
economy is low for the Eurozone (short rates are at -0.5 percent), and Europe is
already printing money to monetize debt.
SPAIN-KEY DRIVERS OF OUR COUNTRY POWER SCORE
Overall Empire Score (0-1) Level: 0.20 Rank: 11 4
The Big Cycles Level Z-Score Rank Trajectory
Economic/Financial Position Unfavorable -1.9 11
Debt Burden High Debt -1.7 10
Expected Growth 0.0% -1.1 10
Internal Order Moderate Risk 0.0 6 4
Wealth/Opportunity/Values Gap Typical 0.4 5 Я
Internal Conflict Average -0.4 8
External Order
Eight Key Measures of Power
Cost Competitiveness Weak -0.6 7 4
Markets & Financial Center Weak -0.6 9 -►
Military Strength Weak -0.8 10 4
Economic Output Weak -0.9 10
Education Weak -0.9 10 4
Innovation & Technology Weak -1.0 10
Trade Weak -0.9 11 4
Reserve Currency Status
Additional Measures of Power
Geology Weak -0.6 8 -►
Infrastructure & Investment Weak -0.6 9
Governance/Rule of Law Weak -0.7 9
Character/Determination/Civility Weak -1.0 9 4
Resource-Allocation Efficiency Weak -1.6 11
Acts of Nature Weak -0.7 10
Я Getting better ¥ Getting worse 4 Flat
Internal disorder is a moderate risk. Wealth, income, and values gaps are
typical. Regarding inequality, the top 1 percent and top 10 percent in Spain
capture 12 percent and 34 percent of income (respectively the seventh and eighth
highest shares across major countries). Our internal conflict gauge is average. This
gauge measures actual conflict events (e.g., protests), political conflict (e.g.,
partisanship), and general discontent (based on surveys).
Looking in more detail at the eight key measures of power, we would call
out its relative unimportance to global trade and its bad reading on
innovation and technology. Spain accounts for just 2 percent of global exports.
With innovation and technology, small shares of global patent applications (less
than 1 percent), global R&D spending (1 percent), and global researchers (1
percent) are in Spain.
More from the Author
PRINCIPLES
• I M#TO« nuu ItllltLIU
Principles
ABOUT THE AUTHOR
Ray Dalio has been a global macro investor for nearly 50 years. He is the founder
and со-CIO of Bridgewater Associates, an industry-leading institutional
investment firm that is the largest hedge fund in the world.
Dalio grew up a very ordinary middle-class kid on Long Island, started
investing when he was 12 years old, created Bridgewater out of his two-bedroom
apartment when he was 26, and grew it into what Fortune assessed to be the fifth
most important private company in the US. In the process, he became an advisor
to top policy makers, which led TIME to name him one of the “100 Most
Influential People in the World.” CIO and Wired have called him “the Steve Jobs
of investing” for his uniquely inventive and industry-changing way of thinking.
He has also been named by Forbes as one of the 50 most generous philanthropists
in the US.
In 2017, he decided to pass along the principles behind his success in a series of
books and animated videos. His book Principles: Life and Work was a No. 1 New
York Times Best Seller and No. 1 Amazon business book of the year, has sold
more than 3 million copies worldwide, and has been translated into over 30
languages. His 30-minute animated YouTube videos “How the Economic
Machine Works” and “Principles for Success” have together been watched more
than 100 million times, and his book Principles for Navigating Big Debt Crises
was well-received by economists, policy makers, and investors.
In this new book, Principles for Dealing with the Changing World Order,
Dalio applies his unique way of seeing the world to studying the rises and falls of
great reserve currency empires. His hope is that the model shared in these pages
will help readers prepare for the changing times ahead.
AvidReaderPress.com
SimonandSchuster.com
www.SimonandSchuster.com/Authors/Ray-Dalio
ф @avidreaderpress (*' @avidreaderpress ftg) @avidreaderpress
ALSO BY RAY DALIO
Principles: Life and Work
Principlesfor Navigating Big Debt Crises
Principles for Success
We hope you enjoyed reading
this Simon & Schuster ebook.
Get a FREE ebook when you join our mailing list. Plus, get updates on new releases,
deals, recommended reads, and more from Simon & Schuster. Click below to sign up
and see terms and conditions.
CLICK HERE TO SIGN UP
Already a subscriber? Provide your email again so we can register this ebook and send
you more of what you like to read. You will continue to receive exclusive offers in your
inbox.
GLOSSARY OF TERMS
Countries
ARG
Argentina
BEL
Belgium
BRZ
Brazil
CAN
Canada
CHE
Switzerland
CHI
Chile
CHN
China
COL
Colombia
CZK
Czech Republic
DEU
Germany
ESP
Spain
EUR
Euroland
FRA
France
GBR (or UK)
United Kingdom
GRC
Greece
HUN
Hungary
IDR
Indonesia
IND
India
ITA
Italy
JPN
Japan
MEX
Mexico
NLD
Netherlands
NOR
Norway
PLD
Poland
PRT
Portugal
RUS
Russia
SAF
South Africa
SGP
Singapore
SWE
Sweden
TLD
Thailand
TUR
Turkey
USA (or US)
United States
WLD
World
Terms
Adj
Adjusted
Ann
Annualized
Avg
Average
Bln
Billion
СВ
Central bank
Chg
Change
Corp
Corporate
CPI
Consumer price index
Dutch EIC
Dutch East India Company
Est
Estimate
FX (or Spot FX)
Currency exchange rate
GDP
Gross domestic product
Govt
Government
Inti
International
Inv
Inverted
Log
Natural log
MA
Moving average
Mln
Million
Oz
Ounces
Pop
Population
PPM
Parts per million
PPP
Purchasing power parity
RGDP
Real (inflation-adjusted) gross domestic product
TWI
Trade-weighted index
Y (or Yr)
Year
Y/Y
Year-over-year change
$
US dollars
£
British pounds
12mma
12-month moving average
60/40
Refers to a portfolio of 60 percent equities and 40 percent bonds
6mma
6-month moving average
Currencies
CNY
Chinese yuan
GBP
British pound sterling
Guilder
Dutch currency
Maravedi Coin
Spanish coin of 12th—19th centuries
USD
US dollar
For definitions of commonly used economic terms, please see economicprinciples.org
AVID READER PRESS
An Imprint of Simon & Schuster, Inc.
1230 Avenue of the Americas
New York, NY 10020
www.SimonandSchuster.com
Copyright © 2021 by Ray Dalio
All rights reserved, including the right to reproduce this book or portions thereof in any form whatsoever. For
information, address Avid Reader Press Subsidiary Rights Department, 1230 Avenue of the Americas, New
York, NY 10020.
First Avid Reader Press hardcover edition November 2021
AVID READER PRESS and colophon are trademarks of Simon & Schuster, Inc.
For information about special discounts for bulk purchases, please contact Simon & Schuster Special Sales at
1-866-506-1949 or business@simonandschuster.com.
The Simon & Schuster Speakers Bureau can bring authors to your live event. For more information or to
book an event, contact the Simon & Schuster Speakers Bureau at 1-866-248-3049 or visit our website at
www.simonspeakers.com.
Interior design by Creative Kong
Jacket design: Rodrigo Corral / Book design: Creative Kong
Library of Congress Cataloging-in-Publication Data has been applied for.
ISBN 978-1-9821-6027-2
ISBN 978-1-9821-6479-9 (ebook)